FINANCIAL SYSTEMS AND FIRM PERFORMANCE - ETLA
500
Ari Hyytinen and Mika Pajarinen (Editors) FINANCIAL SYSTEMS AND FIRM PERFORMANCE: THEORETICAL AND EMPIRICAL PERSPECTIVES The Research Institute of the Finnish Economy (ETLA) B:200 Publisher: Taloustieto Ltd. Printing: Yliopistopaino Helsinki 2003
-
Upload
khangminh22 -
Category
Documents
-
view
0 -
download
0
Transcript of FINANCIAL SYSTEMS AND FIRM PERFORMANCE - ETLA
Ari Hyytinen and Mika Pajarinen (Editors)
FINANCIAL SYSTEMS AND FIRM PERFORMANCE:
THEORETICAL AND EMPIRICAL PERSPECTIVES
The Research Institute of the Finnish Economy (ETLA) B:200
Publisher: Taloustieto Ltd.
Printing: Yliopistopaino
Helsinki 2003

Cover: MainosMayDay, Vantaa
ISBN 951-628-385-3 ISSN 0356-7443 Printed in Yliopistopaino, Helsinki 2003

Financia l systems and f i rm per formance: Theoret ical and empir ica l perspect ives · i
CONTENTS
Editors’ foreword ......................................................................................................iii List of contributors ....................................................................................................v List of figures............................................................................................................. ix List of tables ...............................................................................................................xi List of project publications ....................................................................................xiii
INTRODUCTION TO THE VOLUME
INTRODUCTION ............................................................................................................ 1 ARI HYYTINEN AND MIKA PAJARINEN
PART I: MACROECONOMIC AND INSTITUTIONAL PERSPECTIVE
1. FINANCIAL SYSTEMS AND VENTURE CAPITAL IN NORDIC COUNTRIES: A COMPARATIVE STUDY ........................................................................................... 19
ARI HYYTINEN AND MIKA PAJARINEN
2. INVESTOR PROTECTION AND FINANCIAL DEVELOPMENT IN FINLAND .............. 65 ARI HYYTINEN, IIKKA KUOSA AND TUOMAS TAKALO
3. THE ROLE OF SHAREHOLDER PROTECTION RULES IN FINANCING FINNISH
COMPANIES ........................................................................................................... 97 TIMO KAISANLAHTI
4. EXITING VENTURE CAPITAL INVESTMENTS: LESSONS FROM FINLAND............. 135 JYRKI ALI-YRKKÖ, ARI HYYTINEN AND JOHANNA LIUKKONEN
5. PATTERNS OF THE FINNISH MERGER AND ACQUISITION ACTIVITY ................... 177 JYRKI ALI-YRKKÖ
PART II: MICROECONOMIC PERSPECTIVE
6. SMALL BUSINESS FINANCE IN FINLAND – A DESCRIPTIVE STUDY .................... 203 ARI HYYTINEN AND MIKA PAJARINEN
7. GLOBALIZATION OF BUSINESS IN A SMALL COUNTRY – DOES OWNERSHIP
MATTER?.............................................................................................................. 249 JYRKI ALI-YRKKÖ AND PEKKA YLÄ-ANTTILA
i i · C o n t e n t s
8. CROSS-BORDER VENTURE CAPITAL.................................................................... 269 MARKKU V. J. MAULA AND MARKUS M. MÄKELÄ
9. VENTURE CAPITAL FINANCE: WHAT IS DIFFERENT?......................................... 293 VESA KANNIAINEN
PART III: PUBLIC POLICY PERSPECTIVE
10. GOVERNMENT FUNDING OF SMALL AND MEDIUM-SIZED ENTERPRISES IN
FINLAND............................................................................................................. 325 ARI HYYTINEN AND LOTTA VÄÄNÄNEN
11. DOES FINANCIAL DEVELOPMENT MATTER FOR INNOVATION AND ECONOMIC
GROWTH? IMPLICATIONS FOR PUBLIC POLICY .................................................. 379 ARI HYYTINEN, PETRI ROUVINEN, OTTO TOIVANEN AND PEKKA YLÄ-ANTTILA
FINNISH SUMMARY
RAHOITUSJÄRJESTELMÄ JA YRITYSTOIMINTA UUDISTUVASSA TALOUDESSA.......... 459 ARI HYYTINEN JA MIKA PAJARINEN

Financia l systems and f i rm per formance: Theoret ical and empir ica l perspect ives · i i i
EDITORS’ FOREWORD
This volume reports the outcome and associated work of “Challenges for a Fi-nancial System in an Era of Technological and Industrial Change”, a research pro-ject of Etlatieto Ltd (a subsidiary of The Research Institute of the Finnish Economy, ETLA) that has been initiated and funded by Tekes (The National Technology Agency) and Sitra (The Finnish National Fund for Research and Development). The project was launched in summer 2001 and completed by spring 2003.
Both the project and this volume have focused on long-term financial development in Finland. By the term financial development we mean the general advance of the Finnish financial system during the past twenty years and particularly since the economic crisis of the early 1990s. We have consid-ered, in particular, what challenges there are for Finland, a country amidst an era of technological and industrial change but with a long-lasting concern of having an Achilles heel of insufficient supply of capital. To identify these challenges, we have addressed the following kinds of questions: How has the Finnish financial system advanced during the past two decades? How has the overall availability of external finance to Finnish firms and especially to small and medium-sized enterprises (SMEs) changed as a result? What are the main sources of capital to Finnish SMEs? Is there a sufficient amount of capi-tal available for Finnish firms at the various stages of their financial growth cycle? What are the roles of private and public sources of capital in a con-stantly developing financial system? It is our hope that this volume provides the reader with tools for thought and insights to these challenging questions.
We researchers have benefited enormously from the comments and in-sights of the research project’s steering group. Members of the group have been Markus Koskenlinna (Executive Director, Tekes), Eija Ahola (Head of Unit, Tekes), Anu Nokso-Koivisto (Director, Sitra), Otto Toivanen (Professor, Helsinki School of Economics), Eva Liljeblom (Professor, Swedish School of Economics), Vesa Puttonen (Professor, Helsinki School of Economics), Erkko Autio (Professor, Helsinki University of Technology), Pekka Ylä-Anttila (Re-search Director, ETLA), and Petri Rouvinen (Research Director, Etlatieto Ltd). The outcome and associated work of the research project, and particularly
i v · E d i t o r s ’ f o r e w o r d
the Chapters of this volume, have also benefited from comments of partici-pants at different workshops and seminars, such as those held at Tekes in February 2002, at the Ministry of Trade and Industry in December 2002, and at the Bank of Finland in January 2003. We would also like to thank Iikka Kuosa, Johanna Liukkonen, and Lotta Väänänen, who have worked as pro-ject researchers at Etlatieto, as well as Lasse Luoma and Jarmo Huttunen from Tietoykkönen Ltd, Sirpa Hautala from the Ministry of Trade and Indus-try, Pasi Holm from the Federation of Finnish Enterprises, Harri Laajarinne from Tekes, Eija Korhonen from the Bank of Finland, and the people in firms, venture capital industry and Statistics Finland who have accepted our re-quests for interviews, research material and data during the various stages of this research project, for their help.
Finally, we editors to this volume would like to thank Jyrki Ali-Yrkkö (Head of Unit, Etlatieto Ltd), Timo Kaisanlahti (Legal Consultant, Klegal), Vesa Kanniainen (Professor, University of Helsinki), Iikka Kuosa (Researcher, Helsinki School of Economics and LTT Research Ltd), Johanna Liukkonen (MPhil Candidate, Graduate Institute of International Studies in Geneva), Markku Maula (Senior Researcher, Helsinki University of Technology), Mar-kus Mäkelä (Researcher, Helsinki University of Technology), Petri Rouvinen (Research Director, Etlatieto Ltd), Tuomas Takalo (Research Supervisor, Bank of Finland), Otto Toivanen (Professor, Helsinki School of Economics), Lotta Väänänen (Project Researcher, Etlatieto Ltd), and Pekka Ylä-Anttila (Research Director, ETLA) for their contributions to this volume.
Helsinki, March 2003
Ari Hyytinen Mika Pajarinen Research Supervisor Researcher Etlatieto Ltd. Etlatieto Ltd.

Financia l systems and f i rm per formance: Theoret ical and empir ica l perspect ives · v
LIST OF CONTRIBUTORS
Jyrki Ali-Yrkkö, Lic.Sc.(Econ.), is a head of unit at Etlatieto Ltd, a project research and informa-tion services unit of The Research Institute of the Finnish Economy (ETLA). His research interests include internationalization of companies, determinants of R&D and fixed in-vestment, corporate governance, and Nokia's role in the Finnish economy.
Ari Hyytinen, Dr.Sc.(Econ.), is a research supervisor at Etlatieto Ltd, a project research and in-formation services unit of The Research Institute of the Finnish Economy (ETLA). His re-search interests include financial markets, corporate finance, government funding of firms, and determinants of corporate R&D. Prior to joining Etlatieto Ltd, Ari Hyytinen worked as a corporate finance advisor at an investment bank, as an economist at the Bank of Finland, and as a researcher at the Helsinki School of Economics. His research has recently been published and accepted for publication in, e.g., Applied Financial Eco-nomics, European Finance Review, Economics Letters, Journal of Financial Services Re-search, and European Journal of Law and Economics.
Timo Kaisanlahti, LL.D., M.Sc.(Econ.), is a legal consultant of KLegal, Finland. In his earlier ca-reer as a civil servant Kaisanlahti was involved in drafting Finnish legislation of securi-ties markets and financial information. His dissertation ("Stakeholders and Risk in a Listed Company" [in Finnish], 1999) for a doctorate of laws considered the company law relations from a law and economics point of view.
Vesa Kanniainen, Dr.Sc.(Econ.), is a Professor at the Department of Economics of the University of Helsinki. He has published work on entrepreneurship, capital income taxation, intel-lectual property rights and innovations, real options, industrial organization, monetary economics, and more recently on venture capital. Kanniainen has been introducing text-books on law and economics in Finland and he has edited recently a book on Ethics and Economy. Kanniainen has been teaching as Visiting Assistant Professor at Brown Uni-versity and Washington State University. He has also been a visiting lecturer at the Uni-versity of Munich, University of Hamburg and University of Uppsala. Kanniainen is a research fellow at CESifo in Munich and associate editor of Finanzarchiv.
Iikka Kuosa, M.Sc.(Econ.), is a researcher at the Helsinki School of Economics and LTT Research Ltd, a research company owned by the Helsinki School of Economics. In addition to in-vestor protection his research has recently dealt with corporate governance, executive compensation, and corporate board work.
Johanna Liukkonen is a MPhil candidate in International Relations at the Graduate Institute of International Studies in Geneva. After working in the projects of the Ministry of Trade and Industry and Etlatieto Ltd., she has been working as a research assistant for Geneva Centre for Democratic Control of the Armed Forces. Her current research interests in-clude security issues (welfare vs. armament) and effects of globalization on welfare countries.

v i · L i s t o f c o n t r i b u t o r s
Markku Maula, Dr.Sc.(Tech.), is a senior researcher at the Helsinki University of Technology, In-stitute of Strategy and International Business. His research interests focus on venture capital, corporate venturing, and entrepreneurial management. He has received several international awards for outstanding scholarship including the Heizer Award for the best doctoral dissertation in the field of new enterprise development. In addition to his research and teaching roles, he acts as an advisor in areas related to business strategy, corporate finance, and innovation and enterprise policy.
Markus Mäkelä, M.Sc.(Econ.), is a researcher at the Helsinki University of Technology, Institute of Strategy and International Business. His primary interests are in the fields of interna-tional technology-based venturing and venture capital and he is currently preparing a doctoral dissertation on cross-border venture capital investments. He also works as an advisor to technology-based start-ups, and has previously worked for the Helsinki School of Economics and Morgan Stanley Dean Witter & Co., among others.
Mika Pajarinen, M.Sc.(Econ.), is a researcher at Etlatieto Ltd., a project research and information services unit of The Research Institute of the Finnish Economy (ETLA). His research in-terests include financial markets, corporate finance, internationalization of business, and determinants of corporate R&D and innovations.
Petri Rouvinen, Ph.D.(Econ.), is a research director at Etlatieto Ltd., a project research and infor-mation services unit of The Research Institute of the Finnish Economy (ETLA). In May 2000 he completed his studies at the Vanderbilt University with Industrial Organization as his major. Since then his work has been published in, e.g., Applied Economics Letters, Economics of Innovation and New Technology, Information Economics and Policy, as well as in Journal of Applied Economics. His current research interests include innova-tion and competitiveness, and the effects of information and communication technology (ICT) on productivity.
Tuomas Takalo, Dr.Sc.(Econ.), is currently a research supervisor at the research department at the Bank of Finland and a docent of industrial economics at the University of Oulu. 2001-2002 he also acted as the Editor of Finnish Economic Papers. His research mainly con-cerns with economics of intellectual property rights, financial intermediation and law and finance. His research has recently been published in, e.g., European Finance Review, Journal of Technology Transfer, R&D Management, and International Journal of Indus-trial Organization.
Otto Toivanen, Ph.D.(Econ.), is a Professor of Technology Management and Policy at the De-partment of Economics, Helsinki School of Economics. He has held positions at the Uni-versity of Warwick and Academy of Finland, and visiting positions at the Massachusetts Institute of Technology (MIT) and National Bureau of Economic Research (NBER). Toivanen has research interests in industrial organization. Among other things he has studied the diffusion of innovations, financing of R&D, and the role of information and learning in financial markets and in entry decisions of firms.
Lotta Väänänen is a M.Sc. candidate at the Helsinki School of Economics and a project researcher at The Research Institute of the Finnish Economy (ETLA) and Etlatieto Ltd. Her research interests include innovation systems, government business support policies and deter-minants of corporate R&D.

L ist of contr ibutors · v i i
Pekka Ylä-Anttila, Lic.Sc.(Econ.), has been working at The Research Institute of the Finnish Economy (ETLA) since 1974. Currently he is a research director of ETLA and managing director of Etlatieto Ltd (a project research and information services unit of ETLA). He is an author or co-author of some 20 books and dozens of articles in the fields of competitiveness analysis, industrial and technology policies, industrial economics, technological change, and internationalization of business.


Financia l systems and f i rm per formance: Theoret ical and empir ica l perspect ives · i x
LIST OF FIGURES
Figure 1.1. Bank lending and bankruptcies in Nordic countries (1982-2001) ...................................24 Figure 1.2. GDP growth and real lending rates in Nordic countries (1990-2001).............................26 Figure 1.3. Stock market capitalization and share turnover in Nordic countries (1990-2001)........28 Figure 1.4. Indicators of financial development and structure in Nordic countries (1990-2000) ...31 Figure 1.5. Private equity funds raised in Nordic countries (1991-2001)...........................................39 Figure 1.6. Private equity investments in Nordic countries (1991-2001) ...........................................41 Figure 1.7. Private equity investments by sector in Nordic countries (1991-2001)...........................43 Figure 1.8. Private equity divestments in Nordic countries (1991-2001) ...........................................45 Figure 1.9. The share of Nordic countries in private equity activity in Europe ...............................47 Figure 1.10. Private equity investment in high technology sectors in Europe (1998-2001).............49 Figure 2.1. Shareholder rights (1980-2001).............................................................................................75 Figure 2.2. Decomposition of shareholder rights (1980-2001).............................................................76 Figure 2.3. Creditor rights (1980-2001) ...................................................................................................77 Figure 2.4. Decomposition of creditor rights (1980-2001) ....................................................................79 Figure 2.5. Summary of shareholder and creditor rights (1980-2001)................................................80 Figure 2.6. Financial development (1980-2000) .....................................................................................83 Figure 2.7. Financial structure (1980-2000) ............................................................................................85 Figure 2.8. Flows of external finance to firms (1980-2000)...................................................................85 Figure 4.1. Venture capital cycle............................................................................................................139 Figure 4.2. Market capitalization of the Finnish listed companies (1980-2002) ..............................144 Figure 4.3. The ratio of market capitalization of domestic shares to GDP (1990-2001) .................145 Figure 4.4. Stock market turnover (1991-2001) ....................................................................................146 Figure 4.5. Concentration of market capitalization and liquidity (2000-2001)................................147 Figure 4.6. Volatility of monthly stock returns (1980-2002)...............................................................148 Figure 4.7. The number of initial public offerings and listed firms in Finland (1980-2002)..........149 Figure 4.8. Initial public offerings per capita (per million people)...................................................150 Figure 4.9. The number of M&As in Finland (1980-2001)..................................................................153 Figure 4.10. Number of trade sales and IPO exits in Finland (1991-2001).......................................157 Figure 5.1. The number of mergers and acquisitions (world total, 1990-2000)...............................178 Figure 5.2. The number of M&As in the U.S. (1895-2000)..................................................................183 Figure 5.3. Causes of M&As...................................................................................................................186 Figure 5.4. The number of M&As in Finland (1980-2001)..................................................................188 Figure 5.5. The M&A activity in the EU member states (1991-99)....................................................190 Figure 5.6. Countries as cross-border M&A targets (1990-99)...........................................................191 Figure 5.7. The number of outward cross-border deals in relation to GDP (1990-99) ...................192 Figure 5.8. The value of outward cross-border deals in relation to GDP (1990-99) .......................192 Figure 6.1. Main lenders and equity sources by R&D-intensity of SMEs........................................229 Figure 6.2. Concentration of debt vs. total assets................................................................................231 Figure 6.3. Concentration of equity vs. total assets ............................................................................232 Figure 6.4. Concentration of debt vs. R&D-expenditures..................................................................233 Figure 6.5. Concentration of equity vs. R&D-expenditures ..............................................................234 Figure 7.1. Ownership in Finnish listed firms, percent of market capitalization (1958-2002) ......255 Figure 7.2. Inward foreign direct investment in Finland, billions of euros (1975-2001)................255

x · L i s t o f f i g u r e s
Figure 7.3. Goals of large Finnish companies, percent of companies ..............................................261 Figure 8.1. Venture capital and private equity investments as a percentage of GDP in 1999.......274 Figure 10.1. Finance as the most significant obstacle to SME development ...................................327 Figure 10.2. Domestic financing granted by Finnvera (1997-2001) ..................................................336 Figure 10.3. Tekes’ R&D financing decisions (1997-2001) ..................................................................339 Figure 10.4. Sitra’s financing (1997-2001) .............................................................................................342 Figure 10.5. FII’s investments (1997-2001)............................................................................................345 Figure 10.6. Subsidies provided by TE-Centers (1997-2001) .............................................................347 Figure 10.7. Total amount of government funding to SMEs (1997-2001) ........................................348 Figure 10.8. Shares of direct SME financing by institution (1997-2001)...........................................350 Figure 10.9. Relative shares of indirect financing by institution (1997-2001)..................................372 Figure 11.1. The effect of financial development on economic growth ...........................................381 Figure 11.2. Finance-growth nexus .......................................................................................................382 Figure 11.3. Financial systems in comparison – overall financial activity.......................................387 Figure 11.4. Financial systems in comparison – financial structure .................................................388 Figure 11.5. Financial development in Finland ...................................................................................389 Figure 11.6. European versus US private equity (1995-2001) ............................................................393 Figure 11.7. Finnish stock market versus Euro area stock markets..................................................395 Figure 11.8. Revealed demand for external finance by large firms (1989-1996) .............................398 Figure 11.9. Demand for external finance by Finnish firms (all sectors) .........................................401 Figure 11.10. Availability of external finance to Finnish SMEs (1996-2002) ....................................402 Figure 11.11. Early-stage (seed and start-up) venture capital (1998-2001) ......................................412 Figure 11.12. Seed-stage venture capital (1998-2001) .........................................................................412 Figure 11.13. Self-employed and capital market tightness ................................................................413 Figure 11.14. Capital market imperfections and the problem of appropriability ..........................417 Figure 11.15. Macroeconomic developments in Finland and the EU (1975-2002)..........................422 Figure 11.16. Graduate education in Finland ......................................................................................423 Figure 11.17. Characteristics of tangible and intangible investment................................................424 Figure 11.18. Productivity in Finland and the US (1975-2001, US 2001 = 100)................................425 Figure 11.19. R&D in ICT relative to GDP ...........................................................................................428 Figure 11.20. Entrepreneurship in selected countries ........................................................................430

Financia l systems and f i rm per formance: Theoret ical and empir ica l perspect ives · x i
LIST OF TABLES
Table 1.1. Nominal market capitalization to GDP (annual averages) ................................................27 Table 1.2. Investor protection...................................................................................................................33 Table 1.3. Analysis of venture capital cycle in Nordic countries versus Europe (1991-2001) .........50 Table 4.1. Europe’s ‘new’ stock markets (as of 2001)...........................................................................151 Table 4.2. Trading activity at the Helsinki Stock Exchange by the list type (1999-2002) ...............152 Table 4.3. Descriptive statistics for IPOs and M&As in Finland (1980-2002) .................................155 Table 4.4. Multivariate regressions for IPOs and M&As....................................................................156 Table 4.5. Exit track record .....................................................................................................................159 Table 4.6. Differences between the companies with and without exit experience .........................159 Table 4.7. Ten most important determinants of the investment decision ........................................160 Table 4.8. Factors influencing the choice of exit route........................................................................161 Table 4.9. Feedback effects and the importance of market environment.........................................162 Table 4.10. Institutional environment of IPOs .....................................................................................163 Table 4.11. Institutional environment of M&As..................................................................................164 Table 4.12. Background information.....................................................................................................173 Table 5.1. Implications of different hypotheses of M&As..................................................................182 Table 5.2. Top five M&A industries in the U.S.....................................................................................185 Table 5.3. Top five industries based on the number of M&As in Finland .......................................188 Table 5.4. The Finnish M&As by the target size (percentages) .........................................................189 Table 5.5. Explaining M&A activity ......................................................................................................194 Table 6.1. Description of unweighted and weighted data .................................................................210 Table 6.2. Estimated distributions of equity, capital loans and debt by firm size and age............212 Table 6.3. Estimated distribution of equity by firm size and age, version 1....................................215 Table 6.4. Estimated distribution of equity by firm size and age, version 2....................................216 Table 6.5. Estimated distribution of principal owner’s equity by firm size and age......................217 Table 6.6. Estimated distribution of debt by firm size and age.........................................................219 Table 6.7. Estimated distributions of equity, capital loans and debt by innovation activity.........221 Table 6.8. Estimated distribution of equity by innovation activity, version 1 .................................223 Table 6.9. Estimated distribution of equity by innovation activity, version 2 .................................224 Table 6.10. Estimated distribution of principal owner’s equity by innovation activity.................225 Table 6.11. Estimated distribution of debt by innovation activity ....................................................227 Table 6.12. Coefficients of correlation between selected sources of finance – Panel A ..................235 Table 6.13. Coefficients of correlation between selected sources of finance – Panel B...................236 Table 7.1. Differences in corporate governance...................................................................................252 Table 7.2. Performance by ownership (using Top 100 data, N = 199)...............................................257 Table 7.3. Performance by ownership (using Top 500 data, N=5121)...............................................258 Table 7.4. Investment by ownership (using Top 500 data, N=5121) .................................................259 Table 7.5. Statistical tests (using Top 500 data, N=5121).....................................................................260 Table 7.6. Comparison of firms’ goals (using Top 100 data, N=199).................................................262 Table 7.7. Performance by goals (using Top 100 data, N = 199) ........................................................262 Table 8.1. Finnish software product companies with and without foreign investors....................275 Table 8.2. Descriptive data......................................................................................................................275 Table 8.3. Regression analysis................................................................................................................277

x i i · L i s t o f t a b l e s
Table 8.4. Description of the case companies.......................................................................................279 Table 10.1. Real annual growth of government funding to SMEs (1998-2001) ...............................349 Table 10.2. Proportion of SMEs receiving finance from the public institutions..............................354 Table 10.3. Proportion of SMEs receiving finance by firm characteristics.......................................356 Table 10.4. Standard Logit regressions .................................................................................................360 Table 10.5. Rare events Logit regressions.............................................................................................362 Table 10.6. Count model regressions ....................................................................................................364 Table 10.7. Sample description – Panel A.............................................................................................373 Table 10.8. Sample description – Panel B .............................................................................................374 Table 11.1. Finnish SMEs’ perceptions of the private debt and equity markets .............................406 Table 11.2. Finnish SMEs’ perceptions of how financially constrained they are ............................407 Table 11.3. Finnish SMEs’ changing innovative activity and financing problems..........................408 Table 11.4. Determinants of financial constraints (Logit regressions)..............................................409

Financia l systems and f i rm per formance: Theoret ical and empir ica l perspect ives · x i i i
LIST OF PROJECT PUBLICATIONS
Research papers and associated work of Etlatieto Ltd’s research project ”Challenges for a Financial System in an Era of Technological and Industrial Change”
Ali-Yrkkö, J., 2002, Mergers and acquisitions – Reasons and results, The Research Institute of the Finnish Economy (ETLA), Discussion papers nr. 792, revised version is a Chapter of this volume.
Ali-Yrkkö, J., Hyytinen, A. and Liukkonen, J., 2001, Exiting venture capital investments: Lessons from Finland, The Research Institute of the Finnish Economy (ETLA), Discussion papers nr. 781, revised version is a Chapter of this volume.
Ali-Yrkkö, J. and Ylä-Anttila, P., 2001, Globalisation of business in a small country – Does ownership matter?, The Research Institute of the Finnish Economy (ETLA), Discussion papers nr. 779, revised version is a Chapter of this volume.
Hyytinen, A., 2002, How important are exits for venture capital finance? Evidence from Finland, Paper prepared for CESifo Conference on Venture Capital, Entrepreneurship and Public Policy, Munich 2002.
Hyytinen, A., Kuosa, I. and Takalo T., 2002, Investor protection and financial development in Finland, mimeo, revised version is a Chapter of this volume.
Hyytinen, A., Kuosa, I. and Takalo, T., 2003, Law or finance: Evidence from Finland, European Journal of Law and Economics, forthcoming, Earlier versions published as ETLA discussion papers nr. 775 and Bank of Finland discussion paper 8/2002.
Hyytinen, A., and Pajarinen, M., 2001, Financial systems and venture capital in Nordic countries: A comparative study, The Research Institute of the Finnish Economy (ETLA), Discussion papers nr. 774, revised version is a Chapter of this volume.
Hyytinen, A. and Pajarinen, M., 2002a, External finance, firm growth and the benefits of information disclosure: Evidence from Finland, The Research Institute of the Finnish Economy (ETLA), Discussion papers nr. 805, submitted.
Hyytinen, A. and Pajarinen, M., 2002b, Small business finance in Finland – A descriptive study, The Research Institute of the Finnish Economy (ETLA), Discussion papers nr. 812, revised version is a Chapter of this volume.
Hyytinen, A. and Pajarinen, M., 2003, Rahoitusjärjestelmä ja yritystoiminta uudistuvassa taloudessa, the Research Insititute of the Finnish Economy (ETLA), mimeo, revised version is a Chapter of this volume.
Hyytinen, A. and Toivanen, O., 2002a, Do financial constraints hold back innovation and growth? Evidence on the role of public policy, The Research Institute of the Finnish Economy (ETLA), Discussion papers nr. 820, submitted.

x i v · L i s t o f p r o j e c t p u b l i c a t i o n s
Hyytinen, A. and Toivanen, O., 2002b, Asymmetric information and the market structure of venture capital industry, Journal of Financial Services Research, forthcoming, Earlier version published as ETLA Discussion papers nr. 768.
Hyytinen, A. and Väänänen, L., 2002, Government funding of small- and medium-sized enterprises in Finland, The Research Institute of the Finnish Economy (ETLA), Discussion papers nr. 832, revised version is a Chapter of this volume.
Kaisanlahti, T. Minority shareholders in the Finnish system of corporate governance, The Research Institute of the Finnish Economy (ETLA), Discussion papers nr. 810, revised version is a Chapter of this volume.
Kanniainen, V. 2002, Venture capital finance – What is different?, University of Helsinki, mimeo, revised version is a Chapter of this volume.
Maula, M. and Mäkelä, M., 2002, Cross-border venture capital in Finland, Helsinki University of Technology, mimeo, revised version is a Chapter of this volume.

INTRODUCTION TO THE VOLUME


Financia l systems and f i rm per formance: Theoret ical and empir ica l perspect ives · 1
INTRODUCTION
Ari Hyytinen and Mika Pajarinen*
1.1. SETTING THE AGENDA
Lack of capital has for long if not always been perceived as one of the most important impediments to economic activity in Finland – the Achilles heel of the Finnish economy. In the early 1990s, amidst one of the deepest economic and banking crisis Finland has ever experienced, the concerns were more real than ever. The National Industrial Strategy for Finland – published in 1993 by the Ministry of Trade and Industry (MTI) – concluded for example that while developing new technology that promotes economic growth is known to be difficult, it is especially difficult for Finnish firms because
“[I]n Finland, the greatest shortcomings are in financing” (ibid, p. 137).
The report moreover noted that
“Financing is one of the most difficult problems of small and medium-sized en-
terprises” (ibid, p. 138).
No one disagreed with the view that the shoring up of the banking system and development of capital markets was then key to stabilizing the economy and to promoting the country’s long-term economic growth. Devel-oping capital markets was key not so much because of the then acute crisis but because high-technology industries and R&D started at about the same time to play an increasingly important role in the Finnish economy. Parallel-ing this development, unemployment, which had increased rapidly during the crisis, turned to a persistent characteristic of the Finnish economy. Mo-mentum was therefore gathering also for entrepreneurs and small and me-dium-sized enterprises (SMEs) to become another instrumental determinant of economic growth and source of employment. These changes combined with rapid advances in technology created demand for new forms of financ-ing and, as some argued, for a restructuring of the whole financial system.
* Ari Hyytinen and Mika Pajarinen are both at The Research Institute of the Finnish Economy (ETLA) and Etla-tieto Ltd. The authors are indebted to Petri Rouvinen, Otto Toivanen and Pekka Ylä-Anttila for their careful comments and suggestions.

2 · Ar i Hyyt inen and M ik a Pajar inen
A great deal of attention has recently been paid to the financing of start-up firms and SMEs also in countries other than Finland. The topic has been of particular policy relevance in the Continental Europe and in the Nor-dic countries, where banks have historically played a pivotal role as a source of funds to firms and where the activities of entrepreneurs and SMEs have been somewhat subdued. Unlike in these countries, private risk capital and stock markets have in the US been among the most important driving forces behind a good number of the most dynamic sectors at least since the 1980s. Private equity has for example been used to finance both the emergence of new businesses and their growth (“venture capital”) as well as the restructur-ing of matured firms and sectors (i.e. management and leveraged buy-outs and buy-ins). Consistent with these views, Kortum and Lerner (2000) have estimated that increases in venture capital activity in an industry are associ-ated with significantly higher patenting rates and that venture capital may have accounted for as much as 8% of industrial innovations over 1983–1992 even though the ratio of venture capital to R&D averaged less than 3% in that period.
Partly due to the recent success of the US in developing new technol-ogy with the help of venture capital, there have been a number of intense academic and policy debates of whether bank-based and stock market-based financial systems support the development of new technology differently, and produce different growth patterns, and if so, which one is better. The su-periority of one system over another depends on the system's ability to mobi-lize resources for investment, select best ventures to be funded, and to pro-vide incentives for the monitoring of the ventures that have received external funding. There is, for example, some evidence – and certainly strong views – that especially innovative and technology-oriented SMEs with above average and informationally opaque risks, negligible cash flows, and intangible assets are prime candidates for facing financial constraints in financial systems where banks and debt play a dominant role. The question of whether a stock market-based system performs these tasks more or less efficiently than a bank-centered system in which financial intermediaries of various types have a significant role, remains nevertheless unanswered. Some even argue that the distinction between bank-based and stock market-based systems is of second-order importance because it is the legal system of a country, i.e., the character of legal rules and the quality of law enforcement, that is the pri-mary determinant of the ability of financial systems to allocate capital effi-ciently.

Introduct ion · 3
At the end of the 1990s increasing amounts of private risk capital be-gan to flow into new ventures and firms in need of restructuring both in the Continental Europe and in the Nordic countries. Simultaneously, the relative importance of stock markets started to increase, partly of course due to the growth of information and communications technology (ICT) sector and emergence of (what many call) the ‘New Economy’.
In this volume we look at these recent trends in financial development from a Finnish perspective. We consider, in particular, what challenges there are for Finland, a country amidst an era of technological and industrial change but with the concern of having an Achilles heel due to insufficient supply of capital. Because changes in capital market conditions that result from changes in overall macroeconomic fluctuations are typically not an in-dication of financial development or contraction, this volume takes explicitly a long-term look at the recent developments and provides a detailed analysis of the main structural changes in the Finnish financial markets and in the roles of various actors.
Why a long-term view? There are many reasons why it is important to take a long-
term perspective when analyzing financial development and its consequences to
the availability of capital. First, even though the latest research shows that fi-
nance may lead to growth, it is a long-standing view that where real economy
goes, finance follows. If that were the case, one should probably just wait pa-
tiently and see how financial development comes to meet the financing demand
of firms. Second, the ability of market participants, policy-makers and research-
ers to differentiate between demand and supply factors is likely to be increasing
with the length of the observation window. Therefore, the longer the perspective,
the likelier that one can genuinely distinguish real financial development (or
contraction) from changes in capital market conditions that are due to normal
macroeconomic fluctuations (which are integral to market economies). Finally,
an apparent contradiction in the views of some contemporary observers makes
the case in point: In a recent evaluation report by the Nordic Industrial Fund,
dated November 2001, it is concluded (p. 161) that “[I]n the Nordic region,
Finland has the best functioning seed capital market, both quantitatively and
with respect to publicly initiated programmes stimulating the growth of the
market.” About a year later in early 2003, Maula and Murray (2003) conclude in
the executive summary of their evaluation of the Finnish Industry Investment Ltd –
one of the publicly initiated programmes to support the development of the Fin-
nish early stage venture capital – that “In terms of market failures, the limited
availability of seed and startup stage venture capital is the most persistent and

4 · Ar i Hyyt inen and M ik a Pajar inen
urgent market failure in the Finnish venture capital market” and that ”[A]t the
margin, there is real confusion expressed by industry observers as to the proper
authority, roles and relations of the main [governmental] actors…”. Taking a suf-
ficiently long-term view and focusing on structural developments is a means to
solve this contradiction – and to show that it may indeed be more apparent than
real.
The key questions that are addressed in this volume are:
• How has the Finnish financial system advanced during the past two dec-ades? How has the overall availability of external finance to Finnish firms and especially to SMEs changed as a result? What are the main sources of capital to Finnish SMEs? Is there a sufficient amount of capital available for Finnish firms at the various stages of their financial growth cycle?
• What are the roles of private and public sources of capital in a constantly developing financial system? To what extent should the government in-tervene in the Finnish capital markets and on what grounds? What impli-cations, if any, does financial development have for industrial policy at large and innovation policy in particular?
1.2. OVERVIEW OF THE VOLUME
This volume consists of eleven Chapters, each of which addresses the relation between financial systems and firm performance from different perspectives. The Chapters are outputs of and associated work to “Challenges for a Financial System in an Era of Technological and Industrial Change”, a research project that was done at Etlatieto Ltd, a subsidiary of The Research Institute of the Fin-nish Economy (ETLA) between summer 2001 and spring 2003.1
The volume is organized in three parts. Part One takes a look at the overall financial development in Finland from a macro perspective during the past twenty years and especially since the economic crisis of the early 1990s. Part Two investigates financial development and current corporate fi-nancing patters in Finland from a micro perspective. It contains, for example, an extensive descriptive study of the capital structure of Finnish SMEs. Part Three of the volume is policy-oriented. It focuses on government funding of Finnish firms and considers the implications of the recent financial develop-ment in Finland for the public policy towards capital markets and innovation policy. In what follows, we provide an overview of each of these parts:

Introduct ion · 5
Part one begins with Financial Systems and Venture Capital in Nordic Countries: A Comparative Study (Chapter 1) written by A. Hyytinen and M. Pa-jarinen. The Chapter presents a comparative analysis of Nordic countries’ fi-nancial systems and considers in particular the recent growth of Nordic pri-vate equity (venture capital and restructuring capital). The authors document that the Nordic countries’ financial systems display several similarities that have characterized their evolution over the past decades. For one, it is shown that during the past decade the Nordic countries’ financial systems have not necessarily grown larger overall but they have become more stock market-centered. This characterization seems to apply particularly to Finland. It is moreover found in the Chapter that despite the growth especially at the end of the 1990s, only the Swedish private equity market has reached the scale of fundraising and investment activity that the country’s GDP share in Europe predicts. This suggests that the Finnish venture capital industry may lack a degree or two of maturity when compared to the other European countries.
It has been convincingly documented in the so-called law and finance research program in financial economics that the size and effectiveness of fi-nancial systems around the world can at least partly be traced to the differ-ences in how the legal system (legal rules and the quality of enforcement) of a country protects investors against expropriation by corporate insiders. In Investor Protection and Financial Development in Finland (Chapter 2), A. Hyyti-nen, I. Kuosa and T. Takalo take a closer look at the recent Finnish financial development in the spirit of this growing and influential research program. Building on Hyytinen, Kuosa and Takalo (2003a), they show that during the period of 1980–2002 shareholder rights have been strengthened whereas creditor rights have been weakened in Finland. As reflected in the indices used in the study, the shareholder rights are currently in many ways compa-rable to their US counterparts. Enhancing the stock market’s overall integrity, including its liquidity, has been one of the most important drivers of the im-provements in shareholder protection. The outcome of the Finnish reforms is a financial system where the rights of shareholders are not so undeveloped as they used to be. T. Kaisanlahti reviews in The Role of Shareholder Protection Rules in Financing Finnish Companies (Chapter 3) – again in the spirit of the law and finance research program – the legal landscape that minority share-holders face in Finland. He takes a look at the material provisions of the Fin-nish legislation (beyond the indices used in Hyytinen et al.) and concludes that they are in many ways comparable to their US counterparts and not so undeveloped as some recent studies suggest. More worrisome than the mate-rial provisions are the Finnish ex post remedies against actual minority op-

6 · Ar i Hyyt inen and M ik a Pajar inen
pression. There are several procedural features that can be interpreted to be biased against a minority shareholder. Without effective remedies potential local and foreign financiers have a lesser incentive to place equity capital in Finnish companies than otherwise. Kaisanlahti concludes that this deficiency can lead to a higher required rate of return for capital, or reduce its supply al-together.
The remaining two chapters of Part One examine two specific parts of the Finnish financial system that have previously received relatively little, if any, attention. In Exiting Venture Capital Investments: Lessons from Finland (Chapter 4), J. Ali-Yrkkö, A. Hyytinen and J. Liukkonen pay attention to the fact that because the exit stage of venture capital process may have several feedback effects on the earlier stages (i.e., fundraising and investing) in the process, the long-run development of the venture capital industry is depend-ent on the exit possibilities the financial system (in which the venture capital firms operate in) generates. In this Chapter, the authors consider the Finnish financial system from this perspective. The analysis suggests that despite its favorable development during the 1990s and success in serving the needs of larger firms, the Finnish stock market does not fully meet the exit needs of Finnish venture capitalists. This is because of the strong clustering of initial public offerings (IPOs) and the volatility and certain other documented char-acteristics of the Finnish stock market. The market for mergers and acquisi-tions (M&As) has provided a substitute route for exits (trade sales) for the Finnish venture capitalists. The analysis indicates the development of Finnish venture capital industry may slow down because the structure of the Finnish financial system is such that it only imperfectly supports successful exiting, something that lies at the heart of the venture capital process. J. Ali-Yrkkö takes a more detailed look at the Finnish M&A activity in Patterns of the Fin-nish Merger and Acquisition Activity (Chapter 5). The Chapter considers the key motives behind M&A activity and provides an analysis of the Finnish market for M&As. A main finding of the Chapter is that after taking into ac-count the size of the economy, Finland ranks first out of all EU member states during the 1990s in terms of M&A activity. This high level of activity is not only due to domestic deals but also due to a high number of outward and inward cross-border M&As.
Part Two begins with Small Business Finance in Finland – A Descriptive Study (Chapter 6) by A. Hyytinen and M. Pajarinen. Using new data originat-ing from a recently conducted survey, the authors examine the financing of SMEs in private debt and equity markets in Finland. They find that the three most important sources of funds are the principal owner’s equity, trade credit

Introduct ion · 7
provided by non-financial firms and debt provided by financial institutions (FIs). These account for about 2/3 of total debt and equity. The Finnish SMEs run a debt ratio of 54%, but it is lower for small than for large SMEs. The debt ratio also varies non-monotonically with the age of firms. Overall, the capital structure of the Finnish SMEs does not seem to fundamentally differ from that in the US (when the study of Berger and Udell (1998) is used as the US benchmark). There is, however, some evidence that as the Finnish SMEs age, they increase indebtedness slowly compared to the US SMEs. The young SMEs also utilize less debt provided by financial institutions in Finland than in the US. The authors also find that the financing of innovative and R&D-intensive SMEs differs in several aspects from that of other SMEs. The data shows, for example, that innovative firms, firms with R&D-activities and firms that own patents and/or intangible assets run a lower debt ratio than their counterparts and that the difference is most notable for the most R&D-intensive SMEs. It also turns out that outside equity is heavily concentrated on few firms within the subset of SMEs doing R&D.
While the studies by Hyytinen and Pajarinen (Chapters 1 and 6) pro-vide a comprehensive descriptive overview of the financial development and the financing patterns of SMEs in Finalnd, one important issue they leave un-touched is the role of foreign investors in the Finnish financial system. In Globalization of Business in a Small Country – Does Ownership Matter? (Chapter 7), J. Ali-Yrkkö and P. Ylä-Anttila take as a starting point that the ownership structures and corporate governance systems of many small countries have recently changed because of globalization. The authors investigate the impli-cations of these changes by examining the effects of ownership nationality on the goals and performance of large firms in Finland. The empirical analysis shows that large Finnish firms adopted the maximization of shareholder value as a major goal during the 1990s. The change coincided with increases in foreign ownership. Furthermore, the results suggest that the foreign-owned companies have performed better than the domestically owned ones.
The findings in Cross-border Venture Capital (Chapter 8), written by M. Maula and M. Mäkelä, echo these views. The focus of that Chapter is on the role of cross-border venture capitalists in supporting the internationalization of Finnish firms as well as in the development of venture capital markets. Based on received literature, new Finnish data, and interviews conducted in summer 2002, the authors argue that well-connected foreign venture capital-ists open doors and improve the credibility of their portfolio companies, thus helping young firms in establishing operations in foreign markets. Market

8 · Ar i Hyyt inen and M ik a Pajar inen
knowledge of experienced foreign investors may help ventures avoid expen-sive mistakes in the internationalization process.
Venture Capital Finance: What is Different? (Chapter 9), a theoretical in-quiry by V. Kanniainen closes Part Two. Kanniainen asks some fundamental questions about venture capital finance, which he considers as a recent phe-nomenon in the long history of financial innovations. Why has venture capi-tal finance emerged? What are the efficiency gains involved? What are the limits to venture capital financing? Understanding the basic problems of cor-porate finance is key to addressing these questions. Kanniainen concludes that venture capital finance is a particular form of “informed finance” that has mainly emerged to address the commercial inexperience of start-up firms by advising them on how to grow. However, venture capital may also cause negative external effects on the quality of projects financed by “uninformed fi-nance” (such as ordinary banks). Kanniainen’s analysis suggests that relative to many other sources of capital, venture capital remains a marginal source of funds. It tends to focus on a few sectors at a time and its availability may be restricted by risk aversion of investors and lack of the expertise required in project evaluation and advising start-up firms.
Part Three begins with Government Funding of Small and Medium-Sized Enterprises in Finland (Chapter 10) by A. Hyytinen and L. Väänänen. This Chapter reviews, in the light of the economic rationales for public efforts to finance SMEs, all of the government institutions providing SME funding in Finland and the objectives and tasks assigned to them. Using recently col-lected data on SMEs, the authors then explore what kinds of SMEs apply for and receive government funding in Finland. It is found i) that the “rhetoric” on what the institutions are set to do is not fully in line with what the eco-nomic rationales suggest; ii) that the total amount of government funding awarded to SMEs has over the past four years grown quite rapidly and cova-ried with the availability of external finance on the marketplace; and iii) that every third SME has applied for and received at least one type of government funding. The econometric results suggest that overall, the characteristics of SMEs applying for and receiving different types of government funding are consistent with the official rhetoric and the general idea of what the different institutions are set to do. Some of the results of the Chapter highlight never-theless the importance of emphasizing selectivity in the provision of gov-ernment funding to SMEs. Finally, in the Chapter that closes this volume and is titled Does Financial Development Matter for Innovation and Economic Growth? Implications for Public Policy (Chapter 11), A. Hyytinen, P. Rouvinen, O. Toivanen and P. Ylä-Anttila consider why financial development might mat-

Introduct ion · 9
ter for innovation and economic growth, and what implications the recent fi-nancial development in Finland has for public policy towards the financing of Finnish firms, especially that of SMEs, as well as for innovation policy. The Chapter also focuses on the needs, if any, to redirect the public policy to-wards capital markets and innovation policy. The main message of the Chap-ter is essentially what is presented next – the main findings of the research project.
1.3. SUMMARY OF MAIN FINDINGS2
An important starting point for the conclusions of the research project – the outcome and associated work of which is reported in this volume – is that domestic financing still matters. In particular, the available evidence from eco-nomic research shows that domestic financial institutions are not becoming irrelevant for innovation and economic growth despite the financial systems becoming increasingly integrated throughout the world. Local financial de-velopment disproportionately matters for the economic success of the smallest firms and entrepreneurs of an area.
Do financial constraints hold back innovation and growth in Finland?
The first major conclusion of ours is that the recent financial development in Finland, by which we mean the advance of the Finnish financial system dur-ing the past twenty years and particularly since the economic crisis of the early 1990s, has had profound consequences on the Finnish corporate financ-ing environment. It is difficult not to agree with the view that the overall availabil-ity of external finance to Finnish firms has improved a great deal. The recent finan-cial development has enhanced both the accumulation of capital and the rate of technological innovation, not least because the Finnish financial system is more diversified and stock market-oriented than it has been in the past.
In particular, it is very difficult to make a case that larger Finnish firms are constrained by the unavailability of external finance, despite their (poten-tially) large financing needs. The availability of finance is not likely to be an issue for a representative Finnish SME either, not least because the need for external finance by such an SME seems to be rather negligible. The situation is therefore quite different from the times when, for example, many of the government institutions providing funding to Finnish firms were initially established.

10 · Ar i Hyyt inen and M ik a Pajar inen
Despite the recent favorable financial development, the availability of financing at the various stages of some SMEs’ growth-cycle may still be an is-sue. First, the available evidence is in harmony with the view that the market for capital that certain types of Finnish SMEs face is characterized by various “black spots”, or market imperfections. In SMEs’ view, the (private) debt market func-tions better than the (private) equity market, but the remaining problems in the debt and equity markets are related to unwillingness and inability of the private financiers to assume risk. These views are echoed both by our analy-ses of the current state of the Finnish financial system, i.e., the limits of Fin-nish venture capital and stock market, the willingness and ability of Finnish credit institutions to assume risk, and the role of foreign investors and by our empirical findings suggesting that the growth-oriented and innovative sub-segments of the SME sector are held back by financial constraints. It therefore seems warranted to conclude that such Finnish firms would benefit above all from having a continuum of strong markets for external equity capital. In par-ticular, the Finnish economy would benefit from having i) more risk capital available for seed stage firms, ii) a more mature venture capital industry and iii) a stronger stock market for growth companies. Despite the steps taken towards a more stock market-oriented financial system, these different mar-kets for equity capital are the black spots of the Finnish financial system from the perspective of the financial growth-cycle of technology entrepreneurs and “equity-dependent” innovative and technology-based new firms.
“Equity-dependent” SMEs and credit institutions: Finnish credit institutions are a
very important but potentially cautiously behaving source of finance to SMEs.
There is therefore a possibility that SMEs in need of external finance that are
likely to be equity-dependent, e.g., those with no established relationship with a
financial institution, those that are growth-oriented or innovative but currently
not “eligible” for venture capital and those with few assets that can be pledged
as collateral, are held back by the imperfections in the market for external equity
capital and, to the extent that they could consider loans as a substitute, by the
cautious behavior of Finnish credit institutions.
Foreign investors: Albeit the role of foreign investors in Finland has become in-
creasingly important since the early 1990s, there is some evidence that the most
important contribution of the foreign investors investing in Finland may be their
positive effect on existing firms’ performance rather than their role as a source of
new capital to the most risky SME sectors or very small firms.

Introduct ion · 11
Second, not all growth-oriented or innovative SMEs are equally constrained by the availability of finance, as there seem to be differences in the allocation of finance to SMEs also within these sub-segments of the SME sector. We have, for example, found that very R&D-intensive SMEs in industries other than the ICT may suffer more from lack of capital than otherwise identical SMEs in the ICT sector. We have also found that within the SME sector, the smallest SMEs and entrepreneurs face more severe financial constraints than other SMEs. In particular, despite the overall favourable financial development that has continued since the early 1990s and the government’s involvement in the market for seed capital, the unavailability of capital as an impediment to entrepre-neurship should not be overlooked (see also Figure 1).
Figure 1. Self-employed and capital market tightness
1989
/119
89/2
1990
/119
90/2
1991
/119
91/2
1992
/119
92/2
1993
/119
93/2
1994
/119
94/2
1995
/119
95/2
1996
/119
96/2
1997
/119
97/2
1998
/119
98/2
1999
/119
99/2
2000
/120
00/2
2001
/120
01/2
2002
/120
02/2
0%
5%
10%
15%
20%
25%
30%
35%
185
190
195
200
205
210
215
thou
sand
s
Capital market tightness (left scale) Self-employment (right scale)
Note: This figure is taken from Hyytinen, Rouvinen, Toivanen and Ylä-Anttila (Chapter 11 in this volume). Data sources are the various surveys by Finnvera Ltd and The Federation of Finnish Enterprises and Sta-tistics Finland. The correlation between the two series is –0.87 between 1989/1 and 2002/2 and still as low as –0.76 between 1995/1 and 2002/2.
Implications for public policy
The financial development has several implications for the public policy to-wards the financing of Finnish SMEs, as well as for innovation policy. Be-cause of the improved overall availability of external finance to Finnish firms, omnipresent government intervention in the Finnish capital markets is increasingly harder to justify purely on the basis of the existence of market failures in these mar-
12 · Ar i Hyyt inen and M ik a Pajar inen
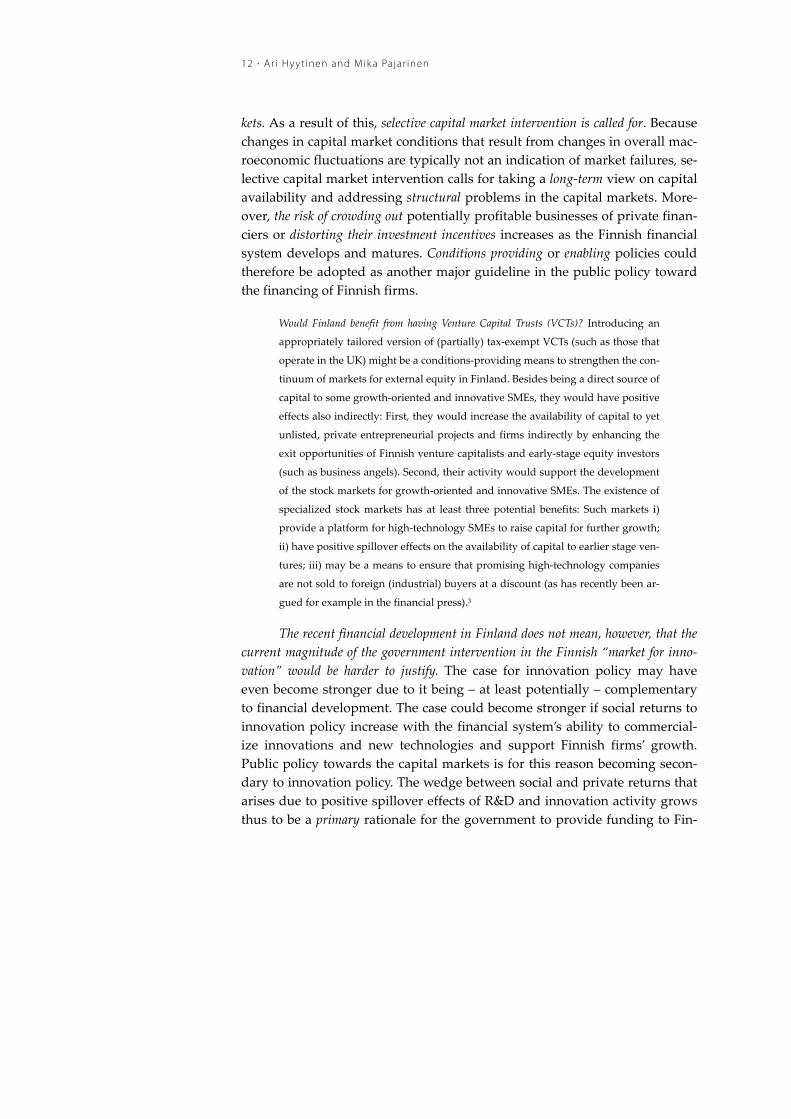
kets. As a result of this, selective capital market intervention is called for. Because changes in capital market conditions that result from changes in overall mac-roeconomic fluctuations are typically not an indication of market failures, se-lective capital market intervention calls for taking a long-term view on capital availability and addressing structural problems in the capital markets. More-over, the risk of crowding out potentially profitable businesses of private finan-ciers or distorting their investment incentives increases as the Finnish financial system develops and matures. Conditions providing or enabling policies could therefore be adopted as another major guideline in the public policy toward the financing of Finnish firms.
Would Finland benefit from having Venture Capital Trusts (VCTs)? Introducing an
appropriately tailored version of (partially) tax-exempt VCTs (such as those that
operate in the UK) might be a conditions-providing means to strengthen the con-
tinuum of markets for external equity in Finland. Besides being a direct source of
capital to some growth-oriented and innovative SMEs, they would have positive
effects also indirectly: First, they would increase the availability of capital to yet
unlisted, private entrepreneurial projects and firms indirectly by enhancing the
exit opportunities of Finnish venture capitalists and early-stage equity investors
(such as business angels). Second, their activity would support the development
of the stock markets for growth-oriented and innovative SMEs. The existence of
specialized stock markets has at least three potential benefits: Such markets i)
provide a platform for high-technology SMEs to raise capital for further growth;
ii) have positive spillover effects on the availability of capital to earlier stage ven-
tures; iii) may be a means to ensure that promising high-technology companies
are not sold to foreign (industrial) buyers at a discount (as has recently been ar-
gued for example in the financial press).3
The recent financial development in Finland does not mean, however, that the current magnitude of the government intervention in the Finnish “market for inno-vation” would be harder to justify. The case for innovation policy may have even become stronger due to it being – at least potentially – complementary to financial development. The case could become stronger if social returns to innovation policy increase with the financial system’s ability to commercial-ize innovations and new technologies and support Finnish firms’ growth. Public policy towards the capital markets is for this reason becoming secon-dary to innovation policy. The wedge between social and private returns that arises due to positive spillover effects of R&D and innovation activity grows thus to be a primary rationale for the government to provide funding to Fin-

Introduct ion · 13
nish firms. This increases the need to identify and measure the wedge and spillovers.
Even though domestic financing matters, increasing the availability of capital is not an all-curing medicine. Increasing the availability of capital will probably not suffice to enhance entrepreneurship, services production, ICT adoption and development of biotechnology, which are (some of the) areas that have been regarded as “black spots” in the current Finnish economic de-velopment. It will not suffice even if the availability of capital was an im-pediment to progress in these areas. The reason for this is that we are in each case talking about a complementary system. Reforming such systems re-quires a simultaneous reform of its major components. In the case of entrepre-neurship that might for example mean improving in a coordinated fashion both the availability of capital and also the other determinants of entrepre-neurship, such as the labor market conditions for failed entrepreneurs and entrepreneurial opportunities for the employees of established companies, which could be a means to enhance the supply of high-quality entrepreneurs. More economic research is called for to understand what should be done to better identify and to rectify the perceived black spots.
The Achilles heel of the Finnish economy has so long been the lack of capital that it may be difficult to see that the lack is gradually disappearing. To see it requires taking a sufficiently long-term view, preferably over the most recent and next foreseeable periods of macroeconomic turbulence. If the market-driven financial development continues, which is something that pol-icy-makers should support by providing enabling conditions for the private financial sector to mature, the lack of capital will soon stop being the Achilles heel. On the other hand, if this development does not continue, we face the risk of not being able to exploit all the growth opportunities that we currently have as one of the most competitive countries in the world.

14 · Ar i Hyyt inen and M ik a Pajar inen
REFERENCES
Ali-Yrkkö, J., 2003, Patterns of the Finnish merger and acquisition activity, in Hyytinen, A. and Pajarinen, M. (eds.): Financial systems and firm performance: Theoretical and empirical perspectives, The Research Institute of the Finnish Economy (ETLA), B:200.
Ali-Yrkkö, J., Hyytinen, A. and Liukkonen, J., 2003, Exiting venture capital investments: Lessons from Finland, in Hyytinen, A. and Pajarinen, M. (eds.): Financial systems and firm performance: Theoretical and empirical perspectives, The Research Institute of the Finnish Economy (ETLA), B:200.
Ali-Yrkkö, J. and Ylä-Anttila, P., 2003, Globalization of business in a small country – Does ownership matter?, in Hyytinen, A. and Pajarinen, M. (eds.): Financial systems and firm performance: Theoretical and empirical perspectives, The Research Institute of the Finnish Economy (ETLA), B:200.
Berger, A. N. and Udell, G. F., 1998, The economics of small business finance: The roles of private equity and debt markets in the financial growth cycle, Journal of Banking and Finance, 22, 613-673.
Hyytinen, A., Kuosa, I. and Takalo, T., 2003a, Law or finance? Evidence from Finland, European Journal of Law and Economics, forthcoming.
Hyytinen, A., Kuosa, I. and Takalo, T., 2003b, Investor protection and financial development in Finland, in Hyytinen, A. and Pajarinen, M. (eds.): Financial systems and firm performance: Theoretical and empirical perspectives, The Research Institute of the Finnish Economy (ETLA), B:200.
Hyytinen, A. and Pajarinen, M., 2003a, Financial systems and venture capital in Nordic countries: A comparative study, in Hyytinen, A. and Pajarinen, M. (eds.): Financial systems and firm performance: Theoretical and empirical perspectives, The Research Institute of the Finnish Economy (ETLA), B:200.
Hyytinen, A. and Pajarinen, M., 2003b, Small business finance in Finland – A descriptive study, in Hyytinen, A. and Pajarinen, M. (eds.): Financial systems and firm performance: Theoretical and empirical perspectives, The Research Institute of the Finnish Economy (ETLA), B:200.
Hyytinen, A., Rouvinen, P., Toivanen, O. and Ylä-Anttila, P., 2003, Does financial development matter for innovation and economic growth? Implications for public policy, in Hyytinen, A. and Pajarinen, M. (eds.): Financial systems and firm performance: Theoretical and empirical perspectives, The Research Institute of the Finnish Economy (ETLA), B:200.
Hyytinen, A. and Väänänen, L., 2003, Government funding of small and medium-sized enterprises in Finland, in Hyytinen, A. and Pajarinen, M. (eds.): Financial systems and firm performance: Theoretical and empirical perspectives, The Research Institute of the Finnish Economy (ETLA), B:200.
Kaisanlahti, T., 2003, The role of shareholder protection rules in financing Finnish companies, in Hyytinen, A. and Pajarinen, M. (eds.): Financial systems and firm performance: Theoretical and empirical perspectives, The Research Institute of the Finnish Economy (ETLA), B:200.

Introduct ion · 15
Kanniainen, V., 2003, Venture capital finance: What is different?, in Hyytinen, A. and Pajarinen, M. (eds.): Financial systems and firm performance: Theoretical and empirical perspectives, The Research Institute of the Finnish Economy (ETLA), B:200.
Kortum, S. and Lerner, J., 2000, Assessing the contribution of venture capital to innovation, Rand Journal of Economics, 31:4, 674-692.
Maula, M. and Murray, G., 2003, Finnish industry investment Ltd: An international evaluation, Ministry of Trade and Industry Publications 1/2003.
Maula, M. and Mäkelä, M., 2003, Cross-border venture capital, in Hyytinen, A. and Pajarinen, M. (eds.): Financial systems and firm performance: Theoretical and empirical perspectives, The Research Institute of the Finnish Economy (ETLA), B:200.
Ministry of Trade and Industry, 1993, National industrial strategy for Finland, Ministry of Trade and Industry Finland Publications 3/1993.
Nordic Industrial Fund, 2001, Seed capital in the Nordic countries: Best practice, Center for Economic and Business Research, Copenhagen.

16 · Ar i Hyyt inen and M ik a Pajar inen
ENDNOTES
1 Not all outputs of the project are published in this volume. Besides the Chapters of this volume, altogether five research papers have been published as ETLA Discussion Papers. Of these papers, all have been submit-ted for publication elsewhere (e.g. in academic journals). The views and research findings of these papers are however duly reflected in the writings and conclusions of this volume. See also the list of publications of the research project at the beginning of this volume. 2 This Section builds to a significant extent on Hyytinen et al., Chapter 11 in this volume. 3 See Hyytinen, Rouvinen, Toivanen and Ylä-Anttila (Chapter 11 in this volume) for further discussion.

PART I: MACROECONOMIC AND
INSTITUTIONAL PERSPECTIVE


Financia l systems and f i rm per formance: Theoret ical and empir ica l perspect ives · 19
1. FINANCIAL SYSTEMS AND VENTURE CAPITAL IN NORDIC COUNTRIES: A COMPARATIVE STUDY
Ari Hyytinen and Mika Pajarinen*
Abstract: In this Chapter we present a comparative analysis of Nordic countries’ financial sys-tems and consider in particular the recent growth of Nordic venture capital indus-tries. We document that the Nordic countries’ financial systems display several simi-larities that have characterized their evolution over the past decades. These include the liberalization of financial markets in the 1980s, the banking crisis in the early 1990s and the renaissance of stock markets in the second half of the 1990s. It seems that during the past decade the Nordic countries’ financial systems have not neces-sarily grown larger overall. However, the financial systems have become more stock market-centered. This characterization seems to apply particularly to Finland. We also show that the Nordic private equity industries have evolved in tandem with the overall macroeconomic and stock market developments. Despite the growth in recent years, only the Swedish venture capital market has reached the scale of fundraising and investment activity that the country’s GDP share in Europe predicts. For the scale of activity achieved, the Nordic countries are also laggards compared to the stage of the private equity cycle in Europe. Our results suggest that the Nordic ven-ture capital may lack a degree or two of maturity when compared to the other Euro-pean countries.
* Ari Hyytinen and Mika Pajarinen are both at The Research Institute of the Finnish Economy (ETLA) and Etla-tieto Ltd. This chapter is based on Etla Discussion Papers, nr. 774 (dated 14/11/2001). The authors would like to thank Markus Koskenlinna, Eva Liljeblom, Anu Nokso-Koivisto, Vesa Puttonen, Petri Rouvinen, Otto Toiva-nen and Pekka Ylä-Anttila for helpful comments. The views expressed in the Chapter are those of the au-thors. The usual caveat applies.

20 · Ar i Hyyt inen and M ik a Pajar inen
1.1. INTRODUCTION
Financial development can accelerate economic growth by enhancing sav-ings, by channeling the savings into real investments efficiently and by di-recting the real investments to the most valuable uses. The availability of pri-vate risk capital is regarded as a key part of the financial development be-cause such capital often backs economies’ most dynamic sectors. In the US for example, private equity has at least since the 1980s been one of the most im-portant sources of external finance for new innovative businesses (“venture capital”) as well as for the restructuring of matured firms and sectors (i.e. management and leveraged buy-outs).1 The availability of venture capital has been of particular policy relevance in the continental Europe and in the Nor-dic countries, because the activities of innovative small and medium-sized firms have traditionally been subdued in many of these countries. Moreover, the trend of increasing inflow of risk capital into new ventures is in Europe a much more recent phenomenon than in the US.
Even though the on-going trend is toward market-based financial sys-tems, many of the European countries nonetheless have bank-oriented sys-tems. There is some evidence and certainly strong views that innovative sec-tors are the prime candidate for facing financial constraints in such financial systems.2 Albeit venture capital industry often remains small in relation to the overall size of the financial system, its growth is welcomed, because ven-ture capital firms specialize in financing firms with informationally opaque risks, negligible cash flows and intangible assets. The venture capital indus-try therefore has potential to eliminate the financing constraints that the in-novative sectors may face in bank-centered financial systems.
The question how private risk capital may emerge and prosper in countries with distinct institutional arrangements has recently received growing attention by academics (see, Florida and Kenney 1988, Black and Gilson 1998, Gompers and Lerner 1998, Milhaupt 1997, Jeng and Wells 2000, Becker and Hellman 2000) and by policy makers (see, e.g., OECD 1993, 1996, Communication from the European Communities 1998, 2000). The emerging academic literature suggests, above all, a strong link between the develop-ment of private equity and the structure of the financial system (Black and Gilson 1998, Jeng and Wells 2000, and Johnson 2000).
In this Chapter, we analyze financial development and particularly the emergence of the market for private risk capital in the Nordic countries, i.e. in Denmark, Finland, Norway and Sweden. Like the large continental Euro-

Financia l systems and venture capita l in Nordic countr ies : A comparat ive study · 21
pean countries such as Germany and France, the Nordic countries have tradi-tionally had strong banking sectors. It is therefore of interest to compare the importance of private equity as a source of funds in the Nordic countries to the role it plays elsewhere in Europe. To these ends, the analysis has two strands. The first documents general financial market trends in the Nordic countries and weights the recent upsurge of private equity against them. The aim is to compare the progress achieved in creating the market for risk capi-tal to the overall changes in the structure of the financial systems. The second strand of analysis consists of a comparison of the stage of the Nordic coun-tries’ private equity market to that of the other European countries.
The organization of the remainder of this Chapter is as follows. In Sec-tion 1.2 the evolution of the Nordic financial systems is described. The emer-gence of Nordic private equity is analyzed in Section 1.3. Finally, we summa-rize the Chapter in Section 1.4.
1.2. FINANCIAL SYSTEMS IN NORDIC COUNTRIES
Recently, there has been a very intense discussion of whether bank-based and market-based financial systems produce different growth patterns and if so, which one is superior (see, e.g. Allen and Gale 2000, Levine 2000).3 The supe-riority of one system over another depends on the system’s ability to mobilize resources for investment, select best ventures to be funded, and to provide incentives for the monitoring of the ventures that receive external funding. Whether a market-based system performs these tasks more (or less) effi-ciently than a bank-centered system, in which financial intermediaries of various types play a significant role, is yet to be answered (Levine 2000; Demirgüç-Kunt and Maksimovic 2001).
The division between market-based and bank-centered financial sys-tems can have important implications for the economy because there might exist a relation between the structure of the financial system, including the ownership and governance of companies, and the types of activities that the companies undertake (Carlin and Mayer 2002). The argument is that institu-tional endowment of a country may confer comparative advantage on activi-ties that are relatively dependent on the institutional input in which the country is well endowed. The financing of innovative ventures is a prime ex-ample of an instance where such a comparative advantage might lie.
A second approach to the analysis of financial systems has been advo-cated by La Porta et al. (1998, 1999, 2000). The approach posits that the legal system of a country, i.e. the character of legal rules and the quality of law en-

22 · Ar i Hyyt inen and M ik a Pajar inen
forcement, is an important if not the primary determinant of financial sys-tems’ efficiency and corporate financing patterns. La Porta et al. (1998) for ex-ample documents that countries with poorer investor protection have smaller and narrower capital markets. The finding is consistent with the view that if a country’s legal system is weak, financial transactions are intermediated through established institutions or agents with bargaining power (see, e.g., Modigliani and Perotti 1999). The reason is that in such an environment, there is a need to enforce financiers’ rights privately. Recently, Demirgüç-Kunt and Maksimovic (1998) and Levine (1998, 1999, 2000) have provided empirical evidence on the effects of the legal system on firm financing and firm growth as well as on macroeconomic growth.4
These findings and arguments have important implications for the fi-nancing of innovative and growing firms. On the one hand, a market-based financial system may be more effective in moving capital from declining in-dustries to emerging ones.5 On the other hand, a distinguishing characteristic of the financing of growing firms is the evolving pattern of their control structures. New investors (starting from the founding entrepreneurs, to fami-lies, individual investors, small groups of investors and to venture capitalists) are sequentially approached to finance the growth. As a result, different in-vestor groups are at different stages interested in exercising control over the growing firm, suggesting that efficient corporate governance is at the heart of an innovative firm’s fundraising ability (Mayer 2002).
1.2.1. THE NORDIC FINANCIAL SYSTEMS: RECENT TRENDS
The Nordic financial systems have traditionally been bank-centered. Particu-larly in Finland and Sweden, banks have served as house banks for numer-ous of the countries’ important corporations and held either directly or indi-rectly large ownership blocks in many of their client firms (see, e.g., Nis-kanen 1999, and Agnblad et al. 2000). The banks have been influential in Norway, too, albeit they are precluded from having significant ownership stakes in the client firms. This traditional Nordic financial landscape has, however, changed over the past twenty years.
Liberalization of financial markets and lending boom
At the beginning of the 1980s, the financial systems of the Nordic countries were relatively heavily regulated. The authorities limited for example both the quantities and rates at which banks could lend, as well as foreign capital

Financia l systems and venture capita l in Nordic countr ies : A comparat ive study · 23
flows. Following the lead of other countries, such as the UK, the Nordic countries liberalized their financial markets and capital movements quite rapidly in the 1980s.6 In Norway the financial markets were effectively liber-alized between 1984 and 1986. In Finland and Sweden the liberalization took place about the same time, or lagged Norway somewhat, while in Denmark, most of the major steps towards a deregulated financial system had been taken a bit earlier. Some restrictions concerning e.g. foreign direct invest-ments and certain cross-border capital movements remained however in ef-fect until the beginning of the 1990s, particularly in Finland.
The deregulation of the financial markets led to increased competition between financial institutions and to very rapid lending growth. As Figure 1.1 reveals, the lending growth was rapid also relative to GDP, especially in Finland. Even in real terms, the maximum annual lending growth rates were of order 25-30% (Koskenkylä 2000, p. 4). The figure speaks for a sequential expansion of intermediated finance in the Nordic countries. In particular, the amount of bank lending relative to GPD reached its peak first in Denmark in 1986, then about the same time in Norway and Sweden in the late 1980s, and last of all in 1992 in Finland.
The growth of the lending reflected both increased supply of credit and the willingness of firms and households to accumulate debt. There are several reasons why the rapid lending growth was in most cases not consid-ered problem. First, the level of bankruptcies and loan losses had been very low in the 1970s and the early 1980s. From Figure 1.1 we can see for example that only in Sweden the number of bankruptcies exceeded 0.5 per thousand of inhabitants in the early 1980s. Combined with quantity rationing, the low regulated interest rates created kind of “favorable selection” among loan ap-plicants (Drees and Pazarbasioglu 1995); the most risky projects were crowded out from the market by the safe ones. Second, it was perceived that the growth of the lending was just reflecting the discharge of the excess de-mand for loans that had been accumulating during the era of the regulated financial markets. Finally, the tax regimes of the 1980s enhanced the incen-tives of Nordic firms and households to borrow (Berg 1994).
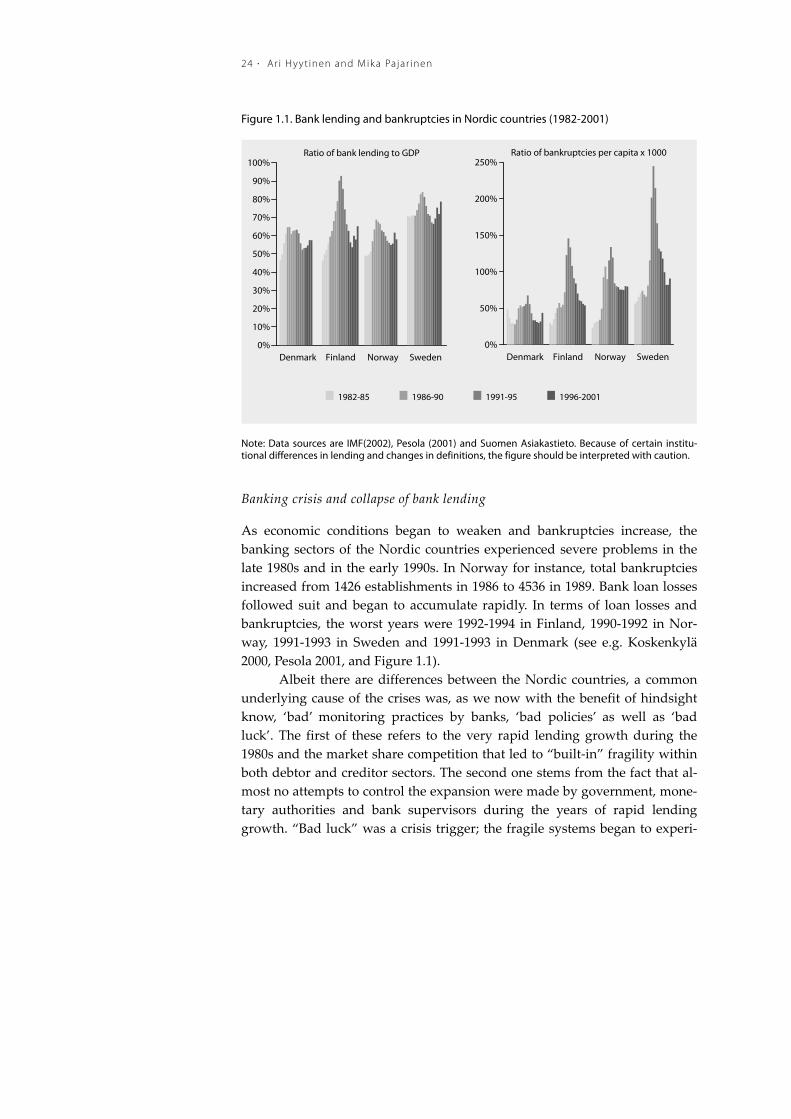
24 · Ar i Hyyt inen and M ik a Pajar inen
Figure 1.1. Bank lending and bankruptcies in Nordic countries (1982-2001)
Denmark Finland Norway Sweden0%
10%
20%
30%
40%
50%
60%
70%
80%
90%
100%Ratio of bank lending to GDP
Denmark Finland Norway Sweden0%
50%
100%
150%
200%
250%Ratio of bankruptcies per capita x 1000
1982-85 1986-90 1991-95 1996-2001
Note: Data sources are IMF(2002), Pesola (2001) and Suomen Asiakastieto. Because of certain institu-tional differences in lending and changes in definitions, the figure should be interpreted with caution.
Banking crisis and collapse of bank lending
As economic conditions began to weaken and bankruptcies increase, the banking sectors of the Nordic countries experienced severe problems in the late 1980s and in the early 1990s. In Norway for instance, total bankruptcies increased from 1426 establishments in 1986 to 4536 in 1989. Bank loan losses followed suit and began to accumulate rapidly. In terms of loan losses and bankruptcies, the worst years were 1992-1994 in Finland, 1990-1992 in Nor-way, 1991-1993 in Sweden and 1991-1993 in Denmark (see e.g. Koskenkylä 2000, Pesola 2001, and Figure 1.1).
Albeit there are differences between the Nordic countries, a common underlying cause of the crises was, as we now with the benefit of hindsight know, ‘bad’ monitoring practices by banks, ‘bad policies’ as well as ‘bad luck’. The first of these refers to the very rapid lending growth during the 1980s and the market share competition that led to “built-in” fragility within both debtor and creditor sectors. The second one stems from the fact that al-most no attempts to control the expansion were made by government, mone-tary authorities and bank supervisors during the years of rapid lending growth. “Bad luck” was a crisis trigger; the fragile systems began to experi-

Financia l systems and venture capita l in Nordic countr ies : A comparat ive study · 25
ence increasing problems because of the occurrence of certain negative shocks. The shocks were in each country external to the banking sector: In Norway, perhaps the most important factor affecting the economy was the decline in oil prices in 1985-1986, whereas in Finland the collapse of the trade with the former Soviet Union at the beginning of the 1990s provided a start for deteriorating economic performance. In Sweden the general decline in the growth of export markets and the 1991 tax reform (leading to higher post-tax interest rates) have been mentioned as factors that contributed to the emer-gence of the crisis.
As can be seen from Figure 1.1, the banking problems led to a sharp fall in the amount of bank lending relative to GDP. They also resulted in a systemic-wide crisis in the other Nordic countries except in Denmark. During the crisis years, most of the Nordic banks and banking groups experienced severe problems. Public support was needed in each country to prevent the banking sectors from collapsing and to limit the perceived adverse impact of the financial sector problems on the real economy. Despite the severity of the problems, only very few of the distressed banks were actually allowed to fail (see, e.g., Koskenkylä 2000).
The crises have had a long-lasting impact on the Nordic banking sec-tors. In Norway for example, the Norwegian government was still as late as in 2000 a large owner in Norway’s two largest commercial banks. Perhaps more importantly, the banks with severe problems began to consolidate both voluntarily and involuntarily, with the authorities forcing a number of banks to merger. In 1987, there were 609, 227, 202, and 527 deposit banks in Finland, Denmark, Norway, and Sweden, respectively. By the end of 1998, the number of banks had reduced to 344, 191, 154 and 104 in the four countries, respec-tively. The consolidation tendency has continued and, in fact, intensified to include cross-border mergers recently (see, e.g., Andersen et al. 2000). The mergers have resulted in more concentrated banking industries and larger banks (banking groups) relative to the firms they finance.
Economic growth and rise of stock market
Besides government intervention, the recovery of the financial systems was supported by favorable macroeconomic development during the 1990s. The Nordic economies have, in terms of real GDP, been growing steadily since 1993/94, Norway to some extent notwithstanding. As Figure 1.2 illustrates, the growth has been very rapid, particularly in Finland in the latter half of the 1990s. Not least because of Norway’s abundant oil resources, the Norwe-

26 · Ar i Hyyt inen and M ik a Pajar inen
gian economy grew essentially the entire 1990s, albeit at a lower rate during the first and last years of the decade. Paralleling the economic growth, the number of bankruptcies dropped off fast (cf. Figure 1.1).
The economic problems of the early 1990s were associated with very high real lending rates (Figure 1.2). In 1992 for example, the real rates of lend-ing were above 9% in all Nordic countries. For comparison it is useful to note that the European real interest rate was, on average, in the range of 4.6-5.2% over the 1991-1998 period (ECB, 2001, p. 18). Since the early 1990s, the rates have decreased, even though the rate of inflation has in each country re-mained at moderate levels. Given that Finland is a member of the EU and the other Nordic countries are not, it is of interest to note that its real rate of lend-ing have in recent times been the lowest.
Figure 1.2. GDP growth and real lending rates in Nordic countries (1990-2001)
1990
1991
1992
1993
1994
1995
1996
1997
1998
1999
2000
2001
80
90
100
110
120
130
140
150
inde
x
GDP volume index1990 = 100
1990
1991
1992
1993
1994
1995
1996
1997
1998
1999
2000
2001
0.0
2.0
4.0
6.0
8.0
10.0
12.0
14.0
per
cent
Average lending rates deflated by CPI
Denmark Finland Norway Sweden
Note: Data sources are IMF(2002) and ETLA Database – OECD Main Economic Indicators.
Another similarity in the financial development of the Nordic coun-tries is the recent growth of the stock markets, particularly during the late 1990s. The Nordic countries’ stock market capitalization represented only 1.5% of the total market capitalization of the advanced countries when aver-aged over 1982-1989.7 Due to the Nordic countries’ economic problems at the beginning of the 1990s, their share increased only moderately to 1.6% when

Financia l systems and venture capita l in Nordic countr ies : A comparat ive study · 27
measured over 1990-1994. Since then, the situation has somewhat improved in relative terms; the Nordic countries’ share of the advanced countries’ mar-ket capitalization was between 1995-1999 on average 2.2%.
Another way of looking at the development of the stock markets is to compare their size to the size of the overall economy (i.e., GDP). To this end, the development of the nominal market capitalization relative to GDP is pre-sented in Table 1.1. As the table reveals, the stock market capitalization has increased relative to the size of the economy in each country particularly to-wards the end of the 1990s. The increase reflects above all the asset price cy-cles associated with the recent economic development.8 The Nordic trend is by no means unique; the favorable economic development similarly sup-ported the development of asset prices in other countries, such as Germany and the U.S, in the late 1990s. In Finland, the (positive) impact of Nokia on the nominal market capitalization has been substantial. Without Nokia, the ratio of market capitalization to GDP lagged over 1996-2001 clearly that of Sweden and exceeded only slightly that of Denmark and Germany. Since the early 2000, the stock prices have been volatile and decreasing.
Table 1.1. Nominal market capitalization to GDP (annual averages)
Denmark Finland Norway Sweden
1990-1995 30 % 23 % 23 % 50 % 1996-2001 55 % 150 % 39 % 120 %
Finland w/o Nokia
Germany US Japan
1990-1995 19 % 22 % 72 % 76 % 1996-2001 63 % 52 % 142 % 65 %
Note: Data sources are FIBV and ETLA Database – OECD Main Economic Indicators. When computing the ratio of market capitalization without Nokia to GDP, the GDP has not been adjusted to reflect Nokia’s GDP share. Over 1996-2001, it has been approximately 2%.
The growth of stock market capitalization reflects, above and beyond initial public offerings (IPOs) and equity issuance by the listed firms, the in-crease in the discounted value of the listed firms’ cash flow. We therefore also measure the development of the stock markets in real terms, i.e. at “con-stant”, expectations-adjusted stock prices (see, e.g., Rousseau and Wachtel 2000). By normalizing the time series of market capitalization at the 1995 stock price level, we obtain a measure of the real developments. They are

28 · Ar i Hyyt inen and M ik a Pajar inen
visible in Figure 1.3: in real terms, the Finnish and Danish stock markets seem to have grown most significantly during the 1990s. Furthermore, the Swedish market stands out as the largest relative to the size of the economy, and is followed by Denmark and Finland.
Figure 1.3. Stock market capitalization and share turnover in Nordic countries (1990-2001)
Denmark Finland Norway Sweden0%
20%
40%
60%
80%
100%
120%
140%
Ratio of value traded to market capitalization
1990-92 1993-95 1996-98 1999-2001
Denmark Finland Norway Sweden0%
10%
20%
30%
40%
50%
60%
70%
Ratio of real market capitalization to real GDP
Note: Data sources are ETLA Database – The Nordic Securities Market: Monthly Statistics and OECD Main Economic Indicators, and IMF(2002). Market capitalization: annual average of monthly observations, value traded: cumulative sum of monthly value traded. The data on value traded is not fully compara-ble across countries due to different data collection methods. Real market capitalization: Stock market capitalization deflated by share price index (1995 = 100); see Rousseau and Wachtel (2000) for details, Real GDP: GDP at 1995 prices.
Figure 1.3 also displays a measure of the liquidity of the market, the ra-tio of value traded to the market capitalization (i.e. the share turnover). Due to differences in the methods of recording trades, conclusions based on the cross-country comparisons of the displayed liquidity measures should be in-terpreted with caution. Bearing this caveat in mind, it seems that the share turnover has in each country clearly improved from the very low levels of the early 1990s.9 It appears that the liquidity of the stock market was very low in particularly Finland and Sweden during the first years of the 1990s. The li-quidity has however improved since then significantly, especially in Sweden.

Financia l systems and venture capita l in Nordic countr ies : A comparat ive study · 29
Assessment: measuring financial development
There is no single measure of financial development that would fully meas-ure how financial system mobilizes capital, distributes and transforms risks and allocates external finance to firms. In the following we summarize some indicators aimed at capturing the overall development (of the deepness) of the Nordic financial systems over the 1990s. We also develop measures in or-der to assess the relative importance of stock markets and intermediated debt finance. All of these indicators are based on the measures recently developed by Levine et al. (2000) and Beck and Levine (2001).
The purpose of the Finance-Activity measure in Levine et al. (2000) and Beck and Levine (2001) is to evaluate the volume of the financial market activities in a country. It is given by the log of the product of two ratios, the value of private sector credits by financial intermediaries divided by GDP, and the value of shares traded on the stock market divided by GDP. The lar-ger the measure, the more extensive is the net of financial transactions in the economy at a given point of time. We modify the Finance-Activity measure in two ways. First, we use a more broad aggregate measure of credit in the economy, namely total domestic credit. Second, to filter the forward-looking component of stock prices, we divide the value traded by market capitaliza-tion. The resulting measure is turnover, which is invariant to the expecta-tions-driven prices, because the stock prices enter in the numerator and de-nominator.
The Finance-Size measure in Levine et al. (2000) and Beck and Levine (2001) is defined as the log of the sum of two ratios, the value of private sec-tor credits by financial intermediaries divided by GDP, and the market capi-talization divided by GDP. Despite many advantages, this measure suffers from the defect that in addition to IPOs and equity issuance by the listed firms, the growth of stock market capitalization reflects asset price inflation. To measure the size of the stock market in real terms, i.e., at expectations-adjusted stock prices (see, e.g., Rousseau and Wachtel 2000), we modify the measure by normalizing the time series of market capitalization and GDP at the 1995 stock and overall price levels, respectively. In addition, the credit component we use is total domestic credit. The third measure in our analysis is Finance-Aggregate that combines the previous two measures and thus represents an aggregate measure of the size and deepness of the financial sec-tor. Specifically, it is the first principal component of Finance-Activity and Fi-nance-Size.10

30 · Ar i Hyyt inen and M ik a Pajar inen
Levine et al. (2000) and Beck and Levine (2001) also assess whether a financial system is stock market-based or bank-oriented. To this end they construct two additional measures, called Structure-Activity and Structure-Size. We adopt the measures but, like in the case of Finance-Activity, we mod-ify them to eliminate the forward-looking component of stock prices and use total domestic credit when evaluating the importance of credit for the econ-omy. Therefore, we define Structure-Activity to equal the log of the ratio of share turnover to total domestic credit, with the latter expressed as a share of the GDP. It contrasts the activities of the stock market to those of the inter-mediated debt market(s). The second measure, Structure-Size, is defined as the log of the ratio of the real stock market capitalization to total domestic credit normalized by GDP. This measure captures the relative size of the stock market with respect to the debt finance. The third measure, Structure-Aggregate, combines the previous two measures and equals the first principal component of them. This measure is thus a summary indicator of the size and activity of stock markets relative to the intermediated debt finance.
Figure 1.4 illustrates the development of the above-mentioned six indi-cators in the Nordic countries during the past decade. As we can see, Finance-Activity has increased in all countries. In addition, stock market activity has increased relatively more than the debt market activity (Structure-Activity). On the other hand, the real size of financial markets compared to the real size of the economy, i.e. Finance-Size, has decreased quite clearly in Finland and Norway whereas in Denmark and Sweden the changes have been more mod-erate. The mean growth rates of the measures are however negative for all countries. As Structure-Size shows, the relative size of stock market has in Finland increased significantly and in Denmark and Norway to some extent.
The development of Finance-Aggregate indicates that overall, the real size (deepness) of the financial sectors has decreased relative to the size of the economy in the Nordic countries during the past decade. It is important to note that this decrease has here been documented using purely a relatively simple quantitative indicator. The measure does not take into account for ex-ample the firms’ need for external finance or the adoption of financial innova-tions in the Nordic countries, and may hence give a too pessimistic view of the development. On the other hand, the development of Structure-Aggregate

Financia l systems and venture capita l in Nordic countr ies : A comparat ive study · 31
Figure 1.4. Indicators of financial development and structure in Nordic countries (1990-2000)
1990
1991
1992
1993
1994
1995
1996
1997
1998
1999
2000
-3.00
-2.00
-1.00
0.00
1.00 Finance-Activity
1990
1991
1992
1993
1994
1995
1996
1997
1998
1999
2000
-3.00
-2.00
-1.00
0.00
1.00 Structure-Activity
1990
1991
1992
1993
1994
1995
1996
1997
1998
1999
2000
-0.50
-0.25
0.00
0.25
0.50 Finance-Size19
90
1991
1992
1993
1994
1995
1996
1997
1998
1999
2000
-1.50
-1.25
-1.00
-0.75
-0.50
-0.25
0.00
0.25
0.50 Structure-Size
1990
1991
1992
1993
1994
1995
1996
1997
1998
1999
2000
-4.00
-3.00
-2.00
-1.00
0.00
1.00
2.00
3.00 Finance-Aggregate
1990
1991
1992
1993
1994
1995
1996
1997
1998
1999
2000
-4.00
-3.00
-2.00
-1.00
0.00
1.00
2.00
3.00 Structure-Aggregate
Denmark Finland Norway Sweden
Note: Data sources are ETLA Database – The Nordic Securities Market: Monthly Statistics and OECD Main Economic Indicators, and IMF(2001). Construction of indicators is based on Levine et al. (2000) and Beck and Levine (2001), with some modifications by the authors.

32 · Ar i Hyyt inen and M ik a Pajar inen
indicates that the countries have moved toward stock market-centered finan-cial systems. This seems to apply in particular to Finland that had the lowest values for Structure-Activity and Structure-Size in the early 1990s and that has in this regard clearly caught up with the other Nordic countries since then. This trend of increasing importance of stock markets is of course not unique to the Nordic countries; the same trend has characterized the recent financial development in other European countries, too.
1.2.2. LEGAL SYSTEMS AND CORPORATE GOVERNANCE
The law-and-finance approach to the analysis of financial systems has been advocated in a series of papers by La Porta et al. (1998, 1999, 2000). The ap-proach theorizes that the legal system of a country is an important if not the primary determinant of corporate financing patterns because it is the key mechanism that protects outside investors from expropriation and from be-ing mistreated by the insiders. When investor rights are well defined and en-forced, investors are willing to provide capital to firms, and no substitute, possibly costly mechanisms are needed. According to this approach, the dis-tinction between bank-based and stock market-based systems is of second-order importance.
The studies of La Porta et al. portray the following picture of the Nor-dic countries’ corporate governance model.11 First, the Nordic average for an index measuring minority shareholder protection (antidirector rights) is 3.00, which is the same as the world average, computed over 49 countries (Table 1.2). It is however lower than the score for the US. Overall, the Nordic coun-tries’ legal systems provide less protection for shareholders than those of the common law countries on average do. In terms of creditor protection, the Nordic countries’ average score is 2.00, which is somewhat below the world average of 2.30. The Nordic countries’ score is below the average of the civil-law family associated with Germany’s legal traditions, which is 2.33.
Second, the quality of enforcement of laws, i.e. the tradition of law and order, is very high in the Nordic countries (La Porta et al. 1998)). Measured over the 1980s and 1990s, the Nordic countries received the maximum score (i.e. 10.00) in an assessment of the law and order tradition. The world average was 6.85, while that of the German-civil-law countries and the US were 8.68 and 10.00, respectively.
Third, the Nordic countries’ average level of ownership is close to the world average (La Porta et al., 1998; see also Table 1.2). Hence they do not have a more concentrated ownership than the other countries do. Such a

Financia l systems and venture capita l in Nordic countr ies : A comparat ive study · 33
finding would be predicted if the level of investor protection was particularly poor. The hypothesis is that concentrated ownership is a substitute for weak protection of investors.
Finally, the Nordic countries have smaller external market capitaliza-tion (in terms of approximated minority ownership) relative to GNP as well as less listed domestic firms per capita than many other countries (La Porta et al., 1997). The result holds even if the size of economies, growth rates, the de-grees of legal investor protection and law and order are accounted for. The same does not hold for indebtedness; La Porta et al., (1997) document that the amount of intermediated debt in the Nordic countries has not been different from the rest of world.
Table 1.2. Investor protection
Denmark Finland Norway Sweden
Antidirector Rights 2.00 3.00 4.00 3.00Creditor Rights 3.00 1.00 2.00 2.00Ownership Concentration 0.45 0.37 0.36 0.28
World average Germany US Japan
Antidirector Rights 3.00 1.00 5.00 4.00Creditor Rights 2.30 3.00 1.00 2.00Ownership Concentration 0.46 0.48 0.20 0.18
Note: Data source is La Porta et al. (1998). Antidirector Rights is the index of minority shareholder rights, Creditor Rights is the index of secured creditor rights, and Ownership Concentration is the ownership fraction of three largest shareholders in the ten largest non-financial firms.
In sum, it appears that on the basis of the analysis on the laws on books, the Nordic countries have adopted an intermediate stance toward the protection of investors; the protection of shareholders is in relative terms weaker than that of the creditors.12 This finding may explain why the Nordic countries have had relatively subdued stock markets when compared to the rest of the world.
Some recent analyses have augmented the picture portrayed by La Porta et al.13 In Sweden, informal corporate governance mechanisms and other means, such as dual-class shares and pyramid holding companies, have enhanced the ability of the Swedish firms to raise external finance (Angblad et al. 2000). In Norway, the legal protection of shareholders is stronger than captured by the measures of La Porta et al., allowing for a relatively low con-centration of ownership (Bohren and Odegaard 2000). In Finland, the concen-

34 · Ar i Hyyt inen and M ik a Pajar inen
tration of ownership has remained rather high even though the protection of shareholders has (by the measures of La Porta) improved while that of the creditors has decreased (Hyytinen et al. 2003 and Chapter 2 in this volume). Kaisanlahti (Chapter 3 in this volume) further argues the legal protection of shareholders is also in Finland stronger than captured by the measures of La Porta. He makes however the further observation that enforcement of con-tracts may be a problem for minority investors. Finally, the large limited companies are characterized by very concentrated ownership in Denmark, reflecting the fact that ownership has been a substitute for the relatively weak protection of the Danish shareholders.
1.2.3. DISCUSSION
The corporate sectors of the Nordic countries have historically been highly dependent on borrowing from financial institutions. Loans were together with retained earnings clearly the most important source of corporate sector funding in all four Nordic countries in the 1980s.14 Particularly small and medium-sized firms have traditionally relied heavily on intermediated debt financing. This traditional landscape began to change in the 1980s and the rate of change accelerated in the 1990s together with the overall development of the financial system. Besides the liberalization of financial markets, the main driving forces of the change have been the problems of banking sectors, the increasing importance of stock markets, as well as technological and in-dustrial advance.
During the lending boom phase that followed the liberalization, the availability of external financing was hardly much of an issue. However, the importance of loans as a source of corporate funding became more of a bur-den to the firms when the problems of the banking sectors began to accumu-late. The financing options of small- and medium-sized firms became fewer because of the banking sector problems and restructuring. The access to pri-vately intermediated debt finance was hampered by the binding capital con-straints of the distressed banks, disrupted lending relationships, and in-creased interbank competition.15 The reduction of financing options was an acute problem particularly for smaller and younger firms with no access to public debt or equity markets.16 The financing of innovative start-ups suf-fered from the situation even more because of their high risk of default and reliance on intangible assets.
As we documented earlier, the Nordic financial systems have during recent years become more market-based. Stock markets have grown in size

Financia l systems and venture capita l in Nordic countr ies : A comparat ive study · 35
and their liquidity has improved. This type of financial development is im-portant for its direct effects on growth and capital allocation. For example, it is equity rather than debt financing that is essential for firms whose near-term cash-flows are negligible and main assets are growth opportunities. Moreover, an arms-length financial system, relying on market-based corpo-rate financing, may be more efficient in providing price information for guidance and hence for more efficient allocation of capital to investments, particularly to investments in intangible assets (see, e.g., Rajan and Zingales 2002). In other words, by making prices more informative and the system less dependent on relationships, the increasing role of the stock market has en-hanced the ability of the Nordic financial systems to finance projects with a high ratio of intangible to tangible assets. The smaller and younger firms have however not benefited directly from the stronger stock markets; besides lack of investor interest, the fixed costs of flotation preclude the listing of firms that are not mature and large enough. In this sense, a financing gap ex-isted.
Recent technological advance have created new industries and oppor-tunities for investment. The emergence of new industries may have increased the demand for external funds and the need for a reallocation of capital from the declining industries to the new ones, because in such industries the firms can rely on internal sources of finance only to a limited extent.17 The growing importance of hi-tech industries, such as information and communications technology (ICT), has in turn created demand for new forms of finance due to the intangible nature of the industries’ assets.18
It is against this background on which we build our analysis of the Nordic venture capital in the next Section.

36 · Ar i Hyyt inen and M ik a Pajar inen
1.3. PRIVATE EQUITY AND VENTURE CAPITAL IN NORDIC COUNTRIES
Practitioners have for long emphasized that the various stages of private eq-uity process are interrelated. Because of the interrelatedness, the business of private equity is best viewed as a private equity cycle (Gompers and Lerner 2000, 2001a), consisting of three interrelated stages: fundraising, investing, and exiting.
Raising capital to establish a venture fund is the first step of the cycle. Investors investing in venture funds include pension funds, insurance com-panies, banks, and corporate investors, to name a few. Once a desired amount of commitments from the investors have been received, the fund is “closed”, i.e. no more commitments are accepted. The capital committed is drawn down over a number of years during the investment stage, which is the second stage of the cycle. It consists of an initial search for venture candi-dates, ex ante monitoring of the candidates, investment decision, as well as interim monitoring and giving advise to the investee firms. Capital is often infused in stages as the investee firms grow and mature. Disposing of, i.e. ex-iting, the investee firms completes the cycle, meaning that venture capitalists sell their stakes in successful firms and write off failures. Because the lifetime of a typical private equity fund is, at least in the U.S, typically predetermined and around ten years, there is mounting pressure to liquidate investments as the lifecycle of the fund approaches its end. The need to exit and return the committed capital forces venture capitalists to periodically return to markets if they are going to raise new funds and remain active in the business of ven-ture capital. The more successful was the previous cycle, the easier it is for a venture capitalist to raise additional funds, and to restart the cycle.
1.3.1. BIRTH AND GROWTH OF VENTURE CAPITAL MARKETS
The era of infant venture capital: the 1980s19
The roots of the modern private equity were created in all four Nordic coun-tries no earlier than in the late 1970s and in the early 1980s. In Sweden for ex-ample, the first venture capital firm, Företagskapital, was established in 1973 (Karaömerlioglu and Jacobsson 2000). Many of the early venture capital firms were “semi-private”, i.e. based on co-operation between the government and private sector.20 In the 1980s the industry began to grow as several new pri-vate venture capital firms were founded. By the mid 1980s, there were about

Financia l systems and venture capita l in Nordic countr ies : A comparat ive study · 37
20 venture capital firms in Denmark, 5-6 in Norway and some 20 private ven-ture capital funds in Sweden, accompanied by around 30 regional and gov-ernment run investment companies (Chritiansen 2000; Karaömerlioglu and Jacobsson 2000). In Finland, the growth lagged a bit the other Nordic coun-tries. However, by 1988 there were 48 venture capital and development com-panies in Finland (Seppä 2000, p. 210).
Around the mid 1980s, a shakeout period began in Sweden, followed by the other Nordic countries during the latter part of the decade. In Sweden for example, most of the private venture capital firms left the industry (Karaömerlioglu and Jacobsson 2000); in Denmark, the number of active ven-ture capital firms decreased to 4-5 by the end of the 1980s (Christensen 2000); and in Finland, the total number of venture capital firms dropped from 48 in 1988 to 30 in 1990, with the private firms being the ones who left the market (Seppä 2000). In Norway, the industry shrank dramatically, if not collapsed, too.
The decrease in activity was reflected in the flows of risk capital. Be-tween 1988-1990 venture capital investments (i.e. start-up, seed and expan-sion investments) were on average 0.148, 0.111, 0.219 and 0.165 as per million of average GDP in Denmark, Finland, Norway and Sweden, respectively (Jeng and Wells 2000). The corresponding figures for France, the UK and the US were 0.541, 1.120 and 0.383, respectively, and thus clearly higher. The col-lapse of activity was also long lasting. For example, averaged over 1986-1995, the UK and US had 2.581 and 2.405 private equity new funds raised per mil-lion of average GDP, while the Nordic average was 0.679, with Sweden hav-ing the largest amount raised in relative terms. Thus, when compared to the US and to many other European countries, the Nordic venture capital indus-try remained – despite the strong start – undeveloped the entire 1980s and, as we shall discuss shortly, much of the early 1990s.
The era of renaissance of venture capital: the 1990s
Before analyzing the development of Nordic private equity in the 1990s, we discuss certain data and measurement problems. First, both the definition of venture capital as well as the data on the venture capital activity varies across countries and sources.21 In the analysis of this section we adhere to the US definition and exclude buy-outs when referring to venture capital. Second, available data pertains to activities by a country’s private equity firms (“coun-try-of-management”) rather than private equity activity within a country (Baygan and Freudenberg 2000).22 Recently, European data on funds raised

38 · Ar i Hyyt inen and M ik a Pajar inen
by country of origin and investment by country of destination have become available, allowing thus an analysis of the importance of international flows of venture capital.
Funds raised
Figure 1.5 displays funds raised as a share of GDP and by the type of inves-tors from 1991 to 2001. The figure reveals that in the early 1990s, the amount of funds raised was close to negligible in each Nordic country. A revitaliza-tion of the private equity industries began in the mid of the 1990s. Fund rais-ing started to increase somewhat earlier in Finland and Sweden than in Denmark and Norway. Like elsewhere in Europe, all the Nordic countries experienced quite a strong growth in the fund raising activity particularly in late 1990s.
Governmental initiatives played a rather important role in the revitali-zation of the venture capital industries in the Nordic countries. The Swedish government released amidst the banking crisis in 1992 no less than SEK 6.5 billion for venture activity via two new investment organizations (Atle and Bure) and state-owned venture capital organizations. In Norway, the gov-ernment launched a Nkr 800 million program in 1989 to rebuilt the industry that had collapsed after the banks begun to run into troubles in the late 1980s. A new (reorganized) governmental investment organization called the Nor-wegian State Industrial and Development Fund was launched with added fi-nancial resources in 1993. In 1996, an (additional) amount of NKr 200 million was earmarked for private equity projects by the Norwegian government. In Finland also, governmental activity was quite crucial to the revitalization of the industry (see also Seppä 2000).23 Besides having run governmental ven-ture capital investment organizations (e.g. The Finnish National Fund for Re-search and Development, Sitra), the Finnish government has offered quaran-tines and provided funding to the industry (since 1995) through a fund-of-funds vehicle, Finnish Industry Investment Ltd.

Financia l systems and venture capita l in Nordic countr ies : A comparat ive study · 39
Figure 1.5. Private equity funds raised in Nordic countries (1991-2001)
Denmark Finland Norway Sweden0.0
2.0
4.0
6.0
8.0
10.0
12.0
14.0
16.0
per
mill
e of
GD
P
1991
1992
1993
1994
1995
1996
1997
1998
1999
2000
2001
0%
20%
40%
60%
80%
100%Denmark
1991
1992
1993
1994
1995
1996
1997
1998
1999
2000
2001
0%
20%
40%
60%
80%
100%Finland
1991
1992
1993
1994
1995
1996
1997
1998
1999
2000
2001
0%
20%
40%
60%
80%
100%Norway
1991
1992
1993
1994
1995
1996
1997
1998
1999
2000
2001
0%
20%
40%
60%
80%
100%Sweden
1991-1995 1996-2000 2001
Other
Realised capital gains
Pension funds and insurance companies
Banks
Government agencies
Corporate investors
Note: Data source is European Private Equity & Venture Capital Association (EVCA), various yearbooks.

40 · Ar i Hyyt inen and M ik a Pajar inen
The growth of Nordic private equity industries ended, however, in 2000-2001. Year 2000 was still the most active year ever for the venture capital industry in Europe. The total sum of funds raised amounted to EUR 48 bil-lion and almost doubled the previous record set in 1999. During the record year, all the Nordic countries except Finland experienced substantial increase in the fund raising activity.24 In 2001 funds raised in Europe decreased by 20% from the previous year but the year was still the second highest ever for funds raised. In all Nordic countries funds raised decreased from the previ-ous year, most significantly in Sweden.
As we can see from Figure 1.5, there has been a lot of variation in the sources of funds to the Nordic private equity firms over time. Over the 1995-2001 period, pension funds and insurance companies stand for an important source of capital both in Finland and Sweden. In Denmark, the primary sources of funds were in the late 1990s banks but in 2000 and 2001 pension funds and insurance companies. Norway differs from the other Nordic coun-tries in this regard as realized capital gains and other (unidentified) sources have been an important source of funds there.
Investments made
Figure 1.6 displays total private equity investments as a share of GDP as well as the stage distribution of the investments for 1991-2001. The ratio of private equity investments to GDP, measured by the country-of-management ap-proach, was quite modest and stable prior to the growth years at the end of the 1990s. The revitalization of the private equity industries in mid and late 1990s shows up in investment flows, too. Particularly in 1999 and 2000, the ratio of private equity investment flows to GDP increased dramatically. Aver-aged over 1995-2001, the Finnish, Norwegian and Swedish private equity in-dustries exhibit significantly higher investment levels than the Danish one. Relative to GDP, the amount invested by the Swedish private equity firms look as if it was exceptionally high in 1999-2001. To some extent, the increase may however reflect improved data gathering and the poor quality of in-vestment figures during earlier years (EVCA 2000, p. 144, and Karaömer-lioglu and Jacobsson 2000). Nevertheless, the developments in the Swedish market were in 1999 and early 2000 fuelled by the strong growth of the econ-omy’s high technology sectors. The growth in Sweden or in the other Nordic countries is by no means unique, as the total amount invested grew at the same time rapidly in most of the other European countries, too.25

Financia l systems and venture capita l in Nordic countr ies : A comparat ive study · 41
Figure 1.6. Private equity investments in Nordic countries (1991-2001) 19
91
1992
1993
1994
1995
1996
1997
1998
1999
2000
2001
0%
20%
40%
60%
80%
100%Denmark
1991-1995 1996-2000 2001
1991
1992
1993
1994
1995
1996
1997
1998
1999
2000
2001
0%
20%
40%
60%
80%
100%Finland
1991
1992
1993
1994
1995
1996
1997
1998
1999
2000
2001
0%
20%
40%
60%
80%
100%Norway
1991
1992
1993
1994
1995
1996
1997
1998
1999
2000
2001
0%
20%
40%
60%
80%
100%Sweden
Replacement capital and buyoutsExpansionSeed and start-ups
Denmark Finland Norway Sweden0.0
1.0
2.0
3.0
4.0
5.0
6.0
7.0
8.0
9.0
10.0
per
mill
e of
GD
P
Note: Data source is European Private Equity & Venture Capital Association (EVCA), various yearbooks.
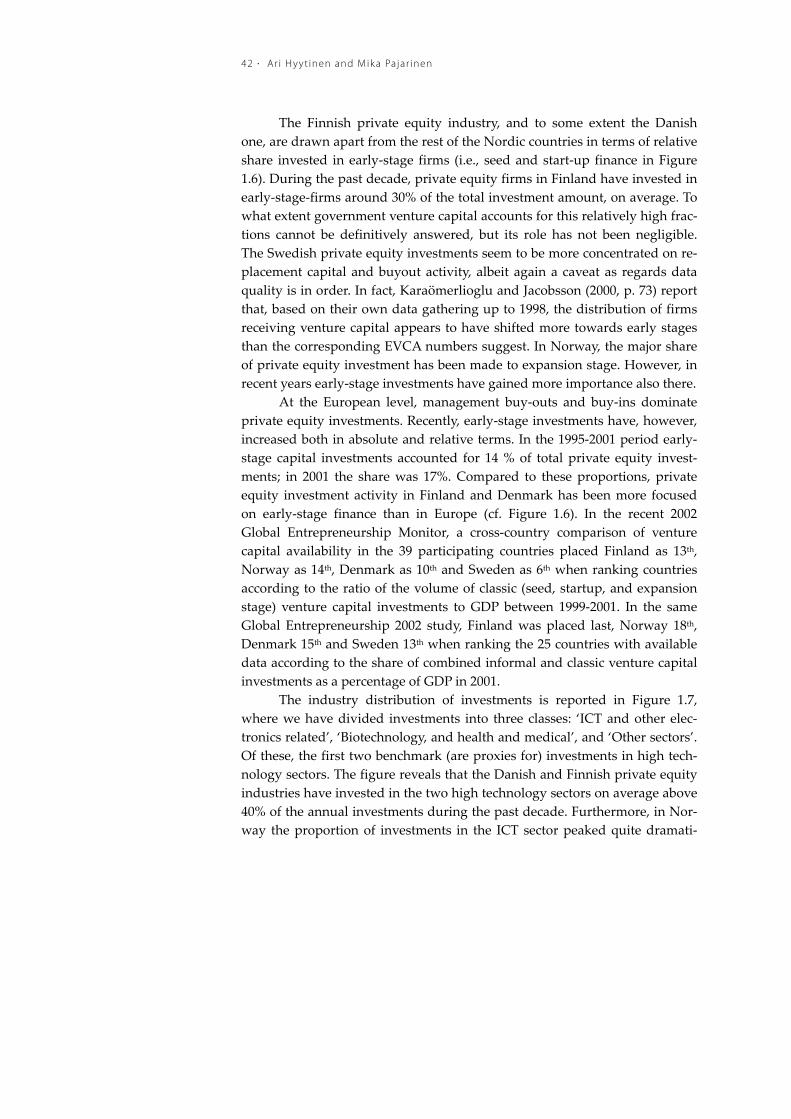
42 · Ar i Hyyt inen and M ik a Pajar inen
The Finnish private equity industry, and to some extent the Danish one, are drawn apart from the rest of the Nordic countries in terms of relative share invested in early-stage firms (i.e., seed and start-up finance in Figure 1.6). During the past decade, private equity firms in Finland have invested in early-stage-firms around 30% of the total investment amount, on average. To what extent government venture capital accounts for this relatively high frac-tions cannot be definitively answered, but its role has not been negligible. The Swedish private equity investments seem to be more concentrated on re-placement capital and buyout activity, albeit again a caveat as regards data quality is in order. In fact, Karaömerlioglu and Jacobsson (2000, p. 73) report that, based on their own data gathering up to 1998, the distribution of firms receiving venture capital appears to have shifted more towards early stages than the corresponding EVCA numbers suggest. In Norway, the major share of private equity investment has been made to expansion stage. However, in recent years early-stage investments have gained more importance also there.
At the European level, management buy-outs and buy-ins dominate private equity investments. Recently, early-stage investments have, however, increased both in absolute and relative terms. In the 1995-2001 period early-stage capital investments accounted for 14 % of total private equity invest-ments; in 2001 the share was 17%. Compared to these proportions, private equity investment activity in Finland and Denmark has been more focused on early-stage finance than in Europe (cf. Figure 1.6). In the recent 2002 Global Entrepreneurship Monitor, a cross-country comparison of venture capital availability in the 39 participating countries placed Finland as 13th, Norway as 14th, Denmark as 10th and Sweden as 6th when ranking countries according to the ratio of the volume of classic (seed, startup, and expansion stage) venture capital investments to GDP between 1999-2001. In the same Global Entrepreneurship 2002 study, Finland was placed last, Norway 18th, Denmark 15th and Sweden 13th when ranking the 25 countries with available data according to the share of combined informal and classic venture capital investments as a percentage of GDP in 2001.
The industry distribution of investments is reported in Figure 1.7, where we have divided investments into three classes: ‘ICT and other elec-tronics related’, ‘Biotechnology, and health and medical’, and ‘Other sectors’. Of these, the first two benchmark (are proxies for) investments in high tech-nology sectors. The figure reveals that the Danish and Finnish private equity industries have invested in the two high technology sectors on average above 40% of the annual investments during the past decade. Furthermore, in Nor-way the proportion of investments in the ICT sector peaked quite dramati-
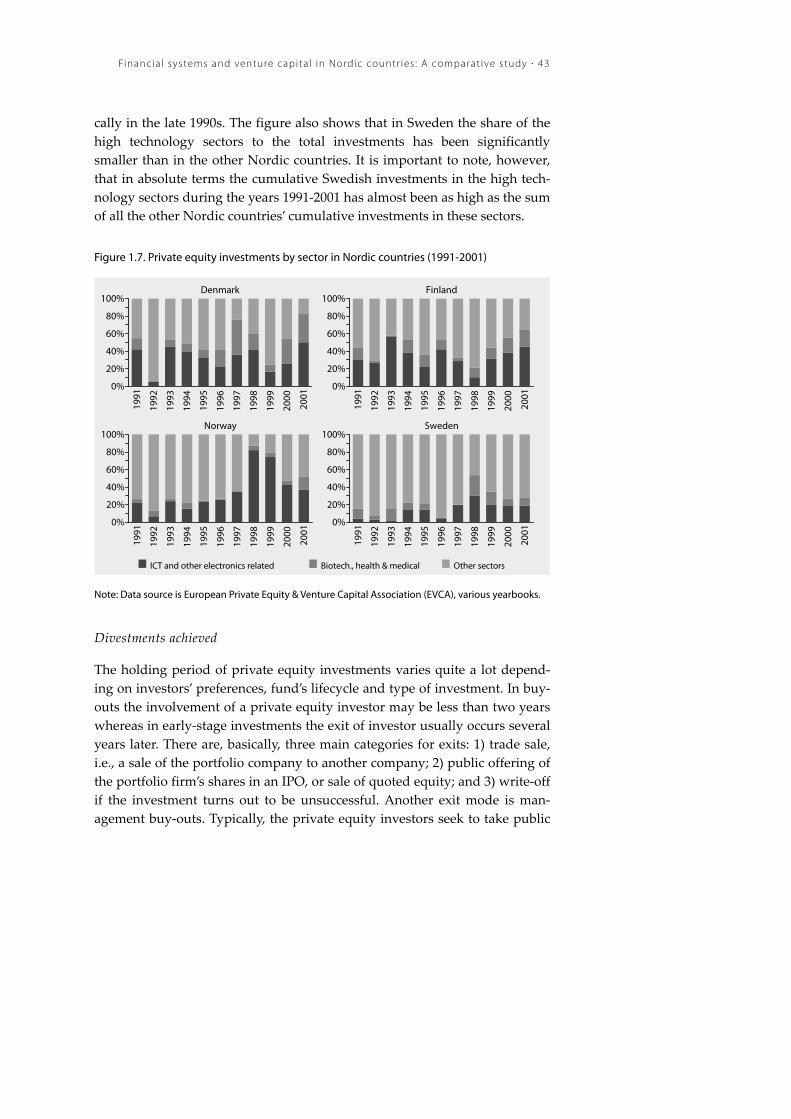
Financia l systems and venture capita l in Nordic countr ies : A comparat ive study · 43
cally in the late 1990s. The figure also shows that in Sweden the share of the high technology sectors to the total investments has been significantly smaller than in the other Nordic countries. It is important to note, however, that in absolute terms the cumulative Swedish investments in the high tech-nology sectors during the years 1991-2001 has almost been as high as the sum of all the other Nordic countries’ cumulative investments in these sectors.
Figure 1.7. Private equity investments by sector in Nordic countries (1991-2001)
1991
1992
1993
1994
1995
1996
1997
1998
1999
2000
2001
0%
20%
40%
60%
80%
100%Denmark
1991
1992
1993
1994
1995
1996
1997
1998
1999
2000
2001
0%
20%
40%
60%
80%
100%Finland
1991
1992
1993
1994
1995
1996
1997
1998
1999
2000
2001
0%
20%
40%
60%
80%
100%Norway
1991
1992
1993
1994
1995
1996
1997
1998
1999
2000
2001
0%
20%
40%
60%
80%
100%Sweden
Other sectorsBiotech., health & medicalICT and other electronics related
Note: Data source is European Private Equity & Venture Capital Association (EVCA), various yearbooks.
Divestments achieved
The holding period of private equity investments varies quite a lot depend-ing on investors’ preferences, fund’s lifecycle and type of investment. In buy-outs the involvement of a private equity investor may be less than two years whereas in early-stage investments the exit of investor usually occurs several years later. There are, basically, three main categories for exits: 1) trade sale, i.e., a sale of the portfolio company to another company; 2) public offering of the portfolio firm’s shares in an IPO, or sale of quoted equity; and 3) write-off if the investment turns out to be unsuccessful. Another exit mode is man-agement buy-outs. Typically, the private equity investors seek to take public

44 · Ar i Hyyt inen and M ik a Pajar inen
the most successful firms in their portfolios. On the other hand, a trade sale is often the only option for (smaller) companies with minor public interest.
Figure 1.8 presents private equity divestments in the Nordic countries over 1991-2001. The figure reveals that the Finnish and Swedish figures for 1999-2001 notwithstanding, the total number of exits have remained rela-tively subdued in the Nordic countries.26 On average, less than 50 exits were made annually over the 1991-98 period. However, the Nordic countries achieved a non-negligible amount of exits in 1999 and 2000. The rise in di-vestments coincided with, among other things, the favorable stock market developments and the increased mergers and acquisitions activity in 1998-99 and early 2000. However, it is of interest to note that except in Norway, the amount of divestments decreased in 2000 and 2001.
Most of the divestments have in recent years been trade sales in Swe-den, public offerings and trade sales in Norway, and trade sales and write-offs in Denmark (Figure 1.8). In Finland, no clear pattern seems to emerge, except that since 1995 the public offerings have become somewhat more im-portant avenue of exit than they were during the economic turbulence of the early 1990s. These findings fit to the European patterns of exit. In Europe, trade sales have recently been the most popular type of exit at 27% share of the total number of exits during the years 1995-2001. The proportion of public offerings has been 14% and the share of write-offs 19%.

Financia l systems and venture capita l in Nordic countr ies : A comparat ive study · 45
Figure 1.8. Private equity divestments in Nordic countries (1991-2001) 19
91
1992
1993
1994
1995
1996
1997
1998
1999
2000
2001
0%
20%
40%
60%
80%
100%Denmark
1991-1995 1996-2000 2001
1991
1992
1993
1994
1995
1996
1997
1998
1999
2000
2001
0%
20%
40%
60%
80%
100%Finland
1991
1992
1993
1994
1995
1996
1997
1998
1999
2000
2001
0%
20%
40%
60%
80%
100%Norway
1991
1992
1993
1994
1995
1996
1997
1998
1999
2000
2001
0%
20%
40%
60%
80%
100%Sweden
Other meansWrite-offPublic offeringTrade sale
Denmark Finland Norway Sweden0
50
100
150
200
250
num
ber
of d
ives
tmen
ts
Note: Data source is European Private Equity & Venture Capital Association (EVCA), various yearbooks.

46 · Ar i Hyyt inen and M ik a Pajar inen
1.3.2. NORDIC VENTURE CAPITAL IN EUROPEAN COMPARISON
Scale of activity
In the first half of the 1990s, the Nordic private equity firms’ share of the funds raised in Europe was, on average, around 7.3%, of the capital invested 3.7% and of the divestments achieved 2.3%. In the 1996-2001 period, the shares were 7.6%, 8.2% and 4.8%, respectively. These figures show that the Nordic private equity firms’ share of the funds raised remained quite un-changed during the past decade while their shares of the European invest-ments and divestments increased. This suggests that the Nordic countries have lagged the European development.
For a closer look, Figure 1.9 reports each Nordic country’s share of pri-vate equity activity in Europe in two different ways. First, the upper part re-ports the Nordic countries’ share of the total European activity for the peri-ods of 1991-1995 and 1996-2001. The figures indicate that the most significant changes have occurred in Sweden; its private equity industry has in particu-lar increased its share of the investments. In addition, Finland’s shares of funds raised, investments and exits have all steadily increased. Second, the lower part of Figure 1.9 presents the Nordic countries’ share of different ven-ture capital activities relative to their GDP share in Europe. If the ratio is lar-ger than one, it implies that the country has more venture capital activity than its GDP share predicts. The figure shows that only Sweden has over the past years reached the level of venture capital activity that its GDP share predicts in all the three dimensions. Finland has been catching up the Euro-pean venture capital with regard to funds raised: during the 1996-2001 pe-riod, the Finnish proportion of European private equity funds raised nearly reached the level predicted by Finland’s GDP share among the European countries. The Finnish shares of investments and divestments also increased but remained still notably below the level predicted by the country’s GDP share. The Danish and Norwegian venture capital industries show only moderate changes by this measure.
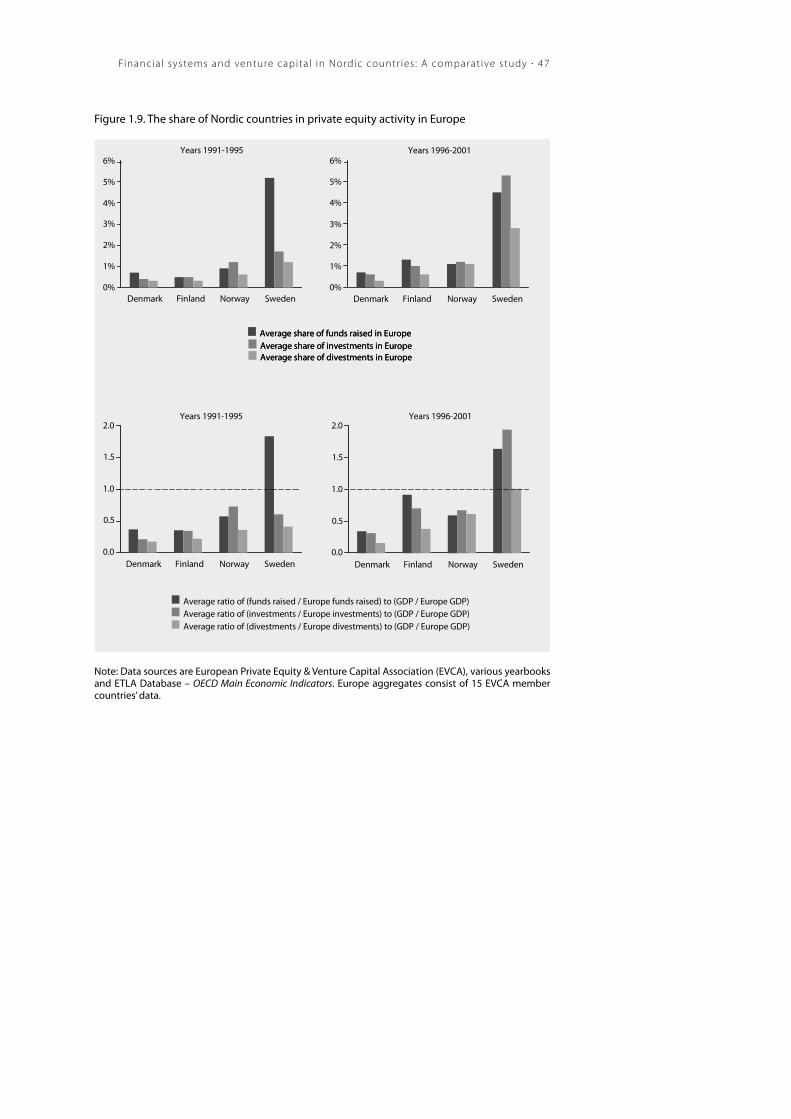
Financia l systems and venture capita l in Nordic countr ies : A comparat ive study · 47
Figure 1.9. The share of Nordic countries in private equity activity in Europe
Denmark Finland Norway Sweden0.0
0.5
1.0
1.5
2.0Years 1991-1995
Denmark Finland Norway Sweden0.0
0.5
1.0
1.5
2.0Years 1996-2001
Average ratio of (funds raised / Europe funds raised) to (GDP / Europe GDP)Average ratio of (investments / Europe investments) to (GDP / Europe GDP)Average ratio of (divestments / Europe divestments) to (GDP / Europe GDP)
Average share of funds raised in EuropeAverage share of investments in EuropeAverage share of divestments in Europe
Average share of funds raised in EuropeAverage share of investments in EuropeAverage share of divestments in Europe
Denmark Finland Norway Sweden0%
1%
2%
3%
4%
5%
6%Years 1996-2001
Denmark Finland Norway Sweden0%
1%
2%
3%
4%
5%
6%Years 1991-1995
Note: Data sources are European Private Equity & Venture Capital Association (EVCA), various yearbooks and ETLA Database – OECD Main Economic Indicators. Europe aggregates consist of 15 EVCA member countries’ data.
48 · Ar i Hyyt inen and M ik a Pajar inen
It is well known that private equity investments and particularly ven-ture capital investments tend to cluster in certain sectors, such as ICT and biotechnology (Gompers and Lerner 2000). At least to a certain extent, the concentration is related to the degree to which entrepreneurs and innovators are able to extract profits from their new products and innovations. For ex-ample, in 1995-2001, the average share of the investments in ICT and other electronics related sectors has in Europe been around 24%. The proportion of biotechnology, medical and health related sectors has been about eight per-cent.
Figure 1.10 summarizes the recent concentration of the private equity investments in the high technology sectors in selected European countries in couple of alternative ways.27 The figure shows, first, that when we normalize the amount of investments by GDP the Swedish private equity firms have been the leading group investing in the ICT sector in Europe. Finland ranks the eighth, which is perhaps surprising if one takes into account its strong position in the ICT production. By this measure, the Swedish, Finnish and Danish industries have invested quite a lot in biotechnology and health and medical sectors. Second, as measured by the proportion of total investment value, the three Nordic countries’ private equity firms have invested quite a lot in biotechnology, health and medical sectors. As to investments in ICT, the Norwegian firms rank exceptionally high among the European countries, whereas the Finland’s position is again surprisingly low. However, no time-series data are available to determine the extent to which Norwegian private equity firms have been investing abroad or foreign private equity investors in Finland.
Maturity (stage of venture capital cycle)
The stage of the venture capital cycle is reflected in the relative amounts of funds raised, investments and exists. For example, if a lot of funds have been raised compared to the investments made, a country is at a relatively early stage of the cycle. In contrast, if a lot of investments have been made com-pared to exists achieved, a country is about to enter the exit stage of the cycle. Because of yearly variation in venture capital flows and the recent growth of
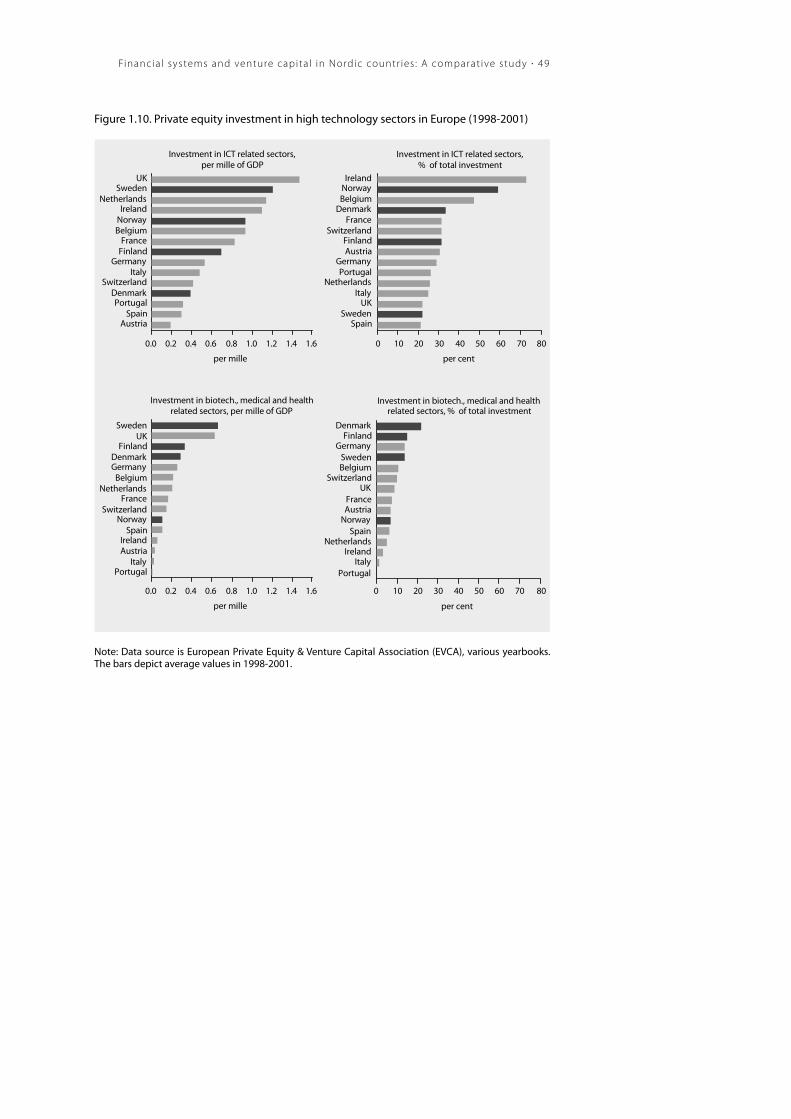
Financia l systems and venture capita l in Nordic countr ies : A comparat ive study · 49
Figure 1.10. Private equity investment in high technology sectors in Europe (1998-2001)
UKSweden
NetherlandsIreland
NorwayBelgium
FranceFinland
GermanyItaly
SwitzerlandDenmarkPortugal
SpainAustria
0.0 0.2 0.4 0.6 0.8 1.0 1.2 1.4 1.6
per mille
Investment in ICT related sectors, per mille of GDP
SwedenUK
FinlandDenmarkGermany
BelgiumNetherlands
FranceSwitzerland
NorwaySpain
IrelandAustria
ItalyPortugal
0.0 0.2 0.4 0.6 0.8 1.0 1.2 1.4 1.6
per mille
Investment in biotech., medical and health related sectors, per mille of GDP
IrelandNorwayBelgium
DenmarkFrance
SwitzerlandFinlandAustria
GermanyPortugal
NetherlandsItaly
UKSweden
Spain
0 10 20 30 40 50 60 70 80
per cent
Investment in ICT related sectors, % of total investment
DenmarkFinland
GermanySwedenBelgium
SwitzerlandUK
FranceAustria
NorwaySpain
NetherlandsIreland
ItalyPortugal
0 10 20 30 40 50 60 70 80
per cent
Investment in biotech., medical and health related sectors, % of total investment
Note: Data source is European Private Equity & Venture Capital Association (EVCA), various yearbooks. The bars depict average values in 1998-2001.

50 · Ar i Hyyt inen and M ik a Pajar inen
the venture capital activity in Europe, our analysis of the stage of the cycle is based on the cumulative values, i.e. on the entire history of the venture capi-tal industries. The idea is to measure the cumulative experience and hence the overall lifecycle of the industry.
Albeit Figure 1.9 already provided some clues about the stage of the venture capital cycle at which the Nordic countries are, we now test directly whether the Nordic countries are lagging behind the European venture capi-tal cycle. To this end, we calculate the ratios of cumulative funds raised to cumulative investments and cumulative investments to cumulative divest-ments using all the data we have, i.e. for 15 European countries for the 1991-2001 period. Table 1.3 summarizes this exercise, with null hypothesis being that the position of the Nordic venture capital industries in the venture capi-tal cycle is the same as that of the other European countries. The hypothesis is tested by computing t-tests for the ratios. The data speak for a laggard’s position in the cycle, if the ratios are statistically significantly higher in the Nordic countries than in Europe.
Table 1.3. Analysis of venture capital cycle in Nordic countries versus Europe (1991-2001)
Cumulative funds raised to cumulative investments
Cumulative investments to cumulative divestments
Nordic average 1.53** 4.24***Denmark 1.86*** 5.16***Finland 1.74*** 4.04***Norway 1.14 2.77Sweden 1.40 4.98***
Ratio of
Note: Data source is European Private Equity & Venture Capital Association (EVCA), various yearbooks. The data have been converted to US dollars prior to calculations. T-test for the null hypothesis that the ratios are the same for the Nordic countries as for the other European countries. *** indicates statistical significance at 1% level and ** at 5% level.
As we can see from Table 1.3, both ratios are statistically significant for the Nordic countries as a whole. Of individual countries, the both ratios ob-tain statistically significant values for Denmark and Finland and in the case of investments to divestments also for Sweden. This analysis indicates that, although the private equity industry in the Nordic countries grew quite rap-idly in late 1990s, they are still laggards relative to the European private eq-uity cycle. In particular, and consistent with our previous findings, only in Norway the amount of funds raised, investments and exits are balanced rela-
Financia l systems and venture capita l in Nordic countr ies : A comparat ive study · 51
tive to each other when benchmarked to the corresponding European levels; the other Nordic countries’ private equity industries are at an earlier stage of the cycle. They have therefore less experience in investing the funds raised and particularly in exiting the portfolio companies than the European coun-tries have on average. This conclusion is reinforced if one agrees with the view that despite their recent growth, the European venture capital markets are at a very early stage of development, less diversified and less efficient than those of the US (see, e.g., Communication of the European Commission 1998 and UNICE 2001).
1.3.3. DISCUSSION
The supply of venture capital is determined by the willingness of investors to provide capital to venture capital firms. The willingness, in turn, depends on the returns that the venture capital firms are expected to offer. From this per-spective it is not surprising that previous research has linked venture capital flows to the availability of exit mechanisms for venture capitalists and par-ticularly to the strength of the IPO market and the size of the stock market. Milhaupt (1997), Black and Gilson (1998), Jeng and Wells (2000) have for ex-ample demonstrated that IPOs are one of the main drivers of venture capital flows (both investments and fundraising) over time and across countries.28 There hence exists a strong indirect link between the availability of external finance to young entrepreneurial firms and the stock market.
The importance of well-functioning financial markets for venture capi-tal stems to a large extent from the vitality of the exit stage for the entire ven-ture capital cycle.29 Perhaps the most obvious reason for the importance of exits is that the exits affect the monetary incentives of venture capitalists to invest in certain firms and industries. Because many venture-backed firms generate little, if any, cash flow, exiting is critical to ensuring attractive re-turns. The incentives to invest therefore depend on how profitably venture capitalists can exit the portfolio companies. The reverse direction of the ven-ture capital process is important also because the opportunities for exits in-fluence the venture capitalists’ ability to raise capital in the future. An active stock market enables the development of the market for private risk capital also because it facilitates “the recycling of informed capital”, i.e. the experi-ence and human capital of the venture capitalists (Black and Gilson 1998, Michelacci and Suarez 2001). The informed capital is recycled when the ma-ture portfolio companies go public. The listing enables exiting and allows the

52 · Ar i Hyyt inen and M ik a Pajar inen
venture capital firms to redirect their financial and non-financial capital to-wards younger firms.
The earlier research suggests that besides a strong stock market, there are also other preconditions for the development of an active private equity market. According to the literature, the development is enhanced by the availability of funding from independent sources (e.g. pension funds); the in-centive structures and contracting mechanisms of the economy; and finally, overall risk tolerance and willingness of entrepreneurs and venture capital-ists to pursue high-risk, high-return ventures (see for example Milhaupt 1997, Black and Gilson 1998, Gompers and Lerner 2000).30 Macroeconomic condi-tions and government programs can play an important role, too.
The Nordic developments are quite consistent with the findings of the earlier research.31 First, the liberalization of domestic financial markets had a positive influence on the development of private equity by raising the num-ber of potential investors and liquidity, both in private and public equity markets. The development improved the prospects for exits and the favor-able stock market environment attracted the first movers to the industry. Sec-ond, the Nordic private equity and venture capital activity nearly collapsed by the end of the 1980s and early 1990s. Deteriorating macroeconomic condi-tions were a main contributing factor to the collapse, as the deterioration in-creased firms’ risks and thus the number of bankruptcies (cf. Section 1.2.1). The firms financed by the venture capital firms have typically a higher than average risk of default. Because such firms are more likely to suffer from macroeconomic turbulence, the venture industry was hit by the downturn sooner and harder than the economy on average. Moreover, the Nordic pri-vate equity and venture capital firms were not up to face the adverse macro-economic shocks because of the following reasons:
• Banks competed for market shares after the liberalization of financial markets. The credit boom of the 1980s may have in this way substituted credit for equity and worsened the adverse selection that the infant ven-ture capital industry faced.32 In other words, the average quality of ven-tures among the potential investee firms may have been of low quality be-cause only very bad projects did not received financing from the banks.
• The venture capital firms lacked a degree or two of maturity and critical size to face adverse shocks. The early venture capitalists were inexperi-enced to guide their portfolio firms over the difficult market conditions. Due to the small size of many of the venture firms, their portfolios were

Financia l systems and venture capita l in Nordic countr ies : A comparat ive study · 53
not well diversified and their financial resources were not sufficient to back up the portfolio firms in financial distress.
• At least some of the early venture capital firms were quite strongly growth-oriented, such as Mancon in Finland, and had therefore had fewer incentives for careful ex ante screening of potential investee firms (see also Seppä 2000).
The Nordic banks were heavily involved in the venture capital sector, but the banks’ own problems prevented them from helping the declining venture capital industry. There was little capital available for the venture capital firms from other sources, too. As a result, a period of slow progress followed in the early 1990s.
Third, the change in the structure of the Nordic financial systems and the governmental initiatives taken after the collapse of the venture industry contributed to the renaissance of venture capital in mid 1990s. In 1999-2000, the industry almost exploded in Finland and Sweden, and grew strongly, al-beit to a much smaller extent, also in Norway and Denmark. In 2001 venture capital boom slowed dramatically down.
Albeit governmental initiatives were important for the initial recovery, the growth of the Nordic stock markets and increased liquidity therein dur-ing the last years of the 1990s had a positive impact on the growth of private equity activity because they improved the prospects for exits and recycling of informed capital. The link between venture capital and stock markets, as suggested by the received theory, was at work. The change in the financial landscape may have also increased the willingness of independent financial institutions and other institutional investors to provide funds to the sector.
Finally, the demand side has been important for the recent develop-ments. The demand for venture capital is largely determined by entrepreneu-rial activity, i.e. the availability of entrepreneurs that have promising ven-tures, managerial skills and ambitions for growth, as well as alternative sources of external funds to ventures (see, e.g., Florida and Kenney 1988, and Milhaupt 1997). On the one hand, the heavy investments in high technology sectors that were made during the 1990s provided the Nordic private equity investors with plenty of interesting investment opportunities. On the other hand, the severity of the banking problems created for sure room for new providers of funding in the mid of the 1990s. Especially from the early-stage and high-risk firms’ point of view, the increase of private equity activity in the mid-1990s was welcomed because these firms may have faced relatively more severe difficulties in getting sufficient financial backup from the tradi-

54 · Ar i Hyyt inen and M ik a Pajar inen
tional sources of funds, i.e. from the banks. In this sense, the growth of ven-ture capital was on demand to fill the financing gap that the reducing lending by the struggling banks induced. Also the high real rates of interest in the early 1990s may have adversely affected the availability and costs of debt funding for firms with above average risk and uncertain cash flows.
1.4. CONCLUSIONS
We have documented several similarities that characterize the development of the Nordic countries’ financial systems over the past decades. These in-clude the liberalization of financial markets and the lending boom in the late 1980s, the banking crises and collapse of bank lending in the early 1990s, as well as the growth of stock markets in the late 1990s. We have also docu-mented that after a strong start, the private equity industries of the Nordic countries first collapsed, then grew slowly in the early 1990s and more inten-sively in the late 1990s. As a result of the recent developments, the Nordic fi-nancial systems have not necessarily become larger. Rather, the countries have moved towards stock market-centered financial systems. This charac-terization seems to apply particularly to Finland where the stock market has grown and the intermediated debt finance has contracted more relative to the size of the economy than in the other Nordic countries.
Despite the growth trend, only in Sweden private equity has over the past years reached the level (scale) of activity that its GDP share predicts. For the scale achieved, the Nordic countries are still laggards compared to the European private equity cycle. They have therefore less experience in invest-ing the funds raised and particularly in exiting the portfolio companies than the European countries have on average. This suggests that the Nordic ven-ture capital may lack a degree or two of maturity when compared to the other European countries.
These findings warrant four broad conclusions. First, because the steps towards stock market based financial systems and the growth of venture capital are recent phenomena and because it takes time to build a well-functioning financial infrastructure (Rajan and Zingales 2002), the Nordic fi-nancial systems are not necessarily mature enough yet to provide the finan-cial services that undertaking (and completing) large-scale change, emerging industries and knowledge-based economic growth require.
Second, the future of the recently established venture capital firms (with weak, if any, reputation) depends on the returns they are able to gener-ate for their investors. Because it seems that the Nordic countries’ private eq-

Financia l systems and venture capita l in Nordic countr ies : A comparat ive study · 55
uity industries are at an earlier stage of the venture capital cycle than else-where in Europe, the long-run vitality of the market for risk capital hinges in these countries on the exit opportunities that their financial systems generate (see Ali-Yrkkö et al. in Chapter 4 in this volume and Hyytinen 2002 for an analysis of the Finnish exit environment).
Third, because of the recent step towards stock market-centered finan-cial systems, the legal systems of the Nordic countries may have a more im-portant role to play for the patterns of corporate finance in the future. The reason for this is that explicit contracts and transparency are relatively more important for an economy with a market-based financial system (Rajan and Zingales 2002). In such systems, institutional relationships and market power matter less, the providers of finance have to rely more on the “protection” provided by the legal system and the ability to write explicit contracts and their pricing determine the financial transactions undertaken. Prompt and unbiased enforcement of contracts is instrumental to the efficient functioning of a market-based financial system. In addition, efficient corporate govern-ance is at the heart of innovative firms’ fundraising ability because of the evolving pattern of their control and capital structures. Whether the Nordic legal systems, mechanisms of corporate governance and particularly the pro-tection of shareholders are up to the task(s) warrants further analysis (see Hyytinen et al. in Chapter 2 and Kaisanlahti in Chapter 4 in this volume).
Finally, the Nordic private equity industries have evolved in tandem with the overall macroeconomic conditions and stock market developments. The initial growth phase and the renaissance in the 1990s coincided with fa-vorable macroeconomic conditions while the collapse coincided, albeit not perfectly, with increasing bankruptcies and macroeconomic turbulence. Even though the current situation is in many ways different from the one that pre-vailed prior to the collapse in the 1980s, there are similarities, too. This – to-gether with the US experiences (see, Gompers and Lerners 2000, 2001b) – suggests that turbulent macroeconomic environment is likely to have a strong impact on the Nordic private equity industries. Because of frictions in fundraising and investing (due to e.g. the contracts with the initial providers of capital), the private equity industry responds to such turbulence with a lag. Thus, if history is of any guidance, cycles will characterize the availabil-ity of venture finance in the Nordic countries.
56 · Ar i Hyyt inen and M ik a Pajar inen
REFERENCES
Agnblad, J., Berglöf, E., Högfeltd, P. and Svancar, H., 2000, Ownership and control in Sweden – strong owners, weak minorities, and social control, mimeo, Stockholm School of Economics.
Andersen, A., Hyytinen, A. and Snellman, J., 2000, Recent developments in the Finnish banking sector, Bank of Finland Discussion Papers 15/2000.
Allen, F. and Gale, D., 2000, Comparing financial systems, The MIT Press, Cambridge, Massachusetts.
Ali-Yrkkö, J., Hyytinen, A. and Liukkonen, J., 2001, Exiting venture capital investments: lessons from the Finnish experience, Chapter 4 in this volume.
Ali-Yrkkö, J. and Ylä-Anttila, P., 2001, Industry and company structures in the Nordic Countries, The Research Institute of the Finnish Economy, ETLA, mimeo.
Baygan, G. and Freudenberg, M., 2000, The internationalization of venture capital activity in OECD countries: Implications for measurement and policy, STI Working Papers, 2000/7, OECD.
Beck, T. and Levine, R., 2001, Industry growth and capital allocation: Does having a market- or bank-based system matter?, Journal of Financial Economics, forthcoming,
Becker, R. and Hellman, T., 2000, The genesis of venture capital: lessons from the German experience, Graduate School of Business, Stanford University, mimeo.
Berg, L., 1994, Household savings and debts: The experience of the Nordic countries, Oxford Review of Economic Policy, 10:2, 42-53.
Berger, A., N., Klapper, L., F., and Udell, G., F., 2001, The ability of banks to lend informationally opaque small businesses, mimeo, Federal Reserve Board.
Berger, A., N. and Udell, G., F., 1998, The economics of small business finance: The roles of private equity and debt markets in the financial growth cycle, Journal of Banking and Finance, 22, 613-673.
Black, B. S. and Gilson, R. J., 1998, Venture capital and the structure of capital markets: Bank versus stock markets, Journal of Financial Economics 47.
Bohren, O. and Odegaard, B. A., 2000, The ownership structure of Norwegian firms: Characteristics of an outlier, Norwegian School of Management BI, mimeo.
Boot, A., W. A. and Thakor, A. V., 2000, Can relationship banking survive competition?, Journal of Finance, 45, 679-713.
Carlin, W. and Mayer, C., 1999, How do financial systems affect economic performance?, Working Paper 1999-FE-08, Oxford Financial Research Center.
Cetorelli, N. and Gampera, M., 2001, Banking market structure, financial dependence and growth: International evidence from industry data, Journal of Finance, 56, 617-648.
Christensen, J. L., 2001, Effects of venture capital on innovation and growth, Aalborg University, mimeo.
Financia l systems and venture capita l in Nordic countr ies : A comparat ive study · 57
Communication of European Commission, 1998, Risk capital: A key to job creation in the European Union, April, 1998,
Communication of European Commission, 2000, Progress report on the risk capital action plan, October, 2000,
Demirgüç-Kunt, A. and Maksimovic, V., 1998, Law, finance and firm growth, Journal of Finance, 53, 2107-2137.
Demirgüç-Kunt, A. and Maksimovic, V., 2001, Funding growth in bank-based and market-based financial systems: evidence from firm level data, Journal of Finance, forthcoming.
Drees, B. and Pazarbasioglu, C., 1995, The Nordic banking crises: Pitfalls in financial liberalisation?, IMF Working Paper 95/61.
ECB (European Central Bank), 2001, Monthly Bulletin, April 2001.
Edey, M. and Hviding, K., 1995, An assessment of financial reform in OECD countries, Economics Department Working Papers, No. 154, OECD.
Englund, P., 1990, Financial deregulation in Sweden, European Economic Review, 34, 385-393.
EVCA (European Private Equity & Venture Capital Association), Yearbooks 1991-2002.
Florida, R. L., and Kenney, M., 1988, Venture capital, high technology and regional development, Regional Studies, 22, 33-48.
Gans, J. S. and Stern, S., 2000, When does funding research by smaller firms bear fruit? Evidence from the SBIR Program, Working Paper, No. 7877, NBER.
Global Entrepreneurship Monitor, 2002.
Gompers, P. and Lerner J., 1998, What drives venture capital fundraising?, Brooking Papers on Economic Activity: Microeconomics, 149-192.
Gompers, P. and Lerner J., 2000, The venture capital cycle, Massachusetts Institute of Technology, the United States.
Gompers, P. and Lerner J., 2001a, The venture capital revolution, Journal of Economic Perspectives, 15, 145-168.
Gompers, P. and Lerner J., 2001b, The money of invention: How venture capital creates new wealth, Harvard Business School Press, Boston, MA.
Hellman, T., 1997, Venture capital: A challenge for commercial banks, Stanford University, mimeo.
Heshmati, A., 2001, The dynamics of capital structure: Evidence from Swedish micro and small firms, SSE/EFI Working Paper Series in Economics and Finance, No. 440.
Hubbart, G. R., 1998, Capital-market imperfections and investment, Journal of Economic Literature, 36, 193-225.
Hyytinen, A., 1999, Stock return volatility on Scandinavian stock markets and the banking industry: Evidence from the years of financial liberalization and banking crisis, Bank of Finland Discussion Papers 19/99.
Hyytinen, A., 2002, How important are exits for venture capital finance? Evidence from Finland, Paper prepared for CESifo Conference on Venture Capital, Entrepreneurship and Public Policy, Munich, November 2002.
Hyytinen, A., Kuosa, I., and Takalo, T., 2003, Law or finance: Evidence from Finland, European Journal of Law and Economics, forthcoming.

58 · Ar i Hyyt inen and M ik a Pajar inen
Hyytinen, A., Kuosa, I., and Takalo, T., 2003, Investor protection and financial development in Finland, Chapter 2 in this volume.
Hyytinen, A. and Pajarinen, M., 2001, Financial systems and venture capital in Nordic countries: a comparative study. The Research Institute of the Finnish Economy (ETLA), discussion papers nr. 774.
IMF (International Monetary Fund), International financial statistics, November 2002.
IMF (International Monetary Fund), International financial statistics, August 2001.
Jeng, L. & Wells, P., 2000, The determinants of venture capital funding: Evidence across countries, Journal of Corporate Finance 6: 241-289.
Johnson, S., 2000, Private contracts and corporate governance reform: Germany’s Neuer Markt, Massachusetts Institute of Technology, USA, mimeo.
Johnson, S., Boone, P., Breach, A. and Friedman, E., 2000, Corporate governance in the Asian financial crisis, ” Journal of Financial Economics, 58, 141-186.
Karaömerlioglu, D. C. and Jacobsson, S., 2000, The Swedish venture capital industry: An infant, adolescent or grown-up?, Venture Capital: International Journal, 2:1, 61-88.
Kaisanlahti, T., 2003, The role of shareholder protection rules in financing Finnish companies, Chapter 3 in this volume.
King, R. and Levine, R., 1993a, Finance and growth: Schumpeter might be right, Quarterly Journal of Economics, 108:3, 225-264
King, R. and Levine, R., 1993b, Finance, entrepreneurship, and growth, Journal of Monetary Economics, 32:3, 513-542.
Kinnunen, H. and Vihriälä, V., 1999, Bank relationships and small-business closures during the Finnish recession of the 1990s, Bank of Finland Discussion Papers 13/99.
Kortum S. ja Lerner, J., 2001, Assessing the contribution of venture capital on innovation, Rand Journal of Economics, forthcoming.
Koskenkylä, H., 2000, The Nordic countries’ banking crises and the lessons learned, Bank of Finland Working Papers 6/00, June 2000.
La Porta, R., Lopez-de-Silanes, F., Shleifer, A. and Vishny, R., 1997, Legal determinants of external finance, Journal of Finance 52, 1131-1150.
La Porta, R., Lopez-de-Silanes, F., Shleifer, A. and Vishny, R., 1998, Law and finance, Journal of Political Economy 106, 1113-1155.
La Porta, R., Lopez-de-Silanes, F., Shleifer, A. and Vishny, R., 2000, Investor protection and corporate governance, Journal of Financial Economics, 58, 2-27.
Levine, R., 1998, The legal environment, banks, and long-run economic growth, Journal of Money, Credit and Banking, 30, 596-613.
Levine, R., 1999, Law, finance and economic growth, Journal of Financial Intermediation, 8, 36-67.
Levine, R., 2000, Bank-based or market-based financial systems: Which is better? University of Minnesota, mimeo.
Levine, R., Loyoza, N., and Beck, T., 2000, Financial intermediation and growth: Causality and causes, Journal of Monetary Economics 46, 31-77.

Financia l systems and venture capita l in Nordic countr ies : A comparat ive study · 59
Mayer, C., 2002, Financing the New Economy: financial institutions and corporate governance, Information Economics and Policy, 14:2, 311-326.
Milhaupt, C. J., 1997, The market for innovation in the United States and Japan: Venture capital and the comparative corporate governance debate, Northwestern University Law Review, 91:3, 865-898.
Minton, B. and Schrand, C., 2000, Does cash flow volatility affect firm value: Its impact on discretionary investment and the costs of debt and equity financing, Journal of Financial Economics, 54, 432-460.
Modigliani, F. and Perotti, E., 1998, Security versus bank finance: The importance of a proper enforcement of legal rules, MIT Sloan School of Management, mimeo.
Niskanen, M., 1999, Corporate borrowing patterns with bank equity ownership, Helsinki School of Economics and Business Administration, A-156.
OECD (Organization for Economic Co-operation and Development), 1993, National systems for financing innovation.
OECD (Organization for Economic Co-operation and Development), 1996, Government programs for venture capital.
Ongena, S., Smith, D. and Michalsen, D., 2000, Firms and their distressed banks: Lessons from the Norwegian banking crisis, 1988-1991, Federal Reserve Board, Working Paper.
Pesola, J., 2001, The role of macroeconomic shocks in banking crises, Bank of Finland Discussion Papers 6/2001.
Petersen, M., A. and Rajan, R. G., 1994, The benefits of firm-creditor relationships: Evidence from small business data, Journal of Finance, 49, 3-37.
Petersen, M., A. and Rajan, R. G., 1995, The effect of credit market competition on lending relationships, Quarterly Journal of Economics, 110, 403-444.
Petersen, M., A. and Rajan, R. G., 2000, Does distance still matter: Information revolution in small business lending, NBER Working Paper No. W7685.
Rajan, R. G. and Zingales, L., 2002, Financial systems, industrial structure, and growth, Oxford Review of Economic Policy, 17, 467-482.
Rajan, R., G. and Zingales, L., 2000, The governance of the new corporation, in Xavier Vives ed. Corporate Governance, Cambridge University Press.
Reitan, B. and Sörheim, R., 1999, The informal venture capital market in Norway – Investor characteristics, behaviour and preferences, in W. D. Bygrave et al. (eds.) Frontiers of entrepreneurship research 1999. Wellesley, MA: Babson College.
Reynolds, P. D., Hay, M., Bygrave, W. D., Cam M. S., and Autio, E., 2000, Global entrepreneurship monitor, 2000 executive report.
Rousseau, P. L. ja Wachtel, P., 2000, Equity markets and growth: Cross-country evidence on timing and outcomes, 1980-1995, Journal of Banking and Finance, 24, 1933-1957.
Saarenheimo, T., 1995, Credit crunch caused investment slump? An empirical analysis using finnish data, Bank of Finland Discussion Papers 6/95.
Sahlman, W., 1990, The structure and governance of venture capital organisations, Journal of Financial Economics, 473-521.

60 · Ar i Hyyt inen and M ik a Pajar inen
Seppä, M., 2000, Strategy logic of the venture capitalist, Jyväskylä Studies in Business Economics 3, University of Jyväskylä.
Stiglitz, J. and Weiss, A., 1981, Credit rationing in markets with imperfect information, American Economic Review, 71, 393-410.
UNICE, 2001, The renewed economy: Business for a dynamic Europe, The UNICE Benchmarking Report 2001.
Vihriälä, V., 1997, Banks and the Finnish credit cycle 1986-1995, Bank of Finland Studies E:7.
Williamson, S., D., 1987, Transaction costs, inflation and the variety of intermediation services, Journal of Money, Credit and Banking, 19, 484-498.
Westhead, P. and Storey, D., J., 1997, Financial constraints on the growth of high-technology small firms in the United Kingdom, Applied Financial Economics, 7, 197-201.

Financia l systems and venture capita l in Nordic countr ies : A comparat ive study · 61
ENDNOTES
1 Private equity consists of venture capital investments, i.e., equity investments in relatively young firms, as well as management buyouts and buy-ins. Unlike in the US, European venture capital statistics classify buy-outs as venture capital. We use these two terms interchangeably and try to be explicit in the analysis where the definition matters. 2 Hellmann (1997) has for example argued that the financing of technology-based ventures whose value derives mostly from growth opportunities is essentially such a high-risk niche that it may frequently be left open by the traditional financial institutions, such as deposit banks. See also Black and Gilson (1998). 3 The importance of financial development for growth has been emphasized for long; see for example King and Levine (1993a, 1993b) and the references therein. 4 A recent paper by Demirgüç-Kunt and Maksimovic (2001) combines the comparison of bank-based vs. market-based systems to the analysis of the importance of the legal system for corporate finance. The paper documents that the development of a country’s legal system predicts access to external finance. There is however no evidence for firms using external financing differently in bank-based than in market-based sys-tems. 5 It is often argued that the market-based financial system is better organized to finance emerging indus-tries (see, e.g., Milhaupt 1997, Rajan and Zingales 2002, 2000, Holmström and Kaplan 2001). 6 Drees and Pazarbasioglu (1995) provide an excellent account of the liberalization process in the four Nor-dic countries. See also Vihriälä (1997) for Finnish, Englund (1990) for Swedish and Ongena et al. (2000) for Norwegian developments. 7 These percentages derive from the authors’ own calculations, and they are based on data from Interna-tional Finance Corporation’s “Emerging Stock Markets Factbook” (various issues). 8 The prices of stocks declined quite markedly at the beginning of the 1990s from their relative high levels that had prevailed after the liberalization of financial markets in the 1980s. In Finland, Norway and Sweden, stock prices reached their lowest value in 1992 (see Hyytinen and Pajarinen, 2001, Appendix 1, Figure A.1). 9 It is worth noting that the volatility of stock prices was exceptionally high at the beginning of the 1990s, too (Hyytinen 1999). 10 In principal component analysis, the aim is to evaluate whether certain variables are related to the extent that the number of variables can be reduced without significant loss of information. This amounts to finding the unit-length linear combinations of the variables with the greatest variance. 11 Due to their common history, the Nordic countries have similar legal systems. The basics of the legal sys-tem in these countries are different from those of common-law and civil law countries to the extent that they form “a separate family” (La Porta et al. 1998). 12 It is important to note that the results of these studies apply best to the situation that prevailed around 1994/1995. It is an open question how much things have changed since then both in absolute and in rela-tive terms. 13 See Hyytinen and Pajarinen (2001, Appendix 2) for a more detailed discussion. 14 See Drees and Pazarbasioglu (1995) and Edey and Hviding (1995, especially p. 61, Table A4). 15 See for further analysis Hyytinen and Pajarinen (2001, Appendix 3) where we develop this argumentation in detail. 16 Edey and Hviding (1995, p. 28-29) have documented that at the beginning of the 1990s, Finland, Norway and Sweden had outstanding amounts of commercial paper and corporate bonds in relation to their re-spective GDP that compares to those of Japan, United Kingdom, Canada and France. The US commercial paper and corporate bond markets were at the time clearly more, and the respective German markets less

62 · Ar i Hyyt inen and M ik a Pajar inen
developed than those of the three Nordic countries. This source of finance was however of limited impor-tance for many firms, as only larger firms had an access to these segments of capital markets. 17 It is difficult to evaluate to what extent the demand for finance has not been satisfied. In Hyytinen and Pa-jarinen (2001, Appendix 4), we touch upon this question by considering to what extent the Nordic firms have used long-term external finance on and above their internal finance to fund their growth. 18 See Hyytinen and Pajarinen (2001, Appendix 5) for the characteristics of the Nordic corporate sectors and the importance of ICT firms therein. 19 See Karaömerlioglu and Jacobsson (2000) for a detailed analysis of the development and emergence of the Swedish venture capital industry; Christensen (2000) for Danish developments; and Seppä (2000) for a description of the Finnish developments. 20 The Swedish Företagskapital was based on such an arrangement. In Finland, the very first development (venture capital-like) company, Sponsor, was established already in 1967 by the Bank of Finland and certain major private-sector financial institutions. 21 The primary data used here are the various yearbooks of the European Private Equity and Venture Capital Association (EVCA). The most recent data set is based on a Pan-European survey that covers the activity of all participants in the industry, regardless of membership of the EVCA. The data are standardized, as it is col-lected similarly from all countries surveyed. However, the previous surveys by the EVCA and therefore the figures represented for the earlier years may be of poorer quality because of the limited coverage of the survey in some countries; see, for instance, Karamömerlioglu and Jacobsson (2000) who question the repre-sentativeness of the Swedish data in the earlier EVCA surveys. On the basis of their own data collection, the authors find that certain earlier studies (using the EVCA data) may have underestimated the size of the Swedish venture capital activity, as well as the share of the high-tech investments and the importance of the early-stage investments by the Swedish venture capital firms. The same applies at least to some extent to the Danish and Finnish data, too. More recent EVCA surveys should no longer be as deficient in this re-gard. Anyhow, in international comparisons the use of the standardized EVCA data is preferable. 22 In addition, the statistics cover only formal private equity that is raised, invested and managed by specific financial intermediaries, venture capital firms. Reynolds et al. (2000) have estimated that total informal risk capital invested in 1999 by private investors was USD 1165 million in Denmark, USD 269 million in Finland, USD 656 in Norway and USD 535 million in Sweden. As a percentage of all nascent, new firm financial sup-port, these numbers represented for 94%, 74%, 87% and 67%, respectively, in the four countries. In the US, the corresponding figures were USD 54 billion and 54%. 23 A telling example of the activities by the authorities is an SME council report of the Ministry of Trade and Industry from 1990, proposing measures for the development of the venture capital industry (see Seppä 2000, p. 214, for details). 24 It is worth noting that according to an analysis of the geographic origin of funds by Baygan and Freuden-berg (2000), the amount managed by the Danish, Finnish and Norwegian private equity companies were, in 1999, smaller than the funds originating from the countries’ investors. Such outflows of funds were not ob-served however for Sweden, where inflows amounted to around 50% of the funds raised by the Swedish private equity firms. In a European comparison (Baygan and Freudenberg, 2000, p. 17), funds originating from the domestic sources but managed by other European private equity firms were far more important for Netherlands and Finland than for the other European countries. On the other hand, the Nordic countries managed essentially no funds that originated from non-European countries and only the Swedish private equity firms managed a non-negligible amount of funds that originated from other European sources. This analysis applies unfortunately only to one year, i.e. 1999. The picture may be very different over time be-cause of the volatile nature of private equity flows. 25 The picture portrayed by Figure 1.6 changes somewhat when, first, international inflows of private equity are taken into consideration. Baygan and Fredenberg (2000) have shown that in Denmark inflows of private equity outweighed investment by domestic private equity firms by a factor of 4.5 in 1999. For Finland, Nor-way and Sweden the corresponding figures were 1.5, 0.8, and 1.0, respectively. As a percentage of GDP, the relative importance of inflows was largest for Denmark, followed by Finland and Sweden. In Norway, the in-flow of funds was small but not non-negligible. Second, in terms of outflows, investments managed by the Swedish and Norwegian private equity firms but going to other European countries were more important than the same figures for Finland and Denmark. In sum, the analysis of Baygan and Fredenberg (2000) re-veals that in an European comparison of private equity flows of European countries (concerning the year

Financia l systems and venture capita l in Nordic countr ies : A comparat ive study · 63
1999), net flows were clearly positive and thus most important for Denmark, relatively important for Finland, negative but quite negligible for Sweden and negative, albeit moderately, for Norway. 26 The amount of divestments can be measured both at cost and in terms of the number of divestments. For brevity, we focus here on the latter. The total Nordic proportion of the European divestments (at cost) was, on average, about 4.2% during the second half of the 1990s (see also Section 1.3.2). 27 We focus here on the period 1998-2000 to reduce the potential problems due to data quality as well as to portray a more recent picture of the concentration. 28 Raw U.S time series data also supports this view; the correlation between the volume of IPOs in general and particularly the volume of venture-backed IPOs and the (subsequent) fundraising appears to be strong (Black and Gilson 1998, Gompers and Lerner 2001a, 2001b). The strength of the IPO market is strongly re-lated to the overall level of stock market prices and capital inflows into venture capital funds are greatest during booming asset markets. 29 The fact that achieving a profitable exit lies in many ways at the heart of the venture capital cycle has been recognized for long; see e.g. Sahlman (1990). 30 Other (non-financial market related) details of the design of institutional environment that support active venture capital market are the regulation of labor market and labor mobility and taxation (Milhaupt 1997, Black and Gilson 1998). An analysis of these other factors for Nordic venture capital is beyond the scope of this study. 31 Karaömerlioglu and Jacobsson (2000) have recently argued that difficulties in access to available funding, inefficient incentive structures, and deficient exit possibilities for venture capitalists blocked for long the re-vitalization of the venture capital industry in Sweden. It seems that the same factors have had bearings on the development of the private equity industry also in the other Nordic countries. 32 The lending boom may thus have postponed in this way the early development of the Nordic private eq-uity industry.

Financia l systems and f i rm per formance: Theoret ical and empir ica l perspect ives · 65
2. INVESTOR PROTECTION AND FINAN-CIAL DEVELOPMENT IN FINLAND
Ari Hyytinen, Iikka Kuosa and Tuomas Takalo*
Abstract: It has been convincingly documented that the size and effectiveness of financial sys-tems around the world can at least partly be traced to the differences in how the legal system (legal rules and the quality of enforcement) of a country protects investors against expropriation by corporate insiders. Hyytinen, Kuosa and Takalo (2003) document how the protection of investors has evolved in Finland. They find that dur-ing the period of 1980–2000 shareholder rights have been strengthened whereas creditor rights have been weakened. In this Chapter we build on this earlier work to take a closer look at the recent developments in investor protection and financial de-velopment in Finland. We find that (as captured by the indices of investor protection used in this study) the shareholder rights are currently in many ways comparable to their US counterparts. Enhancing the stock market’s overall integrity, including its liquidity, as well as market transparency have been the most important drivers of the improvements in shareholder protection. The weakening of the creditor rights is re-lated to the weakening of creditors’ control over bankruptcy due to the Act on Reor-ganisation of Companies of 1993. We also discuss the implications of these findings to the availability of finance to Finnish firms.
* Ari Hyytinen is at the Research Institute of the Finnish Economy (ETLA) and Etlatieto Ltd, Iikka Kuosa at the Helsinki School of Economics and LTT Research Ltd and Tuomas Takalo at the Bank of Finland. Our earlier joint work, reported in Hyytinen et al. (2003), forms the background for much of this Chapter. The views ex-pressed in the Chapter are those of the authors. The usual caveat applies.

66 · Ar i Hyyt inen, I ik k a Kuosa and Tuomas Tak alo
2.1. INTRODUCTION
It has been convincingly documented in the so-called law and finance litera-ture that the size and effectiveness of financial systems around the world can at least partly be traced to the differences in how the legal system (legal rules and the quality of enforcement) of a country protects investors against ex-propriation by corporate insiders (La Porta, Lopez-de-Silanes, Shleifer, and Vishny (LLSV) 1997, 1998, 2000, 2002, Levine, Loyza and Beck 2000, Beck and Levine 2002a, and Glaeser, Johnson, and Shleifer 2001). These studies suggest that upgraded corporate governance could expand financial markets and in-crease their liquidity, facilitate the availability of external financing to new firms, and improve investment allocation both within and between firms. Fo-cusing on Finnish developments over the period of 1980-2000, Hyytinen et al. (2003) find that shareholder protection has in Finland been strengthened whereas creditor protection has been weakened and that these reforms are consistent with a reorganization of the Finnish financial market in which a bank-centered financial system shifted from relationship-based debt finance towards increasing importance by the stock market.
Building on this literature, we review in this Chapter how the protec-tion of shareholders and creditors has in Finland changed during the period of 1980–2000. We consider in particular the changes in the investor protection identified by in Hyytinen et al. (2003). When measuring the investor protec-tion we focus on the 18 indices constructed in Hyytinen et al., developed originally by LLSV (1997, 1998) and extended by Pistor (2000) and Glaeser, Johnson and Shleifer (2001).1 Besides describing the changes in investor pro-tection, we briefly describe the development of the Finnish financial system over the past two decades.
Anticipating, our main findings are as follows. First, as captured by the indices used in this study, the shareholder rights are currently in many ways comparable to their US counterparts. Enhancing the stock market’s overall in-tegrity, including its liquidity, has been one of the most important drivers of the improvements in shareholder protection. Second, the weakening of the creditor rights is related to the weakening of creditors’ control over bank-ruptcy due to the Act on Reorganisation of Companies of 1993. Finally, the re-forms of accounting, auditing and disclosure rules have been comparable to, if not more profound than, the reforms of the specific rules of shareholder and creditor protection. As the recent corporate scandals in the US indicate, the reforms of accounting, auditing and disclosure rules may have been more
Investor protect ion and f inancia l development in Finland · 67
consequential to the availability of finance to firms than the reforms of share-holder and creditor protection. The outcome of the Finnish reforms is a fi-nancial system where the rights of shareholders are not so undeveloped as they used to be.
The remaining of this Chapter is organized as follows. In the next sec-tion, we review the literature that provides a background for our study. In Section 2.3 we discuss the measurement of investor protection. In Section 2.4 the reforms of investor protection are described. In Section 2.5 we then take a brief look at recent financial development in Finland. Section 2.6 concludes. In the Appendix we provide the reader with a summary of changes in the Finnish corporate governance beyond the legal reforms.
2.2. CORPORATE GOVERNANCE REFORM
2.2.1. LITERATURE REVIEW
There are various ways to classify the literature on corporate governance re-form (see, e.g., Gilson 2001, Johnson 2000, and Pistor 2000). First, there is a debate whether corporate governance around the world is converging to-wards US standards or diverging along the path dependent trajectories (see, e.g. Bebchuk and Roe 1999, Coffee 2000, 2001, Pistor 2000, and Schmidt and Spindler 2000). Second, there is a debate whether the convergence or diver-gence is functional, formal, or contractual (see e.g., Gilson 2001, Johnson 2000). In economics (see, e.g., Johnson 2000, and LLSV 2000), functional con-vergence is often identified with the market-driven reforms and formal con-vergence with the legal-driven reforms. Recently several scholars such as Coffee (1999), Gilson (2001) and Johnson (2000) have proposed a third form of corporate governance reform, contractual convergence. We discuss each view in turn, beginning from the debate on convergence versus divergence.
The proponents of the divergence hypothesis draw on the theory of path dependence (for detailed accounts of the theory, see Liebowitz and Margolis 1995 and David 2000). According to Bebhuck and Roe (1999), Pistor, Raiser and Gelfer (2000), and Schmidt and Spindler (2000) initial conditions are the most powerful force in corporate contracting around the world. Insti-tutional constraints shape corporate governance reforms, often leading to the divergence instead of convergence.
The argument for convergence is twofold. Assuming that the current US system emphasizing the shareholder value is the most efficient form of

68 · Ar i Hyyt inen, I ik k a Kuosa and Tuomas Tak alo
corporate governance, competition among firms and institutions forces the rest of the world follow by one way or other. The means are developed either by market (functional convergence) or by regulatory authorities (formal con-vergence). This argument on the survival of the fittest, whose early advocates include Easterbrook and Fischel (1991), rests on the assumption that in the long-run both the market participants and the regulatory authorities will be able to accomplish the required reforms to improve the economic perform-ance.
The market-based view postulates that corporate governance reform is driven by significant changes in the economic environment. Changing envi-ronment creates pressure for market participants to carry out mutually bene-ficial reforms, irrespective of particular legal requirements (Easterbrook and Fischel 1991). According to Johnson (2000), the key elements of market-driven convergence are reputation building by firms (as in Agnblad et al. 2000), independent agencies monitoring firms, and the voluntary codes of conduct. As against this background, legal reforms may even be counterpro-ductive, increasing the number of distortions rather than reducing them.
The market-based view on the reform hinges on the Coase theorem originating from Coase’s (1960) influential article. Without transaction costs, market participants will find the means to achieve efficient outcomes. As the Coase theorem suggests, however, transaction costs may be high enough to generate path dependence in corporate governance, leading to divergence in-stead of convergence (Bebchuk and Roe 1999). In a series of influential arti-cles, LLSV (1997, 1998, 1999 and 2000) show how the differences in corporate governance across the countries stem from legal environment. This finding is at the heart of the legal-based view on corporate governance reform, which maintains that the reforms are driven by the changes in public law or regula-tions. A successful reform thus necessitates changes in legislation (LLSV 2000, Glaeser et al. 2001).
The third form of convergence, recently taken up by Coffee (1999), Gil-son (2000), Johnson (2000), is based on private contracting. As Dixit (2001) shows, market participants may voluntarily enter into contracts with an in-termediate organization and grant it the power to punish misbehavior. A threat of excluding is an additional incentive to obey the rules. Frequently cited examples of such private contracts are the listing rules of the stock ex-change, American Depository Receipts, and international accounting stan-dards (e.g., Coffee 1999 and Johnson 2000).

Investor protect ion and f inancia l development in Finland · 69
2.2.2. INTERNATIONAL EVIDENCE
There are a few studies on corporate governance reforms in various coun-tries. Because corporate governance laws in transition countries were de-signed from scratch, they provide an ideal platform for studying the impacts of the regulatory design. Pistor (2000) documents the changes in the legal protection of shareholder and creditor rights in 24 transition countries. Pistor et al. (2000) then use this database to support the hypothesis of path depend-ence. They show how corporate governance institutions persist despite sub-stantial reforms at the formal level.
Glaeser et al. (2001) study corporate governance reform in Poland, the Czech Republic and, to lesser extent in, Hungary. They conclude that a re-form should be enforced by highly motivated regulators instead of judges. They show how the main reason for the rapid financial market development in Poland is the stringent regulatory enforcement of law. In Poland extensive information disclosure by security issuers and intermediaries was mandated, and an independent and motivated regulator authority was founded. In con-trast, the lax and poorly enforced regulations in the Czech Republic led to the expropriation of outside investors and stagnant financial market develop-ment.
The evidence on corporate governance reforms in the EU countries is scant. Johnson (2000) studies an instance of corporate governance reform in Germany. Traditionally the German financial system is regarded as a bank centered, where ownership is concentrated and security markets thin (Allen and Gale 2000 and Gorton and Schmid 2000). However, the role of the Ger-man stock market has increased compared to what it has traditionally been. Even after taking into account the recent problems that the stock market has faced, it seems that the strengthened role of the stock market for the German economy has at least in part followed from the contractual and legal-based reform of the country’s corporate governance.2 The primary reform was the launch of two new market places called the Neuer Markt and SMAX in 1996 by Deutsche Börse, the company operating the Frankfurt Stock Exchange. In light of the recent developments one might be tempted to argue that the crea-tion of the Neuer Markt was only a part of the now burst high-technology bubble. However, the emergence of such ‘new’ stock markets in Europe was apparently integral to the development of many growth-oriented firms and to the growth of venture capital industry (Bottazzi and Da Rin 2002a,b and Da Rin and Bottazzi 2002). From this perspective it is somewhat unfortunate

70 · Ar i Hyyt inen, I ik k a Kuosa and Tuomas Tak alo
that “[T]he commonly perceived degree of achievement of the ‘new’ markets has varied with stock prices” (Bottazzi and Da Rin 2002b).
2.3. MEASURING INVESTOR PROTECTION
In the next two Sections we describe on how the levels of shareholder and creditor protection conferred by the Finnish legal system can be measured. To this end we describe the indices of shareholder and creditor rights devel-oped by LLSV (1997, 1998) and their extensions by Pistor (2000), Pistor et al. (2000), and Glaeser et al. (2001). We only briefly explain the indices and their coding, referring the reader to Hyytinen et al. (2003) and in particular to the original papers by LLSV (1997, 1998), Pistor (2000), Pistor et al. (2000), and Glaeser et al. (2001) for details.
2.3.1. MEASURING SHAREHOLDER RIGHTS
The main determinants of shareholder rights in Finland can be found from the Finnish Companies Act 734/1978 (effective 1 Jan 1980) and the Securities Market Act 495/1989 (effective 1 Jan 1989). The Companies Act applies to all limited companies – whether private or state owned, family enterprise, or publicly listed. Its preparation was based on Nordic cooperation, which ex-plains the similarity of investor protection across the Nordic countries, as documented in LLSV (1997, 1998).3 Prior to the Securities Market Act of 1989, there was no specific law governing securities markets.
Antidirector index of LLSV (1997, 1998) and extensions
We consider four shareholder rights indices, two of which were developed by LLSV (1997, 1998). The shorter version is also known as the antidirector in-dex, but we label it LLSVsh_6, because it consists of six measures of minority shareholder protection provided by company law or commercial code: 1) one-share-one vote; 2) proxy by mail; 3) shares not blocked before meeting; 4) cumulative voting or proportional presentation; 5) oppressed minorities mechanism; and 6) pre-emptive rights. The longer version, called here LLSVsh_8, includes two additional provisions: 7) percentage of share capital to call an extraordinary shareholders’ meeting; and 8) mandatory dividend.
Pistor (2000) fine-tunes the LLSVsh_6 by splitting three of the original LLSV criteria. For example, she distinguishes between registration of shares and blocking of shares prior to shareholder meeting. Registration of shares

Investor protect ion and f inancia l development in Finland · 71
differs from blocking in that shares preserve control rights in the sharehold-ers’ meeting even if they are traded after registration. We term this modified LLSV index LLSVsh_pis. Glaeser et al. (2001) consider ten additional meas-ures of minority shareholder protection. These include, e.g., minority share-holders’ right to appoint an additional board of auditors, the right to verify participants in the general shareholders’ meeting, and the existence of quo-rum requirements. We denote this index LLSVsh_gla.4
Decomposition of shareholder rights
Pistor’s (2000) taxonomy of shareholder rights suggests five additional indi-ces of investor protection (see also Pistor et al. 2000). These measure the legal dimensions of corporate governance in more detail than the indices con-structed in the previous section. Following Pistor (2000) we denote these by VOICE, EXIT, ANTIMANAGE, ANTIBLOCK and SMINTEGR.
The rationale for constructing the VOICE and EXIT indices emerges from the in-
fluential work of Hirschmann (1970), who argues that shareholders may exercise
their control over management by either exercising voting rights (voice) or sell-
ing shares (exit). Pistor (2000) points out that, although both mechanisms protect
minority shareholders, they are secured by different legal rules and have differ-
ent impacts on shareholder behavior.
The VOICE index attempts to capture the strength of voting rights. The provision for mandatory dividend notwithstanding, this index includes the LLSVsh_8 indicators. It also includes six additional indicators of sharehold-ers’ control rights: 1) minority shareholders may demand convocation of ex-traordinary shareholder meeting; 2) executives (incl. general directors) are appointed or dismissed by the supervisory board rather than by the share-holder meeting; 3) members of management and supervisory board may be dismissed at any time without cause; 4) at least 50% of total voting shares must be represented at a shareholder meeting for it to take binding decisions; 5) fundamental decisions – including charter changes, liquidation of compa-nies, sale of major assets – require qualified majority (at least 3/4); and 6) su-pervisory board members are elected by shareholders (no mandatory repre-sentation of employees or the public).
The EXIT index consists of four legal rules allowing shareholders to leave corporations and liquidate their investments: 1) right to transfer shares is not restricted by law and cannot be limited by charter; 2) formal require-

72 · Ar i Hyyt inen, I ik k a Kuosa and Tuomas Tak alo
ments for transfer of shares are limited to endorsement (bearer shares) and registration (registered shares); 3) minority shareholders have a put option (may demand that their shares be bought by the company at fair value) if they have voted against major transactions such as mergers, reorganization, sale of major assets, and charter changes; and 4) mandatory takeover bid (threshold).
The purpose of the ANTIMANAGE and ANTIBLOCK indices is to capture the impact of a legal system on two main conflicts of interests in cor-porate governance. The ANTIMANAGE index emphasizes the classical cor-porate governance problem, i.e., the conflict of interest between shareholders and management. It includes the following legal rules aimed at protecting shareholders against management: 1) shareholders may take judicial action against executives’ decisions (also included in LLSVsh_8); 2) minority share-holders may demand convocation of an extraordinary shareholder meeting; 3) executives (incl. general directors) are appointed or dismissed by the su-pervisory board rather than by the shareholder meeting; 4) members of man-agement and supervisory board may be dismissed at any time without cause; 5) an audit commission may be called for by minority shareholders repre-senting not more than 10% of shares; and 6) conflict of interest rules, includ-ing rules on disclosing conflict and abstaining from voting, are included in the law.
The ANTIBLOCK index focuses on the tension between minority shareholders and blockholders which, as LLSV (2002) suggest, should be the more severe, the more concentrated the company’s ownership. The AN-TIBLOCK index takes into account eight provisions for protecting minority shareholders against large owners: 1) cumulative voting in election of mem-bers of supervisory board; 2) other rules ensuring proportional board presen-tation; 3) shareholders may take judicial action against decisions by execu-tives; 4) current shareholders have pre-emptive rights in case new shares are issued by the company; 5) at least 50% of total voting shares must be repre-sented at a shareholder meeting for it to take binding decisions; 6) minority shareholders have a put option (may demand that their shares be bought by the company at fair value) if they have voted against major transactions such as mergers, reorganization, sale of major assets, and charter changes; 7) man-datory takeover bid (threshold); and 8) acquisition of large blocks of shares triggers mandatory disclosure (threshold). The first four variables are also in-cluded in LLSVsh_8.
Finally, we code a stock market integrity index called SMINTEGR. It includes six measures of the protection of ‘market liquidity’: 1) conflict of in-

Investor protect ion and f inancia l development in Finland · 73
terest rules, including rules on disclosing conflict and abstaining from voting, are included in the law; 2) shareholder register must be maintained by an in-dependent firm (not the issuing company); 3) insider trading prohibited by law; 4) acquisition of a large block of shares triggers mandatory disclosure (threshold); 5) a state agency conducts capital market supervision; and 6) capital market supervision is formally independent.
2.3.2. MEASURING CREDITOR RIGHTS
The main determinants of creditor rights in Finland can be found in the Liq-uidation Bankruptcy Code 31/1868 (effective 9 Nov 1868), the Act on Compo-sitions 148/1932 (effective 10 May 1932), the Act on Restitution of Assets in Bankruptcy 758/1991 (effective 1 Jan 1992), the Act on Claim Priorities 1578/1993 (effective 1 Jan 1992), and the Act on Reorganisation of Companies 47/1993 (effective 8 Feb 1993). In addition, there are liquidation provisions in the Companies Act.5
Creditor rights index of LLSV (1997, 1998) and an extension
We begin our analysis of creditor rights by coding the index developed by LLSV (1997, 1998). The index, which we refer to as LLSVcr, consists of four measures of creditors’ role in bankruptcy and reorganization: 1) restrictions on going into reorganization; 2) no automatic stay on secured assets; 3) se-cured creditors first; and 4) management does not stay. We also consider an extension to the LLSVcr initiated by Pistor (2000). This index, here denoted LLSVcr_pis, adds to the LLSVcr a discrete variable for the provision for a le-gal reserve, i.e., the minimum percentage of total shares required to avoid dissolution of the company.
Decomposition of creditor rights
The LLSVcr and LLSVcr_pis indices reflect moral hazard problems stemming from US legislation allowing choice between reorganization (Chapter 11) and liquidation (Chapter 7). Because such a choice was impossible in Finland prior to 1993, we draw on Pistor’s (2000) taxonomy of creditor rights to code three alternative indices of investor protection. Following her, we denote them by CREDCON, COLLAT, and REMEDY.
The CREDCON index measures the degree of creditors’ control of the bankruptcy. It includes the LLSVcr indicators, except for the provision on re-

74 · Ar i Hyyt inen, I ik k a Kuosa and Tuomas Tak alo
strictions for going into reorganization, and two additional variables: 1) automatic trigger to file a bankruptcy (debtor unable to meet obligations for more than 90 days); and 2) adoption of a reorganization or liquidation plan requires creditor consent.
As noted in Pistor (2000), the relevance of LLSVcr and CREDCON is subject to collateral rules in a legal system. The two indices in practice as-sume that security interests are in place and, accordingly, tangible assets can be secured. In other words, there is a need to measure the collateral rules. We thus construct the COLLAT index, which includes the following three provi-sions: 1) establishing a security interest in movable assets does not require transfer of asset; 2) law requires the establishment of a register for security in-terests in movables; and 3) enforceable security interest in land may be estab-lished.
The CREDCON and COLLAT indices measure creditors’ control rights in a bankruptcy, but the legislation may also allow the creditors to impose sanctions on management. To capture the creditors’ legal possibilities to pun-ish the management, we construct an index, called REMEDY, consisting of three variables: 1) legal provisions that allow creditors to pierce the corporate veil; 2) management can be held liable for violating provisions of insolvency law (lower threshold than criminal law activities required); and 3) transac-tions preceding the opening of bankruptcy procedures may be declared null and void.
2.4. REFORMS OF INVESTOR PROTECTION IN FINLAND
2.4.1. REFORMS OF SHAREHOLDER RIGHTS
Figure 2.1 displays how shareholder rights have been reformed. All the indi-ces suggest that protection of minority shareholders remained stable until the reform of the Companies Act in 1997, when it was strengthened. The gov-ernment bill to the diet (HE 89/1996) reveals the reason for increasing the protection of (minority) shareholders: there was a need to remove certain in-consistencies that compromised the general principle of equal treatment of shareholders (the changes are discussed in more detail below). Comparison of the values in Figure 2.1 to the findings in LLSV (1997, 1998) is somewhat dubious, because shareholder rights may also have been changed in the other countries. However, keeping this caveat in mind, we can conclude that by 2000 protection in Finland reached the level of the common law countries re-

Investor protect ion and f inancia l development in Finland · 75
ported in LLSV (1997, 1998). For instance, the score of 5 in LLSVsh_6 in 2000 is the same as the average score for common law countries in LLSV (1997, 1998)6 and higher than the world average of 3.0 and the average of 2.33 re-ceived by the French and German civil law countries.
Figure 2.1. Shareholder rights (1980-2001)
1980
1981
1982
1983
1984
1985
1986
1987
1988
1989
1990
1991
1992
1993
1994
1995
1996
1997
1998
1999
2000
2001
40%
50%
60%
70%
80%
90%
100%
LLSVsh_8 LLSVsh_6 LLSVsh_gla LLSVsh_pis
Note: Data source is Hyytinen et al. (2003).
Figure 2.2 displays the development of VOICE, EXIT, ANTIMANAGE, ANTIBLOCK and SMINTEGR in Finland in 1980–2000. The development of SMINTEGR shows that stock market integrity was quite poor at the start of the 1980s, which belongs to the era of the regulated financial system. Stock market integrity improved significantly in the late 1980s and early 1990s. SMINTEGR increased in 1989 due to the introduction of the Securities Mar-ket Act, which led to three improvements in Finnish legislation: First, insider trading was prohibited; second, automatic disclosure triggers for the acquisi-tion of large blocks of shares were established; and third, a State agency was made responsible for capital market supervision. SMINTEGR increased also in 1991 because of the introduction of legislation that required an independ-ent company to conduct the shareholder register. Finally, the reorganization of financial market supervision in 1992–1993 improved the market integrity. SMINTEGR improved in 1993 when the Financial Supervision Authority was officially created to independently oversee the capital market. Figure 2.2 also

76 · Ar i Hyyt inen, I ik k a Kuosa and Tuomas Tak alo
reveals that the emphasis in legislative reform has been on protection of mi-nority shareholders (ANTIBLOCK) rather than the agency problem between management and shareholders (ANTIMANAGE). ANTIBLOCK increased in 1989 due to new legislation requiring automatic disclosure of large blocks of shares.
Internal control rights, as captured by VOICE, have also improved. Our interpretation is that the one share-one vote rule was to an extent adopted in connection with the 1997 company law reform. For corporations with multiple share classes, the old Finnish code did not require a consensus among the shareowners of the different classes. In 1997 the law was changed so that a majority decision is needed in each class in case of major transac-tions – such as mergers, divestitures, and share repurchases – that may en-danger the position of the shareholders in the company. As a result, there is a vote in each share class and, within a class, there are no differences in voting rights.7 Another internal control right was strengthened at the same time: proxy voting by mail was allowed. It is these two changes that explain why VOICE increased in 1997.
Figure 2.2. Decomposition of shareholder rights (1980-2001)
1980
1981
1982
1983
1984
1985
1986
1987
1988
1989
1990
1991
1992
1993
1994
1995
1996
1997
1998
1999
2000
2001
10%
20%
30%
40%
50%
60%
70%
80%
90%
100%
SMINT ANTIMG VOICE ANTIBL EXIT
Note: Data source is Hyytinen et al. (2003).

Investor protect ion and f inancia l development in Finland · 77
2.4.2. REFORMS OF CREDITOR RIGHTS
Figure 2.3 displays how creditor rights have been reformed. Both indices suggest that the Act on Reorganisation of Companies in 1993 was detrimental for creditor protection. The slight increase in LLSVcr_pis in 1997 is due to an increase in the minimum percentage of total shares required to avoid dissolu-tion of the company. The revision of the Companies Act in 1997 increased the legal reserve from 33% to 50%. Note that the sharpest reduction in creditor rights coincides with the economic crisis of the early 1990s when bankrupt-cies reached unprecedented levels and Finnish banks were struggling.
As a result of deterioration of creditor rights, Finnish legislation cur-rently provides a lower level of creditor protection than common or civil law countries, as reported in LLSV (1997, 1998). The score of 1 for Finland in 2000 is lower than the world average of 2.3 and the Nordic average of 2.0. Prior to 1993, the score for Finland was 4. As stated earlier, the comparisons to LLSV should be interpreted cautiously, because the legislation may also have been changed in the other countries.
Figure 2.3. Creditor rights (1980-2001)
1980
1981
1982
1983
1984
1985
1986
1987
1988
1989
1990
1991
1992
1993
1994
1995
1996
1997
1998
1999
2000
2001
10%
20%
30%
40%
50%
60%
70%
80%
90%
100%
LLSVcr_pis LLSVcr
Note: Data source is Hyytinen et al. (2003).

78 · Ar i Hyyt inen, I ik k a Kuosa and Tuomas Tak alo
Figure 2.4 displays the development of CREDCON, COLLAT and REMEDY in Finland in 1980-2000. As against our earlier findings, it is not surprising that creditors’ control over bankruptcy was significantly weak-ened by the Act on Reorganisation of Companies of 1993. The reform implied first of all that the restrictions on going into reorganization were weakened.
We argue that there is an automatic trigger to file a bankruptcy in the Finnish
law, although this differs slightly from the trigger proposed by Pistor (2000). Ac-
cording to the Finnish Companies Act of 1978, if the board of directors finds that
the company’s equity is below 50% of share capital, it should without delay pre-
pare a balance sheet and have it audited. The board should, within two months
from preparation of the balance sheet, convene a general meeting of sharehold-
ers to consider liquidation of the company. If the company’s equity is below 50%
of share capital by the following general meeting – to be held within twelve
months after the first mentioned general meeting – the company must be liqui-
dated.
The reform also implied that the scope of the automatic stay on assets preventing secured creditors from getting their security was expanded and that the Act diluted creditor rights by enabling management to remain in the reorganization. As regards the latter, our interpretation is disputable. After the reform of 1993, the management can stay in a reorganization, although its power is limited and a trustee should be appointed. Prior to the reform, how-ever, the management did not have the option of staying because a trustee and the creditors managed the company in bankruptcy. It was possible for members of the pre-bankruptcy management to be selected to run the com-pany, though.
These three changes explain why CREDCON decreased in 1993. The other creditor rights have remained untouched and strong. In the dimensions measured by the COLLAT, Finnish legislation provides a maximum level of investor protection. Because the Act on Restitution of Assets in Bankruptcy became effective at the start of 1992, it became easier to resituate transactions preceding the opening of bankruptcy. The change increased REMEDY in the crisis year 1992.

Investor protect ion and f inancia l development in Finland · 79
Figure 2.4. Decomposition of creditor rights (1980-2001)
1980
1981
1982
1983
1984
1985
1986
1987
1988
1989
1990
1991
1992
1993
1994
1995
1996
1997
1998
1999
2000
2001
10%
20%
30%
40%
50%
60%
70%
80%
90%
100%
COLLAT REMEDY CREDCON
Note: Data source is Hyytinen et al. (2003).
Summary of shareholder and creditor rights
To evaluate the overall changes in investor protection, we now sum all the shareholder rights indicators given by Pistor (2000). The index is denoted by CUMSUMsh_pis. We then add to the CUMSUMsh_pis the indicators sug-gested by Glaeser et al. (2001) and label it CUMSUMsh_gla. An aggregate in-dex of creditor rights is developed using Pistor’s (2000) indicators; it is called CUMSUMcr_pis. Finally, we combine CUMSUMsh_gla with CUMSUMcr_pis to obtain an index, CUMSUM_total, of general investor protection. The re-sults are reported in Figure 2.5.
Figure 2.5 demonstrates that at the start of the 1980s creditors were in terms of our indices better protected than shareholders but that the situation was reversed by 2000. As measured by the cumulative indices, Finnish legis-lation in 1980 covered about 80% of maximum creditor rights (as measured by the indices), but by 2000 the coverage had decreased to about 60%. After an increase of some 30 percentage points over the sample period, shareholder rights currently cover nearly 70% of maximum shareholder protection. As the development of the CUMSUM_total index illustrates, the increase in share-holder protection more than ‘compensates’ for the decrease in the creditor protection.

80 · Ar i Hyyt inen, I ik k a Kuosa and Tuomas Tak alo
Of course, we should not take too seriously the ability of CUMSUM_total to
measure ‘overall investor protection’, as it may well be that some rules protect-
ing shareholders are in conflict with some interests of creditors but in harmony
with others, and vice versa. In the early 1980s, Finnish legislation covered about
50% of maximum protection, but the coverage increased to more than 60% by
2000. The development has, however, been non-monotonic. During the mid-
1990s, the index value dropped, because the weakening of creditor rights had al-
ready been accomplished, but the main improvements in shareholder rights
were effected only later. The outcome of the Finnish reform is a financial system
where shareholders are, in terms of our indices, ‘better’ protected than creditors.
Figure 2.5. Summary of shareholder and creditor rights (1980-2001)
1980
1981
1982
1983
1984
1985
1986
1987
1988
1989
1990
1991
1992
1993
1994
1995
1996
1997
1998
1999
2000
2001
35%
40%
45%
50%
55%
60%
65%
70%
75%
CUMSUMsh_pis CUMSUMsh_gla CUMSUMtotal CUMSUMcr_pis
Note: Data source is Hyytinen et al. (2003).
2.4.3. REFORMS OF ACCOUNTING STANDARDS AND DISCLOSURE RULES
In the early 1980s Finnish accounting legislation, which was based on an idiosyncratic cost-income theory, differed from international standards. The primary aim of the Finnish accounting system was to determine the income of a financial year, which was in contrast to the Anglo-Saxon, IAS and US GAAP systems, which aimed at disclosing companies’ earnings positions to investors.8 The accounting legislation shared similarities with the German system, which, Johnson (2000) argued, is geared towards protecting creditors and preserving capital and is closely linked to taxation principles.9 In contrast
Investor protect ion and f inancia l development in Finland · 81
to US firms, Finnish firms were unable to minimize taxable income without altering the pre-tax earnings reported to shareholders. The accounting rules also allowed dividend-based earnings management, which was a common practice among the Finnish companies prior to 1989 (Kasanen et al. 1996).
In the 1990s Finnish accounting rules underwent a series of reforms that narrowed the gap vs. IAS rules. Reform of the accounting legislation in 1992 (effective 1 Jan 1993) brought, e.g., the true-and-fair-view principle into Finnish legislation and reduced the scope for use of discretionary reserves. Although the reform was driven by national considerations, it also brought Finnish accounting legislation into line with the fourth and seventh Com-pany Law Directives of the EU. European integration was, however, underly-ing another major reform of the accounting legislation in 1997, when the remnants of the peculiar cost-income theory were replaced. The use of IAS was also facilitated in connection with the revision.
The auditing regulation was also revised in the 1990s. The new Audit-ing Act came into effect at the start of 1995, replacing the old auditing legisla-tion that had been introduced in the early 1980s. Besides incorporating the latest European developments into Finnish legislation, the Act increased both qualification requirements for auditors and their reporting and monitoring duties, and emphasized auditors’ independence (Government bill 295/1993).
Like the accounting and auditing standards, Finnish disclosure rules were still underdeveloped in the early 1980s. By international standards, the quality of Finnish disclosure was low (Keloharju 1993, Kinnunen et al. 2000). Since then, a number of improvements have been made. Disclosure require-ments and sanctions for violations were stipulated in the self-regulation of the Helsinki Stock Exchange in 1985. The mandatory disclosure requirement was incorporated into Finnish legislation by the Securities Markets Act of 1989, which introduced a legal liability for violations of disclosure rules. The rules of the Helsinki Stock Exchange were first revised in 1990 and for the second time in 1994 in conjunction with a revision of the Securities Markets Act. As a result of the reform, Finland’s disclosure rules are close to the stan-dards in the other EU’s member countries (Seppänen 1999).
What the foregoing suggests is that the reforms of accounting, auditing and disclosure rules have been comparable to, if not more profound than, the reforms of the specific rules of shareholders and creditor protection. As the recent corporate scandals in the US indicate, the former reforms may have been more consequential to the availability of finance to firms than the latter ones.
82 · Ar i Hyyt inen, I ik k a Kuosa and Tuomas Tak alo
2.5. RECENT DEVELOPMENTS IN THE FINNISH FINANCIAL SYSTEM
The Finnish financial system has traditionally been relationship-focused, debt-based, and dominated by deposit banks. As a result of the bank domi-nance, the stock market was for example small and illiquid in the early 1980s (Hietala 1989, Kasanen et al. 1996). In this section we take a brief look at how things have changed since then.
2.5.1. OVERALL FINANCIAL DEVELOPMENT
To measure the deepness of a financial system and the relative importance of equity and debt as a source of firms’ external finance is not an easy task. In this section we use the indices computed in Hyytinen et al. (2003) and origi-nally developed in Beck and Levine (2002b) to overcome the measurement problem. We follow the same procedure as for indices of investor protection and explain briefly the measures. The reader is referred to Hyytinen et al. (2003) and especially to the original paper by Beck and Levine (2002b) for further details.10
The Finance-Activity measure in Beck and Levine (2002b) measures the amount of financial market activity in an economy, which is given by the log of the product of two ratios: the value of private sector credit provided by financial intermediaries to GDP and the value of shares traded on the stock market to GDP. The larger is the measure, the higher is the volume of finan-cial transactions in the economy at a given point of time. Hyytinen et al. (2003) modify the Finance-Activity measure in two ways. First, they consider only corporate credit that includes all corporate credit granted by financial institutions, government, and pension funds.11 This corporate lending meas-ure also includes institutions’ holdings of corporate bonds and commercial paper. Second, to filter the forward-looking component of stock prices, the value traded is divided by market capitalization. This gives a turnover meas-ure that is invariant to expectations-driven stock prices, because stock prices enter both numerator and denominator. Because of Nokia’s dominant role in the Helsinki Stock Exchange in the late 1990s, a measure that excludes Nokia, called Finance-Activity (w/o Nokia), is also used.
The Finance-Size measure in Beck and Levine (2002b) is defined by the log of the sum of two ratios: value of private sector credits provided by fi-nancial intermediaries to GDP and market capitalization to GDP. While it has many advantages, the measure suffers from the defect that growth of stock

Investor protect ion and f inancia l development in Finland · 83
market capitalization reflects asset price inflation, i.e., increases in the dis-counted value of companies’ expected cash flows. To measure the size of the stock market in real terms – i.e., at expectations-adjusted stock prices, as in Rousseau and Wachtel (2000) – we normalize the time series of market capi-talization and GDP, respectively, at 1995 share price level and overall price level.
As Figure 2.6 illustrates, Finance-Activity increases in the first half of the 1980s and then declines, hitting bottom during the economic crisis of the 1990s. It then rapidly recoups but, surprisingly, declines again in the end of the 1990s. The effect on the Nokia is small, because the measures have been adjusted for the effect of expectations-driven stock prices. The development of the Finance-Size measure is less volatile, but it also decreases toward the end of the 1990s.
Figure 2.6. Financial development (1980-2000)
1980
1981
1982
1983
1984
1985
1986
1987
1988
1989
1990
1991
1992
1993
1994
1995
1996
1997
1998
1999
2000
-4.50
-4.00
-3.50
-3.00
-2.50
-2.00
-1.50
-1.00
-0.50
-0.70
-0.60
-0.50
-0.40
-0.30
-0.20
-0.10
0.00
0.10
Finance-Activity Finance-Activity (w/o) Nokia Finance-Size (right scale)
Note: Data source is Hyytinen et al. (2003).
This then raises the question of why financial market activity has been stagnant. The individual components of the Financial-Activity and Finance-Size measures reveal that the liquidity of the stock exchange has improved during the latter half of the 1990s, but financial intermediaries’ corporate lending relative to GDP has decreased sharply at the same time. To elaborate on the issue whether the orientation of the Finnish financial system has been

84 · Ar i Hyyt inen, I ik k a Kuosa and Tuomas Tak alo
moving from banks towards the stock market, we follow Beck and Levine (2002b) and construct Structure-Activity and Structure-Size measures. As in the case of the Finance-Activity and Finance-Size measures, we modify them to eliminate the forward-looking component of share prices. Structure-Activity compares activities of the stock market and financial intermediaries. It is equal to the log of the ratio of stock market turnover to corporate claims of financial intermediaries, where intermediaries’ claims are measured in GDP shares. We again control for Nokia’s impact by computing the measure without it (Structure-Activity (w/o Nokia)). The second measure, Structure-Size, captures the relative size of the stock market with respect to intermedi-ated debt finance. It is defined as the log of the ratio of real market capitaliza-tion to corporate claims of financial intermediaries.
Figure 2.7 illustrates developments in the Structure-Activity and Struc-ture-Size indicators. They demonstrate how the Finnish financial system has over the past twenty years disengaged from debt finance towards increasing dominance of stock markets. The trend is clear, although the crisis of the early 1990s temporarily disrupts it. Although there was a change towards stock market-oriented financial system already in the 1980s, the rate of change accelerated during the 1990s.
The structural change of the Finnish financial market is also evident from Figure 2.8, which depicts changes in sources of external finance for four consecutive periods.12 Figure 2.8 shows how equity issues and venture capital have increased in relative importance as sources of external funds to firms. There has been a major decline in the intermediated debt. It seems that mar-ket-based debt finance has also shifted toward shorter maturities, because the corporate bond stock decreased while the commercial paper stock increased.
In summary, it seems that the bank-centered financial system has dis-engaged from relationship-based debt finance towards increasing influence of equity capital and stock markets. The findings of a qualitative analysis of the recent developments in the Finnish financial system, presented in Hyyti-nen et al. (2003), are consistent with this conclusion, too.
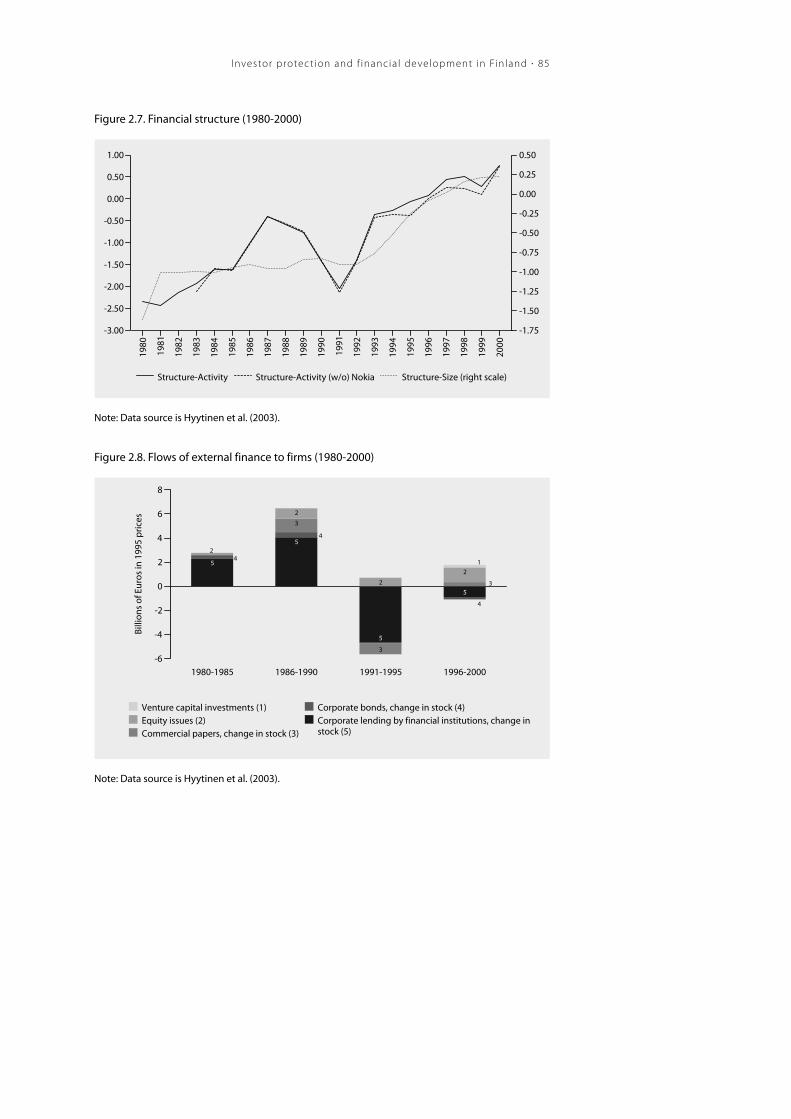
Investor protect ion and f inancia l development in Finland · 85
Figure 2.7. Financial structure (1980-2000)
1980
1981
1982
1983
1984
1985
1986
1987
1988
1989
1990
1991
1992
1993
1994
1995
1996
1997
1998
1999
2000
-3.00
-2.50
-2.00
-1.50
-1.00
-0.50
0.00
0.50
1.00
-1.75
-1.50
-1.25
-1.00
-0.75
-0.50
-0.25
0.00
0.25
0.50
Structure-Activity Structure-Activity (w/o) Nokia Structure-Size (right scale)
Note: Data source is Hyytinen et al. (2003).
Figure 2.8. Flows of external finance to firms (1980-2000)
2
2
2
3
3
5
5
5
5
1980-1985 1986-1990 1991-1995 1996-2000-6
-4
-2
0
2
4
6
8
Billi
ons
of E
uros
in 1
995
pric
es
Venture capital investments (1)Equity issues (2)Commercial papers, change in stock (3)
Corporate bonds, change in stock (4)Corporate lending by financial institutions, change instock (5)
4
4
1
3
42
Note: Data source is Hyytinen et al. (2003).
86 · Ar i Hyyt inen, I ik k a Kuosa and Tuomas Tak alo
2.5.2. CHANGES IN OWNERSHIP STRUCTURES OF FINNISH COMPANIES
A key hypothesis stemming from the growing law and finance literature (see, e.g., LLSV 1998, 2000) is that legal protection and control are substitutes. In this Section we build on Hyytinen et al. (2003) to show that the Finnish evi-dence runs against the hypothesis. As said, at the start of the 1980s the Fin-nish financial system had a main-bank structure. The most important Finnish firms were roughly divided into three spheres, which were controlled by the main Finnish commercial banks (Lantto 1990). A salient feature of the power spheres was the cross-ownership between financial institutions and nonfi-nancial firms. As a result, the financial institutions had a substantial influence on the decision-making of non-financial firms (Pohjola 1988, Kasanen et al. 1996). Because the banks held large stakes in the firms in their spheres through equity and debt, they provided both financial and managerial sup-port, if a firm in their sphere encountered financial difficulties.
As indicated by the analysis of Hyytinen et al. (2003), the banking cri-sis and industry restructuring resolved the spheres almost completely by 2000. The ownership shares of financial institutions increased during the 1980s but have subsequently declined substantially. The role of financial in-stitutions has thus diminished, not only as providers of debt finance, but also as owners.13 Foreign ownership has also grown substantially (see also Kar-hunen and Keloharju 2001, and Ali-Yrkkö and Ylä-Anttila, Chapter 7 in this volume).
Changes in ownership structures of Finnish companies thus seem to support the decreasing importance of deposit banks in the Finnish financial system. Against the findings of LLSV (1997, 1998 and 2000), the conclusion is puzzling in that there has been neither a decrease in ownership concentration nor an increase in the ownership of financial institutions despite the indis-putable strengthening of shareholder rights and equally indisputable weak-ening of creditor rights. The finding is at odds with the view that law and power are substitutes.

Investor protect ion and f inancia l development in Finland · 87
2.6. CONCLUSIONS
It has been convincingly documented in the so-called law and finance litera-ture that the size and effectiveness of financial systems around the world can at least partly be traced to the differences in how the legal system (legal rules and the quality of enforcement) of a country protects investors against ex-propriation by corporate insiders. Building on this view, Hyytinen et al. (2003) document that changes in Finnish corporate governance system have been profound and that they have treated shareholders and creditors un-equally. In particular, it seems that shareholder protection has been strength-ened while creditor protection has been weakened considerably and that the changes in investor protection parallel a complete reorganization of the Fin-nish financial markets. In this reorganization, companies have to a large ex-tent substituted equity for debt and a bank-centered financial system has dis-engaged from relationship-based debt finance towards increasing influence of stock markets.
We have in this Chapter reviewed how Finland’s corporate governance and financial system have changed over the past twenty years, or so. We have, in particular, taken a closer look at the specific changes in shareholder and creditor protection that Hyytinen et al. identified. We have three main findings:
• First, as reflected by the material provisions in the Finnish legislation and captured by the indices used in this study, the shareholder rights are cur-rently in many ways comparable to their US counterparts and not so un-developed as they used to be. Enhancing the stock market’s overall integ-rity, including its liquidity, has been one of the most important drivers of the improvements in shareholder protection. The other changes in share-holder rights have alleviated the tension between minority shareholders and blockholders. Given that the concentration of ownership in Finland has in the past been relatively high, this policy is understandable, espe-cially because the tension should be the more severe the more concen-trated the ownership of firms. Finally, enhancing the strength of voting rights is consistent with the view that in the past shareholders may have had problems in exercising their control over management both because the Finnish boards of director used to be occupied by the top managers of firms and because the opportunities for exit (selling shares) on the market place have been limited.

88 · Ar i Hyyt inen, I ik k a Kuosa and Tuomas Tak alo
• Second, the weakening of the creditor rights is related to the weakening of creditors’ control over bankruptcy due to the Act on Reorganisation of Companies of 1993. The reform implied, among other things, that the restrictions on going into reorganization were weakened and the scope of the automatic stay on assets preventing secured creditors from getting their security was expanded.
• Third, the reforms of accounting, auditing and disclosure rules have been comparable to, if not more profound than, the reforms of the specific rules of shareholders and creditor protection. As the recent corporate scandals in the US indicate, the former reforms may have been more consequential to the availability of finance to firms than the latter ones.
Though our study has several limitations, we boldly draw some policy relevant lessons. The first derives from the finding that the Finnish financial system has contracted relative to the size of the economy to the level it was in the mid 1980s. While we have not examined in detail the main reason for the decline, i.e. the reduced corporate lending by the Finnish financial institu-tions, our study shows that it has taken place after the deterioration of credi-tor rights. Because intermediated debt finance is still a major source of fi-nance to SMEs (Hyytinen and Pajarinen, Chapter 6 in this volume), the ques-tion is whether the financial institutions facing the weakened creditor rights (and increasing competition) have incentives to supply the kind of long-term debt finance the SMEs need. The worst (but not necessarily most likely) sce-nario is that the decline in corporate lending is a symptom that the financial system is slowly becoming unbalanced.
The second lesson that we would like to put forward is that if the avail-ability of capital is a problem, the strong shareholder protection should be maintained, because it may stimulate innovation finance, such as venture capital, and the growth of the stock market. Stimulating these may be of par-ticular importance for Finland, as there is some new evidence showing that financial systems in advanced countries are associated with patterns of R&D rather than fixed investment (Carlin and Mayer 2002). Moreover, there are ar-eas of regulation where appropriate rules could further enhance the availabil-ity of innovation finance and the growth of the stock market. Because the comparative advantage of market-based financial systems essentially builds on transparency and the efficiency of price signals (Rajan and Zingales 2000, see also Holmström and Kaplan 2001), one such area is disclosure regulation. Another is the legislation that influences the possibilities and incentives of investors to enforce financial contracts (cf. Kaisanlahti, Chapter 3 in this vol-

Investor protect ion and f inancia l development in Finland · 89
ume and Glaeser et al. 2001). Facilitating the enforcement may be of special value to Finnish minority shareholders, as there are several procedural fea-tures in the Finnish ex post remedies against actual minority oppression that can be interpreted to be biased against a minority shareholder (Kaisanlahti, ibid.). Finally, our analysis indicates that the Finnish legislation could be fine-tuned to enhance the exit options of shareholders (i.e. liquidity). Besides the minority owners that face enforcement problems, venture capital community might benefit from the rules that facilitate exiting (cf. Ali-Yrkkö et al., Chap-ter 4 in this volume, and Hyytinen 2002).

90 · Ar i Hyyt inen, I ik k a Kuosa and Tuomas Tak alo
REFERENCES
Agnblad, J., Berglöf, E., Högfeldt, P., and Svancar, H., 2000, Ownership and control in Sweden – Strong owners, weak minorities, and social control. Stockholm School of Economics Working Papers.
Ali-Yrkkö, J., Hyytinen, A., and Liukkonen, J., 2003, Exiting venture capital investments: Lessons from Finland, Chapter 4 in this volume.
Ali-Yrkkö, J. and Ylä-Anttila, P., 2003, Globalization of business in a small country - Does ownership matter? Chapter 7 in this volume.
Allen, F. & D. Gale 2000, Comparing financial systems, MIT Press, Massachusetts, USA.
Bebchuk, L. and Roe, M., 1999, A theory of path dependence in corporate ownership and governance, Stanford Law Review, 52, 127–170.
Beck, T. Demirgüç-Kunt, A. and Levine, R., 2000, A new database on financial development and structure. World Bank Economic Review, 14, 597–605.
Beck, T. and Levine, R., 2002a, Stock markets, banks, and growth: Panel evidence, forthcoming in Journal of Banking and Finance.
Beck, T. and Levine, R., 2002b, Industry growth and capital allocation: Does having a market- or bank-based system matter? Journal of Financial Economics, 64, 147-180.
Bottazzi, L. and Da Rin, M., 2002a, Venture capital in Europe and the financing of innovative companies, Economic Policy, April 2002, 229-269.
Bottazzi, L. and Da Rin, M., 2002b, Europe’s ‘new’ stock markets, Centre for Economic Policy Research, Discussion papers, No. 3521.
Carlin, W., and Mayer, C., 2002, Finance, investment and growth, forthcoming in Journal of Financial Economics.
Coase, R. H., 1960, The problem of the social cost, Journal of Law and Economics, 3, 1-44.
Coffee, J., 1999, The future as history: The prospects for global convergence in corporate governance and its implications, Northwestern University Law Review, 93, 631–707.
Coffee, J., 2000, Convergence and its critics: what are the preconditions to the separation of ownership and control?, manuscript, Columbia Law School.
Coffee, J., 2001, The rise of dispersed ownership: the role of law in the separation of ownership and control, manuscript, Columbia Law School.
Da Rin, M. and Bottazzi, L., 2002, Financing entrepreneurial firms in Europe: Facts, issues, and research agenda, Paper prepared for CESifo Conference on Venture Capital, Entrepreneurship and Public Policy (Munich, November 22-23.).
David, P. A., 2000, Path dependence, its critics, and the quest for ‘historical economics’, Standford University Economics Department Working Papers, No. 00-011.
Dixit, A., 2001, On modes of governance, manuscript, Princeton University.

Investor protect ion and f inancia l development in Finland · 91
Easterbrook, F. and Fischel, D., 1991, The economic structure of corporate law, Harvard University Press, Massachusetts, USA.
Gilson, R., 2001, Globalizing gorporate governance: Convergence of form or substance, American Journal of Comparative Law, 49, 329–357.
Glaeser, E., Johnson, S. and Shleifer, A., 2001, Coase versus the Coasians, Quarterly Journal of Economics, 116, 853–899.
Gorton, G. and Schmid, F., 2000, Universal banking and the performance of German firms, Journal of Financial Economics, 58, 29-80.
Hietala, P., 1989, Asset pricing in partially segmented markets. Evidence from the Finnish market, Journal of Finance, 44, 697–718.
Hirschmann, A., 1970, Exit, voice and loyalty, Harvard University Press, Massachusetts, USA.
Holmström, B. and Kaplan, S., 2001, Corporate governance and merger activity in the United States: Making sense of the 1980s and 1990s, Journal of Economic Perspectives, 15, 121–144.
Hyytinen, A., 2002, How important are exits for venture capital finance? Evidence from Finland, Paper prepared for CESifo Conference on Venture Capital, Entrepreneurship and Public Policy, Munich, November 2002.
Hyytinen, A., Kuosa, I. and Takalo, T., 2003, Law or Finance? Evidence from Finland, European Journal of Law and Economics, forthcoming.
Hyytinen, A. and Pajarinen, M., 2003, Financial systems and venture capital in Nordic countries: A comparative study, Chapter 6 in this volume.
Johnson, S., 2000, Which rules matter? Evidence from Germany’s Neuer Markt, manuscript, Sloan School of Management.
Karhunen, J. and Keloharju, M., 2001, Shareownership in Finland 2000, Finnish Journal of Business Economics, 50, 188-226.
Kaisanlahti, T., 2003, Minority shareholders in the Finnish system of corporate governance, Chapter 3 in this volume.
Kasanen, E., Kinnunen, J. and Niskanen, J., 1996, Dividend-based earnings management: Empirical evidence from Finland, Journal of Accounting and Economics, 22, 282–312.
Keloharju, M., 1993, The winner’s curse, legal liability and the long-term price performance of initial public offerings in Finland, Journal of Financial Economics, 34, 251–277.
Kinnunen, J., Niskanen, J. and Kasanen, E., 2000, To whom are IAS earnings informative? Domestic versus foreign shareholders perspectives, European Accounting Review, 9, 499–517.
Lantto, R., 1990, Owners and power in Finland’s listed companies, Startel Oy, Kajaani.
La Porta, R., Lopez-de-Silanes, F., Shleifer, A. and Vishny, R., 1997, Legal determinants of external finance, Journal of Finance, 52, 1131–1150.
La Porta, R., Lopez-de-Silanes, F., Shleifer, A. and Vishny, R., 1998, Law and finance, Journal of Political Economy, 106, 1113–55.
La Porta, R., Lopez-de-Silanes, F., Shleifer, A. and Vishny, R., 2000, Investor protection and corporate governance, Journal of Financial Economics, 58, 2–27.

92 · Ar i Hyyt inen, I ik k a Kuosa and Tuomas Tak alo
La Porta, R., Lopez-de-Silanes, F., Shleifer, A. and Vishny, R., 2002, Investor protection and corporate valuation, Journal of Finance, 57, 1147-1171.
Levine, R., 2001, Bank-based or market-based financial systems: Which is better?, forthcoming in Journal of Financial Intermediation.
Levine, R., Loyoza, N. and Beck, T., 2000, Financial intermediation and growth: Causality and causes, Journal of Monetary Economics, 46, 31–77.
Liebowitz, S., and Margolis, S., 1995, Path dependence, lock-in and history, Journal of Law, Economics, and Organization, 11, 205-226.
Mäkinen, M., 2001, Optiot – Suomalaisjohtajien uusi kannustin, (Stock options - The new incentive of Finnish executives, in Finnish), The Research Institute of the Finnish Economy (ETLA) B:181.
Pistor, K., 2000, Patterns of legal change: Shareholder and creditor rights in transition economies, European Business Organisation Law Review, 1, 59–108.
Pistor, K., Reiser, M. and Gelfer, S., 2000, Law and finance in transition economies, Economics of Transition, 8, 325–368.
Pohjola, M., 1988, Concentration of shareholder voting power in Finnish industrial companies, Scandinavian Journal of Economics, 90, 245–253.
Rajan, R. G. and Zingales, L., 2000, Financial systems, industrial structure and growth, manuscript, Kellog Graduate School of Management.
Ravid, S.A. and Sudgren, S., 1998, The comparative efficiency of small-firm bankruptcies: A study of the US and Finnish bankruptcy codes, Financial Management, 27, 28–40.
Rousseau, P.L. and Wachtel, P., 2000, Equity markets and growth: Cross-country evidence on timing and outcomes 1980–1995, Journal of Banking and Finance, 24, 1933–1957.
Schmidt, R. and Spindler, G., 2000, Path dependence, corporate governance, and complementarity, Goethe University in Frankfurt Working Papers, No. 27.
Seppänen, H., 1999, Discretionary disclosure and external financing: Evidence from a relationship financing environment, Helsinki School of Economics Doctoral Dissertations A:161.
Troberg, P., 1992, Recent developments in financial reporting in Finland, Advances in International Accounting, 5, 25-45.
Ylä-Anttila, P., 2000, Globalization of business in a small country – Implications for corporate governance and national systems of innovation, Ekonomiska Samfundets Tidskrift, 1/00, 5-20.

Investor protect ion and f inancia l development in Finland · 93
APPENDIX. CORPORATE GOVERNANCE: BEYOND THE LEGAL REFORM
This appendix briefly reviews changes in the Finnish corporate governance system regarding corporations’ board of directors, executive compensation, and targets over 1980-2000 (see for further discussion, e.g., Ylä-Anttila 2000, Ali-Yrkkö and Ylä-Anttila, Chapter 7 in this volume, and Mäkinen 2001).
During the 1980s no major changes took place in the main aspects of the governance of the Finnish companies. The board of directors monitored the operative management. The members of the operating management team frequently occupied the board and sometimes they even had an outright ma-jority in the board. A supervisory board usually monitored the board of di-rectors in large Finnish firms. For example, 2/3 out of the 30 largest firms in Finland had the two-tier system in 1989. Cross-board membership was com-mon, too, and a single person was often a board member in four to six listed firms. Executive compensation was based on low-powered incentive schemes. Executive stock options were virtually non-existing, as the first op-tion program was launched in 1988. Finally, shareholder value was not among the main corporate objectives in the 1980s. Instead, various targets, such as success in product market competition, were emphasized.
The 1980s was followed by a decade of major changes. The dual-board governance structure was almost completely waived by the end of the 1990s. Only six of the 30 largest firms had a two-tiered board system in 1999. The board of directors also underwent large reorganizations and they began to play a larger role. In particular, they have become more independent from the operative management team. The number of outside expert members in the boards has increased, whereas the cross-board membership and the mul-tiple board memberships held by a single person have decreased.
There were numerous other changes in addition to the composition of the board of directors. For instance, the number of investor relations depart-ments in firms rose, and the top directors of the Finnish listed firms began to participate in the management of investor relations. The use of high-powered incentive schemes also spread, partially because shareholder value became an explicit corporate target in the 1990s.

94 · Ar i Hyyt inen, I ik k a Kuosa and Tuomas Tak alo
ENDNOTES
1 Following the law and finance literature, we equate corporate governance to those legal mechanisms by which outside investors are protected. 2 The listing rules, especially regarding disclosure requirements, of these new places are considerably stricter than the rules of the old lists of Deutsche Börse. The introduction of these new lists was accompanied by a change in the public law that enhances disclosure requirements. The number of initial public offerings in-creased during the late 1990s, and as a result, the previously virtually non-existing venture capital finance has become a major source of corporate funding in Germany (Johnson 2000). 3 Such legislative cooperation has been quite common within the Nordic legal family and, accordingly, the Finnish legislation shares many similarities with the other Nordic countries. Swedish legislation has been especially influential due to Finland’s organic union with Sweden, which lasted for more than 700 years. 4 Of the measures in Glaeser et al. (2001), we exclude the term of the board of directors from our index, be-cause it is the only measure whose effect cannot be captured by an indicator variable. In Finland the law re-stricts the term to 4 years. There are however no restrictions on the number of terms that a member can be on a company’s board of directors. 5 Until the start of 1993, the principal route of resolution was liquidation bankruptcy. When a firm is declared bankrupt, a trustee takes over the firm and sells its assets. The firm may be sold as a going-concern or liqui-dated piecemeal. The proceeds are then distributed to creditors according to priority of claims. Although the Liquidation Bankruptcy Code of 1868 was amended earlier, the changes were relatively minor com-pared with the changes in the reform of 1993. Workouts, or compositions established by a court, provided an alternative way of resolution until 1993 but, as documented in Government bill 182/1992, they were rarely used. The Act on Reorganisation of Companies of 1993 replaced compositions and introduced court supervised reorganization for financially stressed firms. As Ravid and Sundgren (1998) demonstrate, the Fin-nish Act on Reorganisation of Companies of 1993 is similar in many ways to the US Chapter 11 procedure. 6 In LLSV (1997, 1998) the score for Finland is 3, but our reading of the Finnish legislation is that the score should be 4, because the legislation included a provision on cumulative voting. Casual evidence suggests however that cumulative voting has been used relatively rarely. 7 Our interpretation is of course debatable, but our discussions with leading Finnish legal scholars indicate that there is no unanimity on the interpretation. The analysis would remain qualitatively unchanged if we credited the index by a fraction, say, 0.5 instead of 1, because of the ambiguity. 8 A survey of financial accounting practices by IASC (1988), covering fifty-four countries worldwide, indi-cated that Finnish accounting rules had the lowest conformity with International Accounting Standards (IAS). As a result, Finnish companies in the 1980s began to release dual financial statements, in line with each of the standards, in order to attract international investors (Kinnunen et al. 2000). 9 This feature of the Finnish accounting system, which obtained in the 1980s, is summarized by Troberg (1992) and quoted in Kasanen et al. (1996, p. 291): ’Because the accounting rules are in the form of laws, le-gal and political authorities, in addition to accountants, have significantly influenced the formation of the these rules and consequently their content. Through the Business Tax Act, the Finnish state (tax authorities) has had a major impact on accounting practice. As the financing structure of Finnish companies is by inter-national standards highly leveraged, the role of creditors (banks) in the development of accounting report-ing rules has by no means been a minor one.’ 10 See also Beck, Demirgüç-Kunt and Levine (2000) and Levine (2001), who construct and use similar indices. The indices are based on various stock and flow variables. In computing the ratio of a stock variable meas-ured at the end of a period to a flow variable measured over a period, a bias may arise (see Beck and Levine 2002a). We try to reduce the bias by employing the average of the (real) stock variables in periods t and t–1 and by relating the average to the (real) flow variable for period t. 11 Government accounted on average for 3% of corporate lending in 1980-2000.

Investor protect ion and f inancia l development in Finland · 95
12 The sources are corporate lending by financial intermediaries, corporate bond stocks, commercial paper stocks, equity issues, and venture capital investments. All data are in real (1995 prices) terms. 13 Although there have been frequent changes in the rights of financial institutions to own corporate equity over our sample period, the ownership restrictions have not in practice become more stringent. They thus cannot drive these patterns in ownership. See also Pohjola (1988).


Financia l systems and f i rm per formance: Theoret ical and empir ica l perspect ives · 97
3. THE ROLE OF SHAREHOLDER PRO-TECTION RULES IN FINANCING FIN-NISH COMPANIES
Timo Kaisanlahti*
Abstract: Recent ”law and finance” research suggests that the rights of minority shareholders are heavily affected by the legal tradition of the country. How well these rights are established in turn has an effect on companies’ ability to raise equity capital from outside investors, i.e. minority investors. In this es-say we review in the light of the law and finance research the legal landscape that minority shareholders face in Finland. Our conclusion is that the mate-rial provisions of the Finnish legislation are in many ways comparable to their US counterparts and not so undeveloped as some recent studies suggest. More worrisome than the material provisions are the Finnish ex post reme-dies against actual minority oppression. There are several procedural fea-tures that can be interpreted to be biased against a minority shareholder. Without effective remedies potential local and foreign financiers have a lesser incentive to place equity capital in Finnish companies than otherwise. Be-cause the procedural rules are the monopoly of the legislator and because enterprises cannot by their own means provide adequate substitutes for miss-ing effective remedies (as may happen in the case of substantive rules), this deficiency can lead to a higher required rate of return for capital, or reduce its supply altogether.
* Timo Kaisanlahti is at KLegal (Finland). The author gratefully acknowledges helpful suggestions made by Manne Airaksinen and Ari Hyytinen. Any opinions expressed or errors remaining, however, are the on the sole responsibility of the author.
98 · T imo K aisanlaht i
3.1. INTRODUCTION
Finland belongs to the family of Scandinavian tradition of civil law.1 Recent research by scholars – particularly economists – suggests that minority shareholder rights are heavily affected by the legal tradition. This relation in turn has its economic implications to companies´ ability to raise equity capi-tal from outsiders, especially from minority investors. In a famous article by La Porta et al. (1998) it is concluded that the rights of minority shareholders are more advanced in English origin common-law countries than in ones with civil-law tradition. According to the argument the strict protection of minority shareholders in common-law countries has eased access to external equity financing of companies operating in those countries. On the other hand, within the sphere of civil-law, Finland and other Nordic countries are said to provide only an intermediate level of protection for minority share-holders.
La Porta et al. (1998) draw their conclusions aggregating shareholders formal
rights into so-called “anti-director index”. This index is formed by adding one
when: (i) the country allows to mail their proxy vote to the company; (ii) share-
holders are not required to deposit their shares prior to a general meeting (later
“GM”); (iii) cumulative voting or proportional representation of minority share-
holders in the Board of Directors (“Board”) is allowed; (iv) an oppressed minor-
ity mechanism is in place; (v) the minimum percentage of shares that entitles a
owner to call an extraordinary GM is less or equal to 10 percent; and (vi) share-
holders have pre-emptive rights that can only be waived by a shareholders´ vote.
There are six relevant variables; thus the index ranges from 0 to 6. Finland scores
only 3 points and the other Scandinavian countries from 2 to 4, while the highest
rank, 5 points, is reached by several English origin common-law countries,
among then the United States and United Kingdom.
An other important difference between civil and common-law coun-tries is the role of Courts. The common-law judges are understood to have a very wide discretion and that they use it clearly biased in favour of minority shareholders. A common-law Court applies what Coffee (1999) calls “a smell test” in order to sniff out whether a conduct by the “insider”, i.e. the major shareholder or management, violates their duties.
Coffee claims that the civil-law courts are in contrast required to apply the black letter law of codes quite mechanically to the cases to be decided.2 If

The role of shareholder protect ion rules in f inancing Finnish companies · 99
a new case before a court is not specially covered by the wording of the act or another statutory instrument, the judge will have little discretionary power to deal with it. Legal rules in civil-law countries are made by parliamentary leg-islatures. As the predictability of law is worshipped in civil-law countries, courts are not allowed to go beyond the exact wording of statutory rules. This means that the judges have to restrain from “smell-testing” so dear to their common-law counterparts. Mandatory self-restrain of judges is accord-ing to Coffee a clear invitation to imaginative self-dealing of insiders. An in-sider who finds a new – i.e. not explicitly forbidden in black letter law – way to take advantage of outside investors, can proceed without fear of legal con-sequences.
The aim of this Chapter is to evaluate the rules of investor protection in Finland. For a prospective investor who is considering buying an equity stake in a company, her equality with current shareholders is a major concern – the playing field has to be even for the investor to participate in the very first place. Consequently, we focus on those rights that aim to ensure the equal treatment of shareholders.
The central rules of investor protection are reviewed in Section 3.2. First, to provide background information, Subsection 3.2.1 describes the structure and nature of Finnish company regulation. In the following Subsec-tions 3.2.2 - 3.2.4 we make an assessment of general limits for decision mak-ing by majority vis-à-vis minority rights. For a closer study are then chosen the material Finnish rules that concern dividend payments and other forms of distribution as well as the pre-emptive rights in follow-up equity offerings (Subsections 3.2.5 and 3.2.6). In Subsection 3.2.7 the Finnish disclosure regu-lation is evaluated regarding the equality of access to information. The ex post remedies available for an investor against actual breaches of equal treatment are the object of Subsection 3.2.8. Conclusions of the preceding analysis are drawn in Section 3.3 particularly in respect to financing of Fin-nish companies.3
3.2. EQUAL TREATMENT AND OTHER RULES OF INVESTOR PROTECTION
3.2.1. STRUCTURE AND NATURE OF THE FINNISH COMPANY REGULATION
The core rules of the Finnish companies law are codified in the Companies Act of 1978 (No. 734 – September, 1978; later “FCA”). It is the general law on

100 · T imo K aisanlaht i
companies in which the owners liability is limited to their investment in the shares of the company.4 However, the FCA does by no means cover all the regulation which is relevant to companies. The Finnish regulation is struc-tured as a multi-tier system, particularly in matters that are related to securi-ties markets.
In the context of shares and other securities issued to the public mar-kets the Finnish Securities Markets Act of 1989 (No. 495 – May 26, 1989; later “FSMA”) has a decisive role to play. The FSMA covers inter alia the proce-dures for issuing securities to the public as well for trading and quoting shares and other securities of listed companies. The Act is also aimed at level-ling the playing field of information i.e. ensuring that all the players, even the small investors, receive timely correct and sufficient information of the listed securities as well on the financial standing of their issuers to permit a rea-soned evaluation of securities issued and the issuing company. Moreover, the Auditing Act of 1994 (No. 936 – October 28, 1994) includes some relevant provisions of corporate governance as well the Accounting Act of 1997 (No. 1336 – December 30, 1997) and certain regulations mandated by it. These are of importance inter alia in drawing a resolution at a AGM of the dividend to be distributed. The Accounting Act also obliges a company to file their finan-cial statements with a public register, the Finnish Trade Register.5
The company law in Finland is markedly mandatory. It is generally be-lieved by Finnish lawyers that only the legal system is able to control the ac-tions of a management – or of a major shareholder – in order to prevent them from taking advantage of their position to the detriment of minority owners and creditors. A casual study of Finnish company legislation strengthens this impression. A typical provision, for example, of the FCA in this respect is in-dispositive by nature: a deviation from it may be a burdensome exercise in practice even if the parties protected by the provision would consent to an exception.
On the other hand, however, certain instruments of the Finnish legisla-tion provide shareholders considerable latitude in arranging their internal af-fairs. Most notable of these are articles of association (later “Articles”).6 They stipulate the internal rules of procedure and can therefore be regarded as the company´s statute (Poutiainen 2001, p. 67). Articles are the primary means provided in the FCA by which shareholders govern a company´s affairs and administrative management. Consequently the Articles of Finnish companies are subject to the requirements of the FCA. In Finland the Articles impose binding obligations on the members in their dealings with the company and vice versa on the company in its dealings with the members. Moreover, the

The role of shareholder protect ion rules in f inancing Finnish companies · 101
members are also bound in their relations inter se by stipulations of the Arti-cles. Shareholders enjoy a high degree of freedom in shaping rights provided for in the Articles to suit their interests (Timonen 2002, p. 136-137). The Arti-cles may, at least in principle, deviate from the FCA even if the provisions do not expressly allow such deviation. However, the most notable feature of the FCA in the context of Articles is that the rights which the legislator has granted on a certain minority cannot be limited by a stipulation of Articles to that effect. That is not possible even when the Articles are being drafted at the formative stage i.e. before the meeting founding the company. The free-dom to adapt the Articles to the circumstances of a particular enterprise may not be used to lessen the minority protection provided by the statutes. The majority requirements can only be strengthened and not weakened (e.g. Sil-lanpää 1994, p. 151-152). On the other hand, there are no statutory limits to how much the minority rights may be strengthened by the Articles.7
3.2.2. PRINCIPLE OF ONE SHARE – ONE VOTE
Shareholders exercise ownership control at a GM through the power of their votes.8 In Finland – as in all market economies – the ground rule is that every shareholder is entitled to one vote per share she owns. Because a company is an organisation for economic activity in pursuit of profit, it would not make sense to require all decisions to be made unanimously. If each shareholder was able to veto any decision, economically reasonable action of the company would most likely be paralysed under self-interest.9 A set of voting rules that takes into account the difference in financial stakes between the members is needed. In Finland, the starting point is that decision at a GM are made with a simple majority.
The rights that an ordinary share entitles its holder to can be divided into administrative i.e. control rights and financial rights. The former in-cludes the right to be present, either in person or by proxy, at a GM, to par-ticipate in decision making of the issues to be decided there as well as obtain information of the issues. The administrative rights are complemented by the right to sue on the resolutions of a GM. The financial rights provide the owner of a share right to receive dividend as well as surplus assets in case of the company winding up, to subscribe new shares, share options, warrants and convertible bonds pre-emptively i.e. in a proportion to the owner´s cur-rent holdings.
Another starting points in the Finnish company legislation is that all the shares issued by a particular company are equal i.e. that each share enti-
102 · T imo K aisanlaht i
tles to its holder exactly the same administrative and financial rights as an-other share. On the other hand, the FCA provides some latitude by allowing companies by their Articles to deviate from this principle inter alia in order the differentiate shares in respect to their voting rights by establishing several share classes. Besides, an Agreement may be used in certain situations as an instrument to provide a similar effect.10 Pursuant to Ch. 3 Sc. 1 Para. 1 of the FCA “[a]ll the shares – – shall entitle their holders to equal rights in the com-pany.” The Articles may, however, stipulate that the company has shares with different rights. In such case the rights attaching to each particular class of shares are to be set out in the Articles. Different classes may be established at the formation of a company but a new class can as well be introduced later, in the context of increasing the equity capital by a share issue or by dividing an existing class in two or more classes.11
The Articles may stipulate that an ordinary share entails economic rights that distinctive to its class. Among these are inter alia different rights to share in the profits of company or preferential status to the assets in liqui-dation. A more typical stipulation, however, is that the shares of a certain or-dinary class carry more votes the others. Thus, as La Porta et al. (1998, p. 1131) inform us, the principle of “one share one vote” is not a mandatory rule in Finland. The law sets, however, an absolute maximum for voting differ-ences: the number of votes carried by a share belonging to a class may not be more than 20 times the number of votes entitled by a share of another ordi-nary class (FCA Ch. 3 Sc. 1a Para. 1 in fine).12 Moreover, the FCA requires vot-ing per share classes in certain matters. A majority has to be obtained in each and every class of ordinary shares to have a resolution of a merger adopted. Therefore a majority of the shares with multiple voting rights does not guar-antee per se to their owner an absolute power to form the terms of a merger to the detriment of the holders of shares with lesser voting rights. The same rule applies also to a division of a company as well to share repurchases: the required majority has to be obtained in every class of shares present at the GM (Toiviainen 1999, p. 91).13
The Finnish jurisprudence relies heavily also on a doctrine of indivisibility: the
voting rights, as well as other administrative rights, that a share entitles its
holder to are indivisible from the financial rights of this share. Thus, voting right
should not be separated from share ownership. An owner can neither give up
nor transfer her voting rights without transferring the ownership altogether.
This has practical implications. Firstly, the prohibition against separating voting
rights from share ownership excludes the use of irrevocable voting proxy. The
The role of shareholder protect ion rules in f inancing Finnish companies · 103
FCA Ch. 9 Sc. 2 Para. 1 sets a mandatory time maximum for an authorisation: a
proxy is valid only for three years after its issue. But, even during this time, the
shareholder may draw back her authorisation without a reason. Secondly, an en-
try in the company´s register of shareholders as a “real” shareholder is a manda-
tory prerequisite for voting at a GM. It is not generally permissible to register
anyone but the real shareholder. However, in a listed company with dematerial-
ised shares, a foreign shareholder may have her shares registered under a nomi-
nee´s name (Act on Book-Entry Accounts, Sc. 5a). On the other hand, this type of
arrangement has an disadvantage: the voting rights of shares are not in the
nominee´s or the real owner´s disposal. Only a registered shareholder may vote
at a GM.
3.2.3. SIMPLE AND STATUTORY MAJORITY
There are three types of resolution that may be passed by the members at a GM of a Finnish company: (i) ordinary by a simple majority of votes repre-sented at the meeting, (ii) extraordinary by a supermajority of votes, and (iii) elective by a relative majority. The majority required to pass a resolution de-pends upon the business being transacted, the stipulations of the FCA, and the Articles. As regards normal business, a GM of a Finnish company reaches its decisions by a simple majority, i.e. the number of the votes cast in favour of a proposal must exceed the number of votes against.14 If the votes are cast evenly, the opinion of the chairman will form the decision – even if she is not a shareholder. Unless stipulated otherwise in the Articles, in such case that only one vote is cast in favour and none against the proposal, it is accepted – even if all the other shareholders have attended the meeting but failed to vote.
The FCA does not include a general requirement for a quorum of shareholders present. The rule of simple majority reigns over most of the matters to be dealt at the GM even if the number sufficient to enough to qual-ify as a majority falls short of the amount that equals a majority of all out-standing stock. However, although seldom seen in practice, the Articles may stipulate that the validity of resolutions requires that the majority of shares are present at the GM.15
To balance, at least partially, the missing quorum requirement, certain extraordinary matters require statutory majority at a GM of a Finnish com-pany.16 Pursuant to FCA Ch. 9 Sc. 14 Para. 1 an amendment of the Articles re-quires in most cases that the resolution is favoured by both two-thirds of the votes cast and the very same quorum of the shares present at the meeting.
104 · T imo K aisanlaht i
Even more notable is that the support of two-thirds of shares must be reached by all the classes present at the GM. This is the requirement when the shareholders are casting a vote about accepting a merger with another company or dividing the company (FCA Ch. 14 Sc. 10 and Ch. 14a Sc. 13).17
Regarding elections of Board members in a Finnish company, the re-quirement of simple majority is only relative. In principle a candidate has to receive only one more vote than the other candidates for the post to be elected. The GM may, however, prior to the election accept by a simple majority that the new member is chosen according to the rule of simple majority. The Articles may require even a stricter majority of the votes cast than a simple majority´s as well as a cumulative voting structure.18 The latter alternative, however, is utterly rare in the Finnish practice; none of the listed companies have implemented it. These rules apply as well for the election the members of the Supervisory Board19 as for the appointment of the Auditors.
La Porta et al. (1998) do not give Finland a positive mark for cumulative voting.
We find this conclusion too harsh and oversimplified from a comparative point
of view. Surely, as already mentioned, provisions providing for cumulative vot-
ing are not de facto seen in the Articles of Finnish listed companies while cumu-
lative voting is in principle one of the alternatives available for the companies to
elect the Board members. However, cumulative voting is unpopular among the
US jurisdictions and companies as well: only a few US states still maintain a
mandatory requirement for cumulative voting.20
Some decisions at a GM of Finnish company require even more broader acceptance by the shareholders than the “double” two-thirds rule mentioned above. Whenever (certain class of) current shareholders´ eco-nomic rights – i.e. the right to the profit or net assets – are diminished by an amendment of Articles, the decision must be supported at least by each and every shareholder whose economic rights are affected by the decision (FCA Ch. 9 Sc. 15. Para. 1 Subpara. 1). The rule is important as it states that a share´s nature is truly proprietary in the Finnish legal system: economic rights cannot be altered without every owner´s consent. Each member has an absolute veto right. Liability protection is not considered to be enough in the context of economic rights.

The role of shareholder protect ion rules in f inancing Finnish companies · 105
3.2.4. GENERAL STANDARD OF EQUAL TREATMENT
Besides multiple provisions for qualified majority decisions, the core of mi-nority protection in Finland is generally understood to derive from so called “General Standard” of equal treatment. The right of a (majority) shareholder to exercise her voting rights at a GM as she pleases is subject to equitable considerations that will make it unjust to exercise them in certain ways. The requirement of equal treatment is to be understood as a counterweight to ma-jority principle (Timonen 2002, p. 138). The requirement for equal treatment is manifested in the ”General Standard” of the FCA (Ch. 9 Sc. 16): ”A general meeting of shareholders may not make decisions liable to cause a share-holder or a third person unjust enrichment at the cost of the company or an-other shareholder.” The nature of general standard is mandatory – as a statement of its importance. Thus a company cannot deviate from the stan-dard by inserting a clause to that effect in the Articles.21
The importance of this standard cannot be overemphasised in the Fin-nish context. It overrides all the other provisions of decision making at a GM. It is all-embracing as well completing: the minority is protected beyond the specific rules stipulated in FCA.22 Even if the proposal put forward in a GM is formally in accordance with the specific provisions of the act, it can breach the general standard if it gives an undue advantage to the detriment of the company (i.e. all the other shareholders as a whole) or a certain (minority) shareholder. The general standard provides that the GM – even if a resolu-tion is made in compliance with the majority requirements of FCA and Arti-cles – cannot pass any resolution whereby certain shareholders or other per-sons may clearly obtain an undue advantage at the expense of other share-holders. Majority shareholders are not allowed to commit a wrong on the minority in the exercise of their votes at a GM. On the other hand, it should be noted that the general standard neither provides each shareholder equal powers nor evens out the quantitative differences between shareholdings. Thus the general standard does not promote capital equality.
A textbook example of wrongful action is the majority shareholder authorising de facto the sale of company products or other property to her-self at a price under the current market price. Consequently this “tunneling” damages the interests of other shareholders. Johnson et al. (2000) make a general claim that in civil-law countries tunnelling can take place between a parent company and its subsidiaries because group interest has legal priority over equal treatment. We, however, are not convinced that this applies to Finland. The group interest is alien to FCA: A majority shareholder is not al-

106 · T imo K aisanlaht i
lowed to “tunnel” funds from a subsidiary company at the cost of other (mi-nority) shareholders. Although Finnish tax legislation23 recognises a possibil-ity of “group subsidy” between two companies if a one of them owns at least 90 % of the other,24 the General Standard of the FCA does not allow this kind of transaction to the detriment of other shareholders in a subsidiary com-pany. It is objectionable for a subsidiary to support its parent company if that transaction leads to non-equitable treatment of other shareholders in the sub-sidiary. This applies also to possible loans between companies belonging to same group. Even though loans from a subsidiary to its parent company are not prohibited (FCA Ch. 12. Sc. 7), the parent has to pay (at least) a market in-terest for the loan in order to ensure that the principle of equal treatment is not breached in case that the subsidiary has also minority shareholders.
There is some evidence against the claim that tunnelling is an actual threat for
the minority shareholders in Finland. The magnitude of potential “private bene-
fits” that are available for the majority owner can be assessed. One method is to
estimate the price difference between two classes of shares that are identical in
all other aspects but the voting rights attached to shares. If control is valuable,
then the mechanisms allocating the control – i.e. the different votes attached to
shares – should be valued as well. In a fresh cross-country study Nenova meas-
ured the control benefits of multiple voting rights structures; the study covered
661 dual-class firms in 18 countries, using data for 1997.25 Nenova found that in
Scandinavian civil law countries the average “private benefit” was low (0,5 %)
compared to common law countries (4,5 %); for Finland the outcome was nega-
tive (-5 %) while in US firms the owners of multiple voting shares enjoy a benefit
of 0,2 %. Thus this result does not provide evidence of that the controlling
shareholder, who derives her power position from multiple voting shares, could
in Finland tunnel significantly higher private benefits to herself than her coun-
terpart in the US. However, Dyck and Zingales (2002) who apply a different
methodology than Nenova derive also a contradicting result. In their paper the
private benefits of the major owner are estimated by assessing control block
transactions; altogether 412 control transactions in 39 countries are examined be-
tween 1990 and 2000. Whenever a control block of shares changes hands, Dyck
and Zingales measure the difference between the price per share paid by the ac-
quirer and the price quoted in the market the day after the sale´s public an-
nouncement. If the price of the block is higher that the market price in the fol-
lowing day, the difference represents an estimate of the private benefits enjoyed
by the block´s owner.26 The authors report that the estimated block premia in
Finland is on average 2,5 % of the company´s equity capital while the same fig-

The role of shareholder protect ion rules in f inancing Finnish companies · 107
ure for the US firms is 1,8 %.27 This outcome provides weak support for “tunnel-
ling”. Therefore, the evidence remains mixed, at least for the time being.
To put some more flesh on the bare bones of the General Standard we can consider a famous American case, Nixon v. Blackwell of year 1993, from a Finnish perspective of equal treatment. In this case directors were offered by the company the possibility to have their Class B shares redeemed with funds from “key man” insurance purchased by the company. The other – i.e. non-employee – Class B shareholders sued, alleging they were improperly ex-cluded from the repurchase program. As the program was launched after the plaintiffs had purchased their Class B shares, they could not have been able take the program into account in the price they were willing to offer for the shares they bought. Nevertheless, the Delaware Supreme Court rejected the plaintiffs´ allegation, because the Court identified a company benefit with the exclusive repurchase program: to prevent the shares from passing to descen-dants of employees. Chief Justice Veasey put it bluntly: “shareholders need not always be treated equally for all purposes” (Cox 1997, p. 617-619).
Most unlikely this kind of judgement would be possible in Finland. The Finnish General Standard (Ch. 9 Sc. 16 of the FCA) provides the Courts with a flexible rule that can be applied in various cases of minority oppres-sion. The General Standard does not, however, ever allow a Court to look be-yond a person´s status as a shareholder. Nowadays also the Finnish commen-tators accept in principle, at least, the Anglo-American Business Judgement Rule, but it cannot overcome the General Standard (Castrén 1998). Thus the Rule applies to the management of business but not to the relationship be-tween the owners of a company or division of profit that has accrued to the company.
The General Standard requires the majority to act loyally towards the company as well the minority. A breach of this duty sets the majority under the threat of being made liable for damages caused by the decision made at GM in accordance with the majority´s votes. Chapter 15 Section 3 of the FCA stipulates that “a shareholder shall be liable to compensate a damage caused to the company, a shareholder or a third person to which he has contributed through a wilful or grossly negligent act infringing FCA or the Articles.” In the Finnish legal literature it has been stated that this duty accentuates pro-portionally as the number of shares and votes the majority owns increases. On the other hand, it can be clearly seen from the wording that liability can follow only from active participation in the decision making. If majority re-
108 · T imo K aisanlaht i
mains passive at a GM, there is no threat of liability for damages (Toiviainen 1998, p. 134).
The decisive factor for a court to consider is the actual consequences of the act or measure by the GM. Thus the judgement has an objective nature. The plaintiff is not required to prove that the shareholders at the GM under-stood that the consequences will breach the general standard. On the other hand, she has the burden of proof that damage actually occurred (Savela 1999, p. 210-211). The concept of “unjust enrichment” lies also in the heart of the general standard. It is noteworthy that there is no requirement for en-richment to be essential. On the other hand the word “unjust” is to be read that shareholders may, to a certain extent, pursue their own interests in exer-cising their influence.
3.2.5. PRE-EMPTIVE RIGHTS
Share Issues. The principle of equal treatment is manifested clearly in the pre-emptive rights of shareholders. As a general rule, when a Finnish company issues new shares or other equity-related instruments, the current owners are provided a right to participate in the issue in order to keep their relative share in the company intact. In this purpose existing shareholders have pre-emptive rights to subscribe to the new shares, stock options or convertible loans in the same proportion to which they own shares prior to the capital in-crease. The fact that the new shares of different classes are issued in the same proportion of existing classes shall not be deemed as a deviation from the pre-emptive right if the shareholders have, in proportion to their previous share ownership in the company, a primary right to shares of the same class and a secondary right to shares not subscribed under the primary right (FCA Ch. 4 Sc. 2 Para 1).
The prerogative of current shareholders applies in the manner de-scribed above also to new issues of option rights, warrants and convertibles (Ch. 4 Sc. 2 Para 1). On the other hand, it should noted that the preferential right in new shares is always absolute in respect to bonus issues: not even a unanimous GM can deviate from the pre-emption right of shareholders to subscribe bonus shares in proportion to their current holdings.
As La Porta et al. (1998) correctly state, the Finnish shareholders enjoy the pre-
rogative right in share issues. If new shares will be offered by means of an in-
crease of the share capital (“new issue”), it must have an approval from the GM.
When the issue remains within the limits of the share capital authorized in the

The role of shareholder protect ion rules in f inancing Finnish companies · 109
Articles, the Articles are not required to be amended. Hence, such decision can
be adopted in the GM by the vote of a simple majority of all votes cast unless the
Articles provide that the approval of a qualified majority is required.
The GM may authorize the Board for a certain period, maximum one year, to increase the share capital by a specific amount or up to the maximum share capital authorized in the Articles. The GM may also give authorization for setting aside the shareholders´ pre-emptive rights in connection with the offer.28 Shareholders may give up this right in the interest of the company. Pursuant to the FCA Ch. 4 Sc. 2 Para. 2, it is possible, for a weighty financial reason of the company, to deviate from the pre-emptive rights of sharehold-ers if a majority of at least 2/3 of the votes cast and represented in the share-holders meeting agree (“directed share issue”).29 The FCA contains no provi-sions what constitutes a weighty financial reason. In practice listed compa-nies have deviated from the pre-emptive right, inter alia, in order to issue shares to their employees. However, also a deviation of this kind must be in accordance with the General Standard to ensure that no resolution of GM shall provide a third party with an undue advantage at the expense of the company.30
Some academics have criticised pre-emptive rights of current share-holders. A representative example is offered by Macey (1993, p. 111-112): “– – pre-emptive rights impose transaction costs on firms seeking to recapitalise, but do not provide any corresponding benefits whatsoever. [– –] Rational shareholders may not want pre-emptive rights because the availability of such rights can interfere with the ability of corporations to sell stock in the capital markets.” Empirical evidence, however, suggests that investors may value this right dearly: already in 1980s Bhagat (1983) carried out a study of US companies that took the advantage of new legislation which allowed them to get rid of the pre-emptive rights by amending the Articles: due to amendments the market price of shares in those companies fell on average. The conclusion is clear-cut: pre-emptive right has a true value for rationally acting investors.
Buy-Backs. A Finnish listed company may buy-back shares it has issued through public markets. In order to ensure equal footing for all shareholders, detailed information of the buy-back plan is to be provided to shareholders prior to acquisition of shares. The company is not allowed to repurchase shares in such public trade unless at least one week has passed before the company made public the decision of the Board to begin with acquisitions (FCA Ch. 7 Sc. 5).

110 · T imo K aisanlaht i
If shares are to be acquired outside public markets, the bid has to be made to all shareholders proportional to their existing holdings. This rule en-sures the equality of shareholders. Thus “green-mail” (i.e. repurchase trans-actions favouring one particular investor) so typical to US company practice are strictly forbidden in Finland. On the other hand it is should be admitted that Finnish rules are not compatible with advanced practices of international markets: procedures such as the “Dutch auction” do not fit to Finnish regime (see Airaksinen 2000, p. 2).
The decision of a repurchase in a Finnish company is drawn by the GM. However, the GM may as well authorise the Board on this matter (FCA Ch. 7 Sc. 3 Para. 1). If the company has only one class of shares vested with voting rights and if these shares are planned to be acquired in proportion to the stock-owners´ holdings and for the same price, the decision at the GM of a public company has to be approved by supermajority but in a private com-pany a simple majority is enough (Ch. 7 Sc. 4 Para. 1). However, when there are several classes of shares the decision rules are more complicated.
Each and every shareholder has an absolute veto right against share buy-backs that do not respect the principle of equal treatment in form of pro-portionality and equal price; the only exception is acquisitions that is exe-cuted through public markets and even then a publication of the acquisition plan is required before the acquisition.
The procedure just sketched is a quite cumbersome exercise from a Finnish management´s point of view, especially when compared to common practice in the US. By and large, American law equals buy-backs to dividend distributions. From an economic viewpoint this is logical: de facto both sys-tems are about returning capital to investors. US state laws do not require the GM´s consent for a repurchase nor declaration of dividends; the decision is left completely to the discretion of the Board.31 On the other hand, as already explained, the GM of a Finnish company may authorise the Board to arrange repurchases for a time of one year maximum, and it is a quite common prac-tice in listed companies that Boards are granted this right. Thus, in a sense, the matter of decision making power is simply a technicality.
A more crucial feature in Finland is that the number of shares that may be reacquired by the company is strictly limited by the law. Pursuant to Ch. 7 Sc. 6 a buy-back transaction has to be arranged in such way that aggregate nominal values of the repurchased shares or the voting rights attached to them do not exceed five per cent of the share capital or total.32 This restric-tion, however, applies only to listed companies: in private enterprises all but one share can be reacquired. Due to the restriction the flexibility buy-backs is

The role of shareholder protect ion rules in f inancing Finnish companies · 111
thus severely lost in the Finnish listed companies when compared to US firms which are free to repurchase shares as long as the test of solvency re-quired by the state law is passed:33 generally a company, going concern, without any qualification in the latest Auditor´s report and subsequent ad-verse events normally qualifies the test.34
As already noted above, a US Board may buy-back shares discriminat-ingly, i.e. from a certain stock-owner without providing other investors the same option, while being covered by the Business Judgement Rule at the same time. It is hard to imagine how this diversion of equality would not be taken into account by those who participate in the financing of enterprises: logically, investors are willing to put their money on stake only if offered a higher return for their equity participation than in a jurisdiction where the principle of equality is respected within distributions. Easterbrook and Fischel (1991, p. 143) summarise this as follows: a rule allowing unequal dis-tributions makes shareholders “– – worse off because they – – have an incen-tive to incur wasteful expenditures by monitoring the withdrawal of assets – –.” The more severe is the possibility of infringement of equal distribution, the higher the investor´s requirement on return from the relevant shares, which means that the subscription or buying price is set at a lower lever than otherwise.35
The foregoing conclusion can also be criticised. Enriques and Macey (2001, p. 1197), for example, argue that the limitations on repurchases in Europe may raise the costs of disputes among shareholders. According to En-riques and Macey the restrictions “– – will prevent a company from purchas-ing the stock of dissenting shareholder, making it more difficult to overcome deadlock or disharmony which may negatively affect the company´s opera-tions.” Thus the required return on share-holding is higher ceteris paribus: restrictions on buy-backs make “– – equity investments less liquid, and hence less attractive ex ante because reselling shares to the company may often be the only way for shareholders – – to liquidate their investment.”
This argument, while logical in itself, is too limited. For sure, it is ap-pealing in the context of small private companies where the advantages of liquid public stock market are lacked. On the other hand, Enriques and Macey do not consider at all the possibility that the other owners agree to buy the dissident´s shares for themselves. If all, i.e. the dissident and her fel-low stock-owners, share the view that the dissident must leave the company, it should be no concern for the dissident who – the company or another shareholder – is to buy back her shares. The most difficult part of the dispute will always be, at least outside public markets, the appraisal of dissident´s

112 · T imo K aisanlaht i
shares, and this dispute is not more easily solved when the company is the one which repurchases the shares.
Naturally, it is possible that the shareholders lack financial resources to buy the dissident´s shares. For such cases a repurchase by the company is a relevant alternative. The Finnish companies legislation permits shares to be bought back only with distributable funds i.e accumulated net profits on the balance sheet (FCA Ch. 7 Sc. 3 Para. 1). Compared with this (and law in other European Union countries as well) the American rule is – as Enriques and Macey correctly suggest – formulated in a more flexible way: buy-backs may be carried out as long the company remains going concern, meaning that it can meet its debt and other business payments while in Finland the test, based on figures of the most recent balance sheet, allows repurchases only to the extent that accumulated net profits are exhausted.
Considered from the viewpoint of Finnish shareholders, however, it is not self-evident that they would prefer the US-style test to the “technical” European approach. The tests, both the American and Finnish one, are for the benefit of creditors; the aim is to protect their interest, not minority share-holders. When shares are repurchased despite the fact that the rule is not met, the creditors are allowed to claim damages, if the monies paid for the shares are not returned to the company. In this respect the burden of proof is more easily satisfied under the current Finnish rule because the shareholders can assure themselves ex ante, simply by studying the most current balance sheet, that they will not be held liable if the company goes bankrupt after the repurchase. If the test was more flexible the shareholders would be likely to forego a repurchase to avoid the trouble and cost of determining whether the buy-back can be carried out; and even after a careful study Board members would not be without the fear that after the buy-back a Court might errone-ously hold such distribution to be against the law. Therefore, the validity of Enriques and Macey´s claim is debatable and it is most likely that investors would be willing to switch the flexibility of buy-backs to a system were they are guaranteed of getting equal share of the wealth accumulated in compa-nies.
3.2.6. RIGHT TO DIVIDENDS
In Finland the distribution of dividends is decided by the shareholders at a GM (FCA Ch. 12, Sc. 4.1).36 The dividend may not exceed the sum of profit for the financial period and the distributable funds consisting of accumulated (net) profits from the earlier years. As a general rule, the GM may not dis-

The role of shareholder protect ion rules in f inancing Finnish companies · 113
tribute more dividends than the Board has proposed. This power may not be taken over by the GM, not even by an amendment of Articles to that effect. However, minority shareholders – representing at least 1/10 of all shares – have a right to require the company to distribute as a minimum dividend of an amount at least half of the distributable profit of the financial year (i.e. the profit net of deduction for reserve funds pursuant the Articles). The share-holders may not, however, require more than eight percent of the equity, stated in the balance sheet, to be distributed. If these requirements are not fulfilled, and the Board fails to propose a dividend, shareholders cannot in practice successfully bring a suit claiming for it.37 On the other hand, if the Articles provides for a higher dividend, the Board must naturally comply with the stipulation (FCA Ch. 12 Sc. 4 Para. 4).38
LaPorta et al. evaluate in their cross-country research also minority shareholders´ right to claim a dividend. Their variable “Mandatory Divi-dend” is defined in the following way (1998, p. 1122): “Equals the percentage of net income that the company law or commercial code requires firms to dis-tribute as dividends among ordinary shareholders. It takes a value of zero for countries without such restriction.” On this account the authors grant zero points for Finland – and for the US as well. On the surface, this might appear to be a fair conclusion because, as described above, the Finnish legislation does not provide each and every shareholder a right to require half of the net profit to distributed as dividends; this right is granted only for the holders of (at least) 10 % of all shares unless even a smaller percentage is provided by the Articles.
However, we find the classification applied by La Porta et al. all too rough to describe the national differences in a meaningful way. This comes clear when one turns to the US where the decision whether or not to pay dividends usually rests in the sole discretion of the Board. Not even an unanimous GM can veto the Board´s decision. Shareholders cannot assume the right to declare dividends; they can only replace the Board members later with new ones having more favourable attitude towards shareholders´ expec-tations on dividends (Mann and Roberts 1999, p. 700). Therefore we cannot hold the US system as equal to the one in Finland in this respect: evidently the minority in a Finnish company has more say on the pay-out policies than their counter-parties in American enterprises.
Enriques and Macey (2001, p. 1196) propose that the European balance sheet test constraining dividend payments inhibits an active signalling func-tion of dividend policy. According to them dividends can provide an impor-tant information channel: by paying out large dividends the Board can credi-

114 · T imo K aisanlaht i
bly transmit its confidence in the future prospects. The signal is supposed to be credible because if the true prospects are not as profitable as the amount of dividend leads the investors to believe, the company would have to ac-quire new financing in order to survive and then the Board would be in the investors´ mercy. New financing would be more expensive to company after the attempt to mislead the investors through its pay-out policy. Therefore, ar-ranging such a sham is not a rational course action for a Board; an increase in dividends would be proposed only if the Board is confident that sufficient in-come would flow in to cover the increase. This is a well-accepted view in fi-nancial economics since 1980´s, repeated in all text-books.39
Even when the question of “real” motivation for distributions is left aside, the argumentation of Enriques and Macey remains doubtful. They suggest that flexible US rules are more favourable to dividend payments compared to the European balance sheet test which is based on accounting numbers (Enriques – Macey 2001, p. 1197): “Due to the complexity of ac-counting issues and to the wide discretion accounting principles and rules leave to decision makers, the possibility of courts making errors in judge-ments is more than sufficient to deter risk-averse managers from making dis-tributions.” We are not convinced by this argument; in fact the opposite the-sis is more appealing to us. Enriques and Macey do not seem to pay any at-tention to the fact that the lawfulness of dividend payments can be chal-lenged afterwards, in a later bankrupt by the estate. Then the Board may have to provide evidence for the Court that the amount of dividend paid was proper at the time of its declaration. If the Board can derive its argument from the accounting numbers that were verified by an independent Auditor its case is without any doubt on a firmer ground than by trying to assure the judge within the vague US test that the Board presumed properly that the company would remain going concern even after the dividend payment. – The bankruptcy itself proves that the presumption of going concern did not hold.
Moreover, as regards the cases where the company does not end up in a bankruptcy, one has to bear in mind that the more generous dividends of US companies may simply be based on the fact that the dividend decision is drawn exclusively by their Boards as a business judgement which can be suc-cessfully challenged only in the most extreme settings. Therefore, if a Euro-pean Board wants to have coverage against liability to a similar extent as its US counter-party enjoys, it has to apply prudence principle in the company accounts; consequently, only moderate dividends can be proposed. The in-centive for this kind of action, however, is divergence between the decision
The role of shareholder protect ion rules in f inancing Finnish companies · 115
making authority of US and European Boards, not the accounting rules as Enriques and Macey propose.
3.2.7. EQUAL INFORMATIONAL RIGHTS
Financial Information. One of the most important legal means whereby minor-ity shareholders acquire information is through mandatory disclosure. The financial statements of all Finnish companies – private or not – are public.40 This means that anyone can get a copy of a certain company´s statements from the Trade Register. Every company, no matter the size, has to file its fi-nancial statements within two months after the annual GM where the state-ments were adopted (FCA Ch. 11 Sc. 14). However, the financial statements are in effect made public ex ante the annual GM: pursuant to the Ch. 9 Sc. 9 Para. 4 of the FCA the statements have to be available for members´ inspec-tion at least one week prior to the GM at the registered head office and, if she so requests, must be mailed to a shareholder without delay. Moreover, listed companies have to publish quarterly reports as well (FSMA Ch. 2 Sc. 5).
These requirements are indispositive. Thus the holders of ordinary or preferential shares cannot surrender their rights to regular financial informa-tion by a stipulation to that effect in the Articles. Neither an Agreement can effectively deny this right as the financial statements have to be filed with the public Trade Register in any case.
The Finnish disclosure requirements are stricter in a listed company than in a
private one. Listed companies are required to publish all information relating to
decisions taken as well as to the company and its operations which fundamen-
tally affect the value of the company's shares. Thus, major company actions e.g. a
proposal for a share issue or a merger, has to be published promptly as soon as
the decision on the proposal has been drawn by the management. Related to
this, the Act prohibits strictly dealings on insider information by an universally
applicable ban on the general misuse of insider information.41 Central is the pro-
vision of ad hoc -publicity (FSMA Ch. 2 Sc. 7 Para. 1): A listed company must,
without undue delay, make public all its decisions and as well all information on
the activities of the company that are likely to have material influence on the
value of the shares (and other securities) issued by the company. Any major de-
velopment that is not yet public is informed via Stock Exchange and as a press
release to the investors. The developments to be informed are not exhaustively
stated in the Act: all that is required is an issue which may lead to substantial

116 · T imo K aisanlaht i
movement in the market price by virtue of its effects on assets or liabilities or fi-
nancial position or on the general course of the company´s business.
As regards their substance, financial statements issued by Finnish companies are internationally considered to be of relatively high quality. Ac-cording to a study by the Center for International Financial Analysis & Re-search, Inc. they are among the most informative ones: on average they scored 77 points of 90 while their US counter-parties got only 71.42 Due to the integration with European Union, the Finnish accounting legislation was amended in 1990s to allow investors to have a true and fair view of a firm´s financial position. Most notably, the concept of depreciation according to plan was introduced; until 1993 depreciation practice had followed de facto taxation and consequently the companies stated their earnings in a more con-servative manner than they would have been pursuant to the true and fair view.43
Transparency of Ownership. The Finnish legislator has provided for members in the smallest companies with a special vehicle for information. In a company with no more than 10 shareholders, everyone of them has the right to familiarise herself with the book-keeping records as well as other documents relating to the operations of the company if this is necessary to assess the financial statements and economic status of the company or any other matter handled at a GM (FCA Ch. 9 Sc. 12 Para. 4).44
In principle, the Articles of a company with an even wider owner base than 10 could provide for this kind of inspection right for a shareholder. On the other hand, if all the members in a company with 10 shareholders maxi-mum so consent in an Agreement, they may surrender this right. However, this kind of Agreement cannot be effectively enforced in relation to company; thus if a member breaches the Agreement and wants to have the books for her inspection, the company has to agree.
Besides the financial information, a member of a Finnish company has a right to know who are her fellow shareholders. The Finnish ownership in listed companies is utmost transparent because the book-entry legislation has the effect that name of every Finnish shareholder – even if the ownership consists of only one share – is marked in a public share record of the com-pany and that register is open for everyone to study. A register must be kept of the owners of shares issued by a Finnish company (Kasanen 1999, p. 28).45
The basis for share registration is transparency: a share register has to be open for inspection not only for the management and fellow shareholders of the company but also for the general public. In a private company the
The role of shareholder protect ion rules in f inancing Finnish companies · 117
share register is kept by the company itself. On the other hand, the Finnish Securities Centre maintains the share register for each and every listed com-pany; before a Finnish company can be listed in the Helsinki Stock Exchange it must join the Centre to have its shares dematerialised. By stipulations of the Articles or clauses of an Agreement these mandatory requirements of law cannot be circumvented not even in a private company where the all the members are unanimous on this matter. A stipulation or a clause to that effect is not valid against a third person.46
3.2.8. ACTIONS AND REMEDIES
When considering a shareholder´s rights La Porta et al. (1998) put also weight on remedies available for unfairly treated (minority) shareholders. The au-thors state that some countries provide minority shareholders legal mecha-nisms against perceived oppression. These mechanisms may include the right to challenge the directors´ decision in court (as in the American deriva-tive suit) or the right to force the company to repurchase shares of the minor-ity who object certain fundamental decisions of the management or of the GM, such as mergers or assets sales. On this reasoning La Porta et al. have formed a variable for their study – “oppressed minority mechanism” – that is described in the following way (p. 1122): “Equals one if the – – law – – grants minority shareholders either a judicial venue to challenge the decisions of management or of the assembly or the right to step out of the company by requiring the company to purchase their shares when they object certain fundamental changes such as mergers, asset dispositions, and changes in the articles of incorporation. The variable equals zero otherwise.”
According to La Porta et al. there are no such mechanism available for minority shareholders in Scandinavian that fulfils adequately the require-ments described above; Finland scores zero among others. Among the mem-ber states of the European Union only three qualify: England, Ireland and Spain. Considered from a Nordic point of view this result of La Porta et al. is puzzling because the instruments available for an aggrieved minority in search of a remedy are in many aspects comparable to those available in the US. This applies, however, only to the material provisions in the legislation. More worrisome are the Finnish ex post remedies, as will be documented in what follows.
Representative Action. The ultimate recourse of a shareholder, short of selling her shares, is to bring an action against the decision-makers on behalf of herself or the company. Firstly, a resolution that has not been approved in

118 · T imo K aisanlaht i
proper order at the GM, or which is otherwise against to the FCA or the Arti-cles, may be sued upon by a shareholder (as well as by a member of a Board). A textbook example would be a case where a shareholder sues to restrain a threatened alteration of Articles by a passage of an solution by a simple rather than a special majority. The FCA stipulates the reasons for a lawsuit only generally: the action may be based on breaches of formalities as well as on material grounds. Thus, the reason may be, among others, that the resolu-tion is against the principle of equal treatment expressed in the General Standard of FCA Ch, 9 Sc. 16 (Toiviainen 1998, p. 130 and Timonen 2002, p. 138).
A shareholder is entitled to bring an action against an unlawful resolu-tion of a GM, but only if she has not contributed to it by voting for it. More-over she has to own at least one share in the company to have this right. The nature of the action is representative in such a sense that the owners who were not parties to the legal action shall also be bound by the decision of the Court (FCA Ch. 9 Sec. 17 Para. 4). This feature is designed to prevent multi-plicity of actions. On the other hand, it means that even those minority shareholders who had been quite satisfied with the resolution of the GM have to obey the Court judgement if it is for the plaintiff.
When it is found that the resolution passed by the GM breaches the FCA or the Articles, the Court may set the resolution aside or modify it. However, a modification can only be ordered if a claim for it is set up, and the Court is able to establish the contents that such resolution should to have had (FCA Ch. 9 Sc. 17 Para. 3). Thus the modification is possible only in case where the “right” decision is obvious (Toiviainen 1998, p. 131).
The right to challenge a resolution can, on the other hand, be used to obtain a temporary court order that hinders the Company from executing the resolution. Pursuant to the Ch. 16 Sc. 3 of the FCA a shareholder may request an injunction to delay or prohibit the execution of an illegal resolution pend-ing a suit. This temporary order cannot be subject to separate appeal but the Court may, if it is considered necessary, withdraw the order. If a minority shareholder succeeds in obtaining such an order, the Board may be ready to hear her and settle out of court to avoid a time-consuming legal process (Tenhunen 1997, p. 68).
The Finnish Companies Act contains no provisions regarding a share-holder´s right for action to challenge a decision made by the Board. Never-theless this right has been established in Court practice but, on the other hand, under quite exceptional circumstances. In order to intervene in a Board decision a shareholder had to show, pursuant to Case 1995:213 of the Finnish

The role of shareholder protect ion rules in f inancing Finnish companies · 119
Supreme Court, before the judge that the Board´s action was intended to take advantage of the company and not in the company´s interest (see Savela 1999, p. 234-235). However, as a main rule, it is most exceptional for a Court to grant a shareholder the right of action in the Finnish system of representa-tion. Therefore, for example, if a GM has delegated the Board the right to make decisions on a new issues of shares, a current shareholder cannot effec-tively challenge the decisions that the Board actually makes about e.g. the is-sue price and to whom the shares are allocated if these matters have not been specified in the delegation made at the GM.
Suit for Damages. As in all market economies, in Finland a company limited by shares is treated as a legal person distinct from its owners. There-fore it is the company and not the individual members that is the proper plaintiff in any action; the main rule is that a company is represented not by its members but the directors.47 Where a breach of duty or any other wrong has been committed against a Finnish company, only the company can sue in respect of it. Thus the law in Finland echoes the famous English case of Foss v. Harbottle in this respect.48
There are, however, a number of exceptions, to the aforementioned ground rule. Finnish shareholders representing at least 1/10 of the share capi-tal or 1/3 of the shares represented at the GM are eligible to bring a claim for damages on behalf of the company if the majority at the GM has decided not to bring such claim (FCA Ch. 15 Sc. 6).49 Examples of this kind of “derivative suits” are actions to recover damages from the Board for breach of duty. In such situations, where the Board members represent also majority of votes at a GM, they may well be hesitant to bring a suit against themselves.
There is no requirement for the plaintiff (i.e. the minority sharehold-ers) to post a bond. Moreover, the shareholders do not have to show the Court any material facts, e.g. wrongdoers control of the resolution of the GM, before the Court can allow the minority owners to launch a derivative action. Neither there is a statutory requirement that a shareholder must have owned her shares at the time of the complained transaction occurred in order to bring a derivative suit.
The (minority) shareholders´ derivative suit is singular in that those suing are not pursuing damages for themselves but are acting on behalf of the company as guardians of all shareholders as an unitary group. The shareholder, as a nominal party, has no right or interest in the claim itself. Therefore, any damages obtained by derivative action will accrue to the company, not the suing shareholders personally. However, the Court may order that the shareholders who have brought the action shall be paid from

120 · T imo K aisanlaht i
the funds obtained the portion that devolves on their shares. On the other hand, the costs of such action are of no concern to the company; the share-holders that bring the action are responsible for the litigation costs. They have, however, an entitlement to a compensation from the company to the extent of the funds obtained to the company through the action (Ch. 15 Sc. 6 Para. 4).
Derivative actions materialise quite seldom in the Finnish company practice (see Airaksinen 2000, p. 2). The possibility of a derivative suit, how-ever, does not stop a (minority) owner of the company to bring direct actions for damages; a derivative suit is also not an exclusive remedy for a minority shareholder. Each and every shareholder has the right to demand from the majority owner or other shareholders all the damage they have caused her by assisting a violation of the FCA or the Articles. It is possible to base this de-mand on a violation of the “equality principle” manifested in the General Standard of the FCA Ch. 9 Sc. 16 (Timonen 2002, p. 150).
In Finland tort law has a general starting point that each party must take responsibility for herself for damages she may have suffered: this means that to have somebody else to cover the damage, the requirement must be grounded. To win damages for herself, a minority owner has to prove before the Court that (i) damages were actually caused by a resolution of the GM or another action of shareholders;50 (ii) the action or resolution infringed the FCA or the Articles; and (iii) the infringement was intentional or grossly neg-ligent (FCA Ch. 15 Sc. 3). The burden of proof is on the plaintiff (i.e. minority owner): the culpability of the majority owner or other shareholders is not presumed. For negligence there is no single unambiguous criteria (Pöyhönen 1993, p. 84).
The same applies also to the minority shareholder´s claim against the members of the Board or Managing Director (FCA Ch. 15 Sc. 1).51 She has to show that they acted intentionally or negligently and the act breached the FCA or the Articles. The threshold for negligence, however, is lower than in claims against other shareholders: even a minor negligence qualifies as a ground to sue the Board members or Managing Director. Moreover, a clear breach of the FCA or the Articles constitutes a legal presumption of negli-gence; in such a case the burden of proof lays on the member of the Board: she has to show that her acts were not negligent. The illegality of the action must also have caused such damages that the plaintiff (i.e. shareholder) can demonstrate.
The liability of each shareholder or a Board member is personal. To avoid the liability a shareholder or a Board member may argue that she did

The role of shareholder protect ion rules in f inancing Finnish companies · 121
not participate in the meeting or did not vote in favour of the resolution. A shareholder or a Board member may register her contrary vote in the minutes of the meeting. Unless a dissent is entered in the minutes, the member of the Board is presumed to have assented. For this reason, a Board member who is absent from given meeting should register latest in the following meeting if she dissents.52
Each member has to reimburse all damages she has caused. Mitigation of damages may be applied in case where reimbursement would be too bur-densome and ruin a member´s financial situation. Damages cannot, however, be adjusted downwards by mitigation without a specific reason if the mem-ber´s offence was intentional.
The plaintiff, the challenging minority shareholder, has the burden of proof generally, except in the cases where it is self-evident that the FCA or the Articles were breached. This means in practice that claims for damages are not raised light-heartedly. If she fails to show before the Court the unlawful-ness of the resolution, she has to pay, not only her own, but also the trial ex-penses of the winning side (Jokela 2002, p. 388-389). Due to this financial risk, the resolutions of GMs are not so often challenged in Finnish Courts.
Compared internationally, litigation expenses are relatively low in Finland. However, as the losing party is also liable for the costs of the win-ning party, the monetary risk in litigation is considerable. The introduction of value added tax on legal services has driven the costs up even further (Airak-sinen 2000, p. 3). Under the standard “American Rule” each side bears its own legal fees. As already stated, the rules in Finland are opposite to this as the losing side is normally liable for the winner´s legal expenses. When a mi-nority owner sues a major Company or its Board members and Managing Director, the defendants are likely to incur the large fees and other expenses, and this disproportion is likely to be an prohibitive deterrent to litigation; few individual shareholders will face sufficiently substantial loss to justify the cost of litigation individually. Thus there is a bias for a minority share-holder to remain passive even if she learns about an action or negligence that, for example, breaches the equality of shareholders.
Punitive damages are alien to Finnish legal system; the starting point is the principle of full compensation but damages are normally adjustable downwards. Whenever damages are awarded, they are not intended to pun-ish the party committing the breach but to compensate the insured party for any loss or damages arising from the breach. The damages that may be awarded to the plaintiff must be based on realised economic losses shown to the Court. The basic principle is that the injured party should be restored fi-

122 · T imo K aisanlaht i
nancially as nearly as possible to the position she would have been had the breach not been committed.53 The damages are assessed by the Court on the actual loss to the injured party, and not on the basis of any gain made by the other party. Thus the recovery to be judged cannot, for example, be based on the profit the Board member made by secretly taking to herself a company opportunity, unless it can be shown that the company would have made the profits that she succeeded to acquire. So far the value of damages awarded have been quite moderate in the Finnish company practice.
Moreover, there is no legislation in force supporting class actions in Finland. Thus the personal actions for damages are in principle brought on individual basis. Incentives for attorney driven actions are diminished even further by the fact that contingent fees are a rare event in the Finnish proce-dure (Jokela 2002, p. 372). Thus the risks of litigation are seldom transferred to the plaintiff´s attorney. Lack of such risk sharing mechanism may be con-sequential as the existence of the contingent fee agreement has been consid-ered to be an important means to correct the bias towards non-litigation in the US (see e.g. Coffee 1999).
Redemption and Winding Up. At least partly due to the trial expenses and other disincentives for litigation, other types of remedies are considered to be of importance to ensure the rights of minority shareholders (Airaksinen 2000, p. 3). Both the FCA and FSMA reserve individual shareholders the op-portunity to have their shares redeemed when the company ownership struc-ture changes in a manner prescribed by law. If a majority shareholder – typi-cally a parent company – has come to own more than 9/10 of the shares of a company and these shares give right to at least 9/10 of the total voting rights, a minority shareholder of the company has, according to the FCA (Ch. 14 Sc. 19), the right to demand the majority owner to redeem her shares. In such case also the majority owner has the right to redeem the remaining minority shares, paying the “fair price”. The majority shareholder is liable for the costs of appraisal as well as the other expenses of the redemption process.
The minority owner may also have her shares redeemed by the com-pany due to a merger with another company (FCA Ch. 14 Sc. 12) or a division of a company (Ch. 14a Sc. 3 Para. 5) or a “going private” decision (Ch. 17 Sc. 3). The only condition is that she has voted against the resolution and re-served the right for redemption for herself. On the other hand there is no ap-praisal right due to a sale of company´s (major) assets or an amendment of Articles.54
Appraisal right is not an exclusive remedy: despite the fact that a re-demption is in process the shareholder may in principle demand damages or
The role of shareholder protect ion rules in f inancing Finnish companies · 123
turn to other remedies if she feels that she has a cause for such action. How-ever, as already mentioned, the burden of proof lies on the plaintiff. This re-quirement makes these remedies less tempting alternatives compared to the redemption procedure.
According to the travaux préparatoires of the FSMA, the redemption stipulation is not sufficient to secure minority rights in a company that has its shares listed on a Stock Exchange. This is the motivation for including a pro-vision in the FSMA (Ch. 6 Sc. 6), according to which anyone whose owner-ship increases to exceed 2/3 of all voting rights of the company, has to offer to redeem remaining shares, as well as the convertibles and warrants issued by the company. Also the shareholder whose ownership in a listed company ex-ceeds 2/3 of the voting rights has an obligation to offer to purchase the re-maining shares as well equity-related securities from other shareholders at the fair price. The offer price cannot be set freely as in a voluntary tender of-fer: one has to take into consideration the medium market price of the pre-ceding 12 months as well as the higher prices paid by the acquirer outside the public markets. Besides, minority shareholders are to be treated in all terms as equally as in a voluntary bid (see Astola 1994, p. 78-79 and Kaisanlahti 1997, p. 5-6). 55
The FCA provides each shareholder the right to apply to a court to have the company rounded up if the other shareholders (i.e. majority) have voted in a GM for a resolution that conflicts with the general standard of equal treatment; the minority has the same right in a situation where the ma-jority have otherwise wilfully misused their influence in the company.56 Winding up, however, is most drastic measure. Therefore the FCA provides that such order can be made only where there are exceptional grounds for it. In practice this means that actions are utmost rare. Moreover, the FCA pro-vides an alternative route: the court may, upon the request of the plaintiff, order the company to redeem the shares held by her at a reasonable price (Ch. 13 Sc. 3).
3.3. CONCLUSIONS
The material provisions of the Finnish legislation in the field of minority pro-tection and securities markets are quite modern. At least they are not so un-developed as some studies may let us to understand. We cannot identify any substantial differences in the Finnish rules in comparison – were it even exe-cuted as superfluously as above – to their American counterparts.57 It should also be noted that the principle on equal treatment is well-respected by the

124 · T imo K aisanlaht i
Finnish courts. Fair treatment means in Finland strict equality especially in the context of inter-shareholder relations and in division of the profit accrued in the company. Due to this, the principle can also serve effectively as a self-enforcing deterrent against non-proper transactions by insiders.58
The companies legislation in Finland is a territory of indispositive (i.e. mandatory) rules. A long tradition exists according to which the principle of freedom of contract does not apply to the formation of legal entities. There-fore it is not possible to form an entity with a separate legal personality that is not regulated by any particular statute. Only the forms backed by written law may be legally valid. Indispositivism applies also to various forms of fi-nancing. A limited liability company may issue only such financial instru-ments that are recognised in the legislation. Thus, the options for innovative financial engineering are quite limited compared e.g. to the ones available in the United States.59 On the other hand, the statutes offer considerable latitude for amending the typical terms of recognised instruments. As indicated in this Chapter, the possibilities to amend the rights attached to share are nu-merous. But they are not unrestricted either. The most notable example of mandatory restrictions is the one-to-twenty-rule between classes of shares, i.e. the difference in voting rights may not be greater than twenty-fold. This is obviously aimed at to protect the holders of shares that are entitled to lesser voting rights. The rationality of this restriction, however, is questionable in the light of the fact that the FCA on the other hand allows companies to issue preferential shares with voting rights that are triggered only in certain situa-tions. Consequently, the difference between a preferential share and an ordi-nary one is unlimited most of the time despite the one-to-twenty -rule.
More worrisome than the material rules are the Finnish ex post reme-dies against actual minority oppression.60 There are several procedural fea-tures that can be interpreted to be biased against a minority shareholders. First, in the field of derivative suits the Finnish legislation deviates clearly, in-ter alia, from its US counterpart by requiring that in order to raise a suit, the plaintiff has to be backed by investors representing at least 1/10 of the shares or 1/3 of the votes represented at a GM (FCA Ch. 15 Sc. 6). On the other hand, each shareholder has a subjective right to make a direct claim against the Board members and the Managing Director for the damages they have caused to her by intentional or negligent infringement of the FCA or the Arti-cles. Despite the right, minority has succeeded only rarely in a legal action against Board members or a Managing Director (see Airaksinen 2000, p. 2).
Another worrisome feature is the rule that the losing party of a trial has to bear also the litigation expenses of the winning side. Further, the up-

The role of shareholder protect ion rules in f inancing Finnish companies · 125
side potential of a favourable judgement is severely diminished by the fact that in direct actions for damages the defendant is not the company but the Board members or the Managing Director or even the other shareholders. Thus, in practice the damages that have been awarded have been moderate in company law cases. Together with the fact that punitive damages are non-existent in the Finnish court practice, these features imply that Finland may be classified as one of the less litigation-friendly jurisdictions, at least in the field of company law.61
Without effective remedies potential local and foreign financiers have a lesser incentive to place equity capital in Finnish companies than otherwise. Because the procedural rules are the monopoly of the legislator, firms are not able to stand in the place of courts in order to guarantee effective remedies. Therefore, deficiencies in procedural aspects of investor protection may have relatively more severe effects in financing of Finnish companies than the mandatory nature of substantive rules as such. In particular, they may lead to a higher required rate of return for capital, or reduce its supply altogether.

126 · T imo K aisanlaht i
REFERENCES
Aarnio, A., 2002, Introduction, in Pöyhönen, J. (ed.), An introduction to Finnish law (Second, revised edition), Jyväskylä.
Airaksinen, M., 2000, Enforcement of minority shareholders´ rights, a paper presented at OECD/World Bank corporate governance roundtable for Russia – Shareholders rights and equitable treatment.
Allen, F. and Michaely, R., 2001, Payout policy, Financial Institutions Center at the Wharton School of the University of Pennsylvania, Working Paper, No. 01-21. US.
Astola, T., 1994, Corporate take-overs through the public markets, in: Suviranta, A. (ed.), Finnish national reports to the fourteenth congress of the international academy of comparative law, Athens and Helsinki.
Bhagat, S., 1983, The effect of pre-emptive right amendments on shareholder wealth, Journal of Financial Economics, 289-310.
Bhagat, S. and Brickley, J.A.,1984, Cumulative voting: the value of minority voting rights, Journal of Law and Economics, 339-365.
Bhagat, S. and Romano R., 2001, Event studies and the law: Part II – Empirical studies of corporate law, US.
Blomstedt, Y., 1985, A historical background of the Finnish legal system, in Uotila, J. (ed.), The Finnish legal system (Second, completely revised edition), Mikkeli.
Castrén, M., 1998, Corporate governance – The responsibilities of the board of directors and the supervisory board, in Finnish national reports to the fifteenth congress of the international academy of comparative law, Helsinki.
Cederberg, L., 1936, The new provisions of the joint stock company law for safeguarding the rights of shareholders and shareholder-minorities, Bank of Finland – Monthly Bulletin (March), 25-30.
Coffee, J., 1999, Privatization and corporate governance: the lessons from securities market failure, Columbia Law School, Center for Law and Economics Studies, Working Paper, No. 158, US.
Coffee, J, 2001, Do norms matter? – A cross-country evaluation, University of Pennsylvania Law Review, 2151-2178.
Cox, J., 1997, Equal treatment of shareholders: an essay, Cardozo Law Review, 615-635.
Dalebout, R. 1989, Cumulative voting for corporate directors: majority shareholders in the role of a fox guarding a hen house, Brigham Young University Law Review, 1199-1226..
Dyck, I. and Zingales, L., 2002, Private benefits of control: An international comparison, CEPR Discussion Paper, No. 3177, US.
Easterbrook, F. and Fischel, D. 1991, The economic structure of corporate law, US.

The role of shareholder protect ion rules in f inancing Finnish companies · 127
Enriques, L. and Macey, J., 2001, Creditors versus capital formation: The case against the european legal capital rules, Cornell Law Review, 1165-1204.
Gordon, J., 1994, Institutions as relational investors: A new look at cumulative voting, Columbia Law Review, 124-194.
Helakallio, E., 1996, Supervision of the financial markets, Bank of Finland – Bulletin, 55-59.
Hodge, D., 1999, Minority shareholders (a lecture at the Professional Negligence Bar Association – back to basics course, 10th November), England.
Horsmanheimo, P., 2001, Free movement of auditors and audit firms, Jyväskylä.
Hyytinen, A., Kuosa, I. and Takalo, T., 2003 Law or finance? Evidence from Finland, European Journal of Law and Economics, forthcoming.
Jacobs, G. and Macours, K., 2001, Tracking stock: a European perspective, Butterworths Journal of International Banking and Financial Law, 372-377.
Johnson, S., La Porta, R., Lopez-de-Silanez, F. and Shleifer, A., 2000, Tunneling, AEA Papers and Proceedings, 22-27.
Jokela, Juha, 2002, Legal procedure, in Pöyhönen, J. (ed.), An introduction to Finnish law (Second, revised edition), Jyväskylä.
Kaisanlahti, T., 1997, The Finnish perspective of the proposal for a 13th company law directive on take-overs: a multi-jurisdiction survey, part 2, European Financial Services Law, January, 5-7.
Kane, E., 2000, Designing safety nets to fit country circumstances (mimeo, http://econ.worldbank.org).
Kasanen, J., 1999, Corporate insider trading and its regulation in Finland, Bank of Finland – Bulletin, 27-32.
Kauko, K. and Saukkonen, E., 1996, The stock market, Bank of Finland – Bulletin, 29-34.
Koivula, R., 2001, Tracking stock and its implementation by Finnish listed companies (Master thesis, University of Helsinki – Faculty of Law). Finland.
La Porta, R., Lopez-de-Silanez, F. and Shleifer, A., 1998, Law and finance, Journal of Political Economy, 1113-1155.
La Porta, R., Lopez-de-Silanez, F. and Shleifer, A., 2000, Investor protection and corporate governance, Journal of Financial Economics, 3-27.
Macey, J., 1993, Corporate law and corporate governance in Sweden: A law and economics perspective, SNS Occasional Papers, No. 48, Sweden.
Macey, J., 1999, Fiduciary duties as residual claims: obligations to nonshareholder constituencies from a theory of the firm perspective, Cornell Law Review, s. 1266-1281.
Mann, R. and Roberts, B., 1999, Business law and the regulation of business (6th Ed.). US.
McArthur, J. and Sachs, J., 2001, The growth competitiveness index: Measuring technological advancement and the stages of development, in World Economic Forum: The global competitiveness report 2001 – 2002, US.
Megginson, W., 1997, Corporate finance theory, US.
Ministry of Finance, 2001, Taxation in Finland 2001, Helsinki.

128 · T imo K aisanlaht i
Myrsky, M., 2002, Tax law, in Pöyhönen, J. (ed.), An introduction to Finnish law (Second, revised edition), Jyväskylä.
Nenona, T., 2000, The value of corporate votes and control benefits: A cross-country analysis. US.
Olsson, C., 1967, General clauses for the protection of minority shareholders in the Scandinavian companies acts, in Schmidt, F. (ed.), Scandinavian Studies in Law, Vol 11. Uppsala.
Pezard, A., 1995, The golden share of privatized companies, Brooklyn Journal of International Law, 85-95.
Poutiainen, A., 2001, Shareholders and corporate governance. The principle of one share – one vote, European Business Law Review, 67-75.
Pöyhönen, J., 1993, Torts, in Pöyhönen, J. (ed.), An introduction to Finnish law, Jyväskylä.
Ramsay, I., 1999, Directors´ duties in Australia: Recent developments and enforcement issues, Company Financial and Insolvency Law Review, 260-285.
Rock, E., 1997, Saints and sinners: how does Delaware corporate law work?, UCLA Law Review, 1009-1106.
Rudanko, M., 1992, Civil law and the regulation of financial services, in Timonen, P. (Ed.), Nordic perspectives on European financial integration – Proceedings of Nordic seminar on European financial integration (Hanasaari, April 27 – 28, 1992), Helsinki.
Savela, Ari, 1999, Hostile takeovers and directors – Regulation of takeover defences in Finland, the United Kingdom, the United States and the European Union, Turku.
Sillanpää, M., 1994, Enhancing shareholders equality by a take-over bid in the articles of association, in Suksi, M. (ed.), Law under exogenous influences, Turku.
Sillanpää, M, 2001, The European private company from a Nordic point of view, in Neville, M. and Sörensen, K. (eds.), The internationalization of companies and company laws, Denmark.
Sonninen, J., 1998, Finland, in Gustafsson, L. (ed.), Business laws in the Nordic countries – Legal and tax aspects, Stockholm.
Tenhunen, P., 1997, Finland, in Stecher, M (ed.), Protection of minority shareholders, Cornwall.
Timonen, P., 2002, Business law, in Pöyhönen, J. (ed.), An introduction to Finnish law (Second, revised edition), Jyväskylä.
Toiviainen, H., 1998, Ownership and control in companies limited by shares in Finland, Helsinki.
Toiviainen, H., 1999, Finland, in Baums, T. and Wymeersch, E. (eds.), Shareholder voting rights and practices in Europe and the United States, Great Britain.
Virolainen, K., 1996, Securities settlement systems, Bank of Finland – Bulletin, 43-47.
West, M., 2000, Why shareholders sue: the evidence from Japan, University of Michigan 1993 – John M. Olin Center for Law and Economics, Working Papers, No. 00-010, US.

The role of shareholder protect ion rules in f inancing Finnish companies · 129
ENDNOTES
1 Almost all Finnish law in is “black letter“. This applies also to business enterprises, see Aarnio (2002, p. 12-13). Blomstedt (1985) provides a historical background of the Finnish legal system. 2 To be fair, Coffee´s proposition is shared by many of his colleagues; see e.g. Rock (1997, p. 1101-1102). 3 The aim is not to provide an definite analysis about pros and cons of different rules: we limit our efforts just to sketching the reader how certain important issues are dealt in the Finnish legal environment. In passing, we make some comparisons – most of them only in footnotes due to the space limits – to the company law in the US, the jurisdiction where many notable critics of civil law comes from. As we are in a pursuit of reviewing the features of a representative US company law, references are primary made to the Revised Model Business Corporate Act (later ”RMBCA”) that has been adopted in whole or in part by a majority of the US jurisdictions, see www.uslaw.com/library. In this context, we provide also some remarks on the opin-ions expressed by La Porta et al. (1998) about the minority protection in Finland. The comments to be made are at least by and large applicable to Scandinavian countries – Denmark, Norway and Sweden – due to the common preparatory work of Nordic company statutes, see Sillanpää (2001, p. 80). 4 This Act is also applied additionally, i.e. lex specialis derogat legi generali, even regards to companies sepa-rately regulated as is the case with banks and insurance companies. Commercial Banks Act 1990 (No. 1269 – December 28, 1990) and Insurance Companies Act 1979 (No. 1062 – December 28, 1979), see Toiviainen (1998, p. 5-6). 5 These acts cover both types of companies, the public as well as the private ones. 6 Besides the Articles, also the general rules of contract law may be applied. Some if not all the shareholders may voluntary oblige to a common understanding on relations between themselves. This kind of share-holders´ agreement (“Agreement”) may be useful in mandating candidates for a membership in the Board or in ensuring unified voting policy at a GM. 7 Thus, in principle, the Articles could validly state that all resolutions at a GM shall be drawn unanimously and that each shareholder shall have her representative in the Board. In other words the company could be “frozen” into status quo. For obvious practical reasons, however, these kinds of stipulations are non-existent in the Finnish listed companies. 8 The GM constitutes the supreme organ of a Finnish company. The Board which is usually elected in its en-tirety by the GM, is responsible for the proper organisation of the company and its affairs. The Board ap-points the Managing Director whose duty is the day-to-day management (Ch. 8 Sc. 6 Para. 1). 9 Timonen (2002, p. 137), describes the essence of the majority principle: “ – – the majority decides upon the nature of business activities carried out by the company as well as the way they are carried out.” 10 In this context it may be of interest to note also that under terms provided for in the Articles, a share may be converted to a share of another class. This possibility covers both the administrative and financial rights. The conversion is completed when it is registered by the official Trade Register (FCA Ch. 3 sc. 1 Para. 4).
11 An introduction of a new class which grants the holders of shares less benefits or other rights than those conferred on existing shares may be passed at a GM by the supermajority generally required for an amendment of Articles. On the other hand, the division of existing unitary share capital into different classes will require the consent of each and every shareholder whose legal position will be impaired (Ch. 9 Sc. 15 Para. 1 Subpara. 4). Thus this kind of procedure is cumbersome in practice unless each share of a existing class is divided into new ones in which case – as the current shareholders receive all the new shares – no shareholder can claim that her benefits or other rights are diminished by this action. 12 The right to have multiple voting rights does not necessarily need to be general, covering all the issues that may be put on a vote at a GM. A share may entitle to multiple voting rights only in certain issues. Ex-amples of these, inter alia, are amendments of Articles and election of Board members. It should also be noted that the voting rights that a share entitles its holder to, cannot be stipulated as dependent on the

130 · T imo K aisanlaht i
holder´s person. This means inter alia that so called “golden shares” that allow the government as an owner to have absolute veto right over other shareholders in certain matters are not recognised in Finland unless they are re-classified as a separate class distinct from other shares. See Pezard (1995, p. 85-95). 13 Due to this class voting structure Hyytinen et al. (2003) are ready to claim that rule of one share – one vote applies in Finland to an extent. 14 Attending shareholders having failed to vote are disregarded among those who gave blank or otherwise invalid votes. 15 Company law in the US typically requires a quorum to be present for shareholders to act during a GM. This condition is usually met when members holding more than 50 percent of the outstanding shares are present; the Articles may, however, provide for a higher quorum (RMBCA § 7.25(a) and 7.27(a)). This is not the case in Finland. 16 Coffee (1999) is concerned of low quorum requirements; he classifies them as an instrument for the ma-jority shareholder to discourage minority owners to attend a GM. 17 Pursuant to RMBCA § 7.27(a) the Articles of a US company may provide for a higher approval than a sim-ple majority in extraordinary business matters, for example in mergers; however, this is not a mandatory rule as it is in Finland. 18 Most states in the US permit or require the election of the Board members by cumulative voting. Accord-ing to the RMBCA § 7.28(b), however, cumulative voting is by no means a default rule: it can be applied to the election of the Board members only if the Articles so provide. Neither it is a default rule in Delaware, the state of incorporation for most of the Fortune 500 -companies. 19 The status of a Supervisory Board in the organisational structure of a Finnish company is explained by Castrén (1998, p. 121-122) and Timonen (2002, p. 145-146). As the Supervision Board is not a mandatory or-gan in a Finnish company and quite rare bird nowadays even among listed companies, we do not make any reference to it later. 20 Gordon (1994, p. 145) notes that by 1992 only six US jurisdictions – Arizona, Kentucky, Nebraska, North Dakota, South Dakota, and West Virginia – still require the companies to follow mandatorily cumulative vot-ing procedure in electing Board members. On the other hand, the most important jurisdiction for listed US companies, Delaware, has allowed but not required cumulative voting since 1917, see Sec. 214 of Delaware General Corporation Law. Due to these differences in national jurisdictions, Dalebout (1989) expresses a sceptical view of the importance of cumulative voting. On the other hand, Bhagat – Brickley study of 1984 provides clear evidence that minority shareholders do value the cumulative voting procedure: the authors found that elimination of cumulative voting by an amendment of Articles reduced shareholder wealth by 1,57 percent on average; this result was statistically significant (ibid, p. 354). 21 This standard was introduced in the Finnish companies legislation back in 1935 (see Cederberg 1936). Of the Scandinavian tradition in this respect see Olsson (1967). 22 Poutiainen (2001, p. 67). Usually the preventive effect of these clauses is stressed in the literature: they are aimed to deter potential abuses before they occur. 23 Finnish Act on Group Contribution in Taxation (No. 825 – November 21, 1986). See Ministry of Finance (2001, p. 44) and Sonninen (1998, p. 235-236). 24 Pursuant to the aforementioned act, a contribution between a parent company and its subsidiary can be deducted from the taxable profits of the contributing company if it is as well added to the taxable income of the recipient company. 25 See also Coffee (2001, p. 2162) who concludes from Nenova´s results that “– – the assumed superiority of common law to civil law represents a gross oversimplification.” 26 Dyck and Zingales 2002. The authors found that the value of control ranges between –4 % and +65 %, with an average of 14%. In countries where private benefits of control are larger capital markets are less de-veloped, ownership is more concentrated, and privatizations are less likely to take place as public offerings. Dyck and Zingales also analyse what institutions are most important in curbing these private benefits. A high degree of statutory protection of minority shareholders and high degree of law enforcement are asso-ciated with lower levels of private benefits of control, but so are a high level of diffusion of the press, a high rate of tax compliance, and a high degree of product market competition. It is even suggested that the 'non traditional' mechanisms have at least as much explanatory power as the legal ones commonly mentioned

The role of shareholder protect ion rules in f inancing Finnish companies · 131
in the literature: in a multivariate analysis newspapers' circulation and tax compliance seem to be the dominating factors. 27 Ibid, see Table IV. 28 Unlike a new issue, a ”bonus issue” may only be effected by the GM. In a bonus issue an amount corre-sponding to the aggregate nominal value of shares is transferred to the share capital from the cumulated profits and other ”non-restricted” equity in the balance sheet. 29 If the deviation proposed is in favour of the inner circle of the company, the proposal shall also contain an account of the portion of the share capital in the company held by a member of the inner circle and the portion of the voting rights held by him as a share of the voting right attaching to all the shares of the company before and after the new issue in case he subscribes to all the shares offered to him and the new issue is also otherwise subscribed to in full (FCA Ch. 4 Sc. 4 Para.1 in fine). 30 Most US company statutes either (i) grant pre-emptive rights but allow them be negated in the Articles; or – as stated in the RMBCA § 6.30(a) – (ii) deny pre-emptive rights except to the extent that they are granted in the Articles. As explained above, the FCA does not allow such general negation of the pre-emptive right that is possible in the US. Disapplication resolutions have, nevertheless, become quite routine items on an annual GM agenda of listed companies in Finland. In practice the Boards are usually authorized to issue new shares without pre-emptive rights up to amount equalizing one fifth of the current share capi-tal. The authorisation can be formulated in general terms, stating precisely only the maximum amount of the issue, leaving to the Board the decision concerning subscribers, the number of shares and the issue price.30 However, an authorisation can be granted only for a year; to stay in force for a longer period it has to be renewed in the next AGM. 31 RMBCA § 6.31(a) states plainly that ”[a] corporation may acquire its own shares – –” and according to § 6.40 ”[a] board of directors may authorize – – distributions to its shareholders – –.” The definition of a ”distri-bution” covers all transfers of money and property from the company for the benefit of shareholders: it ”– – may be in the form of a declaration or payment of a dividend; a – – acquisition of shares; – – or otherwise” (§ 1.40(6)). 32 When the 5 % threshold is crossed ”accidentally” through a merger, the shares exceeding the 5 % limit have to be conveyed within three years from the acquisition (Ch. 7 Sc. 8 Para. 1). 33 RMBCA (§ 6.40(c) applies equity insolvency test: ”No distribution may be made if, after giving effect: (1) the corporation would not be able to pay its debts as they come due in the usual course of business; or (2) the corporation´s total assets would be less than the sum of its total liabilities – –.”
34 Official comments to § 6.40. 35 However, this is not say to that the owners cannot agree ex ante of unequal distribution, for example, by establishing several classes of shares with different right to dividends. 36 The resolution of the GM is passed by simple majority unless supermajority is required in the Articles. Of the principles of profit sharing see generally Timonen (2002, p. 148-149). 37 This applies also to the US where courts which are reluctant to interfere with decisions on dividends be-cause it would mean replacing the Board´s business judgement for that of the court´s, Mann and Roberts (1999, p. 700). 38 However, this kind of provision is quite rare, at least in the Finnish listed companies. 39 E.g. Megginson (1997, p. 373-374). On the other hand, it should be noted that this view is challenged in the newest econometric studies. According to Allen´s and Michaely´s (2001) utmost thorough review of these studies, the accumulated evidence indicate that changes in pay-out policies are not motivated by companies´ desire to signal their value and prospects to the investors; instead, both dividends and repur-chases seem to be paid in the first hand to reduce potential over-investment by companies. 40 Financial statements have to provide true and fair view of the company´s financial position and result for the financial period ended (Accounting Act, Ch. 3 Sc. 2 Para. 1). 41 More detailed regulation for the markets is provided by the Ministry of Finance. The supervisor of Finnish securities markets, the Financial Supervision Authority, has also released several guidelines on market con-duct. The Authority operates in conjunction with the Bank of Finland. It is the responsibility of the Financial Supervision to ensure that those operating on the financial markets observe existing rules and regulations. see Helakallio (1996, p. 57-58). Besides the Authority, the Helsinki Stock Exchange, as a private market place,

132 · T imo K aisanlaht i
has its own set of detailed requirements for admission to listing as well as for disclosure of listed companies, see Kauko – Saukkonen (1996, p. 28-30) and Sonninen (1998, p. 181-182) as well the homepage of the Fi-nancial Supervision Authority: www.rata.bof.fi. 42 Finland came out as the third in the study; United Kingdom and Singapore beat Finland by a single point, they both scored 78 points, see Kane (2000, p. 45). Generally, however, the US GAAP (Generally Accepted Accounting Principles) are considered to be more demanding than European or other standards (Horsman-heimo 2001, p. 284).
43 Hyytinen et al. (2003) provide a thorough description of developments toward a more investor protective accounting and disclosure rules in Finland. Further steps are being taken. On 13 June 2000, the Commission of European Union published its Communication on "EU Financial Reporting Strategy: the way forward" in which it was proposed that all publicly traded Community companies prepare their consolidated financial statements in accordance with one single set of accounting standards, namely International Accounting Standards (IAS) by 2005. A regulation (No.1606/2002) was accepted by the European Parliament and the Council in summer 2002. Therefore, the requirement for mandatory IAS-based consolidated statements ap-plies to all listed companies in Finland and other member countries of the Union at the beginning of 2005. 44 This right is subject to the Board´s consideration: if it is deemed that the familiarisation will cause essential harm to the company, the Board may deny the right. The power of inspection is fraught with potential abuses, and the Board is allowed to protect the company from them. For example, a shareholder may prop-erly be denied access to the company books and records to protect harassment or to protect trade secrets or other confidential information. In such a case the Board is under obligation to provide the information to the Auditors in a similar manner as already referred above. In every case the shareholder who has familiar-ised herself with company´s documents, may not disclose or make use of any information that he obtains from those if the disclosure or use of the information may cause essential harm to the company. 45 In Finland bearer shares are not allowed; all shares have to be registered to a specified person. 46 Despite the principle of transparency, in a listed company whose shares are dematerialised i.e. transferred into the Finnish book-entry system, a foreign beneficial owner may have her ownership registered under the name of a custodian, see section 2.2 above. 47 Not even the Articles may be altered to grant the shareholders this right, Savela (1999, p. 235). 48 Of the case mentioned see, for example, Hodge (1999). 49 In this respect the rules of the Finnish derivative suit differs significantly from its US counterpart which provides for each individual shareholder the right to bring a derivative suit. The procedure is also more straightforward in the US: Pursuant to the ground rule of RMBCA § 7.42 a shareholder may commence a de-rivative proceedings as soon as 90 days have expired from the shareholders demand for the company to take suitable action. 50 The causal connection in the Finnish tort law is evaluated on the basis of conditio sine qua non: had the damages not materialised without the action, then the action is the cause of the effect, Pöyhönen (1993, p. 84). 51 See e.g. (Timonen 2002, p. 150). The FCA does not include any provisions for the liability of the company itself against a shareholder for the acts and omissions of its management, see Rudanko (1992, p. 220 and 226-227). Meanwhile, in the US, a shareholder may bring a direct suit, for example, to compel payment of dividends properly declared; this action is against the company (see e.g. Mann and Roberts 1999, p. 720-721) – not the other shareholders or the members of the Board as is in the Finnish direct suit. 52 In this respect the US rules are the same. 53 Damages for pure economic loss, i.e. loss not connected with bodily injury or material damages, are also awarded; this is not the case generally in the Finnish tort law, see Rudanko (1992, p. 218) and Savela (1999, p. 224). 54 RMBCA § 13.2(3) and 13.2(4) provide a shareholder with appraisal rights also in connection of substantial assets sales and material amendments of Articles. On the other hand, however, several US states deny the appraisal rights in listed companies – the idea is that in the liquid and efficient securities markets a minority can always get a fair price for her shares. 55 Some listed companies (e.g. Nokia Ltd) have further tightened the redemption obligation by including a clause in their Articles, in virtue of which the redemption obligation arises already prior the reaching the re-demption limit with the SMA. These clauses typically set the redemption limit at 1/3 of voting rights. For a

The role of shareholder protect ion rules in f inancing Finnish companies · 133
detailed description see Sillanpää (1994); cf. Astola (1994, p. 88) who is doubtful whether this kind of modifi-cations are in accordance with the principle of free transferability of shares. 56 The US law of judicial dissolution resembles the Finnish one. A court may dissolve a company in a trial brought by a shareholder if it is established, for example, that an action of the Board or the majority share-holder is illegal, oppressive or fraudulent (Mann and Roberts 1999, p. 752). The coverage of this right is, however, wider than in Finland as the FCA does not allow for winding up on the basis of improper action by the Board. 57 Thus, a conclusion that the common law system is more effective from the viewpoint of investors is not as easily derived as the studies of La Porta et al. (1998) suppose. See also Hyytinen et al. (2003) that concludes that even in the light of La Porta -indices, Finland has improved minority protection during 1990s. As the Nordic company statutes are based on common preparatory work, the doubts expressed above are at least by large applicable to other Scandinavian countries – Denmark, Norway and Sweden – as well. 58 The new Finnish legislation of 1990s related to investor protection parallels the market developments. The bank-related financial system lost ground for stock markets as companies restructured their balance sheets substituting debt for equity. A fresh study by Hyytinen et al. (2003) affirms that this development was fu-elled by the legislative efforts to strengthen the rights of equity investors.
59 In the United States – as Easterbrook (1997, p. 28) puts it neatly “ – – shares can carry any substantive rights people can dream up, and they sell for whatever price investors are willing to pay.” For example, the concept of a “tracking stock” in alien to the Finnish company and securities market practice, at least for this moment. Of this concept generally see e.g. Jacobs and Macours (2001, p. 372-377); Koivula (2001) considers the possibilities for issuing tracking stock by Finnish companies. More generally, this mandatory feature of Finnish company law is potentially an obstacle to developing modern financial instruments in some impor-tant niche areas, particularly venture capital financing. 60 Also La Porta et al. (2000, p. 7) recognise the crucial role of enforcement: ”When the enforcement of pri-vate contracts through the court system is enough, other forms of protecting property rights, such as judi-cially-enforced laws or even government-enforced regulations, may be more efficient.” 61 Even if we accept this classification, there remains a question: Would the life be better for the Finnish mi-nority shareholders if the US-style derivative suit was in place here? Several econometric studies – after hav-ing tortured statistical data based on the US cases – come to the negative conclusion: derivative suits pro-duce few immediate and direct gains to shareholders. Besides, despite the litigation-friendly jurisprudence, a derivative action is still relatively rare occurrence even in the US. For a survey see Ramsay (1999, p. 276). West (2000) comes to the same conclusion in his study of Japanese cases.


Financia l systems and f i rm per formance: Theoret ical and empir ica l perspect ives · 135
4. EXITING VENTURE CAPITAL INVEST-MENTS: LESSONS FROM FINLAND
Jyrki Ali-Yrkkö, Ari Hyytinen and Johanna Liukkonen*
Abstract: Because the exit stage may have several feedback effects on the earlier stages (i.e. fundraising and investing) in the venture capital (VC) process, the long-run devel-opment of the VC industry is dependent on the exit possibilities that the financial system generates. In this study, we consider the Finnish financial system from this perspective. Our analysis of aggregate level data suggests that despite its favorable development during the 1990s and success in serving the needs of larger firms, the Finnish stock market does not fully meet the exit needs of Finnish venture capitalists. This is because of the strong clustering of initial public offerings (IPOs) and the vola-tility and certain other documented characteristics of the Finnish stock market. The market for mergers and acquisitions (M&As) has been quite active in Finland by in-ternational standards and has provided a substitute route for exits (trade sales) for the Finnish venture capitalists. The results of a survey we administered to the Fin-nish venture capitalists confirm the conclusions based on the aggregate data: They show that the availability of exits is an important determinant of the investment de-cision in Finland and that Finnish venture capital investors’ overall assessment of the institutional environment of IPOs is a degree or two negative and more negative than their assessment of the M&A environment. The analysis indicates the develop-ment of Finnish VC industry may slow down because the structure of the Finnish fi-nancial system is such that it only imperfectly supports successful exiting, some-thing that lies at the heart of the VC process.
* Jyrki Ali-Yrkkö and Ari Hyytinen (corresponding author) are both at The Research Institute of the Finnish Economy (ETLA) and Etlatieto Ltd and Johanna Liukkonen is at the Graduate Institute of International Stud-ies, Geneva. This Chapter is based on Etla Discussion Papers, nr. 781 (dated 17/12/2001). The authors would like to thank Markus Koskenlinna, Eva Liljeblom, Anu Nokso-Koivisto, Vesa Puttonen, Petri Rouvinen, Otto Toivanen and Pekka Ylä-Anttila and seminar participants at the National Technology Agency (TEKES) for helpful comments, Mika Pajarinen and Lotta Väänänen for excellent research assistance, and the Finnish Venture Capital Association and its members for co-operation. We are especially grateful to Armin Schwien-bacher for help in formulating the survey questionnaire used for this study. All errors and the views ex-pressed are those of the authors.

136 · Jyrk i Al i -Yrk kö, Ar i Hyyt inen and Johanna L iuk konen
4.1. INTRODUCTION
Stock markets and especially ‘new stock markets’ have in recent times been heavily criticized because of dismal stock price performance and the markets’ perceived role in the recent mass destruction of investor wealth.1 The criti-cism masks however the essential raison d’etre of stock markets: They exists to alleviate directly and indirectly financial constraints of firms in need for ex-ternal capital, to make available means for providing incentives and monitor-ing management and personnel and, finally, to increase the liquidity of firms’ stock and the scope for diversification by the initial owners of the firms. In this Chapter we focus on what comes close to the last of these essential moti-vations: the role of stock markets in facilitating the availability of risk capital to private, yet unlisted firms.
If the structure of a financial system is such that it does not generate opportunities to dispose of investments in private firms, i.e., to exit, the mar-ket for private risk capital cannot develop properly and in particular the functioning of venture capital industry may be hampered. For example, it is often argued that the lack of exit prospects undermined the development of the European market for venture capital relative to the US, particularly in the early 1990s (see, e.g., Gompers and Lerner 2000). One reason for the lack of exit prospects in Europe is that the continental European countries have tra-ditionally had bank-centered financial systems and relatively concentrated and rigid ownership structures. Concerns of this type are potentially more relevant from the point of view of small European economies, because they have limited scope for developing deep and active financial markets, particu-larly in the presence of significant fixed set-up costs.
The importance of active financial markets for the supply of venture capital stems from the significance of the exit stage for the entire investing process. Achieving a profitable exit lies in many ways at the heart of the ven-ture capital process (Sahlman 1990, Gompers and Lerner 2000), because the various stages of the venture capital process are, as frequently emphasized by the practitioners, interrelated. On the one hand, venture capitalists’ ability to raise capital may have an influence on their contemporary investment be-havior by, e.g., affecting both the size and type of investment they wish to make as well as their investment benchmarks. Today’s investments in turn create a need for means by which the venture capitalists can dispose of their investments. On the other hand, the reverse direction of the venture capital process is also important. Because many venture-backed firms generate little,

Ex i t ing venture capita l investments : Lessons f rom Finland · 137
if any, cash flow, exiting is critical to ensuring attractive returns for investors. The opportunities for exits influence therefore the venture capitalists’ reputa-tion, which determines at least in part their ability to raise capital in the fu-ture (Gompers 1996). Because some investments provide a faster track to ex-its than others, the exit environment may affect the types of investments that the venture capital firms make. Thus, the entire investing process is best viewed as a venture capital cycle (Gompers and Lerner 2000a, 2001).
There is a growing literature that analyses the question how private sources of risk capital, such as venture capital, may emerge and prosper in countries with distinct institutional arrangements (see, Milhaupt 1997, Black and Gilson 1998, Gompers and Lerner 2000a, Jeng and Wells 2000, Becker and Hellman 2000).2 This literature has identified several conditions and details of the design of institutional and economic environment that support active venture capital market and ultimately what Milhaupt (1997) has called “the market for innovation”. Among the most important of such factors are the availability of funding from independent sources (e.g. pension funds); the overall structure and efficiency of the financial system; the incentive struc-tures and contracting mechanisms of the economy; the regulation of the labor market and labor mobility; and finally, overall risk tolerance and willingness of entrepreneurs and venture capitalists to pursue high-risk, high-return ven-tures. All in all, the earlier literature emphasizes the importance of institu-tions that complement the venture capital industry, suggesting in particular a strong link between the growth of venture capital and the functioning of the stock market (Black and Gilson 1998, Jeng and Wells 2000, Michelacci and Suarez 2001).3
In this Chapter, we study the exit opportunities made available by a fi-nancial system from the perspective of venture capital firms. We consider the Finnish financial system and study in particular whether it has the character-istics that enhance the exit opportunities and hence contribute to the long-run development of venture capital. We focus on the following two sets of ques-tions:
• How does the Finnish stock market meet the exit needs of Finnish venture capitalists? Does the market for initial public offerings (IPOs) create a steady flow of opportunities to exit? How does the market for mergers and acquisitions (M&As) work from the perspective of the exit needs of venture capitalists? Is the trade sale of an investee firm – i.e. selling of the investee firm as a whole to another company – a viable alternative exit route in Finland?4

138 · Jyrk i Al i -Yrk kö, Ar i Hyyt inen and Johanna L iuk konen
• What have been the main routes of exits for Finnish venture capital inves-tors in the past? How do the past patterns of exit compare with how the stock market in Finland works? What do Finnish venture capitalists them-selves think about the importance of exits for them and the exit environ-ment they face?5
As we see it, Finland provides a unique platform to consider these questions and thus to study the co-development of the supply of private risk capital and the financial system for several reasons. First, Finland is a rela-tively small economy, it has traditionally had a relatively small stock market and the main source of external finance for the Finnish firms has been inter-mediated debt finance. Second, the Finnish economy has recently undergone a major banking crisis as well as one of the most volatile business cycles among the OECD countries since the Great Depression of the 1930s (see, e.g., Honkapohja and Koskela 1999). Third, because the Finnish venture capital industry has grown rapidly during recent years, it is relatively young and at least to some extent immature.6 Taken together, the historical importance of intermediated debt finance, the volatile nature of the Finnish economy and the young age of the venture capital industry suggest that the functioning of the Finnish financial system and hence the co-development of “the market for exits” may be instrumental for the long-run development of the Finnish venture capital industry.
The remaining of this Chapter is as follows. In Section 4.2 we present a brief review of the literature, placing special emphasis on the importance of exits for the different stages of the venture capital cycle. Section 4.3 describes the Finnish financial system and compares the exit opportunities that it pro-vides to some European countries and to the US. In Section 4.4 we analyze the exit experiences of the Finnish venture capitalists. Section 4.5 concludes.
4.2. THEORETICAL BACKGROUND
4.2.1. VENTURE CAPITAL CYCLE
The business of venture capital is best understood by considering the whole venture capital cycle (Gompers and Lerner 2000, 2001) that we know to con-sist of three interrelated stages: fundraising, investing, and exiting (Figure 4.1). A typical view on venture capital investing is to consider the logical timing of the different stages: Raising capital for a venture fund is the first step of the cycle that is followed by an investment stage. During the investment stage,

Ex i t ing venture capita l investments : Lessons f rom Finland · 139
potential ventures are screened and the money raised from the investors is invested in several carefully selected investee firms.7 After providing the in-vestee firms with the financial capital, the venture capital firm provides advi-sory services and helps the investee firms to mature, with the final target be-ing a successful exit. The exit stage realizes (or not) the financial rewards and provides liquidity for the investments made. It also completes the cycle.
Figure 4.1. Venture capital cycle
Fundraising Investing ExitFundraising Investing ExitFundraising Investing ExitFundraising Investing Exit
There are however reverse mechanisms also in place. In particular, there are four principal mechanisms through which the exit stage has feed-back effects on investing and fundraising and influences the health of the other parts of the venture capital cycle. First, due to costs of writing detailed contracts, the partnership contracts between the venture capitalists and capi-tal providers remain incomplete. Exits are therefore central to the venture capitalists’ accountability to capital providers (Black and Gilson 1998). The ex-its enhance accountability, because the exit performance of a venture capital-ist reveals his ability to outside investors. The exit success of the venture capitalist translates into financial returns, which signal the ability. Because past performance, i.e. one’s track record, is a strong indicator of the ability, the exits have an important effect on the venture capitalist’s reputation and thereby on his capability to raise new capital from the investors in the future.
Second, the need to exit is reflected in the types of investments that the venture capital investors are willing to make. A well functioning exit envi-ronment enhances the degree to which entrepreneurs and venture capitalists are able to extract the revenues associated with the projects they run. If the exit environment boosts the exits of certain types of investments, it distorts the monetary incentives of the venture capitalists towards those investments. The monetary incentives also depend on how efficiently the venture capital-
140 · Jyrk i Al i -Yrk kö, Ar i Hyyt inen and Johanna L iuk konen
ists are able to address the agency and information problems during the in-vesting stage. Black and Gilson (1998) argue for example that the exit oppor-tunities enabled by stock markets are more important than the other exit avenues because the potential for exit through an IPO allows the venture capitalist and the entrepreneur to contract implicitly over control, in a way that gives the entrepreneur an option to reacquire control if she so desires in connection of listing the firm. The initial transfer of control to venture capital-ists may be required because otherwise the venture would not be able raise external financing. The ability to design such options is the more important, the higher the private benefits (the value of control) from running the firm. The analysis of Michelacci and Suarez (2001) suggests another link between exiting and investing. The easier exiting, the faster informed capital, i.e. the human capital of experienced venture capitalists, is recycled towards new ventures. Hence the factors that facilitate exiting also contribute to the flow of capital (both financial and non-financial) towards new firms (see also Kan-niainen and Keuschnigg 2001).
Third, the availability of exit routes not only affects the amount of the revenues that entrepreneurs and venture capitalists are able to extract from the projects they run but also the distribution of those returns (Berglöf 1994, Bascha and Waltz 2001). The exits may therefore have an effect on the incen-tives of the two parties to invest in the relationship. For example, the pros-pect of exiting a venture via a trade sale may reduce the incentives of the en-trepreneur to invest if the private benefits of control are important for her. Fi-nally, Gompers (1996) put forward the hypothesis that young venture capital firms bring their investee firm public earlier than older venture capital firms in order to build their reputation, i.e., to grandstand. Such behavior need not be optimal from the viewpoint of the investee firm’s lifecycle and may there-fore lead to conflict of interest between the entrepreneur and the venture capitalist.
4.2.2. EXITS AND EXIT ENVIRONMENT
The received literature suggests that there are several mechanisms through which the exit stage has feedback effects on investing and fundraising and hence on the health of the other parts of the venture capital cycle. The feed-back effects in turn suggest that functioning (or malfunctioning) of the differ-ent segments of the financial system may have important implications for the long-run development of the venture capital industry. Taken as a whole, the feedback effects impose certain preconditions that the financial system

Ex i t ing venture capita l investments : Lessons f rom Finland · 141
should meet before it “supports” the venture capital cycle and particularly its exit stage.
The first precondition is that the stock market should provide a con-stant flow of opportunities to take companies public, preferably regardless of the type of candidates considering listing, be liquid to enable the disposition of the large blocks typically held by the venture capitalists and be not too volatile to allow for the planning and timing of exits. As the discussion in the previous section suggests, the exits enabled by the stock market are impor-tant because they i) are an important means for the venture capitalists, par-ticularly for the younger ones, to signal their ability, to enhance their reputa-tion and hence to improve upon their ability to attract funds in the long term; ii) provide a means to contract over certain types of agency problems be-tween the venture capitalists and the entrepreneurs8 and iii) are necessary for realizing sufficient financial awards from investments in certain types of in-novative ventures and technologies. The last motivation is of particular im-portance in cases in which asset stripping and the like by strategic investors reduces or prevents the realization of returns in a trade sale (cf. Berglöf 1994). This kind of situation might arise in, e.g., emerging industries where the pro-tection of intellectual property may be weak.
Because liquidity externalities create a strategic complementarity in the decision to go public, stock markets that lack a critical mass of similar listed companies may make IPOs especially costly (Pagano 1993, Michelacci and Suarez 2001). This suggests that from the perspective of the venture capital process, it would be instrumental, particularly in the smaller countries where the stock market can encompass only relatively few industries, to have a match between the sector focus of the domestic stock market and the activi-ties of the venture capital investors.9
The second precondition is that the market for M&As should quite like the stock market be active and “liquid”. In particular, it should provide a constant flow of opportunities to sell companies to industrial buyers that are large enough to have the resources required for the acquisition (e.g., to com-pensate the initial investors and the entrepreneur). The flow of such oppor-tunities reflects, first of all, a search problem as it depends on the efficiency of the matching process through which the buyers and sellers find each other.10 The flow also depends on the structure of the economy. For example, in smaller countries there are fewer domestic industrial buyers because their economies are smaller and less diversified. Matching may therefore in the smaller countries require that also foreign industrial buyers can be attracted. In such a case, the search costs from the perspective of the venture capitalists
142 · Jyrk i Al i -Yrk kö, Ar i Hyyt inen and Johanna L iuk konen
are however greater. The concentration of firm ownership may also affect the flow of M&A opportunities. This constraint may be particularly relevant in Europe because of the extraordinary high degree of concentration of owner-ship (see, e.g., Becht and Röell 1999). Finally, the flow of trade sale opportuni-ties reflects the dependence of the market for M&As on the overall macro-economic conditions. Because the link between M&As and the stock market is typically indirect, the changes in the flow of M&A opportunities is likely to correlate with changing stock market conditions imperfectly and with a lag.
The exits enabled by trade sales are important for the venture capital process because they i) are, at least potentially, less dependent on the overall macroeconomic conditions and hence available in difficult market conditions when the exists enabled by the stock market are typically not; and ii) may have an impact on the types of investments that the venture capital investors are willing to make by providing the venture capitalists with an alternative and yet a potentially profitable route of exit. The latter of these two is particu-larly important for the availability of venture capital to firms that cannot, due to their small size, go public. It is also important when there is significant un-certainty over the value of the investee firm at the time when the venture capitalist desires to exit. In such a case, only an industrial buyer with signifi-cant industry knowledge may have the ability to verify the value of the firm and pay the premium initially expected by the venture capitalists.11 The de-mand for trade sale exits may therefore stem from emerging industries be-cause of the high technological and market risks involved.
4.2.3. IMPLICATIONS
The foregoing discussion suggests four conclusions:
• There are important reverse mechanisms in place in a venture capital cy-cle through which the exit stage has feedback effects on investing and fundraising, and influences the health of the other parts of the venture capital cycle.
• Because of the feedback effects, the overall level of stock market and M&A activity matter for the long-run development of venture capital. Besides the overall level of stock market and M&A activity, the intertemporal dis-tribution of exit opportunities matters, especially for an emerging venture capital industry. In volatile market conditions exiting becomes more diffi-cult and the overhang of investee companies waiting the exit may in-

Ex i t ing venture capita l investments : Lessons f rom Finland · 143
crease. Too much overhang may translate into lower returns and hence to a lower level of venture capital activity in the long term.
• How strongly the exit environment is affected by market turbulence is a characteristic of the financial system and may differ across countries. Be-cause small economies and their financial systems are – mainly due to lower sector diversification – more prone to suffer from macroeconomic volatility than the large ones, the long run development of the venture capital industry may in such economies be particularly dependent on the characteristics of the financial system.
• The IPO opportunities enabled by the stock market and the trade sales enabled by M&A activity are, primarily, substitutes.12 Trade sales are, for example, substitutes for IPOs in macroeconomic downturns, in the case of smaller firms and when the domestic stock market is fragmented or lacks the critical mass in certain industries. Albeit the substitutability is imper-fect, it depends on the characteristics of the financial system how effi-ciently the venture capitalists can substitute away from the unavailable exit route to the other.
4.3. FINNISH FINANCIAL MARKETS FROM VENTURE CAPI-TALISTS’ PERSPECTIVE
4.3.1. STOCK MARKET ACTIVITY
There are several ways to benchmark a national stock market from the per-spective of a venture capitalist. First, the larger is the market and the more IPOs take place, the easier it is to exit by bringing investee companies public. Second, the liquidity of the market is an important determinant of the easi-ness of exit. In a liquid stock market, disposing of a large block should not have an adverse price effect. Third, the more volatile the market, the more likely it is that an IPO cannot be executed as planned. Therefore, a very vola-tile stock market is likely to be less preferred by the venture capitalists.
Among the most usual measures used to characterize stock markets are their size in terms of market capitalization and number of listed compa-nies, the number of new listings and the liquidity in terms of turnover. In ad-dition, the overall price development and the volatility of the price develop-ment are important characteristics of the stock markets. We use these meas-ures in what follows.
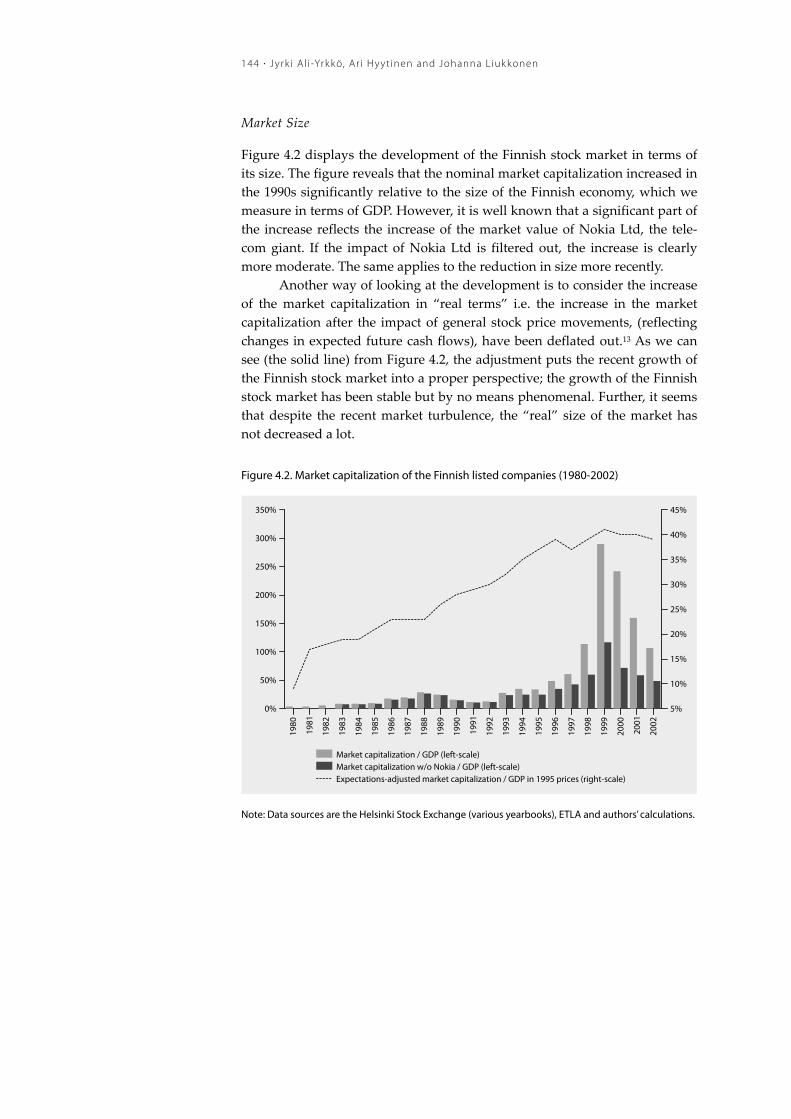
144 · Jyrk i Al i -Yrk kö, Ar i Hyyt inen and Johanna L iuk konen
Market Size
Figure 4.2 displays the development of the Finnish stock market in terms of its size. The figure reveals that the nominal market capitalization increased in the 1990s significantly relative to the size of the Finnish economy, which we measure in terms of GDP. However, it is well known that a significant part of the increase reflects the increase of the market value of Nokia Ltd, the tele-com giant. If the impact of Nokia Ltd is filtered out, the increase is clearly more moderate. The same applies to the reduction in size more recently.
Another way of looking at the development is to consider the increase of the market capitalization in “real terms” i.e. the increase in the market capitalization after the impact of general stock price movements, (reflecting changes in expected future cash flows), have been deflated out.13 As we can see (the solid line) from Figure 4.2, the adjustment puts the recent growth of the Finnish stock market into a proper perspective; the growth of the Finnish stock market has been stable but by no means phenomenal. Further, it seems that despite the recent market turbulence, the “real” size of the market has not decreased a lot.
Figure 4.2. Market capitalization of the Finnish listed companies (1980-2002)
1980
1981
1982
1983
1984
1985
1986
1987
1988
1989
1990
1991
1992
1993
1994
1995
1996
1997
1998
1999
2000
2001
2002
0%
50%
100%
150%
200%
250%
300%
350%
5%
10%
15%
20%
25%
30%
35%
40%
45%
Market capitalization / GDP (left-scale)Market capitalization w/o Nokia / GDP (left-scale)Expectations-adjusted market capitalization / GDP in 1995 prices (right-scale)
Note: Data sources are the Helsinki Stock Exchange (various yearbooks), ETLA and authors’ calculations.

Ex i t ing venture capita l investments : Lessons f rom Finland · 145
Figure 4.3 displays an international comparison of the market capitali-zation as a ratio to GDP, separately for the first and second halves of the 1990s. We use the averages to smooth out the variation in the market capitali-zation due to changes in investors’ expectations and macroeconomic cycles.14 The figure demonstrates that the Finnish market was the smallest in the be-ginning of the 1990s, reflecting in part the deepness of the economic crisis that the Finnish economy underwent. Since the crisis, the Finnish stock mar-ket has gained significance. Over 1996-2001, the ratio of market capitalization to GDP was on average at about the same level as it was in the US and the UK. However, it is again very important to control for the effect of Nokia; the size of the Finnish market is by no means impressive once we filter out its impact. Over 1996-2001, the ratio of market capitalization to GDP was with-out Nokia on average 63%. This size compares to that of Germany, which has a very bank-centered financial system.
Figure 4.3. The ratio of market capitalization of domestic shares to GDP (1990-2001)
FinlandFinland w/o Nokia
SwedenNorway
GermanyUS
UKJapan
0%
20%
40%
60%
80%
100%
120%
140%
160%
180%
1990-1995 1996-2001
Note: Data source is International Federation of Stock Exchanges (FIBV).
Liquidity of the market
Historically, the liquidity of the Finnish stock market has not been very good. In the 1980s, the turnover, defined as the ratio of value traded to market capi-talization, was around 15%. The thinness of the stock market affected, if not distorted, the incentives of the market participants in many ways. For exam-

146 · Jyrk i Al i -Yrk kö, Ar i Hyyt inen and Johanna L iuk konen
ple, it provided incentives for firms to distribute dividends, because to obtain capital gains by trading large blocks was problematic, if not entirely impossi-ble (Kasanen et al. 1996).15 The liquidity of the market has improved since then, and during the 1990s it was on average 41%.16 The increase in the num-ber of foreign investment banks as the trading members of the market have increased the turnover, particularly during the late 1990s. In addition, the di-rect positive impact of Nokia on trading volumes and, perhaps more impor-tantly, the associated positive externalities, such as the visibility of Nokia in the international financial press, have increased the visibility of the Finnish stock market and thus the trading activity therein.
In Figure 4.4 we display an international comparison of market liquid-ity, based on data from the International Federation of Stock Exchanges (FIBV).17 The comparison reveals that the liquidity has during the 1990s im-proved in all countries. It also highlights that even if Nokia’s impact is fil-tered out, the liquidity in Finland has clearly improved. However, when compared to the other countries the Finnish market and its progress do not stand out favorably. The liquidity of the Finnish market has improved in par-allel with the reference countries. Despite the increased trading, the Finnish market is less active than e.g. that of Canada or NYSE.
Figure 4.4. Stock market turnover (1991-2001)
FinlandFinland w/o Nokia
Sweden (REV)Norway (REV)
JapanCanada
US (NYSE)0%
20%
40%
60%
80%
100%
1991-1995 1996-2001
Note: Data source is International Federation of Stock Exchanges (FIBV). Stock market turnover is de-fined as the ratio of value traded to market capitalization.
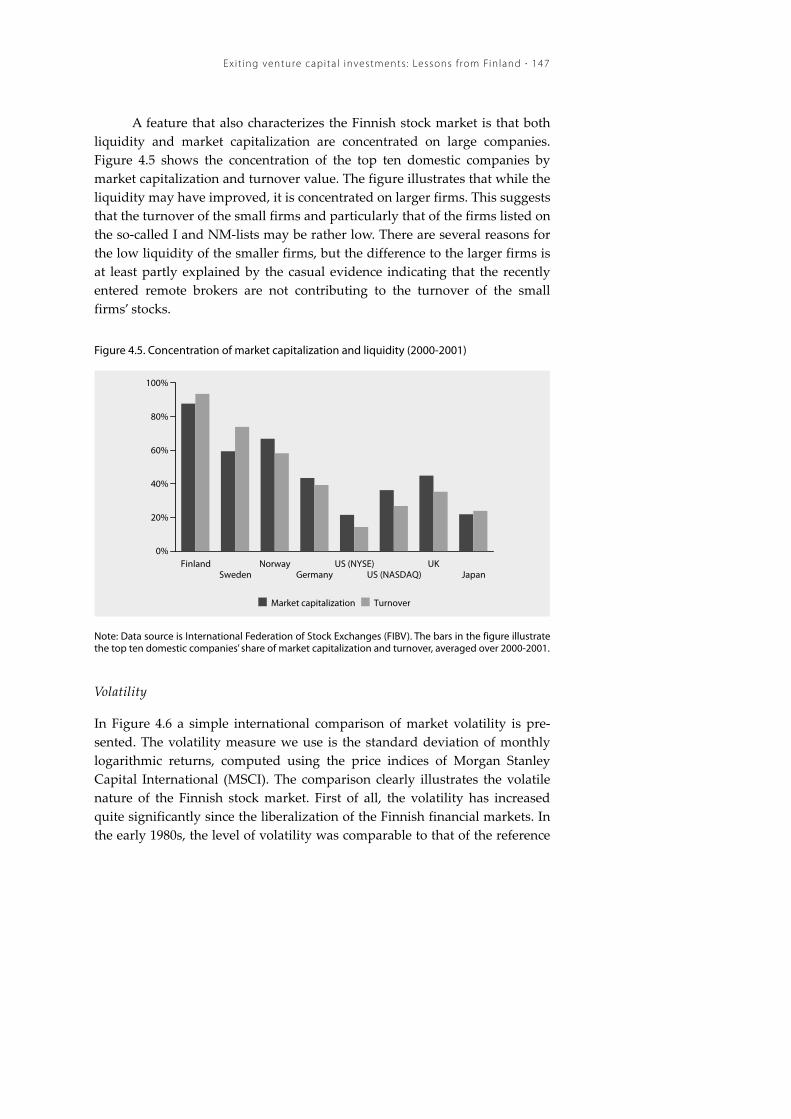
Ex i t ing venture capita l investments : Lessons f rom Finland · 147
A feature that also characterizes the Finnish stock market is that both liquidity and market capitalization are concentrated on large companies. Figure 4.5 shows the concentration of the top ten domestic companies by market capitalization and turnover value. The figure illustrates that while the liquidity may have improved, it is concentrated on larger firms. This suggests that the turnover of the small firms and particularly that of the firms listed on the so-called I and NM-lists may be rather low. There are several reasons for the low liquidity of the smaller firms, but the difference to the larger firms is at least partly explained by the casual evidence indicating that the recently entered remote brokers are not contributing to the turnover of the small firms’ stocks.
Figure 4.5. Concentration of market capitalization and liquidity (2000-2001)
FinlandSweden
NorwayGermany
US (NYSE)US (NASDAQ)
UKJapan
0%
20%
40%
60%
80%
100%
Market capitalization Turnover
Note: Data source is International Federation of Stock Exchanges (FIBV). The bars in the figure illustrate the top ten domestic companies’ share of market capitalization and turnover, averaged over 2000-2001.
Volatility
In Figure 4.6 a simple international comparison of market volatility is pre-sented. The volatility measure we use is the standard deviation of monthly logarithmic returns, computed using the price indices of Morgan Stanley Capital International (MSCI). The comparison clearly illustrates the volatile nature of the Finnish stock market. First of all, the volatility has increased quite significantly since the liberalization of the Finnish financial markets. In the early 1980s, the level of volatility was comparable to that of the reference

148 · Jyrk i Al i -Yrk kö, Ar i Hyyt inen and Johanna L iuk konen
countries. Since then, the volatility has increased, if not hit the roof. The Fin-nish stock market stands out because it has in recent times had the highest volatility among the reference countries considered here.18 The findings im-ply that the Finnish environment for new listings and the pricing of IPOs is surrounded by considerable uncertainty.
The volatility of the stock prices is related to the arrival of new infor-mation and news about the determinants of the stock prices, such as expected dividends and discount rates. In an inefficient or thin stock market, the ob-served volatile movements in stock prices may be due to other factors, too. The degree of diversification of the stock exchanges or the size distribution of the listed companies may also drive the market level volatility. Because vola-tility may spill over, i.e. spread, the presence of a couple of highly volatile large firms in the Finnish stock market may have induced additional overall market uncertainty not experienced in the other markets.
Figure 4.6. Volatility of monthly stock returns (1980-2002)
Finland Germany US Norway Sweden UK0%
2%
4%
6%
8%
10%
12%
14%
16%
18%
1980-85 1986-90 1991-95 1996-2000 2001-2002/10
Note: Data sources are Morgan Stanley Capital International and the authors’ calculations. The volatility is defined as the standard deviation of monthly logarithmic returns.
Listing activity
Figure 4.7 presents an overview of IPOs over 1980-2002 in Finland. Histori-cally, the companies that have gone public in Finland have been relatively old and they have had established operations.19 The Finnish development has in this respect been similar to that of many continental European countries

Ex i t ing venture capita l investments : Lessons f rom Finland · 149
(Jenkinson and Ljungqvist 2001). During the economic crisis of the 1990s, the opportunities for taking a company public were non-existent. However, the IPO “window” opened in 1994 when six new companies were listed. In 1994 the first venture-backed company was listed, too, and in total there have been 24 venture-backed new listings in the Finnish stock market. The number of new listings reached a peak in 1999 but since then the market turbulence has reduced the number of IPOs. Since the end of 2000, the IPO window has been nearly closed.
Figure 4.7. The number of initial public offerings and listed firms in Finland (1980-2002)
1980
1981
1982
1983
1984
1985
1986
1987
1988
1989
1990
1991
1992
1993
1994
1995
1996
1997
1998
1999
2000
2001
2002
0
5
10
15
20
25
30
35
40
45
50
0
25
50
75
100
125
150
175
200
225
250
IPOs (left-scale) Venture-backed IPOs (left-scale) Number of listed firms (right-scale)
Note: Data sources are Keloharju (1993), Helsinki Stock Exchange (various yearbooks) and Finnish Ven-ture Capital Association (various annual publications).
To compare the Finnish IPO activity with other countries, Figure 4.8 displays the average annual number of new listings per million of capita for four periods, covering the era from 1980 to 2000 for six countries. The com-parison verifies, first, that the first Finnish IPO wave in the late 1980s was strong also by international standards. Second, the latter Finnish IPO wave in the late 1990s has clearly been more moderate; in per capita terms, the Fin-nish IPO activity, albeit significant domestically, has outpaced only that of Germany.

150 · Jyrk i Al i -Yrk kö, Ar i Hyyt inen and Johanna L iuk konen
Figure 4.8. Initial public offerings per capita (per million people)
Germany Finland UK Sweden US Norway 0.0
1.0
2.0
3.0
4.0
5.0
6.0
7.0
1980-1985 1986-1990 1991-1995 1996-2000
Note: Data sources are Johnson (2000), Keloharju (1993), Högfeld and Holmen (2001), Ongena and Smith (2001), Helsinki Stock Exchange (various yearbooks), Jay Ritter’s www-site, the www-sites of the stock exchanges, IMF’s International Financial Statistics Database and the authors’ calculations. The bars in the figure correspond to the average annual number of new listings per million of capita.
‘New’ stock markets and marketplaces for the stocks of ‘unlisted’ firms
‘New’ stock markets provide a specialized platform for young, technology-based firms to raise funds for their growth and for venture capital investors to exit their investments. For example, Bottazzi and Da Rin (2002) conclude that Europe’s new stock markets have provided growth-oriented companies with an “unprecedented opportunity to finance their growth”. In similar fashion, Johnson (2000) argues that in Germany, Neuer Markt contributed significantly to the growth of equity culture.
Table 4.1 takes a look at selected Europe’s new stock markets. It reports the distribution of IPOs, market capitalization and turnover, as well as a proxy for the average size of firms in these markets. The table shows the dominant role of London’s TechMARK and Frankfurt’s Neuer Markt (to be closed down). Further, we find that though the new market in the Helsinki Stock Exchange, or the NM-list as it is called, has enabled the listing of a non-negligible number of Finnish growth firms when compared to other Euro-pean markets, it is currently small and illiquid. Also the firms traded on the market are small.

Ex i t ing venture capita l investments : Lessons f rom Finland · 151
Table 4.1. Europe’s ‘new’ stock markets (as of 2001)
Open sinceMarket
capitalizationIPOs (since opening)
TurnoverFirm size,
mill. euros
London (Tech MARK) 1999 87.84% 8.57% 78.48% 2755 Frankfurt 1997 6.55% 37.67% 9.40% 153
Paris 1996 1.97% 18.62% 1.50% 92 Milan 1999 1.94% 4.76% 4.01% 329
Nasdaq Europe 1997 1.05% 6.56% 0.31% 163 Zurich 1999 0.33% 1.80% 2.69% 169
Copenhagen 2000 0.13% 1.38% 3.14% 77 Helsinki 1998 0.06% 1.90% 0.04% 27
Nordic New Market 2000 0.04% 15.87% 0.43% 6 Stockholm 1999 0.04% 2.33% n.a. 15
Amsterdam 1997 0.04% n.a n.a. 38 Athens 2001 0.01% 0.11% n.a. 50 Madrid 2000 0.00% n.a. n.a. 1 Dublin 1997 0.00% 0.42% n.a. 1
Sum 100.00% 100.00% 100.00% -Total (million euros) 762,164 - 44,596 -
Total (number) - 945 - -Average (mill. euros) - - - 277 Median (mill. euros) - - - 63
Distribution of
Note: Data sources are Da Rin and Bottazzi (2002a,b), Helsinki Stock Exchange and the authors’ calcula-tions. Market capitalization refers to the value of stocks in the market; IPOs to the number of initial pub-lic offerings since the opening of the market; turnover to the annual value of stocks traded and firm size to the average market capitalization of the listed firms.
The data reported in Table 4.2 allows us to take a closer look at the NM-list, particularly its liquidity. The table reports average monthly turn-over, defined as the ratio of monthly value of trading to market value, for the Main List, I-list and NM-list in the Helsinki Stock Exchange (Panel A) and the correlation of the monthly turnover between the Main List and the NM-list, the NM-list’s share of the total market capitalization and total monthly turn-over in the Helsinki Stock Exchange (Panel B). The table shows that while the turnover on the Main List has over the past four years improved that of the NM-list has decreased quite dramatically. Panel B shows that the NM-list’s turnover currently has a negative correlation with the Main List’s turnover, which suggests that changes in the liquidity of the Main List’s firms have negative spillover effects on the liquidity of the Finnish growth firms’ stocks. Moreover, it seems that the NM-list has deteriorated more in terms of its turnover than its market capitalization. Judging on the basis of the foregoing findings and on how the Finnish investors and financial press look upon the

152 · Jyrk i Al i -Yrk kö, Ar i Hyyt inen and Johanna L iuk konen
market, the NM-list as it currently stands does not provide a lucrative plat-form for exits from the Finnish venture capitalists’ perspective.
Table 4.2. Trading activity at the Helsinki Stock Exchange by the list type (1999-2002)
Panel A
Main list I-List NM-List
1999 4.52% 2.42% 7.10% 2000 5.54% 2.26% 8.00% 2001 8.19% 0.39% 2.54% 2002 9.46% 1.04% 1.52%
Panel BCorrelation of the
turnover between the main list and NM-list
NM-list share of total HEX market capitalization
NM-list share of total HEX turnover
1999 0.24 0.11% 0.20% 2000 0.10 0.34% 0.41% 2001 -0.08 0.30% 0.09% 2002 -0.23 0.25% 0.04%
Turnover
Note: Data sources are the Helsinki Stock Exchange and the authors' calculations. Turnover is measured by the ratio of monthly value of trading to market capitalization.
Besides ‘New’ stock markets, marketplaces for securities issued by unlisted firms are important for enabling efficient pricing of such securities and for the availability of capital to many growth-oriented firms and SMEs. In September 2002 Helsinki Stock Exchange opened a new BL Market (“ML-market”) for trading of unlisted companies' securities. A company is admit-ted to the BL Market on its own initiative or that of a specialist, which can for example be a trading member or a listing manager. As of December 2002, no market however existed in practice.
A somewhat more encouraging market driven development is the emergence of a securities marketplace and venture capital broker called Privanet, which was established in 2000. The aim of this private marketplace is organize funding for private growth companies and to connect venture capital seeking companies and investors by providing a centralized market-place using the Internet.20 The investors gain access to a pre-screened deal flow and are offered information production services to support their in-vestment decisions in share issues. Privanet acts also as a broker/dealer on the secondary market for private equity, manages a book of all buy and sell orders placed by the investors and, in order to increase market transparency,
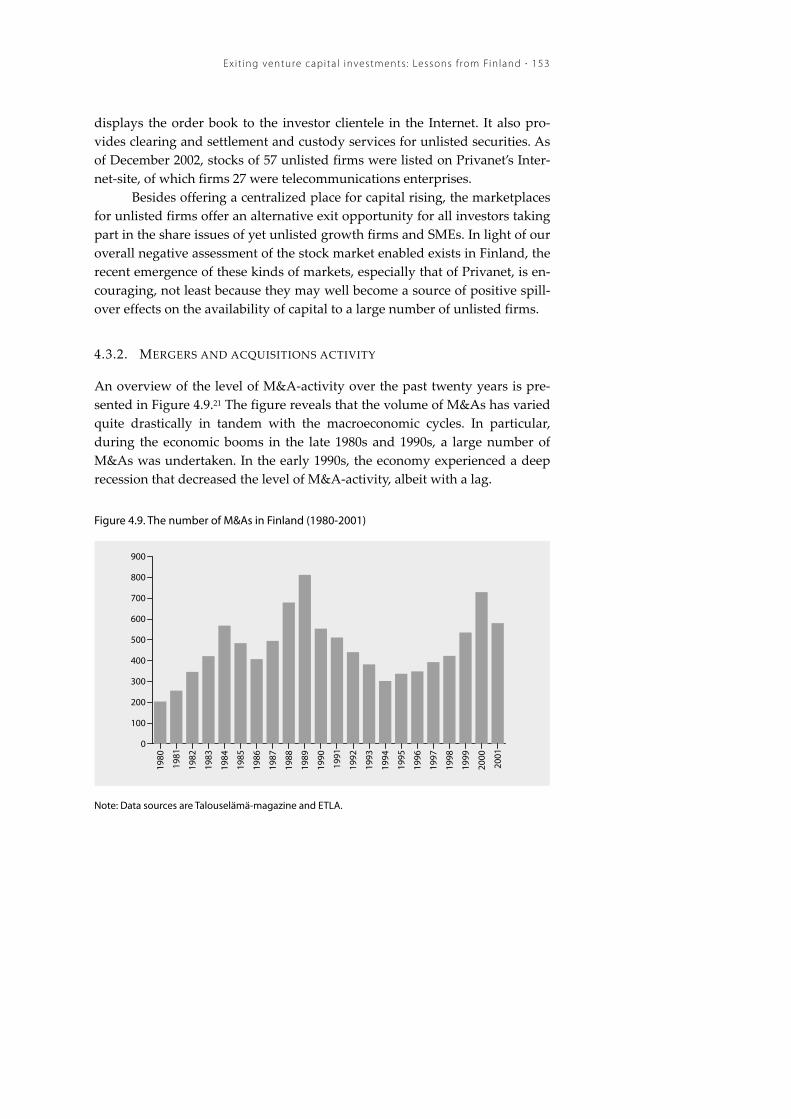
Ex i t ing venture capita l investments : Lessons f rom Finland · 153
displays the order book to the investor clientele in the Internet. It also pro-vides clearing and settlement and custody services for unlisted securities. As of December 2002, stocks of 57 unlisted firms were listed on Privanet’s Inter-net-site, of which firms 27 were telecommunications enterprises.
Besides offering a centralized place for capital rising, the marketplaces for unlisted firms offer an alternative exit opportunity for all investors taking part in the share issues of yet unlisted growth firms and SMEs. In light of our overall negative assessment of the stock market enabled exists in Finland, the recent emergence of these kinds of markets, especially that of Privanet, is en-couraging, not least because they may well become a source of positive spill-over effects on the availability of capital to a large number of unlisted firms.
4.3.2. MERGERS AND ACQUISITIONS ACTIVITY
An overview of the level of M&A-activity over the past twenty years is pre-sented in Figure 4.9.21 The figure reveals that the volume of M&As has varied quite drastically in tandem with the macroeconomic cycles. In particular, during the economic booms in the late 1980s and 1990s, a large number of M&As was undertaken. In the early 1990s, the economy experienced a deep recession that decreased the level of M&A-activity, albeit with a lag.
Figure 4.9. The number of M&As in Finland (1980-2001)
1980
1981
1982
1983
1984
1985
1986
1987
1988
1989
1990
1991
1992
1993
1994
1995
1996
1997
1998
1999
2000
2001
0
100
200
300
400
500
600
700
800
900
Note: Data sources are Talouselämä-magazine and ETLA.

154 · Jyrk i Al i -Yrk kö, Ar i Hyyt inen and Johanna L iuk konen
The Finnish data is consistent with the international evidence on merger waves (see, e.g., Weston et al. 1998). The reasons for the clustering are not well understood, but the evidence suggests that the waves are different in terms of industry composition and thus that they might result from industry-level shocks. Examples of such shocks are deregulation, rapid technological advance, and supply shocks, such as increasing oil prices. From the view-point of the venture capitalists, the volatility of the M&A market is problem-atic because, as we described earlier, also the IPO activity depends heavily on general macroeconomic cycles.
Ali-Yrkkö (Chapter 5 in this volume) documents that Finland ranked the first out of the EU member states in terms of the relative M&A activity in the 1990s. Finland’s share of the total M&A volume in the EU area is more than double when compared to its share of the EU’s GDP. He further reports that the ratio of cross-border transactions to GDP is clearly highest for Lux-embourg, followed by Finland, Sweden and Ireland. The finding indicates that the high M&A activity in Finland is not (solely) due to domestic transac-tions; also foreign companies have been active buyers in Finland. However, Ali-Yrkkö’s analysis shows that the size of the cross-border deals may have been small, suggesting that at least some Finnish firms have been sold abroad at a relatively early stage of their lifecycle.
4.3.3. ASSESSMENT
Table 4.3 presents summary statistics for the IPO and M&A activity in Finland. The table tells that the number of IPOs and the M&A activity have during the 1990s decreased relative to the activity in the 1980s.22 The coeffi-cients of variation moreover confirm that IPOs have been more volatile than M&As. The volatility of both activities has, however, decreased somewhat during the 1990s. It also seems that the correlation between IPOs and M&As has been high (coefficient of correlation = 0.54), but decreasing.
The decrease in the average number of IPOs and M&As is a slightly surprising finding. We therefore examine the development of IPOs and M&As in more detail by using multivariate regressions. In the regressions, the dependent variables are (the logarithm of) the number of IPOs and M&As. The dependent variables are clustered over time and related to the overall macroeconomic cycles, but there is no agreement on the determinants of the aggregate IPO activity or the merger movements (Jenkinson and Ljungqvist 2001, p. 37 and Weston et al. 1998, p. 121). To us, the main variable of interest is time trend (Trend).23 In addition to the time trend, we include the

Ex i t ing venture capita l investments : Lessons f rom Finland · 155
(logarithm of) contemporary and once lagged real GDP (log(Real GDPt)) to control for the size of the economy, as well as the contemporary and once lagged stock market returns (Sreturnt) to control for the stock market condi-tions.24 Because the size of the sample is small and because there is no formal model linking the explanatory variables to IPOs and M&As, the regression coefficients should be interpreted as providing descriptive partial correla-tions rather than estimates of an underlying model.
Table 4.3. Descriptive statistics for IPOs and M&As in Finland (1980-2002)
IPO M&A IPO M&A IPO M&A
Mean 6.9 464.0 8.2 467.3 5.8 461.3 Median 3 432 4 453 3 432 Maximum 43 812 43 812 25 729 Minimum 0 204 0 204 0 302 Standard deviation 10.3 150.9 13.3 185.4 7.7 123.9 Coefficient of variation 1.50 0.33 1.62 0.40 1.32 0.27 Correlation 0.54 0.68 0.27
1980-2002 1980-1989 1990-2002
Note: The data are from Keloharju (1993), Helsinki Stock Exchange (various yearbooks), and Ta-louselämä-magazine and the authors’ calculations.
Table 4.4 reports the results. The table confirms our earlier findings: First, the IPO activity is closely related to the stock market conditions, as il-lustrated by the positive relation between the number of IPOs and the stock market returns. Second, the number of M&As grows as the size of the econ-omy increases. Third, there seems to be a negative trend in the number of M&As in Finland once the size of the economy is controlled for. In other words, holding the size of the economy constant, the M&A activity exhibits a decreasing trend. The trend variable can, of course, be a surrogate for one or more underlying variables affecting negatively IPOs and M&As. Whatever the potential unobservable variables are, they result in a rate of decay in M&As once we account for the influence of the size of the economy.25
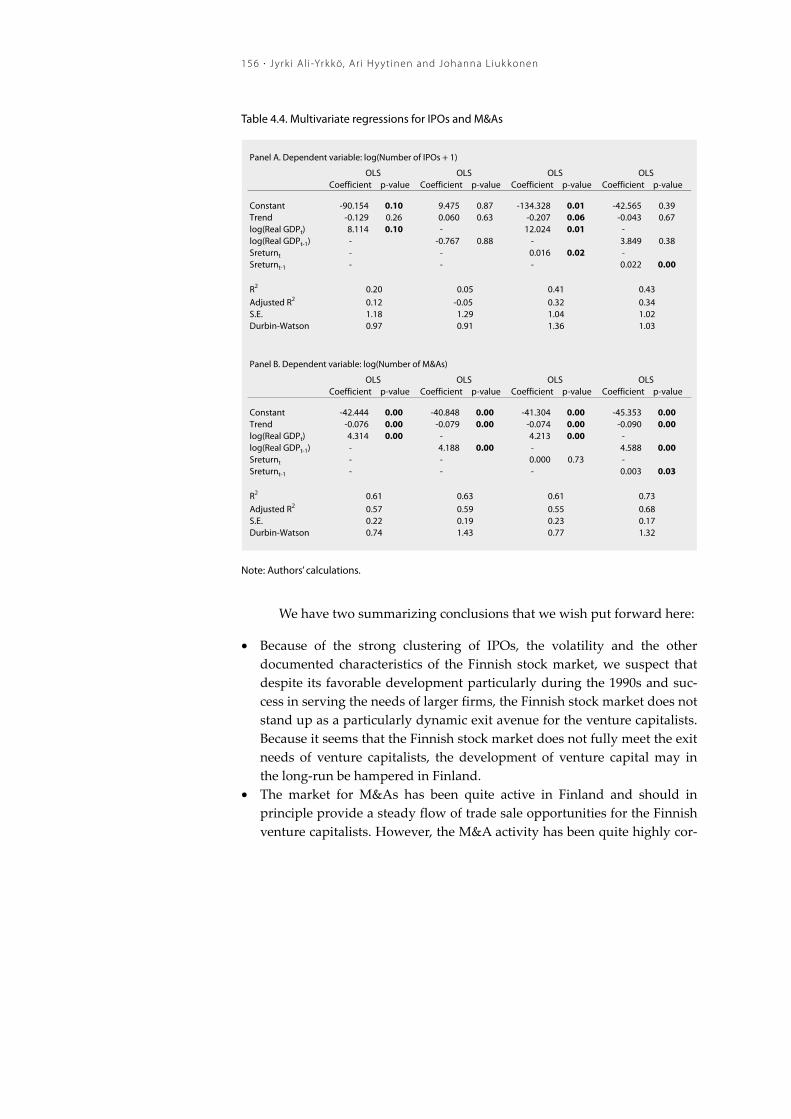
156 · Jyrk i Al i -Yrk kö, Ar i Hyyt inen and Johanna L iuk konen
Table 4.4. Multivariate regressions for IPOs and M&As
Panel A. Dependent variable: log(Number of IPOs + 1)
Coefficient p-value Coefficient p-value Coefficient p-value Coefficient p-value
Constant -90.154 0.10 9.475 0.87 -134.328 0.01 -42.565 0.39 Trend -0.129 0.26 0.060 0.63 -0.207 0.06 -0.043 0.67 log(Real GDPt) 8.114 0.10 - 12.024 0.01 -log(Real GDPt-1) - -0.767 0.88 - 3.849 0.38 Sreturnt - - 0.016 0.02 -Sreturnt-1 - - - 0.022 0.00
R2
Adjusted R2
S.E.Durbin-Watson
Panel B. Dependent variable: log(Number of M&As)
Coefficient p-value Coefficient p-value Coefficient p-value Coefficient p-value
Constant -42.444 0.00 -40.848 0.00 -41.304 0.00 -45.353 0.00 Trend -0.076 0.00 -0.079 0.00 -0.074 0.00 -0.090 0.00 log(Real GDPt) 4.314 0.00 - 4.213 0.00 -log(Real GDPt-1) - 4.188 0.00 - 4.588 0.00 Sreturnt - - 0.000 0.73 -Sreturnt-1 - - - 0.003 0.03
R2
Adjusted R2
S.E.Durbin-Watson
OLS OLS OLS OLS
OLS OLS OLS OLS
0.20 0.12 1.18 0.97
0.05 -0.05
1.29 0.91
0.41 0.32 1.04 1.36
0.43 0.34 1.02 1.03
0.61 0.57 0.22 0.74
0.63 0.59 0.19 1.43
0.61 0.55 0.23 0.77
0.73 0.68 0.17 1.32
Note: Authors’ calculations.
We have two summarizing conclusions that we wish put forward here:
• Because of the strong clustering of IPOs, the volatility and the other documented characteristics of the Finnish stock market, we suspect that despite its favorable development particularly during the 1990s and suc-cess in serving the needs of larger firms, the Finnish stock market does not stand up as a particularly dynamic exit avenue for the venture capitalists. Because it seems that the Finnish stock market does not fully meet the exit needs of venture capitalists, the development of venture capital may in the long-run be hampered in Finland.
• The market for M&As has been quite active in Finland and should in principle provide a steady flow of trade sale opportunities for the Finnish venture capitalists. However, the M&A activity has been quite highly cor-

Ex i t ing venture capita l investments : Lessons f rom Finland · 157
related with IPO activity and the cross-border transactions may have been biased towards small transactions. Further, the overall time trend of M&As activity appears to be decaying. If persistent, the trend may un-dermine the long-run prospects for trade sale exits. Because the venture capitalists typically finance emerging industries, the limited size of the Finnish domestic economy and the absence of large mature companies in many of the emerging fields, such as life science and particularly biotech-nology, may undermine the long-run prospects for trade sale exits, too.
4.4. EXIT EXPERIENCES OF FINNISH VENTURE CAPITAL IN-VESTORS
4.4.1. PATTERNS OF PAST EXITS
Figure 4.10 presents the number of exits achieved via public offerings and trade sales in Finland during the period of 1991-2001.
Figure 4.10. Number of trade sales and IPO exits in Finland (1991-2001)
1991 1992 1993 1994 1995 1996 1997 1998 1999 2000 20010
10
20
30
40
50
60
Trade sale Public offering (IPO + sale of quoted equity)
Note: Data sources are the Finnish Venture Capital Association (FVCA), various yearbooks, and the au-thors’ calculations.
The data shows that in the early 1990s essentially no exit took place via a public offering. During the latter part of the 1990s, the relative importance of public offerings has increased, but trade sales have still been the dominant model of exits. This finding confirms the subdued role and cyclical character-

158 · Jyrk i Al i -Yrk kö, Ar i Hyyt inen and Johanna L iuk konen
istic of the stock market enabled exits in Finland. It is also consistent with the view that the market for M&As has been relatively active.
4.4.2. SURVEY EVIDENCE
We have gathered additional data directly from the Finnish venture capital-ists using a mail survey. In addition to the survey, we carried out 17 inter-views. In what follows, we report what the survey evidence and interviews bear on the Finnish exit environment.26
Table 4.5 reports the exit track record of the sample firms over 1997-2001. Of the sample firms, 73% has had some kind of exit experience and as many as 67% of the venture capital firms have divested one or more portfolio firms via a trade sale. Only 15 (50%) firms have exited an investment via an IPO. The three most common exit routes are trade sale (37%), management buy-out (27%) and IPO (16%).
The share of IPOs in Table 4.5 is lower than what Schwienbacher (2002) reports for a sample of six European countries and the US. It is also of inter-est to contrast these numbers to what Finnish venture capitalists report about their preferred methods of exit: according to our survey respondents, 42% (51%) considered IPO (trade sale) as their preferred exit route. That IPOs are not the most preferred exit route is in contrast to what venture capitalists re-port in the US and UK. These findings provide further support for the sub-dued prospects for the stock market enabled exits in Finland.
Table 4.6 provides a comparison between the venture capital firms that have and those that have not achieved exits during the past four years. The companies with exit experience are clearly older than the companies with no such experience. What’s more, the companies with exit experience have in-vested in fewer early-stage firms, have larger portfolios and make larger in-vestments on average. All these findings are as expected, but only the first difference is also statistically significant.

Ex i t ing venture capita l investments : Lessons f rom Finland · 159
Table 4.5. Exit track record
Number of firms
Share of firms
Number of exits
Share of exits
IPO 15 50% 29 16% Sale of listed equity 4 13% 4 2% Trade sale 20 67% 65 37% Management buy-out 6 20% 48 27% Liquidation (write-off) 9 30% 20 11% Secondary sale/refinancing 3 10% 12 7%
Has some kind of exit experience 22 73% Total number of exits 178 100%
Note: The table reports exits during the past four years or since established if the age of venture capital firm less than four years.
Table 4.6. Differences between the companies with and without exit experience
Has exit experience
No exit experience
p-value for t-test
Age of venture capital firm 6 3 0.033 Number of firms in portfolio 24 13 0.195 Share of technology-based small firms in portfolio 60% 65% 0.771 Share of early-stage firms in portfolio 30% 45% 0.366 Average size of investment, million EUR 5.0 3.0 0.436
Do exits and exit experience matter?
The Finnish venture capital firms ranked the various determinants of the in-vestment decision as reported in Table 4.7.27 The table shows that the avail-ability of exit routes is together with the entrepreneur’s track record the fourth most important investment criterion. The finding is not fully in line with those reported for the US or the UK. Kaplan and Strömberg (2002) found for example that financial market and exit conditions were less fre-quently mentioned than management’s track record in venture capital analy-ses for investments (they were explicitly mentioned in only 11% of the analy-ses). In the UK, potential exit routes have been found to be the 12th most im-portant investment criterion whereas the expertise of the entrepreneur(s) was the 2nd (Van Osnabrugge and Robinson 2000). These differences indicate that the availability of proper exit routes may be a particular cause of concern to Finnish venture capital firms.

160 · Jyrk i Al i -Yrk kö, Ar i Hyyt inen and Johanna L iuk konen
Table 4.7. Ten most important determinants of the investment decision
Average rank
1. Growth potential 6.62. Sales potential 5.43. Financial rewards 5.44. Entrepreneur's track record 4.44. Exit routes 4.46. Competitive protection 3.67. Innovativeness 3.58. Entrepreneur's expertise 3.39. Entrepreneur's trustworthiness 3.3
10. Own understanding of business 3.2
Note: Respondents were asked to rank ten most important determinants of their investment decisions among 18 alternatives by marking 10 for the most important determinant, 9 for the second most im-portant, etc.
The Finnish venture capital firms ranked the various factors affecting the decision to exit by a trade sale and by an IPO as reported in Table 4.8. The decision to pursue an IPO is relatively more dependent on the current stock market conditions, the investee firms’ future profitability and the firm’s growth opportunities. These findings are in line with the findings reported in Schwienbacher (2002) for a sample of six European countries and the US. The table also reveals an interesting difference between IPOs and trade sales: in all the other dimensions except in those directly related to the degree of in-novativeness of the investee firm (R&D and patents), the decision to exit via an IPO is more sensitive, sometimes also to a statistically significant extent, to the factors listed than the decision to exit via a trade sale. Thus, venture capi-talists clearly consider the nature of the investee firm’s activities carefully, in-dicating that the market conditions are decisive for an exit decision and that there may be demand for specific vehicles of exit depending on the type of investee firms.

Ex i t ing venture capita l investments : Lessons f rom Finland · 161
Table 4.8. Factors influencing the choice of exit route
Trade sale IPO
Industry sector of the firm financed 65% 71% 0.802 The firm’s expected market position 77% 92% 0.104 Quality of management 52% 92% 0.002 The current stock market conditions 48% 100% 0.000 The firm’s current profitability 63% 80% 0.212 The firm’s future profitability 89% 100% 0.083 The firm’s expected market cap. 59% 92% 0.003 The firm’s growth opportunities 74% 100% 0.005 The firm’s R&D intensity 70% 60% 0.265 The number of patents the firm owns 41% 32% 0.265
p-value for t-test
Note: The percentages represent the number of respondents who regarded the factor in question im-portant, i.e., they answered 5-7 in a seven-point scale with higher score indicating higher importance. Paired t-test was applied to test H0: The proportions are equal.
In our survey, we also asked the venture capital firms to report to what extent certain selected factors influence their fundraising, investment and exit. Table 4.9 summarizes the results. Beginning first from the first stage of the venture capital cycle, i.e. the fundraising, the available data speak, in ad-dition to the importance of experience for fundraising, for the existence of feedback effects between the exit performance and environment and the abil-ity to raise funds. Mechanisms of this type together with a clear emphasis on the importance of reputation building were also the concern that was most systematically put forward in the interviews we had with the venture capital-ists. The table also reveals that the ability to generate returns for investors seem to be of particular concern for the venture capital firms with no earlier exit experience. Together with the emphasis on experience and age of the venture capital firms, the findings of ours are, as we see it, consistent with the hypothesis that demonstrating one’s ability is relatively more important in the venture capital business for the less experienced (Gompers 1996).28 The data shows too that in a considerably high number of venture capital firms, the state of the exit environment is perceived to have an impact on their ac-tivity. In particular, investing becomes cautious if exit environment becomes more uncertain.
What’s more, as many as 90% of the respondents think that the uncer-tain exit environment leads to a reduction in the number of full exits that the venture capital firms are able to make. The Finnish venture capitalists are thus unanimous that market turbulence translates into a larger overhang of investee companies. While this finding itself is by no means surprising, it il-lustrates the sensitivity of the venture capital process to changes in overall

162 · Jyrk i Al i -Yrk kö, Ar i Hyyt inen and Johanna L iuk konen
operating environment: If the overhang in the venture capital firms becomes excessive, the venture capitalists may find it difficult to raise new capital when the demand for venture capital increases next time.
Table 4.9. Feedback effects and the importance of market environment
Whole sample
Has exit experience
No exit experience
p-value for t-test
Factors that have/have had an impact on fundraising:recent exit performance 78% 83% 60% 0.411 domestic stock market conditions 52% 56% 40% 0.589 previous returns on investors 83% 78% 100% 0.042 age of the venture capital firm 83% 84% 80% 0.854 experience of partners and other senior employees 96% 95% 100% 0.331
Investments: Uncertain exit environment has/has had a negative impact on
investment activity in general 79% 77% 86% 0.628 investments in seed and start-up firms 63% 65% 57% 0.740 investments in technology-based small firms 70% 70% 71% 0.948 degree of specialisation (in investing) 54% 52% 57% 0.841
"Hot-issue markets": Considerations about the ability to exit have led to
too many investments being undertaken in “hot” industries
71% 76% 57% 0.416
too few investments in industries not in the public limelight
29% 29% 29% 1.000
Periods of market turbulance: Considerations about the ability to exit have led to
too many investments in the industries that are perceived less risky
36% 38% 29% 0.665
too few investments in technology-based small firms 25% 29% 14% 0.429
Uncertain exit environment has/has had a negative impact on number of full exits you are able to make
90% 91% 86% 0.747
Note: The percentages represent the number of respondents who agreed with the question i.e., they answered 5-7 in a seven-point scale with higher score indicating higher agreement. t-test (with un-equal variances assumption) was applied to test H0: The proportions of the respondents who agree with the question are equal.
Institutional environment
In this section we consider how the Finnish venture capitalists view the exit environment they face. Table 4.10 shows that the lack of market sophistica-tion in the form of efficient price formation, the volatility of the domestic market and the capabilities of investment banks bringing firms public is the problem expressed by the majority and more frequently experienced than,

Ex i t ing venture capita l investments : Lessons f rom Finland · 163
e.g., the investment behavior of institutional investors or the securities mar-ket regulation. Venture capitalists with no exit experience expressed their concern over the efficiency of price formation and the market liquidity more strongly.29 Overall, the Finnish venture capitalists’ perceptions of the Finnish stock market are a degree or two negative. The same conclusion describes the views put forward in the interviews, in which the problems due to the thin-ness and cyclical nature of the domestic stock market were highlighted.
Table 4.10. Institutional environment of IPOs
Whole sample
Has exit experience
No exit experience
p-value for t-test
IPOs and stock market:In Finland price formation is as efficient and prices as informative as in other market places
25% 33% 0% 0.005
The anticipation of poor secondary market liquidity affects adversely the primary market
86% 81% 100% 0.042
Finnish market place as an exit route is more sensitive to general market conditions than the market places of other advanced economies
64% 57% 86% 0.136
It is very difficult to bring a firm to the public market if there are only few, if any, listed firms in the stock market that are similar to the firm
71% 71% 71% 1.000
In Finland, it is as easy to list technology-based small firms as it is to list any other firm
48% 35% 86% 0.014
The anticipation of poor secondary market liquidity affects adversely particularly the primary market of technology-based small firms
68% 71% 57% 0.543
The institutional investors active in the Finnish market pay only little attention to technology-based small firms
37% 35% 43% 0.740
Securities regulatory requirements have a significant impact on the cost of taking a firm public
48% 48% 50% 0.915
Investment banks operating in Finland...screen and evaluate carefully firms that they take public 26% 32% 13% 0.266 ...have expertise to bring all kinds of firms to the public market
37% 32% 50% 0.416
...have sufficient placing power (sales power) to bring also technology-based small firms to the public market
52% 42% 75% 0.123
Note: The percentages represent the number of respondents who agreed with the question i.e., they answered 5-7 in a seven point scale with higher score indicating higher agreement. t-test (with unequal variances assumption) was applied to test H0: The proportions of the respondents who agree with the question are equal.
From Table 4.11 we see that 59% of the sample companies reported that the finding of an industrial buyer is problematic. The results also indi-cate that the use of external advisors is considered beneficial, particularly when it comes to cross-border transactions. To find a buyer for secondary

164 · Jyrk i Al i -Yrk kö, Ar i Hyyt inen and Johanna L iuk konen
sales seems to be of more concern, particularly in the eyes of the more experi-enced venture capitalists. Overall, the Finnish venture capitalists’ assessment of the institutional environment for trade sales is more neutral than that con-cerning the stock market.30
Table 4.11. Institutional environment of M&As
Whole sample
Has exit experience
No exit experience
p-value for t-test
Trade salesThere is clear lack of strategic / industrial buyers in Finland
59% 62% 50% 0.595
In Finland, it is as easy to find a buyer for a technology-based small firm as it is for a less technology dependent ("old-economy") firm
59% 52% 75% 0.273
The Finnish M&A-market as an exit route is more sensitive to general market conditions than the markets of other advanced economies
44% 40% 57% 0.476
Trade sale can be executed more efficiently by using outside advisors
86% 90% 75% 0.402
In a trade sale, outside advisors are useful in - identifying international buyers 90% 90% 88% 0.837 - driving cross-border deals through 83% 86% 75% 0.567
Secondary sales and buy-backsIt is difficult to find a buyer in secondary sales 61% 75% 25% 0.022 It is difficult to find financing for a buy-back / MBOs 30% 32% 25% 0.743
Note: See Table 4.10.
4.4.3. ASSESSMENT
The foregoing supports the following conclusions:
• The patterns of past exits are consistent with the view that the Finnish stock market has served as a less important exit avenue for the venture capitalists than the market for M&As.
• The survey evidence and the interviews support the earlier conclusion of ours that despite the advance achieved in the 1990s, the Finnish stock market does not fully meet the exit needs of Finnish venture capitalists. The fact that the availability of exits is an important determinant of the investment decision and that Finnish venture capital investors do not re-gard IPOs as their preferred method of exit support the conclusion. More-over, Finnish venture capital investors’ overall assessment of the institu-

Ex i t ing venture capita l investments : Lessons f rom Finland · 165
tional environment of IPOs is a degree or two negative and more negative than their assessment of the M&A environment.
4.5. CONCLUSIONS
The received literature suggests that because the exit stage may have several feedback effects on the earlier stages in the venture capital process, the long-run development of the venture capital industry is dependent on the exit possibilities the financial system (in which venture capitalists operate) gener-ates. In this Chapter, we consider the Finnish financial system and study in particular whether it has the characteristics that enhance the exit opportuni-ties and hence contribute to the long-run development of venture capital.
Our analysis of aggregate level data suggests that despite its favorable development particularly during the 1990s and success in serving the needs of larger firms, the Finnish stock market does not fully meet the exit needs of Finnish venture capitalists. This is because of the strong clustering of IPOs, the volatility and the other documented characteristics of the Finnish stock market. The market for M&As has been quite active in Finland and should in principle provide a steady flow of trade sale opportunities for the Finnish venture capitalists. However, the overall trend may be decaying once the size of the economy is controlled for. Because the venture capitalists typically fo-cus on emerging industries, the limited size of the Finnish domestic economy and particularly the absence of large mature companies in many of the emerging fields, such as biotechnology, may undermine the long-run pros-pects for trade sale exits, too.
The survey we administered to Finnish venture capitalists confirms the above conclusions. The survey results suggest that the Finnish stock market does not necessarily have the characteristics that enhance the exit opportuni-ties of venture capitalists. The venture capitalists’ assessment of the stock market is a degree or two negative and more negative than their assessment of the M&A environment. Consistent with the importance of feedback effects, the availability of exits is an important determinant of the investment deci-sion for the Finnish venture capitalists.
Because a large fraction of the Finnish venture capital industry is rather young, the long-run prospects of the industry depend crucially on the industry’s success in generating returns to investors and in building reputa-tion (see Hyytinen 2002). The exits enabled by the stock market would be in-strumental to achieving these goals, particularly for the less established ven-ture capital firms. The Finnish venture capital industry would therefore bene-

166 · Jyrk i Al i -Yrk kö, Ar i Hyyt inen and Johanna L iuk konen
fit a great deal if Finland had a “stronger” stock market. Moreover, even though the amount of risk capital available to private, unlisted firms has grown quite rapidly in the recent past, the analysis indicates a reason why the development of Finnish venture capital industry may slow down: The Finnish market for venture capital matures slowly, if at all, because the struc-ture of the Finnish financial system is such that it only imperfectly supports successful exiting, something that lies at the heart of the venture capital proc-ess.
The emergence of private marketplaces for the stocks of unlisted Fin-nish firms is a step towards alleviating the problems identified in this Chap-ter. The development deserves therefore the full attention of financial mar-kets community and policy-makers. To overlook it amounts to nothing less than undermining the competitive advantage of Finland, as the lack of exit opportunities means that investors may need to focus on cash-generating, shortsighted projects in which they invest on the basis of short-term cash flow outlook instead of long-term capital gains. This means that capital gets allocated in a distorted fashion, away from long-gestation period and poten-tially most innovative projects.
Ex i t ing venture capita l investments : Lessons f rom Finland · 167
REFERENCES
Ali-Yrkkö, J., 2001, Mergers and acquisitions: Reasons and results, The Research Institute of the Finnish Economy (ETLA), mimeo.
Bascha, A. and Walz, U., 2001, Convertible securities and optimal exit decisions in venture capital finance, Journal of Corporate Finance, forthcoming.
Becht, M. and Röell, A., 1999, Blockholdings in Europe: An international comparison, European Economic Review, 43, 1049-1056.
Becker, R. and Hellman, T., 2000, The genesis of venture capital: Lessons from the German experience, Graduate School of Business, Stanford University, mimeo.
Berglöf, E., 1994, A control theory of venture capital finance, Journal of Law, Economics and Organisation, 10: 2, 247-267.
Black, B. S., 2001, The legal and institutional preconditions for strong securities markets, UCLA Law Review, 48, 781-858.
Black, B. S. ja Gilson, R. J., 1998, Venture capital and the structure of capital markets: Bank versus stock markets, Journal of Financial Economics, 47, 243-277.
Bottazzi, L. and Da Rin, L., 2002, Europe’s ‘new ‘ stock markets, Centre for Economic Policy Research, Discussion Paper No. 3521.
Da Rin, M. and Bottazzi, L., 2002, Financing entrepreneurial firms in Europe: Facts, issues, and research agenda, Paper prepared for CESifo Conference on Venture Capital, Entrepreneurship and Public Policy.
EVCA (European Private Equity and Venture Capital Association), various yearbooks.
FVCA (Finnish Venture Capital Association), various yearbooks.
Gans, J. S. and Stern, S., 2000, When does funding research by smaller firms bear fruit? Evidence from the SBIR program, National Bureau of Economic Research, Working Papers No. 7877.
Gompers, P. A., 1996, Grandstanding in the venture capital industry, Journal of Financial Economics, 42, 133-156.
Gompers, P. A. and Lerner, J., 2000, The venture capital cycle, The MIT Press, US.
Gompers, P. A. and Lerner, J. A., 2001, The venture capital revolution, Journal of Economic Perspectives, 15, 145-168.
Helsinki Stock Exchange, various yearbooks.
Honkapohja, S. and Koskela, E., 1999, The economic crisis of the 1990s in Finland, Economic Policy, 14, 400-436.
Hyytinen, A. and Pajarinen, M., 2003, Financial systems and venture capital in Nordic countries: A comparative study, Chapter 1 in this volume.

168 · Jyrk i Al i -Yrk kö, Ar i Hyyt inen and Johanna L iuk konen
Hyytinen, A., 2002, How important are exits for venture capital finance? Evidence from Finland, Paper prepared for CESifo Conference on Venture Capital, Entrepreneurship and Public Policy.
Högfeld, P. and Holmen M., 2001, A law and finance analysis of initial public offerings, Stockholm School of Economics, mimeo.
Jeng, L. A. and Wells, P. C., 2000, The determinants of venture capital funding: Evidence across countries, Journal of Corporate Finance, 6, 241-289.
Jenkinson, T. and Ljungqvist, A., 2001, Going public: The theory and evidence on how companies raise equity finance, Oxford University Press, UK.
Johnson, S., 2000, Private contracts and corporate governance reform: Germany’s Neuer Markt, Massachusetts Institute of Technology, mimeo.
IMF (International Monetary Fund), International financial statistics, various publications.
Kanniainen, V. and Keuschnigg, C., 2001, Start-up investment with scarce venture capital support, University of Helsinki, mimeo.
Kaplan, S. N. and Strömberg, P., 2002, Characteristics, contracts, and actions: Evidence from venture capitalist analyses, National Bureau of Economic Research Working Paper No. 8764.
Kasanen, E., Kinnunen, J. and Niskanen, J., 1996, Dividend-based earnings management: Empirical evidence from Finland, Journal of Accounting and Economics, 22, 282-312.
Keloharju, M., 1993, The winner's curse, legal liability and the long-term price performance of initial public offerings in Finland, Journal of Financial Economics, 34, 251-277.
Michelacci, C. and Suarez, J., 2001, Business creation and stock market, CEMFI, Madrid, mimeo.
Milhaupt, C. J., 1997, The market for innovation in the United States and Japan: Venture capital and the comparative corporate governance debate, Northwestern University Law Review, 91, 865-898.
Nenova, T., 2000, The value of corporate votes and control benefits: A cross-country analysis, Harvard University, mimeo.
Neuer Markt Report, 2001, Gateway to European capital markets – Key to growth, Deutsche Börse AG.
Ongena, S. and Smith, D. C., 2001, The duration of bank relationships, Journal of Financial Economics, 61, 449-475.
Pagano, M., 1993, The flotation of companies in the stock market: A coordination failure model, European Economic Review, Vol. 37, 1101-1125.
Pagano, M., Röell, A. A. and Zechner, J., 2001, The geography of equity listing: Why do companies list abroad?, Centre for Economic Policy Research, Discussions Papers, No. 2681.
Rousseau, P. L. ja Wachtel, P., 2000, Equity markets and growth: Cross-country evidence on timing and outcomes 1980-1995, Journal of Banking and Finance, Vol. 24, 1933-1957.
Sahlman, W., 1990, The structure and governance of venture capital organizations, Journal of Financial Economics, Vol. 27, 473-521.
Schwienbacher, A., 2002, An empirical analysis of venture capital exits in Europe and in the United States, mimeo.

Ex i t ing venture capita l investments : Lessons f rom Finland · 169
Van Osnabrugge, M. and Robinson, R. J., 2000, Angel investing: Matching start-up funds with start-up companies, Jossey-Bass, San Francisco, US.
Weston, J. F., Kwang, S. and Siu, J. A., 1998, Takeovers, restructuring, and corporate governance, Prentice Hall, New Jersey, US.

170 · Jyrk i Al i -Yrk kö, Ar i Hyyt inen and Johanna L iuk konen
APPENDIX. DATA AND SURVEY DESIGN
We used a survey to collect additional primary data. This additional empiri-cal evidence is based on the results of a questionnaire administered to 39 Finnish venture capitalists covering nearly the entire population of the Fin-nish venture capitalists and corporate ventures. We excluded two funds of funds (Finvest and Proventure) and public venture capitalists (The Finnish National Fund for Research and Development (Sitra) and The Finnish Indus-try Investment Ltd (Teollisuussijoitus)) from the target sample because our primary interest is in the private part of the venture capital sector that invests directly in the firms in need of external capital.
Model of questionnaire
The model of our questionnaire was based on a questionnaire used in Armin Schwienbacher (2002). We modified it to reflect our special interest in the role of exit stage in the venture capital cycle and in the exit environment that ven-ture capitalists face. The questionnaire was divided into six main parts. The parts were roughly about the respondent and the company’s background in-formation, investment decisions, exit experiences, fundraising and the Fin-nish institutional and legal environment.
Several types of questions were used. First, the respondents were ex-pected to provide and estimate quantitative data, such as the number of ven-tures in their portfolio, achieved exits, type of exits, usage of exit agreements and syndication deals, to name a few. Second, the respondents were pre-sented statements and asked to take a stance on them. These questions were measured with a Likert-scale, which indicates whether the respondent agrees or disagrees with a statement on a scale from 1 to 7. The scale values of the statements were as follows: 1-3 indicate disagreement, 4 indicates indiffer-ence and 5-7 indicate agreement. Third, the respondents were asked to pro-vide rankings of certain factors. Some of the answers were expected to be given for a time period covering the past four years, i.e. 1997-2001.
The questionnaire was distributed to the target sample together with a cover letter that suggested the companies to choose a respondent, a single in-formant, who had strongly been involved in the decision-making in exit

Ex i t ing venture capita l investments : Lessons f rom Finland · 171
processes. The questionnaires were sent to the target firms in the end of June 2001 and received back by the end of August 2001.
Achieved sample
A total of 30 completed questionnaires were returned out of the 39 question-naires that were distributed. This results in a response rate of 77%. The re-sponse rate is higher than in many similar surveys that have involved re-spondents in high executive positions and that have required the provision of detailed, company-specific information. Albeit the achieved sample is small in absolute terms, it is a representative sample of the private Finnish venture capital firms.
Field study and interviews
In addition to the survey, we carried out 17 interviews with the Finnish ven-ture capital companies. The interview questions were designed to support the research questionnaire and in particular to get a closer look at topical is-sues surrounding exists. The aim of the interviews was also to enhance our knowledge about the nature and stage of the venture capital cycle in Finland, as well as uncover any other factors and problems that might affect adversely the venture capital processes. The interviews took place in July and August 2001.
Description of the survey data
Table 4.12 provides background information on the characteristics of the re-spondent firms. As can be seen from the table, the Finnish venture capital in-dustry is relatively young. Nearly 60% of the private, currently operative Finnish venture capital firms have been established during the past five years. Because of the financial crisis of the early 1990s and the fact that the Finnish financial markets were for long bank-centered and debt-dominated, this finding is by no means very surprising. The age profile suggests, how-ever, that a large part of the industry is relatively inexperienced and may hence lack a degree or two of maturity (see also Hyytinen and Pajarinen Chapter 1 in this volume). Over half of the companies in our data are inde-pendent venture capital firms, and the second biggest group is those belong-ing to some financial corporation or group. Of the sample companies, 73% manages closed-end funds, suggesting that the Finnish venture capitalists

172 · Jyrk i Al i -Yrk kö, Ar i Hyyt inen and Johanna L iuk konen
are, as their counterparts in the US, forced from time to time to return to the market in order to raise new funds due to the limited lifetime of the funds. Finally, we note that insurance companies and pension funds serve as the main sources of funds while the role of banks and retained capital gains as the source of funds is less important. The class “Other”, which includes capi-tal infusions into the venture funds for example by fund-of-funds and private persons, has too been mentioned to be an important source of funds.
The venture capital firms have, on average, 21 investee firms in their portfolio. A closer look at the size distributions shows, however, that the dis-tribution of the venture capital firms is skewed towards the smaller-sized firms. The total number of investee firms in the portfolios managed by the venture capital firms in our sample is 630, suggesting that our sample is very representative indeed: at the end of year 2000, the size of the total (popula-tion) portfolio was 626 firms (Finnish Venture Capital Association 2000).
The average size of the investments in portfolio companies is EUR 4.5 million. One third of the investee companies are at seed and start-up stage and 61% of them can be classified as investments in technology-based small firms (TBSFs), defined as a firm with less then 250 employees that operates in a “high-technology” industry. There seems to be no notable changes in the investment behavior; the portfolio composition in terms of the stage of the investee firms and their type (i.e. TBSF or not) today is about the same as it has been during the past four years.

Ex i t ing venture capita l investments : Lessons f rom Finland · 173
Table 4.12. Background information
Number of respondents 30
Year of establishmentbefore 1990 13%1990-1995 30%1996-2001 57%
Type of businessindependent venture capitalist 53%subsidiary of non-financial corporation 3%international organization related 3%subsidiary of financial corporation 23%government / municipal related 7%other 10%
Manages closed-end funds 73%
Main sources of fundsbanks 4%corporate investors 8%insurance firms 25%government agencies 15%realized capital gains 2%pension funds 23%other 23%
Proportion of funds provided or guaranteed by the public sector 11%Number of firms in current portfolio 21Average size of investments, million EUR 4.47
Share of technology-based small firms in portfoliocurrent situation 61%over past four years 59%
Share of seed and start-up firms in portfoliocurrent situation 34%over past four years 37%

174 · Jyrk i Al i -Yrk kö, Ar i Hyyt inen and Johanna L iuk konen
ENDNOTES
1 As Bottazzi and Da Rin (2002) have noted, “[T]he commonly perceived degree of achievement of the ‘new’ markets has varied with stock prices”. The recent bear market is reflected in many recent assessments (see, e.g., “Since April 2000 Germany’s Neuer Markt has shrunk by EUR211 bn… now the market itself is to close” in Financial Times, September 27, 2002; and “NM-lista nylki mummotkin” in Talouselämä, October 18, 2002, No. 35.) 2 See also Black (2001) who considers the legal and institutional preconditions, such as the existence of re-strictions against self-dealing, mechanisms of investor protection and functioning of reputational interme-diaries, for strong securities markets. 3 There indeed exists evidence that IPOs are a systematic determinant of venture capital investing across countries; see Section 2 for further discussion. 4 Besides IPOs and trade sales, there are other exit vehicles available for venture capitalists, such as buybacks (share repurchase by the founding entrepreneurs), secondary sales (selling of shares to institutional inves-tors), and write-offs. However, IPOs and trade sales are typically the most profitable routes of exit and also most commonly used. 5 To address these questions we have gathered data directly from the Finnish venture capitalists using a mail survey. In addition to the survey, we carried out 17 interviews. The survey, data and interviews are de-scribed in detail in Appendix. 6 Despite the recent growth, the level of investment and divestment activity has nevertheless remained be-low the level predicted by the country’s GDP share in Europe. In Finland, the peak year in terms of funds raised (EUR 628 million) was 1999 while and in terms of investments (EUR 384 million) it was 2000. When compared to other European countries, it appears that the Finnish venture capital industry is also at an ear-lier stage of the venture capital cycle (see also Hyytinen and Pajarinen, Chapter 1 in this volume). 7 Information and incentive problems in the financing of innovative entrepreneurs and technology-based small firms (TBSFs) are typically so severe that they undermine and often block the entrepreneurs’ and TBSFs’ access to conventional sources of external finance. The firms that venture capital firms finance are plagued with higher uncertainty, deeper information asymmetries, worse incentive problems and higher risk of out-right failure than the more traditional firms. Moreover, the firms that the venture capital firms finance are of-ten young, generate limited cash flow, have a short track record, and own only few, if any, assets that they could pledge as collateral. The venture capitalists are therefore thought to solve a more extreme set of agency and informational problems than the traditional financial intermediaries, such as the deposit banks do. 8 This possibility may be particularly important if the private benefits of control account for a significant frac-tion of the entrepreneurs’ compensation. The empirical importance of the private benefits of control is diffi-cult to evaluate. However, some surveys administered by the Federation of the Finnish enterprises provide a hint that the control may be highly valued within the Finnish entrepreneur community. Moreover, a recent study by Nenova (2000) suggests that the control value, i.e. the benefits that controlling shareholders ex-tract out of corporate control, is higher in Finland than in the other Nordic countries but lower than in cer-tain civil law countries. 9 The existence of such a match cannot be taken for granted in Europe, because only relatively established and old firms have traditionally gone public. Seen in this light, the importance of the recent growth of new hi-tech stock market segments in Europe cannot be over-emphasized. If domestic listing is not feasible, an exit enabled by public offering to an international stock exchange may be required. While listing abroad may be an integral part of the strategy of globally oriented growth firms, it involves, however, higher flota-tion costs. In the case of smaller firms with some but limited globalization prospects, the listing abroad may be an infeasible choice because of the costs and, additionally, because of the lack of interest by the foreign investors. For a detailed treatment of the benefits and costs of listing abroad, see Pagano et al. (2001).

Ex i t ing venture capita l investments : Lessons f rom Finland · 175
10 Investment banks, consulting firms, specialized M&A advisors, law firms as well as accounting firms are an integral part of the financial infrastructure that enhance the matching process. See also Black (2001) who considers the importance of these institutions for strong securities markets. 11 Johnson (2000) considers this problem from another perspective and suggests a reason why the institu-tional design of stock markets may matter for the development of the venture capital industry. Because many of the high-risk ventures face a considerable amount of uncertainty even at the time when they want to become public, a sufficient amount of disclosure of information is needed for the listing to take place; otherwise investors are reluctant to buy the shares of the company in the IPO and thereafter. Johnson points out that the private contract offered by Deutsche Börse, requiring companies to commit to disclo-sure and to use US-GAAP or IAS for their financial statements, attempts overcoming the information prob-lems. If companies are willing to adopt this listing contract, Deutsche Börse enforces compliance and pro-vides a basis for successful IPO. Johnson argues that at least in Germany, the use of such private arrange-ments has proven consistent with a significant increase of venture-backed IPOs and a more active venture capital industry. 12 In other words, the venture capitalists can substitute away from the unavailable exit route to the other. To be sure, IPOs and M&As can also sometimes be complements because occasionally one makes the other available. Such complementarity would, for example, arise if the most important industrial buyers are the larger companies listed on the stock exchange in which case better liquidity would enhance M&As. It would also arise if the smaller investee companies were merged to increase the company size prior to flotation. The exits enabled by MBOs and LBOs in connection of firm restructuring and de-listings suggest yet an-other instance of complementarity. 13 The adjustment addresses the forward-looking nature of the stock prices and puts more weight on the dimension of the stock market capitalization that reflects the importance of financing through equity issues and new listings (see Rousseau and Wachtel 2000). 14 Even in a cross-section, the ratio has varying interpretations, as it reflects, besides new listings and equity issuance, the discounted value of the listed firms’ expected future cash flows. The measure’s deficiencies notwithstanding, it is an indicator of the relevance of the stock market for an economy. 15 Kasanen et al. (1996) reports that during 1970-1989, the average ratio of annual dividends paid by a group of Finnish listed firms was as high as 100.3% of the annual turnover of the Stock market. 16 Because the turnover is measured by dividing the value traded by the market capitalization, the forward-looking nature of the stock prices is not driving the improvement. 17 Because the turnover (value traded) is recorded in international stock exchanges in different ways, the numbers we present should be interpreted with care. The numbers for the Finnish stock market are re-corded according to a Trading System View (TSV), which measures only transactions passing through the stock exchange’s trading system. The same methodology is used in Japan, Canada and in the New York Stock Exchange (NYSE) in the US. In several other stock exchanges, including Stockholm’s and Oslo’s ex-changes as well as Nasdaq in the US, also off-market transactions are recorded (based on Regulated Envi-ronment View (REV) methodology). The turnover under REV is typically higher than the turnover under the TSV concept. Therefore, the Finnish numbers can be compared only to the group of exchanges using the TSV. Albeit a comparison of growth rates can too be misleading, we display the turnover for Norway and Sweden for completeness. 18 The finance theory predicts that higher risk comes with higher expected returns. The comparison pre-sented here does not take into account the trade-off. 19 Between World War II and the early 1980s, only a handful of companies went public in total. Amidst the liberalization of the financial markets, the IPO activity increased. The common procedure in the 1980s was to list new companies on a separate list called “Stockbroker’s list” and on the OTC market. These companies were typically quite small, operating most often in manufacturing and financial services sectors. 20 Privanet Capital Group consists of three companies: Privanet Capital Corporation and its fully owned sub-sidiaries Privanet Ventures Ltd and Privanet Securities Ltd. Privanet Securities Ltd is an investment firm that operates in accordance with EU Investment Services Directive (93/22/EEC). It is registered in Finland and regulated by the Finnish Ministry of Finance and supervised by the Finnish Financial Supervision Authority. The parent company of the group, Privanet Capital Corporation, is a full member of the Finnish Venture Capital Association. The only institutional shareholder of Privanet is Sitra, the Finnish National Fund for Re-search and Development, which owned 31.1% of Privanet as of December 2002. Privanet has also received

176 · Jyrk i Al i -Yrk kö, Ar i Hyyt inen and Johanna L iuk konen
funding from Tekes, the National Technology Agency as a part of the SPIN 2000-2003 technology program. For more information, see https://www.privanetcapital.com/priv/julkinen/. 21 Because no official M&A data exist, we use different databases in the comparisons that follow; see Ali-Yrkkö (2001). 22 An explanation for this finding is a reform of the taxation of capital gains in the late 1980s. 23 The explicit introduction of the trend variable in the regression may be acceptable only if the trend un-derlying the variables is deterministic and not stochastic. Because in the reported regressions the coefficient of determination is larger than the value of the Durbin-Watson statistic, the Granger-Newbold rule of thumb for a spurious regression suggests that the results are not dubious. We also explicitly corrected in un-reported regressions for the possible effects of autocorrelation in the error terms, but the results did not change. 24 We also experimented by including the real market capitalization of the stock market into the regressions. Our qualitative conclusions are robust to the experiment. 25 The decreasing trend in M&As can be uncovered even if we control for the stock market returns and the real size of the stock market. 26 We benefited a great deal from Armin Schwienbacher’s help when drafting the questionnaire for the sur-vey. The survey, data and interviews are described in detail in Appendix. 27 It is important to notice that we now analyze entirely subjective assessments of the importance of the se-lected factors. Essentially, we can only report to what extent the respondents agreed or not with certain statements concerning the Finnish exit environment and its impacts on the venture capital process. The limitation of this assessment is, of course, that the respondents provided only their subjective judgment of the statement, not a quantitative measure of the actual impact. 28 See also Hyytinen (2002) who finds further support for the hypothesis. 29 In light of this negative assessment, it is a little surprising that the less experienced venture capital firms nevertheless thought that listing a technology-based firm is as easy as it is to list any other firm. 30 We asked (in unreported questions) whether the pricing of the services that investment banks (and other external advisors) provide is “competitive”. In the case of listing, 37% of the firms reported that the pricing is competitive, while in a question addressing the costs arising in trade sales, (only) 31% of the respondents indicted that the pricing of the services is competitive.

Financia l systems and f i rm per formance: Theoret ical and empir ica l perspect ives ·1 7 7
5. PATTERNS OF THE FINNISH MERGER AND ACQUISITION ACTIVITY
Jyrki Ali-Yrkkö*
Abstract: The aim of this Chapter is to consider the key motives behind mergers and acquisi-tions (M&As) and to provide an analysis of the Finnish market for M&As. In par-ticular, we are interested in how active the Finnish M&A market is compared to that of other countries. We find that Finnish companies have faced an active M&A mar-ket. In fact, after taking into account the size of the economy, Finland ranked the first out of all EU member states during the 1990s. This high level of activity is not only due to domestic deals but also due to a high number of outward and inward cross-border M&As. Our analysis also indicates that a large part of the cross-sectional and time-series variation of the M&A activity can be explained by using some prominent macroeconomic factors, such as GDP and the size of the stock market. However, even after controlling for these factors, there is something different about Finland, as there exists some other positive factor(s) that have contributed to the Finnish M&A activ-ity.
* Jyrki Ali-Yrkkö is at the Research Institute of the Finnish Economy (ETLA) and Etlatieto Ltd. The author would like to thank Ari Hyytinen, Markus Koskenlinna, Eva Liljeblom, Anu Nokso-Koivisto, Vesa Puttonen, Petri Rouvinen, Otto Toivanen and Pekka Ylä-Anttila for helpful comments. The views expressed in the Chap-ter are those of the author. The usual caveat applies.

178 · Jyrk i Al i -Yrk kö
5.1. INTRODUCTION
The latest merger and acquisition (M&A) wave that started in the mid of the 1990s can be termed “the wave of megadeals”, reflecting the high number of very big M&As that were carried out.1 Most of the largest deals were hori-zontal in nature, but also diversifying mergers were undertaken, particularly in the financial industry where banks and insurance companies merged. While the biggest deals received most of the attention in the headlines, a great number of smaller M&As were also closed. However, the recent M&A activity is far from being a unique phenomenon, as it is the fifth wave that has occurred during the last hundred years.
One of the driving forces behind the recent surge in M&As is global-ization. As shown in Figure 5.1, domestic M&As still dominate the M&A market although the number of cross-border deals has during the past ten years grown three-fold. Particularly in the U.S, the latest wave has been characterized as the first international merger wave.
Figure 5.1. The number of mergers and acquisitions (world total, 1990-2000)
1990 1991 1992 1993 1994 1995 1996 1997 1998 1999 2000E0
5,000
10,000
15,000
20,000
25,000
30,000
Domestic Cross-border
Note: Data sources are OECD (2001) and the author’s calculations.

Patterns of the Finnish merger and acquis i t ion act iv i ty · 179
The long history and waves of M&As raise the question of importance of M&As for national economies. M&As affect not only market structures and industry dynamics, but also wealth of shareholders and welfare of stakeholders. Moreover, M&As serve as an important mechanism of corpo-rate control.
In this study, the key questions addressed are as follows:
• What are the key motives behind M&As? • How active is the Finnish market for M&As? In particular, how active is it
compared to that of other countries?
The rest of this Chapter is organized as follows. In Section 5.2 the rele-vant literature concerning the motives of M&A is reviewed. Section 5.3 gives a description of Finnish M&A activity overtime and compared to other coun-tries. Finally, Section 5.4 concludes.
5.2. MOTIVES OF MERGERS AND ACQUISITIONS
5.2.1. FIRM-LEVEL MOTIVES FOR M&AS
Economic performance and efficiency
The dominant motive of M&As in the economics and finance literature is that they lead to improvements in economic performance. The motive suggests that M&As occur because of the economic gains that merging two companies give rise to. According to this motive, the value of a merged company ( ABV ) is higher than the sum of the value of separate companies ( ,A BV V ), i.e.,
( )AB A BV V V> + . The condition is related to the neoclassical theory of firms and to the assumption that firms maximize their profits or shareholder value.
Maximizing profits or shareholder value is however too general to be a motive for M&As. It is too general, because it does not identify the sources of the improvements in economic performance. There are several possible sources of performance gains, including the following ones:
• Cost savings. The term synergy is often used as a synonym for cost sav-ings. According to this motive, M&As are undertaken to achieve savings in both variable and fixed costs. Perhaps the most obvious source of cost savings is the elimination of overlapping operations of two merging com-panies, such as administration and IT. Due to the nature of fixed costs,

180 · Jyrk i Al i -Yrk kö
cost reduction potential is not restricted only to horizontal mergers. Verti-cal mergers (integration) can be a source of cost reduction. For instance, cost savings can be achieved by avoiding costs of communication and bargaining (Arrow 1975, Williamson 1975). Moreover, if production proc-esses require a tightly integrated production chain, lower production costs may be achieved by vertical integration (Mueller 1980, p. 30). The size of the new entity can be the source of cost reductions for less than minimum efficient size firms.2 It has also been argued that companies may achieve financial synergies by merging. While some firms have ex-cess cash flow, others short of financing have large investment opportuni-ties. Due to the lower costs of internal financing versus external financing (Myers and Majluf 1984), combining two such companies may result in financial synergies, i.e. cost savings. Also tax-related savings may drive some firms to combine.
• Market power. According to the market power motive companies merge to increase their market power (see e.g. Stigler 1950). If the merger or acqui-sition is large enough, the combined firm may obtain a monopoly-like po-sition and earn above-normal profits. Moreover, if a large economy of scale exists, a big company may set its price above marginal cost but be-low the level that would lead to entry. M&As may thus be a means to cre-ate entry barriers.
• Acquiring resources. By acquiring an existing company, control of the target company’s resources is transferred to the acquirer. This transfer offers several potential advantages for the acquirer. First, it is able to increase its own capacity without increasing the total capacity of the industry. This motive may be particularly important in declining industries. Moreover, an acquisition offers a rapid way to increase capacity compared to a greenfield investment. Second, in vertical mergers, the acquirer can secure supply of a critical input and reduce external uncertainty (Porter 1980). In addition to raw materials, intermediate products and distribution chan-nels, this resource-seeking motive also covers acquisition of know-how, such as technological, geographical and managerial knowledge. Rather than developing technology only through R&D, acquisitions can be used as a means to acquire new technology. In acquisitions patents, copyrights and also technological know-how of the acquired unit’s personnel are transferred to the acquiring company. Moreover, cross-border acquisitions offer a potential means to acquire geographical know-how. Particularly for companies with a limited international experience, a cross-border ac-
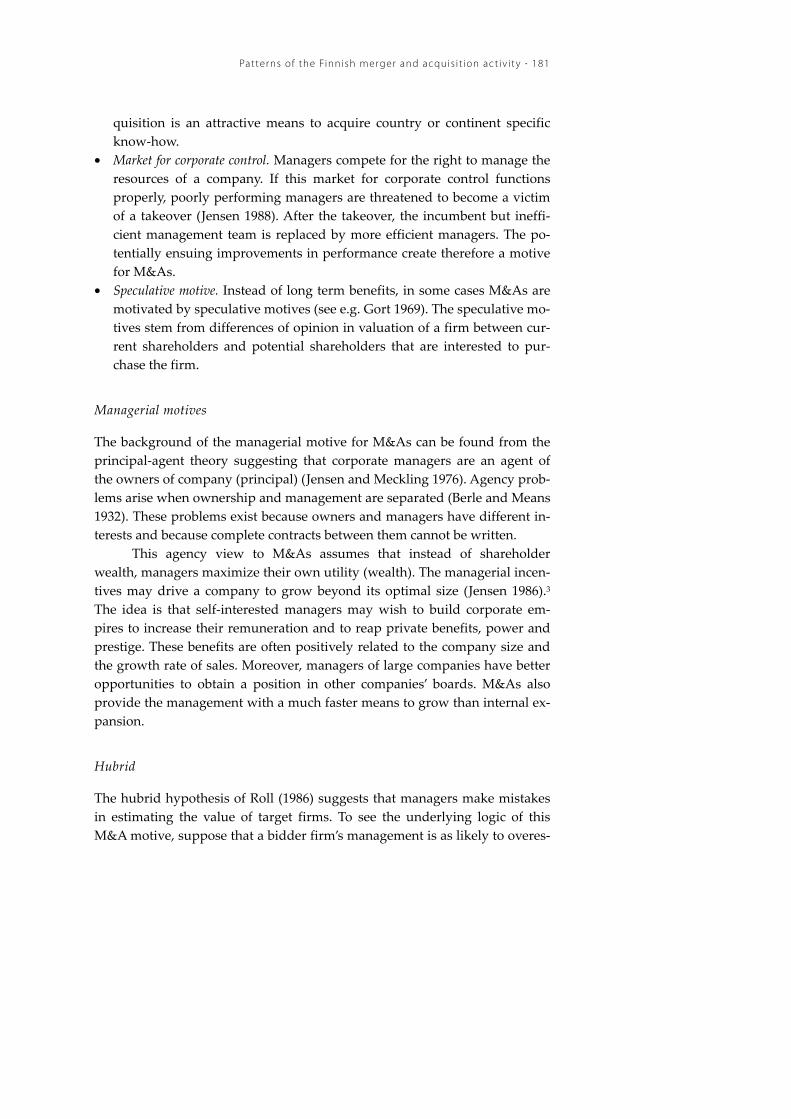
Patterns of the Finnish merger and acquis i t ion act iv i ty · 181
quisition is an attractive means to acquire country or continent specific know-how.
• Market for corporate control. Managers compete for the right to manage the resources of a company. If this market for corporate control functions properly, poorly performing managers are threatened to become a victim of a takeover (Jensen 1988). After the takeover, the incumbent but ineffi-cient management team is replaced by more efficient managers. The po-tentially ensuing improvements in performance create therefore a motive for M&As.
• Speculative motive. Instead of long term benefits, in some cases M&As are motivated by speculative motives (see e.g. Gort 1969). The speculative mo-tives stem from differences of opinion in valuation of a firm between cur-rent shareholders and potential shareholders that are interested to pur-chase the firm.
Managerial motives
The background of the managerial motive for M&As can be found from the principal-agent theory suggesting that corporate managers are an agent of the owners of company (principal) (Jensen and Meckling 1976). Agency prob-lems arise when ownership and management are separated (Berle and Means 1932). These problems exist because owners and managers have different in-terests and because complete contracts between them cannot be written.
This agency view to M&As assumes that instead of shareholder wealth, managers maximize their own utility (wealth). The managerial incen-tives may drive a company to grow beyond its optimal size (Jensen 1986).3 The idea is that self-interested managers may wish to build corporate em-pires to increase their remuneration and to reap private benefits, power and prestige. These benefits are often positively related to the company size and the growth rate of sales. Moreover, managers of large companies have better opportunities to obtain a position in other companies’ boards. M&As also provide the management with a much faster means to grow than internal ex-pansion.
Hubrid
The hubrid hypothesis of Roll (1986) suggests that managers make mistakes in estimating the value of target firms. To see the underlying logic of this M&A motive, suppose that a bidder firm’s management is as likely to overes-

182 · Jyrk i Al i -Yrk kö
timate as to underestimate the synergies to be achieved by acquiring a listed company. The bidder firm’s management knows that the current market price is the lowest price that the target company’s shareholder can accept. Hence, when the valuation of the bidder firm’s management is below the market price, it does not make offer. If the bidder firm’s management believes that there are potential synergies when actually there are none, the takeover pre-mium is a mistake made by them. Of course, such errors are made also in the opposite direction but those cannot be observed empirically because they are not made public. Thus, the hubrid hypothesis does not imply that managers act consciously against owner’s interests. The main implication is that man-agers make mistakes in valuating target firms.
Summary
Berkovitch and Narayanan (1993) have summarized the different motives for M&As and their implications into three categories as shown by Table 5.1. The table suggests that the motives of M&As can be empirically evaluated by ex-amining correlation between different gains. The empirical evidence pre-sented in Berkovitch and Narayanan (1993) is based on a sample of tender of-fers in U.S. during 1963-1988. The evidence is consistent with the view that the synergy motive dominates. Moreover, their results suggest that the dominating motive of value-decreasing acquisitions is managerial related, not hubrid. Focusing on foreign acquisitions of U.S. firms, Seth et al. (2000) report similar results. While these results are suggestive, a serious problem with them is that the motives for M&As are derived from the post-merger fi-nancial performance. This implies that the causes and consequences of M&As get mixed.
Table 5.1. Implications of different hypotheses of M&As
Gains to acquirer Gains to target Total gains
Economic performance and efficiency + + +Managerial motives (agency) - + -Hubrid - + 0
Note: The original source of the table is Berkovitch and Narayanan (1993), modified by the author.

Patterns of the Finnish merger and acquis i t ion act iv i ty · 183
Ingham et al. (1992) suggest that managers pursue several goals with M&As. Based on survey data on mergers in the UK during 1984-88, they find that the top three motives are 1) increasing profitability, 2) pursuing market power and 3) marketing economics of scale. Brouthers et al. (1998) report similar results based on survey data on mergers of Dutch firms in 1994. Brouthers et. al. put forward an alternative categorization for the motives of M&As. They conclude that economic motive is the most important followed by strategic and personal motives. The problem in using survey data to study the motives for M&As is that managers may have weak incentives to reveal the true motive for M&As. For example, it is unlikely that they would admit that M&As are not driven by a pursuit of increased financial performance.
5.2.2. MACRO-LEVEL CAUSES FOR M&AS
Mergers occur in waves
Figure 5.2 illustrates M&A activity in the United States from 1895 to 2000. Despite the problem of data inconsistency that arises because different data sources have been used to construct the figure, the figure clearly shows that the M&As occur in waves (gray areas).
Figure 5.2. The number of M&As in the U.S. (1895-2000)
1895
1900
1905
1910
1915
1920
1925
1930
1935
1940
1945
1950
1955
1960
1965
1970
1975
1980
1985
1990
1995
2000
0
2,000
4,000
6,000
8,000
10,000
Note: Data sources are Yago et. al. (2000), Nelson (1959), Thorp (1941), Mergerstat’s statistics and the au-thor’s calculations.

184 · Jyrk i Al i -Yrk kö
The first wave (1897-1904) involved predominantly M&As between large firms operating in the same industry (i.e. horizontal M&As). These M&As resulted in an increase in concentration rates and even in the creation of monopolies. The second wave (1916-1929) was mostly composed of M&As in industries outside the previously consolidated heavy manufacturing in-dustries. Rather than monopolies, the second wave created many oligopolies. The third wave (1965-1969) can be termed “the wave of conglomerates”. To reduce cyclical risks, a number of companies acquired unrelated firms and business units. The fourth wave (1981-1989) was characterized by leveraged buyouts and hostile takeovers (Holmström and Kaplan 2001). In Finland, a number of large Finnish firms started overseas production by acquiring companies abroad. The latest wave (1994-2000) can be termed “the wave of megadeals”. A number of very big M&As were carried out. Most of the larg-est deals were horizontal in nature but also diversifying mergers were under-taken (e.g. deals between banks and insurance companies). Particularly in the U.S., the latest wave has be considered to be the first truly international merger wave (Black 2000).
Changes in economic environment as a driving force
Merger waves seem to coincide with economic booms (Mueller 1989). During booms, the stock market typically surges. Consistent with this, empirical evi-dence suggests that M&As are positively correlated with stock market prices (Nelson 1959). The stock market may an impact on M&As via three different channels. First, a high market capitalization helps a company to finance its acquisitions if it uses its stocks as a method of payment. In this case the ac-quirer does not have to spend its retained profits or raise additional debt to finance the deal. Second, cash reserves of companies are during booms in general high and also debt finance is more easily available than during reces-sions. Finally, rising prices of assets increase the collateral value of firms’ as-sets.
Ordinary business cycles are not a sufficient condition for the existence of merger waves. Economic upturns are observed much more frequently than merger waves. The question arises: Does the appearance of a merger wave require more profound changes in the economy? It seems that merger waves coincide with big changes in environment and technology. New means of transportation and communications and energy production have been intro-duced during the past hundred years or so. The first merger wave accompa-nied major changes in economic infrastructure and business environment.

Patterns of the Finnish merger and acquis i t ion act iv i ty · 185
Railroads were built and use of electricity and coal became common about at the time the first wave took place. Also the second wave coincided with big changes in infrastructure. Major developments in transportation, communi-cation and merchandising were the main motivational factors behind the re-structuring during the second wave (Weston et al. 1990). Broaddus (1998) suggests that the most important force behind banks’ consolidation in the 1990s has been the development of communications and data processing technology. It has been argued that cost savings achieved by utilizing these latest technologies increase with the size of company.
Also political decisions impact M&As. Forming free trade areas, such as NAFTA and EU, have changed the business environment of firms operat-ing in member states. The prime example of such changes is perhaps that new competitors may enter. Moreover, the deregulation of financial markets has had a positive impact on M&As. The liberalization of foreign ownership has lead to a growing number of cross-border deals.4
Macroeconomic changes may also lead to excess capacity and ulti-mately to downsizing and exit. M&As that aim at closing inefficient units are one means to resolve the problem of excess capacity (Jensen 1993). Changes in economic environment also form a basis of an industry shock explanation for M&As (Mitchell and Mulherin 1996). Different kinds of industry-level shocks push companies to react to changes by restructuring. Mitchell and Mulherin (1996) and Andrade et al. (2001) provide empirical evidence about industry clustering in the M&A activity. As Table 5.2 shows, industries that are involved in one wave do not necessarily do so in other waves.
Table 5.2. Top five M&A industries in the U.S.
1970s 1980s 1990s
Metal mining Oil and gas Metal miningReal estate Textile Media and telecommmunicationOil and gas Miscellaneous manufacturing BankingApparel Non-Depository credit Real estateMachinery Food Hotels
Note: Data source is Andrade et al. (2001). M&As have been ranked by market values.

186 · Jyrk i Al i -Yrk kö
5.2.3. ASSESSMENT – WHAT DRIVES M&AS?
Despite M&As occurring in waves, the waves are not similar. This pattern suggests that different kinds of industry shocks might cause changes in the merger activity. The interesting point of the industry shock explanation is that it does not contradict with the three firm-level motives (economic, managerial and hubrid motives) for M&As. The industry shock explanation therefore complements rather than substitutes previous hypotheses about the causes of M&As. Taken together, the foregoing suggests that M&As are driven by macro-level, industry-level and firm-level factors. Figure 5.3 illus-trates this idea.
Figure 5.3. Causes of M&As
Shocks
Economicbooms
Technologydevelopment
Regulation and law
Economicmotives
Managerialmotives
Hubrid motives
M&A decision
Macro-level
Industry-level
Firm-level
Globalization
Shocks
Economicbooms
Technologydevelopment
Regulation and law
Economicmotives
Managerialmotives
Hubrid motives
M&A decision
Macro-level
Industry-level
Firm-level
Globalization
In the top of the figure, some macro-level factors are displayed. Albeit in some cases these factors influence directly firm-level motives, they might also cause industry-level shocks. Firms react to these industry shocks by en-tering the market for M&As. Industry shocks may create, for instance, excess capacity and need for consolidation. In these cases the firm-level motive is ef-

Patterns of the Finnish merger and acquis i t ion act iv i ty · 187
ficiency or economic. But shocks and booming industries might also provide managers an opportunity to acquire more personal benefits by empire-building. These managerial motives may be conveniently hidden in the turbu-lence of industry. But it is also likely that due to the industry shocks, it is dif-ficult to estimate accurately the real value of a target firm. Also the hubrid hy-pothesis is thus a valid part of the industry shock explanation. Naturally, the firm-level motives for M&As are also valid without industry shocks. How-ever, the shocks may boost restructuring needs and also create room for (or amplify) the firm-level motives.
5.3. PATTERNS OF FINNISH M&A ACTIVITY
5.3.1. VOLUME OVER TIME
Figure 5.4 displays the number of Finnish M&As over the past twenty years. The figure reveals that the volume of M&As varies drastically in tandem with macroeconomic cycles. In particular, a great number of M&As was under-taken during the economic booms in the late 1980s. Besides the boom, the major causes behind the high M&A activity were the liberalization of capital markets and changes in capital income taxation. It is of interest to note that many deals were carried out just before the changes in the taxation in 1990. In the early 1990s, Finland ran into a deep economic crisis, which reduced the number of M&As.
As discussed, received theory and recent empirical evidence suggest that industry clustering characterizes M&A activity. In Table 5.3 we display the industries most heavily involved in M&A activity for each decade (ranked by the number of deals). The table shows that only few industries show up repeatedly. This finding suggests that M&A booms are not similar in Finland. An explanation for this industry clustering is, as discussed, indus-try level shocks. Companies react to such shocks by restructuring (Andrade et al. 2001). For example, due to the deep banking crisis in the beginning of 1990s, the entire banking industry was restructured. The industry clustering hypothesis is backed up by the events in 2000. The IT industry was booming and a number of IT companies were listed in the Helsinki Stock Exchange during the latter half of the 1990s and in 2000. After listing these companies were able to use their stocks as a payment in acquisitions. This may explain why a large number of IT-firms was involved in M&As during 2000.

188 · Jyrk i Al i -Yrk kö
Figure 5.4. The number of M&As in Finland (1980-2001)
1980
1981
1982
1983
1984
1985
1986
1987
1988
1989
1990
1991
1992
1993
1994
1995
1996
1997
1998
1999
2000
2001
0
100
200
300
400
500
600
700
800
900
Note: Data sources are Talouselämä-magazine and ETLA.
Table 5.3. Top five industries based on the number of M&As in Finland
1980s 1990s 2000(1982-1989) (1990-1998)
Metal and engineering Metal and engineering IT-servicesOther services Wholesale business Other servicesWholesale business Retailing Metal and engineeringConstruction and contracting Other services RetailingPrinting industry Finance and banking Construction and contracting
Note: Data sources are Talouselämä-magazine and the author’s calculations.

Patterns of the Finnish merger and acquis i t ion act iv i ty · 189
Table 5.4 shows that a large share of Finnish M&As has targeted small companies. Roughly 60% of the targets have had less than 50 employees and 20% of all targets have had less than 10 employees. The share of the targets with more than 500 employees is only 7%. However, the latest figures indi-cate that the share of large targets has slightly risen during the latter part of 1990s, reflecting perhaps the growth of the economy.
Table 5.4. The Finnish M&As by the target size (percentages)
1-49 50-99 100-199 200-499 >500
1982 63% 14% 11% 6% 6% 1983 61% 19% 9% 6% 6% 1984 62% 17% 11% 6% 4% 1985 56% 16% 15% 9% 4% 1986 59% 13% 10% 11% 7% 1987 64% 14% 8% 8% 6% 1988 62% 14% 10% 9% 4% 1989 67% 13% 8% 8% 5% 1990 64% 14% 11% 6% 6% 1991 61% 13% 12% 7% 6% 1992 62% 16% 7% 9% 6% 1993 55% 16% 10% 11% 8% 1994 63% 11% 11% 9% 6% 1995 53% 16% 14% 9% 8% 1996 57% 13% 10% 8% 12% 1997 53% 16% 10% 10% 11% 1998 54% 14% 7% 14% 11%
Average 60% 15% 11% 8% 7%
Number of employees in the target firm
Note: Data sources are Talouselämä-magazine and the author’s calculations.
5.3.2. VOLUME IN CROSS-COUNTRY COMPARISON
During the past 15 years, the evolution of the number of M&As have varied between different areas. At the end of the 1980s, a great number of deals was undertaken in Finland and in the EU. Even though such a peak cannot be ob-served in the US (in terms of the number of deals), the 1980s were character-ized by a large dollar volume of M&As. During the latter part of 1990s, the overall trend of M&A activity in the US, EU and Finland shows remarkable similarities. While in 1995 the number of M&As was roughly 8800 in the EU, in 1999 the corresponding figure was 12 800, representing a growth of 46% (European Economy 2000). In Finland, the corresponding growth was 55% and in the US, the growth exceeded 150% during the same period.

190 · Jyrk i Al i -Yrk kö
Figure 5.5 benchmarks Finland against other EU member states. The relative size of countries has been taken into account by proportioning each country’s share of the number of M&As in the EU to each country’s share of the total GDP of EU area. If this figure is above one, more M&As are under-taken in that country than would be expected by considering its GDP. These figures cover both national and cross-border M&As.
The result of the comparison is surprising. Finland ranks the first out of the EU member states during the 1990s. Finland’s share of the total M&A volume in the EU area is more than double compared to its share of GDP in EU. It seems hence that during the 1990s, once we control the size of national economy, Finnish companies have faced a very active M&A market.5
Figure 5.5. The M&A activity in the EU member states (1991-99)
Finl
and
Luxe
mb
ourg UK
Irel
and
Swed
en
Net
herla
nds
Den
mar
k
Belg
ium
Port
ugal
Fran
ce
Aus
tria
Spai
n
Ger
man
y
Ital
y
Gre
ece
0.0
0.5
1.0
1.5
2.0
2.5
3.0
Note: Data sources are European Economy, Supplement A, No 5/6 – 2000 and the author’s calculations. M&A activity is defined as the ratio of a country’s share of EU’s M&A activity to the country’s share of EU’s total GDP.
Cross-border inward investments by country are portrayed in Figure 5.6. As the figure reveals, the ratio of cross-border transactions to GDP is clearly highest for Luxembourg (25.7) followed by Finland, Sweden and Ire-land. The figure suggests that the high M&A activity of Finland is not only due to domestic transactions, but also foreign companies have been active buyers of Finnish firms.
Benchmarking the value of inward cross-border M&As by country provides a slightly different picture of the M&A activity in different countries
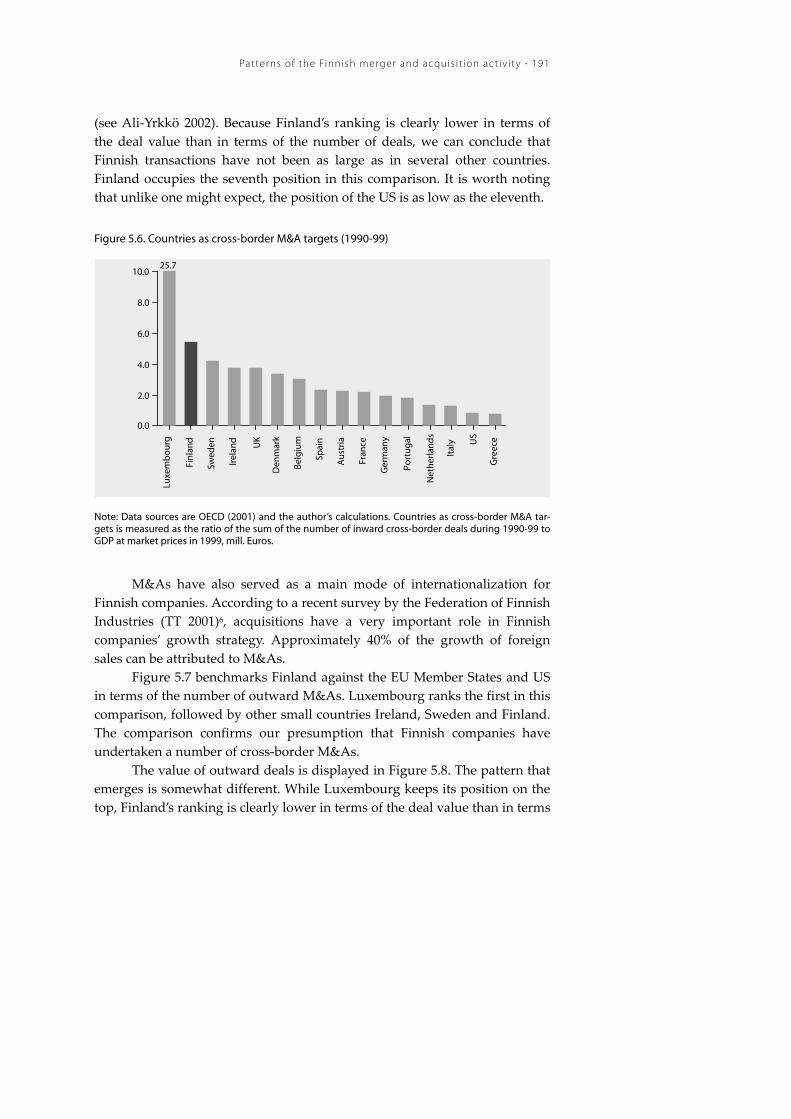
Patterns of the Finnish merger and acquis i t ion act iv i ty · 191
(see Ali-Yrkkö 2002). Because Finland’s ranking is clearly lower in terms of the deal value than in terms of the number of deals, we can conclude that Finnish transactions have not been as large as in several other countries. Finland occupies the seventh position in this comparison. It is worth noting that unlike one might expect, the position of the US is as low as the eleventh.
Figure 5.6. Countries as cross-border M&A targets (1990-99)
25.7
Net
herla
nds
Luxe
mbo
urg
Finl
and
Swed
en
Irela
nd UK
Den
mar
k
Belg
ium
Spai
n
Aus
tria
Fran
ce
Ger
man
y
Port
ugal
Italy U
S
Gre
ece
0.0
2.0
4.0
6.0
8.0
10.0
Note: Data sources are OECD (2001) and the author’s calculations. Countries as cross-border M&A tar-gets is measured as the ratio of the sum of the number of inward cross-border deals during 1990-99 to GDP at market prices in 1999, mill. Euros.
M&As have also served as a main mode of internationalization for Finnish companies. According to a recent survey by the Federation of Finnish Industries (TT 2001)6, acquisitions have a very important role in Finnish companies’ growth strategy. Approximately 40% of the growth of foreign sales can be attributed to M&As.
Figure 5.7 benchmarks Finland against the EU Member States and US in terms of the number of outward M&As. Luxembourg ranks the first in this comparison, followed by other small countries Ireland, Sweden and Finland. The comparison confirms our presumption that Finnish companies have undertaken a number of cross-border M&As.
The value of outward deals is displayed in Figure 5.8. The pattern that emerges is somewhat different. While Luxembourg keeps its position on the top, Finland’s ranking is clearly lower in terms of the deal value than in terms
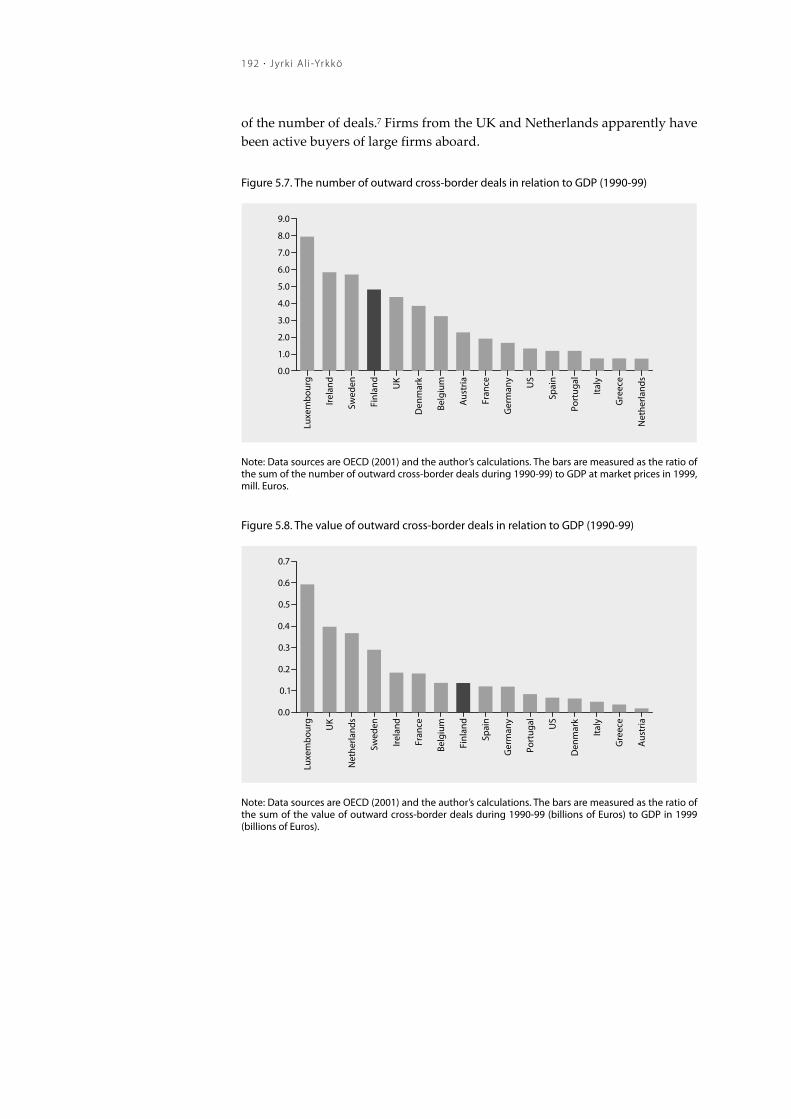
192 · Jyrk i Al i -Yrk kö
of the number of deals.7 Firms from the UK and Netherlands apparently have been active buyers of large firms aboard.
Figure 5.7. The number of outward cross-border deals in relation to GDP (1990-99)
Luxe
mb
ourg
Irel
and
Swed
en
Finl
and
UK
Den
mar
k
Belg
ium
Aus
tria
Fran
ce
Ger
man
y
US
Spai
n
Port
ugal
Ital
y
Gre
ece
Net
herla
nds
0.0
1.0
2.0
3.0
4.0
5.0
6.0
7.0
8.0
9.0
Note: Data sources are OECD (2001) and the author’s calculations. The bars are measured as the ratio of the sum of the number of outward cross-border deals during 1990-99) to GDP at market prices in 1999, mill. Euros.
Figure 5.8. The value of outward cross-border deals in relation to GDP (1990-99)
Luxe
mb
ourg UK
Net
herla
nds
Swed
en
Irela
nd
Fran
ce
Belg
ium
Finl
and
Spai
n
Ger
man
y
Port
ugal US
Den
mar
k
Ital
y
Gre
ece
Aus
tria
0.0
0.1
0.2
0.3
0.4
0.5
0.6
0.7
Note: Data sources are OECD (2001) and the author’s calculations. The bars are measured as the ratio of the sum of the value of outward cross-border deals during 1990-99 (billions of Euros) to GDP in 1999 (billions of Euros).

Patterns of the Finnish merger and acquis i t ion act iv i ty · 193
The foregoing suggests that the Finnish M&A activity has exceeded the EU average in the 1990s. Is the Finnish M&A market as active as this finding suggests? It this question we address next.
5.3.3. ASSESSMENT – IS FINLAND DIFFERENT?
As discussed above, macroeconomic factors are an important driver of M&As. In what follows we consider three macroeconomic factors – GDP, stock market capitalization and the number of listed companies – when try-ing to explain the distribution and evolution of M&A activity in the EU Member States during the period 1994-99. Like most macroeconomic phe-nomena, also the factors we consider are not exogenous. Therefore, we can-not make claims about the direction of causality between the number of M&As and GDP, market capitalization and the number of listed firms. In-stead, our focus is on the question if Finland is somehow different: Is the Finnish M&A market as active as the earlier finding of ours suggests?
The basic regression model that we consider is:
1 2 3it it it it itMA GDP MCAP LISTED eα β β β= + + + + ,
where itMA = the number of M&As in country i in year t, itGDP = GDP (millions EURO at 1995 prices) in country i in year t, itMCAP = market capi-talization (millions EURO at 1995 prices) in country i in year t, itLISTED = the number of listed companies in country i in year t, and ite = error term. The Appendix describes the construction of the variables in more detail.
Table 5.5 shows the results of regressions for the number of M&As. In models (1-2) the dependent variable is the number of M&As, while in models (3-4) it is the logarithmic of the number of M&As. The results show that R-squared varies from 0.70 to 0.91 indicating that most of cross-sectional and time series variation can be explained by the included regressors.

194 · Jyrk i Al i -Yrk kö
Table 5.5. Explaining M&A activity
Constant -133.760 *** -178.670 *** -2.272 *** -0.293(-3.196) (-4.221) (-3.680) (-0.323)
GDP 0.399 *** 0.433 *** 0.299 *** 0.414 **(5.39) (6.066) (3.759) (2.465)
Market capitalization 0.543 *** 0.496 *** 0.384 *** 0.767 ***(4.202) (4.000) (3.661) (4.504)
Number of listed firms 0.849 *** 0.890 *** 0.308 ** -0.589(9.361) (10.187) (2.289) (-0.311)
Dummy (Finland=1) 358.94 *** 1.096 ***(3.132) (3.759)
R2 0.91 0.92 0.77 0.70Number of obs. 90 90 90 90Degrees of freedom 86 85 85 72Hausman’s test 5.8
p-value 0.12
(3)
OLS, logarithmic
(4)
Random effects, logaritmic
(1)
OLS
(2)
OLS, with dummy
Note: t-statistics in parentheses, *** denotes statistical significance at the 1% level and ** at the 5% level. In models (3) and (4) the logarithmic transformation was also taken of the independent variables (excluding the dummy).
As indicated by model (1), the coefficients on GDP, market capitaliza-tion and the number of listed firms are positive and highly significant. The positive coefficient of GDP indicates that the larger the economy, the more M&As. Moreover, it indicates that the growth rate of GDP impacts the num-ber of M&As. The coefficients of market capitalization and the number of listed firms suggest that also the size of financial market correlate positively with the number of M&As. In model (2), the dummy variable (Finland=1, others=0) is added into the equation. Its positive coefficient and high statisti-cal significance indicate that in addition to the included explanatory vari-ables, there are some other factor(s) in Finland, not captured by the regres-sors, that affect positively the number of M&As in Finland. The results for model (3) are very similar to model (1) and (2). In model (4), a panel data es-timation procedure is used.8 As can be seen from the table, the results deviate slightly from the other models. The number of listed firms is no longer statis-tically significant and the coefficient is negative.
The estimation results suggest that a large share of cross-country and time series variation in the number of M&As can be explained by GDP, mar-ket capitalization and the number of listed firms. However, the results sug-gest there is something different about Finland. The Finnish M&A market

Patterns of the Finnish merger and acquis i t ion act iv i ty · 195
seems to be rather active even after controlling for some prominent macro-economic drivers of M&A activity.
5.4. CONCLUSION
The latest surge of M&A activity is the fifth merger wave during the past hundred years. Received theory suggests that the waves of M&As and more generally the M&A activity are driven by macro-level, industry-level and firm-level factors.
Our analyses show that the M&A activity varies drastically between the EU member countries. During the 1990s, the most active countries have been Finland, Luxembourg, Sweden and Ireland. After taking into account the size of the economy, Finland ranks the first among the EU member states in terms of the number of M&As. The high M&A activity is not only due to domestic deals but also many cross-border deals have been undertaken.
Our statistical analysis suggests that the number of M&As correlate positively with GDP, market capitalization and the number of listed firms. However, it is difficult to draw causal inferences about the relations of these variables. The econometric analysis also indicates there is something differ-ent about Finland: Even after controlling for the three macroeconomic drivers of M&A activity, there exists some (other) positive factor(s) that have contrib-uted to the Finish M&A activity.
The question that arises is why the Finnish M&A activity has been so high. There may be several reasons for this. First, approximately 60% of the Finnish target companies have been small companies with less than fifty em-ployees. This suggests that the small size of target firms may explain why Finland ranks high particularly when the number of M&As is considered. Second, during the 1990s the structure of the Finnish national economy has drastically changed. A number of former conglomerates have carried out re-structuring programs that have led to divestments. Third, it is easy to find in-dustry shock explanations for the high Finnish M&A activity. For instance, due to the banking crisis and deregulation of financial market, a number of banks were consolidated during the 1990s. Moreover, the booming IT indus-try undertook a great number of deals during the late 1990s. Fourth, because Finland is a small country with a small domestic market, a number of Finnish firms have expanded their international operations by undertaking M&As. Fifth, due to the creation of the internal market of the EU, possibilities and in-centives to undertake M&As have multiplied. The liberalization of restric-tions of foreign ownership has made it possible to carry out deals abroad.

196 · Jyrk i Al i -Yrk kö
Moreover, companies have responded to the increased competition by re-structuring and acquiring business units.
Taken together, our analysis shows that by international standards, the Finnish M&A market has been active during the past ten years. Albeit we have proposed some preliminary explanations for the high Finnish M&A ac-tivity, the question of why it has been so active remains open. It is therefore an important topic for future research.
Patterns of the Finnish merger and acquis i t ion act iv i ty · 197
REFERENCES
Ali-Yrkkö, J., 2002, Mergers and acquisitions – Reasons and results, The Research Institute of the Finnish Economy (ETLA), Discussion papers nr. 792.
Andrade, G., Mitchell, M. and Stafford, E., 2001, New evidence and perspectives on mergers, Journal of Economic Perspectives, 15, 103-120.
Arrow, K. J., 1975, Vertical integration and communication, Bell Journal of Economics, 6, 173-183.
Berkovithch, E. and Narayanan, M., 1993, Motives for takeovers: An empirical investigation, Journal of Financial and Quantitative Analysis, 28, 347-361.
Berle, A. and Means, C., 1932, The modern corporation and private property, Macmillan, New York.
Black, B., 2000, Is this the first international merger wave?, mimeo, downloadable at: http://lawschool.stanford.edu/programs/olin/workingpapers/WP202BLACK.pdf.
Broaddus, A., 1998, The bank merger wave: Causes and consequences, Federal Reserve Bank of Richmond Economic Quaterly 84/3.
Brouthers, K, van Hastenburg P. and van den Ven, J., 1998, If most mergers fail why are they so popular?, Long Range Planning, 31, 347-353.
European Economy, 2000, Supplement A, Economic trends, No 5/6 – 2000, European Commission.
Gort, M., 1969, An economic disturbance theory of mergers, Quarterly Journal of Economics, 83, 624-642.
Holmström, B. and Kaplan, S., 2001, Corporate governance and merger activity in the U.S: Making sense of the 80s and 90s, Journal of Economic Perspectives, 15, 121-144.
Ingham, H., Kran, I., and Lovestam, A., 1992, Mergers and profitability: A managerial success story? Journal of Management Studies 29:2, 195-208.
Jensen, M., 1986, The agency costs of free cash flow. Corporate finance and takeovers, American Economic Review, 76, 323-329.
Jensen, M., 1988, Takeovers: their causes and consequences, Journal of Economic Perspectives, 2, 21-48.
Jensen, M., 1993, The modern industrial revolution, exit, and the failure of internal control systems, The Journal of Finance, 48, 831-880.
Jensen, M. and Meckling, W., 1976, Theory of the firm: Managerial behaviour, agency costs and ownership structure, Journal of Financial Economics, 3, 305-360.
Kale, J. R., Kini, O. and Ryan, H. E., 2000, An analysis of the creation and distribution of shareholder wealth gains in successful corporate takeovers, forthcoming in Journal of Financial and Quantitative Analysis, downloadable at: http://www.finance.lsu.edu/cryan/jfqa1.pdf

198 · Jyrk i Al i -Yrk kö
Mitchell, M. and Mulherin, J., 1996, The impact of industry shocks on takeover and restructuring activity, Journal of Financial Economics, 41, 193-230.
Mueller, D., 1980, The determinants and effects of mergers: International comparison, Cambridge.
Myers, S. and Majluf, N., 1984, Corporate finance and investment decisions when firms have information that investors do not have, Journal of Financial Economics, 13, 187-221.
Nelson, R., 1959, Merger movements in American industry: 1895-1956, Princeton University Press, Princeton.
OECD, 2001, New patterns of industrial globalization – Cross-border mergers and acquisitions and strategic alliances, OECD, Paris.
Porter, M. E., 1980, Competitive strategy, Free Press, New York.
Roll, R., 1986, Hubrid hypothesis of corporate takeovers, Journal of Business, 59, 197-216.
Schwert, G. W., 1996, Markup pricing in mergers and acquisitions, Journal of Financial Economics, 41, 2, 153-192.
Seth, A, Kean, S. and Richardson, P., 2000, Synergy, managerialism or hubris? An empirical examination of motives for foreign acquisitions of U.S. firms, Journal of International Business Studies, 31: 3, 387-406.
Stennek, J. and Verboven, F., 2001, Merger control and enterprise competitiveness – Empirical analysis and policy recommendations, IUI Working Paper No. 556, Sweden.
Stigler, G. J., 1950, Monopoly and oligopoly by merger, American Economic Review, 40, 23-34.
Thorp, W., 1941, The merger movement, in The structure of industry, Temporary National Economic Committee, monograph, no. 27, part III, 231-234.
TT, 2001, Suomalaisyritysten ulkomaantoiminta ja sen kehitysnäkymät, Teollisuus ja Työnantajat, January 2001.
Weston, J., Chung, K. and Siu, J., 1997, Takeovers, restructuring, and corporate governance, second edition, Prentice-Hall Inc, New Jersey, US.
Williamson, O. E., 1975, Market and hierarchies: Analysis and antitrust implications, New York: Free Press.
Yago, G., Bates, M., Huang, W. and Noah, R., 2000, A tale of two decades: Corporate control changes in the ‘80s and ‘90s, Milken Institute, downloadable at: http://www.milkeninstitute.org

Patterns of the Finnish merger and acquis i t ion act iv i ty · 199
APPENDIX
The variables used in the regression analysis:
M&As :
The number of cross-border M&As (source: OECD 2001)1-share of national M&As (source: European Economy 2000)
GDP: GDP in millions EURO/ECU, current prices. Source: Eurostat.
Market capitalization: Market capitalization (millions ECU/EURO), current prices. Source: Interna-tional Federation of Stock Exchanges, see: http://www.fibv.com.
Listed firms: The number of listed firms. Source: International Federation of Stock Ex-changes, see: http://www.fibv.com.
Dummy (FIN): Dummy variable for Finland. The variable gets value 1 for Finland otherwise the value is 0.
Population: The population (thousands) at the end of each year. Source: Eurostat.

200 · Jyrk i Al i -Yrk kö
ENDNOTES
1 In this study, the terms “acquisition”, “deal”, and “merger” are used as a synonym for both mergers and ten-der offers. 2 In this case, with the help of bigger size, average unit costs may reduce, which implies that the new entity enjoys economics of scale. However, in multi-product case, the relation between scale economies and benefits of mergers is more complex. Due to diseconomies of scope, there may exist overall diseconomies of scale even if there are product specific economies of scale (Stennek and Verboven 2001). 3 According to the free cash flow hypothesis of Jensen (1986), managers use free cash-flow, i.e., the cash flow that is left after all investment with a positive net present value are funded, in excess investments in-stead of paying this money to shareholders. 4 Of course, political decisions do not always increase the M&A activity. Antitrust authorities may for exam-ple be able to block deals. 5 Proportioning countries’ M&A activity to the total population and to the number of listed companies yields similar results; see Ali-Yrkkö (2002). 6 In Finnish, Teollisuus ja Työnantajat: Suomalaisyritysten ulkomaantoiminta ja sen kehitysnäkymät, January 2001. 7 However, recent statistics by KPMG show that during (the first half of ) 2000, the value of Finnish outward M&As drastically increased. 8 The value of Hausman’s test argues in favor of the random effects model rather than the fixed effect model.

PART II: MICROECONOMIC
PERSPECTIVE


Financia l systems and f i rm per formance: Theoret ical and empir ica l perspect ives · 203
6. SMALL BUSINESS FINANCE IN FINLAND – A DESCRIPTIVE STUDY
Ari Hyytinen and Mika Pajarinen*
Abstract: In this Chapter we examine the financing of small and medium-sized enterprises (SMEs) in private equity and debt markets in Finland. We find that the three most important sources of funds are the principal owner’s equity, trade credit provided by non-financial firms and debt provided by financial institutions (FIs). These account for about 2/3 of total debt and equity. The Finnish SMEs run a debt ratio of 54%, but it is lower for small than for large SMEs. The debt ratio also varies non-monotonically with the age of firms. Overall, the capital structure of the Finnish SMEs does not seem to fundamentally differ from that in the US (when the study of Berger and Udell (1998) is used as the US benchmark). There are however some evi-dence that as the Finnish SMEs age, they increase indebtedness slowly compared to the US SMEs. The young SMEs also utilize less FI debt in Finland than in the US. We also find that the financing of innovative and R&D-intensive SMEs differs in several aspects from that of other SMEs. The data shows that innovative firms, firms with R&D-activities and firms that own patents and/or intangible assets run a lower debt ratio than their counterparts. The difference is most notable for the most R&D-intensive SMEs, which also rely less on debt supplied by FIs than other firms do. SMEs with R&D-activities seem to resort more on inside equity than other SMEs do. The analysis suggests that a partially “reversed” pecking order may best characterize innovation finance. We also provide new evidence on main sources, concentration and interconnectedness of SME finance.
* Ari Hyytinen and Mika Pajarinen are both at the Research Institute of the Finnish Economy (ETLA) and Etla-tieto Ltd. This Chapter is based on Etla Discussion Papers, nr. 812 (dated 25/6/2002). The authors would like to thank Markus Koskenlinna, Eva Liljeblom, Anu Nokso-Koivisto, Vesa Puttonen, Petri Rouvinen, Otto Toivanen, Pekka Ylä-Anttila, the participants at the OECD-BRIE conference on Venture Capital and Local De-velopment (Paris) as well as the seminar participants at the Helsinki School of Economics and the Research Institute of the Finnish Economy (ETLA) for useful comments. The views expressed in the Chapter are those of the authors. The usual caveat applies.

204 · Ar i Hyyt inen and M ik a Pajar inen
6.1. INTRODUCTION
Small and medium-sized enterprises (SMEs) are nowadays considered an engine of economic growth and a heart of national innovation capacity. Unlike on large firms, there is relatively little information available on SMEs and particularly on the private capital markets providing funding to them. SMEs are informationally opaque, because financial press does not system-atically follow them, because they are not subject to equally demanding dis-closure requirements as large firms and because commercial financial data vendors and credit rating services collect their data only to a limited extent (Berger and Udell 1998, BU for short). Innovative and R&D-intensive SMEs may be even more informationally opaque than the SMEs are on average be-cause R&D projects are often beset with high uncertainty and secrecy. A con-sequential upshot of the informational opacity is that it reduces the availabil-ity of external finance to SMEs. Curiously enough, it also prevents policy makers, providers of public SME support and researchers from studying the determinants and availability of small business finance on the marketplace.
The private equity and debt markets that fund SMEs are different from the public markets that provide funding to transparent and well-known large businesses. In contrast to the public markets, the private markets are charac-terized by relationships, tailored financing solutions, combinations of explicit and implicit contracts and private information production and monitoring (see also BU 1998). These are market responses to the informational opacity and to asymmetric information that arises because the insiders of a firm typi-cally know more than outside investors about the likelihood of the firm mak-ing a breakthrough or going bankrupt (adverse selection). They also are market responses to the frictions that arise because neither firms nor financiers can commit not to behave opportunistically (moral hazard).
Financial intermediaries (FIs), such as banks, finance companies, in-surance companies and venture capital firms, play a special role as informa-tion producers in the private markets. Their specialized information produc-tion and monitoring are an important means to address the problems of ad-verse selection and moral hazard and to assess the quality of SMEs. How ef-ficiently they perform the tasks determines financial intermediaries’ ability to channel external finance to firms, be it equity or debt. Other sources of exter-nal finance, such as trade credit, private persons and family finance, are also important, as they may have a comparative advantage in providing finance to some of the most opaque SMEs. The comparative advantage of these other

Smal l business f inance in Finland – A descr ipt ive study · 205
sources of external finance is however based on their natural relationships and interaction with the SMEs rather than on specialization. Trade credit, for example, is a funding mechanism in which some firms act as intermediaries channeling funds from the financial institutions to their peers (Demirgüç-Kunt and Maksimovic 2001).
Using new data originating from a recently conducted survey, this Chapter aims at addressing two questions. First, what are the most important sources of finance to SMEs? Because Finland’s financial sector has recently undergone a major restructuring in which a bank-centered financial system shifted from relationship-based debt finance towards a US type system with increasing influence of the stock market (Hyytinen and Pajarinen Chapter 1 in this volume, and Hyytinen et al. 2003), it is of particular interest to com-pare the sources of small business finance in Finland with those in the US.1 Second, are the sources of finance different for innovative small businesses and/or for SMEs investing in R&D?
We proceed in Section 6.2 with a theoretical discussion of the determi-nants of small business finance. We consider the financial growth cycle of SMEs in general and particularly the financing of R&D-intensive SMEs. In Section 6.3 we provide a detailed analysis of small business finance in Finland. Section 6.4 concludes.
6.2. FINANCING OF SMALL BUSINESSES AND R&D: THEORY
The traditional view of small business finance is descriptively captured by the notion of financial growth cycle of SMEs (BU 1998). In this Section, we first describe the basic building blocks of the financial growth cycle view and the broad predictions it puts forward for the optimality of the different sources of finance. We then discuss briefly some theories of the financing of R&D-intensive small businesses, and consider how they contrast with the traditional view.
6.2.1. THE TRADITIONAL VIEW: THE FINANCIAL GROWTH CYCLE OF SMES
The financial growth cycle view of small business finance posits that the less informationally opaque the firm, the easier its access to frictionless capital markets. Typically, a firm characterized by severe informational asymmetries about its quality, with no track record or assets that it could pledge as collat-eral must rely primarily on insider finance. After insider finance has been ex-hausted, it is optimal to use debt. The optimality may be related to many
206 · Ar i Hyyt inen and M ik a Pajar inen
things, such as asymmetric information between corporate insiders and out-siders. The received theory suggests that firms may wish to minimize issue costs by issuing the safest security first, as its value is least sensitive to the in-formational asymmetries. Because of adverse selection and other capital market imperfections, issue costs, including underpricing, may be smaller for debt than for equity. Leverage may also limit management’s opportunities to use corporate resources opportunistically (Jensen 1986). After feasible bor-rowing opportunities have been exhausted, outside equity is raised. Outside equity is however a last resort, because its value is most sensitive to the informational asymmetries.
The financial growth cycle view suggests that the financing needs and options of an SME change as the firm grows. The youngest and smallest firms with limited track record and assets in place do not necessarily obtain significant amounts of debt finance from FIs. Because of this, these firms may be forced to rely disproportionately on “initial” insider finance. The initial in-sider finance consists of funds provided by the entrepreneur and start-up team. It may also include capital infusions by family and friends during the infant stages of the firm, though these should probably be considered as a form of angel finance. For entrepreneurs with limited wealth, angel finance and trade credit together with other financing from alternative providers of external finance, such as non-financial firms, are potentially an important source of funds. Because of their natural relationships and interaction with SMEs, the alternative providers of external finance may have a comparative advantage in providing finance to some of the most opaque SMEs.
As firms grow and become a bit more transparent, they gain access to intermediated debt finance.2 FIs play a special role as information producers in the markets for intermediated finance. Their specialized information pro-duction and monitoring are an important means to address the informational and agency problems that SMEs with limited track record and assets in place are beset with. SMEs can sometimes obtain more and cheaper financing from FIs by establishing close relationships with them (Petersen and Rajan 1994, Boot 2000). The value of the securities of those firms that become medium-sized and have some track record and collateral available becomes less sensi-tive to the private information of the corporate insiders. They are therefore more likely to receive financing also from less specialized FIs. Private place-ments of debt and equity provide a financing option for firms that are rela-tively large and that can demonstrate a convincing track record. At this point, firms often cease belonging to the class of SMEs. Finally, the larger and more
Smal l business f inance in Finland – A descr ipt ive study · 207
successful firms gain access to domestic public equity and debt markets and at some point also to international financial markets.
Because of its characteristics, the financial growth cycle view closely resembles the pecking order theory of (external) financing developed by Myers and Majluf (1984) and Myers (1984).3 The pecking order implies that firms prefer internal to external finance, specifically when information asymmetries are prevalent. If external finance is required, firms will issue debt before equity. External equity is the most costly source of external fi-nance. It is therefore a last resort. The pecking order theory suggests that if the need for external finance reduces, firms first trim down their use of eq-uity and then use of risky debt. As summarized in Myers (2001), a conse-quence of this is that each firm’s debt ratio reflects its cumulative need for ex-ternal finance.
6.2.2. FINANCING OF INNOVATIVE AND R&D-INTENSIVE SMES
It is a widely held view that the financing of R&D investments and techno-logical innovations is characterized by a number of market failures (Hall 2002). Besides uncertainty over technological opportunities, investments in technological innovations are beset by appropriability problems (i.e., by diffi-culties in extracting the social value of innovations)4 and capital constraints. Capital constraints are directly related to an innovative firm’s access to exter-nal finance. The access depends on how effectively the problems of adverse selection and moral hazard are addressed on the marketplace. Adverse selec-tion arises because the insiders of the innovative firm know more about the likelihood of the firm delivering an innovation than outside investors. Moral hazard arises because the insiders may have an incentive to engage in oppor-tunistic behavior at the expense of the outside investors (Stultz and Johnson 1985).
The conventional wisdom underlying the financial growth cycle view need not apply to innovative small businesses investing heavily in R&D. There are several reasons to this. First, moral hazard rather than adverse se-lection (underlying especially the pecking order theory) may be the main problem in innovation finance. Moral hazard may disproportionately charac-terize innovation finance because, if anything, the exact nature of an innova-tion is ill-defined ex ante.5 Holmström’s (1989) analysis for example suggests that the market for innovation finance may fail because of the agency costs that stem from the forward-looking, high-risk, labor-intensive and idiosyn-cratic nature of innovative activities and because designing appropriate in-

208 · Ar i Hyyt inen and M ik a Pajar inen
centive schemes for such activities is difficult. Another related source of moral hazard is the incompleteness of R&D contracts (Aghion and Tirole 1994), as it is difficult, if not impossible, to contract for a delivery of a specific innovation.
Second, R&D-intensive SMEs may have a limited amount of assets in place to back up their debt and to reduce the risk of the debt securities they issue. More generally, it is often argued that the debt capacity of growth op-portunities, defined as the amount of debt that firms optimally raise for an incremental project, is smaller than that of assets in place (see, e.g., Smith and Watts 1992). Recently, Barclay et al. (2001) have shown that because more growth options increase the under-investment cost of debt (Myers 1977) and reduce the benefits of debt in controlling over-investment by corporate man-agement (Jensen 1986), the debt capacity of growth opportunities can even be negative.
Finally, R&D-intensive SMEs may find it difficult to reveal the quality of their projects to the providers of external finance due to confidential na-ture of the projects (Anton and Yao 1994, Bhattacharya and Chiesa 1995). Partly for this reason, R&D-intensive SMEs cannot necessarily rely on rela-tionship banking as a source of debt finance as much as other SMEs can. The costs of relationship banking are potentially high to R&D-intensive SMEs, because banks obtain proprietary information about them as part of their re-lationships and because the proprietary information may allow the banks to charge (ex post) high loan interest rates (see Boot 2000). It is this threat of be-ing “locked-in” which reduces the benefits of relationship banking to R&D-intensive SMEs.
The above considerations suggest that a partially “reversed” pecking order theory may best apply to innovative small businesses, especially to those investing heavily in R&D. In the reversed pecking order, firms resort to outside equity finance before they (can) obtain significant amounts of debt.6 Data would be consistent with the partially reversed pecking order if
• leverage decreases and the use of equity-linked securities (i.e. capital loans) increases with “innovativeness”; and if
• R&D-intensive firms rely less on debt than the firms that can already demonstrate a degree of innovativeness do.
However, as many have observed, tapping the market for outside eq-uity may be difficult. Myers (2000) and Zingales (2000) argue for example that tapping the market may require co-investment of both human and fi-

Smal l business f inance in Finland – A descr ipt ive study · 209
nancial capital by the corporate insiders. Data would be consistent with these views, i.e. that it is relatively expensive to issue outside equity, if
• R&D-intensive firms disproportionately rely on inside equity (holding the debt ratio constant).
6.3. FINANCING OF SMALL BUSINESSES AND R&D: EVI-DENCE
6.3.1. RAW DATA AND SAMPLE WEIGHTS
The empirical evidence in this Chapter is based on new data originating from a recently conducted private survey. The survey covered SMEs from most major sectors of the Finnish economy as only farm (agricultural), financial, and real-estate sectors were fully excluded.7
The survey resulted in an original sample that consists of 936 firms. Because initially 2600 firms were contacted, this implies a response rate of 36 percent. For this study we use a smaller sample of 754 SMEs. The sample is smaller because some of the firms in the original sample are not SMEs and because some answers to certain key questions (from the viewpoint of this Chapter’s analysis) were missing or inconsistent.
The data are book values and unless otherwise indicated, the data are weighted to adjust for our sampling design (see Appendix) and to permit rough inferences about the capital structure of the population of the Finnish SMEs. However, because there is no data available to us against which we could check the accuracy or consistency of our data, we caution the reader that the estimates should be considered to give only a general idea of the fi-nancing sources of the Finnish SME sector.
Table 6.1 illustrates un-weighted and weighted data. Firms in the un-weighted data are younger, more R&D-intensive and more growth-oriented than in the weighted data. Moreover, in the un-weighted data firms have more patents and other intangible assets than in the weighted data. These patterns are expected, as they reflect our desire to over-sample technology-based SMEs.
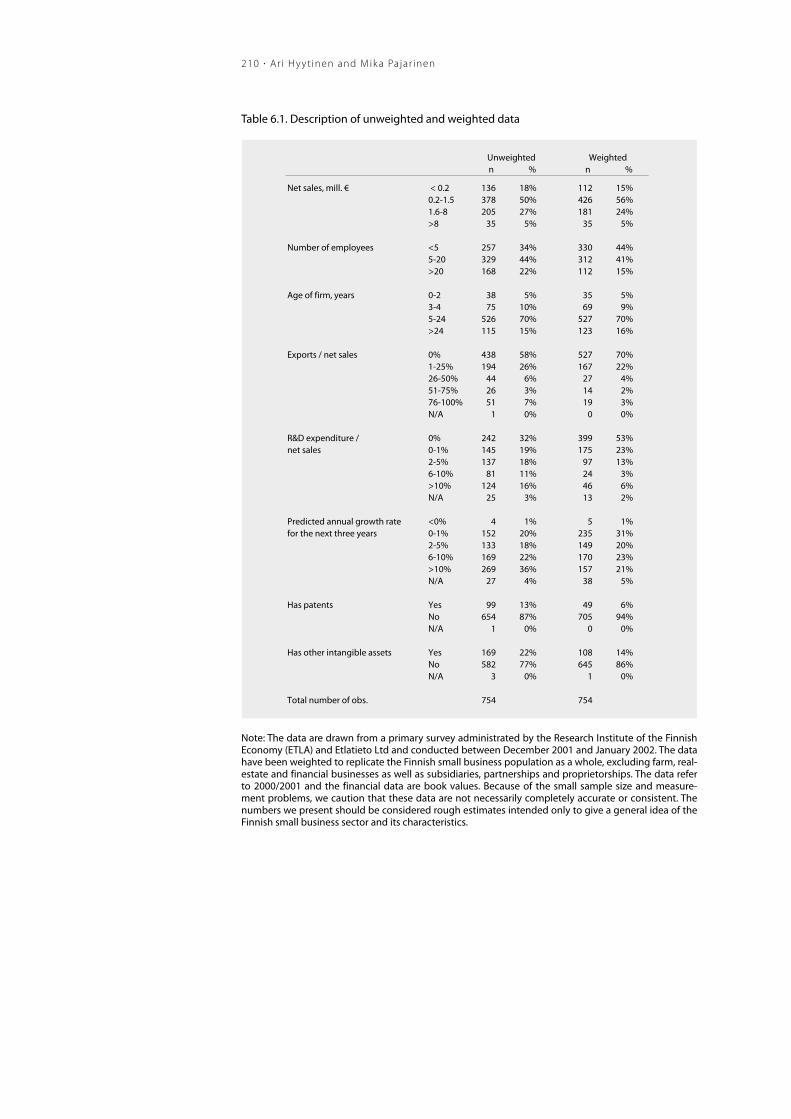
210 · Ar i Hyyt inen and M ik a Pajar inen
Table 6.1. Description of unweighted and weighted data
n % n %
Net sales, mill. € < 0.2 136 18% 112 15% 0.2-1.5 378 50% 426 56% 1.6-8 205 27% 181 24% >8 35 5% 35 5%
Number of employees <5 257 34% 330 44% 5-20 329 44% 312 41% >20 168 22% 112 15%
Age of firm, years 0-2 38 5% 35 5% 3-4 75 10% 69 9% 5-24 526 70% 527 70% >24 115 15% 123 16%
Exports / net sales 0% 438 58% 527 70% 1-25% 194 26% 167 22% 26-50% 44 6% 27 4% 51-75% 26 3% 14 2% 76-100% 51 7% 19 3% N/A 1 0% 0 0%
R&D expenditure / 0% 242 32% 399 53% net sales 0-1% 145 19% 175 23%
2-5% 137 18% 97 13% 6-10% 81 11% 24 3% >10% 124 16% 46 6% N/A 25 3% 13 2%
<0% 4 1% 5 1% 0-1% 152 20% 235 31% 2-5% 133 18% 149 20% 6-10% 169 22% 170 23% >10% 269 36% 157 21% N/A 27 4% 38 5%
Has patents Yes 99 13% 49 6% No 654 87% 705 94% N/A 1 0% 0 0%
Has other intangible assets Yes 169 22% 108 14% No 582 77% 645 86% N/A 3 0% 1 0%
Total number of obs. 754 754
Predicted annual growth rate for the next three years
Unweighted Weighted
Note: The data are drawn from a primary survey administrated by the Research Institute of the Finnish Economy (ETLA) and Etlatieto Ltd and conducted between December 2001 and January 2002. The data have been weighted to replicate the Finnish small business population as a whole, excluding farm, real-estate and financial businesses as well as subsidiaries, partnerships and proprietorships. The data refer to 2000/2001 and the financial data are book values. Because of the small sample size and measure-ment problems, we caution that these data are not necessarily completely accurate or consistent. The numbers we present should be considered rough estimates intended only to give a general idea of the Finnish small business sector and its characteristics.
Smal l business f inance in Finland – A descr ipt ive study · 211
6.3.2. DISTRIBUTIONS OF EQUITY AND DEBT BY FIRM AGE AND SIZE
Small size and young age are often considered a potential source of financial constraints for SMEs. In this Section, we document how the distribution of sources of funds depends on firm size and age. We also compare the distribu-tion to that of the US SMEs using Table 1 from BU (1998, p. 620) as the bench-mark.8
Overview
Table 6.2 - Table 6.6 show the estimated distribution of the sources of funds for the Finnish small businesses as well as their decomposition by firm size and age.9 The size and age categories roughly follow BU (1998); we will ex-plain them in more detail shortly.
In Table 6.2 the funding sources are displayed for two sources of eq-uity, two sources of capital loans and three sources of debt.10 “Principal owner” is defined either as a shareholder who is one of the five largest own-ers with significant control over the firm’s capital structure and governance or, for some firms, as the largest shareholder if such a shareholder unambi-guously exists. “Other equity” consists of the remaining shareholders’ equity. “Private” capital loans are supplied by FIs and other private sources, while “Public” capital loans include capital loans supplied by the National Tech-nology Agency (Tekes), Finnvera plc (a specialised financing company owned entirely by the Finnish state), the Finnish National Fund for Research and Development (Sitra), and other governmental bodies.11 The sources of debt are “Financial institutions” that include banks, finance companies, in-surance companies, pension funds, foreign financial institutions and other credit institutions. “Other institutions” are defined as government sources and non-financial firms. “Other debt” consists of commercial papers and bonds, which, as we will see, are a negligible source of debt in our data, as well as unidentifiable sources of debt. More detailed categorizations are pre-sented in tables that we will discuss in a moment.
Table 6.2 shows that like large companies, SMEs depend heavily on both equity and debt.12 The (capital loans inclusive) debt ratio, i.e., the ratio of the sum of debt and capital loans to the sum of debt, capital loans and equity financing, is 54%. Finnish SMEs are somewhat more indebted that their US counterparts who run a debt ratio of 50% (BU 1998). However, treating capi-tal loans as a part of debt increases the debt ratio of the Finnish SMEs by 2 percentage points. The most important source of funds is unsurprisingly the
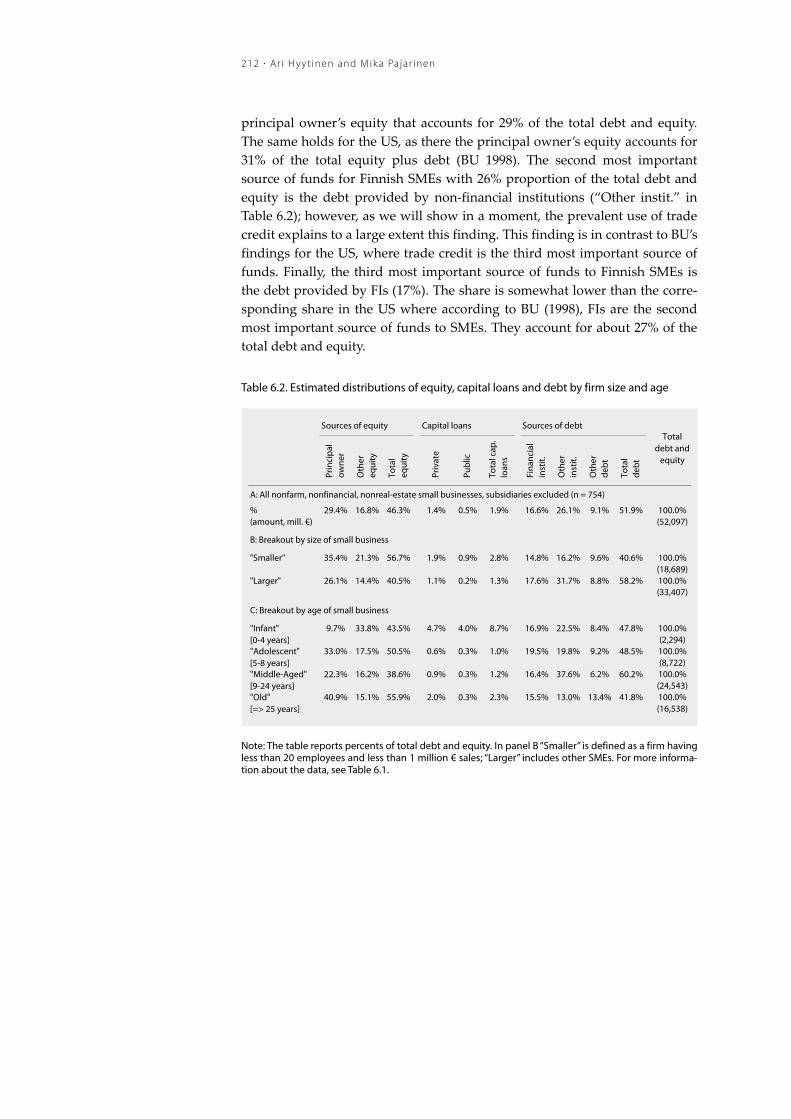
212 · Ar i Hyyt inen and M ik a Pajar inen
principal owner’s equity that accounts for 29% of the total debt and equity. The same holds for the US, as there the principal owner’s equity accounts for 31% of the total equity plus debt (BU 1998). The second most important source of funds for Finnish SMEs with 26% proportion of the total debt and equity is the debt provided by non-financial institutions (“Other instit.” in Table 6.2); however, as we will show in a moment, the prevalent use of trade credit explains to a large extent this finding. This finding is in contrast to BU’s findings for the US, where trade credit is the third most important source of funds. Finally, the third most important source of funds to Finnish SMEs is the debt provided by FIs (17%). The share is somewhat lower than the corre-sponding share in the US where according to BU (1998), FIs are the second most important source of funds to SMEs. They account for about 27% of the total debt and equity.
Table 6.2. Estimated distributions of equity, capital loans and debt by firm size and age
Sources of equity Capital loans Sources of debt
Prin
cip
al
owne
r
Oth
er
equi
ty
Tota
l eq
uity
Priv
ate
Pub
lic
Tota
l cap
. lo
ans
Fina
ncia
l in
stit.
Oth
er
inst
it.
Oth
er
deb
t
Tota
l
deb
t
A: All nonfarm, nonfinancial, nonreal-estate small businesses, subsidiaries excluded (n = 754)
% 29.4% 16.8% 46.3% 1.4% 0.5% 1.9% 16.6% 26.1% 9.1% 51.9% 100.0%(amount, mill. €) (52,097)
B: Breakout by size of small business
35.4% 21.3% 56.7% 1.9% 0.9% 2.8% 14.8% 16.2% 9.6% 40.6% 100.0%(18,689)
26.1% 14.4% 40.5% 1.1% 0.2% 1.3% 17.6% 31.7% 8.8% 58.2% 100.0%(33,407)
C: Breakout by age of small business
9.7% 33.8% 43.5% 4.7% 4.0% 8.7% 16.9% 22.5% 8.4% 47.8% 100.0%(2,294)
33.0% 17.5% 50.5% 0.6% 0.3% 1.0% 19.5% 19.8% 9.2% 48.5% 100.0%(8,722)
22.3% 16.2% 38.6% 0.9% 0.3% 1.2% 16.4% 37.6% 6.2% 60.2% 100.0%(24,543)
40.9% 15.1% 55.9% 2.0% 0.3% 2.3% 15.5% 13.0% 13.4% 41.8% 100.0%(16,538)
"Smaller"
"Larger"
"Old" [=> 25 years]
Total debt and
equity
"Infant" [0-4 years]"Adolescent" [5-8 years]"Middle-Aged" [9-24 years]
Note: The table reports percents of total debt and equity. In panel B “Smaller” is defined as a firm having less than 20 employees and less than 1 million € sales; “Larger” includes other SMEs. For more informa-tion about the data, see Table 6.1.

Smal l business f inance in Finland – A descr ipt ive study · 213
A breakout by the size of SMEs is presented in Panel B. “Larger SMEs” are defined to have at least 20 employees or one million euros in sales. Panel C displays the sources of funds over the lifecycle of firms. In this panel, SMEs are divided into four categories by their age. The categories are “Infant (0-4 years )”, which approximates the seed and start-up stages, “Adolescent (5-8 years)”, “Middle-aged (9-24 years)” and “Old (25 or more years)”, which cor-respond to the later stages of the firms lifecycle.13
Panel B of the table reveals that large SMEs are more indebted than small ones. Despite small SMEs relying more on capital loans than large SMEs (3% vs. 1%), the debt ratio of the large SMEs is 59% while that of the small SMEs is 43%. This finding is in line with the results reported by BU (1998) for the US. Principal owner’s equity is the most important source of funds both for small SMEs and for large SMEs, but it is relatively more im-portant for the former (35% vs. 26%). These findings are in line with the US results (BU 1998), too.
The age categorization of Table C shows that that the debt ratio is non-monotonic over the lifecycle of firms. It is first high at 56% when SMEs are “Infant”, i.e., 0-4 years old, decreases thereafter somewhat, and reaches its peak at 61% when firms become middle-aged. The high debt ratio of the “In-fant” SMEs is explained by the prevalent use of capital loans. They represent nearly 9% of the total debt and equity in the “Infant” category and seem to be a substitute for the (standard) debt provided by FIs. The life-cycle closes when firms become old. The table reveals that at that stage the debt ratio again decreases. One explanation for this phenomenon may be the accumula-tion of retained earnings, as it may be that SMEs that survive to become “Old” are those that are able to generate internal funds.
The non-monotonic development of the debt ratio over the lifecycle of SMEs is qualitatively identical to BU’s (1998) findings regarding the evolution of the capital structure of the US small businesses. The Finnish data are also consistent with that of the US regarding the role of principal owner as a holder of shareholders’ equity: the principal owner accounts for a relatively low fraction of total funds among the “Infant” SMEs. The fact that the princi-pal owner’s equity increases after the infant years more than the total equity indicates that the principal owner is perhaps buying shares from other shareholders.
Overall, we can conclude that the capital structure of Finnish SMEs does not fundamentally differ from that of the US SMEs when the study by BU (1998) is used as the US benchmark. There however are some differences
214 · Ar i Hyyt inen and M ik a Pajar inen
between Finland and the US in addition to the difference in the relative im-portance of trade credit documented earlier. We discuss them next.
Comparing Panel C to BU (1998) shows that the Finnish SMEs start with about the same level of debt than their US counterparts do. However, it seems that
• the Finnish SMEs increase the level of indebtedness slowly compared to the US SMEs (according to BU, the debt ratios of SMEs in the US peak when firms are from 3 to 4 years old while in Finland they peak when firms become middle-aged, i.e., older than 9 years);
• the youngest SMEs (that are 0-4 years old) utilize less debt provided by FIs in Finland than in the US (according to BU, the ratio of FI debt to total equity and debt is in the US over 30%, while in Finland the corresponding ratio is around 22% even if capital loans supplied by FIs are taken into ac-count).
The raw data provide us with no good explanation for these differ-ences. However, if the differences are not entirely attributable to differences in demand, they suggest that the debt market in Finland is perhaps not as conducive for entrepreneurship and start-ups as it is in the US.
Sources of equity
Table 6.3 - Table 6.5 report the sources of equity in more detail. Concentrating first on Table 6.3, Panel A reveals that following the principal owner’s contri-bution of 64% (of total equity), the second largest source of equity (with 24% share of the total equity) are managers and employees who are actively in-volved in the daily business of firms (but who do not have control over the firm as required by the definition of the principal owner). Other individuals, which include “business angels” and other individual investors who do not participate in the daily business or have control over the firm, are the third largest source of equity (about 5%), followed by non-financial firms (about 4%).14 Venture capital firms’ (VCs) contribution to the total equity of SMEs is modest, about 1%, but it is well known that they invest very selectively and the overwhelming majority of SMEs are not candidates for venture capital. Finally, “Other equity” in Table 6.3 includes residual shareholders’ equity, which we were unable to assign to any specific investor category (2% of total equity).

Smal l business f inance in Finland – A descr ipt ive study · 215
Breakout by the size of SMEs in Panel B reveals, on the one hand, that the principal owner has a slightly lower proportion of the total equity in small SMEs than in large ones (62% vs. 65%). On the other hand, managers and employees are a more significant source of equity in small SMEs than in large ones (33% and 17%, respectively).15 Panel C of Table 6.3 illustrates the sources of equity by the age of SMEs. It tells us that the principal owner is the dominant source of equity in all age categories but “Infants”. In this category, managers and employees contribute more to the equity capital than the prin-cipal owner. Panel C also illustrates that VCs and other non-financial firms (“Other firms”) are important holders of equity in the youngest SMEs in Finland.16
Table 6.3. Estimated distribution of equity by firm size and age, version 1
Individuals Institutions
Prin
cip
al
owne
r
Man
ager
s &
em
pl.
Oth
er
indi
vid.
Pub
lic
VC Pr
ivat
e
VC Fina
ncia
l in
stit.
Oth
er
firm
s
Oth
er
Equi
tyA: All nonfarm, nonfinancial, nonreal-estate small businesses, subsidiaries excluded
% 63.6% 24.3% 4.7% 0.3% 0.8% 0.1% 3.9% 2.4% 100.0%(amount, mill. €) (24,116)
B: Breakout by size of small business
62.4% 33.0% 1.7% 0.5% 0.7% 0.1% 1.0% 0.5% 100.0%(10,589)
64.5% 17.4% 7.0% 0.1% 0.8% 0.1% 6.2% 3.8% 100.0%(13,527)
C: Breakout by age of small business
22.2% 58.2% 1.3% 4.1% 5.7% 0.5% 8.0% 0.0% 100.0%(998)
65.3% 33.3% 0.6% 0.2% 0.3% 0.0% 0.3% 0.0% 100.0%(4,403)
57.9% 28.3% 0.4% 0.1% 0.9% 0.1% 8.4% 3.9% 100.0%(9,467)
73.1% 12.2% 11.4% 0.1% 0.4% 0.0% 0.7% 2.2% 100.0%(9,248)
"Adolescent" [5-8 years]"Middle-Aged" [9-24 years]"Old" [=> 25 years]
"Smaller"
"Larger"
Total sources
of equity
"Infant" [0-4 years]
Note: The table reports percents of total equity. In panel B “Smaller” is defined as a firm having less than 20 employees and less than 1 million € sales; “Larger” includes other SMEs. For more information about the data, see Table 6.1.
Table 6.3 and Table 6.4 allow us to track the relative importance of “in-side” and “outside” equity for the Finnish SMEs. From Table 6.3 we can compute “broad inside equity” as the sum of the equity owned by the princi-pal owner and that owned by managers and employees. The remaining eq-

216 · Ar i Hyyt inen and M ik a Pajar inen
uity in the firm is a proxy for “outside equity”. In Table 6.4 the category of principal owner has been disaggregated into categories according to the identity of owners. From this table, we can identify “narrow inside equity” as the equity held by individuals that are actively involved in a firm’s daily business, such as management and employees. Again, the remaining equity is a proxy for “outside equity”.
Table 6.4. Estimated distribution of equity by firm size and age, version 2
Individuals Institutions
Act
ive
in
bus
ines
s
Oth
er
indi
vid.
Pub
lic
VC Pr
ivat
e
VC Fina
ncia
l in
stit.
Oth
er
firm
s
Oth
er
equi
ty
A: All nonfarm, nonfinancial, nonreal-estate small businesses, subsidiaries excluded
% 83.1% 6.6% 0.4% 1.0% 0.1% 4.7% 4.1% 100.0%(amount, mill. €) (24,116)
B: Breakout by size of small business
87.7% 5.4% 0.6% 0.8% 0.1% 2.3% 3.2% 100.0%(10,589)
79.5% 7.5% 0.1% 1.2% 0.1% 6.6% 4.8% 100.0%(13,527)
C: Breakout by age of small business
77.2% 2.2% 4.1% 6.5% 0.5% 9.1% 0.6% 100.0%(998)
91.1% 7.9% 0.2% 0.3% 0.0% 0.4% 0.2% 100.0%(4,403)
85.2% 0.9% 0.3% 0.9% 0.1% 8.7% 4.0% 100.0%(9,467)
77.8% 12.3% 0.1% 0.9% 0.0% 2.3% 6.5% 100.0%(9,248)
"Smaller"
"Larger"
Total sources
of equity
"Old" [=> 25 years]
"Infant" [0-4 years]"Adolescent" [5-8 years]"Middle-Aged" [9-24 years]
Note: In the table the category of principal owner has been disaggregated into categories according to the identity of owners. The table reports percents of total equity. In panel B “Smaller” is defined as a firm having less than 20 employees and less than 1 million € sales; “Larger” includes other SMEs. For more in-formation about the data, see Table 6.1.
Taken together, we can infer from Table 6.3 and Table 6.4 that the eq-uity provided by corporate insiders is a very important source of funds for Finnish SMEs. Specifically, on the basis of Table 6.3, we find that the broad inside equity
• accounts for about 88% of the total shareholders’ equity among the Fin-nish SMEs;
• is more important for small SMEs than for large SMEs (95% vs. 82%);

Smal l business f inance in Finland – A descr ipt ive study · 217
• is used non-monotonically over the life-cycle of SMEs, as it accounts for about 80% in the “Infant”, 88% in the “Adolescent”, 86% in the “Middle-Aged” and 85% in the “Old” category.
Table 6.4 confirms the above findings, as narrow inside equity behaves similarly as the broad insider equity does. Specifically, it confirms that out-side equity is in relative terms most important for the youngest SMEs. Fi-nally, the tables show that VCs and “Other firms”, i.e. non-financial firms, are a disproportionately important source of outside equity to the youngest SMEs.
Finally, Table 6.5 provides information about the identity of the princi-pal owner by disaggregating the category of principal owners into two types of individuals and three types of institutions. The table provides us with a rough distribution of control in Finnish SMEs.
Table 6.5. Estimated distribution of principal owner’s equity by firm size and age
Individuals Institutions
Act
ive
in
bus
ines
s
Oth
er
indi
vid.
Vent
ure
cap
ital
Oth
er
firm
s
Oth
er
inst
it.
A: All nonfarm, nonfinancial, nonreal-estate small businesses, subsidiaries excluded
% 92.5% 3.0% 0.5% 1.3% 2.7% 100.0%(amount, mill. €) (15,341)
B: Breakout by size of small business
87.6% 5.8% 0.3% 2.0% 4.2% 100.0%(6,612)
96.3% 0.8% 0.6% 0.7% 1.6% 100.0%(8,730)
C: Breakout by age of small business
85.3% 4.3% 3.2% 4.8% 2.4% 100.0%(222)
88.5% 11.1% 0.0% 0.1% 0.3% 100.0%(2,876)
98.2% 0.8% 0.3% 0.6% 0.1% 100.0%(5,485)
89.9% 1.2% 0.8% 2.2% 6.0% 100.0%(6,758)
"Adolescent" [5-8 years]"Middle-Aged" [9-24 years]"Old" [=> 25 years]
"Smaller"
"Larger"
Total principal
owner
"Infant" [0-4 years]
Note: The table reports percents of total principal owner’s equity. In panel B “Smaller” is defined as a firm having less than 20 employees and less than 1 million € sales; “Larger” includes other SMEs. For more information about the data, see Table 6.1.

218 · Ar i Hyyt inen and M ik a Pajar inen
Panel A in Table 6.5 shows that over 92% of the principal owner’s eq-uity originates from entrepreneurs and other individuals active in the daily business of firms. The breakouts by the size and age of SMEs in Panel B and Panel C depict that the share of the individuals that are active in business in-creases as SMEs grow and mature. The fact that individuals that are active in business account for a smaller fraction of the principal owner’s equity in the smallest and youngest firms indicates that these firms may have been forced to relinquish control in order to receive financing from FIs and other institu-tional investors.
Sources of debt
Table 6.6 sheds light on the sources of SME debt by dividing institutional creditors into nine categories.17 The nine categories consist of four types of fi-nancial institution debt, four types of debt from non-financial business and governmental bodies, and an aggregate of public debt instruments (commer-cial papers and corporate bonds). The four types of FIs are self-explanatory. The debt provided by non-financial firms is either “Trade credit” or other lending by “Other nonfin. business”. The governmental bodies are either “Govt.: Finnvera”, which refers to Finnvera plc and “Other govt.”, which in-cludes all the other governmental sources. A tenth category in the table is “Other debt”. This category includes debt from individuals and also some re-sidual debt provided by sources that the survey data did not allow us to identify.
Panel A in Table 6.6 shows that the most important source of debt for SMEs is trade credit that accounts for 45% of total debt. Although high, this finding is expected. BU (1998) for example reports that trade credit repre-sents 31% of the total debt among the U.S. SMEs.18 Domestic banks are the second most important source of debt finance, as they supply 26% of the total debt. “Other debt”, coming mainly from individuals, is the third largest cate-gory of debt, while governmental bodies are the fourth largest creditors. They supply 5% of the total debt, but note that over 90% of the debt comes from one source, Finnvera. As expected, commercial papers and other in-struments of public debt account for a negligible proportion of total small business debt.
Breakout by the size of SMEs in Panel B reveals that trade credit is the most important source of debt finance for small and large SMEs, although for the latter, the share is higher. Banks are unsurprisingly the second most sig-nificant source of debt in both size categories, though small SMEs rely rela-

Smal l business f inance in Finland – A descr ipt ive study · 219
tively more on it than large SMEs do. The governmental bodies are only a slightly more important source of debt for small SMEs than for large SMEs.
Table 6.6. Estimated distribution of debt by firm size and age
Financial institutions Nonfin. business and govt.
Dom
esti
c b
anks
Dom
esti
c fin
ance
firm
s
Oth
er d
om.
finan
cial
inst
.
Fore
ign
fin.
inst
itut
ions
Trad
e cr
edit
Oth
er n
onfin
. b
usin
ess
Gov
ernm
ent:
Finn
vera
Oth
er
gove
rnm
ent
CPs
and
b
onds
Oth
er d
ebt
A: All nonfarm, nonfinancial, nonreal-estate small businesses, subsidiaries excluded
% 26.4% 3.3% 2.1% 0.3% 45.0% 0.3% 4.7% 0.5% 0.0% 17.5% 100.0%(amount, mill. €) (27,016)
B: Breakout by size of small business
30.9% 3.9% 1.7% 0.1% 33.6% 0.6% 4.8% 0.9% 0.0% 23.5% 100.0%(7,585)
24.6% 3.0% 2.2% 0.4% 49.4% 0.2% 4.6% 0.3% 0.0% 15.2% 100.0%(19,432)
C: Breakout by age of small business
25.8% 6.9% 1.9% 0.7% 34.4% 2.6% 8.9% 1.1% 0.2% 17.4% 100.0%(1,097)
34.8% 5.0% 0.3% 0.0% 35.3% 0.4% 4.8% 0.4% 0.0% 19.0% 100.0%(4,234)
21.9% 2.7% 2.0% 0.6% 58.2% 0.1% 3.8% 0.4% 0.0% 10.4% 100.0%(14,775)
30.8% 2.8% 3.4% 0.0% 24.3% 0.3% 5.9% 0.5% 0.0% 32.0% 100.0%(6,911)
Total sources of debt
"Smaller"
"Larger"
"Old" [=> 25 years]
"Infant" [0-4 years]"Adolescent" [5-8 years]"Middle-Aged" [9-24 years]
Note: The table reports percents of total debt. In panel B “Smaller” is defined as a firm having less than 20 employees and less than 1 million € sales; “Larger” includes other SMEs. For more information about the data, see Table 6.1.
Panel C shows the distribution of debt finance by firm age. It shows that the only age category in which trade credit is not the most important source of funds is “Old”, i.e., firms older than 25 years. The ratio of bank loans to total debt increases as firms mature from the “Infant” category to “Adolescent”, then decreases significantly in the “Middle-age” category and increases again when firms mature to the “Old” category. The drop in the share of bank loans among the middle-aged SMEs is related to the simulta-neous increase in the proportion of trade credit. Panel C also shows that the proportion of debt from finance firms, other non-financial firms as well as from the governmental bodies is the highest during the early stages of SMEs’ lifecycle. In particular, the share of the debt provided by finance companies is high among the “Infant” but decreases monotonically when firms mature.
220 · Ar i Hyyt inen and M ik a Pajar inen
In summary, the two most important sources of (standard) debt – trade credit and loans from domestic deposit banks – account for about 71% of the total debt held by the Finnish SMEs. However, sources of debt are more het-erogeneous for the smallest and especially youngest (“Infant”) SMEs than they are for the older and larger SMEs.
6.3.3. DISTRIBUTIONS OF EQUITY AND DEBT BY FIRM INNOVATIVENESS
AND R&D-INTENSITY
Besides small size and young age, innovativeness and investments in R&D are often considered as a source of financial constraints for SMEs. In this Sec-tion, we document how the distribution of sources of funds depends on SMEs’ innovativeness and R&D-activities.
Overview
Table 6.7 displays the estimated distribution of sources of funds for the Fin-nish small businesses by their innovativeness and R&D-activities. Whereas Panel A of the table displays the unconditional distribution, the distribution in Panel B has been conditioned on SMEs’ innovativeness.19 The definition for an “Innovative firm” is taken from Statistics Finland’s (1998) innovation sur-vey and Detragiache et al. (2000): a firm is innovative if it has innovated its products, production processes, or both during the last three years. The pro-portion of firms fulfilling the criterion is about 33%. In Panel C we have di-vided SMEs into three categories by their R&D-intensity, which is defined as the ratio of R&D expenditure to sales during the last fiscal period. A firm has “High R&D intensity” if the ratio is over 5%, “Low R&D intensity” if it is positive but less than 5% and “No R&D expenditure” if the firm reports no R&D expenses. The proportion of firms falling in “High R&D intensity”, “Low R&D intensity” and “No R&D expenditure” categories are (roughly) 9%, 36% and 53%, respectively. Finally, Panels D and E of Table 6.7 categorize SMEs by the “output” of their R&D activity. In Panel D SMEs are classified according to whether they own patents (6% of SMEs report that they own patents) while in Panel E the classification is based on whether they own other valuable intangible assets besides patents (14% of SMEs report that they own such intangible assets).

Smal l business f inance in Finland – A descr ipt ive study · 221
Table 6.7. Estimated distributions of equity, capital loans and debt by innovation activity
Sources of equity Capital loans Sources of debt
Prin
cip
al
owne
r
Oth
er
equi
ty
Tota
l eq
uity
Priv
ate
Pub
lic
Tota
l cap
. lo
ans
Fina
ncia
l in
stit.
Oth
er
inst
it.
Oth
er
deb
t
Tota
l
deb
t
A: All small businesses which responded to questions related to innovation activity (n =728)
% 26.6% 17.9% 44.6% 1.5% 0.5% 1.9% 17.7% 26.4% 9.5% 53.5% 100.0%(amount, mill. €) (48,382)
B: Breakout by innovations of small business
29.2% 18.7% 48.0% 2.1% 1.0% 3.1% 20.8% 18.8% 9.4% 49.0% 100.0%(19,446)
24.9% 17.4% 42.3% 1.0% 0.1% 1.1% 15.6% 31.5% 9.5% 56.6% 100.0%(28,936)
C: Breakout by R&D intensity of small business
33.2% 26.6% 59.8% 2.0% 3.0% 5.0% 9.8% 17.9% 7.4% 35.1% 100.0%(4,290)
33.8% 17.8% 51.6% 1.2% 0.1% 1.4% 17.7% 16.2% 13.1% 47.0% 100.0%(22,033)
18.2% 16.3% 34.6% 1.6% 0.3% 1.9% 19.2% 38.2% 6.2% 63.6% 100.0%(22,058)
D: Breakout by patenting activity of small business
29.7% 25.8% 55.5% 1.2% 1.9% 3.1% 20.4% 13.9% 7.1% 41.4% 100.0%(5,346)
"No patents" 26.2% 17.0% 43.2% 1.5% 0.3% 1.8% 17.3% 27.9% 9.8% 55.0% 100.0%(43,036)
E: Breakout by other intangible assets of small business
31.7% 14.3% 46.1% 4.9% 1.6% 6.5% 25.3% 13.5% 8.6% 47.4% 100.0%(7,591)
25.7% 18.6% 44.3% 0.8% 0.3% 1.1% 16.3% 28.8% 9.6% 54.7% 100.0%(40,791)
"No intagible assets"
"High R&D intensity""Low R&D intensity""No R&D expenditure"
"Has patents"
Total debt and
equity
"Innovative firms"
"Non-innovat. firms"
"Has intangible assets"
Note: The table reports percents of total debt and equity. For more information about the data, see Table 6.1.
Panels B, C, D and E provide us with the following findings:
• Innovative firms, firms with R&D-activities (those with “High R&D inten-sity” or “Low R&D intensity”), and firms that own patents and/or intan-gible assets run a lower debt ratio than their counterparts. The difference is most notable for the most R&D-intensive SMEs (“High R&D intensity”).
• Unlike for their (non-innovative) counterparts, the most important source of funds for innovative firms, firms with R&D-activities, and firms that own patents and/or intangible assets is equity attributable to the principal owner.

222 · Ar i Hyyt inen and M ik a Pajar inen
• Despite the low leverage, innovative firms, firms with R&D-activities and firms that own patents and/or intangible assets resort quite a lot to capital loans. For example, the most R&D-intensive firms have 5% of total debt and equity provided in the form of capital loans.20
• The most R&D-intensive firms are less leveraged than firms that can al-ready demonstrate a degree of innovativeness.
The Finnish SME data is thus not inconsistent with the partially re-versed pecking order theory that we loosely outlined in Section 6.2: innova-tive small businesses investing in R&D emphasize equity over debt. The evi-dence is also consistent with the cross-sectional evidence for the US that R&D-intensity and leverage are negatively correlated across firms (Smith and Watts 1992, Bhagat and Welch 1995, Barclay et al. 2001, see also the discus-sion in Hall 2002).
Sources of equity
Table 6.8 - Table 6.10 provide more detailed information on the sources of eq-uity by firm innovativeness and R&D-intensity. Panels B, C, D, and E of Table 6.8 and Table 6.9 show that
• SMEs with R&D-activities rely clearly more on (both broad and narrow) inside equity than other SMEs do.21 As the other classifications of innova-tiveness reveal, insider equity is not, in relative terms, as important for firms that can demonstrate a degree of innovativeness as it is for SMEs with R&D-activities.
• For the most R&D-intensive SMEs, the most important sources of outside equity are venture capital and other non-financial firms (“Other firms”).
• For SMEs with some but low R&D-intensity, innovations, patents and/or intangible assets, the most important source of outside equity are other individuals (that are neither principal owners nor otherwise active in the firms’ daily business), i.e., business angles.
What we find is that holding the amount of equity constant, especially R&D-intensive firms resort heavily to inside equity. Demand side considera-tions may explain the finding to a large extent, but it may also reflect defi-ciencies in the market for innovation finance. In particular, the finding is con-sistent with the view that the most R&D-intensive firms find it expensive to issue outside equity.

Smal l business f inance in Finland – A descr ipt ive study · 223
Table 6.10 finally decomposes the sources of principal owners’ equity by innovativeness and R&D-intensity. The table indicates that holding the amount of equity contributed by the principal owner constant, individuals active in the daily business of firms account for a larger proportion of the principal owner’s equity in innovative firms, firms with R&D-activities, and firms that own patents and/or intangible assets than in other firms. This fact suggests that retaining control by individuals active in business is dispropor-tionately important in innovative firms, firms with R&D-activities, and firms that own patents and/or intangible assets. It is however also in line with the view that the individuals active in business that are owners of such firms find it expensive to issue outside equity.
Table 6.8. Estimated distribution of equity by innovation activity, version 1
Individuals Institutions
Prin
cip
al
owne
r
Man
ager
s &
em
pl.
Oth
er
indi
vid.
Pub
lic
VC Pr
ivat
e
VC Fina
ncia
l in
stit.
Oth
er
firm
s
Oth
er
Equi
tyA: All small businesses which responded to questions related to innovation activity
% 59.8% 26.9% 5.3% 0.3% 0.8% 0.1% 4.4% 2.6% 100.0%(amount, mill. €) (21,558)
B: Breakout by innovations of small business
60.9% 24.3% 9.0% 0.6% 1.6% 0.1% 0.9% 2.6% 100.0%(9,325)
58.9% 28.9% 2.4% 0.1% 0.1% 0.0% 7.1% 2.6% 100.0%(12,233)
C: Breakout by R&D intensity of small business
55.5% 34.8% 1.5% 2.3% 2.3% 0.5% 2.0% 1.2% 100.0%(2,567)
65.5% 22.8% 9.3% 0.0% 0.8% 0.0% 0.5% 1.1% 100.0%(11,370)
52.7% 30.3% 0.5% 0.0% 0.1% 0.0% 11.1% 5.3% 100.0%(7,622)
D: Breakout by patenting activity of small business
53.6% 33.1% 8.2% 1.6% 1.6% 0.0% 0.6% 1.4% 100.0%(2,966)
"No patents" 60.8% 25.9% 4.8% 0.1% 0.6% 0.1% 5.0% 2.8% 100.0%(18,592)
E: Breakout by other intangible assets of small business
68.9% 17.2% 7.7% 1.4% 1.8% 0.2% 0.3% 2.4% 100.0%(3,497)
58.0% 28.8% 4.8% 0.1% 0.5% 0.0% 5.2% 2.6% 100.0%(18,061)
"No intagible assets"
"High R&D intensity""Low R&D intensity""No R&D expenditure"
"Has patents"
"Innovative firms"
"Non-innovat. firms"
"Has intangible assets"
Total sources
of equity
Note: The table reports percents of total equity. For more information about the data, see Table 6.1.
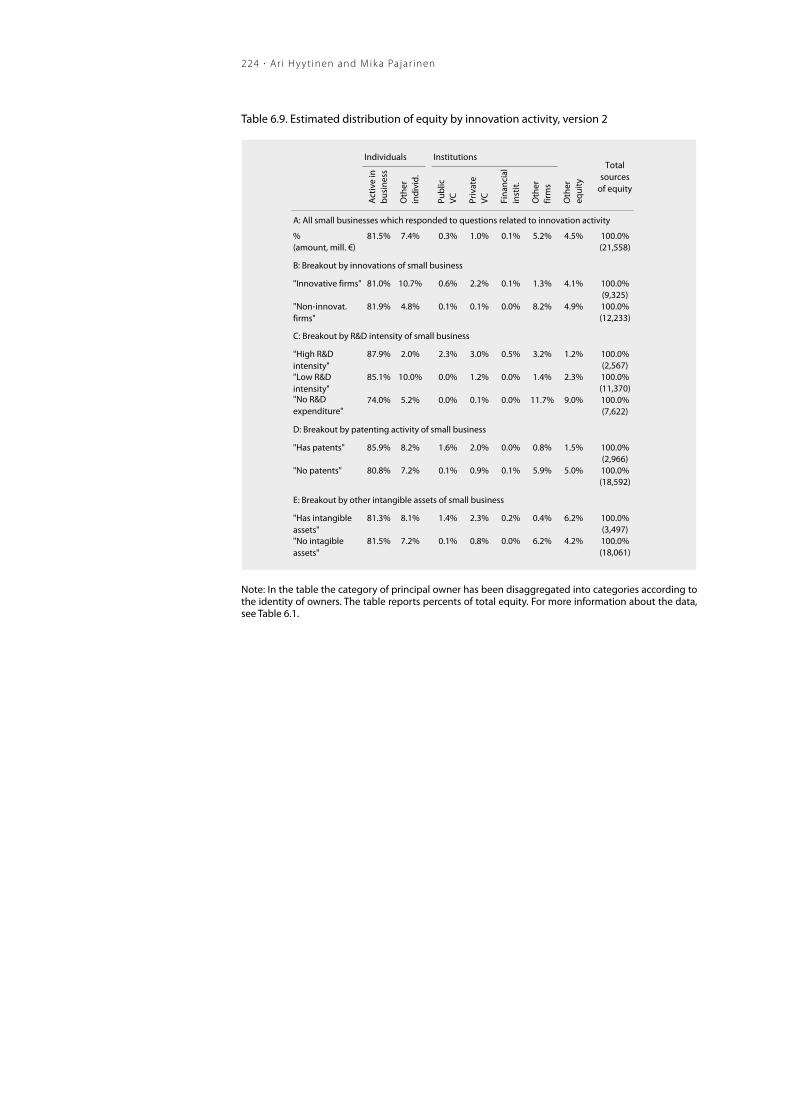
224 · Ar i Hyyt inen and M ik a Pajar inen
Table 6.9. Estimated distribution of equity by innovation activity, version 2
Individuals Institutions
Act
ive
in
bus
ines
s
Oth
er
indi
vid.
Pub
lic
VC Pr
ivat
e
VC Fina
ncia
l in
stit.
Oth
er
firm
s
Oth
er
equi
ty
A: All small businesses which responded to questions related to innovation activity
% 81.5% 7.4% 0.3% 1.0% 0.1% 5.2% 4.5% 100.0%(amount, mill. €) (21,558)
B: Breakout by innovations of small business
81.0% 10.7% 0.6% 2.2% 0.1% 1.3% 4.1% 100.0%(9,325)
81.9% 4.8% 0.1% 0.1% 0.0% 8.2% 4.9% 100.0%(12,233)
C: Breakout by R&D intensity of small business
87.9% 2.0% 2.3% 3.0% 0.5% 3.2% 1.2% 100.0%(2,567)
85.1% 10.0% 0.0% 1.2% 0.0% 1.4% 2.3% 100.0%(11,370)
74.0% 5.2% 0.0% 0.1% 0.0% 11.7% 9.0% 100.0%(7,622)
D: Breakout by patenting activity of small business
85.9% 8.2% 1.6% 2.0% 0.0% 0.8% 1.5% 100.0%(2,966)
"No patents" 80.8% 7.2% 0.1% 0.9% 0.1% 5.9% 5.0% 100.0%(18,592)
E: Breakout by other intangible assets of small business
81.3% 8.1% 1.4% 2.3% 0.2% 0.4% 6.2% 100.0%(3,497)
81.5% 7.2% 0.1% 0.8% 0.0% 6.2% 4.2% 100.0%(18,061)
"Innovative firms"
"Non-innovat. firms"
"Has intangible assets"
Total sources
of equity
"No intagible assets"
"High R&D intensity""Low R&D intensity""No R&D expenditure"
"Has patents"
Note: In the table the category of principal owner has been disaggregated into categories according to the identity of owners. The table reports percents of total equity. For more information about the data, see Table 6.1.

Smal l business f inance in Finland – A descr ipt ive study · 225
Table 6.10. Estimated distribution of principal owner’s equity by innovation activity
Individuals Institutions
Act
ive
in
bus
ines
s
Oth
er
indi
vid.
Vent
ure
cap
ital
Oth
er
firm
s
Oth
er
inst
it.
A: All small businesses which responded to questions related to innovation activity
% 91.4% 3.5% 0.5% 1.4% 3.3% 100.0%(amount, mill. €) (12,884)
B: Breakout by innovations of small business
93.0% 2.8% 1.1% 0.7% 2.4% 100.0%(5,679)
90.1% 4.1% 0.0% 1.9% 3.9% 100.0%(7,204)
C: Breakout by R&D intensity of small business
95.6% 0.9% 1.3% 2.2% 0.0% 100.0%(1,424)
95.1% 1.1% 0.6% 1.3% 1.9% 100.0%(7,445)
83.0% 8.9% 0.0% 1.1% 7.0% 100.0%(4,015)
D: Breakout by patenting activity of small business
98.5% 0.1% 0.8% 0.5% 0.2% 100.0%(1,589)
"No patents" 90.4% 4.0% 0.4% 1.5% 3.7% 100.0%(11,295)
E: Breakout by other intangible assets of small business
93.1% 0.6% 0.7% 0.1% 5.4% 100.0%(2,410)
91.0% 4.2% 0.4% 1.7% 2.8% 100.0%(10,474)
"No intagible assets"
"High R&D intensity""Low R&D intensity""No R&D expenditure"
"Has patents"
"Innovative firms"
"Non-innovat. firms"
"Has intangible assets"
Total principal
owner
Note: The table reports percents of total principal owner’s equity. For more information about the data, see Table 6.1.
226 · Ar i Hyyt inen and M ik a Pajar inen
Sources of debt
Table 6.11 provides information on the sources of debt by firm innovative-ness and R&D-intensity. Panels B, C, D, and E of the table show that:
• The most R&D-intensive SMEs rely less on debt from domestic banks than other firms do. For them, the most important source of debt is trade credit that together with other credit from non-financial firms account for 36% of the total debt.
• Domestic banks are the largest source of debt for small businesses which are able to report “output” for their innovative activity, i.e., they have in-novated or hold patents and/or other intangible assets. The same holds for SMEs with low R&D-intensity. The use of trade credit is clearly less preva-lent among these SMEs than among their counterparts.
• Debt other than trade credit provided by non-financial firms is systemati-cally more important for innovative firms, firms with R&D-activities, and firms that own patents and/or intangible assets than for their counter-parts.
• The debt provided by governmental bodies and specifically by Finnvera seems to be an important source of debt for innovative firms, firms with R&D-activities and firms that own patents and/or intangible assets. Spe-cifically, the debt provided by Finnvera accounts for about 10% of the total debt of the most R&D-intensive firms.
The data shows that there are systematic differences in the sources of debt between the most R&D-intensive and other SMEs. Provided that the dif-ferences are not entirely attributable to differences in demand, it seems that the deposit banks in Finland are less willing to finance R&D-intensive SMEs than SMEs with signs of innovativeness. The other side of the finding is that the SMEs with signs of innovativeness seem to be able to raise non-negligible amounts of standard debt from domestic banks.

Smal l business f inance in Finland – A descr ipt ive study · 227
Table 6.11. Estimated distribution of debt by innovation activity
Financial institutions Nonfin. business and govt.
Dom
esti
c b
anks
Dom
esti
c fin
ance
firm
s
Oth
er d
om.
finan
cial
inst
.
Fore
ign
fin.
inst
itut
ions
Trad
e cr
edit
Oth
er n
onfin
. b
usin
ess
Gov
ernm
ent:
Finn
vera
Oth
er
gove
rnm
ent
CPs
and
b
onds
Oth
er d
ebt
A: All small businesses which responded to questions related to innovation activity
% 27.2% 3.4% 2.2% 0.3% 43.7% 0.3% 4.8% 0.4% 0.0% 17.7% 100.0%(amount, mill. €) (25,894)
B: Breakout by innovations of small business
33.8% 4.0% 4.4% 0.4% 27.2% 0.6% 9.5% 1.1% 0.0% 19.1% 100.0%(9,520)
23.3% 3.0% 0.9% 0.3% 53.4% 0.1% 2.1% 0.0% 0.0% 16.9% 100.0%(16,374)
C: Breakout by R&D intensity of small business
22.1% 1.7% 2.1% 2.1% 33.2% 2.8% 10.6% 4.3% 0.0% 21.1% 100.0%(1,507)
30.6% 3.6% 3.3% 0.1% 27.7% 0.3% 6.3% 0.2% 0.0% 27.9% 100.0%(10,362)
25.1% 3.3% 1.3% 0.4% 56.7% 0.0% 3.1% 0.2% 0.0% 9.8% 100.0%(14,024)
D: Breakout by patenting activity of small business
45.7% 1.1% 1.5% 1.0% 23.3% 1.4% 7.8% 1.0% 0.0% 17.2% 100.0%(2,214)
"No patents" 25.4% 3.6% 2.2% 0.3% 45.6% 0.2% 4.5% 0.4% 0.0% 17.7% 100.0%(23,680)
E: Breakout by other intangible assets of small business
43.7% 3.9% 5.2% 0.6% 16.1% 1.6% 10.2% 0.6% 0.0% 18.1% 100.0%(3,597)
24.5% 3.3% 1.7% 0.3% 48.2% 0.1% 3.9% 0.4% 0.0% 17.6% 100.0%(22,296)
"No intagible assets"
"High R&D intensity""Low R&D intensity""No R&D expenditure"
"Has patents"
"Innovative firms"
"Non-innovat. firms"
"Has intangible assets"
Total sources of debt
Note: The table reports percents of total debt. The debt data do not include capital loans. For more in-formation about the data, see Table 6.1.
6.3.4. EQUITY AND DEBT IN R&D-INTENSIVE SMES: NEW PERSPECTIVES
So far, we have examined the financing patterns of SMEs from the viewpoint of conventional capital structure studies. In this Section, our aim is to provide new perspectives on the financing patterns of SMEs by examining main sources, concentration and interconnectedness of finance.
We look at the main sources of finance, because recent research on re-lationship banking suggests that SMEs can sometimes obtain more and cheaper financing by resorting to a single source of finance and by establish-ing a close relationship with it (Petersen and Rajan 1994, Boot 2000). If the

228 · Ar i Hyyt inen and M ik a Pajar inen
main sources of funds are more heterogeneous for R&D-intensive firms, it may suggest that the costs of relationship finance are high for them. We look at the concentration of finance because it can point to the presence of capital market failures (Gans and Stern 2000). For example, the concentrated use of, say, FI debt may be a sign of credit rationing (Stiglitz and Weiss 1981). Con-centration may, of course, also point to the clustering of technological oppor-tunities and to cross-sectional variation in appropriability of the returns from innovations. Finally, we look at the interconnectedness of finance because it may be related to the existence and, especially, transmission of capital market frictions. Interconnectedness stems from the possibility that the various sources of funds may be substitutes or complements (BU 1998). With com-plementary sources, a capital market failure originating from one source hin-ders the availability of the other. However, with substitute sources, a capital market failure originating from one source forces SMEs to substitute the available source for the unavailable.22 Thus, if anything, interconnectedness is an indication of a more complex system of SME finance where the function-ing of one segment of the private capital market affects that of the other seg-ments. We therefore specifically examine if interconnectedness is more preva-lent among R&D firms than among other firms.
Main sources
Figure 6.1 presents the main lenders and equity sources of SMEs by R&D in-tensity. In this figure, a firm is recorded to have, say, a financial institution as its main lender if the largest provider of credit to it is a financial institution. A similar rule also identifies main equity sources.
Figure 6.1 reveals that the importance of FIs as the main lender de-creases as firms’ R&D intensity increases. Over 40% of the SMEs with no R&D have a financial institution as their main lender, while the correspond-ing percentage for the most R&D-intensive firms is below 25%. The finding echoes our previous result, as it shows that FIs provide disproportionately more credit to less R&D-intensive firms. A reverse pattern is found to apply to the credit supplied by governmental bodies, while the role of non-financial institutions, such as other non-financial firms, as the main lender of SMEs does not seem to depend on the R&D-intensity. Interestingly, the most R&D-intensive firms have many kinds of main lenders. They also have more fre-quently than other SMEs two equally significant sources of debt, which amounts to saying that there is a tie between the two largest sources of debt (see the bars marked as “No main identifiable lender type” in the figure). The

Smal l business f inance in Finland – A descr ipt ive study · 229
findings are not inconsistent with the view that the costs of relationship fi-nance are high for R&D-intensive firms.
Figure 6.1 also shows that the narrowly defined insiders are the main equity holders in more than 80% of the SMEs irrespectively of the level of R&D-intensity. This may seem to be in contrast with our earlier finding that R&D-intensive SMEs depend more on insider equity than other SMEs do. However, it is not, because the firms with R&D-activities run lower debt ra-tios and because the insiders of these firms hold on average larger stakes of equity. These imply that the insiders can be a disproportionately important source of equity in the R&D-intensive firms even though they are not as fre-quently as one would expect the main source of equity funds. As a final re-mark it is of interest to note that venture capital is the main source of equity in a small number of the most R&D-intensive SMEs (1.1%).
Figure 6.1. Main lenders and equity sources by R&D-intensity of SMEs
No R&D Low R&D High R&D0%
5%
10%
15%
20%
25%
30%
35%
40%
45%
Financial institutionsNon-financial instit.Government
Non-institutionsNo main indentif. lender
Main lender type
No R&D Low R&D High R&D0%
10%20%30%40%50%60%70%80%90%
100%
'Insider' individual'Outsider' individualVenture capital
Other institutionsNo main equity source
Main equity source
Note: The charts report the proportion of SMEs in which the selected providers of finance are the main source of debt or equity finance.
Concentration
Our starting point in this Subsection is the possibility that the distribution of debt and equity may be concentrated.23 As an example of such concentration consider SMEs with R&D-activities. Whereas they were found to rely less on debt than other SMEs, it may be that some of the SMEs with R&D-activities use no debt and that some use a disproportionately large fraction of it.

230 · Ar i Hyyt inen and M ik a Pajar inen
To study the patterns of concentration, we rely on Lorenz curves that are typically used to measure (income) inequality. The Lorenz curves meas-ure how evenly a characteristic of firms is distributed across the SMEs. Fol-lowing Gans and Stern (2000), we modify the basic Lorenz curve so that it plots cumulative percentages of the characteristic in question against cumula-tive percentages of a scale variable. SMEs are ranked along the x-axis of the Lorenz curve in terms of their rank of the ratio of the characteristic to the scale variable. The ranking implies that SMEs with a large “amount“ of the characteristic relative to the scale variable contribute to the Lorenz curve first. The Lorenz curve thus assumes the position of the 45-degree line if all SMEs have an equal “amount” of the characteristic relative to the scale variable. The extent to which the estimated Lorenz curves deviate from the hypotheti-cal line of no concentration indicates the degree of concentration of the char-acteristic within the SMEs.
Concentration relative to assets in place (firm size)
In what follows, we distinguish firms that have a positive ratio of R&D ex-penditures to sales (“R&D>0”) and that have innovated their products, pro-duction processes, or both (“Innovative firms”) from the SMEs that do not satisfy these criteria. The firms satisfying (either or both of) the criteria are collectively called “the R&D/innovative firms”.
Figure 6.2 presents the Lorenz distribution of bank loans, FI loans and total debt relative to assets in place, measured by firms’ total assets. The charts reveal that relative to the distribution of assets in place, 50% of SMEs accounts for most (around 75%) of the total debt. The use of bank and FI debt is much more concentrated than that of the total debt. That is, even after con-trolling for firm size, a very small subset of SMEs exhausts most of the debt provided by banks and FIs. However, it seems that the concentration of the FI or total debt among the R&D/innovative firms is not qualitatively different from that among their counterparts.
Figure 6.3 presents the Lorenz distribution of outside and inside equity relative to assets in place.24 The charts reveal that relative to the distribution of assets in place, a very small share of SMEs account for most of the outside equity. The outside equity is also a lot more concentrated than total equity; most of the SMEs have no outside equity at all. Moreover, the concentration of outside equity among the R&D/innovative firms is stronger than among their counterparts.

Smal l business f inance in Finland – A descr ipt ive study · 231
Figure 6.2. Concentration of debt vs. total assets
No R&D
0.0
0.2
0.4
0.6
0.8
1.0
0.0 0.2 0.4 0.6 0.8 1.0
Total assetsBa
nk lo
ans,
fina
ncia
l ins
t. lo
ans,
tota
l deb
t
R&D >0
0.0
0.2
0.4
0.6
0.8
1.0
0.0 0.2 0.4 0.6 0.8 1.0
Total assets
Bank
loan
s, fi
nanc
ial i
nst.
loan
s, to
tal d
ebt
0.0
0.2
0.4
0.6
0.8
1.0
0.0 0.2 0.4 0.6 0.8 1.0
Total assets
Bank
loan
s, fi
nanc
ial i
nst.
loan
s, to
tal d
ebt
Innovative firms
0.0
0.2
0.4
0.6
0.8
1.0
0.0 0.2 0.4 0.6 0.8 1.0
Total assets
Bank
loan
s, fi
nanc
ial i
nst.
loan
s, to
tal d
ebt
Non-innovative firms
Financial institutions’ loans Total debtBank loans
No R&D
0.0
0.2
0.4
0.6
0.8
1.0
0.0 0.2 0.4 0.6 0.8 1.0
Total assetsBa
nk lo
ans,
fina
ncia
l ins
t. lo
ans,
tota
l deb
t
R&D >0
0.0
0.2
0.4
0.6
0.8
1.0
0.0 0.2 0.4 0.6 0.8 1.0
Total assets
Bank
loan
s, fi
nanc
ial i
nst.
loan
s, to
tal d
ebt
0.0
0.2
0.4
0.6
0.8
1.0
0.0 0.2 0.4 0.6 0.8 1.0
Total assets
Bank
loan
s, fi
nanc
ial i
nst.
loan
s, to
tal d
ebt
Innovative firms
0.0
0.2
0.4
0.6
0.8
1.0
0.0 0.2 0.4 0.6 0.8 1.0
Total assets
Bank
loan
s, fi
nanc
ial i
nst.
loan
s, to
tal d
ebt
Non-innovative firms
Financial institutions’ loans Total debtBank loans Financial institutions’ loansFinancial institutions’ loans Total debtTotal debtBank loansBank loans
Note: The Lorenz curves measure how evenly a characteristic of firms is distributed across the SMEs. Lo-renz curve plots cumulative percentages of a characteristic in question (bank loans, say) against cumu-lative percentages of a scale variable. SMEs are ranked along the x-axis of the Lorenz curve in terms of their rank of the ratio of the characteristic to the scale variable. The Lorenz curve would assume the characteristic of the 45-degree line if all SMEs had an equal “amount” of the characteristic relative to the scale variable. The extent to which the estimated Lorenz curves deviate from the hypothetical line of no concentration indicates the degree of concentration of the characteristic within the SMEs. For more in-formation about the data, see Table 6.1.

232 · Ar i Hyyt inen and M ik a Pajar inen
Figure 6.3. Concentration of equity vs. total assets
No R&D
0.0 0.2 0.4 0.6 0.8 1.0
Total assets
0.0
0.2
0.4
0.6
0.8
1.0
Out
sid
e eq
uity
, tot
al e
qui
ty
0.0
0.2
0.4
0.6
0.8
1.0
0.0 0.2 0.4 0.6 0.8 1.0
Total assets
Out
sid
e eq
uity
, tot
al e
qui
ty
Innovative firms
0.0
0.2
0.4
0.6
0.8
1.0
0.0 0.2 0.4 0.6 0.8 1.0
Total assets
Out
sid
e eq
uity
, tot
al e
qui
ty
Non-innovative firms
Total equityOutside equity
R&D >0
0.0
0.2
0.4
0.6
0.8
1.0
0.0 0.2 0.4 0.6 0.8 1.0
Total assets
Out
sid
e eq
uity
, tot
al e
qui
ty
No R&D
0.0 0.2 0.4 0.6 0.8 1.0
Total assets
0.0
0.2
0.4
0.6
0.8
1.0
Out
sid
e eq
uity
, tot
al e
qui
ty
No R&D
0.0 0.2 0.4 0.6 0.8 1.0
Total assets
0.0
0.2
0.4
0.6
0.8
1.0
Out
sid
e eq
uity
, tot
al e
qui
ty
0.0
0.2
0.4
0.6
0.8
1.0
Out
sid
e eq
uity
, tot
al e
qui
ty
0.0
0.2
0.4
0.6
0.8
1.0
0.0 0.2 0.4 0.6 0.8 1.0
Total assets
Out
sid
e eq
uity
, tot
al e
qui
ty
Innovative firms
0.0
0.2
0.4
0.6
0.8
1.0
0.0 0.2 0.4 0.6 0.8 1.0
Total assets
Out
sid
e eq
uity
, tot
al e
qui
ty
Innovative firms
0.0
0.2
0.4
0.6
0.8
1.0
0.0 0.2 0.4 0.6 0.8 1.0
Total assets
Out
sid
e eq
uity
, tot
al e
qui
ty
Non-innovative firms
0.0
0.2
0.4
0.6
0.8
1.0
0.0 0.2 0.4 0.6 0.8 1.0
Total assets
Out
sid
e eq
uity
, tot
al e
qui
ty
Non-innovative firms
Total equityOutside equity Total equityTotal equityOutside equityOutside equity
R&D >0
0.0
0.2
0.4
0.6
0.8
1.0
0.0 0.2 0.4 0.6 0.8 1.0
Total assets
Out
sid
e eq
uity
, tot
al e
qui
ty
R&D >0
0.0
0.2
0.4
0.6
0.8
1.0
0.0 0.2 0.4 0.6 0.8 1.0
Total assets
Out
sid
e eq
uity
, tot
al e
qui
ty
Note: See Figure 6.2.

Smal l business f inance in Finland – A descr ipt ive study · 233
Concentration relative to R&D-expenditures
Figure 6.4 and Figure 6.5 present the Lorenz distribution of financial institu-tions’ loans, total debt as well as outside and inside equity relative to firms’ R&D-expenditure. The figures apply only to SMEs with R&D-activities and they contrast the relative distribution of the different sources of finance to the distribution of R&D-investments. For completeness, we present separate curves for small and large firms, as well as for young and old firms.
The figures show that FI loans are more concentrated than total debt relative to the distribution of R&D-investments. The same applies to outside equity, which is more concentrated than the total equity. The figures specifi-cally reveal that
• FI loans are concentrated even among the SMEs with R&D-activities, as a very small number of SMEs receive a high share of the overall credit pro-vided by FIs (Figure 6.4).
• Outside equity is very concentrated even among the SMEs with R&D-activities, as a very small number of SMEs receive a high share of the overall outside equity (Figure 6.5).
Figure 6.4. Concentration of debt vs. R&D-expenditures
Size
0.0
0.2
0.4
0.6
0.8
1.0
0.0 0.2 0.4 0.6 0.8 1.0
R&D expenditure
Bank
loan
s, fi
nanc
ial i
nst.
loan
s, to
tal d
ebt
Financial inst. loans, small SMEs
Financial inst. loans, large SMEs
Total debt, small SMEs
Total debt, large SMEs
Age
0.0
0.2
0.4
0.6
0.8
1.0
0.0 0.2 0.4 0.6 0.8 1.0
R&D expenditure
Bank
loan
s, fi
nanc
ial i
nst.
loan
s, to
tal d
ebt
Financial inst. loans, young SMEs
Financial inst. loans, old SMEs
Total debt, young SMEs
Total debt, old SMEs
Size
0.0
0.2
0.4
0.6
0.8
1.0
0.0 0.2 0.4 0.6 0.8 1.0
R&D expenditure
Bank
loan
s, fi
nanc
ial i
nst.
loan
s, to
tal d
ebt
Size
0.0
0.2
0.4
0.6
0.8
1.0
0.0 0.2 0.4 0.6 0.8 1.0
R&D expenditure
Bank
loan
s, fi
nanc
ial i
nst.
loan
s, to
tal d
ebt
Financial inst. loans, small SMEs
Financial inst. loans, large SMEs
Total debt, small SMEs
Total debt, large SMEs
Financial inst. loans, small SMEs
Financial inst. loans, large SMEs
Financial inst. loans, small SMEsFinancial inst. loans, small SMEs
Financial inst. loans, large SMEsFinancial inst. loans, large SMEs
Total debt, small SMEs
Total debt, large SMEs
Total debt, small SMEs
Total debt, large SMEs
Age
0.0
0.2
0.4
0.6
0.8
1.0
0.0 0.2 0.4 0.6 0.8 1.0
R&D expenditure
Bank
loan
s, fi
nanc
ial i
nst.
loan
s, to
tal d
ebt
Age
0.0
0.2
0.4
0.6
0.8
1.0
0.0 0.2 0.4 0.6 0.8 1.0
R&D expenditure
Bank
loan
s, fi
nanc
ial i
nst.
loan
s, to
tal d
ebt
Financial inst. loans, young SMEs
Financial inst. loans, old SMEs
Total debt, young SMEs
Total debt, old SMEs
Financial inst. loans, young SMEs
Financial inst. loans, old SMEs
Financial inst. loans, young SMEsFinancial inst. loans, young SMEs
Financial inst. loans, old SMEsFinancial inst. loans, old SMEs
Total debt, young SMEs
Total debt, old SMEs
Total debt, young SMEsTotal debt, young SMEs
Total debt, old SMEsTotal debt, old SMEs
Note: See Figure 6.2.

234 · Ar i Hyyt inen and M ik a Pajar inen
Figure 6.5. Concentration of equity vs. R&D-expenditures
Outside equity, small SMEs
Outside equity, large SMEs
Total equity, small SMEs
Total equity, large SMEs
Size
0.0
0.2
0.4
0.6
0.8
1.0
0.0 0.2 0.4 0.6 0.8 1.0
R&D expenditure
Out
sid
e eq
uity
, tot
al e
qui
ty
Outside equity, small SMEs
Outside equity, large SMEs
Total equity, small SMEs
Total equity, large SMEs
Outside equity, small SMEs
Outside equity, large SMEs
Outside equity, small SMEsOutside equity, small SMEs
Outside equity, large SMEsOutside equity, large SMEs
Total equity, small SMEs
Total equity, large SMEs
Total equity, small SMEsTotal equity, small SMEs
Total equity, large SMEsTotal equity, large SMEs
Size
0.0
0.2
0.4
0.6
0.8
1.0
0.0 0.2 0.4 0.6 0.8 1.0
R&D expenditure
Out
sid
e eq
uity
, tot
al e
qui
ty
Size
0.0
0.2
0.4
0.6
0.8
1.0
0.0 0.2 0.4 0.6 0.8 1.0
R&D expenditure
Out
sid
e eq
uity
, tot
al e
qui
ty
Outside equity, young SMEs
Outside equity, old SMEs
Total equity, young SMEs
Total equity, old SMEs
Age
0.0
0.2
0.4
0.6
0.8
1.0
0.0 0.2 0.4 0.6 0.8 1.0
R&D expenditure
Out
sid
e eq
uity
, tot
al e
qui
ty
Outside equity, young SMEs
Outside equity, old SMEs
Total equity, young SMEs
Total equity, old SMEs
Outside equity, young SMEs
Outside equity, old SMEs
Outside equity, young SMEsOutside equity, young SMEs
Outside equity, old SMEsOutside equity, old SMEs
Total equity, young SMEs
Total equity, old SMEs
Total equity, young SMEsTotal equity, young SMEs
Total equity, old SMEsTotal equity, old SMEs
Age
0.0
0.2
0.4
0.6
0.8
1.0
0.0 0.2 0.4 0.6 0.8 1.0
R&D expenditure
Out
sid
e eq
uity
, tot
al e
qui
ty
Age
0.0
0.2
0.4
0.6
0.8
1.0
0.0 0.2 0.4 0.6 0.8 1.0
R&D expenditure
Out
sid
e eq
uity
, tot
al e
qui
ty
Note: See Figure 6.2.
Interconnectedness
Empirically, the hypothesis of interconnectedness translates into a (generally unknown) correlation structure that characterizes the relationships of the in-terconnected sources of finance. Table 6.12 and Table 6.13 report the coeffi-cients of correlation for the different sources of finance. The sources of equity finance are the same as those used in Table 6.4. The sources of debt finance are the same as those used in Table 6.6, with the minor modification that we report no results for “CPs and Bonds” because of their insignificance as the source of debt finance. We have computed the correlations separately for firms with no R&D-activity and for firms with a positive R&D-intensity.
The tables reveal that there are more statistically significant coefficients of correlation across the sources of funds of SMEs with R&D-activities than with no R&D. This implies that the different sources of funding are more of-ten substitutes or complements for SMEs with R&D-activities than for SMEs with no R&D-activity. It also implies that the hypothesis of the intercon-nected SME finance applies better to firms that do R&D. The following also characterizes the data:

Smal l business f inance in Finland – A descr ipt ive study · 235
Table 6.12. Coefficients of correlation between selected sources of finance – Panel A
Debt EquityD
omes
tic b
anks
Dom
estic
fina
nce
firm
s
Oth
er d
omes
tic
finan
cial
inst
it.
Fore
ign
finan
cial
in
stitu
tions
Trad
e cr
edit
Oth
er n
onfin
. b
usin
ess
Gov
ernm
ent:
Finn
vera
Oth
er
gove
rnm
nent
Oth
er d
ebt
Indi
vidu
als
activ
e in
bus
ines
s
Oth
er in
divi
dual
s
Vent
ure
cap
ital
Fina
ncia
l in
stitu
tions
Oth
er fi
rms
Oth
er e
quity
1.00
-0.02 1.00(0.71)
0.00 0.03 1.00(0.94) (0.45)
-0.06 0.02 0.00 1.00(0.21) (0.62) (0.97)
-0.37 -0.14 -0.14 -0.06 1.00(0.00) (0.00) (0.00) (0.17)
-0.08 -0.04 -0.04 -0.02 -0.09 1.00(0.07) (0.40) (0.42) (0.72) (0.06)
-0.06 -0.03 0.07 -0.01 -0.23 -0.03 1.00(0.18) (0.46) (0.13) (0.88) (0.00) (0.51)
-0.09 -0.06 -0.04 -0.02 -0.14 -0.03 0.03 1.00(0.05) (0.21) (0.34) (0.64) (0.00) (0.46) (0.52)
-0.34 -0.12 -0.09 -0.06 -0.30 -0.08 -0.21 -0.11 1.00(0.00) (0.02) (0.07) (0.19) (0.00) (0.09) (0.00) (0.02)
0.00 0.04 -0.01 -0.07 0.02 -0.10 -0.07 -0.10 0.03 1.00(1.00) (0.39) (0.75) (0.12) (0.70) (0.03) (0.11) (0.04) (0.53)
0.01 -0.02 0.01 -0.04 -0.02 0.05 0.04 -0.04 0.09 -0.67 1.00(0.90) (0.70) (0.79) (0.42) (0.63) (0.30) (0.39) (0.40) (0.09) (0.00)
-0.01 0.00 -0.02 -0.03 -0.06 0.10 0.13 0.15 -0.08 -0.33 -0.01 1.00(0.81) (0.93) (0.60) (0.55) (0.18) (0.03) (0.01) (0.00) (0.12) (0.00) (0.84)
0.11 -0.02 -0.02 -0.01 -0.06 -0.01 -0.04 0.10 -0.02 -0.13 0.00 0.05 1.00(0.01) (0.58) (0.60) (0.83) (0.19) (0.80) (0.36) (0.02) (0.66) (0.00) (0.98) (0.30)
0.00 -0.03 -0.01 0.06 0.07 -0.02 0.01 0.11 -0.10 -0.46 -0.04 -0.02 0.04 1.00(0.96) (0.45) (0.85) (0.19) (0.13) (0.59) (0.83) (0.01) (0.05) (0.00) (0.33) (0.63) (0.34)
-0.02 -0.02 0.05 0.18 -0.02 0.10 0.00 0.01 -0.03 -0.38 -0.05 -0.03 -0.01 0.00 1.00(0.61) (0.65) (0.28) (0.00) (0.66) (0.02) (0.98) (0.84) (0.59) (0.00) (0.25) (0.50) (0.80) (0.92)
Other equity
Other debt
Individ. active in b.
Other individ.
Venture capital
Domestic banks
Domestic finance f.
Financial institit.
Other firms
Trade credit
Other nonfin. b.
Govt.: Finnvera
Other govt.
Oth. dom. fin. inst.
Foreign fin. inst.
Note: Data consist of SMEs with R&D-activities. The table reports the coefficients of correlation and p-values that are in parentheses. The coefficients of correlation that are in bold are statistically significant at the 5% level.

236 · Ar i Hyyt inen and M ik a Pajar inen
Table 6.13. Coefficients of correlation between selected sources of finance – Panel B
Debt Equity
Dom
estic
ban
ks
Dom
estic
fina
nce
firm
s
Oth
er d
omes
tic
finan
cial
inst
it.
Fore
ign
finan
cial
in
stitu
tions
Trad
e cr
edit
Oth
er n
onfin
. b
usin
ess
Gov
ernm
ent:
Finn
vera
Oth
er
gove
rnm
nent
Oth
er d
ebt
Indi
vidu
als
activ
e in
bus
ines
s
Oth
er in
divi
dual
s
Vent
ure
cap
ital
Fina
ncia
l in
stitu
tions
Oth
er fi
rms
Oth
er e
quity
1.00
0.00 1.00(0.99)
-0.05 -0.01 1.00(0.48) (0.89)
-0.01 -0.02 0.10 1.00(0.89) (0.76) (0.11)
-0.41 -0.13 -0.10 -0.05 1.00(0.00) (0.04) (0.12) (0.41)
-0.01 -0.02 -0.01 -0.01 -0.07 1.00(0.92) (0.77) (0.89) (0.90) (0.26)
-0.09 -0.03 -0.05 0.04 -0.16 -0.04 1.00(0.15) (0.63) (0.42) (0.50) (0.01) (0.57)
-0.03 0.15 0.00 0.00 -0.03 -0.01 -0.03 1.00(0.70) (0.02) (1.00) (0.94) (0.64) (0.88) (0.68)
-0.40 -0.11 -0.10 -0.05 -0.29 0.00 -0.22 -0.04 1.00(0.00) (0.14) (0.17) (0.49) (0.00) (0.99) (0.00) (0.61)
-0.08 0.02 0.09 0.03 -0.02 0.05 0.10 -0.11 -0.02 1.00(0.22) (0.82) (0.18) (0.68) (0.71) (0.40) (0.11) (0.09) (0.77)
0.05 -0.02 -0.06 -0.02 0.01 -0.04 -0.10 0.16 0.00 -0.74 1.00(0.45) (0.74) (0.35) (0.76) (0.83) (0.54) (0.12) (0.01) (0.97) (0.00)
-0.04 -0.03 -0.02 -0.01 0.13 -0.01 -0.01 -0.01 -0.05 -0.12 -0.03 1.00(0.50) (0.69) (0.76) (0.93) (0.05) (0.87) (0.89) (0.92) (0.45) (0.07) (0.69)
0.05 -0.02 -0.02 0.00 0.03 -0.01 -0.02 0.00 -0.05 -0.19 -0.02 -0.01 1.00(0.47) (0.76) (0.82) (0.95) (0.61) (0.90) (0.72) (0.94) (0.49) (0.00) (0.76) (0.93)
0.01 0.01 -0.05 -0.01 0.03 -0.03 -0.03 -0.01 0.04 -0.44 -0.02 -0.02 0.41 1.00(0.84) (0.83) (0.48) (0.84) (0.61) (0.69) (0.67) (0.82) (0.63) (0.00) (0.76) (0.80) (0.00)
0.09 0.00 -0.04 -0.01 -0.04 -0.02 -0.02 -0.01 0.04 -0.47 -0.05 -0.01 -0.01 0.08 1.00(0.19) (0.98) (0.57) (0.86) (0.50) (0.73) (0.71) (0.84) (0.60) (0.00) (0.42) (0.82) (0.86) (0.20)
Domestic banks
Domestic finance f.
Financial institit.
Other firms
Trade credit
Other nonfin. b.
Govt.: Finnvera
Other govt.
Oth. dom. fin. inst.
Foreign fin. inst.
Other equity
Other debt
Individ. active in b.
Other individ.
Venture capital
Note: Data consist of SMEs with no R&D expenditures. The table reports the coefficients of correlation and p-values that are in parentheses. The coefficients of correlation that are in bold are statistically significant at the 5% level.

Smal l business f inance in Finland – A descr ipt ive study · 237
• SMEs substitute (the narrowly defined) insider equity for outside equity irrespectively of the source of the outside equity.
• Trade credit is a substitute source of finance, particularly for SMEs with R&D-activities.
Among SMEs with R&D-activities, the debt provided by Finnvera and other governmental bodies is a complement to the equity provided by ven-ture capitalists, while it is a substitute to trade credit and “Other debt”, which comes from individuals and unknown sources.25
6.4. CONCLUSIONS
Inspired by a recent study of BU (1998), this Chapter explores a number of facets of the Finnish SME finance. We specifically explore two questions. First, what are the most important sources of finance to SMEs? Because Finland’s financial sector has recently undergone a major restructuring in which a bank-centered financial system shifted from relationship-based debt finance towards a US type system with increasing influence of the stock mar-ket, we also compare the sources of SME finance in Finland with those in the US. Second, are the sources of finance different for innovative small busi-nesses and/or for SMEs investing in R&D?
The conventional financial growth cycle view of SME finance suggests that the most opaque firms, such as young and small SMEs, use first insider funds, then debt, and only as a last resort outside equity. This conventional wisdom need not however apply to innovative small businesses investing in R&D. In contrast, a partially reversed pecking order may best apply to them, as outside equity rather than debt may for a number of reasons be the opti-mal form of finance for them.
Our analysis reveals that the capital structure of SMEs significantly varies with the size and age of firms. Consistent with conventional wisdom, we find that the three most important sources of funds are the principal owner’s equity, trade credit provided by non-financial firms and debt pro-vided by FIs. These account for about 2/3 of total equity and debt. The Fin-nish SMEs run a debt ratio of 54%, but the debt ratio is lower for small SMEs than for large SMEs. It also varies non-monotonically with the age of firms. Overall, these findings are in line with what BU (1998) have documented for the US. It seems that the capital structure of the Finnish SMEs does not differ fundamentally from that of the US SMEs.

238 · Ar i Hyyt inen and M ik a Pajar inen
We also document some interesting differences between Finland and the US. Although the Finnish SMEs start with about the same level of debt than their US counterparts,
• SMEs increase the level of indebtedness more slowly in Finland than in the US; and
• the youngest SMEs rely on FI debt less in Finland than in the US.
If the differences are not entirely attributable to differences in demand, they suggest that the debt market in Finland is perhaps not as conducive for en-trepreneurship and start-ups as it is in the US.
Our analysis also reveals that the financing of innovative small busi-nesses differs in several important aspects from that of other SMEs. In par-ticular, the evidence is consistent with the partially reversed pecking order in which equity is preferred to debt. The data speak for the partially reversed pecking order in the following dimensions:
• Innovative firms, firms with R&D-activities and firms that own patents and/or intangible assets run a lower debt ratio than their counterparts. The difference is most notable for the most R&D-intensive SMEs.
• Unlike for their (non-innovative) counterparts, the most important source of funds for innovative firms, firms with R&D-activities, and firms that own patents and/or intangible assets is equity attributable to the principal owner.
• Despite the low leverage, innovative firms, firms with R&D-activities and firms that own patents and/or intangible assets resort quite a lot to capital loans.
• The most R&D-intensive firms are less leveraged than firms that can al-ready demonstrate a degree of innovativeness.
• The most R&D-intensive firms are less dependent on the debt supplied by FIs than other firms are.
This evidence is consistent with the US cross-sectional evidence showing that R&D-intensity and leverage are negatively correlated across firms (Smith and Watts 1992, Bhagat and Welch 1995 and Hall 2002). It is also consistent with the view that an important determinant of SMEs’ investments in innovative-ness is the availability of internal finance (quite like in the US, see Himmel-berg and Petersen 1994) and equity.

Smal l business f inance in Finland – A descr ipt ive study · 239
We also document some interesting, new patterns in the financing of innovative small businesses. First, the most R&D-intensive SMEs have a vari-ety of main lenders when compared to their less R&D-intensive counterparts. Second, a small subset of SMEs exhausts most of the debt provided by banks and FIs as well as most of the outside equity. In fact, most of the SMEs have no outside equity at all. Third, different sources of funding are more often substitutes or complements for SMEs with R&D-activities than for SMEs with no R&D-activity. This suggests interconnectedness may be a characteristics feature of innovation finance.
Taken together, the findings of this Chapter indicate several fruitful di-rections for further analysis, both for researchers and policy makers. We sub-jectively emphasize two of them: On the one hand, it seems that the Finnish FIs provide debt finance to SMEs selectively, leaving in particular the financ-ing of the youngest and most R&D-intensive SMEs to other investors. Whether this is a signal of a credit market imperfection, specialization within the private market for debt and equity or something else, is an open but im-portant question, especially because government agencies (particularly Finn-vera) seem to be strongly present in the market that provides debt to these firms.
On the other hand, the financing of the most R&D-intensive SMEs is surprisingly dependent on equity, especially inside equity. The mere finding supports the view that it may be efficient to finance R&D investments with equity. Whether the prevalent reliance by the most R&D-intensive SMEs on inside equity is a signal of an equity market imperfection, or something else, is another open but important question, especially because SMEs’ possibili-ties to tap the market for outside equity are closely linked to macroeconomic conditions. Because the Finnish venture capital industry may lack a degree or two of maturity (Hyytinen and Pajarinen, Chapter 1 in this volume) and be-cause the Finnish stock market (and the economy) seems to be rather volatile (Ali-Yrkkö et al., Chapter 4 in this volume), special attention should perhaps be paid to the availability of equity financing in different market conditions. Temporary hiring and firing of research personnel and other adjustments to SME’s R&D projects due to disruptions in the availability of equity finance would be, if anything, inefficient. They would result in losses of firm-specific knowledge, in information leaks to competitors and in other adjustment costs that characterize involuntary scaling of R&D projects.

240 · Ar i Hyyt inen and M ik a Pajar inen
REFERENCES
Aghion, P. and Tirole, J., 1994, The management of innovation, Quarterly Journal of Economics, 109:4, 1185-1210.
Ali-Yrkkö, J., Hyytinen, A. and Liukkonen, J., 2003, Exiting venture capital investments: Lessons from Finland, Chapter 4 in this volume.
Anand, B. N. and Galetovic, A., 2000, Weak property rights and holdup in R&D, Journal of Economics and Management Strategy, 9, 615-642.
Ang, J. S., 1992, On the theory of finance for privately held firms, Journal of Small Business Finance, 1, 185-203.
Anton, J. J. and Yao, D. A., 1994, Expropriation and inventions: Appropriable rents in the absence of property rights, American Economic Review, 84, 190-209.
Barclay, M. J., Morellec, E. and Smith, C. W. Jr., 2001, On the debt capacity of growth opportunities, mimeo, University of Rochester.
Besanko, D., and Thakor, A. V., 1987, Collateral and rationing: Sorting equilibria and monopolistic and competitive markets, International Economic Review, 28, 671-689.
Bhattacharya, S. and Chiesa, G., 1995, Proprietary information, financial intermediation, and research incentives, Journal of Financial Intermediation, 4, 328-357.
Bhagat, S. and Welch, I., 1995, Corporate research and development investments: International comparisons, Journal of Accounting and Economics, 19, 443-470.
Bester, H., 1985, Screening vs. rationing in credit markets with imperfect information, American Economic Review, 75, 850-855.
Berger, A. N. and Udell, G. F., 1995, Relationship lending and lines of credit in small business finance, Journal of Business, 68, 351-382.
Berger, A., N. and Udell, G. F., 1998, The economics of small business finance: The roles of private equity and debt markets in the financial growth cycle, Journal of Banking and Finance, 22, 613-673.
Boot, A. W. A., 2000, Relationship banking: What do we know? Journal of Financial Intermediation, 9, 7-25.
Carey, M., Post, M. and Sharpe, S. A., 1998, Does corporate lending by banks and finance companies differ? Evidence on specialization in private debt contracting, Journal of Finance, 53, 845-878.
Detragiache, E., Garella, P. and Guiso, L., 2000, Multiple versus single banking relationships: Theory and evidence, Journal of Finance, 55, 1133-1161.
Demirgüç-Kunt, A. and Maksimovic, V., 2001, Firms as financial intermediaries: Evidence from trade credit data, mimeo, the World Bank.
Diamond, D. W., 1991, Monitoring and reputation: The choice between bank loans and directly placed debt, Journal of Political Economy, 99, 688-721.

Smal l business f inance in Finland – A descr ipt ive study · 241
Gans, J. S. and Stern, S., 2000, When does funding research by smaller firms bear fruit? Evidence from the SBIR program, NBER Working Paper, No. 7877.
Hall, B. H., 2002, The financing of research and development, NBER Working Paper, No. 8773.
Harhoff, D. and Körting, T., 1998, Lending relationships in Germany – Empirical evidence from survey data, Journal of Banking and Finance, 22, 1317-1353.
Himmelberg, C. P. and Petersen, B. C., 1994, R&D and internal finance: A panel study of small firms in high-tech industries, Review of Economics and Statistics, 76, 38-51.
Holmström, B., 1989, Agency costs and innovation, Journal of Economic Behaviour and Organization, 12, 305-327.
Hyytinen, A. and Pajarinen, M., 2002, Small business finance in Finland. A descriptive study, The Research Institute of the Finnish Economy, ETLA, Discussion papers, nr. 812.
Hyytinen, A. and Pajarinen, M., 2003, Financial systems and venture capital in Nordic countries: A comparative study, Chapter 1 in this volume.
Hyytinen, A., Kuosa, I. and Takalo, T., 2003, Law or finance: Evidence from Finland, European Journal of Law and Economics, forthcoming.
IMD, World Competitiveness Yearbook 2001, Lausanne.
Jensen, M., 1986, Agency costs of free cash flow, corporate finance and takeovers, American Economic Review, 76, 323-329.
Myers, S. C., 1977, Determinants of corporate borrowing, Journal of Financial Economics, 5, 147-175.
Myers, S. C., 1984, Presidential address: The capital structure puzzle, Journal of Finance, 39, 575-592.
Myers, S. C. and Majluf, N., 1984, Corporate financing and investment when firms have information that investors do not have, Journal of Financial Economics, 13, 187-221.
Myers, S. C., 2000, Outside equity, Journal of Finance, 55, 1005-1037.
Myers, S. C., 2001, Capital structure, Journal of Economic Perspectives, 15, 81-102.
Mörttinen, L., 2000, Essays on loan pricing and the credit channel of monetary policy, University of Helsinki, Research Reports, No. 85, Dissertationes Oeconomicae,
Niskanen, J. and Niskanen, M., 2000, Accounts receivable and accounts payable in large Finnish firms’ balance sheets: What determines their levels? Finnish Journal of Business Economics, 4/00, 489-503.
OECD (Organisation for Economic Co-operation and Development), 1996, Technology and industrial performance.
OECD (Organisation for Economic Co-operation and Development), 1999, Science, Technology and industry scoreboard 1999. Benchmarking the knowledge-based economies.
Petersen, M. A. and Raghuram G. R., 1994, The benefits of firm-creditor relationships: Evidence from small business data, Journal of Finance, 49, 3-37.
Smith, C. W. Jr. and Watts, R. L., 1992, The investment opportunity set and corporate financing, dividend and compensation policies, Journal of Financial Economics, 32, 263-292.
Statistics Finland, 1998, Innovation survey 1996 (Innovaatiotutkimus 1996), Tiede ja teknologia 1998:3.

242 · Ar i Hyyt inen and M ik a Pajar inen
Stiglitz, J. E. and Weiss, A., 1981, Credit rationing in markets with imperfect information, American Economic Review, 71, 393-410.
Stultz, R. M. and Johnson, H., 1985, An analysis of secured debt, Journal Financial Economics, 14, 501-522.
WEF (World Economic Forum), 2001, Global competitiveness report 2001.
Zingales, L., 2000, In search of new foundations, Journal of Finance, 55, 1623-1653.

Smal l business f inance in Finland – A descr ipt ive study · 243
APPENDIX. DATA AND SURVEY DESIGN
The data are drawn from a primary survey administrated by the Research In-stitute of the Finnish Economy (ETLA) and Etlatieto Ltd. The main objective of the survey was to obtain quantitative information on the funding sources, including equity, and financial structure of Finnish firms, particularly those of technology-based SMEs. The survey was conducted between December 2001 and January 2002.
Sample design and interviews
The survey respondents were drawn from a population of active, for-profit, non-financial and non-farm corporations registered in Finland. Proprietor-ships, partnerships as well as subsidiaries were excluded from the sample. The subsidiaries were excluded, because the internal capital markets of firms may fundamentally differ from the markets for external capital (Stein 2001) and because the characteristics of a subsidiary firm may carry no information about its creditworthiness or ultimate sources of (external) finance (Harhoff and Körting 1998). Proprietorships and partnerships were excluded from the sample because of the financial and other intertwining of owners and their businesses (see Ang 1992) in such firms.
Because of our special interest in the technology-based SMEs, we over-sampled firms in the high-technology (NACE Rev.1 244, 30, 321, 322, 353), medium high-technology (NACE Rev.1 24 excluding 244, 29, 31, 323, 33, 34, 352) and information-intensive service (NACE Rev.1 642, 721, 722, 73, 743) sectors. Many earlier studies consider these sectors innovative and R&D-intensive (see, for example OECD 1996, 1999), though we acknowledge that the classification is not complete. The over-sampled sectors account for 60% of the sample. The remaining sample consists of firms in basic manufactur-ing, services and trade.
The survey was conducted as computer-assisted telephone interviews and the interviews were carried out by Tietoykkönen Ltd (for more informa-tion, see www.tieto1.fi). Trained interviewers, mostly university students in statistics and business administration, suggested a contacted firm to choose a respondent, a single informant, who is strongly involved in the firm’s deci-

244 · Ar i Hyyt inen and M ik a Pajar inen
sion-making. All the questions in the survey asked the respondent to provide the interviewer with either quantitative data or a “Yes/No”-answer. The ques-tions requiring the provision of quantitative data were asked in three stages. First, the respondent was expected to provide the quantitative data at the level of accuracy the accounting books or other written sources of the firm al-lowed her to respond. If no accurate number was available, or the respondent was not reluctant to provide it, she was asked to provide a rough estimate of the data item in question. Finally, if no rough estimate was available either, the respondent was asked to indicate to which pre-specified category her firm belongs. The prespecified categories were given by the interviewer. This strategy of letting the respondents to self-select at which level they are will-ing to provide information turned out to be important in questions address-ing firms’ R&D-intensity, for example.
The initial objective of ours was that around 1000 firms would partici-pate in the survey. To this end, around 2600 firms were initially contacted. Though some of the contacted firms were subsidiaries, proprietorships or partnerships and therefore excluded, over 1100 firms declined to participate in the survey. The most frequently presented reason for not participating was that the respondent was too busy to participate (63% of the non-respondents). Some of the respondents said, however, that they are not will-ing to disclose the information we were interested in. Such explicit declines due to data confidentiality were quite rare (5%), as the interviewers con-stantly stressed that full anonymity and confidentiality would be guaranteed. Of the initial sample of 1000 firms, 936 responses were after certain logical tests and other data checks eventually accepted. These firms constitute our original sample, yielding a response rate of 36 percent. For this study, the data quality in the original sample was further analyzed and answers cross-checked. The further checks decrease the sample to 754.
Questionnaire design
The structure of the survey reflected our special interest in the funding sources and financial structure of Finnish SMEs. Besides some ordinary in-come and balance sheet items, the survey questions were about firms’ basic characteristics (such as age), product market environment, ownership struc-ture, creditors, innovation activity, support from governmental bodies, and systems of corporate governance, totaling to nearly 70 questions. To cover this broad set of questions, the survey was divided into six main parts. In the first part, the respondent, who typically was either the CEO or CFO of the

Smal l business f inance in Finland – A descr ipt ive study · 245
firm, was asked to provide us with background information on the firm. In the second, third and fourth parts of the survey, detailed information about the sources of debt, capital loans and equity were asked. Capital loans were given a special treatment, because the Finnish Companies Act allows firms to include them to the share capital even though their economic nature resem-bles more that of debt. In particular, capital loans are special in that if they conform the restrictions of the Companies Act, they contribute to share-holder’s equity even though the holders of a capital loan do not have voting or other ownership rights. In part five, the respondent provided us with information on her firm’s previous and current use of public support. Finally, part six consisted of a series of questions addressing the firm’s innovative-ness, such as its R&D intensity.
In the initial sample, the average duration of interviews was 23 min-utes, ranging from 10 to 65 minutes. Given that the length of the survey in terms of the total number of questions, the average duration may seem low. However, it is important to note that not all firms were required to answer to all questions. For example, a firm with no R&D, no capital loans, and no use of public support was expected to answer fewer than 30 questions, most of which were “Yes/No”-type of questions.
246 · Ar i Hyyt inen and M ik a Pajar inen
ENDNOTES
1 We will use BU’s study as the US benchmark. 2 There are several reasons to this. First, the longer the firm survives and the larger it grows, the more assets it can accumulate to back up the use of debt finance (Stiglitz and Weiss 1981, Bester 1985, Besanko and Thakor 1987). Second, the older the firm, the more time it has had to build reputation (Diamond 1991) and the more likely it is that the firm can demonstrate a history of interaction (i.e., a relationship) with the out-side investors, such as FIs (Petersen and Rajan 1994, BU 1995). 3 As Myers (2001) has recently concluded, there is no universal theory of the capital structure choice. Besides the pecking order theory, the other two theories that have in recent times been put forward are the trade-off theory and the free cash-flow theory. The tradeoff theory considers the balance between the tax advan-tages of additional debt and the costs of possible financial distress. It typically predicts moderate borrowing by tax-paying firms (Myers 2001). The free-cash flow theory of Jensen (1986) focuses on agency problems and applies best to firms with plenty of internal finance available. 4 R&D-intensive SMEs may face more severe appropriability problems than the SMEs face on average, as it is sometimes prohibitively costly to obtain intellectual property rights for innovations and as SMEs are not likely to own complementary assets, such as reputation and existing distribution channels, to enhance the appropriability (see Gans and Stern 2000) 5 If the amount of external finance needed to finance the invention (research) and innovation (develop-ment) is large relative to the amount of committed insider finance, moral hazard problems can become more severe. Moreover, there is a potential hold-up problem in the relationship between the firm/researchers performing R&D and the providers of external finance (Anand and Galetovic 2000). The hold-up problems arise because the knowledge acquired through costly research becomes embodied in the human capital of researchers and because the researchers can commercialize the knowledge on their own. This may allow the researchers to act opportunistically and thus worsen the moral hazard problem fur-ther. 6 Other factors influencing the use of external equity finance by a firm are the desire of founding entrepre-neurs to keep ownership and control of the firm, the founding entrepreneurs’ need for risk-sharing and the amount of unused interest tax shields that the firm has. 7 We also excluded SMEs that are proprietorships, partnerships, or subsidiaries. A detailed description of the survey and data is presented in Appendix. 8 It is very important to note that the US numbers refer to early 1990s, so the comparison is indicative at best. 9 The size of the sample for which the entries in the tables have been calculated is reported on the top row of Panel A. Firms were dropped from the analysis in this section if they had responded incompletely in the questions regarding the sources of funds and if these missing observations could not be replaced by the authors’ own calculations using available data. 10 Capital loans are loans that satisfy the regulations set out in the Finnish Companies Act. Because of their special treatment in the Companies Act, capital loans must in the financial statements be included in the shareholders’ equity. However, because their economic nature resembles that of debt, we have included them neither in equity nor in debt. 11 Tekes, Sitra and Finnvera are the most prominent sources of public support to firms in Finland. Tekes fi-nances R&D projects of companies and universities and its funds are awarded from state budget via the Ministry of Trade and Industry. Sitra provides government venture capital funding for early stage technol-ogy companies and for commercialization of innovations. Finnvera offers financing services, such as subsi-dized loans and quarantines, to promote the domestic operations and internationalization of Finnish SMEs. In addition to Tekes, Sitra and Finnvera, there are 16 Regional Employment and Economic Development Centres (‘TE Centres’) that provide public support, both financial and non-financial, to SMEs.

Smal l business f inance in Finland – A descr ipt ive study · 247
12 Note that total debt and equity does not necessarily equal to the balance sheet total because there are items in the balance sheet not reported in the tables, such as provisions and accumulated closing entries. 13 The size category is the same that BU (1998) uses. The age categories differ, because we did not have enough observations in the younger end of the age distribution. Our “Infant” corresponds to what would result if BU’s “Infant” and “Adolescent” were combined. As a result, “Adolescent” in this Chapter is a subset of BU’s “Middle-aged”. We take these differences in the definitions into account when commenting differences in financing patterns between Finland and the US. 14 It is important to note that these data are not in “reduced form”, as the identity of the principal owner is not restricted in any way. The category for the principal owner can therefore include capital contributions both by individuals and by institutional investors. 15 Somewhat surprisingly, other individuals, including business angels, are more important owners in large SMEs than in small SMEs (7% vs. 2%). As expected, public VCs invest proportionally more heavily in small SMEs than private VCs albeit the difference seems to be small. In addition, non-financial companies seem to be quite a significant source of equity in large SMEs with a 6% share of total equity. This source of equity may include minority stakes in spin-offs, joint ventures, etc. 16 In addition, it reveals that passive non-controlling individuals (“Other individuals”) are a significant group of investors only for the category of “Old” SMEs (11%). 17 Note that these debt data do not cover capital loans. 18 The finding that Finnish firms rely more on trade credit than their US counterparts is by no means new. Mörttinen (2000) reports that between 1970 and 1985, trade credit accounted for 17% of total financing sources of the Finnish non-financial enterprises and that the corresponding figure in the U.S. was 8.4%. The figure for Finland is nicely in line with our more recent survey data, as in our data set trade credit represents 23% of the total debt and equity. Niskanen and Niskanen (2000) reports a similar difference between the Finnish and US firms using more recent data on accounts payable. 19 The sample on which we rely in this section includes only firms which responded to the survey questions regarding innovativeness and R&D-activities; we applied no statistical method to “impute” values for the non-respondents or to match the totals with the preceding tables. As a result, the sample size is in this sec-tion about 2% smaller than in the previous sections. Panel A of Table 6.7 summarizes the current sample. The table reveals that the current sample has a debt ratio that is only slightly higher than that reported in Panel A of Table 6.2 (55% vs. 54%). This suggests that the firms that did not respond to the questions regard-ing innovativeness and R&D-activities were no different from the ones that did. 20 Thus, had we included capital loans into equity, we would find an even lower debt ratio. 21 Recall that the sum of the equity held by a firm’s principal owner and its managers and employees consti-tutes the broadly defined insider equity in Table 6.8. The narrowly defined insider equity equals the equity held by individuals active in a firm’s daily business (“Active in business”) in Table 6.9. The tables show that the broad inside equity increases from around 83% of the total equity in firms with no R&D to 90% in the most R&D intensive SMEs, while the corresponding numbers for the narrow inside equity are 74% and 89%. 22 For example, not receiving angel finance may decrease the probability of obtaining venture capital fi-nance (complements), while firms may substitute trade credit for intermediated debt finance if FIs ration credit (substitutes). 23 A characteristic feature of the US private equity market is, for example, that venture financing is concen-trated heavily on certain industrial segments (see, e.g., Gans and Stern 2000). On the US private debt mar-ket, observably riskier borrowers tend to rely more on finance companies than on banks (Carey et al.1998). 24 The inside equity is here measured using the narrow definition of inside equity; specifically, it consists of the equity held by individuals active in a firm’s daily business, including management and employees. We use the narrow definition because to examine the concentration of “non-entrepreneurial” equity. 25 The debt from governmental bodies other than Finnvera is additionally a complement to the equity pro-vided FIs and non-financial firms and a substitute to the equity provided by the (narrowly defined) insiders.


Financia l systems and f i rm per formance: Theoret ical and empir ica l perspect ives · 249
7. GLOBALIZATION OF BUSINESS IN A SMALL COUNTRY – DOES OWNERSHIP MATTER?
Jyrki Ali-Yrkkö and Pekka Ylä-Anttila*
Abstract: Globalization has recently changed the ownership structures and corporate govern-ance systems of many small countries. In this Chapter, we investigate the implica-tions of these changes by examining the effects of ownership nationality on firms’ goals and performance in one such small country, Finland. Our empirical analysis shows that large Finnish firms adopted the maximization of shareholder value as a major goal during the 1990s. The change coincided with increases in foreign owner-ship. Our results suggest that foreign-owned companies have performed better than domestically owned ones. The result applies both to the firms that are subsidiaries of foreign companies and to the firms that have foreign portfolio investors as their major owners.
* Jyrki Ali-Yrkkö and Pekka Ylä-Anttila are both at the Research Institute of the Finnish Economy (ETLA) and Etlatieto Ltd. The authors would like to thank Ari Hyytinen, Markus Koskenlinna, Eva Liljeblom, Anu Nokso-Koivisto, Vesa Puttonen, Petri Rouvinen and Otto Toivanen for helpful comments. The views expressed in the Chapter are those of the authors. The usual caveat applies.

250 · Jyrk i Al i -Yrk kö and Pek k a Ylä-Antt i la
7.1. INTRODUCTION
In this Chapter we take a look at the effects of globalization of business, own-ership and corporate governance on firms’ goals and performance. By global-ization we refer to the international integration of markets for goods, tech-nology, labor and capital. None of these components of globalization is really new, but the intensity of the current globalization process is different from what it has been in the past. What is going on in the form of rapidly increas-ing capital flows has, as the argument goes, much more far-reaching conse-quences for national institutions and capital market models than the previous phases of globalization.
Globalization is, to a large extent, an economic phenomenon driven by multinational firms. The central and increasing role of firms in allocating re-sources in the economy has stimulated a debate among economists and poli-ticians about how to govern corpotations to enhance the efficiency of busi-nesses and the welfare of national economies. The subject of corporate gov-ernance has proved to be of huge practical importance for economic per-formance (see, e.g., Jonung 2002).
The issue has become topical, especially in Europe, as a consequence of major cross-border mergers and acquisitions and the growing presence of large American institutional investors. The globalization of capital markets and ownership has triggered major changes in corporate governance towards the US model in most European countries (see, e.g., Berglöf 1997).
Empirical evidence on the effects of ownership structure and the na-tionality of ownership on firm’s goals and performance is in harmony with the view that ownership matters. Thomsen and Pedersen (2000) find using European data that market-to-book value is higher in firms whose largest owner is a financial institution than in firms whose largest owner is a family, another firm or a government. Interestingly, the nationality of owners has an impact on these relations. The results by Griffith (1999) concerning produc-tivity differences between domestic and foreign-owned companies in the mo-tor vehicle and parts industry supports the view that foreign-owned firms have higher financial performance. Chibber and Majumdar (1999) focus on the influence of foreign ownership on the financial performance of firms op-erating in India. According to their results, subsidiaries of foreign firms out-performed domestic companies. Finally, raw data from Sweden (Statistics Sweden 1996, Strandell 1997) and Japan (METI 2001) suggest that in terms of return on equity, foreign-owned companies outperform domestic companies.
Global izat ion of business in a smal l countr y – Does ownership matter? · 251
There is very little empirical evidence on the effects of foreign owner-ship on firm performance in Finland. The aim of this Chapter is to fill this gap in the literature by studying the effects of foreign ownership on the per-formance and goals of Finnish firms. We ask whether the internationalization of ownership matters: Do foreign-owned companies perform better than Fin-nish-owned ones? Are there differences in goals and governance? Are the announced goals and actual financial performance in line with each other?
To our best knowledge, the only other paper addressing the role of foreign owners in Finnish firms is Maula and Mäkelä (Chapter 8 in this vol-ume). They provide evidence that cross-border venture capital (the presence of foreign external investors) is positively associated with the growth expec-tations of Finnish software companies. Anticipating, our results are in har-mony with theirs, as we find that foreign-owned companies have performed better than Finnish-owned ones.
The remaining of this Chapter is organized as follows. In the next Sec-tion we go through selected theoretical explanations why ownership might matter. In Sections 7.3 and 7.4 we look at the effects of the internationaliza-tion of business and ownership in Finland. Section 7.5 concludes.
7.2. OWNERSHIP NATIONALITY – WHY MIGHT IT MATTER?
7.2.1. THE EFFECTS OF CORPORATE GOVERNANCE
There are essentially two types of corporate governance or capital market models in modern market economies: the outsider system (or the US/UK sys-tem) and the insider system (or the German/Continental European system).1 The former is characterized by a large number of listed firms, dispersed own-ership, strong minority protection, and maximization of shareholder value. In this system, so it has been argued, there is also an efficient market for cor-porate control, and management failure is corrected by the take-over mecha-nism. The latter system – also known as a stakeholder model – is characterized by concentrated ownership, a small number of listed companies, domination of banks in the financial market, and weak minority protection. The man-agement is controlled and disciplined by a small group of the largest shareholders.2
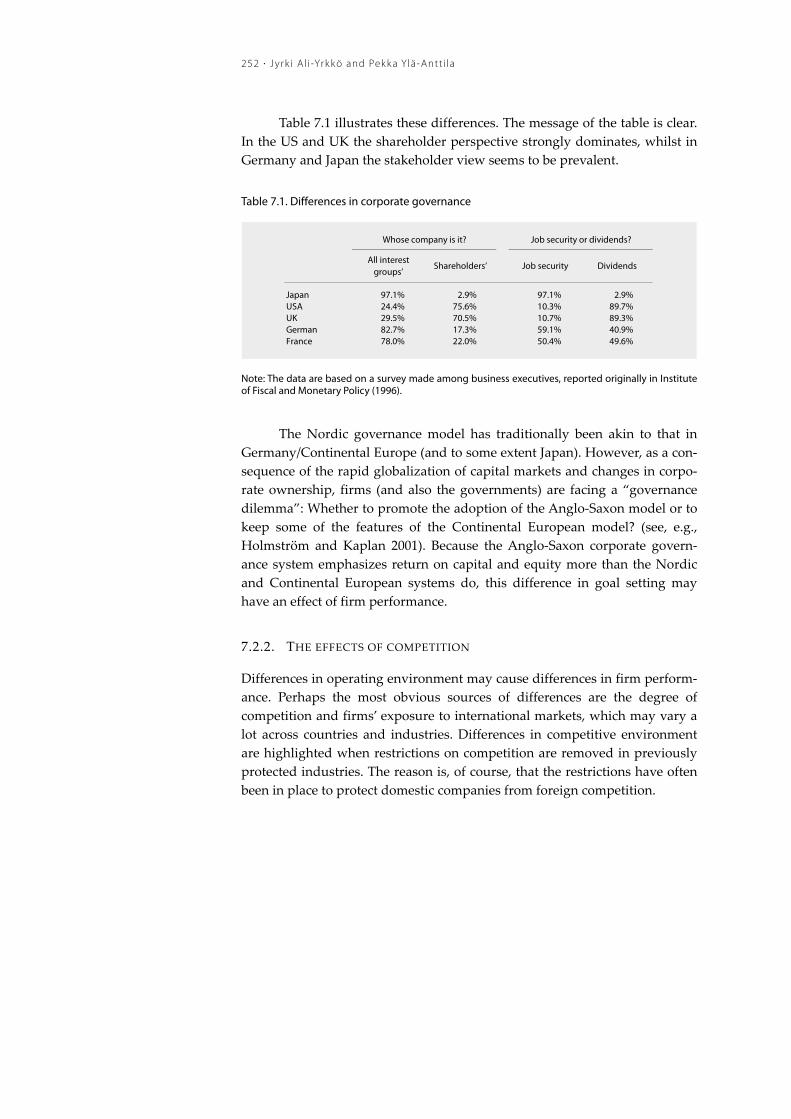
252 · Jyrk i Al i -Yrk kö and Pek k a Ylä-Antt i la
Table 7.1 illustrates these differences. The message of the table is clear. In the US and UK the shareholder perspective strongly dominates, whilst in Germany and Japan the stakeholder view seems to be prevalent.
Table 7.1. Differences in corporate governance
All interest groups’
Shareholders’ Job security Dividends
Japan 97.1% 2.9% 97.1% 2.9% USA 24.4% 75.6% 10.3% 89.7% UK 29.5% 70.5% 10.7% 89.3% German 82.7% 17.3% 59.1% 40.9% France 78.0% 22.0% 50.4% 49.6%
Whose company is it? Job security or dividends?
Note: The data are based on a survey made among business executives, reported originally in Institute of Fiscal and Monetary Policy (1996).
The Nordic governance model has traditionally been akin to that in Germany/Continental Europe (and to some extent Japan). However, as a con-sequence of the rapid globalization of capital markets and changes in corpo-rate ownership, firms (and also the governments) are facing a “governance dilemma”: Whether to promote the adoption of the Anglo-Saxon model or to keep some of the features of the Continental European model? (see, e.g., Holmström and Kaplan 2001). Because the Anglo-Saxon corporate govern-ance system emphasizes return on capital and equity more than the Nordic and Continental European systems do, this difference in goal setting may have an effect of firm performance.
7.2.2. THE EFFECTS OF COMPETITION
Differences in operating environment may cause differences in firm perform-ance. Perhaps the most obvious sources of differences are the degree of competition and firms’ exposure to international markets, which may vary a lot across countries and industries. Differences in competitive environment are highlighted when restrictions on competition are removed in previously protected industries. The reason is, of course, that the restrictions have often been in place to protect domestic companies from foreign competition.

Global izat ion of business in a smal l countr y – Does ownership matter? · 253
Porter (1990) points to the importance of domestic competition in cre-ating competitive edge in international markets. Protected and non-competi-tive home markets lead to inefficiencies and uniformity of firm strategies. Management literature provides a lot of evidence showing that a competitive environment leads to more efficient decision making structures and increases incentives to monitor costs (see, e.g., Caves 1980). In economics literature there is fairly little empirical evidence on the effects of competition on firm performance. The existing evidence points, however, in the same direction: Deregulation and a higher level of competition are associated with productivity gains (for a review, see Allen and Gale 2000).
7.2.3. THE EFFECTS OF OWNERSHIP CHANGE
Lichtenberg (1992) has proposed that ownership change is caused by lapses in firms’ efficiency. These lapses may be due to the incompatibility (or “bad matching”) between a plant (an asset) and the characteristics of an owner (i.e. a parent firm). This argument, which is the key hypothesis of Lichtenberg’s (1992) “matching theory”, is based on three primary assumptions: i) Some owners have a comparative advantage in owning certain plants; ii) The qual-ity of the match is a decisive factor in the decision to maintain the ownership of the plant; and iii) The quality of the match can be measured by productiv-ity performance.
The matching theory of plant turnover does not assume that there are good and bad owners, but that there are good and bad matches. This view has two major implications: First, a poor match, which is indicated by a low level of current productivity, may lead to a change of ownership. Second, a change of ownership will lead to an increase in plant productivity. The qual-ity of each match is assumed to be randomly distributed. Thus, given that the quality of the first match was low, the expected value of a new match (from an identical distribution) is higher.
In practice, many acquisitions are preceded by a deterioration of the target firm’s economic performance. This deterioration may act as a signal to an owner that she/he is operating the plant less efficiently than an alternative parent would. Because the freeing of capital movements and liberalization of capital markets have increased the potential for better international matches, a growing number of cross-border mergers and acquisitions is likely to fol-low. The primary motive of these transactions may well be related to the op-portunity of profiting from differences in firm performance across countries.

254 · Jyrk i Al i -Yrk kö and Pek k a Ylä-Antt i la
7.3. GLOBALIZATION OF FINNISH CAPITAL MARKETS
In the Nordic countries, notably Finland, there has been a fast and dramatic change in ownership policies and structures.3 The trend has during the 1990s been that a large number of Finnish firms have been merged with foreign firms or acquired by foreign buyers (see also Ali-Yrkkö, Chapter 5 in this vol-ume). Figure 7.1 provides an illustrative example of this trend by showing how rapidly foreign ownership has increased in the Finnish listed firms. The data on inward foreign direct investment in Finland presented in Figure 7.2 provide further support for the trend.
Until recently, the Finnish corporate governance system has been more akin to the German/Japanese system than the Anglo-Saxon system. In line with this, the ownership of major Finnish companies was for long concen-trated. Founding families, banks, other companies or the state, typically wielded control.4 In the 1990s, companies, their governance and operations changed remarkably. Cross-ownership diminished when banks and large in-dustrial companies sold their shares of other companies. The privatization of state-owned companies also proceeded fast during the past decade: in many cases, the buyer was a foreign firm or investor.
As a consequence of the globalization of Finnish capital markets a number of changes have taken place. First, the supervisory board, which used to be quite common in large Finnish companies, is a rare bird today. Second, the board of directors no longer consists only of operating manage-ment as it used to. Third, a number of diversified companies have focused on their core competencies and businesses by selling off less strategic busi-nesses. Fourth, as we will show below, companies have changed their targets. Shareholder value has become one of the key targets in most large compa-nies. All these changes are consistent with the view that the nationality of ownership matters. How the increasing foreign ownership has affected the behavior and performance of Finnish firms is considered in more detail in what next follows.

Global izat ion of business in a smal l countr y – Does ownership matter? · 255
Figure 7.1. Ownership in Finnish listed firms, percent of market capitalization (1958-2002)
1958
1960
1962
1964
1966
1968
1970
1972
1974
1976
1978
1980
1982
1984
1986
1988
1990
1992
1994
1996
1998
2000
2002
0%
10%
20%
30%
40%
50%
60%
70%
80%
Foreign ownership Institutional owners (domestic) Households
Note: The data are based on the authors’ estimates and derived from Grandell (1959), Laakso (1979), Airaksinen and Kallinen (1987) and the Helsinki Stock Exchange.
Figure 7.2. Inward foreign direct investment in Finland, billions of euros (1975-2001)
1975
1976
1977
1978
1979
1980
1981
1982
1983
1984
1985
1986
1987
1988
1989
1990
1991
1992
1993
1994
1995
1996
1997
1998
1999
2000
2001
-10123456789
101112
Note: Data source is Bank of Finland. The bars depict net inward capital flows.

256 · Jyrk i Al i -Yrk kö and Pek k a Ylä-Antt i la
7.4. EMPIRICAL ANALYSIS
Differences in corporate governance, degree of competition, and lapses in the matching of resources suggest that the nationality of ownership (foreign ver-sus domestic) might cause differences in firms’ goal setting and performance. The casual observations that we made in the previous Section seemed to support this view. In this Section we examine whether also firm-level data supports the existence of such differences. We examine, in particular, whether there are differences between foreign and Finnish-owned firms in terms of their goal setting, investment rate, and financial performance.5
7.4.1. DATA
We use two data sets on Finnish companies. The first data set (“Top 100”) is derived from a database on the 100 largest Finnish corporations (ranked according to sales). The database covers the period from 1986 to 1998. However, due to mergers and restructuring we have comparable data over the whole period on only 50 corporations. The database includes information on firms’ financial performance and corporate governance, such as ownership structure, organization, and what kinds of goals (shareholder value, growth, etc.) the companies have pursued.
The second data set (“Top 500”) consists of financial statement data on the 500 largest companies in Finland for the period from 1986 to 1998. The data allows us to make financial performance analyses, but does not include information concerning firms’ goal setting, nor other measures of governance structures. As far as the ownership structure is concerned, only the distinc-tion between foreign-controlled (majority-owned firm) and domestically owned firms can be made. Approximately one third of these companies were in 1998 foreign-owned, i.e., subsidiaries of foreign firms. There is no data on the amount of the foreign portfolio investment in this data set.
7.4.2. FOREIGN VS. DOMESTIC OWNERSHIP: DOES IT MATTER?
We start by examining whether the financial performance of Finnish firms differs from that of foreign-owned firms. To this end, we use the Top 100 data and divide firms into two groups on the basis of whether the foreign owner-ship in a firm is above or below 20%. As shown in Table 7.2 we use several measures of financial performance, including the Economic Value Added
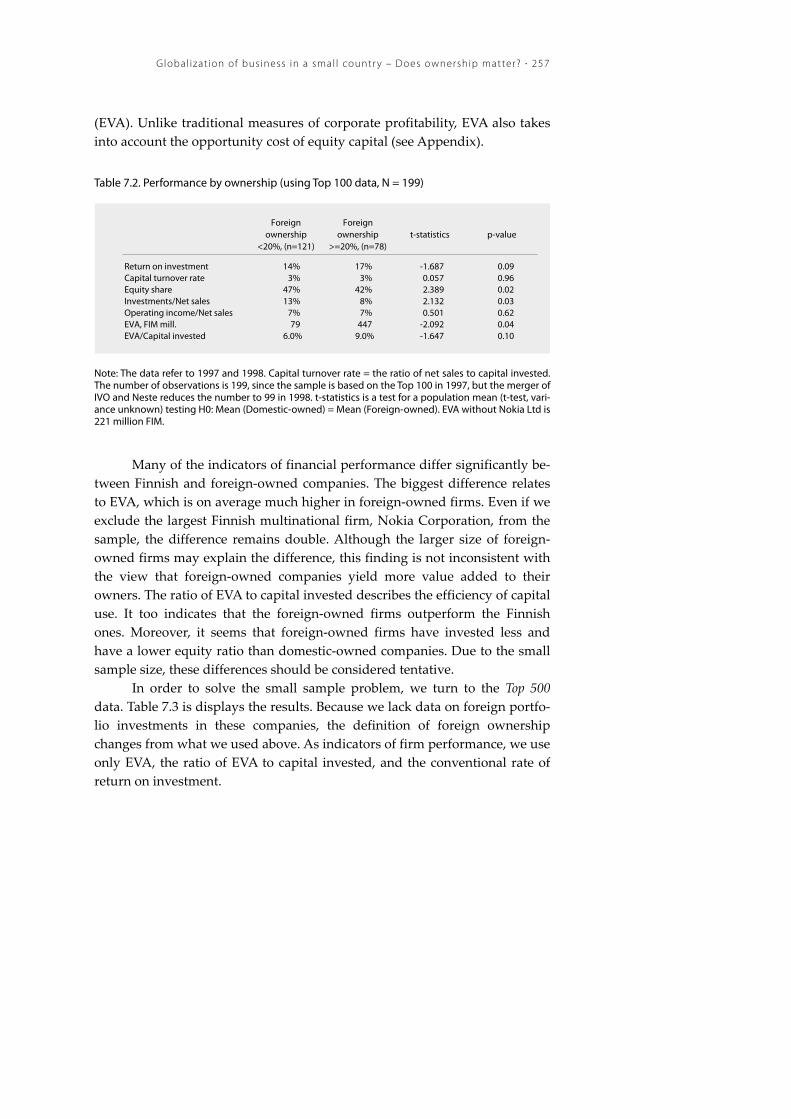
Global izat ion of business in a smal l countr y – Does ownership matter? · 257
(EVA). Unlike traditional measures of corporate profitability, EVA also takes into account the opportunity cost of equity capital (see Appendix).
Table 7.2. Performance by ownership (using Top 100 data, N = 199)
Foreign ownership
<20%, (n=121)
Foreign ownership
>=20%, (n=78)t-statistics p-value
Return on investment 14% 17% -1.687 0.09 Capital turnover rate 3% 3% 0.057 0.96 Equity share 47% 42% 2.389 0.02 Investments/Net sales 13% 8% 2.132 0.03 Operating income/Net sales 7% 7% 0.501 0.62 EVA, FIM mill. 79 447 -2.092 0.04 EVA/Capital invested 6.0% 9.0% -1.647 0.10
Note: The data refer to 1997 and 1998. Capital turnover rate = the ratio of net sales to capital invested. The number of observations is 199, since the sample is based on the Top 100 in 1997, but the merger of IVO and Neste reduces the number to 99 in 1998. t-statistics is a test for a population mean (t-test, vari-ance unknown) testing H0: Mean (Domestic-owned) = Mean (Foreign-owned). EVA without Nokia Ltd is 221 million FIM.
Many of the indicators of financial performance differ significantly be-tween Finnish and foreign-owned companies. The biggest difference relates to EVA, which is on average much higher in foreign-owned firms. Even if we exclude the largest Finnish multinational firm, Nokia Corporation, from the sample, the difference remains double. Although the larger size of foreign-owned firms may explain the difference, this finding is not inconsistent with the view that foreign-owned companies yield more value added to their owners. The ratio of EVA to capital invested describes the efficiency of capital use. It too indicates that the foreign-owned firms outperform the Finnish ones. Moreover, it seems that foreign-owned firms have invested less and have a lower equity ratio than domestic-owned companies. Due to the small sample size, these differences should be considered tentative.
In order to solve the small sample problem, we turn to the Top 500 data. Table 7.3 is displays the results. Because we lack data on foreign portfo-lio investments in these companies, the definition of foreign ownership changes from what we used above. As indicators of firm performance, we use only EVA, the ratio of EVA to capital invested, and the conventional rate of return on investment.

258 · Jyrk i Al i -Yrk kö and Pek k a Ylä-Antt i la
Table 7.3. Performance by ownership (using Top 500 data, N=5121)
Year EVA, FIM mill. EVA / Capital
investedReturn on
investmentEVA, FIM mill.
EVA / Capital invested
Return on investment
1986 -27 -1% 8% 2 1% 11% 1987 10 2% 10% 16 7% 15% 1988 24 3% 11% 18 8% 17% 1989 11 1% 10% 12 6% 16% 1990 -24 -1% 8% -1 0% 11% 1991 -71 -4% 6% -3 -4% 8% 1992 -70 -3% 8% -2 -3% 9% 1993 -32 0% 9% 1 2% 12% 1994 13 3% 12% 11 10% 20% 1995 36 4% 16% 23 12% 27% 1996 14 4% 17% 19 9% 24% 1997 37 5% 18% 24 11% 26% 1998 54 5% 17% 23 10% 24%
-4 1% 12% 12 6% 18%
Finnish-owned Foreign subsidiaries
Total average
The message is clear. Foreign-owned companies have performed much better than domestic ones. Foreign companies created slightly negative value added during the recession (1991-1993), but at the same time, the average EVA of Finnish-owned companies was strongly negative. The ratio of EVA to capital invested, which is not as much driven by differences in firm size, has averaged to 1% in Finnish companies, while the same figure for foreign-owned companies is 6%. The rate of return on capital invested in foreign companies is also higher than in Finnish-owned companies.
Table 7.4 reports the capital turnover rate, the ratio of investment to net sales, and the number of companies. It seems that Finnish-owned companies need far more capital to generate the same sales or value added than foreign-owned companies.
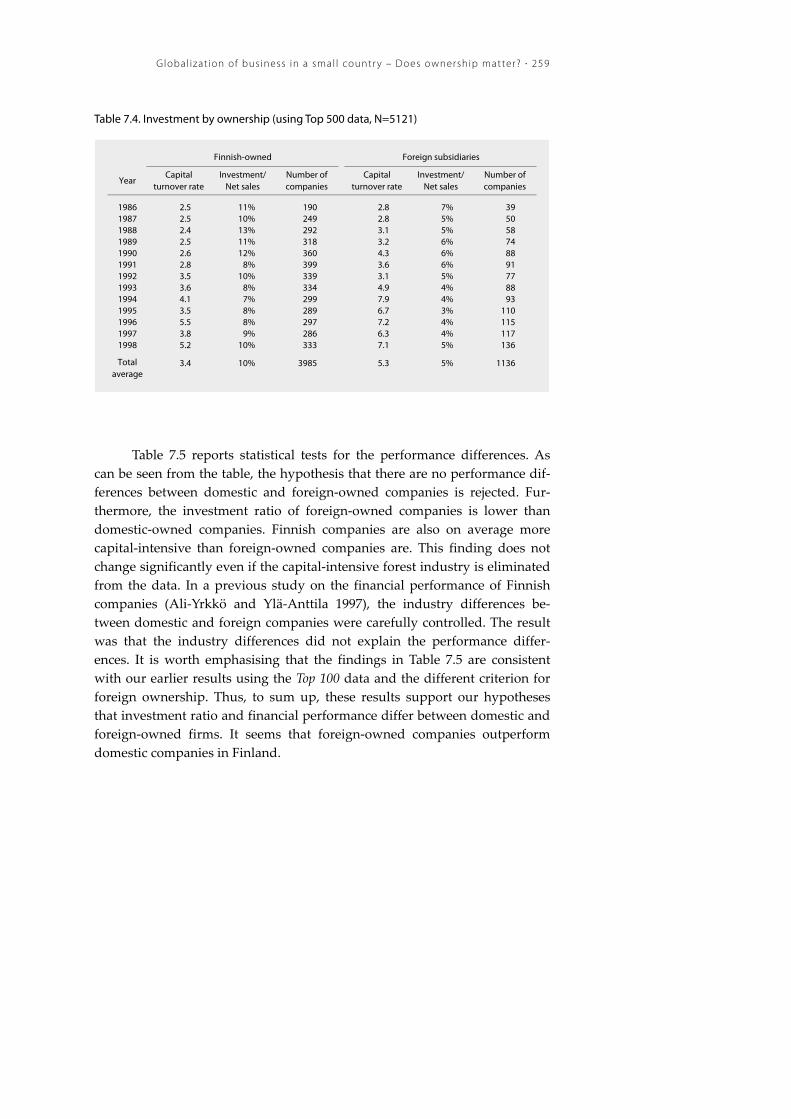
Global izat ion of business in a smal l countr y – Does ownership matter? · 259
Table 7.4. Investment by ownership (using Top 500 data, N=5121)
YearCapital
turnover rateInvestment/
Net salesNumber of companies
Capital turnover rate
Investment/ Net sales
Number of companies
1986 2.5 11% 190 2.8 7% 39 1987 2.5 10% 249 2.8 5% 50 1988 2.4 13% 292 3.1 5% 58 1989 2.5 11% 318 3.2 6% 74 1990 2.6 12% 360 4.3 6% 88 1991 2.8 8% 399 3.6 6% 91 1992 3.5 10% 339 3.1 5% 77 1993 3.6 8% 334 4.9 4% 88 1994 4.1 7% 299 7.9 4% 93 1995 3.5 8% 289 6.7 3% 110 1996 5.5 8% 297 7.2 4% 115 1997 3.8 9% 286 6.3 4% 117 1998 5.2 10% 333 7.1 5% 136
3.4 10% 3985 5.3 5% 1136
Finnish-owned Foreign subsidiaries
Total average
Table 7.5 reports statistical tests for the performance differences. As can be seen from the table, the hypothesis that there are no performance dif-ferences between domestic and foreign-owned companies is rejected. Fur-thermore, the investment ratio of foreign-owned companies is lower than domestic-owned companies. Finnish companies are also on average more capital-intensive than foreign-owned companies are. This finding does not change significantly even if the capital-intensive forest industry is eliminated from the data. In a previous study on the financial performance of Finnish companies (Ali-Yrkkö and Ylä-Anttila 1997), the industry differences be-tween domestic and foreign companies were carefully controlled. The result was that the industry differences did not explain the performance differ-ences. It is worth emphasising that the findings in Table 7.5 are consistent with our earlier results using the Top 100 data and the different criterion for foreign ownership. Thus, to sum up, these results support our hypotheses that investment ratio and financial performance differ between domestic and foreign-owned firms. It seems that foreign-owned companies outperform domestic companies in Finland.

260 · Jyrk i Al i -Yrk kö and Pek k a Ylä-Antt i la
Table 7.5. Statistical tests (using Top 500 data, N=5121)
EVAReturn on
investmentInvestment/
Net salesCapital
turnover rate
t-statistic -4.258 -10.376 14.350 -5.075 p-value < 0.01 < 0.01 < 0.01 < 0.01
Variable
Note: t-test, variance unknown, H0: Mean (Domestic-owned) = Mean (Foreign subsidiary)
Why do the differences arise? Are Finns poor managers? Anecdotal evidence is not consistent with poor management. Case studies of firms that have been taken over by foreign firms show that the old management has of-ten been allowed to keep its position after the takeover. However, the per-formance of these firms has improved. These findings are consistent with the view that foreigners are more demanding owners than Finns, i.e., that more is squeezed out of the firm.
7.4.3. GOALS AND OWNERSHIP
The annual reports of Finnish companies usually include a section describing their goals and targets. All companies state several goals. Figure 7.3 shows that profitability and its improvement were the main goals throughout the 1990s. Companies announced either that they would maintain profit per-formance at the same level as before, or that they would try to improve it. Another goal, not shown in the figure, is improving the debt/equity ratio. Since the sample is small, the conclusions based on it should be regarded ten-tative.
It is of interest to note that during the recession in the 1990s, the desire of companies to grow diminished. This finding is not very surprising, be-cause growth was not a very realistic goal in the depth of the recession. In fact, most companies tried to keep their sales at the same level as before. It is interesting that the goal of customer orientation declined during the eco-nomic slowdown. It may be that many companies were forced to concentrate on improving their financial position, such as debt/equity ratios, at the ex-pense of other goals.

Global izat ion of business in a smal l countr y – Does ownership matter? · 261
Figure 7.3. Goals of large Finnish companies, percent of companies
RestructuringProfitability
Customer orientationGrowth
Shareholder valueEmployees
0%
10%
20%
30%
40%
50%
60%
70%
80%
90%
100%
1986 1990 1994 1998
Note: The data are from the Top 100 data set and consist only of firms that mentioned their goals.
Stressing the owners’ role increased rapidly during the 1990s. Since 1990, more and more companies have announced that they seek value added for shareholders. By the end of the 1990s, almost half of the large companies stated shareholder value as one of their key goals. Shareholder value is, of course, closely related to other targets, like profitability and growth. How-ever, stating it explicitly as one of the key goals includes a specific signal to current and potential owners and is, at least, an indication how shareholder value became an increasingly common goal of Finnish firms in the 1990s.
Table 7.6 shows how goals differ between Finnish and foreign-owned companies. The results in the table suggest that foreign-owned companies are more customer, growth and shareholder-value-oriented than domestic companies. To summarize, these results support our hypothesis that the goals of foreign and domestic-owned companies are not similar.

262 · Jyrk i Al i -Yrk kö and Pek k a Ylä-Antt i la
Table 7.6. Comparison of firms’ goals (using Top 100 data, N=199)
Foreign ownership
<20%
Foreign ownership
>20%t-statistic p-value
Restructuring 38 38 -0.353 0.72 Profitability 76 67 0.406 0.68 Customer orientation 49 63 -2.721 0.00 Growth 63 73 -2.313 0.01 Shareholder Value 28 52 -3.990 0.00 Employees 38 29 -1.474 0.14
7.4.4. PERFORMANCE AND GOALS
As shareholder value has become an important goal during recent years, an interesting question is whether those who put emphasis on shareholder value have really created more value added for their owners than other companies have. In Table 7.7 the firms have been divided into two groups, i.e. into firms that are “Aspirants to shareholder value” and “Others”. Unexpectedly, the performance of the firms that are aspirants to shareholder value does not de-viate significantly from the other firms. The only difference is in EVA, which is probably explained by the larger size of the aspirants to shareholder value. Announcing shareholder value as a key goal is not necessary associated with higher than average performance. One obvious explanation in light of our earlier results is that foreign ownership is driving the both (and thus an omit-ted variable here). However, as we are looking at only two years, we cannot be conclusive on this matter.
Table 7.7. Performance by goals (using Top 100 data, N = 199)
Others (N=127)
Aspirants to shareholder value (N=72)
t-statistic p-value
EVA, FIM mill. 87.7 468.2 -1.977 0.05 EVA/Capital invested 7.0% 8.1% -0.633 0.53 Return on investment 15.0% 16.4% -0.763 0.45 Investment/Net sales 9.6% 13.9% -1.454 0.15 Equity ratio 45.0% 45.8% -0.337 0.74

Global izat ion of business in a smal l countr y – Does ownership matter? · 263
7.5. CONCLUSIONS
As a consequence of globalization, capital flows – both FDI and portfolio in-vestment – have increased significantly. The role of foreign capital and for-eign ownership has increased rapidly in many countries. In this study, we have focused on financial performance and differences in governance struc-tures between domestic and foreign-owned companies, using data on Finnish companies.
Our data show that maximizing shareholder value has been increas-ingly adopted as a major goal in most large Finnish companies since the early 1990s. The increase coincided with increasing foreign ownership in the Fin-nish business sector. Our empirical results suggest that ownership matters in goal setting. There are significant differences between foreign-owned and domestic-owned firms in terms of their announced objectives.
Furthermore, our comparisons suggest that foreign-owned companies have not invested as much as domestic companies. This partly explains why foreign-owned companies produce a higher rate of return on capital than domestically-owned companies. The difference applies not only to compa-nies that are majority-owned and controlled by foreigners (subsidiaries of foreign firms) but also to companies with lower (but still significant) foreign ownership. Consistent with the earlier empirical evidence, our analysis also shows that foreign companies perform better than Finnish-owned compa-nies.
Taken together, our evidence suggests that increases in foreign owner-ship have improved the efficiency of capital use. The results also imply that in less integrated and partly protected markets it was possible to pursue goals other than the rate of return on capital. In the future, the nationality of ownership (domestic vs. foreign) in determining firm performance will probably diminish. Owners will pursue high rates of return irrespective of their nationality.

264 · Jyrk i Al i -Yrk kö and Pek k a Ylä-Antt i la
REFERENCES
Airaksinen, T. and Kallinen, T., 1987, Yhteisöomistus ja ristiinomistus suomalaisissa suuryrityksissä, The Research Institute of the Finnish Economy (ETLA), C:41.
Allen, F. and Gale, D., 1999, Corporate governance and competition, Wharton Financial Institutions Center 99-28, The Wharton School, University of Pennsylvania.
Ali-Yrkkö, J. and Ylä-Anttila, P., 1997, Foreign owners set their sights higher than local ones, Unitas, 2/1997, 14 – 19.
Ali-Yrkkö, J., Sirviö, S. and Ylä-Anttila, P., 1997, Foreign firms in Finland – Successful acquisitions or more efficient operations? (in Finnish ‘Ulkomaiset yritykset Suomessa – Onnistuneita yritysostoja vai tehokkaampaa toimintaa?’), The Research Institute of the Finnish Economy (ETLA), Discussion papers, nr. 579.
Ali-Yrkkö, J. and Ylä-Anttila, P., 1999, Ownership internationalises – Corporate governance systems are changing (in Finnish 'Omistus kansainvälistyy – johtamis- ja valvontajärjestelmät muuttuvat'), The Research Institute of the Finnish Economy (ETLA), Discussion papers, nr. 665.
Berglöf, E., 1997, Reforming corporate governance: Redirecting the European agenda, Economic Policy, 12, 91-123.
Caves, R., 1980, Industrial organization, corporate strategy and structure, Journal of Economic Literature, 18, 64-92.
Chhibber, P, K. and Majumdar, S. K., 1999, Foreign ownership and profitability: Property rights, control, and the performance of firms in Indian industry, Journal of Law and Economics, 42, 209-38.
Grandell, A., 1959, Aktiesparande, Meddelanden från företagseknomiska institutionen vid Handelshögskolan vid Åbo Akademi, Nr. 6, Åbo.
Grant, J., 1997, Foundations of economic value added, Frank J. Fabozzi Associates, New Hope, Pennsylvania, U.S.
Griffith, R., 1999, Productivity and foreign ownership in the UK car industry, The Institute for Fiscal Studies, Working Paper Series No. W99/11.
Holmström, B. and Kaplan, S., 2001, Corporate governance and merger activity in the United States: Making sense of the 1980s and 1990s. Journal of Economic Perspective, 15:2.
Hyytinen, A., Kuosa. I. and Takalo. T., 2003, Law or finance: Evidence from Finland, European Journal of Law and Economics, forthcoming.
Institute of Fiscal and Monetary Policy, 1996, Socio-economic systems of Japan, the United States, the United Kingdom, Germany and France.
Jonung, L., (editor), 2002, Vem skall äga Sverige?, SNS Förlag, Stockholm.
Kasanen, E., Kinnunen, J. and Niskanen, J., 1996, Dividend-based earnings management: Empirical evidence from Finland, Journal of Accounting and Economics, 22, 283-312.

Global izat ion of business in a smal l countr y – Does ownership matter? · 265
Laakso, J., 1979, Osake, obligaatio ja pörssi, Taloustieto r.y., Taloustasku 1, Helsinki
Lichtenberg, F.R., 1992, Corporate takeovers and productivity, MIT Press, Cambridge, MA.
METI, 2001, Summary of the 2000 survey of foreign affiliates' business activities, downloadable at http://www.meti.go.jp/english/statistics/downloadfiles/h2c201be.pdf.
Porter, M. E., 1990, The competitive advantage of nations, The Free Press, New York.
Schleifer, A. and Vishny, R., 1997, A survey of corporate governance. Journal of Finance, LII:2, 737-783.
Statistics Sweden, 1996, Foreign-owned enterprises, in Swedish, Statistics Sweden, Order no. F18SM9701.
Strandell, A., 1997, Foreign-owned enterprises in Sweden, in NUTEK Publication “Swedish industry and industrial policy 1997”.
Thomsen, S. and Pedersen, T., 2000, Ownership structure and economic performance in the largest European companies, Strategic Management Journal, 21, 689-705.
Ylä-Anttila, P., 2000, Globalization of business in a small country – Implications for corporate governance and national innovation system, Ekonomiska Samfundets Tidskrift 1/2000, 5-20.
266 · Jyrk i Al i -Yrk kö and Pek k a Ylä-Antt i la
APPENDIX
Unlike traditional measures of corporate profitability, such as net operating profit after tax, and net income, EVA looks at a firm’s “residual profitability,” net of both the cost of debt capital and the cost of equity capital (Grant, 1997). It can be computed as follows: EVA = Net result minus (Riskless rate of inter-est plus Beta times Risk premium) times Equity share, where the riskless rate of interest is measured using the treasury bond (5 years) yield in Finland (Source: Bank of Finland), Beta is measured using betas by industries (Source: Finnish Economic Weekly (Talouselämä, 20/1997)) and risk premium is assumed to be 4.5 %.

Global izat ion of business in a smal l countr y – Does ownership matter? · 267
ENDNOTES
1 See, e.g., Shleifer and Vishny (1997). 2 An often cited statement of the CEO of Volkswagen AG some 30 years ago is still thought to be an illustra-tion of the German (Continental Europe) system: “Why should I care about the shareholders, whom I see once a year at the general meeting. It is much more important that I care about the employees; I see them every day.” 3 See Ali-Yrkkö and Ylä-Anttila (1999) and Ylä-Anttila (2000). 4 The number of listed companies has been rather small, and banks have served as a major source of fi-nance to Finnish companies. These basic characteristics of the traditional system are described in more de-tail, e.g., in Kasanen et al. (1996). Changes in institutional and legal settings in the 1990s are described by Hyytinen et al. (2002). 5 The causality might, of course, run also to the other direction, i.e., companies with high financial perform-ance are attractive investment targets for foreign companies and investors. Indeed, a previous study with Finnish data shows that foreign companies tend to acquire firms with higher than average rate of return. It is of interest to note that the difference in the rate of return between domestic-owned and foreign-owned companies seems to grow after the acquisition (see, Ali-Yrkkö and Ylä-Anttila 1997 and Ali-Yrkkö et al. 1997).


Financia l systems and f i rm per formance: Theoret ical and empir ica l perspect ives · 269
8. CROSS-BORDER VENTURE CAPITAL
Markku V. J. Maula and Markus M. Mäkelä*
Abstract: Venture capital investments that span national borders have become an increasingly important phenomenon during recent years. Yet, there is very little research examin-ing the role of foreign venture capitalists in the development of their portfolio compa-nies or as a part of a financial system. This Chapter focuses on the role of cross-border venture capitalists in supporting the internationalization of their portfolio companies as well as in the development of venture capital markets. We argue that on the firm level, well-connected foreign venture capitalists can open doors and improve the credibility of their portfolio companies thus helping them in establishing operations in foreign markets. However, building and managing an international venture capi-tal syndicate is not without challenges. When investing abroad, venture capitalists seek opportunities that justify the costs of operating in the foreign markets. Distant investors may be quick to retreat in the case of decrease in expected returns from the investment. Credible local venture capital investors are of high importance in attract-ing foreign venture capital investors and managing the syndicate. On the financial system level, foreign venture capitalists may be an important source of venture capi-tal in countries with limited supply of domestic venture capital. Foreign venture capitalists can also stimulate the supply of domestic venture capital by opening up new exit opportunities abroad. In conclusion, we argue that foreign venture capital-ists are in many ways important for the internationalization of ventures and for the development of financial systems particularly in small and open economies such as Finland.
* Markku V. J. Maula and Markus M. Mäkelä are both at the Helsinki University of Technology. The authors gratefully acknowledge valuable comments by Ari Hyytinen and Gordon Murray. The views expressed in the Chapter are those of the authors. The usual caveat applies.

270 · Mark ku V. J . Maula and Markus M. Mäkelä
8.1. INTRODUCTION
Cross-border venture capital investments have become an increasingly im-portant phenomenon in the domain of venture capital, representing 18% of all venture capital investments in Europe in 1999 (Baygan and Freudenberg, 2000). By cross-border venture capital, we refer to venture capital funds in-vesting in portfolio companies located in foreign countries. Cross-border ven-ture capitalists have played an important role in growth-oriented technology companies in several markets with limited domestic supply of venture capi-tal (Baygan and Freudenberg 2000; OECD 2001; Bassolino 2002; Dossani and Kenney 2002; Kenney et al. 2002a, 2002b; Mayer et al. 2002; OECD 2002).
In a recent OECD report, Baygan and Freudenberg (2000) recognized that in some countries cross-border flows of venture capital are of such mag-nitude that inflows plus outflows outweigh domestic investments by local venture capital funds. The report also noted that while such cross-border flows of venture capital can improve the efficiency of the global venture capi-tal market, they can also reduce the relative importance of domestic supply factors in favor of domestic demand factors, such as creativity, innovation, risk-taking, and entrepreneurship. Overall, the report argued that in policy-making, a relevant measure of investments would be investments made in a country (“country of destination”), by subtracting cross-border outflows and including inflows.
Despite of the increased importance of this phenomenon, there is very little academic research examining cross-border venture capital (Lockett and Wright 2001). Most of the “international venture capital” literature remains at the level of comparing venture capital activities in several countries. Cross-border aspects are rarely noted in this research (e.g. Sapienza et al. 1996; Manigart et al. 2002). Only very recently have some researchers started to ex-amine the specific nature of cross-border venture capital investments.
In this Chapter, we attempt to create some understanding of the role of cross-border venture capitalists by employing empirical data on Finnish ven-tures financed by cross-border venture capital investors. In our analyses, we examine the role of foreign venture capitalists using data from a recent (Spring 2002) survey of 228 Finnish software product companies as well as data from 65 interviews with the stakeholders of 10 Finnish technology ven-tures, which have received financial backing from foreign venture capitalists.
The rest of the Chapter is structured as follows. In the second Section, we start by reviewing the existing literature on cross-border venture capital.

Cross-border venture capita l · 271
In the third Section, we present empirical research on cross-border venture capital in Finland, which is the context of our empirical research. In this Sec-tion we present first some empirical results from a recent survey of Finnish software product companies. Thereafter, we report detailed analyses of mul-tiple cases of Finnish technology-based new firms with backing from cross-border venture capitalists. In the last Section, we discuss the conclusions and identify the implications of cross-border venture capital investments for vari-ous stakeholders.
8.2. LITERATURE REVIEW
One of the new streams of research emerging in the area of cross-border ven-ture capital has focused on how venture capitalists adapt to operating with in new markets and how their foreign investments differ from their domestic investments. In this stream of research, Wright et al. (2002) have examined how Western venture capitalists operate in foreign markets by examining risk assessment and information usage behavior of foreign and domestic in-vestors in India. They found that foreign firms in India place significantly greater emphasis on product market factors and accountants’ reports than do domestic venture capitalists. When conducting the ‘due diligence’ process, foreign investors in India place notably less emphasis on the financial contri-butions of management as a signal of quality and on the information pro-vided by entrepreneurs than do U.S. firms in their domestic market. U.S. ven-ture capitalists in India make more use of information from trade publica-tions and information from accountants' reports than do domestic venture capital firms in India. Overall, the authors concluded that when entering for-eign markets, venture capitalists have to change their behavior significantly to adapt to the local market instead of directly replicating their home market strategies.
Examining the specific characteristics of investments in cross-border venture capital, Cumming (2002) compared a sample of investments by U.S. venture capitalists in U.S. and Canadian portfolio companies. Supporting prior research, he found that when U.S. venture capitalists financed U.S. en-trepreneurial firms, most of the investments were made as ‘convertible pre-ferred equity’. However, in contrast to investments in U.S. entrepreneurial firms, he found that U.S. venture capitalists financed Canadian entrepreneu-rial firms with a large variety of forms of finance. He argued that the differ-ences in same investors using different forms of finance are related to institu-tional determinants of venture capitalist capital structures within the U.S.

272 · Mark ku V. J . Maula and Markus M. Mäkelä
and abroad. For instance, he argued that U.S. venture capitalists often do not choose convertible preferred shares in foreign investments in the absence of tax considerations that favor this specific financing vehicle.
In line with the other studies focusing on foreign investments from the venture capitalists perspective, Zhang (2002) examined foreign investments in Chinese markets and concluded that that while foreign investors may be able to find very attractive investment targets, they also face high risks and should adapt to local market conditions. Meyer and Shao (1995) made the point that physical distance and cultural differences may cause difficulties in international venture capital investments.
Another new stream of research has examined the role of national stock exchanges on the development of venture capital markets (Black and Gilson 1998, 1999; Ali-Yrkkö et al. 2003). These authors have argued that ven-ture capital is likely to flourish only if venture capitalists can exit from a suc-cessful portfolio company through an initial public offering (IPO), which re-quires an active and liquid stock market. Very recently, some researchers have argued that while liquid public markets certainly are a requirement for the venture capital market to develop, such public markets might not neces-sarily have to reside in the home country (Rock 2001; Hursti and Maula 2002). In some markets, such as Israel, entrepreneurs have frequently listed their companies in foreign stock exchanges. In their empirical research of European companies’ listings in foreign stock exchanges, Hursti and Maula (2002) have shown that ownership by foreign investors increases significantly the likelihood of a listing to a foreign stock exchange when making an initial public offering. This phenomenon can be interpreted as foreign venture capi-tal investors in opening up new foreign exit opportunities in response to il-liquid or inefficient domestic public markets.
In addition to improving the supply of venture capital through im-proving exit opportunities, foreign venture capitalists have been important in many countries because of their direct provision of risk capital to growing firms. Lockett and Wright (2001) estimated that across the European venture capital industry as a whole, the percentage of annual amount of non-domestic investments rose from 11% in 1992 to 23% in 1998. According to Baygan and Freudenberg (2000), when using a “country of destination ap-proach”, the share of investments by funds from other European countries totaled 18% of all investments. For some countries such as Ireland, Denmark, and Finland the share of such cross-border venture capital investments rep-resented over 40% of all venture capital investments made in those countries in 1999. Inflows of foreign venture capital is commonly seen as very impor-

Cross-border venture capita l · 273
tant for the development of venture capital markets. Accordingly, many countries have taken very clear measures to stimulate cross-border venture capital (Israeli Ministry of Finance 2001; AVCAL 2002).
Taken together, research on cross-border venture capital is scarce and has only started to develop very recently. The main lines of research have so far focused on the adaptation of venture capital investors in new markets, the effects of foreign venture capital investments in opening up new exit oppor-tunities in foreign public markets, and the role of foreign venture capital in the supply of venture capital. A number of important issues warrant further research.
8.3. EMPIRICAL EVIDENCE FROM FINLAND
We carry out our empirical analyses examining cross-border venture capital in Finland. During the recent years, cross-border venture capital has been a relatively prevalent form of financing for Finnish high-tech ventures with high international growth expectations and potential. In a study of cross-border venture capital in the OECD countries, Baygan and Freudenberg (2000) identified Finland as the third country after Ireland and Denmark in terms of share of invested venture capital that is contributed by foreign ven-ture capitalists. Many of the largest rounds of venture capital investments made into Finnish high-technology ventures have involved foreign venture capitalists. Figure 8.1 reports domestic and other European investments us-ing the country of destination approach as outlined in Baygan and Freuden-berg (2000). Based on the analysis of Baygan and Freudenberg, the share of foreign investments of all investments made in Finland was 43% in Finland in 1999.
In their book, Cardwell et al. (1999) predicted an increasingly impor-tant role for foreign venture capital investors in Finland as well as a growth in investments by foreign institutional investors in Finnish venture capital firms. Similarly, Rönkkö (2001) observed that international venture capitalists were actively monitoring investment opportunities in Finnish information and communications technology companies. Rönkkö observed a particularly important role for foreign investors in the largest investment rounds made into Finnish high-technology ventures. Both Cardwell et al. (1999) and Rönkkö (2001) recognized that syndication of investments with local and in-ternational investors was becoming increasingly popular. They suggested

274 · Mark ku V. J . Maula and Markus M. Mäkelä
Figure 8.1. Venture capital and private equity investments as a percentage of GDP in 1999
UK
Uni
ted
Stat
es
Swed
en
Net
herla
nds
Euro
pea
n U
nion
Tota
l Eur
ope
Belg
ium
Can
ada
Icel
and
Fran
ce
Finl
and
Nor
way
Switz
erla
nd
Ital
y
Ger
man
y
Spai
n
Irel
and
Port
ugal
Den
mar
k
Gre
ece
Aus
tria
0.0
0.1
0.2
0.3
0.4
0.5
0.6
0.7
0.8
0.9
Country of management approach (% of GDP) Country of destination approach (% of GDP)
Note: Data source is Baygan and Freudenberg (2000).
that in many cases, local expertise combined with an international network of contacts makes a successful match. More recently, a report on the Finnish software product industry by Hietala et al. (2002) showed that companies co-financed by foreign external investors were significantly more oriented to-wards rapid international growth compared to their counterparts without foreign external investors. The present Chapter uses the data collected in this survey to examine in more detail the role of cross-border venture capital investors.
8.3.1. QUANTITATIVE EVIDENCE
In order to create some quantitative understanding of the impact of cross-border venture capital investors on the performance of their portfolio com-panies, we employ survey data gathered from 228 Finnish software product companies in Spring 2002. Table 8.1 illustrates differences between software product companies with and without external foreign investors. Particularly

Cross-border venture capita l · 275
the differences in the expected total revenues and expected foreign revenues from own software products in 2004 are striking.
Table 8.2 reports descriptive statistics. The correlation between the dummy variable of foreign external investor and foreign revenue from own software products is 0.38 and statistically significant.
Table 8.1. Finnish software product companies with and without foreign investors
With foreign external investors
Without foreign external investors
All
Total revenue from 2001 (MEUR) 3.17 12.26 11.72 (1.45) (0.50) (0.50)
Estimated total revenue 2004 (MEUR) 26.93 5.41 6.94 (12.50) (1.40) (1.60)
Foreign revenue from own software products 0.27 2.44 2.28 2001 (MEUR) (0.03) (0.00) (0.00)
Estimated foreign revenue from own software 19.69 2.60 4.00 products 2004 (MEUR) (4.00) (0.20) (0.20)
R&D-to-revenue ratio 1.84 0.55 0.63 (0.45) (0.20) (0.20)
Number of employees 2001 56.55 108.45 105.79 (53.00) (8.00) (9.00)
Number of domestic venture capital investors 1.20 0.42 0.50 (1.00) (0.00) (0.00)
Note: Means (medians in parentheses).
Table 8.2. Descriptive data
Mean Std. dev. N 1 2 3 4
1 Estimated foreign revenue from own software products 2004 (log)
0.58 0.93 110 1.00
2 Foreign revenue from own software products 2001 (log)
0.38 0.88 151 0.56 1.00
3 Venture age in years 10.43 7.05 216 -0.20 0.19 1.00 4 R&D-to-revenue ratio 0.63 2.63 153 0.16 -0.06 -0.16 1.00 5 Foreign external investors (dummy) 0.05 0.22 228 0.38 -0.06 -0.15 0.12
Summary statistics Correlation matrix
Note: Total sample size is 228. The measures of foreign revenue from own software products are nor-malized using the natural logarithm ln(x+1). The foreign investors dummy variable measures the lower boundary of the presence of foreign external investors. The dummy takes the value 1, if the respondent indicated that the venture has one or more foreign venture capital investor, business angel, or corpo-rate investor. The dummy takes value 0 if no foreign investors were indicated. Without missing values, the share of companies with foreign external investors would be greater.
276 · Mark ku V. J . Maula and Markus M. Mäkelä
Table 8.3 reports the results the regression analyses that explain the expected foreign revenues from own software product business. The analyses were first carried out using ordinary least squares regression analysis for the subset of observations where estimate for the foreign revenues in 2004 was given (Table 8.3, first column). In the analyses, the missing values in the R&D-to-sales ratios and in foreign revenues from own software products were imputed using the algorithm available in the statistical software Stata 7.0.1 Imputation was conducted for the independent variables using the other independent variables. The natural logarithm was used to transform the revenue variables.2 In our regression analysis, no signs of multicollinearity were identified when examining the variance inflation factor measures. However, our diagnostics indicated significant heteroskedasticity. Robust standard errors are therefore reported.
Only 110 companies of the 228 companies in our sample had an-nounced their estimate for foreign revenues from own software products in 2004. Because of the likely non-randomness of the missing values in the esti-mated foreign revenues from own software products, we carried out some robustness tests. First, we tested the assumption that entrepreneurs who do not expect rapid growth in foreign revenues are disproportionally presented in the missing values. We set the revenues in missing values at zero and ran a Tobit regression (Table 8.3, second column). The influence of foreign inves-tors is more significant in the Tobit regression compared to the normal re-gression analysis. Second, we reran the analyses using the Heckman selection model (See Heckman 1979; Maddala 1997). Using this methodology, it is pos-sible to test whether the decision of CEOs to provide estimates for the reve-nues is random, or whether certain factors influence this choice. In our analy-ses, the existence of foreign external investors was positively related to the decision to provide an estimate of foreign revenues (Table 8.3, Selection equa-tion). The Heckman correction of the selection biases increased the positive effect of foreign external investors on the foreign revenues from own soft-ware products compared to the ordinary least squares regression analysis (Table 8.3, Substantive equation).
Taken together, our analyses indicate that the existence of foreign ex-ternal investors is positively related to the expected revenues from foreign software product business even after the current foreign revenue from own software products, venture age, and R&D to sales ratio are controlled for.

Cross-border venture capita l · 277
Table 8.3. Regression analysis
Dependent variable: Estimated foreign revenue from own software products 2004 (log)
Foreign revenue from own software 1.21 *** 0.12 0.79 *** -0.51 **products 2001 (log) (19.12) (0.70) (3.72) (2.17)
Venture age in years -0.03 *** -0.06 *** -0.02 -0.01(3.55) (2.81) (1.82) (0.91)
R&D-to-revenue ratio 0.04 0.05 0.05 ** 0.02(1.50) (1.21) (2.33) (0.75)
Foreign external investors (dummy) 1.05 ** 1.52 *** 1.23 *** 1.30 ***(2.23) (3.49) (2.65) (2.75)
Constant 0.58 *** -0.24 -0.08 0.00(5.17) (1.08) (0.64) (0.02)
Observations 110 228 110 228R-squared 0.49 0.12
Heckman selection model
Substantive equation
Selection equation
OLS Tobit
Note: *** denotes statistical significance at 1% level and ** at 5% level. (2-tailed tests). Absolute robust t-statistics in parentheses for OLS and Heckman regressions, and absolute t-statistics in parentheses for tobit regression.
Despite of the relatively strong statistical results, there are certain limitations to be acknowledged when interpreting them. First, the dependent variable is an estimate by the CEO concerning the firm’s future foreign reve-nues from own software products. Estimating such figures is challenging, and certain biases might influence the estimates. For instance, existence of aggressive venture capital investors is likely to lead to the portfolio compa-nies providing optimistic growth goals. Whether or not the goals can be real-ized over time remains to be seen. The analysis could be improved by using realized growth measures. Unfortunately, such measures are not readily available. Most of the cross-border venture capital investments in Finnish software companies have taken place within the last couple of years. How-ever, at a minimum, the measure of expected growth in revenues from own software products tells a lot about the growth and international orientation of the ventures. Despite these limitations, when combining these results with other measures and other research, it seems safe to conclude that cross-border venture capital is positively associated with rapid international growth.

278 · Mark ku V. J . Maula and Markus M. Mäkelä
Another methodological caveat is also important to keep in mind. The analysis explains growth in international sales by the existence of foreign ex-ternal investors. While it is in line with theoretical arguments that foreign in-vestors can support their portfolio companies in a rapid internationalization process, there is another co-existing mechanism that associates rapid interna-tionalization and foreign external investors. Certainly, foreign investors will choose companies that they view as having opportunities to create substan-tial international business. Therefore, a fully rigorous analysis should deal with such endogeneity of the existence of foreign investors. However, a deeper analysis of endogeneity is outside the scope of this Chapter.
8.3.2. QUALITATIVE EVIDENCE
In order to create an in-depth understanding of the realities of cross-border venture capital investments, we also carried out a total of 65 interviews among ten Finnish ventures financed by cross-border venture capital syndi-cates. In supporting the relevance of a case approach, Yin (1994) argued that “In general, case studies are the preferred strategy when “how” or “why” questions are being posed…” The ventures, their investor syndicates, and the interviews are described in Table 8.4.
Value-added from cross-border venture capital
In our multiple case analyses, we examined how cross-border venture capi-talists add value to internationalizing new ventures. Conclusions from our analysis are that a prominent foreign venture capital investor based on the in-ternationalization target market of a venture can offer valuable support for the internationalization of that company. The benefits from foreign investors are likely to be higher the more complex and critical the product is for the po-tential customers. A key determinant for the capability of the foreign investor to effectively support the venture is whether or not the investor is located on the market where the venture is planning to internationalize its operations. The following comment by an interviewee is representative:
Naturally it helps a lot to have local contacts -- especially in recruiting [they are
valuable]. -- Naturally the expertise of VCs could be better utilized if we decided
to internationalize to a place where they have expertise.

Cross-border venture capita l · 279
Table 8.4. Description of the case companies
Company Founding Round 1 Round 2 Round 3Approximate
% of sales abroad
Foreign offices
Interviews
Venture 1 1999 2000-Q2 2001-Q4 100% - CEO2 DVCs 2 DVCs 2 DVCs
1 FVC 1 FVC
Venture 2 1992 1997-Q4 2000-Q4 80% Several in CEO1 DVC 1 DVC Europe, CTO1 DCVC 2 FVCs USA, 1 DVC
1 FCVC Asia 1 FVCOthers
Venture 3 2000 2001-Q1 2002-Q2 Product USA CEO1 FVC 2 FVCs development1 FCVC 1 FCVC stageOthers Others
Venture 4 2000 2000-Q4 2001-Q1 80% Sweden, CEO1 DVC 2 DVCs Germany, 2 DVCs
UK, USA
Venture 5 1997 2000-Q3 2001-Q3 60% Singapore, CEO1 DVC 1 DVC UK CTO
1 FVC 1 DVC1 FVC
Venture 6 1999 2000-Q1 2001-Q1 2001-Q3 60% - 2 Ex-CEOs1 DVC 1 DVC 1 DVC CTO
1 FVC 2 FVCs 1 DVC2 FVCs
Venture 7 1997 1999-Q3 2000-Q3 2002-Q1 90% Germany, CEO1 FCVC 1 FVC 2 FVCs Sweden, VP
1 FCVC UK, Ex-VPUSA 3 FVCs
Venture 8 1997 1998-Q3 2000-Q4 20% - CEO1 DVC 1 DVC VP1 DCVC 1 DCVC 2 DVCs
1 FVC 4 FVCs3 FCVCsOthers
Venture 9 2000 2000-Q1 2000-Q3 60% Germany, CEO2 DVCs 2 DVCs USA CTOOthers 1 FVC 2 DVCs
Others 1 FVCs
Venture 10 1999 2001-Q1 2001-Q4 50% Germany, Dep. CEO1 DVC 2 DVCs Netherlands, CFO
1 FCVC Sweden, 2 DVCsUK 1 FVC
Investment rounds Status of internationalization
(Summer 2002)
Note: DVC= domestic venture capitalist, DCVC=domestic corporate venture capitalist, FVC = foreign venture capitalist, FCVC = foreign corporate venture capitalist.

280 · Mark ku V. J . Maula and Markus M. Mäkelä
Previous research has documented that networks can help internation-alizing firms by exposing them to opportunities, learning, and benefits ac-crued from the pooling of resources (Chetty and Holm 2000; Yli-Renko et al. 2001; Arenius 2002). In our detailed analysis, we find that foreign venture capitalists can offer internationalization support in many forms. In our data, commonly mentioned types of value-added in foreign markets include help in recruiting, attracting customers, opening doors to business partners, con-veying knowledge of the legal environment, enhanced credibility, and pro-viding contacts to financiers. Of the most common types of help that foreign venture capitalists provide with their investee firms (MacMillan et al. 1989), the above mentioned ones seem to be most important when supporting in-ternational expansion.
Firms that enter a new market are liable for not being familiar to the decision-makers and customers on that market, as compared with firms that have an established presence (see, for instance, Zaheer 1995; and Burgel and Murray 2000). Based on the ten cases in our analysis, we find that foreign venture capitalists operating in the target market can be of significant value by decreasing these ‘liabilities of foreignness’ by connecting their brand with the entrepreneurial firm (see also Stuart et al. 1999) and thus improving the credibility of the firms in the foreign market. Also direct support is important for internationalizing new ventures. The ability to open doors for potentially important business contacts is one important form of value-added where venture capitalists support an investee venture both directly and through their mere presence. “The most important one [benefit from investors] is that we can talk to nearly anyone,” commented an entrepreneur in a reply that il-lustrates our cases well. While other contacts, such as those obtained by part-nerships, are also a central means for getting doors opened, venture capital-ists seem to play a key role in ventures that they finance.
However, we also found that a powerful foreign venture capitalist may drive the internationalization decisions of a small-economy-origin venture at least in terms of location and timing of internationalization, and particularly in the establishment of offices. Foreign investors appear to be eager to drive the portfolio company to expand operations on the markets that they know best. The situation may be difficult for the entrepreneurs if this drive by for-eign investors is not in line with the internationalization goals of the venture. The following vignette from an entrepreneur illustrates pressures exerted by a foreign venture capitalist:

Cross-border venture capita l · 281
-- there was quite a lot of pressure to move everything to the States. When we
decided to continue here, there has still been occasional pressure: ‘have you con-
sidered this and what is the situation and so on, if you should focus more on the
U.S.’
We conclude that if the selection of target market has not been thor-oughly considered, it is hard to benefit from foreign venture capital investors, unless they happen to be on the markets on which the venture actually ought to expand its operations. However, if the company is planning to enter a for-eign market, a prominent investor based on that market can be a significant support for the internationalization.
Attracting cross-border venture capital investments
In our research, we also examined how ventures are able to attract foreign venture capitalists to invest in them. We found that a local venture capital in-vestor often plays an important role in this process – not only through its contacts to investors but by taking care of certain responsibilities that are of-ten easier to manage from a proximate location. Our results strongly support the view that these contributions of a local investor are typically very impor-tant for the development of a venture aiming at rapid international growth. The following vignettes capture the essence of our results.
It is important that there is a helpful and active local investor. -- In early stages
[of the venture’s life] it is very advantageous to have a local VC. [The entrepre-
neurial team obtains] local contacts and advice et cetera. -- [Foreign] VCs from
Europe are more comfortable if there is a Finnish investor involved. Especially, if
there already is a relationship with such an investor.
The contribution of the local investor is very important. It is very important to be
physically close. Geography and culture have an effect. We would not invest
without a local investor. Good ventures probably always have a local VC. The
local investor also knows a lot about the law. They have important information
on the local market. -- We are interested especially of those firms in which our
[local] trusted prior acquaintances have invested.

282 · Mark ku V. J . Maula and Markus M. Mäkelä
Besides taking care of certain responsibilities in the management of portfolio companies, local venture capitalists may influence the investment selection of foreign investors. A foreign venture capitalist can view the exis-tence of a respected local venture capitalist as a positive signal certifying the quality of the venture. The following comment illustrates:
A local investor is probably very important as a sender of signals. A foreign [in-
vestor] may have doubts that there is something wrong if [the firm] has not re-
ceived investments from its home country.
The above quotations also touch the types of local investors’ contribu-tions. According to our analysis, local investors are most important in pro-viding knowledge of the local market and regulation and in providing ‘day-to-day’ help in various operative decisions of running a business. Ventures are typically in the greatest need of operative help in the earliest stages of their life cycle. While foreign investors typically enter a firm later than on the first round of investment, it could be argued that a local investor takes these roles for the mere reason that there are no foreign investors. However, our analysis clearly reveals that these contributions are ones that are difficult to provide from a foreign country.
We also found that the need of a venture for these contributions of a local investor is significantly decreased if the entrepreneurial team possesses notable prior experience in running an independent business. Furthermore, if the home market is not very important in terms of sales or as a launching pad of international operations (see Kuemmerle 2002), local investors’ knowledge of the market is not as essential. In addition, the contacts of local investors to foreign investors are also a key resource that they can contribute. Here, our conclusion extends the results of prior venture capital studies (Gorman and Sahlman 1989; MacMillan et al. 1989) to the cross-border context.
Retaining cross-border venture capital investors
Ventures may experience problems in retaining the attention and active con-tribution of the venture capitalists that have agreed to take part in developing the company. Our results suggest that in comparison to domestic investors, foreign venture capitalists are faster to abandon their active role in board work and in other forms of concrete value-added if the development of the

Cross-border venture capita l · 283
company does not meet the milestones or if the return expectations are low-ered. We discuss here the factors that affect the commitment of foreign ven-ture capitalists to cross-border syndicates.
Both financial and strategic motivations appear to drive investors’ propensity to give up active participation. One of the investors may rate the prospects of a venture lower than others and conclude that further participa-tion will not be profitable. An investor may also have satisfied its desire to learn from the technology or other features of the venture’s business, or the strategic benefit can be accrued due to contractual rights even without con-tinuing active participation.
Overall, we find that a reduction in the value that an investor expects an investment to yield will lead to reduced commitment and value-added. Our analysis leads us to conclude that there are three important factors that have an impact on the power of this effect: distance, the dependence of the foreign investor of investors and entrepreneurs in the key locations of the venture, and financial relevance.
Distance refers here to both geographical and cultural distance. It seems that if an investor loses some of its interest towards an investee firm, this is more likely to show in its commitment to the syndicate if it is situated geographically far away (see, for instance, Grinblatt and Keloharju 2001). Cultural distance (Kogut and Singh 1988) – the measure of how remote cul-tures are from each other in terms of the most important dimensions – has an analogous effect.
A foreign investor may be dependent on institutions and people in the investee firm’s location in several ways. For example, if the investor wishes to make other investments in the country in question, collaborate with venture capitalists that come from the country, or attract positive references from ven-ture capitalists of the country, it may be dependent so that it will consider the reputational risks from abandoning the venture as too high. The reputational risks of relinquishing participation in and commitment to the syndicate may be too high regardless of the outcome of one investment. Venture capital in-vestors have to take a portfolio approach that safeguards future streams of profitable opportunities. The following quote illustrates the view that reputa-tional concerns of the investor may save an investee from loss of attention:
It is clear that [a foreign investor’s] reputation might suffer [if they would not
take care of their investment]. And [name of a local investor] helps [by being
present]. An investor’s reputation towards other investors has a lot of relevance.

284 · Mark ku V. J . Maula and Markus M. Mäkelä
Finally, an investment into a single company may represent only a very small fraction of the value of a fund. In such a case, the financial rele-vance of the investment is low, and this is likely to increase the effect of de-creased value expectations on commitment.
The key conclusions from this analysis are that although all venture capital investors adjust their commitment level based on the achievement of milestones and the likelihood of success and value creation, venture capital-ists with less distance and more other investments in the market, better con-tacts with the local co-investors, and higher financial stakes are likely to be more patient in retaining their interest in the case of adverse developments in the perceived prospects of an investee’s business.
8.4. CONCLUSIONS
In this Chapter we set out to explore the role of cross-border venture capital-ists in supporting the development and internationalization of their portfolio companies and in facilitating the development of the venture capital indus-try. In our quantitative analyses of Finnish software product companies, we found that the existence of foreign external investors was positively related to the expected growth in foreign revenues from own software products. In an in-depth analysis of ten Finnish ventures co-financed by foreign venture capitalists, we focused on the value-added by cross-border venture capital; the issues related to attracting foreign venture capitalists; and issues related to retaining the commitment of foreign venture capitalists.
The conclusions from the analysis of the value added provided by for-eign venture capitalists are that a prominent foreign venture capital investor domiciled in the target market of a venture can offer valuable support for the internationalization of that venture. A respected venture capitalist operating and influential in the target market can improve the credibility of and open doors for an ‘unknown’ foreign venture. The benefits are likely to be higher the more complex and critical the product is for the potential customers and where switching or adoption costs are correspondingly high. However, if the selection of the target market is not yet clear, it is hard to benefit from foreign venture capital investors. Foreign venture capital investors tend to drive portfolio companies towards their home countries making the situation diffi-cult for the venture if the home country of the foreign investors is not the pre-ferred target of the venture.

Cross-border venture capita l · 285
The conclusions from the analysis concerning the issues related to at-tracting cross-border venture capital are that local venture capital investors usually play an important role in attracting the foreign venture capital inves-tors. However, if the experience of the entrepreneurial team is particularly strong, the role of the local venture capitalist may be less critical. Also if the home market of the venture is insignificant for the future plans, the role of the local investor may be less crucial. Contacts between the local venture capitalist and foreign venture capitalists increase the likelihood of a foreign venture capitalist investing in the venture. As to retaining cross-border ven-ture capital investors our main finding is that although all venture capital in-vestors adjust their commitment level based on the likelihood of success and value creation, venture capitalists that are geographically proximate and have more other investments and better long-term reciprocal contacts with the local co-investors are likely to be more patient in retaining commitment to portfolio companies.
The implications of our findings can be summarized as follows:
• Implications for entrepreneurs: A prominent cross-border investor is likely to beneficial for ventures trying to internationalize their operation if it is a respected and well-connected investor in the target market of the venture. The findings suggest moreover that entrepreneurs should be careful in managing the expectations of foreign investors who may be quick to re-duce commitment if ventures are not able to achieve stated goals and sat-isfy expectations.
• Implications for venture capitalists: The findings indicate that syndicating with foreign venture capitalists may help to attract valuable complemen-tary support for the internationalization of portfolio companies. In addi-tion to helping to develop international business, foreign venture capital-ists appear to open doors for accessing international public capital mar-kets as an exit route. This is particularly important in the case of illiquid domestic public markets. The research also indicates that domestic ven-ture capitalists often perform important roles in attracting foreign venture capitalists and in managing the relationships. It may therefore be strategi-cally highly valuable for a domestic venture capitalist to identify and to develop a long-term, reciprocal working relationships with major venture capital firms in the key internationalization target markets of their portfo-lio companies.
• Implications for public policy: A well functioning exit market is a necessity for the development of a venture capital market. Within the borders of a
286 · Mark ku V. J . Maula and Markus M. Mäkelä
small country, exit opportunities are always relatively limited no matter how liquid the domestic stock exchange is.3 Cross-border venture capital-ists appear to be useful in opening up a new range of exit opportunities. The support from foreign investors in tapping international public mar-kets as an exit route also improves conditions for domestic venture capi-talists. Consequently, the supply of venture capital is increased both through the direct supply of international venture capital as well as through an improved supply of domestic venture capital as a conse-quence of improved exit routes for domestic venture capitalists. More-over, foreign investors are in a strong position to support new ventures to become successful international businesses, and as co-owners of their portfolio companies highly incentivized to do so. Therefore, public policy should view cross-border venture capital not only as a source of risk capi-tal but also as a source of human capital that enhances the internationali-zation of businesses and as a vehicle that facilitates the development of the local venture capital industry.
When examining the outcomes of foreign venture capital investments from a national policy perspective, cases can certainly be found in which the ownership of some promising domestic business has been lost to another country. However, such cases should not be allowed to lead to excessive ‘pro-tectionism’ that may prevent any significant internationally successful busi-ness from being developed in the first place. It is quite impossible to even picture some meaningful global business being developed within the borders of one single country. As noted, cross-border venture capitalists can signifi-cantly aid the internationalization of their portfolio companies by helping them develop a global perspective to their business and open doors in the in-ternationalization process. However, the impact is not limited to portfolio companies. The presence of international investors in the venture capital market is likely to improve the awareness of new ventures about the global competition already before they receive any investments. In conclusion, cross-border venture capitalists play an important role in the financial system as one facilitator of transforming cutting edge R&D into internationally suc-cessful business.
The results of this Chapter highlight the importance of conducting more in-depth research on cross-border venture capital. Cross-border ven-ture capital appears to be a very recently discovered area in venture capital studies with many new questions unanswered by conventional venture capi-tal research that focuses on domestic investments with a heavy emphasis on

Cross-border venture capita l · 287
the U.S. market. Cross-border venture capital is a particularly important form of financing for smaller technology-oriented countries such as Israel, Ireland, Finland, and Sweden. While cross-border venture capital may not be relevant for the large majority of SMEs in any country, it is likely to be very relevant for the small elite group of the internationally most potential ventures, which may have a disproportional impact on the growth of the economy. The com-plicated issues in cross-border venture capital warrant attention from a wide array of theoretical and methodological disciplines. We hope that this Chap-ter will inspire new research in this fruitful area.

288 · Mark ku V. J . Maula and Markus M. Mäkelä
REFERENCES
Ali-Yrkkö J., Hyytinen A., and Liukkonen J., 2003, Exiting venture capital investments in Finland: Lessons from Finland, Chapter 4 in this volume.
Arenius P. M., 2002, Creation of firm-level social capital, its exploitation, and the process of early internationalization, Doctoral Dissertations 2002/3, Helsinki University of Technology, Institute of Strategy and International Business, Espoo.
AVCAL, 2002, Australian venture capital industry welcomes introduction of VCLP bills, Press release 14.11.2002, Australian Venture Capital Association Limited, Accessed: 2.12.2002, <http://www.avcal.com.au/html/news/2002/vclp.html>.
Bassolino F., 2002, Private equity in China: Why the time is right, The Journal of Private Equity, 5, 44-52.
Baygan G. and Freudenberg M., 2000, The internationalization of venture capital activity in OECD countries: Implications for measurement and policy, STI Working Papers - 2000/7, Organization for Economic Co-operation and Development, Paris.
Black B. S. and Gilson R. J., 1998, Venture capital and the structure of capital markets: Banks versus stock markets, Journal of Financial Economics, 47, 243-277.
Black B. S. and Gilson R. J., 1999, Does venture capital require an active stock market?, Journal of Applied Corporate Finance, 36-48.
Burgel O. and Murray G. C., 2000, The international market entry choices of start-up companies in high-technology industries, Journal of International Marketing, 8, 33-62.
Cardwell W., Mäkelä M., Jokinen J., and Kumpulainen M., 1999, Attracting foreign investment into early-stage Finnish technology companies, Finnish National Fund for Research and Development, Sitra, and LTT Research Ltd, Tampere, Finland.
Chetty S. and Holm D. B., 2000, Internationalisation of small to medium-sized manufacturing firms: A network approach, International Business Review, 9, 77-93.
Cumming D. J., 2002, United States venture capital financial contracting: Foreign securities, Working paper.
Dossani R. and Kenney M., 2002, Creating an environment for venture capital in India, World Development, 30, 227-253.
Gorman M. and Sahlman W. A., 1989, What do venture capitalists do, Journal of Business Venturing, 4, 231-248.
Grinblatt M. and Keloharju M., 2001, How distance, language, and culture influence stockholdings and trades, Journal of Finance, 56, 1053-1073.
Heckman J. J., 1979, Sample selection bias as a specification error, Econometrica, 47, 153-161.
Hietala J., Maula M. V. J., Autere J., Lassenius C., and Autio E., 2002, Finnish software product business: Results from the national software industry survey 2002, Centre of Expertise for Software Product Business and Helsinki University of Technology.

Cross-border venture capita l · 289
Hursti J. and Maula M. V. J., 2002, Acquiring financial resources from foreign equity capital markets: Examination of the factors influencing foreign initial public offerings, Paper presented at the 22nd Annual International Conference of the Strategic Management Society, Paris, 22-25.9.2002.
Israeli Ministry of Finance, 2001, Vice premier and finance minister Silvan Shalom announces tax exemption for nonresident investors in Israeli venture-capital funds, Press release 24.9.2001, Israeli Ministry of Finance, Accessed: 2.12.2002, <http://www.mof.gov.il/beinle/press55.htm>.
Kenney M., Han K., and Tanaka S., 2002, Scattering geese: The venture capital industries of east Asia: A report to the World Bank, BRIE Working Papers WP146, The Berkeley Roundtable on the International Economy.
Kenney M., Han K., and Tanaka S., 2002b, Scattering geese: The venture capital industries of East Asia, Worldbank.
Kofman P. and Sharpe I., 2000, Imputation methods for incomplete dependent variables in finance, No 409 in Econometric Society World Congress 2000 Contributed Papers from Econometric Society, Econometric Society.
Kogut B. and Singh H., 1988, The effect of national culture on the choice of entry mode, Journal of International Business Studies, 19, 411-432.
Kuemmerle W., 2002, Home base and knowledge management in international ventures, Journal of Business Venturing, 17, 99-122.
Lockett A. and Wright M., 2001, The syndication of venture capital investments, Omega-International Journal of Management Science, 29, 375-390.
MacMillan I. C., Kulow D. M., and Khoylian R., 1989, Venture capitalists involvement in their investments – Extent and performance, Journal of Business Venturing, 4, 27-47.
Maddala G. S., 1997, Limited-dependent and qualitative variables in econometrics, Cambridge University Press, Cambridge, MA.
Manigart S., Lockett A., Meuleman M., Landström H., and Desbrières P., 2002, The syndication of venture capital investments in Europe: Evidence from five European countries, Paper presented at the Babson-Kauffman Entrepreneurship Research Conference.
Mayer C., Schoors K., and Yafeh Y., 2002, Sources of funds and investment activities of venture capital funds: Evidence from Germany, Israel, Japan and the UK, Oxford Financial Research Centre working paper.
Meyer J. E. and Shao J. J., 1995, International venture capital portfolio diversification and agency costs, Multinational Business Review, 53-58.
OECD (Organization for Economic Co-operation and Development), 2001, The new economy beyond the hype: The OECD growth project.
OECD (Organization for Economic Co-operation and Development), 2002, Venture capital country note: Israel, DSTI/IND(2002)16.
Rock E. B., 2001, Greenhorns, yankees and cosmopolitans: Venture capital, IPOs, foreign firms and U.S. markets, Theoretical Inquiries in Law, forthcoming.
Rubin D. B., 1987, Multiple imputation for nonresponse in surveys, John Wiley & Sons, New York, NY.

290 · Mark ku V. J . Maula and Markus M. Mäkelä
Rönkkö P. 2001, Growth and internationalization of technology-based new companies: Case study of 8 Finnish companies, In Paija, L. (ed.), Finnish ICT cluster in the digital economy, The Research Institute of the Finnish Economy (ETLA) B:176, Helsinki.
Sapienza H. J., Manigart S., and Vermier W., 1996, Venture capitalist governance and value added in four countries, Journal of Business Venturing, 11, 439-469.
Schafer J. L., 1997, Analysis of incomplete multivariate data, Chapman & Hall, London.
Stuart T. E., Hoang H., and Hybels R. C., 1999, Interorganizational endorsements and the performance of entrepreneurial ventures, Administrative Science Quarterly, 44, 315-349.
Wright M., Lockett A., and Pruthi S., 2002, Internationalization of western venture capitalists into emerging markets: Risk assessment and information in India, Small Business Economics, 19, 13-29.
Yin R. K., 1994, Case study research: Design and methods (2nd. ed.), Sage Publications, Thousand Oaks, CA.
Yli-Renko H., Autio E., and Tontti V., 2001, Social capital, knowledge, and the international growth of technology-based new firms, International Business Review, 11, 279-304.
Zaheer S., 1995, Overcoming the liability of foreignness, Academy of Management Journal, 38, 341-363.
Zhang T. T., 2002, Managing risks of private equity investing in China, The Journal of Private Equity, 5, 40-43.
Cross-border venture capita l · 291
ENDNOTES
1 Econometric research typically employs large databases without a significant share of missing values. Therefore, the choice to drop all the cases without complete responses (listwise deletion) does not usually influence the results significantly. However, in survey research, missing responses to questions could lead to dropping a significant share of observations and unnecessary loss of information. Because many of the some missing value may not be random, various methods have been developed to deal with missing re-sponses (see, for instance, Rubin 1987; Schafer 1997; and Kofman and Sharpe 2000). In our analysis, we used imputation to deal with missing values, but found also same results when using other simple methods such as mean substitution or pairwise deletion. Because of the uniformity of our results across these methods, we left more sophisticated methods out of the scope of the present Chapter. 2 Transformation ln(x+1) was used to account for a common pattern of zeros in the variable measuring cur-rent revenues. We also ran the same analyses using another constant in the transformations (0.01) without finding major differences in the results. 3 The European Union has attempted to facilitate the integration of European financial markets including support for the creation of a pan-European stock exchange. However, the integration has been slow, and stock exchanges that span several countries have to date been unsuccessful partly because of persistent ‘home biases’ of listing firms. Cross-border venture capital appears to be one factor that has potential to help break this barrier (Hursti and Maula 2002).


Financia l systems and f i rm per formance: Theoret ical and empir ica l perspect ives · 293
9. VENTURE CAPITAL FINANCE: WHAT IS DIFFERENT?
Vesa Kanniainen*
Abstract: Venture capital (VC) finance is a recent phenomenon in the long history of financial innovations. Why has VC finance emerged? What are the efficiency gains involved? What are the limits to VC financing? Understanding the basic problems of corporate finance is key to addressing these questions. In a risky multi-stage project (i.e., in founding a firm), uncertainty is greatest at the early stages. An insider entrepreneur may observe a signal on how likely the success is earlier than outsider investors. The entrepreneur’s desire to survive so as to reap some private benefits even if liquidation would be more efficient creates an interest conflict between her and investors. An ex-perienced informed investor or controlling shareholder equipped with liquidation rights is able to cope with the incentive problem. Firms at different stages of their life-cycle and from different industries require, however, different solutions. The institu-tional equilibrium matches the idea that “uninformed capital” (banks, capital mar-kets) finances less risky assets (i.e., mature firms and industries) while ”informed capital” finances more risky assets (i.e., start-up firms and emerging industries). VC finance is a particular form of informed finance that addresses the commercial inex-perience of start-up firms by advising them on how to grow. However, VC may also cause negative external effects on the quality of projects financed by the uninformed capital. We conclude that relative to many other sources of capital, VC remains a marginal source of funds. It tends to focus on a few sectors at a time and its availabil-ity may in the long-term be restricted by risk aversion of investors and lack of the ex-pertise required in project evaluation and advising start-up firms.
* Vesa Kanniainen is at the Department of Economics, University of Helsinki. The author gratefully acknowl-edges the many helpful comments by Ari Hyytinen and Mikko Mustonen. The views expressed in the Chap-ter are those of the author. The usual caveat applies.
294 · Vesa K annia inen
9.1. INTRODUCTION
For the welfare of any economy regardless of its institutions, it is important that new projects are properly selected and funded. Today’s world is charac-terized by the existence of numerous complex financial contracts both be-tween financiers and firms and between managers and firms. A natural in-terpretation is that the evolution of institutions and markets throughout his-tory witnesses the intrinsic development of economic systems to address the fundamental problem of project selection.1
Many preconditions must be met for a financial system to operate properly. New projects only succeed if proper incentives are created for in-novative efforts and only if the financial contracts facilitate the selection of the right projects and the rejection of less promising ones. Both acceptance errors and rejection errors are possible. One of the necessary ingredients for the financial system to operate properly is that there exists a stable social in-frastructure, i.e. the existence of sufficient social capital in the form of trust, respect of property rights and enforcement of contracts.2 Despite the exis-tence of such infrastructure, informational constraints and the possibility of opportunism shape project choice, financial contracts and incentives.
The financial evolution is a never-ending process. For example, the his-tory of informal contracts – as primitive as such contracts might have been – is almost as long as the history of mankind. Helping friends, neighbors or relatives in the spirit of reciprocity may be viewed in terms of implicit primi-tive “contracts” and mutual understanding of evolving social norms. The ideas of institutionalizing such practices were a logical step. It is known that credit institutions existed in ancient China at least 4000 years ago. Derivatives are not an invention of our times. Implicit risk sharing arrangements with properties of forward contracts are known to have existed among primitive hunting nations (Ridley 1996).3
There has been an active discussion on the relative merits of market-based financial systems (like those in the US and UK) and bank-centered fi-nancial systems (like those in continental Europe and Japan). It has been sug-gested that banking-centered systems may have some advantages over mar-ket-based systems, as banks provide monitoring services which markets do not provide. The severe banking crises not only in the US, but also in Europe and Japan, however, point to that the proposed superiority is not warranted. There also are other observations that suggest that this discussion may have been misplaced. The development of VC finance is a new phenomenon and
Venture capita l f inance: What is d i f ferent? · 295
apparently solves some of the problems where the efficiency of the banking system is limited. The attractiveness of VC perhaps lies in that it tends to combine the strengths of both systems, providing strong incentives for entre-preneurs and for the controlling role of capital, i.e., the VCs. The traditional roles of the stock market in providing equity capital and a market value for existing companies are augmented by a third economic mechanism. Stock markets allow for an exit for VC investors, facilitating reallocation of capital to yet unlisted firms and new start-ups.
The current article reviews these issues. From the financial market’s points of view, financing of an innovative idea looks like a “lemon” problem (see Akerlof 1970 for the path-breaking analysis of this problem). Conse-quently, there tends to be a lemon’s premium incorporated in the cost of fi-nancing R&D projects. The evidence is consistent with external finance being more expensive than internal finance (Hall 2002). As a consequence, R&D –intensive firms tend to face a high cost of capital. There is more to it. R&D is different from “ordinary investment” first of all because a large part of it con-sists of wages of highly educated scientists and engineers whose efforts cre-ate intangible assets and tacit knowledge that become embedded in human capital and lost if the workers leave the firm. As firms tend to avoid firing their knowledge workers, the required rate of return has to cover such costs. Second, the degree of uncertainty is greatest at the beginning of the research program and mostly creates what might be called “growth options”.
New projects tend to be subject both to market and idiosyncratic, en-terprise-specific risks. In particular, risky R&D projects tend to be subject to under-investment for the reason identified by Arrow (1992), known as the appropriability problem. Knowledge is a (nonrival) public good and can be exploited by competing imitators. Though imitation is costly, concerns for underinvestment remain. There is another argument pointing to market fail-ure in Arrow (1962), the gap between the private rate of return and the cost of capital. When the investor and financier are different entities, external inves-tors require a higher rate of return on their investment than an entrepreneur investing her own funds.
In the case of more mature companies, separation of ownership and control leads to principal-agent problems and facilitates opportunism. This is a challenge for corporate governance. Managers tend to spend on activities that benefit themselves and not to work as hard as the owners of the firm would like him to work. Moreover, risk aversion may make managers less keen to invest in risky R&D. Controlling the amount of free cash flow avail-able to managers may mitigate the agency cost of the first type. A means to it

296 · Vesa K annia inen
is to lever the company. There are, however, obvious limits to the extent that debt can serve as a disciplinary device and to solve moral hazard problems of this kind.
The organized VC finance is a rather new instrument. In the US, the VC industry consists of fairly specialized pools of funds that are managed and invested in companies by individuals knowledgeable about the industry in which they are investing. From this perspective, VC can be viewed as “in-formed capital”. Informed capital can help to control both the lemon and moral hazard problems but it has to face abnormal risks.
Using US data, Kaplan and Strömberg (2000) examine 200 VC con-tracts. They find that the contracts often provide for separate allocation of cash flow rights, control rights, voting rights, board positions, and liquida-tion rights, and that the rights are frequently contingent on performance measures. If performance is poor, the VCs often gain full control of the firm. Provisions such as delayed vesting are often included to mitigate hold-up by the entrepreneurs as suggested by Anand and Galetovic (2000). Kapland and Stromberg conclude that VC contracts are most consistent with the predic-tions of Aghion and Bolton (1992) and Dewantripont and Tirole (1994) as in-complete contracts. Put simply, a VC contract is a complex debt-equity hy-brid that looks more like debt when the firm does poorly (giving control to the investor) and more like equity when the firm does well (giving control to the entrepreneur).
Economists speak of the history of VC in the present form extending over a few decades only, noticing that the annual inflows to VC funds started from virtually zero in the mid-1970s (cf. Gompers and Lerner 1999). Many of the most valuable companies, including Apple Computer, Genentech, Intel, Lotus, Microsoft and Yahoo were all backed by VC funds. The first modern VC firm, American Research and Development (ARD), was formed in 1946 by MIT and the Harvard Business School. They sought to commercialize the technologies developed for World War II (Gompers and Lerner, p. 6). The success of the investments ranged widely. Almost half of ARD’s profits came from its investment in Digital Equipment Company in 1957. The first corpo-rate venture funds began in the mid-1960s. Excited by the ARD success, large companies began establishing divisions that emulated VCs. During the late 1960s and early 1970s, more than 25 percent of the Fortune 500 firms at-tempted corporate venture programs. There were setbacks associated with the stock market crash of 1987. However, the end of 1990s was a period of tremendous expansion of VC finance. One explanation for such a develop-ment is the response of investors, like pension funds to new opportunities, al-

Venture capita l f inance: What is d i f ferent? · 297
lowed by legal changes and provided by those organizing VC funding. While VC in the US amounted to no more than 2-4 billion USD annually in 1980-93, recent estimates put it at almost 40 billion in 1999. After lagging behind for a long time, Europe started to catch up as well. In 1998, its VC was 14 billion euros, three times what it was only five years earlier. 4 It is by now observed that the boost was followed by a dramatic slowdown in VC finance linked to downturn of the stock markets that started in 2000.
To understand the rise (and fall!) of VC, one must first understand what the corporate finance problem really is about, why it has been so diffi-cult to gain an understanding of it and why it has been such a tremendous research challenge for the economic profession. At this junction, one cannot close one’s eyes to the fact that firms and enterprises in different stage of their life-cycle are in rather different starting points when searching for finance. New firms or their entrepreneurs typically have an idea but no money, no history, and no reputation. Firms with established reputation, in turn, can rely both on financial intermediaries and capital markets to raise funding. Such access may not be available for small firms that must try to convince outside investors of the quality of their ideas.
For a project success, both the entrepreneur and a company need help with special commercial skills in addition to the technical skills provided by the innovator or production manager. Firms at different stages of their life-cycle find different solutions. A start-up consults VCs, a mature company consults the hired manager. A start-up has to give up control rights to a VC. A mature company need not – it can issue debt on capital markets at the market rate of interest.
Viewing a risky project as a multi-stage process in this vein implies two matters. First, uncertainty is greatest at the early stage of the project. In-formation arrives over time, not automatically but after innovation efforts and commercialization of the product. Success can be tested only in the mar-ket place. Second, it is the insider entrepreneur who typically obtains a signal of the likelihood of success (“the cash flow”) earlier than the outsider finan-cier. This tends to create a moral hazard incentive, an incentive for opportun-ism, and the desire to survive so as to reap some private benefits even if liq-uidation would be more efficient. Uninformed outside finance rationally an-ticipates this incentive and refuses financing. An experienced, informed fin-ancier or controlling shareholder equipped with liquidation rights can better cope with the opportunism.5
It appears that the task of the VC is a much more challenging one than is the task of a financial manager in a mature company. The VC has to evalu-

298 · Vesa K annia inen
ate a project when uncertainty is greatest, almost under a veil of ignorance. It also has to convince the investors who fund VC pools and know that the critical resource is the special expertise of VCs. As we will argue, the limits to VC finance arise from the fact that there may be only a handful of competent people who have such expertise. Managers of mature companies also sell their expertise to their companies. But their involvement in fund raising is perhaps more trivial, given that their companies is mature and known.6
If start-up firms indeed face a higher cost of capital than mature com-panies why are investors willing to invest in VC pools? What we suggest is that a standard risk preference view becomes relevant here. Optimal portfo-lio management allows for diversification of investment between low and high risk assets. The resulting institutional equilibrium matches with the idea that uninformed capital (banks, capital markets) “supplies less risky assets” while the informed capital “supplies more risky assets”. Such an equilibrium will be discussed later in this essay. The outcome of the emergence of in-formed capital is that we witness start-ups that in the absence of such capital would never come into existence. This is a major source of welfare gain. To arrive at these conclusions, we start by going back to the basics.
9.2. CORPORATE FINANCE: WHERE DO WE STAND?7
9.2.1. DEBT, EQUITY AND LIMITED LIABILITY
It has been argued that the nature of a firm today tends to be different from it used to be earlier (see, in particular, Zingales 2000). In the traditional theory, the “firm” was understood to be very asset-intensive and highly vertically in-tegrated with tight control over its employees – control that is concentrated at the top of the organizational pyramid. Its boundaries were clear-cut and suf-ficiently stable. Not any more, claims Zingales. The nature of the firm is changing. Large conglomerations have been broken up, and their units have spun off as stand-alone companies. Vertically integrated manufactures have relinquished direct control of their suppliers and moved toward looser forms of collaboration. Human capital is emerging as the most crucial asset. As a result of these changes, the boundaries of the firms are in constant flux, and financing and governance choices can easily change them.8
We learn from Zingales (2000) that
“The practice of actively raising capital from a large public of investors for the
purpose of undertaking new private ventures started with the spread of the legal

Venture capita l f inance: What is d i f ferent? · 299
concept of a corporation. In fact, during the seventeenth century, early corpora-
tions (such as the East India Company) were granted limited liability with a spe-
cial royal decree for the purpose of facilitating the raising of capital for socially
beneficial endeavors that involved too much capital and too much risk to be un-
dertaken by a few wealthy individuals. In spite of some major setbacks, this sys-
tem proved so successful that after the middle of the nineteenth century, Eng-
land started granting freedom to incorporate to all business enterprises. All
other major countries followed promptly. Thus, although financing in some
forms goes back as far as the Babylonian King Hammurabi (1800 B.C.), it was
only after the middle of the nineteenth century that the raising of funds in the
market place became common practice.”
The analytic idea of a firm as a nexus of contracts goes back at least to Alchian and Demsetz (1972) and in particular to Jensen and Meckling (1976). It has, however, been known since Coase (1937) that the defining characteris-tic of a firm is that it substitutes authority for the price mechanism in deter-mining how decisions are made. What does the traditional view imply for the value of a firm and why is it that we have shareholder supremacy, Zin-gales (2000) asks. Is a new view of a firm needed and what would it imply for our thinking about corporate governance and the financing corporations? One implication is that if the decision rights should be allocated to the party which can benefit and lose the most from decisions, the party in control must be able to make decisions that alter the distribution of payoffs among the members of the nexus. The implication is that though the shareholders carry most of the risk, other members of the nexus cannot be fully protected either. Also implicit contracts are part of the nexus. This view tends, however, to suggest that explicit contracts and shareholder control may no more be suffi-cient for efficiency.
Informational constraints and interest conflicts are the source of the problem, though emphasized differently in different traditions. To under-stand the principles of corporate finance, one cannot indeed overlook the fundamental implications of limited liability. It is the most distinguishing fea-ture of the legal entity called the corporation that investors are not personally responsible for debt issued by the corporation. Both the principles of limited liability and corporate governance have an impact on incentives and corpo-rate finance. Limited liability turns a firm’s equity into a call option and thereby enables investors to reduce portfolio risks by diversifying.9 On the other hand, it is the limited liability, as important as it is, which is the source of interest conflict between debt holders and equity holders. That is, it gives
300 · Vesa K annia inen
rise to the “asset-substitution” incentive identified by Jensen and Meckling (1976) and to the debt overhang and under-investment problem identified by Myers (1977). The fact that in large corporations, investors are dispersed with a limited possibility to coordinate, leads also to a free-riding problem. Only large shareholders have an incentive to monitor and acquire information on the state of the corporation, making them demand information rents.
The importance of the interaction of assets in place and growth oppor-tunities was considered by Myers (1977) and Myers and Majluf (1984). If a manager has private information that the market is undervalying the assets in place, she will prefer to pass up valuable growth options rather than dilut-ing the value of assets of the existing shareholders. On the other hand, there are limits to debt, as an excessive amount of debt raised to finance existing assets makes it very costly for shareholders to raise new equity. The reason is that it would increase the value of existing debt at the expense of equity. These are the sources of the under-investment problem.
The theory of project finance started as a theory of corporate finance, not as a theory of enterprise finance. Venture capital funds are those primar-ily devoted to equity or equity-linked investments in young growth-oriented firms. Their time to mature and be listed is long ahead. Indeed, small firm fi-nance is an issue in its own right. Firms seem to evolve through a financial growth cycle (Berger and Udell 1998).
When a firm acquires outside finance in the form of debt, some protec-tion has to be offered for debt-holders. This protection is created in terms of first priority to project returns, implying that equity-holders have the resid-ual rights. Second, debt-holders typically have access to control right when the project is unable to meets its financial obligation, i.e. to service its debt. Furthermore, debt contracts today can include a number of covenants that help to control the potentially many incentive problems. The equity-holders, however, are protected by the principle of limited liability in the case where the worst state of the world takes place.
9.2.2. INFORMATION CONSTRAINTS FACED BY OUTSIDERS
The possibilities of an outsider financier to safeguard his money handed over to a firm are limited. One wants to know to what extent the project-holder puts her effort into the project. Some uncertainty also remains as to how money is invested and how the project’s true return is reported to outsiders.
The striking starting point in the early development of the theory of corporate finance was that though project riskiness was recognized, all par-

Venture capita l f inance: What is d i f ferent? · 301
ticipants were assumed to have access to the same information. Subsequently, this has been viewed as a fatal mistake.10 The early contributions by Miller and Modigliani, published in 1958 and 1961, were unable to explain for why finance seems to matter. They were rewarded with a Nobel price if only to recognize that while it is important to know the right answer, it may be even more important to identify the right issue. The result that they proved indi-cated that the value of corporate capital really depends only on its ability to generate cash flow, not on the way the acquired capital was financed. Equity-holders of a leveraged company do require a premium on their stake but this cannot distort the value of a company’s total liabilities. If altering the finan-cial mix could change the company’s total value, this would allow for profit-able arbitrage opportunities. However, as the argument goes, such opportu-nities cannot survive as an equilibrium phenomenon.
Practitioners in the field and experts in academia knew that the result was wrong. What they did not know was why it was wrong. The ideas of ex-ternal bankruptcy costs or tax distortions were around but they could not provide a sufficiently general explanation. It seemed that finance directors in companies are more important than implied by the theory. They were deemed to earn their top salaries but the theory just could not explain why!
It took no less than almost twenty years when the new track was found. Jensen and Meckling (1976) provided the light, establishing a new re-search agenda. What Jensen and Meckling suggested was that the managers, bond-holders and equity holders all are governed by their own interests. This becomes important when information is asymmetric – the idea which at the same time was changing so much in the other areas of economics. Corporate insiders may not be inclined to maximize corporate wealth, because by pro-viding a costly effort, they can reap only part of the generated benefit. This tends to invite slack. There is no information or incentive problem when the same person owns and runs the company. After the initial growth stage is passed, the situation changes, however, as outside finance typically is needed to expand. A manager working one more hour has to share the profits she makes with the rest of financiers. With shared ownership, an incentive to provide effort is reduced. A manager in a company with outside equity tends to equalize private benefits and costs.11 When equity is issued, she may have to give up some of those benefits to the extent that equity-holders monitor her activities. The existence of agency costs of equity means a deadweight loss. This is the basic tragedy of a shareholder corporation. Why are they still doing so damn well?

302 · Vesa K annia inen
An attempt to find a solution for the managerial problem and to syn-chronize the incentives of owners and managers is represented, for example, by manager options. Judging on the basis of some recent observations, this may be very costly to shareholders. Here one can refer to the 2002 scandals, the Enron case and the ABB pension plan for managers, to name just a few. A good question is whether there are alternative ways to control the manage-ment and how much it is worth devoting resources to it.
9.2.3. FINANCE AND DISCIPLINE: DEBT FIRST
It was suggested by Jensen (1986) that corporate debt could operate as a dis-ciplinary mechanism (see also Stulz 1990). Moreover, with debt finance the incentive for provision of labor effort of an entrepreneur is greater than with equity finance. With debt, the upside risk is unlimited and the return, net of debt service belongs fully to the entrepreneur. With equity financing, an en-trepreneur has to share the surplus (cf. Poitevin 1989). With debt, the entre-preneur obtains revenue only if the debt is fully serviced. With equity, no similar discipline exists in terms of dividends.
Why then is it not the case that all finance is in terms of debt? One pos-sible answer is the asset substitution problem. It cannot concern a small start-up enterprise which does not make choices between projects. It concerns companies which have a larger number of projects and new ones being planned. The problem is that debt transforms corporate equity into a call op-tion. In the light of Black and Scholes (1973), the value of a call option is posi-tively related to the risk involved. In a corporation that is highly leveraged, the owners have an incentive to try to switch to high-risk projects to exploit the limited liability and benefit at the expense of debt-holders. When mana-gerial options are related to corporate equity, there is an equally obvious risk that managers find it in their interest to take too much risk.
9.2.4. HOW SHOULD THE RIGHT TO MAKE FUTURE DECISIONS BE ALLO-
CATED?
Hart (2001) addresses the mystery why so many different financial structures exist. There is a general problem with the theories of capital structure em-phasizing agency view, as has also been pointed out by Holmstrom and Ti-role (1989): why use the financial structure rather than an incentive scheme to solve the agency problems? Hart therefore focuses on decision (control) rights in the framework of incomplete contracts. He asks: how should the

Venture capita l f inance: What is d i f ferent? · 303
right to make future decisions be allocated between the entrepreneur and the investor? It appears in practise that shareholders have decision rights as long as the firm is solvent while creditors acquire rights in default states. In his in-sightful review, Hart identifies the fundamental interest conflict between an insider entrepreneur and an outsider financier arising from the fact that the entrepreneur is mostly interested in private benefits (as earlier suggested by Aghion and Bolton 1992). The interest conflict has to be resolved. Who is supposed to make the decisions on cash flow allocation and control ex post, after some signal on the likelihood of success (the cash flow) has been ob-served? Hart explains the diversity of outside claims in the context where in-tervention by an outside investor is costly. It appears that heterogenous claimants can put more pressure on management than homogenous claim-ants. Hart also shows that if the debt level is very high, its disciplinary role is lost.
9.2.5. FINANCIAL INTERMEDIATION
The development of intermediaries has served a good purpose. While credit institutions have existed for thousands of years, the history of understanding the banking industry is much shorter and still subject to many open ques-tions. The first well-established approach to customer screening problem was introduced by Stiglizt and Weiss (1981). It was not a fully adequate analysis (cf. Bester 1985) but it was a good start. It was the first analysis to show the impact of uncertain knowledge of projects to be financed on credit terms. Their approach, however, had to assume the existence of collateral. Yet, new start-ups do not have access to collateral, own assets to be put as collateral, not even a history or reputation. Banks usually do not finance start-ups with-out collateral. The potential entrepreneurs only have an idea, a talent or abil-ity to work with the idea. The quality of their human capital cannot be veri-fied either. Viewed in this vein, there seems to have existed a social invitation to a new form of finance: VC had to be born! Given also that it is so hard to control corporate management and protect shareholder wealth, one is led to ask whether VC finance can make a difference.
Venture capital finance seeks start-ups that try to develop new tech-nologies with highly risky prospects, which have no proven track record and will probably generate negative cash flow for a long time. Matching start-ups with VCs is to a large extent a random process and may require costly mar-keting effort by VC companies, who all may have rather different business experience. Even more, venture funds have to be established, i.e., securities

304 · Vesa K annia inen
have to be issued to collect money. Indeed, a VC fund is an intermediary who is involved in contracts on two frontiers: with its investors and with its start-ups. On the first frontier it is an agent, on the second it is a principal. In VC finance, there are two cycles to be explained. Money goes and money is re-turned. There is another preceding cycle, money has to be collected and money will be returned.
Development of a new idea is always subject to risks. As Geroski (1995) has documented, market entry is risky. During the first three years, 30 per cent of new projects fail and during the first five years, the failure rate goes up to 50 per cent. In VC backed industries, risks are manifold: only 2 out of 10 projects which are financed by VCs survive. There is another possible explanation for the high failure rate: is there excess entry to entrepreneur-ship? The fact that such a proposition cannot be rejected right away points to a need to understand the fundamentals of financial contracts. Finance tends to be restricted, as the financial institutions are aware of the lemon problem. Though market entry is the only test available, a limited ability to identify project risks ex ante, however, tends to lead to cross-subsidization of project costs (de Meza and Webb 1997). This means that high-quality projects subsi-dize low-quality projects through intermediation.
In what follows we try to understand what’s different about VC fi-nance and how it fits the financial landscape that we know to exist.
9.3. VENTURE CAPITAL
9.3.1. NATURE OF VENTURE CAPITAL FINANCE
In an influential early review of VC finance, Sahlman (1990, p. 473-474) de-scribed VC financing as follows:
“The venture capital industry has evolved operating procedures and contracting
practices that are well adapted to environments characterized by uncertainty
and information asymmetries between principals and agents. By venture capital
I mean professionally managed pool of capital that is invested in equity-linked
securities of private ventures at various stages in their development. Venture
capitalists are actively involved in the management of the ventures they fund,
typically becoming members of the board of directors and retaining important
economic rights in addition to their ownership rights. The prevailing organiza-
tional form in the industry is the limited partnership, with the venture capitalists
acting as general partners and the outside investors as limited partners.”

Venture capita l f inance: What is d i f ferent? · 305
Consistent with this description, VC partnerships enter into contracts with both the outside investors who invest their funds into “the professionally managed pools of capital” and the entrepreneurial ventures that the VCs fi-nance. It has been found that the contracts share the following characteristics: i) staging the commitment of capital and preserving the option to abandon; ii) using compensation systems directly linked to value creation; and iii) pre-serving ways to force management to distribute investment proceeds.
These characteristics of the contracts address three fundamental prob-lems: i) the sorting problem, i.e., how to select the best VC organizations and the best entrepreneurial ventures, ii) the agency problem, i.e., how to mini-mize the present value of agency costs, iii) the operating-cost problem, i.e., how to minimize the present value of operating costs, including taxes.
After a decade with new financial experience, Gompers and Lerner (1999, p. 3-4) emphasize in their description of VC finance three key themes:
“The first is the tremendous incentive and information problems that venture
capitalists must overcome. Venture investors typically concentrate on industries
with a great deal of uncertainty, where information gaps among entrepreneurs
and investors are commonplace. These firms typically have substantial intangi-
ble assets, which are difficult to value and may be impossible to resell if the firm
fails. Similarly, market conditions in many of these industries are highly vari-
able. The nature and magnitude of the information gaps and uncertainty at each
stage of the cycle leave many opportunities for self-interested behavior by the
various parties. At each stage of the cycle, the venture industry has developed
novel checks and balances, ensuring that incentives are properly aligned and in-
creasing the probability of success. The second theme is the interrelatedness of
each aspect of the venture capital process. Venture capital can be viewed as a cy-
cle that starts with the raising of a venture fund; proceeds through the investing
in, monitoring of, and adding value to firms; continues as the venture capitalist
exits successful deals and returns capital to their investors; and renews itself
with the venture capitalist raising additional funds. To understand the venture
capital industry, one must understand the whole “venture cycle…”. A final
theme is how slowly the venture capital industry adjusts to shifts in the supply
of capital and the demand for funding…”
Thus, after a decade, two new features of VC finance are emphasized: The first one is the interrelatedness of each stage of the venture capital process, which points to the importance of understanding the entire “venture capital cycle”. The second one is the existence of frictions in, or limits to, VC finance.

306 · Vesa K annia inen
9.3.2. FEATURES OF VENTURE CAPITAL FINANCE
What are the ventures discussed?
The rise of VC finance was largely linked to the “third industrial revolution” i.e., to the emergence of new industries like information and communications technology, biotechnology, medical and health care industries, and software, to name a few. While these industries may have existed already before, the rise of the VC finance was related to unprecedented rates of business forma-tion and the associated increase in the number of start-ups, equipped with new ideas for future products and services, in these industries.12
Most if not all relevant features of these industries and, more generally, “new economy” (which lost glory in the stock market downturn that began in 2000 but whose products will certainly be permanent) can be summarized as follows: the industries are human capital intensive; the risks are substan-tial; there are often network externalities in demand, especially after a critical mass of consumers has been attracted; there are large fixed costs in research and development but potentially trivial production costs (as many products are digital); a position as an early market leader is an advantage; product life-cycles may be short and the product variability is large; products tend to be experience goods; and, finally; relevant markets are often global.
Sorting out the best projects in industries with these features is not an easy task, not least because a typical venture organization receives many dozens of business plans for each one it funds. A fundamental aspect of VC finance is that serious venture candidates are extensively scrutinized through both formal analyses of technology and market strategy and informal as-sessment of management team. The decision to invest in a venture is fre-quently made conditional on the identification of a syndication partner who agrees that the venture is an attractive investment.
What stages are involved?
The stages involved in creation of new enterprises are pre-seed, seed, start-up, expansion, and restructuring (see, e.g., Christensen 2001). In the pre-seed stage, the business idea is developed, examined and evaluated from a techno-logical and commercial point of view. At this stage, the level of uncertainty is high. In the seed stage, a right combination of risk capital, economic guid-ance and competencies need to be available for the idea to develop so that it begins to be attractive to investors, including VCs. Capital is typically needed to further develop the initial idea, which may for example be a concept or a

Venture capita l f inance: What is d i f ferent? · 307
prototype. Seed finance is, however, hard to obtain. One may have to rely on one’s savings, loans from relatives or friends. In some cases, commercial al-ternatives may be available, like incubators, science parks, business angels and (risk-loving) VCs.
If the right combination of risk capital, economic guidance and compe-tencies is available, the initial idea can lead to a start-up. In the start-up stage, uncertainty is still high and demand for capital increases. Additional financ-ing is required for example for further product development and initial mar-keting. As the transition from the pre-seed to start-up stage may have taken only a short time, the product or service has at this stage not yet been tested commercially. Only after the critical stage of commercialization of product has been passed, the level of uncertainty decreases. Of course, the start-up may turn out to be a success or a failure. If it is successful, the expansion stage may follow, including increasing the scale of production and sales ca-pacity. At this point, break even may be reached. The last stage in the link be-tween an enterprise and a VC is when the VC cashes in its profit, leaving the company in connection with an IPO or a trade sale.
Michelacci and Suarez (2000) have produced a fascinating explanation for why a VC stays in a firm only for a limited period of time. They argue that while the rate of return initially is high (as the VC is able to exploit the economic rents that its expertise generates), it is reduced as the firm matures. An exit from the maturing firm leads to then the next stage in the “VC cycle”, i.e., in a new investment in a new venture.
What is special about VC finance?
In starting up new firms, pioneering entrepreneurs have been a major driv-ing force in the growth of many emerging, knowledge-intensive industries. Innovative projects in such industries can be highly profitable but extremely risky. The risks involved explain why business failure is common among start-ups. Entrepreneurs also face several barriers when starting a new firm. As compared to start-up investment costs, their own resources tend to be lim-ited and they are commercially inexperienced. Their superior technological knowledge and proprietary information makes it difficult for outside financi-ers to evaluate the quality of the project and to monitor its progress. As start-ups have no own track record and often few assets that could be pledged as collateral, finance from traditional sources, such as banks, is often not avail-able to them. It is this void that is filled by VCs.
But why VC finance? What is special about it? The short answer is that VC is a special form of “informed” capital, because VC firms provide new

308 · Vesa K annia inen
and growing firms with also something else than just capital. They provide firms with informed capital, because the VCs also advice the firms on how to grow. Given the often-limited business competence of the founding entrepre-neur, the VC’s advice in building business relations, hiring personnel and marketing the product becomes a valuable if not the key input.13 The mana-gerial expertise and industry knowledge of the financier, i.e. his competence, can be the critical ingredient, as there are probably few industries where ex-perience matters as much as it does in VC investing. Thus, what makes VC different is that it addresses the problem that arises from the scarcity and quality of management skills in the newly established firms.
The competence of VCs rests on their own experience and active busi-ness involvement in the industries the VC financing focuses on. This implies that competence cannot be acquired in a short time, nor is it easily transfer-able to other persons. Further, in a rapidly changing business environment, competence cannot be permanent either and may easily depreciate.
The foregoing discussion does not suggest that VC-backed firms do not fail. Mistakes and risks are an essential part of economic progress and even the most experienced VCs cannot probably fully avoid them. However, it is the limited supply of experienced VCs, rather than the availability of capital per se, that may in the long-term be decisive for the emergence and growth of young innovative firms. Or as Gompers and Lerner (1999, p. 4) put it: “Not only is it difficult to raise a new VC fund without a track record, but the skills needed for successful VC investing are difficult and time-consuming to acquire”. It is this special nature of VC finance why VC may remain a marginal source of funds relative to many other sources of capital, why it tends to focus on a few sectors at a time, and why its availability may be restricted in the long-term.
VC control: more powerful than debt?
The role of debt as a disciplinary device is well-known (as discussed above). It arises, however, less from active monitoring and more from the fact that debt must be serviced before equity. VC contracts can include even more powerful covenants than debt. The covenants are a monitoring device and a means to nurture and have power over start-ups. The existence of such cove-nants suggests that the relationship between a VC and an entrepreneur is special and, in particular, that VCs do not only advise. They also control.
Schertler (2000) provides an illuminating survey of empirical and theo-retical studies on various control mechanisms in VC contracts. He reviews forms of entrepreneurs’ compensation, types of financing, staging of capital
Venture capita l f inance: What is d i f ferent? · 309
infusions, and various other control rights. The main mechanisms of control can be summarized as follows:
• Using cash-flow: “Delay” in paying the entrepreneur her share of profits can be used as a control device. The entrepreneur is often entitled only to some basic salary that she receives as long as the project is not abandoned. He also obtains an equity stake that allows her to participate in realized profits. Consistent with this view, Kaplan and Strömberg (2000) find that unlike in Europe, 94 percent of the US VC-backed enterprises are financed with convertible preferred stocks. Furthermore, VC contracts often con-tain a specification of events (i.e., “milestones”) after which an automatic conversion of the convertible financing instruments occurs. In Gompers (1997) it is documented that most VC contracts specify an automatic con-version at the time of an initial public offering, as it is the best signal of enterprise success. The use of convertible securities, combining elements of both debt and equity contracts, reveals a key feature of VC contracts: they fall in the area of “incomplete contracts”. This is one of the key dif-ferences when one compares traditional debt and equity with VC: Use of convertible securities has the major advantage of making VC finance unat-tractive to low quality entrepreneurs and also provides VCs with the in-centive to perform.
• Using capital infusion: Staging capital infusion is apparently one of the most important mechanisms in strengthening the incentives of an entre-preneur. Financing start-ups in stages enables the VC to obtain significant information about the progress of the firms in their portfolio.14
• Using direct control rights: Direct control rights, such as having VCs on the board of the portfolio firms, augment the other control means. Cornelius (1997) shows for example that out of seventy-seven VC investments, al-most 62 percent use voting restrictions in the seed stage. In the early stages of growth, over 80 percent of the investments use this covenant, while in the later stage of growth only 25 percent relies on it (see also Kaplan and Strömberg 2000). Moreover, VCs withhold in 66 percent of the analyzed arrangements the majority votes in the “pre-revenue” stage compared to 49 percent in the “post-revenue” stage.15
While it is difficult to judge empirically the real effects of VC, the foregoing discussion is not inconsistent with what empirical evidence suggests. It has been found, for example, that VC–backed enterprises outperform non-VC-backed ones even after the initial public offering (Brav and Gompers 1997, and Gompers and Lerner 1999, ch. 14). In addition, there is evidence that the

310 · Vesa K annia inen
total cost of going public is lower for VC–backed enterprises, since the degree of under-pricing and the compensation of underwriters are lower (Meggin-son and Weiss (1991)). On the top of this, VC-backed enterprises seem to ac-count for a disproportionate share of patented innovations (Kortum and Lerner 2000).
9.3.3. THEORETICAL RESULTS ON VC-FINANCE16
The theoretical literature on VC finance is young but expanding. In what fol-lows, we provide a selective survey of some of the new models and results of this literature:
• Entrepreneur’s performance evaluation and contingent replacement: It has been found that entrepreneurs may not work as hard as would be socially op-timal, i.e., that the so-called first-best effort choices cannot be achieved. Chan et al. (1990) consider VC financing and problems related to unob-servable entrepreneurial skill and firing or retaining of an entrepreneur. Their major result is that the optimal severance pay for an entrepreneur is, surprisingly, a fixed payment. In a related context, Hellman (1998) finds that when an entrepreneur is fired, her expected severance pay is strictly lower than when she stays. These models thus emphasize the idea of con-tract incompleteness and renegotiation in VC finance.
• Stage financing and convertible financing instruments: In Repullo and Suarez (1999), a double moral hazard characterizes VC financing and results in effort choices that are not first-best. It is found that the initial contracts are very much like warrants. In Bergeman and Hege (1997), moral hazard by entrepreneurs hampers VC financing in a multi-period model. They argue that a contract which involves funding a project up to some time actually does better than a stage financing contract. In Cornelli and Yosha (1997), an entrepreneur can manipulate the signal that financiers (VCs) observe about the success of the project. This results in a convertible debt-component in the financing contract that helps the VCs to address win-dow-dressing by the entrepreneur.
• Moral hazard with endogenous information: Dessi (1999) explains three fea-tures of VC finance: i) control rights over the decision to liquidate, ii) the use of convertible financing, and iii) large post-IPO VC equity holdings. In this model, information is revealed at an interim stage and a decision is made whether to liquidate or to continue the project after the information

Venture capita l f inance: What is d i f ferent? · 311
is revealed. It turns out that the use of the conversion right by the VC is consistent with him signaling information to outside investors.
• Learning the VC ability: Gompers and Lerner (1999) introduce a learning model where there is initially uncertainty about the (advisory) ability of a VC. Uncertainty concerns either the VC’s skill in selecting portfolio com-panies (either through screening or through proactively identifying trans-actions) or his ability to advise the portfolio firms to grow. In this model, the VC is assumed to raise two consecutive funds. The fund’s return is a function of the VC’s ability, his effort and random factors (“noise”). The VC’s compensation (profit share) is a linear function of the fund’s returns. Investors are risk neutral as they typically are pension funds and insur-ance companies, while the VC is risk averse. Contracts are designed be-fore the effort by VC is chosen. The second contract is conditional on learning the outcome of the first contract. The first outcome affects inves-tor’s beliefs of the ability the VC. The model shows that in this environ-ment, the optimal profit share of the VC and his fixed compensation cor-respond to what are observed empirically.17
• Venture capitalists signaling their ability: A VC knows his ability in selecting start-ups to be financed but the outsiders investing in VC funds do not. Gompers and Lerner (1999) argue that the high-quality VCs can try to signal their ability (“quality”) to attract funding at favorable terms. In this framework, information about the ability is totally revealed in the first pe-riod and has an impact on the fixed compensation obtained by the VC in the second period. It turns out that a signaling equilibrium obtains in which the high-ability type offers a contract that makes the low-ability types unwilling to mimic the high-type’s offer.
• Double moral hazard: Venture capital advice and consulting can be viewed as a costly unobservable input. Project success depends therefore both on the effort of the entrepreneur and the financier. What this means is that a double moral hazard problem characterizes VC finance. Repullo and Suarez (1999) were among the first to formalize the problem and to study its implications. Schmidt (1999) has argued that the double moral hazard can be avoided using convertible instruments. Hellman (2002) shows that when the new venture and the core business are complements, a corpo-rate VC would provide more support than an independent VC. Which one of the two moral hazard problems matters more is perhaps one of the most important open questions in this area of research. Traditionally, it has been assumed that it is the entrepreneurial moral hazard that matters in the relationship between entrepreneurs and their financiers.

312 · Vesa K annia inen
• Syndication: Syndication represents an institutional development that helps to manage risks and pool information. From the economic point of view, it can be regarded as equivalent to information and risk sharing. Such additional mechanisms tend to enhance the efficiency of VC finance (see, e.g., Schertler 2000).
As the above selective survey shows, the theoretical literature on VC finance is young and also quite fragmented. While we do not have a complete model of VC finance to fully understand what VC finance is and how it works, we have a pretty good idea why VC finance has emerged and what efficiency gains are involved. However, we know relatively little about what the limits to VC financing are and how its emergence affects the functioning of the other markets that provide capital to firms. What is known on the basis of the few existing theoretical analyses is the following:
Optimal start-up portfolio and limits to VC industry
The quality of advice is what makes VC finance different. Kanniainen and Keuschnigg (2000) explore the implications for the quality of advice when VC is involved in financing several start-up firms simultaneously and has thus a pool of companies to advise.18 When entrepreneurs with promising ideas are abundant but the supply of experienced VCs is limited, rents will usually be abnormally high. In such an environment, VCs will be tempted to include an unoptimal number of start-ups in their portfolios. Managerial advice then tends to be stretched too thin over numerous firms, reducing the quality of advice and thus VC's value added to each single portfolio company. This might raise the risk of business failure.
High rents over a prolonged time will eventually attract additional VCs to enter and ease the shortage in managerial advice. Kanniainen and Keuschnigg (2000) argue that VCs will then advise each portfolio firm more intensively and thereby keep the risk of business failure small. Since special-ized managerial competence is acquired only through active business experi-ence, the emergence and entry of experienced VCs is presumably a slow process. The supply of VC finance is therefore rather inelastic in the short run. It is this inelasticity that limits the expansion of VC industry. In a sense, the limits to the VC industry arise from elimination of excess rents in equilib-rium. The results that Kanniainen and Keuschnigg (2000) obtain also illus-trate how demand and supply side shocks might change the way the indus-try works.

Venture capita l f inance: What is d i f ferent? · 313
How do financial markets help in allocating various talents into right indus-tries?
People equipped with different talents tend to produce different project ideas. Various institutions with different risk-sharing capabilities have devel-oped to evaluate and finance these projects. Kanniainen and Leppämäki (2002) raise two questions: First, how do different talents get allocated to match various projects (industries) in an economy under different financial institutions? Second, what determines the scope of these institutions, the in-stitutional equilibrium, to match with these projects?19
Matching between tasks and talents is challenging. For an individual, an occupational choice means a long-term commitment, requires costly in-vestments and is typically accomplished under imperfect information. It is essential for allocational efficiency that people get allocated to the right in-dustries. In Kanniainen and Leppämäki (2002), there are two types of finan-cial institutions, those that provide “uninformed” finance and those that pro-vide “informed” finance. Allocation of finance is based on self-selection, where financial terms are determined by uninformed financiers' average judgment of projects and informed financiers' information advantage. The uninformed finance is provided by institutions called “banks” while the in-formed financier are called “venture capitalists”.
When only uninformed finance is available, uninformed financiers un-der-price new start-ups (in the spirit of the lemon problem identified earlier by Akerlof 1970, and Myers and Majluf 1984). It moreover turns out that un-informed finance gives rise to excessive entry both in human capital intensive and in conventional industries when the financial institutions cannot identify the entrepreneurial talent. This result thus arises when information about the talent is asymmetric, the financial terms are tailored, for the average agent starting a project within an industry, and there is cross-subsidization built into the financial contract. Losses inflicted on uninformed financiers are “fi-nanced” by the high-talented entrepreneurs.
There are two arguments for the superiority of VCs as start-up financi-ers. The first is their capability for providing advice to the entrepreneurs in various forms. The second argument relates to their superior ability to screen potential applicants ex ante and through stage financin (see for instance Amit et al. 1998). Focusing exclusively on the latter mechanism,20 Kanniainen and Leppämäki show that introduction of informed capital with superior screen-ing ability results in an institutional equilibrium with efficiency gains in hu-man capital industries. The more advanced financiers are able to exploit their

314 · Vesa K annia inen
expertise in screening the potential agents entering the riskier and more hu-man capital intensive industry. In contrast to common thinking, the institu-tional equilibrium with informed capital is, however and for this reason, characterized by a more limited entry to the industry that requires high-talented human capital. The institutional equilibrium is shaped by risk pref-erences of investors, costs of establishing uninformed and informed capital, and the initial distribution of talent in the economy.
The total welfare effect of having informed capital is ambiguous. The reason is that by screening out projects that do not qualify for the human capital intensive industries, VC industry pushes some of those projects into other sectors that are then financed by other intermediaries like banks. As these project holders tend to raise the average quality of more conventional projects, there is more room for cross-subsidization within the industries fi-nanced by banks. This, in turn, calls for the excessive entry of lower talents into the entrepreneurship in conventional industries. Allocation of non-informed capital becomes hence less efficient in the conventional industry. Consequently, the total welfare effect remains ambiguous. Thus, though ex-pansion of VC financing has favorable welfare implications in improving the quality of entry to the human capital-intensive industries, it may have an ad-verse impact on the quality of banking.
9.4. CONCLUSIONS
Consistent with the analysis of this Chapter, the recent review by Hall (2002) arrives at two important conclusions:
1. There is fairly clear evidence, based on theory, surveys, and empirical es-timation, that small and start-up firms in R&D-intensive industries face a higher cost of capital than their larger competitors and firms in other in-dustries. In addition to compelling theoretical arguments and empirical evidence, the mere existence of the VC industry and the fact that it is concentrated precisely on where these start-ups are most active means that this is so. In spite of considerable entry into the VC industry, returns remain high, which does suggest a high required rate of return in equilib-rium.
2. The VC solution to the problem of financing innovation has its limits. First, it does tend to focus only on a few sectors at a time, and to make in-vestments of a minimum size that are too large for start-ups in some fields. Second, good performance of the VC sector requires a thick market

Venture capita l f inance: What is d i f ferent? · 315
in small and new firm stocks in order to provide an exit strategy for early stage investors.
Technological advance and financial innovations, such as the mergence of venture capital, raise challenging issues for public policy. Current tax poli-cies are a prime example in this regard, as they are mostly based on inherited tax rules which were designed to tax profits and returns to capital in the “old” economy. Based on such inherited rules, governments might be tempted to interpret the success of some VC firms and VC-backed firms as a social invitation to tax the rents that they seem to generate. An IPO of a suc-cessful start-up firm may for example result in substantial capital gains both to the financier and to the innovator. However, there are reasons to believe that taxing them may be harmful. First, because most of the returns arising from innovations and new technologies represent returns to human capital, taxing the returns may reduce investments in human capital. Second, the in-troduction of a capital gains tax may reduce the incentive of VCs to provide advice (see for a more detailed analysis, Keuschnigg and Nielssen 2001a,b,c).21
Despite some negative theoretical results, we have good reasons to be-lieve that the rise of the VC industry is welfare-increasing. Some countries have been faster than others in introducing measures that are designed spe-cifically to support the availability of risk capital and particularly the growth of the VC sector (cf. Venture Capital Incentives in Europe, 1997). Tradition-ally, these policies have mainly consisted of facilitating entrepreneurs’ and firms’ access to risk capital. Indeed, the VC industry has expanded vigor-ously. It is, however, doubtful whether VC deserves its name in terms of the value added, i.e., the quality of managerial advice that it actually offers. What is needed is informed capital that carefully addresses the commercial inexpe-rience of start-up entrepreneurs and avoids excessive rates of business fail-ure. Informed capital is much scarcer and more difficult to expand than risk capital in the traditional sense. Especially in Europe, the availability of high quality VC is probably still a considerable bottleneck in the emerging and successful expansion of innovative industries. Because of this fact, challenges to public policies continue to exist also in areas other than taxation.

316 · Vesa K annia inen
REFERENCES
Admati, A.R. and Pfleiderer, P., 1994, Robust financial contracting and the role of venture capitalists, Journal of Finance, 49, 371-402.
Aghion, P. and Bolton, P., 1992, An incomplete contracts approach to financial contracting, Review of Economic Studies, 59, 473-494.
Akerlof, G., 1970, The market for ‘lemons’: Quality uncertainty and the market mechanism, Quarterly Journal of Economics, 84, 3, 488-500.
Alchian, A.A. and Demsetz, H., 1972, Production, information costs, and economic organization, American Economic Review, 62, 5, 777-795.
Amit, R., Brander, J. and Zott, C., 1998, Why do venture capital firms exist? Theory and Canadian evidence, Journal of Business Venturing, 13, 441-466.
Anand, B. N. and Galetovic, A., 2000, Weak property rights and holdup in R&D, Journal of Economics and Management Strategy, 9, 4, 615-642.
Arrow, K. J., 1962, Economic welfare and the allocation of resources for invention, In Richard Nelson, ed., The rate and direction of inventive activity, Princeton, N.J.: Princeton University Press.
Bergemann, D. and Hege, U., 1998, Venture capital financing, moral hazard, and learning, Journal of Banking and Finance, 22, 703-735.
Berger, A.N. and Udell, G. F., 1998, The economics of small business finance: The roles of private equity and debt markets in the financial growth cycle, Journal of Banking and Finance, 22, 613-673.
Berglöf, E., 1994, A control theory of venture capital, Journal of Law, Economics and Organization, 10, 247-267.
Bester, H., 1985, Screening vs. rationing in credit markets with imperfect information, American Economic Review, 75:4, 850-855.
Bhattacharya, S., 1999, Startup financing and venture capital: An overview, Presented at the University of Helsinki Conference on Entrepreneurship, October 1999.
Black, F. and Scholes, M., 1973, The pricing of options and corporate liabilities, Journal of Political Economy, 81:3, 637-654.
Brav, A. and Gompers, P. A., 1997, Myth or reality? The long-run underperformance of initial public offerings: Evidence from venture and nonventure capital-backed companies, Journal of Finance, 52, 1791-1821.
Chan, Y.-S., Siegel, D. and Thakor, A., 1990, Learning, corporate control, and performance requirements in venture capital contracts, International Economic Review, 31, 365-381.
Christensen, J.L., 2001, Effects of venture capital on innovation and growth, Report for Ministry of Trade and Industry, Copenhagen.
Coase, R., 1937, The nature of the firm, Economica, 4, 386-405.

Venture capita l f inance: What is d i f ferent? · 317
Cornelius, B., Covenants in venture capital, Middle East Business and Economic Review, 9:1, 38-51.
Cornelli, F. and Yosha, O., 1997, Stage financing and the role of convertible debt, CEPR Discussion Paper 1735.
Cumming, D.J., 2001, The determinants of venture capital portfolio size: Empirical evidence, School of Business, University of Alberta, February 2001.
De Meza, D. and Webb, D.C., 1997, Too much investment: A problem of asymmetric information, Quarterly Journal of Economics, 102:2, 281-292.
Dessi, R., Financing entrepreneurs: Optimal contracts and the role of intermediation, Financial Markets Group d 328, 1999.
Dewatripont, M. and Tirole, J., 1994, A theory of debt and equity: Diversity of securities and manager-shareholder congruence, Quarterly Journal of Economics, 109:4, 1027-1054.
Geroski, P. A., 1995, What do we know about entry, International Journal of Industrial Organization, 13, 421-440.
Gompers, P. A., 1997, Ownership and control in entrepreneurial firms: An examination of convertible securities in venture capital investments, wp, Harvard University, Cambrigde: MIT.
Gompers, P. A., 1995, Optimal investment, monitoring, and the staging of venture capital, Journal of Finance, 50:5, 1461-1489.
Gompers, P. and Lerner, J., 1999, The venture capital cycle, Cambridge, Mass.: MIT Press.
Gorman, M. and Sahlman, W. A., 1989, What do venture capitalists do?, Journal of Business Venturing, 4, 231-248.
Grant, S., King, S. P. and Polar, B., 1996, Information externalities, share-price based incentives and managerial behaviour, Journal of Economic Surveys, 10, 1-21.
Hall. B.H., 2002, The financing of research and development, Oxford Review of Economic Policy, 18, 35-51.
Harris, M. and Raviv, A., 1991, The theory of capital structure, Journal of Finance, 46:1, 297-355.
Hart, O., 2001, Financial contracting, Journal of Economic Literature, XXXIX, 1079-1100.
Hellman, T., 1998, The allocation of control rights in venture capital contracts, Rand Journal of Economics, 29, 57-76.
Hellman, T., 2002, A theory of corporate venture investing, Journal of Financial Economics, 64, 285-314.
Holmstrom, B.R. and Tirole J., The theory of the firm, handbook of industrial organization, 1, eds. R.Schmalensee and R.Willig, Noth-Holland, 1989.
Jensen, M.C. and Meckling, W., 1976, Theory of the firm: Managerial behavior, agency costs and capital structure, Journal of Financial Economics, 3, 305-360.
Jensen, M.C., 1986, Agency costs of free cash flow, corporate finance, and takeovers , American Economic Review, 76:2, 323-329.
Kanniainen, V., 2000, Empire building by corporate managers, Journal of Economic Dynamics and Control, 24:1, 127-142.
Kanniainen, V. and Keuschnigg, C., 2000, The optimal portfolio of start-up firms in venture capital finance, CESifo working paper No.381, Journal of Corporate Finance, forthcoming.

318 · Vesa K annia inen
Kanniainen, V. and Keuschnigg, C., 2001, Start-up investment with scarce venture capital support, CESifo working paper No.439.
Kanniainen, V. and Leppämäki, M., 2002, Financial institutions and the allocation of talent, Bank of Finland, Discussion Papers 5/2002.
Kaplan, S. N. and Strömberg, P., 2000, Financial contracting theory meets the real world: An empirical analysis of venture capital contracts, NBER working paper series 7660.
Keuschnigg, C. and Nielsen, S.B., 2001a, Start-ups, venture capitalists, and the capital gains tax, mimeo 2001.
Keuschnigg, C. and Nielsen, S.B., 2001b, Public policy for venture capital, International Tax and Public Finance, 8, 557-72.
Keuschnigg, C. and Nielsen, S.B., 2001c, Tax policy, venture capital, and entrepreneurship, Journal of Public Economics, forthcoming.
Kortum, S. and Lerner, J., 2000, Assessing the contribution of venture capital to innovation, Rand Journal of Economics, 31, 674-692.
Megginson, W. L. and Weiss, K.A., 1991, Venture capitalist certification in initial public offerings, Journal of Finance, 46:3, 879-903.
Michelacci, C. and Suarez, J., 2000, Business creation and the stock market, CEMFI and CEPR, mimeo.
Miller, M. H. and Modigliani, F., 1958, The cost of capital, corporation finance and the theory of investment, American Economic Review, 48, 261-297.
Miller, M. H. and Modigliani, F., 1961, Dividend policy, growth and the valuation of shares, Journal of Business, 34, 411-433.
Myers, S., 1977, Determinants of corporate borrowing, Journal of Financial Economics, 5, 147-175.
Myers, S. and Nicholas, M., 1984, Corporate financing and investment decisions when firms have information that investors do not have, Journal of Financial Economics, 13, 187-221.
Norton, E. and Tenenbaum, B. H., 1993, Specialization versus diversification as a venture capital investment strategy, Journal of Business Venturing, 8, 431-442.
Poitevin , M., 1989, Moral hazard and the financing of entrepreneurial firms, Centre de recherche, Universite de Montreal, discussion paper.
Reid, G. C., Smith, J. A. and Terry, N. G, 1997, Risk management in venture capital investor-investee relations, European Journal of Finance, 3, 27-47.
Repullo, R. and Suarez, J., 1999, Venture capital finance: A security design approach, CEPR DP No. 2097.
Ridley, M., 1996, Origin of virtue, Sane Töregård Agency.
Sahlman W. A., 1990, The structure and governance of venture-capital organizations, Journal of Financial Economics, 27, 473-521.
Schertler, A., 2000, Venture capital contracts: A survey of the recent literature, Kiel Institute of World Economics, working paper Nr. 1917.
Schmidt, K. M., 1999, Convertible securities and venture capital finance, CESifo WP No. 217.
Stiglitz, J. and Weiss, A., 1981, Credit rationing in credit markets with imperfect information, American Economic Review, 71, 393-410.

Venture capita l f inance: What is d i f ferent? · 319
Stulz, R., 1990, Managerial discretion and optimal financing policies, Journal of Financial Economics, 26, 3-27.
Trester, J.J., 1998, Venture capital contracting under asymmetric information, Journal of Banking and Finance, 22, 675-699.
Ueda, M, 2000, Banks versus venture capital, Universitat Pombeu Fabra, mimeo.
Venture capital incentives in Europe, Special paper, European Venture Capital Association, ed. by S. J. Berwin & Co, 1997.
Virtanen M., 2001, The new alliance capitalism and competition policy, in Kanniainen, V. and Määttä K.: The economic approach to competition policies, Helsinki: Kauppakaari.
Zingales, L., 2000, In search for new foundations, Journal of Finance, 4, 1623-53.

320 · Vesa K annia inen
ENDNOTES
1 Even the existing rich variety of financial instruments does not provide what economists might call “com-plete securities markets”. In other words, tomorrow’s state of the world is open to a very large number of eventualities and even the most sophisticated financial system can only imperfectly deal with the risks that the eventualities may give a rise. 2 Of course, the transactions are backed by the legal system. It also is the case that when the anticipated cost of legal backing is high, transactions simply do not take place! 3 The Bible tells of the agreement between Jacob and Laban, the father of Rakel and Lea. It is most appro-priate to be interpreted as the first documented forward contract concerning the future “delivery” of Laban’s daughter Rakel in exchange for Jacob’s labor input. There is more to this. For Jacob, it actually was a risky contract as it was Lea who was delivered to him! 4 It is not, however, easy to judge empirically the role and contribution of VC industries (Hall (2002)). 5 For allocation of control rights, see Berglöf (1994) and Hart (2001). 6 Complex contracts have been developed to compensate both the VCs and the company managers. A key feature is that neither the VC or the manager sell their knowledge using a standard labor contract. 7 Extensive and recommended summaries of corporate finance include those by Holmstrom and Tirole (1989), Harris and Raviv (1991), and Zingales (2000). These articles explore various views of a firm, its func-tions and boundaries, indicating how much we have learned over the past decades on these complex is-sues. 8 Virtanen (2001) provides an informative illustration of the contractual structure of the Nokia corporation (unfortunately in Finnish). 9 The principle of limited liability is the key to understanding why it has been possible to create large com-panies collecting financial capital from a number of small investments and why the stock markets allow for an efficient platform for diversifying risks. In the absence of limited liability, diversification would result in risk maximization from the perspective of an individual investor. 10 We note, however, that the recent work on control rights abstains from informational asymmetries, cf. Hart (2001). 11 One way for a manager to pursue her own interests it thus to try to convert corporate wealth into private use, consuming perks inside a corporation. The bigger the company the more there is room for private benefits within a corporation. Jensen (1986) propagated a view that corporation managers tend to build empires, this author (2000) formalized Jensen’s idea. 12 National governments jealously fighting for jobs, companies and employment in the globalized world economy have been actively involved in subsidizing and supporting the creation of these industries. 13 The areas where the contribution of the financiers can be valuable include technological know-how, in-dustry specific knowledge, networks, access to alternative funding, recruitment, strategic alliances, organ-izational restructuring, and internationalization (see, for example, Christensen 2001). 14 There are a number of theoretical papers explaining the staging phenomenon; see for example Berge-mann and Hege (1998) and Cornelli and Yosha (1997). 15 Several studies have addressed the issue of control rights. Chan et al. (1990) relate the rights to the un-known ability and unobservable actions of entrepreneurs. In Hellman (1998a), the entrepreneur not only re-ceives a monetary pay-off but also private benefits resulting from control. The same holds in Kirilenko (2001) who shows that the entrepreneur is compensated for a loss of control through better terms of financing, ability to extract higher rents from asymmetric information, and improved risk sharing. 16 For a more comprehensive survey (to which ours owes some intellectual debt), see Bhattacharya (1999).

Venture capita l f inance: What is d i f ferent? · 321
17 Gompers and Lerner (1999) present evidence on how the US venture capital limited partnership agree-ments define compensation over the fund’s life to be paid to the VCs. They show that these agreements designate a percentage of the fund’s capital or assets as an annual management fee and a percent of the profits to be paid out as investment returns are realized. Compensation is based on actual returns from the venture fund’s investments. Their data on 419 ventures suggests that the share of profit received by VCs var-ies but that in 81 percent of the funds, it is between 20 and 21 percent. 18 See Gorman and Sahlman (1989), Sahlman (1990), Norton and Tenenbaum (1993) and Reid et al. (1997) for empirical evidence on the size of the pools of companies that VCs finance. 19 Kanniainen and Leppämäki (2002) build on the work by de Meza and Webb (1997). Kanniainen and Lep-pämäki consider a multiple industry framework where talent has industry-specific productivity and where the allocation is of concern at two margins, i.e. between labor markets and the entrepreneurial class and at the allocation of entrepreneurs between various industries. 20 See also Ueda (2000) who compares VCs and banks as start-up financiers. 21 Overall, very little is known of the ex ante effects of taxation on the formation of VC market, structures of financial contracts, and VCs’ incentives to provide advisory capital to start-ups.


PART III: PUBLIC POLICY
PERSPECTIVE


Financia l systems and f i rm per formance: Theoret ical and empir ica l perspect ives · 325
10. GOVERNMENT FUNDING OF SMALL AND MEDIUM-SIZED ENTERPRISES IN FINLAND
Ari Hyytinen and Lotta Väänänen*
Abstract: Not unlike elsewhere, the government in Finland has been keen to provide funding to Finnish firms, especially to small and medium-sized enterprises (SMEs). In this Chapter we review, in the light of the economic rationales for public efforts to finance SMEs, all of the government institutions providing SME funding in Finland and the objectives and tasks assigned to them. Using recently collected data on SMEs, we then explore what kinds of SMEs apply for and receive government funding in Finland. We find i) that the “rhetoric” on what the institutions are set to do is not fully in line with what the economic rationales suggest; ii) that the total amount of government funding awarded to SMEs has over the past four years grown quite rap-idly and simultaneously with increases in the availability of external finance on the marketplace; and iii) that every third SME has applied for and received at least one type of government funding. Our econometric results suggest that overall, the char-acteristics of SMEs applying for and receiving different types of government funding are consistent with the official rhetoric and the general idea of what the different in-stitutions are set to do. Our results highlight the importance of emphasizing selectiv-ity in the provision of government funding to SMEs, as we also find some evidence that the fundamental screening problem of finding out SMEs truly in need for gov-ernment funding is not addressed adequately in practice.
* Ari Hyytinen and Lotta Väänänen are both at the Research Institute of the Finnish Economy (ETLA) and Et-latieto Ltd. This Chapter is based on Etla Discussion Papers, nr. 832 (dated 6/11/2002). The authors would like to thank Pertti Valtonen and Sirpa Hautala as well as Pasi Holm for helping us to receive some of the data presented in this Chapter. The authors have also benefited from the material sent by Harri Laajarinne from Tekes and from the comments provided by Markus Koskenlinna, Eva Liljeblom, Markku Maula, Anu Nokso-Koivisto, Vesa Puttonen, Petri Rouvinen, Otto Toivanen and Pekka Ylä-Anttila as well as by seminar partici-pants at the Ministry of Trade and Industry and Bank of Finland. The views expressed in the Chapter are those of the authors. The usual caveat applies.

326 · Ar i Hyyt inen and Lotta Väänänen
10.1. INTRODUCTION
Not unlike elsewhere, the government in Finland has recently been keen to provide funding to Finnish firms, especially to small and medium-sized en-terprises (SMEs).1 In this Chapter, we focus on the following set of questions: Which government institutions provide funding to SMEs in Finland? What are they set to do? What is the relative importance of the different govern-ment institutions providing SME funding? How has the total amount of government funding awarded to SMEs developed in the recent past? What kinds of SMEs apply for and receive government funding? Are there systematic differences between SMEs that apply for and receive the different types of government funding?
A natural starting point for considering these questions is the National Industrial Strategy for Finland that was published in 1993 by the Ministry of Trade and Industry (MTI) amidst the economic and banking crisis that Finland experienced in the early 1990s.2 The report concluded (p. 138) that
“Financing is one of the most difficult problems of small and medium-sized en-
terprises”
and emphasized (p. 143) that
“The shoring up of the banking system and development of capital markets
would promote industrial growth”.
Figure 10.1 displays survey data on the percentage of Finnish SMEs reporting that the availability of capital is the most significant obstacle to de-veloping the firm. The data suggest that the concerns put forward in the MTI report were not unfounded, as the availability of capital was the greatest con-cern to many SMEs in 1992. What the figure also shows is that things have changed dramatically since then. Today, only about 6 percent of SMEs regard the availability of capital as the most significant obstacle to developing the firm.

Government funding of smal l and medium-sized enterpr ises in Finland · 327
Figure 10.1. Finance as the most significant obstacle to SME development
II/85
I/86
II/86
I/87
II/87
I/88
II/88
I/89
II/89
I/90
II/90 I/91
II/91
I/92
II/92
I/93
II/93
I/94
II/94 I/95
II/95
I/96
II/96
I/97
II/97
I/98
II/98
I/99
II/99
I/00
II/00 I/01
II/01
I/02
II/02
0%
5%
10%
15%
20%
25%
30%
35%
Finance as the most significant obstacle (% of SMEs)
Note: The data are from the survey “Pk-yrityksen rahoituskysely 2002”, administrated by the Federation of Finnish Enterprises and Finnvera Ltd.
A similar portrait of the current situation of the Finnish capital markets as that conveyed by Figure 10.1 emerges from the survey data reported in the IMD World Competitiveness Yearbook 2002: among the 49 countries researched, Finland ranks first in the question of how easily credit flows from banks to businesses; second in the question of how easily venture capital is available for business development; and finally, fourth in the question of how ade-quately the stock market provides financing to companies.3 Seed Capital in the Nordic Countries: Best Practice, a report of the Nordic Industrial Fund, argues that Finland has the best functioning seed capital market in the Nordic re-gion. Finally, the Global Entrepreneurship Monitor report from 2001 mostly ech-oes these results: among the 29 countries researched, Finland ranks fourth in the analysis of how easily entrepreneurs can access debt and equity.
Faced with this evidence, it is difficult to disagree with the view that the availability of external finance to Finnish firms has on the whole im-proved. Provided that the investment opportunities of Finnish firms have not dramatically decreased, there are three mutually non-exclusive explanations for the drastic reduction in the perceptions of how tight the market for capital is for a representative firm: either good profitability of firms has reduced the overall demand for external finance4, the functioning of the private capital

328 · Ar i Hyyt inen and Lotta Väänänen
market has improved significantly or government funding has successfully complemented the private market.
In this Chapter, we focus on the last of these explanations by studying the government funding of SMEs in Finland. How government funding gets allocated across SMEs is a question that has earlier been addressed only to a limited extent, if at all.5 The question is however topical and of first rate im-portance, not least because recent evidence suggests that certain types of SMEs may still face problems in raising external finance (despite that the overall availability of external finance to firms has improved). The most re-cent survey (from 2002) by the Federation of Finnish Enterprises and Finn-vera Ltd for example indicates that the availability of external financing is a problem for as many as every second growth-oriented SME. Further, the Global Entrepreneurship Monitor report from 2001 shows that among the 29 countries researched, Finland ranks (interestingly) only sixteenth in the analysis of how smoothly the markets for venture capital, angel finance and initial public of-ferings operate.
We concentrate on the main institutions that currently provide gov-ernment funding to Finnish SMEs. They are the state-owned specialized fi-nancing company Finnvera, the Finnish National Fund for Research and De-velopment (Sitra), the National Technology Agency (Tekes) and the govern-ment venture capital firm Finnish Industry Investment (FII). Financing to SMEs also flows from the budgets of various ministries through regional Employment and Economic Development Centers (TE-Centers) and from various regional governmental and semi-governmental venture capital firms. On the whole, these institutions provide SMEs with financing via a variety of tools, including gratuitous (i.e. non-repayable) funding, such as direct subsi-dies, grants, aid, and guarantees, and non-gratuitous funding (i.e. funding that is repayable or provided in exchange for, e.g., an ownership stake in the firm) such as loans, capital loans, and direct equity investments.6
The rest of the study is organized as follows. In Section 10.2 we review the main economic rationales for providing government funding to SMEs. In Section 10.3 we describe the sources of government funding to SMEs in Finland. Section 10.4 presents an empirical analysis of the characteristics of SMEs applying for and receiving government funding. Section 10.5 con-cludes.
Government funding of smal l and medium-sized enterpr ises in Finland · 329
10.2. THEORETICAL CONSIDERATIONS
Economic analysis suggests two main rationales for governments to subsi-dize or to directly provide funding to SMEs, especially to technology inten-sive SMEs (see e.g. Lerner 1999). First, public finance theory posits that if SMEs are a unique source of new ideas and growth that generate beneficial externalities to other industries and firms, supporting them is appropriate. For example, because the social return from SMEs’ R&D expenditures may exceed the private returns due to ‘knowledge’ spillovers (Arrow 1962, Griliches 1992), firms will tend to underinvest in R&D from the social point of view. Certain kinds of spillovers can also emerge within a firm if an R&D subsidy to a particular project turns other current and future R&D projects into profitable investments (Lach 2002).7 Second, capital market imperfec-tions, such as asymmetric information between firms and financiers, may re-sult in persistent “funding caps” that constrain the birth of new enterprises, investments in innovative activity and the growth of SMEs (see also Cressy 2002). If that is the case and if government organizations are able to success-fully identify firms that have unduly been excluded from receiving external finance in the marketplace, government funding might boost firm creation, innovation and growth, because it then rectifies capital market failures.8
Doubt has been cast even on these two rationales. Holtz-Eakin (2000) argues that evidence does not support the view that SMEs provide a dispro-portionate share of new ideas in the economy or that SMEs are producing too little innovative activity because they cannot capture the social return from it. Moreover, he emphasizes that even though a growing body of literature sug-gests that imperfections in capital markets, such as asymmetric information, may impede entrepreneurship and innovation, the literature does not show that “too few businesses are created each year, or that the ‘wrong’ firms get financed” (p. 286). De Meza (2002) moreover argues that subsidizing credit may under asymmetric information decrease efficiency, because the effect will be to draw in more low-quality types, resulting in too much unsound en-terprise. And even if capital market imperfections were an important obstacle to entrepreneurship and innovative activity, the problem would still be, as emphasized by Holtz-Eakin, that “the government faces exactly the same difficulty [as the financial sector] and unless it somehow has an ability greater than the financial sector to discern the probability of business success, there is little that it can do to more efficiently allocate credit [capital].” (p. 287).9 The two main rationales for governments to provide SME funding and the doubt cast by Holtz-Eakin suggest that government funding should, if it

330 · Ar i Hyyt inen and Lotta Väänänen
is to be provided at all, be allocated across SMEs selectively. First, not all firms (should) choose to apply for it. Second, if government organizations aim at financing i) firms that generate beneficial externalities to society and other industries and ii) firms that suffer from capital market imperfections, firms that chose to apply need to be screened by the institutions providing gov-ernment funding to find out those truly “eligible for it”.
Taken together, these considerations call to mind two things:
• First, market failures, i.e., the inability of SMEs to appropriate the benefi-cial externalities that their activities might generate and the imperfections in the market for SME finance, are not a sufficient argument for a gov-ernment to provide SME funding.10 To rectify the market failures, it is re-quired that they can be identified and, particularly, that the institutions providing government funding can solve the fundamental screening problem of being able to determine those truly eligible for government funding.11 Otherwise, there is a non-negligible risk of government failure, i.e., that private activity is crowded out and that public funds are used in-efficiently. Solving the fundamental screening problem is costly but amounts to nothing less than avoiding undesirable and counter-productive transferring of income (capital) between different sectors of the economy and raising capital via (distorting) taxation in vain.12
• Second, because the institutions providing government funding should according to the economic rationales be set to rectify market failures, they should (almost by definition) pursue the kinds of activities that are not privately profitable. What this means is that these activities cannot in eco-nomic terms be profitable in the long-term. In fact, if they were, it would constitute evidence that the institutions are not solving the fundamental screening problem and taking sufficient risks, and that they practice busi-ness activity that competes with the private sector.
In what follows, we take a look at the government financing of Finnish SMEs and contrast it with the two main economic rationales for governments to provide funding to SMEs. We first examine whether and how the ration-ales and the fundamental screening problem are taken into account in the rhetoric of the Finnish legislation governing the government institutions that support the Finnish corporate sector. Thereafter, we analyze recently col-lected data to explore the characteristics of SMEs partly financed by Finnish taxpayers’ money.

Government funding of smal l and medium-sized enterpr ises in Finland · 331
10.3. INSTITUTIONAL DESCRIPTION
The Finnish legislation contains two Acts on the use of government funds in granting government aid and business subsidies in general.13 These provide information on the general aims and conditions of government support. The Act on government aid 688/2001 applies to the use of government funds in government aid. It refers to the granting of subsidies, loans and other financ-ing, interest subsidies, guarantees, and other similar benefits. Section 7 of the Act describes the general conditions on the granting of government aid:
“1) the purpose for which the aid is granted is socially acceptable; 2) the granting
of government aid is justifiable based on the aims set for the use of the aid; 3) the
granting of government aid must be considered necessary, taking into account
any other public support received by the applicant, as well as the quality and
scale of the project or operations targeted; as well as 4) the granting of govern-
ment aid is not estimated to cause more than minor distortions on competition
and the market, in a state belonging to the European economic area14. ” (Au-
thors’ translation)
The Act on the general conditions on business subsidies 786/1997 ap-plies to the granting of business aid directly or indirectly from government funds. Business subsidies refer to government aid and interest subsidies as well as loans, guarantees, or other financing, which involve a subsidy to the recipient.15
Section 3 describes the general objectives of a business support pro-gram:
“A business support program must promote the growth potential of the econ-
omy as well as increase the efficiency of business activity. A business support
program must be targeted primarily to such purposes, which remove deficien-
cies in the market.” (Authors’ translation)
“A business support program must be composed in such a way that the distor-
tion on competition is minimized.” (Authors’ translation)
“A business support program must be directed primarily at research, product
development, education, internationalization or other intangible business devel-
opment or improving the competitiveness of SMEs in the long term. For financ-
ing typical large company investments and working capital, business subsidies
can be granted only on special grounds.” (Authors’ translation)

332 · Ar i Hyyt inen and Lotta Väänänen
Section 5 describes the general conditions on business subsidies:
“Business subsidies can only be granted for such business activity, which is esti-
mated to have the requisites for continuous profitable activity. The giver of the
subsidy, when making the business subsidy decision, must establish the amount
of public support as well as the total financing, profitability and effects on com-
petition of the project in question.” (Authors’ translation)
In Finland, the government has empowered the MTI to create and implement policies that provide an environment conducive to the establishment of new businesses and their growth, where an important aspect is the development of corporate financing. According to the MTI,
“the objective is to improve the financing environment by measures corrective of
operative deficiencies of the market and by actions promoting market opera-
tions”16
Of the currently active government institutions providing SME fund-ing, the MTI administers Finnvera, Tekes, TE-Centers, and FII. These institu-tions serve as the public special financing infrastructure in the Finnish econ-omy. In addition to the institutions administered by the MTI, Sitra and vari-ous regional (governmental, semi-governmental, and municipal) venture capital firms provide funding to Finnish firms.
10.3.1. HISTORICAL BACKGROUND
The currently active institutions providing SME finance were established during two waves of government activity. The first wave began already in the 1960s, when the Finnish capital markets were heavily regulated. Financing of firms, especially SMEs, and innovative activity was then a cause of concern especially to a couple of influential individuals at the Bank of Finland (see Rosenlew 1985 and Seppä 2000).17 To address the concern, the Finnish gov-ernment together with the Bank of Finland established a semi-governmental venture capital firm, Sponsor, and Sitra, in 1967. Other government organiza-tions were also established during the era of regulated capital markets. In 1971, Kehitysaluerahasto Oy (the Fund for Developing Regions, known then as Kera and today as Finnvera) was founded to subsidize businesses and provide loans especially to firms residing in the less developed rural areas. In the early 1980s, no less than seven regionally focused government develop-ment companies (kind of venture capital firms), were established by the mu-

Government funding of smal l and medium-sized enterpr ises in Finland · 333
nicipalities and Kera. Establishing Tekes in 1983 to advance the financing of R&D and innovative activity eventually completed the first wave.
Much has happened after the first wave ended. Following the financial liberalization and credit boom of the 1980s, Finland underwent in the early 1990s the most serious cyclical downswing in the industrialized countries since the Great Depression of the 1930s (see e.g. Kiander and Vartia 1996, and Honkapohja and Koskela 1999). Integral to the economic distress was a major banking crisis that led to heavy government intervention and complete reor-ganization of the Finnish banking sector.18 Because banks had for decades been the major source of external finance to Finnish SMEs, it is no surprise that in the Finnish industrial policy, the SME sector and its financing received special attention in the early 1990s.
The second wave of government activity can be said to have begun when a new government venture capital firm, SFK Finance Oy, was estab-lished in 1990 by Kera to manage a new government venture capital fund, Start Fund of Kera. At about the same time, in 1991, Sitra, which had been ac-tive in developing the venture capital culture already at the end of the 1980s, was separated from the control of the Bank of Finland, transferred to under the supervision of the Parliament, and activated as a venture capital investor.
Inspired, at least in part, by the suggestions of the National Industrial Strategy for Finland and by the example of the European Investment Fund as well as Norwegian and Swedish government initiatives, the government fund of funds, FII, was established in 1995 to promote the development of venture capital in Finland. In 1997, TE-Centers were established. The second wave was completed in 1999 when the state-owned specialized financing company Finnvera was created through the merger of Kera and the Finnish Guarantee Board.
10.3.2. GOVERNMENT INSTITUTIONS FUNDING SMES
Finnvera plc
Finnvera plc is a state-owned specialized financing company administered by the MTI. It also is Finland’s official Export Credit Agency and acts as an intermediary between the European Union’s financing programs and Finnish SMEs.
As we mentioned in the previous section, Finnvera obtained its present form in the beginning of 1999. Its activities are regulated by a number of

334 · Ar i Hyyt inen and Lotta Väänänen
Acts. The Act on the State-Owned Specialized Financing Company 443/1998 describes the official purpose of Finnvera. According to section 1 of the Act, Finnvera’s objective is:
“to promote and develop particularly SME operations as well as firm interna-
tionalization and export operations, by offering financing services. In its activi-
ties, the institution must also promote government’s regional policy measures.
The operations must be directed at correcting any deficiencies that exist in the
provision of financial services.”19 (Authors’ translation)
Section 2 of the Act defines the tasks set for Finnvera:
“The company practices financing activities by providing and managing credit,
securities and guarantees as well as other commitments. The company also con-
ducts research related to business finance, and provides business development
services and advice.” (Authors’ translation)
The Act on Credits and Guarantees Provided by the State-Owned Spe-cialized Financing Company 445/1998 sets that the finance must be directed primarily at SMEs. It also sets that credit can be granted without sufficient collateral or with no collateral, and that for special loans the government pays interest subsidies to Finnvera that it channels to the firms. The Act on State’s Export Credit Guarantees 422/2001 sets that the objective of export guarantee activities is to strengthen the economic development in Finland by promoting exports and firm internationalization. Export credit guarantees are granted to cover for the risk of losses from exports and investments abroad.
Finnvera’s mission is directly taken from the objectives set by law. How Finnvera perceives its position in the market is best described by quot-ing the Managing Director:
“…Finnvera has gained an established position as a co-operation partner sharing
the financial risks of Finnish enterprises, regardless of whether these enterprises
have just started their business, are in the phase of growth and internationaliza-
tion, or already operate in the export market.”20
Section 4 of the Act on the State-Owned Specialized Financing Com-pany 443/1998 sets the economic principles governing Finnvera’s operations:
“Finnvera must aim at self-sufficiency, i.e. that the expenses from its operations
can be covered with income from its operations in the long term. To cover such

Government funding of smal l and medium-sized enterpr ises in Finland · 335
activities that the government decides to support separately, the required appro-
priations are included in the state budget.” (Authors’ translation)
However,
“As a public limited company that operates in an inherently risky investment
environment, the State has established certain provisions that allow the com-
pany to take risk while remaining self-sufficient.”21 (MTI 2000)
Finnvera’s services are offered both through its own national network of 16 regional offices and through the cooperation network of other public organizations providing services for enterprises. The following two quotes, taken from Finnvera’s web site, refer to the criteria Finnvera applies when granting finance:
“Finnvera's objective is to provide risk financing to enterprises with a sound
business idea and preconditions for profitability when a company has insuffi-
cient collateral to raise funds for investments and development projects.”
“The financing decision is preceded by a company analysis conducted by Finn-
vera’s corporate analyst, that analyses the company’s business operations, own-
ership, management, and finances. The company’s potential for success is evalu-
ated based on these.” (Authors’ translation)
Finnvera’s business financing includes loans, guarantees and export credit guarantees. Finnvera offers entrepreneur loans for starting up a busi-ness, development loans for business development projects, investment and working capital loans and guarantees, internationalization loans and guaran-tees, and environmental loans and guarantees. According to Finnvera, it is able to offer interest-subsidized special loans and accept collateral for loans considered insufficient by the private sector. Special subsidized loans are also available for firms in the European Union’s objective regions. Finnvera also engages in risk sharing with the private sector. It has, for example, estab-lished cooperation relations with banks and insurance institutions in which the role of Finnvera is to share risk by guaranteeing loans.
Figure 10.2 shows the total amount of domestic financing granted by Finnvera (and its predecessors Kera and Finnish Guarantee Board) over the years 1997-2001.22 The total amount granted, consisting of loans and guaran-tees, has increased by about 20% in real terms over the five years. This is mostly the result of a large increase of 48% from the year 1999 to 2000 in the amount of guarantees granted. The amount of loans granted has increased by

336 · Ar i Hyyt inen and Lotta Väänänen
only 5% over the whole five-year period. As a result, the share of guarantees in Finnvera’s financing has increased from less than half to more than half. While not shown in the figure, the share of Finnvera’s total domestic financ-ing that is directed to SMEs is slightly below 90% and has increased a little over the years.23
Figure 10.2. Domestic financing granted by Finnvera (1997-2001)
1997 1998 1999 2000 20010
100
200
300
400
500
600
700
800
€ m
illio
n
Loans Guarantees
Note: The data for 1997-1998 are from Kera Oyj and Finnish Guarantee Board Annual Reports, and for 1999-2001 from Finnvera’s Annual Reports. The data are deflated, and measured in 2001 prices.
The National Technology Agency (Tekes)
Tekes is the main financing organization for R&D in Finland. The Act on the National Technology Agency 429/1993, section 2, sets the objective for Tekes:
“to promote the societal welfare and stable development by improving directly
or indirectly the technological evolution and competence of industry to enhance
its ability to develop internationally competitive products, processes and ser-
vices.” (Authors’ translation)
Section 3 specifies the tasks set for Tekes:
“The National Technology Agency plans, finances, and administers R&D pro-
jects that promote the development and utilization of technology. It funds and
consults in ventures aimed at the development of products, processes and ser-
vices as well as promotes widespread utilization of international technological
know-how and cooperation, and technology transfer. In addition, Tekes takes

Government funding of smal l and medium-sized enterpr ises in Finland · 337
part in the planning of Finnish technology and innovation policies along the
lines given by the MTI.” (Authors’ translation)
The decree on the National Technology Agency 467/1993, section 1, de-fines the activities stated in the Act in more detail, with additional references to:
“strengthening competitive, technology-based business activity particularly in
the SME sector.” (Authors’ translation)
“developing the technological cooperation between firms and research institutes
to facilitate effective utilization of research results in business.” (Authors’ trans-
lation)
The decision of the Council of State 461/1998 sets the general rules governing the granting of finance for technological research and develop-ment. Tekes can grant subsidies and loans (including capital loans) to com-panies and other associations for the purpose of technological research and development. The decision sets the amounts of subsidies and loans that can be granted. Where the finance is directed to SMEs, EU projects, cross-national R&D projects or cooperation of the public and private sector, the amounts can be raised (by 10-25%). Where finance is granted to large companies, some degree of networking or other cooperation is required. The loan interest rates charged by Tekes are below the market rate and the maturity of its loans can be up to ten years.24 The repayment of the loan can be terminated if the R&D project fails or does not lead to profitable business.
Tekes’ mission statement, as found on its web site, states that:
“Tekes’ primary objective is to promote the competitiveness of Finnish industry
and the service sector by technological means. Activities aim to diversify pro-
duction structures, increase production and exports, and create a foundation for
employment and social well-being.”
Furthermore, Tekes has translated its tasks into strategic goals:
“ [1] to strengthen the national knowledge base in the sectors of society and the
economy most important in terms of Finland’s future. [2] to increase the number
of technology-based companies and ensure their growth. [3] to increase the
number of companies that engage in R&D, and to ensure that R&D projects im-
plemented are more challenging and longer-term. [4] to produce commercially
338 · Ar i Hyyt inen and Lotta Väänänen
viable results from R&D and accelerate their commercial application. [5] to en-
sure that technology policy supports regional development.”
Tekes financing is decided and determined annually and comes di-rectly from the state budget. It does not have a requirement for self-sufficiency.
Tekes offers its services through its agents at the regional TE-Center of-fices, through its own personnel at the headquarters in Helsinki, and also through four offices abroad. According to Tekes, its funding is targeted at projects, which are expected to produce new know-how, and bear high tech-nological and commercial risks. Some of the qualification criteria for receiv-ing finance from Tekes are presented on Tekes’ web site:
“The following factors are evaluated: the company's competitiveness and
growth, the competitive advantages of the technology or technique, the com-
pany’s resources, and how Tekes financing will influence the project.”
“Tekes takes a positive view towards projects that involve networking with other
companies, joint ventures, the use of local SME subcontractors in the case of lar-
ger companies, participation in national technology programs, contracting of
services from Finnish research institutes and universities and promotion of in-
ternational co-operation.”
“The results of the work will have to improve the competitiveness and expertise
in Finnish industry.”
Tekes uses all types of financing that the decision of the Council of State allows it to use: industrial R&D grants and loans, capital loans for R&D, and research funding.25 In addition to funding various kinds of R&D projects using these instruments, Tekes organizes technology programs in selected strategic areas. The aim of these programs is to promote the competitiveness of industry and enhance technological cooperation and networking.
Figure 10.3 presents the amounts of Tekes’ financing over the past five years, divided into industrial R&D loans, capital loans, grants to companies, and research funding for universities and research institutes. We see that the bulk of Tekes’ financing is in the form of R&D grants and research funding. On the whole, Tekes’ financing has increased by 8% in real terms over the years 1997-2001. From 1997 to 1999, there was a real increase of 18% in fi-nancing but this has been offset by a decrease of 8% from 1999 to 2001.

Government funding of smal l and medium-sized enterpr ises in Finland · 339
One significant trend is that capital loans have gained importance in Tekes’ financing; over the five-year period the amount of capital loans granted has more than doubled. The share of Tekes’ total financing that is directed to SMEs has increased from a little above 40% to over 50% during the five years.26
Figure 10.3. Tekes’ R&D financing decisions (1997-2001)
1997 1998 1999 2000 20010
100
200
300
400
500
€ m
illio
n
Research funding R&D grants R&D capital loans R&D loans
Note: The data are from Tekes’ Annual Report 2001. The data are deflated, and measured in 2001 prices.
The Finnish National Fund for Research and Development (Sitra)
Sitra is an independent public foundation under the supervision of the Fin-nish Parliament. The Fund was set up in conjunction with the Bank of Finland in 1967, and transferred to the Finnish Parliament in 1991. The Act on the Finnish National Fund for Research and Development 717/1990, section 2, sets the objectives for Sitra:
“to promote stable and balanced development, business activity and its quality,
as well as international competitiveness and cooperation of Finland by undertak-
ing such ventures, which have the effect of more efficient use of resources or im-
proving the standard of research and education, or which explore future devel-
opment opportunities.” (Authors’ translation)
Section 3 of the Act defines the activities that Sitra can undertake to achieve its aims:

340 · Ar i Hyyt inen and Lotta Väänänen
“The Fund can: 1) conduct or outsource research, 2) grant loans and other
financing (the repayment of which can be made conditional), 3) grant subsidies,
4) grant securities and guarantees, as well as 5) participate in cooperation
projects and own shares in companies.” (Authors’ translation)
Sections 4-7 of the Act set the economic principles for Sitra’s activities. Section 5 states that:
“The operations of the Fund are financed from its endowment capital and re-
turns from its financing activities.” (Authors’ translation)
Section 6 adds that:
“The government can take appropriations in its budget to increase the endow-
ment capital of the Fund. Appropriations can also be taken to finance the opera-
tions described in section 3.” (Authors’ translation)
Sitra’s own interpretation of its aims and tasks, found on its web site and annual reports, coincides with the rhetoric in the legislation but is rather general in nature:
“The Fund aims to promote Finland’s economic prosperity by encouraging re-
search, backing innovative projects, organizing training programs and providing
venture capital.”
“Sitra – aims to further economic prosperity in Finland by developing new and
successful business operations, by financing the commercial exploitation of ex-
pertise, [and] by promoting international competitiveness and co-operation.”
With regard to its business financing activities:
“The principal purpose of Sitra’s corporate funding is to create and develop
competitive and profitable business in Finland by offering entrepreneurs and
companies financing and services to help them develop.” (Annual Report 2001,
p.22)
The business financing activities are divided into four areas: technol-ogy, life sciences, regional operations and early stage SMEs. According to Si-tra, its venture capital operations focus on start-up companies, companies in the phase of product development, and especially on “innovative technology companies”. In Sitra’s Annual Report 2001 Sitra’s technology team specifically

Government funding of smal l and medium-sized enterpr ises in Finland · 341
states that it “concentrates on those areas where private investors are not yet prepared to provide funding alone” (p. 12).
Sitra offers its services through its office in Helsinki. The following quotes from Sitra’s web site provide us with some information on how Sitra assesses the projects to be financed:
“Sitra invests in companies whose activities are based on technological innova-
tions or other special expertise and which can also be expected to become impor-
tant business actors. Very often a company’s growth depends on its possibility of
gaining access to the international arena. The object of Sitra’s investment may
also be a project whose aim is to found a company that will exploit research car-
ried out by a research institute or university.”
“Sitra evaluates the following factors before deciding to provide capital: the
market potential of the company’s products, the uniqueness of the technology
and whether it can be protected, the company’s prospects for growth, the weak-
ness and strengths of the company’s management, and the company’s competi-
tiveness.”27
Though Sitra could use a variety of financing instruments, it finances firms mainly using equity and equity-linked instruments.28 Using these in-struments, Sitra collaborates with both public and private investors.29 In ad-dition to its direct investments, Sitra makes investments in international funds and management companies, regional funds and management compa-nies, and other Finnish funds and management companies.30
Figure 10.4 presents Sitra’s financing figures for the years 1997-2001. Financing is divided into research, innovative projects and training (RIT), di-rect investments, and domestic and international fund investments. The amount of direct investments made annually has increased by 142% in real terms over the five years. Fund investments have varied from year to year, year 2000 being a peak year, when large investments into international funds were made. In 2000, also portfolio investments nearly doubled, and thus the total amount of financing granted more than doubled from 1999 to 2000. Overall, more than half of the investments go to portfolio companies.31

342 · Ar i Hyyt inen and Lotta Väänänen
Figure 10.4. Sitra’s financing (1997-2001)
1997 1998 1999 2000 20010
20
40
60
80
100
120
€ m
illio
n
RIT Internat. funds Domestic funds Portfolio companies
Note: The data are from Sitra’s Annual Reports 1997-2001. The data are deflated, and measured in 2001 prices.
Finnish Industry Investment (FII)
FII is a state-owned equity investment company, administered by the MTI. The Act on Finnish Industry Investment Ltd. 1352/1999 sets the objective for FII:
“To improve the conditions particularly for SME operations by investing equity
into venture capital funds. FII can also make equity investments directly into
target companies particularly in business ventures requiring long-term risk tak-
ing.” (Authors’ translation)
The Decision of the Council of State (2000) sets general guidelines for FII’s investment activities. Section 1 specifies that
“Investments are directed to targets, where the market does not channel suffi-
cient funds” (Authors’ translation)
Furthermore, it sets the focus of FII’s activities:
“The first area of focus is the improvement of equity funding to seed companies.
Especially important in this regard is the setting up, development, and financing
of funds investing in seed and start-up stage firms, the development and financ-
ing of a regional network of funds, as well as the channeling of EU finance.”
(Authors’ translation)

Government funding of smal l and medium-sized enterpr ises in Finland · 343
“Another area of focus is equity investments into large business ventures requir-
ing long-term risk-taking” (Authors’ translation)
“In addition to the industry, the investment activities also target the service sec-
tor, especially knowledge intensive service enterprises.” (Authors’ translation)
Section 2 of the Decision defines the objectives of the investment activity in more detail:
“[1] Enhance equity investments into seed and start-up stage innovative compa-
nies by encouraging the setting up of funds targeting those; [2] promote the
channeling of private equity into seed/start-up funds; [3] speed up the commer-
cialization and internationalization of the results of R&D; [4] promote structural
change in the economy by direct investments in line with the aims of economic
policies; [5] promote the functioning of the venture capital market aiming at a
more developed market; [6] improve firms’ possibilities for growth, internation-
alization, and public stock offerings by utilizing the possibilities of international
fund cooperation; [7] to promote the channeling of equity-based EU funding to
Finland.” (Authors’ translation)
FII has translated the tasks set in law into four objectives, which are in line with the legislation.32
The funding of FII is based on proceeds accrued from the privatization of state-owned companies but the section 2 of the Act 1352/1999 on FII sets that:
“The company’s activities should be profitable in economic terms.” (Authors’
translation)
It also states that:
“In individual investment decisions, the company can accept lower expected re-
turns and higher risks than normally” (Authors’ translation)
The Decision of the Council of State further specifies that:
“Due to the economic policy tasks set for the company, a lower target on returns
is accepted than in the venture capital industry in general.” (Authors’ transla-
tion)

344 · Ar i Hyyt inen and Lotta Väänänen
And that:
“to balance [FII’s] investment portfolio and to secure the profitability objective,
[FII] can make investments in the market into funds that target companies in the
later development phases.” (Authors’ translation)
FII invests in three types of funds targeted at financing companies in different growth phases. Private equity funds target later growth stage com-panies, including corporate restructuring. Venture capital fund investments target early and initial growth stage companies. Regional funds target com-panies in various growth stages in the fund's regions. FII also engages in di-rect investment together with other investors and financial institutions. Ac-cording to FII, direct investments are channelled into “restructuring efforts” or “selected growth” companies.
FII offers its services through its office in Helsinki. Concerning the screening process for direct investments, the Decision of the Council of State asserts that “the starting point in direct investments is the identification of market deficiencies and cooperation with private equity.” However, there is some indication that FII also pays attention to other objectives, such as diver-sifying Finnish firms’ production structures, keeping firms’ know-how and production facilities in Finland, and increasing the rate of employment (see for example FII’s Annual Report 2001, p. 11). Given the starting point and these objectives, the following statement from FII’s Annual Report 2001 has in many ways a contrasting indication, “[direct] investments are expected to yield earnings on market terms” (p. 11).
Figure 10.5 presents FII’s investment figures for the past five years, di-vided into fund investments and direct investments. Clearly most of the in-vestments are made into funds, as investments into target companies typi-cally make up less than one tenth of the total. The total annual investments made increased by 70% in real terms from 1997 to 1999 but have fallen since then by about 30%.

Government funding of smal l and medium-sized enterpr ises in Finland · 345
Figure 10.5. FII’s investments (1997-2001)
1997 1998 1999 2000 20010
10
20
30
40
50
60
€ m
illio
n
Funds Direct investments
Note: The data are from FII’s Annual Reports 1997-2001. The data are deflated, and measured in 2001 prices.
Employment and Economic Development Centers (TE-Centers)
TE-Centers (Employment and Economic Development Centers) are public of-fices under ministerial supervision33, providing various business related ser-vices and finance. They also channel subsidies from the EU Structural and Social Funds to Finnish SMEs. The Act on the Employment and Economic Development Centers 23/1997 sets the tasks of the TE-Centers as to promote specified areas of business activity, labor issues, as well regional development by offering financial, training, development, and other services. The one of interest for this study is:
“to promote particularly SME operations and operating conditions as well as
their technological development and internationalization.” (Authors’ translation)
There are a number of TE-Centers located regionally, and they are or-ganized in departments. The decree 93/1997 assigns the task of promoting SMEs within the operating region of a Center to the business departments of the TE-Centers.
The business departments at the TE-Centers aim to serve the needs of SMEs by providing business development services and finance. As quoted on the TE-centres’ web site, their tasks related to SME development are as fol-lows:

346 · Ar i Hyyt inen and Lotta Väänänen
“[1] to support and advise small and medium-sized enterprises at the various
stages of their life cycles, [2] to promote technological development in enter-
prises and assist in matters associated with export activities and internationali-
zation, [3] to influence and participate in regional development in general”
TE-Centers offer services through their 15 regional centers. TE-Centers offer entrepreneurship grants for unemployed people to become self-employed. TE-Centers also partially finance enterprise investment and de-velopment projects. Grants are the dominant form of financing. The most important kinds of financing are regional investment aid, small business aid, development aid, aid for improving operational conditions for firms, and in-ternationalization aid. The grants can cover up to 50% of the costs of the pro-ject, and vary across the EU objective regions of Finland. On their web site, they provide information on the prerequisites for receiving financing. For in-vestment projects:
“…the company is expected to have the requisites for continuous profitable op-
erations. In addition, the expansion or renewal is expected to have the effect of
substantially increasing the number of jobs, or the value-added of the produc-
tion or services.” (Authors’ translation)
For development projects:
“Development projects are expected to have significance and novelty value in
view of the company’s operations. Correspondingly, internationalization projects
are expected to have significance in view of the firm’s internationalization… The
granting of finance requires that the applicant has realistic requisites to complete
the planned project and to benefit from its results.” (Authors’ translation)
Figure 10.6 presents the financing provided by the TE-Centers over the years 1997-2001. The financing, consisting of both national and EU funds, is divided into investment subsidies, development subsidies, and subsidies for improving the operational conditions for firms.34 Total financing granted an-nually has increased by about 8% in real terms from 1997 to 2001. Most of the financing, about two thirds, consists of investment subsidies, which are also responsible for the increase in total financing.

Government funding of smal l and medium-sized enterpr ises in Finland · 347
Figure 10.6. Subsidies provided by TE-Centers (1997-2001)
1997 1998 1999 2000 20010
20
40
60
80
100
120
140
€ m
illio
n
Operating conditions Development Investment
Note: The data are from MTI. The data are deflated, and measured in 2001 prices.
Summary: How has the total amount of government funding awarded to SMEs developed in the recent past?
Figure 10.7 shows the total amount of direct and indirect financing granted to SMEs by the institutions over the years 1997-2001.35 What we can see from the figure is that the total amount of direct financing has increased quite dra-matically, from €486 million to €575 million (in 2001 prices). This increase means that direct SME financing has according to our estimates grown in real terms by more than 18%. The increased financing by Finnvera accounts for about 32% of the total (real) increase, while Tekes accounts for 41% and Sitra for the remaining. The figure also shows that the volume of indirect financ-ing has grown in real terms, too. Comparing the direct SME funding by the government to an estimate for the classical venture capital investments (i.e., excluding MBOs and restructuring finance) made by the private Finnish ven-ture capitalists in 2001, which was about €208 million, is a means to set the volume of government funding into a perspective.

348 · Ar i Hyyt inen and Lotta Väänänen
Figure 10.7. Total amount of government funding to SMEs (1997-2001)
1997 1998 1999 2000 20010
200
400
600
800
1,000
1,200
€ m
illio
n
Indirect SME finance Direct SME finance
Note: Direct financing refers to subsidies, loans, capital loans, and direct equity investments. Indirect fi-nancing refers to fund investments by Sitra and FII, as well as to Finnvera’s guarantees and Tekes’ financ-ing channeled to SMEs via large company projects. The data are from the annual reports of the relevant government institutions and MTI. Because no data were available for the share of financing to SMEs by Finnvera in 1997-1998, an assumption was made that the share was 85% (as it was in 1999). Of TE-Center financing, development subsidies and subsidies for improving operational conditions are 100% SME finance. For investment subsidies 1997-1999 the share of SME finance was assumed to be 94% (as it was in 2000). Of Sitra’s financing, direct investments are taken to be SME finance, and indirect financ-ing includes both domestic and international funds. The data are deflated, and measured in 2001 prices. Note that (i) indirect financing, as we have defined it here, is not necessarily directed only to Fin-nish SMEs, and that (ii) financing includes EU funds channeled to Finnish SMEs.
To get a closer look at the recent developments in SME funding, Table 10.1 displays the annual real growth rates of direct SME funding, computed separately for each government institution from 1998 to 2001 (Panel A); the annual real growth rates of indirect SME funding (Panel B); the annual real growth rate of private venture capital investments (Panel C); and the per-centage of SMEs reporting in a survey that they have encountered problems when raising external finance (Panel D). As a comparison across the panels shows, the various institutions providing SME funding have increased their financing simultaneously. In particular, government’s direct funding to SMEs increased more rapidly during the two boom years of 1999 and 2000 than during 1998 or 2001. Based on these short time series, we cannot exclude the possibility that increases in government funding to SMEs have coincided with increases in the availability of external finance on the market. Of course, to the extent that the institutions providing government funding have co-operated and invested in collaboration with private financiers, the positive correlation is not surprising.

Government funding of smal l and medium-sized enterpr ises in Finland · 349
Table 10.1. Real annual growth of government funding to SMEs (1998-2001)
1998 1999 2000 2001
Panel A. Direct SME funding Total growth -2% 10% 14% -3%By institution
Finnvera -9% 5% 21% -5%Tekes 15% 16% -1% 7%Sitra -4% 11% 1% -7%TE-Centres 11% 26% 82% -5%
Average growth 3% 14% 25% -3%
Panel B. Indirect SME fundingTotal growth 0% 2% 31% 1%By institution
Finnvera 1% -6% 40% 10%Tekes 53% -5% -24% 1%Sitra -49% 23% 159% -54%FII 13% 48% -28% -9%
Average growth 4% 15% 37% -13%
Panel C. Private sectorPrivate VC investments 43% 49% 31% -18%
Panel D. Market tightness"No problems in external finance" 62% 64% 79% 75%
Note: Direct financing refers to subsidies, loans, capital loans, and direct equity investments. Indirect fi-nancing refers to fund investments by Sitra and FII, as well as to Finnvera’s guarantees and Tekes’ financ-ing channeled to SMEs via large company projects. The data are from the annual reports of the relevant government institutions, MTI, the annual publications of Finnish Venture Capital Association, and from the survey administrated by the Federation of Finnish Enterprises. Because no data were available for the share of financing to SMEs by Finnvera in 1997-1998, an assumption was made that the share was 85% (as it was in 1999). Of TE-Center financing, development subsidies and subsidies for improving op-erational conditions are 100% SME finance. For investment subsidies 1997-1999 the share of SME fi-nance was assumed to be 94% (as it was in 2000). Of Sitra’s financing, direct investments are taken to be SME finance, and indirect financing includes both domestic and international funds. The data are de-flated, and measured in 2001 prices. Note that indirect financing, as we have defined it here, is not nec-essarily directed only to Finnish SMEs.
Finally, Figure 10.8 displays the relative shares of the total direct fi-nancing granted to SMEs by the various institutions. The figure shows that unsurprisingly, Finnvera is clearly the largest player by the volume of financ-ing (about 50%), followed by Tekes (about 20%) and that the relative shares of the total financing granted to SMEs by the various institutions have been quite stable. Despite the fact that Sitra has increased its SME financing over 1997 and 2001 most dramatically, its relative share has increased only moder-ately, from 4% to about 7% in 2001. We can conclude that no dramatic shifts in the relative volumes of SME financing by the different institutions have taken place.36

350 · Ar i Hyyt inen and Lotta Väänänen
Figure 10.8. Shares of direct SME financing by institution (1997-2001)
1997 1998 1999 2000 20010%
10%
20%
30%
40%
50%
60%
70%
80%
90%
100%
Sitra Te-centres Tekes Finnvera
Note: The data are from the annual reports of the relevant institutions.
10.3.3. ASSESSMENT
Overall, the “rhetoric” in the Finnish legislation governing the government institutions that support the Finnish corporate sector provides us with a gen-eral idea of what the institutions are set to do. The rhetoric for the various in-stitutions shares quite a few common themes, such as promoting Finnish firms’ and particularly Finnish SMEs’ development, growth and internation-alization, but varies in its emphasis. Moreover, what institutions themselves argue to be doing is unsurprisingly not inconsistent with the general idea of what they are set to do. The rhetoric is, however, general in nature, leaving a lot of room for interpretation and subjective judgment.
How does the rhetoric compare with the two main rationales that eco-nomic analysis put forward for governments to provide funding to the SME sector? In our view, the following stands out:
• First, the rhetoric does not explicitly emphasize that Finnish firms, espe-cially SMEs, are to be supported because they underinvest in activities that generate positive externalities to other industries and firms. Of course, it is difficult to argue that such a view does not underlie the general objec-tives set for the institutions and the institutions’ own reporting, such as promoting firms’ innovativeness, competitiveness and internationaliza-tion. The view is however not explicit.

Government funding of smal l and medium-sized enterpr ises in Finland · 351
• Second, the legislation does quite explicitly refer to the need to rectify capital market failures.37 References to capital market failures are, how-ever, made at a very general level, and no definition for a capital market failure is provided. Because this lack of detail leaves (too) much room for interpretation and subjective judgment, the danger is that also a minor functional deficiency may be interpreted to constitute a market failure.
• Third, the rhetoric in the legislation does not take into account that the ex-istence of a market failure is not a sufficient argument to provide gov-ernment funding. In particular, besides the rather general clauses in the Acts on government aid and subsidies 688/2001 and 786/1997, no explicit requirement is made that the institutions providing government funding devote efforts to solve the fundamental screening problem of determining those truly eligible for government funding. For example, no reference is made in the legislation (or in the institutions own reporting) to the identi-fication or measurement of “social returns” or beneficial externalities that the projects financed by the government are supposed to generate. Lack of such requirements for selectivity is unfortunate, because firms may well seek government funding just to increase their profits (wrong kind of self-selection) and because SMEs may receive funding on the basis of their likely success, regardless of whether it is needed (wrong kind of screen-ing).
• Fourth, the rhetoric in the legislation is a bit puzzling because at least for Finnvera, Sitra and FII, there is a requirement for self-sufficiency. Our hunch is that also the other institutions providing government funding may implicitly have faced similar performance requirements in the sense that unless they can demonstrate that they have invested at least in some profitable firms or projects, outsiders would judge that they have done nothing but “wasted tax-payers money”. Such explicit or implicit re-quirements for self-sufficiency are not consistent with the idea that the in-stitutions are in the business of rectifying market failures. That means that they are set to perform activities that have not been successfully carried out by the private sector that primarily responds to profit motives. The in-stitutions can, of course, be self-sufficient if they also practice business or investment activities other than those aiming at rectifying market failures. However, the rhetoric is not explicit that the requirement cannot typically be extended to the activities that aim at rectifying market failures.38 In fact, what is evident from the institutions’ own criteria used for screening ap-plicants, is that they are not far from the private sector requirements and refer to “potential for success” and “requisites for profitability”.

352 · Ar i Hyyt inen and Lotta Väänänen
Finally, because of the favorable overall financial development be-tween 1997 and 2001, it is a bit puzzling that government funding to SMEs has according to our estimates grown in real terms more than 18% during the period. It is puzzling especially because
• the institutions providing government funding increased their financing simultaneously and most rapidly during the two boom years of 1999 and 2000.
It in fact seems that government funding has varied in tandem with, or has lagged somewhat, increases in the availability of finance on the market place. Various interpretations can be given for these findings. On the one hand, it is possible that government officials react to correlated signals about the need for government funding so that they are likely to adjust their levels of funding simultaneously. If such signals are correlated with the SMEs’ de-mand for private funding, the documented outcome follows. Another inter-pretation for the findings is that the institutions providing government fund-ing have co-operated and invested in collaboration with private financiers. A positive correlation between private and public funding might in such an ar-rangement emerge if the institutions providing government funding can suc-cessfully identify the demand for public funding and persuade private finan-ciers to fund SMEs that would otherwise not be able raise funding on the market place. It is also possible that things have gone wrong. The positive correlation between private and public funding may also emerge, if the insti-tutions providing government funding have difficulties in distinguishing be-tween the demand for private and public funding and thus if they fund firms that would be able to raise funding from the private financiers (thus crowd-ing out private financing). It is, however, important to note that the institu-tions providing government funding may have had an incentive to satisfy the demand for private funding to some extent because they may have faced a constraint to invest counter-cyclically. Such a constraint may have existed be-cause of the self-sufficiency requirements (performance targets) that we men-tioned earlier.
If, as practitioners often argue, market failures become more severe during downturns, the policy of investing in collaboration with private fi-nanciers and the self-sufficiency requirements may hamper the ability of the government institutions to act appropriately. Of course, it is hard to blame any single institution for this apparent ‘lack of coordination’ between the agencies and also with respect to the private financiers. The finding calls, however, for better coordination in these dimensions.

Government funding of smal l and medium-sized enterpr ises in Finland · 353
10.4. EMPIRICAL ANALYSIS
As discussed, the data on the SMEs’ use of government funding reflect the equilibrium of two selection processes: When we observe that a firm receives government funding, it has i) decided to apply for it and ii) passed the screen of the government organization providing the funding. In this section, we take a look at the outcome of these two selection processes by studying the characteristics of the Finnish SMEs that have in the recent past applied for and received government funding.39
Because of data limitations, we focus in most of what follows on four main “types” of government funding. The first two are funding provided by Finnvera and funding provided by Tekes, which both at least in principle have quite clearly defined roles in the Finnish SME finance. They both pro-vide gratuitous finance (i.e. funding that is not repayable, such as direct sub-sidies, grants, various forms of aid, and guarantees) as well as non-gratuitous finance (i.e. funding that is repayable in a sense, consisting of loans, capital loans and equity). The other two “types” of funding are government venture capital and other subsidies. Government venture capital consists of funding provided by Sitra, FII and the various governmental, semi-governmental and municipal venture capital firms and fund management companies operating regionally.40 We call this funding government venture capital, because these institutions typically only grant non-gratuitous funding. Other subsidies con-sist of gratuitous government funding, provided for the most part through the TE-Centres.41
10.4.1. DESCRIPTIVE ANALYSIS
Extent of government funding
For the purpose of the descriptive analysis presented in this section, sam-pling weights are used to weigh the sample to make it as representative of the Finnish SME population as possible. Table 10.2 presents the proportion of SMEs that reported in the survey that they have received government fund-ing during the last fiscal year, or thereafter (the first column), as well the pro-portion of SMEs that have received government funding prior to their last fiscal year (the second column). The table shows that as many as 17.1% (27.9%) of SMEs has recently (in the past) applied for and received at least one type of government funding. Combining the information in the two col-umns and eliminating double accounting yields the following finding:
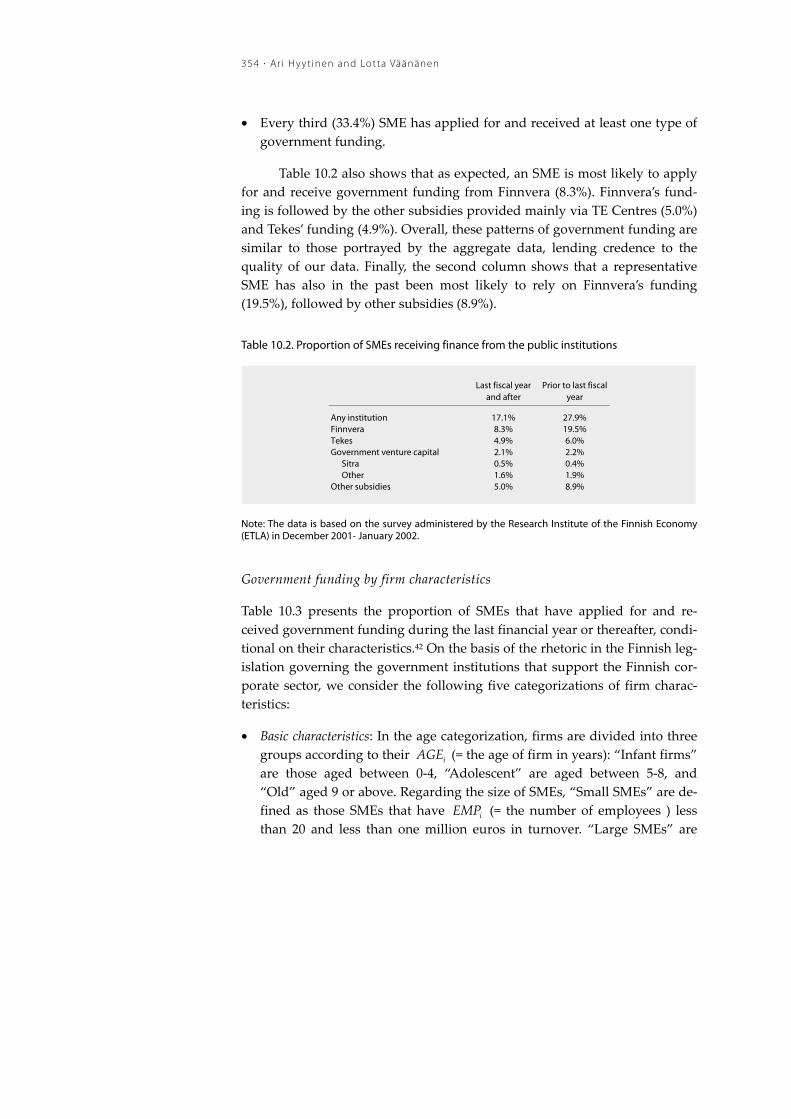
354 · Ar i Hyyt inen and Lotta Väänänen
• Every third (33.4%) SME has applied for and received at least one type of government funding.
Table 10.2 also shows that as expected, an SME is most likely to apply for and receive government funding from Finnvera (8.3%). Finnvera’s fund-ing is followed by the other subsidies provided mainly via TE Centres (5.0%) and Tekes’ funding (4.9%). Overall, these patterns of government funding are similar to those portrayed by the aggregate data, lending credence to the quality of our data. Finally, the second column shows that a representative SME has also in the past been most likely to rely on Finnvera’s funding (19.5%), followed by other subsidies (8.9%).
Table 10.2. Proportion of SMEs receiving finance from the public institutions
Last fiscal year and after
Prior to last fiscal year
Any institution 17.1% 27.9%Finnvera 8.3% 19.5%Tekes 4.9% 6.0%Government venture capital 2.1% 2.2%
Sitra 0.5% 0.4%Other 1.6% 1.9%
Other subsidies 5.0% 8.9%
Note: The data is based on the survey administered by the Research Institute of the Finnish Economy (ETLA) in December 2001- January 2002.
Government funding by firm characteristics
Table 10.3 presents the proportion of SMEs that have applied for and re-ceived government funding during the last financial year or thereafter, condi-tional on their characteristics.42 On the basis of the rhetoric in the Finnish leg-islation governing the government institutions that support the Finnish cor-porate sector, we consider the following five categorizations of firm charac-teristics:
• Basic characteristics: In the age categorization, firms are divided into three groups according to their iAGE (= the age of firm in years): “Infant firms” are those aged between 0-4, “Adolescent” are aged between 5-8, and “Old” aged 9 or above. Regarding the size of SMEs, “Small SMEs” are de-fined as those SMEs that have iEMP (= the number of employees ) less than 20 and less than one million euros in turnover. “Large SMEs” are

Government funding of smal l and medium-sized enterpr ises in Finland · 355
SMEs exceeding either of the criteria. In the growth categorization, “High growth” refers to firms whose iGROWTH (= the average sales growth rate over the next three years, as projected by the entrepreneurs them-selves) exceeds 10%, and the rest belong to the “Low growth” category.
• Innovativeness: In the R&D classification, “No R&D” refers to those firms for which & iR D (= the ratio of R&D expenditures to sales) is zero, “Low R&D” to firms for which it is positive but less than 5%, and “High R&D” to those for which it is more than 5%. Furthermore, SMEs are divided into “Yes”/”No” categories on the basis of iPATENT (= dummy set to 1 if firm has patents) and iINTANG (= dummy set to 1 if the entrepreneur evalu-ates that his/her firm owns other intangible assets than patents).
• Internationalization: In the export categorization, “No exports” refers to SMEs with iEXPORT (= the ratio of export to total sales) zero, “Low ex-ports” to SMEs with iEXPORT up to 25% and “High exports” to SMEs for which it is above 25%. SMEs are also divided into “Yes”/”No” categories on the basis of iFOREOPER (= dummy set to 1 if firm has other activities abroad besides export), and AUDITi (= dummy set to 1 if firm is audited by one of the internationally recognized ‘Big Five’ accounting firms)43.
• Profitability: SMEs are divided into “Yes”/”No” categories on the basis of iPROFIT (= dummy set to 1 if firm’s return on assets was positive in the
last fiscal year) and iPROFITCH (= dummy set to 1 if the entrepreneur answered in the survey that her firm’s current profitability is better than it has been over the last three years on average).
• Other: Here SMEs are classified into “Yes”/”No” categories on the basis of LOANDENi (= dummy set to 1 if firm’s loan applications have been turned down in the marketplace because of lack of collateral and/or guarantees during the last two years).

356 · Ar i Hyyt inen and Lotta Väänänen
Table 10.3. Proportion of SMEs receiving finance by firm characteristics
Finnvera TekesGovernment
venture capitalOther
subsidies
BASIC CHARACTERISTICS
AGEi Infant 17.2% 4.4% 1.5% 6.2% Adolescent 5.3% 2.1% 3.7% 3.9% Old 7.7% 6.1% 1.6% 5.2%
EMPi Small SMEs 7.1% 2.7% 1.6% 3.8% Large SMEs 10.7% 9.2% 2.9% 7.6%
GROWTHi Low growth 7.6% 4.1% 1.8% 4.1% High growth 10.6% 8.3% 3.2% 8.6%
INNOVATIVENESS
RDi No R&D 5.8% 0.6% 1.6% 2.7% Low R&D 9.6% 7.2% 2.7% 6.7% High R&D 16.5% 17.7% 2.1% 10.9%
PATENTi Yes 14.0% 16.4% 3.8% 7.8% No 8.0% 4.2% 2.0% 4.9%
INTANGi Yes 11.2% 8.8% 1.6% 10.6% No 7.9% 4.3% 2.2% 4.2%
INTERNATIONALIZATION
EXPORTi No exports 7.5% 3.1% 1.8% 4.2% Low exports 7.3% 5.0% 3.0% 6.9% High exports 18.4% 20.8% 2.4% 7.8%
FOREOPERi Yes 8.4% 10.5% 1.8% 6.2% No 8.3% 4.5% 2.1% 5.0%
AUDITi Yes 10.1% 8.2% 2.3% 4.8% No 8.0% 3.7% 1.1% 6.1%
PROFITABILITY
PROFITi Yes 7.3% 5.2% 3.5% 3.3% No 12.6% 3.7% 0.7% 7.0%
PROFITCHi Yes 7.7% 5.1% 7.5% 6.2% No 7.6% 4.6% 0.9% 4.8%
OTHER
LOANDENi Yes 17.2% 2.3% 1.1% 4.9% No 7.8% 5.0% 2.1% 5.0%
Note: The data is based on the survey administered by the Research Institute of the Finnish Economy (ETLA) in December 2001- January 2002.
The table verifies Finnvera’s dominant role in the provision of gov-ernment funding to SMEs, and yet qualifies it in an important way. Compar-ing across columns tells us that despite the fact that Tekes only accounts for about 14% of the total government funding to SMEs, high R&D SMEs, SMEs with patents, high export SMEs, and SMEs with (other) foreign operations

Government funding of smal l and medium-sized enterpr ises in Finland · 357
are in absolute terms (i.e., not just compared to their counterparts) more likely to apply for and receive funding from Tekes than from Finnvera (or from any other government institution). This finding is important, because it is consistent with the idea that different types of SMEs apply for and receive different types of government funding.
Comparing across rows allows us to uncover four patterns worth em-phasizing:44 First, technology-intensive SMEs (high R&D SMEs, SMEs with patents and/or intangible assets) are more likely than their counterparts to apply for and receive funding from both Tekes and Finnvera. Second, the same applies to internationally oriented SMEs (high export SMEs, SMEs with (other) foreign operations and SMEs audited by the international recognized auditors), as also they are more likely than their counterparts to apply for and receive funding from both Tekes and Finnvera. Similar patterns underlie the other types of funding too, but far less prominently and not with respect to all the variables considered. Third, SMEs whose loan applications have been rejected in private credit markets are more likely than their counterparts to apply for and receive financing from Finnvera. Interestingly, this is not the case for the other types of funding. Finally, the table shows that of the 13 SME characteristics considered, only four share an important common effect: Large SMEs, high growth SMEs, SMEs who own patents and SMEs whose profitability has improved recently are more likely than their counterparts to apply for and receive government funding from any institution.
The foregoing findings indicate that there are selection processes at work. We cannot however make too much out of them, because we have not controlled for the other characteristics of SMEs. To control for them requires that we use multivariate methods. That is done in the next section.
10.4.2. ECONOMETRIC ANALYSIS
Regressions analysis
The main empirical model that we employ to study the characteristics of SMEs that apply for and receive government funding is the standard Logit model:
1( ' 0)gi i iy Xβ ε= + > (1)
where giy is a dummy set to one if firm i has applied for and received gov-
ernment funding from government institution g, β is a vector of coefficients,

358 · Ar i Hyyt inen and Lotta Väänänen
iX is a vector of explanatory variables and iε is distributed according to a lo-gistic density with mean zero and constant variance. We run Logits sepa-rately for each government institution to investigate whether there are sys-tematic differences between the institutions in the allocation of SME finance. The regressions are run on an unweighted sample, but we have included the stratifying variable (sector dummies; see below) in the regressions. The reader is however advised to interpret the results carefully, as the results from the regression analysis are not necessarily representative of the whole Finnish SME population.45
The characteristics of firms that we control for are, bar a few modifica-tions, the same as those used as the conditioning variables in Table 10.3. They are iAGE , iEMP (= the number of employees), iGROWTH , iHIGHRD (= dummy set to 1 if firm’s lagged & iR D > 10%), iPATENT , iINTANG ,
iHIGHEXPORT (= dummy set to 1 if firm’s iEXPORT > 25%), iFOREOPER , iAUDIT , iPROFIT and iPROFITCH and, finally, iLOANDEN .
We also introduce eight new control variables. The first one is a dummy for ‘small SMEs’ iSD (= dummy set to one if firm’s sales are less than euro 1.5 million). The second one is ‘small R&D intensive firms’, iSRD (= dummy set to one if the ratio of firm’s R&D to sales exceeds 10% and if its sales are less than euro 1.5 million). We introduce the dummy, because lack of capital has in the past been identified as one of the most important ‘barriers to innovation’ for small R&D intensive firms (CSO 1991). We also bring in two new controls for the innovativeness of firms. They are 1iINNO (= dummy set to 1 if firm has innovated its products during the last three years), and 2iINNO (= dummy set to 1 if firm has innovated its production proc-esses during the last three years). We also add two variables to control for the characteristics of the CEO of the firms. These are iCEOAGE (= the number of years firm’s current CEO has managed the firm), and iCEOEDUC (= dummy set to 1 if firm’s CEO has a university degree). Finally, all of the regressions include iREGION (= a dummy set to 1 if firm resides in an agricultural mu-nicipality), broad sector dummies (the sectors are high-technology (reference category), medium technology, information intensive services, and other), as well as dummies indicating in which province the firm resides in (the prov-inces are Province of Uusimaa (reference category), Province of Western Finland (“West”), Province of Eastern Finland (“East”); and Province(s) of Oulu and Northern Finland (“North”)).
Table 10.4 provides results of estimating equation (1) for Finnvera’s and Tekes’s funding, as well as for government venture capital and other subsidies. In each column, the dependent variable is a dummy set to one if a

Government funding of smal l and medium-sized enterpr ises in Finland · 359
firm has applied for and received the type of government funding in ques-tion. The results presented below are based on unweighted estimations. As weighted estimation provided somewhat different results in terms of the sta-tistical significance of some variables, we tested whether there is evidence for a bias in not using sample weights by a likelihood ratio test between the model used here and one where the stratifying variable is included both line-arly and as an interaction between all the other variables. As the likelihood ratio test did not reject the more restricted model we have included the strati-fying variable only in a linear form, i.e., without taking the interaction terms (see Graubard and Korn 2002 for a statistical motivation for following this procedure).
The table shows that, overall, there are systematic differences between SMEs that apply for and receive different types of government funding. It also shows that we can find further support for two of the four patterns that we discovered above. First, technology-intensive SMEs (high R&D SMEs, SMEs with patents) are more likely than their counterparts to apply for and receive funding from Tekes but not from Finnvera. Second, as before, we find that internationally oriented SMEs (high export SMEs, and SMEs audited by the international recognized auditors) are more likely than their counterparts to apply for and receive funding from both Tekes and Finnvera. Third, we also again find that SMEs whose loan applications have been rejected in pri-vate credit markets are more likely than their counterparts to apply for and receive financing from Finnvera. We find no similar effects for the other types of government funding. Finally, it seems that there are only few, if any, SME characteristics that have a similar effect across the various types of govern-ment funding on the probability that an SME applies for and receives gov-ernment funding.46
The regression results also provide us with some additional insights. We have chosen to emphasize the following two:
• Growth-oriented SMEs apply for and receive government funding more of-ten than their counterparts only from Finnvera.
• Smallish SMEs with a limited amount of sales are less likely than their counterparts to apply for and receive funding particularly from Finnvera and other subsidies.
Another point to bring forward is that SMEs that belong to “Other” sectors, i.e. not technology- or information intensive, are less likely to apply for and receive all but Finnvera’s financing. This is interesting since the main characteristics that make the sectors different, such as innovativeness, are

360 · Ar i Hyyt inen and Lotta Väänänen
controlled for. Finally, it is perhaps of some interest to note that SMEs that re-side in the Western- and Eastern Provinces, are more likely to apply for and receive financing from Finnvera and Tekes than those SMEs that reside in the Province of Uusimaa.
Table 10.4. Standard Logit regressions
Coef. Coef. Coef. Coef.
AGEi -0.013 1.58 -0.020 2.30 ** -0.015 1.04 0.002 0.20EMPi 0.005 1.20 0.012 2.28 ** 0.009 0.90 0.000 0.05GROWTHi 0.711 2.43 ** 0.300 0.98 0.279 0.65 0.242 1.03HIGHRDi -1.361 1.73 * 1.287 2.30 ** 0.243 0.31 -0.671 0.95PATENTi -0.196 0.57 0.780 2.41 ** 0.793 1.46 -0.036 0.10INTANGi 0.108 0.39 0.146 0.54 0.024 0.05 0.505 1.82 *HIGHEXPORTi 0.656 2.09 ** 0.524 1.84 * 0.007 0.01 0.346 1.05FOREOPERi 0.275 0.80 0.313 0.83 0.303 0.49 0.021 0.05AUDITi 0.519 1.91 * 0.412 1.67 * 0.642 1.28 0.408 1.46PROFITi -0.404 1.15 -0.688 2.07 ** -1.366 2.74 *** -0.192 0.53PROFITCHi 0.110 0.47 -0.074 0.30 0.668 1.48 -0.408 1.67 *LOANDENi 0.871 2.10 ** -0.551 1.00 0.513 0.77 0.339 0.79SRDi 1.943 2.32 ** -0.612 0.95 -0.469 0.55 0.695 0.91SDi -1.316 4.31 *** -0.737 2.32 ** -0.005 0.01 -0.988 3.17 ***INNO1i 0.721 2.68 *** 0.366 1.35 0.549 1.20 0.541 1.87 *INNO2i 0.125 0.49 0.263 0.99 0.432 0.95 0.404 1.53CEOAGEi -0.037 2.00 ** 0.029 1.49 0.012 0.30 0.007 0.41CEOEDUCi -0.554 1.90 * 0.311 1.09 0.184 0.38 0.180 0.61REGIONi -0.279 0.85 0.209 0.61 0.971 1.82 * 0.830 2.77 ***SECTOR
Medium-tech 0.407 1.02 -0.392 1.10 -0.516 1.01 -0.149 0.39Info-intensive 0.018 0.04 -0.383 1.01 -0.669 1.05 -0.083 0.18Other 0.521 1.29 -0.964 2.65 *** -1.515 2.34 ** -0.721 1.88 *
PROVINCEWest 0.666 2.40 ** 0.497 1.93 * -0.513 1.05 -0.006 0.02East 0.847 2.19 ** 0.781 1.96 ** 0.240 0.36 -0.269 0.59North 0.385 0.90 0.751 1.87 * -0.800 1.11 0.210 0.48
ObservationsLog likelihoodWald Chi2
degr. of freedomsignificance
R2pseudo
z-stat. z-stat. z-stat. z-stat.
Finnvera Tekes Other subsidiesGovernment venture capital
763 763 763 763 -264.90 -262.55 -104.81 -248.24 106.78 130.95 86.63 80.99
25 25 25 25 0.00 0.00 0.00 0.00
0.18 0.24 0.19 0.13
Note: The data is based on the survey administered by the Research Institute of the Finnish Economy (ETLA) in December 2001 - January 2002. *** denotes statistical significance at 1% level, ** at 5% level and * at 10% level.

Government funding of smal l and medium-sized enterpr ises in Finland · 361
Because to apply for and receive government venture capital (pro-vided by Sitra and regional governmental/semi-governmental venture capital firms) are “rare events”, i.e., it is much less likely that an SME applies for and receives financing (events) than that it does not apply for or receive (non-events) financing from them, Logit regression can underestimate the prob-ability of the event and yield biased coefficients in small samples. The prob-lem is that in rare events data, ones are statistically more informative than ze-ros. To address the problem, we re-estimate model (1) using a rare events lo-gistic regression recently developed by King and Zeng (2000, 2001). The method proposed by King and Zeng corrects for problems due to finite sam-ple or rare events. When the results make a difference, the method should work better than the standard logistic regression; when it does not, it gives the same answer as the logistic regression.
Table 10.5 provides results of estimating equation (1) using the rare events Logit. The table shows that our qualitative conclusions do not change, even though the magnitude of some coefficients has changed. With these at hand, we can compute relative risks, i.e., the percentage changes in the prob-ability of something happening, due to a change in selected explanatory vari-ables. We do not report the relative risks in a table to save space, but just briefly discuss some of them. According to our unweighted estimates, the probability that an SME applies for and receives Finnvera funding is about two times larger if its loan application has been rejected on the market place ( = 1iLOANDEN ) than if it has not been rejected ( = 0iLOANDEN ). Similarly, the probability that an SME applies for and receives Tekes funding is as much as two and a half times larger if it is an R&D intensive firm ( = 1iHIGHRD ) than if it is not ( = 0iHIGHRD ). Finally, the probability that an SME applies for and receives Finnvera (Tekes) funding would be 1.7 (1.5) times larger if it was an export intensive SME ( = 1iHIGHEXPORT ) than if it was not ( = 0iHIGHEXPORT ).47

362 · Ar i Hyyt inen and Lotta Väänänen
Table 10.5. Rare events Logit regressions
Coef. Coef. Coef. Coef.
AGEi -0.012 1.40 -0.018 2.08 ** -0.008 0.52 0.002 0.33EMPi 0.005 1.18 0.011 2.18 ** 0.010 1.00 0.000 0.01GROWTHi 0.693 2.45 ** 0.317 1.07 0.291 0.70 0.281 1.23HIGHRDi -1.161 1.53 1.154 2.13 ** 0.393 0.53 -0.553 0.81PATENTi -0.190 0.57 0.720 2.30 ** 0.684 1.30 -0.037 0.10INTANGi 0.115 0.43 0.152 0.58 0.041 0.08 0.487 1.81 *HIGHEXPORTi 0.617 2.03 ** 0.495 1.80 * 0.055 0.10 0.336 1.05FOREOPERi 0.270 0.81 0.311 0.85 0.331 0.55 0.048 0.12AUDITi 0.496 1.88 * 0.395 1.66 * 0.591 1.22 0.391 1.45PROFITi -0.385 1.13 -0.653 2.03 ** -1.233 2.56 ** -0.192 0.55PROFITCHi 0.105 0.46 -0.070 0.29 0.585 1.34 -0.387 1.63LOANDENi 0.828 2.06 ** -0.485 0.91 0.520 0.81 0.347 0.84SRDi 1.723 2.12 ** -0.512 0.82 -0.568 0.69 0.584 0.79SDi -1.260 4.26 *** -0.717 2.34 ** 0.004 0.01 -0.942 3.12 ***INNO1i 0.696 2.68 *** 0.356 1.36 0.503 1.14 0.520 1.86 *INNO2i 0.125 0.51 0.250 0.97 0.404 0.92 0.385 1.51CEOAGEi -0.034 1.91 0.027 1.46 0.010 0.26 0.007 0.42CEOEDUCi -0.525 1.86 * 0.293 1.06 0.134 0.29 0.167 0.58REGIONi -0.248 0.78 * 0.211 0.64 0.902 1.75 * 0.798 2.75 ***SECTOR
Medium-tech 0.368 0.95 -0.378 1.10 -0.495 1.00 -0.155 0.42Info-intensive 0.013 0.03 -0.363 0.99 -0.574 0.93 -0.079 0.18Other 0.473 1.21 -0.918 2.61 *** -1.365 2.18 ** -0.694 1.87 *
PROVINCEWest 0.630 2.35 ** 0.467 1.87 * -0.462 0.98 -0.007 0.02East 0.812 2.17 ** 0.744 1.93 * 0.228 0.36 -0.232 0.53North 0.383 0.92 0.718 1.85 * -0.610 0.87 0.220 0.52
Observations
z-stat.z-stat.z-stat.z-stat.
Finnvera Tekes Government venture capital
Other subsidies
763 763 763 763
Note: The data is based on the survey administered by the Research Institute of the Finnish Economy (ETLA) in December 2001 - January 2002. *** denotes statistical significance at 1% level, ** at 5% level and * at 10% level.
Count model analysis
Calls for a better co-ordination between the various government institutions providing SME funding have recently increased.48 There are several ration-ales to enhance the degree of co-ordination. One is that it may be difficult to evaluate the pros and cons of SMEs’ technological projects (pre-commercial research) without simultaneous consideration of their ability to later com-mercialize government-funded technology (Lerner 2002). Enhancing coordi-nation might therefore improve the commercialization of technology. An-other rationale for coordination is that there might be a coordination problem between the various government institutions providing SME funding that re-sults in undesirable time-series variation in the total amount of financing

Government funding of smal l and medium-sized enterpr ises in Finland · 363
available to SMEs (just as our evidence suggests). Finally, evidence from the US suggests that firms that receive research grants from numerous govern-ment sources may be underachieving, i.e., they have few, if any, tangible re-sults to show from previous R&D awards (Lerner 1999, 2002 and Gompers and Lerner 1999). As suggested by Lerner (2002), the problem with such firms is that they can attribute the lack of results to the high-risk nature of their projects. This means that firms can drift from one government agency to the next and avoid accountability for a long time, if not indefinitely and sug-gests that lack of co-ordination can lead to misallocation of government fund-ing.
In our (estimating) sample, there are 262 SMEs that have received at least one type of government funding. Of these, about 32% have received more than one type of government funding. We can study the characteristics of these SMEs using Poisson regression model for count data. The primary equation in the Poisson model (Greene 2000, p. 880) is
λ λ= =( )
!
i iyi
i ii
eProb Y y
y (2)
where = 0,1,2,3,...iy and where typically λ β=ln( ) 'i iX . In our case, the de-pendent variable is the number of government institutions from which an SME applies for and receives funding. We use the same vector of explanatory variables as above.
Table 10.6 provides results of estimating a standard regression model (with = 0,1,2,3,...iy as the dependent variable) using OLS and equation (2) using maximum likelihood methods. The table shows, for example, that lar-ger, export-oriented SMEs are more likely to apply for and receive more than one type of government funding. What is interesting is that the table also shows that i) small R&D intensive firms are neither more nor less likely to ap-ply for and receive more than one type of government funding, ii) that small-ish SMEs are less likely to apply for and receive more than one type of gov-ernment funding, and finally iii) that SMEs audited by the Big Five interna-tional accounting firms are more likely to apply for and receive more than one type of government funding.49 Finally, it is perhaps of some interest to note that SMEs that reside in the Western- and Eastern Provinces, are more likely to apply for and receive financing from several sources than those SMEs that reside in the Province of Uusimaa. There seems to be a regional dimension in the allocation of government funding to Finnish SMEs.

364 · Ar i Hyyt inen and Lotta Väänänen
Table 10.6. Count model regressions
Coef. Coef.
AGEi -0.004 2.36 ** -0.008 2.00 **EMPi 0.003 1.72 * 0.004 2.11 **GROWTHi 0.221 2.15 ** 0.219 2.09 **HIGHRDi 0.104 0.47 -0.039 0.19PATENTi 0.211 1.90 * 0.131 0.90INTANGi 0.079 1.08 0.165 1.42HIGHEXPORTi 0.270 2.90 *** 0.313 2.53 **FOREOPERi 0.106 1.09 0.149 1.02AUDITi 0.193 2.67 *** 0.337 2.95 ***PROFITi -0.229 2.57 ** -0.392 2.76 ***PROFITCHi -0.015 0.30 -0.046 0.43LOANDENi 0.142 1.02 0.242 1.31SRDi 0.035 0.15 0.410 1.63SDi -0.292 4.03 *** -0.773 5.32 ***INNO1i 0.169 3.00 *** 0.437 3.47 ***INNO2i 0.096 1.50 0.233 2.08 **CEOAGEi 0.000 0.09 0.001 0.09CEOEDUCi 0.007 0.10 0.001 0.01REGIONi 0.122 1.65 * 0.234 1.68 *SECTOR
Medium-tech -0.034 0.37 -0.079 0.54Info-intensive -0.101 1.02 -0.150 0.84Other -0.143 1.78 * -0.377 2.38 **
PROVINCEWest 0.093 1.79 * 0.240 1.99 **East 0.182 2.16 ** 0.333 2.05 **North 0.122 1.33 0.262 1.51
ObservationsLog likelihoodF-stat (Chi2 for Poisson)
degr. of freedomsignificance
R2 (R2pseudo for Poisson)
t-stat. z-stat.OLS Poisson
0.31 0.18
0.00 0.00 25 25
10.61 360.72 -590.81
763 763
Note: The data is based on the survey administered by the Research Institute of the Finnish Economy (ETLA) in December 2001 - January 2002. *** denotes statistical significance at 1% level, ** at 5% level and * at 10% level.
10.4.3. ASSESSMENT
We find that as many as every third SME has hitherto applied for and re-ceived at least one type of government funding. Further, nearly every fifth Finnish SME has recently applied for and received at least one type of gov-ernment funding. We also find that of the recently supported SMEs, every third SME has received more than one type of government funding. If any-thing, these findings indicate the Finnish government is rather heavily inter-vening in the market for SME finance.

Government funding of smal l and medium-sized enterpr ises in Finland · 365
What can be deduced from our econometric analysis? To answer the question, we must first emphasize that the data generated by selection proc-esses is in sharp contrast to the data that we would observe if government funding was allocated across firms randomly. If we find that the probability that SMEs apply for and receive government funding is in no way related to, say, their R&D intensity, it indicates that SMEs apply for and receive gov-ernment funding independently of their R&D intensity (holding other things constant).50 However, if we find for example a positive relation, it tells us something about the two selection processes. On the one hand, it suggests that firms that are, on average, R&D intensive, have applied for government funding. On the other hand, it suggests that the screen of the government or-ganization providing the funding favors (does not discriminate against) R&D intensive firms. Of course, it may be that both selection processes work to-wards the same direction, enforcing each other.
Overall, it is rather encouraging to find that the econometric results are consistent with the official rhetoric and the general idea of what the institu-tions are set to do. For example, the unweighted regressions showed that the probability that an SME applies for and receives Finnvera funding is much larger if its loan application has been rejected in the market place than if it has not been rejected. Similarly, the probability that an SME applies for and receives Tekes funding is much larger if it is an R&D intensive firm than if it is not. Because these effects are large, they should not be taken at face value. They do indicate, however, that there are strong selection processes at work.
It is also encouraging to find that there are only few, if any, SME char-acteristics that have a similar effect across the various types of government funding on the probability that SMEs apply for and receive government funding. This suggests that different types of SMEs apply for and receive dif-ferent types of government funding. What is not as encouraging to find is the following: The only characteristic that seemed to reduce the likelihood of ap-plying for and receiving government funding across all types of government funding except government venture capital was the smallness of an SME. This importance of realized sales is interesting since many of the characteris-tics that make the SMEs different, such as their size, growth-orientation, and innovativeness, are controlled for. It may be indicative of many things, in-cluding too high application costs and a possible bias against funding SMEs with little realized sales.51
Our econometric results indicate that the characteristics explaining why some SMEs are more likely than their counterparts to obtain many types of government funding are quite in line with what one would expect. Exam-

366 · Ar i Hyyt inen and Lotta Väänänen
ples of such characteristics are the growth-orientation of an SME and its ‘in-novativeness’ in the recent past. A not so encouraging finding is, however, that one of the characteristics is whether an SME audited by one of the “Big Five” accounting firms. The systematic pattern is, in fact, consistent with a wrong kind of self-selectivity: firms audited by the Big Five should, despite the recent Enron scandal, be more “transparent” and therefore more likely to obtain funding in the market place, holding other things constant (see Hyyti-nen and Pajarinen 2002 and the references therein). It is also inconsistent with the idea that the government institutions are overcoming the information problems that the private sector cannot and thus solving the fundamental problem of finding out those truly eligible for government funding. While our analysis does not allow us to exclude other explanations, a danger is that these firms drift from one government agency to the next because they have found that it is a means to enhance their profits.
10.5. CONCLUSIONS
Not unlike elsewhere, the government in Finland has been keen to provide funding to Finnish firms, especially SMEs. In this Chapter we review, in the light of the economic rationales for public efforts to finance SMEs, all of the government institutions providing SME funding in Finland, and what the in-stitutions are set to do. Using recently collected data on SMEs, we then ex-plore what kinds of SMEs apply for and receive government funding in Finland and whether there are systematic differences between SMEs that ap-ply for and receive different types of government funding.
Our main findings are as follows:
• The rhetoric in the legislation on what the institutions are set to do is not fully in line with what the economic rationales suggest.
• The total amount of government funding awarded to SMEs has over the past four years grown quite rapidly (according to our estimates, as much as 18% in real terms). Moreover, it seems that the growth has coincided with increases in the availability of external finance on the marketplace.
• As many as every third SME has applied for and received at least one type of government funding. Comparing our estimate for the direct SME fund-ing granted by the government institutions (about €575 million in 2001) to an estimate for the classical venture capital investments (i.e., excluding MBOs and restructuring finance) made by the private Finnish venture capitalists (about €208 million in 2001) shows that the volume of govern-

Government funding of smal l and medium-sized enterpr ises in Finland · 367
ment funding is not negligible. If anything, these findings indicate that the Finnish government is rather heavily intervening in the market for SME finance.
• Overall, the econometric results are consistent with the official rhetoric and the general idea of what the institutions are set to do. For example, the unweighted regressions showed that the probability that an SME ap-plies for and receives Finnvera funding is much larger if its loan applica-tion has been rejected in the market place than if it has not been rejected. Similarly, the probability that an SME applies for and receives Tekes fund-ing is much larger if it is an R&D intensive firm than if it is not. While these findings suggest that there are selection processes at work, one can-not draw conclusions about selectivity (i.e. whether the ‘right’ SMEs get financed) nor about the welfare effects of government funding (cf. de Meza 2002).
• There are only few SME characteristics that have a similar effect across the various types of government funding on the probability that SMEs apply for and receive government funding. This suggests that from a cross-sectional perspective, different types of SMEs apply for and receive differ-ent types of government funding.
Taken together, the results of this Chapter indicate that the characteris-tics of SMEs explaining why some SMEs are more likely than their counter-parts to apply for and receive different types of government funding are quite in line with what one would expect, both on the basis of the economic rationales for governments to provide funding to SMEs and on the basis of what we have called official rhetoric. We find however that SMEs who are audited by one of the “Big Five” accounting firms are more likely to obtain many types of government funding. This kind of evidence is consistent with a wrong kind of selectivity, not least because such firms are less likely to be constrained by the availability of private capital (see Hyytinen and Pajarinen 2002, and Hyytinen, Rouvinen, Toivanen and Ylä-Anttila, Chapter 11 in this volume). Moreover, while there are some certainly plausible explanations for the positive correlation between private and public funding over time, the correlation also suggests that the institutions providing government funding may have had difficulties in distinguishing between the demand for private and public funding. Policies of investing in collaboration with private finan-ciers and the explicit and implicit self-sufficiency requirements that the gov-ernment institutions face may also have contributed to the positive correla-tion, as they reduce the possibility to act counter-cyclically. If, as practitioners

368 · Ar i Hyyt inen and Lotta Väänänen
often argue, market failures become more severe during downturns, the pol-icy of investing in collaboration with private financiers and the self-sufficiency requirements may hamper the ability of the government institu-tions to act appropriately.
To conclude, our results also suggest that the fundamental screening problem of finding out SMEs truly eligible for government funding is per-haps not addressed adequately in practice. If SMEs receive funding regard-less of whether it is needed, there is a danger that the institutions providing government funding “can claim credit for the firms’ ultimate success even if the marginal contribution of the public funds was very low” (Lerner 2002, p. 14; see also Jaffe 2002). Worse yet, it may be that certain types of SMEs that despite the recent favorable financial development still face problems in rais-ing external finance and that are truly in need for government funding do not get financed. Our analysis thus highlights the importance of emphasizing se-lectivity – both across SMEs and intertemporally – in the provision of gov-ernment funding. Coordination between the different government institu-tions and with the market conditions (timing) could probably be improved, too.

Government funding of smal l and medium-sized enterpr ises in Finland · 369
REFERENCES
Arenius, P., Autio, E., Kovalainen, A., Reynolds, P. D., 2001, The global entrepreneurship monitor, Helsinki University of Technology, Center for Technology Management Research Reports 1-2001.
Arrow, K. J., 1962, Economic welfare and the allocation of resources for invention, in: The rate and direction of inventive activity, Princeton University Press, Princeton, 609-625.
Asplund, R. (Editor), 2000, Public R&D funding, technological competitiveness, productivity, and job creation, The Research Institute of the Finnish Economy (ETLA), B:168.
Berger, A., N. and Udell, G. F., 1998, The economics of small business finance: The roles of private equity and debt markets in the financial growth cycle, Journal of Banking and Finance, 22, 613-673.
Carpenter, R., E. and Petersen, B. C., 2002, Capital market imperfections, high-tech investment, and new equity financing, Economic Journal, 112, F54-F72.
Central Statistical Office in Finland, 1991, Industrial innovation in Finland: An empirical study, Studies 184, Helsinki.
Christensen, C., E. 2001, Seed capital in the Nordic countries: Best practice, a report prepared for the Nordic Industrial Fund.
Cressy, R., 2002, Funding gaps: A symposium, Economic Journal, 112, F1-F16.
de Meza, D., 2002, Overlending?, Economic Journal, 112, F17-F31.
Finnish Industry Investment, Annual Reports 1997-2001.
Finnvera, Annual Reports 1999-2001.
Finnvera, Suomen yrittäjät, 2002, Pk-yritysten rahoituskysely, Toukokuu 2002.
Greene, W., 2000, Econometric analysis, New York University, Prentice-Hall.
Griliches, Z., 1992, The search for R&D spillovers, Scandinavian Journal of Economics, 94, 29-47.
Gompers, P. and Lerner, J., 1999, Capital formation and investment in venture markets: A report to the NBER and the advanced technology program, Report GCR-99-784, Washington: Advanced Technology Program, National Institute of Standards and Technology, U.S. Department of Commerce.
Graubard, B.I. and Korn, E.L. 2002, The use of sampling weights in the analysis of survey data, In: An analysis of operating characteristics of surveys in developing and transition countries: Survey costs, design effects and non-sampling errors, United Nations Statistics Division, Chapter 20.
Holtz-Eakin, D., 2000, Public policy toward entrepreneurship, Small Business Economics, 15, 283-291.
Honkapohja, S. and Koskela, E., 1999, The economic crisis of the 1990’s in Finland, Economic Policy, 14, 400-436.
370 · Ar i Hyyt inen and Lotta Väänänen
Hyytinen, A. and Pajarinen, M., 2003, Small business finance in Finland: A descriptive study, Chapter 6 in this volume.
Hyytinen, A. and Pajarinen, M., 2002, External finance, firm growth and the benefits of information disclosure: Evidence from Finland, The Research Institute of the Finnish Economy (ETLA), Discussion papers, nr. 805.
Hyytinen, A., Kuosa, I. and Takalo, T., 2003, Law or finance: Evidence from Finland, European Journal of Law and Economics, forthcoming.
Hyytinen, A., Rouvinen, P., Toivanen O. and Ylä-Anttila, P., 2003, Does financial development matter for innovation and economic growth? Implications for public policy, Chapter 11 in this volume.
IMD (Institute for Management Development), 2002, IMD World Competitiveness Yearbook 2002.
Jaffe, A. B., 2002, Building programme evaluation in the design of public research-support programmes, Oxford Review of Economic Policy 18, 22-34.
Kera Oyj, Annual Reports 1997 and 1998.
Kiander, J. and Vartia, P., 1996, The great depression of the 1990’s in Finland, Finnish Economic Papers, 9, 72-88.
King, G. and Zeng, L., 2000, Logistic regression in rare events data, Political Analysis, 9:2.
King, G. and Zeng, L., 2001, Explaining rare events in international relations, International Organization, 55: 3, 693-715.
Lach, S., 2002, Do R&D subsidies stimulate or displace private R&D? Evidence from Israel, Journal of Industrial Economics, 50, 369-390.
Lerner, J., 1999, The government as venture capitalist: The long-run effects of the SBIR program, Journal of Business, 72, 285-318.
Lerner, J., 2002, When bureaucrats meet entrepreneurs: The design of effective ‘Public Venture Capital’ programs, Economic Journal, 112, F73-F84.
MTI (Ministry of Trade and Industry), 1993, National industrial strategy for Finland, Ministry of Trade and Industry Finland Publications 3/1993.
MTI (Ministry of Trade and Industry), 1996, A new outlook on industrial policies, Ministry of Trade and Industry Finland Publications 4/1996.
MTI (Ministry of Trade and Industry), 2000, Comparison of public special financing programs for SMEs: Canada, Finland, France, Germany and Norway, Ministry of Trade and Industry Finland Studies and Reports 21/2000.
Muotio, M., 1998, Pk-yritykset ja julkinen tuki: Tutkimus yritystukilain mukaisten yritystukien vaikuttavuudesta, toimivuudesta ja kehittämistarpeista, Vaasan yliopiston tutkimuslaitos, Nr. 77.
North, D., Smallbone, D. and Vickers, I., 2001, Public sector support for innovating SMEs, Small Business Economics 16, 303-317.
Prihti, A., Georghiou, L., Helander, E., Juusela, J., Meyer-Krahmer, F., Roslin, B., Santamäki-Vuori, T. and Gröhn, M. 2000, Assessment of the additional appropriation for research, Sitra Reports series 2.
Rosenlew, G., 1985, Utvecklingsbolag – Ide och verklighet, Ekonomiska Samfundets Tidskrift 3, 125-130.

Government funding of smal l and medium-sized enterpr ises in Finland · 371
Rouvinen, P., 2002, Is technology policy practiced as it is breached? Finnish evidence, mimeo, The Research Institute of the Finnish Economy (ETLA).
Seppä, M., 2000, Strategy logic of the venture capitalist, Jyväskylä Studies in Business and Economics 3, University of Jyväskylä.
Sitra, Annual Reports 1997-2001.
Tekes, Annual Reports 1997-2001.
Web sites:
www.finlex.fi
www.finnvera.fi
www.finpro.fi
www.ktm.fi
www.sitra.fi
www.tekes.fi
www.te-keskus.fi
www.teollisuussijoitus.fi
www.yrityssuomi.fi

372 · Ar i Hyyt inen and Lotta Väänänen
APPENDIX 1. INDIRECT INVESTMENTS
Figure 10.9. Relative shares of indirect financing by institution (1997-2001)
1997 1998 1999 2000 20010%
10%
20%
30%
40%
50%
60%
70%
80%
90%
100%
FII Sitra Tekes Finnvera
Note: The data are from the annual reports (1997-2001) of the relevant institutions. Indirect financing refers to fund investments by Sitra and FII, as well as to Finnvera’s guarantees and Tekes’ financing channeled to SMEs via large company projects.

Government funding of smal l and medium-sized enterpr ises in Finland · 373
APPENDIX 2. SAMPLE AND SAMPLE WEIGHTS
The data are based on the survey administered by the Research Institute of the Finnish Economy (ETLA) in December 2001 - January 2002. The un-weighted sample has over-sampled high-tech firms, thus the weighting is done by assigning different weights to industry groups to randomize the sample.
Table 10.7. Sample description – Panel A
n % n %
BASIC CHARACTERISTICS
AGEi Infant 153 15.6% 125 12.8% Adolescent 228 23.3% 235 24.0% Old 597 61.0% 618 63.1%
EMPi Small SMEs 599 61.2% 651 66.5% Large SMEs 379 38.8% 327 33.5%
GROWTHi Low growth 587 60.0% 704 72.0% High growth 352 36.0% 227 23.2% N/A 39 4.0% 47 4.8%
INNOVATIVENESS
RDi No R&D 328 33.5% 516 52.8% Low R&D 360 36.8% 345 35.3% High R&D 274 28.0% 110 11.2% N/A 16 1.6% 7 0.7%
PATENTi Yes 121 12.4% 52 5.3% No 855 87.4% 926 94.7% N/A 2 0.2% 0 0.0%
INTANGi Yes 215 22.0% 127 13.0% No 760 77.7% 851 87.0% N/A 3 0.3% 0 0.0%
Unweighted Weighted

374 · Ar i Hyyt inen and Lotta Väänänen
Table 10.8. Sample description – Panel B
n % n %
INTERNATIONALIZATION
EXPORTi No exports 598 61.1% 707 72.3% Low exports 233 23.8% 190 19.5% High exports 146 14.9% 80 8.2% N/A 1 0.1% 0 0.0%
FOREOPERi Yes 94 9.6% 55 5.6% No 884 90.4% 923 94.4%
AUDITi Yes 217 22.2% 180 18.4% No 757 77.4% 793 81.0% N/A 4 0.4% 5 0.5%
PROFITABILITY
PROFITi Yes 771 78.8% 791 80.9% No 203 20.8% 187 19.1% N/A 4 0.4% 0 0.1%
PROFITCHi Yes 476 48.7% 482 49.3% No 475 48.6% 468 47.8% N/A 27 2.8% 28 2.9%
OTHER
LOANDENi Yes 55 5.6% 50 5.1% No 923 94.4% 928 94.9%
Unweighted Weighted
Government funding of smal l and medium-sized enterpr ises in Finland · 375
ENDNOTES
1 Following the recommendation by the European Commission 96/280/EU, an SME is in this study defined, whenever possible, as a firm that employs less than 250 people and that either has an annual turnover of at most 40 million euros or a balance sheet total of at most 27 million euros, and less than 25 percent of the shares are owned by large companies. 2 An SME council report of the MTI, written in 1990, had already emphasized the importance of developing the Finnish venture capital industry that had begun to emerge in the 1980s but that almost disappeared because of the economic distress of the early 1990s. See Seppä (2000, p. 214) for further details. 3 In addition, Finland ranks first in the question of how well rights and responsibilities of shareholders are defined. Because investor protection has been found to be an important determinant of the availability of external finance to firms, this could be regarded as an indication of the availability of finance to firms in the long-run. 4 There is some evidence supporting this view. For example, according to the survey data reported in the IMD World Competitiveness Yearbook 2002, Finland ranks first in the question of how sufficient cash flow is generally to allow companies to self-finance. 5 In general, Finland’s public financing programs have been regarded as competitive and successful (see, for example, Muotio (1998), MTI (2000), and Prihti et al. (2000), the studies summarized in Asplund (2000), and Rouvinen (2002)). However, relatively few studies have taken a ‘holistic’ look at the allocation of SME finance. Therefore, relatively little is known about the characteristics of SMEs that apply for and receive government funding from various government organizations. 6 In addition to SME financing, the institutions offer various support activities that include services and con-sulting, training, networking programs, and research. TE-Centers offer a variety of consulting and advisory services, as well as training programs. Tekes promotes networking in R&D through its Technology Programs, and Sitra supports networking in both its innovative programs as well as in its equity funding. Furthermore, Sitra plays an important role in training and in conducting societal research, and Tekes finances both basic and applied research at universities, research institutions, and companies. Other governmental and semi-governmental organizations also provide non-financial support to SMEs. For example Finpro has a role in promoting SME internationalization by offering marketing services and market information. In this Chapter we focus on funding and abstract almost entirely from these non-financial support programs. 7 If capital markets were perfect, the ultimate motivation to subsidize an R&D project on this ground has to do something with (external) spillovers. If initiating a seemingly unprofitable R&D project renders another project profitable, a firm should initiate also the unprofitable project on its own if the total effect will even-tually be profit enhancing. If it is not and if there are no spillovers involved in either of the two projects (i.e., any social returns beyond the private returns), why should the government help the firm in initiating the unprofitable project? 8 In addition, if the government institutions were better than private sector financiers in identifying SMEs that are of high quality, they might also be able to encourage private sector financiers to invest in some of the SMEs that would otherwise remain unfunded in the marketplace (certification hypothesis). See Lerner (1999) for further discussion. 9 Holtz-Eakin also considers whether insufficient risk-taking and market inefficiency would constitute a ra-tionale for treating SMEs preferentially. He concludes that they do not and that on the basis of economic analysis “it is surprisingly difficult to construct a case in favor of systematically favoring small businesses.” (p. 283). ‘ 10 Note that here the term market failure is understood to encompass a rather wide range of failures, includ-ing what some call a system failure in, e.g., an innovation system.

376 · Ar i Hyyt inen and Lotta Väänänen
11 This means that there is a huge amount of information that the institutions providing government fund-ing should process to overcome the same information asymmetries that the private sector financiers can-not and to identify SMEs that are likely to generate positive externalities. 12 de Meza’s (2002) conclusions further qualify this view. He emphasizes that there is a real possibility that lending needs to be curtailed, rather than expanded, to increase efficiency. 13 The source of all the quotes on the legislation is the database at www.finlex.fi. Translations are au-thors’ own. 14 Article 87 of the EC Treaty, 87(1): “1. Save as otherwise provided in this Treaty, any aid granted by a Mem-ber State or through State resources in any form whatsoever which distorts or threatens to distort competi-tion by favoring certain undertakings or the production of certain goods shall, insofar as it affects trade be-tween Member States, be incompatible with the common market.” 15 Section 2 also defines a business support program: “A business support program refers to a system, which is based on legislation or official decision, where the target, form and amount of the business subsidy is de-fined, and by virtue of which individual business subsidy decisions are made.” (Authors’ translation) 16 Source: Ministry of Trade and Industry web site www.ktm.fi 17 Seppä (2000) carefully cites Rosenlew and also provides other references on contemporary accounts of Finnish firm finance. 18 Since the end of the first wave, the Finnish financial system has disengaged from relationship-based debt finance towards increasing influence of stock markets. During the same period, also creditor protection has been weakened while shareholder protection has been strengthened (Hyytinen, Kuosa and Takalo 2003). 19 The following quote from Finnvera’s Annual report hints at how Finnvera is monitored: “Deficiencies on the financial market are charted annually by means of financial studies and analyses. By monitoring [Finn-vera], it is determined how well [Finnvera’s] operations can compensate for existing financial market defi-ciencies.” (Finnvera’s Annual report 2001, p.26) 20 Finnvera’s Annual Report 2001, p.4 21 “Finnvera is exempt from the Act on Credit Institutions; as well it is beyond the Banking Supervisory Au-thorities jurisdiction… The Republic of Finland provides annual assistance to it in three additional ways: in-terest rate subsidy, credit and guarantee loss subsidy, and operating subsidy.” (MTI 2000, p.31) 22 All the time-series presented in this Chapter have been deflated using the consumer price index so that the time-series data are measured at 2001 price level. 23 Over the years 1999-2001, Finnvera’s financing granted to micro firms (defined as firms employing less than 10 people) has increased (in 2001 prices) from just over €150 million to around €180 million, and that to other SMEs has gone up from €320 to €450 million. Finnvera’s foreign risk-taking commitments are mostly directed to major companies. Well below ten per cent of guarantees covering foreign risks are granted to SMEs, yet out of Finnvera’s 240 foreign risk-taking clients, one third are SMEs. 24 The interest rate is three percentage points below the Central Bank rate, yet at least 1%. The interest rate on capital loans is two percentage points higher than that for loans. The first five years can be free of re-payments. 25 In companies’ product development projects Tekes’ typical share of total project finance for SMEs is 35% in R&D grants, 45% in capital loans, and 70% in R&D loans. These figures are higher for SMEs than for large companies. For companies’ research projects the respective figures are 50%, 60%, and 70%. 26 From 1997 to 2001 Tekes’ financing granted to small firms has by 42% in real terms, and that to medium-sized firms has gone up by 32% in real terms. 27 “Competitiveness is evaluated using the following yardsticks: the involvement of the entrepreneurs, the credibility of the concept, the technical and commercial competitiveness of the product/s, market and transfer prospects, strength of know-how and technology, sufficient expertise in entrepreneurship” 28 Sitra’s holding in the start-up stage is usually 15-40 per cent. At the same time, Sitra's representative par-ticipates as a board member in the management and the running of the company, and helps the company to establish international contacts. In general the size of Sitra’s involvement varies between €0.2-2.0 million. Exit from portfolio investments takes place normally within 3-6 years.

Government funding of smal l and medium-sized enterpr ises in Finland · 377
29 “The most likely partners are from the public sector, especially Tekes, from which nearly all Sitra’s compa-nies have received funding” (Annual report 2001, p. 22) and “about a half of Sitra’s portfolio consists of syndi-cations” (Annual report 2001, p. 12) 30 According to Sitra, it also aims at creating SME networks for promising fields of business. It also tries to fill the (financing) ‘gap’ between a business idea and venture capital. To this end, it together with Tekes set up a PreSeed fund in 2001 that provides financing in two phases. The first phase, LIKSA, funds the development of a business plan from a profitable idea. The second phase, INTRO, introduces companies to prospective investors. Finally, Sitra also promotes technology transfer in collaboration with technology-transfer compa-nies. 31 In 2001, seed and start-up companies made up almost half of Sitra’s investment portfolio by value of in-vestment, and early-growth companies close to one fourth. 32 These are, as quoted on FII’s web site, “to encourage more efficient functioning of the venture capital in-vestment market by investing actively in new venture capital and private equity funds in Finland, to pro-mote product realization and commercialization of new innovations by investing in seed and growth-stage enterprises together with private investors, to promote regional venture capital investment, to use direct in-vestments to enable major investments in corporate development, corporate restructuring and the launch of new industrial projects.” 33 More specifically, TE-Centres operate under the supervision of MTI, Ministry of Agriculture and Forestry, and Ministry of Labour. MTI is responsible for their general administration. 34 Financing provided by TE-Centers includes funds from the Finnish government as well as from the EU Structural and Social funds. The share of national funding is slightly over half of the total subsidies granted. The subsidies are mainly targeted to the EU objective programs. 35 Direct financing refers to subsidies, loans, capital loans, and direct equity investments. Indirect financing refers to fund investments by Sitra and FII, as well as to Finnvera’s guarantees. We wish to emphasize that indirect financing, as we have defined it here, is not necessarily directed only to Finnish SMEs. 36 Figure 10.9 in the Appendix 1 shows the relative shares of indirect financing by FII, Sitra, and Finnvera. 37 This is especially clear in the case of Finnvera Ltd and FII. For the other institutions such an objective has not been set so explicitly, though Sitra seems to emphasize it in its own reports. 38 There are exceptions to this view. For example, a government institution might be pursuing activities that are strongly complementary to the activities that it is supposed to finance. In this case, scope economies might arise, rendering the activities that aim at rectifying market failures “profitable” in economic terms. This argument presupposes however strong specialization by the government institution and that it has a com-parative advantage in financing the (complementary) activities. 39 The empirical analysis that follows is based on new data originating from a recently conducted primary survey administrated by the Research Institute of the Finnish Economy (ETLA) and its subsidiary Etlatieto Ltd. The survey was conducted between December 2001 and January 2002. It resulted in a dataset that covers close to 1000 SMEs from all major sectors of the Finnish economy. Only farm (agricultural), financial, and real-estate sectors are fully excluded. The data cover only SMEs that are not proprietorships, partner-ships, or subsidiaries. A detailed description of the survey and data is presented in Hyytinen and Pajarinen (2003). 40 Our data would in principle allow us to study the financing provided by Sitra separately from other gov-ernment venture capital. The total number of SMEs applying for and receiving funding from Sitra is however very small, both in the population of Finnish firms and in our sample. The numbers we could have pre-sented for Sitra would have been based on “rare events” data. Because we cannot be sure that the firms fi-nanced by Sitra that are in our sample are representative of the firms Sitra actually finances, we only con-sider composite government venture capital. 41 To find out the extent of gratuitous funding received by SMEs, entrepreneurs were in the survey asked in a series of questions (Questions 52-55) whether their company had received aid, grants or guarantees from 1) Finnvera, 2) Tekes, 3) Sitra or 4) some other governmental or municipal organization or other public insti-tution during the last fiscal year or thereafter [or: prior to the last fiscal year]. To find out the extent of non-gratuitous funding received by SMEs, the series of questions was repeated in identical form except that “aid, grants, guarantees” was replaced with “loans, capital loans or equity investments”. Some of these questions had a multi-layer structure that was used to further investigate why an SME had not applied for govern-ment funding, etc.

378 · Ar i Hyyt inen and Lotta Väänänen
42 The entries in the table can be interpreted as the conditional probability that an SME applies for and re-ceives certain type of government funding, given its characteristics. 43 KPMG Wideri, Arthur Andersen, SVH PriceWaterhouseCoopers, Tuokko Deloitte & Touche, or Tilintarkasta-jien Oy Ernst & Young. 44 It is important to note that we have not been able to test the statistical significance of these patterns. The reasons for this are that there are low frequencies of SMEs financed by government venture capital (small number of observations in the sample), and that there are low expected frequencies in the case of some of the categories (over 20% of cells have expected frequencies less than 5). 45 When using a stratified random sample, as we have done, it should be noted that unweighted estimates have the risk of being biased. Although weighted estimates would be approximately unbiased for popula-tion parameters, we refrain from using weighted regressions here, because of the loss of efficiency caused by weighting. However, we have also run regressions on the weighted sample, and due to the slight differ-ences in the significant coefficients in the two models, we stress mainly those results that are significant in both models. Furthermore, we have run a model including interaction variables for the stratifying variables (sector) and the other explanatory variables, and performed a likelihood-ratio test between the two models, concluding that the restricted model cannot be rejected. (For a discussion on the use of weighted versus unweighted samples, see Graubard and Korn 2002). 46 In particular, the four SME characteristics that seemed to systematically classify SMEs to users and nonus-ers of government funding, no longer work. If anything, this finding illustrates the benefit of using multi-variate techniques. 47 The same caveat applies as in the logit regressions, see endnote 42. 48 A consequence of such calls is, at least in part, that the government institutions providing public support to Finnish firms have recently launched a joint internet-service “Yritys-Suomi”, which collects the different products and services offered by the various institutions, and serves as the point of information for SMEs. 49 The same caveat applies as in the logit regressions, see endnote 42. 50 There is a theoretical possibility that firms that are, on average, more (less) R&D intensive, have applied for government funding, but that the screen of the government organization providing the funding systemati-cally discriminates against (favors) R&D intensive firms. In this case, we find no relation if the two selection processes cancel each other exactly out. In our view, that hardly is likely. 51 If problems in commercialization of technology means little realized sales, the finding may be indicative of wrong kind of selectivity in the allocation of government funding. It therefore calls, if anything, further re-search.
Financia l systems and f i rm per formance: Theoret ical and empir ica l perspect ives · 379
11. DOES FINANCIAL DEVELOPMENT MATTER FOR INNOVATION AND ECO-NOMIC GROWTH? IMPLICATIONS FOR PUBLIC POLICY
Ari Hyytinen, Petri Rouvinen, Otto Toivanen and Pekka Ylä-Anttila*
Abstract: We consider whether financial development matters for innovation and economic growth and what implications the recent financial development in Finland has for the availability of financing to firms and, thus, for the public policy towards the Finnish capital markets and innovation policy. We argue that the recent financial develop-ment has enhanced the availability of capital a great deal. In particular, it is very dif-ficult to make a case that large firms or even representative small and medium-sized enterprises (SMEs) are constrained by the unavailability of external finance. How-ever, based on our empirical findings, survey data, and other evidence, we conclude that the growth-oriented and innovative sub-segments within the SME sector are still held back by financial constraints and that Finland would above all benefit from having a continuum of strong markets for external equity capital. We also conclude that because of the improved overall availability of capital, omnipresent government intervention in the Finnish capital markets is increasingly harder to justify purely on the basis of the existence of market failures in these markets. As a result of this, more selective capital market intervention is called for. The risk of crowding out potentially profitable businesses of private financiers or distorting their investment incentives increases as the Finnish financial system develops. The case for innovation policy may nevertheless have become stronger due to it being – at least potentially – com-plementary to the financial development.
* Ari Hyytinen, Petri Rouvinen and Pekka Ylä-Anttila are at the Research Institute of the Finnish Economy (ETLA) and Etlatieto Ltd, and Otto Toivanen at the Helsinki School of Economics. The authors would like to thank Markus Koskenlinna, Eva Liljeblom, Anu Nokso-Koivisto and Vesa Puttonen for helpful comments, and Mika Pajarinen and Lotta Väänänen for excellent research assistance. The views expressed in the Chapter are those of the authors. The usual caveat applies.
380 · Ar i Hyyt inen, Petr i Rouvinen, O tto Toivanen and Pek k a Ylä-Antt i la
11.1. INTRODUCTION
What are the determinants of long-term economic growth? What changes the rate of technological innovation? What can the government do to speed up both? There is now a large literature showing that financial development en-hances economic growth. For many, this is not surprising, as it is widely be-lieved that the more developed and efficient the financial system, the more efficient the accumulation of capital and allocation of resources, both across time and space, in an uncertain environment (see Levine 1997, p. 691 and the references therein). In this Chapter, we consider, in the light of the results of latest economic research, why financial development might matter for inno-vation and growth. We moreover consider what, if any, implications these re-sults and the recent financial development in Finland have for the availability of financing to Finnish firms – especially to small and medium-sized enter-prises (SMEs) – and for the public policy towards the Finnish capital markets and innovation policy.
In Figure 11.1 we illustrate the amount of economic growth Finland may have lost in the past due to it having, for long, a less developed financial system than Sweden and the US. The estimated effects are taken from two re-cent studies by Levine et al. (2000) and Levine (2002) that have used a large country-level data set to estimate the effects of financial development on eco-nomic growth. The estimates of the former study are based on an analysis of 71 countries over the 1960-1995 period and those of the latter on 48 countries over the 1980-1995 period. The figure suggests that an exogenous improve-ment in overall financial development, i.e., in the activity of stock markets and financial intermediaries, to the level that prevailed in Sweden over the 1980-1995 period, would have increased the real GDP per capita growth in Finland by 0.7 percentage points per year. Had we caught up with the US during the period, the increase would have been 1.2 percentage points per year. In similar fashion, had we had over the longer 1960-1995 period deeper markets for credit, as measured by the ratio of private sector credit issued by financial intermediaries to GDP, the increase in growth would have been 1.4 percentage points had we caught up with Sweden and 2.0 percentage points had we caught up with the US. Considering that the real per capita GDP growth in Finland averaged to about 2% over 1980-1995 and to 3% over 1960-1995, the economic significance of these effects is perhaps too large to be cor-rect. These estimates illustrate, however, the potentially significant role of fi-nance for economic growth in Finland.

Does f inancia l development matter for innovat ion and economic growth? · 381
Figure 11.1. The effect of financial development on economic growth
per
cent
age
poin
ts
"Had we caught up with Sweden""Had we caught up with the US"
0.0
0.5
1.0
1.5
2.0
2.5
Overall financial development (1980-1995)Private credit to GDP (1960-1995)
Note: Data sources are Levine et al. (2000), Levine (2002) and the authors’ calculations. The figure illus-trates the amount of economic growth Finland may have lost in the past due to it having for long a less developed financial system than Sweden and the US.
The observation that the effect of financial development on economic growth is not likely to be negligible sets the agenda for the rest of this Chap-ter. In Section 11.2 we provide a primer on the economics of financial devel-opment and economic growth. Empirical evidence is also reviewed. In Sec-tion 11.3 we develop a portrait of the current state of the Finnish financial system and corporate financing. Section 11.4 describes some recent trends in the Finnish economy and policy thinking and considers current priorities in the public policy towards capital markets and innovation policy in Finland. Conclusions are in Section 11.5.
11.2. FINANCIAL DEVELOPMENT, FIRM PERFORMANCE AND ECONOMIC GROWTH
11.2.1. WHY MIGHT FINANCIAL DEVELOPMENT MATTER?
Figure 11.2 (taken from Levine 1997) illustrates a theoretical approach to the finance-growth nexus. It shows how market frictions, including the costs of acquiring information and making transactions, provide a foundation for the emergence of financial markets, institutions and contracts. These financial ar-

382 · Ar i Hyyt inen, Petr i Rouvinen, O tto Toivanen and Pek k a Ylä-Antt i la
rangements, in turn, serve five basic functions: They i) mobilize savings, ii) allocate resources, iii) exert corporate control, iv) facilitate risk management, and v) ease trading of goods, services and contracts. Each of the functions promotes economic growth by increasing the accumulation of capital and the rate of technological innovation.
Figure 11.2. Finance-growth nexus
Market frictions- information costs- transaction costs
Financial markets and intermediaries
Financial functions- mobilize savings- allocate resources- exert corporate control- facilitate risk management- ease trading of goods,
services, contracts
Channels to growth- capital accumulation- technological innovation
Growth
Market frictions- information costs- transaction costs
Market frictions- information costs- transaction costs
Financial markets and intermediaries
Financial functions- mobilize savings- allocate resources- exert corporate control- facilitate risk management- ease trading of goods,
services, contracts
Financial functions- mobilize savings- allocate resources- exert corporate control- facilitate risk management- ease trading of goods,
services, contracts
Channels to growth- capital accumulation- technological innovation
Channels to growth- capital accumulation- technological innovation
Growth
Note: Source is Levine (1997).
To better understand Figure 11.2 it is useful to consider why the five basic functions increase the accumulation of capital and the rate of techno-logical innovation. Building on Levine (1997, pp. 691-701), several channels can be identified:
• By pooling capital from multiple small investors, the financial system mobilizes savings and accumulates capital for large real investment that would otherwise be constrained to economically inefficient scales. In ad-

Does f inancia l development matter for innovat ion and economic growth? · 383
dition to this direct effect on capital accumulation, better savings mobili-zation improves technological innovation, because the constraints of self-finance may bias firms’ investment strategy towards developing tech-nologies that are only marginally new. The bias arises, because developing such technologies often requires only small amounts of financing.
• The more developed the financial system, the more efficient the acquisi-tion of information about investment opportunities and hence the alloca-tion of resources (for a given level of capital accumulation). Economizing on the costs of information acquisition is important, because not doing so would prevent capital from flowing to the best production technologies. Further, a developed financial system promotes technological innovation because it is able to identify projects with the best chances of successfully developing commercially viable technologies and production processes (see also King and Levine 1993). The ability to identify such projects is important, because technology-intensive small businesses typically find it difficult to convey the quality of their ventures to the providers of external finance due to appropriability problems and confidential nature of R&D projects.
• Financial systems develop and specialize to exert corporate control, i.e., to monitor entrepreneurs and firm managers after providing funding to an activity or a project (see, e.g., Shleifer and Vishny 1997). Though there is some disagreement about the importance and effectiveness of the various mechanisms of monitoring, economizing aggregate monitoring and en-forcement costs is important for the accumulation and efficient allocation of capital. The efficiency of monitoring may be especially important for technological advance, because the profitability of technology-intensive SMEs’ growth opportunities is typically unknown and because R&D pro-jects are highly uncertain investments in untapped market niches and in tacit knowledge that becomes embedded in the human capital of employ-ees (see, e.g., Hall 2002).1
• Facilitating risk management enhances capital accumulation in the pres-ence of information and transaction costs, because it eases the trading, hedging and pooling of risks, especially liquidity and idiosyncratic risks. A liquid financial system improves the ability of savers to convert their investments (assets) into a medium of exchange, and increases thereby the accumulation of long-term capital available to illiquid production proc-esses.2 The illiquidity of a financial system may especially hamper the de-velopment of long-gestation technologies, i.e., technologies and industries whose development and maturing takes time. Risk diversification also
384 · Ar i Hyyt inen, Petr i Rouvinen, O tto Toivanen and Pek k a Ylä-Antt i la
eases technological advance, because, as Levine (1997) puts it: “The ability to hold a diversified portfolio of innovative projects reduces risk and promotes investment in growth-enhancing innovative activities” (p. 694).
• To ease trading of goods, services and contracts means facilitating ex-change. A developed financial system facilitates exchange, because it promotes specialization. Specialization is promoted, because more spe-cialization requires more transactions (compared to a more autarkic envi-ronment) and because various financial arrangements can lower the costs of these transactions. Specialization creates, in turn, a platform for innova-tion.
While we have discussed separately the direct effects of the five basic functions of a financial system on economic growth, they are likely to interact in various ways. The magnitude of the direct effects and the ways of interac-tion are not fully understood, as sometimes the functions can be substitutes and sometimes complements. What follows as a result is, however, a net ef-fect of financial development on capital accumulation, technological innova-tion and economic growth.
11.2.2. DOES FINANCIAL DEVELOPMENT MATTER?
Theories of financial development
There are several competing theories, or views, on what in financial devel-opment matters most for the (net) effect of financial development on eco-nomic growth. Ross Levine and his co-authors divide the debate into four views (see, e.g., Beck and Levine 2002, and Levine 2002): The bank-based view emphasizes the positive role of banks. According to this view, powerful banks can force firms to disclose information and enforce credit contracts, form long-term financing relationships with firms, provide staged financing even to long-gestation projects, and have an incentive to screen and monitor firms due to their market power. The market-based view builds on the view that the markets have a comparative advantage over banks in allocating capi-tal, especially to new industries. Powerful banks may be able to extract a too large part of the potential returns to innovative activities of new firms (due to their information advantage), protect their old relationship clients from new competition and inhibit effective restructuring of firms.
There are two other views besides those emphasizing the bank vs. market distinction. The financial services view posits that it is not important

Does f inancia l development matter for innovat ion and economic growth? · 385
whether banks or markets emerge to reduce information and transaction costs. Rather, it is the overall ability of the financial system to reduce these costs that matters, especially because banks and markets may be comple-ments in reducing them. The law and finance view, as summarized in La Porta et al. (1999, 2000), reasons that the determinants of financial development should be emphasized when considering the channels promoting economic growth. This view argues that the better the (legal) protection of outside in-vestors, the more developed the financial system and thus the more capital there is available for investment and innovation.
Empirical evidence
Which of the four views have received empirical support? In a series of influ-ential papers, Ross Levine and his co-authors have shown that it is hard to find evidence for the bank-based or the market based views (Levine and Zer-vos 1998, Beck and Levine 2002a, and Levine 2002). The main findings of these papers can be summarized as follows:
• It is the overall financial development, not having a bank-based or mar-ket-based system per se, that matters for economic growth. The data are thus consistent with the financial services view.3
• The legal system plays a critical role in determining the level of growth- promoting services. In particular, there is growing evidence that it is the predetermined component of financial development, attributable to the legal rights of investors and the efficiency of contract enforcement, that is most strongly associated with economic growth (see, e.g., Levine 2001).
While these findings are quite undisputed, other research suggests some qualifications and extensions to them. To begin with, a recent study by Rajan and Zingales (2002) suggests that financial development is not a mono-tonic process. There have been reversals in the development of financial mar-kets during the 20th century. Further, cross-country differences in the level of development have changed over time. This kind of evidence implies that the determinants of financial development can only partly be time-invariant, such as a country’s legal origin, and that the effects of politics (incumbent in-terest groups) can have a significant impact on the development. Beck et al. (2002) find, however, some evidence that the legal origin of a country influ-ences financial development, because rigid legal traditions may create a gap between the contracting needs of an economy and its legislation.

386 · Ar i Hyyt inen, Petr i Rouvinen, O tto Toivanen and Pek k a Ylä-Antt i la
While a main finding of the recent research is that overall financial de-velopment, i.e., both the stock market and banking development, predicts economic growth, there is also some evidence on the special role of stock markets. It has been found, for example, that stock market liberalization spurs investment (Bekaert and Harvey 2000, and Henry 2000) and economic growth (Bekaert et al. 2002). It has also been suggested that stock markets may have a comparative advantage in financing certain intangible invest-ments and innovation, and more generally, times of great industrial change (see, for example, Allen and Gale 2000, Ch. IV, Holmström and Kaplan 2001, Rajan and Zingales 2001). Though there is not much empirical evidence for this view (see however Carlin and Mayer 2002), it is consistent with the re-cent findings of Kortum and Lerner (2000) who find that increases in venture capital activity in an industry are associated with significantly higher patent-ing rates in the US. Further, it seems that new equity financing, in the form of an initial public offering (IPO), is very important for the growth of high-tech firms, as it permits a major increase in firm size at a critical phase of the firm’s lifecycle (Rajan and Zingales 1998, Carpenter and Petersen 2002). The forego-ing discussion emphasizes the importance of having a developed stock mar-ket and can be summarized as follows:
• When compared to stock market-oriented financial systems, bank-based financial systems may go along with smaller firms and end up specializ-ing in financing sectors that are more “traditional”, i.e., sectors that are not particularly new or R&D-intensive (see also Bugamelli et al. 2002).
Recent evidence suggests that besides overall financial development, local financial development matters for the economic success of an area. Us-ing Italian data, Guiso et al. (2002) document, for example, that the more de-veloped the local financial market, the higher the probability that an individ-ual starts his/her own business and the higher the growth of firms, especially that of the smaller firms. There also is growing evidence that liquidity con-straints (the availability of capital) place important roadblocks before poten-tial entrepreneurs4 and that the growth of the smallest firms are consistently most adversely affected by the deficiencies in a country’s financial and legal institutions (Beck et al. 2002a). Further, using a firm-level database covering 48 countries Beck et al. (2002b) document that firm size is an important de-terminant of whether firms have access to different types of external finance. Summing this discussion up provides us with another finding:
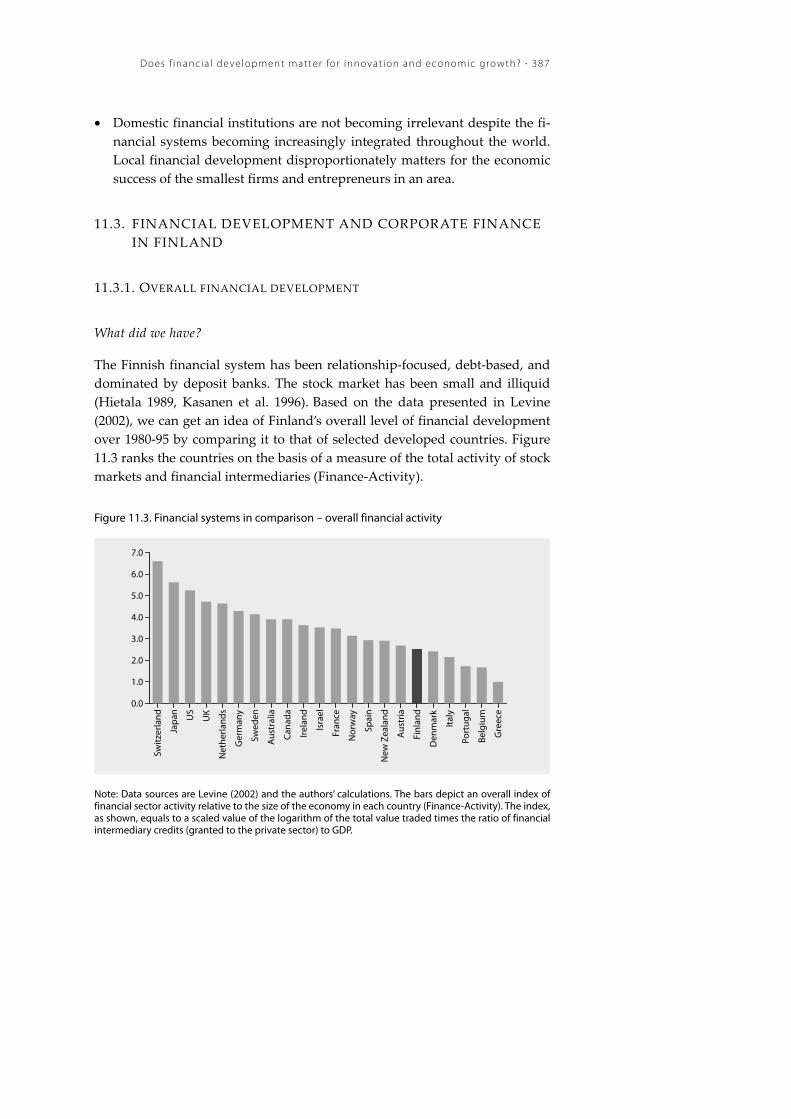
Does f inancia l development matter for innovat ion and economic growth? · 387
• Domestic financial institutions are not becoming irrelevant despite the fi-nancial systems becoming increasingly integrated throughout the world. Local financial development disproportionately matters for the economic success of the smallest firms and entrepreneurs in an area.
11.3. FINANCIAL DEVELOPMENT AND CORPORATE FINANCE IN FINLAND
11.3.1. OVERALL FINANCIAL DEVELOPMENT
What did we have?
The Finnish financial system has been relationship-focused, debt-based, and dominated by deposit banks. The stock market has been small and illiquid (Hietala 1989, Kasanen et al. 1996). Based on the data presented in Levine (2002), we can get an idea of Finland’s overall level of financial development over 1980-95 by comparing it to that of selected developed countries. Figure 11.3 ranks the countries on the basis of a measure of the total activity of stock markets and financial intermediaries (Finance-Activity).
Figure 11.3. Financial systems in comparison – overall financial activity
Swit
zerla
nd
Jap
an US
UK
Net
herla
nds
Ger
man
y
Swed
en
Aus
tral
ia
Can
ada
Irel
and
Isra
el
Fran
ce
Nor
way
Spai
n
New
Zea
land
Aus
tria
Finl
and
Den
mar
k
Ital
y
Port
ugal
Belg
ium
Gre
ece
0.0
1.0
2.0
3.0
4.0
5.0
6.0
7.0
Note: Data sources are Levine (2002) and the authors’ calculations. The bars depict an overall index of financial sector activity relative to the size of the economy in each country (Finance-Activity). The index, as shown, equals to a scaled value of the logarithm of the total value traded times the ratio of financial intermediary credits (granted to the private sector) to GDP.

388 · Ar i Hyyt inen, Petr i Rouvinen, O tto Toivanen and Pek k a Ylä-Antt i la
Figure 11.3 shows that, in terms of this measure, Finland has not had a par-ticularly large and active financial sector.5 Further, Figure 11.4 ranks the countries on the basis of a measure of the activity of stock markets relative to that of banks (Structure-Activity). The figure shows that relative to many other developed countries, Finland has had a bank-centered financial sys-tem.6
Figure 11.4. Financial systems in comparison – financial structure
Switz
erla
nd
Irela
nd US
UK
Jap
an
Can
ada
Isra
el
Aus
tral
ia
Swed
en
Net
herla
nds
Ger
man
y
New
Zea
land
Den
mar
k
Nor
way
Fran
ce
Spai
n
Belg
ium
Ital
y
Gre
ece
Finl
and
Aus
tria
Port
ugal
0.0
0.5
1.0
1.5
2.0
2.5
3.0
3.5
4.0
4.5
Note: Data sources are Levine (2002) and the authors’ calculations. The bars depict an overall index of stock market activity relative to that of the banking system in each country (Structure-Activity). The in-dex equals to a scaled value of the logarithm of the total value traded divided by the ratio of financial intermediary credits to GDP.
What has happened?
The structure of the Finnish financial system has thoroughly changed during the period 1980–2002, especially during the latter part of the 1990s. In par-ticular, due to the growth of the stock market and venture capital and the de-cline in financial institutions’ lending (relative to the size of economy), the Finnish financial system has shifted from relationship-based debt finance to-wards increasing importance of the stock market (Hyytinen and Pajarinen Chapter 1 in this volume, Hyytinen et al. 2003; see also Figure 11.5).

Does f inancia l development matter for innovat ion and economic growth? · 389
Figure 11.5. Financial development in Finland
Finance-ActivityStructure-Activity
Structure-Activity (w/o) Nokia0.0
0.5
1.0
1.5
2.0
2.5
3.0
Average 1980-1995 Average 1996-2000
Note: Data source is Hyytinen et al. (2003). The bars depict indexes calculated equal to Figure 11.3 (Fi-nance-Activity) and Figure 11.4 (Structure-Activity).
Why and how the recent financial development in Finland, and particu-larly the transformation toward a more stock market-based financial system, has influenced the ability of the Finnish financial system to perform the five basic functions of a financial system are important questions. There are, of course, no simple answers to these questions. However, the following general observations, which also apply to many other European countries, can be made:
• Compared to the situation that prevailed in the 1980s and also in the early 1990s, the overall mobilization of Finnish households’ savings has im-proved. It has improved, because the range of savings services that the Finnish financial system provides to households has widened.
Illustrative examples: The range of available savings instruments has increased,
implying that households can hold better-diversified portfolios of their financial
wealth than before. Further, thanks to improved efficiency of banks during the
latter part of the 1990s, as well as an increase in the number of available credit
instruments and non-bank credit institutions, households are today better able
to smooth their consumption intertemporally than they were in the early 1980s.

390 · Ar i Hyyt inen, Petr i Rouvinen, O tto Toivanen and Pek k a Ylä-Antt i la
It is likely that these kinds of improvements have enhanced the formation of
long-term capital available to Finnish firms.
• Allocation of resources has become more efficient, especially during the latter part of the 1990s.
Illustrative examples: For one thing, the operation of Finnish banks is currently
less connected to the maintaining power structures in the Finnish economy, as
the old “power spheres” have disappeared (Hyytinen et al. 2003). An indication
of these changes is that the deposit banks’ role as the direct owners of Finnish
firms has decreased (Hyytinen et al. 2003) and that the number of various kinds
of non-bank financial institutions has increased. Banks have also actively tried to
streamline their operations, not least because of the restructuring that the bank-
ing crisis of the early 1990s commenced. Because the role of relationship-based
debt in the Finnish financial system has decreased while that of the stock market
has grown in importance, and because integral to the recent financial develop-
ment (in Finland and also elsewhere in Europe) has been the growth of the mar-
ket for risk capital to firms (the venture capital market), the Finnish financial sys-
tem is now better positioned to allocate resources to new projects and ideas.
• It is not unwarranted to claim that the ability of the Finnish financial mar-kets to exert corporate control has improved during the past twenty years and specifically during the 1990s. Both the integrity and transparency of the capital markets as well as the protection of (minority) shareholders have improved (Hyytinen et al. 2003, and Chapter 2 in this volume, as well as Kaisanlahti Chapter 3 in this volume).
Illustrative examples: Overall, the Finnish system of corporate governance has
taken a major step towards the Anglo-Saxon corporate governance model. A
prime example of these changes is that the boards of directors of large Finnish
companies are no longer “insider boards” that used to consist mainly if not en-
tirely of the top management. Further, the role of banks in monitoring Finnish
firms has changed. The tight relationships have loosened, and the opportunities
for multiple banking relationships have increased. These changes have made
loan pricing more sensitive to the risk of the project and reduced many of the
adverse effects of relationship lending (see Rajan and Zingales 2001 for an analy-
sis of distortions in relationship-based systems).
• Finnish financial markets and institutions provide today a relatively wide range of means to trade, hedge, and pool risk. In particular, the liquidity

Does f inancia l development matter for innovat ion and economic growth? · 391
of the Finnish stock exchange has increased compared to what it was in the 1980s and during the economic crisis of the early 1990s.
Illustrative examples: Improved liquidity reduces Finnish stock investors’ liquidity
risk and enables a longer-term commitment of capital. Increases in the number
of financial instruments and opening up of the financial system have improved
the opportunities for risk diversification. It is likely that these developments
have increased the ability of the Finnish financial system to accumulate capital
and finance risky projects also at their earlier stages.
• Technological advance has enabled the adoption of financial arrange-ments that have lowered transaction costs.
Illustrative examples: Prime examples of such arrangements are the availability
and the prevalent use of electronic means of payment and credit cards. In
Finland, the ratio of notes in circulation to GDP is the lowest among the EU
countries and the use of bank and credit cards has doubled in terms of the num-
ber of transactions during the past ten years. While there is no direct evidence on
the economic effects of these developments for Finland, the recent evidence from
the US suggests that they are potentially larger than it has been thought: Blanch-
flower, Evans and Oswald (undated) show that most likely, because it is a means
to meet their instant needs of finance, nearly half of the new firms in the US rely
on their owners’ personal credit card. The authors also document that small
businesses have been able to circumvent liquidity constraints by carrying busi-
ness-related credit card debt, and that firms that use credit cards grow much (i.e.,
about twice) faster than those that do not. This finding is in line with the Finnish
evidence showing that domestic finance companies are clearly a more important
source of debt finance to the youngest SMEs than to older SMEs (Hyytinen and
Pajarinen, Chapter 6 in this volume). More generally, the effect of technology-
facilitated exchange is to promote specialization at the micro level. With greater
specialization, entrepreneurs are more likely to make inventions and improve
production processes.
In addition to these above described changes, the Finnish financial sys-tem has opened up. Remaining restrictions on capital movements and for-eign ownership were lifted in 1993. Consequently, there has been a major capital inflow in terms of both portfolio investment and FDI. Foreign owner-ship in Finnish firms has also grown rapidly. As a result, the number of for-eign-owned companies more than doubled from 1990 to 2002 and the Hel-sinki Stock Exchange has become one of the most internationalized stock ex-

392 · Ar i Hyyt inen, Petr i Rouvinen, O tto Toivanen and Pek k a Ylä-Antt i la
changes in the world – measured by market capitalization, foreign investors’ proportion increased to some 60% by the end of the 1990s. Today, over one third of the top 500 companies in Finland are subsidiaries of foreign corpora-tions. Also the number of foreign financial institutions operating in Finland has increased. All these changes as well as the improved access of Finnish firms to international capital markets have contributed to the favorable fi-nancial development.
Where do we stand?
The recent financial development in Finland and particularly the transforma-tion toward a more stock market-based financial system has improved the ability of the Finnish financial system to perform the five basic functions of financial systems. As we have claimed, the improvements have enhanced the accumulation of capital and the rate of technological innovation. However, it is important to note that it takes time to build a well-functioning financial in-frastructure (see also Rajan and Zingales 2001). What this means is that fi-nancial markets and institutions are not likely to appear on demand. If they do not, an immediate response to industrial needs is unlikely. Lags in finan-cial development mean that not even the financial system that is considered very well developed today, such as that in the US, need be able to meet the demand for the financial services and financial innovations that undertaking a large-scale industrial change and the emerging of new industries require. Moreover, because the transformation of the Finnish financial system is a very recent phenomenon, Finland is not likely to have a “mature” financial system. In particular, many, if not most, of the steps towards a more diversi-fied financial system have taken place very recently. It is therefore likely that many important parts of the Finnish financial system are still developing (or should be developed), in some cases precisely because they may currently be still underdeveloped.
The foregoing discussion suggests that there are reasons to believe that despite the recent favorable financial development, there still exist certain “black spots” in the Finnish financial system.7 Here we consider four such spots:
• Venture capital: Despite the recent growth, Finnish private equity (which consists of both classical venture capital, i.e., seed, start-up, and expansion stage, and replacement/buy-out capital) has over the past years only reached the level (scale) of fundraising that its GDP share in Europe pre-

Does f inancia l development matter for innovat ion and economic growth? · 393
dicts. In terms of investments and exits, Finland is still a laggard compared to the other European countries (Hyytinen and Pajarinen, Chapter 1 in this volume). In 2001, the ratio of private equity investments to GDP in Finland was 0.19%, which falls short of the European average of 0.25%. Moreover, in the recent 2002 Global Entrepreneurship Monitor, a cross-country comparison of classical venture capital availability in the 39 par-ticipating countries placed Finland as 13th (Sweden as 6th, Denmark as 10th and Norway as 14th) when ranking countries according to the ratio of the volume of classic venture capital investments to GDP between 1999-2001. In the same Global Entrepreneurship 2002 study, Finland was placed last (Sweden 13th, Denmark 15th and Norway 18th) when ranking the 25 coun-tries with available data according to the share of combined informal and classic venture capital investments as a percentage of GDP in 2001. Con-sidering that the wedge between European and US venture capital has been growing (see Da Rin and Bottazzi, 2002, and Figure 11.6) these find-ings are a cause of concern for Finland.
Figure 11.6. European versus US private equity (1995-2001)
Funds raised (1995-1998)Funds raised (1999-2001)
Investments (1995-1998)Investments (1999-2001)
0
10
20
30
40
50
60
70
80
Europe US
Note: Data sources are Da Rin and Bottazzi (2002, Table 1 and 3) and the authors’ calculations. Data are in billions of current dollars.

394 · Ar i Hyyt inen, Petr i Rouvinen, O tto Toivanen and Pek k a Ylä-Antt i la
Limits of venture capital: Even if the amount of venture capital was not perceived
as a problem, the venture capital solution to the problem of financing high-
growth SMEs and innovation has its limits (see Hall 2002, and Kanniainen,
Chapter 9 in this volume). First, venture capital financing is selective, as it tends
to cluster on certain hot industries (at a time) that are perceived to have particu-
larly great potential. There is also evidence that increases in venture fundraising
may lead to more intense price (valuation) competition for transactions within
an existing set of firms and technologies and not to a greater diversity in the
types of firms funded (Gompers and Lerner 1999, 2000). Venture capitalists also
tend to make investments of a minimum size that are too large for start-ups at
least in some industries. Second, good performance of the venture capital sector
requires a thick market in small and new firm stocks in order to provide an exit
strategy for early stage investors, something Finland lacks (see below). This
black spot of the Finnish financial system may slow down the maturing of the
Finnish venture capital industry. Third, the availability of venture capital may be
restricted by the lack of expertise required in project evaluation and advising
start-up firms (see, e.g., Kanniainen, Chapter 9 in this volume). This observation
suggests that the lack of “informed finance”, i.e., experienced venture capitalists,
rather than the availability of financial capital per se, may limit the venture capi-
tal solution to the problem of financing high-growth SMEs and innovation in
Finland. This problem may be magnified by the fact that a large fraction of Fin-
nish venture capital firms are small and young. The small size may reduce the
possibilities of the venture capitalists to diversify risk and provide truly valuable
advisory services that the globalization of firms requires. These, in turn, may re-
duce the availability of venture capital to risky projects with a long gestation pe-
riod.
• Stock market: New equity financing, especially that raised in connection with an initial public offering (IPO), is very important for high-tech firms and has, at least in the US, permitted a major increase in firm size (see Ra-jan and Zingales 1998, Carpenter and Petersen 2002). Da Rin and Bottazzi (2002) report that despite their recent problems, also Europe’s “new” stock markets have facilitated growth. However, in Finland surprisingly few firms have recently gone public (Ali-Yrkkö et al., Chapter 4 in this vol-ume). In particular, when compared to other countries, the Finnish “IPO window” is volatile and the market segment for growth firms is relatively small and illiquid. Further, it seems that bar the largest firms, the entire Finnish stock market may suffer from illiquidity and that firms do not seem to raise capital from the market, at least when compared to their

Does f inancia l development matter for innovat ion and economic growth? · 395
counterparts in the euro area stock exchanges (Figure 11.7). Having a strong stock market would benefit Finland also because the availability of a well-functioning market for venture capital exits is becoming increas-ingly important for the long-term development of Finnish venture capital (Hyytinen 2002). Lack of a dynamic stock market for growth firms and the small size of many recently established venture capital firms means that the lack of exit opportunities may become a severe impediment to the venture capital industry.
Figure 11.7. Finnish stock market versus Euro area stock markets
Market capitalization relative to Euro areaTurnover relative to Euro area
Equity issues relative to Euro area0.0%
1.0%
2.0%
3.0%
4.0%
5.0%
Note: Data sources are Bank of Finland and the authors’ calculations.
• Risk-taking capacity (willingness) of Finnish credit institutions: In light of the severe banking crisis of the early 1990s, the risk-taking capacity of Finnish banks, which still are a major source of debt finance to SMEs, is an open question. Because of the weakened creditor rights and particularly be-cause of the weakening of the creditors’ control over bankruptcy, so is their willingness to assume credit risk (Hyytinen et al. 2003 and Hyytinen et al., Chapter 2 in this volume).
Collateral requirements: While there is very little analytical evidence to support the
claims about Finnish banks’ potentially limited risk-taking ability in the area of
corporate lending, anecdotal evidence speaks indirectly for it. The surveys ad-
396 · Ar i Hyyt inen, Petr i Rouvinen, O tto Toivanen and Pek k a Ylä-Antt i la
ministrated by Finnvera Ltd and the Federation of Finnish Enterprises indicate
that every second SME (of those that consider the availability of capital as a
problem) says that they have problems because of the unavailability of collateral.8
A recent study by Niskanen and Niskanen (2000) moreover finds that in a sam-
ple of 526 firms operating in the Pirkanmaa region surrounding the city of Tam-
pere, collateral was pledged in as many as 90 percent of the firms’ loans during
the period 1994-1997. Unless they are not entirely attributable to differences in
demand, further indicators of the unwillingness of Finnish credit institutions to
take credit risk are i) that the largest Finnish manufacturing firms are systemati-
cally less levered than firms coming from other EMU-countries (see Bris et al.
2002) and ii) that the youngest SMEs rely on debt provided by financial institu-
tions less in Finland than in the US (Hyytinen and Pajarinen, Chapter 6 in this
volume). Echoing this view, Hyytinen and Pajarinen document also that the
most R&D-intensive SMEs rely less on debt provided by domestic banks than
other firms do, that the importance of financial institutions as the main lender
decreases as SMEs’ R&D intensity increases, and finally that the loans provided
by financial institutions to SMEs with R&D activities are concentrated to a very
small number of SMEs. This quite heavy reliance on collateral by banks (or lend-
ers’ more generally) may indicate that they may perform too little screening of
the potential borrowers’ projects (Manove et al. 2002) and that they are taking lit-
tle exposure to corporate credit risk.
• Role of foreign capital: Although the Finnish financial system has opened up, there is surprisingly little evidence to support the view that the for-eign investors have brought with them large amounts of new capital into Finnish firms.
Foreign investors in Finland – some further observations: First of all, Finland has at-
tracted little direct investments compared to its direct investments abroad (see,
e.g., Pajarinen et al. 1998, Pajarinen and Ylä-Anttila 2001). The stock of inward
FDI in relation to GDP is below that of many other small European economies
like Sweden, The Netherlands, and Switzerland (Pajarinen and Ylä-Anttila 2001,
p. 23). Further, though foreign portfolio investments and especially foreign own-
ership in Finnish listed companies has increased, only the best performing firms
seem to have attracted foreign investors (see the studies summarized in Pa-
jarinen et al. 1998 as well as Ali-Yrkkö and Ylä-Anttila, Chapter 7 in this volume).
There is also some evidence that foreign ownership concentrates on technology
intensive sectors because foreign firms have been interested in buying new tech-
nology (Pajarinen and Ylä-Anttila 2001), which supports the anecdotal evidence
suggesting that relatively few new firms (by means of greenfield investments)

Does f inancia l development matter for innovat ion and economic growth? · 397
have been established by foreign investors. Perhaps the most striking conclusion
that emerges from these findings is that the opening up of the Finnish financial
system has meant the transfer of existing claims on real resources, as compared
to the raising of new funds to facilitate new investment and firm creation.9 Com-
bining this conclusion with the findings of Ali-Yrkkö and Ylä-Anttila (Chapter 7
in this volume) and Maula and Mäkelä (Chapter 8 in this volume) suggests that
the most important contribution of the foreign investors investing in Finland may have
been their effect on Finnish firms’ performance, including their role in helping the Fin-
nish firms to globalize, rather than their role as a source of new capital. Of course, this
conclusion applies only to a limited extent – if not at all – to cross-border venture
capitalists, as they have also been a source of new capital.
Summing up, the recent financial development during the past twenty years and especially during the past ten years has enhanced both the accumulation of capital and the rate of technological innovation. As a result, it is difficult not to agree with the view that the overall availability of external finance to Finnish firms has improved. Whether the availability of financing at the vari-ous stages of a firm’s growth-cycle is still an issue is what we consider next.
11.3.2. DO FINANCIAL CONSTRAINTS HOLD BACK FIRMS AND ENTREPRE-
NEURSHIP IN FINLAND?
Background
The international evidence suggests quite unequivocally that large firms with financing needs can obtain external finance easier than small firms because of their better access to different types of external finance (Berger and Udell 1998, Hubbard 1998; see also the recent studies by Beck et al. 2002a, 2002b). We build on this conclusion when evaluating the existence of financial con-straints and firm performance in Finland. First, it contains an important qualification that should not be overlooked: The availability of external fi-nancing is not an issue for firms that are able to finance their growth inter-nally. Demand for external finance arises only when the magnitude of a firm’s internal cash flow falls short of its investment opportunities. This ar-gumentation suggests that the first step in evaluating the importance of the availability of external capital to Finnish firms is to establish how dependent they are on external finance. Only with such an evaluation at hand can the availability (supply) of financing to Finnish firms be assessed. Second, the conclusion emphasizes that the size of firms is a primary, if not the most im-

398 · Ar i Hyyt inen, Petr i Rouvinen, O tto Toivanen and Pek k a Ylä-Antt i la
portant determinant of firms’ access to external finance. This argumentation suggests that when evaluating the supply of external finance to Finnish firms, the size of firms can be used as a primary indicator of the capital market im-perfections that the firms face.
Financing of large(r) firms
Demirgüç-Kunt and Maksimovic (1998, 2001) have recently estimated the proportion of firms that rely on external finance in several countries. A firm is defined to rely on external finance if its realized sales growth rate exceeds a maximum growth rate that would have been attainable via internal (or inter-nal and short-term debt) financing of investments. Figure 11.8 presents an es-timate for the “demand” for external finance on the basis of this definition in selected countries.
Figure 11.8. Revealed demand for external finance by large firms (1989-1996)
Austria
GermanyCanada
Finland
Japan
USNorway
Sweden
Italy
DenmarkFrance
Netherlands
UK
0% 20% 40% 60% 80% 100%
Share of firms whose mean growth of real sales exceedstheir mean maximum short-term financed growth rate
Austria
GermanyCanada
Finland
Japan
SwedenNorway
US
Denmark
FranceItaly
Netherlands
UK
0% 20% 40% 60% 80% 100%
Share of firms whose mean growth of real sales exceedstheir mean internally financed growth rate
Note: Data source is Demirgüç-Kunt and Maksimovic (2001). The data refers to 1989-1996 averages for the largest publicly traded manufacturing firms.
The figure shows that over 1989-1996, Finnish firms have, together with Australian, German and Canadian firms, had an insufficient internal supply of investment capital. The finding implies that the firms of these countries have been relatively dependent on external financing. In particular, the Finnish firms have relied more on external finance than the firms in the

Does f inancia l development matter for innovat ion and economic growth? · 399
other Nordic countries.10 Even though the estimates are based only on large manufacturing firms, they provide some indication of the overall use of ex-ternal finance by large firms in the economy. The earlier estimates of Demir-güç-Kunt and Maksimovic (1998) mostly echo these results, albeit the sample of the earlier study was smaller and the time period covered 1981-1991.
Using more recent data from 1997-1998 that cover all the main sectors of the economy, Hyytinen and Pajarinen (2002a) report that about 41% of large Finnish firms have grown faster than would be compatible with the availability of internal finance and short-term market financing, i.e. their “maximum short-term financed growth rate” (see later Figure 11.9). Consid-ering that the profitability of Finnish firms improved during the latter half of the 1990s, the number is quite in line with the Demirgüç-Kunt and Maksi-movic (2001) estimates. Recent surveys commissioned by the Bank of Finland, Ministry of Trade and Industry and Confederation of Finnish Indus-try and Employers also support the conclusions that large firms have greater needs for external finance than small firms.11 Thus, on the basis of this evi-dence we conclude that large Finnish firms have been relatively “heavy us-ers” of external finance.
What do we know about the availability of financing to large Finnish firms? Honkapohja and Koskela (1999) show, using a panel of the 500 largest Finnish firms over 1986-1996, that the availability of internal finance has had a significant impact on the investment of especially those firms that were, a priori, financially constrained. They also argue that the availability of internal finance was an especially important determinant of investment during the depression years of the early 1990s. Vilmunen (2002) uses in his recent study the same data set on the 500 largest firms as Honkapohja and Koskela except that he has data over a longer period from 1986 to 1999. He finds that financ-ing constraints may have loosened, as there is no “evidence for the existence of binding financing constraints in firms’ investment spending ”(p. 3).12 Using data on 1549 firms over 1997-1998, Hyytinen and Pajarinen (2002a) find that firms listed on the Helsinki Stock Exchange are more likely to grow at a rate which requires using external finance. The study also finds that only small firms with favorable private information about their growth opportunities (and limited internal resources) have had an incentive to resort to high-quality disclosure against the risk of not being able to raise external finance. Using a recently collected data on about 1000 Finnish firms, Hyytinen and Pajarinen (Chapter 6 in this volume) show that within the SME sector, larger SMEs are more levered, suggesting better access to the market for credit.
400 · Ar i Hyyt inen, Petr i Rouvinen, O tto Toivanen and Pek k a Ylä-Antt i la
Larger firms have also better access to foreign capital. The foreign in-vestors have invested mostly in the largest firms. Karhunen and Keloharju (2001) show, for example, that the (equally weighted average) proportion of listed shares owned by foreign investors was as of June 1, 2000, 30.1% in the largest market capitalization quintile and only 3.4% in the smallest quintile.13 The analysis of Pajarinen and Ylä-Anttila (2001, p. 19) suggests that this pat-tern applies not only to listed but also to non-listed firms. Finally, recent re-search strongly supports the view that larger firms can make use of (and have made use of) their access to foreign capital markets: Keloharju and Nis-kanen (2002) show that most likely because of their better access to the inter-national capital markets, large Finnish firms have borrowed more in foreign currencies than small firms. Further, there is growing international evidence that large firms can use cross-listing as a means to enhance the availability of external finance (Reese and Weisbach 2002, Pagano et al. 2001).
Capital market integration and the effects of EMU: The foregoing conclusions are
echoed by the recent results reported in Bris et al. (2002). They show that most
likely because of the introduction of euro, the valuation, investment and lever-
age of the largest firms in the EMU-countries have increased. The result is espe-
cially strong for countries that have experienced currency crises, such as Finland.
Bris et al. argue that these findings are due to a reduction in currency risks and
the ensuing capital market integration that have reduced firms’ cost of capital.
These results together with the growing evidence that investors exhibit a prefer-
ence for familiar companies (see Grinblatt and Keloharju 2001 and the references
therein) suggest that only firms that are sufficiently large are likely to benefit
from capital market integration.
Taken together, these findings suggest that it is very difficult to make a case that large, established Finnish firms are constrained by the availability of exter-nal finance, despite their (potentially) large financing needs. The results suggest, especially, that the largest Finnish firms can today obtain external finance easier than before and that they have better access to different sources of ex-ternal finance than the smaller firms.
Financing of SMEs
A recent survey by Finnvera Ltd and the Federation of Finnish Enterprises suggests that in 2002, only every fourth SME raised new external finance.14 Another survey (commissioned by the Bank of Finland, the Ministry of Trade

Does f inancia l development matter for innovat ion and economic growth? · 401
and Industry, and the Confederation of Finnish Industry and Employers) suggests the same: only every fourth mid-sized firm has during the past two years had plans to raise external finance.15 These survey results are echoed, to an extent, by the estimates of excess growth presented in Hyytinen and Pa-jarinen (2002a): the estimates indicate that smaller firms have grown at a rate requiring long-term external finance less frequently than large firms (see Figure 11.9).16 Taken together, these above results suggest, by and large, that a representative SME does not seem to be in great need for external capital.
Figure 11.9. Demand for external finance by Finnish firms (all sectors)
All Large firms Small firms0%
5%
10%
15%
20%
25%
30%
35%
40%
45%
Proportion of firms that exceed their maximum short-term financed growth rateProportion of firms that exceed their maximum sustainable growth rate
Note: Data source is Hyytinen and Pajarinen (2002a). The data are from 1997-1998.
The surveys by Finnvera Ltd and the Federation of Finnish Enterprises suggest also that the availability of financing to SMEs has improved, espe-cially compared to the situation that prevailed as recently as in the mid 1990s (see Figure 11.10). According to the data, nearly 70% of SMEs report that they have experienced no difficulties in raising external finance. The share of such firms has, however, recently decreased relative to the year 2000 peak. Why might some SMEs suffer from the lack of capital more than others? What kind of SMEs face problems in raising capital? Are there more problems on the loan market than on the equity market, or is it the other way around? These are the questions that we address in what follows.

402 · Ar i Hyyt inen, Petr i Rouvinen, O tto Toivanen and Pek k a Ylä-Antt i la
Figure 11.10. Availability of external finance to Finnish SMEs (1996-2002)
1996 1997 1998 1999 2000 2001 2002/I 2002/II0%
10%
20%
30%
40%
50%
60%
70%
80%
90%
No problems in raising external finance, % of SMEs who have an external financing need
Note: Data source is the surveys administrated by Finnvera Ltd and the Federation of Finnish Enter-prises and the authors’ calculations.
In a series of papers Niskanen and Niskanen (1999, 2000a, 2001b) have addressed the question of why some SMEs suffer from the lack of capital more than others. Using a sample of firms operating in the Pirkanmaa / Häme region, they report the following main findings: First, Niskanen and Niskanen (2000a) argue that no firm conclusion can be drawn on whether firms with stronger (i.e., fewer and longer) relationships with banks have bet-ter access to funds. They do find, however, that smaller firms with long-term relationships pay lower interest rates, and that controlling for the non-existence of a relationship, larger firms pay lower interest rates and pledge less collateral than smaller firms. Second, Niskanen and Niskanen (2001b) find that the average loan agreement of an SME includes about two cove-nants, the types of which are negative pledge, limits on the debt ratio, restric-tions on asset sales, and corporate acquisitions. Interestingly, they report that high-growth and high-investment are positively correlated with the existence of covenants. Finally, Niskanen and Niskanen (1999) show that rejected loan applications by financial intermediaries might increase a firm’s level of ac-counts payable and that small firm size, lack of a close relationship with banks and financial distress reduce the likelihood that firms use trade credit because of the early-payment discounts it offers. These results indicate that i) larger SMEs have a better access to funding, ii) the lack of collateral reduces

Does f inancia l development matter for innovat ion and economic growth? · 403
the availability of finance and iii) establishing a relationship with a financial institution, such as a bank, determines to some extent the availability and terms of loan financing available to an SME.17
It is of interest to note that the latest survey administrated by Finnvera Ltd and the Federation of Finnish Enterprises suggests that the availability of external financing is a problem for as many as every second growth-oriented SME.18 The survey result is confirmed by the recent study of Hyytinen ja Pa-jarinen (2002a). They show that the ‘excess growth’ of firms made possible by external finance is associated with the quality of disclosure, but only for a priori financially constrained firms. The results of this study indicate that SMEs, especially the smaller ones, with favorable private information about their growth opportunities (and limited internal resources) have an incentive to buy ‘an insurance’ against being opaque and thus against the risk of not being able to raise external finance. Growth-oriented firms benefit from re-sorting to high quality disclosure because it enables them to grow at a rate that requires the use of external finance. These findings indicate that the asymmetry of information between outside financiers and corporate insiders on the growth prospects of SMEs may be a source of market failure in the Finnish market for capital.
Most recent evidence on the financing of Finnish SMEs is based on new data originating from a recently conducted survey by ETLA / Etlatieto on about 1000 SMEs. Using the data,
• Hyytinen and Pajarinen (Chapter 6 in this volume) find that the three most important sources of funds to Finnish SMEs are the principal owner’s equity, trade credit provided by non-financial firms and debt provided by financial institutions (FIs). These account for about 2/3 of to-tal debt and equity. An overall conclusion of the paper is that the capital structure of the Finnish SMEs does not seem to fundamentally differ from that in the US (when the study of Berger and Udell (1998) is used as the US benchmark). There is, however, some evidence that as the Finnish SMEs age, they increase indebtedness slowly compared to the US SMEs. The young SMEs also raise less debt from financial institutions in Finland than in the US. Further, the financing of innovative and R&D-intensive SMEs differs in several aspects from that of other SMEs. The data shows that innovative firms, firms with R&D activities and firms that own pat-ents and/or other intangible assets run a lower debt ratio than their coun-terparts. The difference is most notable for the most R&D-intensive SMEs, which also rely less on debt supplied by FIs than other firms do. SMEs

404 · Ar i Hyyt inen, Petr i Rouvinen, O tto Toivanen and Pek k a Ylä-Antt i la
with R&D activities seem to resort more to inside equity than other SMEs do.
• Hyytinen and Pajarinen (2002c) provide evidence that the debt capacity of growth options of Finnish SMEs, defined as the amount of debt that firms optimally raise for an incremental project, is negative, especially in the in-formation and communications technology (ICT) sector. The finding can be related to the R&D projects that small ICT firms pursue. The results suggest that R&D intensive small businesses, especially in the ICT sector, are “equity dependent”. Such dependence may make them more vulner-able to changes in macroeconomic conditions, shifts in venture investors’ confidence, clustering of equity offerings over time and non-fundamental components of stock prices.
• Hyytinen and Toivanen (2002) show that firms in industries that are more dependent on external financing invest relatively more in R&D and are relatively more growth-oriented when they have more government fund-ing (potentially) available. The finding suggests that SMEs face an up-ward-sloping capital supply curve and hence that the capital market for growth-oriented and innovative SMES is imperfect. The evidence pre-sented in the paper is consistent with the view that financial constraints hold back innovation and growth, and the hypothesis that government funding can alleviate capital market imperfections.
Our final pieces of evidence on the current state of the corporate fi-nance environment of Finnish SMEs are presented in Table 11.1, Table 11.2 and Table 11.3. In these tables we report results from a recent survey (admin-istrated by The Research Institute of the Finnish Economy (ETLA), Etlatieto Ltd and researchers from Helsinki School of Economics) that was conducted in November 2002. Table 11.1 reports Finnish SMEs responses to the ques-tions whether, in their view, the private sector supply of debt (“Debt market functions well”) and equity (“Equity market functions well”) functions well in Finland. Table 11.2 reports responses to the question whether any impor-tant investment, R&D, marketing or other projects of the respondent SME has been left unimplemented due to financial constraints (“Firm is financially constrained”) or whether the respondent SME believes that any important projects have been left unimplemented due to financial constraints in the other firms of the industry (“Industry is financially constrained”). Table 11.3 reports, finally, responses to the question whether an SME (that has practised innovation activity) has reduced its innovation activity over the last 12 months (“Has reduced innovative activity”) and to the question whether an

Does f inancia l development matter for innovat ion and economic growth? · 405
SME with an external financing need has had problems in raising external fi-nance (“Has had problems in raising external finance”) over the last 12 months.
In these three tables, we condition the answers on a set of SME charac-teristics. In the age categorization, firms are divided into two groups accord-ing to their AGE (= the age of firm in years): “Infant” are those aged between 0-4, and “Adolescent and older” are aged 5 or above. Regarding the size of SMEs, “Small SMEs” are defined as those SMEs that have EMPLOYMENT (= the number of employees) less than 20 and less than one million euros in turnover. “Large SMEs” are SMEs exceeding either of the criteria. In the growth categorization, “High growth” refers to firms whose GROWTH (= the average sales growth rate over the next three years, as projected by the entre-preneurs themselves) exceeds 10%, and the rest belong to the “Low growth” category. Further, in the R&D categorization “No/low R&D” refers to firms having either no R&D expenditure or the ratio of R&D expenditure to sales less than 5%, and “High R&D” to those having the ratio over 5%. In the ex-port categorization, “No / low exports” refers to SMEs with EXPORT (= the ratio of export to total sales) up to 25% and “High exports” to SMEs for which it is above 25%. Moreover, AUDIT (= dummy set to 1 if firm is audited by one of the internationally recognized ‘Big Five’ accounting firms) classifies firms according to the identity of their accountants, and SECTOR according to the industries to which the SMEs belong.
The percents reported in Table 11.1 show that SMEs perceive that the debt market functions better than the equity market: four SMEs out of five think that the debt market functions well, while every second SME thinks that the equity market functions well. In unreported questions we also asked the reasons why an SME that perceived problems in the functioning of either the debt or equity market thinks there are problems. The greatest problem in the functioning of the debt market was said to be related to generic willing-ness and ability of the debt financiers to assume credit risk. This view of SMEs is consistent with our earlier hunch that the Finnish credit institutions seem to have quite demanding collateral requirements. The greatest problem in the functioning of the equity market was generally unknown to Finnish SMEs, but of the identified reasons, generic unwillingness and inability of the equity financiers to assume risk was emphasized by a large number of SMEs. Also this view of SMEs is consistent with our earlier hunch that the Finnish venture capital firms are not extremely well equipped to finance risky pro-jects with long gestation periods due to their small size and limited experi-ence.

406 · Ar i Hyyt inen, Petr i Rouvinen, O tto Toivanen and Pek k a Ylä-Antt i la
Table 11.1. Finnish SMEs’ perceptions of the private debt and equity markets
YES NODON'T KNOW
YES NODON'T KNOW
OVERALL 81% 12% 7% 50% 19% 31%
AGEInfant 78% 14% 9% 62% 19% 19% Adolescent and older 82% 12% 7% 48% 19% 33%
EMPLOYMENTSmall SMEs 79% 14% 8% 46% 22% 33% Large SMEs 87% 9% 4% 57% 15% 28%
GROWTHLow growth 82% 11% 7% 51% 17% 32% High growth 79% 14% 7% 46% 24% 30%
R&DNo / Low R&D 83% 11% 6% 50% 19% 31% High R&D 69% 18% 13% 46% 21% 33%
EXPORTNo / Low exports 81% 12% 7% 48% 19% 32% High exports 86% 11% 3% 61% 19% 20%
AUDITYes 85% 9% 6% 45% 16% 39% No 80% 13% 7% 50% 20% 30%
SECTORHigh-tech 79% 15% 6% 56% 22% 21% Medium-tech 76% 13% 11% 48% 20% 32% Info intensive 69% 15% 16% 42% 26% 33% Other 82% 12% 6% 50% 19% 31%
Debt market functions well Equity market functions well
Note: Data sources are the survey data used and described in Hyytinen and Pajarinen (Chapter 6 in this volume ) and a new survey, done in November 2002, which extends the original survey data set and which was administrated by ETLA and Etlatieto Ltd in collaboration with researchers from the Helsinki School of Economics. Both “debt market” and “equity market” are defined broadly and referred in the survey to the part of the private capital market that is relevant from each firm’s own viewpoint.
Table 11.2 shows that only every tenth SME perceives itself as finan-cially constrained despite the fact that almost every second SME thinks that there are other SMEs in their industry that are financially constrained. It seems that within the SME sector, small size, young age, R&D intensiveness, and growth-orientation are associated with financial constraints (see, how-ever, our regression results below).

Does f inancia l development matter for innovat ion and economic growth? · 407
Table 11.2. Finnish SMEs’ perceptions of how financially constrained they are
YES NODON'T KNOW
YES NODON'T KNOW
OVERALL 10% 90% 0% 44% 34% 21%
AGEInfant 22% 78% 0% 52% 29% 19% Adolescent and older 8% 92% 0% 43% 36% 21%
EMPLOYMENTSmall SMEs 12% 88% 0% 45% 35% 20% Large SMEs 6% 94% 0% 43% 34% 22%
GROWTHLow growth 8% 92% 0% 41% 37% 22% High growth 16% 84% 0% 53% 28% 19%
R&DNo / Low R&D 8% 92% 0% 43% 36% 21% High R&D 27% 72% 0% 55% 26% 19%
EXPORTNo / Low exports 10% 90% 0% 44% 35% 21% High exports 13% 87% 0% 48% 27% 25%
AUDITYes 6% 94% 0% 41% 26% 32% No 11% 89% 0% 45% 37% 18%
SECTORHigh-tech 21% 79% 0% 58% 26% 16% Medium-tech 14% 86% 0% 40% 29% 30% Info intensive 19% 81% 1% 57% 23% 20% Other 10% 90% 0% 44% 35% 21%
Firm is financially constrained
Industry is financially constrained
Note: Data sources are the survey data used and described in Hyytinen and Pajarinen (Chapter 6 in this volume ) and a new survey, done in November 2002, which extends the original survey data set and which was administrated by ETLA and Etlatieto Ltd in collaboration with researchers from the Helsinki School of Economics.
Finally, as the first row in Table 11.3 shows, almost every fifth SME has during the past 12 months reduced its investments in innovative activity. While not reported in the table, about 44% (unweighted) of the SMEs re-ported that the reason for reducing investments in innovative activity is re-lated to the unavailability of internal and external financing. The table also indicates that every fifth of those who had a need for external finance has during the past 12 months experienced problems in raising such finance. Again, it seems that within the SME sector, small size, young age, R&D inten-siveness, and growth-orientation are associated with financial constraints.

408 · Ar i Hyyt inen, Petr i Rouvinen, O tto Toivanen and Pek k a Ylä-Antt i la
Table 11.3. Finnish SMEs’ changing innovative activity and financing problems
YES NODON'T KNOW
YES NODON'T KNOW
OVERALL 17% 82% 1% 20% 76% 4%
AGEInfant 15% 84% 1% 22% 71% 7% Adolescent and older 17% 81% 1% 20% 77% 3%
EMPLOYMENTSmall SMEs 18% 81% 1% 25% 69% 6% Large SMEs 15% 83% 2% 15% 84% 1%
GROWTHLow growth 16% 83% 1% 17% 79% 4% High growth 18% 81% 1% 23% 74% 3%
R&DNo / Low R&D 14% 84% 2% 16% 81% 2% High R&D 20% 79% 1% 28% 66% 6%
EXPORTNo / Low exports 16% 82% 1% 20% 77% 3% High exports 19% 80% 1% 22% 73% 5%
AUDITYes 15% 84% 1% 17% 81% 2% No 17% 81% 2% 22% 73% 4%
SECTORHigh-tech 17% 83% 0% 24% 68% 7% Medium-tech 22% 73% 4% 13% 83% 4% Info intensive 16% 84% 0% 32% 63% 5% Other 12% 88% 0% 19% 79% 2%
Has reduced innovative activity
Has had problems in raising market finance
Note: Data sources are the survey data used and described in Hyytinen and Pajarinen (Chapter 6 in this volume ) and a new survey, done in November 2002, which extends the original survey data set and which was administrated by ETLA and Etlatieto Ltd in collaboration with researchers from the Helsinki School of Economics.
Table 11.4 reports the results of (Logit) regressions in which the de-pendent variable equals one if an SME reported that it has, during the past 12 months, left unimplemented any important investment, R&D, marketing or other projects due to financial constraints, i.e., if the firm is “financially con-strained”, and zero otherwise.19 In these regressions we control for a number of observable characteristics of the SMEs to see what kind of SMEs within the SME sector are most likely to face financial constraints. The regression results confirm the findings of our earlier discussion: The most R&D-intensive and growth-oriented sub-segments on the SME sector are more likely to pass, in their view, good investment opportunities due to financial constraints.

Does f inancia l development matter for innovat ion and economic growth? · 409
Table 11.4. Determinants of financial constraints (Logit regressions)
Coef. Coef. Coef. Coef.
Age -0.005 -0.50 -0.006 -0.67 -0.010 -1.00 -0.011 -1.01Employment -0.015 -2.03 ** -0.015 -2.02 ** -0.016 -2.12 ** -0.016 -2.05 **International auditor (dummy) 0.146 0.48 0.173 0.56 0.127 0.41 0.129 0.41High export (dummy) -0.018 -0.05 0.838 1.60 0.495 0.72 0.932 1.33Patents (dummy) -0.241 -0.56 -0.240 -0.55 -0.132 -0.31 -0.193 -0.44Other intang. assets (dummy) 0.210 0.70 0.123 0.40 0.087 0.28 0.076 0.24High growth prev. year (dummy) -0.446 -1.70 * -0.452 -1.69 * -0.431 -1.61 -0.444 -1.63High growth plans (dummy) 0.638 2.20 ** 0.635 2.15 ** 1.022 2.71 *** 0.908 2.23 **Made loss prev. year (dummy) 0.902 2.61 *** 1.232 2.61 *** 1.897 4.31 *** 1.704 3.35 ***ICT industry (dummy) -0.641 -1.53 0.102 0.19 -0.773 -1.33 -0.142 -0.23R&D/Sales 0.868 1.12 1.253 1.58 1.123 1.47 1.235 1.57High R&D/Sales (dummy) 0.776 2.06 ** 1.428 3.17 *** 0.778 2.13 ** 1.286 2.77 ***Foreign owners (dummy) -0.729 -1.15 -0.845 -1.36 -0.743 -1.13 -0.883 -1.33High R&D/Sales x ICT industry -1.111 -1.95 * -1.175 -1.99 **High R&D/Sales x High export -1.257 -1.82 * -0.944 -1.27High R&D/Sales x Made loss -0.518 -0.77 0.687 0.77High growth plans x ICT industry 0.156 0.26 0.387 0.63High growth plans x High export -0.733 -0.92 -0.376 -0.46High growth plans x Made loss -1.900 -3.04 *** -2.234 -2.56 **Constant -2.009 -6.57 *** -2.224 -6.88 *** -2.209 -6.54 *** -2.270 -6.70 ***
Sector dummies Yes Yes Yes YesArea dummies Yes Yes Yes Yes
ObservationsLog likelihoodWald Chi2
degr. of freedomsignificance
R2pseudo 0.11 0.13 0.13 0.15
0.00 0.00 0.00 0.00 19 22 22 25
65.49 69.09 68.40 74.65 -226.58 -222.70 -221.19 -218.03
602 602 602 602
(1) (2) (4)(3)z-stat. z-stat. z-stat. z-stat.
Note: Data sources are the survey data used and described in Hyytinen and Pajarinen (Chapter 6 in this volume ) and a new survey, done in November 2002, which extends the original survey data set and which was administrated by ETLA and Etlatieto Ltd in collaboration with researchers from the Helsinki School of Economics. In the table *** denotes statistical significance at 1% level, ** at 5% level and * at 10% level. The dependent variable equals one if SME reported that it has during the past 12 months left unimplemented important investment, R&D, marketing or other important projects due to financial constraints, i.e., if the firm is “financially constrained”, and zero otherwise.
The same applies to small SMEs and to SMEs that are making losses. Interest-ingly, the regressions reported in columns three and four qualify these con-clusions in an important way. They suggest that if an SME is very growth-oriented and also making losses it is not as likely to face financial constraints as its more profitable counterpart. Moreover, it seems that the most R&D-intensive SMEs in the ICT sector are able to finance their important invest-ment projects easier than the R&D-intensive SMEs in other sectors. Finally, having a foreign owner does not seem to increase the availability of finance.

410 · Ar i Hyyt inen, Petr i Rouvinen, O tto Toivanen and Pek k a Ylä-Antt i la
Taken together, our analysis of the financing of SMEs suggests that the availability of finance is not likely to be an issue for a representative Finnish SME, not least because the need for external finance by such a firm is rather negligible. As the foregoing analysis indicates, there are, however, a number of qualifications to this conclusion. We summarize them in detail after first considering the financing of the smallest of SMEs (“early-stage firms”) and entrepreneurship.
Financing of entrepreneurs and early-stage firms
The Finnish evidence on the availability of capital as an impediment to en-trepreneurship is somewhat mixed. On the one hand, Johansson (2000) re-ports that personal wealth increases the probability of a person becoming self-employed in Finland. On the other hand, Uusitalo (2001) finds that the effect of capital constraints on new business starts is minor and that the lack of a certain kind of human capital, in the form of an entrepreneurship trait that often “runs in the family”, is a much more important impediment. Uusi-talo’s results thus support the view that in addition to providing an adequate access to capital, promoting entrepreneurship in Finland may require some-thing as deep and difficult as influencing people’s attitudes.20 These mixed findings may reflect the fact that the sources of finance are at least potentially very numerous, including entrepreneurs’ own wealth, their family and friends, (potential) employees, business angles, other firms, banks, credit card companies, finance firms, other credit institutions, venture capital firms, and various governmental and semi-governmental sources, to name some (see Hyytinen and Pajarinen in Chapter 6 in this volume for the relative im-portance of these various sources to young SMEs).
If the Finnish credit institutions behave cautiously towards SMEs in general, as we have argued, they are likely to behave cautiously towards very young firms too. Hyytinen and Pajarinen (Chapter 6 in this volume) provide evidence supporting this view, as they document that the youngest SMEs rely on financial institutions’ debt less in Finland than in the US. If this differ-ence is not entirely attributable to a difference in demand, the finding sug-gests that the debt market in Finland is perhaps not as conducive for entre-preneurship and start-ups as it is in the US.
Recently the importance of private venture capital firms as a source of funds to early stage firms in high-technology sectors has been emphasized. The Finnish evidence is also consistent with their importance, as private ven-ture capitalists account for about 6% of the total shareholders’ equity in the

Does f inancia l development matter for innovat ion and economic growth? · 411
youngest Finnish SMEs (see Hyytinen and Pajarinen Chapter 6 in this vol-ume). However, holding the debt-ratio constant, individuals that are actively involved in a firm’s daily operation, such as management and employees, ac-count for a very large fraction of the total shareholders’ equity in the young-est Finnish SMEs. The large ownership share of these corporate insiders may be related to many things (such as incentives, see Holmström 1989 and Casamatta 2002), but the limits of venture capital to meet the demand for capital by these risky early-stage firms are also worth considering: First, ven-ture capital firms tend to be selective in terms of technological focus. Second, they tend to make investments of a minimum size that are too large for many start-ups. Third, given that the private part of the Finnish venture capital in-dustry consists of relatively small and inexperienced firms, its capacity to supply highly risky financing to entrepreneurial projects and firms at seed and start-up stages may be limited.
Figure 11.11 and Figure 11.12 provide some further evidence on the limited capacity of the private part of the Finnish venture capital industry to supply financing to entrepreneurial projects. The figures show that Finland is one of the top two countries in Europe in terms of the amount invested in early-stage ventures and ventures at their seed stage. The figures, however, qualify this finding in an important way by also displaying an estimated proportion of the capital invested that has been provided by public venture capitalists. The estimates show that the role of public venture capitalists has by no means been negligible during the relatively favorable period from 1998 to 2001. Figure 11.11 and Figure 11.12 show that had Finland had no private venture capital flowing into early-stage firms, the total amount of venture capital invested in such firms would still have been above the European mean.
Market failure in early-stage financing: In their recent evaluation of The Finnish In-
dustry Investment, Maula and Murray (2003) go on as far as to conclude that
“[t]here is a significant equity gap in Finland in early-stage (seed and start-up)
venture capital for technology-based new firms.” (Maula and Murray 2003, p.
38).

412 · Ar i Hyyt inen, Petr i Rouvinen, O tto Toivanen and Pek k a Ylä-Antt i la
Figure 11.11. Early-stage (seed and start-up) venture capital (1998-2001)
FinlandSwedenBelgium
NetherlandsIreland
GermanyUK
FranceSwitzerland
DenmarkNorway
ItalySpain
AustriaPortugal
0.0 0.2 0.4 0.6 0.8 1.0
Investment in early-stage companies,per mille of GDP
BelgiumFinlandIreland
DenmarkSwitzerland
GermanyAustria
NorwayFrance
NetherlandsPortugal
ItalySpain
SwedenUK
0 10 20 30 40 50
Investment in early-stage companies,% of total private eq. investment
Note: Data sources are EVCA, Sitra and the authors’ calculations. The bars depict average values in 1998-2001. In the case of Finland, early-stage venture capital has been divided into public (dark gray) and private (light gray) proportions.
Figure 11.12. Seed-stage venture capital (1998-2001)
BelgiumFinland
GermanyDenmark
SwedenUK
ItalySwitzerland
FranceAustriaIreland
SpainNorway
NetherlandsPortugal
0.00 0.05 0.10 0.15 0.20
Investment in seed-stage,per mille of GDP
BelgiumFinland
GermanyDenmark
SwitzerlandAustria
ItalySpain
IrelandFrance
NorwaySweden
UKNetherlands
Portugal
0 1 2 3 4 5 6 7 8 9
Investment in seed-stage,% of total private eq. investment
Note: Data sources are EVCA, Maula and Murray (2003) and the authors’ calculations. The bars depict average values in 1998-2001. In the case of Finland, seed-stage venture capital has been divided into public (dark gray) and private (light gray) proportions.

Does f inancia l development matter for innovat ion and economic growth? · 413
To provide some further evidence on the role of financial constraints in determining entrepreneurship, Figure 11.13 displays the number of self-employed in Finland (excluding agriculture) and an index for capital market tightness, measured as the percentage of SMEs reporting that the availability of finance is the most important obstacle to developing the firm.21 The figure suggests that there is a strong negative correlation between the two time se-ries: over the entire sample, the raw pairwise correlation between them is as low as –0.87. It seems that after the economic crisis of the early 1990s, the cor-relation has weakened somewhat. The correlation is, nevertheless, as low as –0.76 between 1995/1-2002/1.
Figure 11.13. Self-employed and capital market tightness
1989
/119
89/2
1990
/119
90/2
1991
/119
91/2
1992
/119
92/2
1993
/119
93/2
1994
/119
94/2
1995
/119
95/2
1996
/119
96/2
1997
/119
97/2
1998
/119
98/2
1999
/119
99/2
2000
/120
00/2
2001
/120
01/2
2002
/120
02/2
0%
5%
10%
15%
20%
25%
30%
35%
185
190
195
200
205
210
215
thou
sand
s
Capital market tightness (left scale) Self-employment (right scale)
Note: Data sources are the various surveys by Finnvera Ltd and The Federation of Finnish Enterprises and Statistics Finland. Capital market tightness is measured as the percentage of SMEs reporting that the availability of finance is the most important obstacle to developing the firm. Self-employment ex-cludes agricultural sector.
Further, the correlation remains negative even if macroeconomic con-ditions are controlled for. In unreported OLS-estimations with the logarithm of the number of self-employed (excluding agriculture) as the dependent variable and the contemporary (and once lagged) macroeconomic outlook as a control variable, the contemporary (and once lagged) coefficient of our in-dex for capital market tightness is -0.0032 (-0.0033) and statistically highly significant. The tentative estimates of these two regressions suggest that
414 · Ar i Hyyt inen, Petr i Rouvinen, O tto Toivanen and Pek k a Ylä-Antt i la
holding the macroeconomic outlook constant, the number of self-employed decreases by 0.3% as the capital market tightness increases by one percentage point. The estimate implies that for one standard deviation increase (about 10%) in the capital market tightness the number of self-employed would de-crease by 3%, i.e., by (approximately) 6000 entrepreneurs. It is important that these tentative numbers are not taken too seriously.22 They do suggest, how-ever, that despite the overall favorable financial development that has con-tinued since the 1980s and early 1990s, the unavailability of capital as an im-pediment to entrepreneurship in Finland cannot be overlooked.23
11.3.3. INTERIM SUMMARY
The recent financial development and the existence of financial constraints in Finland can be summarized as follows: It is difficult not to agree with the view that the overall availability of external finance to Finnish firms has im-proved during the past twenty years and especially during the past 5-7 years. This recent financial development has most likely enhanced both the accu-mulation of capital and the rate of technological innovation. In particular, it is very difficult to make a case that larger Finnish firms are constrained by the availability of external finance, despite their (potentially) large financing needs. The availability of finance is not likely to be an issue for a representa-tive Finnish SME either, not least because the need for external finance by such an SME seems to be rather negligible.
However, there are reasons to believe that despite the recent favorable financial development, the availability of financing at some stages of an SME’s growth-cycle may still be an issue:
• The available evidence is in harmony with the view that the market for capital that Finnish SMEs face is characterized by various “black spots”, or market imperfections. In SMEs’ view, the (private) debt market func-tions better than the (private) equity market, but the problems, if any, in both the debt and equity market are related to unwillingness and inability of private financiers to assume risk. These views are echoed both by our analysis of the current state of the Finnish financial system (i.e., the limits of Finnish venture capital and stock market, the willingness and ability of Finnish credit institutions assume risk and the role of foreign investors) and by our empirical findings that the growth-oriented and innovative sub-segments within the SME sector are held back by financial constraints. It therefore seems warranted to conclude that Finland would above all bene-

Does f inancia l development matter for innovat ion and economic growth? · 415
fit from having a continuum of strong markets for external equity capital. In particular, the Finnish financial system would be stronger had it both a stronger stock market for growth companies and a more mature venture capital industry. These are the two black spots of the financial system from the perspective of the financing of “equity-dependent” innovative and young technology-based new firms.
“Equity-dependent” SMEs and credit institutions: Finnish banks and other financial
institutions are a very important but potentially cautiously behaving source of
finance to SMEs. There is therefore a possibility that SMEs in need for external
finance that are of likely to be equity-dependent, e.g., those with no established re-
lationship with a financial institution, those that are growth-oriented or innova-
tive but currently not “eligible” for venture capital and those with few assets
that can be pledged as collateral, are held back by the imperfections in the mar-
ket for external equity capital and by the cautious behavior of Finnish credit in-
stitutions.
Foreign investors: Albeit the role of foreign investors in Finland has become in-
creasingly important since the early 1990s, there is some evidence that the most
important contribution of the foreign investors investing in Finland may be their
positive effect on existing firms’ performance rather than their role as a source of
new capital to the most risky SME sectors or very small firms.
• Not all growth-oriented or innovative SMEs are equally constrained by the avail-ability of finance, as there seem to be differences in the allocation of finance to SMEs also within these sub-segments of the SME sector. We have, for example, found that very R&D-intensive SMEs in industries other than the ICT may suffer more from the lack of capital than otherwise identical SMEs in the ICT sector. We have also found that within the SME sector the smallest SMEs and entrepreneurs face more severe financial constraints than the other SMEs do.
• The unavailability of capital seems still to be an impediment to entrepreneurship. Our analysis suggests that this is the case despite the overall favorable fi-nancial development that has continued since the early 1990s and the government’s involvement in the market for seed capital during the late 1990 and first years of the new millennium. However, an extension of our findings for SMEs suggests that it is likely that not all entrepreneurial ini-tiatives are equally constrained by the availability of finance. Whether, for example, technology entrepreneurs, i.e., the possible founders of small, start-up firms developing technology with significant potential for com-

416 · Ar i Hyyt inen, Petr i Rouvinen, O tto Toivanen and Pek k a Ylä-Antt i la
mercial application, are most constrained within the population of would-be entrepreneurs remains an open question that clearly warrants future research.
After having described in detail how the Finnish financial system has developed in the recent past we can now turn into public policy. In what fol-lows, we first set the stage for our policy analysis by reviewing the theoreti-cal foundations of policy and recent developments in the Finnish economy and policy thinking. We then go on to consider what implications the recent financial developments has for the public policy towards capital markets and innovations in Finland.
11.4. PUBLIC POLICY TOWARDS CAPITAL MARKETS AND IN-NOVATION POLICY
11.4.1. BACKGROUND FOR POLICY ANALYSIS I: THEORETICAL FOUNDA-
TIONS
Market failure
Neoclassical economic theory has a very clear stand towards government in-tervention in markets. Taking as a reference point the celebrated (but unreal-istic) model of perfectly competitive markets, economic theory defines mar-ket failure as an outcome that falls below this ideal state of affairs. R&D is on the standard list of examples on market failure. The justification for this is twofold: First, R&D necessitates by definition investments before the com-mercialization of the product. These investments are at least partly sunk, i.e., unrecoverable in any alternative use. Second, the innovating firm is seldom capable of reaping the full surplus generated by its invention. If these two conditions are fulfilled, private returns, those that the firm reaps, fall short of the social returns that include surplus appropriated by other firms (through information spillovers, for example) and consumers (when the first degree or perfect price discrimination is not possible; this is always the case). This wedge between social and private returns means that the firm(s) invest less into R&D than would be optimal from the society’s point of view.
One particular market failure often revoked (see, e.g., Hyytinen and Väänänen Chapter 10 in this volume, and Tekes 2002) to justify active innova-tion policies relates to financial markets’ capability to allocate financing to R&D investments. Because of this attention, the interdependencies between

Does f inancia l development matter for innovat ion and economic growth? · 417
the “traditional” market failure – the appropriability problem discussed above, and financial market failure are worth a short analysis. Figure 11.14 (which builds on Hyytinen and Toivanen 2002) shows i) the marginal private rate of return schedule of R&D investments (“MRR private”), ii) the marginal social rate of return schedule of R&D (“MRR social”), and iii) two marginal cost of capital schedules (solid and dashed “MCC”). As social returns are higher than private returns, the former lies above the latter. In the figure it is assumed that the appropriability problem is of constant size in absolute terms, but this is of course a simplification. The first MCC schedule slopes upward due to imperfections in financial markets. The second is nearly hori-zontal, representing an almost perfect capital market. What the figure illus-trates is that the less developed the financial system, the less firms invest in R&D (C versus D).
Figure 11.14. Capital market imperfections and the problem of appropriability
Cost of fundsRate of return
R&D investmentInnovation activity
MCCMRR private
MRRsocial
C
D D*
C*
Cost of fundsRate of return
R&D investmentInnovation activity
MCCMRR private
MRRsocial
C
D D*
C*
Note: This figure builds on Hyytinen and Toivanen (2002).
The figure also shows that financial development and government policies designed to address the R&D under-investment problem due to lim-ited appropriability may be complementary. There are two potential reasons for this. First, at least when the appropriability problem is of constant size in absolute terms (or an increasing proportion of total surplus), improving fi-nancial market imperfections may actually “exacerbate” the impact of the

418 · Ar i Hyyt inen, Petr i Rouvinen, O tto Toivanen and Pek k a Ylä-Antt i la
traditional market failure. In other words, returns to solving the appropri-ability problem(s) are the greater the more developed the financial system. In terms of the figure, this can be seen by considering an upward shift of the “MRR private” schedule (i.e., an improvement in appropriability) toward the “MRR social” schedule. Such a shift might for example stem from an im-provement in patent protection. As the figure shows, the horizontal distance between C and C* is smaller than the distance between D and D*. This differ-ence suggests that the effect of the improved patent protection would be lar-ger the better developed the financial system. Another and potentially even more important source of complementarity between financial development and government support of R&D projects also emerges. It emerges because the more developed the financial system, the more likely that the “spillovers” that a (possibly subsidized) R&D project of a firm generates can be devel-oped and commercialized by other firms using market finance.
Government failure
After having identified a market failure, the next step in neoclassical analysis would be to design policies that rectify it, public provision of goods and pat-ents being the prime examples. The trouble with such an approach is two-fold: First, the benchmark of perfectly competitive markets is unrealistic, leading one to identify market failures where none exist if a more realistic benchmark is used. Second, neoclassical analysis often assumes too much about the ability of governments to implement policies. Let us discuss these two points in more detail.
The model of perfectly competitive markets is not only an unrealistic description of how the real-world markets behave, but its underlying as-sumptions make too strong demands on governments’ ability to design poli-cies that would rectify identified market failures. Maybe the most important assumption is that a government should have perfect knowledge when de-signing policies. Especially with regard to R&D, this is clearly unwarranted, as also government faces “informational constraints” (see also Hyytinen and Väänänen, Chapter 10 in this volume). As a consequence, if one uses perfect markets as a benchmark when identifying market failures, one may fall prey of the illusion that the government is capable of designing perfect policies. A more realistic benchmark is therefore needed, and modern economic theory offers an alternative. Markets are said to be interim efficient (Holmström and Myerson, 1983) if a benevolent social planner (one designing policies with the goal of maximizing social surplus) could not improve on the market out-

Does f inancia l development matter for innovat ion and economic growth? · 419
come, were she subject to the same informational problems as the market. As an example, if it is equally difficult to the social planner and the market par-ticipants to quantify the returns to R&D, or to assess the capability of R&D engineers, then interim efficiency is a better benchmark than Pareto-efficiency, which is related to perfectly competitive markets. Many phenom-ena that are market failures when comparing the actual state of affairs to per-fectly competitive markets cease to be ones using this more realistic but still demanding benchmark.
The second problem in designing policies to rectify an identified mar-ket failure is often alluded to under the heading of government failure (see also Ministry of Trade and Industry 1993). This term seeks to capture the fact that even if one were able to design theoretically “perfect” policies, a real-world government (broadly defined) may be unable to implement them. A variety of reasons offer themselves: the tools that a government has available may be too crude; there is an inherent principal-agent problem between the government and the civil servants who are supposed to implement the poli-cies; there is a principal-agent problem between the electorate and the politi-cians; and finally, the new political economy literature shows that politicians do not necessarily maximize social returns when in office. By too crude tools one could mean for example the fact that a government is resource con-strained, and therefore, e.g., has to design a patent policy that fails to take into account the specific needs of different industries. The principal-agent problem between the government and civil servants means that the latter have their own private objectives (how to further their career, for example) that may be in conflict with government objectives. If and when civil ser-vants’ actions are imperfectly observable, the government cannot force them to always act in its interest. The principal-agent conflict between the politi-cian and the electorate alludes to a situation where the politician, once in of-fice, can make decisions that benefit himself at the cost of the electorate. The final problem points out that politicians get elected on the votes of a part of the electorate, and may therefore be inclined to implement policies that bene-fit his voters at the expense of the rest of the electorate. Ideally, these “politi-cal constraints” should be taken into account when designing policies to rec-tify market failures in addition to the above-mentioned informational con-straints.
In addition to having to think hard what the attainable benchmark could in the presence of informational and political constraints be – interim efficiency or Pareto-efficiency – one probably has to think about the same question in more concrete terms. Then the question may become whether to

420 · Ar i Hyyt inen, Petr i Rouvinen, O tto Toivanen and Pek k a Ylä-Antt i la
use either of the above two theoretical benchmarks, or a (potentially lower, thus more easily achievable) benchmark of “best practice”. For example, in Finland’s case, the question could be posed as: should Finland strive to have as well functioning capital markets for small technology firms as the US cur-rently has (notwithstanding the fact that there is a lively debate on whether a market failure exists in the US market) or, should the objective be more ab-stract, i.e., achieving (interim) efficiency in those markets?
Where does this leave active government involvement?
The previous Section points out that any government is going to find it hard to justify intervention once the more stringent criterion of interim efficiency is used, instead of the standard market failure or Pareto-efficiency argument. Things are not quite that bleak, however, as the government may exploit two features of information that place the government in a good position to break out of the interim-efficiency conundrum. These central features of informa-tion are that collecting and analyzing information involves incurring sunk costs, i.e., costs that cannot be recovered through other uses. Second, infor-mation is a non-exclusive good, i.e., somebody’s use of a piece of information does not prevent others from using the same piece of information. These are precisely the reasons why private actors may underinvest in information ac-quisition; at the same time, the social returns to such activities can be huge. Thus, a government may have an incentive to set up institutions that are able, through information collection (and, possibly, dissemination), to attain an outcome that is better than the interim efficient outcome would be. However, what this may necessitate is that the government organization that acquires and analyzes the information may not be able to break even. Indeed, to reap the highest social returns, such information should be made publicly avail-able cheaply (for instance, a government credit rating agency offering banks rating analyses at marginal cost). We then face the problem of providing the officials that acquire the information the right incentives to do a good job; in other words, potential government failure may mitigate the benefits from such information acquisition activities.
Finally, one should notice that governments might have a strategic rea-son for intervention. This is pointed out in the paper by Brander and Spencer (1983), which shows that R&D subsidies to process R&D have a prisoner’s di-lemma structure. That is, situations can be imaged in which all governments would be better off (in terms of social welfare) if they did not grant R&D sub-sidies, but each government has an incentive to deviate from this no-R&D

Does f inancia l development matter for innovat ion and economic growth? · 421
situation to support its firms. All governments will deviate, knowing that other governments will do so in any case. This, of course, is hardly a way for a government to publicly motivate its activities – although in practice it may be an important motivation that is difficult to bypass.
11.4.2. BACKGROUND FOR POLICY ANALYSIS II: RECENT TRENDS IN THE
FINNISH ECONOMY
The depression and structural change of the 1990s
In the early 1990s Finland fell into the most serious economic crisis of its postwar history – real GDP dropped by 14% in just three years (1990–3) and unemployment rose from 3% in 1990 nearly to 20% in 1994 (Honkapohja and Koskela 1999, see also (a) and (b) in Figure 11.15). Unfortunate external fac-tors contributed to the crisis, e.g., economic downturn especially in forest-related industries as well as the collapse of the Soviet Union (Kiander and Vartia 1998). According to Honkapohja and Koskela (1999), external factors would have caused a recession in the early 1990s – additional internal factors made it a depression.
The strong economic growth preceding the crisis was strengthened by a booming international market, improving terms of trade, and many struc-tural changes. The most important of these were the deregulation and liber-alization of the Finnish economy at large, and financial sector and interna-tional capital movements in particular.24 Honkapohja and Koskela (1999) ar-gue that financial factors triggered the crisis and bad public policies, leading among other things to credit crunch and excessive private sector indebted-ness, aggravated it. Credit expansion increased both business sector invest-ment and households’ demand for housing and equity, and, consequently, in-creased asset prices. Domestic demand grew considerably faster than exports for several years leading to severe external imbalance (see (c) in Figure 11.15). The depression could also be characterized as a structural crisis (Kiander and Vartia 1998) – the private sector (or export industry; see (d) in Figure 11.15) was simply too small and uncompetitive to support the late 1980s standard of living (Hernesniemi et al. 1996).
The 1990s was an era of re-industrialization and rapid structural change towards a knowledge-driven economy. In 1990, wood, pulp and pa-per accounted for 40% of Finnish exports, slightly above the share of metal and machinery products at 31%. During the 1990s Finland became a major

422 · Ar i Hyyt inen, Petr i Rouvinen, O tto Toivanen and Pek k a Ylä-Antt i la
exporter of electronics and other high-tech products, which by the year 2000 accounted for over 30% of exports. At the same time the high double-deficit of the current account and the public sector vanished rapidly and unem-ployment fell slowly but surely.
Figure 11.15. Macroeconomic developments in Finland and the EU (1975-2002)
1975
1977
1979
1981
1983
1985
1987
1989
1991
1993
1995
1997
1999
2001
0
5
10
15
20
Finland EU
(b) Standardized unemployment rate (%)
1975
1977
1979
1981
1983
1985
1987
1989
1991
1993
1995
1997
1999
2001
20
25
30
35
40
45
Finland EU
(d) GDP share of exports (%)
1975
1977
1979
1981
1983
1985
1987
1989
1991
1993
1995
1997
1999
2001
-10
-5
0
5
10
Finland EU
(a) Real GDP growth (%, p.a.)19
75
1977
1979
1981
1983
1985
1987
1989
1991
1993
1995
1997
1999
2001
-10
0
10
20
30
40
50
60
Finland EU5 (DE, FR, ES, IT, UK)
(c) Interest-bearing net foreign debt per GDP
(%)
Note: Data sources are Eurostat, OECD, Statistics Finland and ETLA/Maury.
The foundations of the Finnish transition to the knowledge-driven economy were laid in the course of several decades. Social cohesion, consis-tent and predictable policy environment, as well as general enabling condi-tions such as necessary infrastructure and appropriate legislative and juridi-cal environment were obviously necessary preconditions. The key factors,

Does f inancia l development matter for innovat ion and economic growth? · 423
however, were raising investments in R&D and educational commitment. While the older generations of Finns are in the lower end of the spectrum when comparing the educational levels in the OECD countries, the younger generations are among the most educated ones (see Figure 11.16).
Figure 11.16. Graduate education in Finland
Kore
a
Ger
man
y
Finl
and
Switz
erla
nd
Fran
ce
Irela
nd
Swed
en
Cze
ch R
ep.
Aus
tria UK
Jap
an
Ital
y
Turk
ey
Mex
ico
Spai
n
Belg
ium
Slov
ak R
ep.
Can
ada
Den
mar
k
Aus
tral
ia
Isra
el
New
Zea
land
Port
ugal
Icel
and
Pola
nd
USA
Net
herla
nds
Nor
way
Hun
gary
0%
10%
20%
30%
40%
50%(b) Share of tertiary type A graduates in engineering, manuf., constr., life sciences,
physical sciences, mathematics and statistics, and computing in all graduates
1951
1953
1955
1957
1959
1961
1963
1965
1967
1969
1971
1973
1975
1977
1979
1981
1983
1985
1987
1989
1991
1993
1995
1997
1999
2001
0
100
200
300
400
500
600
700
800
900(a) Post-graduate degrees in natural sciences and engineering
Note: Data sources are KOTA database (top) and OECD (2002a).
In a few decades Finland went from being one of the least R&D-intensive OECD countries to the second most R&D-intensive country in the world.25 Even in the midst of the depression overall R&D investment re-mained high and public R&D support even rose at the time when virtually all other public expenditures were cut (see (a) and (b) in Figure 11.17).

424 · Ar i Hyyt inen, Petr i Rouvinen, O tto Toivanen and Pek k a Ylä-Antt i la
Finland consciously chose the road of high knowledge and high wages as its future path and there was a widespread political consensus to support the necessary actions. During the boom in the late 1990s, fixed investment in-creased but did not reach the levels of the 1980s; the largest firms increased instead their R&D spending heavily (see (c) and (d) in Figure 11.17).
Figure 11.17. Characteristics of tangible and intangible investment
1975
1977
1979
1981
1983
1985
1987
1989
1991
1993
1995
1997
1999
2001
10
15
20
25
30
35
Finland EU
(c) Gross fixed capital formation (GFCF) per GDP (%)
1981
1983
1985
1987
1989
1991
1993
1995
1997
1999
2001
1.0
1.5
2.0
2.5
3.0
3.5
Finland EU
(a) Gross domestic expenditure on R&D (GERD) per GDP (%)
1981
1983
1985
1987
1989
1991
1993
1995
1997
1999
2001
0
10
20
30
40
50
Finland
(d) Estimated GERD share of ten large companies (%)
1981
1983
1985
1987
1989
1991
1993
1995
1997
1999
2001
25
30
35
40
45
50
Finland EU
(b) Share of GERD financed by government (%)
Note: The data are from the OECD Main Science and Technology Indicators Database and the authors’ calculations. We caveat the reader that the estimates presented in panel (d) are highly uncertain and should be regarded as an illustration only.
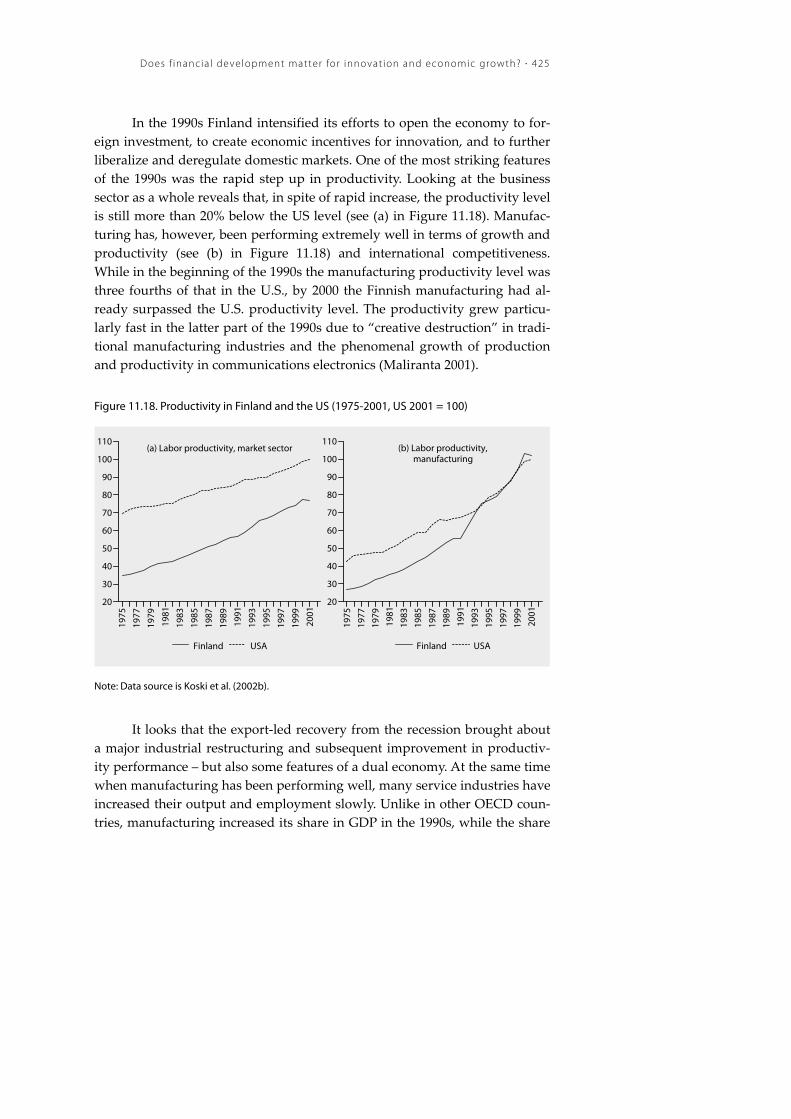
Does f inancia l development matter for innovat ion and economic growth? · 425
In the 1990s Finland intensified its efforts to open the economy to for-eign investment, to create economic incentives for innovation, and to further liberalize and deregulate domestic markets. One of the most striking features of the 1990s was the rapid step up in productivity. Looking at the business sector as a whole reveals that, in spite of rapid increase, the productivity level is still more than 20% below the US level (see (a) in Figure 11.18). Manufac-turing has, however, been performing extremely well in terms of growth and productivity (see (b) in Figure 11.18) and international competitiveness. While in the beginning of the 1990s the manufacturing productivity level was three fourths of that in the U.S., by 2000 the Finnish manufacturing had al-ready surpassed the U.S. productivity level. The productivity grew particu-larly fast in the latter part of the 1990s due to “creative destruction” in tradi-tional manufacturing industries and the phenomenal growth of production and productivity in communications electronics (Maliranta 2001).
Figure 11.18. Productivity in Finland and the US (1975-2001, US 2001 = 100)
1975
1977
1979
1981
1983
1985
1987
1989
1991
1993
1995
1997
1999
2001
20
30
40
50
60
70
80
90
100
110
Finland USA
(a) Labor productivity, market sector
1975
1977
1979
1981
1983
1985
1987
1989
1991
1993
1995
1997
1999
2001
20
30
40
50
60
70
80
90
100
110
Finland USA
(b) Labor productivity, manufacturing
Note: Data source is Koski et al. (2002b).
It looks that the export-led recovery from the recession brought about a major industrial restructuring and subsequent improvement in productiv-ity performance – but also some features of a dual economy. At the same time when manufacturing has been performing well, many service industries have increased their output and employment slowly. Unlike in other OECD coun-tries, manufacturing increased its share in GDP in the 1990s, while the share

426 · Ar i Hyyt inen, Petr i Rouvinen, O tto Toivanen and Pek k a Ylä-Antt i la
of services remained more or less constant. Consequently, the share of the service sector in total employment and production in Finland is still well be-low the OECD average.
Changing growth patterns – from investment-driven to innovation-driven growth
The 1990s saw a significant change in the growth pattern of the Finnish econ-omy. The economic growth from the early 1960s to the mid- or even late 1980s had based on a high (physical) investment ratio (see also (c) in Figure 11.17), and expansion of some scale-intensive export industries. The period was also characterized by a growing supply and extensive use of labor re-sources, when the (post-war) baby-boomers entered the labor market. There was a national consensus to pursue economic growth by enhancing invest-ment and credit expansion. Public policies were geared accordingly. Tax rules favored debt as a primary source of corporate finance.
Indeed, major part of the post war period up to the late 1980s could be characterized as an investment-driven phase of industrial development. Na-tional competitive advantage was based on the willingness and ability of firms to expand by investing in modern and efficient production technolo-gies, often of foreign origin but improved and upgraded nationally. It was also a period when new industries producing capital goods for the forest and mining sectors emerged and started to grow. The roles of services, small and medium-sized firms, as well as consumer market-led innovations were rela-tively small.
The depression of the 1990s was a watershed. There was no return to the investment-driven growth pattern. The foundations of the change were, however, laid already in the late 1970s and early 1980s when both the busi-ness sector and the government started to increase their R&D efforts and put more emphasis on product and process innovations. The crisis of the early 1990s had a crucial impact on both the structural change of the economy and public policy thinking. It is justified to talk about a paradigm shift in public policies parallel to that in many other European countries, but with some specific features in the Finnish case.
The changes in industrial structure could easily be described as mov-ing to a stage of innovation-driven growth in industrial development. In this stage, rather than adopting and applying innovations produced elsewhere, firms innovate themselves. Created and continually upgraded intangible fac-tors – highly educated labor force and know-how – are crucial for national

Does f inancia l development matter for innovat ion and economic growth? · 427
competitive advantage in this stage. Firms are competing on a global market that reinforces innovation activities (cf. Hernesniemi et al. 1996 and Porter 1990). The special feature of the Finnish economy, when entering the knowl-edge-driven stage of industrial growth was the strong role of information and communication technologies, ICT.
ICT and industrial transformation
Despite the well-documented boom and bust of the ‘New Economy’, it is widely believed that digital information and communication technologies have induced a new techno-economic paradigm or the third industrial revo-lution, not unlike steam-power and electricity at their times. The conse-quences of this revolution have been particularly large in Finland – Koski et al. (2002a) show that in a decade the country went from being one of the least ICT-specialized industrial countries to the most specialized one.
ICT is indeed a general-purpose technology having a wide range of applications at virtually all walks of life. So far the revolution has been the most prominent in the ICT-producing sectors, but in our belief the most fun-damental long-run effects relate to the way we generate, store, transmit and exploit information (digitally-coded knowledge). Quah (1999) coins the term weightless economy, recognizing that our economic wealth is increasingly in in-tangible assets, i.e., in economically usable strings of knowledge, such as software, digital content, patents and other intellectual property rights, DNA profiles, business concepts, etc.
Finland has become one of the leading ICT-driven economies due to the rapid growth of, and heavy specialization in, communications technology production. Also ICT service production and exports have grown rapidly since the early 1990s (Mankinen et al. 2001). However, the share of services (incl. ICT services) in total exports is still relatively low in international com-parison. In similar fashion, as a user of ICT Finland ranks only slightly above the average among the OECD countries. The ongoing process of introducing ICT into traditional industries and challenging the current business models is in the long run undoubtedly at least as important as being a leading pro-ducer of these technologies.
A specific feature of the Finnish ICT sector (cluster) is the dominance of one big firm, Nokia, that accounts for some forty per cent of the total ICT cluster production and employment. The total number of cluster firms is more than 4000, out of these – mainly SMEs – some 300 are first-tier suppliers to Nokia (Ali-Yrkkö 2001). The changes in financial markets, and the emer-
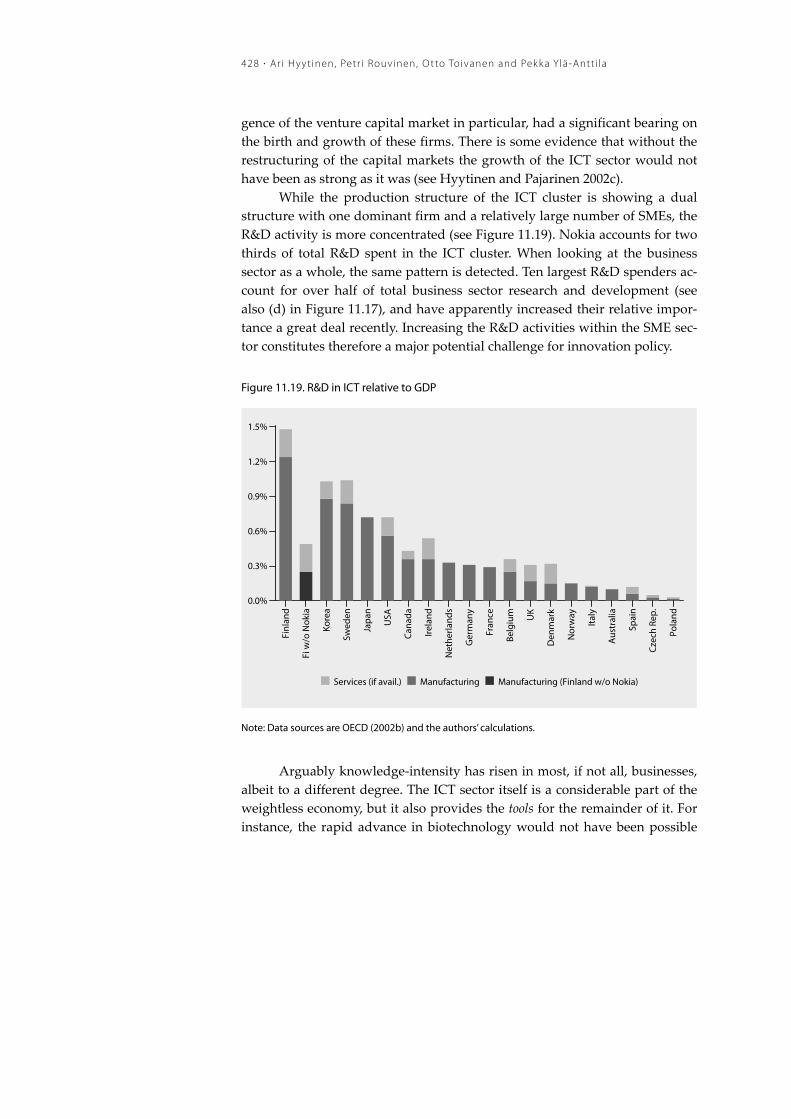
428 · Ar i Hyyt inen, Petr i Rouvinen, O tto Toivanen and Pek k a Ylä-Antt i la
gence of the venture capital market in particular, had a significant bearing on the birth and growth of these firms. There is some evidence that without the restructuring of the capital markets the growth of the ICT sector would not have been as strong as it was (see Hyytinen and Pajarinen 2002c).
While the production structure of the ICT cluster is showing a dual structure with one dominant firm and a relatively large number of SMEs, the R&D activity is more concentrated (see Figure 11.19). Nokia accounts for two thirds of total R&D spent in the ICT cluster. When looking at the business sector as a whole, the same pattern is detected. Ten largest R&D spenders ac-count for over half of total business sector research and development (see also (d) in Figure 11.17), and have apparently increased their relative impor-tance a great deal recently. Increasing the R&D activities within the SME sec-tor constitutes therefore a major potential challenge for innovation policy.
Figure 11.19. R&D in ICT relative to GDP
Finl
and
Fi w
/o N
okia
Kore
a
Swed
en
Jap
an
USA
Can
ada
Irel
and
Net
herla
nds
Ger
man
y
Fran
ce
Belg
ium UK
Den
mar
k
Nor
way
Ital
y
Aus
tral
ia
Spai
n
Cze
ch R
ep.
Pola
nd
0.0%
0.3%
0.6%
0.9%
1.2%
1.5%
Services (if avail.) Manufacturing Manufacturing (Finland w/o Nokia)
Note: Data sources are OECD (2002b) and the authors’ calculations.
Arguably knowledge-intensity has risen in most, if not all, businesses, albeit to a different degree. The ICT sector itself is a considerable part of the weightless economy, but it also provides the tools for the remainder of it. For instance, the rapid advance in biotechnology would not have been possible

Does f inancia l development matter for innovat ion and economic growth? · 429
without amble computing power and online co-operation of researchers. In-deed, the number of new biotech start-ups has grown rapidly in Finland. The country ranks high, when comparing the number of biotechnology start-ups per capita internationally (Hermans and Luukkonen 2002; see also Academy of Finland 2002). However, that has quite little to do with advanced ICT sec-tor. Rather, at least part of the explanation lies in the large public funding of science and technology in this area. Majority of the biotech companies are in the very early stage of their development and most have received public funding as grants and capital loans (Tekes) or as equity capital from public venture capital firms (Sitra). Only few have yet products in the market and most are making significant losses (Hermans and Luukkonen 2002). The re-cent evaluation administrated by the Academy of Finland concludes that Finland has made an admirable start to developing a viable biotechnology industry and has a chance to become one of the leading small countries in the biotechnology sector – just like in ICT (Academy of Finland 2002). Many con-temporary observers seem to think that the chance is real, but that the future of many Finnish biotechnology firms is at risk, not least because of their small size and the fragmented structure of the industry.
The rapid advance in new technologies like ICT and biotechnology has offered good opportunities for new firms and entrepreneurship. Indeed, the number of new firms both in the ICT manufacturing and ICT services as well as in biotechnology grew relatively fast during the past ten years. But did this development remove the problem of low level of entrepreneurship – the tra-ditional black spot of the Finnish industrial development?
Entrepreneurship
Although the number of new firms both in the ICT cluster and in biotechnol-ogy increased considerably in the latter part of the 1990s, the total number of firms remained more or less constant. It seems that the growth of entrepre-neurship in these industries and particularly in ICT crowded out entrepre-neurship in other industries. Moreover, in the beginning of the new millen-nium the exits in the ICT sector (due to bankruptcies and mergers and acqui-sitions) have increased rapidly (Koski et al. 2002b). The traditional black spot of the Finnish industrial development, documented in Figure 11.20, has thus not been removed by the recent developments.

430 · Ar i Hyyt inen, Petr i Rouvinen, O tto Toivanen and Pek k a Ylä-Antt i la
Figure 11.20. Entrepreneurship in selected countries
New Zeal.Iceland
USIreland
CanadaNorway
AustraliaSwitzerl.
IsraelHungary
DenmarkItaly
UKGermany
Netherl.Spain
FinlandPoland
SwedenFrance
BelgiumRussiaJapan
0 5 10 15
Entrepreneurial activity (EA)
SpainItaly
GreeceJapan
AustraliaNew Zeal
FranceNetherl.Switzerl.BelgiumLuxemb.Norway
USGermanyDenmarkPortugal
IcelandCanadaSwedenAustria
UKIrelandFinland
0 5 10 15 20
Entrepreneurs in tot. empl, '74 (%)
ItalySpain
GreeceAustralia
New Zeal.Portugal
JapanUS
BelgiumSwitzerl.
IrelandFrance
NorwayNetherl.Canada
UKGermanyLuxemb.
DenmarkIceland
SwedenFinlandAustria
0 5 10 15 20
Entrepreneurs in tot. empl, '84 (%)
New ZealaNew Zeal.
PortugalAustralia
SpainIcelandGreece
UKIreland
BelgiumCanada
USJapan
Switzerl.Netherl.
GermanyNorway
Luxemb.Sweden
FranceFinland
DenmarkAustria
0 5 10 15 20
Entrepreneurs in tot. empl, '98 (%)
New Zeal.US
IcelandIreland
NorwayCanada
AustraliaSwitzerl.
DenmarkIsrael
UKNetherl.
HungaryGermany
FinlandSpain
ItalySweden
PolandFrance
BelgiumRussiaJapan
0 3 6 9 12
Opportunity-Based EA
New Zeal.HungaryAustralia
IsraelIrelandPoland
USGermany
CanadaSpain
IcelandSwitzerl.
UKSweden
RussiaItaly
JapanNetherl.
DenmarkNorwayFinland
BelgiumFrance
0.0 0.5 1.0 1.5 2.0 2.5
Necessity-Based EA
Italy
% of total empl. in 2002 % of total empl. in 2002 % of total empl. in 2002
Note: Data sources are Fölster (2000) and Global Entrepreneurship Monitor (2002). Entrepreneurial ac-tivity (EA) has been defined as the proportion of labor force that is actively aiming at creating or run-ning a new business. EA consists of two parts: Opportunity-Based EA (the proportion of labor force that is trying to start a new business to pursue a new business opportunity) and Necessity-Based EA (the pro-portion of labor force that is trying to start a new business because (s)he has no better choices of work).

Does f inancia l development matter for innovat ion and economic growth? · 431
Summing up, Finland has taken a major step in its industrial develop-ment towards an innovation-driven economy during past twenty years and especially after its deep economic crisis in the early 1990s. There are however some directions, related to such areas as entrepreneurship, services produc-tion, ICT adoption and biotechnology, where Finland has been thought to have been going but where it apparently is not. These are, in fact, the very same black spots in Finland’s industrial development that have been known to exist for some time now.
11.4.3. BACKGROUND FOR POLICY ANALYSIS III: RECENT TRENDS IN POLICY
THINKING
Paradigm shift in policy thinking and international policy environment
While in hindsight the Finnish public policy of the 1990s was reasonably suc-cessful, the “Finnish miracle” is not primarily one of public policy. As a coun-try Finland was indeed well positioned when the opportunity came, but it was the Finnish companies, Nokia and many others, that made the most of it. The opportunity itself is related to the intervened trends of increasing global-ization and heightening role of technology in general and ICT in particular.
However, policies had their role to play as well. The 1990s saw major changes in public policy priorities. As a consequence of European integration and changes in comparative advantages of the economy, there was a clear shift in the roles of short-term macro policies and longer-term micro policies. Finland had completed its recovery with the help of sound, but stringent macroeconomic policies. A major consolidation effort took place in order to reduce public expenditures and balance the external account. By the early 2000s the general government finances showed a clear surplus, the budget balance in 2002 was over 3% in relation to GDP, and gross public debt was among the lowest in EU (43% of GDP). Net (interest bearing) foreign debt in relation to GDP was reduced from 50% in the early 1990s to zero by 2000 and turned to a surplus in 2002 (see also earlier (c) in Figure 11.15). Joining the EU and EMU had narrowed down the scope of macro policies, but brought about new stability in the economy with low inflation and real interest rates, and increased predictability of fiscal policies.
The cyclical fluctuations have not disappeared, however. The macro-economic turbulence coming from the global markets may have even in-creased due to the global turbulence of the ICT sector. Because of the globally
432 · Ar i Hyyt inen, Petr i Rouvinen, O tto Toivanen and Pek k a Ylä-Antt i la
integrated production networks, the fluctuations are transmitted almost without delay to the Finnish economy.
The great shifts in policy thinking and international economy imply that there is no return to the (fixed capital) investment-driven growth pat-tern. An essential part of this past pattern was devaluation policy that pro-vided temporary protection to some industries and established a kind of col-lective risk-sharing mechanism. Because the need and especially possibilities for such protection and collective risk-sharing have decreased, national com-petitive advantage is today created to a larger extent by decisions made at the micro-level, i.e., in firms, financial institutions, and various policy agencies.
Improving microeconomic business environment – towards innovation policies
The restricted scope of macro policies and the change in Finland‘s compara-tive advantage towards knowledge-based industries has increased the role of micro-based growth policies at the expense of macro-policies. The key priori-ties have been innovation policies and public policy towards capital markets.
In contrast to many OECD countries, R&D expenditure as a share of GDP increased continuously in Finland from the early 1980s. The increase, however, slowed down and halted in 2001 and 2002. The long period of in-creased investment in R&D reflects the economic restructuring and reorienta-tion in industrial policy adopted in the 1980s and reinforced in the early 1990s when policies were reshaped (see Ministry of Trade and Industry 1993). The main content of the new policies is providing conditions for internation-ally competitive firms and particularly enabling the creation and commer-cialization of knowledge. The current policies recognize the difficulties of compensatory policies and subsidies, as well as constraining the freedom of firms to contract for gaining advantages of networking and clustering. Also, the public ownership of business – as a means of regulation and industrial policy – has been regarded less relevant or, in fact, dispensable in the global economic environment.
In general, industrial policies – understood as policies enhancing in-dustrial growth and improving microeconomic business environment – have during the past decades included three kinds of elements: first, subsidizing ailing industries; second, trying to identify promising sectors and promoting their development; and third, aiming at improving the operating conditions of business enterprises. The emphasis of these elements in actual policy mak-ing has varied, however. Although the three approaches have been present all the time, one could describe the shift of emphasis as follows:

Does f inancia l development matter for innovat ion and economic growth? · 433
• Backing the losers – 1970s • Picking the winners – 1980s • Let the winner pick – 1990s
In the 1970s – partly as a consequence of oil shocks – many traditional industries in Europe experienced a major cost crisis leading to bankruptcies and reductions in employment. Industrial policies tried to cope with the problem by subsidizing ailing industries. These policies were adopted also in Finland, although to much less extent than in many other countries. Subsidiz-ing declining industries proved to be a failure, however. It only slowed down the restructuring process that was going on anyway due to rapid changes in factor prices and microelectronics-based technological development.
In the 1980s there was a change in general policy thinking towards picking the winners type of approach. Old industries and traditional firms seemed to grow slowly and new technologies looked to offer growth oppor-tunities if only properly supported. It was thought that public authorities might have some superior knowledge over private firms at least in some key business and technology areas. Many countries were inspired by Japanese industrial and technology policies which seemed to succeed in picking the growth sectors and provided ample resources to promising new technology areas. Again, one can see similar thinking, or at least a lot of this type rheto-ric, in Finland throughout the 1980s.
The 1990s saw a quite different development than expected in the mid 1980s. Identifying and predicting future growth industries proved to be a dif-ficult task. The global integration of markets for goods, technology, and capi-tal proceeded much faster than anticipated, as new ICT-based industries and firms took off and boomed in a way not foreseen even a couple of years ear-lier. Freeing capital movements and advancements in ICT led to the reloca-tion of firms and huge increases in FDI flows worldwide. Countries and re-gions started to compete for (high-tech) firms and human capital. Inter-country competition started to affect industrial policies.
Policies based on indirect measures in influencing firm behavior, avoiding direct interventions in product market, concentrating on rectifying failures in factor markets, promoting competition, and focusing in general on conditions providing measures, fit better in the economic environment of the 1990s and 2000s than policies pursued in the 1980s. This type of conditions providing or enabling policies were adopted as major guidelines of the Finnish industrial policy making in the early 1990s.

434 · Ar i Hyyt inen, Petr i Rouvinen, O tto Toivanen and Pek k a Ylä-Antt i la
The main lesson from the foregoing policy description is that policies need to be tightly connected to the current stage of industrial development and to react flexibly to changes in the policy environment. The basic issue is now where the main focus of micro-policies should lie and what kind of mi-cro-reforms might best enhance economic growth. With this issue, and the theoretical foundations of policy in mind, we should now be ready to con-sider what implications the recent financial development in Finland has for the public policy towards capital markets and innovations.
11.4.4. IS THERE A NEED TO REDIRECT THE PUBLIC POLICY TOWARDS CAPI-
TAL MARKETS OR INNOVATION POLICY?
Financial development and public policy towards capital markets
The recent financial development in Finland has several implications for the public policy towards the financing of Finnish SMEs, as well as for innova-tion policy. First, because the financial development has improved the overall availability of external finance to Finnish firms, omnipresent government inter-vention in the Finnish capital markets is increasingly harder to justify purely on the basis of the existence of market failures in these markets. The policies are omni-present because there is a relatively wide array of different kinds of “mini-interventions” currently in place. These include various “cash” grants (i.e., direct government payments to firms), credit subsidies (government guaran-tees, interest rate subsidies, soft loans), equity and equity-linked subsidies (government equity participations), and “in-kind” subsidies (direct and indi-rect government provision of goods and services to firms), to name some. As a result, the volume of direct government funding allocated to SMEs, as well as the share of SMEs applying for and receiving the funding are not negligi-ble (Hyytinen and Väänänen, Chapter 10 in this volume). As we have shown, the role of public venture capitalists in financing start-ups has not in the re-cent past been negligible either.
As we have discussed, the availability of capital has in the past been among the most important obstacles to developing Finnish firms and SMEs. Omnipresent financing policies toward a representative firm have therefore been quite warranted. The recent financial development implies, however, that the public policy towards the financing of Finnish firms – particularly that of SMEs – faces many challenges, including the following:

Does f inancia l development matter for innovat ion and economic growth? · 435
• Because the availability of finance is no longer likely to be such an impor-tant issue for a representative SME as it has been in the past, more selective capital market intervention is called for.26 There is, for example, growing ob-jective (as opposed to anecdotal) evidence that not all SMEs are equally held back by financial constraints.
Thoughts on market failure approach: In an era of technological and industrial
change, there can be lags in financial development (e.g., due to learning effects
and fixed set-up costs of markets). The downside of such lags is that they can
translate into a temporary – but potentially consequential – structural market
failure and inefficient allocation of capital. Selective capital market intervention
therefore calls for i) continuous market failure identification (multiple market
failures can obviously exist simultaneously), ii) designing of appropriate policy
mechanisms, iii) ex post evaluation of carried policies and adopted instruments
and iv) an initial plan on how the government exits from the market once the
identified failure has been corrected for. If these principles are to become a guid-
ing principle they should be incorporated into policies from the outset. Evalua-
tion mechanisms could, for example, be built in the policies ex ante, i.e., at the
time policies are designed (Jaffe 2002). So could government’s exit mechanisms
(Gilson 2002, Maula and Murray 2003). While the market failure approach has
characterized (at least) the official rhetoric underlying the public policy towards
capital markets, it has not been consistently followed in practice (see also Hyyti-
nen and Väänänen, Chapter 10 in this volume). The requirement for selectivity
also calls for a higher degree of co-ordination among the different institutions
providing government funding to firms.27
• The recent financial development calls for taking a long-term view on capital availability and addressing structural problems in the capital mar-kets. In particular, the more developed the financial system, the harder the identification of market failures. It is for this reason important to think hard to what extent changes in capital market conditions that result from changes in overall macroeconomic fluctuations can be regarded as an in-dication of a market failure.
Is venture capital financing myopic? Venture capitalists provide staged-financing,
which may seem to lead to myopic financing, especially in downturns. Financ-
ing is, however, provided in stages because it is optimal to do so: the shorter the
duration of an individual round of financing, the more frequently the venture
capitalist gathers information on the future prospects of a venture or a project
(Lerner and Gompers 2000a). While entrepreneurs may want to keep their pro-
436 · Ar i Hyyt inen, Petr i Rouvinen, O tto Toivanen and Pek k a Ylä-Antt i la
jects running due to the benefits they get from running them, the venture capi-
talist periodically monitors and critically evaluates whether the projects have
positive net present value. The staging of capital infusions is, in other words, a
means to monitor the progress of projects and provides the venture capitalists
with an option to rationally abandon projects after new “micro- and macroeco-
nomic” information on the projects’ prospects becomes available.
• The more developed the financial system, the better mergers and acquisitions (M&As) and bankruptcies can function as a market mechanism that reallocates scarce resources to more efficient uses. A certain degree of market turbulence is in other words desirable, even if it leads to bankruptcies, as there is an optimal (positive) rate of project and firm closures and bankruptcies for an economy (see also Holtz-Eakin 2000).
Financial factors and bankruptcies: The policy of backing the losers may have been
in fashion in the past, but it does not fit to an economy that has reasonably well-
functioning capital markets and that specializes in inherently risky high-
technology sectors by investing in research and experimentation (R&E). Preventing
R&E induced projects and firms from going bankrupt in a downturn may well
be harmful from the viewpoint of long-term R&E strategy and competitive ad-
vantage. The issue is topical for Finland, as many contemporary observers argue
that, because of the lack of capital, the results from many publicly and privately
financed ventures will be lost as a consequence of “unnecessary” bankruptcies.
But this is exactly how capital markets function: as new information becomes
available, it becomes apparent that not all initiated projects are commercially vi-
able. If that is the case, a fraction of the publicly and privately financed ventures
should receive no follow-up financing as independent ventures. Consolidation
of the ventures and reallocation of resources (including human capital) via bank-
ruptcies would probably be desirable – a natural step in the industry evolution –
to create (new) firms with more robust prospects.
Performance targets and supply of government funding in different market conditions:
If, as it is often argued by practitioners, market failures become more severe in
downturns, supply of government funding should probably increase during
busts. However, when taking a look at the data over the past few years, a puzzle
emerges. On the one hand, Finland is one of the top two countries in Europe in
terms of the amount invested in early-stage ventures and ventures at their seed
stage (see Section 11.3). This seems to be explained to a significant extent by the
strong presence of public venture capitalists in the market. On the other hand,
many contemporary observers argue that the financing of early-stage ventures is
Does f inancia l development matter for innovat ion and economic growth? · 437
currently (as of early 2003) in serious trouble, if not in a crisis (see Maula and
Murray 2003 and the survey evidence presented therein). How can we reconcile
this puzzle? The answer might lie in recognizing that while the availability of
private financing to entrepreneurial projects and seed and start-up stage ventures
may “dry up” during downturns, so may the supply of government funding.
There are two natural explanations for this: First, at least some of the govern-
ment institutions have followed the policy of co-investing with the private finan-
ciers. In such a case, a positive correlation may well emerge (see Hyytinen and
Väänänen, Chapter 10 in this volume for a more detailed discussion). Second,
quite a few of the major government organizations providing funding to entre-
preneurial projects and firms at their seed and start-up stage have at least some
kind of performance target, i.e., a requirement for self-sufficiency (Hyytinen and
Väänänen Chapter 10 in this volume; see also Maula and Murray 2003). Hyyti-
nen and Väänänen hunch, moreover, that even if no explicit performance target
existed, the institutions providing government funding may implicitly face such
a requirement in the sense that unless the institutions can demonstrate that they
invest at least in some profitable firms or projects, outsiders would judge that
they do nothing but “waste tax-payers money”. To meet these kinds of explicit
and implicit performance requirements in a downturn, it would from the gov-
ernment institutions’ viewpoint be rational to invest cautiously in high-risk seg-
ments, such as early-stage ventures. It would be rational particularly because the
high-risk segments are more prone to run into trouble when macroeconomic
conditions are bad.
• The risk of crowding out potentially profitable businesses of private financi-ers or distorting their investment incentives increases as the Finnish financial system develops and matures. The institutions providing government fi-nancing should view their actions in the context of what the private finan-cial institutions do and how they evolve. A means to do so is to develop a deep understanding of how their (i.e. the institutions providing govern-ment funding) presence in the market affects the behavior and incentives of private financiers.
Distorting the investment incentives of private sector – Example 1: Losses are quite
inevitable in investments in early-stage firms and new technologies. A number
of governments have therefore provided private investors with a bailout scheme
(i.e., publicly supported insurance or underwriting schemes) to encourage them
to do such investments. The aim of these polices is to protect the private inves-
tors from downside risks so that they need not bear the full cost of a failed in-
vestment. A fundamental problem with these kinds of policies is that they distort

438 · Ar i Hyyt inen, Petr i Rouvinen, O tto Toivanen and Pek k a Ylä-Antt i la
the investment incentives of the private sector, as they allow less successful in-
vestors to be protected from the consequences of their own actions both at the
time investments are made and at a later stage. Guarantee schemes in venture
capital can also allow private investors to gamble with tax-payers’ money, be-
cause such schemes make it lucrative for a venture capitalist to invest in projects
with a significantly negative net present value given that a considerable element
of the loss is covered and the gain is still fully or largely captured by the venture
capitalist (Maula and Murray 2003). In Finland, the recent amendment (effective
as of 1 September 2001) to the Act on Credit and Guarantees Provided by the
State-Owned Specialized Financing Company (445/1998) renews the existence of
a guarantee scheme for private equity investors. The scheme would fall in the
category of public policy measures that is likely to have undesirable incentive ef-
fects.
Distorting the investment incentives of private sector – Example 2: Conventional wis-
dom holds that the growth of the venture capital industry could be facilitated by
subsidizing heavily the flow of capital to it. The success of venture capital de-
pends, however, crucially on the human capital of the general partners and their
ability to advise the portfolio firms to grow. Because the supply of such experi-
enced labor is quite inelastic, subsidizing heavily the flow of capital may lead to
non-negligible increases in the remuneration of the general partners rather than
increases in the amount of high quality venture capital available (i.e., it may lead
to an increase in the price rather than the quantity). It may even lead to excessive
competition for the limited amount of lucrative investee firms, which just raises
the valuation of such firms. The empirical US evidence reported in Gompers and
Lerner (2000a,b) is consistent with this kind of effects.
• Conditions providing or enabling policies could be adopted as another major guideline in the public policy toward the financing of Finnish firms. Quite like government policy towards the non-financial sector that has increas-ingly focused on developing infrastructure that enables private firms to emerge and develop, developing financial market infrastructure that en-ables private sector financiers to emerge and develop could become a guiding principle.
Enabling policies in financial markets – Venture Capital Trusts: The Finnish venture
capital industry and also other investors investing in early-stage firms would
benefit from a more liquid market for the stocks of growth companies (see Ali-
Yrkkö et al. in Chapter 5 of this volume, Hyytinen 2002, and Maula and Murray
2003). A means to improve upon the liquidity of the market might be to intro-

Does f inancia l development matter for innovat ion and economic growth? · 439
duce Venture Capital Trusts (VCTs). In the UK, VCTs were established (by the
Finance Act 1995) to encourage individuals to invest via VCTs in a portfolio of
smaller, higher risk companies whose shares and securities are not listed on a
recognized stock exchange (but see below). VCTs are investment vehicles similar
in structure to investment trusts, but offer tax incentives to private investors. The
types of investments they can make are restricted by legislation (a targeted in-
tervention). In the UK, VCTs invest in new shares and securities of unquoted
(“growth”) companies, including however companies listed on the Alternative
Investment Market (AIM). A VCT is a company in itself and a quoted vehicle
similar to an investment trust, with active managers and a spread of
investments. After their initial fund raising their shares are quoted on the
London Stock Exchange, so that individuals will effectively be investing in a
company, which invests in small companies. The managers of the VCT have a
fixed period of time (three years) in which to choose companies to invest in.
Individuals have to hold a VCT for a minimum of three (previously five) years to
benefit from the tax reliefs. VCTs are exempt from corporate tax on any gains
arising on the disposal of their investments. The investor is also entitled to
various income tax and capital gains tax reliefs. A further 20% income tax relief
is given on the initial investment. Some have argued that VCTs have turned out
to be one of the success stories of the UK investment sector.28 In the case of
Finland, introducing VCTs, or their tailored equivalents, could be a means to
contribute to the development of the recently emerged but yet relatively small
private market places for growth firms’ stocks (such as the NM-list and yet non-
existent ML-list in the Helsinki Stock Exchange and the market run by the
venture capital broker Privanet). The existence of such markets has at least three
potential benefits. First, such markets provide a platform for high-technology
SMEs to raise capital for further growth; second, they have positive spillover
effects on the availability of capital to earlier stage ventures; and third, they may
be a means to ensure that promising high-technology companies are not sold to
foreign (industrial) buyers at a discount (as some have recently argued).
Enabling policies in financial markets – Example 2: In their recent evaluation of the
Finnish Industry Investment Ltd, Maula and Murray (2003) argue that the gov-
ernment’s intervention in the venture capital market on the supply side has the
more effective and least distorting impact if it is based on indirect rather than di-
rect investing. Maula and Murray propose the creation of targeted venture capi-
tal funds as the mode of indirect policy intervention to support the development
of the Finnish venture capital market. The operating mode is an agreed number
of venture capital funds in which a government agency is one of the founding

440 · Ar i Hyyt inen, Petr i Rouvinen, O tto Toivanen and Pek k a Ylä-Antt i la
limited partners. The government does not invest directly into any single com-
pany nor does it guarantee the fund against losses or have any role in the in-
vestment decisions of the fund. To make this activity attractive for competent
private investors, the government agency as a limited partner needs to engineer
the fund so that it will offer a lucrative internal rate of return (IRR) for private
investors and the management company. A key means to achieve such an IRR in
Maula’s and Murray’s policy proposal is a buy-out option for the private limited
partners to purchase in full the stake of the government agency in the fund in
the event of the fund being commercially successful. The buy-out option creates
a strong incentive for both the general partner and private limited partners to
make the fund commercially successful, as they are rewarded for making the
fund profitable. This is likely to make them select investments carefully and pro-
fessionally advise the portfolio companies to grow. The option also helps a gen-
eral partner to signal already after a relatively short period of time that (s)he has
invested successfully and creates a natural exit for the government agency in the
case of success. The specific policy (operating mode) proposed by Maula and
Murray satisfies several of the general conditions for a selective capital market
intervention that have been put forward in this paper: it is selective, addresses a
structural problem, does not distort the investment incentives of private inves-
tors, includes an exit option for the government, and falls into the class of ena-
bling policies.
Financial development and innovation policy
While the recent financial development in Finland casts doubt on the ration-ale of heavily intervening in the capital markets on the basis of the existence of market failures in these markets, it does not mean, however, that the cur-rent magnitude of government intervention in the Finnish “market for inno-vation” would be harder to justify. As we have argued, the case for innova-tion policy may have even become stronger due to it being – at least poten-tially – complementary to financial development. The case could become stronger if social returns to innovation policy increase with the financial sys-tem’s ability to commercialize innovations and new technologies. The recent financial development in Finland brings also some other issues on the table:
• Public policy towards the capital markets is becoming secondary to inno-vation policy. The wedge between social and private returns that arises due to positive spillover effects of R&D and innovation activity becomes for this reason the primary rationale for the government to provide fund-
Does f inancia l development matter for innovat ion and economic growth? · 441
ing to Finnish firms. Carefully identifying this wedge and measuring its size are increasingly important in practice because they both indicate the po-tential for large spillovers and suggest substantial economic benefits from investment in a technology or venture (see also Tassey 1997).
Measuring the social rate of return to R&D: There is substantial evidence that the
social rate of return to R&D spending exceeds the private rate of return. Empiri-
cal evidence for Finland is however scant, if non-existent (see, however, Rou-
vinen 2002). The spillovers from (R&D) investments in the development of mo-
bile telecommunications technology have in Finland probably been enormous
and implied a high social rate of return (in addition to these investments having
been in many cases privately profitable). The magnitude of these positive spill-
over effects – their economic significance – is important because subsidizing
R&D is not without its adverse effects. A prime example of such often over-
looked effects is the recent evidence from the US indicating that a non-negligible
fraction of increased government spending in R&D goes into higher salary pay-
ments for R&D workers (i.e., scientists and engineers) because of the inelastic
supply of such labor (Goolsbee 1998).
• The financial development may justify a reappraisal of how the innova-tion process is supported. In particular, even though the Finnish venture capital industry is not as mature and large as might be desirable, there is a fair amount of risk capital available to firms in expansion and later stages (see also the analysis and survey results reported in Maula and Murray 2003). On the basis of the existence of market failures in the capital mar-kets, the focus of innovation policy should therefore probably be shifting to i) financing industrial R&D in smaller firms and start-ups and ii) fi-nancing basic R&D and industrial (applied) R&D rather than to financing commercialization and post-commercialization stages.
The economics of R&D in the US: Tassey (1997) studying the economics of R&D in
the US concludes that “[I]n general, industrial applied R&D is not considered to
be subject to industry-specific or technology-specific market failures” (p. 189)
and that “[T]he best majority of applied R&D is best funded and carried out by
the private sector” (p. 203). The Finnish financial system is perhaps not there yet,
but if a sufficiently long-term view in designing innovation policy is taken, these
considerations should not be overlooked today.
The skewness of return distributions: As Scherer and Harhoff (2000) have noted, the
(size) distributions of both private and social returns of investments in new

442 · Ar i Hyyt inen, Petr i Rouvinen, O tto Toivanen and Pek k a Ylä-Antt i la
technology are likely to be very highly skewed. Programs seeking to advance tech-
nology should therefore not be viewed negatively even if they seem to lead to
numerous economic failures. Or as Scherer and Harhoff (2000, p. 565) put it: “…
public sector programs seeking to support major technological advances must
strive to let many flowers bloom”.
What does financial development imply for some currently perceived “black spots” in the Finnish industrial development?
There are some directions – entrepreneurship, services production, ICT adop-tion and biotechnology firms – where Finland has been thought to have been going but where (in the light of the latest evidence; see our discussion above) it apparently is not. This apparent lack of progress – the black spots in the current Finnish economic development – can be captured in the following se-ries of questions: First, what does impede entrepreneurship in Finland? Why is a representative SME rarely growth-oriented and why do the largest Fin-nish firms account for a large part of increases in business R&D? Second, what does hamper the development of the service sector in Finland? Third, what does impede ICT adoption in Finland? Finally, why is it that Finnish biotech-nology is currently perceived to be at a critical stage and risk despite its ad-mirable start?
To address all these profound questions is clearly outside the scope of this analysis. We can, however, ask whether enhancing the availability of capital would in the long-term make a difference and whether the deficien-cies (if any) in the Finnish financial system have anything to do with the lack of progress in these areas. Based on our overall analysis of the recent finan-cial development in Finland, it seems i) that there may be a market failure in the capital market for early-stage (seed and startup) ventures, particularly for technology-based new firms and that financial constraints may well hold back innovation and growth in the Finnish SME sector (see our earlier dis-cussion, and also Hyytinen and Toivanen 2002 and Maula and Murray 2003); ii) that the overall development of the service sector is not likely to be con-strained by the availability of finance29 iii) that ICT adoption may, given that ICT assets can only imperfectly be pledged as collateral, be hampered by the availability of finance to the extent that the Finnish financial sector relies ex-cessively on collateral (and the leasing market for such assets is functioning imperfectly); and finally iv) that future development of the Finnish biotech-nology sector may in the long-term be at risk less because of the unavailability of risk capital than because of the unavailability of experienced biotechnol-

Does f inancia l development matter for innovat ion and economic growth? · 443
ogy business managers and dedicated, internationally connected biotechnol-ogy venture capitalists (i.e., human capital; see also Academy of Finland 2002).
While all the foregoing answers are tentative at best, they have, in our view, one common but yet unstated denominator: In each case enhancing the availability of capital will probably not suffice even if it was an important impediment to progress as identified above. The reason for this is that in each case we are talking about a complementary system (or a mechanism charac-terized by complementarities), in which doing more of any of the activities in the system increases the returns of doing more of the other activities (Mil-grom and Roberts 1995). In a complementary system or mechanism, a single “deviation” (e.g., reforming only one of the system’s components) from the equilibrium (decentralized outcome) is not successful, because the effect of the deviation on the outcome would be negligible due to the complementari-ties (see Milgrom and Roberts 1995 for further analysis of such systems). A key to progress is therefore a simultaneous (coordinated) reform of the major components that have an effect on the outcome. Another way to put this view is that securing the availability of finance is not an all-curing medicine.
Complementarities – Example 1: While there can be many sources of complemen-
tarities in the “ecosystem” whose decentralized outcome determines the equilib-
rium rate of entrepreneurship, one of the most important sources is the labor
market. In the labor market, each participant has a choice of pursuing paid-
employment, or of becoming an entrepreneur. The characteristics of the labor
market are important for the choice because entrepreneurs fail at a very high rate
and because the expected private return to entrepreneurship depends not only
on the return when successful but also on the income expectations for unsuccess-
ful entrepreneurs. These income expectations are determined, in turn, in an im-
perfectly informed external labor market that may attribute the failure to the in-
dividual’s ability even if it was due to bad luck (Gromb and Scharfstein 2002).
Because of Finland’s relatively rigid labor markets (and the bad social stigma as-
sociated with bankruptcies and unemployment), a part of the present value of
the salary or wage income that an individual can expect to earn from a paid-
employment is, in expected terms, destroyed once the individual enters the
(risky) market for entrepreneurship. This tends to reduce the ex ante income ex-
pectations of entrepreneurs and suggests that enhancing the labor market status
of failed entrepreneurs might significantly increase the (marginal) effect of the
capital availability on entrepreneurship. Similar effects might arise if it was
made easier for employees of established companies to leave their current em-

444 · Ar i Hyyt inen, Petr i Rouvinen, O tto Toivanen and Pek k a Ylä-Antt i la
ployer to become an entrepreneur, something that would enhance the supply of
high-quality entrepreneurs (see also Hellmann 2002).
Complementarities – Example 2: In ICT adoption, the inability to borrow against
ICT assets is related to the many complementary investments needed to make
ICT equipment investments valuable. ICT investments mean adoption of “ICT
systems”, which consists of complementary components, such as hardware,
software and necessary (learning) human capital to run the system (see, for ex-
ample, Shy 2001). Improving, for example, the functioning of the leasing market
for ICT equipment or subsidizing their adoption might alleviate the problems re-
lated to the financing of such equipments, but its marginal effect on the rate of
adoption might remain low due to the required additional complementary in-
vestments, for which particularly SMEs may lack resources.
Complementarities – Example 3: In the case of biotechnology, managerial human
capital and financial capital are complementary (as they are in venture capital fi-
nancing more generally), so the unavailability of one of them reduces the mar-
ginal return to the other. Increasing biotechnology funding may therefore in-
crease the long-term prospects of the industry only a little, if at all, if the com-
plementary human capital required for commercialization and maturing of the
biotechnology ventures is not available (see also Academy of Finland 2002).
11.5. CONCLUSIONS
In this Chapter we considered why financial development might matter for innovation and growth. We moreover considered what, if any, implications these results and the recent financial development in Finland have for the availability of financing to Finnish firms – especially to SMEs – and, thus, for the public policy towards the Finnish capital markets and innovation policy.
An important starting point for our conclusions is that domestic financ-ing matters. In particular, the available evidence from economic research shows that domestic financial institutions are not becoming irrelevant for in-novation and economic growth despite the financial systems becoming in-creasingly integrated throughout the world. Local financial development dis-proportionately matters for the economic success of the smallest firms and en-trepreneurs in an area.
The first major conclusion of ours is that the recent financial develop-ment in Finland, by which we mean the advance of the Finnish financial sys-tem during the past twenty years and particularly since the economic crisis of

Does f inancia l development matter for innovat ion and economic growth? · 445
the early 1990s, has had profound consequences for the Finnish corporate fi-nance environment. It is difficult not to agree with the view that the overall avail-ability of external finance to Finnish firms has improved. The recent financial de-velopment has enhanced both the accumulation of capital and the rate of technological innovation, not least because the Finnish financial system is more diversified and stock market oriented that it has been in the past. In particular, it is very difficult to make a case that larger Finnish firms are con-strained by the unavailability of external finance, despite their (potentially) large financing needs. The availability of finance is not likely to be an issue for a representative Finnish SME either, not least because the need for external finance by such an SME seems to be rather negligible. The situation is therefore quite different from the times when, for example, many of the government institutions providing funding to Finnish firms were initially established.
However, there are reasons to believe that despite the recent favorable financial development, the availability of financing some of the stages of an SME’s growth-cycle may still be an issue:
• The available evidence is in harmony with the view that the market for capital that certain types of Finnish SMEs face is characterized by various “black spots”, or market imperfections. In SMEs’ view, the (private) debt market functions better than the (private) equity market, but the remaining problems in both the debt and equity markets are related to unwillingness and inabil-ity of private financiers to assume risk. These views are echoed both by our analysis of the current state of the Finnish financial system, i.e., the limits of Finnish venture capital and stock market, the willingness and ability of Finnish credit institutions to assume risk, and the role of foreign investors, and by our empirical findings that the growth-oriented and inno-vative sub-segments within the SME sector are held back by financial con-straints. It therefore seems warranted to conclude that Finland would above all benefit from having a continuum of strong markets for external equity capital. In particular, the Finnish economy would benefit from having i) more risk capital available for seed stage firms, ii) a more mature venture capital in-dustry and iii) a stronger stock market for growth companies. Despite the steps taken towards a more stock market-oriented financial system, these different markets for equity capital are the black spots of the Finnish fi-nancial system from the perspective of the financial growth-cycle of tech-nology entrepreneurs and “equity-dependent” innovative and technol-ogy-based new firms.

446 · Ar i Hyyt inen, Petr i Rouvinen, O tto Toivanen and Pek k a Ylä-Antt i la
• Not all growth-oriented or innovative SMEs are equally constrained by the avail-ability of finance, as there seem to be differences in the allocation of finance to SMEs also within these sub-segments of the SME sector. We have, for example, found that very R&D-intensive SMEs in industries other than the ICT may suffer more from the lack of capital than otherwise identical SMEs in the ICT sector. We have also found that within the SME sector, the smallest SMEs and entrepreneurs face more severe financial con-straints than other SMEs. In particular, despite the overall favorable finan-cial development that has continued since the early 1990s, and the gov-ernment’s involvement in the market for seed capital, the unavailability of capital as an impediment to entrepreneurship should not be overlooked.
The financial development has several implications for the public pol-icy towards the financing of Finnish SMEs, as well as for innovation policy. Because of the improved overall availability of external finance to Finnish firms, omnipresent government intervention in the Finnish capital markets is in-creasingly harder to justify purely on the basis of the existence of market failures in these markets. As a result of this, selective capital market intervention is called for. Because changes in capital market conditions that result from changes in overall macroeconomic fluctuations are typically not an indication of market failures, selective capital market intervention calls for taking a long-term view on capital availability and addressing structural problems in the capital mar-kets. Moreover, the risk of crowding out potentially profitable businesses of private financiers or distorting their investment incentives increases as the Fin-nish financial system develops and matures. Conditions providing or enabling policies could therefore be adopted as another major guideline in the public policy toward the financing of Finnish firms. Introducing a tailored version of tax-exempt Venture Capital Trusts might be a conditions-providing means to strengthen the markets for external equity in Finland, as they would en-hance both the exit opportunities of the Finnish venture capitalists (and also other early-stage equity investors) and support the development of the stock market for growth-oriented and innovative SMEs.
The recent financial development in Finland does not mean, however, that the current magnitude of the government intervention in the Finnish “market for inno-vation” would be harder to justify. The case for innovation policy may have even become stronger due to it being – at least potentially – complementary to financial development. The case could become stronger if social returns to innovation policy increase with the financial system’s ability to commercial-ize innovations and new technologies, and support Finnish firms’ growth.

Does f inancia l development matter for innovat ion and economic growth? · 447
Public policy towards the capital markets is, for this reason, becoming secon-dary to innovation policy. The wedge between social and private returns that arises due to positive spillover effects of R&D and innovation activity, grows thus to be a primary rationale for the government to provide funding to Fin-nish firms. This increases the need to identify and measure the wedge and spillovers.
We have also identified and discussed some directions, related to areas such as entrepreneurship, services production, ICT adoption and biotechnol-ogy, where Finland has been thought to have been going but where it appar-ently is not. In each case except in service production, the availability of capi-tal may be an impediment to progress, but enhancing the availability will probably not suffice (even if it was an important impediment to progress). Increasing the availability of financing is hardly an all-curing medicine. The reason for this is that in each case we are talking about a complementary sys-tem – reforming such systems requires a simultaneous reform of its major components, which for example in the case of entrepreneurship might mean improving in a coordinated fashion both the availability of capital and also other determinants of entrepreneurship, such as the labor market conditions for failed entrepreneurs and entrepreneurial opportunities of the employees of established companies, which could enhance the supply of high-quality en-trepreneurs (Hellmann 2002, Gromb and Scharfstein 2002).

448 · Ar i Hyyt inen, Petr i Rouvinen, O tto Toivanen and Pek k a Ylä-Antt i la
REFERENCES
Academy of Finland, 2002, Biotechnology in Finland. Impact of public research funding and strategies for the future. Evaluation report, Publications of the Academy of Finland 11/02.
Aghion, P. and Tirole, J., 1994, The management of innovation, Quarterly Journal of Economics, 109:4, 1185-1210.
Ali-Yrkkö, J., 2001, Nokia's network – Gaining competitiveness from co-operation, The Research Institute of the Finnish Economy (ETLA), B:174, Helsinki.
Allen, F. and Gale, D., 2000, Comparing financial systems, The MIT Press.
Arenius, P., Autio, E., Kovalainen, A. and Reynolds, P. D., 2001, Global entrepreneurship monitor – Finnish executive report. Helsinki University of Technology – Center for Technology Management Research Reports.
Beck, T., Demirgüç-Kunt, A. and Levine, R., 2002, Law, politics, and finance, manuscript.
Beck, T., Demirgüç-Kunt, A. and Maksimovic, V., 2002a, Financing patterns around the world: the role of institutions, World Bank Policy Research Paper 2905.
Beck, T., Demirgüç-Kunt. A. and Maksimovic, V., 2002b, Financial and legal constraints to firm growth. Does size matter?, World Bank, manuscript.
Beck, T. and Levine, R. 2002, Industry growth and capital allocation: Does having a market- or bank-based system matter? Journal of Financial Economics, forthcoming.
Beck, T. and Levine, R. 2002b, Stock markets, banks, and growth: Panel evidence, Journal of Banking and Finance, forthcoming.
Bekaert, G., Harvey, C. R. and Lundblad, C., 2002, Does financial liberalization spur growth?, manuscript.
Berger, A. N. and Udell, G. F., 1998, The economics of small business finance: The roles of private equity and debt markets in the financial growth cycle, Journal of Banking and Finance, 22, 613-673.
Blanchflower, D. G., Evans, D. and Oswald, A., undated, Credit cards and entrepreneurship, National Economic Research Associates. Cambridge, Massachusetts.
Blanchflower, D. G., Levine, P. B., and Zimmermann, D. J., 1998, Discrimination in the small business credit market, manuscript, Dartmouth College, Hanover.
Bugamelli, M., Pagano, P., Paterno, F., Pozzolo, A. F., Rossi, S. and Schivardi, F., 2002, Ingredients for the new economy: how much does finance matter?, Paper presented in International Conference on European Financial Systems, Maastricht, 4-5 October.
Brander, J. and Spencer, B., 1983, International R&D rivalry and industrial strategy, Review of Economic Studies, 50, 707-722.
Bris, A., Koskinen, Y. and Nilsson, M., 2002, The Euro is good after all: Corporate evidence, manuscript.
Does f inancia l development matter for innovat ion and economic growth? · 449
Carlin, W. and Mayer, C., 2002, Finance, investment and growth, Journal of Financial Economics, forthcoming.
Carpenter, R. E., and Petersen, B. C., 2002, Capital market imperfections, high-tech investment, and new equity financing, Economic Journal, 112, F55-F72.
Casamatta, C., 2003, Financing and advising: Optimal financial contracts with venture capitalists, Journal of Finance, forthcoming.
Da Rin, M. and Bottazzi, L., 2002, Financing entrepreneurial firms in Europe: Facts, issues, and research agenda, A paper presented at the Venture Capital, Entrepreneurship, and Public Policy Conference, Munich 22-23 November.
Demirgüç-Kunt, A. and Maksimovic, V., 2001, Firms as financial intermediaries: Evidence from trade credit data, mimeo, the World Bank
Demirgüç-Kunt, A. and Maksimovic, V., 1998, Law, finance, and firm growth, Journal of Finance, 53, 2107-2137.
Evans, D. and Leighton, L. S., 1989, Some empirical aspects of entrepreneurship, American Economic Review, 79, 519-535.
Evans, D. and Jovanovic, B., 1989, An estimated model of entrepreneurial choice under liquidity constraints, Journal of Political Economy, 97, 808-827.
Finnvera and Suomen Yrittäjät, Pk-yritysbarometri, syksy 2002.
Fölster, S., 2000, Företagarens återkomst: Den nya ekonomin och det entreprenanta samhället, SNS Förlag, Stockholm.
Gilson, R. J., 2002, Engineering a venture capital market: Lessons from the American experience, manuscript.
Global Entrepreneurship Monitor, 2002.
Gompers, P. and Lerner, J., 2000a, The venture capital cycle, The MIT Press, Cambridge.
Gompers, P. and Lerner, J., 2000b, Money chasing deals? The impact of fund inflows on private equity valuations, Journal of Financial Economics, 55, 281-325.
Gompers, P. and Lerner, J., 1999, Capital formation and investment in venture markets: Implications for the advanced technology program, A report to the Advanced Technology Program and the National Bureau of Economic Research.
Goolsbee, A, 1998, Does government R&D policy mainly benefit scientists and engineers?, American Economic Review, 88:2, 298-302.
Grimblatt, M. and Keloharju, M., 2001, How distance, language, and culture influence stockholdings and trades, Journal of Finance, 56:3, 1053-1064.
Gromb, D. and Scharfstein, D., 2002, Entrepreneurship in equilibrium, Centre for Economic Policy Research, Discussion Papers No. 3652.
Guiso, L., Sapienza, P. and Zingales, L., 2002, Does local financial development matter, manuscript.
Hall, B. H., 2002, The financing of research and development, Oxford Review of Economic Policy, 18, 35-51.
Hall, B. H., and van Reenen, J., 2000, How effective are fiscal incentives for R&D? A review of the evidence, Research Policy, 29, 449-470.

450 · Ar i Hyyt inen, Petr i Rouvinen, O tto Toivanen and Pek k a Ylä-Antt i la
Helmann, T., 2002, When do employees become entrepreneurs?, Stanford Graduate School of Business, Research Paper nr. 1770.
Henry, P., 2000, Do stock market liberalizations cause investment booms?, Journal of Financial Economics, 58, 301-34.
Hermans, R., and Luukkonen, T., 2002, Findings of the ETLA survey on Finnish biotechnology firms, The Research Institute of the Finnish Economy (ETLA), Discussion papers nr. 819.
Hernesniemi, H., Lammi, M. and Ylä-Anttila, P., 1996, Advantage Finland: The future of Finnish industries, The Research Institute of the Finnish Economy (ETLA), B:113.
Hietala, P., 1989, Asset pricing in partially segmented markets. Evidence from the Finnish market, Journal of Finance, 44, 697–718.
Holmström, B., 1989, Agency costs and innovation, Journal of Economic Behaviour and Organization, 12, 305-327.
Holmström, B. and Kaplan, S., 2001, Corporate governance and merger activity in the United States: Making sense of the 1980s and 1990s, Journal of Economic Perspectives, 15, 121-144.
Holmström, B. and Myerson, R., 1983, Efficient and durable decision rules with incomplete information, Econometrica, 51, 1799-1820.
Holtz-eakin, D., Joulfaian, D. and Rosen, H. S., 1994, Entrepreneurial decisions and liquidity constraints, Rand Journal of Economics, 25, 334-347.
Honkapohja, S. and Koskela, E., 1999, The economic crisis of the 1990s in Finland. Economic Policy, 14:29, 399-436.
Hubbard, G. R., 1998, Capital-market imperfections and investment, Journal of Economic Literature, 36, 193-225.
Hyytinen, A., 2002, How important are exits for venture capital finance: Evidence from Finland, A paper presented at the Venture Capital, Entrepreneurship, and Public Policy Conference, Munich 22-23 November.
Hyytinen, A. and Pajarinen, M., 2002a, External finance, firm growth and the benefits of information disclosure: Evidence from Finland, The Research Institute of the Finnish Economy (ETLA), Discussion papers nr. 805.
Hyytinen, A. and Pajarinen, M., 2002b, Small business finance in Finland – A descriptive study, Chapter 6 in this volume.
Hyytinen, A. and Pajarinen, M., 2002c, Financing of technology-intensive small businesses: Some evidence of the uniqueness of the ICT industry, The Research Institute of the Finnish Economy (ETLA), Discussion papers nr. 813.
Hyytinen, A. and Toivanen, O, 2002, Do financial constrains hold back innovation and growth? Evidence on the role of public policy, The Research Institute of the Finnish Economy (ETLA), Discussion papers nr.. 820.
Hyytinen, A. and Väänänen, L ., 2002, Government funding of small and medium-sized enterprises in Finland, Chapter 10 in this volume.
Hyytinen, A., Kuosa, I., and Takalo, T., 2003, Law or finance? Evidence from Finland, European Journal of Law and Economics, forthcoming.
Jaffe, A., B, 2002, Building programme evaluation into the design of public research-support programmes, Oxford Review of Economic Policy, 18:1, 22-33

Does f inancia l development matter for innovat ion and economic growth? · 451
Johansson, E., Essays on the determinants of self-employment, the Swedish School of Economics and Business Administration Publications nr. 85.
Karhunen, J. and Keloharju, M., 2001, Share ownership in Finland 2000, Liiketaloudellinen Aikakausikirja, 2, 188-226.
Kasanen, E., Kinnunen, J. and Niskanen, J., 1996, Dividend-based earnings management: Empirical evidence from Finland, Journal of Accounting and Economics, 22, 282-312.
Keloharju, M. and Niskanen, M., 2002, Why do firms raise foreign currency denominated debt? Evidence from Finland, European Financial Management, 7:4, 481-496.
Kiander, J. and Vartia, P., 1998, Suuri lama – Suomen 1990-luvun kriisi ja talouspoliittinen keskustelu, The Research Institute of the Finnish Economy (ETLA), B:143, Helsinki.
King, R. G., and Levine, R., 1993, Finance, entrepreneurship and growth: Theory and evidence, Journal of Monetary Economics, 32:3, 513-542.
Kinnunen, H. and Vihriälä, V., 1999, Bank relationships and small-business closures during the Finnish recession of the 1990s, Bank of Finland, Discussion papers 13/99.
Kortum, S. and Lerner, J., 2000, Assessing the contribution of venture capital to innovation, Rand Journal of Economics, 31:4, 674-692.
Koski, H., Rouvinen, P. and Ylä-Anttila, P., 2002a, ICT clusters in Europe: The great central banana and small Nordic potato, Information Economics and Policy, 14:2, 145-165.
Koski, H., Rouvinen, P., and Ylä-Anttila, P., 2002b, Tieto ja talous – mitä ”uudesta taloudesta” jäi, Sitra 253, Helsinki.
Koski, H., and Sierimo, C., 2003, Industrial entry and exit patterns: ICT vs. other sectors, The Research Institute of the Finnish Economy (ETLA), Discussion papers, forthcoming.
La Porta, R., Lopez-de-Silanes, F., Schleifer, A. and Vishny, R., 2000, Investor protection and corporate governance, Journal of Financial Economics, 58, 3-27.
La Porta, R., Lopez-de-Silanes, F., Schleifer, A. and Vishny, R., 1999, Law and finance, Journal of Political Economy, 106:6, 1113-1155.
La Porta, R., Lopez-de-Silanes, F., Schleifer, A. and Vishny, R., 1997, Legal determinants of external finance, Journal of Finance, LII:3, 1131-1150.
Levine, R., 2002, Bank-based or market-based financial systems: Which is better?, Journal of Financial Intermediation, 11:4, 398-428.
Levine, R., 1997, Financial development and economic growth, views and agenda, Journal of Economic Literature, 45, 688-726.
Levine, R. and Zervos, S., 1998, Stock markets, banks, and economic growth, American Economic Review, 88, 537-558
Levine, R., Loyoza, N. and Beck, T., 2000, Financial intermediation and growth: Causality and causes, Journal of Monetary Economics, 46, 31–77.
Lindh, T. and Ohlsson, H., 1996, Self-employment and windfall gains: Evidence from Swedish lottery, Economic Journal, 106, 1515-1526.
Maliranta, M., 2001, Productivity growth and micro-level restructuring – Finnish experiences during the turbulent decades, The Research Institute of the Finnish Economy (ETLA), Discussion papers nr. 757.

452 · Ar i Hyyt inen, Petr i Rouvinen, O tto Toivanen and Pek k a Ylä-Antt i la
Mankinen, R., Ali-Yrkkö, J. and Ylä-Anttila, P., 2001, Palvelujen vienti ja kansainvälistyminen, The Research Institute of the Finnish Economy (ETLA), Discussion papers nr. 767.
Manove, M., Padilla, A.J. and Pagano, M., 2002, Collateral vs. project screening: A model of lazy banks, Rand Journal of Economics, forthcoming.
Maula, M. and Murray, G., 2003, Finnish industry investment Ltd: An international evaluation, Ministry of Trade and Industry Publications 1/2003.
Milgrom, P. and Roberts, J., 1995, Complementarities and fit. Strategy, structure, and organizational change in manufacturing, Journal of Accounting and Economics, 19, 179-208.
Ministry of Trade and Industry, 1993, National industrial strategy for Finland, Ministry of Trade and Industry Publications 3/1993.
Mörttinen, L., 2000, Essays on loan pricing and the credit channel of monetary policy, Doctoral dissertation, University of Helsinki, Department of Economics Publications No. 85/2000.
Niskanen, J. and Niskanen, M., 2001a, The effect of banking ownership on loan maturity, Liiketaloudellinen Aikakausikirja, 1, 116-127.
Niskanen, J. and Niskanen, M., 2001b, Covenants in Finnish small firms’ loans: Firm level examination of their commonness, types and determinants, Small Business Economics, forthcoming.
Niskanen, J. and Niskanen, M., 2000a, Does relationship banking have value for small firms? Liiketaloudellinen Aikakausikirja, 2, 245-262.
Niskanen, J. and Niskanen, M., 2000b, Accounts receivable and accounts payable in large Finnish firms’ balance sheets: What determines their levels?, Liiketaloudellinen Aikakausikirja, 4, 489-503.
Niskanen, J. and Niskanen, M., 1999, The determinants of corporate trade credit policies in a bank-dominated financial environment. A study on Finnish small firms, manuscript, University of Tampere.
OECD (Organization for Economic Co-Operation and Development), 2002a, Education at glance.
OECD (Organization for Economic Co-Operation and Development), 2002b, Measuring the information economy.
Pagano, M., Randl, O., Röell, A. A., and Zechner, J., 2001, What makes stock exchanges succeed? Evidence form cross-listings decisions? European Economic Review, 770-782.
Pajarinen, M. and Ylä-Anttila, P., 2001, Maat kilpailevat investoinneista – teknologia vetää sijoituksia Suomeen (Countries compete for investment – Finnish technology attracts foreign firms), The Research Institute of the Finnish Economy (ETLA), B:173, Helsinki.
Pajarinen, M., Rouvinen, P. and Ylä-Anttila, P. 1998, Small country strategies in global competition. Benchmarking the Finnish case, The Research Institute of the Finnish Economy (ETLA), B:144, Sitra 203.
Porter, M. E., 1990, The competitive advantage of nations, The MacMillan Press Ltd, London.
Quah, D., 1999, The weightless in growth, Business Economist, 30, 40-53.
Rajan, R. G. and Zingales, L., 2002, The great reversals: The politics of financial development in the 20th century, Journal of Financial Economics, forthcoming.
Rajan, R. G. and Zingales, L., 2001, Financial systems, industrial structure, and growth, Oxford Review of Economic Policy, 17:4, 467-482.

Does f inancia l development matter for innovat ion and economic growth? · 453
Rajan, R. G. and Zingales, L., 1998, Financial dependence and growth, American Economic Review, 88, 559-587.
Reese, W. A. Jr. and Weisbach, M. S., 2002, Protection of minority shareholder interests, cross-listings in the United States, and subsequent equity offerings, Journal of Financial Economics, forthcoming.
Rouvinen, P., 2002, The existence of R&D spillovers: A cost function estimation with random coefficient, Economics of Innovation and New Technology, 11:6, 525-541.
Scherer, F. M., and Harhoff, D., 2000, Technology policy for a world of skew-distributed outcomes, Research Policy, 29, 559-566.
Schleifer, A. and Vishny, R., 1997, A survey of corporate governance, Journal of Finance, 52, 737-783.
Shy, O., 2001, The economics of network industries, Cambridge University Press, Cambridge.
Tassey, G., 1997, The economics of R&D policy, Quorum Books, London.
Tekes, 2002, Ylihuomisen kilpailukyky ratkaistaan tänään: Teknologiarahoituksen tulokset ja vaikutukset, Tekes.
Teollisuus- ja palveluyritysten rahoituskysyly: Vuosi 2002, Teollisuuden ja Työnantajain Keskusliitto, Kauppa- ja teollisuusministeriö, Suomen Pankki.
Uusitalo, R., 2001, Homo entreprenaurus?, Applied Economics, 33, 1631-1638.
Vihriälä, V., 1997, Banks and the Finnish credit cycle 1986-1995, Bank of Finland Studies E:7, Helsinki.
Vilmunen, J., 2002, Dynamics of investment behaviour in Finland: Aggregate and firm level evidence. Bank of Finland, Discussion Papers 22/02. Helsinki.

454 · Ar i Hyyt inen, Petr i Rouvinen, O tto Toivanen and Pek k a Ylä-Antt i la
ENDNOTES
1 These characteristics create scope for moral hazard problems and suggest that high agency and contract-ing costs may be a characteristic feature of R&D projects (Holmström 1989). The significance of exerting corporate control for technological advance cannot be overemphasized because it is difficult, if not impos-sible, to contract for a delivery of a specific innovation (Aghion and Tirole 1994). 2 Individual investors may for various reasons be reluctant to commit their savings for very long periods. 3 Beck and Levine (2002b) provide microeconomic evidence for this finding. They document using industry level data on 42 countries that it is the overall level of financial development and not the structure of the fi-nancial system that boost industry growth and new firm formation. Demirgüç-Kunt and Maksimovic (2001) show that also firm-level growth is boosted by the overall financial development, but not by the structure of the financial system. 4 Several (but not all) of the papers studying the determinants of entrepreneurship in the US and UK sug-gest that an impediment to entrepreneurship is the lack of capital (Evans and Leighton 1989, Evans and Jovanovic 1989, Holtz-eakin et al. 1994, Blanchflower and Oswald 1998). The Swedish evidence suggests the same (see, e.g., Lindh and Ohlsson 1996). Taken together, these studies support the existence of liquidity constraints and thus suggest that wealthier people are more likely to become self-employed. There is how-ever no unanimity on the quantitative importance of these liquidity constraints. 5 Finance-Activity is an overall index of financial sector activity relative to the size of an economy. It equals the logarithm of the total value traded times the ratio of financial intermediary credits (granted to the pri-vate sector) to GDP. Levine also develops other measures of overall financial sector activity and size. They rank Finland in the same way as Finance-Activity does. 6 Structure-Activity is an overall index of stock market activity relative to that of the banking system. It equals the logarithm of the total value traded divided by the ratio of financial intermediary credits to GDP. Levine also develops other measures of overall financial sector activity and size. They rank Finland in the same way as Structure-Activity does. 7 Further, because of the recent step towards stock market-centered financial system, the legal system may have an important role to play for the patterns of corporate finance in the future. The reason for this is that explicit contracts and transparency are relatively more important for an economy with a market-based fi-nancial system (Rajan and Zingales 2001). In such systems, institutional relationships and market power matter less, the providers of finance have to rely more on the “protection” provided by the legal system and the ability to write explicit contracts, and their pricing determine the financial transactions undertaken. Prompt and unbiased enforcement of contracts is instrumental to the efficient functioning of a market-based financial system. There are reasons to believe that even though the rules and regulations defining the potential level of investor protection may be up-to-date (Hyytinen et al. 2003, and Kaisanlahti, Chapter 3 this volume), prompt and unbiased enforcement of financial contracts is a problem in Finland (Kaisanlahti, Chapter 3 this volume) 8 Using data on 330 long-term loan contracts by 44 Finnish firms over 1985-1991, Niskanen (1999) shows that banks are less likely to demand collateral from firms in which they have a large ownership stake. Nis-kanen also reports that “allowing banks to hold equity claims in borrowing firms enhances loan availability to the firm if the bank’s equity claim is neither very small or very large.” (p. 102). These findings might be in-terpreted to support the view that Finnish banks have a tradition to rely on collateral to reduce the risk of their corporate lending. 9 While the old (presumably Finnish) owners of the existing claims may have used the funds that they have received when selling their stakes in new investments and firms, they may equally well have invested them abroad or in financial assets.

Does f inancia l development matter for innovat ion and economic growth? · 455
10 In the total sample of Demirgüç-Kunt and Maksimovic (2001), South-African firms relied least on external financing; only 11% of the firms had growth rates that exceeded their internally generated supply of in-vestment funds. In the figure, the UK firms relied least on external financing. 11 See, e.g., Teollisuus- ja palveluyritysten rahoituskysely: Vuosi 2002. 12 This conclusion is based on the observation that the cash flow variable does not obtain a significant coef-ficient in an investment regression. 13 The difference is remarkable because giving each share calls an equal weight downplays the role of large companies, which account for the bulk of the market capitalization. 14 See Pk-yritysbarometri, syksy 2002. 15 See Teollisuus- ja palveluyritysten rahoituskysely: Vuosi 2002. 16 Of course, these estimates support the survey evidence only if the difference is not entirely attributable to capital market imperfections. 17 The importance of a lending relationship for SMEs is supported by the findings of Kinnunen and Vihriälä (1999) who show that firms that had such a relationship with the distressed savings banks were more likely to close in 1992 than other firms during that year or the same firms in other years. 18 See Pk-yritysbarometri: Syksy 2001. 19 The reported z-values have been computed using a robust covariance matrix. We have also run the re-gressions as Probit and Rare Events Logit -models. The results did not change. 20 Uusitalo also concludes that formal schooling does not appear to be an effective means to increase en-trepreneurship in Finland. Rather, in his view what matters is the creation of an “environment” that encour-ages individuals to become more dynamic, self-confident and less risk-averse, i.e. a kind of “homo entrepre-neurs”. 21 In the figure, the time-series for the percentage of SMEs reporting that the availability of finance is the most important obstacle to developing the firm is lagged one period. 22 There are far too many reasons to list here why these estimates should not be taken too seriously. The only reason we address here is the possibility that our result may be dubious due to potential non-stationary of the two time-series. If something were wrong in the regression model for this reason, a first in-dication would be a “very low” Durbin-Watson statistic. In the reported two regressions, it is 1.49 and 1.22. For a reader who thinks that the two values are very low, we have rerun the regressions after first-differencing all the variables. The proxy for capital market tightness obtains a negative coefficient that is sta-tistically significant also in these regressions. 23 Unfortunately, available evidence does not allow us to rank the (un)availability of capital relative to other impediments to entrepreneurship. A recent analytical study raises the possibility that labor market rigidities together with bankruptcy rules and social stigma that “penalize” failed ventures may spur financing new projects within existing firms rather than financing the creation of new firms (Grom and Scharfstein 2002). In a rigid labor market, perhaps such as that in Finland, where failed entrepreneurs earn a disproportion-ately low wage, transition to entrepreneurship is likely to be subdued. If anything, these interesting proposi-tions warrant further research. 24 Importantly, the exchange rate regime remained fixed (pegged). 25 Next to only Sweden in terms of gross domestic investment in R&D (GERD) relative to GDP. 26 Selective capital market intervention should be contrasted to policies or instruments that aim at making all firms eligible for, say, a certain type of investment subsidy or tax credit. Such generic policies might be designed to address for example a general (perceived) under-investment problem had there occurred a permanent shift in behavior toward less risk tolerance across the entire private sector (Tassey 1997). 27 However, there is a need for coordination also among higher-level policy-makers (e.g., different ministries) that are involved both directly and indirectly in implementing and designing policies that have an impact on corporate financing. Taxation and the regulation of financial institutions are prime and topical examples in this regard. Some of the recently proposed tax reforms will, for example, have effects also on corporate fi-nancing. A further reason to consider the effects of taxation is that there is relatively undisputed empirical evidence that the level of industrial R&D is influenced positively by the existence of R&D tax credits (Hall and

456 · Ar i Hyyt inen, Petr i Rouvinen, O tto Toivanen and Pek k a Ylä-Antt i la
van Reenen 2000). The introduction of the New Basel Capital Accord may, in turn, have an impact on the costs of funds to SMEs. 28 VCTs have certainly higher risk than quoted equity investments but their attraction is in the combination of a fund manager with a good track record, the spread of investments in a large VCT and the generous tax reliefs. For further information, see the site of the British Venture Capital Association at www.bvca.co.uk and Venture Capital Trusts (VCTs): A Brief Guide, Business Series IR 169 by Inland Revenue. 29 The availability of finance may, of course, hamper growth-oriented service firms, not least because factu-ally many services are “weightless”, although their reliance on intangible assets varies. In this sense a group of services known as KIBS, knowledge intensive business services, is at the leading edge and a prime candidate for facing financial constraints. If that is the case we are back in the more general argument that the avail-ability of capital may be an issue for growth-oriented SMEs.

FINNISH SUMMARY


Financia l systems and f i rm per formance: Theoret ical and empir ica l perspect ives · 459
RAHOITUSJÄRJESTELMÄ JA YRITYSTOI-MINTA UUDISTUVASSA TALOUDESSA
Ari Hyytinen ja Mika Pajarinen*
Tällä kirjoituksella on kaksi tavoitetta. Ensinnäkin se on suomenkielinen kuvaus toimittamastamme teoksesta ”Financial Systems and Firm Performance: Theoretical and Empirical Perspectives”, johon on koottu Elinkeinoelämän tutkimuslaitoksen ty-täryhtiön Etlatieto Oy:n koordinoiman tutkimusprojektin ”Rahoitusjärjestelmän haasteet uuden talouden toimintaympäristössä” puitteissa laadittuja tutkimuksia. Toiseksi kirjoituksemme on yhteenveto mainitun tutkimusprojektin tuloksista ja joh-topäätöksistä. Tutkimusprojektin rahoittajina ovat toimineet Teknologian kehittämis-keskus (Tekes) ja Suomen itsenäisyyden juhlarahasto (Sitra).
1.1. JOHDANTO
Rahoituksen saatavuutta ja pääomien vähäisyyttä on usein pidetty yhtenä merkittävimmistä taloudellisen kehityksen ja talouskasvun esteistä Suomes-sa. Tämä näkemys korostui erityisesti 1990-luvun alun talousongelmien ja pankkikriisin aikana. Esimerkiksi Kauppa- ja teollisuusministeriön vuonna 1993 julkaisemassa Kansallinen teollisuusstrategia -julkaisussa arvioitiin, että vaikka uuden, taloudellista kasvua edistävän teknologian kehittäminen on yleensäkin vaikeaa, niin se on erityisen vaikeaa suomalaisille yrityksille, sillä
”Suomessa suurimmat puutteet ovat rahoituksessa (ibid, s. 119).
Julkaisussa todettiin myös, että
”Rahoitus on pienten ja keskisuurten yritysten vaikein ongelma” (idid, s. 120)
* Kiitämme Jyrki Ali-Yrkköä, Markus Koskenlinnaa, Anu Nokso-Koivistoa, Petri Rouvista, Otto Toivasta ja Pekka Ylä-Anttilaa kommenteista. Haluamme korostaa, että tässä kirjoituksessa esitetyt näkemykset ovat kirjoittaji-en omia.

460 · Ar i Hyyt inen ja M ik a Pajar inen
1990-luvun alun talousongelmien aikana vallitsi yksimielisyys siitä, et-tä kansantalouden tasapaino ja pitkän aikavälin kasvu edellyttivät pankkijär-jestelmän tervehdyttämistä ja rahoitusmarkkinoiden kehittämistä. Jälkikä-teen arvioiden rahoitusmarkkinoiden kehittäminen ei ehkä ollut avainase-massa niinkään silloisen kriisin vuoksi, vaan siksi, että korkean teknologian toimialat ja panostus tutkimukseen ja tuotekehitykseen (T&K) alkoivat tuol-loin saada yhä keskeisemmän aseman Suomen taloudessa. Samaan aikaan alettiin korostaa myös yrittäjyyden ja pienten ja keskisuurten yritysten (pk-yritysten) merkitystä sekä talouskasvun ja innovaatioiden lähteenä että myös työpaikkojen luojana. Nämä muutokset yhdistettynä nopeaan teknologiseen kehitykseen loivat kysyntää uudenlaisille rahoituksen muodoille ja asettivat paineita koko rahoitusjärjestelmänkin uudistamiselle.
Myös muissa maissa innovaatiotoiminnan, uusien yritysten ja pk-sektorin rahoitus on viimeaikoina saanut osakseen paljon huomiota talous- ja elinkeinopolitiikassa. Aihe on ollut erityisen merkittävä Euroopassa, jossa pankit ovat perinteisesti olleet tärkeä yritysten rahoituksen lähde (ks. mm. Euroopan unionin komissio 1998). Päinvastoin kuin eurooppalaisissa maissa, Yhdysvalloissa yksityinen riskipääoma ja osakemarkkinat ovat jo pitkään tu-keneet monien dynaamisten toimialojen kehitystä. Yksityisellä riskipääomal-la on siellä rahoitettu sekä uusia yrityksiä ja yritysten kasvua että vanhempi-en yritysten ja toimialojen uudelleenjärjestelyitä. Kortum ja Lerner (2000) ovat esimerkiksi arvioineet estimointitulostensa perusteella, että pääomasijoi-tusten (so. listaamattomiin kasvu- ja teknologiayrityksiin tehtyjen sijoitusten) kasvu on lisännyt patenttien määrää ja että pääomasijoitukset selittävät jopa kahdeksan prosenttia Yhdysvaltojen teollisista innovaatioista vuosina 1983-1992, vaikka pääomasijoitusten osuus T&K-menoista kyseisellä ajanjak-solla oli keskimäärin alle kolme prosenttia. Tällaisten tulosten valossa onkin myönteistä, että 1990-luvun lopulla yksityisen riskipääoman tarjonta niin uu-sille kasvu- ja teknologiayrityksille kuin yritysjärjestelyihinkin alkoi lisääntyä myös Euroopassa. Samanaikaisesti osakemarkkinoiden suhteellinen merkitys kasvoi, mikä tosin osaltaan liittyi tieto- ja viestintäteknologiasektorin (ICT) kasvuun ja ”uuteen talouteen” liittyneeseen huumaan.
Viime aikoina on sekä akateemisessa että talouspoliittisessa keskuste-lussa ollut runsaasti väittelyä siitä, poikkeavatko pankki- ja osakemarkkina-keskeinen rahoitusjärjestelmä oleellisesti toisistaan. Tämä johtuu sekä Yh-dysvaltojen menestyksestä kehittää uutta teknologiaa pääomasijoitusten avulla että pyrkimyksestä ymmärtää paremmin eurooppalaista kehitystä. On mm. pohdittu, eroaako järjestelmien kyky tukea uuden teknologian kehittä-mistä toisistaan, tuottavatko ne erilaisia kasvumalleja ja jos tuottavat, niin

Rahoitus jär jestelmä ja yr i tystoiminta uudistuvassa ta loudessa · 461
kumpi järjestelmä on parempi. Rahoitusjärjestelmän mahdollisuudet tukea uuden teknologian kehittämistä riippuvat sen kyvystä allokoida investoin-teihin tarvittavia pääomia, kyvystä valikoida parhaat rahoitettavat hankkeet ja kyvystä tarjota riittäviä kannustimia ulkopuolista rahoitusta saaneiden hankkeiden seurantaan. On esimerkiksi olemassa jonkin verran tutkimustu-loksia ja paljon ad hoc näkemyksiä, että erityisesti innovatiiviset ja teknolo-giaintensiiviset pk-yritykset kärsivät enemmän rahoituksen puutteesta ja ra-hoitusrajoitteista pankkikeskeisessä kuin osakemarkkinapainotteisessa rahoi-tusjärjestelmässä. Avoin kysymys kuitenkin yhä on, kanavoiko osakemarkki-naperusteinen järjestelmä pankkikeskeistä järjestelmää tehokkaammin rahoi-tusta yrityksille, joiden liiketoiminnalliset riskit ovat vaikeammat ulkopuoli-sen arvioida, joilla on lähes olematon kassavirta ja joiden arvo koostuu pää-osin aineettomista ”kasvumahdollisuuksista”. Eräissä yhteyksissä on jopa argumentoitu, että erot pankkikeskeisen ja osakemarkkinalähtöisen rahoitus-järjestelmien välillä ovat toisarvoisia, koska kunkin maan oikeusjärjestelmä, ts. lainsäädännön ominaispiirteet ja lakien toimeenpanon laatu, on tärkein taustatekijä rahoitusjärjestelmän kyvyssä allokoida pääomia tehokkaasti.
Elinkeinoelämän tutkimuslaitoksen tytäryhtiön Etlatieto Oy:n koor-dinoiman tutkimusprojektin ”Rahoitusjärjestelmän haasteet uuden talouden toimintaympäristössä” loppuraportiksi toimittamassamme kirjassa ”Financial Systems and Firm Performance: Theoretical and Empirical Perspectives” tarkastel-laan viime vuosien rahoitusmarkkinakehitystä Suomessa. Erityisesti analy-soidaan sitä, millaisia haasteita Suomen perinteisesti varsin pankkikeskeisenä pidetyllä rahoitusjärjestelmällä on uudistuvassa taloudessa. Haasteita on ai-nakin potentiaalisesti, sillä lähtökohtana on, että Suomi on keskellä teknolo-gisen ja teollisen kehityksen murrosta. Samanaikaisesti valtiot ja niiden inno-vaatiojärjestelmät käyvät keskenään yhä kovempaa kilpailua osaamisesta ja pääomista (ks. myös Valtion tiede- ja teknologianeuvosto 2003). Tämänkaltai-sissa tilanteissa talouden ja teknologisen kehityksen ”Akilleen kantapäänä” ja esteenä on toistuvasti pidetty yksityisen rahoituksen saatavuutta ja pääomien vähäisyyttä.
Tämä kirjoitus etenee siten, että seuraavaksi kuvaamme lyhyesti yllä mainitun kirjan sisällön. Sen jälkeen pohdimme rahoitusjärjestelmän haastei-ta uudistuvassa taloudessa.
462 · Ar i Hyyt inen ja M ik a Pajar inen
1.2. KIRJAN ”FINANCIAL SYSTEMS AND FIRM PERFORM-ANCE: THEORETICAL AND EMPIRICAL PERSPECTIVES” KUVAUS
Kirja ”Financial Systems and Firm Performance: Theoretical and Empirical Perspec-tives” koostuu kolmesta osasta, joissa analysoidaan eri näkökulmista rahoi-tusjärjestelmän ja yritysten toiminnan välisiä yhteyksiä. Kirjassa käsitellään mm. seuraavia kysymyksiä:
• Kuinka Suomen rahoitusjärjestelmä on kehittynyt viimeisten kahden vuo-sikymmenen aikana ja erityisesti 1990-luvulla? Onko ulkopuolisen rahoi-tuksen saatavuudessa tapahtunut muutoksia etenkin pk-yritysten kannal-ta? Mitkä ovat tärkeimmät pk-yritysten rahoituslähteet? Onko yrityksille tarjolla riittävästi rahoitusta niiden eri kasvuvaiheissa?
• Mikä on yksityisen ja toisaalta julkisen yritysrahoituksen rooli jatkuvan muutoksen alaisessa rahoitusjärjestelmässä? Missä määrin julkisen vallan tulisi puuttua pääomamarkkinoiden toimintaan ja millä perustein? Mitä rahoitusjärjestelmän kehittyminen merkitsee julkisen yritysrahoituksen sekä laajemmin elinkeino- ja teknologiapolitiikan kannalta?
Kirjan ensimmäisessä osassa tarkastellaan Suomen rahoitusmarkkinoiden yleistä kehitystä lähinnä makrotalouden näkökulmasta viimeisten kahden vuosikymmenen aikana ja erityisesti 1990-luvulla. Toisessa osassa tutkitaan rahoitusmarkkinoita ja yritysrahoitusta mikrotalouden välinein ja mik-ronäkökulmasta. Kolmannen osan näkökulma on politiikkapainotteinen. Seuraavassa kuvaamme hieman tarkemmin kunkin osan tutkimuksia.
Osa yksi: Makronäkökulma
Ensimmäinen osa alkaa Ari Hyytisen ja Mika Pajarisen tutkimuksella (Chap-ter 1: Financial Systems and Venture Capital in Nordic Countries: A Comparative Study), jossa tarkastellaan rahoitusmarkkinoiden ja pääomasijoitustoimialan kehitystä Pohjoismaissa. Tutkimuksen analyysi osoittaa, että rahoitusjärjes-telmien kehitys on eri Pohjoismaissa ollut hyvin samankaltaista ja että viime vuosikymmenen aikana Pohjoismaiden rahoitusjärjestelmät eivät ole juuri-kaan kasvaneet talouden kokoon verrattuna. Ne ovat kuitenkin tulleet aikai-sempaa osakemarkkinakeskeisimmiksi. Tämä kehitys näyttää olleen erityisen selvää Suomessa. Tutkimuksessa havaitaan myös, että huolimatta pääomasi-joitustoimialan voimakkaasta kasvusta 1990-luvun jälkipuoliskolla vain

Rahoitus jär jestelmä ja yr i tystoiminta uudistuvassa ta loudessa · 463
Ruotsissa pääomasijoitustoimiala on saavuttanut pääomien keräämisen (funds raised) ja niiden sijoittamisen (investments) osalta sen suhteellisen ta-son, joka vastaa maan osuutta Euroopan bruttokansantuotteesta. Tämä tar-koittaa sitä, että Suomessa pääomasijoitustoimiala ei ole niin kypsä kuin muualla Euroopassa, koska se tavallaan tulee ”pääomasijoitussyklissä” hie-man eurooppalaista kehitystä jäljessä.
Kirjan ensimmäinen osa jatkuu Ari Hyytisen, Iikka Kuosan ja Tuomas Takalon tutkimuksella (Chapter 2: Investor Protection and Financial Develop-ment in Finland) suomalaisesta yritysrahoitusympäristöstä ja sijoittajien suo-jassa tapahtuneista muutoksista. Tutkimuksen lähtökohta on kasvava ns. law-and-finance tutkimussuuntaus, jonka mukaan rahoitusjärjestelmän koon ja te-hokkuuden taustalla on ainakin osaksi se, kuinka oikeusjärjestelmä (lait ja niiden toimeenpano) ”suojaa” ulkopuolisia sijoittajia yrityksen ja sen sisäpii-rin väärinkäytöksiltä. Teesinä siis on, että ulkopuolisten rahoittajien oikeus-asema määräytyy suuressa määrin sen oikeusjärjestyksen mukaan, johon asi-anomaisen yhtiön rekisteröintivaltio kuuluu. Oikeusasema puolestaan vai-kuttaa yhtiön mahdollisuuksiin hankkia ulkoista rahoitusta sijoittajilta. Hyy-tisen, Kuosan ja Takalon tutkimuksessa osoitetaan, että (vähemmis-tö)osakkeenomistajien oikeudet vahvistuivat, kun taas luotonantajien oikeu-det heikkenivät aikavälillä 1980-2002 (ks. myös Hyytinen, Kuosa ja Takalo 2003a). Uudistusten tuloksena Suomessa on nykyisin rahoitusjärjestelmä, jos-sa osakkeenomistajien oikeudet eivät ole niin alikehittyneet kuin mitä ne ai-kaisemmin ovat olleet. Omanpääomanehtoista rahoitusta tarjoavien markki-noiden yleisten toimintaedellytysten (ja ”integriteetin”) edistäminen on ollut yksi tärkeimmistä tekijöistä, joka on vahvistanut riskisijoittajien asemaa.
Kirjan ensimmäisen osan kolmannessa tutkimuksessa (Chapter 3: The Role of Shareholder Protection Rules in Financing Finnish Companies) Timo Kai-sanlahti käsittelee – edelleen law-and-finance tutkimussuuntaukseen pohjau-tuen – vähemmistöosakkeiden oikeudellista suojaa Suomessa. Oikeusvertai-lun tulemana on, ettei aineellisissa normeissa ole merkittäviä eroja esimer-kiksi Yhdysvaltoihin nähden. Puutteita on kuitenkin osoitettavissa suomalai-sessa lainkäyttömenettelyssä, mikä on omiaan nostamaan suomalaisyhtiöi-den oman pääomanehtoisen rahoituksen kustannuksia tai jopa vähentämään rahoituksen saatavuutta. Koska prosessuaalisia kysymyksiä koskeva säätely on lainsäätäjän yksinoikeus, ei yhtiöillä käytännössä ole mahdollisuutta vai-kuttaa siihen. Lainkäyttö onkin suomalaisyrityksen rahoituskustannusten ja rahoituksen saatavuuden kannalta ongelmallisempi kysymys kuin mahdolli-set puutteet aineellisissa vähemmistösuojasäännöksissä, sillä niitä yhtiöissä voidaan ainakin periaatteessa täydentää omin yhtiöjärjestysmääräyksin.

464 · Ar i Hyyt inen ja M ik a Pajar inen
Kirjan ensimmäisen osan kaksi viimeistä tutkimusta tarkastelevat suomalaista rahoitusjärjestelmää pääomasijoittajien irtautumistarpeiden kannalta ja yrityskauppoja osana rahoitusjärjestelmää. Nämä kaksi aihetta ovat saaneet aiemmassa tutkimuksessa varsin vähän huomiota huolimatta siitä, että ne ovat ainakin potentiaalisesti tärkeitä erityisesti kasvuyrityksiin kanavoituvan riskirahoituksen kannalta ja kasvuyritysten elinkaaren näkö-kulmasta. Jyrki Ali-Yrkön, Ari Hyytisen ja Johanna Liukkosen tutkimus (Chapter 4: Exiting Venture Capital Investments: Lessons from Finland) käsittelee aiheista ensin mainittua. Heidän tutkimuksensa lähtökohtana on, että koska pääomasijoituksista irtautumisella voi olla useita heijastusvaikutuksia pää-omasijoittajien myöhempään varainhankintaan ja sijoitusten tekemiseen, niin pääomasijoitustoimialan pitkän aikavälin kehitys riippuu keskeisesti rahoi-tusjärjestelmän tarjoamista irtautumismahdollisuuksista. Tutkimuksessa osoitetaan, että vaikka Suomen osakemarkkinat kehittyivätkin 1990-luvulla suotuisasti ja tyydyttivät hyvin suurten yritysten tarpeita, niin pääomasijoi-tuksista irtautumisen kannalta osakemarkkinat eivät vielä toimi parhaalla mahdollisella tavalla. Tämä johtuu mm. yritysten listautumisantien (Initial public offerings, IPOs) voimakkaasta klusteroitumisesta ajallisesti, osake-markkinoiden volatilisuudesta ja eräistä muista tutkimuksessa identifioiduis-ta tekijöistä. Näyttääkin siltä, että yrityskauppamarkkinat ovat tarjonneet suomalaisille pääomasijoittajille tärkeän mutta pörssilistautumiseen verrat-tuna tyypillisesti toissijaisen irtautumiskanavan. Tutkimuksen tulokset tuke-vat näkemystä, että pääomasijoitustoimialan ja siten riskipääoman tarjonnan kehitys voivat Suomessa hidastua, koska suomalainen rahoitusjärjestelmä tukee vain osittain viimeistä pääomasijoitusprosessin vaiheista eli menestyk-sellisiä irtautumisia sijoituksista listaamattomiin yrityksiin (ks. myös Hyyti-nen 2002).
Kirjan ensimmäinen osa päättyy Jyrki Ali-Yrkön tutkimukseen (Chap-ter 5: Patterns of the Finnish Merger and Acquisition Activity) suomalaisesta yri-tyskauppaympäristöstä. Tutkimuksessa käsitellään tärkeimpiä yrityskauppo-jen motiiveja ja analysoidaan yrityskauppojen kehityspiirteitä. Tutkimukses-sa havaitaan, että EU-maiden vertailussa Suomen yrityskauppa-aktiivisuus oli 1990-luvulla vilkkainta, kun yrityskauppojen lukumäärä suhteutetaan kansantalouden kokoon. Korkean yrityskauppa-aktiivisuuden taustalla eivät ole pelkästään kotimaiset kaupat, vaan sitä selittävät osin myös kansainvälis-ten yrityskauppojen (so. suomalaisten yritysten kaupat ulkomailla ja toisaalta ulkomaisten yritysten hankinnat Suomesta) suuri määrä. Tutkimuksen tulok-set antavat myös joitain viitteitä siitä, että Suomesta on ostettu pienehköjä mutta teknologia-intensiivisiä yrityksiä.

Rahoitus jär jestelmä ja yr i tystoiminta uudistuvassa taloudessa · 465
Osa kaksi: Mikronäkökulma
Kirjan toinen osa alkaa Ari Hyytisen ja Mika Pajarisen tutkimuksella (Chap-ter 6: Small Business Finance in Finland – A Descriptive Study) pk-yritysten ra-hoitusrakenteista ja -lähteistä. Tutkimusta varten kerätyn laajan kyselyaineis-ton pohjalta tutkimuksessa analysoidaan sekä velan että oman pääoman läh-teitä. Tutkimuksen mukaan kolmen tärkeimmän rahoituslähteen, pääomista-jan osakesijoituksen, kauppaluottojen ja rahoituslaitosluottojen, osuus koko rahoituksesta on noin 2/3. Pk-yritysten keskimääräinen velkasuhde on 54% ja se on alhaisempi pienillä kuin suurilla pk-yrityksillä. Velkasuhde vaihtelee li-säksi epälineaarisesti yrityksen iän mukaan. Kaiken kaikkiaan suomalaisten pk-yritysten pääomarakenne ei näyttäisi poikkeavan merkittävästi yhdysval-talaisten pk-yritysten pääomarakenteesta, kun vertailukohtana käytetään Bergerin ja Udellin (1998) tutkimusta pk-yritysten pääomarakenteesta Yh-dysvalloissa. Joitain viitteitä on kuitenkin siitä, että pk-yritysten velkasuhde kasvaa iän myötä hitaammin Suomessa kuin Yhdysvalloissa ja että Suomessa nuorilla yrityksillä rahoituslaitosluottojen osuus on pienempi. Näyttää myös siltä, että innovatiivisten, T&K-intensiivisten ja aineettomia oikeuksia omis-tavien pk-yritysten velkasuhde on alhaisempi verrattuna muihin pk-yrityksiin. Ero on huomattavin kaikkein T&K-intensiivisimpien yritysten kohdalla. Lisäksi tutkimuksen tulokset osoittavat, että yrityksen ulkopuolis-ten tekemät osakesijoitukset ovat erittäin keskittyneitä pieneen osaan pk-yrityksistä.
Vaikka Hyytisen ja Pajarisen tutkimusten (Chapters 1 ja 6) tavoitteena onkin antaa kattava kuvaus suomalaisen rahoitusjärjestelmän kehityksestä ja pk-yritysten pääomarakenteesta, niissä ei kuitenkaan analysoida ulkomaisten sijoittajien merkitystä suomalaisessa rahoitusjärjestelmässä. Tätä aukkoa täyt-tävät kirjan toisen osan kaksi seuraavaa tutkimusta, joista ensimmäisessä Jyrki Ali-Yrkkö ja Pekka Ylä-Anttila (Chapter 7: Globalization of Business in a Small Country – Does Ownership Matter?) analysoivat omistusrakenteen kan-sainvälistymisen vaikutuksia yritysten tavoitteisiin ja kilpailukykyyn. Tutki-muksen empiirisessä osassa havaitaan, että suuret suomalaiset yritykset omaksuivat 1990-luvulla tärkeimmäksi tavoitteekseen yrityksen osakeomis-tuksen arvon maksimoinnin. Tämä tapahtui samaan aikaan kun ulkomaisten sijoittajien osakeomistukset Suomessa lisääntyivät voimakkaasti. Tutkimuk-sen keskeinen tulos on, että ulkomaalaisomisteiset yritykset ovat olleet kes-kimäärin kannattavampia ja tuoneet osakkeenomistajille enemmän lisäarvoa kuin suomalaisomisteiset yritykset.

466 · Ar i Hyyt inen ja M ik a Pajar inen
Analyysia ulkomaisten sijoittajien merkityksestä suomalaisessa rahoi-tusjärjestelmässä jatketaan Markku Maulan ja Markus Mäkelän tutkimukses-sa (Chapter 8: Cross-border Venture Capital). He analysoivat kansainvälisten pääomasijoittajien roolia suomalaisten yritysten kansainvälistymisen taustal-la ja toisaalta Suomen pääomasijoitusmarkkinoiden kehityksessä. Aikaisem-piin tutkimustuloksiin, uuteen suomalaiseen aineistoon ja haastatteluihin pe-rustuen Maula ja Mäkelä päättelevät, että hyvän kontaktiverkoston omaavat ulkomaiset pääomasijoittajat auttavat nuorien yritysten kansainvälistymises-sä ”avaamalla ovia” ja parantaen portfolioyritystensä luotettavuutta. Jos ko-timainen pääomasijoitustoimiala on vasta kehittymässä (niin kuin esimerkik-si Suomessa, ks. myös Hyytisen ja Pajarisen tulokset edellä ja Maula ja Mur-ray 2003), kokeneiden ulkomaisten sijoittajien markkinatuntemus voi auttaa yrityksiä välttämään kalliita virheitä kansainvälistymisprosessissa.
Kirjan toinen osa päättyy Vesa Kanniaisen teoreettiseen tutkimukseen (Chapter 9: Venture Capital Finance: What is Different?) pääomasijoittamisesta yritysrahoituksen muotona. Kanniainen pohtii pääomasijoitustoimialan syn-tyä peilaamalla sitä rahoitusteorian ja erilaisten rahoitusinstrumenttien kehi-tykseen. Kanniaisen tarkastelun lähtökohtana on ajatus, että yritysrahoituk-sen perusongelmien analyysi on avain pääomasijoittajien roolin ymmärtämi-seksi. Kanniaisen johtopäätös on, että pääomasijoitustoimialaa tulisi ajatella eräänlaisena ”informoidun rahoituksen” (informed finance) erityismuotona, joka on pääosin syntynyt lieventämään uusien yritysten kaupallisesta koke-mattomuudesta syntyviä ongelmia. Kanniainen huomauttaa, että pääomasi-joitustoimialan kasvu voi toisaalta aiheuttaa negatiivisia ulkoisvaikutuksia sellaisten yritysten rahoitukselle, jotka tarvitsevat pääasiassa ”ei-informoitua rahoitusta” (uninformed finance, ks. tarkemmin myös Kanniainen ja Leppä-mäki 2002). Tällaiseksi rahoitukseksi voitaisiin lukea esimerkiksi tavallinen pankkirahoitus. Kanniaisen tarkastelun tulokset näyttäisivät myös tukevan johtopäätöstä, että moniin muihin rahoituslähteisiin verrattuna pääomasijoit-taminen tulee jäämään määrällisesti melko pieneksi rahoituslähteeksi. Tähän vaikuttavat mm. se, että pääomasijoituksilla on taipumus keskittyä muuta-mille toimialoille kerrallaan ja se, että informoidun rahoituksen tarjontaa ra-joittaa sekä sijoittajien taipumus riskin kaihtamiseen että hankearvioinnissa ja uusien yritysten neuvontatehtävässä tarvittavan asiantuntemuksen puute.
Osa kolme: Julkisen yritysrahoituksen näkökulma
Kirjan kolmas osa lähestyy rahoitusjärjestelmän kehitystä elinkeino- ja tekno-logiapolitiikan näkökulmasta. Osa alkaa Ari Hyytisen ja Lotta Väänäsen tut-

Rahoitus jär jestelmä ja yr i tystoiminta uudistuvassa ta loudessa · 467
kimuksella (Chapter 10: Government Funding of Small and Medium-sized Enter-prises in Finland) pk-yritysten julkisesta rahoituksesta Suomessa. Tutkimuk-sen lähtökohtana on havainto, että kuten monissa muissakin maissa, valtio on Suomessa ollut varsin innokas tarjoamaan julkista rahoitusta suomalaisille yrityksille, erityisesti pk-sektorille. Tutkimuksessa tarkastellaan taloustietees-tä julkiselle yritysrahoitukselle löydettävissä olevien perusteluiden valossa kaikkia pk-yrityksille julkista rahoitusta tarjoavia valtion organisaatioita Suomessa sekä niille asetettuja tavoitteita ja tehtäviä. Käyttämällä uutta ai-neistoa suomalaisista pk-yrityksistä luvussa tutkitaan myös sitä, minkälaiset pk-yritykset hakevat ja saavat julkista rahoitusta Suomessa. Tutkimus osoit-taa, i) että lainsäädännöstä ja muusta sääntelystä löytyvä ”retoriikka” siitä, mitä eri julkista rahoitusta tarjoavat valtion organisaatiot on asetettu teke-mään (ja mitä ne itse raportoivat tehtävistään ja toiminnastaan) ei ole täysin linjassa taloustieteestä löydettävissä olevien perusteluiden kanssa; ii) että pk-yrityksille myönnetyn julkisen rahoituksen kokonaismäärä on viimeisen nel-jän vuoden aikana kasvanut ja vaihdellut samanaikaisesti markkinaehtoisen ulkoisen rahoituksen saatavuuden kanssa; iii) että joka kolmas pk-yritys on tähän mennessä hakenut ja saanut rahoitusta vähintäänkin yhdeltä julkista rahoitusta tarjoavalta valtion organisaatiolta. Luvussa esitetyt ekonometriset tulokset viittaavat siihen, että kokonaisuutena tarkasteltuna erityyppistä jul-kista rahoitusta saavien ja hakevien pk-yritysten ominaisuudet ovat yhden-mukaisia virallisen ”retoriikan” kanssa, ja sen kanssa mitä ko. organisaatioi-den ”tulisikin tehdä”. Tulokset osoittavat kuitenkin myös, että julkista rahoi-tusta todella tarvitsevien pk-yritysten löytämiseksi ei ehkä ole panostettu riit-tävässä määrin. Tutkimuksen tulokset tukevat ajatusta, että julkisen rahoi-tuksen tulisi olla valikoivaa eli kohdistua vain niille yrityksille, jotka sitä to-della tarvitsevat.
Kirjan viimeisessä luvussa Ari Hyytinen, Petri Rouvinen, Otto Toiva-nen ja Pekka Ylä-Anttila (Chapter 11: Does Financial Development Matter for Innovation and Economic Growth? Implications for Public Policy) pohtivat sitä, miksi rahoitusmarkkinoiden kehityksellä saattaa olla vaikutuksia innovaatio-toimintaan ja taloudelliseen kasvuun ja toisaalta sitä, mitä viime vuosien ra-hoitusmarkkinoiden kehitys merkitsee yrityssektorin (erityisesti pk-yritysten) julkisen rahoituksen sekä elinkeino- ja teknologiapolitiikan kannal-ta. Tutkimuksessa pohditaan myös sitä, onko yrityssektorille kohdistettavan julkisen rahoituksen ja innovaatio- ja teknologiapolitiikan osalta tarvetta uu-delleenarviointeihin tai painopisteiden muutoksiin. Pohjautuen pitkälti tähän kirjan viimeiseen lukuun siirrymme seuraavaksi pohtimaan rahoitusjärjes-

468 · Ar i Hyyt inen ja M ik a Pajar inen
telmän – ja samalla siten julkisen rahoituksen ja innovaatio- ja tekno-logiapolitiikan – haasteista uudistuvassa taloudessa.
1.3. RAHOITUSJÄRJESTELMÄN HAASTEET UUDISTUVASSA TALOUDESSA
Uusin taloustieteellinen tutkimus tukee näkemystä, että kansallisten rahoitus-markkinoiden kehityksellä (financial development) ja kotimaisen yritysrahoituksen saatavuudella on – rahoitusmarkkinoiden integroitumisesta ja globalisoitumi-sesta huolimatta – vahva yhteys taloudelliseen kasvuun ja innovaatiotoimin-taan. Niillä on merkitystä etenkin sen kasvun ja innovaatiotoiminnan kannal-ta, joka tapahtuu pk-yrityksissä ja yrittäjien toiminnan seurauksena. Tämä johtuu mm. siitä, että näihin toimijoihin liittyvä ja rahoittajien kannalta rele-vantti informaatio on paikallista. Kotimaiset rahoitusinstituutiot eivät siis ole käymässä tarpeettomiksi.
Rajoittaako rahoituksen saatavuus innovaatiotoimintaa ja taloudellista kasvua Suomessa?
Viimeisten kahden vuosikymmenen aikana ja erityisesti 1990-luvulla tapah-tuneella rahoitusmarkkinoiden kehityksellä on ollut perinpohjaisia vaikutuk-sia suomalaiseen yritysrahoitusympäristöön. Viimeaikainen rahoitusmarkki-noiden kehitys on edesauttanut sekä pääomien tehokasta akkumuloitumista ja niiden jakautumista erilaisiin hankkeisiin että innovaatiotoiminnan lisään-tymistä. Tämä edistys on seurausta siitä, että rahoitusjärjestelmämme on monipuolistunut ja osakemarkkinoiden asema vahvistunut aikaisempiin vuosikymmeniin verrattuna. Ulkoisen rahoituksen saatavuus on siis rahoi-tusmarkkinoiden kehityksen myötä selvästi parantunut. Osakemarkkinoiden ja pääomasijoitustoimialan merkityksen kasvu rahoituksen välityksessä on parantanut uusien, innovatiivisten ja riskialttiiden yritysten ja hankkeiden rahoitusmahdollisuuksia verrattuna tilanteeseen 1980-luvulla ja vielä 1990-luvun alussa, jolloin rahoitus välittyi pääsääntöisesti rahoituslaitosten kautta. Suomen toimialarakenteen viimeaikaiset muutokset ovatkin sopusoinnussa tämän rahoitusmarkkinoiden rakennemuutoksen kanssa (Kauppi ja Hyyti-nen 2002).
Voidaankin väittää, että suurten suomalaisten yritysten joukosta lienee nykyisin vaikeaa löytää tapausta, jossa elinkelpoisen yrityksen kasvua mer-kittävästi rajoittaisi ulkoisen rahoituksen riittämättömyys, vaikka potentiaa-linen rahoitustarve olisi suurikin. Rahoituksen saatavuus ei varmaankaan ole

Rahoitus jär jestelmä ja yr i tystoiminta uudistuvassa ta loudessa · 469
merkittävä ongelma myöskään tyypilliselle pk-yritykselle (ks. myös kuvio 1), varsinkin kun sen ulkopuolisen rahoituksen tarve näyttäisi useimmiten ole-van melko vähäistä (ks. tarkemmin Hyytinen, Rouvinen, Toivanen ja Ylä-Anttila 2003, [Chapter 11]). Ja vaikka kuvion 1 perusteella voidaan nähdä, et-tä reilulla neljäsosalla pk-yrityksistä on ollut vaikeuksia saada ulkoista rahoi-tusta, on hyvä pitää mielessä se, että ulkoista rahoitusta hakevien joukkoon mahtuu myös sellaisia elin- ja kehityskelvottomia hankkeita, joiden ei tulisi-kaan saada rahoitusta. Hyvin toimivan rahoitusjärjestelmä ominaisuus on, et-tä myös erilaisin markkinaratkaisuin voidaan lieventää rahoituksen kanavoi-tumista hankaloittavia informaatio-ongelmia (ks. tarkemmin Hyytinen ja Pa-jarinen 2002) ja että rahoitusjärjestelmä myös karsii hankkeita ja kohdistaa rahoitusta vain hyviin projekteihin. Joka tapauksessa nykyinen tilanne on Suomessa varsin erilainen verrattuna aikaan, jolloin monet julkista rahoitusta yhä nykyään tarjoavat organisaatiot alunperin perustettiin.
Kuvio 1. Rahoituksen saatavuuteen liittyvät ongelmat pk-sektorilla 1996-2002
1996 1997 1998 1999 2000 2001 2002/I 2002/II0%
10%
20%
30%
40%
50%
60%
70%
80%
90%
Osuus ulkopuolista rahoitusta tarvitsevista pk-yrityksistä, joilla ei vaikeuksia saada sitä
Huom.: Alkuperäinen kuvion lähde on Hyytinen et al. (2003, [Chapter 11]). Aineistolähteenä ovat Finn-veran ja Suomen Yrittäjien kyselytutkimukset ja kirjoittajien laskelmat.
Hyytisen, Rouvisen, Toivasen ja Ylä-Anttilan (2003, [Chapter 11]) ra-portoimat luvut paljastavat, että noin joka kymmenes pk-yritys on jättänyt viimeisen vuoden aikana jonkin yrityksen omasta mielestä keskeisen inves-tointihankkeen toteuttamatta rahoitusrajoitteiden vuoksi. T&K-intensiivisistä
470 · Ar i Hyyt inen ja M ik a Pajar inen
pk-yrityksistä tätä mieltä oli vajaa kolmannes. Pk-yritysten oma näkemys näyttäisi olevan, että pankkiluotto- ja muut markkinat, joilta voidaan hakea velkamuotoista rahoitusta toimivat paremmin kuin markkinat, joilta voidaan hakea omanpääomanehtoista rahoitusta. Niiltä osin kuin ongelmia näillä mo-lemmilla markkinoilla yhä esiintyy, puutteet liittyvät pk-yritysten näkemys-ten mukaan (yksityisten) sijoittajien ja rahoittajien haluttomuuteen ja kyke-nemättömyyteen kantaa sijoitustoimintaan liittyvää riskiä (ks. tarkemmin Hyytinen ja Pajarinen 2003, [Chapter 6] sekä erityisesti Hyytinen, Rouvinen, Toivanen ja Ylä-Anttila 2003, [Chapter 11]).
Edellä kuvatut pk-yritysten näkemykset ovat yhdenmukaisia sen kanssa, että huolimatta viimeisten 10-20 vuoden suotuisasta rahoitusjärjes-telmän kehityksestä pääomamarkkinoilla on edelleen rakenteellisia puutteita (”katvealueita”). Tämänkaltaiset puutteet on tärkeä erottaa normaaleista suhdannevaihtelusta johtuvista muutoksista rahoitusmarkkinoilla, sillä lyhy-en aikavälin tarkastelussa on vaikeaa erottaa kysyntä- ja tarjontatekijöistä johtuvia muutoksia. Jos puutteita on, liittyvät ne käsityksemme mukaan suomalaisten osakemarkkinoiden ja pääomasijoitustoimialan erityispiirteisiin sekä osin myös luottolaitosten toimintaan. Nämä erityispiirteet ainakin osal-taan voivat olla syynä sijoittajien haluttomuuteen tai huonoon kykyyn kantaa yritysrahoitukseen liittyviä riskejä. Näitä rahoitusjärjestelmän yksityisiin toimijoihin liittyviä erityispiirteitä ovat mm. seuraavat:
• Suomi on vasta alkanut siirtyä kohtia monipuolisempaa ja osakemarkki-nakeskeisempää rahoitusjärjestelmää, joten markkinainfrastruktuuri on edelleen kehittymässä (Hyytinen ja Pajarinen 2003a, [Chapter 1]; Hyyti-nen, Kuosa ja Takalo 2003, [Chapter 2]). Myös pääomasijoittajien omat nä-kemykset ovat tämänsuuntaisia (Ali-Yrkkö, Hyytinen ja Liukkonen, [Chapter 4]). Markkinainfrastruktuurin kehitystä saattaa osaltaan viiväs-tyttää taloutemme pieni koko, sillä rahoitusmarkkinainfrastruktuurin ke-hittämiseen liittyy usein erilaisia kiinteitä kustannuksia (Hyytinen ja Paja-rinen 2003a, [Chapter 1]). Näiden kiinteiden kustannusten kattaminen puolestaan edellyttää, että (odotettavissa oleva) toimintavolyymi on riit-tävän suuri. Toinen kehitystä mahdollisesti hidastava tekijä on se, että varsin ajantasaisesta lainsäädännöstä löytyvästä osakesijoittajiensuojasta huolimatta (Hyytinen, Kuosa ja Takalo 2003, [Chapter 2]), suomalainen lainkäyttömenettely on omiaan vähentämään omanpääomanehtoisien ris-kisijoitusten houkuttelevuutta (Kaisanlahti 2003, [Chapter 3]).
• Pääomasijoitustoimiala on Suomessa edelleen jäljessä eurooppalaista pää-omasijoitussykliä ja koostuu pääasiassa varsin nuorista ja pienistä pää-

Rahoitus jär jestelmä ja yr i tystoiminta uudistuvassa ta loudessa · 471
omasijoitusyrityksistä (Hyytinen ja Pajarinen 2003a, [Chapter 1], Ali-Yrkkö, Hyytinen ja Liukkonen 2003, [Chapter 4], ja Hyytinen 2002). Tämä merkinnee mm. sitä, että niiden tämänhetkinen kyky hajauttaa riskejä ja toimia pääomasijoitustoimintaan kiinteästi liittyvässä kasvuyritysten neuvontatehtävässä voi olla puutteellinen (ks. myös Maula and Mäkelä 2003, [Chapter 8] ja Kanniainen 2003, [Chapter 9]). Mikäli viive pääomasi-joitussyklissä ei liity täysin kysyntätekijöihin, se viittaa siihen, että suoma-laiset teknologia- ja kasvuyritykset ovat riskipääoman saatavuuden suh-teen mahdollisesti heikommassa asemassa kuin vastaavat yritykset Eu-roopassa yleensä.
• Listautumismarkkinoiden ja kotimaisen osakemarkkinoiden yleisemmäs-tä ”volatiilisuudesta”, pienempien listattujen yritysten osakkeiden heikos-ta likviditeetistä ja eräistä muista tekijöistä johtuen kotimainen rahoitus-järjestelmä tukee puutteellisesti kasvuyritysten elinkaarta ja riskisijoittaji-en irtautumistarpeita (ks. tarkemmin Ali-Yrkkö, Hyytinen ja Liukkonen 2003, [Chapter 4]). Onnistuneiden irtautumisten merkitys tulee jatkossa kasvamaan mm. siitä syystä, että aikaisemmin alaa hallinneilla julkisilla toimijoilla ei välttämättä ole ollut samanlaisia irtautumistarpeita kuin yk-sityisillä toimijoilla on. Alalle tulleilla uusilla yksityisillä toimijoilla onkin paine viestittää onnistumisistaan ja rakentaa mainettaan pystyäkseen ke-räämään varoja myös tulevaisuudessa (muista syistä, ks. Hyytinen 2002).
• Vaikka erilaiset luottolaitokset ja erityisesti pankit ovatkin tärkeitä pk-yritysten rahoittajia (Hyytinen ja Pajarinen 2003b, [Chapter 6]) on joitain viitteitä siitä, että niiden yritysluotonantoa leimaa tietynlainen varovai-suus (Hyytinen ja Pajarinen 2003b, [Chapter 6] ja Hyytinen, Rouvinen, Toivanen ja Ylä-Anttila 2003, [Chapter 11]). Vaikka syitä varovaisuuteen voi olla monia, on mahdollista, että sekä velkojien suojassa tapahtuneet heikentymiset (Hyytinen, Kuosa ja Takalo 2003, [Chapter 2]) että pankki-kriisi ovat jättäneet jälkensä suomalaisten luottolaitosten yritysluototuk-seen. Tämä varovaisuus puolestaan näkyy konkreettisimmin siinä, että luotonanto sidotaan tiukasti siihen, minkälaisia vakuuksia yrityksillä on tarjota.
Sekä aikaisemmin mainitut pk-yritysten omat näkemykset että edellä kuvatut suomaisten rahoitusmarkkinoiden erityispiirteet sopivat varsin hy-vin yhteen sen kanssa, että ulkopuolinen omanpääomanehtoinen rahoitus näyttää jakautuvan epätasaisemmin pk-yritysten kesken kuin rahoituslaitos-ten luotonanto (ks. Hyytinen ja Pajarinen 2003, [Chapter 6] ja kuviot 2 ja 3). Gans ja Stern (2000) tulkitsevat tämänkaltaisen rahoituksen epätasaisen ja-

472 · Ar i Hyyt inen ja M ik a Pajar inen
kautumisen mahdolliseksi indikaattoriksi pääomamarkkinoiden epätäydelli-syyksistä, sillä se voisi olla seurausta esimerkiksi rahoituksen tarjonnan säännöstelystä (”rationing”).
Pk-yritysten omien näkemysten ja edellä lueteltujen erityispiirteiden valossa ei ole yllättävää, että tutkimustulokset osoittavat, että nimenomaan kasvuhakuiset ja innovatiiviset yritykset ovat suomalaisessa pk-kentässä todennäköi-simmin niitä, joiden toimintaa rajoittaa rahoituksen saatavuus (Hyytinen ja Toiva-nen 2002, Hyytinen, Rouvinen, Toivanen ja Ylä-Anttila 2003, [Chapter 11], ks. myös Maula ja Murray 2003). Ulkopuolisen rahoituksen saamisessa on kes-kimääräistä enemmän vaikeuksia myös pienimmillä pk-yrityksillä. Näin ol-leen ei myöskään ole yllättävää, että ongelmat rahoituksen saatavuudessa näyttävät korreloivan negatiivisesti yrittäjyysaktiviteetin kanssa (ks. kuvio 4).
Vaikuttavatko rahoitusjärjestelmän erityispiirteet kaikkiin pk-yrityksiin samalla tavoin?
On hyvä huomata, että kaikki kasvuhakuiset ja innovatiiviset pk-yrityksetkään
eivät kärsi yhtä paljon rahoitusrajoitteista, sillä myös näiden segmenttien sisällä
on eroja ulkopuolisen rahoituksen kysynnässä ja tarjonnassa. Kuten Hyytinen ja
Toivanen (2002) korostavat, vain ne yritykset ja toimialat, joiden toiminta edel-
lyttää ulkoiseen rahoitukseen turvautumista, voivat edes lähtökohtaisesti kärsiä
ulkoisen rahoituksen tarjontaan liittyvistä ongelmista. Eroja tarjonnassa eri pk-
yritysten segmenttien välillä on vaikea havaita, mutta Hyytisen, Rouvisen, Toi-
vasen ja Ylä-Anttilan (2003, [Chapter 11]) analyysi antaa esimerkiksi viitteitä sii-
tä, että T&K-intensiiviset yritykset tieto- ja viestintäteknologian alalla näyttäisi-
vät saavan rahoitusta paremmin kuin muutoin identtiset yritykset muilla toimi-
aloilla. Lisäksi, kuten jo edellä totesimme, on myös hyvä pitää mielessä, että ul-
koista rahoitusta hakevien joukkoon mahtuu myös sellaisia elin- ja kehityskel-
vottomia hankkeita, joiden ei tulisikaan saada rahoitusta. Hyvin toimivan rahoi-
tusjärjestelmä ominaisuus on, että se myös karsii hankkeita ja allokoi rahoitusta
vain hyviin projekteihin.
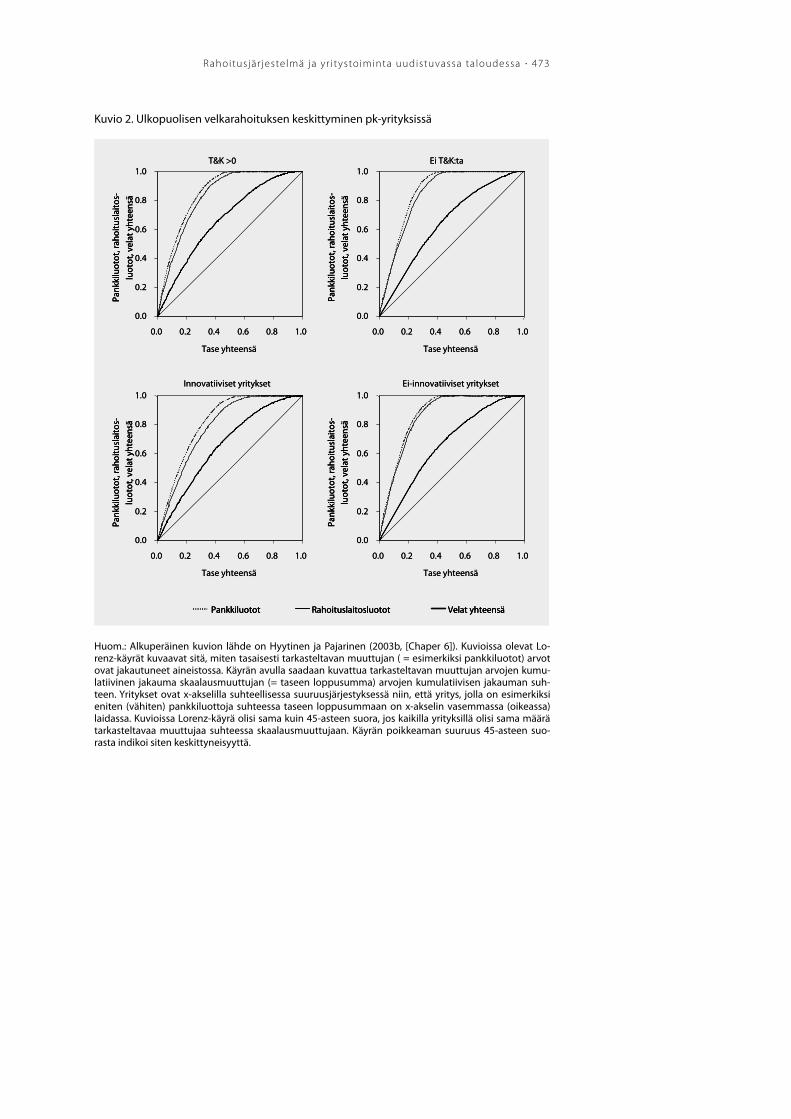
Rahoitus jär jestelmä ja yr i tystoiminta uudistuvassa ta loudessa · 473
Kuvio 2. Ulkopuolisen velkarahoituksen keskittyminen pk-yrityksissä
Ei T&K:ta
0.0
0.2
0.4
0.6
0.8
1.0
0.0 0.2 0.4 0.6 0.8 1.0
Tase yhteensä
T&K >0
0.0
0.2
0.4
0.6
0.8
1.0
0.0 0.2 0.4 0.6 0.8 1.0
Tase yhteensä
Pank
kilu
otot
, rah
oitu
slai
tos-
luot
ot, v
elat
yht
eens
ä
0.0
0.2
0.4
0.6
0.8
1.0
0.0 0.2 0.4 0.6 0.8 1.0
Tase yhteensä
Innovatiiviset yritykset
0.0
0.2
0.4
0.6
0.8
1.0
0.0 0.2 0.4 0.6 0.8 1.0
Tase yhteensä
Ei-innovatiiviset yritykset
Rahoituslaitosluotot Velat yhteensäPankkiluotot
Pank
kilu
otot
, rah
oitu
slai
tos-
luot
ot, v
elat
yht
eens
ä
Pank
kilu
otot
, rah
oitu
slai
tos-
luot
ot, v
elat
yht
eens
ä
Pank
kilu
otot
, rah
oitu
slai
tos-
luot
ot, v
elat
yht
eens
ä
Ei T&K:ta
0.0
0.2
0.4
0.6
0.8
1.0
0.0 0.2 0.4 0.6 0.8 1.0
Tase yhteensä
T&K >0
0.0
0.2
0.4
0.6
0.8
1.0
0.0 0.2 0.4 0.6 0.8 1.0
Tase yhteensä
Pank
kilu
otot
, rah
oitu
slai
tos-
luot
ot, v
elat
yht
eens
ä
Pank
kilu
otot
, rah
oitu
slai
tos-
luot
ot, v
elat
yht
eens
ä
0.0
0.2
0.4
0.6
0.8
1.0
0.0 0.2 0.4 0.6 0.8 1.0
Tase yhteensä
Innovatiiviset yritykset
0.0
0.2
0.4
0.6
0.8
1.0
0.0 0.2 0.4 0.6 0.8 1.0
Tase yhteensä
Ei-innovatiiviset yritykset
RahoituslaitosluototRahoituslaitosluotot Velat yhteensäVelat yhteensäPankkiluototPankkiluotot
Pank
kilu
otot
, rah
oitu
slai
tos-
luot
ot, v
elat
yht
eens
ä
Pank
kilu
otot
, rah
oitu
slai
tos-
luot
ot, v
elat
yht
eens
ä
Pank
kilu
otot
, rah
oitu
slai
tos-
luot
ot, v
elat
yht
eens
ä
Pank
kilu
otot
, rah
oitu
slai
tos-
luot
ot, v
elat
yht
eens
ä
Pank
kilu
otot
, rah
oitu
slai
tos-
luot
ot, v
elat
yht
eens
ä
Pank
kilu
otot
, rah
oitu
slai
tos-
luot
ot, v
elat
yht
eens
ä
Huom.: Alkuperäinen kuvion lähde on Hyytinen ja Pajarinen (2003b, [Chaper 6]). Kuvioissa olevat Lo-renz-käyrät kuvaavat sitä, miten tasaisesti tarkasteltavan muuttujan ( = esimerkiksi pankkiluotot) arvot ovat jakautuneet aineistossa. Käyrän avulla saadaan kuvattua tarkasteltavan muuttujan arvojen kumu-latiivinen jakauma skaalausmuuttujan (= taseen loppusumma) arvojen kumulatiivisen jakauman suh-teen. Yritykset ovat x-akselilla suhteellisessa suuruusjärjestyksessä niin, että yritys, jolla on esimerkiksi eniten (vähiten) pankkiluottoja suhteessa taseen loppusummaan on x-akselin vasemmassa (oikeassa) laidassa. Kuvioissa Lorenz-käyrä olisi sama kuin 45-asteen suora, jos kaikilla yrityksillä olisi sama määrä tarkasteltavaa muuttujaa suhteessa skaalausmuuttujaan. Käyrän poikkeaman suuruus 45-asteen suo-rasta indikoi siten keskittyneisyyttä.

474 · Ar i Hyyt inen ja M ik a Pajar inen
Kuvio 3. Ulkopuolisen omanpääomanehtoisen rahoituksen keskittyminen pk-yrityksissä
Ei T&K:ta
0.0 0.2 0.4 0.6 0.8 1.0
0.0
0.2
0.4
0.6
0.8
1.0
0.0
0.2
0.4
0.6
0.8
1.0
0.0 0.2 0.4 0.6 0.8 1.0
0.0
0.2
0.4
0.6
0.8
1.0
0.0 0.2 0.4 0.6 0.8 1.0
Opo yhteensä Ulkopuolinen opo
T&K >0
0.0
0.2
0.4
0.6
0.8
1.0
0.0 0.2 0.4 0.6 0.8 1.0
Ulk
opuo
linen
op
o, o
po
yhte
ensä
Innovatiiviset yritykset Ei-innovatiiviset yritykset
Tase yhteensä Tase yhteensä
Tase yhteensäTase yhteensä
Ulk
opuo
linen
op
o, o
po
yhte
ensä
Ulk
opuo
linen
op
o, o
po
yhte
ensä
Ulk
opuo
linen
op
o, o
po
yhte
ensä
Ei T&K:ta
0.0 0.2 0.4 0.6 0.8 1.0
0.0
0.2
0.4
0.6
0.8
1.0
0.0
0.2
0.4
0.6
0.8
1.0
0.0 0.2 0.4 0.6 0.8 1.0
0.0
0.2
0.4
0.6
0.8
1.0
0.0 0.2 0.4 0.6 0.8 1.0
Opo yhteensä Ulkopuolinen opo Opo yhteensä Opo yhteensä Ulkopuolinen opoUlkopuolinen opo
T&K >0
0.0
0.2
0.4
0.6
0.8
1.0
0.0 0.2 0.4 0.6 0.8 1.0
Ulk
opuo
linen
op
o, o
po
yhte
ensä
Innovatiiviset yritykset Ei-innovatiiviset yritykset
Tase yhteensä Tase yhteensä
Tase yhteensäTase yhteensä
Ulk
opuo
linen
op
o, o
po
yhte
ensä
Ulk
opuo
linen
op
o, o
po
yhte
ensä
Ulk
opuo
linen
op
o, o
po
yhte
ensä
Huom.: Alkuperäinen kuvion lähde on Hyytinen ja Pajarinen (2003b, [Chaper 6]). Kuvioissa olevat Lo-renz-käyrät kuvaavat sitä, miten tasaisesti tarkasteltavan muuttujan ( = esimerkiksi ulkopuolisen oman-pääomanehtoisen rahoituksen) arvot ovat jakautuneet aineistossa. Käyrän avulla saadaan kuvattua tar-kasteltavan muuttujan arvojen kumulatiivinen jakauma skaalausmuuttujan (= taseen loppusumma) ar-vojen kumulatiivisen jakauman suhteen. Yritykset ovat x-akselilla suhteellisessa suuruusjärjestyksessä niin, että yritys, jolla on esimerkiksi eniten (vähiten) ulkopuolista omanpääomanehtoista rahoitusta suhteessa taseen loppusummaan on x-akselin vasemmassa (oikeassa) laidassa. Kuvioissa Lorenz-käyrä olisi sama kuin 45-asteen suora, jos kaikilla yrityksillä olisi sama määrä tarkasteltavaa muuttujaa suh-teessa skaalausmuuttujaan. Käyrän poikkeaman suuruus 45-asteen suorasta indikoi siten keskittynei-syyttä.

Rahoitus jär jestelmä ja yr i tystoiminta uudistuvassa ta loudessa · 475
Kuvio 4. Yrittäjien määrä (pl. maatalousyrittäjät) ja rahoituksen saatavuus 19
89/1
1989
/219
90/1
1990
/219
91/1
1991
/219
92/1
1992
/219
93/1
1993
/219
94/1
1994
/219
95/1
1995
/219
96/1
1996
/219
97/1
1997
/219
98/1
1998
/219
99/1
1999
/220
00/1
2000
/220
01/1
2001
/220
02/1
2002
/2
0%
5%
10%
15%
20%
25%
30%
35%
185
190
195
200
205
210
215
tuha
tta
henk
ilöä
Ongelmia rahoituksen saatavuudessa (vasen asteikko) Yrittäjien lkm (oikea asteikko)
Huom.: Aineistolähteinä ovat Finnveran ja Suomen yrittäjien kyselytutkimukset, Tilastokeskus sekä kir-joittajien laskelmat (ks. myös Hyytinen, Rouvinen, Toivanen ja Ylä-Anttila 2003, [Chapter 11]). ’Ongelmia rahoituksen saatavuudessa’ on määritelty osuutena pk-yrityksistä, joissa rahoituksen huono saatavuus on tärkein este yrityksen kehittämiselle. Yrittäjien määrä ei sisällä maatalousyrittäjiä.
Tästä pääsemme johtopäätökseen, että tarkasteltaessa jo olemassa ole-vien ja potentiaalisten teknologia- ja kasvuyritysten elinkaaren näkökulmasta ulkopuolista omanpääomanehtoista rahoitusta kanavoivia markkinoita – eli alkuvai-heen yrityksien rahoituksen markkinoita, pääomasijoitustoimialaa ja pörssiä – voi-daan todeta, että ne muodostavat ”harmaan alueen”, joka ei välttämättä kokonaisuu-tena toimi parhaalla mahdollisella tavalla ja jonka vuoksi niitä voidaan pitää katve-alueena suomalaisessa yritysrahoitusympäristössä. Suomi hyötyisikin siitä, että sillä olisi nykyistä kehittyneempi ulkopuolista omanpääomanehtoista rahoi-tusta kanavoiva ”riskirahoitusklusteri” eli jos i) tarjolla olisi enemmän riski-pääomaa siemenvaiheen yrityksille, ii) pääomasijoitustoimiala olisi kypsempi ja koostuisi vahvemmista pääomasijoitusyrityksistä ja iii) jos kasvuyrityksien osakemarkkinat olisivat likividimmät ja vahvemmat. Näin saataisiin kasvu-yritysten elinkaaren näkökulmasta saumattomasti toimiva omanpääomaneh-toista riskirahoitusta kanavoivien toimijoiden kokonaisuus ja eräänlainen riskirahoitusmarkkinoiden jatkumo. Riskirahoitusklusterin kehittäminen voi-taisiin nähdä keinona vastata haasteeseen, jonka tutkimustoiminnan kasvun ja kehityksen täysimääräinen kaupallinen hyödyntäminen innovaatiojärjes-telmälle ja rahoitusjärjestelmälle sen osana asettaa (tästä haasteesta, ks. Valti-on tiede- ja teknologianeuvosto 2003).

476 · Ar i Hyyt inen ja M ik a Pajar inen
Mitä rahoitusjärjestelmän kehittyminen merkitsee julkisen yritysrahoituksen sekä laajemmin elinkeino- ja teknologiapolitiikan kannalta?
Vaikka käytännössä yrityksiä voidaan tukea mitä erilaisimmista syistä, ta-loustieteestä on johdettavissa kaksi markkinoiden epäonnistumiseen liittyvää perustelua sille, miksi voi olla järkevää, että julkinen valta tarjoaa yrityksille rahoitusta (ks. Hyytinen ja Väänänen 2003, [Chapter 10] sekä myös Ilmakun-nas 1994). Ensimmäinen ja ehkä useimmin mainittu perustelu liittyy pääoma-markkinoiden epätäydellisyyksiin. Informaation epätäydellisyyttä ja sen epä-symmetristä jakautumista eri markkinaosapuolten kesken pidetään yleisesti yhtenä markkinaepätäydellisyyden syynä, kun puhutaan nimenomaan ra-hoitusmarkkinoiden puutteista tai katvealueista. Kysymys on yksinkertai-simmillaan siitä, että rahoituksen myöntäjä – esimerkiksi pankki tai pääoma-sijoittaja – ei voi varmasti tietää, onko luotonhakijan hanke tai projekti elin-kelpoinen ja kannattava tai kehitettävissä sellaiseksi. Mitä vähemmän ”lä-pinäkyvää” yrityksen toiminta on, sitä vaikeampaa on sen elinkelpoisuutta arvioida. Jos elinkelpoiset ja kannattavat yritykset tai hankkeet eivät onnistu uskottavasti kertomaan rahoittajille ”laadustaan” tai jos rahoittajilla ei ole kykyä yrityksen laatua selvittää, voivat ne jäädä ilman rahoitusta.
Toinen perustelu sille, miksi julkinen valta tarjoaa yrityksille rahoitusta liittyy innovatiivisen toiminnan positiivisiin ulkoisvaikutuksiin. Yritysten toimin-nasta syntyy positiivisia yhteiskunnallisia ulkoisvaikutuksia, jos yhden yri-tyksen tekemisistä hyötyvät muutkin. Näiden ulkoisvaikutusten johdosta esimerkiksi yrityksen T&K-hankkeen yhteiskunnalliset hyödyt voivat olla suuremmat kuin hankkeesta ko. yritykselle tulevat hyödyt (voitot). Näitä po-sitiivisia T&K-toiminnasta syntyviä ulkoisvaikutuksia voidaan ajatella syn-tyvän mm. tilanteissa, joissa jonkin yrityksen tekemästä innovaatiosta pääse-vät hyötymään innovaatioon liittyvien tieto- ja osaamisvuotojen myötä esi-merkiksi saman toimialan muut yritykset.
Suomessa yrityksiä on ainakin 1990-luvun alkupuolelta lähtien tuettu vedoten melko suoraan pääomamarkkinoiden epätäydellisyyksiin (Kauppa- ja teollisuusministeriö 1993, Hyytinen ja Väänänen 2003, [Chapter 10], ja myös Valtiontalouden tarkastusvirasto 2002), vaikka tämä perustelu on epäi-lemättä ollut jo esimerkiksi Sitran, Sponsorin ja Kehitysaluerahaston perus-tamisen taustalla 1960- ja 1970-luvuilla (ks. myös Seppä 2000). Myös positii-visten ulkoisvaikutusten perustelua on käytetty, mutta se on pääsääntöisesti mukana vain epäsuorasti. Käytännössä perusteluita julkiselle yritysrahoituk-selle on toki johdettu monista muistakin lähtökohdista, kuten esimerkiksi maatalous-, työllisyys- ja aluepoliittisista lähtökohdista. Voitaneenkin sanoa,

Rahoitus jär jestelmä ja yr i tystoiminta uudistuvassa ta loudessa · 477
että Suomessa on eri lähtökohtiin nojautuen oltu varsin innokkaita tarjoa-maan julkista rahoitusta suomalaisille yrityksille, erityisesti pk-yrityksille. Viime vuosina pk-yrityksiin kanavoituneen suoran julkisen yritysrahoituk-sen määrää on vaikea arvioida, mutta vuosittain se lienee ollut noin 500-600 miljoonaa euroa (kuvio 5). Hyytinen ja Väänänen (2003, [Chapter 10]) arvioi-vat, että joka kolmas olemassa oleva pk-yritys on saanut jonkinlaista julkista tukea tai julkista rahoitusta.
Kuvio 5. Julkisen pk-yritysrahoituksen määrä vuosina 1997-2001 (arvio)
1997 1998 1999 2000 20010
200
400
600
800
1,000
1,200
milj
. €
Epäsuora rahoitus Suora rahoitus
Huom.: Suora rahoitus sisältää ne avustukset, lainat, pääomalainat ja suorat osakesijoitukset, joita Finn-vera, Teollisuussijoitus, TE-keskukset, Sitra ja Tekes ovat tehneet pk-yrityksiin (ks tarkemmin Väänänen ja Hyytinen 2003, [Chapter 10]). Epäsuora rahoitus sisältää Sitran ja Teollisuussijoituksen rahastosijoituk-set sekä Finnveran takuut ja Tekesin rahoituksen, joka kanavoidaan pk-yrityksille suurten yritysten pro-jektien kautta. Aineistolähteinä ovat mainitut julkisen rahoituksen organisaatiot ja KTM. Koska Finnve-ran pk-yritysrahoituksen osuudesta ei ollut tietoa vuosilta 1997-98, oletuksena käytettiin 85% osuutta (=osuus vuonna 1999). TE-keskusten rahoituksesta kehittämis- ja toiminta-avustukset kohdistuvat täy-sin pk-sektorille. Investointiavustuksissa osuuden arvioitiin olevan 94% (kuten se oli vuonna 2000). Sit-ran rahoituksesta epäsuoraan rahoitukseen on laskettu sijoitukset sekä kotimaisiin että ulkomaisiin ra-hastoihin. Epäsuora rahoitus ei välttämättä kanavoidu täysin suomalaisiin pk-yrityksiin. Kuvion luvut on deflatoitu vuoden 2001 hintatasolle.
Rahoitusjärjestelmän myönteistä kehitystä 1980-luvun alkupuolelta lähtien ja erityisesti viimeisten kymmenen vuoden aikana on hyvä peilata edellä mainittuihin taloustieteestä julkiselle yritysrahoitukselle löydettävissä oleviin perusteluihin. Koska yritysten ulkopuolisen rahoituksen saatavuus on ylei-sesti ottaen parantunut, niin julkisten rahoittajien puuttumista rahoitusjärjestelmän toimintaan on yhä vaikeampi perustella pelkästään erilaisten markkinapuutteiden olemassaololla. Tästä syystä tarvitaankin valikoivaa julkista rahoitusta eli rahoi-tusmarkkinoiden katvealueisiin yhä selvemmin keskittyvää toimintaa. Lisäk-

478 · Ar i Hyyt inen ja M ik a Pajar inen
si on erityisen tärkeää huomata, että rahoitusjärjestelmän kehittyessä riski siitä, että julkinen rahoitus syrjäyttää kannattavaa yksityistä yritysrahoitusta tai vääristää yksityisten rahoittajien kannustimia, kasvaa. Tämä tarkoittaa mm. sitä, että jul-kisten rahoittajien olisi tunnistettava tilanteet ja markkinat, joissa niitä ei enää tarvita ja että julkisten ja yksityisten toimijoiden työnjakoon ja päällekkäi-syyksiin tulisi yhä enenevässä määrin kiinnittää huomiota (sen lisäksi, että kiinnitetään huomiota eri julkisten rahoittajien työnjaossa oleviin päällekkäi-syyksiin, vrt. Valtiontalouden tarkastusvirasto 2002, ja Maula ja Murray 2003).
Suhdannevaihtelut ja julkinen yritysrahoitus: Koska makrotalouden suhdannevaih-
teluihin liittyvät rahoitusmarkkinoiden muutokset eivät välttämättä ole merkki
markkinapuutteista ja koska näiden muutoksien taustalla olevia kysyntä- ja tar-
jontatekijöitä on varsin vaikea erottaa toisistaan, niin julkisen rahoituksen kehit-
tämisen lähtökohdaksi on syytä nostaa pidemmän aikavälin näkökulma. Rahoi-
tuksen saatavuutta ja pääomamarkkinoiden rakenteellisia ongelmia voitaneen
luotettavasti identifioida vain, jos tarkastelujakso on riittävän pitkä.
Toiseksi ohjenuoraksi julkisessa yritysrahoituksessa voisikin ottaa edellytyksiä luovan politiikan (ks. tarkemmin Hyytinen, Rouvinen, Toivanen ja Ylä-Anttila 2003, [Chapter 11]).
Olisiko erityisten, verotuksellisiin etuihin perustuvien ”pääomasijoitus-
sijoitusrahastojen” (Venture Capital Trusts) perustaminen Suomeen edellytyksiä luovaa
politiikkaa? Isossa-Britanniassa on jo jonkin aikaa toiminut erityisiä, yksityishen-
kilöille avoimia ”pääomasijoitus-sijoitusrahastoja”. Näiden esikuvien mukaan (ja
sopivasti Suomen tarpeisiin räätälöityjen mutta Euroopan unionin valtion tukiin
sovellettavat määräykset huomioon ottaen) ”pääomasijoitus-sijoitusrahastojen”
perustaminen saattaisi olla harkitsemisen arvoinen tapa edistää myös suomalai-
sen rahoitusjärjestelmän kypsymistä nykyistä monipuolisemmaksi ja (osa-
ke)markkinaehtoisemmaksi. Koska juuri ulkopuolista omanpääomanehtoista
rahoitusta kanavoivien markkinoiden – eli alkuvaiheen yritysten rahoituksen
markkinoiden, pääomasijoitustoimialan ja pörssin – muodostama kokonaisuus
ei välttämättä toimi kasvuyritysten elinkaaren näkökulmasta parhaalla mahdol-
lisella tavalla, ”pääomasijoitus-sijoitusrahastojen” perustaminen vahvistamaan
suomalaista ”riskirahoitusklusteria” saattaisi olla perusteltua. Ajatuksena näissä
rahastoissa voisi olla, että niitä erilaisin verohelpotuksin (ja näihin helpotuksiin
liittyvin sijoitusrajoituksin) kannustettaisiin tekemään sijoituksia a) vielä listaa-
mattomiin mutta jo listautumisen kynnyksellä oleviin ja b) jo pörssin (ja/tai
muiden vastaavien markkinapaikkojen) kasvulistoilla listattuihin yrityksiin.

Rahoitus jär jestelmä ja yr i tystoiminta uudistuvassa taloudessa · 479
Pääomien keräämistä näihin rahastoihin helpotettaisiin rahastoihin sijoittaville
myönnettävin verohelpotuksin. ”Pääomasijoitus-sijoitusrahastojen” perustamis-
ta voidaan perustella sillä, että ne toimisivat sekä suorana, uutena pääomanläh-
teenä jo hieman myöhempään kasvuvaiheeseen ehtineille yrityksille että tukisi-
vat riskirahoituksen kanavoitumista alkuvaiheen yrityksiin ja kasvuyrityksiin
myös epäsuorasti. Näitä epäsuoria positiivisia vaikutuksia syntyisi, koska ”pää-
omasijoitus-sijoitusrahastojen” sijoitustoiminta lisäisi pörssin kasvulistalla listat-
tujen yritysten osakkeiden likviditeettiä ja koska tällaiset markkinat voisivat si-
ten toimia tehokkaammin kasvuyritysten pääomahankinnan kanavana. Epäsuo-
ria positiivisia vaikutuksia syntyisi myös, koska jo listattujen kasvuyritysten
osakkeiden markkinapaikkojen vahvistuminen avaisi paremman irtautumis-
kanavan alkuvaiheen yrityksiin sijoittaville pääomasijoittajille ja muille riskisi-
joittajille. Paremmat irtautumismahdollisuudet kannustavat puolestaan näitä al-
kuvaiheen riskisijoittajia tekemään enemmän investointeja ja alentamaan tuotto-
vaatimustaan.
Vaikka julkisten rahoittajien toimintaa rahoitusjärjestelmässä on rahoi-tusjärjestelmän suotuisan kehityksen vuoksi aikaisempaa vaikeampi perus-tella pelkästään erilaisten rahoitusmarkkinapuutteiden olemassaololla, julki-sen rahoituksen kanavoiminen innovaatiotoimintaan on edelleen perusteltua. Perus-telut yritysten innovaatiotoiminnan julkiselle rahoitukselle saattavat olla jopa aikai-sempaa vahvemmat, sillä innovaatiotoiminnan julkisen rahoituksen (yhteiskun-nallinen raja-) tuottavuus on – ainakin potentiaalisesti – parantunut rahoitusjärjes-telmän kehityksen vuoksi. Tuottavuuden voidaan ajatella vahvistuneen, jos in-novaatiotoiminnan positiiviset ulkoisvaikutukset kasvavat sitä mukaa kun rahoitusjärjestelmän kyky kaupallistaa innovaatioita ja uutta teknologiaa se-kä kyky tukea yritysten kasvua vahvistuvat (ks. myös Hyytinen, Rouvinen, Toivanen ja Ylä-Anttila 2003, [Chapter 11]). Edellä mainittujen taloustieteen argumenttien näkökulmasta tämä tarkoittaa sitä, että mitä vahvemmaksi ra-hoitusjärjestelmä kehittyy, sitä vähemmän julkista rahoitusta voidaan moti-voida pääomamarkkinoiden puutteisiin vedoten ja sitä enemmän innovaa-tiotoimintaan liittyviä positiivisia ulkoisvaikutuksia tulisi korostaa. Tämä puo-lestaan lisää tarvetta tunnistaa ja mitata sekä innovaatiotoiminnan positiivisia ul-koisvaikutuksia että erilaisiin hankkeisiin liittyvien yhteiskunnallisten ja yksityisten tuottojen (hyötyjen) välistä kiilaa. Tämän kiilan voidaan olettaa olevan suuri esimerkiksi sekä yhteiskunnan perusrakenteisiin ja infrastruktuuriin liitty-vien teknologioiden ja teknologisten järjestelmien kehittämisessä että ns. so-siaalisissa innovaatioissa (sosiaalisten innovaatioiden tarpeesta Suomessa, ks. Valtion tiede- ja teknologianeuvosto 2003).

480 · Ar i Hyyt inen ja M ik a Pajar inen
Rahoituksen saatavuus ja pääomien vähäisyys on ollut Suomen talou-den ”Akilleen kantapäänä” niin pitkään, että voi olla vaikeaa nähdä sitä, että se on vähitellen häviämässä. Tämän näkeminen vaatii riittävän pitkän aika-välin tarkastelua, jotta talouden suhdannevaihteluista aiheutuvat rahoitus-markkinoiden muutokset voidaan erottaa todellisista rakenneongelmista. Jos markkinavetoinen rahoitusjärjestelmän kehitys jatkuu – ja tätä elinkeino- ja teknologiapolitiikan olisi syytä tukea tarjoamalla edellytyksiä yksityisen ra-hoitussektorin vahvistumiselle – niin yhtenä merkittävimmistä taloudellisen kehityksen ja talouskasvun esteistä ei enää kovinkaan kauan voida pitää huonoa rahoituksen saatavuutta. Jos taas näin ei käy, vaarana on, että voim-me käyttää hyväksi vain osan niistä taloudellisen kehityksen ja kasvun mah-dollisuuksista, joita innovaatiojärjestelmä tuottaa ja joita meillä nyt yhtenä kehittyneimmistä tietoyhteiskunnista (vrt. World Economic Forum 2003) ja kilpailukykyisimmistä maista on.

Rahoitus jär jestelmä ja yr i tystoiminta uudistuvassa taloudessa · 481
LÄHTEET
Ali-Yrkkö, J., 2003, Patterns of the Finnish merger and acquisition activity, teoksessa Hyytinen, A. ja Pajarinen, M. (toim.): Financial systems and firm performance: Theoretical and empirical perspectives, ETLA B:200.
Ali-Yrkkö, J., Hyytinen, A. ja Liukkonen, J., 2003, Exiting venture capital investments: Lessons from Finland, teoksessa Hyytinen, A. ja Pajarinen, M. (toim.): Financial systems and firm performance: Theoretical and empirical perspectives, ETLA B:200.
Ali-Yrkkö, J. ja Ylä-Anttila, P., 2003, Globalization of business in a small country – Does ownership matter?, teoksessa Hyytinen, A. ja Pajarinen, M. (toim.): Financial systems and firm performance: Theoretical and empirical perspectives, ETLA B:200.
Euroopan unionin komissio, 1998, Riskipääoma: Avain työpaikkojen luomiseen Euroopan unionissa, SEC(1998) 552 lopullinen, 31.3.1998.
Gans, J. S. and Stern, S., 2000, When does funding research by smaller firms bear fruit?: Evidence from the SBIR program, NBER Working Paper, No. 7877.
Hyytinen, A., 2002, How important are exits for venture capital finance: Evidence from Finland, esitelmä seminaarissa “Venture Capital, Entrepreneurship, and Public Policy”, München 22.-23.11.2002.
Hyytinen, A., Kuosa, I. ja Takalo, T., 2003a, Law or finance? Evidence from Finland, European Jounral of Law and Economics, tulossa.
Hyytinen, A., Kuosa, I. ja Takalo, T., 2003b, Investor protection and financial development in Finland, teoksessa Hyytinen, A. ja Pajarinen, M. (toim.): Financial systems and firm performance: Theoretical and empirical perspectives, ETLA B:200.
Hyytinen, A. ja Pajarinen, M., 2002, External finance, firm growth and the benefits of information disclosure: Evidence from Finland, ETLAn keskusteluaiheita no. 805.
Hyytinen, A. ja Pajarinen, M., 2003a, Financial systems and venture capital in Nordic countries: A comparative study, teoksessa Hyytinen, A. ja Pajarinen, M. (toim.): Financial systems and firm performance: Theoretical and empirical perspectives, ETLA B:200.
Hyytinen, A. ja Pajarinen, M., 2003b, Small business finance in Finland – A descriptive study, teoksessa Hyytinen, A. ja Pajarinen, M. (toim.): Financial systems and firm performance: Theoretical and empirical perspectives, ETLA B:200.
Hyytinen, A., Rouvinen, P., Toivanen, O. ja Ylä-Anttila, P., 2003, Does financial development matter for innovation and economic growth? Implications for public policy, teoksessa Hyytinen, A. ja Pajarinen, M. (toim.): Financial systems and firm performance: Theoretical and empirical perspectives, ETLA B:200.
Hyytinen, A. ja Toivanen, O., 2002, Do financial constrains hold back innovation and growth? Evidence on the role of public policy, ETLAn keskusteluaiheita no. 820.

482 · Ar i Hyyt inen ja M ik a Pajar inen
Hyytinen, A. ja Väänänen, L., 2003, Government funding of small and medium-sized enterprises in Finland, teoksessa Hyytinen, A. ja Pajarinen, M. (toim.): Financial systems and firm performance: Theoretical and empirical perspectives, ETLA B:200.
Ilmakunnas, P., 1994, Yritystuki taloustieteen näkökulmasta, Kansantaloudellinen aikakausikirja, 90:4, 469-479.
Kaisanlahti, T., 2003, The role of shareholder protection rules in financing Finnish companies, teoksessa Hyytinen, A. ja Pajarinen, M. (toim.): Financial systems and firm performance: Theoretical and empirical perspectives, ETLA B:200.
Kanniainen, V., 2003, Venture capital finance: What is different?, teoksessa Hyytinen, A. ja Pajarinen, M. (toim.): Financial systems and firm performance: Theoretical and empirical perspectives, ETLA B:200.
Kanniainen, V. ja Leppämäki, M., 2002, Financial institutions and the allocation of talent, Suomen Pankin keskustelualoitteita 5/2002.
Kauppa- ja teollisuusministeriö, 1993, Kansallinen teollisuusstrategia, Kauppa- ja teollisuusministeriön julkaisuja 1/1993.
Kauppi, H. ja Hyytinen, A., 2002, Rahoituksen markkinaehtoistuminen ja talouden toimialarakenne. Havaintoja Suomesta 1980-2000, Kansantaloudellinen aikakausikirja, 98:2, 177-198.
Kortum, S. ja Lerner, J., 2000, Assessing the contribution of venture capital to innovation, Rand Journal of Economics, 31:4, 674-692.
Maula, M. ja Murray, G., 2003, Finnish industry investment Ltd: An international evaluation, Kauppa- ja teollisuusministeriön julkaisuja 1 /2003.
Maula, M. ja Mäkelä, M., 2003, Cross-border venture capital, teoksessa Hyytinen, A. ja Pajarinen, M. (toim.): Financial systems and firm performance: Theoretical and empirical perspectives, ETLA B:200.
Seppä, M., 2000, Strategy logic of the venture capitalist, Jyväskylä Studies in Business and Economics 3.
Valtiontalouden tarkastusvirasto, 2002, Valtion erityisrahoitustoiminta, Tarkastuskertomus 38/2002.
Valtion tiede- ja teknologianeuvosto, 2003, Osaaminen, innovaatiot ja kansainvälistyminen, Helsinki.
World Economic Forum, 2003, The global information technology report 2002-2003, Davos.