Choice of Ownership Structure and Firm Performance: Evidence from Estonia
52
THE WILLIAM DAVIDSON INSTITUTE AT THE UNIVERSITY OF MICHIGAN BUSINESS SCHOOL Choice of Ownership Structure and Firm Performance: Evidence from Estonia By: Derek C Jones, Panu Kalmi and Niels Mygind William Davidson Working Paper Number 560 May 2003
Transcript of Choice of Ownership Structure and Firm Performance: Evidence from Estonia

THE WILLIAM DAVIDSON INSTITUTE AT THE UNIVERSITY OF MICHIGAN BUSINESS SCHOOL
Choice of Ownership Structure and Firm Performance: Evidence from Estonia
By: Derek C Jones, Panu Kalmi and Niels Mygind
William Davidson Working Paper Number 560 May 2003

1
DO NOT QUOTE OR REPRODUCE WITHOUT AUTHORS’ PERMISSION.
COMMENTS WELCOMED
Choice of Ownership Structure and Firm Performance:
Evidence from Estonia By
Derek C Jones*, Panu Kalmi** and Niels Mygind ***
April 10 2003
Abstract In this paper we use rich panel data for a representative sample of Estonian enterprises to analyse diverse issues related to the determinants of ownership structures and ownership changes after privatisation. A key focus is to determine whether ownership changes are related to economic efficiency. While employee owned firms are found to be much more prone than other firms to switch ownership categories, often “employee owned” firms remain “insider-owned” as ownership passes from current employees to managers and former employees. Logit analyses of the determinants of ownership structures and ownership changes provides mixed support for several hypotheses. As predicted: (i) wealth and resource constraints play a crucial role in the determination of ownership, with foreigners buying firms with the highest equity levels and insiders buying firms with the lowest equity valuations; (ii) risk aversion explains subsequent ownership changes, especially away from employee ownership; (iii) allocation of ownership depends on the pre-privatisation origin and location of the firm, and these factors also influence subsequent ownership changes. Finally we compare our findings with those achieved by using more conventional approaches to analyze efficiency that use very similar data. Reassuringly the evidence presented in this paper is consistent with the view that efficiency considerations drive ownership changes (while earlier analysis for Estonia and for many other transition economies has identified the impact of ownership on economic performance.) However, the findings in this paper also establish that there are important influences besides economic efficiency that affect enterprise ownership and ownership changes. JEL-codes: G3, J5, P2, P3 Keywords: Privatisation, ownership change, employee ownership, transition economies, Estonia * Dept. of Economics, Hamilton College, Clinton, NY 13323. [email protected]. Jones is corresponding author. ** Helsinki School of Economics, department of economics, PO Box 1210, 00101 Helsinki, Finland, E-mail: [email protected] *** Center for East European Studies, Copenhagen Business School, Howitzvej 60.2, 2000 Frederiksberg, Denmark, [email protected] Earlier versions of the paper has been presented in the RECEP workshop on corporate governance in April 2002 in Moscow, Bank of Finland workshop in May 2002 in Helsinki, and in the seminar of the Research Institute for Finnish Economy in Helsinki, November 2002. The authors are thankful for seminar participants for useful comments. Kalmi gratefully acknowledges financial support from the Danish Research Council, Marcus Wallenberg Foundation, and Yrjö Jahnsson Foundation.

2
I Introduction
Since privatisation processes in Eastern Europe have resulted in the emergence of
diverse ownership structures, an unprecedented opportunity to examine various issues concerning
the nature and effects of different ownership configurations has been provided. One crucial area of
inquiry that has received much attention is the comparative efficiency of differing ownership
structures. Moreover, research on transition economies in this area overwhelmingly has adopted
methods that might be labelled “conventional approaches”, including the estimation of production
functions that are augmented by various measures of ownership (as reviewed, for example, in
Djankov and Murrell, 2002.) In this paper we take a different tack and instead focus on the nature
and the determinants of ownership changes.
We argue that approaching the issue in this alternative way has some benefits to
using mainstream methods and that it produces findings that at least are complementary to the
information derived from other approaches. Some of the reasons for approaching the issue this
way reflect potential problems with using conventional approaches in transition economies. One
argument is based on Demsetz and Lehn (1985). Since firms are likely to adopt an ownership
structure that minimises transaction costs for a given firm or industry, they claim that studies of
the comparative efficiency of varying ownership structures may be biased. In other words, a test
which regresses performance on ownership is not likely to find the true differences in comparative
efficiency. Another important potential deficiency of traditional efficiency analysis reflects the
extent of measurement error in key variables. As many have noted (e.g. Filer and Hanousek,
2002), the accounting data for transition economies, especially during early transition, was often
regarded as unreliable.
The alternative approach is based on ownership dynamics and results from invoking
the Coase theorem (Coase, 1960.) This recognizes that, since privatisation in all transition
economies was a highly politicized process (e.g. Estrin, 1994; Uvalic and Vaughan-Whitehead,
ireynold
William Davidson Institute Working Paper 560

3
1997), the initial ownership structures that emerged from this process were unlikely to be optimal
from the economic point of view. However, in keeping with the Coase theorem, it was expected
that freely tradable property rights would lead to resale of shares which, in turn, would produce
efficiency-enhancing ownership changes (Boycko, Shleifer and Vishny, 1995). According to this
view, one of the reasons why ownership markets are expected to select the most efficient
ownership structures is because of the opportunities for mutually beneficial transactions-- more
efficient owners (who, by definition are able to create more value) would buy shares from less
efficient owners (Jensen and Meckling, 1979; Demsetz and Lehn, 1985; Hansmann, 1996).
Another reason is that product market competition would force high-cost enterprises out of the
market. If the costs of ownership in a particular firm are high, in order to survive, such firms may
be forced to sell equity to other investors. In other words, the direction of ownership changes
should be highly informative concerning the advantages of different ownership forms.
Why different ownership structures emerge and change is also of interest for reasons
other than a narrow focus on comparative efficiency. These broader concerns are of special note in
transition economies where an astonishing feature has been the widespread emergence of insider,
and notably employee, ownership (Estrin and Wright,1999; Uvalic and Vaughan-Whitehead,
1997). Moreover, the transition from insider ownership to conventional ownership structures has
been regarded as a prerequisite for strategic restructuring of enterprises (Aghion and Blanchard,
1998). Hence in this paper, of the diverse possible ownership transitions, we concentrate on issues
surrounding insider vs. investor ownership. Our investigation examines several related matters
including: the characteristics of firms that are changing from insider to outsider ownership; the
determinants of these transitions; the nature of firms in which insider ownership is proving to be
more durable; and whether broad-based employee ownership structures are able to persist or
whether there concentration of ownership among managerial insiders must occur.1 The structure of
the paper is as follows.
ireynold
William Davidson Institute Working Paper 560

4
In the next section we briefly review the literature on the choice of ownership form,
paying particular attention to issues concerning the adoption and the stability of insider ownership.
Since some authors have expressed concerns that ownership dynamics may also be a biased
indicator of economic efficiency, we also review these arguments in this section. To provide
institutional context for our empirical analysis we then review key aspects of privatization in
Estonia. Next we briefly describe our most unusual-- panel data for a large stratified random
sample of Estonian firms. In addition we are able to combine economic and financial information
with several waves of survey data from individual firms collected by the authors, including details
of the evolution of firm ownership. In the following three sections we use these rich new data to
examine a variety of hypotheses on the determinants of ownership structures and ownership
changes. We estimate a variety of binary and multinomial logits and are able to test many
hypotheses that have been unable to be examined in previous work because of limited data. Since
the first year for which we have a cross-section of firm ownership is 1995, we begin by analyzing
the determinants of these initial ownership structures in 1995. Importantly, in that process, we are
able to use financial data starts for 1993, since that is the first year for which such information are
available. Next we analyse ownership changes during the period 1995-1999. Finally, we estimate
the determinants of ownership structures at the end of the period for which data are available,
namely for 1999. In the concluding section, after summarizing our findings, we return to our
original point of departure and compare the results in this paper with those achieved by using
conventional approaches to analyze the same data.
II Conceptual Framework
During recent years, several themes have appeared in the literature that relate to the
incidence and stability of employee ownership vis-à-vis other ownership configurations. Dow
(2003) has nicely captured the major considerations emerging from some of this work concerning
ireynold
William Davidson Institute Working Paper 560

5
the relative advantage of employee ownership in the phrase “incentive optimism vs. finance
pessimism”2 Even though insider ownership promises to align the incentives of insiders with
company performance and should be preferred if judged solely by incentives, for reasons of risk
diversification it is deemed better to delegate ownership to risk neutral investors. For this reason,
one expects to see less insider ownership in firms and industries where the required equity input
and investment requirements are high. This line of reasoning also implies that insiders would be
expected to be owners in firms and industries where business is more stable. However, against
this, it can be argued that control of the company might be especially valuable in volatile
industries, where the likelihood of losing one’s job is higher. In such circumstances, insider
ownership provides an insurance effect and control of the company lowers the probability of
insiders losing their jobs and their investment in firm-specific human capital. Arguably this
consideration is especially relevant in firms owned by managers, since managers have often a lot
to lose if they are fired. The gap between current income and outside opportunities is especially
large for “red” managers who have inherited their positions from socialist times (Aghion and
Blanchard, 1998; Filatochev, Wright and Bleaney, 1999).
The incentive effect can also depend on the size of the workforce. Alchian and
Demsetz (1972) argued that increases in the workforce dilute the impact of group incentive
schemes. According to this argument, when the size of the workforce increases, employees would
benefit from delegating ownership to a central monitor. In other words, higher employment levels
favour managerial ownership over employee ownership, ceteris paribus. Furthermore, Hansmann’s
(1996) argument that the costs of collective decision-making increase with the size of employees
also suggests that employee ownership should be negatively related to the size of the workforce.
As well as greater risk aversion, wealth constraints may lead to insiders having time
preferences that favour current consumption over risky future consumption. Other things equal,
this leads insiders to favour firms with reliable income flows and high profits. By contrast,
ireynold
William Davidson Institute Working Paper 560

6
investors are expected to take a longer-term view and forego current profits in the expectation of
higher profits in the future. Therefore insider ownership should be more prevalent in firms with
higher profits.3
Turning to ownership changes, so far as the movement from insider to outsider
ownership is concerned, a key focus in the literature is the role of strong economic performance.
According to some literature on employee ownership, especially successful employee-owned firms
are often more likely to convert into conventional ownership structures (e.g. Miyazaki, 1984). This
result emerges because departing employees are more likely to get a good return by selling shares
to outside investors than by selling them internally. In turn, outsider owners are more likely to be
interested in firms with a proven performance record. On the other hand, poorly performing firms
may have to turn to investors out of necessity-- in order to survive. The effect of performance on
ownership is thus ambiguous.
Economic performance is also thought to play a crucial role in triggering ownership
changes from investor to insider ownership. Thus employee buy-outs are known to be a device of
saving failing firms by making downward wage adjustments possible (Ben-Ner and Yun, 1996). In
turn, management buy-outs often occur to solve agency problems between managers and owners,
and / or when the managers observe entrepreneurial opportunities that existing owners do not
realise (e.g. Wright et al., 2001). Management buy-outs are likely to happen when share prices are
lower than the management’s subjective valuation of the firm Thus we tentatively hypothesize that
employee buy-outs are related to underperformance, and management buy-outs are related to
undervaluation of shares.4 On the other hand, considerations of risk and time preferences also
apply and perhaps prevent some otherwise efficient transitions from investor to insider ownership.
However it should also be noted that the block holder argument of Shleifer and
Vishny (1986) applies to both types of ownership change. That is, the more shares a minority
owner holds in a given firm, the less costly it is to for that minority owner to take over the
ireynold
William Davidson Institute Working Paper 560

7
company. Thus higher minority ownership stakes should facilitate take-overs irrespective of the
direction of the ownership switch.
Finally, we consider two arguments that cast doubt on the efficiency of market
selection processes, though with rather different implications. First, even though there is empirical
evidence that employee ownership, combined with participation in decision-making, improves
economic performance (e.g. Doucouligos, 1995; Kruse and Blasi, 1997), as an organisational form
it remains rare. To explain this phenomenon, some point to various factors including: limited
returns from innovation to individual employee-owners which lead to limited entry of employee-
owned firms; to difficulties in setting up markets for shares in employee-owned firms; and to
employee wealth constraints and aversion to risk (Ben-Ner, 1988; Dow, 2003). Thus these
arguments predict that employee ownership is selected far less often than is optimal. However, in
transition economies the circumstances were extraordinarily favourable to the formation of
employee-owned firms. The privatisation processes often favoured insiders, e.g. in the form of
under priced equity, so that entry barriers were unusually low. However, the underdevelopment of
capital markets in transition economies has several negative implications for the entry and stability
of employee ownership (Mygind, 2001). During early transition in general bank loans were not
available for employees to finance the buy-out of initial equity. Hence, often it was difficult for
employees to make the necessary investment, even if the purchasing price was rather low.5
Moreover, liquidity constraints and lack of credit may cause employees to sell their shares
whenever possible. In other words, during early transition imperfect credit markets were expected
to work in favour of wealthier investors, especially foreigners, and the elite of domestic investors
and managers.
Furthermore, the absence of functioning markets for shares may cause other
problems, notably the exclusion of new employees from ownership, which in turn leads to
increases in ownership by former employees and concentration of ownership amongst managers.
ireynold
William Davidson Institute Working Paper 560

8
While such developments have been observed, it should be noted that these do not represent
changes from insider to outsider ownership, but rather changes in the composition of insider
owners.6
Aghion and Blanchard (1998) make a diametrically opposite claim. They argue that
insiders are crucially concerned about job security and thus they sell to outsiders less often than
would be optimal.
In sum, the early literature raises several issues concerning the efficiency of the
selection process.7 While some of these influences favour outsider ownership, others point in the
opposite direction. Consequently, questions such as whether the net bias is stronger in one
direction or another and whether particular groups of insider and outsider owners are influenced
by issues unrelated to efficiency remain unresolved.8 We return to these issues in the concluding
section.
III Privatisation in Estonia
Privatisation in Estonia took place in three distinct stages.9 The first stage was
connected to Gorbachev’s reform attempts in the Soviet Union after 1986. Related to Gorbachev’s
perestroika programme, several hundred co-operatives were established in Estonia. A related
development was the establishment of small state enterprises that nominally remained in state
ownership and existed in a symbiotic relationship with state enterprises, but where employees had
control over production, investment, wages, product prices, and distribution of profits. Co-
operatives were privately owned from the start, so they were excluded from the privatisation
programmes, and were the earliest employee-owned enterprises in Estonia. Typically small state
enterprises were privatised later to their employees. Another important programme starting from
1987 was the possibility of establishing joint ventures with foreign partners. Later on these firms
were taken over mostly by foreigners.

9
The last effort of the Soviet authorities to speed up privatisation in Estonia was the
industrial leasing programme whereby the workforce collectively leased the assets from the state
for an agreed fee, and in return gained rights to control and to receive revenues. While the
programme was of little importance in Estonia (only 12 enterprises were privatised under this
programme), it did serve as a model for the Estonian leasing programmes that were introduced
between 1990-92 and which proved to be a major source of employee ownership in Estonia. The
establishment of new private companies became legal in late 1989 and the small privatisation
programme was launched in late 1990. These programmes created a vibrant entrepreneurial sector
in Estonia, where widespread involvement of foreigners was a special characteristic (Liuhto, 1995,
1996).
Privatisation of the collective sector was also an important development. During the
socialist era Estonia had a large consumer co-operative sector, as well as collective and state
farms, rural construction associations, and rural machinery associations. Typically the assets of
collective and state farms were privatised to their employees (excluding land). However, consumer
and supply co-operatives remained in the hands of their members (though some related firms
became daughter companies of central co-operatives). The property of construction and machinery
associations was transferred to private firms (often formed by former employees). Thus, in these
ways, privatisation of the collective sector led to the formation of both outsider ownership and
employee ownership.10
The centralised privatisation programme started with the establishment of the
Estonian Privatisation Enterprise (EPE) in September 1992, followed by the introduction of a law
on privatisation in June 1993, and the establishment of the Estonian Privatisation Agency (EPA,
the successor of EPE) in September 1993. This development led to preferences for privatisation
through tenders to strategic investors and for large concentrated investors rather than insiders or
dispersed investors. It should be noted that our sample includes only companies that were private
ireynold
William Davidson Institute Working Paper 560

10
by 1st of January 1995, and thus excludes a substantial number of firms that were privatised in the
centralised privatisation programme (especially in 1995-1997). For this reason, our data somewhat
exaggerate the importance of insider privatisation. However, since many other researchers have
focused exclusively on the centralised privatisation programmes (e.g. Terk, 2000), our work serves
as a useful reminder on the diversity of Estonian privatisation processes and the resulting
ownership structures that often have been overlooked.
IV Data and Summary Statistics on Ownership Changes
Our data are for a panel of Estonian firms. The panel is derived from a representative
sample of 500 enterprises, stratified by size and industry, which were private in 1995. For these
firms we merge data from a number of sources but mainly by combining fresh ownership
information for 1995-1999 that were collected from new surveys, with accounting data from 1993-
1998.11 Of the original 500 firms, 409 (82%) cooperated in an initial special survey undertaken in
1995 and designed by the authors to provide additional data especially on ownership. Respondents
were asked to indicate the number of shares held by different groups both currently (in fact on
January 1st 1995) as well as at the time of privatisation. Subsequent ownership surveys were
administered annually with the last survey in1999. These ownership data were then matched with
economic and financial data for corresponding firms, as well as with information on firm origin
(privatised, former collective, new, or former joint venture). Further reductions in sample size
resulted from excluding the smallest firms (with fewer than 10 employees in 1995) from the
analysis.
Table 1 shows the association between ownership at the time of privatisation and the
origin of the firm. Ownership groups are determined according to the widely used “dominant
owners” approach, where the firm is assigned to the ownership group holding more shares than
any other group. As the table indicates, the history of a firm clearly affects to whom the firm is
ireynold
William Davidson Institute Working Paper 560

11
privatised. Of state-owned firms privatised before 1995, employees had taken over more firms
than had any other groups (38), closely followed by domestic investors (33) and managers (26). At
this stage foreign involvement in privatisation was clearly less significant than that of domestic
players. Thus domestic investors and employees had taken the largest share of privatized firms that
formerly were collective firms, including former consumer co-operatives, rural construction
associations, and collective and state firms. Typically firms emerging from the consumer co-
operative sector or construction association were owned by domestic investors (either members of
co-operatives or by central co-operatives) and the successor firms of collective and state farms
were taken over by their employees. Almost all joint ventures were taken over by the foreign
partner, and new firms were mainly set up by managers or by foreigners.
Table 2 presents ownership changes between January 1st 1995, which is the earliest
time for which we have ownership data, and January 1st 1999. Importantly, a new group, namely
former employees, has entered the picture. Table 2 reveals that there are many individuals who
owned shares in their company when they were employed, and who have kept their shares after
ceasing employment. This suggests that there is a limited market for shares. Note also that there is
considerable attrition-- around one-third of firms drop from the panel, either because the firm is
liquidated or because the respondent does not want to answer to the questions in successive
rounds.12
It is also clear from Table 2 that employee ownership is diminishing rapidly. During
1995-1999, the number of employee-owned firms fell from 46 to 19. Note also that 12 of these
firms were also employee-owned at the start of the period. In contrast, there has been a sharp
increase in managerially-owned firms (from 65 to 87). Ownership by foreigners and domestic
outsiders has remained relatively stable, while firms owned by former employees have increased
from 5 to 15. However, it can be seen that most changes among insider-owned companies happen
internally: the relative positions of insider ownership and outsider ownership remain virtually
ireynold
William Davidson Institute Working Paper 560

12
unchanged. In fact, the number of insider-owned firms increased by 5, from 116 to 121. This
development does not support the hypothesis that insider ownership would be declining rapidly,
and it appears more supportive to the Aghion and Blanchard (1998) hypothesis that insider
ownership is relatively stable.
V Determinants of Initial Ownership Structures
Table 3 presents summary statistics for variables that are used in the empirical
analysis of the determinants of initial ownership structures (see the appendix for variable
definitions.) Equity capital per employee (EQEMPL93) is designed to capture financing
constraints. Since the privatisation price typically determines the nominal capital of the firm, this
is a good proxy for equity investment requirements. However, for new firms, the interpretation is
somewhat different and, in this case, nominal capital is also likely to reflect owners’ investments
in firm equity. Capital intensity (CAPINTENS93) is a proxy for the investment requirements of
the enterprise and higher values of capital intensity are expected to lead to higher investment.
Earlier literature on the incidence of employee ownership in developed economies has also
related this variable to work organisation, although in conflicting ways. Thus Jones and Kato
(1993) assume that higher capital intensity means more machine-paced production and less
worker discretion and hence less need for share schemes. On the other hand, Kruse (1996)
interprets higher capital intensity as requiring higher worker effort and an increased need for
share schemes. Since both studies find evidence to support their hypotheses, this issue remains
ambiguous. However, since in a previous study for Estonia (Jones and Mygind, 1999) it was
found that higher capital intensity was negatively related to the incidence of insider ownership,
we predict that the incidence of insider ownership is negatively related to capital intensity or
equity investment. The number of employees (EMPLOY93) is related to the free-rider and
collective decision-making problems, and is thought to be negatively related to employee
ireynold
William Davidson Institute Working Paper 560

13
ownership. Ceteris paribus, firms with higher profit-margins (PROFITMARGIN93) are believed
more likely to be insider owned (because of insiders’ preferences for current consumption). An
alternative performance measure is productivity (PRODUCTIV93). If insiders are able to select
the best firms (e.g. Frydman et al., 1999) productivity is expected to be positively related to
insider ownership. In addition, we include controls for location, industry, and origin and also a
variable that examines the importance of the time of privatisation13.
One thing that is apparent from Table 3 is that the hypothesis that employee-
owned firms would be smaller than other firms does not hold for this sample. If anything,
employee-owned firms are bigger than firms with other ownership structures. The mean of
employment for employee-owned firms is 175 employees, while it is 112 employees for all firms.
For two categories, namely foreign-owned and managerially-owned firms, the average number of
employees is clearly smaller than in other groups. However, this is partly because the proportion
of new firms (that are smaller than privatised firms) is larger in these two ownership categories.
Turning to performance measures, we see that productivity (measured by output per employee) is
clearly higher for foreign-owned firms than for other firms.14 However, the situation regarding
profits is quite different. Employee-owned firms have the highest profit margin and foreign-
owned firms the lowest. Examining capital intensity and nominal equity capital per employee,
again there are clear differences between firms. These variables are both much higher in foreign-
owned firms than in other firms, and there is also quite a difference between domestic investor-
owned firms and insider-owned firms. Since nominal capital often reflects the privatisation price,
this suggests that outsiders have had to pay much more than insiders for assets.15 There are
various explanations for this phenomenon. It may indicate that insider-owned firms are more
constrained than others, either by the limited wealth of their owners or by the more restricted
availability of credit for insiders. An alternative explanation is that the assets of these firms were
assigned a lower value than the assets in firms sold to outsiders, and thereby insiders were (at
ireynold
William Davidson Institute Working Paper 560

14
least implicitly, if not explicitly) given preference in the privatisation process. A third alternative
is that there were fewer assets per employees in insider-owned firms (they were less capital
intensive) or the assets were of poorer quality. We address these issues in our econometric
analysis.
Over 70% of foreign-owned firms in the sample are located in the five largest
Estonian cities, while only 45% of employee-owned firms and 33% of firms owned by former
employees are based in these towns. More than 50% of employee-owned firms in the sample are
former state-owned firms, while only 10% of foreign-owned firms are former state firms. Of
foreign firms, more than half are newly-established, while only a quarter of employee-owned
firms are new. Managerially-owned firms are most commonly new firms: 68 % of managerially-
owned firms are new. Finally, among domestically-owned firms, the largest group comprises
former collectives and joint ventures. This is because of the large number of firms from the
former co-operative sector that are now classified as domestically-owned. There are no
pronounced differences in privatisation time across firms in the different ownership categories.
Table 4 presents the results from a simple logit analysis of the determinants of initial
ownership by insiders. The first column gives the raw logit parameter coefficients together with
standard errors and significance levels, while the second column gives the marginal probability
effects for statistically significant coefficients. An important finding is that equity investment
(EQEMPL93) is statistically significantly lower in firms owned by insiders. 16 Moreover, the
parameter coefficient is very high: doubling the equity investment reduces the probability that the
firm is owned by insiders by around 5 percentage points (from the baseline probability of 37%).
This supports the contention that insiders have made a smaller investment in share capital. Since
we also control for capital intensity, it appears that insiders have paid a lower price for the same
amount of capital. This suggests that shares in insider-owned firms have possibly been
undervalued. The sign of the capital intensity coefficient is negative, but insignificant.17
ireynold
William Davidson Institute Working Paper 560

15
Unsurprisingly in view of the findings contained in the summary statistics presented
in Table 3, we also find that the two origin dummies are also significant. The conditional
probability of a new firm being insider-owned is 72 % and, for a formerly state-owned firm, it is
69%. Moreover, insider-owned firms are more often located outside the largest cities. Location in
town reduces the probability of observing insider ownership by around 15 percentage points.
One especially interesting finding is that insiders appear to have bought firms with
lower productivity. Increasing productivity by 100% reduces the probability of observing insider
ownership by around 6 percentage points. This runs counter to some earlier results for other
transition economies that insiders are able to select the best firms (Frydman et al., 1999).
However, since productivity is from the year 1993 (and not always immediately after
privatisation), we cannot be sure that there is not a reverse causality effect. Outsiders may have
been able to improve the performance of firms so much that the difference in productivity has
become significant. The second measure for firm quality, profitability has a positive sign, although
it is statistically insignificant. Other variables are not statistically significant, including all the
industry dummies and privatisation year. It is notable that, contrary to expectations, the parameter
coefficient for employment is positive although it is insignificant.
Additional insights concerning the determinants of initial ownership structures may
emerge from estimating multinomial models. In these estimates, outsider-owned firms are divided
into foreign- and domestically-owned firms, while insider-owned firms are divided into manager-
and employee-owned firms. (The nine firms that were owned by former employees, were assigned
to their initial ownership groups, 7 to employee ownership and 2 to managerial ownership).
Findings from multinomial estimates are reported in Table 5. The three first columns in Table 5
contrast employee-owned firms with other ownership types. The results suggest that the impact of
the explanatory variables is highest when employee-owned firms are contrasted with foreign-
owned firms (first column). There are considerable differences in productivity, equity investment
ireynold
William Davidson Institute Working Paper 560

16
and profitability, all at the 1 % level of statistical significance. Employee-owned firms have lower
productivity and equity investments than do foreign-owned firms, but they are more profitable.
Employee-owned firms are also found to be less capital-intensive, are more often located in the
countryside and, compared to foreign-owned firms, they have more employees.
When employee-owned firms are contrasted with domestic outsider-owned firms,
again the most significant predictor of ownership structure is equity investment. Domestic
outsiders have made considerably larger equity investments in their firms than have employees in
their firms. However, employee-owned firms are more profitable, and the difference is statistically
significant at the 5 % level. If the firm is a former state firm or a new firm, rather than a firm from
the collective sector, it is more likely to be owned by employees. Firms located in the countryside
are more likely to be owned by employees, and firms with higher productivity are more likely to
be owned by domestic outsiders than are employees. There are also differences between
employee-owned firms and managerially-owned firms, especially in employment (larger firms are
employee-owned) and profits (the more profitable firms are employee-owned). Also, new firms
are more likely to be owned by managers.
The next three columns contrast the determinants of ownership structures for firms in
which dominant owners are foreigners or managers, domestic investors or managers, and
foreigners or domestic investors respectively. The results indicate that higher productivity, capital
intensity, and equity capital predict foreign rather than managerial ownership. As such the results
are not that different from the comparisons discussed above, i.e. for firms in which dominant
owners are either foreigners or employees. The multinomial estimates also indicate that
privatisation time is also significant, suggesting that the later a firm is privatised, the more likely it
is to be in foreign rather than in managerial ownership. This indicates that managers (or, more
generally, insiders) were better positioned to seize the early opportunities produced by
privatisation than were foreigners. There are fewer differences between the determinants of initial
ireynold
William Davidson Institute Working Paper 560

17
ownership for firms owned by domestic investors and managers, though a higher level of equity
capital is found to predict investor rather than managerial ownership. Urban location also increases
the probability of investor rather than managerial ownership. Finally, it is interesting to find that
higher productivity, capital intensity and equity capital predict foreign rather than domestic
investor ownership. Hence foreign ownership is rather distinct in these respects. However, a
higher level of employment is found to predict domestic investor ownership rather than foreign
ownership. In addition, the origin dummies are often statistically significant, again highlighting the
role of different privatisation programmes in the emergence of initial ownership configurations.
In sum, findings based on both the simple logit and the multinomial results
concerning factors influencing ownership structures do not support the hypothesis that the
determinants of initial (post privatization) ownership structures were completely random. Several
forces are consistently found to play important roles in these processes. Thus equity investment
is always found to be clearly lower in insider-owned firms. This may reflect the fact that insiders
were unable to buy firms with high capital requirements; on the other hand, it may mean that
insiders were favoured in the privatisation process and were able to buy the firms cheaper. The
effect of lower equity investment extends also to new firms, meaning that firms started up by
outsider investors are much better capitalised than those that are run by manager-owners or
groups of employees. Since outsider-owned new firms in our sample are usually owned by
foreigners, an interpretation of this finding based on wealth constraints is very plausible.
Moreover, we find that the origin and location of the firm are clearly related to the initial
assignment of insider and outsider ownership.
VI The Determinants of Ownership Changes
In the previous section several factors that bear on the determination of initial
ownership structures were identified. While some of these variables are linked with economic
ireynold
William Davidson Institute Working Paper 560
18
efficiency concerns, such considerations clearly did not drive the whole process. Therefore, it is
important to carefully examine ownership changes, to see what motivates subsequent ownership
changes. Hence, in this section, we examine ownership changes. Consistent with our earlier
discussion, we focus on transitions from insider to outsider ownership, and vice versa.
As background for the logit analysis, in Table 6 we show ownership changes for
each year.18 In 1995, six firms moved from outsider to insider ownership, while only one firm
moved from insider to outsider ownership. After that, there hve been the same number of changes
in either direction. Most of the changes took place in 1996 and 1998. In both of these years, eight
firms moved in each direction.19
We use many of the same variables for modelling ownership changes that were
used when modelling ownership structures. However, in addition we are able to use information
on time-variant characteristics of firms including annual growth rates for sales, capital stock,
capital intensity and productivity, as well as averages for profit margins and sales volatility. In
order to better identify the impact on ownership changes, we measure these variables only prior to
ownership change. 20
Table 7 presents the means for these time-dependent variables, and also for minority
ownership in 1995 (for outsider-owned firms the amount of insider ownership, and for insider-
owned firms the amount of outsider ownership), according to firm ownership in 1995. Foreign-
owned firms are clearly growing fastest, both in terms of employment and sales. Surprisingly,
perhaps, foreign-owned firms have experienced a slower growth of capital stock than firms
owned by domestic investors or managers, and their productivity growth is lower than that of any
other group.21 Foreign-owned firms are also least profitable and, on average, are becoming more
labour-intensive. Their sales volatility is also the highest. Firms owned by domestic investors and
managers are behaving in quite similar ways. Firms in both groups were investing quite heavily
and growing moderately. Employment remains stable in manager-owned firms, while domestic-
ireynold
William Davidson Institute Working Paper 560

19
owned firms are shrinking, although not as much as in employee-owned firms in which
employment decreases by almost 10 % annually. Sales in employee-owned firms are also
shrinking, but they are the most profitable of all firms (though not by a great deal), and their sales
volatility is clearly lower than that of other groups. When levels of minority ownership are
examined, it appears that minority ownership in insider-owned firms is very low, while in
outsider-owned firms it is of moderate importance, especially in firms owned by domestic
outsiders. In these firms, insider ownership more often assumes the form of managerial, rather
than employee ownership.
To evaluate the determinants of ownership change, firms are divided into two
groups—those that were initially classified as insider owned, and those that were initially
categorized as outsider owned. In analyzing the determinants of the change from insider to
outsider ownership we have information for 112 firms in our sample that begin as insider owned.
While in the main, the variables that are used are very similar to those used in earlier empirical
work, there are some modest changes. 22
Findings for two alternative specifications are reported in Table 8. While in the first
estimate we use sales growth and investment, in the second specification these are replaced by the
growth in productivity, capital intensity and employment. Alternative specifications are employed
because employment growth is heavily correlated with sales growth and investment and, if we
wish to estimate the impact of employment growth on ownership changes, then it may be better to
use per capita indicators for remaining variables. However, the results reported in Table 8 indicate
that parameter coefficients remain very stable across both specifications. Also, in both cases, the
likelihood ratio indicates that the hypothesis of joint insignificance of all variables must be
rejected. Since the likelihood ratio is slightly higher in specification 1 (and there is one more
significant coefficient than in specification 2) we therefore focus our comments on the first
specification.
ireynold
William Davidson Institute Working Paper 560

20
Our results indicate that ownership change is positively related to the number of
employees, initial productivity, and new firm status, while there is a negative relationship with
sales volatility, sales growth and initial managerial ownership. However, the precise interpretation
to place on the findings is sometimes unclear. Thus the finding that outsiders take over firms that
have more employees is as expected.23 Together with a negative coefficient for employment
growth, this suggests that outsiders take over large firms with falling employment, which arguably
gives support to the notion that outsiders take over somewhat problematic firms. However, the
effect of performance on ownership change remains unclear. While the positive and significant
parameter coefficient for initial productivity suggests that outsiders take over better firms, the
coefficient for sales growth is negative and significant. In addition, the coefficients for
productivity growth and profitability are negative, though insignificant.
The coefficient on sales volatility is negative and statistically significant which,
contrary to expectations, suggests that outsiders take over less risky firms. Alternatively, this
finding may lend support to the hypothesis that insider control is more valuable in volatile firms.
One reason for this is that employee-owned firms that have lower sales volatility were especially
likely to be taken over by outsiders. Furthermore, additional unreported analysis of the data
reveals that the coefficient of variation for sales was not different between firms that were
employee-owned in 1998 and firms that became outsider-owned, while a t-test indicated that it
was statistically significantly higher in managerially-owned firms compared to the rest of the
sample. This suggests that high volatility is typical for firms that have remained or have become
managerially-owned. As such this squares quite nicely with the Aghion-Blanchard (1998)
argument that control in transition economies is especially valuable for managers.
The results also indicate that the status of being a new firm significantly raises the
chance of the firm being taken over by outsiders. One interpretation for this finding is that in
former state firms and collective firms, even weak traditions of insider control may have produced
ireynold
William Davidson Institute Working Paper 560

21
barriers to ownership changes. By contrast, the founders of new firms may always have had the
explicit aim of selling their firm after a few years of operations. Alternatively, it may be that
outsiders regard new firms as more lucrative investments than old firms. The existence of
differences in ownership dynamics between employee- and managerially-owned firms and firm
origins is also revealed by the following facts. Initially, there were 40 new firms in the sample that
were under dominant managerial ownership. Only 3 of them (7.5%) changed to outsider
ownership. But of the 11 new firms initially in employee ownership, 7 (63.6 %) moved to outsider
ownership. By contrast, of 35 privatised firms that were initially majority-owned by employees,
only 7 (20 %) moved to outsider ownership, while the corresponding figure for privatised
managerially-owned firms was 3 of 25 (12 %). This interesting finding shows that it is the
combination of initial employee ownership and de novo status that renders the firm especially
likely to move to outsider ownership, rather than either of these variables in isolation. Many of the
new, employee-owned firms are likely to be co-operatives established in the late 1980s that had a
strongly managerial character from the beginning.
The last column gives the marginal effects on the basis of specification 1 in table 8.
The baseline probability is calculated for a former collective firm that is initially employee-owned,
and all other relevant variables are calculated at sample means. The baseline probability of an
ownership change for such a firm is very small, only 1.5%. However, for managerially-owned
firms, the probability is calculated to be only a quarter of that rate, namely 0.4%. When
employment is doubled, the probability rises to around 10%, whereas when initial productivity is
doubled, the probability is around 5%. However, a 10 percentage point increase in the annual
growth rate of sales would decrease the probability of an ownership change by about a third, to
1%. A 100% increase in the variance of sales would decrease the probability by around 50%. The
most dramatic effect results from the status of being a new firm. Our findings indicate that if the
firm is new (rather than being a former collective), the probability of ownership change increases
ireynold
William Davidson Institute Working Paper 560

22
by 37 percentage points, or by more than 25 times. For a new firm under employee ownership, the
expected probability of ownership change is a little over 38 %, while the observed probability was
around 60 %.
We now turn to modelling the change from outsider to insider ownership.
Essentially we employ specifications that are similar to those used in analysing the change from
insider to outsider ownership. However, in this case we introduce new variables to capture the
picture concerning foreign dominant ownership and minority insider ownership in 1995. Again
two specifications are estimated. Findings are reported in Table 9.
One of the variables that is statistically significant in predicting the change from
outsider to insider ownership is the size of the initial minority stake.24 Insider takeovers are also
related to the initial equity stake of insiders. These findings, that point to the importance of lower
initial equity investments and the size of the initial minority stake for insider takeovers, are
consistent with theoretical expectations. Thus Shleifer and Vishny (1986) stress that the more
shares the buyer owns in advance the more this reduces the costs of the takeover. Moreover, the
initial equity investment is likely to influence the later trading price of shares25, so lower equity
investment also lowers the cost of takeover. The two variables also seem to be interrelated: the
mean (and standard deviation) of log of share capital per employee is 9.84 (2.35) for firms with
less than 10% minority insider ownership, while it is 8.21 (1.89) for firms with at least 10%
insider ownership. This difference in means is significant at the 1% level. This indicates again that
raising equity may be a substantial deterrent to insider ownership.
Sales volatility is also significantly related to the adoption of insider ownership;
moreover, as expected, insiders take over less volatile firms. Given the initial equity investment,
insiders also seem to take over firms with higher capital intensity, which apparently is contrary to
predictions. There is no discernible evidence that firm quality, employment or employment
changes affect the likelihood of the adoption of insider ownership. In particular, we do not find
ireynold
William Davidson Institute Working Paper 560

23
support for the hypothesis that switches into insider ownership would be driven by relative
underperformance. Neither is there evidence that investment, origin of the firm, location or
privatisation time influence an ownership change.
The rightmost column of table 9 presents the marginal effects that are based on these
estimates. The baseline probability for an ownership change that is calculated for a domestically
owned firm from the collective sector, is around 14.5%. A 100% increase in capital intensity
would increase the probability of an insider takeover by around 6 percentage points. In turn,
increasing equity investment by 100% would decrease the probability of an insider takeover by 4
percentage points, while a 100% increase in sales volatility would decrease the probability of
insider takeover by 3 percentage points. A 10 % increase in initial minority insider ownership is
calculated to increase the probability of an ownership change by 8 percentage points.
Taken together, the results indicate that, as hypothesized, outsiders take over larger
insider-owned firms. However, this result may also reflect the fact that larger firms tended to be
employee-owned and more vulnerable to take-overs than managerially-owned firms. However,
when undertaking a similar analysis of ownership changes, though restricting this to only
employee-owned companies, we also found that larger employee-owned firms were more
vulnerable to take-overs.
Our findings also point to significant effects flowing from risk (volatility), but the
effects are not consistent. Thus for firms that are initially insider-owned, we find that outsiders are
more likely to take over less risky firms. But among firms that are initially owned by outsiders,
insiders also take over less risky firms. It is, of course, possible that a high volatility of sales
reduces the demand for control in such firms, ceteris paribus. Also, the result that insiders retain
ownership in riskier firms may point out that managerial control may be especially valuable in
riskier firms.
ireynold
William Davidson Institute Working Paper 560

24
The results concerning the effects of performance, capital intensity or investment
were mainly insignificant and yield no clear patterns. However, the empirical work also indicates
that other variables are important. Outsider takeovers are much more common in newly-
established firms than in privatised firms or in firms from the former collective sector. A closer
examination revealed that the new firms that changed ownership were mainly employee-owned
initially, rather than firms that were managerially-owned. In turn, insider takeovers were related to
the initial minority stake of insiders and to low equity investments. These factors reduce the
capital requirements for a takeover. Since insiders are likely to be liquidity constrained, it is not
surprising that these two variables exercise such an influence concerning insider takeovers.
VII The Determinants of Ownership structures in 1999
In this section, we conclude our empirical work by analysing the determinants of
ownership at the end of the period for which data are available, i.e. in 1999. A strategy similar to
that reported earlier in the analysis of initial ownership structures is used. The first step is to report
findings from a binomial logit analysis for the two broadest ownership groups, insiders and
outsiders. Next, we analyse the determinants of ownership within a multinomial logit framework
and use five groups (foreigners, domestic investors, managers, employees, former employees).
Finally these results are compared to the results concerning initial ownership structures.
Table 10 presents the summary statistics for selected variables in 1998. An important
difference between the variables in this section and those reported earlier is that here the time-
dependent covariates are measured throughout the period 1993-1998 for all firms, while
previously they were measured only up to the time of the ownership change. This difference in
measures reflects the shift in focus—away from factors influencing initial ownership structures,
towards ownership structures at the end of the period.
ireynold
William Davidson Institute Working Paper 560

25
It is especially interesting to compare these summary statistics with those presented
in table 3 for 1995. No longer are employee-owned firms larger than other firms. However, similar
differences prevail concerning capital-intensity and productivity. Also equity capital per employee
is much lower in insider-owned firms, and employee-owned firms continue to be most profitable.
Sales volatility is clearly lowest in employee-owned firms and those owned by former employees
while sales growth is fastest in firms that are majority-owned by foreigners. The proportion of
employee-owned firms in towns is much reduced, and the proportion of employee-owned firms
that are new firms also has decreased drastically, from 25% to 5%. In contrast, the proportion of
the successors of collective farms has increased from a little over 20 % to almost 50% (this is the
residual after subtracting the frequencies for former state-owned and new firms). Moreover, the
proportion of employee-owned firms in manufacturing has increased from slightly over 30% to
over 50%. This suggests that among employee-owned firms, the most resilient are those that are
successors of collective farms, operate in agriculture, and are located in rural areas. This supports
the view of Earle and Estrin (1996) that employee-owned firms bring benefits to depressed areas
and industries, and / or nobody else other than employees is interested in these firms.
Table 11 presents the results of the binary logit analysis. As before, we use two
different specifications. In the first we include sales growth and investment, while the other
includes growth in employment, productivity and capital intensity. The new results make for
interesting findings compared to those reported in table 4, concerning the determinants of initial
ownership structures in 1995. While both productivity and location had statistically discernible
impacts on initial ownership, by 1999 neither is a significant predictor of ownership. However,
equity investment is an important determinant both of initial ownership structures as well as of
ownership at the end of the period. Also, insider ownership has remained much more common in
firms that were formerly state-owned and in new firms, compared to firms that have arisen from
the former collective sector. Interestingly, privatisation time is also now statistically significant
ireynold
William Davidson Institute Working Paper 560

26
with the negative parameter coefficient indicating that firms privatised earlier are more often
owned by insiders than are firms that were privatised later. Also, the findings from specification 2
in table 11 suggest that increases in employment during 1993-1998 are positively related to insider
ownership, though this result is significant only at a 10% level.
The rightmost column in Table 11 presents the marginal effects, calculated from
specification 1. The baseline probability is calculated for a firm from the former collective sector
located in the countryside and the probability of such a firm being majority owned by insiders is
almost the same as in 1995, around 38%. This is not surprising, since the relative frequency of
insider-owned firms has remained stable. It is interesting to compare the marginal effects from
table 11 to those reported in table 4. For instance, the impact of equity investment is even bigger in
1999 than in 1995 with a 100 % increase in equity investment per employee now decreasing the
probability of insider ownership by over 8 percentage points, or over 20 %. As in table 4, the
dummy variables have a strong impact on the probabilities. If the firm is a former state-owned
firm or a new firm, it is more likely that it is owned by insiders than by outsiders. For a former
state firm the probability of being insider owned is 66 % (representing 28 percentage points
increase in the probability), and for new firms it is 57 % (18 percentage points increase). If
privatisation time is increased by one year, then the probability of insider ownership decreases by
6.7 % points.
In the previous multinomial analysis of initial ownership structures, we were able to
use three comparison groups for employee ownership. By contrast, for 1999, we are also able to
include former employees as an additional category. However, since it turns out that the results are
quite similar to those for employee-owned companies, for this reason as well as space
considerations, we choose to omit reporting these comparisons.26
In Table 12 we report the results of the new multinomial analysis. The analysis of
initial ownership structures reveals several differences. From Table 12 we see that some of the
ireynold
William Davidson Institute Working Paper 560

27
differences between employee-owned and outsider-owned firms that were identified in the
analysis of initial ownership configurations have remained. At the same time, the new results
indicate that some of these differences have disappeared. One persistent finding is that, despite the
many changes away from employee ownership, in both years employee ownership remains quite
distinct from other companies. Somewhat surprisingly, in 1999 higher capital intensity predicts
employee ownership rather than any other ownership structure; in addition, the difference with
foreign ownership is statistically significant. This is surprising given that it appears that foreign-
owned firms are more capital-intensive than employee-owned firms (Table 10).27 As before higher
equity capital consistently increases the odds for outsider rather than insider ownership. What is
more, the differences seem to have become more pronounced over time. Lower sales volatility and
higher profitability consistently increase the odds for employee ownership. Both of these findings
are consistent with the hypotheses outlined earlier, namely that employees prefer to be owners in
less volatile firms (or industries) and, other things equal, that they put heavy weight on the
profitability of the firm. Higher productivity increases the probability of foreign ownership.
Privatisation time is significant in the comparison between firms that are majority owned by
managers and employees. This is consistent with the fact that many initially employee-owned
firms have shifted into managerial ownership, but this change takes some time. The coefficient on
privatization time is also statistically significant between the comparisons of managerial
ownership and both types of investor ownership--again, earlier privatisation predicts managerial
ownership. Finally, and consistent with earlier observations, origin dummies are often significant.
VIII Conclusions and Implications
In this paper we use rich panel data to examine diverse issues relating to the nature
and determinants of ownership structures and ownership changes. In many cases our findings
provide evidence of important regularities and support for several hypotheses. The strongest
ireynold
William Davidson Institute Working Paper 560

28
findings are related to the predictions of risk aversion. Firms owned by insiders are less
capitalised. This supports the hypothesis that insufficient wealth to invest in equity limits the
possibilities to establish employee-owned firms, and points out that the unusual circumstances
created by the privatisation process have helped employees to temporarily overcome this obstacle.
A second major finding is related to risk. Our results clearly show that employee
ownership is most durable in less volatile firms. This finding supports similar arguments made
recently by Blair, Kruse and Blasi (2000), though we have to be careful about the causality (Blair
et al. argued that employee ownership tends to stabilise firm performance). In addition, we find
that there are important differences between employee- and managerially-owned firms:
Managerially-owned firms are associated with significantly higher volatility than employee-owned
firms, suggesting that managerial control becomes especially valuable in risky firms.
Employee ownership is especially transient in new firms. This finding was somewhat
unexpected. One possible interpretation of this finding is that, in privatised firms, the resistance to
outsiders is stronger because of a long shared history. Alternatively, the finding may be explained
by outsiders being more interested in new firms that may have better performance potential. A
related finding is that employee ownership has survived better in firms that were successors to
former collective farms. This also helps to explain why employee ownership has remained
important in agriculture. These firms are probably not very attractive to outsider investors, and
employee ownership in these firms may be seen as an attempt to save jobs and maintain social
stability (e.g.. Earle and Estrin, 1996.)
Other empirical work on Estonian firms sheds more light on issues of selectivity.
The survey evidence reported in Kalmi (2003) as well as the case study evidence reported in
Kalmi and Mygind (2003) points out that Estonian firms invariably apply by-laws that limit the
group of potential shareholders. As stressed by Aghion and Blanchard (1998), this reduces
outsider take-overs. The restrictions can be understood as devices for protecting workplace-
ireynold
William Davidson Institute Working Paper 560

29
specific rents. On the other hand, outsider-owned firms also place similar restrictions, thus
preventing potential efficiency-enhancing management-employee buy-outs. These restrictions
mean that the number of take-overs is smaller than it would be in the absence of restrictions, and
that the market for enterprise control is not working as efficiently as it otherwise might.
There is also evidence concerning the other problem mentioned in section 2, namely
the tendency for the number of employee-owners to decline over time (Kalmi, 2002, 2003). This is
also found to be a result of the restrictions on share trading-- it is not possible for outsiders to buy
shares and new employees face similar difficulties. In contrast, retiring employees often keep their
shares, or they sell them to the managers. Consequently, we observe less employee ownership,
fewer employee owners, increased ownership by former employees (which is typically transitory),
more managerial ownership, and more concentrated ownership. It is difficult to say whether these
changes in the character of insider owners increases or decreases the likelihood of sell-out to
outsiders. However, a key finding emerging from this research is that it is often the inactivity in
the market for shares – or indeed the absence of any market – more than active trading of shares
that shapes the ownership relations. Since the process is biased in ways that systematically
influences outcomes, e.g. by promoting managerial ownership and discouraging employee
ownership and ownership changes in general, the efficiency implications of ownership changes
remain somewhat uncertain. For this reason, we now review the results from conventional
efficiency analysis.
In the main the findings from conventional efficiency analysis are consistent with
findings reported in this paper. Thus previous work that uses a neoclassical growth framework
shows that, amongst all ownership categories of Estonian firms, foreign-owned firms record the
highest growth rates (Jones and Mygind, 2000). In addition, based on productivity analysis within
a production function framework, Jones and Mygind (2002) find that foreign-owned firms are
somewhat more productive than are other firms. Manager-owned firms also display better
ireynold
William Davidson Institute Working Paper 560

30
performace than do domestic or employee-owned firms. Finally, Kalmi and Mygind (2003)
present case study evidence that ownership change from employees to managers speeds up
restructuring. Consequently, these studies imply that most ownership changes would be expected
to be towards foreign ownership and to a somewhat lesser extent in the diresction of managerial
ownership
At the same time, findings from all of these conventional efficiency studies,
including both econometric analyses and case studies, do not support the conclusion that rapid
decline in employee ownership is expected—employee owned firms do not grossly underperform.
In fact, since the results of conventional analyses find that the differences between insider and
outsider ownership are not pronounced, one might expect that enterprise ownership would remain
rather stable. To the extent that ownership switches do occur, changes in favour of outsider
ownership might be anticipated, because of the problems of risk aversion and liquidity that
insiders face. Again, these predictions are not fully born out by the data. Most obviously, there are
few changes to foreign ownership, despite its promise of fast growth and good performance.
However, it is possible that foreigners increase their ownership by setting up new startups, rather
than by entering into time-consuming and difficult bargaining processes with incumbent owners.
Our data do not capture this possibility well. On the other hand, we find that managers are
increasing their ownership stakes, and perhaps are doing so to even greater extents than pure
efficiency considerations would warrant. No doubt their informational advantages and hierarchical
positions over employees helps managers to increase their ownership stakes. Perhaps the most
surprising finding is that the changes from outsider to insider ownership outnumber the changes
from insider to outsider ownership (although the difference is not large) and this is mainly due to
the prevalence of managerial take-overs.
In sum the evidence presented in this paper is consistent with the view that efficiency
considerations drive ownership changes, but we also recognise that there are other important
ireynold
William Davidson Institute Working Paper 560

31
influences as well. In future work that seeks to identify the varying importance of efficiency and
non-efficiency considerations we see scope for different types of analysis, including conventional
efficiency analysis, the analysis of ownership changes and survival analysis. In this future work it
will be important to try to capture the impact of ownership changes alongside conventional
determinants of efficiency. 28
ireynold
William Davidson Institute Working Paper 560

32
APPENDIX 1. VARIABLE DEFINITIONS
EMPLOY93 (98) Average number of employees in 1993 (1998) LNEMPLOY93 (98) Natural logarithm of average number of employees in 1993
(98) PRODUCTIV93 (98) Sales per employee in 1993 (98) in 1000 EEK LNPRODUCTIV93 (98) Natural logarithm of sales per employee in 1993 (98) in
EEK CAPINTENS93 (98) Fixed assets per employee in 1993 (98), in 1000 EEK LNCAPINTENS93 (98) Natural logarithm of fixed assets per employee in 1993
(98), in EEK EQEMPL94 (98) Nominal share capital per employee in 1994 (98), in 1000
EEK LNEQEMPL94 (98) Natural logarithm of nominal share capital per employee in
1994 (98), in EEK PROFITMARGIN93 Net profits per unit of sales in 1993 CITY Dummy variable, takes value 1 if firm located in one of the
5 biggest Estonian cities (Tallinn, Tartu, Narva, Kohtla-Järve and Pärnu), 0 otherwise
AGRI The firm is operating in agriculture MANU The firm is operating in manufacturing STATEOWN Dummy variable, takes value 1 if the firm is formerly state-
owned, 0 otherwise NEW Dummy variable, takes value 1 if the firm is new, 0
otherwise TIMEPRIV Time of privatisation where 1988=1, 1989=2,… 1994=7. SALESGROWTH Annual growth rate of real sales. Sales are deflated by
using the EBRD consumer price index for Estonia. INVESTMENT Annual growth rate of real fixed capital. The capital stock
is deflated by using the EBRD consumer price index for Estonia.
EMPLOYGROWTH Annual growth rate of employment. PRODGROWTH Annual growth rate of real sales per employee. Sales are
deflated by using the EBRD consumer price index for Estonia.
CAPINTGROWTH Annual growth rate of real fixed assets per employee. The capital stock is deflated by using the EBRD consumer price index for Estonia.
AVERPROF Average of annual real profits per unit of sales. Both profits and sales are deflated by using the EBRD consumer price index for Estonia.
INS95 (for firms initially in outsider ownership)
The percentage of minority insider ownership in 1995
MANAGER Firm in dominant managerial ownership in 1995 FOREIGN Firm in dominant foreign ownership in 1995 VARSALE1 Natural logarithm of variance of real sales. Sales are
deflated by using the EBRD consumer price index for Estonia.
SALESVOLA2 Variation coefficient of sales (standard deviation to average sales)
ireynold
William Davidson Institute Working Paper 560

33
TABLE 1. ORIGIN AND OWNERSHIP CATEGORY AT THE TIME OF PRIVATISATION.
Former state firms
Former collectives
Former joint ventures
New firms Total
Foreign 9 1 30 48 88 Domestic outsiders
33 46 3 34 116
Managers 26 4 0 58 88 Employees 38 16 0 18 72 Total 106 67 33 158 364 Source: For this and all other tables, the database of Estonian enterprises at CEES, Copenhagen Business School.
Note: This table includes firms that were private at the beginning of 1995.
ireynold
William Davidson Institute Working Paper 560

34
TABLE 2. TRANSITION MATRIX: OWNERSHIP CHANGES BETWEEN 1995 AND 1999
Dominant owners in January 1st 1995 (rows)/ Dominant owners in 1999 (columns) Foreign
ers 99 Domestic investors 99
Managers 99
Employees 99
Former employees 99
Total 95
Foreigners 95 50 3 7 0 0 60 Domestic investors 95
4 53 12 4 3 76
Managers 95 1 5 54 1 4 65 Employees 95 5 9 13 12 7 46 Former employees 95
0 1 1 2 1 5
Total 99 60 71 87 19 15 252
ireynold
William Davidson Institute Working Paper 560

35
TABLE 3. SUMMARY STATISTICS: VARIABLES USED IN INITIAL OWNERSHIP ANALYSIS: MEANS (Standard Deviations). All
N=364 1 Foreign-owned N=89
Domestic-owned N=121
Manager-owned N=90
Employee-owned N=55
Owned by former employees N=9
EMPLOY93 111.555 (176.525)
64.562 (114.413)
149.273 (186.451)
69.556 (129.177)
174.927 (260.472)
101.889 (106.001)
PRODUCTIV93 216.862 (661.374)
616.764 (1239.16)
89.509 (92.790)
103.393 (173.174)
56.531 (45.288)
56.994 (54.642)
CAPINTENS93 59.529 (159.683)
144.405 (270.541)
43.068 (84.258)
28.511 (100.973)
12.047 (11.181)
17.200 (21.772)
EQEMPL93 74.415 (571.647)
291.498 (1234.20)
33.671 (68.789)
4.804 (8.076)
4.920 (8.140)
6.338 (8.142)
PROFITMARGIN93
0.0095 (0.154)
-0.025 (0.227)
0.016 (0.143)
0.0047 (0.104)
0.054 (0.086)
0.035 (0.071)
CITY 0.563 (0.497)
0.719 (0.452)
0.537 (0.501)
0.533 (0.502)
0.455 (0.503)
0.333 (0.500)
AGRI 0.225 (0.418)
0.101 (0.303)
0.339 (0.475)
0.156 (0.364)
0.309 (0.466)
0.111 (0.333)
MANU 0.354 (0.479)
0.360 (0.483)
0.355 (0.481)
0.333 (0.474)
0.364 (0.485)
0.444 (0.527)
STATEOWN 0.291 (0.455)
0.101 (0.303)
0.322 (0.469)
0.278 (0.450)
0.527 (0.504)
0.444 (0.527)
NEW 0.434 (0.496)
0.562 (0.499)
0.240 (0.429)
0.678 (0.470)
0.255 (0.440)
0.444 (1.236)
TIMEPRIV 4.624 (1.291)
4.674 (1.116)
4.835 (1.374)
4.167 (1.318)
4.855 (1.177)
4.444 (1.236)
Notes. 1. Due to missing observations, N varies between 344 and 364. The exception is for TIMEPRIV where N is 206 (i.e. only for firms that were privatized and excluding the 158 new firms.) 2. For definitions of variables, see the Appendix.
ireynold
William Davidson Institute Working Paper 560

36
TABLE 4. DETERMINANTS OF INITIAL OWNERSHIP: BINARY LOGITS Insider ownership (N): 144
Outsider ownership (N):181 Marginal effects (in percentage points, change from baseline probability)
Intercept 7.806*** (1.956)
Baseline probability for insider ownership: 37.1%
LNEMPLOY93 0.104 (0.143)
LNPRODUCTIV93 -0.366** (0.157)
-5.7
LNCAPINTENS93 -0.126 (0.106)
LNEQEMPL94 -0.322*** (0.071)
-5.0
PROFITMARGIN93 0.746 (0.996)
CITY -0.795** (0.310)
-15.1
NEW 1.475*** (0.416)
35.0
STATEOWN 1.332*** (0.399)
32.0
TIMEPRIV -0.168 (0.112)
Industry controls Yes Lr statistics 107.873***
(0.0001)
Pseudo R-square 0.283 Nr of observations 325 Notes: 1. Significance levels: *- 10% level of significance; ** - 5% level of significance; *** - 1% level of significance. 2. Marginal effects were calculated for the following changes: For the underlying continuous (non-logarithmic) variables, 100 % increase. For dummy variables, unit increase. Calculations are reported only for statistically significant coefficients.
ireynold
William Davidson Institute Working Paper 560

37
TABLE 5. DETERMINANTS OF EMPLOYEE OWNERSHIP: MULTINOMIAL LOGITS Employees vs.
Foreign Employees vs. domestic outsiders
Employees vs. managers
Foreign vs. managers
Domestic investors vs. managers
Intercept 18.788*** (3.499)
4.582* (2.518)
1.370 (2.730)
-16.705*** (3.24)
-2.300 (2.456)
LNEMPLOY93 0.557** (0.236)
0.148 (0.184)
0.451** (0.209)
-0.159 (0.219)
0.243 (0.185)
LNPRODUCTIV93 -1.000*** (0.267) )
-0.395* (0.224)
-0.347 (0.234)
0.639*** (0.223)
0.021 (0.203)
LNCAPINTENS93 -0.376** (0.184)
0.068 (0.145)
0.088 (0.145)
0.457*** (0.158)
0.0181 (0.130)
LNEQEMPL94 -0.460*** (0.123)
-0.289*** (0.099)
-0.032 (0.104)
0.403*** (0.106)
0.222** (0.091)
PROFITMARGIN93 5.561*** (1.694)
3.983** (1.621)
5.163*** (1.713)
-0.531 (1.270)
1.082 (1.265)
CITY -1.088** (0.511)
-0.867** (0.403)
-0.274 (0.422)
0.843 (0.459)
0.637* (0.384)
STATEOWN 0.503 (0.669)
1.130** (0.452)
-0.937 (0.673)
-1.543** (0.777)
-2.198*** (0.620)
NEW -0.992 (0.680)
1.004* (0.532)
-1.802*** (0.697)
-0.875 (0.740)
-2.919*** (0.628)
TIMEPRIV -0.289 (0.194)
-0.015 (0.143)
0.137 (0.159)
0.398** (0.178)
0.123 (0.140)
Industry controls Yes Yes Yes Yes Yes Note: 1. Significance levels: *- 10% level of significance; ** - 5% level of significance; *** - 1% level of significance.
ireynold
William Davidson Institute Working Paper 560

38
TABLE 6. OWNERSHIP CHANGES BY YEAR Initial insider ownership Initial outsider ownership No change 88 95 Change in year Insider -> outsider ownership Outsider -> insider ownership 1998 8 8 1997 4 4 1996 8 8 1995 1 6 Changes/total 21/109
(19.3%) 26/121 (21.5%)
ireynold
William Davidson Institute Working Paper 560

39
TABLE 7 SUMMARY STATISTICS: ADDITIONAL VARIABLES USED IN ANALYSIS OF OWNERSHIP CHANGES Foreign Domestic
outsiders Managers Employees and former
employees SALESGROWTH 0.188
(0.558) 0.042 (0.307)
0.039 (0.218)
-0.035 (0.187)
PRODGROWTH 0.039 (0.317)
0.153 (0.318)
0.053 (0.194)
0.074 (0.196)
INVESTMENT
0.109 (0.515)
0.168 (0.940)
0.247 (0.429)
0.073 (0.419)
CAPINTENSGROWTH
-0.025 (0.388)
0.324 (0.927)
0.266 (0.394)
0.197 (0.453)
EMPLOYGROWTH
0.167 (0.398)
-0.071 (0.237)
0.0004 (0.203)
-0.096 (0.126)
SALESVOLA 0.399 (0.280)
0.346 (0.278)
0.338 (0.190)
0.246 (0.163)
AVERPROF -0.012 (0.469)
0.015 (0.239)
0.032 (0.073)
0.035 (0.102)
Minority share by insiders / outsiders
0.0614 (0.140)
0.137 (0.178)
0.0192 (0.0835)
0.0102 (0.0366)
Notes: 1. Entries are average annual growth rates and their standard deviations except for profits and sales volatility, which are averages for the period. Minority ownership is measured in the beginning of the year of ownership change. 2. N=230
ireynold
William Davidson Institute Working Paper 560

40
TABLE 8 DETERMINANTS OF OWNERSHIP CHANGES IN INSIDER-OWNED FIRMS, 1995-1999: BINARY LOGITS Change from insider to
outsider ownership (21/112)
Change from insider to outsider ownership (21/112)
Marginal effects
Intercept -25.517*** (9.163)
-25.421*** (9.377)
Baseline proability of change: 1.5%
LNEMPLOY93 2.896*** (0.892)
2.961*** (0.908)
8.5
LNPRODUCTIV93 1.765** (0.886)
1.882** (0.900)
LNCAPINTENS93 0.127 (0.348)
-0.026 (0.352)
LNEQEMPL94 0.088 (0.202)
0.084 (0.203)
SALESGROWTH -4.317* (2.244)
-0.5
PRODGROWTH -2.536 (1.846)
INVESTMENT -0.754 (0.989)
CAPINTGROWTH -1.064 (0.920)
EMPLOYGROWTH -4.207 (2.994)
AVERPROF -1.320 (3.208)
-1.876 (3.206)
VARSALE -1.066*** (0.373)
-1.062*** (0.374)
-0.8
STATEOWN 1.046 (0.790)
0.839 (1.165)
NEW 3.749*** (1.451)
3.691** (1.448)
37.2
MANAGER -1.341* (0.707)
-1.341* (0.727)
-1.1
TIMEPRIV 0.411 (0.296)
0.418 (0.297)
Industry Controls Yes Yes LR statistic 39.126***
(0.0002) 37.826*** (0.0006)
Pseudo R-square 0.295 0.287 Nr of observations 112 112 Notes: 1. Significance levels: *- 10% level of significance; ** - 5% level of significance; *** - 1% level of significance. 2. Marginal effects were calculated as 100% increase for productivity, employment, sales variance and 10 percentage point increase for sales growth. They are reported only for statistically significant coeffcients. 3. The total number of observations is 112, of which 21 shifted to outsider ownership. 4. The baseline probability is calculated for an initially employee-owned firm from the collective sector. And all other relevant variables are calculated at their sample means.
ireynold
William Davidson Institute Working Paper 560

41
TABLE 9 DETERMINANTS OF OWNERSHIP CHANGES IN OUTSIDER-OWNED FIRMS Change from outsider to
insider ownership (26/124) Change from outsider to insider ownership (26/123)
Marginal effects
Intercept -2.975 (5.308)
-4.270 (5.891)
Baseline probability of change: 14.5%
LNEMPLOY93 -0.022 (0.444)
0.012 (0.467)
LNPRODUCTIV93 0.584 (0.471)
0.710 (0.527) )
LNCAPINTENS93 0.590** (0.297)
0.577* (0.314)
5.8
LNEQEMPL94 -0.506*** (0.166)
-0.483*** (0.179)
-3.8
SALESGROWTH 1.171 (1.631)
PRODGROWTH 2.769 (2.329)
INVESTMENT 0.113 (0.514)
CAPINTGROWTH -0.127 (0.616)
EMPLOYGROWTH 1.423 (1.938)
AVERPROF 1.023 (1.882)
0.990 (1.619)
VARSALE -0.396** (0.156)
-0.413** (0.170)
-3.1
MINORINS95 0.053*** (0.018)
0.053*** (0.019)
7.8
STATEOWN -0.068 (0.805)
0.027 (0.817)
NEW -0.0041 (0.888)
0.098 (0.889)
FOREIGN -1.086 (0.832)
-1.217 (0.860)
TIMEPRIV -0.305 (0.242)
-0.358 (0.249)
Industry Controls Yes Yes LR statistic 46.715***
(0.0001) 48.155*** (0.0001)
Pseudo R-square 0.314 0.324 Nr of observations 124 123 Notes: 1. Significance levels: *- 10% level of significance; ** - 5% level of significance; *** - 1% level of significance. 2. Marginal effects were calculated as 100% increase for productivity, employment, sales variance and 10 percentage point increase 3. The total number of observations is 124, 26 of which shifted from outsider ownership
ireynold
William Davidson Institute Working Paper 560
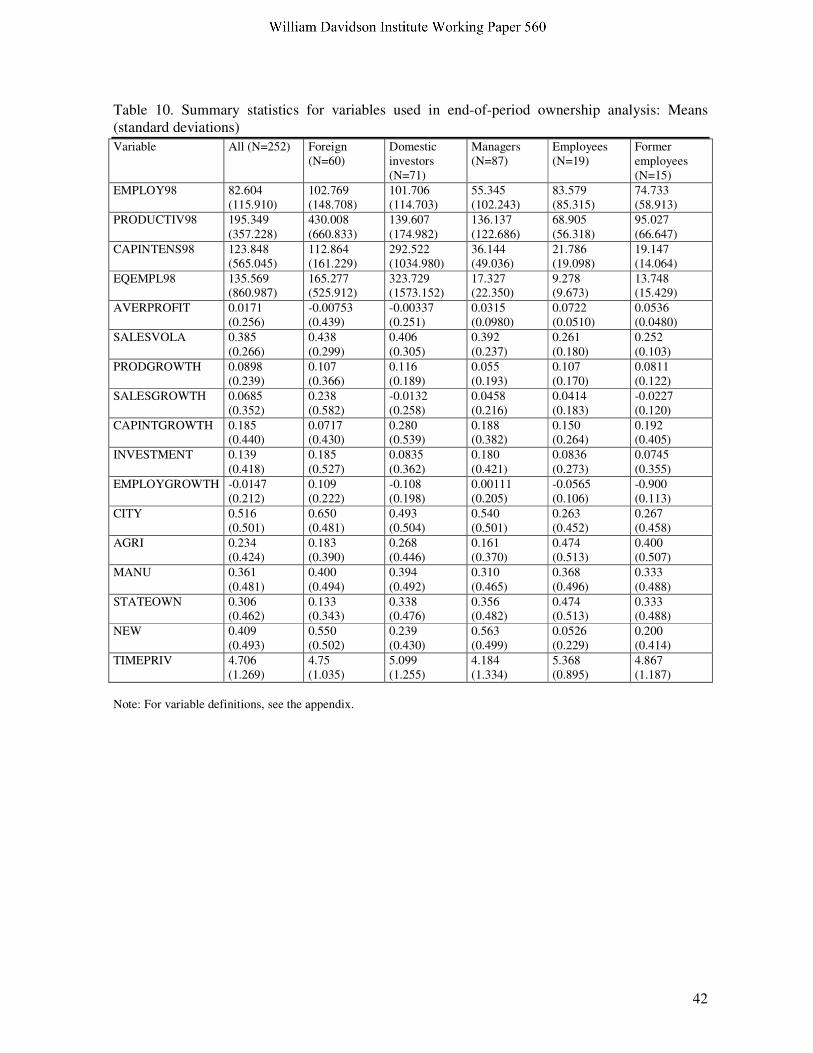
42
Table 10. Summary statistics for variables used in end-of-period ownership analysis: Means (standard deviations) Variable All (N=252) Foreign
(N=60) Domestic investors (N=71)
Managers (N=87)
Employees (N=19)
Former employees (N=15)
EMPLOY98 82.604 (115.910)
102.769 (148.708)
101.706 (114.703)
55.345 (102.243)
83.579 (85.315)
74.733 (58.913)
PRODUCTIV98 195.349 (357.228)
430.008 (660.833)
139.607 (174.982)
136.137 (122.686)
68.905 (56.318)
95.027 (66.647)
CAPINTENS98 123.848 (565.045)
112.864 (161.229)
292.522 (1034.980)
36.144 (49.036)
21.786 (19.098)
19.147 (14.064)
EQEMPL98 135.569 (860.987)
165.277 (525.912)
323.729 (1573.152)
17.327 (22.350)
9.278 (9.673)
13.748 (15.429)
AVERPROFIT 0.0171 (0.256)
-0.00753 (0.439)
-0.00337 (0.251)
0.0315 (0.0980)
0.0722 (0.0510)
0.0536 (0.0480)
SALESVOLA 0.385 (0.266)
0.438 (0.299)
0.406 (0.305)
0.392 (0.237)
0.261 (0.180)
0.252 (0.103)
PRODGROWTH 0.0898 (0.239)
0.107 (0.366)
0.116 (0.189)
0.055 (0.193)
0.107 (0.170)
0.0811 (0.122)
SALESGROWTH 0.0685 (0.352)
0.238 (0.582)
-0.0132 (0.258)
0.0458 (0.216)
0.0414 (0.183)
-0.0227 (0.120)
CAPINTGROWTH 0.185 (0.440)
0.0717 (0.430)
0.280 (0.539)
0.188 (0.382)
0.150 (0.264)
0.192 (0.405)
INVESTMENT 0.139 (0.418)
0.185 (0.527)
0.0835 (0.362)
0.180 (0.421)
0.0836 (0.273)
0.0745 (0.355)
EMPLOYGROWTH -0.0147 (0.212)
0.109 (0.222)
-0.108 (0.198)
0.00111 (0.205)
-0.0565 (0.106)
-0.900 (0.113)
CITY 0.516 (0.501)
0.650 (0.481)
0.493 (0.504)
0.540 (0.501)
0.263 (0.452)
0.267 (0.458)
AGRI 0.234 (0.424)
0.183 (0.390)
0.268 (0.446)
0.161 (0.370)
0.474 (0.513)
0.400 (0.507)
MANU 0.361 (0.481)
0.400 (0.494)
0.394 (0.492)
0.310 (0.465)
0.368 (0.496)
0.333 (0.488)
STATEOWN 0.306 (0.462)
0.133 (0.343)
0.338 (0.476)
0.356 (0.482)
0.474 (0.513)
0.333 (0.488)
NEW 0.409 (0.493)
0.550 (0.502)
0.239 (0.430)
0.563 (0.499)
0.0526 (0.229)
0.200 (0.414)
TIMEPRIV 4.706 (1.269)
4.75 (1.035)
5.099 (1.255)
4.184 (1.334)
5.368 (0.895)
4.867 (1.187)
Note: For variable definitions, see the appendix.
ireynold
William Davidson Institute Working Paper 560

43
TABLE 11 DETERMINANTS OF OWNERSHIP STRUCTURES IN 1999: BINARY LOGITS
IO: 112
OO: 110 IO: 112 OO: 110
Marginal effects
Intercept 8.134*** (2.766)
9.247*** (2.991)
Baseline probability of insider ownership: 38.1%
LNEMPLOY98 -0.163 (0.209)
-0.290 (0.227)
LNPRODUCTIV98 -0.072 (0.277)
-0.150 (0.297)
LNCAPINTENS98 0.133 (0.160)
0.183 (0.165)
LNEQEMPL98 -0.540*** (0.138)
-0.560*** (0.139)
-8.4
SALESGROWTH 0.345 (0.809)
PRODGROWTH -0.132 (1.119)
INVESTMENT 0.164 (0.113)
CAPINTGROWTH -0.090 (0.516)
EMPLOYGROWTH 2.009* (1.150)
AVERPROF 0.884 (1.055)
0.930 (1.129)
VARSALE -0.131 (0.093)
-0.128 (0.097)
CITY -0.105 (0.359)
-0.156 (0.364)
STATEOWN 1.158** (0.451)
1.341*** (0.469)
28.1
NEW 0.757* (0.437)
0.635 (0.446)
18.6
TIMEPRIV -0.300** (0.133)
-0.297** (0.135)
-6.7
Industry controls YES YES LR statistic 60.893***
(0.0001) 64.484*** (0.0001)
Pseudo R-square 0.240 0.252 Nr of observations 222 222 Notes: 1. Significance levels: *- 10% level of significance; ** - 5% level of significance; *** - 1% level of significance. 2. Marginal effects are changes in percentage units, when equity capital increases 100%, when time of privatisation increases by one year, or when the dummy variables increase by one unit.
ireynold
William Davidson Institute Working Paper 560

44
TABLE 12 DETERMINANTS OF OWNERSHIP IN 1999: MULTINOMIAL LOGITS Employees
vs. Foreign Employees vs. Domestic outsiders
Employees vs. Managers
Foreign vs. Managers
Domestic investors vs. Managers
Foreigners vs. Domestic investors
Intercept 17.965*** (6.763)
5.736 (5.888)
0.902 (6.049)
-17.064*** (4.391)
-4.834 (3.552)
-12.230*** (4.283)
LNEMPLOY98 0.328 (0.477)
0.083 (0.434)
0.655 (0.436)
0.328 (0.311)
0.572** (0.269)
-0.245 (0.299)
LNPRODUCTIV98 -1.109 (0.720)
-0.154 (0.646)
-0.355 (0.647)
0.754* (0.423)
-0.201 (0.352)
0.955** (0.438)
LNCAPINTENS98 0.724* (0.424)
0.505 (0.395)
0.407 (0.399)
-0.317 (0.231)
-0.0976 (0.196)
-0.219 (0.223)
LNEQEMPL98 -1.064*** (0.323)
-0.844*** (0.287)
-0.331 (0.295)
0.734*** (0.210)
0.513*** (0.170)
0.221 (0.200)
SALESGROWTH 2.565 (2.634)
3.939 (2.617)
2.394 (2.569)
-0.171 (1.041)
-1.545 (1.182)
1.374 (1.207
INVESTMENT -1.141 (1.390)
-1.631 (1.319)
-1.754 (1.307)
-0.613 (0.675)
-0.123 (0.633)
-0.490 (0.745)
AVERPROF 7.775* (3.981)
8.567** (3.909)
7.324* (3.940)
-0.451 (1.179)
-1.243 (1.283)
0.792 (1.295)
VARSALE -0.517** (0.233)
-0.410** (0.208)
-0.414** (0.206)
0.102 (0.144)
-0.00416 (0.114)
0.107 (0.149)
CITY -0.150 (0.812)
-0.161 (0.744)
-0.376 (0.745)
-0.226 (0.508)
-0.215 (0.444)
-0.0109 (0.499)
STATEOWN 1.176 (0.882)
1.284* (0.741)
-0.660 (0.811)
-1.835** (0.754)
-1.944*** (0.608)
0.108 (0.634)
NEW -2.469* (1.318)
-1.412 (1.258)
-3.487*** (1.290)
-1.017 (0.667)
-2.075*** (0.065)
1.057 (0.560)
TIMEPRIV 0.358 (0.296)
0.180 (0.262)
0.701** (0.274)
0.344* (0.202)
0.521*** (0.178)
0.177 (0.196)
Industry controls Yes Yes Yes Yes Yes Yes Note: 1. Significance levels: *- 10% level of significance; ** - 5% level of significance; *** - 1% level of significance.
ireynold
William Davidson Institute Working Paper 560

45
REFERENCES
Aghion, Philippe and Olivier Blanchard (1998): 'On Privatisation Methods in Eastern Europe and Their Implications', Economics of Transition, 6:87-99. Alchian, Armen and Harold Demsetz (1972): 'Production, Information Costs, and Economic Organization', American Economic Review, 62: 777-795. Ben-Ner, Avner (1988): ‘The Life Cycle of Worker-owned Firms in Market Economies: a Theoretical Analysis’, Journal of Economic Behavior and Organisation, 10:287-313. Ben-Ner, Avner and Buyong Yun (1996): ‘Employee Buyout in a Bargaining Game with Asymmetric Information’, American Economic Review, 86 (3): 502-23. Blair, Margaret, Douglas Kruse and Joseph Blasi (2000): ‘Is Employee Ownership an Unstable Form? Or a Stabilizing Force?’, in Margaret Blair and Thomas Kochan (eds): The New Relationship: Human Capital in American Corporations, Washington D.C.: Brookings. Bowles, Samuel and Herbert Gintis (1993): 'The Democratic Firm: An Agency-Theoretic Evaluation', in Bowles, Gintis and Bo Gustafsson (eds), Markets and Democracy: Participation, Accountability and Efficiency, Cambridge University Press, pp. 13-39. Boycko, Maxim, Andrei Shleifer and Robert Vishny (1995): Privatizing Russia, Cambridge, MA: MIT Press. Coase, Ronald H. (1960): 'The Problem of Social Cost', The Journal of Law and Economics, 1960, 3:1-44. Demzetz, Harold and Kenneth Lehn (1985): 'The Structure of Corporate Ownership: Causes and Consequences', Journal of Political Economy, 93: 1155-77. Doucouliagos, Chris (1995): "Worker Participation and Productivity in Labor-Managed and Participatory Capitalist Firms: A Meta-Analysis", Industrial and Labor Relations Review, 49 (1): 58-77. Dow, Gregory K. (2003): Governing the Firm: Workers’ Control in Theory and Practice, New York: Cambridge University Press. Earle, John S. and Saul Estrin (1996), ‘Employee Ownership in Transition’, in Roman Frydman, Cheryl Gray and Andrzej Rapaczynski (eds).: Corporate Governance in Central Europe and Russia, vol. 2: Insiders and the State. Budapest:CEU Press. Estrin, Saul (1994, ed.): Privatisation in Central and Eastern Europe, Longman. Estrin, Saul and Mike Wright (1999): 'Corporate Governance in the Former Soviet Union: an Overview', Journal of Comparative Economics, 27:398-421. Filatochev, Igor, Mike Wright and Michael Bleaney (1999): 'Privatization, Insider Control and Managerial Entrenchment in Russia', Economics of Transition, 7: 481-504.
ireynold
William Davidson Institute Working Paper 560

46
Filer, Randall K. and Jan Hanousek (2002): ‘Data Watch: Research Data From Transition Economies’ , Journal of Economic Perspectives 16 (1): 225-240. Frydman, Roman, Cheryl Gray, Marek Hessel and Andrzej Rapaczynski (1999): 'When Does Privatization Work? The Impact of Private Ownership on Corporate Performance in the Transition Economies', Quarterly Journal of Economics, 114: 1153-91. Frydman, Roman, Andrzej Rapaczynski and John Earle (1993, eds.): The Privatization Process in Russia, Ukraine and the Baltic States, Budapest: CEU Press, pp. 130-193. Hansmann, Henry (1996): The Ownership of Enterprise, Cambridge, MA: Belknap Press. Jensen, Michael C. and William H. Meckling (1979): 'Rights and Production Functions: An Application to Labor-Managed Firm and Codetermination', Journal of Business, 52(4): 469-506. Jones, Derek C. and Takao Kato (1993): 'On the Scope, Nature and Effects of Employee Ownership in Japan', Industrial and Labour Relations Review, 45 (2): 452-70. Jones, Derek C. and Thomas Weisskopf (1996) "Employee Ownership and Control: Evidence
from Russia, Proceedings of 1996 Industrial Relations Research Association Meetings, pp. 64-76.
Jones, Derek C. and Niels Mygind (1999): 'The Nature and Determinants of Ownership Changes After Privatization: Evidence From Estonia', Journal of Comparative Economics, 27: 422-441. Jones, Derek C. and Niels Mygind (2000): 'Privatization and Enterprise Performance: Evidence from Estonia', in Milica Uvalic and Vojmir Franicevic (eds.), Equality, Participation, Transition: Essays in Honour of Branko Horvat, London: Macmillan. Jones, Derek C. and Niels Mygind (2002): 'Ownership and Productive Efficiency: Evidence from Estonia', Review of Development Economics 6 (2): 284-301. Kalmi, Panu (2002): 'Does Employee Ownership Survive the Transition? Case Study Evidence from Estonia', Acta Oeconomica 52 (3): 307-25. Kalmi, Panu (2003): ‘The Rise and Fall of Employee Ownership in Estonia, 1987-2001’, Helsinki School of Economics, department of economics, working paper. Kalmi, Panu and Niels Mygind (2003): ‘Privatisation and Evolution of Ownership and Corporate Governance in Estonia – 12 Cases’, mimeo, Center for East European Studies, Copenhagen Business School. Kruse, Douglas L. (1996): ‘Why Do Firms Adopt Profit-Sharing and Employee Ownership Plans?’, British Journal of Industrial Relations, 34: 515-538. Kruse, Douglas L. and Joseph R. Blasi (1997): ‘Employee Ownership, Employee Attitudes, and Firm Performance: a Review of the Evidence’, in David Lewin, Daniel J.B. Mitchell and Mahmood Zaidi (eds.): The Human Resource Management Handbook, part I, Greenwich, CT: JAI Press, 113-52.
ireynold
William Davidson Institute Working Paper 560

47
Liuhto, Kari (1995): ‘Foreign Investment in Estonia: a Statistical Approach’, Europe-Asia Studies, 47(3). Liuhto, Kari (1996): ‘Entrepreneurial Transition in Post-Soviet Republics: the Estonian Path’, Europe-Asia Studies, 48 (1). Miyazaki, Hajime (1984): ‘On Success and Dissolution of the Labor-managed Firm in the Capitalist Economy’, Journal of Political Economy, 92: 909-931. Mygind, Niels (1997): ‘Employee Ownership in the Baltic Countries’, in Uvalic and Vaughan-Whitehead (1997).
Mygind, Niels (2000): ‘Privatisation, Governance and Restructuring of Enterprises in the Baltics’, OECD, Centre for Co-operation with non-members, working paper CCNM/BALT, 6, 1-83. Mygind, Niels (2001): 'Enterprise Governance in Transition: A Stakeholder Perspective', Acta Oeconomica 51(3): 315-42. Nuti, D. Mario (1997): 'Employeeism: Corporate Governance and Employee Share Ownership in Transition Economies', in Mario I. Blejer and Marko Skreb (eds.): Macroeconomic Stabilization in Transition Economies, Cambridge, UK: Cambridge University Press, 126-154. Shleifer, Andrei and Robert W. Vishny (1986): 'Large Shareholders and Corporate Control', Journal of Political Economy, 94: 461-488. Terk, Erik (2000): Privatisation in Estonia: Ideas, Processes, Results, Tallinn: Estonian Institute for Future Studies. Uvalic, Milica and Daniel Vaughan-Whitehead (1997, eds.): Privatization Surprises in Transition Economies, Cheltenham: Edward Elgar. Wright, Mike, Robert E. Hoskinsson, Lowell W. Busenitz, and Jay Dial: ‘Finance and Management Buyouts: Agency versus Entrepreneurship Perspectives’, Venture Capital, 3 (3): 239-61.
ireynold
William Davidson Institute Working Paper 560

48
Notes
1 While this paper builds on earlier work (in particular, Jones and Mygind, 1999) there are several innovations in the present paper that together we believe yield more reliable estimates on issues examined in previous work such as the determinants of ownership changes. For example, some of our variables constructed used in this paper were not previously available --especially proxies for potentially crucial variables such as risk aversion and wealth constraints. Moreover, in this paper we are also able to analyse the impact of important preconditions, such as pre-privatisation origin of enterprise, to subsequent ownership development. Also, since there have been additional waves of data collection, in this paper we are able to use data for a longer time period than was previously available. 2 This claim can be generalised to include managerial ownership. 3 Insiders may also prefer to pay out rents as higher wages. Whether insiders are more concerned with the level of profits and dividends than wages depends, among other things, on the distribution of shares among the workforce. See Nuti (1997). 4 The undervaluation of shares is often difficult to discern directly, since it is based on private information held by the managers. 5 Even if bank loans were available for buy-outs, bankers are expected to be more likely to give credit to outside investors or managers than to employees. The low equity employees can offer makes employee-owned firms more risky from a banker’s perspective. See Bowles and Gintis (1993) for a formal model. 6 For the case of Russia see, for example, Jones and Weisskopf (1996). 7 Not all researchers are convinced by these arguments. For instance Hansmann (1996), while admitting that the selection does not work perfectly, maintains that the selection is sufficiently unbiased so that the researchers can derive efficiency implications from ownership changes. 8 For instance, managers possess informational advantages that may favour them in ownership processes relative to other employees. 9 More detailed discussions on Estonian privatisation programmes can be found in Frydman et al. (1993) for early privatisation, in Terk (2000) for the centralised privatisation programme, Mygind (1997) and Kalmi (2003) for employee ownership, and Mygind (2000) for the entire privatisation process. Entry of new firms and small privatisation was also of crucial importance, see Liuhto (1996). 10 In the analysis below, co-operatives that are not owned by their workers (mainly various consumer co-operatives and agricultural marketing co-operatives) are classified as being owned by outside investors. This is a standard application of the insider-outsider typology whereby all firms not owned by their workforces are assigned to the broad and heterogeneous category of outsider ownership. 11 The economic and financial data were provided by the Estonian Statistical Office.
ireynold
William Davidson Institute Working Paper 560

49
12 While unfortunately, in most cases we cannot distinguish reliably between these two possibilities, anecdotal evidence suggests that the bulk of such cases are non respondents. 13 This is a dummy variable where, for privatized firms, 1988=1, 1989=2,... and 1994=7. For definitions of this and other variables see the list of variable definitions. 14 Output is here proxied by sales. While value added might be theoretically preferable, it was lacking from a considerable number of firms. However, we experimented with using value added per employee as a proxy for productivity for a smaller sample, and the results remained essentially unchanged. 15 Of course, this observation does not necessairly hold for start-ups. If a similar difference were found in those firms, it would indicate that insider-owned firms operate with lower equity capital. 16 This finding is also supported in unreported regressions in which we estimate separate regressions for firms with different origins. In these the only variable that was consistently significant across regressions was equity investment: its coefficient remained negative and significant (and large), for state-owned, collective and new firms. These and other unreported findings are available upon request from the authors. 17 CAPINT93 AND EQEMPL93 are also correlated with each other (r=0.49) that makes precise estimation of coefficients difficult. However, tests of multicollinearity did not suggest a problem. 18 Note that data are for 230 firms (of the original sample of 252). For the remaining 22 firms, information on crucial variables was missing so that these observations had to be dropped from the regressions. 19 There were a few cases where ownership changed twice, e.g. in 1995 the firm was owned by insiders, at some later point by outsiders, and in 1999 again by insiders. In these cases, the firm was classified having had no change in ownership. Thus, for all firms that were classified as having experienced a change in ownership structure, it was necessary that the ownership group was different at the beginning and at the end of the period. Our econometric results are not sensitive to re-estimation without including these “double-ownership-switiching” firms. 20 For instance, if on January 1st 1995 the firm was owned by insiders and on January 1st 1996 (and at every subsequent point) owned by outsiders, the annual change was measured between 1993- 1994. For those firms that remained in the same ownership group (insider or outsider) throughout the whole period, the annual change was measured throughout the whole five-year period of 1993-1998. 21 In the main these results are not sensitive to the use of medians rather then means. 22For example, the variable MANAGER is a dummy variable that is assigned the value 1 if the firm was classified as being in dominant manager in 1995. The variable VARSALE is the natural logarithm of variance in sales, not the coefficient of variation as in table 7. 23 Somewhat surprisingly, however, change in employment is negatively related to the change in ownership (in specification 2). But this effect is not statistically significant.
ireynold
William Davidson Institute Working Paper 560

50
24 In all cases where outsiders took over the firm there was no previous outsider ownership. Thus we were unable to include the minority share held by outsiders in the earlier analysis reported in Table 8.� 25 Also there is some case study evidence for Estonia in support of this observation. 26 There was, however, a significant difference between these two concerning sales growth --employee-owned firms declined less 27 However this finding may occur because capital intensity (fixed assets per employee) is correlated with equity per employee. 28 This would require long panels of data on financial information and ownership. Another interesting departure for future research might be to study post-privatisation manager buy-outs. In the early literature on transition, the focus was exclusively on changes from insider to outsider ownership, or from changes from employee to managerial ownership. While there has been much emphasis on manager buy-outs as part of the privatisation process, to our knowledge there have not been many studies of the changes from investor ownership to managerial ownership in transition economies.
ireynold
William Davidson Institute Working Paper 560

DAVIDSON INSTITUTE WORKING PAPER SERIES - Most Recent Papers The entire Working Paper Series may be downloaded free of charge at: www.wdi.bus.umich.edu
CURRENT AS OF 5/1/03 Publication Authors Date No. 560: Choice of Ownership Structure and Firm Performance: Evidence from Estonia
Derek Jones, Panu Kalmi, Niels Mygind
May 2003
No. 559: Explaining Postcommunist Economic Performance Lawrence P. King May 2003 No. 558: Tax Structure and the FDI: The Deterrent Effects of Complexity and Uncertainty
Kelly Edmiston, Shannon Mudd and Neven Valev
Apr. 2003
No. 557: Provincial Protectionism Konstantin Sonin Apr. 2003 No. 556: Nominal and Real Convergence in Estonia: The Balassa-Samuelson (dis)connection
Balázs Égert Apr. 2003
No. 555: Banks-Firms Nexus under the Currency Board: Empirical Evidence from Bulgaria
Nikolay Nenovsky, Evgeni Peev and Todor Yalamov
Apr. 2003
No. 554: To Steal or Not to Steal: Firm Attributes, Legal Environment, and Valuation
Art Durnev and E. Han Kim Apr. 2003
No. 553: Corporate Stability and Economic Growth Kathy S. He, Randall Morck and Bernard Yeung
Apr. 2003
No. 552: So Many Rocket Scientists, So Few Marketing Clerks: Occupational Mobility in Times of Rapid Technological Change
Nauro F. Campos and Aurelijus Dabušinskas
Mar. 2003
No. 551: Determinants of Interregional Mobility in Russia: Evidence from Panel Data
Yuri Andrienko and Sergei Guriev
Feb. 2003
No. 550: Gross Job Flows in Ukraine: Size, Ownership and Trade Effects
Jozef Konings, Olga Kupets and Hartmut Lehmann
Mar. 2003
No. 549: Technology Transfer through FDI in Top-10 Transition Countries: How Important are Direct Effects, Horizontal and Vertical Spillovers?
Jože P. Damijan, Mark Knell, Boris Majcen and Matija Rojec
Feb. 2003
No. 548: Does Foreign Direct Investment Increase the Productivity of Domestic Firms? In Search of Spillovers through Backward Linkages
Beata K. Smarzynska Mar. 2003
No. 547: Re-employment Probabilities and Wage Offer Function for Russian Labor Market
Natalia V. Smirnova Feb. 2003
No. 546: Democratization’s Risk Premium: Partisan and Opportunistic Political Business Cycle Effects on Sovereign Ratings in Developing Countries
Steven Block, Burkhard N. Schrage and Paul M. Vaaler
Feb. 2003
No. 545: Structural Reforms and Competitiveness: Will Europe Overtake America?
Jan Svejnar Feb. 2003
No. 544: Why the Rich May Favor Poor Protection of Property Rights Konstantin Sonin Dec. 2002 No. 543: Reinvested Earnings Bias, The “Five Percent” Rule and the Interpretation of the Balance of Payments – With an Application to Transition Economies
Josef C. Brada and Vladimír Tomšík
Feb. 2003
No. 542: The Impact of Ownership Reform in Chinese Industry, 1995-2001
Gary H. Jefferson, Su Jian, Jiang Yuan and Yu Xinhua
Feb. 2003
No. 541: Defensive and Strategic Restructuring of Firms during the Transition to a Market Economy
Domadenik, Janez Prašnikar and Jan Svejnar
Feb. 2003
No. 540: Tenuous Financial Stability Neven T. Valev and John A. Carlson
Feb. 2003
No. 539: Non-monetary Trade and Differential Access to Credit in the Russian Transition
Vlad Ivanenko Feb. 2003
No. 538: International Price-Fixing Cartels and Developing Countries: A Discussion of Effects and Policy Remedies
Margaret Levenstein and Valerie Suslow with Lynda Oswald
Feb. 2003
No. 537: Foreign Banks in Bulgaria, 1875-2002 Kenneth Koford and Adrian E. Tschoegl
Jan. 2003
No. 536: Forthcoming in Vanderbilt Journal of Transnational Law, “Healthy Organizations and the Link to Peaceful Societies: Strategies for Implementing Organizational Change”
Jeannette Jackson and Maria Coolican
Jan. 2003

![[Estonia] National Cyber Security Strategy - 2008 - EN - ENISA](https://static.fdokumen.com/doc/165x107/63256e49051fac18490d427a/estonia-national-cyber-security-strategy-2008-en-enisa.jpg)