Financial Statements of Government Organizations - Ontario.ca
450
Treasury Board Secretariat PUBLIC ACCOUNTS OF ONTARIO Financial Statements of Government Organizations VOLUME 2B 2016–2017
-
Upload
khangminh22 -
Category
Documents
-
view
0 -
download
0
Transcript of Financial Statements of Government Organizations - Ontario.ca

Treasury Board Secretariat
PUBLIC ACCOUNTSOF ONTARIO
Financial Statements of Government Organizations
VOLUME 2B 2016– 2017


TABLE OF CONTENTS
Volume 2B
Page
General
Responsible Ministry for Government Agencies .......................................................................................... iiA Guide to the Public Accounts ................................................................................................................... iv
FINANCIAL STATEMENTS
Section 1 ─ Government Organizations – Cont’d
Niagara Parks Commission ....................................................................... March 31, 2017...................... 1-11-25Northern Ontario Heritage Fund Corporation ............................................. March 31, 2017......................
Ontario Agency for Health Protection and Promotion(Public Health Ontario)................................................................. March 31, 2017...................... 1-39
1-531-731-891-1071-1271-1431-1611-1951-2051-2311-2451-2731-2871-3131-3271-3431-3631-3791-4011-429
Ontario Capital Growth Corporation........................................................... March 31, 2017......................Ontario Clean Water Agency ..................................................................... December 31, 2016 ...............Ontario Educational Communications Authority (TV Ontario) .................... March 31, 2017......................Ontario Electricity Financial Corporation.................................................... March 31, 2017......................Ontario Energy Board ................................................................................ March 31, 2017......................Ontario Financing Authority ....................................................................... March 31, 2017......................Ontario French-Language Educational Communications Authority............ March 31, 2017......................Ontario Immigrant Investor Corporation..................................................... March 31, 2017......................Ontario Infrastructure and Lands Corporation (Infrastructure Ontario)....... March 31, 2017......................Ontario Mortgage and Housing Corporation .............................................. March 31, 2017......................Ontario Northland Transportation Commission .......................................... March 31, 2017......................Ontario Place Corporation ......................................................................... December 31, 2016 ...............Ontario Securities Commission.................................................................. March 31, 2017......................Ontario Tourism Marketing Partnership Corporation.................................. March 31, 2017......................Ontario Trillium Foundation........................................................................ March 31, 2017......................Ornge......................................................................................................... March 31, 2017......................Ottawa Convention Centre Corporation ..................................................... March 31, 2017......................Province of Ontario Council for the Arts (Ontario Arts Council).................. March 31, 2017......................The Royal Ontario Museum ....................................................................... March 31, 2017......................Toronto Organizing Committee for the 2015 Pan American
and Parapan American Games (Toronto 2015) ........................... March 31, 2017...................... 1-4231-425Toronto Waterfront Revitalization Corporation (Waterfront Toronto).......... March 31, 2017......................
i

PUBLIC ACCOUNTS, 2016-2017
ii
RESPONSIBLE MINISTRY FOR GOVERNMENT BUSINESS ENTERPRISES, ORGANIZATIONS, TRUSTS & MISCELLANEOUS FINANCIAL STATEMENTS
Ministry of Agriculture, Food and Rural Affairs AgriCorp Agricultural Research Institute of Ontario
Ministry of the Attorney General Legal Aid Ontario The Public Guardian and Trustee for the Province of Ontario
Ministry of Economic Development, Employment and Infrastructure/Research and Innovation General Real Estate Portfolio Ontario Capital Growth Corporation Ontario Immigrant Investor Corporation
Toronto Waterfront Revitalization Corporation (Waterfront Toronto)
Ministry of Education Education Quality and Accountability Office Ontario Educational Communications Authority (TV Ontario) Ontario French-Language Educational Communications Authority
Ministry of Energy Brampton Distribution Holdco Inc. Hydro One Limited
Independent Electricity System Operator Ontario Energy Board Ontario Power Generation Inc.
Ministry of the Environment and Climate Change Ontario Clean Water Agency
Ministry of Finance Deposit Insurance Corporation of Ontario Liquor Control Board of Ontario Losses Deleted from the Accounts Motor Vehicle Accident Claims Fund Ontario Electricity Financial Corporation Ontario Financing Authority Ontario Lottery and Gaming Corporation Ontario Securities Commission Pension Benefits Guarantee Fund Provincial Judges Pension Fund Revenue Remissions
zhangsa2
Typewritten Text
zhangsa2
Typewritten Text
zhangsa2
Typewritten Text
zhangsa2
Typewritten Text
zhangsa2
Typewritten Text
zhangsa2
Typewritten Text
zhangsa2
Typewritten Text
zhangsa2
Typewritten Text
zhangsa2
Typewritten Text
zhangsa2
Typewritten Text
zhangsa2
Typewritten Text
zhangsa2
Typewritten Text
Ontario Infrastructure and Lands Corporation (Infrastructure Ontario)
zhangsa2
Typewritten Text
zhangsa2
Typewritten Text
zhangsa2
Typewritten Text
zhangsa2
Typewritten Text
zhangsa2
Typewritten Text
zhangsa2
Typewritten Text
zhangsa2
Typewritten Text
zhangsa2
Typewritten Text
zhangsa2
Typewritten Text
zhangsa2
Typewritten Text
zhangsa2
Typewritten Text
zhangsa2
Typewritten Text
zhangsa2
Typewritten Text
zhangsa2
Typewritten Text
zhangsa2
Typewritten Text
zhangsa2
Typewritten Text
zhangsa2
Typewritten Text
zhangsa2
Typewritten Text
zhangsa2
Typewritten Text
zhangsa2
Typewritten Text
zhangsa2
Typewritten Text
zhangsa2
Typewritten Text
zhangsa2
Typewritten Text
zhangsa2
Typewritten Text
zhangsa2
Typewritten Text
zhangsa2
Typewritten Text
zhangsa2
Typewritten Text
zhangsa2
Typewritten Text
zhangsa2
Typewritten Text
zhangsa2
Typewritten Text
zhangsa2
Typewritten Text
zhangsa2
Typewritten Text
zhangsa2
Typewritten Text
zhangsa2
Typewritten Text
zhangsa2
Typewritten Text
zhangsa2
Typewritten Text
zhangsa2
Typewritten Text
zhangsa2
Typewritten Text
zhangsa2
Typewritten Text
zhangsa2
Typewritten Text
zhangsa2
Typewritten Text

PUBLIC ACCOUNTS, 2016-2017
iii
RESPONSIBLE MINISTRY FOR GOVERNMENT BUSINESS ENTERPRISES, ORGANIZATIONS, TRUSTS & MISCELLANEOUS FINANCIAL STATEMENTS
Ministry of Health and Long-Term Care Cancer Care Ontario eHealth Ontario Local Health Integration Network – Central Local Health Integration Network – Central East Local Health Integration Network – Central West Local Health Integration Network – Champlain Local Health Integration Network – Erie St. Clair Local Health Integration Network – Hamilton Niagara Haldimand Brant Local Health Integration Network – Mississauga Halton Local Health Integration Network – North East Local Health Integration Network – North Simcoe Muskoka Local Health Integration Network – North West Local Health Integration Network – South East Local Health Integration Network – South West Local Health Integration Network – Toronto Central Local Health Integration Network – Waterloo Wellington Ontario Agency for Health Protection and Promotion (Public Health Ontario) Ornge
Ministry of Labour Workplace Safety and Insurance Board
Ministry of Municipal Affairs and Housing Ontario Mortgage and Housing Corporation
Ministry of Natural Resources and Forestry Algonquin Forestry Authority Forest Renewal Trust
Ministry of Northern Development and Mines Northern Ontario Heritage Fund Corporation Ontario Northland Transportation Commission
Ministry of Tourism, Culture and Sport The Centennial Centre of Science and Technology (Ontario Science Centre) Metropolitan Toronto Convention Centre Corporation Niagara Parks Commission Ontario Place Corporation Ontario Tourism Marketing Partnership Corporation Ontario Trillium Foundation Ottawa Convention Centre Corporation Province of Ontario Council for the Arts (Ontario Arts Council) The Royal Ontario Museum Toronto Organizing Committee for the 2015 Pan American and Parapan American Games (Toronto 2015)
Ministry of Transportation Metrolinx
Treasury Board Secretariat Ontario Pension Board

PUBLIC ACCOUNTS, 2016-2017
iv
A GUIDE TO THE PUBLIC ACCOUNTS
1. SCOPE OF THE PUBLIC ACCOUNTS
The 2016-2017 Public Accounts of the Province of Ontario comprise the Annual Report and Consolidated Financial Statements and three volumes:
Volume 1 contains ministry statements and detailed schedules of debt and other items. The ministry statements reflect the financial activities of the government’s ministries on the accrual basis of accounting, providing a comparison of appropriations with actual spending. Ministry expenses include all expenses that are subject to appropriation approved by the Legislative Assembly, but exclude adjustments arising from consolidation of government organizations whose expenses are not appropriated.
Volume 2 contains the financial statements of Government Organizations and Business Enterprises that are part of the government’s reporting entity and other miscellaneous financial statements.
Volume 3 contains the details of payments made by ministries to vendors (including sales tax) and transfer payment recipients that are not deemed to be prohibited by the Freedom of Information and Protection of Privacy Act.
2. A GUIDE TO VOLUME 2 OF THE PUBLIC ACCOUNTS
The financial statements of the selected crown corporations, boards and commissions are for fiscal periods ending within the Province’s own fiscal period April 1, 2016 to March 31, 2017. They are presented in the same detail as the approved, audited financial statements and as nearly as possible in the same form. The statements have been presented in the order shown in the Table of Contents. In addition, a listing is provided which groups the crown corporations, boards and commissions by ministerial responsibility.

GOVERNMENT ORGANIZATIONS (CONT’D)


THE NIAGARA PARKS COMMISSION
MANAGEMENT REPORT March 31, 2017
The Management of The Niagara Parks Commission are responsible for the financial statements and all other information presented in these statements. The statements have been prepared by management in accordance with the framework identified in Note 2 in the accompanying audited financial statements.
The financial statements include amounts based on best estimates and judgments. Management has determined such amounts on a reasonable basis in order to ensure that the statements are presented fairly, in all material respects.
Management maintains a system of internal accounting and administrative control that is designed to provide reasonable assurance that the financial information is relevant, reliable, accurate and that the Commission’s assets are properly accounted for and adequately safeguarded.
The Board of The Niagara Parks Commission is responsible for gaining assurance that management fulfills its responsibilities for financial reporting and is ultimately responsible for reviewing and approving the financial statements.
The Board, through the Audit and Finance Committee, meets periodically with Management to discuss financial results, auditing matters, financial reporting issues and to satisfy itself that each group is properly discharging responsibilities. The Committee reviews the financial statements before recommending approval by the Board.
The financial statements have been audited by Grant Thornton LLP, the Commission’s appointed External Auditor and in accordance with Canadian generally accepted auditing standards on behalf of the Commission, Minister of Tourism, Culture and Sport and the Provincial Auditor General. Grant Thornton LLP had direct and full access to all Commission records as well as full access to the Audit and Finance Committee with and without the presence of Management to discuss their audit and findings as to the integrity of the Commission’s financial reporting.
_________________________ ________________________________Reegan McCullough Margaret Neubauer Chief Executive Officer Senior Director, Corporate Services June 23, 2017 June 23, 2017
PUBLIC ACCOUNTS, 2016-2017 1-1

Grant Thornton LLP Suite B 222 Catharine Street, PO Box 336 Port Colborne, ON L3K 5W1
T +1 905 834 3651 F +1 905 834 5095 E [email protected] www.GrantThornton.ca
Independent auditor’s report
To The Niagara Parks Commission, the Minister of Tourism, Culture and Sport and the Auditor General of Ontario
We have audited the accompanying financial statements of The Niagara Parks Commission, which comprise the statement of financial position as at March 31, 2017, and the statements of operations, accumulated surplus, changes in net debt and cash flows for the year then ended, and a summary of significant accounting policies and other explanatory information.
Management is responsible for the preparation of these financial statements in accordance with the basis of accounting described in Note 2 to the financial statements, and for such internal control as management determines is necessary to enable the preparation of financial statements that are free from material misstatement, whether due to fraud or error.
Our responsibility is to express an opinion on these financial statements based on our audit. We conducted our audit in accordance with Canadian generally accepted auditing standards. Those standards require that we comply with ethical requirements and plan and perform the audit to obtain reasonable assurance about whether the financial statements are free from material misstatement.
An audit involves performing procedures to obtain audit evidence about the amounts and disclosures in the financial statements. The procedures selected depend on the auditor’s judgment, including the assessment of the risks of material misstatement of the financial statements, whether due to fraud or error. In making those risk assessments, the auditor considers internal control relevant to the entity’s preparation of the financial statements in order to design audit procedures that are appropriate in the circumstances, but not for the purpose of expressing an opinion on the effectiveness of the entity’s internal control. An audit also includes evaluating the appropriateness of accounting policies used and the reasonableness of accounting estimates made by management, as well as evaluating the overall presentation of the financial statements.
We believe that the audit evidence we have obtained is sufficient and appropriate to provide a basis for our audit opinion.
Audit • Tax • AdvisoryGrant Thornton LLP. A Canadian Member of Grant Thornton International Ltd
1-2 PUBLIC ACCOUNTS, 2016-2017

Opinion
In our opinion, the financial statements of The Niagara Parks Commission for the year ended March 31, 2017 are prepared, in all material respects, in accordance with the basis of accounting described in Note 2 to the financial statements.
Emphasis of matters Without modifying our opinion, we draw attention to Note 2 to the financial statements which describes the basis of accounting used in the preparation of these financial statements and the significant differences between such basis of accounting and Canadian public sector accounting standards.
Port Colborne, Canada Chartered Professional Accountants June 23, 2017 Licensed Public Accountants
PUBLIC ACCOUNTS, 2016-2017 1-3
Audit • Tax • AdvisoryGrant Thornton LLP. A Canadian Member of Grant Thornton International Ltd

The Niagara Parks Commission Statement of Financial Position As at March 31 2017 2016
(in thousands of dollars)
Financial assetsCash and cash equivalents $ 8,207 $ 395 Accounts receivable 4,974 1,738Inventories – saleable 4,055 3,892
17,236 6,025
Liabilities Bank indebtedness (Note 3) - 2,180Accounts payable 10,977 9,041Accrued payroll 2,758 2,706Deferred revenue (Note 4) 2,283 1,316Deferred capital funding (Note 5) 28,534 26,390 Long term financing (Note 6) 26,592 28,371 Post-employment benefits (Note 7) 3,121 3,558Power plant stabilization obligation (Note 8) 29,414 29,076
103,679 102,638
Net debt (86,443) (96,613)
Non-financial assets Tangible capital assets (Note 10 and Page 23) 158,613 155,332 Inventories – other 936 1,199 Prepaid expenses 479 1,230
160,028 157,761
Accumulated surplus (Note 11) $ 73,585 $ 61,148
Commitments and contingencies (Notes 12 and 13)
On behalf of the Commission
Janice Thomson, Chair Ian Nielsen-Jones, Commissioner
See accompanying notes to the financial statements.
1-4 PUBLIC ACCOUNTS, 2016-2017

The Niagara Parks Commission Statement of Operations For the year ended March 31, 2017
Budget Actual Actual 2017 2017 2016
(in thousands of dollars)
RevenuesRevenue producing operations $ 73,088 $ 85,424 $ 76,402 Land rent 6,997 7,009 6,882 Commission, rentals and fees 14,480 14,946 12,858 Premium on United States funds – net 800 1,119 1,073 Government transfers – special projects - 520 - Sundry revenue 5 20 7
95,370 109,038 97,222
Expenses (Page 24) Revenue producing operations
Cost of goods sold 12,008 14,871 13,265 Operating 37,044 38,995 36,953 Maintenance 16,133 16,343 15,759 Administrative and police 13,689 13,838 13,584 Marketing and promotion 3,595 3,414 3,283 Special projects - 520 -
82,469 87,981 82,844 Net surplus for the year before other items 12,901 21,057 14,378
Other items Interest expense – net (Note 14) 1,483 1,282 1,502 Amortization of tangible capital assets (Note 10) 9,033 8,754 8,359
Amortization of deferred capital funding (Note 5) (1,670) (1,706) (1,498) Gain on disposal of tangible capital assets - (48) (34)
8,846 8,282 8,329
Net surplus from operations 4,055 12,775 6,049
Net increase in power plant stabilization obligation (Note 8) (705) (338) (239)
Annual surplus $ 3,350 $ 12,437 $ 5,810
See accompanying notes to the financial statements.
PUBLIC ACCOUNTS, 2016-2017 1-5

The Niagara Parks Commission Statement of Accumulated Surplus For the year ended March 31, 2017
Budget Actual Actual2017 2017 2016
(in thousands of dollars)
Accumulated surplus (Note 11) Beginning of year $ 61,148 $ 61,148 $ 55,338
Annual surplus 3,350 12,437 5,810
End of year $ 64,498 $ 73,585 $ 61,148
See accompanying notes to the financial statements.
1-6 PUBLIC ACCOUNTS, 2016-2017
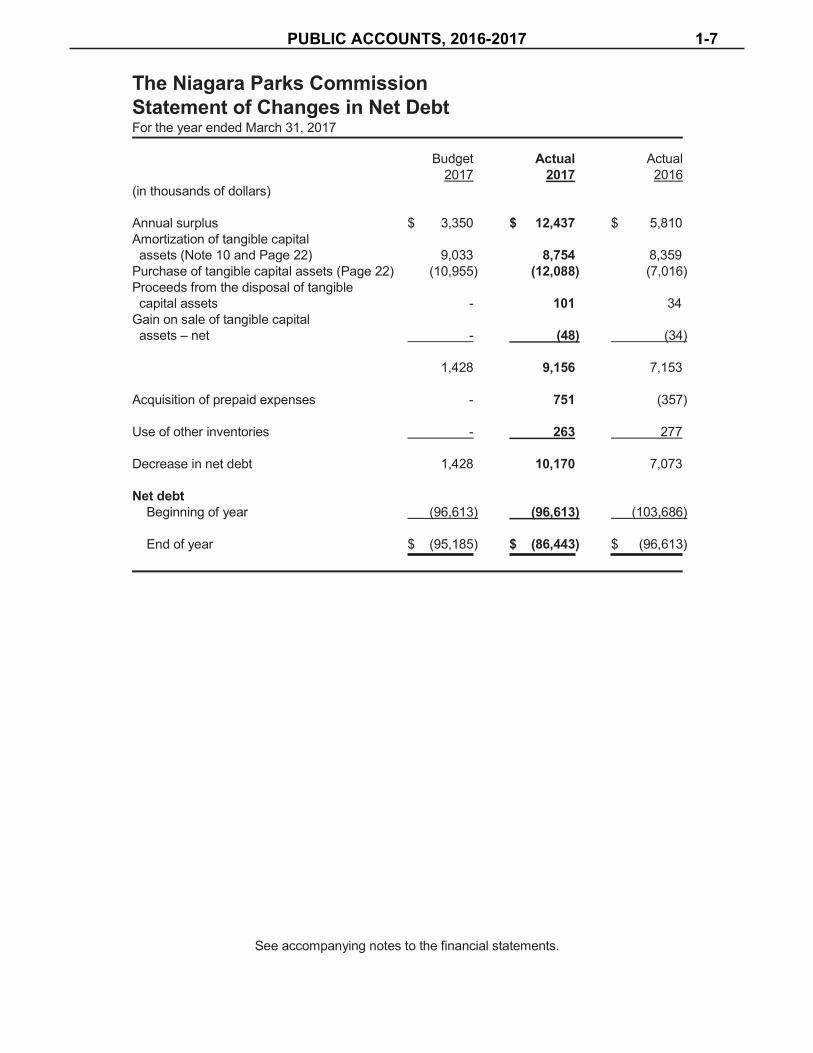
The Niagara Parks Commission Statement of Changes in Net Debt For the year ended March 31, 2017
Budget Actual Actual 2017 2017 2016
(in thousands of dollars)
Annual surplus $ 3,350 $ 12,437 $ 5,810 Amortization of tangible capital assets (Note 10 and Page 22) 9,033 8,754 8,359
Purchase of tangible capital assets (Page 22) (10,955) (12,088) (7,016)Proceeds from the disposal of tangible capital assets - 101 34Gain on sale of tangible capital assets – net - (48) (34)
1,428 9,156 7,153
Acquisition of prepaid expenses - 751 (357)
Use of other inventories - 263 277
Decrease in net debt 1,428 10,170 7,073
Net debt Beginning of year (96,613) (96,613) (103,686)
End of year $ (95,185) $ (86,443) $ (96,613)
See accompanying notes to the financial statements.
PUBLIC ACCOUNTS, 2016-2017 1-7
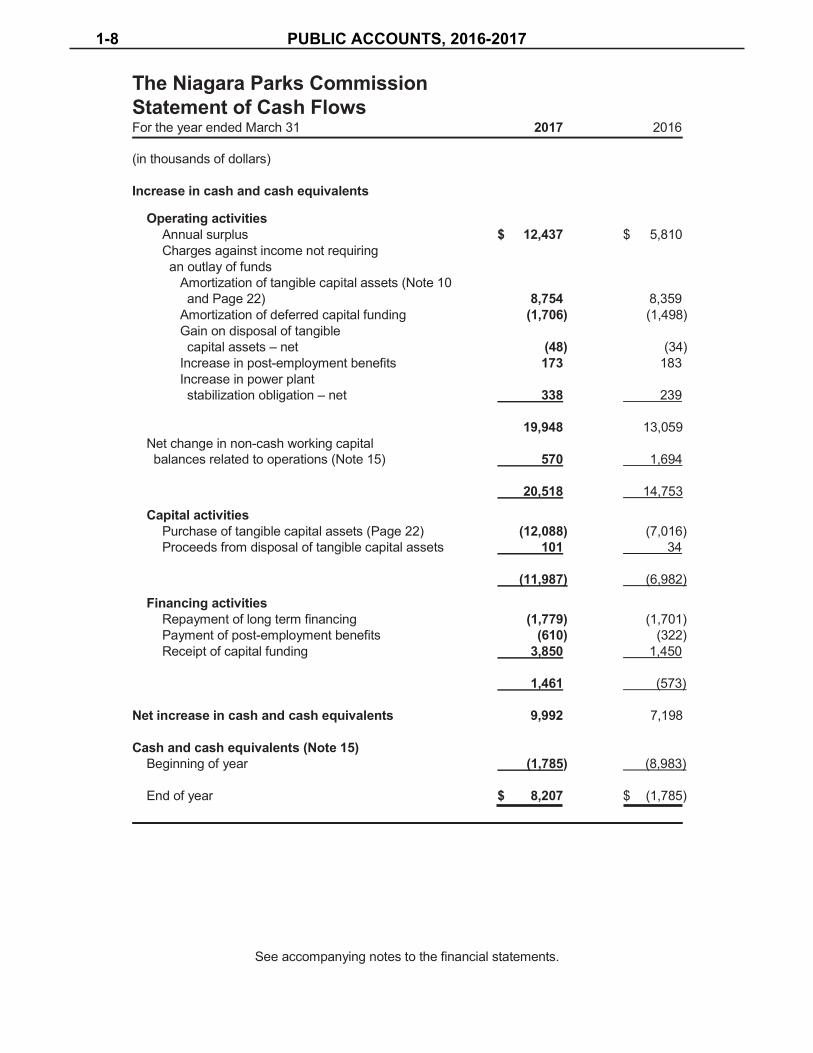
The Niagara Parks Commission Statement of Cash Flows For the year ended March 31 2017 2016
(in thousands of dollars)
Increase in cash and cash equivalents
Operating activities Annual surplus $ 12,437 $ 5,810Charges against income not requiring an outlay of funds
Amortization of tangible capital assets (Note 10 and Page 22) 8,754 8,359
Amortization of deferred capital funding (1,706) (1,498) Gain on disposal of tangible capital assets – net (48) (34)Increase in post-employment benefits 173 183 Increase in power plant stabilization obligation – net 338 239
19,948 13,059 Net change in non-cash working capital balances related to operations (Note 15) 570 1,694
20,518 14,753
Capital activities Purchase of tangible capital assets (Page 22) (12,088) (7,016) Proceeds from disposal of tangible capital assets 101 34
(11,987) (6,982)
Financing activities Repayment of long term financing (1,779) (1,701) Payment of post-employment benefits (610) (322) Receipt of capital funding 3,850 1,450
1,461 (573)
Net increase in cash and cash equivalents 9,992 7,198
Cash and cash equivalents (Note 15) Beginning of year (1,785) (8,983)
End of year $ 8,207 $ (1,785)
See accompanying notes to the financial statements.
1-8 PUBLIC ACCOUNTS, 2016-2017
The Niagara Parks Commission Notes to the Financial Statements For the year ended March 31, 2017
1. Nature of operations
The Niagara Parks Commission (the “Commission”) is governed by the Niagara Parks Act. Initially established in 1885, the Commission is an “Operational Enterprise” of the Province of Ontario and is responsible for maintaining, protecting and showcasing over 1,300 hectares ofparkland stretching some 56 kilometres along the Niagara River from Lake Erie to Lake Ontario. The Commission is exempt from corporate income taxes under the Income Tax Act (Canada) and Ontario Corporation Tax Act.
The Commission is also classified as an Other Government Organization by the Ministry of Finance and as such, the Commission’s audited financial statements are published as part of the Public Accounts.
2. Significant accounting policies
Basis of accounting
The financial statements have been prepared in accordance with the financial reporting provisions of the Ontario Financial Administration Act, Ontario Ministry of Tourism Memorandum of Understanding and the accounting requirements of Regulation 395/11 of the Ontario Financial Administration Act. The Ontario Ministry of Tourism Memorandum of Understanding requires that the financial statements be prepared in accordance with the Canadian public sector accounting standards. The Ontario Financial Administration Act provides that changes may be required to the application of these standards as a result of regulation.
Regulation 395/11 to the Ontario Financial Administration Act requires that contributions received or receivable for the acquisition or development of depreciable tangible capital assets and contributions of depreciable tangible capital assets for use in providing services, be recorded as deferred capital contributions and be recognized as revenue in the Statement of Operations at a rate equal to amortization charged on the related depreciable tangible capital assets. These contributions include government transfers and externally restricted contributions.
The accounting requirement under Regulation 395/11 is not consistent with the requirements of Canadian public sector accounting standards which requires that:
government transfers be recognized as revenue when approved by the transferor and theeligibility criteria have been met unless the transfer contains a stipulation that creates aliability, in which case the transfer is recognized as revenue over the period that theliability is extinguished in accordance with public sector accounting standard PS3410;externally restricted contributions be recognized as revenue in the period in which theresources are used for the purpose or purposes specified in accordance with publicsector accounting standard PS3100.
As a result revenue recognized in the Statement of Operations and certain related deferred revenues and deferred capital contributions would be recorded differently under Canadian Public Sector Accounting Standards.
PUBLIC ACCOUNTS, 2016-2017 1-9

The Niagara Parks Commission Notes to the Financial Statements For the year ended March 31, 2017
2. Significant accounting policies (continued)
Basis of accounting (continued)
The significant accounting principles used in the preparation of these financial statements are summarized below.
Cash and cash equivalents
Cash and cash equivalents include cash on hand, balances with banks and short term deposits with maturities of less than three months.
Inventories
Saleable and other inventories are valued at the lower of average cost and net realizable value.
Tangible capital assets
Tangible capital assets are recorded at cost. Cost includes all directly attributable expenses in the acquisition, construction, development and/or betterment of the asset required to install the asset at the location and in the condition necessary for its intended use. Contributed tangible capital assets are capitalized at estimated fair value upon acquisition.
The Commission capitalizes an amount of interest as part of the costs of its capital works in progress and financed via long term financing.
Works of art for display in the Commission property are not included as capital assets. Works of art are held for exhibition, educational and historical interest. Such assets are deemed worthy of preservation because of the social rather than financial benefits they provide to the community. No valuation of the collection has been disclosed in the financial statements.
Leases are classified as capital or operating leases. Leases that transfer substantially all benefits incidental to ownership are accounted for as capital leases. All other leases are accounted for as operating leases and the related lease payments are charged to expenses as incurred.
Amortization is calculated on a straight-line basis to write-off the net cost of each asset over its estimated useful life for all classes except land. Land is considered to have an infinite life without amortization. Residual values of assets are assumed to be zero with any net gain or loss arising from the disposal of assets recognized in the Statement of Operations. Amortization is charged on a monthly basis. Assets under construction are not amortized until the asset is available for productive use.
Amortization is based on the following classifications and useful lives:
Classification Useful Life Land improvements, buildings, roadways and structures 7 to 40 years
Equipment and furnishings 3 to 10 years Vehicles 10 to 12 years
1-10 PUBLIC ACCOUNTS, 2016-2017

The Niagara Parks CommissionNotes to the Financial Statements For the year ended March 31, 2017
2. Significant accounting policies (continued)
Deferred revenue
Revenue that is restricted by legislation of senior governments or by agreement with external parties are deferred and reported as restricted revenues. When qualifying expenses are incurred, restricted revenues are brought into revenue at equal amounts. Revenues received in advance of expenses that will be incurred in a later period are deferred until they are earned by being matched against those expenses.
Deferred capital funding
Government transfers for capital purposes and contributed tangible capital assets are recorded as a liability, referred to as deferred capital funding, and are recognized into revenue at the same rate as the related tangible capital assets are amortized, in accordance with Regulation 395/11 to the Ontario Financial Administration Act, as disclosed above.
Post-employment benefits
The present value of the cost of providing employees with future benefit programs is expensed as employees earn these entitlements.
Liabilities for contaminated sites
Contaminated sites are a result of contamination being introduced into air, soil, water or sediment of a chemical, organic or radioactive material or live organism that exceeds an environmental standard. The liability is recorded net of any expected recoveries. A liability for remediation of contaminated sites is recognized when a site is not in productive use and all the following criteria are met:
an environmental standard exists;contamination exceeds the environmental standard;the Commission:o is directly responsible; oro accepts responsibility;it is expected that future economic benefits will be given up; anda reasonable estimate of the amount can be made.
The liability is recognized as management’s estimate of the cost of post-remediation including operation, maintenance and monitoring that are an integral part of the remediation strategy for a contaminated site.
Revenue recognition
Revenue from gift shops, restaurants and attractions are recognized when merchandise has been transferred to the customer or services have been rendered. Revenue from land rent, commissions, rentals, fees and sundry are recognized over the life of the agreement or when earned.
PUBLIC ACCOUNTS, 2016-2017 1-11

The Niagara Parks Commission Notes to the Financial Statements For the year ended March 31, 2017
2. Significant accounting policies (continued)
Foreign currency translation
These financial statements are presented in Canadian dollars. Assets and liabilities denominated in foreign currencies are translated at the exchange rates in effect at the Statement of Financial Position date. Gains and losses on translation are reflected in the annual surplus (deficit).
Use of estimates and measurement uncertainty
The preparation of financial statements in accordance with Canadian public sector accounting standards requires management to make estimates and assumptions that affect the reported amounts of assets and liabilities and disclosure of contingent assets and liabilities at the date of the financial statements and the reported amounts of revenues and expenses during the reporting period. Actual results could differ from those estimates. Two areas in which estimates are used are with regards to post-employment benefits and the power plant stabilization obligation.
3. Credit facilities
The credit facilities, which have a maximum borrowing capacity of $ 15,000,000, provide for two types of loans. There is a variable rate loan facility which varies with the Canadian Imperial Bank of Commerce prime rate and there is a fixed rate operating loan facility available with a maximum term not to exceed 364 days at rates which are set relative to banker’s acceptance rates. These credit facilities are unsecured and expire on March 31, 2021, with an option of a three year renewal at the Commission’s discretion. As at March 31, 2017, $ Nil has been drawn upon for all credit facilities (2016 - $ 1,371,416). Taking into account outstanding cheques and deposits, the balance reported on the Statement of Financial Position is $ Nil(2016 - $ 2,179,628).
1-12 PUBLIC ACCOUNTS, 2016-2017

The Niagara Parks Commission Notes to the Financial Statements For the year ended March 31, 2017
4. Deferred revenue 2017 2016(in thousands of dollars)
Defunct power stations (Note 8) $ 8 $ 135 Sale proceeds related to Fort Erie land transaction 314 321 Other 1,961 860
$ 2,283 $ 1,316
Fort Erie land transaction obligation
In fiscal 2009, the Commission and the Peace Bridge Authority (“PBA”) entered into an agreement to transfer parcels of land. The PBA acquired a 5.952 acre parcel located in Fort Erie from the Commission for $ 2,021,206. The Commission acquired an option for $ 670,000 plus an annual sum of $ 7,300 adjusted for inflation, to receive 1.973 acres of river front property located at the end of Jarvis Street in Fort Erie from the PBA. The agreement calls for the net proceeds to the Commission in the amount of $ 1,351,206 to be spent on a) funding improvements at Old Fort Erie which are intended for the 200th year anniversary of the War of1812 and b) returning and/or maintaining the Jarvis Street property as parkland.
The net proceeds were recorded as part of deferred revenue on the Statement of Financial Position. To date approximately $ 996,000 from these proceeds have been spent on the capital works project for the renovation of Old Fort Erie and approximately $ 47,000 has been spent on the Jarvis Street property maintenance. As of March 31, 2017, approximately $ 314,285 remains for use in 2018 and beyond.
5. Deferred capital funding 2017 2016 (in thousands of dollars)
Deferred capital funding Beginning of year $ 26,390 $ 26,438
Received during year for capital projects 3,850 1,450
Amortization (1,706) (1,498)
End of year $ 28,534 $ 26,390
PUBLIC ACCOUNTS, 2016-2017 1-13

The Niagara Parks Commission Notes to the Financial Statements For the year ended March 31, 2017
6. Long term financing 2017 2016 (in thousands of dollars)
Unsecured fixed rate term loan requiring blended payments of principal and interest of $ 2,640,907 per annum, bearing interest at 5.06% through to April, 2027 $ 21,951 $ 23,400
Unsecured fixed rate term loan requiring blended first annual payment of $ 543,418 and then payments of $ 569,965 per annum thereafter, bearing interest at 5.07% through to April, 2027 4,553 4,876
The Commission has an option to purchase land requiring annual payments of $ 7,300 until January, 2028 (Note 4) 88 95
$ 26,592 $ 28,371
The principal payments of the long term financial obligations due in the next five years are as follows:
2018 $ 1,877 2019 1,972 2020 2,071 2021 2,173 2022 2,285
1-14 PUBLIC ACCOUNTS, 2016-2017

The Niagara Parks Commission Notes to the Financial Statements For the year ended March 31, 2017
7. Post-employment benefits
Defined termination benefits
The Commission provides a defined employee future benefit, payable on termination to certain full time employees with a minimum of five years of service. The benefit is calculated on the basis of one week’s remuneration, at the time of termination, for every year of full time service provided to the Commission to a maximum of twenty-six weeks. The accrued benefit liability as at March 31, 2017 is $ 3,121,208 (2016 - $ 3,557,888).
The Commission requires that an actuarial valuation of the post-employment benefits be conducted every three years. The last valuation was completed for the year ended March 31, 2016 with extrapolations through to 2019 and updated on March 29, 2017. The latest valuation reflects approved changes by the Commission regarding eligibility and maximum amounts of the benefit payable upon termination.
The actual obligation as at March 31, 2017 is $ 2,331,209 (2016 - $ 2,674,097) which is the actuarial valuation for March 31, 2017 adjusted for the actual benefits paid of $ 609,558, incorporated in an actuarial update provided dated March 29, 2017.
Defined benefit plan information 2017 2016
(in thousands of dollars)
Employee benefit plan assets $ Nil $ Nil Employee benefit plan liabilities 3,121 3,558
Employee benefit plan deficit $ 3,121 $ 3,558
Benefit obligation recognized on the Statement of Financial Position
Benefit obligation, beginning of year $ 3,558 $ 3,697 Expense for the year 173 183 Benefits paid during the year (610) (322)
Benefit obligation, end of year $ 3,121 $ 3,558
PUBLIC ACCOUNTS, 2016-2017 1-15

The Niagara Parks Commission Notes to the Financial Statements For the year ended March 31, 2017
7. Post-employment benefits (continued)2017 2016
(in thousands of dollars)
The net benefit expense is as follows: Current service cost $ 163 $ 170Interest cost 104 117Amortization of actuarial gain/loss (94) (104)
$ 173 $ 183
The main actuarial assumptions applied in the valuation of the defined benefit plan are as follows:
Interest (discount) rate – the accrued obligation and the expense for the year were determined using a discount rate of 4.25% (2016 - 4.25%).
Salary levels – future salary and wage levels were assumed to increase at 2% per annum.
These assumptions were reviewed in the current year.
Pension benefits
The Commission provides pension benefits for all its permanent employees (and to non-permanent employees who elect to participate) through the Public Service Pension Fund (“PSPF”) and the Ontario Public Service Employees’ Union Pension Fund (“OPSEU Pension Fund”). These are defined benefit pension plans for employees of the Province and many provincial agencies. The Province of Ontario, which is the sole sponsor of the PSPF and a joint sponsor of the OPSEU Pension Fund, determines the Commission’s annual payments to the funds. As the sponsors are responsible for ensuring that the pension funds are financially viable, any surpluses or unfunded liabilities arising from statutory actuarial funding valuations are not assets or obligations of the Commission. The Commission’s annual payments of $ 2,316,697 (2016 - $ 2,318,548), of which $ 1,158,349 (2016 - $ 1,159,274) represents the employees’ portion, are included in the administrative and police expense on the Statement of Operations.
The cost of post-employment, non-pension benefits are paid by the Province and therefore are not included in the Statement of Operations.
1-16 PUBLIC ACCOUNTS, 2016-2017
The Niagara Parks Commission Notes to the Financial Statements For the year ended March 31, 2017
8. Power plant stabilization obligation
The Province of Ontario directed the Commission to accept ownership of three former electricity generating power stations all located within Commission lands.
The Toronto Power Generating Station (“TPGS”) and the Ontario Power Generating Station (“OPGS”) were transferred by Ontario Power Generation Inc. (“OPG”) to the Commission at no cost in August, 2007. As part of the terms of transfer of TPGS and OPGS, OPG was to undertake certain structural and environmental work to ensure that the buildings were no threat to the public. The Canadian Niagara Power Generating Station (“CNPGS”) previously owned by Fortis Ontario was transferred April 30, 2009.
The Ministry of Tourism engaged the services of an architectural firm (The Ventin Group Inc.) to ensure that the original Government Directive governing the initial transfer was complied with and to identify work and related costs required to “stabilize and mothball” all the facilities until an ultimate use for the buildings can be determined. The Ventin Group identified the remaining lead paint at the TPGS and OPGS as a deficiency which OPG should have resealed or encapsulated after cleaning. The Ventin Group reported that there are substantial costs required to bring the three power stations to what would be considered a “mothball” state. Therefore, additional costs would be required to bring these buildings to a “development ready” state. Further, there are in existence certain secondary structures related to TPGS and OPGS that were not accounted for in the original Government Directive that will result in additional remediation costs at some point in the future.
The Commission is of the belief that the acceptance of these power generating stations will require a significant infusion of funds that is beyond its capacity to meet. As at March 31, 2017,ongoing discussions with the Province have not resulted in any assurance that the Commission will not be responsible for any future costs. Any costs that are expected to be incurred for the purposes described above will not commence without funding received from the Province.
VFA, Inc. has reviewed the infrastructure through site visits and prepared estimates using standard engineering formulas. Further, they have provided the Commission with their assessment and a requirements list report providing costs for each component of stabilization required, as well as the timing of when these costs should be incurred. Commission engineering staff have reviewed the list and categorized the costs by year according to urgency and based on expected available funding, with the most urgent requirements addressed over the next two years. In addition, the Commission undertook several studies to determine critical underground infrastructure that needs replacing, including seismic studies, review of intake gates, geophysical and geotechnical settlement and a stability investigation.
The stabilization obligation as of March 31, 2017 has been calculated to be $ 29,414,141 (2016 - $ 29,076,363). This is an increase of $ 337,778 from 2016 and has been recorded in theStatement of Operations.
This obligation represents the Commission’s best estimate of the costs required to “stabilize and mothball” the three power stations based on the information noted above. The Commission estimates that this work could take approximately four years to complete and estimates the costs to increase by 1.5% per year, being the five year average industrial construction inflation rate according to Statistics Canada.
PUBLIC ACCOUNTS, 2016-2017 1-17
The Niagara Parks Commission Notes to the Financial Statements For the year ended March 31, 2017
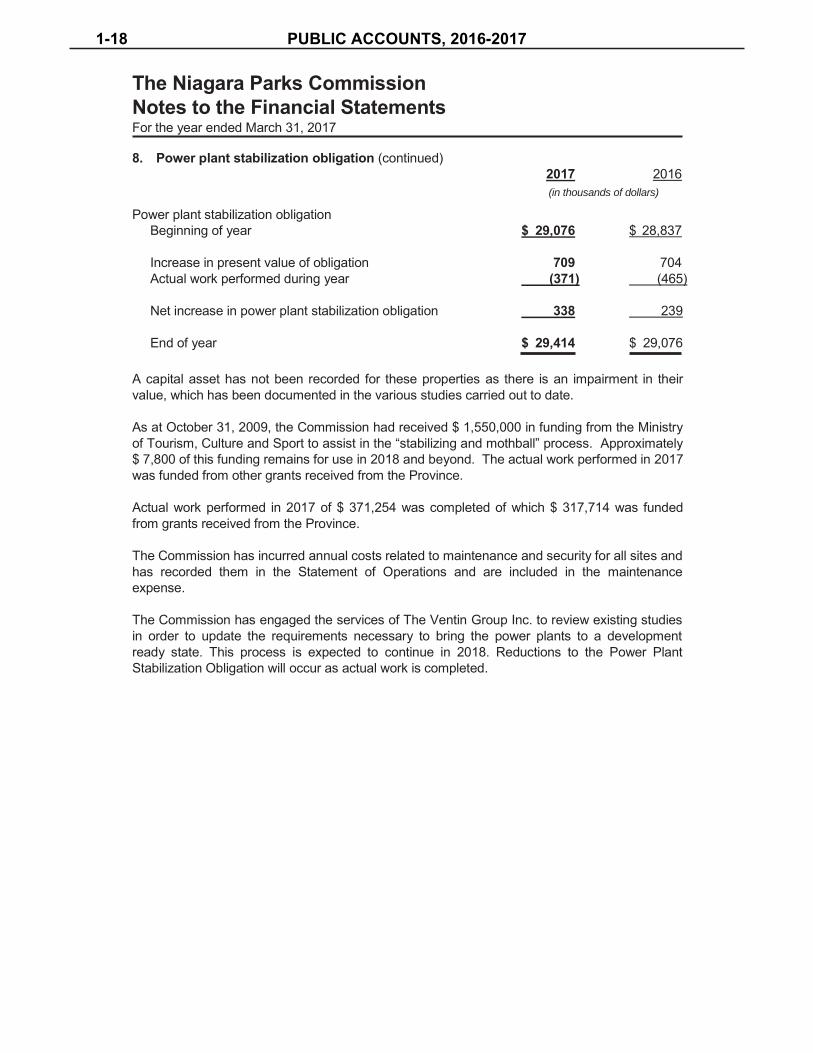
8. Power plant stabilization obligation (continued)2017 2016 (in thousands of dollars)
Power plant stabilization obligation Beginning of year $ 29,076 $ 28,837
Increase in present value of obligation 709 704 Actual work performed during year (371) (465)
Net increase in power plant stabilization obligation 338 239
End of year $ 29,414 $ 29,076
A capital asset has not been recorded for these properties as there is an impairment in their value, which has been documented in the various studies carried out to date.
As at October 31, 2009, the Commission had received $ 1,550,000 in funding from the Ministry of Tourism, Culture and Sport to assist in the “stabilizing and mothball” process. Approximately $ 7,800 of this funding remains for use in 2018 and beyond. The actual work performed in 2017 was funded from other grants received from the Province.
Actual work performed in 2017 of $ 371,254 was completed of which $ 317,714 was funded from grants received from the Province.
The Commission has incurred annual costs related to maintenance and security for all sites and has recorded them in the Statement of Operations and are included in the maintenance expense.
The Commission has engaged the services of The Ventin Group Inc. to review existing studies in order to update the requirements necessary to bring the power plants to a development ready state. This process is expected to continue in 2018. Reductions to the Power Plant Stabilization Obligation will occur as actual work is completed.
1-18 PUBLIC ACCOUNTS, 2016-2017

The Niagara Parks Commission Notes to the Financial Statements For the year ended March 31, 2017
9. Liabilities for contaminated sites
The Commission reports environmental liabilities related to the management and remediationof any contaminated sites where the Commission is obligated or likely obligated to incur such costs. Currently no such contaminated sites have been identified and therefore no liability has been recorded.
The Commission’s ongoing efforts to assess contaminated sites may result in future environmental remediation liabilities related to newly identified sites, or changes in the assessments or intended use of existing sites. Any changes to the Commission’s liabilities for contaminated sites will be accrued in the year in which they are assessed as likely and reasonably estimable.
10. Tangible capital assets 2017 2016(in thousands of dollars)
Accumulated Net Net Cost Depreciation Book Value Book Value
Land $ 14,359 $ - $ 14,359 $ 14,359 Land improvements 17,135 - 17,135 17,135 Buildings, roadways and structures 241,819 121,934 119,885 118,341
Equipment and furnishings 44,148 39,406 4,742 4,297 Vehicles 4,887 3,160 1,727 975
322,348 164,500 157,848 155,107 Capital works in progress 765 - 765 225
$ 323,113 $ 164,500 $ 158,613 $ 155,332
Equipment under capital lease included above $ 69 $ 63 $ 6 $ 13
Amortization of tangible capital assets Budget Actual Actual
2017 2017 2016(in thousands of dollars)
Amortization of income producing assets $ 4,443 $ 4,230 $ 4,428 Amortization of non-income producing assets 4,590 4,524 3,931
$ 9,033 $ 8,754 $ 8,359
PUBLIC ACCOUNTS, 2016-2017 1-19

The Niagara Parks Commission Notes to the Financial Statements For the year ended March 31, 2017
11. Accumulated surplus 2017 2016 (in thousands of dollars)
Operating surplus (deficit) $ 2,633 $ (6,789)
Investment in tangible capital assets 130,079 128,942
Unfunded Long term debt (26,592) (28,371) Post-employment benefits (3,121) (3,558)Power plant stabilization obligation (29,414) (29,076)
(59,127) (61,005)
Accumulated surplus $ 73,585 $ 61,148
Surplus funds
Pursuant to Section 16(2) of the Niagara Parks Act, any surplus moneys shall, on the order of the Lieutenant Governor in Council, be paid to the Minister of Finance and shall form part of the consolidated revenue fund. As of March 31, 2017 no surplus moneys have been recorded as a liability to the Minister of Finance.
12. Commitments
The Commission has committed to approximately $ 13,288,000 in capital works projects in the next year.
The Commission has two agreements with a franchisor requiring the payment of service fees of 4.5% of gross sales and advertising and marketing fees of 2.5% of gross sales. The terms of the agreements are ten years, expiring in April, 2017 and October, 2022.
The Commission leases vehicles, equipment and premises under operating leases expiring in 2018. The total obligation under operating leases amounts to approximately $ 8,603 in 2018.
13. Contingencies
The Commission is in litigation pertaining to certain claims for which the likelihood of loss is not determinable and the amount not reasonably estimable. Accordingly, no provision for these claims is reflected in the financial statements.
1-20 PUBLIC ACCOUNTS, 2016-2017
The Niagara Parks Commission Notes to the Financial Statements For the year ended March 31, 2017
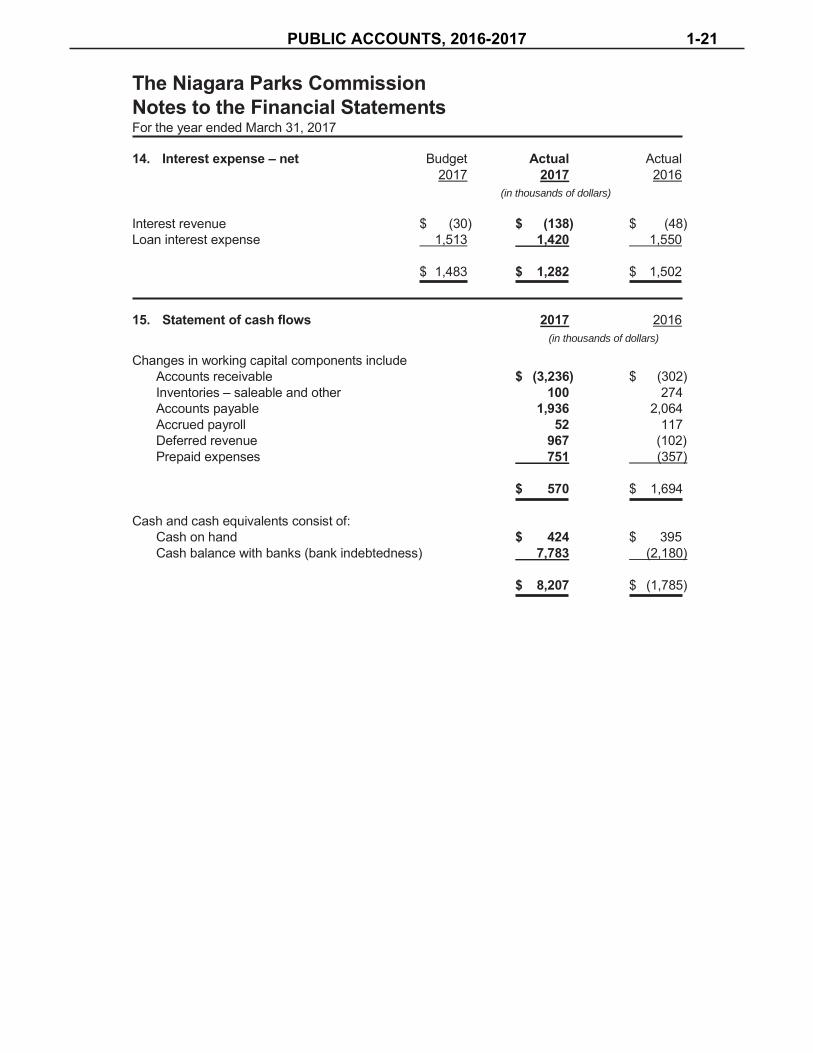
14. Interest expense – net Budget Actual Actual2017 2017 2016
(in thousands of dollars)
Interest revenue $ (30) $ (138) $ (48) Loan interest expense 1,513 1,420 1,550
$ 1,483 $ 1,282 $ 1,502
15. Statement of cash flows 2017 2016 (in thousands of dollars)
Changes in working capital components include Accounts receivable $ (3,236) $ (302) Inventories – saleable and other 100 274 Accounts payable 1,936 2,064 Accrued payroll 52 117 Deferred revenue 967 (102) Prepaid expenses 751 (357)
$ 570 $ 1,694
Cash and cash equivalents consist of: Cash on hand $ 424 $ 395Cash balance with banks (bank indebtedness) 7,783 (2,180)
$ 8,207 $ (1,785)
PUBLIC ACCOUNTS, 2016-2017 1-21

The
Niag
ara
Park
s Co
mm
issi
on
Sche
dule
of T
angi
ble
Capi
tal A
sset
s Fo
r the
yea
r end
ed M
arch
31,
201
7
Build
ings
, Eq
uipm
ent
Cap
ital
Land
R
oadw
ays
and
and
Wor
ks in
La
nd
Impr
ovem
ents
St
ruct
ures
Fu
rnis
hing
s Ve
hicl
es
Prog
ress
20
1720
16
(in th
ousa
nds
of d
olla
rs)
Cost
Be
ginn
ing
of y
ear
$ 14
,359
$
17,1
35
$ 23
3,11
7 $
42,4
96
$ 4,
086
$ 22
5$
311,
418
$ 30
4,58
2
Add
addi
tions
-
- 8,
477
1,90
993
776
512
,088
7,01
6Le
ss d
ispo
sals
- -
- (2
57)
(136
)-
(393
)(1
80)
Tran
sfer
s of
cap
ital w
orks
in
pro
gres
s -
- 22
5-
- (2
25)
--
End
of y
ear
14,3
59
17,1
35
241,
819
44,1
48
4,88
7 76
532
3,11
3 31
1,41
8
Accu
mul
ated
am
ortiz
atio
n Be
ginn
ing
of y
ear
- -
114,
776
38,1
99
3,11
1-
156,
086
147,
907
Add
amor
tizat
ion
- -
7,15
8 1,
415
181
-8,
754
8,35
9 Le
ss d
ispo
sals
- -
- (2
08)
(132
)-
(340
)(1
80)
End
of y
ear
- -
121,
934
39,4
06
3,16
0-
164,
500
156,
086
Net b
ook
valu
e$
14,3
59
$ 17
,135
$
119,
885
$ 4,
742
$ 1,
727
$ 76
5$
158,
613
$ 15
5,33
2
1-22 PUBLIC ACCOUNTS, 2016-2017

The Niagara Parks Commission Schedule of Expenses by Object For the year ended March 31, 2017
Budget Actual Actual 2017 2017 2016
(in thousands of dollars)
Cost of goods sold $ 12,008 $ 14,871 $ 13,265 Salaries, wages and benefits 47,159 48,399 46,343 Sales and other 3,448 3,950 3,466 Equipment repairs and maintenance 4,405 4,652 4,451 Materials and supplies 2,651 2,700 2,568 Advertising and promotion 2,793 3,050 2,684 Facilities 7,025 6,772 6,793 Administrative 2,980 3,067 3,274 Special projects - 520 -
$ 82,469 $ 87,981 $ 82,844
PUBLIC ACCOUNTS, 2016-2017 1-23

Suite 200, Roberta Bondar Place, 70 Foster Drive, Sault Ste. Marie, Ontario P6A 6V8Tel: (705) 945-6700 or 1-800-461-8329, Fax: (705) 945-6701 www.nohfc.com
Place Roberta Bondar, 70, promenade Foster, bureau 200, Sault Ste. Marie (Ontario) P6A 6V8 Tél. 705 945-6700 ou 1 800 461-8329, Téléc. 705 945-6701 www.nohfc.com
Northern Ontario Heritage Fund Corporation Year ended March 31, 2017
Responsibility for Financial Reporting
The accompanying financial statements of the Northern Ontario Heritage Fund Corporation (NOHFC) have been prepared in accordance with Canadian public sector accounting standards, and are the responsibility of management. The preparation of financial statements necessarily involves the use of estimates based on management’s judgment, particularly when transactions affecting the current accounting period cannot be finalized with certainty until future periods. The financial statements have been properly prepared within reasonable limits of materiality and in light of information available up to June 8, 2017.
Management is responsible for the integrity of the financial statements and maintains a system of internal controls designed to provide reasonable assurance that the assets are safeguarded and that reliable financial information is available on a timely basis. The system includes formal policies andprocedures and an organizational structure that provides for appropriate delegation of authority and segregation of responsibilities.
The Board, through the Audit Committee, is responsible for ensuring that management fulfills its responsibilities for financial reporting and internal controls. The Audit Committee, comprised of members who are not employees/officers of NOHFC generally meets periodically with management and the Office of the Auditor General to satisfy itself that each group has properly discharged its respective responsibility.
The financial statements have been audited by the Office of the Auditor General of Ontario. The Auditor’s responsibility is to express an opinion on whether the financial statements are fairly presented in accordance with Canadian public sector accounting standards. The Auditor’s Report outlines the scope of the Auditor’s examination and opinion.
_______________ ___________________ D. Bruce Strapp Melanie MuncasterExecutive Director Assistant Director NOHFC NOHFC
PUBLIC ACCOUNTS, 2016-2017 1-25

__________________ __________________ Susan Richichi, CPA, CA Jocelyn Ouellet, CPA, CMA Manager Financial Services Senior Corporate ControllerNOHFC NOHFC
__________________ Glen Vine Manager Program ServicesNOHFC
1-26 PUBLIC ACCOUNTS, 2016-2017
PUBLIC ACCOUNTS, 2016-2017 1-27

NORTHERN ONTARIO HERITAGE FUND CORPORATIONStatement of Financial Position
March 31, 2017, with comparative information for 2016
($000s) 2017 2016
Financial Assets Current assets:
Cash and cash equivalents (note 3) $ 301,466 $ 283,223 Accrued interest 488 448Loans receivable (note 4) 41,591 43,278
343,545 326,949
Financial Liabilities
Accounts payable and accrued liabilities (note 5) 10,462 13,559
Net financial assets 333,083 313,390
Non-Financial Assets
Tangible capital assets (note 6) 5 9
Commitments (note 9)
Net investment by the Province of Ontario $ 333,088 $ 313,399
See accompanying notes to financial statements.
On behalf of the Board:
______________________ Co-Chair
______________________ Co-Chair
______________________ Executive Director
1-28 PUBLIC ACCOUNTS, 2016-2017

NORTHERN ONTARIO HERITAGE FUND CORPORATION Statement of Operations
Year ended March 31, 2017, with comparative information for 2016
Budget ($000s) 2017 2017 2016
Revenue: Province of Ontario grant $ 100,000 $ 100,000 $ 100,000 Interest on cash and cash equivalents 2,355 1,933 2,163 Interest on loans receivable 2,068 2,158 2,233 Recoveries – 1,167 1,152
104,423 105,258 105,548
Expenses: Conditional contributions 81,081 74,834 74,705 Credit losses (note 7) 8,823 2,981 5,976 Administration (note 8) 9,699 7,754 7,051
99,603 85,569 87,732
Excess of revenue over expenses $ 4,820 19,689 17,816
Net investment by the Province of Ontario, beginning of year 313,399 295,583
Net investment by the Province of Ontario, end of year $ 333,088 $ 313,399
See accompanying notes to financial statements.
PUBLIC ACCOUNTS, 2016-2017 1-29

NORTHERN ONTARIO HERITAGE FUND CORPORATIONStatement of Changes in Net Financial Assets
Year ended March 31, 2017, with comparative information for 2016
($000s) 2017 2016
Excess of revenue over expenses $ 19,689 $ 17,816
Amortization of capital assets 4 3
Increase in net financial assets 19,693 17,819
Net financial assets beginning of year 313,390 295,571
Net financial assets, end of year $ 333,083 $ 313,390
See accompanying notes to financial statements.
1-30 PUBLIC ACCOUNTS, 2016-2017

NORTHERN ONTARIO HERITAGE FUND CORPORATIONStatement of Cash Flows
Year ended March 31, 2017 with comparative information for 2016
($000s) 2017 2016
Lending, investing and financial assistance activities: Loan disbursements $ (14,925) $ (15,923) Loan repayments and recoveries 14,802 13,028 Conditional contributions (77,197) (76,612) Interest received on loans receivable 2,175 2,285Other revenue 7 393
(75,138) (76,829)
Financing activities: Cash contributions from the Province for
lending and financial assistance activities 100,000 100,000
Operating activities: Amortization (4) (3) Interest received on cash and cash equivalents 1,867 2,882 Administration costs (8,482) (6,759)
(6,619) (3,880)
Net increase in cash and cash equivalents 18,243 19,291
Cash and cash equivalents, beginning of year 283,223 263,932
Cash and cash equivalents, end of year $ 301,466 $ 283,223
See accompanying notes to financial statements.
PUBLIC ACCOUNTS, 2016-2017 1-31
NORTHERN ONTARIO HERITAGE FUND CORPORATIONNotes to Financial Statements
Year ended March 31, 2017
1. Nature of the business:The Northern Ontario Heritage Fund Corporation (the “Corporation”) wasestablished, without share capital, on June 1, 1988 under the Northern OntarioHeritage Fund Act. The purpose of the Corporation is to fund infrastructureimprovements and economic development opportunities in Northern Ontario byproviding financial assistance by way of conditional contributions, forgivableperformance loans, and term loans. As an Ontario Crown agency, theCorporation is exempt from federal and provincial income taxes under theIncome Tax Act (Canada).The Corporation partners with communities, businesses and entrepreneursacross Northern Ontario to create jobs and strengthen the Northern economy.The Corporation delivers five targeted programs as follows: Strategic EconomicInfrastructure Program, Northern Community Capacity Building Program,Northern Innovation Program, Northern Business Opportunity Program, andNorthern Ontario Internship Program.
2. Significant accounting policies:
The significant accounting policies used to prepare these financial statementsare summarized below.(a) Basis of accounting:
The financial statements have been prepared by management in accordancewith Canadian public sector accounting standards for provincial reportingentities established by the Canadian Public Sector Accounting Board (PSAB)of the Chartered Professional Accountants of Canada.
(b) Transactions with the Province of Ontario:The Province of Ontario contributes funds to finance the lending and financialassistance activities. The net investment by the Province of Ontario isincreased (reduced) by the excess (deficiency) of revenue over expenses.
(c) Cash and cash equivalents:Cash and cash equivalents consist primarily of funds on deposit in charteredbanks and short-term investments on deposit with the Ontario FinancingAuthority, a related party.
1-32 PUBLIC ACCOUNTS, 2016-2017

NORTHERN ONTARIO HERITAGE FUND CORPORATIONNotes to Financial Statements
Year ended March 31, 2017
2. Significant accounting policies (continued):(d) Financial instruments:
Financial instruments obtained in arm’s-length transactions are initiallymeasured at their fair value. Interest free loans are discounted to fair valuewhen initially recorded. Financial instruments are subsequently measured inone of the following categories (i) fair value or (ii) cost or amortized cost. TheCorporation uses fair value for the subsequent measurement of cash andcash equivalents. The Corporation uses amortized cost for the subsequentmeasurement of loans receivable and accounts payable and accruedliabilities.
(e) Tangible capital assets:Tangible capital assets are recorded at cost, which includes all amounts thatare directly attributable to the acquisition or betterment of the asset.The cost, less residual value of the tangible capital asset, is amortized on astraight line basis over its estimated useful life as follows:
Years
Automotive 7
(f) Provision for credit losses:
Credit losses arise on loans receivable issued by the Corporation. In additionto specific write-offs and write-downs, a provision for credit losses ismaintained in an amount considered adequate to absorb anticipated credit-related losses. The provision for losses on loans consists of provisions onspecific loans and a general provision on the remaining loans and is deductedfrom loans receivable.
The amounts written off and written down in the year and changes inprovisions, are charged to credit losses in the Statement of Operations.Recoveries reflect Funds received during the year from loans provided for in aprior year and are recorded as recoveries on the Statement of Operations.
(g) Revenue recognition:Government grants are recognized when receivable, amounts aredeterminable and collectability is assured. Interest income is recognized onthe accrual basis. Interest revenue on loans receivable is recognized in thefinancial statements in an amount estimated to be recoverable. Interestrevenue ceases to be recognized on fully impaired loans.
PUBLIC ACCOUNTS, 2016-2017 1-33

NORTHERN ONTARIO HERITAGE FUND CORPORATIONNotes to Financial Statements
Year ended March 31, 2017
2. Significant accounting policies (continued):(h) Conditional contributions and forgivable loans:
The Corporation expenses conditional contributions and forgivableperformance loans when disbursed. Approved commitments are notrecognized in the financial statements until the conditions of the funding havebeen met by the recipients.
(i) Use of estimates:Preparation of the financial statements in conformity with Canadian publicsector accounting standards requires management to make estimates andassumptions that affect the reported amounts of assets and liabilities and thereported amounts of revenue and expenses during the reporting period.Actual results could differ from those estimated. Significant estimates includethe provision for credit losses and the loan discount.
3. Cash and cash equivalents:
The Northern Ontario Heritage Fund Act restricts investments to securities issuedor guaranteed by the provinces, Canada, United States, United Kingdom, theInternational Bank for Reconstruction and Development and any CanadianSchedule I or II bank, and other investments as authorized by the LieutenantGovernor in Council. The Corporation, through an Investment ManagementAgreement with the Ontario Financing Authority, invests excess funds insecurities as allowed by the Act.
Cash and cash equivalents consist of:
($000s) 2017 2016
Cash $ 100,243 $ 83,255 Short-term investments 201,223 199,969
$ 301,466 $ 283,224
Short-term investments consist of Treasury Bills (maturing within 365 days) which yielded 0.67% on average (2016 – 0.63%). All Treasury Bills are redeemable on demand.
1-34 PUBLIC ACCOUNTS, 2016-2017

NORTHERN ONTARIO HERITAGE FUND CORPORATIONNotes to Financial Statements
Year ended March 31, 2017
4. Loans receivable:
($000s) 2017 2016
Current $ 7,118 $ 7,185 Long-term 58,896 63,405 Loans in arrears and default 10,080 7,829 Provision for credit losses (34,217) (34,846) Loan discount (286) (295)
$ 41,591 $ 43,278
Generally, loans bear fixed interest rates ranging from 0% to 8.25% and are fully repayable within 20 years from the date disbursed.
The changes in the provision for credit losses are as follows:
($000s) 2017 2016
Balance, beginning of year $ 34,846 $ 56,650 Loans written off in the year (2,478) (27,099) Change in loan provision 1,849 5,295
Balance, end of year $ 34,217 $ 34,846
The change in the loan discount balances are as follows:
($000s) 2017 2016
Balance, beginning of year $ 295 $ 346Amount of loan discount written down – (2) Amount amortized to interest on loans receivable (9) (49)
Balance, end of year $ 286 $ 295
PUBLIC ACCOUNTS, 2016-2017 1-35
NORTHERN ONTARIO HERITAGE FUND CORPORATIONNotes to Financial Statements
Year ended March 31, 2017
5. Accounts payable and accrued liabilities:Accounts payable and accrued liabilities relate largely to normal businesstransactions with recipients, in accordance with conditional grant agreements andintercompany balance between the Ministry and the Corporation.
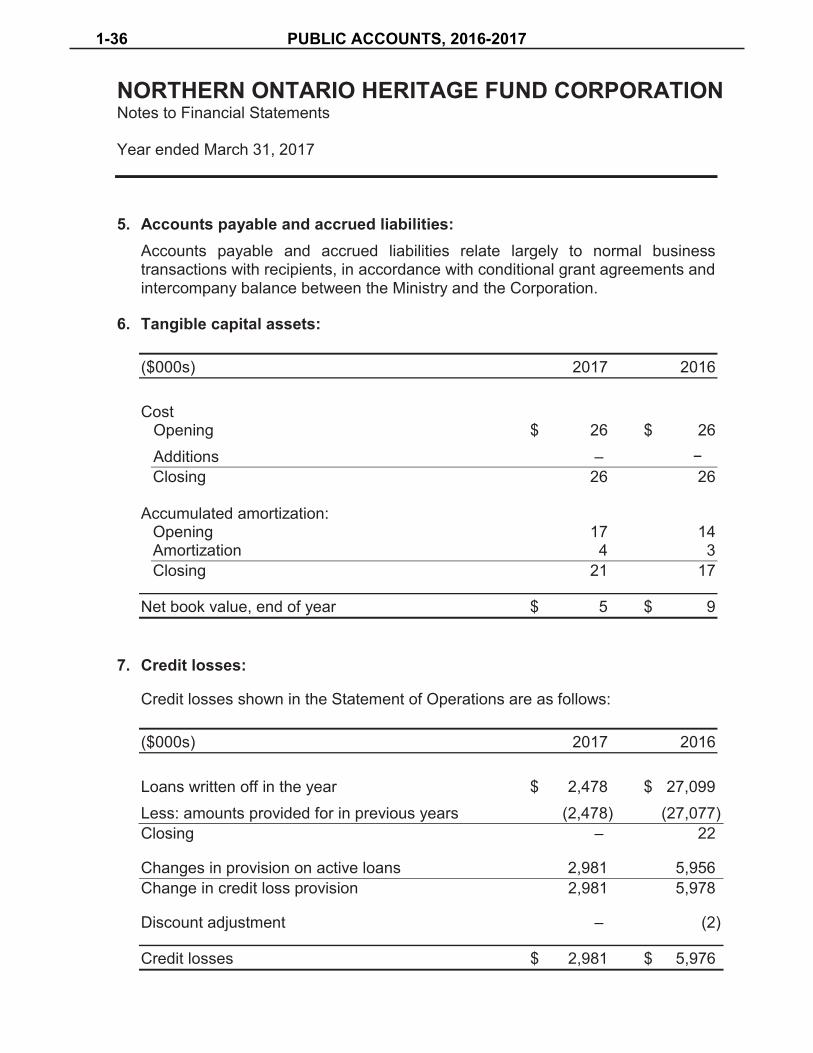
6. Tangible capital assets:
($000s) 2017 2016
Cost Opening $ 26 $ 26 Additions – −Closing 26 26
Accumulated amortization: Opening 17 14Amortization 4 3 Closing 21 17
Net book value, end of year $ 5 $ 9
7. Credit losses:
Credit losses shown in the Statement of Operations are as follows:
($000s) 2017 2016
Loans written off in the year $ 2,478 $ 27,099 Less: amounts provided for in previous years (2,478) (27,077) Closing – 22
Changes in provision on active loans 2,981 5,956 Change in credit loss provision 2,981 5,978
Discount adjustment – (2)
Credit losses $ 2,981 $ 5,976
1-36 PUBLIC ACCOUNTS, 2016-2017

NORTHERN ONTARIO HERITAGE FUND CORPORATIONNotes to Financial Statements
Year ended March 31, 2017
8. Administration expenses:
Details of administration expenses in the year are as follows:
Budget ($000s) 2017 2017 2016
Salaries, wages and benefits $ 2,096 $ 1,952 $ 1,674Transportation and communications 339 386 254Services 3,153 2,214 1,688 Management fees 4,040 3,047 3,019 Marketing – 122 6 Supplies and equipment 67 29 42Financial information system – – 365Amortization on tangible capital assets 4 4 3
$ 9,699 $ 7,754 $ 7,051
The Province provides pension benefits for all of the Corporation’s permanent staff through participation in the Public Service Pension Fund and the Ontario Public Service Employees’ Union Pension Fund which are both multi-employer defined benefit pension plans established by the Province of Ontario. The costs of the pension plans, and other post-retirement non-pension benefits provided to eligible staff are paid by the Province and are not included in these financial statements.
9. Commitments:Funds committed but not disbursed as at March 31, 2017 are $252,664,593(2016 – $217,197,435).
10. Financial instruments:The main risks that the Corporation’s financial instruments are exposed to arecredit risk, liquidity risk, and market risk.
(a) Credit risk:Credit risk is the risk that the counterparty to a financial instrument may fail todischarge an obligation or commitment that it has entered into. TheCorporation provides credit to its loan portfolio clients in the normal course ofoperations. To mitigate the risk, the Corporation screens loan applicants,
PUBLIC ACCOUNTS, 2016-2017 1-37
NORTHERN ONTARIO HERITAGE FUND CORPORATIONNotes to Financial Statements
Year ended March 31, 2017
registers security on the loans and maintains provisions for contingent credit losses.
(b) Liquidity risk:
The Corporation’s exposure to liquidity risk is low as cash and cashequivalents exceed the current commitments. The Corporation mitigates thisrisk by monitoring cash activities and expected outflows.
(c) Market risk:
Market risk is comprised of currency risk, interest rate risk and other pricerisk. The Corporation does not conduct any transactions that aredenominated in foreign currency. The Corporation’s loans receivable bearfixed interest rates. The Corporation’s cash and cash equivalents balanceincludes Treasury Bills where market value is close to cost, so market risk islow.
1-38 PUBLIC ACCOUNTS, 2016-2017

PUBLIC ACCOUNTS, 2016-2017 1-39
Independent auditors’ report
To the Members of Ontario Agency for Health Protection and Promotion
We have audited the accompanying financial statements of Ontario Agency for Health Protection and Promotion [operating as Public Health Ontario], which comprise the statement of financial position as at March 31, 2017, and the statements of operations and changes in net assets and cash flows for the year thenended, and a summary of significant accounting policies and other explanatory information.
Management’s responsibility for the financial statementsManagement is responsible for the preparation and fair presentation of these financial statements in accordance with Canadian public sector accounting standards, and for such internal control as management determines is necessary to enable the preparation of financial statements that are free from material misstatement, whether due to fraud or error.
Auditors’ responsibilityOur responsibility is to express an opinion on these financial statements based on our audit. We conducted our audit in accordance with Canadian generally accepted auditing standards. Those standards require that we comply with ethical requirements and plan and perform the audit to obtain reasonable assurance about whether the financial statements are free from material misstatement.
An audit involves performing procedures to obtain audit evidence about the amounts and disclosures in the financial statements. The procedures selected depend on the auditors’ judgment, including the assessment of the risks of material misstatement of the financial statements, whether due to fraud or error. In making those risk assessments, the auditors consider internal control relevant to the entity’s preparation and fair presentation of the financial statements in order to design audit procedures that are appropriate in the circumstances, but not for the purpose of expressing an opinion on the effectiveness of the entity’s internal control. An audit also includes evaluating the appropriateness of accounting policies used and the reasonableness of accounting estimates made by management, as well as evaluating the overall presentation of the financial statements.
We believe that the audit evidence we have obtained is sufficient and appropriate to provide a basis for our audit opinion.
OpinionIn our opinion, the financial statements present fairly, in all material respects, the financial position of Ontario Agency for Health Protection and Promotion [operating as Public Health Ontario] as at March 31, 2017, andthe results of its operations and its cash flows for the year then ended in accordance with Canadian public sectoraccounting standards.
Toronto, CanadaJune 20, 2017
1-40 PUBLIC ACCOUNTS, 2016-2017
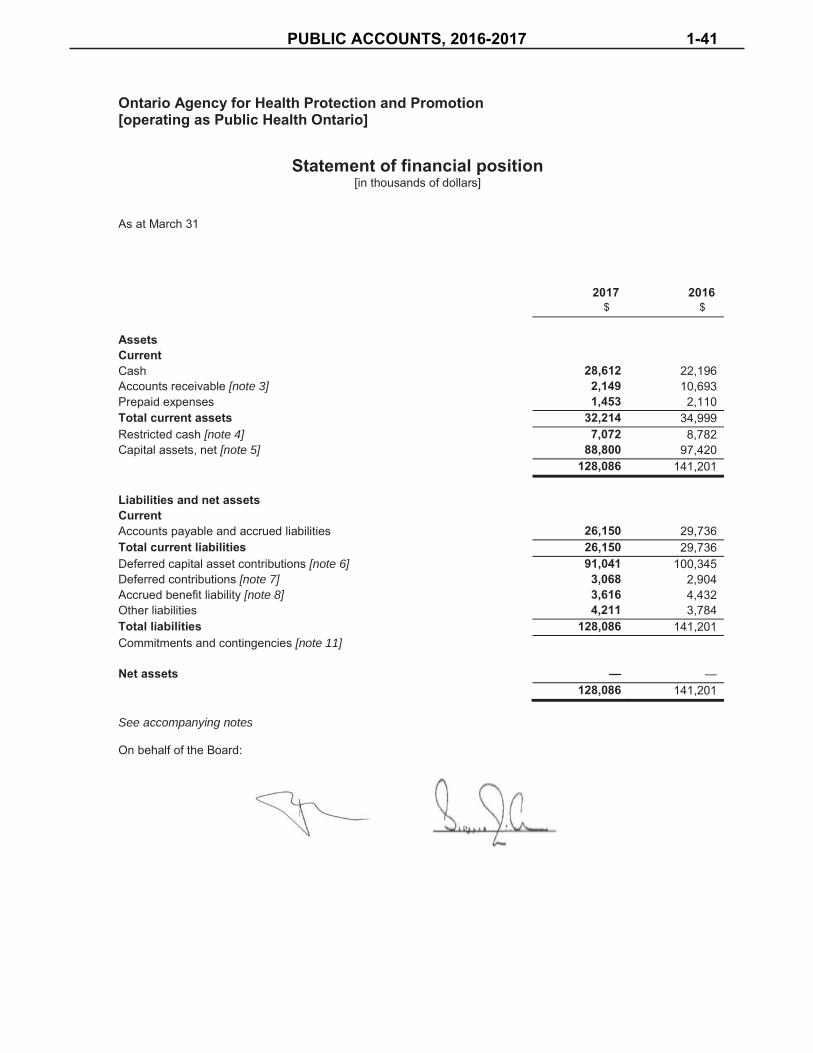
Ontario Agency for Health Protection and Promotion[operating as Public Health Ontario]
Statement of financial position [in thousands of dollars]
As at March 31
2017 2016$ $
AssetsCurrentCash 28,612 22,196Accounts receivable [note 3] 2,149 10,693Prepaid expenses 1,453 2,110Total current assets 32,214 34,999Restricted cash [note 4] 7,072 8,782Capital assets, net [note 5] 88,800 97,420
128,086 141,201
Liabilities and net assetsCurrentAccounts payable and accrued liabilities 26,150 29,736Total current liabilities 26,150 29,736Deferred capital asset contributions [note 6] 91,041 100,345Deferred contributions [note 7] 3,068 2,904Accrued benefit liability [note 8] 3,616 4,432Other liabilities 4,211 3,784Total liabilities 128,086 141,201Commitments and contingencies [note 11]
Net assets — —128,086 141,201
See accompanying notes
On behalf of the Board:
PUBLIC ACCOUNTS, 2016-2017 1-41

Ontario Agency for Health Protection and Promotion[operating as Public Health Ontario]
Statement of operations and changes in net assets
[in thousands of dollars]
Year ended March 31
2017 2016$ $
RevenueMinistry of Health and Long-Term Care
Base operations 152,960 151,437Health Promotion Resource Centre 3,573 3,573
Amortization of deferred capital asset contributions [note 6] 6,932 7,873Other grants 1,746 1,705Miscellaneous recoveries 1,787 876
166,998 165,464
Expenses [note 8]Public health laboratory program 102,690 100,514Science and public health programs 43,361 42,578General and administration [note 9] 14,015 14,499Amortization of capital assets 6,932 7,873
166,998 165,464Excess of revenue over expenses for the year — —
Net assets, beginning of year — —Net assets, end of year — —
See accompanying notes
1-42 PUBLIC ACCOUNTS, 2016-2017
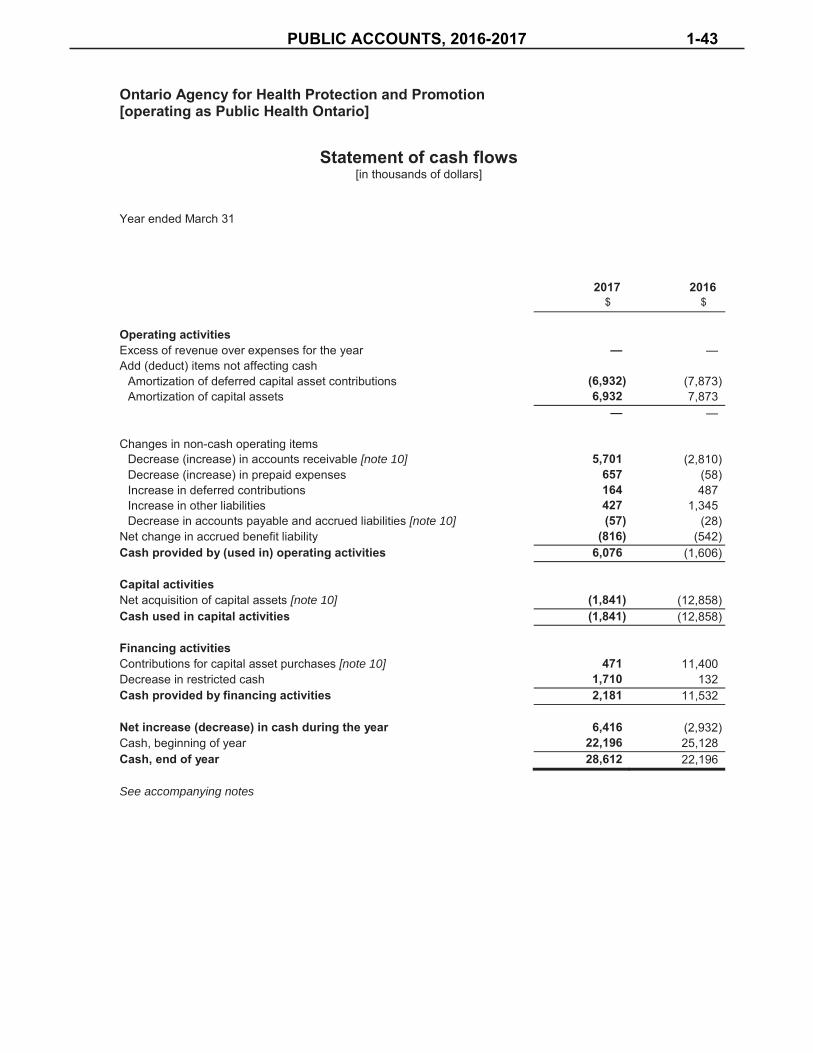
Ontario Agency for Health Protection and Promotion[operating as Public Health Ontario]
Statement of cash flows [in thousands of dollars]
Year ended March 31
2017 2016$ $
Operating activitiesExcess of revenue over expenses for the year — —Add (deduct) items not affecting cash
Amortization of deferred capital asset contributions (6,932) (7,873)Amortization of capital assets 6,932 7,873
— —
Changes in non-cash operating itemsDecrease (increase) in accounts receivable [note 10] 5,701 (2,810)Decrease (increase) in prepaid expenses 657 (58)Increase in deferred contributions 164 487Increase in other liabilities 427 1,345Decrease in accounts payable and accrued liabilities [note 10] (57) (28)
Net change in accrued benefit liability (816) (542)Cash provided by (used in) operating activities 6,076 (1,606)
Capital activitiesNet acquisition of capital assets [note 10] (1,841) (12,858)Cash used in capital activities (1,841) (12,858)
Financing activitiesContributions for capital asset purchases [note 10] 471 11,400Decrease in restricted cash 1,710 132Cash provided by financing activities 2,181 11,532
Net increase (decrease) in cash during the year 6,416 (2,932)Cash, beginning of year 22,196 25,128Cash, end of year 28,612 22,196
See accompanying notes
PUBLIC ACCOUNTS, 2016-2017 1-43

Ontario Agency for Health Protection and Promotion[operating as Public Health Ontario]
Notes to financial statements[in thousands of dollars]
March 31, 2017
1. Description of the organization
Ontario Agency for Health Protection and Promotion [“OAHPP”] [operating as Public Health Ontario] was established under the Ontario Agency for Health Protection and Promotion Act, 2007 as a corporation without share capital. OAHPP’s mandate is to enhance the protection and promotion of the health of Ontarians, contribute to efforts to reduce health inequities, provide scientific and technical advice and support to those working across sectors to protect and improve the health of Ontarians and to carry out and support activities such as population health assessment, public health research, surveillance, epidemiology, planning and evaluation.
Under the Ontario Agency for Health Protection and Promotion Act, 2007, OAHPP is primarily funded by the Province of Ontario.
OAHPP, as an agency of the Crown, is exempt from income taxes.
2. Summary of significant accounting policies
These financial statements have been prepared in accordance with Canadian public sector accounting standards as established by the Public Sector [“PS”] Accounting Board of the Chartered Professional Accountants of Canada. OAHPP has elected to follow PS 4200-4270 in the Public Sector Accounting Handbook.
Revenue recognition
Contributions are recorded in the accounts when received or receivable if the amount to be received can be reasonably estimated and collection is reasonably assured. Unrestricted contributions are recognized as revenue when initially recorded in the accounts. Externally restricted contributions are recorded as deferred contributions or deferred capital contributions when initially recorded in the accounts and recognized as revenue in the period in which the related expenses are incurred.
Capital assets
Capital assets are recorded at acquisition cost. Contributed capital assets are recorded at fair market value at thedate of contribution. Amortization is provided on a straight-line basis based upon the estimated useful service lives of the assets as follows:
Building service equipment 5-30 yearsOther equipment 5-10 yearsFurniture 5-20 yearsLeasehold improvements Over the term of the lease
Inventory and other supplies held for consumption
Inventory and other supplies held for consumption are expensed when acquired.
1-44 PUBLIC ACCOUNTS, 2016-2017
Ontario Agency for Health Protection and Promotion[operating as Public Health Ontario]
Notes to financial statements[in thousands of dollars]
March 31, 2017
Employee future benefits
Contributions to multi-employer, defined benefit pension plans are expensed on an accrual basis.
Other employee future benefits are non-pension benefits that are provided to certain employees and are accrued as the employees render the service necessary to earn these future benefits. The cost of these future benefits is actuarially determined using the projected unit credit method, prorated on service and management’s best estimate of expected salary escalation and retirement ages of employees. Net actuarial gains and losses related to the employee future benefits are amortized over the average remaining service life of 13 years for the related employee group. Employee future benefit liabilities are discounted using the average interest cost for the Province of Ontario’s net new debt obligations with maturities that correspond to the duration of the liability.
Allocation of expenses
The costs of each function include the costs of personnel and other expenses that are directly related to the function. General support and other costs are not allocated.
Contributed materials and services
Contributed materials and services are not recorded in the financial statements.
Financial instruments
Financial instruments, including accounts receivable and accounts payable, are initially recorded at their fair value and are subsequently measured at cost, net of any provisions for impairment.
Use of estimates
The preparation of financial statements in conformity with Canadian public sector accounting standards requires management to make estimates and assumptions that affect the reported amounts of assets and liabilities, the disclosure of contingent assets and liabilities at the date of the financial statements, and the reported amounts of revenue and expenses during the reporting period. Significant estimates and assumptions used in these financial statements require the exercise of judgment and are used for, but not limited to, salary and benefit accruals, employee future benefit plans [severance credits] and the estimated useful lives of capital assets. Actual results could differ from these estimates.
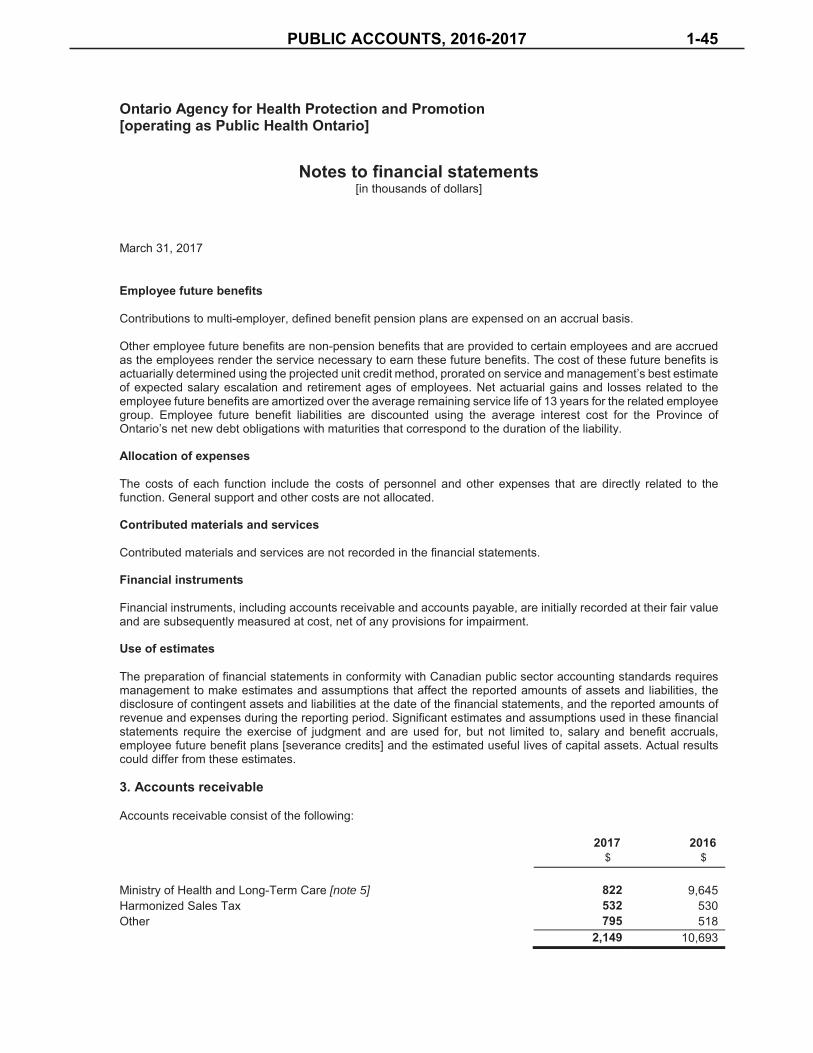
3. Accounts receivable
Accounts receivable consist of the following:
2017 2016$ $
Ministry of Health and Long-Term Care [note 5] 822 9,645Harmonized Sales Tax 532 530Other 795 518
2,149 10,693
PUBLIC ACCOUNTS, 2016-2017 1-45

Ontario Agency for Health Protection and Promotion[operating as Public Health Ontario]
Notes to financial statements[in thousands of dollars]
March 31, 2017
4. Restricted cash
[a] Restricted cash consists of the following:
2017 2016$ $
Ministry of Health and Long-Term Care [note 4[b]] 6,969 8,633Sheela Basrur Centre [note 7[a]] 103 149
7,072 8,782
Restricted cash from the Ministry of Health and Long-Term Care [“MOHLTC”] represents funding received in connection with the liability assumed by OAHPP in connection with severance [note 8[b]], other credits [primarily accrued vacation pay] related to employees who transferred to OAHPP [Ontario public health laboratories in 2008 and Public Health Architecture in 2011] and unspent cash pertaining to capital projects.Funds associated with severance and other credits are drawn down when transferred employees leave employment with OAHPP. Funds associated with capital projects are drawn down when capital assets are purchased.
[b] The continuity of MOHLTC restricted cash is as follows:
2017Severance
creditsOther
creditsCapital projects Total
$ $ $ $
Restricted cash, beginning of year 4,231 1,477 2,925 8,633Interest earned [note 6] 36 13 38 87 Restricted cash drawdown [note 8[b]] (950) (79) (722) (1,751)Restricted cash, end of year 3,317 1,411 2,241 6,969
2016Severance
creditsOther
creditsCapital projects Total
$ $ $ $
Restricted cash, beginning of year 4,873 1,505 2,357 8,735Funding received — — 1,536 1,536Interest earned [note 6] 45 14 59 118Restricted cash drawdown [note 8[b]] (687) (42) (1,027) (1,756)Restricted cash, end of year 4,231 1,477 2,925 8,633
1-46 PUBLIC ACCOUNTS, 2016-2017

Ontario Agency for Health Protection and Promotion[operating as Public Health Ontario]
Notes to financial statements[in thousands of dollars]
March 31, 2017
5. Capital assets
Capital assets consist of the following:
2017
CostAccumulated amortization
Net bookvalue
$ $ $
Building service equipment 369 302 67Other equipment 31,764 27,559 4,205Furniture 3,838 2,925 913Leasehold improvements 96,789 15,537 81,252Construction in progress 2,363 — 2,363
135,123 46,323 88,800
2016
CostAccumulated amortization
Net bookvalue
$ $ $
Building service equipment 369 266 103Other equipment 30,850 25,540 5,310Furniture 3,818 2,566 1,252Leasehold improvements 99,354 11,019 88,335Construction in progress 2,420 — 2,420
136,811 39,391 97,420
In 2015, OAHPP completed leasehold improvements for a new laboratory facility. During 2017, costs of $2,665 were determined to be those of the landlord and not OAHPP. As a result, OAHPP removed leasehold improvements from capital assets with a cost of $2,665 and a corresponding amount from accounts payable and accrued liabilities as these costs were unpaid.
As funding was no longer due from the MOHLTC related to these leasehold improvements, OAHPP reduced accounts receivable from the MOHLTC [note 3] and deferred capital asset contributions [note 6] by $2,665 and further reduced accounts receivable and deferred capital contributions for amounts accrued in excess of costs incurred of $304. The remaining unspent deferred capital contributions of $145 related to these leasehold improvements was removed from deferred capital contributions and recorded as due to the MOHLTC.
PUBLIC ACCOUNTS, 2016-2017 1-47
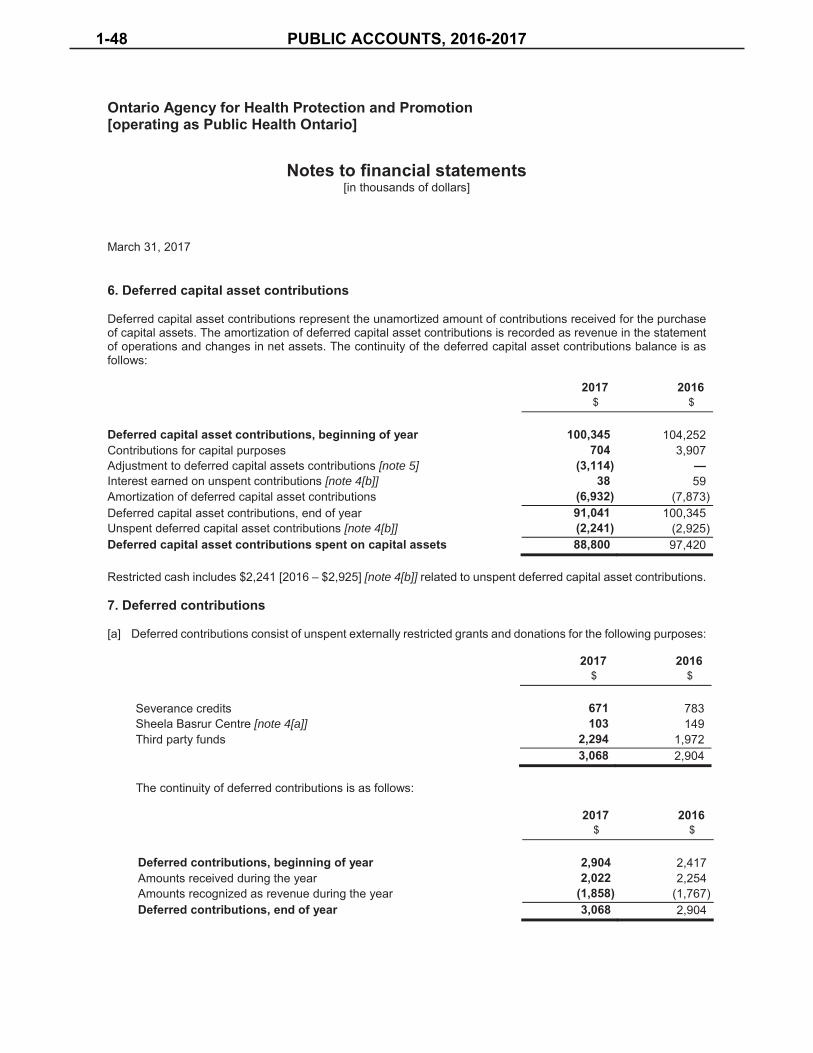
Ontario Agency for Health Protection and Promotion[operating as Public Health Ontario]
Notes to financial statements[in thousands of dollars]
March 31, 2017
6. Deferred capital asset contributions
Deferred capital asset contributions represent the unamortized amount of contributions received for the purchase of capital assets. The amortization of deferred capital asset contributions is recorded as revenue in the statement of operations and changes in net assets. The continuity of the deferred capital asset contributions balance is as follows:
2017 2016$ $
Deferred capital asset contributions, beginning of year 100,345 104,252Contributions for capital purposes 704 3,907Adjustment to deferred capital assets contributions [note 5] (3,114) —Interest earned on unspent contributions [note 4[b]] 38 59Amortization of deferred capital asset contributions (6,932) (7,873)Deferred capital asset contributions, end of year 91,041 100,345Unspent deferred capital asset contributions [note 4[b]] (2,241) (2,925)Deferred capital asset contributions spent on capital assets 88,800 97,420
Restricted cash includes $2,241 [2016 – $2,925] [note 4[b]] related to unspent deferred capital asset contributions.
7. Deferred contributions
[a] Deferred contributions consist of unspent externally restricted grants and donations for the following purposes:
2017 2016$ $
Severance credits 671 783Sheela Basrur Centre [note 4[a]] 103 149Third party funds 2,294 1,972
3,068 2,904
The continuity of deferred contributions is as follows:
2017 2016$ $
Deferred contributions, beginning of year 2,904 2,417Amounts received during the year 2,022 2,254Amounts recognized as revenue during the year (1,858) (1,767) Deferred contributions, end of year 3,068 2,904
1-48 PUBLIC ACCOUNTS, 2016-2017

Ontario Agency for Health Protection and Promotion[operating as Public Health Ontario]
Notes to financial statements[in thousands of dollars]
March 31, 2017
[b] Deferred contributions for severance credits represent the difference between the restricted cash held forseverance credits [note 4[b]] and the portion of the accrued benefit liability associated with service prior to thetransfer of employees of the laboratories to OAHPP [note 8[b]].
[c] Deferred contributions for the Sheela Basrur Centre [the “Centre”] represent unspent funds held by OAHPPrestricted for the Centre’s outreach programs. In addition to these funds, $278 [2016 – $257] is held by theToronto Foundation for the benefit of the Centre and its programs.
Named after the late Dr. Sheela Basrur, a former Chief Medical Officer of Health for the Province of Ontario,the Centre was created to become a prominent provider of public health education and training.
8. Employee future benefit plans
[a] Multi-employer pension plans
Certain employees of OAHPP are members of the Ontario Public Service Employees Union [“OPSEU”]Pension Plan, the Healthcare of Ontario Pension Plan [“HOOPP”] or the Ontario Public Service Pension Plan[“PSPP”], which are multi-employer, defined benefit pension plans. These pension plans are accounted for asdefined contribution plans. OAHPP contributions to the OPSEU Pension Plan, HOOPP and PSPP during theyear amounted to $2,043 [2016 – $2,081], $3,915 [2016 – $3,473] and $511 [2016 – $518], respectively, andare included in expenses in the statement of operations and changes in net assets.
The most recent valuation for financial reporting purposes completed by OPSEU as of December 31, 2016disclosed net assets available for benefits of $19.0 million with pension obligations of $17.3 million, resultingin a surplus of $1.7 million.
The most recent valuation for financial reporting purposes completed by HOOPP as of December 31, 2016disclosed net assets available for benefits of $70.4 million with pension obligations of $54.5 million, resultingin a surplus of $15.9 million.
The most recent valuation for financial reporting purposes completed by PSPP as of December 31, 2015disclosed net assets available for benefits of $10.9 million with pension obligations of $11.1 million, resultingin a deficit of $0.2 million.
[b] Severance credits
OAHPP assumed the unfunded non-pension post-employment defined benefit plans provided to employeesfrom the Government of Ontario as part of the transfer of employees from Ontario public health laboratories[in 2008] and Public Health Architecture [in 2011]. These defined benefit plans provide a lump sum paymentpaid on retirement to certain employees related to years of service. The latest actuarial valuation for the non-pension defined benefit plans was performed as at March 31, 2015. OAHPP measures its accrued benefitobligation for accounting purposes as at March 31 of each year based on an extrapolation from the latestactuarial valuation.
PUBLIC ACCOUNTS, 2016-2017 1-49

Ontario Agency for Health Protection and Promotion[operating as Public Health Ontario]
Notes to financial statements[in thousands of dollars]
March 31, 2017
Additional information on the benefit plans is as follows:
2017 2016$ $
Accrued benefit obligation 4,047 4,905Unamortized actuarial losses (431) (473)Accrued benefit liability, end of year 3,616 4,432
The continuity of the accrued benefit liability as at March 31 is as follows:
2017 2016$ $
Accrued benefit liability, beginning of year 4,432 4,974Expense for the year 134 145Contributions to cover benefits paid [note 4[b]] (950) (687)Accrued benefit liability, end of year 3,616 4,432
The significant actuarial assumptions adopted in measuring OAHPP’s accrued benefit obligation and expenses are as follows:
2017 2016% %
Accrued benefit obligationDiscount rate 2.00 2.00Rate of compensation increase 2.25 2.25Rate of inflation 2.00 2.00
ExpenseDiscount rate 2.00 2.00Rate of compensation increase 2.25 2.25Rate of inflation 2.00 2.00
9. Directors’ remuneration
The Government Appointees Directive requires the disclosure of remuneration paid to directors. During the year ended March 31, 2017, directors were paid $27 [2016 – $17].
10. Supplemental cash flow information
The change in accounts payable and accrued liabilities related to the purchase of capital assets, is adjusted for capital assets received but not paid for of $2,629 [2016 – $6,158] and has been excluded from the statement of cash flows.
1-50 PUBLIC ACCOUNTS, 2016-2017

Ontario Agency for Health Protection and Promotion[operating as Public Health Ontario]
Notes to financial statements[in thousands of dollars]
March 31, 2017
The change in accounts receivable related to contributions for capital asset purchases, is adjusted for contributions receivable but not received as at March 31, 2017 of $822 [2016 – $3,665] and has also been excluded from the statement of cash flows.
11. Commitments and contingencies
[a] Under the Laboratories Transfer Agreement, MOHLTC is responsible for all obligations and liabilities in respect of the public health laboratories that existed as at the transfer date, or that may arise thereafter and have acause of action that existed prior to the transfer date of December 15, 2008.
[b] OAHPP is a member of the Healthcare Insurance Reciprocal of Canada [“HIROC”]. HIROC is a pooling of theliability insurance risks of its members. Members of the pool pay annual deposit premiums that are actuariallydetermined and are expensed in the current year. These premiums are subject to further assessment forexperience gains and losses, by the pool, for prior years in which OAHPP participated. As at March 31, 2017,no assessments have been received.
[c] OAHPP has committed future minimum annual payments to Infrastructure Ontario related to premises asfollows:
$
2018 16,9272019 16,6432020 14,33720212022
11,80211,920
Thereafter 234,348
PUBLIC ACCOUNTS, 2016-2017 1-51


Ontario Capital Growth Corporation
PUBLIC ACCOUNTS, 2016-2017 1-53

1-54 PUBLIC ACCOUNTS, 2016-2017

PUBLIC ACCOUNTS, 2016-2017 1-55

1-56 PUBLIC ACCOUNTS, 2016-2017
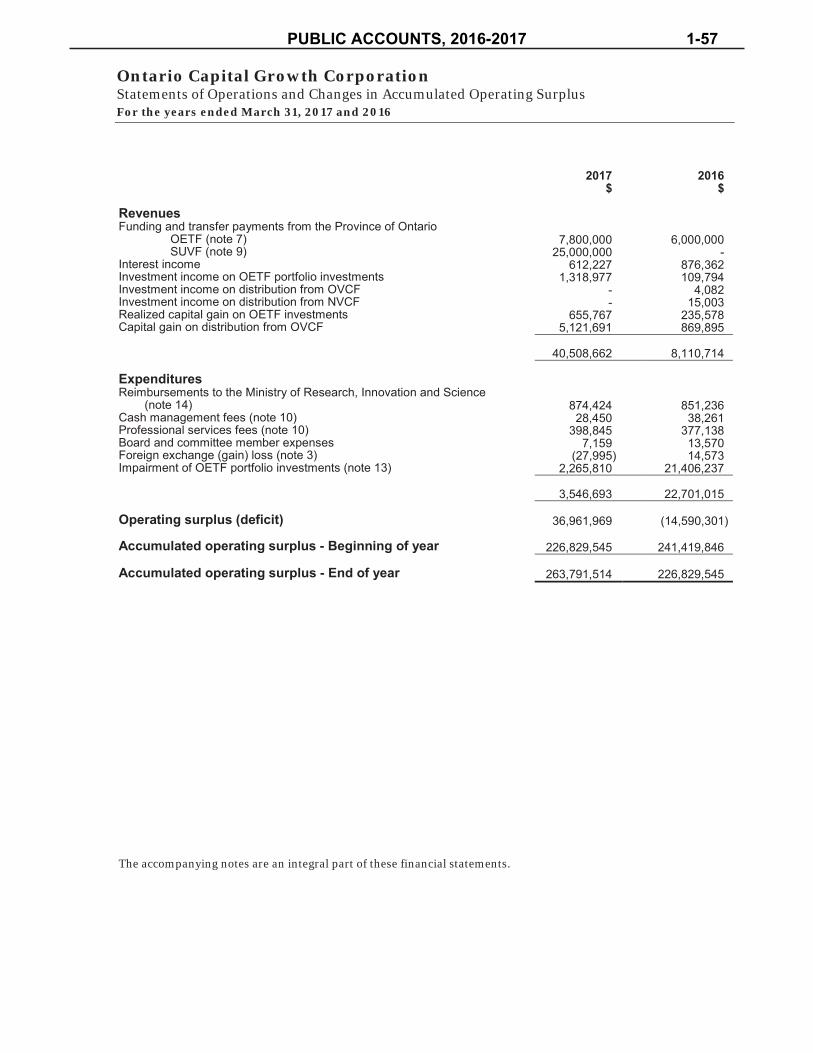
Ontario Capital Growth Corporation Statements of Operations and Changes in Accumulated Operating Surplus For the years ended March 31, 2017 and 2016
The accompanying notes are an integral part of these financial statements.
PUBLIC ACCOUNTS, 2016-2017 1-57
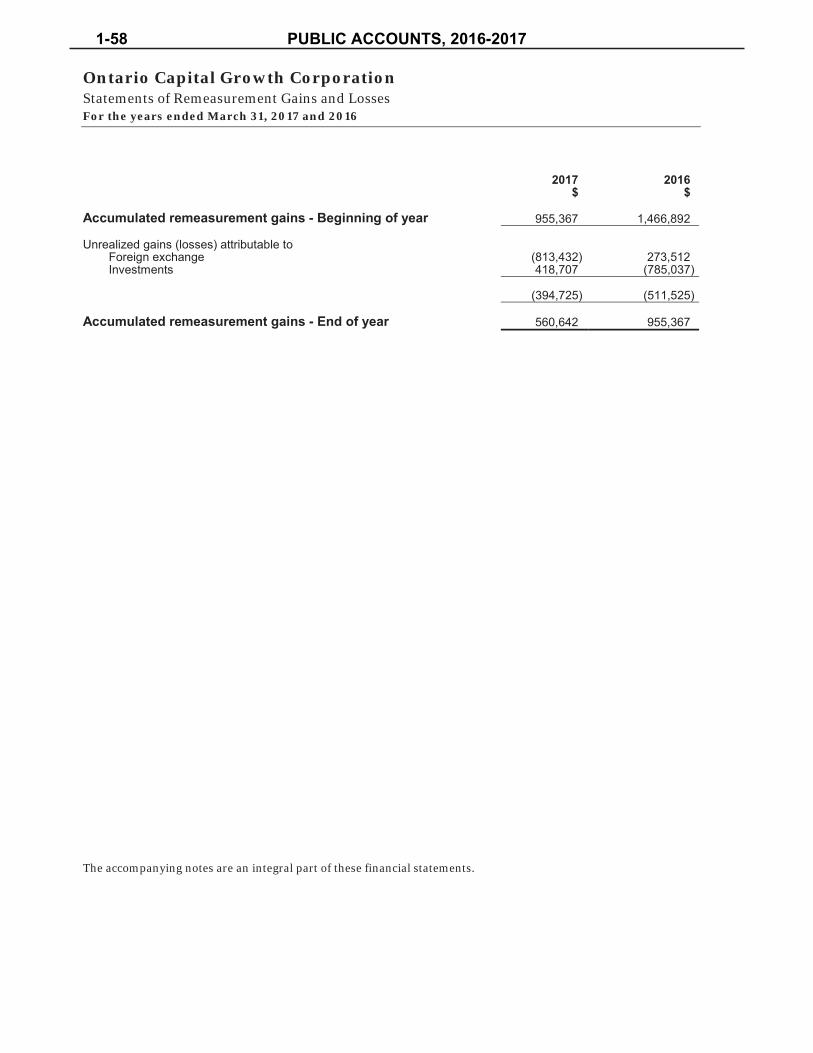
Ontario Capital Growth Corporation Statements of Remeasurement Gains and Losses For the years ended March 31, 2017 and 2016
The accompanying notes are an integral part of these financial statements.
1-58 PUBLIC ACCOUNTS, 2016-2017

Ontario Capital Growth Corporation Statements of Changes in Net Assets For the years ended March 31, 2017 and 2016
The accompanying notes are an integral part of these financial statements.
PUBLIC ACCOUNTS, 2016-2017 1-59

Ontario Capital Growth Corporation Statements of Cash Flows For the years ended March 31, 2017 and 2016
The accompanying notes are an integral part of these financial statements.
1-60 PUBLIC ACCOUNTS, 2016-2017
Ontario Capital Growth Corporation Notes to Financial Statements March 31, 2017 and 2016
1 Description of business
Ontario Capital Growth Corporation (OCGC or the Corporation) is a corporation without share capital, established under the Ontario Capital Growth Corporation Act, 2008 (the Act), which was proclaimed in force as at February 1, 2009 as an agency of the Ministry of Research and Innovation (MRI). In May 2016, MRI was reorganized as the Ministry of Research, Innovation and Science (collectively the Ministry). As at March 31, 2017, OCGC is responsible to the Minister of Research, Innovation and Science (the Minister).
The legislative authority of the Corporation is set out in the Act. Under Section 4 of the Act, the objects of the Corporation are:
to receive, hold, administer and otherwise deal with the interest of the Government of Ontario in thelimited partnership known as the Ontario Venture Capital Fund LP;
to receive, hold and deal with property, whether real or personal, in connection with the objects describedin Section 4(a); and
to carry out the other objects that are prescribed by regulations.
In July 2009, additional objects were prescribed by Ontario Regulation 278/09 made under the Act:
a) to acquire, manage and otherwise deal with a portfolio of investments in businesses that the Corporationconsiders constitute emerging technologies businesses, which portfolio is known in English as the OntarioEmerging Technologies Fund and in French as fonds ontarian de développement des technologiesémergentes; and
b) to receive, hold, invest, sell or otherwise deal with property, whether real or personal, in connection withthe objectives described in clause 1(a).
In May 2013, additional objects were prescribed by Ontario Regulation 149/13 made under the Act to participate in the formation of one or more funds, to acquire interests in the funds, and to hold, administer and otherwise deal with those interests, where each fund meets the following criteria:
a) It receives funding directly or indirectly from, among others, one or more of the following:
the Government of Canada;
the Corporation; and
private sector entities.
b) Its goals include promoting the creation of a globally competitive venture capital industry, increasing thesupply and effective deployment of early-stage investment capital and increasing the supply of topperforming fund managers to manage venture capital investments in Ontario and Canada.
PUBLIC ACCOUNTS, 2016-2017 1-61
Ontario Capital Growth Corporation Notes to Financial Statements March 31, 2017 and 2016
c) It invests in one or both of the following:
other funds that supply venture capital to companies; and
innovative companies that require venture capital.
d) It is managed by a private sector fund manager.
In January 2014, as part of a Government of Ontario $50 million commitment to establish a new Ontario venture capital fund, the Corporation made an initial commitment of $36.25 million to the Northleaf Venture Catalyst Fund LP alongside the federal government and private sector investors. Through a number of subsequent fund closings, as at July 2015, the commitment was increased to a total of $50 million.
In May 2014, the Government of Ontario announced a new Life Sciences Seed Venture Capital Fund (LSSVCF) of up to $30 million. The Corporation will seek to establish the fund in partnership with hospital foundations and the private sector to help finance early-stage Ontario life sciences companies.
In February 2017, as part of a Government of Ontario initiative to establish a new venture capital fund to help Ontario-based companies grow their operations to the point of attracting follow-on financing, the Corporation made an investment commitment of $25 million to the ScaleUP Venture Fund I, LP alongside private sector investors.
As required by the Agencies and Appointments Directive, the Corporation and the Minister have entered into a memorandum of understanding, which outlines the operational, administrative, financial and other relationships that exist between the Minister, the Ministry and the Corporation.
OCGC is classified as an Operational Enterprise Agency. OCGC is responsible for fulfilling the Province of Ontario’s contractual obligations as a limited partner in the Ontario Venture Capital Fund LP (OVCF), the Northleaf Venture Catalyst Fund LP (NVCF) and the ScaleUP Venture Fund I, LP (SUVF). OCGC is also responsible for establishing, holding, managing and administering the Ontario Emerging Technologies Fund (OETF).
OVCF is a joint initiative between the Province of Ontario and leading institutional investors. It is structured as a fund-of-funds that invests primarily in Ontario based and Ontario focused venture capital and growth funds, which, in turn, make investments in innovative, high growth companies. OVCF was established to provide investment funding to venture capital and growth equity managers capable of generating superior returns by investing in enterprises with a view to creating large, globally competitive companies.
OETF is structured as a direct co-investment fund that makes investments in innovative high potential companies alongside other qualified investors with a proven track record of success. OETF is an initiative of the Government of Ontario to invest in innovative high potential companies with an Ontario footprint in three strategic sectors: (i) clean technology; (ii) digital media and information and communications technologies; and (iii) life sciences and advanced health technologies.
1-62 PUBLIC ACCOUNTS, 2016-2017

Ontario Capital Growth Corporation Notes to Financial Statements March 31, 2017 and 2016
NVCF is an initiative between the Government of Ontario, the federal government and private sector investors. It is structured as a fund-of-funds that invests primarily in Canadian venture capital and growth funds, which, in turn, make investments in innovative, high potential companies. NVCF was established to continue the goals and objectives of OVCF; that is, generate risk adjusted returns by investing in enterprises to help create large, globally competitive companies.
SUVF is an initiative between the Government of Ontario and private sector investors. It is structured as a direct investment fund that invests primarily in promising Ontario-based start-ups that have shown initial market success and demonstrate strong growth potential, but require new investment financing and mentorship to expand their operations.
OCGC claims exemption from federal and provincial income taxes under paragraph 149(1)(d) of the Income Tax Act (Canada). As a provincial entity listed in Schedule A of the Canada-Ontario Reciprocal Taxation Agreement, OCGC can claim government rebates of the Harmonized Sales Tax (HST). Under the pay-and-rebate model, OCGC pays the HST on taxable supplies and services, and subsequently applies for a rebate of the HST paid.
OCGC operates in the same fiscal year ending March 31 as the Government of Ontario.
2 Summary of significant accounting policies
The Corporation’s functional and presentation currency is the Canadian dollar. All financial statement disclosures have been prepared in accordance with Canadian public sector accounting standards (PSAS) established by the Canadian Public Sector Accounting Board. The more significant accounting policies of the Corporation are summarized below.
Cash and cash equivalents
Cash and cash equivalents include demand deposits that are readily convertible into known amounts of cash and that are subject to an insignificant risk of change in value. Cash equivalents include investments that are short-term and highly liquid and have maturities of less than three months from the original purchase date.
Investments
Investments in securities that are traded in an active market are measured at fair value as at the dates of the statements of financial position with any unrealized gain or loss recognized on the statements of remeasurement gains and losses. Remeasurement gains and losses related to a particular investment are reclassified to the statements of operations and changes in accumulated operating surplus when that investment is settled. Fair value includes the value of accrued interest, as applicable.
Investments in securities that are not traded in an active market are measured at cost. Impairment losses, which are other than temporary, are recognized in the statements of operations and changes in accumulated operating surplus when they occur.
PUBLIC ACCOUNTS, 2016-2017 1-63
Ontario Capital Growth Corporation Notes to Financial Statements March 31, 2017 and 2016
Ontario Venture Capital Fund LP (OVCF)
The investment in OVCF is classified as a financial instrument and carried at cost based on the capital calls made by the general partner of OVCF. The investment in OVCF is not traded in an active market; therefore, the fair value of the investment is not readily determinable. The OVCF investment is subsequently tested for impairment on each statement of financial position date and any losses due to impairment are recognized in the statement of operations and changes in accumulated operating surplus on that date.
Ontario Emerging Technologies Fund (OETF)
The investments in OETF are classified as financial instruments and carried at cost or measured at fair value based on whether or not there exists an active market for the securities. OETF investments quoted in an active market are measured at fair value as at the statements of financial position dates with any unrealized gain or loss recognized on the statements of remeasurement gains and losses. Remeasurement gains and losses are reclassified to the statements of operations and changes in accumulated operating surplus when an investment becomes impaired or is derecognized. Impairment losses that are other than temporary are recorded to the statements of operations and changes in accumulated operating surplus when recognized. Fair value includes the value of accrued interest or dividends payable, as applicable.
When an OETF investment is not traded in an active market, it is measured at cost. OETF investments are tested for impairment on each statement of financial position date and any impairment losses are recognized in the statement of operations and changes in accumulated operating surplus on that date.
Accrued interest, dividends and realized gains on the sale of OETF investments are recorded as described below under revenue recognition. If the Corporation has evidence the amounts owing will be collected, these amounts are accrued as receivable; otherwise, a reserve is taken against these amounts. If, in a future year, the Corporation receives an amount that had been written off, it is recorded as a recovery that had been previously deemed uncollectible. Amounts written off or recovered are recognized in the statement of operations and changes in accumulated operating surplus in the year in which they occur.
Northleaf Venture Catalyst Fund LP (NVCF)
The investment in NVCF is classified as a financial instrument and carried at cost based on the capital calls made by the NVCF general partner. The investment in NVCF is not traded in an active market and therefore the fair value of the investment is not readily determinable. The NVCF investment is subsequently tested for impairment on each statement of financial position date and any losses due to impairment will be recognized in the statement of operations and changes in accumulated operating surplus on that date.
ScaleUP Venture Fund I, LP (SUVF)
The investment in SUVF is classified as a financial instrument and carried at cost based on the capital calls made by the SUVF general partner. The investment in SUVF is not traded in an active market and therefore the fair value of the investment is not readily determinable. The investment in SUVF is subsequently tested for impairment on each statement of financial position date and any losses due to impairment will be recognized in the statement of operations and changes in accumulated operating surplus on that date.
1-64 PUBLIC ACCOUNTS, 2016-2017
Ontario Capital Growth Corporation Notes to Financial Statements March 31, 2017 and 2016
Fair value and impairment
The Corporation’s carrying values of cash and cash equivalents, accounts receivable and accounts payable approximate their fair values due to the immediate or short-term nature of these financial instruments.
The fair values of investments in OVCF, NVCF and SUVF are not readily determinable and have been recorded at cost. OVCF, NVCF and SUVF do not have a quoted market price in an active market. Subject to an impairment assessment policy, the Corporation may carry out periodic testing of fund investments to determine whether there has been an other than temporary loss in value that would indicate impairment. If the investment is determined to be impaired, it is written down to the new carrying value and the resulting impairment loss is recognized immediately in the statements of operations and changes in accumulated operating surplus.
The co-investments made in OETF are recorded at cost, which represents fair value at the time of acquisition. Investments in OETF that are quoted in an active market are measured at fair value at the statements of financial position dates. Any unrealized gain or loss at these dates is recognized in the statements of remeasurement gains and losses until the investment is derecognized in which the gain or loss is recognized in the statement of operations and changes in accumulated operating surplus. All other investments in OETF are measured at cost or amortized cost. As part of the reporting process to the Province of Ontario, the Corporation is required to carry out periodic valuations of OETF investments to determine whether there has been an other than temporary loss in value that would indicate impairment. If the investments are determined to be impaired, they are written down to the new carrying value and the impairment expense is recognized immediately in the statements of operations and changes in accumulated operating surplus. Furthermore, to the extent that a security held in OETF represents a compound financial instrument with an embedded derivative, such as an equity conversion option, the value of that derivative at acquisition should be measured at fair value unless that derivative is linked to and must be settled by delivery of unquoted equity instruments, in which case, the derivative would be required to be measured at cost. For derivatives classified to the fair value category, value is first determined by referencing a quoted price in an active market, or in the absence of this, by applying a suitable valuation technique.
Revenue recognition
Interest income is recognized as it is earned. For marketable securities and OETF investments, interest income is accrued using the effective interest rate method. Interest income is recorded on an accrual basis in accordance with the terms of the purchase agreement and to the extent that such amounts are expected to be collected.
Dividend income is recognized in the year the Corporation becomes entitled to receive the dividend as per the terms and conditions of the share issuance.
Realized gains on the sale of OETF investments are recognized in the year the Corporation becomes entitled to receive the proceeds as per the terms and conditions of the respective disposition.
Distributions from OVCF, NVCF and SUVF are recognized in the year the Corporation becomes entitled to receive the distribution as per the terms and conditions of the respective limited partnership agreement.
PUBLIC ACCOUNTS, 2016-2017 1-65

Ontario Capital Growth Corporation Notes to Financial Statements March 31, 2017 and 2016
OETF, SUVF and LSSVCF funding received represents monies transferred from the Ministry to the Corporation, as described in notes 7, 9 and 15, respectively. The funding is recognized when received.
Expense categories
Cash management fees primarily represent fees paid to the Ontario Financing Authority (OFA) for cash management and related services.
Professional fees relate to fees paid to third party service providers.
Board and committee member expenses represent monies paid to board and committee members according to the Board and Committee Members Remuneration Policy, which conforms with the Agencies and Appointments Directive of Management Board of Cabinet (February 2015). In 2015, the Canada Revenue Agency (CRA) ruled that part-time per diem appointees (PTPDAs) are to be treated as employees for tax purposes only. This means that HST may not be paid for per diem services, since CRA does not consider appointee services (a) to be taxable supply; and (b) Employment Insurance is applicable. PTPDAs cannot participate in the Canada Pension Plan with respect to their PTPDA services.
Reimbursements to the Ministry represent direct OCGC expenses paid by the Ministry on its behalf for administrative purposes only.
Foreign currency translation
Foreign currency gains and losses on monetary items are recognized immediately in the statements of operations and changes in accumulated operating surplus. Unrealized foreign currency gains and losses on marketable securities, investments in OVCF, investments in NVCF, investments in SUVF and OETF investments are recognized in the statements of remeasurement gains and losses. Unrealized foreign currency exchange gains and losses are reclassified from the statements of remeasurement gains and losses to the statements of operations and changes in accumulated operating surplus when the financial instrument is derecognized.
Measurement uncertainty
The preparation of financial statements in accordance with PSAS requires management to make estimates and assumptions that affect the reported amounts of assets and liabilities, the disclosure of contingent assets and liabilities at the dates of the financial statements and the reported amounts of revenues and expenses during the reporting periods. Such estimates are based on the best information available at the time of preparation of the financial statements and are periodically reviewed to reflect new information as it becomes available. Actual results could differ from those estimates.
1-66 PUBLIC ACCOUNTS, 2016-2017
Ontario Capital Growth Corporation Notes to Financial Statements March 31, 2017 and 2016
3 Financial instruments
The Corporation has exposure to credit risk, liquidity risk, currency risk, interest rate risk and other price risk arising from financial instruments. This note presents information about OCGC’s exposure to each of these risks.
Credit risk
Credit risk arises from the potential a counterparty will fail to perform its obligations. The Corporation is currently exposed to credit risk through its holdings of convertible debt instruments in OETF.
The Corporation considers obligations of the Governments of Ontario and Canada to be relatively risk-free (note 5).
Liquidity risk
Liquidity risk is the risk an entity will encounter difficulty in raising funds to meet both expected and unexpected cash demands associated with its financial liabilities. The Corporation manages liquidity risk by maintaining holdings of cash or highly liquid investments. In addition, the Ministry provides funding to the Corporation to meet obligations as required.
Currency risk
Currency risk is the risk to the Corporation’s results of operations that arises from fluctuations of foreign currency exchange rates and the degree of volatility of these rates. The Corporation’s exposure to foreign currency exchange risk is limited to holding US dollar cash and cash equivalents and holding OETF investments denominated in US dollars. OCGC does not hedge its US dollar exposure. The Corporation had a net exposure of $4,037,509 to the US dollar as at March 31, 2017 (2016 - $5,009,838). A 5% increase or decrease of the Canadian dollar against the US dollar as at March 31, 2017 would result in a decrease or increase of $201,875 (2016 - $250,492) on the statements of remeasurement gains and losses with no impact on the operating surplus. In practice, the actual trading results may differ from this sensitivity analysis and the impact could be material.
Interest rate risk
Interest rate risk is the risk the value of a financial instrument might be adversely affected by a change in interest rates. In seeking to minimize the risks from interest rate fluctuations, the Corporation manages exposure through its normal operating and financing activities. The Corporation is exposed to interest rate risk primarily through its short-term marketable securities and OETF investments. Risks from interest rate fluctuations for marketable securities are minimal due to the investments being held for a term of three years or less to match the OVCF, NVCF and SUVF drawdowns projected by their respective fund managers. The impact of interest rate fluctuations on OETF investments are considered minimal as these instruments are primarily held for purposes of capital appreciation.
PUBLIC ACCOUNTS, 2016-2017 1-67
Ontario Capital Growth Corporation Notes to Financial Statements March 31, 2017 and 2016
Other price risk
Other price risk is the risk the value of financial instruments will fluctuate as a result of changes in market prices or from factors specific to an individual investment. The maximum risk resulting from the financial instruments is equivalent to their fair value. The marketable securities consist of treasury bills that are not subject to significant price risk. As at March 31, 2017, if the value of the investments in OVCF, NVCF, SUVF and OETF had increased or decreased by 5% and all other variables held constant, the value of the investments would have changed by $8,146,557 (2016 - $6,766,040). Investments made through OVCF, NVCF, SUVF or in OETF are highly illiquid, do not have a readily determinable market price, and are generally in early stage companies where the ultimate value that may be realized by OCGC on eventual disposition is inherently unpredictable.
Returns on these investments will depend on factors specific to each company (such as financial performance, product viability and quality of management), and external forces (such as the economic environment and technological progress by competitors). The carrying value of the OETF portfolio is measured at cost less changes for any other than temporary impairment in value at the statement of financial position date; however, the amounts that may ultimately be realized could be materially different.
4 Accounts receivable
As a Schedule A provincial agency, OCGC is required to follow the pay and rebate model with respect to HST applied to direct purchases. The Corporation pays the HST on its purchases and, subsequently, files a monthly rebate claim with the Canada Revenue Agency for the HST paid. HST rebates receivable as at March 31, 2017, amounted to $10,209 (2016 - $21,935).
Realized gains on the sale of OETF investments are recognized in the year the Corporation becomes entitled to receive the proceeds as per the terms and conditions of the respective dispositions. Accounts receivable, as a result of dispositions of OETF investments made in 2017, amounted to $336,762 (2016 - $nil).
5 Marketable securities
OCGC may temporarily invest any monies not immediately required to carry out its objectives in:
a) debt obligations of or guaranteed by the Government of Canada or a province of Canada; or
b) interest bearing accounts and short-term certificates of deposit issued or guaranteed by a chartered bank,trust company, credit union or caisse populaire.
1-68 PUBLIC ACCOUNTS, 2016-2017

Ontario Capital Growth Corporation Notes to Financial Statements March 31, 2017 and 2016
The value of investments in marketable securities as at March 31 is as follows:
Fair value includes any accrued interest owing on the treasury bills.
The fair value of the marketable securities may fluctuate depending on changes in interest rates. For the year ended March 31, 2017, a change in interest rates of 1.0% would result in an impact of $887,456 (2016 - $850,107) to the results of operations.
6 Ontario Venture Capital Fund LP (OVCF)
In June 2008, the OVCF was established with an investment commitment from the Province of Ontario of $90 million. OVCF is a $205 million joint initiative of the Government of Ontario and private institutional investors, formed to invest primarily in Ontario based and Ontario focused venture capital and growth equity funds that support innovative, high potential companies.
The investment in OVCF is carried at cost, based on the capital calls made by the OVCF general partner. As OVCF is not traded in an active market, the fair value of the investment is not readily determinable.
7 Ontario Emerging Technologies Fund (OETF)
OETF was launched in July 2009 with a commitment from the Province of Ontario to provide funding of $250 million. OETF, as a direct co-investment fund, makes investments into innovative high potential companies alongside other qualified investors with a proven track record of success. Investments are in three strategic sectors: (a) clean technology; (b) digital media and information and communication technologies; and (c) life sciences and advanced health technologies.
On May 30, 2012, the Corporation implemented a pause on any new investments under OETF for an indefinite period of time. This decision did not affect the Corporation’s ability to continue to make follow-on investments into existing portfolio companies and did not affect investments-in-process that had already been approved by OCGC’s board of directors but had not yet closed.
For the year ended March 31, 2017, the aggregate OETF transfer payments received from the Ministry were $7,800,000 (2016 - $6,000,000).
PUBLIC ACCOUNTS, 2016-2017 1-69

Ontario Capital Growth Corporation Notes to Financial Statements March 31, 2017 and 2016
8 Northleaf Venture Catalyst Fund LP (NVCF)
In January 2014, the NVCF was established with an initial investment commitment of $36.25 million from the Ontario Capital Growth Corporation. As at March 31, 2016, OCGC had increased its commitment to a final total of $50 million. NVCF is a $300 million joint initiative of the Government of Ontario, Government of Canada and the private sector, formed to invest primarily in Canadian venture capital funds that support innovative, high potential companies.
The investment in NVCF is carried at cost, based on the capital calls net of any return of recallable capital made by the NVCF general partner. As NVCF is not traded in an active market, the fair value of the investment is not readily determinable.
9 ScaleUP Venture Fund I, LP (SUVF)
In February 2017, the Ontario Capital Growth Corporation made an investment commitment of $25 million to the SUVF. SUVF is a joint initiative of the Government of Ontario and the private sector, formed to invest primarily in promising Ontario-based start-ups that have shown initial market success and demonstrate strong growth potential, but require new investment financing and mentorship to expand their operations. The total fund size is $70.25 million as at March 31, 2017.
The investment in SUVF is carried at cost, based on the capital calls net of any return of recallable capital made by the SUVF general partner. As SUVF is not traded in an active market, the fair value of the investment is not readily determinable.
10 Contractual commitments
OCGC has the following contractual commitments:
In accordance with a financial service agreement between the OFA and OCGC, OFA conducts investmentand cash management services and activities for OCGC. OFA is the agency of the Province of Ontarioresponsible for providing financial and centralized cash management services for the government. OCGCpays OFA a fee for these services based on assets under management and reimburses for other relatedactivities on a cost recovery basis.
Pursuant to the OVCF limited partnership agreement, OCGC is committed to making capital contributionson notice of capital calls. As at March 31, 2017, the total uncalled commitment is $21,825,537 (2016 -$27,675,537) to be drawn down over the remaining years of the limited partnership.
Pursuant to the NVCF limited partnership agreement, OCGC is committed to making capital contributionson notice of capital calls. As at March 31, 2017, there is no further uncalled commitment (2016 -$19,930,273) to be drawn over the remaining years of the limited partnership.
Pursuant to the SUVF limited partnership agreement, OCGC is committed to making capital contributionson notice of capital calls. As at March 31, 2017, the total uncalled commitment is $20,750,000 (2016 -$nil) to be drawn down over the remaining years of the limited partnership.
1-70 PUBLIC ACCOUNTS, 2016-2017
Ontario Capital Growth Corporation Notes to Financial Statements March 31, 2017 and 2016
In accordance with the contract between Ernst & Young LLP (E&Y) and OCGC, E&Y conducts duediligence services and activities to qualify OETF co-investors. OCGC pays both fixed and hourly rates forthese services and activities, respectively.
In accordance with the contract between LP Analyst and OCGC, LP Analyst provides investment consultingservices including sourcing strategy, conducts due diligence services and activities for potential new fundinvestments, provides business advice to support negotiation and undertakes portfolio monitoring andreporting. OCGC pays both fixed and hourly rates for these services and activities, respectively.
In accordance with the contract between Covington Capital Corporation (Covington) and OCGC, Covingtonconducts services and activities to qualify, monitor and exit OETF’s investments. OCGC pays both fixedand hourly rates for these services and activities, respectively.
In accordance with the contract between Weiler & Company and OCGC, Weiler & Company performsaccounting functions relating to the operations of OCGC. OCGC pays an hourly rate for these services.
11 Investments in OETF
Investments in OETF can take the form of equity, warrants or convertible debt transacted in Canadian dollars (CAD) or US dollars (USD). The investments in OETF as at March 31 are summarized as follows:
* Represents historical cost net of investments exited and investments written off to $nil.** Represents follow-up on investments committed to by the Corporation but not yet executed.
All investments have been made in accordance with OETF guidelines. As at March 31, 2017, the OETF investment portfolio consisted of investments in 11 different companies, ranging from 0.19% to 4.40% of net assets. The percentage calculations exclude impaired investments in companies with a nominal or $nil carrying value.
12 Income on investment in funds
During the year ended March 31, 2017, the Corporation recognized $1,318,977 (2016 - $109,794) of investment income in funds.
PUBLIC ACCOUNTS, 2016-2017 1-71

Ontario Capital Growth Corporation Notes to Financial Statements March 31, 2017 and 2016
13 Impairment of OETF investments
For the year ended March 31, 2017, impairment charges of $2,265,810 (2016 - $21,406,237) in OETF investments were identified by management and were recognized in the statements of operations and changes in accumulated operating surplus.
14 Accounts payable
The Corporation and the Ministry carry out their respective operations on a shared cost basis. The Corporation reimburses the Ministry for certain expenses incurred on its behalf. These expenses may include but are not limited to staff salaries, benefits, information technology allocations per staff member, accommodations, external legal services, website development, French language translation, and other services.
Recognition and measurement of any reimbursement is subject to annual reconciliation between the Corporation and the Ministry, and approval of the extent and scope of the Ministry services to be provided. For the year ended March 31, 2017, the Corporation will seek certification from the Ministry that any further potential financial liability with respect to eligible expenses incurred on behalf of the Corporation is fully satisfied without further recourse.
The Corporation accrues eligible expenses reimbursable to the Ministry under accounts payable based on estimates provided by the Ministry that can be independently verified by the Corporation. Reimbursement payable in arrears as at March 31, 2017 amounted to $90,628 (2016 - $93,125).
The remaining balance as at March 31, 2017 for $$187,815 (2016 - $128,052) represents payables in arrears to miscellaneous service providers.
15 Life Sciences Seed Venture Capital Fund (LSSVCF)
On March 27, 2015, the Ministry entered into the LSSVCF transfer payment agreement with OCGC to establish and invest in a new Ontario life sciences seed venture capital fund. The size of the proposed fund is up to $30 million with capital commitments from the Government of Ontario, hospital foundations and the private sector.
As at June 30, 2015, the Corporation met the terms and conditions of the LSSVCF transfer payment agreement for the Ministry to disburse the entire $10 million funding obligation which was subsequently received.
As at March 31, 2017, the LSSVCF initiative remains in development.
16 Non-financial assets
The Corporation does not have any tangible capital assets or prepaid expenses. An inventory of office supplies is held for use and expensed in the year in which they are purchased. The total cost of these supplies is not material to the financial statements and they are expected to be used up in a period of less than one year from their purchase date.
1-72 PUBLIC ACCOUNTS, 2016-2017

OCWA’s management and Board of Directors are responsible for the financial statements and all other information presented in this annual report. The financial statements have been prepared by management in accordance with Canadian public sector accounting standards.
OCWA is dedicated to the highest standards of integrity in its business. To safeguard assets, the Agency has a sound set of internal financial controls and procedures that balance benefits and costs. Management has developed, and continues to maintain, financial and management controls, information systems and management practices to provide reasonable assurance of the reliability of financial information in accordance with the bylaws of the Agency. Internal audits are conducted to assess management systems and practices, and reports are issued to the Executive Management Team.
The Board of Directors ensures that management fulfills its responsibilities for financial and internal control. The Board of Directors and the Audit and Finance Committee of the Board meet quarterly to oversee the financial activities of the Agency and at least once a year to review the financial statements and the external auditor’s report and recommend them to the Minister of the Environment and Climate Change for approval.
The Auditor General has examined the financial statements. The Auditor General’s responsibility is to express an opinion on whether the financial statements are presented fairly in accordance with Canadian public sector accounting standards. The Auditor’s Report outlines the scope of the Auditor’s examination and opinion.
Nevin McKeown Prem RooplalActing President and Chief Executive Officer Vice President,
Finance and Corporate Services
Toronto, OntarioApril 6, 2017
Management’s Responsibility for Financial Information
Ontario Clean Water Agency
PUBLIC ACCOUNTS, 2016-2017 1-73

1-74 PUBLIC ACCOUNTS, 2016-2017

Statement of Financial PositionAs at December 31, 2016
(in thousands of dollars)
December 31, 2016
December 31, 2015
Assets
Current assets:
Cash and short-term investments (note 3a) 42,791 43,418
Accounts receivable, net
Municipalities and other customers (note 3b) 25,569 22,890
Ministry of the Environment and Climate Change 16 19
Harmonized sales tax receivable 2,258 1,995
Prepaid Expenses 4,269 506
Current portion of investments receivable for water and wastewater facilities (note 2)
579 612
75,482 69,440
Non-current assets:
Investments in term deposits (note 3a) 31,771 28,366
Investments receivable for water and wastewater facilities (note 2) 283 856
Loan receivable - Ontario Infrastructure and Lands Corporation (note 3c) 120,000 120,000
Tangible Capital Assets, net (note 4) 7,360 8,721
159,414 157,943
Total Assets 234,896 227,383
PUBLIC ACCOUNTS, 2016-2017 1-75

Statement of Financial Position As at December 31, 2016
(in thousands of dollars)
December 31, 2016
December 31, 2015
Liabilities and Net Assets
Current liabilities:
Accounts payable and accrued liabilities (note 6) 21,152 18,094
Current portion of employee future benefits (note 9a) 3,998 4,757
25,150 22,851
Long-term liabilities:
Employee future benefits (note 9a) 9,764 11,948
Net Assets 199,982 192,584
Contingencies and Measurement Uncertainty (note 1e)
Total Liabilities and Net Assets 234,896 227,383
see accompanying notes to financial statements
On behalf of the Board
Director Directortor
1-76 PUBLIC ACCOUNTS, 2016-2017

Statement of Operationsand Change in Net AssetsFor the year ended December 31, 2016
(in thousands of dollars)
December 31, 2016
December 31, 2015
Utility Operations Revenues:
Utility operations 175,892 172,033
Other Business 2,020 2,463
Total Operating Revenues 177,912 174,496
Operating Expenses:
Salaries and benefits (note 9a and note 9b) 71,878 72,947
Other operating expenses 97,198 97,464
Amortization of tangible capital assets 2,656 2,930
Total Operating Expenses 171,732 173,341
Excess of revenue over expenses - Utility Operations 6,180 1,155
Interest from Investments and loans receivable 2,393 2,473
Excess of revenue over expenses 8,573 3,628
Net Assets, opening balance 192,584 188,998
Adjustment to Net Assets (note 7) (1,175) (42)
Net Assets, ending balance 199,982 192,584
see accompanying notes to financial statements
PUBLIC ACCOUNTS, 2016-2017 1-77

Statement of Cash FlowsFor the year ended December 31, 2016
(in thousands of dollars)
December 31, 2016
December 31, 2015
Cash Provided by (used for) Operating Activities
Excess of revenue over expense-Utility Operations 6180 1,155
Items Not Affecting Cash
Amortization of Tangible Capital Assets 2,656 2,930
Increase (decrease) in future employee benefits expense (2,184) 1,140
6,652 5,225
Changes in non-cash operating working capital
Accounts Receivable (2,939) (2,149)
Prepaid Expenses (3,763) (154)
Accounts Payable and Accrued Liabilities 3,058 1,788
Legislated Severance (759) (753)
(4,403) (1,268)
Net Cash Flows from operating activities 2,249 3,957
Cash From Investing Activities
Interest 2,393 2,473
Principal Repaid on Loans 606 792
Increase in non-current Term Deposits (3,405) (6,539)
Net cash flows from investing activities (406) (3,274)
Cash Used in Capital Activities
Tangible Capital Assets Acquired (1,295) (1,817)
Cash Used in Financing Activities
Changes in Net Assets (1,175) (42)
Decrease in Cash and Short-Term Investments (627) (1,176)
Cash and Short-Term Investments, Opening Balance 43,418 44,594
Cash and Short-Term Investments, Closing Balance 42,791 43,418
1-78 PUBLIC ACCOUNTS, 2016-2017

Notes to Financial StatementsDecember 31, 2016
GENERAL
The Ontario Clean Water Agency (The “Agency”) was established on November 15, 1993, under the authority of The Capital Investment Plan Act, 1993 (the “Act”).
The Agency’s objects include:
(a) assisting municipalities, the Government of Ontario and other persons or bodies toprovide water and sewage works and other related services by financing, planning,developing, building and operating those works and providing those services;
(b) financing and promoting the development, testing, demonstration andcommercialization of technologies and services for the treatment and managementof water, wastewater and stormwater;
(c) carrying out the activities described in clauses (a) and (b) in Ontario and elsewherein a manner that protects human health and the environment and encourages theconservation of water resources; and
(d) with respect to activities described in clauses (a) and (b) that are carried out inOntario, carrying them out in a manner that supports provincial policies for land useand settlement.
The Agency is exempt from Federal and Provincial income taxes.
1. SIGNIFICANT ACCOUNTING POLICIES
The Agency is classified as a government not-for-profit for financial reporting purposes. Thesefinancial statements are prepared by management in accordance with Canadian public sectoraccounting standards for provincial reporting entities established by the Canadian PublicSector Accounting Board. The Agency has chosen to use the standards for not-for-profitorganizations that include the 4200 series sections. The significant accounting policies are asfollows:
(a) Cash and Short-term Investments
Cash and short-term investments, including a portfolio of bonds, are recorded atcost. Accrued interest is recorded in accounts receivable. Bonds are expected to beheld until maturity.
PUBLIC ACCOUNTS, 2016-2017 1-79

Notes to Financial StatementsDecember 31, 2016
1. SIGNIFICANT ACCOUNTING POLICIES (cont’d)
(b) Tangible Capital Assets
Major capital expenditures with a future useful life beyond the current year arecapitalized at cost. Tangible Capital Assets are amortized on a straight-line basis asfollows:
Computer Software 2-7 years Information Systems 7 years Furniture and Fixtures 5 years Automotive Equipment 4-20 years Computer Hardware 3-7 years Machinery and Equipment 5 years Leasehold Improvements Life of the lease
(c) Revenue Recognition
Revenue on contracts with clients for the operation of water and wastewatertreatment facilities based on a fixed annual price is recognized in equal monthlyamounts as earned.
Revenue on contracts with clients based on the recovery of costs plus a percentagemarkup or recovery of costs plus a fixed management fee is recognized at the timesuch costs are incurred.
Revenue for additional work for clients outside the scope of the operations andmaintenance contract, such as capital repairs on equipment, is recognized whenthe costs are incurred, and normally includes a pre-determined markup on cost.
(d) Financial Instruments
A financial instrument is an asset that will ultimately be settled in cash.
All financial instruments have been valued at cost, which approximates fair value.
The financial instruments consist of cash and short-term investments, accountsreceivable, investments receivable, bond portfolio, term deposits, loans receivable,accounts payable and accrued liabilities, and employee future benefits.
A Statement of Remeasurement of Gains and Losses has not been preparedbecause all financial instruments are valued at cost and there are no changes in fairvalue to record.
1-80 PUBLIC ACCOUNTS, 2016-2017

Notes to Financial StatementsDecember 31, 2016
1. SIGNIFICANT ACCOUNTING POLICIES (cont’d)
[e) Measurement Uncertainty
The preparation of financial statements in accordance with Canadian public sector accounting standards requires management to make estimates and assumptions that affect the reported amounts of assets and liabilities as at the date of the financial statements and the reported amounts of revenues and expenditures for the period. Significant items subject to such estimates and assumptions include the amortization expense, accrued liabilities and employee future benefits. Actual results could differ from management’s best estimates as additional information becomes available in the future.
2. INVESTMENTS RECEIVABLE FOR WATER AND WASTEWATERFACILITIES
These investments represent the outstanding principal portion of amounts receivable from clients for capital expenditures undertaken by the Agency on their behalf, and recoverable operating costs, if any, not billed.
The investments receivable are supported by agreements that bear interest at rates between 5.97% and 9.63%. Scheduled principal repayments of the investments are as follows:
(12 Months Beginning January) (in thousands of dollars)
2017 579
2018 228
2019 26
2020 29
862
Less: Current portion (579)
283
PUBLIC ACCOUNTS, 2016-2017 1-81
2. INVESTMENTS RECEIVABLE FOR WATER AND WASTEWATER FACILITIES(cont’d)
In August of 1999, the Agency entered into a loan agreement to finance the construction of a water pipeline, which was completed in May 2000. The outstanding loan balance including accumulated interest was $18.6 million at December 31, 2005. The Agency has recognized the loan as fully impaired and accordingly the loan amount of $18.6 million has been reflected in an allowance for loan impairment.
Other than as described in this note, there are no other provisions established for investment receivables.
3. FINANCIAL INSTRUMENTS
(a) Cash and Investments
The Agency has $74.6 million invested in bank balances, term deposits and a bondportfolio as follows:
Notes to Financial StatementsDecember 31, 2016
(in thousands of dollars)
Bank Balances 9,085
Short term bonds (coupon rates 0.75% to 4.20%) 5,306
Term deposits due within a year (Interest rates 1.70%-2.01%)
28,400
Cash and Short-Term Investments 42,791
Term deposits due within two years (Interest rates 1.75%-1.91%)
31,771
74,562
The fair value of the bank balances and term deposits approximates carrying value and the fair value of the short-term bond portfolio is $5.3 million.
1-82 PUBLIC ACCOUNTS, 2016-2017
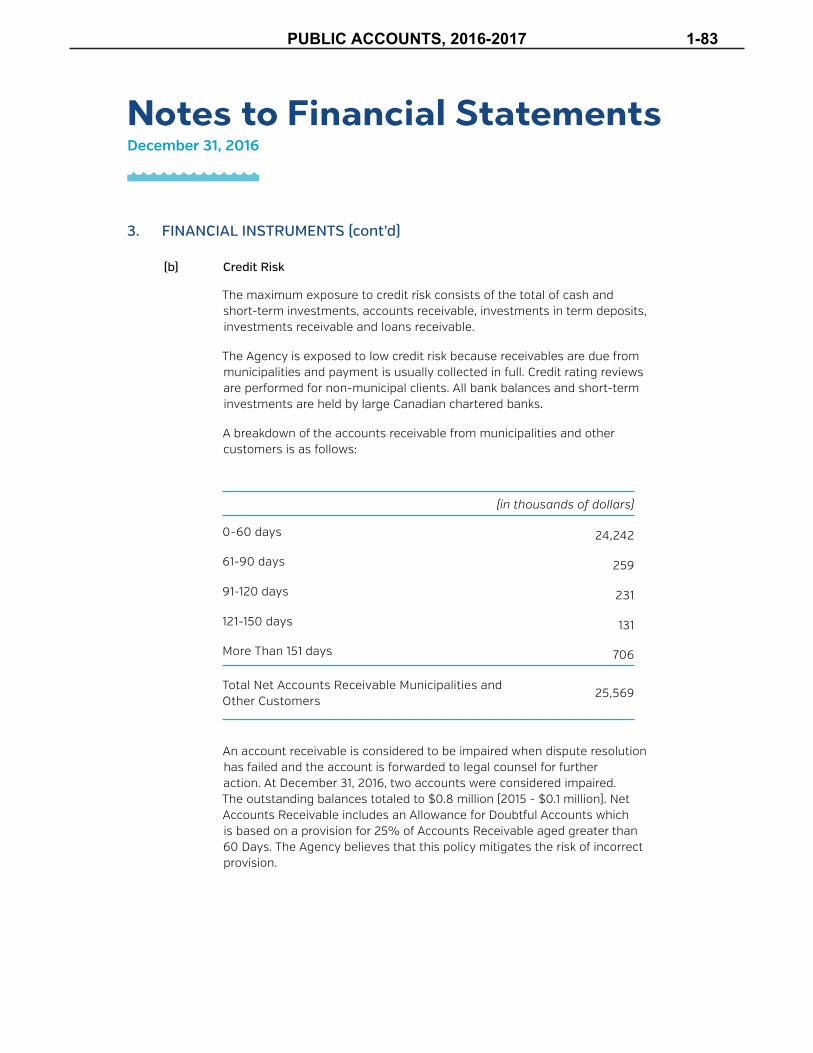
Notes to Financial StatementsDecember 31, 2016
3. FINANCIAL INSTRUMENTS (cont’d)
(b) Credit Risk
The maximum exposure to credit risk consists of the total of cash andshort-term investments, accounts receivable, investments in term deposits,investments receivable and loans receivable.
The Agency is exposed to low credit risk because receivables are due frommunicipalities and payment is usually collected in full. Credit rating reviewsare performed for non-municipal clients. All bank balances and short-terminvestments are held by large Canadian chartered banks.
A breakdown of the accounts receivable from municipalities and othercustomers is as follows:
An account receivable is considered to be impaired when dispute resolution has failed and the account is forwarded to legal counsel for further action. At December 31, 2016, two accounts were considered impaired. The outstanding balances totaled to $0.8 million (2015 - $0.1 million). Net Accounts Receivable includes an Allowance for Doubtful Accounts which is based on a provision for 25% of Accounts Receivable aged greater than 60 Days. The Agency believes that this policy mitigates the risk of incorrect provision.
(in thousands of dollars)
0-60 days 24,242
61-90 days 259
91-120 days 231
121-150 days 131
More Than 151 days 706
Total Net Accounts Receivable Municipalities and Other Customers
25,569
PUBLIC ACCOUNTS, 2016-2017 1-83

FINANCIAL INSTRUMENTS (cont’d)
Cash Flow Risk
The Agency has extended a $120 million loan to Ontario Infrastructure and LandsCorporation which matures on March 1, 2023 with a variable interest rate set at fourbasis points below the average monthly Canadian Dollar Offered Rate. It also hasterm deposits and bank balances that are sensitive to the prevailing interest rates. As aresult, it is exposed to a cash flow risk related to the fluctuations in interest rates.
Other
The Agency is exposed to low risk for electricity and chemical costs because most ofthe contracts are structured to pass these costs through to the customer.
Other than as described in these notes, the Agency is not exposed to any additionalcurrency, liquidity or other price risk on its financial instruments.
TANGIBLE CAPITAL ASSETS
The Board has approved capital and re-engineering expenditures of up to $14.7 million from fiscal 2012 to 2018 to modernize the Agency’s operating and maintenance information technology infrastructure.
(in thousands of dollars) CostAccumulatedAmortization
NetDecember
31, 2016
NetDecember
31, 2015
Computer Software 8,180 3,945 4,235 4,875
Information Systems 5,740 4,755 985 1,446
Furniture and Fixtures 219 152 67 86
Automotive Equipment 4,707 4,514 193 379
Computer Hardware 4,886 3,558 1,328 1,395
Machinery and Equipment 1,086 703 383 351
Leasehold Improvements 417 248 169 189
25,235 17,875 7,360 8,721
Notes to Financial StatementsDecember 31, 2016
1-84 PUBLIC ACCOUNTS, 2016-2017

5. LEASE COMMITMENTS
Annual lease payments under operating leases for rental of office equipment, premises and vehicles in aggregate are as follows:
(in thousands of dollars)
2017 2,820
2018 2,516
2019 2,034
2020 1,018
2021 210
8,598
6. ACCOUNTS PAYABLE AND ACCRUED LIABILITIES
Included in the accounts payable and accrued liabilities is a provision for restructuring costs of $1.0 million (2015 - $2.5 million) for severance costs relating to a reorganization within the Agency. The amount charged to the income statement in 2016 was $0.3 million (2015 - $0.2 million) and is included in salaries and benefits expenses in the Statement of Operations and Changes in Net Assets.
7. NET ASSETS
When the Agency was first established, the opening net assets were received from the Province of Ontario in the form of the book value of net assets in excess of obligations assumed.
Subsequent adjustments to the opening balance relate to legal costs that were agreed to prior to the establishment of the Agency.
In 2014, the Agency was named in an action for soil contamination clean up due to a diesel spill the circumstances of which occurred prior to the establishment of the Agency. In 2016 the claim was settled out of court for $1.2 million and the amount has been recorded as an adjustment to net assets.
Notes to Financial StatementsDecember 31, 2016
PUBLIC ACCOUNTS, 2016-2017 1-85
8. CONTINGENCIES
(a) Contingent Liabilities
The Agency is involved in various legal claims and other unresolved matters arisingin the normal course of business, the outcome of which cannot be determined atthis time. Most of the legal claims are covered by insurance after the applicationof a deductible, ranging from $5,000 to $100,000, depending on when the eventgiving rise to the claim occurred and the nature of the claim.
(b) Letters of Credit
The Agency has lines of credit with the Royal Bank of Canada for $15 million. As ofDecember 31, 2016, $11.3 million of these lines of credit have been used to provideletters of credit to municipalities in accordance with the terms of their operationsand maintenance agreements.
9. RELATED PARTY TRANSACTIONS
(a) Non-Pension Employee Future Benefits
The Agency is responsible for its accrued legislated severance, unpaid vacation, andworkers compensation obligations.
The costs of these employee future benefits obligations have been estimated at$13.8 million (2015 - $16.7 million) of which $4.0 million (2015 - $4.8 million) has beenclassified as current liability. The amount charged to the income statement in 2016was $1.4 million (2015 - $1.1 million) and is included in salaries and benefits expensein the Statement of Operations and Changes in Net Assets.
During the year the accrued employee benefits obligation was reduced by $1.5million (2015 – nil) due to a curtailment resulting from changes under the PublicService Act of Ontario. Prior to the curtailment, the decrease in the obligation was$0.4 million (2015 - $0.7 million)
Included in employee future benefits obligation is an estimated workerscompensation obligation in the amount of $3.1 million (2015 - $2.6 million).This amount has been determined from the most recent available actuarialcalculations provided by the Workplace Safety and Insurance Board (WSIB)as at December 31, 2015.
It is management’s opinion that the balance at December 31, 2016 will not bematerially different. Adjustment to the estimated WSIB obligation cumulativebalance, if any, will be made in the year the updated balance is provided by WSIB.
The cost of other post-retirement, non-pension employee benefits is paid by theProvince and therefore is not included in the financial statements.
Notes to Financial StatementsDecember 31, 2016
1-86 PUBLIC ACCOUNTS, 2016-2017
9. RELATED PARTY TRANSACTIONS (cont’d)
(b) Pension Plan
The Agency’s full-time employees participate in the Public Service PensionFund (PSPF) and the Ontario Public Service Employees’ Union PensionFund (OPSEU-PF), which are defined benefit pension plans for employeesof the Province and many provincial agencies. The Province of Ontario,which is the sole sponsor of the PSPF and a joint sponsor of the OPSEU-PF,determines the Agency’s annual payments of the funds. As the sponsorsare responsible for ensuring that the pension funds are financially viable,any surpluses or unfunded liabilities arising from statutory actuarialfunding valuations are not assets or obligations of the agency. TheAgency’s annual payments of $4.6 million (2015 – $4.5 million), are includedin salaries and benefits in the Statement of Operations and Change inNet Assets.
(c) Other
As a result of the relationship of the Agency with the Province, the followingrelated party transactions exist:
(i) The Agency received revenue of $3.0 million (2015 - $2.5 million) from theOntario Infrastructure and Lands Corporation for water and wastewatertreatment services OCWA has provided. The services were provided atcompetitive rates similar to those of other OCWA clients.
(ii) The Agency received revenue of $1.6 million (2015 - $1.7 million) fromthe Ministry of the Environment and Climate Change for water andwastewater treatment services OCWA has provided. The services wereprovided at competitive rates similar to those of other OCWA clients
(iii) The Agency received revenue of $0.1 million (2015 - $0.5 million) fromthe Ministry of the Northern Development and Mines for water andwastewater treatment services OCWA has provided. The services wereprovided at competitive rates similar to those of other OCWA clients.
(iv) The Agency has a $120 million loan receivable with OntarioInfrastructure and Lands Corporation, as described in note 3c.
(v) The Agency relies on the Province to process its payroll and administerits benefits, and to obtain some internal audit and legal services. TheProvince absorbs some of these administrative costs.
Notes to Financial StatementsDecember 31, 2016
PUBLIC ACCOUNTS, 2016-2017 1-87


PUBLIC ACCOUNTS, 2016-2017 1-89
The Ontario Educational Communications Authority
1-90 PUBLIC ACCOUNTS, 2016-2017

PUBLIC ACCOUNTS, 2016-2017 1-91

1-92 PUBLIC ACCOUNTS, 2016-2017

PUBLIC ACCOUNTS, 2016-2017 1-93

1-94 PUBLIC ACCOUNTS, 2016-2017

PUBLIC ACCOUNTS, 2016-2017 1-95
1-96 PUBLIC ACCOUNTS, 2016-2017

PUBLIC ACCOUNTS, 2016-2017 1-97

1-98 PUBLIC ACCOUNTS, 2016-2017
PUBLIC ACCOUNTS, 2016-2017 1-99

1-100 PUBLIC ACCOUNTS, 2016-2017

PUBLIC ACCOUNTS, 2016-2017 1-101

1-102 PUBLIC ACCOUNTS, 2016-2017

PUBLIC ACCOUNTS, 2016-2017 1-103

1-104 PUBLIC ACCOUNTS, 2016-2017

PUBLIC ACCOUNTS, 2016-2017 1-105
1-106 PUBLIC ACCOUNTS, 2016-2017
Financial Statements
Responsibility for Financial Reporting
The accompanying financial statements of OEFC have been prepared in accordance with Canadian public sector accounting standards and are management’s responsibility. The preparation of financial statements necessarily involves the use of estimates based on management’s judgment, particularly when transactions affecting the current accounting period cannot be finalized with certainty until future periods. The financial statements have been properly prepared within reasonable limits of materiality and in light of information available up to August 4, 2017.
Management maintains a system of internal controls designed to provide reasonable assurance that the assets are safeguarded and that reliable financial information is available on a timely basis. The system includes formal policies and procedures and an organizational structure that provides for appropriate delegation of authority and segregation of responsibilities. The Ontario Internal Audit Division of the Treasury Board Secretariat independently evaluates the effectiveness of these internal controls on an ongoing basis and reports its findings to management and the Audit Committee of the Board.
The Board is responsible for ensuring management fulfills its responsibilities for financial reporting and internal controls. The Audit Committee assists the Board in carrying out these responsibilities. The Audit Committee periodically meets with management, the internal auditors and the external auditors to deal with issues raised by them, and to review the financial statements before recommending Board approval.
The financial statements have been audited by the Auditor General of Ontario (the external auditor). The Auditor’s responsibility is to express an opinion on whether OEFC’s financial statements fairly present OEFC’s financial position in accordance with Canadian public sector accounting standards. The Auditor’s Report, which appears on the following page, outlines the scope of the Auditor’s examination and opinion.
On behalf of management:
Gadi MaymanVice-Chair and Chief Executive Officer
Ken KandeepanChief Financial and Risk Officer
ONTARIO ELECTRICITY FINANCIAL CORPORATION
PUBLIC ACCOUNTS, 2016-2017 1-107

Auditor’s Report
Office of the Auditor General of OntarioBureau du vérificateur général de l’Ontario
Independent Auditor’s Report
To the Ontario Electricity Financial Corporationand to the Minister of Finance
I have audited the accompanying financial statements of the Ontario Electricity Financial Corporation, which comprise the statement of financial position as at March 31, 2017, and the statements of operations and cash flow for the year then ended, and a summary of significant accounting policies and other explanatory information.
Management’s Responsibility for the Financial Statements
Management is responsible for the preparation and fair presentation of these financial statements in accordance with Canadian public sector accounting standards, and for such internal control as management determines is necessary to enable the preparation of financial statements that are free from material misstatement, whether due to fraud or error.
Auditor’s Responsibility
My responsibility is to express an opinion on these financial statements based on my audit. I conducted my audit in accordance with Canadian generally accepted auditing standards. Those standards require that I comply with ethical requirements and plan and perform the audit to obtain reasonable assurance about whether the financial statements are free from material misstatement.
An audit involves performing procedures to obtain audit evidence about the amounts and disclosures in the financial statements. The procedures selected depend on the auditor's judgment, including the assessment of the risks of material misstatement of the financial statements, whether due to fraud or error. In making those risk assessments, the auditor considers internal control relevant to the entity's preparation of the financial statements in order to design audit procedures that are appropriate in the circumstances, but not for the purpose of expressing an opinion on the effectiveness of the entity's internal control. An audit also includes evaluating the appropriateness of accounting policies used and the reasonableness of accounting estimates made by management, as well as evaluating the overall presentation of the financial statements.
I believe that the audit evidence I have obtained is sufficient and appropriate to provide a basis for my opinion.
Opinion
In my opinion, the financial statements present fairly, in all material respects, the financial position of the Ontario Electricity Financial Corporation as at March 31, 2017, and the results of its operations, and its cash flows for the year then ended in accordance with Canadian public sector accounting standards.
Toronto, OntarioAugust 4, 2017
Bonnie Lysyk, MBA, CPA, CA, LPAAuditor General
1-108 PUBLIC ACCOUNTS, 2016-2017

Ontario Electricity Financial CorporationStatement of Financial Position
As at March 31, 2017 ($ millions)
Approved on behalf of the Board:
Scott ThompsonChair
Gadi MaymanVice-Chair and Chief Executive Officer
See accompanying notes to financial statements.
2017 2016 ASSETS
Cash $ 3 $ 12Investments 2,556 3,413Accounts receivable (Note 4) 290 466Interest receivable 26 31Due from Province of Ontario (Note 5) 3,577 4,281Notes and loans receivable (Note 6) 11,375 12,524
$ 17,827 $ 20,727
LIABILITIES
Accounts payable and accrued liabilities (Note 7) $ 93 $ 104 Interest payable 372 393Debt (Note 8) 20,413 24,345Power purchase contracts (Note 10) 178 307
21,056 25,149NET DEBT (3,229) (4,422)
NON-FINANCIAL ASSETSDeferred costs on hedging 27 29
UNFUNDED LIABILITY (Notes 1, 3, 12) $ (3,202) $ (4,393)Contingencies (Note 13)
PUBLIC ACCOUNTS, 2016-2017 1-109
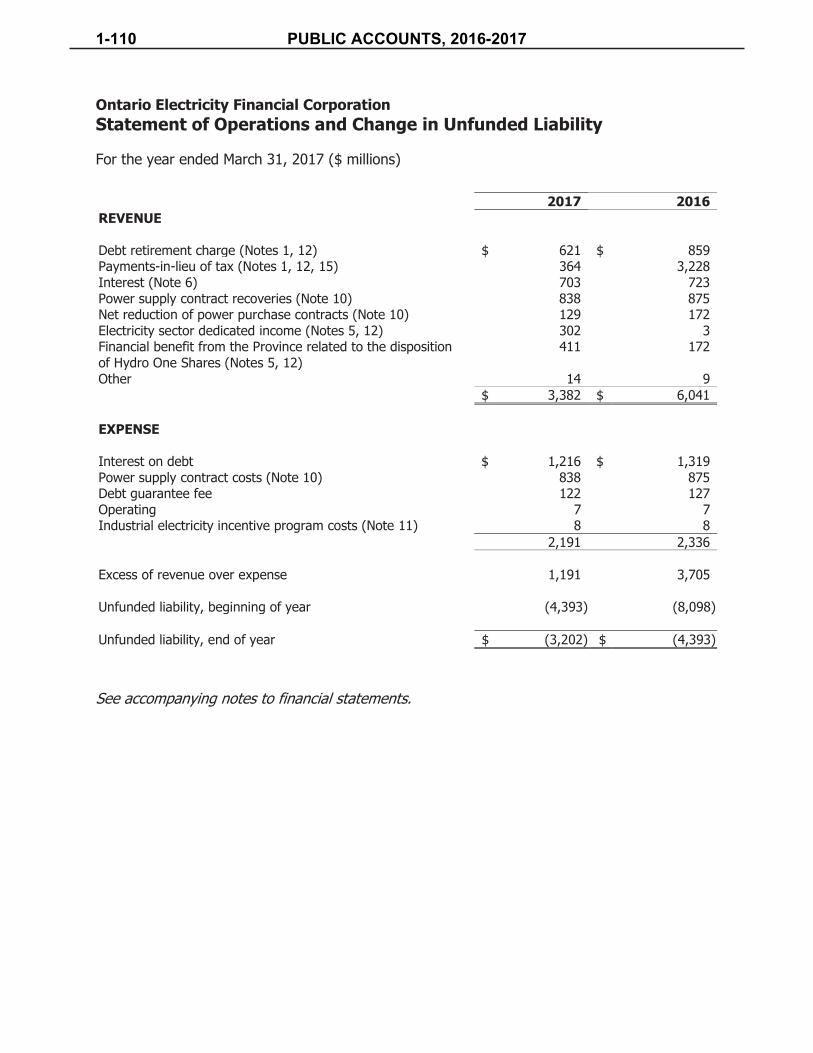
Ontario Electricity Financial CorporationStatement of Operations and Change in Unfunded Liability
For the year ended March 31, 2017 ($ millions)
See accompanying notes to financial statements.
2017 2016REVENUE
Debt retirement charge (Notes 1, 12) $ 621 $ 859Payments-in-lieu of tax (Notes 1, 12, 15) 364 3,228Interest (Note 6) 703 723Power supply contract recoveries (Note 10) 838 875Net reduction of power purchase contracts (Note 10) 129 172Electricity sector dedicated income (Notes 5, 12) 302 3Financial benefit from the Province related to the disposition of Hydro One Shares (Notes 5, 12)
411 172
Other 14 9$ 3,382 $ 6,041
EXPENSE
Interest on debt $ 1,216 $ 1,319 Power supply contract costs (Note 10) 838 875Debt guarantee fee 122 127Operating 7 7Industrial electricity incentive program costs (Note 11) 8 8
2,191 2,336
Excess of revenue over expense 1,191 3,705
Unfunded liability, beginning of year (4,393) (8,098)
Unfunded liability, end of year $ (3,202) $ (4,393)
1-110 PUBLIC ACCOUNTS, 2016-2017

Ontario Electricity Financial CorporationStatement of Cash Flow
For the year ended March 31, 2017 ($ millions)
See accompanying notes to financial statements.
2017 2016CASH FLOWS USED IN OPERATING ACTIVITIES
Excess of revenue over expense $ 1,191 $ 3,705Adjustments for:
Decrease in accounts receivable (Note 4) 176 61Decrease (increase) in interest receivable 5 (1)Decrease in due from province of Ontario (Note 5) 704 622Decrease in accounts payable and accrued liabilities (Note 7) (11) (23)(Decrease) increase in interest payable (21) 6Net increase in debt from revaluation 22 6Net reduction of power purchase contracts (Note 10) (129) (172)Decrease (increase) in deferred costs on hedging 2 (30)Other items 7 1
Cash provided from operations $ 1,946 $ 4,175
CASH FLOWS FROM INVESTING ACTIVITIESNet proceeds from (purchase of) investments 857 (3,413)
CASH FLOWS FROM FINANCING ACTIVITIES
Long-term debt issued $ – $ 1,073Long-term debt retired (2,978) (2,033)Short-term debt retired, net (976) (21)Note receivable repayment, net 1,142 230
Cash required by financing activities (2,812) (751)
(Decrease) increase in cash (9) 11Cash, beginning of year 12 1
Cash, end of year $ 3 $ 12
Interest on debt paid during the period and included in excess of revenue over expense $ 1,237 $ 1,313
PUBLIC ACCOUNTS, 2016-2017 1-111

Notes to Financial Statements
1) Nature of Operations
Effective April 1, 1999, pursuant to the Electricity Act, 1998 (the Act), Ontario Hydro was continued as a corporation without share capital under the name “Ontario Electricity Financial Corporation” (OEFC or Corporation). The Corporation is one of five entities established by the Act as part of the restructuring of the former Ontario Hydro. It is exempt from federal and provincial income taxes under paragraph 149(1)(d) of the Income Tax Act (Canada).
OEFC is a Crown agency whose mandate includes:managing the debt and administering the assets, liabilities, rights and obligations ofOntario Hydro not transferred to other successor entities and managing the former OntarioHydro’s non-utility generator (NUG) contracts;providing financial assistance to the successor corporations of Ontario Hydro; andentering into financial and other agreements relating to the supply and demandmanagement of electricity in Ontario.
These other successor entities are:
Ontario Power Generation (OPG), an electricity generation company;Hydro One, a regulated electricity transmission and distribution company;Independent Electricity System Operator (IESO), the regulated, independent system operatorresponsible for directing system operations, operating the electricity market, planning for andsecuring resources to meet medium and long-term energy needs, and coordinatingconservation efforts; andElectrical Safety Authority (ESA), which performs a regulatory function related to electricalinspections.
On April 1, 1999, the Ministry of Finance determined that the estimated value of the assets being transferred to the new entities was $17.2 billion, which was exceeded by the former Ontario Hydro’s total debt and other liabilities of $38.1 billion. OPG, Hydro One (and their subsidiaries) and the IESO were transferred assets valued at $8.5 billion, $8.6 billion and $78 million respectively in exchange for debt payable to OEFC. The resulting shortfall of $20.9 billion was determined by the Ministry of Finance to be “stranded debt.” After adjusting for $1.5 billion in loans and other assets retained by OEFC, $19.4 billion was the unfunded liability reflected on the OEFC opening balance sheet.
To allow OEFC to service and retire $38.1 billion in total debt including the $20.9 billion in stranded debt, the Province established a long-term plan where debt service and repayment would be through dedicated revenues from electricity-sector companies. This would be broken down for the electricity sector as follows:
Notes receivable from the Province, OPG, Hydro One and IESO;Payments in lieu of taxes (PILs), which are equivalent to the corporate income, propertyand capital taxes paid by private corporations;Debt retirement charge (DRC) paid by electricity consumers; and
1-112 PUBLIC ACCOUNTS, 2016-2017

The cumulative combined profits of OPG and Hydro One (proportionate to the Province’sownership share) in excess of the government’s annual interest cost of its investments inthe two companies.
As of April 1, 1999, the present value of the future PILs and the cumulative combined profits of OPG and Hydro One in excess of the government’s $520 million annual interest cost of its investments in the two companies to be dedicated to OEFC was estimated at $13.1 billion. As a result, subtracting the $13.1 billion from the stranded debt of $20.9 billion resulted in an initial estimate of $7.8 billion, for the residual stranded debt.
The Act provided for the DRC to be paid by electricity consumers until the residual stranded debt was retired. The 2014 Budget announced that the government would remove the DRC from residential users’ electricity bills as of January 1, 2016. At March 31, 2014, the residual stranded debt was $2.6 billion. In addition, the 2015 Fall Economic Statement announced the proposed removal of the DRC for all commercial, industrial and all other electricity consumers as of April 1, 2018. Pursuant to this announcement, the Electricity Act, 1998 was amended by the Budget Measures Act, 2015 and all reference to the “stranded debt” and “residual stranded debt” were removed. This also included the removal of the requirement to determine the residual stranded debt from time-to-time and the regulation-making authority for O. Reg. 89/12 – rendering the regulation obsolete.
2) Summary of Significant Accounting Policies
(a)Basis of AccountingAs OEFC is a government organization, these financial statements are prepared in accordancewith Canadian public sector accounting standards.
(b)Net Debt PresentationA statement of changes in net debt is not presented since this information is readily apparent. Acomparison between budget and actual has been excluded due to the unique nature of OEFC’srevenues and expenses over which the agency has minimal control. OEFC is a passive recipientof revenues that it receives on the basis of either legislation (e.g., DRC, GRC, PILs, recovery ofNUG contractual costs) or allocated by the Province at its discretion (ESDI).
(c) Measurement UncertaintyUncertainty in the determination of the amount at which an item is recognized in the financialstatements is known as measurement uncertainty. Such uncertainty exists when it is reasonablypossible there could be a material variance between the recognized amount and anotherreasonably possible amount, as there is whenever estimates are used. Measurement uncertaintyin these financial statements exists in the valuation of the power purchase contracts andpayments-in-lieu of tax revenue, payments-in-lieu of tax receivable and tax refundable. Estimatesare based on the best information available at the time of preparation of the financial statements.
(d)InvestmentsInvestments include term deposits held with the Province recorded at cost and mature within oneyear.
PUBLIC ACCOUNTS, 2016-2017 1-113

(e)Revenue RecognitionThe main sources of revenue are:
Debt retirement charge (DRC) from ratepayers is recognized in the period earnedbased on the consumption of electricity.Payments-in-lieu of taxes (PILs) are recognized in the period that they are earnedfrom OPG, Hydro One and municipal electric utilities. Also included under PILs are GrossRevenue Charge amounts and amounts allocated by the Province to OEFC equal toprovincial corporate income taxes payable by Hydro One Inc. (post – IPO).Interest income is recognized in the period it is earned on notes receivable from theProvince, OPG, IESO, and NUGs.Power supply contract recoveries are recognized as recovered at the same amountas the costs incurred on the Power supply contracts.Electricity sector dedicated income is allocated at the discretion of the Province ofOntario, using the cumulative combined net income of OPG and Hydro One Limited(related to the Province’s ownership share) and Brampton Distribution Holdco Inc. inexcess of the Province’s interest costs of its investment.Provincial allocation related to the sale of Hydro One is recognized in accordancewith section 50.3 of the Electricity Act, 1998 where OEFC receives a benefit as a resultof the sales of Hydro One shares.
(f) Financial InstrumentsThe corporation’s financial assets and liabilities are accounted for as follows:
Cash and investments are subject to an insignificant risk of change in value so carryingvalue approximates fair value.
Accounts Receivable, Due from Province and Notes and Loans Receivable are recorded atcost.
Debt is composed of short, medium and long-term bonds, notes and debentures. Debtdenominated in foreign currencies that has been hedged is recorded at the Canadian dollarequivalent using the rates of exchange established by the terms of the hedge agreements.Other foreign currency debt, liabilities and assets are translated to Canadian dollars atyear-end rates of exchange and, in accordance with Canadian public sector accountingstandards, any exchange gains or losses are deferred and amortized over the remainingterm to maturity.
Discounts, premiums and commissions arising from the issuance of debt or the acquisitionof debt prior to maturity are deferred and amortized to operations over the life of theunderlying debt. Unamortized debt issue costs are included in total debt.
Derivatives are financial contracts the value of which is derived from underlyinginstruments. OEFC uses derivatives for the purpose of hedging and to minimize interestcosts. Hedges are created primarily through swaps, which are legal arrangements underwhich OEFC agrees with another party to exchange cash flows based upon one or morenotional amounts during a specified period. Other derivative instruments used by OEFCinclude forward foreign exchange contracts, forward rate agreements, futures and
1-114 PUBLIC ACCOUNTS, 2016-2017

options. Derivatives are recognized at cost on the date on which derivatives are entered and are not subsequently re-measured at fair value at each reporting date.
(g)Debt guarantee feeA fee equal to 0.5 per cent is payable to the Province annually based on the principal amount ofnotes, debentures and other indebtedness of the Corporation owed to the Province orguaranteed by the Province excluding adjustments to debt related to unrealized foreignexchange gains and debt issue costs.
(h)Deferred Costs on HedgingFees and other costs from debt related derivatives are deferred and amortized to operations overthe life of the underlying debt. Unamortized amounts are classified under non-financial assets.
(i) Accounts payable and accrued LiabilitiesAccounts payable relate to normal business transactions with third-party suppliers and are subjectto standard commercial terms.
(j) Power Purchase ContractsThe liability for power purchase contracts was originally calculated by discounting estimatedlosses over the life of the contracts. Under the Electricity Restructuring Act, 2004, OEFC beganreceiving actual contract prices for power from electricity consumers, effective January 1, 2005,and no longer incurs losses on these power purchase contracts. At that time, the decision wasmade to amortize the liability to revenue over the period when most existing electricity contractsexpire with the liability fully eliminated in fiscal 2021–22.
3) Going Concern
OEFC is dependent on the Province to borrow funds to finance maturing debt and to cover any cash shortfalls in the Corporation, and on OPG repaying its outstanding notes receivable. It is also dependent on the government’s long-term plan to defease the unfunded liability as described in Note 12.
4) Accounts Receivable
As at March 31 ($ millions) 2017 2016Debt retirement charge $ 91 $ 91Payments-in-lieu of tax 109 284Power supply contract recoveries 85 83Other receivables 5 8Total $ 290 $ 466
PUBLIC ACCOUNTS, 2016-2017 1-115

5) Due from the Province
In 1999, the Province put in place a policy commitment to allocate annually the combined net income of OPG and Hydro One in excess of the Province’s interest cost of its investment in its electricity subsidiaries to OEFC. Under these arrangements, the Province recoups all costs associated with its investments in electricity subsidiaries on a cumulative basis before any of the combined net income is allocated to and recognized by OEFC.
For the year ended March 31, 2017, for the purposes of Electricity Sector Dedicated Income, the Province’s combined net income of OPG, Hydro One Limited and Brampton Distribution Holdco Inc. was $816 million (2016 – $ 523 million). After deducting the Province’s $514 million interest cost of its investment in these subsidiaries (2016 – $520 million), the Province at its discretion allocated to OEFC electricity sector dedicated income of $287 million (2016 – $3 million). OEFC however, is reporting $302 million which includes, estimated income allocated from Brampton Distribution Holdco Inc. (Hydro One Brampton) of $15 million (2016 – $ 15 million) which, at the time of preparation of these statements, had not yet been finalized and approved by the Province as part of the discretionary allocation of ESDI to OEFC (the agency will be requesting provincial approval in due course) but is included in ESDI to ensure consistency and comparability with prior periods. During fiscal 2016–17, the Province paid $1,270 million to OEFC which reduced the balance due.
Section 50.3 of the Electricity Act, 1998 governs the payments to be made to the Corporation in respect of the disposition of any securities of Hydro One. For fiscal 2016–17, OEFC recognized $411 million from the Province under section 50.3 in connection with Hydro One share sales (2016 – $172 million). During fiscal 2016–17, the Province settled $172 million of the amount due through a remission of short-term debt that OEFC held with the Province.
In addition, section 91.2 of the Electricity Act requires the Province to pay to the Corporation an amount equal to the amount of tax payable under the Taxation Act, 2007 by Hydro One Inc. (or subsidiaries). For fiscal 2016–17, OEFC has recognized $24.8 million under section 91.2 (2016 – $2.9 million, for November 5 – December 31, 2015 post Hydro One IPO).
As at March 31 ($ millions) 2017 2016Electricity sector dedicated income $ 3,138 $ 4,106Financial benefit related to disposition of Hydro One shares
411 172
Amount equal to Hydro One Inc. provincial income tax
28 3
Total $ 3,577 $ 4,281
1-116 PUBLIC ACCOUNTS, 2016-2017
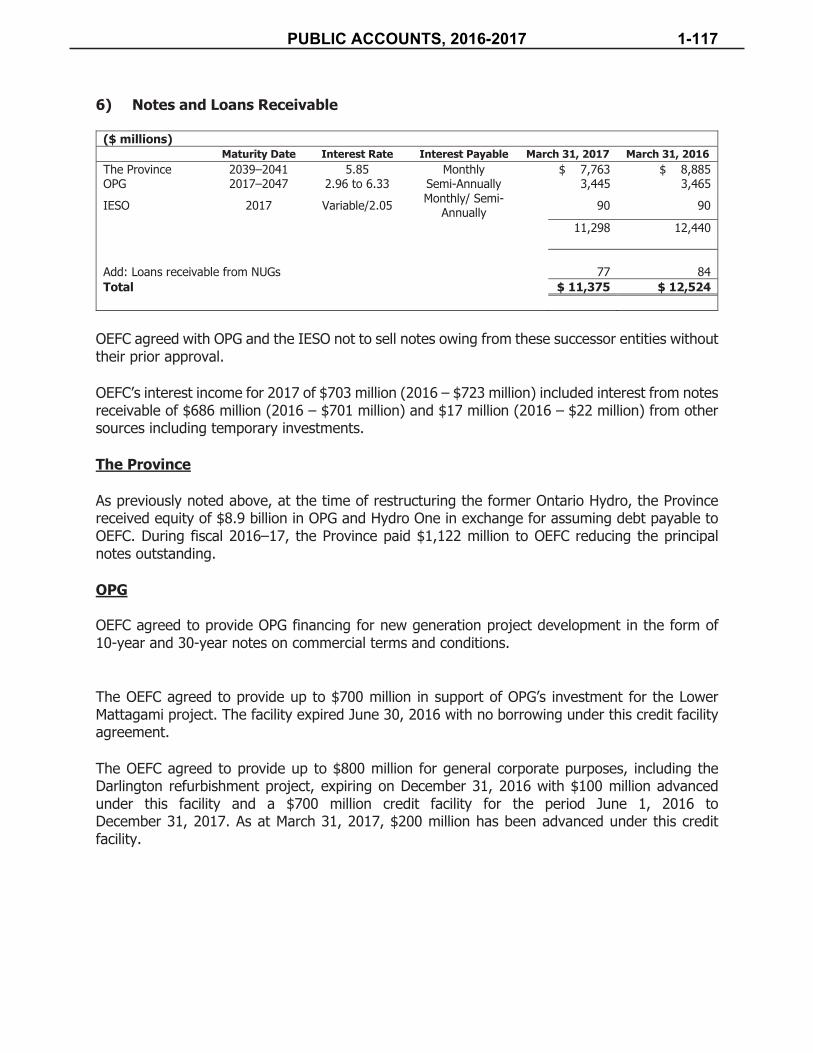
6) Notes and Loans Receivable
($ millions)Maturity Date Interest Rate Interest Payable March 31, 2017 March 31, 2016
The Province 2039–2041 5.85 Monthly $ 7,763 $ 8,885OPG 2017–2047 2.96 to 6.33 Semi-Annually 3,445 3,465
IESO 2017 Variable/2.05 Monthly/ Semi-Annually 90 90
11,298 12,440
Add: Loans receivable from NUGs 77 84Total $ 11,375 $ 12,524
OEFC agreed with OPG and the IESO not to sell notes owing from these successor entities without their prior approval.
OEFC’s interest income for 2017 of $703 million (2016 – $723 million) included interest from notes receivable of $686 million (2016 – $701 million) and $17 million (2016 – $22 million) from other sources including temporary investments.
The Province
As previously noted above, at the time of restructuring the former Ontario Hydro, the Province received equity of $8.9 billion in OPG and Hydro One in exchange for assuming debt payable to OEFC. During fiscal 2016–17, the Province paid $1,122 million to OEFC reducing the principal notes outstanding.
OPG
OEFC agreed to provide OPG financing for new generation project development in the form of 10-year and 30-year notes on commercial terms and conditions.
The OEFC agreed to provide up to $700 million in support of OPG’s investment for the Lower Mattagami project. The facility expired June 30, 2016 with no borrowing under this credit facility agreement.
The OEFC agreed to provide up to $800 million for general corporate purposes, including the Darlington refurbishment project, expiring on December 31, 2016 with $100 million advanced under this facility and a $700 million credit facility for the period June 1, 2016 to December 31, 2017. As at March 31, 2017, $200 million has been advanced under this credit facility.
PUBLIC ACCOUNTS, 2016-2017 1-117
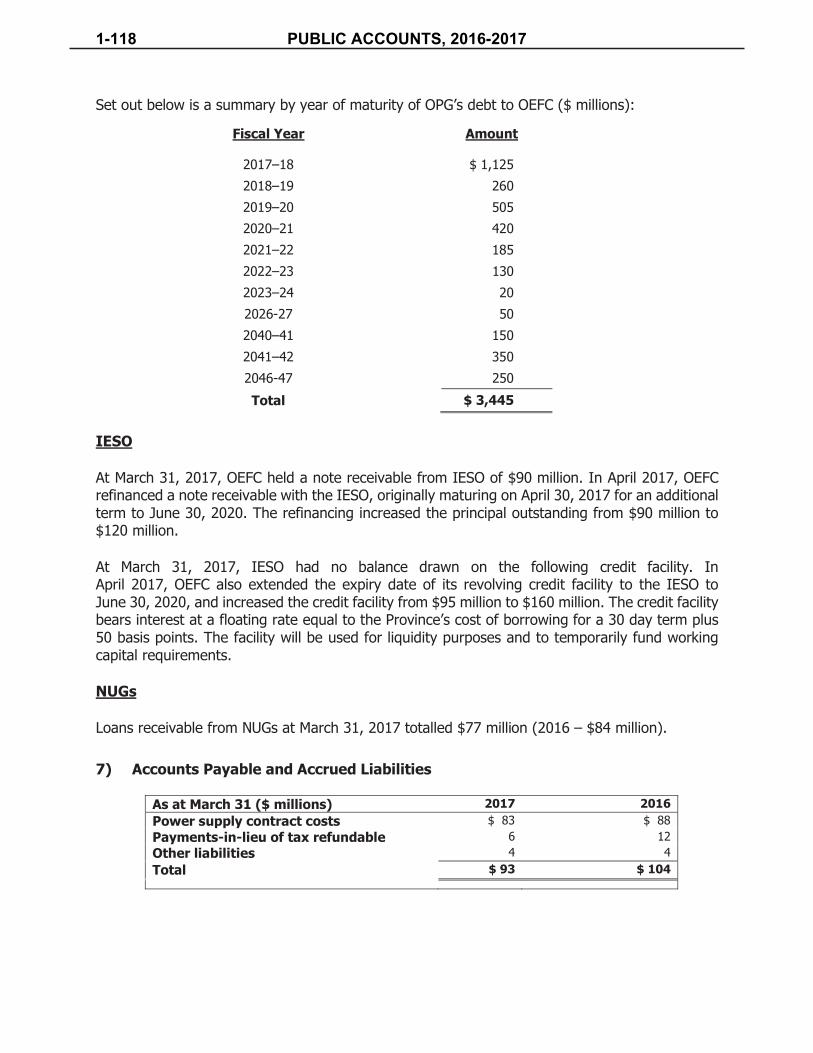
Set out below is a summary by year of maturity of OPG’s debt to OEFC ($ millions):
Fiscal Year Amount
2017–18 $ 1,1252018–19 2602019–20 5052020–21 4202021–22 1852022–23 1302023–24 202026-27 502040–41 1502041–42 3502046-47 250Total $ 3,445
IESO
At March 31, 2017, OEFC held a note receivable from IESO of $90 million. In April 2017, OEFC refinanced a note receivable with the IESO, originally maturing on April 30, 2017 for an additional term to June 30, 2020. The refinancing increased the principal outstanding from $90 million to $120 million.
At March 31, 2017, IESO had no balance drawn on the following credit facility. In April 2017, OEFC also extended the expiry date of its revolving credit facility to the IESO to June 30, 2020, and increased the credit facility from $95 million to $160 million. The credit facility bears interest at a floating rate equal to the Province’s cost of borrowing for a 30 day term plus 50 basis points. The facility will be used for liquidity purposes and to temporarily fund working capital requirements.
NUGs
Loans receivable from NUGs at March 31, 2017 totalled $77 million (2016 – $84 million).
7) Accounts Payable and Accrued Liabilities
As at March 31 ($ millions) 2017 2016Power supply contract costs $ 83 $ 88Payments-in-lieu of tax refundable 6 12Other liabilities 4 4Total $ 93 $ 104
1-118 PUBLIC ACCOUNTS, 2016-2017
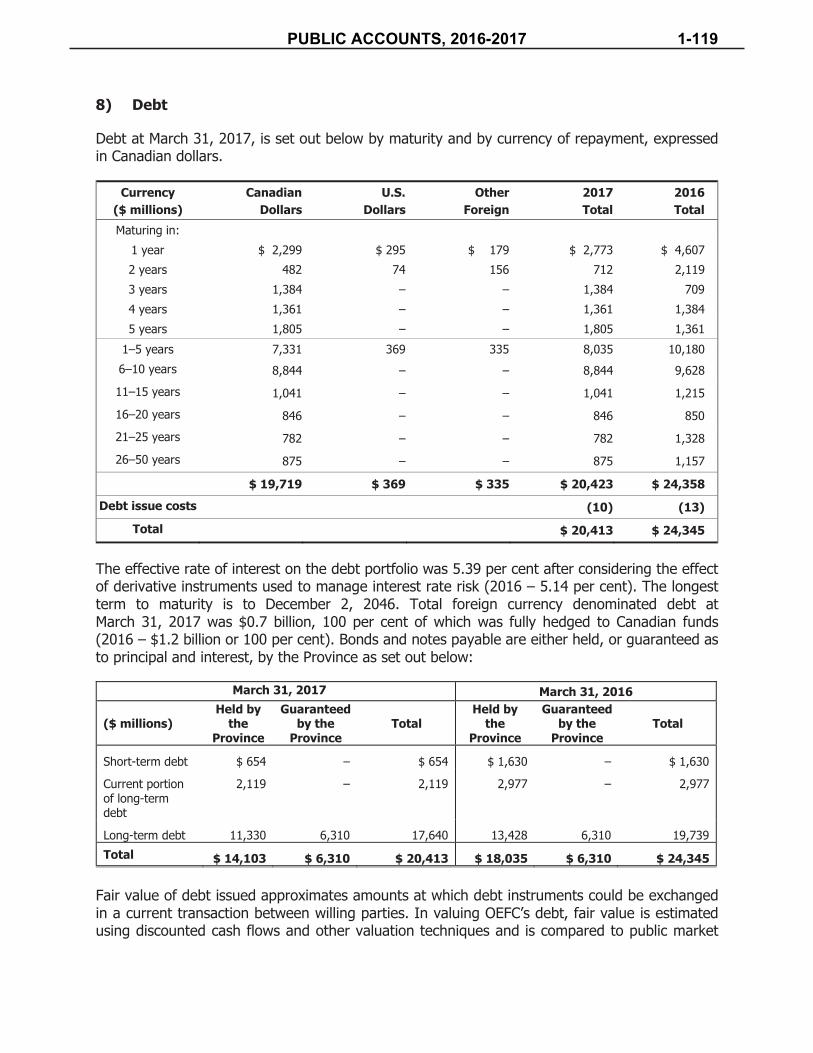
8) Debt
Debt at March 31, 2017, is set out below by maturity and by currency of repayment, expressed in Canadian dollars.
Currency ($ millions)
CanadianDollars
U.S.Dollars
OtherForeign
2017Total
2016Total
Maturing in:1 year $ 2,299 $ 295 $ 179 $ 2,773 $ 4,6072 years 482 74 156 712 2,1193 years 1,384 – – 1,384 7094 years 1,361 – – 1,361 1,3845 years 1,805 – – 1,805 1,361
1–5 years 7,331 369 335 8,035 10,1806–10 years 8,844 – – 8,844 9,62811–15 years 1,041 – – 1,041 1,21516–20 years 846 – – 846 85021–25 years 782 – – 782 1,32826–50 years 875 – – 875 1,157
$ 19,719 $ 369 $ 335 $ 20,423 $ 24,358
Debt issue costs (10) (13)
Total $ 20,413 $ 24,345
The effective rate of interest on the debt portfolio was 5.39 per cent after considering the effect of derivative instruments used to manage interest rate risk (2016 – 5.14 per cent). The longest term to maturity is to December 2, 2046. Total foreign currency denominated debt at March 31, 2017 was $0.7 billion, 100 per cent of which was fully hedged to Canadian funds (2016 – $1.2 billion or 100 per cent). Bonds and notes payable are either held, or guaranteed as to principal and interest, by the Province as set out below:
March 31, 2017 March 31, 2016
($ millions)Held by
the Province
Guaranteed by the
ProvinceTotal
Held by the
Province
Guaranteed by the
ProvinceTotal
Short-term debt $ 654 – $ 654 $ 1,630 – $ 1,630
Current portion of long-term debt
2,119 – 2,119 2,977 – 2,977
Long-term debt 11,330 6,310 17,640 13,428 6,310 19,739Total $ 14,103 $ 6,310 $ 20,413 $ 18,035 $ 6,310 $ 24,345
Fair value of debt issued approximates amounts at which debt instruments could be exchanged in a current transaction between willing parties. In valuing OEFC’s debt, fair value is estimated using discounted cash flows and other valuation techniques and is compared to public market
PUBLIC ACCOUNTS, 2016-2017 1-119

quotations where available. These estimates are affected by the assumptions made concerning discount rates and the amount and timing of future cash flows.
The estimated fair value of OEFC debt at March 31, 2017, was $24.5 billion (2016 – $29.3 billion). This is higher than the book value of $20.4 billion (2016 – $24.3 billion) because current interest rates are generally lower than the interest rates at which the debt was issued. The fair value of debt does not reflect the effect of related derivative contracts.
9) Risk Management and Derivative Financial Instruments
OEFC operates within strict risk exposure limits to ensure exposure to risk is managed in a prudent and cost-effective manner. A variety of strategies are used including the use of derivative financial instruments (“derivatives”). Derivatives are financial contracts, the value of which is derived from underlying instruments. OEFC uses derivatives for the purpose of hedging and to minimize interest costs. Hedges are created primarily through swaps, which are legal arrangements under which OEFC agrees with another party to exchange cash flows based upon one or more notional amounts during a specified period. This allows OEFC to offset its existing obligations and thereby effectively convert them into obligations with more desirable characteristics. Other derivative instruments used by OEFC include forward foreign exchange contracts, forward rate agreements, futures and options.
Foreign exchange/currency risk
Foreign exchange or currency risk is the risk foreign currency debt principal and interest payments and foreign currency transactions will vary in Canadian dollar terms due to fluctuations in foreign exchange rates. To manage currency risk, derivative contracts are used to convert foreign currency cash flows into Canadian dollar denominated cash flows. The current policy allows unhedged foreign currency debt principal, net of foreign currency holding, to reach a maximum of 5.0 per cent of total debt. At March 31, 2017, the actual unhedged level was 0.0 per cent of total debt (2016 – 0.0 per cent).
Net Interest Rate Resetting Risk
Net interest rate resetting risk is the exposure to changes in interest rates. Exposure to rate changes is reduced by entering into derivative contracts that convert floating interest payments to fixed interest payments. The current policy allows unhedged floating rate debt and fixed rate debt maturing within the next 12 months, net of liquid reserves, to reach a maximum of 35.0 per cent of total debt.
At March 31, 2017, net interest rate resetting risk as a percentage of total debt was minus 3.1 per cent (2016 – 7.6 per cent).
1-120 PUBLIC ACCOUNTS, 2016-2017
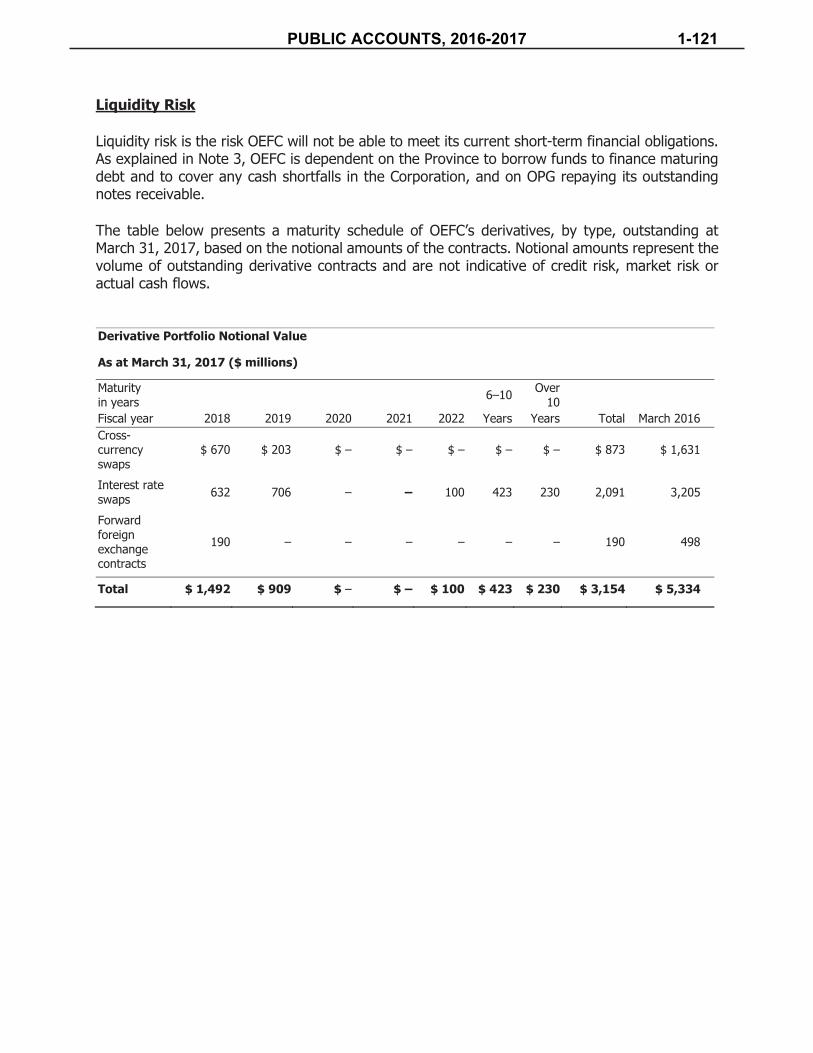
Liquidity Risk
Liquidity risk is the risk OEFC will not be able to meet its current short-term financial obligations. As explained in Note 3, OEFC is dependent on the Province to borrow funds to finance maturing debt and to cover any cash shortfalls in the Corporation, and on OPG repaying its outstanding notes receivable.
The table below presents a maturity schedule of OEFC’s derivatives, by type, outstanding at March 31, 2017, based on the notional amounts of the contracts. Notional amounts represent the volume of outstanding derivative contracts and are not indicative of credit risk, market risk or actual cash flows.
Derivative Portfolio Notional Value
As at March 31, 2017 ($ millions)
Maturity in years 6–10 Over
10Fiscal year 2018 2019 2020 2021 2022 Years Years Total March 2016Cross-currency swaps
$ 670 $ 203 $ – $ – $ – $ – $ – $ 873 $ 1,631
Interest rate swaps 632 706 – – 100 423 230 2,091 3,205
Forward foreign exchange contracts
190 – – – – – – 190 498
Total $ 1,492 $ 909 $ – $ – $ 100 $ 423 $ 230 $ 3,154 $ 5,334
PUBLIC ACCOUNTS, 2016-2017 1-121
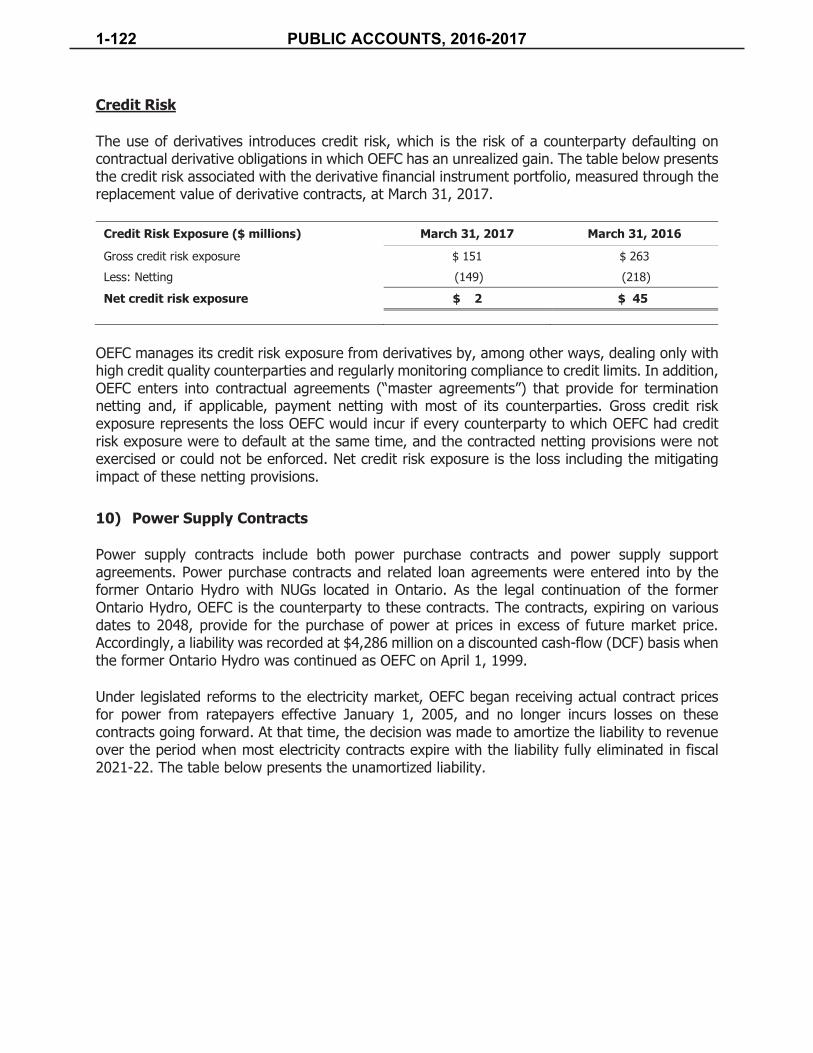
Credit Risk
The use of derivatives introduces credit risk, which is the risk of a counterparty defaulting on contractual derivative obligations in which OEFC has an unrealized gain. The table below presents the credit risk associated with the derivative financial instrument portfolio, measured through the replacement value of derivative contracts, at March 31, 2017.
Credit Risk Exposure ($ millions) March 31, 2017 March 31, 2016
Gross credit risk exposure $ 151 $ 263Less: Netting (149) (218)
Net credit risk exposure $ 2 $ 45
OEFC manages its credit risk exposure from derivatives by, among other ways, dealing only with high credit quality counterparties and regularly monitoring compliance to credit limits. In addition, OEFC enters into contractual agreements (“master agreements”) that provide for termination netting and, if applicable, payment netting with most of its counterparties. Gross credit risk exposure represents the loss OEFC would incur if every counterparty to which OEFC had credit risk exposure were to default at the same time, and the contracted netting provisions were not exercised or could not be enforced. Net credit risk exposure is the loss including the mitigating impact of these netting provisions.
10) Power Supply Contracts
Power supply contracts include both power purchase contracts and power supply support agreements. Power purchase contracts and related loan agreements were entered into by the former Ontario Hydro with NUGs located in Ontario. As the legal continuation of the former Ontario Hydro, OEFC is the counterparty to these contracts. The contracts, expiring on various dates to 2048, provide for the purchase of power at prices in excess of future market price. Accordingly, a liability was recorded at $4,286 million on a discounted cash-flow (DCF) basis when the former Ontario Hydro was continued as OEFC on April 1, 1999.
Under legislated reforms to the electricity market, OEFC began receiving actual contract prices for power from ratepayers effective January 1, 2005, and no longer incurs losses on these contracts going forward. At that time, the decision was made to amortize the liability to revenue over the period when most electricity contracts expire with the liability fully eliminated in fiscal 2021-22. The table below presents the unamortized liability.
1-122 PUBLIC ACCOUNTS, 2016-2017

Statement of Liability for Power Purchase Contracts As at March 31, 2017 ($ millions)
2017 2016Liability, beginning of year $ 307 $ 479Amortization (129) (172)
Liability, end of year $ 178 $ 307
In addition, effective January 1, 2009, OEFC entered into a support contract, the Contingency Support Agreement (CSA), with OPG whereby OPG agreed to maintain the reliability and availability of Lambton and Nanticoke coal-fired stations following implementation of a greenhouse gas emissions-reduction strategy. Under the contract, OEFC agreed to ensure OPG would recover the actual costs of operating the stations after implementing this strategy. Any costs to OEFC under this agreement are fully recovered from ratepayers. As at December 31, 2013, OEFC triggered an early termination clause in the CSA to reflect the advanced closure of these plants by one year to the end of 2013. OPG is allowed to recover actual costs that cannot reasonably be avoided or mitigated, during the period from the early shut down date until December 31, 2014, consistent with the original end date of the CSA.
During the year ended March 31, 2017, OEFC’s costs under power supply contracts totalled $838 million, including purchases of power from NUGs of $840 million (2016 – $865 million) and OPG support contract costs of $2 million recovered related to the settlement of a property tax assessment (2016 – $10 million costs).
Under a decision dated March 12, 2015 the Ontario Superior Court of Justice found that following the enactment of Ontario Regulation 398/10 under which the allocation of the Global Adjustment among electricity consumers was changed effective as of January 1, 2011, the Corporation had incorrectly calculated the price indices under certain power purchase agreements between the Corporation and the applicant non-utility generators (NUGs). In October 2016 the corporation paid $181 million in retroactive payments including interest to the applicant NUGs. Following the January 19, 2017 dismissal of OEFC’s application for leave to appeal by the Supreme Court of Canada from the judgment of the Court of Appeal of Ontario, about $79 million became payable to certain NUGs that were not applicants to the original claim but that entered into standstill agreements with OEFC following the original court decision. All amounts are recoverable from the Global Adjustment via the IESO settlement process.
11) Industrial Electricity Incentive Program Costs
Consistent with its objects, OEFC is supporting the IESO’s electricity demand management program, the Industrial Electricity Incentive (IEI) program. The IEI program assists with the management of electricity demand by encouraging increased industrial production through electricity-based price adjustments. Offered in three streams, qualified participants can receive reduced electricity rates for eligible incremental consumption over a specified term.
PUBLIC ACCOUNTS, 2016-2017 1-123

On March 31, 2014, OEFC entered into a legal agreement, and as amended on May 13, 2015, with the former OPA to support the IEI program. Subsequent to the January 1, 2015 merger of the IESO and the OPA into a new entity, also called the IESO, the contract is now between the IESO and the OEFC. OEFC is providing payments to the IESO to offset the cost of the DRC portion of the electricity bill paid to OEFC on IEI-eligible incremental consumption by IEI participants. The agreement is currently set to be effective until December 31, 2024, with contracts subject to various termination clauses.
The Budget Measure Act, 2015, passed on December 10, 2015 will remove the DRC as of April 1, 2018 for all commercial, industrial and all other electricity consumers. OEFC will no longer provide offsetting payments to the IESO on IEI-eligible incremental electricity consumed beginning April 1, 2018.
12) Unfunded Liability
Pursuant to the Act and consistent with the principles of electricity restructuring, the government has a long-term plan to defease the unfunded liability from funds from the electricity sector.
Prior to the Hydro One IPO (see note 15), these funds included Notes Receivable, PILs, Gross Revenue Charges (GRC), DRC and ESDI.
Following the Hydro One IPO, these funds include Notes Receivable, PILs, GRC, Provincial Corporate Income Taxes allocated by the Province to OEFC from taxes payable by Hydro One Inc. in accordance with The Budget Measures Act, 2015, DRC, ESDI and a financial benefit from the proceeds of the IPO and any future share sales in accordance with section 50.3 of the Electricity Act, 1998.
13) Contingencies
OEFC is involved in various legal actions arising out of the ordinary course and conduct of business. For some claims which relate to the former Ontario Hydro prior to the establishment of OEFC on April 1, 1999, OPG or Hydro One is required to indemnify OEFC for any liability arising from the claim. There are currently no such claims. For claims on which OEFC is provided no indemnification and where the outcome and ultimate disposition of these legal actions is not determinable at this time, the settlements, if any, will be reflected in the period in which settlement occurs.
Prior to October 31, 2015, subject to a $10 million deductible, OEFC agreed to indemnify Hydro One in respect of any adverse claim to title to any asset, right or thing transferred or intended to be transferred to the company at April 1, 1999, and any failure of the transfer order to transfer such assets, rights or things and with respect to payment to or from or other dealing with any equity account of Ontario Hydro, including certain related litigation. Effective October 31, 2015, OEFC and Hydro One, with the consent of the Minister of Finance, terminated this indemnity. A similar indemnity provided to OPG was terminated as of May 31, 2006.
1-124 PUBLIC ACCOUNTS, 2016-2017

14) Related Party Transactions
In the normal course of operations, OEFC has transactions with the following related parties:
a) Province of Ontariob) Ontario Power Generation Inc.c) Hydro One Inc. (for the period up to October 2015) and Hydro One Ltd. (post IPO)d) Independent Electricity System Operator
The Corporation has entered into service level agreements with the following entities:
Ontario Financing Authority
The Ontario Financing Authority (OFA), an agency of the Province responsible for borrowing and investing monies for the Province and other public bodies, provides day-to-day management services to OEFC on a cost-recovery basis of $3.8 million (2016 – $3.7 million).
Ministry of Finance (MOF)
MOF provides revenue collection and reporting services to OEFC on a cost-recovery basis of $1.7 million (2016 – $1.7 million).
15) Broadening Hydro One Ownership
On November 5, 2015, the Province completed the first phase of its plan to broaden Hydro One ownership. It sold about 16 per cent of the Province’s outstanding Hydro One common shares at a price of $20.50 per share, through an IPO and through related share sales to electricity sector union trusts. On November 4, 2015, Hydro One paid a departure tax of $2.6 billion to OEFC as a consequence of leaving the PILs regime. Hydro One also paid a one-time additional PIL of tax payment of $191 million associated with the transaction. The Province also initiated a secondary share offering of Hydro One shares on April 5, 2016 which upon completion reduced the Province’s holdings of Hydro One to approximately 70 per cent.
As a result of the Hydro One IPO, Hydro One and all its subsidiaries are subject to corporate income taxes (CIT). Under the amendments made to the Electricity Act, 1998 in the fall Budget Measures Act, 2015, the Minister of Finance must pay the OEFC an amount equal to provincial tax payable under the Taxation Act, 2007 by Hydro One Inc., to continue to help service and pay down the electricity sector stranded debt.
Proceeds related to the book value of the shares sold and the special dividend payment of $800 million paid by Hydro One to the Province will be used to pay down the Province’s electricity sector debt and other payables. As noted in Notes 5 and 6, OEFC received $2,392 million from the Province during fiscal 2016–17 related to the book value of Hydro One common shares sold in November 2015 and April 2016, of which the Province applied $1,270 million to reduce its payable related to cumulative electricity dedicated earnings (Due from the Province of Ontario) and $1,122 million to reduce the principal amount of notes payable to OEFC that the Province had assumed on acquiring the shares of Hydro One. In February 2016, the Province also paid OEFC the $800 million that it had received as a special dividend from Hydro One prior to the IPO,
PUBLIC ACCOUNTS, 2016-2017 1-125

which the Province applied to reduce its payable related to cumulative electricity sector dedicated earnings (Due from the Province of Ontario).
In accordance with section 50.3 of the Electricity Act, 1998, in the year ended March 31, 2017 OEFC recognized a financial benefit from the Province of $411 million (2016 – $172 million) in connection with the Province’s disposition of Hydro One common shares in April 2016. As noted in Note 5, during fiscal 2016–17, the Province settled $172 million related to the 2016 benefit through a remission of short-term debt that OEFC held with the Province.
On May 17, 2017 the Province announced that it had completed the final public offering of Hydro One shares, selling 120 million common shares at $23.25 per share.
16) Comparative Figures
Certain of the prior year’s comparative figures have been reclassified to conform with the financial statement presentation adopted for the current period.
1-126 PUBLIC ACCOUNTS, 2016-2017

Ontario Energy Board
PUBLIC ACCOUNTS, 2016-2017 1-127
1-128 PUBLIC ACCOUNTS, 2016-2017

PUBLIC ACCOUNTS, 2016-2017 1-129
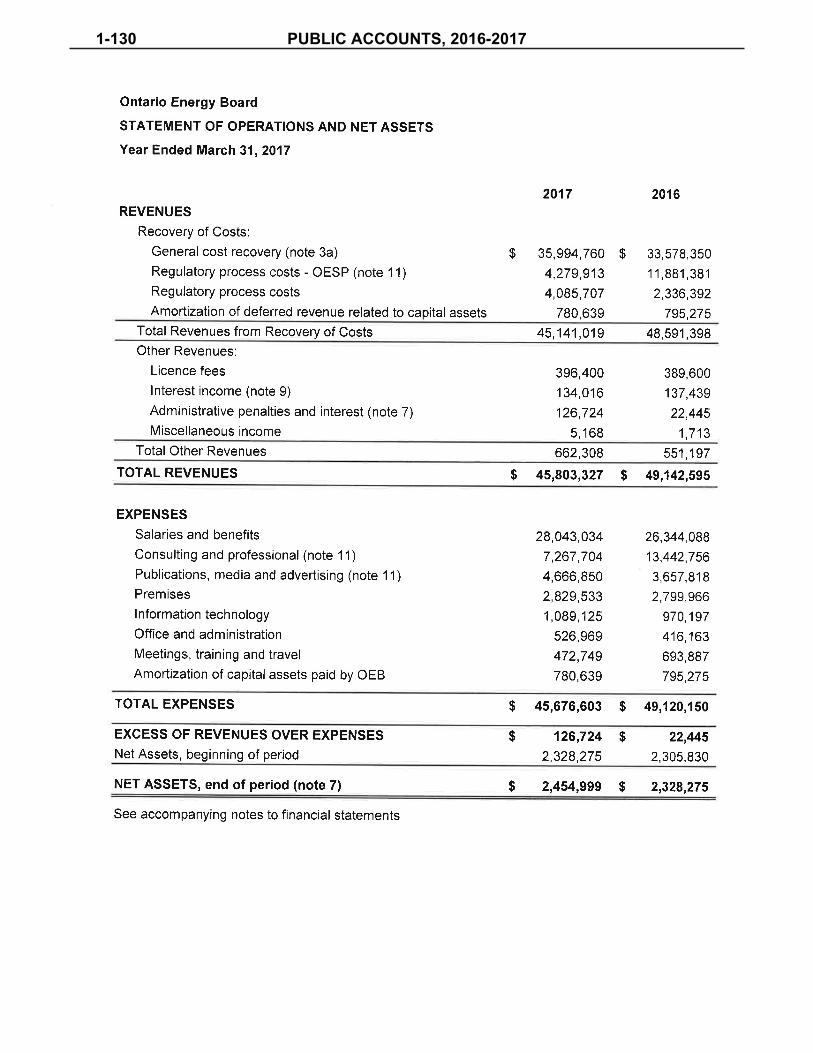
1-130 PUBLIC ACCOUNTS, 2016-2017

PUBLIC ACCOUNTS, 2016-2017 1-131
1-132 PUBLIC ACCOUNTS, 2016-2017

PUBLIC ACCOUNTS, 2016-2017 1-133

1-134 PUBLIC ACCOUNTS, 2016-2017

PUBLIC ACCOUNTS, 2016-2017 1-135
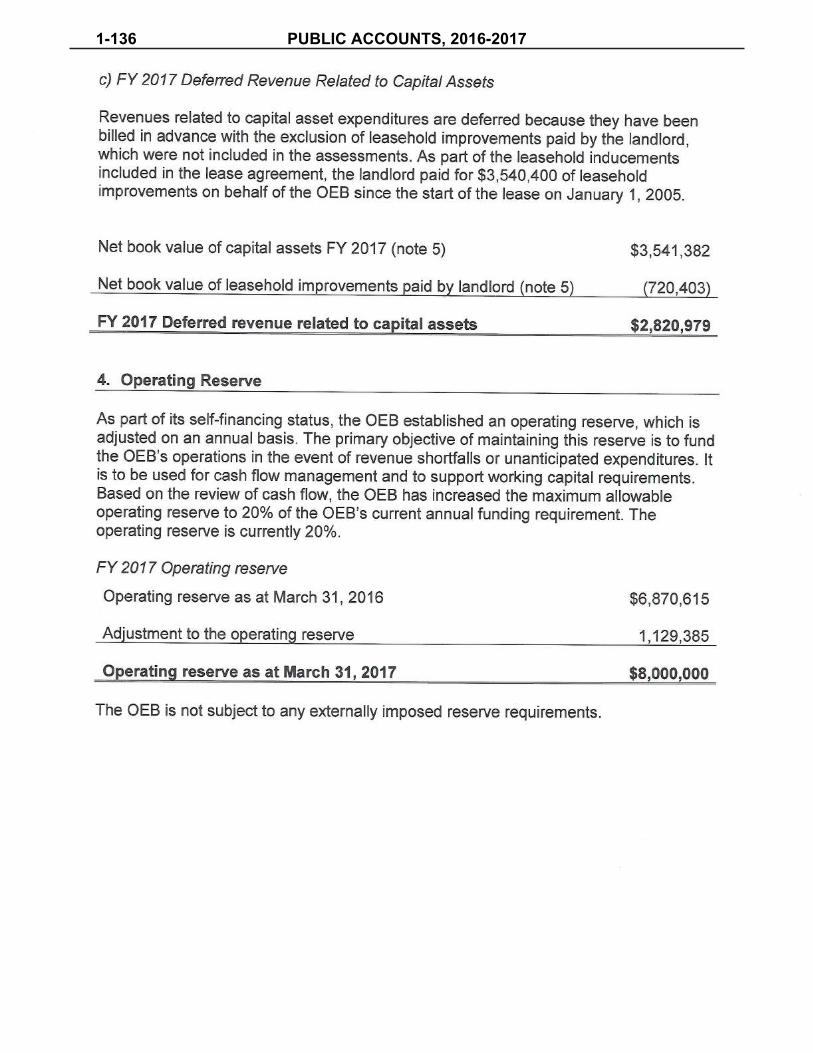
1-136 PUBLIC ACCOUNTS, 2016-2017

PUBLIC ACCOUNTS, 2016-2017 1-137

1-138 PUBLIC ACCOUNTS, 2016-2017
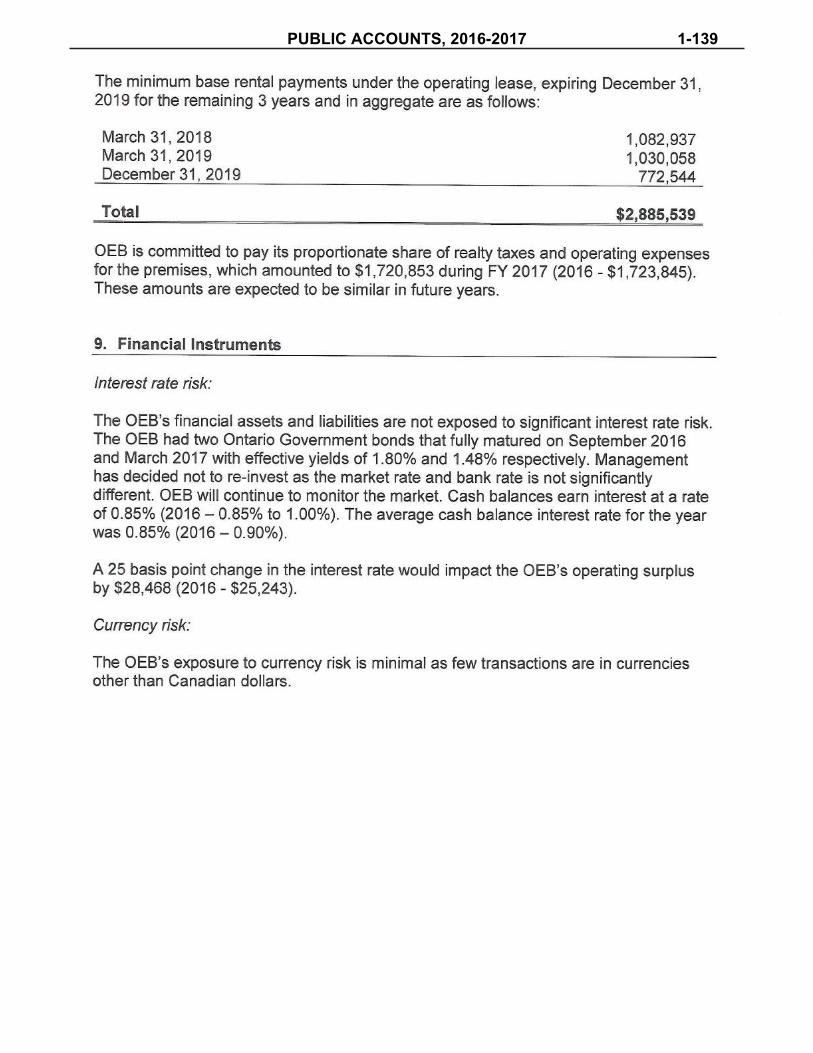
PUBLIC ACCOUNTS, 2016-2017 1-139
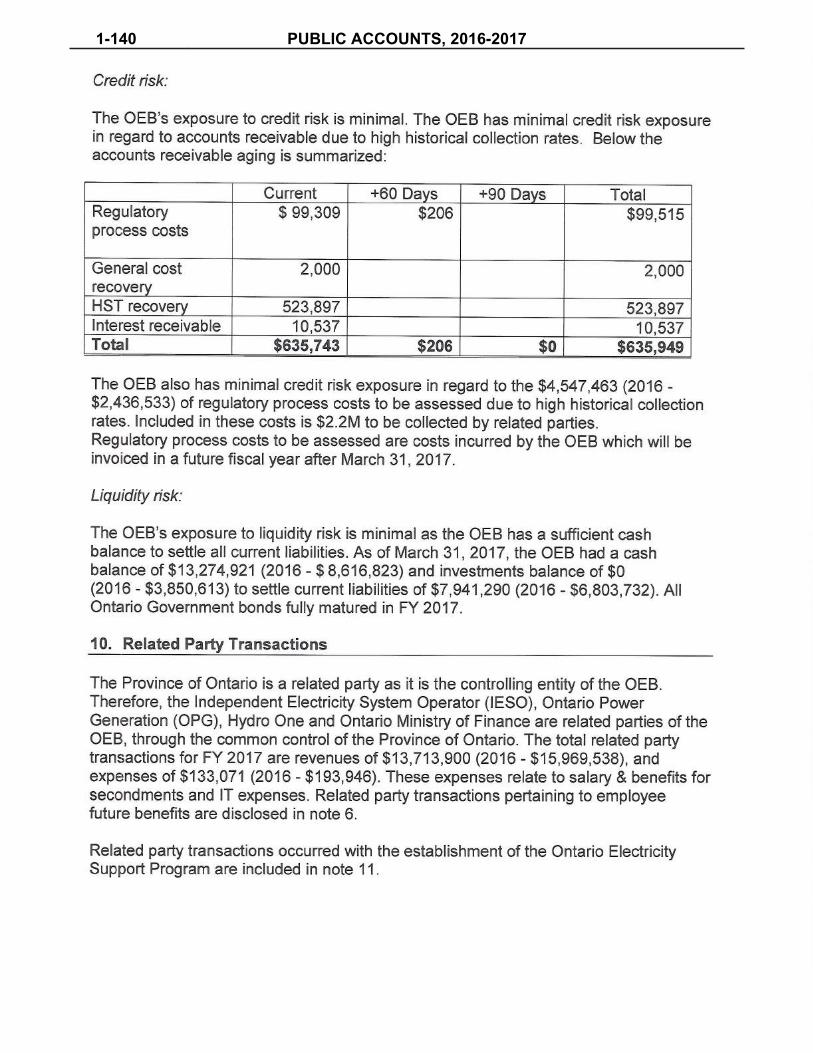
1-140 PUBLIC ACCOUNTS, 2016-2017

PUBLIC ACCOUNTS, 2016-2017 1-141


Financial Statements Responsibility for Financial Reporting
The accompanying Financial Statements of the OFA have been prepared in accordance with Canadian public sector accounting standards. The preparation of the Financial Statements necessarily involves the use of estimates based on management’s judgment, particularly when transactions affecting the current accounting period cannot be finalized with certainty until future periods. The Financial Statements have been properly prepared within reasonable limits of materiality and in light of information available up to June 16, 2017.
Management maintains a system of internal controls designed to provide reasonable assurance that assets are safeguarded and that reliable financial information is available on a timely basis. The system includes formal policies and procedures and an organizational structure that provides for appropriate delegation of authority and segregation of responsibilities. An internal audit function independently evaluates the effectiveness of these internal controls on an ongoing basis and reports its findings to management and the Audit and Risk Management Committee of the Board.
The Board, through the Audit and Risk Management Committee, is responsible for ensuring management fulfils its responsibilities for financial reporting and internal controls. The Audit and Risk Management Committee meets periodically with management, the internal auditors and the external auditor to deal with issues raised by them and to review the financial statements before recommending approval by the Board.
The Financial Statements have been audited by the Auditor General of Ontario. The Auditor General’s responsibility is to express an opinion on whether the Financial Statements are fairly presented in accordance with Canadian public sector accounting standards. The Auditor’s Report, which appears on the following page, outlines the scope of the Auditor’s examination and opinion.
On behalf of management:
Gadi Mayman Chief Executive Officer
Ken Kandeepan Chief Financial and Risk Officer
ONTARIO FINANCING AUTHORITY
PUBLIC ACCOUNTS, 2016-2017 1-143
Auditor’s Report
Office of the Auditor General of Ontario Bureau du vérificateur général de l’Ontario
Independent Auditor’s Report
To the Ontario Financing Authority and to the Minister of Finance
I have audited the accompanying financial statements of the Ontario Financing Authority, which comprise the statement of financial position as at March 31, 2017, and the statements of operations, changes in net financial assets and cash flow for the year then ended, and a summary of significant accounting policies and other explanatory information.
Management’s Responsibility for the Financial Statements
Management is responsible for the preparation and fair presentation of these financial statements in accordance with Canadian public sector accounting standards, and for such internal control as management determines is necessary to enable the preparation of financial statements that are free from material misstatement, whether due to fraud error.
Auditor’s Responsibility
My responsibility is to express an opinion on these financial statements based on my audit. I conducted my audit in accordance with Canadian generally accepted auditing standards. Those standards require that I comply with ethical requirements and plan and perform the audit to obtain reasonable assurance about whether the financial statements are free from material misstatement.
An audit involves performing procedures to obtain audit evidence about the amounts and disclosures in the financial statements. The procedures selected depend on the auditor’s judgment, including the assessment of the risks of material misstatement of the financial statements, whether due to fraud or error. In making those risk assessments, the auditor considers internal control relevant entity’s preparation and fair presentation of the financial statements in order to design audit procedures that are appropriate in the circumstances, but not for the purpose of expressing an opinion on the effectiveness of the entity’s internal control. An audit also includes evaluating the appropriateness of accounting policies used and the reasonableness of accounting estimates made by management, as well as evaluating the overall presentation of the financial statements.
I believe that the audit evidence I have obtained is sufficient and appropriate to provide a basis for my audit opinion.
Opinion
In my opinion, the financial statements present fairly, in all material respects, the financial position of the Ontario Financing Authority as at March 31, 2017 and the results of its operations, its change in net financial assets and its cash flow for the year then ended in accordance with Canadian public sector accounting standards.
Toronto, OntarioJune 16, 2017
Bonnie Lysyk, MBA, CPA, CA, LPAAuditor General
1-144 PUBLIC ACCOUNTS, 2016-2017

ONTARIO FINANCING AUTHORITY Statement of Financial Position As at March 31, 2017
( in thousands of dollars ) 2017 2016
FINANCIAL ASSETS Cash $ 21,664 $ 18,400
Due from agencies & related parties (Note 6) (c) 3,555 3,088
Due from the Province of Ontario 1,743 1,919
26,962 23,407
LIABILITIES Accounts payable and accrued liabilities 1,743 1,919
Due to the Province of Ontario 1,422 1,346
Deferred revenue (Note 3) 1,504 1,551
4,669 4,816
Net financial assets 22,293 18,591
NON-FINANCIAL ASSETS Tangible capital assets (Note 2) 1,196 1,201
Prepaid expenses 308 350
1,504 1,551
Accumulated surplus $ 23,797 $ 20,142
See accompanying notes to financial statements.
Approved on behalf of the Board of Directors:
Scott Thompson Chair
Gadi Mayman Chief Executive Officer
PUBLIC ACCOUNTS, 2016-2017 1-145

ONTARIO FINANCING AUTHORITY Statement of Operations For the year ended March 31, 2017
( in thousands of dollars ) 2017 2017 2016
Budget Actual Actual
REVENUE
Cost recovery from the Province of Ontario (Note 4) $ 21,326 $ 18,280 $ 18,268 Cost recovery from Agencies & related parties (Note 6) (c) 4,861 4,841 4,753 Amortization of deferred capital contributions (Note 3) 881 831 782
Interest revenue (Note 5) 3,003 3,655 3,364
30,071 27,607 27,167
EXPENSES
Salaries, wages and benefits 21,250 19,257 19,098
Administrative and general 4,937 3,864 3,923
Amortization of tangible capital assets (Note 3) 881 831 782
27,068 23,952 23,803
Annual surplus 3,003 3,655 3,364
Accumulated surplus at beginning of year 20,142 20,142 16,778
Accumulated surplus at end of year $ 23,145 $ 23,797 $ 20,142
See accompanying notes to financial statements.
1-146 PUBLIC ACCOUNTS, 2016-2017

ONTARIO FINANCING AUTHORITY Statement of Change in Net Financial Assets For the year ended March 31, 2017
2017 2017 2016 ( in thousands of dollars ) Budget Actual Actual
Annual Surplus $ 3,003 $ 3,655 $ 3,364
Acquisition of tangible capital assets (Note 3) (865) (826) (722)
Amortization of tangible capital assets (Note 3) 881 831 782
Prepaid expenses – 42 22
Change in net financial assets 3,019 3,702 3,446
Net financial assets at beginning of year 18,591 18,591 15,145
Net assets at end of year $ 21,610 $ 22,293 $ 18,591
See accompanying notes to financial statements.
PUBLIC ACCOUNTS, 2016-2017 1-147

ONTARIO FINANCING AUTHORITY Statement of Cash Flow For the year ended March 31, 2017
( in thousands of dollars ) 2017 2016
Operating transactions
Annual Surplus $ 3,655 $ 3,364
Amortization of Tangible Capital Assets 831 782
Increase in due from agencies & related parties (467) (247)
Decrease/ (Increase) in due from the Province 176 (122)
(Decrease)/ Increase in Accounts Payable (176) 122
Decrease in prepaid expenses 42 22
Increase in recoveries payable to the Province 76 5
Decrease in deferred revenue (47) (82)
Cash provided by operating transactions 4,090 3,844
Capital transactions
Cash used to acquire tangible capital assets (826) (722)
Cash applied to capital transactions (826) (722)
Increase in cash 3,264 3,122
Cash at beginning of year 18,400 15,278
Cash at end of year $ 21,664 $ 18,400
See accompanying notes to financial statements.
1-148 PUBLIC ACCOUNTS, 2016-2017
ONTARIO FINANCING AUTHORITY Notes to Financial Statements For the year ended March 31, 2017
BACKGROUND
The Ontario Financing Authority (the “OFA”) was established as an agency, of the Crown, on November 15, 1993, by the Capital Investment Plan Act, 1993 (the "Act"). In accordance with the Act, the OFA:
conducts borrowing, investment and financial risk management for the Province of Ontario (“theProvince”);manages the Provincial debt;provides centralized financial services for the Province including banking and cash management;advises ministries, Crown agencies and other public bodies on financial policies and projects;assists Crown agencies and other public bodies to borrow and invest money;acts at the direction of the Province in lending to certain public bodies;invests on behalf of some public bodies;with Ontario Power Generation Inc. (OPG), manages the investment activities of OPG’s Used FuelSegregated Fund and Decommissioning Segregated Fund; andcarries out the day-to-day operations of Ontario Electricity Financial Corporation (OEFC) and providesa broad range of financial services to Ontario Infrastructure and Lands Corporation (InfrastructureOntario).
In addition, the OFA’s objects include: providing such other financial services as are considered advantageous to the Province or any public body;andany additional objects as directed by the Lieutenant Governor in Council.
The OFA is a corporation established under the laws of Ontario. The OFA is exempt from federal and provincial income taxes under paragraph 149(1)(d) of the Income Tax Act (Canada).
1. SIGNIFICANT ACCOUNTING POLICIES
(a) Basis of Accounting: These financial statements are prepared by management in accordancewith Canadian Public Sector Accounting Standards for provincial reporting entities establishedby the Canadian Public Sector Accounting Board.
(b) Tangible capital assets: Tangible capital assets are stated at cost. Amortization is providedusing the straight-line method over the estimated useful life of the asset, as listed below.
Furniture and equipment 5 years Computer hardware 3 years Leasehold improvements Term of lease
PUBLIC ACCOUNTS, 2016-2017 1-149

Funding received from the Province for the acquisition of tangible capital assets is recorded as deferred revenue and amortized to cost recovery on the same basis as the tangible capital assets.
(c) Measurement uncertainty: The preparation of financial statements in accordance withCanadian public sector accounting standards requires management to make estimates andassumptions that affect the reported amounts of assets and liabilities at the date of the financialstatements, and the reported amounts of revenues and expenses during the reporting period. Itemsrequiring the use of significant estimates include: useful life of tangible capital assets, accruals and theaccrued benefit obligation. Estimates are based on the best information available at the time ofpreparation of the financial statements and are reviewed annually to reflect new information as itbecomes available. Measurement uncertainty exists in these financial statements. Actual results coulddiffer from these estimates.
(d) Accounts Payable and Accrued Liabilities: Accounts payable relate to normal businesstransactions with third-party vendors and are subject to standard commercial terms. Accruedliabilities relate to accruals for salaries and benefits.
(e) Revenue and Expenses: OFA is funded from the Consolidated Revenue Fund (CRF) as partof Treasury Program. OFA can charge fees subject to statutory and regulatory authority and it earnsrevenues from public bodies outside of the CRF; the OFA retains revenues earned from the interestrate spread on its loans to public bodies.
(f) Financial Instruments: The OFA’s financial assets and liabilities are accounted for as follows:
Cash is subject to an insignificant risk of change in value so carrying value approximates fairvalue; and
Accounts receivable, Due from Agencies & related parties, Due from the Province ofOntario, accounts payable, Due to the Province of Ontario and Deferred Revenue arerecorded at cost.
The OFA does not use derivative financial instruments on its own behalf.
1-150 PUBLIC ACCOUNTS, 2016-2017

2. TANGIBLE CAPITAL ASSETS Year ended March 31, 2017
(in thousands of dollars)
Computer Hardware
Leasehold Improvements
Furniture and Equipment
Total
Cost Opening balance, April 1, 2016 $13,650 $1,833 $1,093 $16,576 Additions 768 25 33 826 Disposals (392) – – (392) Closing balance, March 31, 2017 14,026 1,858 1,126 17,010
Accumulated Depreciation Opening balance, April 1, 2016 12,702 1,608 1,065 15,375 Amortization 638 182 11 831 Disposals (392) – – (392) Closing balance, March 31, 2017 12,948 1,790 1,076 15,814
Net Book Value, March 31, 2017 $1,078 $68 $50 $1,196
Year ended March 31, 2016
(in thousands of dollars)
Computer Hardware
Leasehold Improvements
Furniture and Equipment
Total
Cost Opening balance, April 1, 2015 $13,072 $1,833 $1,068 $15,973 Additions 697 – 25 722 Disposals (119) – – (119) Closing balance, March 31, 2016 13,650 1,833 1,093 16,576
Accumulated Depreciation Opening balance, April 1, 2015 12,227 1,428 1,057 14,712 Amortization 594 180 8 782 Disposals (119) – – (119) Closing balance, March 31, 2016 12,702 1,608 1,065 15,375
Net Book Value, March 31, 2016 $948 $225 $28 $1,201
PUBLIC ACCOUNTS, 2016-2017 1-151

3. DEFERRED REVENUE
Deferred revenue represents the unamortized portion of the cost recovered from the Province forthe acquisition of tangible capital assets as well as prepaid expenses to be allocated over the periodthe resources are consumed.
(in thousands of dollars) Tangible
Capital Assets
Prepaid Expenses Total
Balance, beginning of year $ 1,201 $ 350 $ 1,551 Additions 826 548 1,374 Amortization (831) – (831) Expensed in the current year
– (590) (590)
Balance, end of year $ 1,196 $ 308 $ 1,504
Amortization of $831,000 represents the offset to the contributions received for the purchase of tangible capital assets. The $590,000 expensed represents the amount allocated to the current year expenses from the prepaid expenses.
4. DEBT AND INVESTMENT MANAGEMENT FOR THE PROVINCE
The OFA manages debt on behalf of the Province amounting to $332.4 billion, as at March 31, 2017(2016 Actual – $327.4 billion) as per the interim projection published in the 2017 Annual Budget.The OFA also manages investments amounting to $44.4 billion as at March 31, 2017 (2016 –$47.0 billion) including $19.9 billion (2016 – $18.6 billion) under the joint management of fundsowned by Ontario Power Generation Inc. (OPG) under the Ontario Nuclear Funds Agreement (ONFA).The Province, OPG and certain OPG subsidiaries entered into the agreement in March 2002 to setaside funds necessary to dispose of nuclear waste and used fuel and to decommission nuclear powerstations. The agreement came into force on July 24, 2003.
Cost recovery from the Province for all debt management and investment activities for the year endedMarch 31, 2017 was $18.3 million (2016 – $18.3 million).
5. TRANSACTIONS WITH PUBLIC BODIES
The OFA provides financing to various public bodies on direction from the Province. As the OFA isdirected by the Province to make these loans in furtherance of stated Provincial initiatives, and theseloans are included in the Province’s consolidated financial statements, these transactions are notreflected in these financial statements.
Funds for these loans are advanced to the OFA by the Province under credit facilities aggregating$16.9 billion expiring from 2036 to 2044. Principal repayments received from public bodies by the
1-152 PUBLIC ACCOUNTS, 2016-2017

OFA are forwarded to the Province. The interest rates charged to public bodies is generally slightly higher than the rate charged on the advances from the Province to fund the loans (“the spread”).
The OFA will generally retain a portion of the spread in order to recover the administrative costs of managing these loans. The spread retained by the OFA includes a cost recovery component and, where applicable, a proxy commercial interest rate spread. The inclusion of the proxy commercial spread results in an interest rate equivalent to what would be charged on the loan by a commercial lender and reflects the relative risk associated with the loan. During the year ended March 31, 2017, $3.7 million in interest rate spread revenue was recognized (2016 – $3.4 million) of which $2.1 million in receivable at year end (2016 – $1.7 million).
As at March 31, 2017, the principal amounts receivable by the OFA on behalf of the Province represent long term and short term loans. Interest accrued on the outstanding loans listed below, amounted to $93.9 million (2016 – $93.6 million), of which $92.7 million (2016 – $92.6 million) will be flowed to the Province.
These are related party transactions, with the exception of those with the Corporation of the City of Windsor and the University of Ontario Institute of Technology.
(in thousands of dollars)
March 31, 2017 March 31, 2016
Centennial Centre of Science and Technology $ – $ 500
Colleges of Applied Art and Technologies 320,653 221,450
Corporation of the City of Windsor 8,171 9,916
Independent Electricity System Operator 81,209 –
Niagara Parks Commission 4,553 4,876
Ontario Lottery and Gaming Corporation 33,769 34,085
Ottawa Convention Centre Corporation 48,016 45,872
Ontario Northland Transportation Commission 2,564 2,950
Royal Ontario Museum 26,000 30,145
School Boards 5,473,075 5,611,958
University of Ontario Institute of Technology 5,501 10,611
Total $ 6,003,511 $ 5,972,364
PUBLIC ACCOUNTS, 2016-2017 1-153

Loans to Public Bodies by the Province:
The Centennial Centre of Science and Technology is a Crown agency of the Province under the Centennial Centre of Science and Technology Act, 1990. The loan made to fund the construction of the Agents of Change project matured in March 2017 and has been repaid in full.
Colleges of Applied Art and Technologies have been loaned $320.7 million (2016 – $221.5 million) for various campus projects including new and expanded student residences, computer equipment, parking facilities, and an energy saving capital project. These loans bear interest ranging from 0.90 per cent to 5.75 per cent and mature from 2018 to 2042.
The Corporation of the City of Windsor is a municipality within the meaning of the Municipal Act. The financing provided is for the acquisition, design and construction of the Windsor Justice Facility consisting of a provincial division courthouse and city police headquarters. This is a 20 year loan bearing interest at 6.41 per cent and maturing in March 2021. The outstanding balance is $8.2 million (2016 – $9.9 million).
The Independent Electricity System Operator (IESO) has been provided a maximum $975 million credit facility to primarily fund the Regulated Price Plan variance account. This credit facility has been extended until November 30, 2019. IESO has drawn $81.2 million from this facility as of March 31, 2017 bearing an interest rate of 0.83 per cent and maturing on April 24, 2017.
The Niagara Parks Commission, a Crown agency of the Province, operating under the Niagara Parks Act, 1990, has been provided a loan of $4.6 million (2016 – $4.9 million) to finance additional capital costs incurred for the redevelopment of phase I of Table Rock House in Queen Victoria Park, Niagara Falls. This loan bears interest at 5.07 per cent and matures in April 2027.
The Ontario Lottery and Gaming Corporation (OLG) is a Crown agency of the Province under the Ontario Lottery and Gaming Corporation Act, 1999, and has been provided loans totalling $33.8 million (2016 – $34.1 million) to fund several projects, bearing interest at rates ranging from 0.98 to 2.32 per cent and maturing from October 2017 to January 2018.
The Ontario Northland Transportation Commission (ONTC) is a Crown agency of the Province under the Ontario Northland Transportation Commission Act, 1990. ONTC’s total borrowing of $2.6 million (2016 – $2.9 million) matures from 2020 to 2031 and bears interest ranging from 4.90 to 5.22 per cent.
Ottawa Convention Centre Corporation (OCC) is a Crown agency of the Province governed under the Ottawa Convention Centre Corporation Act, 1988, and has been provided a loan of $48.0 million (2016 – $45.9 million) for the purpose of providing debt to finance part of the construction of the Ottawa Convention Centre. This is a 25-year loan, bears interest at 4.67 per cent and matures in September 2036. Pursuant to a directive signed by the Minister of Finance on November 2, 2012, the Province provided OCC with a repayment deferral of principal and interest up to five years. Interest continues to accrue over the five year deferral period. The outstanding amount includes capitalized interest of $8.0 million.
1-154 PUBLIC ACCOUNTS, 2016-2017

The Royal Ontario Museum (ROM) is a Crown agency of the Province under a Special Act of the Ontario Legislature and has borrowed $26.0 million (2016 – $30.1 million) bearing floating rate interest, currently set at 2.27 per cent. All outstanding loans are scheduled to be repaid by March 2027.
School boards have been provided loans under various programs beginning in 2006. During the year ended March 31, 2017, school boards were provided with additional loans and made semi-annual blended payments of principal and interest, leaving the total outstanding amount at $5,473.0 million (2016 – $5,611.9 million). These loans bear interest ranging from 2.43 to 5.38 per cent and mature from 2019 to 2042. The School Board loan program has been gradually replaced by a Ministry of Education capital grant facility model. Since April 1, 2017, this new funding model fully replaced the need for capital loans from the OFA. School Boards will however, continue to make interest and principal payments until all outstanding balances are paid off.
The University of Ontario Institute of Technology (UOIT) is a corporation established under the University of Ontario Institute of Technology Act, 2002. The Province has provided a five-year term loan of $5.5 million (2016 – $10.6 million) bearing an interest rate at 2.77 per cent and maturing in October 2017.
6. INVESTMENT AND DEBT MANAGEMENT FOR RELATED PARTY AGENCIES
a. The OFA provides investment management services to the following related party agencies. Feesare aimed at recovering OFA costs and are charged on the basis of either the market or par valueof the assets under management based on a range of up to 0.20 per cent.
Deposit Insurance Corporation of Ontario Ontario Immigrant Investor Corporation Northern Ontario Heritage Fund Ontario Infrastructure and Lands Corporation Ontario Capital Growth Corporation Ontario Trillium Foundation Pension Benefits Guarantee Fund
Investments managed on behalf of these entities totalled $1,904 million at March 31, 2017 (2016 – $2,733 million).
b. The OFA provides debt management services to the following related party agencies on a costrecovery basis:
Ontario Electricity Financial Corporation (OEFC)The OFA provides financial services and advice on a cost recovery basis to OEFC and managesits debt portfolio of approximately $20.4 billion (2016 – $24.3 billion).
PUBLIC ACCOUNTS, 2016-2017 1-155

Ontario Infrastructure and Lands Corporation (OILC) The OFA provides borrowing and other financial services and advice on a cost recovery basis to OILC and manages its debt of approximately $3.7 billion at March 31, 2017 (2016 – $4.4 billion) including loans from the Province, a provincial agency and third parties.
c. The total costs recovered and receivables outstanding for related party agencies at March 31,2017 are set out below:
(in thousands of dollars)
March 31, 2017 March 31, 2016
Costs Recovered:
OEFC $ 3,765 $ 3,684
OILC 740 750 Investment Management 336 319
Total $ 4,841 $ 4,753
Receivables:
OEFC $ 1,070 $ 1,041
OILC 187 187
Investment Management 180 132
Interest Rate Spread (Note 5) 2,118 1,728
Total $ 3,555 $ 3,088
7. RISK MANAGEMENT AND FINANCIAL INSTRUMENTS
The main risks that the OFA’s financial instruments are exposed to are credit risk, liquidity risk andmarket risk. These risks are limited to the financial instruments reflected on the statement of financialposition and do not extend to the financing provided to various public bodies, disclosed in note 5 tothe financial statements.
Credit risk
Credit risk is the risk that the counterparty to a financial instrument may fail to discharge an obligationor commitment into which it has entered. This risk is minimal as most of the receivables are fromthe Province of Ontario.
The risk of not collecting the receivables related to OEFC, OILC and others is also considered to beminimal.
1-156 PUBLIC ACCOUNTS, 2016-2017
Liquidity risk
Liquidity risk is the risk that the OFA will not be able to meet its cash flow obligations as they fall due. The OFA’s exposure to liquidity risk is minimal as all operating and capital expenses are cost recovered from the Province of Ontario.
Market risk
The market risk arises from the possibility that changes in market prices will affect the value of the financial instruments of the OFA. The OFA is not exposed to market risk.
8. FUTURE EMPLOYEE BENEFITS
(a) Pension Benefits
The OFA provides pension benefits to its full-time employees through participation in the Public Service Pension Plan (PSPP), which is a multi-employer defined benefit pension plan established by the Province of Ontario. The Ministry of Government and Consumer Services (MGCS) is responsible for funding the employer’s contribution to the Pension Fund and accordingly, the OFA has no additional liability for these future costs. In addition, the cost of post-retirement, non-pension benefits is paid by MGCS and is not reported in these financial statements.
(b) Accrued Employee Benefits Obligation
The legislated severance entitlement upon retirement for the Association of Management, Administrative and Professional Crown Employees of Ontario (AMAPCEO), excluded employees, management-excluded employees and other Management employees who retire after January 1, 2016, will be paid based on the salary in effect on December 31, 2015. The legislated severance entitlement upon retirement for the Ontario Public Service Employee Union (OPSEU), excluded employees who retire after January 1, 2016, will be paid based on the salary in effect on December 31, 2016.
For all other employees subject to terms set out in collective agreements who have completed five years of service, the OFA provides termination pay equal to one week’s salary for each year of service up to a maximum of 50 percent of their annual salary.
The costs of this legislated severance entitlements earned by AMAPCEO and OPSEU, excluded employees, management excluded employees, management employees as at March 31, 2017 amounted to $3,918,000 (2016 – $4,076,000). In addition, the unused vacation entitlements earned by all employees as at March 31, 2017 amounted to $757,000 (2016 – $624,000).
On an ongoing basis, MGCS is responsible for funding the legislated severance entitlements, as well as unused vacation entitlements and accordingly no additional expense or liability is reported in these financial statements. Accrued employee benefits obligation is recorded at cost on the entitlements earned by employees up to March 31, 2017. A fair value estimate based on actuarial assumptions
PUBLIC ACCOUNTS, 2016-2017 1-157
about when these benefits will actually be paid has not been made, as it is not expected that there would be a significant difference from the recorded amount.
9. COMMITMENTS AND CONTINGENCIES
Lease Commitment:
The OFA rents its premises under an operating lease which expires on June 30, 2017. The leaseagreement has been extended for another 5 years and the minimum base rental payments for the leaseare as follows:
(in thousands of dollars)
March 31, 2017
2018 876 2019 893 2020 952 2021 972 2022 972 Total $4,665
OFA is committed to pay its proportionate share of realty taxes and operating expenses for the premises for the year ended March 31, 2017, which amounted to $999,900 (2016 – $1,133,000).
Committed Credit Facilities:
At the direction of the Province, the OFA has committed to finance a number of public bodies for which funds have not yet been advanced. The details are as follows:
The Deposit Insurance Corporation of Ontario (DICO) was provided a maximum $400 million revolving credit facility to ensure DICO’s capacity to address systematic difficulties in the credit union system or the failure of large institutions that require resources above those in the Deposit Insurance Reserve Fund (DIRF) which is currently valued at approximately $232.7 million. All principal and interest is required to be repaid by December 31, 2029. As of March 31, 2017, DICO had not utilized this credit facility.
The Ontario Infrastructure and Lands Corporation (OILC) is a Crown agency of the Province under the Ontario Infrastructure and Lands Corporation Act, 2011 and has been provided a Revolving Credit Facility to a maximum amount of $200 million maturing in June 2019. As of March 31, 2017, OILC had not drawn any funds from this facility.
In the event fund are advanced under the above facilities they will be disclosed under Note 5 – Transactions with Public Bodies.
1-158 PUBLIC ACCOUNTS, 2016-2017

Contingencies:
At March 31, 2017, there were no claims under which the OFA would be financially liable. The Province continues to guarantee the term deposits issued by the Province of Ontario Savings Office prior to 2003.
PUBLIC ACCOUNTS, 2016-2017 1-159


PUBLIC ACCOUNTS, 2016-2017 1-161
MANAGEMENT’S REPORT
Management of the Ontario French-language Educational Communications Authority (OFLECA) is responsible for the financial statements, the notes to the financial statements and all other financial information contained in this financial report.
Management has prepared the financial statements in accordance with Canadian public sector accounting standards. In order to achieve the objective of fair presentation in all material respects, reasonable estimates and professional judgements were used. Management believes the financial statements present fairly the OFLECA’s financial position as at March 31, 2017, as well as the results of its operations and its cash flows for the year then ended.
In fulfilling its responsibilities and recognizing the limits inherent in all systems, Management has developed and maintains a system of internal controls designed to provide reasonable assurance that the OFLECA’s assets are safeguarded from loss and that the accounting records are a reliable basis for the preparation of financial statements.
The Board of Directors is responsible for ensuring that the OFLECA’s Management fulfills its responsibilities for financial reporting and is ultimately responsible for reviewing and approving the financial statements. The Board of Directors carries out its responsibility for review of the financial statements principally through the Audit Committee. The Audit Committee meets with Management and the external auditors to discuss the results of audit examinations and financial reporting matters and to satisfy itself that each party is properly discharging its responsibilities. The external auditors have full access to the Audit Committee with or without the presence of Management.
The financial statements for the year ended March 31, 2017 have been audited by Marcil Lavallée, Chartered Professional Accountants, Licensed Public Accountants, the independent external auditors appointed by the members of the OFLECA. The accompanying Independent Auditor’s Report outlines their responsibilities, the scope of their examination and their professional opinion on the financial statements.
_______________________________________________Glenn O’Farrell
President and Chief Executive Officer
________________________________________________Lisa Larsen, CPA, CA
Director of Finance responsible for Financial, Legal and Administrative Services
Toronto, OntarioJune 16, 2017
ONTARIO FRENCH-LANGUAGE EDUCATIONAL COMMUNICATIONS AUTHORITY (OFLECA)

INDEPENDENT AUDITOR'S REPORT
To the Directors ofOntario French-language Educational Communications Authority
We have audited the accompanying financial statements of the Ontario French-language Educational Communications Authority (OFLECA),which comprise the statement of financial position as at March 31, 2017, and the statements of operations, changes in net assets and cash flows for the year then ended, as well as a summary of significant accounting policies and other explanatory information.
Management's Responsibility for the Financial Statements
Management is responsible for the preparation and fair presentation of these financial statements in accordance with Canadian public sectoraccounting standards and for such internal control as management determines is necessary to enable the preparation of financial statements that are free from material misstatement, whether due to fraud or error.
Auditor's Responsibility
Our responsibility is to express an opinion on these financial statements based on our audit. We conducted our audit in accordance with Canadian generally accepted auditing standards. Those standards require that we comply with ethical requirements and plan and perform the audit to obtain reasonable assurance about whether the financial statements are free from material misstatement.
An audit involves performing procedures to obtain audit evidence about the amounts and disclosures in the financial statements. The procedures selected depend on the auditor's judgment, including the assessment of the risks of material misstatement of the financial statements, whether due to fraud or error. In making those risk assessments, the auditor considers internal control relevant to the entity's preparation and fair presentation of the financial statements in order to design audit procedures that are appropriate in the circumstances, but not for the purpose of expressing an opinion on the effectiveness of the entity's internal control. An audit also includes evaluating the appropriateness of accounting policies used and the reasonableness of accounting estimates made by management, as well as evaluating the overall presentation of the financial statements.
We believe that the audit evidence we have obtained is sufficient and appropriate to provide a basis for our audit opinion.
1-162 PUBLIC ACCOUNTS, 2016-2017

Opinion
In our opinion, the financial statements present fairly, in all material respects, the financial position of the Ontario French-language Educational Communications Authority as at March 31, 2017, as well as the results of its operations and its cash flows for the year then ended in accordance with Canadian public sector accounting standards.
Chartered Professional Accountants, Licensed Public Accountant
Ottawa, OntarioJune 16, 2017
PUBLIC ACCOUNTS, 2016-2017 1-163

ONTARIO FRENCH-LANGUAGE EDUCATIONAL COMMUNICATIONS AUTHORITY (OFLECA)STATEMENT OF FINANCIAL POSITIONMARCH 31, 2017
2017 2016
ASSETSCURRENT ASSETS
Cash $ 6,301,711 $ 8,100,698Accounts receivable (Note 4) 2,458,310 2,707,384Prepaid expenses 1,049,600 1,063,080
9,809,621 11,871,162
RESTRICTED CASH (Note 5) 3,486,866 3,853,117
BROADCASTING RIGHTS (Note 6) 15,508,462 17,941,907
IN-HOUSE PROGRAMMING (Note 7) 19,557,126 20,241,936
ASSET – EMPLOYEE FUTURE BENEFITS (Note 8) 2,232,286 1,326,200
CAPITAL ASSETS (Note 9) 8,535,918 9,179,376
49,320,658 52,542,536
$ 59,130,279 $ 64,413,698
1-164 PUBLIC ACCOUNTS, 2016-2017

PUBLIC ACCOUNTS, 2016-2017 1-165
ONTARIO FRENCH-LANGUAGE EDUCATIONAL COMMUNICATIONS AUTHORITY (OFLECA)STATEMENT OF FINANCIAL POSITIONMARCH 31, 2017
2017 2016
LIABILITIESCURRENT LIABILITIES
$ 5,280,554 $ 7,325,272Accounts payable and accrued liabilities (Note 10)Deferred contributions (Note 11) 1,178,978 2,142,482
6,459,532 9,467,754
2,214,700 2,011,500
16,007,540 18,118,630
19,557,126 20,241,936
LIABILITY – EMPLOYEE FUTURE BENEFITS (Note 8)
DEFERRED CONTRIBUTIONS – BROADCASTING RIGHTS (Note 12)
DEFERRED CONTRIBUTIONS – IN-HOUSE PROGRAMMING (Note 13)
DEFERRED CONTRIBUTIONS – CAPITAL ASSETS (Note 14) 9,833,192 10,183,651
47,612,558 50,555,717
54,072,090 60,023,471
NET ASSETSInternal Restrictions (Note 5)
- TFO Fund 1,519,008 1,519,008- 323,400- Pension Fund
Unrestricted 3,539,181 2,547,819
5,058,189 4,390,227
$ 59,130,279 $ 64,413,698
ON BEHALF OF THE BOARD
_____________________________________President of the Board
_______________________________________President of the Finance and Audit Committee
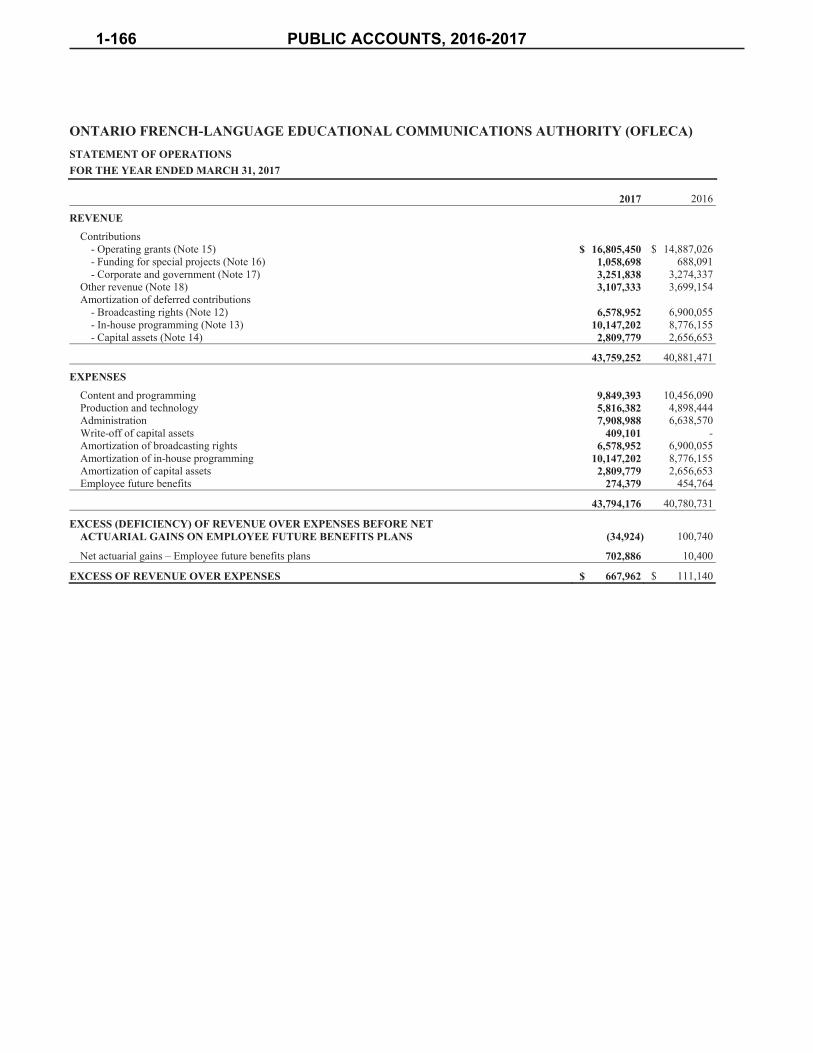
ONTARIO FRENCH-LANGUAGE EDUCATIONAL COMMUNICATIONS AUTHORITY (OFLECA)STATEMENT OF OPERATIONSFOR THE YEAR ENDED MARCH 31, 2017
2017 2016
REVENUE
Contributions- Operating grants (Note 15) $ 16,805,450 $ 14,887,026- Funding for special projects (Note 16) 1,058,698 688,091- Corporate and government (Note 17) 3,251,838 3,274,337
Other revenue (Note 18) 3,107,333 3,699,154Amortization of deferred contributions
- Broadcasting rights (Note 12) 6,578,952 6,900,055- In-house programming (Note 13) 10,147,202 8,776,155- Capital assets (Note 14) 2,809,779 2,656,653
43,759,252 40,881,471
EXPENSES
Content and programming 9,849,393 10,456,090Production and technology 5,816,382 4,898,444Administration 7,908,988 6,638,570Write-off of capital assets 409,101 -Amortization of broadcasting rights 6,578,952 6,900,055Amortization of in-house programming 10,147,202 8,776,155Amortization of capital assets 2,809,779 2,656,653Employee future benefits 274,379 454,764
43,794,176 40,780,731
EXCESS (DEFICIENCY) OF REVENUE OVER EXPENSES BEFORE NET ACTUARIAL GAINS ON EMPLOYEE FUTURE BENEFITS PLANS (34,924) 100,740
Net actuarial gains – Employee future benefits plans 702,886 10,400
EXCESS OF REVENUE OVER EXPENSES $ 667,962 $ 111,140
1-166 PUBLIC ACCOUNTS, 2016-2017

ONTARIO FRENCH-LANGUAGE EDUCATIONAL COMMUNICATIONS AUTHORITY (OFLECA)STATEMENT OF CHANGES IN NET ASSETSFOR THE YEAR ENDED MARCH 31, 2017
Internal Restrictions (Note 5)TFOFund
Pension Fund Unrestricted
2017Total
2016Total
BALANCE, BEGINNING OF YEAR $ 1,519,008 $ 323,400 $ 2,547,819 $ 4,390,227 $ 4,279,087
Excess of revenue over expenses - - 667,962 667,962 111,140
Restriction – Pension Plan - (323,400) 323,400 - -
BALANCE, END OF YEAR $ 1,519,008 $ - $ 3,539,181 $ 5,058,189 $ 4,390,227
PUBLIC ACCOUNTS, 2016-2017 1-167

ONTARIO FRENCH-LANGUAGE EDUCATIONAL COMMUNICATIONS AUTHORITY (OFLECA)STATEMENT OF CASH FLOWSFOR THE YEAR ENDED MARCH 31, 2017
2017 2016
OPERATING ACTIVITIESExcess of revenue over expenses $ 667,962 $ 111,140Adjustments for:Amortization of broadcasting rights 6,578,952 6,900,055Amortization of in-house programming 10,147,202 8,776,155Amortization of capital assets 2,809,779 2,656,653Net actuarial gains – Employee future benefits Plan (702,886) (10,400)Amortization of deferred contributions – broadcasting rights (6,578,952) (6,900,055)Transfer – deferred contributions – broadcasting rights (204,850) (2,224,719)Amortization of deferred contributions – in-house programming (10,147,202) (8,776,155)Amortization of deferred contributions – capital assets (2,809,779) (2,656,653)Transfer – deferred contributions capital assets (4,275) (986,432)Loss on write-off of capital assets 409,101 -
165,052 (3,110,411)Net change in non-cash working capital items (Note 3) (2,745,668) (1,357,131)Programming grant 4,672,712 9,334,061In-house programming grant 9,462,392 10,271,708Capital grant 2,463,595 2,865,977
14,018,083 18,004,204
INVESTING ACTIVITIES RELATED TO CAPITAL ASSETS AND INTANGIBLE ASSETSAcquisition of broadcasting rights (4,145,507) (8,130,728)Acquisition of in-house programming (9,462,392) (10,271,708)Net acquisition of capital assets (2,591,488) (2,861,662)Proceeds from disposal of capital assets 16,066 -
(16,183,321) (21,264,098)
NET INVESTING ACTIVITYNet change in restricted cash 366,251 2,593,112
NET INCREASE (DECREASE) IN CASH AND CASH EQUIVALENTS (1,798,987) (666,782)
CASH AND CASH EQUIVALENTS, BEGINNING OF YEAR 8,100,698 8,767,480
CASH AND CASH EQUIVALENTS, END OF YEAR $ 6,301,711 $ 8,100,698
1-168 PUBLIC ACCOUNTS, 2016-2017
ONTARIO FRENCH-LANGUAGE EDUCATIONAL COMMUNICATIONS AUTHORITY (OFLECA)NOTES TO THE FINANCIAL STATEMENTSMARCH 31, 2017
1. STATUTE AND NATURE OF OPERATIONS
The Ontario French-language Educational Communications Authority (the Authority) is a Crown corporation created by a decree on April 1,2007. The Authority is an independent French language broadcasting network and a charitable organization under the Income Tax Act and, assuch, is exempt from income tax.
The Authority’s main objectives are to provide French language educational broadcasting and telecommunications to the general public, toprovide for the francophone community’s interests and needs, and to develop the knowledge and skills of this community.
2. SIGNIFICANT ACCOUNTING POLICIES
The financial statements have been prepared in accordance with Canadian public sector accounting standards (PSAS-GNFPO). The Authorityhas elected to apply Section SP 4200 series for government not-for-profit organizations. The accounting policies are set out below:
Management estimates
The preparation of financial statements in compliance with the PSAS-GNFPO requires management to make estimates and assumptions thataffect the reported amounts of assets and liabilities, the disclosures of contingent assets and liabilities at the date of the financial statementsand the reported amounts of revenues and expenses for the periods covered. Actual amounts could differ from these estimates. The mainestimates relate to the useful life of capital assets, broadcasting rights and capitalized in-house programming costs. Estimates also include thebasis of allocating expenses used to capitalize the portion of the salaries and other expenses related to in-house programming. Estimates alsoinclude assets and liabilities related to employee future benefits.
The main items for which significant estimates were made are the defined benefits assets and liabilities for the accrued benefit pension planand other retirement benefits plan. To estimate these amounts, management is required to make various assumptions that it considersreasonable, including with respect to inflation rates, discount rates and mortality rates. Management also takes into account future salaryincreases and the retirement age of employees. Any changes to the assumptions could have a significant impact on the Authority’s results andfinancial position. The staff pension benefit expense could increase or decrease in upcoming years.
PUBLIC ACCOUNTS, 2016-2017 1-169

ONTARIO FRENCH-LANGUAGE EDUCATIONAL COMMUNICATIONS AUTHORITY (OFLECA)NOTES TO THE FINANCIAL STATEMENTSMARCH 31, 2017
2. SIGNIFICANT ACCOUNTING POLICIES (continued)
Contribution receivable
A contribution receivable is recognized as an asset when the amount to be received can be reasonably estimated and ultimate collection isreasonably assured.
Revenue recognition
Contributions
The Authority follows the deferral method of accounting for contributions.
Unrestricted contributions are recognized as revenue in the statement of operations when received or receivable if the amount to be receivedcan be reasonably estimated and collection is reasonably assured.
Contributions which are, explicitly or implicitly, externally restricted for the purchase of capital assets or broadcasting rights or internallydeveloped television broadcasting subject to amortization (in-house programming) are deferred in the statement of financial position andrecognized as revenue in the statement of operations on the same basis and over the same periods as the related assets.
Contributions which are, explicitly or implicitly, externally restricted for specific expenses to be incurred in future years (in-houseprogramming and others) are deferred in the statement of financial position and recognized as revenue in the statement of operations in theperiod in which the related expenses are incurred.
Subscriptions
Revenue from signal subscriptions is recognized as revenue when received or receivable if the amount to be received can be reasonablyestimated and collection is reasonably assured.
Interest income
Interest income is recognized as revenue when earned.
1-170 PUBLIC ACCOUNTS, 2016-2017

ONTARIO FRENCH-LANGUAGE EDUCATIONAL COMMUNICATIONS AUTHORITY (OFLECA)NOTES TO THE FINANCIAL STATEMENTSMARCH 31, 2017
2. SIGNIFICANT ACCOUNTING POLICIES (continued)
Revenue recognition (continued)
Contributions received in the form of supplies and services
The Authority accounts for the contributions received in the form of supplies and services when the fair value of these contributions can bereasonably estimated, and when the Authority would have obtained the supplies and services for its regular operations in another manner.Contributions received in the form of supplies and services are recorded at the fair value of the supplies and services received. When the fairvalue of the supplies and services received cannot be reasonably determined, the contributions are recognized at the fair value of the suppliesand services transferred.
Financial instruments
Measurement of financial instruments
The Authority initially measures its financial assets and liabilities at fair value, except for certain non-arm’s length transactions.
The Authority subsequently measures all its financial assets and financial liabilities at amortized cost, except for investments in equityinstruments that are quoted in an active market, which are measured at fair value. Changes in fair value are recognized in operations.
Financial assets measured at amortized cost include cash and cash equivalents, accounts receivable and restricted cash.
Financial liabilities measured at amortized cost include accounts payable and accrued liabilities.
Impairment
Financial assets measured at amortized cost are tested for impairment when there are indicators of impairment. The amount of the write-downis recognized in operations. The previously recognized impairment loss may be reversed to the extent of the improvement, directly or byadjusting the allowance account, provided it is no greater than the amount that would have been reported at the date of the reversal had theimpairment not been recognized previously. The amount of the reversal is recognized in operations.
PUBLIC ACCOUNTS, 2016-2017 1-171

ONTARIO FRENCH-LANGUAGE EDUCATIONAL COMMUNICATIONS AUTHORITY (OFLECA)NOTES TO THE FINANCIAL STATEMENTSMARCH 31, 2017
2. SIGNIFICANT ACCOUNTING POLICIES (continued)
Financial instruments (continued)
Transaction costs
The Authority recognizes its transaction costs in operations in the period incurred. However, financial instruments that will not besubsequently measured at fair value are adjusted by the transaction costs that are directly attributable to their origination, issuance orassumption.
Cash and cash equivalents
The Authority’s policy is to present unrestricted cash and investments with a term equal to or less than three months in cash and cashequivalents.
In-house programming, broadcasting rights and production costs
In-house programming, broadcasting rights and production costs are accounted for as follows:
In-house programming
In-house programming is defined as internally developed television broadcasting. Completed and in-progress programming having a futureeconomic value through rebroadcasting and the use of web-based interactive tools is accounted for on an individual basis at cost, deductedfrom accumulated amortization and cumulative loss in value. Cost includes the cost of supplies and services and the portion of the labour andother direct expenses related to programming. Programming costs are recognized in the statement of operations with the television and newmedia services expense using the straight-line method over a period of four years or when programming is sold or unusable.
Broadcasting rights and production costs
Broadcasting rights and productions under co-production, pre-purchase and acquisition contracts are accounted for at cost. Broadcastingrights are amortized over a period of four years on a straight-line basis.
1-172 PUBLIC ACCOUNTS, 2016-2017
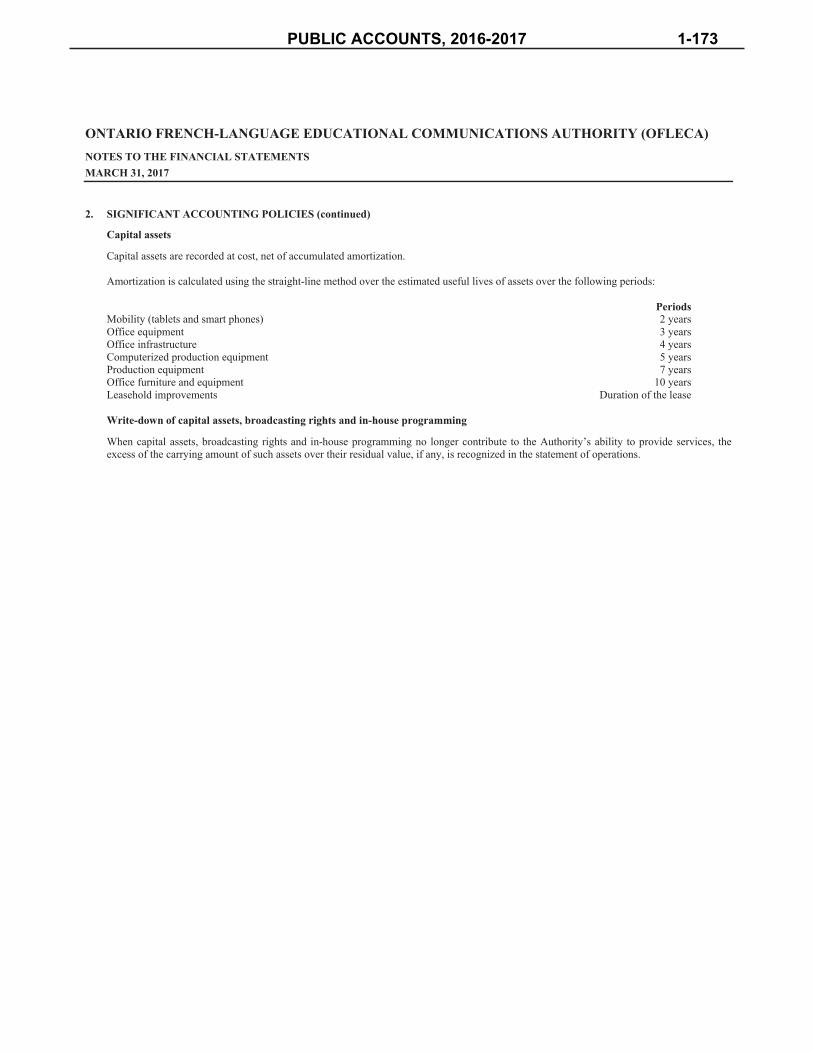
ONTARIO FRENCH-LANGUAGE EDUCATIONAL COMMUNICATIONS AUTHORITY (OFLECA)NOTES TO THE FINANCIAL STATEMENTSMARCH 31, 2017
2. SIGNIFICANT ACCOUNTING POLICIES (continued)
Capital assets
Capital assets are recorded at cost, net of accumulated amortization.
Amortization is calculated using the straight-line method over the estimated useful lives of assets over the following periods:
PeriodsMobility (tablets and smart phones) 2 yearsOffice equipment 3 yearsOffice infrastructure 4 yearsComputerized production equipment 5 yearsProduction equipment 7 yearsOffice furniture and equipment 10 yearsLeasehold improvements Duration of the lease
Write-down of capital assets, broadcasting rights and in-house programming
When capital assets, broadcasting rights and in-house programming no longer contribute to the Authority’s ability to provide services, the excess of the carrying amount of such assets over their residual value, if any, is recognized in the statement of operations.
PUBLIC ACCOUNTS, 2016-2017 1-173

ONTARIO FRENCH-LANGUAGE EDUCATIONAL COMMUNICATIONS AUTHORITY (OFLECA)NOTES TO THE FINANCIAL STATEMENTSMARCH 31, 2017
2. SIGNIFICANT ACCOUNTING POLICIES (continued)
Employee future benefits
The Authority accrues its obligations under the employee defined benefit plans, net of the fair value of plan assets. In order to do so, theAuthority has adopted the following policies:
- The actuarial determination of the accrued benefit obligations for pensions and other retirement benefits uses the projected benefitmethod prorated on service. This determination incorporates management’s best estimate of future salary levels, discount rate, othercost escalation, retirement ages of employees and other actuarial factors;
- For the purpose of calculating the expected return on plan assets, those assets are valued at fair value;
- An actuarial gain (loss) arises from the difference between the actual long-term rate of return on plan assets for a period and theexpected long-term rate of return on plan assets for that period or from changes in actuarial assumptions used to determine the accruedbenefit obligations. Actuarial gains (losses) for each period are recognized on a systematic basis and are amortized over the averageremaining service life of active employees covered by the pension plan, which is 13 years. The average remaining service period of theactive employees covered by the other retirement benefit plans is 17 years.
Foreign currency translation
Monetary assets and liabilities in foreign currency are translated at the exchange rate in effect at the balance sheet date, whereas other assets and liabilities are translated at the exchange rate in effect at the transaction date. Revenue and expenses in foreign currency are translated at the average rate in effect during the year, with the exception of expenses relating to non-monetary assets and liabilities, which are translated at the historical rate. Exchange gains and losses are recognized in the current year’s operations.
Excess financing
Government ministries can require the reimbursement of any excess funding. All such reimbursements will be accounted for in the financial year in which they occur.
1-174 PUBLIC ACCOUNTS, 2016-2017

ONTARIO FRENCH-LANGUAGE EDUCATIONAL COMMUNICATIONS AUTHORITY (OFLECA)NOTES TO THE FINANCIAL STATEMENTSMARCH 31, 2017
3. NET CHANGE IN NON-CASH WORKING CAPITAL ITEMS
2017 2016
Accounts receivable $ 249,074 $ (191,877)Prepaid expenses 13,480 11,597Accounts payable and accrued liabilities (2,044,718) 2,498,791Deferred contributions (963,504) (3,675,642)
$ (2,745,668) $ (1,357,131)
4. ACCOUNTS RECEIVABLE2017 2016
Ministry of Education $ 43,631 $ 36,207Governments and government agencies 594,332 646,965Subscriptions (cable broadcasting and educational subscriptions) 200,049 396,591Commodity taxes 886,714 1,271,498Others 733,584 356,123
$ 2,458,310 $ 2,707,384
PUBLIC ACCOUNTS, 2016-2017 1-175

ONTARIO FRENCH-LANGUAGE EDUCATIONAL COMMUNICATIONS AUTHORITY (OFLECA)NOTES TO THE FINANCIAL STATEMENTSMARCH 31, 2017
5. RESTRICTED CASH2017 2016
Reserves- Capital renewal (a) $ 1,000,000 $ 1,000,000- Pension Fund (b) - 863,400- TFO Fund (c) 1,519,008 1,519,008- Broadcasting rights (d) 400,000 -- Transition 55,011 87,734- AODA (e) 116,495 201,977
Commitments- Broadcasting rights 99,078 176,723- Capital assets 297,274 4,275
$ 3,486,866 $ 3,853,117
(a) A portion of the funding received annually can be set aside to ensure that the Authority’s technical capital assets keep pace withtechnological changes and can be maintained or replaced.
(b) During the year, all amounts allocated to the Pension Fund were transferred to the TFO Pension Plan as additional contributions.
(c) During the 2008-2009 year, the Authority decided to restrict contributions obtained from the dissolution of the TVOntario Foundation,which were received during the previous year. To this effect, these restricted funds may be used for purposes determined by the Board ofDirectors from time to time, and only with the approval of the Board.
(d) During fiscal year 2016-2017, $400,000 was specifically restricted for the acquisition of broadcasting rights for cinema content andeducational content for children.
(e) Annually, a portion of the operating budget is specifically allocated to meet the requirements of the Accessibility for Ontarians withDisabilities Act, 2005 (AODA). The balance of $116,495 was recognized as deferred revenue and as an addition to the restricted cash.This amount will be used during the year ended March 31, 2018.
1-176 PUBLIC ACCOUNTS, 2016-2017

ONTARIO FRENCH-LANGUAGE EDUCATIONAL COMMUNICATIONS AUTHORITY (OFLECA)NOTES TO THE FINANCIAL STATEMENTSMARCH 31, 2017
6. BROADCASTING RIGHTS2017
CostAccumulated amortization Net value
Broadcasting rights and completed productions $ 31,711,653 $ 19,948,549 $ 11,763,104Broadcasting rights written off during the year (8,164,321) (8,164,321) -
23,547,332 11,784,228 11,763,104
Work in progress 3,745,358 - 3,745,358
$ 27,292,690 $ 11,784,228 $ 15,508,462
2016
CostAccumulated amortization Net value
Broadcasting rights and completed productions $ 64,677,995 $ 49,713,269 $ 14,964,726Broadcasting rights written off during the year (36,343,672) (36,343,672) -
28,334,323 13,369,597 14,964,726
Work in progress 2,977,181 - 2,977,181
$ 31,311,504 $ 13,369,597 $ 17,941,907
PUBLIC ACCOUNTS, 2016-2017 1-177

ONTARIO FRENCH-LANGUAGE EDUCATIONAL COMMUNICATIONS AUTHORITY (OFLECA)NOTES TO THE FINANCIAL STATEMENTSMARCH 31, 2017
7. IN-HOUSE PROGRAMMING2017
CostAccumulated amortization Net value
In-house programming $ 48,588,672 $ 29,031,546 $ 19,557,126In-house programming completely amortized and written off during the year (7,395,596) (7,395,596) -
$ 41,193,076 $ 21,635,950 $ 19,557,126
2016
CostAccumulated amortization Net value
In-house programming $ 43,456,880 $ 23,214,944 $ 20,241,936In-house programming completely amortized and written off during the year (4,330,600) (4,330,600) -
$ 39,126,280 $ 18,884,344 $ 20,241,936
1-178 PUBLIC ACCOUNTS, 2016-2017

ONTARIO FRENCH-LANGUAGE EDUCATIONAL COMMUNICATIONS AUTHORITY (OFLECA)NOTES TO THE FINANCIAL STATEMENTSMARCH 31, 2017
8. ASSET AND LIABILITY – EMPLOYEE FUTURE BENEFITS
Description of pension and other retirement benefit plans
The Authority has a number of funded and unfunded defined benefit plans, as well as defined contribution plans, that provide pension, otherretirement and post-employment benefits to most of its employees.
The pension plan to which most of the Authority’s employees contribute is made up of two components. The first component consists of adefined benefit plan entirely funded by the Authority. According to this plan, pension benefits are based on the number of years of serviceand the employee’s salary at the end of their career. Every year, the pension benefits are grossed-up in accordance with the rate of inflation,up to a maximum of 3%. The second component consists in a defined contribution plan, with contributions paid by both the Authority and theparticipants. Other retirement benefit plans are contributory health care, dental and life insurance plans.
Total cash payments
Cash payments made for future employee benefits, consisting of cash contributed by the Authority to its funded pension plan, cash paymentsdirectly to beneficiaries on account of its unfunded other retirement benefit plans, and cash contributed to its defined contribution plans,amount to $860,205 (2016: $834,430). In addition, the Authority made an exceptional contribution of $863,400 to the funded pension plan.
Defined benefit plans
The Authority measures its accrued defined benefit obligations and the fair value of the plan assets as at March 31 of each year. The mostrecent actuarial valuation of the pension plan, for funding purposes, was prepared by Mercer as at March 31, 2017 and is a data extrapolationand evaluation based on the complete actuarial valuation dated March 31, 2014.
The next full actuarial valuation, as of March 31, 2017, is currently being prepared. The final actuarial valuation report was not available atthe date of approval of the financial statements.
PUBLIC ACCOUNTS, 2016-2017 1-179
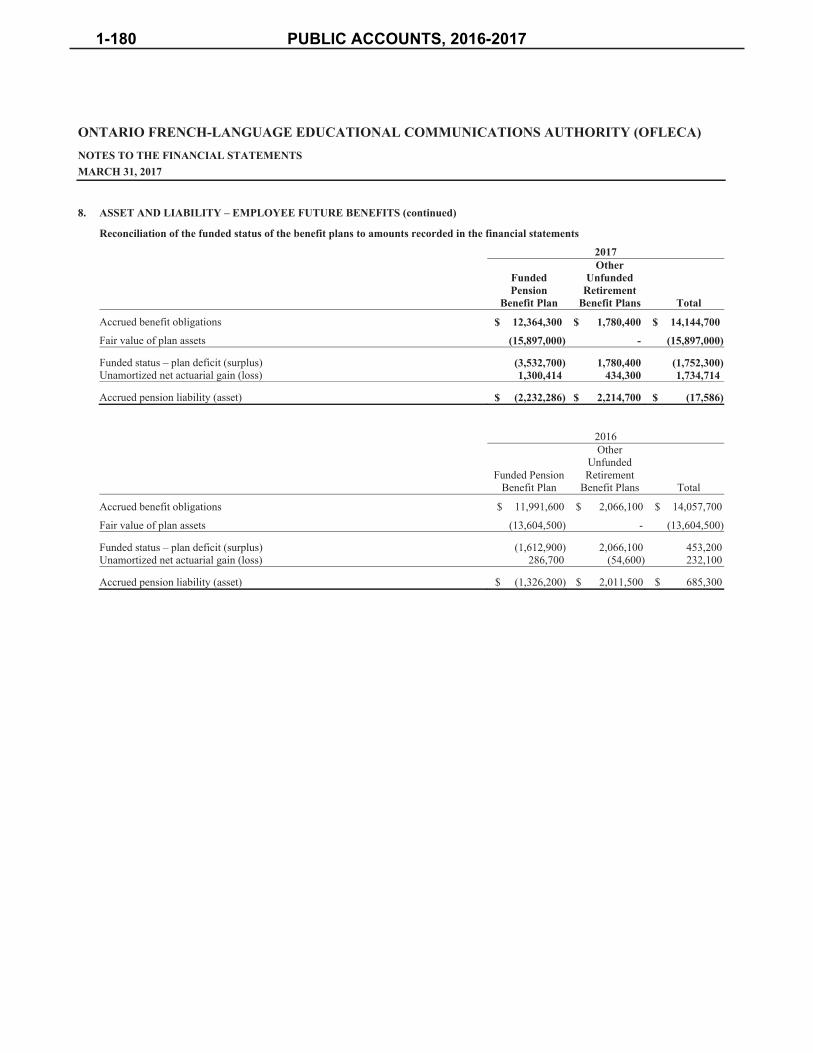
ONTARIO FRENCH-LANGUAGE EDUCATIONAL COMMUNICATIONS AUTHORITY (OFLECA)NOTES TO THE FINANCIAL STATEMENTSMARCH 31, 2017
8. ASSET AND LIABILITY – EMPLOYEE FUTURE BENEFITS (continued)
Reconciliation of the funded status of the benefit plans to amounts recorded in the financial statements
2017
Funded Pension
Benefit Plan
Other Unfunded
RetirementBenefit Plans Total
Accrued benefit obligations $ 12,364,300 $ 1,780,400 $ 14,144,700
Fair value of plan assets (15,897,000) - (15,897,000)
Funded status – plan deficit (surplus) (3,532,700) 1,780,400 (1,752,300)Unamortized net actuarial gain (loss) 1,300,414 434,300 1,734,714
Accrued pension liability (asset) $ (2,232,286) $ 2,214,700 $ (17,586)
2016
Funded Pension Benefit Plan
Other UnfundedRetirement
Benefit Plans Total
Accrued benefit obligations $ 11,991,600 $ 2,066,100 $ 14,057,700
Fair value of plan assets (13,604,500) - (13,604,500)
Funded status – plan deficit (surplus) (1,612,900) 2,066,100 453,200Unamortized net actuarial gain (loss) 286,700 (54,600) 232,100
Accrued pension liability (asset) $ (1,326,200) $ 2,011,500 $ 685,300
1-180 PUBLIC ACCOUNTS, 2016-2017
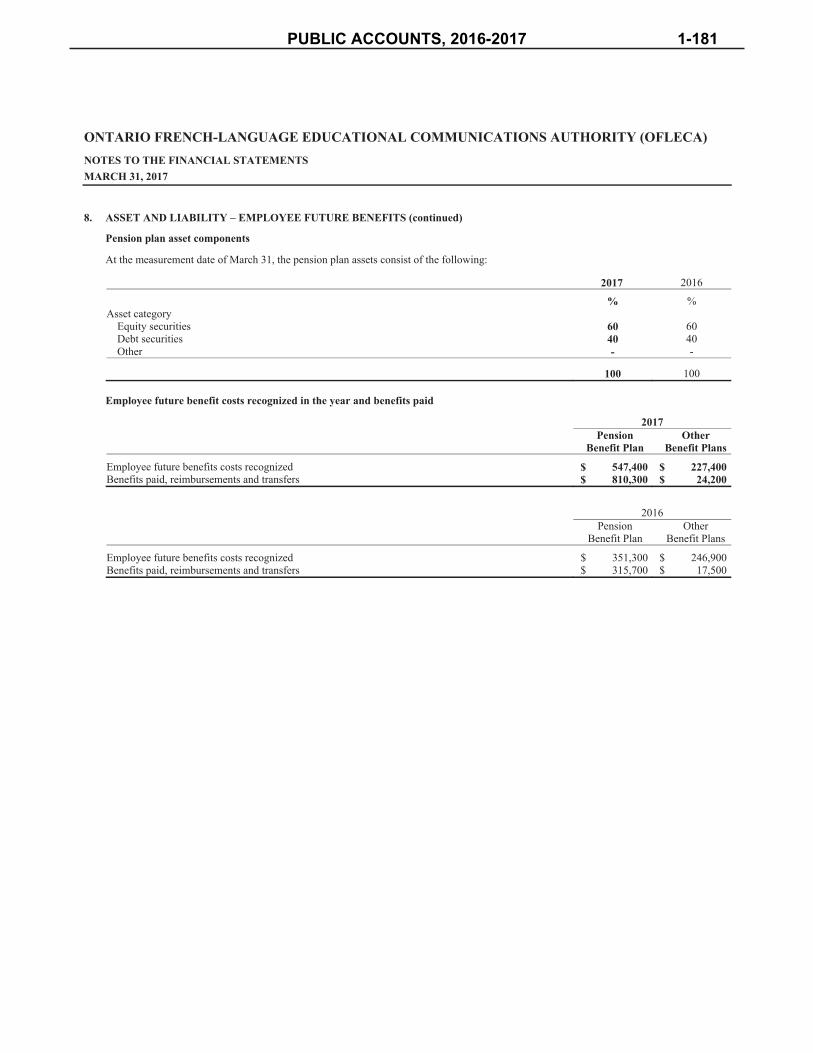
ONTARIO FRENCH-LANGUAGE EDUCATIONAL COMMUNICATIONS AUTHORITY (OFLECA)NOTES TO THE FINANCIAL STATEMENTSMARCH 31, 2017
8. ASSET AND LIABILITY – EMPLOYEE FUTURE BENEFITS (continued)
Pension plan asset components
At the measurement date of March 31, the pension plan assets consist of the following:
2017 2016
% %Asset category
Equity securities 60 60Debt securities 40 40Other - -
100 100
Employee future benefit costs recognized in the year and benefits paid
2017Pension
Benefit PlanOther
Benefit Plans
Employee future benefits costs recognized $ 547,400 $ 227,400Benefits paid, reimbursements and transfers $ 810,300 $ 24,200
2016Pension
Benefit PlanOther
Benefit Plans
Employee future benefits costs recognized $ 351,300 $ 246,900Benefits paid, reimbursements and transfers $ 315,700 $ 17,500
PUBLIC ACCOUNTS, 2016-2017 1-181

ONTARIO FRENCH-LANGUAGE EDUCATIONAL COMMUNICATIONS AUTHORITY (OFLECA)NOTES TO THE FINANCIAL STATEMENTSMARCH 31, 2017
8. ASSET AND LIABILITY – EMPLOYEE FUTURE BENEFITS (continued)
Employee future benefits costs recognized consists of the following:
Pension Benefit Plan Other Benefit Plans2017 2016 2017 2016
Current service benefits’ costs $ 667,000 $ 631,000 $ 151,600 $ 166,000Amortization of net actuarial losses (gains) (30,200) (131,900) 7,600 20,600Interest costs of pension benefits 691,100 638,500 68,200 60,300Expected return on plan assets (780,500) (786,300) -
$ 547,400 $ 351,300 $ 227,400 $ 246,900
Significant assumptions
The significant assumptions used are as follows (weighted average):2017
Pension Benefit Plan
OtherBenefit Plans
% %Accrued benefit obligations
Discount rate 5.75 3.10Rate of compensation increase
Non-unionized employees 1.50 until 2019 -Non-unionized employees 2.50 2020 and after -Unionized employees 2.50 per year -
Employee future benefits costsDiscount rate 5.70 3.20Expected long-term rate of return on plan assets 5.70 -Rate of compensation increase
Non-unionized employees 1.50 until 2019 -Non-unionized employees 2.50 2020 and after -Unionized employees 2.50 per year -
1-182 PUBLIC ACCOUNTS, 2016-2017

ONTARIO FRENCH-LANGUAGE EDUCATIONAL COMMUNICATIONS AUTHORITY (OFLECA)NOTES TO THE FINANCIAL STATEMENTSMARCH 31, 2017
8. ASSET AND LIABILITY – EMPLOYEE FUTURE BENEFITS (continued)
Significant assumptions (continued)2016
Pension Benefit Plan
OtherBenefit Plans
% %Accrued benefit obligations
Discount rate 5.70 3.20Rate of compensation increase:
Non-unionized employees 1.50 until 2019 -Non-unionized employees 2.50 2020 and after -Unionized employees 2.50 per year -
Employee future benefits costsDiscount rate 5.70 2.80Expected long-term rate of return on plan assets 5.70 -Rate of compensation increase:
Non-unionized employees 1.50 until 2019 -Non-unionized employees 2.50 2020 and after -Unionized employees 2.50 per year -
The assumed health care cost trend rates are based on the following:2017 2016% %
Growth rate of health care costs 5.46 5.46Prescription medication:
Initial health care cost trend rate 6.5 6.5Cost trend rate declines to 4.5 4.5Year that the rate reaches the rate it is assumed to remain at 2030 2030
Hospitalization cost, eye care, dental care and other medical care Between 0 and 5.00 Between 0 and 5.00
Defined contribution plan
The total expense recognized in relation with the defined contribution plan amounts to $244,957 (2016: $226,900).
PUBLIC ACCOUNTS, 2016-2017 1-183

ONTARIO FRENCH-LANGUAGE EDUCATIONAL COMMUNICATIONS AUTHORITY (OFLECA)NOTES TO THE FINANCIAL STATEMENTSMARCH 31, 2017
9. CAPITAL ASSETS2017
CostAccumulated amortization Net value
Mobility $ 89,025 $ 44,148 $ 44,877Office equipment 523,529 170,584 352,945Office infrastructure 558,022 205,643 352,379Production equipment 13,468,839 10,849,740 2,619,099Computerized production equipment 11,301,493 8,637,794 2,663,699Office furniture and equipment 1,773,743 851,495 922,248Leasehold improvements 6,271,579 4,690,908 1,580,671
$ 33,986,230 $ 25,450,312 $ 8,535,918
2016
CostAccumulated amortization Net value
Mobility $ 63,256 $ 10,243 $ 53,013Office equipment 488,870 4,579 484,291Office infrastructure 558,022 105,630 452,392Production equipment 12,333,868 10,302,172 2,031,696Computerized production equipment 10,735,275 7,573,448 3,161,827Office furniture and equipment 2,040,691 677,030 1,363,661Leasehold improvements 5,726,954 4,094,458 1,632,496
$ 31,946,936 $ 22,767,560 $ 9,179,376
1-184 PUBLIC ACCOUNTS, 2016-2017
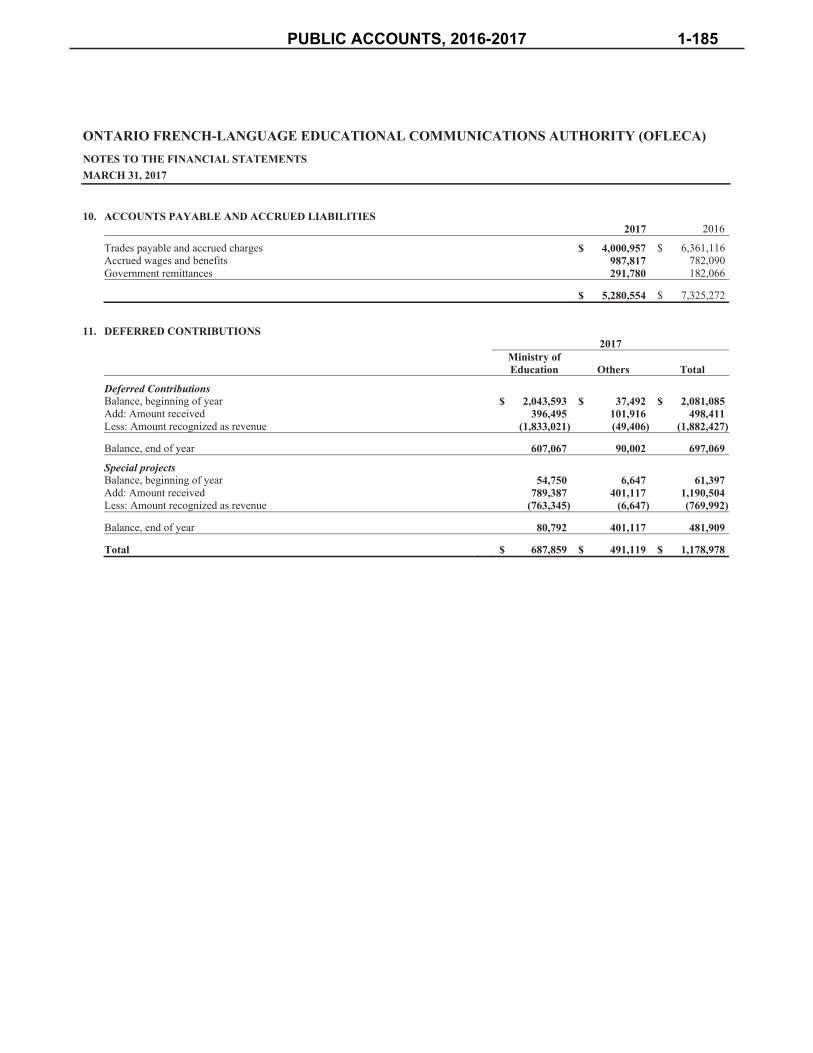
ONTARIO FRENCH-LANGUAGE EDUCATIONAL COMMUNICATIONS AUTHORITY (OFLECA)NOTES TO THE FINANCIAL STATEMENTSMARCH 31, 2017
10. ACCOUNTS PAYABLE AND ACCRUED LIABILITIES2017 2016
Trades payable and accrued charges $ 4,000,957 $ 6,361,116Accrued wages and benefits 987,817 782,090Government remittances 291,780 182,066
$ 5,280,554 $ 7,325,272
11. DEFERRED CONTRIBUTIONS2017
Ministry of Education Others Total
Deferred ContributionsBalance, beginning of year $ 2,043,593 $ 37,492 $ 2,081,085Add: Amount received 396,495 101,916 498,411Less: Amount recognized as revenue (1,833,021) (49,406) (1,882,427)
Balance, end of year 607,067 90,002 697,069
Special projectsBalance, beginning of year 54,750 6,647 61,397Add: Amount received 789,387 401,117 1,190,504Less: Amount recognized as revenue (763,345) (6,647) (769,992)
Balance, end of year 80,792 401,117 481,909
Total $ 687,859 $ 491,119 $ 1,178,978
PUBLIC ACCOUNTS, 2016-2017 1-185

ONTARIO FRENCH-LANGUAGE EDUCATIONAL COMMUNICATIONS AUTHORITY (OFLECA)NOTES TO THE FINANCIAL STATEMENTSMARCH 31, 2017
11. DEFERRED CONTRIBUTIONS (continued)2016
Ministry of Education Others Total
Deferred contributionsBalance, beginning of year $ 5,655,970 $ 76,023 $ 5,731,993Add: Amount received 1,507,300 46,490 1,553,790Less: Amount recognized as revenue (5,119,677) (85,021) (5,204,698)
Balance, end of year 2,043,593 37,492 2,081,085
Special projectsBalance, beginning of year 72,132 14,000 86,132Add: Amount received 276,357 320,000 596,357Less: Amount recognized as revenue (293,739) (327,353) (621,092)
Balance, end of year 54,750 6,647 61,397
Total $ 2,098,343 $ 44,139 $ 2,142,482
12. DEFERRED CONTRIBUTIONS – BROADCASTING RIGHTS2017 2016
Balance, beginning of year $ 18,118,630 $ 17,909,342Add:
Amount received this year – Ministry of Education 3,694,426 8,331,561Amount received prior year – Ministry of Education - 1,002,000Amount received – Others 978,286 500
Less : Transfer (204,850) (2,224,718)Amortization – Amount recognized as revenue (6,578,952) (6,900,055)
Balance, end of year $ 16,007,540 $ 18,118,630
1-186 PUBLIC ACCOUNTS, 2016-2017

ONTARIO FRENCH-LANGUAGE EDUCATIONAL COMMUNICATIONS AUTHORITY (OFLECA)NOTES TO THE FINANCIAL STATEMENTSMARCH 31, 2017
13. DEFERRED CONTRIBUTIONS – IN-HOUSE PROGRAMMING2017 2016
Balance, beginning of year $ 20,241,936 $ 18,746,383Add:
Amount received – Ministry of Education 8,678,754 9,541,708Amount received – Canadian Media Fund 783,638 730,000
Less: Amortization – Amount recognized as revenue (10,147,202) (8,776,155)
Balance, end of year $ 19,557,126 $ 20,241,936
14. DEFERRED CONTRIBUTIONS – CAPITAL ASSETS2017 2016
Balance, beginning of year $ 10,183,651 $ 10,960,759Add :
Amounts added to deferred contributions – Ministry of Education 2,463,595 2,865,977Less :
Transfer (4,275) (986,432)Amortization – Amount recognized as revenue (2,809,779) (2,656,653)
Balance, end of year $ 9,833,192 $ 10,183,651
PUBLIC ACCOUNTS, 2016-2017 1-187

ONTARIO FRENCH-LANGUAGE EDUCATIONAL COMMUNICATIONS AUTHORITY (OFLECA)NOTES TO THE FINANCIAL STATEMENTSMARCH 31, 2017
15. CONTRIBUTIONS – OPERATING GRANTS2017 2016
Received in current yearGrant – core $ 15,235,943 $ 11,640,739Grant – core – AODA 657,300 657,300Grant – capital 2,475,000 1,867,000Grant – broadcasting rights 3,517,703 6,132,953Grant – in-house programming 8,678,754 9,541,708
Received in prior yearCapital 4,275 986,432Broadcasting rights 176,723 2,189,763AODA 201,977 788,845Dedicated projects 1,091,045 2,873,509
Transfer to deferred contributionsBroadcasting rights (3,694,426) (8,331,561)In-house programming (8,678,754) (9,541,708)Capital assets (2,463,595) (2,865,977)Dedicated projects (280,000) (850,000)Dedicated projects – AODA (116,495) (201,977)
$ 16,805,450 $ 14,887,026
1-188 PUBLIC ACCOUNTS, 2016-2017

ONTARIO FRENCH-LANGUAGE EDUCATIONAL COMMUNICATIONS AUTHORITY (OFLECA)NOTES TO THE FINANCIAL STATEMENTSMARCH 31, 2017
16. CONTRIBUTIONS – FUNDING FOR SPECIAL PROJECTS2017
Ministry of Education Others Total
Funding received in current year $ 1,078,093 $ - $ 1,078,093Funding recognized 54,750 6,647 61,397Less: Deferred contributions (80,792) - (80,792)
$ 1,052,051 $ 6,647 $ 1,058,698
2016Ministry of Education Others Total
Funding received in current year $ 343,357 $ 320,000 $ 663,357Funding recognized 293,739 327,353 621,092Less: Deferred contributions (276,358) (320,000) (596,358)
$ 360,738 $ 327,353 $ 688,091
PUBLIC ACCOUNTS, 2016-2017 1-189
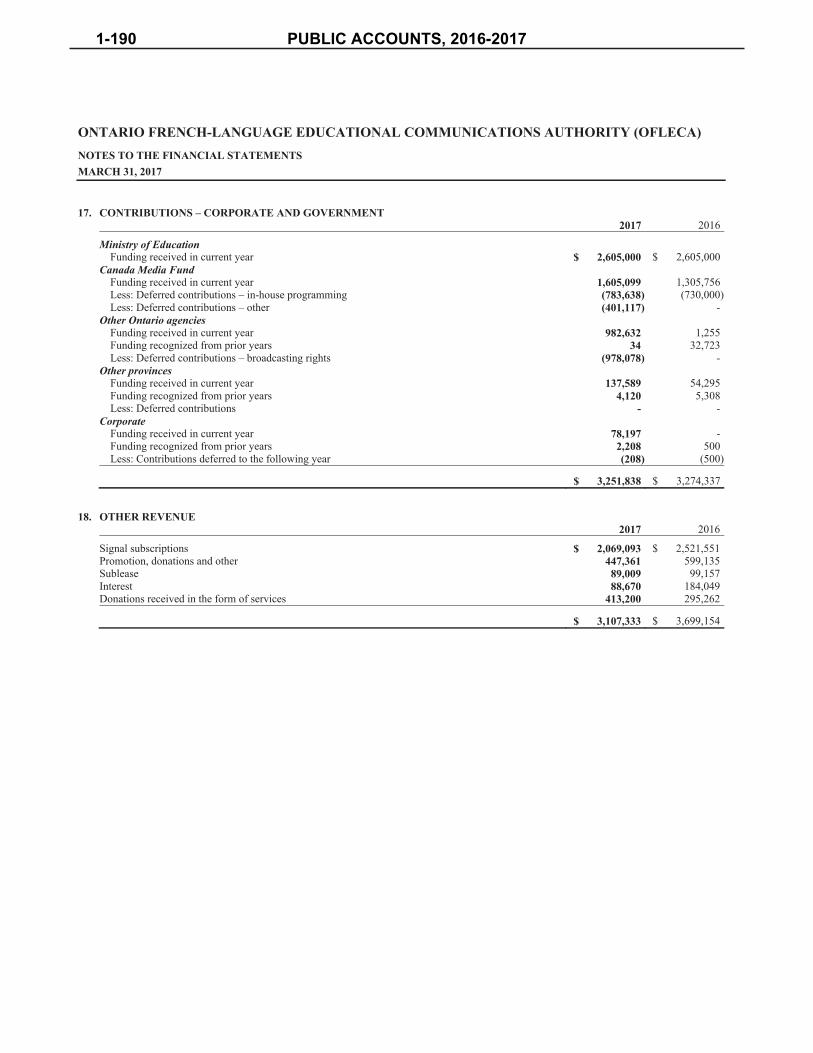
ONTARIO FRENCH-LANGUAGE EDUCATIONAL COMMUNICATIONS AUTHORITY (OFLECA)NOTES TO THE FINANCIAL STATEMENTSMARCH 31, 2017
17. CONTRIBUTIONS – CORPORATE AND GOVERNMENT2017 2016
Ministry of EducationFunding received in current year $ 2,605,000 $ 2,605,000
Canada Media FundFunding received in current year 1,605,099 1,305,756Less: Deferred contributions – in-house programming (783,638) (730,000)Less: Deferred contributions – other (401,117) -
Other Ontario agenciesFunding received in current year 982,632 1,255Funding recognized from prior years 34 32,723Less: Deferred contributions – broadcasting rights (978,078) -
Other provincesFunding received in current year 137,589 54,295Funding recognized from prior years 4,120 5,308Less: Deferred contributions - -
CorporateFunding received in current year 78,197 -Funding recognized from prior years 2,208 500Less: Contributions deferred to the following year (208) (500)
$ 3,251,838 $ 3,274,337
18. OTHER REVENUE2017 2016
Signal subscriptions $ 2,069,093 $ 2,521,551Promotion, donations and other 447,361 599,135Sublease 89,009 99,157Interest 88,670 184,049Donations received in the form of services 413,200 295,262
$ 3,107,333 $ 3,699,154
1-190 PUBLIC ACCOUNTS, 2016-2017

ONTARIO FRENCH-LANGUAGE EDUCATIONAL COMMUNICATIONS AUTHORITY (OFLECA)NOTES TO THE FINANCIAL STATEMENTSMARCH 31, 2017
19. RELATED PARTY TRANSACTIONS BETWEEN RELATED ORGANIZATIONS
As sponsor of the Ontario French-language Educational Communications Authority Pension Plan, the Authority has undertaken to pay certaincosts of the pension plan, including compensation of employees, professional fees and costs associated with the use of premises and otherassociated costs.
20. FINANCIAL INSTRUMENTS
Financial risk management objectives and policies
The Authority is exposed to various financial risks resulting from both its operations and its investment activities. The Authority’smanagement manages financial risks.
The Authority does not enter into financial agreements including derivative financial instruments for speculative purposes.
Financial risks
The Authority’s main financial risk exposure and its financial risk management policies are as follows:
Credit risk
Credit risk is the risk of financial loss for the Authority if a customer or counterparty to a financial instrument fails to meet its contractualobligations. Such risks arise mainly from certain financial assets held by the Authority consisting of cash and cash equivalents and accountsreceivable.
The Authority is exposed to credit risk attributable to its accounts receivable. The credit risk is assessed as low mainly due to the type ofdebtor, for the most part comprised of the government.
The Authority is exposed to concentration risk attributable to cash and cash equivalents and restricted cash since it only trades with onefinancial institution. The Authority manages its credit risk by dealing with a reputable bank.
PUBLIC ACCOUNTS, 2016-2017 1-191
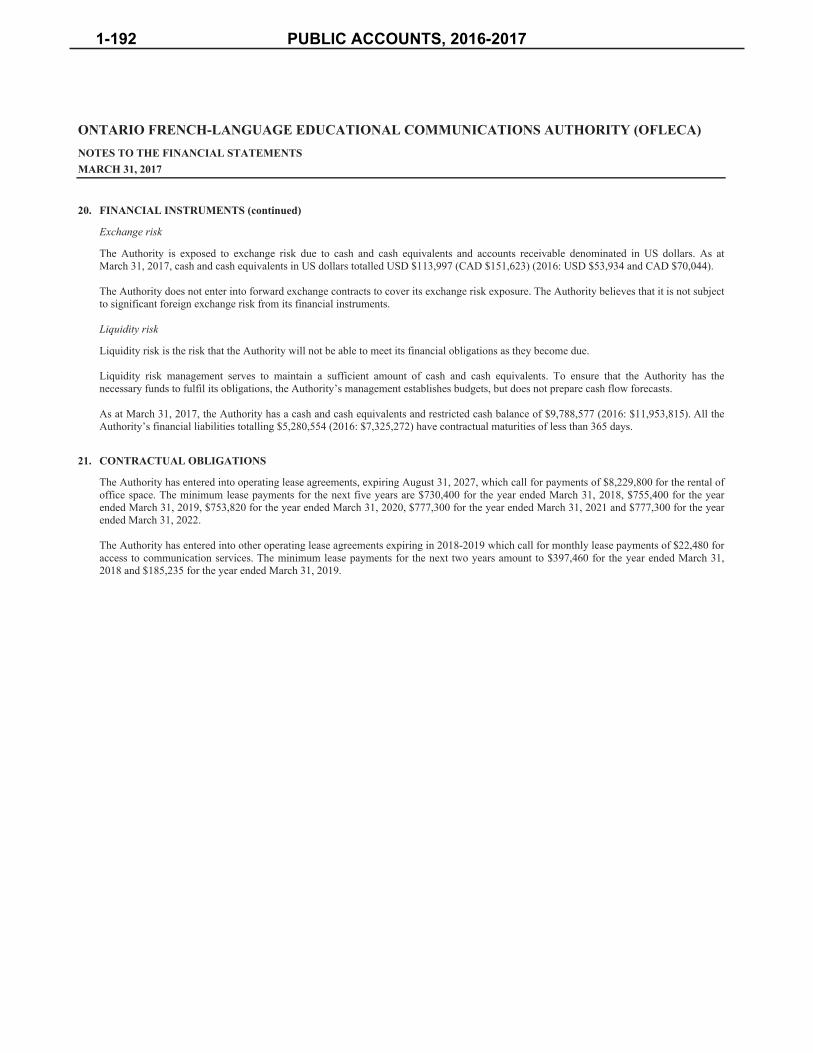
ONTARIO FRENCH-LANGUAGE EDUCATIONAL COMMUNICATIONS AUTHORITY (OFLECA)NOTES TO THE FINANCIAL STATEMENTSMARCH 31, 2017
20. FINANCIAL INSTRUMENTS (continued)
Exchange risk
The Authority is exposed to exchange risk due to cash and cash equivalents and accounts receivable denominated in US dollars. As atMarch 31, 2017, cash and cash equivalents in US dollars totalled USD $113,997 (CAD $151,623) (2016: USD $53,934 and CAD $70,044).
The Authority does not enter into forward exchange contracts to cover its exchange risk exposure. The Authority believes that it is not subjectto significant foreign exchange risk from its financial instruments.
Liquidity risk
Liquidity risk is the risk that the Authority will not be able to meet its financial obligations as they become due.
Liquidity risk management serves to maintain a sufficient amount of cash and cash equivalents. To ensure that the Authority has thenecessary funds to fulfil its obligations, the Authority’s management establishes budgets, but does not prepare cash flow forecasts.
As at March 31, 2017, the Authority has a cash and cash equivalents and restricted cash balance of $9,788,577 (2016: $11,953,815). All theAuthority’s financial liabilities totalling $5,280,554 (2016: $7,325,272) have contractual maturities of less than 365 days.
21. CONTRACTUAL OBLIGATIONS
The Authority has entered into operating lease agreements, expiring August 31, 2027, which call for payments of $8,229,800 for the rental ofoffice space. The minimum lease payments for the next five years are $730,400 for the year ended March 31, 2018, $755,400 for the yearended March 31, 2019, $753,820 for the year ended March 31, 2020, $777,300 for the year ended March 31, 2021 and $777,300 for the yearended March 31, 2022.
The Authority has entered into other operating lease agreements expiring in 2018-2019 which call for monthly lease payments of $22,480 foraccess to communication services. The minimum lease payments for the next two years amount to $397,460 for the year ended March 31,2018 and $185,235 for the year ended March 31, 2019.
1-192 PUBLIC ACCOUNTS, 2016-2017

ONTARIO FRENCH-LANGUAGE EDUCATIONAL COMMUNICATIONS AUTHORITY (OFLECA)NOTES TO THE FINANCIAL STATEMENTSMARCH 31, 2017
21. CONTRACTUAL OBLIGATIONS (continued)
As at March 31, 2017, the Authority had committed an amount of $5,124,670 for the purchase of broadcasting rights, of which $4,410,000will be paid during the year ending March 31, 2018 and $714,670 during the year ending March 31, 2019.
As at March 31, 2017, the Authority had committed an amount of 297,274 for the purchase of capital assets for the 2017-2018 year.
The Authority has also entered into other contracts for an amount of $155,300, of which $108,712 will be paid during the 2017-2018 year.
22. CONTINGENCIES
The nature of the Authority’s activities is such that there may be litigation pending or in the prospect at any time. With respect to claimsexisting as at March 31, 2017, management believes that the Authority has valid defenses and appropriate insurance coverage in place. Evenin the event these claims would be found valid, management believes that such claims are not expected to have a material effect on theAuthority’s financial position. No amount has been recorded in the financial statements.
The funding received from government ministries may be refunded following an audit if the funding received is identified as a surplus basedon the funding arrangements agreed between the parties. As at March 31, 2017, management has not been informed of any potential refund.
23. COMPARATIVE FIGURES
Certain comparative figures have been reclassified to be consistent with the current year’s presentation.
PUBLIC ACCOUNTS, 2016-2017 1-193


PUBLIC ACCOUNTS, 2016-2017 1-195
Ontario Immigrant Investor Corporation (OIIC)
1-196 PUBLIC ACCOUNTS, 2016-2017

PUBLIC ACCOUNTS, 2016-2017 1-197
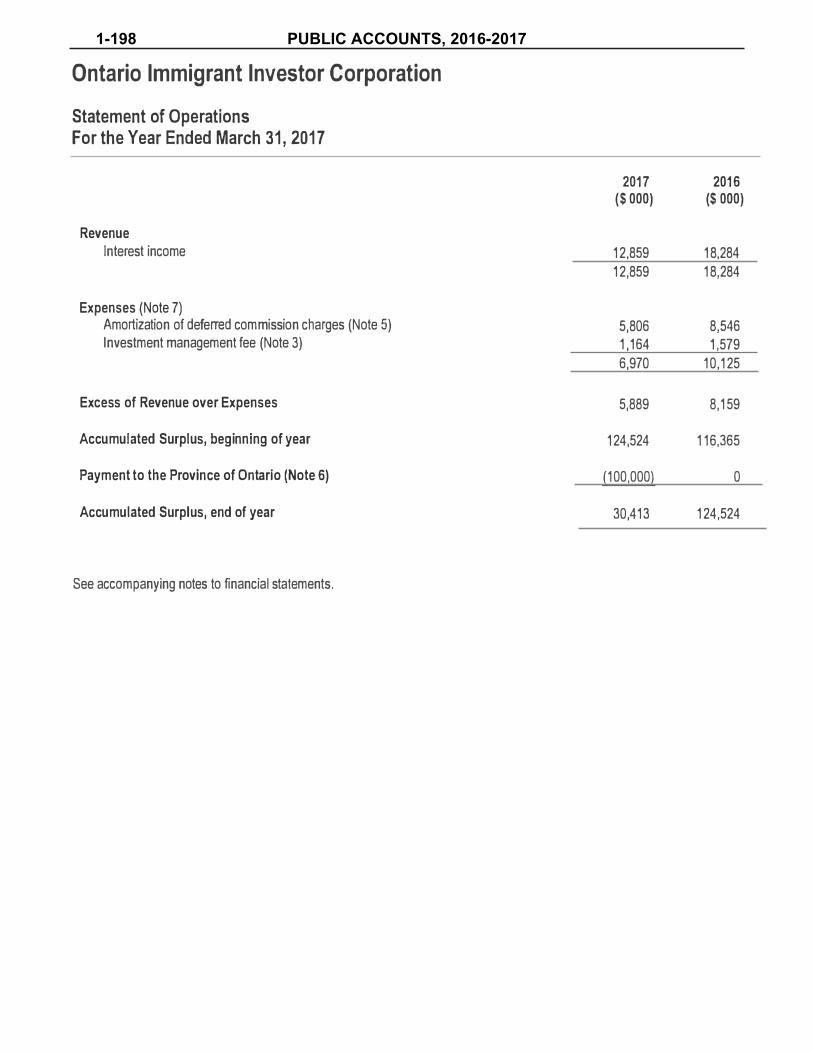
1-198 PUBLIC ACCOUNTS, 2016-2017
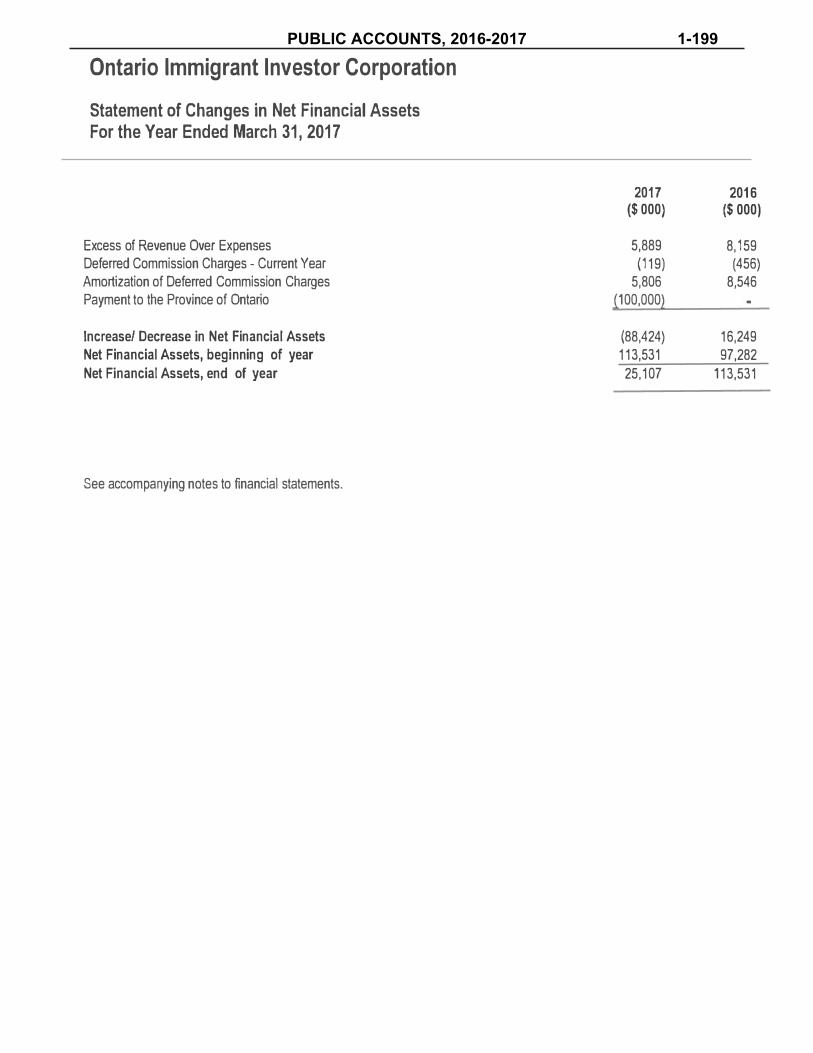
PUBLIC ACCOUNTS, 2016-2017 1-199

1-200 PUBLIC ACCOUNTS, 2016-2017

PUBLIC ACCOUNTS, 2016-2017 1-201
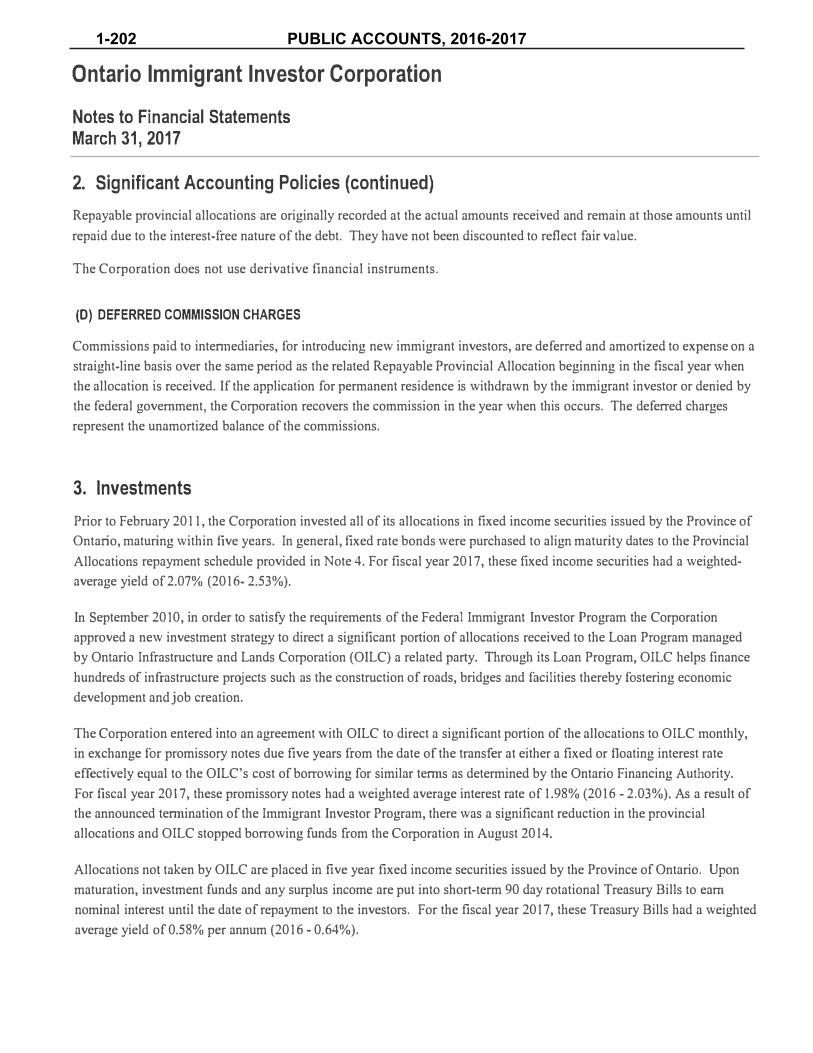
1-202 PUBLIC ACCOUNTS, 2016-2017

PUBLIC ACCOUNTS, 2016-2017 1-203
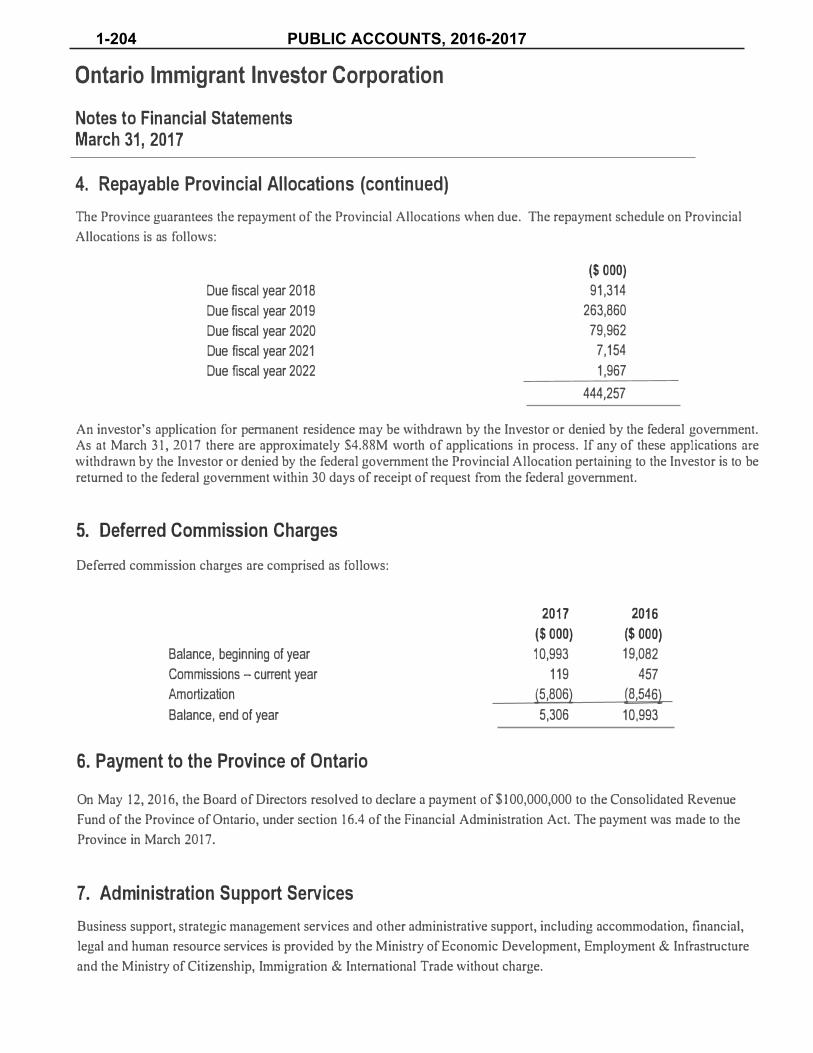
1-204 PUBLIC ACCOUNTS, 2016-2017

INFRASTRUCTURE ONTARIO
RESPONSIBILITY FOR FINANCIAL REPORTING
The accompanying financial statements of Ontario Infrastructure and Lands Corporation have been prepared in accordance with accounting principles for governments recommended by the Public Sector Accounting Board of the Chartered Professional Accountants of Canada and, where applicable, the
recommendations of the Accounting Standards Board of the Chartered Professional Accountants of Canada and are the responsibility of management.
Management maintains a system of internal controls designed to provide reasonable assurance that the assets are safeguarded and that reliable financial information is available on a timely basis. The system
includes formal policies and procedures and an organizational structure that provides for appropriate delegation of authority and segregation of responsibilities.
The Board of Directors oversees management's responsibilities for financial reporting through the Audit Committee. The Audit Committee reviews the financial statements and recommends them to the Board for
approval.
The financial statements have been audited by PricewaterhouseCoopers LLP. The Auditor's responsibility
is to express an opinion on whether the financial statements are fairly presented in accordance with generally accepted accounting principles. The Auditor's report outlines the scope of the Auditor's
examination and opinion.
On behalf of management,
Ehren Cory President and Chief Ex cutive Officer
Krishnan Iyer Executive Vice President Lending and Chief Financial Officer
PUBLIC ACCOUNTS, 2016-2017 1-205
June 22, 2017
Independent Auditor’s Report
To the Directors of Ontario Infrastructure and Lands Corporation
We have audited the accompanying financial statements of Ontario Infrastructure and Lands Corporation, which comprise the statement of financial position as at March 31, 2017 and the statement of operations and accumulated surplus, re-measurement gains and losses, changes in net financial assets and cash flows for the year then ended, and the related notes, which comprise a summary of significant accounting policies and other explanatory information.
Management’s responsibility for the financial statements Management is responsible for the preparation and fair presentation of these financial statements in accordance with Canadian public sector accounting standards, and for such internal control as management determines is necessary to enable the preparation of financial statements that are free from material misstatement, whether due to fraud or error.
Auditor’s responsibility Our responsibility is to express an opinion on these financial statements based on our audit. We conducted our audit in accordance with Canadian generally accepted auditing standards. Those standards require that we comply with ethical requirements and plan and perform the audit to obtain reasonable assurance about whether the financial statements are free from material misstatement.
An audit involves performing procedures to obtain audit evidence about the amounts and disclosures in the financial statements. The procedures selected depend on the auditor’s judgment, including the assessment of the risks of material misstatement of the financial statements, whether due to fraud or error. In making those risk assessments, the auditor considers internal control relevant to the entity’s preparation and fair presentation of the financial statements in order to design audit procedures that are appropriate in the circumstances, but not for the purpose of expressing an opinion on the effectiveness of the entity’s internal control. An audit also includes evaluating the appropriateness of accounting policies used and the reasonableness of accounting estimates made by management, as well as evaluating the overall presentation of the financial statements.
We believe that the audit evidence we have obtained is sufficient and appropriate to provide a basis for our audit opinion.
1-206 PUBLIC ACCOUNTS, 2016-2017

Opinion In our opinion, the financial statements present fairly, in all material respects, the financial position of Ontario Infrastructure and Lands Corporation as at March 31, 2017 and the results of its operations, its re-measurement gains and losses, changes in its net financial assets and its cash flows for the year then ended in accordance with Canadian public sector accounting standards.
Chartered Professional Accountants, Licensed Public Accountants
PUBLIC ACCOUNTS, 2016-2017 1-207

INFRASTRUCTURE ONTARIO STATEMENT OF FINANCIAL POSITION As at March 31 (in thousands of dollars)
March 31 2017 March 31 2016
Financial assetsCash and cash equivalents (Note 2) 486,028$ 1,133,337$ Accounts receivable (Note 3) 35,620 40,900 Interest receivable 45,906 64,721 Investment income receivable 1,779 1,851 Loans receivable (Note 4) 5,661,622 5,225,176 Derivatives (Note 5) 283,271 406,576 Projects receivable (Note 6) 45,086 45,843 Investments (Note 7) 177,505 177,505
6,736,817 7,095,909
LiabilitiesAccounts payable 3,891 6,111 Accrued liabilities 27,024 27,668 Liabilities held in trust (Note 18) 75,244 248,258 Interest payable 67,302 73,892 Derivatives (Note 5) 371,019 554,354 Deferred revenue 25,696 16,839 Debt - loan program (Note 9) 6,068,840 6,144,550
6,639,016 7,071,672
Net financial assets 97,801 24,237
Non-financial assetsTangible capital assets (Note 10) 1,934 3,042
99,735 27,279
Accumulated surplus 187,483 175,057 Accumulated re-measurement losses (87,748) (147,778)
99,735$ 27,279$
Contingencies (Note 16)Commitments (Note 17)
The accompanying notes are an integral part of these financial statements.
Approved
___________________________________ ______________________________________ Board Chair Director, Chair Audit Committee
1-208 PUBLIC ACCOUNTS, 2016-2017
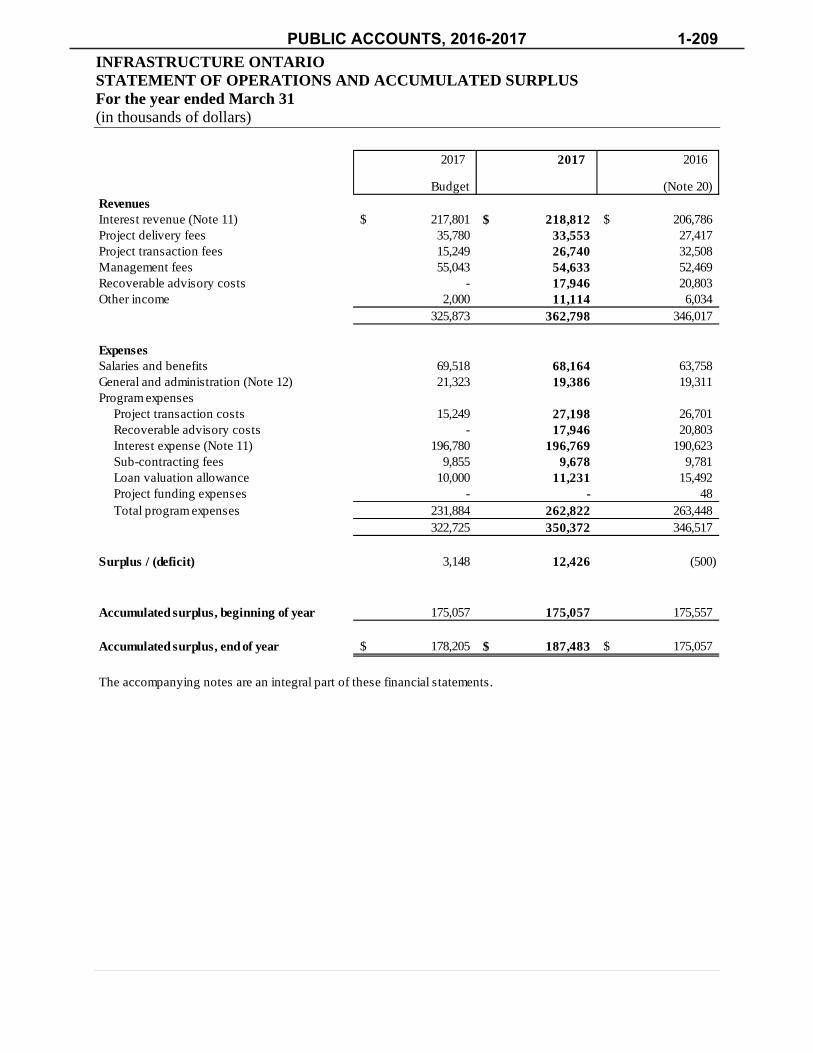
INFRASTRUCTURE ONTARIO STATEMENT OF OPERATIONS AND ACCUMULATED SURPLUS For the year ended March 31 (in thousands of dollars)
2017 2017 2016
Budget (Note 20)RevenuesInterest revenue (Note 11) 217,801$ 218,812$ 206,786$ Project delivery fees 35,780 33,553 27,417 Project transaction fees 15,249 26,740 32,508 Management fees 55,043 54,633 52,469 Recoverable advisory costs - 17,946 20,803 Other income 2,000 11,114 6,034
325,873 362,798 346,017
ExpensesSalaries and benefits 69,518 68,164 63,758 General and administration (Note 12) 21,323 19,386 19,311 Program expenses
Project transaction costs 15,249 27,198 26,701 Recoverable advisory costs - 17,946 20,803 Interest expense (Note 11) 196,780 196,769 190,623 Sub-contracting fees 9,855 9,678 9,781 Loan valuation allowance 10,000 11,231 15,492 Project funding expenses - - 48 Total program expenses 231,884 262,822 263,448
322,725 350,372 346,517
Surplus / (deficit) 3,148 12,426 (500)
Accumulated surplus, beginning of year 175,057 175,057 175,557
Accumulated surplus, end of year 178,205$ 187,483$ 175,057$
The accompanying notes are an integral part of these financial statements.
PUBLIC ACCOUNTS, 2016-2017 1-209
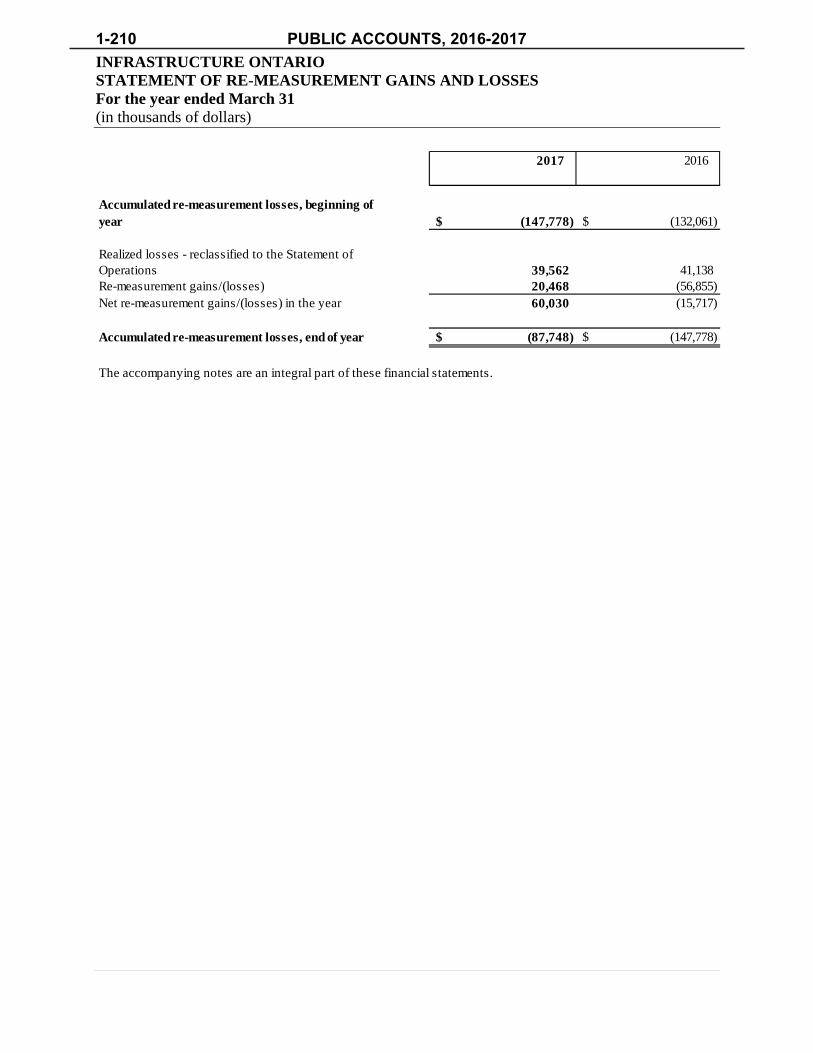
INFRASTRUCTURE ONTARIO STATEMENT OF RE-MEASUREMENT GAINS AND LOSSES For the year ended March 31 (in thousands of dollars)
2017 2016
Accumulated re-measurement losses, beginning ofyear (147,778)$ (132,061)$
Realized losses - reclassified to the Statement ofOperations 39,562 41,138 Re-measurement gains/(losses) 20,468 (56,855) Net re-measurement gains/(losses) in the year 60,030 (15,717)
Accumulated re-measurement losses, end of year (87,748)$ (147,778)$
The accompanying notes are an integral part of these financial statements.
1-210 PUBLIC ACCOUNTS, 2016-2017

INFRASTRUCTURE ONTARIO STATEMENT OF CHANGES IN NET FINANCIAL ASSETS For the year ended March 31 (in thousands of dollars)
2017 2016
Surplus/(deficit) 12,426$ (500)$
Acquisition of tangible capital assets (514) (958) Amortization of tangible capital assets 1,622 1,937 Net re-measurement gains/(losses) in the year 60,030 (15,717)
Net change in net financial assets 73,564 (15,238) Net financial assets at beginning of year 24,237 39,475 Net financial assets at end of year 97,801$ 24,237$
The accompanying notes are an integral part of these financial statements.
PUBLIC ACCOUNTS, 2016-2017 1-211

INFRASTRUCTURE ONTARIO STATEMENT OF CASH FLOWS For the year ended March 31 (in thousands of dollars)
2017 2016(Note 20)
Operating activitiesSurplus/(deficit) 12,426$ (500)$ Items not requiring a current cash outlay:
Loan valuation allowance 11,231 15,492 Amortization of deferred concession costs (6,580) (7,327) Amortization of tangible capital assets 1,622 1,937
18,699 9,602 Changes in non-cash working capital items:
Decrease in accounts receivable 5,280 64,662 Decrease/(increase) in interest receivable 18,815 (755) Decrease in projects receivable 757 18,360 Decrease in accounts payable (2,220) (1,584) Decrease in accrued liabilities (644) (6,927) (Decrease)/increase in liabilities held in trust (173,014) 183,446 (Decrease)/increase in deferred revenue 8,857 (3,052)
Cash (used in)/provided by operating activities (123,470) 263,752
Capital activitiesAcquisition of tangible capital assets (514) (958) Cash used in capital activities (514) (958)
Investing activitiesDecrease in investment income receivable 72 322 Proceeds from disposition of investments - 37,706 Issuance of loans receivable (810,290) (771,786) Loan repayments 369,193 335,782 Cash used in investing activities (441,025) (397,976)
Financing activities(Decrease)/increase in interest payable (6,590) 1,194 Repayment of OFA credit facility - (10,000) Repayment of short term revolving credit facility (115,000) (250,000) Debt issuances 819,408 1,265,786 Debt repayments (780,118) (823,288) Cash (used in)/provided by financing activities (82,300) 183,692
Net (decrease)/increase in cash and cash equivalents (647,309) 48,510 Cash and cash equivalents, beginning of year 1,133,337 1,084,827 Cash and cash equivalents, end of year 486,028$ 1,133,337$
The accompanying notes are an integral part of these financial statements.
1-212 PUBLIC ACCOUNTS, 2016-2017
INFRASTRUCTURE ONTARIO NOTES TO FINANCIAL STATEMENTS March 31, 2017 and 2016
NATURE OF THE CORPORATION
Ontario Infrastructure and Lands Corporation (Infrastructure Ontario, Agency, Corporation) is a Crown corporation reporting to the Minister of Infrastructure (Minister) and is classified by the Government of the Province of Ontario (Province, Government) as an operational enterprise.
The mandate of Infrastructure Ontario includes the following:
To provide financing for infrastructure purposes to municipalities and to eligible public organizations; To provide the Minister with advice and services, including project management, contract management and
development, related to public works for which the Minister is responsible; To provide the Government with advice and services, including project management, contract management
and development, related to public works for which the Minister is not responsible, when directed to do soin writing by the Minister;
To provide financial management for public works managed by the Ministry of Infrastructure (Ministry) orby a Crown agency for which the Minister is responsible;
To carry out the powers, duties and functions delegated by the Minister to the Corporation under the Ministryof Infrastructure Act, 2011;
To provide advice and services related to real property to public sector organizations when directed to do soin writing by the Minister;
To provide advice and services to the Minister or other members of the executive council, on financial,strategic or other matters involving the Government, when directed to do so in writing by the Minister;
To implement or assist in the implementation of transactions involving the Government, when directed to doso in writing by the Minister; and
To provide advice and services, including project management and contract management services related toinfrastructure projects in Ontario that are not public works, when directed to do so in writing by the Minister.
As a Crown corporation, Infrastructure Ontario is exempt from federal and provincial income taxes under paragraph 149(1) (d) of the Income Tax Act of Canada. Infrastructure Ontario is subject to Harmonized Sales Tax (HST).
1. SUMMARY OF SIGNIFICANT ACCOUNTING POLICIES
Basis of accountingThese financial statements are prepared in accordance with Canadian Public Sector Accounting standardsestablished by the Public Sector Accounting Board (PSAB) of the Chartered Professional Accountants ofCanada (CPA Canada).
Management estimatesThe preparation of financial statements in accordance with Canadian Generally Accepted AccountingPrinciples (GAAP) requires management to make estimates and assumptions that affect the reported amountsof assets and liabilities and the disclosure of contingent liabilities at the date of the financial statements and thereported amounts of revenue and expenses during the reporting period. Actual amounts could differ from thoseestimates.
Key areas where management has made estimates are in the percentage of completion for the determination ofrevenue from project delivery fees, the loan portfolio valuation allowance and the fair value of derivatives.Actual results could differ from those and other estimates, the impact of which would be recorded in futureperiods.
Financial instrumentsInfrastructure Ontario’s financial assets include cash and cash equivalents, accounts receivable, interestreceivable, investment income receivable, loans receivable, derivatives, projects receivable, and investments.Infrastructure Ontario’s financial liabilities include accounts payable, accrued liabilities, interest payable,derivatives, and the debt supporting the loan program.
PUBLIC ACCOUNTS, 2016-2017 1-213

INFRASTRUCTURE ONTARIO NOTES TO FINANCIAL STATEMENTS March 31, 2017 and 2016
Initial recognition and measurement All financial assets and liabilities are initially recognized at fair value. Fair value is the amount of the consideration that would be agreed on in an arm’s length transaction between knowledgeable willing parties, who are under no compulsion to act. Financial instruments are classified at initial recognition as either (i) fair value or (ii) cost or amortized cost. Derivatives are classified in the fair value category. All other financial instruments are classified in the cost or amortized cost category.
The amortized cost of the 2003-04 program loans (see Note 4) issued by Infrastructure Ontario, which were considered to have concessionary terms, was determined as the present value of the future cash flows of the loan, and discounted using Infrastructure Ontario’s cost of borrowing. The difference between the face value of the loan and its present value is, in substance, a grant. The grant portion is recognized as a concession cost at the date of issuance of the loan and amortized to match the underlying interest subsidy, over the term of the loan.
Transaction costs for financial instruments measured at cost or amortized cost are added to or netted against the carrying value of the financial asset or financial liability, respectively.
Subsequent measurement The subsequent measurement of financial assets depends on their classification as described below:
i. Financial instruments at fair valueFinancial instruments at fair value are re-measured at their fair value at the end of each reportingperiod. Any unrealized gains and losses are recognized in the statement of re-measurement gains andlosses and are subsequently reclassified to the statement of operations upon disposal or settlement.
Infrastructure Ontario uses the following hierarchy for determining and disclosing the fair value offinancial instruments:
Level 1: quoted (unadjusted) prices in active markets for identical assets or liabilities Level 2: valuation techniques for which all inputs that have a significant effect on the
recorded fair value are observable, either directly or indirectly Level 3: valuation techniques that use inputs that have a significant effect on the recorded
fair value that are not based on observable market data
The fair value of financial instruments not traded in an active market is determined by appropriate valuation techniques, including forward pricing and swap models, using present value calculations. The models incorporate various inputs including forward interest rate curves.
ii. Financial instruments at cost or amortized costFinancial instruments not measured at fair value are measured at cost or amortized cost.
For financial assets and financial liabilities measured at amortized cost, interest is recorded using theeffective interest rate (EIR) method. The EIR is the rate that discounts the estimated future cashpayments or receipts over the expected life of the financial instrument or, where appropriate, a shorterperiod.
1-214 PUBLIC ACCOUNTS, 2016-2017

INFRASTRUCTURE ONTARIO NOTES TO FINANCIAL STATEMENTS March 31, 2017 and 2016
Impairment i. Loss in value of an investment (not quoted in an active market)
A write-down is recognized in the Statement of Operations and Accumulated Surplus when there has been a loss in the value of the investment considered as an ‘other than temporary’ loss. A loss is considered ‘other than temporary’ when the carrying value of the investment exceeds its anticipated value for a prolonged period of time. If the anticipated value of the portfolio investment subsequently increases, the write-down to the statement of operations is not reversed.
ii. Loans receivable impairmentA loan valuation allowance is established against the loan portfolio after management’s review ofexisting economic, industry and portfolio conditions across the different loan segments. The generalvaluation allowance is underpinned by a model in which risk ratings are assigned at the time of loanorigination, monitored on an ongoing basis, and adjusted to reflect changes in underlying credit risk.A specific valuation allowance is also established in instances of known borrower credit deteriorationon the expected non-recoverable portion of the loan receivable.
Cash and cash equivalents Cash and cash equivalents include cash on deposit with a maturity less than three months and highly liquid investments that can be readily convertible to cash.
Derivative financial instruments Infrastructure Ontario uses derivative financial instruments, specifically interest rate swaps, to manage its interest rate risks. Such derivative financial instruments are initially recognized at fair value on the date on which a derivative contract is entered and subsequently re-measured to fair value at each reporting date. Derivatives are carried as financial assets when the fair value is in a receivable position and as financial liabilities when the fair value is in a payable position.
Any unrealized gains or losses arising from changes in the fair value of derivatives are recorded in the Statement of Re-Measurement Gains and Losses and are subsequently re-classified to the Statement of Operations and Accumulated Surplus upon settlement.
Tangible capital assets Tangible capital assets are recorded at cost less accumulated amortization. Amortization is provided using the straight-line method over the estimated useful lives of the assets beginning in the fiscal year of acquisition, with a half-year provision in the year of acquisition and a half-year in the year of disposal. The estimated useful lives of the assets are as follows:
Computer equipment Software Furniture, fixtures and office equipment Leasehold improvements
3 years 5 years 10 years 10 years
Impairment of tangible capital assets The Agency reviews the carrying value of tangible capital assets for potential impairment when there is evidence that events or changes in circumstances exist, that indicate a tangible capital asset no longer contributes to the Government's ability to provide goods and services, or that the value of future economic benefits associated with the tangible capital asset is less than its net book value. In these circumstances, the cost of the tangible capital asset is reduced to reflect the decline in the asset's value. No such impairment losses have been incurred to date.
Revenue recognition Interest revenue Interest on investments and loans receivable are recognized using the effective interest rate method.
PUBLIC ACCOUNTS, 2016-2017 1-215

INFRASTRUCTURE ONTARIO NOTES TO FINANCIAL STATEMENTS March 31, 2017 and 2016
Project delivery fees and project transaction fees Infrastructure Ontario provides professional services under either cost based or fixed price contracts. For cost based contracts, revenue is recorded when an arrangement is in place, costs are incurred, and collectibility is reasonably assured. Revenue from fixed price contracts is recorded using the percentage of completion method. Percentage of completion is calculated based on a ratio of cost incurred to total estimated costs. Losses, if any, on fixed price contracts are recognized during the period they are identified. Deferred revenue is set up when amounts billed on a project exceed the revenue recognized under both cost based and fixed price contracts.
Management fees and recoverable advisory costs Management fees and recoverable advisory costs are recognized as revenue when an arrangement is in place, services are provided and collectibility is reasonably assured.
2. CASH AND CASH EQUIVALENTS
2017 2016($ thousands)
Cash 486,028$ 631,653$ Cash equivalents - 501,684
486,028$ 1,133,337$
Cash includes funds held in trust for Infrastructure Ontario’s lending clients of $55.4 million (2016 - $220.3 million) and project construction consortiums of $19.8 million (2016 - $27.9 million), detailed further in Note 18.
Cash equivalents includes money market investments recorded at cost, which closely approximates fair value. The money market investments were liquidated during the year to repay $520 million of the Province of Ontario loan, detailed further in Note 9.
3. ACCOUNTS RECEIVABLE
2017 2016($ thousands)
Trade accounts receivable 34,713$ 38,136$ HST receivable 907 2,764
35,620$ 40,900$
1-216 PUBLIC ACCOUNTS, 2016-2017

INFRASTRUCTURE ONTARIO NOTES TO FINANCIAL STATEMENTS March 31, 2017 and 2016
4. LOANS RECEIVABLE
2017 2016($ thousands)
Construction advances
Infrastructure renewal loan program $ 349,328 $ 413,515
Debentures receivable Interest % Interest %Concessionary loan programMaturity terms:6 to 10 years 14,150 2.08-2.71 24,971 2.08-2.7111 to 15 years 25,385 2.28-2.67 30,687 2.28-2.6716 to 20 years 234,136 2.36-2.95 257,059 2.36-2.95Greater than 20 years 58,536 2.52-3.05 61,337 2.52-3.05
332,207 374,054
Infrastructure renewal loan programMaturity terms:1 to 5 years 45,048 1.18-4.55 98,450 1.18-4.556 to 10 years 665,754 1.52-5.73 595,603 1.52-5.7311 to 15 years 678,568 2.24-5.26 583,955 2.24-5.2616 to 20 years 1,411,196 2.71-5.89 1,268,622 2.71-5.89Greater than 20 years 2,234,573 2.77-5.91 1,966,282 2.77-5.91
5,035,139 4,512,912
Total 5,716,674 5,300,481
Deferred costs on concessionary loansDeferred costs, beginning of year (43,083) (50,410) Amortization of concession costs 6,580 7,327 Deferred costs, end of year (36,503) (43,083)
Loan valuation allowance (18,549) (32,222)
Loans receivable $ 5,661,622 $ 5,225,176
Construction advances are loans due from municipalities, other public sector bodies and not for profit entities. The interest rate on these construction loans is 30 day bankers’ acceptances plus a fixed spread in basis points depending on the risk categorization of the counterparty. These loans are of a shorter term than the debentures (usually less than five years), and are repaid when construction is complete.
Debentures receivable are due from municipalities, other public sector clients and not for profit entities, with loan maturity terms ranging from four to forty years since inception.
Infrastructure Ontario manages its credit risk with the current loan portfolio through various provisions in the loan agreements. The Agency has an intercept mechanism with the Province, which allows for funds owing to a borrower from the Province to be redirected to Infrastructure Ontario. Loans to non-government borrowers are subject to restrictive covenants on assets and the borrower is required to provide security and in some cases, provide loan insurance.
The loan valuation allowance is based on an assessment of existing economic, industry and portfolio conditions which may indicate that a loan is impaired or losses will be incurred. At March 31, 2017, Infrastructure Ontario has a loan valuation allowance of $18.5 million (2016 - $32.2 million).
PUBLIC ACCOUNTS, 2016-2017 1-217

INFRASTRUCTURE ONTARIO NOTES TO FINANCIAL STATEMENTS March 31, 2017 and 2016
5. DERIVATIVES
Infrastructure Ontario operates within strict risk limits to ensure exposure to interest rate risk is managed in aprudent and cost effective manner. A variety of strategies are used to manage this risk, including the use ofinterest rate derivatives. Infrastructure Ontario does not use derivatives for speculative purposes, and no newderivative contracts have been initiated since Infrastructure Ontario entered into back to back loans with theProvince in April 2015 (Note 9).
Derivatives are financial contracts, the value of which is derived from underlying instruments. InfrastructureOntario, which is a borrower and lender, uses derivatives to create hedges for instruments with differingmaturity dates. The interest rate variability risk is managed through interest rate swaps, which are legal contracts under which Infrastructure Ontario agrees with another party to exchange cash flows based on one or morenotional amounts using stipulated reference interest rates for a specified period. Interest rate swaps allowInfrastructure Ontario to more closely match its existing loans receivable and debt obligations and therebyeffectively convert them into instruments with terms that minimize the Agency’s interest rate risk exposure.Infrastructure Ontario has swapped certain of its fixed rate loans receivable and fixed rate debt portfolio intofloating rate instruments.
The table below presents a maturity schedule of Infrastructure Ontario’s derivatives, outstanding as at March31, 2017, based on the notional amounts of the contracts. The notional amounts of interest rate swaps representthe amount to which the fixed and floating rates are applied in order to calculate the exchange of cash flows.The notional amounts are not recorded in the Statement of Financial Position. They represent the volume ofoutstanding derivative contracts and are not indicative of credit risk, market risk or actual cash flows of suchinstruments.
TotalWithin 2 to 5 6 to 10 11 to 15 Over 15 Notional
($ thousands) 1 year Years Years Years Years Value
Debt 262,500$ 808,982 670,600 - 852,857 2,594,939 Loans receivable 273,787$ 1,081,489 1,094,819 637,024 812,773 3,899,892
Maturity
Derivatives are recorded at fair value as at March 31, 2017 resulting in derivative assets of $283.3 million, derivative liabilities of $371.0 million and accumulated unrealized losses on the Statement of Re-Measurement Gains and Losses of $87.7 million (2016 – derivative assets of $406.6 million, derivative liabilities of $554.4 million and accumulated unrealized losses on the Statement of Re-Measurement Gains and Losses of $147.8 million). Fair values for both were determined using level 2 basis of valuation as defined in Note 1.
The fair values of these derivatives were determined using pricing models, with market observable inputs which take into account current market and contractual prices of the underlying instruments, as well as the time value and yield curve underlying the positions. The determination of the fair value of derivatives includes consideration of credit risk and ongoing direct costs over the life of the instruments.
As at March 31, 2017, all interest rate swap agreements are with the Province. In January 2017, a swap held with MaRS, a former borrower of the lending program, was cancelled through an arrangement with the Ministry of Research and Innovation, with no change to the surplus/deficit in the Statement of Operations and Accumulated Surplus.
1-218 PUBLIC ACCOUNTS, 2016-2017
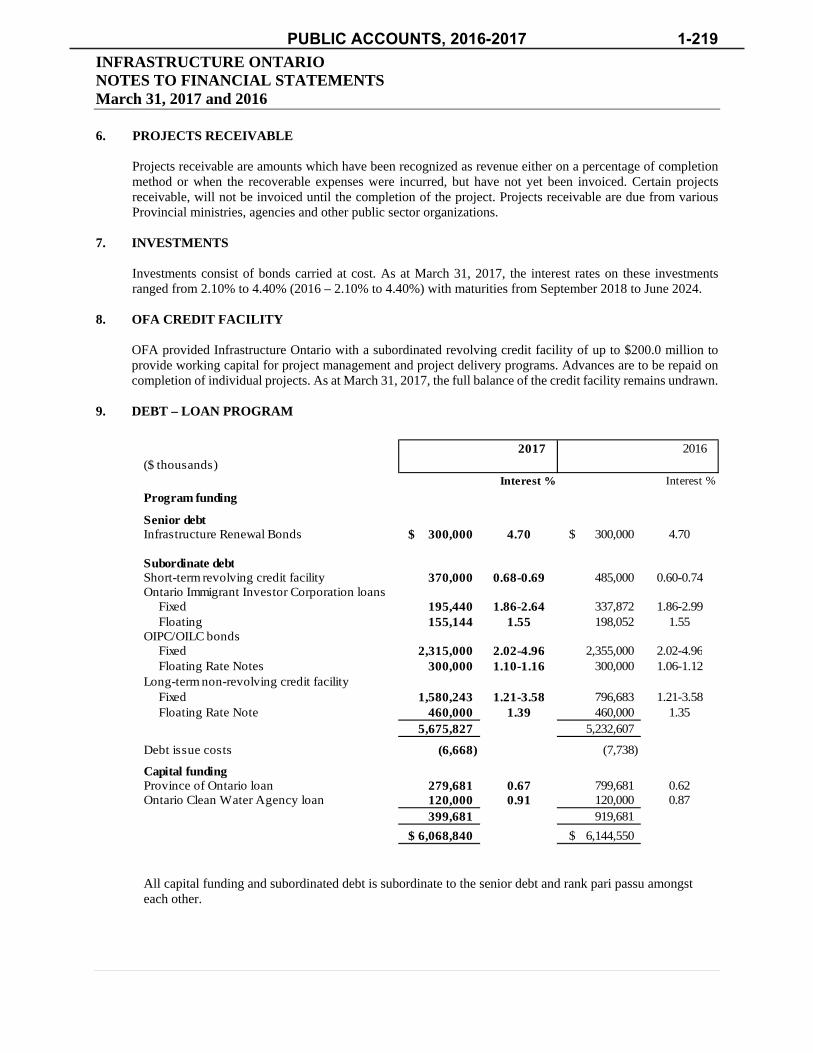
INFRASTRUCTURE ONTARIO NOTES TO FINANCIAL STATEMENTS March 31, 2017 and 2016
6. PROJECTS RECEIVABLE
Projects receivable are amounts which have been recognized as revenue either on a percentage of completionmethod or when the recoverable expenses were incurred, but have not yet been invoiced. Certain projectsreceivable, will not be invoiced until the completion of the project. Projects receivable are due from variousProvincial ministries, agencies and other public sector organizations.
7. INVESTMENTS
Investments consist of bonds carried at cost. As at March 31, 2017, the interest rates on these investmentsranged from 2.10% to 4.40% (2016 – 2.10% to 4.40%) with maturities from September 2018 to June 2024.
8. OFA CREDIT FACILITY
OFA provided Infrastructure Ontario with a subordinated revolving credit facility of up to $200.0 million toprovide working capital for project management and project delivery programs. Advances are to be repaid oncompletion of individual projects. As at March 31, 2017, the full balance of the credit facility remains undrawn.
9. DEBT – LOAN PROGRAM
2017 2016($ thousands)
Interest % Interest %
Program funding
Senior debtInfrastructure Renewal Bonds 300,000$ 4.70 300,000$ 4.70
Subordinate debtShort-term revolving credit facility 370,000 0.68-0.69 485,000 0.60-0.74Ontario Immigrant Investor Corporation loans
Fixed 195,440 1.86-2.64 337,872 1.86-2.99 Floating 155,144 1.55 198,052 1.55OIPC/OILC bonds
Fixed 2,315,000 2.02-4.96 2,355,000 2.02-4.96 Floating Rate Notes 300,000 1.10-1.16 300,000 1.06-1.12
Long-term non-revolving credit facility Fixed 1,580,243 1.21-3.58 796,683 1.21-3.58 Floating Rate Note 460,000 1.39 460,000 1.35
5,675,827 5,232,607
Debt issue costs (6,668) (7,738)
Capital fundingProvince of Ontario loan 279,681 0.67 799,681 0.62Ontario Clean Water Agency loan 120,000 0.91 120,000 0.87
399,681 919,681
6,068,840$ 6,144,550$
All capital funding and subordinated debt is subordinate to the senior debt and rank pari passu amongst each other.
PUBLIC ACCOUNTS, 2016-2017 1-219

INFRASTRUCTURE ONTARIO NOTES TO FINANCIAL STATEMENTS March 31, 2017 and 2016
Infrastructure Renewal Bonds On April 19, 2007, Infrastructure Ontario issued $300 million of Infrastructure Renewal Bonds. The bonds bear interest at 4.70% per annum and mature on June 1, 2037.
Short-term Revolving Credit Facility Effective May 2014, Infrastructure Ontario issues short term notes under a short term revolving credit facility to fund its short term construction loans. The revolving credit facility with the Province is authorized to issue a maximum of $900 million for terms ranging from three months to one year. As at March 31, 2017, maturities ranged from April 3, 2017 to June 15, 2017, while interest on the notes ranged from 0.68% to 0.69% (2016 – 0.60% to 0.74%).
Ontario Immigrant Investor Corporation Loans Ontario Immigrant Investor Corporation (OIIC), an agency of the Province, provided five-year subordinated loans. The loans are subordinated obligations of Infrastructure Ontario and rank behind all other existing and future senior obligations and unsecured public debt of Infrastructure Ontario.
As at March 31, 2017, interest on fixed rate bonds ranged between 1.86% and 2.64% (2016 –1.86% to 2.99%) compounded semi-annually and paid on maturity. Maturities ranged from April 2017 to July 2019. Interest on bonds bearing a variable rate of interest is reset and compounded quarterly with a floor rate of 1.55% (2016 –1.55%) per annum. Maturities ranged from April 2017 to January 2019.
OIPC / OILC Bonds Infrastructure Ontario issued Ontario Infrastructure Projects Corporation (OIPC) and Ontario Infrastructure and Lands Corporation (OILC) bonds to the Province for the purpose of funding its loan program. The bonds are subordinated obligations of Infrastructure Ontario and rank behind all other existing and future senior obligations and unsecured public debt of Infrastructure Ontario.
As at March 31, 2017, interest on fixed rate bonds ranged from 2.02% to 4.96% (2016 – 2.02% to 4.96%) per annum and maturities ranged from September 2017 to June 2045. Interest is paid semi-annually on these bonds until maturity. The Floating Rate Notes (FRN) bear interest from three month CDOR plus 16 basis points to three month CDOR plus 22 basis points and the maturity of the notes is June 30, 2018. Interest is reset and paid quarterly until the maturity of the FRN’s.
Long-term Non-Revolving Credit Facility In April 2015, Infrastructure Ontario began funding long term loans on a back to back basis directly with the Province through a long term non-revolving credit facility. The new debt structures mirror the underlying loans receivable they fund and have similar terms including maturity, payment frequency and type of amortization. This funding structure creates a match between the assets and liabilities and eliminates the need to use derivatives to hedge interest rate risks. In November 2016, Infrastructure Ontario was approved to borrow an additional $2.5 billion from the Province for the purposes of funding the loan program from November 2016 to November 2018. As at March 31, 2017, $2.0 billion of the facility is available and undrawn.
As at March 31, 2017, interest with fixed rates on the back to back loans ranged from 1.21% to 3.58% (2016 – 1.21% to 3.58%) and maturities ranged from May 15, 2019 to March 1, 2047. The FRN bears interest from three month CDOR plus 45 basis points and the maturity of the note is June 30, 2025. Interest is reset and paid quarterly until the maturity of the FRN.
Province of Ontario Loan The Province provided Infrastructure Ontario with a 50 year subordinated loan of approximately $800 million in exchange for a promissory note that matures on March 31, 2053. During the year, $520 million was permanently repaid. The interest on the note is reset quarterly at the Province’s three-month Treasury bill rate and payable quarterly. On March 31, 2017, interest on the note was reset at 0.67% (2016 – 0.62%).
1-220 PUBLIC ACCOUNTS, 2016-2017
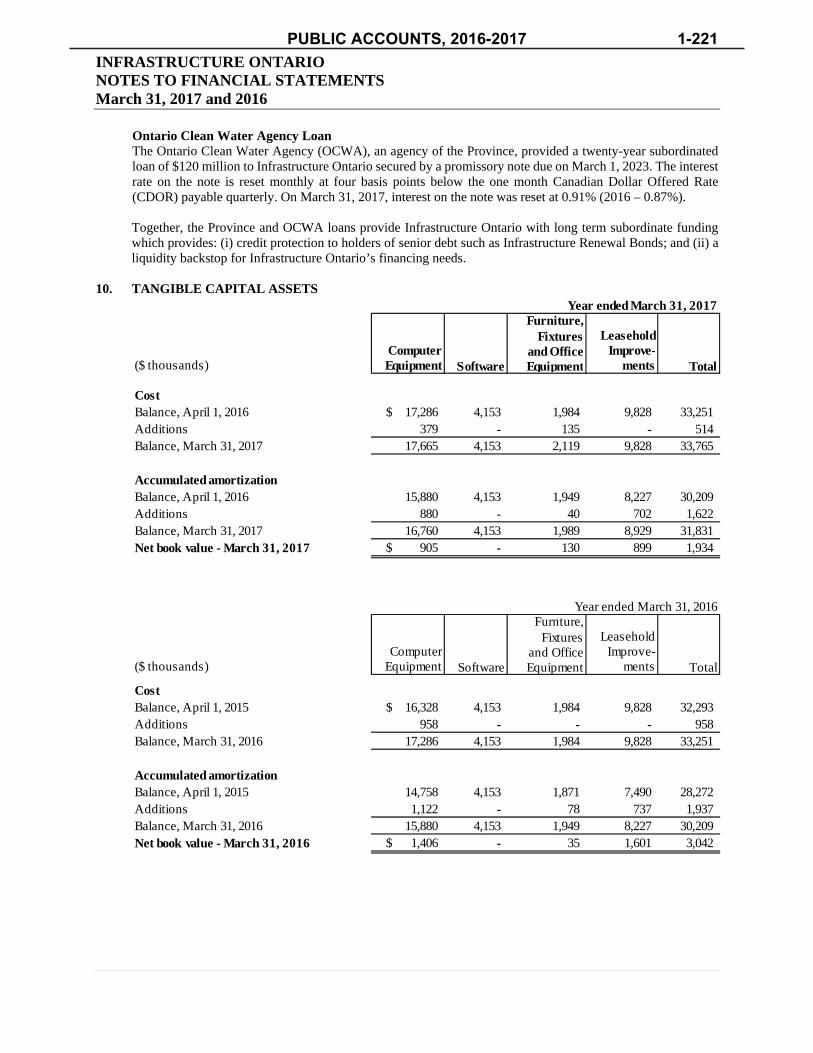
INFRASTRUCTURE ONTARIO NOTES TO FINANCIAL STATEMENTS March 31, 2017 and 2016
Ontario Clean Water Agency Loan The Ontario Clean Water Agency (OCWA), an agency of the Province, provided a twenty-year subordinated loan of $120 million to Infrastructure Ontario secured by a promissory note due on March 1, 2023. The interest rate on the note is reset monthly at four basis points below the one month Canadian Dollar Offered Rate (CDOR) payable quarterly. On March 31, 2017, interest on the note was reset at 0.91% (2016 – 0.87%).
Together, the Province and OCWA loans provide Infrastructure Ontario with long term subordinate funding which provides: (i) credit protection to holders of senior debt such as Infrastructure Renewal Bonds; and (ii) a liquidity backstop for Infrastructure Ontario’s financing needs.
10. TANGIBLE CAPITAL ASSETSYear ended March 31, 2017
Furniture,Fixtures Leasehold
Computer and Office Improve-($ thousands) Equipment Software Equipment ments Total
CostBalance, April 1, 2016 17,286$ 4,153 1,984 9,828 33,251 Additions 379 - 135 - 514 Balance, March 31, 2017 17,665 4,153 2,119 9,828 33,765
Accumulated amortizationBalance, April 1, 2016 15,880 4,153 1,949 8,227 30,209 Additions 880 - 40 702 1,622 Balance, March 31, 2017 16,760 4,153 1,989 8,929 31,831 Net book value - March 31, 2017 905$ - 130 899 1,934
Year ended March 31, 2016Furnture,
Fixtures LeaseholdComputer and Office Improve-
($ thousands) Equipment Software Equipment ments Total
CostBalance, April 1, 2015 16,328$ 4,153 1,984 9,828 32,293 Additions 958 - - - 958 Balance, March 31, 2016 17,286 4,153 1,984 9,828 33,251
Accumulated amortizationBalance, April 1, 2015 14,758 4,153 1,871 7,490 28,272 Additions 1,122 - 78 737 1,937 Balance, March 31, 2016 15,880 4,153 1,949 8,227 30,209 Net book value - March 31, 2016 1,406$ - 35 1,601 3,042
PUBLIC ACCOUNTS, 2016-2017 1-221
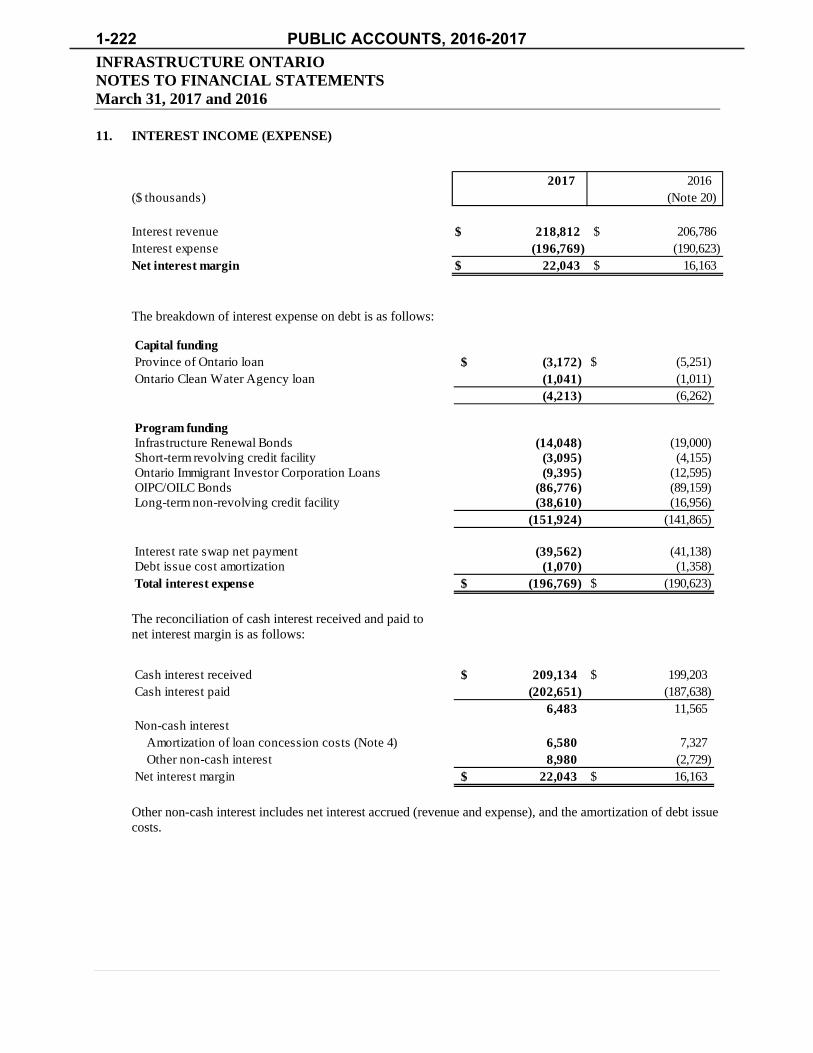
INFRASTRUCTURE ONTARIO NOTES TO FINANCIAL STATEMENTS March 31, 2017 and 2016
11. INTEREST INCOME (EXPENSE)
2017 2016 ($ thousands) (Note 20)
Interest revenue $ 218,812 $ 206,786 Interest expense (196,769) (190,623) Net interest margin $ 22,043 $ 16,163
The breakdown of interest expense on debt is as follows:
Capital fundingProvince of Ontario loan (3,172)$ (5,251)$ Ontario Clean Water Agency loan (1,041) (1,011)
(4,213) (6,262)
Program fundingInfrastructure Renewal Bonds (14,048) (19,000) Short-term revolving credit facility (3,095) (4,155)Ontario Immigrant Investor Corporation Loans (9,395) (12,595) OIPC/OILC Bonds (86,776) (89,159) Long-term non-revolving credit facility (38,610) (16,956)
(151,924) (141,865)
Interest rate swap net payment (39,562) (41,138) Debt issue cost amortization (1,070) (1,358) Total interest expense (196,769)$ (190,623)$
The reconciliation of cash interest received and paid to net interest margin is as follows:
Cash interest received 209,134$ 199,203$ Cash interest paid (202,651) (187,638)
6,483 11,565 Non-cash interest
Amortization of loan concession costs (Note 4) 6,580 7,327 Other non-cash interest 8,980 (2,729)
Net interest margin 22,043$ 16,163$
Other non-cash interest includes net interest accrued (revenue and expense), and the amortization of debt issue costs.
1-222 PUBLIC ACCOUNTS, 2016-2017
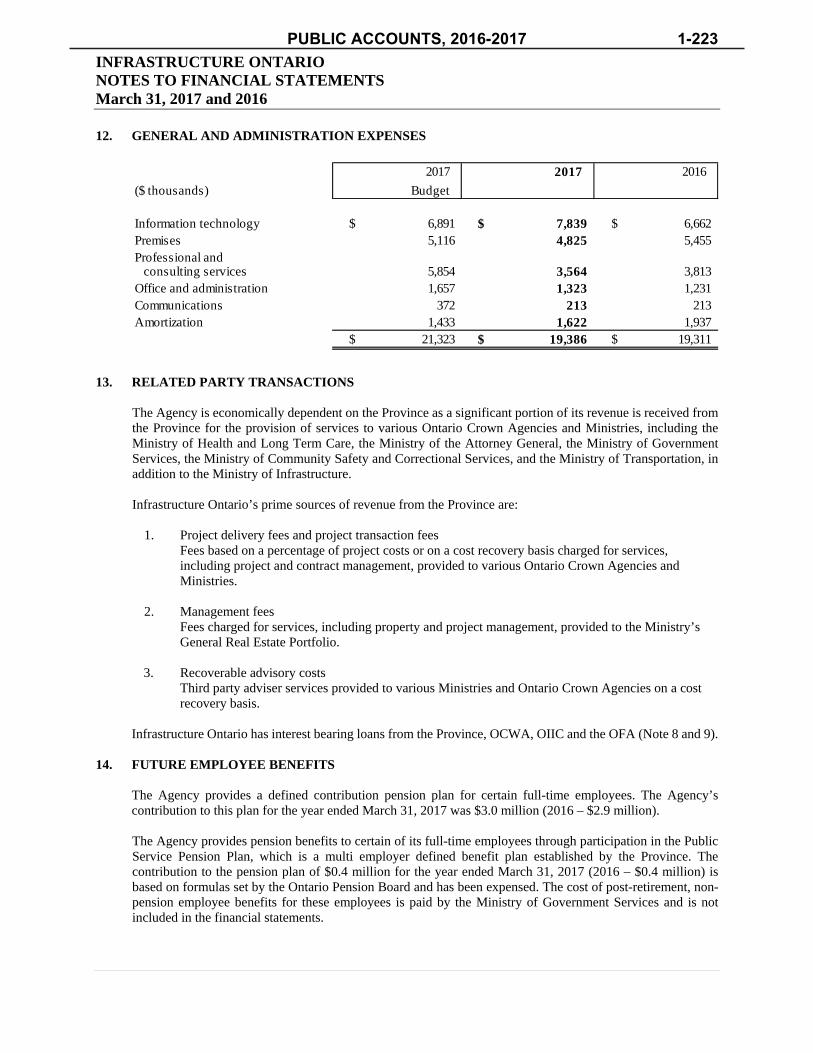
INFRASTRUCTURE ONTARIO NOTES TO FINANCIAL STATEMENTS March 31, 2017 and 2016
12. GENERAL AND ADMINISTRATION EXPENSES
2017 2017 2016
($ thousands) Budget
Information technology 6,891$ 7,839$ 6,662$ Premises 5,116 4,825 5,455 Professional and
consulting services 5,854 3,564 3,813 Office and administration 1,657 1,323 1,231 Communications 372 213 213 Amortization 1,433 1,622 1,937
21,323$ 19,386$ 19,311$
13. RELATED PARTY TRANSACTIONS
The Agency is economically dependent on the Province as a significant portion of its revenue is received fromthe Province for the provision of services to various Ontario Crown Agencies and Ministries, including theMinistry of Health and Long Term Care, the Ministry of the Attorney General, the Ministry of GovernmentServices, the Ministry of Community Safety and Correctional Services, and the Ministry of Transportation, inaddition to the Ministry of Infrastructure.
Infrastructure Ontario’s prime sources of revenue from the Province are:
1. Project delivery fees and project transaction feesFees based on a percentage of project costs or on a cost recovery basis charged for services,including project and contract management, provided to various Ontario Crown Agencies andMinistries.
2. Management feesFees charged for services, including property and project management, provided to the Ministry’sGeneral Real Estate Portfolio.
3. Recoverable advisory costsThird party adviser services provided to various Ministries and Ontario Crown Agencies on a costrecovery basis.
Infrastructure Ontario has interest bearing loans from the Province, OCWA, OIIC and the OFA (Note 8 and 9).
14. FUTURE EMPLOYEE BENEFITS
The Agency provides a defined contribution pension plan for certain full-time employees. The Agency’scontribution to this plan for the year ended March 31, 2017 was $3.0 million (2016 – $2.9 million).
The Agency provides pension benefits to certain of its full-time employees through participation in the PublicService Pension Plan, which is a multi employer defined benefit plan established by the Province. Thecontribution to the pension plan of $0.4 million for the year ended March 31, 2017 (2016 – $0.4 million) isbased on formulas set by the Ontario Pension Board and has been expensed. The cost of post-retirement, non-pension employee benefits for these employees is paid by the Ministry of Government Services and is notincluded in the financial statements.
PUBLIC ACCOUNTS, 2016-2017 1-223
INFRASTRUCTURE ONTARIO NOTES TO FINANCIAL STATEMENTS March 31, 2017 and 2016
15. RISK MANAGEMENT
The principal risks that Infrastructure Ontario is exposed to as a result of holding financial instruments arecredit, market, liquidity and interest rate risks. The Credit and Real Estate Committee of the Board of Directorsreviews policies for managing each of these risks, which are summarized below.
Credit riskCredit risk is the risk of loss arising from a counterparty’s inability to fulfill its financial contractual obligationsto Infrastructure Ontario. The Agency is exposed to credit risk on cash accounts, investments and receivables,but primarily on loans receivable. The Agency manages credit risk through the implementation of policies andreview processes.
Credit risk – loans receivableOversight of the credit risk of the lending program is the primary concern of the Credit and Real EstateCommittee of the Board of Directors.
The credit risk policy ensures loan amounts are commensurate with both the borrower’s ability to service debtand Infrastructure Ontario’s own risk tolerance. The credit risk policy establishes principles for evaluatingcredit risk for each sector based on an established set of risk factors. Separate underwriting and credit functionsexist to ensure an independent review and challenge through the adjudication process. Due diligence isconducted and a final scoring and recommendation for each applicant is presented to the management creditreview committee and to the Board of Directors for approval, if necessary, based on Infrastructure Ontario’sdelegation of authority.
Infrastructure Ontario has a risk based loan review process that covers all lending sectors and provides earlyidentification of possible changes in the credit worthiness of counterparties. The objectives of the loan revieware to: assess the status of funded projects in construction; ensure payment and covenant compliance over theterm of the loan; initiate timely corrective action to minimize any potential credit loss; and escalate potentialloan repayment issues to the management credit review committee and the Board of Directors.
Infrastructure Ontario’s maximum exposure to credit risk on loans receivable, without taking into account anycollateral held or other credit enhancements, as at March 31, 2017 was $5,661.6 million.
Infrastructure Ontario classifies and manages its loans by tiers. Tier 1 borrowers have a tax base and/orreceive provincial transfers which provide a strong source of debt repayment. Tier 2 borrowers are in sectorsthat are either regulated or entitled to government based revenue contracts and therefore have a stable sourceof debt repayment. Tier 3 borrowers are organizations dependent on self generated revenues either by market-set prices or donations and fund raising. The profile of the loans receivable at March 31, 2017 is as follows:
1-224 PUBLIC ACCOUNTS, 2016-2017

INFRASTRUCTURE ONTARIO NOTES TO FINANCIAL STATEMENTS March 31, 2017 and 2016
LoanValuation 2017 2016
($ thousands) Outstanding Allowance
Tier 1 Municipalities 3,710,988$ City of Toronto (as guarantor) 708,282 Universities 129,226 Local service boards 212 Social housing (with municipal guarantee) 153,159 Affordable housing (with municipal guarantee) 1,782 Community health & social service hubs (with municipal guarantee) 3,401
4,707,050 (262) 4,706,788 4,264,931
Tier 2 Local distribution corporations 264,768 Long term care 147,043
Affordable housing (insured by CMHC)(1)
132,175
Affordable housing (not insured by CMHC)(1)
148,273 Social housing 9,446 Aboriginal health access centres 3,176 Community health & social service hubs 20,371
725,252 (3,483) 721,769 726,853
Tier 3 Power generators 117,445 District energy 27,028 Municipal corporations (other) 31,707 Beneficial entities (arts training, etc.) 95,863 Sports and recreation 12,329
284,372 (14,804) 269,568 276,475
Deferred costs on concessionary loansDeferred costs, beginning of year (43,083) Amortization of concession costs 6,580 Deferred costs, end of year (36,503) - (36,503) (43,083)
Loans receivable 5,680,171$ (18,549) 5,661,622 5,225,176
(1) CMHC is defined as Canada Mortgage and Housing Corporation
Collateral – loans receivable Infrastructure Ontario lends on the strength of the applicants’ ability to service loan payments over time. The Agency does not lend on a residual asset value basis and does not factor in possession or control of an asset in the evaluation of debt service coverage. It lends on the basis of a strong assurance of permanent sources of cash flow, namely the unique position of many borrowers to generate tax revenue or receive funding from the Province. Infrastructure Ontario mitigates its credit risk from the loan portfolio through various mitigation control provisions. The Agency has an intercept mechanism with the Province which allows for funds owing to certain borrowers (including municipalities) that receive funding from the Province, to be redirected to Infrastructure Ontario. Clients that do not receive provincial funding are required to provide adequate security such as: guarantees, first ranking mortgage/charge, general security agreement, assignment of rents and leases and assignment of accounts, agreements and collateral.
PUBLIC ACCOUNTS, 2016-2017 1-225

INFRASTRUCTURE ONTARIO NOTES TO FINANCIAL STATEMENTS March 31, 2017 and 2016
Impairment – loans receivable The loan valuation allowance is established against the loan portfolio after management’s review of existing economic, industry and portfolio conditions across the different loan segments. The general valuation allowance is underpinned by a model in which risk ratings are assigned at the time of loan origination, monitored on an ongoing basis, and adjusted to reflect changes in underlying credit risk. A specific valuation allowance is also established in instances of known borrower credit deterioration on the expected non-recoverable portion of the loan receivable.
Credit risk – cash, receivable and investments The maximum exposure to credit risk on the cash, cash equivalents, receivables, derivative assets and investments, without taking into account any collateral held or other credit enhancements, as at March 31, 2017 was:
2017 Past Due($ thousands) >90 days
Cash and cash equivalents 486,028$ -$ Accounts receivable 35,620 11,622 Interest receivable 45,906 - Investment income receivable 1,779 - Projects receivable 45,086 - Derivative assets 283,271 - Investments 177,505 -
1,075,195$ 11,622$
There is no valuation allowance provided against cash and cash equivalents, receivables, derivative assets and investments as at March 31, 2017.
Market risk Market risk is the risk the fair value or future cash flows of a financial instrument will fluctuate due to changes in market prices. This could occur on investments purchased as an economic hedge against borrowed funds that were surplus to immediate lending requirements. These investments were sold as required in order to fund loans. As a result of entering into back to back loan arrangements with the OFA, purchasing investments as an economic hedge is no longer needed. In addition, the entity only invests in bonds authorized under the approved policies and therefore are highly rated by recognized credit rating agencies and can be readily liquidated.
Interest rate risk Interest rate risk is the risk the fair value of future cash flows of a financial instrument will fluctuate because of changes in market interest rates. This could occur when the re-pricing of assets is not aligned with the re-pricing of liabilities. As a result of entering into back to back loan arrangements with the OFA, this re-pricing mismatch has been eliminated on all new loans after April 2015.
Management also controls interest rate risk through the use of interest rate swap derivatives as well as through the alignment of asset and liability risk structures and maturities.
Sensitivity to variations in interest rates The sensitivity of a +/-1% change in the interest rate would have a $1.1 million / ($1.3 million) impact on the annual surplus (deficit); a +/-1 basis point change in the interest rate would have a $0.9 million / ($0.9 million) impact on the accumulated re-measurement gains (losses).
Liquidity risk Liquidity risk is the risk Infrastructure Ontario will not be able to meet its financial obligations as they come due. The senior debt is protected by the capital funding, funded by long-term subordinated loans provided by the Province and the OCWA. The capital funding is invested in short and long term liquid instruments that can be converted into cash in the event of any foreseeable liquidity crisis.
1-226 PUBLIC ACCOUNTS, 2016-2017

INFRASTRUCTURE ONTARIO NOTES TO FINANCIAL STATEMENTS March 31, 2017 and 2016
Infrastructure Ontario’s borrowing by-laws are approved by the Board of Directors and the Minister of Infrastructure as well as the Minister of Finance. Borrowing is reviewed with the Credit and Real Estate Committee of the Board on a quarterly basis. All borrowing is made with prudent consideration of interest rate and liquidity risks and complies with the asset-liability management policy. OFA coordinates and executes all borrowing activities. Infrastructure Ontario borrows directly from the Province for its long-term funding needs through the OFA.
The following illustrates the maturities of contracted obligations as at March 31, 2017:
Within 1 1 to 5 Over 5($ thousands) year years years Total
Accounts payable 3,891$ -$ -$ 3,891$ Accrued liabilities 27,024 - - 27,024 Liabilities held in trust 75,244 - - 75,244 Interest payable 67,302 - - 67,302 Derivative liabilities - - 371,019 371,019 Debt – principal and interest 948,426 1,763,853 5,326,993 8,039,272 Total financial liabilities 1,121,887$ 1,763,853$ 5,698,012$ 8,583,752$
16. CONTINGENCIES
The Agency is involved in various disputes and litigation. In the opinion of management, the resolution ofdisputes against the Agency, will not result in a material effect on the financial position of the Agency.
17. COMMITMENTS
Minimum base rent annual payments under operating leases for the Agency’s office space for the next fiveyears are:
($ thousands)
Fiscal year Amount
2017-2018 4,302$ 2018-2019 4,861 2019-2020 4,942 2020-2021 5,025 2021-2022 5,260
24,390$
Infrastructure Ontario has $551.4 million of unadvanced loan commitments as at March 31, 2017.
18. FUNDS HELD IN TRUST
Infrastructure Ontario is required by the CMHC to collect property taxes and reserve funds as a condition ofproviding certain affordable housing loans. As part of the CMHC certificate of insurance, the funds need to beset up in a trust account and administered by Infrastructure Ontario. As at March 31, 2017, the funds underadministration were $55.4 million (2016 – $220.3 million).
PUBLIC ACCOUNTS, 2016-2017 1-227

INFRASTRUCTURE ONTARIO NOTES TO FINANCIAL STATEMENTS March 31, 2017 and 2016
Infrastructure Ontario maintains a project trust general ledger account to record funds received from various ministries and payable to project construction consortiums related to project substantial completion payments, interim payments, as well as payments received for variations, furniture, fixtures and equipment. Variations are changes to scope agreed to after the initial contract has been executed – also called contract change orders. All the above payments are paid directly by the sponsoring ministries, but flow through Infrastructure Ontario. As at March 31, 2017, Infrastructure Ontario held $19.8 million (2016 – $27.9 million) in its project trust general ledger account.
Infrastructure Ontario maintains several operating bank accounts and a short-term investment account which it holds in trust and administers on behalf of the Ministry. These accounts relate directly to the operations of the Ministry’s general real estate portfolio, for which the Agency is the financial manager pursuant to the Ontario Infrastructure and Lands Corporation Act, 2011. The funds held in trust for the Ministry as at March 31, 2017 were $234.2 million (2016 – $227.8 million), and are not recorded in these financial statements.
19. SEGMENTED INFORMATION
Infrastructure Ontario’s reporting structure reflects how the business is managed. Infrastructure Ontariomanages its operations to enable delivery and accountability on priorities such as those set by the Minister aswell as corporate objectives determined by the Board. Infrastructure Ontario also assesses and anticipates futureassignments and works to align its resources accordingly. As a result, Infrastructure Ontario is able toeffectively allocate its resources and responsibilities by operating divisions in order to ensure efficiency andsustainability of operations over the period of the business plan. The comparative figures for the segmentedinformation has been updated to reflect four business lines whereby land development has been consolidatedwith commercial projects. The table below is a summary of financial information by segment:
For the year ended March 31, 2017
Major Real Commercial
($ thousands) Projects Estate Lending Projects Total
RevenuesInterest revenue $ - - 218,812 - 218,812 Project delivery fees 31,228 - - 2,325 33,553 Project transaction fees 7,520 682 - 18,538 26,740 Management fees - 54,633 - - 54,633 Recoverable advisory costs 17,946 - - - 17,946 Other income - 3,040 8,074 - 11,114
56,694 58,355 226,886 20,863 362,798
ExpensesSalaries and benefits 22,566 37,476 4,906 3,216 68,164 General and administration 7,984 8,201 2,495 706 19,386
Program expenses Project transaction costs 7,888 682 - 18,628 27,198 Recoverable advisory costs 17,946 - - - 17,946 Interest expense - - 196,769 - 196,769 Sub-contracting fees - 9,678 - - 9,678 Loan valuation allowance - - 11,231 - 11,231 Total program expenses 25,834 10,360 208,000 18,628 262,822
56,384 56,037 215,401 22,550 350,372
Surplus/(deficit) $ 310 2,318 11,485 (1,687) 12,426
1-228 PUBLIC ACCOUNTS, 2016-2017
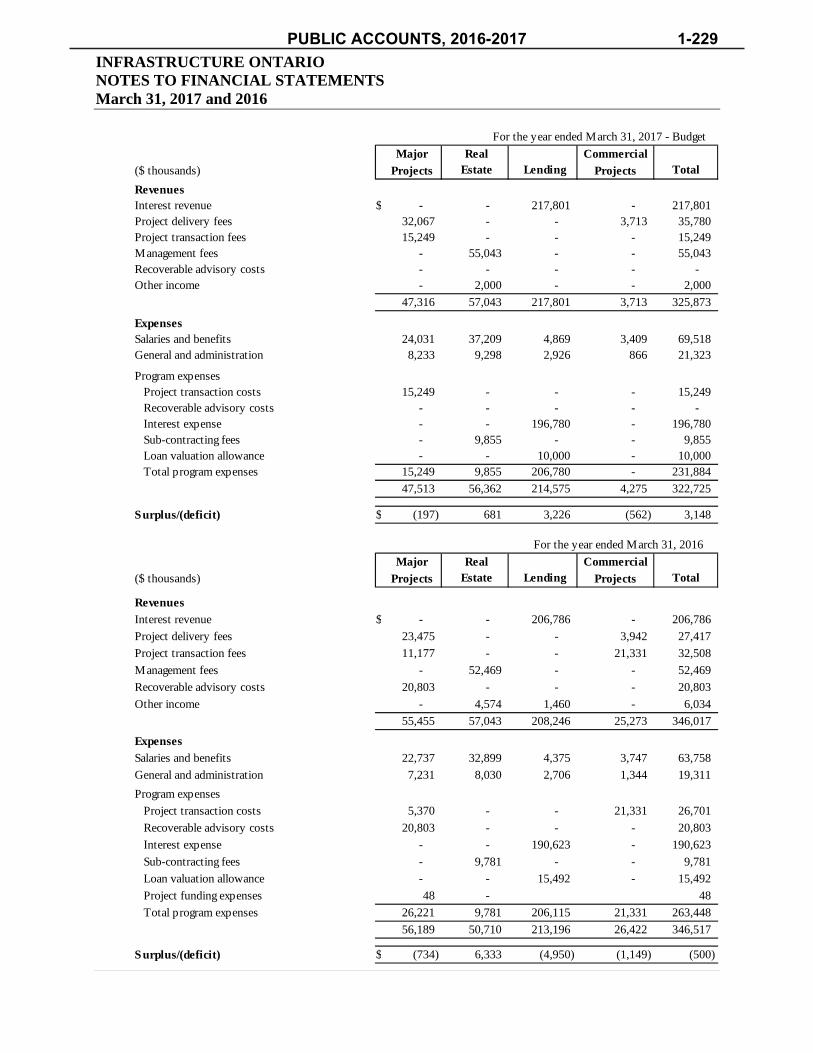
INFRASTRUCTURE ONTARIO NOTES TO FINANCIAL STATEMENTS March 31, 2017 and 2016
For the year ended March 31, 2017 - Budget
Major Real Commercial
($ thousands) Projects Estate Lending Projects Total
RevenuesInterest revenue $ - - 217,801 - 217,801 Project delivery fees 32,067 - - 3,713 35,780 Project transaction fees 15,249 - - - 15,249 Management fees - 55,043 - - 55,043 Recoverable advisory costs - - - - - Other income - 2,000 - - 2,000
47,316 57,043 217,801 3,713 325,873
ExpensesSalaries and benefits 24,031 37,209 4,869 3,409 69,518 General and administration 8,233 9,298 2,926 866 21,323
Program expenses Project transaction costs 15,249 - - - 15,249 Recoverable advisory costs - - - - - Interest expense - - 196,780 - 196,780 Sub-contracting fees - 9,855 - - 9,855 Loan valuation allowance - - 10,000 - 10,000 Total program expenses 15,249 9,855 206,780 - 231,884
47,513 56,362 214,575 4,275 322,725
Surplus/(deficit) $ (197) 681 3,226 (562) 3,148
For the year ended March 31, 2016
Major Real Commercial
($ thousands) Projects Estate Lending Projects Total
Revenues
Interest revenue $ - - 206,786 - 206,786
Project delivery fees 23,475 - - 3,942 27,417
Project transaction fees 11,177 - - 21,331 32,508
Management fees - 52,469 - - 52,469
Recoverable advisory costs 20,803 - - - 20,803
Other income - 4,574 1,460 - 6,034
55,455 57,043 208,246 25,273 346,017
Expenses
Salaries and benefits 22,737 32,899 4,375 3,747 63,758
General and administration 7,231 8,030 2,706 1,344 19,311
Program expenses
Project transaction costs 5,370 - - 21,331 26,701
Recoverable advisory costs 20,803 - - - 20,803
Interest expense - - 190,623 - 190,623
Sub-contracting fees - 9,781 - - 9,781
Loan valuation allowance - - 15,492 - 15,492
Project funding expenses 48 - 48
Total program expenses 26,221 9,781 206,115 21,331 263,448
56,189 50,710 213,196 26,422 346,517
Surplus/(deficit) $ (734) 6,333 (4,950) (1,149) (500)
PUBLIC ACCOUNTS, 2016-2017 1-229
INFRASTRUCTURE ONTARIO NOTES TO FINANCIAL STATEMENTS March 31, 2017 and 2016
20. COMPARATIVE FIGURES
Certain comparative figures have been reclassified to conform to the financial statement presentation in thecurrent year.
The comparative Statement of Operations and Accumulated Surplus, note 11, and note 19 have been reclassified to present the net interest revenue and interest expense earned on interest rate swap transactions.
In addition, the financing activities in the Statement of Cash Flows have been reclassified to separate the shortterm revolving credit facility.
1-230 PUBLIC ACCOUNTS, 2016-2017

PUBLIC ACCOUNTS, 2016-2017 1-231

1-232 PUBLIC ACCOUNTS, 2016-2017

PUBLIC ACCOUNTS, 2016-2017 1-233

1-234 PUBLIC ACCOUNTS, 2016-2017

PUBLIC ACCOUNTS, 2016-2017 1-235

1-236 PUBLIC ACCOUNTS, 2016-2017

PUBLIC ACCOUNTS, 2016-2017 1-237

1-238 PUBLIC ACCOUNTS, 2016-2017
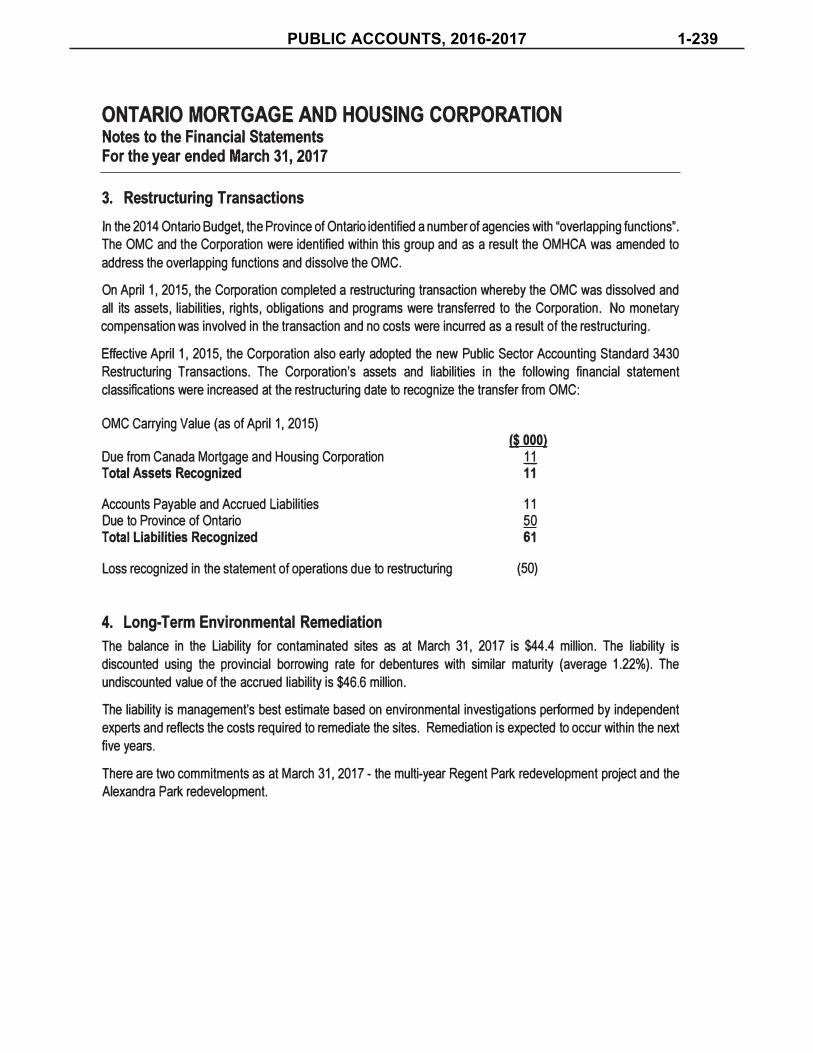
PUBLIC ACCOUNTS, 2016-2017 1-239

1-240 PUBLIC ACCOUNTS, 2016-2017

PUBLIC ACCOUNTS, 2016-2017 1-241
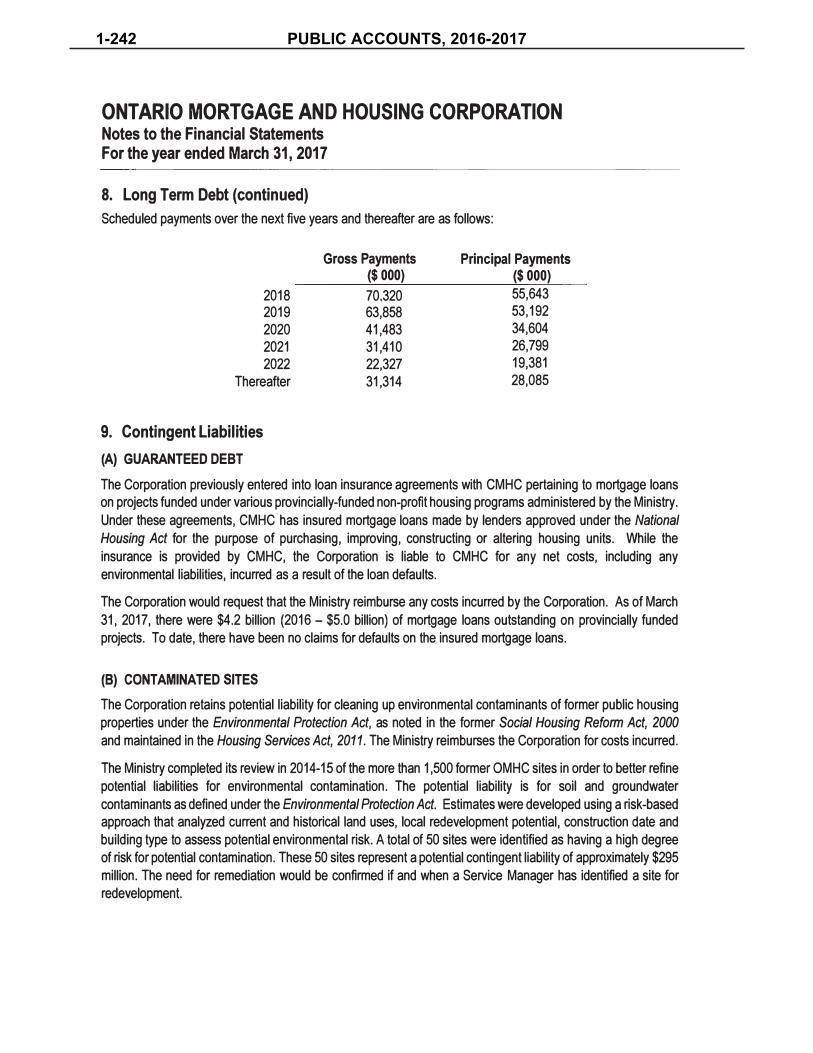
1-242 PUBLIC ACCOUNTS, 2016-2017

PUBLIC ACCOUNTS, 2016-2017 1-243

Management's Responsibility
The Ontario Northland Transportation Commission's management is responsible for the integrity and fair presentation of the consolidated financial statements and other information included in the annual report. The consolidated financial statements have been prepared in accordance with Canadian public sector accounting standards. The preparation of consolidated financial statements necessarily involves the use of management's judgment and best estimates, particularly when transactions affecting the current accounting period cannot be determined with certainty until future periods. All financial information in the annual report is consistent with the consolidated financial statements.
The Commission maintains systems of internal accounting controls designed to provide reasonable assurance that the financial information is accurate and reliable and that the Commission’s assets and liabilities are adequately accounted for and assets safeguarded.
The Commission is responsible for ensuring that management fulfils its responsibilities for internal control and financial reporting. The Commission meets with management and external auditors to satisfy itself that each group has met its responsibilities. These consolidated financial statements have been reviewed and approved by the Commission.
These consolidated financial statements have been audited by the Auditor General of Ontario, whose responsibility is to express an opinion on whether they are fairly presented in accordance with Canadian public sector accounting standards. The Independent Auditor’s Report which follows, outlines the scope of the Auditor’s examination and opinion.
T. LaughrenChair
C. MoorePresident and CEO
North Bay, Ontario June 26, 2017
Ontario Northland Transportation Commission
PUBLIC ACCOUNTS, 2016-2017 1-245

1-246 PUBLIC ACCOUNTS, 2016-2017
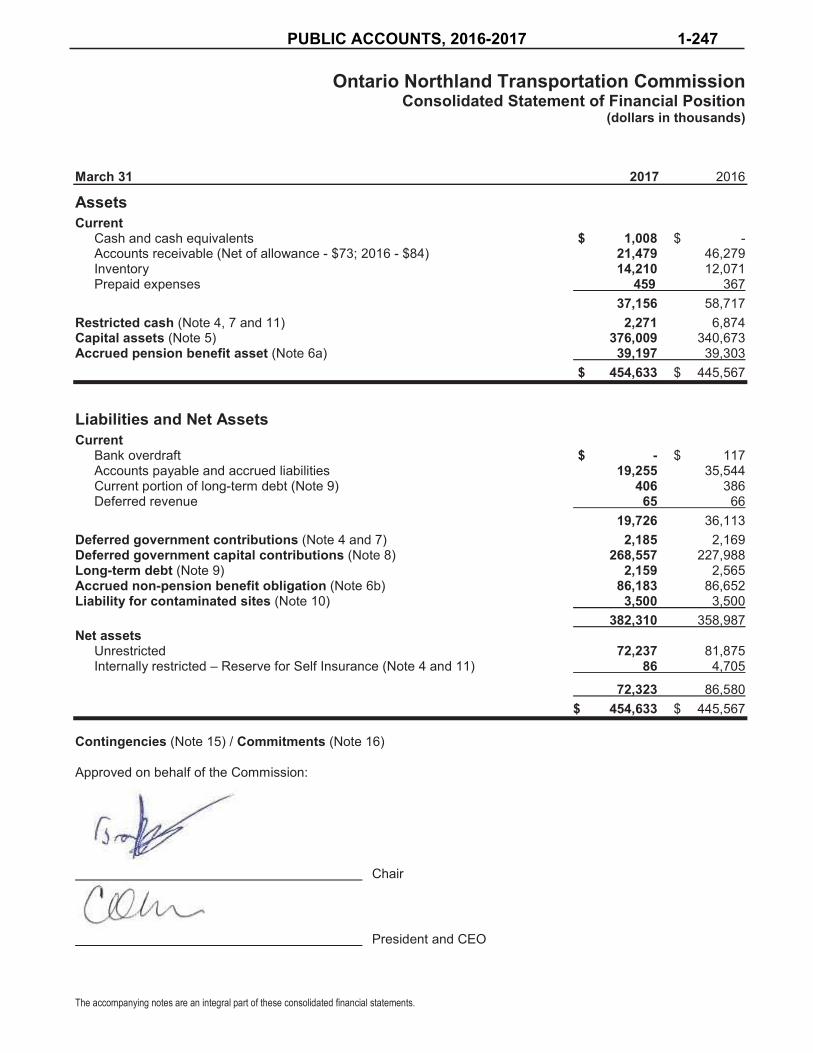
Ontario Northland Transportation Commission Consolidated Statement of Financial Position
(dollars in thousands)
March 31 2017 2016
Assets Current
Cash and cash equivalents $ 1,008 $ - Accounts receivable (Net of allowance - $73; 2016 - $84) 21,479 46,279 Inventory 14,210 12,071 Prepaid expenses 459 367
37,156 58,717 Restricted cash (Note 4, 7 and 11) 2,271 6,874 Capital assets (Note 5) 376,009 340,673 Accrued pension benefit asset (Note 6a) 39,197 39,303
$ 454,633 $ 445,567
Liabilities and Net Assets Current
Bank overdraft $ - $ 117 Accounts payable and accrued liabilities 19,255 35,544 Current portion of long-term debt (Note 9) 406 386 Deferred revenue 65 66
19,726 36,113 Deferred government contributions (Note 4 and 7) 2,185 2,169 Deferred government capital contributions (Note 8) 268,557 227,988Long-term debt (Note 9) 2,159 2,565 Accrued non-pension benefit obligation (Note 6b) 86,183 86,652 Liability for contaminated sites (Note 10) 3,500 3,500
382,310 358,987 Net assets
Unrestricted 72,237 81,875 Internally restricted – Reserve for Self Insurance (Note 4 and 11) 86 4,705
72,323 86,580 $ 454,633 $ 445,567
Contingencies (Note 15) / Commitments (Note 16)
Approved on behalf of the Commission:
Chair
President and CEO
PUBLIC ACCOUNTS, 2016-2017 1-247
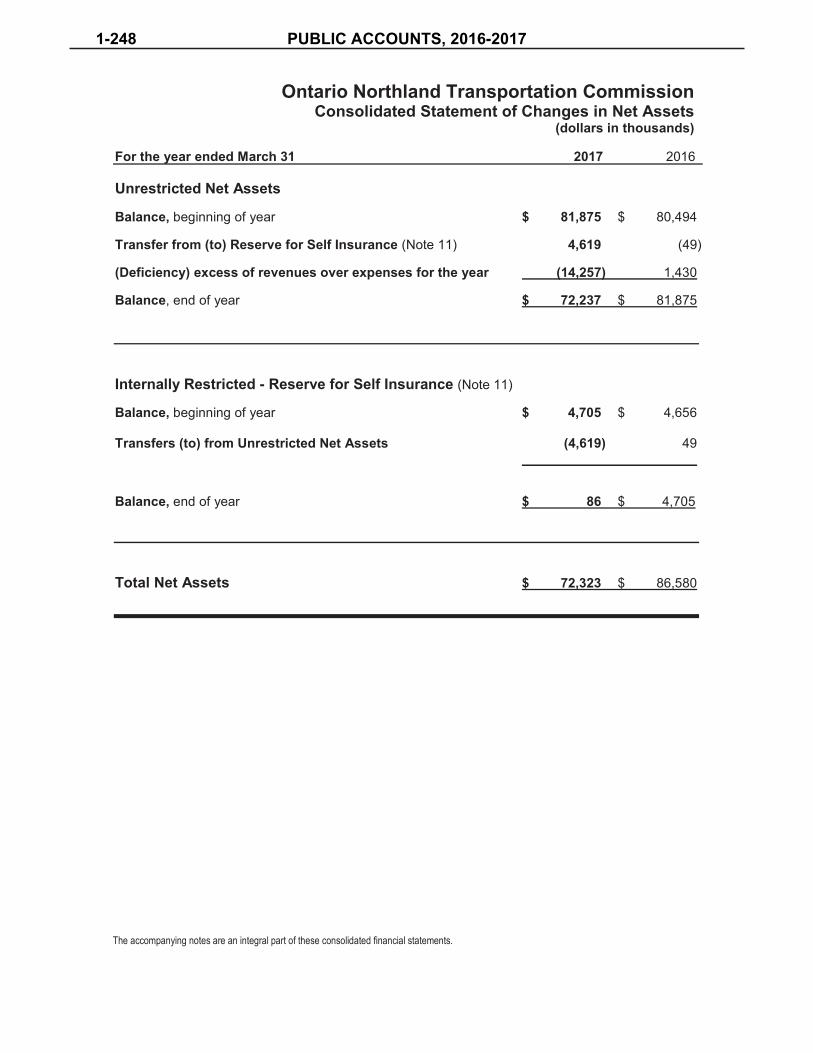
Ontario Northland Transportation Commission Consolidated Statement of Changes in Net Assets
(dollars in thousands)
For the year ended March 31 2017 2016
Unrestricted Net Assets
Balance, beginning of year $ 81,875 $ 80,494
Transfer from (to) Reserve for Self Insurance (Note 11) 4,619 (49)
(Deficiency) excess of revenues over expenses for the year (14,257) 1,430
Balance, end of year $ 72,237 $ 81,875
Internally Restricted - Reserve for Self Insurance (Note 11)
Balance, beginning of year $ 4,705 $ 4,656
Transfers (to) from Unrestricted Net Assets (4,619) 49
Balance, end of year $ 86 $ 4,705
Total Net Assets $ 72,323 $ 86,580
1-248 PUBLIC ACCOUNTS, 2016-2017

Ontario Northland Transportation Commission Consolidated Statement of Operations
(dollars in thousands)
For the year ended March 31 2017 2016
Revenues Sales and other (Note 13) $ 61,435 $ 62,514
Expenses (Note 13)Labour and Benefits (Note 6) 60,659 63,592 Materials and Parts 15,516 13,699 Services 7,998 9,425 Supplies and Equipment 4,475 4,196Other (Note 18) 14,254 8,827 Interest on long-term debt 140 163 Loss (gain) on sale of capital assets 1,466 (315) Investment income (35) (49)Amortization of capital assets 14,109 15,507
118,582 115,045
Deficiency of revenues over expenses before government funding (57,147) (52,531)
Government Operating Contributions (Note 12) 35,224 45,256 Amortization of deferred capital contributions (Note 8) 7,666 8,705
(Deficiency) excess of revenues over expenses for the year $ (14,257) $ 1,430
PUBLIC ACCOUNTS, 2016-2017 1-249
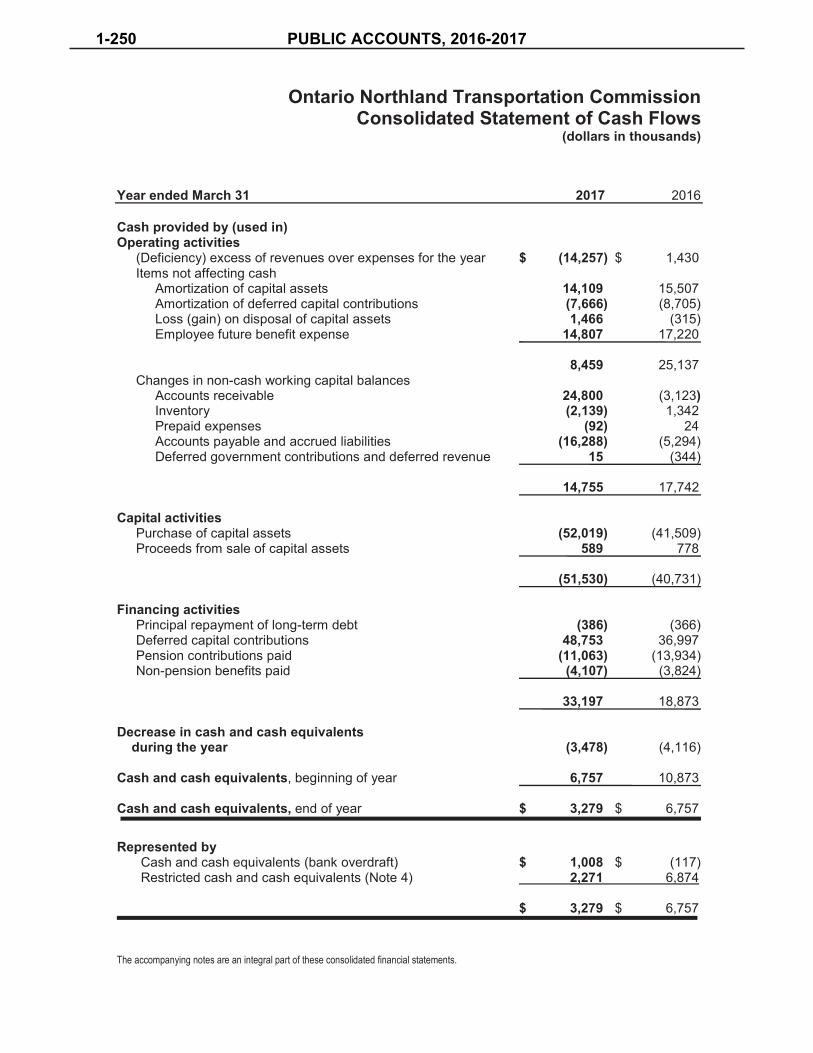
Ontario Northland Transportation Commission Consolidated Statement of Cash Flows
(dollars in thousands)
Year ended March 31 2017 2016
Cash provided by (used in) Operating activities
(Deficiency) excess of revenues over expenses for the year $ (14,257) $ 1,430 Items not affecting cash
Amortization of capital assets 14,109 15,507 Amortization of deferred capital contributions (7,666) (8,705) Loss (gain) on disposal of capital assets 1,466 (315) Employee future benefit expense 14,807 17,220
8,459 25,137 Changes in non-cash working capital balances
Accounts receivable 24,800 (3,123)Inventory (2,139) 1,342 Prepaid expenses (92) 24Accounts payable and accrued liabilities (16,288) (5,294)Deferred government contributions and deferred revenue 15 (344)
14,755 17,742
Capital activities Purchase of capital assets (52,019) (41,509) Proceeds from sale of capital assets 589 778
(51,530) (40,731)
Financing activities Principal repayment of long-term debt (386) (366)Deferred capital contributions 48,753 36,997Pension contributions paid (11,063) (13,934) Non-pension benefits paid (4,107) (3,824)
33,197 18,873
Decrease in cash and cash equivalents during the year (3,478) (4,116)
Cash and cash equivalents, beginning of year 6,757 10,873
Cash and cash equivalents, end of year $ 3,279 $ 6,757
Represented by Cash and cash equivalents (bank overdraft) $ 1,008 $ (117) Restricted cash and cash equivalents (Note 4) 2,271 6,874
$ 3,279 $ 6,757
1-250 PUBLIC ACCOUNTS, 2016-2017
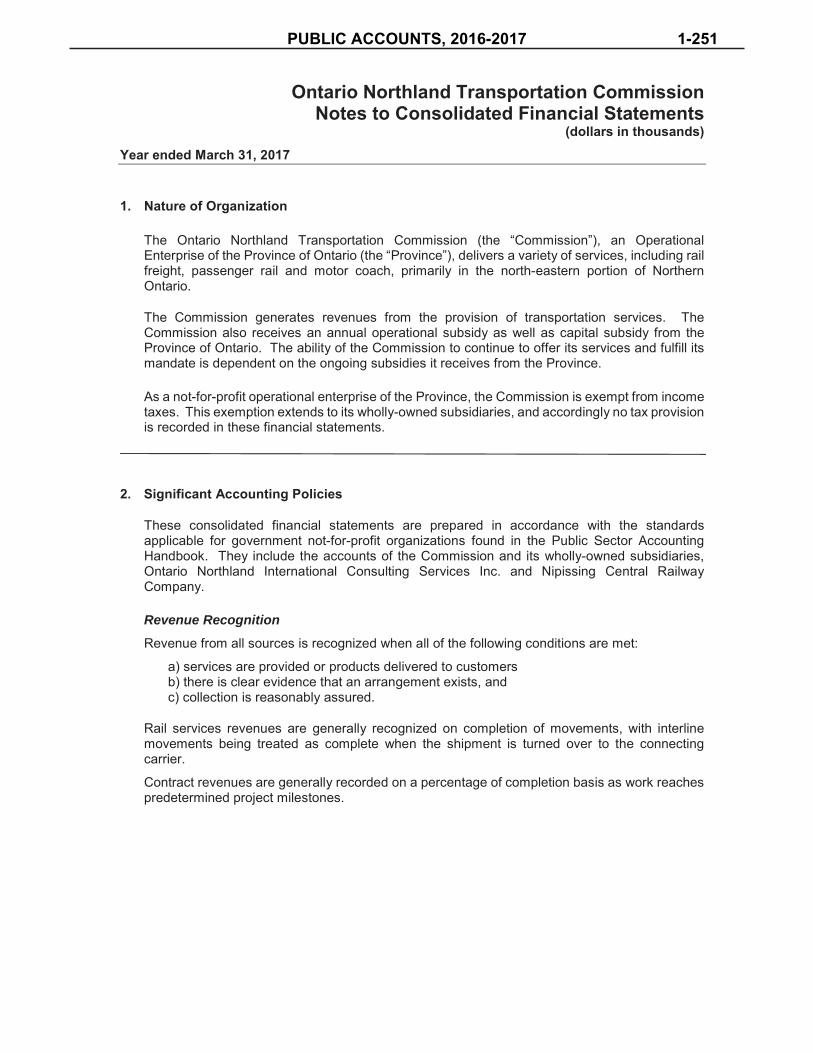
Ontario Northland Transportation Commission Notes to Consolidated Financial Statements
(dollars in thousands) Year ended March 31, 2017
1. Nature of Organization
The Ontario Northland Transportation Commission (the “Commission”), an OperationalEnterprise of the Province of Ontario (the “Province”), delivers a variety of services, including railfreight, passenger rail and motor coach, primarily in the north-eastern portion of NorthernOntario.
The Commission generates revenues from the provision of transportation services. TheCommission also receives an annual operational subsidy as well as capital subsidy from theProvince of Ontario. The ability of the Commission to continue to offer its services and fulfill itsmandate is dependent on the ongoing subsidies it receives from the Province.
As a not-for-profit operational enterprise of the Province, the Commission is exempt from incometaxes. This exemption extends to its wholly-owned subsidiaries, and accordingly no tax provisionis recorded in these financial statements.
2. Significant Accounting Policies
These consolidated financial statements are prepared in accordance with the standardsapplicable for government not-for-profit organizations found in the Public Sector AccountingHandbook. They include the accounts of the Commission and its wholly-owned subsidiaries,Ontario Northland International Consulting Services Inc. and Nipissing Central RailwayCompany.
Revenue Recognition
Revenue from all sources is recognized when all of the following conditions are met:
a) services are provided or products delivered to customersb) there is clear evidence that an arrangement exists, andc) collection is reasonably assured.
Rail services revenues are generally recognized on completion of movements, with interline movements being treated as complete when the shipment is turned over to the connecting carrier.
Contract revenues are generally recorded on a percentage of completion basis as work reaches predetermined project milestones.
PUBLIC ACCOUNTS, 2016-2017 1-251

Ontario Northland Transportation Commission Notes to Consolidated Financial Statements
(dollars in thousands) Year ended March 31, 2017
2. Significant Accounting Policies (continued)
The Commission accounts for provincial contributions under the deferral method of accountingas follows:
• Unrestricted contributions are recognized as revenue when received or receivable if theamounts can be reasonably estimated and collection is reasonably assured.
• Externally restricted contributions related to operating expenditures are recognized asrevenue when the related expenditures are incurred.
• The Province reimburses the Commission for the cost of certain capital assetspurchased for use in operations. The Commission records the contributions as deferredcapital contributions. Deferred capital contributions are amortized to revenue on astraight-line basis at rates corresponding to those of the related capital assets.
Capital Assets
Capital assets are stated at acquisition cost less accumulated amortization. Amortization is provided using the straight-line method over the estimated useful lives of the assets.
The estimated useful lives for principal categories of capital assets are as follows:
Land No amortization Roadway 20 to 50 years Buildings 50 years Equipment 3 to 33 years Coaches 10 to 12 years
No amortization is provided on assets under construction until they are placed in use.
Employee Future Benefits
Pension Plans - The Commission maintains a contributory defined benefit pension plan for its employees. It provides for pensions based on years of service and average pensionable earnings and is generally applicable from the first day of the month following employment. A Supplementary Employee Retirement Plan (SERP) also exists for employees who earn a lifetime pension amount in excess of the Canadian Income Tax Act’s maximum. The obligations under the plan are determined using the accrued benefit method reflecting projected benefits for services rendered to date. The plans are not indexed; however, there have been a variety of ad hoc increases made to pensioners.
Non-Pension Benefit Plans - The Commission offers non-pension post retirement benefits such as group life, health care and long-term disability to employees through defined benefit plans. The costs associated with these future benefits are actuarially determined using the projected benefits method prorated on service and best estimate assumptions. In addition, as a Schedule 2 employer under the Workplace Safety and Insurance Board (WSIB), the Commission recognizes workers compensation benefits on an accrual basis using actuarial calculations provided by the WSIB for benefits in force, benefits not yet awarded and administrative loading costs.
1-252 PUBLIC ACCOUNTS, 2016-2017

Ontario Northland Transportation Commission Notes to Consolidated Financial Statements
(dollars in thousands) Year ended March 31, 2017
2. Significant Accounting Policies (continued)
Employee Future Benefits (continued)
Both Pension and Non-Pension expenses consist of current service costs, interest andadjustments arising from plan amendments, changes in assumptions and net actuarial gains orlosses. These expenses are recorded in the year in which employees render services to theCommission. Past services pension costs were charged to net assets on transition to P5-3250.Actuarial gains and losses are amortized on a straight-line basis over the EARSL of theemployees covered by the plans (approximately 13 years). Past service costs are recognized inthe period of plan amendment.
Pension fund assets are valued using current market values.
Inventory
Materials and supplies, with the exception of used rail and wheel-sets, are valued at the lower ofcost and net realizable value by using the weighted-average costing methodology. Used rail isshown at unamortized book value determined at the time of retirement. Wheel-sets are valuedat standard cost. The Commission uses the same cost formulas for all inventories having asimilar nature and use to the Commission. When net realizable value is less than carrying cost,inventory is written down accordingly. When circumstances which previously caused inventoriesto be written down no longer exist, that previous impairment is reversed.
Impairment of Capital Assets
Capital assets subject to amortization are reviewed for impairment whenever events or changesin circumstances indicate that the capital asset may not contribute to the Commission’s ability todeliver services. Recoverability is measured by a comparison of the carrying amount to theestimated undiscounted future cash flows expected to be generated by the asset. If the carryingamount of the asset exceeds its estimated future cash flows, both the asset and any relateddeferred capital contributions are written down by the amount by which the carrying amount ofthe asset exceeds the fair value of the asset. When quoted market prices are not available, theCommission uses the expected future cash flows discounted at a rate commensurate with therisks associated with the recovery of the asset as an estimate of fair value.
Foreign Currency Translation
Monetary assets and liabilities denominated in foreign currencies are translated at the prevailingrates of exchange at the Consolidated Statement of Financial Position date. Revenues andexpenses are translated at the rates of exchange in effect at the transaction date. Realized andunrealized gains and losses are included in the determination of excess of revenue overexpenses.
PUBLIC ACCOUNTS, 2016-2017 1-253
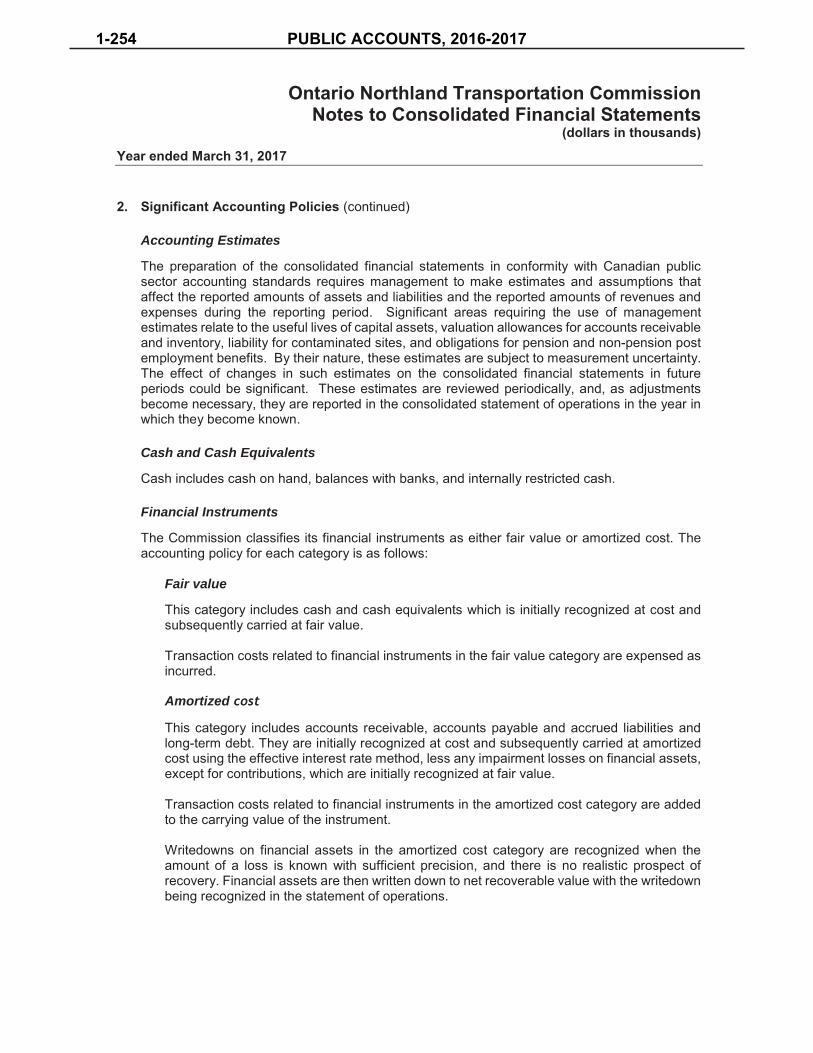
Ontario Northland Transportation Commission Notes to Consolidated Financial Statements
(dollars in thousands) Year ended March 31, 2017
2. Significant Accounting Policies (continued)
Accounting Estimates
The preparation of the consolidated financial statements in conformity with Canadian publicsector accounting standards requires management to make estimates and assumptions thataffect the reported amounts of assets and liabilities and the reported amounts of revenues andexpenses during the reporting period. Significant areas requiring the use of managementestimates relate to the useful lives of capital assets, valuation allowances for accounts receivableand inventory, liability for contaminated sites, and obligations for pension and non-pension postemployment benefits. By their nature, these estimates are subject to measurement uncertainty.The effect of changes in such estimates on the consolidated financial statements in futureperiods could be significant. These estimates are reviewed periodically, and, as adjustmentsbecome necessary, they are reported in the consolidated statement of operations in the year inwhich they become known.
Cash and Cash Equivalents
Cash includes cash on hand, balances with banks, and internally restricted cash.
Financial Instruments
The Commission classifies its financial instruments as either fair value or amortized cost. Theaccounting policy for each category is as follows:
Fair value
This category includes cash and cash equivalents which is initially recognized at cost and subsequently carried at fair value.
Transaction costs related to financial instruments in the fair value category are expensed as incurred.
Amortized
This category includes accounts receivable, accounts payable and accrued liabilities and long-term debt. They are initially recognized at cost and subsequently carried at amortized cost using the effective interest rate method, less any impairment losses on financial assets, except for contributions, which are initially recognized at fair value.
Transaction costs related to financial instruments in the amortized cost category are added to the carrying value of the instrument.
Writedowns on financial assets in the amortized cost category are recognized when the amount of a loss is known with sufficient precision, and there is no realistic prospect of recovery. Financial assets are then written down to net recoverable value with the writedown being recognized in the statement of operations.
1-254 PUBLIC ACCOUNTS, 2016-2017
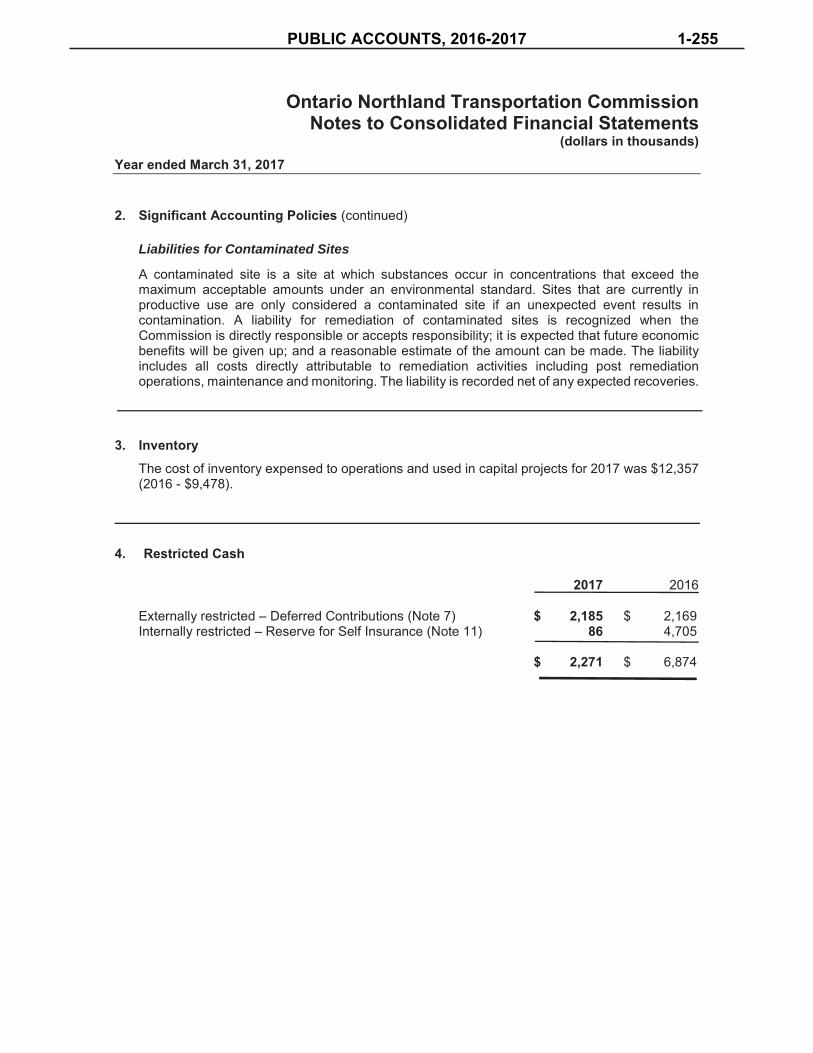
Ontario Northland Transportation Commission Notes to Consolidated Financial Statements
(dollars in thousands) Year ended March 31, 2017
2. Significant Accounting Policies (continued)
Liabilities for Contaminated Sites
A contaminated site is a site at which substances occur in concentrations that exceed themaximum acceptable amounts under an environmental standard. Sites that are currently inproductive use are only considered a contaminated site if an unexpected event results incontamination. A liability for remediation of contaminated sites is recognized when theCommission is directly responsible or accepts responsibility; it is expected that future economicbenefits will be given up; and a reasonable estimate of the amount can be made. The liabilityincludes all costs directly attributable to remediation activities including post remediationoperations, maintenance and monitoring. The liability is recorded net of any expected recoveries.
3. InventoryThe cost of inventory expensed to operations and used in capital projects for 2017 was $12,357(2016 - $9,478).
4. Restricted Cash
2017 2016
Externally restricted – Deferred Contributions (Note 7) $ 2,185 $ 2,169 Internally restricted – Reserve for Self Insurance (Note 11) 86 4,705
$ 2,271 $ 6,874
PUBLIC ACCOUNTS, 2016-2017 1-255

Ontario Northland Transportation Commission Notes to Consolidated Financial Statements
(dollars in thousands) Year ended March 31, 2017
5. Capital Assets
2017 2016
Accumulated Net Book Net BookCost Amortization Value Value
Rail Services Roadway $ 443,671 $ 163,290 $ 280,381 $ 256,345 Buildings 51,019 24,359 26,660 23,178Equipment 92,094 60,443 31,651 26,282 Under construction 21,731 - 21,731 19,483
Motor Coach Services Buildings 2,910 686 2,224 2,246 Coaches 10,684 1,332 9,352 7,607
Refurbishment Buildings 3,999 847 3,152 3,230 Equipment 1,082 224 858 873
Development Buildings - - - 1,429
$ 627,190 $ 251,181 $ 376,009 $ 340,673
1-256 PUBLIC ACCOUNTS, 2016-2017

Ontario Northland Transportation Commission Notes to Consolidated Financial Statements
(dollars in thousands) Year ended March 31, 2017
6. Employee Future Benefits
The Commission is the administrator of its contributory pension plan which covers all permanentstaff. The pension fund assets primarily include marketable securities, real estate and corporateand government bonds, which are invested by professional investment managers. TheCommission’s pension plans have an annual measurement date of December 31st.
The accrued pension benefit asset and non-pension benefit obligation and expenses aredetermined annually by independent actuaries in accordance with accepted actuarial practicesand Canadian public sector accounting standards using management's best estimates. The dateof the most recent actuarial valuation for the contributory pension plans for funding purposeswas January 1, 2014. In accordance with existing pension regulations, annual valuations will becompleted for the Commission’s pension plans. The date of the most recent report foraccounting purposes for the non-pension post employment benefit plan was December 31, 2016.
The pension plan’s asset target percentage allocation and average asset allocation as at March31, 2017, by category are as follows:
Target 2017 2016
Equity securities – Domestic 20% - 30% 26.7% 26.9% – Foreign 10% - 30% 20.7% 24.3%
Debt securities 35% - 55% 49.1% 45.4% Real estate 0% - 15% 1.8% 1.8%Short-term and other 0% - 15% 1.7% 1.6%
Total 100% 100%
PUBLIC ACCOUNTS, 2016-2017 1-257

Ontario Northland Transportation Commission Notes to Consolidated Financial Statements
(dollars in thousands) Year ended March 31, 2017
6. Employee Future Benefits (continued):
a. Reconciliation of accrued benefit obligation to accrued benefit asset (liability):
Pension Plans:
Pension SERP 2017 2016Total Actual
Accrued benefit obligation $ (553,202) $ (3,514) $ (556,716) $ (540,195)
Plan assets at fair value 523,157 - 523,157 524,801
Funded status - plan (deficit) surplus (30,045) (3,514) (33,559) (15,394)
Unamortized net actuarial loss 71,554 1,202 72,756 54,697
Accrued benefit asset (liability) net of valuation allowance, end of year $ 41,509 $ (2,312) $ 39,197 $ 39,303
Pension SERP 2017 2016Total Actual
Accrued benefit asset, beginning of year $ 41,513 $ (2,210) $ 39,303 $ 35,072 Employee future benefit expense (10,851) (318) (11,169) (9,703) Funding contributions 10,847 216 11,063 13,934
Accrued benefit asset, end of year $ 41,509 $ (2,312) $ 39,197 $ 39,303
1-258 PUBLIC ACCOUNTS, 2016-2017

Ontario Northland Transportation Commission Notes to Consolidated Financial Statements
(dollars in thousands) Year ended March 31, 2017
6. Employee Future Benefits (continued):
b. Reconciliation of accrued benefit obligation to accrued benefit asset (liability)
Non-Pension Benefit Plans:
2017 2016
Accrued benefit obligation, end of year $ (88,246) $ (87,343) Unamortized net actuarial gain 2,063 691
Accrued benefit liability, end of year $ (86,183) $ (86,652)
Accrued benefit liability, beginning of year $ (86,652) $ (82,959) Benefit expense (3,638) (7,517) Benefits paid 4,107 3,824
Accrued benefit liability, end of year $ (86,183) $ (86,652)
Included in the accrued non-pension benefit liability are workers’ compensation benefits in the amount of $ 15,296 (2016 - $15,675). This amount has been determined from the most recent available actuarial calculations provided by the Workplace Safety and Insurance Board as at December 31, 2016.
c. Components of Net Periodic Pension Benefit Expense
2017 2016
Current service cost less employee contributions $ 5,581 $ 5,050 Interest on accrued benefit obligation 29,137 29,735 Expected return on plan assets (28,107) (29,006) Amortization of net actuarial loss 4,558 3,924
$ 11,169 $ 9,703
PUBLIC ACCOUNTS, 2016-2017 1-259

Ontario Northland Transportation Commission Notes to Consolidated Financial Statements
(dollars in thousands) Year ended March 31, 2017
6. Employee Future Benefits (continued):
d. Components of Net Periodic Non-Pension Benefit Expense
2017 2016
Current service cost $ 2,334 $ 3,759 Interest on accrued benefit obligation 2,662 2,530 Amortization of net actuarial (gains) losses (1,358) 1,228
$ 3,638 $ 7,517
Total pension and non-pension benefit expense included in Labour and Benefits on the Statement of Operations is $14,807 (2016 - $17,220).
e. Weighted Average Assumptions
Discount rate - pension 5.25% 5.50% Discount rate - non pension 3.61% 3.55% Discount rate – long-term disability 3.61% 3.55% Discount rate - WSIB 4.50% 4.75% Expected long-term rate of return on plan assets 5.25% 5.50% Rate of compensation increase
2016 1.2 % 1.2%2017 to 2019 2.0 % 2.0%2020 2.5 % 2.5%2021 & thereafter 3.0% 3.0%
Average remaining service period (years) 12 12 Drug cost increases (grading down to 5% in 2020) 6.50% 7.50% Medical and hospital cost increases 5.00% 5.00% Dental cost increases 4.50% 4.50% Vision care cost increases 0% 0%
1-260 PUBLIC ACCOUNTS, 2016-2017

Ontario Northland Transportation Commission Notes to Consolidated Financial Statements
(dollars in thousands) Year ended March 31, 2017
7. Deferred Contributions
Deferred contributions are restricted funds received from the Province to be used only on futureexpenditures relating to refurbishment bids for new contracts. These contributions will berecognized as revenue in the fiscal year the related expenditures are incurred.
The change in the deferred contributions balance is as follows:
2017 2016
Balance, beginning of year $ 2,169 $ 2,068 Interest income 16 101
Balance, end of year $ 2,185 $ 2,169
8. Deferred Capital Contributions
Deferred capital contributions represent the unamortized capital contributions received from theProvince to fund the acquisition of capital assets. The amortization of deferred capitalcontributions is recorded as revenue in the consolidated statement of operations using ratessimilar to those used to amortize the related assets acquired.
The changes in the unamortized deferred capital contributions balance are as follows:
2017 2016
Balance, beginning of year $ 227,988 $ 199,696 Contributions from the Province 48,753 36,997 Amortization to revenue (7,666) (8,705) Retirements and transfers (518) -
Balance, end of year $ 268,557 $ 227,988
PUBLIC ACCOUNTS, 2016-2017 1-261

Ontario Northland Transportation Commission Notes to Consolidated Financial Statements
(dollars in thousands) Year ended March 31, 2017
9. Long-term Debt2017 2016
Loan from Ontario Financing Authority, bearing interest at 5.22 % per annum, repayable in blended monthly payments of $30 for 15 years beginning February 1, 2005 $ 962 $ 1,269
Loan from Ontario Financing Authority, bearing interest at 4.90% per annum, repayable in blended monthly payments of $13 for 25 years beginning February 1, 2006. 1,603 1,682
2,565 2,951
Less current portion 406 386
Long-term debt $ 2,159 $ 2,565
Interest on long-term debt was $140 (2016 - $159).
Principal payments required in the next five years and thereafter are as follows:
2017-2018 $ 406 2018-2019 428 2019-2020 390 2020-2021 96 2021-2022 101 Thereafter 1,144
$ 2,565
10. Contaminated sites
The liability for remediation results from specific minerals contaminating soil in a formertransloading operation. Based on engineering studies completed to date, the estimated liabilityis $3,500 (2016 - $3,500). This liability is subject to measurement uncertainty and theCommission will be conducting further studies in the future. Changes to this estimated liabilitywill be recorded in the year they become known.
1-262 PUBLIC ACCOUNTS, 2016-2017

Ontario Northland Transportation Commission Notes to Consolidated Financial Statements
(dollars in thousands) Year ended March 31, 2017
11. Internally Restricted Net Assets – Reserve for Self Insurance
The Commission follows the policy of self-insuring for damages from rolling stock derailmentsand for cargo damage. Annually the Commission gives consideration to transferring funds fromits’ unrestricted net assets to the Reserve for Self Insurance (the “Reserve”) to finance suchcosts. Interest earned on the reserve balance and claims expensed in the reserve balance arerecorded as revenue and expenses in the consolidated statement of operations then transferredto/from the Reserve.
Periodically, the Commission borrows cash from the Reserve for its temporary use. TheCommission pays interest to the Reserve at the bank’s prime rate less 1.75% on these temporaryborrowings.
The Reserve was significantly depleted in the year. The Commission and the Province areworking on an implementation plan to deal with the self insurance fund and any related funding.
12. Government Contributions
A Memorandum of Understanding between the Commission and the Minister of NorthernDevelopment and Mines dated November 4, 2016, defines the amount of operating and capitalcontributions provided each fiscal year.
Details of Government contributions received during the year are as follows:
2017 2016
Ministry of Northern Development and Mines:
Rail - Passenger Service and Moosonee Branch $ 17,144 $ 15,984 Rail and Other System Operations 11,448 19,390 Pension deficit funding pressure 5,852 9,882
$ 34,444 $ 45,256
Special Operating – Ontera towers (Note 18) 780 -
Subtotal 35,224 45,256
Capital contributions (Note 8) 48,753 36,997
Total Government contributions $ 83,977 $ 82,253
PUBLIC ACCOUNTS, 2016-2017 1-263

Ontario Northland Transportation Commission Notes to Consolidated Financial Statements
(dollars in thousands) Year ended March 31, 2017
13. Segmented Information Disclosures
The Commission is a diversified operational enterprise of the Province of Ontario that providesa wide range of services to its customers in Northeastern Ontario such as rail and motor coachtransportation, refurbishment and freight services. Distinguishable functional segments havebeen separately disclosed in the segmented information. The nature of the segments and theactivities they encompass are as follows:
Rail Services
Rail services relates to providing logistics and transportation solutions and the shipment of largequantities of products to and from Northeastern Ontario.
Polar Bear Services
Polar Bear Services relates to providing passenger transportation and shipping solutionsbetween Cochrane and Moosonee.
Motor Coach Services
Motor coach services provides shipping solutions and passenger transportation to connect communities throughout Northeastern Ontario.
Remanufacturing and Repair
The Remanufacturing and Repair team is responsible for the repair and rehabilitation of railway rolling stock from customers spanning North America.
Administration
This relates to the expenses for the operations of the Commission itself and cannot be directly attributed to specific segments. It also includes some rental of properties to external customers in order to reduce overall costs.
1-264 PUBLIC ACCOUNTS, 2016-2017

PUBLIC ACCOUNTS, 2016-2017 1-265

1-266 PUBLIC ACCOUNTS, 2016-2017

Ontario Northland Transportation Commission Notes to Consolidated Financial Statements
(dollars in thousands) Year ended March 31, 2017
14. Foreign Currency Translation
Included in Rail revenue is a foreign currency gain of $1,994 (2016 - gain of $2,245) arisingmainly from rail traffic settlements between Canada and the U.S.A.
15. Contingencies
In the normal course of its operations, various statements of claim have been issued against theCommission claiming damages for personal injury, property damages, environmental actionsand employment-related issues. Damages, if any, cannot be estimated at this time and in anyevent the Commission is of the opinion that these claims are unfounded or covered by insuranceafter application of a $2,000 deductible. Should any loss result, it would be charged to theconsolidated statement of operations when the amount is ascertained.
16. Commitments
The Commission is also obligated to certain job guarantee agreements with a significant numberof its unionized employees. To the extent of any actual claims under these agreements, theCommission would maintain provisions for such items. Due to the nature of these agreements,the exposure for future payments may be material. However, such exposure would be based oncertain actions of the Commission that have not occurred and as such no provision has beenmade as at the year-end date.
17. Economic Dependence - customers
The Rail Services Division derives substantially all of its revenue from four major customers.
18. Other Expenses
Included in Other expenses for the year are the following:
i. During the year the Commission incurred $5,102 in costs related to primarily twoseparate derailments that occurred along its rail line. These costs include labour,benefits, parts and third party contractor costs. The costs were incurred to clean up, doenvironmental testing, and perform track repairs.
ii. During the year the Commission incurred $780 in costs relating to the demolition ofcommunication towers in northern Ontario. These towers were originally sold as part ofthe Ontera disposition in fiscal 2015, however they were transferred back to theCommission in fiscal 2017. Due to environmental concerns the towers were demolishedduring the year and an on-going environmental assessment is being performed over thenext year. The Province provided contributions towards these expenses in the amountof $780.
PUBLIC ACCOUNTS, 2016-2017 1-267
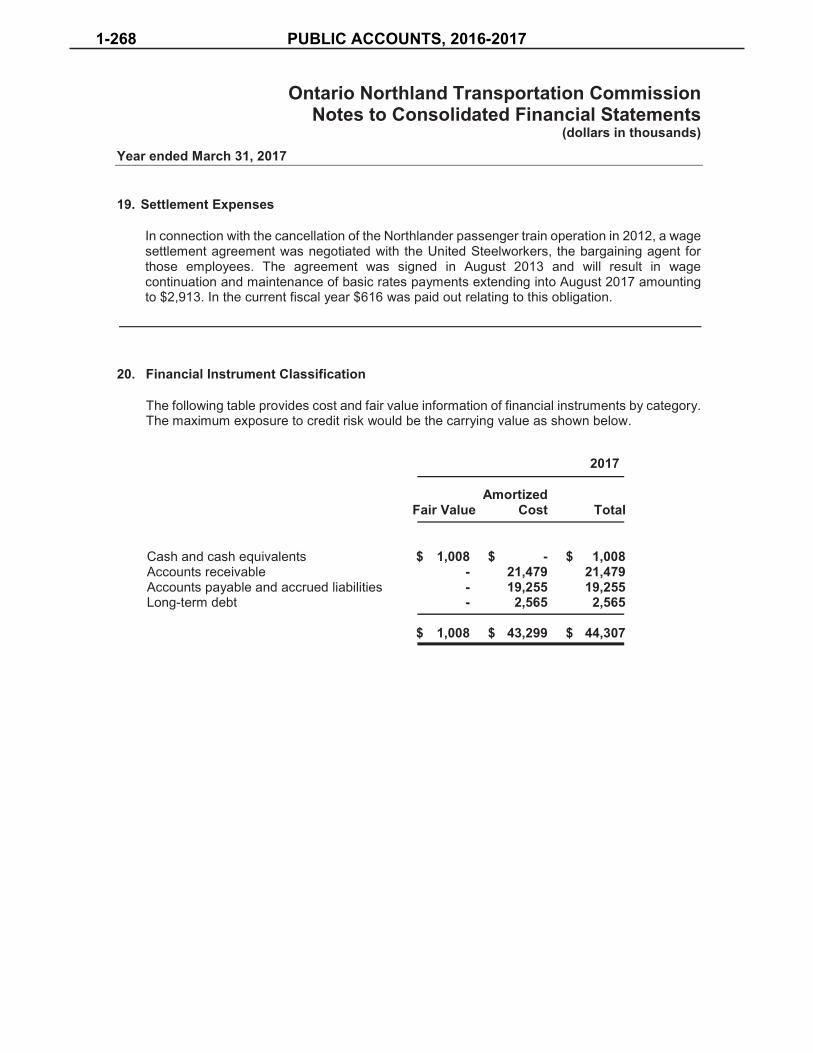
Ontario Northland Transportation Commission Notes to Consolidated Financial Statements
(dollars in thousands) Year ended March 31, 2017
19. Settlement Expenses
In connection with the cancellation of the Northlander passenger train operation in 2012, a wagesettlement agreement was negotiated with the United Steelworkers, the bargaining agent forthose employees. The agreement was signed in August 2013 and will result in wagecontinuation and maintenance of basic rates payments extending into August 2017 amountingto $2,913. In the current fiscal year $616 was paid out relating to this obligation.
20. Financial Instrument Classification
The following table provides cost and fair value information of financial instruments by category.The maximum exposure to credit risk would be the carrying value as shown below.
2017
Amortized Fair Value Cost Total
Cash and cash equivalents $ 1,008 $ - $ 1,008Accounts receivable - 21,479 21,479Accounts payable and accrued liabilities - 19,255 19,255 Long-term debt - 2,565 2,565
$ 1,008 $ 43,299 $ 44,307
1-268 PUBLIC ACCOUNTS, 2016-2017

Ontario Northland Transportation Commission Notes to Consolidated Financial Statements
(dollars in thousands) Year ended March 31, 2017
20. Financial Instrument Classification (continued)
2016
Amortized Fair Value Cost Total
Cash and cash equivalents $ 2,052 $ - $ 2,052Accounts receivable - 46,279 46,279 Accounts payable and accrued liabilities - 35,544 35,544 Long-term debt - 2,951 2,951
$ 2,052 $ 84,774 $ 86,826
The following table provides an analysis of financial instruments that are measured subsequent to initial recognition at fair value, grouped into Levels 1 to 3 based on the degree to which the fair value is observable:
- Level 1 fair value measurements are those derived from quoted prices (unadjusted) in activemarkets for identical assets or liabilities using the last bid price;
- Level 2 fair value measurements are those derived from inputs other than quoted pricesincluded within Level 1 that are observable for the asset or liability, either directly (i.e. asprices) or indirectly (i.e. derived from prices); and
- Level 3 fair value measurements are those derived from valuation techniques that includeinputs for the asset or liability that are not based on observable market data (unobservableinputs).
2017
Level 1 Level 2 Level 3 Total
Cash and cash equivalents $ 1,008 $ - $ - $ 1,008
2016
Level 1 Level 2 Level 3 Total
Cash and cash equivalents $ 2,052 $ - $ - $ 2,052
There were no transfers between Level 1 and 2 for the years ended March 31, 2017 and 2016. There were no transfers in or out of Level 3.
PUBLIC ACCOUNTS, 2016-2017 1-269
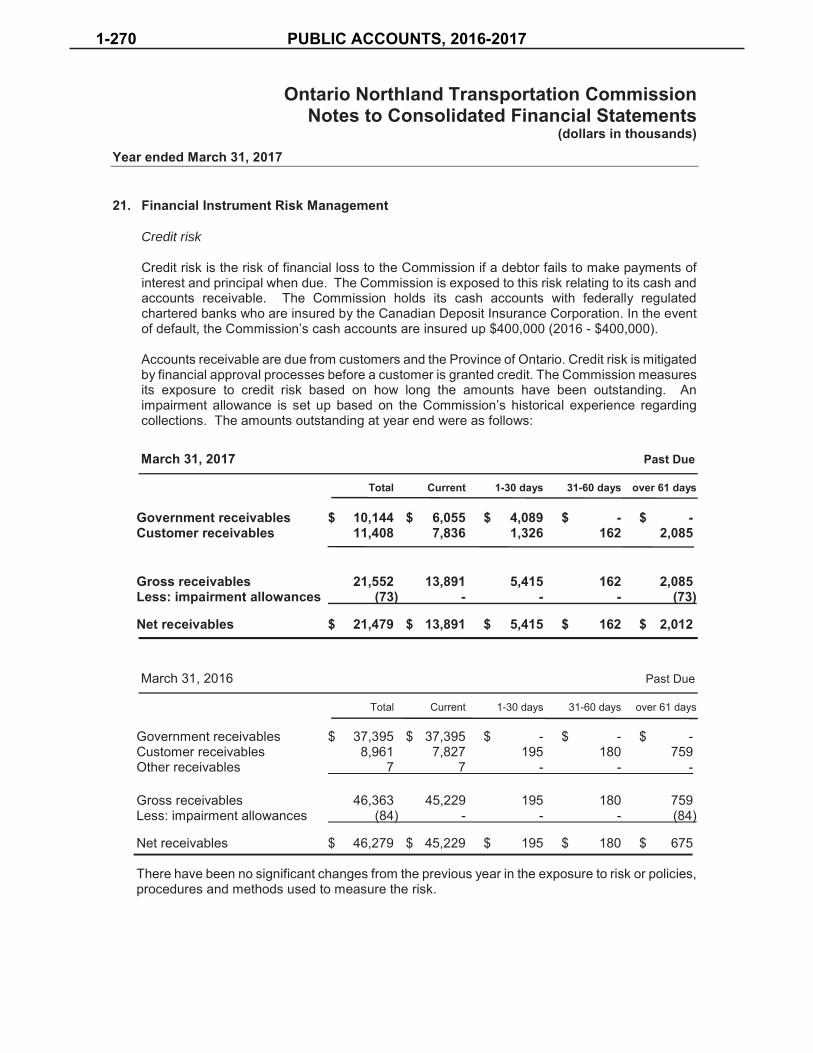
Ontario Northland Transportation Commission Notes to Consolidated Financial Statements
(dollars in thousands) Year ended March 31, 2017
21. Financial Instrument Risk Management
Credit risk
Credit risk is the risk of financial loss to the Commission if a debtor fails to make payments ofinterest and principal when due. The Commission is exposed to this risk relating to its cash andaccounts receivable. The Commission holds its cash accounts with federally regulatedchartered banks who are insured by the Canadian Deposit Insurance Corporation. In the eventof default, the Commission’s cash accounts are insured up $400,000 (2016 - $400,000).
Accounts receivable are due from customers and the Province of Ontario. Credit risk is mitigatedby financial approval processes before a customer is granted credit. The Commission measuresits exposure to credit risk based on how long the amounts have been outstanding. Animpairment allowance is set up based on the Commission’s historical experience regardingcollections. The amounts outstanding at year end were as follows:
March 31, 2017 Past Due
Total Current 1-30 days 31-60 days over 61 days
Government receivables $ 10,144 $ 6,055 $ 4,089 $ - $ - Customer receivables 11,408 7,836 1,326 162 2,085
Gross receivables 21,552 13,891 5,415 162 2,085 Less: impairment allowances (73) - - - (73)
Net receivables $ 21,479 $ 13,891 $ 5,415 $ 162 $ 2,012
March 31, 2016 Past Due
Total Current 1-30 days 31-60 days over 61 days
Government receivables $ 37,395 $ 37,395 $ - $ - $ - Customer receivables 8,961 7,827 195 180 759 Other receivables 7 7 - - -
Gross receivables 46,363 45,229 195 180 759 Less: impairment allowances (84) - - - (84)
Net receivables $ 46,279 $ 45,229 $ 195 $ 180 $ 675
There have been no significant changes from the previous year in the exposure to risk or policies, procedures and methods used to measure the risk.
1-270 PUBLIC ACCOUNTS, 2016-2017

Ontario Northland Transportation Commission Notes to Consolidated Financial Statements
(dollars in thousands) Year ended March 31, 2017
21. Financial Instrument Risk Management (continued)
Market risk
Market risk is the risk that the fair value or future cash flows of a financial instrument will fluctuateas a result of market factors. Market factors include three types of risk: currency risk, interestrate risk and equity risk.
There have been no significant changes from the previous year in the exposure to risk orpolicies, procedures and methods used to measure the risk.
Currency risk
Currency risk relates to the Commission operating in different currencies and converting non-Canadian earnings at different points in time when adverse changes in foreign currency ratesoccur. The Commission maintains a USD bank account to receive USD from customers and topay USD to suppliers and other carriers. There have been no significant changes from theprevious year in the exposure to risk or policies, procedures and methods used to measure therisk.
Interest rate risk
Interest rate risk is the potential for financial loss caused by fluctuations in fair value or futurecash flows of financial instruments because of changes in market interest rates. TheCommission is exposed to this risk through its interest bearing long-term debt.
The Commission’s long-term debt as described in Note 8 would not be impacted as the inherentrate of the debt has been fixed.
There have been no significant changes from the previous year in the exposure to risk orpolicies, procedures and methods used to measure the risk.
Equity risk
Equity risk is the uncertainty associated with the valuation of assets arising from changes inequity markets. The Commission is not exposed to this risk.
There have been no significant changes from the previous year in the exposure to risk orpolicies, procedures and methods used to measure the risk.
Liquidity risk
Liquidity risk is the risk that the Commission will not be able to meet all cash outflow obligationsas they come due. The Commission mitigates this risk by monitoring cash activities andexpected outflows through extensive budgeting and regular reports to the Province of Ontario.
PUBLIC ACCOUNTS, 2016-2017 1-271

Ontario Northland Transportation Commission Notes to Consolidated Financial Statements
(dollars in thousands) Year ended March 31, 2017
21. Financial Instrument Risk Management (continued)
The following table sets out the contractual maturities (representing undiscounted contractualcash-flows of financial liabilities):
2017 Within 6 months
6 months to 1 year 1-5 years > 5 years
Accounts payable $ 19,255 $ - $ - $ - Long-term debt 203 203 1,120 1,039
Total $ 19,458 $ 203 $ 1,120 $ 1,039
2016
Within 6 months 6 months to 1 year 1-5 years > 5 years
Accounts payable $ 35,544 $ - $ - $ - Long-term debt 193 193 1,320 1,245
Total $ 35,737 $ 193 $ 1,320 $ 1,245
There have been no significant changes from the previous year in the exposure to risk or policies, procedures and methods used to measure the risk.
22. Comparative Figures
Prior year’s figures have been reclassified where necessary to conform to the current year’sfinancial statement presentation
1-272 PUBLIC ACCOUNTS, 2016-2017
PUBLIC ACCOUNTS, 2016-2017 1-273

1-274 PUBLIC ACCOUNTS, 2016-2017

PUBLIC ACCOUNTS, 2016-2017 1-275

1-276 PUBLIC ACCOUNTS, 2016-2017

PUBLIC ACCOUNTS, 2016-2017 1-277
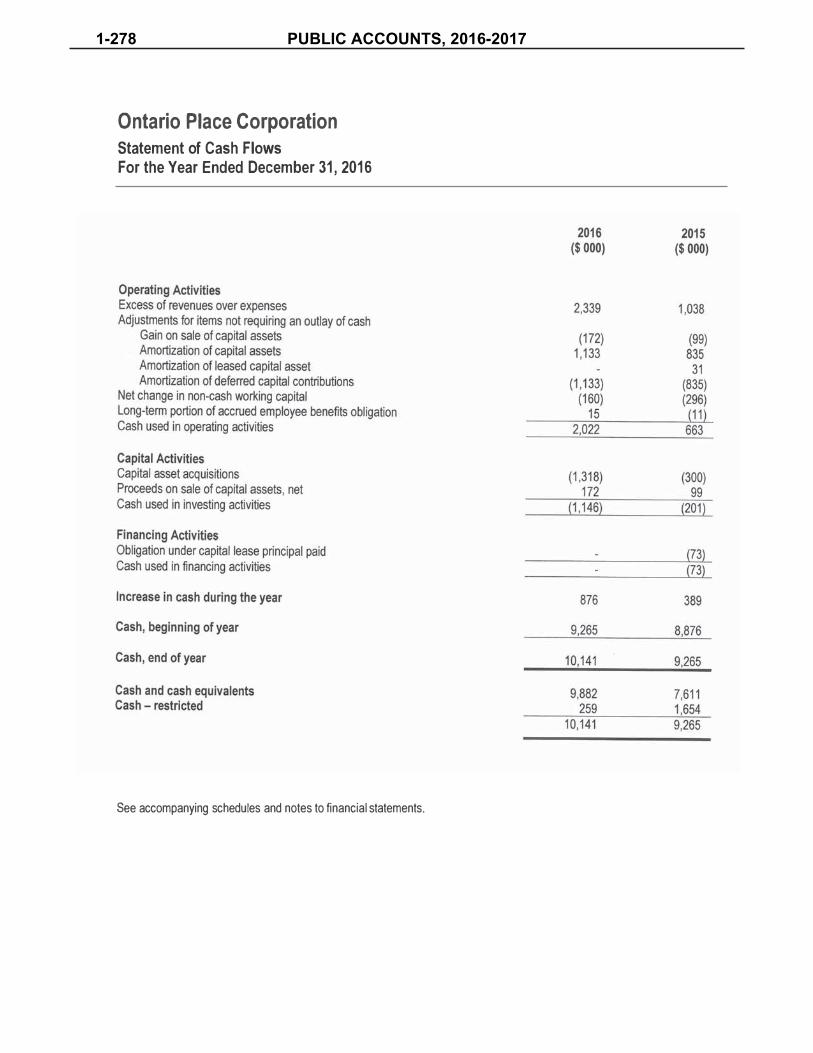
1-278 PUBLIC ACCOUNTS, 2016-2017

PUBLIC ACCOUNTS, 2016-2017 1-279

1-280 PUBLIC ACCOUNTS, 2016-2017
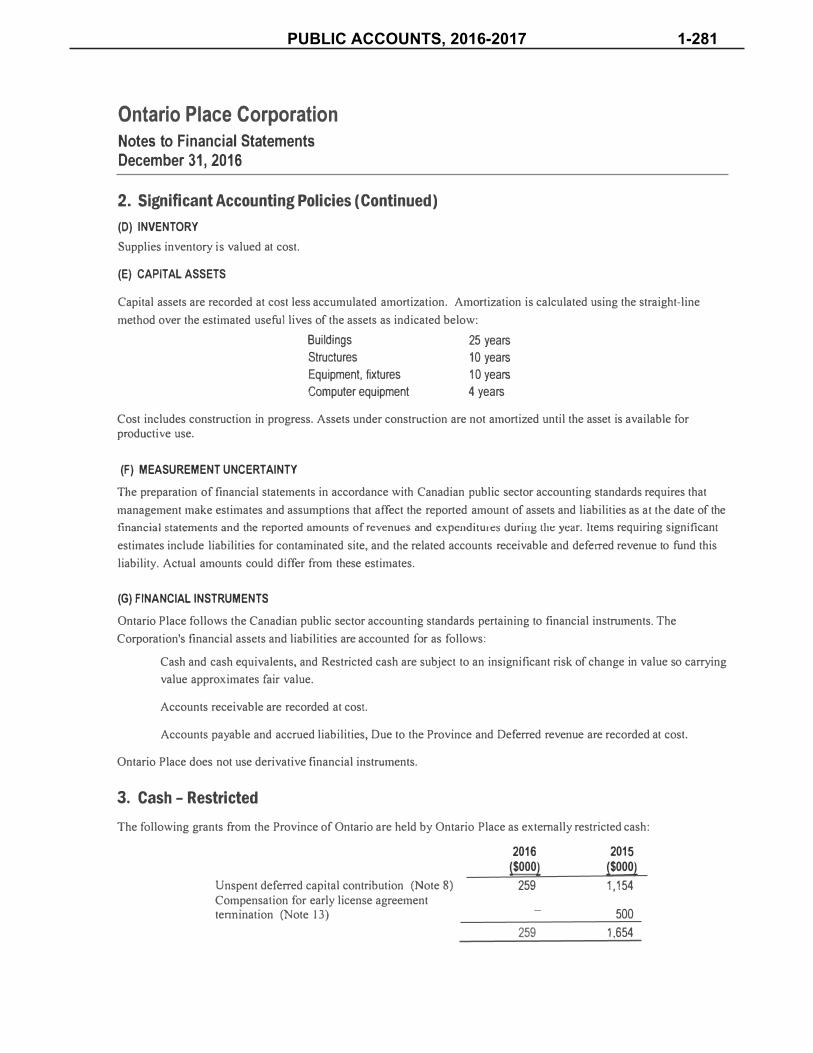
PUBLIC ACCOUNTS, 2016-2017 1-281
_
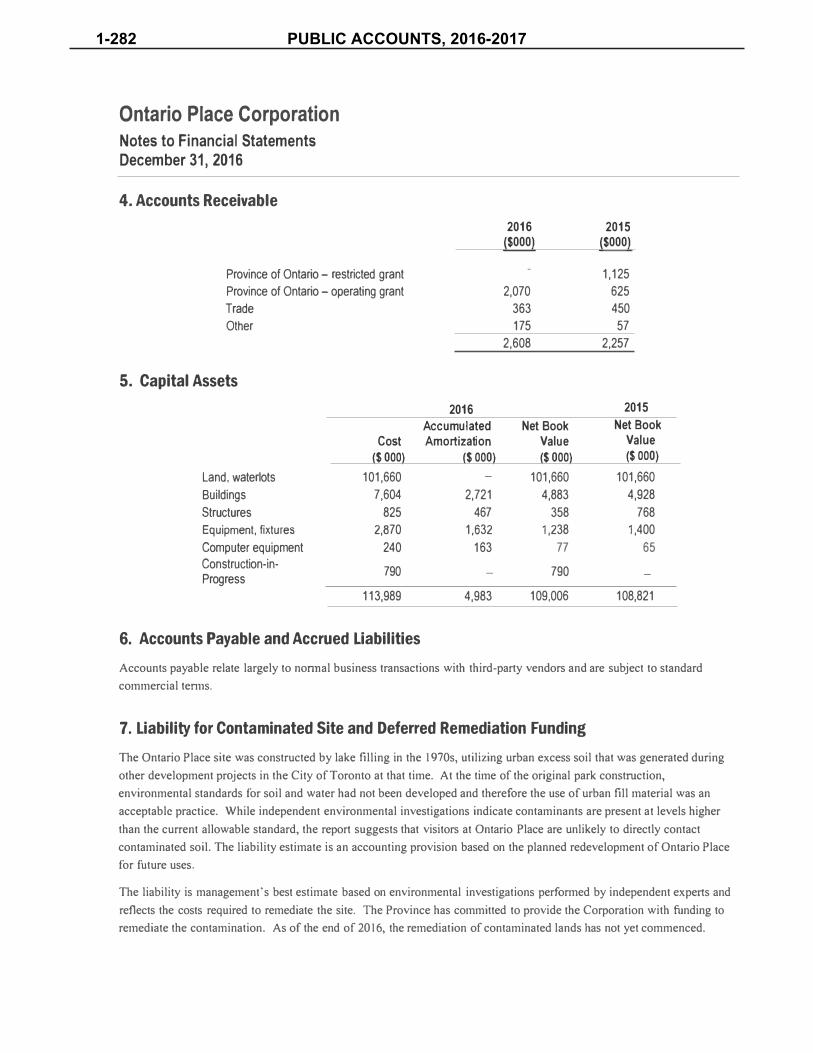
1-282 PUBLIC ACCOUNTS, 2016-2017
-
_ _
_

PUBLIC ACCOUNTS, 2016-2017 1-283

1-284 PUBLIC ACCOUNTS, 2016-2017

PUBLIC ACCOUNTS, 2016-2017 1-285

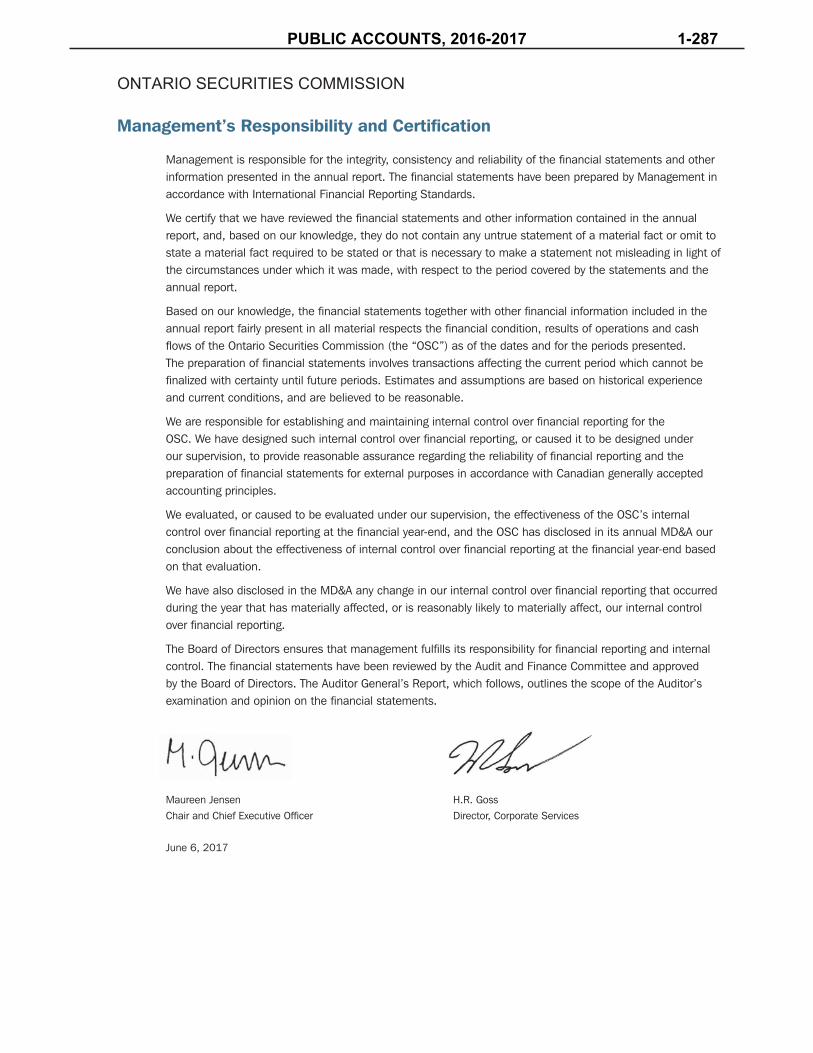
Management is responsible for the integrity, consistency and reliability of the financial statements and other information presented in the annual report. The financial statements have been prepared by Management in accordance with International Financial Reporting Standards.
We certify that we have reviewed the financial statements and other information contained in the annual report, and, based on our knowledge, they do not contain any untrue statement of a material fact or omit to state a material fact required to be stated or that is necessary to make a statement not misleading in light of the circumstances under which it was made, with respect to the period covered by the statements and the annual report.
Based on our knowledge, the financial statements together with other financial information included in the annual report fairly present in all material respects the financial condition, results of operations and cash flows of the Ontario Securities Commission (the “OSC”) as of the dates and for the periods presented. The preparation of financial statements involves transactions affecting the current period which cannot be finalized with certainty until future periods. Estimates and assumptions are based on historical experience and current conditions, and are believed to be reasonable.
We are responsible for establishing and maintaining internal control over financial reporting for the OSC. We have designed such internal control over financial reporting, or caused it to be designed under our supervision, to provide reasonable assurance regarding the reliability of financial reporting and the preparation of financial statements for external purposes in accordance with Canadian generally accepted accounting principles.
We evaluated, or caused to be evaluated under our supervision, the effectiveness of the OSC’s internal control over financial reporting at the financial year-end, and the OSC has disclosed in its annual MD&A our conclusion about the effectiveness of internal control over financial reporting at the financial year-end based on that evaluation.
We have also disclosed in the MD&A any change in our internal control over financial reporting that occurred during the year that has materially affected, or is reasonably likely to materially affect, our internal control over financial reporting.
The Board of Directors ensures that management fulfills its responsibility for financial reporting and internal control. The financial statements have been reviewed by the Audit and Finance Committee and approved by the Board of Directors. The Auditor General’s Report, which follows, outlines the scope of the Auditor’s examination and opinion on the financial statements.
Maureen Jensen H.R. GossChair and Chief Executive Officer Director, Corporate Services
June 6, 2017
ONTARIO SECURITIES COMMISSION
Management’s Responsibility and Certification
PUBLIC ACCOUNTS, 2016-2017 1-287

Independent Auditor’s Report
20 Dundas Street West Suite 1530
Toronto, Ontario M5G 2C2
416-327-2381 fax 416-327-9862 tty 416-327-6123
20, rue Dundas ouest suite 1530
Toronto (Ontario) M5G 2C2
416-327-2381télécopieur 416-327-9862
ats 416-327-6123
www.auditor.on.ca
To the Ontario Securities Commission
I have audited the accompanying financial statements of the Ontario Securities Commission, which comprise the statement of financial position as at March 31, 2017, and the statements of comprehensive income, statement of changes in surplus and statement of cash flows for the year then ended, and a summary of significant accounting policies and other explanatory information.
Management’s Responsibility for the Financial Statements
Management is responsible for the preparation and fair presentation of these financial statements in accordance with International Financial Reporting Standards and for such internal control as management determines is necessary to enable the preparation of financial statements that are free from material misstatement, whether due to fraud or error.
Auditor’s Responsibility
My responsibility is to express an opinion on these financial statements based on my audit. I conducted my audit in accordance with Canadian generally accepted auditing standards. Those standards require that I comply with ethical requirements and plan and perform the audit to obtain reasonable assurance about whether the financial statements are free from material misstatement.
An audit involves performing procedures to obtain audit evidence about the amounts and disclosures in the financial statements. The procedures selected depend on the auditor’s judgment, including the assessment of the risks of material misstatement of the financial statements, whether due to fraud or error. In making those risk assessments, the auditor considers internal control relevant to the entity’s preparation and fair presentation of the financial statements in order to design audit procedures that are appropriate in the circumstances, but not for the purpose of expressing an opinion on the effectiveness of the entity’s internal control. An audit also includes evaluating the appropriateness of accounting policies used and the reasonableness of accounting estimates made by management, as well as evaluating the overall presentation of the financial statements.
I believe that the audit evidence I have obtained is sufficient and appropriate to provide a basis for my audit opinion.
Opinion
In my opinion, the financial statements present fairly, in all material respects, the financial position of the Ontario Securities Commission as at March 31, 2017 and its financial performance, and its cash flows for the year ended in accordance with the International Financial Reporting Standards.
Toronto, Ontario Bonnie Lysyk, MBA, CPA, CA, LPAJune 6, 2017 Auditor General
1-288 PUBLIC ACCOUNTS, 2016-2017

Statement of Financial Position(in Canadian dollars)
As at March 31 Note(s) 2017 2016
ASSETSCurrent Cash $ 42,345,003 $ 29,244,715Trade and other receivables 4, 5 4,795,056 3,831,842Prepayments 1,527,576 1,522,706
Total current $ 48,667,635 $ 34,599,263
Non-currentFunds held pursuant to designated operations and settlements and orders 3(d), 6 37,995,716 35,555,504Net assets held for CSA Systems operations and redevelopment 2, 7, 17 151,732,608 139,855,968 Reserve fund assets 8 20,000,000 20,000,000Property, plant & equipment 9 12,502,675 12,872,939
Total non-current $ 222,230,999 $ 208,284,411
Total assets $ 270,898,634 $ 242,883,674
LIABILITIESCurrentTrade and other payables 10 $ 16,717,810 $ 14,617,340
Total current $ 16,717,810 $ 14,617,340
Non-currentPension liabilities 12(b) 3,839,928 3,608,042Funds held pursuant to designated settlements and orders 3(d), 6 37,995,716 35,555,504Net assets held for CSA Systems operations and redevelopment 2, 7, 17 151,732,608 139,855,968
Total non-current $ 193,568,252 $ 179,019,514
Total liabilities $ 210,286,062 $ 193,636,854
SURPLUSGeneral $ 40,612,572 $ 29,246,820Reserve 8, 13 20,000,000 20,000,000
Operating surplus $ 60,612,572 $ 49,246,820
Total liabilities and surplus $ 270,898,634 $ 242,883,674
The related notes are an integral part of these financial statements.
On behalf of the Board of the Commission
Maureen Jensen William Furlong
Chair Chair, Audit and Finance Committee
PUBLIC ACCOUNTS, 2016-2017 1-289

Statement of Comprehensive Income(in Canadian dollars)
For the year ended March 31 Note(s) 2017 2016
REVENUEFees 3(c), 14 $ 119,516,341 $ 116,638,258Miscellaneous 167,627 43,216Interest income 243,132 167,951
$ 119,927,100 $ 116,849,425
EXPENSES Salaries and benefits 15 $ 81,864,332 $ 79,174,128Administrative 16 9,084,988 7,737,356Occupancy 8,352,813 8,009,082Professional services 6,862,591 5,478,737 Depreciation 9 3,112,148 2,761,282 Other 805,454 797,546
$ 110,082,326 $ 103,958,131
Recoveries of enforcement costs 3(g) (160,250) (899,940)Recoveries of investor education costs 3(g), 19 (1,470,894) (1,198,271)
$ 108,451,182 $ 101,859,920
Excess of revenue over expenses $ 11,475,918 $ 14,989,505
OTHER COMPREHENSIVE INCOMEItems that will not be reclassified to profit and loss:Remeasurements of defined benefit pension plans 12(b) $ (110,166) $ (16,971)
Other comprehensive loss $ (110,166) $ (16,971)
Total comprehensive income $ 11,365,752 $ 14,972,534
The related notes are an integral part of these financial statements.
Statement of Changes in Surplus(in Canadian dollars)
For the year ended March 31 Note(s) 2017 2016
Operating surplus, beginning of year $ 49,246,820 $ 34,274,286Total comprehensive income 11,365,752 14,972,534
Operating surplus, end of year $ 60,612,572 $ 49,246,820
Represented by:General $ 40,612,572 $ 29,246,820Reserve 8, 13 20,000,000 20,000,000
$ 60,612,572 $ 49,246,820
The related notes are an integral part of these financial statements.
1-290 PUBLIC ACCOUNTS, 2016-2017

Statement of Cash Flows(in Canadian dollars)
For the year ended March 31 Note(s) 2017 2016
CASH FLOWS FROM OPERATING ACTIVITIESExcess of revenue over expenses $ 11,475,918 $ 14,989,505Adjusted for:
Interest received $ 232,868 $ 160,772Interest income (243,132) (167,951)Interest expense on line of credit — 55,188Pension liabilities 121,720 30,269Loss on disposal of property, plant & equipment 9 865 8,201Depreciation 9 3,112,148 2,761,282
$ 14,700,387 $ 17,837,266
Changes in non-cash working capital: Trade and other receivables $ (952,951) $ (849,324)Prepayments (4,870) (149,225)Trade and other payables 2,100,470 (1,465,430)
$ 1,142,649 $ (2,463,979)
Net cash flows from operating activities $ 15,843,036 $ 15,373,287
CASH FLOWS USED IN INVESTING ACTIVITIESPurchase of property, plant & equipment 9 $ (2,742,748) $ (3,057,689)
Net cash used in investing activities $ (2,742,748) $ (3,057,689)
CASH FLOWS USED IN FINANCING ACTIVITIESInterest paid on line of credit $ — $ (55,188)
Net cash flows used in financing activities $ — $ (55,188)
Net increase in cash position $ 13,100,288 $ 12,260,410
Cash, beginning of year 29,244,715 16,984,305
Cash, end of year $ 42,345,003 $ 29,244,715
The related notes are an integral part of these financial statements.
PUBLIC ACCOUNTS, 2016-2017 1-291

Notes to the Financial Statements
1. Reporting entityThe Ontario Securities Commission (OSC) is a corporation domiciled in Canada. The address of the OSC’s registered office is 20 Queen Street West, Toronto, Ontario, M5H 3S8. The OSC is a corporation without share capital and is the regulatory body responsible for regulating the province’s capital markets. As a Crown corporation, the OSC is exempt from income taxes.
2. Basis of presentation
(a) Statement of compliance
These financial statements are prepared in accordance with International Financial Reporting Standards (IFRS). These financial statements are as at March 31, 2017 and for the year then ended and includes comparatives. These financial statements were authorized for issue by the Board of Directors on June 6, 2017.
(b) Basis of measurement
The financial statements have been prepared on the historical cost basis except for certain financial instruments that are measured at fair value, and pension liabilities that are measured net of actuarial gains and losses, as explained in Note 3(e). Historical cost is generally based on the fair value of the consideration given in exchange for assets.
(c) Functional and presentation currency
These financial statements are presented in Canadian dollars, which is the OSC’s functional currency. Amounts have been rounded to the nearest dollar.
(d) Use of judgments and sources of estimation uncertainty
(i) Judgments
The preparation of financial statements in accordance with IFRS requires that management make judgments in applying accounting policies that can affect the reported amounts of assets and liabilities as at the date of the financial statements, as well as the reported amounts of revenue and expenditures for the period.
The following are the judgments in applying accounting policies, apart from those involving estimates, that have the most significant effect on the amounts recognized in the financial statements.
Recoveries of investor education costs
Beginning April 1, 2015, the OSC began recovering costs that are in accordance with subparagraph 3.4(2)(b)(ii) of the Securities Act (Ontario) which was amended on June 20, 2012 to expand the purposes for which enforcement monies may be designated to include “for use by the Commission for the purpose of educating investors or promoting or otherwise enhancing knowledge and information of persons regarding the operation of the securities and financial markets” (“investor education costs”). The OSC developed guidelines to assist in determining which costs would be in accordance with subparagraph 3.4(2)(b)(ii). The OSC exercised judgement in evaluating the types of costs incurred which would be in accordance with these guidelines. See Note 19 for a summary of costs recovered.
Net assets held for Canadian Securities Administrators (CSA) Systems operations and redevelopment (CSA Systems net assets)
The OSC has been appointed to administer the financial management processes of the CSA Systems net assets, which mainly consist of surplus funds accumulated from systems fees charged to market participants. Based on an evaluation of the contractual terms and conditions related to the arrangement, OSC management has exercised judgment to determine that participants in the capital markets, rather than the
1-292 PUBLIC ACCOUNTS, 2016-2017

OSC (or other CSA members, including the Investment Industry Regulatory Organization of Canada (IIROC) in the case of NRD until October 13, 2013), obtain the benefit or rewards from the net assets or any future development of the CSA Systems. The OSC has also determined that in performing its administrative role for the CSA Systems net assets, it does not control or have significant influence over how the net assets are managed.
The OSC exercised judgment to determine that the net assets administered by the OSC on behalf of CSA Systems are best represented by the presentation of an asset and a corresponding liability.
See Note 7 for more information, including summary financial information related to the CSA Systems net assets.
(ii) Sources of estimation uncertainty
The preparation of financial statements in accordance with IFRS requires management to make assumptions about the future and other sources of estimation uncertainty that have a significant risk of affecting the carrying amounts of assets and liabilities within the next fiscal year.
Determining the carrying amounts of some assets and liabilities requires management to estimate the effects of uncertain future events on those assets and liabilities at the end of the reporting period. Actual amounts can differ from these estimates to the extent future outcomes differ significantly from management’s estimations. Estimates and underlying assumptions are reviewed on an ongoing basis. Revisions to accounting estimates are recognized in the period in which the estimates are revised and in any future periods affected.
The following are the key assumptions and other major sources of estimation uncertainty that have a significant risk of resulting in a material adjustment within the next financial year.
Supplemental pension plan
Supplemental pension plan liabilities represent the estimated present value of the OSC’s obligation for future payments on March 31, 2017. The OSC utilizes an independent actuarial expert to determine the present value of the defined benefit obligation of the Supplemental pension plan and related impact to the Statement of comprehensive income and Other comprehensive income (OCI).
In some cases, this determination will involve management’s best estimates and information from other accredited sources. A change in one or more of these assumptions could have a material impact on the OSC’s financial statements.
The significant actuarial assumptions used to determine the present values of the defined benefit obligations and sensitivity analysis of changes in the actuarial assumptions used are outlined in Note 12(b).
Designated settlements and orders and Recoveries of enforcement costs
Funds held pursuant to designated settlements and orders and Recoveries of enforcement costs are recorded when settlements are approved or orders are made by the Commission, unless management determines that collecting the settlement amount is significantly doubtful, in which case it is recognized when payment is received. Estimation is required to determine the amount of designated settlements to recognize, orders that will be collected and Recoveries of enforcement costs.
Management considers the ability of the respondent to pay the sanction amount, the ability to locate the respondent and whether the respondent owns any assets. A change in any of these factors could have a material impact on the OSC’s financial statements. Assets and liabilities will change related to estimated designated settlements and order amounts deemed to be collectible. Expenses may change related to the Recoveries of enforcement costs. For more information on Designated settlements and orders, see Note 6.
PUBLIC ACCOUNTS, 2016-2017 1-293

Notes to the Financial Statements
3. Significant accounting policiesThe accounting policies set out below have been applied consistently to all periods presented in these financial statements. See Note 20 for discussion related to accounting standards, interpretations and amendments that became effective in the year.
(a) Financial instruments
Financial assets and financial liabilities are recognized when the OSC becomes a party to the contractual provisions of the instrument.
Financial instruments are classified into one of the following categories: financial assets at fair value through excess of revenues over expenses (held-for-trading), loans and receivables, and other liabilities.
Financial assets and financial liabilities are measured initially at fair value plus transaction costs, except for financial assets carried at fair value through excess of revenues over expenses, which are measured initially at fair value.
Financial assets are derecognized when the contractual rights to the cash flows from the financial assets expire or when all substantial risks and rewards of the financial assets are transferred.
A financial liability is derecognized when it is extinguished; that is, when the contractual obligation is discharged, cancelled or expires.
The OSC has adopted the following classifications for financial assets and financial liabilities:
Financial assets at fair value through excess of revenues over expenses (held-for-trading)
Cash, cash held pursuant to designated settlements and orders, funds included in the Net assets held for the CSA Systems operations and redevelopment, and Reserve fund assets are classified as held-for-trading. The recorded balances approximate their fair value.
Loans and receivables
Trade and other receivables and receivables from designated settlements and orders are classified as loans and receivables and are measured at amortized cost, less any impairment loss. Impairment provisions are recognized when there is objective evidence (such as significant financial difficulties on the part of a market participant, or default or significant delay in payment) that the OSC will be unable to collect all, or a portion, of the amounts due under the terms of the amount receivable.
Other liabilities
Trade and other payables are classified as other liabilities and measured at amortized cost. The recorded balances approximate their fair value.
1-294 PUBLIC ACCOUNTS, 2016-2017
(b) Property, plant & equipment
Items of Property, plant & equipment are recorded at cost less accumulated depreciation and impairment losses. Cost includes expenditures that are directly attributable to the acquisition of the asset.
The cost of the Property, plant & equipment, less any residual value, is depreciated and recognized in excess of revenues over expenses on a straight-line basis over the estimated useful life of the asset, as follows:
Computer hardware and related applications 3 yearsNetwork servers and cabling 5 yearsOffice furniture and equipment 5 to 10 yearsLeasehold improvements Over remaining term of the lease plus one option period
The estimated useful lives, residual values and depreciation method are reviewed at the end of each fiscal year. Any changes in estimates are accounted for on a prospective basis.
An item of Property, plant & equipment is derecognized upon disposal or when no future economic benefits are expected to arise from the continued use of the asset. Any gain or loss arising from the disposal or retirement of an item of Property, plant & equipment is determined as the difference between the net disposal proceeds and the carrying amount of the asset, and is recognized in excess of revenues over expenses.
Items of Property, plant & equipment are reviewed for impairment at each reporting date. If any impairment is indicated, the asset’s recoverable amount is estimated. The recoverable amount is the higher of an asset’s fair value less costs to sell and value in use. An impairment loss is recognized for the amount by which the asset’s carrying amount exceeds its recoverable amount.
(c) Revenue recognition
Participation fees
Participation fees are recognized when received. Prior to receipt of the fee, the probability that the economic benefits associated with the transaction will flow to the OSC is unknown. In addition, reliable measurement of participation fees for new market participants is not possible because the market capitalization of issuers or the specified Ontario revenue of registrants, on which their participation fees are based, cannot be determined prior to receipt.
These fees represent the payment for the right to participate in the Ontario capital markets, and the OSC has no specific obligations throughout the year to any individual market participant. As such, the OSC’s performance consists of a single act, which is receipt of the fee payment. Once the fee is paid, there is no obligation to refund the fees and there are no other unfulfilled conditions on behalf of the OSC. Therefore, participation fees are deemed to be earned upon receipt, except in the case of specified regulated entities that file their participation fees through the OSC’s electronic filing portal, which are recognized when the fee amount can be reliably measured, which is the date the required document has been filed, or the corresponding outstanding fee is paid.
Activity fees
Activity fees represent the direct cost of OSC staff resources expended in undertaking certain activities requested of staff by market participants. Because the activities undertaken are normally completed in a relatively short period of time, activity fees are recognized when the filing is received.
PUBLIC ACCOUNTS, 2016-2017 1-295

Notes to the Financial Statements
Late filing fees
Late filing fees relating to insider trading reports are recognized weekly and include fees related to all insider trading reports filed late in the preceding seven-day period. Other late fee amounts are recognized when the fee amount can be reliably measured, which is the date the required document has been filed, or the corresponding outstanding fee is paid.
(d) Funds held pursuant to designated settlements and orders
Funds held pursuant to designated settlements and orders are recorded when settlements are approved or orders are made by the Commission, unless management determines that collecting the settlement amount is significantly doubtful, in which case they are recognized when payment is received. Due to the restricted use of Funds held pursuant to designated settlements and orders, a corresponding Non-current liability that equals the related Non-current asset is reflected in the Statement of financial position.
(e) Employee benefits
Ontario Public Service Pension Plan (OPSPP)
The OSC provides pension benefits to its full-time employees through participation in the OPSPP. The Province of Ontario is the sole sponsor of the OPSPP. This plan is accounted for as a defined contribution plan because sufficient information is not provided to the OSC or otherwise available for the OSC to apply defined benefit plan accounting to this pension plan.
The plan sponsor is responsible for ensuring that the pension funds are financially viable. Any surpluses or unfunded liabilities arising from statutory actuarial funding valuations are not assets or obligations of the OSC. The OSC is not exposed to any liability to the plan for other entities’ obligations under the terms and conditions of the plan. There is no deficit or surplus in the plan that could affect the amount of future contributions for the OSC.
In addition, there is no agreed allocation of a deficit or surplus on wind-up or withdrawal by the OSC from the plan. Payments made to the plan are recognized as an expense when employees have rendered the service entitling them to the contributions. For more information on the OPSPP, see Note 12(a).
Supplemental pension plan
The OSC also maintains unfunded supplemental pension plans for its current and former Chairs and Vice-Chairs as described in Note 12(b). These plans are final salary pension plans, which provide benefits to members in the form of a guaranteed level of pension payable for life. The level of the target benefits provided depends on the members’ length of service and their salary in the final years prior to retirement. In some plans, the target benefits are indexed with inflation. The target benefits are then offset by the benefits payable from the OPSPP (registered and supplemental plans), which are linked to inflation.
The defined benefit liability recognized in the Statement of financial position for the supplemental pension plans is the present value of the defined benefit obligation at the reporting date.
Actuarial gains and actuarial losses resulting from remeasurements of the net defined benefit liability arising from the supplemental pension plans are recognized immediately in the Statement of financial position with a corresponding debit or credit through OCI in the period in which they occur. Remeasurements are not reclassified to excess of revenues over expenses in subsequent periods.
1-296 PUBLIC ACCOUNTS, 2016-2017
Other post-employment obligations
The costs of non-pension benefits for eligible pensioners are paid by the Government of Ontario and are not included in the Statement of comprehensive income, as described in Note 18(c).
Termination benefits
Termination benefits are generally payable when employment is terminated before the normal retirement date or when an employee accepts voluntary redundancy in exchange for these benefits. The OSC recognizes a liability and an expense for termination benefits at the earlier of the date the OSC has demonstrably committed to either terminating the employment of current employees according to a detailed formal plan without a realistic possibility of withdrawal or when the OSC has recognized costs for providing termination benefits as a result of a restructuring involving a fundamental reorganization that has a material effect on the nature and focus of OSC operations.
Short-term benefits
Short-term employee benefits, such as salaries, pension contributions, paid annual leaves and bonuses, are measured on an undiscounted basis and are expensed as the related service is provided to the OSC.
(f) Leases
All leases currently recorded are classified as operating leases. Lease payments are expensed on a straight-line basis over the term of the lease.
If lease incentives are received to enter into operating leases, the aggregate benefit of the incentives is recognized as a reduction of rental expense on a straight-line basis, except where another systematic basis is more representative of the time pattern in which economic benefits from the leased asset are consumed.
(g) Recoveries
Recoveries of enforcement costs
Recoveries of enforcement costs are recorded as offsets to total expenses on the date a settlement is approved or an order is issued by the OSC, unless management determines that collecting the settlement amount is significantly doubtful, in which case, recovery is recognized when payment is received.
Recoveries of investor education costs
Recoveries of investor education costs are recorded as offsets to total expenses on a quarterly basis based on the eligible expenses recorded in the quarter.
(h) Provisions
A provision is recognized when a present legal or constructive obligation results from past events, it is probable that an outflow of resources will be required to settle the obligation and when a reliable estimate of the amount of the obligation can be made.
PUBLIC ACCOUNTS, 2016-2017 1-297

Notes to the Financial Statements
4. Financial instruments risksThe OSC is exposed to various risks in relation to financial instruments. The OSC’s objective is to maintain minimal risk. The OSC’s financial assets and liabilities by category are summarized in Note 3(a). The main types of risks related to the OSC’s financial instruments are currency risk, interest rate risk, credit risk and liquidity risk. This note provides information about the OSC’s exposure to these risks and the OSC’s objectives, policies and processes for measuring and managing these risks.
Currency risk
The OSC’s exposure to currency risk is minimal due to the low number of transactions denominated in currencies other than Canadian dollars.
Interest rate risk
The OSC’s financial assets and liabilities are not exposed to significant interest rate risk due to their short-term nature. The OSC’s Cash, Funds held pursuant to designated settlements and orders, Net assets held for CSA Systems operations and redevelopment (cash components) and Reserve fund assets are held by Schedule 1 banks (and credit unions in British Columbia with respect to Net assets held for CSA Systems operations and redevelopment cash components). The bank balances earn interest at a rate of 1.85% below the prime rate. The average rate of interest earned on bank balances for the year was 0.85% (2016 – 0.91%).
A 25 basis points change in the interest rate would impact the OSC’s operating surplus as follows:
Impact on operating surplus25 basis points 25 basis points
increase in rates decrease in rates
Reserve fund assets $ 29,863 $ (29,863)Cash balance 41,786 (41,786)
$ 71,649 $ (71,649)
Credit risk
The OSC is exposed to minimal credit risk related to Cash, Funds held pursuant to designated settlements and orders, Net assets held for CSA Systems operations and redevelopment, Reserve fund assets and Trade and other receivables.
Schedule 1 financial institutions hold approximately 75% of the OSC’s financial assets including those held for CSA Systems operations and redevelopment and another 16% are held in two credit unions in British Columbia (for cash components of Net assets held for CSA Systems operations and redevelopment exclusively). The remaining balance of financial assets are accounts receivable. The Credit Union Deposit Insurance Corporation (CUDIC), a statutory corporation, guarantees all deposits of British Columbia credit unions, as set out in the Financial Institutions Act. Given the nature of these counterparties, it is management’s opinion that exposure to concentration of credit risk is minimal. In addition, the investment policy for Cash, Reserve fund assets and for Funds held pursuant to designated settlements and orders limits amounts held on deposit in any one of the Schedule 1 banks to $30.0 million for each category.
1-298 PUBLIC ACCOUNTS, 2016-2017

Trade receivable balances consist of a large number of debtors owing individually immaterial balances.
Other receivables in aggregate are material, with most debtors owing individually and in aggregate immaterial amounts, and a small number of debtors owing larger amounts, which are material in aggregate or individually, and are receivable from:
and other charges incurred,
Therefore, the OSC’s exposure to concentration of credit risk is minimal.
The OSC maintains an allowance for doubtful accounts. Therefore, the carrying amount of Trade and other receivables generally represents the maximum credit exposure. Based on historical information about debtors’ default rates, management considers the credit quality of trade receivables that are not past due or impaired to be good. Collection efforts continue for Trade and other receivables balances, including those that are captured in the allowance for doubtful accounts.
The aging of Trade and other receivables is as follows:
Note March 31, 2017 March 31, 2016
Current $ 2,526,475 $ 2,016,130 Past due 31 to 60 days 922,861 1,099,936 Past due 61 to 90 days 484,114 61,100 Past due greater than 90 days (net) 861,606 654,676
Total Trade and other receivables 5 $ 4,795,056 $ 3,831,842
Past due greater than 90 days detail Note March 31, 2017 March 31, 2016
Past due greater than 90 days (gross) $ 1,034,609 $ 816,511Allowance for doubtful accounts 5 (173,003) (161,835)
$ 861,606 $ 654,676
Reconciliation of allowance for doubtful accounts is as follows:
Note March 31, 2017 March 31, 2016
Opening balance $ 161,835 $ 308,078 Current year provision 316,268 113,210Written-off during the year (305,100) (259,453)
Closing balance 5 $ 173,003 $ 161,835
In 2017, $305,100 of Trade and other receivables that related to balances owing prior to April 1, 2016 were written off, resulting in a reduction to the allowance for doubtful accounts and a corresponding reduction of Trade and other receivables for the same amount. The amount written off was charged to bad debt expense in prior years as part of the current year provision for those prior years. The current year provision of $316,268 was charged to bad debt expense for fiscal 2017.
PUBLIC ACCOUNTS, 2016-2017 1-299

Notes to the Financial Statements
Liquidity risk
The OSC’s exposure to liquidity risk is low as the OSC has sufficient cash, reserve fund assets, and access to a credit facility to settle all current liabilities. As at March 31, 2017, the OSC had a cash balance of $42.3 million and reserve fund assets of $20.0 million to settle current liabilities of $16.7 million.
The OSC has a $52.0 million credit facility to address any short-term cash deficiencies. Interest on the credit facility is charged at a rate of 0.5% below the prime rate. During the year, the OSC utilized the credit facility to a maximum of $75 thousand for one day. As at March 31, 2017, there is no amount outstanding on the credit facility.
The overall exposure to liquidity risk remains unchanged from 2016.
Supplemental pension plan risks
The OSC’s overall exposure to supplemental pension plan risks is low due to the plan being a supplemental plan and the limited number of plan members entitled to plan benefits. For more information, see Note 12(b).
5. Trade and other receivables
Notes March 31, 2017 March 31, 2016
Trade receivables $ 717,605 $ 845,910Other receivables 3,003,059 1,869,080 Allowance for doubtful accounts 4 (173,003) (161,835)
$ 3,547,661 $ 2,553,155
Interest receivable 44,230 33,965 Amount recoverable from investor education costs 19 687,769 629,824HST recoverable 515,396 614,898
Total Trade and other receivables 4 $ 4,795,056 $ 3,831,842
6. Funds held pursuant to designated settlements and ordersThe OSC has a number of settlement agreements and orders arising from enforcement proceedings where monies from these settlements and orders are to be set aside and allocated to such third parties as the Board of the OSC may determine. As a result of an amendment to the Securities Act (Ontario) effective June 2012, these funds are eligible to be allocated to the OSC for the purpose of educating investors, or promoting or otherwise enhancing knowledge and information of persons regarding the operation of the securities and financial markets, including such designated internal costs as approved by the Board.
On July 14, 2016, the OSC established the Whistleblower Program (the “Program”). Under the Program, whistleblowers may be eligible for awards of between 5% to 15% of total monetary sanctions imposed and/or voluntary payments made, if their information leads to an administrative proceeding where these amounts total $1 million or more. The maximum amount of the award has been set at $1.5 million where monetary sanctions and/or voluntary payments are not collected and $5 million where these amounts have been collected. Whistleblowers will be paid out of funds held pursuant to designated settlements and orders. To date, no payments have been made under the Program.
The accumulated funds are held in a segregated bank account and earn interest at the monthly average bank prime rate less 1.85%. The Board will allocate these funds as it determines appropriate in its discretion. This includes allocations to harmed investors, where appropriate and where an allocation can be reasonably effected.
1-300 PUBLIC ACCOUNTS, 2016-2017

As at March 31, 2017, the accumulated balance is determined as follows:
Note March 31, 2017 March 31, 2016
Opening balance $ 35,555,504 $ 24,702,966
Assessed during the year $ 163,955,995 $ 223,287,035Less:
Amounts to be paid directly to investors (148,057,864) (164,260,580)Orders deemed uncollectible (7,988,558) (45,526,682)
Amount recorded from assessments in year 7,909,573 13,499,773
Amounts collected in relation to external order — 105,000Adjustments to amounts assessed in prior years (1,194,980) (1,839,616)
Total settlements and orders recorded 6,714,593 11,765,157
Add: Interest 255,131 195,550Add: Recovery of stale cheque previously paid to harmed investor — 102,350Less: Payments
Paid to the OSC for recovery of Investor education costs 19 (1,412,949) (583,734)Paid to harmed investors (3,116,563) (626,785)
Closing balance $ 37,995,716 $ 35,555,504
Represented by: Cash $ 36,464,623 $ 31,164,377Receivable 1,531,093 4,391,127
$ 37,995,716 $ 35,555,504
The $6,714,593 (2016 – $11,765,157) identified as total settlements and orders recorded reflects the portion of $163,955,995 (2016 – $223,287,035) in settlements and orders that was assessed during the year, for which payment was either received or has been deemed collectible. This total includes a reversal of $1,194,980 (2016 –$1,839,616) in adjustments from orders recorded in prior years. Included in the total assessed was $148,057,864 (2016 – $164,260,580) where the respondents were required to distribute monies to harmed investors, which are not captured in the OSC’s accounting records.
The adjustments to amounts assessed in prior years include portions of orders that had been previously deemed as collectible that are now deemed as uncollectible in fiscal 2017, less the amounts from prior years that are on payment plans that were recorded in fiscal 2017, and the amounts that had been previously deemed uncollectible where payment was received in fiscal 2017. As at March 31, 2017, $1,531,093 (2016 – $4,391,127) was considered receivable because these amounts are expected to be collected.
The OSC collected a total of $7,905,652 (2016 – $10,959,020) of the designated settlements and orders assessed during the year, resulting in an average collection rate of 38.21% (2016 – 18.57%).
As authorized by the Board, the OSC made payments from the designated funds totalling $4,529,512 (2016 – $1,210,519). Details on the recipients of these payments are included in the table above.
PUBLIC ACCOUNTS, 2016-2017 1-301

Notes to the Financial Statements
7. Net assets held for CSA Systems operations and redevelopment(CSA Systems net assets)
The core Canadian Securities Administrators National Systems (CSA Systems) consist of the System for Electronic Document Analysis and Retrieval (SEDAR), the National Registration Database (NRD) and the System for Electronic Disclosure by Insiders (SEDI). The CSA is planning to develop and implement a new marketplace surveillance and analytical system to improve market analytics capacity.
The OSC, British Columbia Securities Commission (BCSC), Alberta Securities Commission (ASC) and l’Autorité des marchés financiers (AMF) are principal administrators (PAs) of the CSA Systems.
The OSC has been appointed the Designated Principal Administrator – Operations (DPA) to collect, hold, and administer the surplus funds accumulated from system fees charged to market participants that use the CSA Systems. This role is essentially that of a custodian. The Net assets held for CSA Systems operations and redevelopment include surplus funds accumulated from operation of the CSA Systems, which are received, held and managed by the DPA on behalf of the PAs, and IIROC (in the case of NRD system fee surplus funds accumulated to October 13, 2013). The use of these surplus funds is restricted by various agreements between the PAs.
CGI Information Systems and Management Consultants Inc. (CGI), as service provider, hosts and maintains the CSA Systems. CGI forwards the gross system fees collected from users of the CSA Systems to the DPA as they are received and invoices the DPA for services provided by CGI in relation to the CSA Systems.
The DPA administers payments to CGI for services provided as they become due from the surplus funds. A CSA Systems Governance Committee (SGC), consisting of members of the four PAs, was established through an agreement signed on April 2, 2013. This agreement also created a governance framework for management and oversight of the CSA Systems, including that of CGI. It outlines how user fees will be collected and deployed, and addresses allocation and payment of liabilities that may arise.
Use of the surplus funds within the terms of the various agreements requires the approval of members of the SGC. Majority approval is required for all permissible uses of the surplus funds as outlined within the various agreements, with the exception of the following, which all require unanimous approval of the PAs:
surplus at such date,
In the case of NRD, IIROC approval is required for any use of the surplus funds that deviates from the contractually agreed uses for funds accumulated prior to October 12, 2013.
The CSA is redeveloping the CSA Systems in a multi-year phased approach. Funding for the redevelopment is coming from the accumulated surplus funds.
1-302 PUBLIC ACCOUNTS, 2016-2017

The results of the Net assets held for CSA Systems operations and redevelopment are presented below.
As at As at Financial position March 31, 2017 March 31, 2016
ASSETS CurrentCash $ 19,886,194 $ 96,490,056Investments 115,000,000 40,000,000Trade and other receivables 4,494,379 2,550,211Prepayments 1,953,035 696,490
Total current $ 141,333,608 $ 139,736,757
Intangible asset 14,636,653 1,862,781
Total assets $ 155,970,261 $ 141,599,538
LIABILITIES CurrentTrade and other payables $ 4,186,601 $ 1,616,813Deferred revenues 51,052 126,757
Total current $ 4,237,653 $ 1,743,570
Total liabilities $ 4,237,653 $ 1,743,570
SURPLUSOpening surplus $ 139,855,968 $ 128,793,173Excess of revenue over expenses 11,876,640 11,062,795
Closing surplus $ 151,732,608 $ 139,855,968
Total liabilities and surplus $ 155,970,261 $ 141,599,538
Year ended Year ended Results of operations March 31, 2017 March 31, 2016
REVENUENRD system fees $ 14,293,387 $ 14,122,155 SEDAR system fees 10,697,122 10,799,086 Data distribution services fees 705,230 615,230 Interest income 1,709,469 1,693,848
Total revenues $ 27,405,208 $ 27,230,319
EXPENSESSalaries and benefits $ 2,564,850 $ 2,893,628 Professional services 11,690,939 12,240,191 Amortization 482,850 411,712Other 789,929 621,993
Total expenses $ 15,528,568 $ 16,167,524
Excess of revenues over expenses $ 11,876,640 $ 11,062,795
PUBLIC ACCOUNTS, 2016-2017 1-303

Notes to the Financial Statements
Year ended Year ended Cash flows March 31, 2017 March 31, 2016
CASH FLOWS FROM OPERATING ACTIVITIES Excess of revenues over expenditures $ 11,876,640 $ 11,062,795 Adjusted for:
Interest income received 263,702 1,901,855 Interest income (1,709,469) (1,693,848)Impairment loss — 210,000 Amortization 482,850 411,712
10,913,723 11,892,514
Changes in non-cash working capital: Trade and other receivables (498,401) 245,303 Prepayments (1,256,545) (23,581)Trade and other payables (191,947) 3,812 Deferred revenues (75,705) 65,817
(2,022,598) 291,351
Net cash flows from operating activities $ 8,891,125 $ 12,183,865
CASH FLOWS USED IN INVESTING ACTIVITIES Purchase of intangible asset (10,494,987) (1,084,317)Purchase of investments (75,000,000) (40,000,000)Maturity of investments — 90,000,000
Net cash flows used in investing activities $ (85,494,987) $ 48,915,683
Net (decrease)/increase in cash position $ (76,603,862) $ 61,099,548Cash position, beginning of period 96,490,056 35,390,508
Cash position, end of period $ 19,886,194 $ 96,490,056
Supplemental cash flow informationIntangible assets funded by Trade and other payables $ 2,761,735 $ —
For more information on the Net assets held for CSA Systems operations and redevelopment, see Note 2(d) and Note 17.
1-304 PUBLIC ACCOUNTS, 2016-2017
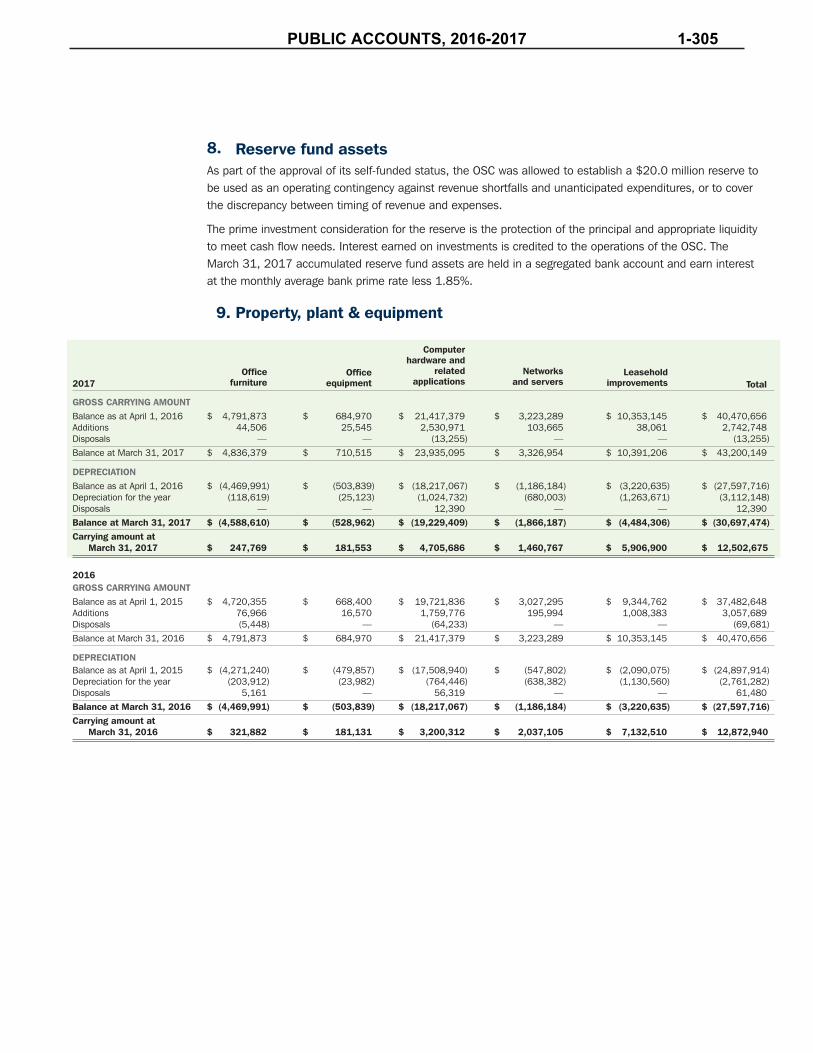
8. Reserve fund assetsAs part of the approval of its self-funded status, the OSC was allowed to establish a $20.0 million reserve to be used as an operating contingency against revenue shortfalls and unanticipated expenditures, or to cover the discrepancy between timing of revenue and expenses.
The prime investment consideration for the reserve is the protection of the principal and appropriate liquidity to meet cash flow needs. Interest earned on investments is credited to the operations of the OSC. The March 31, 2017 accumulated reserve fund assets are held in a segregated bank account and earn interest at the monthly average bank prime rate less 1.85%.
9. Property, plant & equipment
2017
GROSS CARRYING AMOUNTBalance as at April 1, 2016 $ 4,791,873 $ 684,970 $ 21,417,379 $ 3,223,289 $ 10,353,145 $ 40,470,656 Additions 44,506 25,545 2,530,971 103,665 38,061 2,742,748Disposals — — (13,255) — — (13,255)Balance at March 31, 2017 $ 4,836,379 $ 710,515 $ 23,935,095 $ 3,326,954 $ 10,391,206 $ 43,200,149
DEPRECIATIONBalance as at April 1, 2016 $ (4,469,991) $ (503,839) $ (18,217,067) $ (1,186,184) $ (3,220,635) $ (27,597,716)Depreciation for the year (118,619) (25,123) (1,024,732) (680,003) (1,263,671) (3,112,148)Disposals — — 12,390 — — 12,390 Balance at March 31, 2017 $ (4,588,610) $ (528,962) $ (19,229,409) $ (1,866,187) $ (4,484,306) $ (30,697,474)Carrying amount at March 31, 2017 $ 247,769 $ 181,553 $ 4,705,686 $ 1,460,767 $ 5,906,900 $ 12,502,675
2016GROSS CARRYING AMOUNTBalance as at April 1, 2015 $ 4,720,355 $ 668,400 $ 19,721,836 $ 3,027,295 $ 9,344,762 $ 37,482,648 Additions 76,966 16,570 1,759,776 195,994 1,008,383 3,057,689 Disposals (5,448) — (64,233) — — (69,681)Balance at March 31, 2016 $ 4,791,873 $ 684,970 $ 21,417,379 $ 3,223,289 $ 10,353,145 $ 40,470,656
DEPRECIATIONBalance as at April 1, 2015 $ (4,271,240) $ (479,857) $ (17,508,940) $ (547,802) $ (2,090,075) $ (24,897,914)Depreciation for the year (203,912) (23,982) (764,446) (638,382) (1,130,560) (2,761,282)Disposals 5,161 — 56,319 — — 61,480 Balance at March 31, 2016 $ (4,469,991) $ (503,839) $ (18,217,067) $ (1,186,184) $ (3,220,635) $ (27,597,716)Carrying amount at March 31, 2016 $ 321,882 $ 181,131 $ 3,200,312 $ 2,037,105 $ 7,132,510 $ 12,872,940
Networks and servers
Office furniture Total
Leaseholdimprovements
Office equipment
Computerhardware and
relatedapplications
PUBLIC ACCOUNTS, 2016-2017 1-305

Notes to the Financial Statements
10. Trade and other payables
March 31, 2017 March 31, 2016
Trade payables $ 1,148,122 $ 1,320,361Payroll accruals 12,017,104 10,985,698Other accrued expenses 3,552,584 2,311,281
$ 16,717,810 $ 14,617,340
11. Lease commitments
Operating leases
The OSC has entered into operating lease agreements for equipment and office space, and is committed to operating lease payments as follows:
March 31, 2017 March 31, 2016
Less than one year $ 8,205,840 $ 8,362,862Between one and five years 34,513,391 3,518,456More than five years 49,859,515 —
$ 92,578,746 $ 11,881,318
Lease expense recognized during 2017 was $7,826,890 (2016 – $7,491,391). This amount consists of minimum lease payments. A portion of the OSC’s office space is subleased to the CSA IT Systems Project Office and the Government of Canada on a full cost recovery basis. During the year, the OSC recorded sublease payments totaling $794,465 from these two organizations.
The current lease on OSC premises began August 30, 2012 for a term of five years, expiring on August 31, 2017. The OSC has entered into a new lease that begins September 1, 2017 for a term of ten years, expiring on August 31, 2027. The OSC has two consecutive options to extend the term beyond August 31, 2027, each for a period of five years. The lease was approved by the Minister of Finance under the Financial Administration Act section 28, which required review of contingent liabilities inherent in the lease.
12. Pension plans
(a) Ontario Public Service Pension Plan
All eligible OSC employees must, and members may, participate in the OPSPP. The OSC’s contribution to the OPSPP for the year ended March 31, 2017 was $5,078,084 (2016 – $4,851,811), which is included under Salaries and benefits in the Statement of comprehensive income. The expected contributions for the plan for fiscal 2018 are $5,640,450.
Information on the level of participation of the OSC in the OPSPP compared with other participating entities is not available.
(b) Supplemental pension plans
The OSC also has unfunded supplemental defined benefit pension plans for its current and former Chairs and Vice-Chairs. These supplemental pension plans have no plan assets. The actuarial liability and the current service cost are determined by independent actuaries using the projected benefit method prorated on services and management’s best estimate assumptions. The supplemental defined benefit pension plans are non-registered plans. The benefit payments are made by the OSC as they become due.
1-306 PUBLIC ACCOUNTS, 2016-2017

The OSC is responsible for governance of these plans. The OSC Board’s Audit and Finance Committee and Human Resources and Compensation Committee assist in the management of the plans. The OSC has also appointed experienced, independent professional actuarial experts to provide a valuation of the pension obligation for the supplemental plans in accordance with the standards of practice established by the Canadian Institute of Actuaries.
Under the projected benefit method, the Pension liabilities are the actuarial present value of benefits accrued in respect of service prior to the valuation date, based on projected final average earnings. The current service cost is the increase in the present value of the defined benefit obligation resulting from employee service in the current period. The current service cost, expressed as a percentage of pensionable earnings, will be stable over time if the demographic characteristics of the active membership remain stable from valuation to valuation. However, all other things being equal, the current service cost of an active membership whose average age rises between actuarial valuations will result in an increasing current service cost.
The supplemental pension plans expose the OSC to the following risks:
are linked to inflation, higher inflation will lead to lower liabilities. Conversely, for plans where the targetbenefits are linked to inflation, the OSC’s liability increases when inflation increases.
Therefore, increases in life expectancy will result in an increase in the plans’ liabilities.
There were no plan amendments, curtailments or settlements during the period. The duration of all plans combined is approximately 12 years (2016 – 12 years).
March 31, 2017 March 31, 2016
Defined benefit obligation, beginning of year $ 3,608,042 $ 3,560,802 Current service cost 230,996 115,100 Interest cost 129,189 117,627 Benefit payments (238,465) (202,458)Plan amendment — —Actuarial loss on obligation 110,166 16,971
Defined benefit obligation, end of year $ 3,839,928 $ 3,608,042
Actuarial assumptions
The significant actuarial assumptions used to determine the present value of the defined benefit obligation were as follows:
March 31, 2017 March 31, 2016
Discount rate(s) 3.55% 3.70%Inflation 2.25% 2.25%Expected rate(s) of salary increase 0% 0%CPP YMPE increase 2.75% 2.75%Increase in CRA limit $ 2,914.4 $ 2,890.0
The assumptions for mortality rates are based on the 2014 Public Sector Mortality Table (CPM2014Publ), with a size adjustment factor for monthly income of $6,000 and more, and with fully generational projections using the improvement scale CPM-B.
PUBLIC ACCOUNTS, 2016-2017 1-307

Notes to the Financial Statements
Sensitivity analysis
Changes in the actuarial assumptions used have a significant impact on the defined benefit obligation.
The following is an estimate of the sensitivity of the defined benefit obligation to a change in the significant actuarial assumptions (the sensitivity assumes all other assumptions are held constant):
March 31, 2017 March 31, 2016
Discount rate increased by 0.5% (obligation will decrease by) 5.5% 5.3% Discount rate decreased by 0.5% (obligation will increase by) 6.1% 5.8%Life expectancy increased by 1 year (obligation will increase by) 2.9% 2.7% Life expectancy decreased by 1 year (obligation will decrease by) 3.0% 2.8%Inflation rate increased by 0.5% (obligation will decrease by) 2.0% 2.6% Inflation rate decreased by 0.5% (obligation will increase by) 2.5% 3.2%
The OSC’s pension expense relating to the supplemental pension plans for the year ended March 31, 2017 was $360,185 (2016 – $232,727). The OSC expects to incur $236,700 in benefit payments relating to the supplemental pension plan during the next fiscal year.
13. Capital managementThe OSC has established a $20.0 million reserve fund, as described in Note 8, which it considers as capital. The primary objective of maintaining this capital is to fund OSC’s operations in the event of revenue shortfalls and unanticipated expenditures, or to cover the discrepancy between timing of revenue and expenses.
The OSC maintains an investment policy where Reserve fund assets are restricted to direct and guaranteed obligations of the Government of Canada and its provinces, and to instruments issued by Canadian Schedule 1 banks to protect the principal.
The OSC has a $52.0 million credit facility with a Schedule 1 financial institution to address any short-term cash deficiencies. The credit facility was renewed on July 1, 2016 and will expire on June 30, 2018.
The OSC is not subject to any externally imposed capital requirements.
14. FeesThe OSC’s fee structure is designed to generate fees that recover the OSC’s cost of providing services to market participants. The fee structure is based on the concept of “participation fees” and “activity fees”. Participation fees are based on the cost of a broad range of regulatory services that cannot be practically or easily attributed to individual activities or entities, and are intended to serve as a proxy for the market participants’ use of the Ontario capital markets.
Activity fees represent the direct cost of OSC staff resources expended in undertaking certain activities requested of staff by market participants.
Late fees represent fees applied to market participants for not filing required documents and/or paying their participation and activity fees on time.
Any general operating surpluses generated are normally returned to market participants through lower fees than otherwise required to recover costs or direct refunds.
The Commission revised its participation fees and activity fees through fee rule amendments that became effective April 6, 2015. While participation fee rates remained the same, some activity fee rates were adjusted at the beginning of fiscal 2016.
1-308 PUBLIC ACCOUNTS, 2016-2017

Fee rates will be reviewed in fiscal 2018 and the existing surplus will be taken into account in determining new rates. Other factors to be considered when reviewing the level of surplus and fee rates are the projected level of expenses, any projected capital expenses and the level of cash resources required to provide an adequate cash safety margin.
Fees received are as follows:
March 31, 2017 March 31, 2016
Participation fees $ 99,726,141 $ 99,714,224Activity fees 15,470,992 13,840,855Late filing fees 4,319,208 3,083,179
$ 119,516,341 $ 116,638,258
15. Salaries and benefits
March 31, 2017 March 31, 2016
Salaries $ 67,727,969 $ 65,735,420Benefits 8,113,532 7,848,643Pension expense 5,438,269 5,084,538Severance/termination payments 584,562 505,527
$ 81,864,332 $ 79,174,128
16. Administrative
March 31, 2017 March 31, 2016
Commission expense $ 1,887,267 $ 1,755,599Communications & publications 1,865,559 1,511,122Maintenance & support 3,069,562 2,418,854Supplies 799,956 730,270Other expenses 786,178 642,480Training 676,466 679,031
$ 9,084,988 $ 7,737,356
17. Contingent liabilities and contractual commitments
(a) The OSC has committed to paying in full any liability with respect to CSA Systems operations and custodyof the related surplus funds that arises as a result of wilful neglect or wilful misconduct on behalf of the OSC.
Under the agreements described in Note 7, the OSC, ASC, BCSC and AMF, as PAs, have committed to paying an equal share of any claim or expenses related to operation and redevelopment of the CSA Systems that exceed the surplus funds held.
In 2017, there were no such claims or expenses. As described in Note 7, the OSC, in its capacity as DPA, is holding funds in segregated bank and investment accounts that may be used to settle claims and expenses relating to the operation and redevelopment of the CSA Systems.
(b) Occasionally, the OSC is involved in legal actions arising from the ordinary course of business. This year,no new legal actions were commenced against the OSC and there are no other outstanding actions involvingthe OSC from prior years.
PUBLIC ACCOUNTS, 2016-2017 1-309

Notes to the Financial Statements
18. Related party transactions
(a) Net assets held for CSA Systems operations and redevelopment
In the course of normal operations, the OSC entered into transactions with the Net assets held for CSA Systems operations and redevelopment. During the year, total related party charges incurred and to be reimbursed were $3.7 million ($3.2 million in 2016). At March 31, 2017, $1.1 million was still owed to the OSC ($1.0 million in 2016). For more information, see Note 7.
(b) The Province of Ontario
In the course of normal operations, the OSC entered into the following transactions with the Province of Ontario:
(i) The Securities Act (Ontario) states that when ordered to do so by the responsible Minister, the OSC shallremit to the Province of Ontario such surplus funds as determined by the Minister. In light of the fee modelas described in Note 14 and the OSC’s practice of setting fees periodically, the OSC is not required to makeremittances of its surplus to the Consolidated Revenue Fund. Surpluses retained by the OSC are subject toappropriate terms and conditions to be agreed with the Ministry.
(ii) Costs of non-pension benefits for eligible pensioners are paid by the Government of Ontario and are notincluded in the Statement of comprehensive income.
(iii) Certain payments to harmed investors from the Funds held pursuant to designated settlements andorders are made through the Civil Remedies for Illicit Activities Office (CRIA). Payments are made to CRIAfrom the OSC pursuant to forfeiture orders obtained by CRIA under the Civil Remedies Act. CRIA is an officeof the Ministry of the Attorney General of Ontario.
(c) Compensation to key management personnel
The OSC’s key management personnel are the members of the Board of Directors, Chair, Vice-Chairs andExecutive Director.
The remuneration of key management personnel includes the following expenses:
March 31, 2017 March 31, 2016
Short-term employee benefits $ 3,984,123 $ 3,357,387Post-employment benefits 364,594 294,136
Total compensation $ 4,348,717 $ 3,651,523
1-310 PUBLIC ACCOUNTS, 2016-2017

19. Recoveries of investor education costsDuring the year, as described in Note 3(g), the OSC recorded recoveries of investor education costs from the Funds held for designated settlements and orders as follows:
March 31, 2017 March 31, 2016
Payroll costs $ 672,628 $ 527,443OSC in the Community costs 16,134 92,735Media Campaign costs (Fraud Prevention Month) 217,131 73,901Website and other IT costs 154,063 115,492Consulting costs 410,938 388,700
Total $ 1,470,894 $ 1,198,271
The amount recorded in the year is $1,470,894 (2016 – $1,198,271), of which $687,769 (2016 – $629,824) is owing to the OSC at March 31, 2017. The amount reimbursed to the OSC in the year from the Designated settlements fund was $1,412,949 relating to costs incurred in the 2016 and 2017 fiscal years.
20. Accounting pronouncements
Accounting standards adopted in the current year
The following IFRS standards, interpretations and amendments have been issued and are effective for the year ended March 31, 2017.
IAS 1, Presentation of financial statements
IAS 1, Presentation of Financial Statements, was amended in December 2014 to clarify, among other things, guidance on materiality and aggregation, the presentation of subtotals, the structure of financial statements, and the disclosure of accounting policies. The amendment was adopted on April 1, 2016, without significant impact on the OSC’s Statement of financial position or Statement of comprehensive income.
New and revised in issue, but not yet effective
The following new IFRS standards, interpretations and amendments, which have been issued but are not yet effective for the year ended March 31, 2017, have not been applied in preparing these financial statements. These pronouncements are currently under consideration or have been determined not to have a material impact on the financial statements of the OSC.
IFRS 9, Financial Instruments
In July 2014, the IASB issued a finalized version of IFRS 9, Financial Instruments. The completed version of IFRS 9 includes revised guidance on the classification and measurement of financial assets and carries forward the guidance on recognition and derecognition of financial instruments from IAS 39, Financial Instruments: Recognition and Measurement. This standard is effective for annual periods beginning on or after January 1, 2018 with early adoption permitted. IFRS 9 is not expected to have a material impact on the OSC financial statements.
PUBLIC ACCOUNTS, 2016-2017 1-311
Notes to the Financial Statements
IFRS 15, Revenue from Contracts with Customers
In May 2014, the IASB issued IFRS 15, Revenue from Contracts with Customers, that sets out the principles for when revenue should be recognized and how it should be measured, together with related disclosures. This standard replaces all existing IFRS revenue requirements and applies to revenue arising from contracts with customers.
This standard is effective for annual periods beginning on or after January 1, 2018 and must be applied retrospectively, subject to certain practical expedients, using either a full retrospective approach or a modified retrospective approach. The new standard is applicable to the OSC’s financial statements for the year ending March 31, 2019, with an initial application date of April 1, 2018.
Over the next year, the OSC will determine the impact of the standard, which is currently not known or reasonably estimable. During this time, the OSC will select a transition approach and prepare qualitative and quantitative information regarding the impact that initial application of the standard is expected to have on the OSC’s financial statements, if any. The OSC will disclose the impact of the standard in the next annual financial statements.
To ensure effective implementation of the standard, an internal cross-functional team, reporting to the Audit and Finance Committee, is currently engaged in implementing a comprehensive transition plan. This plan includes, among other things, a detailed analysis of our two most material sources of revenue: participation fees and activity fees.
IFRS 16, Leases
In January 2016, the IASB issued IFRS 16, Leases, which sets out the principles for the recognition, measurement, presentation, and disclosure of leases. The standard replaces IAS 17, Leases, and all associated interpretations.
The standard will be mandatorily effective for fiscal years beginning on or after January 1, 2019. The standard is applicable to the OSC’s financial statements for the year ending March 31, 2020, with an initial application date of April 1, 2019. While early adoption is permitted, the OSC will not adopt the standard early.
Under the standard, all leases will be on the balance sheet of lessees, except short-term leases and leases of low value items.
As the OSC has lease arrangements, there may be an increase to both assets and liabilities upon adoption of the standard, and potentially changes to the timing of recognition and classification of expenses associated with the lease arrangements. The OSC is analyzing the standard to determine its impact on the OSC’s financial statements.
To ensure effective implementation of the standard, an internal cross-functional team, reporting to the Audit and Finance Committee, will be engaged in implementing a comprehensive transition plan.
1-312 PUBLIC ACCOUNTS, 2016-2017

Ontario Tourism Marketing Partnership Corporation
Management Report
The accompanying financial statements are the responsibility of the management of the Ontario Tourism Marketing Partnership Corporation. The financial statements have been prepared by management in accordance with Canadian Public Sector Accounting Standards. The statements include certain amounts based on estimates and judgements. Management has determined such amounts on a reasonable basis in order to ensure that the financial statements are presented fairly, in all material respects.
Management maintains a system of internal accounting and administrative control that is designed to provide reasonable assurance the financial information is relevant, reliable and accurate and that the Corporation’s assets are properly accounted for and adequately safeguarded.
The financial statements have been audited by BDO Canada LLP, a firm of independent external auditors appointed by the Board of Directors, whose report follows.
Lisa LaVecchia President and CEO June 14, 2017
Ronald Ting Treasurer June 14, 2017
PUBLIC ACCOUNTS, 2016-2017 1-313

Independent Auditor’s Report
To the Board of Directors of Ontario Tourism Marketing Partnership Corporation
We have audited the accompanying financial statements of Ontario Tourism Marketing Partnership Corporation, which comprise the statement of financial position as at March 31, 2017, and the statements of operations, changes in net assets, and cash flows for the year then ended, and a summary of significant accounting policies and other explanatory information.
Management's Responsibility for the Financial Statements Management is responsible for the preparation and fair presentation of these financial statements in accordance with Canadian Public Sector Accounting Standards and for such internal control as management determines is necessary to enable the preparation of financial statements that are free from material misstatement, whether due to fraud or error.
Auditor's Responsibility Our responsibility is to express an opinion on these financial statements based on our audit. We conducted our audit in accordance with Canadian generally accepted auditing standards. Those standards require that we comply with ethical requirements and plan and perform the audit to obtain reasonable assurance about whether the financial statements are free from material misstatement.
An audit involves performing procedures to obtain audit evidence about the amounts and disclosures in the financial statements. The procedures selected depend on the auditor's judgment, including the assessment of the risks of material misstatement of the financial statements, whether due to fraud or error. In making those risk assessments, the auditor considers internal control relevant to the entity's preparation and fair presentation of the financial statements in order to design audit procedures that are appropriate in the circumstances, but not for the purpose of expressing an opinion on the effectiveness of the entity's internal control. An audit also includes evaluating the appropriateness of accounting policies used and the reasonableness of accounting estimates made by management, as well as evaluating the presentation of the financial statements.
We believe that the audit evidence we have obtained is sufficient and appropriate to provide a basis for our audit opinion.
OpinionIn our opinion, the financial statements present fairly, in all material respects, the financial position of Ontario Tourism Marketing Partnership Corporation as at March 31, 2017, and the results of its operations and its cash flows for the year then ended in accordance with Canadian Public Sector Accounting Standards.
Chartered Professional Accountants, Licensed Public Accountants Mississauga, Ontario June 14, 2017
Tel: 905 270-7700Fax: 905 270-7915 Toll-free: 866 248 6660 www.bdo.ca
BDO Canada LLP1 City Centre Drive, Suite 1700 Mississauga ON L5B 1M2 Canada
1-314 PUBLIC ACCOUNTS, 2016-2017

ONTARIO TOURISM MARKETING PARTNERSHIP CORPORATION
Statement of Financial Position
The accompanying notes are an integral part of these financial statements
March 312017
($ 000)
March 312016
($ 000)
ASSETS
Current Cash 4,997 6,811Accounts receivable 635 651Due from the Province of Ontario - 2,084Prepaid expenses 124 88
5,756 9,634
Capital assets (Note 3) 6,326 6,861
12,082 16,495
LIABILITIES AND NET ASSETS
CurrentAccounts payable and accrued liabilities 3,563 4,440Deferred revenue (Note 4) 86 157
3,649 4,597
Obligation for retirement benefits (Note 2k)Deferred capital contributions (Note 5)
1,722 449
1,783589
2,171 2,372
5,820 6,969
Net assets Unrestricted fund (deficiency) Special projects fund (Note 2h) Investment in capital assets (Note 2g)
(338) 723
5,877
7572,497 6,272
6,262 9,526
12,082 16,495
Approved on behalf of the Board:
__________________________________ _________________________________
PUBLIC ACCOUNTS, 2016-2017 1-315

ONTARIO TOURISM MARKETING PARTNERSHIP CORPORATION
Statement of Operations
The accompanying notes are an integral part of these financial statements
For the year ended March 31 2017 ($ 000)
2016 ($ 000)
Revenues Province of Ontario Grant (Note 6) 37,097 51,866Advertising sales 1,458 1,672Travel Information Centres - sales and rentals 1,098 1,040Trade promotions 183 188Interest income 51 65Amortization of deferred capital contribution 201 205
40,088 55,036
Expenses Advertising and marketing 22,413 33,842Administration (Note 7) 7,222 7,219Travel Information Centres (Note 8) 6,005 5,901Tourism Consumer Information System 3,734 3,513Amortization of capital assets 1,942 1,518Research 818 783Partnerships and sales 608 613Board and committee expenses (Note 9) 44 43Events marketing program - 1,942
42,786 55,374
Deficiency of revenues over expenses (2,698) (338)
1-316 PUBLIC ACCOUNTS, 2016-2017

ONTARIO TOURISM MARKETING PARTNERSHIP CORPORATION
Statement of Changes in Net Assets
The accompanying notes are an integral part of these financial statements
Unrestricted Special InvestmentFund Projects in Capital 2017 2016
(Deficiency) Fund Assets Total Total($ 000) ($ 000) ($ 000) ($ 000) ($ 000)
Net assets, beginning of year 757 2,497 6,272 9,526 10,811
Excess (deficiency) of revenues over expenditures for the year (957) - (1,741) (2,698) (338)
Interest income (23) 23 - - -
Reserve for TCIS redevelopment project (115) 115 - - -
TCIS redevelopment expenses (Note 2h) - (566) - (566) (947)
Purchase of capital assets, net - (1,346) 1,346 - -
Net assets (deficiency), end of year (338) 723 5,877 6,262 9,526
PUBLIC ACCOUNTS, 2016-2017 1-317
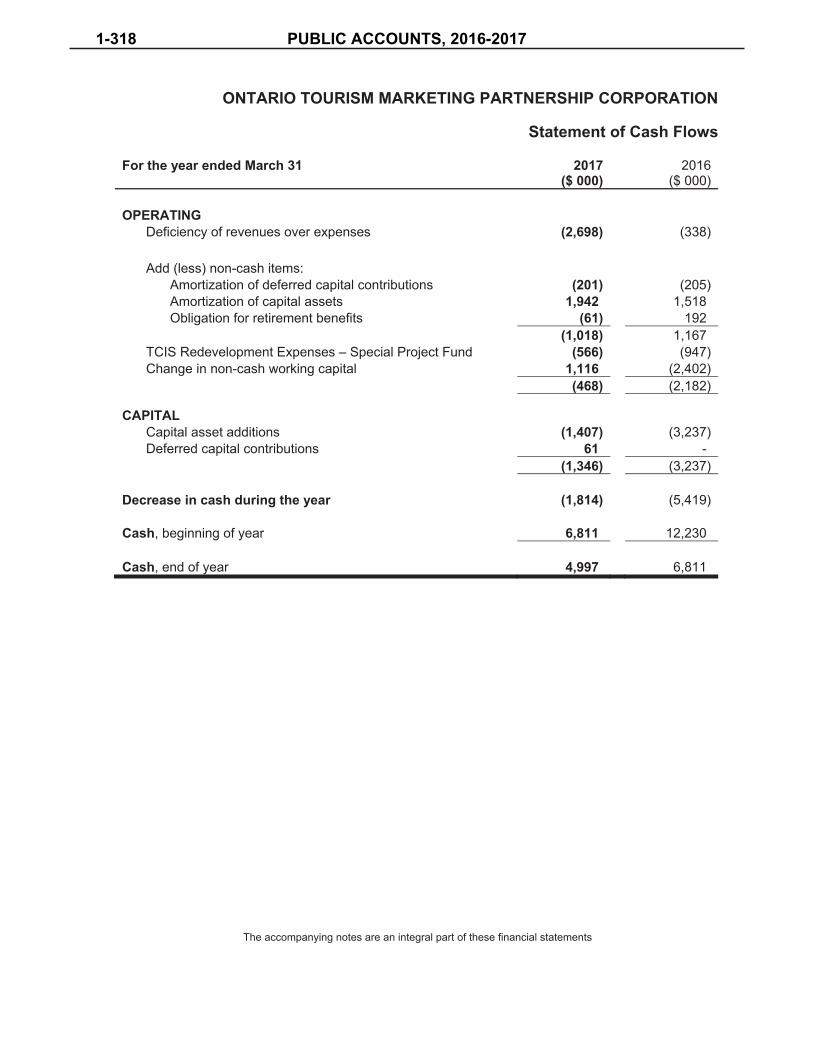
ONTARIO TOURISM MARKETING PARTNERSHIP CORPORATION
Statement of Cash Flows
The accompanying notes are an integral part of these financial statements
For the year ended March 31 2017 ($ 000)
2016($ 000)
OPERATINGDeficiency of revenues over expenses (2,698) (338)
Add (less) non-cash items: Amortization of deferred capital contributions Amortization of capital assets
(201) 1,942
(205)1,518
Obligation for retirement benefits (61) 192(1,018) 1,167
TCIS Redevelopment Expenses – Special Project Fund (566) (947)Change in non-cash working capital 1,116 (2,402)
(468) (2,182)
CAPITALCapital asset additions (1,407) (3,237)Deferred capital contributions 61 -
(1,346) (3,237)
Decrease in cash during the year (1,814) (5,419)
Cash, beginning of year 6,811 12,230
Cash, end of year 4,997 6,811
1-318 PUBLIC ACCOUNTS, 2016-2017

ONTARIO TOURISM MARKETING PARTNERSHIP CORPORATION
Notes to Financial Statements
March 31, 2017
1. NATURE OF CORPORATION
The Ontario Tourism Marketing Partnership Corporation (the “Corporation”) was established as acorporation without share capital on November 30, 1998 pursuant to Ontario Regulation 618/98made under the Development Corporations Act. The Regulation was amended by OntarioRegulation 271/04 in September, 2004 to extend the mandate of the Corporation indefinitely. TheCorporation commenced active operations on April 1, 1999. The objects of the Ontario TourismMarketing Partnership Corporation are:
(a) to market Ontario as a travel destination;(b) to undertake joint marketing initiatives with the tourism industry;(c) to support and assist the marketing efforts of the tourism industry; and(d) in co-operation with the tourism industry, the Government of Ontario, other governments and
other agencies of governments, to promote Ontario as a travel destination.
The Corporation enters into agreements with private and public sector partners in order to add value to tourism marketing programs. The Corporation tracks the dollar value (leverage, in-kind) of such agreements to demonstrate the impact of the Corporation's investment on the partnered marketing programs. However, related partner revenues and expenses are not included in the Corporation's financial statements.
The Corporation is a not-for-profit organization, and thus not subject to income tax.
2. SIGNIFICANT ACCOUNTING POLICIES
(a) Basis of AccountingThe financial statements are the representations of management and are prepared inaccordance with Canadian Public Sector Accounting Standards including the 4200 series ofstandards contained in the Chartered Professional Accountants (CPA) Canada handbook.
(b) Revenue Recognition
The Corporation follows the deferral method of accounting for revenues.
Province of Ontario Grant
The Corporation is funded primarily by the Province of Ontario. Operating grants are recordedas revenue in the period to which they relate. Grants approved but not received at the end ofan accounting period are accrued. Where a portion of a grant is related to a future period, itis deferred and recognized in a subsequent period.
Advertising Sales and Travel Information Centers – sales and rentals
Revenue from Advertising sales and Travel Information Centres – sales and rentals arerecognized in the period in which the service is provided or the program is run, the amountcan be reasonably estimated and collection is reasonably assured.
PUBLIC ACCOUNTS, 2016-2017 1-319

ONTARIO TOURISM MARKETING PARTNERSHIP CORPORATION
Notes to Financial Statements
March 31, 2017
2. SIGNIFICANT ACCOUNTING POLICIES (continued)
Interest Income
Interest income is recognized in the period in which it is earned.
Other
Other revenue items are recognized in the period in which they relate, when the amount can be reasonably estimated and collection is reasonably assured.
(c) Partner SupportThe Corporation benefits from donated services provided by the tourism industry, such astransportation costs (airline and bus tickets), and accommodation and meal costs (discountedor free hotel rooms and restaurant charges). Because of the difficulty of determining their fairvalue, donated services are not recognized in the financial statements.
(d) Inventory
Inventory held from time to time is comprised of merchandise available for sale at the TravelInformation Centres.
Inventory is stated at the lower of cost and net realizable value. Cost is determined on a first-in, first-out basis.
(e) Capital AssetsAll capital assets are recorded at cost. Amortization is provided on a straight-line basis overthe estimated useful life of the asset, with half a year amortization taken in the year ofacquisition and disposition. All capital assets are amortized over three to five years.
(f) Deferred Capital ContributionsDeferred capital contributions represent amounts received from the Ministry of Tourism andCulture and Sport to finance the acquisition of capital assets. The amortization of deferredcapital contributions is recorded as revenue in the statement of operations on the same basisas the amortization of the related assets.
(g) Investment in Capital AssetsInvestment in capital assets represents funds provided for capital assets. The financing ofinvestment in capital assets is transferred from operations and the Special Projects Fund onan annual basis.
(h) Special Projects FundThe Board approved the creation of an internally restricted Special Projects Fund to providefor longer term special projects. At March 31, 2017, $723,000 (2016 - $2,497,000) is beingheld for the Tourism Consumer Information System redevelopment project. Work on thisproject commenced in the summer of 2013 (Note 10a). During the year, the Board approved$566,000 (2016 - $947,000) of redevelopment costs to be charged directly to the fund.Interest earned on these funds is being added to the fund.
1-320 PUBLIC ACCOUNTS, 2016-2017

ONTARIO TOURISM MARKETING PARTNERSHIP CORPORATION
Notes to Financial Statements
March 31, 2017
2. SIGNIFICANT ACCOUNTING POLICIES (continued)
(i) Use of EstimatesThe preparation of financial statements in accordance with Canadian Public SectorAccounting Standards requires management to make estimates and assumptions that affectthe reported amounts of assets and liabilities at the date of the financial statements, and thereported amounts of revenues and expenses during the reporting period. Actual results coulddiffer from those estimates as additional information becomes available in the future.
(j) Financial InstrumentsUnless otherwise noted, it is management's opinion that the Corporation is not exposed tosignificant interest, currency, liquidity or credit risks arising from its financial instruments.
Financial instruments are recorded at cost when acquired or issued. In subsequent periods,investments traded in an active market are reported at fair value. All other financialinstruments are reported at cost or amortized cost less impairment, if applicable. Financialassets are tested for impairment when changes in circumstances indicate the asset could beimpaired. Transaction costs on the acquisition, sale or issue of financial instruments areexpensed for those items remeasured at fair value at each statement of financial position dateand charged to the financial instrument for those measured at amortized cost.
(k) Retirement BenefitsThe costs of any legislated severance under the Public Service Act of Ontario and earned byemployees are recognized when earned by eligible employees. During the year, the obligationwas reduced by $61,000 (2016 – increased by $192,000) based on assumptions derived fromthe March 31, 2016 actuarial valuation completed by the Province of Ontario. The liability iscalculated using management’s best estimate of future inflation rates, employee salary levelsand other underlying assumptions. The liability calculated using the projected benefit methodand the following assumptions approximates $1,722,000 (2016 - $1,783,000). Due to thecurtailment of the obligation, there was no assumption for wage and salary escalation (2016– 1.86%). The discount factor used was 0.76 (2016 – 0.71) and the estimated average yearsto retirement was 15.07 years (2016 – 16.72 years).
(l) Foreign Currency TranslationForeign currency accounts are translated into Canadian dollars as follows;
At the transaction date, each asset, liability, revenue and expense is translated into Canadiandollars by the use of the exchange rate in effect at that date. At the year end date, monetaryassets and liabilities are translated into Canadian dollars by using the exchange rate in effectat that date. The resulting foreign exchange gains and losses are included in income in thecurrent period.
PUBLIC ACCOUNTS, 2016-2017 1-321

ONTARIO TOURISM MARKETING PARTNERSHIP CORPORATION
Notes to Financial Statements
March 31, 2017
3. CAPITAL ASSETS2017
($ 000) 2016
($ 000)
Cost Accumulated Amortization Cost
Accumulated Amortization
Furniture 396 396 396 389Leasehold improvements 2,495 2,050 2,434 1,871Tourism Consumer Information System 15,261 9,380 13,915 7,624
18,152 11,826 16,745 9,884Cost less accumulated amortization 6,326 6,861
4. DEFERRED REVENUE
2017 2016($ 000) ($ 000)
Ministry of Tourism, Culture and Sport OTICS – Capital assets 67 98Fun Pass - 30Advertising programs 19 29
86 157
1-322 PUBLIC ACCOUNTS, 2016-2017
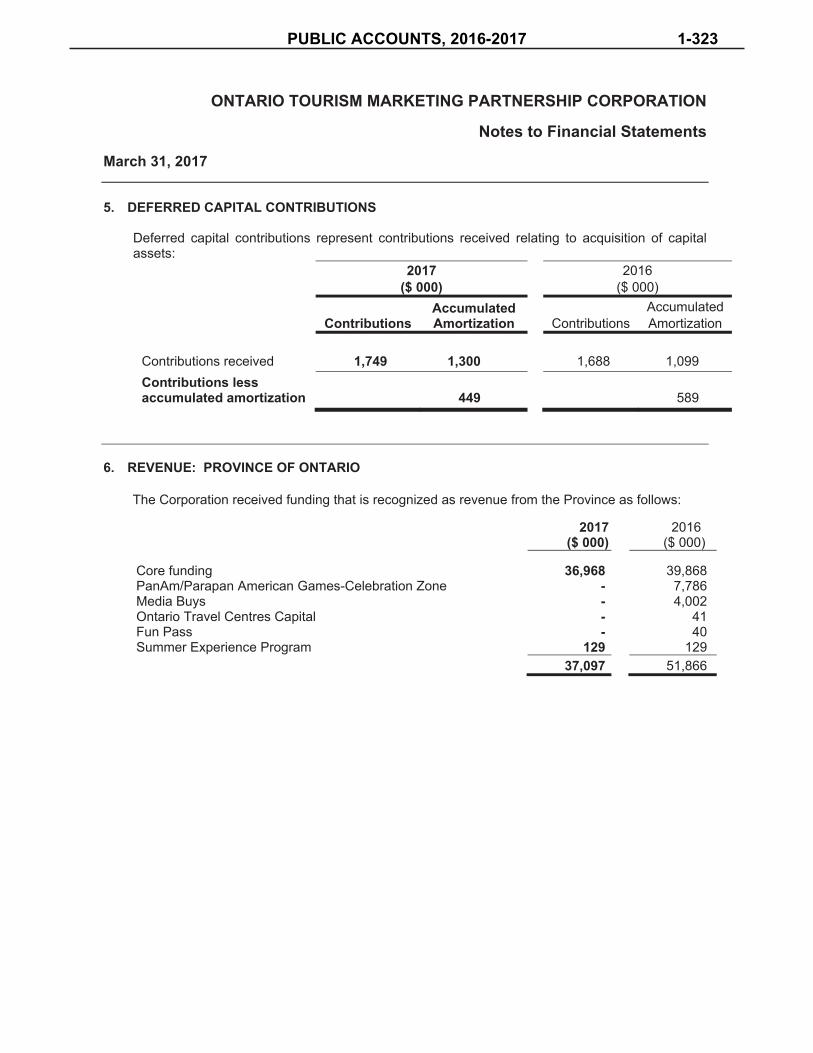
ONTARIO TOURISM MARKETING PARTNERSHIP CORPORATION
Notes to Financial Statements
March 31, 2017
5. DEFERRED CAPITAL CONTRIBUTIONS
Deferred capital contributions represent contributions received relating to acquisition of capitalassets:
2017 ($ 000)
2016 ($ 000)
Contributions Accumulated Amortization Contributions
Accumulated Amortization
Contributions received 1,749 1,300 1,688 1,099Contributions less accumulated amortization 449 589
6. REVENUE: PROVINCE OF ONTARIO
The Corporation received funding that is recognized as revenue from the Province as follows:
2017 2016 ($ 000) ($ 000)
Core funding 36,968 39,868PanAm/Parapan American Games-Celebration Zone - 7,786Media Buys - 4,002Ontario Travel Centres Capital - 41Fun Pass - 40Summer Experience Program 129 129
37,097 51,866
PUBLIC ACCOUNTS, 2016-2017 1-323

ONTARIO TOURISM MARKETING PARTNERSHIP CORPORATION
Notes to Financial Statements
March 31, 2017
7. ADMINISTRATIVE EXPENSES
Certain costs of administration such as legal and human resources support services were providedby the Ministry of Tourism, Culture and Sport without charge. All other administrative expensesare borne by the Corporation and are as follows:
2017 2016($ 000) ($ 000)
Salaries and benefits 6,099 6,114Services 972 932Transportation and communications 128 155Supplies and equipment 23 18
7,222 7,219
The Corporation provides pension benefits for all its full-time employees through participation in the Public Service Pension Fund (PSPF) and the Ontario Public Service Employees’ Union Pension Fund (OPSEU Pension Fund) which are both multi-employer defined benefit pension plans established by the Province. These plans are accounted for as defined contribution plans, as the Corporation has insufficient information to apply defined benefit plan accounting to these pension plans. Included in salaries and benefits are contributions to the PSPF and OPSEU pension funds for the year of $423,000 (2016 – $435,000).
Costs of post-retirement non-pension employee benefits are paid by the Management Board Secretariat and are not included in administrative expenses.
8. TRAVEL INFORMATION CENTRES
The expenditures for the Travel Information Centres are as follows:
2017 2016($ 000) ($ 000)
Salaries and benefits 3,235 3,182Accommodation 1,402 1,382Merchandise for sale 687 600Services 474 530Transportation and communications 131 143Supplies and equipment 76 64
6,005 5,901
Included in salaries and benefits are contributions to the PSPF and OPSEU pension funds for the year of $180,000 (2016 - $184,000).
1-324 PUBLIC ACCOUNTS, 2016-2017

ONTARIO TOURISM MARKETING PARTNERSHIP CORPORATION
Notes to Financial Statements
March 31, 2017
9. BOARD AND COMMITTEE EXPENSES
Board and committee members are reimbursed for travel expenses incurred to attend board ofdirectors and related committee meetings. Board and committee members do not receive perdiems to attend board and committee meetings.
10. TOURISM CONSUMER INFORMATION SYSTEM REDEVELOPMENT AND COMMITMENTS
a) After a competitive procurement process in 2013, Hewlett Packard has been awarded a fiveyear contract as the service provider for hosting, operations, maintenance and redevelopmentof the Tourism Consumer Information System. Total committed amount to Hewlett Packard asat March 31, 2017 is $27,547,000. During the year $5,379,000 was paid out for a total paymentof $23,720,000 against the contract. The estimated payment for next year is:
($ 000) 2018 3,827
b) During the year, total costs incurred for the Tourism Consumer Information System amountedto $5,646,000 (2016 - $7,686,000) of which $566,000 (2016 - $947,000) was charged directlyto the Special Projects Fund (Note 2h) and $1,346,000 (2016 - $3,237,000) was capitalized tothe Investment in Capital Assets. The remaining $3,734,000 (2016 - $3,513,000) is recordedin the statement of operations.
c) The Corporation has various operating leases for its premises and advertising. The operatinglease for the head office expires in 2019. The minimum annual payments for the next two yearsare as follows:
($ 000)2018 1,0422019 422
1,464
PUBLIC ACCOUNTS, 2016-2017 1-325

Ontario Trillium Foundation
Management’s Responsibility For Financial Information
The accompanying financial statements of the Ontario Trillium Foundation are the responsibility of management and have been prepared in accordance with generallyaccepted accounting principles.
Management maintains a system of internal controls designed to provide reasonable assurance that financial information is accurate and that assets are protected.
The Board of Directors ensures that management fulfils its responsibilities for financialreporting and internal control. The Finance & Audit Committee and the Board ofDirectors meet regularly to oversee the financial activities of the foundation, and at leastannually to review the audited financial statements and the external auditors’ reportthereon.
The financial statements have been examined by KPMG LLP, independent externalauditors appointed by the Board of Directors. The external auditors’ responsibility is toexpress their opinion on whether the financial statements are fairly presented in accordance with generally accepted accounting principles. The Auditors’ Report outlinesthe scope of the auditors’ examination and opinion.
Dan Wilson Ina GutiumChief of Staff Vice-President,
Talent and Corporate Services
PUBLIC ACCOUNTS, 2016-2017 1-327

KPMG LLP Vaughan Metropolitan Centre 100 New Park Place, Suite 1400 Vaughan ON L4K 0J3 Canada Tel 905-265-5900 Fax 905-265-6390
KPMG LLP, is a Canadian limited liability partnership and a member firm of the KPMG network of independent member firms affiliated with KPMG International Cooperative (“KPMG International”), a Swiss entity. KPMG Canada provides services to KPMG LLP.
INDEPENDENT AUDITORS' REPORT
To the Board of Directors of Ontario Trillium Foundation
We have audited the accompanying financial statements of Ontario Trillium Foundation, which comprise the statement of financial position as at March 31, 2017, the statements of operations, changes in net assets and cash flows for the year then ended, and notes, comprising a summary of significant accounting policies and other explanatory information.
Management's Responsibility for the Financial Statements
Management is responsible for the preparation and fair presentation of these financial statements in accordance with Canadian public sector accounting standards, and for such internal control as management determines is necessary to enable the preparation of financial statements that are free from material misstatement, whether due to fraud or error.
Auditors' Responsibility
Our responsibility is to express an opinion on these financial statements based on our audit. We conducted our audit in accordance with Canadian generally accepted auditing standards. Those standards require that we comply with ethical requirements and plan and perform the audit to obtain reasonable assurance about whether the financial statements are free from material misstatement.
An audit involves performing procedures to obtain audit evidence about the amounts and disclosures in the financial statements. The procedures selected depend on our judgment, including the assessment of the risks of material misstatement of the financial statements, whether due to fraud or error. In making those risk assessments, we consider internal control relevant to the entity's preparation and fair presentation of the financial statements in order to design audit procedures that are appropriate in the circumstances, but not for the purpose of expressing an opinion on the effectiveness of the entity's internal control. An audit also includes evaluating the appropriateness of accounting policies used and the reasonableness of accounting estimates made by management, as well as evaluating the overall presentation of the financial statements.
We believe that the audit evidence we have obtained is sufficient and appropriate to provide a basis for our audit opinion.
1-328 PUBLIC ACCOUNTS, 2016-2017

Opinion
In our opinion, the financial statements present fairly, in all material respects, the financial position of Ontario Trillium Foundation as at March 31, 2017, and its results of operations and its cash flows for the year then ended in accordance with Canadian public sector accounting standards.
Chartered Professional Accountants, Licensed Public Accountants
June 15, 2017 Vaughan, Canada
PUBLIC ACCOUNTS, 2016-2017 1-329
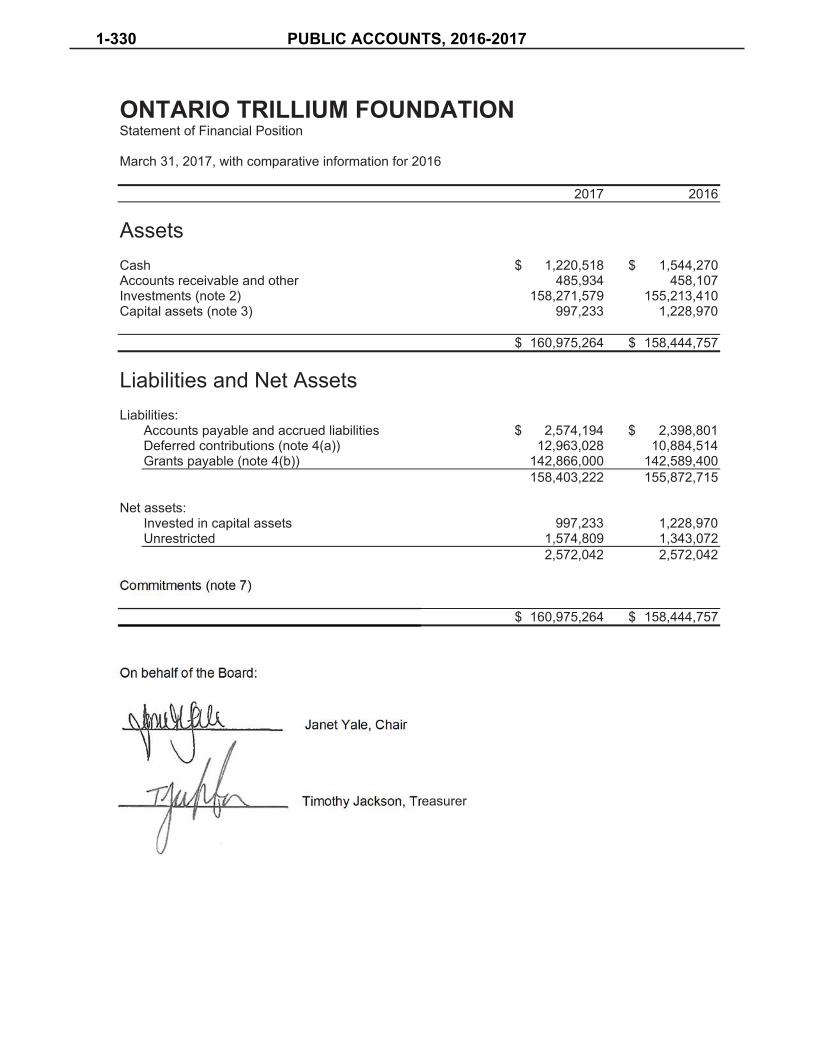
ONTARIO TRILLIUM FOUNDATION Statement of Financial Position
March 31, 2017, with comparative information for 2016
2017 2016
Assets Cash $ 1,220,518 $ 1,544,270Accounts receivable and other 485,934 458,107Investments (note 2) 158,271,579 155,213,410 Capital assets (note 3) 997,233 1,228,970
$ 160,975,264 $ 158,444,757
Liabilities and Net Assets Liabilities:
Accounts payable and accrued liabilities $ 2,574,194 $ 2,398,801 Deferred contributions (note 4(a)) 12,963,028 10,884,514 Grants payable (note 4(b)) 142,866,000 142,589,400
158,403,222 155,872,715
Net assets:Invested in capital assets 997,233 1,228,970 Unrestricted 1,574,809 1,343,072
2,572,042 2,572,042
Commitments (note 7)
$ 160,975,264 $ 158,444,757
On behalf of the Board:
Janet Yale, Chair
Timothy Jackson, Treasurer
1-330 PUBLIC ACCOUNTS, 2016-2017

ONTARIO TRILLIUM FOUNDATION Statement of Operations
Year ended March 31, 2017, with comparative information for 2016
2017 2016
Revenue: Ontario government funding (note 4(a)) $ 134,913,329 $ 123,351,385 Grants rescinded or recovered (note 4(a)) 3,252,397 3,937,788 Investment income (note 4(a)) 1,692,059 1,828,535
139,857,785 129,117,708
Expenses: Program activities:
Grants pledged (note 4(a) and (b)) 112,779,900 109,569,000 Grantmaking expenses (note 4(a)) 15,455,980 14,087,615 Agent grants paid (note 4(a)) 7,712,200 2,028,500Services to the community (notes 4(a) and 6) 1,355,106 887,022
137,303,186 126,572,137 Support services (notes 4(a) and 5) 2,131,187 2,056,137 Amortization of capital assets 423,412 489,434
139,857,785 129,117,708
Excess of revenue over expenses $ – $ –
See accompanying notes to financial statements.
PUBLIC ACCOUNTS, 2016-2017 1-331

ONTARIO TRILLIUM FOUNDATION Statement of Changes in Net Assets
Year ended March 31, 2017, with comparative information for 2016
2017 2016Invested in
capital assets Unrestricted Total Total
Net assets, beginning of year $ 1,228,970 $ 1,343,072 $ 2,572,042 $ 2,572,042
Excess (deficiency) of revenue over expenses (423,412) 423,412 – –
Purchase of capital assets 191,675 (191,675) – –
Net assets, end of year $ 997,233 $ 1,574,809 $ 2,572,042 $ 2,572,042
See accompanying notes to financial statements.
1-332 PUBLIC ACCOUNTS, 2016-2017

ONTARIO TRILLIUM FOUNDATION Statement of Cash Flows
Year ended March 31, 2017, with comparative information for 2016
2017 2016
Cash provided by (used in):
Operating activities: Amortization of capital assets which does not
involve cash $ 423,412 $ 489,434 Change in non-cash operating items 2,502,680 21,104,199
2,926,092 21,593,633
Capital activities: Net purchase of capital assets (191,675) (181,337)
Investing activities: Purchase of investments (1,000,882,965) (959,088,928) Disposal of investments 997,824,796 938,182,455
(3,058,169) (20,906,473)
Increase (decrease) in cash (323,752) 505,823
Cash, beginning of year 1,544,270 1,038,447
Cash, end of year $ 1,220,518 $ 1,544,270
See accompanying notes to financial statements.
PUBLIC ACCOUNTS, 2016-2017 1-333

ONTARIO TRILLIUM FOUNDATION Notes to Financial Statements
Year ended March 31, 2017
Ontario Trillium Foundation (the "Foundation" or "OTF"), an agency of the Ministry of Tourism, Culture and Sport ("MTCS"), is financially supported by the Ontario government. OTF began operations as an arm's-length agency of the Ontario government on August 23, 1982 and was incorporated without share capital under the laws of Ontario under letters patent dated November 17, 1982. OTF's purpose is to build healthy and vibrant communities throughout Ontario, by strengthening the capacity of the voluntary sector through investments in community-based initiatives.
Government funding is subject to Memoranda of Understanding that define how the funds must be invested and distributed.
1. Significant accounting policies:
The financial statements have been prepared by management in accordance with Canadianpublic sector accounting standards, including the 4200 standards for government not-for-profitorganizations.
(a) Revenue recognition:
OTF follows the deferral method of accounting for contributions, which include governmentfunding. Unrestricted contributions are recognized as revenue when received or receivableif the amount to be received can be reasonably estimated and collection is reasonablyassured. Externally restricted contributions are deferred and recognized as revenue in theyear in which the related expenses are incurred.
Investment income is recorded on the accrual basis.
(b) Financial instruments:
Financial instruments are recorded at fair value on initial recognition. All other financialinstruments are subsequently recorded at cost or amortized cost unless management haselected to carry the instruments at fair value. The Foundation has not elected to carry anysuch financial instruments at fair value.
Financial instruments are adjusted by transaction costs incurred on acquisition andfinancing costs, which are amortized using the effective interest rate method.
1-334 PUBLIC ACCOUNTS, 2016-2017

ONTARIO TRILLIUM FOUNDATION Notes to Financial Statements (continued)
Year ended March 31, 2017
1. Significant accounting policies (continued):
All financial assets are assessed for impairment on an annual basis. When a decline is determined to be other than temporary, the amount of the loss is reported in the statement of operations.
As financial instruments are recorded at cost or amortized costs, a statement of remeasurement gains and losses has not been included.
(c) Grants:
Grants awarded by the Foundation are recorded as grants pledged expenses in the yearthat the Foundation approves the grant.
Grants awarded by third party organizations for which the Foundation acts as anadministrative agent are recorded as agent grant payments when payments are issued.
(d) Allocation of support services expenses:
The Foundation classifies expenses on the statement of operations by function. TheFoundation allocates certain costs by identifying the appropriate basis of allocating andapplying that basis consistently each year. The Foundation allocates its support servicesexpenses proportionately on a per capita basis.
(e) Capital assets:
Capital assets are recorded at cost less accumulated amortization. Amortization isprovided on a straight-line basis over the following periods:
Furniture and fixtures 5 years Computer hardware 3 years Computer software 3 years Leasehold improvements Term of lease
PUBLIC ACCOUNTS, 2016-2017 1-335

ONTARIO TRILLIUM FOUNDATION Notes to Financial Statements (continued)
Year ended March 31, 2017
1. Significant accounting policies (continued):
(f) Use of estimates:
The preparation of financial statements requires management to make estimates andassumptions that affect the reported amounts of assets and liabilities and disclosure ofcontingent assets and liabilities at the date of the financial statements and the reportedamounts of revenue and expenses during the year. Actual results could differ from thoseestimates.
2. Investments:
2017 2016
Short-term investments $ 69,640,678 $ 66,707,683 Bonds 15,362,030 15,422,366Laddered bond portfolio 73,268,871 73,083,361
$ 158,271,579 $ 155,213,410
All investments, excluding the laddered bond portfolio, are in fixed income securities and mature within the next six months (2016 - three months). These investments bear interest from 0.53% to 1.12% (2016 - 0.63% to 0.98%).
In OTF's laddered bond portfolio, all bond investments are in fixed income securities and have maturity dates between six months and three years. These investments bear interest from 1.90% to 4.45% (2016 - 1.90% to 4.45%).
The Ontario Financing Authority acts as OTF's investment manager under an investment management agreement that adheres to OTF's policies and procedures governing risk and also includes additional risk concern measures.
3. Capital assets:
2017 2016Accumulated Net book Net book
Cost amortization value value
Furniture and fixtures $ 1,031,790 $ 922,990 $ 108,800 $ 169,266 Computer hardware 1,105,241 903,959 201,282 150,304Computer software 1,178,499 1,101,944 76,555 168,277 Leasehold improvements 1,413,376 802,780 610,596 741,123
$ 4,728,906 $ 3,731,673 $ 997,233 $ 1,228,970
1-336 PUBLIC ACCOUNTS, 2016-2017

ON
TAR
IO T
RIL
LIU
M F
OU
ND
ATI
ON
N
otes
to F
inan
cial
Sta
tem
ents
(con
tinue
d)
Year
end
ed M
arch
31,
201
7
4.D
efer
red
cont
ribut
ions
and
gra
nts
paya
ble:
(a)
Def
erre
d co
ntrib
utio
ns re
pres
ent f
undi
ng re
ceiv
ed fr
om M
inis
tries
that
has
not
yet
bee
n pl
edge
d as
gra
nts,
pai
d to
Loc
al P
over
ty R
educ
tion
Fund
("LP
RF"
) gra
ntee
s or
spe
nt o
n op
erat
ions
. Th
ese
fund
s ar
e re
stric
ted
until
gra
nts
are
appr
oved
by
the
Boar
d of
Dire
ctor
s an
d pl
edge
d to
third
parti
es, L
PRF
gran
t con
ditio
ns a
re m
et a
nd p
aym
ents
are
mad
e or
unt
il op
erat
ing
expe
nditu
res
are
mad
e. O
TF h
as c
ontro
ls in
pla
ce to
ens
ure
that
the
rest
rictio
ns o
n gr
ant p
ledg
es a
re m
et p
rior t
o ut
ilizat
ion
of th
ese
fund
s.
2017
20
16Lo
cal
Ont
ario
150
Com
mun
ity
Yout
h Po
verty
C
omm
unity
G
ener
alC
apita
l O
ppor
tuni
ties
Red
uctio
nC
apita
lop
erat
ions
Fund
Fund
Fund
Fund
Tota
lTo
tal
Def
erre
d co
ntrib
utio
ns, b
egin
ning
of y
ear
$ 6,
909,
595
$ 2,
907,
325
$ 25
1,53
6 $
816,
058
$ –
$ 10
,884
,514
$
7,40
8,79
9
Fund
ing
rece
ived
: M
inis
try o
f Tou
rism
, Cul
ture
and
Spo
rt 90
,000
,000
–
––
25,0
00,0
0011
5,00
0,00
0 11
5,00
0,00
0 M
inis
try o
f Chi
ldre
n an
d Yo
uth
Serv
ices
–
– 13
,491
,843
–
– 13
,491
,843
8,
710,
000
Trea
sury
Boa
rd S
ecre
taria
t–
– –
8,50
0,00
0–
8,50
0,00
03,
117,
100
90,0
00,0
00
–13
,491
,843
8,50
0,00
0 25
,000
,000
1
36,9
91,8
43
126,
827,
100
Inve
stm
ent i
ncom
e re
cord
ed a
s re
venu
e 1,
573,
571
–88
,418
30,0
70
–1,
692,
059
1,82
8,53
5 G
rant
spl
edge
d(7
7,90
8,60
0)–
(12,
000,
900)
–(2
2,87
0,40
0)(1
12,7
79,9
00)
(109
,569
,000
)Ag
ent g
rant
s pa
id
––
–(7
,712
,200
)–
(7,7
12,2
00)
(2,0
28,5
00)
Gra
ntm
akin
g ex
pens
es
(11,
531,
249)
(3
3,18
8)
(1,7
40,9
72)
(943
,496
) (1
,207
,075
)(1
5,45
5,98
0)
(14,
087,
615)
Su
ppor
t ser
vice
s (2
,131
,187
)–
– –
(2,1
31,1
87)
(2,0
56,1
37)
Amor
tizat
ion
(406
,438
)–
(12,
426)
(4,5
48)
–(4
23,4
12)
(489
,434
)Se
rvic
es to
the
com
mun
ity
(1,3
55,1
06)
––
––
(1,3
55,1
06)
(887
,022
) G
rant
s re
scin
ded
or re
cove
red
2,57
5,59
4 17
2,49
2 4,
311
–50
0,00
03,
252,
397
3,93
7,78
8
Amou
nts
reco
gniz
ed a
s O
ntar
io
gove
rnm
ent f
undi
ng
(89,
183,
415)
13
9,30
4 (1
3,66
1,56
9)
(8,6
30,1
74)
(23,
577,
475)
(1
34,9
13,3
29)
(123
,351
,385
)
Cha
nge
durin
g th
e ye
ar
816,
585
139,
304
(169
,726
) (1
30,1
74)
1,42
2,52
5 2,
078,
514
3,47
5,71
5
Def
erre
d co
ntrib
utio
ns, e
nd o
f yea
r $
7,72
6,18
0 $
3,04
6,62
9 $
81,8
10
$ 68
5,88
4 $
1,42
2,52
5 $
12,9
63,0
28
$ 10
,884
,514
PUBLIC ACCOUNTS, 2016-2017 1-337
ONTARIO TRILLIUM FOUNDATION Notes to Financial Statements (continued)
Year ended March 31, 2017
4. Deferred contributions and grants payable (continued):
Community Capital Fund:
On August 27, 2010, the Foundation signed an agreement with MTCS to administer the Community Capital Fund to provide grants for specific infrastructure projects that support Ontario government priorities and help to revitalize community-based infrastructure by directing funding towards capital assets.
Youth Opportunities Fund:
On November 7, 2013, the Foundation signed an agreement with the Ministry of Children and Youth Services ("MCYS") to administer the Youth Opportunities Fund ("YOF") to provide grants for community-based and positive youth development projects that improve conditions for youth who face multiple barriers to positive outcomes in the Greater Toronto Area. On October 8, 2015, the Foundation signed an amending agreement to expand the YOF program throughout the province. On August 30, 2016 the Foundation signed a service contract with MCYS to deliver additional YOF grants, focused on civic engagement, supported through the time-limited Ontario150 initiative.
Local Poverty Reduction Fund:
On November 19, 2015, the Foundation signed an agreement with Treasury Board Secretariat ("TBS") and MTCS to act as an administrative agent for the Local Poverty Reduction Fund, a granting program to provide funding to support innovative, community-driven projects that measurably improve the lives of those most affected by poverty. The transactions are deferred until such time that grant payments are made or operating expenses are incurred. TBS is responsible for application review and approval, and the Foundation supports applicants through the application process and manages the grants once they are approved.
The total funding to be received from TBS is $50,000,000 over six years. During 2017, $8,500,000 (2016 - $3,117,100) was received, of which $7,712,200 (2016 - $2,028,500) is included in agent grants paid.
1-338 PUBLIC ACCOUNTS, 2016-2017
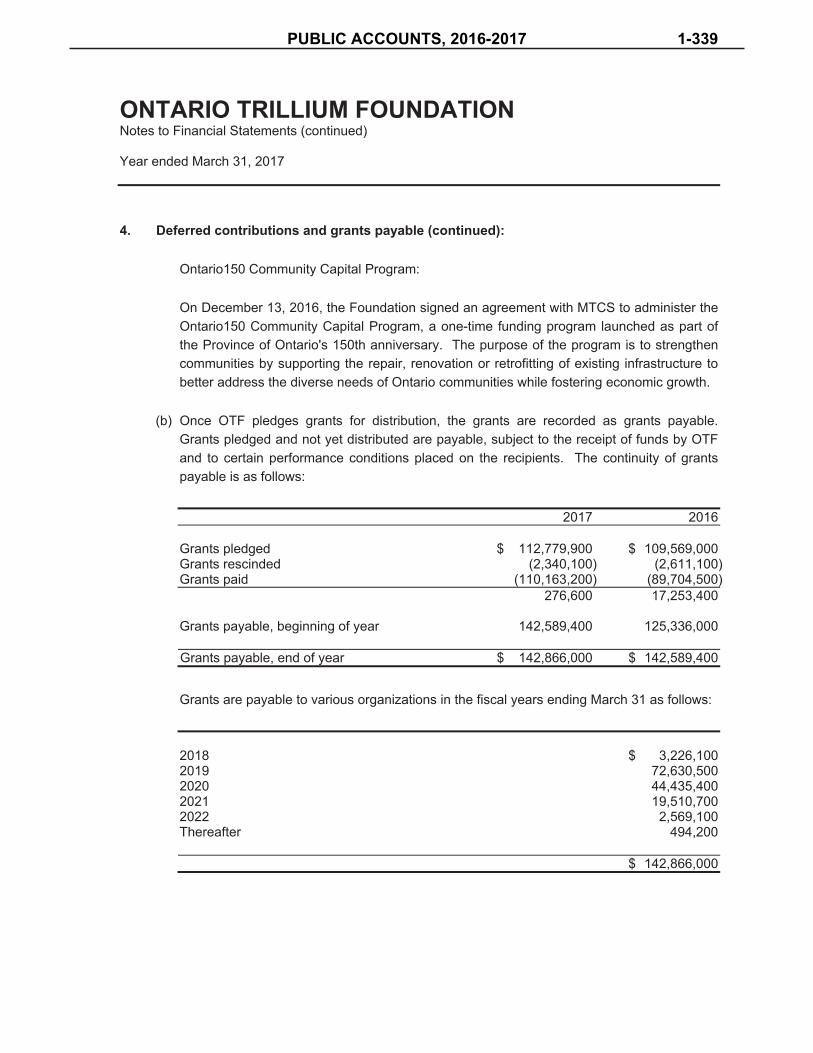
ONTARIO TRILLIUM FOUNDATION Notes to Financial Statements (continued)
Year ended March 31, 2017
4. Deferred contributions and grants payable (continued):
Ontario150 Community Capital Program:
On December 13, 2016, the Foundation signed an agreement with MTCS to administer the Ontario150 Community Capital Program, a one-time funding program launched as part of the Province of Ontario's 150th anniversary. The purpose of the program is to strengthen communities by supporting the repair, renovation or retrofitting of existing infrastructure to better address the diverse needs of Ontario communities while fostering economic growth.
(b) Once OTF pledges grants for distribution, the grants are recorded as grants payable.Grants pledged and not yet distributed are payable, subject to the receipt of funds by OTFand to certain performance conditions placed on the recipients. The continuity of grantspayable is as follows:
2017 2016
Grants pledged $ 112,779,900 $ 109,569,000 Grants rescinded (2,340,100) (2,611,100) Grants paid (110,163,200) (89,704,500)
276,600 17,253,400
Grants payable, beginning of year 142,589,400 125,336,000
Grants payable, end of year $ 142,866,000 $ 142,589,400
Grants are payable to various organizations in the fiscal years ending March 31 as follows:
2018 $ 3,226,1002019 72,630,5002020 44,435,4002021 19,510,7002022 2,569,100Thereafter 494,200
$ 142,866,000
PUBLIC ACCOUNTS, 2016-2017 1-339

ONTARIO TRILLIUM FOUNDATION Notes to Financial Statements (continued)
Year ended March 31, 2017
5. Allocation of expenses:
The Foundation allocates certain of its support services expenses based on the proportion ofthe total staff directly involved with grantmaking and services to the community. The followingpercentages were used to calculate the allocation: grantmaking, 64% (2016 - 66%) andservices to the community, 4% (2016 - 3%).
Support services reported in the statement of operations of $2,131,187 (2016 - $2,056,137) arereported after allocation of $4,243,373 (2016 - $4,320,783) to grantmaking expenses and$262,836 (2016 - $173,758) to services to the community.
6. Services to the community:
Services to the community are charitable activities other than grants, such as convening,knowledge sharing, capacity building and technical assistance to community organizations.
7. Commitments:
Future minimum annual rental payments for premises under operating leases are as follows:
2018 $ 1,397,3002019 1,352,0002020 1,359,8002021 1,394,5002022 720,100
$ 6,223,700
In relation to these leases, OTF has agreed to indemnify the landlord against losses occurring on the lease premises which may arise out of a breach of the lease agreement.
1-340 PUBLIC ACCOUNTS, 2016-2017

ONTARIO TRILLIUM FOUNDATION Notes to Financial Statements (continued)
Year ended March 31, 2017
8. Indemnification of officers and directors:
OTF has indemnified its past, present and future directors, officers, employees and volunteersagainst expenses (including legal expenses), judgments, and any amount actually orreasonably incurred by them in connection with any action, suit or proceeding in which thedirectors are used as a result of their service, if they acted honestly and in good faith with aview to the best interests of OTF. The nature of the indemnity prevents OTF from reasonablyestimating the maximum exposure. OTF has purchased directors' and officers' liabilityinsurance with respect to this indemnification.
9. Financial risks:
(a) Liquidity risk:
Liquidity risk is the risk that the Foundation will be unable to fulfill its obligations on a timelybasis or at a reasonable cost. The Foundation manages its liquidity risk by monitoring itsoperating requirements. The Foundation prepares budget and cash forecasts to ensure ithas sufficient funds to fulfill its obligations.
Accounts payable and accrued liabilities are generally due within 60 days of receipt of aninvoice.
There have been no significant changes to the liquidity risk exposure from 2016.
(b) Market risk:
Market risk is the risk that changes in market prices, such as foreign exchange rates orinterest rates, will affect the Foundation's income or the value of its holdings of financialinstruments. The objective of market risk management is to control market risk exposureswithin acceptable parameters while optimizing return on investment.
There has been no significant change to the market risk exposure from 2016.
PUBLIC ACCOUNTS, 2016-2017 1-341

ONTARIO TRILLIUM FOUNDATION Notes to Financial Statements (continued)
Year ended March 31, 2017
9. Financial risks (continued):
(c) Interest rate risk:
Interest rate risk is the risk that the fair value of future cash flows or a financial instrumentwill fluctuate because of changes in the market interest rates.
Financial assets and financial liabilities with variable interest rates expose the Foundationto cash flow interest rate risk. The Foundation is exposed to this risk through itsinvestments.
As at March 31, 2017, had prevailing interest rates increased or decreased by 1%,assuming a parallel shift in the yield curve, with all other variables held constant, theestimated impact on the market value of bonds would approximate $1,230,000.
The Foundation's investments are disclosed in note 2.
There has been no change to the interest rate risk exposure from 2016.
1-342 PUBLIC ACCOUNTS, 2016-2017
Ornge June 28, 2017
The accompanying consolidated financial statements of Ornge are the responsibility of management and have been prepared in accordance with Canadian public sector accounting standards. The preparation of financial statements necessarily involves the use of estimates and assumptions based on management’s judgment that affect the reported amounts of assets and liabilities and disclosure of contingent assets and liabilities at the balance sheet date and the reported amounts of revenue and expenses during the reporting period. The financial statements have been properly prepared within reasonable limits of materiality and in light of information available up to June 28, 2017.
Management is responsible for the preparation and fair presentation of these financial statements in accordance with Canadian public sector accounting standards, and for such internal control as management determines is necessary to enable the preparation of financial statements that are free of material misstatement, whether due to fraud or error.
The Board of Director of Ornge is responsible for ensuring that management fulfills its responsibilities for financial reporting and internal controls. The Board generally meets periodically with management to satisfy itself that such responsibilities have been fulfilled.
The consolidated financial statements for the year ended March 31, 2017 have been audited by MNP LLP (“MNP”). MNP’s responsibility is to express an opinion on whether the consolidated financial statements present fairly, in all material respects, the financial position of Ornge as at March 31, 2017 and the results of its operations and its cash flow for the year then ended in accordance with Canadian public sector accounting standards. The Auditors’ Report dated June 28, 2017 outlines the scope of MNP’s examination and opinion on the consolidated financial statements.
On behalf of management,
Andrew L. McCallum, MD FRCPC President & Chief Executive Officer
Dan Wright Chief Financial Officer
PUBLIC ACCOUNTS, 2016-2017 1-343

1-344 PUBLIC ACCOUNTS, 2016-2017

Management’s Responsibility for the Consolidated Financial Statements
Auditors' Responsibility
Opinion
PUBLIC ACCOUNTS, 2016-2017 1-345
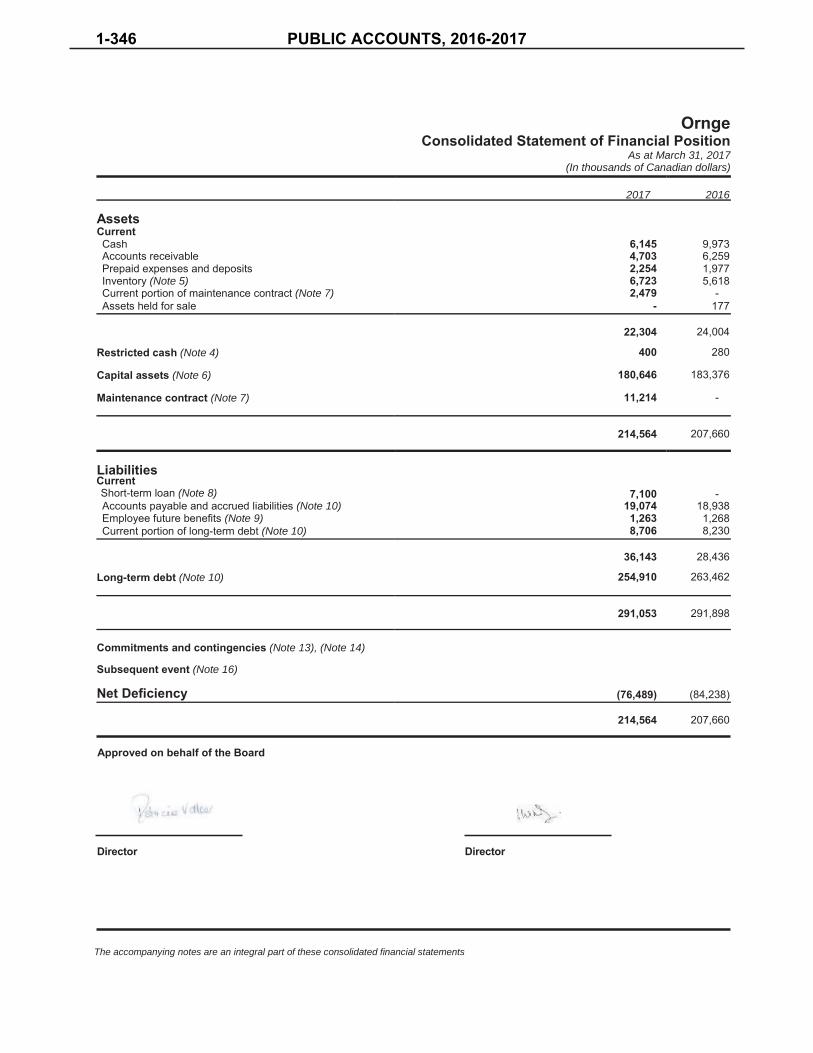
As at March 31, 2017(In thousands of Canadian dollars)
2017 2016
(Note 5)(Note 7)
(Note 4)
(Note 6)
(Note 7)
(Note 8)(Note 10)
(Note 9)(Note 10)
(Note 10)
(Note 13), (Note 14)
(Note 16)
The accompanying notes are an integral part of these consolidated financial statements
1-346 PUBLIC ACCOUNTS, 2016-2017

For the year ended March 31, 2017(In thousands of Canadian dollars)
2017 2016
(Note 12)
(Note 15)
(Note 12)
(Note 6)
The accompanying notes are an integral part of these consolidated financial statements
PUBLIC ACCOUNTS, 2016-2017 1-347

For the year ended March 31, 2017(In thousands of Canadian dollars)
2017 2016
The accompanying notes are an integral part of these consolidated financial statements
1-348 PUBLIC ACCOUNTS, 2016-2017

For the year ended March 31, 2017(In thousands of Canadian dollars)
2017 2016
The accompanying notes are an integral part of these consolidated financial statements
PUBLIC ACCOUNTS, 2016-2017 1-349
For the year ended March 31, 2017(In thousands of Canadian dollars)
Basis of consolidation
Cash
1-350 PUBLIC ACCOUNTS, 2016-2017
For the year ended March 31, 2017(In thousands of Canadian dollars)
(Continued from previous page)
Financial instruments
Inventory
Capital assets
PUBLIC ACCOUNTS, 2016-2017 1-351

For the year ended March 31, 2017(In thousands of Canadian dollars)
(Continued from previous page)
(Continued from previous page)
Maintenance and repairs
Revenue recognition
1-352 PUBLIC ACCOUNTS, 2016-2017

For the year ended March 31, 2017(In thousands of Canadian dollars)
(Continued from previous page)
Foreign currency translation
Employee future benefits
Allocation of expenses
PUBLIC ACCOUNTS, 2016-2017 1-353
For the year ended March 31, 2017(In thousands of Canadian dollars)
(Continued from previous page)
Measurement uncertainty (use of estimates)
Restructuring transactions
2017 2016
2017 2016
1-354 PUBLIC ACCOUNTS, 2016-2017

For the year ended March 31, 2017(In thousands of Canadian dollars)
CostAccumulatedamortization
2017Net book
value
CostAccumulatedamortization
2016Net book
value
PUBLIC ACCOUNTS, 2016-2017 1-355

For the year ended March 31, 2017(In thousands of Canadian dollars)
2017 2016
2017 2016
1-356 PUBLIC ACCOUNTS, 2016-2017

For the year ended March 31, 2017(In thousands of Canadian dollars)
2017 2016
Principal
PUBLIC ACCOUNTS, 2016-2017 1-357

For the year ended March 31, 2017(In thousands of Canadian dollars)
(Continued from previous page)
Credit risk
2017 2016
Liquidity risk
1-358 PUBLIC ACCOUNTS, 2016-2017

For the year ended March 31, 2017(In thousands of Canadian dollars)
(Continued from previous page)
Foreign currency risk
2017 2016U.S.$ U.S.$
(In thousands) (In thousands)
Interest rate risk
Commodity risk
Fair value of financial instruments
PUBLIC ACCOUNTS, 2016-2017 1-359

For the year ended March 31, 2017(In thousands of Canadian dollars)
2017 2016
1-360 PUBLIC ACCOUNTS, 2016-2017
For the year ended March 31, 2017(In thousands of Canadian dollars)
PUBLIC ACCOUNTS, 2016-2017 1-361

PUBLIC ACCOUNTS, 2016-2017 1-363

PricewaterhouseCoopers LLP99 Bank Street, Suite 800, Ottawa, Ontario, Canada K1P 1E4 T: +1 613 237 3702, F: +1 613 237 3963
June 22, 2017
Independent Auditor’s Report
To the Members of Ottawa Convention Centre / Société du Centre des Congrès d’Ottawa
We have audited the accompanying financial statements of Ottawa Convention Centre / Société du Centre des Congrès d’Ottawa, which comprise the statement of financial position as at March 31, 2017 and the statements of operations, changes in net assets (liabilities) and cash flows for the year then ended, and the related notes, which comprise a summary of significant accounting policies and other explanatory information.
Management's responsibility for the financial statements Management is responsible for the preparation and fair presentation of these financial statements in accordance with Canadian public sector accounting standards, and for such internal control as management determines is necessary to enable the preparation of financial statements that are free from material misstatement, whether due to fraud or error.
Auditor's responsibility Our responsibility is to express an opinion on these financial statements based on our audit. We conducted our audit in accordance with Canadian generally accepted auditing standards. Those standards require that we comply with ethical requirements and plan and perform the audit to obtain reasonable assurance about whether the financial statements are free from material misstatement.
An audit involves performing procedures to obtain audit evidence about the amounts and disclosures in the financial statements. The procedures selected depend on the auditor's judgment, including the assessment of the risks of material misstatement of the financial statements, whether due to fraud or error. In making those risk assessments, the auditor considers internal control relevant to the entity's preparation and fair presentation of the financial statements in order to design audit procedures that are appropriate in the circumstances, but not for the purpose of expressing an opinion on the effectiveness of the entity's internal control. An audit also includes evaluating the appropriateness of accounting policies used and the reasonableness of accounting estimates made by management, as well as evaluating the overall presentation of the financial statements.
1-364 PUBLIC ACCOUNTS, 2016-2017

We believe that the audit evidence we have obtained is sufficient and appropriate to provide a basis for our audit opinion.
Opinion In our opinion, the financial statements present fairly, in all material respects, the financial position of Ottawa Convention Centre / Société du Centre des Congrès d’Ottawa as at March 31, 2017 and the results of its operations, changes in its net assets (liabilities) and its cash flows for the year then ended in accordance with Canadian public sector accounting standards.
Chartered Professional Accountants, Licensed Public Accountants
PUBLIC ACCOUNTS, 2016-2017 1-365
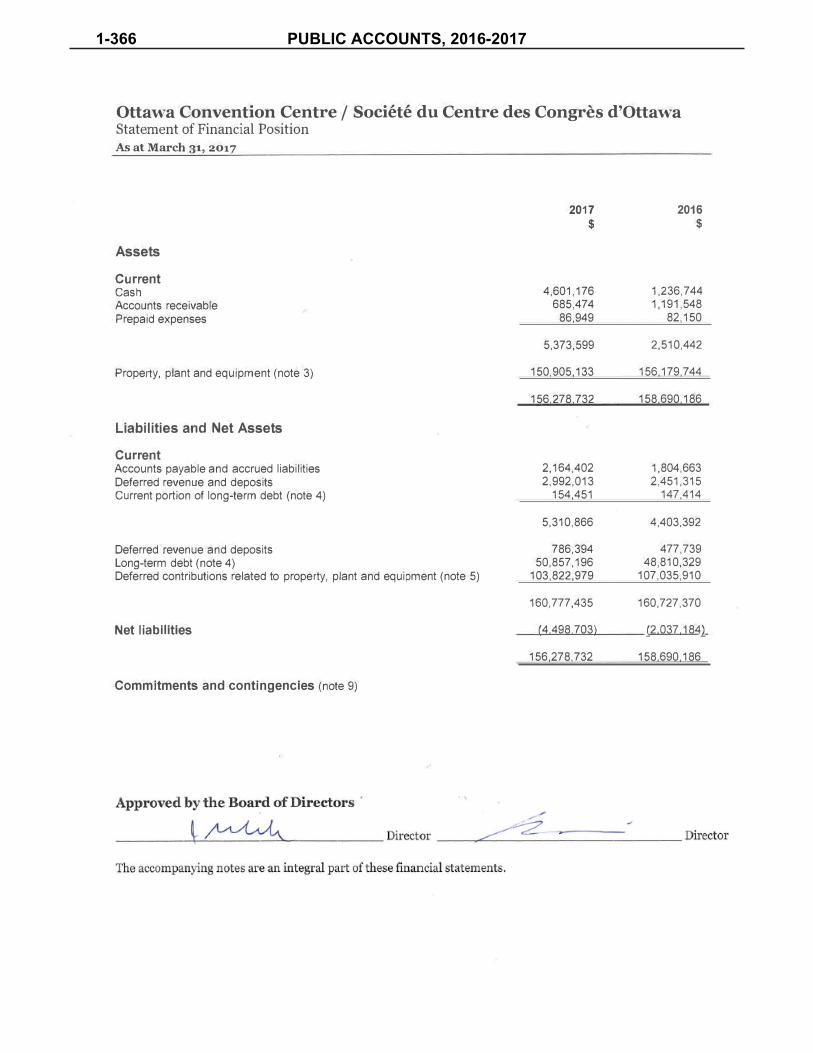
1-366 PUBLIC ACCOUNTS, 2016-2017

Ottawa Convention Centre / Société du Centre des Congrès d’Ottawa Statement of Operations For the year ended March 31, 2017
The accompanying notes are an integral part of these financial statements.
PUBLIC ACCOUNTS, 2016-2017 1-367

Ottawa Convention Centre / Société du Centre des Congrès d’Ottawa Statement of Changes in Net Assets (Liabilities) For the year ended March 31, 2017
The accompanying notes are an integral part of these financial statements.
1-368 PUBLIC ACCOUNTS, 2016-2017

Ottawa Convention Centre / Société du Centre des Congrès d’Ottawa Statement of Cash Flows For the year ended March 31, 2017
The accompanying notes are an integral part of these financial statements.
PUBLIC ACCOUNTS, 2016-2017 1-369

Ottawa Convention Centre / Société du Centre des Congrès d’Ottawa Notes to Financial Statements March 31, 2017
1 Nature of organization
The Ottawa Convention Centre / Société du Centre des Congrès d’Ottawa (“the Centre”) was incorporated by a special Act of the Ontario Provincial Legislature. The mandate of the Centre is to operate, maintain and manage an international class convention centre facility in the City of Ottawa in a manner that will promote and develop tourism and industry in Ontario. The Centre is exempt from income taxes.
2 Summary of significant accounting policies
Basis of presentation
The financial statements of the Centre are prepared in accordance with Canadian Public Sector Accounting Standards (PSAS), including accounting standards that apply to government not-for-profit organizations.
Revenue recognition
Revenue from food, beverage, space rental and other is recognized when the related goods or services are provided to the customer. Advertising revenue is recognized in the year in which the advertising is provided to the client. Commission revenue is recognized in the year in which the related event is held.
The Centre follows the deferral method of accounting for contributions. Restricted contributions are recognized as revenue in the year in which the related expenses are recognized. Unrestricted contributions are recognized as revenue when received or receivable if the amount to be received can be reasonably estimated and collection is reasonably assured.
Contributed materials and services
From time to time, the Centre may receive contributed materials and services. Since these materials and services are either not normally purchased by the Centre or the fair value of the materials or services cannot be reasonably estimated, contributed materials and services are not recognized in these financial statements.
Use of estimates
The preparation of the financial statements in conformity with PSAS requires management to make estimates and assumptions that affect the reported amounts of assets and liabilities and the disclosure of contingent assets and liabilities at the date of the financial statements and the reported amounts of revenues and expenses during the reporting period. Actual results could differ from those estimates.
Significant estimates made in the preparation of these financial statements include the useful lives of property, plant and equipment, and commission revenues earned. By their nature, these estimates are subject to measurement uncertainty and the effect on the financial statements of changes in such estimates in future periods could be significant.
1-370 PUBLIC ACCOUNTS, 2016-2017

Ottawa Convention Centre / Société du Centre des Congrès d’Ottawa Notes to Financial Statements March 31, 2017
Property, plant and equipment
Property, plant and equipment are recorded at cost less accumulated amortization. Amortization is provided for using the straight-line method over the estimated useful lives of the various classes of assets, except in the year of acquisition when a pro-rated share of the year's amortization is recorded based on the fiscal quarter in which the asset is acquired. Amortization is calculated at the following rates.
Building 40 years straight-lineSoftware 5 years straight-line Furniture, equipment and fixtures 10 years straight-line Technology network 15 years straight-line
The Centre reviews long-lived assets for impairment whenever events or changes in circumstances indicate the asset no longer has any long-term service potential to the Centre. The impairment loss, if any, is the excess of the carrying value over any residual value. Impairment losses are not reversed in future periods.
Deferred revenue and deposits
Deferred revenue and deposits represent amounts received in advance from customers in relation to services to be rendered in future periods.
Deferred contributions related to property, plant and equipment
Deferred contributions represent amounts received from various levels of government as well as one of the Centre’s significant partners, to be used towards the construction and purchase of property, plant and equipment.
Deferred contributions are recognized as revenue on the same basis as the amortization of property, plant and equipment.
Employee future benefits
All full-time employees of the Centre are eligible to be members of the Centre’s defined contribution pension plan which offers employees a pension benefit, upon retirement or termination, based on the accumulated contributions made by the individual employee and by the Centre, on their behalf, plus any investment earnings on these contributions. Contributions required to be made by the Centre are recorded in the period in which employee services are rendered.
During the year, the Centre recorded an expense of $71,171 (2016 - $81,023) for contributions made to the defined contribution pension plan, which is included in selling, general and administrative expenses.
PUBLIC ACCOUNTS, 2016-2017 1-371

Ottawa Convention Centre / Société du Centre des Congrès d’Ottawa Notes to Financial Statements March 31, 2017
Financial instruments
The Centre’s financial instruments consist of cash, accounts receivable, accounts payable and accrued liabilities, and long-term debt.
The Centre has classified its financial instruments as follows.
Asset / liability Measurement
Cash Fair value Accounts receivable Amortized cost Accounts payable and accrued liabilities Amortized costLong-term debt Amortized cost
The carrying amount of these financial assets and financial liabilities approximates their fair values unless otherwise disclosed.
3 Property, plant and equipment
1-372 PUBLIC ACCOUNTS, 2016-2017

Ottawa Convention Centre / Société du Centre des Congrès d’Ottawa Notes to Financial Statements March 31, 2017
4 Long-term debt
On November 2, 2012, the Centre was granted an amendment to the financing agreement with the Ontario Financing Authority. As a result of the amendment, the Centre will not be required to pay any annual instalments of principal or interest on this loan for a period of up to five years (“Stalled Repayment Period”), during which interest expense will continue to accrue. At the discretion of the Ontario Financing Authority but no later than September 2018, the Centre is required to resume blended interest and principal repayments, based on an adjusted loan amortization schedule which will be provided by the Ontario Financing Authority, at the end of the Stalled Repayment Period. The loan has been presented as a long-term liability on the assumption that the Ontario Financing Authority will not request early repayment.
Long-term debt, excluding the loan payable to the Ontario Financing Authority, matures over the next five years as follows.
PUBLIC ACCOUNTS, 2016-2017 1-373

Ottawa Convention Centre / Société du Centre des Congrès d’Ottawa Notes to Financial Statements March 31, 2017
5 Deferred contributions
6 Expenses
Expenses presented by function are represented as follows.
The above presentation of expenses by function excludes the amortization of deferred contributions related to property, plant and equipment, as these are considered revenue in accordance with the Centre’s accounting policies described in note 2.
7 Net change in non-cash working capital balances
The net change in non-cash working capital balances consists of the following changes in current assets and liabilities.
1-374 PUBLIC ACCOUNTS, 2016-2017

Ottawa Convention Centre / Société du Centre des Congrès d’Ottawa Notes to Financial Statements March 31, 2017
8 Financial instruments and risk management
The following classification system is used to describe the basis of the inputs used to measure the fair values of financial instruments in the fair value measurement category.
Level 1 - Quoted prices (unadjusted) in active markets for identical assets or liabilities;
Level 2 - Market based inputs other than quoted prices that are observable for the asset or liabilityeither directly or indirectly; and
Level 3 - Inputs for the asset or liability that are not based on observable market data; assumptions arebased on the best internal and external information available and are most suitable and appropriatebased on the type of financial instrument being valued in order to establish what the transaction pricewould have been on the measurement date in an arm’s length transaction.
Cash, being the only financial instrument measured at fair value, was measured as a Level 1 financial instrument.
Credit risk
Credit risk refers to the risk resulting from the possibility that parties may default on their financial obligations to the Centre. The Centre's booking policies are designed to minimize the amounts due from customers upon the conclusion of their event and thereby reduce their credit risk exposure. Further, the Centre’s management performs regular reviews of the credit worthiness of its customers and has collection policies that management feels are adequate to minimize losses in this area. The Centre does not consider its accounts receivable as presenting any significant credit risk.
As at March 31, 2017, based on their invoice date, the following accounts receivable were past due but not impaired.
Liquidity risk
Liquidity risk refers to the risk that the Centre will encounter difficulty in meeting obligations associated with financial liabilities. The Centre is exposed to this risk mainly in respect of its loan payable. In November 2012, the Centre successfully renegotiated its long-term debt agreement with the Ontario Financing Authority (note 4). As at March 31, 2017, the Centre owes $49,324,395 to the Ontario Financing Authority (OFA). The OFA requires that a payment of $4,048,240 be made on September 1, 2018. While the Centre is expected to be able to meet its obligations relating to its ongoing operations as they come due, the Centre does not expect to have sufficient cash on hand to make this payment in addition to meeting its other liabilities.
PUBLIC ACCOUNTS, 2016-2017 1-375
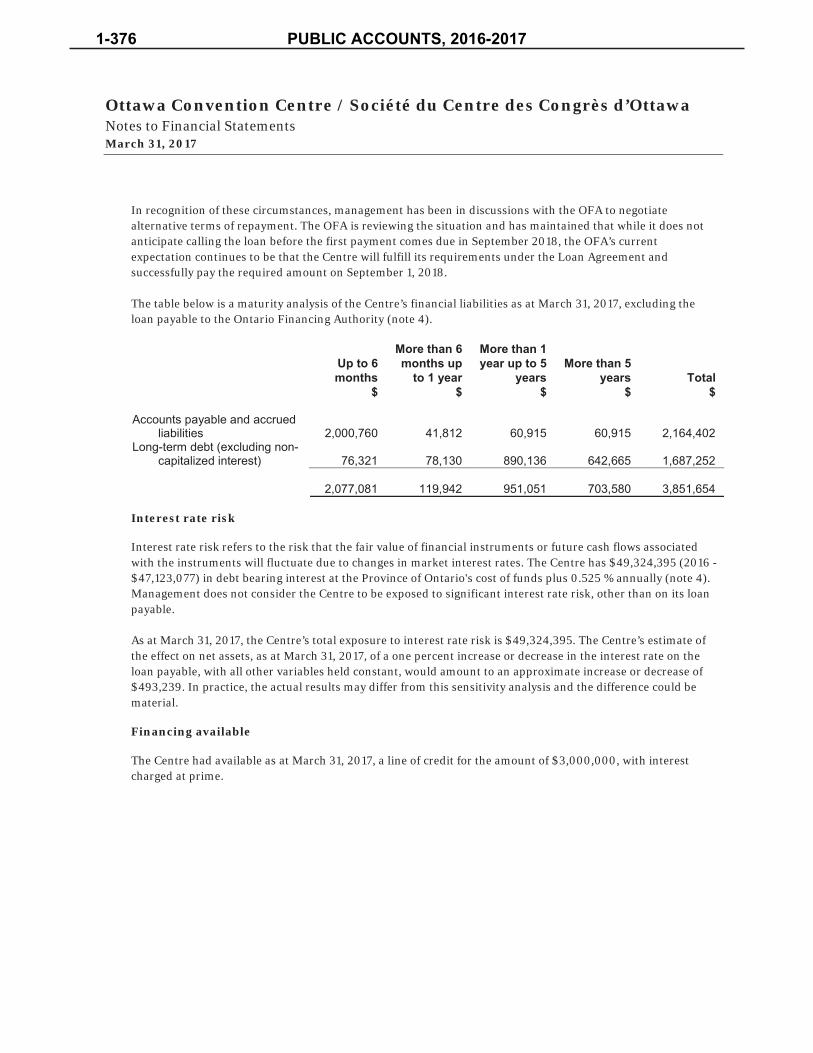
Ottawa Convention Centre / Société du Centre des Congrès d’Ottawa Notes to Financial Statements March 31, 2017
In recognition of these circumstances, management has been in discussions with the OFA to negotiate alternative terms of repayment. The OFA is reviewing the situation and has maintained that while it does not anticipate calling the loan before the first payment comes due in September 2018, the OFA’s current expectation continues to be that the Centre will fulfill its requirements under the Loan Agreement and successfully pay the required amount on September 1, 2018.
The table below is a maturity analysis of the Centre’s financial liabilities as at March 31, 2017, excluding the loan payable to the Ontario Financing Authority (note 4).
Interest rate risk
Interest rate risk refers to the risk that the fair value of financial instruments or future cash flows associated with the instruments will fluctuate due to changes in market interest rates. The Centre has $49,324,395 (2016 - $47,123,077) in debt bearing interest at the Province of Ontario's cost of funds plus 0.525 % annually (note 4). Management does not consider the Centre to be exposed to significant interest rate risk, other than on its loan payable.
As at March 31, 2017, the Centre’s total exposure to interest rate risk is $49,324,395. The Centre’s estimate of the effect on net assets, as at March 31, 2017, of a one percent increase or decrease in the interest rate on the loan payable, with all other variables held constant, would amount to an approximate increase or decrease of $493,239. In practice, the actual results may differ from this sensitivity analysis and the difference could be material.
Financing available
The Centre had available as at March 31, 2017, a line of credit for the amount of $3,000,000, with interest charged at prime.
1-376 PUBLIC ACCOUNTS, 2016-2017

Ottawa Convention Centre / Société du Centre des Congrès d’Ottawa Notes to Financial Statements March 31, 2017
Sensitivity analysis
The sensitivity analysis included in this note should be used with caution as the changes are hypothetical and are not predictive of future performance. The above sensitivities are calculated with reference to year-end balances and will change due to fluctuations in the balances in the future. In addition, for the purpose of the sensitivity analysis, the effect of a variation in a particular assumption on the fair value of the financial instruments was calculated independently of any change in another assumption. Actual changes in one factor may contribute to changes in another factor, which may magnify or counteract the effect on the fair value of the financial instrument.
9 Commitments and contingencies
The Centre has entered into facility services and technology services agreements related to the operation of the new facility, both expiring in 2026. Under the facility services agreement, among other terms, the Centre will pay a facility management fee of $250,000 (2016 - $240,000) with annual escalations of $10,000 thereafter. Under the technology services agreement, the Centre will make annual payments of $296,130 (2016 - $293,000) attributable to the ongoing service agreement. All figures exclude applicable taxes.
The Centre is involved in various claims and litigation that arise in the normal course of business. During the year ended March 31, 2016, a statement of claim in the amount of $9,600,000 was issued against the Centre related to an alleged breach of contract by the plaintiff. The Centre does not agree with the claim. At this time, the outcome of these proceedings cannot be determined. No amounts have been recorded related to this claim.
10 Capital management
The Centre's objective when managing capital is to maintain its ability to continue as a going concern in order to execute its mandate to operate a world class convention facility. The Centre's capital structure is comprised of its net assets, long-term debt and deferred contributions related to property, plant and equipment. The Centre's objective in management of its capital structure is to ensure access to sufficient cash flow to carry out its ongoing operations and service the debt obligations.
PUBLIC ACCOUNTS, 2016-2017 1-377


PUBLIC ACCOUNTS, 2016-2017 1-379
1-380 PUBLIC ACCOUNTS, 2016-2017

PROVINCE OF ONTARIO COUNCIL FOR THE ARTS(OPERATING AS ONTARIO ARTS COUNCIL)
Statement of Financial Position
March 31, 2017, with comparative information for 2016
2017 2016Restricted and
Operating endowmentfund funds Total Total
Assets Current assets:
Cash and cash equivalents $ 2,146,670 $ 1,712,225 $ 3,858,895 $ 3,798,184Accounts receivable 107,467 – 107,467 310,805Prepaid expenses 47,643 – 47,643 22,520
2,301,780 1,712,225 4,014,005 4,131,509
Investments (notes 2(b) and 8) 874,430 28,108,806 28,983,236 26,988,973
Capital assets (note 3) 2,271,489 – 2,271,489 2,820,959
$ 5,447,699 $ 29,821,031 $ 35,268,730 $ 33,941,441
Liabilities and Fund Balances Current liabilities:
Accounts payable and accrued liabilities $ 1,292,497 $ – $ 1,292,497 $ 1,169,051 Current portion of deferred lease
inducement 165,322 – 165,322 165,322Current portion of employee future
benefits (note 2(b)) 282,924 – 282,924 196,4061,740,743 – 1,740,743 1,530,779
Deferred lease inducement 1,281,245 – 1,281,245 1,211,405
Employee future benefits (note 2(b)) 108,998 – 108,998 140,854
Fund balances:Invested in capital assets 824,922 – 824,922 1,444,232Restricted for endowment purposes
(note 4) – 70,311 70,311 70,311Externally restricted funds (Schedule 2) – 16,387,341 16,387,341 16,748,305Internally restricted funds (note 5) – 6,406,858 6,406,858 6,483,985Unrestricted 1,312,342 – 1,312,342 970,413Accumulated remeasurement gains 179,449 6,956,521 7,135,970 5,341,157
2,316,713 29,821,031 32,137,744 31,058,403
$ 5,447,699 $ 29,821,031 $ 35,268,730 $ 33,941,441
Commitments (note 10) Economic dependence (note 11)
PUBLIC ACCOUNTS, 2016-2017 1-381
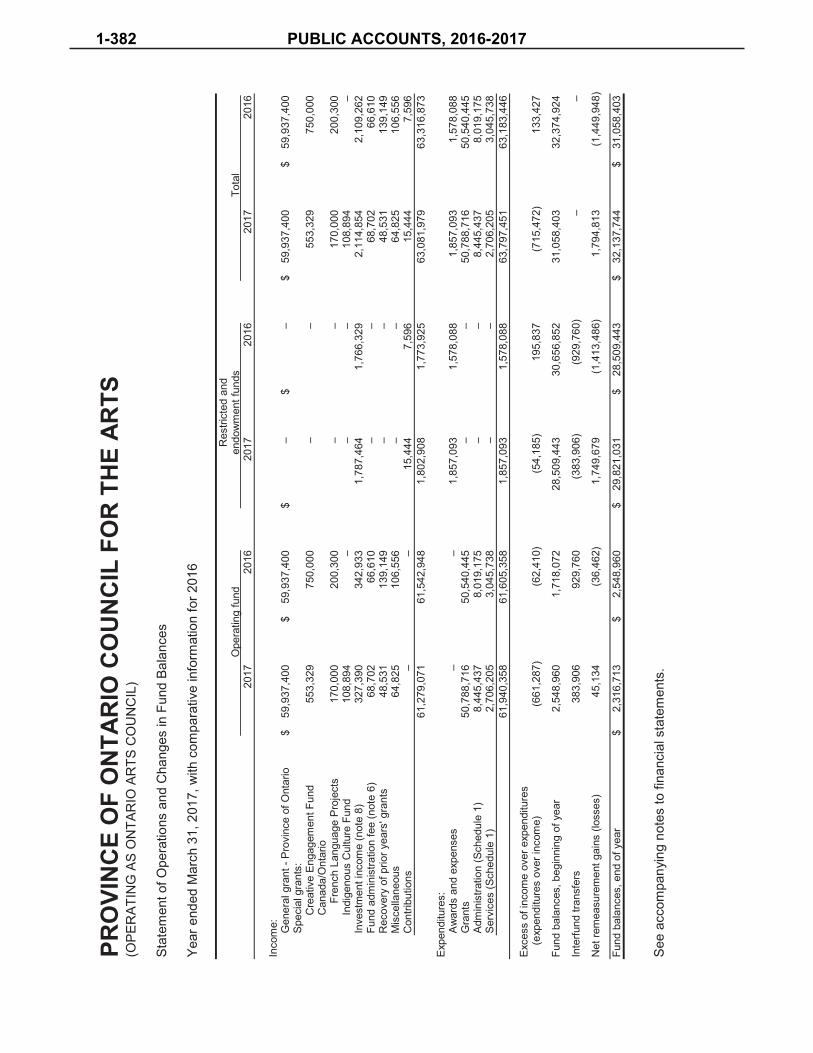
PRO
VIN
CE
OF
ON
TAR
IO C
OU
NC
IL F
OR
TH
E AR
TS(O
PER
ATIN
G A
S O
NTA
RIO
AR
TS C
OU
NC
IL)
Stat
emen
t of O
pera
tions
and
Cha
nges
in F
und
Bala
nces
Year
end
ed M
arch
31,
201
7, w
ith c
ompa
rativ
e in
form
atio
n fo
r 201
6
Res
trict
ed a
ndO
pera
ting
fund
endo
wm
ent f
unds
Tota
l20
1720
1620
1720
1620
1720
16
Inco
me: Gen
eral
gra
nt -
Prov
ince
of O
ntar
io
$ 59
,937
,400
$
59,9
37,4
00
$ –
$–
$ 59
,937
,400
$ 59
,937
,400
Spec
ial g
rant
s:C
reat
ive
Enga
gem
ent F
und
553,
329
750,
000
– –
553,
329
750,
000
Can
ada/
Ont
ario
Fr
ench
Lan
guag
e Pr
ojec
ts17
0,00
020
0,30
0–
– 17
0,00
020
0,30
0In
dige
nous
Cul
ture
Fun
d10
8,89
4–
– –
108,
894
– In
vest
men
t inc
ome
(not
e 8)
32
7,39
034
2,93
31,
787,
464
1,76
6,32
92,
114,
854
2,10
9,26
2Fu
nd a
dmin
istra
tion
fee
(not
e 6)
68
,702
66,6
10–
– 68
,702
66,6
10R
ecov
ery
of p
rior y
ears
' gra
nts
48,5
3113
9,14
9–
– 48
,531
139,
149
Mis
cella
neou
s64
,825
106,
556
– –
64,8
2510
6,55
6C
ontri
butio
ns–
– 15
,444
7,59
615
,444
7,59
661
,279
,071
61,5
42,9
481,
802,
908
1,77
3,92
563
,081
,979
63,3
16,8
73
Expe
nditu
res:
Awar
ds a
nd e
xpen
ses
– –
1,85
7,09
31,
578,
088
1,85
7,09
31,
578,
088
Gra
nts
50,7
88,7
1650
,540
,445
– –
50,7
88,7
1650
,540
,445
Adm
inis
tratio
n (S
ched
ule
1)
8,44
5,43
78,
019,
175
– –
8,44
5,43
78,
019,
175
Serv
ices
(Sch
edul
e 1)
2,
706,
205
3,04
5,73
8–
– 2,
706,
205
3,04
5,73
861
,940
,358
61,6
05,3
581,
857,
093
1,57
8,08
863
,797
,451
63,1
83,4
46
Exce
ss o
f inc
ome
over
exp
endi
ture
s(e
xpen
ditu
res
over
inco
me)
(6
61,2
87)
(62,
410)
(54,
185)
195,
837
(715
,472
)13
3,42
7
Fund
bal
ance
s, b
egin
ning
of y
ear
2,54
8,96
01,
718,
072
28,5
09,4
4330
,656
,852
31,0
58,4
0332
,374
,924
Inte
rfund
tran
sfer
s38
3,90
692
9,76
0(3
83,9
06)
(929
,760
)–
–
Net
rem
easu
rem
entg
ains
(loss
es)
45,1
34
(36,
462)
1,74
9,67
9 (1
,413
,486
)1,
794,
813
(1,4
49,9
48)
Fund
bal
ance
s, e
nd o
f yea
r$
2,31
6,71
3 $
2,54
8,96
0 $
29,8
21,0
31
$ 28
,509
,443
$
32,1
37,7
44
$ 31
,058
,403
See
acco
mpa
nyin
g no
tes
to fi
nanc
ial s
tate
men
ts.
1-382 PUBLIC ACCOUNTS, 2016-2017

PROVINCE OF ONTARIO COUNCIL FOR THE ARTS(OPERATING AS ONTARIO ARTS COUNCIL)
Statement of Remeasurement Gains and Losses
Year ended March 31, 2017, with comparative information for 2016
2017 2016
Accumulated remeasurement gains, beginning of year $ 5,341,157 $ 6,791,105
Unrealized gains (losses) attributed to:Portfolio investments 2,068,212 (1,022,435)
Amounts reclassified to the statement of operations:Portfolio investments (273,399) (427,513)
Net remeasurement gains (loss) for the year 1,794,813 (1,449,948)
Accumulated remeasurement gains, end of year $ 7,135,970 $ 5,341,157
See accompanying notes to financial statements.
PUBLIC ACCOUNTS, 2016-2017 1-383

PROVINCE OF ONTARIO COUNCIL FOR THE ARTS(OPERATING AS ONTARIO ARTS COUNCIL)
Statement of Cash Flows
Year ended March 31, 2017, with comparative information for 2016
2017 2016
Cash provided by (used in):
Operating activities:Excess of income over expenditures
(expenditures over income) $ (715,472) $ 133,427Items not involving cash:
Gain on income distributions (1,502,467) (1,364,354)Gain on sale of investments (344,830) (335,989)Amortization and impairment of capital assets 721,347 550,147Change in deferred lease inducement 69,840 315,097
Change in non-cash operating working capital:Accounts receivable 203,338 (266,755)Prepaid expenses (25,123) 15,114Accounts payable and accrued liabilities 123,446 133,987Recovery of lease inducement – 1,061,630Employee future benefits 54,662 (54,624)
(1,415,259) 187,680
Capital activities:Purchase of capital assets (171,877) (2,350,111)
Investing activities:Proceeds from sale of investments, net 1,647,847 1,615,265
Increase (decrease) in cash and cash equivalents 60,711 (547,166)
Cash and cash equivalents, beginning of year 3,798,184 4,345,350
Cash and cash equivalents, end of year $ 3,858,895 $ 3,798,184
See accompanying notes to financial statements.
1-384 PUBLIC ACCOUNTS, 2016-2017

PROVINCE OF ONTARIO COUNCIL FOR THE ARTS(OPERATING AS ONTARIO ARTS COUNCIL)
Notes to Financial Statements
Year ended March 31, 2017
The Province of Ontario Council for the Arts (operating as Ontario Arts Council) (the "OAC") was established in 1963 by the Government of Ontario to promote the development and enjoyment of the arts across the province. The OAC plays a leadership role in fostering excellence in the arts and making the arts accessible to all Ontarians. The OAC is a registered charity and is exempt from tax under the Income Tax Act (Canada).
1. Significant accounting policies:
(a) Basis of presentation:
The financial statements have been prepared by management in accordance withaccounting standards for government not-for-profit organizations, included in the Canadianpublic sector accounting standards for government not-for-profit organizations.
The OAC follows the restricted fund method of accounting for contributions.
The OAC has elected not to consolidate controlled entities (note 7).
(b) Fund accounting:
Resources are classified for accounting and reporting purposes into funds that are held inaccordance with their specified purposes.
The operating fund reports the publicly funded activities of the OAC funded mainly througha general grant from the Province of Ontario.
The restricted and endowment funds are internally restricted by the OAC or by the termsspecified by the donors in their trust agreements.
Grant approved to be paid in the future upon specific requirements being met are notincluded in the statement of operations and changes in fund balances (note 10(b)).
PUBLIC ACCOUNTS, 2016-2017 1-385

PROVINCE OF ONTARIO COUNCIL FOR THE ARTS (OPERATING AS ONTARIO ARTS COUNCIL)
Notes to Financial Statements (continued)
Year ended March 31, 2017
1. Significant accounting policies (continued):
(c) Cash and cash equivalents:
The OAC considers deposits in banks, guaranteed investment certificates and otherinstruments that are cashable or with original maturities of three months or less as cashand cash equivalents.
(d) Investment income:
Investment income comprised income on pooled investments and bank balances.
Investment income related to the operating fund is recognized based on the actual numberof units held in the pooled investment and recognized as income of the operating fund.
Investment income on the pooled investments related to the restricted and endowmentfunds is recognized as income of the restricted and endowment funds.
(e) Employee benefits:
(i) The OAC follows Public Sector Accounting standards for accounting for employeefuture benefits, which include post-employment benefits payable upon termination.Under these standards, the cost of the post-employment benefits paid upon terminationis charged to operations annually as earned.
(ii) The OAC accrues for sick leave liabilities and other benefits for amounts that accruebut have not vested.
(f) Lease inducements:
Lease inducements include a leasehold improvement allowance and free rents received bythe OAC. The total amount of the lease inducements is amortized on a straight-line basisover the lease term.
1-386 PUBLIC ACCOUNTS, 2016-2017

PROVINCE OF ONTARIO COUNCIL FOR THE ARTS (OPERATING AS ONTARIO ARTS COUNCIL)
Notes to Financial Statements (continued)
Year ended March 31, 2017
1. Significant accounting policies (continued):
(g) Capital assets:
Capital assets are recorded at cost (purchase price). All capital assets are amortized on astraight-line basis over the assets' estimated useful lives as follows:
Audiovisual equipment 5 yearsComputer hardware and software 3 yearsFurniture and fixtures 5 yearsOffice equipment 5 yearsOffice renovations 5 yearsLeasehold improvements Lease term
When a capital asset no longer contributes to OAC's ability to provide services, its carrying value is written down to its residual value.
(h) Financial instruments:
Financial instruments are recorded at fair value on initial recognition. Derivativeinstruments and equity instruments that are quoted in an active market are reported at fairvalue. All other financial instruments are subsequently recorded at cost or amortized costunless management has elected to carry the instruments at fair value. Management haselected to record all investments at fair value as they are managed and evaluated on a fairvalue basis.
Unrealized changes in fair value are recognized in the statement of remeasurement gainsand losses until they are realized, when they are transferred to the statement of operationsand changes in fund balances.
Transaction costs incurred on the acquisition of financial instruments measuredsubsequently at fair value are expensed as incurred. All other financial instruments areadjusted by transaction costs incurred on acquisition and financing costs, which areamortized using the straight-line method.
All financial assets are assessed for impairment on an annual basis. When a decline isdetermined to be other than temporary, the amount of the loss is reported in the statementof operations and changes in fund balances and any unrealized gain or loss is adjustedthrough the statement of remeasurement gains and losses.
PUBLIC ACCOUNTS, 2016-2017 1-387

PROVINCE OF ONTARIO COUNCIL FOR THE ARTS (OPERATING AS ONTARIO ARTS COUNCIL)
Notes to Financial Statements (continued)
Year ended March 31, 2017
1. Significant accounting policies (continued):
When the asset is sold, the unrealized gains and losses previously recognized in the statement of remeasurement gains and losses are reversed and recognized in the statement of operations and changes in fund balances.
The standards require an organization to classify fair value measurements using a fair value hierarchy, which includes three levels of information that may be used to measure fair value:
Level 1 - unadjusted quoted market prices in active markets for identical assets orliabilities;
Level 2 - observable or corroborated inputs, other than Level 1, such as quoted pricesfor similar assets or liabilities in inactive markets or market data for substantially the fullterm of the assets or liabilities; and
Level 3 - unobservable inputs that are supported by little or no market activity and thatare significant to the fair value of the assets and liabilities.
The fair value of measurements for all of the investments held by OAC are categorized as Level 1 and Level 2.
Derivative financial instruments and portfolio investments in equity instruments that are quoted in an active market and included on the statement of financial position are measured at fair value upon inception.
(i) Foreign currency:
Foreign currency transactions are recorded at the exchange rate at the time of thetransaction.
Assets and liabilities denominated in foreign currencies are recorded at fair value using theexchange rate at the financial statement date. Unrealized foreign exchange gains andlosses are recognized in the statement of remeasurement gains and losses. In the periodof settlement, the realized foreign exchange gains and losses are recognized in thestatement of operations and changes in fund balances and the unrealized balances arereversed from the statement of remeasurement gains and losses.
1-388 PUBLIC ACCOUNTS, 2016-2017

PROVINCE OF ONTARIO COUNCIL FOR THE ARTS (OPERATING AS ONTARIO ARTS COUNCIL)
Notes to Financial Statements (continued)
Year ended March 31, 2017
1. Significant accounting policies (continued):
(j) Use of estimates:
The preparation of financial statements requires management to make estimates andassumptions that affect the reported amounts of assets and liabilities and disclosure ofcontingent assets and liabilities at the date of the financial statements and the reportedamounts of income and expenditures during the year. Significant estimates includecarrying value of capital assets and provisions for certain employee future benefitsliabilities. Actual results could differ from those estimates.
2. Employee future benefits:
(a) Pension benefits:
The OAC's full-time employees participate in the Public Service Pension Fund ("PSPF"),which is a defined benefit pension plan for employees of the Province of Ontario and manyprovincial agencies. The Province of Ontario, which is the sole sponsor of the PSPF,determines the OAC's annual payments to the PSPF. Since the OAC is not a sponsor ofthe PSPF, gains and losses arising from statutory actuarial funding valuations are notassets or obligations of the OAC, as the sponsor is responsible for ensuring that the PSPFis financially viable. The annual payments to the PSPF of $329,679 (2016 - $303,878) areincluded in salaries and benefits in Schedule 1.
(b) Non-pension benefits:
The cost of post-retirement non-pension employee benefits is paid by the Treasury BoardSecretariat and is not included in the statement of operations and changes in fundbalances.
The OAC also provides termination benefits earned by eligible employees. The amount ofseverance payments and unused vacation pay accrued at year end was $280,733 (2016 -$247,375), of which $171,734 (2016 - $106,521) has been classified as a current liability.
The OAC has set aside funds to meet these liabilities and other obligations and investedthese funds in the same pooled investments as the restricted and endowment funds. As atMarch 31, 2017, this investment has a market value of $874,430 (2016 - $777,830) and isshown under the operating fund as investments.
PUBLIC ACCOUNTS, 2016-2017 1-389
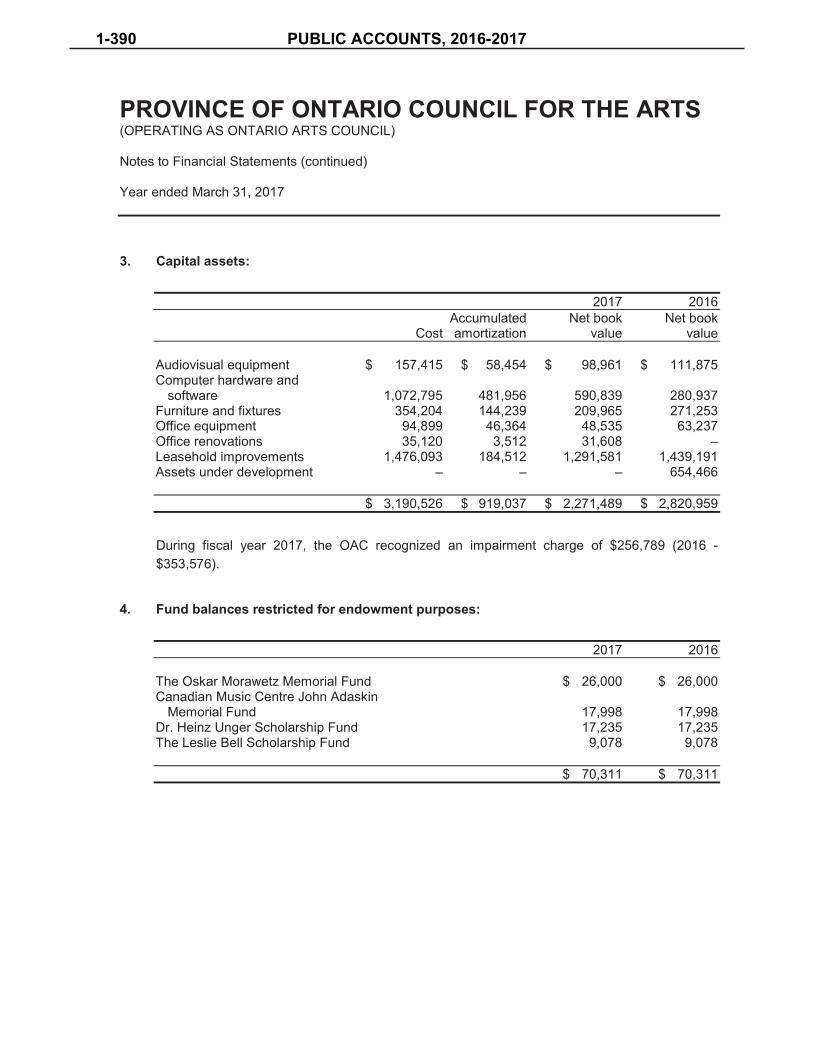
PROVINCE OF ONTARIO COUNCIL FOR THE ARTS (OPERATING AS ONTARIO ARTS COUNCIL)
Notes to Financial Statements (continued)
Year ended March 31, 2017
3. Capital assets:
2017 2016Accumulated Net book Net book
Cost amortization value value
Audiovisual equipment $ 157,415 $ 58,454 $ 98,961 $ 111,875Computer hardware and
software 1,072,795 481,956 590,839 280,937Furniture and fixtures 354,204 144,239 209,965 271,253Office equipment 94,899 46,364 48,535 63,237Office renovations 35,120 3,512 31,608 – Leasehold improvements 1,476,093 184,512 1,291,581 1,439,191Assets under development – – – 654,466
$ 3,190,526 $ 919,037 $ 2,271,489 $ 2,820,959
During fiscal year 2017, the OAC recognized an impairment charge of $256,789 (2016 - $353,576).
4. Fund balances restricted for endowment purposes:
2017 2016
The Oskar Morawetz Memorial Fund $ 26,000 $ 26,000Canadian Music Centre John Adaskin
Memorial Fund 17,998 17,998Dr. Heinz Unger Scholarship Fund 17,235 17,235The Leslie Bell Scholarship Fund 9,078 9,078
$ 70,311 $ 70,311
1-390 PUBLIC ACCOUNTS, 2016-2017

PROVINCE OF ONTARIO COUNCIL FOR THE ARTS (OPERATING AS ONTARIO ARTS COUNCIL)
Notes to Financial Statements (continued)
Year ended March 31, 2017
5. Internally restricted fund balances:
Fund Transfer Fundbalances, from (to) Awards and balances,beginning Operating Investment expenses end of
of year Fund income paid year
Venture fund $ 4,185,685 $ 195,169 $ 564,850 $ (251,071) $ 4,694,633Board-designated reserve fund 1,435,000 (565,625) – – 869,375Granting programs fund 863,300 (20,450) – – 842,850
$ 6,483,985 $ (390,906) $ 564,850 $ (251,071) $ 6,406,858
6. Related party transactions:
(a) Included in Schedule 2, awards and expenses paid, are administration fees charged by theOAC for providing day-to-day administrative support and services to the restricted andendowment funds held by the OAC. As permitted in the respective agreements, the OAChas levied an administration fee, either on a fixed or percentage basis, on the funds held oron the annual investment income earned by the funds held by the OAC.
2017 2016
Fund administration fee $ 68,702 $ 66,610
(b) During the year, the OAC allocated a portion of its monthly office rental fees and a portionof its general and administrative costs to the Ontario Arts Foundation (the "Foundation").The Foundation is controlled by the OAC's Board of Directors through election of theFoundation's Board of Directors. General and administrative costs allocated amounted to$25,276 (2016 - $10,800) and total rent allocated amounted to $10,800 (2016 - $6,000).
The above transactions are in the normal course of operations and are measured at the exchange value, which is the amount of consideration established and agreed to by the related parties.
PUBLIC ACCOUNTS, 2016-2017 1-391
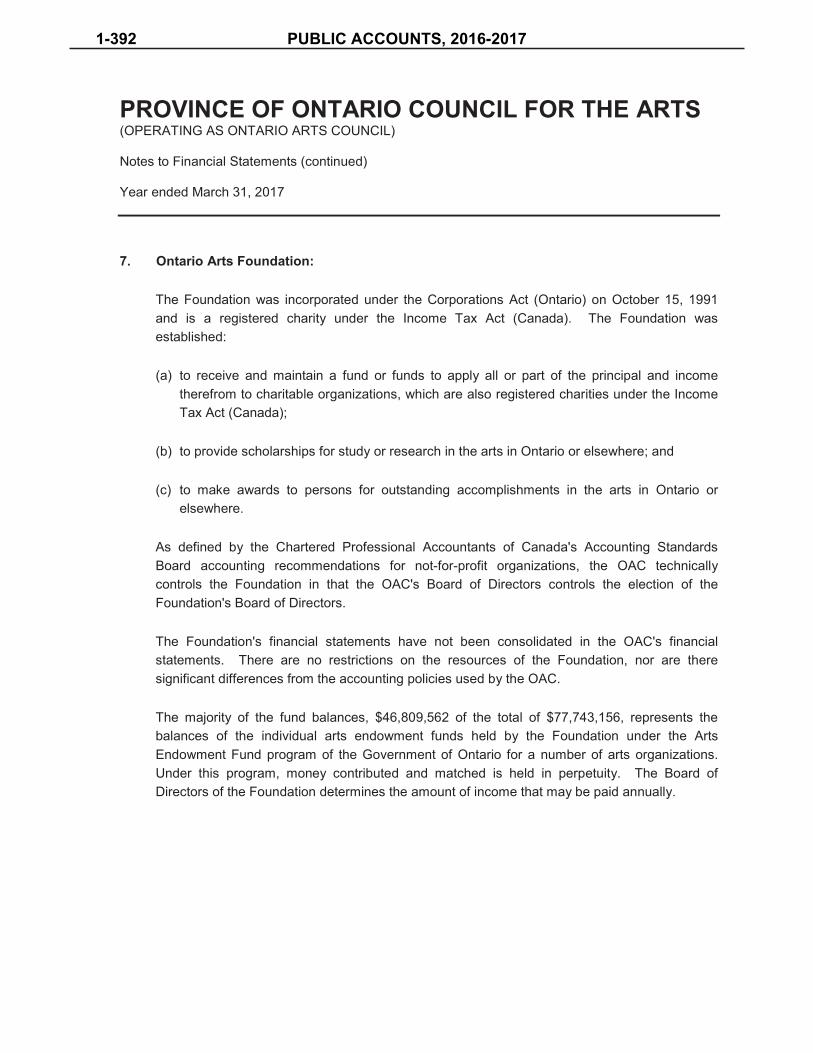
PROVINCE OF ONTARIO COUNCIL FOR THE ARTS (OPERATING AS ONTARIO ARTS COUNCIL)
Notes to Financial Statements (continued)
Year ended March 31, 2017
7. Ontario Arts Foundation:
The Foundation was incorporated under the Corporations Act (Ontario) on October 15, 1991and is a registered charity under the Income Tax Act (Canada). The Foundation wasestablished:
(a) to receive and maintain a fund or funds to apply all or part of the principal and incometherefrom to charitable organizations, which are also registered charities under the IncomeTax Act (Canada);
(b) to provide scholarships for study or research in the arts in Ontario or elsewhere; and
(c) to make awards to persons for outstanding accomplishments in the arts in Ontario orelsewhere.
As defined by the Chartered Professional Accountants of Canada's Accounting Standards Board accounting recommendations for not-for-profit organizations, the OAC technically controls the Foundation in that the OAC's Board of Directors controls the election of the Foundation's Board of Directors.
The Foundation's financial statements have not been consolidated in the OAC's financial statements. There are no restrictions on the resources of the Foundation, nor are there significant differences from the accounting policies used by the OAC.
The majority of the fund balances, $46,809,562 of the total of $77,743,156, represents the balances of the individual arts endowment funds held by the Foundation under the Arts Endowment Fund program of the Government of Ontario for a number of arts organizations. Under this program, money contributed and matched is held in perpetuity. The Board of Directors of the Foundation determines the amount of income that may be paid annually.
1-392 PUBLIC ACCOUNTS, 2016-2017
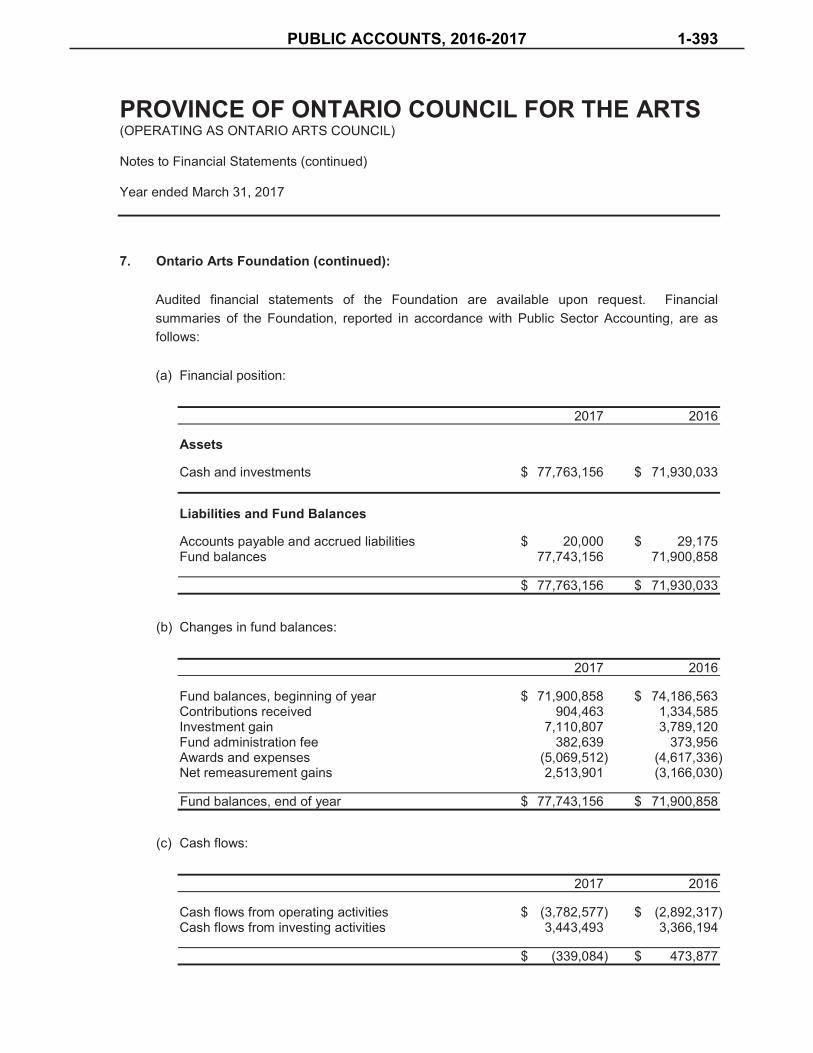
PROVINCE OF ONTARIO COUNCIL FOR THE ARTS (OPERATING AS ONTARIO ARTS COUNCIL)
Notes to Financial Statements (continued)
Year ended March 31, 2017
7. Ontario Arts Foundation (continued):
Audited financial statements of the Foundation are available upon request. Financialsummaries of the Foundation, reported in accordance with Public Sector Accounting, are asfollows:
(a) Financial position:
2017 2016
Assets
Cash and investments $ 77,763,156 $ 71,930,033
Liabilities and Fund Balances
Accounts payable and accrued liabilities $ 20,000 $ 29,175Fund balances 77,743,156 71,900,858
$ 77,763,156 $ 71,930,033
(b) Changes in fund balances:
2017 2016
Fund balances, beginning of year $ 71,900,858 $ 74,186,563Contributions received 904,463 1,334,585 Investment gain 7,110,807 3,789,120 Fund administration fee 382,639 373,956Awards and expenses (5,069,512) (4,617,336)Net remeasurement gains 2,513,901 (3,166,030)
Fund balances, end of year $ 77,743,156 $ 71,900,858
(c) Cash flows:
2017 2016
Cash flows from operating activities $ (3,782,577) $ (2,892,317)Cash flows from investing activities 3,443,493 3,366,194
$ (339,084) $ 473,877
PUBLIC ACCOUNTS, 2016-2017 1-393

PROVINCE OF ONTARIO COUNCIL FOR THE ARTS (OPERATING AS ONTARIO ARTS COUNCIL)
Notes to Financial Statements (continued)
Year ended March 31, 2017
8. Investments and investment income:
Net investment income comprises the following:
2017 2016
Income distributions $ 1,502,467 $ 1,364,354Realized gains 344,830 335,989Bank interest 267,557 408,919
$ 2,114,854 $ 2,109,262
The asset mix of the investments is as follows:
2017 2016
Foreign equities, predominantly U.S. 37% 39% Fixed income securities 24% 25% Canadian equities 21% 19% Alternative investments 16% 15% Cash and cash equivalents 2% 2%
The OAC currently holds $6,955,977 (cost - $5,195,476) (2016 - $6,747,243 (cost - $5,411,954)) in fixed income securities that are exposed to interest rate price risk. The interest rates range from nil to 10.95% (2016 - 0.50% to 10.95%) for the year ended March 31, 2017.
1-394 PUBLIC ACCOUNTS, 2016-2017

PROVINCE OF ONTARIO COUNCIL FOR THE ARTS (OPERATING AS ONTARIO ARTS COUNCIL)
Notes to Financial Statements (continued)
Year ended March 31, 2017
9. Public sector salary disclosures:
Section 3(5) of the Public Sector Salary Disclosure Act (1996) requires disclosure of Ontariopublic sector employees who were paid an annual salary in excess of $100,000 in the calendaryear 2016. For the OAC, this disclosure is shown below:
TaxableName Title Salary benefits
Feizal Bacchus Manager of Operations $ 118,774 $ 176Peter Caldwell Director and CEO 211,031 340Kirsten Gunter Director of Communications 156,554 184Nina Small Director of Human Resources 114,825 185Kathryn Townshend Director of Research, Policy and Evaluation 115,428 186Carolyn Vesely Director of Granting 133,641 212Myles Warren Dance and Awards Officer 102,208 165Jerry Zhang Director of Finance and Administration 125,477 157
10. Commitments:
(a) Lease commitments:
The OAC leases office premises and office equipment under operating leases. The futureannual lease payments, including utilities and operating costs, are summarized as follows:
2018 $ 758,2532019 746,2012020 728,0442021 733,7122022 750,7152023 and thereafter 2,815,181
$ 6,532,106
PUBLIC ACCOUNTS, 2016-2017 1-395

PROVINCE OF ONTARIO COUNCIL FOR THE ARTS (OPERATING AS ONTARIO ARTS COUNCIL)
Notes to Financial Statements (continued)
Year ended March 31, 2017
10. Commitments (continued):
(b) Grant commitments:
The OAC has approved grants of $655,045 (2016 - $726,129), which will be paid in futureyears once the conditions of the grants have been met. These amounts are not reflected inthe statement of operations and changes in fund balances. These amounts are included inthe internally restricted fund balance, as described in note 5.
11. Economic dependence:
The OAC is dependent on the Province of Ontario for the provision of funds to provide awardsand grants and to cover the cost of operations.
12. Financial instruments:
(a) Interest rate and foreign currency risks:
The OAC is exposed to interest rate and foreign currency risks arising from the possibilitythat changes in interest rates and foreign exchange rates will affect the value of fixedincome and foreign currency-denominated investments. The OAC currently does not useany hedging strategies to mitigate the exposure.
(b) Market risk:
Market risk arises as a result of trading equities and fixed income securities. Fluctuationsin the market expose the OAC to a risk of loss. The OAC uses two professional investmentmanagers to advise on investment risks, asset selection and mix to achieve an appropriatebalance between risks and returns. The Finance and Audit Committee of the Board ofDirectors of the OAC monitors investments decisions and results and meets regularly withthe managers.
1-396 PUBLIC ACCOUNTS, 2016-2017

PROVINCE OF ONTARIO COUNCIL FOR THE ARTS (OPERATING AS ONTARIO ARTS COUNCIL)
Notes to Financial Statements (continued)
Year ended March 31, 2017
12. Financial instruments (continued):
(c) Liquidity risk:
Liquidity risk is the risk that the OAC will be unable to fulfill its obligations on a timely basisor at a reasonable cost. The OAC manages its liquidity risk by monitoring its operatingrequirements. The OAC prepares budget and cash forecasts to ensure it has sufficientfunds to fulfill its obligations. Accounts payable and accrued liabilities are generally duewithin 30 days of receipt of an invoice.
There has been no change to the above risk exposures from 2016.
13. Comparative information:
Certain comparative information has been reclassified to conform with the financial statementpresentation adopted in the current year.
PUBLIC ACCOUNTS, 2016-2017 1-397

PROVINCE OF ONTARIO COUNCIL FOR THE ARTS(OPERATING AS ONTARIO ARTS COUNCIL)
Schedule 1 - Administration Expenses and Services
Year ended March 31, 2017, with comparative information for 2016
2017 2016
Administration expenses:Salaries and benefits (notes 2(b) and 9) $ 5,423,282 $ 5,207,969Consulting and legal fees 216,818 233,160Office rent and hydro (note 6) 539,373 956,807Communications 265,046 200,402Travel 137,476 138,329Miscellaneous 83,570 92,323Meetings 71,874 66,864Telephone, postage and delivery 68,906 92,825Amortization and impairment of capital assets 721,347 550,147Maintenance and equipment rental 68,123 77,631Personnel hiring and training 39,334 45,070Office supplies, printing and stationery 46,757 48,038Information services 763,531 309,610
8,445,437 8,019,175
Services:Other programs 1,620,014 2,060,014Jurors and advisors 635,457 635,077Canada/Ontario French language projects 450,734 350,647
2,706,205 3,045,738
$ 11,151,642 $ 11,064,913
1-398 PUBLIC ACCOUNTS, 2016-2017

PRO
VIN
CE
OF
ON
TAR
IO C
OU
NC
IL F
OR
TH
E AR
TS(O
PER
ATIN
G A
S O
NTA
RIO
AR
TS C
OU
NC
IL)
Sche
dule
2 -
Exte
rnal
ly R
estri
cted
and
End
owm
ent F
unds
Year
end
ed M
arch
31,
201
7, w
ith c
ompa
rativ
e in
form
atio
n fo
r 201
6
Fund
Tran
sfer
Awar
dsFu
ndBa
lanc
e of
bala
nces
,fro
man
dba
lanc
es,
Endo
wm
ent
begi
nnin
gC
ontri
butio
nsop
erat
ing
Inve
stm
ent
expe
nses
end
of20
17Fu
ndof
yea
rre
ceiv
edfu
ndin
com
epa
idye
ar*
(not
e 4)
The
Cha
lmer
s Fa
mily
Fun
d$
–$
21,2
30,4
92$
–$
–$
2,86
5,01
4$
(1,5
47,7
30)
$ 22
,547
,776
Th
e O
skar
Mor
awet
zM
emor
ial F
und
26,0
0026
4,45
4–
– 39
,196
(23,
852)
279,
798
Dr.
Hei
nz U
nger
Scho
lars
hip
Fund
17,2
3580
,829
––
13,2
34(1
,301
)92
,762
The
Lesl
ie B
ell S
chol
arsh
ip F
und
9,07
814
5,96
6–
7,00
020
,923
(12,
039)
161,
850
The
Vida
Pee
ne F
und
–12
7,46
115
,444
–17
,201
(17,
690)
142,
416
The
John
Hirs
ch M
emor
ial F
und
–60
,391
– –
8,14
9(8
00)
67,7
40Th
e C
anad
ian
Mus
ic C
entre
Jo
hn A
dask
in M
emor
ial F
und
17,9
9822
,215
– –
5,42
7(5
34)
27,1
08C
olle
en P
eter
son
Song
writ
ing
Fund
–16
,733
– –
2,25
8(1
,758
)17
,233
The
Rut
h Sc
hwar
tzFu
nd–
6,60
5–
– 89
2(3
18)
7,17
9
$ 70
,311
$
21,9
55,1
46
$ 15
,444
$
7,00
0 $
2,97
2,29
4 $
(1,6
06,0
22)
$ 23
,343
,862
Fund
Tran
sfer
Awar
dsFu
ndBa
lanc
e of
bala
nces
,fro
man
dba
lanc
es,
Endo
wm
ent
begi
nnin
gC
ontri
butio
nsop
erat
ing
Inve
stm
ent
expe
nses
end
of20
16Fu
ndof
yea
rre
ceiv
edfu
ndin
com
epa
idye
ar*
(not
e 4)
The
Cha
lmer
s Fa
mily
Fun
d$
–$
22,4
24,2
71$
–$
–$
286,
888
$ (1
,480
,667
) $
21,2
30,4
92Th
e O
skar
Mor
awet
z M
emor
ial F
und
26,0
0028
3,80
6–
– 3,
964
(23,
316)
264,
454
Dr.
Hei
nz U
nger
Sch
olar
ship
Fun
d17
,235
88,6
08–
– 1,
354
(9,1
33)
80,8
29Th
e Le
slie
Bel
l Sch
olar
ship
Fun
d9,
078
138,
385
131
7,12
51,
886
(1,5
61)
145,
966
The
Vida
Pee
ne F
und
–12
9,72
47,
465
–1,
660
(11,
388)
127,
461
The
John
Hirs
ch M
emor
ial F
und
–60
,277
– –
771
(657
)60
,391
The
Can
adia
n M
usic
Cen
tre
John
Ada
skin
Mem
oria
l Fun
d17
,998
25,1
25–
– 55
2(3
,461
)22
,216
Col
leen
Pet
erso
n So
ngw
ritin
g Fu
nd–
17,6
96–
– 22
6(1
,189
)16
,733
The
Rut
h Sc
hwar
tz F
und
–6,
842
– –
87(3
25)
6,60
4
$ 70
,311
$
23,1
74,7
34
$ 7,
596
$ 7,
125
$ 29
7,38
8 $
(1,5
31,6
97)
$ 21
,955
,146
*Fun
d ba
lanc
es e
nd o
f yea
r inc
lude
unr
ealiz
ed g
ain
(loss
es) o
f $6,
956,
521
(201
6 - $
5,20
6,84
1)as
pre
sent
ed in
the
stat
emen
t of f
inan
cial
pos
ition
.
PUBLIC ACCOUNTS, 2016-2017 1-399


PUBLIC ACCOUNTS, 2016-2017 1-401
KPMG LLP Vaughan Metropolitan Centre 100 New Park Place, Suite 1400 Vaughan ON L4K 0J3 Canada Tel 905-265-5900 Fax 905-265-6390
KPMG LLP, is a Canadian limited liability partnership and a member firm of the KPMG network of independent member firms affiliated with KPMG International Cooperative (“KPMG International”), a Swiss entity. KPMG Canada provides services to KPMG LLP.
INDEPENDENT AUDITORS' REPORT
To the Trustees of The Royal Ontario Museum
We have audited the accompanying financial statements of The Royal Ontario Museum, which comprise the statement of financial position as at March 31, 2017, the statements of operations, changes in net deficit and cash flows for the year then ended, and notes, comprising a summary of significant accounting policies and other explanatory information.
Management's Responsibility for the Financial Statements
Management is responsible for the preparation and fair presentation of these financial statements in accordance with Canadian public sector accounting standards, and for such internal control as management determines is necessary to enable the preparation of financial statements that are free from material misstatement, whether due to fraud or error.
Auditors' Responsibility
Our responsibility is to express an opinion on these financial statements based on our audit. We conducted our audit in accordance with Canadian generally accepted auditing standards. Those standards require that we comply with ethical requirements and plan and perform the audit to obtain reasonable assurance about whether the financial statements are free from material misstatement.
An audit involves performing procedures to obtain audit evidence about the amounts and disclosures in the financial statements. The procedures selected depend on our judgment, including the assessment of the risks of material misstatement of the financial statements, whether due to fraud or error. In making those risk assessments, we consider internal control relevant to the entity's preparation and fair presentation of the financial statements in order to design audit procedures that are appropriate in the circumstances, but not for the purpose of expressing an opinion on the effectiveness of the entity's internal control. An audit also includes evaluating the appropriateness of accounting policies used and the reasonableness of accounting estimates made by management, as well as evaluating the overall presentation of the financial statements.
We believe that the audit evidence we have obtained is sufficient and appropriate to provide a basis for our audit opinion.
1-402 PUBLIC ACCOUNTS, 2016-2017

Opinion
In our opinion, the financial statements present fairly, in all material respects, the financial position of The Royal Ontario Museum as at March 31, 2017, and its results of operations and its cash flows for the year then ended in accordance with Canadian public sector accounting standards.
Chartered Professional Accountants, Licensed Public Accountants
June 22, 2017 Vaughan, Canada
PUBLIC ACCOUNTS, 2016-2017 1-403
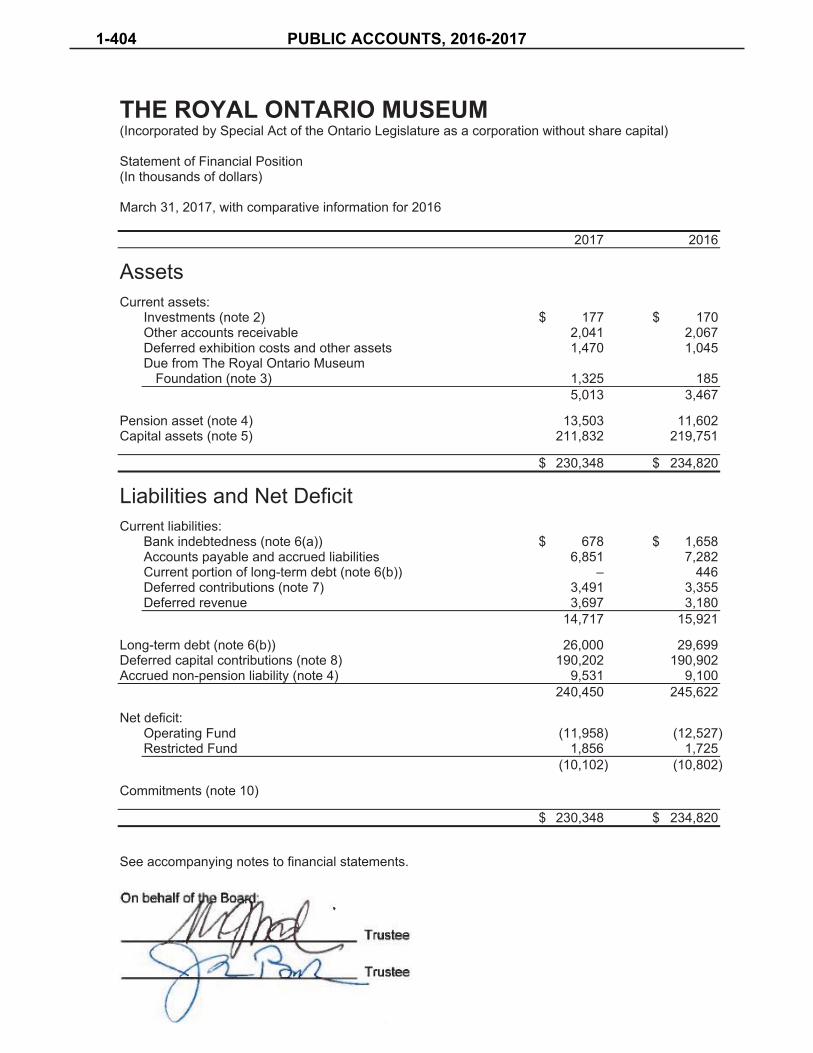
THE ROYAL ONTARIO MUSEUM (Incorporated by Special Act of the Ontario Legislature as a corporation without share capital)
Statement of Financial Position (In thousands of dollars)
March 31, 2017, with comparative information for 2016
2017 2016
Assets Current assets:
Investments (note 2) $ 177 $ 170 Other accounts receivable 2,041 2,067 Deferred exhibition costs and other assets 1,470 1,045 Due from The Royal Ontario Museum
Foundation (note 3) 1,325 185 5,013 3,467
Pension asset (note 4) 13,503 11,602 Capital assets (note 5) 211,832 219,751
$ 230,348 $ 234,820
Liabilities and Net Deficit Current liabilities:
Bank indebtedness (note 6(a)) $ 678 $ 1,658 Accounts payable and accrued liabilities 6,851 7,282 Current portion of long-term debt (note 6(b)) – 446Deferred contributions (note 7) 3,491 3,355Deferred revenue 3,697 3,180
14,717 15,921
Long-term debt (note 6(b)) 26,000 29,699 Deferred capital contributions (note 8) 190,202 190,902 Accrued non-pension liability (note 4) 9,531 9,100
240,450 245,622
Net deficit: Operating Fund (11,958) (12,527) Restricted Fund 1,856 1,725
(10,102) (10,802)
Commitments (note 10)
$ 230,348 $ 234,820
See accompanying notes to financial statements.
1-404 PUBLIC ACCOUNTS, 2016-2017
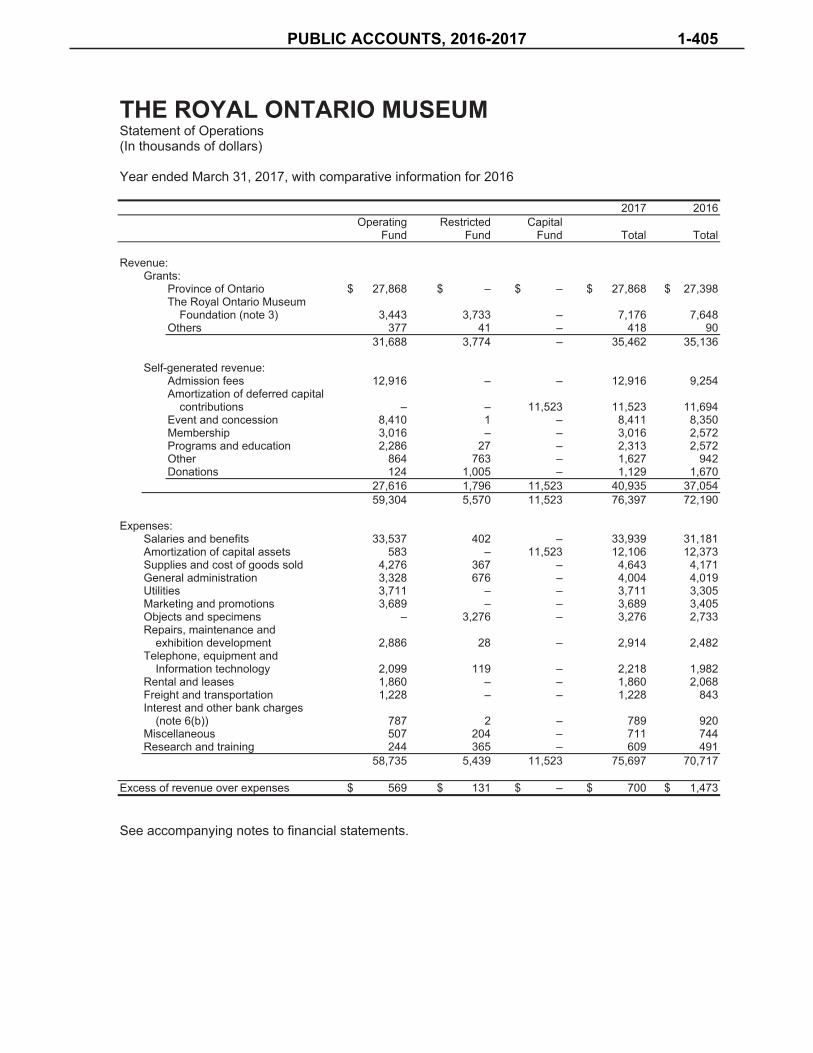
THE ROYAL ONTARIO MUSEUM Statement of Operations (In thousands of dollars)
Year ended March 31, 2017, with comparative information for 2016
2017 2016Operating Restricted Capital
Fund Fund Fund Total Total
Revenue: Grants:
Province of Ontario $ 27,868 $ – $ – $ 27,868 $ 27,398The Royal Ontario Museum
Foundation (note 3) 3,443 3,733 – 7,176 7,648 Others 377 41 – 418 90
31,688 3,774 – 35,462 35,136
Self-generated revenue: Admission fees 12,916 – – 12,916 9,254 Amortization of deferred capital
contributions – – 11,523 11,523 11,694 Event and concession 8,410 1 – 8,411 8,350 Membership 3,016 – – 3,016 2,572Programs and education 2,286 27 – 2,313 2,572 Other 864 763 – 1,627 942Donations 124 1,005 – 1,129 1,670
27,616 1,796 11,523 40,935 37,054 59,304 5,570 11,523 76,397 72,190
Expenses: Salaries and benefits 33,537 402 – 33,939 31,181 Amortization of capital assets 583 – 11,523 12,106 12,373 Supplies and cost of goods sold 4,276 367 – 4,643 4,171 General administration 3,328 676 – 4,004 4,019 Utilities 3,711 – – 3,711 3,305Marketing and promotions 3,689 – – 3,689 3,405 Objects and specimens – 3,276 – 3,276 2,733 Repairs, maintenance and
exhibition development 2,886 28 – 2,914 2,482 Telephone, equipment and
Information technology 2,099 119 – 2,218 1,982 Rental and leases 1,860 – – 1,860 2,068 Freight and transportation 1,228 – – 1,228 843 Interest and other bank charges
(note 6(b)) 787 2 – 789 920 Miscellaneous 507 204 – 711 744Research and training 244 365 – 609 491
58,735 5,439 11,523 75,697 70,717
Excess of revenue over expenses $ 569 $ 131 $ – $ 700 $ 1,473
See accompanying notes to financial statements.
PUBLIC ACCOUNTS, 2016-2017 1-405
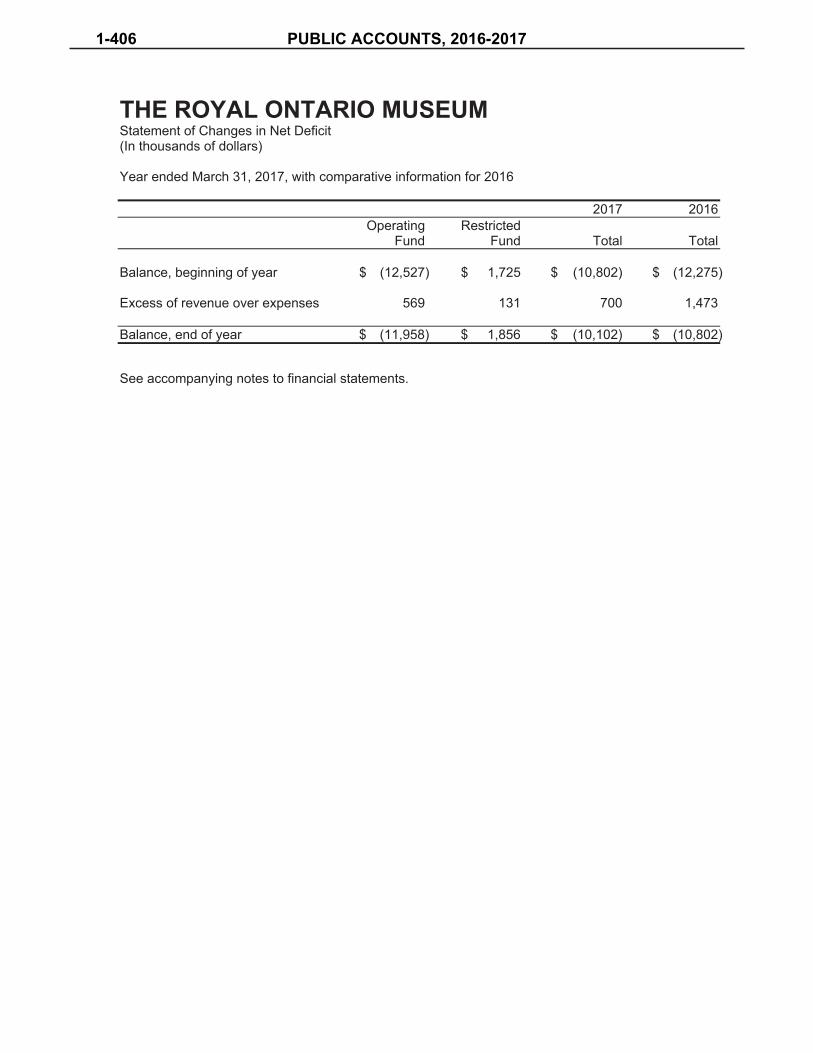
THE ROYAL ONTARIO MUSEUM Statement of Changes in Net Deficit (In thousands of dollars)
Year ended March 31, 2017, with comparative information for 2016
2017 2016 Operating Restricted
Fund Fund Total Total
Balance, beginning of year $ (12,527) $ 1,725 $ (10,802) $ (12,275)
Excess of revenue over expenses 569 131 700 1,473
Balance, end of year $ (11,958) $ 1,856 $ (10,102) $ (10,802)
See accompanying notes to financial statements.
1-406 PUBLIC ACCOUNTS, 2016-2017
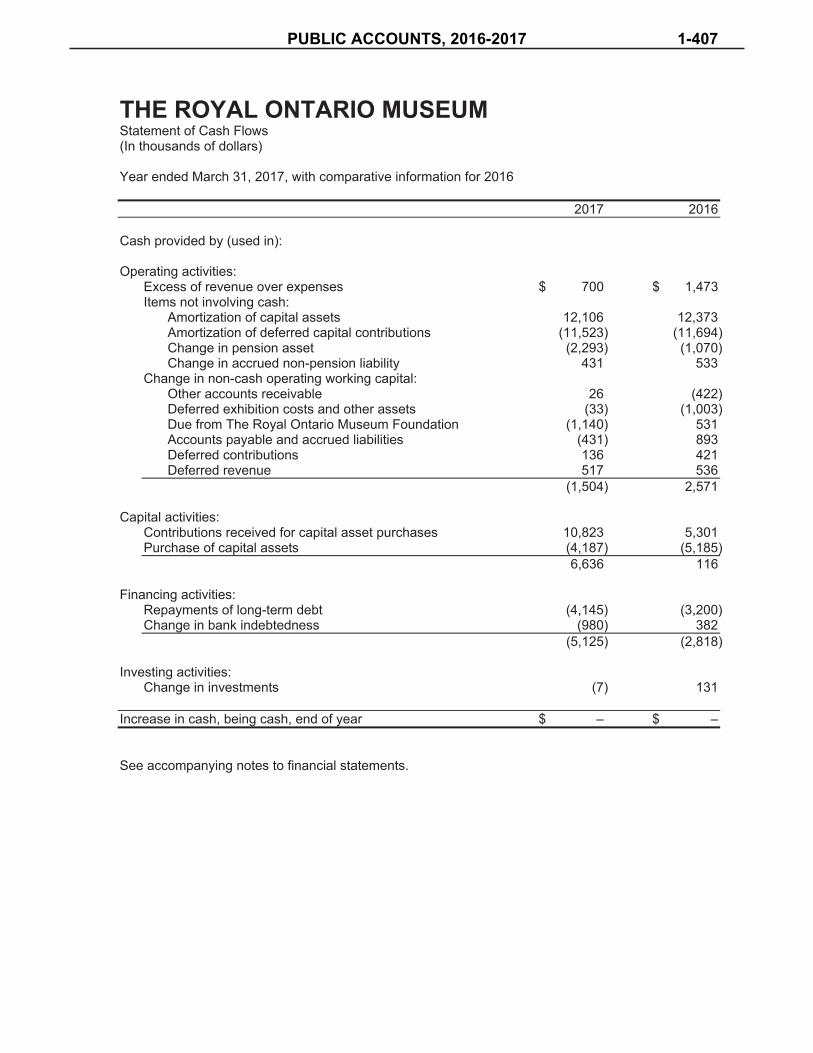
THE ROYAL ONTARIO MUSEUM Statement of Cash Flows (In thousands of dollars)
Year ended March 31, 2017, with comparative information for 2016
2017 2016
Cash provided by (used in):
Operating activities: Excess of revenue over expenses $ 700 $ 1,473 Items not involving cash:
Amortization of capital assets 12,106 12,373 Amortization of deferred capital contributions (11,523) (11,694)Change in pension asset (2,293) (1,070) Change in accrued non-pension liability 431 533
Change in non-cash operating working capital: Other accounts receivable 26 (422) Deferred exhibition costs and other assets (33) (1,003)Due from The Royal Ontario Museum Foundation (1,140) 531 Accounts payable and accrued liabilities (431) 893Deferred contributions 136 421 Deferred revenue 517 536
(1,504) 2,571
Capital activities: Contributions received for capital asset purchases 10,823 5,301 Purchase of capital assets (4,187) (5,185)
6,636 116
Financing activities:Repayments of long-term debt (4,145) (3,200) Change in bank indebtedness (980) 382
(5,125) (2,818)
Investing activities: Change in investments (7) 131
Increase in cash, being cash, end of year $ – $ –
See accompanying notes to financial statements.
PUBLIC ACCOUNTS, 2016-2017 1-407

THE ROYAL ONTARIO MUSEUM Notes to Financial Statements (In thousands of dollars)
Year ended March 31, 2017
The Royal Ontario Museum (the "Museum") is an operating enterprise agency of the Province of Ontario incorporated without share capital by Special Act of the Ontario Legislature. The Museum is Canada's largest museum and one of the few of its kind to explore and exhibit both the art and archaeology of human cultures and the history of the natural world. The Museum's mission is to inspire wonder and build understanding of human cultures and the natural world.
The Museum is registered as a charitable organization under the Income Tax Act (Canada) (the "Act") and, as such, is exempt from income taxes and is able to issue donation receipts for income tax purposes. In order to maintain its status as a registered charity under the Act, the Museum must meet certain requirements within the Act. In the opinion of management, these requirements have been met.
The Museum's multi-year business plan and ongoing forecasts and projections to the Ministry of Tourism, Culture and Sport show that the Museum should be able to operate within the level of its current facility. The Board of Trustees and management will continue to monitor progress to ensure business risks are effectively managed.
1. Significant accounting policies:
The financial statements have been prepared in accordance with Canadian public sectoraccounting standards, including the 4200 standards for government not-for-profit organizations("Standards").
(a) Fund accounting:
For financial reporting purposes, the accounts have been classified into the following funds:
(i) Operating Fund:
The Operating Fund accounts for the Museum's general programs, fundraising andadministrative activities. The Operating Fund reports resources available for immediatepurposes.
(ii) Restricted Fund:
The Restricted Fund consists of those funds where resources are to be used for anidentified purpose as specified by the donors and funders.
1-408 PUBLIC ACCOUNTS, 2016-2017

THE ROYAL ONTARIO MUSEUM Notes to Financial Statements (continued) (In thousands of dollars)
Year ended March 31, 2017
1. Significant accounting policies (continued):
(iii) Capital Fund:
The Capital Fund reports the revenue and expenses related to the Museum's building,building improvements, galleries and the Renaissance ROM Project ("ROM Project").
(b) Revenue recognition:
The Museum follows the deferral method of accounting for contributions, which includegrants and self-generated revenue. Contributions are recognized as revenue whenreceived or receivable if the amount to be received can be reasonably estimated andcollection is reasonably assured. Donations are recorded on a cash basis since pledgesare not legally enforceable claims.
Externally restricted contributions are deferred and recognized as revenue in the year inwhich the related expenses are recognized. Externally restricted contributions for thepurchase of land are credited directly to net assets. Externally restricted contributions forthe purchase of other capital assets are deferred and amortized over the life of the relatedcapital asset.
Membership fees are deferred and recognized as revenue over the term covered by thefees.
Admission fees, museum programs and ancillary services revenue are recorded asrevenue when the services have been provided or the goods delivered.
(c) Financial instruments:
Financial instruments are recorded at fair value on initial recognition. Derivativeinstruments and equity instruments that are quoted in an active market are reported at fairvalue. All other financial instruments are subsequently recorded at cost or amortized cost.Management records all investments at fair value as they are managed and evaluated on afair value basis. Long-term debt is recorded at cost.
Unrealized changes in fair value are recognized, when material, in the statement ofremeasurement gains and losses until they are realized, when they are transferred to thestatement of operations. A statement of remeasurement gains/losses has not beenincluded in these financial statements as the adjustments are not material.
PUBLIC ACCOUNTS, 2016-2017 1-409

THE ROYAL ONTARIO MUSEUM Notes to Financial Statements (continued) (In thousands of dollars)
Year ended March 31, 2017
1. Significant accounting policies (continued):
Transaction costs incurred on the acquisition of financial instruments measured subsequently at fair value are expensed as incurred.
All financial assets are assessed for impairment on an annual basis. When a decline is determined to be other than temporary, the amount of the loss is reported in the statement of operations.
The Standards require an organization to classify fair value measurements using a fair value hierarchy, which includes three levels of information that may be used to measure fair value:
Level 1 - unadjusted quoted market prices in active markets for identical assets orliabilities;
Level 2 - observable or corroborated inputs, other than Level 1, such as quoted pricesfor similar assets or liabilities in inactive markets or market data for substantially the fullterm of the assets or liabilities; and
Level 3 - unobservable inputs that are supported by little or no market activity and thatare significant to the fair value of the assets and liabilities.
Derivative financial instruments are contracts that provide the opportunity to exchange cash flows that are determined by applying certain rates, indices or changes to notional contract amounts. From time to time, the Museum uses interest rate swaps to manage exposure to fluctuations in interest rates and forward foreign currency contracts to manage exposure to fluctuations in exchange rates. These instruments are used for hedging an on-statement of financial position liability or a future contractual obligation.
Derivative financial instruments are carried at fair value. As at March 31, 2017, there are no derivative instruments held by the Museum.
(d) Deferred exhibition costs:
Costs of exhibitions are deferred until the exhibitions are opened to the public and then areexpensed over the year of the exhibitions to which they relate.
1-410 PUBLIC ACCOUNTS, 2016-2017

THE ROYAL ONTARIO MUSEUM Notes to Financial Statements (continued) (In thousands of dollars)
Year ended March 31, 2017
1. Significant accounting policies (continued):
(e) Deferred membership costs:
Goods and Services costs of memberships are deferred to match membership fees.(note 1(b)).
(f) Employee future benefits:
The Museum provides retirement and other future benefits for substantially all retirees andemployees. These future benefits include registered and supplemental defined benefitpensions, which are based on a formula that takes into account earnings and length ofservice, supplemental defined contribution pension benefits, which are based on earningsin excess of those covered under the registered plan, and post-employment and post-retirement health and dental benefits. The supplemental pension plans and the other futurebenefits are unfunded with benefits paid directly by the Museum.
The Museum's registered defined benefit pension plan was merged with The Colleges ofApplied Arts and Technology Pension Plan (the "CAAT Plan") effective January 1, 2016(the "Merger"), which is a jointly sponsored pension plan. The CAAT Plan is financed bycontributions from participating members and participating employers, and by investmentearnings. Information on the funding policy and total financial status of the CAAT Plan canbe found in the CAAT Plan's Annual Report. Obligations for current and former Museumemployees represent 1.2% of total CAAT Plan obligations.
The Museum is accounting for its participation in the CAAT Plan as a defined benefitpension plan. The Merger was approved in late 2016 and assets transferred December 19,2016. For the fiscal year ending March 31, 2016, the Museum expensed what the benefitcost would have been in the absence of the Merger as Merger approval was pending atthat time. For the fiscal year ending March 31, 2017, the Museum maintained definedbenefit plan accounting and expensed what the benefit cost was for the Museum's portionof the CAAT Plan as if the Merger was effective at the beginning of the fiscal year atMarch 31, 2016. Certain comparative amounts have been restated/reclassified to conformwith the presentation adopted in the current period.
PUBLIC ACCOUNTS, 2016-2017 1-411

THE ROYAL ONTARIO MUSEUM Notes to Financial Statements (continued) (In thousands of dollars)
Year ended March 31, 2017
1. Significant accounting policies (continued):
The Museum accrues its obligations under the defined benefit plans as the employees render the services necessary to earn the pension, compensated absences and other retirement benefits. The actuarial determination of the accrued benefit obligations for pensions and other retirement benefits uses the projected benefit method prorated on service (which incorporates management's best estimate of future salary levels, other cost escalation, retirement ages of employees and other actuarial factors).
The most recent actuarial valuation of the CAAT Plan was as at January 1, 2017. The most recent actuarial valuation of the supplementary pension arrangements was as at March 31, 2016. The most recent actuarial valuation of the non-pension plans for accounting purposes was as at March 31, 2015. Actuarial valuations are performed at least every three years.
Actuarial gain (losses) on plan assets arise from the difference between the actual return on plan assets for a period and the expected return on plan assets for that period. Actuarial gains (losses) on the accrued benefit obligation arise from differences between actual and expected experience and from changes in the actuarial assumptions used to determine the accrued benefit obligation. Actuarial gains (losses) in a year are amortized over the average remaining service period of active employees beginning in the following year. The estimated average remaining service period as at April 1, 2016 of the active employees covered by the pension plan is 9 years for the registered plan and 2 years for the supplemental plan. The estimated average remaining service period at April 1, 2016 of the active employees covered by the non-pension plan is 12 years.
Past service costs arising from plan amendments are recognized immediately in the period the plan amendments occur.
Compensated absences, such as parental leaves, accumulated sick days, and sabbaticals that provide compensated, unrestricted time-off for past service, are accrued for as they vest or accumulate in the period in which employees render services to the Museum.
1-412 PUBLIC ACCOUNTS, 2016-2017

THE ROYAL ONTARIO MUSEUM Notes to Financial Statements (continued) (In thousands of dollars)
Year ended March 31, 2017
1. Significant accounting policies (continued):
(g) Capital assets:
Purchased capital assets are recorded at cost. Contributed capital assets are recorded atfair value at the date of contribution. Capital assets are amortized on a straight-line basisover the estimated useful lives of the assets as follows:
Building 40 years Galleries 20 years Building improvements 5 - 10 years Furniture and equipment 3 - 10 years
Construction in progress comprises direct construction and other costs associated with the ROM Project, including capitalized interest. Interest costs are capitalized during the construction period. No amortization is recorded until construction is substantially complete and the assets are ready for use.
(h) Foreign currency translation:
Foreign currency translations are recorded at the exchange rate at the time of thetransaction.
Assets and liabilities denominated in foreign currencies are recorded at fair value using theexchange rate at the financial statement date. Unrealized foreign exchange gains andlosses are recognized in the statement of remeasurement gains and losses when material.
In the year of settlement, the realized foreign exchange gains and losses are recognized inthe statement of operations and the unrealized balances are reversed from the statementof measurement gains and losses.
(i) Objects and specimens:
The value of objects and specimens has been excluded from the statement of financialposition. Gifted objects and specimens are recorded as revenue at values based onappraisals by independent appraisers. The acquisition of both gifted and purchasedobjects and specimens is expensed.
PUBLIC ACCOUNTS, 2016-2017 1-413

THE ROYAL ONTARIO MUSEUM Notes to Financial Statements (continued) (In thousands of dollars)
Year ended March 31, 2017
1. Significant accounting policies (continued):
(j) Contributed materials and services:
Contributed materials and services are recorded only if the fair value can be reasonablyestimated at the date of contribution and when the materials and services are used in thenormal course of the Museum's operations. Contributed materials and services in theamount of $980 (2016 - $1,518) have been recorded as revenue and expenses.
(k) Use of estimates:
The preparation of financial statements requires management to make estimates andassumptions that affect the reported amounts of assets and liabilities and disclosure ofcontingent assets and liabilities at the date of the financial statements and the reportedamounts of revenue and expenses during the year. Significant items subject to suchestimates and assumptions include the useful lives of capital assets, and assets andobligations related to employee future benefits. Actual amounts could differ from thoseestimates.
2. Investments:
Fair value Level 2017 2016
Bond funds 2 $ 153 $ 146 Preferred securities 1 24 24
$ 177 $ 170
3. The Royal Ontario Museum Foundation:
The Royal Ontario Museum Foundation (the "Foundation") was incorporated on July 1, 1992 tocoordinate all private-sector fundraising activities undertaken on behalf of the Museum and itsaffiliates. The objective of the Foundation is to raise funds available for enhancing exhibitionsand public programs, research, acquisitions and capital projects.
1-414 PUBLIC ACCOUNTS, 2016-2017

THE ROYAL ONTARIO MUSEUM Notes to Financial Statements (continued) (In thousands of dollars)
Year ended March 31, 2017
3. The Royal Ontario Museum Foundation (continued):
The accounts of the Foundation are presented separately and are not consolidated in thesefinancial statements. The fund balances of the Foundation as at its most recent fiscal year end,March 31, are as follows:
2017 2016
General funds $ 1,233 $ (1,092) Restricted funds available currently 15,756 11,657 Endowment funds:
Externally restricted 32,153 28,906 Internally restricted 12,607 11,774
$ 61,749 $ 51,245
During the year ended March 31, 2017, the Foundation granted $12,800 (2016 - $10,630) to the Museum. Of this amount, $5,663 (2016 - $3,152) was recorded as an increase in deferred capital contributions in connection with the ROM Project (note 8) and $3,207 (2016 - $3,148) was recorded as deferred contributions for purposes other than the ROM Project (note 7).
Amounts due from the Foundation are non-interest bearing and have no fixed terms of repayment.
4. Employee benefits:
The benefits expense arising during the period for the Museum's pension and non-pensionplans is as follows:
Pension Non-pension 2017 2016 2017 2016
Current period benefit cost $ 1,136 $ 1,325 $ 399 $ 437 Interest cost on accrued benefit
obligation 5,648 5,191 272 242Expected return on market-related
value of plan assets (6,106) (5,743) – –Amortization of actuarial losses
(gains) 670 309 (83) 7
Benefits expense $ 1,348 $ 1,082 $ 588 $ 686
PUBLIC ACCOUNTS, 2016-2017 1-415
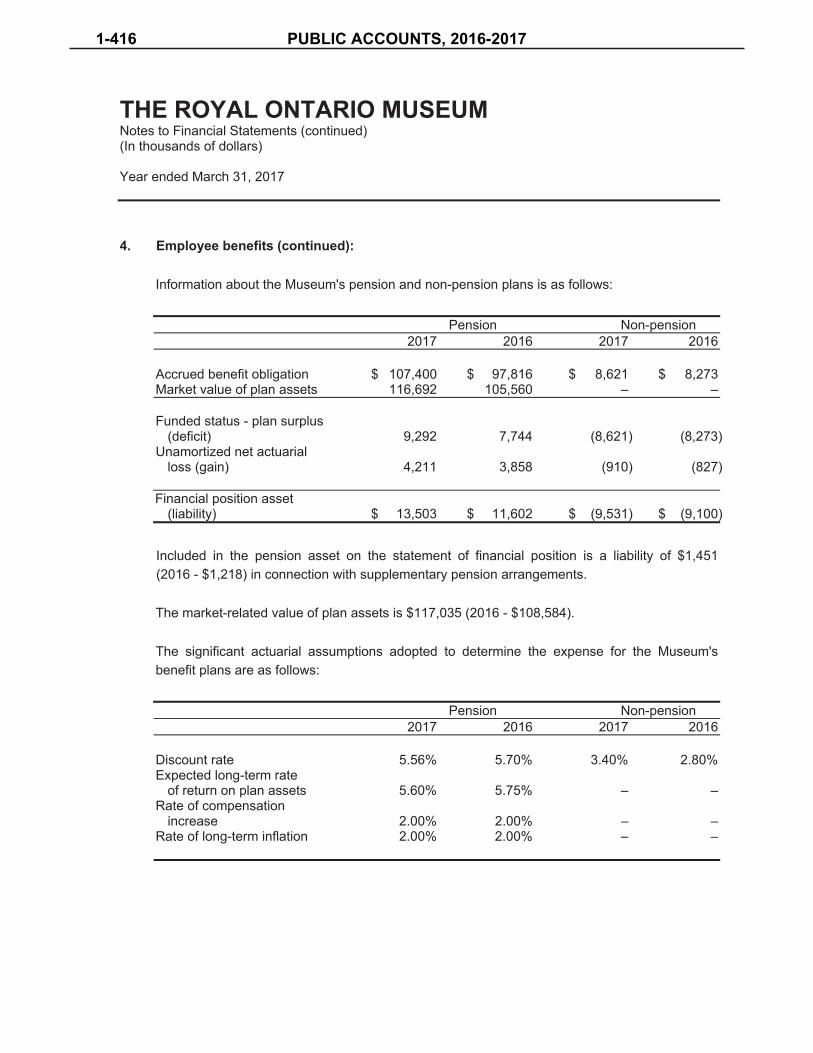
THE ROYAL ONTARIO MUSEUM Notes to Financial Statements (continued) (In thousands of dollars)
Year ended March 31, 2017
4. Employee benefits (continued):
Information about the Museum's pension and non-pension plans is as follows:
Pension Non-pension 2017 2016 2017 2016
Accrued benefit obligation $ 107,400 $ 97,816 $ 8,621 $ 8,273 Market value of plan assets 116,692 105,560 – –
Funded status - plan surplus (deficit) 9,292 7,744 (8,621) (8,273)
Unamortized net actuarial loss (gain) 4,211 3,858 (910) (827)
Financial position asset (liability) $ 13,503 $ 11,602 $ (9,531) $ (9,100)
Included in the pension asset on the statement of financial position is a liability of $1,451 (2016 - $1,218) in connection with supplementary pension arrangements.
The market-related value of plan assets is $117,035 (2016 - $108,584).
The significant actuarial assumptions adopted to determine the expense for the Museum's benefit plans are as follows:
Pension Non-pension 2017 2016 2017 2016
Discount rate 5.56% 5.70% 3.40% 2.80%Expected long-term rate
of return on plan assets 5.60% 5.75% – –Rate of compensation
increase 2.00% 2.00% – –Rate of long-term inflation 2.00% 2.00% – –
1-416 PUBLIC ACCOUNTS, 2016-2017

THE ROYAL ONTARIO MUSEUM Notes to Financial Statements (continued) (In thousands of dollars)
Year ended March 31, 2017
4. Employee benefits (continued):
The significant actuarial assumptions adopted in measuring the accrued benefit assets andliabilities of the Museum's benefit plans are as follows:
Pension Non-pension 2017 2016 2017 2016
Discount rate 5.56% 5.46% 3.50% 3.40% Rate of compensation
increase 3.00% 2.00% – –Rate of long-term inflation 2.00% 2.00% – –
For measurement purposes of the non-pension plans as at March 31, 2017, an initial weighted average increase in the cost of health care and dental benefits of 5.54% in 2017 was assumed decreasing to a 4.50% annual rate of increase after 2028.
Other information about the Museum's pension and non-pension plans is as follows:
Pension Non-pension 2017 2016 2017 2016
Employee contributions $ 2,100 $ 1,782 $ – $ – Employer contributions 3,248 2,545 157 153 Benefits paid 4,430 5,174 157 153 Loss (gain) during the period on
accrued benefit obligation 5,131 2,069 (166) (1,081)Actual return on market
value of assets 10,214 (3,322) – –
The 2016 and 2017 contributions reflect contributions to the Museum registered defined benefit pension plan through December 31, 2015 and contributions to the CAAT Plan thereafter.
The measurement date for the benefit plans was March 31, 2017.
PUBLIC ACCOUNTS, 2016-2017 1-417

THE ROYAL ONTARIO MUSEUM Notes to Financial Statements (continued) (In thousands of dollars)
Year ended March 31, 2017
5. Capital assets:
2017 2016Accumulated Net book Net book
Cost amortization value value
Land $ 931 $ – $ 931 $ 931 Building 46,113 38,196 7,917 9,073Galleries 44,551 26,580 17,971 18,690Building improvements 37,788 23,334 14,454 13,403ROM Project:
Building 204,516 55,397 149,119 154,767Galleries 36,144 18,904 17,240 19,087
Furniture and equipment 9,079 4,879 4,200 3,800
$ 379,122 $ 167,290 $ 211,832 $ 219,751
As at March 31, 2017, the total cost of assets included assets which are under construction. These assets are not in use and to date have not been amortized. The cost of these assets is $9,193 (2016 - $4,472).
6. Credit facilities:
(a) The Museum has a credit agreement with the Museum's banker, as follows:
(i) $5,000 demand revolving operating credit facility with interest payable at prime less10-basis-points (2017 - 2.7%; 2016 - 2.6%). As at March 31, 2017, the outstandingbalance in connection with this facility was $678 (2016 - $1,658).
(ii) $2,000 letter of credit facility. As at March 31, 2017 and 2016, the Museum had noletters of credit outstanding.
(b) On June 29, 2011, the Museum and the Ontario Financing Authority ("OFA") executed anamended agreement that includes a revised payment schedule through March 31, 2027.Under the terms of the agreement, the loan consists of fixed rate and floating rate portions.During the year, the Museum paid off the remainder of the fixed rate portion of the loan.
1-418 PUBLIC ACCOUNTS, 2016-2017
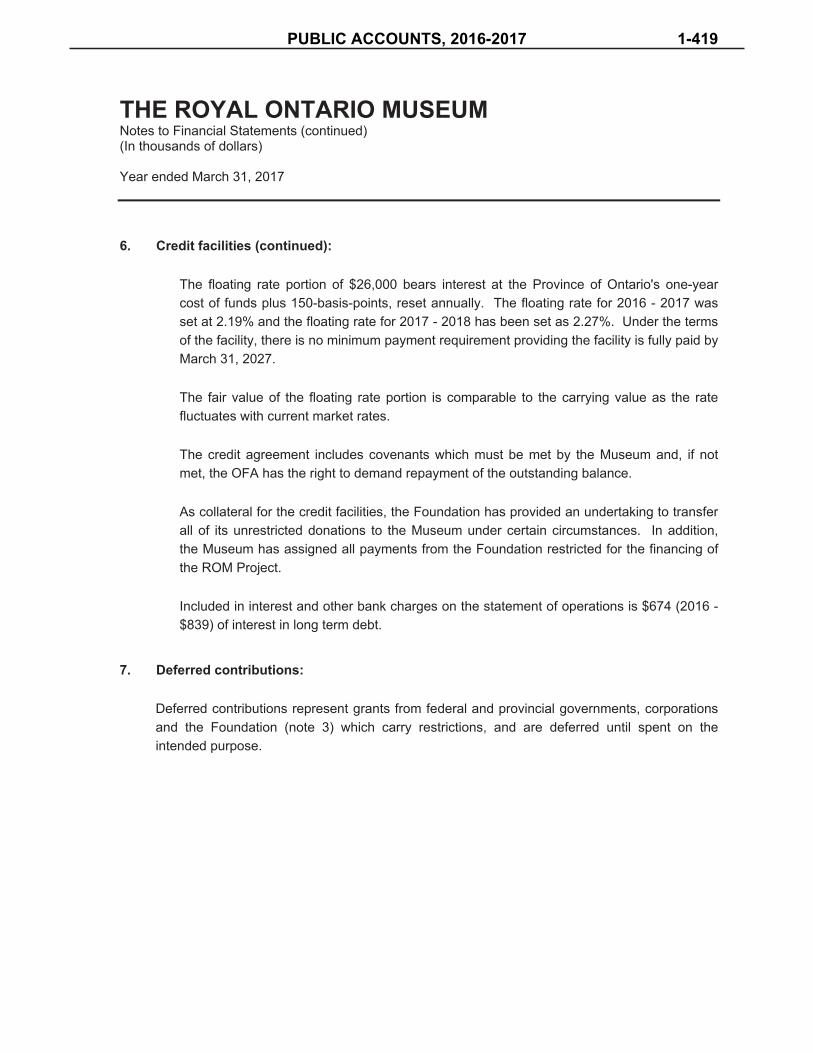
THE ROYAL ONTARIO MUSEUM Notes to Financial Statements (continued) (In thousands of dollars)
Year ended March 31, 2017
6. Credit facilities (continued):
The floating rate portion of $26,000 bears interest at the Province of Ontario's one-year cost of funds plus 150-basis-points, reset annually. The floating rate for 2016 - 2017 was set at 2.19% and the floating rate for 2017 - 2018 has been set as 2.27%. Under the terms of the facility, there is no minimum payment requirement providing the facility is fully paid by March 31, 2027.
The fair value of the floating rate portion is comparable to the carrying value as the rate fluctuates with current market rates.
The credit agreement includes covenants which must be met by the Museum and, if not met, the OFA has the right to demand repayment of the outstanding balance.
As collateral for the credit facilities, the Foundation has provided an undertaking to transfer all of its unrestricted donations to the Museum under certain circumstances. In addition, the Museum has assigned all payments from the Foundation restricted for the financing of the ROM Project.
Included in interest and other bank charges on the statement of operations is $674 (2016 - $839) of interest in long term debt.
7. Deferred contributions:
Deferred contributions represent grants from federal and provincial governments, corporationsand the Foundation (note 3) which carry restrictions, and are deferred until spent on theintended purpose.
PUBLIC ACCOUNTS, 2016-2017 1-419

THE ROYAL ONTARIO MUSEUM Notes to Financial Statements (continued) (In thousands of dollars)
Year ended March 31, 2017
8. Deferred capital contributions:
Deferred capital contributions represent the unamortized amount and unspent amount of grantsand donations received for the purchase of capital assets and gallery development. Theamortization of deferred capital contributions is recorded as revenue in the statement ofoperations. The changes in the deferred capital contributions balance are as follows:
2017 2016
Balance, beginning of year $ 190,902 $ 197,295 Amortization of deferred capital contributions (11,523) (11,694)Contributions received for capital asset
purchases (note 3) 10,823 5,301
Balance, end of year $ 190,202 $ 190,902
9. Financial risks:
(a) Credit risk:
Credit risk refers to the risk that a counterparty may default on its contractual obligations,resulting in a financial loss. The Museum is exposed to credit risk with respect to otheraccounts receivable. However, it does not expect counterparties to fail to meet theirobligations given their high credit rating. There have been no significant changes to thecredit risk exposure from 2016.
(b) Liquidity risk:
Liquidity risk is the risk that the Museum will be unable to fulfill its obligations on a timelybasis or at a reasonable cost. The Museum manages its liquidity risk by monitoring itsoperating requirements. The Museum prepares budget and cash forecasts to ensure it hassufficient funds to fulfill its obligations. The contractual maturities of long-term debt aredisclosed in note 6. There have been no significant changes to the liquidity risk exposurefrom 2016.
1-420 PUBLIC ACCOUNTS, 2016-2017

THE ROYAL ONTARIO MUSEUM Notes to Financial Statements (continued) (In thousands of dollars)
Year ended March 31, 2017
9. Financial risks (continued):
(c) Market risk:
Market risk is the risk that changes in market prices, such as foreign exchange rates orinterest rates, will affect the Museum's income or the value of its holdings of financialinstruments. The objective of market risk management is to control market risk exposureswithin acceptable parameters while optimizing return on investment. There have been nosignificant changes to the market's risk exposures from 2016.
(i) Currency risk:
The Museum is exposed to financial risks as a result of exchange rate fluctuations andthe volatility of these rates with respect to contractual obligations payable in foreigncurrencies.
(ii) Interest rate risk:
Interest rate risk is the risk that the fair value of future cash flows or a financialinstrument will fluctuate because of changes in the market interest rates. Financialassets and financial liabilities with variable interest rates expose the Museum to cashflow interest rate risk. The Museum is exposed to this risk through its floating rateinterest-bearing long-term debt. The Museum mitigates interest rate risk by enteringinto derivative financial instruments from time to time, as well as by holding primarilydebt issued by the financial institutions.
10. Commitments:
The Museum's future commitments under long-term leases for equipment are as follows:
2018 $ 2082019 2082020 1752021 10
PUBLIC ACCOUNTS, 2016-2017 1-421

THE ROYAL ONTARIO MUSEUM Notes to Financial Statements (continued) (In thousands of dollars)
Year ended March 31, 2017
11. Comparative information:
Certain comparative information has been reclassified to conform with the financial statementpresentation adopted in the current year.
1-422 PUBLIC ACCOUNTS, 2016-2017

When available, they will be posted to the website: www.ontario.ca.
PUBLIC ACCOUNTS, 2016-2017 1-423


PUBLIC ACCOUNTS, 2016-2017 1-425

Independent Auditor's Report
To the Board of Directors ofToronto Waterfront Revitalization CorporationWe have audited the accompanying financial statements of Toronto Waterfront RevitalizationCorporation, which comprise the statement of financial position as at March 31, 2017, and thestatements of financial activities, remeasurement gains and losses, changes in net assets and cashflows for the year then ended, and a summary of significant accounting policies and otherexplanatory information.
Management's Responsibility for the Financial StatementsManagement is responsible for the preparation and fair presentation of these financial statementsin accordance with Canadian public sector accounting standards, and for such internal control asmanagement determines is necessary to enable the preparation of financial statements that arefree from material misstatement, whether due to fraud or error.
Auditor's ResponsibilityOur responsibility is to express an opinion on these financial statements based on our audit. Weconducted our audit in accordance with Canadian generally accepted auditing standards. Thosestandards require that we comply with ethical requirements and plan and perform the audit toobtain reasonable assurance about whether the financial statements are free from materialmisstatement.
An audit involves performing procedures to obtain audit evidence about the amounts anddisclosures in the financial statements. The procedures selected depend on the auditors' judgment,including the assessment of the risks of material misstatement of the financial statements, whetherdue to fraud or error. In making those risk assessments, the auditor considers internal controlrelevant to the entity's preparation and fair presentation of the financial statements in order todesign audit procedures that are appropriate in the circumstances, but not for the purpose ofexpressing an opinion on the effectiveness of the entity's internal control. An audit also includesevaluating the appropriateness of accounting policies used and the reasonableness of accountingestimates made by management, as well as evaluating the overall presentation of the financialstatements.
We believe that the audit evidence we have obtained is sufficient and appropriate to provide abasis for our audit opinion.
OpinionIn our opinion, the financial statements present fairly, in all material respects, the financialposition of Toronto Waterfront Revitalization Corporation as at March 31, 2017, and the results ofits operations, its remeasurement gains and losses and its cash flows for the year then ended, inaccordance with Canadian public sector accounting standards.
Chartered Professional Accountants, Licensed Public AccountantsMississauga, OntarioJune 13, 2017
BDO Canada LLP, a Canadian limited liability partnership, is a member of BDO International Limited, a UK company limited by guarantee, and forms part of the international BDO network of independent member firms
Tel: 905 270-7700Fax: 905 270-7915 Toll-free: 866 248 6660 www.bdo.ca
BDO Canada LLP1 City Centre Drive, Suite 1700 Mississauga ON L5B 1M2 Canada
1-426 PUBLIC ACCOUNTS, 2016-2017

PUBLIC ACCOUNTS, 2016-2017 1-427

1-428 PUBLIC ACCOUNTS, 2016-2017
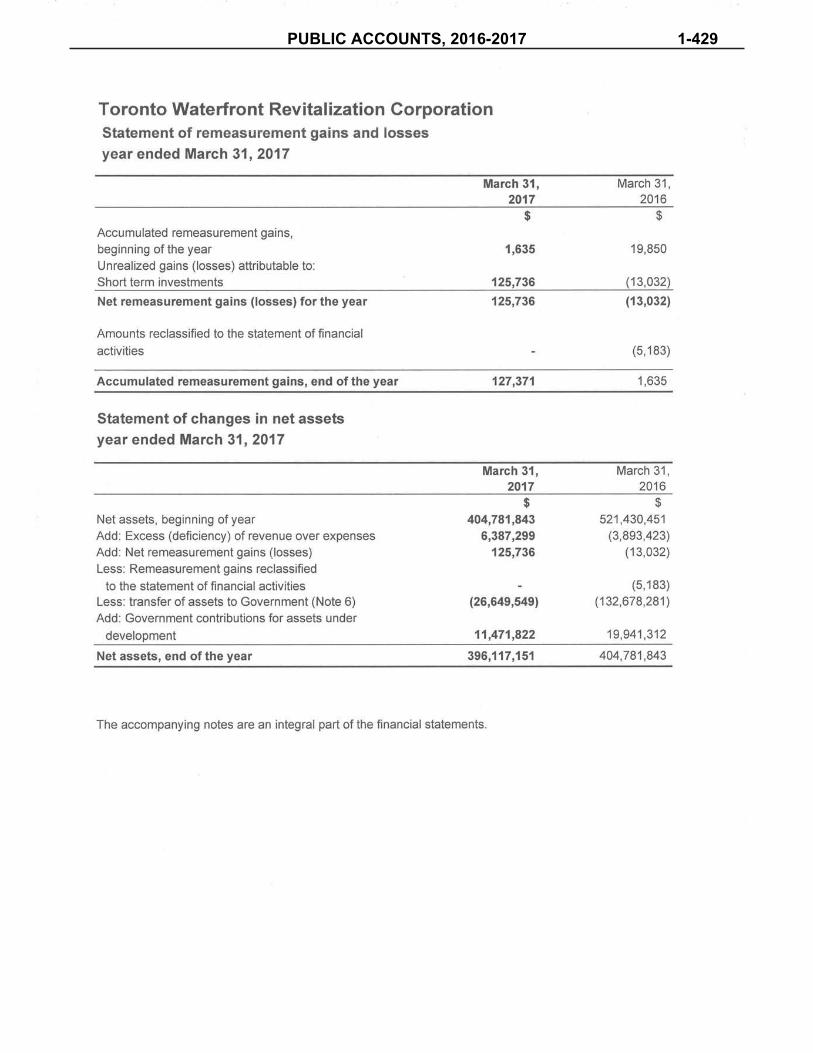
PUBLIC ACCOUNTS, 2016-2017 1-429

1-430 PUBLIC ACCOUNTS, 2016-2017

PUBLIC ACCOUNTS, 2016-2017 1-431

1-432 PUBLIC ACCOUNTS, 2016-2017
PUBLIC ACCOUNTS, 2016-2017 1-433
1-434 PUBLIC ACCOUNTS, 2016-2017

PUBLIC ACCOUNTS, 2016-2017 1-435

1-436 PUBLIC ACCOUNTS, 2016-2017

PUBLIC ACCOUNTS, 2016-2017 1-437

1-438 PUBLIC ACCOUNTS, 2016-2017

PUBLIC ACCOUNTS, 2016-2017 1-439

1-440 PUBLIC ACCOUNTS, 2016-2017

PUBLIC ACCOUNTS, 2016-2017 1-441

1-442 PUBLIC ACCOUNTS, 2016-2017