Financial Inclusion: Assessing Innovative Technology's impact ...
25
HAL Id: hal-02496410 https://hal.archives-ouvertes.fr/hal-02496410 Preprint submitted on 3 Mar 2020 HAL is a multi-disciplinary open access archive for the deposit and dissemination of sci- entific research documents, whether they are pub- lished or not. The documents may come from teaching and research institutions in France or abroad, or from public or private research centers. L’archive ouverte pluridisciplinaire HAL, est destinée au dépôt et à la diffusion de documents scientifiques de niveau recherche, publiés ou non, émanant des établissements d’enseignement et de recherche français ou étrangers, des laboratoires publics ou privés. Financial Inclusion: Assessing Innovative Technology’s impact on Financial Inclusion and Profitability of Financial Institutions in Cambodia Seyha Khek, Phon Sophat, Vety Meng To cite this version: Seyha Khek, Phon Sophat, Vety Meng. Financial Inclusion: Assessing Innovative Technology’s impact on Financial Inclusion and Profitability of Financial Institutions in Cambodia. 2020. hal-02496410
-
Upload
khangminh22 -
Category
Documents
-
view
0 -
download
0
Transcript of Financial Inclusion: Assessing Innovative Technology's impact ...

HAL Id: hal-02496410https://hal.archives-ouvertes.fr/hal-02496410
Preprint submitted on 3 Mar 2020
HAL is a multi-disciplinary open accessarchive for the deposit and dissemination of sci-entific research documents, whether they are pub-lished or not. The documents may come fromteaching and research institutions in France orabroad, or from public or private research centers.
L’archive ouverte pluridisciplinaire HAL, estdestinée au dépôt et à la diffusion de documentsscientifiques de niveau recherche, publiés ou non,émanant des établissements d’enseignement et derecherche français ou étrangers, des laboratoirespublics ou privés.
Financial Inclusion: Assessing Innovative Technology’simpact on Financial Inclusion and Profitability of
Financial Institutions in CambodiaSeyha Khek, Phon Sophat, Vety Meng
To cite this version:Seyha Khek, Phon Sophat, Vety Meng. Financial Inclusion: Assessing Innovative Technology’s impacton Financial Inclusion and Profitability of Financial Institutions in Cambodia. 2020. �hal-02496410�

1
Financial Inclusion: Assessing Innovative Technology's impact on Financial
Inclusion and Profitability of Financial Institutions in Cambodia
Seyha Kheka, Phon Sophatb and Vety Mengc
a,b, c National Bank of Cambodia, Cambodia b Cambodia Econometric Association, Cambodia
Abstract
This study aims to determine how Information Technology (IT) impacts financial inclusion
and strengthens the profit of commercial banks and MDIs in Cambodia using two-stage value
chain DEA technique. The model also provides the efficiency score and approached factors within
financial inclusion and profitability mechanism. The finding suggests that financial inclusion is
backed up by strong significant technology while profitability is anchored at 76.5 percent of total
banks’ profits. Furthermore, through the usage of IT-based transactions at 32 percent, banks and
financial institution could enhance 28 percent of profit, and 78 percent of ATMs has been used to
promote the access and financial usage. From these results, improving institutional IT adoption
could increase financial inclusion and achieves the profit efficiency.
Keywords: Financial inclusion, Profitability, Technology, two-stage Value Chain DEA
1. Introduction
Over the last decade, Cambodia has maintained an economic growth rate of 7 percent,
supported by garment, construction and real estate, tourism, and agriculture sector, while foreign
direct investments (FDIs) have contributed towards the economic growth in the country. The
Cambodia inflation has been manageable with an average of about 2.9 percent since decades.
Furthermore, the financial system in Cambodia is currently dominated by bank system
which are commercial banks, specialized banks and microfinances. In 2016, banking sector
expanded its assets around 27.8 billion US dollars, while credit and deposit increased to 17.6
billion US dollars and 15.4 billion US dollars, respectively. The liquidity ratio (LR) and its
Solvency Ratio (SR) have remained substantial levels at 128 percent and 22.4 percent respectively,

2
while the non-performing loan (NPL) ratio remains lower at 3.5 percent. In addition to that, there
exist various types of Microfinance institutions (MFIs) including deposit-taking and non-deposit-
taking microfinance institution so-called MDIs and MFIs, respectively. The liquidity and solvency
ratio are at a respectively higher level of 152 percent and 21 percent, and NPL ratio of MFIs is the
only 1 percent. These show that the banking system in Cambodia remains healthy and contributes
to the sustainable and inclusive economic growth. In the highly competitive banking sector in
Cambodia, Khek and Naenna (2015) show that the overall score of bank's performance performs
fairly good at around 76 percent in the whole banking system. This can be said that the banking
system employed its excess resources around 24 percent, indicating that the entire banking system
in Cambodia faces high operating cost and cost of fund, while the bank hardly increases their
domestic saving mobilization, and they have to charge high interest rates on its loan as well. With
these challenges, the National Bank of Cambodia (NBC) puts much effort to promote and ensure
equal and transparent competition by introducing new instruments, Liquidity Providing
Collateralized Operation (LPCO), to bank and financial institution that needs source of fund at a
low cost, particularly in Riel currency. However, resource utilization is still high cost, because
Cambodia is current high dollarization economy. Khek and Naenna (2015) also mentioned that the
bank should adopt customer satisfactions and new technology innovation to enhance financial
infrastructure to all people, particularly to the poor in rural areas, to meet consumer’s needs, to
promote financial inclusion, to reduce operational cost and to improve the performance efficiency
by ensuring financial stability and consumer protection. Hence, the NBC introduced FAST
payment system to promote financial inclusion in order to increase efficiency and lower cost in
line with Financial Sector Development Strategy 2011-2020 (FSDS) in 2016.
To accommodate the increasing demands from the public, Banks and MFIs have been
expanding their branch offices nationwide. As of 2016, there were 812 commercial and specialized
bank offices with 1,260 ATMs and 11,761 POS that provided financial services including
withdrawal, deposits, transfer, and payment, and there existed 4,154 and 2,083 of MFIs and
registered microfinance operator branches respectively operating in the whole country. In this
regards, the banking system in Cambodia plays a crucial role in promoting the access to and usage
of financial services to all people—both the rich and the poor in urban and rural areas through
expanding their branches and adopting advanced technology such as ATM, POS and other
financial technology (Fin-tech). These indicate that the presence of information technology (IT) in

3
the banking system has profound implications for financial inclusion as well as financial
productivity and the provision of financial services to the underserved the poor. Moreover, IT has
also vital roles to play in leveraging profitability and market share in economy, (Meepadung et al.
2009).
The great success of the banking sector in Cambodia depends on a sound performance of
each bank and financial institutions, therefore, understanding it inclusiveness is crucial for policy
formulation. A study examines financial inclusion1 and profitability efficiency of the banking
system in Cambodia, employing the data envelopment analysis (DEA) approach, which was first
introduced by Charnes, Cooper, and Rhodes (1978).
DEA is a non-parametric approach for measuring the relative performance efficiency of
decision-making units (DMUs) by converting complex multiple inputs to multiple outputs. DEA
has a lot of advantages because it does not require or assume any functioning relationship and
predetermined weighs between the inputs and outputs, and it offers efficiency rating score,
reference set as the best-practices and target level of improvement for inefficient DMUs to become
efficient (Charne et al., 1978; Chen & Zhu, 2004; Meepadung et al., 2009; Khek & Naenna, 2015).
There are substantial studies mostly applied DEA in assessing bank performance efficiency
and other financial institution (Chen & Zhu, 2004; Meepadung et al., 2009; Piot-Lepetit &
Nzongang, 2014; Khek & Naenna, 2015), and there exist a number of attempts used various
statistic approaches to measure financial inclusion across the countries (Klein & Mayer, 2011;
Demirguc-Kunt & Klapper 2012; Cámara &Tuesta, 2014; Amidžić et al. 2014; Sahay et al. 2015;
Gadanecz & Tissot, 2017), while there is limited empirical research to assess financial inclusion
linking to assess profitability among bank and financial institution. In addition, to measure
financial inclusion index, most studies focus on access to and usage of financial service; however,
there significant gaps exist; particularly, much information is missing on the usage and quality of
financial services and financial infrastructure and inadequate on access to finance likes the number
of bank account or mobile bank account (BIS report 2015; Amidžić et al. 2014). To fulfill the
1 Financial inclusion is treated as the capacity of the financial system which offers financial products and
services to all citizens which refers to operation efficiency (Microfinance Centre—Policy paper for the Europe 2020 strategic objectives)

4
literature of the previous studies, this paper covers the missing dimensions of financial access and
usage of financial services as well as the quality of financial services.
The objectives of this study aim to employ a two-stage value chain DEA application to
measure the financial inclusion and profitability efficiency score and to determine how IT can
impact financial inclusion and strengthen profit among commercial banks and MDIs in Cambodia.
The remaining of this paper is structured as follows: Section 2 discusses literature review
and the research framework, Section 3 summarizes the main empirical result and discussion,
Section 4 draws a conclusion by suggesting possible future extension and policy implication.
2. Literature Review
2.2. Financial Inclusion
Simply defined, financial inclusion is the access to and use of formal financial services by
everyone particularly, households and firms. It is seen by policymakers as a way to improve
people’s livelihoods, reduce poverty, and advance economic development (Demirguc-Kunt &
Klapper, 2012; Cámara &Tuesta, 2014; Amidžić et al., 2014; Sahay et al., 2015; Gadanecz &
Tissot, 2017). Financial inclusion may also be interpreted as having access to and using the type
of financial services that meet the user’s needs (BIS, 2015).
There are several previous studies proposing different approaches to measure financial
inclusion index using different composite indicators. Likewise, Gupte et al. (2012) proposed
Human Development Index (HDI), UNDP approach, to measure financial inclusion for India using
the impact of multi-dimensional variables such as access to, usage, ease of transactions and cost
of a transaction. Later, Amidžić et al. (2014) extended the HDI and a weighted geometric average
for computing the new composite index which focused on access and usage. The use of weighted
average offered an elasticity of substitution between each variable. Cámara &Tuesta (2014)
applied different tool which was called principal component analysis (PCA) to evaluate the
financial inclusion index by using three dimensions—usage, barriers and access that a set of these
correlated variables that were deemed to be latent and estimated the weights of financial literacy
index. Sarma (2011)'s approach used banking penetration and availability of banking services and
usage of financial service indicators to calculate an index of financial inclusion (IFI). The
indicators are equally regarded as important for an inclusive financial system and they should have

5
equal weights. All in all, most previous studies focus on demand side rather than supply-side
perspective that accesses to finance focused on conventional product and technology.
Technological advances are generating new competitive pressure on the financial system
in Cambodia. IT leads to having a noticeable effect on the financial institution's ability to sell their
retail products and services. IT also can provide competitive force, by creating economies of scale
through the automation of routine transactions, (Meepadung et al. 2009). Chakrabarty (2011) also
mentions that technology adoption can promote a greater financial inclusion and consumer
protection, and can provide a lower cost to financial institutions. Moreover, the level of financial
inclusion is the probably to increase while the income level of poor people is rising, new financial
technologies reduce transaction costs and increase outreach; and financial inclusion has become a
policy priority for the most country, (Lapukeni, 2015). Lapukeni (2015) further adds that
information technology, particularly electricity consumption and mobile phone diffusion, has the
positive impact on financial access, and also is a primary driver of communication and network
technology to enhance a great financial inclusion and financial service sector. The innovative use
of IT has organized a large number of small transactions easier and delivered financial service to
the remote areas cheaper. This has shown that technology development innovation such as
telecommunication infrastructure and more advanced payment system facilitates several obstacles
that impact on the supply of and demand for financial service (Lapukeni, 2015).
In other studies, researchers attempted to measure the impact of technology on bank
performance, particularly on operational and profitability efficiency using a non-parametric DEA
application (Meepadung et al. 2009). The variable uses in the operation stage in their study were
similar to other studies in measuring financial inclusion—the number of branches, number of
ATMs, number of full time equivalent (FTEs) or number of employees, interest and operating
expenses to provide financial service to the customer while the demand condition was used to
assess the customer satisfaction in the stage as in the initial inputs to offer basic usages of financial
product and services like savings, loans, bank accounts and the number of IT-based transactions.
In this study, two main initial variables are used for financial inclusion stage such as
financial infrastructure and access and demand condition.

6
2.3. Profitability
Profitability, known as the profit efficiency model, is assessed by the output to input
according to the subjective constraints. This model reflects a unique bank's business model acted
as intermediaries for providing the access to and the use of financial products and services to all
people. The objective of this approach aims to maximize the bank's profit which is interest and
non-interest income (Meepadung et al., 2009).
In this study, four outputs from the financial inclusion stage are recognized as the inputs
for profitability efficiency stage. Therefore, the inputs in this stage are loans, deposits, number of
bank accounts and the IT-based transaction, as shown in Table 1. Bank's interest and non-interest
income, assessed as the bank's outcomes, are listed in Table 1. Non-interest income is
accommodated in this analysis as for it has been played crucial roles in term of competitive
pressure on bank profit since the bank generates more income through fees, commission,
investment and other business income (Wang et al., 2014; & Meepadung et al., 2009). Ta-Ho &
Song-Zhu (2004) provides the correlation coefficients between loans and deposits and non-interest
income which are 81 percent and 78 percent, respectively. The interest income comes from the
interest from the loan (Wang et al., 2014), and from government and corporate bonds, interest and
dividend income on securities (Kao & Liu, 2004). Interest income has a strong correlation with
loans and deposits at 84 percent and 99 percent, respectively (Ta-Ho & Song-Zhu, 2004).
2.1. Two-stage value chain DEA
The mechanism model is approached from Chen & Zhu (2004) to determine the impact of
IT on financial inclusion and profitability efficiency performance as well as to calculate financial
inclusion and profitability score in Cambodia. As a non-parametric approach, a two-stage value
chain DEA is able to address the relative efficiency score of various DMUs in both financial
inclusion and profitability stage by converting the homogeneous inputs into outputs. Therefore,
the mathematical programming technique is simultaneously able to calculate financial inclusion
and profitability efficiency score under input-oriented and output-oriented respectively, while the
usage of financial services (intermediate output) produced by the supply side (financial
infrastructure or access to and quality of financial services or demand condition) in financial
inclusion stage continues to produce profit in the profitability stage. The overall efficiency score
is obtained unless both financial inclusion score and profitability score is efficient. In addition, the

7
model provides the reference set as the best-practices and target level of improvement for
inefficient DMUs to become efficient.
Therefore, the single linear programming is following:
Min w1θ1 − w2θ2 (1)
Subject to
(1st stage: Financial Inclusion Efficiency)
∑ λjxij ≤ θ1xi0 , ∀i = 1, … , mnj=1
∑ λjxij − θ1xi0 ≤ 0, ∀i = 1, … , mnj=1
∑ λjzdj ≥ z̃d0, ∀d = 1, … , Dnj=1
∑ λjnj = 1, ∀j = 1, … , n
λj ≥ 0, ∀j = 1, … , n
(2nd stage: Profitability Efficiency) (2)
∑ μjzdj ≤ z̃d0, ∀d = 1, … , Dnj=1
∑ μjyrj ≥ θ2yr0, ∀r = 1, … , snj=1
∑ μjnj = 1, ∀j = 1, … , n
μj ≥ 0, ∀j = 1, … , n
Where xij, zdj, 𝑎𝑛𝑑 yrj is denoted as input, intermediation and the final output level of DMUj
respectively. The symbol " ~ " is unknown decision variables, so the value of z̃d0 is the unknown
variable, which is computed in the optimum point of the intermediate variable. w1 and w2 are the
weights reflecting the total reference over both financial inclusion and profitability. The value of
w1 = w2 = 1 in first stage and second stage are equally essential so that if θ∗1 = θ∗2 = 1, λj0∗ =
μj0∗ = 1, and z̃d0
∗ = zdj are the infeasible solution and it illustrates that both stages are efficient;
therefore, the DMUs gain overall efficiency rating score.

8
2.4.1. Conceptual Model
2.4.2. Descriptive Variables and Data
To calculate the financial inclusion and profitability efficiency score, and to examine IT's
impact on financial inclusion and profit enhancement of financial institution in Cambodia, the
study attempts to monitor some relevant variables. The data was from 36 commercial banks and 7
MDIs; however, given that a two-stage value chain DEA could not address negative sign variables,
the research study proposes to analyze 35 commercial banks and 6 MDIs within 2016.
Furthermore, MDIs are selected to analyze in this study, because they provide homogeneous
financial products and services to their customers as well as commercial banks. The secondary
data is collected from Annual Report 2016 published by General Directorate of Banking
Supervision of National Bank of Cambodia.
Demand conditions variable refers to a composite index averages scores for the quality of
financial products and services and the perceptions and attitudes of consumers toward the financial
market. This variable is collected through a survey questionnaire based upon 5 points Likert-scale
(the index score ranges from 1 (worst) to 5 (best). The sample size for demand factors is in line
with Yamane (Israel, 2013) which mentions that the number of population is more than 100,000
and the common use confidence level is 95 or 90 percent and the sampling error is 5 or 10 percent,
respectively; therefore, the sample size is 400 and 100, respectively. The questionnaires (Appendix
Financial
Inclusion Profitability
Demand Condition
Commercial banks and MDIs
Financial Inclusion Performance Profitability Performance
Figure 1: Two-stage value chain model
Financial Infrastructure &
Access Loans
Deposits
IT-based transactions
Bank account
Interest Income
Non-Interest Income

9
1) are divided into two parts which are the demographics of the respondents and the hybrid service
quality or ESQUAL (Ganguli & Roy, 2010). The hybrid services cover on technology and
conventional service quality
The Data description for financial inclusion score and profitability score calculation is stressed in
Table 1.
Table 1: Input and Output variables
Variables Descriptions Unit
Financial Inclusion Inputs (𝒙𝒅𝒋)
- Financial Infrastructure and
Access
x1: # of branches Total number of branch offices Number
x2: # of ATMs Total number of ATMs Number
x3: # of employees Labor or Full-Time Equivalents (FTEs) Persons
x4: Interest expenses Total interest expenses Riels
x5: Operating expenses Total non-interest expenses Riels
- Demand Side
𝑧5: Demand conditions Customer's perception on the quality of
financial service
Scale
Financial Inclusion Outputs (𝒛𝒅𝒋)
- Usage of financial services
𝑧1: Total loans Loans and advance to customer Riel
𝑧2: Total Deposits Current, saving, checking, time Riel
𝑧3: Total Bank accounts Total bank accounts number
𝑧4: Total IT-based transaction Total number of IT-based transactions number
Profitability Outputs (𝒚𝒅𝒋)
𝑦1: Interest income Total interest income Riel
𝑦2: Non-interest income Total non-interest income Riel
Source: Author’s calculation
3. Result Discussion
3.1. Descriptive Statistics
The study executes two steps in data collection for DEA and for hybrid service quality.
First, data collection for DEA is mainly from the National Bank of Cambodia website and from
relevant department such as off-site banking supervision, licensing and payment department.

10
Second, the questionnaires are conducted through the online survey for the service quality of
financial institutions. A sample size of 261 respondents has completed the questionnaires.
Table 2 indicates the demographic profile of the respondents. First, males comprised 46
percent of the sample. Second, about 77.8 percent are age 16-30 years, 18 percent are 31-45 years
and 4.2 percent are over 46 years. Third, about 77.4 percent of the respondents are graduated from
university and 18.8 percent are postgraduate while the rest of 3.8 percent completed high school.
Fourth, only 10.3 percent are students while the government and private officials are 18.8 and 70.9
percent, respectively. Fifth, 64.4 percent of the respondents are in Phnom Penh, where 35.6 percent
are in different provinces. Last, the length of service usage is varied with 8 percent using bank
services from 1-6 month; 4.6 percent using from 6 to 12 months; 58.6 percent using from 1 to 5
years; 23.8 percent using from 5 to 10 years and 5 percent using bank services more than 10 years.
Table 2: Respondent's demographic profile
Description Observations Percentages
1. Gender
Male 120 46.0
Female 141 54.0
2. Age
16-30 years 203 77.8
31-45 years 47 18.0
Greater than 46 years 11 4.2
3. Education
High school 10 3.8
Graduate 22 77.4
Postgraduate 49 18.8
4. Occupation
Student 27 10.3
Private Official 185 70.9
Government Official 49 18.8
5. Location
Phnom Penh 168 64.4
Provinces 93 35.6
6. Length of Service Usage
1-6 months 21 8.0

11
6-12 months 12 4.6
1-5 years 153 58.6
5-10 years 62 23.8
More than 10 years 13 5.0
Source: Author’s Calculation
3.2. Data Analysis
3.2.1. Financial Inclusion, Profitability, and Overall Efficiency Score
In this study, the bank and financial institution are selected according to the products and
services, and business purposes. The overall efficiency score is illustrated in Table 3, which is 43
DMUs performed on average accounted for 87.8 percent, while the financial inclusion and
profitability activity accounted for 99.1 percent and 76.5 percent, respectively. The results indicate
that bank and financial institution have strengthened its financial infrastructures and services
quality to value customer very well even though the use of financial products and services are still
limited. The financial services widely provided almost everywhere; particularly in urban areas in
Cambodia; however, most people choose to be self-excluded from financial services or in other
words, people choose not to use financial products and services due to their knowledge, culture
and trust. Therefore, the bank and financial institutions need to put much effort to promote the use
of financial products and services through new product development in order to push up more
profitability.
3.2.2. IT impact on financial inclusion and profitability
The study, it is assumed that IT and ATMs are adopted at each branch to serve business
activities such as loan, deposit, payment services and others related activities. Table 2 shows that
83.7 percent of bank and financial institution efficiently perform in financial inclusion stage, while
16.7 percent are accessed to be efficiency in performance measurement in profitability; therefore,
it implies that the bank and financial institution efficiently use financial infrastructure and provide
good financial services to the client. In particular, according to Table 4, about 85 percent of the
number of branches and 78 percent of ATMs are used to leverage the access to and use of financial
products and services accounted for 20 percent in average (increasing 32 percent in IT-based
transactions, 29 percent in total deposit and 14 percent in total loan). Along with the improvement

12
in financial inclusion activities, the bank and financial institution could reduce expenses on
financial infrastructure accounted for 9 percent in average, which is 14 percent for the number of
branches, 22 percent for ATMs and other operational expenses.
Table 3: DMUs’ Score
DMUs Financial Inclusion Profitability Overall
1 1 1 1
2 1 1 1
6 1 1 1
8 1 1 1
10 1 1 1
11 1 1 1
12 1 1 1
14 1 1 1
15 1 1 1
16 1 1 1
19 1 1 1
21 1 1 1
22 1 1 1
25 1 1 1
28 1 1 1
30 1 1 1
34 1 1 1
39 1 1 1
5 1 0.999 0.999
4 1 0.874 0.937
26 0.921 0.942 0.932
17 1 0.850 0.925
41 1 0.833 0.916
37 1 0.812 0.906
9 0.963 0.836 0.899

13
32 0.911 0.810 0.860
31 1 0.679 0.839
7 1 0.647 0.824
20 1 0.627 0.814
42 0.992 0.621 0.807
3 1 0.604 0.802
13 0.960 0.594 0.777
33 1 0.549 0.774
36 0.997 0.490 0.743
29 1 0.477 0.738
23 1 0.409 0.704
18 1 0.378 0.689
43 1 0.375 0.688
24 0.853 0.466 0.660
40 1 0.301 0.651
38 1 0.256 0.628
27 1 0.255 0.627
35 1 0.210 0.605
Mean 0.991 0.765 0.878
Table 4: Average of Inputs, Intermediations, and Outputs
KPIs Actual Optimum Percentage Gap
Inputs
Number of branches 48.05 41.19 -14.28 percent
Number of ATMs 36.44 28.28 -22.41 percent
Number of employees 1,105.95 1,041.69 -5.81 percent
Interest expenses 64.32 60.26 -6.31 percent
Operating expenses 62.40 59.65 -4.40 percent
Service quality 3.66 3.61 -1.41 percent
Mean -9.10 percent

14
Intermediations
Total loans 1,526.72 1,746.17 14.37 percent
Total deposits 1,658.67 2,135.86 28.77 percent
Number of bank accounts 154.69 163.44 5.65 percent
Number of IT-based Transactions 594.33 786.35 32.31 percent
Mean 20.28 percent
Outputs
Interest income 1,825.20 2,236.40 22.53 percent
Non-interest income 195.75 261.82 33.75 percent
Mean 28.14 percent
Source: Author’s calculation
To understand how IT impacts financial inclusion and profitability in the banking system,
the relationship between financial inclusion and IT usage as well as profitability efficiency is
analyzed, and the results are shown in Table 5. The number of ATMs has the positive correlation
with the use of financial products and services and profitability, and the IT-based transactions have
had the correlation with profit efficiency which indicated that bank and financial institution could
increase profit efficiency through increased use of IT. According to Table 4, through the use of
loans, deposit and IT-based transactions (32percent), banks and financial institutions can increase
profit 28 percent in average. Therefore, IT adoption does not only impact on financial inclusion,
but it also enhances financial products and service as well as profit through the cost-effectiveness.
In order to get more accurate results from the PCA regression and DEA, Table 5 is solved
well with some correlations by proxies and controlling with some correlated variables in the
regression. Hence, its results get better in order to interpret the objective research and apply with
the real situations with financial sector in Cambodia.

15
Table 5: Pearson Correlations
Source: Author’s calculation from survey data
3.3. Customer Service Quality Analysis
Principal Component Analysis (PCA) of customer service quality is employed to determine
the dimension of hybrid service quality in products and services by financial institutions in
Cambodia. 56 variables of hybrid service quality are characterized by factor extraction with
VARIMAX rotation method. The overall response rate of 9 factors extraction accounted for 66.79
percent of the total variance, and the Eigenvalue is greater than one which is shown to be
meaningful and useful (Pett et al., 2003). A higher value of Cronbach's alpha, 0.951, is greater than
0.7 acknowledged to be acceptable and reliable for all factor (Hair et al., 2006). Four items are
removed from the 56 items are Tech-never fail, Tech-low risk, Tech-recognized by name and
Operation hours; the factor loading of 52 items properly loaded. The results of the customer service
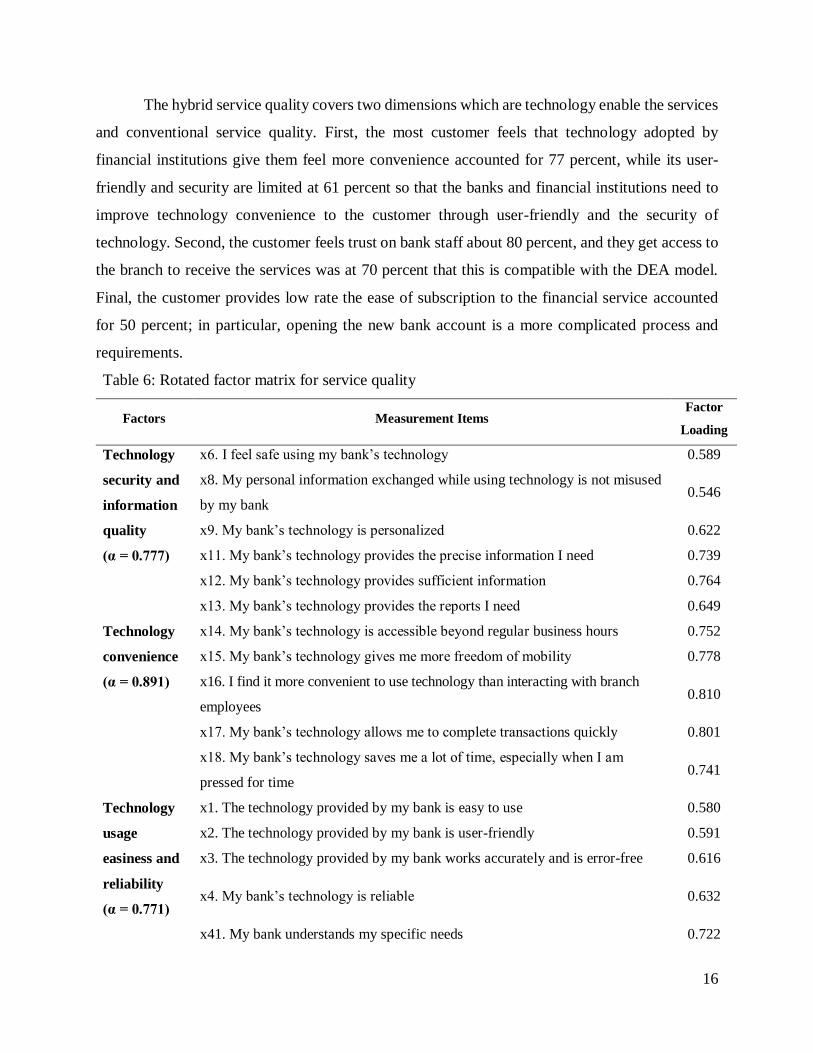
quality for each factor are presented in Table 6.
16
The hybrid service quality covers two dimensions which are technology enable the services
and conventional service quality. First, the most customer feels that technology adopted by
financial institutions give them feel more convenience accounted for 77 percent, while its user-
friendly and security are limited at 61 percent so that the banks and financial institutions need to
improve technology convenience to the customer through user-friendly and the security of
technology. Second, the customer feels trust on bank staff about 80 percent, and they get access to
the branch to receive the services was at 70 percent that this is compatible with the DEA model.
Final, the customer provides low rate the ease of subscription to the financial service accounted
for 50 percent; in particular, opening the new bank account is a more complicated process and
requirements.
Table 6: Rotated factor matrix for service quality
Factors Measurement Items Factor
Loading
Technology
security and
information
quality
(α = 0.777)
x6. I feel safe using my bank’s technology 0.589
x8. My personal information exchanged while using technology is not misused
by my bank 0.546
x9. My bank’s technology is personalized 0.622
x11. My bank’s technology provides the precise information I need 0.739
x12. My bank’s technology provides sufficient information 0.764
x13. My bank’s technology provides the reports I need 0.649
Technology
convenience
(α = 0.891)
x14. My bank’s technology is accessible beyond regular business hours 0.752
x15. My bank’s technology gives me more freedom of mobility 0.778
x16. I find it more convenient to use technology than interacting with branch
employees 0.810
x17. My bank’s technology allows me to complete transactions quickly 0.801
x18. My bank’s technology saves me a lot of time, especially when I am
pressed for time 0.741
Technology
usage
easiness and
reliability
(α = 0.771)
x1. The technology provided by my bank is easy to use 0.580
x2. The technology provided by my bank is user-friendly 0.591
x3. The technology provided by my bank works accurately and is error-free 0.616
x4. My bank’s technology is reliable 0.632
x41. My bank understands my specific needs 0.722

17
Customer
services
(α = 0.874)
x42. My bank pays personal attention to me 0.537
x43. My bank offers its services promptly with very little waiting time 0.720
x48. When I contact my bank’s customer service, my requests are always
anticipated properly 0.775
x49. When I contact my bank’s customer service, I am offered proper
explanations 0.794
x50. When I contact my bank’s customer service, the representatives are
supportive 0.758
x51. When I contact my bank’s customer service, the representatives offer
personalized information 0.746
x52. When I contact my bank’s customer service, my calls are always answered
promptly 0.629
x53. When there are problems, my bank is sympathetic and reassuring 0.563
x54. My bank employees are knowledgeable enough to resolve the problems 0.706
x55. My bank resolves my complaints quickly 0.719
x56. My bank offers a fair compensation for its mistakes 0.692
Staff
competence
(α = 0.861)
x34. My bank employees are trustworthy 0.764
x35. My bank employees are competent 0.763
x36. My bank employees are easily approachable 0.811
x37. My bank employees are courteous, polite and respectful 0.795
x38. My bank employees are willing to help customers 0.800
x39. My bank employees are pleasant and friendly 0.783
x40. My bank employees are caring 0.833
Image or
reputation
(α = 0.859)
x24. My bank has a good reputation 0.578
x25. My bank’s promotional campaigns are effective in building a positive
reputation 0.592
x29. My bank offers a wide range of services 0.632
x30. Within each basic service, my bank provides a variety of options 0.710
x31. My bank fulfills its promises 0.776
x32. My bank performs all services right, the first time 0.729
x33. My bank performs its services reliably, consistently and dependable 0.776
x46. My bank’s statements and other documents are accurate 0.599
x47. My bank’s statements and other documents are easy to understand 0.678

18
Price
(α = 0.826)
x26. My bank clearly explains its service charges 0.606
x27. The fees that my bank charges are acceptable and reasonable 0.787
x28. My bank fees are competitive 0.750
Tangibles
(α = 0.625)
x21. My bank employees are neat in appearance 0.720
x22. My bank’s physical facilities are visually appealing 0.760
x23. My bank’s printed materials (e.g. brochures) are visually appealing 0.564
x44. My bank branches and ATMs are sufficiently available in many locations 0.655
Subscription
ease
(α = 0.617)
x19. It is easy to open a new bank account with my bank 0.458
x20. It is convenient and hassle-free to open a new bank account with my bank 0.527
Note: Principle Component Analysis(PCA) Extraction and VARIMAX Rotation Method
The overall response rate of 9-factor extractions is 66.79 percent of the total variance with 0.951 of
Cronbach's alpha
Source: Author’s calculation
4. Conclusion
This study focuses on firm’s level on the supply side that financial inclusion is treated as
operation performance efficiency in order to convert financial infrastructure and demand condition
to the use of financial products and services to gain the profit. The relative measurement of
financial inclusion and profitability derive from a two-stage value chain DEA which are calculated
based on homogenous outputs to inputs. It determines a process of improvement in the banking
system by calculating the target value of inputs and outputs; particularly defining IT impacts on
financial inclusion and profitability.
Furthermore, the bank branch and employee are the most key drivers to deliver financial
products and service to customers even where it is adopted IT systems and equipped with ATMs
to leverage products and services, cost efficiency, and profit. These also indicated that customers
have limited knowledge of financial technologies (e-banking, mobile banking, mobile payment
and other disruptive financial technologies). Consequently, to promote access and used of financial
products and services and sustainability within micro-level links to macro-level, policy-makers
should consider new financial technology adoption and to promote financial literacy program to
all people at the same time, while some government policies are actively conducted such as the

19
national payment system, interest rate policies, consumer protection, and credit bureau. The micro
data on demand side of this study focuses only on urban areas rather than remote areas; therefore,
next study should use micro data to understand the usage of financial services in urban and remote
areas in Cambodia.

20
References:
[1]. Amidžić G., Massara A., & Mialou A ., (2014). Assessing Countries’ Financial Inclusion
Standing—A New Composite Index. International Monetary Fund, WP/14/36.
[2]. BIS, (2015). Payment aspects of financial inclusion.
[3]. Cámara, Noelia and Tuesta, David, Measuring Financial Inclusion: A Muldimensional
Index (September 22, 2014). BBVA Research Paper No. 14/26.
[4]. Chakrabarty K C., (2011). Convergence of mobile banking, financial inclusion and
consumer protection. Reserve Bank of India.
[5]. Charnes A., Cooper W., & Rhodes E., (1978). Measuring the efficiency of decision-making
units. European Journal of Operational Research, 2, 429-444.
[6]. Chen, Y. and J. Zhu (2004). Measuring Information Technology's Indirect Impact on Firm
Performance. Information Technology and Management 5(1): 9-22.
[7]. Demirgüç-Kunt, Asli, and Klapper, Leora F., Measuring Financial Inclusion: The Global
Findex Database (April 1, 2012). World Bank Policy Research Working Paper No. 6025.
[8]. Faith Lapukeni A., (2015). Financial Inclusion and the Impact of ICT: An Overview.
American Journal of Economics, 5(5), 495-500.
[9]. Gupte R., Venkataramani B., & Gupta D., (2012). Computation of Financial Inclusion
Index for India. Procedia-Social and Behavioral Sciences, 37, 133-149.
[10]. Hair Jr., Black J F., Babin W C., Anderson B. J., & Tatham L R., (2006). Multivariant
Data Analysis. New Jersey: Pearson International Edition.
[11]. Israel G., (2013). Determining sample size. Program Evaluation and Organizational
Development, IFAS, University of Florida, PEOD-6.
[12]. Kao C., & Liu S., (2004). Predicting bank performance with financial forecasts: A case
of Taiwan commercial banks. Journal of Banking & Finance, 28, 2353-2368.
[13]. Klein, Michael U. and Mayer, Colin, Mobile Banking and Financial Inclusion: The
Regulatory Lessons (May 1, 2011). World Bank Policy Research Working Paper No. 5664.

21
[14]. Meepadung N., Tang J., & Khang D., (2009). IT-based banking services: evaluating
operating and profit efficiency at bank branches. Journal of High Technology Management
Research, 20, 145-152.
[15]. Pett M A., Lackey N R., & Sullivan J J., (2003). Making Sense of Factor Analysis: The
Use of Factor Analysis for Instrument Development in Health Care Research. SAGE
Publications, Thousand Oaks.
[16]. Piot-Lepetit, I. and J. Nzongang (2014). Financial sustainability and poverty outreach
within a network of village banks in Cameroon: A multi-DEA approach. European Journal
of Operational Research 234(1): 319-330.
[17]. Sahay R., Čihák M., N’Diaye P., Barajas A., Mitra S., Kyobe A., Nian Mooi Y., & Reza
Yousefi S., (2015). Financial Inclusion: Can It Meet Multiple Macroeconomic Goals?
International Monetary Fund, SDN/15/17.
[18]. Sarma M., & Pais J., (2011). Financial Inclusion and Development. Journal of
International Development, 23.10.1002/jid 1698.
[19]. Seyha Khek, Thanakorn Naenna, (2015). A Two-Stage Value Chain DEA Application
To Assess Performance Measurement Of Commercial Banks In Cambodia. International
Journal of Mechanical and Production Engineering (IJMPE), Vol. 3, Issue:11, pp. 64-70.
[20]. Shirshendu Ganguli, Sanjit Kumar Roy, (2010). Service quality dimensions of hybrid
services. Managing Service Quality: An International Journal, Vol. 20 Issue: 5, pp.404-
424.
[21]. Ta-Ho C., & Song-Zhu D., (2004). Performance measurement of Taiwan's commercial
banks. International Journal of Productivity and Performance Management, 5, 425-434.
[22]. Tissot B., & Gadanecz B., (2017). Measures of financial inclusion— a central bank
perspective. Bank for International Settlements, July 2017.
[23]. Wang K., Huang W., Wu J., & Liu Y., (2014). Efficiency measures of the Chinese
commercial banking system using an addictive two-stage DEA. Omega, 44, 5-20.

22
Appendix: Service Quality Items
1. Technology
Factor 1: Technology security and information quality (TechInfoSecure)
x5. My bank’s technology never fails
x6. I feel safe using my bank’s technology
x7. I feel the risk associated with my bank’s technology is low
x8. My personal information exchanged while using technology is not misused by my bank
x9. My bank’s technology is personalized
x11. My bank’s technology provides the precise information I need
x12. My bank’s technology provides sufficient information
x13. My bank’s technology provides the reports I need
Factor 2: Technology convenience (TechConven)
x10. My bank’s technology recognizes me by name
x14. My bank’s technology is accessible beyond regular business hours
x15. My bank’s technology gives me more freedom of mobility
x16. I find it more convenient to use technology than interacting with branch employees
x17. My bank’s technology allows me to complete transactions quickly
x18. My bank’s technology saves me a lot of time, especially when I am pressed for time
Factor 3: Technology usage easiness and reliability (TechEaseRel)
x1. The technology provided by my bank is easy to use
x2. The technology provided by my bank is user-friendly
x3. The technology provided by my bank works accurately and is error-free
x4. My bank’s technology is reliable
x44. My bank branches and ATMs are sufficiently available in many locations
2. Service quality items—Traditional
Factor 4: Customer services
x45. My bank’s operating hours are convenient for me
x41. My bank understands my specific needs
x42. My bank pays personal attention to me
x43. My bank offers its services promptly with very little waiting time

23
x48. When I contact my bank’s customer service (call centre), my requests are always
anticipated properly
x49. When I contact my bank’s customer service (call centre), I am offered proper
explanations
x50. When I contact my bank’s customer service (call centre), the representatives are
supportive
x51. When I contact my bank’s customer service (call centre), the representatives offer
personalized information
x52. When I contact my bank’s customer service (call centre), my calls are always
answered promptly
x53. When there are problems, my bank is sympathetic and reassuring
x54. My bank employees are knowledgeable enough to resolve the problems
x55. My bank resolves my complaints quickly
x56. My bank offers a fair compensation for its mistakes
Factor 5: Staff competence (Staff Compt)
x34. My bank employees are trustworthy
x35. My bank employees are competent
x36. My bank employees are easily approachable
x37. My bank employees are courteous, polite and respectful
x38. My bank employees are willing to help customers
x39. My bank employees are pleasant and friendly
x40. My bank employees are caring
Factor 6: Image or reputation (Reputation)
x24. My bank has a good reputation
x25. My bank’s promotional campaigns are effective in building a positive reputation
x29. My bank offers a wide range of services
x30. Within each basic service, my bank provides a variety of options
x31. My bank fulfills its promises
x32. My bank performs all services right, the first time
x33. My bank performs its services reliably, consistently and dependably
x46. My bank’s statements and other documents are accurate

24
x47. My bank’s statements and other documents are easy to understand
Factor 7: Price
x26. My bank clearly explains its service charges
x27. The fees that my bank charges are acceptable and reasonable
x28. My bank fees are competitive
Factor 8: Tangibles
x21. My bank employees are neat in appearance
x22. My bank’s physical facilities are visually appealing
x23. My bank’s printed materials (e.g. brochures) are visually appealing
Factor 9: Subscription ease (Esubscription)
x19. It is easy to open a new bank account with my bank
x20. It is convenient and hassle-free to open a new bank account with my bank
Acknowledgements
The authors would like to express their deepest gratitude and thanks to H.E. Dr. Chea Chanto,
Governor and H.E. Dr. Sum Sannisit, Deputy Governor of National Bank of Cambodia, parents
and other colleagues who have usually supported me in any circumstances in this research.