
B Machine Safety Machine Safety Belt Conveyor Safety Understanding the hazards
Upload
khangminh22Category
view
2download
0
B~L 7661 Volume I of II
FINAL SAFETY ANALYSIS REPORT ON THE BROOKHAVEN HIGH FLUX BEAM RESEARCH REACTOR
. J.M. HENDRIE
April 1964
BROOKHAVEN NATIONAL LABORATORY
A S S 0 C I AT E D U N I V E R S I T I E S, I N C.
under contract with the
UNITED STATES ATOMIC ENERGY COMMISSION

FINAL SAFETY ANALYSIS REPORT ON THE
BROOKHAVEN HIGH FLUX BEAM RESEARCH REACTOR
J.M. HENDRIE
April 1964
OFFICIAL USE ONLY UNTIL DECEMBER 1, 1964
BROOKHAVEN NATIONAL LABORATORY
UPTON, NEW YORK
BNL 7661 Volume I of II

Acknowledgments
The material in this report is the work of a large number of people at Brookhaven and at The Lummus company and Combustion Engineering, Inc. Mr. T. v. Sheehan, HFBR Project Manager for Brookhaven, prepared material for the sections on the site and the secondary system, and has reviewed the full report. Dr. H. J. c. Kouts provided material for the reactor physics and reactivity accident sections and has assisted in the review and editing of many other sections. Draft material for most of the report was prepared by the members of the Brookhaven HFBR Project Staff, consisting of R. Baldwin, L. G. Epel, J. B. Godel, G. c. Kinne, J.M. O'Donnell, Jr., c. L. Osborne, J. A. Penney, and P. R. Tichler. The preparation of the illustrations was done by w. R. Sceviour and A. J. Losi of the Project Staff.
Reactor Physics calculations, transient calculations, and critical experiments reported here were done by P. A. Michael, Cesar Sastre, Mrs. Joan Felberbaum~ Dr. Anita Court, Kenneth Downes, and Dr. Kouts. Material for the administration section was prepared by Mr. R. W. Powell, Head of the Reactor Operations Division. M. E. Smith, Seymour Protter, G. deP. Pitcher, and J. R. Weeks provided material on meteorology, purification systems, nuclear instruments, and corrosion matters, respectively. Robert Isler prepared material for the cavity gas and poison systems, and assisted in proof-reading the report. The manuscript was typed by Mrs. Patricia Sives, Mrs. Katherine Sumrow, and Mrs. Marlene Walker.
The Lummus Company and Combustion Engineering, Inc. drawings used in the report were kindly supplied by Mr. E. M. Lindheimer, Project Manager for The Lummus Company, and by Mr. G. A. Anderson and Mr. R. L. Ferguson, Project Managers (at different times) for combustion Engineering, Inc. s. Feldman and w. O'Connor of The Lummus Company prepared material for the sections on foundations and the electrical and utility systems. The Graver Tank and Manufacturing Co. has kindly permitted reproduction of original drawings of the steel dome in Section 3.
Section 1.
1
Final Safety Analysis Report on the Brookhaven High Flux Beam Research Reactor
Outline
INTRODUCTION AND SUMMARY 1.1 Summary Description 1.2 Project Status 1.3 Principal Contractors 1.4 Summary Tables 1.5 Summary of the Safety Analysis
Section 2. SITE DESCRIPTION 2.1 Reactor Location 2.2 Population Distribution
2.2.l Brookhaven National Laboratory Population 2.2.2 Population Distribution Off-Site
2.3 Meterology 2.3.1 General 2.3.2 Meteorological Factors for Reactor Accidents
2.4 Hydrology and Geology 2.5 Seismology
Section 3. REACTOR BUILDING AND CONTAINMENT SYSTEM 3.1 Description of the Containment System
3.1.l Design Basis for the Reactor Building and Containment System
3.1.2 Description of the Building 3.1.2.l Equipment Level 3.1.2.2 Experimental Area 3.1.2.3 Operations Area
3 .1.3 3 .1.4 3 .1.5
3.1.2.4 Areas of the Building Not Part of the Contained Volume
3.1.2.5 Dimensions and Net Volumes of Containment Systems
Occupancy and Activities in the Building Conditions and Methods for Sealing the Building Containment During Refueling and Maintenance
3.2 Structural Design 3.2.1 Loadings
3.2.1.1 Design Pressure 3.2.1.2 Internal Loads 3.2.1.3 External Loads
3.2.2 Steel Dome Structure 3.2.3 Foundation Structure
3.3 Air Locks and Other Openings 3.3.1 Summary Table of Penetrations 3.3.2 Penetration Design Details 3.3.3 Air Inlet and Exhaust Valves 3.3.4 Air Locks and Bulkhead Doors 3.3.5 Testing of Containment Valves
3.4 Atmosphere Control and Exhaust 3.4.1 Heating Venti~ating and Air Conditioning 3.4.2 Shielded Cell and Off-Gas Exhausts 3.4.3 Exhaust Air Filters
Page No.
1-1 1-1 1-2 1-3 1-7
2-1 2-1 2-1 2-1 2-2 2-2 2-5 2-8 2-10
3-1. 3-2 3-2 3-3 3-3
3-3
3-4 3-4 3-4
• 3-5 3-5 3-5 3-5 3-6 3-6 3-6 3-10 3-13 3-13 3-13 3-16 3-17 3-19 3-19 3-19 3-21 3-22

2
3.4.4 Exhaust Air Monitoring and Discharge to Stack 3.5 Building Utilities and Services
3.5.1 Domestic Water Supply 3.5.2 3.5.3 3.5.4 3.5.5 3.5.6
Drain Systems Steam System Fuel Gas Compressed Air Supply Electrical Power 3.5.6.1 General 3.5.6.2 Fan Building 2.4 KV Switchgear 3.5.6.3 Underground Distribution System 3.5.6.4 Pump House 2.4 KV Switchgear 3.5.6.5 Pump House 440 Volt Motor Control Center 3.5.6.6 HFBR 2.4 KV switchgear 3.5.6.7 2.4 KV/480 V 1000 KVA Transformers 3.5.6.8 480 Volt Switchgear 3.5.6.9 Emergency Power System 3.5.6.10 Motor Control Centers 3.5.6.11 Experimental Equipment 3.5.6.12 Lighting System
3.5.7 Communications System 3.5.8 Fire Alarm System
3.6 Containment System Leakage Rate 3.6.1 Design Leakage Rate 3.6.2 Leakage Rate and System Pressure Relation 3.6.3 Initial Leak Rate Test 3.6.4 Retesting for Leak Tightness
Section 4. REACTOR CORE 4.1 Summary Description 4.2 Fuel Elements
4.2.1 Dimensions and Geometry 4.2.2 Materials 4.2.3 Fabrication Methods 4.2.4 Inspection and Testing 4.2.5 Past Experience with Similar Elements 4.2.6 Research and Development on HFBR Element 4.2.7 Operating Conditions, Lifetime and Corrosion
4.3 Control Rod Blades 4.3.l Dimensions and Geometry 4.3.2 Materials 4.3.3 Fabrication Methods
Page No.
3-23 3-23 3-23 3-23 3-24 3-24 3-24 3-25 3-25 3-25 3-26 3-26 3-26 3-26 3-27 3-27 3-27 3-28 3-28 3-29 3-29 3-30 3-30 3-30 3-30 3-31 3-31
4-1 4-1 4-1 4-2 4-2 4-3 4-4 4-4 4-9 4-10 4-10 4-10 4-11
4.3.4 Inspection and Testing 4-12 4.3.5 Past Experience with Similar Control Materials 4-12 4.3.6 Research and Development on HFBR Rods 4-13 4.3.7 Control Rod Guides and Couplings 4-14 4.3.8 Operating Conditions, Blade Blackness and Lifetime 4-15
4.4 Core Support Structure 4-17 4.4.1 General Description 4-17 4.4.2 Lattice Plate 4-18 4.4.3 Lattice Plate Support Saddle 4.4.4 Transition Plate 4.4.5 Flow Shroud
4.5 Other Components in the Core Region 4.5.1 In-Core Irradiation Thimbles and Shrouds
4-20 4-20 4-21 4-22 4-22

4.6
4.7
4.5.2 4.5.3 4.5.4
3
Core Edge Irradiation Thimbles Flow Reversal Valves Anti-Critical Grid
Reactor Physics Design 4.6.1 Introduction 4.6.2 4.6.3 4.6.4 4.6.5 4.6.6 4.6.7
4.6.8 4.6.9 4.6.10 4.6.11 4.6.12 4.6.13
Core Nuclear Properties Flux and Power Distributions Fuel Cycling and Burnup Reactivity Requirements for Operation Control Rod Worths Reactivity of Beam Tubes, Thimbles and Support Structures Reactivity Effects in Fuel Handling Temperature and Void Reactivity Coefficients
Xenon Transients Inherent Transient Response of the Reactor Effects of H20 Contamination
Thermal 4.7.1 4.7.2
Dissolved Helium Reactivity Effects and Hydraulic Design
Core Thermal Design Basis Coolant Flow Characteristics
4.7.3
4.7.2.1 Reactor Vessel Flow Rates 4.7.2.2 Velocity Distribution Hot Spot Temperature Calculation 4.7.3.1 Average Coolant Temperature Rise 4.7.3.2 Coolant Temperature Rise in Hot Channel 4.7.3.3 Heat Flux 4.7.3.4 Heat Transfer Coefficient 4.7.3.5 Film Temperature Rise 4.7.3.6 Fuel Plate Surface Temperature in
Hot Channel 4.7.4 Hot Channel Factors
4.7.5 4.7.6 4.7.7 4.7.8 4.7.9 4.7.10 4.7.11 4.7.12 4.7.13 4.7.14
4.7.4.1 Power Density Variation 4.7.4.2 Reactor Power Measurement 4.7.4.3 Channel Dimensional Tolerance 4.7.4.4 4.7.4.5 4.7.4.6 4.7.4.7 4.7.4.8
Velocity Distribution Measurement Error Velocity Variation Within a Channel Fuel Core Alloy Variation Heat Transfer Coefficient Deviation Reactor Pressure and Inlet Water Temperature Measurement
4.7.4.9 Summary Table of Hot Channel Factors Power Density Factors Cladding and Fuel Temperature Steady State Burnout Analysis Gamma Heating Fission Product Afterheat Pressure Drop in Reactor Vessel Primary Flow Coastdown Shutdown Cooling Flow Flow Reversal and Natural Circulation Control Rod Heating
Section 5. PRIMARY COOLANT SYSTEM 5.1 Summary Description
Page No.
4-23 4-23 4-23 4-24 4-24 4-26 4-26 4-27 4-28 4-29
4-30 4-31 4-31 4-32 4-32 4-34 4-35 4-35 4-36 4-36 4-36 4-37 4-37 4-37 4-38 4-39 4-40 4-40
4-41 4-41 4-41 4-41 4-41 4-42 4-42 4-42 4-43
4-43 4-43 4-43 4-44 4-45 4-47 4-48 4-48 4-49 4-49 4-49 4-51
5-1

4
5.2 Primary Coolant 5.2.1 Coolant Properties 5.2.2 Coolant Inventory 5.2.3 Leakage Rates 5.2.4 Radioactive Contaminants
5.3 System Components 5.3.l Main Heat Exchangers 5.3.2 Main Pumps 5.3.3 Valves
5.3.4
5.3.3.l Introduction 5.3.3.2 5.3.3.3 5.3.3.4 5.3.3.5 Piping 5.3.4.l 5.3.4.2 5.3.4.3 5.3.4.4 5.3.4.5 5.3.4.6 5.3.4.7
Drain Valves Primary Control Valves Pump Suction Valves Primary Check Valves
Piping Design Materials Fabrication Cleaning Inspection and Testing Piping Stresses Flowmeter
5.3.5 Relief Valves 5.4 Process Design Considerations
5.4.1 5.4.2 5.4.3 5.4.4 5.4.5 5.4.6
Flow Rates, Pressures, and Temperatures Coolant Velocities Coolant Cycle Time Corrosion and Erosion Effects of Sudden Changes in Valve Settings Radiation Effects on Materials
5.4.7 Primary-Secondary Pressure Difference 5.5 Reactor Vessel
5.5.1 General Description 5.5.2 Mechanical Loading Conditions
5.5.2.1 Pressure 5.5.2.2 Piping Reactions 5.5.2.3 Weight 5.5.2.4 Fluid Flow Reactions 5.5.2.5 Impact Loads 5.5.2.6 Seismic Loads
5.5.3 Steady State Thermal Loading and Temperature Conditions 5.5.3.1 Thermal Loading 5.5.3.2 Radiation Heat Generation 5.5.3.3 Temperature Conditions
5.5.4 Thermal Transient Loading Conditions 5.5.5 Neutron Irradiation Exposure 5.5.6 Corrosion 5.5.7 5.5.8 5.5.9 5.5.10
Materials of Construction Design Specifications Structural Design Fabrication, Inspection and Testing
Section 6. SECONDARY COOLANT SYSTEM 6.1 General Description
Page No.
5-1 5-1 5-2 5-2 5-4 5-4 5-4 5-7 5-9 5-10 5-10 5-10 5-10 5-11 5-12 5-12 5-12 5-13 5-13 5-16 5-16 5-16 5-16 5-17 5-17 5-18 5-18 5-18 5-20 5-20 5-21 5-21 5-21 5-24 5-24 5-25 5-25 5-25 5-25 5-26
5-26 5-26 5-27 5-27 5-27 5-28 5-30 5-31 5-32 5-32 5-35
6-1 1
t I
_.......

6.2 6.3 6.4
6.5 6.6 6.7
6.8 6.9
5
Water Supply and Composition Operating Experience with Original System Maintenance Provisions 6.4.1 Solids in Recirculated Water 6.4.2 Solids Control 6.4.3 Physical Wear of Tower Structure Make-up and Blowdown Requirements Water Pressures, Temperatures and Flow Rates Methods of Temperature Control and Prevention of Freezing 6.7.1 Normal Procedures 6.7.2 Freezing of Basin 6.7.3 Low Temperature Cooling Water Precautions
6.7.3.1 Reactor Cavity Atmosphere 6.7.3.2 Freezing of D2o 6.7.3.3 Afterheat Removal
Corrosion and Erosion: Preventative Measures Final Heat Sinks
Section 7. AUXILIARY SYSTEMS 7.1 Reactor Shutdown Cooling System
7.1.1 System Design Considerations 7.1.2 Shutdown Pumps 7.1.3 Shutdown Cooler 7.1.4 Piping
7.2 Reactor Natural Circulation System 7.2.l Introduction 7.2.2 Flow Reversal Valves 7.2.3 Depressurizing Valve HCe-102 7.2.4 Shutdown Cooler EA-103 7.2.5 Operation
7.2.5.1 Pump Failure Case 7.2.5.2 Primary System Rupture
7.3 Reactor Poison Solution System 7.4 Reactor Helium System
7.4.1 Introduction 7.4.2 The Helium Supply System 7.4.3 The Helium Circulating System 7.4.4 Reactor Surge Volume Exhaust System
7.5 Primary Coolant Purification System 7.5.1 General Description 7.5.2 Filters 7.5.3 Ion Exchange Beds 7 .5 .4 Piping 7.5.5 Instrumentation
7.6 Primary System Vents, Drains, Transfer System, and Storage Tanks 7.6.1 Introduction 7.6.2 DA Drains 7.6.3 Area Drains 7.6.4 Vents 7.6.5 D20 Storage Tanks 7.6.6 D2o Transfer System
7.7 Lower Pit Gas System 7.8 Fuel Handling
7.8.1 Summary Description
Page No.
6-1 6-4 6-4 6-4 6-4 6-5 6-5 6-6 6-7 6-7 6-7 6-7 6-8
6-8 6-8 6-8
7-1 7-1 7-2 7-3 7-3 7-3 7-3 7-5 7-6 7-6 7-6 7-6 7-8 7-9 7-10 7-10 7-10 7-11 7-12 7-14 7-14 7-14 7-14 7-17 7-17
7-18 7-18 7-18 7-18 7-18 7-19 7-19 7-20 7-21 7-21

7.8.2 7.8.3
6
New Fuel Storage Fuel Discharge - Special Equipment 7.8.3.1 Indexing Mechanism 7.8.3.2 Fuel Handling Shutters 7.8.3.3 Tritium Containment Structure 7.8.3.4 Periscopes
7.8.4 Fuel Discharge - Procedures 7.8.4.1 Sequence of Equipment Installation 7.8.4.2 Discharge Procedure 7.8.4.3 Fuel Rotation 7.8.4.4 Charging New Fuel
7.8.5 Spent Fuel Storage 7.8.5.1 Description of Canal 7.8.5.2 Canal Cleanup System 7.8.5.3 Discharge Chute 7.8.5.4 Retard Chute 7.8.5.5 Temporary Storage Rack 7.8.5.6 Long Term Storage 7.8.5.7 Shipping Cask Loading 7.8.5.8 Overhead Cranes, Monorails, and
the Canal Bridge 7.9 Thermal Shield Cooling System
7.9.1 Description 7.9.2 Water Quality 7.9.3 Coolant Expansion and Pressure Limits 7.9.4 Water Flow Rate Requirements 7.9.5 7.9.6
7.9.7
Corrosion Mechanical Equipment 7.9.6.l Thermal Shield Circulating Pumps 7.9.6.2 Thermal Shield Cooler 7.9.6.3 Valves and Piping 7.9.6.4 Expansion Tank Instrumentation 7.9.7.1 Flowmeters 7.9.7.2 Water Temperature Meters
7.9.8 Effect of Loss of Coolant Flow on Reactor Safety and on the Thermal Shield
7.10 Biological Shield Cooling System 7.10.l Description 7.10.2 Circulating Pumps GA-203A and B 7.10.3 Biological Shield System Cooler, EA-203 7.10~4 Flowmeters 7.10.5 Expansion Tank and Water Level Instruments 7.10.6 Temperature Instruments 7.10.7 Vents and Drains
Section 8. EXPERIMENTAL FACILITIES 8.1 Description of Facilities
8.1.l Beam Holes 8.1.2 Shutters 8.1.3 Thermal Irradiation Thimbles 8.1.4 Fast Irradiation Thimbles
8.2 Experimental Facility Cooling 8.2.1 Introduction 8.2.2 D2o Experimental Facility Cooling
Page No.
7-22 7-22 7-22 7-23 7-23 7-24 7-25 7-25 7-26 7-26 7-27 7-27 7-27 7-27 7-28 7-28 7-28 7-29 7-29
7-29 7-30 7-30 7-30 7-31 7-31 7-31 7-31 7-31 7-31 7-32 7-32 7-34 7-34 7-34
7-34 7-34 7-34 7-35 7-35 7-35 7-36 7-36 7-36
8-1 8-1 8-2 8-3 8-4 8-5 8-5 8-5
t I
I

7
8.2.3 H20 Experimental Facility Cooling 8.3 Shielding of Experiments
8.4 8.5 8.6
8.3.1 Horizontal Beam Tubes 8.3.2 Vertical Irradiation Thimbles Containment Features Description of Typical Experiments Insertion and Removal of Experiments 8.6.1 Horizontal Beam Experiments 8.6.2 Irradiation Thimble Experiments
8.7 Reactivity Limits and Safety Aspects of Experiments
Section 9. INSTRUMENTATION AND CONTROL 9.1 Summary of Reactor Control Scheme
9.1.1 Introduction 9.1.2 Reactivity Control 9.1.3 Control Stations 9.1.4 Instrumentation 9.1.5 Response Time 9.1.6 Start-up Sources
9.2 Operating Control Stations 9.2.1 Control Room
9.2.2 9.2.3 9.2.4 9.2.5 9.2.6 9.2.7
9.2.1.1 Control Console 9.2.1.2 Instrument Panels 9.2.1.3 Annunciator Panels 9.2.1.4 Control Rod Power Panel 9.2.1.5 Rod Control Rack 9.2.1.6 Emergency Power Rack 9.2.1.7 Scram Relay Rack 9.2.1.8 Setback Relay Rack 9.2.1.9 Instrument DC Power Panel 9.2.1.10 Instrument AC Power Panel 9.2.1.11 Fire Alarm Repeater Panel D2o Leak Detector Alarm Heavy Water Transfer System Primary Coolant Purification System Canal Cooling System Emergency Generator Control Station Manual Scram Stations
9.3 Nuclear Instrumentation 9.3.l Safety Channels 1, 2, and 3
9.3.1.l General Description 9.3.1.2 Safety Amplifier 9.3.1.3 Period Amplifier
9.3.2 9.3.3 9.3.4 9.3.5 9.3.6 9.3.7
9.3.1.4 Gamma-Neutron Chamber GN-3 9.3.1.5 Gamma Chamber G-1 9.3.1.6 Dual Voltage Power Supply 9.3.1.7 Constant Voltage Transformer 9.3.1.8 Safety Monitor 9.3.1.9 Safety Channel Power and Period Power Level Indicator, Channel No. 4 Thermopile System, Channel No. 5 Power Level Controller, Channel No. 6 Counting Rate System, Channels 7 and 8 Detector Location Detector Positioning Devices
Recorders
Page No.
7-9 8-10 8-10 8-11 8-12 8-13 8-14 8-14 8-15 8-16
9-1 9-1 9-1 9-2 9-2 9-2 9-3 9-3 9-3 9-3 9-4 9-6 9-7 9-7 9-7 9-7 9- 7 9-7 9-7 9- 7 9-8 9-8 9-8 9-8 9-8 9-8 9-8 9-8 9-8 9-9 9-11 9-13 9-14 9-14 9-14 9-14 9-14 9-15 9-15 9-16 9-17 9-18 9-18

8
9.3.8 Nuclear Instrumentation for Initial Loading and Start-up
9.4 Non-Nuclear Reactor Instrumentation
9.5
9.4.1 Process Instrumentation in the Scram Safety System 9.4.1.1 Core Differential Pressure 9.4.1.2 Primary Coolant Flow Rate 9.4.1.3 Primary System Pressure 9.4.1.4 Primary Coolant Liquid Level
9.4.2 Process Instrumentation in the Setback Safety System
9.4.3
9.4.4
9.4.5
9.4.6
Safety 9.5.1
9.4.2.l Primary Coolant Core Inlet Temperature 9.4.2.2 Shutdown Pumps 9.4.2.3 Thermal Shield Coolant Flow 9.4.2.4 Process 9.4.3.1 9.4.3.2 9.4.3.3 9.4.3.4 9.4.3.5 9.4.3.6 9.4.3.7 9.4.3.8 9.4.3.9 9.4.3.10 9.4.3.11 9.4.3.12 9.4.3.13 9.4.3.14 9.4.3.15 9.4.3.16 9.4.3.17 9.4.3.18
Biological Shield Coolant Flow Instrumentation in the Alarm System Temperature Alarms Primary-Secondary Pressure Difference Low-Low Reactor Pressure Helium Supply Manifold Pressures Instrument Air Pressure Shutdown System Coolant Flow Shutdown Cooler Secondary Flow Secondary Flow to EA-101A and B Irradiation Facilities Coolant Flow
Beam Tube Plug Coolant Flow Biological Shield Concrete Coolant Flow Experimental Facilities System D2o Level Thermal Shield System Water Level Biological Shield System Water Level Canal Water Level Primary Coolant Conductivity D20 Leakage Shielded Cell Doors
9.4.3.19 Switchgear Power, 48 VDC "Non-Alarm" Process Instrumentation 9.4.4.1 Temperature Instrumentation 9.4.4.2 Pressure Instrumentation 9.4.4.3 Flow Rate Instrumentation 9.4.4.4 Liquid Level Instrumentation 9.4.4.5 Conductivity Instrumentation 9.4.4.6 Heat Balance Power Calculator 9.4.4.7 Isotopic Analysis of D2o 9.4.4.8 Hydrogen and Deuterium Ion Concentrations 9.4.4.9 Shield and Vessel Temperature and Stress Process Instrumentation for Initial Loading and Start-up Effect of Trip Levels on Core Temperature and Burnout Margin System Scram System 9.5.1.1 Scram Relays 9.5.1.2 Manual Scram Buttons 9.5.1.3 Console Lockdown Switch 9.5.1.4 Scram Relay Coil Power Supplies 9.5.1.5 Relay Logic Circuitry
Page No.
9-18 9-20 9-20 9-20 9-23 9-24 9-25
9-26 9-26 9-29 9-29 9-29 9-30 9-30 9-30 9-32 9-32 9-32 9-32 9-33 9-33 9-33 9-33 9-34 9-34 9-34 9-34 9-35 9-35 9-35 9-35 9-35 9-36 9-36 9-37 9-38 9-39 9-40 9-40 9-40 9-41 9-41
9-41
9-42 9-45 9-45 9-45 9-46 9-46 9-46 9-47
I I I I I I
•

9.5.2 9.5.1.6 Setback 9.5.2.1 9.5.2.2 9.5.2.3 9.5.2.4
9
Scram Bus Circuit System Setback Relays Setback Relay Power Supply Relay Logic Circuitry Setback Bus Circuit
9.5.3 Flow Reversal System 9.5.3.1 Low-low D20 Level Logic 9.S.3.2 Main Pump Switching 9.5.3.3 Shutdown Pump Switching 9.5.3.4 Depressurization Valve Operation 9.5.3.5 Siphon Break Valve
9.5.4 Primary Pump Start Interlock 9.5.5 Control Rod Gang Withdrawal Interlocks 9.5.6 Low-low Pressure Main Pump Interlock 9.5.7 Safety System During Initial Loading and Start-up
9.6 Radiation Monitoring Systems 9.6.1 Area Radiation Monitors 9.6.2 Secondary Water Monitors
9.6.2.l RRa-301A and RRa-301B 9.6.2.2 RRa-302 9.6.2.3 RRa-303 9.6.2.4 Secondary Water Sample Analysis
9.6.3 Fission Product Monitors 9.6.3.1 RRa-100, Fission Product Water Monitor 9.6.3.2 RRa-105, Fission Product Gas Monitor
9.6.4 Stack Gas and Particulate Monitors 9.6.5 Nuclear Incident Alarm System 9.6.6 Building Air Activity Monitors 9.6.7 Tritium Air Monitors 9.6.8 Radiation Monitoring Systems During Initial
Loading and Start-up 9.7 Control Rod Drive Mechanisms
9.7.1 Introduction 9.7.2 Functional Description
9.7.2.l Geometry 9.7.2.2 Environment 9.7.2.3 Normal Operation 9.7.2.4 Reactor Scram 9.7.2.5 Automatic Control 9.7.2.6 Hand Drive 9.7.2.7 Right and Left Handed Units
9.7.3 Description of External Components 9.7.3.1 Motors and Gear Reducers 9.7.3.2 Main Clutch Drives 9.7.3.3 Power Spring Assembly 9.7.3.4 Drive Shaft and Seal Assembly 9.7.3.5 Position Transmitter and Limit
Switch Assembly 9.7.3.6 External Drive Assembly Mounting Frame
9.7.4 Description of Internal Components 9.7.4.1 Rack and Pinion Housing Assembly 9.7.4.2 Support Tube Assembly 9.7.4.3 Shock Support Bolt and Lateral Guides 9.7.4.4 Neutron Shields
Page No.
9-47 9-48 9-48 9-48 9-48 9-49 9-50 9-50 9-50 9-51 9-51 9-52 9-52 9-52 9-53 9-53 9-53 9-53 9-54 9-54 9-54 9-55 9-55 9-55 9-55 9-56 9-56 9-56 9-57 9-58
9-58 9-58 9-58 9-58 9-58 9-60 9-60 9-62 9-64 9-64 9-65 9-66 9-66 9-67 9-67 9-69
9-69 9-70 9-71 9-71 9-72 9-73 9-74

10
9.7.4.5 Main Rack Assembly 9.7.4.6 Auxiliary Rack Assembly 9.7.4.7 Auxiliary Spring
9.7.5 Position Indicator 9.7.6 Testing
9.8 Instrument and Control Rod Power 9.8.1 Normal Instrument and Control Rod Power
9.8.1.1 AC Power 9.8.1.2 DC Power 9.8.1.3 Instrument Air and Helium Supply
9.8.2 Instrument Emergency Power
Section 10. SHIELDING
9.8.2.l 18 VDC Local Instrument Batteries 9.8.2.2 24 VDC Instrument Emergency Power Supply 9.8.2.3 12 VDC Radiation Instrument Emergency
Power Supply 9.8.2.4 250 VDC System
10.l Summary Description 10.2 Thermal Shield
10.2.1 Location and Function 10.2.2 Geometry, Dimensions, and Materials 10.2.3 Shielding Design 10.2.4 Thermal and Mechanical Design 10.2.5 Radiation Damage 10.2.6 Manufacture, Testing, and Inspection
10.3 Biological Shield 10.3.1 Location and Function
Page No.
9-74 9-76 9-76 9-77 9-78 9-81 9-81 9-81 9-81 9-82 9-82 9-83 9-83
9-83 9-83
10-1 10-1 10-1 10-2 10-4 10-5 10-9 10-10 10-11 10-11
10.3.2 Geometry, Dimensions, and Materials 10-12 10.3.3 Shielding and Thermal Design of the Bulk Shield 10-14 10.3.4 Shielding in the Upper Pit 10-16
10.4 Primary Equipment Cells 10-19 10.4.1 Description 10-19 10.4.2 Shielding Design 10-21
10.5 Miscellaneous Shielding 10-21 10.5.1 D2o Storage Tank FA-101 10-21 10.5.2 D20 Purification System 10-22 i0.5.3 Operations Level D2o Process Area 10-22 10.5.4 D2o Shutdown Pumps 10-22 10.5.5 Auxiliary Process System Shielding 10-22
10.6 Containment Features of the Shield 10-23 10.6.1 Containment of Primary Pipe and Vessel
Failure Accidents 10-23 10.6.2 Containment of Reactor Excursions
Section 11. RADIOACTIVE WASTES AND EFFLUENTS 11.1 Gaseous Wastes
11.1.1 Tritium-Bearing Gaseous Exhausts 11.1.1.1 Reactor Cover Gas Purge During
Operation 11.1.1.2 Surge Volume Depressurization 11.1.1.3 Evaporation During Fuel Changes 11.1.1.4 Valve and Pump Seal Leakage
11.1.2 Volatile Fission Product Exhaust
10-24
11-1 11-1
11-1 11-1 11-2 11-3 11-4

11.1.3 11.1.4
11
11.1.2.1 Reactor Cover Gas Purge During Operation
11.1.2.2 Surge Volume Depressurization Other Surge Volume Radioactive Gases Shield Cavity Gas Purge 11.1.4.1 Carbon-14 Activation 11.1.4.2 Argon-41 Activation
11.2 Liquid Wastes 11.2.1 Tritium-Contaminated Liquid Waste 11.2.2 Other Liquid wastes
11.3 Solid Wastes 11.4 Primary-Secondary Leakage
11.4.1 Leakage in the As-Built Coolers 11.4.2 Detection of Heavy Water Leakage 11.4.3 Secondary System Tritium Concentration 11.4.4 Points of Release of Secondary Water,
Concentrations and Doses 11.4.4.1 Evaporation .11.4.4.2 Secondary System Blow Down 11.4.4.3 Leakage from the Cooling Tower Basin 11.4.4.4 Contaminants Other Than Tritium
11.4.5 Disposal of Contaminated Secondary Water
Section 12. INITIAL TESTS AND OPERATING PROCEDURES 12.1 Preoperational Tests
12 .1.1 General 12.1.2 Process System Cleaning and Filling 12.1.3 Building Utilities 12.l.4 Primary System 12.1.5 Light Water Operational Run 12 .1.6 D2o Fill
12.2 Initial Reactor Loading and Criticality 12.3 Tests at Low Power
12.3.l Control Rod Calibrations 12.3.2 Flow Effects 12.3.3 Uniform Temperature Coefficient of Reactivity 12.3.4 Helium Bubble Effects
12.4 Tests at Intermediate Power 12.4.1 Xenon Transients 12.4.2 Flux Measurements at Experimental Facilities 12.4.3 Reactor Vessel Temperature and Stress 12.4.4 Shield Temperatures 12.4.5 Shielding Measurements
12.5 Tests at Full Power 12.6 Operating Procedures
12.6.1 Normal Operation Cycle 12.6.2 Prestartup Conditions 12.6.3 Start-up and Operation at Normal Power Level 12.6.4 Shutdown Procedures 12.6.5 Operating Instructions and Records
12.6.5.1 HFBR Operating Procedure Manual 12.6.5.2 Temporary Operating Procedures
Logbook 12.6.5.3 Shift Instruction Logbook 12.6.5.4 Reactor Maintenance Manual
Page No.
11-5 11-5 11-6 11-6 11-7 11-7 11-8 11-8 11-8 11-8 11-9 11-9 11-9 11-11
11-11 11-11 11-12 11-12 11-13 11-13
12-1 12-1 12-1 12-2 12-2 12-4 12-4 12-5 12-6 12-6 12-7 12-7 12-7 12-7 12-8 12-8 12-8 12-10 12-10 12-11 12-11 12-11 12-11 12-12 12-13 12-14 12-14
12-14 12-15 12-15

12.6.5.5 12.6.5.6
12
Tickler Card File System Fuel Charging and Discharging Record Sheets
Page No.
12-15
12.6.5.7 12.6.5.8 12.6.5.9 12.6.5.10 12.6.5.11 12.6.5.12
Shift Operations Logbook 12-15 Console and Process System Log Sheets 12-15 Recorder Charts
Canal Logbook Fuel Movements Logbook HFBR Startup Procedures
12.7 Maintenance Procedures 12.7.l General 12.7.2 Main Pumps and Motors 12.7.3 Primary Valves 12.7.4 Primary Coolers 12.7.5 Shutdown System 12.7.6 D20 Purification System 12.7.7 Auxiliary Process Systems 12.7.8 Control Rod Mechanisms
12-15 12-15 12-16 12-16 12-16 12-16 12-16 12-17 12-17 12-17 12-17 12-17 12-17
Section 13. ADMINISTRATION
I ___ _/
13.1 Operating Organization 13-1 13 .1.1 Operations Responsibility 13-1 13.1.2 HFBR Operations Group 13-1
13 .1.2 .1 Group Leader 13-1 13.1.2.2 Shift Supervisors 13-3 13.1.2.3 Plant Operating Crews and Supervisors 13-4
13.1.3 Water Chemistry Group 13-4 13 .1.4 Research Coordination Group 13-4 13.1.5 HFBR Maintenance 13-5
13.1.5.1 Direct Maintenance 13-5 13.1.5.2 Preventive Maintenance 13-5 13.1.5.3 Indirect Maintenance 13-6
13.1.6 Operating Group During Initial Loading, Criticality and Start-up Tests 13-6
13.2 Administrative Procedures and Controls 13-6
13.3
13.2.1 Operating Procedures 13-6 13.2.2 Initial Loading and Start-up Test Procedures 13-6 13.2.3 Operating Records 13-6 13.2.4 Maintenance Procedures 13-6 13.2.5 Reports 13-7
13.2.6 Service 13.3.1 13.3.2 13.3.3
13.2.5.1 Reactor Division Monthly Report 13-7 13.2.5.2 Special Reports 13-7 13.2.5.3 Criticality Inspection Monthly Report 13-8 Emergency Procedures Organizations Reactor Health Physics Maintenance Assistance Technical Assistance
Group From Other Organizations
13.4 Safety Organizations and Committees 13.4.1 The Health Physics Organization
13-8 13-8 13-8 13-9 13-10 13-10 13-10 13-10 13-10
13.4.2 The Ad Hoc Reactor Inspection Committee 13.4.3 The Laboratory Safety Committee 13.4.4 The Reactor and Critical Experiments
Safety Committee 13.5 Hiring and Qualification of Reactor Operators
and Supervisors
13-10
13-12

13
13.5.1 Reactor Operators 13.5.1.1 Hiring Qualifications 13.5.1.2 Probation Period 13.5.1.3 "B" Grade Operator 13.5.1.4 "A" Grade Operator 13.5.1.5 Medical Examinations
13.5.2 Reactor Supervisors 13.5.2.l Hiring Qualifications 13.5.2.2 Probation Period 13.5.2.3 Health Physics Training 13.5.2.4 Reactor Training 13.5.2.5 Reactor Supervisor Qualification
Examinations 13.5.2.6 Requalification 13.5.2.7 Advanced Training
13.5.3 Specific HFBR Training
Section 14. ACCIDENT ANALYSIS 14.1 Introduction 14.2
14.3
14.4
14.5 14.6
Reactivity Accidents 14.2.l Control Rod Withdrawal Accidents 14.2.2 Irradiation Thimble Failure Accident 14.2.3 Broken Control Rod Accident 14.2.4 Light Water Contamination 14.2.5 Cold Water Accident 14.2.6 Pressure Effects During Transients 14.2.7 Fuel Changing Criticality Equipment Failures and Malfunctions 14.3.l Fuel Cladding Failure 14.3.2 Plugged Water Channels in Fuel Elements 14.3.3 Power Failure 14.3.4 Primary System Rupture 14.3.5 Loss of Pressure 14.3.6 Instrument System Malfunctions Fire and Environmental Hazards 14.4.1 Fire 14.4.2 Earthquakes 14.4.3 Floods 14.4.4 Hurricanes 14.4.5 Interaction with the Graphite Reactor Fuel Handling Accident Maximum Credible Accident 14.6.1 Basis for Choice 14.6.2 Description of the Accident
14.6.3 14.6.4 14.6.5
14.6.2.l Summary Description of the Accident 14.6.2.2 Sequence of Events in the Building 14.6.2.3 Calculational Model of the Accident Overpressure and Leak Rate Calculations Cloud Dose Calculations Direct Gamma Dose Calculations
14.6.6 Discussion of Results 14.6.6.1 The overpressure Condition 14.6.6.2 Cloud Doses: The Exclusion
Area, Low Population zone, and Population Center Distance
14.6.6.3 Direct Gamma Dose
Page ~
13-12 13-12 13-12 13-13 13-13 13-14 13-14 13-14 13-14 13-14 13-14
13-14 13-15 13-15 13-15
14-1 14-2 14-2 14-3 14-3 14-4 14-6 14-7 14-7 14-8 14-8 14-10 14-11 14-12 14-14 14-16 14-17 14-17 14-17
• 14-17 14-17 14-17 14-18 14-19 14-19 14-21 14-21 14-21 14-22 14-27 14-30 14-35 14-37 14-37
14-39 14-41

/
l l
SECTION l. INTRODUCTION AND SUMMARY
l.l SUMMARY DESCRIPTION
The Brookhaven High Flux Beam Research Reactor (HFBR) is cooled, moderated, and reflected by heavy water. The nominal power is 40 MW. The core consists of 28 curved-plate fuel elements of the MTR-ETR type. The fuel material is fully enriched uranium, alloyed in aluminum. The reactor is controlled by two sets of neutron-absorbing blades. There ar~ eight main control rods and eight auxiliary control rods. The reactor will be used for basic experimental research, particularly that done with external neutron beams. Nine beam research facilities are provided in the reactor. In addition, seven irradiation facilities are provided for the exposure of small samples to either fast or thermal neutrons.
At normal operating conditions the reactor primary system is pressurized to 200 psig by helium gas. The coolant temperature at the core inlet is l20°F and the temperature rise in the core is 14°F. The primary flow rate is 16,600 gpm. The heat generated in the reactor is rejected to the atmosphere through heat exchangers, a light water secondary system, and cooling towers.
The reactor is housed in a hemispherical containment building of 176 ft-8 in. inside diameter. The building is constructed of steel, with a concrete foundation mat. Three basic floor levels within the building separate the various research and operating activities.
1.2 PROJECT STATUS
The reactor originated in a need for more intense neutron beams than are available from existing reactors. The greater neutron fluxes are needed to extend existing experimental techniques and to develop new experiments. Physics calculations were started in 1956 on a reactor to provide intense and high quality external neutron beams of various energies from sub-thermal to several Kev. These studies culminated in early 1958 in the choice of the HFBR system, which is cooled, moderated, and reflected by heavy water, and in which the core is formed of standard plate-type fuel elements in a close-packed array (l.l).
Following the appropriation of design funds for the HFBR, a project group of Brookhaven scientists and engineers was established to work out the preliminary engineering design. The Lummus Company was selected in the spring of 1960 to provide architect-engineering services, with assistance fr~m Combustion Engineering, Inc. on nuclear engineering matters.
A Site Report (1.2) was prepared and submitted to the AEC in August, 1960, to permit a safety analysis of the reactor location. The site was reviewed by the AEC and by the Advisory Committee on Reactor Safeguards, and was approved subject to an improved containment of possible radioactive effluents from a reactor accident. These changes were made in the design.
The HFBR Title I design report and cost estimate was submitted to the AEC by The Lummus Company in September, 1960. Detailed design work was started several months later and was largely complete by the end of 1961.
A Preliminary Hazards Summary Report (1.3) was prepared and submitted to the AEC in May, 1961. The report was reviewed by the AEC and the ACRS in July, 1961, and the conclusion reached that construction and operation of the HFBR would not present an undue hazard to the health and safety of either the general

1 - 2
public or the laboratory staff.
Construction work was started in the fall of 1961 with the clearing and excavation of the reactor site. Work on the building foundations started at the end of 1961. The construction work is well along at this writing, with all major components received from the fabricators and in place in the reactor plant. The construction phase will be complete in the spring of this year (1964), and the reactor should be ready for fuel loading early in the fall. Full power operation is expected to commence by the end of 1964.
1.3 PRINCIPAL CONTRACTORS
The Lummus Company has provided engineering, procurement, and construction management services under contract with the AEC. Nuclear engineering services were provided by Combustion Engineering, Inc. under subcontract to The Lummus Company. The following list gives the critical reactor components procured by The Lummus Company, and the fabricator:
Reactor vessel
Thermal shield
Experimental facilities
Reactor internals
Control rod mechanisms
Nuclear and process instrumentation
Main pumps
Main heat exchangers
J. B. Beaird Co., Inc. Shreveport, La.
0. G. Kelley & Co., Boston, Mass., and CPC Engineering Co., Sturbridge, Mass.
CPC Engineering Co., Sturbridge, Mass.
Bunell Machine & Tool Co., Cleveland, Ohio
Diamond Power Specialty Corp., Lancaster, Ohio
Milletron, Inc., East Irwin, Pa.
Pacific Pumps, Inc. Huntington Park, Cal.
Southwestern Engineering Co., Los Angeles, Cal.
The construction at the reactor site was carried out by several subcontractors to The Lummus Company. The following list gives the principal subcontractors:
Site clearing and earthwork
Civil and building (except steel dome)
Steel building dome
Cooling tower
Mechanical work and reactor erection
Electrical work
c. L. Hough Co., Selden, N. Y.
Malan Construction Corp., New York, N. Y.
Graver Tank and Manufacturing Co., Chicago, Ill.
Fluor Products Corp., Santa Rosa, Cal.
Kaighin and Hughes, Inc. Toledo, Ohio
Chas. A. Mulligan, Inc., Central Islip, N. Y.

1 - 3
Heating, ventilating, and air conditioning
L. J. Aksman & Co., Inc. New York, N. Y.
The fuel elements were designed by BNL, and the initial fuel contract was awarded to United Nuclear Corp., New Haven, Conn. Control rod blades were also designed by BNL and supplied by United Nuclear Corp. The fuel handling system, canal equipment, and special radiation instrumentation was supplied by BNL.
1.4 SUMMARY TABLES
A summary of the principal parameters and characteristics of the HFBR is given in Table 1.4-1. A list of the system components is given in Table 1.4-2. A pipe-line abbreviation list is given in Table 1.4-3. The component list is given here to provide a convenient reference. All of the components are labelled with letters and numbers, e.g., GA-101A for one of the primary pumps. Reference to a component in the text of the report is frequently made by giving the component number. This is convenient and unambiguous, but is burdensome for the reader who is not completely familiar with the plant. It is hoped that the component list given here will reduce that burden.
Table 1.4-1 Table of HFBR Characteristics
Power 40 MW (fission)
Neutron flux Core, total epithermal Reflector thermal flux, max.
Materials Coolant, moderator, and reflector Fuel Core structure, beam tubes Reactor vessel Primary pipes and process equipment
Fuel element and core Type Uranium concentration in meat alloy Meat thickness C~adding thickness Standard plate thickness End plate thickness Plates per element Uranium enrichment U-235 loading per element Element length Element cross sect·ion dimensions Number of fuel elements in core Active core height Active core volume Internal irradiation volume Equivalent diameter of core Total U-235 loading Water-to-metal volume ratio D/U-235 atom ratio Al/U-235 atom ratio Cycle time for 20% burn-up Reflector thickness Neutron lifetime Delayed fraction, including photoneutrons
15 -2 -1 -1.6 x 10 -~ sec 7 x 1014 cm sec-1
D20 U-235-Al alloy 6061 aluminum 6061 aluminum stainless steel
MTR-ETR, curved-plate 30 wt% .020 in. U-Al .015 in. 6061 Al • 050 in • • 140 in • 17 std., 2 end 93% 274 gm 57.25 in. 2.878 in. x 3.218 28 20. 75 in. 88.3 liters 6 .3~ liters 18.82 in. 7 .67 Kgm .. l.._.365 172 109 38 days 31.6 in. 672 µsec .0078
in.

Table 1.4-1 Continued
Temperature and Void Coefficients Core metal coefficient Core water coefficient Reflector water coefficient Total temperature coefficient Core void coefficient
1 - 4
Excess reactivity reguirements Burn-up, plus Sm and stable f.p.'s Xenon, steady state Temperature Control and experiments Total
Control rods Number of main rods Individual main rod, total worth 8 main rods in gang, total worth Number of auxiliary rods Individual auxiliary rod, total worth 8 auxiliary rods in gang, total worth Total worth of all rods
Heat transfer areas Water channel thickness Fuel plate length, active Water channel width Core alloy width Heat transfer surface per element Total heat transfer surface, core
Water flow data Water channel flow area per element Total channel flow area, core Water velocity in channels Water flow per element Water flow, 28 elements Water flow in control rods, approx. Water flow in bypass, approx. Total water flow Total primary loop pressure drop Pressure drop in fuel elements
Process system design Maximum operating pressure Normal operating pressure Vessel design pressure Vessel design temperature Beam tube design temperature
Core power conditions Average power density over-all peak-to-average power density ratios:
Fresh-fuel core Equilibrium core
Peak power densities, nominal: Fresh-fuel core Equilibrium core
-0.52 x lo-3 %k/OC -6.7 x lo-3 %k/oC -17.2 x 10⁻³ %k/OC -24.4 x lo-3 %k/0 c -0.35 x 10⁻³ %k/cm3
Maximum Normal 6. 7 %k 4.4 0.9 1.4
13.4 %k
8 3.82 %k 30.5 %k 8 0.87 %k 7.0 %k 37.5 %k
0.102 in. 20.75 in. 2.446 in. 2.236 in. 11.68 ft2 327 ft 2
0.0327 ft 2 0.915 ft2 35 ft/sec 513 gpm 14,370 gpm 1020 gpm 1200 gpm 16,600 gpm 69 psi 31 psi
250 psig 200 psig 275 psig 250°F 400°F
.453 MW/liter
3.44 3.18
1.56 MW/liter 1.44 MW/liter
3.9 %k 4.4 0.9 1.4
10.6 %k

1 - 5
Hot channel factors: Bulk water factor Heat flux factor Heat transfer coefficient factor
Core thermal analysis results Reactor inlet temperature Reactor outlet temperature Average convective heat flux Peak convective heat fluxes:
Fresh-fuel core, nominal Fresh-fuel core, with heat flux factor Equilibrium core, nominal Equilibrium core, with heat flux factor
Maximum fuel plate-water interface temperatures:
Fresh-fuel core Equilibrium core
Saturation temperature at hot spot Minimum burnout ratios:
Fresh-fuel core, max. operating condition Fresh-fuel core, slow power increase Equilibrium core, max. operating condition Equilibrium core, slow power increase
Table 1.4-2 System Component Designations
Designation
BG-201 DC-101 EA-lOlA EA-lOlB EA-102 EA-103 EA-201 EA-202 EA-203 EA-302X EE-101 EG-101 FA-101 FA-102 FA-201 FA-202 FA-203 FA-303X FA-304X FA-305 FD-lOlA FD-101B FD-102 FD-103 FD-104 FD-105
System Component
Light Water Purification Unit Reactor Vessel Primary D2o Cooler Primary D2o Cooler Experimental D20 Cooler Shutdown D20 Cooler Thermal Shield H20 Cooler Canal H20 Cooler Biological Shield H20 Cooler Compressed Air Aftercooler Canal Ejector Helium Eductor Primary D2o Storage Tank Primary D20 Storage Tank Thermal Shield H2o Expansion Tank Poison Water Tank Biological Shield H20 Expansion Tank Compressed Air Receiver Compressed Air Dryer 11 F" Liquid Waste Tank Primary D2o Filter Primary D20 Filter Primary D2o Resins Filter Experimental D2o Filter Experimental D2o Filter Helium Particle Filter
1.35 1.27 1.38
120°F 134°F .393 x 106 Btu/hr-ft2
1.26 x 10⁶ Btu/hr-ft2 106 1.60 x
1.17 x 106 II
1.48 x 10⁶
359°F 344°F 376°F
2.46 2.01 2.75 2.27
Reference Section or Table Number*
7.8.5.2 5.5 5.3-1 5.3-1 8.2-2 7.1-2 7.9-2 7.8.5.2 7.10-2 3.5.5 7.8.5.2 7.4-1 7.6.5 7.6.5 7.9.3 7.3 7.10.5 3.5.5 3.5.5 3.5.2 7.5-1 7.5-1 7.5-1 8.2.2 8.2.2 7.4-2
II
II II
Reference Figure
5.1 5.2 5.2 5.2 8.9 7.1 7.13 5.1 ~.14 3.27 5.1 7.5 5.1 5.1 7.13 5.1 7.14 3.27 3.27 3.27 7.6 7.6 7.6 8.9 8.9 7.5

1 - 6
Table 1.4-2 Continued
FD-105A FD-201 GA-lOlA GA-lOlB GA-102A GA-102B GA-103A GA-103B GA-104A GA-104B GA-105 GA-201A GA-201B GA-202 GA-203A GA-203B GA-204 GA-301 GA-303 GA-304 GA-305A GA-305B GA-306 GA-307 GA-308A GA-308B GA-309 GB-301A GB-301B GB-302 GB-303A GB-303B GC-301A GC-301B H-lOlA H-lOlB H-102A H-102B H-103 H-104 HA-301 HA-305 IB-301 IB-302 IB-303 IB-304 IB-305 IB-306 IB-307 IB-308 IB-309 IB-310A IB-310B IB-311 IB-312 IB-314
Helium Iodine Filter Canal H20 Filter Primary D20 Pump Primary D2o Pump Primary D20 Shutdown Pump Primary D20 Shutdown Pump Experimental D20 Pump Experimental D20 Pump Primary D2o Transfer Pump Primary D2o Transfer Pump Helium Eductor Pump Thermal Shield H20 Pump Thermal Shield H20 Pump Canal H2o Pump Biological Shield H20 Pump Biological Shield H20 Pump H2o Purification Pump (BG-201) Cooling Tower H20 Pump Cooling Tower H2o Emergency Pump "D" Liquid Waste Pump Building Steam Condensate Pump Building Steam Condensate Pump "F" Liquid Waste Pump Domestic Hot Water Circulating Pump Building Heaters Circulating Pump Building Heaters Circulating Pump Absorption Chiller Water Pump Air Compressor Air Compressor Fuel Handling Exhaust Fan Building Exhaust Fan Building Exhaust Fan Absorption Type Chiller Absorption Type Chiller Primary D2 0 Cation Bed Primary D20 Nitrate Bed Primary D2o Mixed Bed Primary D20 Mixed Bed Experimental D20 Mixed Bed Helium Recombiner Building Steam Flash Tank Break Tank Operations Floor Air Cond. Operations Floor Air Cond. Experimental Floor Air Cond. Experimental Floor Air Cond. Experimental Floor Air Cond. Experimental Floor Air Cond. Equipment Floor Air Cond. Equipment Floor Air Cond. Lobby Air Cond. D2o Process Equipment Cells Air Cond. D20 Process Equipment Cells Air Cond. Generator Room Air Cond. Fan Transformer Room Air Cond. Fan Domestic Hot Water Heater
7.4-3 7.8.5.2 5.3-2 5.3-2 7.1-1 7.1-1 8.2-1 8.2-1 7.6-2 7.6-2 7.4.3 7.9-1 7.9-1 7.8.5.2 7.10-1 7.10-1 7.8.5.2 6.6 6.6 3.5.2
3.5.2
3.5.3 3.5.5 3.4.2 3.4.l 3.4.1 3.4.l 3.4.1 7.5-2 7.5-2 7.5-2 7.5-2 8.2.2 7.4.3
3.5.1 3.4.1 3.4.1 3.4.1 3.4.l 3.4.1 3.4.1 3.4.l 3.4.1 3.4.1 3.4.l 3.4.1
7.5 5.1 5.2 5.2 7.1 7.1 8.9 8.9 5.1 5.1 7.5 7.13 7.14 5.1 7.14 7.14
6.1 6.1 3.27 3.27 3.27 3.27
3.27 3.27 3.25 3.25 3.25 3.27 3.27 7.6 7.6 7.6 7.6 8.9 7.5 3.27 6.1 3.24 3.24 3.24 3.24 3.24 3.24 3.24 3.24 3.24 3.24 3.24 3.24 3.24

l - 7
Table 1.4-2 Continued
IB-315 IB-316 IB-317 IB-318 IB-321 IB-322 IB-325 KA-102
Building Heaters Hot Water Heater Building Exhaust Roughing Filter Building Exhaust Iodine Filter Building Exhaust Absolute Filter Ladies Room Exhaust Fan (South Wing) Mens Room Exhaust Fan (South Wing) Building Hot Water Expansion Tank Building Air Exhaust Line Venturi
3.4.3 3.4.3 3.4.3
3.4.2
*Table numbers appear with hyphens: e.g., 5.3-1 Refers to Table l of Section 5.3
Table 1.4-3 Pipe-Line Nomenclature
Piping Designation Function
CD Contaminated D2o Drain
DA Equipment D20 Drain
DD Radioactive Water Drain
3.26 3.26 3.26 3.24 3.24
3.26
DF Slightly Radioactive Water Drain
DW Domestic Water
EV Exhaust Vent
F Exhaust to Stack
He Helium
P Primary Process
TW Deionized Water
UDW Used Domestic Water
WC Cooling Water
WD Water Drain
WR Cooling Water Return
WS Cooling Water Supply
1.5 SUMMARY OF THE SAFETY ANALYSIS
The safety of the reactor is based upon redundant instrument systems and safety rods, and upon successive containment systems around the fuel. The instruments monitoring the neutronic behavior of the reactor and the critical process conditions are arranged with three parallel but independent channels for each variable. Any two of three parallel channels cause reactor shutdown. The two out of three coincidence arrangement allows frequent testing of each instrument channel during operation. There are 8 main control rods and 8 auxiliary control rods, all driven by independent mechanisms. In the maximum reactivity configuration of the system, which occurs during the loading of a completely fresh core, 5 main rods alone will keep the reactor subcritical.

1 - 8
For the cold, clean, freshly-fueled core, only 4 main rods are required for shutdown. For the normal core, which contains partially burned fuel elements from the previous cycle, only 3 main rods are required for shutdown.
The self-regulating characteristics of the reactor are similar to those of other enriched uranium-fueled reactors. The core temperature and void reactivity coefficients are negative in all regions of the core. In addition, there is a very large negative temperature coefficient associated with the reflector. The prompt neutron lifetime in the reactor is relatively long due to the heavy water moderation.
Fission products formed in the operation of the reactor are contained, in order, by the fuel alloy, by the metal in which the uranium fuel alloy is dispersed, by the complete metal cladding of all fuel alloy, and by a carefully designed and constructed reactor vessel and primary coolant system. The reactor is protected against accidental ruptures of the primary system or reactor vessel by the arrangement of the shield, which is such as to insure that the core remains covered with coolant in all circumstances. Means have been provided to cool the core after shutdown in the event of a loss of all coolant pumping power. The shield is constructed so that in the worst conceivable reactor accidents any gas overpressures which might occur would be relieved by controlled venting, and no solid missiles would escape from the shield.
The reactor building is constructed to withstand an internal gas pressure of 2 psig, which is about twice the peak pressure developed in the maximum qredible accident, with a maximum leakage of 53 of the building volume per day. The building is protected against negative internal gauge pressures by vacuum breakers. The personnel and equipment entries to the building are through air locks in which one of two doors is always sealed shut. The building is vented through the exhaust filters and reactor stack at all times, since the safety analysis has shown that in the maximum credible accident such venting reduces the radiation doses to persons outside the building.
A wide variety of environmental hazards, reactor system accidents and malfunctions, and human errors have been considered in the safety analysis. In all cases, including that of the maximum credible accident, the resulting radiation doses to persons in the hospital and housing areas within the Brookhaven site, and to all persons outside the site, are well below the guidelines of 10 CFR 100 (1.4).
References
(l.l) T. Auerbach, J. Chernick, J. Juliens, G. Lellouche, W. Zinn and Associates, "Preliminary Design of a High Flux Epithermal Research Reactor for the Brookhaven National Laboratory", Proc. Second Int. Conf., Geneva, 1958, P/424, Vol. 10, 60 (1958).
(1.2) J.M. Hendrie and H. J. C. Kouts, "Site Report on the Brookhaven High Flux Beam Research Reactor", BNL (July, 1962).
(1.3) J. M. Hendrie and H. J. c. Kouts, "Preliminary Hazards Summary Report on the Brookhaven High Flux Beam Research Reactor", BNL (May, 1961).
(1.4) "Reactor Site Criteria", Title 10, Code of Federal Regulations, Part 100 (10 CFR 100, Feb. 11, 1961).

2 - 1
SECTION 2. SITE DESCRIPTION
2.1 REACTOR LOCATION
The site of the HFBR is shown in Figures 2.1, 2.2, 2.3, and 2.4, which are maps of the general area, the Long Island area around BNL, the BNL site, and the populated central area of the BNL site, respectively. The Laboratory is located in Brookhaven Town, Suffolk County, New York. The Laboratory site has an area of about 3500 acres, and is approximately two miles square. The site and the various installations on the site are the property of the Federal Government. The Laboratory is operated by Associated Universities, Inc., under contract with the Atomic Energy Commission. A number of research machines are located at the Laboratory in addition to the HFBR. These include the Alternating Gradient Synchrotron, the Cosmotron, the Graphite Research Reactor, and the Medical Research Reactor. The various research activities at the Laboratory are discussed in detail in the BNL Annual Reports; see, for instance, BNL-806, Annual Report (July 1, 1963). There are actually two land tracts controlled by BNL. The north tract (see Figure 2.2) is not used at present. All BNL research activity is concentrated on the south site of 3500 acres, and all references to the site in this report are concerned only with the south site.
The site boundary is closest to the HFBR on the south, where the distance is 3700 feet. To the west the site boundary distance is 5700 feet, to the north 7200 feet, and to the east 7700 feet. The hospital, which has patients and visitors who are not members of the BNL staff, is 3000 feet from the HFBR. The Laboratory apartment area is 6800 feet from the HFBR.
The HFBR building is located east of the existing Graphite Reactor complex, and faces on Railroad and Cornell Avenues. It is located close to the existing reactor not only for operating convenience, but also so that the two reactors can make joint use of the cooling towers and the stack. The existing three-cell cooling tower system has been increased to five cells, and a new pump has been added at the north end of the sump to provide a combined cooling system suff icient for both reactors (see Section 6). The ventilating air and any off-gases from the HFBR are piped directly to the base of the stack. The stack is large, 350 ft height and of 17 ft I.D. at the top, and has ample capacity for both reactors (see Section 14.4.5). The local HFBR area is shown in Figure 2.10.
The HFBR building has personnel access from Cornell and Rutherford Avenues, truck access from Railroad and Rutherford, and parking lots on the southeast and northwest sides.
2.2 POPULATION DISTRIBUTION
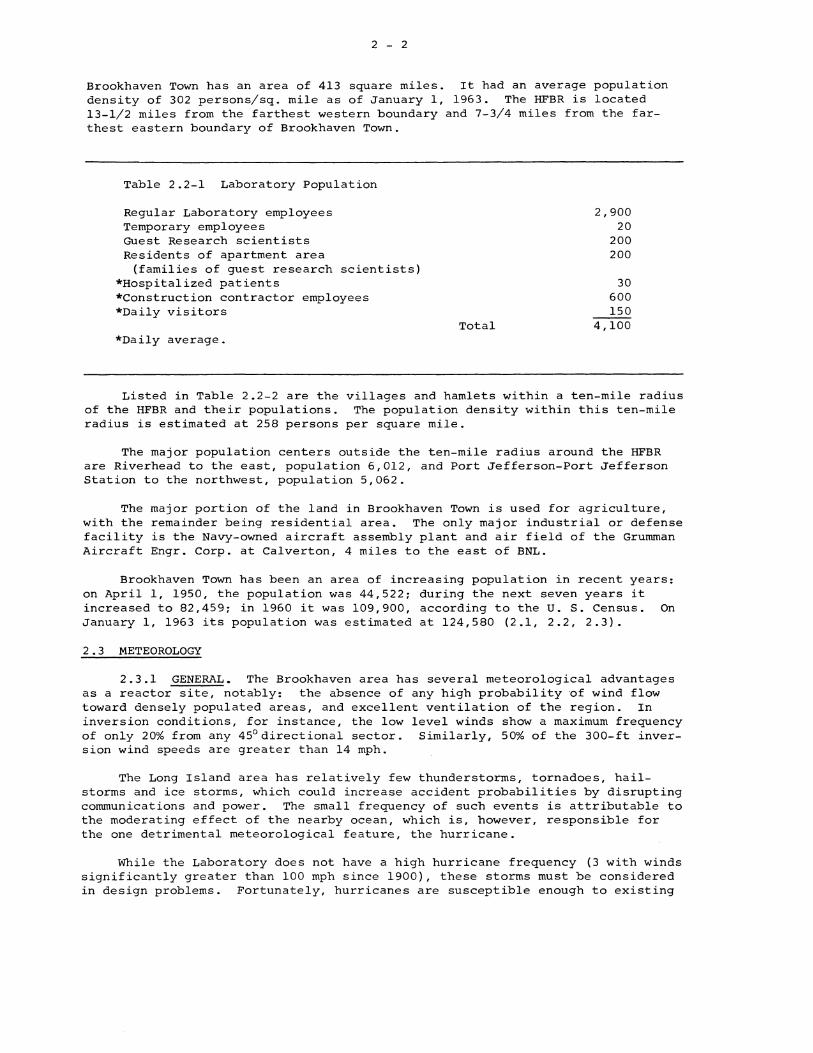
2.2.1 BROOKHAVEN NATIONAL LABORATORY SITE POPULATION. The summer (peak) complement of personnel at the Laboratory during working hours was about 4100 in 1963, with a breakdown as shown in Table 2.2-1.
On certain visitors' days, or days when employees and their families gather at the Laboratory for recreational exercises, 8,000 to 10,000 persons may be present. This number is not additive to the above total, since these large gatherings are not normally present on regular working days. The reactors are not operated on visitor's days.
2.2.2 POPULATION DISTRIBUTION OFF-SITE. Brookhaven National Laboratory is located within Brookhaven Town, County of Suffolk, State of New York. The
2 - 2
Brookhaven Town has an area of 413 square miles. It had an average population density of 302 persons/sq. mile as of January 1, 1963. The HFBR is located 13-1/2 miles from the farthest western boundary and 7-3/4 miles from the farthest eastern boundary of Brookhaven Town.
Table 2.2-1 Laboratory Population
Regular Laboratory employees Temporary employees Guest Research scientists Residents of apartment area
(families of guest research scientists) *Hospitalized patients *Construction contractor employees *Daily visitors
*Daily average.
2,900 20
200 200
30 600 150
Total 4,100
Listed in Table 2.2-2 are the villages and hamlets within a ten-mile radius of the HFBR and their populations. The population density within this ten-mile radius is estimated at 258 persons per square mile.
The major population centers outside the ten-mile radius around the HFBR are Riverhead to the east, population 6,012, and Port Jefferson-Port Jefferson Station to the northwest, population 5,062.
The major portion of the land in Brookhaven Town is used for agriculture, with the remainder being residential area. The only major industrial or defense facility is the Navy-owned aircraft assembly plant and air field of the Grumman Aircraft Engr. Corp. at Calverton, 4 miles to the east of BNL.
Brookhaven Town has been an area of increasing population in recent years: on April 1, 1950, the population was 44,522; during the next seven years it increased to 82,459; in 1960 it was 109,900, according to the U. S. Census. On January 1, 1963 its population was estimated at 124,580 (2.1, 2.2, 2.3).
2.3 METEOROLOGY
2.3.1 GENERAL. The Brookhaven area has several meteorological advantages as a reactor site, notably: the absence of any high probability ·of wind flow toward densely populated areas, and excellent ventilation of the region. In inversion conditions, for instance, the low level winds show a maximum frequency of only 20% from any 45°directional sector. Similarly, 5D°fe of the 300-ft inversion wind speeds are greater than 14 mph.
The Long Island area has relatively few thunderstorms, tornadoes, hailstorms and ice storms, which could increase accident probabilities by disrupting communications and power. The small frequency of such events is attributable to the moderating effect of the nearby ocean, which is, however, responsible for the one detrimental meteorological feature, the hurricane.
While the Laboratory does not have a high hurricane frequency (3 with winds significantly greater than 100 mph since 1900), these storms must be considered in design problems. Fortunately, hurricanes are susceptible enough to existing

2 - 3
Table 2.2-2 Populations of Hamlets and Villages within 10 Miles of BNL (Figure in parenthesis is additional summer population)
Name
Ridge
Manorville
Middle Island
Yap hank
Moriches
Mastic-Shirley
South Haven
Rocky Point
Center Moriches
Coram
Shoreham
Calverton
Brookhaven
Wildwood-Wading River
East Moriches
Mastic Beach
Sound Beach
Medford Station
North Bellport
Eastport-North Moriches
Bellport Station-Hagerman
Selden
Bellport
Miller Place
Baiting Hollow
Speonk
North Patchogue
Mt. Sinai
Farmingville
East Patchogue
Terryville
Holtsville
Remsenberg
Patchogue
•
Population
800
950
1618
3079
500
4116 (4000)
600
2300 (2000)
2750 (3000)
1892
180
600
900
900 (2000)
1300
3300 (5000)
1700 (3000)
2486
3000
1827
2000
1658 (3000)
2600
1312 (2000)
500
600
6000
500 (1000)
2200
6000
1500
3000
650 (900)
9200
Distance from HFBR
1-3/4 Mi.
3-1/4
3-1/2
3-1/2
4-3/4
4-7/8
5
5-3/4
6
6-1/4
6-1/4
6-3/4
6-7/8
6-1/4
7-1/4
7-1/4
7-1/4
7-1/4
7-1/4
7-3/4
8
8
8-1/4
8-1/2
8-1/2
8-3/4
8-3/4
9-1/4
9-1/4
9-1/4
9-1/4
9-1/4
9-1/2
9-3/4
II
II
II
II
II
II
Direction
NNW
ESE
WNW
SW
SSE
SSE
SSW
NNW
SE
WNW
N
ENE
SSW
NE
SE
s NNW
WSW
SW
SE
SW
WNW
SSW
NNW
ENE
SE
WSW
NW
WSW
SW
WNW
WSW
SE
WSW
Reference
2.1
2.1
2.2
2.2
2.1
2.1 & 2.2
2.1
2.1
2.1
2.2
2.2
2.1
2.1
2.1
2.1
2.1
2.1
2.2
2.1
2.2
2.1
2.2
2.1
2.2
2.1
2.1
2.1
2.1
2.1
2.1
2.1
2.1
2.1
2.1

2 - 4
forecasting techniques for advance warning of several hours to be virtually assured. The HFBR building is designed to withstand a wind speed of 120 mph with an ample safety factor, as are the existing reactor structures, including the stack and cooling towers.
The specific location selected for the HFBR, a point southeast of the Graphite Research Reactor, has a number of advantages. Of particular importance is the ability to pipe the ventilation air from the HFBR to the base of the Graphite Research Reactor cooling air stack. This feature assures automatic dilution of the ventilating air by thorough mixing with the large volume of Graphite Reactor cooling air, and it also provides a very high release point for the combined volume. Table 2.3-1 shows the computed effective stack heights achieved by the reactor cooling air under various wind speeds. These are far higher than could possibly be expected from a 350-ft stack serving the HFBR alone. Although no credit is taken for these effects in the calculations of stack gas releases for the HFBR (see Sections 11 and 14), the 85% "on time" of the Graphite Reactor means that in most release cases the effective stack height would be greater than tnat assumed and the ground level concentrations correspondingly less.
Table 2.3-1 Effective Stack Height of the Graphite Research Reactor Plume
Wind Speed (mph)
4.5
9.0
15.5
22.5
29.0
Effective Stack Height (ft)*, Unstable Conditions
1500
740
480
410
390
*Computed from Bosanquet, Carey & Halton equation, G 3 fan operation.
.001,
It is also important to recognize that even if the Graphite Research Reactor were not operating during an accidental release from the HFBR, a natural draft exists, drawing air from the HFBR up the stack rather than allowing it to be released at ground level (see Section 14.4.5).
The location of the HFBR takes good advantage of the site area and the natural wind distribution, minimizing the chance that any accidentally released gases or particulates will be carried over the central, populated portion of the site. At the same time good separation from the site boundary is maintained.
Figure 2.5A, which shows the annual wind roses for both stack level and ground level, indicates that the wind blows toward the site population center during only 25% of all hours. During the remaining 75%, the air moves toward lightly populated areas. The location is also favorable with respect to the off-site population in the directions of the prevailing winds, since the site

2 - 5
boundary is about 2 kilometers distant in these directions. This advantage is not derived for winds blowing to the south, where the site boundary is only 1 kilometer distant, but on the other hand this direction includes the region of minimum population off-site.
It is important to ascertain whether the wind distribution associated with the worst diffusion conditions is more or less favorable than the general wind rose. Figure 2.5B answers this question satisfactorily. If a release should occur at ground level during a temperature inversion, there is less probability that the effluent would proceed over the generally populated area of the site than during the better diffusion conditions found during the daytime.
Inspection of Figure 2.5B does show, however, that a large percentage of inversion hours are recorded as "calms" at the 37 ft level, and the actual direction of air flow during such conditions is in question, since there is usually appreciable air movement, whether recorded or not. Figure 2.5C shows the general terrain pattern of the area in and about Brookhaven. Smoke diffusion tests conducted at various levels on the Meteorological Tower suggest that a northerly drainage wind in near calm conditions is to be expected. We thus feel that the wind rose, Figure 2.5B, representative of the poorest diffusion conditions, is even more favorable for this location than the statistics show.
In terms of particulate deposition, as opposed to cloud dosage, previous experience at this site and the studies of the problem suggest that the least favorable condition would be poor diffusion accompanied by light precipitation (2.4). Accordingly, the wind rose representation of the hours with precipitation, Figure 2.5D is presented. Clearly, this wind rose is less favorable as far as the general site population is concerned, since the northeast, east and southeast winds are represented much more prominently during precipitation hours than is true otherwise. However, this disadvantage is compensated in part by the fact that precipitation situations are frequently associated with higher than average winds, and therefore somewhat better diffusion than normal. This is .shown by the comparison of the precipitation wind speed distribution shown in Table 2.3-2. In the latter, over 50% of the low level winds for all hours are found in the 0 to 6 mph grouping, while during precipitation hours, some 58% of the wind speeds range from 7 to 20 mph.
Table 2.3-2 Percentage Distribution of 37 ft Wind Speeds
Speed Group (mph) All Hours Precipitation Hours
0 - 6 54% 39%
7 - 20 45 58
>21 1 3
In summary, it is felt that the general meteorology of the BNL area is favorable for a reactor site, and that the specific location selected for the HFBR maximizes its safety to both on-site and off-site personnel in every respect except particulate contamination associated with precipitation.
2.3.2 METEOROLOGICAL FACTORS FOR REACTOR ACCIDENTS. There are several accident situations (see Sections 11 and 14) in which radioactive material might

2 - 6
be released from the contained volume of the HFBR building. In some of these cases the release would occur only from the reactor stack. In the maximum credible accident, however, the building atmosphere pressure may rise above that of the environment, with a resulting release at ground level. Meteorological conditions and calculations pertinent to all of these cases are discussed in this section.
The diffusion of the radioactive cloud is described in all cases by Sutton's equation (2.5):
2Q (- h2 ) 3 X (x) = 1TC c ux2-n exp cz2x2-n I c/m
y z
Here y(x) is the cloud centerline concentration at the ground in c/m3 at distance x meters from the source. Q is the radioactive source strength in c/sec (time dependent in some cases): <:Y•cz and n are diffusion parameters for the lateral and vertical spreading of the cloud and for the turbulence effect, respectively: u is the average wind velocity in m/sec: and h is the height of the source point above the ground in meters.
In the calculation of total radioactive exposure from a cloud an integration over time is necessary. This integration involves the source strength, Q, but not the remainder of the equation so long as the meteorological conditions are assumed constant over the course of the accident. Thus, it is convenient to remove from the equation the time independent parts, and to discuss the meteorological aspects of the accident cases in terms of these quantities. We call the time-independent part Sutton's function S(x), understanding that it is a function of the diffusion parameters as well as of the distance. Explicitly,
S(x) sec
7
In those accident cases in which both ground level and stack top releases are involved, separate Sutton's functions must be used for each release. The Sutton's function for the stack release will always have h = 108 meters, while that for the building, or ground level release, will always have h = 0 meters. Further, the diffusion parameters are generally slightly different for the two sources, even for simultaneous releases.
There are four meteorological cases which must be considered in the accident analysis. Two of these cases are of relatively rare occurrence, but are important because they give the largest cloud concentrations from the stack release. The other two cases represent the worst diffusion conditions for night and day conditions and are of frequent occurrence in the Brookhaven area.
The rare cases are designated Case I and Case II. Both are weak neutral meteorological conditions with relatively low wind speed and minor turbulence. Both cases produce a peak in the ground level cloud concentration from the stack release at a distance of about 2.6 kilometers.
Case II is a simple weak neutral condition with no significant variation in the diffusion conditions with height. This condition occurs during one to two percent of all hours in the Brookhaven area. Table 2.3-3 gives the diffusion parameters and wind velocities appropriate for this case and graphs of the stack and building release Sutton's functions are shown in Figures 2.6 and 2.7.
Case I is a weak neutral condition with an inversion lid above the top of

2 - 7
the stack. This situation may occur when a warm frontal surface lies immediately above the stack. A significant number of cases have been observed at the Meteorological Tower in which marked inversions between the middle and top of the tower have persisted for several hours. The case I situation is estimated to exist during no more than two to three percent of all hours.
The inversion layer will not only limit the upward diffusion of the plume, but will augment the ground level concentration from the stack. The effect of the inversion, at a height 6h above the top of the stack, may be accounted for by the customary device of an image source. The appropriate Sutton's function would then be
S(x) h2 ) 2 2-n + exp c x z
t- (h+26h) 2] } 2 2-n
c x z
sec 3
m
This case clearly produces maximum doses if the inversion is just above the stack top, so that 6h=O. We shall assume that this is the case and that there is perfect reflection at the inversion layer. Then the Case I Sutton's function for the stack release is just twice the usual form, or
S(x) (Case I,· stack)
4 2-n
TIC C UX y z
sec -3-m
Diffusion parameters and wind velocities for Case I are given in Table 2.3-3, and graphs of the stack and building release Sutton's functions are shown in Figures 2.6 and 2.7.
It will be noted from Table 2.3-3 that the stack top wind velocity for Cases I and II is only 4 m/sec, or 9 mph. If the Graphite Reactor is operating in these conditions, the effective release point of the stack is raised to about 740 ft, or 226 m, as given in Table 2.3-1. For Case II, this increase in release height moves the stack cloud maximum concentration from 2540 m distance to 6900 m, and reduces the concentration by a factor of 4.4. For Case I, the plume will penetrate an inversion layer close to the stack top, and will not return through the layer until very great distances are reached. Thus, Case I is effectively ruled out while the Graphite Reactor is operating (about 85% of all hours) if the inversion layer is beneath the 740 ft plume height.
Case III is the strong surface inversion condition which occurs frequently during night hours at Brookhaven, and which is the classic meteorological case for reactor safety studies. In this condition the stack release is held aloft to such great distances that it contributes little to the ground dose. The building, or ground level release, however, produces a highly concentrated plume which remains at ground level. Diffusion parameters and wind velocities for Case III are given in Table 2.3-3, and graphs of the stack and building release Sutton's functions are shown in Figures 2.6 and 2.7. Since the building release is the important factor in Case III, the operation of the Graphite Reactor makes little difference in the cloud doses in this case.
Case IV is the normal lapse condition which occurs frequently during daytime hours at Brookhaven. In this case the stack cloud comes rapidly to the ground, producing a maximum concentration at about 600 m from the source. Diffusion parameters and wind velocities for Case IV are given in Table 2.3-3, and graphs of the stack and building release Sutton's functions are shown in Figures 2.6 and 2.7. The wind velocity at the stack top for Case IV is 7 m/sec, or about 15.5 mph, giving an effective plume height of 480 ft, or

2 - 8
146 m, for those times during which the Graphite Reactor is operating. The effect of the operation of the Graphite Reactor on the stack cloud concentration is, therefore, less in this case than in the weak neutral cases: the maximum concentration point is moved to 845 m, and the concentration reduced by a factor of about 1.7.
Table 2.3-3 Sutton's Equation Diffusion Parameters
Case Description Release u n c c .....:L z
I Weak Neutral with Ground 2.0 .50 .35 .35 Inversion Cap Stack* 4.0 .so .30 .30
II Weak Neutral Ground 2.0 .50 .35 .35 Stack 4.0 .50 .30 .30
III Strong Surface Ground 1.0 .55 .40 .10 Inversion Stack 7.0 .55 .40 .05
IV Normal Lapse Ground 4.0 .25 .45 .35 Stack 7.0 .25 .40 .40
Units: u meter/second
n dimensionless
c y
,c z
metersn/2
*The source term is doubled for Stack release in Case I.
2.4 HYDROLOGY AND GEOLOGY
The reactor is located on a small hill of mixed sand, gravel, and clay typical of the Pleistocene glacial deposits which cover the Brookhaven National Laboratory site, and nearly all of central Long Island. The average thickness of the sedimentary out-wash and morainal deposit is 200 ft at the reactor site. Various borings have determined the stratigraphy from the surface to bed rock as is shown in Figure 2.8 (2.6). Examination of Figure 2.8 will show that there are variations in the thickness of the several stratigraphic units, as is to be expected in view of the glacial origin of these recent sediments.
In general, there are three definable aquifers between the surface and the impermeable bed rock, which begins at a depth of about 1600 ft at the site. The upper Pleistocene deposits constitute the most productive aquifer, the Magothy Formation being somewhat less productive, and the Lloyd Sands relatively unproductive in the central Suffolk area. Data on these aquifers are summarized in Table 2.4-1, and the flow of ground water through them is shown in Figure 2.9 (2.7, 2.8).
The source of the ground waters underlying Long Island is percolation from rain and snow. It has been estimated that at the BNL site one-third of the percolation supplies the Magothy and Lloyd Formations, while two-thirds enters the Pleistocene stratum. A very small fraction of the ground water in the

2 - 9
Pleistocene layer is intercepted by the channel of the upper Peconic River and joins that stream. A still smaller fraction eventually emerges in the Forge River, but much the greatest part of the Pleistocene ground water continues on at the general rate of one-half to one foot per day to form submarine springs in the bays and sea to the southeast of the site. At points near the edges of the Island the hydraulic gradient of the ground water has an upward component and the Lloyd and Magothy Sands will, therefore, resupply water to the Pleistocene formation.
Table 2.4-1 Average Characteristics of Aquifers and Clay Formations at the Brookhaven National Laboratory
Pleistocene Deposits Raritan Raritan Below Water Gardiner's Magothy Formation Formation Table Cla::L Formation Cla::L Llo::Ld Sand
Thickness in ft 145 10 800 150-200 314
Coefficient of lateral permea-bility gpd/ft2 1,300 100-400 74
Transmissibility of whole formation gpd/ft 190,000 40,000 23,000
Coefficient of vertical permea-bility gpd/ft2 130-350 0.3
Direction of flow SE SE SE SE SE
Undisturbed hori-zontal velocity of flow, ft/day 0 .5-1.0 .025-0.l 0.005
Hydraulic gradient .0010 .0006 .0002
Porosity, % 35 33 33
All irrigation, domestic, process, and cooling water at the BNL site is drawn from the Pleistocene and Magothy aquifers, with the Pleistocene supplying much the greater quantity of water. The Pleistocene layer is also the most important water source for water users in the surrounding central Suffolk area.
In the event of a spill of radioactive wastes at or near the HFBR site the possible contamination of surface and ground waters must be considered. The surface of the ground in and near the reactor site is so permeable that flow over the surface for any distance is very unlikely (2.9). Following a heavy rain on soaked or frozen ground, small streams flow for short distances, but it would be impossible for contamination to be carried from the Laboratory into the Peconic, Carmans, or Forge Rivers in this way.

2 - 10
The major points in determining the subsequent contamination of the ground water are the direction and rate of movement of the ground water, the dilution of the active solution with the ground water, and the adsorption of the activity by soil materials. The transit time of the Pleistocene layer ground water to the nearest sensitive points outside the Laboratory tract must be measured at least in years and probably in decades, so that only a comparatively few of the longest-lived isotopes are a potential hazard. Because the lamellar flow of ground water precludes mixing by turbulence, dilution should not be of great importance in reducing ground water radioactivity in the event of a spill. It might be expected that much of the ground water stream would remain free of radioactivity but that specific streams of contaminated solution would occur in the layer.
As regards adsorption, the environment at BNL is particularly favorable. Even a few hundred feet of a poorly adsorbent aquifer like a glacial sand has more than adequate potential adsorptive or ion exchange capacity to handle even a very large spill.
Because of the slow and uniform rate of movement of the ground water beneath the Laboratory site, it should be possible in the event of a spill of radioactive wastes to drive scavenging wells to map the limits of the contamination and to pump the active liquid out of the water table. It has been the general conclusion of an extensive study of the geology and hydrology of the Laboratory site that BNL is located in a geologic and hydrologic environment that is unusually well suited to reducing the dangers of serious contamination of the ground water in the event of an accident releasing large quantities of radioactive solution (2.10).
2.5 SEISMOLOGY
The probability of occurrence of an earthquake in the BNL area of sufficient intensity to cause damage to building and reactor structures was thoroughly investigated during the construction of the Brookhaven Graphite Reactor. The investigation showed that, in fact, a severe earthquake shock in the Brookhaven area is a most unlikely event. The following paragraph is quoted from the "Supplement to Report on the Brookhaven Nuclear Reactor Prepared for Reactor Safeguard Committee of the Atomic Energy Commission, August 30, 1948":
"It is, therefore, the consensus of seismologists that no significant quakes are to be expected in the foreseeable future and that, if such quakes are to be expected they will be preceded by preliminary shocks easily detected by seismographs. It is the opinion of the seismologists that the probability of a severe shock would be less than 1 in 100,000 years."
The earthquake history of the site has been reviewed and the principal earthquakes of interest are tabulated in Table 2.5-1.
The accelerations to be expected from earthquakes of various intensities on the Mercalli scale are shown in Table 2.5-2.
Tables 2.5-1 and 2.5-2 show that no earthquake has yet produced an intensity in the BNL area in excess of intensity III (1-8 cm/sec2 ). However, Long Island lies in a Zone 1, or "minor damage" seismic probability area, and for this reason it has been assumed that an earthquake of intensity VII could occur at BNL. The reactor building and all associated structures are, therefore, designed to withstand horizontal accelerations of 0.1 g (98 cm/sec2), which is in the range of intensity VII to VIII earthquakes. There are no known active
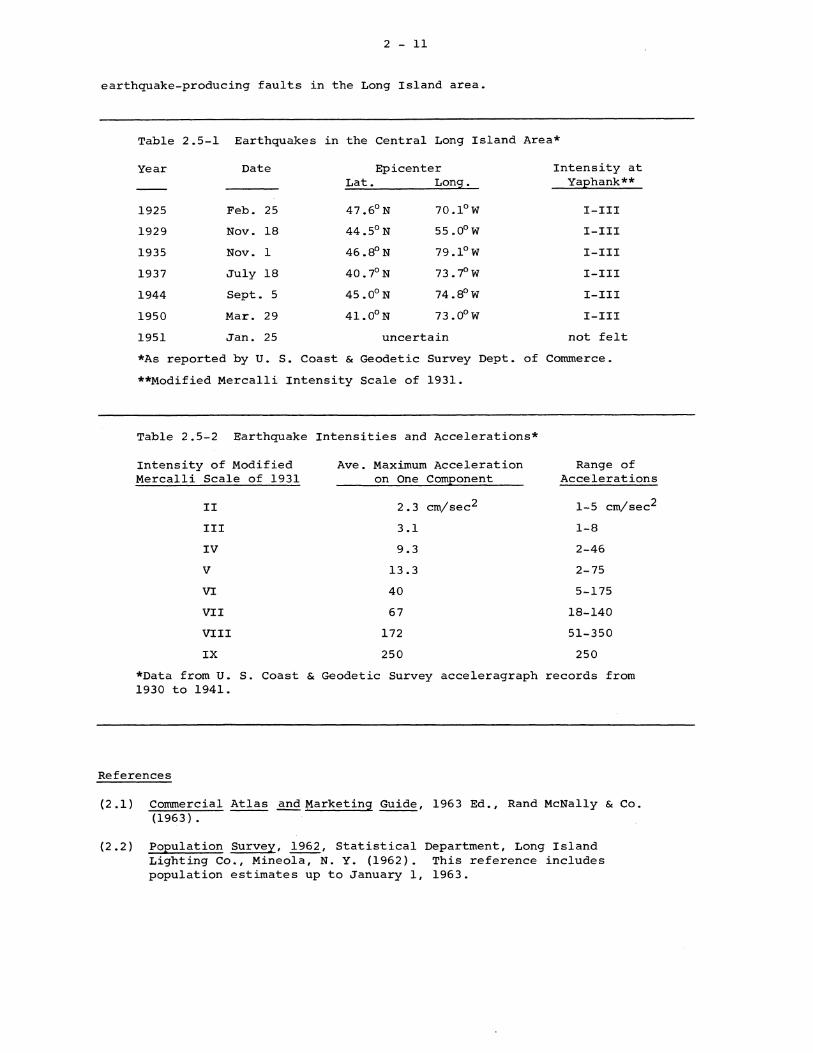
2 - 11
earthquake-producing faults in the Long Island area.
Table 2.5-1 Earthquakes in the Central Long Island Area*
Year Date Epicenter Intensity at Lat. Lon9. Ya;ehank**
1925 Feb. 25 47 .6°N 70.1°w I-III
1929 Nov. 18 44 .5°N 55 .0° w I-III
1935 Nov. 1 46 .a°N 79 .1°W I-III
1937 July 18 40. 7°N 73. 7° w I-III
1944 Sept. 5 45 .0°N 74.8°w I-III
1950 Mar. 29 41.0°N 73 .o0 w I-III
1951 Jan. 25 uncertain not felt
*As reported by U. S. Coast & Geodetic Survey Dept. of Commerce.
**Modified Mercalli Intensity Scale of 1931.
Table 2.5-2 Earthquake Intensities and Accelerations*
Intensity of Modified Mercalli Scale of 1931
II
III
IV
v VI
VII
VIII
IX
Ave. Maximum Acceleration on One com;eonent
2.3 cm/sec2
3.1
9.3
13.3
40
67
172
250
Range of Accelerations
1-5 cm/sec2
1-8
2-46
2-75
5-175
18-140
51-350
250
*Data from U. S. Coast & Geodetic Survey acceleragraph records from 1930 to 1941.
References
(2.1) Commercial Atlas andMarketin9 Guide, 1963 Ed., Rand McNally & Co. (1963).
(2.2) Po;eulation Survey, 1962, Statistical Department, Long Island Lighting Co., Mineola, N. Y. (1962). This reference includes population estimates up to January 1, 1963.

2 - 12
(2.3) Final Population Counts, 1960 Census, PC (Al)-34 Rev., Bureau of the Census (March 16, 1961).
(2 .4.) M. E. Smith and I. A. Singer, "Diffusion, Deposition, and Rainout of the Radioactive Cloud", Appendix E, WASH-740, U.S.A.E.C. (March, 1957).
(2.5) Meteorology and Atomic Energy, AECU-3066, U. S. Weather Bureau (July, 1955), p. 47.
(2.6) Wallace de Laguna, Geology and Hydrology of Brookhaven National Laboratory and Vicinity, Suffolk County, N. Y., Part I: Geology, U. S. Dept. of the Interior Geological Survey (Sept., 1958), p. 9.
(2.7) M. A. Warren and N. J. Lusczynski, Geology and Hydrology of Brookhaven National Laboratory and Vicinity, Suffolk County, ~., Part II: Hydrology, U.S. Dept. of the Interior Geological Survey (April, 1958), p. 69.
(2 .8) N. A. Christensen, ~ Study of Proposed ~ of Ground Water at the Brookhaven National Laboratory and Its Effect Upon the Water Table, Brookhaven National Laboratory (1959), p. 7.
(2.9) Wallace de Laguna, Geology and Hydrology of Brookhaven National Laboratory and Vicinity, Suffolk County, ~·· Part IV: Patterns of Movement and Spread of Water Borne Contamination, U.S. Dept. of the Interior Geological Survey (May, 1958), p. 56.
(2.10) Ibid, p. 87.

" ' ' ""' ' '
N
........_
\ ... ' ~ .... .....
NEW JERSEY ~ ... .....
NEW
YORK
("" ' \
,.....,/
I I I
I I l \ ' ' ,. .... >
,./
CONNECTICUT
LONG ISLAND SOUND
I FERRY TO \,BRIDGEPORT
JEFFERSON
~-<;IC.
"-<;'-"
oc.~"~
Figure 2.1 Map of the general Long Island area.
//FERRY TO NEW LONDON
IENT POINT
0

WYANDANCH • SOUTHERN
N
+
Figure 2.2
LDNG ISLAND SOUND
ATLANTIC OCEAN
+'"., ,.o
~.p-.§>
REGIONAL MAP CENTRAL SUFFOLK COUNTY,LONG ISLAND
SCALE ·--==--==--c::::i 0 I 2 3 4 DMI
Map of the central area of Suffolk County around Brookhaven National Laboratory.

"(''
0 b-_
I ""("
4
" " ~
CONTOUR INTERVAi. 10'
DATUM IS ME..W SEA. lfVEl
~MllE.
I ""("
'-- Jf/ ..._ ____ ,o
n· 51'
Figure 2.3 Map of the Brookhaven National Laboratory •ite.
/ I I \ \
I,
• 0 =:::::::::
KEY
SITE BOUNDARY
PERMANENT 8UflDINGs (EXISTING ANO AUTHORIZED)
TEMPORARY IUJlDINGS FIRE lltEAkS
~., . .,._
\.'.\,.,..
N
f--' ln

SOUTH SITE BOUNDRY
Figure 2.4 Map of the central portion of Brookhaven National Laboratory and the location of the HFBR. The circles have radii of 100, 200, 300, 500, 800, and 1100 meters.
"'
..... Cl'
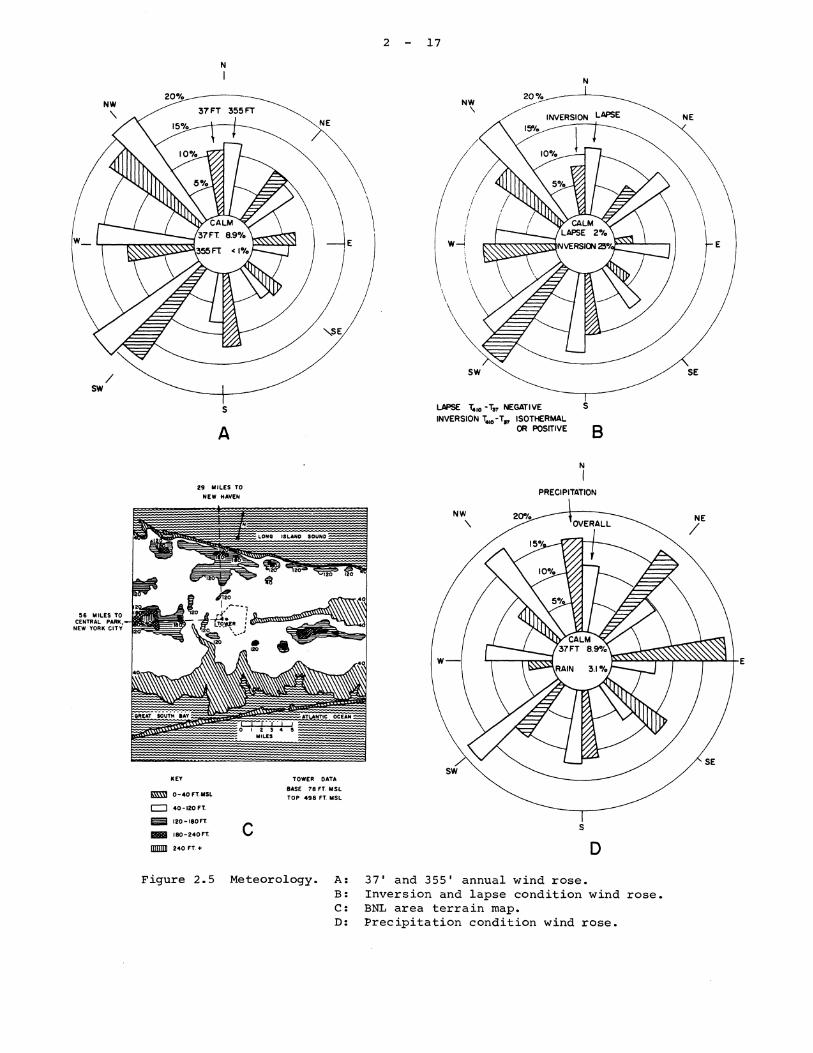
~6 MILES TO CENTRAL PARK,
NEW YORK CITY
N
I
s
A
21 MILE'S TO NEW HAVEN
KEY
m\'I 0-40 ,T. MSL
c::J 40-120 ,T.
eil 120-1aon.
11111 180-240FT.
DDIDD 240 FT. +
c
TOWER DATA
BASE 78 n. MSL TOP 498 FT. MSL
2 17
\ I
NW
'
f w-!
\ \
N
20% __,.--· / INVERSION LAPSE
LAPSE T.oio ·T01 NEGATIVE S INVERSION ~0 -T11 ISOTl-E:RMAL
OR POSITIVE B
N
I PRECIPITATION
s
D
Figure 2.5 Meteorology. A: 37' and 355' annual wind rose. B: Inversion and lapse condition wind rose. C: BNL area terrain map. D: Precipitation condition wind rose.
NE

.. z 0 fu 10-6 z :::> u.. (J) .. z 0 If:::> (J)
w (J)
<C w _J 10-1 w a:: ::ic:: u <C f(J)
2 - 18
,,
-
__ , CASE I
' ''
'CASE II
CASE :m:
CASE m
103 104
DISTANCE, METERS
Figure 2.6 Sutton's functions for stack releases (h = 108 rn).

2 19
r 't- + ~++-1-H+++H,*,1+-++t+t-I+~' J1-+-1-->++H+--l-++-+-H-+-+,1++e-,, rte,w1-1-t-t+t++H+t+++1-++++-++tt
·: :E· + .l-IC)
~ I r th
....... u Q) Ul
CASE m z 0 I- 10-5 (.)
z ::::> LL
CJ)
z 0 I-I-::::> CASE 18 lI: CJ)
1.1.J CJ) <t 1.1.J
10-6 _J 1.1.J a: CASE nz: 0 z ::::> 0 a: (!)
10-7 ........... _._............,..w.w.wa..~cuw.w.u..u..L..L........,-'-"-'u..u..u.u.w.w.w.u..u.u.Ju.i.w.JJ.U...J...w...u'-'-""--'-'-'-..__._._.'-1.J-U.....,,,..w..w..u..u."'"'-'-'-'"-'-'-<'-'-'-".&.U I 0 2 103 104 105
DISTANCE, METERS
Figure 2.7 Sutton's functions for ground level releases.

CONNECTICUT LONG ISLAND SOUND LONG ISLAND HARBOR HILL
MORAINE BROOKHAVEN RONKONKOMA LABORATORY MORAINE
GREAT SOUTH
ATLANTIC OCEAN
..._ BEACH
.~iA ___ ~ SEALEVEL O --- -- ------·-- ........_::::,,-,----200FEET
=: -----· ~ ~ ·-·"·" u I UPPER LIMITO,LLOYD ~ ~ UPPER LIMI.
,.._ __ ,,u M~ :""~~~.~:.-:-::;~~ 1-600
-800
-1000 SAND IS UNKNOWN
-1200-------------------------------""-.:::----
-1400 GENERALIZED GEOLOGIC CROSS SECTION
-1600 ------ ALONG MERIDIAN 72° 52' 30" -TO SHOW GENERAL RELATIONS OF
-1800 AQUIFERS UNDERLYING CENTRAL SUFFOLK COUNTY
-2000 FEET ------ 0 I 2 3 4 5 MILES
Figure 2.8 North-south geologic cross section through Brookhaven National Laboratory showing the underlying strata.
-1000
-1200
-1600
-1800
-2000
"'
"' 0

NORTH
SEA LEVEL
200'
400'
600'
800'
1000'
1200'
1400'
1600'
1800'
2000'
2200'
APPROXIMATE WATER
I TAI:~~:~:::: NATIONAL LABORATORY
AREA
LANATION
1111
-APPROXIMATE EXTENT OF SALT WATER
FLOW LINES
0 I 2 3 4 5 6 7 8 9 10 MILES I l I I _l ___ L_ l_
SCALE
Figure 2.9 North-south cross section through Brookhaven National Laboratory showing the movement of ground waters in the various aquifers.
SOUTH
SEA O' LEVEL
200'
400'
600'
800' (\.)
1000'
1200' (\.)
I-'
1400'
1600'
1800'
2000'
2200'

~ ~
~110
-I I I 0 25 50
I I 100 200
SCALE IN FEET
COOLING TOWERS
HEAVY WOODS
~
PUMP HOUSE ~- --+--11-----[f'
2------' ~ BwALKWAY ______ ,
l~_________.-90
I 300 _.....-----,
90~ /- ~0---r---_
CORNELL AVENUE
1-.., .., ~ c
~ ...J
L ;;! I LONG BEAM
--~--------~~~~~~(
Figure 2.10 Map of the immediate site of the HFBR and adjacent reactor facilities.
,._,
N
N N

3 1
SECTION 3. REACTOR BUILDING AND CONTAINMENT SYSTEM
3.1 DESCRIPTION
3.1.1 DESIGN BASIS. The HFBR building must serve the dual purpose of housing the reactor and the research activities connected with it, and of retaining the radioactive products of any conceivable reactor accident. The design basis for these two features of the reactor building, as well as for the internal arrangement of the reactor plant within the building are discussed separately below.
The design basis for the containment features of the reactor building are as follows:
1. The building shell must be designed to withstand an internal pressure greater than that which could arise from any conceivable reactor accident. Further, the leakage from the building at such an overpressure must not lead to radiation doses to the general public which are in excess of the levels used in guide lines for analyzing the consequences of such accidents.
2. In normal operation, a slight negative pressure should be maintained within the reactor building to insure that any air leakage is inward rather than outward.
3. All exhaust gases from the reactor building should pass through appropriate filters and be discharged from a high stack.
4. The building should normally be in such a configuration that it is sealed. That is, entryways for personnel and for equipment must be of the airlock type, so that one sealed doo.r is closed at each entryway at all times.
5. ventilation entryports and exhaust vents should be equipped with valves which close automatically in the event of a reactor accident which releases radioactive material.
In view of the large building required to house the experiments, it is not economical to construct the building shell to endure any missile loadings which might result from reactor accidents. The primary system shielding is, therefore, constructed to absorb and confine all violent excursions which might occur, leaving to the building shell the containment function of a low pressure gas barrier.
It is found that the dose to persons off-site from a major release of fission products to the building volume is considerably reduced by venting the building overpressure through the exhaust gas filters and releasing the effluent from the reactor stack. Thus, the main exhaust line from the building is automatically throttled (rather than being closed tight) if radioactive material is released, and the building exhaust fans are switched off.
The design basis for the reactor building and for the arrangement of the reactor plant is as follows:
1. The building and plant layout must provide a sheltered, air conditioned environment for the research activity associated with the reactor.

3 2
2. The external beam experiments require a large clear space around the reactor shield, with heavy duty crane service and laboratory space for each experiment.
3. The experimental area for external beam experiments should be free of radioactive contamination and nonessential traffic. Access for heavy equipment is required from outside the building.
4. The radiation experiments require free access to the thimble terminations and an area in which radioactive materials may be handled.
5. The reactor plant must be as compact as possible to minimize the inventory of heavy water.
A variety of building arrangements were considered in the design stage. Designs with the reactor machinery above the reactor vessel or outside the reactor building were discarded because of greater expense in floor structures and in heavy water inventory, and because these arrangements hampered access to the experimental facilities. The reactor machinery was finally located directly beneath the core vessel, and a piping arrangement laid out to minimize heavy water inventory and achieve acceptably low stresses in the piping system. The entire primary system is within the containment volume of the building.
The experimental requirements led to a plant layout which separates the beam experiments from the irradiation experiments and from reactor operations. This goal is achieved by providing separate floor levels, with graded air conditioning, for the beam experiments and for the irradiation thimble terminations.
The shape chosen for the reactor building is a hemispherical dome supported on a short cylinder, with a reinforced concrete foundation slab. The structure is divided into three basic levels, with the reactor machinery in the basement, beam experiments on the first floor, and reactor operations and thimble terminations on the second floor.
3.1.2 DESCRIPTION OF THE BUILDING. Elevations of the HFBR building are shown in Figures 3.1 and 3.2. Floor plans of the various levels of the building are shown in Figures 3.3 through 3.6 and these levels are discussed in the individual subsections which follow.
3.1.2.1 Equipment Level. The general plan of the equipment level is shown in Figure 3.3. The elevation of this floor is 93 ft-0 in. On the east side of the equipment level a truck airlock extends out from the circular perimeter of the building. on the south, at elevation 101 ft-0 in., there is an entrance lobby which is connected to the reactor building by a personnel airlock. The entrance from the south lobby is into a stair well between the equipment floor and the next level above in the reactor building proper.
The dominant feature of the equipment level is the shielded cell area for the primary system pumps and heat exchangers, located in the center of the floor. The fuel storage canal is to the east of the central shielded cells, with overhead monorail and bridge crane service. The fuel discharge chute from the top of the reactor vessel passes down through the concrete shielding and into the canal. The canal is 20 ft deep for most of its length, with a 30 ft deep pit under the fuel discharge chute end. A small bay on the north side of the canal provides additional space for fuel element storage and for gamma irradiations.
3 3
Three rooms along the south wall of the equipment level are partitioned off from the rest of the area. These are the transformer room, the filter room, and the emergency generator room. Each of these areas has access from outside the building and is ventilated directly from the outside atmosphere. These rooms also connect to the interior of the contained volume through gasketed, bulkhead doors which are normally kept closed and locked.
The heavy water cleanup system is installed in pits sunk into the floor in the northeast quadrant of the equipment level. The canal cleanup system is also mounted in this quadrant, as are a temporary storage tank for F waste and one of the heavy water storage tanks.
The remaining equipment on this level supplies building steam, hot water, air conditioning chilled water, and compressed air.
3.1.2.2 Experimental Area. The experimental area is shown in Figure 3.4. The elevation of this floor is 113 ft-6 in. There is a truck airlock on the north side of the area, with a smaller airlock for personnel next to it. A receiving room and receiving platform are located next to the airlocks.
The reactor structure occupies the central portion of the experimental area, with a large clear space around it for the external beam experiments. Laboratories are located along the wall of the building. on the north side of the area are a machine shop, stock room, and a health physics office.
The experimental floor is indented with a series of radial and circumferential trenches which allow access for water, electrical power, vacuum lines, etc., for experimental uses around the reactor structure. A radial traveling beam crane of 20 ton capacity services the experimental area from the pile face to the line of the columns.
The balcony, which is part of the 3.5. washrooms, a lunch room, and air mental area are located on this level. 128 ft-6 in.
experimental area, is shown in Figure conditioning equipment for the experi
The elevation of the balcony floor is
3.1.2.3 Operations Area. The operations area, on the top floor of the building, is shown in Figure 3.6. The reactor shielding structure rises 7-1/2 ft above the floor level in the center of the area. The elevation of the operations floor is 141 ft-6 in. To the southwest of the pile top there is a process area for pumps and heat exchangers for the experimental facilities heavy water cooling system. One of the primary system heavy water storage tanks is also located in this process area, as are the reactor helium circulation equipment and the poison water tank. The fuel storage vault is behind the process area.
A series of offices and work rooms are located on the east side of the operations area. The reactor control room is on the second story of this assembly of offices. A 20 ton traveling beam crane operates over the central part of the floor area to service the reactor top and adjacent experimental equipment.
3.1.2.4 Areas of the Building Not Part of the Contained volume. The areas of the building which are not part of the contained volume are listed in this section. The south lobby wing, located at elevation 101 ft-0 in. between the equipment level and the experimental level, is not part of the contained volume. It is connected to the stair well inside the building by a small airlock. On the equipment level, at elevation 93 ft-0 in., are the

3 4
transformer room in the southeast quadrant, and the filter room and emergency generator room in the southwest quadrant of the area, which are not part of the contained volume. On the experimental level, at elevation 113 ft-6 in., the receiving room and platform on the north side of the building are not part of the contained volume.
All other areas of the reactor building are part of the containment vol-ume.
3.1.2.5 Dimensions and Net volumes of containment system. The hemispherical dome of the reactor building has an inside diameter of 176 ft-8 in. The base of the hemisphere is at the experimental floor level. The inside diameter of the base cylinder, including the concrete wall, is 175 ft-0 in. The height of the base cylinder from the equipment level floor to the experimental level floor is 20 ft-6 in. The gross internal volume of the containment system is 1.92 x 106 ft3, and the net internal volume is 1.73 x 106 ft3. The net internal volume is distributed as follows: equipment area, .38 x 3106 ft 3 ; experimental area, .59 x 106 ft 3 ; and operations area, .76 x 106 ft •
3.1.3 OCCUPANCY AND ACTIVITIES IN THE BUILDING. The normal occupancy of the HFBR building during working hours is expected to be about 120 persons, including both reactor operations and research personnel.
The reactor operations personnel include Operators and supervisors on shift, research coordination people, instrument specialists, designers, maintenance engineers, machine shop personnel, and Health Physics staff. The research staff will be drawn mostly from the Physics and Chemistry Departments of the Laboratory, with some guest scientists and visitors. Since the irradiation facilities are handled by operating personnel, the number of research staff associated with these facilities is not expected to be large. The neutron beam experiments in the experimental area, however, will be attended by research staff technicians, designers, engineers, and maintenance people, as well as scientists.
The occupancy of the building during evening hours and on weekends will be much reduced. Most of the data taking for the neutron beam experiments will be automated, so that the accumulation of experimental information can go on with relatively little attention during evening and weekend hours. For these "off-hour" times the building population may be 20 to 30 persons.
No special provisions or exclusions should be necessary for occupancy of the experimental area during refueling or maintenance operations, except for limited times when seal plugs are removed from experimental holes. The operations area and equipment level will normally be restricted to Reactor Operations Division and Health Physics personnel during refueling operations. Access to the building will be limited at all times to those persons having appropriate business in the building.
3.1.4 CONDITIONS AND METHODS FOR SEALING THE BUILDING. The interior of the reactor building is normally isolated from the atmosphere except for three 30-in. diameter air duct pipes. TWO of the 30-in. pipes are fresh air inlets to the air conditioning system. The third pipe is the exhaust line to the filter bank and stack. Each of the 30-in. air pipes can be blocked close to the containment shell by a butterfly valve. The butterfly valves are closed upon a signal .from either of two nuclear incident alarm stations mounted on the balcony level of the building.
In the event of a release of radioactive material to the building, the

3 5
nuclear incident alarms cause the two inlet air valves to close tight. At the same time, the exhaust line valve is partially closed, to throttle the exhaust air flow to a level at which the filters will operate with full efficiency. The radiation level at which the nuclear incident monitors cause the butterfly valves to close is 30 r/hr. Details of the valves and the valve control system are given in Sections 3.3.3 and 9.6.5. The same alarm signal which closes the butterfly valves causes the building exhaust fans to be switched off.
3.l.5 CONTAINMENT DURING REFUELING AND MAINTENANCE. Normal containment provisions will be maintained during all refueling and maintenance operations. In the course of the normal refueling sequence, carried out every three weeks, the reactor primary system is cooled to about 75°F, and is brought to atmospheric pressure. At special maintenance shutdowns the primary system is brought to 75°F and atmospheric pressure, and the complete fuel loading is removed to the canal. On these occasions, the control rod blades are changed.
3.2 STRUCTURAL DESIGN.
3.2.l LOADINGS.
3.2.l.l Design Pressure. The containment system is designed to withstand an internal pressure of 2 psig. The choice of this value of the maximum internal pressure for the containment system is based in part upon a consideration of possible reactor accidents, and in part upon considerations of leak testing and of the economics of the building cost. Since the primary system water temperatures and pressures in the HFBR are low: l20-l35°F, and 200 psig, the release of the total primary water inventory into the reactor building results in only a modest pressure rise. The peak pressure and temperature in the maximum credible accident are 0.9 psig and l27°F, respectively (see section 14.6). These maxima result from the addition of the core afterheat to the building atmosphere, in combination with the transfer of energy from the atmosphere to internal structures in the building.
In connection with the leak testing procedure, it is desirable to carry out leak tests at as high an internal pressure as practicable, since this results in better accuracy in the measurement of the leak rate. The containment design calls for a leakage rate of a few percent of contained volume per day and it was felt that a higher internal design pressure than the l psig indicated by the maximum accident was necessary in order to achieve reasonable accuracy in the leak test measurement, at least in the initial tests on the building. Further, a consideration of the snow and wind loads for which 'the reactor building had to be designed showed that a structure which would support these loads would withstand an internal pressure of 2 psig with essentially no change in basic structure or cost. Accordingly, the design internal pressure was set at 2 psig.
Since the reactor building is exhausted by suction fans, it is necessary to provide suitable relief valves to insure that the maximum possible negative pressure does not damage the building structure. A pair of vacuum breakers, VSV-IB-306 G and H, are installed in one of the fresh air inlet lines upstream of the butterfly valve. In the event of the inlet butterfly valves inadvertently closing while the exhaust fans continue to draw on the building, this pair of vacuum breakers will open and allow the normal 10,300 cfm to pass through at a maximum pressure drop of 1.4 in. water gauge. The vacuum breakers are Shand-Jurs Company Model st-5455 manhole cover-plate types for mounting on standard 20 in. API manholes. They are constructed of aluminum.

3 6
The fans have a maximum suction head of 6.8 in. water gauge. The building shell is designed for vacuum, snow, and wind loads which are equivalent to an internal negative pressure of 9.25 in. water gauge. Thus, in normal conditions of ligh winds and no snow, the building will easily withstand the full head of the exhaust fans even without the vacuum breakers.
3.2.1.2 Internal Loads. The steel shell of the hemisphere is kept free of any significant loads from equipment or components within the building. The internal building structure, which is of reinforced concrete, is supported through the central biological shield column and through perimeter columns and walls, with all of these loads being transmitted to the concrete foundation mat. Table 3.2-1 lists the dead loads and equipment weights in the building, and Figure 3.7 shows the permitted live loading of the various floors and areaways.
3.2.1.3 EXternal Loads. The external design loads on the reactor building are due to snow, wind, and earthquake. The design snow load is 20 psf. The design wind load corresponds to winds of 120 mph, i.e., hurricane intensity, with a reduction of the wind pressure in view of the hemispherical shape of the building according to the ASA Building Requirements, Section A58.l. The net effect is a wind load external pressure of 24 psf. The design earthquake load is a horizontal acceleration of 0.1 g. With a gross weight in the hemispherical portion of the dome of 739,000 lbs, the earthquake loading is a horizontal force of 73,900 lbs.
3.2.2 STEEL DOME STRUCTURE. The steel dome structure of the reactor building is formed of welded steel plates supported upon an internal I-beam frame work. The shape of the building is that of a hemisphere resting upon a short cylindrical section. The inside diameter of the hemisphere (and cylinder) is 176 ft-8 in. The height of the cylindrical base is 22 ft-4 in. The base rests upon a bed plate which is bolted to the reinforced concrete foundation ring. The hemispherical portion of the dome is insulated on the outside and the insulation is covered by aluminum sheets. The cylindrical section of the dome is covered on the outside by a brushed tar and felt layer on the buried portion, and by a cement coating on the exposed portion.
The material for the plates which form the surface of the hemispherical and cylindrical sections of the dome is an intermediate tensile strength carbon steel, ASTM Specification A285-57T, grade C, flange quality. The minimum yield point for this steel is 30,000 psi, with a tensile strength range .of 55,000 to 65,000 psi. The steel plates in the hemispherical section of the dome are 0.250 in. thick, and those in the cylindrical portion are 0.375 in. thick. The internal I-beam structure in both the hemispherical and cylindrical sections of the dome is formed of 'beams of 6 in. depth by 4 in. flange width, with a weight of 8.5 lbs/ft. The material for these beams is a structural quality carbon steel to ASTM specification A36-61T. The minimum yield point for this material is 36,000 psi, with a tensile strength range of 60,000 to 80,000 psi.
The inner surface of the hemisphere and the I-beam structure is painted with an epoxy primer paint, retouched after all welding and finishing is completed, and finished with a coat of an epoxy amine resin paint. The primer and finish coat have a combined dry film thickness of 4 mils minimum. The outer surface of the steel hemisphere is shop painted with an epoxy primer paint, touched up in the field with a red chromate primer after all welding and finishing is completed.
The insulation material applied to the outside of the hemispherical

Table 3;.2-1 Table of Dead Leads and Operating Equipment Weights in the HFBR Building.
OPERATIONS LEVEL
CORE STRUCTURE ON EXPERIMENTAL LEVEL
Craneway Crane JD-102 Hoist JD-105
ITEM
Instrument Shop & Office Structure D2o and Health Physics Labs Offices (2) Fuel Element Room Shield Wall Core Platform k FA-102,FA-202,EA-202 (Exel. 64 D20) Floor Slab & Girders (Uniform) Additional Slab & Lead Shielding
Crane JD-101, 1/2 wt. on core Reactor vessel and Internals Reactor vessel D2o Inventory Reactor Lead Shielding LOwer Thermal Shield Upper Thermal Shield Thermal Shield Support: steel
Lead
Reactor Inlet Line P-101 control Rods & Mechanisms Lower Service Floor upper service Floor Top Plug:
steel Shot
steel Concrete
Horizontal Port & Shutter Assemblies vertical Irradiation Biological Shield:
Tube Assemblies steel Plate
& Pipe Lead, Boral concrete at 275#/cu.ft,
Other Piping (Except Buried Lines)
LOAD IN THOUSANDS OF LBS
141 44
6 465
38 27
106 5 6
4640
..J1Q2. 6278
29 18 18
9 110
30 4 9 8
21 5
31 8
201 36
126 16
343 119
3440 __ 3
4584
BALCONY LEVEL
EXPERIMENTAL LEVEL
EQUIPMENT LEVEL
FOUNDATIONS
ITEM
crane JD-101, 1/2 wt. on Bale. columns Above Floor and Girders Columns Below Balcony Masonry & Tiling Air Conditioning & Miscellaneous
42" Slab Below Bio-shield Polygon 75" Slab over cave Walls 42" Slab (47' radius) 32" Slab (To outer cols.) Slabs & Girders (To perimeter wall) Beam Plug storage vault Trench cover Plates Masonry Structures North Truck Lock (within bldg.) Piping & Equipment, ceiling hung crane JD-103 Hoists JD-104 & JD-107
5' Thick cave Walls stacked Block Shielding Rolling Shielding Doors Pumps & EXchangers in caves Operating Liquid in Pumps & Exchangers Reactor outlet Line P-103 Columns Below EXper. Level Perimeter wall Dorne concrete walls, Gen., Transf. & Filter Rooms
Masonry Structures Equipment: Process, Electrical, Etc.
Core Structure Foundation Perimeter Wall Footing Perimeter Bay Slab D2o Treating Pits
LOAD IN THOUSANDS OF LBS
29 22
1898 145 215
~ 2337
252 1480 2400 3120 1672 440
84 179 101 120
4 _.1Q. 9872
2000 360 100 130
60 25
735 1410
975
475 125 200
6595
13100 1400 1100
_!lQ 15770

3 8
section of the dome is a roofing foam board of rigid fiberglass, 1.25 in. thick. The heat transfer "U" factor of this material is 0.18 Btu/hr-ft2-°F. The insulation material is retained by 18 gauge galvanized steel clips which are welded to the steel dome. The clips also hold wooden nailer strips which are used for mounting the aluminum surfacing. The fiberglass insulation is completely covered with a vapor barrier consisting of a 1 ply layer of 30 lb felt. Adjacent layers of felt are lapped and the joint brush-coated with a liquid cold tar.
The final surfacing on the outside of the hemispherical portion of the dome is low specular gloss aluminum sheet .032 in. thick. The aluminum sheets are held in place by .050 in. thick aluminum batten bars and caps attached to the nailer strips.
The inside of the cylindrical portion of the dome and the I-beam structure attached to it are completely covered by a reinforced concrete inner wall which extends from the foundation footing under the cylinder to the level of the experimental area floor. This concrete wall, which is 10 in. thick, serves to stiffen the steel cylinder, provides a very long sealing path for the steel-to-concrete joint, and supports the internal concrete structures above it without loading the steel structure from those sources. Figure 3.8 shows a cross-section of the steel cylinder, the internal concrete wall, and the attachment of the steel cylinder to the base plate and the foundation ring.
Details of the steel dome structure are shown in Figure 3.9, which is a general assembly drawing for both the plate structure and the I-beam structure, and in Figu~es 3.10, 3.11, and 3.12. The latter three drawings cover the layout of the steel plates for the cylinder, for the hemisphere, and the layout of the internal steel beam structure.
The steel plates and I-beams were cut to size and rolled to the proper shape in the shops of the Graver Company. At the construction site the base plate for the steel dome was laid down on the anchor bolts provided in the reinforced concrete foundation ring. The steel plates of the cylindrical section of the dome were individually placed and welded together. The hemisphere was formed in subsections at an assembly area at the construction site. These subsections, comprising a number of surface plates with the supporting I-beam structure, were assembled and welded together on jigs which provided the basic hemispherical shape. The subsections of the hemisphere were then hoisted into place and welded together on the dome.
All welding procedures and welder qualifications conformed to section IX of the ASME Code. The horizontal welded joints between plates of the base cylinder were done by an automatic submerged-metallic-arc process and are of the double-groove butt weld type. vertical welds between the plates in the cylinder, and all other welds on the dome, were of the manual metallic-arc type. The vertical joints between cylinder section plates were double-groove butt seams. Joints between plates of the hemispherical section were single-groove butt welds with either a backing strip or the integral backup provided by the I-beam support structure. All welds in the surface plates of both hemisphere and cylinder were checked for leak tightness by a soap bubble test under a vacuum box. spot checks, particularly at weld intersections, were made by radiographing welds. The radiographic examinations were made in accordance with ASME Code section VIII, Item UW-52, with the addition of a porosity standard. The general quality of the welding during fabrication was excellent, and very few spots in the steel dome structure required repair. At the conclusion of the few weld repairs which were necessary, no leaks could be detected with the soap bubble-vacuum box test in any of the seams sealing the

3 9
plates of the hemisphere and cylinder.
The 2 psig internal pressure for which the steel dome is designed is expected to occur only rarely in the life of the shell. The initial building pressure test will be made at the full internal pressure of 2 psig. subsequent building tests will be done at the minimum internal pressure necessary to give meaningful results to leak rate tests. In view of the small number of pressurization cycles to the full 2 psig which are expected for the structure, maximum allowable stresses for this condition were set at 85% of the minimum yield strength of the material in question. As the steel structure was actually designed, however, the 2 psig loading results in stresses which are substantially lower than this allowable maximum. The membrane stresses resulting from the full internal pressure are 8480 psi for the hemisphere plates, and 5660 psi for the cylinder plates. Bending stresses in both the hemisphere and cylinder plates are negligible for the internal pressure condition. The I-beam structure follows the expansion of the plate shell under the internal pressure loading.
For the thin-walled steel dome, the internal overpressure case is a simple one in terms of the analysis for stresses and stability. Under a positive internal pressure, the plate stresses are simple membrane stresses and are readily calculable. The various external loadings, however, present a more difficult problem. The several external loads are considered below as an equivalent external pressure. The components of this equivalent external pressure are:
a. 3/4 in. H20 vacuum 4 psf
b. snow load 20
c. wind load 24
d. skin weight 11
Total 59 psf = 0.41 psi
The stresses in the hemisphere plate under this equivalent external pressure are calculated for the rectangular section between the I-beam framing. For the case where the plate bears on all of the circumferential I-beams the unsupported plate sections are approximately square. Since the plates are welded to the vertical I-beams, bearing on the vertical members is assured. The total stress in the plate for the case of a square section between supports is 10,000 psi. Most of this is due to bending moments, with only 920 psi of the total due to diaphragm stress. The deflection of the plate at the center is .30 in. in this case. Even if the hemisphere plates bear only on every fourth circumferential beam, the total stress is not greatly increased; 13,000 psi for this case.
The over-all elastic stability of the hemisphere under the 0.41 psi equivalent external pressure depends upon the I-beam framing. The membrane stress in the plates is 885 psi, compared to an allowable value of 224 psi for elastic stability of an unstiffened hemisphere. The I-beam framing provides an equivalent thickness to the composite section of 1.29 in., and raises the allowable membrane stress to 1100 psi for elastic stability. The maximum spacing of the supporting I-beams is 83.25 in., compared to a calculated allowable maximum spacing of 112 in. to interrupt and prevent the formation of lobes in the unstiffened hemisphere.
The earthquake loading of 0.1 g, or 73,900· lbs, appears as a tangential shear and ~ horizontal thrust at the base of the hemisphere. The addition
3 10
of a 6 x 6 x 1/2 in. girth angle to the top of the cylindrical wall provides adequate resistance to these forces. The thrust loading amounts to only 1150 psi, while the tangential shearing stress is 13,630 psi, well below allowable.
The weight of the steel dome, with insulation and aluminum covering, amounts to 1758 lbs per foot of circumference. The corresponding compressive stress in the steel cylinder plates, without consideration of the I-beam structure, nor the stiffening effect of the concrete wall, is only 390 psi. The bearing stress on the concrete foundation under the steel base plate is 14.6 psi. Even under full external pressure loading from snow, wind, and vacuum, giving 3712 lbs per foot of circumference, the compressive stresses are not large: 825 psi in the steel cylinder plates and 31 psi bearing load on the concrete. The base plate, which is 10 in. wide and 1 in. thick, is stressed at 4350 psi for normal loading, and 9250 psi at full equivalent external pressure load.
The forces on the base plate and anchor bolts of the dome from the uplift force of the 2 psig loading are as follows. 6The total upward force on the dome at 2 psig internal pressure is 7.05 x 10 lbs. The total dome steel and insulation weight is .975 x 106 lbs, leaving a net uplift force of 6.075 x 10⁶ lbs, or 10,950 lbs per foot of circumference. The dead load on the concrete wall, transmitted to the base plate at the foot of the wall, amounts to 5850 lbs/ft. The remaining uplift of 5100 lbs/ft is offset by the weight of the foundation ring and the loads on the equipment level floor, of total amount 6180 lbs/ft. The 5100 lbs/ft force is transmitted to the dome structure by the anchor bolts and by reinforcing bars in the concrete which tie the foundation ring to the concrete wall. stress levels in the 1 in. diameter ASTM A-7 bolts and the .75 in. diameter ASTM A-432 reinforcing dowels are 19,100 and 11,700 psi, respectively.
3.2.3 FOUNDATION STRUCTURE. The foundation of the reactor building is a reinforced concrete mat bearing on the soil beneath the building. The central load supporting elements, the columns and shielded cell walls, are carried on a unitized central mat. The outer load support element, the perimeter wall, is carried on a continuous ring mat. An annular ring slab connects the two main support mats, supporting localized loads of walls and equipment, and is supported in turn on its inner and outer edges by the foundation mats. Detailed dead loads and operating equipment weights are given for each level of the building in Table 3.2-1. A convenient summary of this detailed list is given in Table 3.2-2 below.
Test borings made at the building site showed that the soil in the building area consists of sandy material with localized traces of clay and gravel. Lenses of various thickness and consistency exist to depths at least as great as the 90 ft of the deepest test boring. There is no uniformity of grain size distribution or density in the soil beneath the building. Experience with this type of glacial moraine deposit shows that it will withstand maximum loadings of 6,000 lbs/ft2 with settlements in the range of 0.5 to 0.75 in. The sandy substrate is not a suitable medium for load bearing piles and the bedrock is at such a great depth as to make piles bearing on rock impossible. The nature of the substrate as well as the large variations in local loadings on the building foundation, dictated the choice of a reinforced concrete mat foundation. soil bearing pressures from the building, together with the original overburden conditions at the building site, are given in Table 3.2-3.
Material specifications for the constitutents of the reinforced concrete are as follows. ·"rhe Portland Cement is Type 1, per ASTM C-150. Aggregate

3 11
Table 3.2-2 Summary Table of Dead Loads and operating Weights of Equipment
SUMMARY
ITEM
Operations Level Core Structure to El. 110 ft-9 in. Balcony Level EXperimental Level Equipment Level
Total on Foundations
Foundations
Total
DISTRIBUTION OF LOADINGS
Core Mat Perimeter Footing Perimeter Bay
Total
Table 3.2-3 Average Soil Pressures
SOIL PRESSURES FROM HFBR BUILDING
core Mat (15600 ft 2)
Perimeter Footing (2750 ft 2 )
Perimeter Bay (8600 ft 2)
ORIGINAL OVERBURDEN AT HFBR SITE
Diameter
Average Height
volume
Approx. Weight
Average overburden soil Pressure
LOAD IN THOUSANDS OF POUNDS
6278 4584 2337 9872 6595
29666
15770
45436
37696 6000 1740
45436
2420 lbs/ft2
2180
200
177 ft
23 ft
564,000 ft3
59 x 106 lbs
2400 lbs/ft2
materials are to ASTM C-33 and c-58, with the fine aggregate being "Port Washington" or "Port Jefferson" sand, and the coarse aggregate being broken stone of the type known locally as "Hudson River Trap Rock". Reinforcing bars for the concrete are deformed bars per ASTM A-432. This steel has a minimum yield point of 60,000 psi, a minimum tensile strength of 90,000 psi, and an elongation of 11% minimum in full diameter, 8 in. long test specimens. The mix water was specified to be drinking quality.
The specified strength of the concrete was 3600 psi minimum compressive strength at 28 days. Proportioning of the concrete to obtain this strength was done according to Method 2, ACI-318. All of the concrete in the foundation structures was delivered ready-mixed, with the loading of trucks and the

3 12
mixing procedure controlled by ASTM C-94, "Standard Specification for ReadyMix Concrete." Slump tests were made from each truck load delivered to the job site in accordance with ASTM C-143 and ASTM c-172. The design slump was 3 in. for slabs and 5 in. for walls. Although the design slump was greater than would be required for normal sections, it was found that better placement around closely spaced reinforcing was obtained, Strength was in no case sacrificed. Loss of density was minor and the possibility of honeycombing minimized. However, in the actual placement of concrete in several high wall areas and in the canal walls, some evidences of honeycombing were discovered. The honeycombed areas were repaired by carefully chipping out the defective deposits back to sound concrete and then filling with pneumatically applied mortar.
Test cylinders of all concrete pours were obtained and were tested according to ASTM C-42, "Methods of Securing, Preparing, and Testing Specimens for Hardened concrete for Compressive and Flexural Strengths." The results of these tests have shown the concrete strength actually obtained in the foundation mat to run well above the specified minimum compressive strength of 3600 psi.
The principal loading on the foundation of the HFBR building is carried by the core mat, as is seen in Table 3.2-2. The core mat has a uniform thickness of 5 ft and a diameter of 141 ft-0 in. There are several irregularities in the core mat, notably the fuel storage canal which is 43 ft long, 8 ft wide, and 20 ft deep. The canal has a deeper section at one end which is 30 ft deep. Pits for a n 2o storage tank and freight and personnel elevators are located at the edge of the core mat and are constructed integrally with the mat.
The structural design of the core mat was based on the analysis of a uniform slab on an elastic foundation, considering all loads within the effective mat area and correcting for the boundary conditions at the mat edges and for other irregularities. A maximum allowable stress of 24,000 psi was set for the steel reinforcing bar. Concrete maximum allowable stresses were set according to ACI-318, "Building Code Requirements for Reinforced Concrete." Thus, the allowable flexural compressive stress was set at 1620 psi, the allowable shear stress at 90 psi, and the allowable bond stress at 245 psi. Since the core mat tends to be generously reinforced, the actual stresses to be expected are well below the maximum allowable values in all sections.
The perimeter wall footing, which is the foundation for the steel shell of the building, is a fairly uniformly loaded member. This permits the foundation to proceed on the more straightforward basis of the ACI Building code. several cases had to be considered in the design of the perimeter footing, including the 2 psig internal pressure case where the foundation is actually lifted slightly by the steel dome, and the case of normal operating loads, dead loads, and wind and snow loads on the steel dome. Stresses in the concrete and reinforcing elements are minor for all cases of loading. The cross sectional dimensions of the foundation ring are 3 ft-6 in. depth by 5 ft-0 in. width. The circumference of the ring is 555 ft. The steel shell of the building and the perimeter concrete wall are joined to the footing as shown in Figure 3.8, and as discussed in section 3.2.2.
The perimeter bay floor connecting the core mat with the perimeter foundation is a 12 in. thick reinforced concrete slab, poured over compacted soil fill between the central mat and the perimeter foundation and resting on those two members. The radial span is 15 ft-6 in. The loading conditions considered in the design include both the normal load case, where the floor slab is partially supported by the substrate, and the building pressurization

3 13
test case where the slab is supported only at the inner and outer edges. Steel stresses in the latter case are close to the 24,000 psi maximum allowable stress. Under normal loading conditions, however, the steel stresses are reduced to about 1/3 of allowable values.
Since the foundation structure is part of the containment shell of the building, special provisions were necessary to insure the desired tightness of joints. Expansion joints in the foundation structure, necessary between the core mat and the perimeter bay floor, were sealed as shown in detail A of Figure 3.13. Construction joints are necessary in the core mat itself, since the mass of concrete in this structure is too great to be laid down in a single continuous pour. Details of the air seals for construction joints in the core mat are shown in detail B of Figure 3.13. The joint between the perimeter bay floor, the perimeter foundation ring, and the perimeter concrete and steel cylindrical walls is shown in Figure 3.8. Other penetrations, for doors, airlocks, and piping and electrical penetrations, are shown in the assembly of figures presented with section 3.3.
3.3 AIR LOCKS AND OTHER OPENINGS
3.3.l SUMMARY TABLE OF PENETRATIONS. The tables below, 3.3-la and 3.3-lb, give a summary of the electrical, piping, and airlock penetrations of the containment shell. There are about 250 penetrations; ranging in size from 12 ft x 14 ft airlock doors to 3/4 in. pipe. The various sealing details are shown in Figures 3.14 to 3.19, and are discussed in the next section.
3.3.2 PENETRATION DESIGN DETAILS. Details of the sealing of the various penetrations listed in Tables 3.3-la and 3.3-lb are shown in the series of drawings 3.14 to 3.19. The sealing of the electrical penetrations to the containment shell is shown in Figures 3.14, 3.15, and 3.16. In general, where an electrical conduit penetrates the steel dome, there is a seal weld from the dome plate to the conduit wall. Where the penetration is through a concrete wall or the concrete floor slab, conduit seal assemblies are used. These fittings have long leak-path flanges cast into the concrete, with the fitting-to-conduit seal being a rubber gasket under compression. The ground cables are cast into the foundation ring (Detail 23, Figure 3.14), passing through sections of 1 in. conduit at the surface of the concrete. The ground cable and conduit assembly is completely filled with solder.
The seals between the conduits and the cable insulating sheaths are made with potting compound. . The fittings used to contain the potting compound incorporate dams or compression gaskets through which the cables pass and appropriate entry ports so that the rubber sealing compound may be poured in to surround and seal the cables.
In those cases where a multistranded conductor is used, particularly on the large gauge power leads into the building, there is a further sealing detail between the insulation sheath of the cable and the cable termination. This is accomplished as shown in Detail 58 (Figure 3.14), where the conductors are fitted into the socket of a compression lug termination and the whole cup filled solid with solder. A double layer of self-vulcanizing high voltage rubber tape (splicing compound) and Scotch Electrical Tape are then laid on to cover the socket of the compression lug and are carried back to make a seal onto the insulating sheath of the cable. Where the cable terminates in cable clamps on bus bars, as in the case of the 2300 volt main power leads into the building, the tape layers are carried from the insulating sheath of the cable over the cable clamp assembly and sealed onto the bus bar itself. Both these

' 3 14
Table 3.3-la Electrical Penetrations of Containment
SEAL TO CABLE SHEATH WIRE TO NAME NUMBER CONDUIT SIZE BUILDING SHELL TO CONDUIT CABLE TO SHEATH
Grounds 26 250 MCM Ground cast into concrete Cable filled with Solder Solder
Detail A Detail A Detail A
Lights 3 3/4" Detail 38 CH Type EZS Cable Taped & soldered
Lights 9 3/4", l" Detail 21 conduit CH Type EZS Cable Taped & soldered Wall Entrance Seal Seal with Compound Assy with Gland &
Gasket to conduit
Lights 5 3/4", l" , lJ.,i" Detail 32 CH Type EZS Taped & Soldered
Lights l l" Detail 22 CH Type EYS Taped & soldered Floor Seal
Fire Alarm l 3/4" Detail 38 CH Type EZS Taped & Soldered welded to Shell
Fire Alarm 7 3/4" Detail 21 CH Type EZS Taped & Soldered
Fire Alarm 3 2" Detail 32 CH Type EZS Taped & Soldered
Power Lines 13 2" , 4" Detail 22 oz Type CRC Detail 58
Power Lines 4 l" , li.,," 4 , 2" Detail 32 CH Type EZS Detail 58
Power Lines 4 l" , lJ.,i" Detail 21 CH Type EZS Detail 58
Power Lines 5 2" , 4" Detail 22 CH Type EZS Detail 58
communications 6 3/4" Detail 21 Conduit CH Type EZS Taped & Soldered wall Entrance Seal Assy with Gland &
Gasket to conduit
Communications 3 l" Detail 32 CH Type EZS Tape at Joint to Bus
Telephone 2 3/4" Detail 32 CH Type EZS Telephone Co. Dam
Telephone 1 4" Detail 22 OZ Type CRC Telephone Co. Dam
Instrumentation l l" Detail 32 CH Type EZS Taped & Soldered
Instrumentation 5 l" , lJ.,i", ii.," Detail 21 CH Type EZS Taped & Soldered
Spare Power 8 4" Detail 22 capped Cables
spare 14 l" Detail 21 Capped
Spare 10 l" , li.,," 4 , 2" Detail 32 capped
Spare 2 l" Detail 38 Capped welded to Shell

Table 3.3-lb
NAME
Piping
Drain - sanitary
Drain - Sanitary Cleanout
Piping
Drain - Sanitary
Piping
Piping
Piping
Sump, GA-303
Fast Chopper Beam
Elevators Hydro Cylinder
Piping
Piping
Nitrogen
Drain - sanitary Floor
Air Intake & Exhaust Pipes
Air Piping
Piping
Piping, spares
Drain - Sanitary Floor
Air Loe~. Piping
Air Lock, Piping
Air Lock, Shaftway
Air Lock, Piping
Doors, Bulkhead
Doors, Air Lock
Doors, Air Lock
Building Test Air Inlet
Bui.lding Test Instruments
Piping Penetrations of Containment
NUMBER
4
20
6
l
4
3
l
l
l
l
2
13
2
l
9
3
l
l
2
2
9
13
l
2
4
2
6
l
5
PIPE SIZE
2" • 4"
2" • 3" • 4"
4"
2" in 4"
4" • 6"
2"in 4"
l~"
3"
24"
36" ID
8-5/8"xl/4" Wall l6"xl/4" Wall
3/4". l" • l~". 3" • 6" • 24"
2", 4"
8"
4"x2", 4 11x8 11 ,
6 11x3 11 , Funnels
30"
3/4"
2 11 in 4 11
4"
3"
l/2". l"
3/4", l/2", l~"
4' x 8'
6" Sleeve with 4 l/2" couplings
2'6"x6', 2'6"x3'6" 6'x7'
12' x 14' 3'4" x 7'
3'4"x7', 6'x8'9" 12' x 14'
10"
l"
SEAL TO BUILDING
Detail D
Detail G
Detail F
Detail K
Detail K
Detail K
Detail D
Detail D
Detail Similar to G
Detail B
Detail G
Detail E
Detail similar to E
Detail c
Detail 0
Details D & K
Welded to shell
Detail Similar to E
Detail E
Detail M
Welded to Door Frame
Puddle Flange cast into Concrete
Angle cast into concrete
Puddle Flange Cast into concrete
Door Frame cast into concrete Thiokol caulk at Joint
Frame Welded to Shell
Frame cast into concrete Thiokol seal at Joint
Detail E
Detail E
INTERNAL SEAL
Closed System External· to Containment
6' Trap
Detail F
Closed system External to Containment
6' Trap
Closed system
6' Trap
Closed System
7' Trap
Flanged
Closed System
Closed system
Closed System
Flanged
6' Trap
Butterfly Valves; Neoprene Gaskets on vacuum Breakers
Closed system
Closed system
capped
6' Trap
Closed system
Closed System
Gasket
Closed system
Gasket between Door & Frame
Inf lated Gasket between Door & Frame
Inflated Gasket between Door & Frame
Blind Flange and Gasket
capped

3 16
latter types of tape seals on large cables have been tested for leakage and found to be tight.
Piping penetrations to the steel dome of the containment shell are seal welded to the dome plates. Figure 3.17 shows typical details of these nozzles. Since the design overpressure for the building is only 2 psig, simple fillet welds on the pipe penetrations are adequate. For pipe penetrations through the concrete foundation, typical details are shown in Figure 3.18. Here the pipe is simply cast into the foundation slab with a groove left around the pipe at the top surface of the concrete. This groove is then caulked with Thiokol LP-32 rubber base sealing compound.
The internal seals for the various piping penetrations are, in many cases, a 6-ft high liquid trap formed by an appropriate loop in the pipe either just inside or just outside the containment shell. Since the liquid in all such trapped pipe lines is water, the 6-ft trap height is more than adequate to maintain a liquid seal against a 2 psig overpressure in the building (55.4 in. of water). A number of piping systems, for instance the cooling tower water system, are closed systems within the containment shell. The air lock pneumatic control piping systems, the steam supply system, and the domestic water supply are other examples of closed piping systems. Such systems generally have block yalves either inside or outside the containment shell wall. These closed systems are also at internal pressures which are larger than the 2 psig maximum pressure in the contained volume.
3.3.3 AIR INLET AND EXHAUST VALVES. During all normal reactor operation, including refueling and maintenance procedures, the containment system is open to the outside atmosphere only through the two 30-in. diameter fresh air inlet pipes and the 30-in. diameter exhaust pipe to the filter bank and stack. The inlet pipes are sealed and the exhaust pipe is throttled, in the case of any release of radioactive material, by valves CV-IB-303F, CV-IB-304F, and CV-IB-306F. Thus, the proper automatic closing of these three valves is essential to the maintenance of the containment system during a reactor accident.
The valves are 30-in. diameter butterfly valves supplied by the Continental Equipment Company. The valve bodies are lined with a bonded neoprene liner which extends out onto the flange faces to form the flange gasket on either side. The material of the valve bodies and discs is cast iron. The disc shafts are stainless steel. The valves conform to the standards of the ASA for 125 psi, Class 2 butterfly valves.
Figure 3.20 is a drawing of the valve and operating mechanism, typical of all three valves. Rotation of the valve shaft through nearly 90° to achieve full closure from the fully-open position is accomplished by a 50 lb actuating weight on a 20 in. lever arm. The valve shaft and lever arm assembly are held in the open position by a latch pin. The latch pin is held down by a pneumatic valve operator against a net spring force of 300 lbs. When the compressed air supply to the operator is cut off, the spring lifts the latch pin and the lever arm and weight close the valve. overtravel of the valve disc past the fullyclosed position is prevented by a mechanical stop.
The pneumatic operator is a Robertshaw 3-15 psig bellows-type valve topworks. compressed air is supplied to the operator from the building air system through a pressure reducer and a three-way, solenoid operated control valve. The solenoid valve is arranged so that the coil must be energized to supply air to the pneumatic operator. The butterfly valves are closed on a failure of the air supply, a failure of the electrical control circuit, or a trip action which opens the control circuit, Once a trip signal has been

3 17
given and the valve allowed to close, reopening of the valve must be done manually. The lever arm is raised to the open position and the latch pin is reengaged in a notch in the lever arm support plate. After a trip signal has been applied, therefore, it is impossible for any subsequent electrical or compressed air signals to open the butterfly valves.
The inlet air duct butterfly valves close tight in response to a trip signal. The exhaust duct valve disc, however, is stopped short of a tight seal by a mechanical stop which intercepts the actuating weight and lever arm. The amount of opening left in the exhaust duct is such as to reduce the air flow to the filter bank to 7,000 scfm at 2 psig internal building pressure. This is 70% of normal flow rate to the filters, and assures adequately low face velocities in the filter elements for full efficiency.
The butterfly valves are controlled by the nuclear incident alarm system, which monitors the radiation level in the building. Should a major release of radioactive material occur, the alarm system causes the butterfly valves to close, switches off the exhaust fans, sends an alarm signal to the Laboratory security Office, and closes the air conditioning unit condensate drain valves. The alarm system and associated control circuits are discussed in Section 9.6.5. In addition to the automatic closing of the butterfly valves by the incident alarm system, the valves may also be closed under manual control from the reactor control room. The closure time of the butterfly valves is expected to be less than 2 sec from the time of application of the trip signal from the alarm system. The response of the alarm system is quite fast, with a response time less than .5 sec.
Since the building leak rate is measured without the exhaust vent to the stack, the exhaust duct must be completely closed for leak rate tests. This is accomplished by removing the throttling stop which holds the exhaust duct valve partially open, and allowing the exhaust valve to close tight. After the leak rate test is completed the stop is replaced.
In addition to the butterfly valves, which respond either to manual control or to the presence of radioactive material within the building, the air inlet ducts have additional closure mechanisms which respond to an overpressure condition in the building. These overpressure protection devices are gravity check valves in the air stream. As long as air flows into the reactor building the check valves are held open. A reversal in the flow direction causes them to close. Figure 3.21 shows a sectional drawing of one of the check valves.
3.3.4 AIR LOCKS AND BULKHEAD DOORS. There are four air locks, with a vertical air lock shaft connected to one of them, and three bulkhead-type gasketed doors in the HFBR containment shell. The table below gives the basic dimensions of these components of the structure.
The air locks are constructed of reinforced concrete. Figures 3.22 and 3.23 show the south personnel air lock which leads from the south stairway to the entrance lobby. The construction is typical of all of the air locks and of the air lock shaftway. The location of the several air locks and bulkhead doors will be found on the building architectural layouts, Figures 3.3 through 3.6.
Door frames for the air lock doors and bulkhead doors are welded to the steel dome structure, where appropriate, or are set into the concrete structure around them and are sealed with Thiokol LP-32 caulking compound. The air lock doors are sealed to the frames in the closed position by applying air

3 18
Table 3.3-2 Air Lock and Bulkhead Door Dimensions
Inside Dimensions Door Dimensions Length Width Height Width Height
East Truck Air Lock 65'-0" 14'-0" 15'-0" 12'-0" 14'-0"
North Truck Air Lock 65'-0" 14'-0" 14'-4" 12'-0" 14'-0"
North Personnel Air Lock 18'-0" 9'-0" 14'-4" 6'-0" 8'-9"
south Personnel Air Lock 9'-0" 7'-0" 8'-0" 3'-3" 7'-0"
Transformer Room Bulkhead Door 2 '-6" 6 1 -8 11
Emergency Generator Room Bulkhead Door 2 1 -6 11 6 1 -8 11
Filter Room Bulkhead Door 2 1 -6 11 6 1 -8 11
North Air Lock vertical Shaftway 8'-0" 4'-0" 13'-l" 4'-0" 8'-0"
pressure to an inflatable rubber gasket which expands against the frame. A detail of the gasket is shown on Figure 3.23. Each door is equipped on each side with a push-button control station and the two doors to each air lock are controlled so that only one may be open at a time. The control system is pneumatic, operating on 15 psig compressed air from the building air system. operation of the push-button control at a door vents the gasket air, leaving the door free to open. At the same time a pilot-operated valve inactivates the air dump circuit on the opposite door of the air lock, preventing it from being opened. When the first door is closed, the gasket on that door is reinflated and the dump circuit of the opposite door is restored to operating condition. If the "open" button at a door is pushed, but the door is not opened, the gasket is reinflated in 10 seconds so that the opposite door can be opened. Suitable connections are available on the outside of the building at the several air lock locations for attaching compressed gas cylinders. This allows the operation of the air lock doors in the event that the building compressed air system should fail.
The bulkhead doors are manually operated, marine-type gasketed steel doors. They are sealed shut against soft rubber gaskets by locking wedges. The north air lock shaftway, which connects to the interior of the north truck lock, is sealed at the upper end by a rectangular reinforced concrete hatch which rests upon a soft rubber gasket. This shaftway is used for transferring materials from the operations floor directly onto a truck in the north truck lock. The shaftway hatch cover is operated as one door of the truck air lock, and the outer door of the lock cannot be opened unless the hatch is closed.
Because of the relatively large population within the reactor building for research activities, the personnel air locks will be in more or less constant use during the normal working day. Truck entry, requiring opening of the large

3 19
air locks, will be less frequent, about once each working day.
3.3.5 TESTING OF CONTAINMENT VALVES. The proper operation of the nuclear incident alarm system and the three butterfly valves on the building air inlet and exhaust-ducts will be frequently tested. The operating plans for the reactor call for a test of the butterfly valve closing mechanisms at every scheduled shutdown. (Shutdowns for regular refueling occur every three weeks.) The method of testing will be to trip one of the two radiation monitoring units in the nuclear incident alarm system with a calibration source. An inspection will be made to see that all three of the air duct butterfly valves have closed properly. The calibration source will then be removed and the butterfly valves reset to the open position. The procedure will be carried out at each shutdown, with alternate radiation detector units being used to supply the trip signal on alternate shutdowns. The use of a radioactive source at the detector unit to activate the test operation of the system insures that all components in the system are operating properly.
No specific tests of the building air locks are required. Since the air locks are in daily use, a faulty gasket or door mechanism will be noticed much more frequently from the normal use of the air locks than from any periodic testing which might be instituted.
3.4 ATMOSPHERE CONTROL AND EXHAUST
3.4.1 HEATING, VENTILATING, AND AIR CONDITIONING. The building ventilation system is arranged to provide a small negative pressure throughout the reactor building at all times. The fresh air requirement of 10,300 cfm is supplied to the experimental area. Ducting of the ventilation system is arranged so that areas subject to radioactive contamination are maintained under lower pressure than the cleaner areas, thus insuring that air flow will be from clean to contaminated areas. The experimental area is maintained at 1/8 to 1/4 in. water gauge negative pressure. The operations area and equipment area are maintained at a pressure from 1/8 to 1/4 in. water gauge less than that of the experimental area. Shielded process areas and cells are, in turn, maintained at slightly lower pressures to insure that leakage to them is inward only. All exhaust air is removed from the building by an exhaust duct system to the filter room and then to the atmosphere via the stack.
Each area of the building is air conditioned and heated by a system of local air handling units. Each of these units has circulation fans, filters, cooling coils, and reheat coils, the latter two items being fed with chilled water and hot water from the mechanical equipment area in the reactor building basement. The local units discharge into a supply air duct system with ceiling distribution in the areas served. Zone thermostats control conditions in each area or zone in the building. A major portion of the air taken into each unit is recirculated.
TWo absorption type chillers, operating in parallel for high loads, supply the necessary additional chilling to the domestic well water for humidity and air conditioning of the building. Hot water for reheat coils is supplied from the building hot water system.
Figure 3.24 shows the detailed air recirculation, fresh air supply, and exhaust for the building system. The air conditioning units IB-301 and 302 are situated on the operations floor. The total, cooling load for this area is 819,500 Btu/hr. The two units each recirculate 13,820 cfm. The air conditioning units IB-303, 304, 305, and 306 service the experimental area, which includes both the experimental floor and the balcony level. These units have

3 20
a cooling load of 2,350,400 Btu/hr. The recirculation rate of these units is about 18,500 cfm each. The units IB-304 and IB-306 each take 5150 cfm of fresh air. from the outside as part of their circulation flow. Much of the cooling load in this area is due to experimental equipment, and the total cooling load noted above is an estimate of the maximum load which might occur in this area. The units IB-307 and 308 service the equipment floor. The cooling load in this area is 581,400 Btu/hr, exclusive of the main pump heating load which is carried separately. Each of these units recirculates 11,100 cfm. The units IB-310A and IB-310B are located in the shielded cells for the D2o process equipment. These units remove the heat generated by the main pumps and certain auxiliary pumping equipment. The cooling load is 235,000 Btu/hr, and each of these units recirculates 3,000 cfm.
The north loading dock area and the air locks are not air conditioned, although the loading dock enclosed area is heated. The air locks receive conditioned air only through door usage into the main building area.
On the equipment level the rooms for the 1,000 KVA transformers, the emergency electrical generator, and the filters are not part of the contained area. The transformer room and the generator room are forced draft ventilated using fresh air from the outside atmosphere. These rooms are heated by the building hot water system. The filter room is heated from the building hot water system.
The south lobby area of the facility is not part of the contained volume. It is separately ventilated and air conditioned by the unit IB-309. The cooling load in this area is 224,000 Btu/hr, and the unit recirculates 4,800 cfm.
The design conditions for the air conditioning system are as follows. During summer conditions with the outside temperature not exceeding 95°F dry bulb and 78°F wet bulb, offices, laboratories, the south wing building, the control room, and the entire experimental area and balcony will be 76°F, 5D°fe relative humidity. Toilets, locker rooms, the equipment floor, and the operating floor, will be 80°F, 50% relative humidity. The primary equipment rooms in the basement are held at 95°F, and about 27% relative humidity. During winter conditions with the outside temperature not below 0°F dry bulb, all air conditioned spaces in the general building area will be maintained at 72°F and 50% or less relative humidity. The primary equipment rooms will be held at 95°F, and 27% or less relative humidity. The receiving area will be heated to 68°F.
Exhaust air is collected by an overhead duct system with branches on all four levels of the building. The various duct branches combine in a single 30 in. pipe on the equipment level. The main air exhaust flows through a venturi section in this pipe where the various shielded cell exhausts enter the stream. The venturi section is followed by the exhaust valve, after which the exhaust air leaves the building contained volume and enters the filter bank. The exhaust fans take suction on the filter bank, discharging the air past a monitoring station to the stack. Of these assorted components of the exhaust system the venturi and shielded cell exhaust are discussed in section 3.4.3, the exhaust valve in section 3.3.3, the filters in Section 3.4.2, and the monitoring station and sta9k discharge in section 3.4.4. The exhaust fans remain to be treated here.
The building exhaust fans, GB-303A and GB-303B are Trane company Size 26A industrial units of the non-overloading centrifugal type. The fans are belt-driven at 800 rpm. Each fan will move 10,300 cfm of air at 70°F, developing a suction pressure of 6.25 in. water gauge. The required brake
f

3 21
horsepower at this operating point is 14.6 hp. The maximum suction head is 6.80 in. water gauge. The exhaust blowers are connected to the building emergency electrical supply and have an automatic switchover which starts the standby fan if the normally operating fan should fail. Only in the event of an alarm signal from the nuclear incident alarm system are the exhaust fans switched off.
The air conditioning units IB-304 and IB-306 on the balcony level are the only units which will produce an appreciable amount of water condensate. These units draw 5150 cfm each of fresh air from outside the building. The maximum condensation rate, for humid summer days, is about 15 gal/hr for each unit. The condensate is normally drained to the sanitary sewer system. In the event of an alarm signal from the nuclear incident alarm system, spring-loaded airoperated valves in the condensate drain lines close, and the condensate is retained in the building. The alarm system and associated circuitry is described in section 9.6.5.
3.4.2 SHIELDED CELL AND OFF-GAS EXHAUSTS. The shielded cell and off-gas exhausts are connected ventilation systems which exhaust air from various equipment cells and pits directly to the filters. These systems are all shown in Figure 3.25. It is desirable to maintain the shielded cells and pits at a slightly lower pressure than the surrounding building atmosphere, so that air will leak into these spaces rather than out. The pressure differential to maintain the cells and pits at a lower pressure than the building is derived from taps on a 30-in. diameter venturi section in the main building exhaust line. The main exhaust, amounting to 9,850 cfm, is pulled through the venturi, KA-102, by the exhaust blowers and produces a reduced pressure in the midsection of the venturi. The shielded cell exhaust lines are connected to the main line at this low pressure section.
The principal shielded cell exhaust system is that in the reactor pit and the heavy water process rooms immediately beneath the reactor. The reactor pit and the heavy water process rooms are maintained at about 3/8 in. water gauge negative pressure, somewhat lower than the operations level and equipment levels. About 200 cfm of air is allowed to leak through the top shield plugs into the upper reactor pit. This air flow ventilates the reactor pit and is exhausted by a vent line into the process cells beneath the reactor. An additional 200 cfm of ventilating air is allowed to leak directly into the shielded cells. The total of 400 cfm is dumped into the main exhaust duct.
Other shielded cells which are exhausted in this fashion are the FA-101 pit, the trenches around the heavy water filters and ion exchange beds, and the pump sump at GA-304. The helium cover gas in the heavy water storage tanks FA-101 and FA-102 and in the experimental D2o system heat exchanger (~A-102} i'.s vj:!nted into the venturi.
The various heavy water pumps all have mechanical shaft seals. Liquid drainage from these shaft seals is collected in a heavy water liquid drain system. The cavities into which the seals are allowed to leak must be vented through exhaust lines to keep tritium-bearing water vapor from the general building atmosphere. Thus, the various heavy water pump seal chambers are all exhausted into the venturi.
In addition to these various shielded cell, storage tank off-gas, and pump seal exhausts, there is a main off-gas manifold which collects radioactive gases from the irradiation thimbles terminating on the operations level, from the reactor helium circulation system, the reactor vessel safety valves, and from fuel handling operations in the reactor pit. This off-gas manifold

3 22
is connected to the main exhaust venturi through a blower, GB-302. The blower is normally run only during fuel handling operations when an especially high volume of air flow is necessary in the reactor pit to cool the fuel elements in the process of transfer to the canal.
The co2-filled cavity in the lower reactor pit is vented through a collection manifold and water vapor separator into one of the exhaust lines from the process equipment.
Throughout the building there are ports on the exhaust gas ducts for attaching exhaust lines from portable hoods which will be used when it is necessary to open a tritium-containing system for servicing.
3.4.3 EXHAUST AIR FILTERS. The arrangement of the exhaust air filters is shown in Figure 3.26. The building exhaust air flow of 10,300 cfm passes from the exhaust duct into a concrete plenum chamber, through a series of entry ports, and into the filter bank. The filters are contained in a concrete-walled chamber and are separated by sheet metal partitions. The air passes in turn through a roughing filter, IB-316, an iodine filter, IB-317, and an absolute-t~pe filter, IB-318. The exhaust air is then pumped by the exhaust fan into a 30 in. pipe to the stack.
The roughing filter, IB-316, is a deep bed, pocket-type dry filter with a spun glass filtering medium. The filter bank consists of 12 units, each 27 in. square in face dimension by 36 in. deep. The total face dimension of the roughing filter is 6 ft-9 in. wide by 9 ft-0 in. high for a total face area of 60 7 ft 2 • At the normal exhaust flow· the roughing filter carries 170 cfm/ft~, corresponding to a nominal velocity of 2.83 ft/sec. The pressure drop through the roughing filter is .25 in. water gauge clean and .so in. fouled.
The roughing filter units are manufactured by American Air Filter Company, Inc., and are their model A air mat deep bed filter. A single layer of 100 FG filter down medium is used in these units. The roughing filters are designed to withstand a pressure differential of 6 in. water gauge for a period of 5 minutes.
The iodine filter, IB-317, is of the silver-plated copper mesh type. The filter bank consists of 15 units, each with face dimensions 24 in. by 24 in., and 4-1/2 in. deep. The total face dimension of the iodine filter bank is 6 ft-0 in. wide by 10 ft-0 in. height, for a total face area of 60 ft 2 • At normal exhaust flow the filter carries 172 cfm/ft2 , corresponding to a nominal velocity of 2.86 ft/sec. The pressure drop in the iodine filter at normal exhaust flow is .125 in. water gauge clean and .25 in. fouled.
The iodine filter units are manufactured by Flanders Filters, Inc., using silver-plated copper ribbon supplied by Metal Textile Corporation, fabric 32-1/2 Fll2 Ag/Cu. The filter medium is compressed to a density of 27 lbs/ft3 and is held in place by 1/8 in. diameter rod wire grills on either side of the frame. The nominal surface area of the iodine filters is 27.5 ft2/lb of silver-plated copper ribbon mesh. The filters are designed to withstand a pressure drop of 6 in. water gauge for 5 minutes. The removal efficiency for elemental iodine is 95 percent.
The absolute filter, IB-318, is designed to remove 99.97% of all particulate matter in the exhaust air flow of 0.3 micron diameter or larger. The filter bank consists of 12 units, each 24 in. by 24 in. in face dimension by 5-7/8 in. depth. The total face dimension is 6 ft-0 in. ~idth by 8 ft-0 in.

3 23
height for a total face ~ea of 48 ft 2 • At normal exhaust flow the absolute filter carries 215 cfm/ft , corresponding to a nominal velocity of 3.58 ft/sec. The pressure drop through the absolute filter at normal exhaust flow is 1.0 in. water gauge clean and 2.0 in. fouled.
The absolute filter units are manufactured by Flanders Filters, Inc., stock number 6H70-a. The filter medium is glass with asbestos separators. The filter frames are treated for fire resistance and the over-all filter unit is rated for 300°F. Each filter unit is tested for strength, being required to support a pressure differential of 6 in. water gauge for 5 minutes, and for air flow capacity within rated pressure drops. The dioctyl phthalate (DOP) smoke test is used to test and confirm the rated efficiency for particle removal.
3.4.4 EXHAUST AIR MONITORING AND DISCHARGE TO STACK. The exhaust air monitoring system samples the exhaust flow from the building filter bank as it enters the line to the stack. An isokinetic sampling nozzle removes a small stream of the exhaust air to a particulate monitor, RRa-305, and then to a gas sampling monitor, RRa-306. The exhaust air monitoring units are discussed in section 9.6.4. The radiation levels in the exhaust air stream from both particulates and gas are displayed in the reactor control room with suitable alarms for high activity. The monitoring system itself, with tape deck and gas sampler chamber, is located in the filter room on the equipment level of the building.
The stack through which all of the exhaust air from the HFBR passes is the Graphite Reactor stack. The stack is 27 ft I.D. at the base, 17 ft I.D. at the top and rises to an elevation of 350 ft above the general level of the Laboratory and the surrounding terrain. A very large flow of heated air from the Graphite Reactor passes up this stack, resulting in effective release heights for the effluent well above the top of the stack (see section 2.3). The high elevation of the stack top reduces the probability that exhaust gases from the HFBR will be recirculated into the building.
3.5 BUILDING UTILITIES AND SERVICES
3.5.l DOMESTIC WATER SUPPLY. Water is supplied to the HFBR complex from the BNL domestic water system (see Section 6.2). This system consists of a number of deep wells and an elevated storage tank. The well water is filtered and chlorinated to meet drinking water standards, and is further treated to stabilize solids. The temperature of the domestic water supplied to the building will be about 54°F. The HFBR complex will use about 1200 gpm, of which 700 gpm will circulate through the building air conditioning units before being added to the secondary system as make-up. About 300 gpm passes directly to the cooling tower system as make-up. The canal cooler, EA-202, uses 50 gpm which is then dumped to the storm sewer through the GA-303 sump and trap. The remaining 150 gpm supplied to the building complex is used in the various research and maintenance operations in the building on an intermittent flow basis. Where the domestic water supply is used as a source of make-up water for cooling systems, the supply is first led to a break tank, H-305, located on the operations level. The domestic hot water supply is derived from the heater, IB-314, in which water is heated with the building steam supply.
3.5.2 DRAIN SYSTEMS. There are five general drain systems in the HFBR complex. The first two of these are the DA drain system for the heavy water process systems and the CD drains for possible heavy water spillage. The DA system is a closed, stainless steel piping system which drains heavy water process equipment directly into the storage tanks. The CD drain system is

3 24
installed to collect spillage of heavy water and to transfer it to the FA-101 pit where it may be recovered. Both of these systems are discussed in detail in section 7.6. The remaining three systems are the D waste system, the F waste system, and the sanitary sewer system. These latter three systems may properly be considered building utilities and will be discussed in this section.
The D liquid wastes are those which are almost certainly radioactive, excluding heavy water. The D drain system collects these liquid wastes from the various areas of the building and carries them to the sump of pump GA-304. This pump transfers the D wastes to the collection tanks in the Hot Laboratory. From there they are pumped to the general laboratory liquid waste storage tanks, the waste concentration plant, and subsequent disposal (see Section 11.2.2).
The F liquid waste system handles waste liquids which may possibly contain radioactive materials. The F waste system drains into a storage vessel, FA-305, on the equipment level of the building. The circulation pump, GA-306, agitates the liquid in the tank so that representative samples can be taken to determine the radioactive content. The tank is partitioned into two halves to provide some flexibility in holding and sampling suspect liquids. Those wastes which are found to be above tolerance in radioactive material content are drained to GA-304 and are pumped to the Hot Laboratory as D wastes. Liquids which are below tolerance are disposed of to the building sanitary sewer system. Figure 3.27 shows the pump and collection tank arrangement for the F waste system and the pump for transferring D wastes to the Hot Laboratory.
The sanitary sewer system in the building is radioactively clean and removes normal building wastes. The sanitary sewer leaves the building through a six foot trap and empties into the laboratory sewer system. The laboratory sewerage is treated, analyzed for possible radioactive material content, and is eventually drained into the Peconic River to the east of the laboratory. The six foot trap in the sewer line insures that a 2 psig pressure in the building will not cause air leakage through the sewer lines.
3.5.3 STEAM SYSTEM. Saturated steam at 90 psig is supplied to the building from the laboratory steam distribution system. It is reduced inside the building to 50 psi, and then to 15 psi for building heating, air conditioning, and hot water service. condensate is collected and pumped back to the boiler house. About 8100 lbs/hr at 90 psig are required. The domestic hot water supply system and miscellaneous uses account for 3000 lbs/hr, while the building air conditioning and heating loads consume the rest. The steam system flow diagram is shown on Figure 3.27.
3.5.4 FUEL GAS. Fuel gas (LPG) is supplied at approximately 30 psi from the iaboratory fuel gas distribution system. It is used at about 10 scfm to fuel the propane gas engine which drives the emergency electrical generator. The fuel gas system is confined to the emergency generator room, and does not enter the contained volume of the building.
3.5.5 COMPRESSED AIR SYSTEM. Air from outside the building is compressed in two reciprocating air compressors, GB-301A and GB-301B, cooled in an aftercooler, EA-302X, and then dried in a heatless desiccant dryer, FA-304X. The dryer also acts to remove oil from the air supply line since the air is used, among other things, for breathing.
The compressor jackets and the aftercooler are cooled by water from the cooling tower system. During power failures it will be necessary to open 3/4 in. drains on the return water cooling lines of the compressors and

3 25
aftercoolers to the building sewerage system. This will allow a gravity circulation of cooling water from the cooling tower pool through the compressor jacket and aftercooler. The compressor jackets use about 1 gpm each, and the common aftercooler about 1.5 gpm.
The pressure in the compressed air distribution system around the building is 80 to 90 psig. The compressors are arranged so that either or both can be operated continuously. One of the compressors, GB-301A, is alternately powered from the emergency generator supply, so that it will continue to operate during power failures. The compressor capacities are 95 scfm at 100 psig. The air compressor system is shown on Figure 3.27.
3.5.6 ELECTRICAL POWER
3.5.6.l General. The HFBR complex draws electrical power from the BNL substation in common with the Graphite Reactor complex. Distribution from the substation to the two reactors is at 13.8 KV. TWO transformers located at the Graphite Reactor fan house of 6,500 KVA capacity each reduce the substation voltage to 2.4 KV. Power to the BNL substation is supplied by the Long Island Lighting Company from a generating station in Port Jefferson, New York. The electrical supply to the Laboratory has been increasingly reliable in recent years, although short term failures continue to occur from time to time, chiefly in the thunderstorm season.
To supply electrical power to the varied users in the HFBR complex, an electrical distribution system consisting of the following major components has been provided:
Fan building 2.4 KV switchgear Underground distribution system Pump house 2.4 KV switchgear Pump house 440 v motor control center HFBR 2.4 KV switchgear 480 V switchgear Emergency power system Motor control centers Experimental equipment Lighting system
The Figures 3.28 and 3.29 show the interconnections of the above components. These components are discussed in detail in the sections which follow.
3.5.6.2 Fan Building 2.4 KV Switchqear. Power is supplied to the HFBR from the fan building 2400 volt switchgear. The fan building 2400 volt switchgear is split into two buses, isolated by a normally open bus-tie circuit breaker. Each bus section is supplied power from a 6500 KVA, 13.8 KV to 2310 volt transformer, fed through a main incoming 2400 volt circuit breaker. Bus No. 1 serves the Graphite Reactor fans and the pump house and cooling tower area. Bus No. 2 serves the HFBR and has provisions for a future feeder. The two main incoming circuit breakers and the bus-tie circuit breakers are electrically interlocked to permit the following modes of operation:
a. Normal Operation Main incoming circuit breakers #1 and #2 closed, bus-tie circuit breaker open.
b. Emerqency or Standby Operation Main incoming circuit breaker #1 closed, main incoming circuit breaker #2 open, and bus-tie circuit breaker closed.

3 26
or
Main incoming circuit breaker #1 open, main incoming circuit breaker #2 closed, and bus-tie circuit breaker closed.
The Emergency or Standby operation would be utilized if the normal power supply to either bus #1 or bus #2 was lost because of component failure or maintenance requirements. Both bus #1 and bus #2 would be supplied (after the manual switching of the circuit breakers) from a single 6500 KVA, 13.8 KV to 2310 volt transformer. During Emergency or Standby operation, care must be exercised to limit overloading of the transformer to short periods of time.
3.5.6.3 Underground Distribution System. An underground conduit and manhole system is used to distribute the power from the fan building to the HFBR building. This distribution system consists of manholes B6A, B6C, and B6D and their interconnecting duct banks.
The HFBR power feeder consists of 9 single conductor, 400 MCM cables (three per phase), run in three 4 inch conduits. Based on six active conduits in the duct bank and an ambient temperature of 20°C, the rating of the 400 MCM cable is 350 amperes per cable, or 1050 amperes per phase. At the distribution voltage of 2310, these cables are capable of supplying the HFBR with 4200 KVA of power.
Three 4 inch spare conduits are provided for future feeders emanating from bus #2 of the fan building 2.4 KV switchgear. These conduits terminate in the HFBR building, at the HFBR 2.4 KV switchgear.
The 125-250 volt DC feeder, consisting of 3 single conductor, 250 MCM cables, is run in a 4 inch conduit. The DC feeder runs from the DC panel in the fan building to the DC section of the emergency motor control center in the HFBR building.
3.5.6.4 Pump House 2.4 KV Switchgear. The 2.4 KV switchgear in the Pump House is furnished power from a feeder circuit breaker on bus #1 of the fan building 2.4 switchgear. The pump house switchgear feeds four cooling tower circulating water pump motors, and a 2300 volt/480 volt, 500 KVA transformer which supplies power to the 440 volt motor control center.
3.5.6.5 Pump House 440 volt Motor Control center. The motor control center feeds the three existing cooling tower fans, the two new cooling tower fans and a lighting circuit. The fans are normally controlled from the "Start-stop" push button at the fan motor on the cooling tower, but a "stop" push button has been provided at each motor starter to allow for fan shutdown remote from the motor.
3.5.6.6 HFBR 2.4 KV Switchgear. The HFBR 2.4 KV switchgear is supplied by a feeder from the fan building 2.4 KV switchgear. The HFBR switchgear is so arranged that a future main feeder cubicle can be added and a bus-tie breaker installed in an existing cubicle. The switchgear bus would then be split, with one bus section feeding experimental loads and the other bus section feeding reactor and building service loads. In the present arrangement all feeders of the HFBR switchgear supplying the primary loop circulating pumps GA-101A and GA-101B, each 400 hp, and two 1000 KVA transformers, 2400 volts to 480 volts, are connected to a common HFBR bus.
The switchgear power breakers are solenoid operated, 250 VDC for "close" operation and 48 VDC for "trip" operation. The 250 VDC power is supplied from
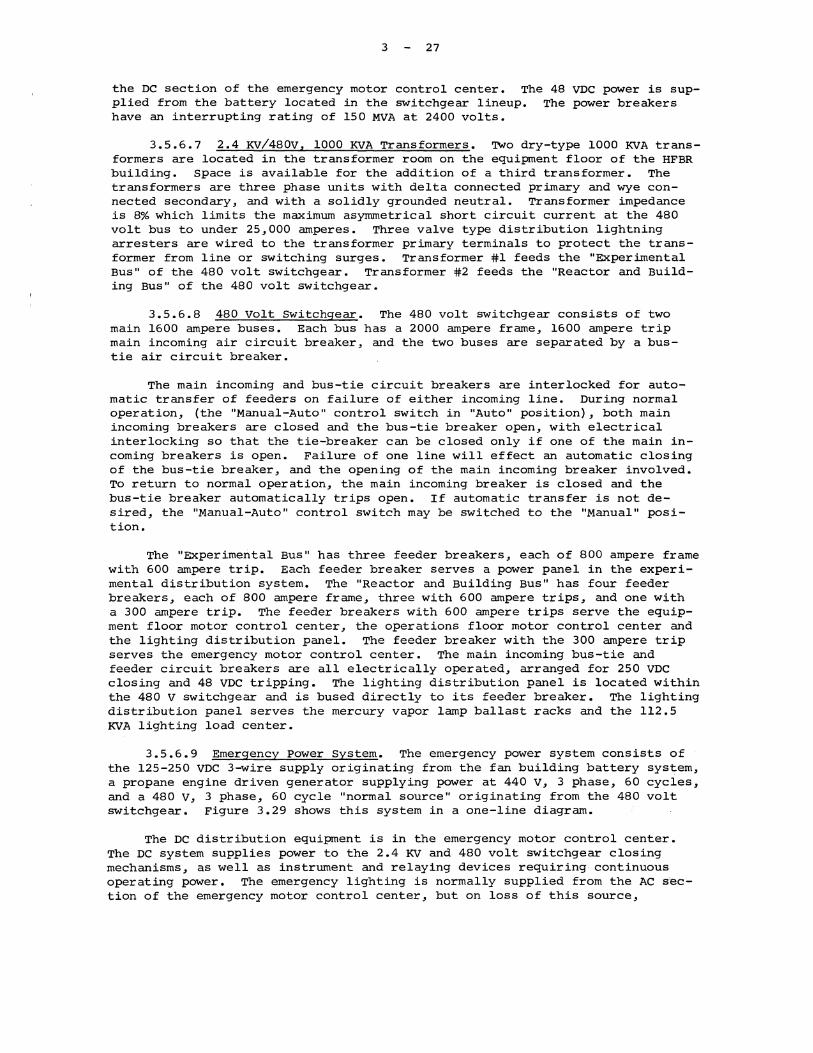
3 27
the DC section of the emergency motor control center. The 48 VDC power is supplied from the battery located in the switchgear lineup. The power breakers have an interrupting rating of 150 MVA at 2400 volts.
3.5.6.7 2.4 KV/480V, 1000 KVA Transformers. TWO dry-type 1000 KVA transformers are located in the transformer room on the equipment floor of the HFBR building. space is available for the addition of a third transformer. The transformers are three phase units with delta connected primary and wye connected secondary, and with a solidly grounded neutral. Transformer impedance is 8% which limits the maximum asymmetrical short circuit current at the 480 volt bus to under 25,000 amperes. Three valve type distribution lightning arresters are wired to the transformer primary terminals to protect the transformer from line or switching surges. Transformer #1 feeds the "Experimental Bus" of the 480 volt switchgear. Transformer #2 feeds the "Reactor and Building Bus" of the 480 volt switchgear.
3.5.6.8 480 volt Switchgear. The 480 volt switchgear consists of two main 1600 ampere buses. Each bus has a 2000 ampere frame, 1600 ampere trip main incoming air circuit breaker, and the two buses are separated by a bustie air circuit breaker.
The main incoming and bus-tie circuit breakers are interlocked for automatic transfer of feeders on failure of either incoming line. During normal operation, (the "Manual-Auto" control switch in "Auto" position), both main incoming breakers are closed and the bus-tie breaker open, with electrical interlocking so that the tie-breaker can be closed only if one of the main incoming breakers is open. Failure of one line will effect an automatic closing of the bus-tie breaker, and the opening of the main incoming breaker involved. To return to normal operation, the main incoming breaker is closed and the bus-tie breaker automatically trips open. If automatic transfer is not desired, the "Manual-Auto" control switch may be switched to the "Manual" position.
The "Experimental Bus" has three feeder breakers, each of 800 ampere frame with 600 ampere trip. Each feeder breaker serves a power panel in the experimental distribution system. The "Reactor and Building Bus" has four feeder breakers, each of 800 ampere frame, three with 600 ampere trips, and one with a 300 ampere trip. The feeder breakers with 600 ampere trips serve the equipment floor motor control center, the operations floor motor control center and the lighting distribution panel. The feeder breaker with the 300 ampere trip serves the emergency motor control center. The main incoming bus-tie and feeder circuit breakers are all electrically operated, arranged for 250 VDC closing and 48 VDC tripping. The lighting distribution panel is located within the 480 v switchgear and is bused directly to its feeder breaker. The lighting distribution panel serves the mercury vapor lamp ballast racks and the 112.5 KVA lighting load center.
3.5.6.9 Emergency Power svstem. The emergency power system consists of the 125-250 VDC 3-wire supply originating from the fan building battery system, a propane engine driven generator supplying power at 440 V, 3 phase, 60 cycles, and a 480 v, 3 phase, 60 cycle "normal source" originating from the 480 volt switchgear. Figure 3.29 shows this system in a one-line diagram.
The DC distribution equipment is in the emergency motor control center. The DC system supplies power to the 2.4 KV and 480 volt switchgear closing mechanisms, as well as instrument and relaying devices requiring continuous operating power. The emergency lighting is normally supplied from the AC section of the emergency motor control center, but on loss of this source,

3 28
automatically transfers to the DC supply.
The primary shutdown pumps, GA-102A and GA-102B, have 250 volt direct current motor drivers. switching of these pumps is so arranged that only one pump at a time may be connected to the static AC to DC rectifier power source. Both pumps may be connected to the emergency battery power source. Normally one pump is operating and receives its direct current power from the normal AC power supply system through the rectifier. With a failure of the normal AC power supply, the pump driver is switched to the emergency battery power supply until the gas engine driven emergency generator is up to speed and capable of carrying this load. After a few seconds delay the pump driver is then transferred back to the rectifier source of power. The switching arrangement is such that in the event that the normally running pump stops the other pump will be started automatically with its power supplied from the emergency batteries. A manual selector switch has been provided so that either of the pumps, GA-102A or GA-102B, can be driven from the "normal" power source (feeding through the rectifier).
The propane engine driven generator is the "emergency" source for the emergency motor control center. On failure of the "normal" 480 volt source, the engine will start up automatically, and after it has come up to speed and stabilized, will automatically transfer to the emergency AC bus to assume the load previously supplied by the "normal" AC supply. The emergency generator rating at 440 volts, 3 phase, 60 cycles, is 125 KW continuous and 140 KW standby. The maximum operating load now on the emergency motor control center is 115 KVA. After the restoration of "normal" power, the retransfer back to the "normal" AC supply is by manual control of the automatic-transfer switch in the emergency motor control center. The engine-generator must also be shut down manually by means of the selector switch on the engine instrument and starting panel.
3.5.6.10 Motor control centers. There are three motor control centers in the HFBR complex. The emergency motor control center has been described under "Emergency Power System". The other motor control centers are MCC #1, on the equipment floor and MCC #2, on the operations floor. The motor control centers are supplied power from the feeder breakers in the 480 volt switchgear. The motor control centers are rated at 440 volts, 3 phase, 60 cycles, with the main power bus rated at 600 amperes and braced to withstand 25,000 amperes asymmetrical fault current. The starters are combination, plug-in type, employing a molded case circuit breaker and a magnetic air contactor with two manually reset thermal overload relays. Circuit breaker handles can be padlocked in the off position. contactor control is at 110 volts, by means of a step-down transformer with a secondary protective fuse.
3.5.6.11 Experimental Equipment. Power is provided for experimental users from the "Experimental Bus" of the 480 volt switchgear. Each of the three feeders supplies a 440 volt, 3 phase, 60 cycle power panel located on the experimental floor. Each power panel supplies power to the primaries of two 112.5 KVA load centers. The load center secondary is 120/208 volts, 3 phase, 60 cycle, 4 wire, bused to a distribution panel in the load center.
Each load center distribution panel feeds two or more experimental or lab receptacle panels. The experimental panels supply power at 120 volts and 208 volts. Each experimental panel (on the experimental level) is located at a column and straddles a floor trench. Cables from the experimental panels to the user's equipment will be routed through the floor trench system. The power panels (for supply of 440 volt power) are also connected to the floor trench system.

3 29
For the DC requirements of the experimental users, tern has been furnished. Silicon rectifiers are used to 3 phase power to DC. The rectifier output is connected panel #1. From the distribution panel, a circuit is run location on both the experimental and operations floors. location, the DC circuit is terminated at blocks mounted
a 125/250 volt DC systransform the 440 volt, to DC distribution to each experimental At the experimental
in an appropriate box.·
3.5.6.12 Lighting system. Power for the lighting system is supplied from the reactor and building bus of the 480 volt switchgear. The 480 volt lighting distribution panel is located in the 480 volt switchgear. The mercury vapor lighting is operated from 480 volt ballasts fed directly from feeder breakers in the lighting distribution panel. The incandescent lighting is supplied from the lighting load center located on the balcony level. The lighting load center consists of a 112.5 KVA transformer with 480 volt primary fed from the lighting distribution panel, and a 120/208 volt, 3 phase, 60 cycle, 4 wire secondary bused to 3 pole feeder breakers which supply the lighting panels located throughout the building.
3.5.7 COMMUNICATIONS SYSTEMS. The communications systems within the HFBR complex include a utility telephone system, and independent paging and intercommunications system. The telephone system ties into the main BNL telephone switchboard. The telephone cabinet is located on the equipment level just outside the filter room. Additional telephone cabinets are located on the experimental and operations levels, as well as in the lobby. All telephone wires and cables and the phones themselves will be provided, installed, and connected by the New York Telephone Company. All maintenance on the telephone system will also be done by that company.
The paging and intercommunications system is used for general announcements, paging, and to permit communications between the various nuclear facilities and control areas by members of the operating Division. The system consists of a main communications system rack housing the amplifiers, power supplies, volume controls, inverters, etc., microphones at the receptionist's desk in the lobby and at the operating console in the control room, and a number of telephone head sets, hand sets, jacks, and loud speakers located within the building.
The two modes of operation are "paging" and "talking". Paging is accomplished by talking into either of the microphones (one in the lobby, one in the control room) or by pressing the page button at a telephone hand set and talking into the transmitter. The caller's words are then broadcast on all speakers throughout the building.
The "talking" operation permits a two-w-ay conversation between the party being paged and the caller. up to 10 phones may take part in the conversation by removing hand sets from the hook switches or plugging head sets into jacks. If the page button on the hand sets is not depressed, telephone conversations between parties on hand sets or head sets will not be transmitted over the loud-speakers.
The paging and intercommunications system is normally powered from the 120 volt, single phase, 60 cycle supply at lighting panel H. An emergency power feed is also furnished from instrument panel IDC. The emergency feed is 250 VDC. Upon failure of the normal AC power source, an automatic transfer relay switches to the emergency DC supply. The DC power is fed through inverters to convert to AC. On restoration of normal power, transfer from the emergency to the normal source is automatic.

3 30
3.5.8 FIRE ALARM SY8TEM. The fire alarm system is a completely automatic system which transmits a coded signal to the BNL fire house and at the same time sounds fire bells in the HFBR building. The system also lights an annunciator panel in the lobby of the HFBR building indicating the origin of the alarm signal. The building is divided into 14 zones, each monitored by automatic fire detectors. There are three zones on the equipment floor, one in the south lobby, five zones on the experimental level, two on the balcony level, and three zones on the operations floor. In addition to the automatic fire detectors, manual fire alarm pull stations are located throughout the building.
On operation of an automatic detector or manual fire station, the fire alarm bells throughout the building sound and a coded signal is transmitted to the BNL fire house. The bells continue to sound until an alarm transfer switch in the fire alarm cabinet in the south lobby is operated. This is normally done by the arriving Fire Department personnel. A remote annunciator panel for all of the fire stations is located in the reactor control room. This insures that operating personnel are informed of possible fire troubles when the lobby is not occupied, as during evening and weekend times.
The fire alarm system is equipped with a trouble circuit which sounds a bell when a ground or open circuit condition occurs in the wiring system. The power supply for the fire alarm system is a 24 VDC nickel-cadmium battery. A battery charger powered from the 120 volt lighting system maintains the battery in a charged condition. The battery and charger unit are located in the south lobby at the fire alarm cabinet.
3.6 CONTAINMENT SYSTEM LEAKAGE RATE
3.6.1 DESIGN LEAKAGE RATE. There are two leakage rates which must be known for the HFBR building. These are the intrinsic building leakage rate and the rate of venting through the filter bank and stack. The building leakage rate is measured with the stack vent closed off, and is due to the inevitable cracks and apertures in the containment shell which remain unsealed. The stack leakage is a deliberate venting of any internal overpressure through the exhaust duct butterfly valve.
The design leakage rate for the building is 5.8 x 10⁻⁷ of the contained volume per second at 2 psi pressure difference between the building atmosphere and the environment. The fractional leakage rate corresponds to 5% per day gt 2 ~si overpressure. With a net internal volume in the building of 1.73 x 10 ft • the volumetric leakage flow rate is 60 cfm at 2 psig.,
The design leakage rate for the stack venting is 6.0 x 10⁻⁵ of the contained volume per second at 2 psi overpressure. The corresponding volumetric flow rate is 6230 cfm at 2 psig.
3.6.2 LEAKAGE RATE AND SYSTEM PRESSURE RELATION. The variation of the leakage rate with system pressure depends, in general, upon the nature of the leakage paths. For the stack venting, the leakage path is clearly of the orifice type, and the stack leakage will vary directly with the square root of the system pressure. For the building leakage, which will be due to a number of different types of leakage paths, it is expected that terms proportional to both the first power and the square root of the system pressure will be present. An attempt will be made in the initial leakage rate tests to separate these two components of the building leakage rate. In all calculations on reactor accidents in this report it has been assumed that both the building and stack leakage rates are proportional to the square root of the building

3 31
overpressure.
3.6.3 INITIAL LEAK RATE TEST. The initial leak rate test of the building will be done at 2 psig internal pressure. This test will also serve as a proof test for the steel dome and foundation structure against the design internal overpressure. The initial test will be performed at a time when the building structure is essentially complete. All of the piping systems will be complete, all of the air locks will be in operating condition, sewer system water traps will be full, and all electrical penetration seals will have been made.
The building will be pressurized by a centrifugal blower mounted in the north receiving room, outside the contained volume. The pressurizing blower system is a permanent installation, and includes appropriate valves and connections to the building.
A leak-tight reference volume system will be set up inside the building. This system will be assembled of standard copper pipe sections connected together by lengths of soft copper tubing. sections of the reference volume system will be placed on the operations level, the experimental level, and the equipment level, with the ratio of volumes the same as those in the building areas. The reference volume will be connected to a differential manometer. Other manometers will be used to measure the absolute system pressure and the environmental atmospheric pressure.
It is expected that observations of the differential pressure and temperature between the reference volume and building, as well as observations of the building and outside atmospheric pressure~ humidity, and temperature will be made during the night hours from midnight to 8 a.m.
Leakage rate measurements will be made with all the inner air lock doors closed, as a first step. Since there is no way to test individual air locks for tightness, the leakage rate measurements will have to be repeated with the inner doors open.
A complete test report will be prepared as soon as the leakage rate tests are completed. The witnessing of final tests by AEC personnel is anticipated.
3.6.4 RETESTING FOR LEAK TIGHTNESS. The building will be retested for leak tightness at intervals of 2 to 4 years. Provided the initial building test shows that it is a feasible operation, retesting will be done at a pressure below the nominal 2 psig design pressure for the shell. The reference volume method will be used for retesting.

'1111' NO~r~ $ c:::r
!1MlfCNT4 l llA :I I
SEAL AT OPE2. fUX'/2. C!V#l
Cit.TL. 110'-o•
OP,N Pl.Jfr''°-flltf llGCJ!"fV,Nt;
.114'-'-'
Figure 3.1
~ / ~- .... . '--~(---~---/ -------ti~ . ~ 0 ~ I!(
·'['!(" . -~ :J ~ "4
i:!•~· '""_____!-------.., _Jf: .\f"§ 6?\-2~"'J~~1" rJ..11}'-'
Ei--1.11·::.~.
'• a.-1.t CONY .l.CyEi. Et.. 128~ '10~
-~~!t ~-
LOl"YP.;>Y
'• ~ +--hl.fii"i# 111 wqfl __A iot.o'
~ ~~~ J t..Jµ ! I I I r-11 · d I 11 _.lJ~:L ___ JJ _ •ou1'!._~-"_I __ ~1~~--.g__,-~~: ··1:· ·:\ I : ~A [ ~J.L I I I I I I I L
I I I I I I
__ l_ -~~T~':'_~--~!!_~~_§)__ €__/,:.__.!-!;.. ~--
-BOT"_:>'"~~ <>~~~P hr ___? __ E_!:_. __ 1.l__'-_E)_
Elevation of the HFBR building in the north-south direction.
Jlot-..IA~"-k~~"j"t
w
w N

f:" ao ,._ t:,.'9NI I ? ! /{....rn:M•L >TON ~~~';!""-1'
';4'•
~~" ... 'l'IOAI• u11~1. ''· ,.,._.,- ~,I .L.J1Z !'--: .. rr
sA.,ctJNY "'v1L ~'· 11.s·-s· /=u l\'i 1
-1-1..0.!!iJL..L~~~' 1111·-o-
~JINA~ •l•,;1 ....
· ...
I-- I . ;-:11'~."-~-~~~'-~(!,_J•'-o~ ··~ eorJ:Ol"DofEP' 111.H.!.....ll:.. f.I~~
c
Figure 3.2 Elevation of the HFBR building in the east-west direction.
w
w w

GR/
s
Figure 3.3
·'I' II• I
~ .~
~
0
)\ ' \ i ;
\ \ I \
.!..~ -----+- +-- w - o· / I
F'IN. FL..e-L. 101'-o•
-.ll
w
""
Plan of the equipment level of the HFBRbuilding at elevation 93 ft-0 in.

~~
@)
Figure 3.4 Plan of the experimental level of the
7
t;ijrit:f'"
w
w Lil
fOP:. Gir:t.i~A.L tJ01t~ ~ LtC1t-1Jo :)f:'~ J>Wt; n4l-,~·IO),
HFBR building at elevation 113 ft-6 in.

fP4
I I I I I I I I I C .i!loitxH w•No
,-
Figure 3.5
lla.YJJJJ ·~ ~-QllU_tt.L!J.9..
~' ' ·~ " "-, ·~·~
" ··~ ~.,'<
~. ~~· -------.S!~-'
'"
04'·0
I i
PR0'/1ae 4,.4 c.u.e.a .tr ~l/o~u.es
G!NERAL. Nons
I. -'LL 1'1 .. f\llt.IS D&•14,.,ATl.D 'I"' AAI ,ollf. DICO ... T.liiMI NATION •
.1. .SlofOW•lll:~ M.liilillC•D • ...... aM•lll4•"1C'V ,,.,..l"TV '"owa.e.s.
s. * Fu1t...i1 ... -4ID 8¥' OTl-leR•.
+. :~~ u~: .. ~ P:,tTl~~~\.~-c~:~:~:.~·
L.l!.Gl.NO
D. I'. D"INll:.lllif4 ,OUNTA1M
e.w. !:Yt: w.-..~ .... S. L. &U'~ &INti:
R~felltlJCE: DR:.O.WlllG!> . l.ARCHJLAOR. PL .. tol, H,ollP~~U:~R.•l:L.-,,, .. d"j 46fS~OI Z.. • • ~ t:&~Hllf. LEiltrL•l!t".ll,'· 0-4r.JS•IO"l
3:.__.._ _ • ·• Ol'P:IVI"~~°' .. P.OOllC<!.l!.L.141~~
~=~~r-~o·(~?-~H'J g::1;:.:,~ , •. -fllrtc.M. Cit.OU 11iV10'!4 l~its<!of ·\oJ•'lT) D ... G-S\·lC!C. J;::AR.CMllt-CTVltAL C.TA1~ .f61J?t• Ill
~~-!~::~~rt -:·::f::~~ 1CIMC. F-1Ut~lrl'.2L,._~ Piil. ~UOlly Ltffi.•tL, ltll"Cfo" ~U,5< I'll
.to.. llOUTlll& ofM P\.~ •• 4 ul'IU1'1' PIPUI& . 1·4Go•S·416
·PRol!:CTnl&-Xl'E-t.l'l,111LLAROlllD OtJ'fSIOe-"01'"-.U..ILc,lltO~(T6CU-Jw1.
~tJr~~';~Al'll. Q;Cl,.UllU·D A"
Plan of the balcony level of the HFBR building at elevation 128 ft-6 in.
w
w
°'
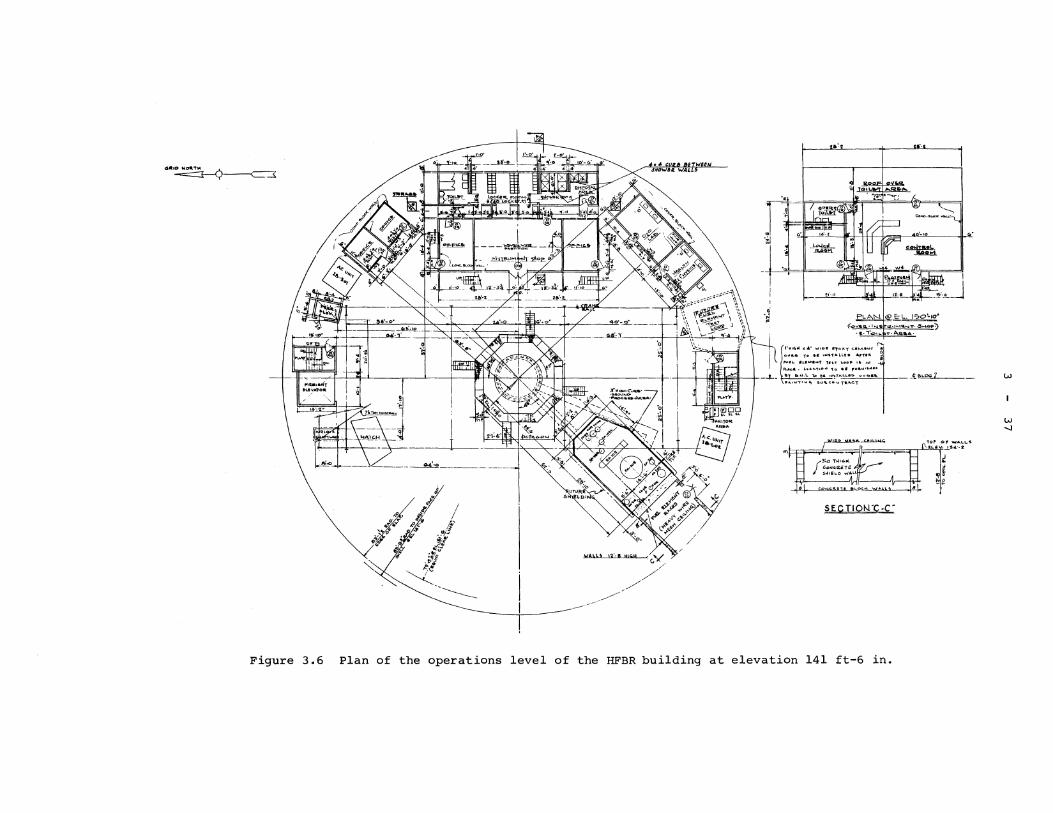
dlllll~
Figure 3.6
.·hi ,.,J.. " I ~~\11R.·. _!'l .. ~?
if'u.'!
-~* ~I
-~ ~
-------- I ~/ --J-----/
~ .:.
· 11 ~ r:m ~ii ~rn "> n. -·'"I"® ~
m, l .-JL ,,., lit I.~ r ( __ J - ••'->• JL~· -~1
~-. l.•'"-•TaO_. 'to •f ru•Y•t.ol•'" •i b...i.1,. To er. , .... , ... 1..1.~D .,. .. ..,.-.
.... 1Y'Tl"fi=-d ... C,; .. ~
SECTIOt-l"C·C"
- -t'="""=,~--
TOP op WAl..L..4 1.1.•r I, •..• rl.
.. 1!
Plan of the operations level of the HFBR building at elevation 141 ft-6 in.
w
w ..J

N" -
~E~ ZONE A4
OPERATIONS FLOOR (EL. 141'-6")
ZONE Al - To support heavy concrete and lead blocks for thimble shielding,
ZONE AZ - To support reactor shield heavy concrete covers in single layer; weight 4ZO' # /SF and lead pigs; weight 6 tons on 36" dia.
ZONE A3 - To support forktruck and storage.
ZONE A4 - For light storage.
DESIGN LIVE LOADS ( # /SF)
FLOOR COLUMNS FOUNDATION
ZONE Al zooo 1600 soo ZONE AZ* soo zso 100 ZONE A3* soo zso 100 ZONE A4 zso zso 100
*ZONES AZ AND A3 TO PROVIDE FOR 6 TON FORK LIFT TRUCK AS ALTERNATE LOAD FOR FLOOR AND COLUMN DESIGN.
ROOF LIVE LOAD
3 38
ZONE BS - TRUCK LOCK AREA
EXPERIMENTAL FLOOR (EL, 113'-6")
ZONE Bl - Reactor core area
ZONE BZ - To support heavy concrete blocks and lead blocks for shielding.
ZONE B3 - To support piles of heavy concrete blocks stacked up to 8' high or piles of lead pigs stacked up to 3' high - either spread over only l/Z this floor area. Individual piles limited to an area 16' x 16' with 10' aisles for fork truck activity.
ZONE 3A ACCESSWAY ZONE B4 LABORATORY, STORAGE AND SHOP AREA
DESIGN LIVE LOADS ( # /SF)
FLOOR COLUMNS FOUNDATION
ZONE Bl 4000 4000 4000 ZONE BZ 4000 zooo 1000 ZONE B3 3000 1000 zoo ZONE 3A 1000 soo zoo ZONE B4 zso zso 100
FLOOR AND COLUMN LOADS INCLUDE IMPACT.
SNOW Z 0 # /S. F, , Red. for shape WIND 40 # /S. F., "
INTERNAL AIR PRESSURE Z P. S. I. G.
BALCONY FLOOR iEL. lZB'- 6") - LIVE LOAD= 100 #/SF
EQUIPMENT FLOOR (EL. 93'-0") - LIVE LOAD= SOO
TRUCK LOCKS AND LOADING DOCK SOO STAIRWAYS 100
ZONE BS ALTERNATE LOADING ZS TON AXLE LOAD
ti
#/SF
#/SF #/SF
Figure 3.7 Live loading permitted on various floors of the HFBR building.

Thiokol Sealer 3" 3" i'4 x i'4
(Also Around Joists)
3 39
Joists For Dome
176'-8" Ins. Dia. Shell It.
176°-2~8' Dia. e.c. 1" Dia. Bolt
DETAIL -0A
I 3'-6"
'
Reinforcement • • Woll
..
Figure 3.8 Section and details of the cylindrical base wall of the HFBR building-

3 40
©
©
' ~-...,....,,.-_JI ~---:-.. ~, .. --:
~ i
'
~I ~,
i
,I~
;J i!i I!

111.l!>Ut ...-
' :
--p.L .,;:-•"'U''- PIWC. 'llol, ... ,,. •
l"~.._ .. •'ftC. PllOC.. 1os••~·I
-...., .... ,. .. __ ..... -.. .....
i!J»P AP mlltlt•Jtp~ l'e !l~ct
... :. . ., ..........
T:f!ltS."' SIS11"! "THU !t•b
!!. !!
t=J'S Ollt.'T•lh ')..•
TYPIC...\. Y!!,TIAAL ltRLL. MftM
S&!:.'J'ION
-- I
C.-CCI" iltio~l'llCll"_~_-____ ..,
!;)l!"'fa.11, .. l!ott.11!. P\.a."Tll. ... ,..M,
·~:-__!!~-~~ ~A.a5•0 ~-JP •n1t15
o..i lloQ'I'"" IE."'••
r~--c• ] : l-~
3fl __ JI
tH!T•11.. c• 'E.E•\.. PL•'T1!!.
::l:TEM •4· 4.& ll~Ci''O. ~bD
·1YtJJ I .... I
DS,-•11... 1 TISM e4
"r- -1 ' l
-~~~ ·~"
DaCltlPnON • ~ 1•1. .. ...... •IMC. .......... TT•l•d
\I&·•" 2'1·••, • u• aia
,., ~e-rc. ...... 11:1.- a.Pl..e. 1• .. 51" •t•o• llot zc ISl.•'1' ......... --W/ ............. TM •!I .... ....... a 1111•&. .,.. "• &Go!O •• •· ..
...... R.1uc,, •••M. ~'TRM~ ... ,.,, -z. ...... &lii° ... 'll
4•1 P'-•'T••1•.'t•11. SY .. 11. \l'..'1~"u&T ~"' • '"""~ -•• -., ... 16" It ....... .. -~.,...,, ,~,, ... .,,,. ""'1>4'1•" W•'T • ,"'ll!." Jr. ;z:,-,-1..9•
I I , ........ 1. l"\(oo··•"Dl•M- ~
•t. I 1:0 I •....:....a'=' o·•"" ~" "'.,,., .. • 'l,'-"• W.&T OW "e,._ ... ,. .... ......_,~ TO
1.,.,~ & ll4•D1•t"\, 'To• 1t.).
•••a'- ewo:a. ciaa. i&'i' .. -"ii 111.•'T. a.a.•-, .. --,;--, ......... iav&•
lt4 lc.c I ~T .._.et 4• .. v4• "cr-io\i,.•
aio•O OW U.lto•~I. Oii °'-•· a1 • 1.,~., ., •. t:.•I! <1•N•111.•i.. 111.t.SeM. oa .. ic11 '°" NOY&•.
w
""' I-'
~ __ ]-~~--J ~~:-:~r.~----r~;~~]~ !!. I ~ l ~ I I I I I I I I
!!. !!. l!!. !U ~ II! Ill A.•.
!! !l. !!. £
Olli.'1~1..0PI!. M&U'T 0 ... ~~8'1..1.. Pt.•"T'l:!.::!o --=-.:· ~o..;:.r,.iO_i.:::Jt~·i:~":& ····"" - ·-o-.-, ... ·==-
Figure 3.10
!!. " "'-
!L ~-
.. ,-,
"-- !ll
!!.
t.Utll._,.11\ co. 11.Q, M•, "4G.'!ollo-$- ~'SOO
.Jae. tJ .. 40.~'9.
- .~ORDER No. 50 I G'Z
--~ ~:".~.~~~-~~~!:~
~/
cia.T•1i."' otr e•-=o• P1o.•T11 ( St1et..1.. ....,... bQW'taO ~Uh-a•..,C. ~ .. C\.OS.U• ..
w.fl ....... •i.D&. NDo '1li0
1·~ I ~ ;;;::=:::j-n••a -M~ --'~"-·t.'lWl~C .. ,,,_,.~-···11,G\I•'- W-lec:•••DO_'K_L D&ft "_-, '"•
-- .. M, DRG.No.L-\818<0-I ·'

~ J ll r I
I ~ i ':t. ~ i.
u ·~i j• .. ~. 14 • =
' . • J • • . . i•t . ' t• . ' • J 0 J • if.
" •• ••• . . I ' . • a , ' ' ~ ! ,. ~ ~ i~ ! ~ ! • !
: • • . . • . h . ~ ~ .
~
I
I
L ~ 0
s~ . . ii~ . . . -~ ' H •• ~
~
r
; :. . ' . ' u • .. • >
~ J s ' .. . ~ i ~ , ' ~ 41 ! u •
-g
-~9-,; -~ 9~9 . ;;
.. !?.:<; ... ,t:'!il .;._ ~
L ._ J 'al..•.,,.o1cowo.w-:1-,.•.i..1•.•
~
··"·-=*•
i
.. ;Ii
J
' .. d
ij
l ~ H
~
• • , i .. • Q
J . • • ..
t j .t
3 42
t r ..... ~ ... ,.~ ··~·-·v-."1 I .... L·:~--~... .~L-'lj• ...... I
. 0 0
" -r-· \ ~I
"'--.
0 0 .. . .. •• ~ ~ •• .. 7 1
0 • . ~
~ ~. ~ .. • . .. : ~ 0 '"' ..,1 ~ ~ ~ 1 I , ? • ~r " ... .. ' ; IO -· (1 ~ g
' r-0 • 8 ii ,
I·~ UI iS . , . . ~ . ~ .. . . ~p , 0 •
ffi ! -. .: ~ ~ i "' ~
Ii!~ go '8 ci
I 2i 0
.. u j
~ " ...... • ...... ~ CV)
QI ~
L ::s 0 °' , ·.-i • Ii< .. • 0
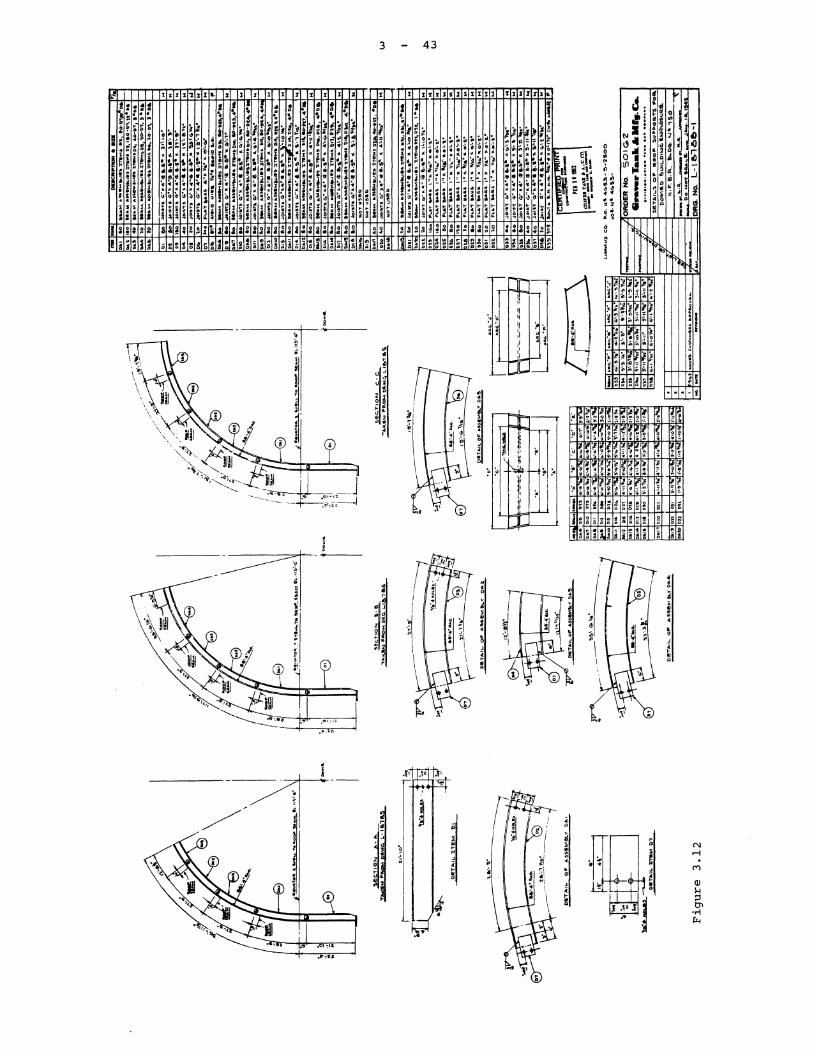
' . I 1 "J. I I. • J • l x • • • • z
~ •U • • 1: .TI ~ ' I ' • • : ... \ • t " \ ~ • \ ,. ~
' . " .. '~ ' i g; Ii ~= • 'S
.i ·- . i ;~ . i I ''Ii ii ); I~ lh
I: !~ ·~ • a ~ '!. ;; ,
~~,~ •I ~i . . . ,. 2f ~f ~ t ~'~ tSi .. ~ !! ·' : , I OD 1;; • , ~ .. ... . . . •D
i I U! • • G • ! q ~I t:1i • t . ~ .. ;: i . ; . i. . . ..
~e •• ·a ~~,; 1 ~ "~ ~E . ~ '!. ... .. ... . " •• .. ; ! ! •• •• ... t' : ! =1; a .; . .. ... 4ioi .. s . .. ... ••• '. o! •! q .. '. ~'' ~~ 7-;. .. ~ ! i ' l .. ' ' . ' . ' • i •j• • 1 J •• :- i ~ I •• H • &' • !' • n . . :; . ' ~ i 'Ii ~ !ii "0 -:S\t" ~ i d ! "2 " ! !i •• l .. d • . . . . e • • • r· • p H u ~. q~ • s •• . . Ii & ; ; ii ~ s i ii& H H jhl ~= ~i d . '~ ~ .. ~
a: ;s u u a• -. •• 0 H J& ~a .u 0 • .. u a: :a .. .. a: s: u H "" H u u s~ J: ~! t: "" 9 .. : . ~w jg )i ia '" H Q g 0. &6 a a a" : & I&
~1 ~·
ii ~1
I i
3 43
I
: . ~ a ~~ i . ~-'Ii
=· l: J • 8' .. Ii :: ~!i
" • ~
~ , ~ ~
I : . l . • . ,.
r xr • J .. J SI r I l
I s ~ .
1f1 :J. i' ~-iJ s ! :.- .. :.:. ~~ ..
~ ~ • • f~ . , , ·' ' , • • •• .. .. i .: .. 1: ~ . •• .. .. ·~ )~ ~t )iJ i~ . ~ ~ • .i .. . . . . . . .. ~· J 1! .. :.:. '. I~
.. .. : ~ .. ii . . . . • • ii ii •• • • . :. u u • c p ~ ~ ~2 ~~ ~ ; 2~ I! .~ .. t. ~. :t SJ ; ; ~: ~: :: ~s
;; ! .. $\I f: :! = .a.=: Oo :; . . 0 ...
-~ :; • i
. • 0
>
' 5 . ' . ~ J
i
IX S Jir l.
~! ~ I ~~ H~ ". p ~~ -;, iii- ~i . ..
i~ ..
~f.~ • • jj i ... •• ••e •• •; 4 ~ ~ H ~ i . . . . .
~ ~ d.d "." ; ~ ~ ~:; li ~ Ci Ci ~l .. ::J :: :~ :!i ~~ f" Q~
., .c
s l ~II ~!:I· ; ~ii
- e·· ~l
II t1: ~ 2"
; ~g ~ ! o§ r . -
NI .. • I
ia 1 • " " .. • Ii i I() -· • 2
'. !H ~J . -• 0 . ~
0
i .. . " . • .J 0 0 ~di
1J •• H
% 'sg i •• zo I c
~.
···~ ~ ~ l
··~~ ~
~~ "Ji# ~! i ~ ~" = ... ;i. ~ ~~
~; n~ ~~ n • jft;;. ~~ I .• ~~~ =~ ·s ~ . ;:.;:. ii.ii · .. ;, i l~ ~~ ~~ .. Q =
'~ ...... ;:.
iu·
* I ·'
I: s .. !! ~ E ! § ... I
1 .• ~ .,., "l'tl ~.-.I ,-, ~ ~I~ . ~ ~~ ~~ ~ ~ ~ ~ !!: ~i • '= r1"' H"I !~ I~ H • d ? .f ~ ~ t _,.:. .1 ~, liJt ,1H #'I ~ ~~ " . "· .. '~: . " . . .... ,.;;.·
"' jl~ n ~ 'J ~ lr ; ;p :- ~ "~ ~: .1: .. ~ ~% ~ . :. fl,':!.
... .,.,. n '11H ti ~ .,., ... .. . . . f ~ ~ ~ ~ I~ = • • ;i i ·.; .. ~ iii~
Is E f I! ~: g ! ! fj a: h I 5 i& ... ~! ~ iii! ,,. a ii
i• .. i ! &H t • i ~· I 3 : :. u s:
ag· 5 0 N . li .-I ~
• E . ~ . l
M
, QJ • !--! g ::s °' ·ri µ,,

3 44
.. ~ ~ .
I I . I" FL.tX. c/0/NT IY,t/T~,e fTOP l I l""ILJ..E!e
A EIVL/IR(jEO L)ETAIL
TYP/C,qL EXP,qNSION c/OINT DETAii-
'f&E EN~A,e4ED PerAI~ AT ,e1<;HT
I THIOKOL ~ SEAUNT-\I
1---....->.-.i----4
a TYPICAL CONSTRUCTION
JOINT IN MAT
Figure 3.13 Details of air seals at joints in the foundation structure of the HFBR building.

3 45
..
... .., IMSTA LL &.5" ~ 0F61101llll>C""Ll
~%:~.":i:".: SH ~ET'-IL•t,4
Z.•OlolCMG,l«IUHD
t?.;E.(FU~"IWD ~!ALLY
DETAIL""23
I NSTol.LLEO 11>'1' OfHUS)
CAP>Lt:: CC>NNllC:TOR. \.UG, f:TC. tlT POINT OF "T"f!!RMINATION lN \.OWa1'. PRlt$$URe AR.l!A.
(MOTC:>lli:: CC>~"TROL C:~NTl!:ll, Sl/lllTCMOl!A1') ETC.)
nus po11:T10 CONN!<CTIO" &Ii: SOLl>l!:lt D 50 TllAT IMTl!1" C!P CA&l..E'fl llRCO~PLl:Tl!'l..Y FILL~. t .S&ALE.D OFF
P>ARll_, 9TRANDEO /--+.-r....,.""""-t C.l'P>LI! 'WITH INSULATION ~ICIN>Jeo !IACIC.
IC'.&tl' 'TM~ OIMl!WSION 4S J SMALL 'A~ Possn•1..e
N01E:":-
.. - ..
CABLE
... ' SOLDER - FILLED CONDUIT
DETAIL A
'fl.HS PORT ION Of CONNECTION Sl'ALL &e FIMI :!>Hep WITM TWO MALF LAPPED LA'l'r:R5 OF HIC.11 Gll:AOe eLECTRICAL. TAPt 1 5COTClol<l'5:5 OR &qLJAL.
STll'AHDED CA&LE ~ IN~ULATION
SoL10 CAe.Ll!:"S SMALL 51:' IAPl:'D ONLY
DE.TAIL Nesa MCTHOD Of- .S~AllNG CAP.LU IN l.OINeir. p~e:ssutz:e A.ltEA
N.TS.
Figure 3.14 Containment air seal details of electrical penetrations, details "A", "23", and "SB".

, 4
3 46
• IA !
•A '
: .
A
4. .
-C.OIJC.~£TE WAl..L
/
- (Ot.IOUIT SIU O\l 1.t..'fOIJ,. owq.
----~~--coi..aou•T .;.-.,.. ---+-
"" ~. -~ I "''"'~ --·. ·. FLIJC!i. --~~---+ -----f- ".>1.L-ELEV. t;,~~WN-;:A'<OUT D;Ca~~iU--t
FORA,TlVf COMDUtT!i RE MO~t! PIPE PLltG t AND IXTlHD CDN::.Ult ~ ll'lDICATlS>
STEEL S.l-IEW.. Of e,1.11LC•oJ<4
,
<I·.'/ ·p!--
,·
I RE.FER TO <t.OF A~'l>!lll&L'I' 1 .._ _______________ , _ _J
'I
A'
--4-i
_1'.0 &E. COMPLE.lf:L.Y FURNl~ll_!.~tW~~~~Q HLf:l.b.~CE ~Y-~"!_El._L.fA.~~-\C:~.IP..B,_
£.LEYATIDtt!> ~llOWM IN LAVOlJT-- 7 DWCS R£FE.RTO t.OF ~!l!.fMBLY I
I
/[ ~
;#: ~ 2 ----
- CONC>UIT C:.OvpLIN(i
~- F'ULL ~,, SEA.L WEl..C>S
Tp_g_cOMPL.E.TELV FURNliH!~_-Lw_E'~~l> __ lN ~L\.At._E -~".. ~':';_L,J,._..f~~Rlft-~
- De:... TAIL J. 35 ··-=":""...;.::.~-===-=.:.::....=.. ~.::......;:;.:.;··~ --=
IJT'S ' MIT'4oc:> OF SElll.Lll..14 COMOUIT I; C:ABI.£ f?1JTE."llJ<4 BUILOl.i(li THltOIJ<:itlM STEltl.. SMIE'.L.&.. Ae.ovt. EL.. II~- Qo''
Figure 3.15 Containment air seal details of electrical penetrations, details "32" and "38".

J
3 47
"'S S::O.<fUIRE.C W ... LI.. TH ICKN,~['"'S.=S.~-----------i
'Ir.
,•··· f\..°'tlC.£0 la.COY-...,-,·'
4
.-\HSl'Ot 'CLO'<:. WAI.I. '. tJECi"""I WE. PllL S 'SU llE. ilo.1n:"'
J
- FURMl!>"E.D' 4 IMStTALLl:I> e.v OTN£11!>
CONO\l'\'T --(Tll;: RitNfORC.INCi ROD!.
Of 'OllOlllT g,..11>< 11110 HOOi'. SL"!!. 'TO~ Tllil). SU· 0£TA1L. e·.!15}
DETA1L•22 METHOD Of S.E111.IN6 COllDU\T I! .C:M!•I.£. PE.METRll'TIWG EQ\llPME.Nl FLOOR 5.1.At!i
WOT TO S.C.A\..E
Figure 3.16 Containment air seal details of electrical penetrations, details "21" and "22".

I 4
I II
5 1-816---
J ~O.D I s - _Jj_. -~
_J__ ~- //
l 4
Penetration
Nitrogen
For Liquid
Supply II II
Detail C
3 - 48
Penetration For Fast
Chopper Beam II II
Detail B
Seal
Weld
Piping Penetration,
Ty pica I II II
Detail D
Figure 3.17 Containment air seal details of piping penetrations, details "B", "C", and "D".
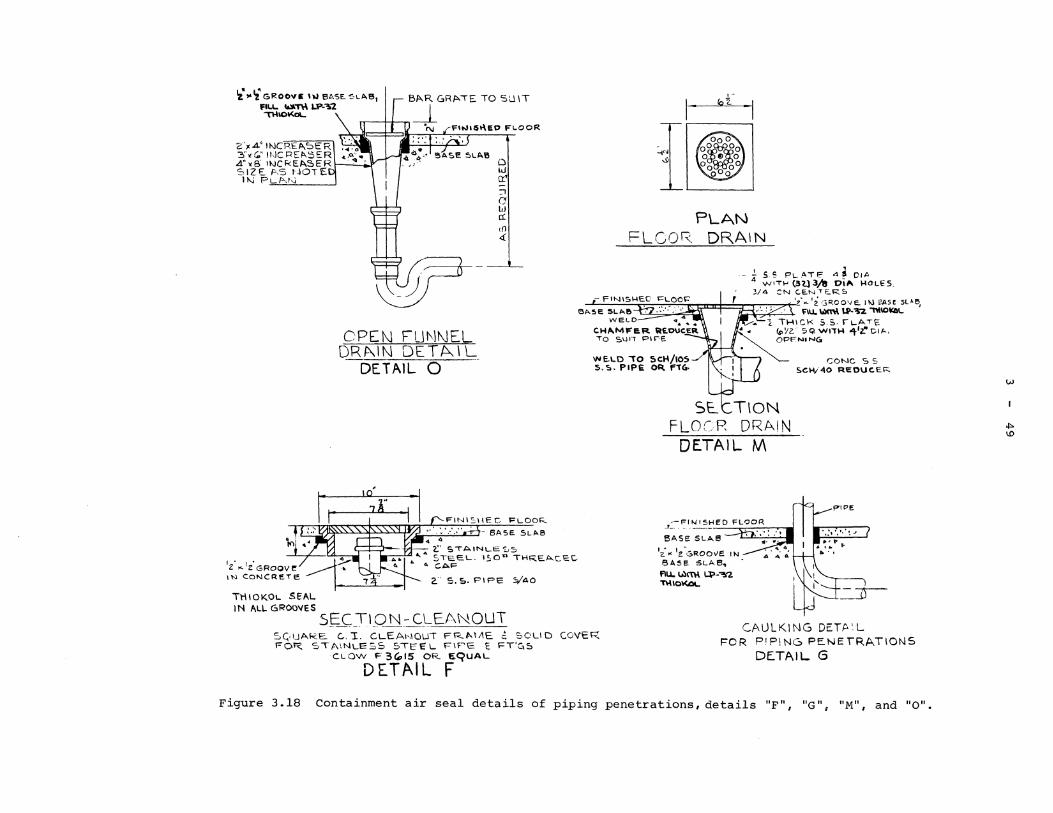
'i ,.e; GROOVS Ii.I BASE. :!·L:J_(B' B/>.R GRP..IE 10 SU IT "'I.I.. llll-n\ U"-.,.'2 _J_ "THIOt<o\.. '\
.l'\I
2. 0 JC.4." INCRt/>;<;;)ER ".?i'•~" lhlCPEl>-5ER A."~g 1NCR.EP.5ER~ SIZE. p.,5 ~JOTE IN Pt.../-',t-.i
Q w o:'I :i 0 Ll a: <fl <!
I or I
I ------' FLCOR.
PLAN DRAIN
-- .!. .S !; F'L.. ,ATE' 4 S 01;1 4 W•TI-' {3t:}3/8 Dtl'\ HOL.ES. :?./4 ~N C.E.N'TE::.R~
t-'""'=io...,~'- .-~uu.,. I ' 'e • .c.'2.·3R.00'JE..ltJE'ASCSLA6
13i>.5e. 5L ... &~-·"::;\i'. F:y\ fiu..\o)lt\\ U'-"'2 ""''°~ '
Ttl!OK.01.. SEAL IN ALL 6ROo"es
CPEN FLJl'.lNEL DRl\IN DET~IL
DETAIL 0 --
2." S. &. PI PE S;/AO
Sf:Cil_QN_-C_~E/\NOUT S<:;·UARE C... I. C.LEA1,1QUT FR~lllE. ~ SOU D COVER r-o~ STAINLESS $\Ee L FIF'E t: l=T'e:.~
CLOW f= 3'115 OR tt~UAL
DETAIL F
WELD • - I -~2_ THICK .$.$- tt....ATe (d.YZ." 5Q. Wl1'H "'l-'t' CIA. OPFNING
TION FLOCR DRAIN
DETAIL M
'i" 1e".:;Roove 1N 6A:SE!- SLAB,
Fii.i.~~-~ 'T\\10~
CONC SS S.GM/<IO REOUC.Er-:.
PIPE
~~
CAULKING DETP'.L FOR P!P\NG PE.NErRATIONS
DE.TAIL. G
Figure 3 .18 Containment air seal details of piping penetrations, details "F", "G", "M", and "O".
w
ol=> \0

LES:FND:
Im - TH /OKOL CAULKIN(i
ffi - HOT i.IA/-FS -A~8E5T0.5 /lOf'E CCltJ LtA./IU1 - ..!UTE Oil OAKUM
PLUM8/NG PENETRATIONS -
PrPE Z"~SMAlLE~·/"p_,,_, 'fW1 ·,PIPE t:JJl'i!Ji Z" - :Z" f"'ROJ~ -'( CA/llSON Sr. $LE~Ve".S (.f<:.114'.?, r L.AR"iER. /N P.t4M. T/IAAI f'h
SECTION /I/RU WALLS SECTION THRU t=LOORS
£J£TAIL ~// /VOT OR'AWN ro '-5 CALE
~ ~ lj
1!.o"
!#."
/!~"
~"'
11 I 11 I ·1 1 l '8 II
11 I .L
w
OVT.SIOE or .S/ld.i. 4 "'THICK A~CllO/l fi., ~
TYPICAL /'IPl!Y6 CONNECTION
OE TAIL N-e // NOT DRAW/I/ J'Z> .SCALE
Figure 3 .19 Containment air seal details of piping penetrations, details "E" and "K".
-

Outboard Roller Bearings, Both
Ends 2" Dia. Valve Shafi
29 ~· i 34 '4"----1 lo" Butterfly Valve -125 * A.S.A~
Class 2. Continental Equipment Carp. Type 3101, Automatic T•ip, Manual Reset. Continuous Neoprene Lining On Body Bore And Flange Faces.
3 51
27~"
20"
Robertshaw• 1082 Valve Topworks
3-15 psig Bellows Operator
Air Duct
50* Actuating Weight On 20" Effective Lever Arm
(Closed Position)
Figure 3.20 Air inlet and exhaust duct butterfly valves and operators.
SHEET METAL
DUCT
BLAST PROOF BOX
3'-4'x 2'-o'' x 2'-o'' LG.
II II
6 x 6 BOLTED S GASKETED ACCESS
DOOR
J_" STEEL ft B TYP.
AIR TIGHT SEAL
\WITH ¥8" NEOPRENE GASKET
Y8" HINGED STEEL It WEIGHTED TO MAINTAIN
AGAINST 5150 C.F.M.
I " Y9 S. P.
INCOMING
AIR
FLOW
DIRECTION
Figure 3.21 Elevation drawing of an inlet air duct swing check valve.

'° DJ" ~~~
f.J ~
_:_i
EE B111t»1tc1& a 1 -... , - +-·------·-------- -
EL 11~·-~ _i.
CIO 1---r---,.-
r--------------·-·ct'·o.. ____________ --~J PL,A..t-J
(SouTH W1N• Pl.ll~o ... NS.I. ... ,l. Loe:."")
.-5'TU.L C>CME ~ ")
4
li\..101'-o
R ___ }: E_'::_ ~~-~-~
fl'Oll OQOR. 0£'T"'ILS -, SU Pi'\'.•,,:: {_
11 ,..i
I I i I
I()
0
-~-
y LOF!.BY, FLOOR.
1 . &di , •, : , • Et..J [-'-- _f:.L ~~!-~ o_
' _)
C:OMP .... :: T£:.t> l!>..._C:l<.Flll.
~___.., ....
SE:CT\Ot\) C.-C.
co
-:1 ·.,n~l 40
• 5 t!. l'L ....
rn
.., .... ---··--· - ·--· ·-
~o~ "'----
1.llC:TIO.., .IT.
•s If. l'Z oc.
lw f *!l__~ It. oc.~ CCIMPl\C.TED e. ... C:KrtlL
SE.C.TIOt.J D-D
,, " ]) 't\~\\_ - t
5 W4Tlll'iTOI·
T1<1:.1<.cL LI' lt_,.1,. C:AC'll<1"t' 12 ~I'!.
Tl'PICAL COl.ISTRUCT\014 JOINT tJo·n: •• i:ill co..i<;.TIZIJC..'TIOIJ .1011..\TS '"'
i:i:Rloe.11:.s TO !>L ~"Mil/ITH :ilMIL"''R.. 'tl,._Tli.IZ. STOP~ TMtcl!:.OL <;;F.ALAIJT OM IMSll>I> Olt. PR.ESSUeE 'F'AC:E,
Figure 3.22 South personnel air lock plan and elevation drawings.
. . E
""' e ! " Q 2
ii :i 0 0
~~ " 0 ~~ • Ill
'-'
w
U1 IV

3 53
tlE.IMF. R_ / t>'I" OOMI:. 'll'IHIDOR.
i "a PR.Et1oULDED Jo1>JT \ F1LL£R. AiT roP, 'ilD&.S 4 &OT.
1'!. PQEMOUlOEb I F1LL£1i. "'T Top ~ .._T ~IDE'io
b==~~~!=:t=:f ---1-
\..IEA.D J A.Me (s1111LAA.)
E
DETA.\l ··,;_
. .. c
~I --!
7'1 ·.-1
I
51LL
I I
\ ,.--GRIN., li.DG.l.'i,;.· ; I
1:\. -~~-' ,._ _1 l.
o. -' ....
fAA"'\ING, I>"'( l>oM.:
.Su~c::o>ltRA.C. ToK...
SE C:.TI 0"1 E- E.
IA'FL/ITABLE /YEIJ,PREIVE -CQ/V'?)h'E //It RU86£/t
ZJ1t: M.3.Z~4
. " J)E TAIL c
Figure 3.23 South personnel air lock door and door frame details.

~
~~~~;------'~=--".'.'."~~- f~ -------------------
I
~ ~:~ I
I I I t ---- - -------------------------r-- -- - -
-----~--------------
-1c.r9' S.VO•'I"
~~
I I lo
~ -r -'
""-~"-4i I I I I I I I I L--
IWT ... 101t, .. 1•14•o'""z.<>Ntf
~------'-"_&~-~~w' ____ _
u•r:i-at";."""
I~ ~
~
ru A..C.D. - ............. 'l'lC CIO"T- H .....
"'·L··- ooo• Lou,..11,
Z.H.C, - z.oNt ll111t1,.. C:OK.
f'. ,.._ - '•••·H ,.._,Ill. -- --.-............ 'llllC.TWOll.M.
----- ., .. t\,.,u.,, _,..__ - ""Ill "tt.frlllH•l..(9'( Utlill"'t'fl
'Bouh.lb"ll'I' OF CoJ.1TA'11to11!b llolu"lr
01' .. \lll'JILN,ii
~
r-\fl.l;r--1.!!.~.!!-----LBJ --------------------------------------
Figure 3. 24 Air conditioning and exhaust flow diagram for the HFBR building.
w
U1 ,.,.

Pirfobll Hood for Working
on D20 Eaulpm1nt
!,~·~~~~, 10,300 CFM
Slide Votv1
(300CFM)j ~ ~ ~'
2"EV1!8
2''EV119
Noli-Air Quantities Shown In Porenthetlt Are lntermifont Mo1imum1.
OD1ratlon1 LIVll
Bolcony l1v1I
Equipment level
TE~~·~u~~·- I ·~r-.v ¥• ... , I 2,840 CFM
r~::~:~r.
Tot11t R'ms E11;hou1t
1,330 CFM
Tr~~nv:~f,
FA-305 E11;hou1t
(300CFM)
V1ntllotlon 8 Shofl Wayt
v1ntllation= 5,060 CFM
Ventllotlon & Short wo,1
8 ,.~
~ " ~ :; .. :li .. ·~
1-112'' OV 101-109 SP. A3tc
New Rodioactlll't Vint Line from 010 Proc111 Room on Operotlont Floor to Eaulpm1nt Room E1hou1t Duct
;-c-·-...... - 1. I y '~ L1nH{ 1 1 s"ev101SPA3tc
l1•oocrMJ J SP. S2Z
SP. A3tc
I· l/2"EVI07 SP.A3K
1 ;;,v ... .-m--,-rr----r- II~ I I 1 (9,850CFMJ I ~~ I
co~ from
onCL'~~!:.'n1 :Y T ----J Floor
2"co1os
From Floor Drains) on Op1rollon1 Floor
211 CDl04 SPA3K
Venturi to Maintain AP) Betw11n Off Gn S stem a Shielded Space E11~ou1t
In Normol Op1ration 4"EV Ill S2Z (350 CFM
Portable Hood tor Worklno
on 020 Equipment I A2
Figure 3.25 Gas exhaust system flow diagram.
'"•""" l' m I To Srocll
Btowersl2J GB-303 A a B
w
lJI lJI

10 Reinf.
l" Steel 8
An ~
Bulkhead Access
30 11 Dia. Sch. 10
Pipe To Stock
Column
G
" 30 Dia.
Seal Weld
\GB- 302
\_ Conn. To 2"EVI08
l{\I\
o~
Di o. Due I /
6
KA-102
w
VI 0\
Containment Wall Shown
Shaded
To Filler Room
Figure 3.26 Arrangement of the building filters and filter room on the equipment level.

ByOlhlrs -:l -:l
COz BotllH 8 Manifold
By Others -J: -l: "-I
He Bo!tlH a Manifold
By others -1 -1
te,.e:i.:i~~I~
C02 8 Ha S"fP'y Flow • SpecifieotiOll T3K 8 B3K
Unlen Nalld
To-Ga1En9ine
Ga1cac11
Specificotion H2A Unl111 Noted
~r.~:i~.,
ToVerticol Thimble Pl91 #5
ToFA-202
~u g=!
~:h ~ti ••
"oo~3Ji i!!ii5CO::c ,---
~Supply Ument
Return Ta 2"C313 O.SllL.Header I
BUILOING STEAM SUPPLY FLOW
Specification H2AUnl111Nated
Figure 3.27
~ ~ ...... "F"Oraifll
AIR COMPRESSOR SYSTEM Sp1cifitation H2A Unless Noted
i~;.a,o1in9 I 24"WR301 l I l #18
CWR302
> GC-301 e Air Conditianin9
~ System I .#18 DW302 o., 04653-18
.-I= ~ l--1~1-----...J 2"wR31'1-...
B"Wff303
COOLING TOWER WATER FLOW SP11c1ficahan H2A Unl111MD11d
Flow diagrams for various building utilities.
3K'Oraln
~ 8 .•
"o"oroin1
. .,,
~ CWA-Ch1Ued Waler Return
OD-Hot Drains OF-warm Drains
WS-CooLintW11terSupply
WR- Coolln9 WOter Return # :If: SM-Saturated SteamlMedium Prt-11ur1190 8 SO SL- Saturated Steam I Law Prn1ure11s•
C-Cal'densat.
FG-F1.11IGCl1
IA-ln1tru1n1ntAir
EX- Ellhou1t Ta Atmo1pll1r1 wc-wat1rCoolln9
WD-WoterOrain
WW-W.11 Waler
OW- Dom11tic Wat1r
UDW-U11d Da1f111!1c WOter
PIPE SPECIFICATION
AU.-l50#RF. Corban stffl H2A-125#Stondord·Stnl PiPll A3K-150#R.F.30'1 S.SIL
REFERENCE DRAWINGS
#2-~r~h1!t~~~n8,.~;~, ~;1_e3:2s #S- Refers Ta PipinQ 8 lnslrumenl Flaw
Diagram; 0.9. E"6!i3-5, Fi9. 5.1
I""'."'.-:::'.' CJ 1 ............ '*"
w
U1 -..J
NOTE• For lnstrummt ldenhficatlaft - SH Lepndonl>llg.E-.. 653·!1 0
FIQ. 5.1

· · m~~:~~~'1:1::t ~:~~~~:.~~~:::1~~:f£~~ ~::: ....
Fo•f<otH•hfo•onooO<ewlo90,IHlltoo••tEOH3·'1A
t!.61). ,V,;fiil',:::·· ''00 ',.,. .!. To 1~ ••v s. ........ ..
---'1~~~~~t~t~7::::~-1
"'""} 7'(HI H'lll,UH• 7'0-•C
---- _L~l~·~ .. !.!~-!!!!_1!2__ ----1 I 1 ____ --=::-::::0 I I
!£ ' ~ ; i ; ~ ~ ... ~ ~ ,. .::~
~~ i i :=~ I:
~'rcU~~~~;:.::•-•soo•v• l'e. [~J ~::·::::.:·~.o..c .. ,. ...
r:~
~
-------~Fonlr.11
_2~!!.!'.·~·:!.!!!..•~·~----- ~~~~>-::.::7:::0~ .. *®~> ~;;~;;;.:~=.~~~=·
® ~ .... ~ ........ -·--· B-···-"'· 0-'"""
.. _"'"'' ~ ~~TE.~:.~::~~,,~ .. :~. IZJ ~:!ii%:!.i-:::l:".!::::::·1·:\~ a, ·~ ............ ·-·· '""""' D ..., .. ,_ st- ~:.::~ ~~:';.~:: -'-' lod.cotoo
~~~>-Ei''J!2::'=..~-U. °::~~,,.
HI- ,. .. "' .. '"""'"" .... ~ S.olctiwu•IOt•<•h•I l•tl'I•
@I
E!l 0
........ 1 .. •0..0<0-°'*"'"' D 5 ~J: ~";:Si:?=~~1~ Ill l:.:.1:i,;:-~"- ·-··"• i l ..... ,, ........ n.""'"' ... ''"
-<~>-=:: •• a.:~ ~= .. ::.i·,=.:=:..i:: .... © ~--· G> ~ ..... . '\' ............ . i;J. :::;.~r.::-- ...... ~ [I} ~=-:f.. ';:.~.!:'.~':" .. ::;:-·••! C.010<1
8-·~·-.. 8·---·· e~ ...... .. •.-""~"""~.ooo.•o.•
•-•"•••~·-·""-8···-•"Moo-® - ~··· ....... ··- ~ .. 0-1., ... s,.,,..,.,, .... ..,u.o,.
e e-.z:;;..~p-... ':;~-@ .......... .
~ iiij~~i}E~-r::: q, m:::::.=~·g.~~=:::. ':.'.'~
~ -··-.. ··~···-~0.-0ff-S"'"'".'"'"''"'L'fN ~ ==.:::~'!.":;'~~:.:::::.:: 00 Oll-/M-IO<S.O• ..
lll~ ... "*<·l•P ...... loo_.,, El ..... ~~ - ... ,_, .. w
__ _.!~ ... ~~·~£..£.. _____ - ----;;;:;,,----------~------,
IOOAf.~&T, ooo!.-~., I l11
• u " u =" ~ ~ l ~ I I 1 j1 s !il
I .. r i: l, iS li j
l< J; u 3~ .::2
I If CJ4i: Jjij l)il! l 00
' -~-J 01 G ~l
i I I! I
I ,, .. H
r----------------
--,ffffCf ........ :~m=-! n!;'t'iJo
"' "'"'"'' v., ....... ., ~; ••• [~j [~"J t'J "''""'JV.oo•Llthli•t
Ooo1ot1n1Lo .. 1
At""-'40 t·J [~·~ r~-1 l':J
f00<0u<1Y_,a<Lolh1'n1 Bo•o••1L .. OI
~~p i;---;i, ~-:-J l"J
1
I x• ~rn i l I I ~ .. }
l l
! ! ~ ~ l l l l
··-· ''- I i l ... ! !!-; ~ ' I h ~ ; A • ! iL ' I Jq~ l '- J j l ~''! J l 11. '~ • h l 0
' ' ' ' ' • ' • • : I 1· I 0 -I !• l~ 'l I ! ! ' ! ! • • l I I ;i ii . !o g-~ 8"2 I~ /1 Ill l I. ~ ! l ! & ;:J 3J
Figure 3.28 Electrical power distribution system diagram for the HFBR building.

By Othrl -! -!
C~ Bol!IH a Manifold
By Olfttn-=±---=±-
~·J:rii~~
.,13 Vtrlical Thimble Pig1
Ta FA·202
LOW PRESSURE SYSTEM
112:.... ToHC1·IOlc
-:;)-f*.foReactor lnd.Pur91
#~DC-101
HIGH PRESSURE SYSTEM
C01&Ht SuPp!y Flow Spleificalion T31< a 831<
Unl111 Ndld
To-Ga1Engin1
Ga1Cotll
Sp1cifica11on H2A Unt111 Noted
mr.~::..,
Return To O.S.B.L.HIGdlf
2"C3t3
BUILDING STEAM SUPPLY FLOW
Sptcificolion H2AUnl11SNated
Oz Supply 0, Um1nt
GA-305 A 6 B Vacuum Cond.
Pump• 8R1c1iv1r
Figure 3.27
AIR COMPRESSOR SYSfEM Specification H2AUnJeuNoted
'I I~ .• :-:'.:: __ ...,..,_ "'
To Cooling M"WR30r r ....
.. ur""'' •F"Droln1
.:O"Droin•
~ ..
ii 1#18
CWA302
:ii- GC·30I ~ Air Conditioning :r! Sy1t1m I .#I& OW302
Owg 04653·18
~i= .. 1---1~11-----__J 2"WR314..,.
e"wR303
COOLING TOWER WATER FLOW S~ificotion HZA Unln1 N!Od
~
Flow diagrams for various building utilities.
~ CWR-Ch1U1d Wl#tr R1turn
DD-Kot Drain• OF-warm Droln1
WS- Cooling W011r SupPly
WR-Cooling Wallf R1turn • # SM-Saturated Sltom(Mldium Pre1111rel90 a 50
SL- Soturottd SltomlLow PrH1urtl15•
C-Cond1n1at1
FG-FuelGo• IA-ln1trum1ntAir
EX- Ed1Q1,11! To Afmasphlrt WC-Water Cooling
WD-WotlrDroin
WW-Well Wot1r
OW-Oont11tie wat1r
UOW-UMd Oont11llt WOt1r
PIPE SPECIFICATION
A2A-150# RF. Carbon St1el H2A-125#Stondord·St11I Pipt A3K- 150# R.F 304 S.SU.
REFERENCE DRAWINGS
•2-~::!r;h!:1~'8:;.'W4~;~. ~:1.'~u #5- R1fen To Piping & lnlirumtnl Flh'
Diagram; Owg. £4653-5, Fig. 5.t
( "'.,'.".~' I Cl , ...... _'f#l5
w
lJ1 -..J
NOTE• For ln1trum1nt ld1nlif1collon - S.1L191ndonD-o.E-46'3-5,
F/9.5.1

.. q
i ~
r;::::===========::Jm
3 58
r----, I II! I I ~ -J::~~~
: I I I : !!H~+,,._.{") I I
I I I
~I :1 <I ii ~ ·1 I I
l-l8Flh:r.=o;<l.:. '::".:~-..~olo
I 1-©"'~=•m~ ~~!~-~oiu I lu·· L----'ill
Jsj s:: 0
·ri .µ ::s .a
·.-t M .µ Ill
·ri 'O
M QI ) 0 lli
....i Al tJ
·ri M .µ u QI
....i r.:I

O.C. Powr 12!1.-250V D. C. From O.C.Pantl In Fon Bld'9(#704l SH
~ r---------------- ----
°""· E ·14&~-'3A
:II 225AF / IZ!l-250V 0 c 3 Wl11 ) 17!1AT UnQround•d Neutral I I 2P
I I I
l!IA 'l 100A 2P l ZP
Sport
L ____ _
),~ ... ~' IOOA 2P
)IOOA 2P l oo•
2P
..,
')'~" )~" 150• 2P
l!IKVA 440-120/240V
11,60 ...
I I I
r:~r~.,:.1,zw~~~.;,1.:0 ... IP Brtoker•
!;I~ ~ ~
21 ~ ~ ~
"-v-J ~ To 2.4 KV Sw'gr To 480Y Sw'ar ZSOVD.C.Powir 250VD.C.Pow1r fot'C.8.Clo•int farC.B.Clo1lng
~
~ ~
I I L ______ _
~ .._ NOTE 1 _.,,
i 1-..--i; ~.~:_.~M'°'--i 11 : L_J L-...1
To2.4KV llC. Swtr.Tld lnllr11m1r1t
Po111r Pan11 250Volt 125/250VOll
J~..,,~~o" 120-Z40V
IEquip.Lev1IJ
Auto Tran1f9r Swi~tt_~-3P
SB·IS.l1ctor Switch Po1.l"A.Pump Automatlc·B SIG11dby Pt:llZ"EfPump Automolic•AStandbJ
Normal Power Supply
Reactor ~~1ii:u6811':~'~~0Vo111 S.1k:hr,:ir~~~I see0w,.E~53llA
_,..-::!11M1f99nc:y M.CC HFBR Bl'cf9.7!101Equlp.FI-) - ------------------...,
~ ti:
Inst.Cob fl' J:,~, ~ Room
3 ~I
,40• 3P
')~A
~I
1~KVA440- -1201208V ll20f208V :se,60-'t-: ..,3•,60-""\.- ,
~I ~1 m m 0 0
440V A.C 3 I But
~
I I I I I
l~: I I I
__J
ff~~ Sol9noid
I I 1J.\17S0-1Qa
a750-•o·~ : 1>i +~~);
Locot•don
"ri:'"" /-25
'--/ GB·3CllA
lnltr. Air
'''''" GB-303A
Bf'd"~~~··
L_J 1!1~rg .
AC PowttPontl
o~-303 '"~~:!'"' ~~.tt::'t'f,. I ... '°' Coohnt Wal9r 1201208V:AC ODft LIVll E•holi1t B~•r Shut-Down 12oi20Rv !Fuel Holldlmtl
Pump
ff~>1 IQ:~r.&i
PUtierPanel#I
E~~~:V.1 ~':I:~geOJ!111
112
IB-311 Em•'OlllCJ Gen•rQlor
Room
"'
TbEqu1pmentL•v•I M.C.C. fot GB-303 B BuildinQ E•hollst mo-
Figure 3.29 Emergency electrical power distribution system diagram.
EQUIPMENT •
f.i..1 TtantlonMr at Per Dtterlptian L"'fJ KVA Ralina al lndt~ld
-r"- Air Circuit Breaklr.3 Pall
---- CambinoUan Circuit BNalllr e. MOQMllc --..---- Start.r.Acrou lhl LiM TrPI
Macln1tic Slorhlr O.C.Without Sharl Circuit -S- Pro11ction,Wit11 Two _Acc111ratifll Point•
(SIC1rt,RunJ and Tim1n; R11ar
GMQrorO.tigncstiC1nSH.P.atlndicatH
I Hclnd-Off-AlltoSwitch
a On-Oft Di1C011n1ct Switch With PllCll Light
a Starl-SICIP Puttlbutton Mam1ntar, CCllllOl:t r,,.
a,.. Storl-Stap Pulhbuttan MC1intC1inld COntact Tp
B Start·StClp Pu1llbullcin Maintoin1d Contact M Type With P1lal Li;ht
I Start-Stop PuthbullC1n-Mam1nlarr CC1nt11111Ct T,pe With PilCll Ll9ht1
w
U1 ID

4 - 1
SECTION 4. REACTOR CORE
4.1 SUMMARY DESCRIPTION
The HFBR core is formed of 28 type KD fuel elements in a close-packed array, immersed in D20. The fuel material is fully-enriched uranium, alloyed in aluminum and clad with aluminum in curved plates. The active height of the core is 20.75 inches, and the equivalent cylinder diameter is 18.82 inches. Total core volume is 94.60 liters (3.34 ft3), including 6.3 liters of irradiation volume in the center of the core. The total U-235 loading is 7.67 kgm. The design power of the core is 40 MW. The direction of coolant flow is downward through the fuel elements. The average temperature and pressure of the bulk water in the core are 127°F and 185 psig, respectively.
There are 16 control rod blades, separated into main and auxiliary groups. There are 8 main and 8 auxiliary rods. The rods operate in the side reflector, just outside the core. The blades are angle-shaped in cross-section, and are made of Eu2o3 and oy2o3 in stainless steel, all clad with stainless steel.
The fuel elements are supported by a grid plate which is mounted on a support saddle on the bottom of the reactor vessel. The upper ends of the fuel elements are retained by a close-fitting horizontal member which is called the transition plate. The transition plate is attached to a cylindrical shroud which, in turn, is supported by a flange in the neck of the reactor vessel. Figures 4.1, 4.2, and 4.3 show the type KD fuel element, an elevation of the core structure, and a horizontal section of the core and control elements, respectively. Figure 4.14 shows the mounting of the internal structures in the reactor vessel. Figure 4.4 shows the positions of the control rod blades around the core at shutdowns and during operation.
4.2 FUEL ELEMENTS
4.2.l DIMENSIONS AND GEOMETRY. The type KD fuel element is shown in the general sketch, Figure 4.1 and in the drawings 4.5 and 4.6. The element has a total length of 57.25 inches. The fueled region of the element is 20.75 inches in length, starting at a point 18.625 in. from the lower end of the element and running to a point 17.875 in. from the upper end of the element. The fuel region is centered on the horizontal midplane of the spherical section of the reactor vessel. The fueled section consists of 17 standard fuel plates of .050 in. thickness, 2 outer fuel plates of .140 in. thickness, and 2 side plates of .187 in. thickness. The fuel alloy cores of the standard plates are .020 in. thick, leaving .015 in. of aluminum cladding material on either side of the fuel alloy. The fuel alloy in the outer plates is .010 inches thick, or may be of greater thickness in a lower uranium content alloy. This choice is left to the discretion of the fuel fabricator. The minimum cladding thickness for the outer plates is .050 inches. The standard fuel plates have a total length of 21.75 in., which is the sum of the fueled length of 20.75 in. and two .50 in. picture frames at the ends of the plate. The outer fuel plates are 23 inches in length, extending above the standard plates by 1.25 inches. The upward extensions of the outer plates, which contain no fuel alloy, are welded to a transition casting which connects the box section of the element in the fuel region to the oval inlet tube of the element. The tops of the side plates terminate at the same elevation as the tops of the outer fuel plates and are similarly welded into the transition casting.
The inlet tube section of the element is 12.375 inches in length, ending

4 - 2
at the upper end in a rectangular box section of 1 inch length. The box sections of the elements in the core form a tight fitting array within the outline of the opening in the transition plate, and form a tube sheet which directs the coolant flow down through the inlet tubes of the elements and through the fueled regions. The triangular ears above the box section at the top of the element are the handles by means of which handling tools are attached to individual fuel elements.
At the bottom of the element a rectangular section 3.5 inches in length is machined to fit within the cells in the grid plate. The side plates extend down from the fueled region to form 2 sides of this box section. The other 2 sides are formed by the lower members of "Z-braces" which reinforce the side plates below the fueled region.
The cross-section of the fuel element throughout its length lies within a rectangular unit cell of dimensions 3.220 inches by 2.880 inches. In the fuel region, the clearance of the side plates from the unit cell boundaries is .030 inches. Thus, in the assembled core there is a nominal clearance between side plates of .060 inches. The outer fuel plates also lie within the unit cell boundaries, by .015 inches for the convex plate (No. 1) and by .020 inches at closest approach for the concave plate (No. 19). Each of the fuel plates is bent to a radius of 6.000 inches on the concave side.
The water channel thickness is .102 inches on centerline for the central channels of the element. The 3 water channels at each end of the element have progressively greater thicknesses, of .108 inches, .116 inches, and .129 inches for the outermost water channels.
4.2.2 MATERIALS. The fuel alloy is a uranium-aluminum alloy containing 30 wt % U, 3 wt% Si, and 67 wt % Al. The uranium is enriched to a minimum of 95% U-235. The aluminum melting stock is alloy 1100 (ASTM Specification B-209-58T, alloy 990A). Maximum boron content in the melting stock is 10 ppm. The silicon addition promotes formation of the compound UA13 rather than the usual uranium-aluminum compound, UA14 . This change in the compound formation is desirable to leave as much aluminum as possible for the matrix which surrounds grains of UA1 3 in the fuel alloy, and to produce a more uniform alloy. The fuel alloy density is 3.566 gm/cm3. The U-235 content of the fuel element is 274: 4 gm. The U-235 content of the standard plates is 15.2: 0.3 gm and the U-235 content of the outer plates is 7.6 ± 0.2 gm. The total weight of the element is 12.5 lbs.
The picture frame, the fuel plate cladding, and the side plates of the element are all of aluminum alloy 6061 (ASTM Specification B-209-58T, alloy GS llA), with a maximum boron content of 10 ppm. The spacing comb at the top of the fuel plates is also of this material. The pins which hold the comb and the Z-brace sections are alloy 6061 (ASTM Specification B-211-58T, alloy GS llA). The inlet tube section is alloy 6061 (ASTM Specification B-235-58T, alloy GS llA), with maximum boron content 10 ppm. The inlet box and transition castings are of alloy 356-T7 (ASTM Specification B-179-58, alloy GS 70A). Welding rod material is aluminum rod to ASTM Specification B-285-57T, AWS-ASTM Classification ER4043.
4.2.3 FABRICATION METHODS. Fuel alloy billets are formed by melting the core materials, uranium, silicon, and aluminum together in a crucible. The alloy billets are rolled to a rectangular shape and individual cores for fuel plates are cut from the rolled billet. The cladding material is metallurgically bonded to the fuel alloy and picture frame by hot rolling in a series of passes to produce a plate of slightly thicker section than the finished product. After

4 - 3
the hot rolling each plate is heated to a minimum of 1000°F and held at that temperature for one hour to develop blisters in any unbonded areas. After the blister test, which also anneals the fuel plate, the final reduction to nominal plate thickness is accomplished by cold-rolling. The final reduction by coldrolling is not less than 15% nor greater than 25% of the final thickness. The final cold-rolling insures a reasonable amount of work hardening in the plate material. curvature of the fuel plates is accomplished by pressing against a curved die.
Grooves are milled into the side plates to take each of the fuel plates. Individual fuel plates are joined to the side plates to form a complete element by the roll-swaging process. Each fuel plate in turn is mechan-ically fastened to the side plate by deforming the edge of the groove into the surface of the fuel plate with a swaging wheel. The element specification requires that the swaging process develop a mechanical strength of 150 lbs per linear inch of swaging.
The transition castings are joined to the upper end of the fuel box structure by a series of 8 plug welds around the 4 sides of the box. The inlet tube section is welded to the transition casting and, at the upper end, to the inlet box casting. Welding is done with the inert gas, shielded arc process. The Z-braces are welded to the lower parts of the side plates to form the lower box. Final machining is done on the grid plate box end and on the inlet box end after assembly of the element and completion of welding.
Segregation and variation of uranium in the alloy is monitored by radiographing the unclad fuel cores. Those which show any variation in uranium density detectable by eye on the radiographs are rejected. The U-235 content of each plate is determined by a counting technique in which a single channel gamma spectrometer scans the entire fuel core prior to bonding, responding to the natural radioactivity of the fuel alloy. Each fuel plate is identified with serial numbers which establish the alloy heat or melt from which it was made. Assembled elements are identified by numbers cut into the side plates. Each plate is fluoroscoped prior to final shearing to establish the outline of the core material. The allowable increase of thickness of the uranium-aluminum alloy core at the ends of the plate (dog-boning) is limited to .002 in. maximum in the standard P.lates and to .001 in. maximum in the thick outer plates.
4.2.4 INSPECTION AND TESTING. The inspection of an element starts with an analysis of each batch of uranium metal resulting from the conversion of UF6 by a qualified independent laboratory to determine uranium isotopic content and chemical impurities. Each batch of uranium thus converted and analyzed must be approved prior to use of the material in the fabrication of HFBR fuel elements.
At the fabricator's plant, samples are taken from the top and bottom of each fuel alloy melt, properly identified, and held for future analysis. Each individual fuel plate is identified as to the total quantity of U-235, the weight of the fuel alloy core which went into the plate, the serial number of the alloy melt from which the core was fabricated, and the U-235 enrichment fraction for the melt. For each element a tally is kept of the individual plates which go into it, and the total quantity of U-235 in the assembly.
Each rolled fuel ingot is radiographed prior to shearing of the cores. Any visible sign of segregation or variation in uranium density" in the core radiograph is grounds for rejection of that core. After each fuel plate is roll-bonded by hot rolling, it is blister tested by being held at a minimum temperature of l000°F for a minimum period of one hour. The appearance of any

4 - 4
blisters or laminations after this heating are cause for rejection of the plate.
Each plate is fluoroscoped to establish the outline of the fuel alloy material for final shearing. The sheared fuel plates are then radiographed, and the radiographs are inspected for segregation and for fuel core outline.
All fuel plates which are to be assembled into finished elements are inspected for bonding by a recorded ultrasonic test. Unbonded areas of 1/16 inch diameter or larger are cause for rejection of a plate. Each fuel plate is gamma-scanned to determine uranium distribution. Since the gamma scan is sensitive to variations in uranium content from one area of the plate to another, a further opportunity is provided by this test for the rejection of plates with excessive variation in uranium content along the plate length.
The efficiency of the roll swaging assembly technique is tested by determining the force which is necessary to fail test sections. Minimum joint strengths of 150 lbs per linear inch of roll swaged joint are required. The assembly of elements in the production run is done in the same manner and by the same operations used in the fabrication of satisfactory pull test specimens.
After assembly of the element, the water channel spacing is measured along the element centerline in each water channel of each element. These measurements, together with the other dimensional measurements are submitted as part of the inspection data on each fuel element. Certified copies of all reports establishing and identifying all materials used in the fabrication of a fuel assembly are also required.
After fuel elements are received at BNL, they are given a dimensional check and selected elements are hydraulically tested. The hydraulic test consists of placing the element in a test cell in a hydraulic loop and pumping water through it at a velocity of 49 ft/sec. This corresponds to 1.4 times the nominal water velocity in the reactor core, and results in a pressure drop across the element which is twice the normal drop. The hydraulic test establishes the over-all strength of the element assembly to withstand reactor operating conditions. It is intended that the first fuel elements received will all be tested in the hydraulic loop at BNL. If it is found that all elements being tested are satisfactory, the complete testing will be discontinued and about 1 element in 5 will be tested.
4.2.5 PAST EXPERIENCE WITH SIMILAR ELEMENTS. The enriched uranium fueled, plate-type element, with aluminum as a structural and cladding material has a long and trouble-free history in research and test reactor technology. All of the variations in the basic plate-type element derive from the MTR design and development work done about 1950. The MTR itself commenced operation in 1952. Since that time a variety of reactors using the same general type of element have been built and operated in this country and abroad. The basic plate-type fuel element, operating at coolant conditions and power densities not greatly different from those of the HFBR, has by this time many hundreds of megawatt years of successful operating experience behind it.
The table below, 4.2-1, shows the similarity in essential characteristics of a group of high power density, water-cooled test and research reactors.
4.2.6 RESEARCH AND DEVELOPMENT ON HFBR ELEMENT. The development effort on the HFBR fuel element has been directed to those areas in which there are differences between the standard plate-type element as used in MTR, ORR, ETR, etc., and the HFBR. These differences are in the fuel alloy, where the HFBR uranium content is somewhat higher than in other plate-type elements, in the

Table 4.2-1 Fuel Element Operating Conditions in High Power Density Research and Test Reactors
Reactor ORR GETR MTR ETR HFBR
Core Inlet Water Temp., °F 120 120 115 120 120
Water Velocity in Fuel Element Channels, ft/sec 30 22 33 35 35
Core Pressure Drop, psi 25 25 40 45 nominal 31 55 max.
Nominal Water Channel .104 .110 .116 4 at .119 2 at .129 Thickness, in. 2 at .115 2 at .116
12 at .105 2 at .108 12 at .102
Fuel Plate Thickness, in. .050 inside • 050 .050 inside .050 .050 inside • 065 outside • 065 outside .140 outside
,,,. Fuel Meat Thickness, in. • 020 .015 .020 .020 .020 inside
.010 outside VI
Weight % U in Fuel Alloy 18 28 18 22 30
Width of Fuel Plates Between 2.512 2.625 2.622 2.624 2.446 Side Plates, in.
Curved or Straight Plates Curved Straight Curved Straight curved
Radius of Curvature, in. 5 - - 5.5 - - 6
Maximum Heat Flux, 2
7.5xl05 7xl05 9x10⁵ l.35x106 l.60xl0~ first core Btu/hr-ft l.48xl0 equilibrium
Hot Spot Surface Temperature, OF 240 320 312 400 359 first core 344 equilibrium
Average U-235 Burn-up, % 35-40 35 20-25 17 20.4
Maximum U-235 Burn-up, % 70 55 - - - - 42.5
Reference 4.1 4.2 4.3 4.3

4 - 6
use of thick outer fuel plates in the element assembly to resist core pressure drop forces, and in the top and bottom structures which support the element and guide the water flow into the cooling channels.
The HFBR fuel element meat alloy contains 30 wt % uranium and the burn-up is 20.4% average and 42.5% peak. At the end of the element life, fission product concentrations in the meat alloy amount to 6.12 wt% average and 12.75 wt % peak. Higher burn-up, if attainable, would reduce the operating cost of the reactor by increasing the element life.
The existing data on uranium-aluminum fuel alloy burn-up are mainly in the 18-22 wt% uranium range. Normal ETR-MTR operating cycles give 20-30% burn-up of the 18-22 wt% alloy (4.3), corresponding to 4-5 wt% fission products at the end of element life. Individual fuel elements of the MTR alloy (18 wt % uranium) have been irradiated to about 75% burn-up, corresponding to 13.5 wt% fission products, without difficulty (4.4). The ORR fuel elements, again at 18 wt % uranium, are normally carried to 35-400~ average burn-up and 700~ peak burn-up (4.1). The fission product concentrations corresponding to these burn-ups are 6.3-7.2 wt% average and 12.6 wt% peak. The existing data thus appear to cover the HFBR burn-up range. The 30 wt% uranium HFBR meat alloy, however, has less aluminum in the matrix surrounding the fuel grains than the 18 wt% alloy, and it was felt that some irradiation data at the higher uranium content were necessary to assure satisfactory element performance. The irradiation program which has been carried out has also included meat alloys of higher uranium content than 30 wt % to provide data for possible future increases in the HFBR uranium loading.
A series of nine fuel element irradiations have been performed in the ETR and MTR. In all cases the experimental fuel elements were made identical to standard ETR and MTR fuel elements in external dimensions and in total uranium loading. These features permitted the experimental elements to be used as part of the normal element loadings in the ETR and MTR. The meat alloys, internal geometry, and burn-up of the experimental elements were in the range desired for the HFBR. Test element parameters are given in Table 4.2-2. The "peened lug" construction referred to in the table is done in the following manner. After each fuel plate is rolled, it is trimmed so that "ears" 1/2 in. wide and extending about .070 in. from the side of the plate are left along the plate sides. The fuel plate is assembled to the side plates of an element by passing the ears through slots in the side plate and hand peening the ears. All plates of all elements were blister-annealed and ultrasonically tested for voids and non-bonding prior to assembly of the elements.
Results of the irradiation program are given in Table 4.2-3. Element #4 was damaged in handling early in the irradiation sequence and discharged to the reprocessing plant. The elements #1 through #7 were irradiated in the ETR to burn-ups as high as 52.6% of the U-235. Elements #8 and 9 were irradiated in the MTR, where reactivity considerations prevented the irradiation from going beyond 27-28% burn-up of U-235. Eleme.nts #1, 2, 3, 5, 6, 8, and 9 were scheduled for hot cell examination. All of the elements except #5 have been thus examined and the general results given in Table 4.2-3. Element #5 is scheduled for hot cell examination late in 1964, and results are not available at this writing. However, element #5 was probed while in the ETR canal, to determine whether water channel distortion had occurred. As noted in the table, the channels probed showed only minor (-.010 in.) deviations from nominal. Element #7 was similarly probed in the canal at the ETR.
It is apparent from Table 4.2-3 that the 6061-clad elements assembled by the roll swaging technique suffered much less distortion than the 8001-clad

Table 4.2-2 Fuel Element Parameters, HFBR Test Program
Element Type
No.
---- ----·-
1 ETR-J( 2 )
2 ETR-J
3 ETR-J
4 ETR-J
5 ETR-J
6 ETR-D (3 )
7 ETR-D
8 MTR-K(4 )
9 MTR-K
Notes:
No. of Total U-235 U-235 per Meat Alloy Total Plate Meat
Plates Loading Plate Thickness Thickness Alloy (l)
(gm) (gm) (in.) (in.) (w% U)
-------
19 400±4 21. 25 max. 0.016 0.050 30.07
19 400±4 21. 25 max. 0.013 0.050 33.4
19 400±4 21.25 max. O.Oll o. 050 37.3
19 400±4 21. 25 max. o. 013 0.050 34.7-38.l
19 400±4 21. 25 max. 0.013 0.050 34.7-38.1
15 inside 400+4 25.25 max. 0.014 0.054 34.7-38.1 2 outside 12.62 max. 0.007 0.175
15 inside 400±4 25.25 max. 0.014 0.054 34.7-38.l 2 outside 12.62 max. 0.007 0.175
15 inside 200±4 12.5±.25 0.012 0.056 35.9-36.4 2 outside 6.25±.20 0.006 0.186
15 inside 200±4 12.5±.25 0.012 0.056 35.9-36.4 2 outside 6.25±.20 0.006 0.186
(1) All meat alloys contained 3 W"/o silicon. Uranium was fully enriched_.
(2) The reactor (ETR or MTR) in which the irradiation took place is indicated by the "type" designation. The type· J element has all fuel plates of the same thickness and loading and the fuel plates are straight.
(3) Type D fuel elements have thick outside fuel plates with half the loading of the inside plates. All plates are straight.
(4) Type K fuel elements have thick outside fuel plates with half the loading of the inside plates. The plates are curved to an inside radius of 5.5 in.
Cladding Assembly
Alloy Method
8001 Al peened lug
8001 Al peened lug
8001 Al peened lug
6061 Al roll swage
6061 Al roll swage
6061 Al roll swage .!'>
I
6061 Al roll swage -.J
6061 Al roll swage
6061 Al roll swage
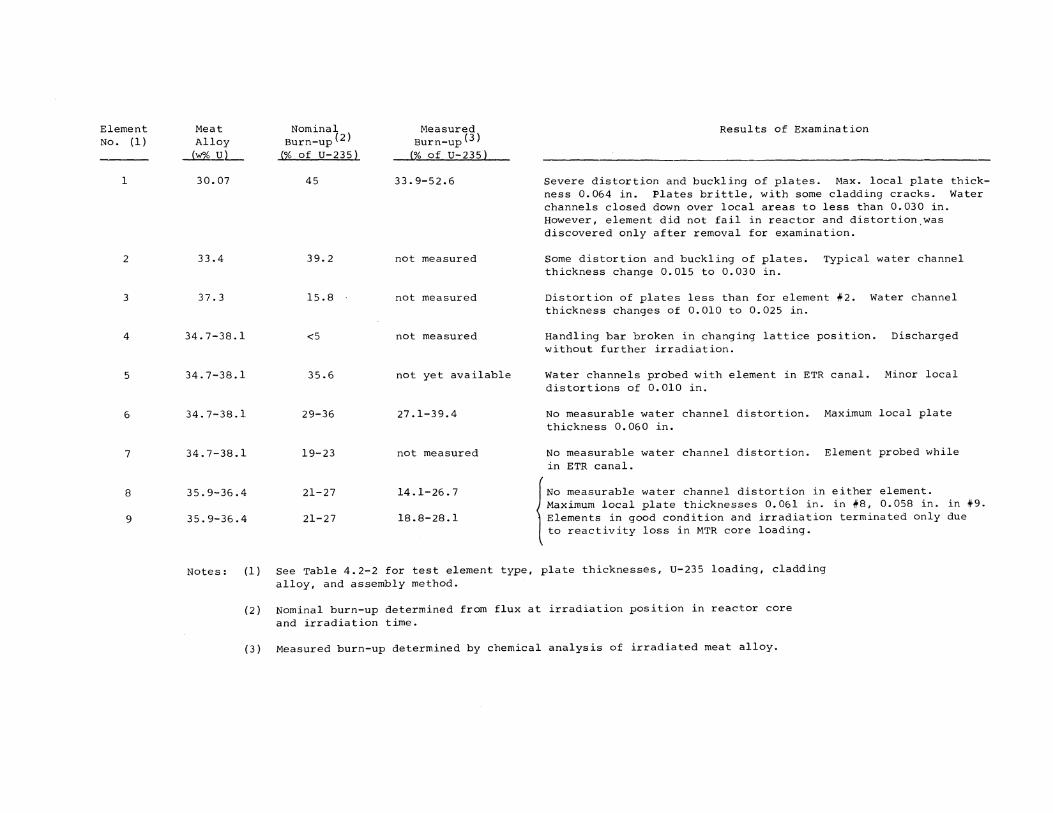
Element No. (1)
1
2
3
4
5
6
7
8
9
Meat Alloy
(w",f, Ul._
30.07
33.4
37.3
34.7-38.l
34.7-38.l
34.7-38.l
34.7-38.l
35.9-36.4
35.9-36.4
Nominal Burn-up( 2 )
(% of U-235)
45
39.2
15.8
<5
35.6
29-36
19-23
21-27
21-27
Measured Burn-up( 3 )
___.1% of U-235)
33.9-52.6
not measured
not measured
not measured
not yet available
27.1-39.4
not measured
14.1-26.7
18.8-28.1
Results of Examination
Severe distortion and buckling of plates. Max. local plate thickness 0.064 in. Plates brittle, with some cladding cracks. Water channels closed down over local areas to less than 0.030 in. However, element did not fail in reactor and distortion.was discovered only after removal for examination.
Some distortion and buckling of plates. Typical water channel thickness change 0.015 to 0.030 in.
Distortion of plates less than for element f2. Water channel thickness changes of 0.010 to 0.025 in.
Handling bar broken in changing lattice position. Discharged without further irradiation.
Water channels probed with element in ETR canal. Minor local distortions of 0.010 in.
No measurable water channel distortion. Maximum local plate thickness 0.060 in.
No measurable water channel distortion. Element probed while in ETR canal.
{
No measurable water channel distortion in either element. Maximum local plate thicknesses 0.061 in. in f8, 0.058 in. in f9. Elements in good condition and irradiation terminated only due to reactivity loss in MTR core loading.
Notes: (1) See Table 4.2-2 for test element type, plate thicknesses, U-235 loading, cladding alloy, and assembly method.
(2) Nominal burn-up determined from flux at irradiation position in reactor core and irradiation time.
(3) Measured burn-up determined by chemical analysis of irradiated meat alloy.
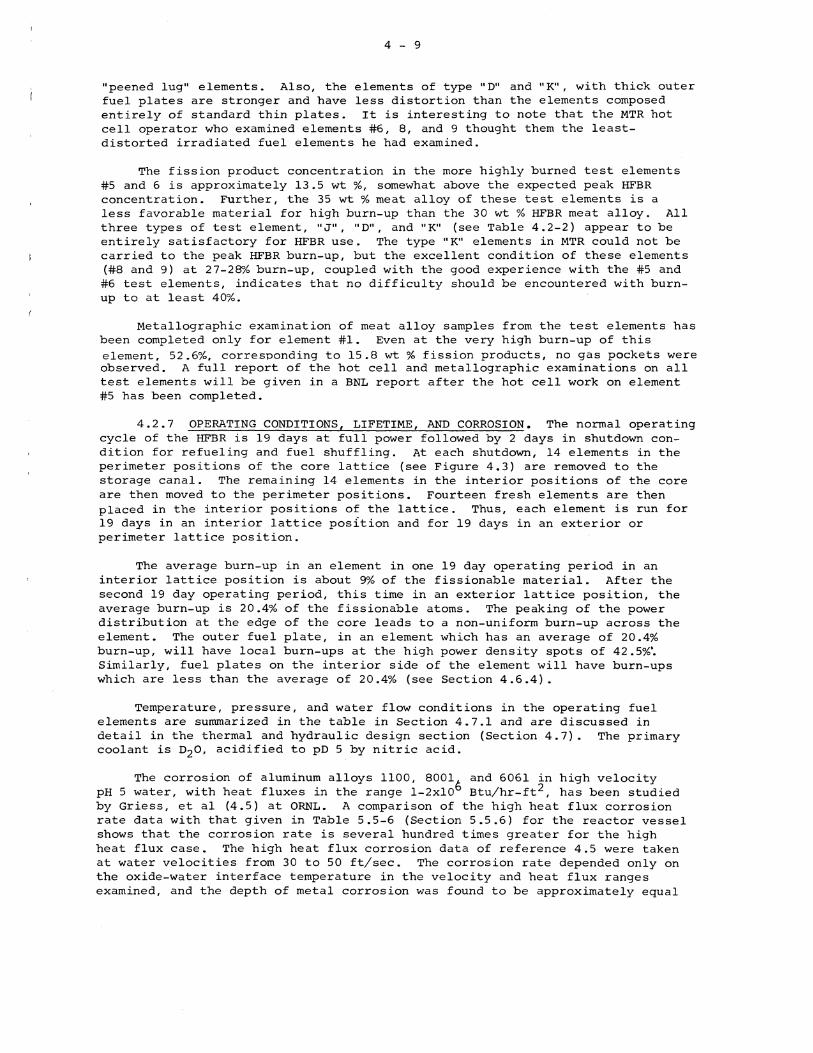
4 - 9
"peened lug" elements. Also, the elements of type "D" and "K", with thick outer fuel plates are stronger and have less distortion than the elements composed entirely of standard thin plates. It is interesting to note that the MTR hot cell operator who examined elements #6, 8, and 9 thought them the leastdistorted irradiated fuel elements he had examined.
The fission product concentration in the more highly burned test elements #5 and 6 is approximately 13.5 wt%, somewhat above the expected peak HFBR concentration. Further, the 35 wt % meat alloy of these test elements is a less favorable material for high burn-up than the 30 wt % HFBR meat alloy. All three types of test element, "J", "D", and "K" {see Table 4.2-2) appear to be entirely satisfactory for HFBR use. The type "K" elements in MTR could not be carried to the peak HFBR burn-up, but the excellent condition of these elements (#8 and 9) at 27-28"/o burn-up, coupled with the good experience with the #5 and #6 test elements, indicates that no difficulty should be encountered with burnup to at least 40%.
Metallographic examination of meat alloy samples from the test elements has been completed only for element #1. Even at the very high burn-up of this element, 52.6%, corresponding to 15.8 wt% fission products, no gas pockets were observed. A full report of the hot cell and metallographic examinations on all test elements will be given in a BNL report after the hot cell work on element #5 has been completed.
4.2.7 OPERATING CONDITIONS, LIFETIME, AND CORROSION. The normal operating cycle of the HFBR is 19 days at full power followed by 2 days in shutdown condition for refueling and fuel shuffling. At each shutdown, 14 elements in the perimeter positions of the core lattice {see Figure 4.3) are removed to the storage canal. The remaining 14 elements in the interior positions of the core are then moved to the perimeter positions. Fourteen fresh elements are then placed in the interior positions of the lattice. Thus, each element is run for 19 days in an interior lattice position and for 19 days in an exterior or perimeter lattice position.
The average burn-up in an element in one 19 day operating period in an interior lattice position is about gofo of the fissionable material. After the second 19 day operating period, this time in an exterior lattice position, the average burn-up is 20.4% of the fissionable atoms. The peaking of the power distribution at the edge of the core leads to a non-uniform burn-up across the element. The outer fuel plate, in an element which has an average of 20.4% burn-up, will have local burn-ups at the high power density spots of 42 .5%'. Similarly, fuel plates on the interior side of the element will have burn-ups which are less than the average of 20.4% {see Section 4.6.4).
Temperature, pressure, and water flow conditions in the operating fuel elements are summarized in the table in Section 4.7.1 and are discussed in detail in the thermal and hydraulic design section {Section 4.7). The primary coolant is D2o, acidified to pD 5 by nitric acid.
The corrosion of aluminum alloys 1100, 8001 and 6061 in high velocity pH 5 water, with heat fluxes in the range l-2xl06 Btu/hr-ft2 , has been studied by Griess, et al (4.5) at ORNL. A comparison of the high heat flux corrosion rate data with that given in Table 5.5-6 {Section 5.5.6) for the reactor vessel shows that the corrosion rate is several hundred times greater for the high heat flux case. The high heat flux corrosion data of reference 4.5 were taken at water velocities from 30 to 50 ft/sec. The corrosion rate depended only on the oxide-water interface temperature in the velocity and heat flux ranges examined, and the depth of metal corrosion was found to be approximately equal

4 - 10
to the oxide film thickness.
The maximum fuel plate surface temperature in the operation of the HFBR is found at the end of an outside fuel plate which has excessive "dog-boning" (a local increase in meat alloy thickness at the end of the plate). The temperature at this point may be as high as 359°F at the beginning of an operating cycle with all fresh fuel, and with all possible variations in the thermal and hydraulic parameters at "worst" values. The temperature decreases to 325°F at the end of 19 days of operation. Using an effective interface temperature of 350°F for the cycle for this maximum corrosion case, and the data in reference 4.5 (Part IV), the total corrosion is .C019 in. The average corrosion rate in the core is much lower than that for the hot spot since the plate sur-f ace temperatures are much lower. The nominal "average" plate surface temperature is about 185°F, and the corresponding corrosion depth is about 0.00013 in. for 19 days.
Even at the hot spot for a fresh fuel loading the corrosion of the fuel plate cladding is not great enough to cause concern about the integrity of the cladding. A more serious effect of the corrosion is the formation of the oxide layer at the plate surface, since the conductivity of the oxide is small and the presence of the layer raises the fuel plate metal temperature. This effect is discussed in Section 4.7.6.
4.3 CONTROL ROD BLADES
4.3.1 DIMENSIONS AND GEOMETRY. There are two types of control rod blades in the HFBR, main blades and auxiliary blades. Both blades are shown in Figure 4.7. The two types of blades are identical in cross-section, both being hollow right-angle shapes. The basic outside dimensions of the angle are 3.043 in. x 3.043 in. x .710 in. The blades are formed of composite section rolled plates .130 in. thick. Each plate contains a poison material core .080 in. thick fabricated of Eu2o3 or ny2o3 in "elemental" type 304 stainless steel. The poison material matrix is clad and "picture-framed" with type 304 stainless steel. The angle shape for the control rod blades was chosen because it gives good rigidity and because it is a good fit to the outside of the core.
The main blade has a length of 40.25 in. The poison material starts .25 in. from the lower end of the blade, and is Eu 2o3 in stainless steel for a distance of 12 in. Thereafter the poison material is 0y2o3 in stainless steel for a distance of 25.5 in. The remaining blade material is type 304 stainless steel. A coupling block is welded to the upper end of the main blade, as shown in Figure 4.8.
The auxiliary blade has a length of 12.5 in. The poison material starts .25 in. from the upper end of the blade, extends downward 12 in., and is the Eu2o3-stainless steel mixture. At the upper end of the auxiliary blade a hinged coupling block connects the blade to an aluminum follower shaft which terminates in the same type of coupling as the main blade (see Figure 4.8).
4.3.2 MATERIALS. The principal neutron absorbing elements in the control rod blades are Eu and Dy. The europium is used for the entire auxiliary rod blade, and for the lower 12 inches of the main control rod blade. The dysprosium is used in the upper section of the main control rod blade. Both the europium and dysprosium are in the oxide forms, Eu2o3 and Dy2o3 . The oxide powders used in forming the poison material are a minimum of 99% pure, with a spectrographic analysis made on each powder lot. The oxide particle size is -325 mesh (US Standard Sieve), and water of hydration is held to as low a level as practicable in the manufacturing process.

4 - 11
The stainless steel matrix of the dispersion consists of 71 wt % electrolytic iron powder, 18 wt % chromium, and 11 wt% nickel powders. Maximum silicon content is limited to .03 wt %. The rare earth oxide and elemental stainless steel powders are combined into a dispersion which contains 30 vol % of either Eu2o3 or 0y2o3 • The density of the dispersion is required to be at least 97% of ~heoretical density.
The rare earth oxide-stainless steel dispersion is a high strength material. At 30 vol% oxide, the dispersion has a yield strength of 30,000 psi and a tensile strength of 37,500 psi at 500°F. At 1000°F, the strengths are 29,000 psi yield and 35,000 psi tensile (4.6). The dispersion is less ductile than the base type 304 stainless steel, but both the strength and ductility of the clad dispersion are very good. The elongation goes from 0.9 % per inch for unclad dispersion material to 10 % per inch for the clad dispersion (4.7). The stainless steel-clad dispersion plates of which the control rod blades are assembled have very nearly the same mechanical properties as equivalent thickness sections of solid type 304 stainless steel.
!he densities of the base materials in the poison dispersion are 7.91 gm/cm3 for the stainless steel, 7.34 gm/cm3 for the europium oxide and 7.90 gm/cm for the dysprosium oxide. The dysprosium oxide and stainless steel densities are so nearly alike that the 30 vol % dispersion is also a 30 wt % dispersion, and its theoretical density is 7.91 gm/cm3 • For the 30 vol% europium oxide dispersion, the theoretical density is 7.74 gm/cm3 , and the material is 28.45 wt% Eu2o3 •
In both the dysprosium and europium dispersions, neutron capture results in the formation of higher mass isotopes of the same element or of neighboring rare earths. In the europium dispersion rod sections which sustain the highest burn-up, about 8 % of the initial Eu atoms are converted to gadolinium. In the dysprosium dispersion (main rods only) the highest burn-up sections have about 1 % of the initial dysprosium atoms converted to holmium. Figure 4.9 shows the change in the fractional isotope concentrations of europium with thermal flux exposure. The maximum flux exposures are in the range 2-4xlo21 nvt for europium and l-2xlo19 nvt for dysprosium in the HFBR rods (see Section 4.3.8).
The fact that higher isotopes of the same rare earth element are the principal products of neutron capture, and that the small quantity of foreign elements introduced are also rare earth metals, means the dispersion is relatively insensitive to the integrated neutron exposure, as far as structural damage to the material is concerned. There is, of course, a substantial effect on the total absorption cross-section of the poison dispersion (see Section 4.3.8).
The structural materials of the blades; the cladding, picture frames, end pieces, and coupling blocks are all type 304 stainless steel. The aluminum follower pipe for the auxiliary control rod blade is aluminum alloy 6061-T6 ASTM Specification B-241-61.
4.3.3 FABRICATION METHODS. The rare earth oxide-stainless steel dispersion is prepared by standard powder metallurgical methods, as outlined in ORNL-2733 (4.8). A homogeneous material is obtained by mixing the dry powders for several hours in a blender. The powder is initially cold compacted at moderate pressure and the green compact is sintered at about 1200°c for several hours. The compact is then repressed at a higher pressure, yielding compacts of density very close to theoretical.
The dispersion compacts thus formed are framed and clad with type 304

4 - 12
stainless steel by standard hot roll bonding methods, with the addition of thin iron foils between the compacts and the frames and cladding (4.8). After roll bonding the plates are machined to shape as necessary. Four plates are assembled to form a single control rod blade. The assembly method involves electron beam welding of the plates to end pieces of type 304 stainless steel. A joint strength of 2500 lb/in., based on 1/8 inch penetration, is required in the assembly. The coupling blocks are attached by welding. The minimum allowable coupling weld joint strength is 1700 lb/in.
The first set of control rod blades were manufactured by the United Nuclear Corp. of New Haven, Conn.
4.3.4 INSPECTION AND TESTING. The control rod plates are checked by several nondestructive tests before they are assembled into the control rod blade. A test of the bond of the cladding to the dispersion is made by ultrasonic techniques. A full inspection of all clad surfaces is made, with unbonded areas of 1/8 ino diameter or greater being cause for rejection. Radiographs of the absorber plates are taken to determine the core outline and to reveal any voids or inclusions. The latter items are cause for rejection. The cladding thickness is measured by an eddy current technique, with .020 in. being the minimum acceptable cladding thickness. The plates are given a bright anneal for 1.5 hours in dry hydrogen at 1B00°F. The dimensions of each plate are carefully measured before and after the anneal and a dimensional change exceeding 2% in any direction is cause for rejection of the plate. The appearance of any blisters on a plate after the hydrogen anneal makes the plate unacceptable. The final test on the plates is a cladding integrity and corrosion test which is done in an autoclave in deionized water at 650°F and 2200 psia for 72 hours. Any weak spots or pin holes in the cladding which have escaped detection by the other tests should be apparent after the autoclave run.
As a part of the control rod blade procurement effort, a qualification period is required of the vendor in which a series of plates and blades are fabricated, tested by the nondestructive techniques listed above, and are then sectioned and examined in detail to determine the effectiveness of the nondestructive testing. Further, plate joint strengths and ~oupling attachment weld strengths are determined by destructive testing of qualification samples.
After the plates are assembled into a complete blade a full dimensional check is made. Blade over-all dimensions, water channel dimensions, blade straightness, and coupling block alignment are verified. The assembly welds are visually inspected on the water channel side to check for full penetration of the welds. The internal quality of the welds is inspected by radiography. The coupling block attachment welds are inspected visually and by dye penetrant tests.
4.3.5 PAST EXPERIENCE WITH SIMILAR CONTROL MATERIALS. The major previous use of Eu20 3-stainless steel rods has been in the SM-1 reactor (previously APPR). Irradiations of samples in ETR to exposures as high as 2.87xlo21 nvt (4.9) and 4.5xlo21 nvt (4.10) in support of this project have shown no evidence of swelling or change in microstructure of the dispersion. The structures of the ORNL compacts before and after irradiation are shown in Figures 4.lOa and b. The swelling shown in earlier work at KAPL (4.11) after 2-5 MTR cycles is attributable to the presence of Si in the stainless steel dispersion. Elimination of Si eliminates the swelling, as shown by ORNL data (4.12).
The ORNL group have recently examined a complete SM-1 control rod assembly which received a total of about 4 megawatt-years exposure (- 25% full core design life). This element showed no sign of swelling or change in assembly

4 - 13
dimensions outside of fabrication tolerance. There was no change in the thickness of the individual plates, nor was there any evidence of serious corrosion. Although the assembly saw a wide range of flux from bottom to top, there was no corresponding dimensional profile, indicating that radiation had no detrimental effect on the properties of the dispersion (4.13).
The ORNL workers have also demonstrated that when intentional cladding failures are contacted with water at 570°F and 1200 psi pressure, no Eu enters the water system (4.14). The maximum swelling in the 30 wt% Eu2o3 defective specimens was -15%. Any blades which pass the 650°F water autoclave test should be safe from this swelling, since in-reactor corrosion of stainless steel in high-purity D2o is expected to be negligible at HFBR temperatures.
There are no data available from other reactor programs on the behavior of ny2o3-stainless steel compacts under irradiation comparable to that for Eu 2o3-stainless steel. The next section covers the irradiation testing of ny2o3-stainless steel samples for the HFBR rods.
4.3.6 RESEARCH AND DEVELOPMENT ON HFBR RODS. The general development of the rare earth-stainless steel control rods is summarized in reference 4.6, Chapters 6 and 7, and a full set of references are given there to the original literature. As noted in the previous section, irradiation testing of Eu2o3-stainless steel compacts in the ETR, and actual control rod experience in the SM-1 reactor give ample confidence in the Eu2o3 -stainless steel material. The material in the upper portion of the HFBR olades, Dy203-stainless steel, however, had had no similar irradiation testing when it was selected for HFBR use. A testing program was, therefore, carried out for the dysprosium dispersion.
A number of ny2o3-stainless steel compacts, clad with stainless steel, were fabricated by Dresser Products, Inc., of Great Barrington, Mass. The test plates were 2-7/8 in. long, 2-5/16 in. wide, and 0.250 in. thick. The ny203-stainless steel dispersion core was 0.180 in. thick, with 0.035 in. stainless steel cladding. Dispersions were fabricated at both 20 and 30 vol % Dy2o3 • Since dyspro.sium does not form a monoxide •. as does europium, the silicon-free stainless steel powder and isolating iron foils are not required in fabricating the ny2o3-stainless steel compacts. The irradiation behavior of the dysprosium dispersion is expected to be similar to that of the europium dispersion since the daughter products of both are trivalent rare earth metals.
One of the 30 vol % ny2o3-stainless steel test plates was placed in the MTR (4.15) in February, 1962. The irradiation was limited to a single plate to avoid excessive flux perturbations. The test plate was examined after one year in-pile, corresponding to about l.4xlo21 nvt. The examination, carried out in the MTR hot cell, showed the plate to be intact. The maximum thickness increase was 0.008 in., with a major portion of this presumably due to a visible surface oxide layer. The test plate was put back in the MTR for further irradiation, to an exposure of about 2xlo21 nvt. Examination after the final exposure showed the plate to be in good condition. Detailed measurements of thickness, density, and bend strength, as well as metallographic examinations were unfortunately lost through a misunderstanding about hot cell procedures. The plate was cut in half and immersed in water for about 4 hours to make a density measurement. The reaction of ny2o3 with the water caused a swelling of the dispersion and generally made any subsequent measurements of properties of the plate meaningless.
The positive evidence which is available from the irradiation is that the 30 vol % ny2o3-stainless steel dispersion endured an unperturbed thermal neutron

4 - 14
exposure of about 2xlo21 nvt with no signs of serious swelling or blistering. Since the plate was removed from the reactor at each shutdown for thickness measurements, these data were obtained to the full exposure in spite of the hot cell error.
4.3.7 CONTROL ROD GUIDES AND COUPLINGS. The main control rod blades and the aluminum follower pipes for the auxiliary rods pass through the transition plate above the core (see Figures 9.22, 9.25, and 4.2). Since the core pressure drop from the coolant flow appears as a differential pressure across the transition plate (with the higher pressure area above the plate) the glands through which the main blades and auxiliary followers pass must be relatively tight-fitting to reduce coo"iant leakage. The pressure differential across the transition plate is about 31 psi.
The main blade gland, called the "penetration insert" is a type 304 stainless steel piece which fits snugly into a "Y"-shaped opening in the transition plate and is bolted to it. The main blade passes through an appropriate hole in the insert, with a nominal clearance of .040 in. on all sides. This clearance is enough to insure that the main blade will not bind as it passes through the insert. The coolant leakage through the clearance annulus is about 120 gpm for each gland or 960 gpm total for the 8 main blades and inserts. Although the main control rod mechanism is sufficiently rigid so that the main blade normally travels up and down without touching the insert, the insert will act as a guide for the main blade should some misalignment occur in the drive column above. The insert piece can be unbolted and removed after the main rod blade has been removed. These pieces will be inspected each time that the control rod blades are replaced. Figure 4.11 shows the penetration insert.
The auxiliary rod follower gland is a Graphitar 14 sleeve bearing in a type 304 stainless steel shell. The bearing and shell assembly, called the "auxiliary bushing" (Figure 4.11), is held captive between the transition plate and the penetration insert piece. The auxiliary bushing is a snug fit on the follower pipe, and the coolant leakage through the bushing is only a few gpm. A tight-fitting bearing can be used for the auxiliary rod follower because of its simple cylindrical shape and because there is no fast motion associated with the auxiliary blade.
The main control rod blades are not guided or shrouded below the penetration insert in the transition plate. The auxiliary control rod blades, however, move within aluminum guides which are fastened to the lattice plate below the core. The outline of the guide structure may be seen in Figure 4.15 and in the isometric drawing, Figure 4.17. The guide structure is a part of the lattice plate assembly and is welded to it.
Both the main and auxiliary control rod blades are attached to the stainless steel follower shafts of the control rod mechanisms by the same type of taper joint and threaded nut coupling. This coupling is shown in Figure 4.8. The lower end of the follower shaft is recessed with a tapered hole and slot. The upper end of the coupling piece on the blade has a corresponding tapered shaft extension, and orientation pin. The tapered sections engage, with the pin sliding in the slot in the follower to insure a precise angular orientation of the two pieces. The connection is locked together and heavily reinforced mechanically by a stainless steel lock nut which engages the threaded portion of the coupling block on the blade. The locking nut is rotated by a gear tool which engages gear teeth cut on the upper end of the nut. Once threaded onto the blade coupling end and screwed down tight, the lock nut is prevented from accidentally backing off by a series of ball plunger locks engaging grooves in the nut.
f

t 4 - 15
4.3.8 OPERATING CONDITIONS, BLADE BLACKNESS, AND LIFETIME. The control rod operating configuration is shown in Figure 4.4. There are a total of 16 rods, divided into 8 main rods operating above the core and 8 auxiliary rods operating below the core. The safety requirements are adequately met by action of the main rods alone, so that only the main rods are dropped on a scram signal. In the fully inserted position the main rods extend along the sides of the core to a point 3-5/8 in. above the bottom of the fuel. The auxiliary rod blades in the fully inserted position extend 2-1/8 in. above the bottom of the fuel. To avoid the difficulties inherent in bottom penetrations of the reactor vessel for control rod drives, both the main and auxiliary rods are actuated by drive mechanisms high on the vessel. Both the main rod blades and the followers which connect the auxiliary blades to their drive mechanisms pass through the transition plate above the core. This geometry has been discussed in the previous section.
The reactor is operated with the two sets of rods in symmetrical positions above and below the core centerline. The symmetrical rod pattern insures a minimum flux perturbation in the horizontal midplane of the reactor, and hence a relatively constant source flux for the beam tubes. The main and auxiliary rod blades have identical reactivity characteristics over the pertinent control range. The rod calibration curve is given in Figure 4.25, and the shutdown margin provided by the rods is discussed in Section 4.6.6. The auxiliary rods are driven to the full-in position at normal speed on a scram signal. They are not needed for safety reasons, but the automatic insertion insures identical rod positions for all start-ups. The drive mechanisms are discussed in Section 9.7, and the normal drive motion and the scram motion are described there.
Most of the heat generated in the control rod blades during reactor operation is removed by heavy water flowing through the internal water channels in the blades. The balance of the heat is transferred to the reflector water at the outer surfaces of the blades. For the main blades, which extend through the transition plate, the cooling water enters the internal channels through orifice plates at the top of blades. The pressure difference across the transition plate drives the coolant through the channels. The cooling water flows out of the open bottoms of the blades into the reflector region.
For the auxiliary blades, it is necessary to supply the internal cooling water through the aluminum follower pipes. These pipes pass through the transition plate and have appropriate openings for cooling water entry in the high pressure region just above the transition plate. The cooling water flows down the aluminum pipes, through the elbow couplings at the tops of the auxiliary blades and into the internal cooling channels. The water flows into the reflector region from both ends of the internal channel of an auxiliary blade. Details of the flow conditions, heating rates, temperatures, and thermal stresses in the blades are given in Section 4.7.14.
The initial thermal neutron blackness of the europium dispersion sections of the blades is 0.992, where "blackness" has the usual definition of neutrons absorbed per neutron incident on the blade. The dysprosium dispersion sections have an initial blackness of 0.945 (4.16).
The changes in the europium isotope concentrations with thermal neutron flux exposure (nvt) are shown in Figure 4.9. The effect of the changing isotope concentrations, hence of the average absorption cross-section and of the blackness must be taken into account along the length of the blade. The relative neutron absorption in the blade as a function of distance from the end of the blade is shown in Figure 4.12. This curve is the result of critical

4 - 16
experiment measurements and represents the best available estimate of the· cycleaverage neutron absorption along the blade at times early in the life of the blade. As the exposure continues the absorption curve must tend to flatten, with the rod end absorption, in particular, being decreased relative to the rest of the blade. For purposes of determining minimum blackness and maximum irradiation effects, we assume that the absorption curve (Figure 4.12) does not change with time, and that the high absorption rate at the rod tip continues throughout rod life.
The sharp increase in neutron absorption at the tip of the blade results in an accelerated decrease in blackness in a limited region near the tip. Figure 4 .13 shows this effe"ct; the tip blackness decreases to O. 78 after three years of reactor operation. The region of substantial blackness change is only 1/4 in. long, however, and the reactivity characteristic of the blade is not greatly changed. The only observable effect in the operation of the rods would be a slow drift inward of the critical positions, by about 1/4 in. over three years of reactor operation.
The neutron absorption rate is low enough in the dysprosium sections of the blades so that no noticeable change in blackness occurs over at least three years of reactor operation. The initial blackness of the dysprosium blade sections is lower than that of the europium sections because the average absorption cross-section is smaller (950 vs. 4300 barns) and the scattering cross-section is higher (11 vs. 8 barns). In the fabrication of the main blades the europium and dysprosium dispersions are rolled together and merge into each other in the boundary zone. This transition is indicated on Figure 4.13 by a change in blackness in the region 12 to 12-1/2 in. from the end of the blade. The auxiliary blades contain only the 12-inch length of europium, so that only the 0-12 in. portion of the Figure 4.13 graph applies.
The useful life of the rare earth dispersion control rod blades is at least three years of 40 MW reactor operation from the standpoint of thermal neutron blackness. There is, however, another limitation on blade life which suggests a shorter term for the first set of blades. This limitation is the extent of our present knowledge of the effects of fast and thermal neutron irradiation of the blade materials.
The best existing irradiation data on the europium dispersion is that reported in Section 4.3.5 from Oak Ridge. The "unperturbed" thermal flux exposure of the sample shown in Figures 4.lOa and b was 4.5xlo21 nvt. The corresponding flux exposure in the sample material is less by a factor of 2 to 4. The table below, 4.3-1, gives the thermal flux exposure in the HFBR blades as a function of position along the blade and operating time.
It will be noted in Table 4.3-1 that the flux exposure is not necessarily proportional to operating time. The difference is particularly noticeable at the end of the rod. The flux exposure (nvt) given in the table is the product of average flux in the poison dispersion and time, and is related to "unperturbed" flux exposure (hence to operating time) through the cross sectiondependent flux depression factor. The rod-end flux exposures given in Table 4.3-1 are calculated on the basis of the absorption curve of Figure 4.12, and are, therefore, somewhat higher than would actually be the case.
Comparing the flux exposure numbers in Table 4.3-1 with the exposures on the ORNL europium dispersion samples, one sees that the HFBR rod tips have reached the limit of existing irradiation data at the end of two years. At the end of three years the rod tips have received 2-4 times the thermal neutron irradiation of the extant samples. The excellent condition of the ORNL samples

4 - 17
(compare Figures 4.lOa and b) shows that the HFBR rods will have a life of at least two years, and quite likely three or more years, from the standpoint of thermal neutron irradiation.
Table 4.3-1 Thermal Neutron Flux Exposure in HFBR Control Rod Blades (40 MW Reactor Power)
Distance from Flux Exposure After Operating Times of: End of Blade 1 Year 2 Years 3 Years
0 in. o.51x1021 nvt l.83xlo21 nvt 4.07xlo21
0.25 .27 .97 1.81
0.50 .19 .62 1.30
1.00 .13 .37 .80
2.00 .091 .21 .43
3.00 .068 .15 .27
4.00 .052 .11 .18
6.00 .029 .062 .095
9.00 .013 .026 .039
12.00 .005 .011 .016
nvt
The fast neutron (>l Mev) flux exposure rate at the tip of a rod (the maximum exposure point) amounts to about lxlo21 nvt/year. The fast flux does not suffer a variable flux depression in the blade material, and the total fast exposure is proportional to operating time. The fast flux decreases much more rapidly with distance from the core (a factor of 10 in 8 cm) than does the thermal flux, and the exposure to fast flux along the blade is more sharply peaked at the end than the thermal exposure shown in Figure 4.12. This means that although the blade tip may suffer a very high fast exposure, portions of the blade a few inches away will have one tenth or less of the tip exposure. The europium dispersion sample shown in Figures 4.lOa and b was exposed in an ETR core position in which the ratio of thermal to fast (>l Mev) flux was about two: the sample was thus exposed to about 2.2xlo2 1 nvt (fast), with no sign of deterioration.
A tentative blade lifetime of two years is set in view of the neutron irradiation data. After two years of full power reactor operation, when the blades are changed, some of the first set of blades should be left in place. These blades can later be removed and examined after total exposures corresponding to three years (or more) operating time. If the blade material is in good condition, the n01ninal blade life may be extended.
4.4 CORE SUPPORT STRUCTURE
4.4.l GENERAL DESCRIPTION. The structures which support the core in the reactor vessel are shown in the vessel elevation, Figure 4.14. There are two sets of structures in the core support arrangement. The lattice plate assembly, located below the core, supports the fuel elements and provides guides for the auxiliary control rods. The flow shroud assembly, located above the core,

4 - 18
holds the upper ends of the fuel elements, directs the coolant through the core, and provides guides and supports for the control rod mechanisms.
The lattice plate assembly consists of the lattice plate (or grid plate), the support saddle, the anti-critical grid, and the saddle mounting blocks. The mounting blocks are welded to the reactor vessel and the saddle is bolted to the blocks, as shown in the vessel drawings, Figures 5.11, 5.13, 5.14, and 5.21, and in Figure 4.2. The anti-critical grid is bolted to the saddle, as is the lattice plate. Detailed descriptions of these components, and of the flow shroud assembly, are given in the sub-sections which follow.
The flow shroud assembly consists of the transition plate and the flow shroud. The shroud is bolted to an internal flange in the reactor vessel between the inlet and outlet nozzles. The transition plate is pinned to the lower end of the shroud.
The fuel element lower end boxes fit within individual cells in the lattice plate with a nominal clearance of 0.015 in. on all sides. The elementlattice plate fit is kept as loose as possible, but is still snug enough to keep the elements in a vertical position with no other support. When the full core of elements is assembled, the element top boxes fit tightly together within the outline of the transition plate. The nominal clearance between element top boxes in the assembled core is 0.002 in. Manufacturing tolerances for the elements will increase the actual clearance to about 0.005 in. between top boxes. The tight fit at the transition plate level is desirable to reduce the free lateral space for element motion to a minimum, and to limit the leakage flow between elements.
Both the lower end box and the top box are symmetrical about the vertical centerline of an element. Thus, elements may be rotated 180° about the vertical in the core. The rectangular shape of the end boxes prevents 90° rotation. Adjacent "reversed" elements do not interfere in the mechanical sense, nor are the heat transfer properties, temperatures, or physics behavior affected.
4.4.2 LATTICE PLATE. The lattice plate, or grid plate, is shown in Figure 4.15, and in the isometric drawing, Figure 4.17. The lattice plate is an aluminum alloy forging whose base element is a 2-inch thick plate of rectangular shape with lateral dimensions 23-1/4 x 22-13/32 inches. A 3-1/4-inch high grid of 1/4-inch thick plates is located above the 2-in. portion of the plate. The 2-in. plate section and the 3-1/4. in. grid work were machined from a single forging. The end boxes of the fuel elements fit into the cells in the grid structure. Around the periphery of the lattice plate there is a guide structure for the auxiliary control rod blades which extends upward 15-1/2 inches from the top of the basic 2-inch plate. The 2-inch plate has a series of 2-3/8-inch diameter holes drilled in it for coolant flow.
The grid plate is supported on the vertical webs of the support saddle. The plate is bolted down to the saddle with four bolts of the type shown in the assembly drawing, Figure 4.14. Like all of the threaded fastenings used in the reactor vessel, these bolts are secured by locking devices which do not depend on friction. Two operations must be performed in securing the bolts. One is the tightening of the screw thread itself, and the other is the plastic deformation of a retaining cup into a position in which it prevents the loosing of the main bolt. The design is such that if the loaded part of the bolt fails the fragment will be held captive by the locking cup. Special tools have been designed to install and remove these bolts from outside the reactor vessel. As mounted in the reactor vessel, the top of the 2-inch base plate of the lattice plate is 29 in. below the center of the core.
I
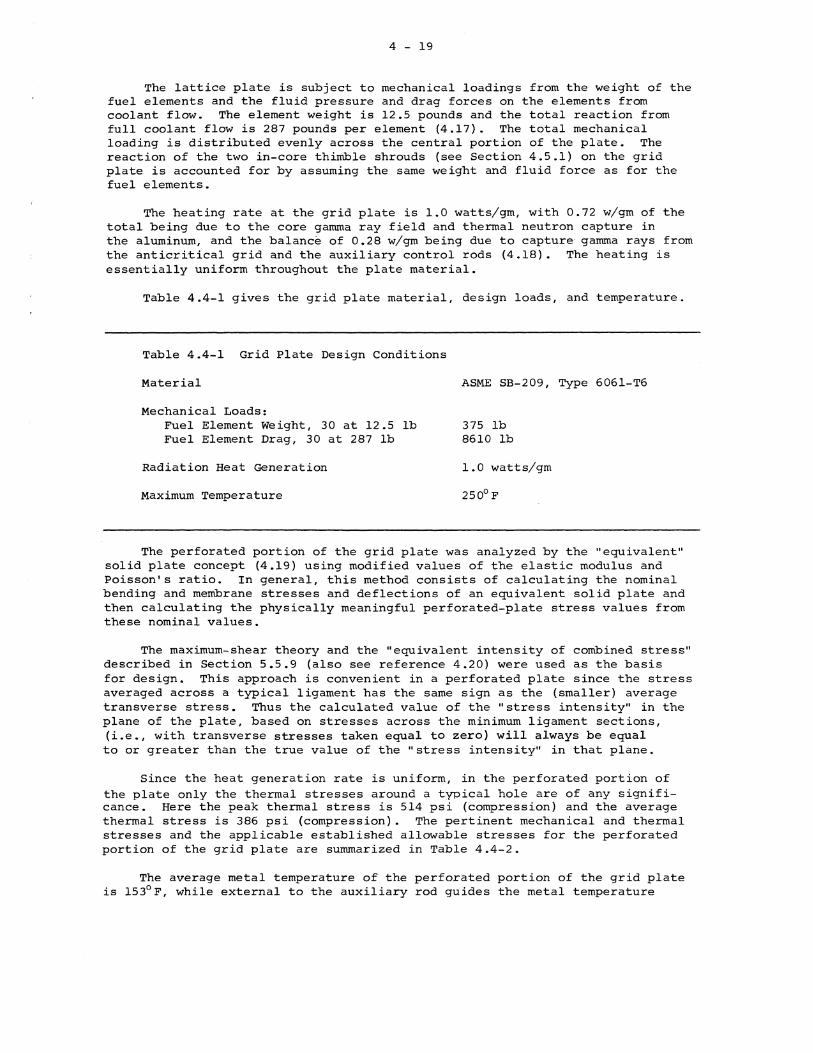
4 - 19
The lattice plate is subject to mechanical loadings from the weight of the fuel elements and the fluid pressure and drag forces on the elements from coolant flow. The element weight is 12.5 pounds and the total reaction from full coolant flow is 287 pounds per element (4.17). The total mechanical loading is distributed evenly across the central portion of the plate. The reaction of the two in-core thimble shrouds (see Section 4.5.1) on the grid plate is accounted for by assuming the same weight and fluid force as for the fuel elements.
The heating rate at the grid plate is 1.0 watts/gm, with 0.72 w/gm of the total being due to the core gamma ray field and thermal neutron capture in the aluminum, and the balance of 0.28 w/gm being due to capture gamma rays from the anticritical grid and the auxiliary control rods (4.18). The heating is essentially uniform throughout the plate material.
Table 4.4-1 gives the grid plate material, design loads, and temperature.
Table 4.4-1 Grid Plate Design Conditions
Material ASME SB-209, Type 6061-T6
Mechanical Loads: Fuel Element Weight, 30 at 12.5 lb Fuel Element Drag, 30 at 287 lb
Radiation Heat Generation
Maximum Temperature
375 lb 8610 lb
1.0 watts/gm
250°F
The perforated portion of the grid plate was analyzed by the "equivalent" solid plate concept (4.19) using modified values of the elastic modulus and Poisson's ratio. In general, this method consists of calculating the nominal bending and membrane stresses and deflections of an equivalent solid plate and then calculating the physically meaningful perforated-plate stress values from these nominal values.
The maximum-shear theory and the "equivalent intensity of combined stress" described in Section 5.5.9 (also see reference 4.20) were used as the basis for design. This approach is convenient in a perforated plate since the stress averaged across a typical ligament has the same sign as the (smaller) average transverse stress. Thus the calculated value of the "stress intensity" in the plane of the plate, based on stresses across the minimum ligament sections, (i.e., with transverse stresses taken equal to zero) will always be equal to or greater than the true value of the "stress intensity" in that plane.
Since the heat generation rate is uniform, in the perforated portion of the plate only the thermal stresses around a typical hole are of any significance. Here the peak thermal stress is 514 psi (compression) and the average thermal stress is 386 psi (compression). The pertinent mechanical and thermal stresses and the applicable established allowable stresses for the perforated portion of the grid plate are summarized in Table 4.4-2.
The average metal temperature of the perforated portion of the grid plate is 153°F, while external to the auxiliary rod guides the metal temperature
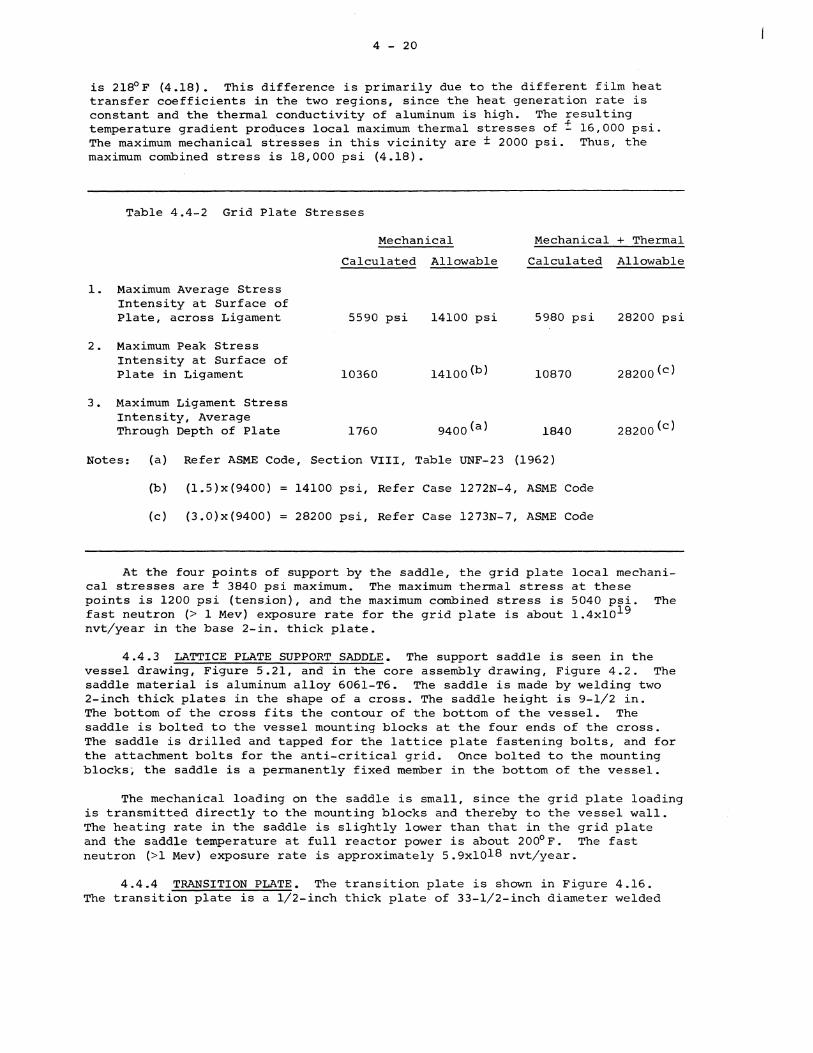
4 - 20
is 218°F (4.18). This difference is primarily due to the different film heat transfer coefficients in the two regions, since the heat generation rate is constant and the thermal conductivity of aluminum is high. The resulting temperature gradient produces local maximum thermal stresses of i 16,000 psi. The maximum mechanical stresses in this vicinity are ± 2000 psi. Thus, the maximum combined stress is 18,000 psi (4.18).
Table 4.4-2 Grid Plate Stresses
1. Maximum Average Stress Intensity at Surface of Plate, across Ligament
2. Maximum Peak Stress Intensity at Surface of Plate in Ligament
3. Maximum Ligament Stress Intensity, Average Through Depth of Plate
Mechanical
Calculated Allowable
5590 psi 14100 psi
10360 14loo<b)
1760 9400(a)
Mechanical + Thermal
Calculated Allowable
5980 psi 28200 psi
10870 20200Cc)
1840 28200(c)
Notes: (a) Refer ASME Code, Section VIII, Table UNF-23 (1962)
~) (l.5)x(9400) 14100 psi, Refer Case 1272N-4, ASME Code
(c) (3.0)x(9400) 28200 psi, Refer Case 1273N-7, ASME Code
At the four points of support by the saddle, the grid plate local mechanical stresses are ± 3840 psi maximum. The maximum thermal stress at these points is 1200 psi (tension), and the maximum combined stress is 5040 psi. The fast neutron (> 1 Mev) exposure rate for the grid plate is about l.4xlo19 nvt/year in the base 2-in. thick plate.
4.4.3 LATTICE PLATE SUPPORT SADDLE. The support saddle is seen in the vessel drawing, Figure 5.21, and in the core assembly drawing, Figure 4.2. The saddle material is aluminum alloy 6061-T6. The saddle is made by welding two 2-inch thick plates in the shape of a cross. The saddle height is 9-1/2 in. The bottom of the cross fits the contour of the bottom of the vessel. The saddle is bolted to the vessel mounting blocks at the four ends of the cross. The saddle is drilled and tapped for the lattice plate fastening bolts, and for the attachment bolts for the anti-critical grid. Once bolted to the mounting blocks~ the saddle is a permanently fixed member in the bottom of the vessel.
The mechanical loading on the saddle is small, since the grid plate loading is transmitted directly to the mounting blocks and thereby to the vessel wall. The heating rate in the saddle is slightly lower than that in the grid plate and the saddle temperature at full reactor power is about 200°F. The fast neutron (>l Mev) exposure rate is approximately 5.9xl018 nvt/year.
4.4.4 TRANSITION PLATE. The transition plate is shown in Figure 4.16. The transition plate is a 1/2-inch thick plate of 33-1/2-inch diameter welded

4 - 21
to a short cylinder of about the same diameter. The material of the transition plate is type 304 stainless steel. The central section of the circular plate is cut out in the outline of the top of the core. The circular plate is further pierced by a series of "Y" openings for the main control rod blades and the auxiliary control rod follower tubes. The plate is reinforced between these penetrations by a series of fourteen 3/8-inch thick gusset plates. There are other penetrations in the transition plate, for the four flow reversal valves, and the two core-edge irradiation thimbles.
The transition plate is attached to the upper shroud by twelve 3/4-inch diameter pins. This attachment method allows differential expansion to take place between the stainless steel transition plate and the aluminum upper shroud cylinder without stressing either member. The pin material is type 304 stainless steel, chrome plated. The pins are plug welded to the transition plate after assembly.
The mechanical loading of the transition plate is due to the differential pressure across the plate from the core pressure drop. A design value of 40 psi has been used in calculating the transition plate mechanical stresses. At 40 psi the mechanical stresses are all less than half of the allowable stress. The thermal loading is due to the radiation heating rate of 1.65 watts/gm, of which 1.03 w/gm is due to neutron capture in the plate, and 0.62 w/gm to core and main control rod gamma rays (4.18). The maximum temperature of the plate, for design and allowable stress purposes, is 300°F (actual plate temperatures are less than 300°F). The plate material is stainless steel, ASME SA-240, Type 304L. Allowable stress levels for the 300°F design temperature were established at 16,000 psi for mechanical stresses alone and 24,000 psi for combined mechanical and thermal stresses, as per ASME Code, Section VIII, Table UHA-23 (1962), and Code Case 1272N-4.
In the flat portion of the transition plate the average temperature is 234°F, and the maximum temperature is 246°F. The maximum mechanical stress is ± 7320 psi and the thermal stresses are + 7550 psi and +7730 psi on the top and bottom surface, respectively. The maximum combined stress is 14870 psi.
In the cylindrical portion of the transition plate the average temperature is 225°F and the peak temperature is 271°F. Both the mechanical and thermal stresses are at a maximum on the inside surface. Here, the mechanical tangential stress is + 1850 psi and the longitudinal stress is + 3250 psi. The thermal tangential stress is + 19200 psi, while the longitudinal stress is negligible. The maximum combined stress is+ 21050 psi.
In a typical gusset plate the average temperature is 181°F. The maximum mechanical bending stress is ± 6750 psi. The maximum thermal stress across the width of the gusset is + 4310 psi. The maximum thermal stress due to the average temperature difference between the gusset plate(s) and the rest of the structure is+ 13460 psi. The maximum combined stress is 20,210 psi (4.18). The fast neutron (>l Mev) exposure rate at the transition plate is about l.9xlo19 nvt/year.
4.4.5 FLOW SHROUD. The flow shroud is shown in the elevation of the vessel, Figure 4.14. Its general shape and location in the vessel are also shown in the isometric sketch, Figure 9.22. The flow shroud is a cylindrical piece 10 ft-6 3/4 in. long, with an outside diameter of 32.687 inches at the lower end and 44.250 inches at the upper end. The shroud is a composite section of two basic members. The lower member is a heavy-walled cylinder (3/4 in.) which is supported by a flange in the reactor vessel neck. The transition plate is pinned to the bottom of this section. The upper section

4 - 22
of the shroud is a light cylinder (1/4 in. wall) which extends above the flange to support the rod drive mechanisms. The material of the flow shroud is aluminum alloy 6061-T6 throughout.
The function of the shroud is to direct the incoming coolant from the vessel inlet nozzle downward through the transition plate and through the core. It also serves as a wall of the return annulus in the neck of the vessel for coolant leaving the vessel.
The loading on the shroud is due to the internal pressure caused by the core pressure drop. This is expected to be 31 psi at full flow conditions, and leads to stresses of only a few hundred pounds per square inch in the heavywalled shroud. Most of the shroud operates at a temperature dictated by the mean between the inlet coolant temperature of 120°F and the outlet temperature of 134°F. Radiation heating is negligible save at the very lower end of the shroud where a design rate equal to that in the transition plate (1.65 w/gm) was used. At this heating rate the lower end of the aluminum shroud has a mean temperature of 145°F. The pinned joint between the transition plate and the flow shroud has a nominal 0.010-in. wide radial clearance (at 70°F) to allow for differential thermal expansion. With the flow shroud lower end at 145°F and the transition plate cylinder at 225°F at full power, the clearance gap is increased to 0.017 in.
4.5 OTHER COMPONENTS IN THE CORE REGION
4.5.1 IN-CORE IRRADIATION THIMBLES AND SHROUDS. The in-core irradiation thimble shroud is shown in the core elevation drawing, Figure 4.2. The shroud is a circular filler piece which fits into a central lattice position of the core. The shroud is 57.25 inches in length, to match the fuel elements. At the upper end it is fitted with a standard top box and fuel handling ears identical to those on the fuel elements. At the lower end there is an end box, identical to that of the fuel elements, which fits into the lattice plate. The body of the shroud is a 2.75-inch O.D. by .125-inch thick wall aluminum alloy 6061-T6 tube. The two central positions in the core are occupied by these in-core thimble shrouds.
The in-core thimbles themselves, V-15 and V-16, are bayonet-type thimbles which extend from the core region on up through the top plate of the vessel. They are connected to the coolant lines of the experimental o2o circuit, and have openings for the insertion and removal of irradiation samples. The thimbles are discussed in Section 8.1.4. The portions of the in-core thimbles in the core region are 2 in. Schedule 80 aluminum alloy 6061-T6 pipes. The 2 in. Schedule 80 pipe has a nominal outside diameter of 2.375 inches, leaving a 1/16-inch thick annular clearance between the outside of the thimble and the inside of the shroud wall. Water flow down this annulus at 30 gpm per thimble (20 ft/sec) cools the shroud tube.
The primary function of the shrouds is to prevent excessive bypass flow between the in-core thimbles and the rectangular openings in the fuel element top box array at the transition plate level. This is accomplished by the top box structures of the shrouds and by the relatively close fit of the shroud tubes to the thimble pipes. The long engagement (about 38 in.) of the thimbles in the shrouds gives a sufficient flow impedance to limit the bypass flow to the desired level for cooling the shroud tubes without danger of erosion. A secondary function of the shrouds is to position the thimbles in the core and provide lateral support for them. Should the reactor be operated without an in-core thimble in place, a suitable flow-blocking member must be substituted for the shroud.
4 - 23
4.5.2 CORE EDGE IRRADIATION THIMBLES. The core edge irradiation thimbles, V-13 and V-14, are 2 in. Schedule 80 aluminum alloy 6061-T6 pipes, ending in weld caps 6-1/8 inches below the centerline of the core. They are located outside two corners of the core, as shown in Figure 4.3. The core edge thimbles pass through openings in the transition plate and are supported from a flange at the top of the reactor vessel. Outside the vessel they connect to the coolant lines of the experimental D20 system and to loading stations on the pile top. These details are discussed in Section 8.1.3. When a core edge thimble is not in use and is removed from the vessel, a cap is placed on the opening in the transition plate or a dummy thimble is inserted to prevent excessive bypass flow of the coolant through the opening.
The openings in the transition plate through which the thimbles pass are 4-inch long collars of type 304 stainless steel. Each core edge thimble has an external sleeve of type 304 stainless steel which fits into the transition plate collar and overlaps it at the top end. The sleeve is fitted to the thimble pipe with a .010 in. maximum diametral clearance. The sleeve is 4-1/4 in. long and is held captive on the thimble by weld deposit nipples several inches above and below the normal sleeve position. The fit of the sleeve on the thimble pipe allows the necessary vertical differential expansion motion to take place without restraint, but limits the coolant bypass flow velocity along the aluminum pipe to 20 ft/sec.
4.5.3 FLOW REVERSAL VALVES. The flow reversal valve is shown in Figure 7.2, which also shows the flow diagram for the actuating process circuits. The operation of the valves is described in Section 7.2.2. Four of the flow reversal valves are located on the transition plate above the core. Their purpose is to provide flow openings in the event that forced cooling of the reactor core becomes impossible. The openings in the transition plate created by the opening of the flow reversal valves offer a return path for natural convection cooling of the core.
The flow reversal valve is constructed of aluminum alloy 6061-T6, except for some type 304 stainless steel screws and nuts and an Inconel tension spring. All of the aluminum parts are anodized to limit corrosion and wear.
The valve is composed essentially of two parts, a stationary cylinder which is bolted to the transition plate above a 2-31/32 in. diameter hole and an internal piston. The piston is forced down to close the hole by water pressure from process systems outside the reactor vessel. It is opened by an Inconel tension spring when this driving pressure is relieved.
The wall sections of the valve are relatively thin, of the order of 1/4 inch, and are cooled both externally and internally. The valve temperature rise above the water temperature is, therefore, modest (20 to 30°F) at full reactor power. The external cooling flow is from the main coolant stream. The internal cooling is from a 5 gpm flow in the driving pressure line, which passes through the clearance between the piston and the cylinder, the clearance around the indicator pin, and through bleed holes in the piston.
4.5.4 ANTI-CRITICAL GRID. The anti-critical grid is shown in the reactor vessel drawing, Figure 5.18, and in the core drawings, Figures 4.2 and 4.14. The anti-critical grid is a set of stainless steel bars mounted in the base of the vessel to prevent criticality of molten fuel in the event that the core should overheat, melt, and resolidify in the bottom of the vessel. The grid is divided into four quadrants. Each quadrant has two side pieces at 90°which bolt to the support saddle in the base of the vessel. Between the two side pieces a set of one-inch diameter type 304 stainless steel bars are bent into

4 - 24
quadrants of circles. The volume of the bars in the area at the bottom of the vessel which the grid occupies is 15% of the total available volume. This much stainless steel is found to be necessary to maintain a core melt in sub-critical configuration (4.21). The anti-critical grid serves an auxiliary purpose in shielding the bottom of the reactor vessel from the direct jetting flow of coolant water from the core.
The portion of the core coolant flow which passes through the lattice plate provides excellent cooling around the anti-critical grid bars. Calculations of bar temperatures made for design heating rates which are somewhat higher than those expected at full power give maximum temperatures of 220°F center and 156°F surface. The resulting thermal expansion (about 0.005 in.) is taken up by a flexing of the quarter-circle bars and the side pieces.
4.6 REACTOR PHYSICS DESIGN
4.6.1 INTRODUCTION. The High Flux Beam Reactor is the first of a new generation of reactors specifically designed for particular kinds of physical research. The physical research in this instance is primarily that done with neutron beams. The design also provides, but does not emphasize, facilities for small sample studies of radiation damage by high energy neutrons, and for the production of radioisotopes.
The emphasis on efficient production of neutron beams has guided the physics design. It has led to a choice of materials and a configuration which provides high neutron intensity at positions where beam tubes can be placed. The neutron energy distribution varies with position, so that beam tube locations have been matched to specific experimental needs. The design causes some aspects of the neutron physics behavior to differ in first appearance from those of more conventional reactors. However, these differences are generally superficial, and there are no unusual effects on the safety of the system.
The moderator volume fraction in the core is much less than is customary in heavy water reactors. This feature leads to poor neutron moderation in the core and to high neutron escape probability into the reflector. On the other hand, the heavy water reflector is an efficient neutron moderator. It scatters the neutrons and degrades their energies, so that enough neutrons return to the core at low energy to produce additional fissions and sustain the chain reaction. In other words, the reactor is in large part externally moderated.
It follows that the low energy neutron intensity is greatest in the reflector, where the beam tubes must be placed. The low energy flux peaking is so great that the product of flux times importance times capture cross section of control rod absorber material also peaks in the reflector, about one inch from the core face, and therefore the control rods are placed in this region. Viewed another way, control rods fulfill their safety function in providing shutdown by masking the core from the return of neutrons from the reflector. Since the part played in the neutron cycle by these returning neutrons is so large, the reflector control rods are highly effective.
The point that low energy neutrons are found mostly in the reflector while higher energy neutrons are concentrated within the core is used also in the placement of irradiation tubes for the study of high energy neutron damage to small samples, such as single crystals. Two such irradiation tubes are located in empty fuel element positions in the core center. Two others are placed in the region of somewhat lesser fast neutron quality, just outside the core. Three isotope production facilities are placed in the reflector, at positions where the neutron flux is well thermalized.
I

4 - 25
Early in the conceptual stage of the HFBR, it was realized that the geometry of the system would make accurate theoretical predictions of many properties impossible within reasonable limits of time and computing machine usage. The geometric complications are primarily the. large void volumes of beam tubes and similar facilities, but the reactivity effects of structural components in the more than usually important reflector also make calculations difficult. The lack of flux separability in the reactor would have made it necessary to do all design calculations in three dimensional geometry. The complete job could not be done in a reasonable time even by the fast large memory computing machines now available. It was, therefore, necessary to design the reactor core to a large extent from critical experiments.
More than one thousand critical experiments have been performed in arriving at the final design. These have touched on nearly all aspects of the reactor behavior, including core size versus excess reactivity, power distribution, gamma heating, control rod effectiveness, reactivity effects of structures, safety problems, and many others. One fundamental result has been the unusual orientation of the beam tubes to be used for neutron diffraction studies; these are so aligned that they see few of the highly directional fast neutrons and gamma rays from the core, while at the same time their extraction of the more isotropic low energy neutrons is unimpaired (4.22).
The neutron physics properties of the reactor have been well established in the course of the critical experiments. The physics parameters which were calculated but could not be measured during the critical experiments, and that are needed for safety or operational effectiveness, will be measured during the startup program, discussed in Section 12.
4.6.2 CORE NUCLEAR PROPERTIES. In this section we list the core parameters relevant to neutron physics behavior (references 4.23 through 4.30).
Active Core Volume
Mass U-235 (initial)
Average D2o Volume Fraction
Core Length (fueled region)
Atom Densities of Core Constitutents (initial) U-235 Deuterium Oxygen Aluminum
Excess Reactivity, Cold Clean Core; All rods Withdrawn
Excess Reactivity, Cold, Equilibrium Core; All Rods Withdrawn
Total Reactivity Effect, All Rods
Shutdown Margin, All Rods
Total Reactivity Effect, Main Rod Crown Only
Shutdown Margin, Main Rod Crown Only
Core Void Coefficient (uniform)
Core Water Temperature Coefficient (uniform)
Core Fuel Temperature Coefficient (uniform)
88.29 liters
7.67 kgm
0.5771
20. 75 inches
2.23xlo20 cm- 3 3.83xlo22 cm- 3
l.92xlo22 cm- 3
2.42xlo22 cm- 3
13.4 %k
10.6 o/ok
37 .5 o/ok
24 .1 %k
30.5 o/ok
17.lo/ok
-3.53xlo-4 o/ok/cm3 void
-6. 7xl0-3 %kl° C
-O .52x10-3 o/ok/° c

4 - 26
Reflector Temperature Coefficient (uniform)
Total Uniform Temperature Coefficient
Neutron Lifetime
Effective Delayed Neutron Fraction (including photoneutrons)
Peak-to-Average Power Ratio (hot, with Xe, clean core)
Peak-to-Average Power Ratio (hot, with Xe, equilibrium.core)
-17.2xl0-3 %k/°C
-24 .4xlo- 3 %k/° C
672 µsec
0.0078
3.44
3.18
4.6.3 FLUX AND POWER DISTRIBUTIONS. The neutron flux distribution has been calculated as a function of energy and position in the core and reflector (4.31). The calculations are necessarily idealized; they assume the geometry to be either spherical or cylindrical, and account for the neutron capture and leakage in the beam tubes and thimbles by a uniformly distributed l/v absorber in the reflector. Some measurements of the thermal ·neutron flux distribution have been made in the reflector, mostly to establish the size of the perturbing effects. Figure 4.18 shows the calculated neutron flux in broad energy groups, compared with the experimental thermal flux distribution along one line between the core-reflector interface and the vessel wall. This figure shows in striking fashion the effect of the external neutron moderation on the flux distributions, especially at low neutron energy. The thermal neutron flux has a strong peak in the reflector, with the maximum occurring about 12 cm from the core-reflector interface. This feature is ideal from the standpoint of the placement of beam tubes, which must extract neutrons from the reflector region.
Because the fission cross section is greatest at low energies, there is a tendency for the power production distribution to follow the thermal neutron spacial variation. The largest power peaks occur at the core boundary, rather than in the core interior. As with other reactors, the power distribution and the peak-to-average power ratio change as the core burns out. Information on the initial power distribution has been found from critical experiments, where the fission activation of mockup fuel elements has been measured throughout the core (4.27). It was not feasible to reproduce in the critical experiments the effect of fuel burnup on the change in power distribution, and these effects have been calculated.
Measurements were made with distributed copper in the critical assembly, core to represent the reactivity effects of equilibrium xenon and the operating temperature. The assembly was then critical with control rods in positions corresponding to the rod positions in the reactor at 40 MW, with equilibrium xenon, shortly after the reactor is first started up with clean fuel. The observed power distribution in the critical, copper-poisoned core is shown in Figure 4.19, which is a two-dimensional plot of the relative power density variation across horizontal planes at the core center, 6.5 in. above center, and at the core top. The figure also shows the horizontal variation of the relative power density average taken vertically in the direction of the coolant channels.
The data from the experiments have been used as the starting point in a calculation that predicts the change in power distribution as burnup proceeds and as fuel recharging takes place. In this calculation, the rate at which fuel is burned in a given position is assumed to be proportional to the initial burnup rate at that point, and to the density of fuel remaining. It is assumed that each nineteen days partly burned fuel elements from the inside fourteen

4 - 27
positions are moved to the outside fuel positions, and new fuel elements are loaded in the inside locations. In this manner, the change in power distribution is followed throughout a sequence of operating periods and reloading operations until the equilibrium core is reached, and the variation during each cycle agrees with that during the next. This analysis is approximate in that it neglects any departures from the initial flux distribution. These departures may arise from changes in uranium density as burnup proceeds, and they are also introduced by control rod position changes. The reshaping of neutron flux due to burnup will probably cause little change in the peak-to-average power ratio, because the increase in low energy flux at the hot spot as the effective core boundary moves inward is compensated by the increase in fission rate inside the core caused by the greater transparency of the outer fueled region. The primary effect of rod motion away from the core will be to increase the heat generation at the top and bottom of the core.
The calculated relative power density profiles for the partly burned cores are shown in Figures 4.20 and 4.21. Figures 4.20 and 4.21 show the relative power density profiles at the beginning and end of an equilibrium cycle. The variation of the relative power density in the vertical direction along the "hot" corner of the "hot" fuel plate is shown in Figure 4.22 for the beginning and end of both the equilibrium cycle and the first cycle for a loading of unburned fuel elements. The behavior of the peak-to-average power ratio as a function of time through the first cycle, with the fresh core at full power and equilibrium xenon, and also throughout the equilibrium cycle is shown in Figure 4.23.
The power distribution measurement in the critical assembly mockup shows the initial peak-to-average power ratio of the hot core with equilibrium xenon to be 3.44. The maximum value in the equilibrium cyle, which occurs just after reloading, is 3.18.
4.6.4 FUEL CYCLING AND BURNUP. At the design power of 40 MW, the U-235 fission rate will be 41.3 grams/day. Each fuel element will remain in the core for 38 full power days, during which period the average loss per element from fission of the U-235 will be 56.0 grams of U-235. Since the initial fuel content of an element is 274 grams of U-235, the average burnup in fuel elements just prior to their removal is 20.4 %.
If the positions of elements were not changed during the 38 day element life, the burnup of uranium at the point of peak fission generation would be 60 %, well beyond the region in which radiation histories have been obtained. The fuel cycling chosen will avoid this problem by starting fresh fuel elements in sections of the core where the burnup rate is low, and transferring them at the midpoint of the element life to high burnup rate positions. The cycle is briefly this. At the end of an operating cycle the reactor will be shut down and allowed to remain on shutdown cooling for a period long enough to permit the shorter lived fission products to decay. The fuel in the fourteen outer fuel positions will then be removed and transferred to the canal. The fuel elements in the fourteen inner positions will then be transferred to the positrons left vacant. New fuel will be inserted in the inner fuel positions. The reactor will then be taken to power again, to run through another 19 day cycle.
With half the fuel elements being removed at each scheduled shutdown, the interval between shutdowns is three weeks, a period of time that has also been found convenient for the required changes to experiments. The peak burnup is reduced to 42.5 % of the initial U-235 content, because fuel remains in high burnup positions for only half the fuel life. The 42.5 % burnup is comparable

4 - 28
with that to which test elements in the MTR and ETR have been run (see Sections 4.2.5, 4.2.6). The reactivity swing during operation is reduced by the fuel cycling procedure, as are the required control rod motions and the associated effects on flux distributions near experiments.
4.6.5 REACTIVITY REQUIREMENTS FOR OPERATION. The initial core size and atom concentrations have been chosen to allow for reactivity losses caused by fuel burnup, stable fission product buildup, equilibrium xenon and samarium poisoning, the cold-to-hot reactor reactivity change, and some irradiation samples in the experimental facilities (4.24). Some allowance is also present for reactivity control by the rods at the end of core life.
No separate allowance is made for transient xenon override. After an unscheduled shutdown, advantage will be taken of whatever available reactivity remains to regain power before the transient xenon poison buildup becomes excessive.
The reactivity effects of the separate contributions listed above are not arithmetically additive. For instance, the reactivity losses introduced individually by xenon buildup and fuel burnup do not add up to the reactivity loss caused by the two taken together. This feature is not special to the HFBR: it is characteristic of all reactors that have large allowances for reactivity changes in the course of their operation. Calculations have been performed to establish the keff that the core must have initially to meet the reactivity requirements for the several effects separately, and also when they exist together. The results of these calculations that are of most interest here are the following.
The reactor, when ready for reloading in the equilibrium cycle, with equilibrium xenon and samarium, but at room temperature, would have a keff of 1.023 if all rods were fully withdrawn. The 2.3 % excess keff supplies the temperature defect, permits the addition of some absorbers in irradiation tubes, and allows a minimum of about 0.5 % keff for control purposes. After xenon decay has occurred, but still with equilibrium samarium, and at room temperature, the reactor would have a k ff of 1.067 with all rods fully withdrawn. e
After reloading has been completed, with xenon decayed in the partly burned fuel on the core periphery, with equilibrium samarium in the partly burned fuel, and at room temperature, the reactor would have a keff of 1.106 with all rods withdrawn. The system is then ready for operation. After the return to power, with xenon and at operating temperature, the keff would be 1.062.
In order that the keff should be 1.023 at the point just before reloading is needed, the initially loaded reactor core (all fresh fuel elements) must have a keff of 1.134.
Although the individual reactivity effects are not strickly additive it is useful to have the approximate magnitude of the individual effects. For this purpose we construct the table below.
Burnup, Sm, and stable fission products, equilibrium cycle
Xenon, equilibrium
Temperature defect
3.9 o/ok
4.4
0.9

Irradiation sample allowance
Control margin, end of cycle
Burnup, Sm, and stable fission products in outer 14 elements at start of equilibrium cycle
4 - 29
0.9
0.5
10.6
2.8
The failure of the individual reactivity effects to add in a linear fashion is shown by the calculated system reactivity of 6.2 %k at operating temperature, with xenon, but with no burnup, as compared to the value 5.3 o/ok which would be inferred from the table above.
The preceeding reactivity values are the results of computer calculations. Critical experiments have shown that the required keff of 1.134 will be achieved with a core volume of 88 liters, with the atom density ratios as given above (4.24). This result is found to be almost independent of the precise core shape. With the fuel element cross sectional dimensions chosen, the fueled length is then 20.75 inches.
The contemplated use of the reactor will not call for appreciable reactivity changes caused by changes in experiments during operation. The total allowance for irradiation experiments is only 0.9 o/ok, and this must be divided between the three isotope (thermal) thimbles in the reflector and the four fast thimbles in and near the core.
4.6.6 CONTROL ROD WORTHS. The physical properties of the control rod blades are discussed in Section 4.3. A prototype control rod blade identical to those to be used in the HFBR has been tested in the critical experiments to establish the blade reactivity worth and calibration curve. The prototype blade was a main blade, as shown in Figure 4.7. The auxiliary control rod blade should have a reactivity effect very nearly the same as the main blade at corresponding positions. The effect of the stainless steel coupling block on the auxiliary blade may increase the auxiliary rod worth slightly.
The measured calibration curve for the prototype main rod is shown in Figure 4.25. The main rod stroke is 30 in., with the zero position at "fullout". As might be expected, the rate of reactivity change with rod insertion is smallest at the point of maximum withdrawal, where the blade tip is farthest from the top of the reactor core. The maximum differential worth occurs when the blade partly covers the side face of the reactor; over most of this interval the differential worth is nearly constant. Figure 4.25 is also assumed to be the calibration curve for a single auxiliary rod, over the portion of the stroke from 0 to 15 in.
The total reactivity worth of the prototype main blade is 3.82 %k. The calibration curve was measured with seven other main blades and eight auxiliary blades -placed around the mock-up core in simulation of the full reactor control rod configuration. These blades were cadmium-stainless steel blades of the same size and shape as the reactor blades. The calibration curve for the prototype main blade (Figure 4.25) thus includes shadowing effects. On the basis of the prototype calibration curve the total reactivity worth of the eight main rods is 30.5 %k. The worth of a single auxiliary blade is 0.87 %k, and the total worth of the eight auxiliary blades is 7.0 %k. The reactivity effect of all 16 control rods is 37.5 %k.

4 - 30
Of course, when reactivity worths of these magnitudes are discussed, the precise values become unreliable because of fundamental questions of definition. The values used here are based on the assumption of the continued validity of the point reactor model over the course of the transient experiments that measured the reactivity effects. The small size of the core, measured in terms of the migration length, implies that such an assumption is reasonable.
The substantial worth of the control rod blades is another result of the extermal moderation of neutrons. The sections of the blades in the top and bottom reflectors poison the moderator where it is most effective. Sections of blades covering the side faces of the reactor during shutdown intercept moderated neutrons on their way back to the core.
The reactor is seen to be shut down by a very substantial margin by all sixteen control rods, or by the eight main rods alone (see the table in Section 4.6.2). The least shutdown margin will exist with the fresh, unburned core. At that time, the shutdown margin of the cold, xenon-free reactor, with all rods inserted, will be 24.1 o/ok. The shutdown margin with all bottom rods withdrawn and only seven of the eight top rods inserted (stuck rod situation) will be 13.3 o/ok. Thus the HFBR will amply meet the stuck rod criterion. In fact, only four main rods of the total array of 8 main rods and 8 auxiliary rods are required to shut down the fresh, unburned core: the shutdown margin in this case is 1.88 %k. For the equilibrium core, only three main rods are required, the shutdown margin in this case being 1.06 %k.
The rod withdrawal speed is 4.3 inches/minute. Reactivity rate curves are shown in Figure 4.24. From these curves it is concluded that the maximum reactivity addition rate is caused by withdrawal of the main rod crown, and is 0.126 %k/second. However, this maximum rate occurs when the reactor is still subcritical. The reactivity addition rate by steady withdrawal of either rod crown just as the reactor becomes critical is 0.097 %k/sec for the fresh-fuel core and 0.083 %k/sec for the equilibrium core, both at the beginning of the cycle. These are the maximum reactivity addition rates from the rods which occur during operation of the critical reactor. The maximum rate at which reactivity will be changed by the automatic power level control system, which controls a single auxiliary blade, is 0.0116 %k/sec for both the fresh-fuel and equilibrium cores. In Figure 4.24, note that the curves apply to the main rods over the full 0 to 30 in. stroke, and to the auxiliary rods from rod positions 0 to 15 in.
4.6.7 REACTIVITY OF BEAM TUBES, THIMBLES, AND SUPPORT STRUCTURES. Critical assembly measurements have established the reactivity effects of the experimental facilities and the structural components that are of interest from the standpoint of reactor safety.
The beam tubes and irradiation thimbles are especially significant in this connection. It has been found that flooding a single tube or thimble with heavy water would increase the system reactivity by the amount shown in the following table:
Facility
Standard beam tube
Cold neutron facility
Central irradiation thimble
Core-edge irradiation thimble
Isotope irradiation thimble
Reactivity Effect from Flooding (dollars)
0.5C
negligible
0.85
0.24
negligible

4 - 31
The combined effect of flooding all beam tubes is found to be an increase in reactivity of 2.63 %k (3.37 dollars). This increase is amply covered by the large shutdown margin of the control rods, and the reactor would be subcritical even if a major system break were to flood the reactor vessel from the outside by filling the thermal shield cavity with heavy water.
Although it is not apparent how the reactivity effects of other structural components about the core might be of concern in connection with reactor safety, these reactivity effects have nevertheless been measured. They are all found to be smaller than the effect of flooding a central irradiation tube.
4.6.8 REACTIVITY EFFECTS IN FUEL HANDLING. At some stages in fuel loading, the shutdown margin will be less than at the fully loaded stage. This effect is caused by the highly undermoderated nature of the core. Removing some fuel elements from the interior of the reactor increases the reactivity by improving the internal neutron moderation. For this reason, critical experiments have been performed to determine the ability of the main control rods to keep the reactor subcritical regardless of the configuration of fuel elements in the core region (4.25).
These experiments have shown that the clean, cold, fully loaded reactor core can be held subcritical by any four of the eight main control rods. The most reactive configuration of fuel is that shown in Figure 4.26. Any five of the main control rods will hold this configuration subcritical. The critical experiments were performed with fuel elements similar to the unburned ones for HFBR. The holddown capability will improve even further as the U-235 burns and fission products are formed.
The increase in reactivity from the fully loaded core to the most reactive configuration (Figure 4.26) was found to be approximately 2 1ok. These studies have shown that the stuck rod criterion is more than amply met by the HFBR design, and that reactivity changes during fuel reloading are well within the capability of the control system.
4.6.9 TEMPERATURE AND VOID REACTIVITY COEFFICIENTS. There are three basic components in the temperature coefficient of reactivity. The thermal expansion of fuel plates causes an increase of metal volume fraction in the core, expelling D2o and reducing the amount of in-core neutron moderation; this leads to a small negative prompt coefficient. A slightly delayed moderator temperature coefficient is caused by expansion of D20 in the core with heating, with the sign of the effect being negative because of reduced in-core neutron moderation. A longer delay time (3.8 seconds) is associated with a strong negative reflector temperature coefficient. D20 that has passed through the core goes through the reflector on its way to the exit pipe, and so an increased heat flux in the core causes the reflector temperature to rise. The coefficient is large and negative because reduced density in the reflector leads to poorer neutron moderation in the fixed D20 volume, and also to higher net leakage of neutrons from the vessel.
These temperature coefficients have been calculated by multigroup computer methods (4.29) to be
Source
Fuel
Core D2o Reflector D2o
Uniform Coefficient (%k/°C)
-0.52xlo- 3
-6.7x10- 3
-17.2xlo- 3
4 - 32
The uniform core void coefficient was also found from multigroup computer calculations. It is -3.53xlo-4 o/ok/cm3 void. The temperature and void coefficients are negative everywhere in the core and reflector. The temperature coefficients of reactivity will be measured more accurately during the startup period, as discussed in Section 12. The uniform temperature coefficient of all components together will be found at low power by supplying non-nuclear heat. It is hoped that studies at higher power will allow a separation of the individual coefficients to be made.
The core temperature and void coefficients of the HFBR are comparable in size to those of other enriched uranium fueled reactors, in spite of the unusual feature of external neutron moderation. The large negative reflector temperature coefficient is an added feature of the HFBR.
4.6.10 XENON TRANSIENTS. The high power density in the HFBR leads to large xenon transients after shutdown. Figure 4.27 shows the expected transient reactivity loss caused by xenon buildup and decay following shutdown from steady operation at power levels ranging from 10 MW to 40 MW. The maximum reactivity held by xenon after shutdown from 40 MW is about 30 %k, about 10 hours after shutdown. The xenon transient analysis has been made by analog computer methods.
The time available for restarting the reactor after an unintentional shutdown will depend on the excess reactivity available by rod motion, and this in turn will depend on the time in the burnup cycle when the shutdown occurs. During the latter part of the cycle, it will not be possible to reverse a xenon transient that has begun because of shutdown from steady 40 MW operation. When restarting is desired and the transient cannot be reversed, it will be necessary to wait between 40 and 50 hours. Late in the cycle, it may be most convenient to consider fuel burnup to have progressed enough to justify partial core reloading in the normal manner.
4.6.11 INHERENT TRANSIENT RESPONSE OF THE REACTOR. Experiments have shown that in spite of the feature of external neutron moderation, the reactor has a conventional zero power transfer function. The measured neutron lifetime as found from transfer function measurements and from pulsed neutron studies is 672 µsec, which is in the range to be expected of heavy water reactors. It is concluded that the transient response to reactivity changes will follow the usual pattern for highly enriched uranium, o2o moderated reactors. It should also be noted that the core is small compared to the slowing down length and diffusion length of o2o. This assures that the power distribution will be rigid against spacial instabilities.
The expected transient behavior of the HFBR has been calculated in a number of levels of approximation (4.32). The physical models used have been reasonably successful in accounting for the details of transients with the light water moderated SPERT-III reactor. It is hoped that before HFBR startup there will be some appropriate transients of the heavy water moderated SPERT-II, with high velocity coolant flow through the core. While the power transient calculations for the HFBR are believed reliable, the conclusions which we draw as to the degree of damage to the core are thought to be quite pessimistic. The SPERT-II transients could shed light on this matter.
The models used analyze the time dependence of transient behavior on purely causal grounds. Heat generated in the fuel is distributed between fuel and water by film heat conduction. Transport of o2o through the core is taken into account. Feedback reactivity is supplied by heating of the fuel, the core o2o and the reflector o2o, with the amount established by the heat and power

4 - 33
equations and the space weighted reactivity coefficients. When the film temperature exceeds the boiling point of o2o, steam is produced according to an empirical description which has been found reasonably good in predicting the reactivity feedback from voids in SPERT reactors.
The degree of complexity needed in analyzing the transient behavior depends on the rate of change of reactor power. When the power does not change by large amounts in the time required for coolant o2o to traverse the core (about fifty milliseconds) the core parameters can be lumped. When the transient is faster, a three-dimensional model for heat transfer, heat transport, and buildup of reactivity compensation is needed. The calculations that have been done, therefore, range from simple analog computer studies that treat the reactor as a point, to IBM-7094 code calculations that treat the thermal and reactivity feedback problems in three dimensions in computing the time behavior of heat transfer, heat transport, and reactor power. The lumped parameters appropriate to the analog calculations were found by fitting the response in typical cases to digital computer calculated transients.
A set of survey calculations has established the effects of reactivity compensation alone in modifying the transient behavior of the reactor. Figures 4.28, 4.29, and 4.30 show typical calculated transients, assumed to be initiated from full power (this initial condition leads to the most severe results), with no safety rod action.
As discussed in Section 4.6.3, the power distribution in the core changes over the period of fuel burnup. The effect on the power history of transients is small, but there is an appreciable change in the fuel temperature at the hot spot, because of the altered uranium density. Each figure giving the results of step reactivity inputs shows the maximum fuel temperature, calculated for transients at the beginning of core life and also just after reloading in equilibrium fuel cycling. In the calculation of these temperature histories, all hot spot and hot channel factors were applied, and the possibility of burnout was neglected.
The amount of fuel damage from severe power transients cannot be predicted reliably, because little is known about transient burnout. The various SPERT plate-fueled reactors have all withstood excursions of several dollars without appreciable damage to the fuel elements. However, no SPERT assemblies have had the combination of long neutron lifetime and high coolant velocity that is characteristic of the HFBR. As the calculated transient histories show (c.f., Figures 4.28-4.30), the reactor power would change relatively slowly after a step reactivity input. This suggests that burnout might be likely in HFBR at transient power levels that SPERT assemblies studied so far could tolerate without damage.
The conservative view has, therefore, been taken that fuel damage might be expected at transient powers and temperatures which, if maintained, would lead to statistically significant probability of fuel plate burnout. The results of this view can be illustrated by referring to the previously mentioned calculations of transients caused by step reactivity inputs and not ended by rod insertion. At each time in the calculations, the instantaneous temperatures and heat fluxes were used to estimate the burnout ratio according to the Bernath correlation. The burnout ratio became equal to unity in the hot channels at the times and power levels indicated in the table below. Because of the sharp power peaking of HFBR, burnout in these tra~sients would be highly localized in the hot channels at the core edges. The amount of fuel melted, according to the conservative view adopted, would be small. The reactivity step needed to produce widespread fuel damage in the absence of safety rod action would be much

4 - 34
greater, in the neighborhood of two dollars.
New Core Equilibrium Core Reactivity Step Time Power Time Power
(dollars) (sec) (MW) (sec) (MW)
a.so 12.5 84.6
0.75 0.20 91.6 0.25 97.5
1.00 0.13 101.6 0.15 108.2
The same features that might make burnout likely in an uncontrolled transient act to reduce pressure buildup. SPERT experience has shown that transient pressures become sizable only at reactor periods of a few milliseconds, with violent steam production. The long neutron lifetime and the rapid removal of heat by the coolant in the HFBR imply that transient pressures could not be substantial unless very large step inputs of reactivity caused uncontrolled transients. Apart from the need to assume complete failure of the safety system if these transients are to be visualized, there is no credible mechanism for rapidly injecting reactivity of the amount needed to reach these short periods.
The transient characteristics that the study of the HFBR has established can be summarized as follows. The kinetic response is described by the usual time-dependent reactor theory, with reactivity feedback coefficients from core temperature and voids being approximately the same as those of other light or heavy water moderated research reactors. In addition, HFBR has a large negative delayed reflector coefficient which acts to stabilize the tail of the transients. A conservative view implies that uncontrolled transients from step reactivity inputs of between fifty cents and one dollar could cause localized fuel melting in the hot channels; this view may be relaxed if suitable SPERT-II transients show no damage.
4.6.12 EFFECTS OF H20 CONTAMINATION. Replacing all of the D20 in the reactor vessel with H20 would cause a substantial reactivity increase. Critical experiments have shown that the reflector control blades are not effective enough to hold the reactor subcritical if light water is used as the coolant and reflector material.
Increasing the H2o contamination causes the reactivity to change in two ways. There is a decrease in reactivity from poisoning the reflector, and there is a reactivity increase from improving the neutron moderation within the fueled region. The balance of effects can be seen in Figure 4.31, which shows the calculated variation of keff with light water concentration when all rods are withdrawn. At low concentrations, the dominant effect of light water is to reduce the reactivity through hydrogen capture in the reflector. As the H2o fraction is increased, the improved in-core moderation of neutrons becomes more pronounced, until at about 5% H20 content in the coolant the reactivity effects balance. Past this point, the effect of light water addition is to increase the reactivity gain over the pure n2o configuration (4.33).
Inserting the safety rods may itself be considered as poisoning the reflector and reducing its importance. Thus the reflector poisoning effect of light water contamination is reduced when safety rods are inserted. In this case, increasing the light water fraction causes a monotonic increase in reactivity, with the maximum value at 100 % light water.
A critical experiment designed to indicate the amount by which the light
4 - 35
water moderated and reflected reactor might be supercritical with all safety rod blades inserted gave results in approximate agreement with the calculations. Extrapolation based on the increase in multiplication with water addition indicated that the core would have been critical when the water height had approximately reached the core midplane. A repetition of the experiment with copper poison plates distributed among the fuel indicated that with full light water moderator and reflector the reactor would have been supercritical by 7 o/ok with all safety rods inserted (4.34).
4.6.13 DISSOLVED HELIUM REACTIVITY EFFECTS. The reactor primary system is pressurized by helium gas in the expansion volume at the top of the reactor vessel. Normal operating gas pressure is 200 psig. The gas is in contact with heavy water on the inlet side of the core, at a normal operating temperature of 120°F. Over the operating temperature range of the system, the solubility of helium in heavy water increases with temperature and pressure (4.35). As the cooling water passes through the core the helium solubility increases due to the bulk water temperature rise and decreases due to the pressure loss. The maximum reactivity effect from the precipitation of gaseous helium will occur at very low power levels, where the bulk temperature rise is essentially zero. If we assume no water temperature rise, take the core pressure drop at the full flow value, and assume that the inlet water is saturated with helium at 120°F and 200 psig, then the maximum possible helium precipitation leads to a void volume fraction of 1.37xlo-3 in the heavy water. The reactivity effect of the distributed gas void is more severe in the reflector than in the core. The reflector uniform void reactivity is 0.050 o/ok and the core uniform void reactivity is 0.022 %k, for a total effect of 0.072 o/ok (4.36).
The reactivity held by helium voids at full power is somewhat less than that given above because of the increased solubility at higher water temperatures. Because of the increase in water temperature with power, the power reactivity coefficient for the helium effect will be positive. The power coefficient is small, since the maximum possible change in reactivity is only 0.072 %k, or 9 cents, with the suppression of all void formation by temperature rise alone.
The reactivity effects introduced by helium bubbles will be smaller than the numbers quoted above because of the short cycle time for coolant flow through the primary system. Experiments done elsewhere indicate that the characteristic time for bubble growth is comparable to the passage time for the HFBR coolant from core inlet to the main pumps (where the pressure is increased and bubbles will redissolve). Further, the characteristic time for bubble growth is long compared to the passage time of the coolant through the core. These points indicate that the bubble void fraction to be expected in the core is much less than that assumed above, and that the void fraction in the reflector will also be less than that assumed, although by a smaller factor.
Since the precipitated helium in the coolant water will be distributed among many thousands of small bubbles, the fluctuation in void reactivity will be very much smaller than the total effect. A conservative estimate of the root mean square fluctuation in helium void reactivity, based on the maximum total effect numbers given above, is about 2x10⁻⁴ o/ok (4.36). The actual fluctuation is expected to be much smaller.
4.7 THERMAL AND HYDRAULIC DESIGN
4.7.1 CORE THERMAL DESIGN BASIS. The following criteria were involved in establishing the thermal design: (l) operate the reactor at the maximum permissible power density so that the maximum neutron flux is produced, and (2) avoid the need to develop advanced fuel elements by adopting the MTR-ETR

4 - 36
plate-type element design.
These criteria are satisfied at a total power level of 40 MW and a coolant velocity in the channels of the fuel elements of 35 ft/sec. A hot spot analysis was performed to determine the maximum surface temperature in the core and thus establish the system pressure required to suppress local boiling. In this hot spot analysis the conventional approach was taken of superimposing all the hot channel factors at one point or channel in the core. Table 4.7-1 gives a summary list of HFBR thermal characteristics.
Table 4.7-1 HFBR Thermal Characteristics
Reactor power, MW fission
Average power density, MW/liter
Peak power density, MW/liter: Fresh-fuel core, nominal Fresh-fuel core, with heat flux factor Equilibrium core, nominal Equilibrium core, with heat flux factor
Average convective heat flux, Btu/hr-ft2 :
Peak convective heat flux, Btu/hr-ft2 : Fresh-fuel core, nominal Fresh-fuel core, with heat flux factor Equilibrium core, nominal Equilibrium core, with heat flux factor
Over-all peak to average power density ratio: Fresh-fuel core Equilibrium core
Hot channel factors: Bulk water factor Heat flux factor Heat transfer coefficient factor
Maximum fuel plate-water interface temperature, °F: Fresh-fuel core Equilibrium core
Saturation temperature at hot spot, °F
Minimum burnout ratio: Fresh-fuel core, max. operating condition Fresh-fuel core, slow power increase Equilibrium core, max. operating condition Equilibrium core, slow power increase
*increases to 1.51 at ends of fuel alloy (dog-bone)
4.7.2 COOLANT FLOW CHARACTERISTICS
40
0.453
1.56 1.98 1.44 1.83
3.93xl05
l.26xl06 l.60x106
l.17xl06 l.48xlo6
3.44 3.18
1.35 1.27* 1.38
359 344
376
2.46 2.01 2.76 2.27
4.7.2.l Reactor Vessel Flow Rates. The fuel element flow rates are calculated in a straightforward manner from the known flow areas and specified average channel velocity. The bypass flow is a result of flow paths in parallel with the core and the pressure drop across these flow paths is essentially equal

4 - 37
to the core pressure drop (31,0 psi). The bypass flow rates at this pressure drop are determined by calculation or by measurements performed on mockups (4.37 and 4.38). A summary of the vessel flow rates and flow areas is given
below in Table 4.7-2.
Table 4.7-2 Flow Areas and Flow Rates
Flow areas, in.2: One element 28 elements (total core) Average channel Channel 1 or 18 (hot channel)
Equivalent diameters, in.: Average channel Channel 1 or 18
Fuel element flow rates (at 35 ft/sec), gpm: One element 28 elements
Bypass flow rates, gpm: Between fuel elements Control rod cooling, main rods (8)
, auxiliary rods (8) Control rod bypass (16) In-core facility (2) Core-edge facility (2)
Total reactor vessel flow rate, gpm
4.7039 131.7
0.2613 0.3139
0.2035 0.2424
513 14,370
150 380 640 960 60 40
16,600
4.7.2.2 Velocity Distribution. Experiments have been done to determine the velocity distribution in the HFBR fuel element. Measurements were made with a 1/16-in. O.D. pitot static type probe inserted into the channel from the bottom. Data were taken only at the center of each channel because reliable measurements could not be made close to the narrow sides of the channel. Listed in Table 4.7-3 are the relative velocities at the center of each channel.
4.7.3 HOT SPOT TEMPERATURE CALCULATION. Examination of the results of power distribution measurements in the HFBR critical experiments and of the flow distribution measurements in a test element indicates that the highest metal surface temperatures in the core will be in the fuel plate adjacent to the reflector in fuel element position C-5 (and by symmetry, C-6, C-12, and C-13). The element numbering code for the core is shown in Figure 4.32. The hot channel will be channel 1 or 18 depending upon the orientation of the element (see Figure 4.1). The calculational methods used to obtain the hot spot temperature are given in the following sections.
4.7.3.l Average Coolant Temperature Rise. The average temperature rise of the cooling water in the fuel elements is calculated as follows:

4 - 38
where
a conversion factor, 4.25xl05 Btu-gal/MW-ft3-min fraction of fission energy appearing as the thermal energy in the coolant, 0.95 (Section 4.7.5) total fission power, 40 MW total volumetric flow rate through fuel elements, 14,370 gpm average water density, 68.3 lb/ft3 specific heat, 1.0 Btu/lb-°F
With the numberical values, the average cooling water temperature rise in the fuel elements is 16.5°F.
Table 4.7-3 Relative Coolant Velocity in Channels of the HFBR Element
Channel
1 2 3 4 5 6 7 8 9
10 11 12 13 14 15 16 17 18
Channel Width, in.
0.129 0.116 0.108 0.102
0.108 0.116 0.129
Relative Velocity
1.05 1.03 1.00 0.98 0.98 1.00 1.00 1.01 0.98 0.99 0.98 0.99 0.98 0.98 1.00 1.00 1.01 1.04
4.7.3.2 Coolant Temperature Rise in Hot Channel. In this analysis the peak power densities in the hot channel are used and mixing of the coolant across the width of the channel is assumed negligible. The coolant temperature rise to axial position z in the hot channel is calculated as follows:
where
L w
hot channel factor for bulk rise, 1.35 (Section 4.7.4) axial distance measured from top of fuel section, in. normalized peak power density at position z in the hot channel, average of peak density in the two fuel plates adjoining the hot channel, Figures 4.33 and 4.34 length of fuel alloy, 20.75 in. nominal mass flow rate in channel 1 or 18 relative to the flow rate in the average channel, 1.25

4 - 39
Note that the coordinate "z" in the thermal analysis runs from zero at the top of the fuel to 20.75 in. at the bottom of the fuel. The power density curves shown in Figures 4.33 and 4.34 are symmetrical about the horizontal midplane of the core, and are given in terms of the distance from the midplane. The curves F(z) in Figures 4.33 and 4.34 are the same as those in Figure 4.22. for the equilibrium core and the freshly-fueled core, both at startup. The curves F(z) give the normalized power density averaged between the two fuel plates which contribute energy to the hot channel. Both sets of curves, F(z) and F(z), refer to the "hot corner" of the hot channel, and no credit is taken for the decrease in power generation across the width of the hot channel. The magnitude of this decrease may be seen in Figures 4.19 and 4.20: it is roughly a factor of 2. Any mixing which occurs in the coolant stream across the width of the hot channel will decrease the bulk water temperature rise as calculated above. Since it is difficult to assess the degree of mixing, we choose the conservative approach and assume the mixing to be negligible.
The bulk water temperature is shown in the lower curves of Figures 4.35 and 4.36 for equilibrium and freshly-fueled cores. In these graphs the inlet water temperature is taken at 125°F, to account for a maximum temperature measurement error of 5°F (see Section 4.7.4.8). The bulk water temperature rise at a position z in the channel may be obtained from Figures 4.35 and 4.36 by subtracting the 125°F inlet condition from the value given for distance z. For the equilibrium core the total hot channel, hot corner bulk rise is 48°F, and the rise to the core midplane is 24°F. For the freshly-fueled core the corresponding values are 52°F and 26°F.
4.7.3.3 Heat Flux. The maximum heat flux at position z in the hot plate is
Where
cp (z) 2
, Btu/hr-ft
a conversion factor, 3.412xl06 Btu/hr-MW normalized peak power density at position z in the hot plate, Figures 4.33 and 4.34 reactor fission power, 40 MW hot channel heat flux factor (see Section 4.7.4) fraction of fission energy deposited directly at the site of fission, 0.853 (Section 4.7.5) heat flux at the hot spot due to gamma ray energy deposition in metal, 3.7xl04 Btu/hr-ft 2 at 40 MW (Section 4.7.5) total heat transfer area in core based on fuel width, 327 ft2
The maximum heat flux is of particular interest at two locations in the hot fuel plate and for both equilibrium and freshly-fueled cores. The two locations are both at the "hot corner", the first at the midplane of the core, where the power density is a maximum, and the second at the top or bottom of the core, where a local thickening of the fuel alloy (known as "dogboning") gives a maximum hot channel heat flux factor. The heat flux factor, Fq, is 1.27 for the midplane location and 1.51 for the dogbone area (see Section 4.7.4). The normalized peak power density values, F(z), are 3.18 and 2.38 for the equilibrium core at center and dogbone, respectively. The corresponding values for the fresh-fuel core are 3.44 and 2.72. With these numerical values the maximum fluxes are as given in Table 4.7-4. The end of cycle heat fluxes have been added to Table 4.7-4 for comparison. The nominal heat fluxes at the core midplane or top or bottom may be obtained from Table 4.7-4 by dividing by the heat flux hot channel factors; 1.27 for the midplane and 1.51 for the top

4 - 40
or bottom of the core.
Table 4.7-4 Heat Fluxes at the Hot Corner of the Hot Fuel Plate
Start of cycle: Core midplane Core top or bottom, at dogbone
End of cycle: Core midplane Core top or bottom, at dogbone
Equilibrium Core (Btu/hr-ft2)
l.48xl06 l.32xl06
l.05x106 l.09xl06
Fresh-Fuel Core (Btu/hr-ft2)
l.60xl06 1.5lxl06
l.20xl06 l.25xl06
4.7.3.4 Heat Transfer Coefficient. The heat transfer coefficient is calculated by the modified Colburn correlation (4.39):
0.023 [~] 0.8
f [¥] 0.3
f
where
h = heat transfer coefficient, Btu/hr-ft2-0 p De equivalent diameter, 0.0202 ft for channels 1 and 18 k thermal conductivity of coolant, Btu/hr-ft-°F, Figure 5.6 V coolant velocity, l.3xlo5 ft/hr for channels 1 and 18 p coolant density, lb/ft3, Figure 5.4 µ coolant viscosity, lb/ft-hr, Figure 5.6 Cp specific heat, Btu/lb-°F, Figure 5.5
The subscript f means that the properties are evaluated at the film temperature. The film temperature is taken to be the average of the heat transfer surface temperature and the bulk water temperature. Figure 4.37 gives the heat transfer coefficient in the hot channel as a function of the film temperature.
4.7.3.5 Film Temperature Rise. The temperature difference between the fuel plate surface and the bulk water in the hot channel is given by
where
cp (z)
Fh h
' Op
heat flux, Section 4.7.3.3 hot channel heat transfer coefficient factor, 1.38 (Section 4.7.4) heat transfer coefficient, calculated from the modified Colburn correlation, Figure 4.37
Since the heat transfer coefficient is itself a function of the film temperature rise, the calculation of this term is an iterative process. Values of the film temperature rise, or "film drop" are given in Table 4.7-5 for several positions of interest in the hot channel.
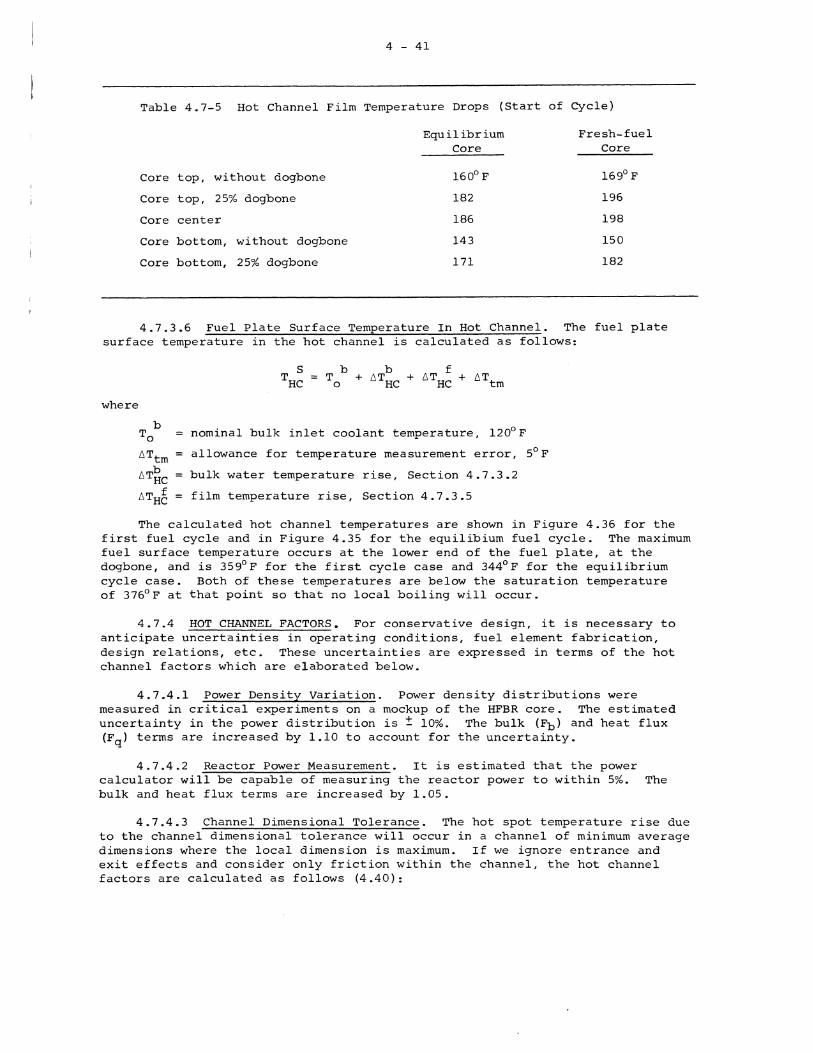
4 - 41
Table 4.7-5 Hot Channel Film Temperature Drops {Start of Cycle)
Equilibrium Fresh-fuel Core Core
Core top, without dogbone 160°F 169°F
Core top, 25% dog bone 182 196
Core center 186 198
Core bottom, without dogbone 143 150
Core bottom, 25% dogbone 171 182
4.7.3.6 Fuel Plate Surface Temperature In Hot Channel. The fuel plate surface temperature in the hot channel is calculated as follows:
where
nominal bulk inlet coolant temperature, 120°F
allowance for temperature measurement error, 5°F
bulk water temperature rise, Section 4.7.3.2
film temperature rise, Section 4.7.3.5
The calculated hot channel temperatures are shown in Figure 4.36 for the first fuel cycle and in Figure 4.35 for the equilibium fuel cycle. The maximum fuel surface temperature occurs at the lower end of the fuel plate, at the dogbone, and is 359°F for the first cycle case and 344°F for the equilibrium cycle case. Both of these temperatures are below the saturation temperature of 376°F at that point so that no local boiling will occur.
4.7.4 HOT CHANNEL FACTORS. For conservative design, it is necessary to anticipate uncertainties in operating conditions, fuel element fabrication, design relations, etc. These uncertainties are expressed in terms of the hot channel factors which are elaborated below.
4.7.4.1 Power Density variation. Power density distributions were measured in critical experiments on a mockup of the HFBR core. The estimated uncertainty in the power distribution is ± 10%. The bulk {Fb) and heat flux (Fq) terms are increased by 1.10 to account for the uncertainty.
4.7.4.2 Reactor Power Measurement. It is estimated that the power calculator will be capable of measuring the reactor power to within 5%. The bulk and heat flux terms are increased.by 1.05.
4.7.4.3 Channel Dimensional Tolerance. The hot spot temperature rise due to the channel dimensional tolerance will occur in a channel of minimum average dimensions where the local dimension is maximum. If we ignore entrance and exit effects and consider only friction within the channel, the hot channel factors are calculated as follows (4.40):

4 - 42
( ) 5./3
Fb : :~: F S ( : ::: } ( : :~: ) 1/3
d channel thickness nom refers to nominal value min refers to minimum value max refers to maximum local value in channel of minimum average
dimension
The channel thickness of channel 1 or 18 is 0.129 in. with a maximum tolerance of± 0.005 in. These dimensions yield values of 1.066 for the bulk term and 1.09 for the heat transfer coefficient term.
4.7.4.4 Velocity Distribution Measurement Error. The precision of the velocity distribution measurements was ± 4%. Since velocity is proportional to the square root of the measured quantity (velocity head) the uncertainty in velocity is ± 2%. This increases the bulk term by 1.02 and the heat transfer coefficient term by 1.016.
4.7.4.5 Velocity Variation Within A Channel. The channel coolant velocity of concern is the velocity at a distance of 0.075 in. from the sides of each channel. The 0.075 in. dimension is the minimum distance between the fuel edge and the element side plate. Further, the power density peaks at the fuel edge, so that this location is the "hot corner" referred to above. Because of the difficulty experienced in measuring the velocity at the sides of the channels in the HFBR element tests, the velocity distribution data reported (4.41) for a modified ETR element with unequal plate spacing is used as a guide. The velocity at a distance of 0.075 in. from the side of each ETR channel was not less than 0.95 of the average velocity in that channel. The velocity variation increases the bulk term by 1.05 and the heat transfer coefficient term by 1.04.
4.7.4.6 Fuel Core Alloy Variation. The total fuel content of each fully loaded (thin) fuel plate is 15.2 ± 0.3 gm U-235. The half-loaded end plates have a U-235 content of 7.6 ± 0.2 gm. The allowable variation then is 2% for the thin plate and 2.6% for the end plate. The bulk term is accordingly increased by 1.026 to account for variations in the total energy generation in a fuel plate due to U-235 loading.
Local variations in fuel loading are limited to ± 5% by the specification of fuel alloy final thickness at 0.020 ± 0.001 in. The thickness specification can be met without great difficulty by the fuel fabricator except at the ends of the plate. Here the fuel alloy develops a local thickened region in the rolling process. The thickened section is generally of short length, two to four times the nominal meat thickness. It is called the "dogbone". The fuel specifications for HFBR elements limit the total dogbone thickness to 0.022 in. for standard plates and 0.011 in. for end plates, or 10% over nominal, and production tests are currently in process on this basis. The dogbone thickness is a s~nsitive item in the hot spot analysis, however, and it has seemed prudent to base this analysis on a less optimistic estimate of the fabricator's skill. We have, therefore, assumed a dogbone region maximum thickness of 25% above the nominal meat thickness for all plates.
The fuel alloy thickness variation is combined with the dimensional tolerances on width and length (hence heat transfer area). The allowable variation in the core heat transfer area is ± 4.6%. Thus, the heat flux term is increased by 1.10 (l.05xl.046) everywhere except at the ends of fuel where it is increased by 1.31 (l.25xl.046).
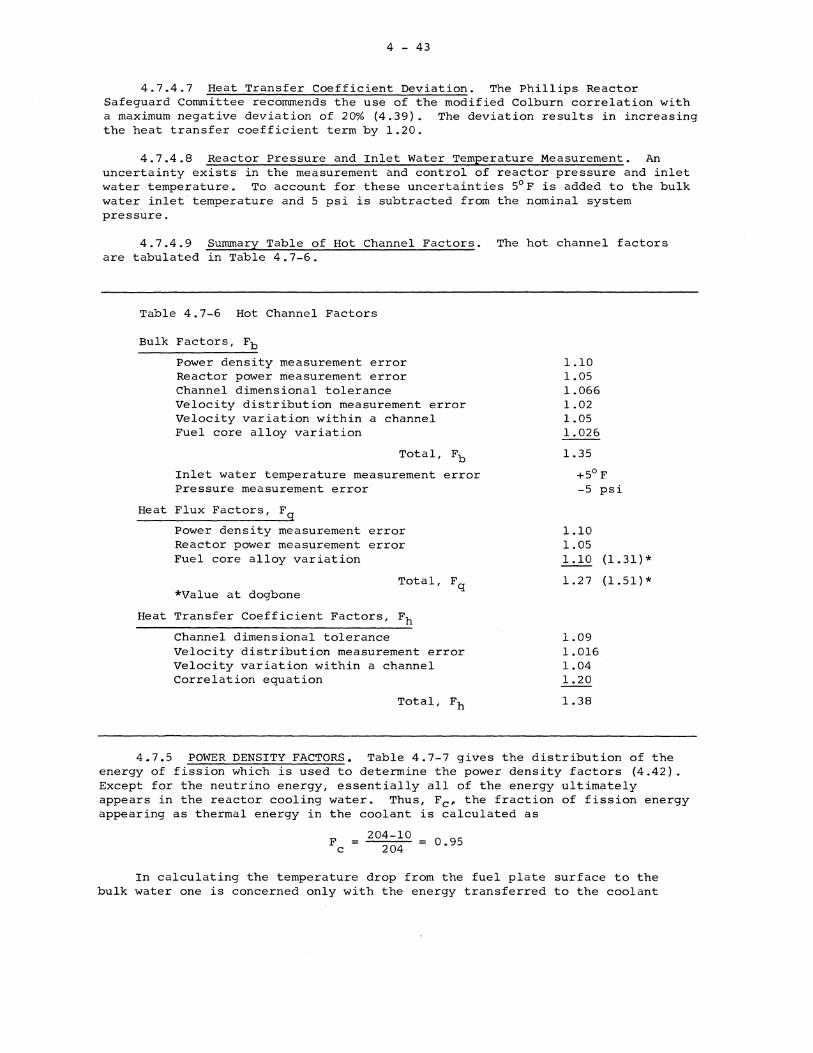
4 - 43
4.7.4.7 Heat Transfer Coefficient Deviation. The Phillips Reactor Safeguard Committee recommends the use of the modified Colburn correlation with a maximum negative deviation of 20% (4.39). The deviation results in increasing the heat transfer coefficient term by 1.20.
4.7.4.8 Reactor Pressure and Inlet Water Temperature Measurement. An uncertainty exists in the measurement and control of reactor pressure and inlet water temperature. To account for these uncertainties 5°F is added to the bulk water inlet temperature and 5 psi is subtracted from the nominal system pressure.
4.7.4.9 Summary Table of Hot Channel Factors. The hot channel factors are tabulated in Table 4.7-6.
Table 4.7-6 Hot Channel Factors
Bulk Factors, Fb
Power density measurement error Reactor power measurement error Channel dimensional tolerance Velocity distribution measurement error Velocity variation within a channel Fuel core alloy variation
Total, Fb
Inlet water temperature measurement error Pressure measurement error
Heat Flux Factors, F9
Power density measurement error Reactor power measurement error Fuel core alloy variation
*Value at dogbone Total, Fq
Heat Transfer Coefficient Factors, Fh
Channel dimensional tolerance Velocity distribution measurement error Velocity variation within a channel Correlation equation
Total, Fh
1.10 1.05 1.066 1.02 1.05 1.026
1.35
+5°F -5 psi
1.10 1.05 1.10 (1.31) *
1.27 (1.51)*
1.09 1.016 1.04 1.20
1.38
4.7.5 POWER DENSITY FACTORS. Table 4.7-7 gives the distribution of the energy of fission which is used to determine the power density factors (4.42). Except for the neutrino energy, essentially all of the energy ultimately appears in the reactor cooling water. Thus, Fe• the fraction of fission energy appearing as thermal energy in the coolant is calculated as
F c
204-10 = 0.95 204
In calculating the temperature drop from the fuel plate surface to the bulk water one is concerned only with the energy transferred to the coolant

4 - 44
by convection. This energy is the sum of the fission fragment and beta decay energies and some fraction of the gamma ray and fast neutron energies. Fa, the fraction of fission energy which is deposited directly at the fission site is calculated as
174 204
0.853
The distribution of gamma ray and fast neutron energies deposited in the core metal is not the same as the fission energy distribution. The gamma ray contribution is determined from gamma heating measurement made on the HFBR critical assembly, and therefore includes both the fission gamma rays listed above and the capture gamma rays. The gamma heat~ng rate at the edge of the core (the hot spot location) is 3.2xl06 Btu/hr-ft (4.25) at a 40 MW power level. Since the hot spot is on the inside surface of the 0.140-in. thick end plate the heat flux due to gamma capture is
3.2 x 206 x 0 -~~o = 3.7 x 10⁴ Btu/hr-ft2
In this calculation heat transfer to the reflector water from the thick end plate is neglected. The fraction of fast neutron kinetic energy deposited in core metal is estimated to be 5%. This represents a negligible fraction of the total fission energy and is neglected.
Table 4.7-7 Table of Energy Distribution in U-235 Fission
Energy deposited at the site of fission (fission fragment kinetic energy and beta decay energy)
Total gamma ray energy
Fast neutron kinetic energy
Neutrino energy
Total
174 Mev
15
5
10
204
4.7.6 CLADDING AND FUEL TEMPERATURE. The formation of a layer of boehmite (aA1 2o3 ·H20) on the fuel plate cladding will increase the temperature of the cladding and fuel. The rate of formation of the oxide layer was measured by Griess, et al. (4.5) under conditions similar to those in the HFBR core and was found to be a function of the temperature of the oxide-water interface (see Section 4.2.7). The oxide layer thickness was found to be given by the following equation:
where
x 443(t) •778 exp (-4600/T) , mils
X oxide layer thickness in mils (1 mil = 0.001 in.) t exposure time, hours T oxide-water interface temperature, °K
The maximum interface temperature in the HFBR core is found at the hot corner of the hot channel, for the startup power distribution in a freshlyfueled core. This temperature is 359°F, with all hot channel factors at "worst" values. As the cycle goes on, the temperature at this hot spot

4 - 45
decreases. The heat flux decreases from l.5lxlo6 Btu/hr-ft2 at the beginning to l.25xl06 Btu/hr-ft2 at the end of the fresh-fuel cycle (19 days). The hot spot temperature is 325°F at the end of the cycle. Taking an effective average hot spot temperature for the 19 days of 350°F, and using the oxide thickness equation above, the oxide thickness at the end of the cycle is 0.0019 in. With a thermal conductivity of 1.3 Btu/hr-ft-°F for the oxide (4.5 and 4.43), the oxide temperature drop is 152°F and the metal temperature is 477°F at maximum accumulation.
The high temperature region is small since the power peaking at the hot spot is quite sharp. Further, the maximum metal surface temperature of 477°F · requires that all possible variations in element dimensions, flow conditions, and fuel alloy distribution be at the worst values for a fresh-fuel loading. The fresh-fuel loading itself is a rare condition, occurring perhaps once every year to two years, so that the full combination of circumstances may never occur in the life of the reactor.
The calculation of oxide buildup and metal temperatures for the equilibrium core case involves consideration of 19 days operation with the fuel element in a core interior position followed by 19 days in an exterior position. The hot spot, with maximum oxide buildup, is again at the lower dogbone in the outer plate. The element position is at C-18 for the first 19 days and at C-5 for the second 19 days (see Figure 4.32). All hot channel factors are applied to both positions. In the C-18 position the hot spot average heat flux is 0.8ox106 Btu/hr-ft2 and the average oxide-water interface temperature is 260°F. The oxide accumulation in 19 days is 0.0005 in. Moving to position C-5, the hot· spot heat fluxes at the beginning and end of the cycle are l.32xl06 and l.09xl06 Btu/hr-ft2. The oxide-water interface temperatures are 344°F and 300°F (beginning and end of cycle). An effective average interface temperature of 333°F gives an oxide accumulation of 0.0015 in. The total oxide thickness is then 0.0020 in., and the end of life oxide temperature drop is 140°F. The corresponding metal surface temperature is 440°F. As noted above for the fresh-fuel case, the high temperature region is small in size and the maximum temperature occurs only when all hot channel parameters combine in the worst condition.
4.7.7 STEADY STATE BURNOUT ANALYSIS. A survey of existing methods of burnout prediction in subcooled liquids reveals that a correlation developed by Mirshak, Durant and Towell (4.44) is based on data which comes closest to matching the proposed operating conditions of the HFBR. Listed in Table 4.7-8 is a comparison of the range of variables covered in the experimental work with the HFBR conditions.
Since the pressure and subcooling ranges for the HFBR fall outside the range of the Mirshak data, the direct use of the Mirshak correlation for burnout prediction in HFBR is not indicated. Instead, several more generalized burnout formulae are tested against the Mirshak correlation to find the generalized equation which, with an appropriate safety factor, is best suited for estimating the burnout heat flux under HFBR conditions.
To date the only correlations which have been tested against a reasonable variety of Data and whose ranges include the HFBR operating conditions are those of Bernath (4.45), Menegus (4.46), and Gambill (4.47). In testing these equations against the Mirshak correlation, the values of subcooling and pressure were chosen so as to minimize the subsequent extension to the HFBR conditions. The values chosen were 74°c and 85 psia. Table 4.7-9 gives the results of this comparison. Safety factors have not been applied to the numbers in the table.

4 - 46
Table 4.7-8 Comparison of Burnout Variables
Variables
Velocity, ft/sec
Sub cooling, ° C
Pressure, psia
Equivalent diameter, in.
Geometry
Flow of coolant
Mirshak* Data
5-42
6-74
25-85 0.239-0.467
rectangular
downward
*The annular geometry data are not included here.
Table 4.7-9 Comparison of Burnout Correlations
HFBR
36.4
-100-130
~190
0.242
essentially rectangular
downward
Correlation Burnout Heat Flux, Btu/hr-ft2
Mirshak 3.95xl06
Bernath 4.03x10⁶
Menegus 3.15x10⁶
Gambill 4.05xl06
Since both the Bernath and Gambill correlations predict burnout heat fluxes which are reasonably close to the Mirshak value, either one should be applicable under HFBR conditions. The Bernath correlation is selected because it is somewhat simpler to use. A safety factor of 1.4 is applied to the Bernath correlation for use on HFBR burnout conditions.
The Bernath equation is (without safety factor)
where
~o T
w
~o De
Di
v p
2 , Btu/hr-ft
10,890 De/(De+Di) + 48V/De 0 •6 , Btu/hr-ft2-°F
102.6 ln P - 97.2P/(P+l5) - V/2.22 + 32 , °F
heat flux at burnout, Btu/hr-ft2
equivalent diameter, 0.0194 ft
"heated diameter", the heated perimeter divided by 'Ir, 0.199 ft
coolant velocity, 33.4 ft/sec
pressure, 187 psia
bulk coolant temperature, °F

4 - 47
The coolant velocity used here, 33.4 ft/sec, is less than the nominal velocity in channels 1 and 18, .36.4 ft/sec, by the channel dimensional tolerance and velocity distribution measurement error hot channel factors, 1.066 and 1.02. The equivalent diameter of the channel is also reduced from the nominal value, 0.0202 ft, to cover hot channel variations. With the numerical values given above, and with the correlation safety factor of 1.4 applied, the Bernath equation, reduces to the simple form
cpbo 12,860 2
, Btu/hr-ft
The Bernath equation is used to compute the burnout heat fluxes at the maximum heat flux operating conditions, i.e., at the beginning of the operating cycle for both the equilibrium core and the fresh-fuel core. The results are given in Table 4.7-10. Comparison of the burnout heat fluxes in Table 4.7-10 to the maximum operating heat fluxes in Table 4.7-4 gives the burnout ratios listed.
Table 4.7-10 Burnout Heat Fluxes and Burnout Ratios for Start of Cycle Operating Conditions
b THC 'Pho 2
(° F) (Btu/hr-ft )
Equilibrium core: 4.08xl06 Core midplane 149
Lower dogbone 173 3. 77xl06
Fresh-fuel core: Core midplane 151 4.05xl06 Lower dogbone 177 3. 72xl06
Burnout Ratio
2.76 2.86
2.53 2.46
The burnout ratios in Table 4.7-10 show the margin between possible burnout and the maximum operating conditions at the critical points in the core. The burnout ratios do not represent the factor by which the reactor power could be increased without burnout, since a power increase raises the bulk water temperature and decreases the burnout heat flux. To obtain the power increase burnout ratios we assume a gradual rise in power level with a proportional increase in bulk water temperature and heat flux. The core pressure, flow rate, and inlet temperature remain constant. For a given location in the core, the ratio of heat flux to bulk water temperature rise is independent of power level (but not of time during the cycle since the power distribution changes). Calling this ratio "K" the heat flux at burnout is given by
6 cpbo = (4.385xl0 )/(1+12,860/K)
2 , Btu/hr-ft
Values of K, the burnout heat flux, and the burnout ratio are given in Table 4.7-11 for the maximum heat flux location (core midplane) and the maximum surface temperature location in the hot channel. The table applies to the beginning of the equilibrium cycle and the beginning of the fresh-fuel cycle, at which times the power peaking is at a maximum.
4.7.8 GAMMA HEATING. Critical experiment data (4.25) on the gamma heating rates in the reflector, extrapolated to full reactor power, are shown in Figure 4.38. The heating rates shown are 1/2 to 2/3 the rates assumed for

4 - 48
Table 4.7-11 Burnout Heat Fluxes and Burnout Ratios for a Slow Power Rise at the Start of the Operating Cycle
K ~bo Burnout
Btu/hr-ft 2
Ratio
Equilibrium core: 6.17xlo4 3.63xl06 Core midplane 2.45
Lower dogbone 2.75xl04 2.99xl06 2.27
Fresh-fuel core: Core midplane 6.15xl04 3.63xlo6 2.27 Lower dogbone 2.90xl04 3.04xl06 2.01
the design of the reactor vessel (compare Figure 5.22). The heating rates shown in Figure 4.38 apply to small samples, or to larger aggregates of materials such as aluminum, graphite, or water which have relatively low neutron capture cross sections. For large volumes of high cross section material, such as stainless steel, the energy generated in the material by neutron capture must be added to the data shown in Figure 4.38. The gamma ray energy flux from the core is shown in Figure 4.39, as a function of distance from the core-reflector boundary.
4.7.9 FISSION PRODUCT AFTERHEAT. The fission product afterheat rates are based on a recent study by Shure (4.48). The total fission product energy release rate and the gamma energy release rate are shown in Figure 4.40 for a full HFBR core following operation at 40 MW for 38 days. In Figure 4.41 the total energy release rate is displayed for a single fuel element exposed for 38 days in the maximum power location. The total afterheat energy generated from reactor shutdown to any given time is shown in Figure 4.42. In addition to the fission product decay energy, there is a small shutdown fission rate contribution to the total energy generation. The shutdown fission rate amounts to only a few percent of the fission product afterheat rate, as is shown in Figure 4.42. The magnitude of the shutdown fission rate may be judged from Figure 4.43, which shows the fractional neutron population in the reactor as a function of the time after shutdown and of the shutdown reactivity margin. Figure 4.43 is based on the full fission product inventory (hence the photoneutron production) for an equilibrium core at the end of the operating cycle.
4.7.10 PRESSURE DROP IN REACTOR VESSEL. The coolant pressure losses in the HFBR core have been calculated from standard formulae and the results compared with a measured pressure loss using a test element (4.49). The measured pressure loss, corrected for the density difference between light and heavy water, is 30.2 psi. The calculated value is 31.0 psi. The calculated value (31.0) has been used in the flow analysis as the best conservative estimate of the pressure drop across the core at an average channel coolant velocity of 35 ft/sec. Additional losses in the remainder of the water circuit within the vessel add up to 2.2 psi and give a total frictional pressure loss of 33.2 psi from inlet to outlet of the reactor vessel.
The primary piping and heat exchangers have a total pressure loss of 17.4 psi~ this, together with the vessel drop and an allowance of 18.4 psi across the main throttle valves give a total primary system pressure drop of 69 psi at the normal flow rate. System pressures are established on the basis

4 - 49
of a cover gas pressure of 200 psig, which leads to ample pressurization at the core hot spot to suppress local boiling (see Section 5.4.1).
4.7.11 PRIMARY FLOW COASTDOWN. In normal operation of the reactor plant the primary coolant flow is established before the reactor is brought to power. Similarly, the full coolant flow is maintained for some time after the reactor is shut down. It is necessary to consider, however, those abnormal conditions in which a failure of electrical power to the plant causes the main pumps and reactor to shut down. The matters to be considered are the coastdown time of the primary coolant to the shutdown cooling flow level and whether local or bulk boiling occurs during the transient.
Early calculations indicated that without any additional mechanical inertia supplied to the primary system, coastdown to the shutdown flow level, 800 gpm, would take place in about 14 seconds. Downflow stability tests conducted in a single test channel at atmospheric pressure revealed that flow instability could occur in the hottest channel up to about 14 seconds after reactor shutdown. By adding mechanical inertia in the form of flywheels coupled to the main pump motors, the coastdown time to 800 gpm was extended to 45 seconds and the stability of the downward flow in the hot channel during the coastdown was thus assured (4.50). The primary flow coastdown curve is shown in Figure 5.10 in Section 5.
During the first phase of. the coastdown transient, from the time electrical power failure occurs until control rods are driven into the core (0.2 seconds), the hot spot temperature rises 11°F, from 359°F to 370°F (4.50). In this calculation the freshly-fueled core is treated as though the full end of equilibrium cycle fission product inventory was present in the fuel alloy. This is obviously not the case, but the calculation sets an upper limit on the hot spot temperature rise. For the equilibrium core, again with the assumption of full fission product inventory, the hot spot temperature rises 10°F in the transient, from 344°F to 354°F. After the nuclear shutdown the hot spot temperature falls rapidly into the range 140-160°F due to the large heat exchange rate in the primary coolers while the flow is coasting down. After the system flow rate settles down at the 800 gpm shutdown level, the hot spot temperature and the primary bulk water temperature rise to post-shutdown maximum values of about 235°F and 140°F, respectively. The bulk water maximum temperature occurs about 20 minutes after shutdown. Thereafter both temperatures decrease again as the afterheat rate decreases. Since the saturation temperature at the hot spot is 376°F throughout the transient, no boiling of any kind takes place.
4.7.12 SHUTDOWN COOLING FLOW. The shutdown cooling flow rate is 800 gpm. This flow is provided by either one of two shutdown pumps. The heat is removed in a separate heat exchanger (see Section 7.1). The shutdown pumps have three sources of electrical power; the normal supply, an emergency power generator set driven by a propane engine, and a storage battery bank. One of the shutdown pumps is in operation at all times, so that on failure of the main pumps the primary coolant flow coasts down only to the 800 gpm shutdown level.
The downflow of water in a heated test section was examined experimentally (4.51) to see if there is any danger of flow instability in the hottest channel in the core at the 800 gpm level. The tests show that no such instability exists, even if the vessel were accidentally depressurized and near atmospheric conditions existed in the core (4.50).
4.7.13 FLOW REVERSAL AND NATURAL CIRCULATION. In the event of failure of all forced flow cooling through the reactor core, the opening of flow reversal valves in the transition plate above the core provides a low resistance return

4 - 50
path around the core so that natural circulation cooling can be established (see Section 7.2). Complete power failure also causes the reactor vessel to
be depressurized through a vent valve in the helium system. The depressurization is done because calculations indicated that the margin to burnout in flow reversal and natural circulation is somewhat greater with the resulting static head than at full system pressure (4.50).
Under normal flow conditions the flow reversal valves are maintained closed by the pressure drop developed across any one of the main or shutdown pumps. The flow reversal valves will open when the pressure drop across the core falls below 3 psi (see Section 7.2.2). As the flow rate falls below the shutdown level it will reach a value at which the head opposing downflow due to thermal buoyancy becomes comparable to friction losses in the core. At this point flow reversal will occur. Since the afterheat at this time may be fairly large, boiling in the core commences and provides the driving force for reverse flow. The reverse flow circuit is completed by water flow through the flow reversal valves into the reflector region and back to the bottom of the core.
During the natural circulation boiling existing after flow reversal, the steam generated in the fuel element channels condenses in the water column above the core, thereby producing an increase in the temperature of the water in the entire reactor vessel. After some time the water temperature increases to approximately the atmospheric boiling point and net steam generation occurs. Steam rates and makeup water requirements for various natural circulation situations are discussed in Section 7.2.5.
Since little information exists in the literature on flow reversal or on natural circulation in channels with a flow restriction in the return leg, a series of experiments (4.52) were carried out to determine the feasibility of the system. The tests were performed with electrically heated nickel channels representing the core, a ball valve and orifice representing the flow reversal valves, and auxiliary piping and equipment to simulate other pertinent structure in the reactor vessel. The maximum heat flux in the core during flow reversal is 25,000 Bt/hr-ft2 , and the adiabatic plate temperature rise is 91°F/sec. The flow reversal tests were carried out to a heat flux of 46,700 Btu/hr-ft2 , at an adiabatic rise of 96°F/sec, with a slightly smaller channel size (.0156 ft equivalent diameter vs •• 0202 for the HFBR hot channel).
The results of the tests (4.50, 4.52, and 4.53) show that:
(1) Flow reversal will occur without burnout under the anticipated worst conditions,
(2) The removal of fission product decay heat by the natural circulation boiling regime which follows flow reversal can continue for an indefinitely long time without burnout,
(3) If all of the flow reversal valves fail to open on demand, burnout will probably occur, and
(4) The failure of one of the four flow reversal valves will not prevent the safe reversal of flow.
The maximum temperatures which occur during the flow reversal and natural circulation cooling occur in the fraction of a second between the onset of the failure of forced flow and the shutdown of the reactor. The situation here is the same as that discussed in Section 4.7.11, and the hot spot temperatures are the same, 370°F for the freshly-fueled core and 354°F for the equilibrium core. The hot spot temperatures decrease during the coastdown and flow reversal phases to values a few degrees (i.e., 20 to 30°F) above the atmospheric boiling point.
f

4 - 51
4.7.14 CONTROL ROD HEATING. Aside from the fuel elements themselves, the highest heating rates in the reactor are encountered in the control rods. The control blades are sometimes close to the core in the strong gamma field, and in addition capture many neutrons with resulting energy generation. The axial variation in the neutron current into a control blade has been measured and the results given in Figure 4.12. The poison material used in the high absorption rat~ ends of the blades is europium, which yields energetic gamma rays following neutron capture. The control blade heating is then due to both the core gamma flux and to the gamma flux from neutron absorption in the blade. The partial and total heat generation rates are shown in Figure 4.44.
The heat generated in the blades is transferred to the water flowing in the internal channels by forced convection and to the reflector water by natural convection. The forced convection cooling is more efficient and most of the heat generated in the blade is removed by the internal flow (4.54).
Cooling water enters the interior of the main blade through an orifice at the top of the internal channel. Since the top of the main blade is always above the transition plate, while the lower end (and the discharge end of the cooling channel) is in the reflector, the cooling water flow is driven by the core pressure drop. The orifice at the top of the channel limits the flow to about 48 gpm, with a corresponding velocity of 7.9 ft/sec, at normal core pressure drop (31 psi).
Cooling water enters the auxiliary blade follower pipe through slots just under the coupling fitting. This portion of the follower is always above the transition plate and, as in the main blade, the internal cooling flow is driven by the core pressure drop. The cooling water passes through the elbow joint and into the auxiliary blade internal channel. Both ends of the channel are open, and the cooling flow splits and exits from both ends of the blade. The flow rate is about 80 gpm per blade, with velocities of 30 ft/sec in the follower pipe, and 6.9 ft/sec upward and 6.2 ft/sec downward in the blade channel, (all at normal core pressure drop).
The maximum heat generation occurs about 1/2 in. from the end of the blade (see Figure 4.44). The blade surface temperatures in this region are 231°F on the reflector side and 173°F on the cooling channel side. The maximum temperature is at the outside interface between cladding and dispersion, and is 233°F (4.54). The blade temperatures decrease with distance from the end, with the "hot interface" temperature being about 170°F at 12 in. from the end.
The maximum total stress which occurs in the blade is 6800 psi, in tension, in the cladding material at the maximum heat generation spot. The maximum stress in the dispersion is 3500 psi compression, and the maximum dispersion tensile stress is 1400 psi (4.55). The blade stresses are all due to the heating, with essentially zero primary mechanical stress.
The forced convection cooling is not necessary from the standpoint of the safe operation of the blades. Should the forced flow be cut off, the heat is removed by boiling heat transfer at the outer surface of the blades. The blade temperature rises, in this case, to a value 20 to 30°F above the saturation temperature, i.e., to about 400°F. The stainless steel frame and cladding and the rare earth-stainless steel dispersion are not affected adversely by the temperature, and the thermal stresses in the blade are actually lower than in normal operation. The boiling heat transfer method of cooling the blades is undesirable as a normal operating condition only because of the neutron "noise" which results, and not because of any limitations on blade strength, effectiveness, or durability at the higher temperature.

4 - 52
References
(4.1) J. A. cox, Supt., Operations Division, ORNL (private communication, Sept. 10, 1963).
(4.2) w. N. Lorentz, Tech. Standards Engineer, GETR (private communication, Sept. 12, 1963).
(4.3) W. M. Hawkins, MTR-ETR Supt., Phillips Petroleum Co. (private communication, Sept. 10, 1963).
(4.4) W. F. Francis, Phillips Petroleum Co. (private communication, Sept • , 196 3 ) •
(4.5) J. c. Griess, et al, Effect of Heat Flux on the Corrosion of Aluminum by Water, Part III, ORNL-3230 (Dec. 5, 1961), and Part IV, ORNL-3541 (Feb • , 1964) •
(4.6) w. K. Anderson and J. S. Theilacker, Neutron Absorber Materials for Reactor Control, p. 580 (U. S. Gov't. Printing Office, Washington, D. C., 1962).
(4.7) w. E. Ray, Dresser Products, Inc. (private communication).
(4.8} c. F. Leitten, Jr., R. J. Beaver, and J. E. Cunningham, Specifications and Fabrication Procedures on Europium-Bearing Absorber Rods for Reactivity Control in Core II of SM-1, ORNL-2733 (July 29, 1959).
(4.9) L. D. Schaeffer, Army Reactors Program, Annual Progress Report of Period Ending Oct. 13, 1962, ORNL-3386, p. 84 (April 10, 1963).
(4.10) C. F. Leitten, Jr., ORNL (private communication, June 11, 1963).
(4.11) W. K. Anderson and D. F. Dunning, Nuc. Sci. and Engr., _i, 458 (1958).
(4.12) See reference 4.6, p. -580-584, also c. F. Leitten, Jr., ORNL-2422, p. 136 (Classified).
(4.13) A. E. Richt (private communication, Sept. 27, 1963, to be published in Army Reactors Program Annual Progress Report for Period Ending Oct • 31 , 196 3 ) •
(4.14) A. E. Richt, ORNL-3231, p. 41 (Jan. 21, 1962), and reference 4.9, p. 87.
(4.15) The ny2o3-stainless steel plate was irradiated in MTR through the courtesy of w. c. Francis, who made space available in his irradiation capsule.
(4.16) J.M. Hendrie, "HFBR Rare Earth Control Rods", BNL Memorandum (Feb. 2 , 1964) •
(4.17) P.R. Tichler, "Fuel Element Reactions on HFBR Grid Plate at Full Flow", BNL Memorandum (Jan. 28, 1964).
(4.18) J. M. O'Donnell, Jr., "Temperatures and Stresses, Core Support Structures", BNL Memorandum (Feb. 12, 1964).

4 - 53
(4.19) w. J. O'Donnell and B. F. Langer, "Design of Perforated Plates", ASME 1961 Winter Meeting, Paper No. 61-WA-115.
(4.20) Tentative Structural Design Basis for Reactor Pressure Vessels and Directly Associated Components, OTS No. PB151987, Dept. Commerce (Dec. 1, 1958) •
(4.21) P. Michael, "HFBR Safety Calculations", BNL Memorandum (July 3, 1962).
(4.22) H.J. C. Kouts, "Beam Tube Design For the High Flux Beam Reactor", J. Nuc. Energy, 17, 153 (July, 1963).
(4.23) J.M. Hendrie, "Type KD Fuel Element and Core", BNL Memorandum (Aug. 16, 1963).
(4.24) H. Kouts, "HFBR Fuel Length", BNL Memorandum (July 22, 1963).
(4.25) A. Court, K. Downes, and H. Kouts, HFBR Critical Assembly Report No. 22, "Reactivity and Gamma Heat Measurements~ Core 15 and Core 16" (Dec. 6, 1962).
(4.26) G. A. Price, E. Starr, K. Downes, A. Court, and H. Kouts, HFBR Critical Assembly Report No. 17, "Measurement of Neutron Generation Time in BBRR" (May 25, 1960).
(4.27) H. Kouts and K. Downes, "Power Distribution in HFBR", BNL Memorandum (Sept • 6 , 196 3 ) •
(4.28) H. Kouts, K. Downes, and A. Court, HFBR Critical Assembly Report No. 23, "Estimate of K Element Fuel Length" (March 28, 1963).
(4.29) L. G. Epel, "Density Coefficient of Reactivity for KD Core", BNL Memorandum (Sept. 10, 1963).
(4.30) L. G. Epel, "Eigenvalues for 86 Liter HFBR Core", BNL Memorandum (July 3, 1963).
(4.31) P. Michael and w. Rothenstein, BNL Memoranda "Critical Volume Calculations of D20 Reactor Using GNU Code" (Dec. 1, 1958), "Clean Spherical HIFI Calculations" (Dec. 3, 1958), "Reference Core Size" (Feb. 19, 1959), "Further BBRR Calculations" (May 28, 1959), "Neutron Leakage" (July 14, 1959), and L. G. Epel, "AIM-6 Calculations of HFBR Fluxes", BNL Memorandum (April 2, 1964).
(4.32) C. Sastre and H. Kouts, "Computations of SPERT-III Transients", BNL Memorandum (Dec., 1963).
(4.33) L. G. Epel, "Multiplication Constant of the HFBR KD Core with Light Water Contamination and All Rods OUt", BNL Memorandum (Feb. 11, 1964).
(4.34) K. Downes, A. Court, and H. Kouts, unpublished critical experiment work (Dec., 1963), and L. G. Epel, "Multiplication Constant of the HFBR KD Core with Light Water Contamination and All Rods In", BNL Memorandum (Dec. 20, 1963).
(4.35) R. R. Hood and I. Isakoff, Heavy Water Moderated Power Reactors Progress Report, July 1962, DP-765, p. 9 and Figures 1 and 2 (August, 1962).

(4.36)
(4 .37)
(4 .38)
(4 .39)
(4.40)
(4.41)
(4 .42)
(4 .43)
(4 .44)
(4 .45)
(4 .46)
(4 .4 7)
(4.48)
(4 .49)
(4 .SO)
(4 .51)
(4 .52)
(4.53)
(4.54)
(4. 55)
4 - 54
L. G. Epel, "Reactivity Effect of Dissolved Helium", BNL Memorandum (Feb. 10, 1964).
John R. Pozzato, "HFBR Flow By-Pass Test", Combustion Engineering, Inc. (November 14, 1961).
John R. Pozzato, "HFBR Recirculation Valve Test", Combustion Engineering, Inc. (February 23, 1962).
R. J. Nertney, Calculated Surface Temperatures for Nuclear Systems and Analysis of Their Uncertainties, ID0-16343 (June 1, 1957).
B. W. LeTourneau and R. E. Grinble, Nucl. Sci. and Eng., l· 359 (1956).
R. G. Beck, Hydraulics of Modified Fuel Elements for ETR, ID0-16465, (November 7, 1958).
See, for example, Nuclear Engineering Handbook, H. Etherington, 3_-2 and _!-85 (McGraw-Hill, New York, 1958).
J. c. Griess, H. C. Savage, T. H. Mauney, J. L. English, and J. G. Rainwater, ORNL-3056 (1961).
S. Mirshak, w. S. Durant, and R. H. Towell, Heat Flux at Burnout, DP-355, E. I. DuPont de Nemours & Co. (February, 1959).
L. Bernath, "A Theory of Local Boiling Burnout and Its Application to Existing Data", Chern. Eng. Prog. Syrnp. Series, No. 30, Vol. 56 (1960).
R. L. Menegus, Burnout of Heating Surfaces in Water, DP-363, E. I. duPont de Nemours & Co. (March 1959).
W. R. Gambill, "Burnout Heat Flux Prediction for Flowing Subcooled, Wetting Liquids", Research Reactor Fuel Element Conference, Gatlingburg, Tennessee, Book 1, 112 (September, 1962).
K. Shure, Fission Product Decay Energy, WAPD-BT-24 (Dec. 1961).
P. R0 Tichler, "Primary Circuit Pressure Drop and Flow Rates", BNL Memorandum (December 6, 1963).
P. R. Tichler, "Thermal and Hydraulic Conditions During Coastdown, Shutdown and Flow Reversal", BNL Memorandum (December 6, 1963), and "Primary System Temperatures Following Normal and Emergency Shutdowns", BNL Memorandum (March 18, 1964).
P.R. Tichler, "Primary Flow Coastdown", BNL Memorandum (January 29, 1962).
P. Tichler and F. Hill, "Experimental Evaluation of the HFBR Emergency Cooling System", BNL Memorandum (April, 1963).
P. R0 Tichler, "Flow Reversal Valve Failure", BNL Memorandum (July 30, 1963).
P.R. Tichler, "Control Rod Heating and Temperature Distribution", BNL Memorandum (December 10, 1963).
J.M. O'Donnell, Jr., "Stresses in Control Rod Blades", BNL Memorandum (Dec. 15, 1963).
f

57 ~II
FUEL ELEMENT 11 KD 11
4 - 55
(17) Inner Fuel Plates, 2134 11 Long, .050 11 Thick.
Fuel Alloy Core 20 34 11 Long, .020 11 Thick. Cladding .015 11 Thick.
(2) Outer Fuel Plates, 23 11 Long, .140 11 Thick. Fuel Alloy Core 2034 11 Long,.010 11 Thick. Cladding .050' Minimum.
.075 Min
6'i Rad
Section A-A
Figure 4.1 HFBR fuel element. All dimension are in inches.

Transition Plate
Fast Irradiation Thimble Shroud
Thermal Irradiation Thimble
Auxiliary Control
Rod
Anti Critical
Grid
.. .. __ d ----- MI
I
I Main _[_ontral Rod
Flow Reversal
Valve
I
ill!ll
Reactor Vessel
Woll
Iype 11 KD 11 Fuel Element
Rod Guide Structure
Grid Plate
Saddle
Figure 4.2 Elevation of the HFBR core.
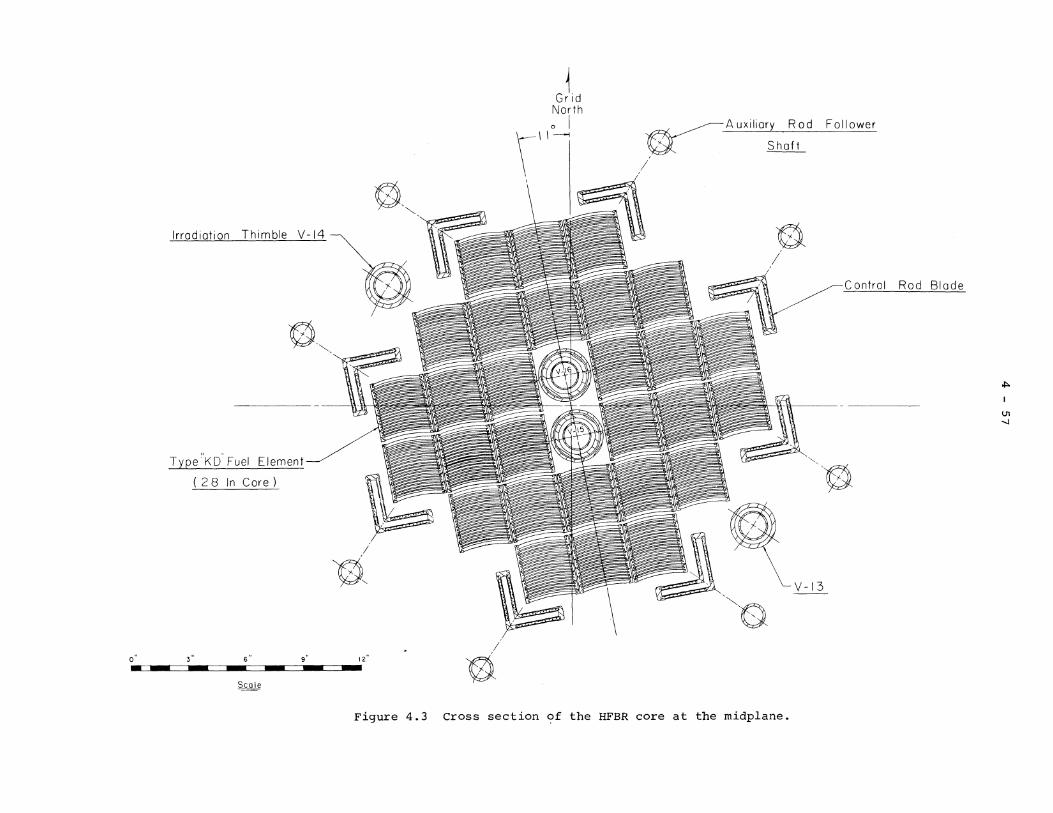
Irradiation Thimble V-14
0-~-~
Type KD Fuel Element
( 2 8 In Core)
I z" -- - - - - -9" a 3"
S_cale
Figure 4.3
I
0
1 Gr id
North o I \ \\ "
0 /
Follower
Control Rod Blade
~--0
V-13
Cross section of the HFBR core at the rnidplane.
""' U1 -.J

4 - 58
( 81 MAIN RODS
CORE
FULL-IN POSITION CRITICAL POSITION FULL - OUT POSITION
Figure 4.4 Control rod blade positions around the core at shutdown (full-in position) and during operation.

.nc.r. 29 REF.
...___ _____ -18!
~------..-1~"+-----·
roii"Ct
__ i _______ _
rs ---12\i
~ ~~
0
~ IM oi
SECTION A-A
0
"' q
roiF-
UNSIDE SURFACES or TRANSITION PIECE SHALL BE £LUSH OR UNDERCUT .010 FROM INSIDE SURFACE.S OF Sl~E PLATES AND FUEL PLATES.
a: > .... ;t. ;;;
+.000 -.005
+.0000 l.300·.0025
FUEL PLATES TO BE SECURED TO SIDE PLATES BY THE ROLL SWAGING METHOD OF ASS'Y.
"'
SECTION B-B
~ WELDING TO BE DONE PRIOR TO Flf..;AL MACHINING. ;:!;
lF::,00 I 1--2.290
~ ;· --... ~no•1.1•nvt-+.075MIN.
3.EXTERNAL BOUNDARY PLANES CONSIST OF TWO SETS OF MUTUALLY PERPENDICULAR PLANES, F-ACH SET CONSISTING OF TWO PARALLEL. PLANES.THESE PLANES1 ANO THE MINIMUM ALLOWABLE DISTANCE TO THE PLANES AS NOTED, ESTABLISH THE LIMITS OF THE AREA IN ~\·1!CH THE··PROJEClll1N AT ANY SECTION OF ntE fUEI £1 C:MENT MAY fALL, THESE BOUNDARY PLANES DEFINE THE TOTAL
~o~~~J:~:~~~~~N~~G5~~CE~~~~~.~~~T, 4. CLEAR SPACE IN INTERNAL WATER PASSAGES
SHALL NOT BE MORE TtiAN ±.005 FROM JiOMINAL
..¥JEW E-E
o~ oo .. 0 +' ~
0\
I
I ~ o;
g~ ~'f.o ,_
"'
BOUNDARY PLANES
'j !
SECTION C-C SCALE 211
ENGRAVE i'.aLOCK...NllMERALS_QN tACli.SIDE PLA TE . .D05. T0..010.DEEP. f>IUMflERS TO.BE CONSECUTIVE ANO -.~.ill>IE.J\10 NUMBER IS TO BE )JSln.,MllBE.llW< ONCL"
a,a.t'lP.
0 0
~ ;;;
"'
"' II! ,;-"' ;;;
0
frb "' ~
0 0
"' ~
BOUNDARY PLANES
llE:.1.0.7.-352-4(1T,3)
~ o,
0
"' "' "' "' 0:
"' 0 q
2.87~
_SECTION o_co. _ .. SCAL! 2fL
Figure 4.5 Detailed assembly drawing of the HFBR fuel element.
. ' " ~__F_UEL PLATE ~I CHANNEL..12.9 ALONG THE PLATE(.
F-:~ I :16\ 1 • .r-- ----.4 .102
- 5 ~·6 .• , •e 1ro ··11 :•12
~l ~•15 l .102
--:~~ ·I?: 8 8 CHANNELJ29 ALONG THE PLATE t
FUEL PLATE
~100.M!NJ.YP.
_ME·l07o35CMIJJJ.
.... 101

.0701-.... d:d~~ ,- I +l.
•000.~rir I /I--,,,,!=""! ::lDIA.HOLE 8
SEE NOTE I 3 8
I I \.._ __
@ OUTSIDE FUEL PLATE(LOWERt°l9 L REOa'IL
.070---i_"..,61 "IZZ:i2
r-1
1 6.oao 11~1 IY,-..__ :J ....__-----.I
I_ ~°'A.HOC< ---,
1 "!--:-+=' =t - - ~ SEE NOTE I
@ OUTSIDE FUEL PLATE(UPPER)#I I REQ'D.
±.OOI .140
±,001 .OIO@ 3.0 W/o FUEL ALLOY OR.030!.00I@ 10 w/o ETC. (SEE NOTE 3)
SEE NOTE.L
.015 MIN.CLADDING
SECTION C-C
SEE NOTE I
±001
SEE NOTE I
-----c.010@ 30w/o FUEL ALLOY QR.030±poi@ IOw/o ETC. (SEE NOTE 3)
SECTION A-A
;-001 .020 f'UELALL.OY lSEE NOTE 2)
-.015 CLADDING 6061-T6 ALUM.
SEGJION B-B SCALE 4/1
L.056 .. 001
/s.ooolY.--......__ ~--~
CD
NOTE:
+3 I ,-16 2
21::l 4
' I I L_ l·-1:
B
_j~-
INSIDE FUEL PLATE #2 To*1 s 17 REQ'D.
I, THIS DIMENSION DETERMINED BY FABRICATOR. 2, THE THICKNESS OF THE CORE OVER THE FIRST
l;z"FROM EITHER END OF THE THIN PLATES SHALL NOT EXCEED.022 AT ANY POINT. THE REMAINDER OF THE CORE LENGTH MUST NOT BE LESS THAN.019 NOR MORE THAN.021 IN THICKNESS,
B
3. THE THICKNESS OF THE CORE OVER THE FIRST l;2"FROM EITHER END OF THE THICK PLATES SHALL NOT EXCEED 1.10 TIMES THE NOMINAL CORE THICKNESS. THE REMAINDER OF THE CORE LENGTH SHALL NOT BE LESS THAN 0.95 TIMES THE NOMINAL THICKNESS NOR MORE THAN 1.05 TIMES NOMINAL THICKNESS.
4 THIS RELIEF IS ALLOWED FOR ROLL SWAGING IF REQUIRED.
.i:-
°' 0
Figure 4.6 Fuel plate detail drawing, HFBR fuel element.

lllTEllMALllO..lrlDAllYPl.ANESCONSISTOF T'Ml sns OF MUTUALY PEllPENOICULAlt ••
~~ii_~rT':~~:.:~':.~s Df.FINETHETOT.\Ll.lllllTOI" lllllEGUt.A111TIH P'EllllllUILC DUI!. lO TWIST, IOW, CAMll!ll a llllACK1NINl10LEllANCf.SFOllTHEUfTIM:LMlf. t.f.NltK. ••l'f.~NDICUl.AllTOWITHINOOl•f'f.lllNCH
ENVELOPE SECTION
:sit ----+-~--------------~!
'---------------:57~~ t.f.~
11 - I UN CU.SS H THREADS, Fl.AIHCHllCIC
I 4.07M:I':
L , ~: SECTION C· C
JD YOI. 'lo Dy1 0 1 1N ID4 ITAINt.EIS STt:f.t.
!OVOL'lo h101 tN304 STAINt.ESS ITU\.
llOTHSTAINl.ESSITt:[t.CUID
MAIN ROD BLADE
C.1111AINDIWYE1· lllEtr.l
2.IHllU
l SECTION B-B
t~A
CHAllll''Ht.EADf.Det: h•4S•
OUTLINE WIOTH FllOlll NOMINAl.lliEC.A-A,111!·22H·Sf.l TOIET"INUST2"0FCOflE. ROUND COflNElll ON COllE OUTl.1NE AllEPEllMISSet.E. •otHf.NDIOl'COllE.
¥
~· OPTIONAi.
SECTION A-A
12t• ______ __,
•llllAClllHEIU"Tt:llAllf.11111.Y
••4S•CM.t,llll'f.ll TTl!FORQITSIDE COflNlllS
ut• ,,,. I
11 Dl -----~·~~~~,.•-• t :L1v ':=~~~·:.~"""''"~-"'HU~
Figure 4.7
COUPl.IN8HH,D STAHlll.US ITHI.
AUXILIARY ROD BLADE
' ! - __________________ J
LA COllElllATPllAL:JDVOl..'loh10.
IN!04STAIHt.E.SSSTHt., STAINl.HllTIE!t.CU.0.
HINIEOCOUPl.1 .. ll.OCll, 11• MAX. fKJT'ATION, STAINl.HllTt:Et..
MAll'.llf.DUCT!OlflNCOAf.OUTLINE WlDTHFllOlllNOMINAl.llEC.W ME·221·4·1EITO•E ....... LAIT l!"Ol"GOllt.llOl.M>COf!NEllSOflltlCllll! DUTl.INl:AllEl'EllllllSlllL.E. TTf\llOTHIENlllOfCOllf..
Detailed drawings of the main and auxiliary control rod blades.
SECTION D-D
"" 0\ I-'

Rack Follower Main Control Rod
Coupling Nut Material: SS t. Shrink Fit with Rack Follower
Jergens Ball Plunger 3 Req'd:
Main Control Rod Blade Stainless Matrix
T3~T
*
6-1/4
::'fl •. :~J I~ 111 I
~: ilp ~J_ __ _l~
'1 ( I I I I I I I
:)
0
1.001 Dia.
1.0115 Dia.
Rack Follower Main Control Rod Material: SSt.
I.BOO PD.
2Dia.
Gear Data: Diametral Pitch= 10 I.BOO Pitch Dia. No. of Teeth= IB 20° Press. Angle
1.014 Dia.-j
Female Coupling- .-1-I,....;-It-;....' ml .,_1 __ ~--r-~.---Main Material:SSt;---.,. ll\ I 1 I~!-:- : f f
-· i-- -T-- . -: 11
Undercut 1-11/16 1 I
l_ /I I.I\ 1, ,/"""1-9/16-B UN 2A Threads ~ / Flash Chrome 3-13/16
+ 1.630 }, , I , z;; r-Orifice Plate
Dia.- , ., , ··--rl 111'-I Iii I
1-1/2
~
B-13/16
I I
L_ I I
I I I I I
2 .. 4 5 6 Inches
·-Blade Handling Hole
1.640 Dia.
11~ , I 1 >IL '1 1.423 Dia.
5-3/B
l_,LJ Dia.
1-9/16-B UN 28 Threads
I 0°Typ,
·i··; ';<.
.054
--===--===--====i Figure 4.B Details of the coupling between the main control rod blade and the
drive mechanism rack follower.
.,,.
°' "'

1.00••1 11!!1!!!!H!lllHTillTiffilllJll!lllllllH!lfiil!l!llllii!lllliili!i!lii•
!tilllttilllmttm1111111m1111111 lllffilTillll!!l'l!i a111111111111:n11H11rn:rmsi t 1 1 ;:1 .:1;;1 • 1 I•· ,:::l!iiil!ii!ITITITTITI 1!iIT!ffEf!J:'T•·.1··•.l •••i•···i··•T•••1 TT1•··1
;p •ild'til;i!d!!l'il'. 11T'I I I Tl I I 11 I I I I I I I I.:
H:li'di1': 1•11
i!\I!: liil!!lil:: ITT l'IH'l'TI TTJ I ·I I. I I I I I I I I .I I
11t1·H"T :t I I I I I I I T I I I I T J I I I ;1:;1::i
THERrv1AL NEUTRON EXPOSURE 1·;:'1->·
-
.• ,, . .,,~i:J;JJ l'Jl'f TT'IH i"':I: ;;j, !lillli:;,t; ITTTT LI •111 •l 1t1hH1!il::liffcJSf1.:I I :I I I 11. I I I ::pr1 I I I I I I I I I ~bmr:: LI TH I I I I HT. kt:!l 'liJ'i!lli!:,[I It I I 'I Ji ! ii •Jt I' '1!1il:L:l:1q I I: I I 'I I .I J1Pf"'I I 1··1
·::1:;;11:::· [T'K:F:l l1•.·1···rd!:::l.'i1l:iii'!illi•:11:·,1;1,·1 .•. ·1.··1:1:l!'1•lr·•il•'•'l!'!d::',l::•rm::.l•''·l:•''l::·l•·TJ'TTTT·LA"1 ···I· ··I ···•t• iil:41 .• •1•• 1· 1• ·1.•i·I' N.Jli li',J.·j !!'l•:1!i••!HiiiJiil'ITi!l·:l:l 1'1.t.• !l'i!l'l.l.;::i'''il:11•li' •:1.;·:1::•:t.; i l•'!!lii 1•11:••1·:;1.:· .1·:: ·I: ··•I· ::•t• 1.1~ ' ·I I
Fl I
I" H-4 I RT
r
4b 1,1·1:· ii•' l,il•:H::HFHliM!L,lif!fH'!' IN•:'I · .•l•• .. l• .. •I:: ··1··. •l'•••I••: I:• li:i•L1Jsrmr1:,1:·: 'l.!Jili!1il!!!!i'l!T;ms;nsrmc: I .I· ,o'li:'l· I T¥121ii'l.Hl'i•I H!flT IT'N.:TTTTTI ITT J l1'i:/:.:'Li'11'In/:'JTSEll' 1L!!b I I I ·I. J I I I •1"'fPGli"G'VittlH,f!t•iJ;t:TTLIXTllll>l l'l>l.lJP!'.l•kl t:hH:·I 11 11 I 11•1.•1
··il:::•l':•l:•:'I'' '1 1•••1:•.•1•. 'H''l•'l•···l.·· l .. ·.t::•'l·'TCX:l .. l ..• ,l,.:l'1·l·•·1···:1••. l:Jr l.·•·I: TITFrflCFl2FFT l•·.1•.''ITIT I I 1111.111nnr1r11kt•lll N.JJJ:IL?l •l:IJ I I I 11·11·1 I 11•1 It I
AO~ l LLI 11: I 'I J:::i:·n1:: I 'l:.1 T 11 >I HI 111· 11I111 l+H 11 r lclF I fftT1+Hl I· 1··1 · 11 f1 I I l>.lrill·l•'liJ:"lll·I'lti:l!''il:,kllA•ll I N..l<l 111111 I r ' i. 1· 11.+ .. 1 t 1 +:rrrFT·IA 1~n1. 11 l'L 1 r 1 1 1 I. I I .·I· I
l':l:o I T' l' I Y' IJ I l .VI I >I l.J I t t t t r-- I I I !'TTI.· lll'Tl'l''TTTI I'll ICi!'ll<lrTHrr·111·1•1 r-- I ··111
.20~1:~ttll1~2 1 I I lt1tE I :lef 1l~:;r 11111111 :1:~lttfllltllTitff~~tIT I fr
mirlll,:f-,,~ I i.
~ r LLl I ~
2 3 4 5 6 X 10²¹ N/cM2
NVT
Figure 4.9 Europium isotope fractions as a function of thermal neutron exposure.
*" O'I w

Figure 4.lOa
Figure 4.lOb
Transverse Section is cladding.
4 - 64
section of unirradiated Eu 2o3 absorber specimen. 30 wt % Eu 2o3 in type 304 stainless steel, with 304 As polished, 250 x. (ORNL R-16188, courtesy A. E. Richt)
Transverse section of absorber specimen similar to that of Figure 4.lOa, irradiated to 4.5 x 10²¹ nvt (unperturbed, thermal) at 150°F. As polished, 250 X. (ORNL R-16189, courtesy A. E. Richt)

4 - 65
Holding Bolt for Insert
Transition Plate Insert
Transition Plate
Flow Shroud
Transition Plate Flange
Auxiliary Blade Follower Bushing
...._---Auxiliary Blade Follower
Figure 4.11 Detail of the transition plate insert for the control rods.

4 - 66
6
LLJ I-<( a: 5 z 0
ii: a: 4 0 (/)
CD <(
z 0 a: I-::> LLJ z LLJ > I-<( _J LLJ a:
2 4 6 8 10 12 DISTANCE FROM END OF ROD, IN
Figure 4.12 Cycle-average neutron absorption rate in an HFBR control rod as a function of distance from the end of the rod.
(/) (/)
LLJ z :.:: u <( _J CD
----Eu2 03 -St. St.--------
~TRANSITION REGION r-Dy2 0 3-St. St.~
1.00
.95
.90
.85
.80
0 2 4 6 8 10 12 14 16 18
DISTANCE FROM END ROD, IN.
Figure 4.13 Blackness of HFBR control rod blades as a function of position along the rod and operating time (40 MW reactor power).

Head Undercut for Capture by Torque Tool
Lateral Guide Plates for Drive Mechanisms
Tabs 11A11
Prevent Rotation
Keyways for Torque Tool (Cup Deformed into Keyways ofter Torquing to Prevent Bolt Rotation)
Threaded Bolt
Retaining Cup
Groove for ,_ __ L_ ___ _,:___ Tab 11 8 11
Thread Insert
Saddle
Typical Threaded Fastener Within Reactor Vessel
Seal Flange
Lower Guide Blocks for Drive Mechanisms
Main Blade-
Auxiliary Blade-·
Auxiliary / Blade Guides~
Shutdown Cooling Inlet
Flow Shroud
7 Access Holes
Flow Shroud
Clearance Slots for Remova I of Drive Mechanisms
Thermal Irradiation Tube
Saddle
"' "' N
Anti-Critical Grid- --·--·---L-----'-
Figure 4.14
Reactor Vessel And Internals
o._ .. lii::====2illl .. •3l::::::===4:ill .. .C5=====i6Feet
Elevation of the reactor vessel, showing the arrangement of the internal structure.

4 Holes Equally Spaced as Shown in Section B~B On A 26.875 Dia. B.C. .250 Typ.
10.205 Typ.
9.955 Typ.
7.075 Typ.
4.195 Typ.
Grid North O"
.500 Dia. Thru 2 Holes ,180° Apart
Locate From Template
'-go·>· SECTION B-B
Figure 4.15
~ ... l $ $
~t!' ~ "' "' "' CIO
I- "' ....
"' c,; c,;
;;;
L1__J'. ... ~
~ ... ~
l!l d
_I
A
GRID
3/32 R
ID !!! <:: CIO
"' ' 2! "'
·-·- ..,,_,
I 0 I 2 3
Material Notes:
Forgings To Be Of ASME SB-247,6061 T6 Aluminum Alloy
2. Plates To Be ASME 209, 6061 T6, Aluminum Alloy
3/8 Dia. Hole (12) Req•d.
INCHES
'----- 15·1/2 2 ~Ref l------11-112 .
PLATE
1/16 R.--.,. ~ ·ooru+i 1/32 R. Typ i ~
-i "' _J
SECTION C-C
4 5 6 INCHES
Lattice plate details.
,,,.
O'I CD

:x " ~ u d. ~
~ "' ci
~ 8.125 Typ. J: 9.553 Typ. l
Grid North 0°
\
l/2-13 UNC-2 I B Thru,2 Holes ' ,
1 8 Places I K-,
I
4,320 Typ. I
7.230 Typ. l 7.200 Typ. Cutout 11 X1
12.969 Typ. 10.080 Typ. Cutout 11 Y'
MATERIAL NOTES
(a) Fabricate Cylinder, Lower Plate and Gussets From• ASME SA-240, Type 304L
(b) 3" Tubes ASME SA-312 or SA 213, Both Type 304L
Drill and Ream Light Press. Fit For 3/4 Dia. Pin,12 Req'd.
3 Dia.Thru, C'Bore 3-31/32 Dia. x 1/8 Deep, 4 Holes
1/2-13 UNC-28 Thru 3 Holes, 4.875 B.C.
o.
d. ~ N <D 0 ,,;
N c. N"' ,,;I-
1.375
I
I d. ,..
..... 0
"" 0
"" <D <D <D
ai
TYPICAL CUTOUT
ci i5 ci
i5 <D I'-
' 0
"' ..., ~ N
"' "'
I I
8 Places at 11 X11 8 11 Y11Locotions
Figure 4.16 Transition plate details.
I
II ci i5 N
"'
I ,( 0 ::E ci i5
"'
1D~r·m .2 0
N ::::: ,;, "'
~I 250 x3/8 Lg. Dowel
,-Weld I
4 1/2
SECTION K-K
0 I 2 3 4 5 6 INCHES
- - - I
"" O'I \0

" ., .. I
NE 1014 u .... z .,: t: (/) z w c x :::> ...J ~
z 0 a: 1013 I-:::> w z
10 0
1/2
1/2 Typ.
3-5164 Typ.
10
Auxiliary Rod Penetration (8 Places)
1-1/4 Dia. Typ.
0 I 2 3 4 5 6 INCHES
- - - I
Grid Plate Web
ISOMETRIC VIEW OF CORNER OF GRID PLATE, SHOWING AUXILIARY ROD GUIDE STRUCTURE
Figure 4.17
EXPERIMENTAL THERMAL
ENERGY GROUPS
.821 10.0 MeV
9.10 821 keV
.167 9.10 keV
22.6 167 eV
3.06 22.6 eV
0.78 3.06 eV
0 0.78 eV
20 30 40 50 60 70 80 90 100
RADIUS, cm
Figure 4.18 Calculated and measured flux traverses.
110

o. CORE CENTER
-lo
c. CORE TOP
...
...
4 - 71
COORDINATE SYSTEM
Jo .. .. ,, .. 3 ·• .. .. ;; ·• ,/
~ <0_9
I? ·• ,, ~ .. ;: .. ~ • ..
·•
i
b. 6t IN. ABOVE CENTER
•.o .. ·• ,, ..
"' .. I ..
·• ·• ~ 2..o./
8 .. g " ,, ~ .. ~
.. .• .. ·• ~
~ l!l
~ Ii'
d. VERTICAL AVERAGE
Figure 4.19 Power distributions in a core with all resh fuel, at full power and equilibrium xenon soon after startup ("day 0, cycle O"). Parts a, b, and c show the horizontal variation in power density at the core center, 6.5 in. above center, and at the core top, respectively. Part d shows the variation in the power density average taken vertically.
...
...

o. CORE CENTER
c. CORE TOP
~
4 - 72
COORDINATE SYSTEM
Jo .. ·• .> ·•
~ .. ~ . ffi .. ~ ·2
~ 2.o·' 8 .. i'! ..
" ~ >
~ > ~
11 i!i "' ~
~
b. 6-f IN. ABOVE CENTER
d. VERTICAL AVERAGE
Figure 4.20 Power distributions in an equilibrium core at full power and equilibrium xenon soon after startup ("day 0, cycle 10"). Parts a, b, and c show the horizontal variation in power density at the core center, 6.5 in. above center, and at the core top, respectively. Part d shows the variation in the power density average taken vertically.
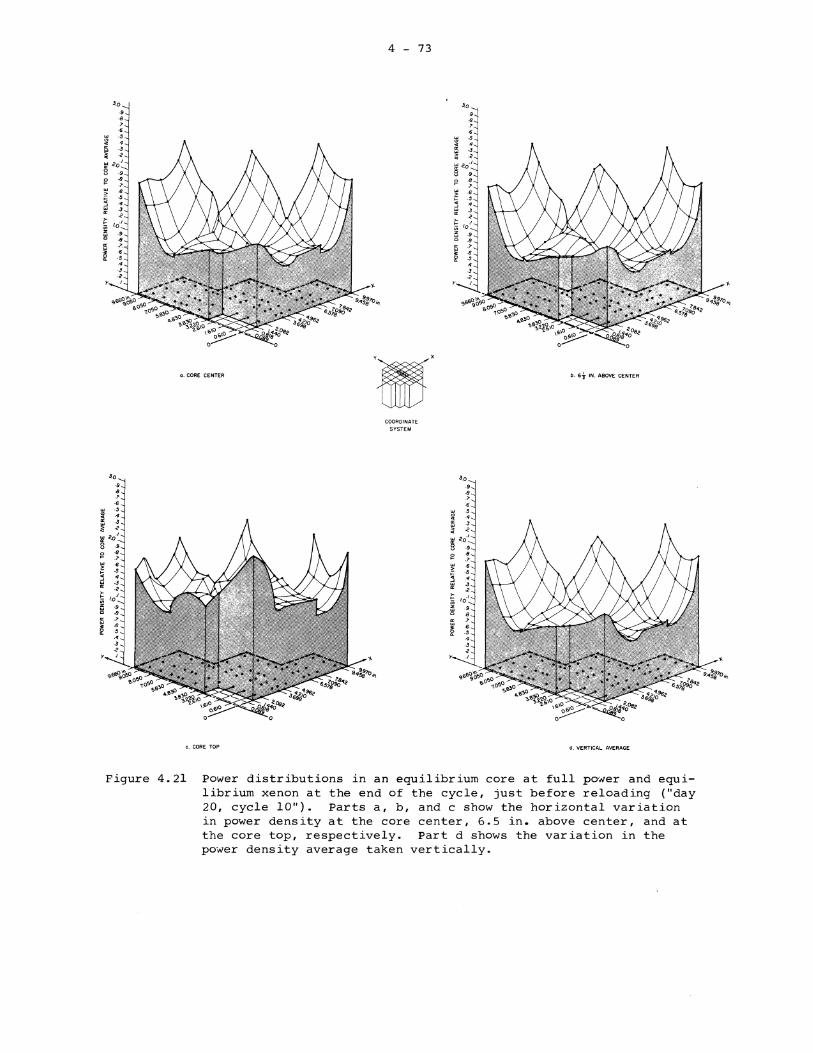
J.o
·• ·• .?
·• w .5 ~ . ~ :~ ~ 2.o·' 8 ·9 0 8 >- ?
~ . ~ .5
> >-~ l!l
>
~ > >-
z 0 . ~
ti. CORE CENTER
~
i;;. CORE TOP
4 - 73
COORDINATE SYSTEM
Jo
J.o .. 8 ?
b. st IN. ABOVE CENTER
d. VERTICAL AVERAGE
Figure 4.21 Power distributions in an equilibrium core at full power and equilibrium xenon at the end of the cycle, just before reloading ("day 20, cycle 10"). Parts a, b, and c show the horizontal variation in power density at the core center, 6.5 in. above center, and at the core top, respectively. Part d shows the variation in the power density average taken vertically.
~

4 - 74
4
FRESH-FUEL CORE: START OF CYCLE
>- >-I- !::: Ui (J)
3 z z w w a a a:: a::
w w :!= :!= 0 0 Cl. Cl.
w w 2 2: > I-i== <(
<( -' -' w w a:: a::
I 0 2 4 6 8 10
DISTANCE ABOVE CENTER,INCHES
4
EQUILIBRIUM CORE: START OF CYCLE
>- >-I-t:: u;
(J)
3 z z w w a a
a:: a:: w w :!= :!= 0
0 Cl. Cl.
w w > 2 2: !;x I-
<(
-' -' w w a:: a::
I .____.___.____.___.~,____.__.___.___.~~
0 2 4 6 8 10 DISTANCE ABOVE CENTER, INCHES
4
FRESH-FUEL CORE: END OF CYCLE
3
2
I 0 2 4 6 8 10
DISTANCE ABOVE CENTER,INCHES
4
EQUILIBRIUM CORE: END OF CYCLE
3
2
I'--__,_~~~~~-'-~~~'--~
0 2 4 6 8 10 DISTANCE ABOVE CENTER, INCHES
Figure 4.22 Vertical variation of the power density at the hot corner of the hot fuel plate in the HFBR core relative to the average power density in the core, for the beginning and end of the equilibrium fuel cycle and the first cycle for a freshly fueled core.

4 - 75
0
~ 3 n: n: w
EQU ILi BRI UM CYCLE 3:: 0 Q.
w 2 C> <[ n: w > <[ PEAK TO AVERAGE POWER RATIO
I vs 0 ., TIME ll:: <[ w Q.
0 0 2 4 6 8 10 12 14 16 18 20
DAYS AFTER LOADING
Figure 4.23 Variation of the peak to average power density ratio during the 19 day operating cycle for a core of fresh fuel elements and for the equilibrium core •
. 14 " Cl>
"' ' .12 ,,,, ,.!! 0 . . 10 UJ
!:i n: >- .08 8- ROD CROWN .016 !::: :::
.06 I-u
" Cl>
"' .014 ' ~ <[
UJ ,.!! 0
n: .04 .012 c UJ 0 n: .02 I
~ .010 er
I-J: ~ 0 UJ
>-I-
.008 ~ I-u
.006 <[ UJ er c
.004 0 er UJ
.002 -' ~ z iii
0 0 5 10 15 20 25 30
ROD POSITION, INCHES
Figure 4.24 Reactivity rate curves for a single rod and for a crown of 8 rods, driven at the normal speed of 4.3 in./min.

3
:I:: I--a:: 2 0 ~
0 0 a::
0 0 5 10 15 20
ROD POSITION, INCHES 25 30
Figure 4.25 Control rod calibration curve for one cadmium-stainless steel rod. the main rod stroke is from 0 to 30 in. rod position (full out at 0 in.). The auxiliary rod stroke is from 0 to 15 in. rod position (full out at 0 in.). Main and auxiliary rods have the same reactivity characteristics over the 0 to 15 in. portion of the stroke.

o"
Irradiation Thimble V-14
0-"'-~
Type "Ko'' Fuel Element
I 3" 9" 12" 0 Seo le
1 Grid
North o I \"_, Follower
0 /
Control Rod Blade
-"-o
V-13
Figure 4.26 Core configuration of maximum reactivity for HFBR fuel elements.
*" -..J -..J

-"' ~
~ I-
> 20 I-u <l: w a::
10
5
0 0
' I
10 20
4 - 78
XENON REACTIVITY TRANSIENTS AFTER SHUTDOWN FROM
CONSTANT POWER
30 40 50 HOURS AFTER SHUTDOWN
60
Figure 4.27 Xenon transient curves for various operating levels.
120
100
80 ;;:: :a: -a::
60 w ;;:: 0 a.
40
20
0 0 2
POWER
FRESH FUEL
PARTLY-BURNED FUEL
TRANSIENT AFTER A 50 ¢ REACTIVITY STEP INPUT
3 4 5 6 7
TIME, SECONDS
8 9
350
300 u 0
-w a::
250 ::::> I-<l: a:: w a.
200 :a: w I-
150
100
Figure 4.28 Reactor response to a step reactivity input of 50 cents (.39%k) at full power, with no safety rod action.
1

100 3: ::!!! -a:
LaJ 3: 0 a..
4 - 79
POWER
FRESH FU
PARTLY-BURNED FUEL
TRANSIENT AFTER 75 4 REACTIVITY STEP INPUT
O'--~~~~~~-'-~~~~~~~--'-~~~~~~---''--~
0 2 3 Tl ME, SECONDS
400
350 u 0
LaJ a: :::>
300 !:( a: LaJ a.. :ii
250 LaJ I-
200
150
Figure 4.29 Reactor response to a step reactivity input of 75 cents (.585%k) at full power, with no safety rod action.
a: ILi 3: 0 a..
POWER
FRESH FUEL
PARTLY- BURNED FUEL
TRANSIENT AFTER I $ STEP REACTIVITY INPUT
O'--~~~~~~-'-~~~~~~~-'-~~~~~~--"'--~
0.5 1.0 1.5
TIME, SECONDS
600
u 500 0
w a: :::> I-
400 <(
a: ILi a.. :ii
300 ILi I-
200
Figure 4.30 Reactor response to a step reactivity input of 1 dollar (.78%k) at full power, with no safety rod action.

1.20
I.I 5
4 - 80
k.EFF vs LIGHT WATER CONTAMINATION, ALL RODS WITHDRAWN
1.10 '----'-~--'-~'-----'-~--'-~'----'-~--'-~'----'-~--'-~'----'-~-'-~-'----'-~-'-~..........___.~_. 0 20 40 60 BO
PERCENT LIGHT WATER
Figure 4.31 Effects of light water addition to the heavy water in the core and reflector of the HFBR.
GRID NORTH
B C-2 C-3
BEJC-16 EJB BEJBBBEJEJ EJBBEJBBEJ
EJBBBB EJBEJ
Figure 4.32 Element numbering code for the HFBR core.
100

~3 u; z ~ a: II.I 2
0
4 - 81
NORMALIZED POWER DENSITIES IN HOT CHANNEL AT BEGINNING OF EQUILIBRIUM
FUEL CYCLE
-· -;-·-+
0 2 3 4 5 6 7 8 9 10 11
4
0
VERTICAL DISTANCE FROM CENTER OF FUEL, INCHES
Figure 4.33
NORMALIZED POWER DENSITIES IN HOT CHANNEL AT BEGINNING OF FIRST FUEL
CYCLE
0 2 3 4 5 6 7 8 9 10 11 VERTICAL DISTANCE FROM CENTER OF FUEL, INCHES
Figure 4.34

LL. 0
390
370 350
330
a.J 310 a: :::> !ci 290 a: L&J 0.. 270 ~ ~ 180
160
140
120
4 - 82
0 2 4 6 8 10 12 14 16 18 20 22
380
360
340
w-- 320
~ :::> 300 t:i a: ~ 280 ~ 180 ~
160
140
VERTICAL DISTANCE FROM TOP OF FUEL, INCHES
Figure 4.35
120 0 2 4 6 8 10 12 14 16 18 20 22 VERTICAL DISTANCE FROM TOP OF FUEL, INCHES
Figure 4.36

LL. o, II
N --I ~
.s= .... :::> .... m .... -z 10 l.&J
u ii:: LL. l.&J 0 u 0: l.&J LL. (/)
z <{ 0: .... .... <{ l.&J :z:
9
8
7 120
4 - 83
BASED ON MODIFIED COLBURN EQUATION
hDe =0.023 (oevp)o.s(cpµ.)o.3 kf µ. f k f
o. = 0.0202 ft.
V = 36.4 ft/sec
160 200 240 280
Fl L M TEMPERATURE, ° F
Figure 4.37

::!! <.!)
..... (/)
II<t 31::
102 .---r--.,.-.--.--.----.--.--.----.--,.--.--~
CORE
't.
I I
I 10
CORE EDGE
RADIATION HEATING AT FULL POWER (CRITICAL EXP. REPORT :fl: 22)
\ \ ~H-2, INNER END
\ \ \
\ \
\ H-9,INNER_:'h
END ~
' '-,
H-2 NOZZLE
VESSEL WALL
'
10•• -20 0 20 40 60 80 DISTANCE FROM CORE EDGE, cm
Figure 4.38
N
E u I u 5l
..... ~ ::!!
1015
1014
CORE EDGE
CORE GAMMA FLUX (EXCLUDING STREAMING
IN BEAM TUBES)
VESSEL WALL
I I I I I I !\ I I I 10131 I I I I I 80 -20 0 20 40 60
DISTANCE FROM CORE EDGE, cm
Figure 4. 39
"" ~
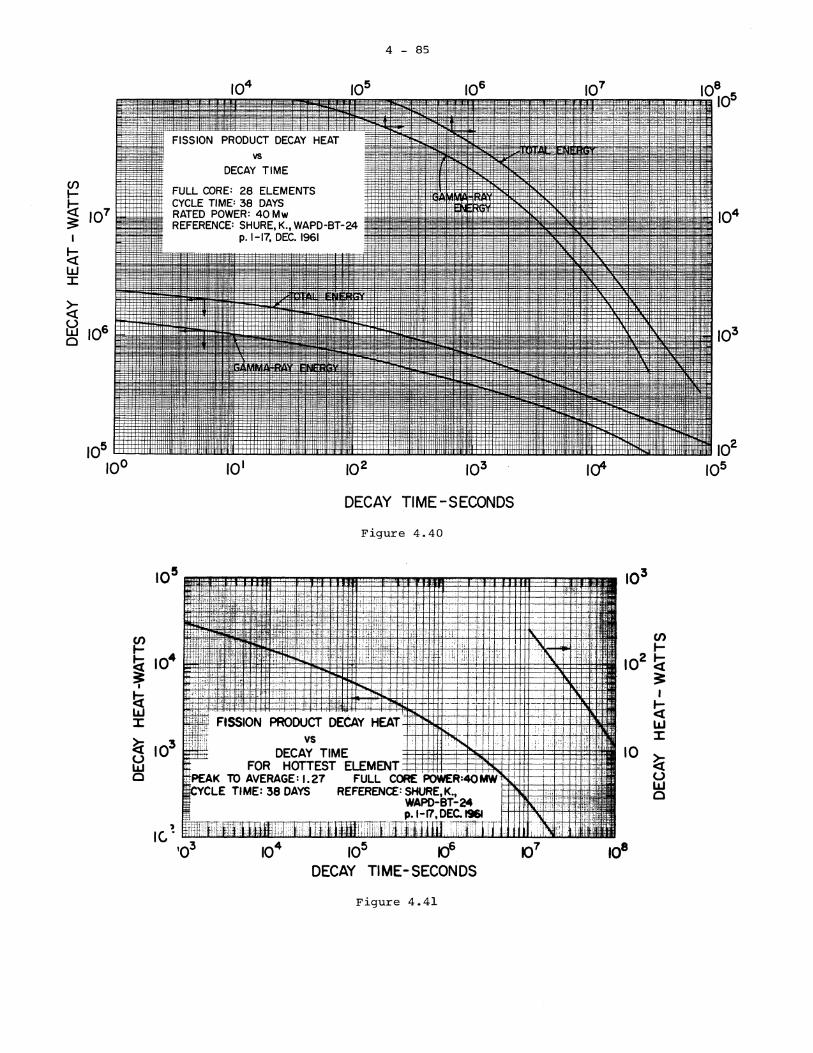
4 - 85
10~05
vs DECAY TIME
CJ) I- FULL CORE: 28 ELEMENTS
~ CYCLE TIME= 38 DAYS
107 RATED POWER: 40 Mw 104 3: REFERENCE: SHURE, K., WAPD-BT-24 I p.1-17, DEC. 1961
~ w J:
~ ~ 106 103 Cl
101 102 104
DECAY TIME-SECONDS
Figure 4.40
Figure 4.41

. 109 1
I
105 106 107 108
DECAY TIME, SECONDS
Figure 4.42 Afterheat integral values as functions of time after shutdown for the equilibrium core.
.10

4 - 87
TIME AFTER SHUTDOWN, SECONDS
Figure 4.43 Fractional neutron population as a function of time after shutdown, for various shutdown reactivity margins.
13xl06
12
"' II -- 10 I ... ..c:
9 ' " iii 8 ui 7 !;:( a:: 6 z 5 Q !:i 4 a:: w 3 z w
2 t!)
!;:( I w 0 :r:
0
ROD CROSS-SECT! N REGION "A"
R~z~( COOLANT CHANNEL
GAMMA HEATING RATE IN CONTROL ROD AT 40 Mw
2 3 4 5 6 7 8 9 AXIAL DISTANCE FROM END OF ROD.cm
Figure 4.44
10


5 - 1
SECTION 5. PRIMARY COOLANT SYSTEM
5.1 SUMMARY DESCRIPTION
Heat is removed from the HFBR core by a flow of 16,600 gpm of heavy water. The complete piping and instrumentation diagram for all reactor systems is shown in Figure 5.1, and for the primary system alone in Figure 5.2.
The flow in the primary system is as follows. Heavy water at 120°F and 203 psig enters the neck of the reactor vessel and flows downward through the shroud to the core, with a small amount of heavy water bypassing the core to cool the control rod blades. After passing through the core, the coolant is dispersed outward to the reflector and flows upward through the reflector to the annulus formed by the shroud and the neck of the vessel. The coolant leaves the vessel at 134°F and 171 psig through an elbow and passes downward through a pipe in the biological shield and through the venturi meter which measures flow in the primary system. After the venturi, the flow is split into two parallel streams which encounter, in order, a block valve, a primary pump, a check valve, a primary cooler, and a primary control valve. The primary pumps are electrically driven, of conventional vertical centrifugal type, and are described in Section 5.3.2. The primary coolers, which transfer the reactor heat from the heavy water to cooling tower water, are shell and tube-type exchangers with the primary coolant on the tube side. They are described in Section 5.3.1. Downstream of the control valves the two streams come together again and the primary coolant flows up through a pipe in the biological shield to the reactor vessel.
The primary system is pressurized by introducing helium at 200 psig into the surge volume at the upper end of the reactor vessel neck. The helium system is described in Section 7.4.
Figure 5.3 shows the spatial arrangement of the primary system components. The reactor vessel is located about 20 ft above the other major components of the system. To prevent a leak in the primary system from draining coolant away from the core, several precautions have been taken. All penetrations in the reactor vessel are located well above the core region. Liquid level instruments are linked to the safety system to shut down the reactor if the coolant level falls below the normal operating level in the vessel. Additional level instrumentation shuts down the main pumps, should the coolant level fall past the scram point. In addition, a bypass line is opened between the reactor inlet and outlet regions on the "low-low" level signal. This action prevents heavy water from being siphoned from the core region during the pump coast-down period. Finally, the reactor vessel is situated in a water-tight pit of such volume that a break in the vessel itself will flood the pit to a level above the active core.
5.2 PRIMARY COOLANT
5.2.l COOLANT PROPERTIES. The primary coolant for the HFBR is heavy water. Graphs of the density, vapor pressure, specific heat, latent heat of vaporization, viscosity, and thermal conductivity of the saturated liquid are shown in Figures 5.4, 5.5, and 5.6 (5.1). The freezing point of heavy water is 3.79°c, or 38.B°F, and the boiling point is 101.41°C, or 214.5°F, both at atmospheric pressure.
At 25°c the dissociation constant for D20 is 1.95 x lo-15 (reference 5.2),

5 - 2
which gives a pD of 7.35 for neutral heavy water as compared to pH= 7.0 for neutral light water. Since aluminum corrosion is reduced in slightly acidic water, the primary coolant in the HFBR is maintained at a pD of 5.0 to 5.1. The acidifying agent is nitric acid, introduced through the nitrate bed in the heavy water purification system (see Section 7.5). The electrical specific resistance of the pD 5 heavy water is about 700,000 ohm-cm at room temperature.
Impurities in the heavy water will be kept at very low concentrations by the filters and ion exchange beds of the purification system. The isotopic purity of the heavy water received from the AEC is 99.75% or better. The light water content of the heavy water will increase slightly from the 0.25% initial value as the primary system is filled and the reactor operated. During normal reactor operation the chief sources of light water contamination of the heavy water will be in fuel changing, when the primary coolant is exposed to water vapor in the atmosphere, and from the resin beds in the purification system. Contamination from the resin beds will be minimized by careful deuterization before putting the beds into service. The degradation rate of the isotopic purity of the primary coolant should not exceed C.03% per year.
5.2.2 COOLANT INVENTORY. The heavy water inventory is given in Table 5.2-1 for the entire HFBR plant.
5.2.3 LEAKAGE RATES. The possible sources of leakage in the heavy water systems are gaskets at flanged pipe joints, pump and control rod mechanical seals, valve packings, and the equipment itself. A further source of heavy water loss is in the fuel handling operations.
Because of the care with which the equipment has been manufactured, chronic leaks in the process system components are not likely. Leaks at gaskets are a possibility but should be quickly detected and corrected in the start-up phase of plant operation. Some leakage at pump and control rod seals can be expected. The life tests on the control rod drive shaft seals showed a maximum leak rate of 4 cm3/hr. If all 16 control rod seals leak at this worst rate, the daily heavy water loss to the DA drains is 1.54 liters, or .41 gal. The seven heavy water pump mechanical seals are of similar design and are expected to leak at about the same rate, for an additional .67 liters, or .18 gal, per day. This mechanical seal water leakage is collected in the storage tank FA-101 or in collection vessels at pumps, except for the minor amount vaporized and carried off in the exhaust air system. The fraction of the mechanical seal leakage which is vaporized may run as high as 10 to 20 percent, leading to a yearly loss of 20 to 40 gal of heavy water from this source.
Valve packings of the types used in the heavy water systems have been shown by long use in many applications to be quite tight at the moderate temperatures and pressures of the HFBR systems. The water leakage from valve packings in good condition will be small, with evaporation carrying away all such leakage with the exhaust air from the plant. An allowance of 20 to 40 gal per year is made for D20 loss from this source. Heavy water is evaporated and lost from the system in the fuel changing operation at each shutdown. About one gallon per shutdown, or 20 gal per year may be estimated for this leakage source.
The total yearly heavy water loss from the above sources is 60 to 100 gal, or .67 to 1.1 percent of the plant inventory. A further loss of high isotopic purity heavy water occurs in the deuteration and dedeuteration of the resins in the purification system. In this process heavy water is not lost, but is degraded with light water and must be returned to the processing plant for upgrading. The amount of heavy water degraded in deuterating and dedeuterating a bed is 40 to 60 lbs, so that the yearly processing for all four beds will

5 - 3
degrade about 25 gal.
Table 5.2-1 Heavy Water Inventory (70°F)
Primary System: Reactor vessel, DC-101* EA-lOlA and B (tube side) GA-lOlA and B 18 and 20 in. pipes and valves
Helium System: GA-105 EG-101 Pipes and valves
Shutdown Cooling System: EA-103 GA-102A and B Pipes and valves
Purification System: FD-lOlA and B, and FD-102 H-lOlA and B H-102A and B Pipes and valves
Transfer and Storage System: GA-104A and B FA-101 FA-102 Pipes and valves
Experimental Facilities Cooling System: Irradiation thimbles V-10 to V-16 EA-102 GA-103A and B FD-103 and FD-104 H-103 Pipes and valves
2175 gal 2390
284 2224 7073
1 1
30 32
79 24
340 443
43 70 70
150 333
8 200 340 116 664
56 136
8 24 35
190 449
TOTAL PLANT INVENTORY: 8994 gal
*The reactor vessel inventory of 2175 gal is for the operating condition: 2470 gal are required to completely fill the vessel.

5 - 4
5.2.4 RADIOACTIVE CONTAMINANTS. To a large extent the radioactive materials to be found in the primary coolant originate in the core region by nuclear reactions. A listing of these contaminants, the reaction in which they are formed, their half-lives, and their concentration in the coolant at the exit from the reactor vessel is found in Table 5.2-2. With the exception of Na-24, which has the aluminum in the fuel element as its source, these radioisotopes originate in the heavy water itself. A curve of the concentration of Na-24 in the primary coolant is shown in Figure 10.17. This graph shows the effect of the purification system at various flow rates on the Na-24 concentration, as well as the decay of the activity after shutdown.
Table 5.2-2 Principal Radioactive Contaminants in the Primary Coolant at the Vessel Outlet During Operation at Full Power
Radioactive Concentration, µc/cc Isotope Formation Half-Life unless otherwise stated
Nl6 16 16 100 0 (n,p)N 7.4 sec
Nl7 17 17 -2 0 (n,p)N 4.2 sec 1.44 x 10
019 18 19 18.9 0 (n,y)O 29 sec
Fl7 016(d,n)Fl7 66.6 sec 5.2
Na 24 27 24
Al (n,a.)Na 15.4 hrs .173
H3 2 3 12.26 1260* H (n,y)H yrs
Photoneutrons 2 1
H (y,n)H 8.96 x 3
10 n/cc-sec
*concentration at the end of one year.
Trace quantities of fission products from fuel element surface contamination and radioactive corrosion products would also be expected to be found in the primary coolant but should be kept at very low levels by the purification system.
The concentration of tritium, which has a long half-life when compared with the other radioisotopes originating in the heavy water, will continue to build up in the primary coolant for many years. The calculated tritium concentration from start-up to 25 years is given in Figure 5.7 for three conditions of heavy water makeup. Since the tritium emits only a low energy beta, it presents a biological hazard only when inhaled, ingested, or absorbed through the skin. Tritium, therefore, requires no extensive shielding in spite of its relatively large concentration in the coolant water.
5.3 SYSTEM COMPONENTS
5.3.l MAIN HEAT EXCHANGERS. The two main heat exchangers, EA-101A and B, are U-tube, counter-flow, water-to-water coolers, mounted in the horizontal position. Table 5.3-1 gives pertinent data on these coolers.
The dimensions of the main coolers are 56 in. shell outside diameter by

5 - 5
27 ft-0 in. overall length. The heavy water inlet and outlet nozzles extend above and below the channel to give an overall height to the main coolers of 9 ft-10 in. Figure 5.3 shows the shape of the coolers and the outline of these nozzles.
Table 5.3-1 Data on the Primary System Coolers EA-101A and B
Manufacturer: Southwestern Engineering Co.
Tube side fluid:
Shell side fluid:
Rated flow per shell: Tube side Shell side
Design pressures: Tube side Shell side
Design temperature:
Operating pressures: Tube side Shell side
Pressure drop (rated flow): Tube side Shell side
Operating temperature (rated flow): D20 in D20 out Cooling water in Cooling water out
Velocity of D20 in tubes (rated flow):
Heat transfer rate: Clean Service
MTD (corrected):
Surface per shell:
Rated heat exchanged per shell:
Materials of construction: Tubes 3/4 in. OD x 16 B.W.G.
D2o primary coolant
Cooling tower water
9,000 gpm 4,000 gpm
300 psig 150 psig
16cl°F
250 psig 45 psig
10 psi 12 psi
134°F 120°F
85°F 119°F
7.3 ft/sec
526 Btu/hr-ft2_oF 256 Btu/hr-ft2_op
23 .6° F
11,330 ft2
68,500,000 Btu/hr
ASTM A-249, stainless steel, type 304, .063 max. carbon, seam welded
5 - 6
Table 5.3-1 (cont'd)
Materials of construction: (cont'd) Channel head
Tube sheet (extended to serve as body flange)
Shell
Number of U tubes per shell:
Number of active tubes: EA-lOlA EA-101B
Number of plugged tubes: EA-lOlA EA-lOlB
Closure design: Channel to tube sheet Tube to tube sheet Shell to tube sheet Inspection hole in shell
Code requirements:
ASTM A-240, stainless steel type 304, .06% max. carbon
1/4 in. stainless steel type 308 ELC cladding laid on 4-3/4 in. ASTM A-212B carbon steel
ASTM A-212B carbon steel
1350
1345 1348
5 2
Welded Rolled and seal welded Bolted, with gasket Bolted, with gasket
TEMA-R for entire cooler~ ASME Unfired Pressure Vessel Code, with Cases 1270N and 1273N, for tube side only
The U-tube type of exchanger, the geometry of the channel, and the arrangement of the primary coolant inlet and outlet nozzles were all determined in the cooler design by the requirement of minimum heavy water inventory. The units are physically compact in view of the large surface they contain. The construction is on the heavy side, with channel, nozzle, and tube wall thicknesses in excess of even the stringent requirements of the ASME Code for nuclear service vessels.
The testing program carried out on the main coolers included the following:
1. An eddy current test of the seam welds in all of the tubing. This test was carried out by the tube manufacturer (Damascus Tube Co.).
2. All tube-side (primary coolant side) plate, pipe, and forging materials were ultrasonically tested for internal flaws.
3. All tube-side welds were radiographed. 4. A hydrostatic test was performed on the tube sides of the coolers at
465 psig. A hydrostatic test at 255 psig was performed on the shell sides of the coolers with fluorescent dye in the water to reveal small leaks. None were found.
5. A mass spectrometer leak test with helium gas was performed on the tube sides of the main coolers. The testing standard was MIL-STD 271B (SHIPS), Section 8, with the additional provisions that the test gas be all helium (instead of a helium-air mixture) and that

5 - 7
the allowable leak rate be 2 x lo-8 STP cm3/sec (instead of 5 x 10⁻⁸ ).
As a result of the tube-side hydrostatic test and an extensive series of helium leak tests, 5 tubes were plugged in EA-101A and 2 tubes were plugged in EA-101B. In the final leak tests of the coolers the shell sides were pressurized to about 50 psig with helium, and no leakage to the evacuated tube sides could be detected with the mass spectrometer. The instrument sensitivity in these tests was 3 - 5 x lo-10 STP cm3/sec. Further tests with the channel ends of the coolers enclosed in envelopes containing atmospheric pressure helium showed no detectable leakage from the channels and nozzles to the atmosphere. We conclude that the tube to shell leakage rate of both exchangers is9of the order of 5 x lo-10 STP cm3 /sec He, and is 'certainly less than 1 x 10- STP cm3/sec He, for a pressure difference of some 65 psi across the tube walls. Such a leakage rate is truly microscopic, and the heavy water leakage to be expected is effectively zero.
The primary coolant sides of the main coolers were cleaned, prior to the final tests discussed above, by a series of detergent and cleaner washes and water rinses. The detergent was an alkaline base material, Oakite No. 62. Repeated clean water rinses removed the cleaning solutions. The final rinses were made with deionized water, and the coolers were then carefully dried.
5.3.2 MAIN PUMPS. The two main pumps, GA-101A and B, are of the vertical in-line centrifugal type. Table 5.3-2 gives pertinent data on these pumps. The performance characteristics of the pumps are given in Figure 5.8.
Table 5.3-2 Data on Primary System Pumps GA-lOlA and B
Manufacturer: Pacific Pumps, Inc.
Flow capacity: Design Test
Number of stages:
Impeller:
RPM:
Motor:
NPSH at rated flow:
Materials of construction: Casing, impeller, inner base parts, shaft
Code:
Number of seals:
9,000 gpm at 128 ft head 9,000 gpm at 142 ft head
One
19-1/4 in. diameter enclosed-type
1190
Louis Allis, 400 hp, 2300 volts, 3 phase, 60 cycle, with special Class "B" epoxy insulation
32 ft
Stainless steel, type 304 0.06% max. carbon
API Standard 610, Centrifugal Pumps for General Refinery Service
One

5 - 8
During the shop testing of main pump GA-lOlB the vibration data below was gathered using an IRD Model 600 Vibrometer. Periodic testing of the vibration of the pumps will be carried out during operation to detect the onset of any vibration problems.
Capacity Speed Pump Vibration
4000 gpm 1190 rpm 0.0003 in.
9000 gpm 1190 rpm 0. 0004 in.
The shaft seals on the main pumps are pressure balanced single seals with auxiliary sealing devices, API Designation BASFHh. The seal is shown in the sectional drawing, Figure 5.9. The seal will be described in detail here, since it is typical of the pump shaft seals used throughout the plant.
The primary coolant is prevented from leaking out of the pump along the shaft by the seal shaft sleeve "O" ring·s. Since the seal shaft sleeve is tightly bound to the pump shaft and rotates with it, these "O" rings form a static seal. They should be completely tight and prevent any leakage between the shaft and the sleeve. The shaft sleeve compression nut and seal ring adapter also rotate with the shaft. The primary coolant is prevented from leaking between the washer and the seal shaft sleeve by the Buna S "0" ring and its back-up ring of polyethylene. These components rotate with the shaft and sleeve, so that the "O" ring seal is static, and should be completely tight.
The dynamic seal, that is, the seal between the rotating parts and the stationary parts bound to the pump casing head, is made at the interface between the carbon washer and the tungsten carbide seat, with the washer rotating and the seat stationary. The outer seal plate clamps the seat to the inner seal plate. These parts are sealed to each other and to the pump casing head by sets of Buna S "O" rings to form a water-tight stationary assembly. The washer is forced against the seat by springs mounted in the washer assembly and backed against the shaft sleeve. The washer itself is shaped so that the pressure drop across the seal does not force the washer against the seat.
A small amount of the coolant from the discharge of the pump is piped to the seal flushing connections in the inner seal plate and flows into the cavity between the washer assembly and the pump casing head. This flushing water stream cools the washer and seat, removing the friction heat generated at the interface. The flushing water also carries away from the critical interface solid particles which might otherwise accumulate in this region and damage the seal. Two other pipe connections in the inner seal plate lead to an annulus around the seat. In some seals cooling water is circulated around the seat in this annulus to keep it cool. The GA-101A and B pumps will not utilize these connections and they will be plugged.
Any coolant which leaks past the dynamic seal will work its way to the chamber formed by the seat, the seal shaft sleeve, and the outer seal plate. This chamber is vented and drained through two pipe connections. Outboard of (i.e., above) the leakage collection chamber is the auxiliary seal. This is formed by the stationary floating seal plate bushing fitting snugly around the shaft sleeve. The floating seal plate bushing is of carbon. It is made in three segments and is held together by a garter spring. The diametral clearance between the floating seal plate bushing and the sleeve is .004 to .006 in. The carbon bushing assembly is pushed against the outer seal plate by four retaining springs, to effect an axial seal between these members.

5 - 9
The purpose of the auxiliary seal is to limit the flow of air into the collection chamber. The chamber is drained to a collection tank for liquid leakage, and is maintained at an air pressure less than that in the pump room by the exhaust connection to the off-gas manifold. Thus, air leaks down the shaft sleeve and through the auxiliary seal into the collection chamber. This arrangement insures that tritium-bearing water vapor from leakage past the main dynamic seal does not get into the room air. In viewing the drawing of the seal, Figure 5.9, it should be kept in mind that the pump shaft is vertical, and that the auxiliary seal is on top of the assembly. When properly installed this type of seal allows for the passage of no liquid and only minute quantities of vapor.
A flywheel having a moment of inertia of 1000 lb-ft2 was added to each pump to improve its coastdown characteristics. The addition of the flywheel brought the total moment of inertia of each pump to 1320 lb-ft2 The coastdown of the installed pumps is dependent to large extent on the configuration of the system in which they are installed, so that test stand figures are not of great value. An analytic approach has been taken using the known moments of inertia of the pumps together with calculated values for the liquid momentum and piping frictional losses. Figure 5.10 presents the analytically derived coastdown curves for the primary coolant system with two pumps initially on line and with one pump initially on line. Actual coastdown times in the system will be measured during the startup experiments.
It should be noted that the initial flow for two pumps is taken at 16,600 gpm, whereas the design flow of each pump is 9000 gpm. The 16,600 gpm flow is used because it is the minimum flow required to operate the reactor at 40 MW. Coastdown for larger initial flows will displace the entire curve upward slightly.
The main pumps may be started and stopped at the console in the control room, or at the switch gear cabinets on the equipment level. Normally, starting and stopping will be done at the control console. The primary coolant system must be pressurized before the main pumps are started because of the 30 ft NPSH required by the pumps at normal flow and the substantial NPSH required even at reduced flow. A cover gas pressure of 120 psig is required to clear the low-low pressure interlock and allow starting of the pumps (see Sections 9.5.4 and 9.5.6).
Pumps are always started one at a time with the pump suction valves fullopen and the primary control valves one-fourth open. When the first pump reaches rated speed, as indicated by the motor current meter in the control room, the corresponding primary control valve is opened to the setting which is required with both pumps operating. The second pump is started in a similar fashion. With the two pumps operating, both primary control valves are trimmed so that the total flow in the system is at the desired level and flow through the two primary coolers is the same. Barring obstructions or other extraordinary occurrences, which would be diagnosed by other instrumentation, flow through the coolers should be essentially the same if the pressures at the primary cooler outlets are the same.
The electrical power for the pump motors is 2300 volt, 3 phase, 60 cycles. The supply for each motor originates at a solenoid operated, 3 pole, draw-out type air circuit breaker in the 2300 volt switchgear cabinet on the equipment level.
5.3.3 VALVES

5 - 10
5.3.3.l Introduction. Valves in the primary system can b~ divided into two categories~ valves which have to do with the control of the coolant in the system, and drain valves. In the former category are the primary control valves, pump suction valves, and the primary check valves. In the second category are the valves in drains for pumps and low places in the system.
5.3.3.2 Drain Valves. Figure 5.1 shows the various drains from the primary system. These drains are part of the DA drain system, which is described in Section 7.6. The valving which separates the primary coolant system from the drain system consists of two block valves in each line to insure no leakage from the primary system. The valves employed are Hancock Type 100 BW solid wedge gate valves made of type 304 stainless steel with a maximum carbon content of 0.06%.
5.3.3.3 Primary Control Valves. The primary control valves HCV-101A and HCV-lOlB are 18 inch Allis-Chalmers Rotovalves. The Rotovalve is essentially a plug cock which, when being opened, is first lifted from its seat and then rotated to the desired position. When in the full open position, the opening through the plug orifice provides an unobstructed fluid passageway. The passageway is closed by rotating the plug orifice to a position perpendicular to the opening in the valve body. When the valve is closed, the plug is forced into the body so that the seat rings on the plug engage mating hard-faced seat rings on the body. Data on the primary control valves are given in Table 5.3-3.
The primary control valves are operated by Hupp air motors, with handwheels for local operation. The Hupp motor is capable of holding the valve plug at any position between fully closed and fully open for an unlimited period of time.
The valves are operated remotely from the control console by "open" and "close" momentary contact push buttons. Valve position is transmitted to the console and is shown on meters on the console. Limit switches at the valves provide signals to "full-open" and "full-close" pilot lights on the console. A torque switch protects the valve from damage in the event of an obstruction or an over-travel command. The switch de-energizes the solenoid valves (hence closes them) which control the air supply to the valve operator motor. The valve operator also has positive mechanical stops to prevent over-travel.
5.3.3.4 Pump Suction Valves. The two pump suction valves, HC-102A and HC-102B, are also 18 inch Allis-Chalmers Rotovalves. The discussion of the Rotovalve given in Section 5.3.3.2 applies to the suction valves, except as noted below.
The pump suction valves are operated by 14 in. Hannifin air cylinders, which are controlled in turn by manually operated 4-way air cocks. The 4-way air cocks are located outside the equipment cells. The valve operating mechanism is provided with limit switches which control pilot lights at the main console to indicate "full-open" and "full-closed" positions. The pump suction valves are not intended for throttling service and will be employed fully open or fully closed.
The data in Table 5.3-3 is applicable to the primary suction valves with the following exceptions:
1. Working pressure is 220 psig. 2. End preparation is one 18 in. 150 psi ASA flange and one 20 in.
weld neck. 3. Test leakage through the valves was 4 oz/hr for HC-102A and
10 oz/hr for HC-102B, both at 250 psi.

5 - 11
Table 5.3-3 Data on the Primary Control Valves HCV-lOlA and B
Design temperature:
Design pressure:
Hydrostatic test pressure:
Working pressure
End preparation:
Materials: body, plug, and head
seat rings upper and lower trunnion facing
head and body bushings head-body gasket
pipe plugs packing
lantern ring plug stub shaft dowel
Motor operator environment design conditions
Leakage through closed valve: design, max. allowable test, HCV-lOlA test, HCV-101B
150°F
300 psig
500 psig
275 psig
one 300 psi ASA flange one 20 in. weld neck
cast stainless steel, ASTM A-296, Grade CFB, .03% max. carbon CO-CR-A laid on body by welding Stellite #6 laid on plug by welding stainless steel, type 410 Flexitallic, stainless steel, type 304 and asbestos stainless steel, type 304 graphite-impregnated braided asbestos or molded polyurethane stainless steel, type 304 stainless steel, type 410 stainless steel, type 304
85% relative humidity, 150°F temperature, 100 R/hr continuous gamma radiation
20 oz/hr at 250 psi 15 oz/hr at 350 psi 7 oz/hr at 350 psi
5.3.3.5 Primary Check Valves. A check valve is located at the discharge end of each of the primary pumps to prevent reverse flow through the pump. The valves are 18-inch Wheatley #BF Frank-Flo swing check valves with both ends beveled for welding per ASA-Bl6.5. There is metal-to-metal contact between the clapper and the seat. Stainless steel, type 304, with .06% maximum carbon was used for the check valves.
Table 5.3-4 gives the pressure drop versus flow characteristics for the valves. It should be noted that the check valves do not close completely until there is substantially less than 400 gpm forward flow. This characteristic of swing check valves to remain open as long as there is any appreciable forward flow insures that there are no flow discontinuities during the coastdown period from abrupt closing of the check valves.

5 - 12
Table 5.3-4 Pressure Drop vs. Flow Characteristics for the Primary Pump Check Valves
Water Flow Rate Pressure DroE Water Flow Rate
400 gpm 0.05 psi 8000 gpm
1000 .08 9000
2000 .14 10 000
3000 .29 11 000
4000 .45 12 000
5000 .68 13 000
6000 1.00 14 000
7000 1.40
5.3.4 PIPING
Pressure Dro:e
1.80 psi
2.25
2.75
3.30
3.90
4.90
7.20
5.3.4.1 Piping Design. These sections will describe the primary and auxiliary system piping which contains heavy water. The heavy water system piping is designed and fabricated to the highest standards used in the plant. It is designated as "P" piping, and may be distinguished on piping and instrument diagrams by the letter "P" proceeding the line number. The "P" piping was fabricated under stringent cleanliness and inspection requirements. The materials are type 304 stainless steel for all pipes except the vessel connections, and aluminum alloy 6061-T6 for the piping connections to the reactor vessel. The DA drain system piping is of the same standard as the "P" piping.
The design of all "P" piping was based on the requirements of the ASA Code for Pressure Piping, Petroleum Refinery Piping, ASA B31.3. Modifications of the ASA Code requirements were permitted only where the modification exceeded the Code requirements. Pipe hangers, supports, and anchors were designed under the requirements of the ASA Code for Pressure Piping, B31.l, ch. 1, Sec 6.
The piping arrangement for the primary system is shown in the isometric drawing, Figure 5.3. The piping layout was chosen to minimize heavy water inventory and to provide sufficient flexibility to accomodate the full range of possible thermal expansion with minimum stresses. In all of the "P" piping, butt welded connections are made where possible, in preference to flanged or socket welded connections, to reduce the number of cavities in the piping which might collect foreign material and to eliminate gaskets.
5.3.4.2 Materials. The general material for piping is type 304 stainless steel, with 6061-T6 aluminum alloy used for pipe connections to the reactor vessel. The "P" piping is divided into four classification groups: A3K, B3K, T3K, and B3C for 150 psi stainless steel piping, 300 psi stainless steel piping, stainless steel tubing, and 300 psi aluminum piping, respectively. Each of these classifications has its own detailed materials list for piping of various sizes, fittings, flanges, gaskets, bolts, and valves. Table 5.3-5 summarizes
5 - 13
these material lists for the four classifications.
Where reference is made to a particular vender's valves in the material classifications, the reference is intended as a precise identification of the type and quality required. Substitution of other valves for those listed was accepted if the substitute was of equivalent type and quality. Specific review and authorization was required for each such change. Certified mill test reports were required of the piping vendors for all materials supplied.
5.3.4.3 Fabrication. The fabrication of piping was governed by the ASA Code and pertinent Lummus Company specifications. Sub-assemblies of the piping were fabricated in clean cbnditions in the sub-contractor's shops and were kept sealed until assembled into the system at the job site. Dimensional tolerances for fabricated piping are given in Table 5.3-6.
Table 5.3-6 Pipe Fabrication Tolerances
Length and linear dimension
Flattening
Flange face alignment
Alignment of joints
Thinning
Bolt hole location
1/8 in.
5% of nominal pipe size
.5 degree max. deviation
1/16 in. max. parallel misalignment
Finished wall not less than 87-1/2% of nominal
1/16 in.
Welded joints required beveling of the cut pipe ends for wall thicknesses greater than 3/16 in. Either 37.5° straight bevels or 20°u bevels were used. The joint fit-ups were made with uniform root spacing. Tack welds to hold joints were removed so that they did not become part of the joint unless made by a qualified welding operator and of the same quality as the finished weld. Joint fit-ups and tack welds were inspected and approved before the final weld was made.
All finished welds on p1p1ng were made only by qualified welding operators. Qualification procedures submitted by the piping subcontractor for all types of welds in the system were reviewed and approved prior to operator qualification tests. The first root pass of all circumferential welds in the "P" piping was made by the inert' gas shielded welding technique. Complete penetration was required. The root of the weld was required to show a smooth contour, with no evidence of non-fused land at the edges of the base metal in the radiographic inspection. Depression of the root pass, or "sink", was not allowed to result in a total thickness less than the original wall thickness of the pipe.
5.3.4.4 Cleaning. The cleaning procedure adopted for the "P" piping utilized flushing, mechanical cleaning, and for the alloy steel piping chemical cleaning with oxalic acid, sodium bisulphate, and wetting agents. Where pipe runs permitted access to both ends, clean rags were soaked in detergent and pulled through the line. The final rinses were done with deionized water. Sections of piping were kept as free of dirt as possible during fabrication and all open ends were covered and sealed. In spite of the precautions taken during

Table 5.3-5 Primary System Pipe and Fitting Specifications
Component
PIPE OR
TUBING
FLANGES
STUB ENDS
FITTINGS
GASKETS
BOLTING
CORROSION ALLOWANCE
A3K 150# Raised Face
304 Stainless Steel
1/2" to 24": ASTM A312 type 304, seamless, Sch.lOS
1/2" to 24": 150# lap joint, ASA Bl6.5, carbon steel Al81 Gr I
150# RF blind, ASA Bl6.5, stainless steel Al82 Gr F304
Material & Sched. same as pipe, dims, to MSS SP-43 & ASA Bl6.9 where applicable, MSS length: Ladish part No. 27410, or equal
1/2" to 2": 200# socket welds, ASA Bl6.ll, Al82 Gr F304
l" to 24": butt weld, dims. to MSS SP-43 & ASA Bl6.9 where applicable, Material & Schedule same as pipe
Flexitallic Style CG or equal, type 304 stainless steel, asbestos filler, carbon steel gage ring
Al93 Gr B7 alloy studs & carbon steel Al94 Gr 2H nuts
zero
B3K 300# Raised Face
304 Stainless Steel
1/2" to 4": A312 type 304, seamless, Sch. lOS
6" to 18": ASTM A312 type 304, Sch. lOS
1/2" to 18": 300# lap joint, ASA Bl6.5, carbon steel Al81 Gr I
300# RF, blind, ASA Bl6.5, stainless steel Al82 Gr F304
Material & Sched. same as pipe, dims. to MSS SP-43 & ASA Bl6.9 where applicable, MSS length: Ladish part No. 27410 or 27400, or equal
Same as A3K
Same as A3K
Same as A3K
zero
T3K Tubing
Stainless Steel
ASTM A269 type 304, seamless fully annealed for bending, 70-74 Rockwell "B", not to exceed 80 Rockwell "B" (max. ladle carbon 0.06%) 1/8" .032 wall 1/4", 3/8", 1/2": .035 wall 5/8", 3/4": .049 wall 7/8": .065 wall l": .109 wall 1-1/4": 1-1/2":
.120 wall
.130 wall
Four piece compression '(Tyloc): Type 316 stainless steel, conforming to Joint Standards (JIC) for Industrial Equipment.
3000# Threaded: ASA Bl6.ll, A234. Tubing-to-tubing welded connections shall be made using Arcos EB Weld Inserts.
B3C 300# Raised Face
Aluminum
l" to 12": aluminum, ASTM B241 GSllA T6, alloy 6061 Sch. 40
14" & larger: aluminum, ASTM B241 GSllA T6, alloy 6061, Sch. 40 or as computed for service with min. • 050" corrosion allowance
l" to 12": 300# RF weld neck, aluminum 6061-T6
14" & larger: 300# RF weld neck or lap joint, aluminum 6061-T6
Material & Sched. same as pipe, dims. to MSS SP-25 and ASA Bl6.9, where applicable
Butt weld, dims. to MSS SP-25 & ASA Bl6.9 where applicable. Material & Sched. same as pipe
Same as A3K
Same as A3K
.050" minimum

Table 5.3-5 (cont'd)
Component
MAINTENANCE JOINTS
PIPE JOINTS
VALVES, GENERAL
GATE
GLOBE
CHECK
INSTRUMENT ANGLE VALVES
ORIFICE VALVES
NOTES:
A3K 150# Raised Face
304 Stainless Steel
Use flanges for break connections. No unions permitted
1/2" to 2": socket weld couplings
l" & over: butt weld
1/2" to 2": 600# Socket Weld, Al82 Gr F304 body (exception use flanged check valves)
1/2" & over: 150# RF, flanged or butt weld, A351 Gr CFS body. All stem & trim 304 stainless steel. Gates & globes: bolted bonnet, OS&Y. Packing: cup and cone solid ring teflon, or solid rings of teflon asbestos. In radiation zones, graphiteimpregnated braided asbestos or molded polyurethane
1/2" to 2": Solid Wedge, Hancock lOOW
1/2" to 24": Double Disc, Aloyco 117-116
1/2" to 2": Loose Disc Hancock lOW
1/2" to 12": Modified Plug Disc, Aloyco 317-316
1/2" to 10": Horizontal Swing, Aloyco 377-376
1/2" to 3/4" & 3/4" x 1/4": OS&Y, Bolted, Jerguson 74G Integral Bleed
1/2" x 1/2" Orifice Block HEX M-HOM, Bolted Bonnet
1/2" x 1/4": Orifice Manifold by-pass with Tyloc Fittings & 3/8" type 304 tubing, HEX M-HOM, Bolted Bonnet
B3K 300# Raised Face
304 Stainless Steel
Same as A3K
Same as A3K
Same as A3K
l" &. over: 300# RF, rest of spec. same as A3K
1/2" to 2": Same as A3K
l" to 8": Double Disc, Aloyco 2117-2116
10" to 12": Solid Wedge, Aloyco 2217-2216
1/2" to 2": Same as A3K
l" to 6": Modified Plug Disc, Aloyco 2317-2316
1/2" to 8": Horizontal Swing, Aloyco 3477, 2376
Same as A3K
Same as A3K
1. No copper bearing material shall be used (except the base alloy, 6061, in B3C). 2. All threaded nipples shall be Schedule 40, minimum. 3. Type 316 stainless steel is acceptable for trim. 4. Valves shall have metal-to-metal seating. 5. Type 304 stainless steel maximum ladle carbon to be 0.06%.
B3C 300# Raised Face
Aluminum
Same as A3K
Butt weld, dims. to MSS SP-25 & ASA Bl6.9 where applicable. Material & Sched. same as pipe
6. All pipe, fittings, and valves to be free of oil, grease, dirt, and paint, except handwheels, which are painted red. 7. Abbreviations: MSS - Manufacturers Standardization Society of the Valves and Fittings Industry.
OS&Y - outside screw and yoke.

5 - 16
fabrication, and the cleaning and sealing of sub-systems as they were completed, it is likely that further cleaning measures will have to be taken on the completely assembled piping system after all construction work has been finished.
5.3.4.5 Inspection and Testing. All welds in the "P" piping were radiographed. The standard of acceptability was that given in the ASA Code for Pressure Piping, ASA B31.3. Welds were required to show complete joint penetration, smooth root contours, and no "sink", in addition to the provisions of ASA B31.3 as to weld appearance, cracks, inclusions, etc. Repaired joints were radiographed and met the full standards for the "P" piping. All "P" piping was hydrostatically tested at a pressure in excess of 425 psig. The piping was held under pressure for a sufficient length of time to allow a thorough inspection of all joints and all pipe surfaces.
5.3.4.6 Piping Stresses. The primary piping is subjected to relatively modest temperature changes. The maximum bulk water temperature is 150°F. Design operating conditions call for a temperature of 120°F from the primary coolers to the reactor vessel and 134°F from the reactor vessel to the primary coolers. However, since the primary piping was kept as compact as possible to minimize heavy water inventory, the thermal expansion stresses were thoroughly investigated. For the calculations a temperature of 120°F was assigned to the reactor inlet piping and 150°F to the outlet piping.
For the case in which both primary coolers are operating, the maximum computed stress in the reactor outlet piping is 2705 psi at two symmetrically located points at the downstream ends of the 18 in. elbows between the pumps and the pump suction valves (see the isometric drawing, Figure 5.3). In the reactor inlet piping the maximum computed stress is 2290 psi at two symmetrically located points at the outlet nozzle flanges of the primary coolers EA-101A and B. These stresses are quite low, and reflect both the small temperature range involved and the relative flexibility of the piping system.
For the case in which only one primary cooling circuit is operating, the most important change in the stress situation is the introduction of torsion in the reactor outlet piping. A check of the stress produced by this loading shows only 345 psi in torsion and a combined stress of 395 psi in the reactor outlet piping. The very low values for the stresses in this case are again due to the flexibility of the system and the small temperature range.
5.3.4.7 Flowmeter. The primary system flowmeter is a venturi section installed in the 20 in. outlet line from the reactor vessel (see Figure 5.3). The flowmeter body material is stainless steel, ASTM A-312, type 304, with a maximum ladle carbon content of 0.06%. The venturi body is welded into the outlet line in accordance with the "P" piping standards. The flowmeter is 36 in. long, with a throat diameter of about 17-1/2 in. Instrument taps are all 3/4 in. Sch. 80 seamless pipe of type 304 stainless steel. Maximum flow through the venturi is 25,000 gpm, at a flow head loss of 6.25 in. water gauge. The maximum differential pressure developed at the instrument taps is 250 in. water gauge. (Pressures given "inches water gauge" all refer to light water.)
5.3.5 RELIEF VALVES. Two Crosby Size 2J3, Style J0-25-3, Type A, safety relief valves having an orifice area of 1.287 square inches each are employed to protect the primary coolant system from overpressures. These valves, SV-101A and SV-lOlB, are connected to the piping which vents the surge volume in the reactor vessel (see Section 7.4.4). Each valve is capable of passing 20,400 lb/hr. of saturated steam, or 350 gpm of water, at a pressure of 275 psig with no more than a 100~ overpressure. The relief capacity of the valves is reduced by the frictional losses in the attached piping, and a conservative estimate

5 - 17
of the relief capacity of the two valves in parallel, with piping losses, is 10,000 lb/hr of steam.
The relief valves are set at the vessel design pressure, 275 psig. Once opened, the valves will reseat at about 230 psig. Complete reseating, with no detectable leakage past the seat, is anticipated. The valves will be tested in place periodically. The portions of the relief valves in contact with the primary fluids are made of stainless steel.
5.4 PROCESS DESIGN CONSIDERATIONS
5.4.l FLOW RATES, PRESSURES, AND TEMPERATURES. The flow rate in the primary system is determined by the heat transfer requirements of the fuel elements at rated power. A primary circuit flow rate of 16,600 gpm gives the required water velocity in the fuel element cooling channels of 35 ft/sec. Reference may be made to Sections 4.7.2 for a detailed analysis of the flow distribution in the reactor vess~l. Figure 5.2 shows the flow direction through the vessel, with downward flow through the core, and in the external circuit. The two pump and heat exchanger loops share the flow equally, carrying 8300 gpm each.
There are no cross-over or bypass lines in the primary circuit which would make it possible to reverse the flow direction. Even if one of the main pumps is shut down and all valves, including the check, remain open in that loop, the flow cannot be reversed through the vessel.
The system pressure is determined by the helium gas pressure in the surge volume at the top of the reactor vessel. This reference pressure is set at 200 psig, which is somewhat greater than the pressure required to suppress boiling at the core hot spot at the normal 16,600 gpm flow rate and full rea~tor power. The hot spot surface temperatures for a freshly-fueled core and the normal core are 359 and 344°F, respectively. The cover gas pressures which give saturation temperatures at the hot spot equal to these values are 164 and 137 psig.
Pressures at various points in the primary circuit are shown in Figure 5.2. The reactor inlet pressure of 203 psig is obtained from the surge volume pressure by the addition of about 3 psi in static head. The reactor vessel pressure drop from inlet to outlet is about 32.5 psi, with 33.2 psi frictional loss and 1.7 psi gain from static head difference. About 31 psi of the vessel frictional loss is due to the core. The piping, valves, and flowmeter in the section from the reactor outlet to the pump suctions have a frictional pressure loss of 4.3 psi. This, together with a gain in pressure of 14.3 psi from the static head difference gives a pressure increase of 10 psi, and a pump suction pressure of 181 psig. The pressure gain through the pumps is 69 psi at 8300 gpm each (see Figure 5.8). The discharge pressure is 250 psig. The section of the primary circuit from the pump discharges to the reactor inlet has a pressure drop of 47 psi, composed of frictional losses of 8.6 psi in the main coolers, 18.4 psi across the throttle valves, and 4.5 psi in the piping, and a static head difference of 15.5 psi.
With the pump suction pressure at 181 psig with normal pressurization and flow in the system, the net positive suction head requirement of 14.3 psig (see Figure 5.8) offers no difficulties. However, if flow is maintained and the system pressure lowered, cavitation will eventually occur in the pumps. For the normal flow rate of 16,600 gpm, a surge volume gas pressure of 34 psig will meet the minimum pump NPSH requirements. However, at this low pressure-normal flow condition the lower portions of the fuel element water channels will be close to

5 - 18
cavitating. A minimum surge volume gas pressure of 50 psig is needed to keep the fuel element water channels above the cavitation point at normal flow. With atmospheric pressure in the surge volume, a maximum flow rate of 5000 gpm (from either one or two pumps) can be tolerated without cavitation difficulties. The reactor safety system (see Section 9.5) is arranged with interlocks which prevent the main pumps from starting unless the cover gas pressure is above 120 psig, and the control rods are fully inserted. Further, the withdrawal of rods to start the reactor requires a cover gas pressure above 180 psig, and normal flow conditions. If the cover gas pressure should fall while the reactor is operating, the rods are inserted when the gas pressure falls below 180 psig, and the main pumps are switched off at 120 psig.
The primary system temperatures in the normal flow and full power condition are shown in Figure 5.2. The inlet temperature to the vessel is set at 120°F on the basis of reasonable secondary system temperatures and heat exchanger surface areas. It is desirable to keep the primary coolant at as low a temperature as possible. However, a lower limit is imposed by the temperature of the atmosphere, which is the ultimate heat sink. Further, too close an approach of the primary coolant temperature to the sink temperature means excessively large heat exchangers, and an accompanying increase in heavy water inventory.
The heat rate into the coolant at full power is 130 x 106 Btu/hr. At the normal 16,600 gpm flow rate, the average temperature rise through the reactor vessel is 14.3°F. The reactor outlet temperature is thus 134.3°F (given in round numbers in Figure 5.2 as 134°F).
5.4.2 COOLANT VELOCITIES. The heavy water coolant velocities in the primary system are given in Table 5.4-1.
Table 5.4-1 Primary System Coolant Velocities
Location Coolant Velocity
Class B3C aluminum inlet and outlet pipes, 22-1/4 in. ID
20 in. Sch. lOS, Class A3K stainless steel piping
18 in. Sch. lOS, Classes A3K and B3K stainless steel piping, and 18 in. plug and check valves
Primary cooler tubes
16,600 gpm 18,000 gpm
13.7 ft/sec 14.8 ft/sec
17.8 19.2
12.0 13.0
6.8 7.3
5.4.3 COOLANT CYCLE TIME. The average cycle time for the coolant in the primary system is 25.6 seconds. This figure is obtained from the primary system inventory of 7073 gallons and the normal flow rate of 16,600 gpm.
5.4.4 CORROSION AND EROSION. The primary coolant system is constructed from stainless steel of type 304 with .06% maximum carbon or aluminum alloys containing less than 2% magnesium. The corrosion of the aluminum alloys is

5 - 19
discussed in Section 5.5.6. The corrosion of the stainless steel and of the stainless steel to aluminum alloy joints will be discussed here. The factors affecting corrosion are found in Table 5.4-2.
Table 5.4-2 Factors Affecting Corrosion and Erosion
pD of primary coolant
Maximum operating temperature of primary coolant
Minimum specific resistance of primary coolant
Chloride content of primary coolant
Maximum primary coolant flow velocity
5.0 to 5.1
134°F
1 x 10⁶ megohm-cm (before addition of HN03 for pD control)
less than 1 ppm, maintained by purification system
20 ft/sec
According to the experience at the Savannah River Laboratory, the primary coolant acidification to a pD of 5 should greatly reduce the turbidity in the coolant. The fouling of stainless steel surfaces with aluminum hydroxide is thus expected to be quite low. The hydroxide fouling tends to absorb and concentrate chloride ions from the water. Even in systems of 1 ppm chloride, a thick hydroxide layer may concentrate the ions and lead to stress corrosion in stainless steel. The low pD of the HFBR coolant should eliminate this problem.
A second factor in stress corrosion of stainless steels is the temperature, with 150~F normally considered the lower limit for this type of attack (5.3). With the HFBR water conditions such as to eliminate turbidity, with the chloride concentration in the water less than 1 ppm, and with the system temperatures all below 150°F, no stress corrosion of coolers or other stainless steel components is expected (5.4).
In joints where stainless steel and aluminum are in contact, the aluminum side may be slightly susceptible to pitting at the point of contact, although evidence for this is somewhat obscure and contradictory at temperatures below 200°F. The only case of such an attack was found at a stainless steel thermocouple spot-welded to an aluminum fuel element. Other aluminum-stainless steel couples in the same water conditions (pD of 4.5) have shown no attack (5.5).
The gaskets at the connections between stainless steel and aluminum pipes are Buna N, double aluminum jacketed asbestos, or natural rubber with aluminum gauge rings. The Buna N gasketed joints should present no corrosion problem. In the case of the double aluminum jacketed asbestos and the natural rubber with aluminum rings, any attack would be on the aluminum portion of the gasket itself, which can be replaced. In any case, the attack would be of the pitting type at the gasket, and if severe enough would lead to small leaks at the joint rather than a gross failure of the pipe. All aluminum to stainless steel gasketed joints are accessible for inspection and maintenance during shutdowns.
The flow velocities in the primary system are well within the safe range from an erosion standpoint for type 304 stainless steel, where no effects should be noticed at velocities of less than 100 ft/sec at 135°F (5.6).

5 - 20
5.4.5 EFFECTS OF SUDDEN CHANGES IN VALVE SETTINGS. Consideration must be given to the possibility of water hammer and other effects resulting from the sudden closing of primary coolant loop valves and to the effects of the rapid depressurization which would result from the sudden opening of vent valves in the helium system.
The primary system check valves may be excluded from these considerations because the only effect which would cause one to close suddenly is a failure of the pump in that circuit while the other pump continues to run. Even so, the clQsing will be soft because the water velocity in the failed loop must come nearly to zero before the check valve will close (see Section 5.3.3.5).
The other two sets of valves, the primary control valves HCV-lOlA and B, and the pump suction valves HC-102A and B, are rotating plug valves and w~ll ch~nge position only when acted upon by the motorized valve operators. They cannot snap closed, therefore. The valve operators take long enough to close the valves so that water hammer will not occur. The closure time depends upon the air supply pressure and upon speed-limiting orifices in the air supply and exhaust lines from the air motors or air cylinders. Valve operation will be ~hecked during the working-in period for the primary system, and the air supply pressure and speed-limiting orifices set to insure that the closure time is long, about 40 seconds.
Although water hammer can be eliminated by adjusting valve closing times, it is possible that the control valves or suction valves might be inadvertently closed with the reactor at powez. Such an action will initiate a scram from the core pressure drop instruments. With the primary valves closed the afterheat is removed by the shutdown cooling system, which is not affected by the primary valve positions. Since the valve closure time is approximately equal to the main pump coastdown time of 45 seconds (to shutdown flow level), the fuel temperature behavior in the valve closure case is the same as in the coastdown case. Reference may be made to Section 4.7.11 for a discussion of the coastdown case.
There are a number of valves in the reactor surge volume exhaust system (see Section 7.4.4) which could be opened accidentally, thus depressurizing the system quickly. The likelihood of the relief valves SV-lOlA and B operating accidentally is remote since they are not provided with an external activating mechanism. On the other hand, the accidental opening of the reactor depressurizing valve HCe-102 is possible, as is the inadvertent opening of one of the bypass hand valves in the helium exhaust lines. The accidental depressurization of the system is considered in detail in Section 14.3.5. Briefly, the reactor is scrammed and the main pumps are switched off by the pressure instruments, and the shutdown cooling system assumes the afterheat load. No core overheating or damage results, nor is there damage to the main pumps.
5.4.6 RADIATION EFFECTS ON MATERIALS. The radiation level to which the primary system components are subjected does not exceed 400 r/hr and in most places is less than 100 r/hr, with the exception of the reactor vessel, discussed in Section 5.5. The source of activity is the heavy water itself, which is activated in passing through the core region. The radiation is almost entirely due to the energetic gamma rays from N-16. These levels of gamma radiation have no effect on the metallic materials employed in the heavy water systems and, therefore, radiation problems played no role in the selection of the metallic materials.
In the choice of gaskets, valve packings, and windings for pump motors, however, radiation considerations play an important part. Flexitallic gaskets made of stainless steel and asbestos are radiation resistant to a high degree,

5 - 21
as are the double aluminum jacketed asbestos gaskets. Where gaskets from elastomers are required, elastomers such as Buna S, Buna N, and polyurethane, which have a high radiation resistance are employed. Teflon for valve stem packings in low radiation level areas was chosen for its unique mechanical characteristics. Valve packings in high radiation level areas are of graphiteimpregnated braided asbestos or molded polyurethane, both of which have a high radiation resistance.
Special radiation resistant insulation is used in motor windings of the primary, shutdown, and experimental facilities cooling pumps.
5.4.7 PRIMARY-SECONDARY PRESSURE DIFFERENCE. The primary system is maintained at a higher pressure than the secondary system to prevent in-leakage of light water. The points where the two systems could leak into one another are in the main coolers, EA-101A and EA-101B, and in the shutdown cooler, EA-103. The secondary pressure in the main coolers is about 45 psig in normal operation, as against 240 psig for the primary pressure. In the event of leaks in the main coolers, the leakage will thus be toward the secondary side. At shutdowns, the secondary sides of the main coolers are closed off by valves in both inlet and outlet lines, and are vented at elevation 103 ft-1 in., several feet above the cooler shells. The secondary pressure in the coolers is then just the static head from elevation 103 ft-1 in. to the bottoms of the shells. The primary pressure during shutdowns, with the cover gas reduced to atmospheric pressure, is the heavy water static head from the free surface at elevation 132 ft-11 in. In these shutdown conditio~s, the cooler primary pressure is greater than the secondary pressure by 14-1/3 psi at the top of the shell and 14-3/4 psi at the bottom of the shell. Leakage during shutdowns, therefore, is also toward the secondary side. The primary-secondary pressure difference is continuously monitored by instruments which give an alarm in the control room if the difference in either cooler falls below 10 psi (see Section 9.4.3.2).
The secondary pressure in the shutdown cooler is 5 psig at the inlet and 1 psig at the outlet, for both normal operation and shutdown conditions. The low secondary pressure is obtained by discharging the effluent to the GA-303 sump at an elevation below the shutdown cooler (see Section 7.1.1). The shutdown cooler primary pressure is about 215 psig during normal operation, and is a minimum of 17 psig at shutdown from the heavy water static head. Any leakage which might occur in the shutdown cooler is, therefore, toward the secondary side.
5.5 REACTOR VESSEL
5.5.1 GENERAL DESCRIPTION. The reactor vessel contains the active core, reflector, and control elements, and provides space and access for the 16 experimental facilities which utilize the high neutron flux in the core region. The pressurized heavy water coolant flows through the vessel, cools the core, acts as both a moderator and reflector, and provides shielding for manual refueling. The vessel has many design and construction features to facilitate safe and efficient refueling and experiment handling operations.
The vessel was designed, fabricated, and tested in accordance with the ASME Boiler and Pressure Vessel Code for Unfired Pressure Vessels, Section VIII, 1959 Edition, including all revisions, addenda, and applicable code case rulings in effect at the date of award of the construction contract.
The design of the vessel is as described by the following drawings:
E4653-5000, Reactor Vessel Assembly

E4653-500l, Reactor E4653-5002, Reactor E4653-5003, Reactor E4653-5004, Reactor E4653-5007, Reactor E4653-5010, Reactor E4653-5012, Reactor E4653-5013, Reactor E4653-5014, Reactor E4653-5015, Reactor
5 - 22
Vessel Miscellaneous Sections Vessel Vessel Lower Section Vessel Upper Section Vessel Assembly, Cover Plate Vessel, Vessel Details and Miscellaneous Sections Vessel, Vessel Details and Miscellaneous Sections Vessel Assembly, Bora! Sheet Shielding Vessel Assembly, Vessel Closure Vessel, Anti-Critical Grid Installation and Details
These drawings are shown in Figures 5.11 through 5.21. They are taken from the detailed Combustion Engineering report on the vessel (5.7) which serves as a general reference for much of the material reported here.
The vessel consists of an 82 in. inside diameter spherical section welded via a transition piece to a 46 in. inside diameter cylinder. The over-all height is 21 ft-3 in. The vessel is of aluminum, type 6061-T6, of varying thicknesses: the sphere is 1-3/4 in., the transition piece is 2-1/2 in., and the cylinder is 2-1/4 in. and 2-1/16 in. The upper end of the cylindrical section is flanged for bolting to the vessel closure. Support arrangements are provided in the cylindrical section for the core structure and control rod drive units described in Sections 4.4 and 9.7, respectively.
The vessel closure is of stainless steel, type 304, with .06% maximum carbon. It consists of a flate plate with a 29-3/4 in. inside diameter nozzle in the center for fueling and maintenance of control rods and drive mechanisms. This access nozzle is closed by a flat plate with a central viewing port. On the inside of the assembly, seats are provided in the closure for the main control rod shock supports described in Section 9.7. The closure is bolted to the cylindrical section. A double gasket seal arrangement is used to insure a tight joint. The gaskets are aluminum-jacketed asbestos and Buna N.
The vessel is provided with a variety of nozzles and penentrations. Their function, size, and location are given in Table 5.5-1. All nozzle and.penetration configurations conform to those shown in the ASME Code, Figure UW-16.1, and identified as (q-1), (q-2), (q-3) modified, and/or (q-4). The over-all height of the completed assembly from the bottom of the spherical section to the top of the viewing port is 24.75 ft.
The vessel assembly is supported by six brackets welded to the outside of the cylindrical section just below the main coolant effluent nozzle. These brackets are bolted to the upper thermal shield assembly described in Section 10.2. Radial guides located approximately six feet above these supports prevent rotation of the vessel while permitting vertical thermal expansion. The radial guides engage brackets in a heavy shield floor assembly in the reactor pit. Figure 8.2 shows the vessel in the shield pit. The support brackets are seen in Figure 8.2 just above the thermal shield. The radial guides are at the elevation of the inlet nozzle centerline. Above the radial guides, at the level of the pit seal floor, a ring flange is welded to the vessel neck. A neoprene seal gasket is bolted to this flange and to the shield floor as part of the lower pit gas seal arrangement (see Sections 7.7 and 10.3.2).
Vessel geometry selection was based on safeguard considerations, experimental requirements, and convenience in handling core components. The long cylindrical portion of the vessel provides heavy water shielding during fuel handling. The spherical shape of the lower section requires less heavy water than a cylindrical shape which would give the same reflector thickness around

5 - 23
Table 5.5-1 Reactor Vessel Nozzles and Penetrations
Nurnber
6
2
1
3
1
2
1
4
1
1
1
1
1
8
8
2
4
5
1
Inside Diameter
3.50 in.
6.00
12.00
3.50
29.00
• 957
29.00
.622
5. 761
3.876
1.939
1.939
.742
4.000
4.000
5.761
3.25 x
4.5
2.5
6.0
Purpose
Horizontal neutron beam tubes H-1, 2 I 3 I 5 I 7 I 8
Horizontal dual neutron beam tubes H-4, 6
Horizontal cold neutron facility H-9
Reflector neutron irradiation facilities V-10, 11, 12
Main coolant effluent
Liquid level bubblers
Main coolant influent
Flow reversal valve pilot lines
Shutdown cooling influent
Anti-siphon line
Helium influent
Helium effluent/safety valves
Liquid level
Main control rods
Auxiliary control rods
Fuel handling periscopes
Core irradiation facilities V-13, 14, 15, 16
Spare ports
Sight glass
Location in Vessel
Near sphere midplane
"
Sphere, upper half
El. 125 ft-4 in.
II 128 ft-1 in •
128 ft-10 in.
128 ft-10 in.
133 ft-1 in.
133 ft-1 in.
II 134 ft-4 in.
Closure
Closure
El. 131 ft-4 in.
II 132 ft-1-1/2 in.
133 ft-3-3/32 in.
Closure
Closure
Closure
the core. All piping penetrations are located above the core in order to prevent the heavy water from draining below the core level in case of a leak in the external system. A siphon-break line connects the upper cylindrical section with the primary effluent piping to prevent siphoning of water from the vessel in case of a major break in the external piping system. Control rod drive unit

5 - 24
penetrations are also located above the core to minimize the possibility of losing heavy water.
The arrangement of the vessel closure assembly provides a central large opening for fuel handling which can be opened without disturbing the core-edge and in-core irradiation thimbles (V-13, 14, 15, and 16). The thimbles are flange-connected to the closure assembly on the large diameter shoulder. The entire closure assembly need be removed only for changing the internal shroud and grid plate. Control rod mechanisms in the vessel can be serviced and changed from the fuel handling opening.
The vessel internals are described in Section 4.4 and are shown in Figure 4.14. The flow of heavy water through the reactor vessel is shown in Figure 5.2. Heavy water enters the 46 in. diameter vessel neck at a velocity of 8-1/4 ft/sec. The heavy water is directed downward by the shroud and through the fuel elements in the core. The velocity of the heavy water past the fuel element plates is 35 ft/sec. Once past the fuel elements a portion of the heavy water flows downward through the lattice plate. However, to lessen the velocity of water through the plate, much of the flow passes directly to the reflector through cut-outs in the lower column sections of the fuel elements.
Heavy water which passes through the lattice plate is diffused by the plate support saddles and anti-critical grid and is turned upward. Water in the reflector region flows upward through the annulus formed by the reactor vessel neck and the shroud and out of the vessel into the pump suction line at an exit velocity of 8-1/4 ft/sec.
5.5.2 MECHANICAL LOADING CONDITIONS. The mechanical loadings considered in the design of the vessel included externally and internally applied pressure, piping reactions due to thermal expansion and fluid flow forces within the associated piping systems, weight of vessel and its normal contents, fluid flow forces within the vessel, impact loads, such as control rod scram shock and rapidly fluctuating pressures, and seismic loads.
5.5.2.1 Pressure. The vessel will operate with a·cover gas pressure of 200 psig which is established by the required pressurization at the core hot spots to suppress boiling. The internal pressure used for all design calculations was 275 psig.
As described in Section 7.4 the primary system is pressurized by adjusting the helium pressure applied to the vessel expansion volume. The helium is supplied from a bank of storage cylinders on the equipment level of the building. Appropriate manifolds and pressure reducing valves are used to set and maintain the cover gas pressure in the vessel. A malfunction of the latter valves could cause an increase in vessel internal pressure. The increase would be a gradual one since the helium is introduced into the system from the storage cylinders through a 3/8 in. line, while the influent and effluent helium connections to the vessel are 2 in. lines and the cover gas volume is relatively large, approximately 27 ft3 at operating conditions. Possible overpressure caused by this equipment malfunction is prevented by two vessel relief valves, SV-lOlA and B, set in accordance with the ASME Code at 275 psig.
A further overpressure case which was considered is that resulting from filling the vessel completely with heavy water and letting the transfer pumps continue to run. The worst set of circumstances for this case are as follows. The primary system, including the vessel, is closed. The storage tank FA-101 is pressurized to the tank relief pressure, 50 psig, and the transfer pump GA-104B

5 - 25
is allowed to pump into the primary system. The liquid level in the vessel will rise to fill the surge volume completely. At 275 psig at the vessel top, the relief valves will open and spill water into the exhaust gas piping. The transfer pump flow capacity at 225 psi head (the difference between the storage tank maximum pressure and the vessel relief valve setting) is 15 gpm. The relief valves have a liquid discharge capacity of 348 gpm at 275 psi (see Section 5.3.5), and even with pipe friction losses considered the relief system will pass about 170 gpm at 275 psi. Thus, the relief capacity is ample to cover this unlikely overfill case.
5.5.2.2 Piping Reactions. Calculations of the reactions on the vessel main inlet and outlet nozzles due to the thermal expansion of the primary piping and associated equipment, i.e., pumps, valves and heat exchangers, have been made for normal operation with two loops. In this case, the system from the exchangers to the vessel is assumed to be at 120°F and from the vessel back to the exchanger at 150°F.
The resulting forces Fx, Fy, Fz, and moments Mx, My, Mz in a Cartesian coordinate system with "y" vertical and "x" in the horizontal plane of the nozzle along the centerline are given in Table 5.5-2.
Table 5.5-2 Reactions on the Reactor Vessel Inlet and Outlet Nozzles (Forces are in pounds; moments in inch-pounds)
Fx 2Y_ Fz Mx !:!Y Mz
outlet nozzle: Thermal expansion +260 +172 0 0 0 +64,920 Fluid flow +1507 +2556 0 0 0 +107,352
Inlet nozzle: Thermal expansion +254 +188 0 0 0 +52,980 Fluid flow -1507 +2556 0 0 0 -107,352
The nozzle reactions are seen to be small. On this basis, a second case of operation with one loop shut down, i.e., with one loop operating at the temperatures given above and the other loop at 70°F, was not fully analyzed. Rather, approximations were made to give the order of magnitude of the reactions. These indicated that a full analysis was hardly warranted.
The piping reactions on the nozzles due to fluid flow are also given in Table 5.5-2. These resultants are based on a primary flow of 25,000 gpm whereas the normal flow rate is 16,600 gpm.
5.5.2.3 Weight. The static weight of the vessel and its normal contents are tabulated in Table 5.5-3.
5.5.2.4 Fluid Flow Reactions. The calculated fluid flow forces within the vessel are tabulated in Table 5.5-4.
5.5.2.5 Impact Loads. The impact load transmitted to the vessel through the control rod supports by a normal (wet) scram is 1912 lbs per drive, or about 15,300 lbs. In a dry scram the force per drive is 45,500 lbs, for a total impact force of 364,000 lbs. The vessel was designed for a dry scram shock load

5 - 26
of 560,000 lbs. The pressure surges which might be generated in the HFBR by reactor power transients are small, and would not cause the vessel pressure to exceed the 275 psig design value (see Section 14.2.6).
Table 5.5-3 Reactor Vessel Static Weights
Component weisht
vessel
Vessel Closure
Anti-Critical Grid
Shroud
Transition Plate
Lattice Plate
Fuel Elements and Thimble Shrouds (30 at 12.5 lbs each)
Control Rod Mechanisms
Control Rod Blades
D20 Inventory at 70°F (291 ft 3 at 69 lbs/ft3 )
Total
Table 5.5-4 Reactor Vessel Internal Fluid Flow Forces
10,000 lbs
5,910
400
1,017
263
130
375
6,852
278
20,100
45,325
Component Calculated Force
Shroud Drag 37,400 lbs
Fuel Element and Shroud Drag (30 at 287 lbs)
Jet Action, Bottom of Sphere
8,610
3,000
5.5.2.6 Seismic Loads. The vessel is designed to withstand horizontal accelerations of 0.1 g (98 cm/sec2 ), which is in the range of an intensity VIII earthquake, as outlined in Section 2.5.
5.5.3 STEADY STATE THERMAL LOADING AND TEMPERATURE CONDITIONS
5.5.3.1 Thermal Loading. The steady state thermal loadings co~sidered in the design of the vessel can be classified under three categories~ internal loadings caused by temperature gradients in the vessel walls, constraints on

5 - 27
thermal expansion imposed by external forces, and thermal loadings at structural discontinuities.
The thermal stress caused by internal gradients is inversely proportional to the material thermal conductivity, which is high for aluminum. The heating rates in the vessel wall are not large enough to cause appreciable stresses from this source, and are not a limiting factor in the vessel design. Further, since all external connections and supports are designed to allow for free thermal expansion of the vessel, the externally imposed constraints on thermal expansion have negligible effect. The third category, thermal loadings at structural discontinuities, does introduce significant stresses and these have been included in the stress analysis of the vessel where applicable.
5.5.3.2 Radiation Heat Generation. The vessel is designed for the volumetric radiation absorption heating rates shown on Figures 5.22, 5.23, and 5.24. Figures 5.22 and 5.23, which cover design parameters at normal operating conditions, are based on conservative theoretical calculations supplemented by some early results from the critical experiment program. Figure 5.24, which covers design parameters at shutdown conditions, is based on various published data on fission product decay heating (5.8).
5.5.3.3 Temperature Conditions. The temperature distributions along the horizontal beam tubes H-1 and H-9, including the transitions between the sphere and the tube nozzles were calculated for two cases at normal operating conditions. In Case I the best estimate of an average film coefficient was used to calculate the temperature distribution. In Case-II it was pessimistically assumed that local boiling occurs at the acute angle section in the transition zone. Temperature distributions for these cases are shown in Figures 5.25 and 5.26. Temperatures for Case II are indicated by the numbers in the rectangles.
The temperature distribution in beam tube H-1 was subsequently used in the analysis for the other beam tubes, H-2 through H-8. Since the H-1 heating is the highest of the group, the results are conservative for the other tubes, except for H-2, where the heating rates are comparable to those in H-1. The temperature distribution in the spherical part of the vessel away from beam tubes was calculated at normal operating conditions. This distribution is shown on Figure 5.27. Temperature measurements will be made on the vessel during th.e startup experiments; see Section 12.4.3.
5.5.4 THERMAL TRANSIENT LOADING CONDITIONS. A conventional thermal transient analysis has not been performed for the reactor vessel since (1) there are no thick sections of steel (except for the closure which will be discussed separately), (2) the coolant is maintained at relatively low temperature and pressure, (3) the thermal conductivity of the metal (aluminum) is exceedingly good, and (4) the surface heat transfer film coefficient is relatively poor. Therefore, it is difficult to postulate a case in which high thermal stresses would be imposed in the reactor vessel by a transient operating condition.
The velocity of the coolant at the spherical vessel wall is low and the resulting coefficient for heat transfer by forced convection is essentially that for natural convection. In natural convection cooling the film coefficient increases as the cube root of the temperature difference between the metal and the bulk fluid. The film temperature drop has to become quite high before much heat is transferred and this, coupled with the excellent thermal conductivity of aluminum, tends to make the temperature difference across the vessel wall quite small.
The possibility of the vessel wall being heated or cooled suddenly by the

5 - 28
coolant has been considered. During a startup from cold conditions the coolant is not appreciably preheated by the circulating pumps as long as there is cooling water flow in the primary coolers. The heating of the vessel wall is due to radiation absorption as the reactor comes to power. Based on the minimum positive period for setback by the safety system, at least 75 seconds are required to heat the wall from essentially ambient temperatures to normal operating temperatures. Heating will be nearly uniform throughout the wall and the largest temperature difference across the wall occurs at full reactor power when the film coefficient reaches its maximum value. At full power, the temperature difference across the vessel wall in the spherical section approaches a maximum of l0°F and in the cylindrical section 15°F (see Figure 5.27). The internal thermal stresses from these temperature gradients are small, 1000 to 1500 psi.
When the reactor is scrammed, the heat generation rate in the wall drops 90% in one second. The decrease in temperature will be uniform, that· is, the temperature difference across the wall will remain the same or decrease during this transient. Curves of heating rate after a shutdown (see Figure 5.24) indicate that the heating rate in the vessel wall at one hundred seconds after shutdown will be .01 watts/gram or 1/26 the heating rate during normal full power operation. At this level of heat input, the natural convection driving force is very low and heat transfer to the coolant will probably be by forced convection. It is estimated that the temperature drop across the film will be approximately 2-l/2°F and that across the metal 0.3°F.
The stainless steel closure will be heated and cooled primarily by the fluid contained in the vessel. Normal startup specifies that the vessel be pressurized before reactor heat is produced. Pressurization.is accomplished by pumping helium into the top of the vessel. During normal operation, helium is circulated at a very slow rate through the top of the vessel. The temperature of the helium should never rise above the coolant temperature. If the helium pressure diminishes and hot water rises to the closure, the surface heat transfer coefficient will be low and the flow rate of heat from the fluid to the closure will be low. Stresses in the closure from thermal transients are, therefore, negligible.
5.5.5 NEUTRON IRRADIATION EXPOSURE. The maximum neutron irradiation exposure of the vessel occurs at the tip of beam tube H-1. The neutron exposure, or time-integrated flux (nvt), for two energy groups (0-1 Mev and >l Mev), assuming a 90.5% load factor for a 25 year vessel life, is given in Table 5.5-5. The flux densities are based on the results of critical experiments, supplemented by theoretical calculations.
Table 5.5-5 Reactor Vessel Maximum Neutron Exposure (Beam Tube H-1 Tip)
nLcm2-sec Integrated Flux
Enersy GrouE Flux 1 nvt/yr nvt/25 years
0 -1 Mev 1.45 x 10¹⁵ 4.1 x 10²² 1 x 1024
>l Mev 6.3 x 10¹³ 1.8 x 10²¹ 4.5 x 10²²
In general, exposure to neutrons per se does not produce large changes in the properties of aluminum and its alloys. A program of aluminum alloy irradiations has been under way for some time at the ETR (5.9). At the present stage

5 - 29
of the program, several alloys have been irradiated at temperatures of 150°F to fast neutron exposure of 1.17 x 10²¹ nvt (>l Mev). Of the materials tested, which included 356, 6061-T6, and 2024-T3 aluminum alloys, 6061-T6 showed the least radiation effects, as shown in Figure 5.28. This surveillance program is still in progress and specimens of the various alloys are in the ETR receiving higher doses of radiation. The 6061-T6 samples in the ETR program will receive as much as 1 x 10²³ nvt (>l Mev) before they are removed for testing in 1967 - 1968.
Recent unpublished data from Phillips Petroleum Co. (5.10) indicate that 6061-T6 aluminum exposed to 2.6 x 10²² nvt (>l Mev) at 15B°F had a Rockwell hardness of B70. Thus, the hardness was increased from approximately B50 to B70 by this neutron irradiation. There does exist one report (5.11) which suggests that a precipitation hardening alloy such as 2024-T3 can revert to essentially the fully annealed condition after an exposure of 8.5 x 10¹⁹ nvt (>l Mev) at high temperatures. However, the value of this data is limited since the specimen operating temperatures are unknown, i.e., the experiment was conducted without instrumentation to determine specimen temperatures. Although the author calculated the highest temperature to be 275°F using estimated heating rates and heat transfer efficiencies, there still remains considerable doubt as to the actual temperature of the specimens during irradiation.
Aging and overaging of 6061 are due to the precipitation from the supersaturated solid solution (in Al) of Mg and Si (as Mg2Si). As Mg and Si atoms tend to associate by diffusion, the lattice becomes distorted in an attempt to accommodate the new Mg2Si lattice. The result is that the alloy becomes stronger and harder. At the T-6 condition, there are no distinct crystals of Mg2Si in the alloy, only highly strained zones (commonly called Guinier-Preston zones) trying unsuccessfully to accommodate structurally to the lattice. In time, these zones will grow, first into nuclei and later into crystallites of Mg 2Si. Such an alloy is softer than T-6, since the aluminum lattice is no longer internally strained. The lattice is said to have become "slightly overaged", at this condition. With further aging, the Mg 2Si is completely precipitated in a number of larger crystallites. Such a fully-precipitated (and fully-overaged) alloy is defined as fully annealed or T-0 temper.
All of the above processes require the diffusion of Mg and Si and a source of energy to nucleate the new phase. Therefore, both the rate and end point are temperature dependent. Radiation is known to enhance diffusion, and therefore might be expected to enhance aging and overaging in precipitation hardened alloys. From the Phillips Petroleum data (5.9, 5.10) it might be deduced that the radiation induced overaging phenomenon is also temperature dependent. Data to base an exact estimate of the over-all effect of radiation are not currently available. The ETR data were obtained at approximately 3 times the maximum flux density at which the HFBR beam tubes will be exposed. It is estimated that the in-reactor overaging should act as if the alloy were 80°C (144°F) hotter than the measured temperature (5.12). This estimate is based on ETR flux levels and is certainly conservative since no overaging effects were noted in any of the ETR data.
The maximum calculated temperature at the tip of beam tube H-1 is 300°F. This temperature is based on a full power heating rate of 11.5 watts/gm, as given in Figure 5.22. Recent critical experiment results indicate that the actual heating rate will be about 7.4 watts/gm (see Section 4.7.8). Using the lower heating rate, the maximum temperature at the tip of H-1 will be 243°F at full power.
Based on the above considerations we believe that the established design

5 - 30
condition for the beam tubes of 275 psig and 400°F are adequate for the full 25 year life of the vessel. Further, since the neutron exposure at the spherical wall of the reactor vessel is less than that of the beam tubes by a large factor (- 104 for >l Mev neutrons), we believe the over-all design to be adequate from the standpoint of neutron irradiation exposure.
5.5.6 CORROSION. outside of general hardware, i.e., nuts, bolts, washers, etc., the vessel is constructed of two materials. The vessel closure assembly is stainless steel, type 304, with .06% maximum carbon and the vessel proper is aluminum, type 6061-T6. At the normal flow rates in the vessel and associated piping, 8-1/4 ft/sec in the vessel and 14-1/2 ft/sec in the 22-1/4 in. ID pipes, erosion is negligible. Furthermore, since the closure is not in contact with the primary coolant during normal operation only general aluminum corrosion need be considered.
In general, the corrosion resistance of aluminum alloys to water is due to the formation of a uniform film of hydrated Al203 which greatly reduces the rate of subsequent reaction. At temperatures above 175°F this film tends to become crystalline and porous, giving access to the aluminum surface for further reaction. The critical factor is the re-formation of the protective film. On 6061 aluminum alloy it does reform, and remains at essentially a constant thickness over many years.
The behavior of the atomic hydrogen produced by the reaction which forms the protective film is also critical. Its migration and subsequent reaction with another atom of hydrogen to form H2 can destroy the film and, indeed, does so on highly pure aluminum at temperatures above 260°F. However, impurities in the metal with lower hydrogen overvoltages than aluminum promote the formation of H2 without damage to the film. Nickel is the most effective impurity in . this regard. Iron and silicon are also effective, and are present in sufficient amounts in 6061 alloy to eliminate this difficulty at the design temperatures.
While the protective film thickness remains essentially constant, the overall oxide layer is continuously growing at approximately a linear rate equal to the corrosion rate (5.13). Most of this oxide layer is crystalline and porous. It does not prevent access of additional water to the thin protective layer, but serves as a heat flow barrier between the metal and the water. Thus, when heat is generated in the metal from radiation heating, the temperature continuously rises at the interface where the rate-controlling reaction is occurring. The thermal conductivity of the film formed at 131 to 223°F is approximately 1.3 Btu/hr-ft2-°F/ft (5.13).
The best data available on aluminum corrosion as a function of pH and temperature is based on the work of Draley and Ruther for 1100 Al (5.14). Since there is little difference in the corrosion rates of 6061 and 1100 Al up to 400°F, this data was used to calculate the expected corrosion of the vessel 6061 aluminum material, which is given in Table 5.5-6.
The data in Table 5.5-6 indicate that the steady state corrosion rate of 6061 aluminum is reduced at temperatures of 250-400°F by factors of 1.5 to 3 by acidifying the water to pH 5 from pH 7. This also decreases the temperature drop through the oxide film by the same factors, and in turn reduces the temperature at the point where the temperature-dependent rate-controlling surface reaction is occurring. Acidification is therefore warranted and the primary coolant will be maintained at a pD of 5. Based on a design life of 25 years, the expected and design values for corrosion and erosion allowance at pertinent locations in the vessel are tabulated in Table 5.5-7.

5 - 31
Table 5.5-6 Type 6061-TO, T4, and T6 Aluminum Corrosion Rates
Temperature OC Op
125 257
150 302
175 347
200 392
pH
5 7 8.5
5 7 8.5
5 7 8.5
5 7 8.5
Steady State Rate mils/day
.87 x 10-4
l.46 8.4
1.9 5.25
12.7
4.95 12.8 19.0
11. 7 36.4
111.0
Total Corrosion mils/25 years
0.8 1.4 7.6
1.8 4.8
11.6
4.5 11.8 18.0
10.6 33.8
101.0
Table 5.5-7 Vessel Corrosion and Erosion Allowance
Material Location
Stainless Closure Steel, 304
Aluminum, 6061
Cylindrical section
Spherical section
Beam tube & thimble walls except finned areas
Finned areas of beam tubes
Max. Operating Temperature
l30°F
160
250
300
200
Corrosion-Erosion Expected Design
Allowance
O in. 0 in.
<. 0008 .030 min.
.0008 .125
.0018 .060
<.0008 0
5.5.7 MATERIALS OF CONSTRUCTION. The vessel is constructed of two materials, 304 stainless steel and 6061 aluminum. In general, these were furnished in accordance with applicable standard material specifications subject to the following amendments: (1) the chemical composition was determined by ladle analysis at the mill and by a check analysis by the vessel fabricator, (2) ultrasonic inspection in accordance with the requirements of Military Standard, Non-destructive Testing Requirements for Metals, MIL-STD-271B (SHIPS), was

5 - 32
performed on 1 in. centers in longitudinal and lateral directions for all plate, piping, tubes, bars, forgings and extrusions.
The applicable material specifications covering all significant forms of materials used in construction of the vessel are given in Table 5.5-8.
Table 5.5-8 Reactor Vessel Materials of Construction
Description
Closure Assembly
Sphere, Transition Section and Cylindrical Section(s)
Nozzles and Penetrations (Refer Table 5.5-1), Top Flange, Beam Tubes and Thimbles
Support Brackets, Shroud Support Ring, Seal Ring Flange, Grid Plate Support Saddles, and Support Saddle Blocks
Specification
ASME SA-182 "Specification for Forged or Rolled AlloyStee l Pipe Flanges, Forged Fittings, and Valves and Parts for High Temperature Service" Type F-304
ASME SB-209 "Specification for Aluminum - Alloy Sheet and Plate" Type 6061
ASME SB-247 "Specification for Aluminum - Alloy Die Forgings" Type 6061
Remarks
Forged - Max •• 058"~ Carbon
Plate procured in fully annealed condition, T-0
Chemical and mechanical requirements as per specifications. Forged in T-0 temper, heat treated to T-4 temper by subcontractor. Exceptions to specifications: forgings not produced as die forgings in recessed dies: maximum thickness of some forgings exceeded the 4 in. maximum.
ASME SB-221 "Specification Procured in T-4 temper for Aluminum Extruded Bars, Rods, and Shapes" Type 6061
.~5-...5_.8 DESIGN SPECIFICATIONS. The pertinent reactor vessel design condi~ tions are given in Table 5.5-9.
5.5.9 STRUCTURAL DESIGN. The vessel was designed in accordance with the ASME Boiler and Pressure Code for Unfired Pressure Vessels, Section VIII, 1959 Edition, including all revisions, addenda, and applicable code case rulings in effect at the date of award of the construction contract. In addition, critical areas of the vessel where discontinuity stresses could be appreciable were examined and analyzed in accordance with the document "Tentative Structural Design Basis for Reactor Pressure Vessels and Directly Associated Components" U. S. Dept. of Commerce, OTS Document No. PB151987, 1 December 1958, along with formulae from reports, documents and publications by Bijlaard, Horvay, Galletly, et al.

5 - 33
Table 5.5-9 Reactor Vessel Design Conditions
Pressure: Design Normal operating Maximum surges
Temperatures: Beam tubes and thimbles exclusive of reinforcement All other metal Normal coolant average Maximum transients
Design Life
275 psig 200 psig see Section 5.5.2
400°F 250°F 127° F see Section 5.5.4
25 years
Three different categories of stress were considered in the detailed stress analysis:
1. Primary stresses are the direct or shear stresses developed by the imposed loading which is necessary to satisfy only the simple laws of equilibrium of external and internal forces and moments. Structural discontinuities are neglected in calculating the primary stresses.
2. Secondary stresses are the direct or shear stresses developed by the constraint of adjacent parts or by self-constraint of a structure subjected to mechanical loadings, i.e., structural discontinuities.
3. · Thermal stresses are the direct or shear stresses developed by the constraint of adjacent parts or by self-constraint of a structure subjected to thermal loadings.
Since the code allowable stresses at various temperatures are related only to the primary stresses, the maximum shear stress theory was used to establish allowable stresses for all three categories. This criterion was applied since it is generally used for ductile materials, the theory is in good agreement with experiment, it is conservative, and it is simple to apply.
In order to make the allowable stress limits directly comparable to data obtained from simple tensile tests, the "equivalent intensity of combined stress", defined as the difference between the algebraically largest and smallest principal stresses at a point, is substituted for the maximum shear stress. This "stress intensity" is numerically equal to twice the maximum shear stress at the point and is directionless.
The allowable membrane stress intensity, Sm, i.e., primary stress, is established from the applicable tables in Section VIII of the Code at the design temperatures.
The allowable combined mechanical stress intensity, Sp, i.e., primary and secondary stress intensities, is defined as the lesser of 90"fe of the yield strength in tension or 60% of the ultimate strength in tension at the applicable design temperatures.

5 - 34
The allowable combined stress intensity, Sy, i.e., primary, secondary, and thermal stress intensities, is established as the yield stress at the applicable design temperatures.
The allowable stress intensities Sm, Sp, and Sy for the vessel materials at the design temperatures are compared with the Code allowable stresses, Smc, Spc, and Syc, in Table 5 .5-10. --;:;--.
Table 5.5-10 Reactor Vessel Allowable Stresses, psi
Material Sm Sm Sp (3) Spc
(1) Sy (3) Syc
(2) c
Aluminum, 6061-T6:
At 250°F 8500 8500 21960 12750 30500 25500
Welded, 250° F 5400 5400 0100<4 ) 8100 16200(4 ) 16200
At 400°F 4000 4000 9960 6000 14000 12000
Stainless Steel, SA-182-F304:
At 250° F 15625 15625 18000 23437 20000 46875
Notes:
1. Spc = 1.5 Smc: This is not well defined in the Code. Case 1272N-4 on "Containment and Intermediate Containment Vessels" established Spc = 1.5 Smc • However, other parts of the Code indicate that higher values may be used at the discretion of the designer, e.g., Section VIII, Par. UA-5(e).
2. Syc = 3.0 Smc: refer Case 1273N-7. 3. The ultimate and yield strengths for aluminum and stainless steel are
based on values given in "Aluminum and Aluminum Alloys for Pressure Vessels", Welding Research Council, Bulletin 28, June 1956, and OTS Document No. PB151987, respectively.
4. Based on ASME Code, since no other reliable reference is available on the variation of the ultimate and yield strength of 6061-T6 welded aluminum with temperature.
To take full advantage of the higher allowable stresses for unwelded 6061-T6 aluminum the following design rules were established.
1. No welds were permitted in areas designed for 400°F, i.e., the beam tubes and thimbles. These pieces were machined from solid forged bars.
2. If possible, all pressure-containing welds were located away from structural discontinuities. This rule was followed except in the transition between the sphere and the cylinder, where allowable stresses for welded material were used.
Pertinent stresses in the reactor vessel, including the thermal stresses for temperature condition Case I (see Section 5.5.3.3), are summarized in Figures 5.29 through 5.34. Examination of the data shown indicates that all stresses are less than the established allowable stresses, and are also less

5 - 35
than the Code allowables for Smc and Spc. The Code allowable stress for Syc is exceeded in one location, at the junction between the hemispherical cap and the beam tube on facilities H-1 through H-8. Here, the outside tangential stress, cr80 = 12370 psi, is greater than Syc but the maximum stress intensity of 13,033 psi is less than the established allowable, Sy. It should be noted that the thermal stresses in these facilities are based on the temperature distribution for H-1 which is the "worst case". Thus, this condition of combined stress is a conservative estimate of the stress in all beam tubes. Also, the allowable stresses are established at 400°F whereas the maximum calculated temperature is 300° F.
The allowable combined stress intensity, Sy, is exceeded at the junction of the beam tubes with the vessel shell when the thermal stresses for temperature condition Case II (see Section 5.5.3.3) are included. As outlined in OTS Document No. PB151987, these steady state thermal stresses are considered as transient conditions. To treat this case the effective steady state stresses (combined primary and secondary stresses) are added to the effective transient stress (thermal stress) in accordance with the modified Goodman Fatique diagram and evaluated for 1300 cold start-up cycles during the 25 year life of the vessel. Due to the lack of low-cycle fatigue data, the allowable alternating stress intensity is established at 5 x 10⁴ cycles, or a usage factor of .026. Under these conditions, the maximum alternating stress intensity at the junctions of the beam tubes with the vessel shell does not exceed the allowable value. Thus, if local boiling occurs at the locations considered, excessive stresses are not produced.
The vessel will be instrumented to check both calculated stresses and temperatures during initial operations. Strain gages will be used to determine steady-state mechanical and thermal stresses at critical locations. The former will be determined during the pre-operational systems tests, and surveillance of the latter will be conducted during the approach to power of the plant. Thermocouples will be located at critical locations to supplement the strain gage data with accurate temperatures during this surveillance program (see Sections 12.4.3 and 12.5).
5.5.10 FABRICATION, INSPECTION AND TESTING. The vessel was fabricated to meet the requirements of Specification CE-l-l-NY-4653 (5.15) by J. B. Beaird, Inc. A thoroughly trained and experienced resident inspector was assigned to the fabricator's shop by the Lununus Company.
Inspection began prior to the start of any manufacturing operations oh the vessel. The fabricator was required to submit for review his complete fabrication and assembly procedures including major tests and inspections, heat treating, cleaning, welding, and weld examination standards. These were subject to approval before any work was performed. Certified copies of all test and inspection data were required.
The location of all major pressure-containing weld joints is shown in Figure 5.35. In general, these welds are all multi-pass double "J" butt welds, except that the welds between the beam tubes and thimbles and the respective nozzles are multi-pass single "J" butt welds. Also, for the purpose of achieving continuity of metal and facilitating the required radiographic examination, all nozzle and penetration configurations conform to those shown in the ASME Code, Figure UW-16.1 and identified as (q-1), (q-2), (q-3) modified, and/or (q-4) .
All welding procedures, welding operators, and welding equipment were qualified in accordance with the ASME Code, Section IX. In addition, simulated

5 - 36
joints were made for each type of weld required on the vessel, and these samples were forwarded to the Lummus Co. and to BNL for inspection and approval prior to any production welding. For a series of joints to be qualified by a single simulated joint, all applicable joints had the same materials, the same joint preparation, the same geometry, the same welding position, the same filler material, the same welding equipment, the same welding operator, the same thickness of relative mating parts within± 20%, and the same procedure. Prior to approval these samples underwent extensive tests including radiographic inspection, tensile tests, side bend tests and macroscopic and/or microscopic metallographic examinations.
In addition, during fabrication a daily fillet weld soundness test specimen and a weekly tensile test specimen were made by each welding operator and/or welding machine for each aluminum welding procedure to be used on that day and/or during that week.
All aluminum welding was don:? by the automatic and semi-automatic inert gas consumable electrode metal arc welding process and the inert gas shielded metal arc welding process with tungsten electrode. All welding was performed with the base metal in either the T-0 or T-4 temper except for the girth seam between the upper and lower cylinder sections which was done with the base metal in the T-6 temper.
The aluminum filler metal used conformed to ASME Specification SB-285, classification ER 4043, or ALCOA Specification C-809. The latter filler metal, which is a mixture of 4043 and 6061, was used only in the welds between the beam tubes and thimbles and the respective nozzles. These areas are relatively thin and tests showed that the ER 4043 filler did not consistently produce welds which met the minimum tensile requirement of 24000 psi. The filler metal was purchased to standard specifications supplemented by the following special requirements: (1) all wire of each type was drawn from ingots of the same heat or batch number; (2) the wire was shaved prior to the final rolling and cleaning operations; (3) the wire was put on individual spools of approximately 10 pounds each which were specially indentified and packaged in evacuated, hermetically sealed plastic bags and placed in styrofoam containers; (4) a certified chemical analysis was furnished for each heat or batch number and a sanple of each spool was independently analyzed by the fabricator.
After arrival at the fabricator's shop the wire was stored in a special area and each spool removed was checked off both by Beaird and the resident inspector. Once a container was opened the wire was kept in an inert atmosphere when not in use. Finally, records were kept indicating which spools of wire went into each weld joint.
The stainless steel was welded by the automatic submerged arc process, the semi-automatic inert gas consumable electrode metal arc process, and the shielded metal arc process. The stainless steel filler metal used with both the submerged arc and inert gas consumable electrode processes conformed to ASTM Specification SA-371, Type 308-ELC. The covered welding electrodes used with the shielded metal arc process conformed with ASME Specification SA-298, Type 308 ELC-16.
It is of interest to note that except for two passes in the main girth seam weld of the sphere, all welding was performed by one man. This rather unique situation introduced extremely high quality weld control and repairs were minimized. Actually, no repairs were required in any aluminum weld, and only one major repair was necessary in the stainless closure assembly girth seam.

5 - 37
Radiographic inspection was performed on the entire length of all completed pressure containing welds. In addition, a preliminary radiographic inspection was performed after 1/4 of the passes had been deposited in each such weld. This latter requirement proved to be invaluable, since most welding problems showed up in the root passes. The minimum porosity standards for radiographic examination for the stainless weld joints was established as p.er ASTM E99-55T Porosity (Gas) Fine-Degree B or better. Since no adequate aluminum porosity standards were available, they were established by mutual agreement from the radiographic results of the qualification weld samples. As established, this standard called for essentially a "water clear" weld. Slag inclusions, undercutting, icicles, lack of penetration, and slugging were not allowed.
Ultrasonic inspection was performed on the entire length of all completed aluminum pressure containing welds. The inspection was conducted in accordance with Case 1275N of the Code with modifications to cover both shear wave and longitudinal wave techniques. All welds in the spherical section were inspected with both longitudinal and shear wave techniques. Welds in the cylindrical section were inspected with just the longitudinal wave technique. All "defects" detected were spots of porosity which, for the most part were seen on the radiographs. The ultrasonic inspection of the base materials was outlined in Section 5.5.7.
Liquid penetrant inspection was performed in accordance with the require-· ments of MIL-STD-271 (SHIPS) on all highly stressed surfaces exposed to the primary coolant. These included the transition from the sphere to the cylindrical section, all areas of structural discontinuities, the entire length of each final pass of all strength welds, the final passes of all seal welds, and the interior and exterior surfaces of all forgings.
All major forming operations on the aluminum were performed with the material in the fully annealed condition. The individual pieces were then solution annealed at 970°F for 4 to 4-1/2 hours except for the lower cylindrical section which was held at 990°F for 3-1/2 hours and water quenched. All welding on the two main sub-assemblies, i.e., the sphere, transition piece, and lower cylindrical section, and the upper cylindrical section complete with top flange, was completed before they were separately artificially aged at 350 ± 5°F for 7 hours to the final T-6 temper.
The basic outline of the aluminum portion of the vessel is formed by only 6 pieces. The sphere is constructed by welding together two formed and machined hemispheres. The transition piece, connecting the sphere to the cylindrical vessel neck is a spun plate with no longitudinal joint. The cylinder is constructed of two pieces of plate, each rolled to the cylindrical shape and having a single longitudinal joint. The top flange ring is again a machined forging with no longitudinal joint. ·
During machining operations the forgings for the main coolant effluent nozzle and thimble V-10 nozzle were gouged. The gouge on the former had a maximum depth of 1/2 in., the latter was gouged to a lesser extent. These areas, which are both on the outside of the vessel, were "buttered up" using the tungsten inert gas shielded metal arc welding process with type ER 4043 filler metal. The repaired areas were dye checked and radiographed with acceptable results.
The vessel was hydrostatically tested in accordance with the ASME Code. The fully assembled vessel was placed in a horizontal position, provided with vents at all high points to purge possible air pockets, filled with filtered tap water at a temperature of 68°F, and pressurized to 430 psig. This pressure

5 - 38
was held for a period of one hour while all welds and connections were inspected for any sign of leakage. No leakage was observed.
References
(5.1) J. N. Elliot, Tables of the Thermodynamic Properties of Heavy Water, AECL-1673, Atomic Energy of Canada, Ltd. (January, 1963).
(5.2) W. s. K. Wynn-Jones, Trans. Faraday Soc.,~. 1397 (1936).
(5.3) M. A. Cordovi, International Nickel Co., private communication with J. R. Weeks.
(5.4) S. P. Rideout, "Stress Corrosion Cracking of Austenitic Stainless Steels in High Purity Water", Proc. Second Inter. Conf. on Metallic Corrosion (1963), and E. C. Hoxie, Savannah River Laboratory, private communication with J. R. Weeks.
(5.5) E. c. Hoxie, Savannah River Laboratory, private communication with J. R. Weeks.
(5.6) F. Welzey, Savnnah River Laboratory, private communication with J. R. Weeks.
(5.7) G. V. Notari, E. A. Gruber, A.H. Levy, G. F. Merganthaler, J. J. Roth, and W. E. Leety, High Flux Beam Reactor : Stress Analysis of the Reactor Vessel, Combustion Engineering, Inc. Report CEND-159, Part I (July, 1963).
(5.8) J. F. Perkins and R. W. King, "Energy Release from the Decay of Fission Products", Nuc. Sci. Engr. _1, 726 (1958). S. Untermyer and J. T. Weills, Heat Generation in Irradiated Uranium, AECD-3454 (1952). J. O. Blomeke and Mary F. Todd, ORNL-2127 (TID-4500), Part I, Vol. 2.
(5.9) M. J. Graber and J. H. Ransick, ETR Radiation Damage Surveillance Program, Progress Report I, ID0-16628 (Jan. 27, 1961).
(5.10) J. M. Beeston, Phillips Petroleum Co., letter to J. R. Weeks (Nov. 7, 1963).
(5.11) S. Wallach, WADC-TR-58-605.
(5.12) w. Francis and J. M. Beeston, Phillips Petroleum Co., private communication.
(5.13) J. C. Griess, H. C. Savage, T. H. Mauney, J. L. English, and J. G. Rainwater, ORNL-3056 (1961).
(5.14) J. E. Draley and W. E. Ruther, Aqueous Corrosion of 2 S Aluminum at Elevated Temperatures, ANL-5001 (Feb. 1, 1953).
(5.15) Engineering Specification for HFBR Reactor Vessel, CE-l-l-NY-4653, The Lummus Co.

~ 6" BUILDING AIR EX HAU ST
1t TW-A3K
i"A3K
Fill
I~" TW-A3K
l'-0" Dia. x 5'-o" BIOLOGICAL SHIELD
COOLING HEAD TANK
FA-203
203 Fla::!D 85
10
..-<.,_;3:..."_T,;_W_22_1_4
E&1L
l"TW215SP A3K
__ :f'_:u~e_:~K __ (Port of line)
SPA3K
rconns. (Typical)
Flex Hose/
FA- 202
P~r Tank
1{'x2"
:l!
"'"' Low/ #IS Pressure He
l"WC212-l-H2A
FA-201
Thermal Shield Expansion Tonk
1-f WC204 A2A
3" 4WC204-I
3"TW223 ,[1-'i S "FP.;..A;.:3-"K--I·----------'
t' Ji v ::; olo <t
Biological Shield~ Water
Purification S stem
EA-203 --<D
l)j J,
2"TW222 SPA 3K
FI a 205
#16
"' "' "' "' "' it ~
0 ., "' "' "' N 3 3 !'" ; ;..,
3 hl!'l6
"' ~1---<a>-------~
Biolooical Shield Pumpa
.. Oi 3 !'" ;..,
211 TW226 SPA3K
Concrete Cooling Coils l"Conns ~
"' "' 2 ~ ;.., ~I . I~
~Lt-J~ ~~-i><1----~---------1"_w_c_2o_s__,~ ~ ~
"' Oi 3 t
~ "" .. ~
1tTW214
Auxiliary H20 Purification
B G-201
111 TW228A3K
EA-202
~ Cooler
3"TW209
SPA3K
d"rA322 Sy~~·~ 4
H2A
4"TW204 SPA3K
- N"' 0 0 0
"'"'"' 3 3 3 ---'-~t-- t-- t-
:C\J "'N "'N Skimmer
Canal
;;\ "' .. ~
0 "' ------'"'~ ".,
GA-202 Canal Pump
EE-101
Ejector
GA-201A
Thermal Shield Pump
To Building Air Exaust
H-104 ~er
2"TW216 A3K
# 16 High Pressure He
. (FR;;\ ~LD
"' "' ;:.; "' "' "' I'-2 I'-.. _a:.
'<D -N
GA-102A Primary
Shut Down Pump
SPB3K
N
'
SP T3K '° ,I r<'llCD #!6
High/ Pressure
~ "' .,
I'--_ .. ~ "' -N
PrimC1ry Shut Dow~
"' Pump "' "' "' "' N 0 0
<i <i -" 0 ·-IN :._JN
GA-1018
Primary ~ Primary ' Pump Pump 0 § <(
' .,
1{0
Pl58 83K 0
N -" =/<11'¢ 2 -,,,.,. "' 0
-IN 1f
0
DAI02 B:3K
To Equipment Room Exhaust
Duct
2"FI04-H2A
#16 -j-"He
Low Pressure He
l 11 Pl6B-83K
Pl 115
0 .,. _a.
FA-102
o2o Storage Tonk
I{.' Pl65 -83K
"' N I
"' 2 "-
-'---'--.J'----'---'--'--'---'--'-----~.;.._----"" __ _,,__ _ _,_ ___ -<-,,,...__,,,.,,,,.,..-"
EA-1018 Primary Cooter
H-101 A Cation Bed
2"Pl83
l'N ii:
:_I
SP 83K
r-------
I Seal LY Trap
2"Pl63 SP B3K FA-IOI
o2o Storage Tonk
"' "' "'
Pipjng Specifications
A2A 150"' R.F. Carbon Steel
B2A 300"" R.F. Carbon Steel A3K 150• R.F. 304 Stainless Steel
B3K 300• R.F. 304 Stainless Steel H2A 125• Standard Steel Pipe H4Z 125"" Standard B3C 300# R.f. Aluminum
Reference D W G.
# 16 Refers To Steam, Water, Gos, a Air Flow Diagram·, O'W'G. 04653-16
F!G.3-27
4" Pl43 SP A3K
FD-104 FD-103
~
ltPl59
H-103 Mixed Bed
4"p43
SPA3K
J·l/2"DAIOB SPB3K
1f'P158
2"Pl61 .J:'
12
.1: 4
2"CDIOl ·A3K
Drains From D20 Equipment Rooms
--2"CD-l01-A3K
~O Drainage Pit
~ SPB3K
f oAI05
GA-1038
D20 Coolant Pump
Transfer Pump
Figure 5.1 Complete piping and instrument diagram for the primary system and the primary sides of the reactor auxiliary process systems.

6RAPHJTf SESfARCH R.fACTOR ~t.DG. •zru
/////////////
"Air Cond,
./~//
f&OO qpm
GRAPHtrf R.fSEAR.CH R-EAC'TOR. l!>LDG!70I _ Air Cooler§ 10 Units Iii PAN Ile: I A+
e"hau.5t 1)uct
HOT. LASORATOllY 6LQG.*'S:DI
/////////////
Ail" Con.:L
./~///
to BGRR Hf!Ht
I ,----L .. __ .. _______ ,,_!_.. 14"0
Yen+
"to storm e.ew-ere 1
euildlng And 'f"peri merrta I £Quiement
l .~ I 5'f:DG."'750
I 1
OW'
~oo qpm total
Makeup from Cy.clotron
Mal«rup from H.1'6R. - 100 9pm
blow-Clown • ~so 9pm
zoo qpm
H,f &,R., ~o
Figure 6.1 Piping and instrument flow diagram of the secondary coolant system.
150 'Jf'IT'
Air Conditiorung Coils
50 ""'
6uildin~ And Oper-.:itions ~
f>u lld i ng And. Ucf!rilmmia I ~u1ement
to~ .::iuxiliar~ HaO -purification
DW Supply

---, IH5 LS HS L& HS LS
Pneum'1ticalh.j Openrled. Syphon
Srec::il<. Valve
.Syphon 5ne<1k. Lrne
r®-
5 41
Reac-tor Helium Eys-tem
To .s+cick
® I Cl§J DC-101 Reac-tor
Reactor .Shutdown
Cooling system
~--------------------1--------1--------
1&1 psi9 Z50 psi9
1~4 F
Primary Pump GA- IOIA
Pump .Suction Valve HC· IOZ.A
Pump Suction Valve HC· IOZ 15
161 pei
Primary Pume GA-JOit>
Primary Purlf1caf1on
Pr1mqry Cooler f:A- IOIA
Pr1mar1;1 Cooler f.A- IOI f>
Coofant -5yst-e.rn
Pnmary Control Valve HCV·IDIA
Pr1marg Control Valv• HCV· IDlf>
Figure 5.2 Reactor primary coolant system schematic diagram.

•
d, , .
.,-" /
,,,"'
o' 1• z• 3' 4' 5' r;' 1' &' 9' 10' _____ ,
.~lier ,,%.t l""_ai;
;~ oLJ ShtJltlt?Wn C-11(!!!. Inlet <l el. l!l!l'I'
,. l".
el· ~~~d P.i.1i::t11.e1·
1p,.f.e pll ',oo .ffL•''
.i. :;··'""
~At
,g," • --t'!'.~%1~ ~.:P.1""'· .,1. f"'''
. ~ ~~) ~· ..... ~ ~ '"fiD"' ~ X. (Pead"'~
,i; p-111
Figure 5.3 Isometric drawing of the primary system and the shutdown cooling system.
lJ1
"" I\.)
-

280 101111111111111111111111111111111111111111111111111m ••m•• 68 •lllllllllllllmlllllllllllllllllllllllllll•-'"""'w'"'--11
rn1
-Hlcu=•-••~••"~~"'",.,'''''''''''''''''''''''''''''.-n'",-~'~~=~~~~-~~ 200
~ 66 ~~1111111111111111~1~ c en ·-a. .....
~ 64 111111111111111111111w11-_..11mum1111111mnllmltramm11-•1w w a:: :::>
i~ 100; V1
"" w
0 60 •llllllllllllllllllll-ll!timul~B1--W•1IJ•m11wij a::
0 a_ <C >
58 -llllllllllllllMlllllllllllm-lmlllllf rn 1111mmnnnmnm111+mrrmm
0 20 100 200 300 400
TEMPERATURE, °F
Figure 5.4 · Density and vapor pressure of heavy water as functions of temperature of the saturated liquid.
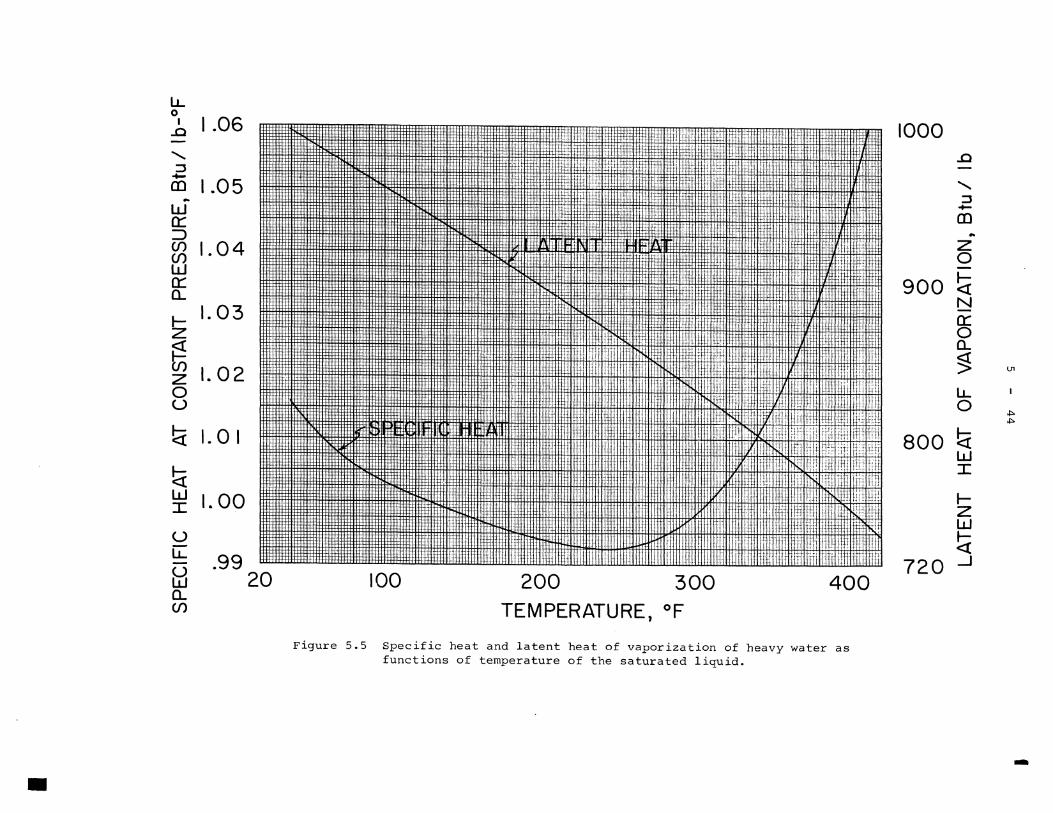
•
LL 0
.b I .06
......... :::J
CE 1.05 .. w 0::: :::> ~ 1.04 w 0::: a.. ~ 1.03
~ CJ) z 0 u
1.02
t:i 1.01
t:i ~ 1.00
u LL
frl a.. en
. 99 20
i-Ht-W-i.0-1-1.;
B:Eifllil"' .. :J-tl!-
Tlllf .l-
.Hfil':'litLHEl
ti. .
rr1w~·
-·l·ft rl11f,t-__ t···
•cit!mrr
u
L,_
n+
,_,._~
ajf 'ttl
'.Jtf t-
j:u
+1-H -~11
100 200 300 400 TEMPERATURE, °F
Figure 5.5 Specific heat and latent heat of vaporization of heavy water as functions of temperature of the saturated liquid.
1000 .c -.........
:::J -en .. z 0
900 ~ N 0::: 0 a.. ~ l11
LL 0
~ ~
800 t:i w I
I-z w ~
720 _J
-

~
.c. I -....
3.5
3.0
' .c 2.0 -~ ~ 1.5 u CJ)
> 1.0
.5
0 20
i:1:tttu.~m1mm:i:1mam.m=m
100 200 TEMPERATURE, °F
300
Figure 5.6 Viscosity and thermal conductivity of heavy water as a function of temperature of the saturated liquid •.
400
.37 LL 0 I -.... I
.36~ ' ~ -m
... >-
.35 ...... > ......
l.11 u :::> 0
.34~ ~ l.11
u _J <(
:! a:: .33 w :I: ......
.32

N 0 .., E u
...... u ::t. z 0 ~ <[ a:: ... z La.I u z 0 u ~ :::> ... a:: ...
Figure 5.7
5 46
10 3
IQ'-'-----'-"'----'-'--'"-'-'----'-'--'--_......-'-'-'-'--'-'-"-~W-l.-'-'-...._.~_,_'--'-'~-~f__;_i__~,w' '--'--'-'-~--'--'"-'-'--'--'-'-'--'-U-J
0 4 8 12 16 20 TIME, YEARS FOR UPPER CURVES,
MONTHS FOR LOWER CURVE
24
Tritium concentration in the HFBR primary coolant as a function of time after start-up. The fraction of n2o lost and replaced in the primary system each year is denoted by f.
I
I

100
200 ~ LL.
90
....= 180 z 80 LL. -z :::c
160 Cf) 70 0 a. <t 140 ~ 60 w ~ :::c 0
120 z 50 a::: _J - w <t ... - 3= U1
>-t- 100 (.) 40 0
a. z z w w ~
80 w 600 ~
-..J a::: - 30 w (.)
0 LL. -LL. 60 LL. 20 + 400 :::c - LL. w 0 w
200 ~ 40 10 ·•+· .... a:::
201- SI I I I I I I I I I I I I I I I I I I lttlttl±l;l+l I I I I I I I H 111 i I lili!:l±l I I I I Ii i I I 1 l~:J:fili+~£lillflliJ I lffifffil 111111 WiaRTITRTIT1 m 2000 4000 6000 8000 10,000 12,000 14,000
GALLONS PER MINUTE
Figure 5.8 Performance characteristic curves for the primary system pumps GA-101A and B.

•
Retaininq
.Seal Flu5hing 2· Connections
1nner Seal Ring ( f!uno S)
RI ng ( 5.5 Type 304)
Retainer(.SSType 304)
5prinq (.SS Type 304)
Pump Casinq Head
To Impeller Shaft
5'1c.k Up Ring ( f,una 5
Washer (carbon)
5eat (Tungsten Ccirbide)
Secil Plate Cooling 1· Connections, Pluqqed
lnner Seal Plate
4- Drain Z · Connections
Plate
Plate Sushinq Retainer
Retainer Plate
floating Seal Plate Bushing (Carbon)
R.etainin9 .5prin9
Set ,Screw
Shaft .Sleeve Compression Nut
'----+----Seal Rinq Adapter
----- To Motor Seal Shaft Sleeve
~--- "0'1 Rings ( 6una S)
Seal .Shaft .Sleeve (SS Tyfe 3JG)
:~~~ Clearance Dia.
,_ Sealinq Ring (euna .S)
5eal .Seat "o" R.inq ( euna .5)
Figure 5.9 Details of the shaft seal on the primary pumps GA-101A and B. This detail is typical of shaft seals for auxiliary system pumps as well .
U1
~ CXl

E ci.
°' 3: 0 ....I LL.
103 SHUTDOWN FLOW RATE
5 - 49
PRIMARY FLOW COASTDOWN
ONE PUMP ON LINE
10 2 '--~~-'-~~-'-~~~'--~~-'-~~--'~~~......._~~-' 0 I 0 20 30 4 0 50 60 70
TIME AFTER POWER FAILURE,SECONDS
Figure 5.10 Calculated coastdown curves for the primary system with one and two pumps operating before power failure.
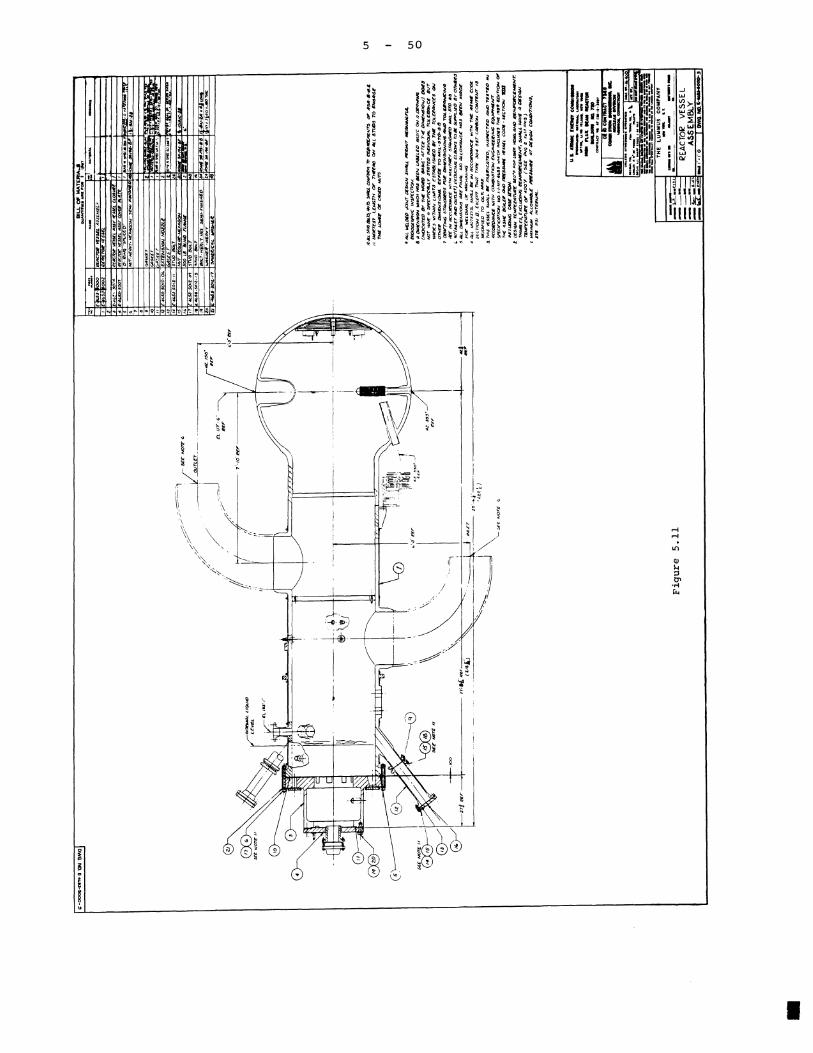
5 - 50
.,/ ___ /· ~
;~ '# ' '
I

5 - 51
. s
d -
'£~-,.. x:!;
. . -NJ; - '
x I
x
I

5 52
t_ __ --, I
'--
I

,.;,ao~-~·'l'ON 'OMO
<~" A"-
<io•pt,,..;,ir""" ----4__t ,. • .i
Gie10 »0211-1 o•
I A_J
~;;.~ll ,!,, -,.,-P(48LO,O::'io) . ~ _l_
; '~"~jo"ne b!!!.C-TIOW ·c-c ~T~Q\./TEL~LOC.>< u
/ -· D1"t ,-.,euTooao""
1"-6\lo.JC:.·Ul>< 11~
t1]_~1f.i~ (8'>,111.IC.) B.C.
~
+,·?fi .. "'"' "" , .. .,., I/>-r--- / ;- ~O:EI"
/;.;__ f
E\.JL-11\t!.C:..ED VIEW W
rB-su DWCo IJO. E- ... <..S!l·!WX:>l
::lf:C)"!O"-J A-A
Figure 5.14
QU~~~'~"'~~ .. ~~J..ERIA'li~-•--~-----i
~-~- ~~~~~~r·~~~~:~-:L-~c:w.~11,zu
~ AtJTl-Cli!ITICAL GltlO ~AS 6EO.J , Olt!ITTEO F"CR CLAe:1TY
(SE£ OW"G. £-4r.51.-SOIS)
'l· 11\U.. WE.L~ .lOllJOJ(1 ~" &t.e;TIOJ.I "'J"Vtl~• ~""rll:l!:IJ6lt\ ~LO Oii! IJCT St<l\LI.. 91: OQVl!l..E 4t;lOOV.. evTT \>,)[~ UWI..~ \Ol~!F"oCPIL!...Y ll.IC'ICPITE:C "!WiT ~~ TYF"t. -..l[Lt> l!o ~'"fll::
&·ALL WE.t D(C JOIVT Clas.i&IJ6 S.141\l L PC.Rto\rT Ml!:f'I .. 1'1<11; >'<JL lo:AO·U'>LM 140C: •IJbP['-1 IOI.I,
1· Wli:LD l'l:ZPAl<r.T,QNS f\RS. s-\Olol .. l'<:C 1Nll'Oli:0¥1'1"_. °"'LY.11\LL ~U>I rl fJ'll\~<,T1QUIO "'""' ...... l..011.J<'.:, Pll!O'l!:OUlllES !,..11\'-4 l!.i. e.P&C.lll't•C
8'>- Mi.I.> U? AA;D 1:1,l,?E ~l.leJEtT "lb Pvlt<ll1'!5Elli'!> "'"'""~"'"~· ~ -'>E-C: ().JC' ~--.S!>-St><- F"Ole 1>.0th"TIOt.lll\L loll!lo<l-llMl"ICf VEH\11.~.
s· "'-L oi•~EIJ51JM-e> ~iow..i """£ To e~ ""EAe.vi:::'"'o "'"T "10""" 4 A.LL t>i"1E>J5101JS 4•V[ .. ARE F"IOJAL • .. o 11\LLo.JJllO.lc.£ Hllt.6 ere.w
"'l"'Oll O:oe. '-'~Lt>•WQi oe! "'111\Cll.lr.llN(ij 3- ~LL MoHEIZ~L --1.. Illa IN lllCC~ll. WIT>\ Till. A""'ll CC"Pll:
'E>li.C."T•O>J 1I E•CEPT T>< ... T "TVPE !IO<I .,.,.IWL.W !>"Tat.I.. Cll'lel!JOM CO•i"'f''-r I>'> MOOIF'•ED TO .O<.,. ... A'I..
'Z T!I~ \ll!:!:i'!>E.L ~u.. - Fll\Sli!ICATED I l'i~PEC."!•D llrooJO ... ~T&D '"' loCCO"MWCI!. Wt'TM C016U6"1'10l.I l.MflloJl.Ulllt" l!.Ql.l\PMl'.t..l'T !:iP£C.lr'ICllfTIO" l.lO.,H·oJ.,.-4'9&'!!1 -\Ct.I INCl..VDl~ -,.~I!: l'ISq 1,01"1'\0IJ 01' Tll.ll J.S.Mll. ecllLle.lit. A"'D ~Eo~u-.11. \/. 5$U ... c.coa - el.CTI~ YIIr It.IC.I..~~ CA&W: lt."FO"l
1-0l!.5ili,IJ ~-~ t"5 Pe;141, ~51Gi,>J Te:MPE~lit.11!: l50""· Tl-llM&..E$, l!:llCLIJ[)lt../.i et1Nf:Of:C£MEP-JT, Sl<Al..L H~V'f. ,ci OES.IJ,IJ TEMPE:~tl'l":JEE or: .100• t:,
U.l.A10lllCl•l1Wl'CO.-· _ ............ TIOHLL-
..,-rooo,t.o-!11.&•G,•l•'IOlll MGt n.ux KAM lt!llC'rOfl
IUIUM ... ..0. TIO ---•,1•-11-1 ...
_ ... - --- •-~-~EACTOR VESSEL ~CIWC" SECTIClll
DWG. NO.t·
Vl
Vl w

5 54
I

.. -l..CIOS·Wtlo-l "CIN "DMO
!I0°'±1t•
11-•LICI< ~DIEEP(OPPO"&l"TE $Of.) ~ HOLE'So-\.OCA"TED 'i~ 5MOwt.J
Figure 5.16
-~ll J11H·11-l l)--
11~~'1
~I II \ : J.r- --y
J' -l~i ._,.,,..., .... z.\ W-- Hf. l.ICITI!. &
' _""_'_j
~lii:~ _1::·;~=:)
!!ol-!16.-51.6 •
ll>M.L 1oJU..CU1 JOlllT ~14f<h ~u. P'atlllrT MIEl'IWINCif~llt.. IU\DIC>Gi1EO.'l'1"tc;. 1~'•.c:now.
U•AU.. Diie~ 4WE.M ~I!. FINf\L. WO lil.LLONl'ltilCK !.!Aft 9£1['-I ~I'.,_ W'l!L~~ ~lllll~.
ct-WELD P'ltf!MR.l'\"TIO•U!> f\l!E ~ ~ U.U:~W\""f!OM Cll.li..'t
"'LL WE.LO -£~"1"10..a.-..iowu..o ... ~o~~· !P'Kll'IU>IN,.._-.U.~fillltE~"TlD~I\~
•·4"'&1(!a° ~lt.Fl'\CL'!o 09' AU.. •L~I!. N\CIE9' ~,,.,.,U..
HJi\111!: a. ~ltJl&"I °"" "\/ ')FLl\W4f. F~OOM.~-u-<n•""'0J
l!k.!._,0 l=Ll\WC.!: ~1-11\LL &e. l\!11 Ll~'Tl!:D It.I "T>ll!. "'"PEIJ0\11 TO "'~ ·e.P-44
.. ltol..L FL ..... C.£!. l'\MD FITTltllti!io SWIL\. lie I~ 'iCto•~ll
~l'ILI.. 'F\.AWolrolt !IU."T ~& ~L '!ol"Rlll'DOLIE CaNTl!.RUWm> ~Llt'6 '4Q"T'IE:D O'THER.""''~
*M..L -"Tf"•-. -L -. 1u l'IC.co•-.11::11: """"'-i'>W.11\Y'IE ax.: !>f:C."TIOM 11 f.11.C.l:PT"TMll(T "TYPI: 5°'!5a."T~--.,.-~ ~T tr,~ICIE.T "'IJi"TIEll'W.. ~ 111: II~ ~-t«l T'rPt: - l!allo"T.
il""-..rf ffrirT -IO-I Cl'INlllO"T SI'. ~~D WITHU.1 Tl« Peli!:el!Uf ~Oii TillE.CCIOEl!oll.,._LlK ~ltCTl!D To#ll J>tlOQf'
~'!o""T ~ #llGtDltOf\WCI: Wl'l'M ""•Plll!ll ... - '-"'IOI, pae>o"' "TU1"T!> 51lllLL 1H ..-~ OU I'\ ~Ol'll. ""Tl!:'!o"T "l•'TUlltlE.. ,,_.., UOT OU TMllt VE~l!.L
l--~ ~ ~-- - .. ~ ....... IW!>Pl:C~D ~~WO ltol ACLOR.C#IC'E loJI™ 0:0.-"T!Oo.I DMtNU.RlloMi E.q.llPMDl"T !oPV..I~~ "',., • .,..,_ 4Cof6 Wtk.>I IMCl.\IOI.'!> "T)ll[ '"'"
Etla"TI0"1 r:lll' "NS "'"°"1! 90!'-Dl ""'° ~ WS:~l!!L. COOL - ~C."TIOU "lml MoJU,VOMC;o c.1161:. ll.10 N
~ ti(!io~l.I PCl£!6\lltll: l-"IS ~. Oll!.!i.W.U ~Rl\"IVRC ~ ...
U.S. A'RIMl(:.Utl ..... coml._ - .. ,-~...... ~ .. ~.-.... nux••~
• _.... m.no
cantacf•Hla-U-1-
Ct:NO CowntACT TIM ----.:=-.=..
THE LUMMUS COMP'ANY --- - --~ - - -·-~ RE#\C:TOR \IE<:.iSEL A,"j.SEH9L"'
CCWER PLPi'Tt!:
DWG. NO .•. _........,,.1
Ln
Ln Ln
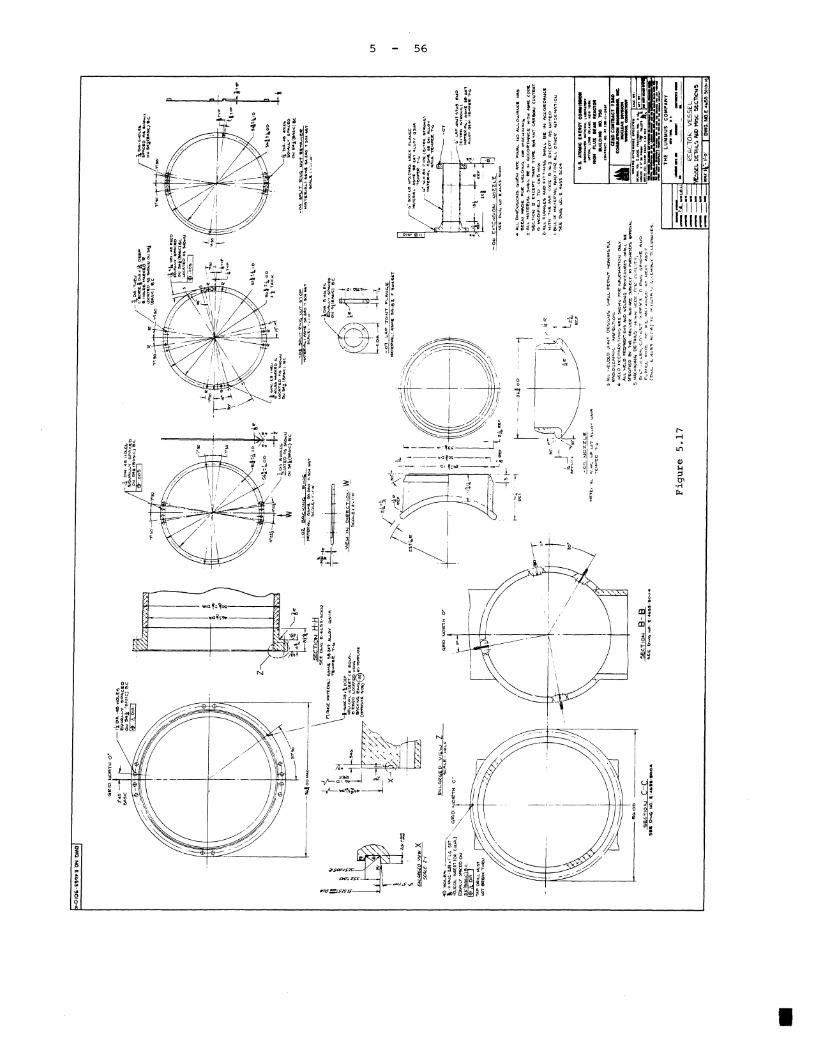
: g q
5 56
I

'-'2.•0!i-CS.,,..~-ON "OMO
~F~--r-3 -.. -r+-,~r 1e:i__c~
M"'"TE~lfl!L """'11! ""'-l'IS B·"J
~:=:~: !:~ ::.·:: -g~I Pi!>Mli &A-I
d~ !Yp r-
~
~jJt=•~:~:,1~< R
-:r~ • ~5Pl-4s;';ICP.L!Ol'
j__~~ ;if ~~.~"'~
- 1'1 ~Pl-IE~lCPi I.. Wf\~E~ W\"1"1:21P.L\ ~E. N0"1E 4
;~J.U.l.Ll,.lU!-l<L .. lW;1J_ia11_1_1 L LI LU LlL!-L, =-'1=-.'__f'_.u.._J ~=~~-t-~-~ I
1 "'"0,i.,v-<~v~~:::c°i·x·
.'2 ;-•· !~ r-j,~ .. I i;_,\ _j j
-1• LOCC<)"T< .. G P•"I G,2.g.1>.IC MP,"TIEC!P.L:#l ...... I!. ~-lq'!l«e.P.OC 8·~
c.~"'"c •-1·-0-
42•0 1-JO"l?"T>l o·
-4 >!OLE.~ t ·>?> UIJ(.. Lit ~ ,. O&!.~ (TAP (Rn l 1l_ ! ~'- O«P} HtL• to11,. 1 .. !>C:e:T ~~"1" OE! r;qUP,L EQ..Jl'\ ... L'"f ~P"/:10:.l!:O 0... t.\8c;:.
'T>Jlt.V 2 Q
~-· -- ·- ;\~ rr .~, D•~R -18ff ~· Lt · - ·~. c __ _
-- J u~_., ...... ~. .!.•.1 l IOEEP
... -'"" -..:i~J- 'l ,- ~ ~~!.r .. -~
-o~ F"L ..... IJC:.E. 80S'O
M"\""Tl:.R.lf'\\..: A,"'°"E. ~8 Ul"l ALLOY G!i!ll'\""l"~"'~R. T·I.
S<'.11\ .... :<-"·•'•"
<
~(f::.1 =(-··
l -/!!::_ _J
16~- p ...L__~·· T. ,~- , q v ~i±J \1 " 'I
~ -0--L~"T~~~ -0'; LOCAT'IJCo Pl'-', G,i'OUl.IC.
""'llW•lfll.' 11 ... .c ~ 1<1'!1 (,IP.>\~ &9 ..:11...e.·<•••'·<>
-Tli.2JllL',_..ll ~·l<i9<;;1f~t>C It-&
m rn~·i--"'' j '"" ~ ~ .. ~.-~
-OC.t!EJI. t!EP,D Pp,O HcL.i ""'P,"TE'£'..\l\L; !¥>ME. ~-!.LO C,~l'\OE !I·~
'!:>U'ILC·t"1"
5'-"\'-11:·<-·•"-o·
- ~'> E~~~':;~ '::PlliC!.0
-=.!.§~C\T\(A,L'-<0?.ID
M#\U.1t\fllL~ ~"T:~: ... ~-:_· ~;:;c:.;;:;..1. p,.~-4 t.19
5' ... L. i llo".•'-0" C"'LC.. W'Tt l('(l \l;!ol
Figure 5.18
I /\ I \. I -z.!'>ii.E!
M~~;<e F- F .,,~;:. ~~~· ... ~·\.~ '': .. s-... soc a
r--" ._,
~·. -14 Sl./PPO~T .<'\'&~V
M11'ft..:1"''-' ~t~:·:,..~~ .ALLCI"< G,•nA
~"''-IE••\:"''-
4·TMI!: P,i.LOV !ff&:ti:L EiPl·lli:!!:IC"'L ~lilt!. lilW.l Coo.!11"012M "TO ..._ .. "II!. AATl!:ltlFI<- &PltC..\F\t.A"T•O>J eA-•t5 ll•C..!iiiPT Tt11',"T 'm(
c-« .... IO'IL C0>1~1'T•O>.I S<l"ILI. 1!11ii ~ FO..LO.l5(A1'!:<1·'4'!Mo}
C.Ali!'V.0'-1 o.ae -0.-4~% W'llJG"'"''-" o.i. - o.6,.. P~Pl-IOC?."1& .047• "1AJI. ~"1LP>IUl2, .041• M"',._ ~\LIC.Ot.J .. ~ - .M1.
c;11~"''"'"' c."1 - o.q1. >t:ll.YllOt!>IU\'\ o.e. - o.?>'.)I, 1J1C.O::EL /.,.! - t.0% To<t: M"'•El?IAL '<*!ALL BE G»JENC:llEO A .. o ~"IP&;ei;:o ""1"0 f.\ "li!DC...:~ELL c;: Hl'\l:?ONE.!>$ Of' 35 "TO 4&.
!;.r>\lEt'l(l'\L """"~>l!ie$ TO B£ l"\C\c;M1>.IEO ..... 0 c;.'<!:OJO>•IO l"i "10,"T(.M -~AO!!"-ED PAl'li!'S 10 O.O"f,. t-11>.ll"IUM 8E..,"l•'IC., ~e.F..,Cll.
,. WE.LO AtE'PJIRl\"T\Ot..11> l'\l!.E !IMOW>.I FOR IWFOlt. ...... "T•otJ OOJL'( • ..,._L 'WELD PllV'f'le'K1 loo.I& 'Ii.JO WElOl>.Ki PISXlJ.Jvltt.'a SlllLL 1511 ~CCIFI[() S'I" ~Lilt lriUD 11\K ~BJEC."T 'TO PVR<;""""'-li?!o #\PP"lOY ... I..
!·<I.LL 0•"'1'."l!>IO'J'i:o (O<llll:'-1 l'\11:( Fl'-1 ... L 1.10 ALLOW"'W(.( Hll<;,
BEE'-1 >111'\0E FO'! "'E\.O<OJG, oQ. >111\C.llW<t.4 l·Al.L M .. T1<1i'1"'L !l'i ... LL K IW ... (.(.0£0Jlo.ll;[ WIT>i .. !>Ml: (.001!
!>ECTIO>J lt E•C.EPT ""l" .... "T 'T.,..PE 50-4 •l!>T, Cl'\otSQ'-1 (.C..>JTl!>.1"1
l!I MDO•,..H!!.O "10 .ov; .... .., ...
U. I. A1011HC fNfllG'I' CO•lhlOW
a
lllOO•M&VPI lt .. IOM&ll&-&TOll• uPTOM. lO .. 1•1.&MD. Ml• '<O••
HIGH nux HAM lltACTOlt MllLDINI '9D. 1'0
co•TJl"P ltO. H(ID·U-HtT
CE.NO CONTIU.Cf USO
~~~
THE LUMMUS COMPANY
--· ~- -· -....-.-CEA("TC'< V['55E.L
'l'E.~~L 0£11\!L!> A.~10 M1e,,c.. S£.C.'Tl01J~
DWG. NO.l.""""69-IJOfZt"
UT
UT -..J

'o %
i--++-4-,--- --+--0
~
5 - 58
I

~t ..... ., ...... " ...... 'Ii!:::;'!!
e «
'
~ ' -~~ I ~ .. ' 4)
l ' " i c u ~ ~!
~;::::i:::~~~ ii ~
5 - 59
0 N
.,.; Qj k ::s l:l'> ..... rz..

5 60
I
t I
l> F ~ :i
" 0~2i
~ J~~ll • ~~ a
11 ~~~~ ~hr ~ ~ l: 0
, '~~~ ~ 0 ~ii .. ~ .-1 F 01:~5 "' v ~ w i ~ "!~ ~ 0
~·j~~ (I)
~u~. 1-1
~~~:~ ::3 O'>
~~ SF ·.-! r..
I

10
CORE
-t I
CORE EDGE
5 - 61
H-8,
VESSEL WALL,
VESSEL WALL
MID PLANE, AWAY FROM BEAM/ SPHERE-CYLINDER
JOINT
RADIATION HEATING RATES FOR REACTOR VESSEL AND BEAM TUBES DESIGN
FULL POWER
-20 0 20 40 60 80 DISTANCE FROM CORE EDGE, cm
Figure 5.22 Radiation heating rates in aluminum used for the design of the reactor vessel and beam tubes for full power operation.
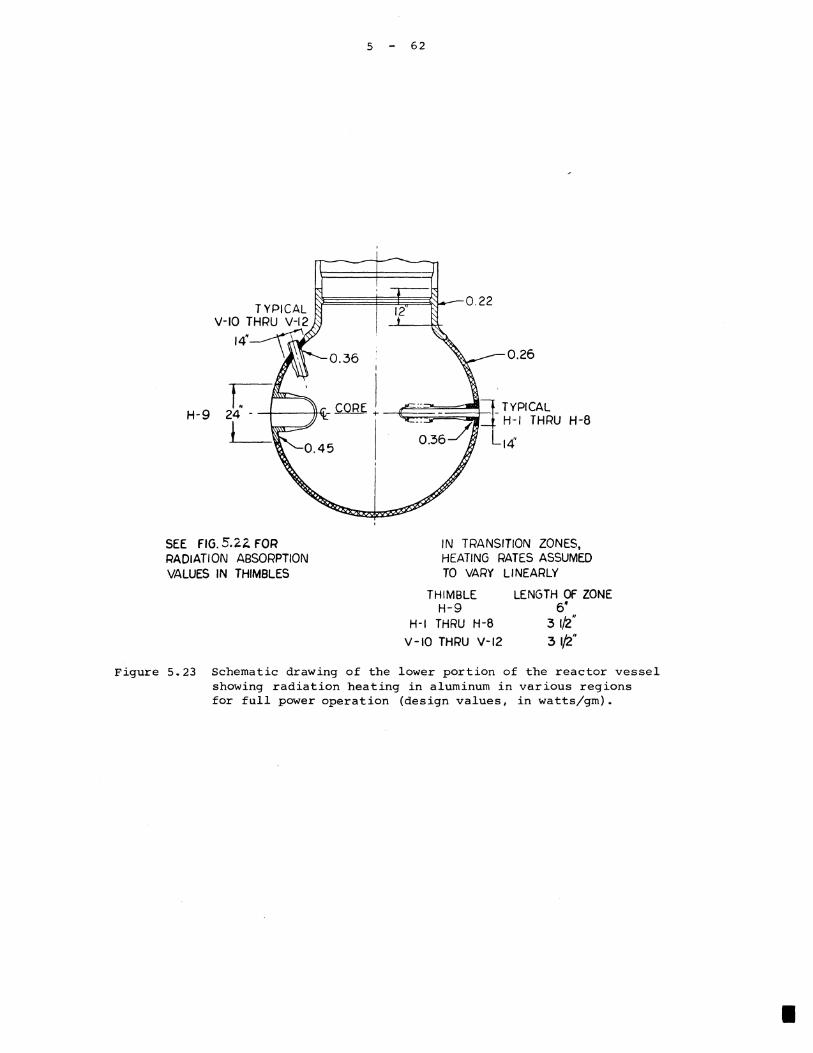
H-9
SEE FIG. 5.iz. FOR RADIATION ABSORPTION VALUES IN THIMBLES
5 62
IN TRANSITION ZONES, HEATING RATES ASSUMED TO VARY LINEARLY
THIMBLE LENGTH OF ZONE H-9 6'
H-1 THRU H-8 3 1/2"
V-10 THRU V-12 3 1/2''
Figure 5.23 Schematic drawing of the lower portion of the reactor vessel showing radiation heating in aluminum in various regions for full power operation (design values, in watts/gm).
I

5 - 63
CORE CORE ~ EDGE I
102 sec AFTER SHUTDOWN
103
104
105 '
106
RADIATION HEATING RATES FOR REACTOR VESSEL AND BEAM TUBE DESIGN, SHUTDOWN CONDITION
-20 0 20 40
DISTANCE FROM CORE EDGE, cm 60 80
Figure 5.24 Radiation heating rates in aluminum used for design of the reactor vessel and beam tubes for various times after shutdown.

5 - 64
Figure 5.25 Temperature distribution in beam tube H-1 at full power. Temperatures in rectangles are for local boiling conditions in the acute angle.
I

5 65
---o----
" -+-e>-+--26S"r-4.<IG9 11 4.2SO--Z!J3•F!__... _ _.... II
---~----~S.650
" -------257"r-8.406
II -+--e--t--24S"F-/a374
II
-t----t--2Z2"F°--!2.549 -----+--216~ -/S.()6/11
------VG°r-14. 311'
II
Figure 5.26 Temperature distribution in beam tube H-9 at full power. Temperatures in rectangles are for local boiling conditions in the acute angle.

5 66
60'' ----''=S'l...:.·=~ .... ·-- lit.a 0 F'
ac.'' 1s'l.e0
~4"
~o·
Z.4"
?c.4cro-£ Vc.f.7£1 7£""'1.PE/f?.#/v,e'E /2/.frL/dvn"~
Figure 5.27 Temperature distribution in the vessel wall away from beam tubes at full power.
I

100
80
x
~ 60 c ~ 0 a. .., c
; 0
= •
- 40
"' "' w a: ... "'
N
"' u c
.. .., c ~ 0 a. .., c :;:: ~
~
"' "' w a: ... "'
20
0 0
60
50
40
2
5 67
/ROCKWELL B HARDNESS
/ x
~ TENSILE STRENGTH
• -- lo..
""---- 0. 2 % OFFSET YIELD STRENGTH
I/% ELONGATION IN I INCH
.
4 6 8 10
RADIATION ( Nvt > I Mev X 10- 20 )
w ... <I :::;; ;:: 1.17 x 10²¹ .J :>
5.17 x 10²⁰
RADIATION IN Nvt > I Mev
x-
• --
12
0 ....
0
"'
0 ,..,
+ <I) <I)
w z 0 a: <I :r
"' .J .J w ~
"' u 0 a:
"' u .!:.
.!:
z Q ... <I ... z 0 .J w
t
0
"'
Q
20'--~~~~~~~~"'--~~~~~~~~"'--~~~~~~~~'--~~~~~~~~ ....... ~~~~~~~--' 0 5 10 15 20
ELONGATION ( % in I inch)
Figure 5.28 Effects of radiation on aluminum (Philips Petroleum Co. Dwg. B-3144, ID0-16628).
25 PPCO- 8 - 5144

STRESS MATL. POINT
@
1 I
0
2 I
n
SA-182 3 T
R TYPE 304L 4 'I'
B
5 'I'
R
6 T
R
ASA 7 T
6061 T-6 0
MATL. STRESS
@ POINT
8 I
0
ASA I 6061 9
T-6 0
10 I
0
STRESS MATL. POINT @
11 I
0 ASA I 6061 12 T-6 0
13 I
0
•
MECHANICAL STEADY-STATE BOLT-LOAD DRY SCRAM PRES. BOLT-LOAD THERMAL
~* ae * tr;:- * s" 7 ~ ~ s~
13 700 l AAQ 5 200
1'; (l?.d 2 026 -13 304 -119
-15 024 -10 808 15 598 12 227
-6 608
7.126
-2.838 18,000 3 198 20,000
l,758 -2 766
2,466 5.187 -3,126 -.d Q')'l
-3,014 3 841
3.014 -3 841
-1 o ?e; n -1 629 -3.786 21,960 _,, 1Qe; -1 779 -4 131 30,500
MECHANICAL STEADY-STATE DRY SCRAM PRE~, WEIGHT & THRM.
"<i" oe Sp ~ "9 s~
3 -h 02 3-686
-420 ? 476
1 200 4 104 30, 500
2 373 3 ,300
-9 73? -8 718 21. 960 -770 1-142
q 73? 1,873 21.960 3,970 2 704
STEADY-STATE PRES. I WT. & THRM.
"i"" '"0 .Sy
3 3B9 t;.814 le: ')(\(\
112 3 247 16-200
-3 038 7.112 30,500
7 (\~ 7 Q Q?7 30500
* 7 = longitudinal stress
°0° =tangential or circumferential stress
rTF ::: radial stress
"'
6.420 h 110
1 112 2 629
'" '>00
16 200 Figure 5.29 Summary of stresses in the reactor vessel
at full power (all stresses in psi).
13
IJ1
0\ Q)

5 - 69
A A
I
MEMBRANE + PRESSURE 8 THERMAL
DISCONTINUITY STRESS ES
RI Rn A 8 A B
°Pl +4089 +8714 +3677 +4060 - +2195 -9864 +3045 -5214 !l>o er-Bi. +4023 +4638 +3757 +4453
u-eo +7667 -1494 +8114 +1393
Figure 5.30 summary of stresses in beam tube H-9, equatorial plane, at full power (all stresses in psi).
'

A
a,;; .PL : +1002 ~ = +4440 °BL= -363 "'Bo= -2158
5 - 70
B
MEMBRANE + PRESSURE B THERMAL
DISCONTINUITY STRESSES
Rm R Ill A B A B
e7j£ +4314 +6314 +4314 +6314 'j'°o +?210 -7468 +2210 -7468 °Si +4467 +6201 +4467 +6201 ~ +70.4Q ..L, e; c:;3 +7049 +1653
Figure 5.31 Summary of stresses in beam tube H-9, meridian plane, at full power (all stresses in psi).
A
I

~ =-3035
Vo :: +1205
~l =-1676
"9. =+3076
l_1 .188
-c,95 Figure 5.32
.205
summary of inner end stresses in beam tubes H-1 through H-8 at full power. The stresses given are the sum of membrane, pressure, and thermal discontinuity stresses. The thermal stresses are based on the temperature profile for H-1 (Figure 5. 25). All stresses in psi.
+4630
-7229
°i"i. = -8433
°8o=-12370
U1
-.J I-'

5 72
A
\
MEMBRANE + PRESSURE 8 THERMAL
DISCONTINUITY STRESSES
RI R Ir A B A B
Oji +8490 +3727 +11.617 -1769
Cj°'o -99 -4307 ...,47q +1189
°Bi +1145 -2418 +490 -816 °i'o +6240 -5108 +5356 +160
Figure 5.33 Summary of vessel flange region stresses in beam tubes H-1 through H-8, equatorial plane, at full power. The stresses shown are based on a "worst case" obtained by combining the section properties of H-7 (maximum angle from radial) with the H-1 temperature profile (highest heating rates). All stresses in psi.
I

5 73
MEMBRANE + PRESSURE a THERMAL
DISCONTINUITY STRESSES
Rm RN A 8 A 8
~ : ... 1 0 711 -A?? +9714 +1890
s +291 -158 -12 -2470
oei. +558 -1696 +1045 -1883
"Bo +6302 -1626 +6768 -3322
Figure 5.34 Summary of vessel flange region stresses in beam tubes H-1 through H-8, meridian plane, at full power. The stresses shown are based on a "worst case" obtained by combining the section properties of H-7 (maximum angle from radial) with the H-1 temperature profile (highest heating rates). All stresses in psi.

5 74
'- / ----=--
/ I
-,~(\ u @··
'. ,\ F '-·/
"
Figure 5.35 Location of major pressure containing welds in the reactor vessel.
I

6 1
SECTION 6. SECONDARY COOLANT SYSTEM
6.1 GENERAL DESCRIPTION
A central system supplies secondary cooling 'Water to the HFBR, the BGRR, and the air conditioning units in both reactor buildings and in the Hot Laboratory. With the construction of the HFBR, the original system was expanded and revised to take care of the new loads. This section describes the complete system.
The system consists of 5 induced draft cooling tower cells, each rated at 3000 gpm of water which can be cooled from 120°F to 85°F on the average "worst" summer day at Brookhaven. On such a day, the outside wet bulb temperature should not exceed 78°F. The cells are mounted above an appropriate concrete basin for collection of the cool water. The system water inventory is 175,000 gal.
The pumping equipment consists of 4 pumps, each suitable for operation at 5000 gpm at a head of 55 psi. Three of the pumps were installed in 1949 in a pump house at the south end of the tower, and the fourth is a new unit mounted outdoors above a pumping well at the north end of the new sections of cooling tower.
Appropriate piping systems are provided for delivery of the water to the various units where cooling is required. Several conditions of operation are necessary as a result of varying loads and seasons. The flow diagram, Figure 6.1, shows all components in the secondary cooling system and indicates the normal summer water flow rates. The operation of the system is explained in the sections which follow. At each reactor the cooling water flows through conventional heat exchange units. At the BGRR, water flows through the tube side of a bank of ten finned-tube air coolers located in the exhaust ducts. At the HFBR, cooling water flows through one side of conventional shell and tube exchangers. Except for the primary D2o coolers, biological shield cooler, and canal cooler, it flows through the tube side of the exchangers. In the primary D20 coolers, cooling water is on the shell side in order to make the low inventory tube side available for D20.
The flow diagram, Figure 6.1, identifies the various components. The materials of construction for these components are listed in Table 6.1-1.
Section 11, Radioactive Wastes and Effluents, includes a discussion of possible leakage from the primary D2o to the secondary system, the resulting concentrations of radioactive isotopes in the secondary water, the points of release of secondary water to the environment, and the results of these releases.
6.2 WATER SUPPLY AND COMPOSITION
The water supply for BNL is pumped from a sand formation underlying the surface.. The depth of the wells varies from approximately 86 ft to 147 ft below grade. The top of the water table varies, across the site, from about 34 ft to 45 ft below grade.
water drawn from the wells is typical of well water found throughout Long Island. The water is acid in nature and tends to be corrosive due to free co2

6 2
and a low dissolved solids content. Most of the wells deliver water containing a quantity of iron which is objectionable because it fouls heat exchange surfaces.
Table 6.1-1 Cooling Tower Water System Materials
Component Material used to Contain Cooling Tower Water
BGRR Air coolers Copper Tubes, Copper-Plated Steel TUbe Sheet, Cast Iron Headers
BGRR Air Conditioning
Hot Lab Air Conditioning
HFBR
Primary n2o Coolers, EA-101A & B
Shutdown n2o Cooler EA-103
Experimental Facilities n2o cooler, EA-102
Thermal Shield Cooler, EA-201
Canal Cooler, EA-202
Biological Shield Cooler, EA-203
Absorption Units, GC-301A & B
Air compressors, GB-301A & B
After cooler EA-302X
Piping
Cooling Tower Sump
Copper Tubes, Steel Tube Sheet & Shell
Copper Tubes, Steel Tube Sheet & Shell
Stainless Steel Tubes, Steel Tube Sheet & Shell
Stainless Steel Tubes & Tube Sheet, Steel Channel
Stainless Steel Tubes & Tube Sheet, Steel Channel
Steel Tubes, TUbe Sheet & Channel
Stainless Steel Tubes & Manifold, Cast Iron Shell
Stainless Steel Tubes & Manifold, Cast Iron Shell
95% copper, 5% Nickel Absorber Tubes, Copper condenser Tubes, Steel Tube Sheet, Cast Iron Boxes
Cast Iron
Steel Shell & Shell Cover, Naval Brass Tube Sheets, Admiralty Metal Tubes
Steel Pipe, Cast Iron, Cast Steel, Bronze, & Brass Valves
Concrete
Water .is distributed through three separate systems on the site. There is a potable or domestic system, a cooling water system serving the Alternating Gradient Synchrotron, and a cooling water system serving the Medical Research Center. The potable system provides water to all facilities on the site for domestic use. It also provides cooling and process water for the HFBR and any other facilities not served by the AGS or MRC cooling water systems. At the present time the potable system is served by four wells. In order to assure safety from disease-causing organisms, water from each well is chlorinated to maintain a residual ion content of 0.4 ppm. In order to neutralize the natural acidity of the raw water, caustic soda solution is added to raise the pH to 9.4. The iron content varies from one well to another. In order to reduce to a minimum the amount introduced into the system, the wells with lowest iron content are pumped preferentially. As demand requires, the wells having higher iron
I
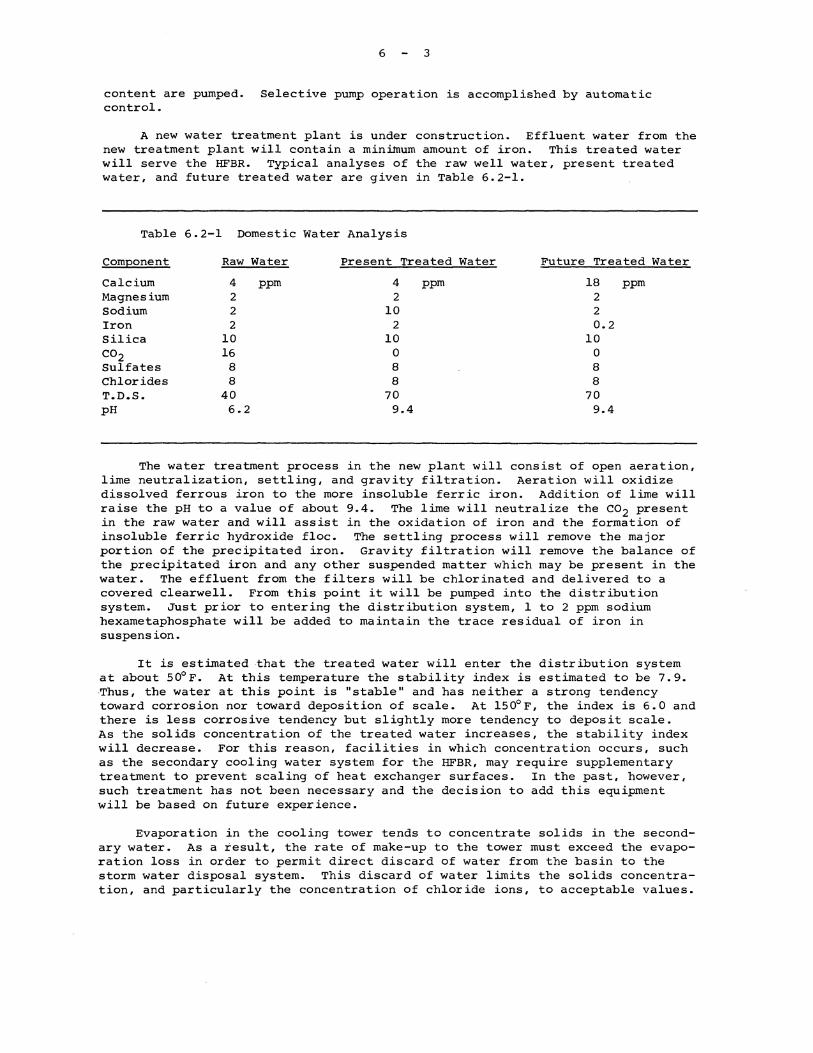
6 3
content are pumped. Selective pump operation is accomplished by automatic control.
A new water treatment plant is under construction. Effluent water from the new treatment plant will contain a mini.mum amount of iron. This treated water will serve the HFBR. Typical analyses of the raw well water, present treated water, and future treated water are given in Table 6.2-1.
Table 6.2-1 Domestic Water Analysis
ComEonent Raw Water Present Treated Water Future Treated Water
Calcium 4 ppm 4 ppm 18 ppm Magnesium 2 2 2 Sodium 2 10 2 Iron 2 2 0.2 Silica 10 10 10 co2 16 0 0 sulfates 8 8 8 Chlorides 8 8 8 T.D.S. 40 70 70 pH 6.2 9.4 9.4
The water treatment process in the new plant will consist of open aeration, lime neutralization, settling, and gravity filtration. Aeration will oxidize dissolved ferrous iron to the more insoluble ferric iron. Addition of lime will raise the pH to a value of about 9.4. The lime will neutralize the co2 present in the raw water and will assist in the oxidation of iron and the formation of insoluble ferric hydroxide floe. The settling process will remove the major portion of the precipitated iron. Gravity filtration will remove the balance of the precipitated iron and any other suspended matter which may be present in the water. The effluent from the filters will be chlorinated and delivered to a covered clearwell. From this point it will be pumped into the distribution system. Just prior to entering the distribution system, 1 to 2 ppm sodium hexametaphosphate will be added to maintain the trace residual of iron in suspension.
It is estimated that the treated water will enter the distribution system at about 50°F. At this temperature the stability index is estimated to be 7.9. ·Thus, the water at this point is "stable" and has neither a strong tendency toward corrosion nor toward deposition of scale. At 150°F, the index is 6.0 and there is less corrosive tendency but slightly more tendency to deposit scale. As the solids concentration of the treated water increases, the stability index will decrease. For this reason, facilities in which concentration occurs, such as the secondary cooling water system for the HFBR, may require supplementary treatment to prevent scaling of heat exchanger surfaces. In the past, however, such treatment has not been necessary and the decision to add this equipment will be based on future experience.
Evaporation in the cooling tower tends to concentrate solids in the secondary water. As a result, the rate of make-up to the tower must exceed the evaporation loss in order to permit direct discard of water from the basin to the storm water disposal system. This discard of water limits the solids concentration, and particularly the concentration of chloride ions, to acceptable values.

6 4
Table 6.2-2 is a condensed statement of the composition of the cooling tower water under present operating conditions, without the water treatment from the new plant.
Table 6.2-2 Cooling Tower Water Analysis
Total Dissolved Solids
Organics
Chlorides
187 ppm
2.5 ppm
32.0 ppm
The cooling tower water composition listed in Table 6.2-2 indicates 32 ppm Cl ion. The water will have a maximum temperature of ~120°F. At temperatures below 150°F, stainless steel stress cracking is rare, and even at 225°F, Cl- ion up to 50 ppm would probably be safe. The major danger appears to be from local concentrations of Cl- ion in crevices. The thick carbon steel tube sheets on the HFBR primary exchangers offer excellent protection to prevent such concentrations, since corrosion of the carbon steel quickly fills the crevice and thus prevents stress-cracking of the stainless steel. By limiting the Cl- ion content of the cooling tower water to 50 ppm or less, there should be no major corrosion difficulties with the heat exchangers on the HFBR. Stress-cracking appears very unlikely for many years of service (6.1).
6.3 OPERATING EXPERIENCE WITH ORIGINAL SYSTEM
Satisfactory operating experience with the cooling tower system has been acquired on the original 3 cells. Two additional cells, with an appropriate basin under them and a fourth pump with its own sump have been added to provide the additional capacity to accommodate the HFBR. Operation of the original equipment under heat load has continued from late 1950 to date. The BGRR has been the primary heat load for the tower: it has operated more than 80% of the time, and the tower has operated a like fraction of the time.
6.4 MAINTENANCE PROVISIONS
6.4.l SOLIDS IN RECIRCULATED WATER. Solids in the cooling tower water are present in two forms, suspended and dissolved.
The suspended or undissolved solids eventually precipitate to the floor of the basin and sump. The cooling tower is occasionally shut down, drained, and debris removed. The material removed is in the form of a finely divided slurry from partially decomposed grass clippings, dust washed out of the air, etc.
Dissolved solids constitute a potential scaling problem on heat exchanger surfaces, although none of the units operate at a temperature high enough to cause rapid deposition of material.
6.4.2 SOLIDS CONTROL. Control of undissolved solids is accomplished, as described in 6.4.l above, by occasionally draining and physically removing this material. This procedure is not done on a periodic routine basis, but rather on a convenience basis since the amount of material accumulated varies with time and is not determined easily without draining the basin.
control of dissolved solids has been accomplished by adding at least twice
I

6 5
as much water as is lost by evaporation and allowing the excess to overflow the basin as blowdown. The blowdown rate is variable because the make-up water now comes from several sources. In addition, as wind velocity and direction, and construction activity is highly variable, the amount of material scrubbed out of the air, and consequently the amount of dissolved solids present in the water, is also highly variable. This is shown by the routine water analyses for dissolved solids and organic material content which are made every two weeks. These analyses vary from not much more than make-up water purity to an occasional order-of-magnitude above this. In the example given in Table 6.2-2, the dissolved solids are about 3 times the solids in the make-up water. What is important is that the chloride ion concentration does not exceed 50 ppm.
6.4.3 PHYSICAL WEAR OF TOWER STRUCTURE. As the cooling tower ages, some weathering of the wood occurs. In the 3 existing cells, some deterioration of the interior fill and the exterior sheathing has occurred. In 1960 the Fluor Company, manufacturer of the cooling tower, was asked to inspect and recommend necessary repairs. They report that the tower is in very good condition considering its ten years of prior operation. There is no evidence of biological or chemical attack.
The repairs recommended by the Fluor company were made in 1960. Since then some damage, principally due to ice resulting from low water temperature operation, has been noted. However, the expense of repairing the ice damage has been more than offset by the power savings on the BGRR fans resulting from the extra cooling of the BGRR exhaust air with the cold water.
6.5 MAKE-UP AND BLOWDOWN REQUIREMENTS
The flow diagram, Figure 6.1, indicates that the combined maximum load on the cooling tower from all heat sources is 14,350 gpm of water at nearly l20°F which is then cooled to 85°F. Neglecting any cooling effect by direct exchange w.ith air, the evaporation necessary for this cooling duty is about 475 gpm. Windage or drift loss from the tower will run about 25 gpm, giving a total water loss of about 500 gpm. A make-up rate of 800-1000 gpm, with the blowdown or discard of 300-500 gpm, limits the solids concentration to about double that in the make-up water. Most of this blowdown is discarded by overflow from the tower basin into the storm sewer, with the balance being discarded to the sewer from the HFBR building.
There are several sources of make-up to the tower. All of these sources of water are connected to the basin through pipes which are well above the w~ter level. Thus, water from the basin can never back up or be sucked into the domestic water system. One source is the direct 4 in. domestic water line through the level controller in the lower basin. The second source is a variable flow of air conditioning and magnet cooling water from the 60 in. cyclotron and Van de Graaff building amounting to 200-500 gpm. The normal source after HFBR starts operating, however, will be the domestic water which has passed through the air conditioning units in the HFBR building. This may run as high as 700 gpm.
Water in the domestic system at BNL has a temperature range of 50°-54° F, and has a considerable cooling potential. In order to reduce the first cost and also the operating costs of the air conditioning and cooling units in the HFBR building, it is planned to send the water required for tower make-up through the HFBR air conditioning chillers, where it is cooled to 46°F. The 46°F chilled water, after passing through the building air cooling coils, is warmed to 60°F, and then flows to the cooling tower basin for make-up. The net temperature rise in the make-up water of 6°F equals 190 tons of refrigeration, or more than 40%

6 6
of the peak cooling load on the HFBR building, and more than one half of the normal cooling load.
6.6 WATER PRESSURES. TEMPERATURES, AND FLOW RATES
Since the system serves two reactors and three air conditioning systems, the load obviously varies with the number of reactors in service and with the season of the year.
Depending on the load, pumps il, 12, or 13 will be placed in service so that ordinarily two of them are loaded to about 5000 gpm. The third pump is a spare. Pump *4 will be loaded to about 4500 gpm. At these pumping rates, about 40-50 psig will be available at various coolers, a head adequate to provide flow through the coolers, return lines, cooling tower risers, and spray nozzles distributing the water in the cell interiors.
Under maximum summer conditions with a full heat load, the basin water temperature is 85°F, and the combined average temperature of the water returning to the tower is 118°-119° F. As the season progresses and the weather gets cooler, the basin water temperature will tend to fall. Moreover, the actual heat load will decrease somewhat because of lessened air conditioning requirements. In the past, water temperature was limited only to avoid freezing and icing. However, with the HFBR on the line, the minimum temperature at which the basin will normally be allowed to operate is 65°F. If the basin water temperature cannot be held above 65°F, steps which must be taken are discussed in section 6.7.
During normal operation two of the pumps at the south end of the tower and pump 14 (GA-301) will be running. If the HFBR is down, one pump can be shut down~ in fact it is likely that all except #4 (GA-301) may be shut down. If the BGRR is down, 14 pump (GA-301) will still be needed for air conditioning unless it is winter. Betwee·n these two extremes there are many intermediate conditions and possibilities which are covered by operating procedures.
Inspection of the flow diagram will show that water enters the HFBR building in the 24 in. cool water header, and is distributed in parallel to the following units.
In Out Unit GPM Teme OF
Primary 020 Cooler EA-101A 4000 85 119
Primary D20 Cooler EA-lOlB 4000 85 119
Experimental Facility Cooler EA-102 110 85 120
o2o Shutdown Cooler EA-103 150 85 108
Thermal Shield Cooler EA-201 400 85 110
Biological Shield Cooler EA-203 80 85 89
Air Compressors GB-301A & B (total) 1.5 85 115
Air Af tercooler EA-302 1.5 85 105
Air Conditioning Absorbers GC-301A & B (total) 1472 85 101
General Building Uses (approximate) 285 85
Total Secondary Water to HFBR 10500 gpm
I

6 7
Discard to sewer Inside HFBR
Total Secondary Return to Tower From HFBR
150 gpm
10350 gpm
Except for 150 gpm, this water is then combined and returned to the tower. The 150 gpm from the shutdown cooler, EA-103, is discarded to the sewer system in the basement of the HFBR building. This provision insures that water flow through EA-103 will not be interrupted even if all pumps stop. It will be noted that in the event of pump stoppage, the check valve on the south side of the cooling tower basin will open and permit water to drain by gravity through EA-103. If the gravity cooling operation is to be carried out for a prolonged period, pump GA-303 can be used to return this gravity-supplied water to the tower, to prevent emptying the basin. There is, in fact, little danger of the basin being emptied as long as the BNL water system is operative. An alternate supply of cooling water to the shutdown cooler is available through the line connected to 2 in. U.DW-301. Domestic water can be supplied to the cooler from the break-tank (H-305) by this route.
Water flow to the BGRR is less conventional. In the past, some 3000 gpm of water has been supplied to the BGRR and Hot Laboratory air conditioning units and this water has been heated very little by these loads. In view of this, it has appeared desirable to reuse this water in the BGRR air coolers. Accordingly, pump f4 (GA-301) was provided at the north end of the tower principally to pump water first through the BGRR and Hot Laboratory AC units in parallel, and then, in series through the BGRR finned-tube air duct coolers, and then back to the tower. Moreover, piping arrangements permit pump 14 to deliver excess water to HFBR, or pumps *l, *2, *3 to deliver excess water to BGRR.
In the event of failure of GA-301, the operation must resort to the old method of running all units in parallel until GA-301 is returned to service.
At a nominal summer load of 14350 gpm total flow rate in the secondary system, and a system volume of 175,000 gal, the average transit time through all systems is about 12 minutes.
6.7 METHODS OF TEMPERATURE CONTROL AND PREVENTION OF FREEZING
6.7.l NORMAL PROCEDURES. The water temperature in the basin will normally be held at or above 65°F. There are two methods of control. Warm return water can be bypassed directly to the basin, to hold the temperature at a higher level. When the bypass line is no longer able to supply more warm water, fans on one or more cells can be stopped to reduce the effective cooling.
No particular effort will be made to limit the temperature of the warm water returned to the tower. To reduce pumping power, it is planned to send return water back to the tower at 118°-120° F by appropriate control of the flow rate.
6.7.2 FREEZING OF BASIN. In very cold weather, with both reactors down, the basin could freeze. However, if the secondary pumps can be operated it has been calculated that the heat added by the power input to the pumps will be able to maintain the basin water temperatures at 45°-50° F in the most severe cold weather anticipated. Piping connections have been provided to permit total bypass of the cooling towers if this procedure is employed. Moreover, steam can be used to prevent freezing by stringing a temporary hose from the fan house to the basin.
6.7.3 LOW TEMPERATURE COOLING WATER PRECAUTIONS. If, because of extreme cold and high winds, it is apparent that the basin temperature will go below
6 8
65°F, the following items must be considered in the HFBR plant. Since the operation of-either reactor provides enough heat to maintain the basin temperature above 65°F, this situation will only occur during a prolonged shutdown of both reactors.
6.7.3.l Reactor Cavity Atmosphere. Low temperatures of the thermal shield and reactor vessel might cause moisture from the cavity atmosphere to condense on these components. Since there might be traces of radiolytically formed HN03 in the cavity, condensation is undesirable. The highest temperature at which condensation might be expected is 60°F, which is approximately the dew point for the building air (70°F, 500~ relative humidity). The cavity atmosphere should normally be much drier than the building air, and have a lower dew point than 60° F.
The temperatures of the D O in the reactor vessel and the H2o in the thermal shield can be prevente~ from falling below 60°F by throttling the cooling water to the respective exchangers. Temperature gages are provided to facilitate control of the water conditions.
6.7.3.2 Freezina of n2Q. Heavy water freezes at 38.8°F, and there is the possibility of freezing the n2o in the exchangers if the secondary water is circulated at a temperature below 38.8°F. The possibility is remote, however, because of the several means of maintaining the basin temperature above 45°F (secondary pump heat input and steam input to the basin) and because the heavy
water systems can also be heated by pumps, even in the absence of core afterheat.
6.7.3.3 Afterheat Removal. A special situation exists with respect to the shutdown exchanger (EA-103) which must be supplied with cooling water until the afterheat following shutdown is reduced to a negligible amount, or until fuel elements are transferred to the canal. Should the HFBR be shut down at a time when the BGRR is down, and with the secondary water temperature falling due to extreme weather conditions, the measures noted above would be used to hold the basin temperature above 45°F. The temperature of the primary system coolant would be held above 60°F by throttling the secondary flow to EA-103. If the circumstances were to be such that the basin water temperature could not be held above 45°F, the shutdown cooler would be switched to domestic water cooling, through the connection to the break-tank line.
6.8 CORROSION AND EROSION; PREVENTIVE MEASURES
Inspection of Table 6.1-l shows that the materials of construction are normal for cooling water service and no particular corrosion problems are expected. It has been pointP.d out that the combination of low temperature water and low chloride ion content present in this system makes stress corrosion cracking unlikely. Experience with the existing secondary coolant system has been good. The treating plant being installed at BNL will improve the quality of the domestic water, especially with respect to the iron content, which has been troublesome. No high velocities exist in the secondary system, and erosion or vibration are not expected to be problems. The basin is cleaned at frequent enough intervals so that abrasive materials are not expected to be picked up by the pumps and moved through the system components.
6.9 FINAL HEAT SINKS
Under normal operating conditions, the final heat sinks are the atmosphere, which absorbs and disperses the vaporized water and drift loss from the tower, and the storm water disposa~ system where the blowdown or overflow is returned to the Long Island surface water. It can be stated that a cooling tower can
I

6 9
dissipate heat under all credible circumstances, provided the hot water is delivered to it. Failure to deliver hot water would require an immediate shutdown of the primary heat source.
As noted in Section 6.6, arrangements have been made to allow gravity flow of water from the tower basin through the shutdown cooler in event all pump power is lost. No emergency power is available for the cooling tower pumps, but the emergency return pump, GA-303, can be powered from the HFBR emergency generator set.
References
(6.1) J. R. Weeks, "The Likelihood of Stress corrosion Cracking of HFBR Stainless Steel Pipes By Cooling Tower Water", BNL Metallurgy Memorandum No. 1035 (Feb. 24, 1964).
NOTE: Figure 6.1, which is the flow diagram for the secondary system, has been printed on the back of Figure 5.1, at the end of Section 5.

I

7 l
SECTION 7. AUXILIARY SYSTEMS
7.1 REACTOR SHUTDOWN COOLING SYSTEM
7.1.l SYSTEM DESIGN CONSIDERATIONS. The reactor shutdown cooling system provides for the removal of fission product afterheat from the core when the main pumps are not operating. Since the control rods are interlocked to prevent operation of the reactor without operation of the primary pumps, the shutdown system must deal only with the afterheat.
Immediately after a reactor shutdown the fission product heat generation rate is sufficient to boil heavy water in the fuel element water channels if there is no forced circulation of the coolant. During a normal shutdown, the primary system is kept operating for some time, but the net positive suction head requirements of the primary pumps precludes their use to circulate coolant once system pressurization is removed. Furthermore, the large flow they deliver would create excessive turbulence during fuel handling. From an emergency shutdown point of view, the power requirements of the primary pumps would make any emergency power system to handle them unreasonably large.
Based on the above considerations, and on the desirability of being able to do maintenance on the primary system during shutdowns, the shutdown cooling system was made largely independent of the primary system. The flow diagram of the shutdown cooling system is shown in Figure 7.1.
The shutdown system has two pumps, GA-102A and GA-102B, connected in parallel. One pump runs continuously, with the other on standby ready to start if needed. During reactor operation, the head developed by the primary pumps exceeds that of the shutdown pumps, so that the latter are backed up to shutoff when the former are running. That is, the discharge check valves on the shutdown pumps are held closed and no flow is permitted. To avoid overheating the shutdown pumps and seals due to running at zero flow, a low flow bypass is provided (l in. Pl80). A valve in this line is actuated by the flow recorder-controller FRa-101. When the flow in the shutdown system main discharge line drops below 300 gpm, the bypass valve is automatically opened to allow a sufficient flow of heavy water to keep the shutdown pumps cool. The bypass flow is returned to the low pressure side of the primary system, at the main pump sue-tion lines.
When the primary pumps are turned off, the head developed by them decreases as the pumps coast down. A point is reached in the coastdown when the shutdown pump head equals that of the primary pumps. After this point the shutdown pump head dominates and the shutdown check valves open as flow to the reactor starts. When the shutdown flow reaches 300 gpm the bypass valve is closed by the controller FRa-101. By the time the primary flow has decreased to a few thousand gpm the shutdown system is delivering the normal 800 gpm to the reactor. The primary pumps coast to a stop but the flow through the reactor does not drop below 800 gpm.
Suction for the reactor shutdown cooling system is taken at a point slightly upstream of the primary system venturi. The shutdown system discharges into the reactor vessel at a point above the primary coolant inlet. During reactor shutdowns, when the shutdown cooling system is pumping 800 gpm, the shutdown cooler, EA-103, will be carrying 500 to 600 gpm and the bypass line around the exchanger (6 in. Pl81) will carry the remaining flow required

7 2
to total 800 gpm.
Cooling tower water flow through the secondary side of the shutdown cooler is discharged into the sump of the cooling tower emergency pump, GA-303. Since GA-303 is normally not operating, this amount of water (150 gpm) flows into the laboratory storm sewer system via the sump overflow and trap. With the system piped in this manner cooling tower water will continue to flow through the shutdown cooler by gravity even if no secondary pumps are operating.
The motor for the cooling tower emergency pump GA-303 is powered by the emergency electric power system. Thus, should it appear that there is any danger of draining too much water from the cooling tower pool, GA-303 can be started and the secondary flow from EA-103 returned to the pool. such an occurence is unlikely, since the make-up flow to the tower pool from the laboratory water system is much larger than the flow through EA-103 (1000 gpm vs 150 gpm).
7.1.2 SHUTDOWN PUMPS. The two pumps, GA-102A and GA-102B, used in the reactor shutdown cooling system are vertical, single stage, centrifugal pumps. Table 7.1-1 gives pertinent data on these pumps.
Table 7.1-1 Characteristics of the Shutdown Pumps, GA-102A and B
Manufacturer Pacific Pumps, Inc.
Flow Design Test
Impeller
RPM
Motor
NPSH at rated flow
Material of construction (Casing, impeller, inner base parts, wear parts, shaft)
Code
seals
800 gpm at 34 ft and 60 gpm at 63 ft 800 gpm at 47 ft and 60 gpm at 64 ft
11-1/2 in. diameter enclosed type
1175
Louis-Allis, 15 hp, 250 volt DC
5 ft
Stainless steel, type 304, 0.06% maximum carbon content
API standard 610
One per pump, similar to seal used in primary pump and described in section 5.3.2
Motors of the shutdown pumps GA-102A and B are powered by the emergency electrical system described in section 3.5.6.9. Normally only one of the shutdown pumps is running. The selection of the running pump is made on a two-position selector switch located adjacent to the pumps. Either pump can be selected and the other then becomes the spare. There is also a disconnect switch adjacent to each pump. The disconnect switches are equipped with green pilot lights which light up when the motor circuit is de-energized.
Once the desired setting of the selector switch is made to designate the
I

7 3
"run" pump and the "spare" pump and the disconnect switches are put on, the pumps are started in the control room. The pump switches at the console have three positions designated "auto", "hand", and "off". For normal operation both pump switches are on "auto" and are put in this position in the correct sequence; that is, the pump which is to run is switched to "auto" first, followed by similar switching for the spare pump. If the "hand-off-auto" switches are set on "auto" in the reverse order, the spare pump will start but will automatically return to standby shortly after the run pump starts.
The pump selected to run then operates on rectified AC power. The spare pump will be started automatically on battery power should there be a 0.5 second interruption of power to the motor of the running pump. The interlocking action of the selector switch prevents simultaneous operation of both pump motors on power from the rectifier. If the power from the rectifier fails, it is possible to run both pumps from the battery, providing the spare pump switch is placed on "hand".
If the rectifier voltage drops below 90% of rated voltage, the running pump motor is automatically transferred to the battery. The interruption in power that occurs during the transfer is too short to cause the spare pump to start. If the running pump stops due to overheating, manual action, or the like, the spare pump automatically starts after a 0.5 second time delay.
Each pump motor has three indicator lights at the control console; red to indicate operation on normal supply (rectified AC), orange to indicate operation on battery, and blue to indicate that the control circuit is alive.
7.1.3 SHUTDOWN COOLER. The shutdown cooler, EA-103, is of the "U" tube type and is mounted in a horizontal position. It was subjected to the same testing and cleaning procedures as the primary coolers, described in section 5.3.1. Data on the shutdown cooler are given in Table 7.1-2.
The shutdown cooler was constructed to the same quality standard as the primary coolers and by the same fabricator. All tube seam welds were eddy current tested, all heavy water-side materials were ultrasonically tested for soundness, and heavy water-side welds were x-rayed. A mass spectrometer leak test was made on the shell (heavy water) side of the cooler. The measured leakage rate was 1.008 x 10⁻⁹ standard cm3/sec of helium from a helium-filled shroud over the cooler to the evacuated shell. The helium leakage rate from the shell to the tube side of the exchanger was smaller than the ultimate sensitivity of the instrument. Hydrostatic tests were performed at 475 psig on the shell side and at 360 psig on the tube side of the shutdown cooler.
7.1.4 PIPING. The shutdown cooling system piping is all classed as "P" piping, and is designed and fabricated to the same standards as the primary piping. The shutdown system piping is of type 304 stainless steel, except for the inlet nozzle to the reactor vessel. The inlet nozzle is of type 6061-T6 aluminum, flanged to stainless steel just outside the vessel. Reference may be made to section 5.3.4 for details of material specifications and fabrication methods.
7.2 REACTOR NATURAL CIRCULATION SYSTEM
7.2.1 INTRODUCTION. The reactor natural circulation system removes fission product afterheat in the event of the loss of all forced flow cooling of the core. Results of calculations on the heat transfer and fluid dynamics of the natural circulation through the core are given in Section 4.7.13. The components involved are the flow reversal valves and piping, the reactor depres-

7 4
surizing valve HCe-102, the shutdown heat exchanger EA-103, and pumps GA-104A and 104B.
Table 7.1-2 Characteristics of the Shutdown Cooler, EA-103
Manufacturer Southwestern Engineering Co.
Shell Side Fluid D2o
Tube Side Fluid Cooling Tower Water
Rated flow, normal service: Shell side Tube Side
Design Temperature
Operating Temperatures: D20 In D2o out Cooling Water In Cooling Water Out
Design Pressures: Shell side Tube Side
Operating Pressures: Shell Side Tube Side
Heat Transfer Rate: Clean Service
MTD (corrected)
Surf ace
Heat Exchanged, Rated
Pressure Drop at Rated Flow: Shell Side Tube Side
Materials of Construction: Tubes - 3/4" x 16 B.W.G.
Shell
Tube Sheet
Channel Spool
Channel Head
Closure Design
Code Requirements
500 gpm + 20% overdesign 150 gpm + 200~ overdesign
150°F
125°F 119°F
85°F 108°F
300 psig 150 psig
215 psig 5 psig
2 400 Btu/hr-ft2-°F 222 Btu/hr-ft -°F
23.3°F
330 ft2
1,700,000
2 psi 4 psi
Btu/hr
ASTM A-249, stainless steel, type 304, 0.06% maximum carbon, seam welded.
ASTM A-240, stainless steel, type 304, 0.06% maximum carbon, seam welded.
ASTM A-128, stainless steel, type 304, 0.06% maximum carbon.
ASTM A-181-II carbon steel flanges and ASTM A-53-B plate.
ASTM A-212-B carbon steel.
All closures are gasketed joints except tube-to-tube sheet joints which are rolled and seal welded.
TEMA-R for entire cooler and ASME Pressure vessel Code cases 1270N and 1273N for shell side only
I

7 5
7.2.2 FLOW REVERSAL VALVES. Four flow reversal valves are located in the reactor internal structure on the transition plate. When open, these valves provide a reverse flow path from the inlet or upper side of the fuel elements to the outlet or lower side of the fuel elements via the reflector, and permit natural upward circulation to take place in the core.
Construction of the valves is shown in a cross-sectional drawing in Figure 7.2. In the closed position the valves serve to keep water being pumped downward toward the reactor core from being short-circuited to the reflector. The valves are closed by water pressure from the primary pumps GA-101A and B or the shutdown pumps GA-102A and B. As can be seen in the flow diagram in Figure 7.2, if any of these pumps are operating the full pump discharge pressure is directed to the flow reversal valves via the pilot lines. In each valve this pressure acts to force the valve piston downward into the closed position, against the combined forces of the tension spring and the pressure of the water beneath the piston. The water pressure beneath the piston is less than that at the pump discharge by the pressure drop through the throttle valves and heat exchangers, when the piston is in the open position. This pressure drop is about 15 psi for the primary valves and coolers and about 10 psi for the shutdown valves and cooler. From it must be subtracted the upward spring force, amounting to about 30 lbs at full stroke, to obtain the net closing force on the piston. The piston face area is 9.6 in.2, so that the net closing force is about 114 lbs (equivalent to 12 psi) for the primary pumps and about 66 lbs (equivalent to 7 psi) for the shutdown pumps. Thus, the operation of any one of the four primary and shutdown pumps will close the flow reversal valves.
Bleed holes in the piston, the clearance gap between the piston and the cylinder, and the clearance gap around the indicator pin all leak water from the inside of the valve to the surroundings. At normal pressure conditions with the primary pumps operating this leakage flow amounts to 5 gpm per valve. The resulting pressure drop in the pilot lines reduces the closing pressure in the valves slightly.
Once the flow reversal valves are closed, the pressure difference across the piston is increased by the pressure drop across the core, about 31 psi at full operating coolant flow. This large force on the valve pistons will hold the valves closed even if the pilot line valves at the pump discharges are closed. The same remark applies.if only one primary pump is operating: the core pressure drop is then 6 to 7 psi, still great enough in itself to hold the valves closed. The core pressure drop at the BOO gpm shutdown flow, however, is too small to overcome the tension spring force, and the flow reversal valves will open if the pilot line valves are closed. This situation is a deliberate design condition and provides a method of testing the flow reversal valve operation at each shutdown.
The indicator pin on each flow reversal valve is anodized red, and may easily be seen from the top of the vessel at shutdowns when the vessel is opened. The testing procedure is to close the pilot line valve on the shutdown pump which is operating. This depressurizes the reversal valve chambers and the pistons are raised by the tension springs. The Operators at the vessel top simply observe the indicator pins rising out of the reversal valve top bodies, showing that the valves have opened. The pilot valve is then opened again and the closing of the flow reversal valves is noted by the falling of the indicator pins.
Should all four of the primary and shutdown pumps stop operating, the flow reversal valves will open automatically as soon as the water flow through the

7 6
core has coasted down far enough to reduce the core pressure drop to less than 3 psi.
A prototype flow reversal valve was built and tested by Combustion Engineering, Inc. The valve was tested for flow characteristics, and for reliability of performance (7.1). After some minor modifications suggested by the first test series, a second set of tests were carried out with completely satisfactory results (7.2). It is clear from the tests performed that the flow characteristics of the reversal valves meet the requirements for the natural circulation flow, and that the valves can be expected to function properly in the relatively clean water of the primary system. A graph of the pressure-flow curve for a single valve in the open position is shown in Figure 7.3. This flow characteristic applies to the natural circulation flow through the valves.
7.2.3 DEPRESSURIZING VALVE HCe-102. The depressurizing valve HCe-102 is a spring-diaphragm pneumatically operated valve which opens and depressurizes the reactor surge volume if both the shutdown pumps and the main pumps are stopped. The valve is kept closed by the application of air pressure to the operator. The air supply is controlled by a normally closed solenoid valve which draws its power from the 250 voe battery bank. Failure of either the air supply or the 250 voe electrical supply thus causes the depressurizing valve to open (and causes a reactor scram). The safety system instruments which cause HCe-102 to open are the vessel low-low liquid level instruments, in 2 out of 3 coincidence, and the four breakers on the primary and shutdown pumps, in 4 out of 4 coincidence.
The depressurizing valve is a 1 in. stainless steel valve rated at 300 psig. It is manufactured by the Fisher-Governor Company. The porting arrangement consists of a single seat which is closed by a downward motion of the plug. The valve seats on 3 psig air pressure with a plug stroke of 1 in. The normal supply pressure is 15 psig, from the building compressed air system. The control circuitry for the depressurizing valve is discussed in Section 9.5.3.4.
7.2.4 SHUTDOWN COOLER EA-103. In Section 7.1.3 the shutdown cooler is discussed in terms of its normal service as a heavy water cooler. As a part of the reactor natural circulation system, however, the shutdown cooler serves as a D2o steam condenser. Data on EA-103 acting as a condenser is found in Table 7.2-1. For data not shown, see Section 7.1.3.
7.2.5 OPERATION. Operation of the natural circulation cooling system may be required in either of two general cases; simultaneous failure of all four primary and shutdown pumps, or a major breach in the primary system. In both cases the fission heat is cut off abruptly by scramming the reactor. Scram signals from the pump switch gear, the core pressure difference meters, flowrneters, and the reactor vessel liquid level instruments will cause the shutdown~
7.2.5.1 Pump Failure case. For the pump failure case, due presumably to electrical supply faults, the primary system is intact and the normal flow coastdown occurs. The flow reversal in the core is speeded by the opening of the flow reversal valves and the reactor depressurizing valve HCe-102. The flow reversal valves open when the pumps cease to develop the necessary holding pressure, and the reactor depressurizing valve is opened by a trip signal from the opening of the four pump motor breakers.
The opening of the reactor depressurizing valve vents the pressurizing helium, lowers the saturation temperature in the core, and thus speeds the onset of bulk boiling in the core. Boiling assists the flow reversal. At first, the steam generated is condensed in the water column above the core and the energy
I
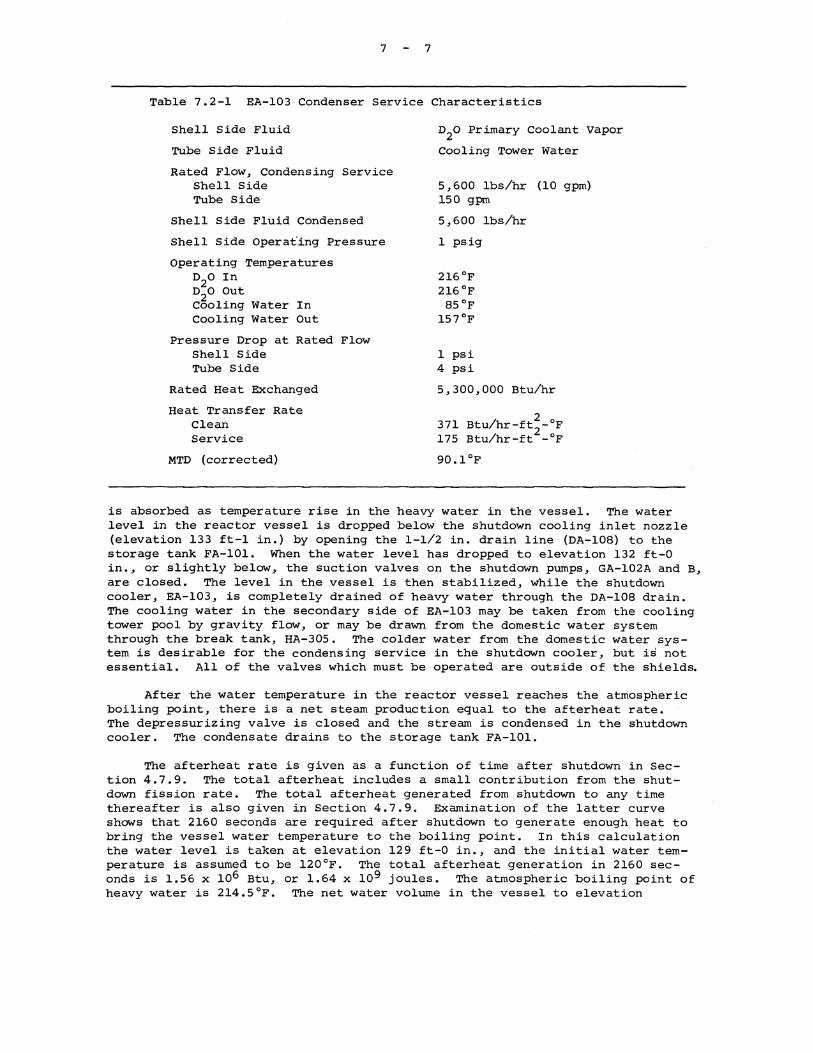
7 7
Table 7.2-1 EA-103 Condenser Service Characteristics
Shell Side Fluid
TUbe Side Fluid
Rated Flow, Condensing service Shell Side TUbe Side
Shell Side Fluid Condensed
Shell Side Operat'ing Pressure
Operating Temperatures D20 In n2o Out Cooling Water In Cooling Water Out
Pressure Drop at Rated Flow Shell Side TUbe Side
Rated Heat Exchanged
Heat Transfer Rate Clean Service
MTD (corrected)
n2o Primary Coolant vapor
Cooling Tower Water
5,600 lbs/hr (10 gpm) 150 gpm
5,600 lbs/hr
1 psig
216°F 216°F
85°F 157°F
1 psi 4 psi
5,300,000 Btu/hr
2 371 Btu/hr-ft2-°F 175 Btu/hr-ft -°F
90.1°F
is absorbed as temperature rise in the heavy water in the vessel. The water level in the reactor vessel is dropped below the shutdown cooling inlet nozzle (elevation 133 ft-1 in.) by opening the 1-1/2 in. drain line (DA-108) to the storage tank FA-101. When the water level has dropped to elevation 132 ft-0 in., or slightly below, the suction valves on the shutdown pumps, GA-102A and B, are closed. The level in the vessel is then stabilized, while the shutdown cooler, EA-103, is completely drained of heavy water through the DA-108 drain. The cooling water in the secondary side of EA-103 may be taken from the cooling tower pool by gravity flow, or may be drawn from the domestic water system through the break tank, HA-305. The colder water from the domestic water system is desirable for the condensing service in the shutdown cooler, but is not essential. All of the valves which must be operated are outside of the shields.
After the water temperature in the reactor vessel reaches the atmospheric boiling point, there is a net steam production equal to the afterheat rate. The depressurizing valve is closed and the stream is condensed in the shutdown cooler. The condensate drains to the storage tank FA-101.
The afterheat rate is given as a function of time after shutdown in Section 4.7.9. The total afterheat includes a small contribution from the shutdown fission rate. The total afterheat generated from shutdown to any time thereafter is also given in Section 4.7.9. Examination of the latter curve shows that 2160 seconds are required after shutdown to generate enough heat to bring the vessel water temperature to the boiling point. In this calculation the water level is taken at elevation 129 ft-0 in., and the initial water temperature is assumed to be 120°F. The total afterheat generation in 2160 seconds is 1.56 x 10⁶ Btu, or 1.64 x 10⁹ joules. The atmospheric boiling point of heavy water is 214.5°F. The net water volume in the vessel to elevation
7 8
129 ft-0 in., ignoring the volume in the inlet and outlet nozzles, is 241 ft 3
(16500 lb at 120°F) •
The afterheat rate at 2160 seconds after shutdown is 534 KW, due to 530 KW from fission product decay heat and 3.8 KW from the shutdown fission rate. The corresponding steam rate is 2050 lb/hr. The boiling is allowed to continue, with steam condensation in the shutdown cooler, for another 288 minutes. At this time, 5.40 hours after shutdown, enough water has boiled away to drop the water level to elevation 120 ft-8 in., which is 12-1/4 inches above the transition plate. No credit for water inventory in the inlet and outlet nozzles is taken in calculating the boil-off time: the water which is assumed to boil away has a volume of 89.8 ft 3 , and at 214°F weighs 5950 lb. The afterheat energy involved is 5.28 x 10⁶ Btu, or 5.57 x 10⁹ joules.
Make-up water from FA-102 to the vessel is started at 5.40 hours after shutdown since a few inches of water head above the transition plate are necessary for natural circulation. The total afterheat rate at 5.40 hours is 232 KW and the required make-up flow is 1.39 gpm at 70°F. The tank FA-102 is located on the operations level, above the reactor, and the heavy water stored there is available as make-up by gravity flow. The flow rate is adjusted on the basis of the water level in the reactor vessel, which is measured by the emergency liquid level instrument LI-107 (see Section 9.4.4.4). A minimum heel of several hundred gallons is normally kept in FA-102, which would provide about three hours of make-up flow.
Condensate collected in the equipment level storage tank, FA-101, can be transferred to FA-102 in the absence of any electrical power for the transfer pumps by steam or gas pressure. The "blowcase" is operated on steam pressure by turning off the cooling water to the shutdown cooler. After the cooler heats up and stops condensing steam, the steam pressure builds up in the cover gas region of FA-101. The transfer line to FA-102 is opened, and water is forced from FA-101 to FA-102 by the pressure. The head required is 50 ft, or about 25 psig. The blowcase arrangement can also be operated with compressed gases, rather than steam, after closing the drain valve from the shutdown cooler. Heavy water in the primary piping and heat exchangers is also available for make-up by draining to FA-101 and subsequent transfer to FA-102.
7.2.5.2 Primary System Rupture. For the case of a major breach in the primary system the reactor vessel low-low liquid level logic trips all pumps and opens the flow reversal valves, the depressurizing valve, and the siphon break valve. If the failure point is in the primary system piping the heavy water which escapes through the break flows through the floor drains in the equipment cells to the FA-101 pit. The transfer pumps GA-104A and GA-104B are arranged to take suction in this pit when the need arises, so that heavy water make-up is available from this source when the heel in FA-102 is exhausted. If electrical power is not available, GA-104B can be manually operated, or can be belt driven by a portable emergency engine. If the failure point is in the lower reactor vessel, the thermal shield cavity fills with heavy water to above the transition plate level. In this case the water in the balance of the primary system can be drained to FA-101 and then transferred to FA-102 to supply make-up.
The natural circulation cooling of the core starts with the vessel water level at elevation 124 ft-1-1/2 in. (the outlet nozzle invert) for the pipe break case, and at elevation 121 ft-3 in. for the lower vessel rupture case. The pipe break case is the more severe in terms of the time interval to net steam evolution and the required make-up flow rate. The reasons for this conclusion are that in the lower vessel rupture accident the volume of water in
I

7 9
the shield cavity and lower vessel is larger, and that a substantial part of the afterheat is removed by natural convection to the thermal shield cooling system. The time after shutdown for the heavy water to reach the boiling point is thus extended, and the required make-up rate reduced, for the vessel rupture case. Further, the heavy water outside the vessel seals the rupture point and steam can be condensed in the shutdown cooler, as in the power failure case discussed in the preceding section.
In the pipe break case the net water volume left in the vessel to elevation 124 ft-1-1/2 in. is 187.7 ft 3 At an initial temperature of 120°F, this volume of water weighs 12860 lb. The energy required to bring the water to the boiling point is 1.21 x 10⁶ Btu, or 1.28 x 10⁹ joules. The time after shutdown for this energy generation is 1500 seconds. The afterheat rate at the start of net steam production is 605 KW, due to 600 KW from the fission product decay heat and 4.6 KW from the shutdown fission rate. The corresponding steam rate is 2320 lb/hr. An additional time of 5200 seconds, or 1.86 hours after shutdown, are required to boil away 2420 lb of heavy water and reduce the vessel water level to 12-1/4 inches above the transition plate (elevation 120 ft-8 in.). The make-up water flow must be started at this time. The total afterheat rate is 352 KW (350 KW from the fission product decay heat and 1.7 KW from the shutdown fission rate), and the required heavy water make-up rate is 2.10 gpm at 70°F. The make-up flow is controlled on the basis of the vessel water level, as measured by the emergency level instrument LI-107 (see Section 9.4.4.4).
An alternate to the heavy water make-up supply may be desirable in the pipe break case. If the break is in a place where the escape of steam to the exhaust system cannot be prevented, a light water make-up can be established to limit the release of tritium-bearing heavy steam. The light water is supplied to the vessel through the poison water tank, FA-202, after the posion solution is drained into the vessel. The poison water system is described in the next section and the environmental effects of the heavy steam release are discussed in Section 14.3.4.
7.3 REACTOR POISON SOLUTION SYSTEM
A 350 gallon supply of cadmium nitrate solution is maintained in vessel FA-202 (see Figure 5.1) for use as an ultimate shutdown agent. The poison water is injected into the reactor vessel above the liquid level. The poison solution vessel, FA-202, is located on the operations floor. The vessel will hold 350 gallons of poison solution containing 3300 lbs of Cd(N03) 2 ·4H2o dissolved in water (7.3). The vessel test pressure is 425 psig and tfie safety valve SV-202 on the vessel is set at 255 psig. Cover gas is supplied from the low pressure helium system and the vessel is vented to the building air exhaust. Provisions are made to pressurize the tank with helium to 250 psig from a separate helium bottle if necessary. The low pressure system is disconnected in the latter case.
The concentration of Cd(NO ) in solution is well below the saturation limit at room temperature, so t~at it is not necessary to heat the solution. In fact, the design concentration, 51.7 gm Cd(N03),/100 gm of solution, will remain fully dissolved down to a temperature of 33 F. The solubility curve (7.4) for the poison salt is shown in Figure 7.4.
The path from the poison vessel to the reactor vessel is through two block valves and a throttle valve into the suction side of the helium gas eductor, EG-101, (see Figure 5.1) which is connected to the reactor vessel. This run is comprised of about 100 ft of 2 in. pipe. With the cover gas pressure in FA-202

7 10
adjusted to equal the gas pressure in the reactor vessel, the hydraulic gradient alone (approximately 14 ft-6 in.) will drive the poison solution into the reactor at 50 gallons per minute. This flow rate corresponds to the addition of 172 lbs of cadmium per minute to the reactor vessel fluid. The rate of poison addition may be greatly increased by increasing the cover gas pressure in FA-202.
Since stainless steel vessels are used commercially to store concentrated cadmium nitrate solutions, corrosion under the mild HFBR conditions (70°F, inert gas cover) should not occur to any significant extent in FA-202. Corrosion of the alumium portion of the primary system by the poison solution is not expected to be a problem. Although no direct corrosion information is available, zinc nitrate and cadmium sulfate in concentrations up to 10% have been tested with aluminum with no significant corrosion observed (7.5). The deposition of the poison salt on aluminum reactor internals has been investigated (7.3). After successive washings with demineralized water, the residual traces of the cadmium nitrate remaining on the vessel wall and on the beam tubes would amount to a reactivity of only a few cents. Continued use of the vessel after an accident which required the injection of the poison solution would depend upon any mechanical damage which might have occurred, rather than upon the amount of poison remaining in the vessel after appropriate rinsing.
Although the poison solution system is an effective shutdown mechanism for the n2o-filled reactor, the primary function of the poison is to insure an adequate shutdown margin in the case of light water flooding of the reactor. The amount of poison solution available, added to the reactor primary system during a light water flooding accident, is about three times the amount necessary to reduce the multiplication constant of the reactor to 0.90 (7.6).
7.4 REACTOR HELIUM SYSTEM
7.4.l INTRODUCTION. The helium cover gas which occupies the surge volume in the top of the reactor vessel serves several functions; it is the means for pressurizing the reactor system, it provides an inert and compressible volume to absorb liquid surges, and it acts as a vehicle to transport radiolytic and corrosion gases from the surge volume. See Figure 7.5 for a schematic diagram of the system. The helium system volume is about 27 ft3.
7.4.2 THE HELIUM SUPPLY SYSTEM. Helium for the reactor system is stored in a bank of cylinders located on the equipment level. A manifold connects the cylinders, with reduction valves at each cylinder. The cylinder bank also supplies helium for various level instruments and for the siphon break valve HCe-lOlC.
Helium is admitted to the reactor vessel by the inlet control valve, PRCa-lOlB, which, along with the outlet control valve, PRCa-lOlA, regulates the pressure in the reactor vessel. Helium is also admitted to the reactor vessel at a steady rate by the reactor vessel bubbler-type liquid level instrumentation. The total normal helium supply rate is 0.13 scfm, or 0.01 cfm at system pressure and temperature (200 psig, 120°F).
A pressure transducer, PRCa-101, senses the gas pressure at a point just upstream of the pressure relief valves SV-lOlA and SV-lOlB. The pressure at this point is the same as in the surge volume in the reactor vessel. The pressure transducer provides an electric signal, proportional to the pressure, to a pressure recorder, and to two indicating controllers. In addition, the signal is furnished to the high and low pressure alarms, and to the scram and low-low pressure logic blocks in the safety system. The set point for each contact is
I

7 11
independently adjustable over the pressure range of the instrument. The pressure recorder (a four-inch strip chart type) is installed on an instrument panel in the control room.
The two pressure indicating controllers are installed on the control console. The reactor helium inlet controller has proportional control. The reactor helium outlet controller has proportional plus floating control. Each controller has its own manual mode. The reactor pressure is controlled by the addition or release of gas to the surge volume. The controllers actuate valves PRCa-lOlA and PRCa-lOlB to maintain a constant surge volume pressure. The controllers operate with a differential gap, or dead band, such that each valve will be closed for a pre-set interval above and below the set pressure. Adjustment of the differential gap is provided by the control index setting of each controller.
Control valve PRCa-lOlA releases helium from the reactor to the vent system when the surge volume pressure rises above the normal setpoint. Control valve PRCa-lOlB admits helium to the system from the supply bank when the reactor pressure falls below the normal setpoint. Both of the control valves are furnished with electro-pneumatic positioners, and both valves close on a loss of instrument supply air or loss of electrical input signal. For normal venting of the reactor surge volume at the completion of an operating cycle, both controllers will be reset to 0 psig, thereby stopping the helium supply and allowing the reactor pressure to fall to zero. There is a valved by-pass around the reactor helium inlet control valve to allow helium to be fed into the reactor vessel manually.
A flow indicator just downstream of PRCa-lOlB measures helium flow into the reactor vessel. A check valve and a block valve downstream of the reactor inlet helium control valve prevent backflow in the line and allow manual stoppage of the helium supply. After the check and block valves, the helium supply line joins the circulating system piping and enters the throat of the eductor, EG-101.
7.4.3 THE HELIUM CIRCULATING SYSTEM. The helium circulating system takes gas from the Surge volume in the reactor vessel, passes it through the recombiner, H-104, and returns it to the surge volume. The function of the recombiner is to keep the concentration of radiolytically and corrosion formed o 2 and n2 gases low. Comparison with the cover-gas conditions in the Canadian NRX reactor leads to an estimate of a maximum n2 evolution rate of four liters/hr (STP). Since the o2 evolved in the system tends to be taken up in corrosion reactions, sufficient additional o2 will be supplied to the gas stream before it enters the recombiner to provide a stoichiometric mixture for the formation of n2o. At a circulation rate of 10 cfm, the n2 concentration will not exceed 0.002%, which is well below the explosive limit of 10% (7.7).
The recombiner, H-104, was manufactured by the Catalytic Combustion Corporation. The recombiner vessel is of type 304 stainless steel, with .06% maximum carbon. The design pressure and temperature are 300 psig and 1000°F, respectively. The vessel is constructed to the ASME Pressure Vessel Code, Section VIII, amended by case 1270N. All welds were radiographed after stress relieving, and a helium leak test performed to MIL-STD-271B (Ships). The catalytic element in the recombiner is a closely packed mat of narrow, thin-gauge nickel-chrome alloy ribbon coated with alloys of the platinum group. The pipe line carrying gas to the recombiner is electrically heated. This insures that the entering gas temperature is above the dew point, and that the catalyst will not be deactivated by wetting. Should wetting occur, the catalyst may be dried and reactivated by heating the entering gas well above the saturation temperature

7 12
(about 380°F).
As can be seen in Figure 7.5, sample connections and temperature recorders have been provided both upstream and downstream of the recombiner. Gas samples from these points will be analyzed for Dz concentration to confirm the proper operation of the recombiner. Further, since the reaction of D2 and o2 is exothermic, a comparison of the gas temperatures before and after the recombiner will indicate whether it is functioning and will give an indication of the extent of reaction taking place. Measurement of the temperature of the gas entering the recornbiner is also required so that the electrical heating of the entering line may be adjusted.
The cover gas is circulated by the helium eductor EG-101. Table 7.4-1 gives data on the eductor. The eductor is powered by a stream of heavy water furnished by pump GA-105. The pump GA-105 is a Chempump canned rotor model, CFH 3 in. 600 lb, with a capacity of 7 gprn at about 153 ft of head. The pump is fabricated from type 316 stainless steel. The pump takes suction from the line· transporting heavy water from the purification system to the primary system.
7.4.4 REACTOR SURGE VOLUME EXHAUST SYSTEM. It is anticipated that the cover gas in the reactor vessel may contain traces of volatile fission products as well as D2 and o2 • The normal exhaust path is through two filters piped in series, the reactor off-gas particle filter, FD-105, and the reactor off-gas iodine filter, FD-105A. Data concerning these filters are given in Tables 7.4-2 and 7.4-3.
After passing through the filters the purged gas, at essentially atmospheric pressure, flows into the off-gas manifold, 6 in. EV-101, shown in Figure 3.25. The exhaust gas is passed through the building filter bank and is discharged from the stack. The effects of the exhaust gas on the environment is discussed in Section 11.
The purge rate is regulated by the set points and differential gaps in the control valves PRCa-lOlA and PRCa-lOlB. The minimum purge rate is necessarily set by the helium flow into the vessel from the liquid level instruments LRa-101, Lia-106, and LA-102. The total normal purge rate is 0.13 scfm. Should the helium recirculation through the recombiner be inoperative for any reason, the D2 concentration in the surge volume can be maintained at less than 1% by a purge rate of 0.3 scfm.
The remaining items of interest on the exhaust side of the helium system are the reactor depressurizing valve HCe-102 and the vessel relief valves. The depressurizing valve (see Sections 7.2.3 and 9.5.3.4) allows rapid venting of the surge volume and the depressurization of the primary system in certain emergency situations. The large flow rate which is necessary for this service precludes filtering the flow in the FD-105 and FD-105A units, although the vented gases do pass through the building exhaust air filters before being released from the stack. Environmental effects of the rapid depressurization are discussed in Section 11.
The safety valves, SV-101A and SV-101B, are described in Section 5.3.5. They are a part of the reactor surge volume vent system, but are used only for emergency relief of pressure surges in the vessel. The relief valves vent into the off-gas manifold, bypassing the FD-105 filters for the same reason as given for HCe-102.
•

7 13
Table 7.4-1 Data for Helium Eductor EG-101
Manufacturer Penberthy Manufacturing Company
Number of Stages
Motive Fluid Data Fluid Pressure, minimum Temperature Viscosity (CP) Design Flow
Suction Fluid Data Fluid Pressure Density Flow
Discharge Pressure Differential Pressure
Hydrostatic Test Pressure
Material
One
D20 Suction fluid pressure + 40 psig 150°F 1 6 gpm
Helium 200 psig operating, 275 psig maximum .12 lbs/ft3 at 200 psig 10 to 20 scfm (design - 20 scfm) ; flow at operating pressure will be 10 to 20 cfm. suction + 2 psi 1/2 to 2 psi (design - 2 psi)
600 psig
AISI Type 316 Stainless Steel
Table 7.4-2 Data for Reactor Off-gas Particle Filter FD-105
Type "Micro Metallic" porous stainless steel
Materials Stainless steel, type 304, max. carbon .06%, or type 316
Pressure rating 300 psig
Temperature 200°F maximum, 120°F normal operating
Flow rating 10 scfm
Particle Size Removal 5 micron pore opening
Table 7.4-3 Data for Reactor Off-gas Iodine Filter FD-105A
Type Activated carbon absorber
Materials Container, type 304L or 316 stainless steel. Filter element, activated carbon-filled canister, replaceable
Pressure rating 300 psig
Temperature 200°F maximum, 120°F normal operating
Flow rating 10 scfm
The radiation monitor RRa-105 is installed in the helium system in line 1-1/2 in. Pll3, and is part of the circulating flow circuit as well as part of of the exhaust side of the system. The monitor RRa-105 is a scintillation-type gamma ray detector. It is shielded against background radiation in the operations level process area, and has an internal check source. The count rate

7 14
from RRa-105 is recorded in the control room, and activates a high level alarm on the annunciator panel. A detailed description of this instrument is given in Section 9.6.3.2.
7.5 PRIMARY COOLANT PURIFICATION SYSTEM
7.5.1 GENERAL DESCRIPTION. The primary water treatment system is designed to remove suspended particulate matter, dissolved ionic solids, and maintain the water at a pD of 5.0 to 5.1. A diagram of this system is shown in Figure 7.6. Operation at a slightly acid pD will inhibit aluminum corrosion (see Section 5.5.6).
The primary coolant purification system is located below the equipment level floor in the northeast sector of the building (see Figure 3.3). The vessels for the filters and ion exchange beds are located in pits in the floor and the connecting piping and valves in trenches in the floor. The pits are covered by 1 ft thick concrete covers and the trenches by 3 in. thick steel plate covers. These covers, along with the shielding integral with t~e vessels and the concrete and earth that surround the pits provide shielding for the system.
A 20-ton monorail, JD-107, serves the primary coolant purification area. It has access to all pits and to the east end of the canal and the east truck lock. This monorail has sufficient capacity to lift the vessels and any auxiliary shielding which might be necessary.
7.5.2 FILTERS. Two filters, FD-101A and B, are employed upstream of the ion exchange beds to remove solids suspended in the primary coolant. One filter, FD-102, is located downstream of the ion exchange beds to keep resin fines out of the primary system. Data on these filter are found in Table 7.5-1.
The permanent-type cartridges which provide a mechanical support for the filtering medium may be removed from the filter tank, cleaned, and used again. The amount of exchangeable hydrogen in the filtering medium is negligible and will, therefore, not cause any significant degradation of heavy water. Normally both FD-101 filters operate in parallel, with one filter being valved off only to replace its element or perform some other maintenance task.
7.5.3 ION EXCHANGE BEDS. Downstream of the pre-filters are four nuclear grade ion exchange resin beds. Data for these beds, which are identical except for the resins, are found in Table 7.5-2. Before being installed, resin beds will be deuterated to prevent the degradation of heavy water with light water. Deuteration is accomplished by the upward displacement of H2o already present in the bed. The heavy water is introduced through the outlet distributor at the bottom of the vessel and displaces the H2o upwards. The optimum flow rate for minimum mixing of the two fluids is 0.08 gpm. It takes about 60 gallons of heavy water to deuterate a bed, and 40 to 60 lbs of heavy water is isotopically degraded in the process.
Exhausted beds will be dedeuterated for recovery of heavy water before being sent to waste storage. Dedeuteration is similar to deuteration except that H2o is introduced at the top of the vessel and the D2o is displaced out the bottom. After the removal of the exhausted bed, the tank will be filled with a charge of fresh resin in the required regenerated form.
The arrangement of piping and valves and the utilization of the pressure drop across the reactor vessel allows water to be diverted through (1) any single bed, (2) the two mixed beds in parallel, (3) the cation bed and a mixed bed in series, and (4) the cation and mixed bed combination in parallel with the
I

7 15
Table 7.5-1 Data on Filters FD-101A, FD-101B, and FD-102
Manufacturer
vessel O.D.
vessel Length overall
Vessel Volume
vessel Closure
Maximum Working Pressure
Materials of Construction: vessel
Gasket
Code for vessel Construction
Radiography
Hydrostatic Test
Filter Media
Rated Filter Capacity
Total Filter Area
Pressure Drop at Rated Capacity:
Clean Charged
Efficiency
other mixed bed.
FD-101A & FD-101B
Dollinger
12-3/4 in.
28-1/2 in.
16.5 gallons
12 in. weld neck flange and blind flange, with 1-1/2 in. inlet and outlet connections
300 psig
Stainless Steel, type 304, with 0.06% max. carbon content Compressed asbestos
ASME Unfired Pressure vessel Code, Case 1270N
All butt welds
475 psig, no leaks
2 layers "Glastex GM" glass fiber
30 gpm
15 sq. ft
2 psi 20 psi max.
92% of 2 micron or larger particles
FD-102
Dollinger
12-3/4 in.
46-5/8 in.
25 gallons
Same as FD-101A & B
300 psig
Same as FD-101A & B
Compressed asbestos
same as FD-101A & B
All butt welds
475 psig, no leaks
Same as FD-101A & B
60 gpm
30 sq. ft
2 psi 20 psi max.
same as FD-101A & B
Periodically, the primary water will be demineralized by one or both mixed beds (at 20 gpm per bed) until its specific resistance is of the order of several megohm-cm. Flow through the mixed beds will then be cut off and diverted through the nitrate bed at about 5 gpm until sufficient nitric acid has been added to adjust the pD of .the primary water to 5.0 - 5.1. Upon the completion of acidification, flow will be diverted to the cation bed which will be operated continuously at 20 gpm. Operation of the cation bed will permit continuous removal of radioisotopes, most of which are cationic, without removing the nitric acid. Additional adjustments of pD may be made whenever needed by

7 16
Table 7.5-2 Data on Ion exchange Beds 101A and B, 102A and B
Manufacturer Belco Industrial Equipment Division, Bogue Electric Company
vessel O.D. 18 in.
Vessel Length exclusive of external lead shield
Vessel Volume
Vessel Closure
Design Pressure
Design Temperature
Materials of Construction: vessel
Gasket
Code for vessel Construction
Shielding Integral with vessel: Top Bottom
Flow within bed
Inlet and Outlet Piping
Inlet Distributor
Outlet Collector
Volume of Resin per Vessel
Ion Exchange Resin: H-101A
(cation bed)
H-101B (nitrate bed)
H-102A and B (mixed beds)
4 ft-7-3/4 in.
7 cubic ft
18 in., 300 psi slip-on flange with blind flange
300 psig
150°F
Stainless steel, type 304, with 0.06% carbon maximum Pure gum rubber
ASME Unfired Pressure vessel Code, Case 1270N
9 in. lead 6 in. lead
Downward
1-1/2 Sch. 40 stainless steel, type 316
Eight 1/2 in. dia. holes in capped inlet pipe, covered with stainless steel, type 316, 24 x 100 Dutch weave Screen
Four 3/4 in. laterals with holes facing down, covered with stainless steel, type 316, 24 x 100 Dutch Weave Screen, holes located 1/2 in. max. from top of bottom plate
6-1/2 cubic ft
Amberlite hydrogen form XE-77, a strongly acidic styrenedivinylbenzene type resin Duolite nitrate form A-30B, a weakly basic, epoxy-polyamine type resin Amberlite XE-150, a mixture of XE-77 and hydroxide form XE-78, a strongly basic styrenedivinylbenzene type resin
diverting primary system water through either the mixed bed to increase pD or the nitrate bed to lower it.
I

7 17
At a pD of 5.0 the electrical specific resistance of the heavy water is about 0.7 megohm-cm, and the corresponding conductivity (as read on the monitoring instruments) is about 1.4 micromho.
Whenever circumstances require it, 40 gpm of demineralization flow can be obtained by diverting 20 gpm through each of the mixed beds, or the cationmixed bed combination with the other mixed bed in parallel. A throughput of 20-30 gpm for 12-16 hours after shutdown will reduce the Na-24 concentration sufficiently so that operators may work safely at the top of the reactor vessel during shutdowns without over-exposure to the hard gamma radiation of this isotope (see section 10.3.4). The bed capacity is very large: a single mixed bed has sufficient capacity to remove the entire fuel alloy content of a fuel element from solution. Normally, an ion bed would be expected to last at least a year.
7.5.4 PIPING. The piping in the purification system is of the same quality as that in the primary system, described in Section 5.3.4. In the purification system the classification T3K stainless steel tubing plays a more prominent part than in the primary system.
Unlike the primary coolant system piping, which will seldom be disconnected, the purification system piping is expected to be taken apart periodically for the removal and replacement of filters and ion exchange beds. To facilitate this removal each filter and ion bed is equipped with an angle gate valve at its inlet and outlet. The piping components connected to the filter or ion bed are, in order, an angle valve, a short stub of piping ending in a Tyloc female connector coupling (a pipe-to-tube adapter with a four piece compression fitting on the tube end), a run of tubing having a right angle in it, another Tyloc female connector, a run of pipe and a valve. The angle valve and pipe stub with Tyloc fitting all fit within the space described by extending the cylindrical portion of the vessel.
To change a filter or ion bed, the valves on the filter or bed are closed, the valves at the far end of the tubing run are closed, the tubing is removed, and the ion bed or filter lifted out of the pit by the monorail hoist. If the ion exchange bed or filter is radioactive, as may be the case after the reactor has been operating, it will be lifted into a steel-lead shielding cask and transported to the area where the changing of the bed or filter will take place.
7.5.5 INSTRUMENTATION. Two in-line conductivity recording instruments will be relied upon for continuous indication of water quality. The recorder for these instruments is located in the control room (see section 9.4.3.14). One instrument, CRa-2, located upstream of the ion exchange beds, reads the quality of water coming to the ion beds. It is equipped with a high conductivity alarm which will warn of excessively impure water in the primary system and will be symptomatic of such things as fuel element rupture or the breaking down of one of the ion beds. The other conductivity instrument, CR-1, is located downstream of the ion beds and indicates the effectiveness of the primary coolant purification system. The conductivity instrument scales are 0-20 micromho (see Sections 9.4.3.14 and 9.4.4.5).
Periodic pD measurements will be made on "grab samples" taken at either of two sample stations, one being upstream of the ion beds and the other downstream. Periodic measurements of the isotopic purity of the heavy water will also be made on grab samples (see section 9.4.4.7).
The fission product monitor, RRa-100 (see Section 9.6.3.l), indicates

7 18
fission product activity in the primary coolant, and gives an alarm for high activity. The indicating meter and alarm are in the control room. Responding only to fis&ion products, this instrument will detect any failures in the fuel element cladding.
As can be seen from the schematic, Figure 7.6, the purification system is well supplied with pressure instrumentation. Pressure measurements will be the prime indications of the functioning of the system. When the pressure drop across a filter or ion bed increases to a certain level it will indicate that the equipment is becoming charged and the filter element or bed should be changed. Channeling in an ion bed would be indicated by an abnormally low pressure drop across the bed. Flow in the system is regulated by a Kates flow rate regulator located in the piping trench (FCi-lOlA, Figure 7.6). ·
7.6 PRIMARY SYSTEM VENTS, DRAINS, TRANSFER SYSTEM, AND STORAGE TANKS
7.6.1 INTRODUCTION. The primary coolant system, the shutdown system, and the experimental facilities cooling system, are equipped with drains, vents, storage tanks, and transfer equipment so that they may be filled and emptied as needed for operational and maintenance purposes.
7.6.2 DA DRAINS. All the process systems containing heavy water are connected to the DA drains. The DA drains are a system of pipes connected on one side to the various process systems, and on the other side to the heavy water storage tank FA-101. The DA drains are shown in the piping and instrument diagram, Figure 5.1.
The drains are located so that the various heavy water systems may be completely drained, or so that a major component, such as a cooler or pump, may be drained when it is valved off from the remainder of the system. The control rod drive seals are also connected to the DA drains. All drain connections to process components and systems are double blocked by two shutoff valves in series.
7.6.3 AREA DRAINS. All areas containing heavy water process equipment are equipped with a special system of floor drains called the CD drains. The purpose of the CD drains is to collect and make available for reuse any heavy water which might leak from the process equipment. The CD floor drains in the process areas all discharge into the pit which houses the storage tank FA-101. The pit has a capacity substantially greater than the heavy water inventory. Should the need arise to utilize heavy water which has drained into the pit, the transfer pumps GA-104A and B may be connected to take suction in the pit.
7.6.4 ~· All heavy water process systems and storage tanks are equipped with vents to facilitate filling, draining, and the purging of free water surfaces. Ultimately, all the vents of the heavy water systems discharge into the building exhaust system at the throat of the exhaust venturi (see Section 3.4.2). The venting of the reactor vessel, DC-101, is discussed in Section 7.4.
The mechanical seals for the primary pumps GA-101A and B, the shutdown pumps GA-102A and B, the experimental facilities cooling pumps GA-103A and B, and the control rods drive shafts are vented to remove any heavy water in the vapor form which might have leaked through the mechanical seals.
Helium from the low pressure helium system is employed as a cover gas for liquid free surfaces in the heavy water storage tanks FA-101 and FA-102, and the experimental facilities cooler, EA-102. To prevent excessive pressure in
I

7 19
the cover gas, each vessel is equipped with a pressure relief valve which discharges into the vent system. Occasional purging of the cover gas to remove volatile contaminants is accomplished manually by opening the relief by-pass valve at a given vessel. Gas samples are taken periodically from all vessels and are analyzed for deuterium content.
Material vented from the heavy water process systems and storage tanks is potentially radioactive, so the vent system is designed to operate at a pressure lower than the surrounding atmosphere to allow only inward leakage.
7.6.5 .Q.20 STORAGE TANKS. The HFBR has two n2o storage tanks, FA-101 and FA-102. Table 7.6-1 gives pertinent data on these storage tanks .• One of the storage tanks, FA-101, is set in a pit below the equipment floor where it is a low point for gravity drainage of all heavy water systems. The other storage tank, FA-102, is installed on the operations floor, where it is the high point with gravity drainage into the reactor vessel and all heavy water systems. Of course, FA-102 will not drain into the reactor vessel against system pressure. FA-102 is employed as an emergency reservoir for make-up water to the reactor vessel in the event of boiling and natural circulation afterheat cooling (see Section 7.2). The storage tanks have a combined capacity of 11,800 gallons, and are capable of holding the entire heavy water inventory of the plant.
Table 7.6-1 Data on n2o Storage Tanks FA-101 and FA-102
Design Code ASME Unfired Pressure vessel Code
Design Temperature 150°F
Design Pressure 103 mm Hg. abs.
Test Pressure (hydrostatic) 137 psig
Capacity of each tank 5,900 gallons
Material in contact with D2o Stainless Steel, type-304
7.6.6 .Q.20 TRANSFER SYSTEM. A n2o transfer system is required to fill the various process systems and to replace any heavy water lost from these systems during operation. The transfer system consists of the two heavy water storage tanks, two transfer pumps, GA-104A and B, and piping, some of which serves other functions as well as the transfer of heavy water. The piping in the transfer system is of stainless steel, to the primary system piping standard discussed in Section 5.3.4.
Data on the two transfer pumps are given in Table 7.6-2. For transporting heavy water from one storage tank to another, and for filling of systems at atmospheric pressure, GA-104A will deliver a great deal more than its design capacity of 10 gpm. At a head of 490 feet the pump GA-104A delivers about 80 gpm (and even more at lower heads) • The factors limiting flow are the NPSH requirements and the capabilities of the pump motor.
The high head (565 ft) on these pumps is required when they are employed to inject heavy water into the primary coolant system when it is at operating pressure. Periodically during an operating cycle some water will have to be injected to make up for losses at pump seals and through the fission product water monitor, RRa-100. The transfer pump GA-104B is belt-driven so that the

7 20
pump may be powered by a portable gas engine if no electrical power is available.
The transfer pumps are connected so that they can be operated either singly or in parallel and can take suction from either the storage tank FA-101, the DA drains from the primary, shutdown, and experimental facilities cooling systems, or the pit for FA-101. The transfer pumps can deliver heavy water to the primary coolant purification system and from there either to the storage tank FA-101 or into the primary system. The pumps can also deliver heavy water to the operations level where it may be directed to the storage tank FA-102, to the throat of the helium eductor EG-101, or to the experimental facilities cooling system.
Table 7.6-2 Characteristics of the D2o Transfer Pumps GA-104A and B
Manufacturer
Type
Number of Stages
Capacity (Design)
Differential Pressure (Design)
Differential Head (Design)
Discharge Pressure
Normal Suction Pressure
Max. Suction Pressure
Motor Power
Shaft Seal
Drive
Materials
7.7 LOWER PIT GAS SYSTEM
GA-104A
Chem pump
Centrifugal canned rotor
TWO
10 gpm
269 psi
565 ft
270 psig
1 psig
270 psig
20 KW (27 hp)
canned rotor
Direct Coupled
Stainless steel, type-316
GA-104B
Sier-Bath
External gear
One
10 gpm
269 psi
565 ft
270 psig
1 psig
270 psig
10 hp
Mechanical seal (TWo John Crane type DBL-T-9BT and two John Crane type A-9T-1875-119 (T98) with type J-SC-895 closure)
V-belt
Stainless steel, type-316
The atmosphere in the reactor pit up to the pit seal floor at elevation 130 ft-8 in. is carbon dioxide gas at a pressure 3/8 to 1/2 in. water gauge below atmospheric. The co2-filled space includes the inner portions of the beam tubes, the shutter cases, the 1 in. space between the thermal and biological shields, and the various pipe tunnels to elevation 107 ft-3 in., as well as the intermediate pit region above the upper thermal shield. The total gas volume
I

7 21
is about 1200 ft 3 , with 133 ft 3 of this being in the high neutron flux region around the reactor vessel. The various pipe tunnels and the beam tube plugs are arranged to prevent co2 from escaping from the pit. Figure 10.l shows an elevation of the shield in this area.
The co2 atmosphere is provided in the high radiation field areas to exclude air. The obnoxious components of the air are argon-40, nitrogen, and water vapor. The A-40 is activated under thermal neutron irradiation, giving the beta and gamma emitter A-41, of 109 minute half-life. The nitrogen and water vapor could form traces of nitric acid in the radiation field. The nitrogen is also a source of C-14 from the n-p reaction in N-14.
3 The co2 is supplied from a 12 cylinder manifold (capacity 2640 standard ft ) locatea near the truck entrance on the equipment level. Pressure regulators, a flowmeter, and shutoff valves are located at the manifold. A 1-1/2 in. pipe connects the manifold to the bottom of the thermal shield. The low point in this line is connected to a drain and vent manifold by a 1-1/2 in. stainless steel line. These connections are shown in Figure 3.25. A pressure tap, sample line, and block valve are located in the vent and drain line upstream of the manifold. Should any water leakage occur in the reactor cavity, it will drain from the bottom of the thermal shield through this drain line. A leak detector sensing point will detect the presence of water at this drain.
A slow purge of co2 from the reactor cavity is accomplished by connecting the area above the thermal shield to the exhaust venturi through a 1-1/2 in. vent line. A sample station for monitoring the cavity atmosphere is located in the exhaust line. The environmental effects of the cavity purge are discussed in Section 11.1.4.
During normal reactor operation a 0.2 to 0.4 cfm flow of C02 is introduced into the reactor cavity. 3since the gas has a low dew point (-50°F; water content <l x 10-5 lbs a2o/ft co2 ) any rise in water content of the routine gas samples will be indicative of air or water leakage into the cavity. If the small, once-through sweep proves inadequate, a drier and gas recirculation equipment can be added.
During beam tube insertion and removal, building air (70°F., 50"fe RH) from the experimental level will leak into the cavity. As soon as the cavity is resealed, co2 is introduced slowly into the cavity to displace the moist air and restore the normal atmosphere.
7.8 FUEL HANDLING
7.8.l SUMMARY DESCRIPTION. Fuel handling for the HFBR involves not only the movement of fuel in and out of the reactor, but the procurement and dry storage of new fuel as well as the wet storage and shipment of irradiated fuel.
The fuel, as purchased from the manufacturer, arrives at the reactor site in critically-safe containers. Inspection of the new elements includes a dimensional check in a functional fit device and a hydraulic flow test. Following these tests, the fuel will be stored in a vault until such time as it is needed for reactor use. Fuel elements will be moved from the vault to the reactor just prior to charging in the reactor.
Fuel will be discharged from the reactor following a 12 to 24 hour cooling period after a shutdown. The water level in the vessel is raised and the cover gas purged to remove tritium-bearing vapor. The reactor vessel is opened, the· discharge chute uncovered, and the tritium containment structure set in place.

7 22
An exhaust line connects this structure to the building off-gas system, removing airborne contamination and cooling fuel elements as they are moved from the vessel to the discharge chute. A pickup tool is suspended from an indexing mechanism located above the fuel handling shutters. These lead-filled shutters provide a closure for the 22-5/8 in. diameter fuel handling opening through the biological shield top plug. The pickup tool is positioned over and engages the element. This operation is observed through a periscope from outside the pit. The element is lifted out of the reactor, moved to the discharge chute by a pneumatically operated slide in the tritium containment structure, and is dropped to the canal below. Figure 7.7 and 7.8 show this equipment.
In the canal the element is placed in a temporary storage rack. Subsequently the elements are moved one at a time to a cut-off saw where the inlet tube and the lower supporting section are removed. The shortened fuel boxes are then placed in storage racks for the cooling period prior to shipping. After about 270 days the elements are loaded in a cask for shipment to the reprocessing plant.
7.8.2 NEW FUEL STORAGE. A storage area for new fuel has been provided on the operations level. This vault is an enclosed area of ab9ut 324 square feet with the walls made of reinforced concrete, cement blocks, and the steel dome of the building. The ceiling is formed from number 8 gauge wire mesh supported on a channel steel framework. A pair of steel panel doors allow access to the room. The size of the vault is based on the need to store a two year supply of fuel, or about 500 fuel elements in a critically-safe array. The storage rack array is designed so that criticality can not occur even if the vault were flooded with water (7.8).
To conserve space, 168 fuel elements are hung vertically in 3 rows, each two elements wide and two elements high. A steel framework made of 10 in. channels, and 8 in. I-beams support an arrangement of 21 sheet metal boxes in each row. The boxes have 14 cells each and are constructed with 2 removable cover plates (each of which cover 7 cells) • Located above these boxes is a row of steel pins from which the fuel elements are supported. The elements are hung in the inverted position from the lower column section, with the active fuel section located in the steel boxes. The cover plates are bolted into place to retain the elements. Each row of elements in this arrangement is about 12 ft high, 14 ft long, and 11 in. thick, and is separated from the next row by a distance of 4 ft.
7.8.3 FUEL DISCHARGE - SPECIAL EQUIPMENT
7.8.3.1 Indexing Mechanism. This equipment provides the means for accurately locating a lifting tool (pickup head) over any fuel element in the core, grappling the element, and raising it to the discharge position above the reactor vessel. To accomplish these functions, two electrically powered carriage units provide rectilinear horizontal motion, and a take-up reel, mounted on the upper carriage, provides vertical motion for the lifting head.
A fixed frame unit is made from 2-1/2 in. steel angles to form a rectangular base 52 in. by 63 in. The frame is mounted above the shutters on the pile top. Two gear racks, accurately located and parallel to within .030 in., are fixed to the frame. The spur gears of the longitudinal carriage ride these gear racks and are powered through a common shaft. The longitudinal carriage is a rectangular weldment of 2 in. steel angles, 19-3/4 in. by 48 in., and has a gear rack and an inverted v-rail mounted on it to carry the upper carriage.
The upper carriage is a 16 in. by 20 in. weldment made of 2 in. steel
I

7 23
angles carrying a turntable which is mounted on thrust bearings. The turntable is rotated by means of a worm wheel and mating worm drive shaft. The turntable supports the take-up reel with its drive motor. The driving power for the upper carriage is transmitted through the spur gear wheels while the V-grooved wheels serve to guide the carriage. The axles on each of the carriages are mounted in pillow block bearings and are powered by Bodine motors with gear reducers.
The drive motors are controlled from a panel located near the fuel handling periscope. Limit switches prevent override of travel. The lifting head can be accurately maneuvered from the control panel with its movements viewed by the Operator.
7.8.3.2 Fuel Handling Shutters. The fuel handling system requires that the shielding cover on the 22-5/8 in. top plug opening be easily removed and replaced. To fill this requirement, two moveable lead-filled shutters are mounted on the pile top. Each of the shutters is a steel weldment filled with lead, weighing about 6500 lbs, with an effective shield thickness of 12 in. of lead. In the closed position, the two shutters together are 48 in. wide and 56-7/8 in. long. The shutters are mounted on a heavy steel base plate which is bolted to the top plug structure.
The 2 in. thick steel base plate has a 22-5/8 in. diameter hole to match the fuel handling access opening in the reactor shield. The base plate is circular, 84 in. in diameter, and has two parallel steel bars (rail beds) on which are mounted inverted V-tracks that support the shutters. Four of the bolts that hold the central shield plug are extended to hold down the base plate.
The rail beds and center block are bolted in a fixed position on the base plate. The shutters, mounted on V-grooved wheels, move along these rails and in the open position expose the fuel handling access port. Both mating shutter faces have grooved cableways with rollers that permit the passage of the air hose and cable which supports the pickup tool. The mating faces of the shutters are machined to permit them to close together with no more than a 1/16 in. wide gap. The minimal opening, together with the 90° bend, reduce to an acceptable level the radiation streaming from a fuel element suspended above the reactor vessel during the discharging operation.
A containment shell, made of 1/2 in. steel plates bolted together and to the rail beds, surrounds the shutters. Welded to the top inside edges of this structure are retainer bars with a cross section of 3/4 in. x 2 in. Four 8 in. I-beams are bolted to these retainers to support the indexing mechanism above and to strengthen the hold-down structure.
The shutters are individually driven by 3/4 hp electric motors through chain and sprocket drives to lead screws and drive nuts. These motors are mounted on the outer faces of the end containment plates. They are reversible units with brakes attached to reduce override. Limit switches are located at each end-travel position. The motors are controlled from the control panel at the fuel handling periscope. In the event of a power failure, the shutters can be moved by removing the drive chain and turning the lead screw by a hand crank.
7.8.3.3 Tritium Containment Structure. The tritium containment structure serves to contain gaseous radioactive material from the fuel handling process and to support several pieces of equipment. The tritium containment structure confines to a relatively small area the contaimination caused by the lifting tools withdrawn from the reactor during the discharge of spent fuel. The airborne contamination is removed by an exhaust system to the building filters
7 24
with final discharge to the stack. Environmental effects of the discharge are discussed in Section 11.1.
The tritium containment structure is made of aluminum sheet metal formed over a framework of structural members attached to a base plate. Wheels provided for moving the structure are retractable. The upper portion of the containment shell telescopes to allow a seal to be made between the ceiling of the room and the containment structure when it is in position over the vessel top and discharge chute. A door in the wall of the containment structure is provided for access to the equipment within. The air hose and support cable from the indexing mechanism above extend through this structure to the pickup tool. A 300 watt lamp in a moisture-proof fixture illuminates the internal area of the structure.
A supporting mechanism for the cooling air bonnet is mounted in the upper portion of the tritium containment structure. A moveable bracket is mounted on stationary polished steel rods with linear ball bushings for low friction. The bracket carries spring-loaded reels from which the air bonnet is suspended by steel cables.
The air bonnet is coupled to the off-gas manifold by a flexible hose. It is shaped to receive the lifting tool, with a fuel element attached, as the tool and element are raised out of the vessel. With the tool and element drawn up into the air bonnet, 200 cfm of air are pulled through the element to cool it. The air hose and support cable of the lifting tool pass through the air bonnet, and through the center of the support bracket above. When the indexing mechanism on the pile top moves laterally, the air hose and cable of the lifting head act on the bonnet support mechanism, causing it to slide along with the hose.
A slide is located below the bonnet support frame, at the vessel end of the tritium containment structure. The slide is hinged at the upper end, and is actuated by an air piston. The slide normally hangs in a vertical position, well clear of the vessel top opening. When moved by the piston, the slide forms a funnel over the discharge chute with the walls of the containment structure.
The lifting head is supported by an air hose with a steel cable imbedded in it. The head has spring-loaded ears which engage the holes in the top of the fuel element. Air pressure is applied to an air cylinder in the head to retract the ears, either for engaging a fuel element or for releasing it.
7.B.3.4 Periscopes. The fuel handling system is arranged so that all movements of the fuel in and out of the reactor can be observed by the Operator controlling the equipment. To make this possible two periscopes are provided, the tritium containment periscope and the vessel periscope.
The tritium containment periscope is provided to penetrate the 4 ft of biological shielding and extend a scanning head into the tritium containment structure which encloses the vessel top and the discharge chute. This area is well lighted by a 300 watt lamp. With this periscope the movement of fuel elements from the vessel to the discharge chute can be observed by the Operator.
Because of the high radiation level which exists when an element is in the tritium containment structure, a design using an off-set of 3 ft in the periscope was chosen. This moves the observer away from a direct line-of-sight beam of radiation. In addition to this precaution, lead shielding is placed around the off-set section of the periscope on the pile top.
I

7 25
The tritium containment periscope is 3 in. in diameter and 11 ft in length. For convenience in handling and storage, the scope is made in two sections joined together by a coupling in the central region of the 3 ft horizontal section. The periscope has interchangeable eyepieces which give the observer a choice of l or 2-1/2 power. The scanning head is a fixed prism with a 30° field of view which can be rotated through 95° and is controlled by rotation of a knurled knob at the eyepiece.
The periscope has sealed windows at the ends of each section and an "O" ring seal at the coupling joint. With these provisions the periscope can be pressurized with nitrogen or dry air to prevent internal contamination or accumulation of moisture.
The vessel periscope allows the Operator to view the fuel elements in the core of the vessel and direct the movements of the lifting tool as it is used to grapple an element. This periscope is made up in ten sections having an assembled length of 27 ft-7 in. The upper sections (including the eyepiece and 3 ft offset) are similar to those of the tritium containment scope described above. The lower sections, which penetrate the vessel, are movable over a distance of 2 ft and are connected to the vertical section at a 37° elbow. An adjustable length section joins the upper portion to this elbow. Lighting in the vessel is provided by submersible, radiation-resistant lamps.
7.8.4 FUEL DISCHARGE - PROCEDURES
7.8.4.l Sequence of Equipment Installation. Following a reactor shutdown a 12-24 hour cooling period will elapse before discharging any fuel. This time will be utilized for the installation of the special equipment needed during the fuel handling operation. The sequence of steps in installing the fuel handling apparatus is given below. The control rods are all fully inserted and one shutdown pump is operating throughout the shutdown. The reactor control console is locked down. During the fuel handling period an Operator is on duty at the console, and the neutron instrumentation is in operation.
l. The manhole in the top biological shield is opened. The electrical control panel is connected to the various components and the fuel handling shutters opened.
2. The two openings are monitored by Health Physics personnel for airborne contamination and radiation levels. Following this inspection similar checks are made in the reactor pit area. The off-gas line in the pit, used during the fuel handling operation, can be utilized to sweep the area of any air-borne contamination.
3. When the surveys are completed and conditions are found to be satisfactory, operations personnel will enter the pit area, dressed in appropriate clothing, and remove the top from the reactor. Special underwater lights will be lowered into the reactor and the vessel temporarily covered to minimize evaporation.
4. One of the periscope nozzles will be opened and the underwater portions of the fuel handling vessel periscope will be installed. The upper parts of this periscope are set in location by Operators outside the biological shield. After joining these two parts the cable drive is attached to the movable section in the vessel.
5. With the vessel periscope in place the reactor is once more opened, the discharge chute cover removed and the tritium containment structure moved

7 26
into position and bolted down. The off-gas line is connected to the containment structure and to the cooling air bonnet. Power is also connected to the lamp inside the structure.
6. The air hose is lowered into the containment structure and the pickup tool attached. The upper section of the containment structure is sealed against the ceiling of the room and secured. The tritium containment periscope is lowered into place and all equipment is checked for proper operation.
7. All personnel withdraw from the pit area and the manhole is closed.
7.8.4.2 Discharqe Procedure. During the discharge operation, personnel will be assigned as follows: two men will be at the canal to check the fuel elements and move them immediately to the stainless steel rack for the storage of uncut elements. One man will be located at the fuel handling vessel periscope and will operate the panel controlling the pickup tool, shutters and discharge slide. A fourth man will use the tritium containment periscope and assist as necessary throughout the operation. The discharge sequence is as follows.
1. A final check of equipment is made.
2. The pickup tool is lowered into the vessel and the first element to be discharged is grappled and raised to a height just clear of the core. At this elevation the air hose is positioned to allow the fuel handling shutters to close about it. After the shutters are closed, the element is raised to a point just below the surface of the heavy water.
3. At this height the progress of the element is seen through the tritium containment periscope. The element is raised clear of the vessel, engaging the cooling air bonnet as it rises to the full-up position in the tritium containment structure. The slide is actuated, moving the element sideways to line up with the discharge chute.
4. The element is released from the pick-up tool and slides down the discharge chute to the canal. The element enters the water and comes to a stop in the retard section of the chute. Operators at the canal move the element to the storage rack by hand grappling tools.
5. The Operator at the control panel maintains communication with the Operators in the canal area and verifies the disposition of each element before removing the next element from the reactor.
This procedure will be repeated until the 14 burned-up elements to be removed at each normal shutdown have been discharged to the canal.
7.8.4.3 Fuel Rotation. The discharging of fuel from the reactor core and the rotation or movement of elements within the core follows a predetermined pattern. In general, the 14 core-edge elements are discharged from the reactor in the manner just described. With these elements removed from the core the fourteen remaining central elements are shifted to new positions.
Before moving the 14 central elements the following preparations must be made. The manhole is opened and the pit area monitored by Health Physics personnel to check radiation and contamination levels. Operations personnel then remove the tritium containment periscope. The two men assigned to the pit area move the tritium containment structure aside and secure the cover over the discharge chute. A long handled grapple is lowered through the open fuel access
•

7 27
port into the reactor vessel.
Fuel elements are moved individually from central core positions to the peripheral positions with the grappling tool. As each element is relocated a record is made of the movement and the orientation of the element in the core is checked visually.
During the rotation of fuel the grappling tool is not removed from the vessel. The Operator handling the tool stands at the top opening of the vessel, looking at the illuminated core through the water. If it is necessary to use a viewing box to give undistorted vision through the surface of the water, the box will be tethered and will have a colored portion to make the box visible under water.
7.8.4.4 Charging New Fuel. The fuel elements to be charged into the reactor are removed from the storage vault and are moved to the top of the reactor. The tritium containment structure is placed over the reactor vessel with the access door open. Fuel elements are passed one at a time from the top of the shield to an Operator in the pit. Each element in turn is attached to the lifting head and is lowered to the core where it is charged into the proper position. This procedure is monitored by the Supervisor who is able to watch the charging operation through the vessel periscope and maintain a record of the loading. At normal shutdowns 14 new elements are loaded.
Upon completing the loading, the tritium containment structure is moved to the side of the pit. A count is made of all tools and equi_pment used throughout the fuel handling process. The top of the vessel may be temporarily set in place while the vessel periscope is removed and the nozzle cover bolted in place. A final inspection is made of the vessel and the underwater lights removed. The reactor cover is then secured for the next operating cycle.
7.8.5 SPENT FUEL STORAGE
7.8.5.1 Description of Canal. The canal is located on the equipment level to the east of the shielded cells. The building drawings, Figures 3.1, 3.2, and 3.3 show the canal.
The canal is 8 ft wide, 43 ft long, and 20 ft deep. There is a side branch which is 8 ft wide, 10 ft long, and 20 ft deep on the north side. The depth of the canal is increased to 30 ft at the west end, for a length of 8 ft-6 in. The discharge chute from the reactor pit enters the canal at the west end, with the lower end of the chute under water. The canal is of reinforced concrete construction, integral with the foundation mat of the building. Walls and floors are 3 ft thick. On the inside of the canal, the floors are finished with white hard-trowelled cement mortar. The walls are covered with 3/8 in. thick, 6 in. x 9 in. white, glazed, vitrified tile set in cement mortar on a gunite cement surface layer. Tile joints are filled with white Portland cement, waterproofed with 10% hydrated lime. The top edges of the canal are fitted with a 6 in. x 6 in. stainless steel angle for protection.
When filled, the canal will hold some 68,000 gallons of water. The deep pool is normally covered by an aluminum framework which supports a mat of aluminum subway grating, making the working depth throughout the canal 20 ft.
7.8.5.2 Canal Cleanup svstem. A water cleanup system circulates the canal water through the filter bed FD-201, the heat exchanger EA-202, and the purification unit BG-201 (see Figure 5.1). This system keeps the water clear for good visibility and removes the fission product afterheat from the spent

7 28
fuel elements. The circulating flow is driven by the canal pump, GA-202, at a maximum rate of 200 gpm. The full flow passes through the ejector, EE-101, and the filter unit. The ejector unit takes suction on a floating skinuner which collects debris from the surface of the water. About 25 gpm is passed through the purification unit BG-201. Pump suction lines and the return lines to the canal are located along the length of the canal to insure adequate turnover of the water in all areas.
Makeup water to the canal is drawn from the purification unit BG-201. A liquid level instrument, LA-307, with high and low level alarms in the control room monitors the water level. Floor drains in the canal area and drains from the clean-up system process equipment are all routed to the D waste system.
The canal cooler, EA-202, is identical to the biological shield cooler and pertinent data on the unit is given in Table 7.10-2 in Section 7.10. The canal water is carried in the tube side of EA-202. The shell-side fluid is domestic cold water from the break tank, H-305, ~t an inlet temperature of 55°F. The shell-side flow rate is 50 gpm, and the heat removed with the canal fully loaded with spent elements is 510,000 Btu/hr. The canal water temperature is 90°F.
7.8.5.3 Discharge Chute. Spent fuel enters the canal at the west end through the discharge chute, which is a stainless steel pipe 12 in. in diameter and 54 ft long. It extends from the top of the reactor vessel (floor of the fuel handling room) through the heavy concrete of the biological shield to the canal. The top flange of the discharge chute is located at an elevation of 137 ft-6 in., close to the reactor vessel. The lower end is located under 9-1/2 ft of water at elevation 83 ft-0 in., as shown in Figure 7.9.
7.8.5.4 Retard Chute. The retard chute is a 15 ft length of stainless steel pipe, 12 in. in diameter, bent to an 8 ft radius. At the upper end a conical section 6 in. long overlaps the discharge chute to give a smooth entrance. The lower portion has been machined to remove a half-diameter for a length of 7 ft to permit removal of an element. In addition, two slots 2 in. wide x 15 in. long allow an operator to probe with a handling tool inside the curved portion of the chute. The retard chute is shown in Figure 7.9.
The retard chute has a supporting bracket which attaches to a hanger located on the stainless steel lip above the deep pool. The lower end of the chute is supported 4 ft above the canal floor by a framework welded to the chute. The pads under this frame are adjustable for leveling.
The retard chute slows the elements dropped through the discharge chute to a stop at the unloading station end. The design of the retard chute insures control of the dropped elements, with easy access by grappling tools for further handling in the canal.
7.8.5.5 Temporary Storage Rack. As fuel is discharged from the reactor to the canal the elements are placed in a storage rack specifically designed to hold full length fuel elements. The storage rack is a stainless steel eggcrate weldment formed of 1 in. thick plates. The rack has 30 cells, each 3-7/8 in x 3-7/8 in. in cross section and 24-1/2 in. high. The rack is supported 24 in. above the canal floor by legs which rise vertically from the supporting base, as can be seen in Figure 7.10. An expanded metal guard is placed over the rack preventing the movement of fuel elements within a 12 in. buffer zone surrounding the rack.
A critical approach was run to experimentally verify that the rack will
I
I

7 29
hold 30 elements without danger of criticality. The approach was carried out in light water to a full loading of 30 fresh fuel elements by the Critical Experiment Group, and showed a multiplication of less than 2 even at this maximum loading.
7.8.5.6 Long Term Storage. The storage of full-length fuel elements for an extended period of time is economically impractical because of the size and cost of all equipment. The inactive portions of the element are therefore removed from the fuel box section by sawing off the inlet tube and the lower column sections. This work is done under water. The fuel box sections are placed in fuel baskets made of .125 in. thick 1% boron stainless steel. The fuel baskets are of two sizes, one holding 4 cut elements and the other 6 elements, as shown in Figure 7.11. The cell array in the baskets is 2 x 2 for the 4 element basket and 2 x 3 for the 6 element basket. Once a fuel basket is loaded with cut elements, those elements remain in the basket through the storage period in the canal. The loaded baskets are eventually placed directly in the shipping casks, so that the cut elements are not removed from the baskets until they reach the processing plant. Each basket will be tested by the Critical Experiment Group for boron content, and will be suitably marked.
The fuel baskets are stacked in rows in the long term storage racks, which have a capacity of 224 cut elements. There is room in the canal for racks with storage room for 276 additional cut elements. The racks are designed to hold the cut elements (in the baskets) in four rows, each two elements wide. The areas between rows, and a buffer zone along the canal walls, have a covering of expanded metal panels which prevent the movement of fuel in these areas. Each rack will hold 56 cut elements in a total of 12 baskets, as shown in Figure 7.11. Evaluation of the criticality problem shows that this arrangement is safe (7.9). The arrangement of equipment and racks in the canal is shown in Figure 7.12.
The storage rack is made of aluminum angles and stands 3 ft-6 in. high with the fuel baskets supported 2 ft above the canal floor. The rack is 28-3/4 in. wide, which allows room for the placement of 3 fuel baskets in each row. The over-all length of the rack is 7 ft-9-1/2 in., which spaces the four rows of elements 14 in. apart with an 11 in. space along the canal wall.
7.8.5.7 Shipping cask Loading. An area at the east end of the canal is reserved for the loading of cut elements in baskets into the shipping casks. A shock mat protects the canal floor in this area. The shipping casks are lowered into the canal in this area, one at a time. The casks are open for this operation.
The fuel baskets (two 4 element baskets and one 6 element basket) are put in the cask and the cask cover set in place. The cask is then lifted from the canal, washed, and removed from the building.
The transportation of spent fuel elements to the reprocessing plant will be consistent with health and safety (nuclear and conventional) requirements of the pertinent AEC Manual Chapters and ICC regulations. The shipping casks will be approved and a Bureau of Explosives permit will be issued for each shipment.
7.8.5.8 Overhead Cranes, Monorails, and the Canal Bridge. The canal area is serviced by two overhead travelling cranes. A two ton electric travelling bridge crane spans a width of 16 ft and runs 64 ft along the canal. The runway conductors are the insulated type, protected to prevent electrical injury when using long metallic handling tools over the canal. This crane is a general purpose unit servicing the entire canal area.

7 30
In addition to the bridge crane, a 20 ton monorail hoist with motor-driven trolley services the canal along a centerline path. This crane not only traverses the full length of the canal but makes a 180° turn on an 11 ft radius so that it follows a path parallel to the canal. The monorail has a lift of 36 ft with a hoist speed of 10 to 12 ft/min. The runway conductors, like those of the bridge crane, are of the insulated bar type.
Movement of moderate loads such as baskets of fuel will be handled by the 2 ton unit. Shipping casks, which weigh approximately 15 tons, will be moved with the 20 ton monorail equipment. The monorail is located to permit a truck, entering the building through the lock, to park directly under it. This feature will reduce the handling time and costs of spent fuel shipping.
Work in the canal is made easier through the use of a rolling bridge which spans the 8 ft width of the canal. It is electrically driven and travels the length of the canal on stainless steel angles. This bridge serves as a working platform, making it possible to work directly over any area of the canal. Underwater lights are suspended from the bridge so that direct illumination is available for all areas. Bridge movement is controlled by the Operator standing on the bridge.
7.9 THERMAL SHIELD COOLING SYSTEM
7.9.1 DESCRIPTION. The thermal shield cooling system consists of circulating pumps, valves, heat exchangers and an expansion tank connected to the cooling circuits in the thermal shield to remove the heat generated by radiation absorption. There are three parallel circuits, each having its own flow measurement. Flow to two of the circuits is adjusted by hand valves. These are the circuit to the coils imbedded in the lower thermal shield lead layer and the circuit to the upper thermal shield. Circulation to the lower thermal shield main ci~cuit may be adjusted by the circulating pump discharge valves. Figure 7.13 shows the cooling system flow diagram. The coolant is light water.
The total water inventory in the thermal shield cooling system is 1350 gallons. The detailed inventory amounts are given in Table 7.9-1.
Table 7.9-1 Water Inventory in the Thermal Shield Cooling System
Lower thermal shield
Upper thermal shield
GA-201A and B
FA-201 (operating level)
EA-201
Piping, including lower shield cooling coil assemblies
TOTAL
350 gal
100
20
32
303
--2..1.2. 1350
7.9.2 WATER QUALITY. The thermal shield cooling system fluid is demineralized light water. It is processed through the clean-up system BG-201 before entering the thermal shield system. The quality of the water is measured
I

7 31
at the conductivity meter CR-6 at a point where the three parallel circuits have joined.
A small side stream is passed through tern to maintain the quality of the water. the pressure difference across the thermal purification system consists of filters, a remove oxygen.
the thermal shield purification sysThe purification stream is driven by shield pumps, GA-102A and B. The mixed bed deionizer, and a bed to
7.9.3 COOLANT EXPANSION AND PRESSURE LIMITS. Temperature changes of the system will cause corresponding changes in volume. An expansion tank, FA-201, of 78 gallon capacity has been provided to accommodate these changes in volume. A pressure-vacuum relief valve, SV-201, protects the expansion tank from system pressure surges. The valve SV-201 has a low pressure set point of .125 psi vacuum and a high pressure set point of 2 psig.
7.9.4 WATER FLOW RATE REQUIREMENTS. The system is designed to operate on full flow from one of the two pumps, GA-201A and B, with the other standing by as a spare. The required total flow rate is 830 gprn, with 700 gprn to the lower thermal shield, 100 gprn to the upper thermal shield, and 30 gprn to the cooling coils in the lower shield. However, the exact flow required in each circuit will depend on several things: the total pressure drop of the system against which the pump operates, the power level of the reactor, the radiation flux within the thermal shield, and the resultant temperature of the various surfaces of the thermal shield as surveyed by a number of thermocouples installed on these surfaces. The possibility exists that the desired temperature distribution within the thermal shield may not develop with one pump operation. In this event both pumps will have to be used. Maximum flow rates in the three parallel circuits will be established prior to operation of the reactor. Once the reactor has operated at a significant power level for a period of time sufficient to evolve the temperature pattern, flows will be adjusted in each circuit to keep these temperatures within design limits.
7.9.5 CORROSION. Although this system is largely constructed of carbon steel, it is expected that corrosion will be a minor problem because the water used will be kept at high purity and oxygen will be removed. Corrosion products will be removed from the system in the purification system.
7.9.6 MECHANICAL EQUIPMENT
7.9.6.l Thermal Shield Circulating Pumps. The two pumps, GA-201A and B, used in the thermal shield cooling system are of the vertical, one stage, centrifugal type designed for in-line installation. Table 7.9-2 summarizes information on these pumps.
Power for the thermal shield pump motors is derived from a 440 volt, 3 phase breaker in motor control center MCC-1. A disconnect switch with a green pilot light to signify that the power is off is mounted adjacent to each motor. Normally one of the pumps is running. The selection of the running pump and the standby pump is made on two 3-position selector switches mounted on the reactor control console. The selector switches have three positions, "handoff-auto". When one of the selector switches is set on "hand" and the other on "auto", the pump on "hand" position will run continuously and the one on "auto" will start up automatically in the event the running pump fails. It is possible to run both pumps by placing both selector switches in "hand" position.
7.9.6.2 Thermal Shield Cooler. The thermal shield cooler, EA-201, is a "U" tube type mounted horizontally. Although this heat exchanger is of high

7 32
Table 7.9-2 Characteristics of the Thermal Shield Cooling System Pumps GA-201A and B
vendor Pacific Pumps, Inc.
Flow Data design test
Impeller
RPM
Motor
NPSH at rated flow
Materials of Construction
Code
Seals
800 gpm at 47 ft 800 gpm at 51 ft
11-3/4 in. diameter, enclosed type
1185
Louis Allis, 15 hp, 3 phase, 440 volts
4 ft
Case of nodular iron, impeller of cast iron, shaft of AISI 414 chromemoly steel, wear parts of AISI 416 stainless steel
API, Standard 610
One per pump, similar to seal used in the primary pumps and described in Section 5.3.2
quality it does not have the same leak tightness requirement as do the heavy water coolers in the primary, shutdown, and experimental facilities cooling systems. The channel and tube bundle were pressured to 150 psi with fluorescent dye added to the test water and no leaks were detected. The shell side was then pressured to 150 psi with fluorescent dye added to the test water and again no leaks were detected. After the cooler was completely assembled, both sides were pressured to 150 psi. This test was held for one hour with no leaks detected.
As noted in Section 7.9.4, it may be necessary to operate both pumps to develop the design temperature distribution in the thermal shield. The flow rate in this case may be above the cooler design level. To provide for this situation, a bypass around the cooler has been installed. The bypass performs another service: with the reactor shut down and low temperature water arriving from the cooling tower, it allows control of the cooler outlet water temperature. (The same thing can be accomplished, of course, by throttling the cooling tower supply valve.) Table 7.9-3 summarizes data on the cooler.
7.9.6.3 Valves and Piping. All va1ves and piping used in the thermal shield cooling systems are designed to comply with the ASA Code for Pressure Piping, B31.3. The piping and valves were tested hydrostatically after installation for a period of time long enough to detect any existing leaks.
7.9.6.4 Expansion Tank. The thermal shield expansion tank, constructed of carbon steel, ASTM A-285, Grade c, Flange Quality. lindrical tank 20 in. outside diameter and 61 in. in length, with pacity of 78 gallons. The bottom outlet is to the thermal shield
FA-201, is It is a cy
a total caand the top
I

7 33
Table 7.9-3 Data on Thermal Shield Cooler EA-201
Vendor Southwestern Engineering Co.
Shell side fluid demineralized H2o Tube side fluid cooling tower water
Rated flow, normal service Shell side Tube side
Design temperature
Operating temperature Shell side in
out Tube side in
out
Design pressure Shell side Tube side
Operating pressure Shell side Tube side
Heat transfer rate Clean Service
MTD (corrected)
surf ace
Rated Heat exchanged
Pressure drop at rated flow Shell side Tube side
Pressure drop at 120% of rated flow
Shell side Tube side
Materials of construction Tubes (780, 3/4"xl4 B.W.G.) Shell Tube sheet Channel Channel cover Closure design
Code requirements
700 gpm, 2D°fo overdesign 400 gpm, 2D°fo overdesign
150°F
125°F 112°F
85°F 108°F
75 psig 75 psig
5 psig 45 psig
2 400 Btu/hr-ft2-°F 180 Btu/hr-ft -°F
17.3°F
1600 ft2
5,000,000 Btu/hr
4 psi 5 psi
5 psi 7 psi
Steel Steel Steel Steel Steel All closures are gasketed joints except tube to tube sheet joints are rolled
ASME, Section VIII, 1959 TEMA Class C
outlet is to the safety valve SV-201 which vents to the off-gas system. A sight glass for level indication is installed at the central section of the tank. The tank was fabricated by the Richmond Engineering Co., Inc., and was

7 34
hydrostatically tested at 220 psig with no leakage.
7.9.7 INSTRUMENTATION
7.9.7.l Flow Meters. There are three flow meters in the thermal shield cooling system. One, FRa-201, monitors the coolant flow in the inner and outer annulus of the lower thermal shield. The second, FI-207, monitors flow in the coolant coils imbedded in the lead layer of the lower thermal shield. The third, FI-202, monitors flow to the upper thermal shield. FRa-201 is a flow recorder installed in instrument panel #4 in the control room, and FI-207 and FI-202 are flow indicators installed in panel #4 in the control room (see Section 9.4).
7.9.7.2 Water Temperature Meters. The meter TR-5 measures the temperature of the thermal shield cooler outlet water and is recorded as Point #5 on TR-1-12 in instrument panel #2 in the control room. The instrument TRa-6 measures the outlet temperature of the composite water from all three parallel cooling circuits and is recorded as Point #6 on TR-1-12 in the control room. Point #6 has a switch which is set to actuate an alarm tab on the annunciator panel to indicate high temperature. The set point for the alarm will be determined during the start-up experiments from observation of the temperature distribution in the shield. An initial value of 131°F will be used for the startup experiments.
7.9.8 EFFECT OF LOSS OF COOLANT FLOW ON REACTOR SAFETY AND ON THE THERMAL SHIELD. Loss of coolant flow in the thermal shield does not constitute a hazard to the reactor. The thermal shield must have coolant flow when the reactor is running, so that the loss of coolant flow initiates a setback of the reactor. A two out of three setback logic is formed from the two pump breakers and FRa-201. Each of these is annunciated in the control room. For the normal one pump operation the logic becomes one out of two. If the loss of flow is caused by a failure of the running pump, the second pump will start. As soon as proper flow has been re-established the setback condition will be terminated and the operator can take steps to bring the reactor back to power.
In the event of the loss of both thermal shield pumps the reactor will continue in setback condition until all control rods are fully inserted. More likely the operator will recognize the trouble as being unsolvable in the relatively short time before setback has reduced the power level to zero and he will scram the reactor. The effect of the loss of coolant flow with the resulting setback of the reactor has been studied and the maximum temperature differential between adjacent plates in the thermal shield found to be within the design limits (see Section 10.2.4).
7.10 BIOLOGICAL SHIELD COOLING SYSTEM
7.10.1 DESCRIPTION. The biological shield cooling system provides the means of removing heat generated in the beam port shutters, the beam port plugs, and the biological shield. The system is divided into three parallel loops. Demineralized light water is circulated by one of two pumps, GA-203A and B, and heat is removed by a single cooler, EA-203. The heat removed from the biological shield coolant is dissipated to the atmosphere via the cooling tower system. Figure 7.14 shows the piping and instrument diagram for the biological shield cooling system. The biological shield system piping and process components are constructed of stainless steel.
The three parallel circuits supply coolant to the beam port shutters, the beam plugs, and the biological shield cooling coils. Details of these
I
7 35
components are given in Section 8,2.3 for the shutters and plugs and in Section 10.3 for the shield cooling coils. The three loops have separate flow meters and control valves for flow regulation.
The biological shield cooling system is connected to the setback mode of the reactor safety system through a two out of three logic from the two pumps and the shutter loop flowmeter, Fia-203. With only one pump normally in operation, the setback logic becomes one out of two. Other flowmeters and temperature indicators give alarms on the control room annunciator panel for off-normal process conditions.
The total volume of the system is 340 gallons. The normal flow rate for one pump operation is 205 gpm, with 100 gpm to the shutters, 75 gpm to the beam plugs, and 30 gpm to the concrete cooling coils. Make-up water to the system is supplied by the light water purification unit, BG-201. A small side stream, driven by the pressure drop across the circulating pumps, is passed through the biological shield purification system to maintain the water quality. The purification system consists of filters and a mixed bed deionizer.
Volume changes in the coolant due to temperature expansion are accommodated in the surge tank, FA-203, mounted on the operations level. The tank has a total capacity of 28 gallons.
7.10.2 Circulating Pumps GA-203A and B •. The biological shield system pumps GA-203A and GA-203B are normally operated with one pump running and one on standby. Electrical power is supplied to the pump motors from a 440 volt, 3 phase breaker in motor control center MCC-1. A disconnect switch is mounted at each motor, with a green pilot light to signify that power is off to that unit. The pumps are controlled from two 3-position switches on the console in the reactor control room. These switches have the standard "hand-off-auto" positions. The running pump is selected and turned on by setting its selector switch to "hand". The other pump is put on automatic standby by setting its switch to "auto". If the operating pump shuts down the standby pump is automatically turned on. During the switch-over time the flow in the loop decreases and the reactor goes into setback. As soon as flow is reestablished by the second pump the setback condition is cleared automatically and the operator can bring the reactor back to power. If the second pump fails to come on, the reactor continues in setback until all control rods are fully inserted.
Pressure gauges are installed in the pump discharge lines. Suction and discharge valves are installed so as to allow maintenance work on one pump while the other is in operation.
Table 7.10-1 gives data on the pumps and motors.
7.10.3 BIOLOGICAL SHIELD SYSTEM COOLER, EA-203. The biological shield system cooler is a duplicate of the canal cooler. A bypass has been installed around it to carry about half of the 205 gpm system flow. This is necessary because the biological shield system has a high flow rate but a low heat rate. Thus, the small cooler is adequate for the heat load, but not for the full flow rate without excessive pressure drop. Data pertaining to the biological shield system cooler is given in Table 7.10-2.
7.10.4 FLOW METERS. The flow meters in the three parallel circuits transmit 3-15 psi pneumatic signals proportional to the various flow rates to indicators and alarm units in the reactor control room. The shutter and beam plug circuit flowmeters Fia-203 and Fia-204 are differential pressure instruments while the concrete cooling coil loop flowmeter Fia-205 is a variable area

7 36
Table 7.10-1 Characteristics of Biological Shield Cooling System Pumps GA-203A and B
Vendor Pacific Pump Co.
Type Single state, vertical, centrifugal
Size 3 in. x 10-1/2 in.
rpm 1175
Rated capacity 200 gprn
Rated head 49 ft
NPSH at rated head 2. 97 ft
Material of construction
Seal
Code
Motor
case, impeller are stainless steel, type 304
One per pump, similar to seal used in the primary pumps and described in section 5.3.2
API, Standard 610
Louis Allis, 5 hp, 3 phase, 440 volts
Table 7.10-2 Characteristics of Biological Shield System Cooler EA-203.
Manufacturer Graham Manufacturing Co.
Type Graham Heliflow, size 20 x 4C-24L
Shell side fluid Cooling tower water
Tube side fluid Deionized water
Rated flow, shell side
Rated flow, tube side
Design temperature
Operating temperatures Shell side, in Shell side, out Tube side, in Tube side, out
MTD (corrected)
Operating pressures Shell side Tube side
Pressure drops (normal) Shell side Tube side
Heat transfer rate (service)
Rated heat exchanged
Surface
80 gprn
240 gprn
l50°F
85°F 88.8°F 95. 3 °F 94°F
7.1°F
45 psig 20 psig
5 psi 5 psi
263 Btu/hr-ft2-°F
150,000 Btu/hr 2 80.5 ft
I

Table 7.10-2 (cont'd)
Design pressures Shell side Tube side
Test pressures Shell Tube
Design temperatures Shell Tube
Materials of construction Tubes Manifold Shell Shell cover
7 37
75 psig 75 psig
115 psig 115 psig
150°F l50°F
stainless steel, type 304 stainless steel, type 304 cast iron cast iron
type of instrument. The orifices and differential elements of Fia-203 and Fia-204, as well as the tube, float, and fittings of Fia-205 are constructed of stainless steel.
The signal from the shutter loop flowmeter, Fia-203, is indicated and alarmed (for low flow) in the control room and is used in addition as one part of a two out of three setback logic circuit. The other two parts of the logic system are the signal contacts on the circulating pump breakers. With the normal single pump operation expected for this system, the logic reduces to one out of two for setback.
The signals from the plug and shield loop flowmeters Fia-204 and Fia-205 are indicated in the control room and are alarmed for low flow. The alarms from these instruments, as well as that from Fia-203 appear on the control room annunciator panel.
The flowmeter FI-206 is a locally-indicating instrument which is used to measure the purification side stream when BG-201 is being used instead of the biological shield purification system.
7.10.5 EXPANSION TANK AND WATER LEVEL INSTRUMENTS. The expansion tank, FA-203, is a stainless steel vessel of 28 gallon total capacity mounted on the operations level. The water level in the expansion tank is monitored by a sight glass and by the level instrument Lia-203, with high and low level alarms in the control room. The expansion tank cover gas is air at atmospheric pressure. The tank is vented to the building exhaust system.
7.10.6 TEMPERATURE INSTRUMENTS. Thermocouples are installed in the cooling water supply line to the shutters and in the cooling water return line from the three parallel loops. Both of these thermocouples send signals to a multipoint recording potentiometer in the control room. Point #11 (TRa-11), which records the outlet water temperature from the three loops, is equipped with a switch which actuates a high temperature alarm on the annunciator panel in the control room.
7.10.7 VENTS AND DRAINS. The system is vented at the expansion tank, by valves in the inlet and outlet lines of the shutter loop, and by a vent valve

7 38
in the discharge line from the concrete cooling coils. At start-up, it will be necessary to vent the cooling coils by allowing the water to carry over air in the coils so it will eventually escape through the surge tank. Thorough venting of the system is necessary to avoid the possibili~y of an air block which might lead to low flow in one of the loops. Drainage of the system is accomplished by opening drains at the pump bodies. These drains are connected to the D waste system. Other drains leading to the D waste system are provided on either side of the cooler.
References
(7 .1)
(7. 2)
(7. 3)
(7 .4)
(7.5)
(7.6)
(7. 7)
(7. 8)
(7. 9)
J. R. Pozzato, HFBR Recirculation Valve Test, Combustion Engineering, Inc. Test Report (Feb. 23, 1962).
J. R. Pozzato, Additional Test Results from the Prototype Flow Reversal Valve, Combustion Engineering, Inc. Test Report (June 18, 1962).
P. Tichler, "Neutron Absorber for Poison Water Tank, " BNL Memorandum (Oct. 15, 1963) •
A. Sieverts and w. Petzold, Z. Anorg. Chem. 212, 49 (1933).
M. H. Brown, Aluminum Company of America, private communication.
L. G. Epel, "Multiplication Constant of the HFBR KO Core with Light Water Contamination and All Rods In", BNL Memorandum (Dec. 20, 1963).
D. W. Kuhn, et al, Explosion Limits in Mixtures.of Hydrogen, Oxygen, Steam, and Helium, Y-731 (March, 1951) •
P. Michael, "Criticality Calculation of Flooded HFBR Fuel Storage Vault", BNL Memorandum (Jan. 15, 1963).
P. Michael, "HFBR Safety Calculations - Canal Safety Considerations", BNL Memorandum (July 3, 1962).
I

'fRd .... (IOI.) ----------
CS> c 0..
1,
Coo fer f3 y f1C1.S5
G'P-181
Shutdowr> Coo!er EA-105
p. ':i
<O" P-109
---1
I I I I I I
.... 2 f.~
Low flow l"P-180
Ehutdown 4iA-IOZA
PrimarlJ Ehutdown Pump GA- IOZB
.,.... 0 ([
~
Q Q_
'it:>
HS LS
HS LS
HS LS
0 ~ 0.. . -"'
DC- IOI R.eac'tor
Primary Coolant' Sy.st'em
Primary Coolant Purification ,SB.stem
Figure 7.1 Schematic flow diagram of the reactor shutdown cooling system.
-..)
w \()

•
Piston:
Dia. 3.5" Stroke-I" Clearance (Dia.): .005" to 009"
Spring:
lnconel Wire,.120" Dia. Coil O.D. 1.120" 10 Active Coils Spring Rote-30 ! 3 #/Inch. No Initial Tension
D2 0 From Pump Discharges
Indicator Pin
lnconel Tension Spring
SST Transition Plate
2 3Y3:;' Dia. Vo Ive Port--R-4fil::i: T lllrA
112" Dia. SST. Holdown Boll (3 Req'd)
SST. Locking Cup
Direction of Reversed Flow
Flow Reversal Valve (Open Position) Mot' I Anodized 6061-T6 Aluminum, Except As Noted
(4 Req'd)
4 5 6
Scale, Inches
Pilot Lines
To Stock
Flow Reversal Valves (4)
EA-103
Primary Shutdown System
L_
1 Primary System I I I I I I I I
4"~ ~ ~ +-vHH
: GA-102A : GA-102 8 1 J7 GA-IOI A t L ____ J_ _ _ _ _ _ _ _ ~ f ________ _, GA-1018
Flow Reversal Valve Control System
Figure 7.2 Flow reversal valve details and flow diagram for the valve control system.
-..J
""' 0
-

E c. C'
3: 0 ....J IL.
a: w I-<(
3:
5xl0 2
102
7 - 41
PRESSURE FLOW CHARACTERISTIC FOR FLOW REVERSAL VALVE,
OPEN POSITION
10 '--~----''---'---'--'-L-...L...L....L..l.~~-'-~-'--'--L-...L-'-'-......_~~-'-~-'--'-...L-.L-L. ............. 10-2 10-1
u 0 -w a: :::> I-<( a: w CL ~ w I-
PRESSURE DROP, psi
Figure 7.3 Pressure-flow characteristic for the flow reversal valve in the open position.
120~~~~~~~~~~~~~~~~--..-~~~-,-,I
SOLUBILITY OF Cd ( N03)2· 4H20 IN WATER
100 I 80
60
40
20
0
-20
0
POISON TANK HOLDING TEMP.
70° F (21.1°C)
POISON TANK I
CONC. 51.7 I
l /'y)
0
I I
/.
/-1~ ·--............._ .......... / SATURATION LIMIT
........
10 20 30 40 50 60 70 80
gms Cd (NO 3)2 /IOOgms SAT 1D SOL1 N
90
Figure 7.4 Solubility curve of cadmium nitrate in water and the operating point for the poison solution in FA-202.
10

•
~~ Jii™ O<~q..,,_ "'1~~~~-.2i::..."!:P.:.· •:..:1~4-tf""' ~MO.!Ction
~ ~ from fA· Z.OZ
poison wafrr tdnl< f\.'
1 1t"P·ll~
L©J
,. 104,
.'Tl<'ZI~
.,I •I• cc:; :c
(fl\ ~
1~· P· 11~
L0J 2'P,183 to e><Perlmentdl facilitie.,
coolinq ey~tem
1"P·ll&
<()
~ Q.
li.l£!.. fDUCTOR
2"P·115
from fA· IOZ Dzo "tcroqe tank
@j-R. ·- , from hiqh pressure
' 11 9 h•l~um 6upply
t.
l"P·ll<O·I
~ '1'p·11G l"P·ll7
....
"' ~
r•vent f,om 1"£V·IO~ QA· 10:!1 A• I>
l • p-,.~·• l'llel I 110-@
~ a. -~
~~L5
@ljl~ ~L9 :\SJL I I I I
I I I
::>'i:.V·I04
::1"£V· I03
Z"P·llB-1
~ ~ ..
-·- I ---------+---- --------- ------ l ----- - ------=-
Helium
~ (h1qh P"'""ure)
Ii :ii' ~~
1.02.
~ ci. ~
@ 1t'P·1_75
GA- 105 Helium E.ductor
Pump
§ ,;_ ()
'"'
r _J1r------
Corw
\"~
DC- IOI R.eact"or
PrimarlJ Coolant System
Primary Coolant Purification System
ci. ;,.
~~.
Figure 7.5 Piping and instrument diagram for the reactor helium system .
....,
..,. (\.)

"' .... Cl ,.:.
>t 1' "p.17!;·&3K TO HELIUM :g fDUCTOR PUMP ,;, GA-105
~
..... -!!
~
f.. ...
~ TO Dz() .STOllAGE f TE R.
T"Nl<lJ fA·IOI f 1A-IOZ
"' .. "i' !!! .~ -!:!
7 43
H·IPZA MIXED MD
~ NIT AT M.D
s
"' ... '!! !':! f'--!!
Figure 7.6 Piping and instrument diagram for the o2o purification system.

FUEL HANDLING SCOPE
LEAD SHIELDING
OPERATIONS FLOOR
'1 G l>
PERISCOPE
SUPPORT LEG
. · _ .
. ·
-~ _ ..... ,,.
·• . ' ~ , .. .
CABLE WINCH FOR PERISCOPE ADJUSTMENT
TRITIUM
7 44
CONTAINMENT
..
STRUCTURE
PERISCOPE NOZZLE
UPPER TRITIUM CONTAINMENT
IR SUPPLY
fil I I
I i I l \ j ) . ~- /
LOFF- GAS TO STACK
SCOPE IN
I
TRITIUM CONTAINMENT
SCOPE
LEAD SHIELDING
·, ....... t ' '
,,
";
EL.149'-o"
7~6"
-- .. ~ ,, . ,. .... ~
-.
EXTENDED POSITION
Figure 7.7 Elevation of fuel handling equipment in the reactor pit, taken in the east-west direction.
I

INDEXING MECHANISM--~
SUPPORT PLATE
., ~ '*- ' _4 .-_ ·- ) ~ ~ , 0
7 45
FUEL HAN DL\NG
SHUTTERS
SHUTTER MOTOR DRIVE
LEAD SHIELDING
... - '
AIR HOSE 8 CABLE FOR LIFTING TOOL
~~~~__,-AIR BONNET SUPPORT
FUEL ELEMENT LIFTING TOOL---H---t1
FUEL HANDLING FLOOR
COOLING AIR BONNET
FUEL ELEMENT IN DISCHARGE POSITION
Figure 7.8 Elevation of fuel handling equipment in the reactor pit, taken in the north-south direction.

FUEL
•
'~ •' l. ·.',:&··
~::~{i '\;
CANAL WALL '(TILE FACED)
RETARD CHUTE
"· 12'-10~"-·--------H------l ·.·i.
. : ~::.·~ ·•':
,-~-:~~:~ •.I'
"" .. : ~ .1..".1 .. 4j': ...
REMOVABLE ALUMINUM GRATING
30' DEEP POOL
~~::::· ::_.:~:~:<:::i';·_:f;:~~--~ ·."!: ~ :." .,.•o ...
.:<I~· -
:F ·-• _•_,;-o----4-.- o~<.i
3'-5~" 8
EL.93'-o"
20'-o"
'•:.-':.:...:J??I 92'-s"
\·?~~ ~yq~~-~i_r
-:-ii>-
._,,~ . .. . _,· .... .
WATER LEVEL
\.,. ., , EL.84'-d'
.•t:I ,·
d· ':--
~--' •' '· 1· ''·'-· --~ . -~ ~ -"-;; '_,~ ~
HANDLING EYE
i------a·-011---+----1
Figure 7.9 Fuel discharge chute termination in the canal and the retard chute •
~:.':· ,,,.,.
1·.,,
.. • J . .
:o11i<':" . ' ·a' J
J '.! .• ' .. , J·,Lb
""'" . J
.•::.. \.'·:ii
MOUNTING -SRACl(ET
LEVELING

7 - 47
Figure 7.10

7 48
()
() ()
()
()
6 Cell 4 Cell
Fuel Baskets
Basket Rack
Figure 7.11 Fuel baskets for long-term storage of cut fuel elements, and a section of the canal rack for the fuel baskets.
I

>-----~~~~~~~~~~~~~~ 43'-o'·'_• --------------------------1
'-~----------12·-o-- a'-d··'--------i
• ,___-~---8'-9'·c..' -----
FUTURE STORAGE
RACK
GUARD
STORAGE RACK
10'-o"
LONG TERM STORAGE (SHOWING CONTROLLED PLACEMENT OF FUEL)
CUT-OFF SAW AREA
Figure 7.12 Canal layout for retard chute, temporary storage rack, cut-off saw, and long-term storage racks.
-----s'-011-----1
SHIPPING CASK LOADING AREA
fl-d'
-.J
4'> ID

7 50
THERMAL SHIE.LD fXPAN.5101-l TANK
fA- ZOI
·~·wc-Z04-AZA 3 "WC'.·204·1-AZA
-"="" __ _,z,..· f_-_10_1_-H2._A __ r-1o_b~i tditiq
.3" we- 211 -AZA 3'
3"Wc'-Zll·AZA
54"WC-Zll-l-A2A-
1z" V-ENT
Z"WC-Zl3-AZA .z·wc- 214-AZA
6"WC'- Z09-AZA I 8"WC'- ZOl·AZA
~1------------_ THfR.MAL ..SHlfLD
THER.MAL SHIE.l..D ------ WATER. PURIFICATION +------..;;......,..
SYSTEM
&"W<:-'1.09-AZA
G"WC-ZIO·AZA
&'WC·Z07·AZ.A
fA-2.01 THERMAL .5H1f.LD COOLfR drain
D 0
THERMAL .SHIELD PUMPS
1·wc- ZOIP ·AZA
A2A+A!K from auxiliary HzO
ruriflc:at-1on Su· 201
Figure 7.13 Thermal shield cooling system piping and instrument diagram.
•

G~ING ~ l!.XHAUST -
t!.o",.5'·0* BIOLOGICAL SHIE.LO COOLING Hl!.AO TANK
FA·20~
7 51
H·I H•2 H· 9 H·4 H·S
I" .SHUTTfR. COOLING
S"TW· 224 ·A3k Z"TW·ZZ4·A3K
2"TW·ZZ5·A3K
H·I H·2 H·5 H·4
1• =nnec+1ons typ.< ..:B::.,f::.:..;A:.:.M.:.:-.,..i...=..:;.-;:.;::..;:::;~~:;;;....--=~~::;._
1·connecf1ons typ.
Auxiliary HzO .._-1>1 ___ ...,.........i Purification
r~·ASIC BG • 2.01 ofo L____::::::::==:::::...~~
make-up water _j frcm HA·305
GA·Z03B
BIOLOGICAL .SHlfLD PUMP.5
3"1W ·2Z3 ·A3K
COILS
Z"TW·ZZZ·A?IK
SIOLOGICAL .SHIELD -----1 WATER. PURIFICATIO!>t SYSTf:M
~·drorn Dr D ~·drain
oYo
f.A- Z.03 1'10LOGICAL SHlfLD COOLER.
~ drain
"'"
Figure 7.14 Biological shield cooling system piping and instrument diagram.

Copyright © 2022 FDOKUMEN