Final copy A study on effectivness training and development
83
Chapter-I 1.1Introduction Training and development is the frame work for helping employees and to develop their personal and organizational skills, knowledge and abilities. The focus of all aspects of human resource development is no developing the most superior workforces so that the organization and individual employees can accomplish their work goals in services to customer. One can generally categorize such training as on- the- job or off- the –job On-the-job training place in a normal working situation using the actual tools, equipment’s , document ,or material that trainees will use when fully trained on-the-job training has a general reputation as most effective for vocational work Off-the-job training takes place away from normal work situation implying that the employee does not count as a directly productive worker, while such training take places Training differs from exercise in that people may exercise as an occasional activity Training has specific goals of improving ones capability and performances. Training is the systematic development of the knowledge skill and attitudes required by an individual to perform adequately a given task or job training involves learning of various kinds and in various situations. Learning may be something that trainee wants to do for himself or it may be necessary to provide it for him. If training is provided, the individual may need to be motivated to trainee is self-motivated it may still be necessary to provide the guidance and training 1
-
Upload
independent -
Category
Documents
-
view
2 -
download
0
Transcript of Final copy A study on effectivness training and development
Chapter-I
1.1Introduction
Training and development is the frame work for helpingemployees and to develop their personal and organizationalskills, knowledge and abilities. The focus of all aspects ofhuman resource development is no developing the most superiorworkforces so that the organization and individual employees canaccomplish their work goals in services to customer.
One can generally categorize such training as on- the-job or off- the –job
On-the-job training place in a normal workingsituation using the actual tools, equipment’s ,document ,or material that trainees will use whenfully trained on-the-job training has a generalreputation as most effective for vocational work
Off-the-job training takes place away from normalwork situation implying that the employee doesnot count as a directly productive worker, whilesuch training take places
Training differs from exercise in that people mayexercise as an occasional activity Training has specific goals ofimproving ones capability and performances.
Training is the systematic development of theknowledge skill and attitudes required by an individual toperform adequately a given task or job training involves learningof various kinds and in various situations. Learning may besomething that trainee wants to do for himself or it may benecessary to provide it for him. If training is provided, theindividual may need to be motivated to trainee is self-motivatedit may still be necessary to provide the guidance and training
1
facilities which will help him to channel his enthusiasm towardsa worthwhile end
Training can takes place in various situation on the job or offthe job in the company it caninvolvestheuseofmanytechniques:demonstration,practice,coaching,guidedreading,lectures,talks, and discussions, case the discoverymethod and so on. And these techniques can be deployed by manypeople: specialist company trainer, managers, supervisors,colleagues of external trainers and educations.
Therefore training is, or at least can seem to be, acomplex process and the techniques used can vary almostinfinitely according to the situation. There are, however,certain fundamental concept and principles upon which alltraining should be based and in this chapter, these will bereviewed before consideration is given to their application tothe training for different occupations. The first are that willbe covered is learning theory, because all training is, or shouldbe, based upon an understanding of how people learn.
Training is an act of increasing knowledge and skills of anemployee.
Edwin B.Flippo
The organized procedure by which people learn knowledge and skillfor a definite purpose.
Dale S.Beach
Training process includes
2
The identification and analysis of training needs - alltraining must be directed towards the satisfaction of definedneeds; for the company as a whole for specific functions orgroups of employees or for individual.
The definition of training objectives must aim to achievemeasurable goals expressed in terms of the improvements orchanges expected in corporate function, department or individualperformance.
The preparation of training plans-these must describe theoverall scheme of training and its costs and benefits. Theoverall scheme should further provide for the development oftraining programmers and facilities the selection and use ofappropriate training methods and the selection and training oftrainers.
The implement and analysis of results which require thevalidation of the achievements of each training program againstits objectives and the evaluation of the effect of the wholetraining scheme on company or department performance.
The feedback of the results of validations and evaluations sothat training plans, programmers and techniques can be improved.
1.2 Objectives of the study:
3

To study about the demographic characteristics of the staff level
To find out the various training practices followed for employees
To identify the various factors which influences the training
To analyses whether the employee s are satisfied with their current training method
To study the impact of the training program in their day today activities
To find out whether the training programmers were conducted regularly
4

1.3 Scope of the study:
Training covers a whole range of knowledge andskills and various techniques can be employedwith all levels of staff
Sharing of ideas and dissemination of goodpractice
Greater understanding and appreciation offactors affecting work performance
Effective management and implementation ofchange
Encouragement of team spirit Increased motivation and job satisfaction for
the individual
5
1.4 Limitations of the study:
Some of the respondents were unwilling toanswer the questions
Some of the respondents were afraid to givethe true information in some cases
There may be bias on the part of employeeswhile answering to the questions
It was difficult to interact with each andevery executive due to absence of time ,who wasbusy in his day to day activities
6
Chapter -II
2.1Concept of the study
The health of the organization depends on the quality of itshuman resources. Hence it needs well trained and experiencedpeople to perform the activities that have to be done. So for theoptimum and better utilization of the human resources, trainingand development of their skill level is most essential. In thisrapidly changing society, employee training and development isnot only an activity that is desirable but indispensable for anorganization.
As the job becomes more complex, the importance of employeedevelopment also increases. Training also promotes anorganization to maintain a viable and knowledgeable workforce.
7

An organization requires various machineries and materials toachieve its goal. But in reality the goals are achieved by humanresources who use them. A sound manpower makes an organization,successful. For any organization its employees are the mostvaluable asset and management will always try to retain itsemployees. Healthy work atmosphere is also important in regard toencourage employees. A healthy work atmosphere is also importantin regard to encourage employees of an organization. If it is notdone then it will be difficult to retain and the managementcannot get the desired results from the employees. At thisjuncture, the industrial relation plays a vital role insatisfying the needs and self-esteem of the employees.
Today, the growth of the industrialization is rapidly increasingand the progress of the nation also depends on it. On the otherhand, industrialization gives birth too many hazards, which posedanger to the safety of persons working in the industry. Sotraining is very essential to overcome these dangers.
2.2Review of literature
8
J.Kevin ford (1997) explain that theconcept of training effectiveness has been expanded in the recentyears to incorporate notions about trainee and organizationalcharacteristics .training needs to be viewed as more central tothe functioning of organizations alongside financial ,strategicand operational concerns.
The challenge for training researchers is toinfuse the old bottles current training effectiveness paradigmwith new line expanded and enhanced thinking about the potentialoffered through sound training design.
Biswajit Pattanayak (2002) discussedtraining effectiveness is to impart new entrants the basicknowledge and skill which they need for an intelligentperformances of defined tasks .to assist employees to functionmore effectively in their present positions by exposing them tolatest concepts information ,techniques and developing the skillswhich they need their future roles.
To broaden the minds of managers by providingthem with opportunities for an interchange of experiences with inand outside with a view to correct the narrow out look that mayarise from specialization.
K.Aswathappa (1999) describes “how to maketraining effective?”
Ensure that the management commits itself to allocate majorresources and adequate time for training
Ensure the training contributes to competitive strategiesof the firm. different strategies need different humanresources skills for implementation
9

Ensure that a comprehensive and systematics approach fortraining exists and training ,retraining is done at alllevels on a continuous and ongoing basis
Krut Kraiger (1991) discuss that “ in recent yearsconsiderable advances have been made in the practices oftraining evaluation “ after thirty years technologycharacterized by a single theoretical model ,progress hascome from theory and research linking training andretraining evaluation and broader organizational processesthe moderate to specific learning outcome
2.3 COMPANY PROFILE
“On request of the then State government the House of Seshasayeesset-up Seshasayee Paper and Boards Limited on the banks of river Cauvery in Pallipalayam, a village on the outskirts of Erode, under the leadership of the dynamic Sri. S Viswanathan. "
The Company
Seshasayee Paper and Boards Limited (SPB), the flagship company belonging to 'ESVIN GROUP', operates an integrated pulp, paper and paper board Mill at Pallipalayam, Erode-638 007,District Namakkal, and Tamilnadu, India.
10
SPB, incorporated in June 1960, was promoted by Seshasayee Brothers (Pvt) Limited in association with a foreign collaboratorM/s Parsons and White more, South East Asia Inc., USA. After commencement of commercial production, having fulfilled their performance guarantee obligations, the foreign collaborators withdrew in 1969. Main promoters of the Company as on date are a group of companies belonging to the ESVIN group headed by Mr. N Gopalaratnam.
In the second stage of expansion, undertaken in 1976, capacity was enhanced to 55000 tap, through addition of a 60 tpd new PaperMachine (PM-4). Cost of the project, including cost of a ChemicalRecovery Boiler and other facilities for enhanced requirement of utilities, was estimated at Rs. 176 Millions. The same was part financed by term loans from Institutions and Banks to the extent of Rs. 145 Millions and the balance out of internal generation. SPB undertook various equipment balancing and modernization programmers, since then, for improving its operating efficiency, captive power generation capacity, etc., up to 1992-93. Expansion/ Modernization Project
The Company embarked on an Expansion / Modernization Project to enhance its production capacity from 60000 tonnes per annum, to 1,15,000 tonnes per annum and to upgrade some of the existing facilities, at an estimated cost of Rs 1890 million.
The said Expansion / Modernization Project were completed in December 2000. After successful trials, the Commercial Productionout of the new Paper Machine commenced on July 1, 2000.
The current installed capacity of the Company stands at 1, 15,000tonnes per annum.
Raw Materials
The Company's paper plant was originally designed for using bagasse, as the primary raw material mixed with 20% bamboo fibre.Bagasse was being obtained from nearby sugar mill on substitution
11
basis using oil fired boilers.
With sharp increase in oil prices in 1970-71, the Company shiftedover to the use of hardwood, at the time of its expansion undertaken in 1978. Raw material mix underwent a substantial change, with bamboo and hardwood forming 60% and 40%, respectively, of its raw material consumption.
Soon Company started apprehending difficulties in procurement of bamboo. In 1981, it added one more digester, to increase the share of the hardwood in the furnish mix to 80% and restricting bamboo use to only 20%.
With the commissioning of more wood based industries in Tamilnadu, there was again an apprehension about availability of hardwood.
As a long term strategy, the Company at this time decided on restructuring use of bagasse which was seen to be the most reliable source of fiber for the entire Industry.
In 1984, the Company promoted Ponni Sugars and Chemicals Limited,as the captive source for bagasse supply. It added bagasse handling systems and modernized PM-1 and PM-2, to shift over to the use of bagasse.
The furnish mix for the existing Paper Machines of the Company is55% bagasse and 45% hardwood. The Company has vast experience in handling bagasse and is expected to be one of the major strong points vis-à-vis its competitors in India, as the Indian Paper Industry will continue to be bogged down by the problem of raw material availability.
For the new Paper Machine, the furnish is imported waste paper and imported pulp which are sourced from Far East countries, Europe and USA. A small quantity is supplemented out of captive pulp production.
12

Exports performance
SPB's exports are nearly 20% of its production and is a significant exporter in the Indian Paper Industry. Due to its excellent export performance, SPB has been awarded 'Golden ExportHouse' status.
Awards
SPB is in receipt of various Awards awarded by Government of India, Government of Tamilnadu, Industry Associations, etc. Some of the Awards received by SPB in the past include:
Capacity Utilization Award Energy Conservation Award Environmental Protection Award Safety Award Export Performance Award Good Industrial Relations Award TERI - Corporate Environmental Award
Environmental Protection
The Company attaches paramount importance to the conservation andimprovement of the environment. In its efforts to improve the environmental protection measures, the Company has installed:
two Electro Static Precipitators for its Boilers to control dust emissions
an Anaerobic lagoon for high BOD liquid effluents a Secondary Treatment System for liquid effluents and An Electro Static Precipitator and Cascade Evaporator to the
Recovery Boiler.
These facilities will ensure sustained compliance by the Company of the pollution control norms prescribed by the Pollution Control Authorities.
13
ISO 9001/ IS0 14001 Accreditation
The Company's quality systems continue to be covered by the "ISO 9001" accreditation awarded by Det Norske Veritas, The Netherlands.
The Company has also been accredited with "ISO 14001" certification by Det Norske Veritas, The Netherlands, for its Environmental Quality Systems. Board of Directors
The Company's Board is broad based comprising 11 Directors:
Sri N Gopalaratnam, Chairman and Managing Director Sri R V Gupta, I.A.S., (Retd.) Dr S Narayan, I.A.S., (Retd.) Sri Bimal Kumar Poddar Sri Arun G Bijur Sri V Sridar Sri S K Prabakar, I.A.S (Nominee of TIIC) Sri Mohan Verghese Chunkath, I.A.S (Nominee of Govt. of
Tamilnadu) Smt Philomena Thomas (Nominee of LIC) Sri K S Kasi Viswanathan, Deputy Managing Director Sri V Pichai, Director (Finance) & Secretary
Organization
The day to day affairs of the Company are looked after by the Chairman and Managing Director and supported by:
Sri K S Kasi Viswanathan, Deputy Managing Director and Sri V Pichai, Director (Finance) & Company Secretary.
They are ably assisted by a team of qualified and experienced
14

professionals in operations, personnel, finance and marketing disciplines.
2.4 History of paper industry
15

The paper industry has an important social role to play for thecountry use of paper is considered as an index of cultural growth
The paper industry in India is more than a century old at thepresent there are over 600 paper mills manufacturing a widevariety of items required by the consumers
These paper mills are manufacturing industrial grade and otherspecialty paper . The paper industry in India could be classifiedinto 3 categories according to the raw material consumed
Wood based
Agro based
Waste paper based
While the number of wood based mills is around 20 and balances580 mills are based on non-conventional raw material
the government of India has relaxed the rules and regulation andalso delicensed the paper industry
The paper industry would be growing at the present rate of 7-8%of compounded rate and would require 9.5-19 million my by the endof the decided from the existing production af around 6.7 millontonnes.
16
CHAPTER -III
RESEARCH METHODOLOGY
Methodology is the way to solve the research problemsystematically
Decision regarding what, where, when, how and by whatmeans concerning an enquiry (or) a research study constitute aresearch design .a research design is the arrangement ofcondition for collection and analysis of data in a manner thataims to combine relevance to the research purposes with economyin procedure.
Descriptive study is concerned with describing thecharacteristics of particular individual. It is also concernedwith the predication and narration of facts and characteristicsconcerning individual, group (or) situtation.it describes thedemographics characteristics of an individual .the present studyis based on descriptive research through questionnaires
3.1Research design:
Descriptive research design wasused to identify the effectiveness of training among theemployees
A research design is the arrangement of conditions forcollection and analysis of data in manner that aim to combinerelevance to the research purposes with economy in procedure
17
Decision regarding what, where, when, whom, how much by whatmeans concerning an inquiry or a research study constitute aresearch design
3.2Area of the study:
The area of the study is seshasayeepaper and boards limited
3.3Sample size:
The size of sample for the study 150respondents of male and female staff in seshasayee paper andboards limited
3.4 Sampling Method
Simple random sampling selecting therespondents from the employee list randomly
3.5Sources of the study
Primary data:
The primary data is collected throughdirect interaction with staff and collected information throughquestionnaire
Secondary data:
The secondary data is based on variousdetails retrieved from the website, company records and books.
3.6Data collection method
18
The data was collected throughquestionnaires
3.7Statistical tools used:
Percentage analyses Chi-square analyses Anova T-test Bar chart Pie chart
Percentage analyses
The Percentage analysis is used to comparisonbetween two or more series of data in this project the percentageanalyses test was used the formula is as follows.
Percentage of respondent = no .of respondent/totalno.of respondents*100
Chi-square analyses
Chi-square test has been used in thestudy to find the quality of training programmer and satisfactionlevel of staffs. Chi-square is a statistical test commonly usedto compare observed data with data we would expect to obtainaccording to a specific hypothesis
The formula for computing chi-square (x2) is as follows
X2= £
[(o-e)²/E]
19
Anova
Analysis of variances (anova) is an extremely usefultechniques concerning researcher in the fields of economicsbiology, education psychology, sociology, business and inresearches of several other disciplines this techniques is usedwhen multiplied sample cases are involved stated of severalearlier the significances of the differences between the means oftwo samples can be judged through either
1. Z-test
2. T-test
T-test
A statistical examination of two population means. A two-samplet-test examines whether two samples are different and is commonlyused when the variances of two normal distributions are unknownand when an experiment uses a small sample size.
A statistical test involving confidence limits for therandom variable t of a t distribution and used especially intesting hypotheses about means of normal distributions when thestandard deviations are unknown
20
CHAPTER –IV
Data analysis and
interpretation
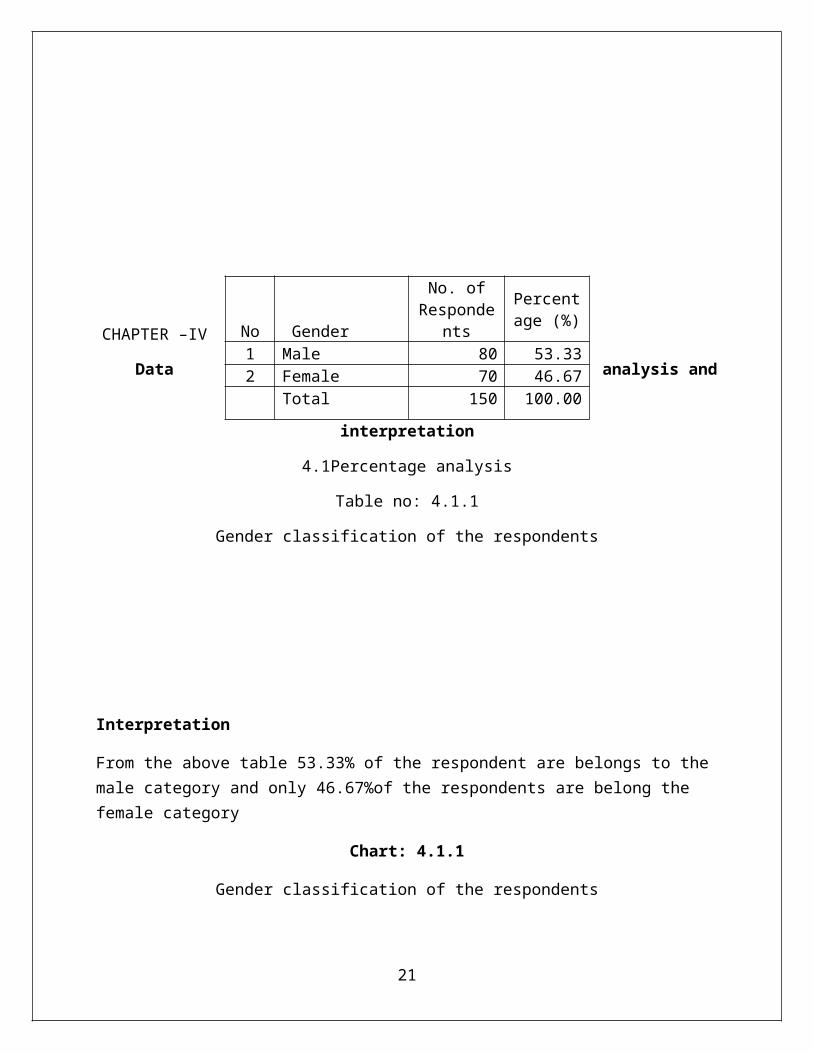
4.1Percentage analysis
Table no: 4.1.1
Gender classification of the respondents
Interpretation
From the above table 53.33% of the respondent are belongs to the male category and only 46.67%of the respondents are belong the female category
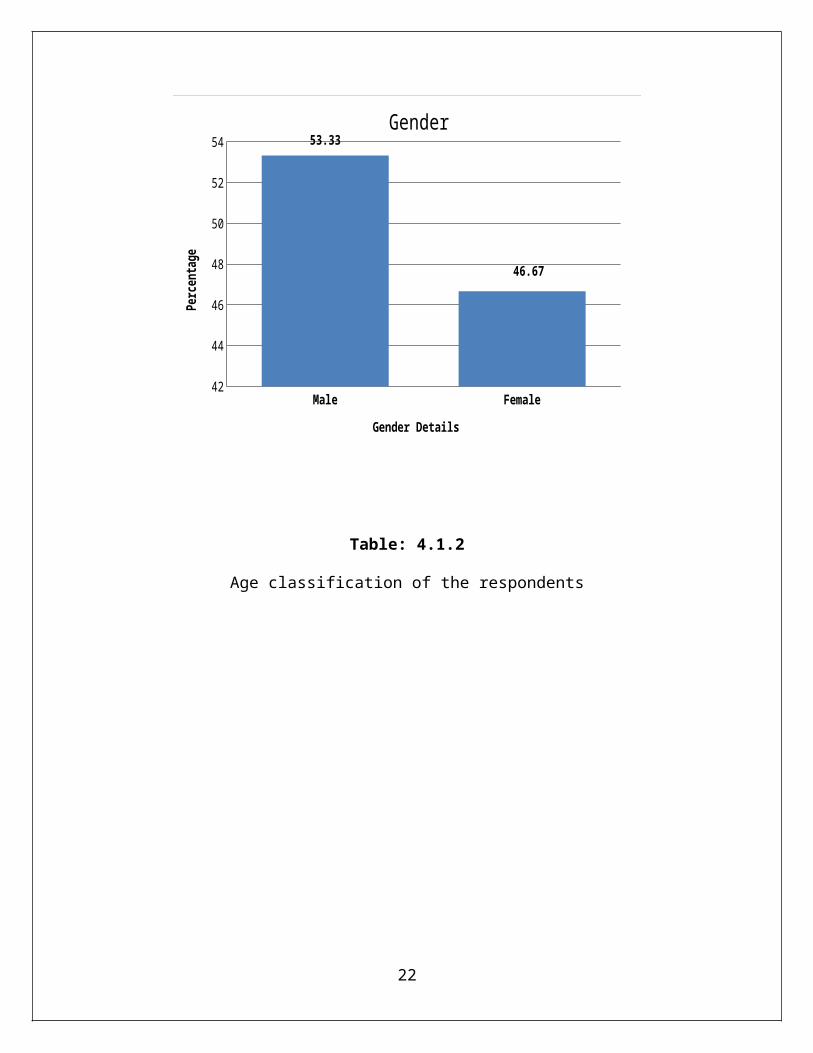
Chart: 4.1.1
Gender classification of the respondents
21
No Gender
No. ofResponde
nts
Percentage (%)
1 Male 80 53.332 Female 70 46.67
Total 150 100.00
Male Female42
44
46
48
50
52
54 53.33
46.67
Gender
Gender Details
Percen
tage
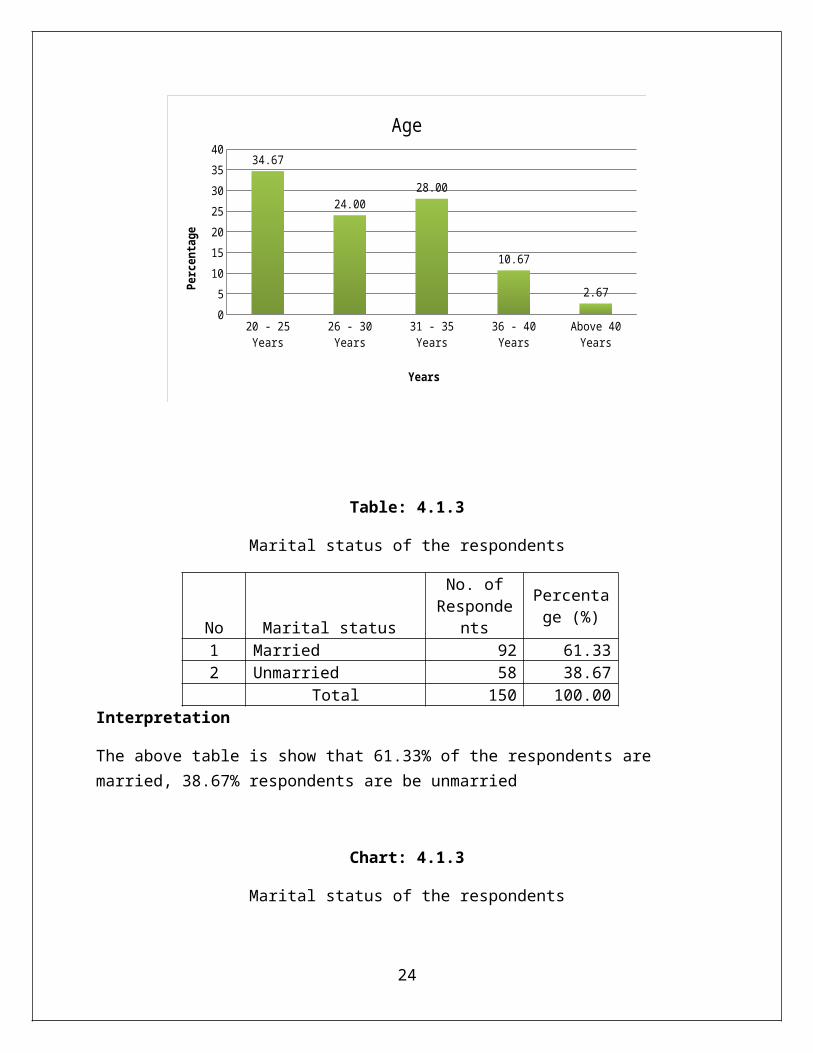
Table: 4.1.2
Age classification of the respondents
22
Interpretation
The above table is show that 34.67% of the respondents are 20- 25years, 24.00% are between in 26-30years age group, 28.00% respondents were in between31-35 years and 10.67% were 36- 40 years, 2.67% respondents are between above 40 years
Chart: 4.1.2
Age classification of the respondents
23
No Age
No. ofResponden
ts
Percentage (%)
1 20 - 25 Years 52 34.672 26 - 30 Years 36 24.003 31 - 35 Years 42 28.004 36 - 40 Years 16 10.675 Above 40 Years 4 2.67
Total 150 100.00
20 - 25 Years
26 - 30 Years
31 - 35 Years
36 - 40 Years
Above 40 Years
05
10152025303540
34.67
24.0028.00
10.67
2.67
Age
Years
Percen
tage
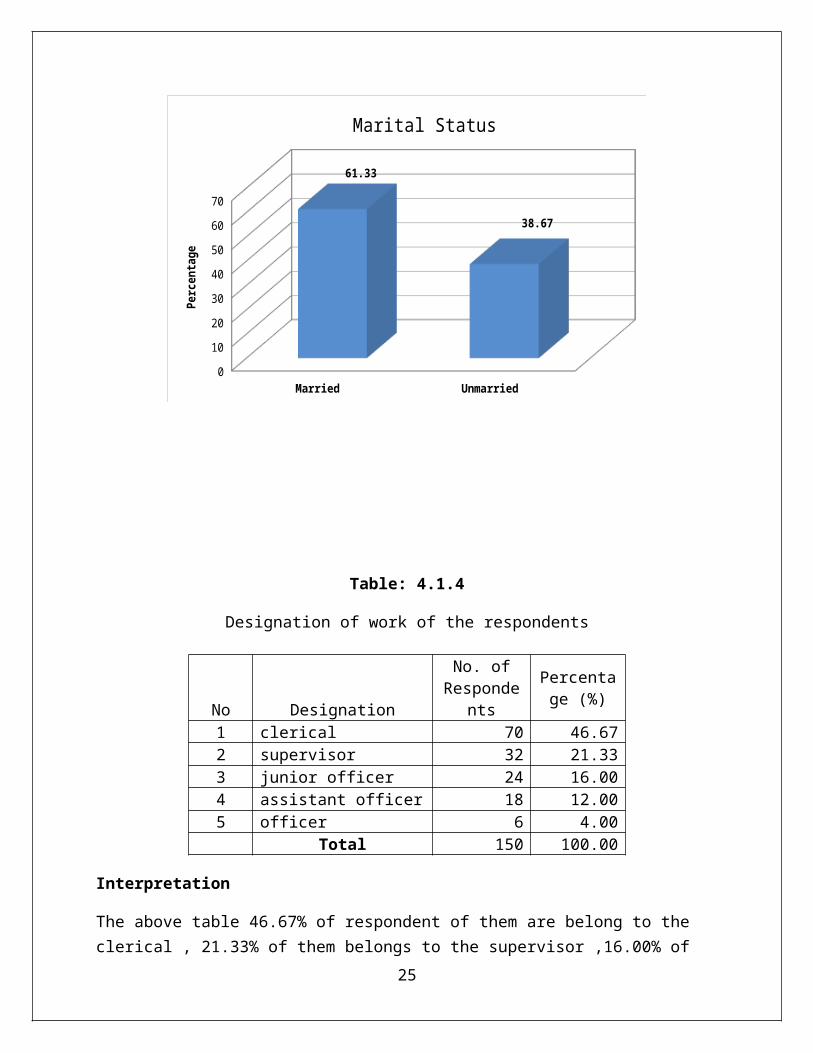
Table: 4.1.3
Marital status of the respondents
No Marital status
No. ofResponde
nts
Percentage (%)
1 Married 92 61.332 Unmarried 58 38.67
Total 150 100.00Interpretation
The above table is show that 61.33% of the respondents are married, 38.67% respondents are be unmarried
Chart: 4.1.3
Marital status of the respondents
24
Married Unmarried0
10203040506070
61.33
38.67
Marital Status
Percen
tage
Table: 4.1.4
Designation of work of the respondents
Interpretation
The above table 46.67% of respondent of them are belong to the clerical , 21.33% of them belongs to the supervisor ,16.00% of
25
No Designation
No. ofResponde
nts
Percentage (%)
1 clerical 70 46.672 supervisor 32 21.333 junior officer 24 16.004 assistant officer 18 12.005 officer 6 4.00
Total 150 100.00
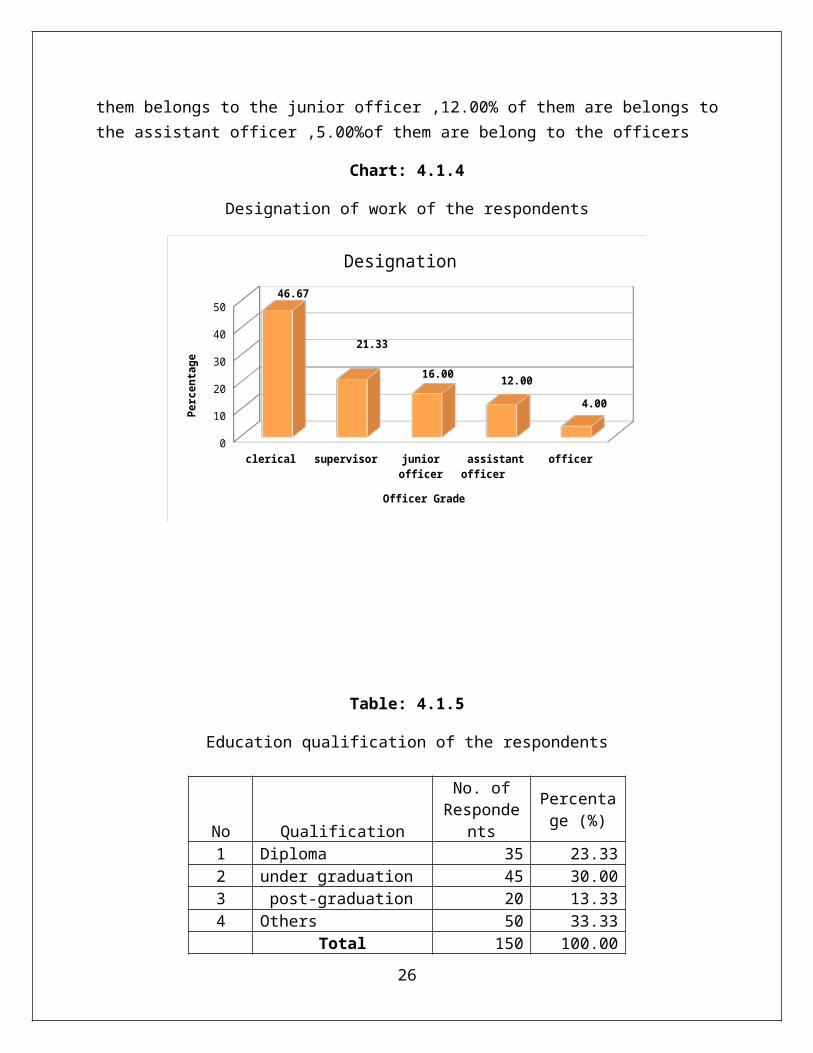
them belongs to the junior officer ,12.00% of them are belongs tothe assistant officer ,5.00%of them are belong to the officers
Chart: 4.1.4
Designation of work of the respondents
clerical supervisor junior officer
assistant officer
officer0
10
20
30
40
5046.67
21.33
16.00 12.00
4.00
Designation
Officer Grade
Percen
tage
Table: 4.1.5
Education qualification of the respondents
26
No Qualification
No. ofResponde
nts
Percentage (%)
1 Diploma 35 23.332 under graduation 45 30.003 post-graduation 20 13.334 Others 50 33.33
Total 150 100.00
Interpretation
From the above table 23.33% of the respondents has diploma, 30.00% of the respondent has under graduation, 13.33% of respondent are completed up to post graduate and 33.33% of respondent are completed up to others
Chart: 4.1.5
Education qualification of the respondents
Diploma Under graduation
post-graduation Others0
5
10
15
20
25
30
35
23.33
30.00
13.33
33.33Educational Qualification
perc
entage
Table: 4.1.6
Experiences of the respondents
27
No Experiences
No. ofResponde
nts
Percentage (%)
1 0-5years 63 42.002 6-10 years 29 19.333 10-15years 33 22.004 16-20years 11 7.335 more than 20years 14 9.33
Total 150 100.00
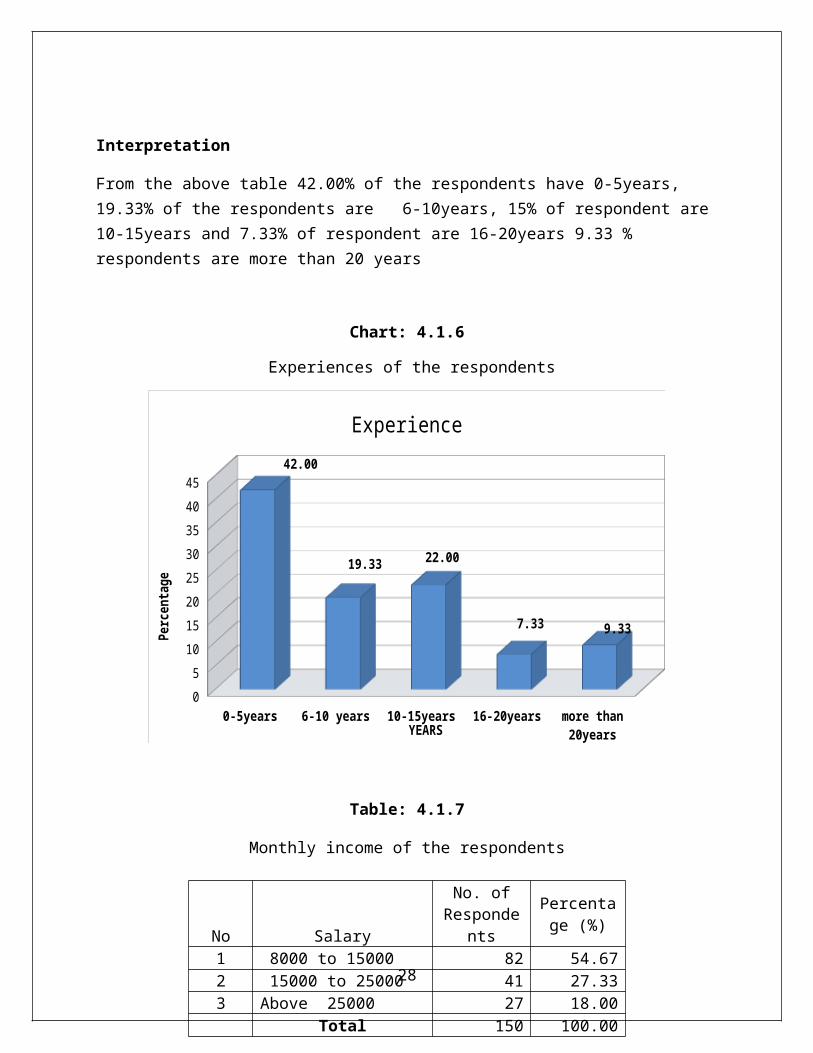
Interpretation
From the above table 42.00% of the respondents have 0-5years, 19.33% of the respondents are 6-10years, 15% of respondent are 10-15years and 7.33% of respondent are 16-20years 9.33 % respondents are more than 20 years
Chart: 4.1.6
Experiences of the respondents
0-5years 6-10 years 10-15years 16-20years more than 20years
051015202530354045
42.00
19.33 22.00
7.33 9.33
Experience
YEARS
Percen
tage
Table: 4.1.7
Monthly income of the respondents
28
No Salary
No. ofResponde
nts
Percentage (%)
1 8000 to 15000 82 54.672 15000 to 25000 41 27.333 Above 25000 27 18.00
Total 150 100.00
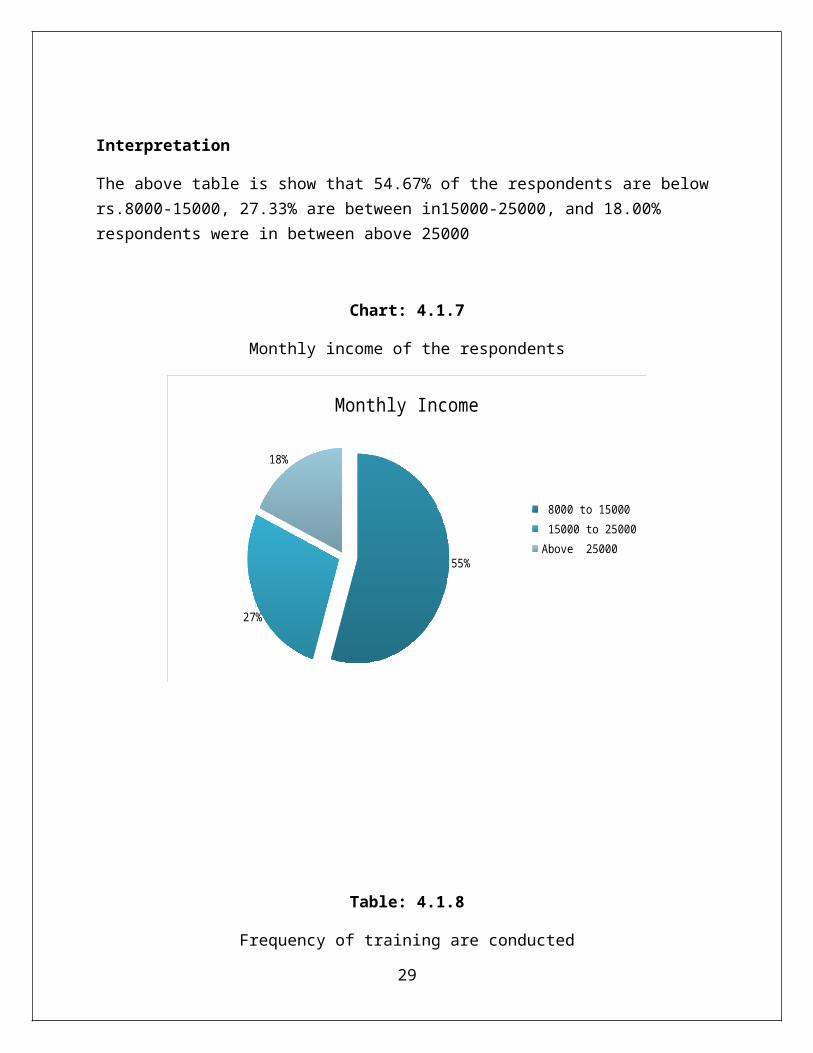
Interpretation
The above table is show that 54.67% of the respondents are below rs.8000-15000, 27.33% are between in15000-25000, and 18.00% respondents were in between above 25000
Chart: 4.1.7
Monthly income of the respondents
55%
27%
18%
Monthly Income
8000 to 15000 15000 to 25000Above 25000
Table: 4.1.8
Frequency of training are conducted
29
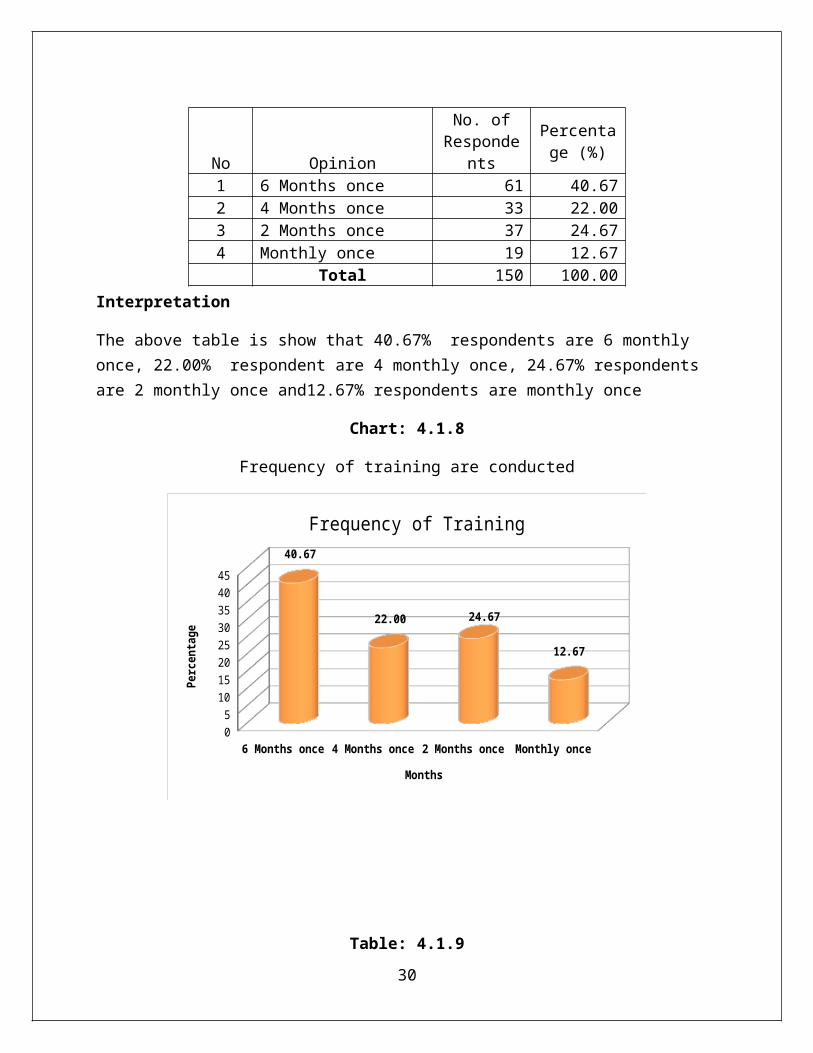
Interpretation
The above table is show that 40.67% respondents are 6 monthly once, 22.00% respondent are 4 monthly once, 24.67% respondents are 2 monthly once and12.67% respondents are monthly once
Chart: 4.1.8
Frequency of training are conducted
6 Months once 4 Months once 2 Months once Monthly once05
1015202530354045
40.67
22.00 24.67
12.67
Frequency of Training
Months
Percen
tage
Table: 4.1.930
No Opinion
No. ofResponde
nts
Percentage (%)
1 6 Months once 61 40.672 4 Months once 33 22.003 2 Months once 37 24.674 Monthly once 19 12.67
Total 150 100.00
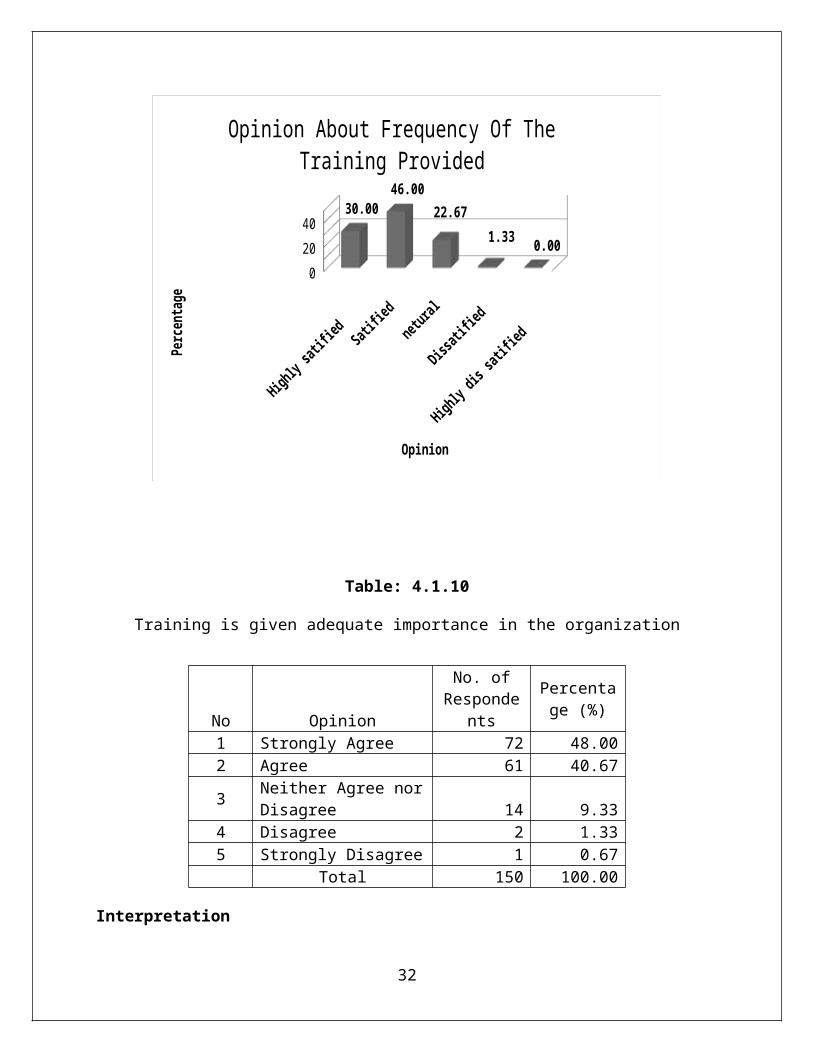
Are you satisfied with the frequency of the training provided?
Interpretation
The above table is show that 30.00% of the respondents are highlysatisfied, 46.00% respondents are satisfied, and 22.67% respondents are neutral 1.33% respondents are dissatisfied ,0.00%respondent are highly dissatisfied
Chart: 4.1.9
Are you satisfied with the frequency of the training provided?
31
No opinion
No. ofResponde
nts
Percentage (%)
1 Highly satisfied 45 30.002 Satisfied 69 46.003 Neutral 34 22.674 Dissatisfied 2 1.33
5 Highly dissatisfied 0 0.00
Total 150 100.00
Highly
satif
ied Sat
ified
netura
l
Dissat
ified
Highly
dis s
atifie
d
02040
30.0046.00
22.671.33 0.00
Opinion About Frequency Of The Training Provided
Opinion
Percen
tage
Table: 4.1.10
Training is given adequate importance in the organization
Interpretation
32
No Opinion
No. ofResponde
nts
Percentage (%)
1 Strongly Agree 72 48.002 Agree 61 40.67
3 Neither Agree norDisagree 14 9.33
4 Disagree 2 1.335 Strongly Disagree 1 0.67
Total 150 100.00
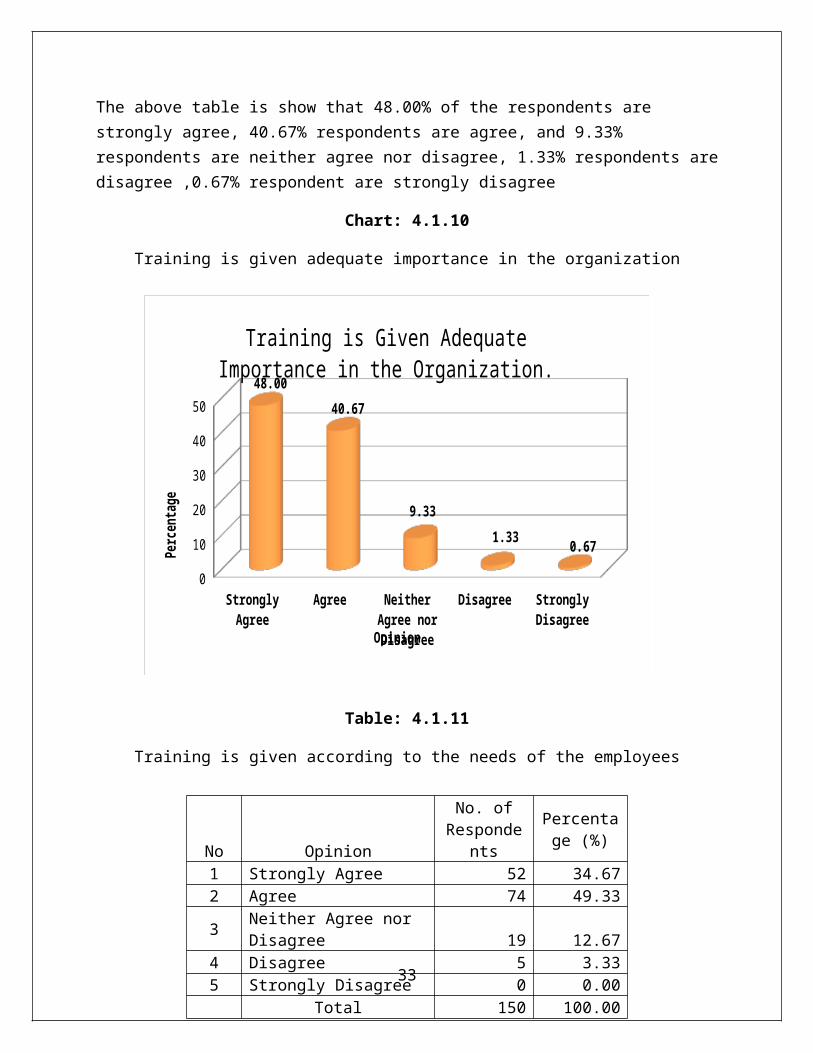
The above table is show that 48.00% of the respondents are strongly agree, 40.67% respondents are agree, and 9.33% respondents are neither agree nor disagree, 1.33% respondents aredisagree ,0.67% respondent are strongly disagree
Chart: 4.1.10
Training is given adequate importance in the organization
Table: 4.1.11
Training is given according to the needs of the employees
33
No Opinion
No. ofResponde
nts
Percentage (%)
1 Strongly Agree 52 34.672 Agree 74 49.33
3 Neither Agree nor Disagree 19 12.67
4 Disagree 5 3.335 Strongly Disagree 0 0.00
Total 150 100.00
Strongly Agree
Agree Neither Agree nor Disagree
Disagree Strongly Disagree
0
10
20
30
40
5048.00
40.67
9.331.33 0.67
Training is Given Adequate Importance in the Organization.
Opinion
Perc
enta
ge
Interpretation
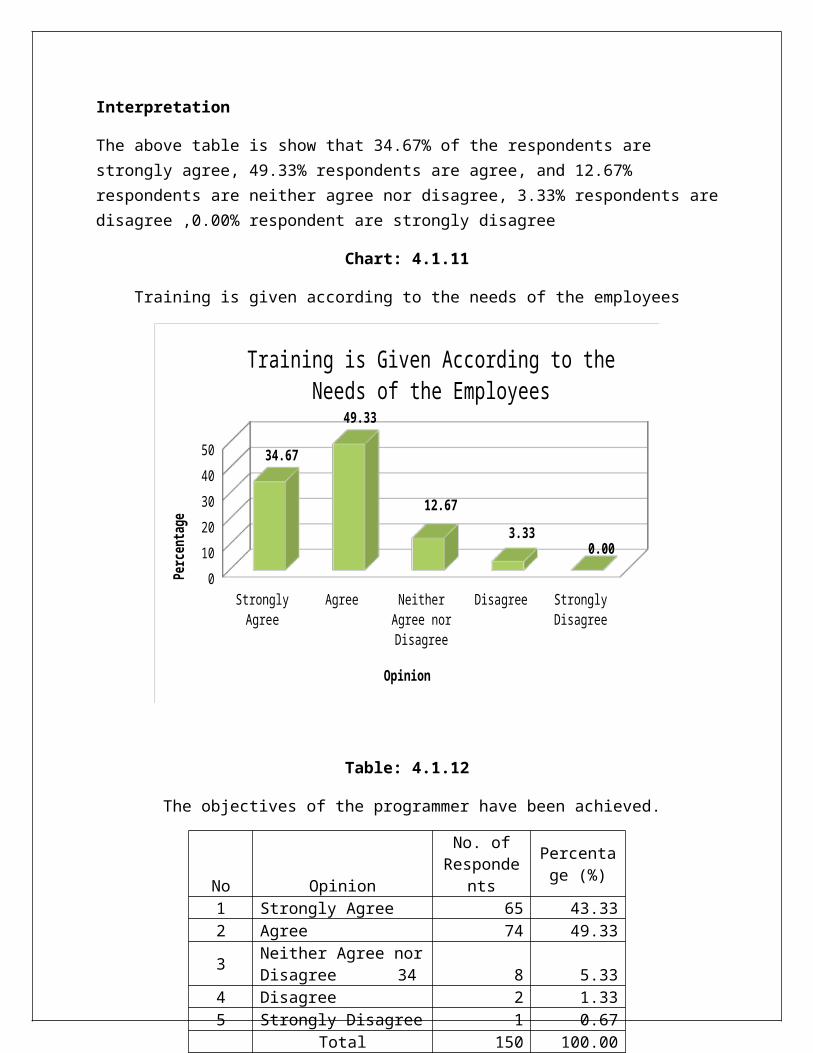
The above table is show that 34.67% of the respondents are strongly agree, 49.33% respondents are agree, and 12.67% respondents are neither agree nor disagree, 3.33% respondents aredisagree ,0.00% respondent are strongly disagree
Chart: 4.1.11
Training is given according to the needs of the employees
Strongly Agree
Agree Neither Agree nor Disagree
Disagree Strongly Disagree
01020304050 34.67
49.33
12.673.33
0.00
Training is Given According to the Needs of the Employees
Opinion
Perc
enta
ge
Table: 4.1.12
The objectives of the programmer have been achieved.
34
No Opinion
No. ofResponde
nts
Percentage (%)
1 Strongly Agree 65 43.332 Agree 74 49.33
3 Neither Agree norDisagree 8 5.33
4 Disagree 2 1.335 Strongly Disagree 1 0.67
Total 150 100.00
Interpretation
The above table is show that 43.33% of the respondents are strongly agree, 49.33% respondents are agree, and 5.33% respondents are neither agree nor disagree, 1.33% respondents aredisagree ,0.67% respondent are strongly disagree
Chart: 4.1.12
The objectives of the programmer have been achieved.
Strongly Agree
Agree Neither Agree nor Disagree
Disagree Strongly Disagree
01020304050
43.3349.33
5.33 1.33 0.67
The Objectives of the Programme Have Been Achieved
Opinion
Perc
enta
ge
Table: 4.1.13
Training develops self-reliance and motivation
35
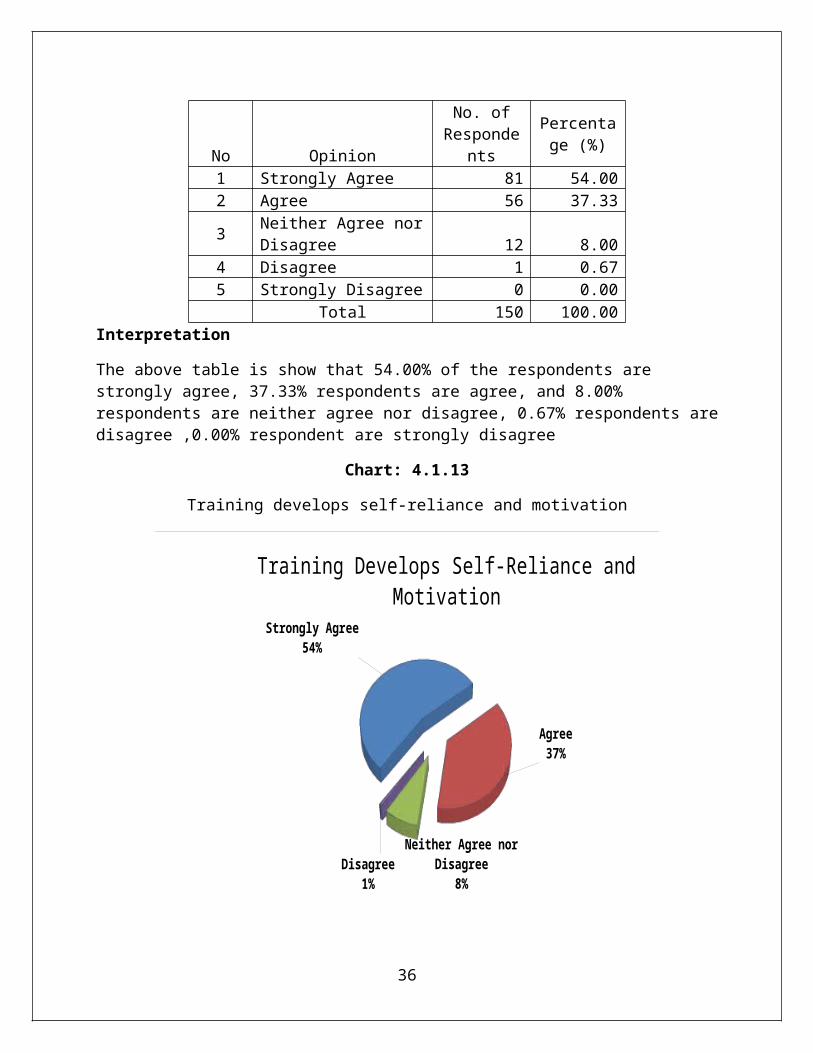
Interpretation
The above table is show that 54.00% of the respondents are strongly agree, 37.33% respondents are agree, and 8.00% respondents are neither agree nor disagree, 0.67% respondents aredisagree ,0.00% respondent are strongly disagree
Chart: 4.1.13
Training develops self-reliance and motivation
Strongly Agree54%
Agree37%
Neither Agree nor Disagree
8%Disagree
1%
Training Develops Self-Reliance and Motivation
36
No Opinion
No. ofResponde
nts
Percentage (%)
1 Strongly Agree 81 54.002 Agree 56 37.33
3 Neither Agree norDisagree 12 8.00
4 Disagree 1 0.675 Strongly Disagree 0 0.00
Total 150 100.00
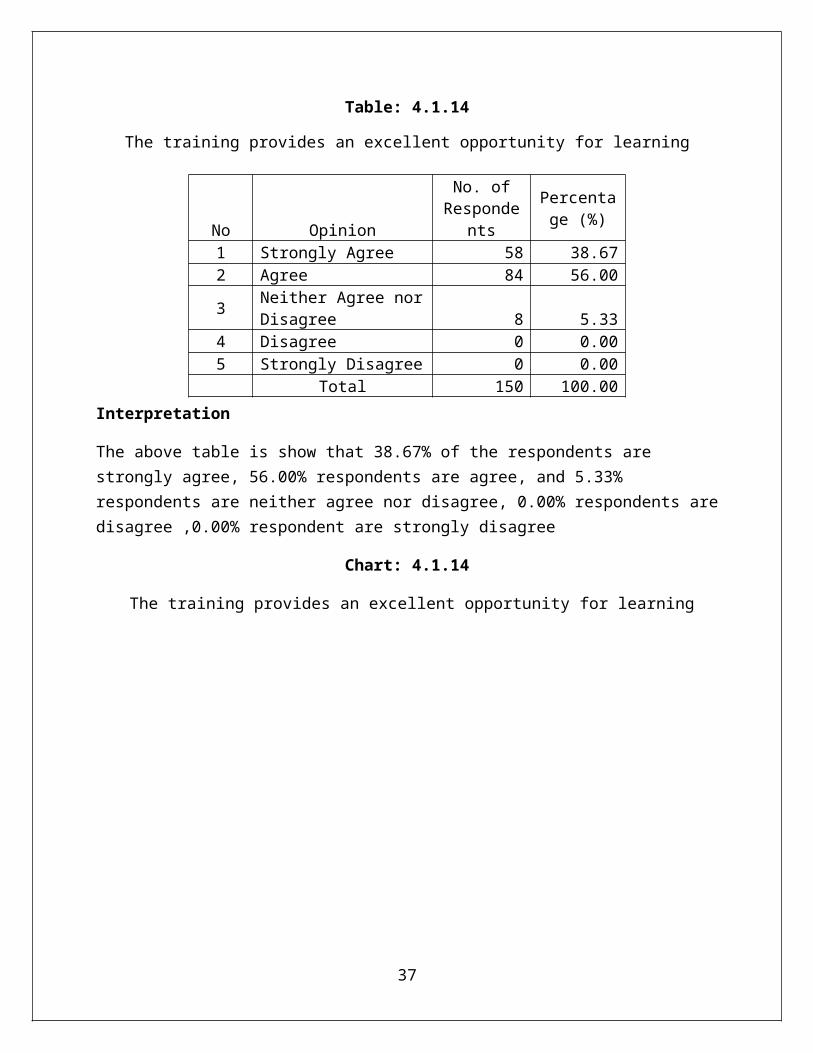
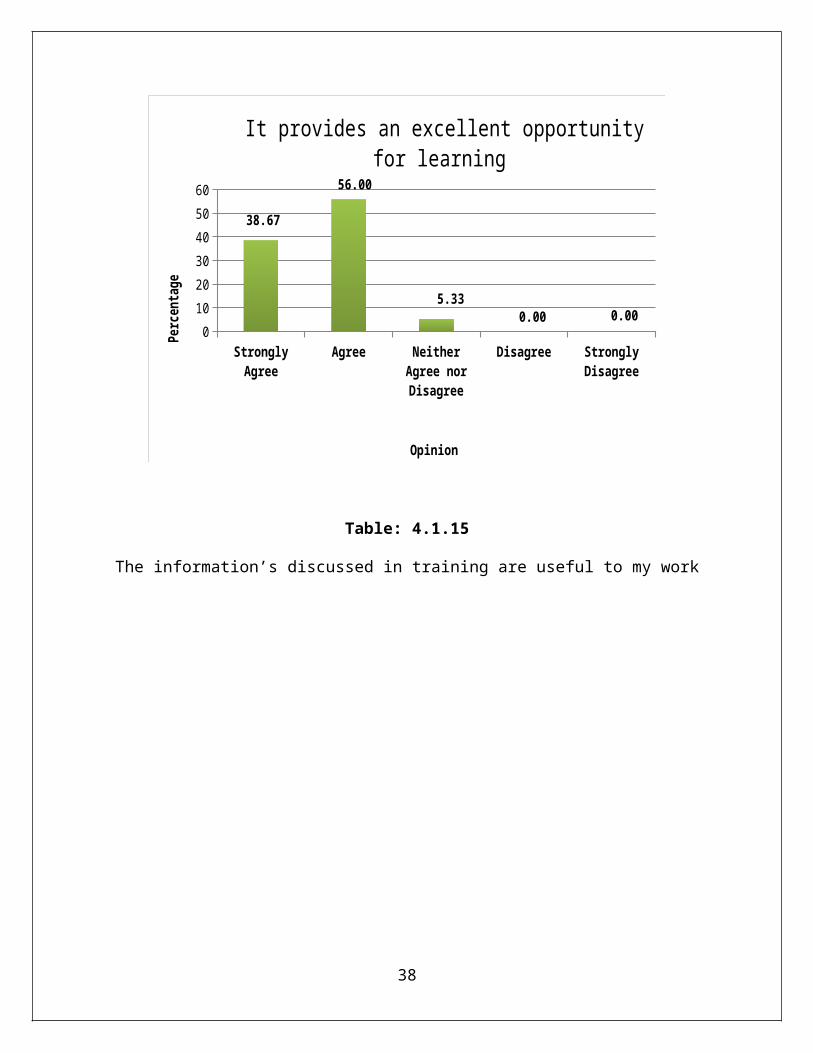
Table: 4.1.14
The training provides an excellent opportunity for learning
Interpretation
The above table is show that 38.67% of the respondents are strongly agree, 56.00% respondents are agree, and 5.33% respondents are neither agree nor disagree, 0.00% respondents aredisagree ,0.00% respondent are strongly disagree
Chart: 4.1.14
The training provides an excellent opportunity for learning
37
No Opinion
No. ofResponde
nts
Percentage (%)
1 Strongly Agree 58 38.672 Agree 84 56.00
3 Neither Agree norDisagree 8 5.33
4 Disagree 0 0.005 Strongly Disagree 0 0.00
Total 150 100.00
Strongly Agree
Agree Neither Agree nor Disagree
Disagree Strongly Disagree
0102030405060
38.67
56.00
5.330.00 0.00
It provides an excellent opportunity for learning
Opinion
Perc
entage
Table: 4.1.15
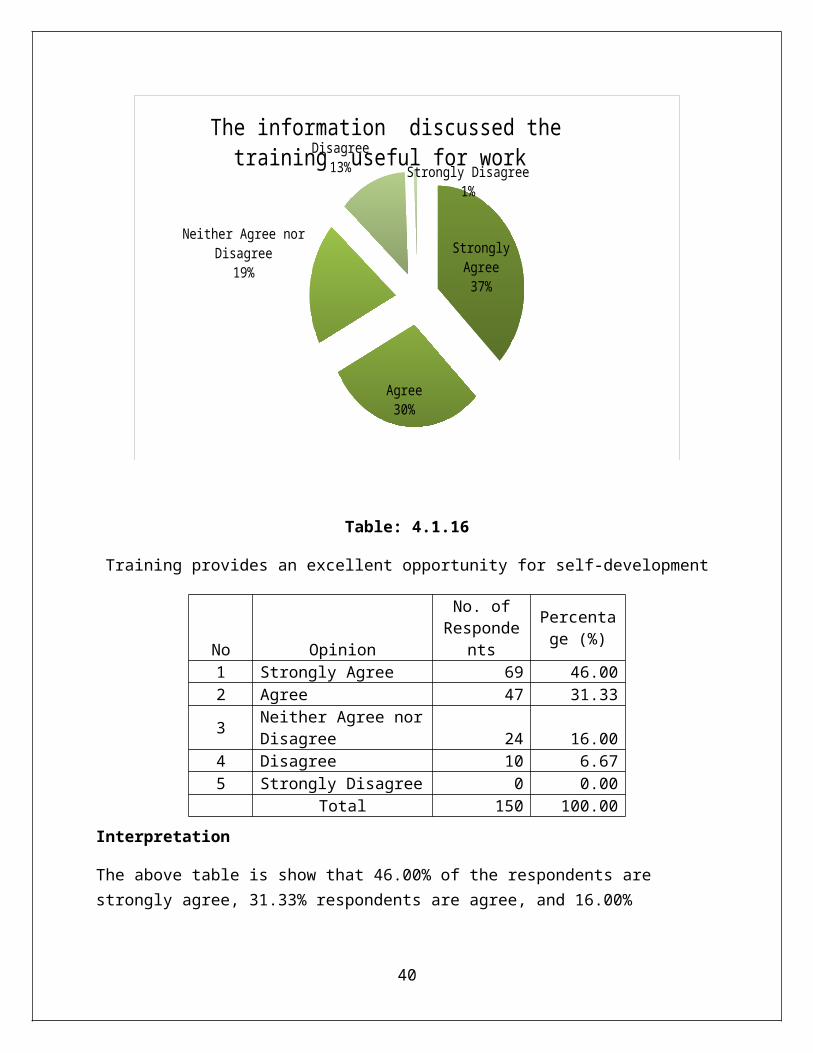
The information’s discussed in training are useful to my work
38
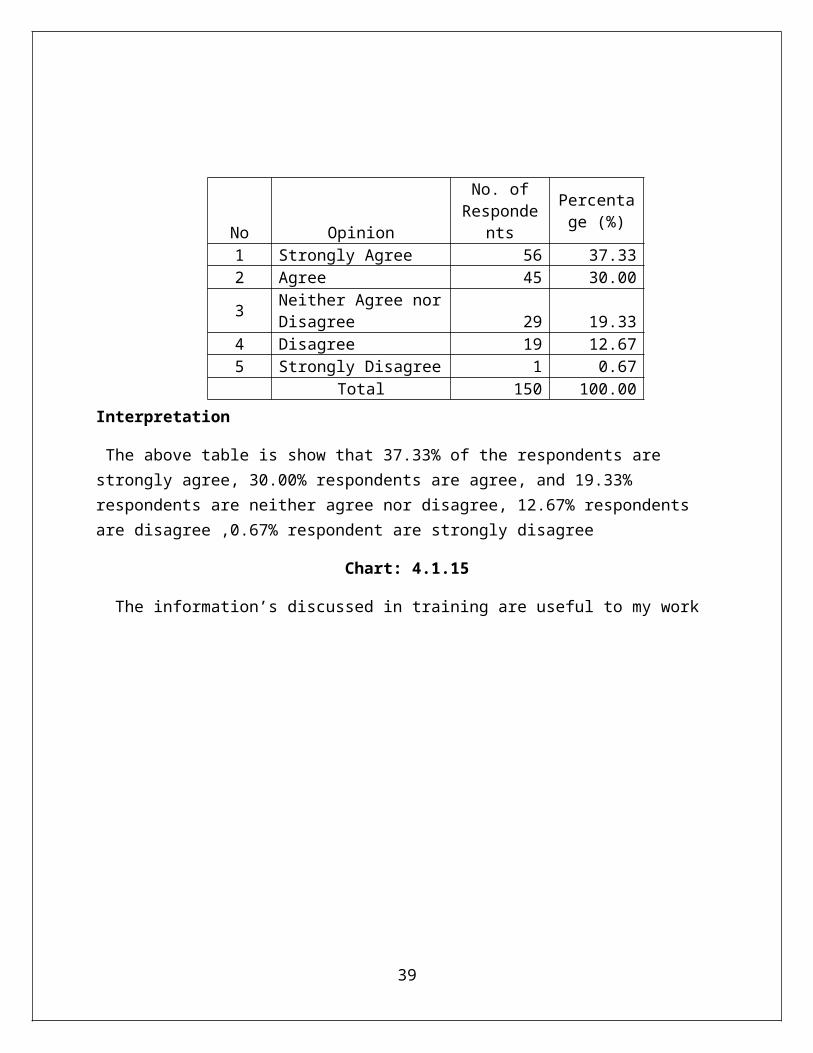
Interpretation
The above table is show that 37.33% of the respondents are strongly agree, 30.00% respondents are agree, and 19.33% respondents are neither agree nor disagree, 12.67% respondents are disagree ,0.67% respondent are strongly disagree
Chart: 4.1.15
The information’s discussed in training are useful to my work
39
No Opinion
No. ofResponde
nts
Percentage (%)
1 Strongly Agree 56 37.332 Agree 45 30.00
3 Neither Agree norDisagree 29 19.33
4 Disagree 19 12.675 Strongly Disagree 1 0.67
Total 150 100.00
Strongly Agree37%
Agree30%
Neither Agree nor Disagree
19%
Disagree13% Strongly Disagree
1%
The information discussed the training useful for work
Table: 4.1.16
Training provides an excellent opportunity for self-development
Interpretation
The above table is show that 46.00% of the respondents are strongly agree, 31.33% respondents are agree, and 16.00%
40
No Opinion
No. ofResponde
nts
Percentage (%)
1 Strongly Agree 69 46.002 Agree 47 31.33
3 Neither Agree norDisagree 24 16.00
4 Disagree 10 6.675 Strongly Disagree 0 0.00
Total 150 100.00
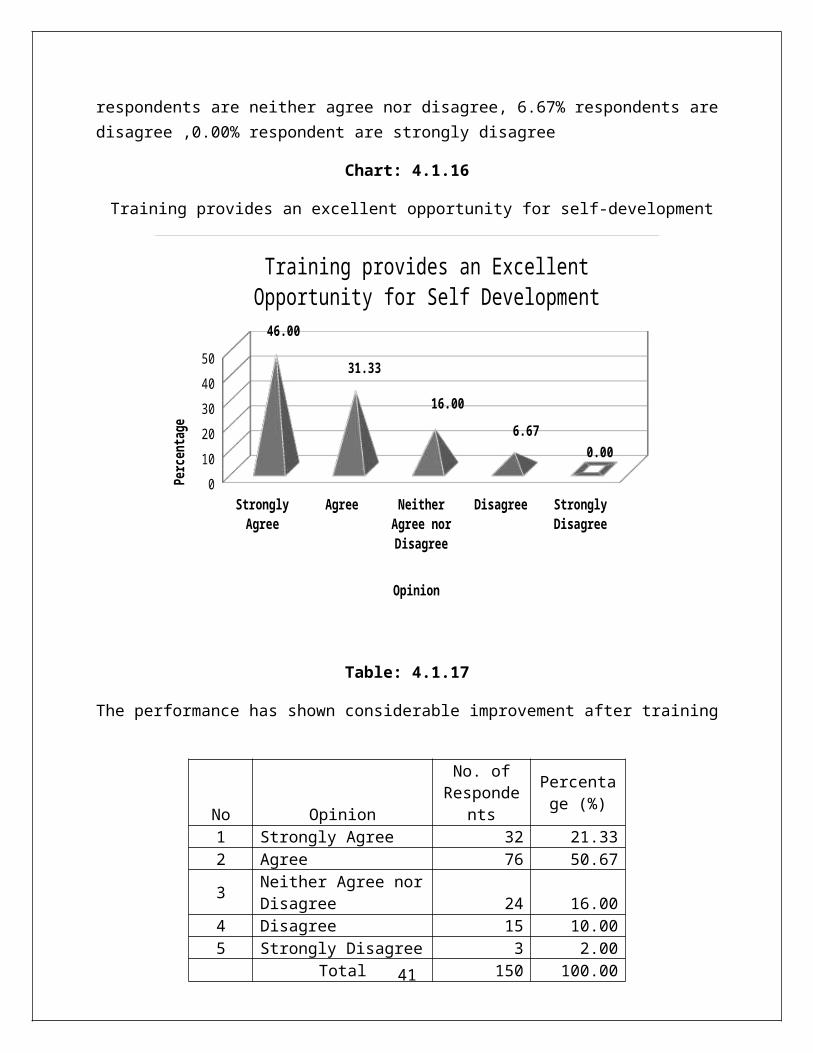
respondents are neither agree nor disagree, 6.67% respondents aredisagree ,0.00% respondent are strongly disagree
Chart: 4.1.16
Training provides an excellent opportunity for self-development
Strongly Agree
Agree Neither Agree nor Disagree
Disagree Strongly Disagree
01020304050
46.00
31.33
16.006.67
0.00
Training provides an Excellent Opportunity for Self Development
Opinion
Perc
entage
Table: 4.1.17
The performance has shown considerable improvement after training
41
No Opinion
No. ofResponde
nts
Percentage (%)
1 Strongly Agree 32 21.332 Agree 76 50.67
3 Neither Agree norDisagree 24 16.00
4 Disagree 15 10.005 Strongly Disagree 3 2.00
Total 150 100.00
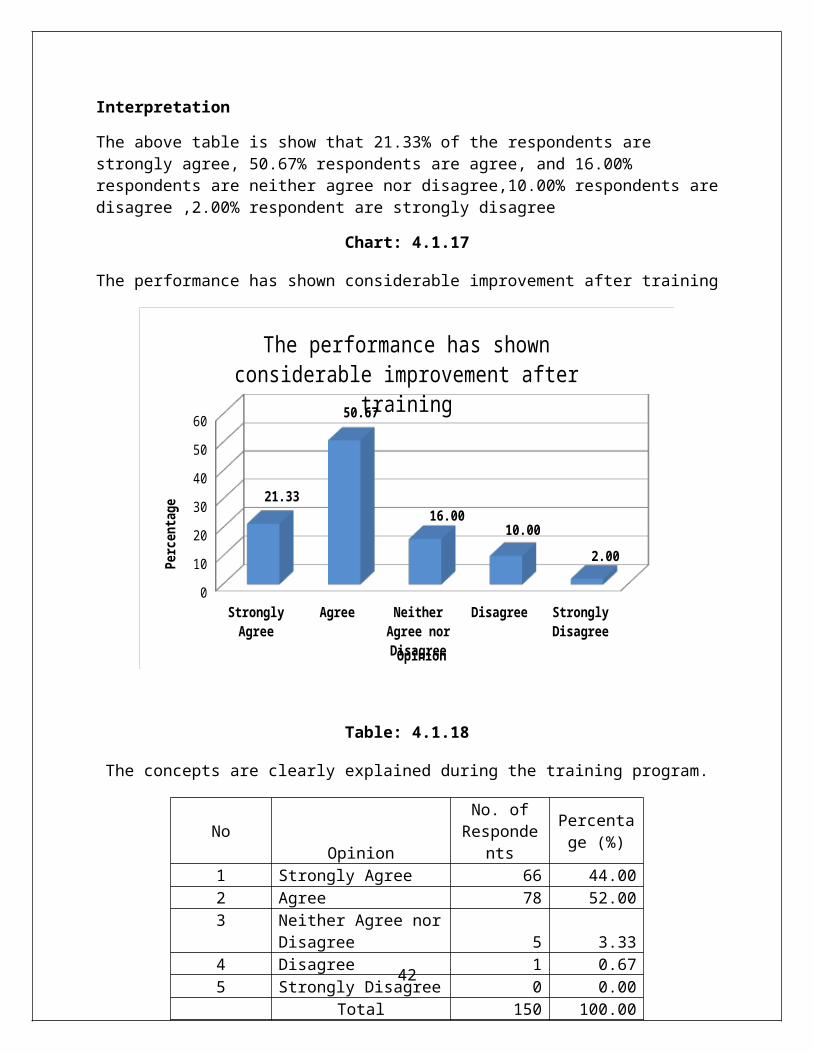
Interpretation
The above table is show that 21.33% of the respondents are strongly agree, 50.67% respondents are agree, and 16.00% respondents are neither agree nor disagree,10.00% respondents aredisagree ,2.00% respondent are strongly disagree
Chart: 4.1.17
The performance has shown considerable improvement after training
Strongly Agree
Agree Neither Agree nor Disagree
Disagree Strongly Disagree
0102030405060
21.33
50.67
16.0010.00
2.00
The performance has shown considerable improvement after
training
Opinion
Perc
entage
Table: 4.1.18
The concepts are clearly explained during the training program.
42
NoOpinion
No. ofResponde
nts
Percentage (%)
1 Strongly Agree 66 44.002 Agree 78 52.003 Neither Agree nor
Disagree 5 3.334 Disagree 1 0.675 Strongly Disagree 0 0.00
Total 150 100.00
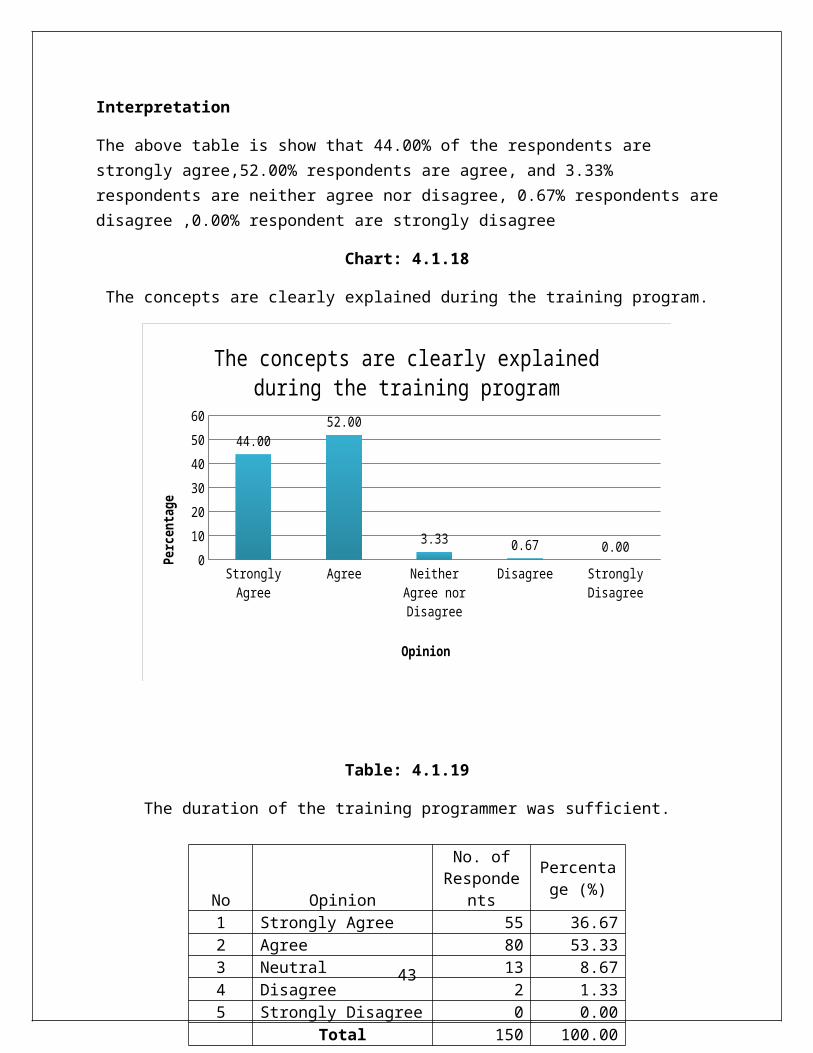
Interpretation
The above table is show that 44.00% of the respondents are strongly agree,52.00% respondents are agree, and 3.33% respondents are neither agree nor disagree, 0.67% respondents aredisagree ,0.00% respondent are strongly disagree
Chart: 4.1.18
The concepts are clearly explained during the training program.
Strongly Agree
Agree Neither Agree nor Disagree
Disagree Strongly Disagree
0102030405060
44.0052.00
3.33 0.67 0.00
The concepts are clearly explained during the training program
Opinion
Perc
enta
ge
Table: 4.1.19
The duration of the training programmer was sufficient.
43
No Opinion
No. ofResponde
nts
Percentage (%)
1 Strongly Agree 55 36.672 Agree 80 53.333 Neutral 13 8.674 Disagree 2 1.335 Strongly Disagree 0 0.00
Total 150 100.00
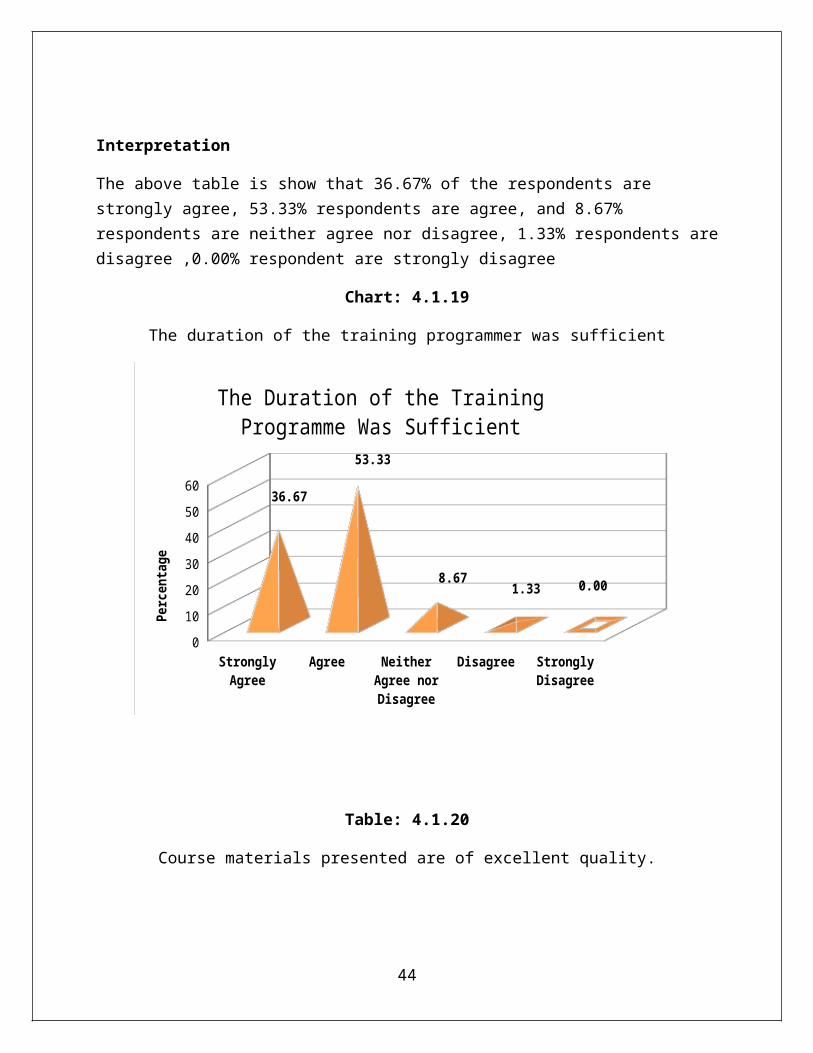
Interpretation
The above table is show that 36.67% of the respondents are strongly agree, 53.33% respondents are agree, and 8.67% respondents are neither agree nor disagree, 1.33% respondents aredisagree ,0.00% respondent are strongly disagree
Chart: 4.1.19
The duration of the training programmer was sufficient
Strongly Agree
Agree Neither Agree nor Disagree
Disagree Strongly Disagree
0102030405060 36.67
53.33
8.67 1.33 0.00
The Duration of the Training Programme Was Sufficient
Percen
tage
Table: 4.1.20
Course materials presented are of excellent quality.
44
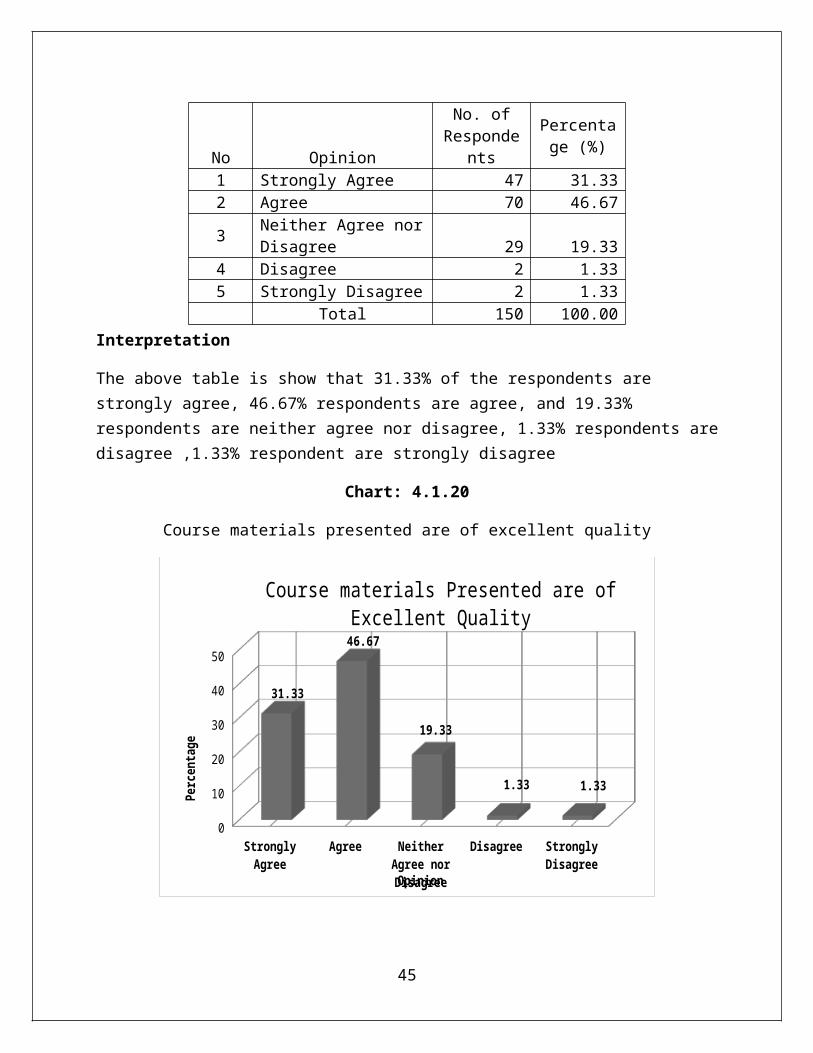
Interpretation
The above table is show that 31.33% of the respondents are strongly agree, 46.67% respondents are agree, and 19.33% respondents are neither agree nor disagree, 1.33% respondents aredisagree ,1.33% respondent are strongly disagree
Chart: 4.1.20
Course materials presented are of excellent quality
Strongly Agree
Agree Neither Agree nor Disagree
Disagree Strongly Disagree
0
10
20
30
40
50
31.33
46.67
19.33
1.33 1.33
Course materials Presented are of Excellent Quality
Opinion
Perc
enta
ge
45
No Opinion
No. ofResponde
nts
Percentage (%)
1 Strongly Agree 47 31.332 Agree 70 46.67
3 Neither Agree norDisagree 29 19.33
4 Disagree 2 1.335 Strongly Disagree 2 1.33
Total 150 100.00

Table: 4.1.21
Satisfied with the training environment provided by the company
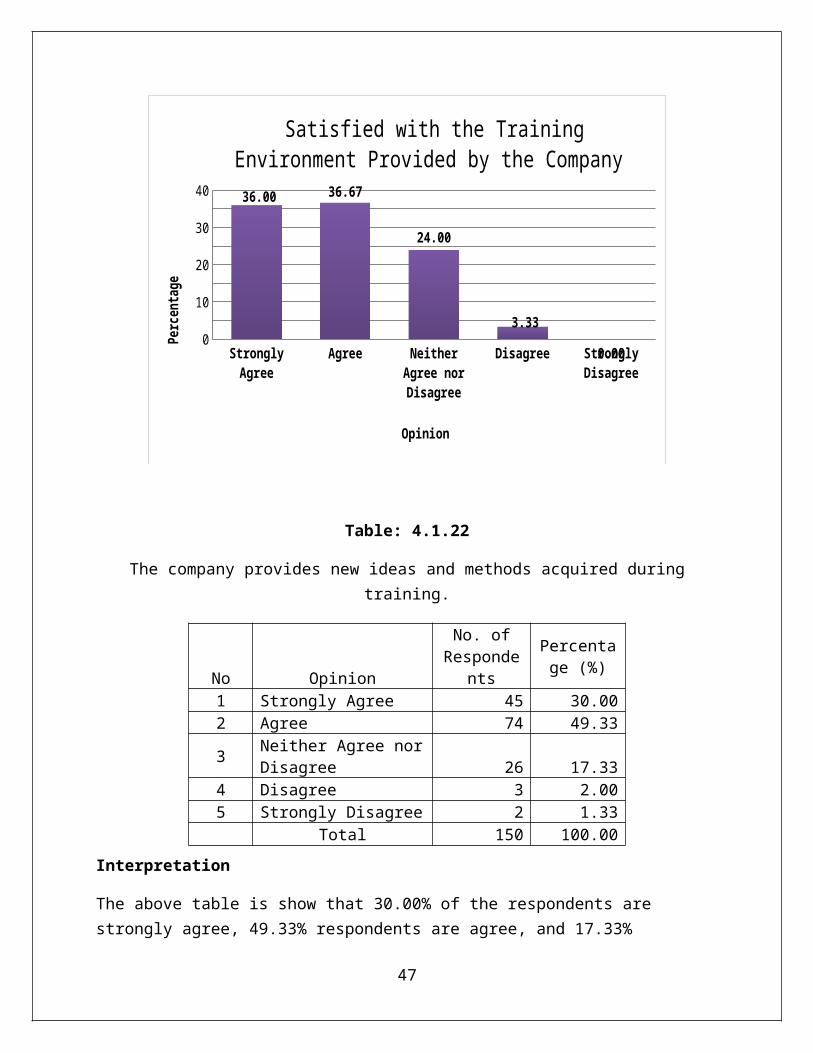
Interpretation
The above table is show that 36.00% of the respondents are strongly agree,36.67% respondents are agree, and 24.00% respondents are neither agree nor disagree, 3.33% respondents aredisagree ,0.00% respondent are strongly disagree
Chart: 4.1.21
Satisfied with the training environment provided by the company
46
No Opinion
No. ofResponde
nts
Percentage (%)
1 Strongly Agree 54 36.002 Agree 55 36.67
3 Neither Agree norDisagree 36 24.00
4 Disagree 5 3.335 Strongly Disagree 0 0.00
Total 150 100.00
Strongly Agree
Agree Neither Agree nor Disagree
Disagree Strongly Disagree
0
10
20
30
40 36.00 36.67
24.00
3.33
0.00
Satisfied with the Training Environment Provided by the Company
Opinion
Percentage
Table: 4.1.22
The company provides new ideas and methods acquired duringtraining.
Interpretation
The above table is show that 30.00% of the respondents are strongly agree, 49.33% respondents are agree, and 17.33%
47
No Opinion
No. ofResponde
nts
Percentage (%)
1 Strongly Agree 45 30.002 Agree 74 49.33
3 Neither Agree norDisagree 26 17.33
4 Disagree 3 2.005 Strongly Disagree 2 1.33
Total 150 100.00
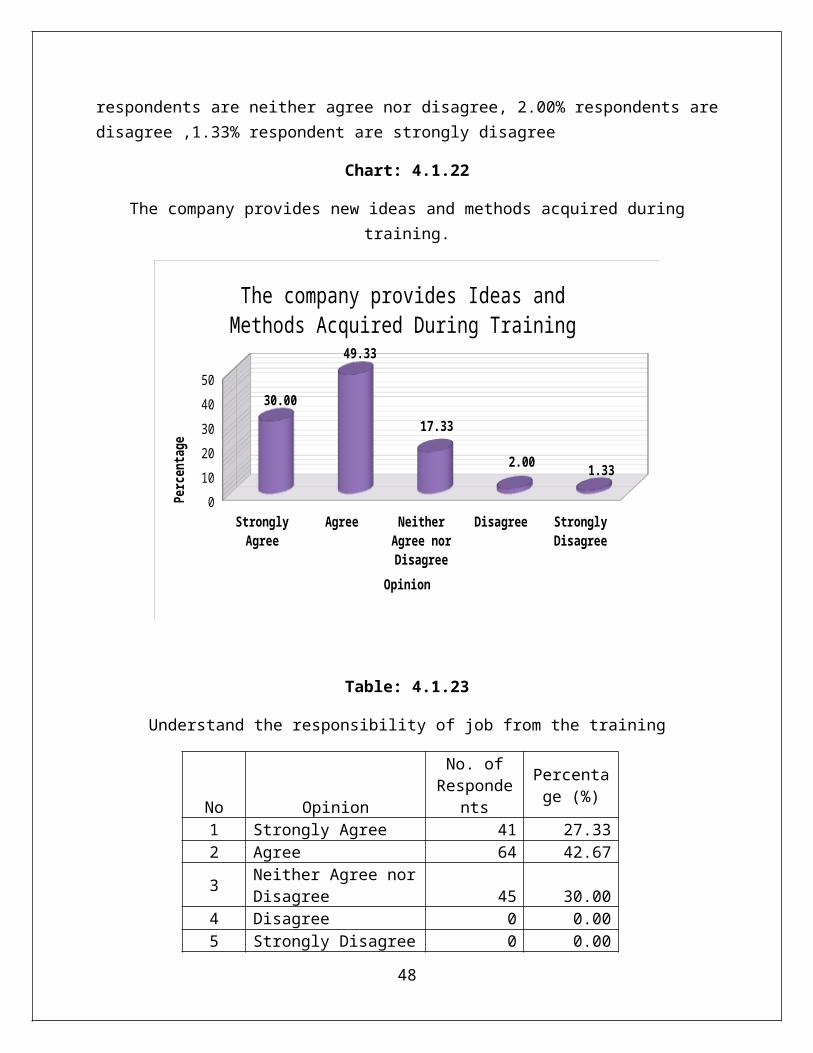
respondents are neither agree nor disagree, 2.00% respondents aredisagree ,1.33% respondent are strongly disagree
Chart: 4.1.22
The company provides new ideas and methods acquired duringtraining.
Strongly Agree
Agree Neither Agree nor Disagree
Disagree Strongly Disagree
01020304050
30.00
49.33
17.33
2.00 1.33
The company provides Ideas and Methods Acquired During Training
Opinion
Perc
enta
ge
Table: 4.1.23
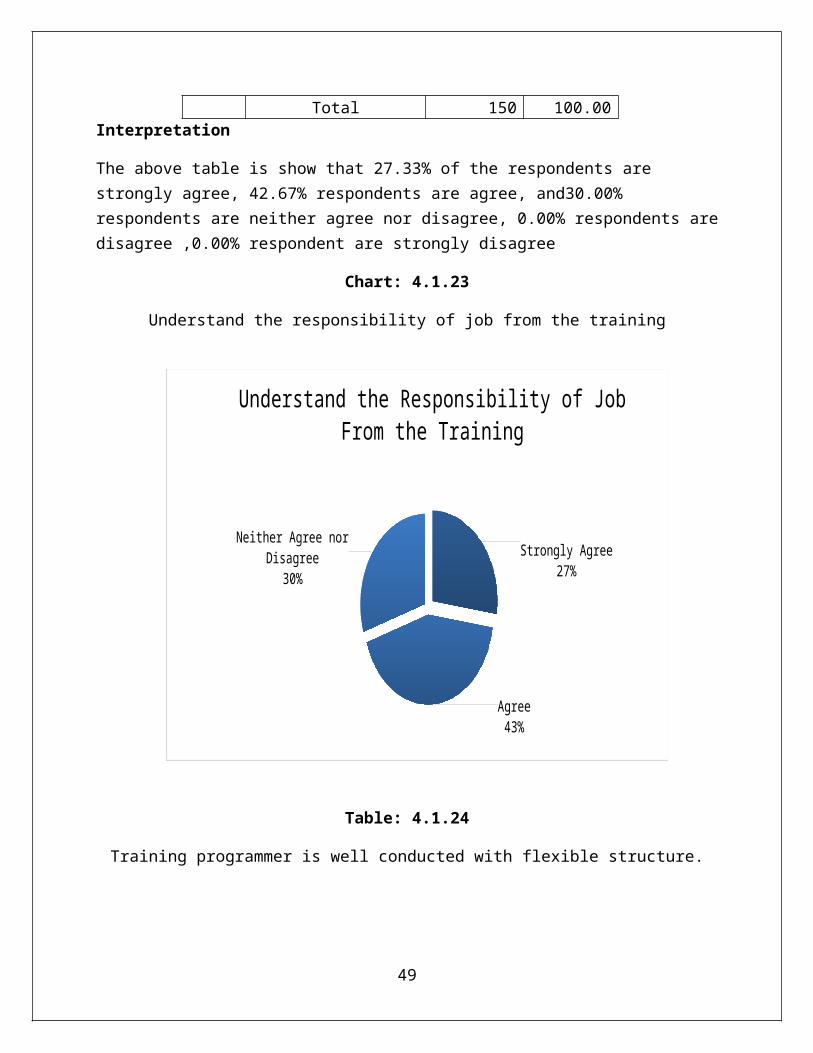
Understand the responsibility of job from the training
No Opinion
No. ofResponde
nts
Percentage (%)
1 Strongly Agree 41 27.332 Agree 64 42.67
3 Neither Agree norDisagree 45 30.00
4 Disagree 0 0.005 Strongly Disagree 0 0.00
48
Total 150 100.00Interpretation
The above table is show that 27.33% of the respondents are strongly agree, 42.67% respondents are agree, and30.00% respondents are neither agree nor disagree, 0.00% respondents aredisagree ,0.00% respondent are strongly disagree
Chart: 4.1.23
Understand the responsibility of job from the training
Table: 4.1.24
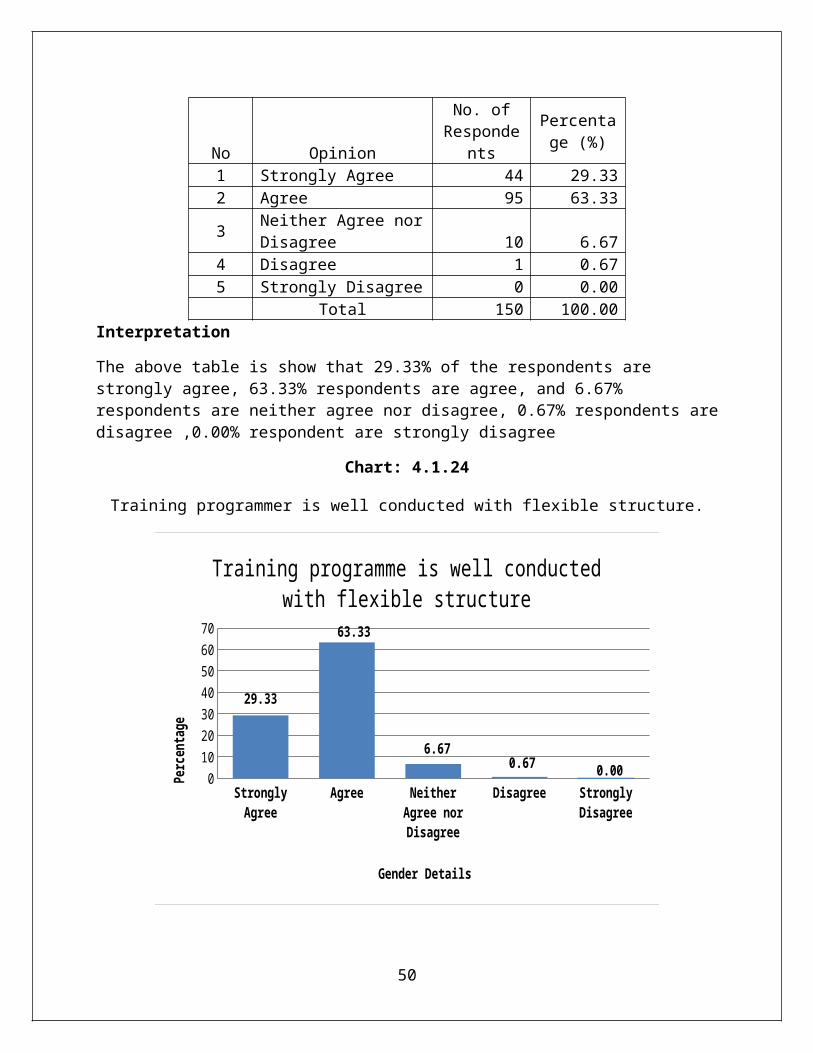
Training programmer is well conducted with flexible structure.
49
Strongly Agree27%
Agree43%
Neither Agree nor Disagree
30%
Understand the Responsibility of Job From the Training
Interpretation
The above table is show that 29.33% of the respondents are strongly agree, 63.33% respondents are agree, and 6.67% respondents are neither agree nor disagree, 0.67% respondents aredisagree ,0.00% respondent are strongly disagree
Chart: 4.1.24
Training programmer is well conducted with flexible structure.
Strongly Agree
Agree Neither Agree nor Disagree
Disagree Strongly Disagree
010203040506070
29.33
63.33
6.670.67 0.00
Training programme is well conducted with flexible structure
Gender Details
Perc
entage
50
No Opinion
No. ofResponde
nts
Percentage (%)
1 Strongly Agree 44 29.332 Agree 95 63.33
3 Neither Agree norDisagree 10 6.67
4 Disagree 1 0.675 Strongly Disagree 0 0.00
Total 150 100.00
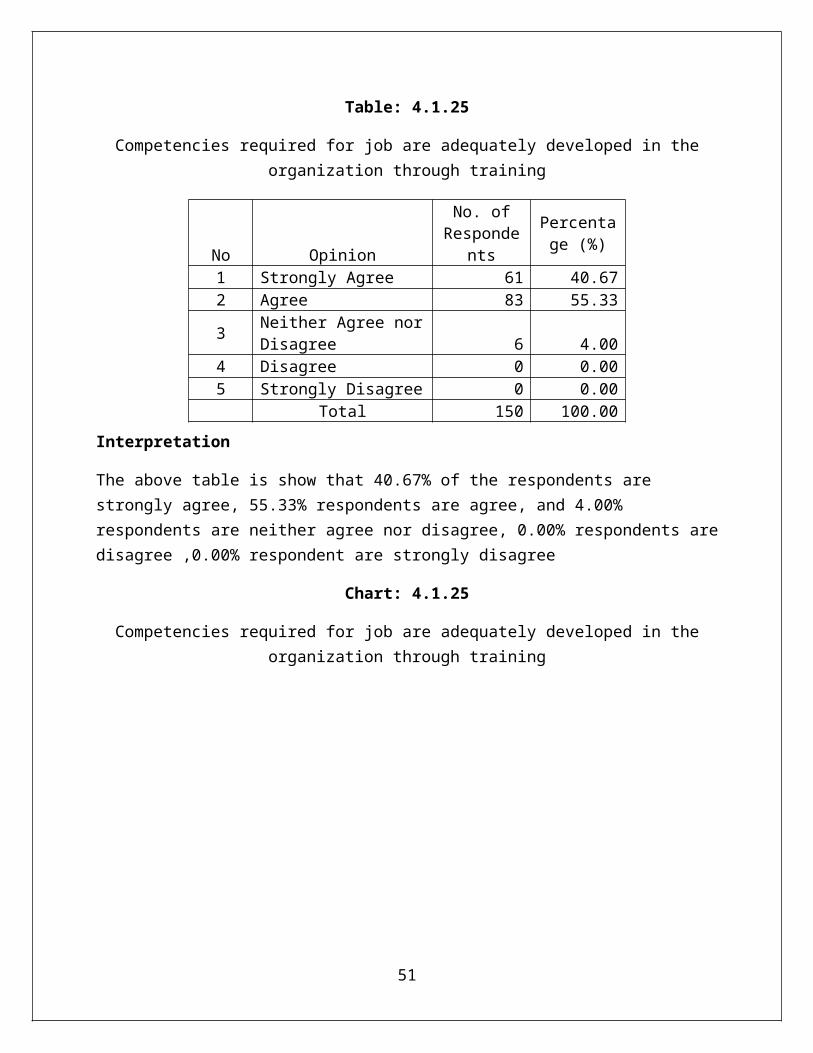
Table: 4.1.25
Competencies required for job are adequately developed in theorganization through training
Interpretation
The above table is show that 40.67% of the respondents are strongly agree, 55.33% respondents are agree, and 4.00% respondents are neither agree nor disagree, 0.00% respondents aredisagree ,0.00% respondent are strongly disagree
Chart: 4.1.25
Competencies required for job are adequately developed in theorganization through training
51
No Opinion
No. ofResponde
nts
Percentage (%)
1 Strongly Agree 61 40.672 Agree 83 55.33
3 Neither Agree norDisagree 6 4.00
4 Disagree 0 0.005 Strongly Disagree 0 0.00
Total 150 100.00
Strongly Agree
Agree Neither Agree nor Disagree
Disagree Strongly Disagree
0
20
40
6040.67
55.33
4.00 0.00 0.00
Competencies required for job are adequately developed in the
organization through training
YEARS
Percen
tage
Table: 4.1.26
Senior managers are eager to help their junior’s developmentthrough training.
Interpretation
The above table is show that 32.67% of the respondents are strongly agree, 39.33% respondents are agree, and 23.33% respondents are neither agree nor disagree, 4.67% respondents aredisagree ,0.00% respondent are strongly disagree
52
No Opinion
No. ofResponde
nts
Percentage (%)
1 Strongly Agree 49 32.672 Agree 59 39.33
3 Neither Agree norDisagree 35 23.33
4 Disagree 7 4.675 Strongly Disagree 0 0.00
Total 150 100.00
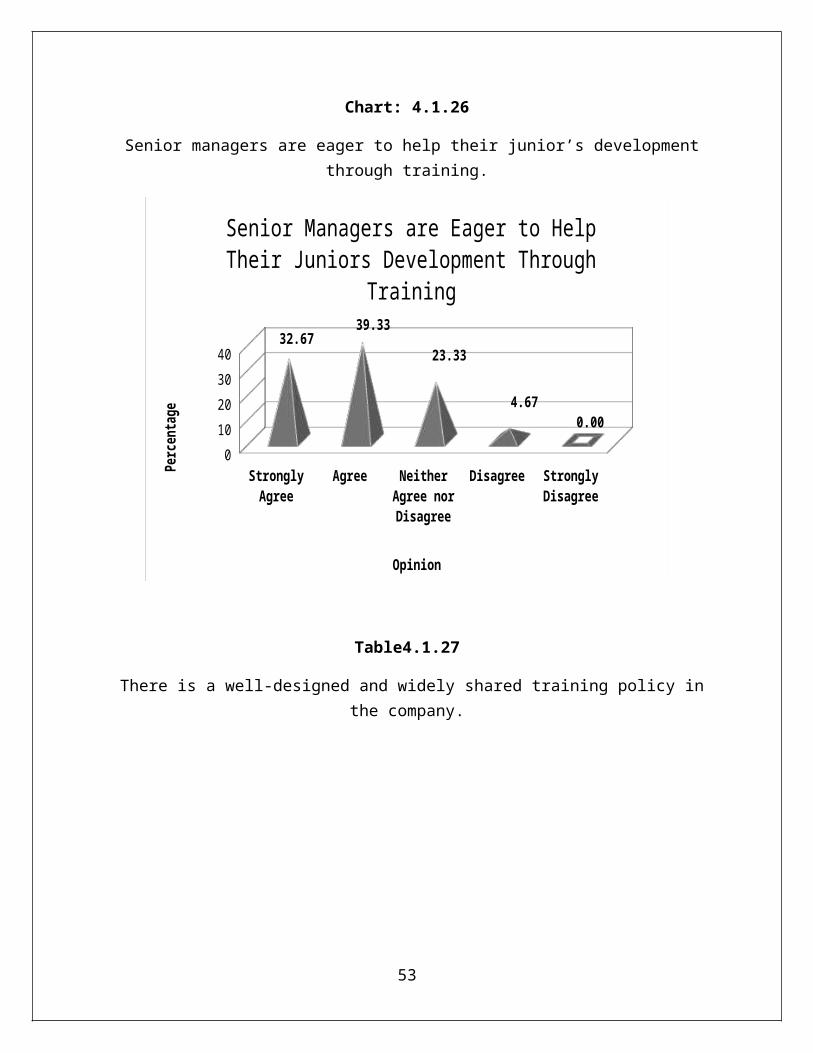
Chart: 4.1.26
Senior managers are eager to help their junior’s developmentthrough training.
Strongly Agree
Agree Neither Agree nor Disagree
Disagree Strongly Disagree
010203040
32.6739.33
23.33
4.670.00
Senior Managers are Eager to Help Their Juniors Development Through
Training
Opinion
Perc
enta
ge
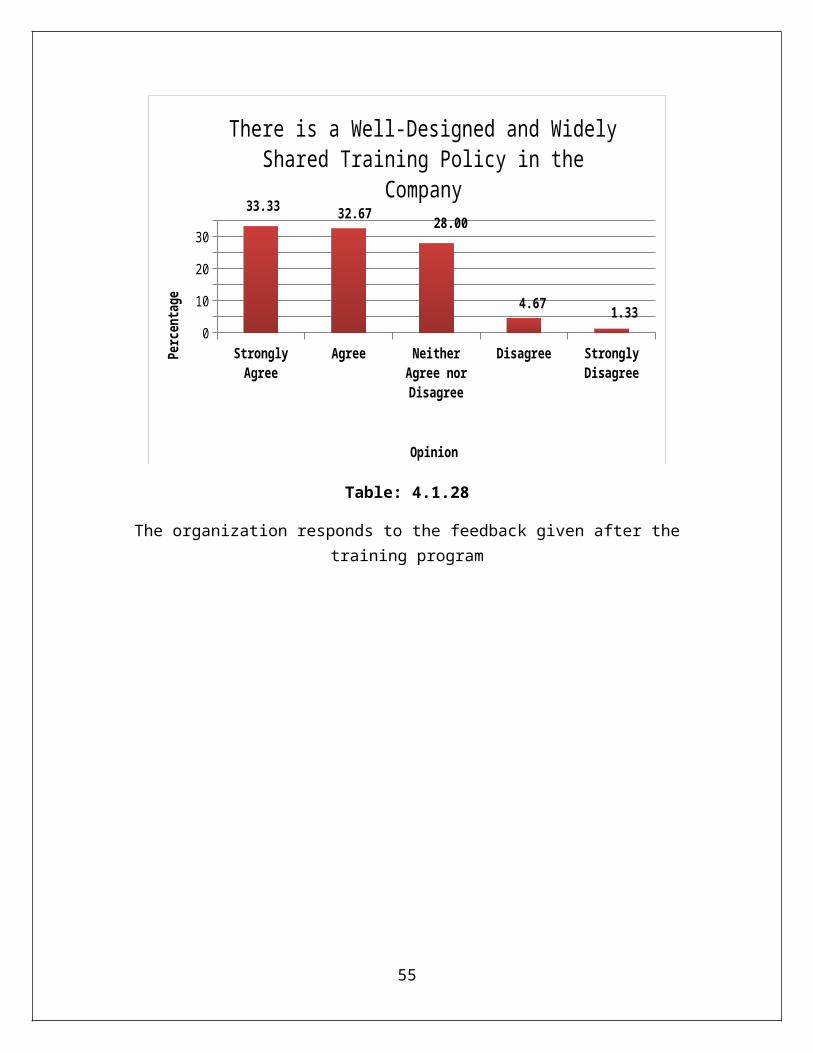
Table4.1.27
There is a well-designed and widely shared training policy inthe company.
53
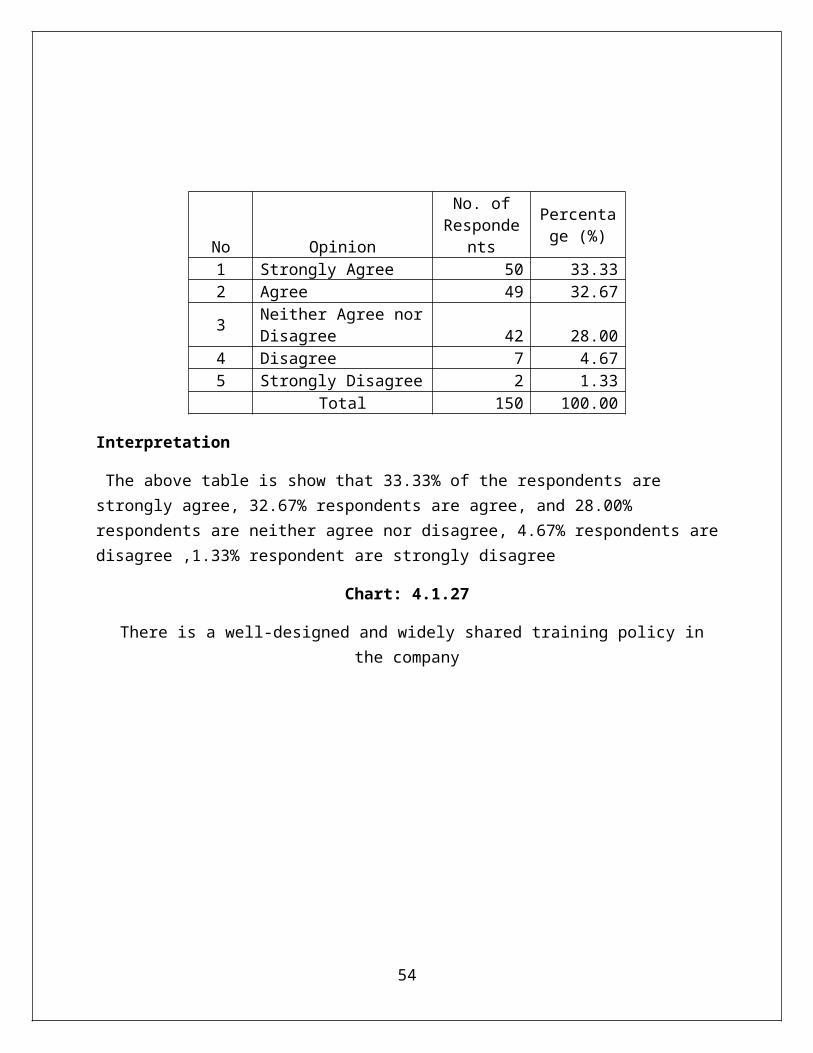
Interpretation
The above table is show that 33.33% of the respondents are strongly agree, 32.67% respondents are agree, and 28.00% respondents are neither agree nor disagree, 4.67% respondents aredisagree ,1.33% respondent are strongly disagree
Chart: 4.1.27
There is a well-designed and widely shared training policy inthe company
54
No Opinion
No. ofResponde
nts
Percentage (%)
1 Strongly Agree 50 33.332 Agree 49 32.67
3 Neither Agree norDisagree 42 28.00
4 Disagree 7 4.675 Strongly Disagree 2 1.33
Total 150 100.00
Strongly Agree
Agree Neither Agree nor Disagree
Disagree Strongly Disagree
0
10
20
30
33.33 32.67 28.00
4.67 1.33
There is a Well-Designed and Widely Shared Training Policy in the
Company
Opinion
Percentage
Table: 4.1.28
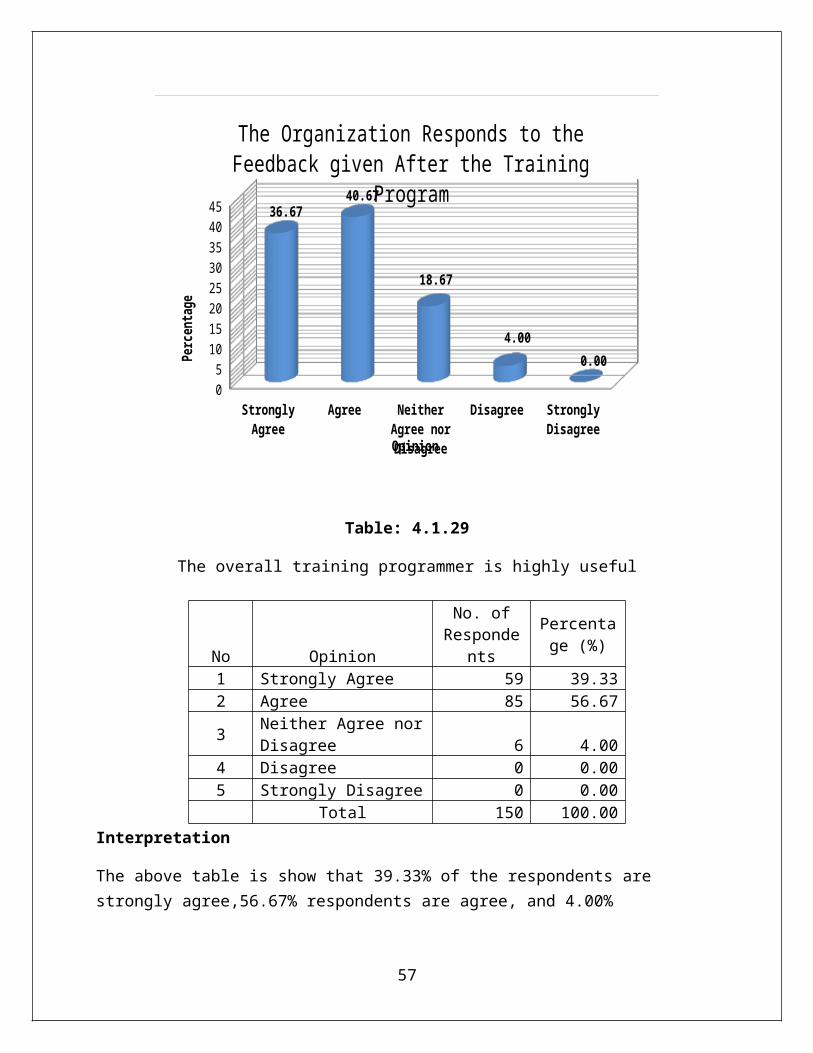
The organization responds to the feedback given after thetraining program
55
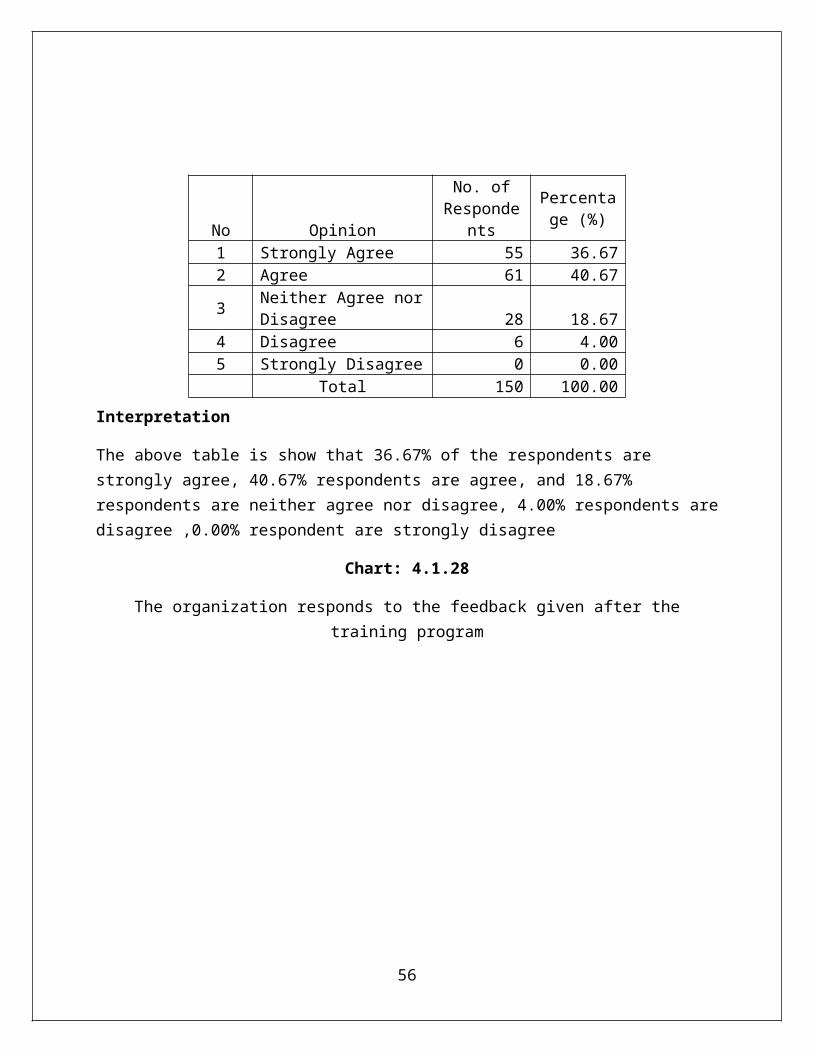
Interpretation
The above table is show that 36.67% of the respondents are strongly agree, 40.67% respondents are agree, and 18.67% respondents are neither agree nor disagree, 4.00% respondents aredisagree ,0.00% respondent are strongly disagree
Chart: 4.1.28
The organization responds to the feedback given after thetraining program
56
No Opinion
No. ofResponde
nts
Percentage (%)
1 Strongly Agree 55 36.672 Agree 61 40.67
3 Neither Agree norDisagree 28 18.67
4 Disagree 6 4.005 Strongly Disagree 0 0.00
Total 150 100.00
Strongly Agree
Agree Neither Agree nor Disagree
Disagree Strongly Disagree
051015202530354045 36.67
40.67
18.67
4.000.00
The Organization Responds to the Feedback given After the Training
Program
Opinion
Perc
entage
Table: 4.1.29
The overall training programmer is highly useful
Interpretation
The above table is show that 39.33% of the respondents are strongly agree,56.67% respondents are agree, and 4.00%
57
No Opinion
No. ofResponde
nts
Percentage (%)
1 Strongly Agree 59 39.332 Agree 85 56.67
3 Neither Agree norDisagree 6 4.00
4 Disagree 0 0.005 Strongly Disagree 0 0.00
Total 150 100.00
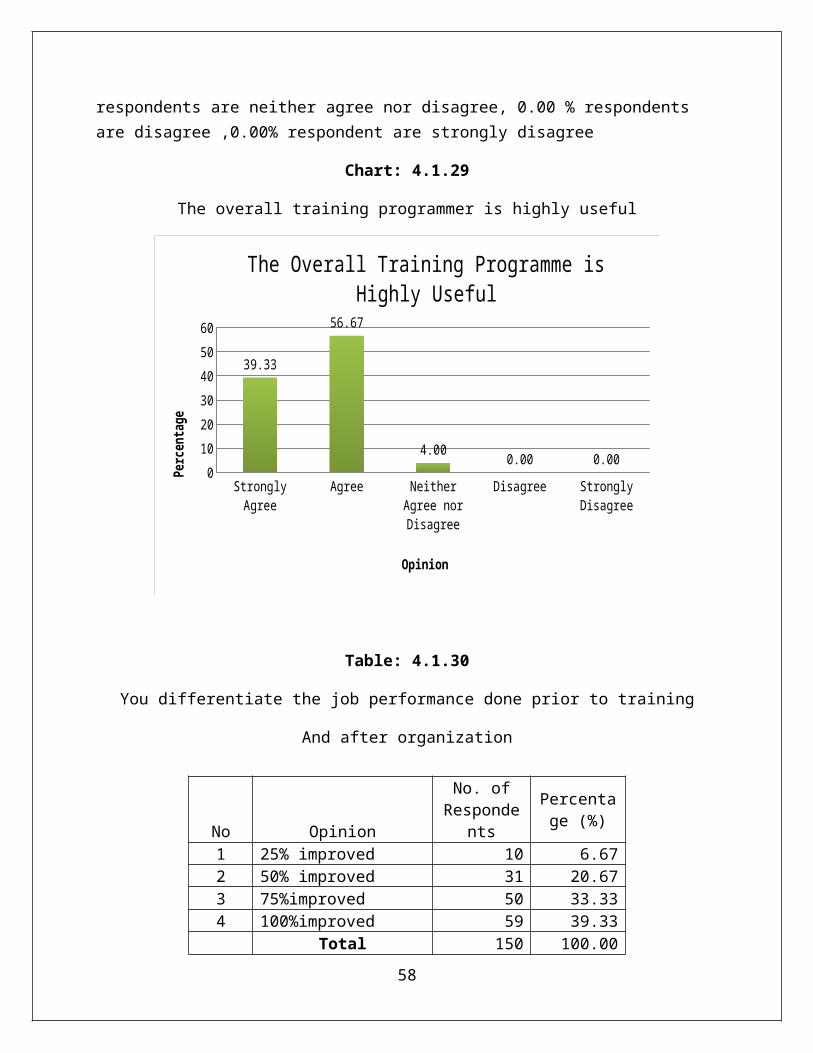
respondents are neither agree nor disagree, 0.00 % respondents are disagree ,0.00% respondent are strongly disagree
Chart: 4.1.29
The overall training programmer is highly useful
Strongly Agree
Agree Neither Agree nor Disagree
Disagree Strongly Disagree
0102030405060
39.33
56.67
4.00 0.00 0.00
The Overall Training Programme is Highly Useful
Opinion
Perc
enta
ge
Table: 4.1.30
You differentiate the job performance done prior to training
And after organization
58
No Opinion
No. ofResponde
nts
Percentage (%)
1 25% improved 10 6.672 50% improved 31 20.673 75%improved 50 33.334 100%improved 59 39.33
Total 150 100.00
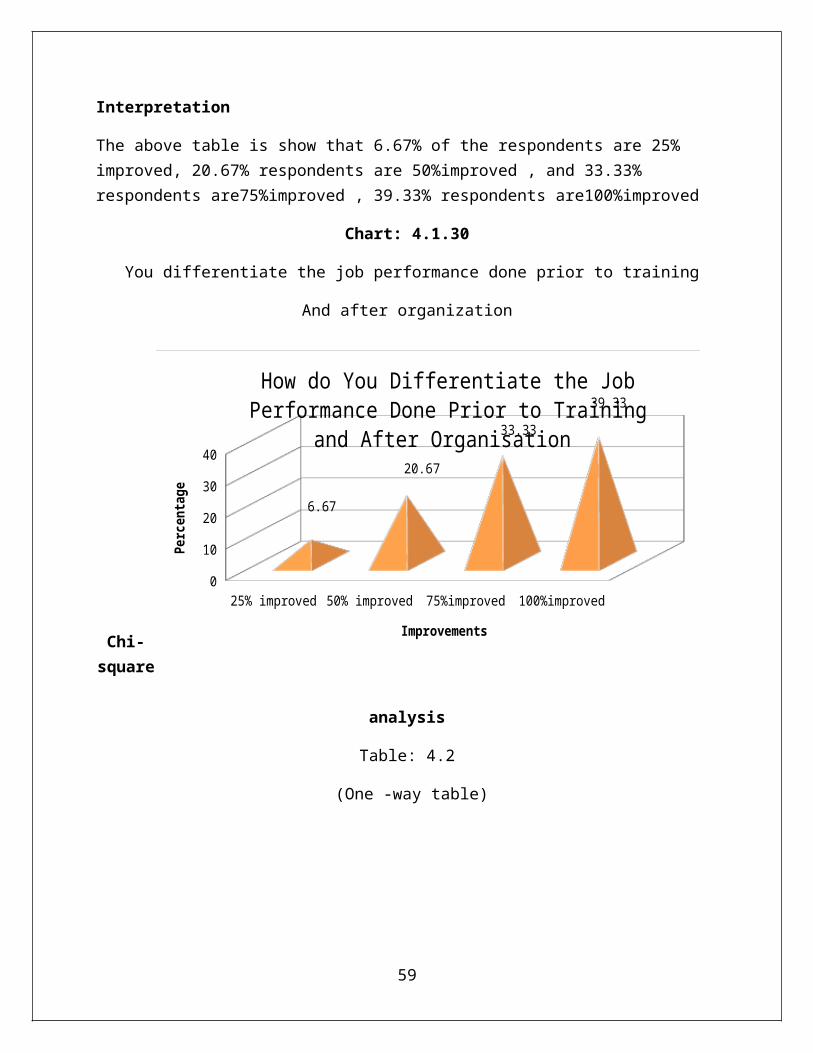
Interpretation
The above table is show that 6.67% of the respondents are 25% improved, 20.67% respondents are 50%improved , and 33.33% respondents are75%improved , 39.33% respondents are100%improved
Chart: 4.1.30
You differentiate the job performance done prior to training
And after organization
Chi-square
analysis
Table: 4.2
(One -way table)
59
25% improved 50% improved 75%improved 100%improved0
10
20
30
40
6.67
20.67
33.3339.33
How do You Differentiate the Job Performance Done Prior to Training
and After Organisation
Improvements
Perc
entage
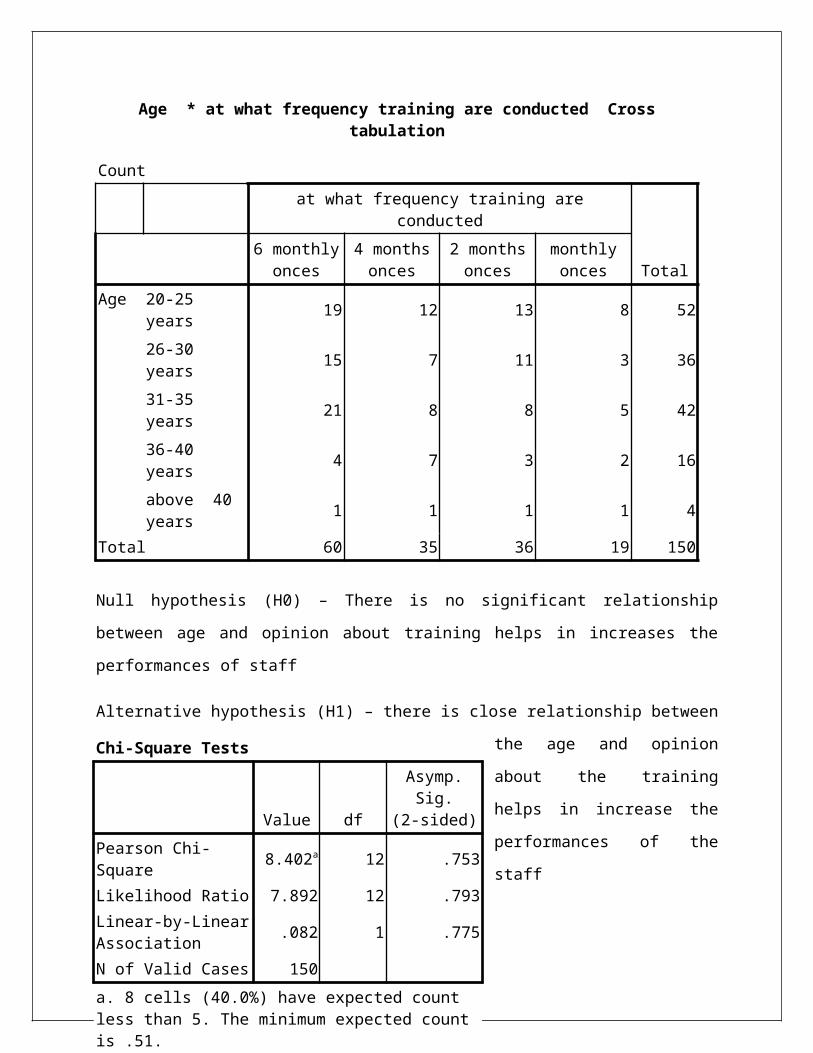
Age * at what frequency training are conducted Crosstabulation
Countat what frequency training are
conducted
Total6 monthlyonces
4 monthsonces
2 monthsonces
monthlyonces
Age 20-25 years 19 12 13 8 52
26-30 years 15 7 11 3 36
31-35 years 21 8 8 5 42
36-40 years 4 7 3 2 16
above 40 years 1 1 1 1 4
Total 60 35 36 19 150
Null hypothesis (H0) – There is no significant relationship
between age and opinion about training helps in increases the
performances of staff
Alternative hypothesis (H1) – there is close relationship between
the age and opinion
about the training
helps in increase the
performances of the
staff
60
Chi-Square Tests
Value df
Asymp.Sig.
(2-sided)Pearson Chi-Square 8.402a 12 .753
Likelihood Ratio 7.892 12 .793Linear-by-LinearAssociation .082 1 .775
N of Valid Cases 150a. 8 cells (40.0%) have expected count less than 5. The minimum expected count is .51.
Chi-square (x²) calculation
Calculated x²value =1.99 Degree of freedom =1 Table value =3.841 Significant result =0.05% level
Interpretation
From the above analyses we find the calculated value of x² is
greater than the table value and hence null hypothesis
rejected.so there is differences between ages may give the
frequency of training is conducted for the employees is help
to increases the performances in their work
61
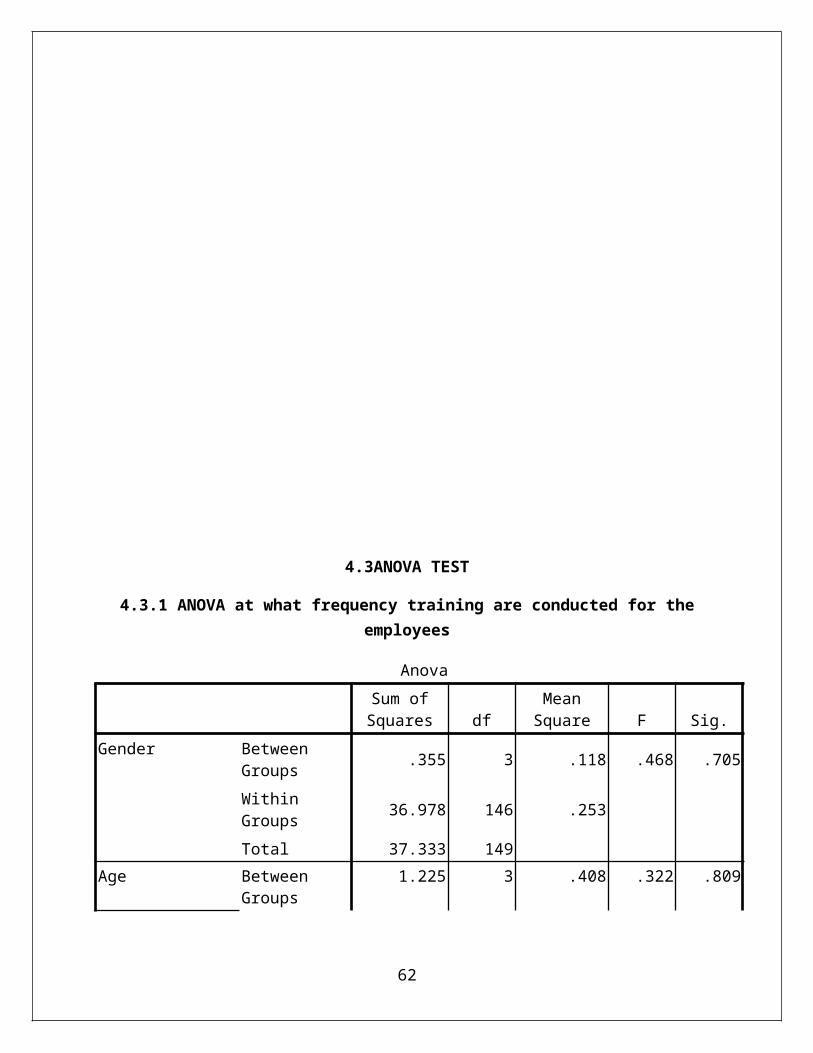
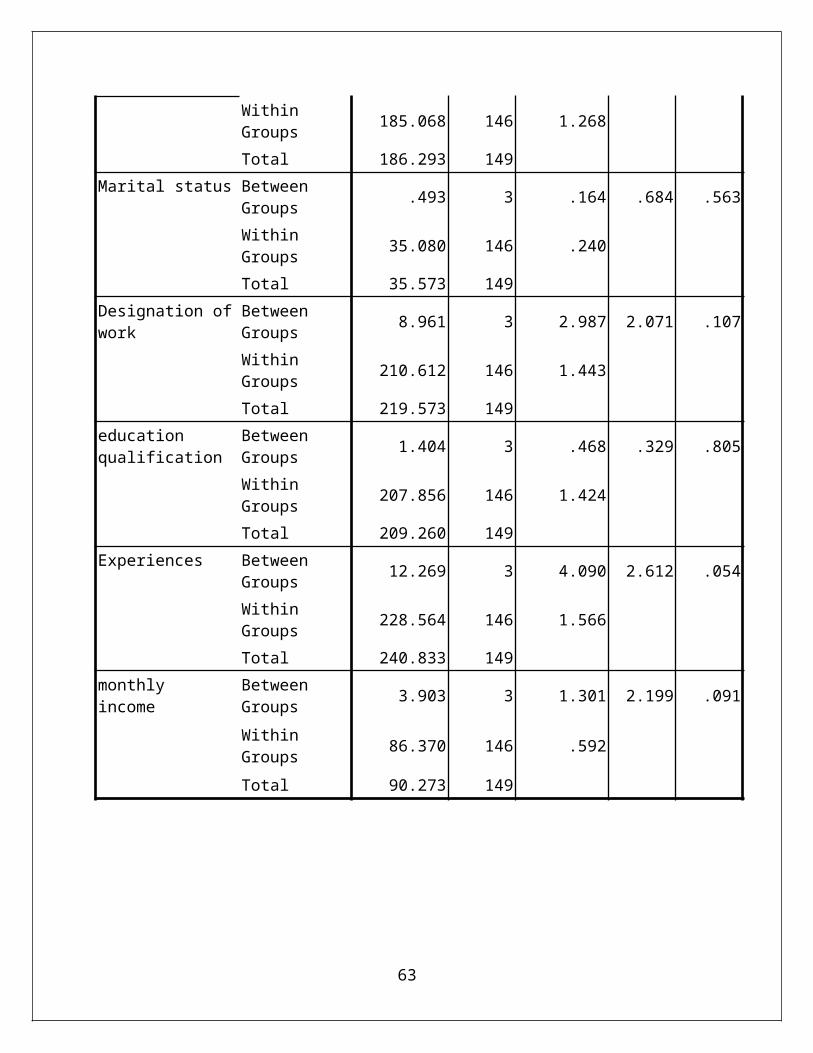
4.3ANOVA TEST
4.3.1 ANOVA at what frequency training are conducted for theemployees
AnovaSum ofSquares df
MeanSquare F Sig.
Gender Between Groups .355 3 .118 .468 .705
Within Groups 36.978 146 .253
Total 37.333 149Age Between
Groups1.225 3 .408 .322 .809
62
Within Groups 185.068 146 1.268
Total 186.293 149Marital status Between
Groups .493 3 .164 .684 .563
Within Groups 35.080 146 .240
Total 35.573 149Designation ofwork
Between Groups 8.961 3 2.987 2.071 .107
Within Groups 210.612 146 1.443
Total 219.573 149education qualification
Between Groups 1.404 3 .468 .329 .805
Within Groups 207.856 146 1.424
Total 209.260 149Experiences Between
Groups 12.269 3 4.090 2.612 .054
Within Groups 228.564 146 1.566
Total 240.833 149monthly income
Between Groups 3.903 3 1.301 2.199 .091
Within Groups 86.370 146 .592
Total 90.273 149
63

Null Hypothesis (Ho): There is no significant difference between the levels of satisfaction in training among the age group, income group
Alternative Hypothesis (H1): There is a significant difference between the levels of satisfaction in training among the age group, income group
INTERPRETATION
The above table shows significant and non-significant of the employees training
Non-significant of training
The gender is the non-significant differences between the frequencies of training are conducted for the employees
The age is the non-significant differences between the frequencies of training are conducted for the employees
The marital status is the non-significant differences between the frequencies of training are conducted for the employees
The designation of work is the non-significant differences between the frequencies of training are conducted for the employees
The education qualification is the non-significant differences between the frequencies of training are conducted for the employees
The monthly income is the non-significant differences between the frequencies of training are conducted for the employees
Significant of training
The experiences is the significant differences between the frequencies of training are conducted for the employees
64
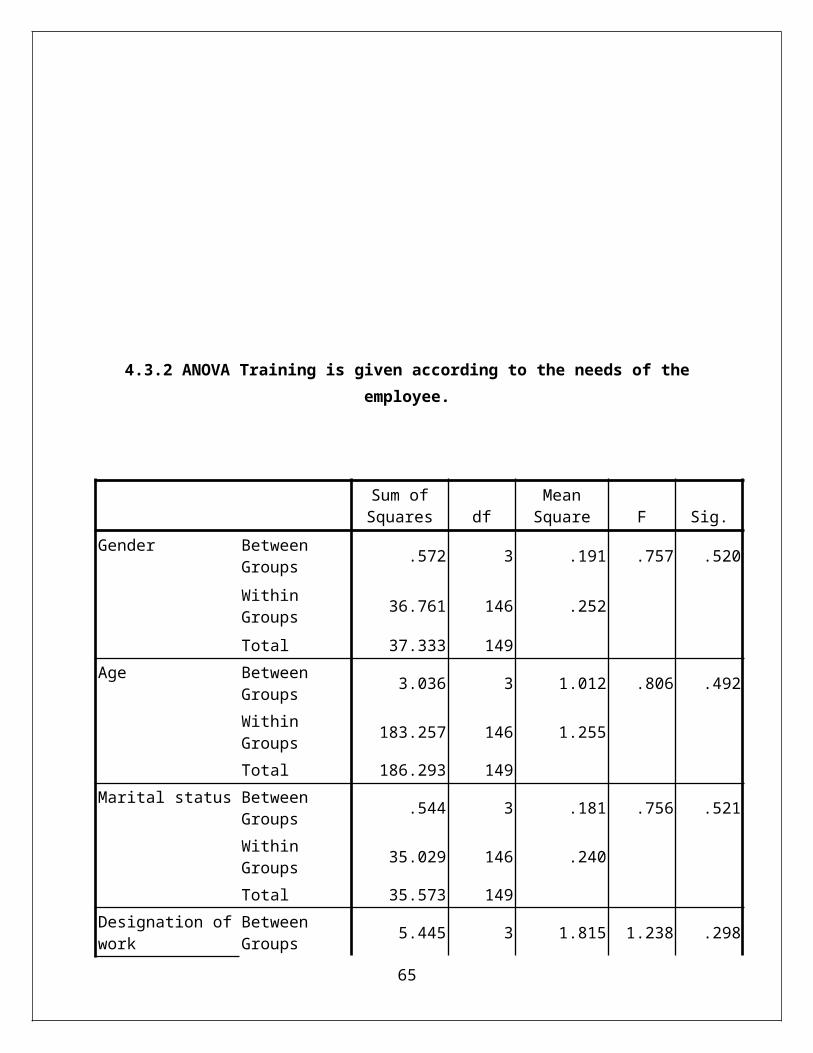
4.3.2 ANOVA Training is given according to the needs of theemployee.
Sum ofSquares df
MeanSquare F Sig.
Gender Between Groups .572 3 .191 .757 .520
Within Groups 36.761 146 .252
Total 37.333 149Age Between
Groups 3.036 3 1.012 .806 .492
Within Groups 183.257 146 1.255
Total 186.293 149Marital status Between
Groups .544 3 .181 .756 .521
Within Groups 35.029 146 .240
Total 35.573 149Designation ofwork
Between Groups 5.445 3 1.815 1.238 .298
65
Within Groups 214.128 146 1.467
Total 219.573 149education qualification
Between Groups 7.801 3 2.600 1.885 .135
Within Groups 201.459 146 1.380
Total 209.260 149Experiences Between
Groups 1.400 3 .467 .285 .836
Within Groups 239.433 146 1.640
Total 240.833 149monthly income
Between Groups 2.555 3 .852 1.417 .240
Within Groups 87.719 146 .601
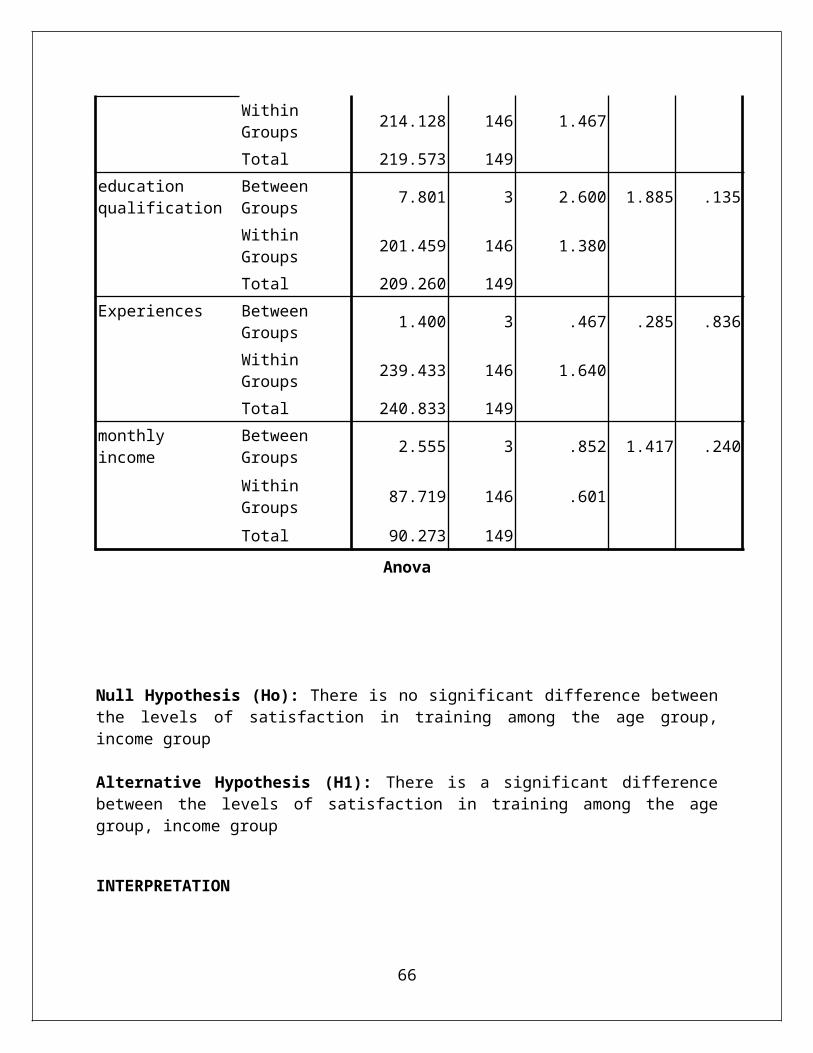
Total 90.273 149Anova
Null Hypothesis (Ho): There is no significant difference betweenthe levels of satisfaction in training among the age group,income group
Alternative Hypothesis (H1): There is a significant differencebetween the levels of satisfaction in training among the agegroup, income group
INTERPRETATION
66
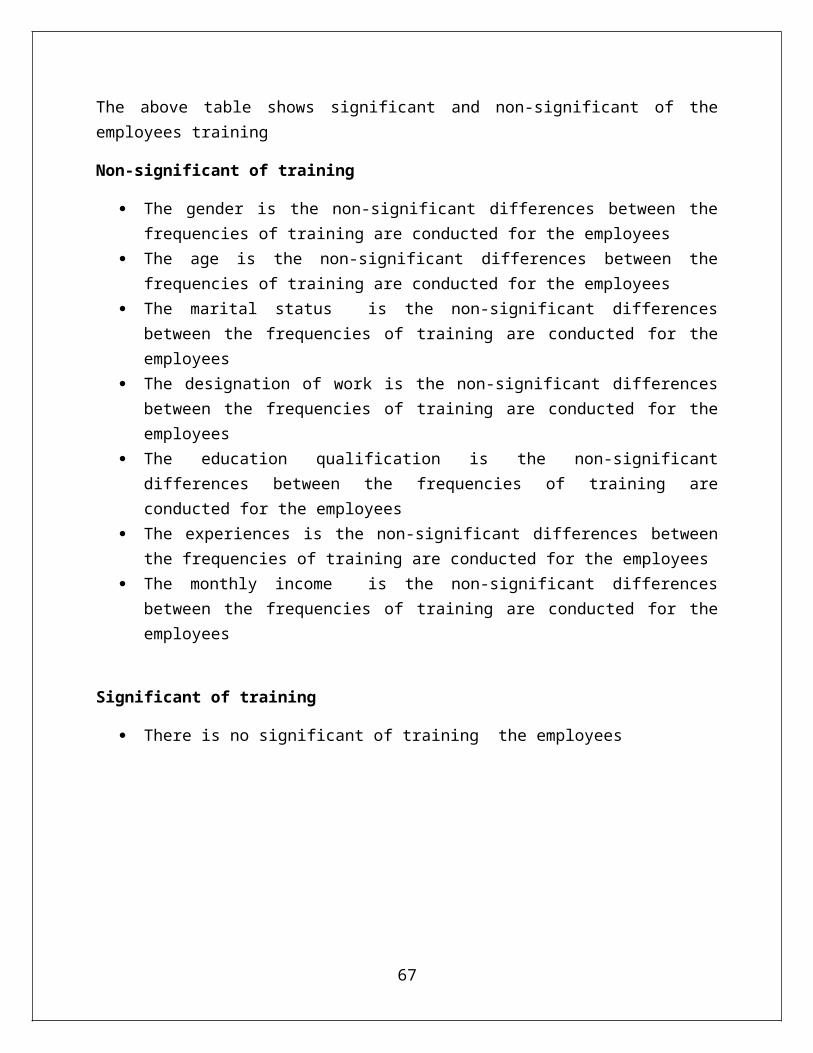
The above table shows significant and non-significant of theemployees training
Non-significant of training
The gender is the non-significant differences between thefrequencies of training are conducted for the employees
The age is the non-significant differences between thefrequencies of training are conducted for the employees
The marital status is the non-significant differencesbetween the frequencies of training are conducted for theemployees
The designation of work is the non-significant differencesbetween the frequencies of training are conducted for theemployees
The education qualification is the non-significantdifferences between the frequencies of training areconducted for the employees
The experiences is the non-significant differences betweenthe frequencies of training are conducted for the employees
The monthly income is the non-significant differencesbetween the frequencies of training are conducted for theemployees
Significant of training
There is no significant of training the employees
67
4.3T-Test
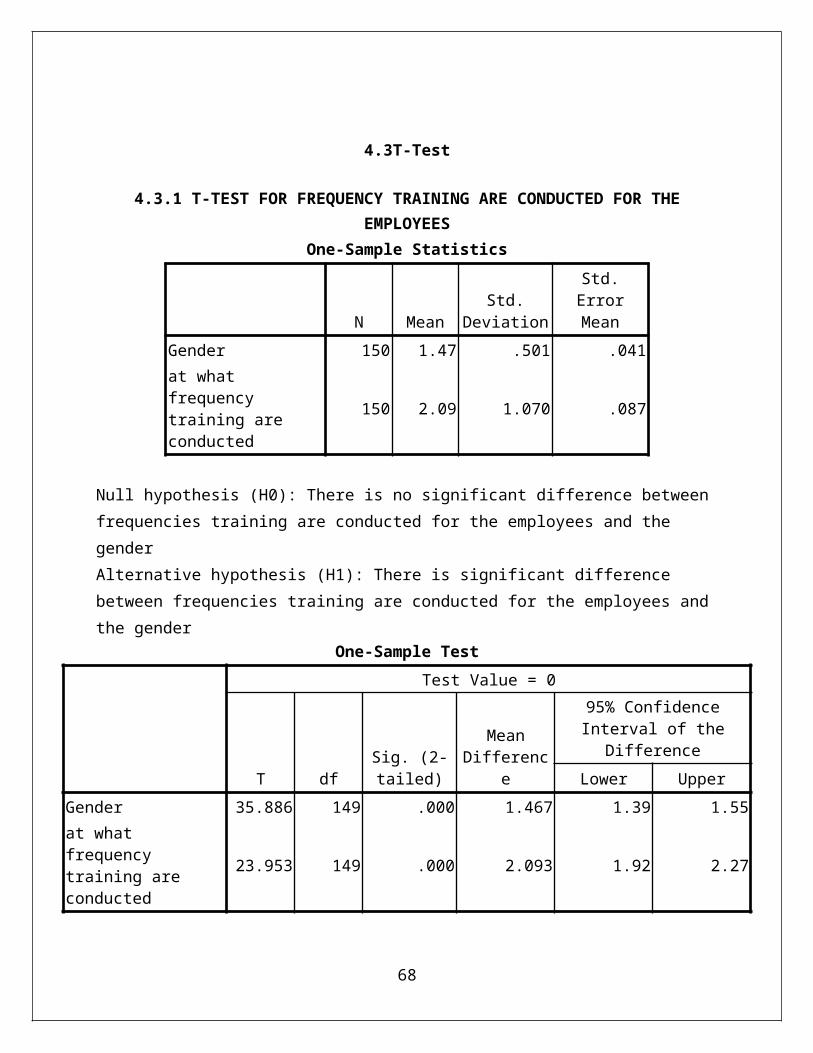
4.3.1 T-TEST FOR FREQUENCY TRAINING ARE CONDUCTED FOR THEEMPLOYEES
Null hypothesis (H0): There is no significant difference between frequencies training are conducted for the employees and the gender Alternative hypothesis (H1): There is significant difference between frequencies training are conducted for the employees and the gender
One-Sample TestTest Value = 0
T dfSig. (2-tailed)
MeanDifferenc
e
95% ConfidenceInterval of the
DifferenceLower Upper
Gender 35.886 149 .000 1.467 1.39 1.55at what frequency training are conducted
23.953 149 .000 2.093 1.92 2.27
68
One-Sample Statistics
N MeanStd.
Deviation
Std.ErrorMean
Gender 150 1.47 .501 .041at what frequency training are conducted
150 2.09 1.070 .087
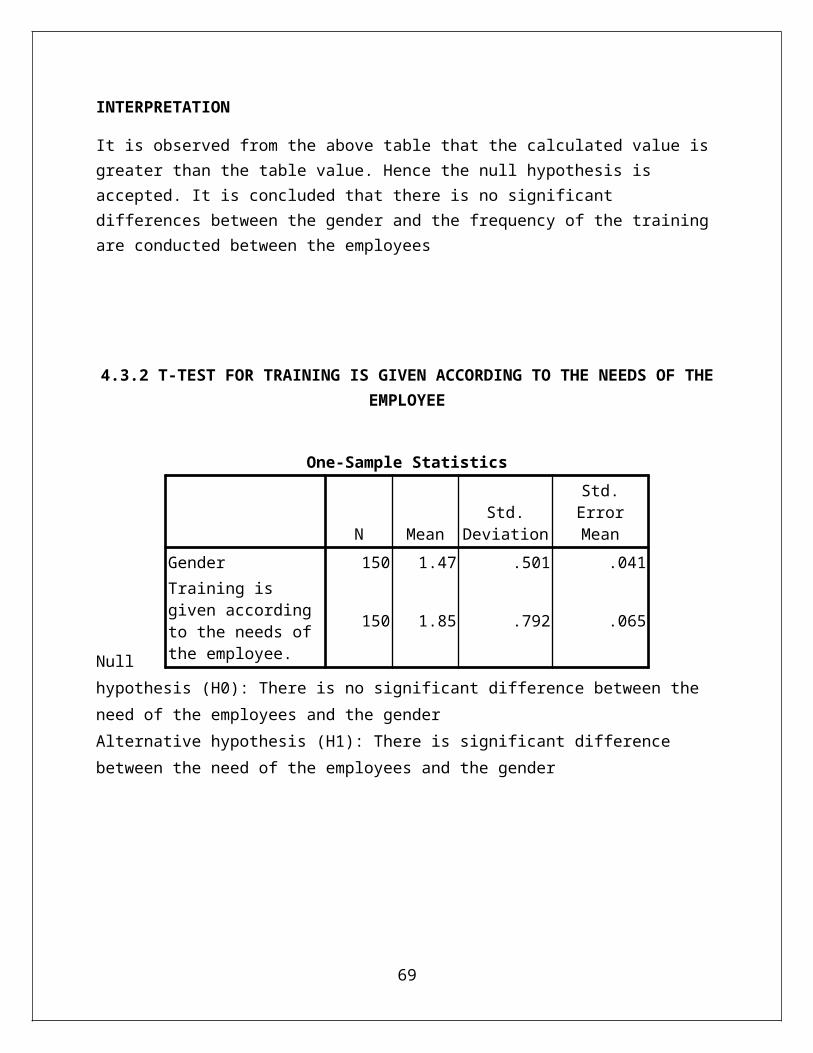
INTERPRETATION
It is observed from the above table that the calculated value is greater than the table value. Hence the null hypothesis is accepted. It is concluded that there is no significant differences between the gender and the frequency of the training are conducted between the employees
4.3.2 T-TEST FOR TRAINING IS GIVEN ACCORDING TO THE NEEDS OF THEEMPLOYEE
Nullhypothesis (H0): There is no significant difference between the need of the employees and the gender Alternative hypothesis (H1): There is significant difference between the need of the employees and the gender
69
One-Sample Statistics
N MeanStd.
Deviation
Std.ErrorMean
Gender 150 1.47 .501 .041Training is given according to the needs of the employee.
150 1.85 .792 .065
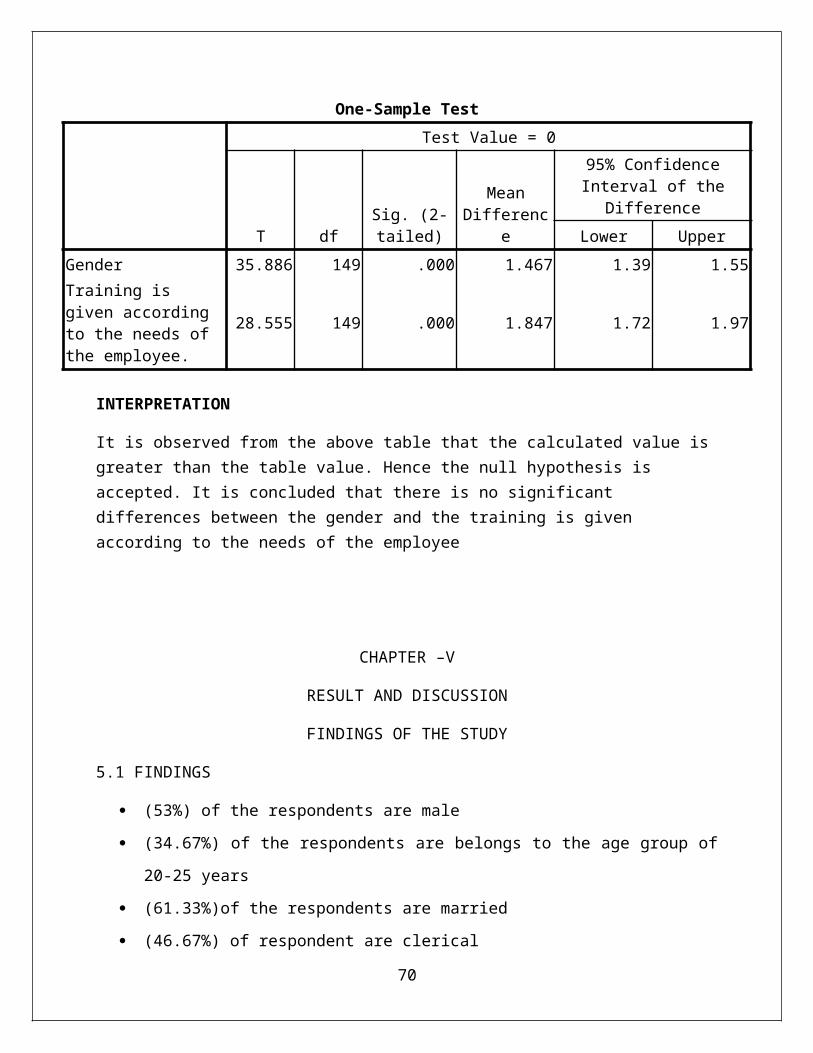
One-Sample TestTest Value = 0
T dfSig. (2-tailed)
MeanDifferenc
e
95% ConfidenceInterval of the
DifferenceLower Upper
Gender 35.886 149 .000 1.467 1.39 1.55Training is given according to the needs of the employee.
28.555 149 .000 1.847 1.72 1.97
INTERPRETATION
It is observed from the above table that the calculated value is greater than the table value. Hence the null hypothesis is accepted. It is concluded that there is no significant differences between the gender and the training is given according to the needs of the employee
CHAPTER –V
RESULT AND DISCUSSION
FINDINGS OF THE STUDY
5.1 FINDINGS
(53%) of the respondents are male
(34.67%) of the respondents are belongs to the age group of
20-25 years
(61.33%)of the respondents are married
(46.67%) of respondent are clerical
70
(30%) respondent are education qualification others
(42%) respondent are 0-5 years of experiences
(54.67%) respondent are. 8000to 15000 of salary
(40.67%) respondent are frequency training are conducted
within 6 months once
(46%) respondent are satisfied with the frequency of the
training provided
(48%) respondent are strongly agree training is given
adequate importance in the organization
(49.33%) respondent are agree training is given according to
the needs of the employees
(49.33%)respondent are agree the objectives of the
programmer have been achieved
(54%)respondent are strongly agree training develops self-
reliance and motivation
(56%) respondent are agree the training provides an
excellent opportunity for learning
(37%) respondents are strongly agreed the information’s
discussed in training are useful to my work.
(46%)respondent are strongly agree training provides an
excellent opportunity for self-development
(50.67%) respondent are agree the performance has shown
considerable improvement after training
(52.00%) respondent are agree the concepts are clearly
explained during the training program
71
(53.33%)respondent are agree. the duration of the trainingprogrammer was sufficient
(46.67%)respondent are agree. course materials presentedare of excellent quality
(36.67%) respondent are agree Satisfied with the trainingenvironment provided by the company
(49.33%) respondent are agree the company provides newideas and methods acquired during training
(42.67%) respondent are agree Understand the responsibilityof job from the training
(6.33%)respondent are agree training programmer is wellconducted with flexible structure
(55.33%) respondents are agreeing Competencies required forjob are adequately developed in the organization throughtraining
(39.33%) respondent are agree strongly agree senior managersare eager to help their juniors development throughtraining.
(33.33%) respondents are there is a well-designed and widelyshared training policy in the company.
(40.67%) respondent are agree the organization responds tothe feedback given after the training program
(56.67%) respondent are agree the overall trainingprogrammer is highly useful
(39.33%)respondent are 100%improved you differentiate thejob performance done prior to training and afterorganization
In chi-square null hypothesis rejected.so there isdifferences between ages may give the frequency of trainingis conducted for the employees is help to increases theperformances in their work
In anova the experiences are the significant differencesbetween the frequencies of training are conducted for the
72
employees and non-significances are gender, age, maritalstatus etc……
In anova there is no significant of training the employeesand all the demographic factors are Non-significant
In t-test null hypothesis is accepted. It is concluded thatthere is no significant differences between the gender andthe frequency of the training are conducted between theemployees
In t-test null hypothesis is accepted. It is concluded thatthere is no significant differences between the gender andthe training is given according to the needs of theemployees
5.2 SUGGESTIONS
The researcher has been successful in giving suggestion to the Seshasayee paper and board limited:
The organization has to verify whether all employees have
attended all the training programmers conducted.
After the training programmers, follow up action can be
conducted it’s to sustain importance.
Most of employees are needed the frequency of training
programmer once in a year because they have benefited from
improvement of their personal skill and updating the
knowledge.
Lack of information flow or communication gap between
Management and staff can be removed.
73
The organization try to improve the quality of training to
help the staff on formulating ideas like providing good
environment and providing experienced trainers etc….
Organizing training program can be in a
systematic/sequential manner.
Updated training methods can bring better results among
participants.
Feedback of the staff can be considered, without any
ambiguity.
More training programmers can be conducted, with sufficient
budget allocation of funds.
5.3CONCLUSION
Training refers to development the existing knowledge. By acquiring training, staff gain knowledge, upgrade their internal
74
and external activities with respect to their nature of work in the organization.
The study showed that training had more significant effect on productivity. Apart from that respondents satisfaction,explanation,principles provided to them, sequence oftraining programme,the workers have the opinion that the trainingprogrammers were necessary to update their knowledge,skill,etc.,
Training program play an important role in Seshasayee paper and Board Limited. It gives priority to human resource development. It is effectively implemented by the way of efficient training which be beneficial to both employees to the organization, and bylarge to the society.
75
Bibliography
Human Resources Management , gupta c.b (2000) ,sultan Chand & sons, new Delhi
Personal Management, memoria c.b (1980) published by Himalaya publishing house
Personal management and industrial relations ,tripathi p.c (1996) , published by sultan Chand &sons
Research methodology, Kothari c.r (2000) published by k.k gupta for vishwa prakasham ,new Delhi
Web sites
www.spbltd.com www.google.com www.ispi.org www.researchersworld.com www.trove.nla.gov.au www.biswajeetpattanayak.com www.researchersworld.com www.owlnet.rice.edu www.doi.apa.org
76

QUESTIONARIES
Name:
Department:
1. Gender
A. male B. female
2. Age
A. 20-25years B.26-30years C.31-35yearsD.36-40years E. above 40years
3. Marital status
A. married B. unmarried
4. Designation of work
A. clerical B. supervisor C. junior officerD. assistant officer E. officer
5. Education qualification
77
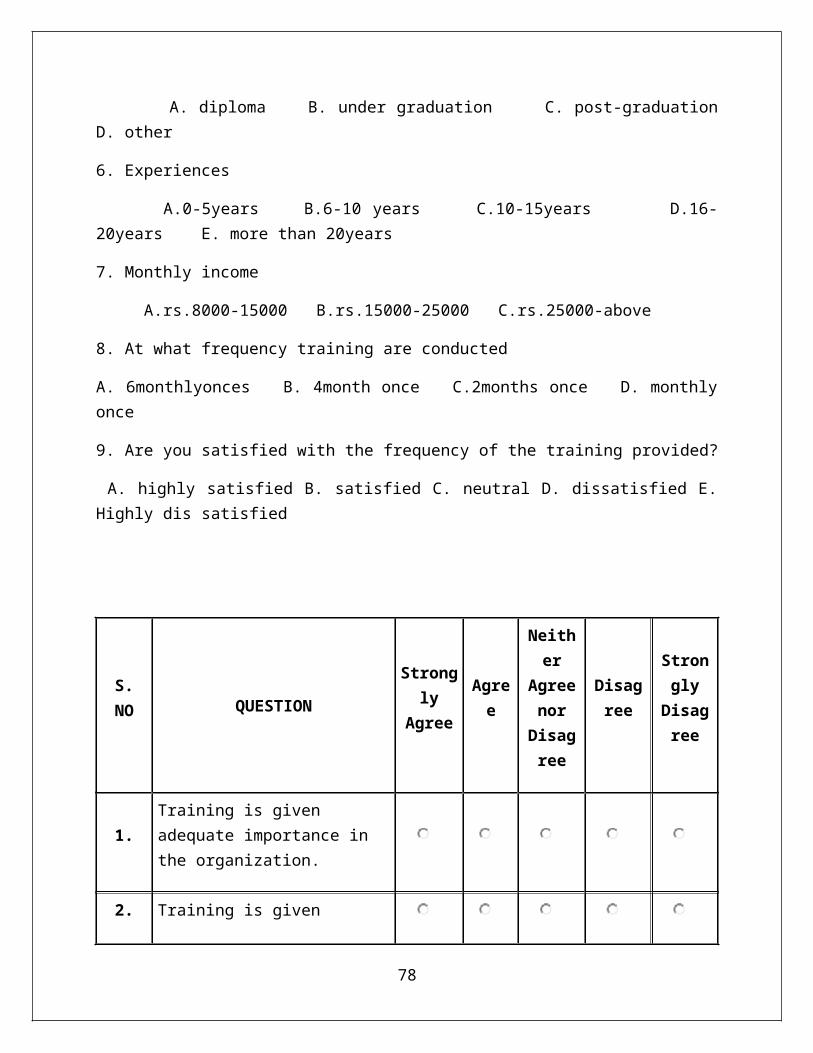
A. diploma B. under graduation C. post-graduationD. other
6. Experiences
A.0-5years B.6-10 years C.10-15years D.16-20years E. more than 20years
7. Monthly income
A.rs.8000-15000 B.rs.15000-25000 C.rs.25000-above
8. At what frequency training are conducted
A. 6monthlyonces B. 4month once C.2months once D. monthlyonce
9. Are you satisfied with the frequency of the training provided?
A. highly satisfied B. satisfied C. neutral D. dissatisfied E.Highly dis satisfied
S.NO QUESTION
Strongly
Agree
Agree
Neither
Agreenor
Disagree
Disagree
StronglyDisagree
1.Training is given adequate importance in the organization.
2. Training is given
78
according to the needs
of the employee.
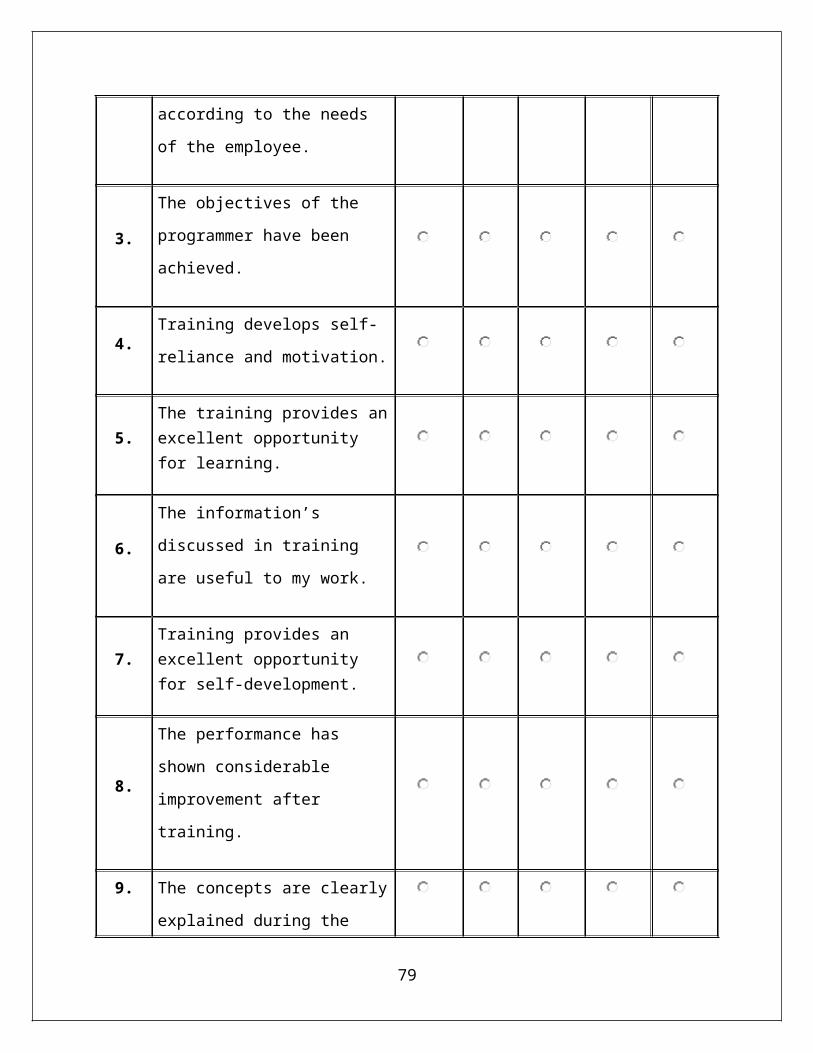
3.
The objectives of the
programmer have been
achieved.
4.Training develops self-
reliance and motivation.
5.The training provides anexcellent opportunity for learning.
6.
The information’s
discussed in training
are useful to my work.
7.Training provides an excellent opportunity for self-development.
8.
The performance has
shown considerable
improvement after
training.
9. The concepts are clearly
explained during the
79
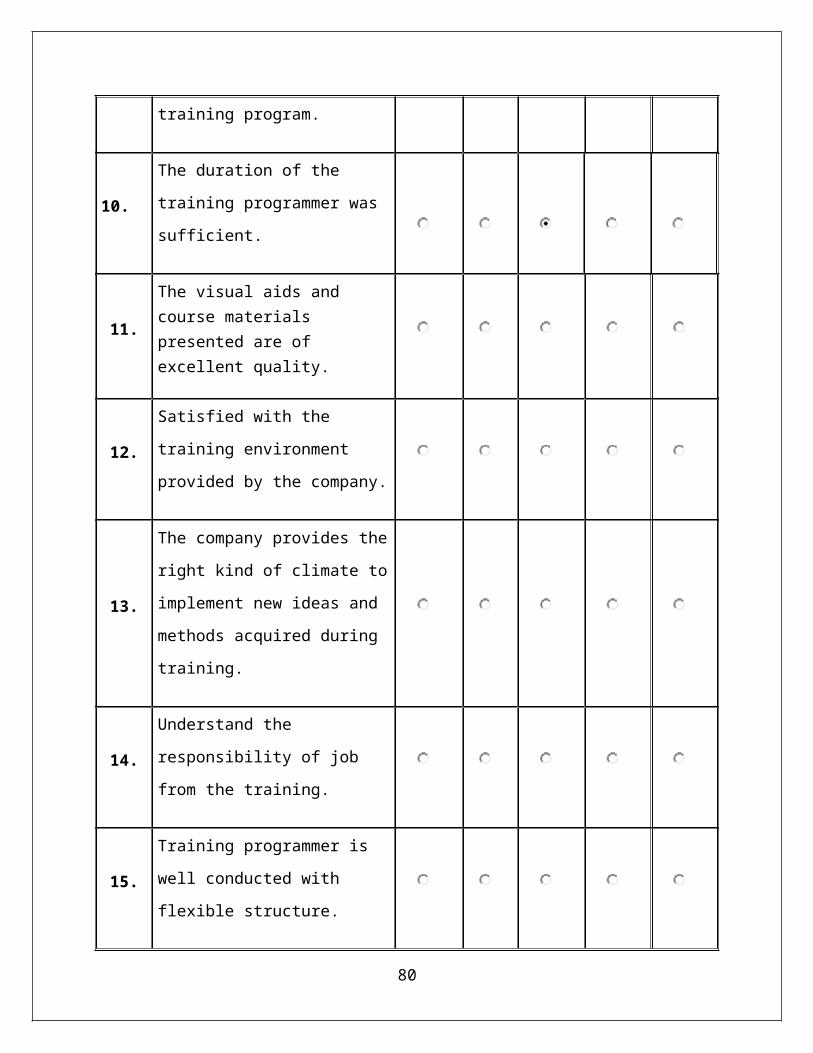
training program.
10.
The duration of the
training programmer was
sufficient.
11.
The visual aids and course materials presented are of excellent quality.
12.
Satisfied with the
training environment
provided by the company.
13.
The company provides the
right kind of climate to
implement new ideas and
methods acquired during
training.
14.
Understand the
responsibility of job
from the training.
15.
Training programmer is
well conducted with
flexible structure.
80
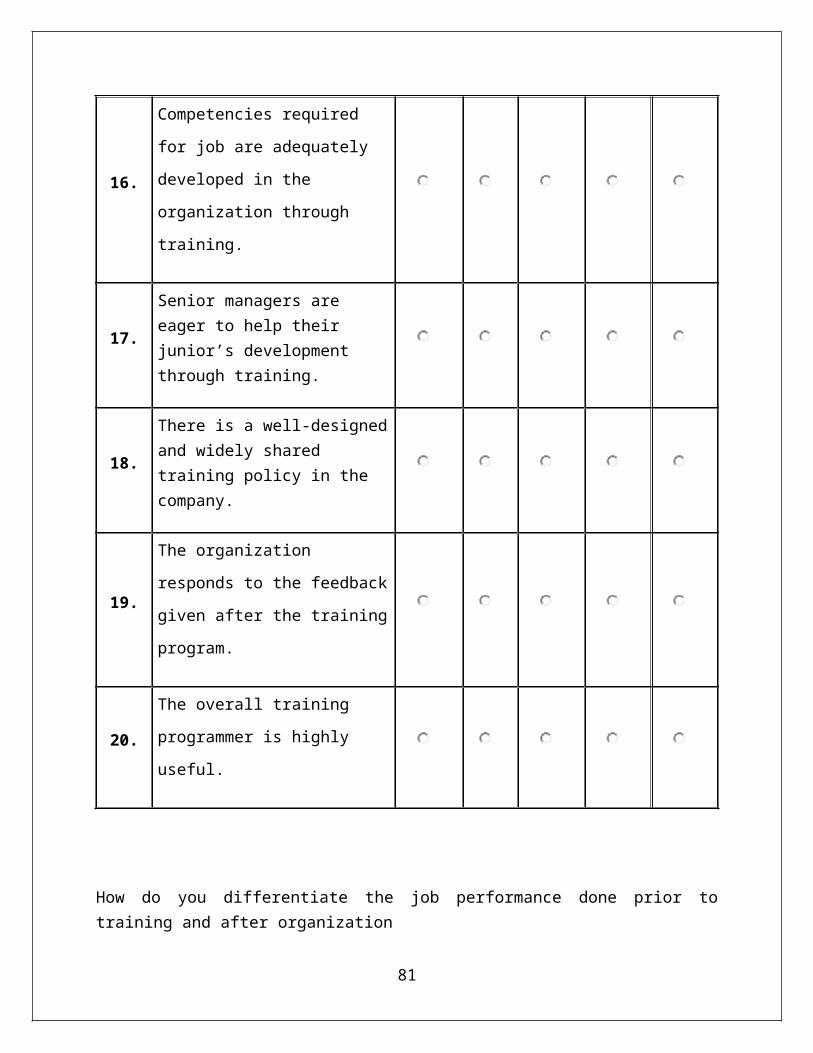
16.
Competencies required
for job are adequately
developed in the
organization through
training.
17.
Senior managers are eager to help their junior’s development through training.
18.
There is a well-designedand widely shared training policy in the company.
19.
The organization
responds to the feedback
given after the training
program.
20.
The overall training
programmer is highly
useful.
How do you differentiate the job performance done prior totraining and after organization
81
A.25% improved B.50% improved C.75%improvedD.100%improved
What are your suggestions to improve training for developing theemployees?
82

83


![On Mountains and Molehills [final pre-proof copy of paper published in Constellations, 2015]](https://static.fdokumen.com/doc/165x107/6316154b3ed465f0570be034/on-mountains-and-molehills-final-pre-proof-copy-of-paper-published-in-constellations.jpg)