Exhibit 1 Deceptive Pricing: Markdowns Paired with High Fees
Upload
khangminh22Category
view
0download
0
Filed: 2019-04-25 EB-2018-0305 Exhibit I.STAFF.1 Page 1 of 1
ENBRIDGE GAS INC. Answer to Interrogatory from
Board Staff (STAFF) Reference: Exhibit A – Letters of Comment Question: Following publication of the Notice of Application, the OEB received several letters of comment. Sections 2.1.6 of the Filing Requirements state that distributors will be expected to file with the OEB their response to the matters raised within any letters of comment. Please file a response to the matters raised in the letters of comment that were also copied to Enbridge Gas Inc. (Enbridge Gas). Going forward, please ensure that responses to any matters raised in subsequent comments or letters that the applicant receives are filed in this proceeding. Please ensure that name and contact information is redacted for public filings. All responses must be filed before the argument (submission) phase of this proceeding. Response As of April 25, 2019, Enbridge Gas received 141 letters of comment. As per the Board’s Decision and Procedural Order No. 2, Enbridge Gas will provide a response to the letters received before the close of record for this proceeding.1
1 Decision and Procedural Order No. 2, April 1, 2019, page 7.

Filed: 2019-04-25 EB-2018-0305 Exhibit I.STAFF.2 Page 1 of 4
ENBRIDGE GAS INC. Answer to Interrogatory from
Board Staff (STAFF) Reference: Exhibit A1/Tab 5/Schedule 2/Pg. 11, Exhibit B1/Tab 1/Schedule 1/Appendix H and Staff Interrogatory #3, EB-2018-0131 Question: In the Conditions of Service, Enbridge Gas notes that to connect an applicant (customer) to the distribution system, Enbridge Gas completes a construction estimate to assess the costs associated with the installation and that applicants may be required to pay a contribution in aid of construction (CIAC) as the share of the costs to make the installation financially feasible. In response to an OEB staff interrogatory in the EB-2018-0131 proceeding, Enbridge Gas indicated that prior to 2015, Enbridge Gas Distribution provided a threshold of 20 meters for standard residential service connections and customers were required to pay the appropriate CIAC when the service length exceeded the threshold. Since 2015, it has refined its approach to determine feasibility using the “grid method” which uses actuals for each Forward Sorting Area (FSA). Under this approach, Enbridge Gas is able to account for variability in customer circumstances when assessing the CIAC amount for residential infill service connections. The CIAC amount for residential infill customers is now determined by individually estimating the revenue allowance and the service cost estimate which is typically a regionally tailored estimate based on historical data from similar services in the same area (FSA). The amount of service cost in excess of the revenue allowance is the CIAC amount which is recovered from customers before service installation. The PI of each customer connection is brought to 1.0 under this scenario. Enbridge Gas noted that collection of the CIAC serves to ensure that new customers bear the cost of providing new services without causing undue burden on existing customers, as prescribed by EBO 188 guidelines. For 2017, Enbridge Gas collected over $8 million in contributions as a result of changes to the Conditions of Service.
a) The Conditions of Service do not explicitly explain these changes. Has Enbridge Gas provided this information on its website and is the information easy to locate on the website? Please provide a detailed response.
b) Has Enbridge Gas communicated the change to builders and other business customers that are likely to be impacted as a result of the policy change?
c) In Enbridge Gas’ opinion, was it the intent of the OEB in the EBO 188 guidelines that the utility should calculate the PI for every individual customer and bring the PI of each customer connection to 1.0? If that is the intent, please explain why

Filed: 2019-04-25 EB-2018-0305 Exhibit I.STAFF.2 Page 2 of 4
the OEB in its report recommends a PI of 1.0 for the Rolling Project Portfolio and not for individual customer connections (Final Report of the Board, January 30, 1998, EBO 188)?
d) Please provide the amounts collected in CIAC for 2018 as a result of changes to the Conditions of Service where the PI is determined for each infill customer.
e) Union Gas in its Conditions of Service (Exh. A1/Tab 5/Sch. 3/pg.14) still provides customers with 30 meters of service installation at no cost. Why is Union Gas’ Condition of Service different from that of Enbridge Gas Distribution? Does Enbridge Gas intend to harmonize the Conditions of Service and calculate the PI for each Union Gas infill customer? If yes, please provide the timeline.
f) Enbridge Gas’ existing rates assume a certain number of new customer additions each year and its capital expenditure plan includes certain dollars earmarked for providing infill customer connections. Since these costs are included in current rates, why did Enbridge Gas implement a change to the Condition of Service in a year when its costs and revenues were not examined under a cost of service approach?
g) In its interrogatory response (referenced above), Enbridge Gas notes that upon rebasing, the modified approach to feasibility analysis will benefit ratepayers because the new amounts being added to utility rate base for residential infill customers will be lower than would be the case under the prior approach. Enbridge Gas will now rebase in 2024 and until then no adjustments to rate base will be made. Please provide the benefits that ratepayers will receive in rates until 2023 as a result of the change to the Conditions of Service. Please also explain why it was not appropriate to implement these changes at the time of rebasing?
h) Please provide the total estimated amount that Enbridge Gas is expected to collect from 2017 to 2023 as a result of changes to the Conditions of Service under which residential infill customer are expected to pay a CIAC for connecting to the natural gas distribution system.
i) Has Enbridge Gas received complaints from residential customers or builders after implementing this change to the Conditions of Service? If yes, please provide the number of complaints and the general theme of the grievances.
Response a) & b) The Conditions of Service for the EGD rate zone describe the current policy
and process employed to assess the economic feasibility of service connections. The Conditions of Service can be found easily by using an internet search engine to find “Enbridge Gas Conditions of Service”. A PDF copy of the current Conditions of Service usually appears as the first item found. EGD personnel met with the members of Heating, Refrigeration and Air Conditioning Institute of Canada (“HRAI”) to communicate this process change. HRAI is a trade association of HVAC contractors appliance manufacturers.

Filed: 2019-04-25 EB-2018-0305 Exhibit I.STAFF.2 Page 3 of 4
Also, when customers apply for a new service connection (either directly or through an HVAC contractor) and there is a project under consideration, Enbridge Gas clearly communicates the process to them. This communication sets clear expectations that a feasibility analysis will be carried out based on the estimated installation cost and there may be a cost (or CIAC) to install the service. Customers are also notified that they must agree to these costs before Enbridge Gas processes their application.
c) As described at paragraph 261 of Appendix B to the OEB’s Guidelines for Assessing
and Reporting on Natural Gas System Expansion in Ontario (the “Guidelines”) the Board provided for a portfolio approach with the intent of allowing the utilities a greater degree of flexibility in determining which projects to undertake, while allowing the Board to retain regulatory oversight ensuring no undue cross subsidy or rate impacts would result from distribution system expansion. At paragraph 149 of the Guidelines the Board stated “In order to ensure fairness and equity in the application and design of contribution requirements, the Board finds that all projects must achieve a minimum threshold P.I. of 0.8 for inclusion in a utility's Rolling Project Portfolio.” (emphasis added) Enbridge Gas’s view is that its service installation policy is consistent with the Guidelines.
d) Enbridge Gas does not have data required to determine the difference between the
CIAC amount collected in 2018 and the CIAC amount that would have been collected in 2018 under the Company’s former customer connection policy.
e) The Conditions of Service currently applied in the Union Gas rate zones evolved
while Enbridge Gas Distribution and Union Gas were operating as independent corporate entities. Each entity addressed its customer connection policies differently. Now that the process of amalgamating Enbridge Gas Distribution and Union Gas into a single entity is in progress, steps will be taken to harmonize the Conditions of Service and other corporate policies. This activity is currently underway with the goal of implementing a harmonized customer connection policy before the next IR period.
f) The change in the customer connection policy was required to ensure that the
Company’s Investment Portfolio achieves a PI of greater than 1.0. g) As noted in response to part f) above, the change was necessary to be compliant
with EBO 188. The modified approach was adopted to comply with the regulation and ensure that economically feasible customers are attached to the system. If unfeasible customers are attached, utility earnings will be negatively impacted until rebasing. Upon rebasing, existing ratepayers would be negatively impacted because rate base would be higher compared to what it will be with the current approach to collecting CIACs.

Filed: 2019-04-25 EB-2018-0305 Exhibit I.STAFF.2 Page 4 of 4
h) In response Exhibit I.B.EGDI.STAFF.3 part d) in EB-2018-0131, Enbridge noted its
limitation with respect to the provision of historical data for customer contributions related to infills. Prior to 2016, Enbridge systems were unable to distinguish between services contribution from residential infills and subdivision projects. As such, Enbridge Gas has no means to forecast a difference in collection of CIAC amounts before and after the Conditions of Service were changed.
i) Please see table below:
Connection Complaints
Total New Connections
# of Complaints
T Themes
2015 31,533 367 Cost, Installation dates, Communication 2016 29,991 634 Cost, Installation dates, Communication 2017 34,005 444 Cost, Installation dates, Communication 2018 29,037 298 Cost, Installation dates, Communication
YTD 2019 4,730 91 Cost, Installation dates, Communication

Filed: 2019-04-25 EB-2018-0305 Exhibit I.STAFF.3 Page 1 of 2
ENBRIDGE GAS INC. Answer to Interrogatory from
Board Staff (STAFF) Reference: Exhibit B1/Tab 1/Schedule 1/pgs. 6-7 Question: The Enbridge Gas Distribution rate zone has an approved methodology where the gas supply portfolio is updated in rates on an annual basis. Accordingly, gas cost rates have been adjusted for the Enbridge Gas Distribution rate zone to reflect changes to the 2019 gas supply portfolio (i.e. impact of supply mix change, net of price changes that are otherwise captured through the QRAM methodology), as well as changes in contracted storage and associated transported costs. The Ontario Energy Board in its Decision and Procedural Order No. 2 determined that it would not address the cost consequences of Enbridge Gas Distribution’s 2019 Gas Supply Plan in this proceeding.
a) Please indicate if the gas cost consequences of Enbridge Gas Distribution’s 2019 Gas Supply Plan have been reflected in prior QRAM applications. If yes, please provide details.
b) Please discuss the implications of the gas cost consequences of Enbridge Gas Distribution’s 2019 Gas Supply Plan not being addressed in this proceeding.
Response a) No, the gas cost consequences / impacts on rates stemming from changes to the
2019 gas supply portfolio (i.e. impact of supply mix change, net of price changes that are otherwise captured through the QRAM methodology), as well as changes in contracted storage and associated transportation costs have not been reflected in January 1, 2019 QRAM or April 1, 2019 QRAM applications.
b) The key implication of the gas cost consequences of the 2019 Gas Supply Plan for the EGD rate zone not being addressed in this proceeding is that currently there is no other Board-approved mechanism to recover (i.e. pass through to customers) the impact of the gas costs from the changes in the gas supply portfolio, contracted storage and associated transportation costs.

Filed: 2019-04-25 EB-2018-0305 Exhibit I.STAFF.3 Page 2 of 2
This is because the Board approved methodology1 in the EGD rate zone contemplates these adjustments to rates as part of the annual rate setting mechanism. This is explained in the application at Exhibit B1, Tab 1, Schedule 1, page 6:
The EGD rate zone has an approved methodology where the gas supply portfolio is updated in rates on an annual basis. Accordingly, gas cost rates have been adjusted for the EGD rate zone to reflect changes to the 2019 gas supply portfolio relative to the 2018 gas supply portfolio (i.e. impact of supply mix change, net of price changes that are otherwise captured through the QRAM methodology), as well as changes in contracted storage and associated transportation costs. Changes to these cost elements are not captured through the QRAM methodology for the EGD rate zone.
In the MAADs Decision, the Board did not direct any changes to this methodology. The Board approved the “Y-Factors” “as proposed by the applicants.”2 Gas costs are a Y-factor and Enbridge Gas had not proposed any changes to the methodology for passing through those costs. The impact of the year-over-year changes in 2019 rates is approximately $1.48 per year3 for a typical residential customer and approximately $4 million across all customers. As per Procedural Order No. 3, the OEB is prepared to establish a 2019 Gas Supply Plan Cost Consequences deferral account for the Enbridge Gas Distribution rate zone that would track the proposed amounts from January 1, 2019 for recovery to be reviewed and disposed of as part of a future proceeding.
1 2007 Rate application (EB-2006-0034), 2008-2012 Revenue Cap per Customer (EB-2007-0615), and 2014-2018 Custom IR (EB-2012-0459). 2 MAADs Decision and Order (EB-2017-0306/2017-0307) 3 See Exhibit F1, Tab 1, Rate Order, Working Papers, Schedule 3, Pages 2 and 10, Typical Residential Customer, Volume 2,400 m3 Item 3.6 Total Sales ($4.26 at page 2 vs. $5.74 at Page 10)

Filed: 2019-04-25 EB-2018-0305 Exhibit I.STAFF.4 Page 1 of 1
ENBRIDGE GAS INC. Answer to Interrogatory from
Board Staff (STAFF) Reference: Exhibit B1/Tab 1/Schedule 1/pgs. 6-7 Question: Enbridge Gas Distribution has modified the heat content reference in rate schedules, from the existing heat content of 38.42 MJ per m3 to 38.53 MJ per m3. Please confirm if there is an impact on 2019 distribution rates as a result of changes to the heat content of natural gas. If yes, please provide the impacts. Response There is no impact on EGD’s 2019 distribution rates resulting from the year over year change in heat content.

Filed: 2019-04-25 EB-2018-0305 Exhibit I.STAFF.5 Page 1 of 3
ENBRIDGE GAS INC. Answer to Interrogatory from
Board Staff (STAFF) Reference: Exhibit B1/Tab 1/Schedule 1/pg. 12 Question: The Enbridge Gas Distribution rate zone average use adjustment reflects the existing OEB-approved methodology to forecast the year over year change in average use consumption for Rate 1 and Rate 6 customers. The methodology relies on regression equations to estimate the underlying historical trend of average use. Driver variables have remained unchanged and coefficients of existing models are re-estimated to include the most recent year of actual data.
a) In the last Enbridge Gas deferral and variance accounts proceeding (EB-2017-0102), the utility acknowledged that the average use model was updated with the 2016 actual value and a diagnostic test indicated that a structural break occurred in 2016 for some models. Please confirm whether Enbridge Gas has rectified the issues identified in 2016. If not, please explain why.
b) Please explain the steps that Enbridge Gas has taken to ensure that the results to estimate the year over year change in 2019 average use are reliable.
Response a) The addition of 2017 actual data confirmed that the abnormally large decline in 2016
average use was just an outlier and there is no structural break in 2017 in any of Enbridge Gas’ models used to determine 2019 average use forecast.
For its 2019 rate application Enbridge Gas hasn’t changed its models and used the same models as its 2014 to 2018 rate application. The models are planned to be reviewed/tested once again at rebasing as directed by the Board (with the amended settlement proposal dated December 6, 2017, and with its Decision and Order August 30, 2018 for EB-2017-0306/ EB-2017-0307). Table 1 below shows the 10-Year history of Normalized Actual versus Board-Approved average uses normalized to each year’s respective Budget degree days. The out-of-sample average percentage variance over the last 10 years is -0.5% for Rate 1 and 0.5% for Rate 6. The results support the view that the General Service

Filed: 2019-04-25 EB-2018-0305 Exhibit I.STAFF.5 Page 2 of 3
average use forecasting methodology continues to be a reliable predictor for General Service average use.
Col. 1 Col. 2 Col. 3 Col. 4
Actual Board-Approved Variance %Variance Test Normalized Normalized Normalized NormalizedYear Rate Classes Average Use Average Use Average Use Average Use
2008 Rate 1 2,636 2,647 (11) -0.4%Rate 6 24,869 24,204 665 2.7%Total General Service 4,493 4,449 44 1.0%
2009 Rate 1 2,616 2,637 (21) -0.8%Rate 6 27,654 28,165 (511) -1.8%Total General Service 4,659 4,770 (111) -2.3%
2010 Rate 1 2,579 2,622 (43) -1.6%Rate 6 29,106 27,949 1,157 4.1%Total General Service 4,403 4,705 (302) -6.4%
2011 Rate 1 2,594 2,643 (49) -1.8%Rate 6 29,471 28,029 1,442 5.1%Total General Service 4,764 4,726 38 0.8%
2012 Rate 1 2,529 2,510 18 0.7%Rate 6 28,941 30,122 (1,182) -3.9%Total General Service 4,642 4,715 (73) -1.5%
2013 Rate 1 2,547 2,568 (22) -0.8%Rate 6 29,203 29,878 (675) -2.3%Total General Service 4,665 4,719 (54) -1.1%
2014 Rate 1 2,475 2,433 41 1.7%Rate 6 28,634 28,383 251 0.9%Total General Service 4,543 4,461 82 1.8%
2015 Rate 1 2,427 2,419 9 0.4%Rate 6 28,600 28,341 259 0.9%Total General Service 4,485 4,465 20 0.4%
2016 Rate 1 2,401 2,480 (79) -3.2%Rate 6 28,203 28,753 (550) -1.9%Total General Service 4,413 4,537 (124) -2.7%
2017 Rate 1 2,485 2,472 13 0.5%Rate 6 29,462 29,058 404 1.4%Total General Service 4,569 4,538 31 0.7%
TABLE 1GENERAL SERVICE AVERAGE USE

Filed: 2019-04-25 EB-2018-0305 Exhibit I.STAFF.5 Page 3 of 3
b) The key factor used to evaluate the accuracy of the General Service average use forecast is the percentage variance between normalized actual and normalized forecast average use per customer. As seen in Table 1 above, the results support the view that the General Service average use forecasting methodology continues to be a reliable predictor for General Service average use. Besides tracking historical accuracy through the percentage variances, the models also have been subjected to a battery of tests. The models’ estimation and test results for 2019 forecast show that the models continued to have high R-squared, and to generate small forecast errors while passing most of the statistical specification tests. Therefore they continued to be good predictors of average use.

Filed: 2019-04-25 EB-2018-0305 Exhibit I.STAFF.6 Page 1 of 1
ENBRIDGE GAS INC. Answer to Interrogatory from
Board Staff (STAFF) Reference: Exhibit B1/Tab 1/Schedule 1/pgs. 12-13 Question: The MAADs Decision (EB-2017-0306/0307) accepted an annual adjustment to rates to reflect the declining trend in use. Enbridge Gas has applied existing OEB-approved methodologies for the Enbridge Gas Distribution and Union Gas rate zones to adjust rates to account for changes in average use/normalized average consumption.
a) Please provide the impact on 2019 proposed revenue requirement as a result of adjustments to average use/normalized average consumption.
b) Are these changes captured in the respective deferral and variance accounts? Response a) The 2019 proposed revenue is not affected by the changes in forecast/target
average use. The proposed adjustments for changes in average use impacts the proposed 2019 unit rates only.
When average use decreases (increases), rates must be increased (decreased) to
maintain the same revenue. The forecasted/target average use for 2019 relative to the forecasted/target 2018 has increased between 1.7% to 2.3% in the EGD rate zone and between 3.0% to 4.8% in the Union rate zones. If the rates for 2019 were not reduced by a similar proportion, customers would be charged approximately an additional $9.5 million in the EGD rate zone and $11.7 million in the Union rate zones due to higher average use.
b) As indicated in a) above, the change in forecast/target 2019 average use has been
reflected in 2019 proposed unit rates, and would therefore not be captured in the respective deferral accounts. Enbridge Gas has not proposed any changes to the AUTUVA and NAC deferral accounts for 2019. These deferral accounts will continue to capture the revenue impact, for general service rate classes, resulting from normalized actual average use which deviates from the forecast/target average use underpinning rates.

Filed: 2019-04-25 EB-2018-0305 Exhibit I.STAFF.7 Page 1 of 2
ENBRIDGE GAS INC. Answer to Interrogatory from
Board Staff (STAFF) Reference: Exhibit B1/Tab 1/Schedule 1/pg. 18 and Appendix A/pgs. 1-5 Question: In the MAADs proceeding, the applicant indicated that post amalgamation, contracts between Enbridge Gas Distribution and Union Gas will cease to exist. The accounting order with respect to the Purchase Gas Variance Account removed the reference to recording amounts related to Limited Balancing Agreement with Union Gas.
a) Different rate zones still exist for Enbridge Gas Distribution and Union Gas. Please explain how the removal of the amounts relating to the Limited Balancing Agreement will impact the amounts being allocated to customer groups in different rate zones.
b) After the Limited Balancing Agreement is ceased, please explain whether revenues/costs are still tracked between the different rate zones.
Response a) As part of the MAADs proceeding, Enbridge Gas indicated that upon amalgamation
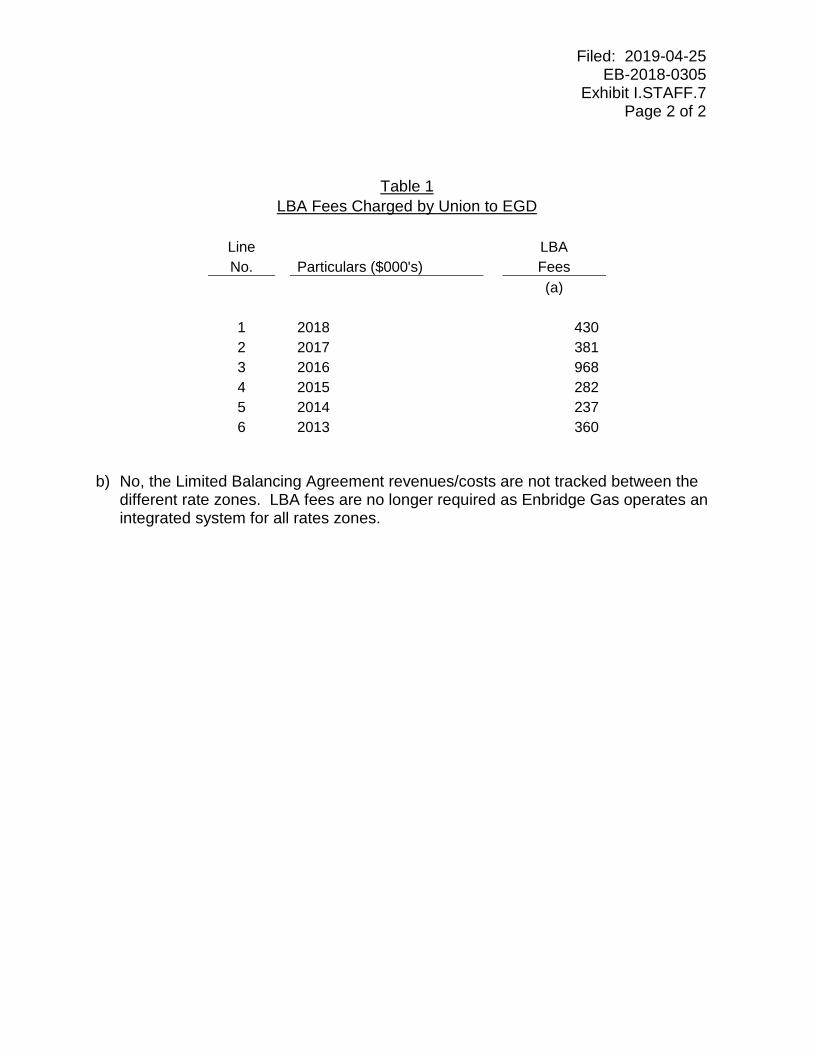
it planned to discontinue charging Limited Balancing Agreement (“LBA”) fees between the Union rates zones and the EGD rate zone1. LBA fees were previously charged at interconnections between legacy Union and legacy EGD on daily and cumulative imbalances outside of agreed upon tolerances. Upon amalgamation, LBA fees are no longer required as Enbridge Gas operates an integrated system for all rates zones. Prior to amalgamation, the revenue from the LBA was recorded in Union’s Short-Term Storage and Other Balancing Services deferral account (179-70) of which 90% was credited to the benefit of Union’s in-franchise customers. The cost of the LBA was recorded in EGD’s Purchase Gas Variance Account as a charge to EGD’s customers. The impact to Enbridge Gas customers in the different rate zones related to the LBA are not a material benefit or cost. Table 1 provides the LBA fees charged by legacy Union to legacy EGD from 2013 to 2018.
1 EB-2017-0306/EB-2017-0307, Exhibit C.SEC.1, Attachment 1, p.3.
Filed: 2019-04-25 EB-2018-0305 Exhibit I.STAFF.7 Page 2 of 2
Table 1
LBA Fees Charged by Union to EGD
Line
LBA No.
Particulars ($000's)
Fees
(a)
1
2018
430 2
2017
381
3
2016
968 4
2015
282
5
2014
237 6
2013
360
b) No, the Limited Balancing Agreement revenues/costs are not tracked between the different rate zones. LBA fees are no longer required as Enbridge Gas operates an integrated system for all rates zones.

Filed: 2019-04-25 EB-2018-0305 Exhibit I.STAFF.8 Page 1 of 3 Plus Attachments
ENBRIDGE GAS INC. Answer to Interrogatory from
Board Staff (STAFF) Reference: Exhibit B1/Tab 1/Schedule 1/pgs. 19-21 Question: The MAADs Decision directed Enbridge Gas to add rate base and depreciation associated with Union Gas’ capital pass-through projects to the 2013 OEB-approved rate base and depreciation in determining the eligible incremental capital amount for the Union Gas service territory. Enbridge Gas has therefore proposed to fix the capital pass-through revenue requirement in rates and discontinue the use of capital pass-through deferral accounts, except for the purpose of capturing utility tax timing variances.
a) Please provide further details as to why Enbridge Gas is proposing to amend the capital pass-through deferral accounts so that it only captures a portion of the revenue requirement impact related to the projects.
b) For the capital pass-through projects, please confirm that the variances between Enbridge Gas’ revenue requirement adjustment excluding utility tax timing differences in this application and actual revenue requirement excluding utility tax timing differences could be material.
c) Table 6 shows the actual/forecast utility tax timing differences from 2014 to 2018, and table 7 shows the forecast utility tax timing difference for 2019 to 2023. For 2014 to 2018, and 2019 to 2023, please provide a table showing the difference between approved (or forecasted to be approved) and forecasted revenue requirement recorded in the capital pass-through deferral accounts, broken down by the portion relating to tax timing differences and the remaining revenue requirement.

Filed: 2019-04-25 EB-2018-0305 Exhibit I.STAFF.8 Page 2 of 3 Plus Attachments
Response a) As a direct result of the MAADs Decision, which directed Enbridge Gas to add rate
base and depreciation associated with the capital pass-through projects to determine the ICM threshold value1, Enbridge Gas requires: a one-time adjustment to rates to include the revenue requirement of the capital pass-through projects; and continuation of the capital pass-through deferral accounts to capture the utility tax timing differences only. These changes are required to align the ICM threshold value with the capital investment that can be supported by rates. One-time Adjustment The capital pass-through funding as a Y factor provides for incremental revenue to support the revenue requirement of the capital pass-through projects only. It does not support the funding of any additional capital. When the actual revenue requirement of the projects is passed through to customers each year through rates or the deferral account, customers benefit from the normal decline in return on the capital pass-through projects rate base and there is no incremental revenue related to PCI or growth for these projects. As a Y factor, there is no opportunity to fund incremental capital investments as assumed when the depreciation and rate base are added to the ICM threshold value calculation. By adding the 2019 forecast rate base and depreciation of the capital pass-through projects in the ICM threshold calculation, the 2019 ICM threshold value for the Union rate zones is $80.7 million2 higher than what rates can support when capital pass-through projects are treated as a Y factor. Enbridge Gas has proposed to include a one-time adjustment for the capital pass-through revenue requirement in 2019 rates3 to address the disconnect that would otherwise be created between the annual capital investment supported by rates and the ICM threshold value calculation. The proposal for a one-time adjustment aligns rates with the amount assumed to be funded through rates, as determined in the ICM threshold value calculation. The basis of the ICM threshold value calculation assumes that rate base, as supported by rates, is maintained through the reinvestment of the depreciation amount and additional capital funding is available from applying the PCI and growth to that rate base annually.
1 EB-2017-0306/EB-2017-0307, Decision and Order, August 30, 2018, pp. 32-34. 2 The ICM threshold value without the capital pass-through rate base and depreciation is $294.5 million compared to the $375.2 million including the capital pass-through rate base and depreciation. 3 The capital pass-through revenue requirement has been updated to reflect the 2019 forecast. Refer to Exhibit I.LPMA.7 c).

Filed: 2019-04-25 EB-2018-0305 Exhibit I.STAFF.8 Page 3 of 3 Plus Attachments
To illustrate this disconnect, Enbridge Gas has provided a comparison at Attachment 1 of the proposed ICM threshold value to the threshold value supported by rates assuming Enbridge Gas continued to pass-through the annual revenue requirement of the capital pass-through projects over the deferred rebasing period. The cumulative difference of $410 million represents the potential capital investment amount not supported by rates when changes in rate base are passed through to customers. Changes to Deferral Accounts to Capture Utility Tax Timing Differences Only The proposed one-time adjustment by itself does not support the level of capital investment assumed by the ICM threshold value because of the impact the utility tax timing differences have on the revenue requirement of the projects. Normal decreases in annual revenue requirement as a result of the annual decline in rate base are more than offset by increases to annual revenue requirement resulting from decreases in the utility tax timing benefits in each year of the deferred rebasing period. The ICM threshold value calculation does not consider the impact changes in utility tax timing differences has on funding incremental capital projects. The utility tax timing differences related to the capital pass-through projects create significant impacts to the revenue requirement that are not within the normal course of business because of the large addition to rate base over a short period of time and the differences in capital cost allowance and depreciation expense on the assets. Enbridge Gas has proposed to change the capital pass-through deferral accounts to address the utility tax timing differences only to support the level of capital investments as assumed by the ICM threshold value calculation through the revenue requirement in rates of the projects. Enbridge Gas has proposed to continue to record the utility tax timing variance component of the revenue requirement in the deferral accounts because otherwise, over the deferred rebasing period, customers would receive a benefit of $57.9 million greater than the actual tax benefit that Enbridge Gas will receive over the same time period. In the absence of changing the deferral accounts as proposed, Enbridge Gas’s rates cannot support the changes in utility tax timing differences or the required level of incremental capital investment prior to ICM funding.
b) Confirmed. The higher revenue requirement in rates during the deferred rebasing period as a result of the one-time adjustment is required to support the level of capital investment prior to ICM funding as discussed in part a). Please also refer to Exhibit I.SEC.6, Attachment 1.
c) Please see Attachment 2.

Line
As
File
dN
o.P
artic
ular
s20
19 (1
)20
2020
2120
2220
2320
1920
2020
2120
2220
2320
1920
2020
2120
2220
23(a
)(b
)(c
)(d
)(e
)(f)
(g)
(h)
(i)(j)
(k) =
(a-f)
(l) =
(b-g
)(m
) = (c
-h)
(n) =
(d-i)
(o) =
(e-j)
1B
ase
Year
2013
2013
2013
2013
2013
2013
2013
2013
2013
2013
--
--
-2
Num
ber o
f Yea
rs s
ince
reba
sing
(n)
67
89
106
78
910
--
--
-3
Pric
e C
ap In
dex
(PC
I) (%
)0.
72%
0.72
%0.
72%
0.72
%0.
72%
0.72
%0.
72%
0.72
%0.
72%
0.72
%-
--
--
4G
row
th F
acto
r (g)
(%)
1.19
%1.
19%
1.19
%1.
19%
1.19
%1.
19%
1.19
%1.
19%
1.19
%1.
19%
--
--
-5
Dea
d B
and
(%)
10.0
0%10
.00%
10.0
0%10
.00%
10.0
0%10
.00%
10.0
0%10
.00%
10.0
0%10
.00%
--
--
-
6R
ate
Bas
e (R
B)
5,33
15,
331
5,33
15,
331
5,33
13,
735
3,73
53,
735
3,73
53,
735
1,59
71,
597
1,59
71,
597
1,59
77
Dep
reci
atio
n (d
)23
923
923
923
923
919
619
619
619
619
643
4343
4343
8IC
M T
hres
hold
Val
ue %
157.
1%15
8.0%
158.
9%15
9.9%
160.
8%15
0.2%
151.
0%15
1.7%
152.
5%15
3.4%
6.9%
7.1%
7.2%
7.3%
7.5%
9IC
M T
hres
hold
Val
ue37
5.2
377.
337
9.5
381.
838
4.1
294.
529
6.0
297.
529
9.1
300.
780
.781
.382
.082
.783
.3
10C
umul
ativ
e IC
M T
hres
hold
Val
ue37
5.2
752.
51,
132.
01,
513.
81,
897.
929
4.5
590.
588
8.0
1,18
7.2
1,48
7.9
80.7
162.
024
4.0
326.
741
0.0
Not
es:
(1)
Exh
ibit
B1,
Tab
2, S
ched
ule
1, T
able
3.
UN
ION
RAT
E Z
ON
ESC
ompa
rison
of I
CM
Thr
esho
ld V
alue
Sup
porte
d by
Rat
esA
s P
ropo
sed
vs. P
ass-
thro
ugh
of A
nnua
l Rev
enue
Req
uire
men
t
As
Pro
pose
dP
ass-
thro
ugh
of A
nnua
l Rev
enue
Req
uire
men
tD
iffer
ence
Filed: 2019-04-25 EB-2018-0305
Exhibit I.STAFF.8 Attachment 1
Page 1 of 1

Util
ityR
emai
ning
Tota
lU
tility
Rem
aini
ngTo
tal
Util
ityR
emai
ning
Tota
lLi
neTi
min
gR
even
ueR
even
ueTi
min
gR
even
ueR
even
ueTi
min
gR
even
ueR
even
ueN
o.P
artic
ular
s ($
000'
s)D
iffer
ence
sR
equi
rem
ent (
1)R
equi
rem
ent
Diff
eren
ces
Req
uire
men
t (1)
Req
uire
men
tD
iffer
ence
sR
equi
rem
ent (
1)R
equi
rem
ent
(a)
(b)
(c)=
(a+b
)(d
)(e
)(f)
= (d
+e)
(g)=
(d-a
)(h
)= (e
-b)
(i )=
(f-c)
App
rove
d1
2014
(1,6
18)
1,
342
(2
76)
(2,1
91)
1,44
0
(751
)(5
73)
98(4
75)
220
15(9
,342
)
15,6
38
6,
296
(8,8
60)
15
,067
6,20
748
2
(5
71)
(89)
320
16(2
4,91
9)
55
,140
30,2
21
(22,
665)
52,3
62
29
,697
2,
254
(2
,778
)
(5
24)
420
17(3
8,15
3)
11
4,93
1
76,7
78
(39,
192)
109,
603
70
,411
(1
,039
)
(5,3
28)
(6,3
67)
520
18 -
Dra
ft (2
)(4
6,02
0)
17
3,66
9
127,
649
(42,
442)
150,
782
10
8,34
1
3,
578
(2
2,88
7)
(19,
309)
Pro
pose
d6
2019
- Fo
reca
st(3
6,41
5)
15
3,65
3
117,
238
(36,
415)
153,
653
11
7,23
8
-
--
720
20 -
Fore
cast
(36,
415)
153,
653
11
7,23
8
(2
9,86
5)
15
3,65
3
123,
787
6,54
9
-6,
549
820
21 -
Fore
cast
(36,
415)
153,
653
11
7,23
8
(2
4,05
1)
15
3,65
3
129,
601
12,3
63
-
12,3
639
2022
- Fo
reca
st(3
6,41
5)
15
3,65
3
117,
238
(19,
054)
153,
653
13
4,59
8
17
,360
-17
,360
1020
23 -
Fore
cast
(36,
415)
153,
653
11
7,23
8
(1
4,75
2)
15
3,65
3
138,
901
21,6
63
-
21,6
63
Not
es:
(1)
Pan
hand
le R
einf
orce
men
t pro
ject
reve
nue
requ
irem
ent n
et o
f inc
rem
enta
l pro
ject
reve
nue.
(2)
The
2018
reve
nue
requ
irem
ent i
nclu
ded
in ra
tes
as a
ppro
ved
in E
B-2
017-
0087
. The
fina
l act
ual a
mou
nts
incl
uded
in d
efer
rals
will
be
filed
as
part
of E
nbrid
ge G
as's
201
8D
ispo
sitio
n of
Def
erra
l Acc
ount
Bal
ance
s pr
ocee
ding
.
Incl
uded
in R
ates
Incl
uded
in D
efer
rals
Def
erra
l Bal
ance
UN
ION
RA
TE Z
ON
ES
Sum
mar
y of
201
4-20
23 C
apita
l Pas
s-Th
roug
h R
even
ue R
equi
rem
ent -
App
rove
d &
For
ecas
t In
clud
ed in
Rat
es v
s. In
clud
ed in
Def
erra
ls
Filed: 2019-04-25 EB-2018-0305
Exhibit I.STAFF.8 Attachment 2
Page 1 of 1

Filed: 2019-04-25 EB-2018-0305 Exhibit I.STAFF.9 Page 1 of 1
ENBRIDGE GAS INC. Answer to Interrogatory from
Board Staff (STAFF) Reference: Exhibit B1/Tab 1/Schedule 1/pg. 23 Question: Enbridge Gas has proposed to close the Unbundled Services Unauthorized Storage Overrun Deferral Account (Account No. 179-103) effective January 1, 2019.
a) Please confirm that there is a $0 balance in the account as at December 31, 2018.
b) If not, please indicate the balance in the account and why the account should be closed at this time.
Response Confirmed.
Filed: 2019-04-25 EB-2018-0305 Exhibit I.STAFF.10 Page 1 of 2
ENBRIDGE GAS INC. Answer to Interrogatory from
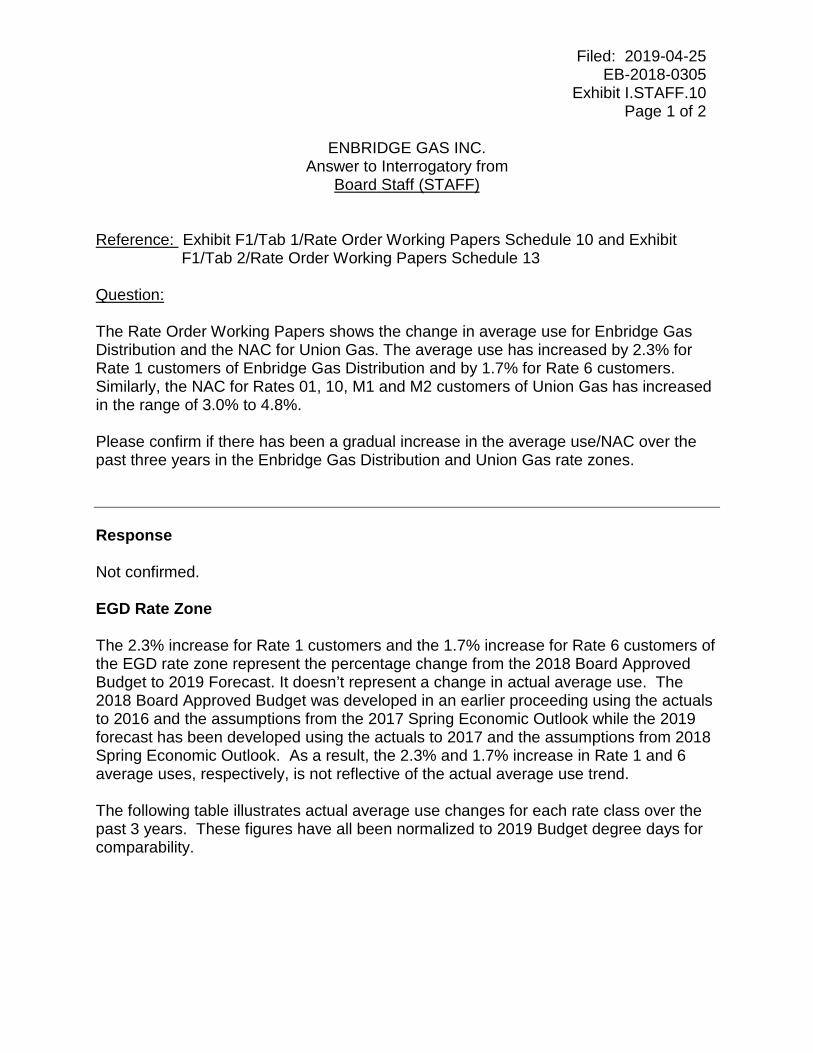
Board Staff (STAFF) Reference: Exhibit F1/Tab 1/Rate Order Working Papers Schedule 10 and Exhibit F1/Tab 2/Rate Order Working Papers Schedule 13 Question: The Rate Order Working Papers shows the change in average use for Enbridge Gas Distribution and the NAC for Union Gas. The average use has increased by 2.3% for Rate 1 customers of Enbridge Gas Distribution and by 1.7% for Rate 6 customers. Similarly, the NAC for Rates 01, 10, M1 and M2 customers of Union Gas has increased in the range of 3.0% to 4.8%. Please confirm if there has been a gradual increase in the average use/NAC over the past three years in the Enbridge Gas Distribution and Union Gas rate zones. Response Not confirmed. EGD Rate Zone The 2.3% increase for Rate 1 customers and the 1.7% increase for Rate 6 customers of the EGD rate zone represent the percentage change from the 2018 Board Approved Budget to 2019 Forecast. It doesn’t represent a change in actual average use. The 2018 Board Approved Budget was developed in an earlier proceeding using the actuals to 2016 and the assumptions from the 2017 Spring Economic Outlook while the 2019 forecast has been developed using the actuals to 2017 and the assumptions from 2018 Spring Economic Outlook. As a result, the 2.3% and 1.7% increase in Rate 1 and 6 average uses, respectively, is not reflective of the actual average use trend. The following table illustrates actual average use changes for each rate class over the past 3 years. These figures have all been normalized to 2019 Budget degree days for comparability.

Filed: 2019-04-25 EB-2018-0305 Exhibit I.STAFF.10 Page 2 of 2
Historical AU for EGD Rate Zones, Calculated Using 2019 Budget Degree Days (m3 per customer)
Enbridge Gas does not believe that short term changes will represent the general trend in average use. However, Rate 1 average use per customer has declined at an average rate of 1.0% per year over the last 3 years while Rate 6 average use declined at an average rate of 0.2% in the same period. The Company’s average use models rely on historical data and given the historical trend, in the absence of any other development that would reverse the trend, the expectation is that the declining trend for Rate 1 will continue. Please refer to the response to Exhibit I.EP.5 for a graphical representation of the long-term average use trends. Union Rate Zones The percentage changes listed at Exhibit F1, Tab 2, Rate Order, Working Papers, Schedule 13 represent the actual NAC changes from 2016 to 2017, as well as an update from the 2018 Board-approved weather normal to the 2019 Board-approved weather normal for Union rate classes. For comparability, the following table illustrates actual NAC changes for each rate class over the past 3 years, calculated using the 2019 weather normal. Historical NAC for Union Rate Zones, Calculated Using 2019 Weather Normal (m3 per
customer)
For all Union rate classes, actual NAC decreased from 2014 to 2015 and from 2015 to 2016, and then increased from 2016 to 2017. Enbridge Gas does not believe that short term changes will represent the general NAC trend, and we are still seeing a long-term declining trend for all Union rate classes. Please see Exhibit I.EP.5 for a graphical representation of the long-term NAC trends.
2014 2015 2016 2017 2014-15 2015-16 2016-17Average %
ChangeRate 1 2,531 2,508 2,408 2,457 -0.9% -4.0% 2.0% -1.0%Rate 6 29,299 29,661 28,340 29,102 1.2% -4.5% 2.7% -0.2%
2014 2015 2016 2017 2014-15 2015-16 2016-17Average %
ChangeRate M1 2,840 2,741 2,685 2,767 -3.5% -2.0% 3.0% -0.8%Rate M2 171,998 166,287 160,692 167,039 -3.3% -3.4% 3.9% -0.9%Rate 01 3,013 2,861 2,815 2,853 -5.0% -1.6% 1.4% -1.8%Rate 10 176,921 165,118 161,075 164,301 -6.7% -2.4% 2.0% -2.4%

Filed: 2019-04-25 EB-2018-0305 Exhibit I.STAFF.11 Page 1 of 3 Plus Attachment
ENBRIDGE GAS INC. Answer to Interrogatory from
Board Staff (STAFF) Reference: Exhibit B1/Tab 1/Schedule 1/pgs. 28-29 Question: Enbridge Gas has proposed to build into rates the surplus Dawn-Parkway capacity of 30,393 GJ per day resulting from the 2017 Dawn-Parkway Expansion project. As part of the 2017 Dawn-Parkway proceeding, parties agreed that Union Gas would credit the Lobo D/Bright C/Dawn H Compressor Project Deferral Account (Account No, 179-144) for revenue generated from the 30,393 GJ per day of surplus capacity. Enbridge Gas anticipates that this surplus capacity will be sold long term beginning on November 1, 2018 and for the remainder of the deferred rebasing period. To account for the incremental project demands and revenue, Enbridge Gas has added 30,393 GJ per day of project demands to the allocation of the 2019 project costs. As revenue of the surplus capacity will be built into 2019 rates, there is no longer a requirement to track the revenue associated with the surplus capacity in the project deferral account.
a) Please confirm whether the surplus capacity has been sold long term as of November 1, 2018. If yes, please provide the total capacity sold, rate and the length of the term.
b) What is the impact on 2019 rates as a result of building into rates the surplus Dawn-Parkway capacity resulting from the 2017 Dawn-Parkway expansion project?
c) Does the revenue of the surplus capacity relate to the entire surplus capacity of 30,393 GJ per day or a portion of it? How does the revenue (rate per GJ) relate to other surplus capacity that Union Gas has sold in the past two years?
d) Has any of the 30,393 GJ per day of Dawn-Parkway surplus capacity been used to reduce the Parkway Delivery Obligation? If yes, please provide details.
e) Has the cost of the 30,393 GJ per day of surplus capacity been allocated to Union Gas customers in order to reduce the Parkway Delivery Obligation?
f) Enbridge Gas has indicated that the revenue of the surplus capacity is built into 2019 rates. Please provide the revenue that has been built into 2019 rates and the associated calculation to show that the revenue is an off-set to the 2019 proposed revenue requirement.

Filed: 2019-04-25 EB-2018-0305 Exhibit I.STAFF.11 Page 2 of 3 Plus Attachment
Response a) Enbridge Gas sold 42,378 GJ/d of Dawn-Parkway capacity starting November 1,
2018 and ending October 31, 2040 at posted M12 rates. However, based on changes affecting the overall surplus since the time the original schedule was filed in 2015 (i.e., turnback, modelling changes, etc.), Enbridge Gas has surplus Dawn-Parkway capacity of approximately 126 TJ as of November 1, 2018. Enbridge Gas has sold additional long-term M12 contracts beginning November 1, 2019 which will completely utilize the surplus Dawn-Parkway capacity.
b) The 2019 Rate M12 demand charges have been reduced by the equivalent of the incremental $1.3 million in Rate M12 Dawn-Parkway revenue that has been sold long term.
c) The revenue of $1.3 million relates to the entire surplus capacity of 30,393 GJ/d (30,393 GJ/d x 12 x $3.586 GJ/m). The revenue is based on approved Rate M12 Dawn-Parkway demand charges, which is consistent with the sale of long-term Dawn-Parkway capacity sold over the past two years. The M12 rate is also comparable with the average price obtained for short-term and interruptible services sold over the past two years.
d) No. The 30,393 GJ/d of Dawn-Parkway surplus capacity was not used to reduce the Parkway Delivery Obligation. Please see part a).
e) No. Please see part d).
f) The forecast revenue associated with the 30,393 GJ/d is $1.3 million in 2019. To account for the incremental project revenue that has been sold long-term under Rate M12, Enbridge Gas has adjusted the Rate M12 billing units in the derivation of 2019 Rate M12 demand charges. This adjustment for the incremental project demands is consistent with the approved billing unit adjustments made in the 2017 Dawn-Parkway Project (EB-2015-0200) to account for the incremental project revenue. The inclusion of the 30,393 GJ/d of Rate M12 Dawn-Parkway demands in rates results in a decrease to the Rate M12 demand charges equivalent to the $1.3 million that Enbridge Gas will earn from the sale of 30,393 GJ/d based on the proposed 2019 Dawn-Parkway rate of $3.586 GJ/m (30,393 GJ/d x 12 x $3.586 GJ/m). Please see Attachment 1 for a reconciliation of the proposed 2019 Rate M12 demand charges including and excluding the 30,393 GJ/d to illustrate the revenue adjustment of $1.3 million that is included in 2019 proposed rates. The inclusion of

Filed: 2019-04-25 EB-2018-0305 Exhibit I.STAFF.11 Page 3 of 3 Plus Attachment
the incremental demands in 2019 Rates results in lower Rate M12 demand charges that would have otherwise been higher had the excess capacity not been sold.

Ann
ual
Line No.
Par
ticul
ars
(1)
Usa
ge (G
J) (3
)A
s P
ropo
sed
(4)
Adj
uste
d (5
)V
aria
nce
As
Pro
pose
d (4
)A
djus
ted
(5)
Var
ianc
e(a
)(b
)(c
)(d
) = (b
- c)
(e)=
(a x
b /
1000
)(f)
= (a
x c
/ 10
00)
(g)=
(e -
f )
In B
ase
Rat
es1
Daw
n-P
arkw
ay60
,115
,592
3.58
63.
604
(0.0
19)
215,
554
216,
676
(1,1
22)
2D
awn-
Kirk
wal
l8,
708,
176
3.04
33.
059
(0.0
16)
26,5
0326
,641
(138
)3
Kirk
wal
l-Par
kway
2,86
5,32
80.
542
0.54
5(0
.003
)1,
554
1,56
2(8
)4
Wes
terly
9,02
3,65
50.
844
0.84
9(0
.004
)7,
620
7,66
0(4
0)25
1,23
125
2,53
9(1
,308
)In
crem
enta
l Dem
ands
5D
awn-
Par
kway
(2)
364,
716
3.58
6-
3.58
61,
308
-1,
308
6To
tal i
n B
ase
Rat
es81
,077
,467
252,
539
252,
539
-
Incr
emen
tal R
even
ueE
xclu
ded
from
Bas
e R
ates
7D
awn-
Par
kway
(2)
364,
716
-3.
604
(3.6
04)
-1,
315
(1,3
15)
8D
efer
ral A
ccou
nt A
djus
tmen
t (6)
-(1
,315
)1,
315
9To
tal R
even
ue25
2,53
925
2,53
9-
Not
es:
(1)
Rat
e M
12 re
venu
e re
quire
men
t allo
cate
d to
Rat
e M
12 tr
ansp
orta
tion
path
s us
ing
appr
oved
rate
des
ign
met
hodo
logi
es.
(2)
Ann
ual f
orec
ast u
sage
of 3
64,7
16 G
J ca
lcul
ated
as
30,3
93 G
J/d
x 12
mon
ths.
(3)
Boa
rd-a
ppro
ved
billin
g un
its u
pdat
ed to
incl
ude
incr
emen
tal D
awn-
Par
kway
dem
ands
of 3
0,39
3 G
J/d
at li
ne 5
.(4
)P
ropo
sed
dem
and
char
ges
and
reve
nue
incl
udin
g th
e in
crem
enta
l Daw
n-P
arkw
ay d
eman
ds o
f 30,
393
GJ/
d.(5
)A
djus
ted
dem
and
char
ges
and
reve
nue
excl
udin
g th
e in
crem
enta
l Daw
n-P
arkw
ay d
eman
ds o
f 30,
393
GJ/
d.(6
)In
crem
enta
l rev
enue
exc
lude
d fro
m b
ase
rate
s w
ould
be
reco
rded
and
dis
pose
d of
in th
e D
awn
H/L
obo
D/B
right
C C
ompr
esso
r Pro
ject
Co s
tsD
efer
ral A
ccou
nt (A
ccou
nt N
o. 1
79-1
44).
EN
BR
IDG
E G
AS
INC
. P
ropo
sed
Rev
enue
Adj
ustm
ent A
ssoc
iate
d w
ith In
crem
enta
l 30,
393
GJ/
d
Fore
cast
Dem
and
Cha
rges
($/G
J/m
)A
nnua
l Rev
enue
($00
0's)
Filed: 2019-04-25 EB-2018-0305
Exhibit I.STAFF.11 Attachment 1
Page 1 of 1

Filed: 2019-04-25 EB-2018-0305 Exhibit I.STAFF.12 Page 1 of 2
ENBRIDGE GAS INC. Answer to Interrogatory from
Board Staff (STAFF) Reference: Exhibit B1/Tab 1/Schedule 1/Pg. 29 Question: Enbridge Gas has proposed to maintain the current level of the general service monthly customer charge for the Union Gas rate zone at $21 per month for Rate M1 and Rate 01 and $70 per month for Rate M2 and Rate 10. Please provide the list of monthly customer charges that have been changed in the current application for Enbridge Gas Distribution and Union Gas rate zones. Response Please see Table 1 for the monthly customer charges that have a proposed change as part of the current application.

Filed: 2019-04-25 EB-2018-0305 Exhibit I.STAFF.12 Page 2 of 2
Table 1 Proposed Changes to the Monthly Customer Charge by Rate Class
Line No.
Particulars
Approved Monthly Customer Charge
Proposed Monthly Customer Charge
(a) (b) EGD
1 Rate 9 $235.95 $238.47 2 Rate 100 $122.01 $123.32 Union North
3 Rate 20 $860.69 $918.21 4 Rate 25 $289.76 $317.47 5 Rate 100 $1,341.41 $1,409.84 Union South
6 Rate M4 – Interruptible $644.34 $681.74 7 Rate M5 $644.34 $681.74 8 Rate T1 $1,896.28 $1,964.91 9 Rate T2 $5,440.88 $5,987.98 10 Rate T3 11 City of Kitchener $19,843.96 $20,640.21 12 Natural Resource Gas $3,046.25 $3,168.48 13 Six Nations $1,015.42 $1,056.16
The update to the monthly customer charges by rate class for each of the rate zones is generally consistent with the past practice used by legacy Union and legacy EGD during their previous IRM terms. The Union practice updates the monthly customer charge for contract rate classes. The EGD practice previously did not update the monthly customer charge for any rate class. As part of 2019 Rates, Enbridge Gas did update customer charges for Rate 9 and Rate 100 in the EGD rate zone for the Price Cap Index, however, there are no impacts associated with this update as there are no forecast customers that would take service under these rate classes.

Filed: 2019-04-25 EB-2018-0305 Exhibit I.STAFF.13 Page 1 of 2
ENBRIDGE GAS INC. Answer to Interrogatory from
Board Staff (STAFF) Reference: Exhibit B1/Tab 1/Schedule 1/pgs. 29-31 Question: In Table 11 (page 31) of the evidence, Enbridge Gas has provided a table that shows the impact of the proposed rate design changes for Union South M1 and Union North Rate 01 customers. The rate impact for a Union South M1 customer consuming 2,200 m3 under the current approved rate design is 1.9% (Delivery bill impact) and under the proposed rate design it is 2.7%. Similarly, for a Union South M1 customer consuming 40,000 m3, the rate impact changes from 5.2% to 1.3% using the proposed rate design. a) Please provide the rate impact on a Union South M1 customer under the two
consumption scenarios if the percentage rate impact for those consuming 2,200 m3 and 40,000 m3 is the same.
b) Please provide the percentage rate impact on a Union South M1 customer consuming 40,000 m3 if the percentage rate impact for a customer consuming 2,200 m3 is held to 2.2%.
Response a) Please see Table 1. A delivery bill impact percentage of 2.4% creates the same bill
impact percentage for a Union South Rate M1 customer consuming 2,200 m3 and 40,000 m3.

Filed: 2019-04-25 EB-2018-0305 Exhibit I.STAFF.13 Page 2 of 2
Table 1 Delivery Bill Impacts for Rate M1
Same Delivery Bill Impact Percentage
Line
Union South No.
Particulars ($)
Rate M1
(a) (b)
1
Annual Consumption
2,200 m3 40,000 m3
2
Current Approved Delivery Bill
374 2,222 3
2019 Rates – Same Impact Percentage
383 2,276
4
Difference (line 3 - line 2)
9 54 5
Delivery Bill Impact (%) (line 4 / line 2)
2.4% 2.4%
b) Please see Table 2. A residential delivery bill impact percentage of 2.2% creates a
3.6% delivery bill impact percentage for a Union South Rate M1 customer consuming 40,000 m3.
Table 2 Delivery Bill Impacts for Rate M1
2.2% Residential Delivery Bill Impact
Line Union South No.
Particulars ($)
Rate M1
(a) (b)
1
Annual Consumption
2,200 m3 40,000 m3
2
Approved Delivery Bill
374 2,222 3
2019 Rates – 2.2% Residential Impact
382 2,303
4
Difference (line 3 - line 2)
8 81 5
Delivery Bill Impact (%) (line 4 / line 2)
2.2% 3.6%

Filed: 2019-04-25 EB-2018-0305 Exhibit I.STAFF.14 Page 1 of 2
ENBRIDGE GAS INC. Answer to Interrogatory from
Board Staff (STAFF) Reference: Exhibit B1/Tab 1/Schedule 1/pgs. 31-33 and Exhibit F1/Tab 2/Working Papers/Schedule 11 Question: Enbridge Gas has updated the Parkway Delivery Obligation and Parkway Delivery Commitment Incentive costs to reflect the 2019 Rate M12 Dawn-Parkway toll and Dawn-Parkway compressor fuel, based on Union Gas’ October 2018 QRAM. The cost impact on the 2019 revenue requirement is $627,000. Schedule 11 of the Working Papers shows the total Parkway Delivery Obligation costs to be $24.723 million. In the EB-2017-0087 Rate Order Working Papers (Schedule 20), the total Parkway Delivery Obligation costs for 2018 is $24.855 million. Please explain how the cost of $627,000 has been derived in relation to the 2018 amount shown in EB-2017-0087 and the $24.723 million for 2019. Response Please see Table 1 for a reconciliation between the $24.855 million PDO and PDCI costs as filed in the EB-2017-0087 application and the $24.723 million as filed in this application. The 2019 revenue requirement impact of $0.627 million is shown on line 6.

Filed: 2019-04-25 EB-2018-0305 Exhibit I.STAFF.14 Page 2 of 2
Table 1 PDO and PDCI Cost Reconciliation
Line No.
Particulars ($ millions)
Total PDO and
PDCI Costs
1 2018 as filed in EB-2017-0087 draft rate order 24.855 2 2018 adjustment (1) (0.253) 3 2018 as approved in EB-2017-0087 final rate order 24.602 4 2018 adjustment (2) (0.507) 5 2018 as approved in EB-2018-0253 final rate order 24.095 6 2019 impact as proposed 0.627 7 2019 as filed in EB-2018-0305 draft rate order 24.723
Notes: (1) PDCI costs adjusted in the EB-2017-0087 final rate order (Union’s 2018
Rates) to reflect an update to the Rate M12 Dawn to Parkway Cap-and-Trade Facility-Related Charge from $0.009/GJ to $0.006/GJ as approved in EB-2016-0296 (Union’s 2017 Cap-and-Trade Compliance Plan).
(2) PDCI costs updated in the EB-2018-0253 final rate order (Union’s October 2018 QRAM) to reflect the removal of the Rate M12 Dawn to Parkway Cap-and-Trade Facility-Related charge of $0.006/GJ.

Filed: 2019-04-25 EB-2018-0305 Exhibit I.STAFF.15 Page 1 of 1
ENBRIDGE GAS INC. Answer to Interrogatory from
Board Staff (STAFF) Reference: Exhibit B1/Tab 1/Schedule 1/pgs.38-39 Question: Enbridge Gas has proposed to change the Aid to Construction language in Union Gas’ Rate M13 General Terms and Conditions (GT&C), effective January 1, 2019. The GT&C outlines the calculation of Aid to Construction payments associated with the capital cost of building a local producer station on Enbridge Gas’ system rather than in the customer’s contract or a separate precedent agreement. For consistency with other rate classes, Enbridge Gas proposes to move the specific Aid to Construction payment language from the GT&C to the customer’s contract and replace it with the description used in the Union Gas Rate M16 GT&C.
a) What type of customers take service under Rate M13? b) Is there a material difference in the language or the terms with respect to how Aid
to Construction will be treated or calculated as a result of the proposed changes? If yes, please explain the changes in the terms.
c) How does Enbridge Gas propose to inform customers who have already contracted for service under Rate M13 of the changes noted above?
Response a) The M13 rate schedule is applicable to customers located in the Union South rate
zone who enter into a contract with Enbridge Gas for the transportation of natural gas produced within Ontario to Dawn.
b) No. There is no material difference in the language or the terms with respect to how
Aid to Construction will be treated or calculated as a result of the changes. c) The M13 General Terms and Conditions are posted on Union’s website at
https://www.uniongas.com/storage-and-transportation/informational-postings/tariffs. Changes to general terms and conditions are highlighted and posted with 60 days notice at this location with an associated effective date stated. This change will not impact existing M13 customers because the General Terms and Conditions that are in effect when the customer enters into contractual arrangements with Enbridge Gasremain in effect until the contract terminates.

Filed: 2019-04-25 EB-2018-0305 Exhibit I.STAFF.16 Page 1 of 1
ENBRIDGE GAS INC. Answer to Interrogatory from
Board Staff (STAFF) Reference: Exhibit B1/Tab 1/Schedule 1/Appendices A and B Question: Enbridge Gas provided two draft accounting orders for each of the three new accounts: Accounting Policy Change Deferral Account (Appendix A, page 34 and Appendix B, page 35), Earnings Sharing Mechanism Deferral Account (Appendix A, page 35 and Appendix B, page 36) and the Tax Variance Deferral Account (Appendix A, page 36 and Appendix B, page 37). Please explain why there are two draft accounting orders for each of the new accounts. Response Enbridge Gas provided two draft accounting orders for each of the three new accounts for the purposes of completeness, in order to show that each of the accounts is applicable to both the EGD and Union Gas rate zones. This was done solely for presentation, as Appendix A of Exhibit B1, Tab 1, Schedule 1 provided the accounting orders applicable to the EGD rate zone, while Appendix B provided the accounting orders applicable to the Union Gas zones. As seen in each appendix, the accounting orders for the three accounts are identical, and titled as Enbridge Gas Inc. accounting orders, while other accounting orders are titled as either EGD rate zone or Union Gas rate zones specific.

Filed: 2019-04-25 EB-2018-0305 Exhibit I.STAFF.17 Page 1 of 1 Plus Attachments
ENBRIDGE GAS INC. Answer to Interrogatory from
Board Staff (STAFF) Reference: Exhibit B1/Tab 1/Schedule 1/pgs. 13, 17 and Appendices A and B Question:
a) For the accounts listed in Table 5, where there have been adjustments to existing deferral and variance accounts, please provide a black lined version of the accounting orders showing the change from the original accounting order.
b) Page 13 states that the existing accounting orders have been updated to reflect the applicability of the account to the Enbridge Gas Distribution and Union Gas rate zones. For all existing accounts excluding those listed in Table 5, please confirm that the only change in the accounting orders was to update the naming of the specific rate zones under Enbridge Gas Inc. If not, please provide a black lined version of the accounting orders showing the change from the original accounting order and explain the need for the change.
Response a) Please see Attachment 1 and Attachment 2 for the EGD and Union rate zones,
respectively.
b) Confirmed.

ACCOUNTING TREATMENT FOR A POST-RETIREMENT TRUE-UP VARIANCE ACCOUNT
(“PTUVA”) – EGDEGD RATE ZONE
In accordance with the EB-2017-0086 Settlement Proposal, during 2018 the purpose of the Post-Retirement True-Up Variance Account (PTUVA) iswill be to record any allowed revenue impact that results from actual pension and OPEB related amounts (accrual based expense amounts and cash based funding) which differ compared to what was forecast and included in rates. This would include any allowed revenue impacts arising as a result of proposed changes to Ontario pension legislation and regulations which proceed. The PTUVA will be cleared subject to the condition that any allowed revenue variance in excess of $5 million (credit or debit) will remain in the account, so that large variances can be cleared over time (smoothed). Under this approach, the maximum amount (debit or credit) that will be cleared from the PTUVA will be $5 million with any balance to remain in the account for future clearance. In accordance with the EB-2017-0306/EB-2017-0307 Decision and Order, beginning in 2019 the PTUVA will only be utilized to reflect any residual balance from 2018 that has not been cleared due to the smoothing mechanism related to the account.
Simple interest is to be calculated on the opening monthly balance of this account using the Board approved EB-2006-0117 interest rate methodology. The balance of this account, together with carrying charges, will be disposed of in a manner designated by the Board in a future rate hearing.
Accounting Entries
1. To record the pension and post-employment benefit allowed revenue true-upamounts:
Debit: PTUVA (Account 179. 24_) Credit: Accounts payable (Account 251. 010)
Or Debit/Credit: Operating revenue (Account 300.000) Credit/Debit: PTUVA (Account 179.24_)
To record the allowed revenue impact resulting from variances between actual pension and post-employment benefits, versus amounts embedded in rates.
2. Interest accrual:
Debit/Credit: Interest on PTUVA (Account 179. 25_) Credit/Debit: Interest expense (Account 323. 000)
To record simple interest on the opening monthly balance of the PTUVA using the Board approved EB-2006-0117 interest rate methodology.
DRAFT
Filed: 2019-04-25, EB-2018-0305, Exhibit I.STAFF.17, Attachment 1, Page 1 of 11

ACCOUNTING TREATMENT FOR AN OPEN BILL REVENUE VARIANCE ACCOUNT
(“OBRVA”) – EGDEGD RATE ZONE
The purpose of the OBRVA is to track and record the ratepayer share of net revenue for Open Bill Services. The account allows for net annual revenue amounts in excess of $7.389 million to be shared 50/50 with ratepayers, and allows for a credit to the CompanyEnbridge in the event that net annual revenues are less than $4.889 million, equal to the shortfall between actual net revenues and $4.889 million. The net revenue amounts will be determined in accordance with the EB-20092013-009943 Board Aapproved Open Bill Access Settlement Proposal dated October 15, 2009, as amended and approved by the Board from time to timewith updated Fees and Costs as determined in the EB-2013-0099 proceeding. Simple interest is to be calculated on the opening monthly balance of this account using the Board approved EB-2006-0117 interest rate methodology. The balance of this account, together with carrying charges, will be disposed of in a manner designated by the Board in a future rate hearing. Accounting Entries 1. To track and record Open Bill services net revenue:
Debit: Other income (Account 319. 010) Credit: OBRVA (Account 179. 48_)
Or Debit: OBRVA (Account 179. 48_)
Credit: Operating revenue (Account 300. 000)
To record the variance in the ratepayer porting of net revenue associated with Open Bill Service programs in excess of $7.389 million or below $4.889 million.
2. Interest accrual:
Debit/Credit: Interest on OBRVA (Account 179. 49_) Credit/Debit: Interest expense (Account 323. 000)
To record simple interest on the opening monthly balance of the OBRVA using the Board approved EB-2006-0117 interest rate methodology.
DRAFT
Filed: 2019-04-25, EB-2018-0305, Exhibit I.STAFF.17, Attachment 1, Page 2 of 11

ACCOUNTING TREATMENT FOR AN EX-FRANCHISE THIRD PARTY BILLING SERVICES DEFERRAL ACCOUNT
(“EFTPBSDA”) – EGDEGD RATE ZONE
The purpose of the EFTPBSDA is to record and track the ratepayer portion of revenues, net of incremental costs, generated from third party billing services provided to ex-franchise parties. The net revenue is to be shared on a 50/50 basis with ratepayers. The net revenue amounts will be determined in accordance with the EB-20092013-0043 0099 Board Aapproved Open Bill Access Settlement Proposal, dated October 15, 2009, with updated Fees and Costs as determined in the EB-2013-0099 proceeding.as amended and approved by the Board from time to time. Simple interest is to be calculated on the opening monthly balance of this account using the Board approved EB-2006-0117 interest rate methodology. The balance of this account, together with carrying charges, will be disposed of in a manner designated by the Board in a future rate hearing. Accounting Entries
1. To track and record the ratepayer portion of net revenue:
Debit/Credit: EFTPBSDA (Account 179. 08_) Credit/Debit: Various accounts (Account ___. ___)
To record net revenue associated with Ex-Franchise third party Billing Services. 2. Interest accrual:
Debit/Credit: Interest on EFTPBSDA (Account 179. 09_) Credit/Debit: Interest expense (Account 323. 000)
To record simple interest on the opening monthly balance of the EFTPBSDA using the Board approved EB-2006-0117 interest rate methodology.
DRAFT
Filed: 2019-04-25, EB-2018-0305, Exhibit I.STAFF.17, Attachment 1, Page 3 of 11

ACCOUNTING TREATMENT FOR A PURCHASED GAS VARIANCE ACCOUNT
(“PGVA”) – EGDEGD RATE ZONE
The purpose of the PGVA is to record the effect of price variances between actual gas purchase prices and the forecast prices that underpin the revenue for rates to be charged throughout the fiscal year. Without this deferral account, the ratepayers and the Company are exposed to the risk of purchased gas price variances, which could unduly penalize or benefit one party at the benefit or expense of the other. Lower than forecast gas purchase prices would result in an over recovery from the customers and higher prices would result in an under recovery to the Company. This deferral account ensures that such effects are eliminated.
Methodology
The actual unit cost is determined by dividing the total commodity and transportation costs (less the demand charges related to unutilized TransCanada firm service transportation capacity, if any) plus any other costs associated with emerging gas pricing mechanisms incurred in the month by the actual volumes purchased in the month. The rate differential between the PGVA reference price and the actual unit cost of the purchases, multiplied by the actual volumes purchased, is recorded in the PGVA monthly.
The fixed cost component of the TransCanada firm service transportation costs (i.e., Transportation Demand Charge) is included in the determination of the reference price. However, any demand charges relating to unutilized transportation capacity, either forecast or actual, are excluded. This treatment of forecast and actual Transportation Demand Charges for unutilized transportation capacity is consistent with the Board's concerns that these amounts be excluded from the PGVA.
Since all transportation costs on volumes purchased by the Company related to forecast utilized capacity are included in the determination of the PGVA reference price, any changes in the TransCanada tolls will be recorded in the PGVA. Any toll changes related to the cost of forecast unutilized capacity will not be recorded in the PGVA and therefore, requires separate adjustment. The inclusion of changes in TransCanada tolls in the PGVA is consistent with past practice.
Since the transportation tolls for other transportation services, such as for the Vector, Link, and NEXUS pipelines, that were used in the determination of the PGVA reference price were based upon an estimate, any variation between the actual transportation costs (including associated fuel costs) and the estimated transportation costs will be recorded in the PGVA.
Since transportation costs related to the transport of Western Canada Bundled T-service volumes are not included in the derivation of the PGVA reference price,changes in TransCanada tolls will be recorded in the PGVA as a separate adjustment.
DRAFT
Filed: 2019-04-25, EB-2018-0305, Exhibit I.STAFF.17, Attachment 1, Page 4 of 11

Throughout the fiscal year expenditures related to TransCanada's Storage Transportation Services, including balancing fees related to TransCanada's Limited Balancing Agreement, will be recorded in the PGVA. The PGVA will also record amounts related to a Limited Balancing Agreement with Union Gas. The PGVA will record adjustments related to transactional services activities which are designed to record the impact of direct and avoided costs between the PGVA and the TSDA. These adjustments are required to ensure appropriate allocation of costs and benefits to the underlying transactions and appropriate recording of amounts in the PGVA and TSDA for purposes of deferral account dispositions. In addition, the PGVA will record the amounts related to unforecast penalty revenues received from interruptible customers who do not comply with the Company's curtailment requirements, unauthorized overrun gas revenues, the use of electronic bulletin boards, and the unforecast Unabsorbed Demand Charge ("UDC") that arises as a consequence of the Company voluntarily leaving transportation capacity unutilized in order to gain a net benefit for the customer by purchasing lower priced unforecast discretionary delivered supplies. The PGVA will also record an inventory valuation adjustment every time a recalculated “Utility Price” or PGVA Reference Price comes into effect at the beginning of a quarter. The adjustment consists of the storage inventory valuation adjustment necessary to price actual opening inventory volumes at a rate equal to the Board approved quarterly PGVA reference price. The PGVA will also record any refund/collection associated with Board approved Gas Cost Adjustment Riders. The Company will record, at the time a Banked Gas Account Balance is purchased from a customer, the difference in the amount payable to the customer and the amount included in the PGVA (Transportation Service Rider A). This amount would be credited to a sub-account of the PGVA. In the event the Company incurs unforecast UDC costs as a result of having to purchase Banked Gas Account Balances then the amount in such sub-account will be used to offset corresponding UDC costs. All amounts remaining in this sub-account, after offsetting these UDC costs, will be rolled up into the PGVA. The commodity sale price on the disposition of Banked Gas Account Balances, the incentive sale price, is set at 120% of an average Empress price over the 12 months of the contractual year. Any amount in excess of 100% of the gas supply charge stated in the applicable rate schedule, net of the commodity related bad debt, will be included in the PGVA for each fiscal year. Simple interest is to be calculated on the opening monthly balance of the PGVA using the Board Approved EB-2006-0117 interest rate methodology. The balance of the PGVA, together with carrying charges, will be disposed of in a manner designated by the Board in a future rate hearing.
Filed: 2019-04-25, EB-2018-0305, Exhibit I.STAFF.17, Attachment 1, Page 5 of 11

Accounting Entries 1. To record the monthly gas purchase variance: Debit: PGVA (Account 179. 70_) Credit: Gas in Storage (Account 152. 000) or Debit: Gas in Storage (Account 152. 000) Credit: PGVA (Account 179.70_) To record the total rate variance on the current month’s gas purchases. 2. TransCanada Toll changes related to forecast unutilized transportation capacity: Debit: PGVA (Account 179. 70_) Credit: Accounts Payable (Account 259. 000) or Debit: Gas in Storage (Account 152. 000) Credit: PGVA (Account 179. 70_)
To record the amounts related to TransCanada toll changes on forecast unutilized transportation capacity.
3. TransCanada Toll changes related to Western Canada Bundled T-Service
transportation capacity: Debit: PGVA (Account 179. 70_) Credit: Accounts Payable (Account 259. 000) or Debit: Gas in Storage (Account 152. 000) Credit: PGVA (Account 179. 70_)
To record the amounts related to TransCanada toll changes on Western Canada Bundled T-Service transportation capacity.
4. Transactional services activities: Debit/Credit: TSDA (Account 179. 80_) Debit/Credit: Various accounts (Account ___. ___) Credit/Debit: PGVA (Account 179. 70_)
To record adjustments for direct and avoided costs related to Transactional Services activities between the PGVA and TSDA, and other accounts such as Gas Costs, Gas Stored Underground and Storage Demand Charges.
Filed: 2019-04-25, EB-2018-0305, Exhibit I.STAFF.17, Attachment 1, Page 6 of 11
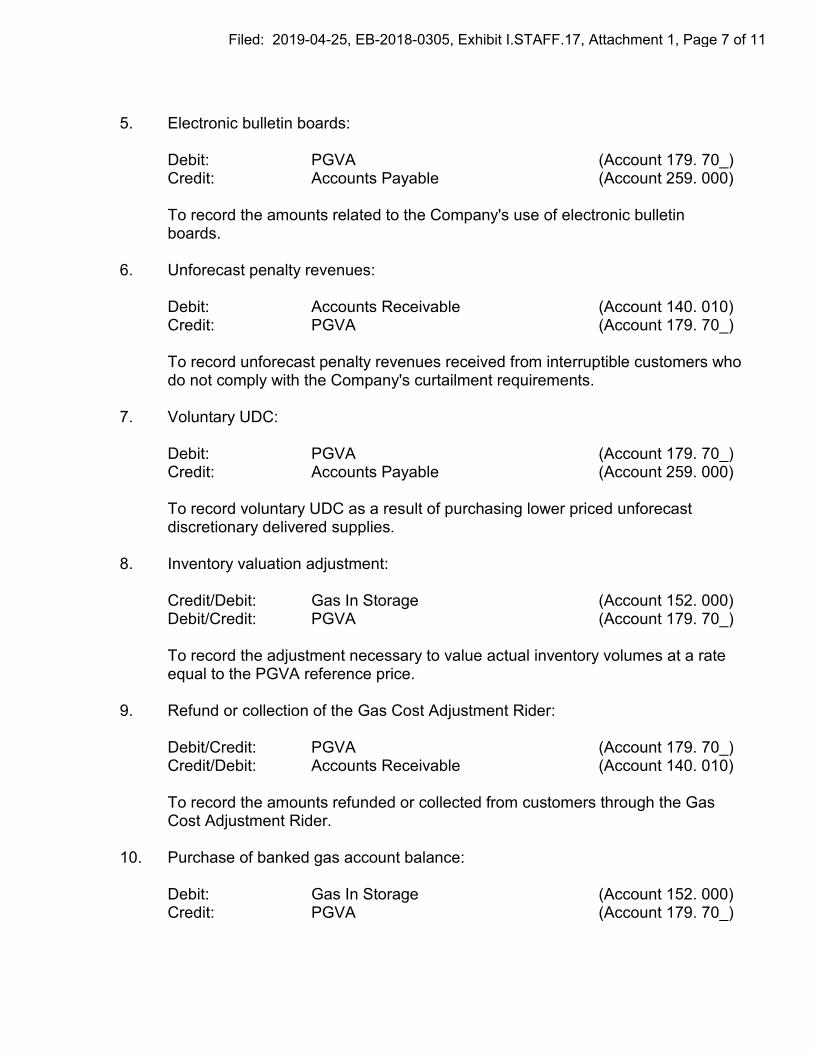
5. Electronic bulletin boards: Debit: PGVA (Account 179. 70_) Credit: Accounts Payable (Account 259. 000)
To record the amounts related to the Company's use of electronic bulletin boards.
6. Unforecast penalty revenues: Debit: Accounts Receivable (Account 140. 010) Credit: PGVA (Account 179. 70_)
To record unforecast penalty revenues received from interruptible customers who do not comply with the Company's curtailment requirements.
7. Voluntary UDC: Debit: PGVA (Account 179. 70_) Credit: Accounts Payable (Account 259. 000)
To record voluntary UDC as a result of purchasing lower priced unforecast discretionary delivered supplies.
8. Inventory valuation adjustment: Credit/Debit: Gas In Storage (Account 152. 000) Debit/Credit: PGVA (Account 179. 70_)
To record the adjustment necessary to value actual inventory volumes at a rate equal to the PGVA reference price.
9. Refund or collection of the Gas Cost Adjustment Rider: Debit/Credit: PGVA (Account 179. 70_) Credit/Debit: Accounts Receivable (Account 140. 010)
To record the amounts refunded or collected from customers through the Gas Cost Adjustment Rider.
10. Purchase of banked gas account balance: Debit: Gas In Storage (Account 152. 000) Credit: PGVA (Account 179. 70_)
Filed: 2019-04-25, EB-2018-0305, Exhibit I.STAFF.17, Attachment 1, Page 7 of 11

To record the purchase of the Banked Gas Account Balance less the Transportation Service Rider A.
11. Unforecast UDC: Debit: PGVA (Account 179. 70_) Credit: Accounts Payable (Account 259. 000)
To record unforecast UDC costs resulting from the purchase of Banked Gas Account Balances from T-Service customers.
12. Sales in excess of 100% of the applicable gas supply charge: Debit: Other Income (Account 319. 010)
Credit: PGVA (Account 179. 70_)
To record the amount of sales in excess of 100% of the gas supply charge stated in the applicable rate schedule, net of the commodity related bad debt amount.
13. Interest accrual: Debit: PGVA - Interest Receivable (Account 179. 71_) Credit: Interest Expense (Account 323. 000) or Debit: Interest Expense (Account 323. 000) Credit: PGVA - Interest Payable (Account 179. 71_)
To record simple interest on the opening monthly balance of the PGVA using the Board Aapproved EB-2006-0117 interest rate methodology.
Filed: 2019-04-25, EB-2018-0305, Exhibit I.STAFF.17, Attachment 1, Page 8 of 11

ACCOUNTING TREATMENT FOR A STORAGE AND TRANSPORTATION DEFERRAL ACCOUNT
(“S&TDA”) – EGDEGD RATE ZONE
The purpose of the S&TDA is to record the difference between the forecast of Storage and Transportation rates (both cost of service and market based pricing) included in the Company’s approved rates and the final Storage and Transportation rates (both cost of service and market based pricing) incurred by the cCompany. It will also be used to record variances between the forecast Storage and Transportation rebate programs and the final rebates received by the cCompany. The accounting treatment for the S&TDA is in line with that established for the 2008 S&TDA, which recognized that storage and transportation services may be provided to the Company by suppliers other than Union Gas and at market based rates. The S&TDA will also record the variance between the forecast Storage and Transportation demand levels and the actual Storage and Transportation demand levels. In addition, this account will be used to record amounts related to deferral account dispositions received or invoiced from Storage and Transportation suppliers. The S&TDA will also record the variance between the forecasted commodity cost for fuel and the updated QRAM Reference Price. Simple interest is to be calculated on the opening monthly balance of the S&TDA using the Board Approved EB-2006-0117 interest rate methodology. The balance of this account, together with carrying charges, will be disposed of in a manner designated by the Board in a future rate hearing. Accounting Entries 1. Storage and Transportation rate variance:
[(Final Storage and Transportation rates) – (Storage and Transportation rates underpinning the Company’s rates)] X Actual storage and/or transportation volumes
Debit/Credit: S&TDA (Account 179. 88_)
Credit/Debit: Gas in Storage (Account 152. 000) or Credit/Debit: Gas Costs (Account 623. 010)
To record the difference between the Storage and Transportation rates included in the Company’s rates and the final Storage and Transportation rates.
DRAFT Filed: 2019-04-25, EB-2018-0305, Exhibit I.STAFF.17, Attachment 1, Page 9 of 11

2. To record variances in the Storage and Transportation rebate programs: Debit: Sundry Accounts Receivable (Account 141. 030) Credit: S&TDA (Account 179. 88_) or Debit: S&TDA (Account 179. 88_) Credit: Accounts Payable (Account 259. 000)
To record the difference between the Storage and Transportation rebate programs included in the Company’s rates and the final rebates received by the Company.
3. To record Storage and Transportation deferral account dispositions: Debit: Sundry Accounts Receivable (Account 141. 030) Credit: S&TDA (Account 179. 88_) or Debit: S&TDA (Account 179. 88_) Credit: Accounts Payable (Account 259. 000)
To record amounts related to deferral account dispositions received or invoiced from Storage and Transportation.
4. Inventory valuation adjustment: Debit/Credit: S&TDA (Account 179. 88_) Credit/Debit: Gas In Storage (Account 152. 000)
To record adjustments to storage and transmission fuel costs associated with quarterly price changes.
5. Interest accrual: Debit/Credit: Interest on S&TDA (Account 179. 89_) Credit/Debit: Interest Expense (Account 323. 000)
To record simple interest on the opening monthly balance of the S&TDA using the Board Aapproved EB-2006-0117 interest rate methodology.
Filed: 2019-04-25, EB-2018-0305, Exhibit I.STAFF.17, Attachment 1, Page 10 of 11

ACCOUNTING TREATMENT FOR AN OEB COST ASSESSMENT VARIANCE ACCOUNT
(“OEBCAVA”) – EGDEGD RATE ZONE
As authorized in the OEB’s letter to all regulated entities, dated February 9, 2016, titled “Revisions to the Ontario Energy Board Cost Assessment Model”, the purpose of the OEBCAVA will be to record any variance between the OEB costs assessed to Enbridge under the prior cost assessment model (prior to April 1, 2016), which are included in rates, and the OEB costs assessed to Enbridge under the new OEB cost assessment model (effective April 1, 2016). Entries into the variance account will be made on a quarterly basis when the OEB’s cost assessment invoice is received. The account is subject to a $1 million materiality threshold. Simple interest is to be calculated on the opening monthly balance of this account using the Board Aapproved EB-2006-0117 interest rate methodology. The balance in this account, together with carrying charges, will be disposed of in a manner designated by the Board in a future rate hearing. Accounting Entries
1. To record the variance in OEB costs:
Debit: OEBCAVA (Account 179. 94_) Credit: Accounts Payable (Account 251. 010)
To record the variance in OEB costs assessed under the updated cost assessment model and the costs assessed under the prior cost assessment model.
2. Interest accrual:
Debit: Interest on OEBCAVA (Account 179. 95_) Credit: Interest expense (Account 323. 000)
To record simple interest on the opening monthly balance of the OEBCAVA using the Board approved EB-2006-0117 interest rate methodology.
DRAFT
Filed: 2019-04-25, EB-2018-0305, Exhibit I.STAFF.17, Attachment 1, Page 11 of 11

UNION GAS LIMITEDRATE ZONES
Accounting Entries for
Parkway West Project Costs
Deferral Account No. 179-136
Account numbers are from the Uniform System of Accounts for Gas Utilities, Class A prescribed under the Ontario
Energy Board Act.
Debit - Account No.179-136
Other Deferred Charges – Parkway West Project Costs
Credit - Account No. 579
Miscellaneous Operating Revenue
To record, as a debit (credit) in Deferral Account No. 179-136, the utility tax timing amounts Unionfor the Parkway
West Project as compared to the utility tax timing amountsthe difference between the actual revenue requirement
related to the costs for the Parkway West Project and the revenue requirement included in rates as approved by the
Board.
Debit - Account No.179-136
Other Deferred Charges – Parkway West Project Costs
Credit - Account No. 323
Other Interest Expense
To record, as a debit (credit) in Deferral Account No. 179-136, interest on the balance in Deferral Account No. 179-
136. Simple interest will be computed monthly on the opening balance in the said account in accordance with the
methodology approved by the Board in EB-2006-0117.
DRAFT
Filed: 2019-04-25, EB-2018-0305, Exhibit I.STAFF.17, Attachment 2, Page 1 of 6

UNION GAS LIMITEDRATE ZONES
Accounting Entries for
Brantford-Kirkwall/Parkway D Project Costs
Deferral Account No. 179-137
Account numbers are from the Uniform System of Accounts for Gas Utilities, Class A prescribed under the Ontario
Energy Board Act.
Debit - Account No.179-137
Other Deferred Charges – Brantford-Kirkwall/Parkway D Project Costs
Credit - Account No. 579
Miscellaneous Operating Revenue
To record, as a debit (credit) in Deferral Account No. 179-137, the utility tax timing amounts for the Brantford-
Kirkwall/Parkway D Project as compared to the utility tax timing amountsthe difference between the actual revenue
requirement related to the costs for the Brantford-Kirkwall/Parkway D Project and the revenue requirement included
in rates as approved by the Board.
Debit - Account No.179-137
Other Deferred Charges – Brantford-Kirkwall/Parkway D Project Costs
Credit - Account No. 323
Other Interest Expense
To record, as a debit (credit) in Deferral Account No. 179-137, interest on the balance in Deferral Account No. 179-
137. Simple interest will be computed monthly on the opening balance in the said account in accordance with the
methodology approved by the Board in EB-2006-0117.
DRAFT
Filed: 2019-04-25, EB-2018-0305, Exhibit I.STAFF.17, Attachment 2, Page 2 of 6
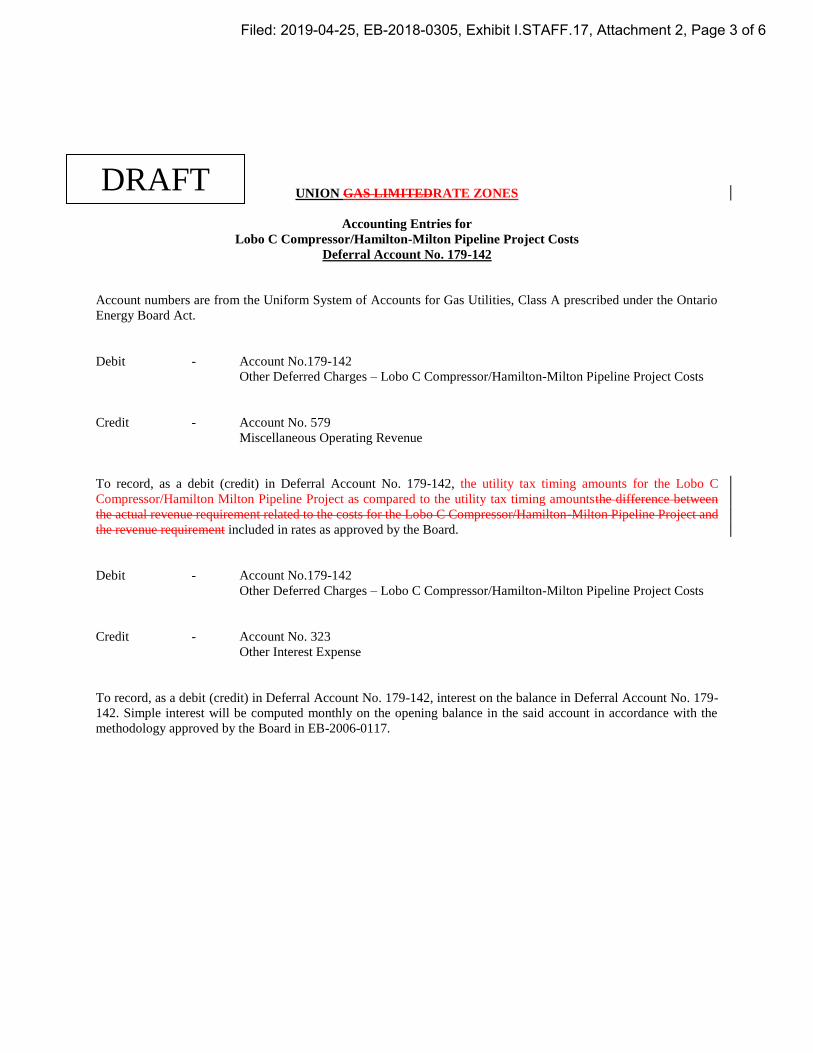
UNION GAS LIMITEDRATE ZONES
Accounting Entries for
Lobo C Compressor/Hamilton-Milton Pipeline Project Costs
Deferral Account No. 179-142
Account numbers are from the Uniform System of Accounts for Gas Utilities, Class A prescribed under the Ontario
Energy Board Act.
Debit - Account No.179-142
Other Deferred Charges – Lobo C Compressor/Hamilton-Milton Pipeline Project Costs
Credit - Account No. 579
Miscellaneous Operating Revenue
To record, as a debit (credit) in Deferral Account No. 179-142, the utility tax timing amounts for the Lobo C
Compressor/Hamilton Milton Pipeline Project as compared to the utility tax timing amountsthe difference between
the actual revenue requirement related to the costs for the Lobo C Compressor/Hamilton-Milton Pipeline Project and
the revenue requirement included in rates as approved by the Board.
Debit - Account No.179-142
Other Deferred Charges – Lobo C Compressor/Hamilton-Milton Pipeline Project Costs
Credit - Account No. 323
Other Interest Expense
To record, as a debit (credit) in Deferral Account No. 179-142, interest on the balance in Deferral Account No. 179-
142. Simple interest will be computed monthly on the opening balance in the said account in accordance with the
methodology approved by the Board in EB-2006-0117.
DRAFT
Filed: 2019-04-25, EB-2018-0305, Exhibit I.STAFF.17, Attachment 2, Page 3 of 6

UNION GAS LIMITEDRATE ZONES
Accounting Entries for
Lobo D/Bright C/Dawn H Compressor Project Costs
Deferral Account No. 179-144
Account numbers are from the Uniform System of Accounts for Gas Utilities, Class A prescribed under the Ontario
Energy Board Act.
Debit - Account No.179-144
Other Deferred Charges – Lobo D/Bright C/Dawn H Compressor Project Costs
Credit - Account No. 579
Miscellaneous Operating Revenue
To record, as a debit (credit) in Deferral Account No. 179-144, the utility tax timing amounts for the Lobo D/Bright
C/Dawn H Compressor Project as compared to the utility tax timing amountsthe difference between the actual
revenue requirement related to the costs for the Lobo D/Bright C/Dawn H Compressor Project and the revenue
requirement included in rates as approved by the Board.
Debit - Account No.179-144
Other Deferred Charges – Lobo D/Bright C/Dawn H Compressor Project Costs
Credit - Account No. 323
Other Interest Expense
To record, as a debit (credit) in Deferral Account No. 179-144, interest on the balance in Deferral Account No. 179-
144. Simple interest will be computed monthly on the opening balance in the said account in accordance with the
methodology approved by the Board in EB-2006-0117.
DRAFT
Filed: 2019-04-25, EB-2018-0305, Exhibit I.STAFF.17, Attachment 2, Page 4 of 6
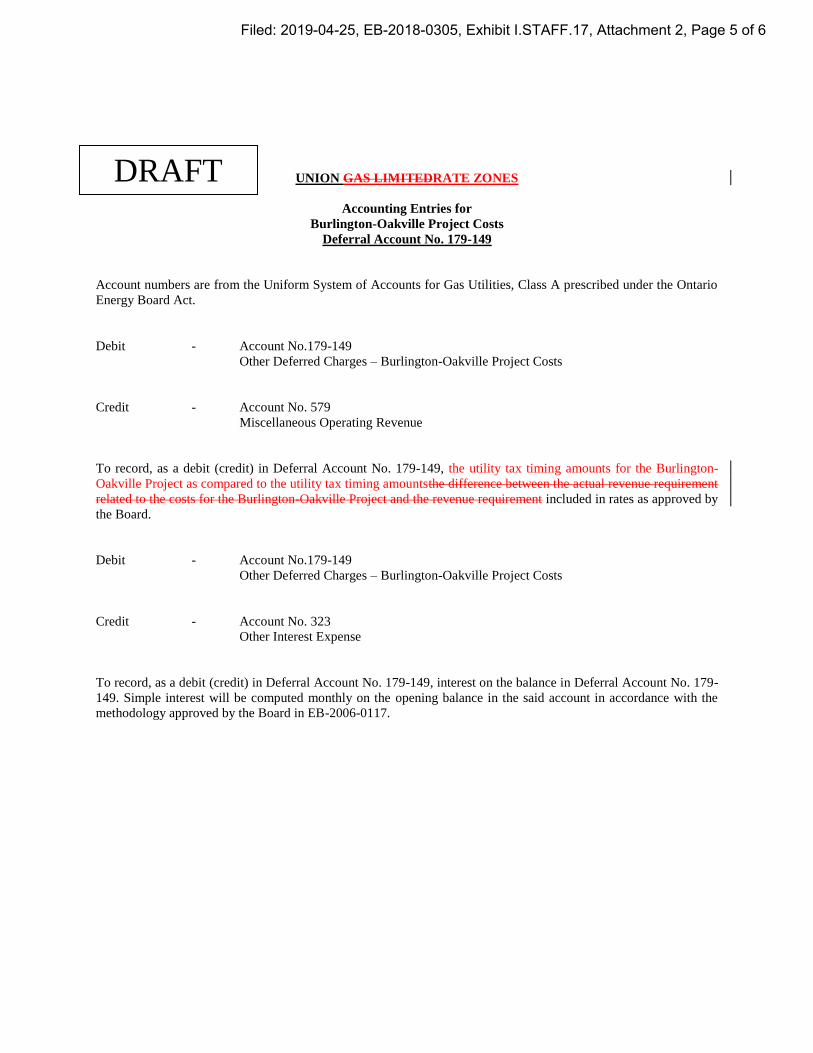
UNION GAS LIMITEDRATE ZONES
Accounting Entries for
Burlington-Oakville Project Costs
Deferral Account No. 179-149
Account numbers are from the Uniform System of Accounts for Gas Utilities, Class A prescribed under the Ontario
Energy Board Act.
Debit - Account No.179-149
Other Deferred Charges – Burlington-Oakville Project Costs
Credit - Account No. 579
Miscellaneous Operating Revenue
To record, as a debit (credit) in Deferral Account No. 179-149, the utility tax timing amounts for the Burlington-
Oakville Project as compared to the utility tax timing amountsthe difference between the actual revenue requirement
related to the costs for the Burlington-Oakville Project and the revenue requirement included in rates as approved by
the Board.
Debit - Account No.179-149
Other Deferred Charges – Burlington-Oakville Project Costs
Credit - Account No. 323
Other Interest Expense
To record, as a debit (credit) in Deferral Account No. 179-149, interest on the balance in Deferral Account No. 179-
149. Simple interest will be computed monthly on the opening balance in the said account in accordance with the
methodology approved by the Board in EB-2006-0117.
DRAFT
Filed: 2019-04-25, EB-2018-0305, Exhibit I.STAFF.17, Attachment 2, Page 5 of 6

UNION GAS LIMITEDRATE ZONES
Accounting Entries for
Panhandle Reinforcement Project Costs
Deferral Account No. 179-156
Account numbers are from the Uniform System of Accounts for Gas Utilities, Class A prescribed under the Ontario
Energy Board Act.
Debit - Account No.179-156
Other Deferred Charges – Panhandle Reinforcement Project Costs
Credit - Account No. 579
Miscellaneous Operating Revenue
To record, as a debit (credit) in Deferral Account No. 179-156, the utility tax timing amounts for the Panhandle
Reinforcement Project as compared to the utility tax timing amountsthe difference between the actual net delivery
revenue requirement related to the costs for the Panhandle Reinforcement Project and the net delivery revenue
requirement included in rates as approved by the Board.
Debit - Account No.179-156
Other Deferred Charges – Panhandle Reinforcement Project Costs
Credit - Account No. 323
Other Interest Expense
To record, as a debit (credit) in Deferral Account No. 179-156, interest on the balance in Deferral Account No. 179-
156. Simple interest will be computed monthly on the opening balance in the said account in accordance with the
methodology approved by the Board in EB-2006-0117.
DRAFT
Filed: 2019-04-25, EB-2018-0305, Exhibit I.STAFF.17, Attachment 2, Page 6 of 6

Filed: 2019-04-25 EB-2018-0305 Exhibit I.STAFF.18 Page 1 of 1
ENBRIDGE GAS INC. Answer to Interrogatory from
Board Staff (STAFF) Reference: Exhibit B1/Tab 1/Schedule 1/Appendices A and B Question: For some variance accounts, the accounts capture the difference between actual revenues/costs and the reference amount, which is the revenues/costs approved in rates. During the deferred rebasing period, specific revenues/costs in the revenue requirement are not forecasted each year, but adjusted by a price cap index instead.
a) Please identify all accounts where the reference amount would be adjusted by the price cap index.
b) For these accounts, please explain how Enbridge Gas proposes to determine the reference amount of the revenues/costs approved in rates. Please explain Enbridge Gas’ rationale.
Response a) Enbridge Gas is not proposing to adjust any of the EGD or Union rate zone deferral
account reference amounts by the price cap index. This is consistent with the treatment of deferral reference amounts for both EGD and Union during prior IR terms.
b) See the response to a) above.

Filed: 2019-04-25 EB-2018-0305 Exhibit I.STAFF.19 Page 1 of 1 Plus Attachment
ENBRIDGE GAS INC. Answer to Interrogatory from
Board Staff (STAFF) Reference: Exhibit B1/Tab 1/Schedule 1/Appendix A/pgs. 33-36 and Appendix B/pg.34-37 Question: For the accounting orders of the new accounts, please revise the accounting orders to include a description of the background of the account, similar to the accounting orders provided for the Enbridge Gas Distribution rate zone (pages 1-32). Response Please see Attachment 1 for the revised accounting orders.

UNION RATE ZONES
Accounting Entries for Incremental Capital Module (ICM) Deferral Account
Deferral Account No. 179-XXX
The purpose of the Union Rate Zones ICM deferral account is to record the difference between the actual revenue requirement for the Union Rate Zones approved ICM projects, and the actual revenues collected through ICM rates approved by the Board for the Union Rate Zones. The actual revenue requirement will include costs associated with the capital investment, including return on rate base, depreciation expense, and associated income taxes, as well as material incremental operating expenses (O&M and property taxes), if applicable. The actual revenues will be those collected through the ICM rate riders approved by the Board for the Union Rate Zones.
Simple interest is to be calculated on the opening monthly balance of this account using the Board-approved EB-2006-0117 interest rate methodology. The balance of this account, together with carrying charges, will be disposed of in a manner designated by the Board in a future rate hearing.
Account numbers are from the Uniform System of Accounts for Gas Utilities, Class A prescribed under the Ontario Energy Board Act.
Debit - Account No.179- XXXOther Deferred Charges – Union Rate Zones – ICM Deferral Account
Credit - Account No. 579Miscellaneous Operating Revenue
To record, as a debit (credit) in Deferral Account No. 179-XXX, the difference between the actual revenue requirement for approved ICM Projects and the actual revenues collected through ICM rates approved by the Board.
Debit - Account No.179-XXXOther Deferred Charges – Union Rate Zones – ICM Deferral Account
Credit - Account No. 323Other Interest Expense
To record, as a debit (credit) in Deferral Account No. 179-XXX, interest on the balance in Deferral Account No. 179-XXX. Simple interest will be computed monthly on the opening balance in the said account in accordance withthe methodology approved by the Board in EB-2006-0117.
DRAFT
Filed: 2019-04-25 EB-2018-0305
Exhibit I.STAFF.19 Attachment 1
Page 1 of 5

EGD RATE ZONE
Accounting Entries for Incremental Capital Module (ICM) Deferral Account
Deferral Account No. 179-XXX
The purpose of the EGD Rate Zone ICM deferral account is to record the difference between the actual revenue requirement for the EGD Rate Zone approved ICM projects, and the actual revenues collected through ICM rates approved by the Board for the EGD Rate Zone. The actual revenue requirement will include costs associated with the capital investment, including return on rate base, depreciation expense, and associated income taxes, as well as material incremental operating expenses (O&M and property taxes), if applicable. The actual revenues will be those collected through the ICM rate riders approved by the Board for the EGD Rate Zone.
Simple interest is to be calculated on the opening monthly balance of this account using the Board-approved EB-2006-0117 interest rate methodology. The balance of this account, together with carrying charges, will be disposed of in a manner designated by the Board in a future rate hearing.
Account numbers are from the Uniform System of Accounts for Gas Utilities, Class A prescribed under the Ontario Energy Board Act.
Debit - Account No.179- XXXOther Deferred Charges – EGD Rate Zone – ICM Deferral Account
Credit - Account No. 579Miscellaneous Operating Revenue
To record, as a debit (credit) in Deferral Account No. 179-XXX, the difference between the actual revenue requirement for approved ICM Projects and the actual revenues collected through ICM rates approved by the Board.
Debit - Account No.179-XXXOther Deferred Charges – EGD Rate Zone – ICM Deferral Account
Credit - Account No. 323Other Interest Expense
To record, as a debit (credit) in Deferral Account No. 179-XXX, interest on the balance in Deferral Account No. 179-XXX. Simple interest will be computed monthly on the opening balance in the said account in accordance withthe methodology approved by the Board in EB-2006-0117.
DRAFT Filed: 2019-04-25
EB-2018-0305 Exhibit I.STAFF.19
Attachment 1 Page 2 of 5

ENBRIDGE GAS INC.
Accounting Entries for Accounting Policy Changes
Deferral Account No. 179-XXX
The purpose of the Accounting Policy Changes deferral account, as established in the Board’s EB-2017-0306/EB-2017-0307 Decision and Order, is to record the impact of any accounting changes that affect revenue requirement, which are required as a result of the amalgamation of Enbridge Gas Distribution and Union Gas Limited into Enbridge Gas Inc.
Simple interest is to be calculated on the opening monthly balance of this account using the Board-approved EB-2006-0117 interest rate methodology. The balance of this account, together with carrying charges, will be disposed of in a manner designated by the Board in a future rate hearing.
Account numbers are from the Uniform System of Accounts for Gas Utilities, Class A prescribed under the Ontario Energy Board Act.
Debit - Account No. 179-XXXAccounting Policy Changes
Credit - Account No. 300Operating Revenues
To record as a debit (credit) in Deferral Account No. 179-XXX the impact of any accounting changes required as a result of the amalgamation that affect revenue requirement.
Debit - Account No. 179-XXXAccounting Policy Changes
Credit - Account No. 323Other Interest Expense
To record, as a debit (credit) in Deferral Account No. 179-XXX, interest on the balance in Deferral Account No. 179-XXX. Simple interest will be computed monthly on the opening balance in the said account in accordance withthe methodology approved by the Board in EB-2006-0117.
DRAFT
Filed: 2019-04-25 EB-2018-0305
Exhibit I.STAFF.19 Attachment 1
Page 3 of 5

ENBRIDGE GAS INC.
Accounting Entries for Earnings Sharing Mechanism Deferral Account
Deferral Account No. 179-XXX The purpose of the Earnings Sharing Mechanism Deferral Account (“ESMDA”) is to record the ratepayer share of utility earnings that result from the application of the earnings sharing mechanism. In accordance with the EB-2017-0306/EB-2017-0307 Decision and Order, if the actual utility return on equity (ROE) exceeds the Board-approved ROE by more than 150 basis points, the excess earnings will be shared equally (i.e. 50/50) between the Company’s ratepayers and shareholders. The calculation of a utility return for earnings sharing determination purposes, will include all revenues that would otherwise be included in earnings and only those expenses (whether operating or capital) that would otherwise be allowable deductions from earnings as within a cost of service application. Simple interest is to be calculated on the opening monthly balance of this account using the Board approved EB-2006-0117 interest rate methodology. The balance of this account, together with carrying charges, will be disposed of in a manner designated by the Board in a future rate hearing. Account numbers are from the Uniform System of Accounts for Gas Utilities, Class A prescribed under the Ontario Energy Board Act. Debit - Account No. 300
Operating Revenue Credit - Account No. 179-XXX Earnings Sharing Mechanism Deferral Account To record as a credit in Deferral Account No. 179-XXX the ratepayers’ 50% share of utility earnings when actual utility ROE exceeds the Board-approved ROE by more than 150 basis points in accordance with the Board’s Decision in EB-2017-0306/EB-2017-0307. Debit - Account No. 323 Other Interest Expense Credit - Account No. 179-XXX Earnings Sharing Mechanism Deferral Account To record, as a credit in Deferral Account No. 179-XXX, interest on the balance in Deferral Account No. 179-XXX. Simple interest will be computed monthly on the opening balance in the said account in accordance with the methodology approved by the Board in EB-2006-0117.
DRAFT
Filed: 2019-04-25 EB-2018-0305
Exhibit I.STAFF.19 Attachment 1
Page 4 of 5

ENBRIDGE GAS INC.
Accounting Entries for Tax Variance Deferral Account Deferral Account No. 179-XXX
The purpose of the Tax Variance Deferral Account is to record 50% of the variance in costs of any tax rate changes, versus the tax rates included in rates that affect Enbridge Gas Inc. As part of the EB-2017-0306/EB-2017-0307 Decision and Order, the Board amended the former Union Gas Limited Tax Variance Deferral Account to expand its applicability to record the impact of any tax rate changes for both the legacy Enbridge Gas Distribution and Union Gas Limited areas (i.e. to all of Enbridge Gas Inc.).
Simple interest is to be calculated on the opening monthly balance of this account using the Board-approved EB-2006-0117 interest rate methodology. The balance of this account, together with carrying charges, will be disposed of in a manner designated by the Board in a future rate hearing.
Account numbers are from the Uniform System of Accounts for Gas Utilities, Class A prescribed under the Ontario Energy Board Act.
Debit - Account No. 179-XXXTax Variance Deferral Account
Credit - Account No. 300Operating Revenues
To record as a debit (credit) in Deferral Account No. 179-XXX 50% of the variance in costs resulting from the difference between the actual tax rates and the approved tax rates included in rates as approved by the Board.
Debit - Account No. 179-XXXTax Variance Deferral Account
Credit - Account No. 323Other Interest Expense
To record, as a debit (credit) in Deferral Account No. 179-XXX, interest on the balance in Deferral Account No. 179-XXX. Simple interest will be computed monthly on the opening balance in the said account in accordance withthe methodology approved by the Board in EB-2006-0117.
DRAFT
Filed: 2019-04-25 EB-2018-0305
Exhibit I.STAFF.19 Attachment 1
Page 5 of 5

Filed: 2019-04-25 EB-2018-0305 Exhibit I.STAFF.20 Page 1 of 3
ENBRIDGE GAS INC. Answer to Interrogatory from
Board Staff (STAFF) Reference: Exhibit B1/Tab 1/Schedule 1/Appendix A/pg. 33 and Appendix B/pg.34 Question: For the ICM Deferral Account, the main journal entry is to record the difference between the actual revenue requirement for approved ICM projects and the actual revenues collected through ICM rates approved by the OEB. The OEB has developed accounting guidance for ICM/ACMs for electricity distributors in the Accounting Procedures Handbook Guidance, March 2015, topic #13 and 14.
a) Please discuss the applicability of the accounting entries to Enbridge Gas Distribution and Union Gas rate zones and revise the accounting orders as needed.
b) Please indicate how Enbridge Gas plans to track ICM related capital assets and depreciation.
Response a) Enbridge Gas has reviewed the Board’s guidance for the Advanced Capital
Module/Incremental Capital Module in both the Report of the Board: New Policy Options for the Funding of Capital Investments: The Advanced Capital Module1 (“Report of the Board”), and the Ontario Energy Board Accounting Procedures Handbook Guidelines, dated March 2015 (“APH Guidelines”). Within the Report of the Board, Enbridge Gas perceives there to be a disconnect between Section 7.4, Reporting Requirements, and Section 7.5 Accounting Treatment (which is consistent with the accounting treatment identified in topics #13 and #14 of the APH Guidelines). In order to address the disconnect, Enbridge Gas has proposed the accounting orders as filed.
Section 7.4, Reporting Requirements, of the Report of the Board states:
1 EB-2014-0219, Report of the Board, New Policy Options for the Funding of Capital Investments: The Advanced Capital Module, dated September 18, 2014.

Filed: 2019-04-25 EB-2018-0305 Exhibit I.STAFF.20 Page 2 of 3
At the time of the next cost of service or Custom IR application, a distributor will need to file calculations showing the actual ACM/ICM amounts to be incorporated into the test year rate base. At that time, the Board will make a determination on the treatment of any difference between forecasted and actual capital spending under the ACM/ICM, if applicable, and the amounts recovered through ACM/ICM rate riders and what should have been recovered in the historical period during the preceding Price Cap IR plan term. Where there is a material difference between what was collected based on the approved ACM/ICM rate riders and what should have been recovered as the revenue requirement for the approved ACM/ICM project(s), based on actual amounts, the Board may direct that over- or under-collection be refunded or recovered from the distributor’s ratepayers”(emphasis added).2
Enbridge Gas’s understanding of the above reporting requirements is that it will need to report on the variance between the actual ICM revenues collected in rates and the actual revenue requirement of the approved ICM projects, namely the revenue sufficiency or deficiency. Based on that understanding, Enbridge Gas does not believe the Board’s Section 7.5 Accounting Treatment meets that requirement. The Board’s accounting treatment only calls for certain revenue requirement / revenue sufficiency (deficiency) elements to be tracked in the deferral account, including capital spend placed in service (an input into a revenue requirement calculation, but not a revenue requirement component itself), depreciation, accumulated depreciation (again an input into a revenue requirement calculation, but not a revenue requirement component itself), and rate rider revenues, while other revenue requirement / revenue sufficiency or deficiency elements, such as taxes and cost of capital (which were considered in the determination of the revenue requirement to be recovered through the ICM rate riders), will continue to flow through the income statement, and therefore not be properly matched against revenues. In addition to this, Enbridge Gas also observes the following:
• Under the Board’s accounting treatment, carrying charges are to be calculated on the incremental capital expenditure (capital spend placed into service), as well as, on the rate rider revenue amounts recorded in the deferral account. As a result, even if the amounts collected through rate
2 EB-2014-0219, Report of the Board, New Policy Options for the Funding of Capital Investments: The Advanced Capital Module, dated September 18, 2014, Section 7.4 Reporting Requirements, Page 26.

Filed: 2019-04-25 EB-2018-0305 Exhibit I.STAFF.20 Page 3 of 3
riders exactly match the actual revenue requirement, an outstanding carrying charge would be calculated.3
• Under the Board’s accounting treatment, when the deferral account is cleared, or amounts are reclassified out of the account at the next cost of service or Custom IR proceeding, the Company’s income statement would be charged with cumulative amounts that relate to prior periods (i.e. out of period amounts that accumulated over the deferred rebasing / incentive regulation term)4
In order to address this Enbridge Gas has proposed to record the annual ICM revenue sufficiency/deficiency (for each of the EGD and Union rate zones) in its proposed ICM deferral accounts. Each year, the actual ICM revenues will be compared to the calculated ICM revenue requirement for approved ICM projects (for each of the EGD and Union rate zones), and any variance will be reflected as an adjustment to revenues, with an offsetting entry to the ICM deferral account. As a result of this proposal, each year the Enbridge Gas’s financial statements will include all actual costs related to ICM projects, and a matched revenue stream, with any revenue sufficiency or deficiency recorded in the deferral account, which will appropriately attract carrying charges until the time of disposition.
b) Enbridge Gas will track ICM capital projects/assets by assigning distinct project numbers to each approved ICM project within its capital accounting systems. These distinct project numbers will be utilized to capture the capital costs associated with each approved ICM project.
3 Ontario Energy Board Accounting Procedures Handbook Guidelines, dated March 2015, Section A.13, Pages 15-16. 4 Ontario Energy Board Accounting Procedures Handbook Guidelines, dated March 2015, Section A.14, Pages 16-18.

Filed: 2019-04-25 EB-2018-0305 Exhibit I.STAFF.21 Page 1 of 1
ENBRIDGE GAS INC. Answer to Interrogatory from
Board Staff (STAFF) Reference: Exhibit B1/ Tab 1/ Sch. 1/ Appendix H/pgs. 6-7, Enbridge Gas Distribution
Inc., Fenelon Falls, Decision and Order EB-2017-0147, pgs. 10-16 and Union Gas Limited, 2019 Community Expansion Application EB-2018-0142, Exhibit A/ Tab 1/ pg. 3
Question: The current application appears to reflect the System Expansion Surcharge (SES) framework approved by the OEB in Enbridge Gas Distribution’s Fenelon Falls application. The current application does not address a Temporary Connection Surcharge (TCS) proposed by Union Gas in its 2019 Community Expansion application (which application is now in abeyance).
a) Has Enbridge Gas adopted verbatim the SES framework approved by the OEB in the Fenelon Falls proceeding? If not, please identify and explain any differences.
b) Does Enbridge Gas believe that the SES framework approved by the OEB in the Fenelon Falls proceeding is applicable to the former Union Gas rate zones? Please explain.
c) Does Enbridge Gas intended to seek approval of a TCS? Please provide a detailed response..
Response When reviewing the evidence the Company discovered that the definition of a community expansion project set out at Exhibit B, Tab 1, Schedule 1, Appendix H, page 6 is not complete. Section 25 of Appendix H has been updated and is filed along with the interrogatory response.
a- c) Enbridge Gas has adopted the SES framework approved by the OEB in the
Fenelon Falls proceeding for the EGD rate zone. Enbridge Gas intends to file updated community expansion applications with the Board later this year which will consider and address the adoption of the Fenelon Falls SES framework for the Union rate zones.
b) Enbridge Gas believes that the Fenelon Falls SES framework could be applicable to the Union rate zones. Enbridge Gas believes that a Board decision and order would be required to apply the Fenelon Falls SES framework to the Union rate zones.

Updated: 2019-04-25 EB-2018-0305 Exhibit B1 Tab 1 Schedule 1 Appendix H Page 6 of 8
22. The Capital Project Feasibility (“CAPF”) program calculates customer revenue based on
consumption levels input by the Customer Connections Representative (“CCR”).
23. A load sheet is used to estimate consumption of commercial and industrial connections.
The load sheet information is provided by the customer and contains consumption of
various appliances installed at the premises.
24. For large volume connections, consumption information should include monthly volumes
and the customer’s contract daily demand.
25. The Investment Review group calculates revenue, based on the input consumption profiles
and the most recent Board Approved revenue rates.
26. In its Community Expansion framework, the Board accepted the following new definitions
which would enable projects to qualify for additional distribution revenue:
• Community Expansion Project: A natural gas system expansion project which will
provide first time natural gas system access where a minimum of 50 potential customers
already exist, for which economic feasibility guidelines derive a Profitability Index
(“PI”) of less than 1.0
• Short Main Extension Projects: All other forms of distribution system expansion which
provide first time natural gas system access to customers where fewer than 50 potential
customers in homes and business already exist and where the PI for the project is less
than 1.0.
• A natural gas system expansion project meeting either of the two definitions above that
requires the SES and potentially other financing mechanisms in order for project
economics to attain a PI of 1.0.
/u
Filed: 2019-04-25, EB-2018-0305, Exhibit I.STAFF.21, Attachment, Page 1 of 1

Filed: 2019-04-25 EB-2018-0305 Exhibit I.STAFF.22 Page 1 of 1
ENBRIDGE GAS INC. Answer to Interrogatory from
Board Staff (STAFF) Reference: Exhibit B1/Tab 1/Schedule 1/Appendix F/Pg.31 Question: In Article II (Gas Quality) of Union Gas’ Rate M13 General Terms and Conditions, Enbridge Gas has proposed to replace the term “molar percent” with “mole percent” in several places.
a) Why has this change been proposed? b) Why is the same change not proposed for the General Terms and Conditions
applicable to other rate classes (such as on pages 42, 51 and 65)? Response a) "Mole percent" is the term used by the industry therefore going forward we will use
this term instead of "molar percent", the term historically used by legacy Union.
b) Over time this change will be incorporated into other applicable General Terms and Conditions.

Filed: 2019-04-25 EB-2018-0305 Exhibit I.STAFF.23 Page 1 of 1
ENBRIDGE GAS INC. Answer to Interrogatory from
Board Staff (STAFF) Reference: Exhibit B1/Tab 1/Schedule 1/Appendix I Question: The table in Appendix I shows the capacity available for PDO, remaining PDO and annual PDO shift for the period 2016 to 2020. The remaining PDO (row 18) shows 26 TJ per day for 2017 and 2018 as filed in EB-2016-0245 and 31 TJ per day for the same period in EB-2017-0087. Please explain the reason for the change in the remaining PDO capacity. Response The table in Appendix I outlines the schedules that have been filed related to PDO in past proceedings. In proceeding EB-2016-0245 the amounts shown in 2017 and 2018 were a projection of expected activity. The assumption used in that proceeding was that all customers would elect to take PDO relief if provided to them, which resulted in the amount on row 18 being reduced from 31 TJ per day to 26 TJ per day. In proceeding EB-2017-0087 the amounts shown in 2017 reflect actual activity. When PDO relief was offered to customers with M12 service it was declined, resulting in the 31 TJ per day remaining as their Parkway Delivery Obligation.

Filed: 2019-04-25 EB-2018-0305 Exhibit I.STAFF.24 Page 1 of 2
ENBRIDGE GAS INC. Answer to Interrogatory from
Board Staff (STAFF) Reference: Exhibit B1/Tab 2/Schedule 1/pgs.18-19 Question: Enbridge Gas has requested incremental capital funding during the current deferred rebasing period for the Sudbury Replacement project as part of this proceeding. Due to the October 2018 in-service date, the project falls between qualifying for incremental rate treatment under Union Gas’ 2014-2018 capital pass-through mechanism and qualifying for incremental rate treatment under the ICM. Given the magnitude of the $95.3 million investment in the Sudbury Replacement project, Enbridge Gas has indicated that incremental funding of the project is required. Union Gas was not able to reprioritize 2018 capital investment in order to fund this investment through existing rates.
a) Does the Sudbury Replacement project qualify for ICM funding under the OEB’s ICM/ACM capital funding policy? If yes, please explain.
b) What was the total capital investment of Union Gas in 2018 excluding the Sudbury Replacement project?
c) If the OEB finds that the Sudbury Replacement project does not qualify for ICM funding, how would the decision impact the future capital investment plans of Enbridge Gas?
d) In Exhibit B1/Tab 2/Schedule 1/Pg. 25, Enbridge Gas has indicated that the budget has been updated from the approved filing budget of $74.1 million in EB-2017-0180. Please explain the reasons for the increase in the actual spend and outline the steps that Union Gas undertook to reduce the spending.
e) Please provide the cost components of the Sudbury project that exceeded the initial estimates and corresponding notes explaining the variance.
Response a) Yes, it is Enbridge Gas’s position that the Sudbury Replacement project qualifies for
ICM funding under the OEB’s ICM/ACM capital funding policy. Enbridge believes the intention of the OEB’s policy is to ensure regulated entities make prudent capital decisions while under a Price Cap incentive rate-setting mechanism.

Filed: 2019-04-25 EB-2018-0305 Exhibit I.STAFF.24 Page 2 of 2
The Sudbury Replacement Project was required to ensure safe and reliable service to customers in the Union North rate zone. As per the Board’s Decision and Order in the Sudbury Replacement Project proceeding:
The OEB finds that the necessity for an expedited completion of the Sudbury Replacement Project to address the safety and reliability risks identified by Union is a “special circumstance” that justifies granting the requested exemption.1
Please refer to Exhibit B1, Tab 2, Schedule 1, pages 18 to 20 for further background on the ICM funding request for the Sudbury Replacement Project.
b) Total capital spend for legacy Union in 2018 was $519.2 million. Excluding capital
pass-through of $80 million and Sudbury spend of $86.3 million, the remaining spend is $352.9 million.
c) Enbridge Gas does not select projects based on their funding mechanisms. Projects
are evaluated and prioritized using a methodology designed to ensure maintenance capital resources are employed to address the highest priority items across all asset categories.
d) Please see Exhibit I.EP.16. e) Please see Exhibit I.EP.16.
1 EB-2015-0042 Decision and Order, April 23, 2015, page 2.

Filed: 2019-04-25 EB-2018-0305 Exhibit I.STAFF.25 Page 1 of 1
ENBRIDGE GAS INC. Answer to Interrogatory from
Board Staff (STAFF) Reference: Exhibit B1/Tab 2/Schedule 1/pgs. 22-24 Question: Enbridge Gas is seeking recovery under ICM for the NPS 30 Don River Replacement Project. The project involves replacement of approximately 0.25 km of NPS 30 XHP on the Don River Bridge crossing with a new NPS 30 XHP under the Don River through the use of trenchless technology. In the EB-2018-0108 leave to construct application the budget for the project was estimated to be $25.6 million. The updated budget is $35.4 million.
a) Please explain the reasons for the increase in the budget. Please provide the cost components of the project that exceeded the initial estimates and corresponding notes explaining the variance.
b) Has Enbridge Gas considered other construction methods or technology that could bring the spending in line with the original forecast?
Response a) The increase in the Don River Replacement Project budget is due to indirect
overhead costs that were not included in the EB-2018-0108 filing. Please see the response to Energy Probe Interrogatory #16(a) found at Exhibit I.EP.16.
b) Please refer to response a) above for explanation on variance to the original
forecast.

Filed: 2019-04-25 EB-2018-0305 Exhibit I.STAFF.26 Page 1 of 1
ENBRIDGE GAS INC. Answer to Interrogatory from
Board Staff (STAFF) Reference: Exhibit B1/Tab 2/Schedule 1/pgs.25-27 Question: The budget for the Kingsville Reinforcement Project has been updated from the EB-2018-0013 filing budget of $105.7 million to $121.4 million.
a) Please explain the reasons for the increase in the budget. Please provide the cost components of the project that exceeded the initial estimates and corresponding notes explaining the variance.
Response Please see Exhibit I.EP.16, part a).
Filed: 2019-04-25 EB-2018-0305 Exhibit I.STAFF.27 Page 1 of 1
ENBRIDGE GAS INC. Answer to Interrogatory from
Board Staff (STAFF) Reference: USP - Exhibit C1/Tab 1/ Schedule 1/ pg. 6 Question: In its application, Enbridge Gas has indicated that, “the integration of Enbridge Gas will drive efficiencies and synergies, create new opportunities for growth, and form a stronger platform to deliver superior value and service to customers. Over time the AMP process will integrate the Enbridge Gas Distribution and Union Gas plans into one”.
a) Will Enbridge Gas submit an integrated USP and AMP, covering Enbridge Gas Distribution and Union Gas in one document, by the 2021 filing?
b) Will the integrated document be organized to comply with the RRF Chapter 5 filing requirements defined in Exhibit C1, p. 46, Table 5, col 1?
Response a) Yes.
b) Please see Exhibit I.STAFF.34.

Filed: 2019-04-25 EB-2018-0305 Exhibit I.STAFF.28 Page 1 of 1
ENBRIDGE GAS INC. Answer to Interrogatory from
Board Staff (STAFF) Reference: USP - Exhibit C1/Tab 1/ Schedule 1/ pgs. 7-8 Question: Enbridge Gas Distribution owns and operates 37,600 km of pipelines for the transportation and distribution of gas. It is also owns 91 billion cubic feet (bcf) of regulated storage and operates a total of 134 bcf of storage. Union Gas’ natural gas assets include 70,000 km. of distribution, storage and transmission pipelines, 188.1 PJ of natural gas storage capacity and 760,000 horsepower of compression.
a) What overall integrated optimization efficiencies does Enbridge Gas project through optimization of storage and transmission for its in-franchise customers as a result of integration of Union Gas and Enbridge Gas Distribution supply, storage and transportation contracts and storage and transmission assets? Please provide a breakdown by each category including compressor fuel savings.
b) When does Enbridge Gas expect to operate the Enbridge Gas Distribution and Union Gas storage and transmission assets, and supply and transmission contracts on a fully integrated basis?
c) What transmission and storage efficiencies does Enbridge Gas expect to achieve by shifting Enbridge Gas Distribution from a contract customer of Union Gas to an in-franchise integrated operation under Enbridge Gas?
Response a-b) Enbridge Gas has been operating as an amalgamated entity for only four months
and is not in a position to provide any estimates of optimization or integration savings.
c) Enbridge Gas does not expect to achieve efficiencies by shifting legacy EGD from
a contract customer of legacy Union to in-franchise. As outlined in the MAADs proceeding, although the transportation and storage contracts ceased to exist at January 1, 2019 they have been replaced with term sheets which contain the same terms (i.e. space, deliverability, ratchets, etc.) as the previous contracts.

Filed: 2019-04-25 EB-2018-0305 Exhibit I.STAFF.29 Page 1 of 2
ENBRIDGE GAS INC. Answer to Interrogatory from
Board Staff (STAFF) Reference: USP - Exhibit C1/Tab 1/ Schedule 1/ pgs. 10-11 Question: Enbridge Gas has indicated that the major contributing factor to Union Gas’ recent infrastructure expansion relates to the growth in natural gas production from the Marcellus and Utica shale basins which are within 300 km of Ontario and shippers that are accessing the Dawn Hub. As a result, the flow of natural gas on the Canadian and U.S. pipeline grid is changing and continuing to evolve. Although difficult to forecast, going forward Enbridge Gas expects further growth along the Dawn Parkway System driven by further demand growth in the U.S. Northeast and Ontario Local Distribution Companies, as well as natural gas fired generation due to Ontario’s nuclear refurbishment plan, when executed.
a) How integral will this source of supply be in satisfying Enbridge Gas’ in-franchise customer needs in the future?
b) Is the decision to incorporate increasing amounts of Marcellus and Utica supply volumes exclusively driven by the need to acquire the lowest cost gas?
c) Are other factors considered such as the environmental effects of developing these sources of supply?
Response a) Production in the Marcellus and Utica shale basins is expected to grow over the next
10 years and supply from these basins is an integral part of Enbridge Gas’s balanced gas supply portfolio. Enbridge Gas sources supply directly from the Marcellus and Utica utilizing the combined 260,000 Dth/d long-term NEXUS contracts to deliver supply to Dawn. In addition, Enbridge Gas’s gas supply plan is expected to continue to include commodity purchases from various supply points that are connected to the Marcellus and Utica basins including Dawn, Niagara, Chippawa, Michigan and Chicago.
b) Future gas supply and transportation procurement decisions will be made by balancing Enbridge Gas’s gas supply planning principles. The guiding principles for the assessment of the gas supply plans include: Cost-effectiveness, Reliability and Security of Supply and Public Policy. Cost is a consideration; however, “the need to
Filed: 2019-04-25 EB-2018-0305 Exhibit I.STAFF.29 Page 2 of 2
acquire the lowest cost gas” is not the driver. The gas supply plan is developed to be cost-effective. Cost-effectiveness is achieved by appropriately balancing gas supply planning principles and executing the supply plan in an economically efficient manner.
c) The gas supply plan will be developed by appropriately balancing gas supply planning principles. Its development will consider alignment with public policy which is one of the principles.

Filed: 2019-04-25 EB-2018-0305 Exhibit I.STAFF.30 Page 1 of 2
ENBRIDGE GAS INC. Answer to Interrogatory from
Board Staff (STAFF) Reference: USP - Exhibit C1/Tab 1/ Schedule 1/ pgs. 12-14 Question: Each year Enbridge Gas completes an annual budget and multi-year Long Range Planning (LRP) process. Prior to 2019, the process was completed separately for Enbridge Gas Distribution and Union Gas. Starting in 2019, the process will be completed for Enbridge Gas as a whole. The demand forecast is the starting point for the budget and LRP process, and includes a detailed customer and volume forecast. The demand forecast provides inputs into the four main components of the company’s financial budget and LRP process (1. Distribution Revenue, 2. Storage and Transportation Revenue, 3. Operating and Maintenance Costs, and 4. Capital Investment). Figure 2 on page 14 provides a process map for the budget and LRP process. The four major components of the process are well defined in the filing but the integration of those four components at the executive level drives the questions below.
a) Are Shared Services including Administrative and General expenses and other Non-commodity Carrying system expenses allocated to the four main budget components?
b) How are the various submissions prioritized at the Budget and LRP Consolidation step in the process? Is there a standardized numerical ranking that allows a direct comparison between each item of the four main budget components? If not, what process is used to approve or reject the various competing expenditures?
Response a) Shared Services function expenses are budgeted as part of the overall O&M budget
process. A portion of these expenses would be allocated to capital projects through the capitalized overhead process for both the EGD and Union rate zones.
b) There is no specific ranking of the four main components of the budget process,
other than in the area of Capital Investment which is prioritized/optimized based on the Asset Management planning process in place for both the EGD and Union rate zones. Please see Exhibit I.BOMA.22 for the prioritization/optimization process.

Filed: 2019-04-25 EB-2018-0305 Exhibit I.STAFF.30 Page 2 of 2
The consolidated budget is reviewed by the Company’s Senior Executive Team and adjustments are made to meet overall company objectives.

Filed: 2019-04-25 EB-2018-0305 Exhibit I.STAFF.31 Page 1 of 1
ENBRIDGE GAS INC. Answer to Interrogatory from
Board Staff (STAFF) Reference: Exhibit C1/ Tab 1/ Schedule 1/ Section 4.2/ pg. 35 and Exhibit C1/ Tab 2/
Schedule 1/ pg. 66 Question: Enbridge Gas notes that Enbridge Gas Distribution and Union Gas have unique investment categories. These categories have been mapped in Table 2 to the four general investment categories outlined in Chapter 5 of the Filing Requirements for Electricity Applications. In the Enbridge Gas Distribution AMP, nine asset classes (Figure 4.1-2) are used to categorize and manage investment decisions. Each asset class has its own asset class manager and asset class director. Both roles are responsible for understanding the operational risks and opportunities associated with their respective asset class and managing the portfolio of work to ensure risk is managed to the lowest practicable level and optimum value is realized.
a) In order to clarify cost significance of each asset class, please provide a table in which the overall Enbridge Gas Distribution expenditures (Capital and O&M) for each asset class are shown?
b) Please also indicate in the table the predominant Chapter 5 investment category for each asset class (System Access, or System Renewal, or System Service, or General Plant)?
Response a) & b) Please refer to Exhibit I.BOMA.22 for capital expenditures. O&M expenditures
are not summarized in the Asset Management Plan.

Filed: 2019-04-25 EB-2018-0305 Exhibit I.STAFF.32 Page 1 of 2
ENBRIDGE GAS INC. Answer to Interrogatory from
Board Staff (STAFF) Reference: USP - Exhibit C1/Tab 1/ Schedule 1/ pgs. 37-41 Question: Enbridge Gas’ total historical and overall forecasted 10-year spend profile by investment category is provided in Figure 6 of the USP. Similarly, the 10-year spend profile of Enbridge Gas Distribution and Union Gas is provided in figures 7 and 8 respectively. The spending profile of Enbridge Gas Distribution and Union Gas is developed using the current AMP methodologies of the respective companies.
a) How will Enbridge Gas and its customers benefit in terms of costs and rates as a result of the integration of the two AMP methodologies?
b) Would it be reasonable to limit the major capital expenditures for Enbridge Gas Distribution and Union Gas to all but the essential expenditures until the fully integrated USP and AMP programs are filed in 2021?
c) In each of Figures 6, 7 and 8, the Overhead line item comprises nominally 20% of each year’s expenditures. Please provide the major cost components of this line item.
d) Please confirm if the Overhead line item includes any OM&A costs. If not, please provide a reference where the associated OM&A costs can be found.
Response a) Enbridge Gas customers will benefit as a combined asset management process and
asset management plan will describe:
• Policy and strategies for achieving effective asset management for all assets within Enbridge Gas’s regulated operations;
• Process and governance for asset management; • Asset class objectives and life cycle management policies; • Asset inventory, condition methodology, condition findings, risks,
opportunities, and strategies; and, • Optimized 10-year capital expenditures required to manage assets from
2019-2028.

Filed: 2019-04-25 EB-2018-0305 Exhibit I.STAFF.32 Page 2 of 2
This is a ratepayer benefit as it provides transparency into how and why costs will be incurred. It demonstrates Enbridge Gas’s commitment to safety and reliability while managing costs effectively and provides a long-term view and rationale for expenditures.
b) No, both legacy Asset Management System of Union Gas and Enbridge Gas
Distribution are founded on asset management principles of ISO 5500x. Enbridge Gas has identified projects to address asset condition and risk mitigation based on the respective asset management frameworks to date. In cases where the integrated assets may impact the solution identified, projects are planned in the future to allow the integration work to further inform the solution. As a result, the major capital expenditures identified in the respective AMPs are considered to be essential expenditures.
c) Figure 6 for Enbridge Gas is the sum of the overheads presented in Figure 7 and
Table 8 for EGD and Union respectively.
Figure 7 - EGD overheads are comprised of four cost components:
• Administrative & General overheads (“A&G”). A&G are costs that support the delivery of capital projects but cannot be tied directly to a particular project. It is the capitalization of support services based on an approved OEB rate of capitalization for departments such as HR, Finance, and IT, Legal, Executive, Supply Chain, Regulatory, etc.
• Departmental Labour Costs (“DLC”). DLC are determined by the degree of support each functional group provides directly to capital projects. DLC is generally allocated from Operations and Engineering departments.
• Interest during construction • Alliance partner overheads
Table 8 – Union overheads are comprised of three cost components:
• Indirect overhead allocations (“OH”). OH are costs that support the delivery of capital projects but cannot be tied directly to a particular project. It is the capitalization of support services such as HR, IT, Finance, Legal, etc. and direct capital support (Engineering, Operations)
• Alliance partner overheads • District contractor pre-work costs
d) The overhead categories of A&G, DLC and OH listed in part c) above are all
allocations of OM&A costs that have direct causal linkage to support capital projects.

Filed: 2019-04-25 EB-2018-0305 Exhibit I.STAFF.33 Page 1 of 3
ENBRIDGE GAS INC. Answer to Interrogatory from
Board Staff (STAFF) Reference: Exhibit C1/Tab 1/Schedule 1/pgs.39-40 Question: Enbridge Gas Distribution’s projected spend totals $2.57 billion and $5.17 billion over the five (to 2023) and ten year period (to 2028) respectively. Union Gas’ projected spend totals $2.61 billion and $4.93 billion over the five and ten years respectively. Did the projected spend change as a result of the feedback from the customer engagement process? If no, please provide reasons. If yes, please provide details of the changes and the impact on the specific investment category. Response In the development of Enbridge Gas’s business planning, customer views were taken into consideration when designing the AMPs in terms of balancing the pace of capital spend while maintaining safety and reliability levels. As referenced in Exhibit C1, Tab 3, Schedule 1, page 21 and Exhibit C1, Tab 2, Schedule 1, page 54, from the Customer Engagement consultation conducted by both Ipsos and Innovation Research Group, for legacy EGD and legacy Union respectively, customers identified that the most important outcomes are price, safety and reliability. In general, customers are satisfied with the reliability and the safe delivery of natural gas, and they feel that the utility should invest in maintaining the current levels of reliability. Customers are satisfied with the value they receive for the money they pay for their service and the majority found it acceptable to pay more on their bills to cover the cost associated with aging infrastructure to maintain the current level of reliability and safety. All capital requirements support the maintenance of existing assets based on the conditions and strategies outlined in the respective asset management plans. Timing is based on risk, asset life cycle strategies, with consideration to ratepayer impact.1
1Exhibit C1, Tab 2, Schedule 1, page 382.

Filed: 2019-04-25 EB-2018-0305 Exhibit I.STAFF.33 Page 2 of 3
Portfolios for Enbridge Gas such as Fleet Purchases, TIS, CRES (REWS), Stations, Measurement (Customer Assets) have a relatively stable level of spend. Specific to Union, in relation to spending on buildings, equipment and IT, Exhibit D1, Tab 2, Schedule 1, page 71 reveals that customers believe that Union should spend what is needed compared to simply making do with the building, equipment and IT it currently has. There are cases in which customer feedback for ensuring the long-term health of the system have supported increased spending. An example of this would be the steel mains replacement program for EGD and other specific project examples such as Union’s Windsor Line and London Line replacement projects as well as EGD’s NPS 30 Don River replacement project. Although customer knowledge varies on GHG reduction initiatives and on renewable natural gas, there is alignment with customers on the preference to invest in renewable energy sources to reduce the overall network consumption and in conservation programs.2 In Union’s customer engagement in particular, results from businesses indicate a preference to not go beyond minimum requirements, and residential seem to support an increase in rates to proactively seek opportunities. Enbridge Gas is committed to providing consumers access to safe, reliable and affordable natural gas services. Enbridge Gas is also committed to its role in offering balanced solutions that support emission reduction targets, including: (i) energy savings information that enables consumers to optimize their energy consumption; (ii) a portfolio of Board-approved energy conservation programs to facilitate transparent and measurable conservation; and, (iii) development and testing of low-carbon technology solutions. See Enbridge Gas’ USP for more details.3 The upgrade and obsolescence programs within the measurement portfolio have more flexibility than the Meter Exchange Program and were adjusted to balance the overall portfolio spend for 10 years to a steady pace while satisfying the risk mitigation required for each program.4 On the specific topic of automated meter reading in Union’s customer engagement survey, the customer feedback indicates a preference to install these meters over time in order to minimize costs. Legacy Union has decided to replace meters with automated meters over time in alignment with customer preferences. 2 Exhibit C1, Tab 2, Schedule 1, page 54. 3 Exhibit C1, Tab 1, Schedule 1, pages 30 to 32. 4 Exhibit C1, Tab 3, Schedule 1, Table 5.4.3.6.1 page 95.

Filed: 2019-04-25 EB-2018-0305 Exhibit I.STAFF.33 Page 3 of 3
In addition, EGD has a Customer Experience Transformation project, consisting of initiatives that span multiple asset subclasses within the TIS asset class. This two year project proactively transforms the way we do business with our customers and to improve customer interactions.5 More information on Customer Experience can be found at Exhibit C1, Tab 2, Schedule 1, page 354. For bare and unprotected steel, “Union’s 2017 customer engagement survey found that 50 per cent of those surveyed recommend prioritized replacements” supporting the strategy to replace over the next six years.6 “MOP verification was also included in the 2017 customer engagement survey: 40 per cent recommend proactively implementing industry standard. Spreading the verifications over several years will keep costs down and proactively implement an industry standard, which provides additional support for this program. Starting this program as forecast will mitigate the need for higher expenditures in a shorter time frame to meet these expected future mandated requirements.”7 Within the Distribution Growth portfolio the customer feedback for a desired steady pace of spend is managed in planning the Distribution and Station Reinforcement projects to a combined annual spend that is consistent over the 10 year forecast.8
5 Exhibit C1, Tab 2, Schedule 1, page 348. 6 Exhibit C1, Tab 3, Schedule 1 page 83. 7 Exhibit C1, Tab 3, Schedule 1 page 85. 8 Exhibit C1, Tab 3, Schedule 1, Table 5.2.1.1, page 71.

Filed: 2019-04-25 EB-2018-0305 Exhibit I.STAFF.34 Page 1 of 1
ENBRIDGE GAS INC. Answer to Interrogatory from
Board Staff (STAFF) Reference: USP - Exhibit C1/Tab 1/ Schedule 1/ pgs. 46-47 Question: Enbridge Gas has indicated that the AMPs were built using guidance from the OEB’s filing requirements for natural gas distributors. Further guidance was obtained through the more detailed Chapter 5 of the filing requirements for electric distributors. Table 5 provides the alignment of sections that comprise each of Enbridge Gas Distribution’s and Union Gas’ AMPs to the Chapter 5 requirements. Going forward, does Enbridge Gas plan to align Section 5.0 of overall USP to be the same format and content as outlined in Chapter 5 of the filing requirements. In particular to comply with Section 5.3 "Asset Management Process", specifically sub-sections 5.3.1, 5.3.2, 5.3.3 and 5.3.4? Response Enbridge Gas is still assessing its future asset management process and will create an asset management plan with industry best practice and OEB filing requirements in mind. Any future asset plan will be compliant with the intent of the “Chapter 5 Consolidated Distribution System Plan” document.

Filed: 2019-04-25 EB-2018-0305 Exhibit I.STAFF.36 Page 1 of 2
ENBRIDGE GAS INC. Answer to Interrogatory from
Board Staff (STAFF) Reference: USP - Exhibit C1/Tab 1/ Schedule 1/ pg. 53 Question: Another way Enbridge Gas Distribution and Union Gas have historically sought to continually improve is through industry engagement. Key subject matter experts involved in the design and operations of assets are engaged in industry related code committees and industry best practices to better understand compliance requirements, to support the improvement of codes and standards that drive operational safety, and to learn and share best practices from industry peers. Examples include active membership of subcommittees for the Canadian Standards Association – Oil and Gas Pipeline Systems, Canadian Gas Association and American Gas Association surveys and workshops and participation in AGA peer reviews. Please provide specific examples of improvements in Enbridge Gas’ asset management planning and practices that have occurred as a result of benchmarking against the best practices in the industry? Where possible, please provide specific examples. Response Exhibit C1, Tab 2, Schedule 1 pages 55-57, section 3.1 of the EGD rate zone’s AMP addresses asset management improvements and section 3.4 discusses the approach taken to assess asset management planning and practices through an independent review. Similarly for the Union rate zones’ AMP, Exhibit C1, Tab 3, Schedule 1, pages 32 to 33 outlines the approach to review asset management practices and continual improvement. Participation of the CGA committees for Integrity Management and Asset Management have helped shape Enbridge Gas’s programs and approach to risk management. Further, involvement with the CSA Technical Sub-committees helps Enbridge Gas: 1) influence and gain insight on issues that impact the safety and reliability of assets, 2) define metrics to measure performance, and 3) structure the programs and type of tools used to complete integrity assessments.

Filed: 2019-04-25 EB-2018-0305 Exhibit I.STAFF.36 Page 2 of 2
As part of the amalgamation of Union Gas and Enbridge Gas Distribution, the quality management resources have been combined into one group within Enbridge Gas. The goal of combining quality management resources is to ensure an integrated approach to risk management, identifying and auditing key safety processes and field procedures. Through chairing and participating in the committee for development of the CSA Z260 – Pipeline Safety Metrics, Enbridge Gas is concurrently developing an internal standard to align with the CSA Z260 Transmission standard and developing proposed draft metrics for CSA Z260 Distribution for the purpose of gaining insight and trends that can be shared as comments and lessons learned to other industry participants. Setting of the compressor metrics is done in consideration with AGA Compressor metrics. Monitoring these metrics has led to further investigation of a poor hot weather start performance at Dawn Plant J. The resolution recommendation, involving the original equipment manufacturer, has led to a proposal to increase the horsepower of the starter motor in the future.

Filed: 2019-04-25 EB-2018-0305 Exhibit I.STAFF.37 Page 1 of 2
ENBRIDGE GAS INC. Answer to Interrogatory from
Board Staff (STAFF) Reference: AMP - Exhibit C1/Tab 2/ Schedule 1/ pg.19 Question: The AMP states that the Asset Management Program considers all OEB-regulated assets, which have been grouped into nine classes: Pipe, Stations, Storage, Customer Assets, Fleet & Equipment, Technology & Information Services (TIS), Real Estate & Workplace Services (REWS), Customer Growth, and Business Development. Investment decisions are categorized and managed on an asset class basis, where each asset class has a unique set of objectives and life cycle management policies that guide decision-making. With an understanding of the asset inventory and the evaluation of condition and risk, resultant strategies are outlined. From the statements in this Section (i.e. 1.6 "Asset Classes") it is not clear whether the implementation of the asset management process is consistent across the EGD asset classes (i.e. prioritization of assets among the assets classes which would be selected for monitoring as part of the asset management process may not have common basis to allow comparison).
a) Please explain or point to a section in this document which explains the sources used to establish these EGD Asset Classes
b) Customer Growth and Business Development are referred to as assets. Please explain how these are considered to be assets?
c) What are the common basis on which the prioritization of investments across assets classes is achieved (e.g. system/equipment health indexing, common asset registry information, end of life criteria etc.)?
Response a) EGD Asset Classes were defined based on categorization of EGD’s regulated
assets, the organizational structure managing these assets and ISO 5500x. Additional consideration was given to the grouping of like assets that performed a specific function, had similarities in operation and/or life cycle strategy and, in some

Filed: 2019-04-25 EB-2018-0305 Exhibit I.STAFF.37 Page 2 of 2
cases, were aligned by organizational function Evidence references to where this is discussed in the EGD AMP are located is Section 4.1
b) Customer Growth and Business Development are Asset Classes; their respective assets and lifecycle policies are described in Sections 5.1 and 5.9 of the AMP.2 The Customer Growth Asset Class represents a significant annual spend to the organization and bridges multiple asset classes. The organization made the decision that Customer Growth would be best managed as its own Asset Class. Once the assets are in service the management of the asset falls within the respective asset class such as Stations, Pipe, and Customer Asset Classes. In the case of the Business Development Asset Class, there is a relatively small asset inventory and the decision was made to align this asset class with the organizational structure that manages the assets.
c) Investments are optimized based on the Asset Management Principles outlined in
Section 4.1.3.4 Optimize Portfolio Based on Asset Management Principles (p. 71-4). Please refer to the Asset Management Core Process steps Risk Management (Section 4.2.1 p. 79), Solution Planning (Section 4.2.2 p. 83) and Portfolio Optimization (Section 4.2.3 p. 84).
1 Exhibit C1, Tab 2, Schedule 1, page 62. 2 Exhibit C1, Tab 2, Schedule 1, page 95; and page 361.

Filed: 2019-04-25 EB-2018-0305 Exhibit I.STAFF.38 Page 1 of 4 Plus Attachment
ENBRIDGE GAS INC. Answer to Interrogatory from
Board Staff (STAFF) Reference: Exhibit C1/ Tab 2/ Schedule 1/ Section 1.8 – Condition and Strategy
Overview, pgs. 20-41 Question: Enbridge Gas Distribution presents series of asset class tables starting on page 20 through to page 41. The heading on the majority tables is “ASSET SUBCLASS AVG. AGE (YR)/CONDITION RISK / OPPORTUNITY MAINTENANCE STRATEGY REPLACEMENT / RENEWAL STRATEGY”
a) Please present the capital values for each of the assets in these tables? b) Typical End-Of-Life (EOL) criteria would address function/purpose, economy of
continued operation, safety, reliability/ risk, and design/ obsolescence). Has Enbridge Gas defined such EOL criteria? If so, does it apply them in determining asset replacement rates? If yes, please explain how this has been done?
c) Corporate values do not appear to be consistently reflected in description of RISK/OPPORTUNITY column. Examples are to be seen on page 20 for “Integrity Mains” and for Distribution Steel Mains. There is no explicit mention of injury/Loss of Life under the Risks/ opportunity. In general, expenditures to prevent injury/loss of life would be expected to receive the highest weighting, with proportionally less financial weighting to reducing other risks such as “relighting customer gas appliances”. Would it be possible to show the linkage from Risk/opportunity to the financial weighting applied to risks in order to determine the appropriateness of the balance struck and where proportionate savings have been allocated for lower impact risks? If yes, please present or highlight this?
d) Discussion of risk of injury/loss of life is generally associated with the three risks listed: Safety, Financial and Customer satisfaction. Does the Enbridge Gas asset management policy and strategy fully reflect these risks? If so, please substantiate the linkages.

Filed: 2019-04-25 EB-2018-0305 Exhibit I.STAFF.38 Page 2 of 4 Plus Attachment
e) Failure curve predictions for pre-1985 plastic mains vs/risk/opportunity (pdf p83)
“The maintenance strategy for distribution plastic mains requires a leak survey to be conducted every five years” Please explain or point to a section in this document which explains:
I. How is the shape of the failure curve referred to above derived and verified?
II. Is the failure curve referred to above qualified through laboratory examination of Enbridge Gas Distribution field samples sufficient to reliably predict rate of progression and ultimate failure? If so, please provide an example of how it is used in the analysis to narrow the uncertainty in the risk?

Filed: 2019-04-25 EB-2018-0305 Exhibit I.STAFF.38 Page 3 of 4 Plus Attachment
Response
a) By “capital values” Enbridge Gas believes the question is referring to the capital investment associated with each asset sub-class or category of spend. The summary tables at the end of each asset class section in Section 5 of the EGD rate zone’s AMP provide this information, and are reproduced in Attachment 1 with a column added (first column) to better align with the summary tables at Exhibit C1, Tab 2, Schedule 1, pages 20 and 41.
b) No. The term “End-of-Life” used is a generic term used to imply an asset’s end state.
The renewal/maintenance strategy takes into consideration each asset class, and their unique objectives and life-cycle management policies. As shown in Figure 4.1-6, several inputs are used to inform decision-making during an asset’s life.1
Consistent criteria were used for each asset section in the EGD rate zone’s AMP: “Condition Methodology”, “Condition Findings”, “Risk and Opportunity”, and “Strategy”. This was designed to clearly outline the methodology and subsequent conclusions that led to each renewal /maintenance strategy.
c) The series of tables starting on page 20 through to page 41 in the EGD rate zone AMP
was intended to provide a high level summary by asset subclass category. In its risk management framework, Enbridge Gas weighs safety risk higher than
customer satisfaction and financial risk. This is presented in the EGD rate zone AMP strategy and planning section:
• Risk tolerances are defined for each risk dimension and Figure 4.2-4: Safety Risk Matrix on this page illustrates the lower tolerance for safety related risks compared to Financial (Figure 4.2-5) and Customer Satisfaction (Figure 4.2-6).2
• When calculating discounted lifetime risk reduction, “customer satisfaction and financial risk are discounted over the life of the asset, while safety risk is not, as it is of paramount importance.”3 d) Yes. As EGD’s asset management policy states in Section 4, under Strategy and Planning:
Core asset management goals are employee and public safety, compliance, financial performance, operational reliability, environmental sustainability, and customer satisfaction.4
1 Exhibit C1, Tab 2, Schedule 1, p. 70. 2 Ibid., p.82. 3 Ibid., p.89.

Filed: 2019-04-25 EB-2018-0305 Exhibit I.STAFF.38 Page 4 of 4 Plus Attachment
Risk assessments use the dimensions of Safety, Financial, and Customer Satisfaction (CSAT) to quantify risk. These are described in Table 4.1-2: EGD's Risk Dimensions and align to the Enterprise Strategic Priorities and the Asset Management Core Process.5
Figure 4.1-8 illustrates how EGD’s Asset Management Policy, Strategies and Risk Dimensions align with the Company’s Enterprise Strategic Priorities. This alignment is the core of EGD’s Asset Management Strategic Framework.6
e) I. The failure projection is created by applying statistical model on historical failure data
from 2007-2017. The projection is being monitored and verified against actuals on an annual basis. Sections in the EGD rate zone AMP that explain this are provided below.
a leak projection model created by applying a structured methodology to convert historical failure data into a statistical model that forecasts the probability of failure (PoF). The leak projections are refined with input obtained through direct assessment, internal and external industry studies, and SMA input.7 EGD continually monitors the performance of these assets and refines its analytical models based on best available data. As the quality of models and data continue to improve through the Plan-Do-Check-Act methodology, EGD will be better able to predict asset condition and manage its long term replacement strategy accordingly.8
II. The EGD rate zone has collected gas pipe samples of pre-1977 plastic mains to send
to the Gas Technology Institute (“GTI”) for testing and analysis. The GTI was able to produce a Rate Pre-process Method model for the pre-1977 Aldyl A plastic mains, which was used to estimate time to first failure for this asset sub-class.
In addition to statistical modeling, EGD has also concluded an extensive study on pre-1977 Aldyl A plastic pipe with GTI to develop data-driven predictions on the remaining useful life expectancy of the Aldyl A plastic pipe used in the EGD system.9
4 Ibid., p.64. 5 Ibid., p.71. 6 Ibid., p.76. 7 Ibid., p.132. 8 Ibid., p.138 9 Ibid., p.132.

Tabl
e 1:
Cus
tom
er G
row
th C
apita
l Sum
mar
y ($
Tho
usan
ds)
Asse
t Su
bcla
ss
Sect
or
2019
20
20
2021
20
22
2023
20
24
2025
20
26
2027
20
28
10-y
ear
Fore
cast
Vario
us
Com
mer
cial
22
,946
23
,804
24
,304
24
,049
24
,027
23
,710
23
,500
22
,932
22
,731
22
,757
23
4,76
1
Indu
stria
l 3,
763
3,90
3 3,
985
3,94
3 3,
940
3,88
8 3,
853
3,76
0 3,
727
3,73
2 38
,494
Resi
dent
ial
72,1
26
74,8
23
76,3
93
75,5
93
75,5
24
74,5
28
73,8
66
72,0
83
71,4
51
71,5
32
737,
919
Tota
l 98
,835
10
2,53
0 10
4,68
1 10
3,58
5 10
3,49
1 10
2,12
6 10
1,21
9 98
,775
97
,909
98
,021
1,
011,
174
Filed: 2019-04-25, EB-2018-0305, Exhibit I.STAFF.38, Attachment, Page 1 of 7

Tabl
e 2:
Pip
e Ca
pita
l Sum
mar
y ($
Tho
usan
ds)
As
set S
ubcl
ass
Prog
ram
/Pro
ject
N
ame
2019
20
20
2021
20
22
2023
20
24
2025
20
26
2027
20
28
10-y
ear
Fore
cast
Dist
ribut
ion
Mai
ns -
Stee
l St
eel M
ains
Re
plac
emen
t 18
,844
21
,599
24
,117
26
,929
30
,068
33
,574
37
,489
41
,859
46
,740
52
,189
33
3,40
8
Dist
ribut
ion
Mai
ns -
Stee
l &
Inte
grity
Mai
ns
Corr
osio
n Pr
even
tion
Prog
ram
(Ano
de
Repl
acem
ent)
1,21
1 1,
229
1,24
7 1,
265
1,28
4 1,
303
1,32
3 1,
342
1,36
2 1,
383
12,9
49
Vario
us
Pipe
Em
erge
ncy
Repl
acem
ent
2,00
0 2,
000
2,00
0 2,
000
2,00
0 2,
000
2,00
0 2,
000
2,00
0 2,
000
20,0
00
Dist
ribut
ion
Mai
ns -
Stee
l M
ajor
Pip
elin
es
25,4
01
2,60
0 9,
240
40,6
42
2,65
0 10
,750
60
0 -
- -
91,8
82
Dist
ribut
ion
Mai
ns -
Plas
tic
Vint
age
Plas
tic
Repl
acem
ent
1,88
9 2,
276
2,74
6 3,
319
4,01
8 4,
870
5,91
0 7,
178
8,72
6 10
,615
51
,546
Vario
us
Relo
catio
ns
16,0
17
27,0
06
10,5
50
9,70
0 9,
700
9,70
0 9,
700
9,70
0 9,
700
9,70
0 12
1,47
3
Vario
us
Engi
neer
ing
Tech
nolo
gy
- 1,
358
1,09
3 1,
382
583
- -
- -
- 4,
415
Inte
grity
Mai
ns
Inte
grity
Ret
rofit
s 3,
855
- -
- -
- -
- -
- 3,
855
Dist
ribut
ion
Serv
ices
&
Dist
ribut
ion
Rise
rs
Serv
ice
Rela
y Bl
anke
t 17
,723
20
,296
21
,195
22
,175
23
,183
24
,261
25
,233
26
,223
27
,236
28
,252
23
5,77
7
Dist
ribut
ion
Rise
rs -
Copp
er
Copp
er R
iser
Re
plac
emen
t Pr
ogra
m
4,40
7 4,
483
6,84
1 9,
279
10,8
40
13,0
05
19,5
39
24,8
46
25,2
76
25,7
13
144,
227
Vario
us
Rein
forc
emen
ts
20,3
32
13,1
67
5,19
3 4,
924
11,6
02
16,7
28
18,9
12
2,84
5 50
4 -
94,2
07
Pi
pe T
otal
11
1,67
8 96
,013
84
,222
12
1,61
5 95
,928
11
6,19
0 12
0,70
5 11
5,99
3 12
1,54
3 12
9,85
2 1,
113,
739
Filed: 2019-04-25, EB-2018-0305, Exhibit I.STAFF.38, Attachment, Page 2 of 7

Tabl
e 3:
Sta
tions
Cap
ital S
umm
ary
($ T
hous
ands
)
Asse
t Su
bcla
ss
Prog
ram
/Pro
ject
N
ame
2019
20
20
2021
20
22
2023
20
24
2025
20
26
2027
20
28
10-Y
ear
Fore
cast
Gate
&
Feed
er
Stat
ions
Gat
e &
Fee
der
Stat
ion
Prog
ram
7,
504
12,9
87
7,74
1 11
,469
8,
652
13,0
51
7,24
0 6,
848
3,61
2 3,
484
82,5
86
Dist
rict
Stat
ions
Di
stric
t Sta
tions
Re
build
Pro
gram
6,
500
8,18
9 7,
000
8,00
0 7,
500
7,50
0 7,
500
7,50
0 7,
500
8,50
0 75
,689
Head
er
Stat
ions
He
ader
Sta
tions
Re
build
Pro
gram
92
4 92
4 92
4 92
4 92
4 92
4 92
4 92
4 92
4 92
4 9,
240
Sale
s St
atio
ns
Sale
s Sta
tions
Re
build
Pro
gram
1,
100
1,50
0 2,
000
2,03
5 2,
071
2,10
7 2,
144
2,18
1 2,
219
2,25
8 19
,615
Sale
s St
atio
ns
Insi
de R
egul
ator
Re
loca
tion
and
ERR
Prog
ram
50
0 50
0 50
0 50
0 50
0 50
0 50
0 -
- -
3,50
0
Gate
&
Feed
er
Stat
ions
In
tegr
ity R
etro
fits
2,57
3 1,
850
1,19
7 1,
500
1,40
0 45
0 -
- -
- 8,
971
Gate
&
Feed
er
Stat
ions
Te
lem
etry
Pro
gram
1,
400
1,40
0 1,
400
1,40
0 1,
400
1,40
0 1,
400
1,40
0 1,
400
1,40
0 14
,000
Gate
&
Feed
er
Stat
ions
M
&R
Com
plia
nce
200
200
200
200
200
200
200
200
200
200
2,00
0
Vario
us
Stat
ion
Emer
genc
y Re
plac
emen
t 20
0 20
0 20
0 20
0 20
0 20
0 20
0 20
0 20
0 -
1,80
0
St
atio
ns T
otal
20
,901
27
,750
21
,163
26
,228
22
,846
26
,332
20
,108
19
,253
16
,055
16
,766
21
7,40
1
Filed: 2019-04-25, EB-2018-0305, Exhibit I.STAFF.38, Attachment, Page 3 of 7

Tabl
e 4:
Sto
rage
Cap
ital S
umm
ary
($ T
hous
ands
)
Asse
t Sub
clas
s Pr
ogra
m/P
roje
ct
Nam
e 20
19
2020
20
21
2022
20
23
2024
20
25
2026
20
27
2028
10
-Yea
r Fo
reca
st
Gas C
ompr
esso
rs
Com
pres
sor
Equi
pmen
t 24
,066
27
,870
27
,589
10
,513
10
,999
5,
953
4,93
4 3,
299
2,48
9 2,
660
120,
370
Vario
us
Inte
grity
Initi
ativ
es
577
771
1,04
0 73
5 72
8 85
1 1,
075
744
1,11
3 1,
134
8,76
7
Vario
us
Fiel
d Li
nes
2,07
9 1,
343
498
1,00
6 1,
496
930
398
3,50
9 1,
225
225
12,7
09
Rese
rvoi
rs
Wel
ls a
nd W
ell
Equi
pmen
t 7,
246
3,97
6 3,
298
2,14
3 1,
167
3,74
9 1,
927
11,0
98
739
1,40
3 36
,746
Vario
us
Mea
sure
men
t and
Re
gula
ting
Equi
pmen
t 14
14
14
72
9 20
9 14
14
14
79
14
1,
118
St
orag
e To
tal
33,9
81
33,9
74
32,4
40
15,1
26
14,5
99
11,4
97
8,34
9 18
,664
5,
646
5,43
5 17
9,71
0
Tabl
e 5:
Cus
tom
er A
sset
s Cap
ital S
umm
ary
($ T
hous
ands
)
Prog
ram
/Pro
ject
N
ame
2019
20
20
2021
20
22
2023
20
24
2025
20
26
2027
20
28
10-Y
ear
Fore
cast
Mea
sure
men
t Sy
stem
s 38
,126
40
,749
39
,328
41
,973
43
,558
51
,512
44
,097
43
,694
51
,527
44
,500
43
9,06
5
Regu
latio
n, S
afet
y,
and
Pipi
ng
2,41
1 2,
427
754
461
463
465
466
468
470
- 8,
385
Belo
w G
roun
d an
d In
tern
al P
ipin
g Sy
stem
s 55
55
-
- -
- -
- -
- 11
0
Cust
omer
Ow
ned
Syst
ems
443
400
203
203
203
203
400
400
400
400
3,25
7
Cust
omer
Ass
ets
Tota
l 41
,036
43
,631
40
,285
42
,637
44
,224
52
,180
44
,964
44
,562
52
,398
44
,900
45
0,81
6
Filed: 2019-04-25, EB-2018-0305, Exhibit I.STAFF.38, Attachment, Page 4 of 7

Tabl
e 6:
Rea
l Est
ate
& W
orkp
lace
Ser
vice
s Cap
ital S
umm
ary
($ T
hous
ands
)
Prog
ram
/Pro
ject
Nam
e 20
19
2020
20
21
2022
20
23
2024
20
25
2026
20
27
2028
10
-Yea
r Fo
reca
st
Arnp
rior
- -
500
1,60
0 -
- -
- -
- 2,
100
Barr
ie
- 1,
000
6,00
0 -
- -
- -
- -
7,00
0
Colo
ny C
ourt
10
0 3,
100
- -
- -
- -
- -
3,20
0
Broc
kvill
e -
1,50
0 3,
350
- -
- -
- -
- 4,
850
SMO
C/Co
vent
ry C
onso
lidat
ed
Faci
lity
- 25
-
- -
- 9,
000
19,0
00
2,80
0 -
30,8
25
Kelfi
eld
- 1,
000
4,70
0 1,
100
- -
- -
- -
6,80
0
Kenn
edy
- -
- 9,
200
8,00
0 4,
500
- -
- -
21,7
00
Osh
awa
-
- -
- -
- -
- -
100
100
Pete
rbor
ough
-
- 1,
000
3,45
0 -
- -
- -
- 4,
450
Stat
ion
B -
5,00
0 1,
500
- -
- -
- -
- 6,
500
Thor
old
- -
- -
- -
200
5,80
0 -
- 6,
000
TOC
EMEC
Exp
ansi
on
50
50
3,50
0 -
- -
- -
- -
3,60
0
VPC
2,63
0 4,
950
7,25
0 4,
500
- 10
,000
10
,000
-
- -
39,3
30
Build
ing
Syst
ems P
rogr
am
1,83
1 1,
863
1,89
5 1,
928
1,96
1 1,
995
2,03
0 2,
065
2,10
0 2,
137
19,8
05
Cabl
ing
102
103
105
107
109
111
113
115
117
119
1,10
0
EGD
Targ
eted
GHG
& E
nerg
y Re
duct
ions
35
0 35
0 35
0 -
- -
- -
- -
1,05
0
Furn
iture
and
Erg
onom
ics
203
207
211
214
218
222
226
229
233
237
2,20
1
Dire
ct C
apita
l Ove
rhea
ds
530
530
530
250
250
250
250
175
- -
2,76
5
REW
S To
tal
5,79
6 19
,678
30
,891
22
,349
10
,538
17
,078
21
,818
27
,384
5,
251
2,59
3 16
3,37
6
Filed: 2019-04-25, EB-2018-0305, Exhibit I.STAFF.38, Attachment, Page 5 of 7

Tabl
e 7:
Fle
et a
nd E
quip
men
t Cap
ital S
umm
ary
($ T
hous
ands
)
Prog
ram
/Pro
ject
Nam
e 20
19
2020
20
21
2022
20
23
2024
20
25
2026
20
27
2028
10
-yea
r Fo
reca
st
Ligh
t & M
ediu
m D
uty
Vehi
cles
5,
069
4,90
3 5,
051
4,65
2 4,
871
4,58
6 4,
495
4,63
6 4,
636
4,63
6 47
,533
NG
Conv
ersio
n Ki
ts fo
r New
Fle
et
Vehi
cles
40
0 40
8 41
6 42
4 43
2 58
6 53
5 54
6 55
7 -
4,30
4
Heav
y Eq
uipm
ent
500
500
500
500
454
741
622
636
636
636
5,72
5
Tool
s 80
0 80
0 80
0 1,
000
1,00
0 1,
000
1,00
0 1,
000
1,00
0 1,
000
9,40
0
Flee
t Ass
ets T
otal
6,
768
6,61
0 6,
767
6,57
6 6,
757
6,91
3 6,
652
6,81
8 6,
829
6,27
2 66
,962
Tabl
e 8:
TIS
Cap
ital S
umm
ary
($ T
hous
ands
)
Asse
t sub
clas
s Pr
ogra
m/P
roje
ct
Nam
e 20
19
2020
20
21
2022
20
23
2024
20
25
2026
20
27
2028
10
-Yea
r Fo
reca
st
Hard
war
e an
d So
ftw
are
CIS
Repl
acem
ent
16,4
00
4,00
0 -
- -
5,00
0 5,
600
- -
600
31,6
00
Soft
war
e Cu
stom
er
Expe
rienc
e Tr
ansf
orm
atio
n
7,00
0 -
- -
- -
- -
- -
7,00
0
Hard
war
e Ha
rdw
are
1,27
0 2,
400
2,71
5 4,
070
3,00
0 4,
215
3,20
5 3,
620
3,03
0 2,
100
29,6
25
Soft
war
e So
ftw
are
14,9
65
15,8
45
18,5
70
20,1
66
18,9
66
12,7
51
12,1
61
18,3
46
18,9
36
19,2
66
170,
972
Com
mun
icat
ions
Co
mm
unic
atio
n 25
0 25
0 25
0 17
5 17
5 17
5 1,
175
175
175
175
1,97
5
TI
S To
tal
39,8
85
22,4
95
21,5
35
24,4
11
22,1
41
22,1
41
22,1
41
22,1
41
22,1
41
22,1
41
241,
174
Filed: 2019-04-25, EB-2018-0305, Exhibit I.STAFF.38, Attachment, Page 6 of 7

Tabl
e 9:
Bus
ines
s Dev
elop
men
t Cap
ital S
umm
ary
($ T
hous
ands
)
Asse
t sub
clas
s Pr
ogra
m/P
roje
ct
Nam
e 20
19
2020
20
21
2022
20
23
2024
20
25
2026
20
27
2028
10
-Yea
rFo
reca
st
Larg
e an
d U
tility
N
atur
al G
as fo
r Tr
ansp
orta
tion
Stat
ions
(NGT
)
NGT
Mai
nten
ance
68
6 69
8 71
0 75
8 59
6 60
6 61
7 62
7 63
8 64
9 6,
586
Smal
l NGT
Sta
tions
/ Ve
hicl
e Re
fuel
ing
Appl
ianc
e (V
RA)
Rent
al V
RAs
250
254
259
263
268
272
277
282
287
292
2,70
4
Larg
e an
d U
tility
N
atur
al G
as fo
r Tr
ansp
orta
tion
Stat
ions
(NGT
)
NGT
Ren
tal
Com
pres
sors
(Non
-Tr
ansit
) 2,
600
5,60
0 4,
500
3,00
0 3,
000
3,00
0 3,
000
3,00
0 3,
000
3,00
0 33
,700
Low
er c
arbo
n st
rate
gies
Hy
drog
en B
lend
ing
1,20
0 36
5 -
- -
- -
- -
- 1,
565
Busi
ness
Dev
elop
men
t To
tal
4,73
6 6,
918
5,46
9 4,
021
3,86
4 3,
879
3,89
4 3,
909
3,92
5 3,
941
44,5
55
Filed: 2019-04-25, EB-2018-0305, Exhibit I.STAFF.38, Attachment, Page 7 of 7

Filed: 2019-04-25 EB-2018-0305 Exhibit I.STAFF.39 Page 1 of 2
ENBRIDGE GAS INC. Answer to Interrogatory from
Board Staff (STAFF) Reference: Exhibit C1/ Tab 1/ Schedule 1/Pg. 42, 43 and 49, and Exhibit C1/Tab
2/Schedule 1/Pg. 19 Question: Enbridge Gas states that the asset categories are used by both Enbridge Gas Distribution and Union Gas to organize and define assets in the respective AMPs. The list of asset categories are provide in Table 3 of the USP. However, the asset classes provide on page 19 of the Enbridge Gas Distribution AMP are different from those identified in Table 3.
a) Please explain the reasons for the differences between the “asset categories” and “asset classes”. Where possible, please reconcile the differences.
b) Table 6 in the USP provides a list of potential ICM projects for both Enbridge Gas Distribution and Union Gas. The table also identifies the asset class, in-service year and capital costs. Does Enbridge Gas have a similar table for the base spend? If not, please provide a table showing the base spend in a similar format (if it is not onerous). Please also confirm that Enbridge Gas will be able to provide a similar table for the base spend in the next iteration of its AMP.
Response a) The asset classes for the EGD rate zone and asset categories for the Union rate
zones are essentially equivalent. The column headings for Table 3 provided below and found on page 43 in Exhibit C1, Tab1, Schedule1 has been updated to clearly identify the asset categories for the EGD and Union rate zones.

Filed: 2019-04-25 EB-2018-0305 Exhibit I.STAFF.39 Page 2 of 2
Union Gas EGD
Pipelines Pipe Stations Stations Distribution / System Growth Customer Growth
Measurement Contained within Storage, Stations, Customer Assets Asset Classes
Contained within pipelines, stations, measurement asset categories
Customer Assets
Utilization Contained within Customer Assets Asset Classes
Underground Storage Storage
Compression and dehydration Contained within Storage Asset Class
Liquid Natural Gas (LNG) n/a Corporate Real Estate (CRES) Real Estate and Workplace Services Fleet Fleet and Equipment
Information Technology (IT) TIS (Technology Information Services)
n/a Business Development
b) A complete summary of all projects in the Enbridge Gas asset plan are included in
Exhibit I.BOMA.22. The projects and programs greater than $2M that are part of the 2019 capital budget of each utility system plan are included in Exhibit C:
• EGD rate zone AMP: Appendix 7. 2-1 to Appendix 7.2-9. • Union rate zones AMP: Appendix D.
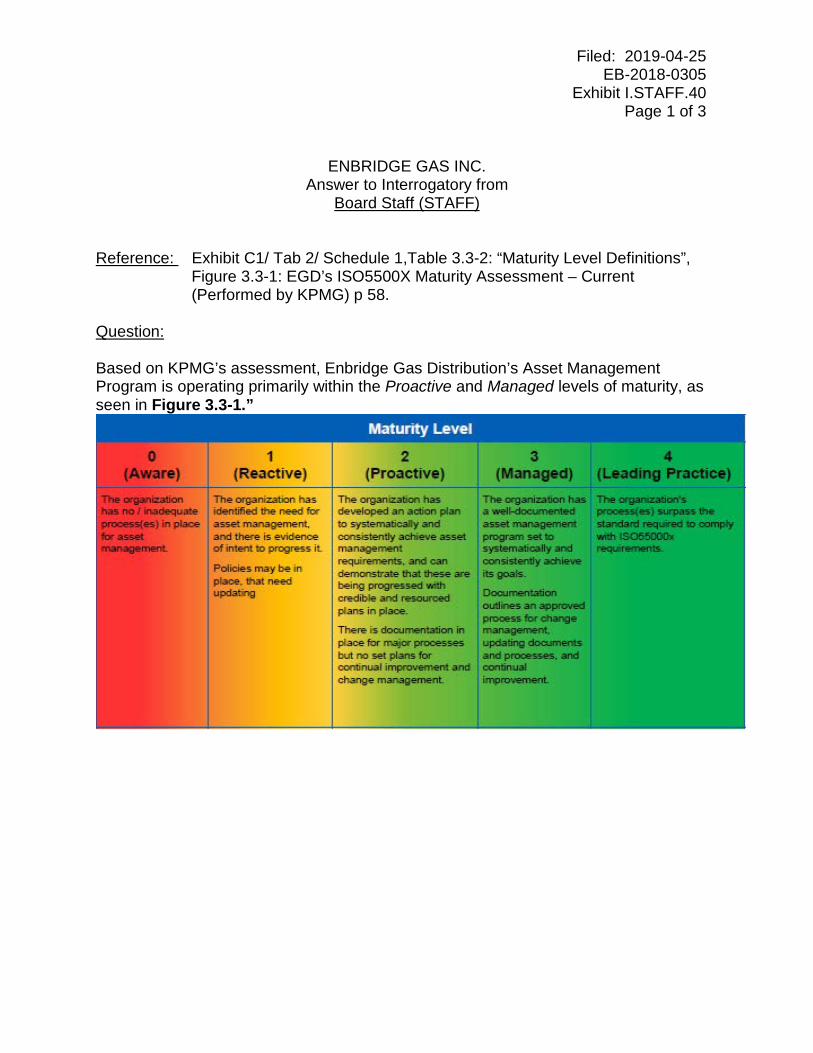
Filed: 2019-04-25 EB-2018-0305 Exhibit I.STAFF.40 Page 1 of 3
ENBRIDGE GAS INC. Answer to Interrogatory from
Board Staff (STAFF) Reference: Exhibit C1/ Tab 2/ Schedule 1,Table 3.3-2: “Maturity Level Definitions”,
Figure 3.3-1: EGD’s ISO5500X Maturity Assessment – Current (Performed by KPMG) p 58.
Question: Based on KPMG’s assessment, Enbridge Gas Distribution’s Asset Management Program is operating primarily within the Proactive and Managed levels of maturity, as seen in Figure 3.3-1.”

Filed: 2019-04-25 EB-2018-0305 Exhibit I.STAFF.40 Page 2 of 3
Table 3.3-2: “Maturity Level Definitions
Figure 3.3-1: EGD’s ISO5500X Maturity Assessment – Current (Performed by KPMG) The statement on pg. 58 could be interpreted as Enbridge Gas being between the 2 and 3 level of maturity. Please confirm that this is an accurate interpretation. Also, please confirm that this determination included comparison against the peers in the industry similar to Enbridge Gas and if, so, please confirm that these companies included some at Maturity Levels 3 and 4 where industry best practices would be expected to be evident? Response Confirmed. The statement ‘Enbridge Gas Distribution’s Asset Management Program is operating primarily within the Proactive and Managed levels of maturity’ can be interpreted as the EGD rate zone’s AMP being between the 2 and 3 level of maturity. In performing the Asset Management Assessment, legacy EGD evaluated policies, practices and processes against the ISO 5500x framework. Industry practices at peer utilities were taken into account as part of this assessment. In legacy EGD’s work with KPMG, it was found that peer organizations also had a combination of Proactive, Managed and Leading Practices for ISO components within their asset management environment. Some organizations in the United States and

Filed: 2019-04-25 EB-2018-0305 Exhibit I.STAFF.40 Page 3 of 3
Europe were leading in certain areas as they initiated asset management programs earlier than legacy EGD due to a regulatory or other requirements. It is Enbridge Gas’s intention and strategy to progress to being between Managed and Leading Practice in all components of the ISO framework.

Filed: 2019-04-25 EB-2018-0305 Exhibit I.STAFF.41 Page 1 of 2
ENBRIDGE GAS INC. Answer to Interrogatory from
Board Staff (STAFF) Reference: Exhibit C1/ Tab 2/ Schedule 1, pg. 63 Question: The Enbridge Enterprise Strategic Priorities (Section 2.2.4) sets the foundation for all company-wide operations and initiatives. The Asset Management Policy (Section 4.1.2) translates the Enterprise Strategic Priorities into the application of asset management at Enbridge Gas Distribution and outlines the high-level goals and principles used to manage assets. Asset Management Strategies (Section 4.1.3) supports the policy, and outlines the methods employed for asset management success. Lastly, the Asset Management Core Process (Section 4.2) outlines how the identified strategies will be executed. The alignment of Asset Management Strategies to the Enterprise Strategic Priorities is summarized in Section 4.1.4. Please explain the reason(s) for the asset management policy and asset management strategy being integrated into the same document as the AMP? Generally, accepted best practices asset management policy and strategy could be part of a set of “higher-tier” corporate governance documents which reflect senior management commitments and expectations providing authority to lower tier documents such as the AMP. Are the asset management policy and strategy part of such higher–tier corporate governance or other documentation? If so, please confirm this and identify the “higher-tier” documents. Response In designing its AMP, legacy EGD chose to consolidate all Asset Management material into one document to ensure complete line of sight from enterprise priorities down to asset level strategies. Please refer to Figure 1.2-1 for an illustration of the EGD rate zone’s Asset Management structure1 The preliminary sections of the AMP document (Sections 2, 3, and 4) reflect EGD’s “SAMP”, which ISO defines as the content that “details the asset management objectives, explains their relationship to the organizational objectives and the framework
1 Exhibit C1, Tab 2, Schedule 1, page.16.

Filed: 2019-04-25 EB-2018-0305 Exhibit I.STAFF.41 Page 2 of 2
required to achieve the asset management objectives”2. EGD has chosen different titles, which is acceptable by ISO; “NOTE: A SAMP can be referred to by other names, e.g. “asset management strategy”.3 “While it is necessary to distinguish between the SAMP and the asset management plan(s), it is not a requirement of ISO 55001 to create separate pieces of documented information for each”.4
2 ISO 55002:2018, page. 18. 3 Ibid. 4 Ibid.

Filed: 2019-04-25 EB-2018-0305 Exhibit I.STAFF.42 Page 1 of 2
ENBRIDGE GAS INC. Answer to Interrogatory from
Board Staff (STAFF) Reference: Exhibit C1/ Tab 2/ Schedule 1/ pg. 90 – Asset Information Management. Question: Asset data provides the foundation for asset life cycle decision-making, as outlined in Asset Management Strategies (Section 4.1.3). Asset data exists in both structured (from databases residing within information systems), and unstructured (on paper and scanned) forms. Asset information derived from these sources, supported by company and industry knowledge, is leveraged for asset analysis and modeling to:
• Understand condition and predict risk • Support risk and opportunity assessments • Inform and support asset health reviews and Engineering Reliability
Assessments • Establish asset inventory and population over time • Ensure compliance with company policy and regulatory requirements • Make operational asset decisions, e.g. emergency response • Ensure safe and reliable operations e.g. core work, maintenance
With the company's growing focus on asset, integrity, and process safety management, there is a need for various groups in Operations, Integrity, and Asset Management to perform analyses based on a common understanding of hazards, asset master data, and a current understanding of the asset condition. Tools and methods to collect, store, manage, and use this data in a consistent and repeatable way are described in Table 4.2-3.”
a) The company has indicated that one of the objectives for asset analysis and modeling is to establish asset inventory and population over time. What is the degree of completion of the asset inventory?
b) For the assets in (a) above, what percentage of assets have undergone asset condition assessment?
Response a) Asset Classes and Sub-classes are defined in Asset Plan and there is an inventory
of the gas-carrying assets, fleet, real estate, and physical IT Assets. These exist in various systems in the organization but there is only one system of record for any

Filed: 2019-04-25 EB-2018-0305 Exhibit I.STAFF.42 Page 2 of 2
particular asset or sub-asset as defined in the asset plan. In some cases, the inventory is derived from attributes of the asset (for example valve or regulator type, installation date). To the extent that this information is missing or inaccurate, there is an ongoing effort to confirm the inventory of that asset sub-class. A visual representation of each asset class as well as the current asset inventory is included for each of the 9 asset classes in the EGD rate zone’s AMP.1
b) Some assets can be directly assessed in terms of their condition (inline inspection of
pipelines, direct inspection of stations). In other cases, no direct condition assessment can be completed because the assets are below grade.
1 Exhibit C1, Tab 2, Schedule 1, page 105.

Filed: 2019-04-25 EB-2018-0305 Exhibit I.STAFF.43 Page 1 of 4
ENBRIDGE GAS INC. Answer to Interrogatory from
Board Staff (STAFF) Reference: Exhibit C1/ Tab 2/ Schedule 1/ pg. 93 – Probability of Failure and Asset
Health Indices Question: With respect to asset analytics, Enbridge Gas Distribution has noted that for some asset classes, historic failure data can be combined with structured tacit knowledge and statistical methods to establish a probability of failure based on age and other statistically significant factors. The probability of failure is used to establish an Asset Health Index – a measure of the current health of the asset population and its expected deterioration.
a) Please provide a list of the asset classes for which health indices are available? b) Please provide an outline of a process describing how the health indices were
arrived at and how the health data is combined with maintenance data to determine asset replacement rates?
Response a) The 2017 Asset Health Review has asset health indices for the following assets and
components.
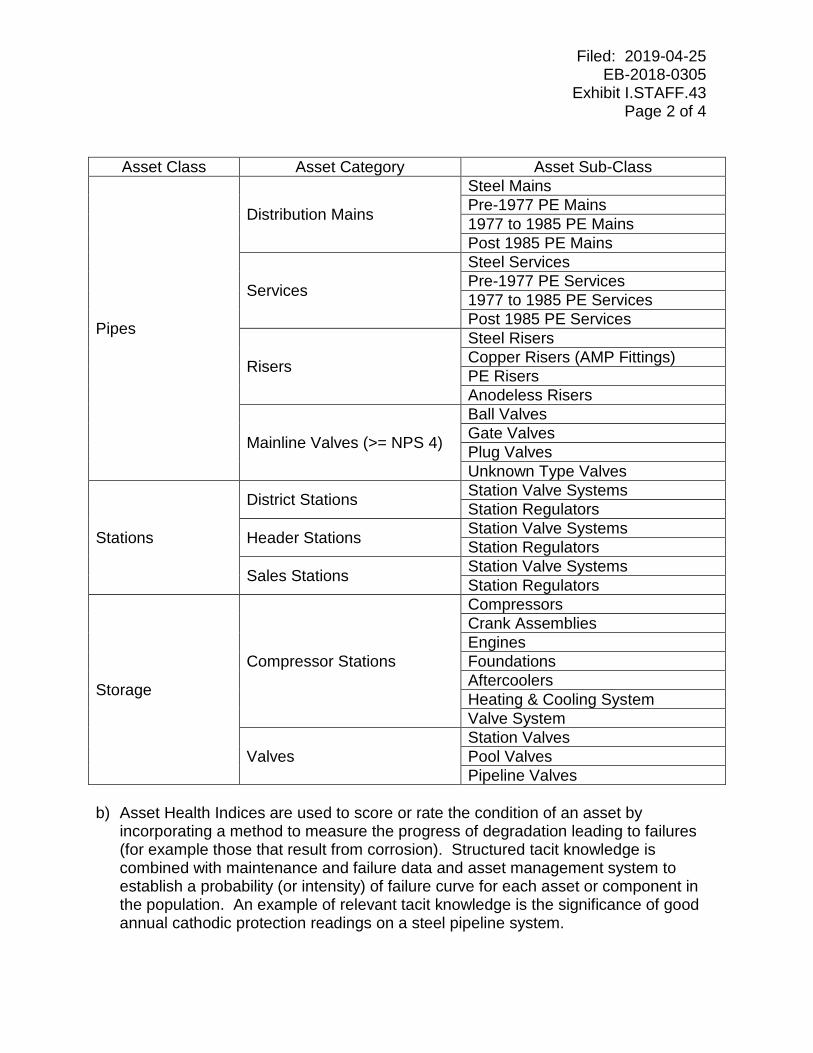
Filed: 2019-04-25 EB-2018-0305 Exhibit I.STAFF.43 Page 2 of 4
Asset Class Asset Category Asset Sub-Class
Pipes
Distribution Mains
Steel Mains Pre-1977 PE Mains 1977 to 1985 PE Mains Post 1985 PE Mains
Services
Steel Services Pre-1977 PE Services 1977 to 1985 PE Services Post 1985 PE Services
Risers
Steel Risers Copper Risers (AMP Fittings) PE Risers Anodeless Risers
Mainline Valves (>= NPS 4)
Ball Valves Gate Valves Plug Valves Unknown Type Valves
Stations
District Stations Station Valve Systems Station Regulators
Header Stations Station Valve Systems Station Regulators
Sales Stations Station Valve Systems Station Regulators
Storage
Compressor Stations
Compressors Crank Assemblies Engines Foundations Aftercoolers Heating & Cooling System Valve System
Valves Station Valves Pool Valves Pipeline Valves
b) Asset Health Indices are used to score or rate the condition of an asset by
incorporating a method to measure the progress of degradation leading to failures (for example those that result from corrosion). Structured tacit knowledge is combined with maintenance and failure data and asset management system to establish a probability (or intensity) of failure curve for each asset or component in the population. An example of relevant tacit knowledge is the significance of good annual cathodic protection readings on a steel pipeline system.

Filed: 2019-04-25 EB-2018-0305 Exhibit I.STAFF.43 Page 3 of 4
Statistical tools such as SAS and ReliaSoft are used to support this work. A reliability curve can be developed for each asset or component in the gas distribution system using failure and asset data for the population as a whole. If the tacit knowledge referenced above is available for particular assets, it can be used to adjust the reliability curve to reflect that knowledge. Reliability engineering applies statistical techniques to calculate the probability of failure for individual assets. An Asset Health Index (“AHI”) is the quantification of a calculated condition assessment using reliability engineering to determine the condition of an asset relative to its end of life for non-repairable assets, or its next expected failure for repairable assets. The AHI methodology provides a high level 10-year overview of the failure probability of asset types. The AHI takes the 10-year average of an asset’s probability of failure and classifies the asset into a grouping which showcases the expected time span of its failure. The AHI incorporates an asset’s current day probability of failure and the degradation of that asset averaged over a 10-year period. The table below describes the AHI categories for Pipe, and Station gas carrying assets based on years. Health Index Category Time to First or Next Failure HI1 Greater than 40 years HI2 Within 40 years HI3 Within 25 years HI4 Within 10 years HI5 Within 5 years
The Storage Health Index (“SHI”) method shown in the table below also incorporates probability of failure, however instead of using the age parameter, it uses run time. The five categories were established to closely represent a typical year based on 2,000 run hours per year.
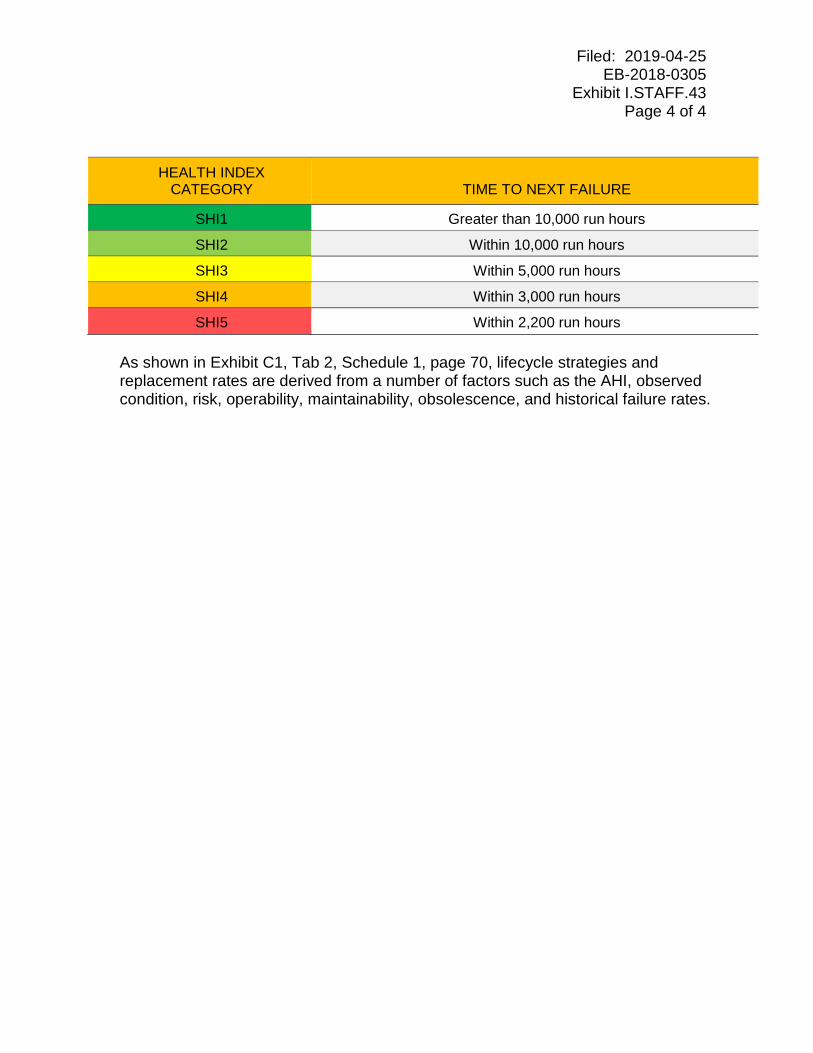
Filed: 2019-04-25 EB-2018-0305 Exhibit I.STAFF.43 Page 4 of 4
HEALTH INDEX CATEGORY TIME TO NEXT FAILURE
SHI1 Greater than 10,000 run hours
SHI2 Within 10,000 run hours
SHI3 Within 5,000 run hours
SHI4 Within 3,000 run hours
SHI5 Within 2,200 run hours As shown in Exhibit C1, Tab 2, Schedule 1, page 70, lifecycle strategies and replacement rates are derived from a number of factors such as the AHI, observed condition, risk, operability, maintainability, obsolescence, and historical failure rates.

Filed: 2019-04-25 EB-2018-0305 Exhibit I.STAFF.44 Page 1 of 2
ENBRIDGE GAS INC. Answer to Interrogatory from
Board Staff (STAFF) Reference: AMP – Exhibit C1/Tab 2/Schedule 1/Pg.99 and Asset Management Plan
(EB-2012-0459, Exhibit B2/Tab 10/Schedule 1/Pg.35) Question: In 2013, Enbridge Gas Distribution filed an Asset Management Plan (AMP) with the OEB for the first time as part of its Customer IR filing (EB-2012-0459). In that AMP average customer growth for the period 2018 to 2022 was forecasted at an average rate of 40,000 per year. In the current AMP the average customer growth between 2018 and 2028 has been forecasted at approximately 30,000 per year. The table below compares the Customer Growth Capital Costs for the period 2019 to 2022 based on the two Asset Management Plan
Customer Growth Capital Costs ($000)
2019 2020 2021 2022
AMP – EB-2012-0459 105,956 108,137 110,324 112,966 AMP – EB-2018-0305 98,835 102,530 104,681 103,585
a) Please explain how the 25% reduction in customer growth has impacted the
customer growth related capital expenditure forecast for the period 2019 to 2028. b) Based on the table above, there is a minimal reduction in customer growth
related capital costs between the two AMPs. Considering the significant reduction in customer growth forecast between the two AMPs, why is there no corresponding reduction in capital costs?
How has the change in the Customer Connection Policy of Enbridge Gas that requires every new customer to meet a PI of 1.0 and pay a capital contribution if required, impacted the capital expenditure forecast for the period 2019 to 2023. Response The customer growth related capital expenditure for the period 2019-2028 was determined using the most up to date customer growth forecasts and the most recent historical costs. This is further explained in section 5.5, under the methodology heading:

Filed: 2019-04-25 EB-2018-0305 Exhibit I.STAFF.44 Page 2 of 2
One of the key drivers of Customer Growth capital requirements is the historical spend profile in each area. Capital spend is not uniform across all areas, as some areas have inherently higher costs (e.g., hard rock, type of joint trench agreements, densely populated areas, and type of customers predominantly being attached). Based on the historical spend in each area containing unique characteristics, combined with forecast customer additions and inflation, the 10-year capital expenditure forecast was determined. The capital requirement includes an allowance for some localized main extensions and operational considerations.1
Other capital considerations that impact the capital costs for customer additions are included in section 5 of the Asset Plan.2 Some of the key cost impacts discussed in this reference are:
• Increased need for hydrovac in working around live gas facilities • Increased winter construction resulting in higher construction costs (winter
premium) • Increased municipal and conservation authority requirements (increased
trenchless technologies) • Increased apartment apartments/condominiums due to urban density have been
accounting for a larger share of total housing starts, and one building counts as a single customer addition.
As discussed above, the customer growth related capital expenditure was determined using the most up to date forecasts. Any impacts accruing to Enbridge Gas Distribution’s refinement in 2015 of its cost estimation approach for residential infill customers is reflected in the net historical costs. Therefore, the change in the Customer Connection Policy has been included in the estimate.
1 Exhibit C1, Tab 2, Schedule 1, pages 102-103. 2 Ibid.

Filed: 2019-04-25 EB-2018-0305 Exhibit I.STAFF.45 Page 1 of 1
ENBRIDGE GAS INC. Answer to Interrogatory from
Board Staff (STAFF) Reference: AMP – Exhibit C1/Tab 2/Schedule 1/Pg.121 Question: Enbridge Gas has noted that the number of leaks on steel mains have been on an upward trend over the last 11 years. Figure 5.2-11 provides the number of leaks on steel mains from 2007 to 2017.
a) The number of leaks has increase significantly from 2013 to 2017. Does Enbridge Gas have an estimate of how much natural gas has escaped as a result of these leaks?
b) What is the contribution of leaks on steel mains to Unaccounted for Gas over the past four years?
Response a) Natural gas loss is estimated at the distribution system level and not specifically
reported on steel mains gas leaks. b) Unaccounted for Gas (“UAF”) is reported at the distribution system level. The UAF
captures the total gas loss from the system, but it does not differentiate gas leaks from other types of gas loss. Therefore steel main leaks are included in the UAF but not specifically quantified.

Filed: 2019-04-25 EB-2018-0305 Exhibit I.STAFF.46 Page 1 of 2
ENBRIDGE GAS INC. Answer to Interrogatory from
Board Staff (STAFF) Reference: Exhibit C1/ Tab 2/ Schedule 1/ pg.122 and 131 Question: The evidence indicates that Enbridge Gas Distribution is engaged in a comprehensive, on-going program to measure, quantify and take remedial action to preserve the integrity of its steel mains. However, according to Enbridge Gas Distribution’s analytical models, the projected rate of increase of leaks in its steel pipe is forecasted to grow “exponentially” over the next 40 years (Figure 5.2-13: Steel Mains Leak Projections (2017 – 2057).
a) Is Enbridge Gas anticipating having to commit significantly more financial resources per year to adequately fund the steel main repair/replacement program based on the potential to increase its nominal replacement rate from 9km/year to a higher number (e.g. 18km/year) to align with the “100 years of age” criterion that is noted? If this is the case, when will this higher level of expenditure begin and what is the forecasted magnitude of the increase?
b) Does Union Gas have similar issues? Is Enbridge Gas participating with industry bodies such as the CSA Z662 standards committee and the applicable American Gas Association and Canadian Gas Association committees to address this issue?
c) Is the Enbridge Gas Distribution Steel Main Leak Analytical Model(s) unique to Enbridge Gas Distribution or is it based on an “industry standard” that it applies to its unique pipeline integrity data?
d) Does Union Gas have similar leak forecast data as Enbridge Gas Distribution put forward in Figure 5.2-13: Steel Mains Leak Projections (2017 – 2057)? If yes, please provide the data and a graphical representation.
e) Will Enbridge Gas provide a similar level of detail as Enbridge Gas Distribution when it submits the integrated AMP?
Response a) Yes, Enbridge Gas expects a significant increase in its level of spend to adequately
manage the lifecycle of steel mains. As outlined in the EGD rate zone AMP:

Filed: 2019-04-25 EB-2018-0305 Exhibit I.STAFF.46 Page 2 of 2
At the current rate of replacement (approximately nine kilometers per year) it would take over 200 years to address 2,200 kilometers of 1950s pipe alone. The potential volume of leaks associated with the increasing amount of pipe over 100 years in age could eventually compromise EGD’s ability to maintain a safe and reliable distribution system; depending on the timing and annual rate of replacement, EGD’s ability to respond to leaks will be impacted. EGD will continue to refine its Distribution Steel Mains Replacement Strategy to manage this aging asset population based on advancements in the understanding of leak projections, asset age limit, and resource capacity.1
The NPS 30 Don Valley crossing, Windsor Line and London Line replacement
projects are examples of some priority replacements that Enbridge Gas is advancing in the near term based on known asset condition and risk results.
b) The Enbridge Gas combined asset base will be evaluated to determine if there are
similar issues with the Union rate zone assets. Yes, Enbridge Gas is currently participating in the CSA and AGA forums and
conferences. c) Statistical models are developed internally using failure data. Currently there is no
industry standard, i.e. similar to the CSA Z662, for leak analytical models. However, the methodology is considered to be an industry methodology that is currently used in Europe. Based on the company knowledge from the AGA, CSA and GTI industry committees, Enbridge Gas is the first North American company to use this form of predictive analytics. Recently, several other companies have indicated adoption of a similar approach.
d) No, leak projection data is not available for the Union rate zone assets. e) Enbridge Gas will assess the data availability and compatibility of the combined
assets to determine the appropriate level of detail to provide in the integrated AMP.
1 Exhibit C1, Tab 2, Schedule 1, page 131.
Filed: 2019-04-25 EB-2018-0305 Exhibit I.STAFF.47 Page 1 of 1
ENBRIDGE GAS INC. Answer to Interrogatory from
Board Staff (STAFF) Reference: AMP – Exhibit C1/Tab 2/Schedule 1/Pg.140 Question: Isolated steel services are a small population of steel services (numbering approximately 2,200) that are disconnected from the cathodic protection of the original parent steel main. This occurs when poorly performing steel mains are replaced with plastic mains and existing steel services are reconnected to the plastic mains, isolating the services from the cathodic protection received through the original steel main. To remain cathodically protected, these isolated assets are reliant on their coatings and localized anode protection systems. Over time, these localized, sacrificial anodes degrade and no longer protect the service. The lack of cathodic protection over time, coupled with poor coating condition and environmental stressers causes accelerated degradation of isolated steel services and results in accelerated corrosion growth, which can ultimately lead to failure and loss of containment. a) Has Enbridge Gas considered any other approach apart from replacing poor
performing steel mains with plastic mains? b) What measures has Enbridge Gas taken to slow down or delay the rapid
degradation of isolated steel services and accelerated corrosion growth? Response a) Yes, Enbridge Gas has considered other approaches to manage steel mains, such
as using cathodic protection system to prevent corrosion when appropriate. b) Enbridge Gas will continue to identify isolated steel services in the system. For the
isolated steel services in good condition, cathodic protection could be added to prevent accelerated corrosion. If an isolated steel service is discovered in poor condition, it would be more appropriate to replace it with a plastic service.

Filed: 2019-04-25 EB-2018-0305 Exhibit I.STAFF.48 Page 1 of 2
ENBRIDGE GAS INC. Answer to Interrogatory from
Board Staff (STAFF) Reference: AMP – Exhibit C1/Tab 2/Schedule 1/Pg.140 Question: Pre-1977 plastic services refer to Aldyl A vintage plastic using early manufactured resins. These services range in age from 41 to 50 years, and account for 4% of the total services (approximately 84,000). Though Aldyl A services are not subject to the same stressors as Aldyl A mains, their failure modes are identical, with consequences more severe than the typical pinhole failure of steel services. Cracking failures have higher consequences, as sudden cracking produces a higher volume of natural gas released compared to pinhole failures due to corrosion observed in steel services. The GTI study identified that the remaining life of Aldyl A varies between 10 and 50 years. It is expected that when failures do occur, the rapid degradation of Aldyl A services may prove difficult to manage. Further studies are required to identify which stress intensifiers are applicable in the Enbridge Gas Distribution network and how the combined effect of environmental factors affect Aldyl A useful life.
a) Has Enbridge Gas Distribution experienced any failures of Aldyl A services? If yes, please provide details, impacts and number of occurrences.
b) Are there any solutions to prevent the rapid degradation of Aldyl A services? c) Enbridge Gas Distribution has noted that further studies are required to identify
which stress intensifiers are applicable in the distribution network and how the combined effect of environmental factors affect Aldyl A useful life. When are the further studies expected to be completed and will this issue be addressed in the next AMP?
Response a) 106 failures have been recorded between 2007 and 2017. There is an ongoing
effort to review and understand the failure mechanism. The impact of a service leak is summarized in table 1.8.2 in the Risk/Opportunity column.1
1 Exhibit C1, Tab 2, Schedule 1, page 21.

Filed: 2019-04-25 EB-2018-0305 Exhibit I.STAFF.48 Page 2 of 2
b) No, the rapid degradation of Aldyl A plastic pipe is a material property that is highly dependent on temperature and total hoop stress of the pipe.
c) Further study on vintage plastic mains is expected to be completed in the next
5 years.

Filed: 2019-04-25 EB-2018-0305 Exhibit I.STAFF.49 Page 1 of 1
ENBRIDGE GAS INC. Answer to Interrogatory from
Board Staff (STAFF) Reference: AMP – Exhibit C1/Tab 2/Schedule 1/Pgs. 146-154 Question: The evidence notes that the most vulnerable risers in the system are copper (AMP) risers which make up approximately 14% of the overall population (approximately 285,000 units), and are subjected to an erosion corrosion method of internal degradation, resulting in either pinholes or cracks. The condition of copper risers is expected to significantly degrade over time with the expected yearly increase in the number of leaks over the next ten years. The current proactive replacement program replaces 4,000 copper risers per year.
a) What would be the total cost of replacing all copper risers within the next two decades?
b) Has Enbridge Gas Distribution estimated the volume of natural gas lost as a result of leaks or cracks in copper risers? Please provide a detailed response.
Response a) Using the estimated average unit cost from the program, excluding future inflation
and other potential cost changes, the high-level estimate to replace all copper risers within the next two decades is approximately $337 million.
b) Natural gas loss is estimated at the distribution system level and not specifically
reported on copper riser leaks.

Filed: 2019-04-25 EB-2018-0305 Exhibit I.STAFF.50 Page 1 of 1
ENBRIDGE GAS INC. Answer to Interrogatory from
Board Staff (STAFF) Reference: AMP – Exhibit C1/Tab 2/Schedule 1/Pg.158 Question: Fibre optic monitoring is a key initiative for installation along new construction pipelines. Fibre optic sensing systems operate and serve up information in real time. Incident response capacity and quality is superior to the current practice. Enbridge Gas Distribution has indicated that fibre optic monitoring will allow it to detect and quickly respond to unauthorized third party activity or intrusions. Enbridge Gas Distribution will also have the ability to pinpoint leak locations, improving public safety and reliability.
a) What is the total spend on fibre optic monitoring to-date? b) What percentage of the pipelines are currently being monitored using fibre optic
monitoring? c) What percentage of the total pipeline does Enbridge Gas Distribution target for
installation of fibre optic monitoring? d) Does the Union Gas rate zone also use fibre optic monitoring on key pipelines?
Response a) The total spend on fibre optic monitoring to-date is $0.9 million.
b) The percentage of the pipelines that are currently being monitored using fibre optic
monitoring is less than one percent.
c) The percentage of total pipeline targeted in the EGD rate zone for installation of fibre optic monitoring is less than ten percent. Installation of fibre optic monitoring is intended for use on key pipelines operating at 20% – 30% Specified Maximum Yield Stress (SMYS), and greater than 30% SMYS.
d) The Union Gas rate zone does not use fibre optic monitoring on key pipelines.

Filed: 2019-04-25 EB-2018-0305 Exhibit I.STAFF.51 Page 1 of 1
ENBRIDGE GAS INC. Answer to Interrogatory from
Board Staff (STAFF) Reference: AMP - Exhibit C1/Tab 2/ Schedule 1/ pg.166 Question: The Telemetry System components connect station components to a network that remotely transmits station performance information to Enbridge Gas’ Gas Control group in Edmonton.
a) Will Enbridge Gas operate one gas control centre for Enbridge Gas Distribution and Union Gas? If no, why not? If there will be one gas control centre, where will it be located?
b) What gas control efficiencies does Enbridge Gas expect as a result of integration?
Response a) Enbridge Gas will operate one gas control centre for Enbridge Gas Distribution and
Union Gas. It will be located in Chatham, ON.
b) Enbridge Gas is in the very early stages of integration. However, as per the response provided to part a), there is an expectation that there will be some cost savings associated with gas control.

Filed: 2019-04-25 EB-2018-0305 Exhibit I.STAFF.52 Page 1 of 2
ENBRIDGE GAS INC. Answer to Interrogatory from
Board Staff (STAFF) Reference: AMP – Exhibit C1/Tab 2/Schedule 1/Pg.234 Question: With respect to storage assets, Enbridge Gas has indicated that the understanding of the current state and condition of the filters, separators, and tanks is based on Subject Matter Advisors input and supported by the in-progress pressure valve and tank inspection program that is under development. Condition assessment of filters, separators, and tanks are currently underway. Please provide an update on the condition assessment of filters, separators and tanks. If the assessment is complete, please provide the results. Response Current status of the Pressure Vessel and Inspection Program is summarized in the following chart.

Filed: 2019-04-25 EB-2018-0305 Exhibit I.STAFF.52 Page 2 of 2
Summary of findings to date have been categorized as “red” (immediate concerns that have already been or are in the process of being resolved), “yellow” (concerns requiring repairs, and/or more frequent inspection), and “green” (items with no major concerns). Red:
• Chatham D: S_CHT-543-T-111 – full through failure of waste fluids tank • Crowland: S_CRW-543-T-104 – secondary containment failure • Corunna Comp Station: Glycol piping between glycol vessels, extremely thin wall • Corunna Comp Station: Drain piping from separator sump with extremely thin
wall • Corunna Comp Station: Cracked sight glasses replaced
Yellow • Crowland: S_CRW-543-T-103 – secondary containment integrity concern
Green • All remaining inspected vessels and tanks

Filed: 2019-04-25 EB-2018-0305 Exhibit I.STAFF.53 Page 1 of 2
ENBRIDGE GAS INC. Answer to Interrogatory from
Board Staff (STAFF) Reference: AMP – Exhibit C1/Tab 2/Schedule 1/Pgs. 243-253 Question: Enbridge Gas has several storage wells. Additional reservoirs have been added to the Gas Storage Operation either by acquisition (Chatham D) or operating agreement (Crowland). Enbridge Gas has identified several maintenance and replacement issues with respect to storage operations including gas compressors for storage, yard auxiliary systems, yard valves and actuators, metering system, flow control systems, dehydrators, incinerators, filters, separators, tanks, pipelines, wells and master valves. The total capital spend for storage is estimated to be $180 million for the 10-year period (2019 to 2028).
a) Has Enbridge Gas considered reducing the number of wells or abandon a portion of its storage assets in order to reduce capital spending considering that it now has access to the large storage pool of Union Gas?
b) Enbridge Gas has indicated that most wells at Crowland do not possess a suitable master valve and wellhead, and have only two casings. Many Crowland wells are re-lined, further justifying replacement. Replacement of well assets, especially at Crowland, is expected to be a significant capital request within the scope of the 10-year Asset Management Plan. Since Crowland has an operating agreement, why has Enbridge Gas not considered abandoning this facility?
c) What is the total capital expenditure on the Crowland storage facility for the planned period (2019 to 2028)?
d) Please provide the cost of abandoning the Crowland facility and the associated savings in avoided capital and operating costs?
Response a) Enbridge Gas has been operating as an amalgamated entity for only four months
and is not in a position to provide estimates of optimization or integration savings.
b) As described in the response to Exhibit I.STAFF.32, the major capital expenditures identified in the respective AMPs are considered to be essential expenditures. Additional analyses, considering the now-combined storage assets, of various
Filed: 2019-04-25 EB-2018-0305 Exhibit I.STAFF.53 Page 2 of 2
options to manage Crowland are currently underway. Once the optimal solution is confirmed, the asset management plan will be updated accordingly.
c) Execution of the proposed well and field line work at Crowland is currently planned for 2024 to 2026 in the AMP. The estimated costs for the well and field lines is $11,648,000 and $3,457,000 respectively and is included in Exhibit C1, Tab 2, Schedule 1, page 1181 to 1185, 1196 to 1200. Station upgrades are not included in the maintenance capital portfolio, because the scope and cost are unclear. An updated financial assessment will be completed in 2019 when additional information is available.
d) Additional analyses of various options to manage Crowland are currently underway.

Filed: 2019-04-25 EB-2018-0305 Exhibit I.STAFF.54 Page 1 of 1
ENBRIDGE GAS INC. Answer to Interrogatory from
Board Staff (STAFF) Reference: AMP - Exh. C1/Tab 2/ Schedule 1/ pgs. 252-253 and Exh. C1/ Tab 3/Schedule 1/pg. 99 Question: The total spending on Storage is estimated at $180 million from 2019 to 2028 for Enbridge Gas Distribution and $17.9 million for Union Gas.
a) What storage optimization benefits does Enbridge Gas expect to achieve as a result of operating the Enbridge Gas Distribution and Union Gas storage operations on an integrated basis?
b) What benefits would be achieved by deferring all but essential major storage capital and operating and maintenance expenditures until the Enbridge Gas Distribution and Union Gas AMPs are fully integrated?
Response a) Enbridge Gas has been operating as an amalgamated entity for only four months
and is not in a position to provide any estimates of optimization or integration savings.
b) Please see Exhibit I.STAFF.32, part b.

Filed: 2019-04-25 EB-2018-0305 Exhibit I.STAFF.55 Page 1 of 2
ENBRIDGE GAS INC. Answer to Interrogatory from
Board Staff (STAFF) Reference: AMP - Exhibit C1/Tab 2/ Schedule 1/ pg.356 Question: Enbridge Gas Distribution’s Customer Experience Transformation project consists of initiatives that span multiple Customer Information System asset subclasses. The proposed two year project proactively transforms the way Enbridge Gas Distribution does business with its customers to make customer interactions easier. The project is estimated to provide Enbridge Gas Distribution with O&M savings of approximately $13 million annually. In Year 1 Enbridge Gas Distribution has provided a list of activities that it plans to undertake, one of which is to leverage analytics and Artificial Intelligence (AI) to improve bill estimation.
a) Please provide additional information on how Enbridge Gas Distribution intends to leverage analytics and AI to improve bill estimation.
b) What is the total cost of the Customer Experience Transformation project? c) Enbridge Gas Distribution has identified O&M savings of $13 million annually.
When will Enbridge Gas realize these savings? d) Does Enbridge Gas intend to implement a similar project for the Union Gas rate
zone? Please elaborate on the response. e) Is Enbridge Gas’ intent to use AI in its operations over and above its intent to
leverage analytics and AI to improve bill estimation? f) What other AI activities does Enbridge Gas plan to pursue and when? What
productivity improvements does Enbridge Gas expect for each AI activity? Response a) From an analytics perspective the intent is to better use the entire history of
consumption and weather (degree day) data available for each premise/account to calculate estimation factors. The methodology previously configured in SAP does not use the entire history of data available and results in changes in estimation factors which could cause inconsistency. From an AI perspective, the intent is to adjust estimation factors more quickly based on changes in consumption patterns. A simplistic example would be a customer replacing their furnace resulting in a decrease in natural gas consumption. Employment of AI would enable identification

Filed: 2019-04-25 EB-2018-0305 Exhibit I.STAFF.55 Page 2 of 2
of these changes in consumption more quickly resulting in more accurate bill estimation.
b) Total capital spend on the program over 2017/2018 was $17.5 million. Additional costs not capitalized (design, analytics, change management, training) totalled $4.6 million. The forecasted capital spend for 2019 is $7.0 million.
c) Savings from the program were identified in two key areas: reduced operating costs under the Customer Care Services Agreement (CCSA) with Accenture and increased electronic billing adoption. The savings anticipated in the original business case are being realized.
d) Enbridge Gas is in the initial stages of integration and has not made any decisions on timing regarding projects related to customer self-service.
e) Yes, the intent is to use AI in customer care operations over and above bill estimation.
f) The intent is to pursue AI activities that allow for proactive anticipation and handling of customer issues. The ultimate goal in these types of activities is to eliminate live agent interactions and drive down the total cost-to-serve. Reducing call volumes and handle time results in direct improvements in productivity. The most common use of AI in customer service is through introducing new channel options like a Virtual Assistant (Chatbot). Enbridge Gas has plans to launch a web-based virtual assistant in Q3 2019. Issue or call prediction is another example where AI can improve productivity in a few different ways including:
• proactively offering a self-service transaction to the customer through the myAccount channel;
• containing the inquiry in our Interactive Voice Response system; or • routing the inquiry to the agent best equipped to handle the nature of the
inquiry.

Filed: 2019-04-25 EB-2018-0305 Exhibit I.STAFF.56 Page 1 of 2
ENBRIDGE GAS INC. Answer to Interrogatory from
Board Staff (STAFF) Reference: AMP – Exhibit C1/Tab 2/Schedule 1/Pgs.364-374 Question: Enbridge Gas has provided information about its Natural Gas for Transportation (NGT) program. Enbridge Gas promotes the use of natural gas to these customers as an alternate fuel source to provide a lower cost and lower emission fueling solution for vehicles such as garbage trucks, light duty vehicles, and transit buses. Enbridge Gas Distribution has two general categories for NGT station types: Large, Mobile and Utility NGT stations and Small NGT stations (also referred to as VRAs). Enbridge Gas is continually working to promote and grow its NGT business. Business Development’s Marketing Solutions team promotes the economic and environmental benefits of using natural gas as a vehicle fueling source through marketing opportunities such as trade shows, industry networking events, and approaching potential customers. Enbridge Gas’ NGT station rental rate is based on a regulated rate of return with a Profitability Index of 1.0, with maintenance costs on a fully recoverable basis from the customer. Enbridge Gas currently services 201 external customers and 19 internal Enbridge Gas Distribution sites with NGT stations for fueling fleet.
a) Does Enbridge Gas consider NGT as a core natural gas distribution activity? What is the benefit to distribution ratepayers of the NGT business?
b) Has Enbridge Gas considered separating the NGT business as a non-utility business?
c) Please provide the total costs and revenues of the NGT business for 2017 and 2018.
d) Has Enbridge Gas lost business from external customers within the past three years due to the switch to electric and hybrid vehicles? If yes, please provide details.
e) Have any existing customers informed Enbridge Gas that they will be switching to electric or hybrid vehicles in the near future? If yes, please provide details.
f) How many full-time equivalents are dedicated to the operation and maintenance of the NGT business?
g) Please confirm that the total capital spend on the NGT program for the ten year forecast period is $43 million. What value will distribution ratepayers derive as a result of this capital spend?

Filed: 2019-04-25 EB-2018-0305 Exhibit I.STAFF.56 Page 2 of 2
Response a) Enbridge Gas treats NGT as an ancillary service. This service is subject to imputed
revenues in the event the program does not achieve the utility’s allowed level of return on equity, subject to being attributed fully allocated cost.
b) Enbridge Gas is not proposing any change to the treatment of its NGT business at this time.
c) Please see the requested figures in the table below.
d) No, Enbridge Gas is not aware of losing NGT external customer business within the past three years as a result of customers switching from natural gas powered vehicles to electric or hybrid vehicles.
e) No, there have been no existing NGT customers that have notified the Company that they will be switching to electric or hybrid vehicles in the near future.
f) There were three full time equivalent employees supporting the operation and maintenance of the Enbridge Gas Distribution NGT program in 2018.
g) Confirmed, the Asset Management Plan includes total estimated capital spend for NGT Maintenance, Rental VRAs, and NGT Rental Compressors (Non-Transit) of approximately $43 million over the ten year forecast period from 2019 to 2028.1 Ratepayers benefit from having the potential to participate in the sharing of NGT program earnings above the utility’s regulated rate of return by way of earnings sharing. Ratepayers also benefit from having access to lower cost, lower CO2 emitting vehicle fuel and reduced CO2 emissions originating in Ontario. Further, these initiatives are consistent with and supported by the provincial governments “A Made-in-Ontario Environment Plan” (pages 33 and 34).
1 Exhibit C1, Tab 2, Schedule 1, page 374.

Filed: 2019-04-25 EB-2018-0305 Exhibit I.STAFF.57 Page 1 of 2
ENBRIDGE GAS INC. Answer to Interrogatory from
Board Staff (STAFF) Reference: AMP – Exhibit C1/Tab 2/Schedule 1/Pgs. 375-377 Question: Enbridge Gas has indicated that it is eligible to request rate recoveries for qualifying incremental capital investments over and above the calculated materiality threshold through the OEB’s ICM. The applicant has provided a list of ICM eligible projects in Table 6.1-3. Some of the specific projects are listed below.
Project Name In Service Year Total In-Service Capital
($ million) Kennedy Road Expansion 2022 $21.7 NPS 12 Martin Grove Rd. Main Replacement – Phase 2
2024 $11.8
VPC Core and Shell Obsolescence 2025 $20.0
a) Is it the understanding of Enbridge Gas that any capital spending above the materiality threshold is eligible for ICM funding?
b) In the Toronto Hydro Electric Systems Ltd.’s three year application for 2012 to 2014 rates (EB-2012-0064), the OEB in its decision regarding the application for ICM funding noted, “the Board does not expect that projects that are minor expenditures in comparison to the overall budget should be considered eligible for ICM treatment. A certain degree of project expenditure over and above the threshold calculation is expected to be absorbed within the total capital budget.” (pgs.18-19) Please provide the proportion of each individual project noted above to the overall capital budget for the respective year.
c) Why is it not possible to absorb the costs of the projects noted above considering the quantum of the in-service capital, specifically the NPS 12 Martin Grove Rd Main Replacement?
Response a) For a description of the criteria used to determine Enbridge Gas’s ICM funding
request for 2019, please refer to Exhibit B1, Tab 2, Schedule 1, page 8, Section 2.

Filed: 2019-04-25 EB-2018-0305 Exhibit I.STAFF.57 Page 2 of 2
b-c) Enbridge Gas is not seeking any relief for the projects specified in the question in
2019. Accordingly, Enbridge Gas declines to respond.

Filed: 2019-04-25 EB-2018-0305 Exhibit I.STAFF.58 Page 1 of 1
ENBRIDGE GAS INC. Answer to Interrogatory from
Board Staff (STAFF) Reference: AMP – Exhibit C1/Tab 2/Schedule 1/Pg. 694-696 Question: In the business case summary for the NPS 20 Don River Relocation there is $4 million budgeted as retirement cost in 2020. Please provide details about the retirement cost and what are they related to? Response The $4 million in retirement costs is associated with abandoning the main that is being relocated for the project.

Filed: 2019-04-25 EB-2018-0305 Exhibit I.STAFF.59 Page 1 of 1
ENBRIDGE GAS INC. Answer to Interrogatory from
Board Staff (STAFF) Reference: AMP – Exhibit C1/Tab 2/Schedule 1/Pgs. 713-748 Question: The AMP provides information and costing for the replacement of pre-1977 plastic mains. The strategy is to increase the replacement rate to approximately 10 km per year over the next ten years. The cost for 2020 replacement is $2.3 million and then increases every year until 2028 when the cost is $10.6 million. Please explain the reasons for the significant increase in costs considering that the length of replacement is fairly constant over the 2020 to 2028 period. Response The cost increase of the program corresponds to a gradual increase in the replacement length from approximately 2km/year to 10km/year over the ten year period.

Filed: 2019-04-25 EB-2018-0305 Exhibit I.STAFF.60 Page 1 of 1
ENBRIDGE GAS INC. Answer to Interrogatory from
Board Staff (STAFF) Reference: AMP – Exhibit C1/Tab 2/Schedule 1/Pgs. 859-896 Question: The AMP Fitting Replacement Program is a proactive replacement program to replace copper risers and the AMP fittings that transition plastic services to copper risers. Enbridge Gas intends to start with 4,000 units per year in 2019 and increasing to 20,000 units per year by 2026 and beyond.
a) Please provide details with respect to retirement costs that are referred to in the business case.
b) The retirement cost starts at $3.6 million in 2019, gradually increasing to $10.5 million in 2028. The retirement costs constitute 30% to 40% of the total capital costs. Please explain the relatively high amounts for retirement costs.
Response a-b) The retirement cost listed for this program is an estimate of the cost to remove the
copper risers to take them out of service, which entails the excavation of the riser, isolation and removal of the fitting. The cost of removing the copper riser is estimated to be approximately 30-40% of the total cost for a copper riser replacement. Enbridge Gas believes these retirement costs to be reasonable.

Filed: 2019-04-25 EB-2018-0305
Exhibit I.STAFF.61 Page 1 of 1
ENBRIDGE GAS INC. Answer to Interrogatory from
Board Staff (STAFF)
Reference: AMP – Exhibit C1/Tab 2/Schedule 1/Pgs. 964-965
Question:
The business case for the York Region Reinforcement does not provide the primary issue/concern. The Issue/Concern section is generic and does not explain why the York Region Reinforcement will be required and how the magnitude of the costs are justified.
Response
The York Region area is experiencing significant load growth, and the distribution system in the region will require additional infrastructure to support the forecasted growth. Regulator station inlet pressures at the Baseline and McCowan Station are low and indicate growth in the downstream system. This station is furthest from the Gate Stations feeding York Region and the supply to this area will need to be reinforced to sustain growth in the downstream systems. Historical pressure data indicates that minimum pressures are being reached at the tag end of the system. System pressure and flow biasing is being used to ensure a predictable and reliable supply of gas to the Keswick area. The reduction in regulator station inlet pressure and the current flow biasing activities indicate an impending need to reinforce the system. Forecasting and pipeline modeling activities have indicated that customer growth will continue to increase demand on the system further reducing pressures.
There are a number of components to this reinforcement as detailed in the business case, those portions of the project that meet the criteria for a leave to construct will be filed at a future date.

Filed: 2019-04-25 EB-2018-0305 Exhibit I.STAFF.62 Page 1 of 1
ENBRIDGE GAS INC. Answer to Interrogatory from
Board Staff (STAFF) Reference: AMP – Exhibit C1/Tab 2/Schedule 1/Pgs. 1026-1113 Question: The District Station Rebuild Program strategy is to maintain a consistent operational reliability profile and requires the replacement of approximately 20 to 30 district stations per year. Each station in a given year will require a complete rebuild including the removal and replacement of the pressure control components, valves, associated piping and enclosure. Enbridge Gas has schedule one replacement in each year from 2019 to 2028.
a) In each of the years, the cost for the station rebuild includes $1.0 million in retirement costs. Please explain what the retirement costs are and what contributes to the quantum.
b) Is the $1.0 million an estimate for each of the years and what is the reason for the cost being the same in every year, from 2019 to 2028?
Response a) Retirement costs are those incurred on removal, demolition and dismantling of
existing station assets during the course of their retirement. b) The $1.0 million retirement is an estimate for each year of the program. The
estimate for each year is based on the combination of the number of sites planned and scope for each site. Please refer to the EGD rate zone AMP, Exhibit C1, Tab 2, Schedule 1, pages 192 to 193.

Filed: 2019-04-25 EB-2018-0305 Exhibit I.STAFF.63 Page 1 of 1
ENBRIDGE GAS INC. Answer to Interrogatory from
Board Staff (STAFF) Reference: AMP – Exhibit C1/Tab 3/Schedule 1/Pgs. 20-21 Question: Union Gas conducted Customer Engagement Research to explore the needs and preferences of customers regarding future initiatives to inform the organization’s five year investment plans. Please detail all changes that Union Gas made to the Asset Management Plan as a result of feedback from the Customer Engagement Research. Response Please see Exhibit I.STAFF.33.

Filed: 2019-04-25 EB-2018-0305 Exhibit I.STAFF.64 Page 1 of 1
ENBRIDGE GAS INC. Answer to Interrogatory from
Board Staff (STAFF) Reference: AMP – Exhibit C1/Tab 3/Schedule 1/Pgs. 48-49 Question: In 2002, Union Gas developed a software algorithm with the assistance of a third party consultant to aid in risk assessments for the pipelines greater than 30 percent Specified Minimum Yield Strength (SMYS). This software tool processed through an application called the Risk Analyst Tool, uses a number of probability and consequence factors to calculate a Total Risk Score for all pipelines greater than 30 percent SMYS within Union Gas’ system. Moving forward, the Risk Analyst Tool will be used on an annual basis to generate updated asset health data for review and assessment. Does Enbridge Gas intend to use the Risk Analyst Tool along with the software algorithm for assessing Enbridge Gas Distribution assets? If yes, would this require a change to the software algorithm? Response As Enbridge Gas progresses through integration, the Company will look at aligning risk methodologies. This includes examining the tools and techniques that have been used in the past at each company and how they might fit into the risk assessments that will be completed in the future. The goal is to determine the best overall risk approach. That process is in the early stages and no decision has been made on the use of the risk analyst tool.

Filed: 2019-04-25 EB-2018-0305 Exhibit I.STAFF.65 Page 1 of 2
ENBRIDGE GAS INC. Answer to Interrogatory from
Board Staff (STAFF) Reference: AMP – Exhibit C1/Tab 3/Schedule 1/Pgs. 84-85 Question: Minimum Operating Pressure (MOP) verification is the process of reviewing all existing records for a pipeline system and confirming the maximum operating pressure of pipelines that are greater than 30 percent SMYS. While this is not currently mandated by code in Canada, it is required in the United States and is expected to become a requirement in Canada in the future. Given that Union Gas has approximately 2,980 km of pipelines greater than 30 percent SMYS, MOP verification will be a multi-year project requiring a dedicated team to complete the verifications and determine if any pipeline remediation is required. Spreading the verifications over several years will keep costs down and proactively implement an industry standard, which provides additional support for this program. Starting this program as forecast will mitigate the need for higher expenditures in a shorter time frame to meet these expected future mandated requirements.
a) Please provide the costs (capital and OM&A) of this program for the planned period.
b) The evidence states that the project will require a dedicated team to complete the verifications. How many FTEs and external resources will be required to implement this program?
c) MOP verification is not currently a requirement in Canada. Does Union Gas know when MOP verification will become a requirement in Canada? Is there a possibility that the MOP verification program could be different in Canada as compared to the United States?
d) The Customer Engagement Survey of Union Gas shows than 43% of those surveyed recommend waiting until the regulation is implemented in Canada. Why has Union Gas decided to implement this program when it is not a requirement in Canada and a large portion of its customers are recommending that they wait until the verification is required in Canada?
e) Union Gas has indicated that starting this program earlier will mitigate the need for higher expenditures in a shorter time frame to meet expected future mandated requirements. Union Gas has assumed that when Canadian authorities implement the regulations, they will not give companies enough time

Filed: 2019-04-25 EB-2018-0305 Exhibit I.STAFF.65 Page 2 of 2
to implement this program. Why does Union Gas believe that Canadian authorities will not give companies sufficient time to implement the program when the regulations are put in place?
Response a) For the OM&A and Capital costs please refer to Exhibit C1, Tab 3, Schedule 1,
Table 5.4.1.4.1 on page 86, and Table 5.4.1.3.1 on page 82.
b) The expected FTEs required for this work is 10 in 2020, increasing to a total of 15 for years 2021 and beyond. These resources will be a mix of Enbridge Gas employees and contingent workers
c) No, Enbridge Gas does not know when MOP verification will become a requirement in Canada. It is unlikely the program would be substantially different than what is required in the United States, as the Engineering work required to verify a Pipeline MOP is not fundamentally different in Canada than it is in the United States.
d) While 43% of those surveyed in the Customer Engagement Survey recommended waiting for regulation requirements to keep costs down, 40% recommended proactively implementing industry standard. Through the customer engagement exercise, Union found that the top three most important outcomes for its customers are price, safety and reliability. The intent of the MOP Verification Program is to spread the verification work over several years to keep costs down and mitigate the need for higher expenditures in a shorter timeframe to meet these expected future mandated requirements. MOP verification programs are fundamentally tied to safety and operational reliability. The driver for the regulated requirement in the United States is directly tied to the San Bruno incident. Therefore, while the results of the Customer Engagement Survey were mixed, the Company looked at the outcomes that are most important to customers and decided MOP Verification was a priority.
e) In all likelihood the regulators will provide a deferred time period for demonstrating compliance. By taking a proactive approach it will allow Enbridge Gas to spread the required costs out and allow for more flexibility than that of a regulated period of compliance in alignment with customer preference for steady pace of spend.

Filed: 2019-04-25 EB-2018-0305 Exhibit I.STAFF.66 Page 1 of 1
ENBRIDGE GAS INC. Answer to Interrogatory from
Board Staff (STAFF) Reference: AMP – Exhibit C1/Tab 3/Schedule 1/Pgs. 126 Question: Union Gas has indicated that it intends to make a major lifecycle replacement as the current version of its billing system (Banner) and underlying technologies will be over 20 years old. The total capital spend on this program is estimated to be $123 million over the ten year planning period.
a) Has Enbridge Gas considered to implement the Enbridge Gas Distribution billing system for the Union Gas rate zones?
b) What would be the costs and savings of discontinuing the Banner system and implementing the Enbridge Gas Distribution billing system for the entire Enbridge Gas franchise area?
Response a- b) Enbridge Gas is currently reviewing alternatives to consolidate the two Customer
Information Systems. This investigation is in the preliminary stages and costs and savings have not been identified.
Filed: 2019-04-25 EB-2018-0305 Exhibit I.STAFF.67 Page 1 of 1
ENBRIDGE GAS INC. Answer to Interrogatory from
Board Staff (STAFF) Reference: AMP – Exhibit C1/Tab 3/Schedule 1/Pgs. 123-127 Question: Union Gas has a number of Information Technology (IT) applications that provide critical functionality to Union Gas employees and customers by contributing to the support and growth of Union Gas’ operations.
a) Has Enbridge Gas completed the review of all Enbridge Gas Distribution and Union Gas IT infrastructure and identified those that can be integrated and the ones that can be discontinued? If yes, please provide details. If no, please provide the estimated timeline of completing the review.
b) Can any of the proposed IT spending projects identified by Enbridge Gas Distribution and Union Gas in the AMP be deferred until the integration of the two utilities? If no, please provide reasons.
Response a) Enbridge Gas has not completed a detailed review of the EGD and Union rate
zones’ IT Business Applications. The integration of the systems and processes require careful planning and execution and will take significant effort. The plan is currently under development and is expected to be complete by the end of 2019.
b) As stated in part (a), the detailed review of the IT Business Applications is not complete. As stated in the response to Exhibit I.STAFF.32, part b, the capital expenditure identified in the respective AMPs are considered to be essential expenditures.

Filed: 2019-04-25 EB-2018-0305 Exhibit I.STAFF.68 Page 1 of 2
ENBRIDGE GAS INC. Answer to Interrogatory from
Board Staff (STAFF) Reference: AMP of Enbridge Gas Distribution and Union Gas Question:
a) Please identify any capital spending that has been deferred or cancelled as a result of implementing Demand Side Management (DSM) initiatives in the ten year capital plans of Enbridge Gas Distribution and Union Gas.
b) Will the integrated AMP identify specific projects that were deferred or cancelled as a result of implementing DSM or other carbon reduction initiatives?
c) Enbridge Gas Distribution has provided a more comprehensive AMP with details about asset condition and the AMP process as compared to the AMP of Union Gas. Please confirm that the integrated AMP will use the approach of Enbridge Gas Distribution.
Response
a) As referenced in Exhibit C1, Tab 2, Schedule 1, page 61, the primary goal of infrastructure planning is to ensure that the utility’s infrastructure is sufficiently robust to provide reliable and safe natural gas service that meets the designed condition peak hour requirement forecast. The historical impact of broad-based DSM programs on infrastructure investment is inherently captured in the infrastructure planning process.
As outlined in EB-2017-0128 DSM Mid-term Review, Appendix E, pages 10 to
12, Enbridge indicated that in 2019 one area of focus would be the review of reinforcement / LTC projects and identification with IRP Study outcomes and Transition Plan processes in mind. At the time of this 2019 rates application this process is ongoing. Further as indicated in the reply submission of EB-2018-0306 Stratford Reinforcement Project:
Enbridge Gas is committed to continuing to take steps to study and evolve natural gas IRP. ICF’s conclusions from the IRP Report finds that integrating the potential for DSM to reduce infrastructure requirements into the facilities planning process will require significant changes in policy, as well as changes in the utility planning process. Enbridge Gas is reviewing potential reinforcement projects with in-service dates sufficiently in the future to allow geo-targeted DSM and

Filed: 2019-04-25 EB-2018-0305 Exhibit I.STAFF.68 Page 2 of 2
other non-facility options to be considered as alternatives. Enbridge Gas intends to make an application to the OEB seeking approval of an IRP proposals later this year.1
IRP will continue to be monitored as part of Enbridge Gas’s Asset Management
Plan to ensure advancements made are acknowledged and incorporated during asset investment planning.
b- c) Please see Exhibit I.STAFF.34. At this time, it has not been determined what
approach will be followed or what information will be included in the integrated AMP.
1 EB-2018-0306 Stratford Reinforcement Project, Enbridge Gas Reply Submission, pages 1 to 2.

Filed: 2019-04-25 EB-2018-0305 Exhibit I.STAFF.69 Page 1 of 2
ENBRIDGE GAS INC. Answer to Interrogatory from
Board Staff (STAFF) Reference: AMP of Enbridge Gas Distribution and Union Gas Question: Enbridge Gas has provided separate comprehensive AMPs for the Enbridge Gas Distribution rate zone and Union Gas rate zones.
a) What incremental costs did Enbridge Gas incur in developing the USP and the two AMPs submitted in this proceeding? Please segment your response into the following categories:
I. Direct in-house Labour and Overheads II. Consulting and Contractor Costs III. Direct Shared Services Costs IV. Indirect Costs (Admin & General, indirect Shared Services, Audit)
b) What additional costs will Enbridge Gas incur to fully integrate the Enbridge Gas
Distribution and Union Gas AMPs? Please use the same categories. c) What additional costs will Enbridge Gas incur to maintain and update the USP
and the integrated AMP going forward? Please use the same categories. Response a) Enbridge Gas is interpreting this question to mean the costs of creating the current
versions of the asset management plans and the USP. Both the EGD and Union rate zones have established Asset Management systems to support the creation of an annual asset plan and provide business support. Given that these systems are already in place in 2018, creating the current versions of the Asset Management Plan and USP did not require any incremental costs. The EGD rate zone is able to provide department budgets for 2018.
However, for the Union rate zone, the function of asset management was not
consolidated into one department. The costs associated with development are not collected as the work is dispersed across multiple functions in roles that are not solely allocated to the creation of the asset management plan. The costs shown

Filed: 2019-04-25 EB-2018-0305 Exhibit I.STAFF.69 Page 2 of 2
below are an estimate of the internal labour required to support the creation of the asset plan (review, meetings, writing, and prioritization analysis). The costs associated with the analysis that an Asset Class Manager conducts to understand the condition of an asset and to develop a proposed mitigation plan (capital investment) is not included as this work is not incremental to the creation of an asset management plan.
Summary by Cost Category EGD 2018 Actual UG 2018 Actual I. Capital - Direct Project Labour $ 3,170,184 OM Labour = Overhead $ 761,399 $ 563,000 Total Direct In-House labour and Overhead $ 3,931,583 $ 563,000 Consulting $ 92,047 Contractor & Other $ 1,596,382 II. Total Consulting & Contractor $ 1,688,429 Burden $ 6,809 Corp.Overhead $ 62,931 III. & IV. Total Direct and Indirect - Shared Services $ 69,740 Total $ 5,689,752 $ 563,000
b-c) Enbridge Gas is currently in the process of developing the plan and corresponding
costs for the integrated Asset Management Plan. The additional project cost is estimated to be $0.5 million to $1 million per year in 2019 and 2020.

Filed: 2019-04-25 EB-2018-0305 Exhibit I.STAFF.70 Page 1 of 1
ENBRIDGE GAS INC. Answer to Interrogatory from
Board Staff (STAFF) Reference: AMP – Exhibit C1/Tab 3/Schedule 1/Pg. 161 Question: In its AMP, Union Gas has identified a Compressed Natural Gas (CNG) project along Highway 401. The objective of the project is to provide the reliability and attractive pricing that is critical for the many fleets that regularly use the Highway 401 corridor to make long-term CNG adoption decisions for their operations. In addition, construction and operation of new CNG fueling stations by third parties is also expected to occur and Union Gas will need to provide the gas distribution facilities (e.g. mains, service and meter stations). Union Gas intends to build three stations at an estimated cost of $9 million in 2018.
a) Please list the benefits that distribution customers will receive as a result of Union Gas’ CNG initiatives for transportation services.
b) Has Union Gas considered operating the CNG services as a non-utility business?
Response As described at Exhibit C1, Tab 3, Schedule 1, page 161, the investment in the three Highway 401 CNG refueling stations is a non-utility initiative.
Investment in gas distribution facilities to support the CNG refueling stations will benefit distribution customers to the extent they contribute to earning sharing during the deferred rebasing period. On rebasing the revenues associated with these facilities will be built into rates. Customers will indirectly benefit through reduced transportation costs and reductions in greenhouse gas emissions. Further, these initiatives are consistent with and supported by the provincial governments “A Made-in-Ontario Environment Plan” (pages 33 and 34).

Filed: 2019-04-25 EB-2018-0305 Exhibit I.STAFF.71 Page 1 of 1
ENBRIDGE GAS INC. Answer to Interrogatory from
Board Staff (STAFF) Reference: AMP – Exhibit C1/Tab 3/Schedule 1/Pg. 173 (AMP ID 2375) Question: In its AMP, Union Gas has provided information about the Owen Sound Transmission Reinforcement project. The project has been planned as pressure will reach minimums in 2025 on a design day. Union Gas has noted that the project will allow for the addition of five years’ in-franchise growth. The estimated cost of the project is $52 million.
a) Please provide the additional capacity that the reinforcement project will add downstream.
b) Please clarify whether the project is classified as a transmission reinforcement as suggested from the title or a distribution reinforcement.
c) Will the reinforcement project require a capital contribution? If yes, what quantum of the costs will be borne by Enbridge Gas ratepayers?
Response a) The reinforcement project is designed to provide an additional capacity of
17,300 m3/hr of in-franchise growth on the system.
b) The pipeline will be classified as other transmission for the purposes of cost allocation.
c) As this project is not proposed to be constructed until 2025 the detailed need and project economics have not yet been finalized. When the leave to construct application is submitted to the Board for approval details of any capital contribution will be identified.

Filed: 2019-04-25 EB-2018-0305 Exhibit I.STAFF.72 Page 1 of 2
ENBRIDGE GAS INC. Answer to Interrogatory from
Board Staff (STAFF) Reference: AMP – Exhibit C1/Tab 3/Schedule 1/Pg. 174 (AMP ID 863) Question: In its AMP, Union Gas has provided information about a second Owen Sound Transmission Reinforcement project. The project has been planned to serve in-franchise growth and to add EPCOR, a new utility that will serve the area of South Bruce. Reinforcement of the Owen Sound Transmission System is required between Durham Gate and Owen Sound Transmission Station. Union Gas has noted that the project will allow for the addition of five years’ in-franchise growth and meet the needs of EPCOR. The estimated cost of the project is $58 million.
a) Please explain how this project is related to the earlier Owen Sound Reinforcement Project (AMP ID 2375). Please clearly explain the dependencies between the two projects.
b) Please provide the additional capacity that the reinforcement project will add downstream.
c) Please clarify whether the project is classified as a transmission reinforcement as suggested from the title or a distribution reinforcement.
d) Will the reinforcement project require a capital contribution? If yes, what quantum of the costs will be borne by Enbridge Gas ratepayers?
Response a) This project (AMP ID 863) was the most beneficial to the system to meet the needs
of EPCOR and five years of in-franchise growth on the system. AMP ID 2375 currently planned for 2025 is the most beneficial project after AMP ID 863 is in-service. If AMP ID 863 is not installed, the scope of AMP ID 2375 will change.
b) The reinforcement project was designed to provide an additional capacity of 17,300 m3/hr of in-franchise growth on the system.
c) The pipeline will be classified as other transmission for the purposes of cost allocation.

Filed: 2019-04-25 EB-2018-0305 Exhibit I.STAFF.72 Page 2 of 2
d) It is expected that a Leave to construct application for this project will be submitted to the Board later in 2019. Final project economics have not been completed at this time. The application will identify the quantum of any capital contributions as well as what costs will be borne by Enbridge Gas ratepayers.

Filed: 2019-04-25 EB-2018-0305 Exhibit I.STAFF.73 Page 1 of 2
ENBRIDGE GAS INC. Answer to Interrogatory from
Board Staff (STAFF) Reference: AMP – Exhibit C1/Tab 3/Schedule 1/Pg. 176 Question: Based on the current forecast for in-franchise general service and contract growth in the Panhandle Transmission System market, Union Gas has identified the need to reinforce the Panhandle Transmission System for the 2026 to 2027 winter operating season. Union Gas has proposed to extend the NPS 36 pipeline an additional 14 km from the Dover Transmission Station towards the Comber Transmission Station. The total estimated expenditure for the project is $112.6 million from 2024 to 2027.
a) When did Union Gas last reinforce portions of the Panhandle Transmission System? Please provide a brief summary of the completed project.
b) Union Gas has noted that the proposed reinforcement will supply natural gas to four large power generation plants and a number of greenhouses in the Chatham-Kent and Leamington-Kingsville areas. What portion of the additional capacity will be consumed by contract customers and greenhouses?
Response a) The Panhandle Transmission System was last reinforced in 2017 as part of
EB-2016-0186. A brief summary of the project is provided below:
Union is proposing to reinforce the Panhandle System by constructing approximately 40 kilometres of NPS 36 pipeline from Union’s Dawn Compressor Station (“Dawn”) in the Township of Dawn Euphemia to the Dover Transmission Station (“Dover Transmission”) in the Municipality of Chatham-Kent. The Project also requires station modifications at Dawn, as well as at the Mersea Gate Station, Dover Centre Station and Dover Transmission. To install the Proposed Pipeline, Union will use a “lift and lay” construction process. Specifically, the existing NPS 16 will be removed (lift) and the new NPS 36 pipeline will be installed in the same easement as that used for the NPS 16 (lay) except where pipeline abandonment sections are required.1
1 EB-2016-0186, Exhibit A, Tab 9, page 1, Lines 4 to13.

Filed: 2019-04-25 EB-2018-0305 Exhibit I.STAFF.73 Page 2 of 2
The Union rate zone is installing the Kingsville Transmission Reinforcement Project in 2019 as part of EB-2018-0013. A brief project description is provided below.
Union is proposing to reinforce the Panhandle system by construction approximately 19 kilometres of NPS 20 pipeline from Union’s NPS 20 Panhandle Line in the Town of Lakeshore to a new station in the Town of Kingsville in the County of Essex2
b) The majority of the created capacity is forecast to be consumed by contract rate
customers and greenhouses. Further information is provided at Exhibit C1, Tab 3, Schedule 1, page 176: “in addition to serving residential, commercial and industrial customers, the Panhandle Transmission System also supplies four large power generation plants and a number of greenhouses in the Chatham-Kent and Leamington/Kingsville areas”.
2 EB-2018-0013, Schedule A, Tab 11, page 1, Lines 3 to 5.

Filed: 2019-04-25 EB-2018-0305 Exhibit I.STAFF.74 Page 1 of 1
ENBRIDGE GAS INC. Answer to Interrogatory from
Board Staff (STAFF) Reference: AMP – Exhibit C1/Tab 3/Schedule 1/Pg. 180 Question: Union Gas has identified further expansion of the Sarnia Industrial Line as one of the proposed projects in the AMP. The system reinforcement is required to serve forecasted industrial contract rate growth in the Sarnia market. The total estimated expenditure for the project is $65 million from 2018 to 2021.
a) How many contract rate customers are expected to receive additional supplies as a result of the proposed expansion?
b) Will any contract rate customers make a capital contribution or contribute through a higher rate or demand charge to receive additional supplies? If not, please explain why.
Response a) Two.
b) Yes.

Filed: 2019-04-25 EB-2018-0305 Exhibit I.STAFF.75 Page 1 of 1
ENBRIDGE GAS INC. Answer to Interrogatory from
Board Staff (STAFF) Reference: AMP – Exhibit C1/Tab 3/Schedule 1/Pgs. 196-197 Question: Union Gas has identified replacing the London Line which will extend from Dawn to just south of Komoka Transmission Station, a distance of 75 km. Union Gas has indicated that the condition of the London Lines is generally poor and indicative of a pipeline reaching end of life. Union Gas has further noted that there are currently multiple outstanding leaks located along these lines and sections of the line have been abandoned due to condition.
a) Please explain what abandonment of a section of the line means. Is it not maintained anymore or is not used for providing service?
b) There are currently multiple outstanding leaks. Does Union Gas have an estimate of the natural gas that is lost annually due to leaks in the London Line? If reliable information is not available, please provide a best estimate.
Response a) Abandoned means that the pipeline segment has been decommissioned and is no
longer in service. The London Lines consist of NPS 8 and NPS 10 pipelines which extend in a corridor from Dawn to Komoka, with numerous interconnections between the two pipelines. The pipelines were constructed in the 1930’s and 1950’s and are nearing the end of their useful life; in certain locations it has been possible to abandon one of the existing pipelines in place following the TSSA’s abandonment guidelines. Natural gas service can be provided from the other pipeline in the corridor.
b) Please see Exhibit I.STAFF.45.

Filed: 2019-04-25 EB-2018-0305 Exhibit I.STAFF.76 Page 1 of 2
ENBRIDGE GAS INC. Answer to Interrogatory from
Board Staff (STAFF) Reference: AMP – Exhibit C1/Tab 3/Schedule 1/Pg. 204 Question: Union Gas has identified the Windsor distribution line for replacement. The replacement will address the integrity and operational risks with the Windsor Line. Based on the integrity concerns and the significant effort and resources spent on repairing leaks on the line, the Windsor Line has been deemed a high risk and has therefore been identified as requiring replacement. The project includes the replacement of the entire 65 km Windsor Line. The existing line is a combination of NPS 10 and NPS 8 and will be replaced by an NPS 6 pipeline at an estimated cost of $88 million. The project will be constructed in 2020.
a) Union Gas has noted that the Windsor Line has used significant resources to repair leaks. What was the total spend on repairing leaks on the Windsor Line in the past five years (2014 to 2018 inclusive)?
b) Why is the proposed line a NPS 6 versus the original NPS 8 pipeline? c) How much future growth will the NPS 6 pipeline provide as opposed to a NPS 8
pipeline? d) What is the estimated difference in costs if a NPS 8 pipeline is considered for the
project? Response a) Since 2014 there have been three major repairs to the Windsor line. The costs of
these three repairs were approximately $600,000. In addition, there have been over 25 minor repairs along this line due to condition. The combined costs of these minor repairs were approximately $90,000. Additionally, between 2005 and 2014 there have been four major repairs the combined costs of which were $676,000. There are currently 16 active leaks on the segment identified for replacement that are being actively monitored in compliance with Standard Operating Practice requirements.
b) The proposed NPS 6 3450kPa MOP Windsor Line replacement will operate at a higher pressure than the original NPS 8/NPS 10 1380kPa MOP. By increasing the operating pressure of the pipeline, the diameter can be reduced without impacting

Filed: 2019-04-25 EB-2018-0305 Exhibit I.STAFF.76 Page 2 of 2
the capacity available along the pipeline. Enbridge evaluated the option of installing an NPS 8 3450kPa replacement pipeline, however the identified growth was not sufficient to support the incremental cost associated with the increase in diameter. Based on the expected growth, the proposed NPS 6 replacement will be able to serve the existing and forecasted demand for the next 20 years.
c) See response to part b).
d) The incremental magnitude cost to replace the current line with a NPS 8 pipeline instead of the currently planned NPS 6 pipeline would be approximately $16 million. The cost increase is due to higher material costs and increased construction labour and equipment costs required to complete installation including larger equipment, deeper/wider trenching, and more welding.

Filed: 2019-04-25 EB-2018-0305 Exhibit I.STAFF.77 Page 1 of 1
ENBRIDGE GAS INC. Answer to Interrogatory from
Board Staff (STAFF) Reference: Customer Engagement Research Question: With respect to customer concerns among large volume customers, 24% mentioned costs associated with new natural gas service as a concern.
a) Please confirm whether Enbridge Gas probed this concern any further and provide further information on this issue if available.
b) Is this concern related to the PI calculation completed for every new infill customer and requiring a CIAC to complete the connection to the distribution system?
Response a) The intent of the customer engagement survey was to get customer preferences
regarding various future initiatives which would then inform the Company’s investment plan. While the Company didn’t specifically take steps to probe the results from that particular survey, it regularly completes other market research projects to engage with customers and understand their concerns, needs and preferences. Please see Exhibit I.STAFF.33 for an overview of how Enbridge Gas incorporated feedback from the customer engagement process into its business plans.
b) No, customers did not express any specific concerns related to the PI calculation
and CIAC for infill customer to connect to the distribution system.

Filed: 2019-04-25 EB-2018-0305 Exhibit I.STAFF.78 Page 1 of 1
ENBRIDGE GAS INC. Answer to Interrogatory from
Board Staff (STAFF) Reference: Exhibit D1/Tab 1/Schedule 1/Pg.22 Question: Slightly more than half (56%) of large volume customers believe that increasing rates by 1.5% over the next five years to keep up with aging infrastructure costs to maintain the current level of reliability and safety is reasonable (14%) or necessary (42%), compared to four in ten (40%) who would oppose it. Did Enbridge Gas probe the results further to understand why 40% of the respondents would oppose an increase in rates to cover costs associated with aging infrastructure? Response Please see Exhibit I.STAFF.77, part a).

Filed: 2019-04-25 EB-2018-0305 Exhibit I.STAFF.79 Page 1 of 1
ENBRIDGE GAS INC. Answer to Interrogatory from
Board Staff (STAFF) Reference: Exhibit D1/Tab 2/Schedule 1/Pg. 56 Question: The Union Gas survey found that three in four (74%) of residential participants find the price for distributing gas “reasonable” with 21% who find it “very reasonable”. Nearly one in five (17%) find it “somewhat unreasonable” and just 6% find it “very unreasonable”. Is there any significant difference in the results among those who are on Equal Billing Plan and those who are not? Response The referenced Customer Engagement survey did not distinguish between customers on the equal billing plan and those who are not on equal billing.

Filed: 2019-04-25 EB-2018-0305 Exhibit I.STAFF.80 Page 1 of 2
ENBRIDGE GAS INC. Answer to Interrogatory from
Board Staff (STAFF) Reference: Exhibit D1/Tab 2/Schedule 1/Pgs. 75-95 Question: In its survey, Union Gas sought feedback on a number of trade-offs and also tried to gauge customer perception for additional spending that was quantified as a rate impact for customers. For example, the impact of maintenance capital spending is $1 per year for residential customers, renovating older buildings was 50 cents a year per residential customer, information technology spending was $3 a year per residential customer, replacement of bare and unprotected pipes would cost $1 a year per residential customer, website enhancements for $1 a year per residential customer, research spending on new technologies costing $3 per year per residential customer and other such spending initiatives.
a) Were the respondents provided information on the possible cumulative rate impact of all these initiatives? If no, why not?
b) Did Union Gas gauge the perception of customers on the cumulative spending and how supportive they were if all the proposed initiatives were implemented?
Response a) Yes. Please see Exhibit D1, Tab 2, Schedule 1, page 248, which is also provided
below for convenience.
Currently, the average residential customer pays $390 a year in distribution rates. On average this is $32.50 each month but in practice it is higher in the winter and lower in the summer due to the variable delivery charge when people use more gas for heating. For each question, the financial impact is expressed as the dollar impact each year on an average residential bill. The actual impact will depend on your own individual usage. While the individual impact of each decision may be small, please keep in mind the total impact of all the choices included in this planning process could add up to a significant increase.
You will see that each time you are asked for your opinion, there is room for comments. Feel free to use these comment sections to explain why you prefer a particular option, or in any other way to expand on your viewpoint. Your comments will help develop a list of criteria Union Gas can use when addressing other issues.

Filed: 2019-04-25 EB-2018-0305 Exhibit I.STAFF.80 Page 2 of 2
b) Customers were not asked about the cumulative rate impacts of their choices in this engagement. INNOVATIVE did not develop a tool to enable customers to review their decisions and the cumulative bill impacts of those decisions until 2018. The engagement relied on both ratings and rankings of customer outcomes to provide customer insights for the utility to consider in assessing the best balance between system improvements and rate increases. Please see Exhibit I.STAFF.33 for an overview of how Enbridge Gas incorporated feedback from the customer engagement process in its business plans.

Filed: 2019-04-25 EB-2018-0305 Exhibit I.APPrO.1 Page 1 of 1
ENBRIDGE GAS INC. Answer to Interrogatory from
Association of Power Producers of Ontario (APPrO) Reference: Exhibit B1, Tab 1, Schedule 1 Section 2.2.6 Capital Pass Through Deferral
Accounts – Union Rate Zones Preamble: Enbridge proposes to make adjustments to rate base and depreciation
based on the Board’s direction in the EB-2017-0306/0307 to reflect certain capital pass-through during prior IRM. Enbridge has indicated that it proposes to continue to capture the utility tax timing variances in the respective deferral accounts to recognize the reversal of the benefits customers received in rates from 2014-2018. Over the following PCI period, Enbridge notes that it would receive $124.1 million of utility tax timing differences based on the current forecast and without capturing the reversal in the deferral account, customers would receive a benefit of $182.0 million.
Question: Please identify if Enbridge raised the issue of tax timing differences in the above noted proceedings and if so, the Board’s ruling on the matter. Response No. At the time of the MAADs proceeding, Enbridge Gas intended to continue with Union’s capital pass-through deferral accounts to capture the impact of changes in income tax timing differences. In the MAADs Decision, the Board approved Enbridge Gas’s proposal for the deferral and variance accounts that would continue upon amalgamation1 including Union’s capital pass-through deferral accounts. Enbridge Gas’s proposal to fix the capital pass-through revenue requirement in rates and discontinue the deferral account treatment for the projects with the exception of the utility tax timing differences was made following the MAADs Decision. For further details of why Enbridge Gas is proposing to adjust the capital pass-through deferral accounts please see Exhibit I.STAFF.8 a).
1 EB-2017-0306/EB-2017-0306 Decision with Reasons, p. 45.

Filed: 2019-04-25 EB-2018-0305 Exhibit I.APPrO.2 Page 1 of 2
ENBRIDGE GAS INC. Answer to Interrogatory from
Association of Power Producers of Ontario (APPrO) Reference: i) Exhibit B Tab 2 Schedule 1 Preamble: Enbridge is seeking approval for revenue requirement associated with the
replacement of the Sudbury lateral that was constructed in 2018. APPRO would like to better understand this investment. The Sudbury lateral LTC application was filed on May 5, 2017 and was approved by the Board on September 28, 2017 and was planned to be in service in 2018.
Question: a) Please confirm that the project is operational and went into service in 2018. If it
failed to go into service in 2018, please explain why Enbridge failed to meet its planned in service date.
b) Enbridge notes that $3.4 million is to go into service in 2019. Please explain what this amount is in relation to (i.e. is it related to remediation work or is a portion of the pipeline that will not go into service until 2019 or some other reason).
c) Given that this project was approved for construction in 2017, did Enbridge seek approval for a capital pass through in its 2018 rate case? If no, why not? If yes, what was the determination?
d) Please confirm that the 2014-2018 IRM expired on December 31, 2018. e) If the project went into service in 2018, please outline the income tax effects, if
any, that were captured in 2018. f) If the Board does not approve the request to provide the full year revenue
requirement of approximately $9 million in 2019, how many basis points would this reduce Enbridge’s ROE in 2019?
Response a) The Sudbury Replacement Project went into service in October of 2018.
b) The $3.4 million in spend includes construction clean up, baseline integrity
inspection, painting of impacted pipeline stations and anode installation on some services lines off the replaced pipeline.

Filed: 2019-04-25 EB-2018-0305 Exhibit I.APPrO.2 Page 2 of 2
c) The Sudbury Replacement Project did not qualify for capital pass through treatment in 2018 because there were only two months of revenue requirement, but within 2019 there is a full year’s revenue requirement that would make it eligible.
d) Confirmed.
e) The income tax captured in 2018 provided a benefit to the project nearly offsetting
the operating cost and return components of the 2018 revenue requirement. The 2018 income tax effect can be found in the ICM revenue requirement calculation which is filed as Exhibit B1, Tab 2, Schedule 1, Appendix E.
f) At present, without knowing what Enbridge Gas’s 2019 actual utility rate base will
be, Enbridge Gas is only able to provide an approximate ROE impact. Assuming Enbridge Gas’s revenue stream was $9.8 million lower than it otherwise would have been due to the Sudbury ICM amount not being approved it would result in an after tax reduction in utility earnings of approximately $7.2 million (assumed tax rate of 26.5%). Further, assuming that Enbridge Gas’s 2019 utility rate base will be in the range of $13 billion to $14 billion, which would result in a 36% deemed equity level of $4.68 billion to $5.04 billion, a $7.2 million reduction in utility income would translate into a utility ROE reduction in the range of 14 to 15 basis points.

Filed: 2019-04-25 EB-2018-0305 Exhibit I.APPrO.3 Page 1 of 2
ENBRIDGE GAS INC. Answer to Interrogatory from
Association of Power Producers of Ontario (APPrO) Reference: i) Exhibit B1 Tab 2 Schedule 1 Preamble: The ICM materiality threshold within the Union Rate Zone for 2019 is
$375.2 million. Enbridge is seeking ICM funding for amounts in excess of this threshold for several specific projects. Enbridge is seeking funding in 2019 to cover the $91.9 million in capital associated with the Sudbury Lateral, as well as $146.1 million associated with the Kingsville and Stratford reinforcements. $2.8 million of these capital amounts may be below the threshold amounts and therefore not eligible for incremental ICM funding. Enbridge has applied this $2.8 million to reduce the costs of the Kingsville and Stratford laterals.
Question: a) Please explain why Enbridge is proposing to apply all of the capital amounts falling
below the threshold amounts (i.e. $2.8 million in this case) to the Union South projects only? Given that there are ICM projects in other rate zones, why wouldn’t a proportionate allocation among both rate zones be more appropriate? Since projects occur in each rate zone, what is the rate impact in each rate zone under this alternate allocation methodology?
b) In the event some of the other regularly occurring capital amounts are elevated over the historical average (e.g. General Plant) in the same year a major reinforcement project is also proposed, this could have the effect of increasing the ICM amount attributable to reinforcement than had these other capital expenditures not occurred. If the allocation methodology for the major reinforcements is different from the allocation methodology for the other asset types also experiencing higher spending, then the resulting rates could be distorted. APPrO would like to understand the cost allocation principles that Enbridge intends to apply during the IRM period should these situations occur.
c) To the extent that the threshold capital amounts are not exceeded in any year, is it the company’s intention to “bank” the differences to apply against future amounts that do exceed the threshold?

Filed: 2019-04-25 EB-2018-0305 Exhibit I.APPrO.3 Page 2 of 2
Response a) The $2.8 million reduction in project capital is a result of the Union rate zones capital
spend exceeding the maximum eligible incremental capital for the Union rate zones identified at Exhibit B1, Tab 2, Schedule 1, Table 7. Since the reduction is attributable to the Union rate zones calculation, it has been applied to the Union rate zones. There is no 2019 in-service capital forecast for the Union North rate zone, therefore the reduction for the Union rate zones has been applied to the Union South rate zone only.
b) As per the OEB’s ICM policy, Enbridge Gas is required to propose cost allocation and associated recovery of the incremental revenue requirement from customer classes for each discrete project that exceed the ICM materiality threshold. Note that projects proposed for incremental capital funding during the IRM period must be discrete projects rather than programs or regularly occurring capital amounts. Enbridge Gas’s proposed cost allocation and incremental revenue recovery from customers in this application (as will also be the case in future applications) are based on cost causality (i.e., customers’ usage of the ICM project assets) for each discrete ICM project. The proposed cost allocation methodology for 2019 ICM projects is provided at Exhibit B1, Tab 2, Schedule 1, pages 32 to 34. Also note that in-service capital expenditures / additions below the ICM materiality threshold are recovered through Enbridge’s base rates during the IRM period. Accordingly, cost allocation is not carried out or proposed for those assets.
c) No.

Filed: 2019-04-25 EB-2018-0305 Exhibit I.APPrO.4 Page 1 of 2
ENBRIDGE GAS INC. Answer to Interrogatory from
Association of Power Producers of Ontario (APPrO) Reference: i) Exhibit B1 Tab 2 Schedule 1, Table 10 Preamble: Enbridge has provided projections on the 2019 Incremental Revenue
Requirement for the ICM projects.
Question: Enbridge notes that there were no material incremental O&M expenses associated with the 2019 eligible projects and therefore excluded in the incremental revenue requirement calculation. a) Please confirm that the Sudbury lateral in fact lowers the O&M costs, due to the
high historical integrity issues. If so, please explain why there would not be a reduction in O&M costs due to this ongoing savings.
b) Similarly, the Don River crossing replacement would also be expected to lower O&M costs as a result of removing exposed pipeline and a bridge that would otherwise require increased maintenance and inspection. Please explain why there would not be a credit to O&M expenses as a result of this replacement.
c) Please provide the annual O&M expenses incurred for each section of pipe that is being replaced for each of the above noted projects for the last 5 years.
d) Please indicate if potential O&M savings form a part of the business case to replace these facilities, if so please provide a copy of the respective business case.
Response a) The Sudbury lateral replacement project is replacing an existing pipeline. The
regular maintenance on the pipeline (such as leak survey, corrosion survey, valve inspections, etc.) will still be required, so it will not lead to O&M savings. Although the inline inspection interval will be decreased from every 7 years to 10 years, these savings are not significant. The majority of the repair costs, that will be avoided in the future, are attributed to replacement of discrete sections of pipe due to integrity concerns. These discrete replacements have therefore been addressed with maintenance capital rather than O&M expense.

Filed: 2019-04-25 EB-2018-0305 Exhibit I.APPrO.4 Page 2 of 2
b) The Don River crossing replacement project (starting in April) is replacing above ground pipe bridge crossing (approx. 45 metres) with below ground crossing of the river. The regular maintenance on the pipe (such as leak survey, corrosion survey, valve inspections, etc.) will still be required and will not lead to O&M savings. As this is a short section of pipeline, the regular pigging activities that are a continued requirement will not result in O&M savings.
c) O&M costs are not allocated to sections of pipe, thus, unable to provide a response to this question.
d) There is no business case incorporating O&M savings related to the Sudbury lateral and Don River crossing replacement project mentioned in a) and b) above.

Filed: 2019-04-25 EB-2018-0305 Exhibit I.BOMA.1 Page 1 of 1 Plus Attachment
ENBRIDGE GAS INC. Answer to Interrogatory from
Building Owners and Managers Association of Greater Toronto (BOMA) Reference: Application Letter Question: Please provide the annual rate increase for 2019 over 2018, with and without any proposed rate riders, for each rate class in the three rate zones. Assume a low, medium, and high consumption case for each rate class. Response The proposed bill impacts for the EGD rate zone can be found at Exhibit F1, Tab 1, Working Papers, Schedule 3. There are no proposed ICM rate riders for the EGD rate zone. The proposed bill impacts for the Union South rate zone can be found at Exhibit F1, Tab 2, Working Papers, Schedule 4, pages. 2 to 3. There are no proposed ICM rate riders for the Union South rate zone. The proposed bill impacts for the Union North rate zone can be found at Exhibit F1, Tab 2, Working Papers, Schedule 4, page 1 and include the ICM rate rider. Attachment 1 compares the proposed bill impacts for the Union North rate zone excluding and including the ICM rate rider.

UNION RATE ZONESUnion North In-Franchise
Calculation of 2019 Sales Service and Direct Purchase Bill Impacts for Typical Small and Large Customers
ApprovedEB-2018-0253 (1)
Total Total Total Bill Total Bill Total Total Bill Total BillLine Bill (2) Bill (3) Change Impact Bill (4) Change ImpactNo. Particulars ($) ($) ($) (%) ($) ($) (%)
(a) (b) (c) = (b - a) (d) = (c / a) (e) (f) = (e - a) (g) = (f / a)
Small Rate 011 Delivery Charges 455 454 (0.89) -0.2% 463 7.91 1.7%2 Gas Supply Charges (5) 497 494 (3.03) -0.6% 494 (3.03) -0.6%3 Total Bill 952 948 (3.92) -0.4% 957 4.88 0.5%
4 Sales Service Impact (3.92) -0.4% 4.88 0.5%5 Bundled-T (Direct Purchase) Impact (3.98) -0.6% 4.82 0.7%
Small Rate 106 Delivery Charges 4,868 4,842 (26) -0.5% 5,065 198 4.1%7 Gas Supply Charges (5) 12,326 12,259 (68) -0.5% 12,259 (68) -0.5%8 Total Bill 17,194 17,101 (93) -0.5% 17,324 130 0.8%
9 Sales Service Impact (93) -0.5% 130 0.8%10 Bundled-T (Direct Purchase) Impact (95) -1.0% 128 1.4%
Large Rate 1011 Delivery Charges 16,059 15,952 (107) -0.7% 16,883 824 5.1%12 Gas Supply Charges (5) 51,360 51,078 (282) -0.5% 51,078 (282) -0.5%13 Total Bill 67,419 67,030 (389) -0.6% 67,961 542 0.8%
14 Sales Service Impact (389) -0.6% 542 0.8%15 Bundled-T (Direct Purchase) Impact (397) -1.2% 534 1.6%
Small Rate 2016 Delivery Charges 74,615 74,519 (96) -0.1% 79,733 5,118 6.9%17 Gas Supply Charges (5) 519,322 516,541 (2,781) -0.5% 516,541 (2,781) -0.5%18 Total Bill 593,936 591,059 (2,877) -0.5% 596,273 2,337 0.4%
19 Sales Service Impact (2,877) -0.5% 2,337 0.4%20 Bundled-T (Direct Purchase) Impact (2,967) -1.5% 2,247 1.1%
Large Rate 2021 Delivery Charges 290,019 287,415 (2,605) -0.9% 309,761 19,742 6.8%22 Gas Supply Charges (5) 2,506,994 2,495,139 (11,855) -0.5% 2,495,139 (11,855) -0.5%23 Total Bill 2,797,013 2,782,554 (14,459) -0.5% 2,804,900 7,887 0.3%
24 Sales Service Impact (14,459) -0.5% 7,887 0.3%25 Bundled-T (Direct Purchase) Impact (14,909) -1.8% 7,437 0.9%
Average Rate 2526 Delivery Charges 61,501 63,522 2,021 3.3% 70,984 9,483 15.4%27 Gas Supply Charges (5) 331,301 331,495 193 0.1% 331,495 193 0.1%28 Total Bill 392,802 395,016 2,214 0.6% 402,478 9,676 2.5%
29 Sales Service Impact 2,214 0.6% 9,676 2.5%30 T-Service (Direct Purchase) Impact 2,021 3.3% 9,483 15.4%
Small Rate 10031 Delivery Charges 256,549 264,426 7,877 3.1% 314,925 58,376 22.8%32 Gas Supply Charges (5) 6,375,442 6,374,349 (1,093) 0.0% 6,374,349 (1,093) 0.0%33 Total Bill 6,631,992 6,638,776 6,784 0.1% 6,689,274 57,282 0.9%
34 Sales Service Impact 6,784 0.1% 57,282 0.9%35 T-Service (Direct Purchase) Impact 7,877 3.1% 58,376 22.8%
Large Rate 10036 Delivery Charges 2,083,042 2,144,490 61,448 2.9% 2,573,727 490,685 23.6%37 Gas Supply Charges (5) 55,569,773 55,560,797 (8,976) 0.0% 55,560,797 (8,976) 0.0%38 Total Bill 57,652,815 57,705,287 52,472 0.1% 58,134,523 481,708 0.8%
39 Sales Service Impact 52,472 0.1% 481,708 0.8%40 T-Service (Direct Purchase) Impact 61,448 2.9% 490,685 23.6%
Notes:(1) Reflects approved rates per October 2018 QRAM (EB-2018-0253), Appendix A.(2) EB-2018-0305, Exhibit F1, Tab 2, Rate Order, Working Papers, Schedule 4, p. 1, column (a).(3) EB-2018-0305, Exhibit B1, Tab 2, Schedule 1, Appendix H, column (a).(4) EB-2018-0305, Exhibit F1, Tab 2, Rate Order, Working Papers, Schedule 4, p. 1, column (c).(5) Gas Supply charges based on Union North East Zone.
ENBRIDGE GAS INC.
Excluding ICM Rate Rider Including ICM Rate RiderProposed - EB-2018-0305 Proposed - EB-2018-0305
Filed: 2019-04-25 EB-2018-0305
Exhibit I.BOMA.1 Page 1 of 1
Attachment 1

Filed: 2019-04-25 EB-2018-0305 Exhibit I.BOMA.2 Page 1 of 1
ENBRIDGE GAS INC. Answer to Interrogatory from
Building Owners and Managers Association of Greater Toronto (BOMA) Reference: Application Letter Question: Please provide data when EGD/Union commenced work on their 2019 rates applications. Given that the companies have been under common ownership since February 27, 2017, how much of the application for the 2019 rates were they able to do prior to the certificate of amalgamation being issued? Response EGD and Union have been aware of the need to bring forward a 2019 rates application for some time. However, the application could not be completed until the framework in the MAADs and Rate Setting Mechanism proceeding was approved.1 As the 2019 rates application was filed in December 2018, it was all completed prior to the January 1, 2019 effective date of the amalgamation and receipt of the Certificate of Status on January 10, 2019.
1 EB-2017-0306/EB-2017-0307 Decision and Order, August 30, 2018.

Filed: 2019-04-25 EB-2018-0305 Exhibit I.BOMA.3 Page 1 of 1
ENBRIDGE GAS INC. Answer to Interrogatory from
Building Owners and Managers Association of Greater Toronto (BOMA) Reference: Exhibit B1, Tab 1, Schedule 1, p14 Question: (a) Why should the Board establish a deferral account for capital projects which are
funded from ICM funds when they do not do so for capital projects funded through existing rates (price cap index plus growth adjustments)?
(b) Open Bill Revenue Variance Account – On what basis should the ratepayers be
responsible for all of the shortfall between revenue from the program and $4,889M? Please provide the numerical analysis underpinning that feature of the account.
Response a) Enbridge Gas is requesting the establishment of the deferral accounts in relation to
capital projects funded through ICM in accordance with the Board policy on ICM.
b) Enbridge credits ratepayers with $5.389 million for OBA program net revenues each
year. Parties to the settlement agreements which govern the provision of Open Bill services agreed that it would be appropriate for Enbridge to be credited any shortfall between actual annual net revenues and $4.889 million. The Board approved settlement agreement related to the provision of OBA services (EB-2009-0043) for the years 2009 to 2012 established the Open Bill Revenue Variance Account (OBRVA) and the mechanics of that variance account, including the provision that Enbridge would be credited for annual net revenues that are less than $4.889 million. Subsequent Board approved settlement proposals - EB-2011-0354 which related to OBA services for 2013 and EB-2013-0099 which related to OBA services for 2014 to 2018 – carried forward the OBRVA as established in EB-2009-0043. In the EB-2017-0306/0307 MAADs decision, the OEB approved the continuation of the OBRVA for the deferred rebasing term. In the recent EB-2018-0319 Board-approved Settlement Proposal, all parties agreed that Enbridge will continue offering the OBA program under its existing financial terms (including the operation of the OBRVA) until such time as a decision is rendered in that proceeding.

Filed: 2019-04-25 EB-2018-0305 Exhibit I.BOMA.4 Page 1 of 1
ENBRIDGE GAS INC. Answer to Interrogatory from
Building Owners and Managers Association of Greater Toronto (BOMA) Reference: Exhibit B1, Tab 1, Schedule 1, Appendix A, p18 Question: Please explain the revised wording of the PTUVA Account. Response The wording of the EGD rate zone PTUVA accounting order has been updated to reflect the findings of the Board’s EB-2017-0306 / EB-2017-0307 Decision and Order, in the Company’s application for amalgamation and rate setting mechanism proceeding. 1 For reference, a blacklined version of the EGD Rate Zone PTUVA accounting order showing the changes that were made to the account wording is provided at Exhibit I.STAFF.17 Attachment 1.
1 EB-2017-0306/ EB-2017-0307 Decision and Order, August 30, 2018, page 45.

Filed: 2019-04-25 EB-2018-0305 Exhibit I.BOMA.5 Page 1 of 1 Plus Attachment
ENBRIDGE GAS INC. Answer to Interrogatory from
Building Owners and Managers Association of Greater Toronto (BOMA) Reference: Report on 2019 Rates on "Unaccounted for Gas"; p63 Question: (a) Please provide a copy of the Certificate of Amalgamation, together with any
submissions to the OSC or the Ministry of Commercial and Corporation Affairs Ontario to support the Application for Amalgamation.
(b) Please confirm that the Union and EGD rates are not being harmonized pursuant
to this Application and, in effect, each of the existing 2018 rates of EGD and Union will be escalated by the formula authorized by the Board in the MAADs application.
Response a) Attached are the Articles of Amalgamation that were filed with the Ontario Ministry of
Government and Consumer Services that effect the amalgamation as of January 1, 2019. The first page of the Articles with the Ministry’s stamp may be referred to as the Certificate of Amalgamation. No other submissions to the Ontario Securities Commission or the Ministry were required to effect the amalgamation.
b) Confirmed.

Request ID: 022567947 Province of Ontario Date Report Produced: 2019/01/10 Demande n° : Province de l'Ontario Document produit le : Transaction ID: 70450109 Ministry of Government Services Time Report Produced: 09:02:55 Transaction n° : Ministère des Services gouvernementaux Imprimé à : Category ID: CT Catégorie :
CERTIFICATE OF STATUSATTESTATION DU STATUT JURIDIQUE
This is to certify that according to the D'après les dossiers du Ministère des records of the Ministry of Government Services gouvernementaux, nous attestons Services que la société
E N B R I D G E G A S I N C .
Ontario Corporation Number Numéro matricule de la société (Ontario)
0 0 5 0 0 8 2 9 6
is a corporation incorporated, est une société constituée, prorogée ou née amalgamated or continued under d'une fusion aux termes des lois de la the laws of the Province of Ontario. Province de l'Ontario.
The corporation came into existence on La société a été fondée le
J A N U A R Y 0 1 J A N V I E R , 2 0 1 9
and has not been dissolved. et n'est pas dissoute.
Dated Fait le
J A N U A R Y 1 0 J A N V I E R , 2 0 1 9
DirectorDirecteur
The issuance of this certificate in electronic form is authorized by the Ministry of Government Services.La délivrance du présent certificat sous forme électronique est autorisée par le Ministère des Services gouvernementaux.
Filed: 2019-04-25, EB-2018-0305, Exhibit I.BOMA.5, Attachment, Page 1 of 28

Filed: 2019-04-25, EB-2018-0305, Exhibit I.BOMA.5, Attachment, Page 2 of 28

Filed: 2019-04-25, EB-2018-0305, Exhibit I.BOMA.5, Attachment, Page 3 of 28

Filed: 2019-04-25, EB-2018-0305, Exhibit I.BOMA.5, Attachment, Page 4 of 28

Filed: 2019-04-25, EB-2018-0305, Exhibit I.BOMA.5, Attachment, Page 5 of 28

Filed: 2019-04-25, EB-2018-0305, Exhibit I.BOMA.5, Attachment, Page 6 of 28

Filed: 2019-04-25, EB-2018-0305, Exhibit I.BOMA.5, Attachment, Page 7 of 28
Filed: 2019-04-25, EB-2018-0305, Exhibit I.BOMA.5, Attachment, Page 8 of 28

Filed: 2019-04-25, EB-2018-0305, Exhibit I.BOMA.5, Attachment, Page 9 of 28

Filed: 2019-04-25, EB-2018-0305, Exhibit I.BOMA.5, Attachment, Page 10 of 28

Filed: 2019-04-25, EB-2018-0305, Exhibit I.BOMA.5, Attachment, Page 11 of 28

Filed: 2019-04-25, EB-2018-0305, Exhibit I.BOMA.5, Attachment, Page 12 of 28

Filed: 2019-04-25, EB-2018-0305, Exhibit I.BOMA.5, Attachment, Page 13 of 28

Filed: 2019-04-25, EB-2018-0305, Exhibit I.BOMA.5, Attachment, Page 14 of 28

Filed: 2019-04-25, EB-2018-0305, Exhibit I.BOMA.5, Attachment, Page 15 of 28

Filed: 2019-04-25, EB-2018-0305, Exhibit I.BOMA.5, Attachment, Page 16 of 28

Filed: 2019-04-25, EB-2018-0305, Exhibit I.BOMA.5, Attachment, Page 17 of 28

Filed: 2019-04-25, EB-2018-0305, Exhibit I.BOMA.5, Attachment, Page 18 of 28

Filed: 2019-04-25, EB-2018-0305, Exhibit I.BOMA.5, Attachment, Page 19 of 28

Filed: 2019-04-25, EB-2018-0305, Exhibit I.BOMA.5, Attachment, Page 20 of 28

Filed: 2019-04-25, EB-2018-0305, Exhibit I.BOMA.5, Attachment, Page 21 of 28

Filed: 2019-04-25, EB-2018-0305, Exhibit I.BOMA.5, Attachment, Page 22 of 28

Filed: 2019-04-25, EB-2018-0305, Exhibit I.BOMA.5, Attachment, Page 23 of 28

Filed: 2019-04-25, EB-2018-0305, Exhibit I.BOMA.5, Attachment, Page 24 of 28
Filed: 2019-04-25, EB-2018-0305, Exhibit I.BOMA.5, Attachment, Page 25 of 28

Filed: 2019-04-25, EB-2018-0305, Exhibit I.BOMA.5, Attachment, Page 26 of 28

Filed: 2019-04-25, EB-2018-0305, Exhibit I.BOMA.5, Attachment, Page 27 of 28

Filed: 2019-04-25, EB-2018-0305, Exhibit I.BOMA.5, Attachment, Page 28 of 28

Filed: 2019-04-25 EB-2018-0305 Exhibit I.BOMA.6 Page 1 of 1
ENBRIDGE GAS INC. Answer to Interrogatory from
Building Owners and Managers Association of Greater Toronto (BOMA) Reference: Exhibit A, Tab 2, p 3 of 6 Question: Please provide a table which shows for each of Union pass-through projects already approved by the Board, their proposed assets in service in 2019, their contribution to the 2019 revenue requirement, the actual expenditure in 2018, and the forecast 2018 expenditure. Response Enbridge Gas believes the reference is to Exhibit A, Tab 2, page 4. Please see the table below for the forecast and draft actual Capital Expenditure for 2018 and the forecast Capital Expenditure for 2019 as well as the 2019 Revenue Requirement for the Capital Pass-through Projects.
Capital Capital
Capital
Revenue
Expenditure Expenditure
Expenditure
Requirement
Approved in Rates
Draft Actual
Proposed in Rates
Proposed in Rates
Particulars ($000's) 2018 2018
2019
2019
Parkway West - 1,092
1,504
19,227 Brantford-Kirkwall/ Parkway D - -
-
14,874
2016 Dawn-Parkway Expansion - 2,464
-
25,059 Burlington to Oakville - 1,455
-
5,447
2017 Dawn-Parkway Expansion 14,267 32,959
6,960
40,916 Panhandle Reinforcement 30,612 36,454
500
11,715 (1)
Total 44,879 74,424
8,964
117,238 Notes: (1) Panhandle Reinforcement project revenue requirement net of incremental project revenue.

Filed: 2019-04-25 EB-2018-0305 Exhibit I.BOMA.7 Page 1 of 1
ENBRIDGE GAS INC. Answer to Interrogatory from
Building Owners and Managers Association of Greater Toronto (BOMA) Reference: Exhibit A, Tab 3, Schedule 1, p3 Question: (a) Please explain fully why there will be no 2019 rate impacts for potential rate riders
associated with the Don River, Kingsville, and Stratford ICM Projects, and that will be dealt with the 2020 rates submission, not the 2019 rates submission (EB-2018-0305).
(b) Why do the Union North zone proposed 2019 rate increases for the direct purchase customers include the ICM impacts, while the sales service customers' proposed 2019 rate increases exclude the ICM impacts?
Response a) As described at Exhibit B1, Tab 2, Schedule 1, page. 32, the Don River
Replacement, Kingsville and Stratford Reinforcement projects have a negative revenue requirement1 in 2019, which is the in-service year of the projects. Enbridge Gas proposes to net the negative revenue requirement in the in-service year with the revenue requirement in the second year and defer the ICM impact until the second year of the project. This proposal reduces rate volatility and the impact on customers while also ensuring the negative revenue requirement of the first year accrues to the benefit of customers.
Enbridge Gas is seeking approval of the proposed ICM projects in the current application. If approved, Enbridge Gas proposes to calculate the 2020-2023 ICM unit rates for the 2019 approved ICM projects as part of each respective annual rate proceedings based on the annual revenue requirements approved in this application and the updated forecast billing units.
b) The bill impacts for both direct purchase and sales services customers, as provided
at Exhibit A, Tab 3, Schedule 1, page 3, are inclusive of ICM projects.
1 The negative revenue requirement results from utility tax timing differences as the capital cost allowance deductions in arriving at taxable income exceeds to provision of book depreciation in the year.

Filed: 2019-04-25 EB-2018-0305 Exhibit I.BOMA.8 Page 1 of 1
ENBRIDGE GAS INC. Answer to Interrogatory from
Building Owners and Managers Association of Greater Toronto (BOMA) Reference: Exhibit A, Tab 3, Schedule 1, p4 Question: Please provide copies of the most recent three years of customer satisfaction surveys that EGD and Union have conducted. Response The customer engagement reports supporting this 2019 rates application for Enbridge Gas are provided at Exhibit D. As per the MAADs decision, Enbridge Gas will file a consolidated USP in 2021. In support of the USP, the company will conduct a customer engagement survey which will be filed as part of the 2021 rate application.

Filed: 2019-04-25 EB-2018-0305 Exhibit I.BOMA.9 Page 1 of 2
ENBRIDGE GAS INC. Answer to Interrogatory from
Building Owners and Managers Association of Greater Toronto (BOMA) Reference: Conditions of Service; Exhibit A, Tab 3, Schedule 1 Question: The reference to the conditions of service state that they are meant to be guidelines, and not to override any item in any contract EGD has with the customers. (a) Do the guidelines have any legal effect, in EGD's view, either for contract
customers or general service customers?
(b) Have they ever been relied upon in any legal claim, launched against EGD?
(c) Has the Board ever approved EGD's Conditions of Service? In what proceeding(s)?
(d) Section 2.4 GS – "Depletion or shortage of gas supply" – What if EGD were judged to be imprudent in its gas purchase decisions? Is it still exonerated by this clause?
Response a) Enbridge Gas must comply with its Customer Service Policy as set out in its
Conditions of Service, as required by section 8.3.1 of the Board’s Gas Distribution Access Rule (GDAR). As noted in the reference, the Conditions of Service do not supersede contractual terms in place with customers, however, includes terms and conditions set out in the EGD rate zone’s Rate Handbook.
b) Legacy EGD received only one legal claim that relied upon the Conditions of
Service, to the best of our knowledge. This was in relation to a meter reading issue that was ultimately resolved with the customer and there was no determination that EGD was in breach of its Conditions of Service.
c) The revision history of the Conditions of Service is set out on pages 2 to 5 of
Exhibit A1, Tab 5, Schedule 1. For each revision, EGD filed the revised Conditions

Filed: 2019-04-25 EB-2018-0305 Exhibit I.BOMA.9 Page 2 of 2
of Service with the Board in accordance with section 8.5 of the GDAR. Board approval of the Conditions of Service is not required for each revision.
d) In the event of an interruption or cessation of gas deliveries, Enbridge Gas would
have to consider all of the circumstances in order to determine whether to declare a force majeure. Force majeure events typically are events that are beyond the control of the Company, as noted and listed in section 2.4 of the Conditions of Service.

Filed: 2019-04-25 EB-2018-0305 Exhibit I.BOMA.10 Page 1 of 1
ENBRIDGE GAS INC. Answer to Interrogatory from
Building Owners and Managers Association of Greater Toronto (BOMA) Reference: General Definition of Mains Question: Please provide a definition of EGD's mains. What criteria are utilized, for example, pressure, diameter pipe, function or purpose, length, or other factors. Please specify what other factors come into play. Response The EGD rate zone’s mains are described as “the connection between the entry of natural gas into EGD’s system and the delivery of gas to where energy is used by customers.” This definition can be found at section 5.2, page 105, in the EGD rate zone’s AMP which is filed at Exhibit C1, Tab 2, Schedule 1. Mains are categorized by material, namely Steel and Plastic. Steel Mains are further divided into Integrity and Steel Mains. The definition of these assets can be found at section 5.2 in the EGD rate zone’s AMP which is filed at Exhibit C1, Tab 2, Schedule 1. Please refer to sub-section 5.2.4, page 113 for Integrity Mains, sub-section 5.2.5, page 116 for Distribution Steel Mains and sub-section 5.2.6 page 131 for Distribution Plastic Mains.

Filed: 2019-04-25 EB-2018-0305 Exhibit I.BOMA.11 Page 1 of 1
ENBRIDGE GAS INC. Answer to Interrogatory from
Building Owners and Managers Association of Greater Toronto (BOMA) Reference: Union Gas Conditions of Service; Exhibit A, Tab 5, Schedule 3, p5 Question: Please provide a further definition of mains, or its equivalent, in addition to "The pipe that is used to carry gas to a service". Response Mains are the pipe that serves as a common source of supply for more than one service. A service connects the main to the customer premises. Mains are generally within the public right of way, or within an easement, whereas service piping can be included on private property to serve the individual customer.

Filed: 2019-04-25 EB-2018-0305 Exhibit I.BOMA.12 Page 1 of 1
ENBRIDGE GAS INC. Answer to Interrogatory from
Building Owners and Managers Association of Greater Toronto (BOMA) Reference: Exhibit B1, Tab 1, Schedule 1, p9 Question: a) Please provide details on which distribution related costs are recovered through
EGD's commodity, transportation, and load balancing charges. b) Please describe each of these costs, and indicate in which of the Company's
commodity, transportation, and load balancing charges contain each of the described costs.
c) Please provide a breakdown of that number into the number for each of the pass-through projects which make it up. Please provide details of the treatment of each of the pass-through projects in the 2019 rates proposal.
Response a-b) Please see Exhibit I.FRPO.1 to 3. d) Please note that there are no project pass through costs that are recovered
through the Company’s gas supply commodity, transportation, and load balancing charges.

Filed: 2019-04-25 EB-2018-0305 Exhibit I.BOMA.13 Page 1 of 1
ENBRIDGE GAS INC. Answer to Interrogatory from
Building Owners and Managers Association of Greater Toronto (BOMA) Reference: Exhibit B1, Tab 1, Schedule 1, p15 Question: What are the accounting policy changes, if any, that result from the merger, and which will be entered in the Accounting Policy Changes Deferral Account in 2019? Response Consistent with direction from the Board in its MAADs Decision1, Enbridge Gas is in the process of evaluating the revenue requirement impact of accounting changes resulting from amalgamation. Accounting changes that may impact revenue requirement include changes related to pensions, capitalization policy and depreciation.
1 EB-2017-0306/0307, MAADs Decision and Order, Page 46.

Filed: 2019-04-25 EB-2018-0305 Exhibit I.BOMA.14 Page 1 of 3
ENBRIDGE GAS INC. Answer to Interrogatory from
Building Owners and Managers Association of Greater Toronto (BOMA) Reference: Exhibit B1, Tab 1, Schedule 1, p19 Preamble: "The MAADs Decision directed Enbridge Gas to add rate base and
depreciation associated with Union's capital pass-through projects to the 2013 Board-approved rate base and depreciation in determining the eligible incremental capital amount for the Union service territory. As a result, Enbridge Gas proposes to fix the capital pass-through revenue requirement in rates (as described in Section 4.2.1) and discontinue the use of the capital pass-through deferral accounts, except for the purposes of capturing utility tax timing variances".
Question: a) Please provide a further explanation for Union's decision to "fix" the capital pass-
through revenue requirement in rates and how that follows from the first sentence in the quoted excerpt from its evidence.
b) Please provide the revenue requirement for each of 2014-2018, which underpin the amounts shown in Table 2.
c) Please provide the revenue requirement for 2019 which underpins the numbers in the 2019 column.
d) Please explain why the amount of $36,415M is shown for each of 2019 through 2023 in line 7 of Table 7.
e) What are the actual utility tax timing differences for 2018?
f) Please provide an explanation for the link between the MAADs decision to include the rate base and depreciation for each of Union's six capital pass-through projects in the calculation to determine the eligible incremental capital capacity, and Union's decision to reverse the benefits in the years 2019-2023.

Filed: 2019-04-25 EB-2018-0305 Exhibit I.BOMA.14 Page 2 of 3
Response a) Please see to Exhibit I.STAFF.8, part a).
b) Enbridge Gas assumes that the question is referencing Exhibit B1, Tab 1,
Schedule 1, Table 6 and not Table 2.
Union’s Capital Pass-through Projects Actual Revenue Requirement
Union’s 2014-2018 IRM Updated for Exhibit I.BOMA.14
Line No. Particulars ($000's) 2014 2015 2016 2017
Forecast 2018 Total
(a) (b) (c) (d) (e) (f)
1 Parkway West (751) 6,039 15,045 16,656 18,590 55,579 2 Brantford-Kirkwall/ Parkway D - 502 13,127 14,569 14,533 42,731 3 2016 Dawn-Parkway Expansion - (334) 2,381 22,825 24,311 49,182 4 Burlington to Oakville - - 335 4,824 5,207 10,367 5 2017 Dawn-Parkway Expansion(1) - - (1,191) 11,454 34,349 44,612 6 Panhandle Reinforcement(2) - - - 83 10,544 10,627
7 Total (751) 6,207 29,697 70,411 107,534 213,098
Notes: (1) 2017 Dawn-Parkway Expansion net of revenue allocated to deferral account related to sale
of excess capacity of 30,393 GJ/d. (2) Panhandle Reinforcement revenue requirement is net of incremental revenue.
c) Enbridge Gas assumes that the question is referring to Exhibit B1, Tab 1, Schedule 1, Table 7. Please refer to Exhibit B1, Tab 1, Schedule 1, Table 10 for the revenue requirement included in 2019 proposed rates.
d) Enbridge Gas assumes the question is referencing Line 8 and not Line 7 of Table 7.
The 2019 forecast utility tax timing difference amount of ($36,415) thousand is shown for each year of the 2019-2023 deferred rebasing period on Line 8 of Table 7 consistent with Enbridge Gas’s rate design proposal, detailed in Section 4.2.1 of Exhibit B, Tab 1, Schedule 1, to do a one-time adjustment to include the forecast

Filed: 2019-04-25 EB-2018-0305 Exhibit I.BOMA.14 Page 3 of 3
2019 capital pass-through revenue requirement (inclusive of the 2019 utility tax timing difference) in rates for the deferred rebasing term. For further details please refer to Exhibit I.STAFF.8.
e) Please see Exhibit I.LPMA.2, part a).
f) Please see Exhibit I.STAFF.8, part a).

Filed: 2019-04-25 EB-2018-0305 Exhibit I.BOMA.15 Page 1 of 1
ENBRIDGE GAS INC. Answer to Interrogatory from
Building Owners and Managers Association of Greater Toronto (BOMA) Reference: One-Time Adjustment of Capital Pass-Through Projects; Exhibit B1, Tab 1,
Schedule 1, p26; Exhibit F1, Tab 2, Rate Order, Schedule 16, pp4-5 Question: Please provide the underlying calculation to support EGD's proposed one-time adjustment to rates "in lieu of continuing to make Y-factor adjustments to the revenue requirement of the Projects during the 2019-2023 deferral rebasing period". What would be the annual adjustments over the 2019-2023 period if the one-time payment approach were not used? Response Please see Exhibit F1, Tab 2, Rate Order, Schedule 16, pages 4 to 5 for the calculation supporting the one-time adjustment for Union’s capital pass-through projects. Please see Exhibit I.SEC.6, Attachment 1 for the 2019-2023 forecast annual revenue requirement of Union’s capital pass-through projects.

Filed: 2019-04-25 EB-2018-0305 Exhibit I.BOMA.16 Page 1 of 1
ENBRIDGE GAS INC. Answer to Interrogatory from
Building Owners and Managers Association of Greater Toronto (BOMA) Reference: Exhibit B1, Tab 1, Schedule 1, p28; Exhibit F1, Tab 2, Rate Order,
Schedule 16, p28 Question: Please expand on the explanation given for building into rates the surplus Dawn-Parkway capacity of 30,393 GJ/day. Please provide the excerpt from the 2017 Dawn-Parkway proceeding, cited at line 18, related to the crediting of revenue earned to Deferral Account 179-144. Please confirm that all of the surplus capacity in question has been sold as of November 1, 2018, and for what term(s). Response Please see Exhibit I.STAFF.11 part a). Enbridge Gas has adjusted Rate M12 demand changes to account for the incremental revenue associated with the 30,393 GJ/d of surplus capacity that has been sold long term under Rate M12. The excerpt from the 2017 Dawn-Parkway Settlement Agreement (EB-2015-0200) starting at p.23 states:
In the interest of Settlement, Union will include in the deferral account balance a credit of $1.34 million related to the 30,393 GJ/d of surplus capacity. As addressed at B.ANE.18, the $1.34 million is the maximum annual revenue that could be realized from the sale of long-term firm surplus capacity effective November 1, 2017 (30,393 GJ/d x $0.121/GJ/d x 365 days). Variances in the actual revenue generated from the surplus capacity to the $1.34 million will also be recorded in the deferral account, and will be subject to review at the time of disposition of the account.

Filed: 2019-04-25 EB-2018-0305 Exhibit I.BOMA.17 Page 1 of 3
ENBRIDGE GAS INC. Answer to Interrogatory from
Building Owners and Managers Association of Greater Toronto (BOMA) Reference: Exhibit C1, Tab 1, Schedule 1; Utility System Plan/EGD, pp7-8 Question: For EGD's rate zone, please provide definition of mains system. For Union's two rate zones, please provide the definition and categorization of system stations, length of mains, and size of fleet. Response Mains System – EGD Rate Zone Mains system are defined as distribution piping which “includes EGD-owned and maintained piping including pipe, valves, all pipe appurtenances, services, and risers installed up to Customer Asset components and upstream of the meter.” This definition can be found at Section 5.2 in the EGD rate zone’s AMP, filed at Exhibit C1, Tab 2, Schedule 1, page 105. System Stations – Union Rate Zone As defined at section 5.4.2, page 87 in the Union rate zones’ AMP, filed at Exhibit C1, Tab 3, Schedule 1, System stations are:
“typically above grade facilities designed to reduce the operating pressure of natural gas pipeline systems through pressure control and over pressure protection. These facilities are used to transmit and/or distribute natural gas to reduced operating pressure pipeline systems which supply natural gas to cities and towns. System station components consist of piping, meters, regulators, valves, filters, separators, heaters, odourant, controls, and in some cases, structures. System station components can vary greatly depending on the station’s application and design complexity. At Union, system stations are broken down into subclasses which drive design and operating practices as well as inspection requirements.”
Further categorization can be found in table 5.4.2.2.1, page 88. The table below shows a revised inventory of System Stations by the Union North and South rate zones.

Filed: 2019-04-25 EB-2018-0305 Exhibit I.BOMA.17 Page 2 of 3
Station Subclass
Operating Parameters Systems Station Inventory
Maximum Inlet Pressure Inlet Size Union North
Rate Zone Union South Rate Zone Total
Subclass A Over 3,450 kPa NPS 3 and
over 103 187 290 Any Pressure NPS 8 and over
Subclass B Over 3,450 kPa NPS 2
289 476 765 3,450 kPa and Under
NPS 3 to NPS 6
Subclass C 3,450 kPa and
Under NPS 2
723 1,191 1,914 All Pressures Less than NPS 2
Total Number of Stations 2,969 Length of mains – Union Rate Zone Enbridge Gas’s assets in the Union rate zones include over 70,000 km of distribution, transmission, and storage pipelines. For more details on the Union rate zones’ length of mains, please refer to page 8 of the USP filed at Exhibit C1, Tab 1, Schedule 1. The length of mains is greater than 19,000 km for the Union North rate zone, and greater than 51,000 km for the Union South rate zone. Size of fleet – Union Rate Zone Enbridge Gas owns approximately 1,280 vehicles, trailers, and equipment across Ontario from Windsor to Cornwall to Kenora to support its operational business needs. For more details on the size of fleet, please refer to section 5.4.8.2, page 120 in the Union rate zones’ AMP filed at Exhibit C1, Tab 3, Schedule 1. The table below shows a revised inventory of vehicle type by the Union North and South rate zones.

Filed: 2019-04-25 EB-2018-0305 Exhibit I.BOMA.17 Page 3 of 3
Vehicle Type Example Union South Rate Zone
Union North Rate Zone
Total Inventory
Cars Ford Focus, Escape
36 14 50
Light Trucks Vans, Pick-ups, USR 1 Trucks
304 149 453
Medium Trucks USR 2 & USR 3, Cube Vans, etc.
165 68 233
Heavy Trucks Dump Trucks 31 12 43 Totals 536 243 779

Filed: 2019-04-25 EB-2018-0305 Exhibit I.BOMA.18 Page 1 of 1
ENBRIDGE GAS INC. Answer to Interrogatory from
Building Owners and Managers Association of Greater Toronto (BOMA) Reference: Exhibit C1, Tab 1, Schedule 1; Utility System Plan/EGD, p1 Question: a) Where in the US Northeast does Union see the most likely new market for gas
transmitted through the Dawn-Trafalgar system?
b) With respect to future growth in the US Northeast market for ex-franchise service, please assess the competitive position of gas transmitted through DT and into the US at Union/EGD exit points, in light of new or expanded pipelines from Utica/Marcellus to US Northeast.
Response a) The potential growth of the Dawn Parkway System for U.S. Northeast customers
primarily comes from natural gas demand growth for utilities located in Maine, Vermont, New Hampshire, Massachusetts, Connecticut, Rhode Island, and New York.
b) Dawn is well positioned as a source of supply for U.S. Northeast customers that are able to secure transportation on the Portland Natural Gas Transmission System and the Iroquois Gas Transmission System. These pipelines represent major routes for customers in the U.S. Northeast to transport gas supplies directly to their delivery areas or to other U.S. Northeast pipelines that connect to their delivery areas. Given challenges faced by several projects to successfully build new pipeline capacity to serve demand growth in the U.S. Northeast, expansion of existing capacity along major pipeline routes into the U.S. Northeast is an attractive option for these customers. For example, a current pipeline expansion project on the Portland Natural Gas Transmission System, called the Portland X-Press Project, has resulted in new and existing U.S. Northeast and Eastern Canadian customers contracting for incremental capacity from the Dawn Hub beginning in 2018 - 2020.

Filed: 2019-04-25 EB-2018-0305 Exhibit I.BOMA.19 Page 1 of 1
ENBRIDGE GAS INC. Answer to Interrogatory from
Building Owners and Managers Association of Greater Toronto (BOMA) Reference: Exhibit C1, Tab 1, Schedule 1; Utility System Plan/EGD, p11 Question: Please provide ICF gas price projection/study for 2018 and, if available, for 2019. Response ICF has provided the updated chart which includes their Q1 2019 projection below.
Used with permission.

Filed: 2019-04-25 EB-2018-0305 Exhibit I.BOMA.20 Page 1 of 1
ENBRIDGE GAS INC. Answer to Interrogatory from
Building Owners and Managers Association of Greater Toronto (BOMA) Reference: Exhibit C1, Tab 1, Schedule 1; Utility System Plan/EGD, p18 Question: What share of revenue from sales of storage by the unregulated storage entity to third parties does the regulated utility obtain? What is the rationale for that number?. Response Revenue from the sale of excess utility storage space is recorded in Deferral Account No. 179-70 of which 90% is shared with ratepayers.

Filed: 2019-04-25 EB-2018-0305 Exhibit I.BOMA.21 Page 1 of 2
ENBRIDGE GAS INC. Answer to Interrogatory from
Building Owners and Managers Association of Greater Toronto (BOMA) Reference: Exhibit C1, Tab 1, Schedule 1; Utility System Plan/EGD, p21 Question: a) What percentage of EGD and Union rate zone workforce are unionized? How many
positions in which unions? How are collective bargaining results incorporated into the OM&A budgets?
b) Please describe, for each of EGD and Union:
(i) the extent to which labour costs are capitalized into the various capital
projects; (ii) for 2019, how many FTEs (positions) will be capitalized; (iii) what are the impacts of capitalization for both the capital and OM&A budget; (iv) what principles or guidelines do EGD and Union observe in deciding how
much labour cost to capitalize? Please provide any published relevant Accounting Principles.
Response a) Enbridge Gas has approximately 4,600 employees (headcount), and approximately
1,490 (582 legacy EGD/908 legacy Union) unionized employees, which represents a 32% unionized workforce. In terms of collective bargaining results being incorporated into the OM&A budgets, a market analysis of other recent collective bargaining agreements settled in Ontario is done, and is then reviewed with finance to ensure the general wage increase is appropriate.
b)
i) Please see to Exhibit I.STAFF.32, part (c). ii) FTE information is not tracked at the O&M vs. Capital level. As noted in
Exhibit I.STAFF.32 (c), in the case of EGD, overheads related to labour cost are determined by the degree of support each functional group provides to capital projects, representing a portion of an FTE.
iii) The table below summarizes the capitalized overhead for EGD and UG based on the 2019 budget.

Filed: 2019-04-25 EB-2018-0305 Exhibit I.BOMA.21 Page 2 of 2
2019 Budget EGD UG Total Capitalized Overhead 151M 82M 233M
iv) Please see Exhibit I.STAFF.32, part c).

Filed: 2019-04-25 EB-2018-0305 Exhibit I.BOMA.22 Page 1 of 2 Plus Attachments
ENBRIDGE GAS INC. Answer to Interrogatory from
Building Owners and Managers Association of Greater Toronto (BOMA) Reference: Exhibit C1, Tab 1, Schedule 1; Utility System Plan/EGD, p28 Question: For each of EGD and Union:
(a) Please provide copies of the business cases for each capital project included in the 2019 capital budget, or a reference to the business case provided in the evidence, including the breakdown into system access, system renewal, system service, and general plant.
(b) Which of the projects will require Leaves to Construct from the Board?
(c) Please provide a prioritized list, eg. from 1 to 20 of the projects listed in response to subsection (a);
(d) Please indicate the priority ranking, within that list, of the projects for which ICM financing is requested in 2019.
Response (a) For projects and programs greater than $2M forming part of the EGD Asset Plan,
detailed information can be found at Appendix 7. 2-1 to Appendix 7.2-9.1 The details for projects and programs greater than $2M that are part of the Union
Asset Plan can be found in Appendix D.2
b-d) Please see Attachment 1 and Attachment 2. The EGD capital plan was optimized using the Asset Management Process (outlined in Section 4.2). The result addresses the organization’s known asset risks and opportunities requiring action over the next 10 years. The details of how EGD completed its optimization are
1 Exhibit C1, Tab 2, Schedule 1, pages 400 -1459. 2 Exhibit C1, Tab 3, Schedule 1, page 185.

Filed: 2019-04-25 EB-2018-0305 Exhibit I.BOMA.22 Page 2 of 2 Plus Attachments
included in Section 4.1.3.4 Optimize Portfolio Based on Asset Management Principles (p. 71 - 74). Please refer to the Asset Management Core Process steps Risk Management (Section 4.2.1 p. 79), Solution Planning (Section 4.2.2 p. 83) and Portfolio Optimization (Section 4.2.3 p. 84).3 It should be noted that Enbridge Gas in the EGD rate zone optimizes capital by maximizing the risk reduction of a portfolio of work subject to a constraint such as cost. As such, it is not possible to assign a numerical ranking to each business case. Through the optimization process the Asset Investment Planning Tool seeks to drive the efficient allocation of capital over the 10 year portfolio and will place projects in that 10 year horizon to meet this objective. All of the business cases included in the Asset Plan, and provided in this response, represent work that this organization considers necessary to do and the Asset Management Process allows this work to be assigned to a specific year.
The Union capital plan prioritized investments based on the Asset Management approach as outlined in Section 4.2.1.1.3 Risk Management (p. 51to54) and Section 4.2.1.1.4 Project Prioritization and Selection (p. 55 to 58).4 In Exhibit C1, Tab 3, Schedule 1, page 56, the Union AMP outlines the need for a mix of high-priority and lower-priority projects allowing for adjustments to be made in the portfolio as circumstances change. For example, when high-risk or emergency situations arise, the ability to reallocate funding from lower-priority work is beneficial. Maintaining some lower-priority work in the portfolio also allows the organization to be proactive in mitigating risks that if repeatedly deferred will become more significant risks until such time as the organization is compelled to address them in a reactive fashion. Attachment 1 and 2 include the following information:
• Business Case ID/Unique Identifier • Investment Category • Asset Class/Asset Category • Asset Program/Portfolio • Project Name/Description • ICM Eligible • Mandatory • Lifetime Risk Return on Investment / Priority • Spend profile • Potential for LTC
3 Exhibit C1, Tab 2, Schedule 1. 4 Exhibit C1, Tab 3, Schedule 1.

Project Listing for EGD (2019‐2023)
1
Business Case ID Investment Category Asset Class Asset Program Project Name ICM -
Eligible Mandatory LRROI (%) 2019 ($) 2020 ($) 2021 ($) 2022 ($) 2023 ($) Potential
for LTC
2367 System Access Business Development NGV NGV Rental Compressors - Ex Transit - (Until 2020) N 89 2,600,000 5,600,000 - - -
2368 System Access Business Development NGV NGV Rental VRA's - (Until 2025) N 100 250,000 254,325 258,725 263,201 267,754
2369 System Access Business Development NGV NGT Maintenance Capital for company/fleet NG refueling stations - (Until 2020) N 178 405,000 412,007 - - -
8550 System Access Business Development NGV NGT Rental Compressors - Ex Transit - (2021 to 2028) N 118 - - 4,500,000 3,000,000 3,000,000
9552 System Access Business Development NGV NGT Existing customer Maintenance Capital - (Until 2026) N 108 281,311 286,178 291,128 296,165 301,289
9553 System Access Business Development NGV NGT Maintenance Capital for company/fleet NG refueling stations (2021 to 2028) N 155 - - 419,134 461,773 294,530
19223 System Access Business Development NGV Establishing Hydrogen (H2) Interoperability Criteria N 100 1,200,000 365,000 - - -
2986 System Renewal Customer Assets Regulator Refit 2019 Regulator & Meter Exchanges, Replacements, Resets, Vent Aways Y 162 17,290,020 - - - -
2987 System Renewal Customer Assets Regulator Refit 2020 Regulator & Meter Exchanges, Replacements, Resets, Vent Aways Y 162 - 17,696,396 - - -
2988 System Renewal Customer Assets Regulator Refit 2021 Regulator & Meter Exchanges, Replacements, Resets, Vent Aways Y 162 - - 17,884,761 - -
3010 System Renewal Customer Assets Remediation - Customer Assets 2019 HP-XHP Remediation Y 189 901,614 - - - -
3012 System Renewal Customer Assets Remediation - Customer Assets 2020 HP-XHP Remediation Y 185 - 917,211 - - -
3016 System Renewal Customer Assets Remediation - Customer Assets 2019 Commercial / Industrial LPDMS Program Y 226 652,706 - - - -
3021 System Renewal Customer Assets Remediation - Customer Assets 2020 Commercial / Industrial LPDMS Program Y 226 - 652,706 - - -
3030 System Renewal Customer Assets Remediation - Customer Assets 2021 Commercial / Industrial LPDMS Program Y 226 - - 652,706 - -
3032 System Renewal Customer Assets Remediation - Customer Assets 2019 Service Extension Sample Removals N 34 55,000 55,000 - - -
3035 System Access (30%) / System Renewal (70%) Customer Assets Meters - Capital Purchase Program 2019 Meter Purchases Y 113 20,621,317 - - - -
3036 System Access (30%) / System Renewal (70%) Customer Assets Meters - Capital Purchase Program 2020 Meter Purchases Y 113 - 22,827,885 - - -
3037 System Access (30%) / System Renewal (70%) Customer Assets Meters - Capital Purchase Program 2021 Meter Purchases Y 113 - - 21,353,189 - -
3626 System Renewal Customer Assets Remediation - Customer Assets 2021 Farm tap Program Y 40 - - 101,400 - -
3627 System Renewal Customer Assets Remediation - Customer Assets 2019 Farm tap Program Y 40 856,941 - - - -
3628 System Renewal Customer Assets Remediation - Customer Assets 2020 Farm tap Program Y 40 - 856,615 - - -
8501 System Access (30%) / System Renewal (70%) Customer Assets Meters - Capital Purchase Program 2018 Meter shop Machinery Upgrades Y 261 40,000 - - - -
8529 System Renewal Customer Assets Regulator Refit 2022 Regulator & Meter Exchanges, Replacements, Resets, Vent Aways Y 165 - - - 18,270,259 -
8531 System Renewal Customer Assets Regulator Refit 2023 Regulator & Meter Exchanges, Replacements, Resets, Vent Aways Y 162 - - - - 18,625,418
8542 System Renewal Customer Assets Remediation - Customer Assets 2022 Commercial / Industrial LPDMS Program Y 226 - - - 357,749 -
8543 System Renewal Customer Assets Remediation - Customer Assets 2023 Commercial / Industrial LPDMS Program Y 226 - - - - 357,749
8570 System Access (30%) / System Renewal (70%) Customer Assets Meters - Capital Purchase Program 2022 Meter Purchases Y 137 - - - 23,592,268 -
8571 System Access (30%) / System Renewal (70%) Customer Assets Meters - Capital Purchase Program 2023 Meter Purchases Y 113 - - - - 24,687,621
8803 System Renewal Customer Assets Remediation - Customer Assets 2022 Farm tap Program Y 40 - - - 103,155 -
8804 System Renewal Customer Assets Remediation - Customer Assets 2023 Farm tap Program Y 40 - - - - 104,939
9141 System Renewal Customer Assets Remediation - Customer Assets 2019 Assets Downstream of Bulk Meters Y 144 443,000 - - - -
9142 System Renewal Customer Assets Remediation - Customer Assets 2020 Assets Downstream of Bulk Meters Y 144 - 400,000 - - -
9143 System Renewal Customer Assets Remediation - Customer Assets 2021 Assets Downstream of Bulk Meters Y 144 - - 203,410 - -
9144 System Renewal Customer Assets Remediation - Customer Assets 2022 Assets Downstream of Bulk Meters Y 144 - - - 203,410 -
9167 System Access (30%) / System Renewal (70%) Customer Assets Meters - Capital Purchase Program 2019 Meter shop Machinery Upgrades N 123 175,000 - - - -
Filed: 2019-04-25, EB-2018-0305, Exhibit I.BOMA.22, Attachment 1, Page 1 of 13

Project Listing for EGD (2019‐2023)
2
Business Case ID Investment Category Asset Class Asset Program Project Name ICM -
Eligible Mandatory LRROI (%) 2019 ($) 2020 ($) 2021 ($) 2022 ($) 2023 ($) Potential
for LTC
9168 System Access (30%) / System Renewal (70%) Customer Assets Meters - Capital Purchase Program 2020 Meter shop Machinery Upgrades N 127
-
225,000
-
-
-
9169 System Access (30%) / System Renewal (70%) Customer Assets Meters - Capital Purchase Program 2021 Meter shop Machinery Upgrades Y 123
-
-
90,000
-
-
9170 System Access (30%) / System Renewal (70%) Customer Assets Meters - Capital Purchase Program 2022 Meter shop Machinery Upgrades N 123
-
-
-
110,000
-
9172 System Access (30%) / System Renewal (70%) Customer Assets Meters - Capital Purchase Program 2023 Meter shop Machinery Upgrades N 123
-
-
-
-
245,000
17966 System Renewal Customer Assets Remediation - Customer Assets 2023 Assets Downstream of Bulk Meters Y 144
-
-
-
-
203,410
3402 System Access Customer Growth Apartment Ensuite - New Construction Area 10 - Apartment Ensuite - New Construction Y 109
2,321,778
2,408,584
2,459,123
2,433,377
2,431,158
3405 System Access Customer Growth Apartment Traditional - New Construction Area 10 - Apartment Traditional - New Construction Y 1257
2,079
2,156
2,202
2,179
2,177
3406 System Access Customer Growth Commercial - New Construction Area 10 - Commercial - New Construction Y 37
5,700,134
5,913,249
6,037,326
5,974,117
5,968,670
3408 System Access Customer Growth Residential - Replacement Area 10 - Residential - Replacement Y 24
6,852,731
7,108,939
7,258,105
7,182,115
7,175,566
3700 System Access Customer Growth Residential - New Construction Area 10 - Residential - New Construction Y 291
852,491
884,364
902,920
893,467
892,652
3720 System Access Customer Growth Industrial - New Construction Area 10 - Industrial - New Construction Y 0
31,186
32,352
33,030
32,685
32,655
3722 System Access Customer Growth Apartment Ensuite - New Construction Area 20 - Apartment Ensuite - New Construction Y 724
11,360
11,784
12,032
11,906
11,895
3724 System Access Customer Growth Apartment Traditional - New Construction Area 20 - Apartment Traditional - New Construction Y 625
459
476
486
481
481
3726 System Access Customer Growth Commercial - New Construction Area 20 - Commercial - New Construction Y 143
2,173,646
2,254,914
2,302,228
2,278,125
2,276,047
3727 System Access Customer Growth Industrial - New Construction Area 20 - Industrial - New Construction Y 0
299,503
310,701
317,221
313,899
313,613
3729 System Access Customer Growth Residential - New Construction Area 20 - Residential - New Construction Y 226
5,807,199
6,024,317
6,150,724
6,086,328
6,080,778
3730 System Access Customer Growth Residential - Replacement Area 20 - Residential - Replacement Y 41
875,836
908,581
927,646
917,934
917,097
3731 System Access Customer Growth Apartment Ensuite - New Construction Area 30 - Apartment Ensuite - New Construction Y 156
608,409
631,156
644,400
637,653
637,072
3735 System Access Customer Growth Commercial - New Construction Area 30 - Commercial - New Construction Y 63
3,572,436
3,706,002
3,783,764
3,744,149
3,740,735
3736 System Access Customer Growth Industrial - New Construction Area 30 - Industrial - New Construction Y 0
148,523
154,076
157,309
155,662
155,520
3738 System Access Customer Growth Residential - New Construction Area 30 - Residential - New Construction Y 138
11,031,571
11,444,016
11,684,144
11,561,815
11,551,273
3739 System Access Customer Growth Residential - Replacement Area 30 - Residential - Replacement Y 14
4,344,294
4,506,717
4,601,281
4,553,107
4,548,956
3740 System Access Customer Growth Apartment Ensuite - New Construction Area 40 - Apartment Ensuite - New Construction Y 392
46,688
48,433
49,449
48,932
48,887
3744 System Access Customer Growth Commercial - New Construction Area 40 - Commercial - New Construction Y 178
1,157,598
1,200,878
1,226,076
1,213,240
1,212,133
3747 System Access Customer Growth Residential - New Construction Area 40 - Residential - New Construction Y 248
4,776,794
4,955,387
5,059,365
5,006,395
5,001,830
3748 System Access Customer Growth Residential - Replacement Area 40 - Residential - Replacement Y 32
4,904,971
5,088,356
5,195,124
5,140,733
5,136,046
3753 System Access Customer Growth Commercial - New Construction Area 50 - Commercial - New Construction Y 168
721,116
748,077
763,773
755,777
755,088
3756 System Access Customer Growth Residential - New Construction Area 50 - Residential - New Construction Y 164
5,906,023
6,126,836
6,255,394
6,189,902
6,184,258
3757 System Access Customer Growth Residential - Replacement Area 50 - Residential - Replacement Y 30
3,590,204
3,724,433
3,802,582
3,762,771
3,759,340
3758 System Access Customer Growth Apartment Ensuite - New Construction Area 60 - Apartment Ensuite - New Construction Y 345
21,720
22,532
23,005
22,764
22,743
3759 System Access Customer Growth Apartment Traditional - New Construction Area 60 - Apartment Traditional - New Construction Y 4989
1,765
1,831
1,869
1,849
1,848
3761 System Access Customer Growth Commercial - New Construction Area 60 - Commercial - New Construction Y 42
4,405,692
4,570,411
4,666,311
4,617,456
4,613,246
3762 System Access Customer Growth Industrial - New Construction Area 60 - Industrial - New Construction Y 0
2,412,263
2,502,452
2,554,961
2,528,211
2,525,906
3764 System Access Customer Growth Residential - New Construction Area 60 - Residential - New Construction Y 115
10,807,094
11,211,146
11,446,388
11,326,548
11,316,220
3765 System Access Customer Growth Residential - Replacement Area 60 - Residential - Replacement Y 51
6,526,446
6,770,455
6,912,518
6,840,147
6,833,910
3766 System Access Customer Growth Apartment Ensuite - New Construction Area 80 - Apartment Ensuite - New Construction Y 0
933
968
989
978
977
Filed: 2019-04-25, EB-2018-0305, Exhibit I.BOMA.22, Attachment 1, Page 2 of 13

Project Listing for EGD (2019‐2023)
3
Business Case ID Investment Category Asset Class Asset Program Project Name ICM -
Eligible Mandatory LRROI (%) 2019 ($) 2020 ($) 2021 ($) 2022 ($) 2023 ($) Potential
for LTC
3769 System Access Customer Growth Commercial - New Construction Area 80 - Commercial - New Construction Y 148
870,247
902,784
921,727
912,077
911,245
3770 System Access Customer Growth Industrial - New Construction Area 80 - Industrial - New Construction Y 0
871,046
903,612
922,573
912,914
912,081
3772 System Access Customer Growth Residential - New Construction Area 80 - Residential - New Construction Y 149
5,330,790
5,530,096
5,646,133
5,587,020
5,581,926
3773 System Access Customer Growth Residential - Replacement Area 80 - Residential - Replacement Y 41
519,754
539,186
550,500
544,736
544,239
3783 System Access Customer Growth Commercial - Replacement Area 20 - Commercial - Replacement Y 108
537,770
557,876
569,582
563,619
563,105
3822 System Access Customer Growth Commercial - Replacement Area 80 - Commercial - Replacement Y 31
792,328
821,952
839,198
830,412
829,655
3523 General Plant Fleet & Equipment Capital Purchase Program - Equipment & Materials 2017 - 2021 485 Heavy Work Equipment N 231
500,000
500,000
500,000
-
-
3526 General Plant Fleet & Equipment Capital Purchase Program - Vehicles 2017- 2021 - 484 Light and Medium duty vehicles N 118
5,068,514
4,902,904
5,051,154
-
-
3546 General Plant Fleet & Equipment Capital Purchase Program - Tools 2017 -2021 - 486 Tools & Equipment Y 0
800,000
800,000
800,000
-
-
8548 General Plant Fleet & Equipment Capital Purchase Program - Vehicles 2022 to 2028 - 484 Light and Medium duty vehicles N 83
-
-
-
4,652,374
4,871,000
8549 General Plant Fleet & Equipment Capital Purchase Program - Tools 2022 to 2028 - 486 Tools & Equipment Y 0
-
-
-
1,000,000
1,000,000
8555 General Plant Fleet & Equipment Capital Purchase Program - Equipment & Materials 2022 to 2028 - 485 Heavy Work Equipment N 125
-
-
-
500,000
453,801
9554 General Plant Fleet & Equipment Capital Purchase Program - Vehicles NG conversion kits for new fleet vehicles Y 0
399,514
407,504
415,654
423,967
432,446
1210 System Renewal Pipe Main Replacement 2019 Steel Mains Replacement Program Y 1
18,843,521
-
-
-
-
1213 System Service Pipe System Reinforcement - Pipe York Region Reinforcement Y
2,522,000
70,000
-
-
280,000
1224 System Service Pipe System Reinforcement - Pipe Bayview/Truman Reinforce. Y 0
40,000
-
-
-
-
1418 System Renewal Pipe Service Relay 2019 AMP Fitting Replacement Program Y 56
4,406,944
-
-
-
-
2458 System Service Pipe System Reinforcement - Pipe Peterborough Reinforcement Y 125
50,000
2,071,657
-
-
- Y
2522 System Service Pipe System Reinforcement - Pipe Rodinea Road Y 0
921,000
-
-
-
-
2564 System Service Pipe System Reinforcement - Pipe Sideline 16 Pressure Elevation Y 0
50,000
-
-
-
-
6423 System Renewal Pipe Main Replacement NPS 30 Don River Replacement Y Y 24
24,900,530
800,000
-
-
- Y
7706 System Service Pipe System Reinforcement - Pipe Bathurst Reinforcement Y 78
8,810,839
650,000
-
-
- Y
7709 System Service Pipe System Reinforcement - Pipe Bisset Ave Reinforcement Y 23
-
-
-
-
641,155
7710 System Service Pipe System Reinforcement - Pipe McCowan Ave HP Reinforcemen Y 190
-
30,000
533,522
60,000
-
7714 System Service Pipe System Reinforcement - Pipe NW 2103 - Hwy 10, Orangeville Reinforcement Y 89
-
-
-
1,859,632
-
7715 System Service Pipe System Reinforcement - Pipe Heritage and Embleton - Phase 2 reinforcement Y 187
1,790,660
-
-
-
-
7718 System Service Pipe System Reinforcement - Pipe North Bradford Reinforcement Y 151
644,749
-
-
-
-
7721 System Service Pipe System Reinforcement - Pipe Network 3750 - 2nd Concession Road Reinforcement Y 133
-
-
-
214,879
-
7724 System Service Pipe System Reinforcement - Pipe Oro-Medonte IP Network Reinforcement Y 102
-
742,847
-
-
-
7727 System Service Pipe System Reinforcement - Pipe Welland IP NW8925 Reinforcement Y 10
1,669,305
832,152
-
-
-
7728 System Service Pipe System Reinforcement - Pipe Welland IP NW8926 Reinforcement Y 17
-
-
-
669,036
-
7729 System Service Pipe System Reinforcement - Pipe Port Colborne IP NW8521 Reinforcement Y 60
-
1,447,683
-
-
-
7732 System Service Pipe System Reinforcement - Pipe AJAX Reinforcement Y 103
-
160,000
3,052,025
-
- Y
7740 System Service Pipe System Reinforcement - Pipe Kemptville Reinforcement Y 15
-
-
-
186,000
4,839,454 Y
7742 System Service Pipe System Reinforcement - Pipe Rockland IP Reinforcement Y 98
-
692,747
-
-
-
7743 System Service Pipe System Reinforcement - Pipe L'Original Reinforcement Y 129
172,500
3,896,608
-
-
- Y
Filed: 2019-04-25, EB-2018-0305, Exhibit I.BOMA.22, Attachment 1, Page 3 of 13

Project Listing for EGD (2019‐2023)
4
Business Case ID Investment Category Asset Class Asset Program Project Name ICM -
Eligible Mandatory LRROI (%) 2019 ($) 2020 ($) 2021 ($) 2022 ($) 2023 ($) Potential
for LTC
8928 System Access Pipe Rebillable Relocation 2019 Rebillable Relocation Blanket - All Area Y 0
1,500,000
-
-
-
-
8930 System Access Pipe Rebillable Relocation 2020 Rebillable Relocation Blanket - All Area Y 0
-
3,000,000
-
-
-
8932 System Renewal Pipe Corrosion Prevention Anode Blanket - All Areas (10 Year Plan: 2018-2027) Y 221
1,210,943
1,228,735
1,246,841
1,265,265
1,284,014
8948 System Renewal Pipe Main Replacement Emergency Replacement Blanket - All Areas (10 year plan: 2018-2027) Y 0
2,000,000
2,000,000
2,000,000
2,000,000
2,000,000
8949 System Renewal Pipe Service Relay Relay Blanket - All Areas (10 year plan: 2018-2027) Y 28
17,722,914
20,295,803
21,195,208
22,174,994
23,183,476
9216 System Service Pipe System Reinforcement - Pipe Old ChurchRoad to Bruno Ridge Dr. Reinforcement Y 155
-
-
-
-
496,862
9521 System Service Pipe System Reinforcement - Pipe Sideline 16 and Brock Pressure Control Station (part of pipe Reinforcement) Y 0
1,107,845
-
-
-
-
9551 System Service Pipe Integrity Initiatives - Pipe Fiber Optics on Vital and Critical Mains N 6
-
1,358,000
1,092,500
1,381,500
583,000
10087 System Access Pipe Rebillable Relocation NPS 20 Don River Relocation Y Y 121
13,016,712
22,006,030
850,000 Y
10089 System Renewal Pipe Main Replacement NPS 12 St. Laurent Ottawa North Main Replacement (2021+) Y N 1
-
-
9,239,682
40,641,901
2,250,000 Y
10223 System Renewal Pipe Service Relay 2020 AMP Fitting Replacement Program Y 61
-
4,483,144
-
-
-
10224 System Renewal Pipe Service Relay 2021 AMP Fitting Replacement Program Y 66
-
-
6,841,115
-
-
10261 System Renewal Pipe Service Relay 2022 AMP Fitting Replacement Program Y 71
-
-
-
9,279,287
-
10262 System Renewal Pipe Service Relay 2023 AMP Fitting Replacement Program Y 76
-
-
-
-
10,839,819
10281 System Access Pipe Rebillable Relocation 2021 Rebillable Relocation Blanket - All Area Y 0
-
-
7,700,000
-
-
10282 System Access Pipe Rebillable Relocation 2022 Rebillable Relocation Blanket - All Area Y 0
-
-
-
7,700,000
-
10283 System Access Pipe Rebillable Relocation 2023 Rebillable Relocation Blanket - All Area Y 0
-
-
-
-
7,700,000
10321 System Renewal Pipe Main Replacement 2020 Steel Mains Replacement Program Y 1
-
21,598,770
-
-
-
10322 System Renewal Pipe Main Replacement 2021 Steel Mains Replacement Program Y 1
-
-
24,116,965
-
-
10323 System Renewal Pipe Main Replacement 2022 Steel Mains Replacement Program Y 1
-
-
-
26,928,763
-
10324 System Renewal Pipe Main Replacement 2023 Steel Mains Replacement Program Y 1
-
-
-
-
30,068,397
10342 System Renewal Pipe Main Replacement 2019 Vintage PE Main Replacement Program Y 2
1,889,314
-
-
-
-
10343 System Renewal Pipe Main Replacement 2020 Vintage PE Main Replacement Program Y 2
-
2,275,540
-
-
-
10345 System Renewal Pipe Main Replacement 2021 Vintage PE Main Replacement Program Y 2
-
-
2,745,970
-
-
10346 System Renewal Pipe Main Replacement 2022 Vintage PE Main Replacement Program Y 2
-
-
-
3,319,220
-
10347 System Renewal Pipe Main Replacement 2023 Vintage PE Main Replacement Program Y 2
-
-
-
-
4,018,034
11443 System Renewal Pipe Main Replacement NPS 12 Martin Grove Rd Main Replacement Ph 2 Y N 3
-
-
-
-
400,000
16507 System Service Pipe System Reinforcement - Pipe Limoges Reinforcement Y 82
-
-
1,386,603
-
-
16744 System Service Pipe System Reinforcement - Pipe Amaranth System Reinforcement Y 39
-
-
100,000
100,000
-
16748 System Service Pipe System Reinforcement - Pipe Erin IP System Reinforcement Y 69
1,454,120
-
-
-
1,711,158
16749 System Service Pipe System Reinforcement - Pipe Mearns & Flaxman Upsize / Reinforcement Y 178
98,696
-
-
-
-
16751 System Service Pipe System Reinforcement - Pipe Thornton XHP reinforcement Y 158
-
-
-
1,834,811
3,633,007 Y
16752 System Service Pipe System Reinforcement - Pipe Bridle Path Reinforcement Y 6
-
1,663,977
-
-
-
17227 System Service Pipe System Reinforcement - Pipe Caledon IP System Reinforcement Y 124
-
100,000
121,136
-
-
17243 System Service Pipe System Reinforcement - Pipe NW 2225 terra cotta Reinforcement Y 18
-
809,144
-
-
-
17364 System Renewal Pipe Integrity Retrofit - Pipe NPS 8 Blackburn Extension Y 0
3,855,000
-
-
-
-
Filed: 2019-04-25, EB-2018-0305, Exhibit I.BOMA.22, Attachment 1, Page 4 of 13

Project Listing for EGD (2019‐2023)
5
Business Case ID Investment Category Asset Class Asset Program Project Name ICM -
Eligible Mandatory LRROI (%) 2019 ($) 2020 ($) 2021 ($) 2022 ($) 2023 ($) Potential
for LTC
19123 System Service Pipe System Reinforcement - Pipe York Region Reinforcement - Civic Centre to Baseline 2.1 Km Y 0
1,000,100
-
-
-
-
19345 System Renewal Pipe Non-Rebillable Relocation 2019 Non-Rebillable Relocation Blanket - All Area Y 0
1,500,000
-
-
-
-
19346 System Renewal Pipe Non-Rebillable Relocation 2020 Non-Rebillable Relocation Blanket - All Area Y 0
-
2,000,000
-
-
-
19347 System Renewal Pipe Non-Rebillable Relocation 2021 Non-Rebillable Relocation Blanket - All Area Y 0
-
-
2,000,000
-
-
19349 System Renewal Pipe Non-Rebillable Relocation 2022 Non-Rebillable Relocation Blanket - All Area Y 0
-
-
-
2,000,000
-
19352 System Renewal Pipe Non-Rebillable Relocation 2023 Non-Rebillable Relocation Blanket - All Area Y 0
-
-
-
-
2,000,000
19503 System Renewal Pipe Main Replacement NPS 20 Lake Shore KOL Replacement (Parliament to Bathurst) Planning & Design N 0
250,000
1,650,000
-
-
-
19505 System Renewal Pipe Main Replacement St Laurent NPS 12 Planning Dollars (2019/2020) N 0
250,000
150,000
-
-
-
1796 General Plant REWS Furniture / Structures & Improvements Brampton Operations Centre Alterations Y 123
100,000
3,100,000
-
-
-
3634 General Plant REWS Furniture / Structures & Improvements VPC-1 N 109
-
4,200,000
-
-
-
3635 General Plant REWS Furniture / Structures & Improvements VPC-B N 91
-
-
2,000,000
-
-
3636 General Plant REWS Furniture / Structures & Improvements VPC-2 N 113
1,180,000
-
-
-
-
3637 General Plant REWS Furniture / Structures & Improvements VPC-Link and stairwells N 89
-
750,000
750,000
-
-
3638 General Plant REWS Furniture / Structures & Improvements TOC EMEC Expansion N 102
50,000
50,000
3,500,000
-
-
3639 General Plant REWS Furniture / Structures & Improvements Kennedy Road Expansion Y N 90
-
-
-
9,200,000
8,000,000
3640 General Plant REWS Furniture / Structures & Improvements Station B New Building N 83
-
5,000,000
1,500,000
-
-
3641 General Plant REWS Furniture / Structures & Improvements EGD targeted GHG & Energy reductions N 237
350,000
350,000
350,000
-
-
3642 General Plant REWS Furniture / Structures & Improvements Eastern Region Consolidated facility Y N 58
-
25,000
-
-
-
3644 General Plant REWS Furniture / Structures & Improvements 2017,2019-21 Furniture & Ergonomic blanket Y 193
203,460
206,979
210,560
-
-
3675 General Plant REWS Furniture / Structures & Improvements Cabling 2017-2021 Y 112
101,730
103,489
105,280
-
-
4333 General Plant REWS Furniture / Structures & Improvements Direct Capital Overheads Y 72
530,000
530,000
530,000
250,000
250,000
6081 General Plant REWS Furniture / Structures & Improvements 2019 Blanket for Building Systems Y 106
1,831,140
-
-
-
-
6082 General Plant REWS Furniture / Structures & Improvements 2020 Blanket for Building Systems Y 106
-
1,862,819
-
-
-
6083 General Plant REWS Furniture / Structures & Improvements 2021 Blanket for Building Systems Y 106
-
-
1,895,045
-
-
6087 General Plant REWS Furniture / Structures & Improvements New Mechanical Services Building N 135
-
-
4,500,000
4,500,000
-
6104 General Plant REWS Furniture / Structures & Improvements Barrie Operations Centre Obsolescence N 85
-
1,000,000
6,000,000
-
-
6143 General Plant REWS Furniture / Structures & Improvements Peterborough Operations Centre Obsolescence N 70
-
-
1,000,000
3,450,000
-
8677 General Plant REWS Furniture / Structures & Improvements Arnprior Operations Centre Obsolescence N 70
-
-
500,000
1,600,000
-
8701 General Plant REWS Furniture / Structures & Improvements Kelfield Operations Centre Obsolescence. N 91
-
1,000,000
4,700,000
1,100,000
-
8703 General Plant REWS Furniture / Structures & Improvements Brockville Operations Centre Obsolescence N 74
-
1,500,000
3,350,000
-
-
8765 General Plant REWS Furniture / Structures & Improvements 2022 Blanket for Building Systems Y 106
-
-
-
1,927,830
-
8766 General Plant REWS Furniture / Structures & Improvements 2023 Blanket for Building Systems Y 106
-
-
-
-
1,961,181
8826 General Plant REWS Furniture / Structures & Improvements Cabling 2022-2026 Y 112
-
-
-
107,101
108,954
8828 General Plant REWS Furniture / Structures & Improvements 2022-2026 Furniture & Ergonomic blanket Y 193
-
-
-
214,203
217,909
15603 General Plant REWS Furniture / Structures & Improvements VPC Emergency Life Safety Systems Backup Power Y 0
1,450,000
-
-
-
-
1011 System Renewal Stations Gate & Feeder Station SCHOMBERG GATE Y 25
-
-
-
1,278,897
698,558
Filed: 2019-04-25, EB-2018-0305, Exhibit I.BOMA.22, Attachment 1, Page 5 of 13

Project Listing for EGD (2019‐2023)
6
Business Case ID Investment Category Asset Class Asset Program Project Name ICM -
Eligible Mandatory LRROI (%) 2019 ($) 2020 ($) 2021 ($) 2022 ($) 2023 ($) Potential
for LTC
1012 System Renewal Stations Gate & Feeder Station LEEDS GATE N 69
-
200,000
573,229
-
-
1013 System Renewal Stations Gate & Feeder Station MARKHAM GATE Y 10
-
-
-
-
1,480,274
1029 System Renewal Stations Gate & Feeder Station DEEP RIVER GATE Y 27
1,767,000
-
-
-
-
1031 System Renewal Stations Gate & Feeder Station ORO-MEDONTE GATE Y 4
1,064,449
630,218
-
-
-
1239 System Renewal Stations Gate & Feeder Station MARTIN GROVE FEEDER Y 16
-
-
-
-
747,157
1240 System Renewal Stations Gate & Feeder Station WEST MALL FEEDER Y 48
1,400,000
-
-
-
-
1261 System Renewal Stations Inside Regulator Program ERR Program Y 0
500,000
500,000
500,000
500,000
500,000
1700 System Renewal Stations Gate & Feeder Station BLACKHORSE GATE Y 244
1,200,000
2,433,653
-
-
-
2719 System Renewal Stations Gate & Feeder Station YONGE AND STEELES FEEDER N 58
-
-
215,608
369,715
-
3455 System Renewal Stations Station Rebuild Harmer District Station Y 0
-
1,688,739
-
-
-
3483 System Renewal Stations Station Rebuild 2019 Header stations rebuilds Y 150
924,000
-
-
-
-
3484 System Renewal Stations Station Rebuild 2020 Header stations rebuilds Y 150
-
924,000
-
-
-
3486 System Renewal Stations Station Rebuild 2021 Header stations rebuilds Y 150
-
-
924,000
-
-
3573 System Renewal Stations Gate & Feeder Station 2019 M&R Compliance Project Y 357
200,000
-
-
-
-
3574 System Renewal Stations Gate & Feeder Station 2020 M&R Compliance Project Y 357
-
200,000
-
-
-
3575 System Renewal Stations Gate & Feeder Station 2021 M&R Compliance Project Y 357
-
-
200,000
-
-
3579 System Renewal Stations Station Rebuild 2019 Sales stations rebuilds Y 130
1,100,000
-
-
-
-
3580 System Renewal Stations Station Rebuild 2020 Sales stations rebuilds Y 87
-
1,500,000
-
-
-
3581 System Renewal Stations Station Rebuild 2021 Sales stations rebuilds Y 60
-
-
2,000,000
-
-
3584 System Renewal Stations Station Rebuild 2019 District Station Rebuilds Program Y 185
6,500,000
-
-
-
-
3585 System Renewal Stations Station Rebuild 2020 District Station Rebuilds Program Y 160
-
6,500,000
-
-
-
3586 System Renewal Stations Station Rebuild 2021 District Station Rebuilds Program Y 123
-
-
7,000,000
-
-
3605 System Renewal Stations Gate & Feeder Station BAYVIEW FEEDER N 54
-
-
338,581
853,264
-
3609 System Renewal Stations Gate & Feeder Station CONSUMERS RD N 34
750,626
-
-
-
-
3610 System Renewal Stations Gate & Feeder Station CROWLAND STORAGE TRANSFER Y 15
-
-
-
611,314
127,373
3612 System Renewal Stations Gate & Feeder Station LISGAR GATE Y 30
-
-
-
2,593,599
2,346,579
3619 System Renewal Stations Gate & Feeder Station MITCH OWENS GATE ABANDONMENT Y 0
58,892
-
-
-
-
3621 System Renewal Stations Station Rebuild ROCKCLIFFE CONTROL DISTRICT N 3
-
-
-
500,000
-
3624 System Renewal Stations Gate & Feeder Station VICTORIA SQUARE GATE N 4
-
500,000
-
-
-
3631 System Renewal Stations Gate & Feeder Station 2019 Telemetry Y 59
1,400,000
-
-
-
-
3632 System Renewal Stations Gate & Feeder Station 2020 Telemetry Y 60
-
1,400,000
-
-
-
3633 System Renewal Stations Gate & Feeder Station 2021 Telemetry Y 57
-
-
1,400,000
-
-
7061 System Renewal Stations Gate & Feeder Station BRAMPTON GATE Y 23
-
300,000
1,194,515
-
-
7747 System Renewal Stations Gate & Feeder Station BEAMSVILLE GATE N 12
-
128,712
-
-
-
7748 System Renewal Stations Gate & Feeder Station BETHEL GATE Y 31
-
-
-
974,903
675,571
7750 System Renewal Stations Gate & Feeder Station HALEY GATE Y 0
-
-
-
255,573
-
Filed: 2019-04-25, EB-2018-0305, Exhibit I.BOMA.22, Attachment 1, Page 6 of 13
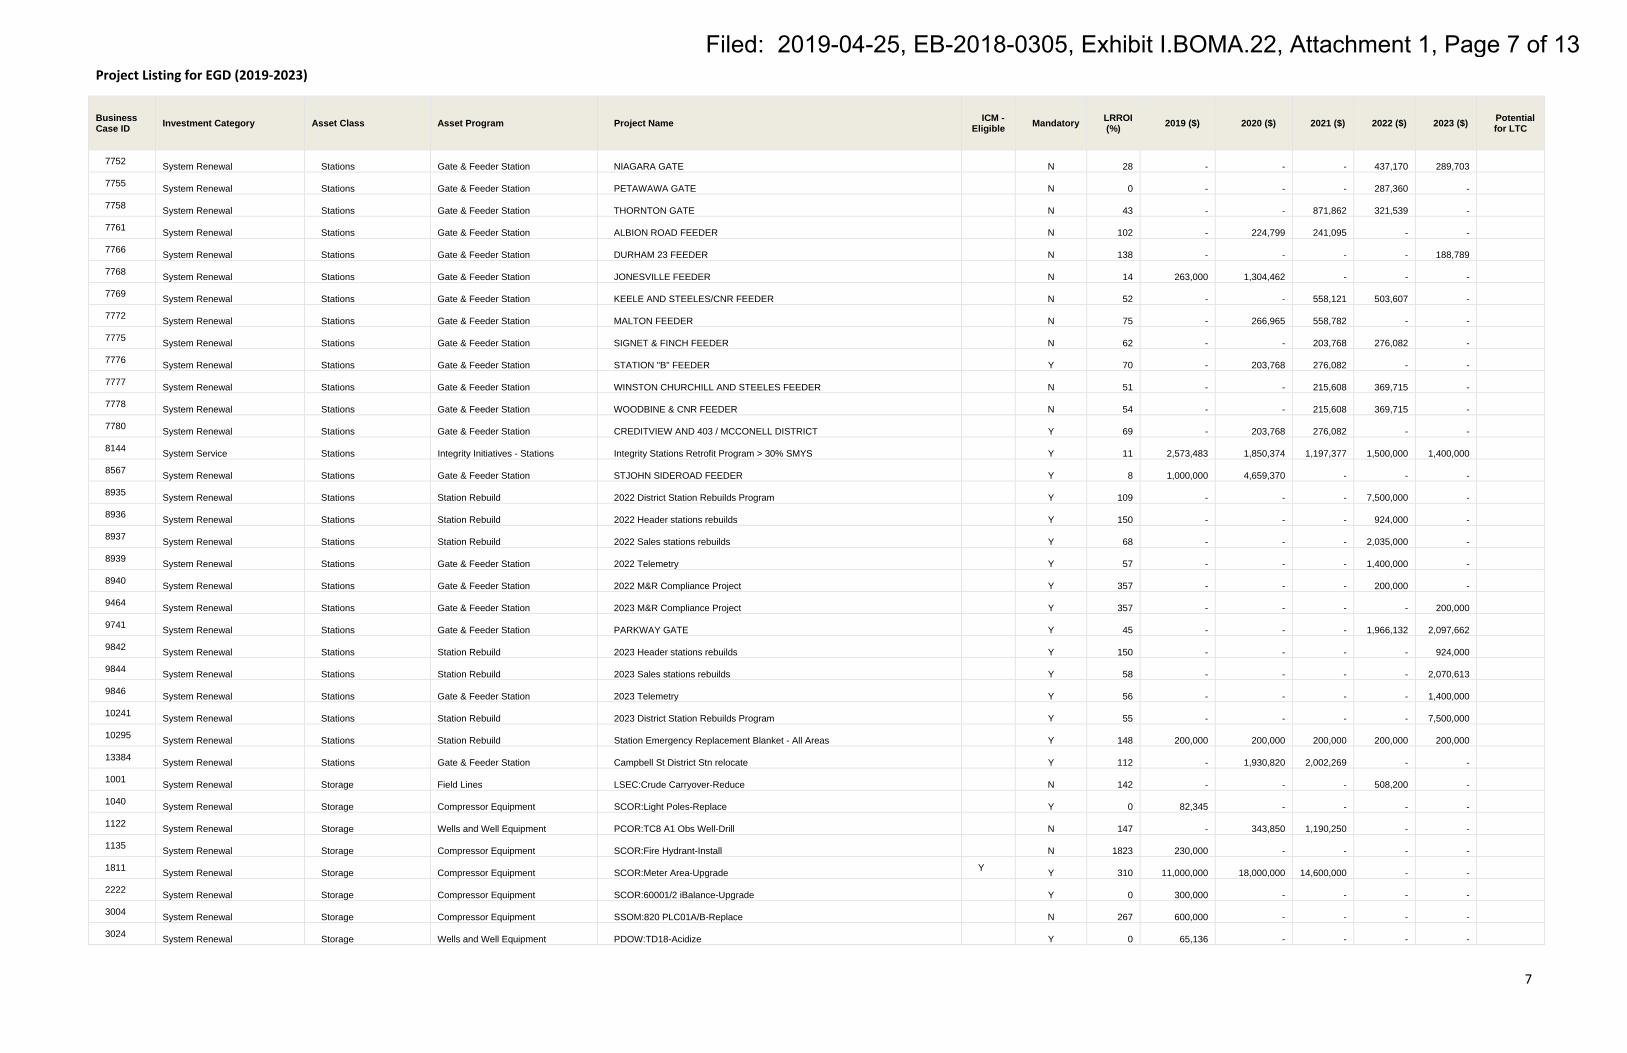
Project Listing for EGD (2019‐2023)
7
Business Case ID Investment Category Asset Class Asset Program Project Name ICM -
Eligible Mandatory LRROI (%) 2019 ($) 2020 ($) 2021 ($) 2022 ($) 2023 ($) Potential
for LTC
7752 System Renewal Stations Gate & Feeder Station NIAGARA GATE N 28
-
-
-
437,170
289,703
7755 System Renewal Stations Gate & Feeder Station PETAWAWA GATE N 0
-
-
-
287,360
-
7758 System Renewal Stations Gate & Feeder Station THORNTON GATE N 43
-
-
871,862
321,539
-
7761 System Renewal Stations Gate & Feeder Station ALBION ROAD FEEDER N 102
-
224,799
241,095
-
-
7766 System Renewal Stations Gate & Feeder Station DURHAM 23 FEEDER N 138
-
-
-
-
188,789
7768 System Renewal Stations Gate & Feeder Station JONESVILLE FEEDER N 14
263,000
1,304,462
-
-
-
7769 System Renewal Stations Gate & Feeder Station KEELE AND STEELES/CNR FEEDER N 52
-
-
558,121
503,607
-
7772 System Renewal Stations Gate & Feeder Station MALTON FEEDER N 75
-
266,965
558,782
-
-
7775 System Renewal Stations Gate & Feeder Station SIGNET & FINCH FEEDER N 62
-
-
203,768
276,082
-
7776 System Renewal Stations Gate & Feeder Station STATION "B" FEEDER Y 70
-
203,768
276,082
-
-
7777 System Renewal Stations Gate & Feeder Station WINSTON CHURCHILL AND STEELES FEEDER N 51
-
-
215,608
369,715
-
7778 System Renewal Stations Gate & Feeder Station WOODBINE & CNR FEEDER N 54
-
-
215,608
369,715
-
7780 System Renewal Stations Gate & Feeder Station CREDITVIEW AND 403 / MCCONELL DISTRICT Y 69
-
203,768
276,082
-
-
8144 System Service Stations Integrity Initiatives - Stations Integrity Stations Retrofit Program > 30% SMYS Y 11
2,573,483
1,850,374
1,197,377
1,500,000
1,400,000
8567 System Renewal Stations Gate & Feeder Station STJOHN SIDEROAD FEEDER Y 8
1,000,000
4,659,370
-
-
-
8935 System Renewal Stations Station Rebuild 2022 District Station Rebuilds Program Y 109
-
-
-
7,500,000
-
8936 System Renewal Stations Station Rebuild 2022 Header stations rebuilds Y 150
-
-
-
924,000
-
8937 System Renewal Stations Station Rebuild 2022 Sales stations rebuilds Y 68
-
-
-
2,035,000
-
8939 System Renewal Stations Gate & Feeder Station 2022 Telemetry Y 57
-
-
-
1,400,000
-
8940 System Renewal Stations Gate & Feeder Station 2022 M&R Compliance Project Y 357
-
-
-
200,000
-
9464 System Renewal Stations Gate & Feeder Station 2023 M&R Compliance Project Y 357
-
-
-
-
200,000
9741 System Renewal Stations Gate & Feeder Station PARKWAY GATE Y 45
-
-
-
1,966,132
2,097,662
9842 System Renewal Stations Station Rebuild 2023 Header stations rebuilds Y 150
-
-
-
-
924,000
9844 System Renewal Stations Station Rebuild 2023 Sales stations rebuilds Y 58
-
-
-
-
2,070,613
9846 System Renewal Stations Gate & Feeder Station 2023 Telemetry Y 56
-
-
-
-
1,400,000
10241 System Renewal Stations Station Rebuild 2023 District Station Rebuilds Program Y 55
-
-
-
-
7,500,000
10295 System Renewal Stations Station Rebuild Station Emergency Replacement Blanket - All Areas Y 148
200,000
200,000
200,000
200,000
200,000
13384 System Renewal Stations Gate & Feeder Station Campbell St District Stn relocate Y 112
-
1,930,820
2,002,269
-
-
1001 System Renewal Storage Field Lines LSEC:Crude Carryover-Reduce N 142
-
-
-
508,200
-
1040 System Renewal Storage Compressor Equipment SCOR:Light Poles-Replace Y 0
82,345
-
-
-
-
1122 System Renewal Storage Wells and Well Equipment PCOR:TC8 A1 Obs Well-Drill N 147
-
343,850
1,190,250
-
-
1135 System Renewal Storage Compressor Equipment SCOR:Fire Hydrant-Install N 1823
230,000
-
-
-
-
1811 System Renewal Storage Compressor Equipment SCOR:Meter Area-Upgrade Y Y 310
11,000,000
18,000,000
14,600,000
-
-
2222 System Renewal Storage Compressor Equipment SCOR:60001/2 iBalance-Upgrade Y 0
300,000
-
-
-
-
3004 System Renewal Storage Compressor Equipment SSOM:820 PLC01A/B-Replace N 267
600,000
-
-
-
-
3024 System Renewal Storage Wells and Well Equipment PDOW:TD18-Acidize Y 0
65,136
-
-
-
-
Filed: 2019-04-25, EB-2018-0305, Exhibit I.BOMA.22, Attachment 1, Page 7 of 13
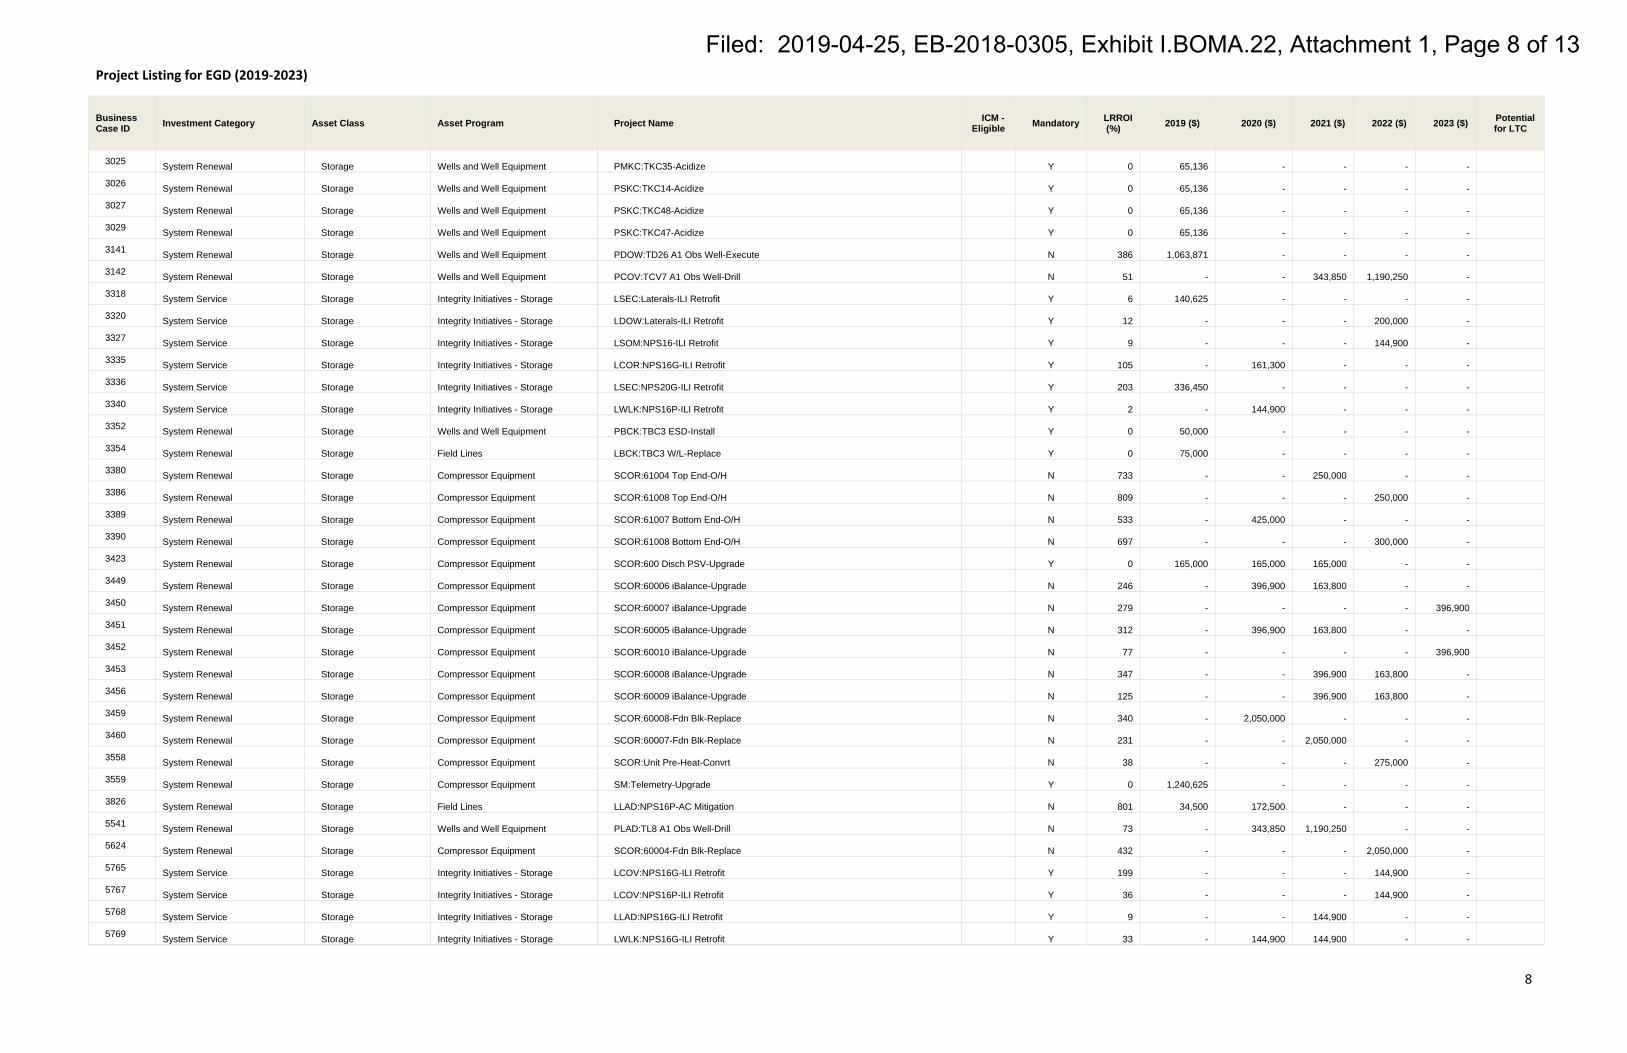
Project Listing for EGD (2019‐2023)
8
Business Case ID Investment Category Asset Class Asset Program Project Name ICM -
Eligible Mandatory LRROI (%) 2019 ($) 2020 ($) 2021 ($) 2022 ($) 2023 ($) Potential
for LTC
3025 System Renewal Storage Wells and Well Equipment PMKC:TKC35-Acidize Y 0
65,136
-
-
-
-
3026 System Renewal Storage Wells and Well Equipment PSKC:TKC14-Acidize Y 0
65,136
-
-
-
-
3027 System Renewal Storage Wells and Well Equipment PSKC:TKC48-Acidize Y 0
65,136
-
-
-
-
3029 System Renewal Storage Wells and Well Equipment PSKC:TKC47-Acidize Y 0
65,136
-
-
-
-
3141 System Renewal Storage Wells and Well Equipment PDOW:TD26 A1 Obs Well-Execute N 386
1,063,871
-
-
-
-
3142 System Renewal Storage Wells and Well Equipment PCOV:TCV7 A1 Obs Well-Drill N 51
-
-
343,850
1,190,250
-
3318 System Service Storage Integrity Initiatives - Storage LSEC:Laterals-ILI Retrofit Y 6
140,625
-
-
-
-
3320 System Service Storage Integrity Initiatives - Storage LDOW:Laterals-ILI Retrofit Y 12
-
-
-
200,000
-
3327 System Service Storage Integrity Initiatives - Storage LSOM:NPS16-ILI Retrofit Y 9
-
-
-
144,900
-
3335 System Service Storage Integrity Initiatives - Storage LCOR:NPS16G-ILI Retrofit Y 105
-
161,300
-
-
-
3336 System Service Storage Integrity Initiatives - Storage LSEC:NPS20G-ILI Retrofit Y 203
336,450
-
-
-
-
3340 System Service Storage Integrity Initiatives - Storage LWLK:NPS16P-ILI Retrofit Y 2
-
144,900
-
-
-
3352 System Renewal Storage Wells and Well Equipment PBCK:TBC3 ESD-Install Y 0
50,000
-
-
-
-
3354 System Renewal Storage Field Lines LBCK:TBC3 W/L-Replace Y 0
75,000
-
-
-
-
3380 System Renewal Storage Compressor Equipment SCOR:61004 Top End-O/H N 733
-
-
250,000
-
-
3386 System Renewal Storage Compressor Equipment SCOR:61008 Top End-O/H N 809
-
-
-
250,000
-
3389 System Renewal Storage Compressor Equipment SCOR:61007 Bottom End-O/H N 533
-
425,000
-
-
-
3390 System Renewal Storage Compressor Equipment SCOR:61008 Bottom End-O/H N 697
-
-
-
300,000
-
3423 System Renewal Storage Compressor Equipment SCOR:600 Disch PSV-Upgrade Y 0
165,000
165,000
165,000
-
-
3449 System Renewal Storage Compressor Equipment SCOR:60006 iBalance-Upgrade N 246
-
396,900
163,800
-
-
3450 System Renewal Storage Compressor Equipment SCOR:60007 iBalance-Upgrade N 279
-
-
-
-
396,900
3451 System Renewal Storage Compressor Equipment SCOR:60005 iBalance-Upgrade N 312
-
396,900
163,800
-
-
3452 System Renewal Storage Compressor Equipment SCOR:60010 iBalance-Upgrade N 77
-
-
-
-
396,900
3453 System Renewal Storage Compressor Equipment SCOR:60008 iBalance-Upgrade N 347
-
-
396,900
163,800
-
3456 System Renewal Storage Compressor Equipment SCOR:60009 iBalance-Upgrade N 125
-
-
396,900
163,800
-
3459 System Renewal Storage Compressor Equipment SCOR:60008-Fdn Blk-Replace N 340
-
2,050,000
-
-
-
3460 System Renewal Storage Compressor Equipment SCOR:60007-Fdn Blk-Replace N 231
-
-
2,050,000
-
-
3558 System Renewal Storage Compressor Equipment SCOR:Unit Pre-Heat-Convrt N 38
-
-
-
275,000
-
3559 System Renewal Storage Compressor Equipment SM:Telemetry-Upgrade Y 0
1,240,625
-
-
-
-
3826 System Renewal Storage Field Lines LLAD:NPS16P-AC Mitigation N 801
34,500
172,500
-
-
-
5541 System Renewal Storage Wells and Well Equipment PLAD:TL8 A1 Obs Well-Drill N 73
-
343,850
1,190,250
-
-
5624 System Renewal Storage Compressor Equipment SCOR:60004-Fdn Blk-Replace N 432
-
-
-
2,050,000
-
5765 System Service Storage Integrity Initiatives - Storage LCOV:NPS16G-ILI Retrofit Y 199
-
-
-
144,900
-
5767 System Service Storage Integrity Initiatives - Storage LCOV:NPS16P-ILI Retrofit Y 36
-
-
-
144,900
-
5768 System Service Storage Integrity Initiatives - Storage LLAD:NPS16G-ILI Retrofit Y 9
-
-
144,900
-
-
5769 System Service Storage Integrity Initiatives - Storage LWLK:NPS16G-ILI Retrofit Y 33
-
144,900
144,900
-
-
Filed: 2019-04-25, EB-2018-0305, Exhibit I.BOMA.22, Attachment 1, Page 8 of 13

Project Listing for EGD (2019‐2023)
9
Business Case ID Investment Category Asset Class Asset Program Project Name ICM -
Eligible Mandatory LRROI (%) 2019 ($) 2020 ($) 2021 ($) 2022 ($) 2023 ($) Potential
for LTC
5770 System Service Storage Integrity Initiatives - Storage LSKC:NPS20L-ILI Retrofit Y 4544
-
144,900
-
-
-
5772 System Service Storage Integrity Initiatives - Storage LDOW:NPS20x16G-ILI Retrofit Y 303
-
-
-
-
483,000
5861 System Service Storage Integrity Initiatives - Storage LWLK:Laterals-ILI Retrofit Y 0
-
75,000
-
-
-
5882 System Service Storage Integrity Initiatives - Storage LMKC:Laterals-ILI Retrofit Y 5
-
-
150,000
-
-
6361 System Renewal Storage Field Lines LDOW:Leaking Wells-Replace N 74
1,205,800
-
-
-
-
6362 System Renewal Storage Field Lines LSKC:TKC67H New HWell N 74
110,400
517,500
-
-
-
6363 System Renewal Storage Wells and Well Equipment PSKC:TKC67H New HWell N 68
300,000
2,395,000
-
-
-
8622 System Renewal Storage Compressor Equipment SCHT:Inverter-Replace Y 0
65,000
-
-
-
-
8624 System Renewal Storage Compressor Equipment SCHT:Control Room-Expand N 49
-
-
-
-
780,000
8625 System Renewal Storage Compressor Equipment SCHT:Air Comp,Dryer-Replace N 104
-
-
-
-
260,000
8628 System Renewal Storage Compressor Equipment SCHT:Dehy Automatn-Upgrade N 3
-
-
-
-
325,000
8629 System Renewal Storage Compressor Equipment SSOM:Limitorque MX-Replace N 113
210,000
210,000
210,000
210,000
420,000
8630 System Renewal Storage Measurement and Regulating Equipment - Storage SSOM:UT Meters-Replace N 91
-
-
-
520,000
-
8632 System Renewal Storage Compressor Equipment SSOM:GAC Fan-Upgrade N 4
-
-
-
391,642
-
8640 System Renewal Storage Compressor Equipment SSOM:HMI Hi Perf Grafx-Install N 169
-
-
-
-
455,000
8641 System Renewal Storage Compressor Equipment SSOM:LAN Room-Install N 24
-
-
-
-
1,040,000
8644 System Renewal Storage Compressor Equipment SSOM:Video Wall-Install N 475
-
195,000
-
-
-
8651 System Renewal Storage Compressor Equipment SM:Industr'l Wireless-Install N 291
97,500
97,500
-
-
-
8652 System Renewal Storage Measurement and Regulating Equipment - Storage LM:MS Wireless Mesh-Install N 32
-
-
-
195,000
195,000
8653 System Renewal Storage Compressor Equipment SCOR:810001 IDC-Replace Y 42
-
-
650,000
-
-
8654 System Renewal Storage Compressor Equipment SCOR:HMI PCs-Replace Y 0
65,000
-
-
-
-
8661 System Renewal Storage Compressor Equipment SSOM:622xx Vssl Closure-Upgrade N 26
-
-
-
-
276,761
8670 System Renewal Storage Compressor Equipment SSOM:Methane Vent-Reduce Y 0
370,984
738,802
-
-
-
8671 System Renewal Storage Compressor Equipment SCHT:Methane Vent-Reduce Y 0
370,984
738,802
-
-
-
8673 System Renewal Storage Compressor Equipment MM:Leak Detection-Develop Y 0
98,000
-
-
-
-
8675 System Renewal Storage Wells and Well Equipment PDOW:TD27 Obs Well-Install Y 391
1,190,250
-
-
-
-
8686 System Renewal Storage Wells and Well Equipment PM:ESD Methanol Injectn-Install Y 0
90,000
-
-
-
-
8687 System Renewal Storage Compressor Equipment SSOM:61001-Engine Minor N 731
-
-
-
130,000
-
8688 System Renewal Storage Compressor Equipment SSOM:61002-Engine minor N 731
-
-
-
130,000
-
8841 System Renewal Storage Compressor Equipment SCOR:HMI Hi Perf Grafx-Install N 169
-
-
-
455,000
455,000
8844 System Renewal Storage Compressor Equipment SCOR:HMI PCs-Replace Y 0
-
-
-
65,000
-
8851 System Renewal Storage Compressor Equipment SSOM:UPS-replace N 73
-
-
-
130,000
-
8853 System Renewal Storage Measurement and Regulating Equipment - Storage LM:MS UPS-Replace Y 0
14,300
-
-
-
-
8854 System Renewal Storage Compressor Equipment SSOM:Platforms-Install Y 0
65,000
-
-
-
-
8857 System Renewal Storage Wells and Well Equipment PM:Wells-Acidize N 397
-
390,816
-
-
-
8858 System Renewal Storage Wells and Well Equipment PM:Wells-Acidize N 397
-
-
-
390,816
-
Filed: 2019-04-25, EB-2018-0305, Exhibit I.BOMA.22, Attachment 1, Page 9 of 13

Project Listing for EGD (2019‐2023)
10
Business Case ID Investment Category Asset Class Asset Program Project Name ICM -
Eligible Mandatory LRROI (%) 2019 ($) 2020 ($) 2021 ($) 2022 ($) 2023 ($) Potential
for LTC
8891 System Service Storage Integrity Initiatives - Storage LDOW:NPS24P-ILI Retrofit Y 0
-
-
-
-
144,900
8943 System Service Storage Records Integrity - Storage MM:Carryover Dwgs-Complet Y 0
50,000
-
-
-
-
8957 System Service Storage Records Integrity - Storage MM:Carryover Dwgs-Complet Y 0
-
50,000
-
-
-
8958 System Service Storage Records Integrity - Storage MM:Carryover Dwgs-Complet Y 0
-
-
50,000
-
-
8959 System Service Storage Records Integrity - Storage MM:Carryover Dwgs-Complet Y 0
-
-
-
50,000
-
8960 System Service Storage Records Integrity - Storage MM:Carryover Dwgs-Complet Y 0
-
-
-
-
50,000
8967 System Renewal Storage Field Lines LM:Well Loops-Adjust Y 0
71,045
-
-
-
-
8968 System Renewal Storage Field Lines LM:Well Loops-Adjust Y 0
-
71,045
-
-
-
8969 System Renewal Storage Field Lines LM:Well Loops-Adjust Y 0
-
-
71,045
-
-
8970 System Renewal Storage Field Lines LM:Well Loops-Adjust Y 0
-
-
-
71,045
-
8971 System Renewal Storage Field Lines LM:Well Loops-Adjust Y 0
-
-
-
-
71,045
8981 System Renewal Storage Field Lines LM:Leaking Valves-Replace Y 109
462,000
-
-
-
-
8985 System Renewal Storage Field Lines LM:Leaking Valves-Replace Y 109
-
462,000
-
-
-
8987 System Renewal Storage Field Lines LM:Leaking Valves-Replace Y 109
-
-
307,000
-
-
8990 System Renewal Storage Field Lines LM:Leaking Valves-Replace Y 109
-
-
-
307,000
-
8991 System Renewal Storage Field Lines LM:Leaking Valves-Replace Y 109
-
-
-
-
307,000
9016 System Renewal Storage Wells and Well Equipment PM:Well Casing-Replace Y 153
400,000
-
-
-
-
9017 System Renewal Storage Wells and Well Equipment PM:Roads&Laneways-Improve Y 0
66,000
-
-
-
-
9018 System Service Storage Integrity Initiatives - Storage SM:FIMP Recommend'ns-Implement Y 0
50,000
-
-
-
-
9019 System Renewal Storage Wells and Well Equipment PM:Roads&Laneways-Improve Y 0
-
66,000
-
-
-
9020 System Service Storage Integrity Initiatives - Storage SM:FIMP Recommend'ns-Implement Y 0
-
50,000
-
-
-
9021 System Service Storage Integrity Initiatives - Storage SM:FIMP Recommend'ns-Implement Y 0
-
-
50,000
-
-
9022 System Service Storage Integrity Initiatives - Storage SM:FIMP Recommend'ns-Implement Y 0
-
-
-
50,000
-
9023 System Service Storage Integrity Initiatives - Storage SM:FIMP Recommend'ns-Implement Y 0
-
-
-
-
50,000
9041 System Renewal Storage Compressor Equipment SM:SCADA-Annual Upgrade Y 0
55,000
-
-
-
-
9042 System Renewal Storage Compressor Equipment SM:SCADA-Annual Upgrade Y 0
-
55,000
-
-
-
9061 System Renewal Storage Compressor Equipment SM:SCADA-Annual Upgrade Y 0
-
-
55,000
-
-
9062 System Renewal Storage Compressor Equipment SM:SCADA-Annual Upgrade Y 0
-
-
-
55,000
-
9063 System Renewal Storage Compressor Equipment SM:SCADA-Annual Upgrade Y 0
-
-
-
-
55,000
9181 System Renewal Storage Measurement and Regulating Equipment - Storage LM:MS UPS-Replace Y 0
-
14,300
-
-
-
9182 System Renewal Storage Measurement and Regulating Equipment - Storage LM:MS UPS-Replace Y 0
-
-
14,300
-
-
9183 System Renewal Storage Measurement and Regulating Equipment - Storage LM:MS UPS-Replace Y 0
-
-
-
14,300
-
9184 System Renewal Storage Measurement and Regulating Equipment - Storage LM:MS UPS-Replace Y 0
-
-
-
-
14,300
9542 System Renewal Storage Wells and Well Equipment PM:Well Casing-Replace Y 153
-
400,000
-
-
-
9543 System Renewal Storage Wells and Well Equipment PM:Well Casing-Replace Y 153
-
-
400,000
-
-
9544 System Renewal Storage Wells and Well Equipment PM:Well Casing-Replace Y 153
-
-
-
400,000
-
Filed: 2019-04-25, EB-2018-0305, Exhibit I.BOMA.22, Attachment 1, Page 10 of 13

Project Listing for EGD (2019‐2023)
11
Business Case ID Investment Category Asset Class Asset Program Project Name ICM -
Eligible Mandatory LRROI (%) 2019 ($) 2020 ($) 2021 ($) 2022 ($) 2023 ($) Potential
for LTC
9545 System Renewal Storage Wells and Well Equipment PM:Well Casing-Replace Y 153
-
-
-
-
400,000
9581 System Renewal Storage Wells and Well Equipment PM:Roads&Laneways-Improve Y 0
-
-
66,000
-
-
9582 System Renewal Storage Wells and Well Equipment PM:Roads&Laneways-Improve Y 0
-
-
-
66,000
-
9583 System Renewal Storage Wells and Well Equipment PM:Roads&Laneways-Improve Y 0
-
-
-
-
66,000
10029 System Renewal Storage Compressor Equipment SCHT:UPS-replace Y 0
-
-
26,000
-
-
11703 System Renewal Storage Compressor Equipment SCOR:Storage-Maintenance N 474
1,240,154
1,017,800
1,134,800
518,000
366,200
12627 System Renewal Storage Wells and Well Equipment PDOW:TD28H New HWell Y 74
1,799,983
-
-
-
-
12628 System Renewal Storage Wells and Well Equipment PDOW:TD29H New HWell Y 74
1,875,902
-
-
-
-
12863 System Renewal Storage Compressor Equipment SCOR:Unit Pre-Heat-Convrt N 31
-
-
-
-
275,000
12913 System Renewal Storage Compressor Equipment SCOR:62008 Comp-Major O/H N 653
-
-
325,000
-
-
12916 System Renewal Storage Compressor Equipment SCOR:62011 Comp-Major O/H N 563
-
-
325,000
-
-
12919 System Renewal Storage Compressor Equipment SCOR:61004 Bottom End-O/H N 509
-
-
400,000
-
-
12922 System Renewal Storage Compressor Equipment SCOR:620xx Cyl Liner-Replace N 421
-
-
-
263,040
-
12924 System Renewal Storage Compressor Equipment SCOR:64105 JWC-Replace N 246
-
227,267
306,544
-
-
12925 System Renewal Storage Compressor Equipment SCOR:64106 JWC-Replace N 225
-
-
227,267
306,544
-
12926 System Renewal Storage Compressor Equipment SCOR:64107 JWC-Replace N 210
-
-
-
-
227,267
12942 System Renewal Storage Compressor Equipment SCOR:Methane Vent-Reduce Y 0
958,542
1,026,964
-
-
-
12947 System Renewal Storage Compressor Equipment SCOR:100MOV Yard Valve-Replace N 38
684,997
-
-
-
-
12948 System Renewal Storage Compressor Equipment SCOR:100MOV Yard Valve-Replace N 33
-
392,909
-
-
-
12949 System Renewal Storage Compressor Equipment SCOR:100MOV Yard Valve-Replace N 33
-
-
392,909
-
-
12950 System Renewal Storage Compressor Equipment SCOR:100MOV Yard Valve-Replace N 33
-
-
-
392,909
-
12956 System Renewal Storage Compressor Equipment SCOR:100MOD Hdr Valves-Replace N 103
-
1,041,884
-
-
-
12957 System Renewal Storage Compressor Equipment SCOR:100MOD Hdr Valves-Replace N 106
-
100,000
5,118,230
-
-
12958 System Renewal Storage Compressor Equipment SCOR:100MOD Hdr Valves-Replace N 100
-
-
100,000
3,766,880
-
12959 System Renewal Storage Compressor Equipment SCOR:100MOD Hdr Valves-Replace N 108
-
-
-
100,000
3,766,880
12960 System Renewal Storage Compressor Equipment SCOR:100MOD Hdr Valves-Replace N 104
-
-
-
-
50,000
12975 System Renewal Storage Compressor Equipment SCOR:622xx Bypass Valve-Upgrade N 85
-
-
-
264,000
-
12977 System Renewal Storage Compressor Equipment SCOR:622xx Bypass Valve-Upgrade N 85
-
-
-
-
264,000
13006 System Renewal Storage Compressor Equipment SCOR:525 UPS-Replace N 73
-
132,000
-
-
-
13007 System Renewal Storage Compressor Equipment SCOR:525 UPS-Replace N 73
-
-
-
-
132,000
13013 System Renewal Storage Compressor Equipment SCOR:810002 IDC-Replace N 41
-
-
-
-
660,000
13014 System Renewal Storage Compressor Equipment SCOR:800 Bldg1 I/O Connection-Replace N 17307
250,800
-
-
-
-
13031 System Renewal Storage Compressor Equipment SCOR:MCC3 APU PLC-Rplace N 0
-
462,000
-
-
-
13047 System Renewal Storage Wells and Well Equipment PSEC:TS23H Well-Install N 63
-
-
-
-
605,000
13048 System Renewal Storage Field Lines LSEC:TS23H G/L-Modify N 63
-
-
-
-
47,500
16784 System Renewal Storage Field Lines MM:ESD Bottles-Upgrade Y 113
120,000
-
-
-
-
Filed: 2019-04-25, EB-2018-0305, Exhibit I.BOMA.22, Attachment 1, Page 11 of 13

Project Listing for EGD (2019‐2023)
12
Business Case ID Investment Category Asset Class Asset Program Project Name ICM -
Eligible Mandatory LRROI (%) 2019 ($) 2020 ($) 2021 ($) 2022 ($) 2023 ($) Potential
for LTC
16785 System Renewal Storage Field Lines MM:ESD Bottles-Upgrade Y 113
-
120,000
-
-
-
16803 System Renewal Storage Compressor Equipment SCOR:512K725-O/H Y 0
40,000
-
-
-
-
16806 System Renewal Storage Field Lines MM:ESD Bottles-Upgrade Y 113
-
-
120,000
-
-
16807 System Renewal Storage Field Lines MM:ESD Bottles-Upgrade Y 113
-
-
-
120,000
-
16808 System Renewal Storage Field Lines MM:ESD Bottles-Upgrade Y 113
-
-
-
-
120,000
16825 System Renewal Storage Wells and Well Equipment PSEC:Well Tools-Purchase Y 0
84,000
-
-
-
-
16826 System Renewal Storage Wells and Well Equipment PCOR:Well Tools-Purchase Y 0
-
36,000
-
-
-
16827 System Renewal Storage Wells and Well Equipment PDOW:Well Tools-Purchase N 17
-
-
108,000
-
-
16828 System Renewal Storage Wells and Well Equipment PSKC:Well Tools-Purchase Y 0
-
-
-
96,000
-
16829 System Renewal Storage Wells and Well Equipment PMKC:Well Tools-Purchase Y 0
-
-
-
-
96,000
16835 System Renewal Storage Field Lines LM:Lateral Separator-Build N 45
-
-
-
-
950,000
16837 System Service Storage Integrity Initiatives - Storage LCRW:P/L-ILI Retrofits Y 0
-
-
500,000
-
-
18103 System Renewal Storage Compressor Equipment SCRW:Noise-Mitigate Y 0
250,000
-
-
-
-
18183 System Renewal Storage Compressor Equipment SCOR:Storage Renewal-FEED Y 0
2,500,000
-
-
-
-
19128 System Renewal Storage Compressor Equipment SCOR:61005 Crankshaft-Replace N 521
3,125,621
-
-
-
-
19383 System Renewal Storage Compressor Equipment SCOR:525 UPS-Replace N 73
-
-
132,000
-
-
19384 System Renewal Storage Compressor Equipment SCOR:525 UPS-Replace N 73
-
-
-
132,000
-
19391 System Renewal Storage Compressor Equipment SCOR:60004 iBalance-Upgrade N 338
-
-
-
-
396,900
3222 General Plant TIS IT Implementation Business Objects Upgrade and Enhancements Y 246
-
50,000
-
-
-
3224 General Plant TIS IT Implementation Data Lake and WAMS DataMart Enhancements N 121
700,000
250,000
250,000
-
-
3245 General Plant TIS IT Implementation EnMar Replacement Y 209
200,000
-
-
-
-
3246 General Plant TIS IT Implementation GIS/GPS releases N 138
-
-
250,000
-
-
3255 General Plant TIS IT Implementation SCADA Replacement Project Y 158
2,500,000
-
-
-
-
3284 General Plant TIS IT Implementation Ops Small apps releases N 0
250,000
500,000
-
-
-
5583 General Plant TIS IT Implementation CIS Hardware Replacement N 118
10,000,000
-
-
-
-
5584 General Plant TIS IT Implementation HANA Software Implementation N 168
6,400,000
4,000,000
-
-
-
5646 General Plant TIS IT Implementation Microsoft SQL Server Software Upgrade N 148
150,000
-
-
-
-
5647 General Plant TIS IT Implementation Oracle Middleware Upgrades N 186
-
-
350,000
-
-
5681 General Plant TIS IT Implementation Oracle Database Software Upgrade N 291
-
270,000
-
-
-
5685 General Plant TIS IT Implementation ETL Tools and Enhancements N 222
300,000
-
-
-
-
5949 General Plant TIS IT Implementation CS&C Initiatives Y 184
400,000
650,000
550,000
250,000
-
5968 General Plant TIS IT Implementation WAMS stabilization & releases (2018 - 2027) Y 106
2,500,000
3,000,000
3,000,000
-
-
6049 General Plant TIS IT Implementation Asset Management IT N 480
800,000
800,000
800,000
-
-
8551 General Plant TIS IT Implementation SAP BW Enhancements Y 90
200,000
-
5,000,000
-
-
8576 General Plant TIS IT Implementation IT Meeting Room AV Sustainment N 260
-
-
740,000
-
-
8601 General Plant TIS IT Implementation System Measurement Systems Y 133
200,000
200,000
200,000
-
-
Filed: 2019-04-25, EB-2018-0305, Exhibit I.BOMA.22, Attachment 1, Page 12 of 13

Project Listing for EGD (2019‐2023)
13
Business Case ID Investment Category Asset Class Asset Program Project Name ICM -
Eligible Mandatory LRROI (%) 2019 ($) 2020 ($) 2021 ($) 2022 ($) 2023 ($) Potential
for LTC
8602 General Plant TIS IT Implementation Operation Digital N 188
1,300,000
3,000,000
1,000,000
-
-
8603 General Plant TIS IT Implementation Engineering Application/Network Analysis/Land Management Releases N 164
500,000
500,000
500,000
-
-
8683 General Plant TIS IT Implementation Customer Experience Transformation (Digital) (includes all business cost and Accenture cost) N 184
7,000,000
-
-
-
-
8684 General Plant TIS IT Implementation Mobile Records / Records Access in the Field N 111
-
-
1,500,000
-
-
8923 General Plant TIS IT Implementation IT - 00 - Desktop Sustainment (2018 - 2027) Y 123
400,000
400,000
400,000
-
-
8925 General Plant TIS IT Implementation IT - 00 - Desktop Replacement (2018 - 2028) Y 122
870,000
2,000,000
1,575,000
-
-
8926 General Plant TIS IT Implementation IT - 00 - Mobile Devices (2018 - 2027) Y 121
250,000
250,000
250,000
-
-
8927 General Plant TIS IT Implementation IT - 00 - Microsoft Enterprise Agreement (2018 - 2027) Y 72
1,300,000
1,300,000
1,300,000
-
-
8944 General Plant TIS IT Implementation Records Storage Repository 2018 N 1108
400,000
-
-
-
-
9307 General Plant TIS IT Implementation Gas Storage Business Solutions (2019) N 179
500,000
-
-
-
-
9308 General Plant TIS IT Implementation Gas Storage Business Solutions (2020) N 179
-
400,000
-
-
-
9309 General Plant TIS IT Implementation Gas Storage Business Solutions (2021) N 179
-
-
400,000
-
-
9318 General Plant TIS IT Implementation Finance Business Solutions (2019) N 131
220,000
-
-
-
-
9319 General Plant TIS IT Implementation Finance Business Solutions (2020) N 131
-
450,000
-
-
-
9321 General Plant TIS IT Implementation Finance Business Solutions (2021) N 131
-
-
520,000
-
-
9341 General Plant TIS IT Implementation Customer Care Information System (CIS) Business Solutions (2019 -2021) Y 91
400,000
400,000
800,000
800,000
-
9344 General Plant TIS IT Implementation Integrity Business Solutions (2019) N 130
225,000
225,000
-
-
-
9346 General Plant TIS IT Implementation Integrity Business Solutions (2020) N 130
-
750,000
-
-
-
9348 General Plant TIS IT Implementation Integrity Business Solutions (2021) N 130
-
-
550,000
-
-
9683 General Plant TIS IT Implementation GIS/GPS Upgrades Y 93
1,000,000
1,000,000
-
-
-
11403 General Plant TIS IT Implementation EQMT Upgrade & Enhancements N 0
-
200,000
-
-
-
15803 General Plant TIS IT Implementation Project Portfolio Optimization N 480
-
500,000
-
-
-
16704 General Plant TIS IT Implementation Major projects & Planning TIS program N 55
300,000
300,000
500,000
360,000
-
16705 General Plant TIS IT Implementation NetOps TIS program N 68
100,000
500,000
200,000
500,000
-
16706 General Plant TIS IT Implementation Telemetry Security Improvements Y 0
200,000
-
-
-
-
16710 General Plant TIS IT Implementation Distribution Protection and Operations Services TIS Program Y 52
300,000
600,000
500,000
360,000
-
16718 General Plant TIS IT Implementation Extranet Releases (2021-2028) N 863
-
-
400,000
-
-
17943 General Plant TIS IT Implementation IT Business Applications Upgrades, Enhancement Projects, Infrastructure Upgrades (2022-2028) Y 0
-
-
-
22,141,286
22,141,286
19323 General Plant TIS IT Implementation Small Application Upgrade Y 0
20,000
-
-
-
-
Filed: 2019-04-25, EB-2018-0305, Exhibit I.BOMA.22, Attachment 1, Page 13 of 13

Project Listing for UGL (2019‐2023)
1
Unique Identifier Investment Category Asset/Growth Category Portfolio Description ICM -
Eligible Mandatory Priority 2019 ($) 2020 ($) 2021 ($) 2022 ($) 2023 ($) Potential for LTC
859 System Access CNG CNG CNG Refueling Stations Placeholder Y 1 1,000,000 - - - -
1439 System Access CNG CNG CNG Refueling Stations Placeholder Y 1 - 2,250,000 1,875,000 1,875,000 -
21 System Service Compression & Dehy Compressor and Dehy Capital Maintenance STO ABSENT TANK INSTALLS - VARIOUS Y 1 364,418 - - - -
166 System Renewal Compression & Dehy Cathodic Protection Advancements STO CATHODIC PROTECTION Y 1 117,748 117,748 117,748 117,748 117,748
209 System Renewal Compression & Dehy Station Painting STO - HPC Y 1 700,000 - - - -
225 System Renewal Compression & Dehy Compressor Overhauls Dawn PltC PowerTurb&Inboard CompOverhaul N 2 - - - 364,110 -
226 System Renewal Compression & Dehy Compressor Overhauls Bright A2 Compressor Engine Overhaul N 2 - - - - 2,809,080
370 General Plant Compression & Dehy Tools STO COMPRESSOR EAST TOOL ADDITIONS N 2 66,774 - - - -
372 General Plant Compression & Dehy Tools STO CAPITAL TOOLS ADDITIONS -TECHNICIANS N 2 22,258 - - - -
373 General Plant Compression & Dehy Tools STO CAPITAL TOOLS ADDITIONS - Mech N 2 22,258 - - - -
392 General Plant Compression & Dehy Tools STO CAPITAL TOOLS REPL - TECH WEST N 2 22,258 - - - -
393 General Plant Compression & Dehy Tools STO CAPITAL TOOLS REPL - Mech N 2 22,258 - - - -
481 System Renewal Compression & Dehy Compressor and Dehy Capital Maintenance Bright B Lube Oil Skid Repalcement N 2 214,134 - - - -
482 System Renewal Compression & Dehy Compressor and Dehy Capital Maintenance Bright B Boiler Upgrade N 3 - - 800,000 - -
483 System Renewal Compression & Dehy Compressor and Dehy Capital Maintenance OSE Compressor Ignition System Upgrade N 3 - 60,000 - - -
484 System Renewal Compression & Dehy Compressor and Dehy Capital Maintenance STO - Switch Gear Aux 2 N 2 198,248 - - - -
485 System Renewal Compression & Dehy Compressor and Dehy Capital Maintenance Parkway Siemens MCC replacement N 3 - 333,856 - - -
489 System Renewal Compression & Dehy Compressor and Dehy Capital Maintenance STO - PLC5 upgrade to ControlLogix N 2 320,797 - - - -
499 System Service Compression & Dehy Compressor and Dehy Capital Maintenance Dawn Dehy Plant Process Tank Replacement N 3 - 234,090 416,160 - -
503 System Renewal Compression & Dehy Compressor and Dehy Capital Maintenance Parkway A - Fire/Gas Detection Panel N 3 - 107,188 - - -
542 System Renewal Compression & Dehy Compressor and Dehy Capital Maintenance LOBO B - Fire/Gas Detection Panel N 2 112,945 - - - -
543 System Renewal Compression & Dehy Compressor and Dehy Capital Maintenance Bright B - Fire/Gas Detection Panel N 2 112,945 - - - -
546 System Renewal Compression & Dehy Compressor and Dehy Capital Maintenance LOBO A1 - Fire/Gas Detection Panel N 3 - 112,945 - - -
547 System Renewal Compression & Dehy Compressor and Dehy Capital Maintenance LOBO A2 - Fire/Gas Detection Panel N 3 - 112,945 - - -
582 System Renewal Compression & Dehy Compressor and Dehy Capital Maintenance Dow A Water Jacket/Coolers N 3 - 533,394 - - -
598 System Service Compression & Dehy Compressor and Dehy Capital Maintenance STO PARKWAY SAFETY & SECURITY UPGRADES N 4 50,000 - - - -
602 System Service Compression & Dehy Compressor and Dehy Capital Maintenance STO SAFETY & SECURITY UPGRADES - VARIOUS N 4 100,000 - - - -
604 System Service Compression & Dehy Compressor and Dehy Capital Maintenance STO LED LIGHTING UPGRADES N 4 152,976 - - - -
605 System Service Compression & Dehy Compressor and Dehy Capital Maintenance STO LED LIGHTING UPGRADES EASTERN COMP N 4 87,236 - - - -
952 System Renewal Compression & Dehy Compressor Overhauls Bright A1 Engine mid-life Overhaul N 2 - - - - 3,265,871
956 System Renewal Compression & Dehy Compressor Overhauls Bright B Engine End-of-Life Overhaul N 2 - - - - 2,288,880
958 System Renewal Compression & Dehy Compressor Overhauls Bright B PT/Comp Overhaul N 2 - - - - 364,140
1055 System Renewal Compression & Dehy Obsolete RB211-24A C Plant Obsolete RB211-24A C Plant Y N 3 - - - 19,300,000 82,900,000 Y
1063 System Renewal Compression & Dehy Compressor Overhauls Parkway B PT/IB Comp Overhaul N 2 - 371,423 - - -
1070 System Renewal Compression & Dehy Compressor Overhauls Payne Compressor Overhaul N 2 - - - - 216,486
1077 System Renewal Compression & Dehy Compressor and Dehy Capital Maintenance PLC 5 Conversion upgrades N 3 - 212,242 - - -
Filed: 2019-04-25, EB-2018-0305, Exhibit I.BOMA.22, Attachment 2, Page 1 of 29

Project Listing for UGL (2019‐2023)
2
Unique Identifier Investment Category Asset/Growth Category Portfolio Description ICM -
Eligible Mandatory Priority 2019 ($) 2020 ($) 2021 ($) 2022 ($) 2023 ($) Potential for LTC
1084 System Renewal Compression & Dehy Compressor and Dehy Capital Maintenance Siemen's MCC's N 3 - 318,362 324,730
331,224
337,849
1152 System Renewal Compression & Dehy Waubuno Waubuno Y N 2 - 3,183,624 15,154,050 - - Y
1194 System Renewal Compression & Dehy Compressor Overhauls Dawn J Plant Engine Overhaul N 2 - 1,500,000 - - -
1479 General Plant Compression & Dehy Tools STO COMPRESSOR EAST TOOL REPLACEMENTS N 2 66,774 - - - -
1539 System Renewal Compression & Dehy Compressor and Dehy Capital Maintenance STO DAWN DEHY TOWER RELIEF VALVE RPLCMT N 3 - 200,000 - - - 1541 General Plant Compression & Dehy Compressor and Dehy Capital Maintenance STO DAWN WELD SHOP BACKUP GENERATOR N 3 - 93,256 - - - 1542 System Renewal Compression & Dehy Compressor and Dehy Capital Maintenance STO PARKWAY MAIN CNTRL BLDG FIRE/GAS N 3 - 112,945 - - - 1543 System Renewal Compression & Dehy Compressor and Dehy Capital Maintenance STO PARKWAY A VIBRATION MONITOR N 3 - 80,010 - - -
1544 System Renewal Compression & Dehy Compressor and Dehy Capital Maintenance STO PARKWAY A MCC REPLACEMENT N 2 168,199 - - - -
1571 System Service Compression & Dehy MSAPR EMISSIONS ACTION PLAN Dow A Compressor– install catalytic convertor Y 1 110,000 - - - -
2100 System Renewal Compression & Dehy Compressor and Dehy Capital Maintenance STO-UPS N 2 - 119,718 119,718
119,718
119,718
2101 General Plant Compression & Dehy Tools STO-TOOLS N 2 - 311,612 311,612
311,612
311,612
2102 System Renewal Compression & Dehy Station Painting STO - HPC all sites Y 1 - 700,000 700,000
700,000
700,000
2379 System Service Compression & Dehy MSAPR EMISSIONS ACTION PLAN Edy’s Mills Compressor – install catalytic convertor Y 1 110,000 - - - -
2380 System Service Compression & Dehy MSAPR EMISSIONS ACTION PLAN Dawn Aux 3 Generator – install catalytic convertor Y 1 - 110,000 - - - 2381 System Service Compression & Dehy MSAPR EMISSIONS ACTION PLAN Dawn Aux 4-1 Generator – install catalytic convertor Y 1 - 110,000 - - -
2382 System Service Compression & Dehy MSAPR EMISSIONS ACTION PLAN Oil Springs East Unit 1 Compressor – install catalytic convertor Y 1 - -
110,000 - -
2383 System Service Compression & Dehy MSAPR EMISSIONS ACTION PLAN Oil Springs East Unit 2 Compressor – install catalytic convertor Y 1 - -
110,000 - -
2384 System Service Compression & Dehy MSAPR EMISSIONS ACTION PLAN 167 Compressor – install catalytic convertor Y 1 - - - 110,000 -
2385 System Service Compression & Dehy MSAPR EMISSIONS ACTION PLAN Dawn Aux 4-2 Generator – install catalytic convertor Y 1 - - - - 110,000
146 General Plant CRES Service Facilities Maintenance South Furniture, Decor & Flooring Y 1 125,000 125,000
125,000
125,000
125,000
150 General Plant CRES Service Facilities Maintenance South Grounds & Parking Y 1 300,000 200,000
200,000
200,000
200,000
156 General Plant CRES Service Facilities Maintenance South Unplanned Blanket Y 1 250,000 300,000
300,000
300,000
300,000
158 General Plant CRES Service Facilities Maintenance South Security Y 1 500,000 400,000
350,000
400,000
400,000
159 General Plant CRES Service Facilities Maintenance South Equipment, Controls, Mechanical Y 1 300,000 500,000
500,000
500,000
700,000
162 General Plant CRES Service Facilities Maintenance South Roofing, Bldg Envelope, Windows Y 1 500,000 200,000
200,000
200,000
200,000
185 General Plant CRES Service Facilities Maintenance North Furniture, Decor & Flooring Y 1 125,000 125,000
125,000
125,000
125,000
188 General Plant CRES Service Facilities Maintenance North Grounds & Parking Y 1 200,000 100,000
100,000
100,000
100,000
192 General Plant CRES Service Facilities Maintenance North Unplanned Blanket Y 1 250,000 200,000
200,000
200,000
200,000
194 General Plant CRES Service Facilities Maintenance North Equipment, Controls, Mechanical Y 1 300,000 500,000
500,000
500,000
600,000
197 General Plant CRES Service Facilities Maintenance North Roofing, Bldg Envelope, Windows Y 1 300,000 200,000
200,000
200,000
200,000
1161 General Plant CRES Service Facilities Modernization 50 Keil Drive Modernization Y 1 - 4,000,000 5,000,000
5,000,000
5,000,000
1167 General Plant CRES Service Facilities Modernization Dawn North Administration Modernization Y 1 - - 2,850,000
5,300,000 -
1171 General Plant CRES Service Facilities Modernization Orillia - New Building Y 1 - - - 1,500,000
5,000,000
1493 General Plant CRES New Service Facilities CS-Belleville PropertyPurch&Eng. Y 1 3,451,681 - - - -
1546 General Plant CRES Service Facilities Modernization 50 Keil CCHP Equipment Y 1 5,739,347 - - - -
Filed: 2019-04-25, EB-2018-0305, Exhibit I.BOMA.22, Attachment 2, Page 2 of 29

Project Listing for UGL (2019‐2023)
3
Unique Identifier Investment Category Asset/Growth Category Portfolio Description ICM -
Eligible Mandatory Priority 2019 ($) 2020 ($) 2021 ($) 2022 ($) 2023 ($) Potential for LTC
1547 General Plant CRES Service Facilities Maintenance 50 Keil LED Lighting Replacement Y 1 1,000,000 - - - -
1548 General Plant CRES Service Facilities Maintenance 50 Keil Parking Lot - Final Phase Y 1 1,400,000 - - - -
1549 General Plant CRES Service Facilities Maintenance North Security Y 1 250,000 100,000
100,000
100,000
100,000
1985 General Plant CRES New Service Facilities Belleville - New Building Y 1 - 3,500,000 4,000,000 - -
1986 General Plant CRES Service Facilities Modernization Cambridge - Refurbishment Y 1 - 3,450,000 - - -
1987 General Plant CRES Service Facilities Modernization Guelph - Refurbishment Y 1 - - - - 1,500,000
1991 General Plant CRES Service Facilities Maintenance North LED Lighting Conversions Y 1 - 75,000 75,000
75,000
75,000
1992 General Plant CRES Service Facilities Maintenance South LED Lighting Conversions Y 1 - 125,000 125,000
125,000
125,000
1993 General Plant CRES Service Facilities Maintenance Facility Assessments Y 1 - 50,000 50,000
50,000
50,000
2410 General Plant CRES Service Facilities Maintenance Hamilton Park St Y 1 - 850,000 - - -
211 System Service Distribution Growth Distribution Reinforcement Sudbury Lateral Repl *C/O 2018* Y Y 1 3,000,000 - - - -
457 System Service Distribution Growth Station Reinforcement HALT-ThirdLine&UpperMiddleStn18Y-231R-Oa Y 1 451,880 - - - -
473 System Service Distribution Growth Distribution Reinforcement Powassan-TBS Y 1 - 520,516 - - - 614 System Service Distribution Growth Station Reinforcement LOND: Ingersol Trans Regulator Replaceme Y 1 - 500,829 - - -
732 System Access Distribution Growth General Customer Growth Plan-(B)-Dist-Addn-Contr-NB-Scattered Y 1 1,206,994 - - - -
733 System Access Distribution Growth General Customer Growth Service Installations-Random-Contractor Y 1 1,860,405 - - - -
734 System Access Distribution Growth General Customer Growth Land Rights-Additions Y 1 27,198 - - - -
735 System Access Distribution Growth General Customer Growth Meter & Regulator Inst-Addn-Company Y 1 690,540 - - - -
736 System Access Distribution Growth General Customer Growth Indirect Materials-Additions Y 1 130,907 - - - -
737 System Access Distribution Growth General Customer Growth WIND Generic Greenhouse Windsor Y 1 1,696,586 - - - -
738 System Access Distribution Growth General Customer Growth Plan-(B)-Dist-Addn-Contr-NB-Scattered Y 1 200,658 - - - -
739 System Access Distribution Growth General Customer Growth Service Installations-Random-Contractor Y 1 216,156 - - - -
740 System Access Distribution Growth General Customer Growth Meter & Regulator Inst-Addn-Company Y 1 131,768 - - - -
741 System Access Distribution Growth General Customer Growth Indirect Materials-Additions Y 1 21,769 - - - -
742 System Access Distribution Growth General Customer Growth Plan-(B)-Dist-Addn-Contr-NB-Scattered Y 1 120,163 - - - -
743 System Access Distribution Growth General Customer Growth Service Installations-Random-Contractor Y 1 451,844 - - - -
744 System Access Distribution Growth General Customer Growth Land Rights-Additions Y 1 5,000 - - - -
745 System Access Distribution Growth General Customer Growth Meter & Regulator Inst-Addn-Company Y 1 144,936 - - - -
746 System Access Distribution Growth General Customer Growth Plan-(B)-Dist-Addn-Contr-NB-Scattered Y 1 1,345,186 - - - -
747 System Access Distribution Growth General Customer Growth Plan-(B)-Dist-Addn-NB Scattered-Other Y 1 95,895 - - - -
748 System Access Distribution Growth General Customer Growth Service Installations-Random-Contractor Y 1 3,768,849 - - - -
749 System Access Distribution Growth General Customer Growth Land Rights-Additions Y 1 20,000 - - - -
750 System Access Distribution Growth General Customer Growth Meter & Regulator Inst-Addn-Company Y 1 1,214,982 - - - -
751 System Access Distribution Growth General Customer Growth Meter & Regulator Inst-Addn-Contractor Y 1 35,627 - - - -
752 System Access Distribution Growth General Customer Growth Indirect Materials-Additions Y 1 300,000 - - - -
753 System Service Distribution Growth Distribution Reinforcement LOND: Southdale & Bostwick Reinforcement Y 1 - - - - 258,829
Filed: 2019-04-25, EB-2018-0305, Exhibit I.BOMA.22, Attachment 2, Page 3 of 29

Project Listing for UGL (2019‐2023)
4
Unique Identifier Investment Category Asset/Growth Category Portfolio Description ICM -
Eligible Mandatory Priority 2019 ($) 2020 ($) 2021 ($) 2022 ($) 2023 ($) Potential for LTC
755 System Access Distribution Growth General Customer Growth LOND: New Business Additions Y 1 618,445 - - - -
756 System Access Distribution Growth General Customer Growth LOND: Verasen Contract Customer Load Add Y 1 - 329,009 - - -
757 System Access Distribution Growth General Customer Growth Plan-(B)-Dist-Addn-Contr-NB-Scattered Y 1 189,975 - - - -
758 System Access Distribution Growth General Customer Growth Service Installations-Random-Contractor Y 1 1,315,243 - - - -
759 System Access Distribution Growth General Customer Growth Meter & Regulator Inst-Addn-Company Y 1 399,282 - - - -
761 System Access Distribution Growth General Customer Growth Plan-(B)-Dist-Addn-Contr-NB-Scattered Y 1 1,713,169 - - - -
762 System Access Distribution Growth General Customer Growth New Business-Services Y 1 3,951,106 - - - -
763 System Access Distribution Growth General Customer Growth Land Rights-Additions Y 1 50,000 - - - -
764 System Access Distribution Growth General Customer Growth New Business-Meters & Regs Y 1 1,546,400 - - - -
765 System Access Distribution Growth General Customer Growth Indirect Materials-Additions Y 1 318,585 - - - -
767 System Access Distribution Growth General Customer Growth Plan-(B)-Dist-Addn-Contr-NB-Scattered Y 1 2,281,320 - - - -
768 System Access Distribution Growth General Customer Growth Service Installations-Random-Contractor Y 1 1,823,664 - - - -
769 System Access Distribution Growth General Customer Growth Land Rights-Additions Y 1 15,000 - - - -
770 System Access Distribution Growth General Customer Growth Meter & Regulator Inst-Addn-Company Y 1 604,104 - - - -
771 System Access Distribution Growth General Customer Growth Indirect Materials-Additions Y 1 135,377 - - - -
772 System Access Distribution Growth General Customer Growth Plan-(B)-Dist-Addn-Contr-NB-Scattered Y 1 4,134,977 - - - -
773 System Access Distribution Growth General Customer Growth Service Installations-Random-Contractor Y 1 3,302,269 - - - -
774 System Access Distribution Growth General Customer Growth Land Rights-Additions Y 1 15,000 - - - -
775 System Access Distribution Growth General Customer Growth Meter & Regulator Inst-Addn-Company Y 1 736,741 - - - -
776 System Access Distribution Growth General Customer Growth Indirect Materials-Additions Y 1 197,509 - - - -
777 System Service Distribution Growth Distribution Reinforcement HALT-THIRD LINE & NORTH SERVICE-HALT Y 1 - - 410,567 - -
778 System Access Distribution Growth General Customer Growth Plan-(B)-Dist-Addn-Contr-NB-Scattered Y 1 1,162,127 - - - -
779 System Access Distribution Growth General Customer Growth DSD-Plan-(B)-Dist-Addn-Compy-Services Y 1 848,090 - - - -
780 System Access Distribution Growth General Customer Growth Plan-(B)-Dist-Addn-Compy-NB-Scattered Y 1 219,915 - - - -
781 System Access Distribution Growth General Customer Growth Service Installations -Random Contractor Y 1 4,975,634 - - - -
782 System Access Distribution Growth General Customer Growth Land Rights-Additions Y 1 20,000 - - - -
783 System Access Distribution Growth General Customer Growth Meter & Regulator Inst-Addn-Company Y 1 837,861 - - - -
784 System Access Distribution Growth General Customer Growth Indirect Materials-Company Y 1 155,806 - - - -
790 System Access Distribution Growth General Customer Growth SMC-Meter & Regulator Additions South Y 1 5,345,412 - - - -
791 System Access Distribution Growth General Customer Growth Plan-(B)-Dist-Addn-Compy-Services Y 1 1,196,890 - - - -
792 System Access Distribution Growth General Customer Growth Plan-(B)-Dist-Addn-Compy-NB-Scattered Y 1 247,671 - - - -
793 System Access Distribution Growth General Customer Growth Land Rights-Additions Y 1 15,300 - - - -
794 System Access Distribution Growth General Customer Growth Meter & Regulator Inst-Addn-Company Y 1 194,834 - - - -
795 System Access Distribution Growth General Customer Growth Indirect Materials-Company Y 1 44,083 - - - -
796 System Access Distribution Growth General Customer Growth Plan-(B)-Dist-Addn-Contr-NB-Scattered Y 1 489,239 - - - -
797 System Access Distribution Growth General Customer Growth Plan-(B)-Dist-NB Scatt Stn Y 1 3,826 - - - -
Filed: 2019-04-25, EB-2018-0305, Exhibit I.BOMA.22, Attachment 2, Page 4 of 29

Project Listing for UGL (2019‐2023)
5
Unique Identifier Investment Category Asset/Growth Category Portfolio Description ICM -
Eligible Mandatory Priority 2019 ($) 2020 ($) 2021 ($) 2022 ($) 2023 ($) Potential for LTC
798 System Access Distribution Growth General Customer Growth Plan-(B)-Dist-Comp-Services Y 1 181,441 - - - -
799 System Access Distribution Growth General Customer Growth Plan-(B)-Dist-Addn-Compy-NB-Scattered Y 1 86,490 - - - -
800 System Access Distribution Growth General Customer Growth Service Installations-Contractor SSMarie Y 1 3,327,024 - - - -
801 System Access Distribution Growth General Customer Growth Land Rights-Additions Y 1 30,000 - - - -
802 System Access Distribution Growth General Customer Growth Meter & Regulator Inst-Addn-Company Y 1 262,180 - - - -
803 System Access Distribution Growth General Customer Growth Misc Material-Company Y 1 45,072 - - - -
804 System Access Distribution Growth General Customer Growth Propane Converstions Y 1 10,000 - - - -
805 System Access Distribution Growth General Customer Growth Plan-(B)-Dist-Addn-Compy-Services Y 1 319,192 - - - -
806 System Access Distribution Growth General Customer Growth Plan-(B)-Dist-Addn-Compy-NB-Scattered Y 1 219,496 - - - -
807 System Access Distribution Growth General Customer Growth Land Rights-Additions Y 1 15,300 - - - -
808 System Access Distribution Growth General Customer Growth Meter & Regulator Inst-Addn-Company Y 1 51,362 - - - -
809 System Access Distribution Growth General Customer Growth Indirect Materials-Company Y 1 42,695 - - - -
810 System Service Distribution Growth Distribution Reinforcement NW_HWY 655 Reinforcement_TIMMINS Y 1 598,915 - - - -
811 System Access Distribution Growth General Customer Growth Plan-(B)-Dist-Addn-Contr-NB-Scattered Y 1 503,334 - - - -
812 System Access Distribution Growth General Customer Growth Plan-(B)-Dist-NB Scatt Stn Y 1 3,826 - - - -
813 System Access Distribution Growth General Customer Growth Service Installations-Contractor Orillia Y 1 2,978,818 - - - -
814 System Access Distribution Growth General Customer Growth Land Rights-Additions Y 1 30,000 - - - -
815 System Access Distribution Growth General Customer Growth Meter & Regulator Inst-Addn-Company Y 1 335,278 - - - -
816 System Access Distribution Growth General Customer Growth Misc Materials-Company Y 1 45,072 - - - -
819 System Access Distribution Growth General Customer Growth SMC-Meter & Regulator Additions North Y 1 1,934,629 - - - -
821 System Access Distribution Growth General Customer Growth Preferred Design Capital Blanket Y 1 1,000,000 - - - -
848 System Access Distribution Growth General Customer Growth Greenstone *C/O 2018* Y 1 500,000 3,407,000 - - - Y
854 System Access Distribution Growth CK Rural CK Rural Pipeline Extension(DresdenRein) Y 1 16,206,727 359,000 - - - Y
863 System Service Distribution Growth Transmission Reinforcement WAT - OwenSound Reinforc Ph 4 - c/o2018 Y Y 1 - 51,042,071 898,000 - - Y
1202 System Service Distribution Growth Transmission Reinforcement Dunnville Line Reinforcement Loop 10" reinforcement from outlet of Caledonia Trans, ending at Stoneman Rd
Y Y 1 - - 11,000,000 - - Y
1494 System Service Distribution Growth Kingsville Transmission Reinf Project WIND_KTRP Road 2 E Reinf_Kingsville Y 1 2,671,074 - - - -
1495 System Service Distribution Growth Distribution Reinforcement LOND - Woodstock Reinforcement-Woodstock Y 1 258,829 - - - -
1496 System Service Distribution Growth Distribution Reinforcement LOND-Perth Rd 163 Reinforcemnt- St Marys Y 1 - 129,076 - - -
1497 System Service Distribution Growth Distribution Reinforcement LOND - Iona Gate Looping - Iona Y 1 60,770 - - - -
1498 System Service Distribution Growth Distribution Reinforcement BRAN-Pleasant Ridge Syst Reinf,Brant Cty Y 1 - 388,216 - - -
1499 System Service Distribution Growth Distribution Reinforcement WAT-Elora Fergus System Reinforcement Y 1 607,851 - - - -
1500 System Service Distribution Growth Distribution Reinforcement WAT-Breslau System Reinforcement Y 1 - 1,343,534 - - - 1501 System Service Distribution Growth Distribution Reinforcement WAT-New Hamburg Baden System Reinforcemt Y 1 - 599,345 - - -
1502 System Service Distribution Growth Distribution Reinforcement WAT-St Jacobs System Reinforcement Y 1 352,101 - - - -
1503 System Service Distribution Growth Distribution Reinforcement WAT-Owen Sound System Reinforcement Y 1 - 143,038 - - -
Filed: 2019-04-25, EB-2018-0305, Exhibit I.BOMA.22, Attachment 2, Page 5 of 29

Project Listing for UGL (2019‐2023)
6
Unique Identifier Investment Category Asset/Growth Category Portfolio Description ICM -
Eligible Mandatory Priority 2019 ($) 2020 ($) 2021 ($) 2022 ($) 2023 ($) Potential for LTC
1504 System Service Distribution Growth Distribution Reinforcement Wat - Linwood System Reinforcement Y 1 1,876,417 - - - -
1505 System Service Distribution Growth Station Reinforcement WAT-Waterloo Gate Stn Reinf 19S-601 Y 1 213,759 - - - -
1506 System Service Distribution Growth Station Reinforcement WAT-HWY 23 Distribution Stn 21Q-103R Y 1 - 418,838 - - -
1507 System Service Distribution Growth Station Reinforcement WAT-Guelph West Gate Stn Reinf 19U-201 Y 1 86,125 - - - -
1508 System Service Distribution Growth Distribution Reinforcement HAMI-Rymal Rd E Reinforcement Hamilton Y 1 1,724,151 - - - -
1509 System Service Distribution Growth Distribution Reinforcement HALT-Appleby Line Reinforcement-Oakville Y 1 354,521 - - - -
1510 System Service Distribution Growth Distribution Reinforcement HALT-Stocksbridge Reinforcement Oakville Y 1 33,523 - - - -
1511 System Service Distribution Growth Station Reinforcement HALT-19Y-303R-2221 Ninth line Station Re Y 1 68,738 - - - -
1512 System Service Distribution Growth Distribution Reinforcement King - County Rd 2 - Odessa - Install +/ Y 1 929,258 - - - -
1513 System Service Distribution Growth Distribution Reinforcement Chippewa Rd West of James St Y 1 - 792,179 - - -
1514 System Service Distribution Growth Station Reinforcement Airport Rd TBS - SSM Y 1 7,000 - - - -
1515 System Service Distribution Growth Station Reinforcement Parkewood Estates PRS - SSM Y 1 75,817 - - - -
1516 System Service Distribution Growth Distribution Reinforcement Esten Dr PRS - Elliot Lake Y 1 - 3,950 - - -
1518 System Service Distribution Growth Transmission Reinforcement Byron Transmission Stn Rebuild Reinf Y Y 1 - - 349,000
15,253,000 -
1519 System Access Distribution Growth General Customer Growth WAT-Xiniyi Glass Service & Customer Stn Y 1 - 1,500,000 - - -
1537 System Service Distribution Growth Station Reinforcement Parry Sound TBS Y 1 453,429 - - - -
1550 System Service Distribution Growth Kingsville Transmission Reinf Project WIND_KTRP Dependent Customers_Kingsville Y 1 4,678,168 - - - -
1551 System Service Distribution Growth Kingsville Transmission Reinf Project WIND_KTRP Graham Side Rd Reinf_Kingsvill Y 1 1,357,207 - - - -
1552 System Access Distribution Growth General Customer Growth WIND_CK Expan Dependent Cust_Chatham Y 1 2,835,253 - - - -
1553 System Service Distribution Growth Transmission Reinforcement Oxford Looping Y 1 100,000 - - - -
1558 System Service Distribution Growth Transmission Reinforcement Stratford Reinforcement *C/O 2018* Y Y 1 23,074,784 506,000 - - - Y
1559 System Service Distribution Growth Transmission Reinforcement EPCOR Customer Station Y 1 2,780,259 - - - -
1575 System Service Distribution Growth Distribution Reinforcement 800 m installed on Tower St South to loop 2" PE on SE side of Fergus Y 1 - 470,059 - - -
1576 System Service Distribution Growth Distribution Reinforcement Loop with 6" PE out of main station Y 1 - 101,576 - - - 1577 System Service Distribution Growth Distribution Reinforcement Install 4" PE along Bay St from Alberto to Huron St Y 1 - 51,678 - - -
1578 System Service Distribution Growth Distribution Reinforcement Extend 4" PE to the bridge. Streets may vary. District to indicate route Y 1 - 206,712 - - -
1579 System Service Distribution Growth Station Reinforcement • Replace regulators with 4” • Rebuild piping from outlet of filter to downstream isolating valve of each regulator run Y 1 - 59,586 - - -
1580 System Service Distribution Growth Distribution Reinforcement Install ~750m of 4" PE 420 kPa MOP main from the existing 3" main on Hwy 119 looping the existing 2" main along 40 Line. Y 1 - 139,762 - - -
1581 System Service Distribution Growth Station Reinforcement Increase capacity to 1000m3/hr and outlet to 310 kPa. Supports growth in Mitchell. Y 1 - 325,000 - - -
1582 System Service Distribution Growth Distribution Reinforcement Loop part of the existing 8'' HP on Guelph Line with 12" S. Y 1 - 1,885,000 - - -
1583 System Service Distribution Growth Distribution Reinforcement Lay a new main on main street Y 1 - 55,000 - - -
1584 System Service Distribution Growth Distribution Reinforcement New 4" PE main on Concession Rd 5 W needed to keep system above min pressure due to 374 and 367 5th Concession Y 1 - 250,000 - - -
1585 System Service Distribution Growth Station Reinforcement New station (~ @ 2317 Khalsa Gate) that is going to be installed instead of Bronte Creek crossing Y 1 - 600,000 - - -
1586 System Service Distribution Growth Station Reinforcement Replace exisiting heater with a new cwt 385 MBTU Heater Y 1 - 275,000 - - -
Filed: 2019-04-25, EB-2018-0305, Exhibit I.BOMA.22, Attachment 2, Page 6 of 29

Project Listing for UGL (2019‐2023)
7
Unique Identifier Investment Category Asset/Growth Category Portfolio Description ICM -
Eligible Mandatory Priority 2019 ($) 2020 ($) 2021 ($) 2022 ($) 2023 ($) Potential for LTC
1588 System Service Distribution Growth Distribution Reinforcement Continue the reinforcement from 2018, tying into the 8" main along Oxford St Y 1 - 110,000 - - -
1589 System Service Distribution Growth Station Reinforcement Rebuild both regulator runs to larger orifices and new relief valves and stacks. Y 1 -
5,500 - - -
1590 System Service Distribution Growth Station Reinforcement Pushing station too hard - modifications in 2018 to get to 2020 max. Requires a full rebuild by 2019/2020 to a 9.S-144H with a CWT heater installed. Y 1 - 520,516 - - -
1591 System Service Distribution Growth Station Reinforcement Rebuild both regulator runs to larger orifices and new relief valves and stacks. Y 1 -
5,500 - - -
1594 System Service Distribution Growth Distribution Reinforcement Adding second feed from 1210kPa system using new station to cut to 420kPa. New main connecting station and development. Y 1 - 138,600 - - -
1595 System Service Distribution Growth Station Reinforcement A new station 9S-142 required considering current/future flow. Y 1 - 76,000 - - -
1596 System Service Distribution Growth Station Reinforcement
This station was partially built in 2016. Station can handle flow for future but need to verify that both regulator's orifice size is 4.8 mm. If not, orifice size needs to changed to 4.8 mm
Y 1 - 500 - - -
1597 System Service Distribution Growth Station Reinforcement Existing orifice (6.4 mm) needs to be changed to 9.5 mm to provide required load for future Y 1 -
500 - - -
1598 System Service Distribution Growth Station Reinforcement Increase Station Capacity Y 1 - 107,980 - - -
1599 System Service Distribution Growth Distribution Reinforcement
6" Main extension from Windsor Line (Provincial & Concession Rd 8) to the Mega Hospital Site. Please include a tie-in to the 2" main at Baseline & Concession Rd 8. New Station required.
Y 1 - 2,386,992 - - - Y
1600 System Service Distribution Growth Distribution Reinforcement Loop existing 6" ST along County Rd 14 from the outlet of 04E-102 County Rd 14 Stn to the 6" ST along Hwy 77 (FID 517370824) Y 1 - 1,156,539 - - -
1601 System Service Distribution Growth Distribution Reinforcement Install 4"PE along Watson Pkwy to Speedvale Ave Y 1 - - 106,458 - -
1602 System Service Distribution Growth Distribution Reinforcement Install 4"PE along Elm St Y 1 - - 62,101 - -
1603 System Service Distribution Growth Station Reinforcement Station to be rebuild with 9.S-144, will required land purchase. Provisions for heat will be added but not heater provided Y 1 - -
498,474 - -
1604 System Service Distribution Growth Station Reinforcement
This station should be rebuilt similarly to 9.S-147 with an additional regulator run, inlet piping to stay the current NPS8, outlet piping will be NPS10 • Removal of current building • Complete rebuild of both sets of regulator runs to monitor operator setup • Addition of a third regulator run • Replace existing 8” station piping to 10” to exit of station • Replacement of filter • Reworking of electrical and additional heat trace • New Heater
Y 1 - - 745,988 - -
1605 System Service Distribution Growth Station Reinforcement Increase capacity due to growth in Simcoe Y 1 - - 275,159 - -
1606 System Service Distribution Growth Station Reinforcement Increase capacity due to growth in Brantford Y 1 - - 812,160 - -
1607 System Service Distribution Growth Distribution Reinforcement Connect existing mains along Robinson Rd Y 1 - - 210,000 - -
1608 System Service Distribution Growth Distribution Reinforcement Payne Mills - 2550m NPS 8 ST from Payne Mills along Dutton Lines Y 1 - -
1,785,000 - -
1609 System Service Distribution Growth Distribution Reinforcement
Looping on main St is required to maintain system pressure. 101m is the min length of looping required to keep system min until 2026. More is recommended to avoid having to lay main in this area.
Y 1 - - 380,000 - -
1610 System Service Distribution Growth Station Reinforcement Can reduce min inlet to 860 kpa (from 1035 kPa) and Y 1 - - - -
Filed: 2019-04-25, EB-2018-0305, Exhibit I.BOMA.22, Attachment 2, Page 7 of 29

Project Listing for UGL (2019‐2023)
8
Unique Identifier Investment Category Asset/Growth Category Portfolio Description ICM -
Eligible Mandatory Priority 2019 ($) 2020 ($) 2021 ($) 2022 ($) 2023 ($) Potential for LTC
increase trim size to 100%. 500
1611 System Service Distribution Growth Distribution Reinforcement Lay new 4'' main to sustain new development Y 1 - - 150,000 - -
1612 System Service Distribution Growth Station Reinforcement Increase outlet pressure to 380 in order to maintain system min Y 1 - -
500,000 - -
1613 System Service Distribution Growth Station Reinforcement
Install new station to feed into the area near 10246 Glendon Dr. Previously 2017 project, but subdivisions have not started yet. Project should be brought forward to align with new subdivisions.
Y 1 - - 250,000 - -
1614 System Service Distribution Growth Distribution Reinforcement
Install new main to feed from new station. Previously 2017 project, but subdivisions have not started yet. Project should be brought forward to align with new subdivisions.
Y 1 - - 64,238 - -
1615 System Service Distribution Growth Distribution Reinforcement Connecting two 1210 kPa MOP systems with 2" ST (from FID#552379785 to FID#552380650) Y 1 - 205,689 - - -
1616 System Service Distribution Growth Distribution Reinforcement Looping existing 2" ST (FID#801879687) with 4" ST Y 1 - - 385,841 - -
1617 System Service Distribution Growth Distribution Reinforcement Continuation of 2019 4"ST looping Y 1 - - - - 254,205
1618 System Service Distribution Growth Distribution Reinforcement Looping existing 2" PE (FID#804313689) with 4"PE Y 1 - - 62,500 - -
1619 System Service Distribution Growth Distribution Reinforcement Looping existing 3" ST (FID 517100121) with 4" ST Y 1 - - 520,000 - -
1620 System Service Distribution Growth Station Reinforcement A full rebuild required with 9S-150FR Y 1 - - 13,900 - -
1621 System Service Distribution Growth Station Reinforcement Increase Station Capacity Y 1 - - 418,000 - -
1622 System Service Distribution Growth Distribution Reinforcement Loop existing 6" ST420kPa along Seacliff from Graham to near Summers Ave Y 1 - -
722,924 - -
1623 System Service Distribution Growth Distribution Reinforcement
Kingsville - Run new 8" ST along Graham & Road 4 E from the capped 8" at Graham Sdrd & Road 4 E (FID 516519428) to the 4" ST at the intersection of County Rd 31 & Graham
Y 1 - - 1,357,207 - -
1624 System Service Distribution Growth Distribution Reinforcement Loop existing 2"PE with 6"PE along Victoria Rd S Y 1 - - - 350,220 -
1625 System Service Distribution Growth Distribution Reinforcement Guelph - Loop existing 12" ST along Woodlawn Rd W Y 1 - - - 1,185,380 - Y
1626 System Service Distribution Growth Distribution Reinforcement Tie 4" PE to 2" PE at bridge st Y 1 - - - 18,275 -
1627 System Service Distribution Growth Station Reinforcement • Replace heater with 3” Coil • Replace inlet piping to heater Y 1 - - -
86,475 -
1628 System Service Distribution Growth Station Reinforcement
• Remove current CWT 380 and add CWT 770 heater • Add two new regulator runs with two cuts Cut 1. Monitor operator cut from 6160 MOP to 3450 MOP Cut 2. Monitor operator cut from 3450 MOP to 480 MOP • Add ~350ft of NPS 12 piping parallel to current NPS 8 • Abandon NPS 8 Piping and remove current reg runs
Y 1 - - - 574,894 -
1629 System Service Distribution Growth Station Reinforcement • Station to be rebuild with 9.S-142 • Land should be purchased for this station size Y 1 - - -
68,437 -
1630 System Service Distribution Growth Station Reinforcement Increase Capacity at Tupperville Trans Y 1 - - - 150,200 -
1631 System Service Distribution Growth Distribution Reinforcement loop existing 2" ST along Main St from the 4" on Graham Rd to the small section of 4" along Main St (FID 517954237) Y 1 - - -
153,664 -
1632 System Service Distribution Growth Distribution Reinforcement Lay 4" PE main on Main St N. This pipe needs to connect back into the existing 2'' (FID 554264151) Y 1 - - -
75,000 -
1633 System Service Distribution Growth Distribution Reinforcement Loop existing 2" to allow for new developments from outlet of 19Y-303R on Ninth Line. Y 1 - - -
150,000 -
1634 System Service Distribution Growth Station Reinforcement Beachville Gate (14R-101) increase capacity Y 1 - - - 280,000 -
1635 System Service Distribution Growth Distribution Reinforcement North London install 600m 4" PE. Y 1 - - - 24,546 -
Filed: 2019-04-25, EB-2018-0305, Exhibit I.BOMA.22, Attachment 2, Page 8 of 29

Project Listing for UGL (2019‐2023)
9
Unique Identifier Investment Category Asset/Growth Category Portfolio Description ICM -
Eligible Mandatory Priority 2019 ($) 2020 ($) 2021 ($) 2022 ($) 2023 ($) Potential for LTC
1636 System Service Distribution Growth Distribution Reinforcement Sudbury - Install 4" PE through existing 8" casing along Long Lake Rd - PHASE 2 Y 1 - - -
1,000,000 -
1637 System Service Distribution Growth Station Reinforcement Full Rebuild to a 142 size station Y 1 - - - 75,000 -
1640 System Service Distribution Growth Station Reinforcement With current setup, station cannot support 380 kPa Max. Sust. rebuild required for increased load with 380 max sust based on 9S-150TC Y 1 - - -
28,000 -
1641 System Service Distribution Growth Station Reinforcement Station is flagged for IOPP. A partial rebuild required. Y 1 - - - 12,000 -
1642 System Service Distribution Growth Station Reinforcement With current setup, station cannot support 380 kPa Max. Sust. rebuild required for increased load with 380 max sust based on 9S-142 Y 1 - - -
76,000 -
1643 System Service Distribution Growth Distribution Reinforcement Continue looping along Seacliff Dr from the end of the 2021 reinforcement to the 6" ST along Union Ave Y 1 - - -
1,161,523 -
1644 System Service Distribution Growth Distribution Reinforcement Install 6" PE along Whippoorwill Dr tie-ing into existing station 20S-603 Y 1 - - - -
90,181
1645 System Service Distribution Growth Distribution Reinforcement Loop existing 2" PE with 6" PE on Arkell Rd Y 1 - - - - 152,614
1646 System Service Distribution Growth Distribution Reinforcement Install 4" St down Wellington Rd 7 to 1st line. Buy station property Y 1 - - - -
340,464
1647 System Service Distribution Growth Station Reinforcement • Station to be rebuild with 9.S-142 • Land should be purchased for this station size Y 1 - - - -
69,263
1648 System Service Distribution Growth Station Reinforcement Station to be rebuild with 9.S-144H Y 1 - - - - 514,951
1649 System Service Distribution Growth Station Reinforcement Station to be rebuild with 9.S-150FR Y 1 - - - - 11,598
1650 System Service Distribution Growth Station Reinforcement Similar station to 18S-374 in 2018 Y 1 - - - - 818,321
1651 System Service Distribution Growth Distribution Reinforcement Brantford - Loop out of Brantford Balmoral Gate - phase 1 Y 1 - - - -
1,600,000
1652 System Service Distribution Growth Station Reinforcement Increase the capacity of the station from 3000 to 4000 to handle increase flow from the 2020 main reinforcement. Y 1 - - - -
300,000
1653 System Service Distribution Growth Distribution Reinforcement Road crossing on Mill St W (@ Birchway Pl) to help pressure in subdivision Y 1 - - - -
25,000
1654 System Service Distribution Growth Station Reinforcement Increase capacity through a station rebuild. The flow in this station may impact the capacity on the Hamilton HP line Y 1 - - - -
400,000
1655 System Service Distribution Growth Distribution Reinforcement lay new 4'' main to sustain new development Y 1 - - - - 150,000
1657 System Service Distribution Growth Distribution Reinforcement Install 930m 6" PE. Y 1 - - - - 248,490
1658 System Service Distribution Growth Distribution Reinforcement Assume Hartley Farm and Sally Creek will be installed Y 1 - - - - 44,182
1659 System Service Distribution Growth Station Reinforcement Increase capacity of London Westmount to handle increase flow from main reinforcement (13O-402) Y 1 - - - -
240,000
1660 System Service Distribution Growth Distribution Reinforcement Loop existing 4" Steel (FID 552078657) with 6" Steel Y Y 1 - - - - 15,000,000 Y
1663 System Service Distribution Growth Distribution Reinforcement Add 4" PE road crossing to backfeed subdivision Y 1 - - - - 8,750
1664 System Service Distribution Growth Station Reinforcement *Outlet MOP in SAP is 550 kPa and GIS shows 420 kPa. For a 420 kPa Outlet MOP we cannot achieve 380 kPa Max Sust. It requires a full rebuild of 9S-150FR with 627F. Y 1 - - - -
13,000
1665 System Service Distribution Growth Distribution Reinforcement Looping existing 6" ST (FID 500095554) with 8" ST Y 1 - - - - 800,000
1666 System Service Distribution Growth Station Reinforcement Station can support current flow but a full rebuild required as per 9S-144 for higher max sustainalbe in future Y 1 - - - -
107,000
1667 System Service Distribution Growth Station Reinforcement
Changing trim size from 30% to 60% will provide sufficient load for future. Regulators do not have enough differential and it can provide only less than 90% capacity. Higher Inlet will help to get high capacity if possible.
Y 1 - - - - 1,000
1668 System Service Distribution Growth Station Reinforcement Station has obsolete regulator of 630HP. To support for 380 Max sust and supporting future load, a full rebuild is required with 9S-144 Y 1 - - - -
105,000
1669 System Service Distribution Growth Distribution Reinforcement Loop existing 6" ST 620kPa from end of 8" (FID 516927203) to Mersea Rd 2 & 2nd Conc Station 03E- Y 1 - - - -
1,291,198
Filed: 2019-04-25, EB-2018-0305, Exhibit I.BOMA.22, Attachment 2, Page 9 of 29

Project Listing for UGL (2019‐2023)
10
Unique Identifier Investment Category Asset/Growth Category Portfolio Description ICM -
Eligible Mandatory Priority 2019 ($) 2020 ($) 2021 ($) 2022 ($) 2023 ($) Potential for LTC
115R
1709 System Service Distribution Growth Distribution Reinforcement Looping existing 4"ST along Highway 655 with 6" ST. Continuation of 2018 6"ST 6895kPa MOP looping. Y 1 - -
602,077 - -
1710 System Service Distribution Growth Distribution Reinforcement Looping existing 4"ST upstream of Highway 655 with 6"ST. Y 1 - - -
1,061,000 -
1994 System Access Distribution Growth General Customer Growth Taylor Mine Y 1 1,307,000 - - - - Y
2187 System Access Distribution Growth General Customer Growth Scattered Mains Y 1 - 14,337,548 14,585,587
14,837,918
15,094,614
2188 System Access Distribution Growth General Customer Growth Services Y 1 - 32,780,366 33,347,466
33,924,378
34,511,269
2189 System Access Distribution Growth General Customer Growth Meter & Reg Installs (Addns - Labour) Y 1 - 7,985,311 8,123,457
8,263,993
8,406,960
2190 System Access Distribution Growth General Customer Growth Land Rights Y 1 - 231,987 236,001
240,083
244,237
2191 System Access Distribution Growth General Customer Growth Indirect Materials Y 1 - 1,544,217 1,570,932
1,598,109
1,625,756
2192 System Access Distribution Growth General Customer Growth Propane Conversion Y 1 - 2,297
2,337
2,378
2,419
2193 System Access Distribution Growth General Customer Growth Scattered Other Y 1 - 48,114 48,946
49,793
50,654
2308 System Access Distribution Growth General Customer Growth Generic Customer Growth - Rate 20 (North) Y 1 - - - - 5,000,000
2353 System Service Distribution Growth Hamilton Gate Hamilton Gate 1 Y Y 1 - - - 20,000,000 -
2354 System Service Distribution Growth Hamilton Gate Hamilton Gate 2 Y Y 1 - - 7,000,000 - -
2356 System Access Distribution Growth General Customer Growth Meter & Regulator Additions Y 1 - 7,510,220 7,758,427
8,120,741
8,388,583
2359 System Service Distribution Growth Distribution Reinforcement Install 6" PE along west side of 16th Ave tying into 2" Y 1 - 92,453 - - -
2361 System Service Distribution Growth Station Reinforcement • Replace orifices/regs with 6.4mm • Rebuild relief after isolating valve and replace with 1808A Y 1 -
4,109 - - -
2363 System Service Distribution Growth Station Reinforcement Reduce outlet P to 335 from 380 Y 1 - 500 - - -
2367 System Service Distribution Growth Station Reinforcement Currently a below-grade vault station, trim change Y 1 - 500 - - -
2368 System Service Distribution Growth Station Reinforcement Replacing Orifice Y 1 - 5,500 - - -
2369 System Service Distribution Growth Distribution Reinforcement Looping existing 3" ST (from FID#552724885 to FID#552299258) with 4" ST Y 1 - 753,858 - - -
2370 System Service Distribution Growth Distribution Reinforcement Connect existing 2" PE (FID 518792595) to existing 4" PE (FID 518792810) Y 1 - 28,600 - - -
2371 System Service Distribution Growth Distribution Reinforcement Looping existing 3" ST (FID 518847342) with 4" PE Y 1 - 73,920 - - -
2372 System Service Distribution Growth Station Reinforcement Orifice change to (22.2X15.9) for both Fisher 99 regulators will provide sufficient flow for future load Y 1 -
500 - - -
2373 System Service Distribution Growth Station Reinforcement Increase Max sustainable back to where it once was. Increase min inlet to accommodate this change. Y 1 -
8,500 - - -
2374 System Service Distribution Growth Transmission Reinforcement Oxford Phase 2 Reinforcement Y 1 - - 20,031
623,559
6,254,716 Y
2375 System Service Distribution Growth Transmission Reinforcement 2025 Owen Sound Reinforcement Y Y 1 - - - - 140,948 Y
2377 System Service Distribution Growth Station Reinforcement Requires min inlet to be lowered from 620 kPa and over capacity. Y 1 - -
255,000 - -
2390 System Service Distribution Growth Distribution Reinforcement Sudbury - Install 4" PE through existing 8" casing along Long Lake Rd - PHASE 1 Y 1 - -
1,100,000 - -
2394 System Service Distribution Growth Distribution Reinforcement Sudbury - Install new transmission line along Kingsway from Coniston TBS to Sudbury East. This will be cut down to 420 kPa and support the distribution system. PHASE 1 Y 1 - - - -
1,430,000
2397 System Service Distribution Growth Station Reinforcement Sudbury Transmission - 2 x 2100 HP Compressor upstream of coniston at Marten River takeoff Y Y 1 - - - -
31,200,000 Y
2398 System Service Distribution Growth Transmission Reinforcement
Listowel - 1.9km of 6" ST at 1900 kPa MOP. This project in conjuction with the 2024 project will accommodate approximately 5 years' growth on the Listowel lateral starting in 2023
Y 1 - - - - 1,600,000
2399 System Service Distribution Growth Transmission Reinforcement Cambridge - Lift and lay 1km of 8" 3450 kPa with 1 km of 10" 3450 kPa main. Y 1 - - - -
1,800,000
Filed: 2019-04-25, EB-2018-0305, Exhibit I.BOMA.22, Attachment 2, Page 10 of 29

Project Listing for UGL (2019‐2023)
11
Unique Identifier Investment Category Asset/Growth Category Portfolio Description ICM -
Eligible Mandatory Priority 2019 ($) 2020 ($) 2021 ($) 2022 ($) 2023 ($) Potential for LTC
2408 System Service Distribution Growth Station Reinforcement Oxford County - Rebuild both cuts 1A and 2A at Oxford Gate Station for additional flow. See planning for details. Y 1 - 1,000,000 - - -
2409 System Service Distribution Growth Station Reinforcement Hensall - Require higher outlet pressures out of 14N-302 Hensall Transmission Station to defer reinforcement of the Hensall Trans System by 3 years Y 1 - - - -
2,000,000
2900 System Service Distribution Growth Distribution Reinforcement Level Distribution Growth to $11M (Dist & Stations) Y 1 - (4,941,650) (688,093)
4,469,386
(274,045)
171 General Plant Fleet Fleet OS - Transportation-Replacements Y 1 10,000,000 - - - -
938 General Plant Fleet Fleet Fleet Capital purchase Y 1 - 12,000,000 12,000,000
8,000,000
8,000,000
840 General Plant IT Applications Contrax Modernization Y 1 11,465,934 - - - -
841 General Plant IT Applications Service Suite Lifecycle C/O 2018 Y 1 3,800,000 - - - -
871 General Plant IT Applications My Account Lifecycle Y 1 1,000,569 - - - -
1997 General Plant IT Applications Banner Enhancements Y 1 1,000,000 - - - -
1998 General Plant IT Applications Cars Enhancements Y 1 100,000 - - - -
1999 General Plant IT Applications EDW Program Y 1 100,000 - - - -
2000 General Plant IT Applications GIS Enhancements Y 1 150,000 - - - -
2001 General Plant IT Applications GMAS Y 1 50,000 - - - -
2002 General Plant IT Applications Interruptions Application Lifecycle Y 1 100,000 - - - -
2003 General Plant IT Applications IPCC Enhancements Program Y 1 75,000 - - - -
2004 General Plant IT Applications Itron FCS Upgrade Y 1 25,000 - - - -
2005 General Plant IT Applications Material Traceability Implementation Y 1 500,000 - - - -
2006 General Plant IT Applications New Service Offerings Y 1 50,000 - - - -
2007 General Plant IT Applications ProjectWise Upgrade (TRIM) Y 1 125,000 - - - -
2008 General Plant IT Applications RiskMaster Upgrade Y 1 100,000 - - - -
2009 General Plant IT Applications Sitecore CMS Upgrade 2018 Y 1 100,000 - - - -
2010 General Plant IT Applications Sitecore CMS Upgrade 2019 Y 1 15,000 - - - -
2011 General Plant IT Applications Unionline Customer Experience Enhancement Program Y 1 200,000 - - - -
2012 General Plant IT Applications WCMS Program Y 1 100,000 - - - -
2013 General Plant IT Applications Web Analytics Replacement Y 1 40,000 - - - -
2014 General Plant IT Applications SCADA Enhancements/CRM Y 1 300,000 - - - -
2015 General Plant IT Applications SCADA Upgrades Y 1 700,000 - - - -
2016 General Plant IT Hardware Data/Voice Network Sustainment Y 1 1,348,000 - - - -
2017 General Plant IT Hardware Desktop Lifecycle/Sustainment Y 1 2,294,500 - - - -
2018 General Plant IT Hardware Plotter Lifecycle Y 1 50,000 - - - -
2019 General Plant IT Hardware Server Lifecycle/Sustainment Y 1 2,607,880 - - - -
2020 General Plant IT IT Technologies BO Suite Upgrade 2019 Y 1 200,000 - - - -
2021 General Plant IT IT Technologies CARS Discoverer Migration Y 1 150,000 - - - -
2022 General Plant IT IT Technologies FTP Server Lifecycle 2019 Y 1 5,000 - - - -
2023 General Plant IT IT Technologies Internal Web Environment Lifecycle 2018 Y 1 50,000 - - - -
Filed: 2019-04-25, EB-2018-0305, Exhibit I.BOMA.22, Attachment 2, Page 11 of 29

Project Listing for UGL (2019‐2023)
12
Unique Identifier Investment Category Asset/Growth Category Portfolio Description ICM -
Eligible Mandatory Priority 2019 ($) 2020 ($) 2021 ($) 2022 ($) 2023 ($) Potential for LTC
2024 General Plant IT IT Technologies Oracle Upgrade 2019 Y 1 200,000 - - - -
2025 General Plant IT IT Technologies SAP Replication Server Replacement Y 1 230,000 - - - -
2026 General Plant IT IT Technologies SQL Server 2018 Upgrade Y 1 40,000 - - - -
2027 General Plant IT IT Technologies TFS Upgrade 2019 Y 1 20,000 - - - -
2028 General Plant IT IT Technologies Windows 10 Application Compatibility Program Y 1 250,000 - - - -
2029 General Plant IT IT Technologies Windows Server 2008 Lifecycle Program Y 1 250,000 - - - -
2274 General Plant IT Applications Banner Y 1 - 3,500,000 2,100,000
2,100,000
2,250,000
2275 General Plant IT Applications CARE Y 1 - 6,100,000 11,150,000
10,150,000
9,175,000
2276 General Plant IT Applications CARS Y 1 - 300,000 7,200,000
7,350,000
7,350,000
2277 General Plant IT Applications ConTrax Y 1 - 100,000 350,000
250,000
120,000
2278 General Plant IT Applications Corrosion N 3 - 1,500,000 2,000,000
250,000 -
2279 General Plant IT Applications Customer Interaction Centre Y 1 - 75,000 75,000
75,000
50,000
2280 General Plant IT Applications Emergency Service Address Listings Y 1 - 150,000 - - -
2281 General Plant IT Applications Enterprise Data Warehouse Y 1 - 200,000 200,000
200,000
200,000
2282 General Plant IT Applications GIS N 3 - 1,500,000 750,000
6,000,000
6,000,000
2283 General Plant IT Applications ProjectWise Y 1 - 100,000 - 100,000 -
2284 General Plant IT Applications Service Suite N 2 - 500,000 1,000,000
500,000
500,000
2285 General Plant IT Applications Underground Storage Suite Y 1 - - 500,000 - -
2286 General Plant IT Applications UnionGas.com Y 1 - 150,000 150,000
215,000
150,000
2287 General Plant IT Applications UnionLine Y 1 - 10,000 50,000
25,000
25,000
2288 General Plant IT Applications SCADA Y 1 - 1,000,000 1,000,000
1,000,000
1,100,000
2289 General Plant IT Applications SAP N 3 - 500,000 250,000
250,000
250,000
2290 General Plant IT Applications Meters & Measurement Y 1 - 3,910,000 150,000
550,000
125,000
2291 General Plant IT Applications Asset Management Program Y 1 - 1,200,000 450,000
300,000
200,000
2292 General Plant IT Applications Material Traceability N 3 - 500,000 750,000
250,000
100,000
2294 General Plant IT Applications Applications - Other Y 1 - 1,070,000 630,000
510,000
3,530,000
2295 General Plant IT Applications Applications - Cloud Y 1 - 350,000 600,000
850,000 -
2297 General Plant IT Hardware Hardware - Blanket Y 1 - 4,385,625 4,359,857
4,560,650
5,386,481
2298 General Plant IT Hardware Corrosion Y 1 - - 275,000 - -
2299 General Plant IT Hardware Customer Interaction Centre Y 1 - - - 100,000
450,000
2300 General Plant IT Hardware GIS Y 1 - - 50,000 -
60,000
2302 General Plant IT Hardware STO Smartphones / Lone Worker Y 1 - - 275,000 - -
2303 General Plant IT Hardware USR Smartphones Y 1 - 300,000 - - 325,000
2304 General Plant IT Hardware USR Toughbooks Y 1 - 2,750,000 - - -
2305 General Plant IT Hardware Meters & Measurement Y 1 - - 1,425,000 -
115,000
2306 General Plant IT IT Technologies IT Technologies - Blanket Y 1 - 1,105,000 1,350,000
1,115,000
1,260,000
Filed: 2019-04-25, EB-2018-0305, Exhibit I.BOMA.22, Attachment 2, Page 12 of 29

Project Listing for UGL (2019‐2023)
13
Unique Identifier Investment Category Asset/Growth Category Portfolio Description ICM -
Eligible Mandatory Priority 2019 ($) 2020 ($) 2021 ($) 2022 ($) 2023 ($) Potential for LTC
400 General Plant LNG Tools STO CAPITAL TOOLS ADDITIONS - HAGAR LNG N 2 22,258 - - - -
401 General Plant LNG Tools STO CAPITAL TOOLS REPL - HAGAR LNG N 2 22,258 - - - -
1035 System Renewal LNG LNG - Possible Large Projects KVGR and Cycle Mix Cooler N 3 - - - 6,242,400 -
1042 System Renewal LNG LNG Capital Maintenance L10 Liquid Nitrogen Upgrades Y 1 - 21,224 - - -
1545 System Renewal LNG Compressor and Dehy Capital Maintenance STO IROQUOIS FALLS VIBRATION MONITOR N 3 - - - - 80,010
24 General Plant Measurement Measurement Electronics Upgrades ENG - LAB FACILITIES UPGRADE Y 1 70,000 - - - -
30 System Service Measurement Odourant Upgrades ENG - Odourant Upgrade Y 1 1,024,932 - - - -
42 System Renewal Measurement Obsolete RTU Equipment ENG -Bristol 3330 Replacement Program N 3 1,364,775 - - - -
52 General Plant Measurement Tools ENG -Technician Tools Additions N 2 50,000 - - - -
54 System Service Measurement Measurement Electronics Upgrades ENG -Turbine Meter Automatic Oilers N 2 34,340 - - - -
56 System Renewal Measurement Labour Cost for exchanges (maint.) Meter & Regulator Inst Repl-Company Y 1 621,478 - - - -
60 System Renewal Measurement Labour Cost for exchanges (maint.) Meter & Regulator Inst Repl-Company Y 1 589,447 - - - -
66 System Renewal Measurement Labour Cost for exchanges (maint.) Meter & Regulator Inst Repl-Company Y 1 1,855,576 - - - -
72 System Renewal Measurement Labour Cost for exchanges (maint.) Meter & Regulator Inst Repl-Company Y 1 432,005 - - - -
78 System Renewal Measurement Labour Cost for exchanges (maint.) Meter & Regulator Inst Repl-Company Y 1 1,183,758 - - - -
82 System Renewal Measurement Labour Cost for exchanges (maint.) Meter & Regulator Inst Repl-Company Y 1 630,579 - - - -
92 System Renewal Measurement Labour Cost for exchanges (maint.) Meter & Regulator Inst Repl-Company Y 1 614,849 - - - -
99 System Renewal Measurement Labour Cost for exchanges (maint.) Meter & Regulator Inst Repl-Company Y 1 1,175,826 - - - -
108 System Renewal Measurement Labour Cost for exchanges (maint.) Meter & Regulator Inst Repl-Company Y 1 746,090 - - - -
121 System Renewal Measurement Labour Cost for exchanges (maint.) Meter & Regulator Inst Repl-Company Y 1 825,808 - - - -
129 System Renewal Measurement Labour Cost for exchanges (maint.) Meter & Regulator Inst Repl-Company Y 1 401,781 - - - -
139 System Renewal Measurement Labour Cost for exchanges (maint.) Meter & Regulator Inst Repl-Company Y 1 578,631 - - - -
176 System Renewal Measurement Labour Cost for exchanges (maint.) Meter & Regulator Inst Repl-Contractor Y 1 605,965 - - - -
178 System Renewal Measurement Labour Cost for exchanges (maint.) Meter & Regulator Inst Repl-Contractor Y 1 1,291,973 - - - -
180 System Renewal Measurement Labour Cost for exchanges (maint.) Meter & Regulator Inst Repl-Contractor Y 1 261,594 - - - -
384 System Renewal Measurement Labour Cost for exchanges (maint.) Meter & Regulator Inst Repl-Contractor Y 1 707,274 - - - -
386 System Renewal Measurement Labour Cost for exchanges (maint.) Meter & Regulator Inst Repl-Contractor Y 1 1,029,519 - - - -
388 System Renewal Measurement Labour Cost for exchanges (maint.) Meter & Regulator Inst Repl-Contractor Y 1 1,053,787 - - - -
491 System Renewal Measurement Meter Exchange Program SMC-Meter & Regulator Replacements North Y 1 5,541,546 - - - -
620 System Renewal Measurement Meter Exchange Program SMC-Meter & Regulator Replacements South Y 1 14,672,477 - - - -
925 System Renewal Measurement Measurement Electronics Upgrades Billing Communication - lifecycle N 3 - 102,000 102,000
102,000
102,000
926 General Plant Measurement Tools Electronic Technician Tools N 2 - 50,000 50,000
50,000
50,000
927 System Renewal Measurement Meter Exchange Program Gas Meters and Devices - Plant Item Costs Y 1 - 15,593,827 15,879,514
16,084,744
16,773,539
929 General Plant Measurement Measurement Electronics Upgrades Lab Upgrades Y 1 - 70,000 70,000
70,000
70,000
930 System Renewal Measurement Meter Exchange Program Labour Cost for exchanges (maint.) Y 1 - 14,561,450 14,681,955
14,681,955
15,048,875
932 System Renewal Measurement Measurement Electronics Upgrades Measurement replacement at low flow odorant sites Y 1 - 51,000 102,000
102,000
102,000
Filed: 2019-04-25, EB-2018-0305, Exhibit I.BOMA.22, Attachment 2, Page 13 of 29

Project Listing for UGL (2019‐2023)
14
Unique Identifier Investment Category Asset/Growth Category Portfolio Description ICM -
Eligible Mandatory Priority 2019 ($) 2020 ($) 2021 ($) 2022 ($) 2023 ($) Potential for LTC
933 System Service Measurement Odourant Upgrades Odourant Upgrade Y 1 - 1,428,000 1,020,000
1,020,000
1,020,000
934 System Renewal Measurement Obsolete RTU Equipment Replacement of Obsolete RTUs N 3 - 3,050,000 3,050,000
2,540,000
2,030,000
32 Overheads Overheads Overheads 3rd Party Pre-Work Y 1 323,360 - - - -
49 Overheads Overheads Overheads 3rd Party Pre-Work Y 1 275,000 - - - -
61 Overheads Overheads Overheads 3rd Party Pre-Work Y 1 260,580 - - - -
73 Overheads Overheads Overheads 3rd Party Pre-Work Y 1 400,000 - - - -
94 Overheads Overheads Overheads 3rd Party Pre-Work Y 1 50,000 - - - -
109 Overheads Overheads Overheads 3rd Party Pre-Work Y 1 120,000 - - - -
141 Overheads Overheads Overheads 3rd Party Pre-Work Y 1 50,000 - - - -
170 Overheads Overheads Overheads 2019 Contractor Fixed Overhead-STIP Y 1 1,268,680 - - - -
201 Overheads Overheads Overheads O&M Capitalized for OEB Y 1 59,234,618 - - - -
831 Overheads Overheads Overheads 3rd Party Pre-Work - New Business Y 1 127,786 - - - -
832 Overheads Overheads Overheads 3rd Party Pre-Work - New Business Y 1 325,000 - - - -
833 Overheads Overheads Overheads 3rd Party Pre-Work - New Business Y 1 200,000 - - - -
834 Overheads Overheads Overheads 3rd Party Pre-Work - New Business Y 1 100,000 - - - -
835 Overheads Overheads Overheads 3rd Party Pre-Work - New Business Y 1 100,000 - - - -
836 Overheads Overheads Overheads 3rd Party Pre-Work - New Business Y 1 30,000 - - - -
837 Overheads Overheads Overheads 3rd Party Pre-Work - New Business Y 1 60,000 - - - -
1193 Overheads Overheads Overheads Overheads Y 1 - 49,264,138 58,291,176
71,367,050
60,613,858
1564 Overheads Overheads Overheads ICM Capitalized OH Y Y 1 19,100,492 - - - -
2357 Overheads Overheads Overheads Overheads Allocation ICM Y Y 1 - 30,735,862 21,708,824
8,632,950
19,386,142
1 System Service Pipelines Other King- Isolation Valves - District - Inst Y 1 124,955 - - - -
5 System Access Pipelines Municipal Replacement Plan-(B)-Dist-Repl-Contr-Mains Municipal Y 1 1,549,799 - - - -
7 System Access Pipelines Municipal Replacement Plan-(B)-Dist-Repl-Contr-Mains Municipal Y 1 6,201,817 - - - -
9 System Access Pipelines Municipal Replacement Plan-(B)-Dist-Repl-Compy-Mains Municipal Y 1 120,995 - - - -
11 System Access Pipelines Municipal Replacement Plan-(B)-Dist-Repl-Compy-Mains Municipal Y 1 104,473 - - - -
14 General Plant Pipelines Other Indirect Materials-Replacements Y 1 51,841 - - - -
17 General Plant Pipelines Other Indirect Materials-Replacements Y 1 46,038 - - - -
18 System Renewal Pipelines Other NW_Lateral Clamp Cut Outs_ATIKOKAN Y 1 - - - 2,400,000 -
28 System Access Pipelines Municipal Replacement Plan-(B)-Dist-Repl-Contr-Mains Municipal Y 1 3,147,110 - - - -
31 General Plant Pipelines Other Indirect Materials-Replacements Y 1 125,569 - - - -
33 System Renewal Pipelines Anodes ANODES Y 1 1,147,503 - - - -
37 System Access Pipelines Municipal Replacement Plan-(B)-Dist-Repl-Contr-Mains Municipal Y 1 226,828 - - - -
39 General Plant Pipelines Other Indirect Materials-Replacements Y 1 22,671 - - - -
40 System Access Pipelines Municipal Replacement Vidal St Municipal Y 1 800,000 - - - -
46 System Access Pipelines Municipal Replacement Plan-(B)-Dist-Repl-Contr-Mains Municipal Y 1 2,670,650 - - - -
Filed: 2019-04-25, EB-2018-0305, Exhibit I.BOMA.22, Attachment 2, Page 14 of 29

Project Listing for UGL (2019‐2023)
15
Unique Identifier Investment Category Asset/Growth Category Portfolio Description ICM -
Eligible Mandatory Priority 2019 ($) 2020 ($) 2021 ($) 2022 ($) 2023 ($) Potential for LTC
50 System Renewal Pipelines Anodes ANODES Y 1 593,415 - - - -
62 System Renewal Pipelines Anodes ANODES Y 1 997,375 - - - -
69 System Access Pipelines Municipal Replacement Plan-(B)-Dist-Repl-Contr-Mains Municipal Y 1 4,149,144 - - - -
70 General Plant Pipelines Land Rights Land Rights-Replacements Y 1 15,000 - - - -
74 System Renewal Pipelines Anodes ANODES Y 1 1,662,019 - - - -
79 System Access Pipelines Municipal Replacement Plan-(B)-Dist-Repl-Contr-Mains Municipal Y 1 1,804,307 - - - -
80 General Plant Pipelines Land Rights Land Rights-Replacements Y 1 15,000 - - - -
90 System Renewal Pipelines Other King- Casing Upgrade District various - Y 1 100,643 - - - -
91 System Access Pipelines Municipal Replacement Plan-(B)-Dist-Repl-Compy-Mains Municipal Y 1 651,285 - - - -
93 General Plant Pipelines Other Indirect Materials-Replacements Y 1 55,645 - - - -
95 System Renewal Pipelines Anodes ANODES Y 1 525,486 - - - -
96 System Renewal Pipelines Cathodic Protection Advancements King- Sectionalization Various -District Y 1 163,127 - - - -
107 General Plant Pipelines Land Rights Land Rights-Replacements Y 1 10,200 - - - -
110 System Renewal Pipelines Anodes ANODES Y 1 589,781 - - - -
111 System Renewal Pipelines Cathodic Protection Advancements Northwest 2019 Sectionalization Y 1 412,721 81,600
81,600
81,600 -
119 System Access Pipelines Municipal Replacement Plan-(B)-Dist-Repl-Contr-Mains Municipal Y 1 181,905 - - - -
120 General Plant Pipelines Land Rights Land Rights-Replacements Y 1 12,500 - - - -
122 General Plant Pipelines Other Misc Materials-Company Y 1 5,565 - - - -
123 System Renewal Pipelines Anodes Anodes Y 1 299,162 - - - -
124 System Renewal Pipelines Cathodic Protection Advancements Sudbury/SSmarie Sectionalization Y 1 96,431 100,000
100,000
100,000 -
128 General Plant Pipelines Land Rights Land Rights-Replacements Y 1 10,200 - - - -
137 System Access Pipelines Municipal Replacement Plan-(B)-Dist-Repl-Contr-Mains Municipal Y 1 181,905 - - - -
138 General Plant Pipelines Land Rights Land Rights-Replacements Y 1 12,500 - - - -
142 System Renewal Pipelines Anodes Anodes Y 1 433,126 - - - -
143 System Renewal Pipelines Cathodic Protection Advancements North Bay/Orillia Sectionalization Y 1 382,326 108,000
108,000
108,000 -
173 System Service Pipelines Class Location Class Location Change Progam Y 1 20,350,417 - - - -
175 System Renewal Pipelines Integrity Management Program ENG - Integrity Management Program Y 1 14,642,739 - - - -
182 System Renewal Pipelines Bruce Lake Bruce Lake Lateral - c/o 2018 N 3 9,500,000 - - - -
212 System Renewal Pipelines Windsor Line Windsor Line Ph 1 Y N 2 3,000,000 - - - - Y
220 System Renewal Pipelines London Lines LOND-London Lines Y N 3 - 4,000,000 107,000,000
3,000,000 - Y
236 General Plant Pipelines Tools Capital Tools- Additions-Dist Ops N 2 60,892 - - - -
237 General Plant Pipelines Tools Capital Tools- Repl- Dist Ops N 2 44,698 - - - -
240 General Plant Pipelines Tools Capital Tools-Additions-Dist Ops N 2 19,339 - - - -
241 General Plant Pipelines Tools Capital Tools-Repl-Dist Ops N 2 26,782 - - - -
244 General Plant Pipelines Tools Capital Tools- Additions-Dist Ops N 2 150,000 - - - -
245 General Plant Pipelines Tools Capital Tools- Repl- Dist Ops N 2 110,000 - - - -
Filed: 2019-04-25, EB-2018-0305, Exhibit I.BOMA.22, Attachment 2, Page 15 of 29

Project Listing for UGL (2019‐2023)
16
Unique Identifier Investment Category Asset/Growth Category Portfolio Description ICM -
Eligible Mandatory Priority 2019 ($) 2020 ($) 2021 ($) 2022 ($) 2023 ($) Potential for LTC
251 System Renewal Pipelines Leakage Plan-(B)-Dist-Repl-Contr-Mains Leakage N 3 499,984 - - - -
252 System Renewal Pipelines Service Replacement Plan-(B)-Dist-Repl-Contr-Services N 3 285,256 - - - -
254 System Renewal Pipelines General Mains Plan-(B)-Dist-Repl-General Mains N 3 253,468 - - - -
255 System Renewal Pipelines Service Replacement Plan-(B)-Dist-Repl-Compy-Services N 3 522,571 - - - -
260 System Renewal Pipelines Leakage Plan-(B)-Dist-Repl-Contr-Mains Leakage N 3 70,917 - - - -
261 System Renewal Pipelines Service Replacement Plan-(B)-Dist-Repl-Contr-Services N 3 61,621 - - - -
262 System Renewal Pipelines General Mains Plan-(B)-Dist-Repl-General Mains N 3 40,317 - - - -
263 System Renewal Pipelines Service Replacement Plan-(B)-Dist-Repl-Compy-Services N 3 49,751 - - - -
266 System Renewal Pipelines Service Replacement Plan-(B)-Dist-Repl-Contr-Services N 3 71,545 - - - -
267 System Renewal Pipelines Service Replacement Plan-(B)-Dist-Repl-Compy-Services N 3 94,800 - - - -
276 System Renewal Pipelines Leakage Plan-(B)-Dist-Repl-Contr-Mains Leakage N 3 299,100 - - - -
277 System Renewal Pipelines Service Replacement Plan-(B)-Dist-Repl-Contr-Services N 3 71,545 - - - -
278 System Renewal Pipelines General Mains Plan-(B)-Dist-Repl-Contr-Other-Scattered N 3 253,203 - - - -
280 System Renewal Pipelines General Mains Plan-(B)-Dist-Repl-General Mains N 3 125,293 - - - -
281 System Renewal Pipelines Service Replacement Plan-(B)-Dist-Repl-Compy-Services N 3 224,472 - - - -
282 General Plant Pipelines Tools Capital Tools-Additions-Dist Ops N 2 79,000 - - - -
283 General Plant Pipelines Tools Capital Tools-Repl-Dist Ops N 2 106,000 - - - -
286 System Renewal Pipelines Leakage Plan-(B)-Dist-Repl-Contr-Mains Leakage N 3 199,970 - - - -
287 System Renewal Pipelines Service Replacement Plan-(B)-Dist-Repl-Contr-Services N 3 107,849 - - - -
294 System Renewal Pipelines Service Replacement Plan-(B)-Dist-Repl-Contr-Services N 3 339,725 - - - -
295 System Renewal Pipelines General Mains Plan-(B)-Dist-Repl-Contr-Other-Scattered N 3 199,905 - - - -
297 System Renewal Pipelines General Mains Plan-(B)-Dist-Repl-General Mains N 3 199,959 - - - -
298 General Plant Pipelines Tools Capital Tools-Additions-Dist Ops N 2 50,000 - - - -
299 General Plant Pipelines Tools Capital Tools-Repl-Dist Ops N 2 110,000 - - - -
307 System Renewal Pipelines Leakage Plan-(B)-Dist-Repl-Contr-Mains Leakage N 3 587,656 - - - -
308 System Renewal Pipelines Service Replacement Plan-(B)-Dist-Repl-Contr-Services N 3 378,842 - - - -
310 System Renewal Pipelines General Mains Plan-(B)-Dist-Repl-General Mains N 3 239,224 - - - -
311 System Renewal Pipelines Service Replacement Plan-(B)-Dist-Repl-Compy-Services N 3 271,937 - - - -
312 General Plant Pipelines Tools Capital Tools-Additions-Dist Ops N 2 27,000 - - - -
313 General Plant Pipelines Tools Capital Tools-Repl-Dist Ops N 2 131,750 - - - -
319 System Renewal Pipelines Leakage Plan-(B)-Dist-Repl-Contr-Mains Leakage N 3 180,310 - - - -
320 System Renewal Pipelines Service Replacement Plan-(B)-Dist-Repl-Contr-Services N 3 683,869 - - - -
322 System Renewal Pipelines General Mains Plan-(B)-Dist-Repl-General Mains N 3 358,761 - - - -
323 System Renewal Pipelines Service Replacement Plan-(B)-Dist-Repl-Compy-Services N 3 236,085 - - - -
329 System Renewal Pipelines Service Replacement Plan-(B)-Dist-Repl-Compy-Services N 3 309,402 - - - -
330 General Plant Pipelines Tools Capital Tools Add-Eastern Dist N 2 121,000 - - - -
Filed: 2019-04-25, EB-2018-0305, Exhibit I.BOMA.22, Attachment 2, Page 16 of 29
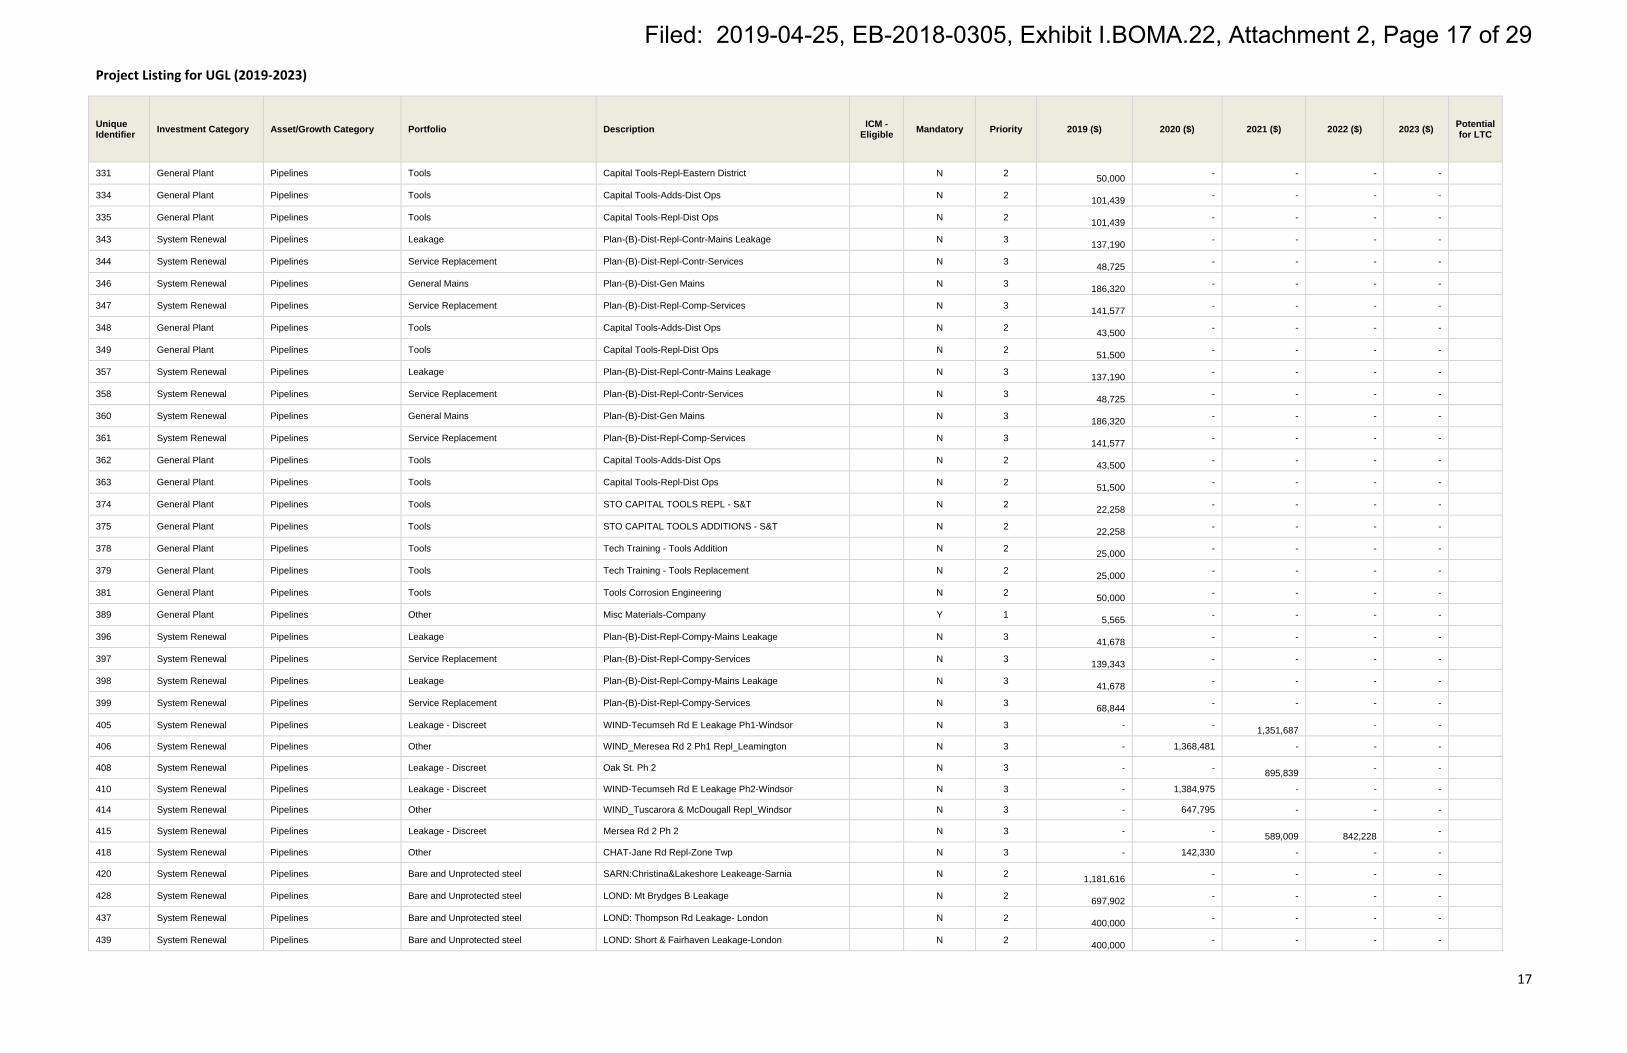
Project Listing for UGL (2019‐2023)
17
Unique Identifier Investment Category Asset/Growth Category Portfolio Description ICM -
Eligible Mandatory Priority 2019 ($) 2020 ($) 2021 ($) 2022 ($) 2023 ($) Potential for LTC
331 General Plant Pipelines Tools Capital Tools-Repl-Eastern District N 2 50,000 - - - -
334 General Plant Pipelines Tools Capital Tools-Adds-Dist Ops N 2 101,439 - - - -
335 General Plant Pipelines Tools Capital Tools-Repl-Dist Ops N 2 101,439 - - - -
343 System Renewal Pipelines Leakage Plan-(B)-Dist-Repl-Contr-Mains Leakage N 3 137,190 - - - -
344 System Renewal Pipelines Service Replacement Plan-(B)-Dist-Repl-Contr-Services N 3 48,725 - - - -
346 System Renewal Pipelines General Mains Plan-(B)-Dist-Gen Mains N 3 186,320 - - - -
347 System Renewal Pipelines Service Replacement Plan-(B)-Dist-Repl-Comp-Services N 3 141,577 - - - -
348 General Plant Pipelines Tools Capital Tools-Adds-Dist Ops N 2 43,500 - - - -
349 General Plant Pipelines Tools Capital Tools-Repl-Dist Ops N 2 51,500 - - - -
357 System Renewal Pipelines Leakage Plan-(B)-Dist-Repl-Contr-Mains Leakage N 3 137,190 - - - -
358 System Renewal Pipelines Service Replacement Plan-(B)-Dist-Repl-Contr-Services N 3 48,725 - - - -
360 System Renewal Pipelines General Mains Plan-(B)-Dist-Gen Mains N 3 186,320 - - - -
361 System Renewal Pipelines Service Replacement Plan-(B)-Dist-Repl-Comp-Services N 3 141,577 - - - -
362 General Plant Pipelines Tools Capital Tools-Adds-Dist Ops N 2 43,500 - - - -
363 General Plant Pipelines Tools Capital Tools-Repl-Dist Ops N 2 51,500 - - - -
374 General Plant Pipelines Tools STO CAPITAL TOOLS REPL - S&T N 2 22,258 - - - -
375 General Plant Pipelines Tools STO CAPITAL TOOLS ADDITIONS - S&T N 2 22,258 - - - -
378 General Plant Pipelines Tools Tech Training - Tools Addition N 2 25,000 - - - -
379 General Plant Pipelines Tools Tech Training - Tools Replacement N 2 25,000 - - - -
381 General Plant Pipelines Tools Tools Corrosion Engineering N 2 50,000 - - - -
389 General Plant Pipelines Other Misc Materials-Company Y 1 5,565 - - - -
396 System Renewal Pipelines Leakage Plan-(B)-Dist-Repl-Compy-Mains Leakage N 3 41,678 - - - -
397 System Renewal Pipelines Service Replacement Plan-(B)-Dist-Repl-Compy-Services N 3 139,343 - - - -
398 System Renewal Pipelines Leakage Plan-(B)-Dist-Repl-Compy-Mains Leakage N 3 41,678 - - - -
399 System Renewal Pipelines Service Replacement Plan-(B)-Dist-Repl-Compy-Services N 3 68,844 - - - -
405 System Renewal Pipelines Leakage - Discreet WIND-Tecumseh Rd E Leakage Ph1-Windsor N 3 - - 1,351,687 - -
406 System Renewal Pipelines Other WIND_Meresea Rd 2 Ph1 Repl_Leamington N 3 - 1,368,481 - - -
408 System Renewal Pipelines Leakage - Discreet Oak St. Ph 2 N 3 - - 895,839 - -
410 System Renewal Pipelines Leakage - Discreet WIND-Tecumseh Rd E Leakage Ph2-Windsor N 3 - 1,384,975 - - - 414 System Renewal Pipelines Other WIND_Tuscarora & McDougall Repl_Windsor N 3 - 647,795 - - -
415 System Renewal Pipelines Leakage - Discreet Mersea Rd 2 Ph 2 N 3 - - 589,009
842,228 -
418 System Renewal Pipelines Other CHAT-Jane Rd Repl-Zone Twp N 3 - 142,330 - - -
420 System Renewal Pipelines Bare and Unprotected steel SARN:Christina&Lakeshore Leakeage-Sarnia N 2 1,181,616 - - - -
428 System Renewal Pipelines Bare and Unprotected steel LOND: Mt Brydges B Leakage N 2 697,902 - - - -
437 System Renewal Pipelines Bare and Unprotected steel LOND: Thompson Rd Leakage- London N 2 400,000 - - - -
439 System Renewal Pipelines Bare and Unprotected steel LOND: Short & Fairhaven Leakage-London N 2 400,000 - - - -
Filed: 2019-04-25, EB-2018-0305, Exhibit I.BOMA.22, Attachment 2, Page 17 of 29

Project Listing for UGL (2019‐2023)
18
Unique Identifier Investment Category Asset/Growth Category Portfolio Description ICM -
Eligible Mandatory Priority 2019 ($) 2020 ($) 2021 ($) 2022 ($) 2023 ($) Potential for LTC
445 System Renewal Pipelines Bare and Unprotected steel HAMI-FiddlersGreenRdLeakage-Ancaster N 2 748,819 - - - -
448 System Renewal Pipelines Other HAMI-Hwy6NPS10Replacement-Caledonia N 3 - 2,005,396 - - - Y
458 System Renewal Pipelines Other REPL Crowe River Crossing N 3 - 596,084 - - -
459 System Renewal Pipelines Other REPL Bath and Days Rd N 2 329,941 - - - -
464 System Renewal Pipelines Emo Sched 10 Schedule 10 Replacement Emo N 3 2,821,046 - - - -
466 System Service Pipelines Depth of Cover <30% SMYS NW_Centennial 8" Exposed_TBAY N 3 - 550,564 - - - 467 System Service Pipelines Other Northwest Valve Installations N 3 - 172,669 - - - 472 System Renewal Pipelines Bridge Crossings North Bay-Lamorie Bridge Repl N 3 - 396,253 - - -
505 System Renewal Pipelines Bare and Unprotected steel WIND_East Ruscom River Repl_Lakeshore N 2 144,087 - - - -
512 System Renewal Pipelines Other WIND_Chatham St Repl_Windsor N 3 - 134,887 - - - 514 System Renewal Pipelines Water Crossings CHAT_Fourteenth Line Repl_Raleigh N 3 - 35,092 - - -
527 System Renewal Pipelines Bare and Unprotected steel BRAN-Lierman Dam Rd & Old Mill Rd Leakag N 2 668,808 - - - -
528 System Renewal Pipelines Bare and Unprotected steel BRAN-Hewitt Rd Leakage Repl BU-Vittoria N 2 88,000 - - - -
529 System Renewal Pipelines Bare and Unprotected steel BRAN-Talbot & Big Creek Rd Leak BU Delhi N 2 105,000 - - - -
533 System Renewal Pipelines Bridge Crossings WAT-Weber St N Bridge Crossing Repl,Wloo N 3 - - 450,000 - -
555 System Renewal Pipelines Bare and Unprotected steel WAT-Church St S Repl (Vine to Moore) N 2 84,000 - - - -
565 System Renewal Pipelines Pipeline Integrity > 30% SMYS NPS36 Valve Oper Repl, Beachville N 3 - 108,268 - - -
569 System Renewal Pipelines Other King- Ingredian -Cardinal - Remove exist N 3 - - - 614,058 -
581 System Renewal Pipelines Cathodic Protection Advancements North Bay/Orillia Rectifiers Y 1 154,131 - - - -
611 System Renewal Pipelines Cathodic Protection Advancements Walker Rd Repl. Y 1 58,977 - - - -
617 System Renewal Pipelines Cathodic Protection Advancements Sudbury/SSmarie Rectifiers Y 1 148,033 - - - -
890 System Renewal Pipelines Anodes anodes Y 1 - 6,400,000 6,400,000
6,400,000
6,400,000
897 System Service Pipelines Class Location Class Location Y 1 - 20,000,000 20,000,000
15,000,000
15,000,000
898 General Plant Pipelines Tools DO Tools N 2 - 1,300,000 1,300,000
1,300,000
1,300,000
900 System Renewal Pipelines General Mains General Mains N 2 - 3,364,046 3,364,046
3,364,046
3,364,046
902 System Renewal Pipelines Integrity Management Program Integrity Management Program Y 1 - 14,065,000 13,865,000
12,907,000
12,350,000
903 System Renewal Pipelines Leakage Leakage N 2 - 4,268,934 4,268,934
4,268,934
4,268,934
906 System Service Pipelines MOP Verification MOP Verification Y 1 - - - - 5,000,000
907 System Access Pipelines Municipal Replacement Municipal Replacement Y 1 - 24,000,000 24,000,000
24,000,000
24,000,000
910 System Renewal Pipelines Service Replacement Service Replacement Y 1 - 4,429,166 4,505,790
4,583,741
4,663,039
913 System Renewal Pipelines Windsor Line Windsor Line Y N 3 - 83,000,000 2,000,000 - - Y
1204 System Renewal Pipelines Bare and Unprotected steel LOND: Tecumseh & Edward - London N 2 - 270,504 - - -
1205 System Renewal Pipelines Bare and Unprotected steel LOND: Hamilton & Hydro - London N 2 464,000 - - - -
1206 System Renewal Pipelines Bare and Unprotected steel LOND: Talbot Line - Talbotville N 2 - 124,848 - - - 1207 System Renewal Pipelines Bare and Unprotected steel LOND: St George & Talbot - St Thomas N 2 - 52,020 - - - 1208 System Renewal Pipelines Bare and Unprotected steel WAT-Scott St-Windham N 2 - 199,293 - - -
Filed: 2019-04-25, EB-2018-0305, Exhibit I.BOMA.22, Attachment 2, Page 18 of 29

Project Listing for UGL (2019‐2023)
19
Unique Identifier Investment Category Asset/Growth Category Portfolio Description ICM -
Eligible Mandatory Priority 2019 ($) 2020 ($) 2021 ($) 2022 ($) 2023 ($) Potential for LTC
1209 System Renewal Pipelines Bare and Unprotected steel WIND-Riverside from Arlington to Kensington Replacement N 2 - 396,913 - - -
1210 System Renewal Pipelines Bare and Unprotected steel LOND: Hale & Dundas - London N 2 - 62,424 - - - 1211 System Renewal Pipelines Bare and Unprotected steel LOND: Ashland & Brydges N 2 - 124,848 - - - 1212 System Renewal Pipelines Bare and Unprotected steel LOND: Hickson & Belgrave N 2 - 72,828 - - - 1213 System Renewal Pipelines Bare and Unprotected steel LOND: Little Hill & Hamilton N 2 - 124,848 - - - 1214 System Renewal Pipelines Bare and Unprotected steel LOND: Lovett & Rectory N 2 - 62,424 - - - 1215 System Renewal Pipelines Bare and Unprotected steel LOND: Brisbin & Hamilton N 2 - 312,120 - - - 1216 System Renewal Pipelines Bare and Unprotected steel LOND: Hydro & Hamilton N 2 - 187,272 - - - 1217 System Renewal Pipelines Bare and Unprotected steel LOND: Vauxhall & Egerton N 2 - 124,848 - - - 1218 System Renewal Pipelines Bare and Unprotected steel SARN: Lynwood & Elmhurst - Sarnia N 2 - 243,454 - - - 1219 System Renewal Pipelines Bare and Unprotected steel SARN: Lakeshore C - Sarnia N 2 - 728,280 - - - 1220 System Renewal Pipelines Bare and Unprotected steel HAMI-Kerr-Oakville N 2 - 676,260 - - - 1221 System Renewal Pipelines Bare and Unprotected steel WAT-Peel-Delhi N 2 - 556,449 - - - 1222 System Renewal Pipelines Bare and Unprotected steel WAT- Bay 1 - Port Rowan N 2 - 76,467 - - - 1223 System Renewal Pipelines Bare and Unprotected steel WAT-Catherine - Port Rowan N 2 - 45,960 - - - 1224 System Renewal Pipelines Bare and Unprotected steel WAT-Croton - Delhi N 2 - 832,320 - - - 1225 System Renewal Pipelines Bare and Unprotected steel WAT-Dalton- Delhi N 2 - 495,230 - - - 1227 System Renewal Pipelines Bare and Unprotected steel WIND-Maidstone & Talbot Replacement N 2 - 204,126 - - - 1228 System Renewal Pipelines Bare and Unprotected steel WIND-Arthur & Talbot Replacement N 2 - 39,691 - - - 1229 System Renewal Pipelines Bare and Unprotected steel WIND- Laird from Alice to Victor Replacement N 2 - 453,614 - - -
1230 System Renewal Pipelines Bare and Unprotected steel WIND-Lacasse from St Denis to Tecumseh Rd E Replacement N 2 - 113,404 - - -
1231 System Renewal Pipelines Bare and Unprotected steel LOND:St Julien & Tommy Hunter N 2 - 31,212 - - - 1232 System Renewal Pipelines Bare and Unprotected steel LOND: Jellicoe & Blake N 2 - 239,292 - - - 1233 System Renewal Pipelines Bare and Unprotected steel SARN: Woodrow & Egmond N 2 - 718,916 - - - 1234 System Renewal Pipelines Bare and Unprotected steel SARN: O'dell & Colborne N 2 - 143,575 - - - 1235 System Renewal Pipelines Bare and Unprotected steel HAMI-John St - Hagersville N 2 - 148,777 - - - 1236 System Renewal Pipelines Bare and Unprotected steel HAMI-Haldimand Trail - Dunn N 2 - 338,130 - - - 1237 System Renewal Pipelines Bare and Unprotected steel WAT- Archibald N 2 - 111,037 - - -
1238 System Renewal Pipelines Bare and Unprotected steel WIND-Hagerty & Amy (Thames River) Aeriel Crossing Replacement N 2 - 136,084 - - -
1239 System Renewal Pipelines Bare and Unprotected steel HAMI- HWY 6 Seneca N 2 - 208,080 - - -
1240 System Renewal Pipelines Bare and Unprotected steel LOND: Central & Talbot N 2 - - 83,232 - -
1241 System Renewal Pipelines Bare and Unprotected steel LOND: St Clair & Michigan N 2 - - 5,202 - -
1242 System Renewal Pipelines Bare and Unprotected steel WIND-Erie Shore & Bisnett Replacement - Harwich N 2 - - 40,784 - -
1243 System Renewal Pipelines Bare and Unprotected steel WIND-County Rd 27 (south of County Rd 42) Replacement N 2 - -
1,794,690 - -
1244 System Renewal Pipelines Bare and Unprotected steel LOND: Kent & Talbot N 2 - - 130,050 - -
1245 System Renewal Pipelines Bare and Unprotected steel LOND: Grosvenor & Gammage N 2 - - 43,697 - -
1246 System Renewal Pipelines Bare and Unprotected steel LOND: Dalmage & Forward N 2 - - 59,303 - -
Filed: 2019-04-25, EB-2018-0305, Exhibit I.BOMA.22, Attachment 2, Page 19 of 29
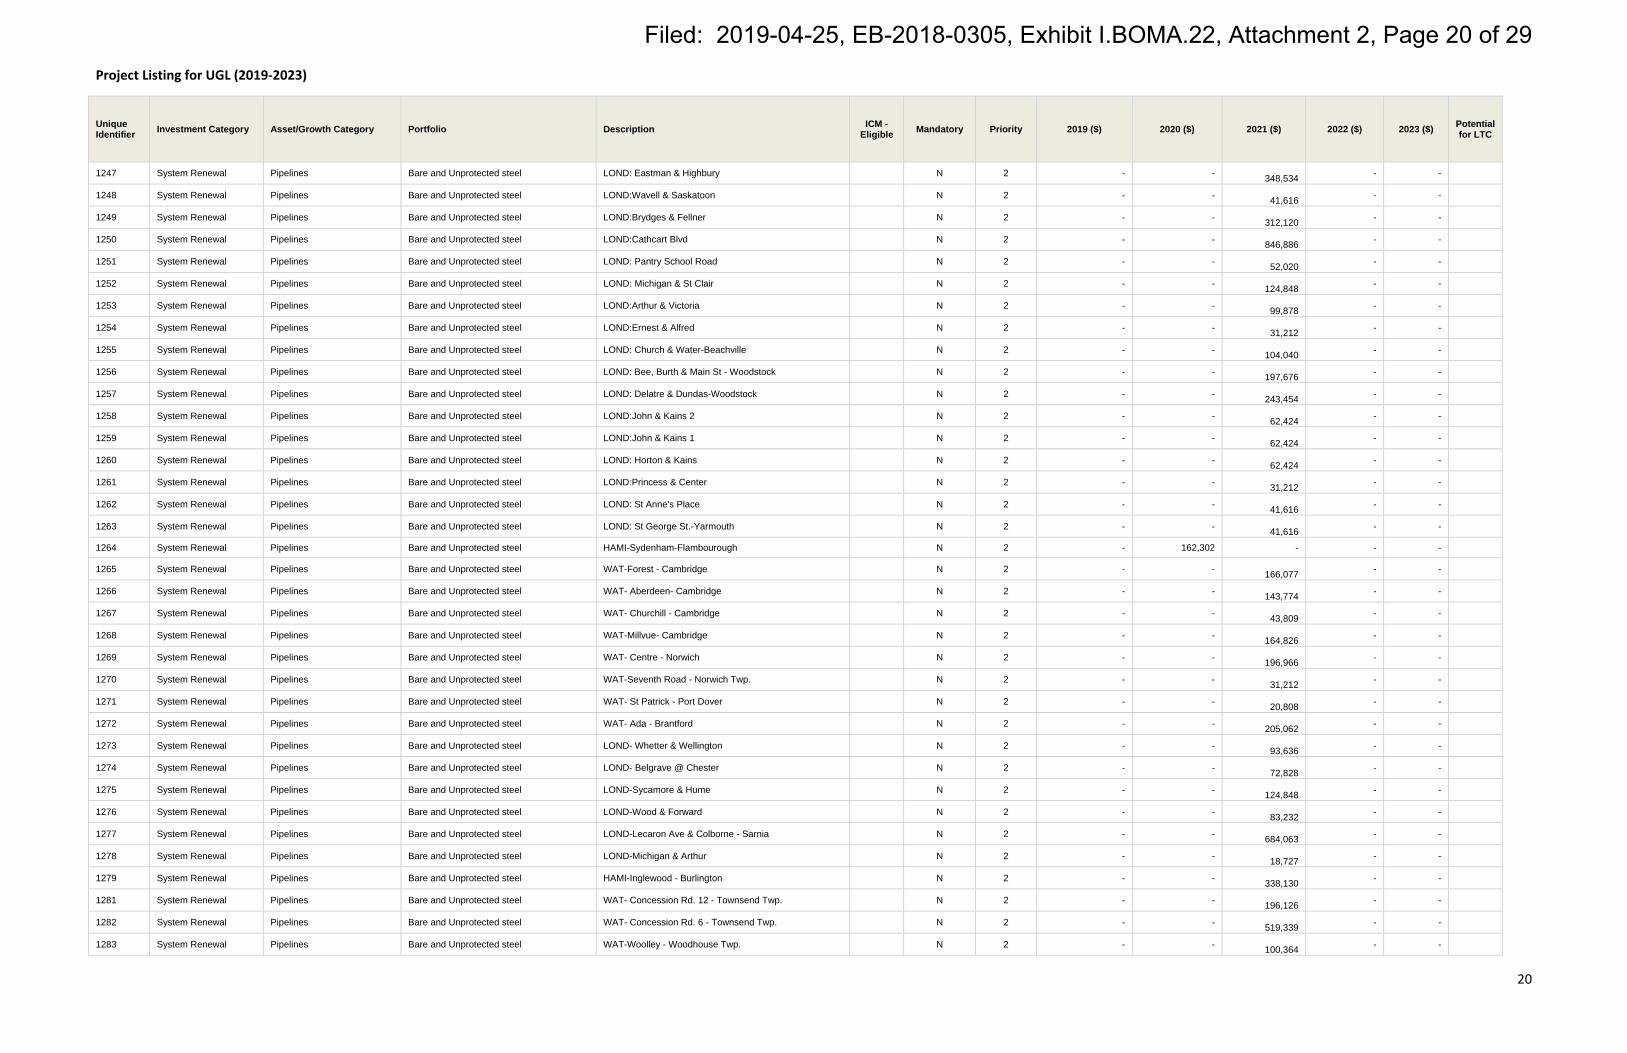
Project Listing for UGL (2019‐2023)
20
Unique Identifier Investment Category Asset/Growth Category Portfolio Description ICM -
Eligible Mandatory Priority 2019 ($) 2020 ($) 2021 ($) 2022 ($) 2023 ($) Potential for LTC
1247 System Renewal Pipelines Bare and Unprotected steel LOND: Eastman & Highbury N 2 - - 348,534 - -
1248 System Renewal Pipelines Bare and Unprotected steel LOND:Wavell & Saskatoon N 2 - - 41,616 - -
1249 System Renewal Pipelines Bare and Unprotected steel LOND:Brydges & Fellner N 2 - - 312,120 - -
1250 System Renewal Pipelines Bare and Unprotected steel LOND:Cathcart Blvd N 2 - - 846,886 - -
1251 System Renewal Pipelines Bare and Unprotected steel LOND: Pantry School Road N 2 - - 52,020 - -
1252 System Renewal Pipelines Bare and Unprotected steel LOND: Michigan & St Clair N 2 - - 124,848 - -
1253 System Renewal Pipelines Bare and Unprotected steel LOND:Arthur & Victoria N 2 - - 99,878 - -
1254 System Renewal Pipelines Bare and Unprotected steel LOND:Ernest & Alfred N 2 - - 31,212 - -
1255 System Renewal Pipelines Bare and Unprotected steel LOND: Church & Water-Beachville N 2 - - 104,040 - -
1256 System Renewal Pipelines Bare and Unprotected steel LOND: Bee, Burth & Main St - Woodstock N 2 - - 197,676 - -
1257 System Renewal Pipelines Bare and Unprotected steel LOND: Delatre & Dundas-Woodstock N 2 - - 243,454 - -
1258 System Renewal Pipelines Bare and Unprotected steel LOND:John & Kains 2 N 2 - - 62,424 - -
1259 System Renewal Pipelines Bare and Unprotected steel LOND:John & Kains 1 N 2 - - 62,424 - -
1260 System Renewal Pipelines Bare and Unprotected steel LOND: Horton & Kains N 2 - - 62,424 - -
1261 System Renewal Pipelines Bare and Unprotected steel LOND:Princess & Center N 2 - - 31,212 - -
1262 System Renewal Pipelines Bare and Unprotected steel LOND: St Anne's Place N 2 - - 41,616 - -
1263 System Renewal Pipelines Bare and Unprotected steel LOND: St George St.-Yarmouth N 2 - - 41,616 - -
1264 System Renewal Pipelines Bare and Unprotected steel HAMI-Sydenham-Flambourough N 2 - 162,302 - - -
1265 System Renewal Pipelines Bare and Unprotected steel WAT-Forest - Cambridge N 2 - - 166,077 - -
1266 System Renewal Pipelines Bare and Unprotected steel WAT- Aberdeen- Cambridge N 2 - - 143,774 - -
1267 System Renewal Pipelines Bare and Unprotected steel WAT- Churchill - Cambridge N 2 - - 43,809 - -
1268 System Renewal Pipelines Bare and Unprotected steel WAT-Millvue- Cambridge N 2 - - 164,826 - -
1269 System Renewal Pipelines Bare and Unprotected steel WAT- Centre - Norwich N 2 - - 196,966 - -
1270 System Renewal Pipelines Bare and Unprotected steel WAT-Seventh Road - Norwich Twp. N 2 - - 31,212 - -
1271 System Renewal Pipelines Bare and Unprotected steel WAT- St Patrick - Port Dover N 2 - - 20,808 - -
1272 System Renewal Pipelines Bare and Unprotected steel WAT- Ada - Brantford N 2 - - 205,062 - -
1273 System Renewal Pipelines Bare and Unprotected steel LOND- Whetter & Wellington N 2 - - 93,636 - -
1274 System Renewal Pipelines Bare and Unprotected steel LOND- Belgrave @ Chester N 2 - - 72,828 - -
1275 System Renewal Pipelines Bare and Unprotected steel LOND-Sycamore & Hume N 2 - - 124,848 - -
1276 System Renewal Pipelines Bare and Unprotected steel LOND-Wood & Forward N 2 - - 83,232 - -
1277 System Renewal Pipelines Bare and Unprotected steel LOND-Lecaron Ave & Colborne - Sarnia N 2 - - 684,063 - -
1278 System Renewal Pipelines Bare and Unprotected steel LOND-Michigan & Arthur N 2 - - 18,727 - -
1279 System Renewal Pipelines Bare and Unprotected steel HAMI-Inglewood - Burlington N 2 - - 338,130 - -
1281 System Renewal Pipelines Bare and Unprotected steel WAT- Concession Rd. 12 - Townsend Twp. N 2 - - 196,126 - -
1282 System Renewal Pipelines Bare and Unprotected steel WAT- Concession Rd. 6 - Townsend Twp. N 2 - - 519,339 - -
1283 System Renewal Pipelines Bare and Unprotected steel WAT-Woolley - Woodhouse Twp. N 2 - - 100,364 - -
Filed: 2019-04-25, EB-2018-0305, Exhibit I.BOMA.22, Attachment 2, Page 20 of 29

Project Listing for UGL (2019‐2023)
21
Unique Identifier Investment Category Asset/Growth Category Portfolio Description ICM -
Eligible Mandatory Priority 2019 ($) 2020 ($) 2021 ($) 2022 ($) 2023 ($) Potential for LTC
1284 System Renewal Pipelines Bare and Unprotected steel WAT- Huron - Brantford N 2 - - 54,563 - -
1285 System Renewal Pipelines Bare and Unprotected steel WAT- Ryerse Blvd - Port Ryerse N 2 - - 162,660 - -
1286 System Renewal Pipelines Bare and Unprotected steel HAMI- Napier - Hamilton N 2 - - 101,439 - -
1287 System Renewal Pipelines Bare and Unprotected steel HAMI-HWY 6 Argyle - Caledonia N 2 - - 297,554 - -
1288 System Renewal Pipelines Bare and Unprotected steel WAT- Salisbury Avenue - Cambridge N 2 - - 139,060 - -
1289 System Renewal Pipelines Bare and Unprotected steel WAT - Crescent - Cambridge N 2 - - 42,296 - -
1290 System Renewal Pipelines Bare and Unprotected steel WAT- Beverly - Cambridge N 2 - - 31,212 - -
1291 System Renewal Pipelines Bare and Unprotected steel WAT-Rooshill - Cambridge N 2 - - 136,446 - -
1292 System Renewal Pipelines Bare and Unprotected steel WAT- King St South - Port Ryerse N 2 - - 108,010 - -
1293 System Renewal Pipelines Bare and Unprotected steel WAT-Creekside Ln - Port Ryerse N 2 - - 70,175 - -
1294 System Renewal Pipelines Bare and Unprotected steel SARN: Errol East N 2 - - - 1,083,056 -
1295 System Renewal Pipelines Bare and Unprotected steel WAT- Otterville road 1 N 2 - - - 1,560,600 -
1296 System Renewal Pipelines Bare and Unprotected steel WAT- Otterville road 2 N 2 - - - 468,180 -
1297 System Renewal Pipelines Bare and Unprotected steel WAT- Otterville road 3 N 2 - - - 728,280 -
1298 System Renewal Pipelines Bare and Unprotected steel WAT- Norfolk N 2 - - - 65,751 -
1299 System Renewal Pipelines Bare and Unprotected steel WIND- County road 31 & Essex County road 2 Replacement N 2 - - -
1,136,637 -
1300 System Renewal Pipelines Bare and Unprotected steel LOND: St Neots & Ridout N 2 - - - 83,232 -
1301 System Renewal Pipelines Bare and Unprotected steel LOND: Curry & Piccadilly N 2 - - - 83,232 -
1302 System Renewal Pipelines Bare and Unprotected steel LOND: Josephine & Maud N 2 - - - 83,232 -
1303 System Renewal Pipelines Bare and Unprotected steel LOND: Stevenson & Brydges 1 N 2 - - - 1,300,500 -
1304 System Renewal Pipelines Bare and Unprotected steel LOND: Stevenson & Brydges 2 N 2 - - - 780,300 -
1305 System Renewal Pipelines Bare and Unprotected steel LOND: Newell & Michigan - Sarnia N 2 - - - 355,817 -
1306 System Renewal Pipelines Bare and Unprotected steel LOND: Highbury Pk & Christina N 2 - - - 62,424 -
1307 System Renewal Pipelines Bare and Unprotected steel LOND: Young St - Woodstock N 2 - - - 124,848 -
1308 System Renewal Pipelines Bare and Unprotected steel LOND: Cathcart & Alma - Ingersoll N 2 - - - 72,828 -
1309 System Renewal Pipelines Bare and Unprotected steel WIND-Renaud & Demarse Replacement-Tecumseh N 2 - - - 47,858 -
1310 System Renewal Pipelines Bare and Unprotected steel HAMI-Brookfield-Dunnville N 2 - - - 297,554 -
1311 System Renewal Pipelines Bare and Unprotected steel WAT- Wellington East - Otterville N 2 - - - 23,132 -
1312 System Renewal Pipelines Bare and Unprotected steel CHAT: Thomas & Van Allen MUB Replacement N 2 - - - 23,929 -
1313 System Renewal Pipelines Bare and Unprotected steel WIND-Canal & Riverside Replacement N 2 - - - 155,540 -
1314 System Renewal Pipelines Bare and Unprotected steel HAMI-Glassco Avenue - Hamilton N 2 - - 162,302 - -
1315 System Renewal Pipelines Bare and Unprotected steel HAMI-Brant Street-Dunnville N 2 - - 108,202 - -
1316 System Renewal Pipelines Bare and Unprotected steel HAMI-Holmesdale Ave -Hamilton N 2 - - 135,252 - -
1317 System Renewal Pipelines Bare and Unprotected steel HAMI-David Street-Dundas N 2 - - 121,727 - -
1318 System Renewal Pipelines Bare and Unprotected steel HAMI-Sutor - Rainham N 2 - - 405,756 - -
1319 System Renewal Pipelines Bare and Unprotected steel SARN: Errol & Christina N 2 - - - - 716,836
Filed: 2019-04-25, EB-2018-0305, Exhibit I.BOMA.22, Attachment 2, Page 21 of 29
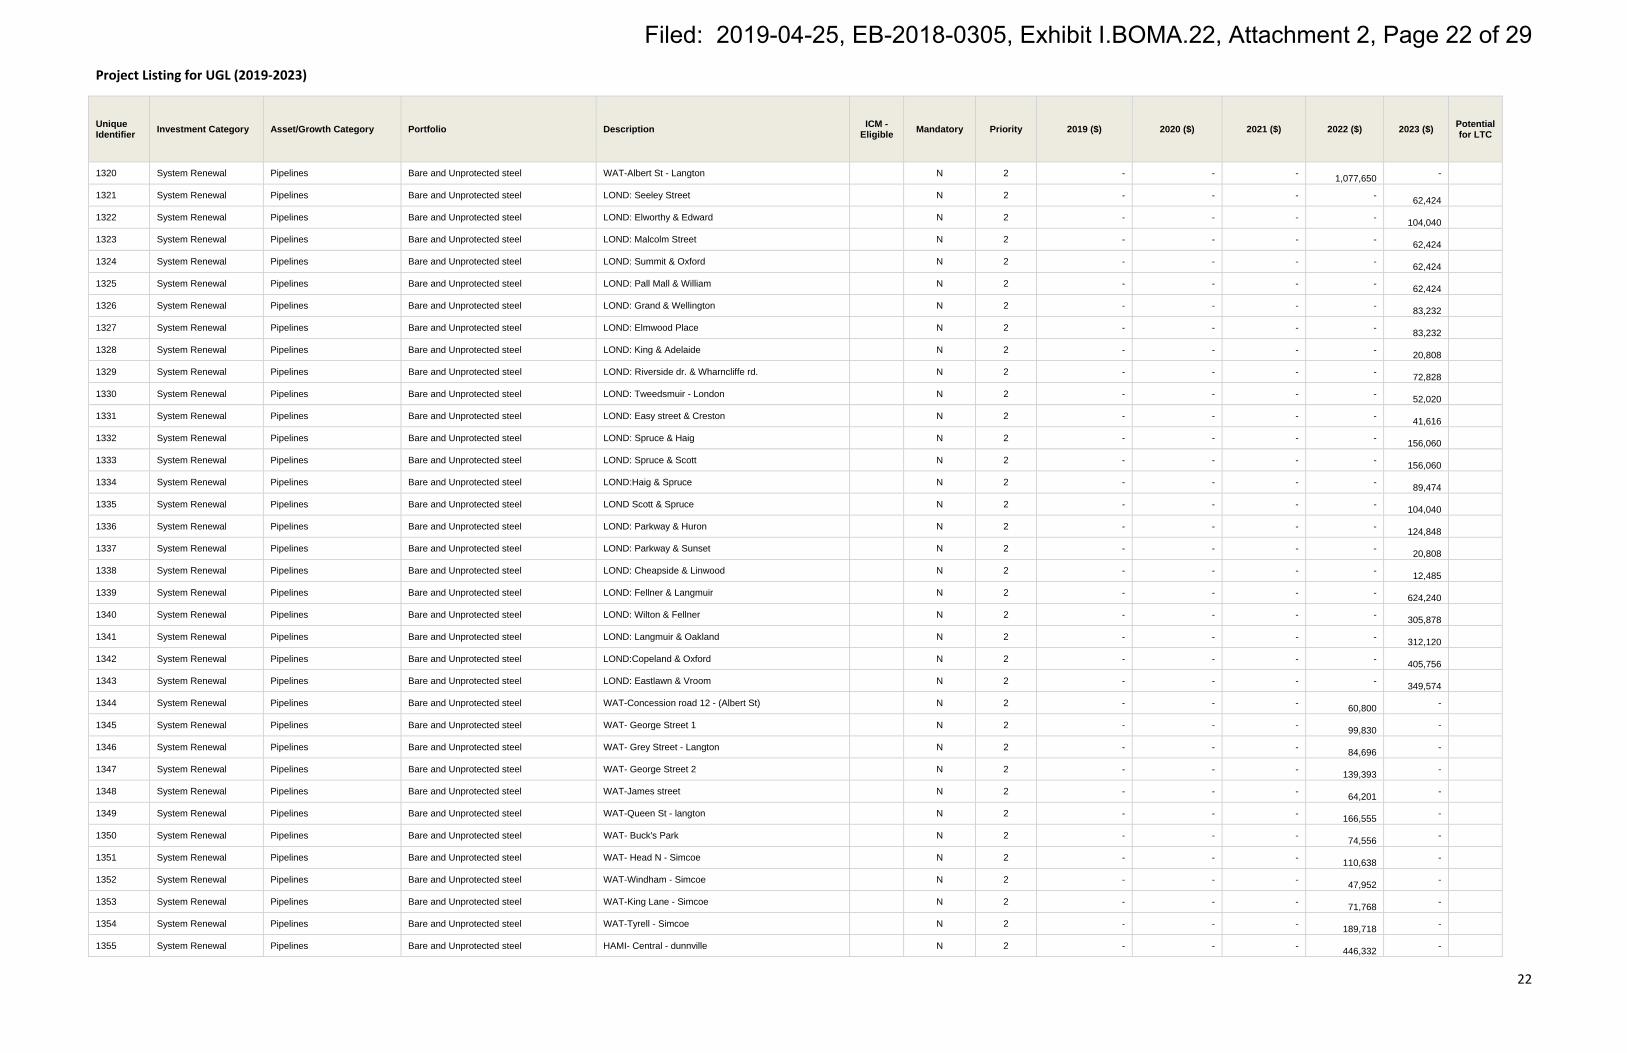
Project Listing for UGL (2019‐2023)
22
Unique Identifier Investment Category Asset/Growth Category Portfolio Description ICM -
Eligible Mandatory Priority 2019 ($) 2020 ($) 2021 ($) 2022 ($) 2023 ($) Potential for LTC
1320 System Renewal Pipelines Bare and Unprotected steel WAT-Albert St - Langton N 2 - - - 1,077,650 -
1321 System Renewal Pipelines Bare and Unprotected steel LOND: Seeley Street N 2 - - - - 62,424
1322 System Renewal Pipelines Bare and Unprotected steel LOND: Elworthy & Edward N 2 - - - - 104,040
1323 System Renewal Pipelines Bare and Unprotected steel LOND: Malcolm Street N 2 - - - - 62,424
1324 System Renewal Pipelines Bare and Unprotected steel LOND: Summit & Oxford N 2 - - - - 62,424
1325 System Renewal Pipelines Bare and Unprotected steel LOND: Pall Mall & William N 2 - - - - 62,424
1326 System Renewal Pipelines Bare and Unprotected steel LOND: Grand & Wellington N 2 - - - - 83,232
1327 System Renewal Pipelines Bare and Unprotected steel LOND: Elmwood Place N 2 - - - - 83,232
1328 System Renewal Pipelines Bare and Unprotected steel LOND: King & Adelaide N 2 - - - - 20,808
1329 System Renewal Pipelines Bare and Unprotected steel LOND: Riverside dr. & Wharncliffe rd. N 2 - - - - 72,828
1330 System Renewal Pipelines Bare and Unprotected steel LOND: Tweedsmuir - London N 2 - - - - 52,020
1331 System Renewal Pipelines Bare and Unprotected steel LOND: Easy street & Creston N 2 - - - - 41,616
1332 System Renewal Pipelines Bare and Unprotected steel LOND: Spruce & Haig N 2 - - - - 156,060
1333 System Renewal Pipelines Bare and Unprotected steel LOND: Spruce & Scott N 2 - - - - 156,060
1334 System Renewal Pipelines Bare and Unprotected steel LOND:Haig & Spruce N 2 - - - - 89,474
1335 System Renewal Pipelines Bare and Unprotected steel LOND Scott & Spruce N 2 - - - - 104,040
1336 System Renewal Pipelines Bare and Unprotected steel LOND: Parkway & Huron N 2 - - - - 124,848
1337 System Renewal Pipelines Bare and Unprotected steel LOND: Parkway & Sunset N 2 - - - - 20,808
1338 System Renewal Pipelines Bare and Unprotected steel LOND: Cheapside & Linwood N 2 - - - - 12,485
1339 System Renewal Pipelines Bare and Unprotected steel LOND: Fellner & Langmuir N 2 - - - - 624,240
1340 System Renewal Pipelines Bare and Unprotected steel LOND: Wilton & Fellner N 2 - - - - 305,878
1341 System Renewal Pipelines Bare and Unprotected steel LOND: Langmuir & Oakland N 2 - - - - 312,120
1342 System Renewal Pipelines Bare and Unprotected steel LOND:Copeland & Oxford N 2 - - - - 405,756
1343 System Renewal Pipelines Bare and Unprotected steel LOND: Eastlawn & Vroom N 2 - - - - 349,574
1344 System Renewal Pipelines Bare and Unprotected steel WAT-Concession road 12 - (Albert St) N 2 - - - 60,800 -
1345 System Renewal Pipelines Bare and Unprotected steel WAT- George Street 1 N 2 - - - 99,830 -
1346 System Renewal Pipelines Bare and Unprotected steel WAT- Grey Street - Langton N 2 - - - 84,696 -
1347 System Renewal Pipelines Bare and Unprotected steel WAT- George Street 2 N 2 - - - 139,393 -
1348 System Renewal Pipelines Bare and Unprotected steel WAT-James street N 2 - - - 64,201 -
1349 System Renewal Pipelines Bare and Unprotected steel WAT-Queen St - langton N 2 - - - 166,555 -
1350 System Renewal Pipelines Bare and Unprotected steel WAT- Buck's Park N 2 - - - 74,556 -
1351 System Renewal Pipelines Bare and Unprotected steel WAT- Head N - Simcoe N 2 - - - 110,638 -
1352 System Renewal Pipelines Bare and Unprotected steel WAT-Windham - Simcoe N 2 - - - 47,952 -
1353 System Renewal Pipelines Bare and Unprotected steel WAT-King Lane - Simcoe N 2 - - - 71,768 -
1354 System Renewal Pipelines Bare and Unprotected steel WAT-Tyrell - Simcoe N 2 - - - 189,718 -
1355 System Renewal Pipelines Bare and Unprotected steel HAMI- Central - dunnville N 2 - - - 446,332 -
Filed: 2019-04-25, EB-2018-0305, Exhibit I.BOMA.22, Attachment 2, Page 22 of 29

Project Listing for UGL (2019‐2023)
23
Unique Identifier Investment Category Asset/Growth Category Portfolio Description ICM -
Eligible Mandatory Priority 2019 ($) 2020 ($) 2021 ($) 2022 ($) 2023 ($) Potential for LTC
1356 System Renewal Pipelines Bare and Unprotected steel HAMI- South Cayuga - Dunnville N 2 - - - 405,756 -
1357 System Renewal Pipelines Bare and Unprotected steel HAMI- Haddon - Hamilton N 2 - - - 67,626 -
1358 System Renewal Pipelines Bare and Unprotected steel HAMI-South Coast - Walpole N 2 - - - 67,626 -
1359 System Renewal Pipelines Bare and Unprotected steel HAMI - Dunkirk - Hamilton N 2 - - - 74,389 -
1360 System Renewal Pipelines Bare and Unprotected steel HAMI - HWY 6 - Walpole N 2 - - - 236,691 -
1375 System Renewal Pipelines Bare and Unprotected steel WAT- Schafer 1 - Middleton N 2 - - - - 25,928
1376 System Renewal Pipelines Bare and Unprotected steel WAT- Schafer 2 - Middleton N 2 - - - - 1,320,421
1377 System Renewal Pipelines Bare and Unprotected steel WAT- Lawrence Road - Charlotteville twp N 2 - - - - 74,317
1378 System Renewal Pipelines Bare and Unprotected steel HAMI- Locke - Dunnville N 2 - - - 838,562 -
1379 System Renewal Pipelines Bare and Unprotected steel WAT- Murray - Vittoria N 2 - - - - 224,821
1380 System Renewal Pipelines Bare and Unprotected steel WAT- New - Vittoria N 2 - - - - 37,358
1381 System Renewal Pipelines Bare and Unprotected steel WAT- Water - Vittoria N 2 - - - - 132,623
1382 System Renewal Pipelines Bare and Unprotected steel WAT- Rebecca - Vittoria N 2 - - - - 76,547
1383 System Renewal Pipelines Bare and Unprotected steel WAT- Colborne - Brantford N 2 - - - - 38,411
1384 System Renewal Pipelines Bare and Unprotected steel WAT- Hamilton - Cambridge N 2 - - - - 476,166
1385 System Renewal Pipelines Bare and Unprotected steel WAT-Glen Morris N 2 - - - - 156,060
1386 System Renewal Pipelines Bare and Unprotected steel HAMI- King William - Caledonia N 2 - - - 74,389 -
1387 System Renewal Pipelines Bare and Unprotected steel HAMI - Haldimand road 12 - Rainham N 2 - - - - 74,389
1388 System Renewal Pipelines Bare and Unprotected steel HAMI- Taylor - Dunnville N 2 - - - - 74,389
1389 System Renewal Pipelines Bare and Unprotected steel HAMI- Albion - York N 2 - - - - 74,389
1390 System Renewal Pipelines Bare and Unprotected steel HAMI- Port Maitland - Dunn N 2 - - - - 148,777
1401 System Renewal Pipelines Bare and Unprotected steel HAMI- Upper Wellington - Hamilton N 2 - - - - 29,755
1402 System Renewal Pipelines Bare and Unprotected steel HAMI- Rainham Road - Walpole N 2 - - - - 845,325
1418 System Renewal Pipelines Bare and Unprotected steel HAMI - Reg road 8 - Rainham N 2 - - - - 101,439
1419 System Renewal Pipelines Bare and Unprotected steel HAMI - Concession 10 - Walpole N 2 - - - - 74,389
1420 System Renewal Pipelines Bare and Unprotected steel HAMI - Third Street - Walpole N 2 - - - - 74,389
1421 System Renewal Pipelines Bare and Unprotected steel HAMI - King Street - Hagersville N 2 - - - - 94,676
1422 System Renewal Pipelines Bare and Unprotected steel SARN: Sarnia Various N 2 - - - - 312,120
1423 System Renewal Pipelines Bare and Unprotected steel SARN: Moore Twp Various N 2 - - - - 416,160
1424 System Renewal Pipelines Bare and Unprotected steel SARN: Sombra Various N 2 - - - - 156,060
1476 System Renewal Pipelines Bare and Unprotected steel WIND_Huron Church Repl_Windsor N 2 114,403 - - - -
1477 System Renewal Pipelines Bare and Unprotected steel BRAN-Otterville Rd Leak Repl BU -Norfolk N 2 404,539 - - - -
1478 System Renewal Pipelines Other SSM Wallace Terrace Bridge Crossing N 3 - 34,169 - - - 1484 System Renewal Pipelines Bare and Unprotected steel WIND-Laird from Hanlan to Day Replacement N 2 - 208,080 - - -
1522 System Renewal Pipelines Other Atikokan Landfill Crossing NPS 10 Repl Y 1 571,194 - - - -
1523 System Renewal Pipelines Other WIND_Somme Valve Repl_Windsor N 3 - 68,543 - - -
Filed: 2019-04-25, EB-2018-0305, Exhibit I.BOMA.22, Attachment 2, Page 23 of 29

Project Listing for UGL (2019‐2023)
24
Unique Identifier Investment Category Asset/Growth Category Portfolio Description ICM -
Eligible Mandatory Priority 2019 ($) 2020 ($) 2021 ($) 2022 ($) 2023 ($) Potential for LTC
1524 System Renewal Pipelines Other WIND_Red Zoo Valve Repl_Kingsville N 3 - 219,657 - - - 1525 System Renewal Pipelines Other WIND_Mersea Rd 6 Aerial Repl_Leamington N 3 - 40,770 - - -
1526 System Renewal Pipelines Bridge Crossings WIND_River Canard Bridge Repl_Lasalle N 3 - - 547,085 - -
1534 System Renewal Pipelines Other HAMI-MohawkandUpperParadiseRepl-Hamilton N 3 - 251,956 - - - 1536 System Renewal Pipelines Other NE - Old Hwy 69 PLPRs N 3 - 235,699 - - -
1568 System Renewal Pipelines Cathodic Protection Advancements WIND_Devonshire Rectifier Bed_Windsor Y 1 24,480 - - - -
1569 System Renewal Pipelines Cathodic Protection Advancements WAT-Cambridge Sectionalization Y 1 100,000 - - - -
1570 System Renewal Pipelines Cathodic Protection Advancements WAT-Owen Sound Sectionalization Y 1 187,172 - - - -
1572 System Renewal Pipelines Leakage - Discreet HAMI-BartonStLeakage-Hamilton N 2 1,296,483 - - - -
1573 System Renewal Pipelines Bare and Unprotected steel HAMI-JohnStRepl-Dunnville N 2 994,392 - - - -
2031 System Renewal Pipelines Bare and Unprotected steel HAMI-FennellAveELeakage-Hamilton N 2 727,496 - - - -
2032 System Renewal Pipelines Bridge Crossings HALT-BronteCreekBridge-Oakville N 3 - - 744,190 - -
2033 System Renewal Pipelines Bare and Unprotected steel WAT- Bay 2 - Port Rowan N 2 - 20,471 - - -
2034 System Renewal Pipelines Leakage - Discreet HAMI-BartonStLeakage Phase 2-Hamilton N 3 - 2,000,000 2,000,000
2,000,000
2,000,000
2035 System Renewal Pipelines Cathodic Protection Advancements HAMI - 20" Shorted Casing on Hwy 5 -Phase 1 N 3 - - 3,000,000 - -
2036 System Renewal Pipelines Cathodic Protection Advancements HAMI - 20" Shorted Casing on Hwy 5 - Phase 2 N 3 - - - 3,000,000 -
2037 System Renewal Pipelines Cathodic Protection Advancements HAMI - 8" Dunnville Shorted Casing N 3 - 150,000 - - -
2081 System Renewal Pipelines Other Couchiching, Fort Frances Y 1 - - - - 1,000,000
2083 System Renewal Pipelines Bridge Crossings Kapuskasing Bridge N 3 - 250,000 - - - 2084 System Renewal Pipelines Bridge Crossings Hwy 130 Bridge over Kam River 4" relocation Y 1 - 600,000 - - -
2086 System Service Pipelines Depth of Cover <30% SMYS Atikokan Lateral - TP8 - Depth of Cover Y 1 - - - 300,000 -
2087 System Service Pipelines Depth of Cover <30% SMYS Atikokan Lateral - TP14 - Exposed Pipe Y 1 - 60,000 - - -
2090 System Renewal Pipelines Bridge Crossings WATE - Concession St Bridge Crossing Cambridge N 3 - - - - 500,000
2092 System Renewal Pipelines Bridge Crossings WATE - Shade St. Bridge Crossing New Hamburg N 3 - - - 500,000 -
2093 System Renewal Pipelines Bridge Crossings WATE - 378 Wellington Rd 18 Water Crossing Nichol Twp N 3 - 100,000 - - -
2210 System Renewal Pipelines Other 101 Main St E North Bay N 3 - 30,000 - - -
2211 System Renewal Pipelines Other 133 Main St E North Bay N 3 - - 32,000 - -
2212 System Renewal Pipelines Other 361 Main St E North Bay N 3 - - - 33,000 -
2213 System Renewal Pipelines Other 128 McIntyre St W North Bay N 3 - - - - 34,000
2226 System Renewal Pipelines Other Mckeown Ave Repair North Bay N 3 - - - - 150,000
2228 System Renewal Pipelines Other Garson Mine Service Replacement Garson N 3 - - - 200,000 -
2229 System Renewal Pipelines Other Great Northern Rd - Roof Top Meters SSM N 3 - - 85,000 - -
2230 System Renewal Pipelines Other 205 Main St E, North Bay N 3 - - - - 35,000
2231 System Renewal Pipelines Other XBOR Lasalle Blvd, Sudbury N 3 - - - 110,000 -
2241 System Renewal Pipelines Other 65 Larch St Valve Cut out (Leak), Sudbury N 3 - - 30,000 - -
2242 System Renewal Pipelines Other Kingsway Valve repair, Sudbury N 3 - - 30,000 - -
Filed: 2019-04-25, EB-2018-0305, Exhibit I.BOMA.22, Attachment 2, Page 24 of 29

Project Listing for UGL (2019‐2023)
25
Unique Identifier Investment Category Asset/Growth Category Portfolio Description ICM -
Eligible Mandatory Priority 2019 ($) 2020 ($) 2021 ($) 2022 ($) 2023 ($) Potential for LTC
2245 System Service Pipelines Depth of Cover <30% SMYS 119 Whittaker St Lowering, North Bay N 3 - - - 45,000 -
2246 System Renewal Pipelines Bridge Crossings Mattawa Bridge N 3 - - - - 65,000
2254 System Renewal Pipelines Other Flour Mill Easement, Sudbury N 3 - 15,000 - - -
2255 System Renewal Pipelines Other inside service on Elgin St., Sudbury N 3 - - 10,000 - -
2256 System Renewal Pipelines Other unused PLPRs Hamner, Sudbury N 3 - 20,000 - - -
2258 System Service Pipelines Depth of Cover <30% SMYS Shallow main, Sudbury N 3 - - - 40,000 -
2259 System Renewal Pipelines Other Crossings through concrete drainage structures, Sudbury N 3 - - 25,000 - -
2260 System Service Pipelines Depth of Cover <30% SMYS 863 Attlee St shallow main, Sudbury N 3 - - - 80,000 -
2261 System Renewal Pipelines Bridge Crossings Bridge in levack, Sudbury N 3 - - - - 20,000
2262 System Renewal Pipelines Other Ironbridge @ Right of Way, SSM N 3 - 25,000 - - -
2263 System Renewal Pipelines Bridge Crossings Old Garden River Road Bridge Crossing, SSM N 3 - - 125,000 - -
2265 System Renewal Pipelines Other Day's Inn Bay street, SSM N 3 - 10,000 - - -
2266 System Renewal Pipelines Other 123 March Street, SSM N 3 - - 40,000 - -
2267 System Renewal Pipelines Other Kingsmount bannister tees, SSM N 3 - - - 20,000 -
2273 System Renewal Pipelines Other Grasshopper to old levack mine, Sudbury N 3 - - 35,000 - -
2311 System Renewal Pipelines Other Roseland Phase 1 & 2 N 3 - - 687,500 - -
2313 System Renewal Pipelines Bare and Unprotected steel St Anne from Arbour to County Rd 22 Replacement N 2 - - 360,300 - -
2315 System Service Pipelines Depth of Cover <30% SMYS 5585 Eighth Line Replacement N 3 - - 100,000 - -
2319 System Renewal Pipelines Leakage - Discreet Chatham Head Office Valve Replacement N 3 - 115,000 - - -
2326 System Renewal Pipelines Other Erie St N Aerial Crossing N 3 - - - 75,000 -
2330 System Renewal Pipelines Bare and Unprotected steel Gordon & Elm Replacement N 2 51,412 - - - -
2334 System Renewal Pipelines Bare and Unprotected steel Major & East Puce Replacement N 2 170,000 - - - -
2337 System Renewal Pipelines Leakage - Discreet Prince Albert and McNaughton Replacement N 3 - - 901,117 - -
2338 System Renewal Pipelines Bare and Unprotected steel Regent St Replacement N 2 - - 150,000 - -
2341 System Renewal Pipelines Other Sarnia Line Aerial Crossings N 3 - 300,000 - - - 2343 System Renewal Pipelines Bare and Unprotected steel Stowe St & Victoria St N 2 - 140,000 - - -
2349 System Renewal Pipelines Leakage - Discreet Tecumseh Rd E Replacement Phases 3-7 N 3 - - - - 1,701,497
2350 System Renewal Pipelines Other King- Casing Upgrade District various - Y 1 - 124,955 124,955
124,955
124,955
2351 System Service Pipelines Other King- Isolation Valves - District - Inst Y 1 - 100,643 100,643
100,643
100,643
2352 System Renewal Pipelines Cathodic Protection Advancements King- Sectionalization Various -District Y 1 - 163,127 163,127
163,127
163,127
2413 System Renewal Pipelines Bare and Unprotected steel WAT - Temperance - Waterford N 2 600,000 - - - -
2414 System Renewal Pipelines Bare and Unprotected steel HAMI - Thorpe-Dundas N 2 380,000 - - - -
2415 System Renewal Pipelines Bare and Unprotected steel WIND - County Rd 22 (from Beechwood to Maplewood) Replacement N 2
650,000 - - - -
3 System Renewal Stations Replacement of Vaulted Stations HAMI-KingStETRStn16X-106R-Dundas N 3 - - - - 500,000
13 System Renewal Stations Stations Capital Maintenance Plan(T)-Dist-Stn Measuring/Corrosion Stn N 3 141,337 - - - -
16 System Renewal Stations Stations Capital Maintenance Plan(T)-Dist-Stn Measuring/Corrosion Stn N 3 141,337 - - - -
Filed: 2019-04-25, EB-2018-0305, Exhibit I.BOMA.22, Attachment 2, Page 25 of 29

Project Listing for UGL (2019‐2023)
26
Unique Identifier Investment Category Asset/Growth Category Portfolio Description ICM -
Eligible Mandatory Priority 2019 ($) 2020 ($) 2021 ($) 2022 ($) 2023 ($) Potential for LTC
206 System Renewal Stations Station Painting Station Painting Y 1 1,500,000 - - - -
253 System Renewal Stations Stations Capital Maintenance Plan(T)-Dist-Stn Measuring/Corrosion Stn N 3 286,091 - - - -
279 System Renewal Stations Stations Capital Maintenance Plan(T)-Dist-Stn Measuring/Corrosion Stn N 3 70,475 - - - -
296 System Renewal Stations Stations Capital Maintenance Plan(T)-Dist-Stn Measuring/Corrosion Stn N 3 29,385 - - - -
309 System Renewal Stations Stations Capital Maintenance Plan(T)-Dist-Stn Measuring/Corrosion Stn N 3 127,321 - - - -
321 System Renewal Stations Stations Capital Maintenance Plan(T)-Dist-Stn Measuring/Corrosion Stn N 3 53,051 - - - -
328 System Renewal Stations Stations Capital Maintenance Plan(T)-Dist-Stn Measuring/Corrosion Stn N 3 208,645 - - - -
345 System Renewal Stations Stations Capital Maintenance Plan(T)-Dist-Stn Mea./Cor N 3 81,423 - - - -
359 System Renewal Stations Stations Capital Maintenance Plan(T)-Dist-Stn Mea./Cor N 3 81,423 - - - -
409 System Renewal Stations Obsolete Heating Equipment WIND_03D-306R Mersea-Gosfield Stn_Leam N 3 - - 1,051,696 - -
416 System Renewal Stations Obsolete Heating Equipment WIND_03D-301 Leamington North Gate_Leam N 3 - 220,183 - - - 417 System Renewal Stations Obsolete Heating Equipment WIND_05C-501 Essex Trans Boiler_Essex N 3 - 246,913 - - - 419 System Renewal Stations Obsolete Heating Equipment CHAT_08F-601 Dover Centre Station_Dove N 3 - 867,727 - - - 423 System Renewal Stations Stations Capital Maintenance SARN: Suncor Hydrogen Filter Replacement N 3 - 192,050 - - - 424 System Renewal Stations Stations Capital Maintenance SARN: Oakdale Header Regulator Replacmnt N 3 - 136,954 - - - 429 System Renewal Stations Frost Heave LOND: Lambeth Leakage - London N 3 - 683,400 - - - 433 System Renewal Stations Stations Capital Maintenance LOND: Hensall Gate Station Rebuild N 3 - 685,470 - - - 435 System Renewal Stations Obsolete Heating Equipment LOND: Melrose Gate Boiler Replacement N 3 - 147,327 - - -
443 System Renewal Stations Stations Capital Maintenance WAT-St Jacobs Trans Stn 20S-602 N 3 - - 378,630 - -
444 System Renewal Stations Obsolete Heating Equipment WAT-Wloo Erbville Gate Stn 19S-602 N 3 - 253,891 - - -
452 System Renewal Stations Replacement of Vaulted Stations HAMI-Hwy5&BrockRdStn17W-605R-Dundas N 3 - - - 594,134 -
453 System Renewal Stations Obsolete Heating Equipment HAMI-HamiltonGate3Stn16X-601-Hamilton N 3 - 1,122,297 - - -
455 System Renewal Stations Replacement of Vaulted Stations HALT-CampbellvilleStn19W-601R-Milton N 3 - - 500,000 - -
460 System Renewal Stations Obsolete Heating Equipment STN Trenton TBS Line Heater N 3 - 118,739 - - - 461 System Renewal Stations Obsolete Heating Equipment STN Cardinal TBS Lineheater N 3 - 171,562 - - - 470 System Renewal Stations Stations Capital Maintenance Coniston- Primary Control Valve Repl N 3 - 265,282 - - - 471 System Renewal Stations Stations Capital Maintenance Espanola DRS N 3 - 127,748 - - - 508 System Renewal Stations Stations Capital Maintenance WIND_06C-102R Tecumseh&Arlington_Tecumse N 3 - 52,351 - - - 520 System Renewal Stations Stations Capital Maintenance Dawn Concession 8 Station Repairs N 3 - 55,197 - - - 526 System Renewal Stations Obsolete Heating Equipment BRAN-Hawtrey Trans Stn 13T-402 Norwich S N 3 - 112,490 - - -
532 System Renewal Stations Frost Heave WAT-Guelph Hwy 24 19U-601 - Guelph N 3 - - 112,490 - -
534 System Renewal Stations Obsolete Heating Equipment WAT-Strausburg Trans Stn 18T-501, Wloo N 3 - - 905,986 - -
535 System Renewal Stations Obsolete Heating Equipment HAMI-LyndenGateStn16V-604-Lynden N 3 - 185,610 - - -
536 System Renewal Stations Replacement of Vaulted Stations HAMI-SouthBend&UpperJamesStn16X-225R-Ham N 3 - - - - 500,000
537 System Renewal Stations Replacement of Vaulted Stations HAMI-TireRd&BurlingtonStStn16Y-110R-Hami N 3 - - 500,000 - -
538 System Renewal Stations Obsolete Heating Equipment HAMI-SummitTransStn16W-203-Dunnville N 3 - - 150,000 - -
540 System Renewal Stations Replacement of Vaulted Stations HALT-CorporateDr&ApplebyLnStn18Y-425R-Bu N 3 - 448,097 - - -
Filed: 2019-04-25, EB-2018-0305, Exhibit I.BOMA.22, Attachment 2, Page 26 of 29

Project Listing for UGL (2019‐2023)
27
Unique Identifier Investment Category Asset/Growth Category Portfolio Description ICM -
Eligible Mandatory Priority 2019 ($) 2020 ($) 2021 ($) 2022 ($) 2023 ($) Potential for LTC
612 System Renewal Stations Stations Capital Maintenance LOND- Confined Space Removal-Woodstock N 3 - 398,800 - - -
615 System Renewal Stations Obsolete Heating Equipment King- Cobourg E TBS - Cobourg - Lineheat N 3 - - 118,739 - -
1174 System Renewal Stations Stations Capital Maintenance Distribution Operations Station Maintenance Blankets N 2 - 2,012,907 2,012,907
2,012,907
2,012,907
1175 System Renewal Stations Station Painting Distribution Operations Station Painting Y 1 - 2,000,000 2,000,000
2,000,000
2,000,000
1178 System Renewal Stations Regulators/Reliefs Maintenance - Meter Shop Overhead Costs (Regs) N 2 - 55,189 55,189
55,189
55,189
1179 System Renewal Stations Regulators/Reliefs Maintenance - Plant Item Costs (Filters/Strainers) N 2 - 90,378 90,378
90,378
90,378
1180 System Renewal Stations Regulators/Reliefs Maintenance - Plant Item Costs (Regs) N 2 - 7,217,229 7,217,229
7,217,229
7,217,229
1181 System Renewal Stations Regulators/Reliefs Maintenance - Plant Item Costs (Reliefs) N 2 - 1,667,766 1,550,452
1,541,944
1,806,750
1182 System Renewal Stations Stations Capital Maintenance Obsolete equipment N 3 - 1,000,000 100,000
100,000
100,000
1186 System Renewal Stations Stations Capital Maintenance Regulator Freeze off N 3 - 1,000,000 100,000
100,000
100,000
1442 System Renewal Stations Stations Capital Maintenance Class 7 Cambridge N 3 - 25,000 - - - 1445 System Renewal Stations Stations Capital Maintenance SSM Second Line E Valve N 3 - 72,782 - - -
1521 System Service Stations Hamilton Gate HAMI - Hamilton Gate 1 and 2 Rebuild N 3 1,966,237 - - - -
1527 System Renewal Stations Obsolete Heating Equipment WIND_06B-401 Grand Marais Station Heater N 2 - 456,651 - - -
1528 System Renewal Stations Obsolete Heating Equipment WIND_06B-301 Lauzon Rd Station Heater Re N 2 402,469 - - - -
1529 System Renewal Stations Replacement of Vaulted Stations WIND_03D-101 Kingsville Gate Valve Repl N 3 - 126,443 - - -
1531 System Renewal Stations Obsolete Heating Equipment LOND: London North Gate Boiler Replaceme N 3 1,377,485 - - - -
2040 System Renewal Stations Replacement of Vaulted Stations HALT-Third Line and QEW Vault Station N 3 - - 500,000 - -
2041 System Renewal Stations Frost Heave HALT-Milton TBS N 3 - 100,000 - - -
2044 System Renewal Stations Frost Heave HAMI-Airport Rd Station N 3 - - 300,000 - -
2046 System Access Stations Regulators/Reliefs HAMI - HSR N 3 - 30,000 - - - 2048 System Renewal Stations Obsolete Heating Equipment HALT - Parkway Transmission N 3 - 150,000 - - - 2052 System Renewal Stations Replacement of Vaulted Stations HALT-ApplebyLn and Mainway Vault Station N 3 - 500,000 - - - 2053 System Renewal Stations Replacement of Vaulted Stations HAMI-Cascade and Lake Vault Station N 3 - 500,000 - - -
2054 System Renewal Stations Replacement of Vaulted Stations HAMI-Malta and Montrose Vault Station N 3 - - 500,000 - -
2057 System Renewal Stations Stations Capital Maintenance HALT - Procor Lrd N 3 - - 15,000 - -
2059 System Renewal Stations Stations Capital Maintenance HAMI - Guelph Line and Mt Nemo Station N 3 - - 30,000 - -
2063 System Renewal Stations Replacement of Vaulted Stations HAMI-Kenora and Bancroft Vault Station N 3 - - 500,000 - -
2064 System Renewal Stations Replacement of Vaulted Stations HALT-Centennial and Guelph Line Vault station N 3 - - 500,000 - -
2065 System Renewal Stations Replacement of Vaulted Stations HAMI-Industrial St Vault Station N 3 - - 500,000 - -
2067 System Renewal Stations Frost Heave HALT-New Oakville Hospital N 3 - - - 50,000 -
2068 System Renewal Stations Replacement of Vaulted Stations HALT-Winston Churchill and 10 Side Rd Vault Station N 3 - - - 500,000 -
2069 System Renewal Stations Replacement of Vaulted Stations HAMI-Binkley Rd Vault Station N 3 - - - 500,000 -
2072 System Renewal Stations Replacement of Vaulted Stations HALT-Plymouth Dr and Winston Churchill Vault Station N 3 - - - - 500,000
2103 System Renewal Stations Stations Capital Maintenance Cornwall East TBS rebuild N 3 - - - - 200,000
2105 System Renewal Stations Frost Heave LOND: Huron and Clarke N 3 - - 32,000 - -
Filed: 2019-04-25, EB-2018-0305, Exhibit I.BOMA.22, Attachment 2, Page 27 of 29
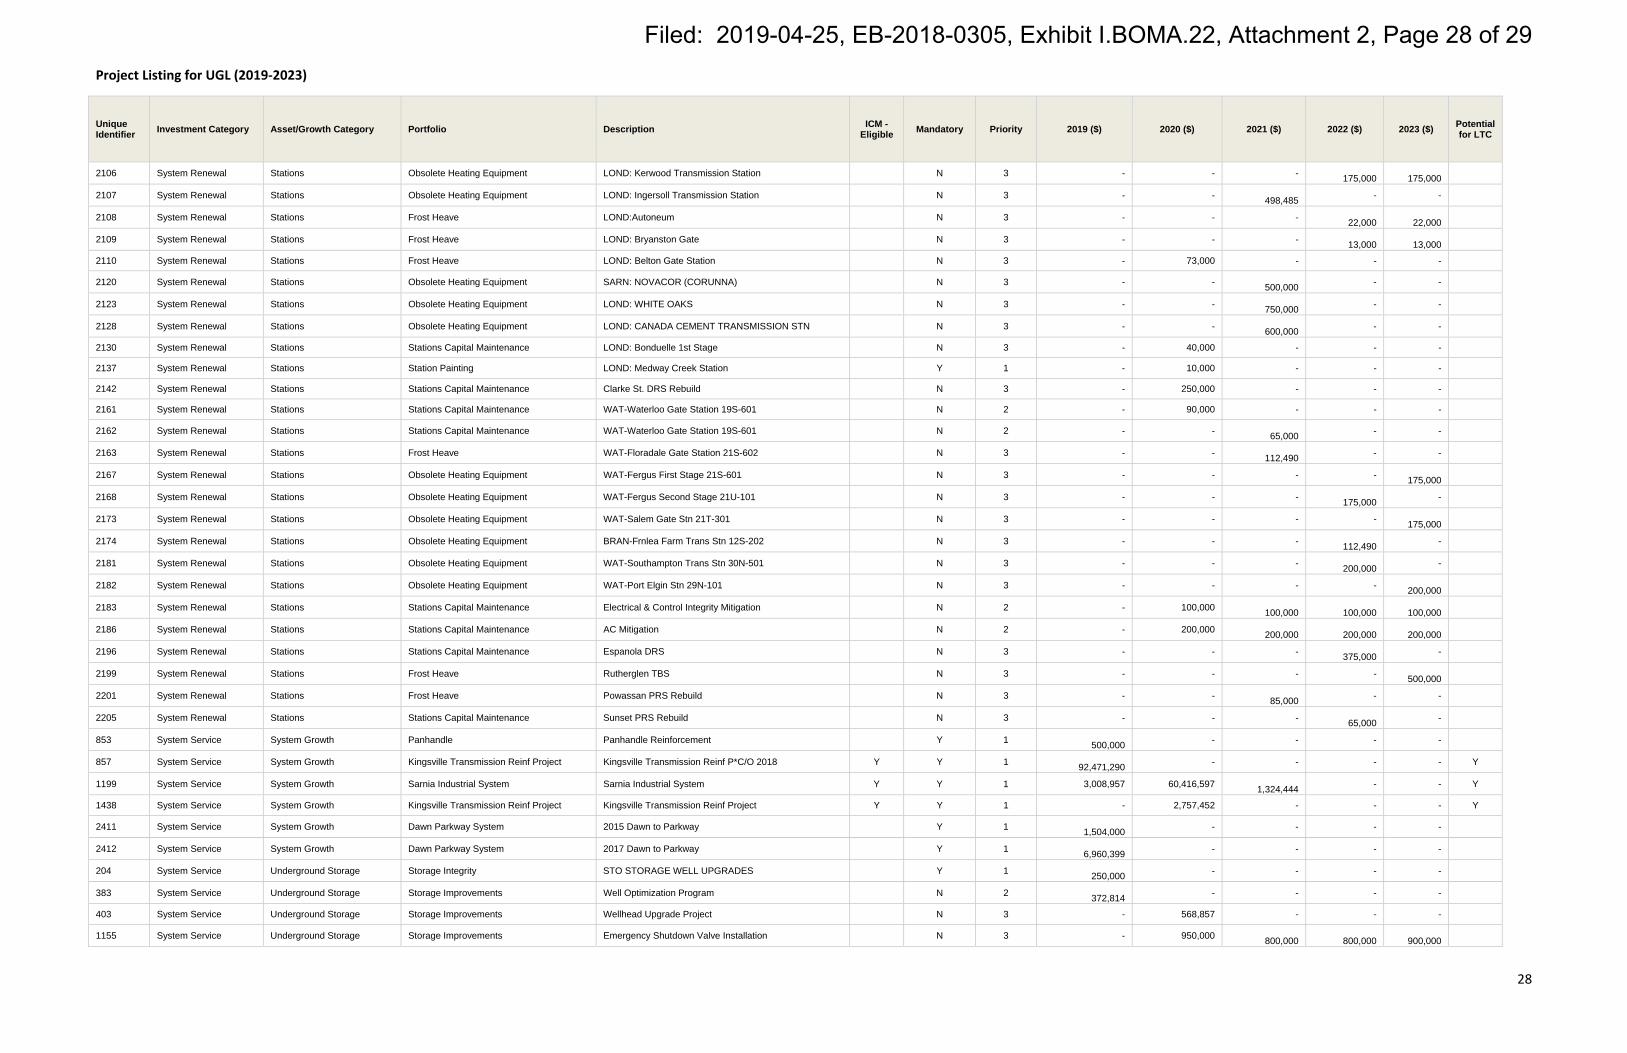
Project Listing for UGL (2019‐2023)
28
Unique Identifier Investment Category Asset/Growth Category Portfolio Description ICM -
Eligible Mandatory Priority 2019 ($) 2020 ($) 2021 ($) 2022 ($) 2023 ($) Potential for LTC
2106 System Renewal Stations Obsolete Heating Equipment LOND: Kerwood Transmission Station N 3 - - - 175,000
175,000
2107 System Renewal Stations Obsolete Heating Equipment LOND: Ingersoll Transmission Station N 3 - - 498,485 - -
2108 System Renewal Stations Frost Heave LOND:Autoneum N 3 - - - 22,000
22,000
2109 System Renewal Stations Frost Heave LOND: Bryanston Gate N 3 - - - 13,000
13,000
2110 System Renewal Stations Frost Heave LOND: Belton Gate Station N 3 - 73,000 - - -
2120 System Renewal Stations Obsolete Heating Equipment SARN: NOVACOR (CORUNNA) N 3 - - 500,000 - -
2123 System Renewal Stations Obsolete Heating Equipment LOND: WHITE OAKS N 3 - - 750,000 - -
2128 System Renewal Stations Obsolete Heating Equipment LOND: CANADA CEMENT TRANSMISSION STN N 3 - - 600,000 - -
2130 System Renewal Stations Stations Capital Maintenance LOND: Bonduelle 1st Stage N 3 - 40,000 - - - 2137 System Renewal Stations Station Painting LOND: Medway Creek Station Y 1 - 10,000 - - - 2142 System Renewal Stations Stations Capital Maintenance Clarke St. DRS Rebuild N 3 - 250,000 - - - 2161 System Renewal Stations Stations Capital Maintenance WAT-Waterloo Gate Station 19S-601 N 2 - 90,000 - - -
2162 System Renewal Stations Stations Capital Maintenance WAT-Waterloo Gate Station 19S-601 N 2 - - 65,000 - -
2163 System Renewal Stations Frost Heave WAT-Floradale Gate Station 21S-602 N 3 - - 112,490 - -
2167 System Renewal Stations Obsolete Heating Equipment WAT-Fergus First Stage 21S-601 N 3 - - - - 175,000
2168 System Renewal Stations Obsolete Heating Equipment WAT-Fergus Second Stage 21U-101 N 3 - - - 175,000 -
2173 System Renewal Stations Obsolete Heating Equipment WAT-Salem Gate Stn 21T-301 N 3 - - - - 175,000
2174 System Renewal Stations Obsolete Heating Equipment BRAN-Frnlea Farm Trans Stn 12S-202 N 3 - - - 112,490 -
2181 System Renewal Stations Obsolete Heating Equipment WAT-Southampton Trans Stn 30N-501 N 3 - - - 200,000 -
2182 System Renewal Stations Obsolete Heating Equipment WAT-Port Elgin Stn 29N-101 N 3 - - - - 200,000
2183 System Renewal Stations Stations Capital Maintenance Electrical & Control Integrity Mitigation N 2 - 100,000 100,000
100,000
100,000
2186 System Renewal Stations Stations Capital Maintenance AC Mitigation N 2 - 200,000 200,000
200,000
200,000
2196 System Renewal Stations Stations Capital Maintenance Espanola DRS N 3 - - - 375,000 -
2199 System Renewal Stations Frost Heave Rutherglen TBS N 3 - - - - 500,000
2201 System Renewal Stations Frost Heave Powassan PRS Rebuild N 3 - - 85,000 - -
2205 System Renewal Stations Stations Capital Maintenance Sunset PRS Rebuild N 3 - - - 65,000 -
853 System Service System Growth Panhandle Panhandle Reinforcement Y 1 500,000 - - - -
857 System Service System Growth Kingsville Transmission Reinf Project Kingsville Transmission Reinf P*C/O 2018 Y Y 1 92,471,290 - - - - Y
1199 System Service System Growth Sarnia Industrial System Sarnia Industrial System Y Y 1 3,008,957 60,416,597 1,324,444 - - Y
1438 System Service System Growth Kingsville Transmission Reinf Project Kingsville Transmission Reinf Project Y Y 1 - 2,757,452 - - - Y
2411 System Service System Growth Dawn Parkway System 2015 Dawn to Parkway Y 1 1,504,000 - - - -
2412 System Service System Growth Dawn Parkway System 2017 Dawn to Parkway Y 1 6,960,399 - - - -
204 System Service Underground Storage Storage Integrity STO STORAGE WELL UPGRADES Y 1 250,000 - - - -
383 System Service Underground Storage Storage Improvements Well Optimization Program N 2 372,814 - - - -
403 System Service Underground Storage Storage Improvements Wellhead Upgrade Project N 3 - 568,857 - - -
1155 System Service Underground Storage Storage Improvements Emergency Shutdown Valve Installation N 3 - 950,000 800,000
800,000
900,000
Filed: 2019-04-25, EB-2018-0305, Exhibit I.BOMA.22, Attachment 2, Page 28 of 29

Project Listing for UGL (2019‐2023)
29
Unique Identifier Investment Category Asset/Growth Category Portfolio Description ICM -
Eligible Mandatory Priority 2019 ($) 2020 ($) 2021 ($) 2022 ($) 2023 ($) Potential for LTC
1156 System Service Underground Storage Storage Integrity Well Integrity - Maintenance Capital upgrades (STO - STORAGE WELL UPGRADES) Y 1 - 250,000
250,000
250,000
250,000
1158 System Service Underground Storage Storage Improvements Well Optimization program N 2 - 372,814 372,814
372,814
372,814
Filed: 2019-04-25, EB-2018-0305, Exhibit I.BOMA.22, Attachment 2, Page 29 of 29

Filed: 2019-04-25 EB-2018-0305 Exhibit I.BOMA.23 Page 1 of 1
ENBRIDGE GAS INC. Answer to Interrogatory from
Building Owners and Managers Association of Greater Toronto (BOMA) Reference: Exhibit C1, Tab 1, Schedule 1; Utility System Plan/EGD, p27 Question: For each of Union and EGD, what are the percentage capitalized overheads added to the consolidated capital budget? Please itemize the parts of overhead and explain the company's capitalization policies and relevant accounting policy for each part. Response The percentage of capitalized overheads added to the EGD budget is 28.5%. The percentage of capitalized overheads added to the UG budget is 15.5%. Please refer to Exhibit I.STAFF.32 for an explanation of the components of overhead.

Filed: 2019-04-25 EB-2018-0305 Exhibit I.BOMA.24 Page 1 of 1
ENBRIDGE GAS INC. Answer to Interrogatory from
Building Owners and Managers Association of Greater Toronto (BOMA) Reference: Exhibit C1, Tab 1, Schedule 1; Utility System Plan/EGD, p28 Question: Please compare EGD's Lifetime Risk Return on Investment approach and Union's prioritization and risk ranking methodology used to develop their respective capital plans. Please provide a document that illustrates the use of each of these methods in arriving at EGD's and Union's capital plans, including the prioritization of the constituent capital projects. Response Please see Exhibit I.VECC.12.

Filed: 2019-04-25 EB-2018-0305 Exhibit I.BOMA.25 Page 1 of 1
ENBRIDGE GAS INC. Answer to Interrogatory from
Building Owners and Managers Association of Greater Toronto (BOMA) Reference: Exhibit C1, Tab 1, Schedule 1; Utility System Plan/EGD, p29 Question: a) Please itemize and describe how "opportunities outside of core business
activities that have different funding … mechanisms and supported through public and governmental policies/regulations" are dealt with in the prioritization process. Do they rank ahead of all of the core business opportunities, behind all core business activities, or otherwise. Please explain.
b) As among price, safety, and reliability, which do customers of each rate zone rank first, second, and third priority?
Response a) Non-core business activities are not considered in the prioritization process of core
capital and follow a separate approval process. As indicated on page 29 in the Company’s USP, filed at Exhibit C1, Tab 1, Schedule 1, opportunities outside of core business activities that have different funding mechanisms and are driven and supported through public and governmental policies/regulations, (such as Community Expansion, renewable natural gas, etc.), do not flow through the prioritization process.
b) The Customer Engagement survey in the EGD rate zone did not ask customers to
prioritize between price, safety, or reliability. In the Union rate zones, as indicated on page 10 in the Customer Engagement
survey filed at Exhibit D1, Tab 2, Schedule 1, customers generally rate price as the top priority followed by safety and reliability. Some business customers prioritize reliability over safety.

Filed: 2019-04-25 EB-2018-0305 Exhibit I.BOMA.26 Page 1 of 1
ENBRIDGE GAS INC. Answer to Interrogatory from
Building Owners and Managers Association of Greater Toronto (BOMA) Reference: Exhibit C1, Tab 1, Schedule 1; Utility System Plan/EGD, pp30-31 Question: Please provide the extent to which current EGD and Union programs are able to "meter measure" the results of their CDM programs. Response Both of Enbridge Gas’s Run it Right and Run Smart program offerings estimate cumulative cubic metres (“CCM”) of natural gas savings by leveraging the metered gas consumption from each participating facility.

Filed: 2019-04-25 EB-2018-0305 Exhibit I.BOMA.27 Page 1 of 1
ENBRIDGE GAS INC. Answer to Interrogatory from
Building Owners and Managers Association of Greater Toronto (BOMA) Reference: Exhibit C1, Tab 1, Schedule 1; Utility System Plan/EGD, pp31-32 Question: Please describe the in-field studies on CDM impacts on infrastructure demand currently underway, and state when they will be available. Response The two in-field case studies that are currently underway are at various states of implementation / completion. Information from the case study underway in Ingelside Ontario will be available late 2019 or early 2020 and information from the case study in Deep River ON is anticipated to be available later in 2020.

Filed: 2019-04-25 EB-2018-0305 Exhibit I.BOMA.28 Page 1 of 1
ENBRIDGE GAS INC. Answer to Interrogatory from
Building Owners and Managers Association of Greater Toronto (BOMA) Reference: Exhibit C1, Tab 1, Schedule 1; Utility System Plan/EGD, p33 Question: Please confirm that the utilities' integrity capital management programs are part of annual OM&A and/or budgets. Please provide details of each utility's integrity capital management program for 2019. Response Confirmed. The EGD rate zone’s integrity capital management program for 2019 can be found at Exhibit C1, Tab 2, Schedule 1, section 5.2.4, page 113. The Union rate zones’ integrity capital management program for 2019 can be found at Exhibit C1 Tab 3 Schedule 1, page 84.

Filed: 2019-04-25 EB-2018-0305 Exhibit I.BOMA.29 Page 1 of 1
ENBRIDGE GAS INC. Answer to Interrogatory from
Building Owners and Managers Association of Greater Toronto (BOMA) Reference: Exhibit C1, Tab 1, Schedule 1; Utility System Plan/EGD, p34 Question: Please explain why the capital expenditure plans are made for a ten year period. Please provide details. Has the ten year forecast always been used by each utility? How does the five year EGD and Union utility system plan and, eventually, the single Enbridge Gas system plan, get distilled from the ten year plans? Please provide prioritized lists of projects to be initiated in each of the five years of each utility system plan. Response Capital expenditure plans are made over a 10 year horizon to identify future needs for asset investments and make proactive decisions whenever possible. It supports the organizations in its ability to plan, resource and execute the work and consider proactive life cycle management decisions and rate impacts over a longer term. The EGD rate zone has completed a 10 year asset plan since 2013, and the Union rate zone has completed a 10 year asset plan since 2016. Enbridge Gas’s utility system plan is the first five years of the EGD and Union rate zones’ 10-year Asset Management Plans for regulated capital. Please see Exhibit I.BOMA.22 for a listing of all projects for both the EGD and Union rate zones.

Filed: 2019-04-25 EB-2018-0305 Exhibit I.BOMA.30 Page 1 of 1
ENBRIDGE GAS INC. Answer to Interrogatory from
Building Owners and Managers Association of Greater Toronto (BOMA) Reference: Exhibit C1, Tab 1, Schedule 1; Utility System Plan/EGD, p35 Question: Please explain what EGD meant by "tacit knowledge". Your evidence suggests that EGD and Union currently use two different risk assessment approaches in their capital planning. What are the relative strengths and weaknesses of each approach? How do you propose to reconcile those two approaches to achieve the best possible approach for the new combined utility? Response The EGD rate zone uses the term tacit knowledge to distinguish information that comes from people, and information that comes from databases and other structured sources. In the context of risk assessment, it is often necessary to rely on tacit knowledge to identify hazards, and to establish their likelihood and potential consequence. Both the EGD and Union rate zones use tacit knowledge extensively in risk assessments. Union has used a 5 x 5 matrix to define the severity of the risk whereas EGD has developed more quantitative risk assessments. Risk assessment methods can range from qualitative through semi-quantitative and quantitative. The strength of a more qualitative approach is that it can be done relatively quickly if the risk is clearly low (requiring no further action) or clearly high (requiring mitigation). A qualitative assessment is not as useful if there are a number of potential hazards that may interact and lead to consequences that are magnified by the interaction of the potential hazards. Conversely, a quantitative risk assessment can account for increased complexity with many contributing and escalating factors and layers of protection. The weakness of the quantitative risk assessment is that it requires a lot of data and a lot of time from risk specialists and those that are knowledgeable about the process that is under examination. These methods are all widely used and are appropriate based on the purpose of the risk assessment. As per the response at STAFF.34, Enbridge Gas is still assessing its future asset management processes.

Filed: 2019-04-25 EB-2018-0305 Exhibit I.BOMA.31 Page 1 of 1
ENBRIDGE GAS INC. Answer to Interrogatory from
Building Owners and Managers Association of Greater Toronto (BOMA) Reference: Exhibit C1, Tab 1, Schedule 1; Utility System Plan/EGD, p37 Question: (a) In Tables 6, 7, 8, 9, 10, and 11, what is meant by the phrase "direct capital" along
the vertical access? For each of EGD and Union, what other capital, in addition to direct capital, is forecast to be spent over the ten year planning period by each? How much in 2019? Please discuss in detail.
(b) Will the projects "under development", currently not included in EGD's and Union's forecast ten year spending, be added to that spend? In approximately which year, and in what amounts? Please provide ranges if exact amounts not available. Will these projects, if they receive the authority to proceed, displace existing projects in the current five and ten year project lists, or will they require additional capital, to be financed by ICM funding, or otherwise?
Response
a) Figures 6, 7, 8, 9, 10, and 11 are incorrectly labelled and should read ‘net capital’ along the vertical axis as they include both direct and indirect capital.
b) Projects “under development” will be included in Enbridge Gas’s spend when their scope, timing, and cost are more developed. Please refer to section 6.3, page 391, in EGD rate zone’s AMP filed at Exhibit C1, Tab 2, Schedule 1 for the approximate year and amounts of these projects for EGD. In Union rate zone, the only project that has been identified as under development in the Union rate zone for which capital expenditures are not yet estimated is for the Dawn to Parkway System expansion Exhibit C1, Tab 3, Schedule 3 page 75. Cost estimates are currently under development. The known details of this project are outlined in Exhibit I.FRPO.25. If these projects receive authority to proceed, the capital requirements will be considered along with all other capital requirements over the 10 year horizon.

Filed: 2019-04-25 EB-2018-0305 Exhibit I.BOMA.32 Page 1 of 2
ENBRIDGE GAS INC. Answer to Interrogatory from
Building Owners and Managers Association of Greater Toronto (BOMA) Reference: Exhibit C1, Tab 1, Schedule 1; Utility System Plan/EGD, p36; Table 2 Question: For each of EGD and Union, how much of system access (in millions of dollars) is accounted for by mandatory projects in each year? BOMA defines mandatory projects to be projects required by law, for example, replacements due to road widening, other municipal infrastructure, or other projects requiring compliance. What do EGD and Union include in the category of compliance projects or mandatory projects over and above the projects EGD and Union are legally required to do, as described in this question? Please describe for each of EGD and Union, the capital projects in their respective prioritized list of projects are ones required to mitigate what they describe as an intolerable risk. Please define what they consider to be an intolerable risk, and provide examples. Response “System access investments are additions and modifications (including asset relocation) to a distributor’s system that a distributor is obligated to perform in order to provide a customer or group of customers with access to natural gas services via the distribution system.”1 In the EGD rate zone, 96% of the System Access capital requirements are classified mandatory. In the Union rate zones 100% of the System Access capital requirements are classified mandatory. The EGD and Union rate zones’ capital expenditure for the 10 year planning period for all categories are provided in the USP.2 Mandatory and compliance projects are defined in the EGD rate zone’s AMP at Exhibit C1, Tab 2, Schedule 1, Table 4.1-4, page 74. Excerpts are provided below.
A risk that must be addressed within its required time window. Mandatory risks can be the result of:
1 Exhibit C1, Tab 1, Schedule 1, page 35. 2 Ibid., page 40 – 41.

Filed: 2019-04-25 EB-2018-0305 Exhibit I.BOMA.32 Page 2 of 2
- Compliance requirements - Exceeding a risk limit where the risk is assessed within EGD’s intolerable risk region - Third-party relocation driven - Program work with sufficient history and risk to warrant continuation3
Compliance is defined as:
“Required adherence with applicable laws and regulations, industry codes, standards, and internal policies.”4
The Union rate zones define mandatory projects at Exhibit C1, Tab 3, Schedule 1, page 57. Mandatory projects are considered Priority 1 and are related to:
- Compliance-related items - Growth - Contractual Obligations - Risk Rank 1 Items
Where, “Risk Rank 1 projects are considered a significant risk that is intolerable and requires notification to the president within 48 hours of discovery. Short-term mitigation plans must be put in place in less than four weeks and the target to implement long-term mitigations is less than six months. In cases where this is not possible, specific approvals must be attained.”5 The system access category does not contain any projects with an intolerable risk classification. Please see Exhibit I.BOMA.22 for a complete listing of projects in the Enbridge Gas asset plans.
3 Exhibit C1, Tab 2, Schedule 1, Table 4.1-4, page 74. 4 Ibid. 5 Exhibit C1, Tab 3, Schedule 1, page 57.

Filed: 2019-04-25 EB-2018-0305 Exhibit I.BOMA.33 Page 1 of 1
ENBRIDGE GAS INC. Answer to Interrogatory from
Building Owners and Managers Association of Greater Toronto (BOMA) Reference: Exhibit C1, Tab 1, Schedule 1; Utility System Plan/EGD, p43 Question: Please explain what Table 3 is intended to show. Response Please see Exhibit I.STAFF.39.

Filed: 2019-04-25 EB-2018-0305 Exhibit I.BOMA.34 Page 1 of 1
ENBRIDGE GAS INC. Answer to Interrogatory from
Building Owners and Managers Association of Greater Toronto (BOMA) Reference: Exhibit C1, Tab 1, Schedule 1; Utility System Plan/EGD, p45 Question: For 2019, for each of EGD and Union rate zones, please prioritize all capital projects within each category of the capital budget, eg. system access, system renewal, etc. Response Please see Exhibit I.BOMA.22 for a complete summary of all projects in the Enbridge Gas asset plans.

Filed: 2019-04-25 EB-2018-0305 Exhibit I.BOMA.35 Page 1 of 1
ENBRIDGE GAS INC. Answer to Interrogatory from
Building Owners and Managers Association of Greater Toronto (BOMA) Reference: Exhibit C1, Tab 1, Schedule 1; Utility System Plan/EGD, p47 Question: Please provide the lifecycle calculations and 5x5 matrix underlying EGD's and Union's respective risk assessment methodologies. Response The EGD rate zone quantifies its risk and uses the risk matrix as a tool to present risks and opportunities for informational purposes. The EGD rate zone’s risk methodology and 7x7 matrix can be found in section 4.2.1, filed at Exhibit C1, Tab 2, Schedule 1, page 79. The EGD rate zone’s lifecycle information can be found Exhibit C1, Tab 2, Schedule 1, Section 5, pages 95 to 374. The Union rate zones’ utilizes a 5x5 risk matrix to evaluate risk. Details of the risk management process can be found at Exhibit C1, Tab 3, Schedule 1, pages 51 to 58. The Union rate zones’ methodology for determining the overall risk is qualitative and as such does not generally rely on calculation to arrive at the overall risk level.

Filed: 2019-04-25 EB-2018-0305 Exhibit I.BOMA.36 Page 1 of 1
ENBRIDGE GAS INC. Answer to Interrogatory from
Building Owners and Managers Association of Greater Toronto (BOMA) Reference: Exhibit C1, Tab 1, Schedule 1; Utility System Plan/EGD, p48 Question: Please explain how the examples given for "maintenance projects", Dawn C Plant Replacement, Windsor Line Replacement, and SCOR Meter Area upgrade, are funded. Please provide amounts broken down into capital and OM&A. Response Enbridge Gas is not seeking any relief for the projects specified in the question in 2019. Accordingly, Enbridge Gas declines to respond.

Filed: 2019-04-25 EB-2018-0305 Exhibit I.BOMA.37 Page 1 of 1 Plus Attachment
ENBRIDGE GAS INC. Answer to Interrogatory from
Building Owners and Managers Association of Greater Toronto (BOMA) Reference: Exhibit C1, Tab 1, Schedule 1; Utility System Plan/EGD, p49 Question: a) Please provide, for each project, for which EGD or Union is seeking ICM treatment
in 2019, the amount to be expended in the 2019 capex, the 2019 assets in-service, and the impact on the 2019 revenue requirement, the project capital expenditures, and in-service assets for each year 2020, 2021, 2022, and 2023, and revenue requirement for each of those years.
b) For the Sudbury Lateral Replacement, please provide the year in which it entered service, the capital expenditure for each year from its initiative to its in-service date in 2018.
c) How does the Sudbury project meet ICM criteria?
d) Does EGD intend to ask for ICM treatment for all the projects listed in Table 49 over the term of the five year plan? If not, for which projects?
Response a) Please see Exhibit B1, Tab 2, Schedule 1, Appendix E, pages 1 to 4 for the detailed
revenue requirement calculations for the projects with 2019 assets in-service for each year 2020, 2021, 2022 and 2023. Appendix E, page 3 has been updated and is filed along with the interrogatory response.
b) Please see Exhibit I.EP.16.
c) Please see Exhibit I.STAFF.24 part (a).
d) All of the projects listed in Exhibit C1, Tab 1, Schedule 1, page 49, Table 6 represent
potential ICM Projects over the five year plan.

Updated: 2019-04-25EB-2018-0305
Exhibit B1Tab 2
Appendix EPage 3 of 4
LineNo. Particulars ($000's) 2019 2020 2021 2022 2023
(a) (b) (c) (d) (e)
Incremental Rate Base Investment1 Capital Expenditures 118,183 3,171 - - - 2 Average Rate Base 14,677 118,411 117,650 115,287 112,924
Incremental Revenue Requirement Calculation:
Return on Incremental Rate Base: (1)3 Long-term Debt Interest 588 4,740 4,709 4,615 4,520 4 Short-term Debt Interest (0) (1) (1) (1) (1) 5 Preference Shares 12 99 98 96 94 6 Equity 472 3,807 3,782 3,706 3,630 7 Total Return on Incremental Rate Base 1,072 8,645 8,589 8,417 8,244
Incremental Operating Expenses:8 Operating and Maintenance Expenses - - - - - 9 Depreciation Expense (2) 192 2,331 2,363 2,363 2,363 10 Property Taxes (3) 45 270 274 278 282 11 Total Incremental Operating Expenses 237 2,601 2,637 2,641 2,645
Incremental Income Taxes:12 Return on Equity and Preference Shares (line 5 + line 6) 484 3,906 3,881 3,803 3,725
Utility Timing Differences13 Add: Depreciation Expense (line 9) 192 2,331 2,363 2,363 2,363 14 Less: Current Year Tax Deductions (13,617) (8,948) (7,985) (7,209) (6,527) 15 Taxable Income (line 12 + line 13 + line 14) (12,941) (2,711) (1,741) (1,044) (439)
16 Income Taxes Before Gross Up (line 15 x 26.5%) (4) (3,429) (719) (461) (277) (116)
17 Total Incremental Income Taxes After Gross Up (line 16 / (1-26.5%) (4) (5) (4,666) (978) (628) (376) (158)
18 Total Incremental Revenue Requirement (line 7 + line 11 + line 17) (3,358) 10,269 10,598 10,681 10,731
Notes:(1) The return on rate base is calculated based on Union's 2013 Board-approved capital structure:
Return Capital Structure Component % Cost Rate Component Long-term Debt 61.30% 6.53% 4.00% Short-term Debt -0.03% 1.31% 0.00% Preference Shares 2.74% 3.05% 0.08% Equity 36.00% 8.93% 3.21%Total 100.00% 7.30%
(2) Depreciation expense at Union's 2013 Board-approved depreciation rates.(3) Incremental property tax costs as a result of the project facilities.(4) Union's current provincial and federal tax rate is equal to 26.5%.(5)
Kingsville Transmission Reinforcement - ICM Project Revenue Requirement
Incremental taxes related to utility timing differences are negative as the capital cost allowance deduction in arriving at taxable income exceeds the provision of book depreciation in the year.
Filed: 2019-04-25, EB-2018-0305, Exhibit I.BOMA.37, Attachment, Page 1 of 1

Filed: 2019-04-25 EB-2018-0305 Exhibit I.BOMA.38 Page 1 of 2
ENBRIDGE GAS INC. Answer to Interrogatory from
Building Owners and Managers Association of Greater Toronto (BOMA) Reference: Exhibit C1, Tab 1, Schedule 1; Utility System Plan/EGD, pp51-53; Tables 9, 10, and 11 Question: (a) What is the total amount of projects in-service with proposed ICM financing:
(i) in 2019;
(ii) over the five year period 2019-2023; and
(iii) amounts in 2019 and 2020-2023, including overhead.
(b) What would be the impact on the revenue requirement of implementing the proposed ICM projects in 2019, in each year from 2020 to 2023?
(c) Please provide the actual and normalized ROE compared to allowed ROE for each of EGD and Union, in each of the last five years, 2018, 2017, 2016, 2015, and 2014.
Response a) i) The total amounts of projects in service with proposed ICM funding can be
found at Exhibit B1, Tab 2, Schedule 1, Table 8.
ii-iii) The 2019 ICM projects and potential ICM projects for 2020 – 2023 can be found at Exhibit C1, Tab 1, Schedule 1, Table 6.
b) The revenue requirement of each of the 2019 ICM projects for 2020 to 2023 can be found at Exhibit B1, Tab 2, Schedule 1, Appendix E, pages 1-4. Please refer to Exhibit B1, Tab 2, Schedule 1, page 35 for Enbridge Gas’s ICM unit rate proposal for 2019 – 2023.
c) Please see Table 1 below for the EGD and Union rate zones’ ROE’s for 2013-2018.

Filed: 2019-04-25 EB-2018-0305 Exhibit I.BOMA.38 Page 2 of 2
Table 1 UNION ROE 2013-2018 (%)
2013 (1) 2014 (1) 2015 (1) 2016 (1) 2017 (2) 2018 (3) Actual ROE (4) 10.67 10.69 9.89 9.24 9.16 9.66 Weather Normalized ROE (4) 9.73 9.23 9.46 9.78 9.55 9.36 Board-Approved ROE 8.93 8.93 8.93 8.93 8.93 8.93
EGD ROE 2013-2018 (%)
2013 (1) 2014 (1) 2015 (1) 2016 (1) 2017 (1) 2018 (3) Actual ROE (4) 11.13 12.39 10.41 8.76 9.71 11.41 Weather Normalized ROE (4) 10.41 10.46 9.82 9.42 10.27 10.66 Board-Approved ROE 8.93 9.36 9.30 9.19 8.78 9.00
Notes:
(1) EB-2017-0306/0307, Exhibit C.LPMA.18, Pages 2-3. (2) EB-2018-0105, Exhibit A, Tab 2, Appendix B, Schedule 1/Exhibit A, Tab 5, Page 5.
(3) 2018 Return on equity figures draft. The actual amounts will be filed later this year as part of Enbridge Gas’s 2018 Earning Sharing Mechanism and Deferral and Variance Account proceeding. (4) Actual and weather normalized ROE’s do not reflect the impact of earnings sharing amounts where applicable.

Filed: 2019-04-25 EB-2018-0305 Exhibit I.BOMA.39 Page 1 of 1
ENBRIDGE GAS INC. Answer to Interrogatory from
Building Owners and Managers Association of Greater Toronto (BOMA) Reference: Exhibit C1, Tab 2, Schedule 1, p17; EGD Asset Management Plan Question: Please provide a copy of ISO 5500X. Response ISO 5500X refers to a suite of ISO Asset Management guidelines:
• ISO 55000: Asset Management – What to do and Why • ISO 55001: Asset Management - Management Systems: Requirements • ISO 55002: Guidelines for the application of ISO 55001
ISO documentation is provided at a cost for its subscription where the transaction requires agreement to adhere to ISO’s copyright policy (included in all documents):
All rights reserved. Unless otherwise specified, no part of this publication may be reproduced or utilized otherwise in any form or by any means, electronic or mechanical, including photocopying, or posting on the internet or an intranet, without prior written permission. Permission can be requested from either ISO at the address below or ISO’s member body in the country of the requester. ISO copyright office Ch. de Blandonnet 8 • CP 401 CH-1214 Vernier, Geneva, Switzerland Tel. +41 22 749 01 11 Fax +41 22 749 09 47 [email protected] www.iso.org

Filed: 2019-04-25 EB-2018-0305 Exhibit I.BOMA.40 Page 1 of 1 Plus Attachment
ENBRIDGE GAS INC. Answer to Interrogatory from
Building Owners and Managers Association of Greater Toronto (BOMA) Reference: Exhibit C1, Tab 2, Schedule 1, p19 Question: Please provide a copy of the revised Strategic Plan in 2018. Response The 2018 Strategic Plan summary referenced in EGD’s Asset Management Plan is filed as Attachment 1.

2018 Strategic Plan Summary
Filed: 2019-04-25 EB-2018-0305
Exhibit I.BOMA.40 Attachment 1 Page 1 of 18

Table of Contents 3 The New Enbridge
4 Strategic Plan
5 Our Strategic priorities
10 Maintain the Foundation
11 Business Units
12 Liquids Pipelines
14 Gas Transmission and Midstream
16 Utilities
Our vision is to be the leading energy delivery company in North America, and our five strategic intents represent our long-term road map for the future. They guide our decision making at both big-picture strategic and day-to-day tactical levels. They establish our direction to build a sustainable, successful Enbridge for decades to come.
The five strategic intents are:
Be an energized and proud team
Deliver the energy people need and want
First choice of our customers
Trusted by our stakeholders
A must-own investment
Long-Term Vision
Filed: 2019-04-25 EB-2018-0305
Exhibit I.BOMA.40 Attachment 1 Page 2 of 18

3
At Enbridge, we exist to fuel people's quality of life.
We are North America’s premier energy infrastructure company, connecting key supply basins with consuming markets to move a very large slice of North America’s oil, natural gas and natural gas liquids, safely and reliably.As a leading, global-scale infrastructure company, we are critical to the North American economy.
Today, Enbridge is balanced between oil and natural gas, including North America’s premium natural gas transmission franchise, our world-class liquids pipeline business and our top-notch gas utility business.This footprint provides us with scale and diversity to compete, to grow and to provide the energy people need and want.
The New Enbridge
2018 estimate2016 2018 estimate
51% 32%
13%
4%
2016
74%
8%
12% 6%
Liquids pipelines
Gas transmission & midstream
Gas distribution
Renewables & other
EBITDA* = C$6.9BTotal Assets = C$86B
* Earnings before interest, taxes, depreciation and amortization
EBITDA* = ~ C$12.5BTotal Assets = ~ C$171B
Filed: 2019-04-25 EB-2018-0305
Exhibit I.BOMA.40 Attachment 1 Page 3 of 18
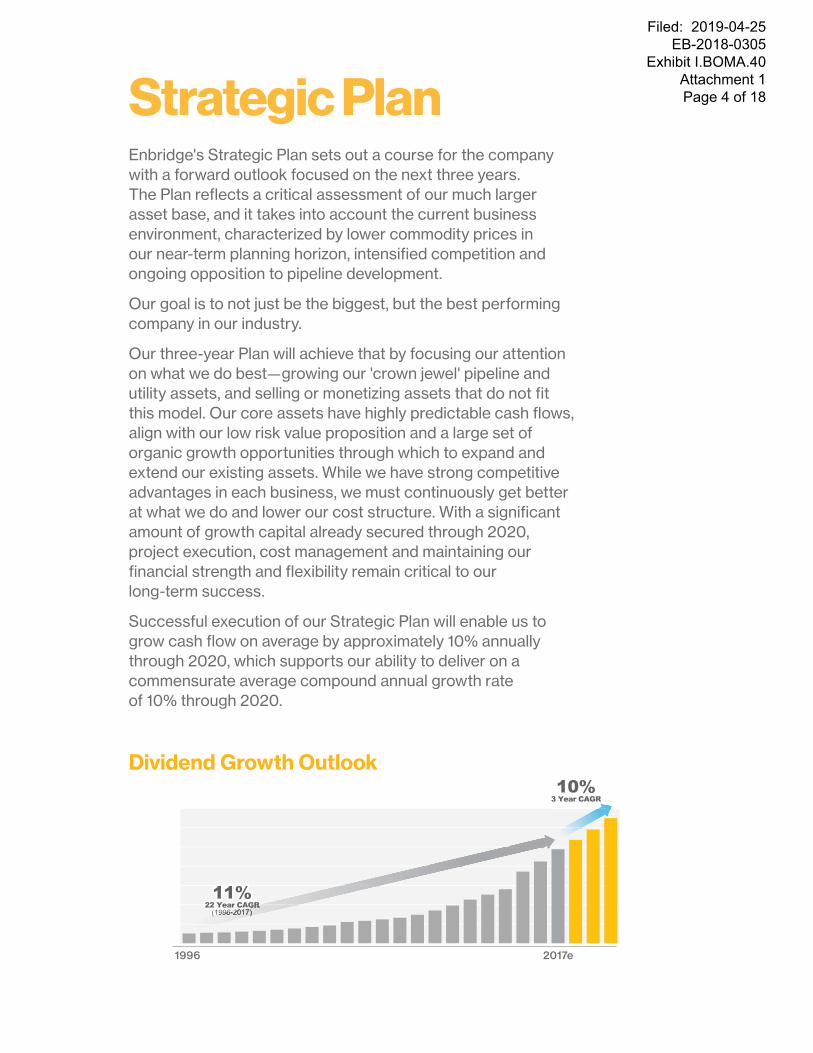
Enbridge's Strategic Plan sets out a course for the company with a forward outlook focused on the next three years. The Plan reflects a critical assessment of our much larger asset base, and it takes into account the current business environment, characterized by lower commodity prices in our near-term planning horizon, intensified competition and ongoing opposition to pipeline development.
Our goal is to not just be the biggest, but the best performing company in our industry.
Our three-year Plan will achieve that by focusing our attention on what we do best—growing our 'crown jewel' pipeline and utility assets, and selling or monetizing assets that do not fit this model. Our core assets have highly predictable cash flows, align with our low risk value proposition and a large set of organic growth opportunities through which to expand and extend our existing assets. While we have strong competitive advantages in each business, we must continuously get better at what we do and lower our cost structure. With a significant amount of growth capital already secured through 2020, project execution, cost management and maintaining our financial strength and flexibility remain critical to our long-term success.
Successful execution of our Strategic Plan will enable us to grow cash flow on average by approximately 10% annually through 2020, which supports our ability to deliver on a commensurate average compound annual growth rate of 10% through 2020.
Strategic Plan
Dividend Growth Outlook
1996 2017e
Filed: 2019-04-25 EB-2018-0305
Exhibit I.BOMA.40 Attachment 1 Page 4 of 18

Based on external and internal factors, our strategic plan is focused on the following six strategic priorities:
Our Strategic Priorities
1. Safety & OperationalReliability
2. Execute CapitalProgram
3. Maximize Value of Core Business
4. Position forLong-term Growth
5. Strengthen FinancialPosition
6. Complete Integration& Transformation
Uphold Enbridge
Values
Maintain the Foundation
Maintain thetrust of our
stakeholders
Attract, retain& develop highlycapable people
Filed: 2019-04-25 EB-2018-0305
Exhibit I.BOMA.40 Attachment 1 Page 5 of 18

6 2018 Strategic Plan Summary
2. Execute Capital ProgramOver the next three years, we plan to spend $22 billion on organic growth opportunities within our core assets. Our secured capital program includes projects such as the Line 3 Replacement, NEXUS, Dawn-Parkway Expansion and the Hohe See Offshore Wind project. Project execution is both integral to our near-term financial performance and balance sheet strength, but also to positioning the business for the long-term. It therefore remains a critical priority for execution teams to manage challenges and engage proactively with regulators and communities.
1. Focus on Safety and Operational ReliabilityAbove all else, safety and reliability of our operations remains our number one priority. If we fail to meet our safety and operational goals, our business as a whole cannot deliver the outcomes laid out in this strategic plan. We will continue to strive for industry safety and reliability leadership and drive a strong performance-based safety culture.
Our Six Strategic Priorities
Filed: 2019-04-25 EB-2018-0305
Exhibit I.BOMA.40 Attachment 1 Page 6 of 18

7
4. Position for Long-Term GrowthA company of our size requires a large opportunity set to sustain growth. We will continue to evaluate new opportunities within our core businesses that fit our value proposition and position Enbridge for the energy mix of the future. As we grow, we are committed to being part of the transition to a lower carbon economy across all our businesses. Natural gas will play an important role and we continue to see significant opportunities in offshore wind.
3. Maximize Value of Core Business We are re-focusing Enbridge’s asset mix to a pure regulated pipeline and utility business model: liquids pipelines and terminals; gas transmission and storage; and natural gas utilities. This will enable us to continue to deliver on our low-risk, reliable value proposition. These core assets have similar characteristics:
• Strategic asset positioning—linking key supply basins with large, growing demand markets;
• Strong commercial underpinnings—long-term contracts, established customers, strong risk-adjusted returns; and
• Organic growth opportunities—the ability to create value by repurposing, reconfiguring and replacing assets already in the ground.
Filed: 2019-04-25 EB-2018-0305
Exhibit I.BOMA.40 Attachment 1 Page 7 of 18

8 2018 Strategic Plan Summary
5. Strengthen Financial PositionTo execute on our secured capital program and to position the company for long-term growth, it will be important to further bolster the balance sheet and provide additional funding flexibility. Our funding plan is designed to sustain strong investment-grade credit ratings, which are key to efficiently funding future growth. We have already begun taking actions to ensure we maintain an industry-leading balance sheet.
Non-core Businesses Our non-core assets include certain non-regulated natural gas midstream gathering and processing (G&P) businesses and onshore renewable assets. Our plan is to monetize or sell a portion or all of those businesses over time. These are valuable assets, but they no longer fit the profile of our core businesses and will be more valuable to another player.
This is not an exit from renewables. We may only sell a portion of our onshore business and we will continue to invest in offshore wind. Investing in these projects remains integral to our longer-term positioning of Enbridge’s energy infrastructure mix.
6. Complete Integration & TransformationWe will remain focused on transforming how we do business by optimizing our systems and processes, and driving cost efficiencies to ensure we remain highly competitive and effective in the future. To maintain a competitive cost structure, we must achieve top quartile cost performance, which will require a renewed focus on how and where we spend our money.
Filed: 2019-04-25 EB-2018-0305
Exhibit I.BOMA.40 Attachment 1 Page 8 of 18

9
Our Strategic Plan emphasizes our attractive investor value proposition. We offer investors a unique combination of strong organic growth and a stable, low risk business model that enables premium dividend growth. In the last three years alone we have grown the dividend by 62% and we’re confident that our Strategic Plan will continue to deliver superior shareholder value.
Attractive Investor Value Proposition
Filed: 2019-04-25 EB-2018-0305
Exhibit I.BOMA.40 Attachment 1 Page 9 of 18

10 2018 Strategic Plan Summary
Maintain the Foundation Underpinning the Strategic Plan are the foundational elements of our company: adhering to our values; maintaining trust of our stakeholders; and developing our people.
Uphold Enbridge ValuesWe adhere to a strong set of core values that govern how we conduct our business and pursue strategic priorities, as articulated in our value statement: “Enbridge employees demonstrate integrity, safety and respect in support of our communities, the environment and each other.” Employees are expected to uphold these values in their interactions with each other, customers, suppliers, landowners, community members and all others with whom we deal, and to ensure our business decisions are consistent with these values.
Maintain the Trust of Our StakeholdersEarning and maintaining the trust of our stakeholders is critical to our ability to execute on our growth plans. We are increasingly focused on building long-term relationships by understanding, accommodating and resolving public concerns related to our projects and operations. We engage our key stakeholders through collaboration and by demonstrating openness and transparency in our communication. We also publicly advocate company positions on key issues and policies that are critical to our business. Ultimately, we strive to build awareness of the role that energy plays in people’s lives and how the energy our company generates and delivers contributes in a meaningful way to their standard of living, health and prosperity.
Develop our Highly Capable PeopleOur employees are fundamental to executing our Strategic Plan, to leading through large-scale change and to delivering on the long-term success of our organization. We all need to think and act like owners of the business—this is our company. Greater ownership and accountability will lead to an energized, engaged and proud team.
Filed: 2019-04-25 EB-2018-0305
Exhibit I.BOMA.40 Attachment 1
Page 10 of 18

11
TorontoToronto
CalgaryCalgary
HoustonHouston
Liquids Pipeline
Natural Gas Transmission Pipeline
Natural Gas Gathering Pipeline
Natural Gas Liquids Pipeline
Crude Storage or Terminal
Gas Storage Facility
NGL Storage Facility
Gas Processing Plant
Gas Distribution Service Territory
Affiliated Gas Distribution Territory
LNG Facility
Rail
Trucking Facility
Propane Terminal
Power Transmission
Renewable Energy
The overarching strategy for each of our business units is to: maximize the value of our core business, execute on major projects and position the business for growth until 2020 and beyond. The following pages provide an overview of each core business, including our competitive advantage for each area, and how Enbridge will continue to be the first choice for our customers.
Business Units
Enbridge Operations
Filed: 2019-04-25 EB-2018-0305
Exhibit I.BOMA.40 Attachment 1
Page 11 of 18

12 2018 Strategic Plan Summary
We operate approximately 30,040 kilometers (18,666 miles) of liquids pipelines—making it the world’s longest and most complex crude oil and liquids transportation system.
Liquids PipelinesEnbridge’s world-class pipeline network is North America’s premier crude system. The size and scale, and geographic reach, along with the absolute criticality of our system to producers and refiners, gives our system a strong competitive position.
Over the last few years, Enbridge’s crude oil and liquids network has evolved to offer customers unparalleled market access and flexibility. The Mainline System, which moves Western Canadian crude to markets in Eastern Canada and the U.S. Midwest, remains the heart of our portfolio. It ships 2.85 million barrels per day of light and heavy crudes along with natural gas liquids and refined products.
Liquids Pipelines
EdmontonEdmonton
HardistyHardisty
New OrleansNew Orleans
BuffaloBuffalo
SteckmanRidgeSteckmanRidgeSalisburySalisbury
GurleyGurleyGuernseyGuernseyCasperCasper
EdgarEdgarBuffaloBuffalo
WestoverWestoverSarniaSarniaStockbridgeStockbridge
ToledoToledo
Port ArthurPort Arthur
TorontoToronto
FlanaganFlanagan
ChannahonChannahonChicagoChicago
MontrealMontreal
HoustonHouston
SuperiorSuperiorClearbrookClearbrook
GretnaGretnaCromerCromer
KerrobertKerrobert
ReginaRegina
MinotMinot
FortMcMurray
FortMcMurray CheechamCheecham
AthabascaAthabascaZamaZama
Norman WellsNorman Wells
RowattRowatt
PatokaPatokaWood River
Wood River
CushingCushing
Liquids Pipeline
Crude Storage or Terminal
Rail
Trucking Facility
Filed: 2019-04-25 EB-2018-0305
Exhibit I.BOMA.40 Attachment 1
Page 12 of 18

13
Execute Capital ProgramOur main priority over the next three years is to ensure our Mainline System remains full and to protect our dominant competitive position. We will continue to focus on mainline expansion by increasing capacity and optimizing the system. Execution of the Line 3 Replacement project—expected to be in service in late 2019—is a critical element of the liquids strategy. We will also increase capacity of our Southern Access Pipeline to move incremental western Canadian barrels.
Post-2019 we see opportunities for staged capacity expansion across our mainline, should either Keystone XL or the Trans Mountain Expansion project not move ahead as scheduled.
Position for Long-term GrowthIn addition to the mainline suite of growth projects post-2019, other opportunities for growth through expansion include:
• Expansion capability on Flanagan South/Seaway systems;
• Involvement in the potential Capline reversal, connecting Patoka to the eastern Gulf Coast;
• Expansion potential for the Express/Platte and Dakota Access lines; and
• Opportunity to establish a strategic footprint in the U.S. Gulf Coast terminal and pipeline business.
We also see other development opportunities within key supply basins, including the Oil Sands, North Dakota and the Permian.
Filed: 2019-04-25 EB-2018-0305
Exhibit I.BOMA.40 Attachment 1
Page 13 of 18

14 2018 Strategic Plan Summary
In addition to our ‘rock solid’ base business, we have visible, contractually secured growth for the next three years. Our secured growth program will extend our system and provide geographic diversity.
We believe the next wave of projects will be regional in scope, rather than the massive, multi-state projects we’ve built in the past. We will participate in future growth by leveraging our significant asset footprint. We see growth opportunities in the following regions:
• Rising demand in the Gulf Coast, the rapidly growing epicenter of America’s liquefied natural gas (LNG) and Mexican exports;
• Retiring electricity generation sources, such as coal, being replaced by natural gas in the U.S. Northeast and New England;
• Continued growth in natural gas-fired power generation in the U.S. Southeast; and
• Expansions in Western Canada to support producers looking for egress solutions out of the Montney and Duvernay regions.
Execute Capital Program
Position for Long-Term Growth
Enbridge's gas transmission assets are unrivaled in the industry due to their scale, scope and connectivity. What sets us apart is our first and last mile advantage; we connect North America's most prolific supply areas to the continent's major demand centres.
This competitive advantage has helped drive our base business. Our customer base consists largely of stable and growing gas and electric companies, and when our customers grow, we grow by supporting them.
GTM has solid, low-risk revenues that underpin the business.
Gas Transmission and Midstream (GTM)
Filed: 2019-04-25 EB-2018-0305
Exhibit I.BOMA.40 Attachment 1
Page 14 of 18

15
Gas Transmission and Midstream
Our gas pipelines cover more than 54,700 kilometers (34,000 miles) in 31 U.S. states, five Canadian provinces and offshore in the U.S. Gulf of Mexico. In the United States, we are no longer a south-to-north pipeline system. Our Texas Eastern system is a fully bi-directional pipeline that delivers gas from the Marcellus and Utica basins to markets in the East, South and Midwest U.S.
We have connections to utilities in Manhattan and Philadelphia; we are the largest supplier to New England, the Southeast and virtually all of Florida; and our transmission network also webs its way throughout the Gulf Coast.
In Western Canada, our pipelines directly link supply areas like the Montney to markets in southern British Columbia, the Pacific Northwest and the U.S. Midwest.
TampaTampaNew OrleansNew Orleans
New YorkNew York
OakfordOakford
AccidentAccident SteckmanRidgeSteckmanRidge
SaltvilleSaltvilleNashvilleNashville
LeidyLeidyChathamChatham WestoverWestover
VancouverVancouver
Port ArthurPort Arthur
TorontoToronto
FrederictonFredericton
HoustonHouston
Fort St. JohnFort St. John
BostonBoston
PhiladelphiaPhiladelphia
BobcatBobcatEganEganMoss BluffMoss Bluff
HalifaxHalifax
Natural Gas Transmission PipelinesNatural Gas Gathering PipelinesNatural Gas Liquids PipelineGas Storage FacilityNGL StorageGas Processing PlantsLNG FacilityPropane Terminals
Filed: 2019-04-25 EB-2018-0305
Exhibit I.BOMA.40 Attachment 1
Page 15 of 18

16 2018 Strategic Plan Summary
Utilities Enbridge has the best situated natural gas utility business in Canada. We are located in major growth centres and are connected to diverse gas supplies. Our utilities business is an extremely strong growth platform as we provide gas to heat homes, run businesses and transport goods.
We deliver energy to 3.6 million homes and businesses in Ontario, Quebec, New Brunswick and New York State—a number that is growing.
Our priorities over the next three years are to support customer growth and rate base renewal, including delivering energy to new communities, and expansion of our Dawn Hub.
Execute Capital Program
Customer GrowthEach year, our utilities add over 50,000 customers and deploy capital in excess of $1 billion to maintain and grow our assets. We expect customer growth to remain strong, driven by Ontario population growth and demand for natural gas as a cost effective source of energy. In Ontario, natural gas can cost as little as one-third of alternatives. We are also expanding into new markets in Ontario, partially supported by a government grant program to help bring natural gas to remote locations, including Indigenous communities.
We will continue to build connecting pipelines and expansions to support commercial growth in southwestern Ontario.
Transportation and Storage Our storage facilities in Ontario, including Dawn and Tecumseh in the southwestern part of the province, feature a total of 278 billion cubic feet of storage—the energy equivalent of more than 60% of Ontario’s annual electricity consumption. Our storage is connected to supply basins across North America, including the Utica and Marcellus in the U.S. Northeast and the Montney and Duvernay in Western Canada.
Filed: 2019-04-25 EB-2018-0305
Exhibit I.BOMA.40 Attachment 1
Page 16 of 18

17
Utility Amalgamation PlanWe applied to the OEB to amalgamate Enbridge Gas Distribution and Union Gas on January 1, 2019 —a development that would create the single largest natural gas utility in North America in terms of send-out volumes, and third largest in terms of customers.
This harmonization would drive efficiencies and synergies, leverage greater supply-chain strength, create new opportunities for growth, and form a stronger platform to deliver strong, predictable returns to shareholders and superior value and service to customers.
Position for Long-Term GrowthWe will continue to develop opportunities over the next several years to support a lower carbon future in Ontario, including:
• Expanding generation and capture of Renewable Natural Gas (RNG) from landfill waste;
• Increasing the use of Compressed Natural Gas (CNG) in transportation, particularly in urban transportation systems like buses and garbage trucks as well as heavy-haul transportation; and
• Integration of gas and electric infrastructures using technologies like combined heat and power, geothermal loops and hydrogen storage and blending.
Gas Distribution
ChathamChatham
TorontoToronto
FrederictonFrederictonMontrealMontreal
Gas Distribution Service Territory
Affiliated Gas Distribution Territory
Filed: 2019-04-25 EB-2018-0305
Exhibit I.BOMA.40 Attachment 1
Page 17 of 18

Forward Looking InformationThis document includes references to forward-looking information. By its nature this information applies certain assumptions and expectations about future outcomes, so we remind you it is subject to risks and uncertainties that affect every business, including ours. The more significant factors and risks that might affect future outcomes for Enbridge are outlined in “Forward-Looking Information”, slide four of the Enbridge Investor Days Opening Remarks slide presentation, available here:https://www.enbridge.com/~/media/Enb/
Documents/Investor%20Relations/2017/2017_
ENBDays_OpeningRemarks.pdf
Filed: 2019-04-25 EB-2018-0305
Exhibit I.BOMA.40 Attachment 1
Page 18 of 18

Filed: 2019-04-25 EB-2018-0305 Exhibit I.BOMA.41 Page 1 of 2
ENBRIDGE GAS INC. Answer to Interrogatory from
Building Owners and Managers Association of Greater Toronto (BOMA) Reference: Exhibit C1, Tab 2, Schedule 1, p20 Question: a) Please provide a copy of Pipeline Integrity Management Program document.
Please define what integrity means. How do "integrity mains" differ from distribution steel mains? What are length, diameter, and pressures of integrity mains? Please distinguish vital mains from integrity mains. Please define CSAT Risk.
b) Please discuss the various categories of mains, their risk/opportunities. What are typical end of life ages for those categories of mains?
c) Please describe how "leak projections" are made.
d) Please summarize the leak survey intervals for each category of mains. Are there any exceptions to those time periods?
Response a) The Pipeline Integrity Management Program is described in further detail in
Exhibit C1, Tab 2, Schedule 1, pages 113 to115.
Please define what integrity means. System Integrity is described in Table 5.2-1 “Maintain the natural gas distribution system to meet or exceed codes, standards, and the requirements of applicable governmental authorities for safety and operational effectiveness.” (Reference: Exhibit C1, Tab 2, Schedule 1, page 106) How do “integrity mains” differ from distribution steel mains? Integrity Mains are defined as “Integrity Management Program (IMP) mains are all pipelines operating at stress levels of 30% Specified Minimum Yield Strength (SMYS) and greater, and targeted Vital Mains that operate at stress levels less than 30% SMYS.” (Exhibit C1, Tab 2, Schedule 1, page 113)

Filed: 2019-04-25 EB-2018-0305 Exhibit I.BOMA.41 Page 2 of 2
Distribution Steel Mains are steel pipelines operating less than 30% SMYS and do not include IMP steel mains. What are length, diameter, and pressures of integrity mains? There are 403 km of Integrity Mains as inventoried within Table 5.2-3 (Exhibit C1, Tab 2, Schedule 1, page 109). The diameter and pressures vary but are specified as “all pipelines operating at stress levels of 30% Specified Minimum Yield Strength (SMYS) and greater, and targeted Vital Mains that operate at stress levels less than 30% SMYS.” (Exhibit C1, Tab 2, Schedule 1, page 113) Please distinguish vital mains from integrity mains. Vital Mains consist of all NEB regulated lines, integrity lines, transmission lines and select distribution lines. Vital mains are critical to the safe and reliable operation of the gas distribution system. Integrity Mains (as defined above) are a subset of Vital Mains. Please define CSAT Risk. Customer Satisfaction Risk (CSAT) is a risk category that is comprised of the following risk dimensions:
i. Emissions (GHG) ii. Rehabilitation iii. Operational Reliability iv. Reputational (Exhibit C1, Tab 2, Schedule 1, Page 81)
b) Please refer to table 5.2.3. (Exhibit C1, Tab 2, Schedule 1, Pages 110 to 111)
c) As outlined in Exhibit C1, Tab 2, Schedule 1, page 132 – section 5.2.6.1: “…leak
projection model created by applying a structured methodology to convert historical failure data into a statistical model that forecasts the probability of failure (PoF). The leak projections are refined with input obtained through direct assessment, internal and external industry studies, and SMA input.” (“SMA” is a Subject Matter Advisor)
d) A leak survey is conducted every five years for distribution steel mains and
distribution plastic mains as indicated in the “Maintenance Strategy” within table 5.2.3. (Exhibit C1, Tab 2, Schedule 1, Page 110); exceptions are given for vital mains and pipelines identified with extensive hard surface cover, for which they are surveyed annually.

Filed: 2019-04-25 EB-2018-0305 Exhibit I.BOMA.42 Page 1 of 2
ENBRIDGE GAS INC. Answer to Interrogatory from
Building Owners and Managers Association of Greater Toronto (BOMA) Reference: Exhibit C1, Tab 2, Schedule 1, p21 Question: (a) Please provide a copy of the 1977 – 1985 plastic main integrity assessment.
(b) Do you proactively replace plastic mains on basis of age alone? Please discuss.
(c) Do you conduct condition assessments of all mains assets?
(d) How many copper ICMs services mains in operation? What is the average age?
What are plans to replace them?
(e) How do you determine when a valve on a pipe is leaking?
(f) Please distinguish between system reinforcement, asset replacement, and asset removal.
(g) What steps are being taken to address valves in poor condition? Response a) The integrity assessment on 1977 to 1985 plastic main is a proposed strategy for
that specific asset sub-class. The assessment will be initiated in 2019 and targeted for completion over the next 5 years.
b) No. The current focus of the vintage plastic replacement program is to replace the mains that have shown the effect of rapid degradation due to stress factors such as rock impingement.
c) Not on all mains. Condition of Integrity Mains is assessed through in-line inspection, while direct assessments are performed opportunistically on distribution mains during maintenance activities. The condition information obtained from this direct assessment is used in our predictive analytics to support the development of

Filed: 2019-04-25 EB-2018-0305 Exhibit I.BOMA.42 Page 2 of 2
statistical models to help inform asset health. (Exhibit C1, Tab 2 / Schedule 1, page 113 to 114, section 5.2.4.1)
d) There are no copper mains in the system, only copper services. The average age of the remaining active copper services is approximately 49 years. (Exhibit C1, Tab 2 Schedule 1, page 21, section 1.8.2). There are approximately 5,100 active copper services in operation at the time the Asset Plan was written. The current plan is to replace all copper services with steel or plastic services over the next 10 years. (Exhibit C1, Tab 2, Schedule 1, page 143, figure 5.2 to 41)
e) When a potential leak is detected through the Leak Survey program or when a suspected gas leak is reported by the public to Enbridge Gas, a leak investigation is conducted to confirm if it is a natural gas leak and to determine the gas source. Leaks on valves can also be detected during the valve inspection program.
f) As per Exhibit C1, Tab 2, Schedule 1, page 159, section 5.2.11:
System Reinforcement projects involve the installation or modification of existing gas distribution assets to maintain minimum required system pressures, maintain distribution capacity, and meet growing natural gas demands. These projects are primarily driven by increased customer demand, customer growth and system reliability considerations.
Asset replacement pertains to the like-for-like replacement of an asset to address condition issues. Asset removal refers to the removal from service, either physically or more commonly by abandonment in place where the asset is disconnected from the distribution system and replaced by a new asset under asset replacement.
g) When an issue is identified on a valve, it will be assessed by field operations to
determine if the issue can be remedied through maintenance work or repair. In the event where the valve is not repairable, it will be replaced.

Filed: 2019-04-25 EB-2018-0305 Exhibit I.BOMA.43 Page 1 of 2
ENBRIDGE GAS INC. Answer to Interrogatory from
Building Owners and Managers Association of Greater Toronto (BOMA) Reference: Exhibit C1, Tab 2, Schedule 1, p31 Question: (a) Have the April 2018 federal methane reduction regulations come into force?
Please provide a copy, or a link to where the regulations can be found. What steps are Union and EGD taking to comply with the regulations?
(b) Please confirm that any revenue from the sale of buildings or facilities in 2019 will accrue to the ratepayers. Does either EGD or Union intend to sell land or facilities in 2019? Which ones?
Response a) Environment and Climate Change Canada (“ECCC”) published the final “Regulations
Respecting the Release of Methane and Certain Volatile Organic Compounds (Upstream Oil and Gas Sector)” (the “methane regulation”), to reduce methane emissions from Canada’s Oil and Gas Sector in Canada Gazette, Part II, on April 28th, 2018. The methane regulation applies to the upstream oil and gas sector which includes the transmission and storage segment of the natural gas industry, but not the distribution segment. A copy of the regulation can be found at https://laws-lois.justice.gc.ca/eng/gregulations/SOR-2018-66/. Beginning in 2020, the following regulatory requirements will come into force:
• Annual measurement requirements and emission limits for reciprocating
compressor unit rod packing and centrifugal compressor unit seals
• Leak Detection and Repair (“LDAR”) requirements for natural gas storage and transmission facilities
Enbridge Gas is in the process of developing a plan to ensure compliance with the 2020 regulatory requirements, for legacy Union and legacy EGD facilities. Key steps in the plan include preliminary testing (2018/2019) of rod packing and seal emissions from compressor units in order to identify potential compliance issues and development of a resource plan and schedule to meet the new LDAR requirements for 2020. Future work

Filed: 2019-04-25 EB-2018-0305 Exhibit I.BOMA.43 Page 2 of 2
will include an assessment of high bleed pneumatic devices and other venting sources in order to ensure compliance with additional regulatory requirements coming into force in 2023. Enbridge, in conjunction with the natural gas industry, is also continuing consultation with ECCC, to provide further clarity on the implementation of the regulatory requirements. Based on testing completed to date, EGD has developed and began implementing plans in order to meet the regulated emission rate for some of its large bore reciprocating compressors. b) Not confirmed. At present, Enbridge Gas does not have any planned land or facility
sales for 2019.

Filed: 2019-04-25 EB-2018-0305 Exhibit I.BOMA.44 Page 1 of 3
ENBRIDGE GAS INC. Answer to Interrogatory from
Building Owners and Managers Association of Greater Toronto (BOMA) Reference: Exhibit C1, Tab 2, Schedule 1, p45 Question: (a) Please explain what Fig. 1.9-2 is intended to show.
(b) Please confirm that for 2019, $364M represents the base capital.
(c) Please confirm that the only EGD ICM request for 2019 is the NPS Don River
Replacement. What is the amount being requested for 2019 in-service capital? In what year did the remainder of the capital for Don River Replacement come into service, and in what amounts? Please provide the business case.
(d) Please provide a priority listing, and a business case, if one is not already in evidence, for each of the other ICM eligible capital projects listed in Fig. 1.9-5.
(e) Please describe the steps EGD takes to establish its proposed 2019 capex. Please show how each step leads to the prioritized project list requested above.
Response a) Figure 1.9-2 is an illustration from the EGD rate zone’s PowerPlan Asset
Management Planning (“PP-AMP”) levelling tool that shows the profile of capital spend from 2019 to 2028 (excluding total overheads) prior to the annual portfolio optimization process. “The initial spend profile is the result of the previous optimization and approved portfolio, with the addition of new business cases and updates to existing ones”.1
The different colour blocks illustrate the various projects and programs, the hatched area illustrates those that are mandatory and fixed, and the red line from years 2019 to 2023 illustrates the optimization capital as derived from Table 1.9-3.2
1 Exhibit C1, Tab 2, Schedule 1, page 44. 2 Ibid.

Filed: 2019-04-25 EB-2018-0305 Exhibit I.BOMA.44 Page 2 of 3
b) $364 million represents the total capital prior to the EGD rate zone’s optimization process (excluding overhead) for the year 2019; this includes base capital and ICM-eligible capital.
c) Confirmed, the Don River Replacement project is the only project in the EGD rate zone for which ICM treatment is being requested. The 2019 in-service capital is $34.2 million. The remaining capital comes into service in 2020 and amounts to $1.1 million. Please refer to Table 9 in Exhibit B1, Tab 2, Schedule 1. As shown in Table 8 in Exhibit B1, Tab 2, Schedule 1, the Company is seeking for partial funding for the Don River Replacement project of $13.1 million due to the amount of ICM capital exceeding the maximum eligible incremental capital amount. The business case for this project can be found in Exhibit C1, Tab 2, Schedule 1, page 699.
d) The table below shows the 2019 ICM-eligible project and future potential ICM projects listed in Table 1.9-5 with reference to the respective business cases.
Project Name Business Case Reference
NPS 30 Don River Replacement Exhibit C1, Tab 2, Schedule 1, page 699
NPS 20 Don River Relocation Exhibit C1, Tab 2, Schedule 1, page 694
SCOR: Meter Area Upgrade Exhibit C1, Tab 2, Schedule 1, page 1176
NPS 12 St. Laurent Ottawa North Main Replacement
Exhibit C1, Tab 2, Schedule 1, page 708
Kennedy Road Expansion Exhibit C1, Tab 2, Schedule 1, page 1292
NPS 12 Martin Grove Road Main Replacement Phase 2
Exhibit C1, Tab 2, Schedule 1, page 703
VPC Core and Shell Obsolescence Exhibit C1, Tab 2, Schedule 1, page 1332
SMOC/Coventry Consolidated Facility
Exhibit C1, Tab 2, Schedule 1, page 1282

Filed: 2019-04-25 EB-2018-0305 Exhibit I.BOMA.44 Page 3 of 3
e) The EGD rate zone’s Asset Management process of establishing its proposed capital expenditure budget is illustrated at Figure 4.2-1.3 The relevant steps described for this response include steps 1, 2, 3a, 3b, 6, 7, 8, 9, 10.
Step in EGD’s Asset Management Core Process (from Figure 4.2-1):
Description of how this informs capital budget:
1. Risk/Opportunity Identification
2. Business Case Initiation
3a. Quantitative Risk Assessment (Ro)
Risks and opportunities are identified by the business and preliminary risk is assessed. A business case is created in PP-AMP. [Refer to Exhibit C1, Tab 2, Schedule 1, Page 79-82 for details.]
3b. Quantitative Risk Assessment (Ro, Rn)
6. Business Case Scope Development & Cost Estimation
7. Asset Manager Review & Approval of Business Case
Solution scope and cost estimation is developed by the business. Risk assessment is advanced with solution planning. Completed risk assessment and solution details are incorporated on the business case in PP-AMP. Asset Class Manager (ACM) reviews and approves the business case for consideration in portfolio optimization. [Refer to Exhibit C1, Tab 2, Schedule 1, Page 83-84 for details.]
8. Portfolio Optimization
9. Review & Approval of Asset Class Optimized Portfolio
10. Approved Portfolio
In the process of portfolio optimization at EGD the “Annual Net Direct Capital is constrained, and the lifetime pre- and post-solution risks determined by QRAs are analyzed to minimize the total risk associated with the portfolio over a specific timeframe” ” [Exhibit C1, Tab 2, Schedule 1, Page 84].
All ACM endorsed project and program business cases are considered in portfolio optimization. An overview of the process is described in Exhibit C1, Tab 2, Schedule 1, Page 84-86.
“Running the leveling tool (as outlined in Section 4.2.3) at the defined optimization capital (Table 6.1-1), an optimized solution could not be obtained. This was due to the level of fixed and mandatory projects. To resolve this, business cases that met the incremental capital criteria (Table 6.1-2) were removed from the leveling process and leveling was repeated until an optimized solution was obtained. Since ICM-eligible capital is different in kind from initiatives carried out through base capital, removing these initiatives from levelling provided EGD with the best understanding of an optimized typical base spend profile. ICM eligible business cases (presented in Table 6.1-3) were considered in addition to the optimized result. Where possible, through subsequent reviews of the results, ICM-eligible capital was proposed within the optimization capital and treated as base (Table 6.1-1). The optimized result is illustrated in Figure 6.1-2.” [Exhibit C1, Tab 2, Schedule 1, Page 377].
3 Exhibit C1, Tab 2, Schedule 1, page 78.

Filed: 2019-04-25 EB-2018-0305 Exhibit I.BOMA.45 Page 1 of 1
ENBRIDGE GAS INC. Answer to Interrogatory from
Building Owners and Managers Association of Greater Toronto (BOMA) Reference: Exhibit C1, Tab 2, Schedule 1, p47 Question: Please provide the amount of capitalized overhead costs, as defined in Table 1.10-1, that is not included in that number, and the components of capital overhead costs. Response The amount of capitalized overhead can be found in table 1.9-3, page 44 in EGD rate zone’s AMP filed at Exhibit C1, Tab 2, Schedule 1. Please see Exhibit I.STAFF.32 part (c) for an explanation of the components of capital overhead costs.

Filed: 2019-04-25 EB-2018-0305 Exhibit I.BOMA.46 Page 1 of 1
ENBRIDGE GAS INC. Answer to Interrogatory from
Building Owners and Managers Association of Greater Toronto (BOMA) Reference: Exhibit C1, Tab 2, Schedule 1, p48 Question: Please provide copies of any third party Asset Condition/Management studies utilized to determine the proposed capex in 2019 for each of EGD and Union. Response EGD and Union use the results of consultant studies, internal and external data, and tacit knowledge to identify risks and opportunities that may require investment. The various solutions that are considered to address the risk or opportunity are developed within EGI. It is these solutions that would be the primary drivers of the capex required to address the risk or opportunity. At Legacy EGD, the decision to include or exclude an investment from the capex is the result of the asset management process which is depicted in section 4.2, page 77 in EGD rate zone’s AMP filed at Exhibit C1, Tab 2, Schedule 1. At Legacy Union, the decision to include or exclude an investment from the capex is the result of the portfolio prioritization process which is described on page 34 to 65 in Union rate zone’s AMP, filed at Exhibit C1, Tab 3, Schedule 1. As such, there are no consultant studies that determine the proposed capex explicitly.
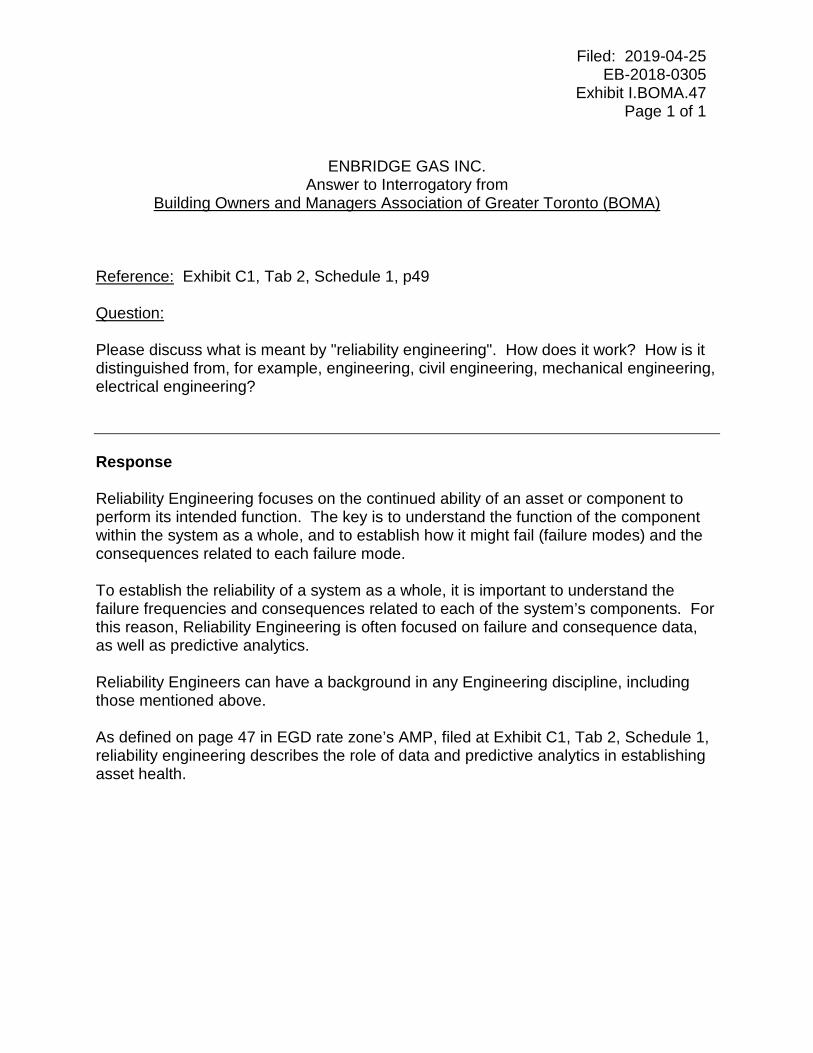
Filed: 2019-04-25 EB-2018-0305 Exhibit I.BOMA.47 Page 1 of 1
ENBRIDGE GAS INC. Answer to Interrogatory from
Building Owners and Managers Association of Greater Toronto (BOMA) Reference: Exhibit C1, Tab 2, Schedule 1, p49 Question: Please discuss what is meant by "reliability engineering". How does it work? How is it distinguished from, for example, engineering, civil engineering, mechanical engineering, electrical engineering? Response Reliability Engineering focuses on the continued ability of an asset or component to perform its intended function. The key is to understand the function of the component within the system as a whole, and to establish how it might fail (failure modes) and the consequences related to each failure mode. To establish the reliability of a system as a whole, it is important to understand the failure frequencies and consequences related to each of the system’s components. For this reason, Reliability Engineering is often focused on failure and consequence data, as well as predictive analytics. Reliability Engineers can have a background in any Engineering discipline, including those mentioned above. As defined on page 47 in EGD rate zone’s AMP, filed at Exhibit C1, Tab 2, Schedule 1, reliability engineering describes the role of data and predictive analytics in establishing asset health.

Filed: 2019-04-25 EB-2018-0305 Exhibit I.BOMA.48 Page 1 of 1
ENBRIDGE GAS INC. Answer to Interrogatory from
Building Owners and Managers Association of Greater Toronto (BOMA) Reference: Exhibit D1, Tab 1, p5 Question: For EGD, have there been any surveys done since August 2017, the delivery date of the Final IPSOS Report? Please describe generically, who are rate 6 customers – typical rate 6 business customers. Response Please see Exhibit I.BOMA.8. As per EGD’s Rate Handbook, the applicability of Rate 6: General Service is defined as follows: “To any applicant needing to use the Company's natural gas distribution network to have transported a supply of natural gas to a single terminal location ("Terminal Location") for non-residential purposes” Typical customers taking Rate 6 include the following: Apartment and condominium buildings; Office buildings; Schools; Hospitals and other medical buildings; Churches; Hotels and motels; Shopping malls; Warehouses; Various retail buildings and stores; Restaurants

Filed: 2019-04-25 EB-2018-0305 Exhibit I.BOMA.49 Page 1 of 1
ENBRIDGE GAS INC. Answer to Interrogatory from
Building Owners and Managers Association of Greater Toronto (BOMA) Reference: Exhibit D1, Tab 1, pp5-7 Question: Please describe the impact of the margin of error for the four cohorts on the usefulness of the survey data.
Response The margin of error is a statistic expressing the confidence one should have in the sampling error for survey results. The statistic considers the total size of the survey universe and the size of the survey sample. Generally, the larger the sample size the lower the margin of error. Also, the larger the universe generally means that a larger sample size would be more appropriate. For context, an industry standard sample size for the population of Ontario (18+ adults) is n=800 interviews. As a measure of sampling error the impact of the margin of error means that the results of the Residential customer survey can be considered accurate between plus or minus 3%, the results of the General Service customer survey can be considered accurate between plus or minus 4%, the results of the Rate 6 Business customer survey can be considered accurate between plus or minus 6%, and the Large Volume customer survey can be considered accurate between plus or minus 13%.

Filed: 2019-04-25 EB-2018-0305 Exhibit I.BOMA.50 Page 1 of 1
ENBRIDGE GAS INC. Answer to Interrogatory from
Building Owners and Managers Association (BOMA)
Reference: Exhibit D1, Tab 1, p8 Question: (a) The data for satisfactory customer service, 72% Rate 6, 66% Rate 6, 66%R, GS
(65%) seems rather low, with only two-thirds of customers expressing satisfaction. (b) Given that satisfaction with value for money also were 72% (6), 66%LV, 66%R, 65T
GS, what steps is EGD planning to increase these numbers for both customer service and value for money?
Response Please see Exhibit I.STAFF.77.

Filed: 2019-04-25 EB-2018-0305 Exhibit I.BOMA.51 Page 1 of 1
ENBRIDGE GAS INC. Answer to Interrogatory from
Building Owners and Managers Association (BOMA)
Reference: Exhibit D1, Tab 1, pp15-17 Question: (a) Why have a significantly higher percentage of general service customers
experienced outages than the residential rate 6, or large volume customers? (b) Why have general service and rate 6 customers who experienced one unplanned
outage over the last five years, also on average experienced 2.6 outages per year? Response a) The research indicates that General Service customers are more likely to experience
an unplanned natural gas outage compared to Residential customers (8% vs 5%, respectively). There is no statistically significant difference with self-reported experiences of unplanned natural gas outages between General Service and Rate 6 or Large Volume customers. Ipsos cannot comment why a higher proportion of General Service customers, compared to Residential customers, have ever experienced an unplanned natural gas outage.
b) To clarify, question 3 (Q4 for LVC customers) asks respondents if they have ever experienced an unplanned natural gas outage. Question 4 (Q5 for LVC customers) asks, among those who indicate that they have ever experienced an unplanned natural gas outage, how many unplanned outages they have experienced in the past 5 years.
Filed: 2019-04-25 EB-2018-0305 Exhibit I.BOMA.52 Page 1 of 1
ENBRIDGE GAS INC. Answer to Interrogatory from
Building Owners and Managers Association (BOMA)
Reference: Exhibit D1, Tab 1, p19 Question: A large minority of large volume customers expressed some concerns about EGD. Of those, 24% mention high costs for new natural gas service, and 16% had meter reading accuracy. What steps is EGD taking to deal with these complaints, in particular, meter reading accuracy? Response Please see Exhibit I.STAFF.77.

Filed: 2019-04-25 EB-2018-0305 Exhibit I.BOMA.53 Page 1 of 1
ENBRIDGE GAS INC. Answer to Interrogatory from
Building Owners and Managers Association (BOMA)
Reference: Exhibit D1, Tab 1, p21 Question: EGD has stated that the average business customer bill will have to increase by 3% per year starting 2019, until 2023, a total of 15% over the five year plan term. What is the equivalent percentage increase in EGD's delivery charge in 2019 and over the five year term? Approximately what percentage of the average total bill for each of residential, rate 6, GS, and large volume customers does the delivery charge represent? Response The rate impact in the customer engagement survey was based on a high level estimate at the time of the study. Please see below for the equivalent percentage increase in EGD’s delivery charge for 2019 as filed in this application. The Customer Bill Impacts for the EGD rate zone for 2019 are filed at Exhibit F1, Tab 1, Rate Order, Working Papers, Schedule 3 for all rate classes. Schedule 3, page 3 and 4 show the typical impacts for Rate 6 customers (average business customer), the delivery charge for 2019 is forecast to increase by approximately 1%. For a typical residential sales service customer (Rate 1) consuming 2,400 m3 annually, the delivery charge represents approximately 53% of their total bill. For a typical commercial sales service customer (Rate 6) consuming 22,606 m3, the delivery charge represents approximately 39% of their total bill. For a typical large volume sales service customer (Rate 110) consuming 9,976,121 m3, the delivery charge represents approximately 14% of their total bill. For 2020 to 2023, the applicant does not have the rate impact as the parameters underlying the rate setting mechanism are not known.

Filed: 2019-04-25 EB-2018-0305 Exhibit I.BOMA.54 Page 1 of 1
ENBRIDGE GAS INC. Answer to Interrogatory from
Building Owners and Managers Association (BOMA)
Reference: Exhibit D1, Tab 1, pp21-22 Question: (a) Why was the increase expressed differently for each of the four cohorts? (b) Please confirm that fewer than half of rate 6 and general service customers believe
that the increase in bills of 3% annually for five years is reasonable or necessary, and that only 56% of large volume customers believe that raising rates by 1.5% annually for five years is reasonable or necessary.
Response a) The increase is expressed differently to account for the different amount of natural
gas consumed on average by the various customer groups. b) Correct. To confirm fewer than half (44%) of Rate 6 customers believe that an
increase in bills of 3% annually for five years is reasonable or necessary to maintain currently levels of safety and reliability. Also, slightly more than half (56%) of Large Volume customers believe that an increase in bills of 1.5% annually for five years is reasonable or necessary.

Filed: 2019-04-25 EB-2018-0305 Exhibit I.BOMA.55 Page 1 of 1
ENBRIDGE GAS INC. Answer to Interrogatory from
Building Owners and Managers Association (BOMA)
Reference: ROE Question: Please confirm that due to the timing of the studies, they did not ask questions about the impact of the federal carbon program. Response Confirmed. The studies did not ask questions about the impact of the federal carbon program.

Filed: 2019-04-25 EB-2018-0305 Exhibit I.BOMA.56 Page 1 of 1
ENBRIDGE GAS INC. Answer to Interrogatory from
Building Owners and Managers Association (BOMA)
Reference: Exhibit D1, Tab 1, pp 33 Question: BOMA does not understand what the question on blending RNG is about. What is meant by "additional blending"? Response The previous question asked about a baseline blending amount for a fee, this follow-up question asked how much more customers would be willing to pay to blend more RNG into the system.

Filed: 2019-04-25 EB-2018-0305 Exhibit I.BOMA.57 Page 1 of 1
ENBRIDGE GAS INC. Answer to Interrogatory from
Building Owners and Managers Association (BOMA)
Reference: Exhibit D1, Tab 1, p42 Question: For rate 6 customers, what would the increase in delivery charge be for 2019, and over the period 2019-2023, inclusive, at three volume/demand points, low, medium, and high? Response The rate impact in the customer engagement survey was based on a high level estimate at the time of the study. Please see below for the increase in EGD’s delivery charge for 2019 as filed in this application. Customer Bill Impacts for the EGD rate zone for 2019 are filed at Exhibit F1, Tab 1, Rate Order, Working Papers, Schedule 3 for all rate classes. Schedule 3, pages 3 and 4 show the typical impacts for Rate 6 customers (average business customer), the delivery charge for 2019 is forecast to increase by approximately 1% for a low, 1.6% for a medium and 1.8% for a large Rate 6 customer. For 2020 to 2023, the applicant does not have the rate impact as the parameters underlying the rate setting mechanism are not known.

Filed: 2019-04-25 EB-2018-0305 Exhibit I.BOMA.58 Page 1 of 1
ENBRIDGE GAS INC. Answer to Interrogatory from
Building Owners and Managers Association (BOMA)
Reference: Exhibit D1, Tab 1, p44, Figure 31 Question: Please confirm that only 16% of rate 6 customers would agree to pay 3% more on their gas bill to maintain existing level of reliability, safety, and service. Response In Figure 31, 11% of Rate 6 customers indicate that they would be willing to pay an additional 3% per month to maintain current levels of safety and reliability, an additional 12% of Rate 6 customers would be willing to pay an additional 7% per month to maintain safety and reliability and to invest in RNG.

Filed: 2019-04-25 EB-2018-0305 Exhibit I.BOMA.59 Page 1 of 1
ENBRIDGE GAS INC. Answer to Interrogatory from
Building Owners and Managers Association (BOMA)
Reference: Exhibit D1, Tab 1, p46 Question: Please confirm that cost of gas was highest negative comments for rate 6 (residential) general service customers, and large volume customers. Response Correct, 9% of residential customers mention high cost / increasing price, which was also mentioned by 8% of Rate 6 Business customers 11% of General Service customers, and 6% of Large Volume customers.

Filed: 2019-04-25 EB-2018-0305 Exhibit I.BOMA.60 Page 1 of 1
ENBRIDGE GAS INC. Answer to Interrogatory from
Building Owners and Managers Association (BOMA)
Reference: Exhibit D1, Tab 1, p79 Question: The diagram shows the capital (general plant maintenance) and IT upgrades. Why is "Other Capital" shown separately for System Integrity and Reliability? Response This diagram is to show that 90% of the EGD rate zone’s capital investments are directly attributed to attaching new customers and maintaining a safe and reliable distribution system.

Filed: 2019-04-25 EB-2018-0305 Exhibit I.BOMA.61 Page 1 of 1
ENBRIDGE GAS INC. Answer to Interrogatory from
Building Owners and Managers Association (BOMA)
Reference: Exhibit D1, Tab 2, Schedule 1 (Innovative Research), p8 Question: Please advise when the workbook was reviewed by intervenors, and which intervenors. Response A stakeholder session was held on January 23, 2017 to review the workbook. The following parties were invited to the session:
APPrO Board Staff BOMA CCC City of Kitchener CME Energy Probe FRPO IESO IGUA LPMA OAPPA OGVG
SEC Six Nations Shell TransCanada VECC

Filed: 2019-04-25 EB-2018-0305 Exhibit I.BOMA.62 Page 1 of 1
ENBRIDGE GAS INC. Answer to Interrogatory from
Building Owners and Managers Association (BOMA)
Reference: Exhibit D1, Tab 2, Schedule 1 (Innovative Research), p10 Question: Why were the categories somewhat reasonable or somewhat unreasonable introduced? Aren't prices either reasonable or unreasonable? Response The scale is used to capture the intensity of customer views. It is well established in the literature that people hold opinions with different levels of intensity. The more strongly someone holds a view, the more likely they are to act upon it. Since this is the case, Innovative’s normal practice is to propose scales that capture intensity.

Filed: 2019-04-25 EB-2018-0305 Exhibit I.BOMA.63 Page 1 of 1
ENBRIDGE GAS INC. Answer to Interrogatory from
Building Owners and Managers Association (BOMA)
Reference: Exhibit B1, Tab 2, Schedule 1, pp4-5 of 36; ICM Question: (a) Please add a column for 2018 actuals to Tables 1 and 2. (b) Please confirm that, for 2019, in Tables 1 and 2, the word "Budget" is equivalent
to "Forecast". (c) Comparing Tables 1 and 2, why is the EGD "Overhead" percentage of in-service
capital much greater than Union, approximately one-third versus one-sixth, or twice as great a share of the total?
Response a) Please see Exhibit I.LPMA.10.
b) Confirmed.
c) The capitalization process and composition of overheads differs between the EGD and Union rate zones. Both utilities follow the Enbridge Harmonized Enterprise-wide Capitalization Policy, however the overhead capitalization processes are still legacy based. A key difference is the use of burden rates. Union directly capitalizes labour (burdens) to capital projects whereas EGD treats these costs as overheads (DLC, or Departmental Labour Costs). Please refer to Exhibit I.STAFF.32 (c) for an explanation of the components of overheads.

Filed: 2019-04-25 EB-2018-0305 Exhibit I.BOMA.64 Page 1 of 1
ENBRIDGE GAS INC. Answer to Interrogatory from
Building Owners and Managers Association (BOMA)
Reference: Exhibit B1, Tab 2, Schedule 1, p12 Question: Please provide the calculation of the 1.07% price cap index. Please confirm that for EGD, 1.07% is not an average but simply the index based on the inflation forecast less the productivity factors for 2019. Response Please see Exhibit B1, Tab 1, Schedule 1, page 4, Table 2 and Table 3 for the calculation of the Price Cap Index. Confirmed. The 1.07% PCI for EGD is based on the inflation forecast less the productivity and stretch factors for 2019.

Filed: 2019-04-25 EB-2018-0305 Exhibit I.BOMA.65 Page 1 of 1 Plus Attachment
ENBRIDGE GAS INC. Answer to Interrogatory from
Building Owners and Managers Association (BOMA)
Reference: Exhibit B1, Tab 2, Schedule 1, p10 Question: Please provide the calculation for Union rate base of 5,331, showing for each year from 2013 through 2019 the rate base and depreciation associated with capital pass-through treatment in each year of that period. Response Exhibit B1, Tab 2, Schedule 1, page 16, Table 6, Lines 2 to 4 provides a breakdown of the Union rate zone ICM Threshold rate base and depreciation amounts. Both the rate base and depreciation values are calculated by adding the Union 2013 Board-approved values, to the 2019 proposed/forecast capital pass-through values. Attachment 1 to this response provides the rate base and depreciation amounts for capital pass-through projects, for 2013 to 2019.

Cap
ital P
ass-
Thro
ugh
Proj
ect
Rat
e B
ase
Dep
reci
atio
nR
ate
Bas
eD
epre
ciat
ion
Rat
e B
ase
Dep
reci
atio
nR
ate
Bas
eD
epre
ciat
ion
Rat
e B
ase
Dep
reci
atio
nR
ate
Bas
eD
epre
ciat
ion
Rat
e B
ase
Dep
reci
atio
nPa
rkw
ay W
est
--
12,2
0057
810
3,75
03,
071
215,
846
5,18
521
7,52
35,
415
213,
974
5,47
921
0,03
35,
508
Bra
ntfo
rd to
Kirk
wal
l/Par
kway
D-
--
-24
,171
2,36
418
5,27
34,
857
187,
254
4,99
018
2,72
74,
995
177,
700
4,99
520
16 D
awn-
Park
way
Exp
ansi
on P
roje
ct-
--
-2,
259
176
64,0
924,
066
328,
149
8,03
032
9,68
98,
255
323,
388
8,26
1B
urlin
gton
to O
akvi
lle P
roje
ct-
--
--
-15
,902
821
78,8
701,
668
79,2
891,
720
78,2
771,
732
2017
Daw
n-Pa
rkw
ay E
xpan
sion
Pro
ject
--
--
--
18,3
681,
225
258,
892
8,97
556
9,94
016
,035
583,
664
17,3
06Pa
nhan
dle
Rei
nfor
cem
et P
roje
ct-
--
--
--
-22
,610
2,02
720
3,41
24,
473
223,
844
4,93
9To
tal
--
12,2
0057
813
0,18
05,
611
499,
481
16,1
541,
093,
298
31,1
051,
579,
031
40,9
571,
596,
906
42,7
41
Not
es:
(1) E
B-2
015-
0010
, Exh
ibit
A, T
ab 1
, p. 3
2.(2
) EB
-201
5-01
18, E
xhib
it A
, Tab
1, p
p. 3
4, 4
1, 5
0.(3
) EB
-201
7-00
91, E
xhib
it A
, Tab
1, p
p. 3
0, 3
8, 4
9, 5
6, 6
1.(4
) EB
-201
8-01
05, E
xhib
it A
, Tab
1, p
p. 3
0, 3
7, 4
6, 5
3, 6
0, 6
6.(5
) Act
ual 2
018
Rat
e B
ase
and
Dep
reci
atio
n fig
ures
are
exp
ecte
d to
be
incl
uded
in th
e A
pplic
atio
n an
d Ev
iden
ce fo
r the
EG
I 201
8 D
efer
rals
and
Ear
ning
s Sha
ring
proc
eedi
ng, b
ut a
re d
raft
at th
is ti
me
and
may
cha
nge.
(6) P
ropo
sed
in E
B-2
018-
0305
, Exh
ibit
F1, T
ab 2
, Rat
e O
rder
, Wor
king
Pap
ers,
Sche
dule
16,
pp
4-5.
Tabl
e 1
Cap
ital P
ass-
Thro
ugh
Rat
e B
ase
and
Dep
reci
atio
n (2
013-
2019
) ($
000'
s)
2019
Pro
pose
d (6
)20
13 A
ctua
l20
14 A
ctua
l (1)
2015
Act
ual (
2)20
16 A
ctua
l (3)
2017
Act
ual (
4)20
18 A
ctua
l (5)
Filed: 2019-04-25 EB-2018-0305
Exhibit I.BOMA.65 Attachment 1
Page 1 of 1

Filed: 2019-04-25 EB-2018-0305 Exhibit I.BOMA.66 Page 1 of 1
ENBRIDGE GAS INC. Answer to Interrogatory from
Building Owners and Managers Association (BOMA)
Reference: Exhibit B1, Tab 2, Schedule 1, p9 Question: Please provide separate calculations which show what the Union 2019 rate base and depreciation would be if all additions to rate base and depreciation for each year from 2013 through to 2019 were added to 2013 rate base and depreciation , and show what the eligible ICM capacity would be, if that were done. Response The use of ICM was subject to litigation in the MAADs and Rate Setting Mechanism proceeding, and made available to EGD and Union as part of the Board’s Decision and Order dated August 30, 2018. As per the decision, the Board ordered Enbridge Gas to add the rate base and depreciation associated with capital pass-through projects to the 2013 OEB-approved rate base and depreciation in determining the eligible incremental capital amount for Union. Enbridge Gas declines to provide the calculation as it is not in accordance with the Board’s MAADs decision, and it does not represent what current rates can support.

Filed: 2019-04-25 EB-2018-0305 Exhibit I.BOMA.67 Page 1 of 1
ENBRIDGE GAS INC. Answer to Interrogatory from
Building Owners and Managers Association (BOMA)
Reference: Exhibit B1, Tab 2, Schedule 1, p10 Question: Are EGD and Union seeking approval for all its "ICM projects" planned for the term of the Agreement, or only the 2019 assets in-service in 2019? Please discuss. Response As per the MAADs Decision, the Board approved an ICM mechanism for Enbridge Gas to seek rate recovery for incremental capital during the deferred rebasing term. As part of this rate application, Enbridge Gas is seeking approval for ICM rate recovery associated with 2019 in-service projects which includes the NPS 30 Don River Replacement project, Sudbury Replacement project, Kingsville Transmission Reinforcement project, and Stratford Reinforcement project. For any future ICM projects, Enbridge Gas will seek the Board’s approval for ICM rate recovery as part of its annual rate applications, if it determines that these projects are eligible for incremental funding as per the MAADs Decision and the Board’s ICM policy.

Filed: 2019-04-25 EB-2018-0305 Exhibit I.BOMA.68 Page 1 of 1 Plus Attachment
ENBRIDGE GAS INC. Answer to Interrogatory from
Building Owners and Managers Association (BOMA)
Reference: Exhibit B1, Tab 2, Schedule 1, p19 Question: (a) Please provide the revenue requirement impact of:
(i) the Sudbury Replacement Project for each year of the deferral rebasing period 2019-2023;
(ii) the historical spend on the Sudbury Replacement Project in each year since it received Leave to Construct approval, and a copy of the Board's Leave to Construct decision.
(b) When was the Sudbury Leave to Construct filed; approved? Response (a) (i) Please see Exhibit B1, Tab 2, Schedule 1, page 31, Table 11, Line No. 2 for
the revenue requirement on Sudbury Replacement project. A further breakdown of the revenue requirement can be found at Exhibit B1, Tab 2, Schedule 1, Appendix E, page 2.
(ii) Please see Exhibit I.BOMA.37 for historical spend information. A copy of the Board’s Leave to Construct decision can be found at Attachment 1. (b) The Sudbury Leave to Construct, EB-2017-0180 was filed on May 5, 2017 and
approved on September 28, 2017.

DECISION AND ORDER EB-2017-0180
UNION GAS LIMITED
Application for approval to construct a natural gas pipeline in the City of Greater Sudbury
BEFORE: Lynne Anderson Presiding Member
September 28, 2017
Ontario Energy Board Commission de l’énergie de l’Ontario
Filed: 2019-04-25, EB-2018-0305, Exhibit I.BOMA.68, Attachment 1, Page 1 of 21

TABLE OF CONTENTS
INTRODUCTION ............................................................................................................. 1
THE PROCESS .............................................................................................................. 2
STRUCTURE OF THE DECISION .................................................................................. 4
NEED FOR THE PROJECT AND ALTERNATIVES....................................................... 5
PROJECT ECONOMICS AND RATE IMPACTS ............................................................ 7
LAND MATTERS ............................................................................................................ 9
DESIGN AND SAFETY REQUIREMENTS ................................................................... 10
CONSULTATION WITH INDIGENOUS COMMUNITIES .............................................. 11
CONDITIONS OF APPROVAL ..................................................................................... 12
CONCLUSION .............................................................................................................. 13
ORDER ....................................................................................................................... 14
ATTACHMENT A
ATTACHMENT B
Filed: 2019-04-25, EB-2018-0305, Exhibit I.BOMA.68, Attachment 1, Page 2 of 21

Ontario Energy Board EB-2017-0180 Union Gas Limited
Decision and Order 1 September 28, 2017
INTRODUCTION On May 5, 2017, Union Gas Limited (Union Gas) applied to the Ontario Energy Board (OEB) under section 90(1) of the Ontario Energy Board Act, 1998 for an approval of its proposal to build 20 km of NPS 12 hydrocarbon (natural gas) pipeline in the Sudbury area (the Proposed Pipeline). This Proposed Pipeline would replace two sections of NPS 10 pipeline in the City of Greater Sudbury. A map of the facilities is included as Attachment A.
Union Gas stated that the Proposed Pipeline is needed because its Integrity Management Program has identified multiple integrity issues through inspections and investigative digs. The current pipeline was predominately constructed in 1958. Union Gas proposed to increase the size of the pipeline to 12 inches (NPS 12) to provide capacity for future growth on the Sudbury system.
Union Gas stated in its application that the Proposed Pipeline was the continuation of three previous pipeline replacement projects in the Sudbury area (Sudbury Replacement Projects) previously approved by the OEB1 . One issue that arose is whether the Proposed Pipeline should be NPS 12 in size rather than NPS 10, the size of the existing pipeline. The OEB is granting leave to construct the NPS 12 pipeline proposed by Union Gas, but has noted that Union Gas could improve future applications by providing the OEB with a forecast of growth to support the upsizing of any pipelines, as well as information on the longer-term plans for supply to an area in order to provide context for individual projects. Leave is granted under section 90(1) of the OEB Act for the Proposed Pipeline. For the reasons set out in this Decision and Order, the OEB finds that the construction of the Proposed Pipeline is in the public interest.
1 EB-2015-0042, EB-2016-0122 and EB-2016-0222
Filed: 2019-04-25, EB-2018-0305, Exhibit I.BOMA.68, Attachment 1, Page 3 of 21

Ontario Energy Board EB-2017-0180 Union Gas Limited
Decision and Order 2 September 28, 2017
THE PROCESS The OEB issued a Notice of Application (Notice) on June 8, 2017. Union Gas published and served the Notice as directed by the OEB. The Notice was served to all directly affected landowners and encumbrancers; the clerks of the City of Greater Sudbury; Indigenous communities with lands or interest in the lands directly affected by the Proposed Pipeline; the Métis Nation of Ontario; all affected utilities and railway companies; members of the Ontario Pipeline Coordinating Committee (OPCC); and the Sudbury Conservation Authority. Union Gas published the English and French versions of the Notice in the Sudbury Star and Sudbury Le Voyageur, and posted the Notice on its website.
Union Gas requested that this application be determined by way of a written hearing. The Notice of Hearing for this application set a June 26, 2017 deadline for requests for intervenor status and for any requests for an oral hearing. The OEB received no requests for intervenor status, or requests for an oral hearing, The OEB did not receive any letters of comment in respect of this application.
The OEB issued Procedural Order No. 1 on July 7, 2017, setting the schedule for written interrogatories and written submissions. Union Gas filed responses to OEB staff interrogatories on July 25, 2017. According to Procedural Order No. 1, the submission from OEB staff was due by August 9, 2017, and Union Gas’ reply submission, if any,
was due by August 16, 2017. However, in response to OEB staff interrogatory no. 6, Union Gas indicated that it was awaiting a letter from the Ministry of Energy (MoE) to inform Union Gas if there was a duty to consult, as well as to provide the MoE’s
comments regarding the consultation activities that Union Gas had completed and further consultation that was proposed.
According to section 3.3 of the OEB Environmental Guidelines for the Location,
Construction and Operation of Hydrocarbon Pipelines and Facilities in Ontario (OEB Environmental Guidelines), the MoE is to provide a letter to the applicant expressing its view on the adequacy of the Indigenous consultation prior to the record being closed by the OEB for a leave to construct proceeding.
By August 8, 2017 the OEB had not received the letter from the Ministry referred to in Union Gas’ response to interrogatory no. 6. For this reason, the OEB issued a letter
dated August 8, 2017, cancelling the remaining schedule set in Procedural Order No. 1, and advising that, “the new schedule for the balance of this proceeding will be issued after the OEB receives complete documentation on the Indigenous consultation activities as required by the OEB Environmental Guidelines.”
Filed: 2019-04-25, EB-2018-0305, Exhibit I.BOMA.68, Attachment 1, Page 4 of 21

Ontario Energy Board EB-2017-0180 Union Gas Limited
Decision and Order 3 September 28, 2017
On August 11, 2017, Union Gas filed a letter from the MoE dated August 10, 2017 advising that “the Ministry is of the opinion that the procedural aspects of consultation
undertaken by Union Gas to date for the purpose of the Ontario Energy Board’s leave to
construct is satisfactory”.
Union Gas also filed an update to the version of the Indigenous consultation log filed in its response to OEB staff interrogatories. Union Gas’ August 11, 2017 filings completed the evidentiary record for this proceeding. The OEB issued Procedural Order No. 2 to set the dates for an OEB staff written submission and written reply submission by Union Gas. OEB staff filed written submissions on August 25, 2017 and Union Gas filed a reply submission on September 1, 2017. This concluded the record for the proceeding.
Filed: 2019-04-25, EB-2018-0305, Exhibit I.BOMA.68, Attachment 1, Page 5 of 21

Ontario Energy Board EB-2017-0180 Union Gas Limited
Decision and Order 4 September 28, 2017
STRUCTURE OF THE DECISION This is an application under section 90 of the OEB Act seeking an order for leave to construct a natural gas pipeline. Section 96 of the Act provides that the OEB shall make an order granting leave if the OEB finds that “the construction, expansion or
reinforcement of the proposed work is in the public interest”. When determining whether
a project is in the public interest, the OEB typically examines the need for the project and alternatives, the project’s economics and rate impacts, the environmental impacts, land matters, design and safety requirements, and consultation with Indigenous communities.
This Decision and Order is structured by each of these issues.
Filed: 2019-04-25, EB-2018-0305, Exhibit I.BOMA.68, Attachment 1, Page 6 of 21

Ontario Energy Board EB-2017-0180 Union Gas Limited
Decision and Order 5 September 28, 2017
NEED FOR THE PROJECT AND ALTERNATIVES Union Gas stated in its application that the Proposed Pipeline was the continuation of three previous pipeline replacement projects in the Sudbury Area (Sudbury Replacement Projects) previously approved by the OEB2. OEB staff asked questions about why Union Gas did not file a single application for each of these projects. Union Gas responded that there could not have been a single application because there were specific requirements for each individual case.
The existing pipeline in question was predominately constructed in 1958. Union Gas did inspections of the existing pipeline in 2002 and again in 2006/2007 and 2014/2015. Union Gas stated that the pipeline continues to deteriorate due to corrosion and denting. Cathodic protection is used to reduce corrosion, but Union Gas has stated that it is difficult to maintain because of the pipeline’s location in both granite bed rock and
low lying swamps.
Union Gas is also proposing to increase the size of the pipeline from 10 inches to 12 inches (NPS 10 to NPS 12) in this replacement project. According to Union Gas, this would increase the capacity of the Sudbury Lateral System by 5% at an incremental cost of $1.5M (approximately a 2% increase to the cost forecast).
Union Gas did not provide a load forecast for the Sudbury area in its application. In response to interrogatories, Union Gas provided a general service growth forecast of 1400 m3/hr/year and stated that the incremental capacity of moving from a 10 inch pipe to a 12 inch pipe would be utilized within 8 years based on this forecast. In its reply submission, Union Gas provided a table with a load forecast to demonstrate that the capacity of the pipelines in the Sudbury area would reach capacity in 2026/2027, even with the Proposed Pipeline. Since these details were only available at the time of the reply submission, there was no opportunity for OEB staff to ask questions or comment on this forecast.
Union Gas also stated that while it had not determined the impacts of the Cap and Trade program on its facilities, there was an expectation that annual customer usage would decline but peak hour demands may not. Union Gas designs its systems based on peak hour demands, the maximum amount of natural gas the pipeline needs to carry in peak periods.
2 EB-2015-0042, EB-2016-0122 and EB-2016-0222
Filed: 2019-04-25, EB-2018-0305, Exhibit I.BOMA.68, Attachment 1, Page 7 of 21

Ontario Energy Board EB-2017-0180 Union Gas Limited
Decision and Order 6 September 28, 2017
Findings
The OEB accepts Union’s evidence that the project is needed to maintain a safe and secure supply of gas in the Sudbury area. The pipeline is nearly 60 years old and Union has stated that its inspections have uncovered integrity issues.
The OEB accepts Union Gas’ proposal to use 12 NPS pipeline for the Proposed
Pipeline. While Union Gas did not provide a customer and volume forecast to be tested as part of its application, the incremental cost of the 12 NPS pipe over the 10 NPS is forecast to be $1.5M, a 2% increase in the cost of project. This is expected to increase the capacity of the Sudbury Lateral System by 5%. If Union Gas’ volume forecast is
accurate, installing NPS 12 pipe now will be the lowest cost option to meet the capacity requirement in the Sudbury area. The OEB notes that the accuracy of Union Gas’ current forecasts can be tested in a future rate application when the rates are sought to recover the cost of the Proposed Pipeline. The OEB has also approved the use of NPS 12 in previous applications for pipelines in the Sudbury area.
The OEB accepts that Union Gas has not yet determined the impact of the cap and trade program on its facilities at this time as the program is still new. In the future, if Union Gas is proposing that a pipeline be upsized to support growth, it should provide a forecast of that growth in its application.
With respect to the coordination of multiple projects into a single application, this is the preferred approach whenever possible so the OEB can consider the overall plan for supply to an area when assessing each project. The OEB understands that all of the details required for a leave to construct application might not be available to file a comprehensive application for multiple projects in an area at the same time. There is an expectation, however, that utilities file information to provide context to each application. Robust planning and asset management is a key element of the OEB’s Renewed
Regulatory Framework. System integrity was an issue in the recent Sudbury Replacement Projects. Union Gas’ Integrity Management Program should be
developing at least a five year plan for facility replacements to be included in a comprehensive asset management plan. On this basis, when an application for a pipeline replacement in an area is filed, Union Gas can provide details of other planned projects in the area to provide the appropriate context for considering each application.
Filed: 2019-04-25, EB-2018-0305, Exhibit I.BOMA.68, Attachment 1, Page 8 of 21

Ontario Energy Board EB-2017-0180 Union Gas Limited
Decision and Order 7 September 28, 2017
PROJECT ECONOMICS AND RATE IMPACTS Union Gas considered two other alternatives: Replace the existing pipe with another pipe of the same size (NPS 10), or only replace those segments of the pipeline identified as having integrity concerns.
The proposed project is forecast to cost approximately $74M. This is in the range of 29%-64% higher cost per metre than the recent Sudbury Replacement Projects3. Union Gas has stated the Proposed Pipeline has large proportions of rock excavation, wetland management, specialized cathodic protection design and bypass installations that were not present to the same extent in other Sudbury replacement projects. In addition, Union Gas estimated in its interrogatory responses that the cost of managing known integrity issues in this section of the Sudbury system is $8 to $10M over the next several years and that these issues will be addressed with the Proposed Pipeline.
Union Gas is not seeking approval of the cost consequences of the Proposed Pipeline in this proceeding and it did not provide estimated bill impacts to customers. Union Gas has indicated that it will seek cost recovery of the Proposed Pipeline as part of its 2019 rates application.
Findings
The use of NPS 12 pipe was discussed earlier in this Decision and Order. Given the age of the existing pipeline, the OEB accepts Union Gas’ explanation for why it did not
propose the option to replace only sections of the existing pipeline. The OEB therefore approves the option selected by Union Gas for the Proposal Pipeline.
The OEB finds that the cost estimates are acceptable to address potential safety and security issues from the existing pipeline. In 2013, the OEB approved a rate base for Union Gas of $3.7B4. This project at $74M is material, but is not expected to result in an unreasonable rate impact to customers when depreciated over the typical 50 year period.
The OEB expects to review the costs of the Proposed Pipeline in a future rate application at which time the OEB will be able to assess the actual costs for the project.
3 OEB Staff interrogatory #3 4 This rate base was approved in the OEB’s Decision EB-2011-0210 on Union Gas’ Cost of Service rates application.
Filed: 2019-04-25, EB-2018-0305, Exhibit I.BOMA.68, Attachment 1, Page 9 of 21

Ontario Energy Board EB-2017-0180 Union Gas Limited
Decision and Order 8 September 28, 2017
ENVIRONMENTAL ASSESSMENT
As required by the OEB’s Environmental Guidelines, Union Gas had an Environmental Report (ER) prepared for the Proposed Pipeline. The ER was provided to members of the OPCC. No concerns were raised by the OPCC.
OEB staff asked questions about safety measures for blasting and hoe-ramming of rocks and the methods for dewatering of swamps and wet areas. Union Gas committed to following applicable provincial standards: Specification, OPSS.MUNI 120 General Specification for the Use of Explosives; Ontario Provincial Standard Specification, OPSS.ROV 120 General Specification for the Use of Explosives; and Guidelines for the Use of Explosives In or Near Canadian Fisheries Waters. In addition, Union Gas will follow its own procedures and specifications. This will include the hiring of a blasting consultant to work with its contractor in developing a blasting plan.
Findings
The OEB finds that Union Gas has adequately addressed the environmental issues through its proposed mitigation measures and its commitment to implement recommendations in the Environmental Report.
Filed: 2019-04-25, EB-2018-0305, Exhibit I.BOMA.68, Attachment 1, Page 10 of 21

Ontario Energy Board EB-2017-0180 Union Gas Limited
Decision and Order 9 September 28, 2017
LAND MATTERS Based on Union Gas evidence, there are 77 properties directly affected by the Proposed Pipeline. While existing easements will be used where possible, numerous new easements are being obtained. Union Gas has also stated that numerous temporary easements will be required from 61 properties.
Union Gas also plans to use road allowances. Union Gas has a franchise agreement with the City of Greater Sudbury that establishes, among other things, the terms and conditions of using road allowances for natural gas pipelines.
In its reply submission Union Gas provided an update that 57% of the necessary land rights are in place.
Per section 97 of the OEB Act, leave to construct cannot be granted until an OEB-approved form of agreement has been offered to landowners. Union Gas filed in its application a copy of the form of easement agreement that has been provided to property owners for the OEB’s approval. Union Gas submitted that this is the same form of agreement approved by the OEB in the recent Union Gas Panhandle Reinforcement proceeding5 . OEB staff agreed with Union Gas that the form of agreement is consistent with past OEB approved agreements.
Findings
The OEB is satisfied that Union Gas is addressing land matters appropriately and the OEB approves the form of agreement offered to landowners. The OEB notes that it is the form of agreement that is approved by the OEB and that the content of each clause may be amended by mutual agreement between parties through further negotiations.
5 EB-2016-0186
Filed: 2019-04-25, EB-2018-0305, Exhibit I.BOMA.68, Attachment 1, Page 11 of 21

Ontario Energy Board EB-2017-0180 Union Gas Limited
Decision and Order 10 September 28, 2017
DESIGN AND SAFETY REQUIREMENTS Union Gas has stated that the new pipeline will be constructed to meet or exceed the requirements of CSA Code Z662-15 Standard and will be designed and constructed in accordance with Ontario Regulation 210/01 and the Technical Standards and Safety Act
2000, Oil and Gas Pipeline Systems. Union Gas also stated that the pipe used for the Proposed Pipeline will be manufactured to CSA Z245, 1-14 Steel Pipe Standard.
For any pipe to be abandoned in place, Union Gas has stated that it will follow the TSSA Abandonment Guidelines.
The Technical Standards and Safety Authority (TSSA) was served notice of this application as part of the OPCC. No concerns were raised.
Findings
The OEB finds that Union Gas has provided adequate evidence to confirm that the proposed facilities will be designed and constructed in accordance with current technical and safety requirements.
The OEB finds that Union Gas has provided adequate evidence to confirm that the existing facilities will be abandoned in accordance with current technical and safety requirements.
Filed: 2019-04-25, EB-2018-0305, Exhibit I.BOMA.68, Attachment 1, Page 12 of 21

Ontario Energy Board EB-2017-0180 Union Gas Limited
Decision and Order 11 September 28, 2017
CONSULTATION WITH INDIGENOUS COMMUNITIES Notice of this proceeding was provided to all potentially impacted Indigenous communities. As detailed in the materials filed with the OEB, Union Gas has conducted various meetings, open houses, and other communications with a number of Indigenous communities. Summaries of these meetings were filed as part of the record. Union Gas has committed to continuing this dialogue as the project progresses, and the OEB is not aware of any significant concerns about the project. No Indigenous communities sought to intervene in this proceeding.
During construction, Union Gas has committed to having staff in the field to meet with Indigenous organizations to discuss and review any issues. Union Gas will also consult with and provide the results of any archaeological assessments for the project to any Indigenous group upon their request.
The Ministry of Energy (MoE) sent a letter to Union Gas on August 10, 2017 advising that “the Ministry is of the opinion that the procedural aspects of consultation undertaken by Union Gas to date for the purposes of the Ontario Energy Board’s Leave
to Construct is satisfactory.”
The MoE also asked that Union Gas continue to dialogue with the Atikameksheng Anishnawbek First Nation about the community's concerns and to keep the MoE informed about upcoming meetings with the Wahnapitae First Nation and Atikameksheng Anishnawbek First Nation. Union Gas agreed to undertake these meetings and keep the MoE and OEB informed of the outcomes.
Findings
The OEB is satisfied that the duty to consult has been adequately discharged up to this stage of the project. The OEB expects Union Gas meet its commitments to the MoE and to continue to work closely with any potentially impacted Indigenous communities as the project moves forward.
Filed: 2019-04-25, EB-2018-0305, Exhibit I.BOMA.68, Attachment 1, Page 13 of 21

Ontario Energy Board EB-2017-0180 Union Gas Limited
Decision and Order 12 September 28, 2017
CONDITIONS OF APPROVAL OEB staff proposed a number of conditions of approval for the Proposed Pipeline based on conditions approved by the OEB for similar projects. Union Gas stated that it can accept the conditions proposed by OEB staff.
The OEB approves the conditions of approval proposed by OEB staff for this project, which are provided in Attachment B.
Filed: 2019-04-25, EB-2018-0305, Exhibit I.BOMA.68, Attachment 1, Page 14 of 21

Ontario Energy Board EB-2017-0180 Union Gas Limited
Decision and Order 13 September 28, 2017
CONCLUSION The OEB finds that the Proposed Pipeline serves the public interest. The OEB accepts Union Gas’ evidence that the project is needed to maintain a safe and secure supply of gas to the area.
The OEB approves the form of agreement offered to landowners by Union Gas pursuant to section 97 of the Act.
The MoE provided an opinion that Union Gas’ consultation described in its Indigenous Consultation Report has been satisfactory. The OEB is satisfied that the duty to consult has been sufficiently discharged for the Proposed Pipeline as of the time of this approval.
The OEB notes that Union Gas is responsible for obtaining all necessary approvals, such as permits, licences, certificates, land agreements including agreements pertaining to access roads construction and removal, connection agreements and easement rights required to construct, operate and maintain the Proposed Pipeline, at such time(s) as they may be necessary.
Filed: 2019-04-25, EB-2018-0305, Exhibit I.BOMA.68, Attachment 1, Page 15 of 21

Ontario Energy Board EB-2017-0180 Union Gas Limited
Decision and Order 14 September 28, 2017
ORDER THE ONTARIO ENERGY BOARD ORDERS THAT:
1. Union Gas Limited is granted leave, pursuant to subsection 90(1) of the OEB Act, to construct 20 km of NPS 12 hydrocarbon (natural gas) pipeline to replace the existing pipeline segments in the City of Greater Sudbury, as described in its application. Leave to construct is subject to the Conditions of Approval set forth in Attachment B.
2. Union Gas Limited shall pay the OEB’s costs incidental to this proceeding upon
receipt of the OEB’s invoice.
DATED at Toronto September 28, 2017 ONTARIO ENERGY BOARD Original signed by
Kirsten Walli Board Secretary
Filed: 2019-04-25, EB-2018-0305, Exhibit I.BOMA.68, Attachment 1, Page 16 of 21

Ontario Energy Board EB-2017-0180 Union Gas Limited
ATTACHMENT A
MAP OF FACILITIES
DECISION AND ORDER
UNION GAS LIMITED
EB-2017-0180
SEPTEMBER 28, 2017
Filed: 2019-04-25, EB-2018-0305, Exhibit I.BOMA.68, Attachment 1, Page 17 of 21
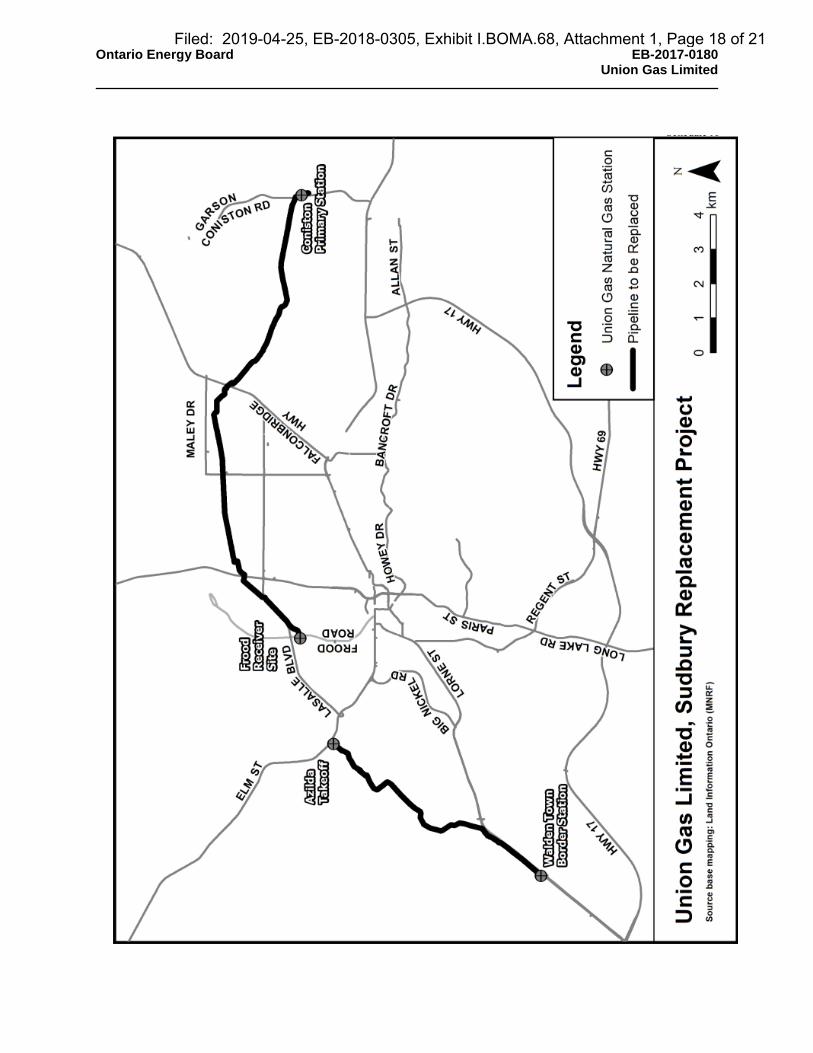
Ontario Energy Board EB-2017-0180 Union Gas Limited
Filed: 2019-04-25, EB-2018-0305, Exhibit I.BOMA.68, Attachment 1, Page 18 of 21

Ontario Energy Board EB-2017-0180 Union Gas Limited
ATTACHMENT B
CONDITIONS OF APPROVAL
DECISION AND ORDER
UNION GAS LIMITED
EB-2017-0180
SEPTEMBER 28, 2017
Filed: 2019-04-25, EB-2018-0305, Exhibit I.BOMA.68, Attachment 1, Page 19 of 21

Ontario Energy Board EB-2017-0180 Union Gas Limited
Leave to Construct Conditions of Approval
Union Gas Limited
EB-2017-0180
1. Union Gas Limited (Union Gas) shall construct the facilities and restore the land in accordance with the OEB’s Decision and Order in EB-2017-0180 and these Conditions of Approval.
2. (a) Authorization for leave to construct shall terminate 12 months after the decision is issued, unless construction has commenced prior to that date. (b) Union Gas shall give the OEB notice in writing:
i. of the commencement of construction, at least ten days prior to the date construction commences;
ii. of the planned in-service date, at least ten days prior to the date the facilities go into service;
iii. of the date on which construction was completed, no later than 10 days following the completion of construction; and
iv. of the in-service date, no later than 10 days after the facilities go into service.
3. Union Gas shall implement all the recommendations of the Environmental
Report filed in the proceeding, and all the recommendations and directives identified by the Ontario Pipeline Coordinating Committee review.
4. Union Gas shall advise the OEB of any proposed change to OEB-approved
construction or restoration procedures. Except in an emergency, Union Gas shall not make any such change without prior notice to and written approval of the OEB. In the event of an emergency, the OEB shall be informed immediately after the fact.
5. Union Gas shall file, in the proceeding where the actual capital costs of the
project are proposed to be included in rate base, a Post Construction Financial Report, which shall indicate the actual capital costs of the project and shall provide an explanation for any significant variances from the cost estimates filed in this proceeding.
Filed: 2019-04-25, EB-2018-0305, Exhibit I.BOMA.68, Attachment 1, Page 20 of 21

Ontario Energy Board EB-2017-0180 Union Gas Limited
6. Both during and after construction, Union Gas shall monitor the impacts of construction, and shall file with the OEB one paper copy and one electronic (searchable PDF) version of each of the following reports:
a) A post construction report, within three months of the in-service date, which shall: i. provide a certification, by a senior executive of the company, of
Union Gas’ adherence to Condition 1; ii. describe any impacts and outstanding concerns identified during construction; iii. describe the actions taken or planned to be taken to prevent or mitigate any identified impacts of construction; iv. include a log of all complaints received by Union Gas, including the
date/time the complaint was received, a description of the complaint, any actions taken to address the complaint, the rationale for taking such actions; and
v. provide a certification, by a senior executive of the company, that the company has obtained all other approvals, permits, licenses, and certificates required to construct, operate and maintain the proposed project.
b) A final monitoring report, no later than fifteen months after the in-service
date, or, where the deadline falls between December 1 and May 31, the following June 1, which shall: i. provide a certification, by a senior executive of the company, of
Union Gas’ adherence to Condition 3; ii. describe the condition of any rehabilitated land; iii. describe the effectiveness of any actions taken to prevent or
mitigate any identified impacts of construction; iv. include the results of analyses and monitoring programs and any
recommendations arising therefrom; and v. include a log of all complaints received by Union Gas, including the
date/time the complaint was received; a description of the complaint; any actions taken to address the complaint; and the rationale for taking such actions.
Filed: 2019-04-25, EB-2018-0305, Exhibit I.BOMA.68, Attachment 1, Page 21 of 21

Filed: 2019-04-25 EB-2018-0305 Exhibit I.BOMA.69 Page 1 of 1
ENBRIDGE GAS INC. Answer to Interrogatory from
Building Owners and Managers Association (BOMA)
Reference: Exhibit B1, Tab 2, Schedule 1, p20 Question: Please provide, for both EGD and Union, the actual ROEs from 2013 through 2018, relative to the Board approved ROE for each of those years. Response Please see Exhibit I.BOMA.38.

Filed: 2019-04-25 EB-2018-0305 Exhibit I.BOMA.70 Page 1 of 1
ENBRIDGE GAS INC. Answer to Interrogatory from
Building Owners and Managers Association (BOMA)
Reference: Exhibit B1, Tab 2, Schedule 1, p20 Question: Please confirm that the Advanced Capital Module (EB-2014-0219) defined ICM/ACM projects as being discrete, incremental, material, and not part of utilities' typical annual capital programs. Response Confirmed.

Filed: 2019-04-25 EB-2018-0305 Exhibit I.BOMA.71 Page 1 of 1
ENBRIDGE GAS INC. Answer to Interrogatory from
Building Owners and Managers Association (BOMA)
Reference: Exhibit B1, Tab 2, Schedule 1, p24 Question: Please provide the reason for the increase in the cost of the Don River from $25.6M (LTC) to $34.2M in Table 8, p18 of 36. Response Please see Exhibit I.STAFF.25, part (a).

Filed: 2019-04-25 EB-2018-0305 Exhibit I.BOMA.72 Page 1 of 1
ENBRIDGE GAS INC. Answer to Interrogatory from
Building Owners and Managers Association (BOMA)
Reference: Exhibit B1, Tab 2, Schedule 1, p24 Question: Please provide the revenue requirement impact of the Don River Replacement for each year of 2019-2023. Response Please refer to Exhibit B1, Tab 2, Schedule 1, page 31, Table 11, Line No. 1. A further breakdown of the revenue requirement can be found at Exhibit B1, Tab 2, Schedule 1, Appendix E, page 1.

Filed: 2019-04-25 EB-2018-0305 Exhibit I.BOMA.73 Page 1 of 1
ENBRIDGE GAS INC. Answer to Interrogatory from
Building Owners and Managers Association (BOMA)
Reference: Exhibit B1, Tab 2, Schedule 1, p24 Question: Please provide the assets in-service for the Don River project for each of the years 2017, 2018, and 2019, through until 2023. Have there been any changes to the forecast December 2019 in-service date? Response The existing NPS 30 Don River Bridge crossing was in-service through 2017, 2018 and will continue to be in-service in 2019 until it is abandoned after the new NPS 30 pipe replacement project is completed and in-service. There has been no change to the forecasted December 2019 in-service date for the Don River Replacement project.

Filed: 2019-04-25 EB-2018-0305 Exhibit I.BOMA.74 Page 1 of 1 Plus Attachment
ENBRIDGE GAS INC. Answer to Interrogatory from
Building Owners and Managers Association (BOMA)
Reference: Exhibit B1, Tab 2, Schedule 1, p25 Question:
(a) Please provide a detailed breakdown of the cost increase to $95.3M from the Leave to Construct filing budget of $74.1M, approximately a 30% increase.
(b) Please provide the priority of the Sudbury project with the Union 2018 and 2019 capital budget. Please provide a prioritized list of Union 2018 capital projects.
Response (a) Please see Exhibit I.EP.16.
b) The Sudbury project was identified as a Risk Ranked II project as per the criteria
outlined in the Risk Analysis section, page 53 of Union rate zones’ AMP, filed at Exhibit C1, Tab 3, Schedule1. Union uses a simple priority ranking scale of 1 to 4 to help to organize the entire capital portfolio and to ensure that the highest priority work is identified and planned accordingly. The Sudbury project is a Priority Level 2 based on the “Priority Ranking Scale” criteria provided on Table 4.2.1.1.4.1, page 53 in Union rate zones’ AMP.
Enbridge Gas has attached a listing of all projects for 2018 for the Union rate zone.
This listing includes the following information:
• Asset Category • Portfolio • Project Name • Priority • Project Cost

Proj
ect L
istin
g fo
r Uni
on R
ate
Zone
201
8
Asse
t Cat
egor
yPo
rtfo
lioDe
scrip
tion
Prio
rity
2018
Com
pres
sion
& D
ehy
Com
pres
sion
& D
ehy
Abse
nt T
ank
Inst
alls
- Var
ious
132
1,07
1.50
$
Com
pres
sion
& D
ehy
Com
pres
sion
& D
ehy
STO
Cat
hodi
c Pr
otec
tion
111
7,21
3.40
$
Com
pres
sion
& D
ehy
Com
pres
sion
& D
ehy
STO
- HP
C D/
L/B/
P/H
140
0,00
0.00
$
Com
pres
sion
& D
ehy
Com
pres
sion
& D
ehy
Payn
e Co
mpr
esso
r Eng
ine
Ove
rhau
l2
761,
382.
60$
Co
mpr
essio
n &
Deh
yCo
mpr
essio
n &
Deh
yTe
cum
seh
UPS
Upg
rade
288
,561
.06
$
Com
pres
sion
& D
ehy
Tool
sST
O C
OM
PRES
SOR
EAST
TO
OL
ADDI
TIO
NS
266
,282
.00
$
Com
pres
sion
& D
ehy
Tool
sST
O C
APIT
AL T
OO
LS A
DDIT
ION
S - C
OM
P W
EST
266
,282
.00
$
Com
pres
sion
& D
ehy
Tool
sST
O C
APIT
AL T
OO
LS A
DDIT
ION
S -T
ECHN
ICIA
NS
222
,094
.00
$
Com
pres
sion
& D
ehy
Tool
sST
O C
APIT
AL T
OO
LS A
DDIT
ION
S - M
ech
222
,094
.00
$
Com
pres
sion
& D
ehy
Tool
sST
O C
APIT
AL T
OO
LS R
EPL
- TEC
H W
EST
222
,094
.00
$
Com
pres
sion
& D
ehy
Tool
sST
O C
APIT
AL T
OO
LS R
EPL
- Mec
h2
22,0
94.0
0$
Co
mpr
essio
n &
Deh
yCo
mpr
essio
n &
Deh
yDa
wn
- UPS
Bat
tery
repl
acem
ents
323
,724
.40
$
Com
pres
sion
& D
ehy
Com
pres
sion
& D
ehy
LBP
- UPS
Bat
tery
repl
acem
ents
323
,724
.40
$
Com
pres
sion
& D
ehy
Com
pres
sion
& D
ehy
Rem
otes
- U
PS B
atte
ry re
plac
emen
ts3
23,7
24.4
0$
Co
mpr
essio
n &
Deh
yCo
mpr
essio
n &
Deh
yO
il Sp
rings
E W
ater
Jack
et/C
oole
rs2
1,05
0,40
6.60
$
Com
pres
sion
& D
ehy
Com
pres
sion
& D
ehy
STO
- PL
C5 u
pgra
de to
Con
trol
Logi
x3
320,
504.
07$
Co
mpr
essio
n &
Deh
yCo
mpr
essio
n &
Deh
yBr
ight
B -
Vibr
atio
n m
onito
r3
79,3
67.0
0$
Co
mpr
essio
n &
Deh
yCo
mpr
essio
n &
Deh
yLo
bo B
MCC
repl
acem
ent
316
6,92
7.80
$
Com
pres
sion
& D
ehy
Com
pres
sion
& D
ehy
Brig
ht B
MCC
repl
acem
ent
316
6,92
7.80
$
Com
pres
sion
& D
ehy
Com
pres
sion
& D
ehy
Daw
n D
Lube
Oil
Skid
Rep
alce
men
t3
214,
033.
00$
Co
mpr
essio
n &
Deh
yCo
mpr
essio
n &
Deh
yDa
wn
Dehy
drat
ion
Plan
t Gly
col F
iltra
tion
324
9,55
6.10
$
Com
pres
sion
& D
ehy
Com
pres
sion
& D
ehy
Daw
n Au
xilla
ry B
uild
ing
2 Bo
iler R
epla
ce3
179,
536.
85$
Co
mpr
essio
n &
Deh
yCo
mpr
essio
n &
Deh
yLO
BO A
1 - F
ire/G
as D
etec
tion
Pane
l3
112,
089.
20$
Co
mpr
essio
n &
Deh
yCo
mpr
essio
n &
Deh
yLO
BO A
2 - F
ire/G
as D
etec
tion
Pane
l3
112,
089.
20$
Co
mpr
essio
n &
Deh
yCo
mpr
essio
n &
Deh
yLo
bo A
1 &
A2
Avon
Ext
Soa
k W
ash
Syst
em*
100,
000.
00$
Co
mpr
essio
n &
Deh
yCo
mpr
essio
n &
Deh
yST
O -
Park
way
Saf
ety
and
Secu
rity
Upg
rad
*50
,000
.00
$
Com
pres
sion
& D
ehy
Com
pres
sion
& D
ehy
STO
-Saf
ety
& S
ecur
ity U
pgra
des-
Vario
us*
75,0
00.0
0$
Co
mpr
essio
n &
Deh
yCo
mpr
essio
n &
Deh
yST
O -
LED
Ligh
ting
Upg
rade
*15
2,16
3.20
$
Com
pres
sion
& D
ehy
Com
pres
sion
& D
ehy
STO
- LE
D Li
ghtin
g U
pgra
de- E
aste
rn C
omp
*86
,607
.45
$
Com
pres
sion
& D
ehy
Com
pres
sion
& D
ehy
GC
BUIL
DIN
G G
as D
etec
tion
Repl
acem
ent
*66
,907
.36
$
Com
pres
sion
& D
ehy
Com
pres
sion
& D
ehy
STO
- G
as C
hrom
atog
raph
*19
8,75
6.70
$
Com
pres
sion
& D
ehy
Com
pres
sion
& D
ehy
STO
- Co
mp
E Bl
owdo
wn
Stac
k Fe
ncin
g*
50,0
00.0
0$
Co
mpr
essio
n &
Deh
yCo
mpr
essio
n &
Deh
yST
O -
Haga
r Non
Cre
s Bui
ldin
g U
pgra
des
*50
,000
.00
$
Com
pres
sion
& D
ehy
Com
pres
sion
& D
ehy
STO
DAW
N Y
ARD
PAVI
NG
and
TRE
NW
AY R
EPLA
CE*
100,
000.
00$
Co
mpr
essio
n &
Deh
yCo
mpr
essio
n &
Deh
yEd
y's M
ills -
Deh
ydra
tion
faci
lity
aban
d*
157,
477.
40$
Fl
eet
Flee
tO
S - T
rans
port
atio
n-Re
plac
emen
ts1
12,0
00,0
00.0
0$
ITIT
Cont
rax
Mod
erni
zatio
n **
C/O
201
7**
112
,578
,697
.44
$
IT
ITSe
rvic
e Su
ite L
ifecy
cle
C/O
201
71
7,79
9,47
9.50
$
ITIT
IS B
usin
ess S
uppo
rt1
2,40
0,09
0.04
$
ITIT
IS P
roje
cts
11,
599,
350.
83$
IT
ITSC
ADA
179
7,95
5.25
$
ITIT
IT S
ervi
ces
13,
062,
358.
38$
LN
GTo
ols
STO
CAP
ITAL
TO
OLS
ADD
ITIO
NS
- HAG
AR L
NG
222
,094
.00
$
Filed: 2019-04-25, EB-2018-0305, Exhibit I.BOMA.74, Attachment 1, Page 1 of 6

Asse
t Cat
egor
yPo
rtfo
lioDe
scrip
tion
Prio
rity
2018
LNG
Tool
sST
O C
APIT
AL T
OO
LS R
EPL
- HAG
AR L
NG
222
,094
.00
$
LN
GLN
GHa
gar L
NG
Pip
ing
Supp
ort S
ys &
Insu
latio
n3
250,
000.
00$
LNG
LNG
Haga
r Val
ve R
epla
cem
ents
315
9,64
6.20
$
LN
GLN
GHa
gar -
Fire
fight
ing
equi
pmen
t3
43,0
83.2
9$
Mea
sure
men
tLa
b U
pgra
des
ENG
- LA
B F
ACIL
ITIE
S U
PGRA
DE1
70,0
00.0
0$
Mea
sure
men
tO
dora
nt U
pgra
deEN
G -
Odo
uran
t Upg
rade
160
0,00
0.00
$
M
easu
rem
ent
Turb
o Co
rrec
tor U
pgra
des
ENG
- Tu
rbo
Corr
ecto
r Upg
rade
258
,846
.65
$
M
easu
rem
ent
Repl
acem
ent o
f Obs
olet
e RT
Us
ENG
-Bris
tol 3
330
Repl
acem
ent P
rogr
am3
1,42
6,05
7.81
$
Mea
sure
men
tIn
dust
rial B
illin
g - C
ell U
pgra
deEN
G In
dust
rial B
illin
g Ce
ll U
pgra
de*
96,8
83.0
0$
Mea
sure
men
tTo
ols
ENG
-Tec
hnic
ian
Tool
s Add
ition
s2
50,0
00.0
0$
Mea
sure
men
tTu
rbin
e M
eter
Aut
o-O
ilers
ENG
-Tur
bine
Met
er A
utom
atic
Oile
rs2
33,6
69.6
0$
Mea
sure
men
tLa
bour
Cos
t for
exc
hang
es (m
aint
.)M
eter
& R
egul
ator
Inst
Rep
l-Com
pany
173
0,65
8.09
$
M
easu
rem
ent
Labo
ur C
ost f
or e
xcha
nges
(mai
nt.)
Met
er &
Reg
ulat
or In
st R
epl-C
ompa
ny1
360,
937.
02$
Mea
sure
men
tLa
bour
Cos
t for
exc
hang
es (m
aint
.)M
eter
& R
egul
ator
Inst
Rep
l-Com
pany
11,
263,
731.
10$
M
easu
rem
ent
Labo
ur C
ost f
or e
xcha
nges
(mai
nt.)
Met
er &
Reg
ulat
or In
st R
epl-C
ompa
ny1
591,
864.
12$
Mea
sure
men
tLa
bour
Cos
t for
exc
hang
es (m
aint
.)M
eter
& R
egul
ator
Inst
Rep
l-Com
pany
11,
178,
899.
00$
M
easu
rem
ent
Labo
ur C
ost f
or e
xcha
nges
(mai
nt.)
Met
er &
Reg
ulat
or In
st R
epl-C
ompa
ny1
537,
665.
97$
Mea
sure
men
tLa
bour
Cos
t for
exc
hang
es (m
aint
.)M
eter
& R
egul
ator
Inst
Rep
l-Com
pany
144
9,74
5.73
$
M
easu
rem
ent
Labo
ur C
ost f
or e
xcha
nges
(mai
nt.)
Met
er &
Reg
ulat
or In
st R
epl-C
ompa
ny1
1,04
9,33
2.32
$
Mea
sure
men
tLa
bour
Cos
t for
exc
hang
es (m
aint
.)M
eter
& R
egul
ator
Inst
Rep
l-Com
pany
150
5,43
6.31
$
M
easu
rem
ent
Labo
ur C
ost f
or e
xcha
nges
(mai
nt.)
Met
er &
Reg
ulat
or In
st R
epl-C
ompa
ny1
575,
015.
33$
Mea
sure
men
tLa
bour
Cos
t for
exc
hang
es (m
aint
.)M
eter
& R
egul
ator
Inst
Rep
l-Com
pany
130
0,76
9.36
$
M
easu
rem
ent
Labo
ur C
ost f
or e
xcha
nges
(mai
nt.)
Met
er &
Reg
ulat
or In
st R
epl-C
ompa
ny1
403,
553.
38$
Mea
sure
men
tLa
bour
Cos
t for
exc
hang
es (m
aint
.)M
eter
& R
egul
ator
Inst
Rep
l-Con
trac
tor
144
5,35
0.42
$
M
easu
rem
ent
Labo
ur C
ost f
or e
xcha
nges
(mai
nt.)
Met
er &
Reg
ulat
or In
st R
epl-C
ontr
acto
r1
1,06
7,22
0.00
$
Mea
sure
men
tLa
bour
Cos
t for
exc
hang
es (m
aint
.)M
eter
& R
egul
ator
Inst
Rep
l-Con
trac
tor
142
1,15
3.89
$
M
easu
rem
ent
Labo
ur C
ost f
or e
xcha
nges
(mai
nt.)
Met
er &
Reg
ulat
or In
st R
epl-C
ontr
acto
r1
780,
488.
34$
Mea
sure
men
tLa
bour
Cos
t for
exc
hang
es (m
aint
.)M
eter
& R
egul
ator
Inst
Rep
l-Con
trac
tor
185
1,47
5.93
$
M
easu
rem
ent
Labo
ur C
ost f
or e
xcha
nges
(mai
nt.)
Met
er &
Reg
ulat
or In
st R
epl-C
ontr
acto
r1
712,
235.
21$
Mea
sure
men
tRe
gula
tors
/Rel
iefs
SMC-
Met
er &
Reg
ulat
or R
epla
cem
ents
Nor
th1
5,26
6,54
9.22
$
Mea
sure
men
tRe
gula
tors
/Rel
iefs
SMC-
Met
er &
Reg
ulat
or R
epla
cem
ents
Sou
th1
13,0
57,4
54.1
8$
Ove
rhea
dsG
ener
al M
ains
3rd
Part
y Pr
e-W
ork
130
4,62
1.70
$
O
verh
eads
Gen
eral
Mai
ns3r
d Pa
rty
Pre-
Wor
k1
275,
000.
00$
Ove
rhea
dsG
ener
al M
ains
3rd
Part
y Pr
e-W
ork
123
8,84
6.00
$
O
verh
eads
Gen
eral
Mai
ns3r
d Pa
rty
Pre-
Wor
k1
450,
000.
00$
Ove
rhea
dsG
ener
al M
ains
3rd
Part
y Pr
e-W
ork
150
,000
.00
$
O
verh
eads
Gen
eral
Mai
ns3r
d Pa
rty
Pre-
Wor
k1
61,2
00.0
0$
Ove
rhea
dsG
ener
al M
ains
3rd
Part
y Pr
e-W
ork
150
,000
.00
$
O
verh
eads
020
18 C
ontr
acto
r Fix
ed O
verh
ead-
STIP
11,
274,
374.
00$
O
verh
eads
Ove
rhea
dsO
&M
Cap
italiz
ed fo
r OEB
144
,714
,537
.00
$
O
verh
eads
0M
aint
enan
ce C
ashf
low
Adj
195
,525
.00
-$
Pipe
lines
Valv
esKi
ng-D
istrib
utio
n Is
olat
ion
Valv
es (v
ari
112
5,14
7.59
$
Pi
pelin
esM
unic
ipal
Rep
lace
men
tPl
an-(B
)-Dist
-Rep
l-Con
tr-M
ains
Mun
icip
al1
2,08
7,86
9.89
$
Pipe
lines
Mun
icip
al R
epla
cem
ent
Plan
-(B)-D
ist-R
epl-C
ontr
-Mai
ns M
unic
ipal
14,
964,
597.
57$
Pi
pelin
esM
unic
ipal
Rep
lace
men
tPl
an-(B
)-Dist
-Rep
l-Com
py-M
ains
Mun
icip
al1
119,
626.
20$
Filed: 2019-04-25, EB-2018-0305, Exhibit I.BOMA.74, Attachment 1, Page 2 of 6

Asse
t Cat
egor
yPo
rtfo
lioDe
scrip
tion
Prio
rity
2018
Pipe
lines
Mun
icip
al R
epla
cem
ent
Plan
-(B)-D
ist-R
epl-C
ompy
-Mai
ns M
unic
ipal
110
3,35
7.02
$
Pi
pelin
esAt
ikok
anN
W_L
ater
al C
lam
p Cu
t Out
s_AT
IKO
KAN
11,
001,
200.
18$
Pi
pelin
esM
unic
ipal
Rep
lace
men
tPl
an-(B
)-Dist
-Rep
l-Con
tr-M
ains
Mun
icip
al1
3,08
5,99
4.99
$
Pipe
lines
Gen
eral
Mai
nsIn
dire
ct M
ater
ials-
Repl
acem
ents
111
2,01
2.00
$
Pi
pelin
esAn
odes
ANO
DES
156
5,36
3.29
$
Pi
pelin
esM
unic
ipal
Rep
lace
men
tPl
an-(B
)-Dist
-Rep
l-Con
tr-M
ains
Mun
icip
al1
213,
352.
80$
Pipe
lines
Gen
eral
Mai
nsIn
dire
ct M
ater
ials-
Repl
acem
ents
120
,223
.43
$
Pi
pelin
esM
unic
ipal
Rep
lace
men
tSA
RN: V
idal
St W
alki
ng B
ridge
Mun
icip
al1
798,
431.
38$
Pipe
lines
Mun
icip
al R
epla
cem
ent
Plan
-(B)-D
ist-R
epl-C
ontr
-Mai
ns M
unic
ipal
12,
175,
727.
93$
Pi
pelin
esAn
odes
ANO
DES
153
9,99
8.00
$
Pi
pelin
esAn
odes
ANO
DES
184
5,00
1.84
$
Pi
pelin
esM
unic
ipal
Rep
lace
men
tPl
an-(B
)-Dist
-Rep
l-Con
tr-M
ains
Mun
icip
al1
4,00
0,00
0.15
$
Pipe
lines
Land
Rig
hts-
Repl
acem
ents
Land
Rig
hts-
Repl
acem
ents
115
,000
.00
$
Pi
pelin
esAn
odes
ANO
DES
11,
219,
266.
97$
Pi
pelin
esM
unic
ipal
Rep
lace
men
tPl
an-(B
)-Dist
-Rep
l-Con
tr-M
ains
Mun
icip
al1
2,00
0,00
0.40
$
Pipe
lines
Land
Rig
hts-
Repl
acem
ents
Land
Rig
hts-
Repl
acem
ents
115
,000
.00
$
Pi
pelin
esM
unic
ipal
Rep
lace
men
tPl
an-(B
)-Dist
-Rep
l-Com
py-M
ains
Mun
icip
al1
624,
775.
44$
Pipe
lines
Gen
eral
Mai
nsIn
dire
ct M
ater
ials-
Repl
acem
ents
155
,235
.00
$
Pi
pelin
esAn
odes
ANO
DES
152
0,39
9.22
$
Pi
pelin
esCa
sed
pipe
(ste
el)
King
- Cas
ing
Upg
rade
Dist
rict v
ario
us -
110
1,07
9.14
$
Pi
pelin
esLa
nd R
ight
s-Re
plac
emen
tsLa
nd R
ight
s-Re
plac
emen
ts1
10,0
00.0
0$
Pipe
lines
Gen
eral
Mai
nsIn
dire
ct M
ater
ials-
Repl
acem
ents
133
,361
.94
$
Pi
pelin
esAn
odes
ANO
DES
171
8,04
8.57
$
Pi
pelin
esCa
thod
ic P
rote
ctio
n Ad
vanc
emen
tsN
orth
wes
t 201
8 Se
ctio
naliz
atio
n1
381,
988.
47$
Pipe
lines
Mun
icip
al R
epla
cem
ent
NW
_7th
Ave
Brid
ge_K
ENO
RA1
237,
451.
44$
Pipe
lines
Mun
icip
al R
epla
cem
ent
Plan
-(B)-D
ist-R
epl-C
ontr
-Mai
ns M
unic
ipal
117
6,61
1.07
$
Pi
pelin
esLa
nd R
ight
s-Re
plac
emen
tsLa
nd R
ight
s-Re
plac
emen
ts1
12,5
00.0
0$
Pipe
lines
Gen
eral
Mai
nsM
isc M
ater
ials-
Com
pany
15,
523.
50$
Pi
pelin
esAn
odes
Anod
es1
300,
729.
87$
Pipe
lines
Cath
odic
Pro
tect
ion
Adva
ncem
ents
Sudb
ury/
SSM
arie
Sec
tiona
lizat
ion
196
,588
.04
$
Pi
pelin
esLa
nd R
ight
s-Re
plac
emen
tsLa
nd R
ight
s-Re
plac
emen
ts1
10,0
00.0
0$
Pipe
lines
Gen
eral
Mai
nsIn
dire
ct M
ater
ials-
Repl
acem
ents
136
,455
.10
$
Pi
pelin
esM
unic
ipal
Rep
lace
men
tPl
an-(B
)-Dist
-Rep
l-Con
tr-M
ains
Mun
icip
al1
176,
611.
07$
Pipe
lines
Land
Rig
hts-
Repl
acem
ents
Land
Rig
hts-
Repl
acem
ents
112
,500
.00
$
Pi
pelin
esG
ener
al M
ains
Misc
Mat
eria
ls-Co
mpa
ny1
5,52
3.50
$
Pipe
lines
Anod
esAn
odes
145
3,56
5.35
$
Pi
pelin
esCa
thod
ic P
rote
ctio
n Ad
vanc
emen
tsN
orth
Bay
/Oril
lia S
ectio
naliz
atio
n1
382,
766.
48$
Pipe
lines
Clas
s Loc
atio
nCl
ass L
ocat
ion
Chan
ge P
roga
m1
22,8
79,0
27.7
3$
Pipe
lines
Inte
grity
Man
agem
ent P
rogr
amEN
G - I
nteg
rity
Man
agem
ent P
rogr
am1
14,0
61,5
02.1
2$
Pipe
lines
Bruc
e La
ke/E
ar F
alls
Bruc
e La
ke M
OP
Upg
rade
35,
000,
000.
00$
Pi
pelin
esST
O -
HPC
S&T
STO
- HP
C S&
T1
250,
000.
00$
Pipe
lines
Sudb
ury
Line
Sec
tion
2&3
Sudb
ury
Late
ral R
epl
267
,154
,375
.31
$
Pi
pelin
esW
inds
or L
ine
Win
dsor
Lin
e Ph
12
550,
000.
00$
Pipe
lines
Leak
age
Plan
-(B)-D
ist-R
epl-C
ompy
-Mai
ns L
eaka
ge2
35,3
47.1
7$
Pipe
lines
Serv
ice
Repl
acem
ent
Plan
-(B)-D
ist-R
epl-C
ompy
-Ser
vice
s2
86,8
55.9
4$
Filed: 2019-04-25, EB-2018-0305, Exhibit I.BOMA.74, Attachment 1, Page 3 of 6

Asse
t Cat
egor
yPo
rtfo
lioDe
scrip
tion
Prio
rity
2018
Pipe
lines
Leak
age
Plan
-(B)-D
ist-R
epl-C
ompy
-Mai
ns L
eaka
ge2
35,3
47.1
7$
Pipe
lines
Serv
ice
Repl
acem
ent
Plan
-(B)-D
ist-R
epl-C
ompy
-Ser
vice
s2
63,0
49.5
1$
Pipe
lines
Tool
sCa
pita
l Too
ls- A
dditi
ons-
Dist
Ops
255
,892
.00
$
Pi
pelin
esTo
ols
Capi
tal T
ools-
Rep
l- Di
st O
ps2
42,2
45.0
0$
Pipe
lines
Tool
sCa
pita
l Too
ls-Ad
ditio
ns-D
ist O
ps2
33,4
40.0
0$
Pipe
lines
Tool
sCa
pita
l Too
ls-Re
pl-D
ist O
ps2
14,8
06.0
0$
Pipe
lines
Tool
sCa
pita
l Too
ls- A
dditi
ons-
Dist
Ops
215
0,00
0.00
$
Pi
pelin
esTo
ols
Capi
tal T
ools-
Rep
l- Di
st O
ps2
50,0
00.0
0$
Pipe
lines
Leak
age
Plan
-(B)-D
ist-R
epl-C
ontr
-Mai
ns L
eaka
ge2
329,
404.
01$
Pipe
lines
Serv
ice
Repl
acem
ent
Plan
-(B)-D
ist-R
epl-C
ontr
-Ser
vice
s2
272,
255.
48$
Pipe
lines
Gen
eral
Mai
nsPl
an-(B
)-Dist
-Rep
l-Gen
eral
Mai
ns2
238,
780.
75$
Pipe
lines
Serv
ice
Repl
acem
ent
Plan
-(B)-D
ist-R
epl-C
ompy
-Ser
vice
s2
318,
981.
91$
Pipe
lines
Leak
age
Plan
-(B)-D
ist-R
epl-C
ontr
-Mai
ns L
eaka
ge2
69,5
12.2
9$
Pipe
lines
Serv
ice
Repl
acem
ent
Plan
-(B)-D
ist-R
epl-C
ontr
-Ser
vice
s2
65,2
11.0
4$
Pipe
lines
Gen
eral
Mai
nsPl
an-(B
)-Dist
-Rep
l-Gen
eral
Mai
ns2
36,1
77.2
4$
Pipe
lines
Serv
ice
Repl
acem
ent
Plan
-(B)-D
ist-R
epl-C
ompy
-Ser
vice
s2
15,3
84.9
9$
Pipe
lines
Serv
ice
Repl
acem
ent
Plan
-(B)-D
ist-R
epl-C
ontr
-Ser
vice
s2
65,7
48.1
8$
Pipe
lines
Serv
ice
Repl
acem
ent
Plan
-(B)-D
ist-R
epl-C
ompy
-Ser
vice
s2
88,7
16.5
2$
Pipe
lines
Leak
age
Plan
-(B)-D
ist-R
epl-C
ontr
-Mai
ns L
eaka
ge2
299,
411.
81$
Pipe
lines
Serv
ice
Repl
acem
ent
Plan
-(B)-D
ist-R
epl-C
ontr
-Ser
vice
s2
65,7
48.1
8$
Pipe
lines
Gen
eral
Mai
nsPl
an-(B
)-Dist
-Rep
l-Con
tr-O
ther
-Sca
tter
ed2
87,7
22.0
9$
Pipe
lines
Gen
eral
Mai
nsPl
an-(B
)-Dist
-Rep
l-Gen
eral
Mai
ns2
125,
896.
25$
Pipe
lines
Serv
ice
Repl
acem
ent
Plan
-(B)-D
ist-R
epl-C
ompy
-Ser
vice
s2
215,
492.
34$
Pipe
lines
Tool
sCa
pita
l Too
ls-Ad
ditio
ns-D
ist O
ps2
79,0
00.0
0$
Pipe
lines
Tool
sCa
pita
l Too
ls-Re
pl-D
ist O
ps2
106,
000.
00$
Pipe
lines
Leak
age
Plan
-(B)-D
ist-R
epl-C
ontr
-Mai
ns L
eaka
ge2
200,
095.
04$
Pipe
lines
Serv
ice
Repl
acem
ent
Plan
-(B)-D
ist-R
epl-C
ontr
-Ser
vice
s2
117,
484.
53$
Pipe
lines
Serv
ice
Repl
acem
ent
Plan
-(B)-D
ist-R
epl-C
ontr
-Ser
vice
s2
352,
453.
08$
Pipe
lines
Gen
eral
Mai
nsPl
an-(B
)-Dist
-Rep
l-Con
tr-O
ther
-Sca
tter
ed2
199,
004.
38$
Pipe
lines
Gen
eral
Mai
nsPl
an-(B
)-Dist
-Rep
l-Gen
eral
Mai
ns2
200,
031.
61$
Pipe
lines
Tool
sCa
pita
l Too
ls-Ad
ditio
ns-D
ist O
ps2
50,0
00.0
0$
Pipe
lines
Tool
sCa
pita
l Too
ls-Re
pl-D
ist O
ps2
100,
000.
00$
Pipe
lines
Leak
age
Plan
-(B)-D
ist-R
epl-C
ontr
-Mai
ns L
eaka
ge2
542,
069.
39$
Pipe
lines
Serv
ice
Repl
acem
ent
Plan
-(B)-D
ist-R
epl-C
ontr
-Ser
vice
s2
274,
475.
57$
Pipe
lines
Gen
eral
Mai
nsPl
an-(B
)-Dist
-Rep
l-Gen
eral
Mai
ns2
268,
091.
36$
Pipe
lines
Serv
ice
Repl
acem
ent
Plan
-(B)-D
ist-R
epl-C
ompy
-Ser
vice
s2
241,
898.
86$
Pipe
lines
Tool
sCa
pita
l Too
ls-Ad
ditio
ns-D
ist O
ps2
25,0
00.0
0$
Pipe
lines
Tool
sCa
pita
l Too
ls-Re
pl-D
ist O
ps2
118,
700.
00$
Pipe
lines
Leak
age
Plan
-(B)-D
ist-R
epl-C
ontr
-Mai
ns L
eaka
ge2
185,
886.
50$
Pipe
lines
Serv
ice
Repl
acem
ent
Plan
-(B)-D
ist-R
epl-C
ontr
-Ser
vice
s2
451,
149.
38$
Pipe
lines
Gen
eral
Mai
nsPl
an-(B
)-Dist
-Rep
l-Gen
eral
Mai
ns2
403,
225.
10$
Pipe
lines
Serv
ice
Repl
acem
ent
Plan
-(B)-D
ist-R
epl-C
ompy
-Ser
vice
s2
250,
889.
98$
Pipe
lines
Serv
ice
Repl
acem
ent
Plan
-(B)-D
ist-R
epl-C
ompy
-Ser
vice
s2
228,
577.
76$
Pipe
lines
Tool
sCa
pita
l Too
ls Ad
d-Ea
ster
n Di
st2
120,
000.
00$
Pipe
lines
Tool
sCa
pita
l Too
ls-Re
pl-E
aste
rn D
istric
t2
50,0
00.0
0$
Filed: 2019-04-25, EB-2018-0305, Exhibit I.BOMA.74, Attachment 1, Page 4 of 6

Asse
t Cat
egor
yPo
rtfo
lioDe
scrip
tion
Prio
rity
2018
Pipe
lines
Tool
sCa
pita
l Too
ls-Ad
ds-D
ist O
ps2
99,4
51.0
0$
Pipe
lines
Tool
sCa
pita
l Too
ls-Re
pl-D
ist O
ps2
99,4
51.0
0$
Pipe
lines
Leak
age
Plan
-(B)-D
ist-R
epl-C
ontr
-Mai
ns L
eaka
ge2
134,
448.
11$
Pipe
lines
Serv
ice
Repl
acem
ent
Plan
-(B)-D
ist-R
epl-C
ontr
-Ser
vice
s2
47,7
47.2
9$
Pipe
lines
Gen
eral
Mai
nsPl
an-(B
)-Dist
-Gen
Mai
ns2
182,
558.
45$
Pipe
lines
Serv
ice
Repl
acem
ent
Plan
-(B)-D
ist-R
epl-C
omp-
Serv
ices
213
8,63
5.00
$
Pi
pelin
esTo
ols
Capi
tal T
ools-
Adds
-Dist
Ops
242
,500
.00
$
Pi
pelin
esTo
ols
Capi
tal T
ools-
Repl
-Dist
Ops
250
,000
.00
$
Pi
pelin
esLe
akag
ePl
an-(B
)-Dist
-Rep
l-Con
tr-M
ains
Lea
kage
213
4,44
8.11
$
Pi
pelin
esSe
rvic
e Re
plac
emen
tPl
an-(B
)-Dist
-Rep
l-Con
tr-S
ervi
ces
247
,747
.29
$
Pi
pelin
esG
ener
al M
ains
Plan
-(B)-D
ist-G
en M
ains
218
2,55
8.44
$
Pi
pelin
esSe
rvic
e Re
plac
emen
tPl
an-(B
)-Dist
-Rep
l-Com
p-Se
rvic
es2
138,
635.
00$
Pipe
lines
Tool
sCa
pita
l Too
ls-Ad
ds-D
ist O
ps2
42,5
00.0
0$
Pipe
lines
Tool
sCa
pita
l Too
ls-Re
pl-D
ist O
ps2
50,0
00.0
0$
Pipe
lines
Tool
sST
O C
APIT
AL T
OO
LS R
EPL
- S&
T2
22,0
94.0
0$
Pipe
lines
Tool
sST
O C
APIT
AL T
OO
LS A
DDIT
ION
S - S
&T
222
,094
.00
$
Pi
pelin
esTo
ols
Tech
Tra
inin
g - T
ools
Addi
tion
225
,000
.00
$
Pi
pelin
esTo
ols
Tech
Tra
inin
g - T
ools
Repl
acem
ent
225
,000
.00
$
Pi
pelin
esTo
ols
Tool
s Cor
rosio
n En
gine
erin
g2
50,0
00.0
0$
Pipe
lines
Bare
and
Unp
rote
cted
stee
lW
IND-
Coun
ty R
d 31
& 4
2 Re
pl-L
akes
hore
21,
524,
213.
39$
Pi
pelin
esBa
re a
nd U
npro
tect
ed st
eel
SARN
:Chr
istin
a&La
kesh
ore
Leak
eage
-Sar
nia
299
8,04
1.58
$
Pi
pelin
esBa
re a
nd U
npro
tect
ed st
eel
SARN
: Spa
rtan
Wes
t Ph
2- S
arni
a2
489,
038.
58$
Pipe
lines
Bare
and
Unp
rote
cted
stee
lLO
ND:
Mt B
rydg
es B
Lea
kage
269
8,62
8.49
$
Pi
pelin
esBa
re a
nd U
npro
tect
ed st
eel
LON
D: Ja
cque
line
St L
eaka
ge-L
ondo
n2
748,
530.
47$
Pipe
lines
Bare
and
Unp
rote
cted
stee
lHA
MI-F
iddl
ersG
reen
RdLe
akag
e-An
cast
er2
701,
587.
46$
Pipe
lines
Bare
and
Unp
rote
cted
stee
lHA
MI-T
horp
eStL
eaka
ge-D
unda
s2
381,
403.
68$
Pipe
lines
Bare
and
Unp
rote
cted
stee
lHA
MI-C
hurc
hStL
eaka
ge-D
unnv
ille
295
3,54
5.12
$
Pi
pelin
esbr
idge
cro
ssin
gs in
spec
tion
and
repl
acem
ents
King
- Cro
we
Rive
r Brid
ge -
HHD
Cros
sing
344
5,38
2.35
$
Pi
pelin
esDO
C <
30%
SM
YSN
W_H
WY6
1&Ar
thur
Exp
osed
10_
TBAY
323
0,72
2.21
$
Pi
pelin
esVa
lves
Nor
thw
est V
alve
Inst
alla
tions
314
6,29
6.00
$
Pi
pelin
esSc
hedu
le 1
0 pi
peN
W_S
ched
10
Repl
acem
ent_
EMO
/RAI
NY
35,
659,
018.
84$
Pi
pelin
esM
OP
Verif
icat
ion
MO
P Ve
rific
atio
n re
med
iatio
n3
509,
588.
00$
Pipe
lines
Bare
and
Unp
rote
cted
stee
lBR
AN-T
empe
ranc
e St
W L
eaka
ge R
epla
cem
ent
282
8,68
4.86
$
Pi
pelin
esBa
re a
nd U
npro
tect
ed st
eel
BRAN
-Alb
ert L
ane
Leak
age
Repl
acem
t BU
-V2
609,
085.
87$
Pipe
lines
Bare
and
Unp
rote
cted
stee
lW
AT-L
owth
er S
t S R
epl (
King
to Q
ueen
)2
95,0
00.0
0$
Pipe
lines
NPS
36
Valv
e O
pera
tor R
epla
cem
ent,
St M
ary
Cros
sove
rN
PS36
Val
ve O
per R
epl,S
t Mar
ys C
ross
over
399
,521
.00
$
Pi
pelin
esCa
thod
ic P
rote
ctio
n Ad
vanc
emen
tsSu
dbur
y/SS
Mar
ie R
ectif
iers
114
8,03
3.00
$
Pi
pelin
esCa
thod
ic P
rote
ctio
n Ad
vanc
emen
tsN
orth
Bay
/Oril
lia R
ectif
iers
115
4,13
1.00
$
Se
rvic
e Fa
cilit
ies
50 K
eil D
rive,
New
Pow
er H
ouse
CS -
Head
Offi
ce R
enov
atio
ns1
2,09
3,74
4.51
$
Serv
ice
Faci
litie
sG
ener
al C
apita
l Mai
nten
ance
Pro
ject
sSo
uth
Faci
lity
unpl
anne
d Bl
anke
t1
250,
000.
00$
Serv
ice
Faci
litie
sG
ener
al C
apita
l Mai
nten
ance
Pro
ject
sSo
uth
Furn
iture
, Dec
or &
Flo
orin
g1
135,
000.
00$
Serv
ice
Faci
litie
sCo
rpor
ate
Secu
rity
Sout
h Se
curit
y Ad
ditio
ns1
2,35
0,00
0.00
$
Serv
ice
Faci
litie
sG
ener
al C
apita
l Mai
nten
ance
Pro
ject
sSo
uth
Equi
pmen
t, M
echa
nica
l, El
ectr
ical
118
0,00
0.00
$
Se
rvic
e Fa
cilit
ies
Gen
eral
Cap
ital M
aint
enan
ce P
roje
cts
Sout
h LE
D Li
ghtin
g Re
plac
emen
t1
400,
000.
00$
Serv
ice
Faci
litie
sG
ener
al C
apita
l Mai
nten
ance
Pro
ject
sSo
uth
Gro
unds
& P
arki
ng1
300,
000.
00$
Filed: 2019-04-25, EB-2018-0305, Exhibit I.BOMA.74, Attachment 1, Page 5 of 6

Asse
t Cat
egor
yPo
rtfo
lioDe
scrip
tion
Prio
rity
2018
Serv
ice
Faci
litie
sG
ener
al C
apita
l Mai
nten
ance
Pro
ject
sSo
uth
Roof
, Bld
g En
velo
pe, W
indo
ws/
Door
s1
650,
000.
00$
Serv
ice
Faci
litie
s55
5 Ri
verv
iew
Add
ition
/Ren
ovat
ion
555
Rive
rvie
w E
ngin
eerin
g1
1,00
9,36
0.00
$
Serv
ice
Faci
litie
sG
ener
al C
apita
l Mai
nten
ance
Pro
ject
sSo
uth
Faci
lity
Asse
ssm
ents
150
,000
.00
$
Se
rvic
e Fa
cilit
ies
Gen
eral
Cap
ital M
aint
enan
ce P
roje
cts
Nor
th F
acili
ty U
npla
nned
Bla
nket
125
0,00
0.00
$
Se
rvic
e Fa
cilit
ies
Gen
eral
Cap
ital M
aint
enan
ce P
roje
cts
Nor
th F
urni
ture
, Dec
or &
Flo
orin
g1
135,
000.
00$
Serv
ice
Faci
litie
sG
ener
al C
apita
l Mai
nten
ance
Pro
ject
sN
orth
Equ
ipm
ent,
Mec
hani
cal,
Elec
tric
al1
50,0
00.0
0$
Serv
ice
Faci
litie
sG
ener
al C
apita
l Mai
nten
ance
Pro
ject
sN
orth
LED
Lig
htin
g Re
plac
emen
t1
200,
000.
00$
Serv
ice
Faci
litie
sG
ener
al C
apita
l Mai
nten
ance
Pro
ject
sN
orth
Gro
unds
& P
arki
ng1
100,
000.
00$
Serv
ice
Faci
litie
sG
ener
al C
apita
l Mai
nten
ance
Pro
ject
sN
orth
Roo
f, Bl
dg E
nvel
ope,
Win
dow
s/Do
ors
115
0,00
0.00
$
Se
rvic
e Fa
cilit
ies
Belle
ville
- N
ew B
uild
ing
Belle
ville
Fac
ility
Con
stru
ctio
n1
6,08
3,88
9.00
$
Serv
ice
Faci
litie
sG
ener
al C
apita
l Mai
nten
ance
Pro
ject
sN
orth
Fac
ility
Ass
essm
ents
150
,000
.00
$
St
atio
nsSt
atio
ns C
apita
l Mai
nten
ance
Plan
(T)-D
ist-S
tn M
easu
ring/
Corr
osio
n St
n1
138,
014.
28$
Stat
ions
Stat
ions
Cap
ital M
aint
enan
cePl
an(T
)-Dist
-Stn
Mea
surin
g/Co
rros
ion
Stn
113
8,01
4.28
$
St
atio
nsAt
mos
pher
ic T
ank
repl
acem
ent
Atm
osph
eric
Tan
k re
plac
emen
t1
320,
000.
00$
Stat
ions
Dist
ribut
ion
Ope
ratio
ns S
tatio
n Pa
intin
gSt
atio
n Pa
intin
g1
1,50
0,00
0.00
$
Stat
ions
Ham
ilton
Gat
e 1
& 2
HAM
I-Ham
ilton
Gat
e2St
n17X
-402
-Fla
mbo
roug
h2
3,50
0,00
0.00
$
Stat
ions
Stat
ions
Cap
ital M
aint
enan
cePl
an(T
)-Dist
-Stn
Mea
surin
g/Co
rros
ion
Stn
222
8,34
9.95
$
St
atio
nsSt
atio
ns C
apita
l Mai
nten
ance
Plan
(T)-D
ist-S
tn M
easu
ring/
Corr
osio
n St
n2
66,5
06.5
0$
Stat
ions
Stat
ions
Cap
ital M
aint
enan
cePl
an(T
)-Dist
-Stn
Mea
surin
g/Co
rros
ion
Stn
228
,980
.00
$
St
atio
nsSt
atio
ns C
apita
l Mai
nten
ance
Plan
(T)-D
ist-S
tn M
easu
ring/
Corr
osio
n St
n2
107,
218.
38$
Stat
ions
Stat
ions
Cap
ital M
aint
enan
cePl
an(T
)-Dist
-Stn
Mea
surin
g/Co
rros
ion
Stn
253
,609
.00
$
St
atio
nsSt
atio
ns C
apita
l Mai
nten
ance
Plan
(T)-D
ist-S
tn M
easu
ring/
Corr
osio
n St
n2
61,5
99.0
5$
Stat
ions
Stat
ions
Cap
ital M
aint
enan
cePl
an(T
)-Dist
-Stn
Mea
./Cor
210
8,85
9.20
$
St
atio
nsSt
atio
ns C
apita
l Mai
nten
ance
Plan
(T)-D
ist-S
tn M
ea./C
or2
108,
859.
20$
Stat
ions
Stat
ions
Cap
ital M
aint
enan
ceKi
rkw
all B
acku
p G
ener
ator
Rep
lace
men
t3
149,
796.
90$
Stat
ions
Stat
ions
with
Sig
nific
ant C
orro
sion
Daw
n Co
nces
sion
8 St
atio
n Re
pairs
336
,646
.31
$
St
atio
nsVa
ulte
d St
atio
nsW
AT-S
tone
& G
ordo
n St
n 19
V-10
5R, G
uelp
h3
320,
286.
81$
Stat
ions
Stat
ions
Cap
ital M
aint
enan
ceKi
ng- C
olle
ge S
t & S
idne
y St
-Bel
levi
lle3
200,
000.
00$
Stat
ions
Stat
ions
Cap
ital M
aint
enan
ceLO
ND-
Con
fined
Spa
ce R
emov
al-W
oods
tock
339
9,21
6.25
$
U
nder
grou
nd S
tora
geW
ell I
nteg
rity
- Mai
nten
ance
Cap
ital u
pgra
des
STO
STO
RAG
E W
ELL
UPG
RADE
S1
250,
000.
00$
Und
ergr
ound
Sto
rage
Wel
l Opt
imiza
tion
prog
ram
Wel
l Opt
imiza
tion
Prog
ram
236
4,24
5.90
$
U
nder
grou
nd S
tora
geW
ellh
ead
Tele
met
ry/m
easu
rem
ent
Wel
l Mea
sure
men
t Upg
rade
Pro
gram
120
1,89
9.50
$
U
nder
grou
nd S
tora
geW
ell P
ad Im
prov
emen
tW
ell P
ad Im
prov
emen
t*
100,
000.
00$
* Th
ere
are
a nu
mbe
r of p
roje
cts t
hat d
id n
ot le
nd th
emse
lves
wel
l to
the
prio
ritiza
iton
mod
el u
sed
at th
e tim
e an
d di
d no
t hav
e sp
ecifi
c pr
iorit
y as
signe
d. T
hese
s pro
ject
s wer
e m
anag
ed o
n a
case
by
case
bas
is.
Filed: 2019-04-25, EB-2018-0305, Exhibit I.BOMA.74, Attachment 1, Page 6 of 6

Filed: 2019-04-25 EB-2018-0305 Exhibit I.BOMA.75 Page 1 of 1
ENBRIDGE GAS INC. Answer to Interrogatory from
Building Owners and Managers Association (BOMA)
Reference: Exhibit B1, Tab 2, Schedule 1, p18, Table 8 Question:
a) Why should the Board approve ICM funding of $235M for Union, which exceeds its maximum eligible incremental capital of $143.3M (see Table 7) by approximately $90M, an increase of about 70%.
b) Please prioritize Union requests for ICM funding among Sudbury, Kingsville, and Stratford.
Response a) As per the Board’s ICM/ACM policy the maximum eligible incremental capital is
defined as the difference between the forecasted total capital expenditures for a subject year and the materiality threshold for that year. The maximum eligible incremental capital of $143.3 million, found in Table 7, is the 2019 calculation for the Union rate zones. Enbridge Gas is seeking incremental ICM funding for projects that fit within the maximum eligible incremental capital amount for 2019. Accordingly, Enbridge Gas is not exceeding the 2019 maximum eligible incremental capital. As noted in the applicant’s evidence at Exhibit B1, Tab 2, Schedule 1, page 18, the Sudbury Replacement project is a 2018 project for which Enbridge Gas is requesting ICM funding. Please see Exhibit I.STAFF.24 for further detail on the Sudbury Replacement project ICM request. The total ICM funding of $235.2 million includes the required funding for the Sudbury Replacement project ($91.9 million), and the 2019 ICM projects ($143.3 million).
b) Sudbury Replacement, Kingsville Reinforcement and Stratford Reinforcement projects are all required to ensure the safe and reliable service to customers. These projects were all approved as part of leave to construct applications, where the purpose, need, and timing were all considered by the Board as part of that approval. These projects are prioritized using the methodology as outlined in Exhibit C1, Tab 3, Schedule 1 pages 51 to 58.

Filed: 2019-04-25 EB-2018-0305 Exhibit I.BOMA.76 Page 1 of 1 Plus Attachment
ENBRIDGE GAS INC. Answer to Interrogatory from
Building Owners and Managers Association (BOMA)
Reference: Exhibit B1, Tab 2, Schedule 1, p25; Kingsville Question: (a) Please provide a detailed breakdown of the cost increase for the Leave to
Construct forecast of $105.7M to the current forecast of $121.4M, an increase of about 15%.
(b) Please show the Union revenue requirement impact of the ICM treatment of the project for each year from 2019 to 2023.
Response (a) Please see Exhibit I.EP.16.
(b) The forecast Kingsville Reinforcement project’s ICM revenue requirement, for each
year from 2019 to 2023, is shown at Exhibit B1, Tab 2, Schedule 1, Table 11, page 31. Table 11 has been updated and is filed along with the interrogatory response. Please see Exhibit I.BOMA.37, part (a) for further breakdown of the revenue requirement.

Updated: 2019-04-25 EB-2018-0305
Exhibit B1 Tab 2
Schedule 1 Page 31 of 36
The total revenue requirement for each year of the deferred rebasing period is provided in Table 1
11. 2
Table 11 3 Total Incremental Revenue Requirement by Rate Zone 4
5
6
The Don River Replacement, Kingsville and Stratford Reinforcement projects have a 2020 in-7
service capital forecast of approximately $1.1 million, $3.2 million and $0.6 million respectively 8
that have been included in the calculation of the incremental revenue requirement for the deferred 9
rebasing period. Enbridge Gas proposes to reduce the maximum eligible incremental capital in 10
2020 by the actual in-service amounts in that year related to the 2019 ICM approved projects. 11
The detailed incremental revenue requirement detailed for each of the 2019 ICM projects for the 12
deferred rebasing period is filed as Appendix E. 13
14
In the first calendar year of a project’s in-service date, the revenue requirement may be a credit 15
balance due to utility timing differences associated with the difference between utility income and 16
LineNo. Particulars ($000's) 2019 2020 2021 2022 2023
(a) (b) (c) (d) (e)EGD Rate Zone
1 Don River Replacement (370) 1,137 1,227 1,218 1,207
Union North Rate Zone2 Sudbury Replacement 9,762 9,633 9,499 9,358 9,212
Union South Rate Zone3 Kingsville Reinforcement (3,358) 10,269 10,598 10,681 10,731 4 Stratford Reinforcement (766) 2,146 2,221 2,249 2,267 5 Total Union South Rate Zone (4,124) 12,415 12,820 12,930 12,998
6 Total Incremental Revenue Requirement 5,267 23,185 23,546 23,507 23,418
/u
/u
/u
Filed: 2019-04-25, EB-2018-0305, Exhibit I.BOMA.76, Attachment, Page 1 of 1

Filed: 2019-04-25 EB-2018-0305 Exhibit I.BOMA.77 Page 1 of 1
ENBRIDGE GAS INC. Answer to Interrogatory from
Building Owners and Managers Association (BOMA)
Reference: Exhibit B1, Tab 2, Schedule 1, pp24-25 Question: Given that the Sudbury project was to replace an existing section of mains pipe with integrity issues, why is this not treated as a normal part of ongoing utility operations? Response Please refer to Exhibit B1, Tab 2, Schedule 1, pages 18 to 20 for an explanation on why this project could not be funded through existing rates. For further details please see Exhibit I.STAFF.24.

Filed: 2019-04-25 EB-2018-0305 Exhibit I.BOMA.78 Page 1 of 1
ENBRIDGE GAS INC. Answer to Interrogatory from
Building Owners and Managers Association (BOMA)
Reference: Exhibit B1/Tab 2/Schedule 1/Pg.27 Question: Please explain the required five years of growth, the proposed MOP of the proposed pipeline, if proposed as replacement of the smaller diameter pipeline or new greenfield construction. Please provide a map and commentary on what is being proposed. Response The Stratford Reinforcement project is a 10.8 kilometer, NPS 12 pipeline project with a MOP of 6160 kpa. The proposed facilities loop an existing NPS 8 section of the Forest, Hensall, Goderich (“FHG”) system. The project will provide an additional 16,400 m3/hour of capacity to the FHG system. Based on the current customer forecast this capacity will meet eight years of customer demand on the system. A map of the proposed facilities can be found at Schedule 1 of the leave to construct application EB-2018-0306. The project was approved by the Board on March 28, 2019. Construction is proposed to start in May 2019.

Filed: 2019-04-25 EB-2018-0305 Exhibit I.BOMA.79 Page 1 of 1
ENBRIDGE GAS INC. Answer to Interrogatory from
Building Owners and Managers Association (BOMA)
Reference: Exhibit B1, Tab 2, Schedule 1, p28 Question: Were any of Kingsville, Sudbury, or Stratford proposals put to customers during the Union consultation conducted by Innovative, as was done for similar projects in the Alectra case? If so, what were the results? If not, why not? Response Specific questions on the Kingsville, Sudbury or Stratford proposals were not put to customers during the Union consultation conducted by Innovative. Please see Exhibit I.STAFF.33 for an overview of how Innovative’s results were incorporated into the business plans.

Filed: 2019-04-25 EB-2018-0305 Exhibit I.BOMA.80 Page 1 of 1
ENBRIDGE GAS INC. Answer to Interrogatory from
Building Owners and Managers Association (BOMA)
Reference: Exhibit B1, Tab 2, Schedule 1, p31 Question: Please provide an additional piece to Table 11 which shows the total forecast revenue requirement for each of EGD and Union rate zones for each year of the deferral rebasing year. Response Enbridge Gas is seeking the Board’s approval of the 2019 revenue requirement, the detail of which can be found at Exhibit B1, Tab 1, Schedule 1, page 2.
Filed: 2019-04-25 EB-2018-0305 Exhibit I.BOMA.81 Page 1 of 1
ENBRIDGE GAS INC. Answer to Interrogatory from
Building Owners and Managers Association (BOMA)
Reference: Exhibit B1, Tab 2, Schedule 1, p32 Question: Why is EGD deferring the payment to customers in 2019, but not deferring the collection of debits in the remaining year of the deferral rebasing period? Response Please see Exhibit I.BOMA.7.

Filed: 2019-04-25 EB-2018-0305 Exhibit I.BOMA.82 Page 1 of 2
ENBRIDGE GAS INC. Answer to Interrogatory from
Building Owners and Managers Association (BOMA)
Reference: Exhibit B1, Tab 2, Schedule 1, p33 Question: Please explain more fully the cost allocation for the Don River Replacement Project, including the cost allocation method, for extra high pressure mains greater than four inch diameter. What is the MOP and normal operating pressure of the existing line, and how does the high pressure and diameter reflected in the allocation factor? Response The EGD rate zone mains network is sized to meet peak demand capacity on the distribution system. It is divided into three systems based on operating pressure: extra high pressure (“XHP”) (also referred to as transmission pressure (“TP”)), high pressure (“HP”), and low pressure (“LP”). The Board found in EB-2012-0459 (2014 Rate Case) that Rate 125 customers (which are extra-large unbundled firm distribution service customers, such as large power generators) should not be allocated the costs of extra high pressure mains of less than 6” in diameter. Accordingly, the extra high pressure capacity classification is further split into XHP Capacity for mains less than or equal to 4 inch in diameter (XHP Capacity <=4”) and XHP Capacity for mains greater than 4 inches (XHP Capacity>4”). Such a classification of XHP mains capacity ensures that Rate 125 customers are only allocated the costs of mains capacity that is physically capable of serving their loads. Given that the proposed Don River Replacement project is NPS 30 (i.e., 30 inches in diameter) and will operate at extra high pressure, the Board-approved allocation methodology for the EGD rate zone for such a project is the allocation of extra high pressure mains greater than 4 inches in diameter (XHP Capacity>4”). The allocator for XHP Capacity>4” represents / reflects each customer class contribution to the peak demand on the XHP main network.

Filed: 2019-04-25 EB-2018-0305 Exhibit I.BOMA.82 Page 2 of 2
The ICM revenue requirement for the Don River Replacement project will accordingly be allocated and recovered across all of the EGD rate zone’s distribution customer classes, including Rate 125 customers. The MOP for the existing NPS 30 line is 480 psi and the normal operating pressure is 367 psi.

Filed: 2019-04-25 EB-2018-0305 Exhibit I.BOMA.83 Page 1 of 1
ENBRIDGE GAS INC. Answer to Interrogatory from
Building Owners and Managers Association (BOMA)
Reference: Exhibit C1, Tab 3, Schedule 1 Question: Please provide a copy of the Organizational Strategic Plan. Figure 1.9.1 provides a snapshot of a mature pipeline system, in which annual maintenance, including replacements and repairs, and capital are on average at least twice the growth capital. Please confirm that Union has prioritized its capital and maintenance projects for 2019, 2020, and the balance of the deferral rebasing period to 2023, and please provide a prioritized list of all projects, in excess of $5M. Please also file the business case for each of these projects, which are being initiated in 2019, and separately, in 2020, if not already in evidence. Response Please see Exhibit I.BOMA.40. As outlined in section 4.2.1.1.4 on page 55 to 58 in Union rate zone’s AMP, filed at Exhibit C1, Tab 3, Schedule 1, all projects within the 10-year outlook are prioritized based on the information available at the time of the plan creation. All project descriptions/business cases for projects in excess of $2M identified in the 10-year asset plan are provided in Appendix D, page 157 to 278 in Union rate zone’s AMP filed at Exhibit C1, Tab 3, Schedule 1. Please see Exhibit I.BOMA.22 for a complete summary of all projects by year in the Enbridge Gas asset plans.
Filed: 2019-04-25 EB-2018-0305 Exhibit I.CCC.1 Page 1 of 2
ENBRIDGE GAS INC. Answer to Interrogatory from
Consumers Council of Canada (CCC) Reference: Ex. A/T3/S1/p. 2 Question: The evidence set out the annual bill impacts associate with the Application. With respect to those impacts: 1) Please explain whether they include the disposition of the DVA balances proposed
for 2019. If they do please break out the impacts between the rate adjustment and all other factors;
2) Please explain why, if the bill impact of the ICM for the Union North residential
customers is $8.80, why the overall impact is $6.81 and $4.88 for each of the Union North rate zones (North East and North West)
Response 1) Enbridge Gas is not seeking to dispose of 2019 deferral and variance account
(‘DVA’) balances as part of this application. Consistent with legacy EGD and Union’s past practice, Enbridge Gas will seek disposition of its 2019 DVA balances after 2019 financial results are finalized. Similarly, Enbridge Gas will seek disposition of 2018 DVA balances in the coming months.
2) The ICM bill impact of $8.80 for Union North Rate 01 residential customers is higher than the overall Rate 01 residential bill impact because in the absence of ICM, residential customers would experience an overall bill decrease. The estimated bill impact excluding ICM for a Rate 01 residential customer would be a decrease of $1.99 and $3.921 for Union North West and Union North East, respectively.
1 Union North East bill impacts excluding ICM provided at Exhibit I.BOMA.1, Attachment 1.

Filed: 2019-04-25 EB-2018-0305 Exhibit I.CCC.1 Page 2 of 2
The ICM bill impact of $8.80 is partly offset by:
• a decrease in the allocation of DSM budget costs to Rate 01, and • an increase in the forecast billing units used to derive the Rate 01 base unit
rates resulting from an increase in the NAC target included in rates.
Other 2019 rate adjustments result in a bill increase to Rate 01, such as PCI, the deferred tax drawdown base rate adjustment, and capital pass-through projects adjustment.

Filed: 2019-04-25 EB-2018-0305 Exhibit I.CCC.2 Page 1 of 1
ENBRIDGE GAS INC.
Answer to Interrogatory from Consumers Council of Canada (CCC)
Reference: Ex. A/T3/S1/p. 8 Question: Please explain what relief EGI is seeking from the OEB with respect to the new Conditions of Service. Does EGI have plans to consolidate the Conditions of Service for all of the rate zones (Union and EGD)? If so, what is the timing associated with this initiative? Response Enbridge Gas is not seeking relief from the Board with respect to the new Conditions of Services. The revised Conditions of Service were filed in accordance with the Board’s Gas Distribution Access Rule (“GDAR”), section 8.5 “Revisions to a Customer Service Policy”. Section 8.5 is provided below for convenience.
8.5 Revisions to a Customer Service Policy
8.5.1 A rate-regulated gas distributor shall provide advance public notice of any revisions to its Customer Service Policy. Notice shall be, at a minimum, provided to each residential customer by means of a note on or included with the customer’s bill. The notice shall include the timeline for implementation of the revisions to the Customer Service Policy.
8.5.2 A rate-regulated gas distributor shall provide the Board with a copy of its revised Customer Service Policy. The revised Customer Service Policy shall be accompanied by a cover letter that indicates the revisions made and their implementation date.
Enbridge Gas currently has no plans to consolidate its Conditions of Service. Any integration of Enbridge Gas’s Conditions of Service must follow the integration of its systems and processes.

Filed: 2019-04-25 EB-2018-0305 Exhibit I.CCC.3 Page 1 of 1 Plus Attachment
ENBRIDGE GAS INC.
Answer to Interrogatory from Consumers Council of Canada (CCC)
Reference: Ex. A Question: Please provide the most recent Company-wide organization chart down to the Director level. Response Please see Attachment 1.

Cynt
hia
Hans
enExecutive Vice Presid
ent
Jim R
edfo
rdVP
Ene
rgy Services
Jim S
ande
rsSVP Ope
ratio
ns
Mal
ini G
iridh
arVP
Business D
evelop
ment &
Regulatory
Mic
helle G
eorg
eVP
Engineerin
g
Mik
e Sh
anno
nVP
Storage Transmission &
Integration Managem
ent
Office
Tany
a M
ushy
nski
VP Customer Care
Director
IT Gas Distrib
ution
Director Inform
ation
System
s UG
Mar
k Bo
yce
Vice Presid
ent, Law
Wen
dy Z
elon
dVP
Finance
Shar
ed se
rvic
e Vi
ce P
resid
ents a
nd D
irect
ors
have a d
otte
d lin
e re
port
ing
rela
tions
hip
to E
nbrid
ge G
as In
c.’s E
xecu
tive
Vice
Pres
iden
t.
Director
Hum
an Resou
rces
Filed: 2019-04-25, EB-2018-0305, Exhibit I.CCC.3, Attachment 1, Page 1 of 9
Jim R
edfo
rdVP
Ene
rgy Services
Director S&T Bu
sine
ss
Developm
ent
Director Ene
rgy Services
Director Gas Con
trol &
Managem
ent
Director Gas Sup
ply
Filed: 2019-04-25, EB-2018-0305, Exhibit I.CCC.3, Attachment 1, Page 2 of 9

Jim S
ande
rsSVP Ope
ratio
ns
Director Ope
ratio
nal Services
& Governance
Director GTA W
est / Niagara
Ops
Director Eastern Region Ops
Director Northern Region
Ops
Director Sou
theast Region
Ops
Director GTA East O
psDirector Sou
thwest R
egion
Ops
Director To
ronto Region
Ops
Filed: 2019-04-25, EB-2018-0305, Exhibit I.CCC.3, Attachment 1, Page 3 of 9

Mal
ini G
iridh
arVP
Business D
evelop
ment &
Regulatory
Director Pub
lic Affa
irs &
Ombu
dsman
Director Regulatory Affairs
Dir M
arketin
g & Ene
rgy
Conservatio
nDirector Business
Developm
ent
Filed: 2019-04-25, EB-2018-0305, Exhibit I.CCC.3, Attachment 1, Page 4 of 9

Mic
helle G
eorg
eVP
Engineerin
g
Director Asset M
anagem
ent
Chief Engineer
Director System Im
provem
ent
Director Integrity
& IM
S
Filed: 2019-04-25, EB-2018-0305, Exhibit I.CCC.3, Attachment 1, Page 5 of 9

Mik
e Sh
anno
nVP
Storage Transmission &
IMO
Director IM
ODirector Trans & Com
pressio
n Ope
ratio
nsDirector Storage &
Transm
ission Eng
Director Storage Ope
ratio
ns
Filed: 2019-04-25, EB-2018-0305, Exhibit I.CCC.3, Attachment 1, Page 6 of 9

Tany
a M
ushy
nski
VP Customer Care
Director Customer Care
Ope
ratio
nsDirector Customer Care
Developm
ent
Director Distrib
ution In
Franchise
Sales
Director Large Volum
e Co
ntracting & Policy
Filed: 2019-04-25, EB-2018-0305, Exhibit I.CCC.3, Attachment 1, Page 7 of 9

Wen
dy Z
elon
dVP
Finance
Director Finance Utility
and
Power
Director Accou
nting UPO
Director Financial Plann
ing
Director Business S
uppo
rt
Filed: 2019-04-25, EB-2018-0305, Exhibit I.CCC.3, Attachment 1, Page 8 of 9

Mar
k Bo
yce
Vice Presid
ent, Law
Associate General
Coun
sel
Associate General
Coun
sel
Filed: 2019-04-25, EB-2018-0305, Exhibit I.CCC.3, Attachment 1, Page 9 of 9

Filed: 2019-04-25 EB-2018-0305 Exhibit I.CCC.4 Page 1 of 1
ENBRIDGE GAS INC. Answer to Interrogatory from
Consumers Council of Canada (CCC) Reference: Ex. B1/T1/S1 Question: The Application is based on the OEB’s Decision approving the amalgamation of Union and EGD and establishing the rate-setting mechanism (EB-2017-0306/0307). Please indicate if the Application is entirely consistent with all of the elements of the Decision. If it is not, please identify where it is not consistent and the rationale for any alternative proposals. Response Yes, the application is consistent with the Board’s Decision and Order for the amalgamation and rate setting mechanism dated August 30, 2018. The implications of the Board’s Decision are reflected in this rate application.

Filed: 2019-04-25 EB-2018-0305 Exhibit I.CCC.5 Page 1 of 1 Plus Attachment
ENBRIDGE GAS INC.
Answer to Interrogatory from Consumers Council of Canada (CCC)
Reference: Ex. B1/T1/S1/p. 23 Question: Table 9 provides a list of Deferral Account closures that were approved in the MAADs and Rate-setting Decision. What are the current balances in the accounts? Response Please see Attachment 1 for balances in the Deferral Accounts listed at Table 9. The amounts shown are draft. Disposal of the actual amounts will be filed as part of Enbridge Gas’s 2018 Earning Sharing Mechanism and Deferral and Variance Account proceeding.

Acc
ount
Num
ber
Acc
ount
Nam
eA
ccou
nt B
alan
ceIn
tere
st*
Tota
lEG
D R
ate
Zone
179.
16_
Cus
tom
er C
are
CIS
Rat
e Sm
ooth
ing
Def
erra
l Acc
ount
219,
260
(3
2,37
5)
186,
885
$
179.
34_
Con
stan
t Dol
lar N
et S
alva
ge
Adj
ustm
ent D
efer
ral A
ccou
nt-
- -
$
179.
96_
Rel
ocat
ions
Mai
ns V
aria
nce
Acc
ount
- -
-$
179.
98_
Rep
lace
men
t Mai
ns V
aria
nce
Acc
ount
- -
-$
179.
58_
Earn
ings
Sha
ring
Mec
hani
sm D
efer
ral
Acc
ount
(rep
lace
d by
new
Enb
ridge
G
as a
ccou
nt)
(27,
350,
000)
(167
,519
)
(27,
517,
519)
$
Uni
on R
ate
Zone
s17
9-12
0C
GA
AP
to IF
RS
Con
vers
ion
Cos
ts-
- -
$
179-
134
Tax
Var
ianc
e D
efer
ral A
ccou
nt(r
epla
ced
by n
ew E
nbrid
ge G
as
acco
unt)
(413
,448
)(4
,783
)
(418
,231
)$
*Inc
lude
s int
eres
t to
Mar
ch 3
1, 2
019.
Filed: 2019-04-25 EB-2018-0305
Exhibit I.CCC.5 Attachment 1
Page 1 of 1

Filed: 2019-04-25 EB-2018-0305 Exhibit I.CCC.6 Page 1 of 1
ENBRIDGE GAS INC. Answer to Interrogatory from
Consumers Council of Canada (CCC) Reference: Ex. B1/T1/S1/p. 27 Question: EGI has a forecast of $117.238 million for the Capital Pass-Through Projects for 2019. Will this amount be trued up based on actual costs? If not, why not? If so, how will the amounts be trued up? Response Enbridge Gas does not propose to true up the 2019 revenue requirement for Union’s capital pass-through projects in 2019 rates to actual costs during the deferred rebasing period with the exception of utility tax timing differences which will continue to be captured in the capital pass-through deferral accounts. Please see Exhibit I.STAFF.8, part (a).

Filed: 2019-04-25 EB-2018-0305 Exhibit I.CCC.7 Page 1 of 1
ENBRIDGE GAS INC.
Answer to Interrogatory from Consumers Council of Canada (CCC)
Reference: Ex. B1/T2/S1/p. 19 Question: Please set out all project costs for the Sudbury Replacement Project. What is the expected revenue requirement impact for each year 2019-2023? Please explain why it is appropriate for the 2018 costs to be part of the 2019 ICM. Response Please see Exhibit I.EP.16 for the project costs for the Sudbury Replacement Project. Please refer to Exhibit B1, Tab 2, Schedule 1, Appendix E, page 2 for the revenue requirement for each year 2019-2023. Please see Exhibit I.STAFF.24 part (a) for appropriateness of including 2018 costs as part of 2019 ICM.

Filed: 2019-04-25 EB-2018-0305 Exhibit I.CCC.8 Page 1 of 1
ENBRIDGE GAS INC.
Answer to Interrogatory from Consumers Council of Canada (CCC)
Reference: Ex. B1/T2/S1/p. 24 Question: With respect to the Sudbury Replacement Project $3.4 million in expected to go into service in 2019. What is the month in which it is expected to be in-service? Response Please see Exhibit I.APPrO.2.

Filed: 2019-04-25 EB-2018-0305 Exhibit I.CCC.9 Page 1 of 1
ENBRIDGE GAS INC.
Answer to Interrogatory from Consumers Council of Canada (CCC)
Reference: Ex. B1/T2/S1/p. 22 Question: With respect to the NPS 30 Don River Replacement Project what were the costs that were presented in the LTC proceeding? What are the current cost projections? Please explain, in detail, all variances. Please provide the construction schedule that was filed in the LTC proceeding and the current construction schedule. What is the most current projected in-service date? What factors could impact that schedule? Response Please see Exhibit I.EP.16.
Filed: 2019-04-25 EB-2018-0305 Exhibit I.CCC.10 Page 1 of 1
ENBRIDGE GAS INC.
Answer to Interrogatory from Consumers Council of Canada (CCC)
Reference: Ex. B/T2/S1/p. 27 Question: With respect to the Kingsville Reinforcement Project what were the costs that were presented at the LTC proceeding. What are the current cost projections? Please explain, in detail, all variances. Please provide the construction schedule that was filed in the LTC proceeding. What is the most current projected in-service date? What factors could impact that schedule? Response Please see Exhibit I.EP.16.

Filed: 2019-04-25 EB-2018-0305 Exhibit I.CCC.11 Page 1 of 1
ENBRIDGE GAS INC.
Answer to Interrogatory from Consumers Council of Canada (CCC)
Reference: Ex. B/T2/S1/p. 27 Question: What is the current status of the LTC Application regarding the Stratford Reinforcement Project? What is the most current projected in-service date? What factors could impact that date? Response On March 28, 2019 the Ontario Energy Board approved the Stratford Reinforcement project. Construction of the project is proposed to start in May 2019 with an in service date in November 2019. Based on the past history of constructing projects of this type, Enbridge Gas does not anticipate any factors which would delay the in-service date of the project.

Filed: 2019-04-25 EB-2018-0305 Exhibit I.CCC.12 Page 1 of 1
ENBRIDGE GAS INC.
Answer to Interrogatory from Consumers Council of Canada (CCC)
Reference: Ex. B/T2/S1/p. 31 Question: EGI has set out the Total Incremental Revenue Requirement by rate zone for each of the ICM requested projects. Does EGI propose a true-up process regarding these projects? If not, why not? If so, how would that true-up process work? Response The applicant is requesting the opening of new deferral accounts for each rate zone to capture any variances between actual revenue requirement of the ICM projects and the actual revenue collected through the ICM rate as filed on page 16 of Exhibit B1, Tab 1, Schedule 1. Also, as noted on page 33 in the MAADs Decision (EB-2017-0306 EB-2017-0307) and as per section 7.4 in the Report of the Board (EB-2014-0219), the Board will make a determination on the treatment of any differences between forecast and actual ICM projects at the time of rebasing.
Filed: 2019-04-25 EB-2018-0305
Exhibit I.CCC.13 Page 1 of 1
ENBRIDGE GAS INC. Answer to Interrogatory from
Consumers Council of Canada (CCC)
Reference: Ex. C1/T1/S1/p. 55
Question:
Please file the Customer Connection Policy that was revised in 2015. Please explain the nature of the changes made in 2015 and the rationale for those changes. Please specifically identify how the Contribution in Aid of Construction was changed. Please explain the extent to which EGD undertook any customer engagement with respect to these changes.
Response
Enbridge Gas’s feasibility policy has always been aligned with the requirements of E.B.O. 188. In 2015, the EGD rate zone enhanced its process for estimating the service cost used for assessing feasibility of residential conversion customers. The current policy has been filed with this application as Exhibit B1, Tab1, Schedule 1, Appendix H.
Prior to the enhancement in 2015, as noted in Exhibit B1, Tab 1, Schedule 1, Appendix H, paragraph 9, EGD applied a simplified approach to assess economic feasibility which assumed consistent or like circumstances for standard residential service connections.
The underlying assumptions of like circumstances and sufficient cost recovery which allowed EGD to maintain the simplified approach have changed. There is now recognition of increased variability in the cost associated with residential customer attachments which warrants a more precise assessment of individual project costs. The EGD rate zone now accounts for this variability in customer circumstances through assessments by using an individually estimated volumetric allowance and a regionally tailored cost estimate based on historical data from similar services in the same area where available or based on a specific field estimate where necessary. CIAC is now calculated based on customer specific volumetric allowance and cost estimates.
Please see Exhibit I.STAFF.2, part (b) for the customer communication process that was undertaken by the EGD rate zone with respect to this change.

Filed: 2019-04-25 EB-2018-0305 Exhibit I.CCC.14 Page 1 of 1
ENBRIDGE GAS INC.
Answer to Interrogatory from Consumers Council of Canada (CCC)
Reference: Ex. A/T3/S1/ p. 4 Question: Please indicate what relief EGI is seeking from the OEB with respect to the Utility System Plan and the Asset Management Plans for the EGD and Union rate zones. Response Enbridge is not seeking approval of the Utility System Plan and Asset Management Plans (“USP” and “AMPs”). Subsequent to the filing of this IR the Board issued its Decision and Procedural Order No. 2 which confirms this: “The OEB confirms that it will not be approving the USP or AMPs in this proceeding. The review of the USP and AMPs is to provide context for whether the ICMs should be approved.”1
1 Decision and Procedural Order No. 2, April 1, 2019, pages 5 to 6.

Filed: 2019-04-25 EB-2018-0305 Exhibit I.CCC.15 Page 1 of 1
ENBRIDGE GAS INC. Answer to Interrogatory from
Consumers Council of Canada (CCC) Reference: Ex. B1/T2/S1/p. 5 Question: Please explain why EGI has excluded Community Expansion amounts from System Access Capital? Response Community Expansion is categorized under the System Access Capital investment category in Enbridge Gas’s Utility System Plan.1
Despite their opportunities being evaluated using the same investment valuation framework, opportunities outside of core business activities that have different funding mechanisms and are driven and supported through public and governmental policies/regulations do not flow through this process (such as Community Expansion, renewable natural gas, etc.) [emphasis added].2
As such, footnotes were included for Table 1 and Table 2 in Enbridge Gas’s Incremental Capital Module: “System Access capital presented here does not reflect Community Expansion.”3
1 Exhibit C1, Tab1, Schedule 1 page 36. 2 Exhibit C1, Tab1, Schedule 1, page 29. 3 Exhibit B1, Tab 2, Schedule 1, Tables 1 and 2, pages 4 to 5.

Filed: 2019-04-25 EB-2018-0305 Exhibit I.CCC.16 Page 1 of 1
ENBRIDGE GAS INC. Answer to Interrogatory from
Consumers Council of Canada (CCC) Reference: Ex B1/T2/S1/p. 2 Question: The evidence states that, “As there are finite resources to complete capital projects, projects are selected for the AMP on the basis of their relative priority. All projects are evaluated and prioritized/optimized to ensure that capital resources are employed to address the highest priority items across all asset categories.” Please explain if this comment pertains to planning with respect to the two rate zones individually or to the consolidated Company. When does EGI intend to undertake capital planning across the Company as a whole? Response The comment pertaining to planning is relevant to the EGD and Union rate zones. Conversely each AMP was created individually with unique prioritization/optimization methodology. The following excerpt highlights the common considerations included in both planning methodologies: “Enbridge Gas’s methodology for project prioritization/optimization considers risk, customer input and preferences, resource availability and asset portfolio strategies.”1 As per the response at Exhibit I.STAFF.34, Enbridge Gas is still assessing its future asset management processes.
1Exhibit, B1, Tab 2, Schedule 1, page 3.

Filed: 2019-04-25 EB-2018-0305 Exhibit I.CCC.17 Page 1 of 1
ENBRIDGE GAS INC. Answer to Interrogatory from
Consumers Council of Canada (CCC) Reference: Ex. B1/T2/S1/p. 9 and Ex. C1/T1/S1/p. 3 Question: Does EGI intend to use a Company-wide materiality threshold for its ICM requests for 2021? Response Enbridge Gas does not intend to use a Company-wide materiality threshold for its ICM requests for 2021. Please see Exhibit I.VECC.7.

Filed: 2019-04-25 EB-2018-0305 Exhibit I.CCC.18 Page 1 of 1
ENBRIDGE GAS INC. Answer to Interrogatory from
Consumers Council of Canada (CCC) Reference: Ex. A/T3/S1/p. 5 Question: Please explain what relief EGI is seeking from the OEB with respect to the customer consultation undertaken by both EGD and Union. Response Enbridge Gas is not seeking any specific relief from the Board with respect to the customer engagement filed at Exhibit D1. The Board confirmed this in its Decision and Procedural Order No. 2:
The OEB agrees with Enbridge Gas that customer engagement is relevant to the USP and AMP planning processes, and therefore is a consideration for the review of the ICMs. It is generally not a requirement to file the results of customer engagement with IRM applications that do not include ICMs, given the mechanistic nature of the Price Cap IR rate adjustments. A new issue on customer engagement has not been added to the Issues List, as proposed by VECC, because the customer engagement will be considered as part of whether the projects are eligible for ICM funding.1
1 Decision and Procedural Order No. 2, April 1, 2019, page 6.

Filed: 2019-04-25 EB-2018-0305 Exhibit I.CME.1 Page 1 of 2
ENBRIDGE GAS INC. Answer to Interrogatory from
Canadian Manufacturers &Exporters (CME) Reference: Exhibit B1, Tab 2, Schedule 1, page 9 of 36 Question: At Exhibit B1, Tab 2, Schedule 1, EGI states: "Enbridge Gas proposes to use a simple average of the actual annual PCI that has been used to increase rates during the price cap IR term since its last rebasing". According, to EGI, this is because "the average PCI more accurately reflects the impact PCI has had on rates and revenue since the bas year than the use of the current year PCI." (a) What impact would using the current year PCI% of 1.07% have on the Union rate
zone's materiality threshold? Please show all calculations to the degree that they are not already part of the evidence.
(b) Assuming the use of current year PCI% has impact an impact on the Union rate
zone's materiality threshold, does that impact EGI's capital planning or specific projects? If so how?
Response a) Please see Exhibit I.LPMA.11 for the impact of using a PCI% of 1.07% to calculate
the Union rate zones’ materiality threshold. Using the 2019 PCI of 1.07% for Union instead of using the six year average PCI of
0.72% in the threshold formula would indicate that the rates have been adjusted at 1.07% in each individual year for the period of 2014-2019. The cumulated rate increase would have been 6.42% instead of an actual cumulated rate increase of 4.31% as seen in the table on the following page.

Filed: 2019-04-25 EB-2018-0305 Exhibit I.CME.1 Page 2 of 2
Year 2019 PCI Actual PCI 2014 1.07% 0.51% 2015 1.07% 0.66% 2016 1.07% 0.71% 2017 1.07% 0.70% 2018 1.07% 0.66% 2019 1.07% 1.07%
Simple cumulative Total 6.42% 4.31% Arithmetic Average 1.07% 0.72%
As a result, the threshold amount for Union would have been over-estimated by approximately $23.3 million by using the higher PCI rate of 1.07% instead of 0.72%.
b) Many factors were taken into consideration in the respective capital portfolios, such
as asset condition, risk and opportunity, customer preferences, ratepayer impacts and the materiality threshold. Changes to these factors, including the materiality threshold, will have an impact on capital planning. All projects identified within the Asset Management Plans have been identified to fulfill a need and will be completed.
Investments in the EGD rate zone are optimized based on the Asset Management
Principles outlined in Section 4.1.3.4 Optimize Portfolio Based on Asset Management Principles (p. 71-4). Please refer to the Asset Management Core Process steps Risk Management (Section 4.2.1 p. 79), Solution Planning (Section 4.2.2 p. 83) and Portfolio Optimization (Section 4.2.3 p. 84).1
Some projects have more flexibility than others in the timing of their execution and
these are the projects that may either be brought forward or deferred if there was a change to the materiality threshold.
1 Exhibit C1, Tab 2, Schedule 1; Exhibit C1, Tab 3, Schedule 1, pages 46 to 58.

Filed: 2019-04-25 EB-2018-0305 Exhibit I.CME.2 Page 1 of 2
ENBRIDGE GAS INC. Answer to Interrogatory from
Canadian Manufacturers &Exporters (CME) Reference: Exhibit B1, Tab 2, Schedule 1, page 13 of 36; Report of the OEB, EB-2014-0219 – New Policy Options for the Funding of Capital Investments: Supplemental Report Question: At Exhibit B1, Tab 2, Schedule 1, page 13, EGI states: "Enbridge Gas recognizes the Board considered and did not change the approach of comparing weather-normalized revenues to weather-actual revenues in the EB-2014-0219 Supplemental Report. The Board’s explanation for not changing the approach was due to the high proportion of electric revenues from fixed charges that are non-weather sensitive.” In the Board’s supplemental report regarding options for funding capital investments, the Board also stated that another reason for keeping the weather actual demand was that KPMG found no “quantitative evidence that the present calculation is resulting in a systematic bias in the materiality threshold formula, resulting in a misspecification of the amount of capital that is reflected in rates.” (a) Is EGI leading any evidence in this proceeding regarding a possible systematic bias
in the materiality threshold formula? If so, please provide references to its location in EGI’s application.
(b) If the answer to (a) above is no, why not? Response Enbridge Gas is not leading evidence on this topic. Enbridge Gas recognizes the Board considered and did not change the approach of comparing weather-normalized revenues to weather-actual revenues in the EB-2014-0219 Supplemental Report. In the Supplemental report, the Board also observes that any error introduced is reduced by the proportion of revenues that are from non-weather-sensitive charges

Filed: 2019-04-25 EB-2018-0305 Exhibit I.CME.2 Page 2 of 2
such as the monthly fixed service charge among others (variable charges for non-weather sensitive customer classes, and due to the fact that there is base load consumption even for weather-sensitive customers). As stated in Exhibit B1, Tab 2, Schedule 1, page 13 of the evidence, Enbridge Gas has a considerably higher proportion of volumetric charges that are weather sensitive for general service customers than electric LDCs. If the weather-actual results are used in the calculation, then the year over year weather fluctuations would cause more volatility in the year-over-year ICM threshold amount. Using a weather-normalized approach levels this volatility and provides a more predictable outcome.

Filed: 2019-04-25 EB-2018-0305 Exhibit I.CME.3 Page 1 of 1
ENBRIDGE GAS INC. Answer to Interrogatory from
Canadian Manufacturers &Exporters (CME) Reference: Exhibit B1, Tab 2, Schedule 1, pages 24-25 of 36 Question: At Exhibit B1, Tab 2, Schedule 1, pages 25-26, EGI discusses the Sudbury Replacement Project. (a) Please explain all variances between the approved EB-2017-0180 filing budget and
the budget provided in EGI’s present application. Response Please see Exhibit I.EP.16.
Filed: 2019-04-25 EB-2018-0305 Exhibit I.CME.4 Page 1 of 1
ENBRIDGE GAS INC. Answer to Interrogatory from
Canadian Manufacturers &Exporters (CME) Reference: Exhibit B1, Tab 2, Schedule 1, pages 25-26 of 36 Question: At Exhibit B1, Tab 2, Schedule 1, pages 25-26, EGI discusses the Kingsville Reinforcement Project (a) Please confirm whether the current cost projections are still $121.4 million for the
Kingsville Reinforcement project? (b) To the extent that the cost projections have changed, please provide the current cost
projections, and explain all variances. Response a-b) Please see Exhibit I.EP.16.

Filed: 2019-04-25 EB-2018-0305 Exhibit I.CME.5 Page 1 of 1
ENBRIDGE GAS INC. Answer to Interrogatory from
Canadian Manufacturers &Exporters (CME) Reference: Exhibit D1, Tab 1, Schedule 1, page 2 of 86 Question: At Exhibit D1, Tab 1, Schedule 1, page 2, EGI has provided a report by Ipsos Public Affairs. (a) The report is labelled as a “Draft Report”. Was a final report produced by Ipsos? If
so, please file it as part of this proceeding. If not, why not? (b) When were the final reports by Ipsos and Innovative Research Group Inc. delivered
to Enbridge and Union respectively? (c) Please outline how the results of the reports were incorporated in the development
of Enbridge and Union’s (or EGI’s) business planning. Are there any specific projects or investments which were scheduled or postponed as the result of the customer consultations, if so, which projects or investments were they?
Response (a) EGD’s customer engagement study was conducted by Ipsos and a report of the
findings was provided to the company in August 2017. The report was final at the time and was titled as draft as it was an expectation that a customer engagement study would be an ongoing endeavor within utility business planning.
(b) Both customer engagement reports were delivered in August 2017. (c) Please see Exhibit I.STAFF.33.

Filed: 2019-04-25 EB-2018-0305 Exhibit I.ENGLP.1 Page 1 of 2
ENBRIDGE GAS INC. Answer to Interrogatory from
EPCOR Natural Gas Limited Partnership (ENGLP) Reference: Exhibit B1, Tab 1, Schedule 1, p. 40 and Appendix H Preamble: Appendix H is filed in response to a commitment by Enbridge (in its 2017
ESM Proceeding (EB-2018-0131) to file evidence about the refined feasibility analysis approach for residential infill customers (p. 40).
Appendix H: (a) is said to apply to the “EGD Rate Zone”; (b) purports to address “key elements of the Company policy under the Community Expansion framework as approved by the Board in E-2016-0004 ...”; and (c) sets out Enbridge’s procedures and policies to comply with EBO 188. Further, paragraph 10 on page 3 of 8 of Appendix H states that “Where the use of a proposed facility is dominated by a single large volume customer, it is conserved a dedicated facility for CIAC purposes.”
Question: (a) Please advise whether this policy applies to the Union Rate Zone as well. (b) Please advise whether this policy would apply to customers connecting to transmission (as opposed to distribution) assets. (c) Could paragraph 10 noted in the preamble above apply to a “facility” connecting to a
transmission (as opposed to a distribution) asset? Please provide a definition of “dominant customer”.
Response (a) No. Please see Exhibit I.STAFF.2, part (e).
(b) The enhancements were made to ensure compliance with the distribution system guidelines laid out in EBO 188. Cost estimation for transmission projects has not been affected by this change.

Filed: 2019-04-25 EB-2018-0305 Exhibit I.ENGLP.1 Page 2 of 2
c) As explained in (b) above, this Policy only applies to connecting to distribution customers. Dominant Customer is a term used to describe a situation when a pipe is extended to serve multiple customers and where one of the customers’ peak demand consumes more than 75% of the capacity of the line.

Filed: 2019-04-25 EB-2018-0305 Exhibit I.EP.1 Page 1 of 1
ENBRIDGE GAS INC. Answer to Interrogatory from
Energy Probe Research Foundation (EP) Reference: Exhibit A1, List of Evidence Question: a) Please confirm the Application conforms fully to the OEB’s EB-2017-0307 MAADs
Decision and Rate Order. b) If not, please list all items with evidentiary references, that deviate from the
Decision and Rate Order. c) Please provide a summary of the basis of any of the listed deviations. Response a-c) Confirmed. Please see Exhibit I.CCC.4.

Filed: 2019-04-25 EB-2018-0305 Exhibit I.EP.2 Page 1 of 1
ENBRIDGE GAS INC. Answer to Interrogatory from
Energy Probe Research Foundation (EP) Reference: Exhibit A1 Question: Please provide the most recent EGI organization chart down to the Director level. Response Please see Exhibit I.CCC.3.

Filed: 2019-04-25 EB-2018-0305 Exhibit I.EP.3 Page 1 of 2 Plus Attachment
ENBRIDGE GAS INC. Answer to Interrogatory from
Energy Probe Research Foundation (EP) Reference: Exhibit A1, Tab 5, Schedule 2, Conditions of Service Section 6.4.1: Exhibit
A1, Tab 5, Schedule 4. Preamble: “Federal Carbon Charge Pursuant to the Greenhouse Gas Pollution Pricing Act (GGPPA), gas distributors are required to pay to the federal government a fixed carbon charge for use and deliveries of natural gas to customers. This charge is billed based on the amount of natural gas consumed by customers other than industrial emitters who are registered under the GGPPA Output-Based Pricing System (OBPS). For any fixed carbon and OBPS charges that Enbridge must pay to the federal government for its transmission and storage facilities, these charges are included in the “Delivery to You” item on the bill. Question: a) Please confirm (with reference) the Decision/Directive to include the Federal
Carbon Charge in the “Delivery to You” item of the Customer Bill. b) Clarify if/how this Directive differs to the presentation of the prior Cap and Trade
GHG item. c) Please provide an estimate of the amounts of the charge (monthly/yearly) for
Residential Customers in EGD and Union Rate Zones and compare to the 2017/2018 Cap and Trade charge.
Response a) On January 11, 2019 Enbridge Gas filled an application with the Board related to the
Federal Carbon Pricing Program.1 Enbridge has requested approval from the Board to add Federal Carbon Charge as a separate line item on customer bills, which will reflect the charge on the customers natural gas use / consumption. Enbridge has also requested approval from the Board to add a Facility Carbon Charge, which will
1 EB-2018-0187/EB-2018-0205

Filed: 2019-04-25 EB-2018-0305 Exhibit I.EP.3 Page 2 of 2 Plus Attachment
reflect the charge on company use volumes and costs related to the Output Based Pricing System (“OBPS”) for the Company’s transmission and storage facilities. Enbridge Gas has proposed that the Facility Carbon Charge would be included in the “Delivery to You” item on the customer bill. At this time, there is no Decision/Directive related to how the federal carbon charge would be shown on the bill. However, the Minister of Energy, Northern Development and Mines encouraged the Board in a letter issued on February 20, 2019 to ensure a transparent process around the implementation of the federal carbon charge on natural gas bills that provided opportunity to consider stakeholder input. Subsequently, on April 3, 2019, the Board issued its procedural order on the federal carbon charge which includes the opportunity for stakeholder comment around the bill presentment matter.
b) See response to a). For clarity, the Board made a decision in Cap and Trade that the customer and facility related costs associated with that program would be included within the “Delivery to You” line item.2
c) Please see Attachment 1.
2 EB-2015-0363 OEB Determination regarding Billing of Cap and Trade Related Costs and Customer Outreach, July 28, 2016, page 5.

ENBR
IDG
E G
AS IN
C.
Typi
cal R
esid
entia
l Bill
Impa
ct o
f the
Pro
pose
d Fe
dera
l Car
bon
Pric
ing
Prog
ram
and
the
2017
/201
8 C
ap-a
nd-T
rade
Com
plia
nce
Plan
Line
N
o.
Parti
cula
rs ($
)R
ate
(cen
ts/m
3 )Ja
nuar
yFe
brua
ryM
arch
April
May
June
July
Augu
stSe
ptem
ber
Oct
ober
Nov
embe
rD
ecem
ber
Annu
al T
otal
(a)
(b)
(c)
(d)
(e)
(f)(g
)(h
)(i)
(j)(k
)(l)
(m)
(n) =
sum
(b:m
)EG
D R
ate
Zone
Rat
e 1
1C
onsu
mpt
ion
Volu
mes
(m3 )
419
404
354
252
158
6951
5458
9117
431
62,
400
2Pr
opos
ed F
eder
al C
arbo
n C
harg
e (1
)3.
9100
16.3
815
.80
13.8
49.
856.
182.
701.
992.
112.
273.
566.
8012
.36
93.8
43
Prop
osed
Fac
ility
Car
bon
Cha
rge
(1)
0.00
360.
020.
010.
010.
010.
01-
--
--
0 .01
0.01
0.08
4To
tal
3.91
3616
.40
15.8
113
.85
9.86
6.19
2.70
1.99
2.11
2.27
3.56
6.81
12.3
793
.92
5C
ap-a
nd-T
rade
Cus
tom
er-R
elat
ed C
harg
e (2
)3.
3181
13.9
013
.41
11.7
58.
365.
242.
291.
691.
791.
923.
025.
7710
.49
79.6
36
Cap
-and
-Tra
de F
acilit
y-R
elat
ed C
harg
e (2
)0.
0337
0.14
0.14
0.12
0.08
0.05
0.02
0.02
0.02
0.02
0.03
0.06
0.11
0.81
7To
tal
3.35
1814
.04
13.5
511
.87
8.44
5.29
2.31
1.71
1.81
1.94
3.05
5.83
10.6
080
.44
Uni
on R
ate
Zone
sR
ate
01 a
nd R
ate
M1
8C
onsu
mpt
ion
Volu
mes
(m3 )
385
403
332
200
114
6448
4648
106
158
295
2,20
09
Prop
osed
Fed
eral
Car
bon
Cha
rge
(3)
3.91
0015
.05
15.7
412
.99
7.83
4.47
2.49
1.89
1.81
1.89
4.13
6.19
11.5
386
.01
10Pr
opos
ed F
acilit
y C
arbo
n C
harg
e (3
)0.
0084
0.03
0.03
0.03
0.02
0.01
0.01
- -
-0.
010.
010.
020.
1711
Tota
l3.
9184
15.0
815
.77
13.0
27.
854.
482.
501.
891.
811.
894.
146.
2011
.55
86.1
8
12C
ap-a
nd-T
rade
Cus
tom
er-R
elat
ed C
harg
e (4
)3.
3181
12.7
713
.36
11.0
26.
643.
802.
121.
611.
531.
613.
505.
269.
7873
.00
13C
ap-a
nd-T
rade
Fac
ility-
Rel
ated
Cha
rge
(4)
0.02
400.
090.
100.
080.
050.
030.
020.
010.
010.
010.
030.
040.
070.
5414
Tota
l3.
3421
12.8
613
.46
11.1
06.
693.
832.
141.
621.
541.
623.
535.
309.
8573
.54
Not
es:
(1)E
B-20
18-0
187/
EB-2
018-
0205
, Exh
ibit
E, T
ab 1
, Sch
edul
e 1,
p.3
.(2
)EB-
2016
-030
0, D
ecis
ion
and
Rat
e O
rder
, App
endi
x D
, p. 1
.(3
)EB-
2018
-018
7/EB
-201
8-02
05, E
xhib
it E,
Tab
2, S
ched
ule
1, p
.3.
(4)E
B-20
16-0
296,
Rat
e O
rder
, App
endi
x A,
p. 1
, col
umn
(c),
lines
13
& 14
and
p. 7
, col
umn
(c),
lines
6 &
7.
Filed: 2019-04-25 EB-2018-0305 Exhibit I.EP.3 Attachment 1
Page 1 of 1

Filed: 2019-04-25 EB-2018-0305 Exhibit I.EP.4 Page 1 of 2
ENBRIDGE GAS INC. Answer to Interrogatory from
Energy Probe Research Foundation (EP) Reference: Exhibit B1, Tab 1, Schedule 1, Pages 3 and 5, Tables 2 and 3 Question: Please provide a copy of the Statistics Canada Table 36-10-0106-01 (formerly Can Sim 380-066) GDPPI quarterly for 2017 and 2018 a) Please provide the calculations resulting in the values in Table 3. b) Please provide the equivalent calculations for 2018. c) Please provide a version of Table 2 using the 2018 Inflation Factor. Response The GDP IPI FDD quarterly index for the years 2017 and 2018 obtained from the Statistics Canada Table 36-10-0106-01 are summarized in tables below for both parts a) and b) of the answer: a) Annual % Change in GDP IPI FDD for 2017:
Year Quarter Index
Year Over Year
Change Annual %
Average %
Change 2016 Q1 116.5 2016 Q2 116.4
2016 Q3 116.9
2016 Q4 117.5
2017 Q1 118.0 1.5 1.29% 2017 Q2 118.5 2.1 1.80% 2017 Q3 118.2 1.3 1.11% 2017 Q4 119.0 1.5 1.28% 1.37%

Filed: 2019-04-25 EB-2018-0305 Exhibit I.EP.4 Page 2 of 2
b) Annual % Change in GDP IPI FDD for year 2018
Year Quarter Index
Year Over Year
Change Annual %
Average %
Change 2017 Q1 108.0 2017 Q2 108.5
2017 Q3 108.3
2017 Q4 109.0
2018 Q1 109.4 1.4 1.30% 2018 Q2 109.9 1.4 1.29% 2018 Q3 110.6 2.3 2.12% 2018 Q4 111.1 2.1 1.93% 1.66%
c) The calculated Price Cap Index using the 2018 Inflation factor is shown below:
Price Cap Index Inflation factor 1.66% Less: Productivity Factor 0.00% Less: Stretch Factor 0.30% Price Cap Index 1.36%

Filed: 2019-04-25 EB-2018-0305 Exhibit I.EP.5 Page 1 of 4
ENBRIDGE GAS INC. Answer to Interrogatory from
Energy Probe Research Foundation (EP) Reference: Exhibit B1, Tab 1, Schedule 1, Page 12- AUTVA (Enbridge) and NAC (Union); Question: EGD Rate Zones Exhibit F1, Tab 1, Rate Order, Working Papers, Schedule 10
a) Please show Graphically, for Rate 1 and Rate 6, the average use for the last 10 years and for the forecast period. Please provide a comment on the accuracy of the model and trends.
b) Please provide a status report on the review of Average Use models for EGD as agreed in the EB-2017-102, Settlement at Exhibit N1, Tab 1, Schedule 1, page 8
Union Rate Zones Exhibit F1, Tab 2, Rate Order, Working Papers, Schedule 13.
c) Please show Graphically for Rate M1 and M2, the average use for the last 10 years and for the forecast period. Please provide a Comment on the accuracy of the model and trends.
d) Please provide a status report on the review of Average Use models for Union as in the EB-2016-0118 Settlement paragraph 12.
Response a) The Rate 1 and 6 average uses that are normalized to 2019 Board approved degree
days are shown in the charts below. The 2019 forecast is developed using the data up to 2017. During the last 10 years
Rate 1 average use declined 9.3% from 2,708 m3 in 2008 to 2,457 m3 in 2017. Rate 6 in the same period increased 13.9% from 25,551 m3 in 2008 to 29,102 m3 in 2017. For accuracy results, please see Exhibit I.STAFF.5, part a) Table 1, which provides the 10-Year history of Normalized Actual vs. Board-Approved average

Filed: 2019-04-25 EB-2018-0305 Exhibit I.EP.5 Page 2 of 4
uses. Out-of-sample average percentage variance over the last 10 years is -0.5% for Rate 1 and 0.5% for Rate 6. The results support the view that the General Service average use forecasting methodology continues to be a reliable predictor for General Service average use.

Filed: 2019-04-25 EB-2018-0305 Exhibit I.EP.5 Page 3 of 4
b) As per the Board’s Decision and Order in the MAADs and Rate Setting Mechanism
proceeding, Enbridge Gas will develop a proposal for the average use methodology for its next rebasing application.1
c) The weather normalized average use at the 2019 Board approved normal, for Rate
M1 and Rate M2 are shown in the charts below. Over the last 10 years, Rate M1 NAC declined 8.0% from 3,007 m3 in 2008 to 2,767
m3 in 2017. Rate M2 NAC for the same period decreased 10.2% from 186,068 m3 in 2008 to 167,039 m3 in 2017.
When adjusting rates each year for changes to NAC, Union applies the most recent
actual NAC for each rate class, calculated using the Board-approved 50:50 weather normal for the forecast year. For 2019 rates, 2017 actual NAC calculated using the 2019 weather normal is used for each rate class.
Because of actual customer behavior in each rate class, there has been some
variability from year to year in the actual NAC, with an overall declining trend. Enbridge Gas is currently evaluating methodologies regarding NAC forecasting, and will file a proposal with its next rebasing application.
1 EB-2017-0306/EB-2017-0307 Decision and Order, dated August 30, 2018.

Filed: 2019-04-25 EB-2018-0305 Exhibit I.EP.5 Page 4 of 4
d) Please see the response to part b).
Filed: 2019-04-25 EB-2018-0305 Exhibit I.EP.6 Page 1 of 2
ENBRIDGE GAS INC. Answer to Interrogatory from
Energy Probe Research Foundation (EP) Reference: Exhibit B1, Tab 1, Schedule 1, Page 14, Table 4, Appendices A&B Question: a) Please provide a redline comparison of the existing EGDI and Union ESM DAs and
new EGDI ESMDA.
b) Please explain in detail the changes to the dead band threshold and sharing for each Rate Zone.
c) Please provide examples of the ESM calculations for 2019 using 0 -300 bps excess earnings
Response a) Enbridge Gas’s ESMDA is a new deferral account, distinct from the earnings sharing
mechanism deferral accounts used prior to 2019 for each of the legacy utilities. It is not an update of the existing EGD and UGL ESMDAs, therefore a redline comparison has not been attached. Please see Exhibit I.STAFF.19 for a revised Enbridge Gas ESMDA accounting order.
b) Commencing in 2019, Enbridge Gas will calculate earnings sharing based on the utility results for the amalgamated company. In accordance with the MAADs decision, earnings sharing will be calculated on actual utility results (not normalized), and earnings in excess of 150 basis points above the Board approved ROE will be shared 50/50 between ratepayers and the Company. Under EGD’s 2014 – 2018 Custom IR plan, if the actual utility ROE, calculated on a weather normalized basis, was greater than the Board approved ROE, the excess earnings were shared 50/50 between ratepayers and EGD. Under Union’s 2014 – 2018 Price Cap plan, if the difference between the actual (not normalized) utility ROE and the Board approved ROE was greater than 100 basis

Filed: 2019-04-25 EB-2018-0305 Exhibit I.EP.6 Page 2 of 2
points, but less than 200 basis points, the excess earnings were shared 50/50 between ratepayers and Union. If the difference between the actual utility ROE and the Board approved ROE exceeded 200 basis points, the excess over 200 basis points was shared 90/10 between ratepayers and Union.
c) The requested information is not relevant to the relief being sought. Enbridge Gas does not have a combined ESM calculation model at this time.
Filed: 2019-04-25 EB-2018-0305 Exhibit I.EP.7 Page 1 of 1
ENBRIDGE GAS INC. Answer to Interrogatory from
Energy Probe Research Foundation (EP) Reference: Exhibit B1, Tab 1, Schedule 1, Page 26; Exhibit F1, Tab 2, Rate Order,
Working Papers, Schedule 16, pp. 4-5. Preamble: “Enbridge Gas proposes a one-time adjustment of ($10.4) million associated
with the capital pass through projects (“Projects”) that were included in rates as a Y factor during Union’s 2014-2018 IRM term. The proposed adjustment represents the difference between the 2018 Project revenue requirement of $127.6 million included in Union’s Board-approved 2018 rates and the 2019 forecast Project revenue requirement of $117.2 million.”
Question: a) Please confirm that the costs of the projects and adjustments are subject to
prudence review.
b) When will this review occur? Response a) Not confirmed, the one-time adjustment is not subject to a prudence review. b) Any prudence review of the final capital pass through capital expenditures should
take place at rebasing.

Filed: 2019-04-25 EB-2018-0305 Exhibit I.EP.8 Page 1 of 1
ENBRIDGE GAS INC. Answer to Interrogatory from
Energy Probe Research Foundation (EP) Reference: Exhibit B1, Tab 1, Schedule 1, Page 29 Preamble: “Enbridge Gas has added 30,393 GJ/d of project demands to the allocation
of the 2019 project costs and to the derivation of the 2019 Rate M12/C1 Dawn-Parkway demand rate as part of this application. As the revenue of the surplus capacity will be built into 2019 rates, there is no longer a requirement to track the revenue associated with the surplus capacity in the project deferral account.”
Question: a) Please provide a schedule with the term(s) and prices realized for the surplus
capacity (names other than EGI affiliates omitted). b) Please provide a Comparison of the annual revenue and average unit costs to the
M12/C1 rates. c) Please provide references for data/calculations. Response
a) Please see Exhibit I.STAFF.11, part (a). b) Please see Exhibit I.STAFF.11, part (f). c) Please see Exhibit I.STAFF.11, part (f).

Filed: 2019-04-25 EB-2018-0305 Exhibit I.EP.9 Page 1 of 2
ENBRIDGE GAS INC. Answer to Interrogatory from
Energy Probe Research Foundation (EP) Reference: Exhibit B1, Tab 1, Schedule 1, Page 30, Table 11 and Appendix E Preamble: “Enbridge Gas proposes to adjust the customer-related cost variance for the
Union rate zones in proportion to the current approved revenue, assuming the monthly customer charge revenue is recovered in the first delivery block of the volumetric delivery charges.”
Question: a) Please provide clarity on the pathway and endpoint for M1 and M2 customer
charges over the 5-year period.
b) Please explain how is it appropriate in the context of rate design principles, that by adjusting the first delivery rate block to include the monthly customer charge revenue, the bill impacts are more consistent for each customer within the rate class regardless of annual volumes consumed.
c) Are there similar rate design/customer charge changes contemplated for EGDI Rate
zones? Response
a) Enbridge Gas is not proposing any changes to the level of monthly customer charges for Rate M1 and Rate M2 in 2019.
b) By adjusting the first delivery block to include the monthly charge revenue, such revenue is then recovered from all customers, as all customers consume volumes within the first delivery block. This proposal is similar / analogous to the recovery of the monthly customer charge, which is paid by all customers regardless of volumes consumed. The proposal also addresses the significant bill impacts for certain Rate M1 and Rate 01 customers, which is also a rate design consideration.

Filed: 2019-04-25 EB-2018-0305 Exhibit I.EP.9 Page 2 of 2
c) There are no proposed changes to the EGD rate zone monthly customer charges for general service customers in 2019.

Filed: 2019-04-25 EB-2018-0305 Exhibit I.EP.10 Page 1 of 2
ENBRIDGE GAS INC. Answer to Interrogatory from
Energy Probe Research Foundation (EP) Reference: Exhibit B1, Tab 1, Schedule 1, Page 33 and pages 41-46 Appendix I; Exhibit F1, Tab 2, Rate Order, Working Papers, Schedule 11. Preamble: “The MAADs Decision requires Enbridge Gas to track actual costs and
amounts recovered through rates related to the PDO during the deferred rebasing period for review at the time of rebasing.
Enbridge Gas proposes to update the allocation of the PDO and PDCI demand-related costs based on the 2019 Dawn-Parkway design day demands and the allocation of the in-franchise compressor fuel costs based on 2019 forecast volumes.”
Question: a) Please provide a schedule that summarizes the total allocation of 2019 PDO and
PDCI costs and bill impacts for each of the four EGI rate zones, as provided in the evidence at pages 43/44. Provide explanatory notes.
b) When/how will EGI/Union report on the PDCI volumes and balances? c) If there are differences between the forecast in rates and actuals, how will these be
addressed? d) Given the utility restructuring and that:“As of November 1, 2017 the initial Parkway
shortfall has been fully eliminated as a result of Dawn to Kirkwall turnback, and therefore Union did not need to take action to manage the shortfall”.
Why should the PDO continue for the next 5 years? Please discuss. Response a) Please see Table 1.

Filed: 2019-04-25 EB-2018-0305 Exhibit I.EP.10 Page 2 of 2
Table 1
UNION RATE ZONES PDO and PDCI Costs and Residential Bill Impacts
PDO and PDCI
Residential
Costs
Customer
Line
Allocation (1)
Bill Impact (2) No.
Particulars
($000's)
($)
(a)
(b)
1
Union North West
1
0.00 2
Union North East
9
0.03
3
Union South
23,861
8.67 4 Union Ex-franchise – EGD 214 0.06 5
Union Ex-franchise – Other
638
6
Total
24,723
Notes: (1)
The allocation of PDO and PDCI related costs is provided at Exhibit F1, Tab 2,
Working Papers, Schedule 11, p. 1.
(2)
Based on a typical residential customer annual consumption of 2,200 m3 in the Union rate zones and 2,400 m3 in the EGD rate zone.
b) Enbridge Gas does not report on PDCI volumes and balances.
c -d) The Board determined in the MAADs and Rate-Setting Mechanism Decision and
Order that PDO will be reviewed at the time of rebasing.1
1 EB-2017-0306 EB-2017-0307 Decision and Order, September 17, 2018, page 48 and 49.

Filed: 2019-04-25 EB-2018-0305 Exhibit I.EP.11 Page 1 of 2
ENBRIDGE GAS INC. Answer to Interrogatory from
Energy Probe Research Foundation (EP) Reference: Exhibit B1, Tab 1, Schedule 1, Page 40 and Appendix H Preamble: “The MAADs Decision requires Enbridge Gas to track actual costs and
amounts recovered through rates related to the PDO during the deferred rebasing period for review at the time of rebasing.
Enbridge Gas proposes to update the allocation of the PDO and PDCI demand-related costs based on the 2019 Dawn-Parkway design day demands and the allocation of the in-franchise compressor fuel costs based on 2019 forecast volumes.”
Question: a) Is the Feasibility Study filed for Board Approval or information?
b) What changes are there to the Connection Policy Guidelines? Please list any major
amendments. c) Are the Policy/Guidelines applicable to all EGI rate zones?
d) What conclusions should existing ratepayers reach from the feasibility analysis
regarding cost consequences of infill projects and Community Expansion projects? Please discuss.
Response a) Enbridge Gas filed the referenced exhibit for information to the Board in compliance
with its commitment made in the 2017 ESM Proceeding, EB-2018-0131. In this proceeding, Enbridge Gas committed to file evidence about the refined feasibility analysis approach for residential infill customers.
b) The change to the Connection Policy Guidelines can be found in Exhibit B1, Tab 1, Schedule 1, Appendix H, page 2, paragraph 9.
c) Please see Exhibit I.STAFF.2, part e).

Filed: 2019-04-25 EB-2018-0305 Exhibit I.EP.11 Page 2 of 2
d) The new approach for determining the economic feasibility of infill services is intended to improve the accuracy of project feasibility calculations. Accurate project feasibility ensures that under contributing projects pay an appropriate amount of contribution (“CIAC”) without causing undue burden on existing ratepayers, an objective of the Board’s E.B.O.188 guidelines for determining the economic feasibility of gas distribution system expansion. Since the Company’s approach to the determination of the economic feasibility requires system expansion projects to achieve a Profitability Index value of 1.0 or greater there is little, if any, opportunity for existing ratepayers to subsidize the expansion of the Company’s gas distribution system with respect to the addition of new customers. The same holds true for community expansion projects, except that such projects may receive financial assistance from the exiting ratepayers as provided for in Bill 32, the Access to Natural Gas Act, 2018 and its accompanying regulation (Ontario Regulation 24/19).

Filed: 2019-04-25 EB-2018-0305 Exhibit I.EP.12 Page 1 of 2
ENBRIDGE GAS INC. Answer to Interrogatory from
Energy Probe Research Foundation (EP) Reference: Exhibit B1, Tab 2, Schedule 1, Page 9 and Table 4 Preamble: “The Board’s ICM materiality threshold calculation results in a 2019 threshold
value of $468.513 million for the EGD rate zone and $375.2 million for the combined Union rate zones. The materiality threshold establishes the minimum capital expenditures a utility must fund through base rates. The maximum incremental capital investment eligible for ICM funding is the amount of capital expenditures in the year in excess of the threshold value.”
Question: a) Please confirm that per Table 4 the ICM calculation assumes a rate increase for the
PCI for 2019 for EGD of 1.07% and Union of 0.72%.
b) Why is EGI proposing a PCI arithmetic average based in the 5-year deferred rebasing period, as opposed to a forecast of expenditures and base rates over the period? Please explain and discuss the options considered.
c) Please explain why a combined consolidated EGI ICM threshold is not more
appropriate. Response a) The 2019 ICM threshold calculation assumes that, for the EGD rate zone, rates will
increase by 1.07% from its 2018 Board Approved rates. For the Union rate zones, the ICM threshold calculation reflects that rates have been increasing at an average of 0.72% since its 2013 Board Approved rates. Please see Exhibit I.LPMA.12 for the calculation of the average PCI for the Union rate zones.
b) Please refer to:
• Exhibit B1, Tab 2, Schedule 1, Page 10 and Page 11 • Report of the OEB EB-2014-0219 “New Policy Options for the Funding of
Capital Investments: Supplemental Report” January 22, 2016, page 16

Filed: 2019-04-25 EB-2018-0305 Exhibit I.EP.12 Page 2 of 2
• Decision Order: EB-2017-0306/EB-2017-0307, pages 32, 33
The amalgamation and rate setting mechanism approved by the Board for EGD and Union includes the use of the ICM mechanism for the funding of incremental capital.
The ICM materiality threshold formula estimates the threshold value for multiple years ahead of the base year. The multi-year formula requires that both the growth factor “g” and the PCI factor, be annualized. The proposed annualized PCI is calculated as the arithmetic average since the base year.
c) Please see Exhibit I.VECC.7.

Filed: 2019-04-25 EB-2018-0305 Exhibit I.EP.13 Page 1 of 2
ENBRIDGE GAS INC. Answer to Interrogatory from
Energy Probe Research Foundation (EP) Reference: Exhibit B1, Tab 2, Schedule 1, Pages 12 and 13 Preamble: “To determine the 2017 revenue from general service rate classes, Enbridge
Gas used the actual customer count and held the normalized average consumption/average use (“NAC/AU”) per customer constant with the NAC/AU in base rates. If the NAC/AU is not held constant, then any change in NAC/AU would have to be offset by a proportionally similar rate adjustment to keep the revenue per customer constant. Both the EGD and Union rate zones have deferral accounts that record the revenue impact associated with the difference between the forecast normalized average use per customer embedded in rates and the actual normalized average use experienced during the year.”
Question: a) Please confirm that the approved methodology for average use adjustments to rates
includes 3-year averaging.
b) Please explain why average use per customer should be held constant for ICM growth, rather than using a rolling 3-year average.
c) Please provide a revised calculation of the growth factor using an average 3-year rolling average of average use. Compare to Table 5 using the constant/holding average use approach.
Response a) No, the approved methodology for average use adjustments does not include 3 year
averaging for either the EGD or Union Rate Zones. The average use adjustment to rates reflects: • For the EGD rate zone: Rate 1 and Rate 6 customers, the change from the latest
Board-approved average use (2018 Budget) to the 2019 average use forecast

Filed: 2019-04-25 EB-2018-0305 Exhibit I.EP.13 Page 2 of 2
was used. The 2019 forecast was determined using the Board approved methodology.
• For the Union rate zones: Rate M1, Rate M2, Rate 01 and Rate 10, the change from the latest Board approved NAC (2018 Target) to the 2019 Target NAC was used. The 2019 target NAC is based on the latest available actual use (from two years ago) that is normalized to the 2019 weather normal. This methodology was approved during the EB-2013-0202 (Union’s 2014 to 2018 IRM Settlement Agreement) and as subsequently modified in EB-2014-0271 (Union’s 2015 Rates proceeding).
b) The value of the growth factor (“g”) is the % difference in distribution revenues
between the most current year and the base year. The revenues are calculated maintaining the base rate constant. Deferral and Variance Accounts are already in place for NAC and AU for the EGD rate zone and Union rate zones and they respectively to true-up any variances from forecast or target. Enbridge Gas is not proposing that those true-up mechanisms change. Therefore, the growth calculation is net of any AU and NAC changes and the difference in revenue year over year would represent the growth in customers only.
c) As noted in part (b) above, the growth factor is calculated net of average use. Any changes in NAC or AU would be trued up through the deferral and variance accounts and would not impact the growth factor.

Filed: 2019-04-25 EB-2018-0305 Exhibit I.EP.14 Page 1 of 1
ENBRIDGE GAS INC. Answer to Interrogatory from
Energy Probe Research Foundation (EP) Reference: Exhibit B1, Tab 2, Schedule 1, Page 18, Table 8, and Exhibit. B1, Tab 2, Schedule 1, Page 24, Table 8 Preamble: The Schedules show the Total Incremental ICM by rate zone for each of the ICM funded requested projects. Question: Does EGI propose to update the data and will there be a process for discovery regarding material changes in cost and timing. Response Please see Exhibit I.CCC.12.

Filed: 2019-04-25 EB-2018-0305 Exhibit I.EP.15 Page 1 of 1
ENBRIDGE GAS INC. Answer to Interrogatory from
Energy Probe Research Foundation (EP) Reference: Exhibit B1, Tab 2, Schedule 1, Page 31, Table 11 Question: a) Please confirm that over the 5 years the net ICM annual revenue requirement (costs
and revenue) will vary, based on several factors including timing and the dates of in-service additions (ISAs).
b) Does EGI agree that an ISA RR deferral account for ICM projects, is appropriate to
protect ratepayers. If not, please explain why not and/or provide alternatives to an ICM RRVA
Response a) The Company confirms that the annual revenue requirement for each ICM project
could vary from forecast for a number of reasons, which could include variances in the project’s costs capitalized into service, and variances in the project’s in-service timing.
b) Enbridge Gas has requested an Incremental Capital Module (ICM) Deferral Account for each of the EGD and Union rate zones as per Board policy. As indicated at Exhibit B1, Tab 1, Schedule 1, Page 16, and in each of the draft accounting orders found at Exhibit B1, Tab 1, Schedule 1, Appendix A, page 33, and Appendix B, page 34, the purpose of each of the accounts is to capture any variances between the actual revenue requirement of approved ICM projects and the actual ICM revenues collected through ICM rates. Given the scope of the proposed ICM deferral accounts, to compare actual ICM project revenue requirements against actual ICM revenues, the impact of any variances in-service addition amounts or timing (from forecast), each of which impact the actual project revenue requirement, will be one of the impacts captured within the ICM deferral accounts.

Filed: 2019-04-25 EB-2018-0305 Exhibit I.EP.16 Page 1 of 6
ENBRIDGE GAS INC. Answer to Interrogatory from
Energy Probe Research Foundation (EP) Reference: Exhibit B1, Tab 2, Schedule 1, Pages 19 to 27 Question: a) For each of the proposed ICM projects, please provide the detailed itemized cost
estimate including contingency with line by line explanations of differences from the costs approved by the OEB in the LTC proceeding. For each project please provide the current Profitability Index (“PI”) and compare it to the PI approved by the OEB in the LTC proceeding. Also please indicate if there have been any changes in the route or schedule of any project from the route and schedule approved by the OEB in the LTC proceeding.
b) For each proposed ICM project where there is a significant difference between the
cost, PI and route approved by the OEB in the LTC proceeding and the current cost, PI, and route please explain the meaning of the approvals in the LTC proceeding. For example, should not project cost above what was approved in the LTC proceeding be subject to a prudence review?
c) Please recalculate each ICM proposal using project cost approved by the OEB in the
LTC proceeding. Response a) Don River Replacement
The table below shows the estimated costs provided in the LTC application and the current cost projections.

Filed: 2019-04-25 EB-2018-0305 Exhibit I.EP.16 Page 2 of 6
Variances in estimated costs relative to what was filed in the LTC application can be attributed to an increase in the cost related to the required permanent and temporary working easements for the project and the inclusion of indirect overhead costs. Interest during construction was not included in the costs presented in the LTC application. These costs have been included in the “Cost as Filed in EB-2018-0108” column and Contingency Costs have been reduced by an equivalent amount to maintain the overall cost presented in the LTC application. The table below shows the estimated schedule provided in the LTC application and the current schedule.
The current projected in-service date has changed from October 2019 to December 2019 due to delays in receipt of permits and easements which have caused a delay in construction commencement. The routing of the proposed facilities has not changed from the route identified in the LTC application. A DCF analysis was not completed for the Don River Replacement project and therefore no PI calculation is available for this project.
Item No. Description Cost As Filed in EB-2018-0108 Updated Cost Estimate Variancea b b-a
1.0 Material Costs $710,107 $710,107 $02.0 Labour Costs $17,060,285 $17,060,285 $03.0 External & Regulatory Costs $860,000 $1,433,528 $573,5284.0 Land Costs $301,000 $2,264,746 $1,963,7465.0 Overhead Costs $759,000 $9,989,358 $9,230,3586.0 Interest During Construction $208,255 $209,093 $8387.0 Contingency Costs $5,698,892 $3,687,764 ($2,011,128)8.0 Total Project Cost $25,597,539 $35,354,881 $9,757,342
Description Schedule As Filed in EB-2018-0108 Updated ScheduleExpected LTC Approval December 2018 November 2018Reciept of Permits and Approvals December 2018 April 2019Commence Construction January 2019 May 2019Completion of Construction September 2019 November 2019Completion of Reinstatement October 2019 December 2019Final Inspection December 2020 January 2021

Filed: 2019-04-25 EB-2018-0305 Exhibit I.EP.16 Page 3 of 6
Sudbury Replacement The table below shows the estimated costs provided in the LTC application and the current cost projections.
Variances in estimated costs relative to what was filed in the LTC application can be attributed to the inclusion of indirect overhead costs and an increase in contractor costs due to design changes, inclement weather and construction execution. The table below shows the estimated schedule provided in the LTC application and the current schedule.
There were no significant changes to the project schedule for the Sudbury Replacement project. The routing of the proposed facilities did not change from the route identified in the LTC application. A DCF analysis was not completed for the Sudbury Replacement project and therefore no PI calculation is available for this project. Kingsville Reinforcement The table below shows the estimated costs provided in the LTC application and the current cost projections.
Item No. Description Cost As Filed in EB-2018-0180 Updated Cost Estimate Variancea b b-a
1.0 Materials $5,379,000 $5,379,000 $02.0 Construction & Labour $58,361,000 $67,261,000 $8,900,0003.0 Contingencies $9,561,000 $9,561,000 $04.0 Interest During Construction $756,000 $756,000 $05.0 Overheads $12,300,000 $12,300,0006.0 Total Project Cost $74,057,000 $95,257,000 $21,200,000
Description Schedule As Filed in EB-2018-0180 Updated ScheduleOEB Filing May 2017 May 2017OEB Decision September 2017 September 2017Construction Start May 2018 April 2018In Service November 2018 October 2018

Filed: 2019-04-25 EB-2018-0305 Exhibit I.EP.16 Page 4 of 6
Variances in estimated costs relative to what was filed in the LTC application can be attributed to the inclusion of indirect overhead costs. The table below shows the estimated schedule provided in the LTC application and the current schedule.
There have been no changes to the project schedule/in-service date since the original LTC application was filed. The routing of the proposed facilities has not changed from the route identified in the LTC application.
A revised DCF analysis (per EBO 134) has not been completed. The pre-filed evidence for the Kingsville Reinforcement project showed that the project had a positive NPV of between $341 million and $697 million. The increase in costs due to the inclusion of overheads would not have a significant impact on the NPV of the project. Stratford Reinforcement The table below shows the estimated costs provided in the LTC application and the current cost projections.
Item No. Description Cost As Filed in EB-2018-0013 Updated Cost Estimate Variancea b b-a
1.0 Materials $7,725,000 $7,725,000 $02.0 Construction & Labour $82,931,000 $82,931,000 $03.0 Contingencies $13,598,000 $13,598,000 $04.0 Interest During Construction $1,462,000 $1,462,000 $05.0 Overheads $15,700,000 $15,700,0006.0 Total Project Cost $105,716,000 $121,416,000 $15,700,000
Description Schedule As Filed in EB-2018-0013 Updated ScheduleOEB Filing January 2018 January 2018OEB Decision September 2018 September 2018Clearing March 2019 March 2019Construction Start May 2019 May 2019In Service November 2019 November 2019

Filed: 2019-04-25 EB-2018-0305 Exhibit I.EP.16 Page 5 of 6
There have been no changes to estimated project costs since the LTC was filed. Indirect overhead costs were included in the costs filed in the LTC application. The table below shows the estimated schedule provided in the LTC application and the current schedule.
There have been no changes to the project schedule/in-service date since the LTC was filed. The routing of the proposed facilities has not changed from the route identified in the LTC application. Since there are no changes in estimated project costs the DCF analysis (per EBO 134) for the Stratford Reinforcement project has not been updated since the filing of the LTC application.
b) Enbridge Gas interprets the approval associated with LTC applications, Board
findings in the MAADs Decision, and the Board’s ICM Policy as allowing for a prudence review of leave to construct projects and other projects for which ICM treatment is sought at the time of rebasing limited to the difference between forecasted and actual spend. For example, the Board’s ICM Policy states under section 7.4:
At the time of the next cost of service or Custom IR application, a distributor will need to file calculations showing the actual ACM/ICM amounts to be incorporated into the test year rate base. At that time, the Board will make a determination on the treatment of any difference between forecasted and actual capital spending under the ACM/ICM, if applicable, and the amounts recovered through ACM/ICM rate riders and what should have been recovered in the historical period during the
Item No. Description Cost As Filed in EB-2018-0306 Updated Cost Estimate Variancea b b-a
1.0 Materials $2,997,000 $2,997,000 $02.0 Construction & Labour $21,620,000 $21,620,000 $03.0 Contingencies $3,623,000 $3,623,000 $04.0 Interest During Construction $300,000 $300,000 $05.0 Total Project Cost $28,540,000 $28,540,000 $0
Description Schedule As Filed in EB-2018-0306 Updated ScheduleOEB Filing November 2018 November 2018OEB Decision April 2019 March 2019Construction Start May 2019 May 2019In Service November 2019 November 2019

Filed: 2019-04-25 EB-2018-0305 Exhibit I.EP.16 Page 6 of 6
preceding Price Cap IR plan term. Where there is a material difference between what was collected based on the approved ACM/ICM rate riders and what should have been recovered as the revenue requirement for the approved ACM/ICM project(s), based on actual amounts, the Board may direct that over- or under-collection be refunded or recovered from the distributor’s ratepayers.1
c) The table below shows the forecast annual revenue requirement for each of the
proposed ICM projects: assuming the capital costs approved for each project in their respective LTC proceedings, and assuming the cost reduction (generally due to the exclusion of indirect overhead and/or IDC) results in a corresponding reduction in the maximum eligible incremental capital of the applicable rate zone (i.e., reduces the ICM amount). Enbridge Gas notes however, that while these calculations can be made for illustrative purposes, the reclassification/reassignment of certain costs from these projects does not change the total forecast in-service capital for 2019. As such, to the extent that costs apportioned to these projects are reduced, reducing the project specific ICM eligible amount, it may in turn create capacity for another ICM eligible project.
1 Ontario Energy Board, EB-2014-0219, Report of the Board, New Policy Options for the Funding of Capital Investments: The Advanced Capital Module, page 26.
Total Incremental Revenue Requirement by Rate ZoneUsing Project Cost Approved by the OEB in LTC
Line No. Particulars ($000's) 2019 2020 2021 2022 2023
EGD Rate Zone1 Don River Replacement (26) 335 386 383 380
Union North Rate Zone2 Sudbury Replacement 7,690 7,720 7,617 7,509 7,396
Union South Rate Zone3 Kingsville Reinforcement (693) 8,859 9,097 9,187 9,245 4 Stratford Reinforcement (766) 2,146 2,221 2,249 2,267 5 Total Union South Rate Zone (1,459) 11,005 11,318 11,436 11,512
6 Total Incremental Revenue Requirement 6,205 19,060 19,321 19,328 19,288
Filed: 2019-04-25 EB-2018-0305 Exhibit I.EP.17 Page 1 of 1 Plus Attachment
ENBRIDGE GAS INC. Answer to Interrogatory from
Energy Probe Research Foundation (EP) Reference: Exhibit B1, Tab 2, Schedule 1, Page 32 Question: Based on the response to EP-16 regarding updated ICM project costs and timing, please update the 2019 ICM Net Revenue Requirement in Table 11 and the Allocation to Rate classes for 2019. Response Please see Exhibit I.EP.16, part c) for the incremental revenue requirement by rate zone as updated to reflect the leave to construct project costs approved by the Board. Attachment 1 provides the allocation of 2019 project costs reflected in Exhibit I.EP.16, part c).

Delivery Demand Don RiverTP > 4" Replacement
Line Allocator (1) Project (2)No. Particulars % (000's)
(a) (b)
EGD
1 Rate 1 46% -2 Rate 6 41% -3 Rate 9 0% -4 Rate 100 0% -5 Rate 110 2% -6 Rate 115 1% -7 Rate 125 8% -8 Rate 135 0% -9 Rate 145 0% -
10 Rate 170 0% -11 Rate 200 1% -12 Rate 300 0% -
13 Total 100% -
Notes:(1) EGD extra high pressure mains greater than 4 inch diameter are allocated according
to the Board approved cost allocation methodology (EB-2017-0086),Delivery Demand TP > 4 inch allocator, reflecting 2019 forecast peak demand by rate class.
(2) 2019 ICM revenue requirement credit balance associated with the Don RiverReplacement project in the EGD rate zone will be recovered in 2020.
EGD RATE ZONEAllocation of 2019 ICM Project Revenue Requirement
Updated for Exhibit I.EP.17
Filed: 2019-04-25 EB-2018-0305 Exhibit I.EP.17
Attachment 1 Page 1 of 2

Distribution Sudbury Other Kingsville Stratford TotalDemand Replacement Transmission Reinforcement Reinforcement ICM
Line Allocator (1) Project (2) Allocator (3) Project (4) Project (4) AllocationNo. Particulars (%) ($000's) (103m3/d) ($000's) ($000's) ($000's)
(a) (b) (c) (d) (e) (f) = (b+d+e)
1 Rate 01 40 3,078 - - - 3,0782 Rate 10 13 1,006 - - - 1,0063 Rate 20 27 2,052 - - - 2,0524 Rate 25 2 185 - - - 1855 Rate 100 18 1,369 - - - 1,3696 Total Union North 100 7,690 - - - 7,690
7 Rate M1 - - 31,974 - - -8 Rate M2 - - 10,986 - - -9 Rate M4 (F) - - 5,860 - - -
10 Rate M4 (I) - - - - - -11 Rate M5 (F) - - 87 - - -12 Rate M5 (I) - - - - - -13 Rate M7 (F) - - 2,496 - - -14 Rate M7 (I) - - - - - -15 Rate M9 - - 546 - - -16 Rate M10 - - 4 - - -17 Rate T1 (F) - - 2,572 - - -18 Rate T1 (I) - - - - - -19 Rate T2 (F) - - 23,429 - - -20 Rate T2 (I) - - - - - -21 Rate T3 - - 2,501 - - -22 Total Union South - - 80,456 - - -
23 Excess Utility Storage - - - - - -24 Rate C1 (F) - - - - - -25 Rate C1 (I) - - - - - -26 Rate M12 - - - - - -27 Rate M13 - - - - - -28 Rate M16 - - - - - -29 Total Ex-Franchise - - - - - -
30 Total Union 100 7,690 80,456 - - 7,690
Notes:(1) Union North distribution demand allocation for joint-use mains in proportion to 2019 forecast peak day and average day demands.(2) Allocated in proportion to column (a).(3) Union South other transmission demand allocation in proportion to forecast 2019 Union South in-franchise design day demands.(4) The 2019 revenue requirement credit for the Kingsville and Stratford Reinforcement projects will be netted with the 2020 revenue requirement
in the allocation to rate classes in 2020.
Allocation of 2019 ICM Project Revenue RequirementUpdated for Exhibit I.EP.17
Union North Union South
UNION RATE ZONES
Filed: 2019-04-25 EB-2018-0305 Exhibit I.EP.17
Attachment 1 Page 2 of 2

Filed: 2019-04-25 EB-2018-0305 Exhibit I.EP.18 Page 1 of 2
ENBRIDGE GAS INC. Answer to Interrogatory from
Energy Probe Research Foundation (EP) Reference: Exhibit C1, Tab 1, Page 6 and C1, Tab2, Page 41 Preamble: “Examples of this include support for programs such as Renewable Natural Gas, Compressed Natural Gas, and the integration of gas and electric infrastructures using technology like combined heat and power, geothermal loops and hydrogen storage and blending.” Question: Please confirm that the programs listed except for hydrogen blending are non-utility programs. Response As stated on page 41 of EGD rate zone AMP, filed at Exhibit C1, Tab 2, Schedule 1, DSM and hydrogen blending are currently included as rate-regulated activities for the purpose of this Asset Management Plan. The regulatory treatments of the other programs noted in this question vary, and are described below. RNG:
• With respect to Renewable Natural Gas (“RNG”) facilities required to inject RNG into the gas distribution system will be utility assets, whereas any assets created for the purpose of upgrading raw biogas to pipeline quality RNG will be treated as non-utility assets consistent with the OEB’s EB-2017-0319 Decision and Order.
Geothermal Energy Services:
• Legacy EGD also submitted a proposal to the Board in 2018 that called for geothermal ground source loops that would displace natural gas consumption to be included as part of utility rate base as a greenhouse gas emission strategy. This proposal included a non-utility element that would apply to situations where the service was provided to those without access to natural gas distribution services. This proposal was part of the EB-2017-0319 submission which was subsequently held in abeyance given the cancellation of the provincial government’s Green Energy Fund initiatives.

Filed: 2019-04-25 EB-2018-0305 Exhibit I.EP.18 Page 2 of 2
CNG: • This business activity has been included as part of EGD’s regulated utility as an
ancillary business activity and been subject to the imposition of imputed revenues in the event that the program does not achieve the utility’s regulated rate of return in any particular year.
CHP:
• Enbridge Gas actively supports the adoption of CHP facilities.
Filed: 2019-04-25 EB-2018-0305 Exhibit I.EP.19 Page 1 of 1
ENBRIDGE GAS INC. Answer to Interrogatory from
Energy Probe Research Foundation (EP) Reference: Exhibit C1, Tab 1, Pages 8 to 10 Question: Were any financial constraints, such as earnings per share or customer rate impacts such as maximum rate increases, used as constraints in the preparation of the USP? If there were, please list them. If not, please explain why not. Response The financial constraints mentioned above were not considered as constraints in the preparation of the USP. Please see Exhibit I.CME.1 part (b) for examples of the factors that were taken into consideration when developing the Asset Management Plans for both EGD and UG.

Filed: 2019-04-25 EB-2018-0305 Exhibit I.EP.20 Page 1 of 1
ENBRIDGE GAS INC. Answer to Interrogatory from
Energy Probe Research Foundation (EP) Reference: Exhibit C1, Tab 1, Page 22 Preamble: “The budgets are reviewed at successively higher levels of management, with modifications made on an iterative basis as required. A final budget for each area is endorsed by the accountable Vice President responsible for each area.” Question: Please provide a table listing each level of management that reviews the budget and the types of modifications that each level of management makes. Response The process for O&M budget creation begins at the manager level, working closely with Finance. The most detailed review of the budget happens at the management level and each subsequent review/approval is at a higher level. Potential modifications include FTE adjustments and program additions/reductions. Please see the table below:
Level of Management Action Description/Modifications
Manager Create, Review, Modify Manager works with Finance to create initial budget.
Director Review, Modify
Director reviews submission from Manager and makes modifications. Once changes are made the Director approves.
VP Review, Modify, Final Approval for Functional Area
VP reviews submission from Director and makes modifications. Once changes are made the VP approves.
President Review, Modify, Final Approval for Entire Company
President reviews submission from VP's and makes modifications. Once changes are made the President provides final approval.

Filed: 2019-04-25 EB-2018-0305 Exhibit I.EP.21 Page 1 of 1
ENBRIDGE GAS INC. Answer to Interrogatory from
Energy Probe Research Foundation (EP) Reference: Exhibit C1, Tab 1, Pages 23 and 27 Preamble: “The consolidated O&M budget is then consolidated by Finance with the
broader Company budget and is reviewed and approved by the Company’s Senior Executive management team.”
“The consolidated budget and LRP is then reviewed and approved by the Company’s senior executive management team.”
Question: a) Does the Company’s Senior Executive management team in the text refers to
Enbridge Inc. management or to Enbridge Gas Inc. management team? b) Please file a copy of the consolidated 2019 budget that was presented by Finance to
the Company’s Senior Executive Team. Response a) The Company’s Senior Executive Management Team in the text refers to Enbridge
Gas Inc.’s Management Team.
b) The Company declines to provide a copy of the 2019 Budget package given that it has no impact on 2019 rates or this application.

Filed: 2019-04-25 EB-2018-0305 Exhibit I.EP.22 Page 1 of 1
ENBRIDGE GAS INC. Answer to Interrogatory from
Energy Probe Research Foundation (EP) Reference: Exhibit C1, Tab 1, Page 23 Preamble: “The Company’s capital budget process ensures that capital is allocated in a
way that maximizes the value of life cycle-based capital while mitigating risk to the lowest practical level.”
Question: What is “life cycle-based capital” and how is its value maximized? Response Life cycle-based capital is the capital spent on assets across its life cycle stages identified as Acquire/Create, Utilize, Maintain, and Renew/Retire. Options to mitigate risk or pursue opportunities are considered at each life cycle stage as short or long term solutions. Value-based decisions are made to manage cost, risk and performance in relation to the specific asset and the total asset portfolio.

Filed: 2019-04-25 EB-2018-0305 Exhibit I.EP.23 Page 1 of 1
ENBRIDGE GAS INC. Answer to Interrogatory from
Energy Probe Research Foundation (EP) Reference: Exhibit C1, Tab 1, Pages 24, 27 and 34 Question: a) What is LRP and how does it relate to the USP? b) If the LRP and the USP are related please file the LRP Response a) LRP stands for Long Range Plan, which represents the longer term financial
forecast, beyond the budget year, typically the latter years of the plan. As noted in section 3.1 in the USP, filed at Exhibit C1, Tab 1, Schedule 1, the Budget and LRP is a component of the USP. The budget and LRP balance the need to maintain safe and reliable operations that meet the demands of current and new ratepayers, while ensuring Enbridge Gas’s financial viability. The Asset Management Plan underpins the Capital Expenditures for each year of the 10 year plan, which is reflected, along with a portion of the O&M costs, in the LRP, which in turn supports the USP.
b) Enbridge Gas declines to provide the LRP given it is not relevant to the relief requested as part of 2019 rates.

Filed: 2019-04-25 EB-2018-0305 Exhibit I.EP.24 Page 1 of 2
ENBRIDGE GAS INC. Answer to Interrogatory from
Energy Probe Research Foundation (EP) Reference: Exhibit C1, Tab 1, Page 28 and Exhibit C1, Tab 2, Page 89 Question: a) What is the significance of Lifetime Risk Return on Investment? b) Please provide a numerical example of the calculation using NPS 30 Don River
Replacement Project numbers. Response a) Please see Exhibit I.VECC.12.
b)
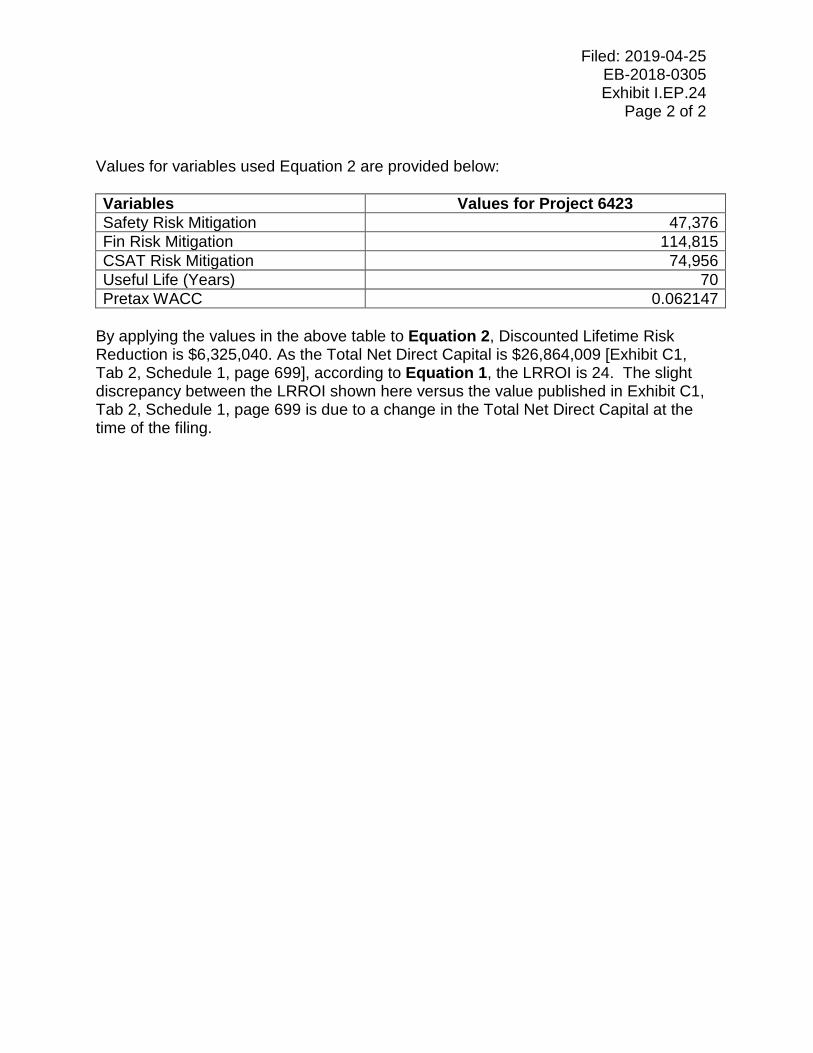
Filed: 2019-04-25 EB-2018-0305 Exhibit I.EP.24 Page 2 of 2
Values for variables used Equation 2 are provided below:
Variables Values for Project 6423 Safety Risk Mitigation 47,376 Fin Risk Mitigation 114,815 CSAT Risk Mitigation 74,956 Useful Life (Years) 70 Pretax WACC 0.062147
By applying the values in the above table to Equation 2, Discounted Lifetime Risk Reduction is $6,325,040. As the Total Net Direct Capital is $26,864,009 [Exhibit C1, Tab 2, Schedule 1, page 699], according to Equation 1, the LRROI is 24. The slight discrepancy between the LRROI shown here versus the value published in Exhibit C1, Tab 2, Schedule 1, page 699 is due to a change in the Total Net Direct Capital at the time of the filing.

Filed: 2019-04-25 EB-2018-0305 Exhibit I.EP.25 Page 1 of 3
ENBRIDGE GAS INC. Answer to Interrogatory from
Energy Probe Research Foundation (EP) Reference: Exhibit C1, Tab 1, Schedule 1, Page 57, Figures 12&13 Question: a) Please clarify if the PI shown in the Figures is based on gross cost or net cost (less
CIAC). b) For Figures 12 and 13 please provide the “Best Fit” Lines and provide the
equations. c) Please explain and discuss the trends in PI for the Project and Rolling Portfolios for
Union and EGD. d) Please provide the historic 2015+ and current approved system expansion projects
for EGD and Union with summary data such as location, cost, customer additions etc.
e) Please discuss the outlook for system expansion projects for each rate Zone.
Delineate projects using SES and Government support. f) How much will be invested in SE during the Deferred rebasing period 2020-2025? Please reconcile to the data in the Utility System Plan. Response a) The PI shown in figures 12 and 13 are based on net cost (less CIAC). b) Please see below the best fit lines and the equation for Figures 12 and 13.
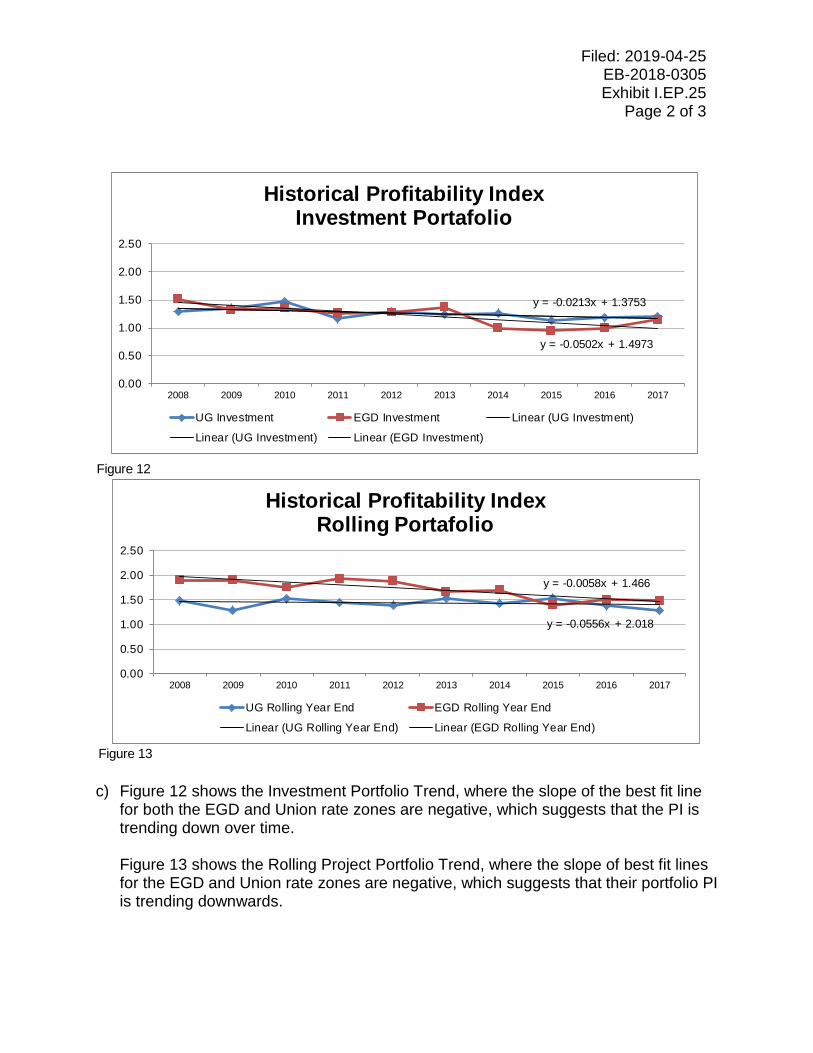
Filed: 2019-04-25 EB-2018-0305 Exhibit I.EP.25 Page 2 of 3
c) Figure 12 shows the Investment Portfolio Trend, where the slope of the best fit line
for both the EGD and Union rate zones are negative, which suggests that the PI is trending down over time. Figure 13 shows the Rolling Project Portfolio Trend, where the slope of best fit lines for the EGD and Union rate zones are negative, which suggests that their portfolio PI is trending downwards.
Figure 12
Figure 13
y = -0.0213x + 1.3753
y = -0.0502x + 1.4973
0.00
0.50
1.00
1.50
2.00
2.50
2008 2009 2010 2011 2012 2013 2014 2015 2016 2017
Historical Profitability IndexInvestment Portafolio
UG Investment EGD Investment Linear (UG Investment)
Linear (UG Investment) Linear (EGD Investment)
y = -0.0058x + 1.466
y = -0.0556x + 2.018
0.00
0.50
1.00
1.50
2.00
2.50
2008 2009 2010 2011 2012 2013 2014 2015 2016 2017
Historical Profitability IndexRolling Portafolio
UG Rolling Year End EGD Rolling Year End
Linear (UG Rolling Year End) Linear (EGD Rolling Year End)

Filed: 2019-04-25 EB-2018-0305 Exhibit I.EP.25 Page 3 of 3
d) The rolling and investment portfolios include all of the distribution expansion projects completed by the company. These projects could be as simple as a 20 meter NPS 2 plastic main extension to 5 km steel NPS 8 reinforcement project. As such it is not practical to provide a list of all of the projects that are included in the rolling and investment portfolios.
e) Enbridge Gas has and will continue to manage its system expansion projects such
that the Profitability Index (“PI”) requirements of the Board’s E.B.O. 188 economic feasibility guideline are met with respect to each of the Company’s rate zones. For projects defined as Community Expansion Projects, the Company will apply the System Expansion Surcharge in compliance with the OEB’s EB-2017-0147 Decision and any other relevant decision of the Board. In cases where a community expansion project is to receive financial support either through the former Natural Gas Grant Program or under the auspices of Bill 32, the Access to Natural Gas Act, 2018 and its accompanying regulation (Ontario Regulation 24/19) the funds provided under either of these programs will serve as contributions in aid of construction, effectively reducing the capital cost of these projects such that they achieve a PI of 1.0. Should the requirements of Bill 32 change, the Company will revise its applicable policies so as to accommodate and be in compliance with such changes.
f) To confirm, the deferred rebasing period is 2019 – 2023. As shown on pages 40
and 41, figure 7 and 8 respectively in the USP, filed at Exhibit C1, Tab 1, Schedule 1, system access investment is approximately $622M for EGD and $493M for Union.

Filed: 2019-04-25 EB-2018-0305 Exhibit I.EP.26 Page 1 of 2
ENBRIDGE GAS INC. Answer to Interrogatory from
Energy Probe Research Foundation (EP) Reference: Exhibit C1, Tab 2, Pages 41and 42 Preamble: “The overall portfolio has an LRROI of 119%. The breakdown by asset class
has been summarized in Table 1.9-1. While different asset classes have higher or lower LRROI values, the value of the lifetime risk reduced is greater than the capital investment.”
Question: a) Please explain the significance of LRROI of 119% for the overall portfolio. What
should the OEB conclude from that number? b) In Table 1.9-1 Storage has the highest LRROI of 284%. Does that mean that
Storage is the most profitable asset class? Please show how the 284% number was calculated.
c) In Table 1.9-1 Pipe has the lowest LRROI of 41%. Does that mean that Pipe is the
least profitable asset class? Please explain how the 41% number was calculated. Response a) Based on an LRROI of 119% for the overall portfolio, the OEB should conclude that
the value of Lifetime Risk reduced is greater than the capital investment for such risk reduction. For more details, please refer to section 1.9, page 42 in the EGD rate zone’s AMP, filed at Exhibit C1, Tab 2, Schedule 1
b) LRROI is not used to measure profitability. Storage having the highest LRROI means that the ratio of risk mitigation to capital requirements for this asset class is the highest, or per dollar of capital, the storage asset class is able to mitigate the most risk compared to the other asset classes. As described in section 4.2.5, page 89 in the EGD rate zone’s AMP, filed at Exhibit C1, Tab 2, Schedule 1, the LRROI was calculated using the equations below:

Filed: 2019-04-25 EB-2018-0305 Exhibit I.EP.26 Page 2 of 2
Lifetime Risk Return on Investment (LRROI) is used to inform optimization where the risk mitigated by a capital investment is normalized by the net direct capital required. LRROI is a measure indicating the efficiency with which risk is reduced across all asset classes. It is calculated using Equation 1. The Discounted Lifetime Risk Reduction is calculated using Equation 2 and represents the present value of the risk reduction over the useful life of the asset. Customer satisfaction and financial risk are discounted over the life of the asset, while safety risk is not, as it is of paramount importance.
c) LRROI is not used to measure profitability. Pipe’s LRROI of 41% indicates that the
capital requirements for the pipe asset class exceed the risk mitigated based on the portfolio of work. Please refer to (b) for the calculation of LRROI.

Filed: 2019-04-25 EB-2018-0305 Exhibit I.EP.27 Page 1 of 1
ENBRIDGE GAS INC. Answer to Interrogatory from
Energy Probe Research Foundation (EP) Reference: Exhibit C1, Tab 2, Page 44, Table 19-3 Question: Please explain how the Total Overhead numbers were determined. Response Please see Exhibit I.STAFF.32, part (c).

Filed: 2019-04-25 EB-2018-0305 Exhibit I.EP.28 Page 1 of 1
ENBRIDGE GAS INC. Answer to Interrogatory from
Energy Probe Research Foundation (EP) Reference: Exhibit C1, Tab 2, Schedule 1, Page 45, Table 1.9-5: ICM-Eligible Capital Projects Question: a) Please explain the relationship between the information in this table and the ICM
project information in Exhibit B1, Tab 2. b) Please provide a consolidated schedule showing approved and forecast ICM
projects over the 5-year deferred rebasing period with summary data on costs and in-service dates.
Response a) The information in Table 1.9.5 identifies discrete and material capital projects in the
EGD rate zone, and includes the NPS 30 Don River Replacement ICM project and potential future ICM projects. The information in Exhibit B1, Tab 2 discusses the evidence in support of the ICM funding requests and includes the business case summary for the NPS 30 Don River Replacement ICM project.
b) A list of potential ICM projects is filed in Table 6, page 49 at Exhibit C1, Tab 1, Schedule 1.

Filed: 2019-04-25 EB-2018-0305 Exhibit I.EP.29 Page 1 of 1
ENBRIDGE GAS INC. Answer to Interrogatory from
Energy Probe Research Foundation (EP) Reference: Exhibit C1, Tab 2, Page 45, Table 19-5 Question: The information in the table indicates that the driver for the NPS 20 Don River Relocation project is “third party relocation”. Does Enbridge have a cost sharing agreement with the “third party”. If the answer is yes, what is the sharing ratio? If the answer is no, please explain why not. Response Enbridge Gas is currently in discussions with the third party stakeholder to determine what type of cost sharing mechanism and agreement will apply to this third party relocation request.

Filed: 2019-04-25 EB-2018-0305 Exhibit I.EP.30 Page 1 of 1
ENBRIDGE GAS INC. Answer to Interrogatory from
Energy Probe Research Foundation (EP) Reference: Exhibit C1, Tab 2, Page 58, Figure 3.3-1 Question: Should the OEB be concerned that 9.1 Monitoring Measurement Risk and Evaluation and 9.2 Internal Audit have been rated as low maturity by KPMG? Response In the ISO framework, 9.1 and 9.2 is focused around monitoring of the overall asset management strategy, plans, processes and KPI’s as opposed to “asset risk and condition monitoring” which is captured in element 6. These elements typically mature after an organization has gone through several annual cycles and has implemented the defined strategy, organization and processes. The low maturity rating is expected given the time of the assessment.

Filed: 2019-04-25 EB-2018-0305 Exhibit I.EP.31 Page 1 of 2
ENBRIDGE GAS INC. Answer to Interrogatory from
Energy Probe Research Foundation (EP) Reference: Exhibit D1, Tab 1, Schedule 1, Page 22 Preamble: The Question to Residential customers regarding higher rates for
infrastructure replacement was:
“In considering its five-year investment plan Enbridge Gas Distribution estimates that it will need to increase investments to keep up with aging infrastructure and still maintain the current level of reliability and safety it delivers to its customers. It is estimated that the average residential customer bill will need to increase by 3% or $2 per month over the next 5 years to maintain current levels of safety and reliability. This increase would start in 2019 and apply until 2023. So, by the end of 2023 residential customers will pay $10 more per month compared to what they pay now, to cover these increased capital investments.”
Question: a) Please confirm this question relates to Sustainment Capital Investment under the
CIR Plan 2020-2025. b) What information was provided to the respondents as context for the question?
Please be specific. c) Why does the CIR Plan not provide sufficient capital for sustainment? Please reply
in detail. d) Please provide the proposed budgets that underpin this question. e) Please provide the current level of reliability and the level in 2025 based on
measurable parameters. f) Will there be offsetting OM&A cost reductions from the investment? Please
delineate.

Filed: 2019-04-25 EB-2018-0305 Exhibit I.EP.31 Page 2 of 2
Response a),c),d),e),f) The capital investment plan underpinning the rate impact in the customer
engagement was based on a high level estimate at the time of the study and does not reflect the CIR plan for 2020 to 2025.
b) The preamble provided above was read to residential customers as context for this
question.

Filed: 2019-04-25 EB-2018-0305 Exhibit I.EP.32 Page 1 of 1
ENBRIDGE GAS INC. Answer to Interrogatory from
Energy Probe Research Foundation (EP) Reference: Exhibit D1, Tab 1, Schedule 1, Page 24 Preamble: The following question was put to Residential Customers:
“As you may know, on January 1, 2017 the Ontario government is planning to introduce a Cap and Trade system to help reduce greenhouse gas emissions in Ontario. Customers will pay a cost related to the amount of greenhouse gases they emit, such as from the use of fossil fuels. The government plans to invest these cap and trade proceeds into various initiatives that reduce greenhouse gases such as renewable sources of energy, public transportation, electric vehicle incentives, and energy conservation programs. Initially, the government expects costs to be about $7 per month for each natural gas customer for home heating, but the exact amounts next year and in future years is not yet known. Some estimates have indicated that the cost could increase by roughly 50 percent by 2023.”
Question: a) Were Residential Customers aware that the Cap and Trade charge was added to
their bills? Please provide data on the level of awareness. b) Has EGI canvassed its customers following the cancellation of the Cap and Trade
and introduction of the Federal Carbon Tax in April 2019? If so please provide the results.
Response a) The specific question asking if residential customers were aware that the Cap and
Trade charge was added to their bills was not asked. Customers were asked if they were aware that starting in 2017 customers would be paying on average more to cover costs associated with Cap and Trade. Residential customers would pay on average $7 more per month – 46% were aware, General Service would pay $36 more per month on average – 36% were aware, Large Volume Customers (various unit rate increases) – 74% were aware, and Rate 6 Business customers would pay an additional 15% increase per month – 31% were aware.
b) No.
Filed: 2019-04-25 EB-2018-0305 Exhibit I.EP.33 Page 1 of 2
ENBRIDGE GAS INC. Answer to Interrogatory from
Energy Probe Research Foundation (EP) Reference: Exhibit D1, Tab 1, Schedule 1, Pages 25 and 26 Question: “There are a couple of ways in which Enbridge Gas can help to lower customer costs to offset this cap and trade cost. One way is to offer conservation programs (such rebates and incentives) to encourage customers to make changes to their home to reduce their household natural gas consumption. Another way is for Enbridge to invest in renewable energy sources that will reduce greenhouse gas emissions across the network and offset the amount of cap and trade costs to customers overall. SOME PEOPLE SAY there is not much more they can do to make their home more energy efficient and therefore they may not be able to lower the cap and trade cost they pay. They are more likely to see savings based on investments Enbridge Gas could make in renewable energy that will reduce the cap and trade costs to customers across the network. OTHER PEOPLE SAY there is more they can do to make their home more energy efficient and they would prefer to have access to rebates and incentives to help them do that to lower the cap and trade cost they pay rather than rely on investments in renewable energy by Enbridge Gas to lower cap and trade cost across the network.”
a) Which of the above questions was put to residential customers?
b) What information was provided to the respondents as context for the question? Be specific such as relative costs and bill impacts.
c) Given the OEB decision on RNG is the question no longer accurate? Please
discuss. Response a) The text provided above refers to two separate questions asked in the residential
surveys:

Filed: 2019-04-25 EB-2018-0305 Exhibit I.EP.33 Page 2 of 2
Question 9:
There are a couple of ways in which Enbridge Gas can help to lower customer costs to offset this cap and trade cost. One way is to offer conservation programs (such rebates and incentives) to encourage customers to make changes to their home to reduce their household natural gas consumption. Another way is for Enbridge to invest in renewable energy sources that will reduce greenhouse gas emissions across the network and offset the amount of cap and trade costs to customers overall. Generally speaking, would you prefer to see Enbridge…? (Read list) Invest in conservation programs to help customer reduce their consumption Invest in renewable energy sources that will reduce the overall network’s consumption Both Neither Don’t know (Read) [Anchor] Question 10: Some people say [ROTATE STATEMENT 1 AND 2] [STATEMENT 1] there is not much more they can do to make their home more energy efficient and therefore they may not be able to lower the cap and trade cost they pay. They are more likely to see savings based on investments Enbridge Gas could make in renewable energy that will reduce the cap and trade costs to customers across the network. Other people say [STATEMENT 2] there is more they can do to make their home more energy efficient and they would prefer to have access to rebates and incentives to help them do that to lower the cap and trade cost they pay rather than rely on investments in renewable energy by Enbridge Gas to lower cap and trade cost across the network. Which is closer to your point of view? Are you… (Read list) More likely to see savings based on renewable energy investments across the network More likely to see savings based on making your home more energy efficient Don’t know (Read) [Anchor]
b) The context provided for each question is detailed in the previous response. c) Please see Exhibit I.EP.34, part b) and c).

Filed: 2019-04-25 EB-2018-0305 Exhibit I.EP.34 Page 1 of 2
ENBRIDGE GAS INC. Answer to Interrogatory from
Energy Probe Research Foundation (EP) Reference: Exhibit D1, Tab 1, Schedule 1, Page 29 Preamble: The following question was put to Residential Customers:
“As you may know, Renewable natural gas (RNG), or bio methane gas or biogas, is a type of renewable gas that is carbon neutral, thus it is better for the environment than conventional natural gas. It is a sustainable fuel that is created by converting organic material such as municipal green bin collection waste (ie. vegetable peelings), farm crop residue, gas from water treatment plants and even landfill gas that is captured and cleaned to the same quality level as natural gas. Renewable natural gas could be produced in Ontario and put into the existing natural gas distribution system. It would be compatible with all your natural gas appliances so there would be no lifestyle change for households. Renewable natural gas helps reduce greenhouse gas emissions by displacing conventional natural gas. Investing in renewable natural gas can start with modest levels of blending renewable energy with conventional energy. Think of this like the 2% blending of ethanol in gasoline. This level of renewable blending is estimated to cost customers approximately $1.60 per month. Over time, it is expected the cost of renewable natural gas will decline, making renewable natural gas less expensive than conventional natural gas in the long-term for customers.”
Question: a) Please provide the basis of the Calculation of the $1.60 per month. b) Is this question accurate, given the OEB decision on RNG? Please discuss. c) Is it still relevant given the Government Policy on RNG? Please discuss.

Filed: 2019-04-25 EB-2018-0305 Exhibit I.EP.34 Page 2 of 2
Response a) The $1.60 per month RNG price premium was based on 2% RNG blending by
volume in EGD’s supply gas supply for residential customers, and assumed an average price of $16/GJ for RNG commodity price at the time the analysis was done.
b), c) On November 29, 2018 the province released A Made-in-Ontario Environment Plan, Ontario’s new plan to preserve and protect our environment for future generations. On page 33 of the plan the province states: “Require natural gas utilities to implement a voluntary renewable natural gas option for customers.”
.

Filed: 2019-04-25 EB-2018-0305 Exhibit I.EP.35 Page 1 of 1
ENBRIDGE GAS INC. Answer to Interrogatory from
Energy Probe Research Foundation (EP) Reference: Exhibit D1, Tab 1, Schedule 1, Page 31 Preamble: “In each of the customer groups, willingness to pay even more for the
additional blending of renewable natural gas into the existing natural gas network is low. In terms of residential customers, only about one third (36%) would be willing to pay more (above the base increase detailed in the previous question).”
Question:
a) Was this result available at the time of the RNG proceeding?
b) If so please provide the reference.
c) Why is EGI bringing this survey regarding RNG into this proceeding? Please be specific regarding the objective(s) for doing so.
Response a) Yes, the result was available at the time of the RNG proceeding
b) The result can be found on page 31 in the customer engagement report, filed at
Exhibit D1, Tab 1, Schedule 1.
c) The customer engagement done by Ipsos Public Affairs and Innovative Research Group (Exhibit D1) is filed in support of Enbridge Gas’s USP and AMP planning process. As per the Board’s Decision and Procedural Order No. 2 dated April 1, 2019 “customer engagement in this proceeding is only relevant to the USP and AMP planning processes, and therefore is a consideration for the review of the ICMs.”

Filed: 2019-04-25 EB-2018-0305 Exhibit I.EP.36 Page 1 of 2
ENBRIDGE GAS INC. Answer to Interrogatory from
Energy Probe Research Foundation (EP) Reference: Exhibit D1, Tab 1, Schedule 1, Page 42 Preamble: “Among Residential customers, more than half (58%) are willing to pay an
increase in their bill to fund an investment. About one third (35%) of Residential customers would be willing to pay
approximately $3.60 more per month for both maintaining current levels of safety and reliability and to invest in renewable natural gas. Slightly more than one in ten (14%) Residential customers would be willing to pay approximately $1.60 more per month to invest in renewable natural gas exclusively, while one in ten (9%) would be willing to pay approximately $2.00 more per month to maintain existing levels of safety and reliability.”
Question: a) Please confirm the cited monthly bill impact of $3.60 is split between replacement
infrastructure ($2.00) and RNG ($1.60). b) What is the current comparable Bill impact for DSM/Conservation? c) Is EGI suggesting to the Board it should charge customers for all three initiatives
plus the federal Carbon Tax during the RNG Plan? If provide the monthly residential bill impact.
d) If not, please clarify exactly what EGI is proposing and the estimated bill impacts
Response a) Yes, the bill impact of $3.60 is split between replacement infrastructure ($2.00) and
RNG ($1.60).
Filed: 2019-04-25 EB-2018-0305 Exhibit I.EP.36 Page 2 of 2
b) The EGD rate zone’s Board-Approved 2019 DSM Budget is $66.4M. The amount budgeted for Rate 1: Residential Service customers is $38.6M for 2019. Based on the budgeted amount of $38.6M, the annual amount a typical Rate 1 residential customer would pay for DSM is $19, which is approximately $1.6 per month.
c, d) Enbridge Gas has been investigating the introduction of a voluntary RNG program that would be designed so as to have minimal bill impacts. This initiative is consistent with and supported by the provincial governments “A Made-in-Ontario Environment Plan” (page 33), which states: “Require natural gas utilities to implement a voluntary renewable natural gas option for customers.” The costs associated with the maintenance of a safe and reliable gas distribution are completely unrelated to those of a voluntary RNG program and are legitimate costs recoverable in rates. Enbridge Gas will be required to bill and remit the Federal Carbon Tax based on end user natural gas consumption regardless as to what costs are recoverable in its rates.

Filed: 2019-04-25 EB-2018-0305 Exhibit I.EP.37 Page 1 of 2
ENBRIDGE GAS INC. Answer to Interrogatory from
Energy Probe Research Foundation (EP) Reference: Exhibit D1, Tab 2, Schedule 1, Page 54 Preamble: • The three most important outcomes for (Union) residential participants
are “pricing” (88% top 3 issue), “safety” (67% top 3 issue) and “reliability” (65% top 3 issue). For business participants it was the exact same order (“pricing”, 85% top 3 issue; “safety”, 62% top 3 issue; “reliability”, 60% top 3 issue).
• Roughly three-in-four (74%) residential and two-thirds (65%) of business participants find the price of distributing gas “reasonable”. Those residential participants with large bills are less likely to find it reasonable ($120+: 65% vs. $0-79: 79% reasonable).
• Nearly all participants are satisfied with Union Gas’ performance on safety (residential: 92%; business: 91%) and reliability (residential: 98%; business: 93%).
Question:
a) Were the respondents asked about paying more for infrastructure replacement, Conservation/DSM and RNG? If not why was this not done? If so please provide the results. b) Were the Respondents asked about paying the Federal Carbon Tax? If so please provide the result and compare with the comment on Page 65.
“Unpacking “lower cost”, most of the codes are general but specific mentions include the delivery charge, showing the carbon tax, and senior discount”.
Response a) Most infrastructure decisions within the plan were driven by asset health and
condition or by the need to meet customer demands. These specific choices are technical considerations that don’t facilitate customer impact. The utility did collect customer input that informed infrastructure decisions in three ways:

Filed: 2019-04-25 EB-2018-0305 Exhibit I.EP.37 Page 2 of 2
1. As noted in the preamble, customers were asked to rate and rank customer outcomes;
2. Customers were asked about the general approach the utility should take to the pacing of investments; and
3. Customers were asked about the general approach the utility should take to safety standards.
Feedback on all three of these topics was considered in evaluating the portfolio of potential investments. b) No, the respondents were not asked about the Federal Carbon Tax.

Filed: 2019-04-25 EB-2018-0305 Exhibit I.FRPO.1 Page 1 of 3
ENBRIDGE GAS INC. Answer to Interrogatory from
Federation of Rental-housing Providers of Ontario (FRPO) Reference: Exhibit B1 / Tab 1 / Schedule 1/ p. 6 Preamble: EGI’s evidence states: The EGD rate zone’s October 1, 2018 EB-2018-0249
rates have a Purchased Gas Variance Account (“PGVA”) reference price of $163.524 103m3. The PGVA reference price is comprised of commodity, transportation and load balancing costs. In order for adjustments to gas cost rates to only capture / reflect the impacts of the plan mix change in the 2019 gas supply portfolio versus the 2018 portfolio, the cost of the 2019 portfolio is based on the October 1, 2018 QRAM PGVA reference price of $163.524 103m3. This approach ensures that the proposed rate impacts are a function of the year-over-year changes in gas supply portfolio only and net of price / cost changes that are otherwise captured through the QRAM methodology.
Question: Being respectful of PO No. 2 which excludes gas supply costs which are the subject of a future proceeding, we are interested in understanding the year over year changes associated with gas supply or load balancing costs that are embedded in the distribution rates. For gas supply or load-balancing costs included in distribution rates:
a) Please provide a brief summary of the principles used to separate gas supply or load balancing costs between gas supply costs and distribution costs.
b) Please provide any changes to cost allocation methodologies, practices or assumptions from to 2018 to 2019.
c) Please provide a summary of the categories of gas supply or load balancing costs that are allocated to distribution rates.
d) Please provide a comparison of the 2018 and 2019 costs for each of those categories of cost.
e) Please explain the drivers associated with any material changes in the quantum of costs allocated to distribution rates.

Filed: 2019-04-25 EB-2018-0305 Exhibit I.FRPO.1 Page 2 of 3
Response a) Enbridge Gas would like to highlight that gas cost rates and distribution rates are
derived on a stand-alone / separate basis. As stated in the evidence at Exhibit B1, Tab 1, Schedule 1, Page 8, starting at line 3, it is for customer billing purposes that the unit rates developed to recover the elements of the gas costs which support the provision of delivery service to customers (i.e., contracted storage and associated transportation, lost and unaccounted for gas) are added to the distribution rates and recovered through the delivery charges on customers’ bills. And similarly, while the distribution costs are recovered in rates primarily through the delivery rates, some distribution related costs and associated unit rates are recovered through the Company’s commodity, transportation, and load balancing charges.
This Board-approved approach ensures that charges on customers’ bills reflect / are based on cost causality for the services provided and that only customers who subscribed for specific services pay for the costs of those services. For example, the cost of facilitating the Sales service (i.e., system gas) supply option (which is part of the Company’s distribution costs) should be recovered from customers who take the Sales service. The cost of unaccounted for gas, given it represents gas losses on the gas distribution system, should be recovered from all customers through delivery charges regardless of the type of service (i.e., Sales service, Western T-service, etc.) they are taking. As described in evidence at Exhibit B1, Tab 1, Schedule 1, Appendix C, the EGD rate zone operated under Custom Incentive Rate (“IR”) rate setting framework approved by the Board under EB-2013-0202 for the 2014 to 2018 period. The Company used the fully allocated cost study (“FACS”) to allocate the Allowed Revenue to the customer classes and develop rates to recover the Allowed Revenue based on the results of the FACS. The FACS was updated annually to reflect forecast costs and forecast cost drivers with the results being used as the starting point for rate design. As noted above, the rates designed based on the results of the FACS (i.e., based on cost causality) have most of the distribution costs recovered through the Company’s delivery rates, however, some distribution related costs are recovered from the commodity, transportation and load balancing rates (given that such distribution costs (i.e., system gas administration, bad debt commodity, or return on gas in inventory) support provisions of these services to customers). Similarly, some gas costs, storage and related transportation, and lost and unaccounted for gas (i.e., commodity) costs are recovered through the Company’s delivery rates.

Filed: 2019-04-25 EB-2018-0305 Exhibit I.FRPO.1 Page 3 of 3
The EGD rate zone will adopt Price Cap IR rate setting framework for the 2019 to 2023 period. Under Price Cap IR distribution related revenues and rates are derived based on a Price Cap Index (“PCI”), which is comprised of an inflation factor, a productivity factor, and a stretch factor. The pass through (Y-factor) costs, such as DSM and gas costs, are not subject to the PCI and are passed through to customers at cost. The pass through (Y-factor) costs reflect forecast of costs for these elements for the test year. For this reason, Enbridge Gas is able to update not only the forecast level of pass through costs but also allocations of pass through costs each year of an IR rate setting period.
b) There are no changes to cost allocation methodologies, practices, or assumptions from 2018 to 2019.
c, d, and e) The categories of gas costs that are recovered through the Company’s delivery charges, as discussed above, can be found for 2019 at Exhibit F1, Tab 1, Schedule 9, Page 2, Items 3.1 to 4.1 and for 2018 at Exhibit F1, Tab 1, Schedule 4, Appendix A, Attachment 1, Items 3.1 to 4.1. For 2019, approximately $187.8 M of the total gas cost forecast of approximately $1,598.1 M will be recovered from customers through the delivery charges. For 2018, approximately $184.2 M of the total gas cost forecast of approximately $1,547.8 M was recovered from customers through the delivery charges. The difference in allocated costs is driven by year-over-year change in demand / volumetric requirements and in the gas supply mix. Exhibit F1, Tab 1, Schedule 6, pages 1 to 3 shows how distribution and gas cost unit rates are added together in order to derive the proposed delivery charge unit rates for each customer class

Filed: 2019-04-25 EB-2018-0305 Exhibit I.FRPO.2 Page 1 of 1
ENBRIDGE GAS INC. Answer to Interrogatory from
Federation of Rental-housing Providers of Ontario (FRPO) Reference: Exhibit B1 / Tab 1 / Schedule 1/ p. 8 Preamble: EGI’s evidence states: Similarly, the distribution costs are recovered in rates primarily from the delivery rates, however, some distribution related unit rates / costs are recovered from the Company’s commodity,
transportation, and load balancing charges Question: Please identify the categories of distribution costs captured in each of:
a) Commodity b) Transportation c) Load Balancing
Response a- c) Please see Exhibit I.FRPO.3.

Filed: 2019-04-25 EB-2018-0305 Exhibit I.FRPO.3 Page 1 of 3
ENBRIDGE GAS INC. Answer to Interrogatory from
Federation of Rental-housing Providers of Ontario (FRPO) Reference: Exhibit B1 / Tab 1 / Schedule 1/ p. 8 Preamble: EGI’s evidence states: Similarly, the distribution costs are recovered in rates primarily from the delivery rates, however, some distribution related unit rates / costs are recovered from the Company’s commodity,
transportation, and load balancing charges Question: Please provide the total forecasted cost for each of the above categories:
a) 2018 b) 2019 c) Please provide the drivers for any material difference between the two years. d) Please provide any changes to cost allocation methodologies, practices or
assumptions from to 2018 to 2019. Response
a) Enbridge Gas would like to highlight that gas cost rates and distribution rates are
derived on a stand-alone / separate basis, which was also noted in the lead-in to the response to Exhibit I.FRPO.1. Further, as described in Exhibit I.FRPO .1, until 2019 the Company used the fully allocated cost study (“FACS”) to allocate the Allowed Revenue to the customer classes and develop rates to recover the Allowed Revenue based on the results of the FACS. The FACS was updated annually to reflect forecast costs and forecast cost drivers with the results being used as the starting point for rate design. The rates designed based on the results of the FACS (i.e. based on cost causality) have most of the distribution costs recovered through the Company’s delivery rates, however, some distribution related costs are recovered from the commodity, transportation and load balancing rates. Similarly, some gas costs are recovered through the Company’s delivery rates.

Filed: 2019-04-25 EB-2018-0305 Exhibit I.FRPO.3 Page 2 of 3
The total 2018 forecast distribution costs recovered through the Company’s gas supply commodity, transportation, and load balancing charges are provided for each customer class in the evidence at: Exhibit F1, Tab 1, Schedule 4, pages 1 to 11, Col. K, Line 8 to 11, and Exhibit F1, Tab 1, Schedule 5, pages 1 to 22, Col. B, Line 8 to 11. For 2018, approximately $42.2 M of the total forecast distribution cost of approximately $1,212.4 M was recovered from customers through the gas supply commodity, transportation, and load balancing charges. The categories of distribution costs recovered through these charges include: For the gas supply commodity charges: system gas fee (cost of facilitating Sales (i.e., system gas) service) commodity related working cash requirement commodity related bad debt expense For the transportation charges: part of the transmission segment (Segment A) of the GTA project(1) For the load balancing charges: carrying cost of gas in inventory part of the transmission segment (Segment A) of the GTA project(1)
Note (1): The OEB approved Segment A of the GTA project for Enbridge Gas to improve diversity and security of its upstream supplies, to facilitate the shift in gas supplies from long haul to short haul, and to accommodate more supply purchases at Dawn. The recovery reflects cost causality / usage of Segment A.
b) The total 2019 forecast distribution costs and associated unit rates recovered through the Company’s gas supply commodity, transportation, and load balancing charges are provided for each customer class in the evidence at: Exhibit F1, Tab 1, Schedule 5, pages 1 to 22, Col. G and J, Line Nos 8 to 11. The Price Cap Index adjustment of 1.07% on the 2018 amount of approximately $42.2 M results in approximately $0.45 M of additional revenue to be recovered from customers in 2019. Exhibit F1, Tab 1, Schedule 6, pages 1 to 3 shows how distribution and gas cost unit rates are added together in order to derive the proposed unit rates for gas supply

Filed: 2019-04-25 EB-2018-0305 Exhibit I.FRPO.3 Page 3 of 3
commodity, transportation, and load balancing charges for each customer class.
c) As described in evidence at Exhibit B1, Tab 1, Schedule 1, Appendix C, the EGD rate zone will adopt Price Cap IR rate setting framework for the 2019 to 2023 period. Under Price Cap IR distribution related revenues and rates are derived based on a Price Cap Index (“PCI”), which is comprised of an inflation factor, a productivity factor, and a stretch factor. Accordingly, the year-over-year change in these costs for the 2019 to 2023 IR period will be a function of the Price Cap Index as shown at Exhibit F1, Tab 1, Schedule 5, pages 1 to 22, Line 8 to 11.
d) Under Price Cap IR distribution related revenues and rates are derived based on a Price Cap Index (i.e., formulaic derivation). Consequently, cost allocation will not be carried out for these cost elements during the 2019 to 2023 IR period.

Filed: 2019-04-25 EB-2018-0305 Exhibit I.FRPO.4 Page 1 of 1
ENBRIDGE GAS INC. Answer to Interrogatory from
Federation of Rental-housing Providers of Ontario (FRPO) Reference: Exhibit B1 / Tab 1 / Schedule 1/ p. 28-29 Preamble: EGI’s evidence states: Enbridge Gas also proposes to build into rates the
surplus Dawn-Parkway capacity of 30,393 GJ/d resulting from the 2017 Dawn-Parkway Expansion project (EB-2015-0200). As part of the 2017 Dawn-Parkway proceeding, parties agreed Union would credit the Lobo D/Bright C/Dawn H Compressor Project Deferral Account (Account No. 179-144) for revenue generated from the 30,393 GJ/d of surplus capacity. Enbridge Gas anticipates that this surplus capacity will be sold long-term beginning on November 1, 2018 and for the remainder of the deferred rebasing period.
Question: For the Dawn-Parkway system
a) What, if any, capacity was turned back in 2018? b) How much additional capacity was sold in 2018? c) What was the 2018/19 winter design capacity of the system? d) What was the 2018/19 design day demand on the system? e) What if, any capacity, is scheduled for turnback in 2019?
Response a) 159,978 GJ/d of Dawn to Parkway capacity was turned back in 2018. This total included
70,009 GJ/d of capacity for TCE Halton Hills as was allowed in the Parkway Delivery Obligation Settlement Agreement (EB-2013-0365). However, this 70,009 GJ/d of capacity is not available to be re-sold as it is required to serve TCE Halton Hills demand.
b) 42,378 GJ/d of Dawn to Parkway capacity was sold beginning November 1, 2018.
c) 7873 TJ/d
d) 7747 TJ/d
e) 336,586 GJ/d of Parkway to Dawn capacity was turned back effective March 31, 2019 and 56,021 GJ/d of Dawn to Parkway capacity will be turned back effective November 1, 2019.

Filed: 2019-04-25 EB-2018-0305 Exhibit I.FRPO.5 Page 1 of 1 Plus Attachments
ENBRIDGE GAS INC. Answer to Interrogatory from
Federation of Rental-housing Providers of Ontario (FRPO) Reference: Exhibit B1 / Tab 1 / Schedule 1/ p. 28-29 Preamble: EGI’s evidence states: Enbridge Gas also proposes to build into rates the
surplus Dawn-Parkway capacity of 30,393 GJ/d resulting from the 2017 Dawn-Parkway Expansion project (EB-2015-0200). As part of the 2017 Dawn-Parkway proceeding, parties agreed Union would credit the Lobo D/Bright C/Dawn H Compressor Project Deferral Account (Account No. 179-144) for revenue generated from the 30,393 GJ/d of surplus capacity. Enbridge Gas anticipates that this surplus capacity will be sold long-term beginning on November 1, 2018 and for the remainder of the deferred rebasing period.
Question: Please provide the EGI index of customers for the Dawn-Parkway system as of Jan. 1, 2019 including totals to each delivery point.
a) What is the forecasted revenue in 2019 for C1 contracts that were in place
January 1, 2019?
Response Please see Attachment 1 for the original January 1, 2019 Transportation Index of Customers as posted on the Union Gas website. Please see Attachment 2 for the January 1, 2019 Transportation Index of Customers showing only those contracts on the Dawn-Parkway system with subtotals for each contracted path. a) The forecasted revenue in 2019 for the C1 contracts that were in place
January 1, 2019 is $15.3 million.

Page
1 o
f 3
Janu
ary
2019
Cu
stom
er N
ame
Con
trac
t Id
enti
fier
Rec
eip
t P
oin
tD
eliv
ery
Po
int
Qu
anti
ty
(GJ)
Sta
rt D
ate
End
Dat
eN
ego
tiat
ed
Rat
eA
ffil
iate
St.
Law
renc
e G
as C
ompa
ny,
Inc.
C10
076
Park
way
Daw
n10
,785
01-A
pr-0
731
-Mar
-21
NY
Gre
enfie
ld E
nerg
y Cen
tre
LP
C10
083
Daw
nD
awn-
Vec
tor
92,8
4501
-Mar
-08
31-O
ct-2
1N
NEn
ergi
r, L
.P.
by it
s G
ener
al P
artn
er E
nerg
ir I
ncC
1008
7Pa
rkw
ayD
awn
100,
000
01-A
pr-1
131
-Mar
-19
NN
Tran
sCan
ada
Pipe
Line
s Li
mited
C
1009
7D
awn
Daw
n (T
CPL
)50
0,00
001
-Nov
-10
31-O
ct-2
1N
NYo
rk E
nerg
y Cen
tre
LP
C10
102
Daw
nPa
rkw
ay11
,654
01-A
pr-1
231
-Oct
-22
NN
Blu
ewat
er G
as S
tora
ge,
LLC
C10
105
Blu
ewat
erD
awn
123,
000
01-N
ov-1
331
-Oct
-23
NN
Emer
a En
ergy
Lim
ited
Par
tner
ship
C10
106
Ojib
way
Daw
n21
,016
01-N
ov-1
531
-Oct
-20
NN
Emer
a En
ergy
Lim
ited
Par
tner
ship
C10
107
Kir
kwal
lD
awn
73,7
4501
-Nov
-15
31-O
ct-2
1N
NEm
era
Ener
gy L
imited
Par
tner
ship
C10
108
Kir
kwal
lD
awn
26,3
3501
-Apr
-15
31-M
ar-2
1N
NSen
eca
Res
ourc
es C
ompa
ny,
LLC
C10
109
Kir
kwal
lD
awn
388,
261
01-N
ov-1
631
-Mar
-23
YN
Rov
er P
ipel
ine
LLC
C10
113
Ojib
way
Daw
n36
,927
01-N
ov-1
731
-Oct
-25
NN
Tran
sCan
ada
Pipe
Line
s Li
mited
C10
114
Park
way
Daw
n51
6,78
701
-Nov
-17
31-O
ct-2
0N
NTr
ansC
anad
a Pi
peLi
nes
Lim
ited
C10
115
Park
way
Daw
n42
,202
01-N
ov-1
731
-Oct
-22
NN
Hus
ky O
il O
pera
tion
s Li
mited
HU
B00
2T03
43D
awn
Park
way
1,20
001
-Dec
-18
28-F
eb-1
9Y
NBP
Can
ada
Ener
gy G
roup
ULC
H
UB04
0E60
Daw
nPa
rkw
ay1,
277
01-N
ov-1
831
-Oct
-19
NN
BP
Can
ada
Ener
gy G
roup
ULC
H
UB04
0E61
Daw
nPa
rkw
ay3,
053
01-N
ov-1
831
-Oct
-19
NN
BP
Can
ada
Ener
gy G
roup
ULC
H
UB04
0E62
Daw
nPa
rkw
ay10
,789
01-N
ov-1
831
-Oct
-19
NN
Ver
mon
t G
as S
yste
ms,
Inc
. H
UB10
0T00
47D
awn
Park
way
10,5
5101
-Nov
-18
31-M
ar-1
9Y
NVer
mon
t G
as S
yste
ms,
Inc
. H
UB10
0T00
48D
awn
Park
way
5,27
501
-Nov
-18
31-M
ar-1
9Y
NShe
ll En
ergy
Nor
th A
mer
ica
(Can
ada)
Inc
. H
UB16
4T01
22D
awn
Ojib
way
20,0
0001
-Dec
-18
31-M
ar-1
9Y
NJu
st E
nerg
y O
ntar
io L
.P.
HU
B25
0T00
4D
awn
Park
way
5,27
501
-Nov
-18
31-M
ar-1
9Y
NJu
st E
nerg
y O
ntar
io L
.P.
HU
B25
0T00
5D
awn
Park
way
1,05
501
-Nov
-18
31-M
ar-1
9Y
NTi
dal E
nerg
y M
arke
ting
Inc
. H
UB30
5T16
8O
jibw
ayD
awn
10,5
5101
-Nov
-18
31-M
ar-1
9Y
YO
ntar
io P
ower
Gen
erat
ion
Inc.
H
UB33
5T00
15Pa
rkw
ayD
awn
2,65
006
-Nov
-18
31-O
ct-1
9Y
NSun
cor
Ener
gy M
arke
ting
Inc
.H
UB34
5T04
18D
awn
Park
way
3,58
701
-Nov
-18
31-M
ar-1
9Y
NSun
cor
Ener
gy M
arke
ting
Inc
.H
UB34
5T04
19D
awn
Park
way
2,63
801
-Nov
-18
31-M
ar-1
9Y
NSun
cor
Ener
gy M
arke
ting
Inc
.H
UB34
5T04
23D
awn
Park
way
10,5
5101
-Dec
-18
31-M
ar-1
9Y
NEm
era
Ener
gy L
imited
Par
tner
ship
HU
B38
0T02
63O
jibw
ayD
awn
13,1
8801
-Jan
-19
31-M
ar-1
9Y
NBlu
ewat
er G
as S
tora
ge,
LLC
HU
B50
7T13
3D
awn
Daw
n-Vec
tor
123,
001
01-N
ov-1
831
-Mar
-19
YN
Nex
tEra
Ene
rgy
Mar
keting
, LL
C
HU
B52
6T00
05D
awn
Park
way
2,63
901
-Nov
-18
31-M
ar-1
9Y
NN
extE
ra E
nerg
y M
arke
ting
, LL
C
HU
B52
6T00
06D
awn
Park
way
5,27
501
-Nov
-18
31-M
ar-1
9Y
NED
F Tr
adin
g N
orth
Am
eric
a, L
LC
HU
B56
1T09
51D
awn
Park
way
31,6
5201
-Nov
-18
31-M
ar-1
9Y
NED
F Tr
adin
g N
orth
Am
eric
a, L
LC
HU
B56
1T09
90D
awn
Park
way
15,8
2601
-Nov
-18
31-M
ar-1
9Y
NH
artr
ee P
artn
ers,
LP
HU
B56
6T03
01St.
Cla
irD
awn
10,5
5101
-Nov
-18
31-M
ar-1
9Y
NM
IECO
IN
C.
HU
B61
5T01
44St.
Cla
irD
awn
10,5
5101
-Nov
-18
31-M
ar-1
9Y
NTw
in E
agle
Res
ourc
e M
anag
emen
t C
anad
a, L
LC
HU
B61
8T00
83D
awn
Park
way
3,00
001
-Nov
-18
31-M
ar-1
9Y
NC
astlet
on C
omm
oditie
s M
erch
ant
Trad
ing
L.P.
H
UB62
3T01
20D
awn
Park
way
2,63
801
-Nov
-18
31-M
ar-1
9Y
NC
astlet
on C
omm
oditie
s M
erch
ant
Trad
ing
L.P.
H
UB62
3T01
23D
awn
Park
way
5,27
501
-Nov
-18
31-M
ar-1
9Y
NC
astlet
on C
omm
oditie
s M
erch
ant
Trad
ing
L.P.
H
UB62
3T01
24D
awn
Park
way
5,27
501
-Nov
-18
31-M
ar-1
9Y
NC
astlet
on C
omm
oditie
s M
erch
ant
Trad
ing
L.P.
H
UB62
3T01
25D
awn
Park
way
5,27
501
-Nov
-18
31-M
ar-1
9Y
NC
astlet
on C
omm
oditie
s M
erch
ant
Trad
ing
L.P.
H
UB62
3T01
26D
awn
Park
way
5,27
501
-Nov
-18
31-M
ar-1
9Y
NC
astlet
on C
omm
oditie
s M
erch
ant
Trad
ing
L.P.
H
UB62
3T01
30D
awn
Park
way
5,27
501
-Jan
-19
31-J
an-1
9Y
NC
astlet
on C
omm
oditie
s M
erch
ant
Trad
ing
L.P.
H
UB62
3T01
31D
awn
Park
way
21,1
0101
-Jan
-19
31-J
an-1
9Y
NBas
ic E
nerg
y In
c.
HU
B75
0T00
1D
awn
Park
way
180
01-N
ov-1
831
-Mar
-19
YN
Ener
gir,
L.P
. by
its
Gen
eral
Par
tner
Ene
rgir
Inc
M12
007D
Daw
nPa
rkw
ay21
,021
01-N
ov-9
131
-Oct
-19
NN
1425
445
Ont
ario
Lim
ited
o/a
Utilit
ies
Kin
gsto
nM
1207
7D
awn
Park
way
6,32
201
-Apr
-04
31-M
ar-2
1N
NSte
lco
Inc.
M
1208
5D
awn
Park
way
11,0
8716
-Sep
-14
31-O
ct-2
0N
NEn
ergi
r, L
.P.
by it
s G
ener
al P
artn
er E
nerg
ir I
ncM
1209
2D
awn
Park
way
35,0
0001
-Nov
-06
31-O
ct-1
9N
NEn
ergi
r, L
.P.
by it
s G
ener
al P
artn
er E
nerg
ir I
ncM
1210
9D
awn
Park
way
65,0
0001
-Nov
-07
31-O
ct-2
7N
NG
orew
ay S
tation
Par
tner
ship
by
its
man
agin
g pa
rtne
r G
orew
ay
Pow
er S
tation
Hol
ding
s U
LCM
1211
0D
awn
Park
way
140,
000
01-N
ov-0
731
-Oct
-28
NN
Ver
mon
t G
as S
yste
ms,
Inc
. M
1211
9D
awn
Park
way
20,0
0001
-Nov
-07
31-O
ct-2
1N
NG
reat
er T
oron
to A
irpo
rts
Aut
hori
tyM
1212
0D
awn
Park
way
7,50
001
-Nov
-07
31-O
ct-2
1N
NSt.
Law
renc
e G
as C
ompa
ny,
Inc.
M
1212
6D
awn
Park
way
10,7
8501
-Nov
-08
31-O
ct-2
1N
Y
Filed: 2019-04-25, EB-2018-0305, Exhibit I.FPRO.5, Attachment 1, Page 1 of 3

Page
2 o
f 3
Janu
ary
2019
Cu
stom
er N
ame
Con
trac
t Id
enti
fier
Rec
eip
t P
oin
tD
eliv
ery
Po
int
Qu
anti
ty
(GJ)
Sta
rt D
ate
End
Dat
eN
ego
tiat
ed
Rat
eA
ffil
iate
Thor
old
CoG
en L
.P.
by it
s G
ener
al P
artn
er N
orth
land
Pow
er
Thor
old
Cog
en G
P In
c.M
1212
9D
awn
Kir
kwal
l49
,500
01-S
ep-0
931
-Aug
-29
NN
Port
land
s En
ergy
Cen
tre
L.P.
by
its
Gen
eral
Par
tner
, Po
rtla
nds
Ener
gy C
entr
e In
c.M
1213
0D
awn
Park
way
100,
000
13-J
an-0
931
-Oct
-28
NN
Ener
gir,
L.P
. by
its
Gen
eral
Par
tner
Ene
rgir
Inc
M12
132
Daw
nPa
rkw
ay52
,343
01-A
pr-0
931
-Mar
-21
NN
Ag
Ener
gy C
o-op
erat
ive
Ltd.
M
1215
1D
awn
Park
way
1,24
701
-Nov
-08
31-O
ct-2
0N
NTh
e N
arra
gans
ett
Elec
tric
Com
pany
d/b
/a N
atio
nal G
rid
M12
164
Daw
nPa
rkw
ay1,
081
01-N
ov-1
131
-Oct
-21
NN
Con
nect
icut
Nat
ural
Gas
Cor
pora
tion
M
1216
6D
awn
Park
way
6,41
001
-Nov
-11
31-O
ct-2
1N
NAg
Ener
gy C
o-op
erat
ive
Ltd.
M
1216
7D
awn
Park
way
1,90
001
-Nov
-11
31-O
ct-2
1N
NCon
solid
ated
Edi
son
Com
pany
of N
ew Y
ork,
Inc
. an
d O
rang
e an
d Roc
klan
d U
tilit
ies,
Inc
.M
1217
1D
awn
Park
way
21,8
2501
-Nov
-11
31-O
ct-2
1N
N
Ener
gir,
L.P
. by
its
Gen
eral
Par
tner
Ene
rgir
Inc
M12
172
Daw
nPa
rkw
ay22
,908
01-A
pr-1
031
-Mar
-21
NN
Ener
gir,
L.P
. by
its
Gen
eral
Par
tner
Ene
rgir
Inc
M12
176
Daw
nPa
rkw
ay88
,728
01-A
pr-1
131
-Mar
-21
NN
Cen
tral
Hud
son
Gas
& E
lect
ric
Cor
pora
tion
(a
subs
idia
ry o
f C
H
Ener
gy G
roup
, In
c.)
M12
182
Daw
nPa
rkw
ay5,
467
01-N
ov-1
131
-Oct
-21
NN
York
Ene
r gy
Cen
tre
LP
M12
184
Daw
nPa
rkw
ay76
,000
01-A
pr-1
231
-Oct
-22
NN
Nia
gara
Moh
awk
Pow
er C
orpo
ration
d/b
/a N
atio
nal G
rid
M12
186
Daw
nPa
rkw
ay55
,123
01-N
ov-1
131
-Oct
-21
NN
Ver
mon
t G
as S
yste
ms,
Inc
. M
1219
0D
awn
Park
way
500
01-N
ov-1
031
-Oct
-21
NN
The
Bro
okly
n U
nion
Gas
Com
pany
d/b
/a N
atio
nal G
rid
NY
M12
193
Daw
nPa
rkw
ay12
,953
01-N
ov-1
031
-Oct
-21
NN
Key
Spa
n G
as E
ast
Cor
pora
tion
d/b
/a N
atio
nal G
rid
M12
194
Daw
nPa
rkw
ay17
,162
01-N
ov-1
031
-Oct
-20
NN
Cen
tral
Hud
son
Gas
& E
lect
ric
Cor
pora
tion
(a
subs
idia
ry o
f C
H
Ener
gy G
roup
, In
c.)
M12
195
Daw
nPa
rkw
ay10
,792
01-N
ov-1
031
-Oct
-21
NN
Bos
ton
Gas
Com
pany
d/b
/a N
atio
nal G
rid
M12
197
Daw
nPa
rkw
ay9,
282
01-N
ov-1
031
-Oct
-21
NN
Col
onia
l Gas
Com
pany
d/b
/a N
atio
nal G
rid
M12
198
Daw
nPa
rkw
ay6,
475
01-N
ov-1
031
-Oct
-21
NN
Bos
ton
Gas
Com
pany
d/b
/a N
atio
nal G
rid
M12
199
Daw
nPa
rkw
ay2,
158
01-N
ov-1
031
-Oct
-21
NN
Libe
rty
Utilit
ies
(Ene
rgyN
orth
Nat
ural
Gas
) C
orp.
M
1220
0D
awn
Park
way
4,31
701
-Nov
-10
31-O
ct-2
2N
NC
onne
ctic
ut N
atur
al G
as C
orpo
ration
M
1220
1D
awn
Park
way
18,0
7701
-Nov
-10
31-O
ct-2
1N
NTh
e Sou
ther
n Con
nect
icut
Gas
Com
pany
M
1220
2D
awn
Park
way
34,9
5001
-Nov
-10
31-O
ct-2
1N
NYa
nkee
Gas
Ser
vice
s Com
pany
dba
Eve
rsou
rce
Ener
gyM
1220
3D
awn
Park
way
43,1
1601
-Nov
-10
31-O
ct-2
1N
NBay
Sta
te G
as C
ompa
ny d
ba C
olum
bia
Gas
of M
assa
chus
etts
M12
204
Daw
nPa
rkw
ay27
,803
01-N
ov-1
031
-Oct
-22
NN
Con
nect
icut
Nat
ural
Gas
Cor
pora
tion
M
1220
6D
awn
Park
way
9,17
001
-Nov
-10
31-O
ct-2
1N
NTh
e Sou
ther
n Con
nect
icut
Gas
Com
pany
M
1220
7D
awn
Park
way
13,9
7001
-Nov
-10
31-O
ct-2
1N
NTh
e Bro
okly
n U
nion
Gas
Com
pany
d/b
/a N
atio
nal G
rid
NY
M12
208
Daw
nPa
rkw
ay30
,217
01-N
ov-1
031
-Oct
-21
NN
Key
Spa
n G
as E
ast
Cor
pora
tion
d/b
/a N
atio
nal G
rid
M12
209
Daw
nPa
rkw
ay22
,772
01-N
ov-1
031
-Oct
-21
NN
Yank
ee G
as S
ervi
ces
Com
pany
dba
Eve
rsou
rce
Ener
gyM
1221
0D
awn
Park
way
20,5
6001
-Nov
-10
31-O
ct-2
1N
NYa
nkee
Gas
Ser
vice
s Com
pany
dba
Eve
rsou
rce
Ener
gyM
1221
2D
awn
Park
way
5,38
001
-Nov
-10
31-O
ct-2
1N
NTh
e Sou
ther
n Con
nect
icut
Gas
Com
pany
M
1221
3D
awn
Park
way
9,73
501
-Nov
-10
31-O
ct-2
1N
NC
onne
ctic
ut N
atur
al G
as C
orpo
ration
M
1221
4D
awn
Park
way
6,48
901
-Nov
-10
31-O
ct-2
1N
NSun
cor
Ener
gy P
rodu
cts
Part
ners
hip
Prod
uits
Sun
cor
Ener
gie,
S.E
.N.C
.M
1221
7D
awn
Park
way
9,58
501
-Nov
-11
31-O
ct-2
1N
N
Tran
sCan
ada
Pipe
Line
s Li
mited
M
1221
9Kir
kwal
lPa
rkw
ay88
,497
01-N
ov-1
231
-Oct
-22
NN
Tran
sCan
ada
Pipe
Line
s Li
mited
M
1222
0Kir
kwal
lPa
rkw
ay17
4,75
201
-Nov
-13
31-O
ct-2
3N
NEm
era
Ener
gy L
imited
Par
tner
ship
M
1222
1Kir
kwal
lPa
rkw
ay36
,751
01-N
ov-1
231
-Oct
-22
NN
Ener
gir,
L.P
. by
its
Gen
eral
Par
tner
Ene
rgir
Inc
M12
222
Daw
nPa
rkw
ay25
7,78
401
-Nov
-15
31-O
ct-2
5N
NVer
mon
t G
as S
yste
ms,
Inc
. M
1222
4D
awn
Park
way
8,10
001
-Nov
-14
31-O
ct-2
4N
NTr
ansC
anad
a Pi
peLi
nes
Lim
ited
M
1223
0Kir
kwal
lPa
rkw
ay36
,301
01-N
ov-1
631
-Oct
-31
NN
Ener
gir,
L.P
. by
its
Gen
eral
Par
tner
Ene
rgir
Inc
M12
232
Daw
nPa
rkw
ay39
,507
01-N
ov-1
631
-Oct
-31
NN
Ener
gir,
L.P
. by
its
Gen
eral
Par
tner
Ene
rgir
Inc
M12
233
Daw
nPa
rkw
ay19
,754
01-N
ov-1
631
-Oct
-31
NN
Ener
gir,
L.P
. by
its
Gen
eral
Par
tner
Ene
rgir
Inc
M12
237
Daw
nPa
rkw
ay85
,680
01-N
ov-1
631
-Oct
-31
NN
Ener
gir,
L.P
. by
its
Gen
eral
Par
tner
Ene
rgir
Inc
M12
244
Daw
nPa
rkw
ay36
,670
01-N
ov-1
731
-Oct
-32
NN
Tran
sCan
ada
Ener
gy L
td.
M12
246
Daw
nPa
rkw
ay14
3,77
501
-Nov
-17
31-O
ct-3
2N
NSt.
Law
renc
e G
as C
ompa
ny,
Inc.
M
1224
9D
awn
Park
way
10,4
1201
-Nov
-17
31-O
ct-3
2N
Y14
2544
5 O
ntar
io L
imited
o/a
Utilit
ies
Kin
gsto
nM
1225
1D
awn
Park
way
5,00
001
-Nov
-17
31-O
ct-3
2N
N14
2544
5 O
ntar
io L
imited
o/a
Utilit
ies
Kin
gsto
nM
1225
2Kir
kwal
lPa
rkw
ay1,
000
01-N
ov-1
731
-Oct
-32
NN
Filed: 2019-04-25, EB-2018-0305, Exhibit I.FPRO.5, Attachment 1, Page 2 of 3

Page
3 o
f 3
Janu
ary
2019
Cu
stom
er N
ame
Con
trac
t Id
enti
fier
Rec
eip
t P
oin
tD
eliv
ery
Po
int
Qu
anti
ty
(GJ)
Sta
rt D
ate
End
Dat
eN
ego
tiat
ed
Rat
eA
ffil
iate
The
Cor
pora
tion
of th
e C
ity
of K
itch
ener
M
1225
3Kir
kwal
lPa
rkw
ay10
,000
01-N
ov-1
731
-Oct
-32
NN
DTE
Ene
rgy
Trad
ing,
Inc
.M
1225
5Kir
kwal
lPa
rkw
ay73
,854
01-N
ov-1
731
-Oct
-31
NN
Nor
ther
n U
tilit
ies,
Inc
. M
1225
6D
awn
Park
way
42,9
6201
-Nov
-17
31-O
ct-3
3N
NPo
rtla
nd N
atur
al G
as T
rans
mis
sion
Sys
tem
M
1226
6-AS1
Daw
nPa
rkw
ay1,
957
01-N
ov-1
831
-Oct
-40
NN
Enbr
idge
Gas
New
Bru
nsw
ick
Lim
ited
Par
tner
ship
by
its
Gen
eral
Pa
rtne
r, E
nbri
dge
Gas
New
Bru
nsw
ick
Inc.
M12
270
Daw
nPa
rkw
ay2,
650
01-N
ov-1
831
-Oct
-40
NY
Bos
ton
Gas
Com
pany
d/b
/a N
atio
nal G
rid
M12
273
Daw
nPa
rkw
ay22
,332
01-N
ov-1
831
-Oct
-40
NN
The
Nar
raga
nset
t El
ectr
ic C
ompa
ny d
/b/a
Nat
iona
l Gri
dM
1227
4D
awn
Park
way
11,3
4901
-Nov
-18
31-O
ct-4
0N
NH
eritag
e G
as L
imited
M
1227
6D
awn
Park
way
3,97
801
-Nov
-18
31-O
ct-4
0N
NEn
brid
ge G
as N
ew B
runs
wic
k Li
mited
Par
tner
ship
by
its
Gen
eral
Pa
rtne
r, E
nbri
dge
Gas
New
Bru
nsw
ick
Inc.
M12
277
Daw
nPa
rkw
ay11
201
-Nov
-18
31-O
ct-4
0N
Y
Tran
sCan
ada
Pipe
Line
s Li
mited
M
12X00
4D
awn
Park
way
50,0
0001
-Sep
-11
31-A
ug-2
1N
NTr
ansC
anad
a Pi
peLi
nes
Lim
ited
M
12X00
5D
awn
Park
way
78,3
1601
-Sep
-11
31-A
ug-2
1N
NTr
ansC
anad
a Pi
peLi
nes
Lim
ited
M
12X01
3D
awn
Park
way
62,6
9501
-Nov
-12
31-O
ct-2
3N
N14
2544
5 O
ntar
io L
imited
o/a
Utilit
ies
Kin
gsto
nM
12X01
5D
awn
Park
way
5,00
001
-Apr
-14
31-M
ar-2
4N
N
Mar
ket
Hub
Par
tner
s C
anad
a L.
P.
M16
004
Daw
nM
arke
t H
ub
Part
ners
- S
t.
Cla
ir P
ool
9,00
001
-Jun
-07
31-M
ay-2
1N
Y
Mar
ket
Hub
Par
tner
s Can
ada
L.P.
M
1600
4M
arke
t H
ub
Part
ners
- S
t.
Cla
ir P
ool
Daw
n5,
000
01-J
un-0
731
-May
-21
NY
Enbr
idge
Gas
Inc
. (I
n-Fr
anch
ise
Cus
tom
ers
- EG
D Z
one)
*D
awn
Park
way
2,91
7,17
301
-Jan
-19
31-O
ct-1
9N
YEn
brid
ge G
as I
nc.
(In-
Fran
chis
e Cus
tom
ers
- EG
D Z
one)
**
Daw
nKir
kwal
l67
,929
01-J
an-1
931
-Oct
-19
NY
Enbr
idge
Gas
Inc
. (I
n-Fr
anch
ise
Cus
tom
ers
- EG
D Z
one)
***
Park
way
Daw
n23
6,58
601
-Jan
-19
31-M
ar-1
9N
YIn
-Fra
nchi
se C
usto
mer
s -
Uni
on S
outh
and
Nor
th Z
ones
Daw
nPa
rkw
ay2,
333,
248
01-N
ov-1
831
-Oct
-19
NY
* -
com
pris
ed o
f fo
rmer
con
trac
t #
's:
M12
079B
, M
1208
0, M
1210
8, M
1212
5, M
1218
8, M
1222
5, M
1223
4, M
1225
0 &
M12
X00
6
** -
com
pris
ed o
f fo
rmer
con
trac
t #
's:
M12
079A
& M
1217
5
***
- co
mpr
ised
of fo
rmer
con
trac
t #
: C
1000
9
Filed: 2019-04-25, EB-2018-0305, Exhibit I.FPRO.5, Attachment 1, Page 3 of 3

Janu
ary
2019
Cu
stom
er N
ame
Con
trac
t Id
enti
fier
Rec
eip
t P
oin
tD
eliv
ery
Poi
nt
Qu
anti
ty
(GJ)
Sta
rt D
ate
End
Dat
eN
egot
iate
d
Rat
eA
ffili
ate
Emer
a En
ergy
Lim
ited
Part
ners
hip
C10
107
Kirkw
all
Daw
n73
,745
1-N
ov-1
531
-Oct
-21
NN
Emer
a En
ergy
Lim
ited
Part
ners
hip
C10
108
Kirkw
all
Daw
n26
,335
1-Apr
-15
31-M
ar-2
1N
NSen
eca
Res
ourc
es C
ompa
ny,
LLC
C10
109
Kirkw
all
Daw
n38
8,26
11-
Nov
-16
31-M
ar-2
3Y
NS
UB
TOTA
L (K
irkw
all t
o D
awn
)4
88
,34
1St.
Law
renc
e G
as C
ompa
ny,
Inc.
C10
076
Park
way
Daw
n10
,785
1-Apr
-07
31-M
ar-2
1N
Y
Ener
gir,
L.P
. by
its
Gen
eral
Par
tner
Ene
rgir I
ncC10
087
Park
way
Daw
n10
0,00
01-
Apr
-11
31-M
ar-1
9N
N
Tran
sCan
ada
Pipe
Line
s Li
mite
d C10
114
Park
way
Daw
n51
6,78
71-
Nov
-17
31-O
ct-2
0N
NTr
ansC
anad
a Pi
peLi
nes
Lim
ited
C10
115
Park
way
Daw
n42
,202
1-N
ov-1
731
-Oct
-22
NN
Ont
ario
Pow
er G
ener
atio
n In
c.
HU
B33
5T00
15Pa
rkw
a yD
awn
2,65
06-
Nov
-18
31-O
ct-1
9Y
NEn
brid
ge G
as I
nc.
(In-
Fran
chis
e Cus
tom
ers
- EG
D Z
one)
***
Park
way
Daw
n23
6,58
61-
Jan-
1931
-Mar
-19
NY
SU
BTO
TAL
(Par
kway
to
Daw
n)
90
9,0
10
Thor
old
CoG
en L
.P.
by it
s G
ener
al P
artn
er N
orth
land
Pow
er
Thor
old
Cog
en G
P In
c.M
1212
9D
awn
Kirkw
all
49,5
001-
Sep
-09
31-A
ug-2
9N
N
Enbr
idge
Gas
Inc
. (I
n-Fr
anch
ise
Cus
tom
ers
- EG
D Z
one)
**
Daw
nKirkw
all
67,9
291-
Jan-
1931
-Oct
-19
NY
SU
BTO
TAL
(Daw
n t
o K
irkw
all)
11
7,4
29
York
Ene
r gy
Cen
tre
LP
C10
102
Daw
nPa
rkw
ay11
,654
1-Apr
-12
31-O
ct-2
2N
NH
usk y
Oil
Ope
ratio
ns L
imite
dH
UB00
2T03
43D
awn
Park
way
1,20
01-
Dec
-18
28-F
eb-1
9Y
NBP
Can
ada
Ener
gy G
roup
ULC
H
UB04
0E60
Daw
nPa
rkw
ay1,
277
1-N
ov-1
831
-Oct
-19
NN
BP
Can
ada
Ener
gy G
roup
ULC
H
UB04
0E61
Daw
nPa
rkw
ay3,
053
1-N
ov-1
831
-Oct
-19
NN
BP
Can
ada
Ener
gy G
roup
ULC
H
UB04
0E62
Daw
nPa
rkw
ay10
,789
1-N
ov-1
831
-Oct
-19
NN
Ver
mon
t G
as S
yste
ms,
Inc
. H
UB10
0T00
47D
awn
Park
way
10,5
511-
Nov
-18
31-M
ar-1
9Y
NVer
mon
t G
as S
yste
ms,
Inc
. H
UB10
0T00
48D
awn
Park
way
5,27
51-
Nov
-18
31-M
ar-1
9Y
NJu
st E
ner g
y O
ntar
io L
.P.
HU
B25
0T00
4D
awn
Park
way
5,27
51-
Nov
-18
31-M
ar-1
9Y
NJu
st E
ner g
y O
ntar
io L
.P.
HU
B25
0T00
5D
awn
Park
way
1,05
51-
Nov
-18
31-M
ar-1
9Y
NSun
cor
Ener
gy M
arke
ting
Inc.
HU
B34
5T04
18D
awn
Park
way
3,58
71-
Nov
-18
31-M
ar-1
9Y
NSun
cor
Ener
gy M
arke
ting
Inc.
HU
B34
5T04
19D
awn
Park
way
2,63
81-
Nov
-18
31-M
ar-1
9Y
NSun
cor
Ener
gy M
arke
ting
Inc.
HU
B34
5T04
23D
awn
Park
way
10,5
511-
Dec
-18
31-M
ar-1
9Y
NN
extE
ra E
ner g
y M
arke
ting,
LLC
H
UB52
6T00
05D
awn
Park
way
2,63
91-
Nov
-18
31-M
ar-1
9Y
NN
extE
ra E
ner g
y M
arke
ting,
LLC
H
UB52
6T00
06D
awn
Park
way
5,27
51-
Nov
-18
31-M
ar-1
9Y
NED
F Tr
adin
g N
orth
Am
eric
a, L
LC
HU
B56
1T09
51D
awn
Park
way
31,6
521-
Nov
-18
31-M
ar-1
9Y
NED
F Tr
adin
g N
orth
Am
eric
a, L
LC
HU
B56
1T09
90D
awn
Park
way
15,8
261-
Nov
-18
31-M
ar-1
9Y
NTw
in E
a gle
Res
ourc
e M
anag
emen
t Can
ada,
LLC
H
UB61
8T00
83D
awn
Park
way
3,00
01-
Nov
-18
31-M
ar-1
9Y
NCas
tleto
n Com
mod
ities
Mer
chan
t Tr
adin
g L.
P.
HU
B62
3T01
20D
awn
Park
way
2,63
81-
Nov
-18
31-M
ar-1
9Y
NCas
tleto
n Com
mod
ities
Mer
chan
t Tr
adin
g L.
P.
HU
B62
3T01
23D
awn
Park
way
5,27
51-
Nov
-18
31-M
ar-1
9Y
NCas
tleto
n Com
mod
ities
Mer
chan
t Tr
adin
g L.
P.
HU
B62
3T01
24D
awn
Park
way
5,27
51-
Nov
-18
31-M
ar-1
9Y
NCas
tleto
n Com
mod
ities
Mer
chan
t Tr
adin
g L.
P.
HU
B62
3T01
25D
awn
Park
way
5,27
51-
Nov
-18
31-M
ar-1
9Y
NCas
tleto
n Com
mod
ities
Mer
chan
t Tr
adin
g L.
P.
HU
B62
3T01
26D
awn
Park
way
5,27
51-
Nov
-18
31-M
ar-1
9Y
NCas
tleto
n Com
mod
ities
Mer
chan
t Tr
adin
g L.
P.
HU
B62
3T01
30D
awn
Park
way
5,27
51-
Jan-
1931
-Jan
-19
YN
Cas
tleto
n Com
mod
ities
Mer
chan
t Tr
adin
g L.
P.
HU
B62
3T01
31D
awn
Park
way
21,1
011-
Jan-
1931
-Jan
-19
YN
Bas
ic E
ner g
y In
c.
HU
B75
0T00
1D
awn
Park
way
180
1-N
ov-1
831
-Mar
-19
YN
Ener
gir,
L.P
. by
its
Gen
eral
Par
tner
Ene
rgir I
ncM
1200
7DD
awn
Park
way
21,0
211-
Nov
-91
31-O
ct-1
9N
N14
2544
5 O
ntar
io L
imite
d o /
a U
tiliti
es K
ings
ton
M12
077
Daw
nPa
rkw
ay6,
322
1-Apr
-04
31-M
ar-2
1N
NSte
lco
Inc.
M
1208
5D
awn
Park
wa y
11,0
8716
-Sep
-14
31-O
ct-2
0N
NEn
ergi
r, L
.P.
by it
s G
ener
al P
artn
er E
nerg
ir I
ncM
1209
2D
awn
Park
way
35,0
001-
Nov
-06
31-O
ct-1
9N
NEn
ergi
r, L
.P.
by it
s G
ener
al P
artn
er E
nerg
ir I
ncM
1210
9D
awn
Park
way
65,0
001-
Nov
-07
31-O
ct-2
7N
NG
orew
ay S
tatio
n Pa
rtne
rshi
p by
its
man
agin
g pa
rtne
r G
orew
ay
Pow
er S
tatio
n H
oldi
ngs
ULC
M12
110
Daw
nPa
rkw
ay14
0,00
01-
Nov
-07
31-O
ct-2
8N
N
Ver
mon
t G
as S
yste
ms,
Inc
. M
1211
9D
awn
Park
way
20,0
001-
Nov
-07
31-O
ct-2
1N
NG
reat
er T
oron
to A
irpo
rts
Aut
hority
M12
120
Daw
nPa
rkw
a y7,
500
1-N
ov-0
731
-Oct
-21
NN
St.
Law
renc
e G
as C
ompa
ny,
Inc.
M
1212
6D
awn
Park
way
10,7
851-
Nov
-08
31-O
ct-2
1N
YPo
rtla
nds
Ener
gy C
entr
e L.
P. b
y its
Gen
eral
Par
tner
, Po
rtla
nds
Ener
gy C
entr
e In
c.M
1213
0D
awn
Park
way
100,
000
13-J
an-0
931
-Oct
-28
NN
Ener
gir,
L.P
. by
its
Gen
eral
Par
tner
Ene
rgir I
ncM
1213
2D
awn
Park
way
52,3
431-
Apr
-09
31-M
ar-2
1N
NAg
Ener
gy C
o-op
erat
ive
Ltd.
M
1215
1D
awn
Park
way
1,24
71-
Nov
-08
31-O
ct-2
0N
NTh
e N
arra
gans
ett
Elec
tric
Com
pany
d/b
/a N
atio
nal G
rid
M12
164
Daw
nPa
rkw
ay1,
081
1-N
ov-1
131
-Oct
-21
NN
Page 1 of 3
Filed: 2019-04-25, EB-2018-0305, Exhibit I.FPRO.5, Attachment 2, Page 1 of 3

Janu
ary
2019
Cu
stom
er N
ame
Con
trac
t Id
enti
fier
Rec
eip
t P
oin
tD
eliv
ery
Poi
nt
Qu
anti
ty
(GJ)
Sta
rt D
ate
End
Dat
eN
egot
iate
d
Rat
eA
ffili
ate
Con
nect
icut
Nat
ural
Gas
Cor
pora
tion
M12
166
Daw
nPa
rkw
ay6,
410
1-N
ov-1
131
-Oct
-21
NN
Ag
Ener
gy C
o-op
erat
ive
Ltd.
M
1216
7D
awn
Park
way
1,90
01-
Nov
-11
31-O
ct-2
1N
NCon
solid
ated
Edi
son
Com
pany
of
New
Yor
k, I
nc.
and
Ora
nge
and
Roc
klan
d U
tiliti
es,
Inc.
M12
171
Daw
nPa
rkw
ay21
,825
1-N
ov-1
131
-Oct
-21
NN
Ener
gir,
L.P
. by
its
Gen
eral
Par
tner
Ene
rgir I
ncM
1217
2D
awn
Park
way
22,9
081-
Apr
-10
31-M
ar-2
1N
NEn
ergi
r, L
.P.
by it
s G
ener
al P
artn
er E
nerg
ir I
ncM
1217
6D
awn
Park
way
88,7
281-
Apr
-11
31-M
ar-2
1N
NCen
tral
Hud
son
Gas
& E
lect
ric
Cor
pora
tion
(a s
ubsi
diar
y of
CH
En
ergy
Gro
up,
Inc.
)M
1218
2D
awn
Park
way
5,46
71-
Nov
-11
31-O
ct-2
1N
N
York
Ene
rgy
Cen
tre
LP
M12
184
Daw
nPa
rkw
ay76
,000
1-Apr
-12
31-O
ct-2
2N
NN
iaga
ra M
ohaw
k Po
wer
Cor
pora
tion
d/b/
a N
atio
nal G
rid
M12
186
Daw
nPa
rkw
ay55
,123
1-N
ov-1
131
-Oct
-21
NN
Ver
mon
t G
as S
yste
ms,
Inc
. M
1219
0D
awn
Park
way
500
1-N
ov-1
031
-Oct
-21
NN
The
Bro
okly
n U
nion
Gas
Com
pany
d/b
/a N
atio
nal G
rid
NY
M12
193
Daw
nPa
rkw
ay12
,953
1-N
ov-1
031
-Oct
-21
NN
Key
Spa
n G
as E
ast
Cor
pora
tion
d/b/
a N
atio
nal G
rid
M12
194
Daw
nPa
rkw
ay17
,162
1-N
ov-1
031
-Oct
-20
NN
Cen
tral
Hud
son
Gas
& E
lect
ric
Cor
pora
tion
(a s
ubsi
diar
y of
CH
En
ergy
Gro
up,
Inc.
)M
1219
5D
awn
Park
way
10,7
921-
Nov
-10
31-O
ct-2
1N
N
Bos
ton
Gas
Com
pany
d/b
/a N
atio
nal G
rid
M12
197
Daw
nPa
rkw
ay9,
282
1-N
ov-1
031
-Oct
-21
NN
Col
onia
l Gas
Com
pany
d/b
/a N
atio
nal G
rid
M12
198
Daw
nPa
rkw
ay6,
475
1-N
ov-1
031
-Oct
-21
NN
Bos
ton
Gas
Com
pany
d/b
/a N
atio
nal G
rid
M12
199
Daw
nPa
rkw
ay2,
158
1-N
ov-1
031
-Oct
-21
NN
Libe
rty
Util
ities
(En
ergy
Nor
th N
atur
al G
as)
Cor
p.
M12
200
Daw
nPa
rkw
ay4,
317
1-N
ov-1
031
-Oct
-22
NN
Con
nect
icut
Nat
ural
Gas
Cor
pora
tion
M12
201
Daw
nPa
rkw
ay18
,077
1-N
ov-1
031
-Oct
-21
NN
The
Sou
ther
n Con
nect
icut
Gas
Com
pany
M
1220
2D
awn
Park
way
34,9
501-
Nov
-10
31-O
ct-2
1N
NYa
nkee
Gas
Ser
vice
s Com
pany
dba
Eve
rsou
rce
Ener
gyM
1220
3D
awn
Park
way
43,1
161-
Nov
-10
31-O
ct-2
1N
N
Bay
Sta
te G
as C
ompa
ny d
ba C
olum
bia
Gas
of
Mas
sach
uset
tsM
1220
4D
awn
Park
way
27,8
031-
Nov
-10
31-O
ct-2
2N
N
Con
nect
icut
Nat
ural
Gas
Cor
pora
tion
M12
206
Daw
nPa
rkw
ay9,
170
1-N
ov-1
031
-Oct
-21
NN
The
Sou
ther
n Con
nect
icut
Gas
Com
pany
M
1220
7D
awn
Park
way
13,9
701-
Nov
-10
31-O
ct-2
1N
N
The
Bro
okly
n U
nion
Gas
Com
pany
d/b
/a N
atio
nal G
rid
NY
M12
208
Daw
nPa
rkw
ay30
,217
1-N
ov-1
031
-Oct
-21
NN
Key
Spa
n G
as E
ast
Cor
pora
tion
d/b/
a N
atio
nal G
rid
M12
209
Daw
nPa
rkw
ay22
,772
1-N
ov-1
031
-Oct
-21
NN
Yank
ee G
as S
ervi
ces
Com
pany
dba
Eve
rsou
rce
Ener
gyM
1221
0D
awn
Park
way
20,5
601-
Nov
-10
31-O
ct-2
1N
NYa
nkee
Gas
Ser
vice
s Com
pany
dba
Eve
rsou
rce
Ener
gyM
1221
2D
awn
Park
way
5,38
01-
Nov
-10
31-O
ct-2
1N
NTh
e Sou
ther
n Con
nect
icut
Gas
Com
pany
M
1221
3D
awn
Park
way
9,73
51-
Nov
-10
31-O
ct-2
1N
NCon
nect
icut
Nat
ural
Gas
Cor
pora
tion
M12
214
Daw
nPa
rkw
ay6,
489
1-N
ov-1
031
-Oct
-21
NN
Sun
cor
Ener
gy P
rodu
cts
Part
ners
hip
Prod
uits
Sun
cor
Ener
gie,
S.E
.N.C
.M
1221
7D
awn
Park
way
9,58
51-
Nov
-11
31-O
ct-2
1N
N
Ener
gir,
L.P
. by
its
Gen
eral
Par
tner
Ene
rgir I
ncM
1222
2D
awn
Park
way
257,
784
1-N
ov-1
531
-Oct
-25
NN
Ver
mon
t G
as S
yste
ms,
Inc
. M
1222
4D
awn
Park
way
8,10
01-
Nov
-14
31-O
ct-2
4N
NEn
ergi
r, L
.P.
by it
s G
ener
al P
artn
er E
nerg
ir I
ncM
1223
2D
awn
Park
way
39,5
071-
Nov
-16
31-O
ct-3
1N
NEn
ergi
r, L
.P.
by it
s G
ener
al P
artn
er E
nerg
ir I
ncM
1223
3D
awn
Park
way
19,7
541-
Nov
-16
31-O
ct-3
1N
NEn
ergi
r, L
.P.
by it
s G
ener
al P
artn
er E
nerg
ir I
ncM
1223
7D
awn
Park
way
85,6
801-
Nov
-16
31-O
ct-3
1N
NEn
ergi
r, L
.P.
by it
s G
ener
al P
artn
er E
nerg
ir I
ncM
1224
4D
awn
Park
way
36,6
701-
Nov
-17
31-O
ct-3
2N
NTr
ansC
anad
a En
ergy
Ltd
.M
1224
6D
awn
Park
way
143,
775
1-N
ov-1
731
-Oct
-32
NN
St.
Law
renc
e G
as C
ompa
ny,
Inc.
M
1224
9D
awn
Park
way
10,4
121-
Nov
-17
31-O
ct-3
2N
Y14
2544
5 O
ntar
io L
imite
d o/
a U
tiliti
es K
ings
ton
M12
251
Daw
nPa
rkw
ay5,
000
1-N
ov-1
731
-Oct
-32
NN
Nor
ther
n U
tiliti
es,
Inc.
M
1225
6D
awn
Park
way
42,9
621-
Nov
-17
31-O
ct-3
3N
NPo
rtla
nd N
atur
al G
as T
rans
mis
sion
Sys
tem
M
1226
6-AS1
Daw
nPa
rkw
ay1,
957
1-N
ov-1
831
-Oct
-40
NN
Enbr
idge
Gas
New
Bru
nsw
ick
Lim
ited
Part
ners
hip
by it
s G
ener
al
Part
ner,
Enb
ridg
e G
as N
ew B
runs
wic
k In
c.M
1227
0D
awn
Park
way
2,65
01-
Nov
-18
31-O
ct-4
0N
Y
Bos
ton
Gas
Com
pany
d/b
/a N
atio
nal G
rid
M12
273
Daw
nPa
rkw
ay22
,332
1-N
ov-1
831
-Oct
-40
NN
The
Nar
raga
nset
t El
ectr
ic C
ompa
ny d
/b/a
Nat
iona
l Grid
M12
274
Daw
nPa
rkw
ay11
,349
1-N
ov-1
831
-Oct
-40
NN
Her
itage
Gas
Lim
ited
M12
276
Daw
nPa
rkw
ay3,
978
1-N
ov-1
831
-Oct
-40
NN
Page 2 of 3
Filed: 2019-04-25, EB-2018-0305, Exhibit I.FPRO.5, Attachment 2, Page 2 of 3

Janu
ary
2019
Cu
stom
er N
ame
Con
trac
t Id
enti
fier
Rec
eip
t P
oin
tD
eliv
ery
Poi
nt
Qu
anti
ty
(GJ)
Sta
rt D
ate
End
Dat
eN
egot
iate
d
Rat
eA
ffili
ate
Enbr
idge
Gas
New
Bru
nsw
ick
Lim
ited
Part
ners
hip
by it
s G
ener
al
Part
ner,
Enb
ridg
e G
as N
ew B
runs
wic
k In
c.M
1227
7D
awn
Park
way
112
1-N
ov-1
831
-Oct
-40
NY
Tran
sCan
ada
Pipe
Line
s Li
mite
d M
12X00
4D
awn
Park
way
50,0
001-
Sep
-11
31-A
ug-2
1N
NTr
ansC
anad
a Pi
peLi
nes
Lim
ited
M12
X00
5D
awn
Park
way
78,3
161-
Sep
-11
31-A
ug-2
1N
NTr
ansC
anad
a Pi
peLi
nes
Lim
ited
M12
X01
3D
awn
Park
way
62,6
951-
Nov
-12
31-O
ct-2
3N
N14
2544
5 O
ntar
io L
imite
d o/
a U
tiliti
es K
ings
ton
M12
X01
5D
awn
Park
way
5,00
01-
Apr
-14
31-M
ar-2
4N
N
Enbr
idge
Gas
Inc
. (I
n-Fr
anch
ise
Cus
tom
ers
- EG
D Z
one)
*D
awn
Park
way
2,91
7,17
31-
Jan-
1931
-Oct
-19
NY
In-F
ranc
hise
Cus
tom
ers
- U
nion
Sou
th a
nd N
orth
Zon
esD
awn
Park
way
2,33
3,24
81-
Nov
-18
31-O
ct-1
9N
YS
UB
TOTA
L (D
awn
to
Par
kway
)7
,37
9,2
55
Tran
sCan
ada
Pipe
Line
s Li
mite
d M
1221
9Kirkw
all
Park
way
88,4
971-
Nov
-12
31-O
ct-2
2N
NTr
ansC
anad
a Pi
peLi
nes
Lim
ited
M12
220
Kirkw
all
Park
way
174,
752
1-N
ov-1
331
-Oct
-23
NN
Emer
a En
ergy
Lim
ited
Part
ners
hip
M12
221
Kirkw
all
Park
way
36,7
511-
Nov
-12
31-O
ct-2
2N
NTr
ansC
anad
a Pi
peLi
nes
Lim
ited
M12
230
Kirkw
all
Park
way
36,3
011-
Nov
-16
31-O
ct-3
1N
N14
2544
5 O
ntar
io L
imite
d o/
a U
tiliti
es K
ings
ton
M12
252
Kirkw
all
Park
way
1,00
01-
Nov
-17
31-O
ct-3
2N
NTh
e Cor
pora
tion
of t
he C
ity o
f Kitc
hene
r M
1225
3Kirkw
all
Park
way
10,0
001-
Nov
-17
31-O
ct-3
2N
ND
TE E
nerg
y Tr
adin
g, I
nc.
M12
255
Kirkw
all
Park
way
73,8
541-
Nov
-17
31-O
ct-3
1N
NS
UB
TOTA
L (K
irkw
all t
o P
arkw
ay)
42
1,1
55
* -
com
pris
ed o
f fo
rmer
con
trac
t #
's:
M12
079B
, M
1208
0, M
1210
8, M
1212
5, M
1218
8, M
1222
5, M
1223
4, M
1225
0 &
M12
X00
6
** -
com
pris
ed o
f fo
rmer
con
trac
t #
's:
M12
079A
& M
1217
5
***
- co
mpr
ised
of
form
er c
ontr
act
#:
C10
009
Page 3 of 3
Filed: 2019-04-25, EB-2018-0305, Exhibit I.FPRO.5, Attachment 2, Page 3 of 3

Filed: 2019-04-25 EB-2018-0305 Exhibit I.FRPO.6 Page 1 of 1
ENBRIDGE GAS INC. Answer to Interrogatory from
Federation of Rental-housing Providers of Ontario (FRPO) Reference: Exhibit B1 / Tab 1 / Schedule 1/ p. 32-33 Preamble: EGI’s evidence states: Enbridge Gas proposes to update the allocation of
the PDO and PDCI demand-related costs based on the 2019 Dawn-Parkway design day demands and the allocation of the in-franchise compressor fuel costs based on 2019 forecast volumes.
Question: We would like to understand better this PDO and PDCI adjustment. Is this adjustment premised on the principle that all of the costs of the Dawn-Parkway system including the 2015-2017 expansions are included? Response No. Enbridge Gas has updated the allocation factors for PDO and PDCI costs in the current application to reflect the 2019 forecast consistent with the use of 2019 forecast billing units to derive the PDO rates provided at Exhibit F1, Tab 2, Rate Order, Working Papers, Schedule 11, pp. 7-9.

Filed: 2019-04-25 EB-2018-0305 Exhibit I.FRPO.7 Page 1 of 2
ENBRIDGE GAS INC. Answer to Interrogatory from
Federation of Rental-housing Providers of Ontario (FRPO) Reference: Exhibit B1 / Tab 1 / Schedule 1/ p. 32-33 Preamble: EGI’s evidence states: Enbridge Gas proposes to update the allocation of
the PDO and PDCI demand-related costs based on the 2019 Dawn-Parkway design day demands and the allocation of the in-franchise compressor fuel costs based on 2019 forecast volumes.
Question: Is this precisely the same methodology including assumptions developed for and implemented in the 2014-2018 period?
a) If not, please re-produce Tab F1, Tab 2, Rate Order, Working Papers, Schedule 11 using the original methodology and assumptions.
b) If so, please describe what adjustments are taking place and provide the 2018 and 2019 figures for those respective categories of adjustments.
Response The methodology used to calculate the proposed 2019 PDO and PDCI costs is the same methodology used to calculate the Board-approved PDO and PDCI costs during the 2014 to 2018 period. A description of the 2019 PDO and PDCI costs changes is provided in Table 1.

Filed: 2019-04-25 EB-2018-0305 Exhibit I.FRPO.7 Page 2 of 2
Table 1 Summary of 2019 PDO and PDCI Changes
PDO and PDCI Costs Line
2018
2019
No.
Particulars ($000's)
Approved (1)
Proposed (2)
Change
(a)
(b)
(c) = (b-a)
1
PDO Demand Costs
9,726
10,880
1,154 (3)
2
PDO Fuel Costs
1,705
1,640
(64) (4) 3
PDCI Demand Costs
10,300
9,930
(370) (5)
4
PDCI Fuel Costs
2,364
2,272
(92) (6) 5
Total
24,095
24,723
627
Notes:
(1) PDO Costs from EB-2017-0087, Rate Order, Working Papers, Schedule 20, p. 1 and
updated PDCI costs from EB-2018-0253, Rate Order, Working Papers, Schedule 3, p. 1.
(2) Exhibit F1, Tab 2, Rate Order, Working Papers, Schedule 11, p. 1. (3) 2019 PDO demand cost change related to the 70 TJ/d of Rate M12 turnback not offset
by increased Rate T2 charges and a decrease in the proposed 2019 Rate M12
Dawn-Parkway demand charge.
(4) 2019 PDO fuel cost change related to an update to the October 1, 2018 QRAM. (5) 2019 PDCI demand cost change related to a decrease in the proposed 2019 Rate M12
Dawn-Parkway demand charge. (6) 2019 PDCI fuel cost change related to an update to the 2019 Rate M12 Dawn-Parkway fuel
ratio and the October 1, 2018 QRAM.

Filed: 2019-04-25 EB-2018-0305 Exhibit I.FRPO.8 Page 1 of 1
ENBRIDGE GAS INC. Answer to Interrogatory from
Federation of Rental-housing Providers of Ontario (FRPO) Reference: Exhibit B1 / Tab 1 / Schedule 1/ p. 42 Preamble: EGI’s evidence states: As of November 1, 2017 the initial Parkway shortfall
has been fully eliminated as a result of Dawn to Kirkwall turnback, and therefore Union did not need to take action to manage the shortfall..
Question: We would like to understand better how the shortfall was managed in the period after PDO reduction started and November 1, 2017. Please confirm that Union South experienced a peak day in mid-February 2015.
a) What was the capacity of the Dawn-Parkway system for the winter of 2014/15? b) For the peak day or day of highest Dawn-Parkway throughput in February:
i) What was the throughput? ii) What was the daily demand at Parkway? iii) What was the daily demand at Kirkwall? iv) What was the in-franchise demand? v) Please explain how any shortfall was managed?
Response While the heating degree day on February 15, 2015 reached the design heating degree day, the day was not considered a design day as it occurred on a holiday when gas usage is lower than if the weather condition occurred during a weekday. a) 6842 TJ/d b) The following are the results from February 15, 2015.
i) 5376 TJ/d ii) 3844 TJ/d iii) 976 TJ/d iv) 1629 TJ/d v) There was a system surplus in Winter 14/15 and therefore no shortfall to
manage

Filed: 2019-04-25 EB-2018-0305 Exhibit I.FRPO.9 Page 1 of 2
ENBRIDGE GAS INC. Answer to Interrogatory from
Federation of Rental-housing Providers of Ontario (FRPO) Reference: Exhibit B1 / Tab 1 / Schedule 1/ Appendix A/ page 2 Preamble: EGI’s evidence states: The PGVA will record adjustments related to
transactional services activities which are designed to record the impact of direct and avoided costs between the PGVA and the TSDA. These adjustments are required to ensure appropriate allocation of costs and benefits to the underlying transactions and appropriate recording of amounts in the PGVA and TSDA for purposes of deferral account dispositions.
Question: We would like to understand better how these transactions are distinguished? Please provide the policy or guidelines followed by staff to differentiate direct and avoided costs between PGVA and TSDA.
a) Please clarify if this is a new practice or, if it has been in place, for how long.
b) Please provide a few examples of how this policy or guideline is used.
c) Are there any financial employee incentives tied to the level of margin for TSDA
for those distinguishing the difference?
Response a) The practice of recording direct and avoided costs between the PGVA and the TSDA
at EGD has been in place for more than 10 years. b) An example of Direct and Avoided costs would be in relation to fuel costs. If by
entering in a Transactional Services deal the Company avoids fuel costs, the deemed fuel cost wold be charged to the PGVA and credited to Transactional Services Revenue.

Filed: 2019-04-25 EB-2018-0305 Exhibit I.FRPO.9 Page 2 of 2
c) There are no specific employee incentives tied to the level of margin for Transactional Services Revenue.

Filed: 2019-04-25 EB-2018-0305 Exhibit I.FRPO.10 Page 1 of 1
ENBRIDGE GAS INC. Answer to Interrogatory from
Federation of Rental-housing Providers of Ontario (FRPO) Reference: Exhibit B1 / Tab 1 / Schedule 1/ Appendix A/ page 2 Preamble: EGI evidences states: In addition, the PGVA will record the amounts
related to unforecast penalty revenues received from interruptible customers who do not comply with the Company's curtailment requirements, unauthorized overrun gas revenues, the use of electronic bulletin boards, and the unforecast Unabsorbed Demand Charge ("UDC") that arises as a consequence of the Company voluntarily leaving transportation capacity unutilized in order to gain a net benefit for the customer by purchasing lower priced unforecast discretionary delivered supplies.
Question: We are interested in understanding better how the un-forecast UDC costs will be tracked with the alternative purchases. Please clarify EGI’s intention regarding tracking these UDC costs. Please include explanation of:
a) The timing of these UDC charges. b) The timing of corresponding alternative arrangements for the purpose of
matching. c) How corresponding marketing of the unutilized capacity will be tracked. d) The determination of net benefit of the series of transactions. e) The allocation of the net benefit.
Response As per the Board’s Procedural Order No. 3, the cost consequences of Gas Supply will be dealt with as part of a future proceeding.

Filed: 2019-04-25 EB-2018-0305 Exhibit I.FRPO.11 Page 1 of 1
ENBRIDGE GAS INC. Answer to Interrogatory from
Federation of Rental-housing Providers of Ontario (FRPO) Reference: Exhibit B1 / Tab 1 / Schedule 1/ Appendix A/ page 24 Preamble: EGI evidence states: The purpose of the LRAM is to record the amount of
distribution margin gained or lost when the Company's DSM programs are less or more successful than budgeted in the fiscal year.
Question: We would like to understand better the margin calculation associated with LRAM. Using the Rate 6 class of customers, please describe from EGD’s most recent approved DSM dispersal how margin is calculated ensuring that description is provided on:
a) once the savings are verified, how the lost revenues are tied to costs. b) detail on how the costs are calculated for both fixed and variable costs of the
company. Response As noted in the evidence, the purpose of the LRAM is to record the amount of distribution margin gained or lost when the volumes savings associated with the Company’s DSM programs are less or more successful than the volumes savings budgeted in the fiscal year. Please note however, that Rates 1 and 6 are not included in the LRAM as these rate classes are covered under the Average Use True-up Variance Account (“AUTVA”). a- b) The distribution margin gained or lost is derived by applying the distribution
margin rates to gained or lost volumes, this derives the revenue amount recorded in the LRAM account. The LRAM does not recognize or take into consideration the costs associated with the DSM programs.
The Company has provided comprehensive/detailed explanations of the
derivation and application of the volumetric margin unit rates used to calculate both the LRAM and AUTVA amounts in previous proceedings including the 2016 deferral and variance account proceeding (EB-2017-0102, Exhibit I.C. EGDI.FRPO.12, pages 1 to 3) and in the 2017 deferral and variance account proceeding (EB-2018-0131, Exhibit I.C.EGDI.FRPO.9, pages 1 and 2).

Filed: 2019-04-25 EB-2018-0305 Exhibit I.FRPO.12 Page 1 of 1
ENBRIDGE GAS INC. Answer to Interrogatory from
Federation of Rental-housing Providers of Ontario (FRPO) Reference: Exhibit B1 / Tab 1 / Schedule 1/ Appendix B/ page 11 Preamble: EGI evidence states: To record as a debit in Deferral Account No. 179-131
a receivable from customers and a reduction in cost of gas for the unit rate of optimization revenues refunded to in-franchise customers multiplied by the actual distribution transportation volumes.
Question: We are interested in understanding better the allocations to this account. How does EGI differentiate between releasing unplanned UDC transacted through release and holding the capacity for exchange opportunities?
a) Please provide an example from this last winter to describe the considerations, evaluation and decision-making associated with these costs/opportunities.
Response As per the Board’s Procedural Order No. 3, the cost consequences of Gas Supply will be dealt with as part of a future proceeding.

Filed: 2019-04-25 EB-2018-0305 Exhibit I.FRPO.13 Page 1 of 1
ENBRIDGE GAS INC. Answer to Interrogatory from
Federation of Rental-housing Providers of Ontario (FRPO) Reference: Exhibit B1 / Tab 1 / Schedule 1/ Appendix G/ page 1 Preamble: EGI evidence states: Committment to post the design day Dawn-Parkway
system capacity required for Union North, Union South and Enbridge Gas zones on an aggregated basis online as part of the Index of Transportation Customers.
Question: Please provide the source of that commitment.
a) Please provide the location, timing and frequency of the posting. Response The source of the commitment was EB-2017-0306/EB-2017-0307, Exhibit C.TCPL.3, part f). a) As stated in EB-2017-0306/EB-2017-0307, Exhibit C.TCPL.3, part f), the posting will
be maintained on the Union Gas website, under the Index of Transportation Customers and would be updated annually to align with the Design Day requirements identified in the annual Gas Supply planning process.

Filed: 2019-04-25 EB-2018-0305 Exhibit I.FRPO.14 Page 1 of 1
ENBRIDGE GAS INC. Answer to Interrogatory from
Federation of Rental-housing Providers of Ontario (FRPO) Reference: Exhibit B1 / Tab 2 / Schedule 1/ page 18-20 Preamble: EGI evidence states: Given the magnitude of the $95.3 million investment
in the Sudbury Replacement project, incremental funding of the project is required. The cumulative revenue requirement of the project from 2018 through 2023 is over $47 million. Union was not able to reprioritize 2018 Capital investment in order to fund this investment using existing rates. The purpose of the capital pass through mechanism was to provide a means for Union to make significant investments under its price cap plan. Given that the timing of the investment in the Sudbury Replacement project occurred in late 2018, Enbridge Gas will be impacted by the first full year revenue requirement in 2019, during which time the Incremental Capital Module will apply.
Question: We would like to understand better the decisions around the Sudbury Replacement project. Please provide Union Gas’ approved capital budget and actual expenditures for each year of the 2014-2018 IRM period. Response The table below includes the 2013 Board Approved capital budget and the subsequent years of actual spend (2014-18).
Filed: 2019-04-25 EB-2018-0305 Exhibit I.FRPO.15 Page 1 of 1
ENBRIDGE GAS INC. Answer to Interrogatory from
Federation of Rental-housing Providers of Ontario (FRPO) Reference: Exhibit B1 / Tab 2 / Schedule 1/ page 18-20 Preamble: EGI evidence states: Given the magnitude of the $95.3 million investment
in the Sudbury Replacement project, incremental funding of the project is required. The cumulative revenue requirement of the project from 2018 through 2023 is over $47 million. Union was not able to reprioritize 2018 Capital investment in order to fund this investment using existing rates. The purpose of the capital pass through mechanism was to provide a means for Union to make significant investments under its price cap plan. Given that the timing of the investment in the Sudbury Replacement project occurred in late 2018, Enbridge Gas will be impacted by the first full year revenue requirement in 2019, during which time the Incremental Capital Module will apply.
Question: When was the need for the Sudbury Replacement first identified? Please provide all internal reports and correspondence that pertain to the need and the timing for replacement. Response Enbridge Gas declines to provide the requested information. The identification of the need for the Sudbury Replacement can be found on pages 3, 4 5 and 6 of the pre filed evidence in the EB-2017-0180 proceeding. The Board approved the Sudbury Replacement project LTC on September 28, 2017.

Filed: 2019-04-25 EB-2018-0305 Exhibit I.FRPO.16 Page 1 of 1
ENBRIDGE GAS INC. Answer to Interrogatory from
Federation of Rental-housing Providers of Ontario (FRPO) Reference: Exhibit C1 / Tab 1 / Schedule 1/ page 45 and Exhibit C1 / Tab 2 / Schedule 1/ page 632, 637, et al. & 703 Preamble: EGI uses the term “intolerable risk”. We were unable to find a specific
definition for the term in the AMP. We would like to understand better how this term is applied
Question: Please provide EGI’s definition of “intolerable risk”.
a) How would EGI measure or qualify an issue into that category? b) How would an issue move from a “tolerable risk” to an “intolerable risk”?
Response a) The term “intolerable risk” is defined within the EGD rate zone’s Risk Tolerance
Framework which is shown in Figure 4.1-7, Exhibit C1, Tab 2, Schedule 1, page.74. When a risk is evaluated in the intolerable (red) region, it is identified as an intolerable risk and has exceeded the acceptable risk limit. Enbridge Gas measures the risk using a risk assessment process which evaluates the risk across the risk dimensions outlined in Table 4.1-2 the Risk Dimensions, Exhibit C1, Tab 2, Schedule 1, page 72 for the EGD rate zone, and Exhibit C1, Tab 3, Schedule 1, page 53 for the Union rate zone.
b) Per Table 4.1-1: Risk and Opportunity, Exhibit C1, Tab 2, Schedule 1, page 71, risk is defined as “A negative effect of uncertainty on the organization’s objectives expressed as a combination of the likelihood and consequence of a potential event”. If either or both likelihood and consequence have increased, there is potential of moving an issue from a “tolerable risk” to an “intolerable risk”.

Filed: 2019-04-25 EB-2018-0305 Exhibit I.FRPO.17 Page 1 of 2
ENBRIDGE GAS INC. Answer to Interrogatory from
Federation of Rental-housing Providers of Ontario (FRPO) Reference: Exhibit C1 / Tab 2 / Schedule 1/ pages 1-94 Preamble: We are interested in understanding better some aspects of the EGD Asset
Management plan. In reviewing the document, it is evident that KPMG has performed a maturity assessment (p.59) and EGD followed Deloitte’s Value-Based Assessment Management Model. However, in reviewing the evidence, it is unclear how either Consulting Firm recognizes the financial incentives to invest capital for the potential of enhanced return.
Question: From Enbridge’s engagement of KPMG, and potentially Deloitte, please provide information shared by the consulting firms that address the reality of shareholder incentives to invest capital.
a) From those materials, please provide information shared by the consulting firm that address the role of employee incentives in enhancing or balancing the shareholder incentives.
b) Please provide EGI’s commentary on steps undertaken to ensure that its organizational leadership balances shareholder incentives with customer value in the area of capital planning and decision-making.
Response Enbridge Gas is committed to the safe, reliable, cost effective and environmentally responsible provision of natural gas to its customers. At the core of this commitment is the effective stewardship of EGD’s assets through governance, policy and practices. EGD will apply leading asset management practises to effectively manage the life cycle of assets. Optimal value will be delivered to customers and stakeholders through a sustainable investment plan that balances cost, risk and performance.1 a -b) No material on employee incentives in enhancing or balancing the shareholder
incentives was provided. KPMG provided guidance on developing the maturity of the Asset Management practice in relation to ISO 55000 principles. One of the
1 Exhibit C1, Tab 2, Schedule 1, page 64.

Filed: 2019-04-25 EB-2018-0305 Exhibit I.FRPO.17 Page 2 of 2
principles is leadership commitment and another is alignment with strategic goals, both of which connect to the interests of our customers. As a public company, our strategic direction is focused on our stakeholder which includes public shareholders.

Filed: 2019-04-25 EB-2018-0305 Exhibit I.FRPO.18 Page 1 of 1
ENBRIDGE GAS INC. Answer to Interrogatory from
Federation of Rental-housing Providers of Ontario (FRPO) Reference: Exhibit C1 / Tab 2 / Schedule 1/ pages 1-94 Preamble: We respect that steel gas mains deteriorate over time. At the same time,
replacement must occur in a prioritized fashion over decades. Question: Please provide any EGD or Union Gas studies that analyzed the merits (financial and risk-related) of enhanced cathodic protection investments to reduce risk and defer replacement requirements. Response No such study has been performed at this time. All protected steel mains are monitored at a minimum annually for adequate cathodic protection levels, those areas where the cathodic protection has fallen below protection criteria are assessed by the Corrosion department and repairs are carried out to return the pipe to protected levels.

Filed: 2019-04-25 EB-2018-0305 Exhibit I.FRPO.19 Page 1 of 2
ENBRIDGE GAS INC. Answer to Interrogatory from
Federation of Rental-housing Providers of Ontario (FRPO) Reference: Exhibit C1, Tab 2, Schedule 1, Page 152 Preamble: EGI evidence states: The predominant failure mechanism for copper risers
at EGD is associated only with internal pipe conditions and is not affected by external conditions or the environment. Analysis determined that turbulent flow will be reached in copper risers at pressure as low as 5 PSIG at 30,000 BTU. The average furnace uses between 70,000 BTU to 100,000 BTU. A typical gas water heater uses between 36,000 BTU to 66,000 BTU. This supports the sampling which showed wall loss on all copper risers, as turbulent flow can be reached at such low pressure from standard home appliances. The localized corrosion failure is illustrated in Figure 5.2-55.
Question: We are interested in understanding better the risks associated with the erosion corrosion of the copper risers. In imperial units (psig), what is the maximum and minimum pressure of the majority of EGD distribution systems?
a) If EGD has multiple pressure ranges for distribution, please provide what term is used to describe the system, what range of pressures and the percentage of each systems of all EGD distribution systems under 100 psig.
b) What percentage of these 280,000 risers would actually be exposed to 5 psig? c) Does EGD have a study that looks at the failure rates of the copper risers in
different pressure systems? i) If so, please file the study.
d) Is EGD giving priority to the replacement of those risers exposed to the lowest pressures?
Response a) All copper risers are operating at pressures less than 100 psig. Approximately 86%
of the networks in the EGD rate zone’s system operate at pressures under 100 psi.

Filed: 2019-04-25 EB-2018-0305 Exhibit I.FRPO.19 Page 2 of 2
b) 99.6% would be exposed to 5 psig or greater. Approximately, 1000 units are operating below 5 psig.
c) No, with the exception of the approximately 1000 units, copper risers are operating in the same range of system pressures.
d) No, the risers at the lowest pressures would present the lowest probability of failure with all other conditions being equal.

Filed: 2019-04-25 EB-2018-0305 Exhibit I.FRPO.20 Page 1 of 1
ENBRIDGE GAS INC. Answer to Interrogatory from
Federation of Rental-housing Providers of Ontario (FRPO) Reference: Exhibit C1, Tab 3, Schedule 1, Page 161 Preamble: We would like to understand better the delineation between regulated and
non-regulated investment in CNG stations. Question: How does Union Gas/EGI differentiate which stations are built inside or outside the regulated utility?
a) Are the regulated stations receiving comparable Federal funding and the non-regulated stations? i) If not, why not?
Response Enbridge Gas does not directly provide CNG retail services. The CNG assets owned by Enbridge Gas are typically rented/provided to customers that use those facilities to refuel fleet vehicles they may use and operate or to provide CNG refueling service to others. The determination as to whether a CNG customer rents the refueling facility from the Company or chooses to own and operate these facilities themselves is determined by the customer. a) Federal government funding in respect of CNG vehicle refueling facilities is subject
to an application process. Any party seeking to avail themselves of this funding is free to apply for it. In some cases the funding has been provided to the utility where it is applied to reduce the capital cost of the utility assets required to connect the CNG refueling facility to the Company’s gas distribution system. In other cases the funding has been awarded to the CNG customer and applied to enhance the economics of their CNG refueling initiative.
i. The direction of the funding between the utility and the retail CNG fuel provider would vary from one situation to another based on the characteristics of each project and the objectives of the federal government agency providing the funds.

Filed: 2019-04-25 EB-2018-0305 Exhibit I.FRPO.21 Page 1 of 1
ENBRIDGE GAS INC. Answer to Interrogatory from
Federation of Rental-housing Providers of Ontario (FRPO) Reference: Exhibit C1, Tab 3, Schedule 1, Page 176 Preamble: EGI evidence states: Based on the current forecast for in-franchise
general service and contract growth in the Panhandle Transmission System market, Union has identified the need to reinforce the Panhandle Transmission System for the 2026 to 2027 winter operating season.
Question: We would like to understand better Union Gas’/EGI efforts to consider market based solutions to avoid or defer infrastructure investment. With increased capability to flow gas on Panhandle Eastern, has Union evaluated the benefit of offering an incentive for firm deliveries at Ojibway?
a) If so, what has been done and what has been learned? b) If not, why not?
Response Please see the responses to EB-2016-0186, Exhibit B.FRPO.15 and Exhibit B.FRPO.18 as well as EB-2018-0013, Exhibit A, Tab 8, Schedule 2, Pages 1 to7 for an explanation of why increased firm deliveries at Ojibway cannot efficiently serve the forecast growth.

Filed: 2019-04-25 EB-2018-0305 Exhibit I.FRPO.22 Page 1 of 1
ENBRIDGE GAS INC. Answer to Interrogatory from
Federation of Rental-housing Providers of Ontario (FRPO) Reference: Exhibit E1 / Tab 4 / Schedule 2/ page 5 Preamble: EGI evidence states: In 2017, EGD introduced a process to track and
assess potential measurement errors at TCPL’s gate stations, compiling a list of measurement assets at each gate station and identified the flow range of each device.
Question: We are interested in understanding better the process that EGI has implemented to assess potential measurement errors at TCPL gate stations. Please provide a list of EGI station sites that have chromatographs or other instrumentation to measure the heat value of the gas received.
a) Beyond the Victoria Square Station, please identify any concerns that EGI has discerned since implementing this program.
b) What issues has this program addressed and rectified?
c) Has EGI agreed to any improvements in custody transfer between itself and TCPL since the initiation of this program?
d) If EGI has a chromatograph on the Ottawa line from TCPL, please provide the average daily heat value for the period of October 2018 to December 2018.
e) If EGI has a chromatograph at Parkway, please provide the average daily heat value for the period of October 2018 to December 2018.
Response As per the Board’s Procedural Order No. 3, the cost consequences of Gas Supply will be dealt with as part of a future proceeding.

Filed: 2019-04-25 EB-2018-0305 Exhibit I.FRPO.23 Page 1 of 1
ENBRIDGE GAS INC. Answer to Interrogatory from
Federation of Rental-housing Providers of Ontario (FRPO) Reference: Exhibit E1 / Tab 4 / Schedule 9/ page 2-3 Preamble: EGI evidence states: This project, in-part, underpins elections made by
Enbridge in TCPL’s 2019 New Capacity Open Season (“NCOS”) which includes 75,000 GJ per day of new short-haul capacity from Parkway to the Enbridge CDA.
Question: We are interested in understanding better the system demand need for this capacity. For the 75,000 GJ per day evidenced in this section:
a) Where is this incremental demand needed?
b) In that location, how much has the 2019/20 demand increased over 2017/18?
c) Is there any compensating reduction in capacity to reduce the impact of the cost of the incremental capacity?
i) If so, please provide the details of the reduction. ii) If not, please provide details on the expected utilization of the excess
capacity. Response As per the Board’s Procedural Order No. 3, the cost consequences of Gas Supply will be dealt with as part of a future proceeding.

Filed: 2019-04-25 EB-2018-0305 Exhibit I.FRPO.24 Page 1 of 1
ENBRIDGE GAS INC. Answer to Interrogatory from
Federation of Rental-housing Providers of Ontario (FRPO) Reference: Exhibit E1 / Tab 4 / Schedule 9/ page 3
Preamble: EGI evidence states: Union Gas and TCPL each have NCOS offerings for
transportation services with projected in service dates for each NCOS as early as November 1, 2021. Union Gas is offering M12 services the Dawn-to-Parkway System, while TCPL is offering various firm transportation services on the Mainline System. The NCOS offering from Union Gas was held from August 29, 2018 to November 16, 2018, while the NCOS offering from TCPL was held from October 15, 2018 to November 14, 2018
Question: We are interested in understanding the results of the open season in the context of asset utilization in the future. Please provide the amount of capacity requested in the initial bid respecting that there are levels of additional negotiating and contracting steps to be exercised (i.e., we respect that the ultimate contracted quantity may vary from the initial bid in the contracting process but we are asking for an indication of the amount bid). Response The amount of capacity requested in the initial bids is presented in the following table:
2021 Dawn – Parkway
(GJ/d)
2021 Kirkwall – Parkway
(GJ/d)
2022 Dawn – Parkway
(GJ/d)
2022 Kirkwall – Parkway
(GJ/d)
165,000 123,441 25,004 30,000 After initial bids were received and during the contract execution process with customers all of the Kirkwall-PKWY bids for both 2021 and 2022 were terminated and 5,333 GJ/d of the 2022 Dawn-PKWY was terminated.

Filed: 2019-04-25 EB-2018-0305 Exhibit I.FRPO.25 Page 1 of 1
ENBRIDGE GAS INC. Answer to Interrogatory from
Federation of Rental-housing Providers of Ontario (FRPO) Reference: Exhibit E1 / Tab 4 / Schedule 9/ page 3
Preamble: EGI evidence states: Union Gas and TCPL each have NCOS offerings for
transportation services with projected in service dates for each NCOS as early as November 1, 2021. Union Gas is offering M12 services the Dawn-to-Parkway System, while TCPL is offering various firm transportation services on the Mainline System. The NCOS offering from Union Gas was held from August 29, 2018 to November 16, 2018, while the NCOS offering from TCPL was held from October 15, 2018 to November 14, 2018
Question: With the best information available at this time, please provide the incremental capacity that would come on line in 2021.
a) What, if any, facilities does EGI believe will be needed to meet this level of contracting?
Response Enbridge Gas is currently planning to construct approximately 10 kilometers of new NPS 48 pipeline between Kirkwall valve site and Hamilton valve site which will provide incremental capacity of approximately 84,000 GJ/day with an expected in-service date of November 1, 2021.

Filed: 2019-04-25 EB-2018-0305 Exhibit I.FRPO.26 Page 1 of 1
ENBRIDGE GAS INC. Answer to Interrogatory from
Federation of Rental-housing Providers of Ontario (FRPO) Reference: Exhibit E1 / Tab 4 / Schedule 9/ page 3
Preamble: EGI evidence states: Union Gas and TCPL each have NCOS offerings for
transportation services with projected in service dates for each NCOS as early as November 1, 2021. Union Gas is offering M12 services the Dawn-to-Parkway System, while TCPL is offering various firm transportation services on the Mainline System. The NCOS offering from Union Gas was held from August 29, 2018 to November 16, 2018, while the NCOS offering from TCPL was held from October 15, 2018 to November 14, 2018
Question: Has EGI initiated any process to determine the markets ability to provide firm transport or obligated deliveries that would reduce potential infrastructure expenditures?
a) If yes, please describe. b) If not, what inhibits EGI from taking this step contemplated in the Settlement
Agreement of Union Gas in last Dawn-Parkway expansion build (EB-2015-0200)?
Response Once Enbridge Gas receives confirmed volumes for incremental Dawn-Parkway demand as a result of an open season, Enbridge Gas will evaluate all alternatives, including additional facilities and market alternatives, when reviewing plans to meet requested incremental demand.

Filed: 2019-04-25 EB-2018-0305 Exhibit I.FRPO.27 Page 1 of 2
ENBRIDGE GAS INC. Answer to Interrogatory from
Federation of Rental-housing Providers of Ontario (FRPO) Reference: Exhibit E1 / Tab 4 / Schedule 9/ page 3
Preamble: EGI’s evidence states: The 2018 to 2020 toll application was filed in
December 2017 under hearing order RH-001-2018 and is currently under review by the NEB. In the meantime, the NEB has approved the tolls resulting from the RH-001-2014 Decision on an interim basis while the 2018 to 2020 toll application is under review. The 2019 Gas Costs budget is underpinned by the interim tolls which, compared to TCPL’s previous finalized tolls, yield $30-million in annual savings for EGD’s transportation contracts that are in place for the 2019 calendar year.
Question: We would like to understand better the cost implications for Ontario resulting from the toll resetting process. Please provide the applicable NEB reference and, ideally the link, for the TCPL 2018-2020 Rates proceeding.
a) Please describe the methodology and the quantities used to determine the $30 million in annual savings for EGD transportation contracts.
i) Please present the determination in a table.
b) Using the same approach in a), please provide the comparable figure for Union Gas’ TCPL transportation contracts.
c) Did the former Enbridge Gas Distribution and Union Gas companies enter into an agreement to set tolls at the applied for levels?
i) If the applied for tolls were not tolls used to calculate the $30 million in EGD transportation contract savings, please calculate the annual savings expected from the applied for tolls versus those in place in 2017 for: (1) EGD transportation contracts (2) Union Gas transportation contracts (3) Please produce the above determination in a table that provides
understanding of the calculation

Filed: 2019-04-25 EB-2018-0305 Exhibit I.FRPO.27 Page 2 of 2
d) Did the NEB accept and implement the applied for tolls of that agreement or did they determine the agreement did not set tolls in the public interest?
i) As a result of the NEB decision, please provide the annual savings expected from the approved tolls versus those in place in 2017 for:
(1) EGD transportation contracts (2) Union Gas transportation contracts (3) Please produce the above determination in a table that provides
understanding of the calculation. Response As per the Board’s Procedural Order No. 3, the cost consequences of Gas Supply will be dealt with as part of a future proceeding.

Filed: 2019-04-25 EB-2018-0305 Exhibit I.LPMA.1 Page 1 of 1
ENBRIDGE GAS INC. Answer to Interrogatory from
London Property Management Association (LPMA) Reference: Exhibit B1, Tab 1, Schedule 1, Table 4 Question: a) Please explain why Enbridge is requesting only one deferral account for the incremental capital module related to the Union Gas zones, rather than one deferral account for each of the Union Gas South zone and the Union Gas North zone. b) Please explain why separate accounts are needed for the EGD zone and the Union Gas zone if separate accounts are not needed for the Union Gas South and North zones. Response a) Enbridge Gas has requested a single ICM deferral account for each of the EGD and
Union rate zones in conjunction with the MAADs Decision, which specified that the ICM threshold and incremental capital amounts would be calculated individually for both legacy Union Gas and EGD.1 As a result, separate ICM deferral accounts for each of the EGD and Union rate zones will be utilized to track the variance between actual ICM rate rider revenues billed in each of the EGD and Union rate zones, versus the actual revenue requirement of ICM projects approved for each of the EGD and Union rate zones. To the extent that costs for ICM projects approved for the Union rate zones are to be recovered differently (i.e. based on usage of the asset) between the Union South and Union North, it will be addressed through the development of ICM rate riders for each respective zone, and through the disposition of amounts captured in the ICM deferral account for the Union rate zones.
b) Please see the response at part a) above.
1 EB-2017-0306/EB-2017-0307 OEB Decision and Order, August 30, 2018, pages 32 to 34.

Filed: 2019-04-25 EB-2018-0305 Exhibit I.LPMA.2 Page 1 of 2
ENBRIDGE GAS INC. Answer to Interrogatory from
London Property Management Association (LPMA) Reference: Exhibit B1, Tab 1, Schedule 1, Tables 6 and 7 Question: a) Please update Table 6 to reflect actual data for 2018. b) If applicable, please update Table 7 to reflect any changes resulting from the update of 2018 from forecast to actual. Response a) Please refer to the table below. The 2018 amounts shown below are draft. The
actual amounts will be filed later this year as part of Enbridge Gas’s 2018 Earning Sharing Mechanism and Deferral and Variance Account proceeding.
Table 6
Union’s Capital Pass-through Projects Actual Utility Tax Timing Differences
Union’s 2014-2018 IRM Updated for Exhibit I.LPMA.2 a)
Line No. Particulars ($000’s) 2014 2015 2016 2017
Draft 2018 Total
(a) (b) (c) (d) (e) (f)
1 Parkway West (2,191) (4,521) (5,843) (4,994) (4,066) (21,615) 2 Brantford-Kirkwall/Parkway D - (3,668) (5,462) (4,744) (3,938) (17,811) 3 2016 Dawn-Parkway Expansion - (673) (6,131) (8,477) (7,411) (22,691) 4 Burlington to Oakville - - (1,539) (2,116) (1,847) (5,502) 5 2017 Dawn-Parkway Expansion - - (3,690) (15,476) (19,681) (38,847) 6 Panhandle Reinforcement - - - (3,385) (5,498) (8,883)
7 Total (2,191) (8,861) (22,665) (39,192) (42,442) (115,350)

Filed: 2019-04-25 EB-2018-0305 Exhibit I.LPMA.2 Page 2 of 2
b) Please refer to the table below.
Table 7
Union’s Capital Pass-through Projects
Forecast of Utility Tax Timing Differences 2019-2023 Deferred Rebasing Period
Updated for Exhibit I.LPMA.2 a)
Line No. Particulars ($000’s) 2019 2020 2021 2022 2023 Total
(a) (b) (c) (d) (e) (f)
1 Parkway West (3,281) (2,587) (1,966) (1,438) (988) (10,259) 2 Brantford-Kirkwall/Parkway D (3,234) (2,625) (2,097) (1,638) (1,239) (10,833) 3 2016 Dawn-Parkway Expansion (6,233) (5,203) (4,301) (3,510) (2,813) (22,060) 4 Burlington to Oakville (1,574) (1,303) (1,073) (877) (709) (5,537) 5 2017 Dawn-Parkway Expansion (16,784) (13,828) (10,968) (8,528) (6,444) (56,553) 6 Panhandle Reinforcement (5,234) (4,481) (3,767) (3,152) (2,622) (19,255)
7 Total (36,339) (30,027) (24,172) (19,143) (14,816) (124,497)
8 2019 Utility Tax Timing Difference (36,415) (36,415) (36,415) (36,415) (36,415) (182,075)
9 Variance (line 7 - line 8) 76 6,388 12,243 17,272 21,599 57,578

Filed: 2019-04-25 EB-2018-0305 Exhibit I.LPMA.3 Page 1 of 1
ENBRIDGE GAS INC. Answer to Interrogatory from
London Property Management Association (LPMA) Reference: Exhibit B1, Tab 1, Schedule 1, pages 28-29 Question: a) Please confirm that the 30,393 GJ/day of surplus capacity noted on page 28 has been sold long-term as of November 1, 2018. If the full amount of the surplus capacity has not been sold, please provide details on the amount sold and the amount currently still available. b) Please provide the revenue requirement associated with the 30,393 GJ/day that has been built into 2019 rates along with the forecasted revenue associated with this surplus capacity that has been built into 2019 rates. c) For each of 2020 through 2023, please provide the forecasted revenue requirement associated with the 30,393 GJ/day of surplus capacity, along with the forecasted revenue generated by this surplus capacity. Response a) Confirmed, please see Exhibit I.STAFF.11, part (a). b) There is no specific revenue requirement for the 30,393 GJ/d of incremental Dawn-
Parkway demands. Enbridge Gas has built the 2017 Dawn-Parkway Project revenue requirement of $40.916 million into 2019 Rates, of which $46.306 million has been allocated to Rate M121. Please see Exhibit I.STAFF.11, part f).
c) Enbridge Gas does not have a forecast of the project revenue requirement
associated with the 30,393 GJ/d. By adjusting the billing units used to derive the Rate M12 demand charges by the incremental demands, the revenue adjustment in rates will be based on the approved Rate M12 Dawn-Parkway demand charge for each year from 2020 to 2023.
1 The allocation of the capital pass-through projects is provided at Exhibit F1, Tab 2, Rate Order, Working Papers, Schedule 16, page 3.

Filed: 2019-04-25 EB-2018-0305 Exhibit I.LPMA.4 Page 1 of 2
ENBRIDGE GAS INC. Answer to Interrogatory from
London Property Management Association (LPMA) Reference: Exhibit B1, Tab 1, Schedule 1, Table 11 Question: a) Please provide a table similar to Table 11 that shows the delivery bill impacts for rates 10 and M2 using appropriate volumes. b) Please confirm that the proposed rate design increases the percent change for small volume users while decreasing the percent change for larger volume users in of the general service rate classes (M1, 01, M2 & 10). If this cannot be confirmed, please explain the different impacts by rate class. Response a) Please see Table 1 for the delivery bill impacts for Rate M2 and Rate 10 of the
current and proposed cost adjustments.

Filed: 2019-04-25 EB-2018-0305 Exhibit I.LPMA.4 Page 2 of 2
Table 1
Delivery Bill Impacts for Rate M2 and Rate 10
Monthly Customer Charge Adjustment Line
Union South
Union North
No. Particulars ($)
Rate M2
Rate 10
(a) (b)
(c) (d)
1 Annual Consumption
60,000 m3 250,000 m3
60,000 m3 250,000 m3
2 Approved Delivery Bill (1)
4,196 14,266
4,868 16,059 3 2019 Rates - Current Approved Rate Design 4,123 13,876
5,086 16,879
4 Difference (line 3 - line 2)
(73) (390)
218 820 5 Delivery Bill Impact (%) (line 4/line 2)
-1.7% -2.7%
4.5% 5.1%
6 2019 Rates - Proposed Rate Design (2)
4,100 13,877
5,065 16,883 7 Difference (line 6 - line 2)
(96) (389)
198 824
8 Delivery Bill Impact (%) (line 7/line 2)
-2.3% -2.7%
4.1% 5.1%
Notes:
(1) October 2018 QRAM (EB-2018-0253)
(2) Exhibit F1, Tab 2, Rate Order, Working Papers, Schedule 4, column (c).
b) Confirmed for Rate M1 and Rate 01.
Not confirmed for Rate M2 and Rate 10. The current approved cost adjustment for Rate M2 and Rate 10 recovers the customer-related cost variance in proportion to the current approved delivery commodity revenue of the first two delivery blocks only. Enbridge Gas proposes to harmonize the monthly customer charge adjustment for all Union rate zone general service classes as proposed. The proposed rate design for Rate M2 and Rate 10 decreases the unit rate of the first two delivery blocks and increases the unit rate of the remaining delivery blocks of each rate class. The delivery bill impact of the proposal for small volume and large volume users in Rate M2 and Rate 10 is less than 1%, as shown in Table 1.

Filed: 2019-04-25 EB-2018-0305 Exhibit I.LPMA.5 Page 1 of 1
ENBRIDGE GAS INC. Answer to Interrogatory from
London Property Management Association (LPMA) Reference: Exhibit B1, Tab 1, Schedule 1, page 33 Question: Please provide a reference for where the “2019 approved volumes” noted at lines 20-21 can be found. Response The volumes used to pool the Rate M4 and Rate M5 DSM costs are based on Enbridge Gas’s 2019 forecast, which are the same volumes used to derive the DSM unit rate. The volumes are provided at Exhibit F1, Tab 2, Rate Order, Working Papers, Schedule 10, page 3, column (b), Line 15 and Line 19 respectively. The evidence should have correctly described the volumes as “2019 forecast volumes”.

Filed: 2019-04-25 EB-2018-0305 Exhibit I.LPMA.6 Page 1 of 1
ENBRIDGE GAS INC. Answer to Interrogatory from
London Property Management Association (LPMA) Reference: Exhibit F1, Tab 2, Rate Order Working Papers, Schedule 4 Question: Please provide the volumes used in calculating the bill impacts for each of the following rate classes in the Union South zone: a) Small M2 customer; b) Large M2 customer; c) Small M4 customer; and d) Large M4 customer. Response Please see Table 1 for the annual volumes used to calculate bill impacts for Rate M2 and Rate M4. Contract demands are also used to calculate bill impacts for Rate M4 and are also provided in Table 1.
Table 1
Parameters for Bill Impacts Calculation
Line No. Particulars
Annual Volumes (m3)
Contract Demand (m3/d)
(a) (b)
1 Rate M2 – Small 60,000 N/A 2 Rate M2 – Large 250,000 N/A 3 Rate M4 – Small 875,000 4,800 4 Rate M4 – Large 12,000,000 50,000
Filed: 2019-04-25 EB-2018-0305 Exhibit I.LPMA.7 Page 1 of 3
ENBRIDGE GAS INC. Answer to Interrogatory from
London Property Management Association (LPMA) Reference: Exhibit B1, Tab 1, Schedule 1, pages 26-29 Question: a) Please expand Table 10 to reflect the revenue requirement for each of the projects shown for each of 2020 through 2023. b) Please confirm that the EB-2017-0306/EB-2017-0307 Decision and Order referenced in footnote 19 directed Enbridge Gas Inc. to include the rate base and depreciation of the noted projects in the calculation of the eligible incremental capital amount of the Union service territory. c) Please confirm that the above noted Decision and Order did not direct Enbridge Gas Inc. to adjust rates to reflect the net difference between the 2018 and 2019 revenue requirements associated with capital pass-through projects in the Union service territory. If this cannot be confirmed, please provide a reference to where this direction occurred. d) Does Enbridge Gas Inc. propose to adjust rates in each of 2020 through 2023 to reflect the net difference between the test year and the previous year revenue requirements associated with the capital pass-through projects in the Union service territory in the same way as it is proposing for 2019 and 2018? If not, why not? Response a) Please refer to the Table on the following page.

Filed: 2019-04-25 EB-2018-0305 Exhibit I.LPMA.7 Page 2 of 3
Table 1
Summary of 2019-2023 Forecast Revenue Requirement of Capital Pass-Through Projects
Line
2019 2020 2021 2022 2023 No.
Particulars ($000's)
Forecast(1) Forecast Forecast Forecast Forecast
(a) (b) (c) (d) (e)
1
Parkway West
19,227 19,673 19,971 20,178 20,307 2
Brantford-Kirkwall/Parkway D
14,874 15,142 15,329 15,447 15,506
3
2016 Dawn-Parkway Expansion 25,059 25,609 26,024 26,328 26,537 4
Burlington to Oakville
5,447 5,596 5,707 5,787 5,840
5
2017 Dawn-Parkway Expansion 40,916 43,394 45,153 46,495 47,480 6
Panhandle Reinforcement (2)
11,715 11,139 10,702 10,177 9,576
7
Total (3)
117,238 120,552 122,887 124,411 125,245
Notes:
(1) Exhibit F1, Tab 2, Rate Order, Working Papers, Schedule 16, pp.4-5.
(2) Panhandle Reinforcement project revenue requirement net of incremental project revenue.
(3) Exhibit I.SEC.6, Attachment 1, line 15.
b) Confirmed. c) Confirmed. Enbridge Gas is proposing to update rates to reflect the 2019 forecast
revenue requirement associated with Union’s capital pass-through projects as part of this application. By updating the revenue requirement in 2019 rates, Enbridge Gas will reduce the variance between the actual revenue requirement and the revenue requirement included in rates that would otherwise be recorded in the capital pass-through deferral accounts in 2019. Without this proposal, the revenue requirement included in rates would continue to be based on the 2018 forecast approved in the leave to construct application for each project.1 The update also supports Enbridge Gas’s proposal to fix the capital pass-through revenue requirement in rates and discontinue recording differences in the deferral account with the exception of utility tax timing differences. Please see Exhibit I.STAFF.8, part (a).
1 EB-2017-0087, Exhibit A, Rate Order, Appendix G, pages 1 to 7.

Filed: 2019-04-25 EB-2018-0305 Exhibit I.LPMA.7 Page 3 of 3
d) No. Enbridge Gas is proposing to fix the capital pass-through revenue requirement in 2019 rates and discontinue recording differences in the deferral account with the exception of utility tax timing differences. Please see Exhibit I.STAFF.8, part (a).

Filed: 2019-04-25 EB-2018-0305 Exhibit I.LPMA.8 Page 1 of 2
ENBRIDGE GAS INC. Answer to Interrogatory from
London Property Management Association (LPMA) Reference: Exhibit B1, Tab 1, Schedule 1, pages 31-33 Question: a) Given that Enbridge Gas is required to track actual costs and amounts recovered through rates related to the PDO during the deferred rebasing period for review at the time of rebasing, please explain why Enbridge Gas is proposing to adjust the PDO related costs for 2019. b) The evidence states that the allocation of the PD) costs for 2019 has been updated for the 2019 forecast and that the allocation of in-franchise compressor fuel costs are also based on 2019 forecast volumes. Please explain how the forecast of 2019 volumes has been determined for each rate class. Response a) Enbridge Gas is proposing to adjust the PDO related costs to comply with the
Settlement Framework for the Reduction of Parkway Delivery Obligation (“PDO Settlement Framework”)1 and to manage variances in the Parkway Obligation Rate Variance Deferral Account (No. 179-138) (“PORVDA”).
The PDO Settlement Framework provides for updates to the annual PDO costs to
reflect the current Rate M12 Dawn to Parkway demand charge and fuel costs based on the October 1 QRAM each year.
The PDO Settlement Framework also provides for updates to the PDCI credit rate
and the PDCI costs to reflect the current Rate M12 Dawn to Parkway demand change and fuel costs at 100% load factor. The PDCI credit rate is payable to direct purchase and sales service customers with continued obligated deliveries at Parkway. The PDCI costs included in 2019 Rates is set to equal and offset the forecast of the PDCI rate payable to customers.
1 Union’s 2014 Rates Decision and Order (EB-2013-0365), June 16, 2014.

Filed: 2019-04-25 EB-2018-0305 Exhibit I.LPMA.8 Page 2 of 2
The objective of the PDO Settlement Framework is to keep Enbridge Gas (previously Union) whole and by updating for changes in PDO and PDCI costs in proposed 2019 rates, Enbridge Gas remains consistent with that objective.
Enbridge Gas has also updated the PDO and PDCI costs in 2019 rates to reduce
the variances that would otherwise be recorded in the PORVDA. The PORVDA is designed to record variances associated with the timing differences between the effective date of the Parkway delivery obligation changes and the inclusion of the cost impacts in approved rates (January 1 of the following year). As part of the MAADs Decision, the OEB approved the continuation of the PORVDA.
The requirement to track actual costs and amounts recovered in rates is in addition
to the PDO Settlement Framework. The MAADs Decision requires Enbridge Gas to track actual costs and amounts recovered through rates related to the PDO during the deferred rebasing period to ensure ratepayers are not paying twice for the required capacity. The annual update in rates for the PDO related costs reflects changes to the Dawn-Parkway capacity already recovered in rates.
b) The 2019 forecast used to allocate 2019 compressor fuel volumes was developed
using methodologies consistent with those used by legacy Union in its last rebasing proceeding (EB-2011-0210).
The 2019 volume forecast by rate class was derived based on customer type. The
2019 general service volume forecast was determined through multiple regression analyses which consider drivers such as the total number of customers, average consumption, approved weather methodologies and conservation programs. The 2019 contract rate volume forecast was determined through review of customer’s historical consumption, consultation with customers and knowledge of customer specific plans.

Filed: 2019-04-25 EB-2018-0305 Exhibit I.LPMA.9 Page 1 of 1
ENBRIDGE GAS INC. Answer to Interrogatory from
London Property Management Association (LPMA) Reference: Exhibit B1, Tab 1, Schedule 1, pages 34-39 Question: Are any of the changes proposed on these pages necessary rate schedule changes? If yes, please explain fully the need and the impact if the changes are not made until rebasing. Response Yes, the rate schedule changes are necessary. While the proposed changes to the rate schedules are administrative, they enable Enbridge Gas to maintain accurate rate schedules and general terms and conditions (“GT&C”) based on current service offerings and business requirements. Specifically, the proposed change to the system expansion surcharge is required for accuracy. While the service is not expiring prior to rebasing, the rate schedule requires an update to correct the contract expiry date for the community expansion project areas of Delaware Nation of Moraviantown First Nation and Prince Township. Enbridge Gas has also proposed to remove a number of services that are no longer in use, including the Union South Rate U2, Union South supplemental services, and the Union South multiple delivery points service option. By requesting elimination of these services, the rate schedules will reflect Enbridge Gas’s current service offerings and will eliminate the need for Enbridge Gas to maintain internal processes and system updates for services and rate classes that are no longer relevant. Union Gas made similar changes to services during its previous IRM term, such as the elimination of the Union North general service unbundled storage Rate S1 rate schedule, which was removed as part of the 2017 Rates application (EB-2016-0245). Similarly, Enbridge Gas also proposed administrative changes to provide consistency and accuracy for the Rate C1 pricing of the Dawn yard interruptible transportation, which is currently provided on Enbridge Gas’s Hub Pricing Schedule 2, and the Rate M13 GT&C.

Filed: 2019-04-25 EB-2018-0305 Exhibit I.LPMA.10 Page 1 of 3
ENBRIDGE GAS INC. Answer to Interrogatory from
London Property Management Association (LPMA) Reference: Exhibit B1, Tab 2, Schedule 1 Question: a) Please updates Tables 1 and 2 to reflect actual data for 2018. b) Does Table 2 include in-service capital additions related to the capital pass-though projects listed in Table 10 of Exhibit B1, Tab 1, Schedule 1? c) If yes, please provide a breakout of the in-service capital additions associated with these projects in Table 2. d) If no, please provide the in-service capital additions related to the capital pass-through projects listed in Table 10 of Exhibit B1, Tab 1, Schedule for the period beginning 2014 and ending in the last year in which there was new in-service capital additions associated with the projects. Response a) 2018 actuals for the EGD rate zone are reflected in in Table 1 - column (e) below.
2018 actuals for the Union rate zones are reflected in in Table 2 - column (e).

Filed: 2019-04-25 EB-2018-0305 Exhibit I.LPMA.10 Page 2 of 3
Table 1
Capital Expenditures by category (2014-2023) – EGD Rate Zone ($ Millions)
(a) (b) (c) (d) (e) Line No. Category
2014 Actual
2015 Actual
2016 Actual
2017 Actual
2018 Actual
1 General Plant 69.0 91.9 82.6 48.1 47.3 2 System Access5 112.8 105.2 118.3 109.3 108.9 3 System Renewal 96.5 102.7 109.1 102.2 92.3 4 System Service 190.5 569.6 127.1 20.2 22.9 5 Total Overhead 141.3 145.9 156.4 148.1 140.2 6 Total - EGD Rate Zone 610.1 1,015.3 593.5 427.8 411.6
1 System Access capital presented here does not reflect Community Expansion.
Table 2
Capital Expenditures by category (2014-2023) – Union Rate Zones ($ Millions)
(a) (b) (c) (d) (e) Line No. Category 2014
Actual 2015
Actual 2016
Actual 2017
Actual 2018
Actual 1 General Plant 56.5 51.4 44.8 42.8 48 2 System Access1 83.9 107.8 105.6 96.2 73.2 3 System Renewal 83.8 73 76.3 87.6 114.9 4 System Service 190.4 391.5 734.3 412.2 196.9
4A Parkway West2 99.3 68.2 16.4 1.4 1.1 4B Brantford-Kirkwall/Parkway D 2 39.8 138.1 7.8 1.6 0.0 4C 2016 Dawn-Parkway Expansion2 14.2 91.5 222.5 17.2 2.3 4D Burlington to Oakville2 1.2 3.5 74.0 2.7 1.5 4E 2017 Dawn-Parkway Expansion2 0.1 51.5 363.0 159.7 39.5 4F Panhandle Reinforcement2 0.0 0.0 7.1 182.4 36.6
5 Total Overhead 68.2 71.5 77.2 78.6 80.1 6 Total - Union Rate Zones 482.9 695.2 1,038.20 717.5 513.1
1 System Access capital presented here does not reflect Community Expansion. 2 Breakdown of capital pass-through items included in System Service total (line 4).
b) Yes, Table 2 includes the in-service capital additions related to capital pass-through.

Filed: 2019-04-25 EB-2018-0305 Exhibit I.LPMA.10 Page 3 of 3
c) Please see the response to part a) for the updates to Table 2 including the breakdown of capital pass-through projects listed in Table 10 of Exhibit B1, Tab 1, Schedule 1.

Filed: 2019-04-25 EB-2018-0305 Exhibit I.LPMA.11 Page 1 of 1
ENBRIDGE GAS INC. Answer to Interrogatory from
London Property Management Association (LPMA) Reference: Exhibit B1, Tab 2, Schedule 1 Question: Please provide a Union column in Table 3 that reflects a price cap index of 1.07% in place of the 0.72% used. Response Please see Table 3 below expanded to include an additional column that reflects the price cap index of 1.07% for Union for the entire period since 2013.
Table 3
ICM Threshold Capital Expenditure Calculation by Rate Zone
Line No.
Particulars ($ millions)
EGD
Union
Union at 1.07% PCI
(a)
(b)
1 Year 2019 2019 2019 2 Base Year 2018 2013 2013
3 Number of Years since rebasing (n) 1 6 6
4 Price Cap Index (PCI) (%) 1.07% 0.72% 1.07% 5 Growth Factor (g) (%) 1.04% 1.19% 1.19% 6 Dead Band (%) 10% 10% 10% 7 Rate Base (RB) 6,246 5,331 5,331 8 Depreciation (d) 305 239 239
9 Threshold Value (%) 153% 157% 167%
10 Threshold Value 468.5 375.2 398.5

Filed: 2019-04-25 EB-2018-0305 Exhibit I.LPMA.12 Page 1 of 1
ENBRIDGE GAS INC. Answer to Interrogatory from
London Property Management Association (LPMA) Reference: Exhibit B1, Tab 2, Schedule 1 Question: Please provide a breakdown of the Union figures shown in Table 4 for each of 2014 through 2019 into the components of the price cap index, being the inflation rate used and the implied productivity factor offset. Response Union’s annualized PCI- simple average since 2013 is provided in the table below:
Price Cap Index for Union Rate Zone
n Yr
Inflation: GDP IPI
FDD (1)
Productivity/Stretch
(2) PCI
(3) = (1) +(2)
Annualized PCI - simple average
since 2013 0 2013
1 2014 1.27% -0.76% 0.51% 0.51% 2 2015 1.66% -1.00% 0.66% 0.59% 3 2016 1.77% -1.06% 0.71% 0.63% 4 2017 1.74% -1.05% 0.70% 0.64% 5 2018 1.65% -0.99% 0.66% 0.65% 6 2019 1.37% -0.30% 1.07% 0.72%

Filed: 2019-04-25 EB-2018-0305 Exhibit I.LPMA.13 Page 1 of 3 Plus Attachment
ENBRIDGE GAS INC. Answer to Interrogatory from
London Property Management Association (LPMA) Reference: Exhibit B1, Tab 2, Schedule 1, page 15 & Exhibit F1, Tab 2, Rate Order Working Papers, Schedule 16 Question: a) Please provide the specific reference from the EB-2017-0306/EB-2017-0307 Decision and Order that directed Enbridge Gas to calculate the ICM threshold using the 2013 Board-approved rate base and depreciation plus the 2019 forecast amount of rate base and depreciation associated with the projects that were eligible for capital pass-through treatment and included in Union’s base rates during Union’s 2014-2018 IRM term. b) The 2019 rate base and depreciation figures used in the ICM calculation, as shown in Exhibit F1, Tab 1, Schedule 16, pages 4-5 in the Rate Order Working Papers uses approved 2018 figures and 2019 forecasts. Please update this schedule using actual 2018 figures and any resulting changes to the 2019 forecast. Please also provide a revised Table 6 and 7 from Exhibit B1, Tab 2, Schedule 1 that reflects these updated figures. Response a) The MAADs Decision directed Enbridge Gas to add the rate base and depreciation
associated with projects that were found eligible for capital pass-through treatment during Union’s 2014-2018 IRM term to the 2013 rate base and depreciation for purposes of determining the eligible incremental capital amount for Union Gas’ service territory. The MAADs Decision did not direct the amount of capital pass-through rate base and depreciation to include. Enbridge Gas updated 2019 rates to reflect the 2019 forecast revenue requirement of the capital pass-through projects and included the 2019 forecast rate base and depreciation of the capital pass-through in the ICM threshold calculation. Since the purpose of the ICM materiality threshold is to determine the amount of capital spend that can be supported through current rates, the 2019 rate base and depreciation

Filed: 2019-04-25 EB-2018-0305 Exhibit I.LPMA.13 Page 2 of 3 Plus Attachment
are used, and is consistent with the proposal to adjust 2019 rates for the 2019 revenue requirement. Please see Exhibit I.STAFF.8, part a).
b) Please see Attachment 1 which provides Exhibit F1, Tab 2, Rate Order, Working Papers, Schedule 16, pages 4 and 5 updated to reflect draft 2018 actual costs and the most recent 2019 forecast revenue requirement for each capital pass-through project. The resulting changes to Table 6 and Table 7 from Exhibit B1, Tab 2, Schedule 1 are provided below.

Filed: 2019-04-25 EB-2018-0305 Exhibit I.LPMA.13 Page 3 of 3 Plus Attachment
Table 6
ICM Threshold Rate Base and Depreciation Expense by Rate Zone Updated for Exhibit I.LPMA.13 b)
Line
Rate No.
Particulars ($ millions)
Base
Depreciation
(a)
(b)
EGD 1
2013 Board-Approved
6,246
305
Union 2
2013 Board-Approved
3,734
196
3
2019 Capital Pass-Through Amounts
1,588
43 4
Total
5,322
239
Table 7 Maximum Eligible Incremental Capital by Rate Zone
Updated for Exhibit I.LPMA.13 b)
Line No.
Particulars ($ millions)
EGD
Union
(a)
(b)
1
2019 In-Service Capital Forecast
481.7
518.5 2
Less: Materiality Threshold Value
468.5
374.9
3
Maximum Eligible Incremental Capital
13.1
143.6

Line
2018
Dra
ft20
19 U
pdat
ed20
18 D
raft
2019
Upd
ated
2018
Dra
ft20
19 U
pdat
edN
o.Pa
rticu
lars
($00
0's)
Actu
als
Fore
cast
Cha
nge
Actu
als
Fore
cast
Cha
nge
Actu
als
Fore
cast
Cha
nge
(a)
(b)
(c) =
(b-a
)(d
)(e
)(f)
= (e
-d)
(g)
(h)
(i) =
(h-g
)
Rat
e Ba
se In
vest
men
t1
Cap
ital E
xpen
ditu
res
1,09
21,
454
362
--
-2,
464
-(2
,464
)2
Aver
age
Inve
stm
ent
213,
974
209,
671
(4,3
03)
182,
727
177,
731
(4,9
95)
329,
689
323,
231
(6,4
58)
Rev
enue
Req
uire
men
t Cal
cula
tion:
Ope
ratin
g Ex
pens
es:
3
Ope
ratin
g an
d M
aint
enan
ce E
xpen
ses
1,32
01,
373
5362
162
1-
951
894
(57)
4
Dep
reci
atio
n Ex
pens
e (1
)5,
479
5,50
929
4,99
54,
995
-8,
255
8,22
9(2
6)5
Pr
oper
ty T
axes
572
584
1193
993
9-
1,09
61,
100
46
Tota
l Ope
ratin
g Ex
pens
es (
line
3 +
line
4 +
line
5)7,
372
7,46
593
6,55
56,
556
-10
,302
10,2
23(7
9)
Req
uire
d R
etur
n:7
In
tere
st E
xpen
se5,
231
5,12
6(1
05)
4,46
74,
345
(122
)7,
090
6,95
1(1
39)
8
Equi
ty R
etur
n6,
879
6,74
0(1
38)
5,87
45,
714
(161
)10
,599
10,3
91(2
08)
9To
tal R
equi
red
Ret
urn
(lin
e 7
+ lin
e 8)
(2)
12,1
1011
,867
(244
)10
,342
10,0
59(2
83)
17,6
8817
,342
(346
)
Inco
me
Taxe
s:10
In
com
e Ta
xes
- Equ
ity R
etur
n (3
)2,
480
2,43
0(5
0)2,
118
2,06
0(5
8)3,
821
3,74
7(7
5)11
In
com
e Ta
xes
- Util
ity T
imin
g D
iffer
ence
s (4
)(4
,066
)(3
,281
)78
6(3
,938
)(3
,234
)70
4(7
,411
)(6
,233
)1,
178
12To
tal I
ncom
e Ta
xes
(lin
e 10
+ li
ne 1
1)(1
,586
)(8
50)
736
(1,8
20)
(1,1
74)
646
(3,5
90)
(2,4
86)
1,10
4
13To
tal R
even
ue R
equi
rem
ent
(line
6 +
line
9 +
line
12)
17,8
9618
,482
586
15,0
7715
,441
363
24,4
0125
,079
678
14In
crem
enta
l Pro
ject
Rev
enue
Adj
ustm
ent
(5)
--
--
--
--
-
15C
apita
l Pas
s-th
roug
h Ad
just
men
ts (
line
13 -
line
14)
17,8
9618
,482
586
15,0
7715
,441
363
24,4
0125
,079
678
Not
es:
(1)
Dep
reci
atio
n ex
pens
e at
201
3 Bo
ard-
appr
oved
dep
reci
atio
n ra
tes.
(2)
(3)
Taxe
s re
late
d to
the
equi
ty c
ompo
nent
of t
he re
turn
at a
tax
rate
of 2
6.5%
.(4
)Ta
xes
rela
ted
to th
e ut
ility
tim
ing
diffe
renc
es a
re n
egat
ive
as th
e ca
pita
l cos
t allo
wan
ce d
educ
tion
in a
rriv
ing
at ta
xabl
e in
com
e ex
ceed
s th
e pr
ovis
ion
of b
ook
depr
ecia
tion
in th
e ye
ar.
(5)
The
requ
ired
retu
rn a
ssum
es a
cap
ital s
truct
ure
of 3
6% c
omm
on e
quity
at t
he 2
013
Boar
d-ap
prov
ed re
turn
of 8
.93%
and
64%
long
-term
deb
t. T
he a
ssum
ed lo
ng-te
rm d
ebt f
or ra
tes
for 2
019
are
3.82
% fo
r Par
kway
W
est a
nd P
arkw
ay G
row
th p
roje
cts,
3.3
6% fo
r 201
6 D
awn-
Park
way
Exp
ansi
on a
nd B
urlin
gton
to O
akvi
lle p
roje
cts,
and
3.2
9% fo
r 201
7 D
awn-
Park
way
Exp
ansi
on a
nd P
anha
ndle
Rei
nfor
cem
ent p
roje
cts.
UN
ION
RAT
E ZO
NES
Sum
mar
y of
201
8 D
raft
Actu
als
and
2019
Upd
ated
For
ecas
t for
Cap
ital P
ass-
Thro
ugh
Proj
ects
Rev
enue
Req
uire
men
t
Park
way
Pro
ject
sPa
rkw
ay W
est
Bran
tford
to K
irkw
all/P
arkw
ay D
2016
Daw
n-Pa
rkw
ay E
xpan
sion
Pro
ject
Incr
emen
tal p
roje
ct re
venu
e re
flect
ed a
s an
incr
ease
to R
ate
M12
and
Rat
e C
1 bi
lling
uni
ts u
sed
to s
et ra
tes
durin
g th
e 20
14-2
018
IRM
term
exc
ept f
or 3
0,39
3 G
J/d
of c
apac
ity re
late
d to
the
2017
Daw
n-Pa
rkw
ay
Proj
ect f
or 2
018
and
the
incr
emen
tal r
even
ue o
f the
Pan
hand
le R
einf
orce
men
t Pro
ject
. Inc
rem
enta
l pro
ject
reve
nue
in 2
018
of th
e 20
17 D
awn-
Park
way
pro
ject
incl
udes
pro
porti
onal
sho
rt-te
rm s
ales
for J
anua
ry to
O
ctob
er a
nd e
ntire
cap
acity
sol
d lo
ng-te
rm M
12 D
awn-
Park
way
for N
ovem
ber a
nd D
ecem
ber.
Incr
emen
tal p
roje
ct re
venu
e of
the
Panh
andl
e R
einf
orce
men
t Pro
ject
trea
ted
as a
redu
ctio
n to
the
capi
tal p
ass-
thro
ugh
adju
stm
ent a
mou
nt a
nd in
clud
es in
crem
enta
l tra
nsm
issi
on a
nd d
istri
butio
n m
argi
n.
Filed: 2019-04-25 EB-2018-0305
Exhibit I.LPMA.13 Attachment 1
Page 1 of 2
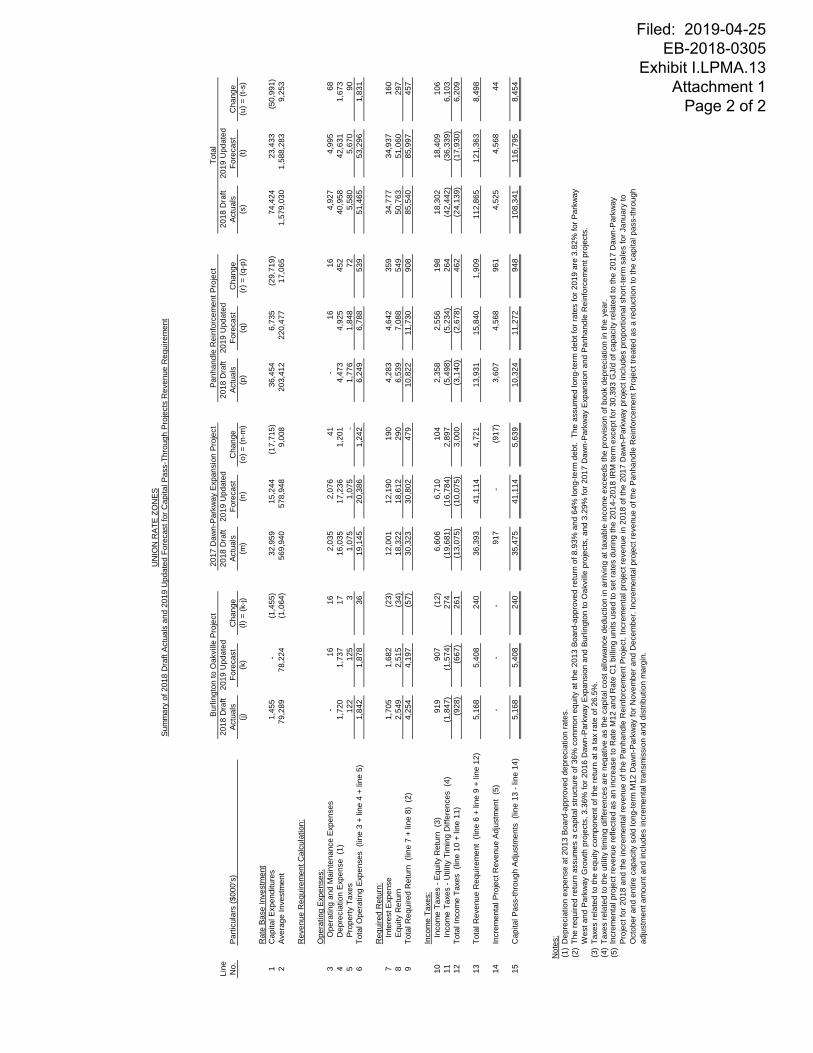
Line
2018
Dra
ft20
19 U
pdat
ed20
18 D
raft
2019
Upd
ated
2018
Dra
ft20
19 U
pdat
ed20
18 D
raft
2019
Upd
ated
No.
Parti
cula
rs ($
000'
s)Ac
tual
sFo
reca
stC
hang
eAc
tual
sFo
reca
stC
hang
eAc
tual
sFo
reca
stC
hang
eAc
tual
sFo
reca
stC
hang
e(j)
(k)
(l) =
(k-j)
(m)
(n)
(o) =
(n-m
)(p
)(q
)(r
) = (q
-p)
(s)
(t)(u
) = (t
-s)
Rat
e Ba
se In
vest
men
t1
Cap
ital E
xpen
ditu
res
1,45
5-
(1,4
55)
32,9
5915
,244
(17,
715)
36,4
546,
735
(29,
719)
74,4
2423
,433
(50,
991)
2Av
erag
e In
vest
men
t79
,289
78,2
24(1
,064
)56
9,94
057
8,94
89,
008
203,
412
220,
477
17,0
651,
579,
030
1,58
8,28
39,
253
Rev
enue
Req
uire
men
t Cal
cula
tion:
Ope
ratin
g Ex
pens
es:
3
Ope
ratin
g an
d M
aint
enan
ce E
xpen
ses
-16
162,
035
2,07
641
-16
164,
927
4,99
568
4
Dep
reci
atio
n Ex
pens
e (1
)1,
720
1,73
717
16,0
3517
,236
1,20
14,
473
4,92
545
240
,958
42,6
311,
673
5
Prop
erty
Tax
es12
212
53
1,07
51,
075
-1,
776
1,84
872
5,58
05,
670
906
Tota
l Ope
ratin
g Ex
pens
es (
line
3 +
line
4 +
line
5)1,
842
1,87
836
19,1
4520
,386
1,24
26,
249
6,78
853
951
,465
53,2
961,
831
Req
uire
d R
etur
n:7
In
tere
st E
xpen
se1,
705
1,68
2(2
3)12
,001
12,1
9019
04,
283
4,64
235
934
,777
34,9
3716
08
Eq
uity
Ret
urn
2,54
92,
515
(34)
18,3
2218
,612
290
6,53
97,
088
549
50,7
6351
,060
297
9To
tal R
equi
red
Ret
urn
(lin
e 7
+ lin
e 8)
(2)
4,25
44,
197
(57)
30,3
2330
,802
479
10,8
2211
,730
908
85,5
4085
,997
457
Inco
me
Taxe
s:10
In
com
e Ta
xes
- Equ
ity R
etur
n (3
)91
990
7(1
2)6,
606
6,71
010
42,
358
2,55
619
818
,302
18,4
0910
611
In
com
e Ta
xes
- Util
ity T
imin
g D
iffer
ence
s (4
)(1
,847
)(1
,574
)27
4(1
9,68
1)(1
6,78
4)2,
897
(5,4
98)
(5,2
34)
264
(42,
442)
(36,
339)
6,10
312
Tota
l Inc
ome
Taxe
s (l
ine
10 +
line
11)
(928
)(6
67)
261
(13,
075)
(10,
075)
3,00
0(3
,140
)(2
,678
)46
2(2
4,13
9)(1
7,93
0)6,
209
13To
tal R
even
ue R
equi
rem
ent
(line
6 +
line
9 +
line
12)
5,16
85,
408
240
36,3
9341
,114
4,72
113
,931
15,8
401,
909
112,
865
121,
363
8,49
8
14In
crem
enta
l Pro
ject
Rev
enue
Adj
ustm
ent
(5)
--
-91
7-
(917
)3,
607
4,56
896
14,
525
4,56
844
15C
apita
l Pas
s-th
roug
h Ad
just
men
ts (
line
13 -
line
14)
5,16
85,
408
240
35,4
7541
,114
5,63
910
,324
11,2
7294
810
8,34
111
6,79
58,
454
Not
es:
(1)
Dep
reci
atio
n ex
pens
e at
201
3 Bo
ard-
appr
oved
dep
reci
atio
n ra
tes.
(2)
(3)
Taxe
s re
late
d to
the
equi
ty c
ompo
nent
of t
he re
turn
at a
tax
rate
of 2
6.5%
.(4
)Ta
xes
rela
ted
to th
e ut
ility
tim
ing
diffe
renc
es a
re n
egat
ive
as th
e ca
pita
l cos
t allo
wan
ce d
educ
tion
in a
rriv
ing
at ta
xabl
e in
com
e ex
ceed
s th
e pr
ovis
ion
of b
ook
depr
ecia
tion
in th
e ye
ar.
(5)
UN
ION
RAT
E ZO
NES
Sum
mar
y of
201
8 D
raft
Actu
als
and
2019
Upd
ated
For
ecas
t for
Cap
ital P
ass-
Thro
ugh
Proj
ects
Rev
enue
Req
uire
men
t
Burli
ngto
n to
Oak
ville
Pro
ject
2017
Daw
n-Pa
rkw
ay E
xpan
sion
Pro
ject
Panh
andl
e R
einf
orce
men
t Pro
ject
Tota
l
Incr
emen
tal p
roje
ct re
venu
e re
flect
ed a
s an
incr
ease
to R
ate
M12
and
Rat
e C
1 bi
lling
uni
ts u
sed
to s
et ra
tes
durin
g th
e 20
14-2
018
IRM
term
exc
ept f
or 3
0,39
3 G
J/d
of c
apac
ity re
late
d to
the
2017
Daw
n-Pa
rkw
ay
Proj
ect f
or 2
018
and
the
incr
emen
tal r
even
ue o
f the
Pan
hand
le R
einf
orce
men
t Pro
ject
. Inc
rem
enta
l pro
ject
reve
nue
in 2
018
of th
e 20
17 D
awn-
Park
way
pro
ject
incl
udes
pro
porti
onal
sho
rt-te
rm s
ales
for J
anua
ry to
O
ctob
er a
nd e
ntire
cap
acity
sol
d lo
ng-te
rm M
12 D
awn-
Park
way
for N
ovem
ber a
nd D
ecem
ber.
Incr
emen
tal p
roje
ct re
venu
e of
the
Panh
andl
e R
einf
orce
men
t Pro
ject
trea
ted
as a
redu
ctio
n to
the
capi
tal p
ass-
thro
ugh
adju
stm
ent a
mou
nt a
nd in
clud
es in
crem
enta
l tra
nsm
issi
on a
nd d
istri
butio
n m
argi
n.
The
requ
ired
retu
rn a
ssum
es a
cap
ital s
truct
ure
of 3
6% c
omm
on e
quity
at t
he 2
013
Boar
d-ap
prov
ed re
turn
of 8
.93%
and
64%
long
-term
deb
t. T
he a
ssum
ed lo
ng-te
rm d
ebt f
or ra
tes
for 2
019
are
3.82
% fo
r Par
kway
W
est a
nd P
arkw
ay G
row
th p
roje
cts,
3.3
6% fo
r 201
6 D
awn-
Park
way
Exp
ansi
on a
nd B
urlin
gton
to O
akvi
lle p
roje
cts,
and
3.2
9% fo
r 201
7 D
awn-
Park
way
Exp
ansi
on a
nd P
anha
ndle
Rei
nfor
cem
ent p
roje
cts.
Filed: 2019-04-25 EB-2018-0305
Exhibit I.LPMA.13 Attachment 1
Page 2 of 2

Filed: 2019-04-25 EB-2018-0305 Exhibit I.LPMA.14 Page 1 of 1
ENBRIDGE GAS INC. Answer to Interrogatory from
London Property Management Association (LPMA) Reference: Exhibit B1, Tab 2, Schedule 1, page 19 Question: If the Sudbury Replacement project had been brought forward under the 2014-2018 capital pass-through mechanism, please provide the following: a) the proposed rate base and depreciation expense for 2018, reflecting the October 2018 in-service date; and b) the forecasted rate base and depreciation expense for 2019. Response a) 2018 Rate Base (000’s) = $17,769
2018 Depreciation (000’s) = $1,362 b) 2019 Rate Base (000’s) = $89,504
2019 Depreciation (000’s) = $2,809

Filed: 2019-04-25 EB-2018-0305 Exhibit I.SEC.1 Page 1 of 1 Plus Attachment
ENBRIDGE GAS INC. Answer to Interrogatory from
School Energy Coalition (SEC) Reference: Ex. A, Tab 3, Sched. 1, p. 4, and Ex. B1, Tab 1, Sched. 1, p. 31 Question: Please provide a table showing distribution bill impacts for a non-residential customer (such as a school) with 40,000 m3 annual consumption in each of rates Union 01 and M1, and EGD 6. If an expansion of Table 11 would accomplish that that is acceptable. Please provide all supporting calculations, in Excel format. Response Please see Table 1. The supporting calculation has been attached and filed in excel format as Exhibit I.SEC.1, Attachment 1.
Table 1 Delivery Bill Impacts for Rate 01, Rate M1 and Rate 6
Line
Union South
Union North
EGD
No.
Particulars ($)
Rate M1
Rate 01
Rate 6
(a)
(b)
(c)
1
Annual Consumption
40,000 m3
40,000 m3
40,000 m3
2
Approved Delivery Bill (1)
2,222
3,570
2,717 3
2019 Rates - Proposed
2,250
3,635
2,744
4
Difference (line 3 - line 2)
28
65
28 5
Delivery Bill Impact (%) (line 4 / line 2)
1.3%
1.8%
1.0%
Notes:
(1) October 2018 QRAM (EB-2018-0253).

Line Union South Union North EGDNo. Particulars ($) Rate M1 Rate 01 Rate 6
(a) (b) (c)
1 Annual Consumption 40,000 m3 40,000 m3 40,000 m3
2 Approved Delivery Bill (1) 2,222 3,570 2,7173 2019 Rates - Proposed 2,250 3,635 2,744
4 Difference (line 3 - line 2) 28 65 285 Delivery Bill Impact (%) (line 4 / line 2) 1.3% 1.8% 1.0%
Notes:(1) October 2018 QRAM (EB-2018-0253).
Delivery Bill Impacts for Rate 01, Rate M1 and Rate 6Table 1
ENBRIDGE GAS INC.
Filed: 2019-04-25 EB-2018-0305 Exhibit I.SEC.1
Attachment 1 Page 1 of 3

Large LargeCustomer Customer
Oct-18 Billing October Proposed Billing 2019 RatesLine Billing QRAM (1) Units QRAM Rates (2) Units ProposedNo. Particulars Units (cents / m³) (m3) ($) (cents / m³) (m3) ($)
Rate 01 General Service1 Monthly Charge bills $21.00 12 $252 $21.00 12 $252
Monthly Delivery Charge2 First 100 m³ 10³m³ 9.3755 1,200 113 10.0484 1,200 1213 Next 200 m³ 10³m³ 9.1356 2,400 219 9.2549 2,400 2224 Next 200 m³ 10³m³ 8.7563 2,400 210 8.8872 2,400 2135 Next 500 m³ 10³m³ 8.4081 5,400 454 8.5496 5,400 4626 Over 1,000 m³ 10³m³ 8.1204 28,600 2,322 8.2708 28,600 2,3657 Delivery Commodity charge 40,000 3,318 40,000 3,383
8 Total 40,000 3,570 40,000 3,635
Rate M1 General Service 9 Monthly Charge bills $21.00 12 $252 $21.00 12 $252
Monthly Delivery Charge10 First 100 m³ 10³m³ 5.0777 1,200 61 5.9775 1,200 7211 Next 150 m³ 10³m³ 4.8140 1,800 87 4.8283 1,800 8712 All over 250 m³ 10³m³ 4.1326 37,000 1,529 4.1436 37,000 1,53313 Delivery Commodity charge 40,000 1,677 40,000 1,692
14 Storage 0.7331 40,000 293.24 0.7653 40,000 306
15 Total 40,000 2,222 40,000 2,250
Notes:(1) October 2018 QRAM (EB-2018-0253).(2) EB-2018-0305, Exhibit F1, Tab 2, Rate Order, Appendix A.
Union Rate Zone General Service Rate 01 and Rate M1 Delivery Bill ImpactsENBRIDGE GAS INC.
Filed: 2019-04-25 EB-2018-0305 Exhibit I.SEC.1
Attachment 1 Page 2 of 3

Commercial CommercialCustomer Customer
Oct-18 Billing October Proposed Billing 2019 RatesLine Billing QRAM (1) Units QRAM Rates (2) Units Proposed
No. Units (cents / m³) (m3) ($) (cents / m³) (m3) ($)
Rate 6 General Service1 Monthly Charge bills $70.00 12 $840 $70.00 12 $840
Monthly Delivery Charge
2 First 500 m³ 10³m³ 7.2824 6,000 $437 7.3356 6,000 $4403 Next 1050 m³ 10³m³ 5.1670 12,600 $651 5.2333 12,600 $6594 Next 4500 m³ 10³m³ 3.6857 21,400 $789 3.7612 21,400 $8055 Next 7000 m³ 10³m³ 2.7340 - $0 2.8154 - $06 Next 15250 m³ 10³m³ 2.3111 - $0 2.3951 - $07 Over 28300 m³ 10³m³ 2.2049 - $0 2.2895 - $08 Delivery Commodity charge 40,000 $1,877 40,000 $1,904
9 Total Delivery Charge 40,000 $2,717 40,000 $2,744
Notes:(1) EB-2018-0305, Exhibit F1, Tab1, Schedule 4, Page 2, Col C minus Col E.(2) EB-2018-0305, Exhibit F1, Tab1, Schedule 6, Page 1, Col D.
ENBRIDGE GAS INC.EGD Rate Zone General Service Rate 6 Delivery Bill Impacts
Filed: 2019-04-25 EB-2018-0305 Exhibit I.SEC.1
Attachment 1 Page 3 of 3

Filed: 2019-04-25 EB-2018-0305 Exhibit I.SEC.2 Page 1 of 1
ENBRIDGE GAS INC. Answer to Interrogatory from
School Energy Coalition (SEC) Reference: A/3/1, p. 6 Question: Please advise which school boards, if any, were included in the strategic account customers with which Union sales representatives met to gather feedback. Please provide the dates of those meetings. Response No, school boards were not included with the strategic account grouping. School boards would be included in the “not-for-profit or community institution” category of business respondents. Please see Exhibit D1, Tab 2, Schedule 1, page 212 for the Firmographic Profile of Business Respondents in Union’s Customer Engagement telephone survey.

Filed: 2019-04-25 EB-2018-0305 Exhibit I.SEC.3 Page 1 of 1
Plus Attachment
ENBRIDGE GAS INC. Answer to Interrogatory from
School Energy Coalition (SEC) Reference: B1/1/1, p. 2 Question: a. Confirm that the proposed increase in revenue for EGD Rate Zone is 1.987%. b. Confirm that the proposed increase in revenue for Union Rate Zones is 2.178%. c. Adjust those two percentages by changes in billing determinants and heat content,
and any other appropriate adjustments, to obtain the weighted average rate increase for each of the EGD Rate Zone and the Union Rate Zones, and provide all supporting calculations, in Excel format.
Response a) Not confirmed. The increase in revenue as the basis for rate making provided at
Exhibit B1, Table 1, results in an increase of 1.987% for the EGD rate zone and 2.178% for the Union rate zone. However, the increase in revenue at Table 1 does not factor in revenue changes associated with changing billing determinants, therefore actual utility revenue will be different.
b) Please see part a).
c) For purposes of this response, Enbridge Gas has estimated an average volumetric 2018 and 2019 delivery rate for in-franchise customers in the EGD and Union rate zones, assuming the proposed revenues are recovered on a volumetric basis only. Note that the average rate does not represent proposed delivery rates for any particular rate class, as the estimated average unit rate does not reflect rate class specific characteristics. The supporting calculation has been filed in excel format as Exhibit I.SEC.3, Attachment 1.

Line
Rev
enue
(1)
Vol
umes
(2)
Uni
t Rat
eR
even
ue (3
)V
olum
es (4
)U
nit R
ate
No.
Par
ticul
ars
($00
0's)
(m3 )
(cen
ts/m
3 )($
000'
s)(m
3 )(c
ents
/m3 )
(a)
(b)
(c)=
(a/b
x 1
00)
(d)
(e)
(f)=
(d/e
x 1
00)
120
18 A
ppro
ved
1,21
2,41
411
,487
,411
10.5
543
808,
508
13,9
94,9
695.
7771
220
19 P
ropo
sed
1,23
6,50
911
,668
,048
10.5
974
841,
671
14,2
69,1
075.
8986
3D
iffer
ence
(lin
e 2
- lin
e 1)
24,0
950.
0431
33,1
630.
1214
4D
iffer
ence
(%) (
line
3 / l
ine
1)1.
987%
0.40
8%4.
102%
2.10
2%
Not
es:
(1)
EB
-201
8-03
05, E
xhib
it B
1, T
ab 1
, Sch
edul
e 1,
Tab
le 1
.(2
)E
xhib
it F1
, Tab
1, R
ate
Ord
er, W
orki
ng P
aper
s, S
ched
ule
5. E
stim
ated
ave
rage
uni
t rat
e ba
sed
on p
ropo
sed
2019
vol
umes
use
d to
set
bas
e de
liver
y ra
tes.
(3)
(4)
Exh
ibit
F1, T
ab 2
, Rat
e O
rder
, Wor
king
Pap
ers,
Sch
edul
e 5.
EN
BR
IDG
E G
AS
INC
.E
stim
ated
201
9 A
vera
ge D
eliv
ery
Uni
t Rat
es fo
r the
EG
D a
nd U
nion
Rat
e Zo
nes
EG
D R
ate
Zone
Uni
on R
ate
Zone
s
EB
-201
8-03
05, E
xhib
it B
1, T
ab 1
, Sch
edul
e 1,
Tab
le 1
, pro
pose
d re
venu
e ch
ange
of $
27.4
48 m
illio
n ad
just
ed to
rem
ove
($5.
715
mill
ion)
for e
x-fra
nchi
se,
Uni
on N
orth
sto
rage
and
tran
spor
tatio
n an
d ga
s su
pply
adm
inis
tratio
n, a
s pe
r Exh
ibit
F1, T
ab 2
, Rat
e O
rder
, Wor
king
Pap
ers,
Sch
edul
e 2.
Filed: 2018-04-25 EB-2018-0305 Exhibit I.SEC.3
Attachment 1 Page 1 of 1

Filed: 2019-04-25 EB-2018-0305 Exhibit I.SEC.4 Page 1 of 1
ENBRIDGE GAS INC. Answer to Interrogatory from
School Energy Coalition (SEC) Reference: B1/1/1, p. 13 Question: Please confirm that the Applicant is not aware of any events or circumstances that would qualify for positive or negative Z factor adjustment to 2019 rates. Please provide a list of all events or circumstances that meet three of the four Z factor criteria described by the Board in EB-2017-0306/7, Decision with Reasons, p. 37, and explain why each does not meet the fourth criterion. Response Confirmed. Enbridge Gas is not proposing a Z factor for 2019 rates. If the applicant determines that a Z factor adjustment is required, it will file an application to that effect as part of its rates application and conform to the Z factor criteria as established by the Board in the MAADs Decision.

Filed: 2019-04-25 EB-2018-0305 Exhibit I.SEC.5 Page 1 of 1 Plus Attachment
ENBRIDGE GAS INC. Answer to Interrogatory from
School Energy Coalition (SEC) Reference: B1/1/1, p. 19 Question: With respect to the proposal to use the capital pass-through account to adjust for tax timing differences:
a. Please provide the reference in the EB-2017-0306/7 Decision with Reasons in
which the Board authorized a base rate adjustment or alteration of rate calculations to reflect tax timing differences.
b. Please explain why the impact of tax timing differences is not just one of the puts
and takes that the Applicant accepted in seeking a deferred rebasing. c. Please provide detailed continuity and CCA schedules for each of the six listed
projects from at least 2014 to 2023 so that the details of the timing differences for each project can be identified.
Response
a) Please see Exhibit I.STAFF.8, part a).
b) Please see Exhibit I.STAFF.8, part a).
c) Please see Attachment 1.

Util
ity T
ax T
imin
g D
iffer
ence
s an
d C
CA
Con
tinui
tyPa
rkw
ay W
est
2014
to 2
023
Actu
alAc
tual
Actu
alAc
tual
Fore
cast
Fore
cast
Fore
cast
Fore
cast
Fore
cast
Fore
cast
Line
N
o.Pa
rticu
lars
($00
0's)
2014
2015
2016
2017
2018
2019
2020
2021
2022
2023
Tota
l(a
)(b
)(c
)(d
)(e
)(f)
(g)
(h)
(i)(j)
(k)
1D
epre
ciat
ion
577
3,07
1
5,18
5
5,41
5
5,46
7
5,50
8
5,53
2
5,53
2
5,53
2
5,53
2
47,3
51
2
CC
A(2
,625
)
(1
3,71
9)
(2
1,39
3)
(1
9,26
8)
(1
6,75
4)
(1
4,60
5)
(1
2,70
7)
(1
0,98
4)
(9
,520
)
(8
,274
)
(1
29,8
50)
3
IDC
& O
ther
(4,0
28)
(1,8
91)
2
-
-
-
-
-
-
-
(5
,917
)
4
Net
Tim
ing
Diff
eren
ces
(6,0
76)
(12,
539)
(16,
206)
(13,
853)
(11,
288)
(9,0
97)
(7,1
75)
(5,4
52)
(3,9
88)
(2,7
41)
(88,
415)
5U
tility
Tax
Tim
ing
Diff
eren
ce(1
,610
)
(3
,323
)
(4
,295
)
(3
,671
)
(2
,991
)
(2
,411
)
(1
,901
)
(1
,445
)
(1
,057
)
(7
26)
(2
3,43
0)
6G
ross
ed U
p U
tility
Tax
Tim
ing
Diff
eren
ce(2
,191
)
(4
,521
)
(5
,843
)
(4
,994
)
(4
,070
)
(3
,280
)
(2
,587
)
(1
,966
)
(1
,438
)
(9
88)
(3
1,87
8)
CC
A C
ontin
uity
CC
A C
lass
1 -
Rat
e 6%
7
Ope
ning
UC
C-
17,3
24
39
,127
43,1
93
41
,623
39,1
26
36
,778
34,5
71
32
,497
30,5
47
8
Ad
ditio
ns17
,860
23,5
49
6,
612
1,
053
-
-
-
-
-
-
9
C
CA
536
1,74
6
2,54
6
2,62
3
2,49
7
2,34
8
2,20
7
2,07
4
1,95
0
1,83
3
20,3
59
10
C
losi
ng U
CC
17,3
24
39
,127
43,1
93
41
,623
39,1
26
36
,778
34,5
71
32
,497
30,5
47
28
,715
CC
A C
lass
7 -
Rat
e 15
%11
O
peni
ng U
CC
-
3,
714
84
,179
77,7
23
67
,387
58,2
42
50
,897
43,2
63
36
,773
31,2
57
12
Ad
ditio
ns4,
015
87
,592
6,67
1
1,42
9
1,04
2
1,50
4
-
-
-
-
13
CC
A30
1
7,
126
13
,127
11,7
66
10
,186
8,84
9
7,63
5
6,48
9
5,51
6
4,68
9
75,6
84
14
C
losi
ng U
CC
3,71
4
84,1
79
77
,723
67,3
87
58
,242
50,8
97
43
,263
36,7
73
31
,257
26,5
69
CC
A C
lass
8 -
Rat
e 20
%15
O
peni
ng U
CC
-
10
,481
20,9
54
17
,563
14,0
43
11
,235
8,98
8
7,19
0
5,75
2
4,60
2
16
Addi
tions
11,6
46
13
,965
889
(8)
-
-
-
-
-
-
17
C
CA
1,16
5
3,49
3
4,28
0
3,51
2
2,80
9
2,24
7
1,79
8
1,43
8
1,15
0
920
22,8
11
18
C
losi
ng U
CC
10,4
81
20
,954
17,5
63
14
,043
11,2
35
8,
988
7,
190
5,
752
4,
602
3,
681
CC
A C
lass
49
- Rat
e 8%
19
Ope
ning
UC
C-
14,9
69
17
,527
17,0
35
15
,776
14,5
14
13
,353
12,2
85
11
,302
10,3
98
20
Ad
ditio
ns15
,593
3,91
2
948
108
-
-
-
-
-
-
21
CC
A62
4
1,
354
1,
440
1,
367
1,
262
1,
161
1,
068
98
3
90
4
83
2
10
,995
22
Clo
sing
UC
C14
,969
17,5
27
17
,035
15,7
76
14
,514
13,3
53
12
,285
11,3
02
10
,398
9,56
6
Non
-Ded
uctib
le23
O
peni
ng
-
28
,105
28,1
29
28
,153
28,1
71
28
,171
28,1
71
28
,171
28,1
71
28
,171
24
Addi
tions
28,1
05
24
24
18
-
-
-
-
-
-
25
Clo
sing
28
,105
28,1
29
28
,153
28,1
71
28
,171
28,1
71
28
,171
28,1
71
28
,171
28,1
71
Tota
l CC
A26
O
peni
ng U
CC
-
74
,594
189,
917
18
3,66
8
167,
000
15
1,28
8
138,
187
12
5,48
0
114,
495
10
4,97
5
27
Addi
tions
77,2
19
12
9,04
2
15,1
44
2,
600
1,
042
1,
504
-
-
-
-
28
C
CA
2,62
5
13,7
19
21
,393
19,2
68
16
,754
14,6
05
12
,707
10,9
84
9,
520
8,
274
12
9,85
0
29
Clo
sing
UC
C74
,594
189,
917
18
3,66
8
167,
000
15
1,28
8
138,
187
12
5,48
0
114,
495
10
4,97
5
96,7
01
Filed: 2019-04-25 EB-2018-0305 Exhibit I.SEC.5
Attachment 1 Page 1 of 6

Util
ity T
ax T
imin
g D
iffer
ence
s an
d C
CA
Con
tinui
tyBr
antfo
rd-K
irkw
all/P
arkw
ay D
2014
to 2
023
Actu
alAc
tual
Actu
alAc
tual
Fore
cast
Fore
cast
Fore
cast
Fore
cast
Fore
cast
Fore
cast
Line
N
o.Pa
rticu
lars
($00
0's)
2014
2015
2016
2017
2018
2019
2020
2021
2022
2023
Tota
l(a
)(b
)(c
)(d
)(e
)(f)
(g)
(h)
(i)(j)
(k)
1D
epre
ciat
ion
-
2,
364
4,
857
4,
990
4,
995
4,
995
4,
995
4,
995
4,
995
4,
995
42
,184
2C
CA
-
(1
0,38
7)
(2
0,00
4)
(1
8,14
7)
(1
5,91
7)
(1
3,96
5)
(1
2,27
6)
(1
0,81
1)
(9
,539
)
(8
,433
)
(1
19,4
79)
3
IDC
& O
ther
-
(2
,150
)
(2
)
-
-
-
-
-
-
-
(2
,152
)
4
Net
Tim
ing
Diff
eren
ces
-
(1
0,17
2)
(1
5,14
9)
(1
3,15
7)
(1
0,92
2)
(8
,970
)
(7
,280
)
(5
,816
)
(4
,544
)
(3
,437
)
(7
9,44
7)
5U
tility
Tax
Tim
ing
Diff
eren
ce-
(2,6
96)
(4,0
15)
(3,4
87)
(2,8
94)
(2,3
77)
(1,9
29)
(1,5
41)
(1,2
04)
(911
)
(21,
053)
6G
ross
ed U
p U
tility
Tax
Tim
ing
Diff
eren
ce-
(3,6
68)
(5,4
62)
(4,7
44)
(3,9
38)
(3,2
34)
(2,6
25)
(2,0
97)
(1,6
38)
(1,2
39)
(28,
644)
CC
A C
ontin
uity
CC
A C
lass
EC
E - R
ate
7%7
O
peni
ng U
CC
-
1,
213
1,
128
1,
049
97
6
90
7
84
4
78
5
73
0
8
Ad
ditio
ns1,
304
-
-
-
-
-
-
-
-
9
C
CA
91
85
79
73
68
64
59
55
51
62
6
10
C
losi
ng U
CC
1,21
3
1,12
8
1,04
9
976
907
844
785
730
679
CC
A C
lass
1 -
Rat
e 6%
11
Ope
ning
UC
C-
2,98
6
2,93
1
2,76
6
2,60
0
2,44
4
2,29
7
2,15
9
2,03
0
12
Addi
tions
3,07
8
128
11
-
-
-
-
-
-
13
C
CA
92
18
3
17
6
16
6
15
6
14
7
13
8
13
0
12
2
1,
309
14
C
losi
ng U
CC
2,98
6
2,93
1
2,76
6
2,60
0
2,44
4
2,29
7
2,15
9
2,03
0
1,90
8
CC
A C
lass
7 -
Rat
e 15
%15
O
peni
ng U
CC
-
71
,825
66,3
41
56
,645
48,1
48
40
,926
34,7
87
29
,569
25,1
34
16
Ad
ditio
ns77
,649
5,71
8
276
-
-
-
-
-
-
17
CC
A5,
824
11
,203
9,97
2
8,49
7
7,22
2
6,13
9
5,21
8
4,43
5
3,77
0
62,2
79
18
C
losi
ng U
CC
71,8
25
66
,341
56,6
45
48
,148
40,9
26
34
,787
29,5
69
25
,134
21,3
64
CC
A C
lass
8 -
Rat
e 20
%19
O
peni
ng U
CC
-
4,
573
4,
562
3,
671
2,
937
2,
350
1,
880
1,
504
1,
203
20
Ad
ditio
ns5,
081
1,
004
24
-
-
-
-
-
-
21
CC
A50
8
1,
015
91
5
73
4
58
7
47
0
37
6
30
1
24
1
5,
147
22
C
losi
ng U
CC
4,57
3
4,56
2
3,67
1
2,93
7
2,35
0
1,88
0
1,50
4
1,20
3
962
CC
A C
lass
49
- Rat
e 8%
23
Ope
ning
UC
C-
92,9
14
87
,529
80,5
88
74
,141
68,2
10
62
,753
57,7
33
53
,114
24
Addi
tions
96,7
85
2,
134
64
-
-
-
-
-
-
25
CC
A3,
871
7,
518
7,
005
6,
447
5,
931
5,
457
5,
020
4,
619
4,
249
50
,118
26
Clo
sing
UC
C92
,914
87,5
29
80
,588
74,1
41
68
,210
62,7
53
57
,733
53,1
14
48
,865
Non
-Ded
uctib
le27
O
peni
ng
-
1,
264
1,
265
1,
265
1,
265
1,
265
1,
265
1,
265
1,
265
28
Ad
ditio
ns1,
264
1
-
-
-
-
-
-
-
29
Clo
sing
1,
264
1,
265
1,
265
1,
265
1,
265
1,
265
1,
265
1,
265
1,
265
Tota
l CC
A30
O
peni
ng U
CC
-
17
4,77
4
163,
755
14
5,98
4
130,
066
11
6,10
1
103,
825
93
,014
83,4
75
31
Ad
ditio
ns18
5,16
1
8,98
5
375
-
-
-
-
-
-
32
CC
A10
,387
20,0
04
18
,147
15,9
17
13
,965
12,2
76
10
,811
9,53
9
8,43
3
119,
479
33
C
losi
ng U
CC
174,
774
16
3,75
5
145,
984
13
0,06
6
116,
101
10
3,82
5
93,0
14
83
,475
75,0
42
Filed: 2019-04-25 EB-2018-0305 Exhibit I.SEC.5
Attachment 1 Page 2 of 6

Util
ity T
ax T
imin
g D
iffer
ence
s an
d C
CA
Con
tinui
ty20
16 D
awn-
Park
way
Exp
ansi
on20
14 to
202
3
Actu
alAc
tual
Actu
alAc
tual
Fore
cast
Fore
cast
Fore
cast
Fore
cast
Fore
cast
Fore
cast
Line
N
o.Pa
rticu
lars
($00
0's)
2014
2015
2016
2017
2018
2019
2020
2021
2022
2023
Tota
l(a
)(b
)(c
)(d
)(e
)(f)
(g)
(h)
(i)(j)
(k)
1D
epre
ciat
ion
-
17
6
4,
066
8,
030
8,
235
8,
261
8,
261
8,
261
8,
261
8,
261
61
,811
2C
CA
-
(7
58)
(1
7,03
0)
(3
1,54
0)
(2
8,91
3)
(2
5,71
7)
(2
2,82
1)
(2
0,28
5)
(1
8,06
0)
(1
6,10
6)
(1
81,2
29)
3
IDC
& O
ther
-
(1
,284
)
(4
,042
)
-
-
-
-
-
-
-
(5,3
26)
4N
et T
imin
g D
iffer
ence
s-
(1,8
66)
(17,
005)
(23,
510)
(20,
679)
(17,
456)
(14,
560)
(12,
024)
(9,8
00)
(7,8
45)
(124
,745
)
5U
tility
Tax
Tim
ing
Diff
eren
ce-
(494
)
(4,5
06)
(6,2
30)
(5,4
80)
(4,6
26)
(3,8
58)
(3,1
86)
(2,5
97)
(2,0
79)
(33,
057)
6G
ross
ed U
p U
tility
Tax
Tim
ing
Diff
eren
ce-
(673
)
(6,1
31)
(8,4
77)
(7,4
56)
(6,2
94)
(5,2
50)
(4,3
35)
(3,5
33)
(2,8
28)
(44,
976)
CC
A C
ontin
uity
CC
A C
lass
EC
E - R
ate
7%7
O
peni
ng U
CC
-
-
840
1,23
9
1,15
2
1,07
2
997
927
862
8
Addi
tions
-
90
4
49
2
-
-
-
-
-
-
9
C
CA
-
63
93
87
81
75
70
65
60
59
4
10
C
losi
ng U
CC
-
84
0
1,
239
1,
152
1,
072
99
7
92
7
86
2
80
2
CC
A C
lass
1 -
Rat
e 6%
11
Ope
ning
UC
C-
591
19,5
76
18
,445
17,3
38
16
,298
15,3
20
14
,401
13,5
37
12
Ad
ditio
ns60
9
19
,609
45
-
-
-
-
-
-
13
C
CA
18
62
4
1,
176
1,
107
1,
040
97
8
91
9
86
4
81
2
7,
538
14
C
losi
ng U
CC
591
19,5
76
18
,445
17,3
38
16
,298
15,3
20
14
,401
13,5
37
12
,725
CC
A C
lass
7 -
Rat
e 15
%15
O
peni
ng U
CC
-
5,
396
10
5,11
7
96,0
81
81
,669
69,4
18
59
,005
50,1
55
42
,631
16
Addi
tions
5,83
4
108,
681
7,
277
-
-
-
-
-
-
17
C
CA
438
8,96
1
16,3
13
14
,412
12,2
50
10
,413
8,85
1
7,52
3
6,39
5
85,5
55
18
C
losi
ng U
CC
5,39
6
105,
117
96
,081
81,6
69
69
,418
59,0
05
50
,155
42,6
31
36
,237
CC
A C
lass
8 -
Rat
e 20
%19
O
peni
ng U
CC
-
-
135
116
93
74
59
48
38
20
Ad
ditio
ns-
150
9
-
-
-
-
-
-
21
CC
A-
15
28
23
19
15
12
10
8
12
9
22
C
losi
ng U
CC
-
13
5
11
6
93
74
59
48
38
30
CC
A C
lass
49
- Rat
e 8%
23
Ope
ning
UC
C-
7,24
2
169,
566
16
4,74
8
154,
084
14
1,75
7
130,
417
11
9,98
3
110,
385
24
Ad
ditio
ns7,
544
16
9,69
1
9,11
2
2,62
0
-
-
-
-
-
25
C
CA
302
7,36
7
13,9
30
13
,285
12,3
27
11
,341
10,4
33
9,
599
8,
831
87
,413
26
Clo
sing
UC
C7,
242
16
9,56
6
164,
748
15
4,08
4
141,
757
13
0,41
7
119,
983
11
0,38
5
101,
554
Non
-Ded
uctib
le27
O
peni
ng
-
-
9,77
1
9,98
5
9,98
5
9,98
5
9,98
5
9,98
5
9,98
5
28
Addi
tions
-
9,
771
21
4
-
-
-
-
-
-
29
C
losi
ng
-
9,
771
9,
985
9,
985
9,
985
9,
985
9,
985
9,
985
9,
985
Tota
l CC
A30
O
peni
ng U
CC
-
13
,229
305,
006
29
0,61
5
264,
321
23
8,60
5
215,
784
19
5,49
9
177,
438
31
Ad
ditio
ns13
,987
308,
806
17
,149
2,62
0
-
-
-
-
-
32
C
CA
758
17,0
30
31
,540
28,9
13
25
,717
22,8
21
20
,285
18,0
60
16
,106
181,
229
33
C
losi
ng U
CC
13,2
29
30
5,00
6
290,
615
26
4,32
1
238,
605
21
5,78
4
195,
499
17
7,43
8
161,
333
Filed: 2019-04-25 EB-2018-0305 Exhibit I.SEC.5
Attachment 1 Page 3 of 6

Util
ity T
ax T
imin
g D
iffer
ence
s an
d C
CA
Con
tinui
tyBu
rling
ton
to O
akvi
lle20
14 to
202
3
Actu
alAc
tual
Actu
alAc
tual
Fore
cast
Fore
cast
Fore
cast
Fore
cast
Fore
cast
Fore
cast
Line
N
o.Pa
rticu
lars
($00
0's)
2014
2015
2016
2017
2018
2019
2020
2021
2022
2023
Tota
l(a
)(b
)(c
)(d
)(e
)(f)
(g)
(h)
(i)(j)
(k)
1D
epre
ciat
ion
-
-
821
1,66
8
1,71
7
1,73
2
1,73
2
1,73
2
1,73
2
1,73
2
12,8
64
2
CC
A-
-
(4
,294
)
(7
,538
)
(6
,786
)
(6
,001
)
(5
,281
)
(4
,667
)
(4
,141
)
(3
,688
)
(4
2,39
6)
3
IDC
& O
ther
-
-
(795
)
-
-
-
-
-
-
-
(7
95)
4
Net
Tim
ing
Diff
eren
ces
-
-
(4,2
68)
(5,8
69)
(5,0
69)
(4,2
70)
(3,5
49)
(2,9
35)
(2,4
09)
(1,9
57)
(30,
326)
5U
tility
Tax
Tim
ing
Diff
eren
ce-
-
(1
,131
)
(1
,555
)
(1
,343
)
(1
,132
)
(9
41)
(7
78)
(6
38)
(5
18)
(8
,036
)
6G
ross
ed U
p U
tility
Tax
Tim
ing
Diff
eren
ce-
-
(1
,539
)
(2
,116
)
(1
,828
)
(1
,539
)
(1
,280
)
(1
,058
)
(8
69)
(7
05)
(1
0,93
4)
CC
A C
ontin
uity
CC
A C
lass
EC
E - R
ate
7%7
O
peni
ng U
CC
-
8,
893
8,
271
7,
692
7,
153
6,
653
6,
187
5,
754
8
Ad
ditio
ns9,
563
-
-
-
-
-
-
-
9
CC
A66
9
62
3
57
9
53
8
50
1
46
6
43
3
40
3
4,
211
10
C
losi
ng U
CC
8,89
3
8,27
1
7,69
2
7,15
3
6,65
3
6,18
7
5,75
4
5,35
1
CC
A C
lass
1 -
Rat
e 6%
11
Ope
ning
UC
C-
199
173
163
153
144
135
127
12
Addi
tions
205
(14)
-
-
-
-
-
-
13
CC
A6
12
10
10
9
9
8
8
71
14
C
losi
ng U
CC
199
173
163
153
144
135
127
120
CC
A C
lass
8 -
Rat
e 20
%15
O
peni
ng U
CC
-
15
,120
12,8
12
10
,250
8,20
0
6,56
0
5,24
8
4,19
8
16
Addi
tions
16,8
00
79
6
-
-
-
-
-
-
17
C
CA
1,68
0
3,10
4
2,56
2
2,05
0
1,64
0
1,31
2
1,05
0
840
14,2
37
18
C
losi
ng U
CC
15,1
20
12
,812
10,2
50
8,
200
6,
560
5,
248
4,
198
3,
359
CC
A C
lass
49
- Rat
e 8%
19
Ope
ning
UC
C-
46,5
27
44
,673
42,5
40
39
,137
36,0
06
33
,126
30,4
76
20
Ad
ditio
ns48
,466
1,94
6
1,50
1
-
-
-
-
-
21
C
CA
1,93
9
3,80
0
3,63
4
3,40
3
3,13
1
2,88
0
2,65
0
2,43
8
23,8
75
22
C
losi
ng U
CC
46,5
27
44
,673
42,5
40
39
,137
36,0
06
33
,126
30,4
76
28
,038
Non
-Ded
uctib
le23
O
peni
ng
-
3,
188
3,
188
3,
188
3,
188
3,
188
3,
188
3,
188
24
Ad
ditio
ns3,
188
-
-
-
-
-
-
-
25
Clo
sing
3,
188
3,
188
3,
188
3,
188
3,
188
3,
188
3,
188
3,
188
Tota
l CC
A26
O
peni
ng U
CC
-
73
,927
69,1
17
63
,832
57,8
31
52
,550
47,8
83
43
,743
27
Addi
tions
78,2
21
2,
728
1,
501
-
-
-
-
-
28
CC
A4,
294
7,
538
6,
786
6,
001
5,
281
4,
667
4,
141
3,
688
42
,396
29
Clo
sing
UC
C73
,927
69,1
17
63
,832
57,8
31
52
,550
47,8
83
43
,743
40,0
54
Filed: 2019-04-25 EB-2018-0305 Exhibit I.SEC.5
Attachment 1 Page 4 of 6

Util
ity T
ax T
imin
g D
iffer
ence
s an
d C
CA
Con
tinui
ty20
17 D
awn-
Park
way
Exp
ansi
on20
14 to
202
3
Actu
alAc
tual
Actu
alAc
tual
Fore
cast
Fore
cast
Fore
cast
Fore
cast
Fore
cast
Fore
cast
Line
N
o.Pa
rticu
lars
($00
0's)
2014
2015
2016
2017
2018
2019
2020
2021
2022
2023
Tota
l(a
)(b
)(c
)(d
)(e
)(f)
(g)
(h)
(i)(j)
(k)
1D
epre
ciat
ion
-
-
1,16
9
8,97
5
16,6
44
17
,306
17,4
18
17
,418
17,4
18
17
,418
113,
767
2
CC
A-
-
(5
,403
)
(4
2,29
3)
(7
1,21
0)
(6
4,24
4)
(5
5,57
8)
(4
7,66
4)
(4
0,91
1)
(3
5,14
8)
(3
62,4
51)
3
IDC
& O
ther
-
-
(6,0
01)
(9,6
07)
(5,0
00)
-
-
-
-
-
(2
0,60
8)
4
Net
Tim
ing
Diff
eren
ces
-
-
(10,
235)
(42,
925)
(59,
566)
(46,
938)
(38,
160)
(30,
245)
(23,
493)
(17,
729)
(269
,292
)
5U
tility
Tax
Tim
ing
Diff
eren
ce-
-
(2
,712
)
(1
1,37
5)
(1
5,78
5)
(1
2,43
9)
(1
0,11
2)
(8
,015
)
(6
,226
)
(4
,698
)
(7
1,36
2)
6G
ross
ed U
p U
tility
Tax
Tim
ing
Diff
eren
ce-
-
(3
,690
)
(1
5,47
6)
(2
1,47
6)
(1
6,92
3)
(1
3,75
8)
(1
0,90
5)
(8
,470
)
(6
,392
)
(9
7,09
2)
CC
A C
ontin
uity
CC
A C
lass
1 -
Rat
e 6%
7
Ope
ning
UC
C-
496
67,4
17
63
,372
59,5
70
55
,996
52,6
36
49
,478
8
Addi
tions
511
69,0
22
-
-
-
-
-
-
9
C
CA
15
2,
100
4,
045
3,
802
3,
574
3,
360
3,
158
2,
969
23
,024
10
Clo
sing
UC
C49
6
67
,417
63,3
72
59
,570
55,9
96
52
,636
49,4
78
46
,509
CC
A C
lass
7 -
Rat
e 15
%11
O
peni
ng U
CC
-
48
,553
412,
259
38
3,94
5
332,
791
28
2,87
3
240,
442
20
4,37
5
12
Addi
tions
52,4
90
40
1,06
9
36,2
43
6,
960
-
-
-
-
13
C
CA
3,93
7
37,3
63
64
,557
58,1
14
49
,919
42,4
31
36
,066
30,6
56
32
3,04
3
14
Clo
sing
UC
C48
,553
412,
259
38
3,94
5
332,
791
28
2,87
3
240,
442
20
4,37
5
173,
719
CC
A C
lass
8 -
Rat
e 20
%15
O
peni
ng U
CC
-
2,
795
2,
958
2,
367
1,
893
1,
515
1,
212
96
9
16
Ad
ditio
ns3,
105
80
3
-
-
-
-
-
-
17
C
CA
311
639
592
473
379
303
242
194
3,13
2
18
Clo
sing
UC
C2,
795
2,
958
2,
367
1,
893
1,
515
1,
212
96
9
77
6
CC
A C
lass
49
- Rat
e 8%
19
Ope
ning
UC
C-
27,3
73
25
,202
23,1
86
21
,331
19,6
24
18
,054
16,6
10
20
Ad
ditio
ns28
,514
19
-
-
-
-
-
-
21
C
CA
1,14
1
2,19
1
2,01
6
1,85
5
1,70
6
1,57
0
1,44
4
1,32
9
13,2
52
22
C
losi
ng U
CC
27,3
73
25
,202
23,1
86
21
,331
19,6
24
18
,054
16,6
10
15
,281
Non
-Ded
uctib
le23
O
peni
ng
-
-
3,42
0
8,42
0
8,42
0
8,42
0
8,42
0
8,42
0
24
Addi
tions
-
3,
420
5,
000
-
-
-
-
-
25
Clo
sing
-
3,42
0
8,42
0
8,42
0
8,42
0
8,42
0
8,42
0
8,42
0
Tota
l CC
A26
O
peni
ng U
CC
-
79
,217
511,
256
48
1,29
0
424,
005
36
8,42
7
320,
764
27
9,85
3
27
Addi
tions
84,6
20
47
4,33
3
41,2
43
6,
960
-
-
-
-
28
C
CA
5,40
3
42,2
93
71
,210
64,2
44
55
,578
47,6
64
40
,911
35,1
48
36
2,45
1
29
Clo
sing
UC
C79
,217
511,
256
48
1,29
0
424,
005
36
8,42
7
320,
764
27
9,85
3
244,
705
Filed: 2019-04-25 EB-2018-0305 Exhibit I.SEC.5
Attachment 1 Page 5 of 6

Util
ity T
ax T
imin
g D
iffer
ence
s an
d C
CA
Con
tinui
tyPa
nhan
dle
Rei
nfor
cem
ent
2014
to 2
023
Actu
alAc
tual
Actu
alAc
tual
Fore
cast
Fore
cast
Fore
cast
Fore
cast
Fore
cast
Fore
cast
Line
N
o.Pa
rticu
lars
($00
0's)
2014
2015
2016
2017
2018
2019
2020
2021
2022
2023
Tota
l(a
)(b
)(c
)(d
)(e
)(f)
(g)
(h)
(i)(j)
(k)
1D
epre
ciat
ion
-
-
-
2,
038
4 ,
494
4,
939
4 ,
944
4,
944
4 ,
944
4,
944
31
,248
2C
CA
-
-
-
(9
,589
)
(1
9,69
1)
(1
9,20
8)
(1
7,05
4)
(1
5,18
0)
(1
3,56
0)
(1
2,15
1)
(1
06,4
33)
3
IDC
& O
ther
-
-
-
(1
,837
)
-
-
-
-
-
-
(1
,837
)
4
Net
Tim
ing
Diff
eren
ces
-
-
-
(9
,388
)
(1
5,19
7)
(1
4,26
9)
(1
2,10
9)
(1
0,23
6)
(8
,615
)
(7
,207
)
(7
7,02
2)
5U
tility
Tax
Tim
ing
Diff
eren
ce-
-
-
(2,4
88)
(4,0
27)
(3,7
81)
(3,2
09)
(2,7
13)
(2,2
83)
(1,9
10)
(20,
411)
6G
ross
ed U
p U
tility
Tax
Tim
ing
Diff
eren
ce-
-
-
(3,3
85)
(5,4
79)
(5,1
45)
(4,3
66)
(3,6
91)
(3,1
06)
(2,5
98)
(27,
770)
CC
A C
ontin
uity
CC
A C
lass
1 -
Rat
e 6%
7
Ope
ning
UC
C-
12 9
7
6
5
4
8
Ad
ditio
ns13
-
-
-
-
-
-
9
CC
A1
2
2
1
1
1
1
10
10
C
losi
ng U
CC
12
9
7
6
5
4
3
CC
A C
lass
8 -
Rat
e 20
%11
O
peni
ng U
CC
- 30
,696
26
, 523
21,2
19
16
,975
13,5
80
10
,864
12
Addi
tions
34,1
07
2,
185
-
-
-
-
-
13
CC
A3,
411
6,
358
5,30
5
4,24
4
3,39
5
2,71
6
2,17
3
27,6
01
14
C
losi
ng U
CC
30,6
96
26
,523
21,2
19
16
,975
13,5
80
10
,864
8,69
1
CC
A C
lass
14.
1 - R
ate
5%15
O
peni
ng U
CC
- 2,
845
2 ,
702
2,
567
2,
439
2,
317
2,
201
16
Ad
ditio
ns2,
994
-
-
-
-
-
-
17
C
CA
150
142
135
128
122
116
110
903
18
Clo
sing
UC
C2,
845
2,
702
2,
567
2,
439
2,
317
2,
201
2,
091
CC
A C
lass
41
- Rat
e 25
%19
O
peni
ng U
CC
- 21
4
1 61
121
90
68
51
20
Ad
ditio
ns24
5
-
-
-
-
-
-
21
CC
A31
54
40
30
23
17
13
207
22
Clo
sing
UC
C21
4
16
1
12
1
90
68
51
38
CC
A C
lass
49
- Rat
e 8%
23
Ope
ning
UC
C-
142,
799
17
0,26
1
157,
120
14
4,55
0
132,
986
12
2,34
7
24
Addi
tions
148,
749
40
,506
500
-
-
-
-
25
CC
A5,
950
13
,044
13,6
41
12
,570
11,5
64
10
,639
9,78
8
77,1
95
26
C
losi
ng U
CC
142,
799
17
0,26
1
157,
120
14
4,55
0
132,
986
12
2,34
7
112,
559
CC
A C
lass
51
- Rat
e 6%
27
Ope
ning
UC
C-
1,51
7
1,42
6
1,34
0
1,26
0
1,18
4
1,11
3
28
Addi
tions
1,56
4
- -
-
-
-
-
29
CC
A47
91
86
80
76
71
67
517
30
Clo
sing
UC
C1,
517
1,
426
1,
340
1,
260
1,
184
1,
113
1,
047
Non
-Ded
uctib
le31
O
peni
ng
- 14
4
1 44
144
144
144
144
32
Addi
tions
144
-
--
--
-
33
C
losi
ng
144
144
144
144
144
144
144
34
Tota
l CC
A35
O
peni
ng U
CC
- 17
8,22
8
201,
227
18
2,51
9
165,
465
15
0,28
5
136,
725
36
Ad
ditio
ns18
7,81
7
42,6
90
50
0
-
-
-
-
37
C
CA
9,58
9
19,6
91
19
,208
17,0
54
15
,180
13,5
60
12
,151
106,
433
38
C
losi
ng U
CC
178,
228
20
1,22
7
182,
519
16
5,46
5
150,
285
13
6,72
5
124,
574
Filed: 2019-04-25 EB-2018-0305 Exhibit I.SEC.5
Attachment 1 Page 6 of 6
Filed: 2019-04-25 EB-2018-0305 Exhibit I.SEC.6 Page 1 of 1 Plus Attachment
ENBRIDGE GAS INC. Answer to Interrogatory from
School Energy Coalition (SEC) Reference: B1/1/1, p. 28 Question: Please provide a detailed calculation showing the amounts that would be recovered from customers in each of 2019 – 2023 for the capital pass-through projects a) using the proposed one-time adjustment approach, and b) continuing to treat the projects as Y factor adjustments. Response Please see Attachment 1 for the capital pass-through project revenue requirement impact1 using the proposed one-time adjustment in rates with continuing to pass-through utility tax timing differences only, and continuing to pass-through the actual revenue requirement of the projects. The total revenue requirement difference of $33.8 million over the deferred rebasing period is required to support the level of capital investment prior to ICM funding as calculated by the ICM threshold value. As directed by the Board, Enbridge Gas has included the rate base and depreciation associated with the capital pass-through projects in calculating the ICM threshold value, resulting in a higher ICM threshold value. Without the proposed one-time adjustment, there would be an imbalance between the level of capital investment that can be supported by rates and the ICM threshold value calculation. Over the deferred rebasing period, the cumulative difference of the imbalance is approximately $410.0 million2 of additional capital investment required prior to an ICM funding request. Please see Exhibit I.STAFF.8 a) for a description of the need for Enbridge Gas’s proposed one-time adjustment and why continuing to pass-through the actual revenue requirement of the projects is not consistent with ICM threshold value calculation directive from the MAADs Decision.
1 The capital pass-through revenue requirement is based on the forecast revenue requirement of each project included in the application. 2 Exhibit I.STAFF.8, Attachment 1.

Diff
eren
ceLi
ne20
1920
2020
2120
2220
2320
1920
2020
2120
2220
23N
o.P
artic
ular
s ($
000'
s)Fo
reca
stFo
reca
stFo
reca
stFo
reca
stFo
reca
stTo
tal
Fore
cast
Fore
cast
Fore
cast
Fore
cast
Fore
cast
Tota
lTo
tal
(a)
(b)
(c)
(d)
(e)
(f) =
sum
(a:e
)(g
)(h
)(i)
(j)(k
)(l)
= s
um (g
:k)
(m) =
(f-l)
Rat
e B
ase
Inve
stm
ent
1C
apita
l Exp
endi
ture
s8,
964
--
--
8,96
4-
--
-2
Ave
rage
Inve
stm
ent
1,59
6,90
61,
596,
906
1,59
6,90
61,
596,
906
1,59
6,90
61,
596,
906
1,55
8,33
11,
515,
453
1,47
2,57
61,
429,
698
Rev
enue
Req
uire
men
t Cal
cula
tion:
Ope
ratin
g E
xpen
ses:
3
Ope
ratin
g an
d M
aint
enan
ce E
xpen
ses
4,60
44,
604
4,60
44,
604
4,60
423
,021
4,60
44,
769
4,86
34,
960
5,06
024
,256
(1,2
35)
4
Dep
reci
atio
n E
xpen
se (
1)42
,741
42,7
4142
,741
42,7
4142
,741
213,
704
42,7
4142
,883
42,8
8342
,883
42,8
8321
4,27
1(5
67)
5
Pro
perty
Tax
es5,
675
5,67
55,
675
5,67
55,
675
28,3
775,
675
5,74
65,
819
5,89
45,
970
29,1
04(7
27)
6To
tal O
pera
ting
Exp
ense
s (l
ine
3 +
line
4 +
line
5)53
,021
53,0
2153
,021
53,0
2153
,021
265,
103
53,0
2153
,397
53,5
6553
,736
53,9
1326
7,63
1(2
,529
)
Req
uire
d R
etur
n:7
In
tere
st E
xpen
se35
,120
35,1
2035
,120
35,1
2035
,120
175,
598
35,1
2034
,270
33,3
2732
,384
31,4
4116
6,54
19,
057
8
Equ
it y R
etur
n51
,337
51,3
3751
,337
51,3
3751
,337
256,
687
51,3
3750
,097
48,7
1947
,340
45,9
6224
3,45
613
,231
9To
tal R
equi
red
Ret
urn
(lin
e 7
+ lin
e 8)
(2)
86,4
5786
,457
86,4
5786
,457
86,4
5743
2,28
586
,457
84,3
6782
,046
79,7
2477
,403
409,
996
22,2
88
Inco
me
Taxe
s:10
In
com
e Ta
xes
- Equ
ity R
etur
n (3
)18
,516
18,5
1618
,516
18,5
1618
,516
92,5
7918
,516
18,0
6817
,571
17,0
7416
,577
87,8
074,
772
11
Inco
me
Taxe
s - U
tilit y
Tim
ing
Diff
eren
ces
(4)
(36,
415)
(29,
865)
(24,
051)
(19,
054)
(14,
752)
(124
,138
)(3
6,41
5)(2
9,86
5)(2
4,05
1)(1
9,05
4)(1
4,75
2)(1
24,1
38)
-12
Tota
l Inc
ome
Taxe
s (l
ine
10 +
line
11)
(17,
899)
(11,
350)
(5,5
36)
(539
)3,
764
(31,
559)
(17,
899)
(11,
797)
(6,4
80)
(1,9
80)
1,82
5(3
6,33
1)4,
772
13To
tal R
even
ue R
equi
rem
ent
(line
6 +
line
9 +
line
12)
121,
578
128,
128
133,
942
138,
939
143,
241
665,
828
121,
578
125,
967
129,
130
131,
480
133,
140
641,
296
24,5
32
14In
crem
enta
l Pro
ject
Rev
enue
(5)
4,34
04,
340
4,34
04,
340
4,34
021
,702
4,34
05,
415
6,24
37,
069
7,89
530
,962
(9,2
60)
15N
et R
even
ue R
equi
rem
ent
(line
13
- lin
e 14
)11
7,23
812
3,78
712
9,60
113
4,59
813
8,90
164
4,12
511
7,23
812
0,55
212
2,88
712
4,41
112
5,24
561
0,33
433
,791
Not
es:
(1)
Dep
reci
atio
n ex
pens
e at
201
3 B
oard
-app
rove
d de
prec
iatio
n ra
tes.
(2)
(3)
Taxe
s re
late
d to
the
equi
ty c
ompo
nent
of t
he re
turn
at a
tax
rate
of 2
6.5%
.(4
)Ta
xes
rela
ted
to th
e ut
ility
timin
g di
ffere
nces
are
neg
ativ
e as
the
capi
tal c
ost a
llow
ance
ded
uctio
n in
arr
ivin
g at
taxa
ble
inco
me
exce
eds
the
prov
isio
n of
boo
k de
prec
iatio
n in
the
year
.(5
)
UN
ION
RA
TE Z
ON
ES
Sum
mar
y of
201
9-20
23 C
apita
l Pas
s-Th
roug
h R
even
ue R
equi
rem
ent R
ecov
ered
from
Cus
tom
ers
As
Pro
pose
d vs
. Pas
s-th
roug
h of
Ann
ual R
even
ue R
equi
rem
ent
Incr
emen
tal p
roje
ct re
venu
e re
flect
ed a
s an
incr
ease
to R
ate
M12
and
Rat
e C
1 bi
lling
units
use
d to
set
rate
s du
ring
the
2014
-201
8 IR
M te
rm e
xcep
t for
the
incr
emen
tal r
even
ue o
f the
Pan
hand
le R
einf
orec
emen
t Pro
ject
. Inc
rem
enta
l pr
ojec
t rev
enue
of t
he P
anha
ndle
Rei
nfor
cem
ent P
roje
ct tr
eate
d as
a re
duct
ion
to th
e ca
pita
l pas
s-th
roug
h ad
just
men
t am
ount
and
incl
udes
incr
emen
tal t
rans
mis
sion
and
dis
tribu
tion
mar
gin.
As
Pro
pose
dP
ass-
thro
ugh
of A
nnua
l Rev
enue
Req
uire
men
t
The
requ
ired
retu
rn a
ssum
es a
cap
ital s
truct
ure
of 3
6% c
omm
on e
quity
at t
he 2
013
Boa
rd-a
ppro
ved
retu
rn o
f 8.9
3% a
nd 6
4% lo
ng-te
rm d
ebt.
The
ass
umed
long
-term
deb
t for
rate
s fo
r 201
9 ar
e 3.
82%
for P
arkw
ay W
est a
nd P
arkw
ay
Gro
wth
pro
ject
s, 3
.36%
for 2
016
Daw
n-P
arkw
ay E
xpan
sion
and
Bur
lingt
on to
Oak
ville
pro
ject
s, a
nd 3
.29%
for 2
017
Daw
n-P
arkw
ay E
xpan
sion
and
Pan
hand
le R
einf
orce
men
t pro
ject
s.
Filed: 2019-04-25 EB-2018-0305 Exhibit I.SEC.6
Attachment 1 Page 1 of 1

Filed: 2019-04-25 EB-2018-0305 Exhibit I.SEC.7 Page 1 of 1 Plus Attachment
ENBRIDGE GAS INC. Answer to Interrogatory from
School Energy Coalition (SEC) Reference: B1/1/1, p. 33 Question: Please provide a side by side table showing the class allocation of DSM costs based on 2019 DSM Budget, vs. based on 2017 Actual DSM program costs. Response Please see Attachment 1, the 2017 actual DSM costs are still subject to audit, and Board approval.

2019 Budget 2017 ActualLine DSM DSMNo. Particulars ($000s) Costs (1) Costs
(a) (b)Union North
1 Rate 01 6,345 5,7712 Rate 10 3,002 1,9793 Rate 20 1,672 1,4314 Rate 100 1,111 807
5 Total Union North 12,129 9,988
Union South
6 Rate M1 27,164 34,0777 Rate M2 10,602 7,3388 Rate M4 (2) 3,150 5,2799 Rate M5 (2) 1,977 1,31810 Rate M7 2,130 1,14311 Rate T1 1,505 2,35612 Rate T2 4,612 3,004
13 Total Union South 51,140 54,515
14 Total Union (line 5 + line 13) 63,269 64,503
Notes:(1) Exhibit F1, Tab 2, Rate Order, Working Papers, Schedule 10, p. 1, column (b) with
the exception of Rate M4 and Rate M5.(2)
UNION RATE ZONES Allocation of 2019 DSM Budget and 2017 DSM Actual Costs by Rate Class
ENBRIDGE GAS INC.
The proposed 2019 allocation to Rate M4 and Rate M5 after the pooling adjustment is$4.674 million and $0.453 million, respectively.
Filed: 2019-04-25 EB-2018-0305
Exhibit. I.SEC.7 Page 1 of 1
Attachment 1

Filed: 2019-04-25 EB-2018-0305 Exhibit I.SEC.8 Page 1 of 1
ENBRIDGE GAS INC. Answer to Interrogatory from
School Energy Coalition (SEC) Reference: B1/1/1, App. H, p. 8 Question: Please file a copy of the AFE manual. Response The Company declines to provide the AFE Manual given that it has no impact on 2019 Rates.

Filed: 2019-04-25 EB-2018-0305 Exhibit I.SEC.9 Page 1 of 1
ENBRIDGE GAS INC. Answer to Interrogatory from
School Energy Coalition (SEC) Reference: B1/2/1, p. 4 Question: Please explain why it would be appropriate for the Board to fund ICM for any of the deferred rebasing years when:
a. The forecast 2019-2023 average annual capital spending in the EGD Rate zone
is $509.4 million, which is less than the $616.9 million annual average capital spending in the 2014-2018 period, in which EGD over-earned in every year.
b. The forecast 2019-2023 average annual capital spending in the Union Rate zone
is $523.3 million, which is less than the $696.5 million annual average capital spending in the 2014-2018 period, in which Union over-earned in almost every year.
Response The ICM funding mechanism was made available to Enbridge Gas in the MAADs and Rate-Setting Mechanism Decision and Order.1 Enbridge Gas’s evidence with respect to Need is provided at Exhibit B1, Tab 2, Schedule 1, page 20. Within the Need section is a description of the Means Test, which legacy EGD and Union pass by not exceeding 300 basis points above the deemed return on equity in their most recent Earnings Sharing and Deferral and Variance Account Clearance applications.2
1 EB-2017-0306/EB-2017-0307 Decision and Order, August 30, 2018, pages 32 to 34. 2 Exhibit B1, Tab 2, Schedule 1, Appendix C.

Filed: 2019-04-25 EB-2018-0305 Exhibit I.SEC.10 Page 1 of 1
ENBRIDGE GAS INC. Answer to Interrogatory from
School Energy Coalition (SEC) Reference: B1/2/1, p. 16 Question: Please explain how there can be 2019 spend in 2014-2018 capital pass-through projects, which by definition should be completed and in-service no later than the end of 2018. Response There are often carry-over costs that occur after a project goes into service. Examples of these costs include activities such as construction clean up, restoration, baseline integrity inspections, painting, installation of anodes and other.

Filed: 2019-04-25 EB-2018-0305 Exhibit I.SEC.11 Page 1 of 1
ENBRIDGE GAS INC. Answer to Interrogatory from
School Energy Coalition (SEC) Reference: B1/2/1, p. 18 Question: Please confirm that the Sudbury Replacement project does not qualify under the Board-approved ICM for the Applicant. If the Applicant believes it does qualify, please provide a detailed explanation. If the Applicant believes it does not qualify, please explain the precise relief the Applicant is seeking from the Board, e.g. a) inclusion of the project in 2019 opening rate base, and a concomitant base year adjustment, b) deeming of the project to have come into service in 2019 and thus qualify for ICM treatment, c) retroactively deeming the ICM mechanism and the capital pass-through mechanism to both apply during 2018 year, d) exempting the Sudbury Replacement project from the $5 million impact requirement of the capital pass-through mechanism, or e) any other relief the Applicant believes is appropriate. SEC is seeking in this question to more clearly understand the exact exception that the Applicant is seeking from the Board from the normal rules and principles that would be applied to rate recovery for this project, in order to understand the implications of that exception both for the Applicant and for other utilities seeking exceptions to the rules. Response Please see Exhibit I.STAFF.24.

Filed: 2019-04-25 EB-2018-0305 Exhibit I.SEC.12 Page 1 of 1
ENBRIDGE GAS INC. Answer to Interrogatory from
School Energy Coalition (SEC) Reference: B1/2/1, p. 22 Question: Please provide a side by side table showing, for each of the proposed ICM projects:
a. The budget for the project provided to the Board in the first filing for the project
(e.g. EB-2018-0108 for the Don River Replacement, etc.).
b. The budget for the project in this Application, for which ICM approval is being sought.
c. An explanation for any material budget variations.
Response Please see the response at Exhibit I.EP.16.

Filed: 2019-04-25 EB-2018-0305 Exhibit I.SEC.13 Page 1 of 1
ENBRIDGE GAS INC. Answer to Interrogatory from
School Energy Coalition (SEC) Reference: B1/2/1, p. 29, 31 Question: Please confirm that, excluding the Sudbury project, the 2019 revenue requirement impact of the ICM projects proposed would be $3.23 million credit to customers, and the 2019-2023 revenue requirement impact of the ICM projects proposed would be $52.395 million recovery from customers. Response Confirmed.

Filed: 2019-04-25 EB-2018-0305 Exhibit I.SEC.14 Page 1 of 1
ENBRIDGE GAS INC. Answer to Interrogatory from
School Energy Coalition (SEC) Reference: B1/2/1, p. 31 Question: Please confirm that the Applicant is seeking to accelerate $4.9 million of 2020 capital expenditures into 2019 for the purpose of determining rates. Please explain why that is appropriate. Response Enbridge Gas has not included the 2020 capital forecast associated with the 2019 ICM projects of $4.9 million in the 2019 revenue requirement of the projects for the purpose of determining 2019 rates. The $4.9 million represents the 2020 in-service capital of the ICM projects, and is reflected in the revenue requirement of each project beginning in 2020. The detailed incremental revenue requirement of the ICM projects is filed at Exhibit B1, Tab 2, Schedule 1, Appendix E.

Filed: 2019-04-25 EB-2018-0305 Exhibit I.SEC.15 Page 1 of 1
ENBRIDGE GAS INC. Answer to Interrogatory from
School Energy Coalition (SEC) Reference: B1/2/1, p. 32 Question: Please confirm that the Applicant is seeking to defer $3.2 million of 2019 credits to customers to 2020 for the purpose of determining rates. Please explain why that is appropriate. Response Please see Exhibit I. BOMA.7.

Filed: 2019-04-25 EB-2018-0305 Exhibit I.SEC.16 Page 1 of 3
ENBRIDGE GAS INC. Answer to Interrogatory from
School Energy Coalition (SEC) Reference: B1/2/1, App. D Question: SEC is seeking to better understand the Union earnings-sharing calculation for 2017. In EB-2017-0306/7 (Ex. C.SEC.19 on March 23, 2018), Union reported 2017 operating revenue of $2,118,989 (all figures $000s), and that is the same amount showing in the current Application. The total operating expenses, however, was reported in the previous case as $1,769,137, and is now reported as $1,772,606, a decrease in earnings of about $3.5 million. The expected tax provision was reported in the previous case as $1.8 million credit, but is now reported as a $5.0 million credit, an increase in earnings of about $3.2 million. Please provide details of these changes from the previous reported figures to the current reported figures for 2017. Response The primary cause for the variances in the quoted amounts results from the comparison of dissimilar values. Within Union’s preliminary1 2017 actual utility results, presented as part of the response to SEC interrogatory #19 Attachment 1 (Exhibit C.SEC.19, Attachment 1) within the EB-2017-0306/7 proceeding, $1,769,137 thousand reflected a Cost of Service value, inclusive of total Operating Expenses of $1,772,786 thousand, Other Expenses of $1,441 thousand, and Income Taxes on earnings of ($5,090) thousand, as can be seen in Attachment 2 to that interrogatory response. By comparison, the $1,772,606 shown in Exhibit B1, Tab 2, Schedule 1, Appendix D of this proceeding, which reflects Union’s final 2017 utility results as were filed at Exhibit A, Tab 2, Appendix B, Schedule 1 of the EB-2018-0105 proceeding, only reflects total Operating Expenses. Table 1 below provides a comparison of the preliminary cost of service amounts reported in Exhibit C.SEC.19 (Attachments 1 and 2) of the EB-2017-0306/7 proceeding, as compared to final actual 2017 amounts presented at Exhibit B1, Tab 2, Schedule 1, Appendix D of this proceeding (as were filed at Exhibit A, Tab 2, Appendix B, Schedule 1 of the EB-2018-0105 proceeding).
1 EB-2018-0306/0307, Exhibit C.SEC.19, Attachment 2, Note (5).

Filed: 2019-04-25 EB-2018-0305 Exhibit I.SEC.16 Page 2 of 3
Table 1 Calculation of Cost of Service for 2017
Line No. Particulars ($ 000's)
EB-2017-0306/7 C.SEC.19 Actual Difference
1 Total Operating Expenses 1,772,786 1,772,606 180 2 Income Taxes (5,090) (5,047) (43) 3 Total Other 1,441 1,441 (0) 4 Cost of Service (line 1 + line 2 + line 3) $ 1,769,137 $ 1,769,001 $ 136 The small change between the preliminary and final Cost of Service is primarily attributable to the removal of $0.180 million in legal fees related to the amalgamation from utility operating expenses, and its corresponding impact on income taxes on earnings. With respect to the referenced tax amounts, the cause of the variance is again due to the comparison of dissimilar values. Within Union’s preliminary 2017 actual utility results, presented as part of the response to SEC interrogatory #19 Attachment 1 (Exhibit C.SEC.19 Attachment 1) within the EB-2017-0306/7 proceeding, ($1,800) thousand reflected the provision of income taxes required to gross-up the net sufficiency amount, whereas the ($5,047) shown in Exhibit B1, Tab 2, Schedule 1, Appendix D of this proceeding, which reflects Union’s final 2017 utility results as were filed at Exhibit A, Tab 2, Appendix B, Schedule 1 of the EB-2018-0105 proceeding, reflects the provision for income taxes on earnings (for which comparable values are shown in Table 1 above). Table 2 below provides a comparison of the preliminary 2017 calculation of the provision for income taxes required to gross-up the net sufficiency amount as reported in Exhibit C.SEC.19 (Attachment 1) of the EB-2017-0306/7 proceeding, as compared to the calculation of the final actual 2017 amount which was presented at Exhibit A, Tab 2, Appendix A of the EB-2018-0105 proceeding. For reference, Exhibit A, Tab 2, Appendix A from the EB-2018-0105 proceeding provides a calculation of Union’s final actual 2017 revenue sufficiency, which is in a similar format to the preliminary actual results which were presented in the response to SEC interrogatory #19 Attachment 1 (Exhibit C.SEC.19 Attachment 1), within the EB-2017-0306/7 proceeding.

Filed: 2019-04-25 EB-2018-0305 Exhibit I.SEC.16 Page 3 of 3
Table 2
Calculation of Provision for Income Taxes on Deficiency/(Sufficiency) for 2017
Line No. Particulars ($ 000's)
EB-2017-0306/7
C.SEC.19 Actual Difference
1 Revenue Deficiency/(Sufficiency) after tax (4,993) (5,112) (119) 2 Tax Prorated (1-.265) 0.735 0.735 0.735
3 Distribution Revenue Deficiency/(Sufficiency) (line 1/line 2) (6,793) (6,955) (162)
4 Provision for Income Taxes on Deficiency/(Sufficiency) (line 3 - line 1) $ (1,800) $ (1,843) $ (43)

Filed: 2019-04-25 EB-2018-0305 Exhibit I.SEC.17 Page 1 of 1
ENBRIDGE GAS INC. Answer to Interrogatory from
School Energy Coalition (SEC) Reference: B1/2/1, App. E, p. 2 Question: Please confirm that the $2.6 million of grossed-up tax savings in 2018 are, under the Applicant’s proposal, remaining to the benefit of the shareholder. Please confirm that the extra taxes payable in the future of $2.6 million because of that accelerated depreciation will be paid by the customers in rates. Response Enbridge Gas confirms that no revenue requirement impacts (i.e., return on rate base, operating expenses, or income tax benefit/requirement), related to the Sudbury Replacement project, were included in Union’s 2018 rates for recovery from customers. As seen in the referenced exhibit, the forecast total 2018 revenue requirement was a cost $0.1 million. With respect to the 2019 to 2023 revenue requirement for the Sudbury Replacement Project (including the tax requirement which will reflect the impact of any reversal of tax timing differences), Enbridge Gas confirms that its ICM proposal, to build the forecast annual revenue requirement into the annual ICM rate rider, combined with the establishment of an ICM deferral account to capture the variance between the actual ICM project revenue requirement and the actual ICM revenues collected, would result in customers paying the actual cost of the approved ICM project, subject to disposition of the deferral account.

Filed: 2019-04-25 EB-2018-0305 Exhibit I.SEC.18 Page 1 of 1
ENBRIDGE GAS INC. Answer to Interrogatory from
School Energy Coalition (SEC) Reference: F/1/1/5, p. 4 Question: Please compare the Rate 6 usage forecast of 4,911,864 103m3 in 2019 to the Applicant’s most current forecast of actual usage in 2019 from Rate 6 customers. Response The current 2019 volume forecast for Rate 6 is 4,923,606 103m3.

Filed: 2019-04-25 EB-2018-0305 Exhibit I.SEC.19 Page 1 of 2
ENBRIDGE GAS INC. Answer to Interrogatory from
School Energy Coalition (SEC) Reference: F1/1/7, p. 2-3 Question: In EB-2017-0086, the EGD Draft Rate Order shows an allocation of $$86.9 million of DSM costs to rate classes (Ex. G2/6/4). Please reconcile that with the allocation of $67.6 million to rate classes in the current reference, at page 2. Please provide a reference for the same allocation as that found on page 3 of the current reference, but in the EB-2017-0086 case, deriving the DSM unit rate for 2018 rates. Response In the Board’s Decision and Order for the approval of 2015-2020 demand side management plans (EB-2015-0029/EB-2015-0049, Decision and Order, page 1), the 2018 EGD approved DSM budget is $67.6 million. In the EB-2017-0086 draft rate order (Exhibit G2, Tab 6, Schedule 4, page 1), the fully allocated DSM costs of $86.9 million was comprised of DSM program and general cost of $67.6 million (i.e., the Board-approved DSM budget), and allocated overheads (benefit costs) of $5.17 million and administrative and general (A&G) of $14.17 million) for a total of $86.9 million. Note that the EGD rate zone was subject to Custom Incentive Regulation framework for the 2014 to 2018 period where the Board approved the cost elements for the derivation of the allowed revenue for each year of the Custom IR period and the Company used the fully allocated cost study to allocate the allowed revenue to the customer classes for rate setting purposes. The allocation of $67.6 million at page 2 (Exhibit F1, Tab 1, Schedule 7) represents the allocation of DSM program and general costs from EB-2017-0086, Draft Rate Order, Exhibit G2, Tab 6, Schedule 4, page 1. For example, for Rate 6 customers the amount is the sum of the first two line items of the referenced exhibit (i.e. $18.1 million + $3.75 million = $21.85 million). Note that the Board approved Y factor treatment for DSM budget costs in the MAADs

Filed: 2019-04-25 EB-2018-0305 Exhibit I.SEC.19 Page 2 of 2
and Rate-Setting Mechanism proceeding.1 Consistent with the Y factor treatment, the Board-approved 2018 DSM budget of $67.6 million was removed from rates and updated with the Board-approved 2019 DSM budget of $66.4 million, which was approved in EB-2015-0029/EB-2015-0049.
1 EB-2017-0306/ EB-2017-0307, Decision and Order, August 30, 2018.
Filed: 2019-04-25 EB-2018-0305 Exhibit I.SEC.20 Page 1 of 2 Plus Attachment
ENBRIDGE GAS INC. Answer to Interrogatory from
School Energy Coalition (SEC) Reference: F1/2/10, p. 3-4 Question: Please confirm that the DSM allocation to Rate 01 declined from $9.124 million in 2018 [EB-2017-0087, Working Papers, Schedule 3] to the current $6.345 million, and the allocation to Rate M1 increased from $24,375 million in 2018 [same reference] to the current $27.164 million. Please explain those changes in allocation. Please provide a reference (in EB-2017-0087 or elsewhere) that shows the derivation of the 2018 unit rates for DSM, with similar granularity to the current reference. Response Confirmed. The change in Rate 01 and Rate M1 DSM costs is driven by Enbridge Gas’s proposal to allocate the 2019 DSM budget costs based on the 2017 actual DSM program costs. Enbridge Gas has updated the allocation in the current application to reflect a forecast of the 2019 DSM budget consistent with the use of 2019 forecast billing units to derive the DSM unit rates. This proposal also reduces the variance between rate classes that would otherwise be recorded in the DSM Variance Account (“DSMVA”)1 (Account No. 179-111) and disposed of as part of the annual DSM Deferral and Variance Account proceedings. The change in the DSM costs for Rate 01 and Rate M1 is consistent with the amounts disposed of in Union’s 2015 and 2016 DSM Deferral proceeding (EB-2017-0323 and EB-2018-0300, respectively). Please see Table 1 for a summary of the DSM budget costs for Rate 01 and Rate M1.
1 The DSMVA records the difference between the allocated DSM budget costs included in rates and the actual DSM program costs for each rate class.

Filed: 2019-04-25 EB-2018-0305 Exhibit I.SEC.20 Page 2 of 2 Plus Attachment
Table 1
UNION RATE ZONES Comparison of 2019 DSM Budget Allocation Change and DSM Variance Account Balances
Proposed Approved
DSM Variance Account (179-111)
2019 DSM 2018 DSM
2016 2015
Line
Budget Budget
Approved Approved No. Particulars ($000's) in Rates (1) in Rates (2) Change
Balance (3) Balance (4)
(a) (b) (c) = (a - b)
(d) (e)
1 Rate 01
6,345 9,124 (2,780)
(3,223) (1,102) 2 Rate M1
27,164 24,375 2,788
2,595 2,511
Notes: (1) Exhibit F1, Tab 2, Rate Order, Working Papers, Schedule 10, p. 1, column (b).
(2) EB-2017-0087, Rate Order, Working Papers, Schedule 11, column (b). (3) EB-2018-0300, Exhibit A, Tab 4, Appendix A, Schedule 1. (4) EB-2017-0323, Rate Order, Working Papers, Schedule 1.
Please see Attachment 1 for the derivation of the Rate 01 and Rate M1 2018 DSM unit rates.

2018 Approved 2018 2018Forecast DSM DSM
Line Usage (1) Budget (2) Rate
No. Particulars (10³m³) ($000s) (cents / m³)(a) (b) (c) = (b / a)
Union NorthRate 01 Small Volume General Service
Monthly Delivery Charge1 First 100 m³ 261,357 2,818 1.07812 Next 200 m³ 296,764 3,118 1.05053 Next 200 m³ 129,460 1,304 1.00694 Next 500 m³ 88,423 855 0.96705 Over 1,000 m³ 110,336 1,030 0.93396 Total Rate 01 886,340 9,124 1.0294
Union SouthRate M1 - Small Volume General Service Monthly Delivery Commodity Charge
7 First 100 m³ 845,823 8,101 0.95788 Next 150 m³ 751,066 6,822 0.90829 All over 250 m³ 1,211,407 9,453 0.7803
10 Total - Rate M1 2,808,296 24,375 0.8680
Notes:(1) EB-2018-0087, Rate Order, Working Papers, Schedule 4, column (r).(2) EB-2018-0087, Rate Order, Working Papers, Schedule 4, column (k).
ENBRIDGE GAS INC.UNION RATE ZONES
Derivation of 2018 Demand Side Management ("DSM") Rates
Filed: 2019-04-25 EB-2018-0305
Exhibit I.SEC.20 Attachment 1
Page 1 of 1

Filed: 2019-04-25 EB-2018-0305 Exhibit I.SEC.21 Page 1 of 1 Plus Attachment
ENBRIDGE GAS INC. Answer to Interrogatory from
School Energy Coalition (SEC) Reference: F1/2/10, p. 3-4 Question: Please provide a breakdown of the DSM budget allocated to Rate 01 and Rate M1 between residential and non-residential spending. For non-program DSM costs allocated to those classes, please identify them separately and divide them in the same proportion as the program costs. Please calculate, based on the proposed DSM unit rates, the amounts of the allocated costs in each of those classes that are expected to be collected in 2019 from residential vs. non-residential customers. Response Please see Table 1 for a breakdown of the 2019 Rate 01 and Rate M1 DSM budget. Attachment 1 provides the forecast amount of 2019 DSM budget to be recovered from residential and non-residential customers.
Table 1
Summary of 2019 DSM Budget Allocation Line
No.
Particulars ($000's)
Rate 01
Rate M1
(a)
(b)
1
Residential Program Costs
1,395
12,873
2
Residential Non-Program Costs
183
1,962 3
Non-Residential Program Costs
1,455
3,988
4
Non-Residential Non-Program Costs
70
278 5
Low-Income Costs (1)
3,241
8,063
6
Total 2019 DSM Budget Allocation (2)
6,345
27,164
Notes: (1)
Allocation of low-income costs to Rate 01 and Rate M1.
(2)
EB-2018-0305, Exhibit F1, Tab 2, Rate Order, Working Papers,
Schedule 10, column (b), line 1 and line 6.

Prop
osed
Tota
l20
19 D
SM20
19 F
orec
ast
Fore
cast
DSM
2019
For
ecas
tFo
reca
st D
SMFo
reca
st D
SMLi
neR
ate
Usa
geBu
dget
Rec
over
yU
sage
Budg
et R
ecov
ery
Budg
et R
ecov
ery
No.
Parti
cula
rs(c
ents
/m3 ) (
1)(1
03 m3 )
($00
0's)
(103 m
3 )($
000'
s)($
000'
s) (
2)(a
)(b
)(c
)= (a
x b
)(d
)(e
) = (a
x d
)(f)
= (c
+ e
)U
nion
Nor
thR
ate
01 S
mal
l Vol
ume
Gen
eral
Ser
vice
Mon
thly
Del
iver
y C
harg
e1
Firs
t
100
m³
0.67
9528
4,14
61,
931
23,8
0716
22,
092
2N
ext
20
0 m
³0.
6621
299,
243
1,98
136
,335
241
2,22
23
Nex
t
200
m³
0.63
4610
0,61
263
827
,955
177
816
4N
ext
50
0 m
³0.
6093
37,7
1023
048
,077
293
523
5O
ver
1,00
0 m
³0.
5885
6,72
240
110,
831
652
692
6To
tal -
Rat
e 01
728,
432
4,82
024
7,00
61,
525
6,34
5
Uni
on S
outh
Rat
e M
1 - S
mal
l Vol
ume
Gen
eral
Ser
vice
Mon
thly
Del
iver
y C
omm
odity
Cha
rge
7Fi
rst
100
m³
0.97
5393
1,79
09,
088
69,7
1168
09,
767
8N
ext
150
m³
0.92
4677
9,87
17,
211
80,7
0374
67,
957
9Al
l ove
r
2
50 m
³0.
7937
597,
651
4,74
459
1,57
64,
695
9,43
910
Tota
l - R
ate
M1
2,30
9,31
221
,042
741,
990
6,12
127
,164
Not
es:
(1)
EB-2
018-
0305
, Exh
ibit
F1, T
ab 2
, Rat
e O
rder
, Wor
king
Pap
ers,
Sch
edul
e 10
, col
umn
(d).
(2)
EB-2
018-
0305
, Exh
ibit
F1, T
ab 2
, Rat
e O
rder
, Wor
king
Pap
ers,
Sch
edul
e 10
, col
umn
(c).
ENBR
IDG
E G
AS IN
C.
Uni
on R
ate
Zone
sFo
reca
st R
ecov
ery
of 2
019
DSM
Bud
get -
Res
iden
tial a
nd N
on-R
esid
entia
l Cus
tom
ers
Res
iden
tial
Non
-Res
iden
tial
Filed: 2019-04-25 EB-2018-0305
Exhibit I.SEC.21 Attachment 1
Page 1 of 1

Filed: 2019-04-25 EB-2018-0305 Exhibit I.VECC.1 Page 1 of 1
ENBRIDGE GAS INC. Answer to Interrogatory from
Vulnerable Energy Consumers Coalition (VECC)
Reference: Exhibit A1/T5/S1/pg.22 Question: a) With respect to the Conditions of Service for the EGD Rate Zone please explain
why it is a pre-requisite to have an account with a financial institution for an eligible low-income customer to have a security deposit waived. Does this provision also apply to the Union Rate Zone?
b) Is the United Way Greater Simcoe County the LEAP administrator for both the
EGD and Union Rate Zones. If not please provide the administrator name(s) for the Union Rate Zones.
Response a) The question misstates the condition. It is the reverse where the condition is no
account with a financial institution. This does not apply for the Union rate zones. The criteria will be reviewed and changed to be consistent with the new Customer Service Rules.
b) Yes, however they have changed their name to United Way Simcoe Muskoka.

Filed: 2019-04-25 EB-2018-0305 Exhibit I.VECC.2 Page 1 of 1
ENBRIDGE GAS INC. Answer to Interrogatory from
Vulnerable Energy Consumers Coalition (VECC)
Reference: Exhibit A1/T5/S1/pg.23 Question: a) Please provide the number (by category) of complaints escalated to the
Enbridge Customer Ombudsman’s Office for the last calendar year (2018)
b) Does the Union Rate Zone have a similar office? If so, please a similar report as in a) for this Rate Zone.
Response a-b) Please see tables below for the number of complaints:
EGD Rate Zone
Complaints 2018
Billing 3870
Collections 1382
Operations 1510
Open Bill 1204
Other 181
Total 2018 8147
Union Rate Zone
Complaints 2018
Billing 1697
Collections 1345
Operations 741
Open Bill 0
Other 1221
Total 2018 5004

Filed: 2019-04-25 EB-2018-0305 Exhibit I.VECC.3 Page 1 of 1
ENBRIDGE GAS INC. Answer to Interrogatory from
Vulnerable Energy Consumers Coalition (VECC)
Reference: Exhibit A1/T5/S3/pg.23 Question: a) The Security Deposit and Low-Income Customer Policies of EGI for its two different
rate zones differ. Please explain why and what plans are being made to harmonize these specific conditions of service provisions.
Response The exact details on operating policies for the different rate zones differ due to each legacy company’s interpretation of guidelines or program parameters. With the implementation of the OEB’s new customer service rules, Enbridge Gas will be harmonizing business practices and policies where differences exist. 1 However, there may still be differences where there are rate implications and Enbridge Gas maintains different rate zones, e.g. fees like new account charge.
1 EB-2017-0183, Notice of Amendment, March 14, 2019.

Filed: 2019-04-25 EB-2018-0305 Exhibit I.VECC.4 Page 1 of 1
ENBRIDGE GAS INC. Answer to Interrogatory from
Vulnerable Energy Consumers Coalition (VECC)
Reference: Exhibit A1/T5/S3/pg.23 Question: a) With respect reasons for the disconnection of service please explain (provide an
example) of what constitutes a “fraudulent use of gas.” If this is meant to address service where illegal activity are suspected please explain what evidence of the activity in question is required.
Response The most obvious example would be altering the gas service to circumvent the gas meter. A disconnection order would be executed if Enbridge Gas personnel encounter a gas service which has been tampered or altered with. Situations where a meter is unlocked, and it is documented that a lock work order was previously completed would also qualify as fraudulent use of gas. In these cases there is no active customer account and required appliance inspections have not been completed.

Filed: 2019-04-25 EB-2018-0305 Exhibit I.VECC.5 Page 1 of 1
ENBRIDGE GAS INC. Answer to Interrogatory from
Vulnerable Energy Consumers Coalition (VECC)
Reference: Exhibit A1/T5/S2/pg.7 Question: The preface to the EGD Conditions of Service state:
We reserve the right to modify the contents of the Conditions of Service at any time. These Conditions of Service are meant as guidelines and do not supersede any terms and conditions set out in Enbridge’s Rate Handbook, or agreed to in our contracts with you.
a) Is it EGI’s position that all of the provisions of its Conditions of Service (both
Rate Zones) may be changed without prior approval of the Ontario Energy Board?
b) If, it is EGI’s position that a subset of the provisions require Board approval
whereas other provisions do not, please identify the provisions in question. Response a-b) In accordance with the Board’s Gas Distribution Access Rule, Enbridge Gas must
file a copy of its Customer Service Policy (i.e., Enbridge Gas’s Conditions of Service) with the Board when revised. Board approval of revisions is not required.

Filed: 2019-04-25 EB-2018-0305 Exhibit I.VECC.6 Page 1 of 2
ENBRIDGE GAS INC. Answer to Interrogatory from
Vulnerable Energy Consumers Coalition (VECC)
Reference: Exhibit B1/T1/S1/pg.5 Table 3 Question: a) Please explain why EGI requires two OEB Cost Assessment Variance Accounts
if there is a single Utility being assessed OEB costs upon amalgamation of the former utilities
b) The OEB Cost Assessment Variance accounts were generically established by
the Board in order to capture the change in the Board’s assessment methodology. Please confirm (or otherwise explain) that this change in methodology is from an assessment based on net revenues to, now, the 3 year average of customer numbers.
c) Please explain how the new variance accounts distinguishes between the normal
expected variance (formerly in revenues – now under the revised methodology in number of customers) from the variance due only to the change in assessment methodology.
d) Is it EGI’s understanding that the change in methodology affected both the inter
and intra assessed OEB regulated payers? That is, did the change in methodology only affect the amount paid as between natural gas utilities or both that and the amounts paid as between gas utilities and other assessed payers (e.g. electricity distributors, transmitters, and other licencees)?
Response a) Enbridge Gas’s application includes the continuation of two OEB Cost Assessment
Variance Accounts, one for the EGD rate zone, and one for the Union rate zones as it aligns with the Board’s EB-2017-0306 / EB-2017-0307 Decision and Order which approved the continuation of the two accounts.
b) Having reviewed the OEB’s February 9, 2016 letter regarding Revisions to the Ontario Energy Board Cost Assessment Model, as well as the supporting MNP Final Executive Report, titled Cost Assessment Model Review, dated December 11, 2015,

Filed: 2019-04-25 EB-2018-0305 Exhibit I.VECC.6 Page 2 of 2
Enbridge Gas’s understanding is that multiple revisions were made to the Board’s Cost Assessment Model. One of the revisions made was to update the electricity distribution and gas distribution intra class cost allocations from a revenue based allocation to a 3 year rolling average customer based allocation methodology. However, one of the other revisions to the model was an update of the OEB’s direct cost allocations, which impacted the inter payor class allocations, resulting in more costs allocated to the gas utilities.
c) Since the Board’s establishment of the account in 2016, both legacy EGD and legacy Union, when calculating amounts to be recorded in their respective accounts compared their current quarterly assessed costs under the new methodology against an amount that was included in rates and reflective of the Board’s costs under the old cost allocation methodology.
d) Further to the response in part b), Enbridge Gas’s understanding is that the revisions
to the Board’s Cost Assessment Model impacted both inter and intra regulated payor class allocations, with the larger impact to gas utilities resulting from inter payor class changes (i.e. more costs assessed to gas utilities, with less going to most of the other payor classes as a result of revisions to direct cost allocations).

Filed: 2019-04-25 EB-2018-0305 Exhibit I.VECC.7 Page 1 of 1
ENBRIDGE GAS INC. Answer to Interrogatory from
Vulnerable Energy Consumers Coalition (VECC)
Reference: Exhibit B1, Tab 2, Schedule 1 Question: a) Why did EGI not calculate two materiality thresholds – one for distribution
function and another for transmissions (e.g. Dawn-Parkway) capital expenditures?
b) For the purpose of calculating and ICM/ACM threshold value why should EGI’s
transmission business not be considered analogous to Hydro One Inc. where the threshold values for the transmission business would be calculated separately from those of the distribution operations?
c) Is it possible to amend Table 3 to show the ICM threshold Capital Expenditure
Calculation by Rate Zone and for the Union Rate Zone by transmission and distribution functions? If yes, please provide that calculation. If not, please explain the impediments to making this calculation.
Response a-c) The availability of ICM to Enbridge Gas was litigated in the MAADs and Rate
Setting Mechanism proceeding, and approved by the Board in its Decision and Order, dated August 30, 2018.1
1 EB-2017-0306/EB-2017-0307, OEB Decision dated August 30, 2018.

Filed: 2019-04-25 EB-2018-0305 Exhibit I.VECC.8 Page 1 of 1
ENBRIDGE GAS INC. Answer to Interrogatory from
Vulnerable Energy Consumers Coalition (VECC)
Reference: Exhibit B/T2/S1/pgs. 12- Question: a) EGI explains that it has used a weather-normalized revenue for the calculation of
the growth factor. Is the weather normalization methodology used for the EGD and Union Rate Zones the same?
b) For the both rate zones please calculate the growth rate if only revenues derived
from the fixed charge were used in the calculation (i.e. showing the growth in fixed charge revenues only).
Response a) No, the weather normalization methodology for the EGD and Union rate zones are
not the same, however, Board approved weather methodologies were used for both. Weather-normalized revenues are derived by using the Board approved degree days methodologies for Union rate zones which is the 50:50 (average of 20 year trend and 30 year moving average), for EGD rate zone are the 50:50 Hybrid (average of 20 year trend and 10 year moving average) for the Central region, the De Bever with trend for the Eastern region and the 10 year moving average for the Niagara region.
b) Assuming that the general service fixed charges are the only component of the
growth factor, that is, it does not include the variable revenue, the contract market revenue and the ex-franchise market revenue, the estimated results are as follows:
Union rate zones average growth factor from 2013 to 2017 : 1.42% EGD rate zone growth factor from 2017 to 2018 : 1.14%

Filed: 2019-04-25 EB-2018-0305 Exhibit I.VECC.9 Page 1 of 2
ENBRIDGE GAS INC. Answer to Interrogatory from
Vulnerable Energy Consumers Coalition (VECC)
Reference: Exhibit B1/T2/S1/pg.19 Question: At the above reference the evidence states: Given the magnitude of the $95.3 million investment in the Sudbury Replacement
project, incremental funding of the project is required. The cumulative revenue requirement of the project from 2018 through 2023 is over $47 million. Union was not able to reprioritize 2018 Capital investment in order to fund this investment using existing rates.
a) Please provide the list of projects that were considered (and subsequently rejected
as per the evidence above) in considering the need for the Sudbury Replacement Project.
b) Please provide the minutes/presentation or other evidence that is demonstrative of
the exercise EGI went through to consider what projects might be deferred in order to complete the Sudbury Replacement Project without the need for an ICM.
Response
a) The alternative projects that were considered for the Sudbury Replacement project
can be found on pages 6 and 7 of pre-filed evidence in the EB-2017-0180 proceeding.
b) As per section 4.2, Asset Planning1, the Sudbury Replacement project was risk
assessed using the Union rate zones’ Risk Matrix2 and assigned priority based on the “Priority Ranking Scale” criteria.3 All projects identified in the planning process
1 Exhibit C1, Tab 3, Schedule 1 pages 39 - 58. 2 Ibid., Figure 4.2.1.1.3.2, page 53. 3 Ibid., Table 4.2.1.1.4.1, page 57.

Filed: 2019-04-25 EB-2018-0305 Exhibit I.VECC.9 Page 2 of 2
are assigned priority based on the “Priority Ranking Scale” without consideration of the funding mechanism.
Please see Exhibit I.STAFF.24 for further information with respect to ICM funding for the Sudbury Replacement project.

Filed: 2019-04-25 EB-2018-0305 Exhibit I.VECC.10 Page 1 of 2
ENBRIDGE GAS INC. Answer to Interrogatory from
Vulnerable Energy Consumers Coalition (VECC)
Reference: Exhibit B1/T2/S1/pg.33 Question: a) With respect to the Sudbury Replacement project please compare/contrast the
proposed cost allocation methodology (peak demand and average demand factor) with the method used to allocate the existing Sudbury assets being replaced.
b) Please do the same for the Don River Replacement, and the Kingsville and
Stratford Replacement projects, pointing out any differences (if any) between how the existing and replacement assets are allocated.
Response
a) The proposed cost allocation methodology of the Sudbury Replacement project in
the Union North rate zone uses the same allocation methodology as the existing Sudbury assets being replaced. Both the project and existing assets are categorized as joint-use distribution mains and are allocated to Union North rate classes in proportion to peak and average day demands. The allocation of the existing Sudbury assets was approved by the Board as part of legacy Union’s 2013 cost allocation study (EB-2011-0210). Enbridge Gas has updated the allocation factor in the current application to reflect the 2019 forecast consistent with the use of 2019 forecast billing units to derive the ICM unit rates.
b) The proposed cost allocation methodology of the Don River Replacement project in
the EGD rate zone uses the same allocation methodology as the existing Don River crossing assets being replaced. Both the project and existing assets are categorized as extra high pressure mains greater than 4 inches in diameter and are allocated to EGD rate classes in proportion to peak delivery demands on the extra high pressure system greater than 4 inches in diameter. The allocation of the existing Don River crossing assets was approved by the Board as part of legacy EGD’s 2018 cost allocation study (EB-2017-0086).

Filed: 2019-04-25 EB-2018-0305 Exhibit I.VECC.10 Page 2 of 2
The proposed cost allocation methodology of the Kingsville and Stratford Reinforcement projects in the Union South rate zone uses the same allocation methodology as existing other transmission assets. Both the project and existing other transmission costs are categorized as other transmission mains and are allocated to Union South rate zone rate classes in proportion to in-franchise design day demands. The allocation of the existing other transmission assets was approved by the Board as part of legacy Union’s 2013 cost allocation study (EB-2011-0210).

Filed: 2019-04-25 EB-2018-0305 Exhibit I.VECC.11 Page 1 of 1
ENBRIDGE GAS INC. Answer to Interrogatory from
Vulnerable Energy Consumers Coalition (VECC)
Reference: Exhibit C1/T1/S1 Figures 6 (pg. 39) and 9 (pg.51) Question: a) Please clarify the relationship between these two figures. Specifically does Figure 6
show the forecast total EGI capital expenditures net of ICM spending? If yes, please explain why the some annual totals in Figure 6 are less than those in Figure 9 (see, for example, 2020 $1037 vs $1024 ENBRIDGE GAS Total).
Response a) The difference between these two figures is explained as follows:
• Figure 9-11 represents the total in-service capital and shows the identified ICM projects (excluding overheads).
• Figure 6-8 represents the annual cash flow of capital expenditure which includes required preliminary and post spend for ICM projects).1
1 Exhibit C1, Tab 1, Schedule 1, page 50, footnote 11.

Filed: 2019-04-25 EB-2018-0305 Exhibit I.VECC.12 Page 1 of 3
ENBRIDGE GAS INC. Answer to Interrogatory from
Vulnerable Energy Consumers Coalition (VECC)
Reference: Exhibit C1/T2/S1/ pgs. 694 – NPS 20 Don River Relocation & pgs.-
pg.854 Service Relay Preamble: The purpose of this interrogatory is to better understand the calculation
and relative use of the Lifetime Risk Return on Investment Analysis Question: a) Please provide the actual calculation for the LRROI for these two projects.
Specifically show how the variables “Safety Risk Mit, Fin Risk Mit, CSAT Risk Mit” are determined for each project.
b) The Don River Relocation project has an LRROI of 119. The Relays project has an
LRROI of 24. In terms of the relative need between these two projects please explain how the LRROI informs the selection of the projects to be included (or excluded) in the capital plans of the Utility.
c) Do the capital projects considered in the Union Rate Zone go through the same
LRROI process as those in the EGD rate zone? Response a) As per Exhibit C1, Tab 2, Schedule 1, page 89, LRROI is calculated using
Equation 1:

Filed: 2019-04-25 EB-2018-0305 Exhibit I.VECC.12 Page 2 of 3
The Discounted Lifetime Risk Reduction is calculated using Equation 2:
The variables “Safety Risk Mit, Fin Risk Mit, CSAT Risk Mit” in Equation 2 represent
risk reductions for the three risk dimensions as described in Table 4.1.2.1 Through the Quantitative Risk Assessment (QRA) process, risks were quantified for these dimensions in each project.2 The consequence ratings that are used to assess the level of risk in each of these dimensions are presented in Table 4.1-3.3
Values for variables used Equation 2 are provided below:
Project # Variables 10087 – NPS 20 Don
River Relocation 16907 – Relay Blanket – All
Areas Safety Risk Mit 36,230 34,216 Fin Risk Mit 2,413,116 299,811 CSAT Risk Mit 226,592 57,824 Useful Life (Years) 70 45 Pretax WACC 0.062147 0.062147
By applying the values in the above table to Equation 2, Discounted Lifetime Risk Reduction for both business cases are:
10087, NPS 20 Don River Relocation: 44,387,289 16907, Relay Blanket All Areas: 6,912,692
As Total Net Direct Capitals for NPS 20 Don River Relocation and Relay Blanket All Area are $35,872,7424 and $28,252,4435 respectively, according to Equation 1, LRROIs for both business cases are:
NPS 20 Don River Relocation (ID No. 10087): 124% Relay Blanket All Areas (ID No. 16907): 24%
1 Exhibit C1, Tab 2, Schedule 1, page 72. 2 Ibid., pages 71, and pages 79 to 82. 3 Ibid., page 73. 4 Ibid., page 695. 5 Ibid., page 855.

Filed: 2019-04-25 EB-2018-0305 Exhibit I.VECC.12 Page 3 of 3
For NPS 20 Don River Relocation, the slight discrepancy between the LRROI shown here versus the value published in Exhibit C1, Tab 2, Schedule 1, page 695 is due to a change in the Total Net Direct Capital at the time of the filing.
b) LRROI is a measure indicating the efficiency with which risk is reduced across all
asset classes.6 When the comparison is done solely on the basis of LRROI between the two selected projects, the Don River Relocation project has higher risk reduction efficiency than the Service Relay project. In addition to LRROI, other aspects are considered in the capital plans of the Utility; please refer to Figure 4.1-7: Risk Tolerance Framework and Table 4.1-4 Types of Risk.7
c) No, the Union rate zones use a more qualitative risk evaluation approach to facilitate a prioritization of their investments. This process is outlined at Exhibit C1, Tab 3, Schedule 1, pages 51 to 58.
6 Ibid., page 89. 7 Ibid., page 74.

Filed: 2019-04-25 EB-2018-0305 Exhibit I.VECC.13 Page 1 of 1
ENBRIDGE GAS INC. Answer to Interrogatory from
Vulnerable Energy Consumers Coalition (VECC)
Reference: Exhibit D Question: a) Please provide the total cost of the customer engagement exercise for this
application distinguishing between (1) contractor/consultant costs and (2) internal allocated – or tracked costs).
Response a) The consultant costs of the customer engagement exercise for legacy EGD and
Union are provided in Table 1. Neither company allocated or tracked other costs associated with the customer engagement exercises.
Table 1
Legacy Utility Consultant Costs EGD $201,500 (excluding HST) Union $353,000 (excluding HST)
Copyright © 2022 FDOKUMEN