FILE COPY - World Bank Documents
161
FILE COPY DOCUMENT OF INTERNATIONAL BANKFOR RECONSTRUCTION AND DEVELOPMENT INTERNATIONAL DEVELOPMENT ASSOCIATION Not For PubLic Use ReportNo. 5la-TA APPRAISAL OF SECOND LIVESTOCK DEVELOPMENT PROJECT TANZANIA March 14, 1973 !riculture ProjectsDepartment astern Africa Regional Office This report was prepared for officialuse only by the BankGroup. It may not be pubLished, quoted or cited without Bank Group authorization. The BankGroup does not accept responsibilityfor the accuracyor completeness of the report. Public Disclosure Authorized Public Disclosure Authorized Public Disclosure Authorized Public Disclosure Authorized
-
Upload
khangminh22 -
Category
Documents
-
view
3 -
download
0
Transcript of FILE COPY - World Bank Documents

FILE COPY
DOCUMENT OF INTERNATIONAL BANK FOR RECONSTRUCTION AND DEVELOPMENTINTERNATIONAL DEVELOPMENT ASSOCIATION
Not For PubLic Use
Report No. 5la-TA
APPRAISAL OF SECOND LIVESTOCK DEVELOPMENT PROJECT
TANZANIA
March 14, 1973
!riculture Projects Departmentastern Africa Regional Office
This report was prepared for official use only by the Bank Group. It may not be pubLished, quotedor cited without Bank Group authorization. The Bank Group does not accept responsibility for theaccuracy or completeness of the report.
Pub
lic D
iscl
osur
e A
utho
rized
Pub
lic D
iscl
osur
e A
utho
rized
Pub
lic D
iscl
osur
e A
utho
rized
Pub
lic D
iscl
osur
e A
utho
rized

CURRENCY EQUIVALENTS
US$1.00 = Tanzania Shilling 7.14 (Tsh)Tsh 1.00 = US$0.14
WEIGHTS AND MEASURES
Metric System
1 hectare (ha) = 10,000 m2 = 2.46 acres1 kilometer (km) = 0.62 miles1 square kilometer (km2) = 0.39 sq. miles - 100 haI kilogram (kg) = 2.20 pounds1 liter (1) = 0.26 gallons1,000 kg = 1 metric ton = 0.98 long ton
ABBREVIATIONS
CBPP = Contagious Bovine PleuropneumoniaDDCs = District Development CorporationsFMD = Foot-and-Mouth DiseaseNACO = National Agricultural Company, Ltd.NAFCO = National Agriculture and Food CorporationSIDA = Swedish International Development AuthorityTAC = Tanzania Audit CorporationTLMC = Tanzania Livestock Marketing CompanyTMPC = Tanzania Meat Processing CompanyTPL = Tanganyika Meat Packers, Ltd.TRDB = Tanzania Rural Development Bank
FISCAL YEAR
July 1 - June 30

TANZANIA
SECOND LTVTFETOCK DFVEFLOPMTNT PPOJFCT
TABLE OF CONTENTS
Page No.
SUMMARY AND CONCLUSIONS ...... ....................... i-ii
I. INTRODUCTION ........................................ 1
II. BACKGROUND .2
A. General. 2Climate ............ 2Ponulation and Cross Domestic Product 2
B. The Agricultural Sector. 3Contribution of Agriculture to the Economy. 3Land Use. 3Ujamaa Cooperatives. 3Livestock. 4Animal Healt'. 5
C. Marketing and Slaughterhouses ..... ........ 5D. Government Services. 6E. Agricultural Institutions and Credit ............ 7F. First Livestock Development Project .... ......... S
III. THE PROJECT .8
A. General Description. .B. Detailed Features. 9
Ranch Development. 9Markets, Stock Routes, and Holding Grounds. 10Meat Processing ..................... .. 11Operating Expenses .12Technical Services .12
C. Cost Estimates .13D. Financing .15E. Procurement .17F. Disbursement .18
This report is based on the findings of an IDA appraisal mission toTanzania in February-March 1972, composed of Messrs. M. Walshe, T.Hussain, N. Worker (IDA), and F. Abercrombie, C. Wolffelt, A. Valdez,C. Reining (Consultants).

TABLE OF CONTENTS - Continued
Page No.
IV. ORGANIZATION AND ?4MNAGENENT ......................... 18
Project Managenent .................................. 18TRT)P ................................................ 19NACO ................................................ 20DDc and Other Ujamaa Cooperative Ranches .... ........ 20Livestock Marketing ................................. 20Meat Processing ..................................... 21Accounts and Audit .................................. 22
V. PRODIJCTTON, MARKET PROSPECTS AND PRICES,AND PRODUCER BENEFITS ............................... 22
Production .......................................... 22Market Prospects and Prices ......................... 24Producer Benefits ................................... 24Government Costs and Revenues ........................ 24
VI. BENEFITS AND JUSTIFICATION .......................... 25
Value of Additional Output .......................... 25Employment .......................................... 26Income Distribution ................................. 26
VlI. AGREEMENTS REACHED AND RECOMMENDATIONS .... .......... 26

ANNEXES
1. Agriculture in the Economy
2. Social Implications of Cattle Ranch Development of Ujaraaa Cooperatives
Appendix 1 - Ujamiaa Ranching Through Utilization of ExistingPasture and Residential Land: Nindo, Segara-Izava, and Nlasai
3. Livestock tarketing Company
Table 1 - Weekly lIarkets Investment CostsTable 2 - Phasing of 1MarketsTable 3 - Revenue and Operating Expense ProjectionTable 4 - New Stock Route Investment CostsTable 5 - Existing Stock Route Investment CostsTable 6 - New Holding Grounds Investment CostsTable 7 - Existing Holding Grounds Investment CostsTable 8 - Stock Routes and Holding Grounds Revernue
and Operating Expense ProjectionTable 9 - TLMC Consolidated Investment Cost, Operating
Cost and RevenueTable 10 - TLMC Consolidated Cash FlowTable 11 - TLMC Operating Expense Projection
4. Meat Processing Plants
Mlodel: Sanitary Improvements for Canned ieat Productionat TPL - Dar es Salaam
Table 1 - Investment ProjectionTable 2 - Sales and Operating Expenses
Model: Mbeya Meat Processing Plant
Table 3 - Investment ProjectionTable 4 - Sales and Operating Expenses
Model: Shinyanga Meat Processing Plant
Table 5 - Investment ProjectionTable 6 - Sales and Operating Expenses
Model: Tanzania Meat Processing Company
Table 7 - Investment and Operating Expense ProjectionTable 8 - Financial ProjectionTable 9 - Profit and Loss Projections

ANNEXES - Continued
5. Financial Institutions and Agricultural Credit
Table 1 - Tanzania Rural Development Bank-Balance Sheets
6. Ranch Development Models
Model: NACO and DDC Corporate Breeding/Fattening Ranch - 40,000 ha
Table 1 - Herd ProjectionTable 2 - Investment CostsTable 3 - Sales and Operating Expense ProjectionTable 4 - Financial Projection
Model: NACO Breeding Ranch (Dakawa) - 40,000 ha
Table 5 - Herd ProjectionTable 6 - Investment CostsTable 7 - Sales and Operating Expense ProjectionTable 8 - Financial Projection
Model: NACO Breeding/Fattening Ranch (Sumbwanga) - 32,000 ha
Table 9 - Herd ProjectionTable 10 - Investment CostsTable 11 - Sales and Operating Expense ProjectionTable 12 - Financial Projection
Model: NACO Breeding/Fattening Ranch (Usangu) - 40,000 ha
Table 13 - Herd ProjectionTable 14 - Investment CostsTable 15 - Sales and Operating Expense ProjectionTable 16 - Financial Projection
Model: Kitulo Plateau Ranch - 9,200 ha
Table 17 - Herd and Flock ProjectionTable 18 - Investment CostsTable 19 - Sales and Operating Expense ProjectionTable 20 - Financial Projection
Model: NACO Fattening Ranch (Malagarasi) - 40,000 ha
Table 21 - Herd ProjectionTable 22 - Investment CostsTable 23 - Sales and Operating Expense ProjectionTable 24 - Financial Projection

ANNEXES - Continued
Model: NACO Fattening Ranch (Mkata II) - 40,000 ha
Table 25 - Herd ProjectionTable 26 - Investment CostsTable 27 - Sales and Operating Exp,ense ProjectionTable 28 - Financial Projection
Model: Ujaama Breeding Ranch - 10,000 ha
Table 29 - Herd ProjectionTable 30 - Investment CostsTable 31 - Sales and Operating Expense ProjectionTable 32 - Financial Projection
Model: Masai Ujamaa Breeding Ranch - 4,000 ha
Table 33 - Herd ProjectionTable 34 - Investment CostsTable 35 - Sales and Operating Expense ProjectionTable 36 - Financial Projection
Tsetse Control and Land Development Unit
Table 37 - Investment CostsTable 38 - Revenue and Operating Expenses
7. The National Agricultural Company, Ltd. (NACO)
Table 1 - NACO Balance SheetTable 2 - NACO Consolidated Cash Flow with Expansion ProgramTable 3 - NACO Consolidated Cash Flow without Phase IITable 4 - NACO Rate of Return on Expansion Program
Appendix 1 - NACO Organization Chart
8. Preparation of the Third Livestock Development Project and TechnicalServices
Table 1 - Project Management and Technical Services
9. Phasing of Investment Costs
10. Estimated Schedule of Disbursement of IDA Credit
11. TRDB Cash Flow from Project
12. Financial Rate of Return
Table 1 - RanchesTable 2 - Marketing and Meat Processing Companies

ANNEXES - Continued
13. Economic Analysis
Table 1 - Economic Rate of ReturnTable 2 - Sensitivity Analysis
MAP
Location of Project Rwxche4, Stock Routes and Holding Grounds
Major Markets and Processing Plants

TANZANIA
SECOND LIVESTOCK DEVELOPMENT PROJECT
StTh4ARY AND CONCLUSIONS
i. The Tanzania Government has placed high priority on agriculture andrural development in its Second Five Year Plan (1969-74). Livestock is oneof the key subsectors and the proposed Project is in line with Government'splan for it. Under the plan emphasis is being placed on improving the live-stock marketing and distribution system, constructing slaughterhouses in themajor cattle areas, and developing Ujamaa cooperative and parastatal ranches.The Project would increase beef Production bv developing ranches and byproviding essential infrastructure, including markets, stock routes and hold-ing grounds, and meat nrocessing plants, the lack of which has reduced off-take in the large traditional herd to less than 3%.
ii. The Project would he the second IDA credit for livestock develop-ment in Tanzania, the first having been made in 1968 for UJS1.3 million.Under that prolect, which is now progressing satisfactorily, cattle productionis being increased on parastatal ranches operated hy the NaLtional AgricultureCompany (NACO). Three other credits have also been extended to Tanzania foragricultural development - USS5 million was Drovided in 1965 for agriculturalcredit; US$9 million in 1970 for flue-cured tobacco; and US$10.8 million in1972 for smallholder tea. The first of these which is fully disbursed ex-perienced difficulties due to weakness in the credit institution, since re-organized, the second is now progressing satisfactorily though developmentis behind schedule, and the third only recently became effective.
iii. The Project would develop 11 parastatal (NACO) ranches, fourDistrict DeveloDment Corporation ranches, snonsored by district councilsand 22 Ujamaa cooperative ranches; develop three large livestock markets,10 medium-size markets, and 20 small markets and remodel 104 small existing
markets; develop 2,300 km of new stock routes and improve 2,200 km of existingstock routes, and establish four new holding grounds and improve 23 existingones; reconstruct one meat processing plant and build two new ones; and pro-vide technical services and training, and future project preparation work.
iv. Project cost is estimated at US$24.7 million and covers a five-year period, from 1973 to 1978. The IDA credit of US$18.5 million wouldfinance foreign exchange costs of USS11.3 million and aboul: half of localcurrency costs at US$7.2 million. Government would on-lend funds under theIDA credit to the Tanzania Rural Development Bank (TRDB) for a term of 20years, including a grace period of five years, with interest charged at 4%per annum, the rate obtaining under previous IDA lending through TRDB. TRDB
would be the lending channel for loans to Project beneficiaries. On-lendingterLs would not exceed 12 years with a grace period of six years for ranch
development loans and 3 years for meat processing and livestock marketing.Interest on all loans would be charged at 8-1/2% D.a. Funds for technicalservices and machinery for the Government Tsetse Control Unit would remainwith Government.

- ii -
v. A Project Management uTnit would be estahlished in the Ministry ofAgriculture to coordinate and supervise Project implementation and wouldincltide a Project Manager, an economist, and a range management waterspecialist. The Project Manager would be responsible to a policy committeechaired by the Principal Secretary, Ministry of Agriculture, and, since theProject comprises a number of components both geographically and organiza-tionally dispersed, an executive committee would be formed to ensure coor-dination and implementation of works. The Project Manager would be itschairman.
vi. International competitive bidding would be used for the construc-tion of two meat Drocessing plants by turn-key contracts - about US$4.1million; remodelling of one meat processing plant - about ITS$ 0.6million;for procurement of all heavy equipment and machinery for the tsetse controlunit and for tractors and machinerv used on ranches - about US$3 million;and on all contracts exceeding US$30,000. Existing commercial channels wouldbe used for purchase of a broad range of miscellaneous items, and cattlewould be purchased locally.
vii. The estimated financial rate of return to the beneficiaries'incremental investments would range from 147 to 26%, while the rate of re-turn to the Tanzanian economy is estimated at 35%. The Project at maturityis expected to increase annual beef production by about 10,000 no tons fromProject ranches, and the stock routes, holding grounds, and the marketingcomponent would increase marketed offtake from the traditional herd hy about11,000 m tons. The increase in foreign exchange sales at full developmentis estimated at USS6 million annually. Newz jobs would be created for about2,500 people, and about 700 families would participate in the ujamaa ranchcooperatives.
viii. Apart from Ujamna ranches, the Project would be channelled throughGovernment owned comnanies and therefore most of its benefits would accrueto Government as profit and tax revenues. The Project will directly benefitthe small cattle owners on: Mamaa ranches and wage employees on ranches, meatprocessing plants and in livestock marketing. In addition, the livestockmarketing and meat processing components would provide significant benefitsto traditional cattle producers on a countrywide basis.
ix. The Project is suitable for an IDA Credit of US$18.5 million.Government would be the Borrower and would bear the foreign exchange risk.

TANZANIA
SECOND LIP1ESTOCK DEVELOPMFNT PROJECT
I. INTRODUCTION
1.01 The Government of Tanzania has placed high Driority on agricultureand rural develonment in its Second Five-Year Plan (1969-74): Its goalsinclude the organization of rural economic activity on socialist lines, boththrough Ujamaa 1/ cooperatives and the expansion of other cooperative acti-vity, to bring about social change to be achieved through a planned programfor expansion of crons and livestock based on disseminationi of modern agri-cultural techniques. To these ends, Government is giving priority to theexpansion of rural credit, in part through the creation of a regional devel-ODment fund, development of cooperatives, and the formation of DistrictDevelopment Councils (DDC's). The Tanzania Rural Development Bank (TRDB)is giving priority to projects submitted by Uiamaa cooperaitives, othercooneratives, and DDC's and the programs for rural water supplies and ruralhousing imnrovement will continue to give priority to Ujamaa villages.Livestock (particularly beef ranching) is one of the key suib-sectors to bedeveloped because of its potential for expansion.
1.02 As part of its plan, Government has requested assistance in financinga second stage of its livestock development program, begun under an IDAassisted project in 1968. Under the project, which is on-going and orogressingsatisfactorily, five large scale National Agricultural Company (NACO) ranchesare being developed. Government's original request comprised continued NACOsupport and substantial development of Iljanaa and ranches sponsored by theDDC's together with a Foot and Mouth Disease (FMD) vaccine production plant,and marketing and processing facilities. During and following appraisal, theGovernment reduced the emphasis on Ujamaa ranches while the appraisal missionfound that further reductions to this and the DDC ranches were prudent in thelight of inadequate experience with this type of development and could notfind justification for FMD vaccine manufacturing. The Project now proposedwould continue to support NACO and would influence production on a broaderbasis by including marketing and processing facilities and limited provisionfor Ujamaa cooperative and DDC ranches.
1.03 The proposed IDA credit would be the fifth for the agriculture sec-tor in Tanzania: US$5 million was provided in 1966 for agricultural creditand is fully disbursed; it experienced difficulties due mainly to weaknessin the credit institution, since reorganized, although the project was tech-nically sound; US$1.3 million was provided in 1968 for livestock developmentand is progressing satisfactorilv (para 2.25); US$9 million was provided in1970 for a flue-cured tobacco project which after some organizational dif-ficulties is now progressing satisfactorily; and USS10.8 million provided inMarch 1972 for smallholder tea became effective only recently.
1/ JUjamaa is a Swahili word meaning "familyhood".

1.04 The proposed Project was vrepared bv the M inistry of Agriculture,with assistance from the staff of the Permanent MAission for Eastern Africaand international consultants. This report is based on the findings of anIDA appraisal mission to Tanzania in February-March 1972, composed ofMessrs. Walshe, Hussain, and Wiorker (IDA) and Abercrombie, Valdes, Wolffelt,and Mrs. Reining (Consultants).
II. BACKGROUND
A. General
2.01 Tanzania extends from the Indian Ocean to its western boundarieswith Zaire, Rwanda, and Burundi (Map). Zanzibar, lying 30 miles off thecoast, is part of the Repuiblic. 2The total area of mainland Tanzania is361,800 square miles (937,000 km ), including 20,650 square miles (53,500 km-)of inland water, and, except for a narrowB strip of land along its 550-mile(900 km) coastline, lies at an altitude of over 300 m. A large part of thecountry is a plateau of about 1,300 m, xith mountainous areas rising to about3,000 m on its southern and northeastern borders.
Climate
2.02 Tanzania has a tropical equatorial climate, with a wide range ofclimatic and ecological conditions due to the different altitudes and thelocation relative to the ocean and inland lakes. Mfean daily temperaturesrange between 22°C and 32°C, with the greatest diural variation occurringover the Central Plateau, where it mav be as much as 20°C! in coastal andlake regions, it is about 8°C. Rainfall ranges from less than 500 mn inparts of the Central Plateau to more than 2,500 mm annually in the areanorthwest of Lake Malawi. About half of the country receives more than 750mm of rain annually and the climate is characterized by alternate wet arn,;dry seasons. In the north, from the northern coastal belt west through theUsambara-Kilimanjaro area, there aretwo distinct wet seasons, with the mainrains in March to May and lesser rains in November to December. In theremainder of the country, except for the area round Lake Malawi, the tworainy seasons merge.
Population and Gross Domestic Product
2.03 The population of Tanzania, currently about 13.5 million isincreasing at an annual rate of about 2.7%. About two-thirds of the people,occupy only 10% of the land and are concentrated in rural locations that aregeographically widely dispersed: in the coastal belt around and north ofDar es Salaam, around Yoshi and Arusha in the north, in the areas west andsouth of Lake Victoria, in the extreme west around Kigoma, and in the extreme

-3-
southwest around Mbgya. The average population density is; only 15/km, whichcompares with 19/km in Kenya and 51/km in Uganda. In recent years (1965-70),the Gross Domestic Product (GDP) has been growing at about: 5.6% ner year,except for a dip to 2.5% during 1969. In 1971, the GDT was about US$1,360million at market prices. The per capita GNP (at market prices) was aboutussion.
B. The Agriculttural Sector
Contribution of Agriculture to the Fconomy
2.04 Agriculture provides 90% of employment but only about 40% of GDPwith subsistence production accounting for over half the value of the sector'stotal output (Annex 1). Production, which increased over the past decade ata rate barely sufficient to keep pace with population growth (para 2.03),comes mostly from small farms, cultivated by hand and using family labor.The main export products produced on small farms include c:otton, coffee,sisal, tobacco, tea, cashew nuts, pyrethrum, meat and hides. Large-scaleagriculture is carried otut only on estates that grow coffee, sisal, tea,and coconut, and state farms that produce wheat, rice, ancd livestock. Es-tate production has diminished in importance, however, particularly as demandfor sisal has declined, and the state farm program remains small.
Land Use
2.05 Only about 9% of the total land area of the mainland is used forcrop cultivation--about 8% is in small farms and 17 in large holdings;another 10% is fallow land or temporary pasture. The remainder is inrange land or indigenous bush, with 10% and 8% set aside f or forest andgame reserves, respectively.
2.06 All land is considered to be public land and title is vested inthe Government, although approximately 80% is held by individuals or groulpsunder rules of tenure in accordance with traditional or tribal rights. Landsformerly granted as freehold have been converted by law to Government lease-hold status and are held under long or short-term rights of occupancy, asare other lands planned for developrment.
Ujamaa Cooperatives
2.07 At present, an estimated 15% (about 1.8 million aersons) of therural poptulation are living in Ujamaa villages. Ujamaa villages are eco-nomic and social communities where neople volunteer to live and work togetherfor the benefit of the community as a whole. Most of the existing Ujamaavillages have been established in relatively poor areas with a view totransforming them into creditworthy cooperative societies practicing com-munal production methods. The members of the Ujamaa village frame a con-stitution to govern their relationships, to provide guidelines for resolving

-4-
conflicts and to define rules for sharing the benefits of their communalefforts. Ujamaa villages are an indigenous attempt to harness African con-cents of communal work and nroperty to modern requirements for successfulcommercial enterprises. The existing ujamaa cooneratives are almost entirelyassociated with crop production and as yet there is scarcely any experienceof the Ujamaa concept applied to livestock production. The application ofthese concents to livestock development in Tanzania are discussed in Annex 2.
Livestock
2.08 With about 13 million cattle and seven million sheep and goatsgrazing about 155,500 square miles, livestock represents a major nationalresource to Tanzania. ?fost of the cattle population are in the traditionalsector and, although individually owned, are grazed on communal land. Sincethe number rather than the quality of cattle is the traditional symbol ofwealth and marketing facilities are limited, overgrazing is widespread andunproductive stock are not rigorously culled.
2.09 The location of the national herd is broadly determined by theabsence of tsetse flY, which precludes extensive cattle keeping in thesoutheast and in large areas of the west. The greater nart of the herd islocated in M4wanza, Shinyanga, Musoma, and Singida regions where cattle arekeDt mainlv by the Sukuma people as an auxiliary activity to growing cottonand maize. Large concentrations are also found, however, in the Dodoma,Arusha, and Kilimanjaro regions where animals constitute a major source ofincome for the Gogo and the Masai.
2.10 Although the national herd has increased by about 2.75% per year,from about 3 million head in 1924 to an estimated 1.3 million at present,its productivity is extremely low. Recorded offtake for slaughter averagesabout 2.5% of the total population and amounted to 318,000 head in 1970.Total offtake, which includes mortality, averages about 10% to 11% ner annumand was estimated at about 1.2 million head in 1970. The low productioncoefficients; a calving rate of about 50%, a calf and adult mortality ofabout 20% and 10% respectively, an average liveweight at slaughter of about250 kg, and an average steer age at slaughter of about six years, can Deattributed to inadequate nutrition, high disease and parasite infestation,poor management, and the poor genetic quality of the native cattle (smallEast African short-horn Zebu).
2.11 Even though reconnaissance information is not available toestablish precisely the potential for livestock development using moderntechnology, the scope is enormous since a considerable proportion of thearea infested with tsetse could carry livestock if tsetse was controlled.There are also areas where stocking rates could be increased substantiallyif water facilities were provided.

-5-
Animal lIealth
2.12 Rinderpest and Contagious Bovine Plueropneumonia (CBPP) havebeen successfullv controlled by a Government vaccination program involvingabout 1 million cattle per year, and the last recorded cases occurred in1964 and 1965, respectively. Tick-borne diseases, particularly East CoastFever, cause serious losses in the traditional livestock sector when thereis no routine dinning, but Government is taking steps to reduce them byconstructing and onerating diDs free of charge for the traditional producer.To date, about 1,000 are in operation. Routine dipping is practiced on allNACO ranches.
2.13 Foot and Mouth Disease (FlIT)) is endemic in the main area of thetraditional livestock sector. Four of the seven Fnl tynes--Type 0, Type A,SAT 1, and SAT2--occur but Type 0 is the most prevalent. Government operatesa strict control program that requires vaccination and quarantine of cattlebefore they can be transferred to new regions and strict qusarantine of in-fected herds. Presence of the disease, however, precludes the export ofun2Soceis,ed meat products to many markets, particularlv in Europe, and,although Tanzania is anxious to control it, a program has not been justifiedon economic grounds at this stage.
2.14 Tsetse fly, the vector responsible for trypanosomiasis of cattleand sleeping sickness in humans, infects more than 60% of Tanzania, butbeef production is possible when effective control measures are applied.On large blocks, (over 80,000 ha) the Tsetse Control Unit in the Ministryof Agriculture establishes a tsetse harrier (1 to 2 km wide) by clearingscrub around an infested area, after which insecticide is applied six timesfrom the air; this is subsequently maintained tsetse-free by ground sprayinga residual insecticide over any accidentallv reinfested isolated pockets.This standard technique Is only economically feasible on large areas; onsmaller areas when the tsetse threat is moderate to low, the use of pro-phylactic drugs is cheaner.
C. M.arketing and Slaughterhouses
2.15 The marketing system for livestock is poorly developed (Annex 3).District development councils 1/ operate about 120 permanent primary marketsand the Ministry of Agriculture about five secondary types, but virtuallynone has proper facilities or organization. Each animal is usually handledby one or more "bush traders" before it is finally sold irn the market. Mar-ket charges vary from district to district and range from Tsh 7 to Tsh 22
1/ Elected municpal bodies.

- 6 -
per head. Until 1969, the dominant buyers were private traders who sold toTanganyika Heat Packcers (TPL) and district council buyers who supplied localtown butchers. Government attempted to reorganiTe marketing in 1969 byrestricting private traders and authorizing the councils to purchase cattlefor TPL, but the effort was unsuccessful, and TPL is, at present, employingits own buyers.
2.16 The absence of essential facilities such as watering and stockhandling facilities and suitable grazing/resting areas on existing holdinggrounds and the total absence of stock routes and holding grounds in manyareas results in tremendous losses in cattle as they move the long distancesfrom production areas to the main slaughtering center at Dar es Salaam andelsewhere. Since animals have to be vaccinated and quarantined at least14 days before being moved between zones and, invariably, adequate water andgrazing are not provided, such losses are estimated at up to 20% of initialbody liveweight.
2.17 Tanzania has only one meat processing plant--the TPL nlant atDar es Salaam--and it is badly located to serve the needs of the livestockinduistrv (Annex 4), being several hundred miles from the railhead orloading point serving the main producer areas such as Shinyanga (638 miles)and Mheva (589 miles). The transnort charge by rail is Tsh 43 per 1headfrom Shinyanga and Tsh 75 per head by truck from 'fbeva. Erected in 1950,the TPI, plant has a total slaughtering canacity of 3nQ,000 head of cattlener year and a total canning capacity of 200,00n head per year. It is 4ointlyowned by Liebigs, an international meat packing companv, and the TanzaniaGovernment, through its parastatal National Agricuilture and Food Company(NAFCO) (52% ownershin) and it exports to th 'K but also to otherEuropean markets. The plant oneratet't about % of canacitv due to itsinability to procure enough cattle. Although it might he expected that TPLwould process a large number of cull cows, the amount actuallv hana ed isquite small due tn TPL's reluctance to offer a good pric4C for this cate-orysince mortality is hioh because of the long transnort distance involvec.(Annex 4).
D. Government Services
2.18 The Ministry of Agriculture and Cooperatives is resoonsible forlivestock production and marketing and carries out its work through itsveterinarv and animal husbandrv research, training, and extension staff andthrough the parastatal corporations NAFCO and NACO. The animal industrysubdivision is responsible for disease control, livestock research centers,tsetse control, stock; routes, holding grounds, quarantine stations, arti-ficial insemination, meat inspection, and grading. About 34% of the 3,400-member extension staff is working in the livestock sector.

- 7 -
2.19 Education and training facilities have been expanded recently.Tanzanians are obtaininr degrees in agriculture at the ITniversitv of Dar esSalaam and at Kampala, Uganda, and in veterinary science at Kahete, Kenya.The Training Institute at Entebbe, Uganda, conducts a two-vear course forveterinarv assistants, with outstanding students permitted to stay for athird year for a dinloma in animal husbandrv. In addition, some 800Tanzanians are studying for certificates and dinlomas in agriculture andveterinary science at training institutes in Tanzania. A course leading toa diploma in ranch management from the Ministry's training institute at Mpwapwais being organized and a course in practical ranch management training, underthe first livestock prolect, has been started.
2.20 Although the quality of veterinarv services, including researchis satisfactory, the extension services and research in animal productiontechnology are extremelv weak. Greater emphasis is needed on animal produc-tion factors, such as aniral husbandry and nutrition, forage production,stocking rates, and water utilization, and research should concentrate onaccumulating data for the main innuts and techniques used in livestock pro-duction and ranching. The Ministry of Agriculture is at present consideringreorganizing the animal industry subdivision by establishing separate produc-tion and veterinary sections, so that production aspects of livestock devel-opment can be given more attention.
E. Agricultural Institutions and Credit
2.21 Tanzanian credit institutions are wholly Government-owned(Annex 5), with the Tanzanian Rural Development Bank (TRDB) responsiblefor agricultural credit. It was created in 1971 and took over agreed assetsand liabilities, as well as the operations of the former National Develo-mentCredit Agency. Most of TRDB's current lending involves three IDA credits(para 1.03), and, since it is TRDB's policy to lend at rates that reflectthe commercial cost of capital, long and short-term loans are generally madeat 8-1/2%. TRDB has its head office in Dar es Salaam and operates 12 regionaloffices but there are plans for six more to obtain countrywide coverage.Technical assistance is given to borrowers bv regional representatives trainedin agriculture and economics, and technical services are being strengthenedby the addition of six IJNDP/FAO snecialists.
2.22 The National Bank of Commerce was established in 1967 to take overthe business of nine nationalized banks. Lending operations extend intoagriculture, industrv and commerce with loans granted to both the privateand public sectors. Most of its lending is on a short-term basis and itsagricultural loans are mainly to cooperatives and Darastata'L companies forproduction, marketing and processing with interest rate at about 8-1/2% perannum (Annex 5).

- 8 -
2.23 The National Agricultural and Food Corporation (NAFCO) was estab-lished in 1969 to promote agricultural development and the production offood. It operates through several subsidiaries which enjoy substantial au-tonomy. Its investments include TPL (jointly with Liebigs - para 2.17) andthe National Agricultural Company (NACO), incorporated in 1968 with anauthorized share capital of Tsh. 50 million fully subscribed and owned byNAFCO.
2.24 NACO is implementing the first livestock project: it operates atotal of 12 ranch-farm enternrises including one sheen and one pig unit.The general policy directed from head office is implemented by ranch managers;four technical ranch officers recently recruited from Australia will furtherstrengthen NACO's management. Over the Dast few years NACO's ranching oper-ations have satisfactorily undergone a transition neriod with a rapid build-up in total stock. The build-up in breeding cows has been particularlysignificant and after 1972, feeder cattle will no longer have to be purchasedfor these ranches.
F. First Livestock Development Project
2.25 The first IDA credit for livestock was made in 1968 for US$1.3million to cover 65% of a beef ranching development with a total cost ofUS$2 million. The project aims to increase the output of beef, expand theproduction of improved breeding stock and demonstrate the advantages ofmodern ranching techniques by developing five cattle ranches and providingtechnical services and a training program for ranch management. Panch devel-opment is now satisfactory and early difficulties have been overcome. Poormanagement on two ranches was rectified by replacing managers with experiencedstaff. Severe drought conditions resulted in high cattle mortality on oneranch and cattle rustling led to unexpected transfers of stock from one ranchto another. A problem outside NACO's control was the low fixed meat pricesprevailing in Tanzania. Prices though still controlled were substantiallyincreased in 1972. Disbursements of IDA funds to mid-December 1972 wereslightly behind schedule with a total of USM1.14 million or 88% of total creditbut the project is expected to be fully disbursed by the closing date (December1973). Generally, this project has demonstrated the feasibility of establishingan efficient beef industrv in Tanzania.
ITT. ThE PPOJECT
A. General Description
3.01 The pronosed Second Livestock Development Project would be abroadLy based, intef'rated program over five years aimed at increasing beef

- 9 -
production in Tanzania through ranch development, meat nrocessing and bvimnroving essential infrastructures. The Project would include:
(a) develonment of 11 NACO ranches, four DDC ranches, and22 ujmaa coonerative ranches:
(b) developrent of three large markets, 10 medium-size markets,and 20 small markets and the remodelling of 104 srmallexisting markets;
(c) development of 2,300 km of new stock routes and 2,200 km ofexisting stock routes and establishrent of four new holdinggrounds and improvement of 23 existing ones;
(d) reconstruction of one meat processing plant (TPL) and theconstruction of two new ones; and
(e) provision of technical services, training and projectpreparation.
3.02 A Project Management Unit would be set up in the Ministry ofAgriculture to coordinate and supervise ProJect operations; TRDB would bethe main credit channel and two new companies would be established to handlelivestock marketing and meat processing.
B. Detailed Features
Ranch Develonment
3.03 NACO Ranches - The Project wouild finance further development ofthree NACO ranches already established at UsanRu, Sumbawanga, the KituloPlateau, establishment of four new NACO ranches at Dakawa, Mkata, Malagarasi,and Missenyi East, and four nexw ranches at M-iisa. The ranch on the KituloPlateau, developed with LTNDP assistance, is nresently owmed by Government,but is to be transferred to NACO, with existing stock and machinery. Itwould be a condition of credit effectiveness that this transfer had takenplace.
3.04 Ranches would average about 34,000 ha and all would be based onnative tropical grasses, except I'itulo (9,200 ha), which would have improvedryegrass and white clover pastures. Breeding and fattening operations wouldbe carried out at IJsangu, Sumbawanpa, Missenyi East, Kitulo, and. the fourranches at Nwisa, wqhile Dukawa would produce feeders for the fattening ranchat ikata. The ranch at Malagarasi would finish locally produced steers forexport to Zaire.

- 10 -
3.05 The main investment items would include firebreaks, farm roads,water development, stock dipping and handling facilities, and workmen'shousing, pasture develonment (Kitulo only), breeding, stock, steers and oper-atinp expenses for the first two years. Development on each ranch would hespread over two vears excent at Kitulo, (five years). Investment ner ranchwould range frorm Tsh. 1.8 million to about Tsh. 7.2 million. Tsetse clearancein the Mwisa area would be accomplished by, the Ministry's Tsetse control unitwith assistance from ITSAID. Fanch projections for the eleven ranches anpearin Annex 6, Tables 1 to 28.
3.06 DDC Ranches - In order to encourage decentralized regional devel-opment, the Government is establishing District Developrent Corporations(DDCs) in part to own and operate breeding/fattening ranches. The Projectwould finance four, and these are exnected to be in Morogoro, Mbeya, Iringaand Inzega Districts. All would be about 40,o0o ha in size and investmentper ranch would be about Tsh. 4.6 million. The development model for theseranches is based on the proposed NACO Missenyi East ranch (Annex 6, Tables1 to 4) with similar inputs. Development on each ranch would be over twoyears.
3.07 IJjamaa Cooperative Ranches - The Project would develop 22 Ujamaacooperative ranches covering about 100,000 ha. Ranches in the ShinyangaRegion comprising a total of about 50,000 ha would be develoned with about200 Sukuma families on sparsely populated under-utilized grazing land.Livestock owners presently grazing the area would become members of theUjamaa and contribtute about eight head of stock each. Similar type rancheson about 20,000 ha are expected to be developed in the Dodoma region. Memberswould be livestock owners from a Gogo and a Nguu village already grazing theircattle in the area. It is expected that eight disrersed Masai Ujamaa coopera-tive ranches would be develoDed in Arusha District through ranching associa-tions formed under the Range Development and Management Act. Eacn ranch wouldbe about 4,000 ha in size and would produce improved Boran bulls for sale tothe ranch association members who are also Ujamaa members and graze about20,000 cattle on a surrounding area of about 150,000 ha. Ranches would berun on commercial lines, with pair management and labor, and would demonstratethe valtue of good ranch management techninues. Profits would be used fordevelopment on each association's ranch area. The ranch developments financedwould include water develonment, firebreaks, stock dipping and handling facil-ities, housing, and incremental working capital. These are aimed ddirectly atthe traditional livestock producer and careful attention was given to physical,technical, sociological, economic, orgaiization and cultural implications ofthe Ujamaa. Development on each ranch would be over two years. Projectionsfor the Ujamaa (Annex 6, Tables 29 to 32) and Masai Ujamaa (Annex 6, Tables33 to 36) ranches are presented to provide broad development guidelines.
Markets, Stock Routes, and Holding Grotunds
3.08 Markets. The Project would develop three larc-e cattle markets(capacity 1,000 head), 10 medium markets (capacity 500 head), and 20 small

- 11 -
markets (capacity 50 to 200 head) and assist in repairing 104 small existingmarkets (Annex 3, Tables 1 to 3). A livestock marketin- company would beformed to carry out develonments and operate related facilities, (hereafterreferred to as the Tanzania Livestock 1-arketing Company (TLMC) (para 4.07).Sales would be held weekly in the large and medium-size facilities and monthlyin the small ones. Markets wiould be develoned in association with stock routesand holding grounds and serve the four major cattle zones--in the north aroundArusha, in the west around Shinyanga and West Lake, in the central zone aroundDodoma, and in the southern zone around ?lbeva. Basic inputs would be yards,pens, simple livestock handling facilities, auction rings, office buildings,stores, water facilities, and livestock weighing scales. The market develop-ment program would be phased over a four-year period.
3.09 Stock Routes and Holding Grounds. The Project would develop 2,300km of new stock routes (Annex 3, Table 4) and improve 2,20CI km of existingones (Annex 3, Table 5). On the new stock routes, the Project would developwater points at intervals of abont 25 km, clear about 2,300 km of cattletracks, and provide six veterinary checknoints with stock clipping and handlingfacilities. On existing stock routes, the Project would clear 2,200 km ofcattle tracks and provide 100 fenced night pens. The Project would alsoestablish four new holding grounds and upgrade 23 existing ones. Basic in-piuts for the holding grounds would be firebreaks, tracks, water facilities,stock handling facilities, vehicles, and enuinment (Annex 3, Tables 6 and 7).Development of stock routes and holding grounds would be over four years.
Meat Processing
3.10 The Project would finance construction of two meat processingplants, one at Mbeya in the southwestern zone (580 miles from Dar es Salaam),and one at Shingyanga in the western zone (640 miles from D)ar es Salaam),each with capacity to handle 200 cattle per day. Although the TPL plant atDar es Salaam is operating below capacity, the new plants will increase off-take in the main cattle producing areas and will be complementary to the TPLplant bv providing boned out meat for canning. They are further justifiedby increases in cattle offtake which under the Project alone is expected toreach about 130,000 annually after 12 years (paras 5.01 and 5.02).
3.11 The Project would also support major reconstruction and remodelingof the TPL. plant, built in 1950 at Dar es Salaam, so that it could continueto meet veterinary and sanitary standards renuired for exporting canned cornbeef to the TK, its main outlet. Investment in the TPL plant would be aboutTsh 11.6 million and would be spread over the first three years of theProject; investment in the new plant at Mbeya and Shinvanga would be spreadover two years and would begin in the Project's first vear. A meat process-ing company to undertake this development (hereafter referred to as theTanzania Meat Processing Company (TiTC) would be established as a subsidiaryof NAFCO (para 4.09). Development details are given in Annex 4.

- 12 -
ODerating Expenses
3.12 The Project would finance certain initial operatinp expenses forranch develonment and the new meat processing plants. The amounts and theitemsq financed are shown in the model investment projections. For ranchmodels fixed and variable net operating costs (sales revenues less costs)are financed for the first two years of development when sales are insuf-ficient to meet operating costs. Incremental working capital is providedfor the M4bevp and Shinyanga meat processing plants (Annex 4, Tables 3 and 5),amounting to about Tsh. 1.9 million.
Technical Services
3.13 The Project would include the following technical services, staffingand training for Project implementation monitoring and evaluation:
(a) a Project Management Unit, staffed with an experiencedproject manager, an assistant project manager, and arange management/water specialist (para 4.01):
(b) a Credit Specialist for TRDB (para 4.03);
(c) the continued services of the Chief Ranch DevelopmentOfficer and four ranch technical officers and financingfor an additional senior ranch development offlcer forNACO (para 4.04 and Annex 7);
(d) an accountant for the proposed Tanzania Livestock MarketingCompanv (paras 4.07 and 4.11);
(e) a meat technologist for the proposed Tanzania MeatProcessing Company (para 4.09):
(f) Project related applied investigational work which wouldbe initiated by the Project Manaaement ITnit;
(g) overseas training (four 2-year fellovshins) for technicalstaff; local training for technical staff (five 3-yearfellowships), and clerical staff (Annex 8);
(h) the preparation of future projects in the livestock sector(Annex 8) and retroactively financing of foreign exchangecosts already incurred in preparing the Project (US$50,000).
It is expected that all specialists except the Project Manager would beexpatriates.

- 13-
3.14 Assurances were obtained during nenotiations that Governmentwould:
(a) as a condition of credit effectiveness, establish theProject IfAnagerent Unit and employ a snitah1.y qualifiedand exnerienced Project Manacyer and Assistant ProjectMana-er whose aqualifications, experience, and terms andconditions of emnilovment would be accentable to ITA:;
(b) as a condition of credit effectiveness, submit a staffingplan accentable to IDA for technical and managerial staffsettine, out the main duties and resDonsihilities of theprorosed Posts and the type, qualifications and experienceof staff to be recruited and thp proposed dates of appoint-ment; and
(c) empl.oy consliltints in rarrvin(T out the Tmeat nrocess:rngcomronent, whose q!ialificitions, experience and tenns andconditions of employment would he acceptahle to IDA.
An assurance xaqs al.so obtained during, ne.otliations that the Government wouldprovide the Pro-ject Managerient Ulnit with hack-un facilities, includingoffices, office ecutipment and sttunpije, an4 seeretarial, assistance.
C. Cost F.stimntes
3.15 Total Project Cost is estiantPd. at ITSql/4.7 million, of whichUS$11.3 million. or 46%, renresents foreivir exchnnc'e reqlirenents. DetailIsare sumniari-ze 1 in tlhe follow.fng taln 1 pq:

- 14 -
PRRCENTAGEFOREIGN
LOCAL FOREIGN TOTAL LOCAL FOREIGN TOTAL EXCHANGE------TSH'000U-------- ------U $'0n---
FIXFD INVFSTMENTS
Livestock purchases 51,795 2,726 54,521 7,254 382 7,636 5Pasture development 739 1,109 1,848 104 155 259 60Firebreaks & Roads 2,648 1,765 4,413 371 247 618 40Water development 5,052 9,382 14,434 708 1,314 2,022 65Stock handlim,facilities 2,755 1,837 4,592 386 257 643 40
Housing/building 4,015 2,677 6,692 562 375 937 40Civil construction
(Plants) 4,090 6,134 10,224 573 859 1,432 60Vehicles & Equinment 3,763 21,325 25,088 527 2,987 3,514 85Engineering & Mis-
cellaneous 525 1,575 2,100 73 221 294 75
Sub-total 75,382 48,530 123,912 10,558 6,797 17,355
OPERATING EXPENSES 5,121 5,122 10,243 717 718 1,435 50
TECHNICAL SERVICES 1,129 10,159 11,29Q 15°, 1,423 1,581 90
Physical Contin.encv 4,531 3,797 9,627 677 531 1,208 44
Total Cost excludingprice contingencies 3,6,463 67,607 154.071 12,11.° 9,469 21,579
Price Contingencies 9,260 12,983 22,243 1,297 1,910 3,116 58
TOTAL 05,723 80,596 176,319 1_ _407 Ll-. Q3 24,695 46
3.16 Costs have been estiriated at prices prevailing in 1972 and, exceptfor livestock purchases, Dh7sical_ contilngencis rngi.ng from- 5,' to 20% havebeen included. A nrice contiigency of about 5' anTuiallv (for both local andforeign costs), and an additional 'US$f.6 million to tnalke account of recentcurrency movements have al.ro been included. These costs do not include taxes.A breakdown of Project costs by Project purpnosts is given below with thephysical continiencies distributed.

- 15 -
Distribution ofTotal Project
Cost Cost CostTsh'fl00 US$000 ooox
RANCHES
NACO 52,030 7,287 30UIJamaa 15,268 2,13q 9DDC 18,352 2,570 10
Sub-total 85,650 11,996 49
LIVESTOCK MARKETING
Markets 4,571 640 3Stockl routes 6,236 873 4Holding Grounds 9,763 1,368 5
Sub-total 20,575 2,881 12
MEAT PROCESSING
Mbeya Plant 12,170 1,705 7Shinyanga Plant 13,269 1,858 8TPL Plant 10,937 1,532 6H.eadquarters 182 26 _
Sub-total 36,558 5,121 21
TECHNICAL SERVICES 11,288 1,581 6
PRTCE CONTINGFNCIES 22,248 3,1_16 12
TOTAL 176?319 24,695 100
C. Finacing
3.17 Financing would be as follows:

- 16 -
PrivateBeneficiaries Government IDA Total
ns$1000 z uss'00n z US$'000 % usS0ooo
RANCIWS
NACO - - 2,44k 30 5,700 70 8,144DDC - - 0,862 30 2,010 70 2,872Masai Ujamaa 0,182 20 - - 0,728 80 0,910Other Ujamaa 0,143 10 - - 1,331 90 1,479
Sub-total 0,33n 310O6 9,769 131425
LIVESTOCK MARKETING
Marketing Company - - 0,960 28 2)439 72 3,399
NFAT PROCESSING
Meat ProcessingCompany - 1,651 28 4,54 72 6,OD5
TE.CHNICAL SFRVICES - - - - 1,88 100 1,8)6
T(TAL 0,330 - 5,917 - 18,44 - 24,695
3.18 The proposed IDA Credit of ITS$13.5 million, representing the for-eign exchange comnonent and about half local costs wTould be to G.overnmenton standard terms and would be channelled as follows:
(a) Funds for ranch development, livestock marketing andmeat processing through TRDR to final beneficiaries.Government would make its contribution (28%) throughNAYCO as its holding company for parastatal ranching(NACO), neat processing (ThPC) and cattle marketing(TWfC) and through DDCs for ranches sponsored by them.Ujamaa members would make their contribution to devel-opment costs by providing cattle and labor. Since theMTasai own large numbers of cattle, their contributionis set at 20%, but other UIjamaa members would contribute10%, the anount judged to be realistic having regard totheir resources.
(b) Funds for project related research, training, equipmentfor the Tsetse Control Unit and nroject prenaration wouldremain with Government and wotuld be handled through theMinistry of Agriculture.

- 17 -
3.19 IDA funds would be made available to TRDB at 4% annually (para 4.02)for 20 years including 5 years of grace in which interest only would be paid.TRDB would on-lend to final beneficiaries at 8-1/2% annuallv (its currentlending rate) for periods of un to 12 years including a six year grace neriodfor ranches and a three year grace Dertod for TT.'¶C and T,PC. The securityfor ranch develonment loans would be a lien on land and chattel mortgage oncattle. A lien on assets financed would be reqiired as security for loansto TLMC and PTCG. It would be a condition of credit effectiveness that asubsidiarv loan agreement between Government and TRDB reflecting the abovelending terms and acceptable to IDA had been executed.
E. Procurerment
3.20 Procurement under the Project would be as follows:
(a) The two nroposed meat processing plants at Shinyanga andMbeya (estimated cost IUS84.1 million) Twould be constructedunder turn-key contracts in order to ensure compatibilityand integration of several tvnes of equinment supplied byvarious manufacturers and selection would be after inter-national competitive bidding in accordance with IDA guide-lines. Machinerv and eruinment required for the remodelingof the TPL plant (US$ 0.6million), the Tsetse Control Unitand for ranches (US$3 million) and miscellaneous items(fertilizers, medicines, small equipment) where an individualcontract would exceed US$30,000 would also be procuredthrough international competitive bidding in accordance withIDA guidelines. Local manufacturers would be allowqed apreferential margin of 15% or the existing rate of imnortduties (whichever is the lover) in accordance with IDAguidelines.
(b) Ranch, markotinp and other infrastructure development wouldbe carried out by Government either bv force account orlocal contract: international biddirg would not he appro-priate due to the scattered onerations and the need tosynchronize various asnects of develonment.
(c) All l.ivestock required for the Project would be purchasedlocallv: local livestock su-ply is adequate. 1/
1/ Study of the availability of Fattening, Beef Breeding and DairyBreeding Stock in East Africa (1970 - 1975). PMEA January 1972.

- 18 -
Assurances on the above procureTnent arrangements were agreed at negotiations.It was also agreed that draft hiddino docutrents for international procurementitems would be submitted for prior IDA a.proval.
F. Disbursement
3.21 Disbursement from the credit would be made for:
(a) The CTP cost (USS1.5 million) of heavv eqltinmnent andmachinerv for the Government Tsetse Control Tinit, andof other vehicles and equit,ment:
(b) 100 percent of TRDB loans for ranch development,livestock marketing and meat processing (loans wouldbe about 70% of total expenditures for each component);
(c) 100% of foreir.n eDnendiiture and 70% of local expenditure(for technical staff);
(d) 10n% of foreign and 70% of local. expenditure for inter-national training: eoiiinyient and materials for technicalwork.
DishurseTmnents fnr TRT)B loans will I-e mnade against a certificate of exrendituire,the docutmentation for which is not qiihritted', for review, but would be retainenbv the borrower and available for ins-eotirn V' IDA during the course of super-vision risqions. Thep phasIng of in'yest-'e'ts .and estimated schedule of li1ar-terly disbursements are given i;r Anr.c>cs 9 n. 10.
T". OPGAANI7I,ATION V"? '1T"ArE7'V.F7T
Project 7`anaglcment
4.01 ±Pn. organization and manalFc lt of the first livestockl; projetct hasbeen tliroun,1. w'ACO, the only organi'.iat-lon directl> involved. These arran^e-ments have been satisqactory hult T.on&-J rermirp to be broadened inder theProject by reason of the wider asnects iy tr-duc1 b Ijanaa and DPC ranchesand thle livestoc7-. marketiig an-v proce-siin-; compani.es as wtell as further -IACndevelopment. The Tanzania Puraj Toeveilon-et Banr7. (TP.DB3) as the channel forfunds, would not be a)nTropriite' as a coordinn.ting entitv for matters whichwould involve the coeneration nr mnyn Govern-7.ent departments and regionalbodies. Accordin,ly, overall resi'onsibility for Project coordination wouldbe vpsted in a policyr cormittee, chaired by the Principal Secretary, Ministryof Agri.culture and Tith re,)resentation fror llinistriees and institutionsinvolved in the Projert. The "roiect Manager would be resnonsible to thc

- 19 -
Principal Secretary, Mlinistry of Agricultre and would he assisted by anAssistant Project Manaoer and a Ran-e Management/W%ater Specialist, who,together, would constitute the Project Management llnit. SiLnce the Projectwould comprise a number of components, botlh geographically and organiza-tionally dispersed, an executive committee under the chairmanshlip of theProject Manager would be formed to ensure coordination. Its other memberswould be the senior executive officers of the major organizations involved.
TP.DB
4.02 TRDB would be the channel for IDA financed loans for NACO (para4.04), DDC's and Ujamaa ranches, and for TLMC (para 4.07) and TMPC (para4.09). TRDB is the channel for other IDA credits and while the operatingpolicies are satisfactory, accounts recently received indicate a sharp risein overdues - from Tsh 15.5 million as of May 1971 to Tsh 75.3 million as ofSentember 1972. TRDB's loan portfolio increased by 63% during this periodand although overdues have remained constant (217 of total) the provisionfor bad debts increased by 11% onlv, from Tsh 11.4 million to Tsh 12.7 mil-lion. Accordingly, it would be a condition of credit effectiveness that ananalysis of such overdues and a statement of measures which TRDB would taketo reduce them to accentable levels would first have been received by TDA.In order to facilitate the strenpthenin- of TRDB's financial nosition ana toenable it to build up reserves, IDA funds would be made available to it at D
4% annually, (para 3.19) the rate applying under the first livestock project Jand would be on-lent to final beneficiaries at 8-1/27 annually (its currentlending rate) giving TRDB a margin of 4-1/2% annually.
4.03 TRDB would be advised bv the Project Management UInit in evaluatingall investment plans as to their technical, financial and economic suitability.TPDB which would be strengthened bv the appointment of an additional creditspecialist would anprove or reject loan proposals on the basis of its ownevaluation. Assurances were obtained during negotiations that the followingconditions Tould be met before a ranch develonment loan was made under theProject:
(a) provisional rights of user covering the whole area forthat ranch had been established by Government:
(h) each Ujamaa vill.age ranch was registered as a cooperativesociety under the Coonerative Societies Act, 1968; and
(c) a certificate of occupancv had been obtained for eachUjamaa, guiaranteeinc to the UTjamaa village the exclusiveuse of the land allocated to it, for a period of at least50 years.

- 20 -
NACO
4.01, NACO iqoild bp res'onnsible for developing' its ranches tinder the2llidance of its ranch officers, along lines similar to those under the firstproject. NACO has good experience of ranch develonment and its technicaland management performance has been greatly improved under the first nroject.1. senior ranch development ofFicer would be located in the West Lake regionto direct develon-enit of the four neu ranches at Mtiisa and direct the fur-ther dcvelonnent of the tlhree existing ranches in that area. The Financialaso,ects of NACO's development will however need careful monitoring; accumu-Slatedl losses incurred over the last five years anotnting to Tsih 5.3 millionare showm in YACO's balance sheet for 1971. During this period rapid devel-opment took place with a large build-un in breeding stock numbers without acorresDonding build-un in sales wihich normally lag three to four years afterthe retention of breeding stock until incremental offtake is generated. Atappraisil it was estimated that 'WACO's cattle stocks were under valued inthe balance sheet b7 about Tsh 5.5 million (Annex 7).
t4. 05 NACO's operatinns will be substantially expanded as a result of theoroject and its financial position strengthened enabling it to operate on acommercial basis. Tn addition, the new investment will improve NACO's liquiid-ltv during the initial Project years (Annex 7, Table 4). At negotiationsassurances were obtained that NACO would submit its develonment program toDA for review and corment at least three months before the beginninp of its'inancial year and that the program submitteA would nroVide detailed ohysicaland financial projections.
DDC and other ITlamaa Coonerative Ranches
4.06 While the main resnonsibilitv for irnlementing developments on DDC.ind Ujamaa ranches would rest with DDC's and Ujamaa committees, TRDB and theMinistrv of Agriculture would provide overall guidance and technical assist-ance. The Project Management Unit would advise and assist the technical sta-fof TRDB and the Mlinistry of Agriculture in detailed ranch planning. Assur-inces were obtained that Government and TRDB would provide the requ-.t.number of technical staff for detailed ranch planning and that both wouldcontinue to supply the required staff for continued extension services andsupervision.
Livestock Marketing
4.07 Marketed offtake from the cattle population is low in Tanzaniaaveraging about 2.6% during 1959-70. During 1971, the total number marketedwas estimated at 338,000 ouit of a nopulation of 13 million cattle. Poororganization and operation of the livestock marketing system is a majorfactor contributing to this low offtake. Accordingly a livestock marketingcompany (TLMC) would be established as a subsidiary of NAFCO but with a largemeasure of autonomv (Annex 3). It would:

- 21 -
(a) have responsibility for carrying out developments onTmarkets, stock routes, and holding grounds under theProject and for oDerating, maintaining and supervising lthese facilities;
(b) organize 13 marketing teams, each of which would condtuctfour secondary 1/ and 12 primary markets 2/ per month; and
(c) become a major cattle buyer ourchasing cattle from TMPC,NACO, flDC's and Ujamaa cooperatives on a contract basis.It is probable that by 19R8 TLMC would nurchase over 50%of cattle entering the marketing svstem. A total of 13buving teams would be est.iblished over a two-year period(Annex 3).
4.08 The establishment of a livestock marketing company would be acondition of credit effectiveness and assurances were obtained that allstock routes and holding grounds and markets currentlv operated by theMinistry of Agriculture would be transferred to the company. The Governmentveterinary service would, however, continue to have responsibility for dis-ease control and certification in the marketing and moveTnent of livestock.Furthermore, in order to assure that livestock marketing in Tanzania couldfunction efficiently an assurance was obtained that a grading and pricingstructure relating liveweight to carcass value and providing adequate in-centives to producers would be established in consultation with IDA withinsix months of credit effectiveness. Since it is olanned that the TLMC wouldbe commercially viable, an assurance was obtained that it would charge fecswhich would allow a reasonable profit after allowing for operating and othercosts. The charges and fees used in the projection for the LivestockiMarketing Company (Annex 3, Tables 3, 8) are included as guidelines.
Meat Processing
4.09 A meat processing company (TMTC) would be established as a sub-sidiary of NAFCO to own and operate the meat packing plants at Shinyangaand l4beva. This comoany would also take over the Government shareholdingin the TPL plant at Dar es Salaam, which oroduces canned corn beef andmeat extracts for export to the ITK by Liebigs under their well-establishedFray Bentos branch (para 2.17). A management contract for the operationof the Shinyanga and Mbeya plants would be drawm up between the TanzaniaMeat Processing Company and an exnerienced international meat processingcompany, the terms and conditions of the contract and the suitability andexperience of the processing connany to be subject to IDIA approval. Assur-ances were obtained to this effect and also that the location, design and
1/ Secondary Market - capacity 500 to 1,000 animals
2/ Primary Market - capacity 50 to 100 animals

- 22 -
specifications for the meat plants including equipment would be approved byIDA. It would be a condition of credit effectiveness that TVPC had beenestablished.
Accounts and Audit
4.10 NACO has a satisfactory svstem of accounts and internal controland, with minor increases in staffing, it could undertake the expanded ac-tivities envisaged under the Project. Delays have occurred in presentin,audited accounts and the auditors' report for 1970 and 1971 to IDA becausean insufficient number of qualified accountants were available in theTanzania Audit Corporation. The Government is proposing to make arrange-ments to overcome this problem hy an association between the corporationand private firms. It was agreed at negotiations that as a condition of creditdisbursement to NACO, audited balance sheet and accounts for FY 1972 should beforwarded to IDA by NACO.
4.11 TLMC would be required to adopt an accounting system that woulIdshow, in accordance with sound, consistently applied nrinciples, the applica-tion of credit funds and the revenues and exnenditures of the various com-nonents of the Project so that the financial results of the operation couldbe fairlv assessed. Assurances were obtained that such a system would beset un under an experienced accountant who would establish financial pro-cedures and introduce adenuate accounting and control methods.
4.12 The present system of accounts and internal control at TPT. issatisfactory and sim,ilar arrangements would be instituted by TMPC for theproposed Mbeya and Shinyanga plants. Each DDC and Ujamaa cooperative ranchwould also be required to keep a set of ranch accounts for submission toTRDB at quarterly intervals. Assurances were obtained during negotiationsfrom TRDB that it would ensure that this was done.
4.13 Assurances were obtained that TRDB, NACO, TIMC and TMPC wouldhave their accounts audited by independent auditors acceptable to IPJ ancr.that accounts and auditors' reports would be furnished to the Associationnot later than six months after the end of their respective financial years.
V. PRODUCTION, -ARKET PPOSPECTS MID PRICES,AND PRODIJCER BENEFITS
Production
5.01 At full development (year 12), it is estimated that Project rancheswould produce annually about 45,000 cattle for slaughter, equivalent to about,10,OnO tons of additional beef, which represents a 22% increase over thecturrent marketed production, and about 13,000 breeding heifers and 1,300breeding bulls. The estimated output of the ranches is surnarized below:

- 23 -
Number of Animals Produced in Year 1?
____ Ujamaa ----NACO DTDC ltasai Other Total
Slaughter Stock
Cull Bxills 5(1 236 48 112 976Ctull Heefers 1 621 63? - 281 2,534
Cull Caos 5,009 1,8800 368 917 8,174Steers: Ranch Brrd 15,874 5,842 - 2,758 24,474
Purchasel 8,886 - - - 8,886
Total 31,70 8,9r 416 4,068 4544
Breeding Stock
Breeding Heifers 7,632 3,020 832 1,281 12,765
Bulls - - 1,312 - 1,]12
Total 7,632 3,020 2,144 1 ,281 14, L77
5.02 In addition the marketing component of the Project is expected to
substantially increase marketed offtake from the traditional herd. Tf the
Project were undertaken without this component, offtake would likely in-
crease by about 100,000 aninals, to about 438,000 animals; by full Project
development. With the marketing component, however, the offtake would be
565,000 annually at full development renresenting an increment of 127,000
animals. After deducting the contribuition of Project ranches (about 45,000
head) to marketed offtake, the marketing component alone is expected to
increase offtake by about 85,000 head and beef production by about 11,000
tons (24%) and the Project is, therefore, expected to increase total beef
production by about 21,000 tons annually at full developrnent (46%).
5.03 The financial rate of return for the investment in TLMC is estim-
ated at about 18%. Financial projection indicate that based on anticipated
fees and charges the marketing companv would be financiaLly viable with
positive net income from year 1 (Annex 3, Table 10). Tq'C would provide an
additional outlet for producers bv opening processing plants in cattleareas and the physical presence of the plants would have a significant im-pact on local cattle offtake. The financial rate of return for TMPC isestimated at 20% and for individual plants, it ranges from 19 to 26%.
Financial projections indicate that on assumed meat Drices (para 5.05) the
company would be financially viable with positive net income from year 4
(Annex 4, Table 9).

- 24 -
Market Prosnects and Prices
5.04 The retail price for beef is controlted in Tanzania by price con-trol ordinances issued for each city. Price control was introduced in 1967when the retail price of beef was fixed at Tsh 2.55 per kg carcass weightand was maintained at that level for the succeeding five years. Low beefprices led to a rapid increase in demand for beef in Dar es Salaam - from37,000 cattle in 1967 to an estimated 100,000 in 1972 representing a demandincrease of about 36% p.a. over this period, compared to 12% p.a. over thepreceding five years (1963-67). The controlled retail prices also keptproducer prices low, which reduced the supply of cattle to TPL. Cattlesupplies to TPL grew at about 8% per annum; and TPL was only allowed toexport surpluses over demand in Dar es Salaam. The slowly increasing supplyand the rapidlv increasing demand led to substantial reduction in exportvolume (from 97,000 head in 1966 to 36,000 head in 1971).
5.05 Recentlv, Government has announced an increase in the retail priceof beef by 33 to 5n% denending on grade, and this is estimated to increaseproducer prices by 40% over those obtaining in recent years. These higherprices have been used in the analysis in the report (an average producerprice of about Tsh 1.65 per kg liveweight). TPL exports canned corned beefmainly to the UK and market prospects are good. The total corned beef cap-acity of Tanzania (200,000 head) represents about 14% of the total importsof canned beef into the UK. In 1972, Tanzania supplied less than 3 percentof 1XK imports, and it should be able to sell its additional corned beef onthe UK market. The balance of production would be sold in the domesticmarket. At negotiations an assurance was obtained that Government wouldconsult regularly witlh TTA on its pricing policies in respect of the produc-tion, processing and marketing of beef cattle and that the objective of suchpolicies shall include (i) the encouragement of nroduction and export of beefproducts; (ii) the financial viability of the Beneficiaries; and (iii) areasonable allocation of investment resources in beef cattle and other saez<r._
Producer Benefits
5.06 The financial rates of return for the individual ranch models varyfrom 14 to 26%. The main incentives for the Ujamaa participants, would beprimarily the increase in the number of cattle owned and secondly improvedincome levels. Further, the rationalization of livestock marketing and thedevelopment of processing plants in high cattle density areas are expectedto have direct and indirect benefits for livestock producers.
Government Costs and Revenue
5.07 The Government would finance US$5.9 million (about 25%) of the totalProject cost. At full development the Project would generate about US$1.9million tax revenue annually and in addition, the parastatal companies wouldgenerate US$2.7 million net income anntally. Although it is difficult to

- 25 -
quantify the incremental operating costs that would be incurred by Govern-ment, the total is not expected to be large since parastatals provide oper-ating costs from revenue and the main additional costs wotlId be to providefield extension services to Ujamaa cooperatives; estimated at about US$50,000annually.
VI. BENEFITS AND JUSTIFICATION
Value of Additional Output
6.01 At full development (year 12), Project incremental beef productionwould be about 21,000 tons, of which half is attributed to the ranches andhalf to the rationalization of the cattle marketing systern and the locationof meat processing plants in Shinyanga and Mbeya. The higher productionlevels would supplement net foreign exchange earnings from increased exportsof canned corned beef building up to the equivalent of 60,000 head annuallyand amounting to a value of US$6 million annually at full development.
6.02 The overall economic return is estimated at about 35%: estimates ofeconomic return on individual components would require arbitrary allocationof the investment in marketing to ranching and processing and would nottherefore be meaningful. In estimating the economic rate of return, thefollowing major adjustments were made from the financial data:
(a) price contingencies were excluded from costs;
(b) unskilled labor was shadow priced at Tsh 77 per manmonth (market wage rate is Tsh 12n/man month) in viewof the substantial under-employment in the range areas;this represents anproximately the value of subsistenceproduction;
(c) foreign exchange costs and benefits were shadow pricedat Tsh 10 per USS to reflect more adequately the scarcityvalue of foreign exchange; the official exchange rate isTsh 7.14 per US$;
(d) to value project production, border prices adjustedfor transport cost were used.
6.03 As indicated in Annex 13, the economic rate of return is likely tobe at least 25 even under less favorable assumptions. An increase in invest-ment costs by 10% would lower the rate of return to 32% and a decrease ingross benefits of 10% would lower the return to 25%. If unskilled laborwere valued at its full market price, the rate of return would be about 27%and if neither labor nor foreign exchange were shadow Driced, the rate ofreturn would be 14%.

- 26 -
Fmployment
6.04 The Project is expected to create an additional 2,500 jobs in theNACO/DDC ranches, stockroutes/holding grounds, and at the meat plants. Inaddition, the Project would create more productive self-employment opportuni-ties for about 1,400 persons in 700 families on Ujamaa ranches; most of thepotential participants are currently under-employed.
-.ncome Distribution
i.0n5 Government would be a maior partner and beneficiary under the Project,with its participation through NACO, DDCs, TUIC and T!AC and most benefitswould thus accrue to Government as profits and tax revenue. Non-government7?articipants in the project would be the small cattle owners and employeesof the ranches, and the meat processing, and livestock marketing companies.For Ujamaa ranchers, family incomes (5 members) would increase from a subsist-ence level of UqS130 per annum to about US$800 per annum, or from US$26 toJS.S160 on a per capita basis. For wage earners the expected family income*jould increase from a subsistance level of about USt130 per annum to 1TS8400ier annum, or from US$26 to TJSS80 per capita. The average per capita incomein the rural sector is US$40 p.a. and therefore the Project is expected tohenefit the lower income groups.
6.06 The Project is not without risks. While the potential for expandingthe livestock sector is great, the problems of implementation are likely tobe considerable, mainly because of the lack of managerial and technical ex-pertise. The livestock marketing and meat processing companies would henewly established, without much experience in their respective fields andcan be expected to experience growing pains. Although the tTjamaa basis forranch organization may be aDpropriate to Tanzanian social conditions, itsapplication to cattle ranching is new and its success depends on the supn'lV
of adeouate managerial and technical exDertise over a long period. Althoughprovision is made in the Project to provide such assistance this asDect w.ll?require close monitoring.
VII. AGREEvENTS REACHED AND RECOM¶MENDATION
7.01 During credit negotiations, agreement was reached on the followingprincipal points:
(a) that NACO would submit its development program to IDA forreview and comment at least three months before the begin-ning of its financial year (?ara 4.05); and that it wouldbe a condition of credit disbursement to NACO that auditedaccounts for Fiscal Year 1972 had been submitted to IDA byNACO (para 4.10);

- 2.7 -
(b) that a new grading and nricing structure for beef cattlewou.ld be develoned in consuiltation with IDA within si.xmonths of credit effectiveness and that ',U4C would chargefees w#hich would all.ow a reasonable profit (nara 4.0t8)
(c) that government wouild constilt regularly with IDA on itspricing nolicies in resnert of the Prodtiction, Drocessingand marketing of beef cattle (Dara 5.05).
7.02 The following wotld be conditions of credit effectiveness:
(i) that Government had transferred the TUitil1o nlateau -ranchto NACO, with existing stock and machinerv (nara 3.03):
(ii) that Covernrent had established a Project Management Unitand employedl a suiitably qualified and experienced ProjectManager and Assistant Project Manager hiose nualifications,exnerience and terms and conditions of emnloyment would beaccentable to IDA (nara 3.14):
(iii) that Cfovrnment had submitted to IDA an accentablo staffingplan as detailed in para 3.14 (b):
(iv) that a slibsidiary loan agreement between Government and TRDBaccentable to IDA had been executred (nara 3.19);
(v) that TP1TB suhmit to TDN an analysis of overdtle accounts anda statement of measures uhliich TPRnB 'otld tnke to rodhuce them(para 4.'2), and
(vi) tlhat NAFCO establish a livpqtock markretin!, compan- (nara 4.OF)and transfer al.l stock rolites, holdin'- grounls and markets toit: and establishi a meat nrocessin comnpanv (n.sra 4.09).
7.03 The nronosed Projret cnrstitutes a -uitable ha'sl' for an IDAcredit of IJU 18.5 mil.lion.
March 1[, 1973


ANNEX IPage 1
TANZANIA
SECOND LIVESTOCK DEVELOPMENT PROJECT
Agriculture in the Economy
Geography and Climate
1. Tanzania, located in East Africa between latitudes 10 and 12° Southand longitudes 29° and 400 West, has a total land area of 91 million ha.Nearly all of the country, with the exception of a narrow coastal belt inthe west, is over 300 m above sea level and more than half is above 1,000 m.The country can be divided broadly into five agricultural areas:
(a) the eastern coastal belt extending from Kenya in thenorth to Mozambique in the south (sisal, rice, cashewnuts, copra, and cotton);
(b) the Iringa/Mbeya regions which, together, make up theSouthern Highlands in the southwest (tea, coffee, maize,tobacco, potatoes, pyrethrum, and livestock);
(c) the central plateau encompassing the Dodoma, Tabora, andKigoma regions (groundnuts, maize, palm oil, sunflowerand castor seed, tobacco, cotton, and livestock);
(d) the area adjacent to Lake Victoria, extending from Bukobain the west around the lower extremities of thle lake toM4wanza and beyond on the eastern shore (coffee, bananas,tobacco, tea, cotton, cassava, and livestock);
te) the north-central area, comprising Arusha, and Kilimanjaro(coffee, potatoes, vegetables, sugar, sisal, wheat, barley,coffee, pyrethrum, and livestock).
2. Most of the country experiences a dry season from June to Octoberand a rainy season between November and lay. Many areas also have a shortdry season in December. Annual precipitation varies from around 500 mm ayear in Dodoma to 2,000 mm and above in the Bukoba Regicin and parts of Mbeyaand Iringa. Temperatures vary from a typical tropical pattern in theeastern coastal belt to a temperate one in the Southern Highlands, wherea considerable expanse of good agricultural land lies at: elevations of2,000 to 3,000 m.

ANNEX 1Page 2
Livestock in the Agricultural Economy
3. Agriculture provides a livelihood for some 90% of Tanzania's 13.5million people, the majority of whom live at subsistence levels. The totalvalue of agricultural production in 1971 was approximately US$466 millionwhich represented some 38% of GDP. Cotton, sisal, livestock, coffee, cashewnuts, tea, groundnuts, pyrethrum, and tobacco are the most important agri-cultural export products. Total beef offtake amounted to approximately 11%of total agricultural production.
4. The total value of agricultural exports in 1971 was about US$176million, of which about US$8 million, or 4.5%, were from processed and livebeef cattle. Because of uncertain market prospects for the three most impor-tant export crops--coffee, cotton, and sisal--diversification of production,with emphasis on beef production, is given high priority by Government.Conside*4rng that Tanzania has a beef herd of some 13 million head, the secondlargest on the African Continent, and extensive range and grasslands andequable climate, the possibilities for expanding beef production are good.
5. The local cattle are a mixture of breeds, with Zebu blood predomi-nating, but they might generally be described as being a small and unifilprovedoverall type. The mature weight of cows is in the range 240 to 280 kg. Inthe past, various breeds, including the Shorthorn, Holstein, Devon, Angus,and Boran, have been used to upgrade the quality and size of the Zebu, butthe most successful cross, from a commercial point of view, appears to bethe Zebu and Boran. Steers have reached mature weight of 480 kg, accordingto records kept by NACO at the Kongwa ranch. For the full potential ofthese crossbred animals to be realized by the traditional farmer, however,there would have to be a considerable increase in the general standard offeeding, management, and disease control.
6. The majority of the national herd is distributed throughout thenorthern part of the country, with the heaviest concentrations in Nwanza.Shinyanga, Musoma, and Singida regions and lesser concentrations in -i_Dodoma, Arusha, and Kilimanjaro regions. This pattern is largely deter-mined by the distribution of the tsetse fly, which limits cattle keepn?iin the southeast and west of the country, except for the Mbeya region inthe southwest.
7. In the Mwanza, Shinyanga, Musoma, and Singida regions, the Sukumapeople are the main cattle owners, running small herds (average, 20-30 head)to supplement their earnings from cotton and maize, which are the principalincome earners. In the Dodoma, Arusha, and Kilimanjaro regions, the Gogoand Masai peoples run bigger herds (average, 50 head), which tend to providemost of the family income. The Sukuma, the Gogo, and the Masai all grazetheir cattle on communal lands and since all regard their animals as capi-tal (i.e., "wealth"), they prefer, in general, to increase their herd sizerather than sell animals. This attitude has been an important factor con-tributing to the expansion of the national herd from around 3 million headiT. 1921 to an estimated 13 million in 1971.

ANNEX 1Page 3
8. The latter increase in cattle numbers, without an accompanyingimprovement in feed supply and management, has resulted in overstocking inseveral areas to a dangerous level, which can neither be increased nor eventolerated indefinitely. Furthermore, increasing pressure on the better landfor cash cropping is tending not only to reduce the total area available forgrazing but to force cattle back to the poorer and less productive areas.
9. In all areas in which cattle are presently found, considerablescope exists for improved production. There is, however, a need for betterwatering facilities, firebreaks, and additional stock routes, and such fa-cilities should be provided on a first priority basis. More efficient util-ization of existing dips is also necessary since less than 1 million (i.e.,less than 8%) of the national herd are now treated regularLy, although exist-ing facilities could accommodate about one-half of the total number. Thereis insufficient knowledge of nutrition and management on the part of themajority of traditional producers, so that there is an urgent need for train-ing throughout the entire country. Again, in the Southern Highlands, thereare hundreds of thousands of acres of good land that are free of tsetse andthat could be developed into high-producing temperate grasslands, based onperennial ryegrass/white clover mixtures, where beef or milk, or a combina-tion of both, could be produced economically. The Kitulo and Lukinga areasare examples of this class of land and considerable investigational work hasalready been done on the former under UNDP/FAO auspices to demonstrate itspotential.
10. As might be expected, the offtake of cattle from the traditionalsector is low, being estimated at 10 to 11% per annum. This figure is basedon export numbers of hides and skins, which includes hides from animals thatwere dying from disease and other causes, along with those killed for sub-sistence needs. In 1970, only 318,000 cattle, or 27% of total estimatedofftake, passed through organized market channels. There is wide scope forincreasing offtake to almost double the present figure and for increasingboth slaughter weights and carcass quality. Such increases can result fromimproved animal management and a more rational use of existing resources andfrom the application of newer techniques and modest physical inputs. Thesemoves, however, need to be coordinated to ensure that transport, market,and slaughter facilities keep step since existing facilities are not alwaysadequate to service even the present numbers.
11. There are good reasons why Tanzania should be encouraged to expandbeef production. Rising internal consumption along with expanding marketsfor live cattle in bordering countries such as Uganda, Kenya, and Zambia,together with good prospects for canned meat on the international market,make future prospects for the cattle industry extremely good.
Livestock Health
12. The main animal health problems are poor general nutrition, Foot-and-Mouth disease, Trypanosomiasis, and East Coast Fever.

ANNEX 1Page 4
13. The level of cattle nutrition in Tanzania varies with season, andanimals are usually underfed once or twice each year, depending on the amountof rainfall and its distribution. No attempt is made to provide supplementaryfeed such as hay or silage during these periods nor to provide areas of cropor special-purpose pasture. Under severe conditions, older animals loseweight to the point of emaciation and younger animals fail to grow. Thesituation is often aggravated by the added stress of internal and externalparasites, disease, mineral deficiency, and lactation.
14. Foot-and-Mouth Disease is endemic in most regions of Tanzania.The disease is controlled by vaccination and quarantine but the program hasbeen handicapped by the lack of vaccines of the right type. This situation,however, has been remedied although poor communications and inadequate stor-age facilities for vaccines impose considerable difficulties. Government,however, has indicated that it intends to expand efforts to contain thedisease, not only because of its effect in lowering production, but alsobecause it is an important constraint on the export of chilled and frozenmeats to Europe and elsewhere.
15. The tsetse fly, the vector of Trypanosomiasis in cattle, is widelydistributed throughout the country, infesting approximately two-thirds ofthe total land area. Where infestation is severe, cattle raising is virtuallyexcluded (para 6). This disease, however, can be eradicated by clearing areasof the fly through a combination of bush felling and insecticide spraying, andits effect on individual animals can be controlled by treatment with drugs.Either of these two approaches, or a combination of both, can be used butlarge-scale on-going ranching enterprises would find it more practical toeradicate the fly from the farmed areas. Much research has been carriedout on this approach in Tanzania and elsewhere in East Africa, and an ef-fective program, involving ring clearing of bush and aerial and groundspraying (costing no more than Tsh 15 per ha), is now in operation underthe Ministry of Agriculture and Cooperatives.
16. East Coast Fever is the most important of the tick-borne diseasesand it causes serious loss in the traditional livestock sector. It is esti-mated, for example, that some 10% of calves are lost because of the disease.Routine dipping at weekly intervals will control this and other tick-bornediseases and Government has built some 800 dips throughout all the main live-stock producing areas. These facilities, plus the dipping chemicals, areprovided free of charge to producers who wish to avail themselves of theservice.
17. Other diseases, which in the past have been a problem, such asRinderpest and Contagious Bovine Pleuropneumonia, have now been successfullycontained through well executed control programs. Approximately 1 millionanimals in the north are vaccinated each year against Rinderpest to form abarrier against reintroduction from the north. No case of the disease hasbeen reported in Northern Tanzania since 1965 and it is over 25 years sinceit last occurred in the south. Contagious Bovine Pleuropneumonia was last

ANNEX 1
Page 5
diagnosed eight years ago in the north of Masailand but prompt vaccinationand quarantine of the area prevented spread and at the present time thedisease is not present in the country.
Technical Services
18. The Ministry of Agriculture and Cooperatives is responsible forlivestock production and marketing and also for advisory services, research,and training within the agricultural sector. Four Divisions of the Ministryare directly involved--the Division of Agriculture, Food, and Advisory Serv-ices; the Division of Production Development and Technical Services; theDivision of Administration, Personnel, and Planning; and the Division ofResearch, Training, and Farmer Education. The National Agricultural Company(NACO), a subsidiary of the National Agriculture and Food Company, is theparastatal organization through which the Ministry's main commercial produc-tion thrust is realized.
19. The Animal Industry Subdivision of the Division of Agriculture,Food, and Advisory Services plays a major role in disease control, tsetsecontrol, stock routes, holding grounds, Al schemes, livestock multiplicationcenters, meat inspection, and grading, while the Division of ProductionDevelopment and Technical Services is responsible for various commercialundertakings of the Ministry. It shares with NACO and the Tanzanian SisalCorporation the main burden of organizing and executing production programs.Project preparation and planning, the organization of marketing, and thecompilation and analysis of vital industry statistics are the chief produc-tion-oriented functions of the Division of Administration, Personnel, andPlanning, and training extension staff, up to the diploma level, and farmers,is the responsibility of the Division of Research, Training, and FarmerEducation, which also directs research in both animal and crop production.
20. The key role of training at all levels is well recognized by Gov-ernment and, insofar as projected requirements for technicians trained tothe certificate and diploma levels in general agriculture are concerned,its requirements through 1980 will be met by existing training schemes.The need for more graduates in agriculture at the degree level is alsorecognized and appropriate steps are being taken to increase enrollment inthe Faculty of Agriculture, University of Dar-es-Salaam, Norogoro.
21. In order to broaden the training schemes presently being sponsoredby the Division of Research, Training, and Farmer Education, the Division,in collaboration with NACO, is organizing a diploma course in Ranch Manage-ment. Candidates will already have had several years of field experience asa condition of entry. They will attend a refresher course in theory subjectsat the Ministry's Training Institute at Mpwapwa, followed by a practicalcourse in Ranch Management at NACO's Mkata ranch. The length of the coursewill be two years. Twelve students will be trained per year and it is antic-ipated that graduates will not only fill key managerial posts on NACO ranchesbut will provide personnel to occupy production posts in the Ministry, theTanzanian Rural Development Bank, and other parastatal entities such as theTanzania Sisal Corporation.

ANNEX 1Page 6
22. NACO operates its own in-service training program for headmen andfield assistants, with supervision provided by individual ranch managers.Farmer groups are also encouraged to visit NACO ranches to see the units atfirst hand and field days are organized for further demonstration purposes.
23. Recently, in order to broaden the training and experience of itsestablished ranch managers, NACO entered into an agreement with an Australianconsultancy firm to provide a practical training course in that country oncertain advanced ranches in areas with climatic patterns and productionproblems similar to those in Tanzania. It is expected that a dozen or moreof NACO's senior ranch managers will take part in this program over thenext three to four years.
24. The situation with respect to research is not as satisfactory asit is with training. In general, the quality of veterinary research inTanzania is good as borne out by the effectiveness of the dipping programand the tsetse control program. However, there is a definite gap inproduction-oriented research and, while NACO has done much to show thathigher production coefficients are possible, a great deal more needs to bedone in such basic fields as brush and weed control, water reticulation,fencing, pasture utilization, supplementary feeding, fertilization, andanimal management. What is required is a series of feasibility trials onexisting NACO ranches, adopting a strict minimum cost - maximum effective-ness approach. Government, through NACO, is fully aware of these gaps andhas indicated a desire to correct the situation.
Government Policy Towards Livestock Development
25. Government has gone to considerable lengths to define constraintsin the livestock industry and has indicated its determination to do every-thing possible to promote expansion. It has noted with concern the problemof overstocking in many areas and has provided good support for the TsetseControl Unit, whose main responsibilities are to control the fly and under-take construction of roads and firebreaks for access and burn protection anddams for water storage and reticulation.
26. In order to improve the social amenities of the traditional pro-ducer and to provide a basis for more effective extension of improved man-agement practices, Government is pushing ahead as quickly as possible withthe concept of ujamaa, which is explained in detail in Annex 2. Suitableland for settlement by ujamaa villagers is available presently or is beingmade available as the work of the Tsetse Control Unit progresses. Govern-ment believes that, given better social services, suitable land, modestphysical inputs, technology, and a rational marketing system, the tradi-tional sector is capable of significantly increasing production to meetthe needs of both the expanding internal and export markets.

ANNEX 2Page 1
TANZANIA
SECOND LIVESTOCK DEVELOPMENT PROJECT
Social Implications of Cattle Ranch Developmentby Ujamaa Cooperatives
A. Introduction
1. Ujamaa, a Swahili word meaning familyhood is an innovative form ofsocio-economic organization to be applied for the first time under the Proj-ect to ranching. The ujamaa ranch would be the vehicle for altering therelationship between such people and their herds from one that is intermittent-ly market-oriented, where animals are sold occasionally, to one that is basic-ally commercial. The ranches, which would directly involve about 3,500 peopleand 34,500 animals in four different parts of the country, would be small-scaleduplicates, technically, of the larger and already established NACO ranches.
2. A second innovation to be introduced by the Project, also aimed atfacilitating commercialization of beef production for the keepers of the trad-itional herd of about 13 million animals, is the establishment of a countrywidenetwork of stock routes, holding grounds, and markets, initegrated with newmeat processing facilities. This effort would indirectly involve many morepeople and animals than would the ranch component itself, even though therewould be no substantive changes in the socio-economic organization. In thenext five years, this second innovation would probably have the greater im-pact since the first is a long-range means of bringing about the necessarychange in attitude toward commercial beef production.
3. The Tanzanian Government sought IDA financing for 90 10,000-acreujamaa ranches in unspecified areas in addition to the wi:Lsa ujamaa ranches(for Haya of West Lake Region). The double innovation of the ranch technicalpackage (firebreaks, dams, disease control and range management) at thisscale and ujamaa organization, however, precludes its introduction in anybut the most favored places. Accordingly, the number has been reduced to15 and the places and peoples specified. The places were selected on thebasis of type of husbandry and commercial orientation, population density,semi-arid range habitat, tsetse clearance requirements, probably avail-ability of water, and recent preinvestment research by other agencies.Adjusting the two innovations to different peoples and habitats involvesmany socio-economic variables, however, and what follows iLs an outline ofobservations designed to support the recommendations and guide their imple-mention.
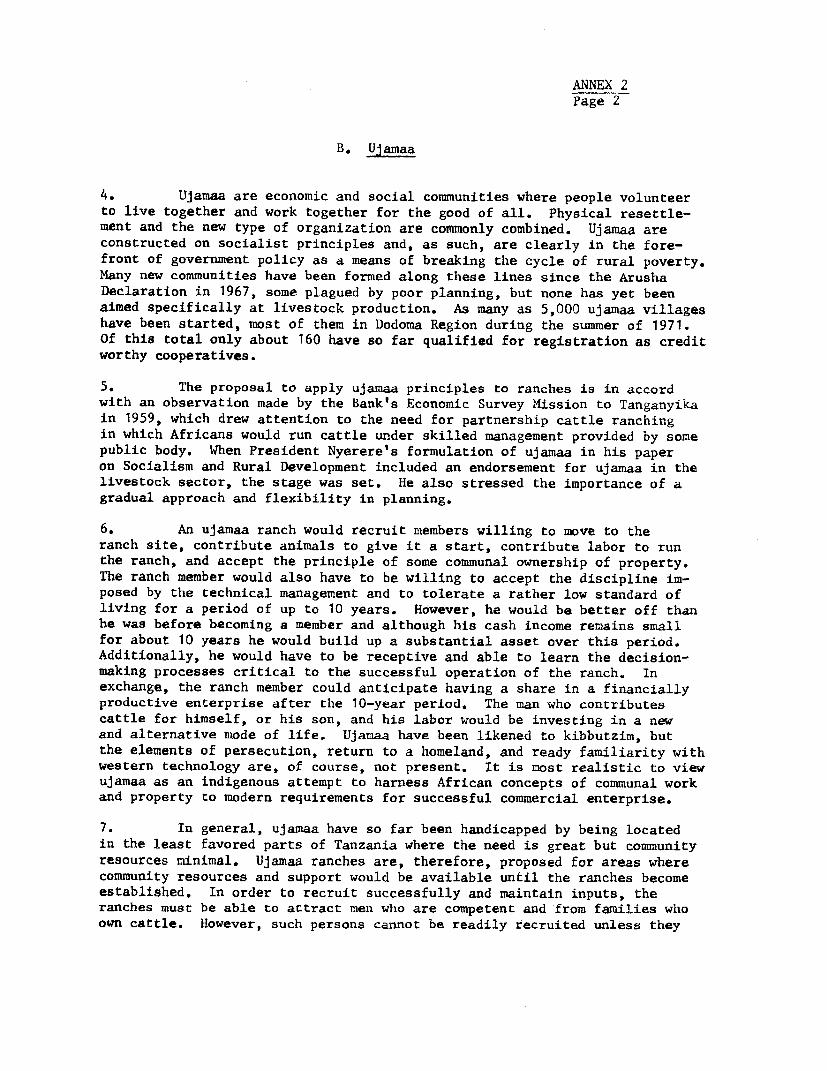
ANNEX 2Page 2
B. Ujamaa
4. Ujamaa are economic and social communities where people volunteerto live together and work together for the good of all. Physical resettle-ment and the new type of organization are commonly combined. Ujamaa areconstructed on socialist principles and, as such, are clearly in the fore-front of government policy as a means of breaking the cycle of rural poverty.Many new communities have been formed along these lines since the ArushaDeclaration in 1967, some plagued by poor planning, but none has yet beenaimed specifically at livestock production. As many as 5,000 ujamaa villageshave been started, most of them in Dodoma Region during the summer of 1971.Of this total only about 160 have so far qualified for registration as creditworthy cooperatives.
5. The proposal to apply ujamaa principles to ranches is in accordwith an observation made by the Bank's Economic Survey Mission to Tanganyikain 1959, which drew attention to the need for partnership cattle ranchingin which Africans would run cattle under skilled management provided by somepublic body. When President Nyerere's formulation of ujamaa in his paperon Socialism and Rural Development included an endorsement for ujamaa in thelivestock sector, the stage was set. He also stressed the importance of agradual approach and flexibility in planning.
6. An ujamaa ranch would recruit members willing to move to theranch site, contribute animals to give it a start, contribute labor to runthe ranch, and accept the principle of some communal ownership of property.The ranch member would also have to be willing to accept the discipline im-posed by the technical management and to tolerate a rather low standard ofliving for a period of up to 10 years. However, he would be better off thanhe was before becoming a member and although his cash income remains smallfor about 10 years he would build up a substantial asset over this period.Additionally, he would have to be receptive and able to learn the decision-making processes critical to the successful operation of the ranch. Inexchange, the ranch member could anticipate having a share in a financiallyproductive enterprise after the 10-year period. The man who contributescattle for himself, or his son, and his labor would be investing in a newand alternative mode of life. Ujamaa have been likened to kibbutzim, butthe elements of persecution, return to a homeland, and ready familiarity withwestern technology are, of course, not present. It is most realistic to viewujamaa as an indigenous attempt to harness African concepts of communal workand property to modern requirements for successful commercial enterprise.
7. In general, ujamaa have so far been handicapped by being locatedin the least favored parts of Tanzania where the need is great but communityresources minimal. Ujamaa ranches are, therefore, proposed for areas wherecommunity resources and support would be available until the ranches becomeestablished. In order to recruit successfully and maintain inputs, theranches must be able to attract men who are competent and from families whoown cattle. However, such persons cannot be readily recruited unless they

ANNEX 2Page 3
have reasonable assurance of their investment being safeguarded. An effectivemeans of providing a realistic and workable interface between the ujanaaprinciples enunciated by President Nyerere and the ujamaa ranches in the formrecommended here is through the constitutions to be drawn for each ranch ofthe four areas.
C. Cattle
8. Only those Tanzanian rural societies with a well-established cattlekeeping tradition should be considered at this time, thus excluding many inTanzania who are dominantly or completely horticultural. Eighty-five percentof the traditional herd is kept in Northern Tanzania. Although the numbersto be directly recruited for ranch membership are very snall, Masai, Gogo,Sukuma, and Haya peoples control 40% of the entire traditional herd and to-gether comprise 24% of the country's population. Masai are completely pas-toral, Gogo primarily so, Sukuma keep cattle as major investment propertyalong with cropping, and Haya have an ancient practice of integrating herdingwith tree crop farming. There are obvious advantages in access to and expe-rience with peoples controlling this portion of the herd. Sukuma and Gogoherd owners would also have general access to the stock route-dip complexin addition to members directly recruited for ujamaa ranches.
9. The traditional herd is a multipurpose resource. Cattle providefood through being milked, butchered, and bled; manure for use as fertilizerin mixed husbandry regimes and as fuel; power as draft animals, and raw ma-terials for craft use. They are also an important indigenous means of in-vestment and exchange used in underwriting marriage transactions (bride-wealth), pacts of friendship and clientship (loan), and inheritance orguardianship (trusteeship). Cattle are prizes in raids and objects oftheft, and can be used to pay fines and settle debts. They figure sym-bolically and actually in rituals and life-cycle ceremonies. For pastoralpeoples, the well-being of the herd is, therefore, the dominant value.
10. However inconsistent such variety of use may appear with conversionto strict commercial utilization, the traditional distinction between dairyand slaughter animals, and the size of the herd allow sufficient flexibilityfor experimentation.
11. Ownership of the traditional herd is concentrated in the hands ofa relative few by availability of suitable habitat (approximately 30% of thecountry), age and sex (nearly all owners are older, adult men), and unequaldistribution (except for Masai, between 30 and 50% of the adult men own allthe cattle and, of these, 10% own half the animals). However, a prolifera-tion of rights has resulted from trusteeship and loan arrangements. Pluralityof rights, in fact, is such a complicating factor that a proper question iswhether all Tanzanian owners can sell their cattle or cont:ribute them toujamaa ranches rather than will they as a matter of volition.

ANNEX 2Page 4
12. The problem of increasing offtake from the traditional herd hasfrequently been tackled in the past through destocking programs aimed atimproving range quality through a reduction in numbers, with culled animalsbecoming available for slaughter. These programs, however, have been viewedby African cattle owners as repressive, and considerable resistance has de-veloped to innovations involving cattle. An increase in quality of cattleand an increase in numbers is demonstrated, though, in the example providedby the existing NACO ranches and that combination is consistent with thevalues and interests of the cattle keeping peoples being considered. Atthe technical level, the ujamaa ranches, especially, and the stock routedip-market complex promise the positive combination and are supportive ratherthan repressive measures. Insofar as these are so perceived, they shouldbe acceptable.
D. Other Factors in Selection of Ujamaa Sites
13. Only areas with low population density (0 to 15 per square mile)are considered suitable for ujamaa ranch location. Optimum ranch size,determined by technical considerations, is 10,000 ha, and a ranch community,determined by social and labor considerations, is 60 families, with an esti-mated population density of seven per square mile. Most mixed husbandry re-gimes involve population densities well above this level and what appears tobe available pasturage is in reality communal grazing land, usually dividedinto wet and dry season portions, with a drought period reserve. It is ex-ceedingly risky to enclose such land for the benefit of a relatively smallnumber of ujamaa ranch members for two reasons: those with rights to thatarea will attempt to exercise them in any event (regardless of formal tenurechanges) and will be especially attracted to do so when new facilities areadded; and fear of retaliation from those deprived of rights could easilyprevent a farmer from joining an ujamaa ranch. The aim, therefore, shouldbe to bring essentially unused land into productive use rather than attemptto rework existing holdings in a new manner. At the same time, such areasshould be physically proximate to the habitat of cattle keeping peoples.Ujamaa ranch sites proposed here have low population density due to lack ofwater supplies (Nindo, Segara-Izava and Masai) (Appendices 1 and 2). Sucha policy would also provide a new social opportunity for those willing,simultaneously, to move and to enter into a new form of organization.
14. The natural habitat suitable for cattle in East Africa is called"semi-arid range", and it occurs over 30% of mainland Tanzania territory.All of the proposed ujamaa ranch sites are within the semi-arid range.
15. Tsetse clearance is prohibitively difficult for ujamaa ranches andsites requiring such work would not be selected unless clearance were as-sumed by another agency.
16. Water supplies are a major constraint on Ujamaa areas which other-wise are suitable for cattle ranching and the provision of water will befinanced under the Project.

ANNEX 2Page 5
17. Prior or complementary work has been or will be done in each ofthe areas by UNDP/SF (Nindo and Segara-Izava and Masai) and USAID.
E. The Constitution
18. The constitution for each ujamaa ranch should make provision forthe social organization of the ranch community and include clauses adaptiveto the particular character of the society involved.
F. General Conclusion
19. The real incentive for prospective ranch members and for governmentis that commercial beef production is feasible in Tanzania. Building thenecessary social safeguards can be done as long as the need to do so isunderstood. The incentives for joining ujamaa are the provision of ranchinfrastructure, the restoration of a favored area, or the well being of theherd (Masai) and the long-term prospect of a good income. The disincentivesare the long, lean years and the novelty of ujamaa cattle ranching. The risks,however, can be reduced through careful planning and thorough explanation toprospective members, and by the clarification of rights and duties in theujamaa constitution.
G. Procedure for Establishing Credit for Ujamaa Ranches
20. Following the formation of the ujamaa villages:
(a) each village would register as a primary or probationaryprimary society under the Cooperative Societies Act, 1968;
(b) a certificate of occupancy would be obtained for eachvillage, such certificate to guarantee to the villagethe exclusive use of the land allocated to it; and
(c) where balanced husbandry and good resource conservationrequire the land to be managed in large units, farminggroups comprised of several villages should be formed.The function of these farming groups, which might beregistered as secondary societies under the CooperativeSocieties Act (in which case they could be known asFarming Unions), would:

ANNEX 2Page 6
(i) through their elected representatives, managethe land they collectively occupy to make thebest use of it for crop and livestock produc-tion; and
(ii) severally and collectively implement the recom-mended development program.
21. When such Farming Unions are formed, their rules and by-laws regard-ing land management and resource conservation would prevail over any rulesthat might be made by an individual member village. In the case of theMasai District and any other areas which are well suited to animal husbandrypracticed under an extensive system of management:
(a) encourage the other farm families in the area to formthemselves into Ranching Cooperatives large enoughto be viable under a livestock regime, register them,
-and then obtain a certificate of occupancy for each; and
(b) proceed to the formation of Farming Unions, the member-ship of which would comprise one Ranching Cooperativeand such cultivator villages as may have been formedwithin its boundaries or adjacent to it.
22. Any Ujamaa Village and Ranching Associations formed in gazettedRange Development Areas prior to the coming into force of the proposedAgricultural Development and Resources Conservation Act should be certifiedby the Minister of Agriculture and Cooperatives.
H. Recommendations
23. As part of the appraisal of proposed ujamaa cooperatives, theProject Management Unit and TRDB should examine the following matters:
(a) drafting of the ujamaa ranch constitution;
(b) document of registration as a cooperative society(and whether primary or multipurpose);
(c) areas gazetted under the Range Management Practice Actin relation to ujamaa ranch sites;
(d) determination of stage (I-III) of development of ujamaaof the ujamaa ranches;
(e) preparation of ranch; consultation with prospective ranchmembers familiar with the area;

ANNEX 2Page 7
(f) consultation with prospective village members familiarwith the area; and
(g) clarification of the rights and responsibilities; ofpresent inhabitants of ujamaa ranch sites, their choiceof joining the ujamaa, and the disposition of their stock.


ANNEX 2Appendix 1Page 1
Ujamaa Ranching Through Utilization of Existing Pastureand Residential Land: Nindo, Segara-Izava, and Masai
Nindo
1. The set of ujamaa ranches proposed for the Nindo area of ShinyangaDistrict and Region would utilize a portion of the cultivation steppe nowrather sparsely populated by Sukumaland standards. Heretofore, the prin-cipal lack has been availability of water supplies and these will be pro-vided under the Project.
2. The Sukuma, a significantly large group in Tanzania, are Bantuspeaking, practice a type of mixed husbandry involving grain crops, surplusportions of which are sold, with cotton as the chief cash crop and cattleas the principal item of investment. The traditional herd is estimated at3 million head. Sukuma social organization involves a flexible interplayamong kin, neighborhood ward, and secret society memberships. A relevantcharacteristic is multiplicity of rights arising from the several member-ships and applied to cattle, water, and grazing rights (as well as to otheraspects of social and economic life). Grazing and water supplies are allo-cated to wet season, dry season, and drought season (kept in long-term re-serve) categories. Consolidating rights and clarifying lines of responsibil-ity should be done, and can be done as long as the need to do so is recognized.In the Nindo area, there is unoccupied land. Familiarity with the local ter-rain on the part of prospective ranch members would be an asset in preparingthe ranch plan. Communal herding of animals is often practiced under indi-genous management in the Nindo area and this also would be an asset.
3. UNDP/FAO study of Ranching Associations in other parts of Sukumacountry concludes that paddocking, improved water supplies, and dippingalready introduced under other loose management are slowly but effectivelybeing integrated into animal management practice. In theise newly improvedareas, however, encroachment by non-Association persons has been a problem.The enclosure problem is evident here. Another finding oE the study withrespect to marketing indicates wide acceptance of cash cropping in theagricultural sector and modest acceptance of commercial sale of cattle inthe livestock sector. With the proposed Nindo ujamaa ranches, the paceof instituting the technical package would be accelerated and ranch manage-ment would be tight. The single-purpose ranch is also an innovation relativeto the Ranching Association approach. In view of the sizeB and importanceof the traditional herd in Sukumaland, the Nindo ujamaa ranches are anecessary experiment. Given the sparse population and the favorable setof ecological conditions, the possibility of success is enihanced.
4. Special care should be taken to:
(a) ascertain water and grazing rights at present a:Llocatedto dry, wet, and drought season use in the proposed area;
ANNEX 2Appendix 1Page 2
(b) ascertain the verbiage, in Kisukuma, used to designatethe contribution of animals made by ranch members; and
(c) delineate the boundaries of the ranch area.
Segara-Izava
5. The two 10,000-ha ranches proposed for Segara and Izava villagesin Dodoma region would be located in the area selected for development bythe UNDP/SF because the plant cover by all vegetation types is good, and,with adequate disease control facilities, the potential for livestockproduction is also good.
6. Approximately 60 Bantu-speaking families, mostly Gogo, live inSegara, and a similar number, mostly Nguu, live in Izava, Gogo have astrong pastoral tradition, but they also cultivate; Nguu are primarilycultivators and are more commercially minded than the Gogo. At present,1,400 owners' animals are being run on the ranches on which preliminarysurvey work has been completed.
7. Segara and Izava ujamaa villages are part of a major district-wide resettlement carried out between M4ay and September of 1971. The twovillages are on the periphery of the ranch sites and already conform tothe model village plan designed by UNDP advisors. By 1973, they expectto be registered as Ranching Cooperative Societies and this follows theUNDP recommendation as well as being consistent with ujamaa policy.
8. Special care should be taken to ensure that:
(a) ranch-member families number no more than 100 andpreferably 40-60;
(b) Gogo in Segara and Nguu in Izava retain a natural separationin the two villages in the interest of greater harmony andease of work;
(c) owner's rights and responsibilities on contributed cattlebe ascertained and discussed with ranch members, especiallyin regard to bridewealth payments;
(d) appropriate regional and party authorities participate inplans and commitments; and
(e) consideration be given to the model village plansdesigned by UNDP/SF.

ANNEX 2Appendix 1Page 3
Masai
9. The eight dispersed Masai ujamaa ranches proposed in ArushaDistrict would be established in conjunction with Ranching Associationsformed under the Range Development and Management Act. Technical servicesand heavy equipment would be supplied by USAID; loans will be primarilyfor dips and water facilities.
10. The Masai, well known as pastoralists in TanzaniaL (and Kenya)would be contributing a nucleus herd of 500 breeding cows from eachRanching Association. Administratively, the ujamaa ranches represent anattempt to adapt the Ranching Association format to the req[uirements ofujamaa policy. More broadly, both Ranching Associations and ujamaa ranchesare designed to aid in transforming Masai management practice, and ideologywith respect to marketing, to take advantage of introduced techniques andMasai skill and endurance in cattle husbandry under conditions pertainingin the Masai steppe.
11. In the opinion of USAID advisors, administrative problems willbe simpler if boundaries of each Ranching Association and ujamaa ranch fallwithin a single Ward.
12. Special care should be taken to:
(a) meet the special requirements of forming ujamaa rancheswithin the Ranching Association;
(b) determine the viability of separating the Mfasai residentialcompound from the cattle night paddock to allow the formerto be relatively permanent and the latter to be moved asnecessity dictates;
(c) plan for the installation of facilities (schools, dispensaries,water supplies, shops, etc.) concurrently with planning forthe ranch proper.


ANNEX 3Page I
TANZANIA
SECOND LIVESTOCK DEVELOPMENT PROJECT
Tanzania Livestock Marketing Company (TLMC)
A. Introduction
1. Marketed offtake from the cattle population is low in Tanzania--averaging about 2.6% during 1959-70. During 1971, the total number of cattlemarketed was 333,000 out of an estimated population of 13 million cattle.Two factors are considered to be primarily responsible for this low figure:
(a) the organization and operation of the livestock marketingsystem; and
(b) the controlled price of beef in the cities, leading to lowproducer prices.
These factors are complementary and have to be taken into account together.The Project would, therefore, place all marketing, stock routes, and holdinggrounds under the direction and control of a parastatal--Tanzania LivestockMarketing Company (TLMC)--set up as a subsidiary of the National Agricultureand Food Company (NAFCO). TLMC would purchase livestock in markets which itwould operate and manage and it would facilitate cattle movement on stockroutes and holding grounds which it also would operate. Disease controlwould continue to be the responsibility, however, of the veterinary depart-ment of the Ministry of Agriculture.
B. Background
Livestock Markets
2. There are two types of livestock markets in Tanzania--secondaryand primary. Secondary markets are operated on a weekly basis by theveterinary department of the Ministry of Agriculture and there are five inthe country. Owners bringing cattle to the secondary markets are requiredto show proof of prior vaccination against FMID, blackquarter, and anthrax,but enforcement is difficult and quarantines have led to outside sales, whichhas had a bad effect on the health control effort. Primary markets, atwhich cattle can be sold without prior vaccination, are operated by DistrictDevelopment Councils (DDC) on a monthly basis. About 220 primary marketsare supposed to be in existence, of which approximately 116 can be classi-fied as permanent. The classification of a market as permanent is basedupon the type of facilities available and not upon the regularity of operation.

ANNEX 3Page 2
Market Facilities
3. Physical facilities at all markets are generally inadequate. Per-manent markets are usually of stone or pipe construction but, due to poormaintenance, they have deteriorated. In most cases, broken corral fencesare repaired by placing a thorn bush in the gap. Temporary markets areno more than improvised thorn bush corrals with pole-type structures forthe auctioneer. Few have crush facilities.
Market Charges
4. Charges vary from district to district. In some, they are paid bythe buyer as a percentage of sale value, while in others, there is a fixedcharge per head. In some, charges are paid by the seller. The table belowprovides some examples:
District Seller's Cost Buyer's Cost Total
Masailand 2 sh/head 5% of value 7 to 22/headMwanze 6 sh/head 6 sh/head 12/headShinyanga 2 sh/head 2/headMara 5 sh/head 5 sh/head 10/headDodoma 5% of sale value 5 to 20/head
Before the practice was discontinued in 1971, markets also served as placesin which to collect taxes, party dues, and other fees. This, however, actedas a discriminative to producers who, partially to avoid these payments, choseto sell instead to bush traders.
Handling Procedures
5. Cattle handling procedures in markets are inefficient. Before theauction begins, cattle are held outside the auction ring and producers haveto herd their own cattle with canes. Minor modifications in handling proce-dures, such as the use of rubber rather than wood to handle animals, couldlead to substantial reduction in bruising and other changes in preauctionsorting and post-auction handling could further reduce damage due to mis-handling.
Selling Procedures
6. Selling procedures are also highly variable, depending on whetherthe DDC allows competition or not. IThere DDC is the sole buyer, the auction-ing process is purely procedureal. Cattle are brought into the ring and theDDC buyer starts the bidding; he continues to bid against himself until hereaches the price he wants to pay; which producer may accept or reject. Inmarkets where other buyers (TPL, traders, etc.) are present, the auctioningis fair. At both of the above types, a substantial part (70% or so) of thesales occur without the animal entering the auction ring.

ANNEX 3Page 3
Major Buyers
7. The major buyers at the markets are the DDC, TPL buyers, bushtraders, foreign buyers, and local butchers. The breakdown in 1970 wasas follows:
PercentBuyer Total of Total
(1000)
Urban/Rural Butchers(excluding Dar es Salaam) 182 51
Tanganyika Packers, Ltd: 103 29Through DDC (72) (20)Through Private Traders (21) (6)Through Own Buyers (10) (3)
Agents from Uganda, Kenya & Zambia 30 8
Traders in Immature Stock(including NACO) 45 12
360 100
8. DDC's have been buying for the local butchers since 1969 whenGovernment restricted the operation of private buyers. The DDC's buycattle at their auction markets; pay the veterinary, stock: route, and hold-ing ground fees; assume death losses; and sell the animals on a dressedcarcass weight basis.
9. Tanganyika Packers Ltd (TPL) uses DDC's, private traders, andsalaried buyers to purchase cattle for its plant, which supplies freshmeat to Dar es Salaam and produces canned corned beef for export. Itsestimated capacity is 300,000 head annually, of which 200,000 is for can-ning but, so far, it has never operated at full capacity. Its highestthroughput was achieved in 1969 when it killed 164,000 cattle. The supplyof cattle has been a bottleneck to increasing production since exportprospects for corned beef are attractive and TPL's part owmer, Liebigs,markets its well-known brand--Fray Bentos--in the UK.
10. Foreign (Kenya, Uganda, and Zambia) buyers also operate in Tanzaniaand in 1970 bought about 30,000 cattle. It is expected that meat shortagesin Uganda and Zambia are likely to last for at least a decade and Tanzaniacould also profitably supply these markets.
Shortcomings of the Marketing System
11. The markets as such are not organized professionally. Even thoughDDC's operate them, they do not seem to assume responsibiiLty for maintenanceand upkeep. Further, due to lack of experience and lack of capital, they

ANNEX 3Page 4
have been generally unsuccessful as buyers and sellers. The stock routesand holding grounds are also in a state of disrepair. Maintenance and up-keep is the responsibility of the Ministry of Agriculture, which does havethe professional expertise but not the capital. After considerable trialand error, the Government has therefore decided to create the parastatalTLMC to serve as the major buyer of livestock and the guardian of the mar-kets, stock routes, and holding grounds.
C. The Tanzania Livestock Marketing Company
12. TLMC would be organized on a zonal basis:
(a) Northern Zone: Arusha, Kilimanjaro, Tanga regions;
(b) Central Zone: Singida, Dodoma, Morogoro and Coast regions;
(c) Western Zone: West Lake, Mara, Mwanza, Shinyanga and Taboraregions;
(d) Southern Zone: Mbeya and Iringa regions.
Headquarters would be in Dar es Salaam, with one office in each of the fourzones. The zonal offices would be established over three years.
13. The company would commence operations on a phased basis. In Year 1,TLMC would establish one buyer each in Shinyanga, Arusha, and Dodoma, whowould buy in DDC-operated markets in competition with other buyers. InYear 2, the company would begin taking over markets from the DDC's and thestock routes and holding grounds from the Ministry of Agriculture.
14. The company would operate weekly and monthly markets throughmarket teams, consisting of a market master, auctioneer, two clerks, andday laborers. Each team would conduct one weekly and 12 monthly marketsa month. A team would, therefore, have about 200 market days per year. Thedevelopment of markets and market teams by zones would be as follows:
Year1 2 3 4 Total
/1 /Zone A- B/ A B A B A B A B
Northern - 1 2 20 - - - - 2 21Central - 1 2 20 2 20 - - 4 41Western - 1 2 20 2 20 1 12 5 53Southern - - - - 1 10 1 12 2 22
Total - 3 6 60 5 50 2 24 13 137
/1 Number of market teams./2 Number of markets.

ANNEX 3Page 5
This gives a total of 13 weekly and 124 monthly markets and a total of 2,164market days per year. The weekly markets would be of two sizes: 1,000 cattleper day and 500 cattle per day. The capital cost of the former would beTsh 150,000 per market and, for the latter, Tsh 100,000 per market.
15. The total investment in TULC is estimated to be Tsh 20.6 million(excluding price contingencies) (Annex 3). Tsh 4.5 million would be used fordeveloping 33 new markets and repairing another 104 and Tsh 6.2 million fordeveloping 2,300 km of stock routes and repairing 2,200 km of existing ones.On the new stock routes, the Project would develop water points at intervalsof about 25 km, clear about 2,300 km of cattle tracks, and provide sixveterinary checkpoints with stock dipping and handling facilities. Onexisting routes, the Project would clear 2,200 km of cattle tracks andprovide 100 fenced night pens. The remaining Tsh 9.8 million would be usedfor developing four new holding grounds and upgrading 23 existing ones.
D. Financial Projection
16. The investment, sales and operating expense tables for the threecomponents of TLMC are given in Tables 1 to 8. Tables 9 and 10 give theconsolidation for TLMC. The company begins to operate with a profit fromaround Year 6. The financial rate of return on total investment is 18%.The financial charges used in estimating the return are summarized below:
Category Charge Description
Markets
a. Market Charge Tsh 5/head Fee for using the marketpaid by buyer
b. Purchase Charge Tsh 10/head Paid by the buyer toTLMC when TLiC acts aspurchasing agent
Stock Routes/Holding Grounds
a. Dipping Charge Tsh 1/head For dipping cattleb. Vaccination & Drugs Tsh 7.50/head Trivalent FMD and
other drugsc. Holding Ground Charge Tsh 2.6/head Service on holding
groundsd. Stock Route Charge Tsh 1/head For use of stock routes
17. NAFCO would contribute 30% of equity capital, wkhile workingcapital needs would be met by borrowing from TRDB and the National Bank ofCommerce.


TANZAINIA
SECOND LIVESTOCK DEVELOPMENT PROJECT
Livestock Marketing Courany
Weekly Markets
Investment Costs(Tsh '000)
Model I Capacity 1.090 Cattle/Day Model II - Canvcity 500 Cattle/DayNumber of Unit Cost of Number of Unit Cost of
Unit Units Cost 1 Market Units Cost I Market
(Tsh) (T.h)
INVESTMENTS
YardsPerimeter Fence 1/ ................... o800 10 8,000 500 10 5,000Perimeter Gate 2/ .no 4 150 600 2 150 300Cattle Pens 3/ ....................... no 30 2,500 75,000 15 2,500 37,500:,oading Rap. no 2 1,400 2.800 1 1,400 1.400
Sub-total ........ ,. 86,400 200
BuildingsAuction Ramp and Offices .no 1 10,500 10,500 1 10,500 10,500Watchman's House .no 1 2,000 2,000 1 2,000 2,000Fodder Shed .no 1 700 700 1 700 700Latrines .no 4 350 1,400 4 350 1.400
Sub-total 14.600
Water 2Piping-/ (From Municipal Supply) 2 200 35 7,000Diesel Pump 5/. no 2 100 200 2 100 200Storage Tank 6/ .no 1 6.000 6,000 1 6,000 6,000Troughs .no 15 150 2 .250 8 150 1.200
Sub-total. 15.450 14.400
Unskilled LaborFor Construction man/months 36 150 5,400 24 150 3,600
Other AssetsCattle Scales .no I 10,000 10,000 1 10,000 10,000Equipment / .set 1 2,100 2,100 1 2,100 2.100
Sub-total 12,100 12,100
Total. 133,950 88900
Physical Contingencies- 107 ... 13,400 8,890
Total Cost 147.35 97_790
1/ Six-wire high tensile steel fence.2/ Using 1.5 inch piping.3/ Each to hold an average of 10 cattle in a space of 200 square feet with concrete floor.4/ Two inch piping.5/ 4.5 h.p.6/ With a capacity of 20,000 gallons.
June 30, 72 7/ Includes loud hailer, safe, cattle control equipment and furnit,re.

TANzANIA
SECOND LIVESTOCK DEVELOPMENT PROJECT
L.vestock Marketin_g Co pany
Phasing of Markets
Investment Costs(Tsh '000:'-
Year 1 ----- Year 2 ---- Year 3 Year 4 -- Total ------
Number of Number of Number of Number of Nuimber of Psrcantage ofUnit o sts Units Cost Units Cost Units Cost Units Cost Units Cost Total Cgot(Tsh '000)
MARKI(TS
Weekly 1/
Model I - 1000 Cattle/Day ........... 147 2 294 1 147 - - - 3 441 12.3Model II- 500 Cattle/Day ..... . 98 - 4 392 4 392 2 196 10 980 27.4
Monthly 2/a) Repairs of Existing Market . 15 40 600 40 600 20 300 4 60 104 1,560 43.6b) New Construction .30 - - 10 300 5 150 5 150 20 600 I t.
Sub-total 894 1.439 842 406 31
0FFICE ROUIPSUkI 3/
Headquarters ............... * .. 15 10 - - 25Northern Zoo . 5Central Zone ......................... 5 - - 5Western Zone 6 2 - - aSouthern Zone ........... ,.-.- 5
Sub-tot el 31 12 5 -
VRHlClS (4-Wheel Drive)
Headquarters ......... ................ 26 1 26 - - - 26Northern Zone ........ ............... 26 3 78 - - - 78Central Zone ........ ................ 26 5 130 - 130Western Zone ......... ................. 26 6 156 - - - 156Southern Zone ........ ................. 26 1 26 - 2 52 _
Sub-total ................. 416 52 _4
OFFICE BUILDINGS _/
Headquarters / . . - -Northern Zone .......... :.............. 15 1 15 - 15Central Zone ........... ............. 15 1 15 15Western Zone ........ ................. 15 1 15 - - 15Southern Zone . ........................ 15 - _ 1 -
Sub-total . _ 156
Total 1.386 1.451 9L14 406
Physical Contingencies-0%. 138 145 91 40
Total Cost ................ 1 524 1596 1.005 446
1/ Cost estimate from Table 1.2/ Capecitle range from 50 to 200 cattle per day.3/ Miscellaneous office items. _/ Four or five-room office blocks.5/ Office space is rented snd appears in operating expenses..une ;5 ..r3

T A N Z A N I A
SECOND LIVESTOC( DEVELOPMENT PROJECT
Livestock Markets
Revenue and Operating Expense Projection
Unit BeforeUnits Cost Development 1 2 3 4 5 6 7 8 9-20
(Ish)
I. Number Entering Markets 00............ °° head 338 365 390 415 440 465 490 515 540 565
II. Of Which, Demand for TPL, NACO,DDC and Ujamaa I/ ...... ............ /000 head 158 191 225 248 248 271 298 315 335 358
III. TPL/NACO/DDC/Ujamaa DemandPurchased by TLMC I/ ..... .......... '000 head - 96 158 198 223 271 298 315 335 358
REVENUE (Tsh. '000)
Market Charge 3/ ...... ........... head 5 - 1,825 1,950 2,075 2,200 2,325 2,450 2,575 2,700 2,825Purchase Charge 4/ ............... head 10 - 960 1.580 1,980 2,230 2,710 2.980 3.150 3,350 3.580
Total Revenue - 2.785 3.530 4.055 4.430 5.035 5.430 5.725 6,050 6.405
OPERATING EXPENSES 5/
Headquarter - 425 438 454 457 288 288 288 288 288Zonal Offices - 260 292 364 372 378 378 378 378 378Market Teams 6/ - 240 480 880 1,040 1,040 1,040 1,040 1,040 1,040Buying Teams 7/ - 840 910 910 910 910 910 910 910 910Market Maintenance 8/ ............ - 90 233 318 358 358 358 358 358 358
Sub-total - 1,855 2,353 2,926 3,137 2,974 2,974 2,974 2,974 2,974
Contingencies (107) - 186 235 293 314 297 297 297 297 297
Total Expenses _ 2,041 2,588 3,219 3,451 3,271 3,271 3,271 3,271 3,271
1/ Estimated from consolidated demand by the ranches and the meat processing plants. By Year 9, the bulk of the demand is by meat plants.21 TLMC - Tanzania Livestock Marketing Company. Assumed that TLMC would be purchasing for TPL/NACO/DDC/Ujamaa starting at 50% in Year I and graduating to 100% by Year 5
(50, 70, 80, 90, and 100% of total demand, respectively).3/ The revenue is = 5 x number entering markets.4/ The revenue is = 10 x animals purchased by TLMC.5/ From Operating Expense table.6/ At the rate 3, 3, 5 and 2 market teams introduced in Years 1, 2, 3 and 4, respectively. To make 13 market teams.7/ At the rate 12, 1 in Years 1 and 2, respectively. To make 13 buying teams.8/ At 10% of cost of market. w
June 30, 1972

ANNEX 3Table 4
T A N Z A N I A
SECOND LIVESTOCK DEVELOPMENT PROJECT
New Stock Routes
Investmnt Costs
(Tsh.)
Unit Total Total
INVEST ENT CATEGORY Units Cost Year 1 Year 2 Year 3 Year 4 Units Cost
Routes
Clearing Tracks ........................... K.. 50 19,166 38,333 38,334 19,167 2,300 115,000
Night Stops
Dozas 1/ .No. 3,000 48,000 96,000 96,000 45,000 95 285,000
Housing Herds,men .No. 1,000 16 000 32 000 32 000 15.000 95 95.000
Sub-total 64,000 128,000 128.000 60.000 380,000
Check Points
Veterinary Centers .No. 35,000 35,000 70.000 70.000 35,000 6 210,000
Dips .No. 15,000 15,000 30,000 30,000 15,000 6 90,000
Crush .No. 7,000 7,000 14,000 14,000 7,000 6 42,000
Boas .No. 3,000 3,000 6,000 6,000 3,000 6 18,000
Nousing Herdsmen .No. 1,000 10000 200 J20 1.000 6 6.000
Sub-tota1 61.000 122,000 122.000 61,000 366.000
Water Development
Dana 2/ .No. 40,000 600,000 1,200,000 1,200,000 600,000 90 3,600,000
Boreholes .No. 90,000 90,000 180,000 180,000 90,000 6 540,000
Storage Tanks 3/ .No. 10,000 10,000 20,000 20,000 10,000 6 60,000
Drinking Troughs .No. 1,000 2,000 4,000 4,000 2,000 12 12,000
Water Pipe ......... ..................... KM. 12,400 - 12.400 12.400 12.400 3 37,200
Sub-total 702.000 1.416.400 1.4164.00 714.400 4.249.200
Equipment
Tools and Equipment .Set 8,000 8.000 16.000 16.000 8.000 6 WOOD
Sub-total 854.166 1.720.733 1.720.733 862.567 5.158.200
Contingency 10% 85.417 172,073 172.,074 86,257 515,820
Total Iwvestment 939.583 1.892.806 1.892.807 948.824 5.674.020
1/ Night Pens - Thorn bush Fence 1600 m/Boza2/ Dams - 24,000 cu yd3/ Storage Tank Concrete - 10,000-gallon capacity
July 17, 1972

T A N Z A N I A
SECOND LIVESTOCK DEVELOPM4ENT PROJECT
Existing Stock Routes
Investment Costs(Tsh.)
Unit Total TotalINVESTMENT CATEGORY Units Cost Year 1 Year 2 Year 3 Year 4 Units Cost
Roue
Track Clearing ........ ................... Rm. 50 18.334 36,667 36.666 18.333 2,200 110.000
Night Stops
Bomas.No. ................................. N. 3,000 50,000 100,000 100,000 50,000 100 300,000Housing HIerdsmen .............. . No. 1,000 16.666 33.333 33.334 16.667 100 100,000
Sub-total 66,666 133,333 133.334 66.667 400.000
Sub-total Investment 85,000 170,000 17MOO 85.000 510.000
Contingency 10% .8500 17,000 177000 8,500 51.000
Total Investment 93,500 187_000 187.000 93.500 561.000
#/ Fenced night pen (1600 m/Boma).
July 17, 1972

T_A N Z_A N I A
SECOND LIVESTOCHK DEVELOPIENT PROJIECI
He'. Ho l ding Ground s
0 I_vestment Costs
'o ('lbTsh.)
EAN_ H_LDINC GROUND Noaguk Jure Nyah Chicola
AREA - Ha 800 3,000 48,000 4,000
Unit Total Tct alINVESTMENT CATEGORY Units Cost Units Cost
Firebreaks and RoadsFirebreaks.m K. 500 5 40 190 65 300 150,000Tracks .m. 500 3 20 95 32 150 75.000
Sub-total 225.000
Water DevelopmentDam 1/ .No. 40,000 1 2 4 3 10 400,000Pumps ......... ........................... No. 2,000 2 2 2 2 8 16,000Troughs .No. 1,000 2 1 4 2 9 9,000Tanks 2/ ................................... No. 10,000 1 1 2 1 5 50,000Water Pipe ......... ........................ m. 12,400 0.5 2 0.5 1 4 49 600
Sub-total 524.600
Stock Handling FacilitiesNight Boma .No. 3,000 2 2 4 2 10 30,000Crush ... ,................................ No. 7,000 2 1 4 3 10 70,000Dip ................ ................. No. 15,000 1 1 2 1 5 75000
Sub- total
RousingHousing AFO 3/ ............ ................ No. 30,000 1 1 2 1 5 150,000Housing FA 4/ ....... ..................... No. 10,000 1 1 2 1 5 50,000Housing Labor ...................... No. 2,000 1 1 10 3 15 30,000Housing Herdsmen ....... I .......... No. 1,000 2 2 10 3 17 17,000Office/Lab/Store .N , No. 20,000 1 1 1 1 4 80 000
Sub-total 327.000
Vehicles and 9sutoPmntTrucks .No. 51,000 1 1 1 1 4 204,0004-Wheel Drive Vehicles .No. 26,000 1 1 1 1 4 104,000Tractors .No. 29,000 1 1 1 1 4 116,ODOTrailers ...... No. 7,000 1 1 1 1 4 28,000Office and Lab Equipmient .No. 10,000 I 1 1 1 4 40,000Tools .No. 8,000 1 1 1 1 4 32,000
Sub-total 524.000
Sub-total Investment 1,775,600
Contingency 100. 177.560
Total Investment 1.953.160
1/ Dams - 24,030 cu yd each2/ Storage Tanks - 10,000 gallons3/ Assistant Field Officer4/ Field Assistant
June ,., 1972

> z < " n , g - M n 2~~~ 0~
n~~~~~~~o 00 0 c~0 [ = n -n :~~~~ ~~~~ -. ..... ... .. .. .q~~~~~k 0 3 - W 0 0 .. .. ... . ... . .. .. . ... .. .


T A N Z A N I A
SECOND LIVESTOCK DEVELOPMENT PROJECT
Stock Routes and Holding Grounds
Revenue and Operating Expense Projection(Tsh. '000)
------------------------------ Year ------------ _-________________-_Unit Before
CATEGORY Units Cost Development 1 2 3 4 5 6 7 8 9-20
Number of Animals EnteringStock Routes and Holding Grourds.- - 338 365 390 415 440 465 490 515 540 565
Revenue-Dipping 1/ .............................. lo. Sh. 1 338 365 390 415 440 465 490 515 540 565Vaccinations and Drugs 2/ ..... ......... No. 7.50 2,535 2,738 2,925 3,112 3,300 3,488 3,675 3,863 4,050 4,238Holding Grounds 3/ ..... No. 2.60 879 949 1,014 1,070 1,144 1,209 1,274 1,339 1,404 1,469Stock Routes ........ ................... No. 1.0 - 365 390 415 440 465 490 515 540 565
Total Income 4,417 4.719 3.021 5 929 2 &67
Operating ExpensesFixedWages 4/ ......... .................... - - 690 810 810 810 810 810 810 810 810 810Repair and Maintenance Fixed 5/ ...... - - 100 141 182 223 266 266 266 266 266 266Machinery Replacement 6/ .... ......... - 100 228 356 484 612 612 612 612 612 612Fuel and Oil Vehicle 7/ .............. - - 107 149 256 363 470 470 470 470 470 470Repair and Maintenance Vehicles 8/ ... - - 78 109 187 _ 256 343 343 343 _ 343 343 343
sub-total 1 Q75 1,437 1.791 2,136 Z.501 2,501 2.501 2.501 2,501 2.501
VariableVaccines 9/ ............... - 1.40 473 510 546 581 616 651 686 721 756 791Drugs 10/ .......... .................. - 1.00 338 365 390 415 440 465 490 515 540 565Dipping II/ ......... - 0.3 101 110 117 125 132 140 147 155 162 170
Sub-total 912 885 1.053 1.121 1.188 1.256 1.323 1,391 1.458 1,526
Total Operating Expenses 1987 2.322 2.844 3.257 3 689 3.757 3.824 3892 3 959 4 027
Net Revenue 1.765 2.095 1.875 1.764 1635 1.830 2,105 3 2 575 2 756
I/Initial Dipping and Vaccination for Blackquarter and Anthrax at market.2/Tri-valent Foot and Moutih Vaccination.3/Service on Holding Grounds for Water, Bomas, Herdsmen Shelters during 14-day quarantine.4/Wages Assistant Field Officer - 10,000 Sh, Field Officer - 5,600 Sh, Skilled Labor - 3 @ 2,800 - 8,400 Sh, Unskilled Labor - 4 @ 1,500 = 6,000 Sh,
total 30,000 Sh/holding ground.5/ Repair and Maintenance 2.5Z Fixed Investment.6/Machinery Replacement 20)1 Investment.7/Fuel and Oil Vehicles -.30 Sh/km, 4-Wheel Drive Vehicle, 18000 km; 8 Sh/hour, tractor, 1000 hrs; .80 Sh/km, truck, 10000 km.8/ Repair and Maintenance Vehicles - .20 Sh/km, 4-Wheel Drive Vehicle, 18000 km; 6 Sh/hr, tractor, 1000 hr; .60 Sh/km, truck, 10000 km.9/ Vaccine Cost - 1.40 Sh/Tri-valent Dose.10/ Drugs Cost - 1.00 Sh/Animal Anthrax and Blackquarter Vaccine plus Initial Dipping at Market.11/ Dipping Cost - 0.10 Sh/Emersion, animals dipped three times during 14-day quarantine.
July 17, 1972


T A N Z A N I A
SECOND LIVESTOCK DEVELOPMENT PROJECT
Tanzania Livestock Marketing Company
Consolidated Investment Cost, Operating Cost and Revenue(Tsh. 'OOOs)
1 2 3 4 5 6 7 8 9-20 Total
A. PHYSICAL INVESTMENT
Livestock Markets ...... ................ 1,524 1,596 1,005 446 4,571Holding Grounds
Existing 1/ .......... , 2,344 2,345 1,563 1,563 7,815New 2/ ............ ... ,.. 1,680 273 - - 1,953
Stock RoutesExisting ............. ,.,.94 187 187 93 561New ................................... 939 1.893 1,893 949 5,674
Total Investment 6,581 6.294 4.648 3,051 20.574
B, OPERATING EXPENSES
Livestock Markets ...... ................ 2,041 2,588 3,Z19 3,451 3,271 3,271 3,271 3,271 3,271Stock Routes/Holding Grounds .... ....... 2,322 2,844 3,257 3,689 3,757 3,824 3,892 3,959 4,027Depreciation on Machinery and Assets 3/ 1.550 1.550 1,550 1.550 1,550 1,550 1,550 1,550 1,550
Total Expenses 5,913 6,982 8,026 8,690 8,578 8,645 8,713 8,780 8,848
C. REVENUE
Livestock Markets ...... ................ 2,785 3,530 4,055 4,430 5,035 5,430 5,725 6,050 6,405Stock Routes/Holding Grounds .... ....... 4,417 4,719 5,021 5,324 5,587 5,929 6,232 6,534 6,783
Total Revenue 7O2 __2 7,249 9,076 9,754
10,622 1135 11,957 12,584 13.188
1/ Phased as 30°, 30%, 20% and 20% in Years 1, 2, 3, 4, respectively. o I2/ Nyahua in Year 1, re,aining three in Year 2; 86% in Year 1, 14% in Year 2. a .3/ For machinery, at 20% per annum. Total investment about Tsh 3.5 million. Replacement after 6 years. For other investment, at 5% per annum. ( z
Total investment about Tsh 17 million '0
July 17, 1972

T A NZA N IA
SECOND LIVESTOCK DEVELOPMENT PROJECT
Tanoania Livestock Marketin Company
Consolidated Cash Flow
as. 00-0)Total
INCOME S'EATEMENT 1_ 2 3 4 5 6 7 8 9 10 11 12 13-20 1-20
Total Revenue 1/........... 7,202 7,249 9,076 9,754 10,622 11,359 11,957 12,584 13,188 13,188 13,188 13,188 13,188
Lass; Total Expenses(Including Depteciation) ... 5,913 6,982 6,026 8,490 8,578 8,645 8,713 8,780 8,848 8,848 8,848 8,848 8,848
investment Deduction 2/I....... 1,316 1,259 930 610 - 700 - - - - 700 - -
Interest ChargesWorking Capit al 3/......... 340 340 340 340 380 484 574 595 595 595 659 638 553
Development Loan.......... - 391 766 1,043 1.224 1,220 1.215 988 761 533 306 153 -
Income Before Taxes ......... (367) (1,723) (986) (929) 440 310 1,455 2,221 2,984 3,212 2,675 3,549 3,787
Tax Loss Carry Forvard........ (367) (2,090) (3,076) (4,005) (3,565) (3,255) (1,800) - - - - - -
Incmse Tax 4/ ..................- 168 1,194 1,285 1.070 1.420 1,515 17,257
Net Income After Taxes........ (367) (1,723) (986) (929) 440 310 1,455 2,053 1,790 1,927 1,605 2,129 2,272
Depreciation and InvestmentJeduction 5/............ 2.866 2.809 2.480 2,160 1,550 2,250 1.550 1,550 1.550 1.550 2.550 1,250 1,550
SOURCES AND APPLICATION OF FUNDS
SOURCES
Income fro. Own Sources........ 2,499 1,086 1,494 1,231 1,990 2,560 3,005 3,603 3,340 3,477 3,855 3,679
Livestock Sales Last Month....... - 4,000 6,500 8,300 9.300 11.300 12,400 13,100 14.000 15,000 15.000 15,000BorrowingWorking Capital 6/ ......... 4,000 4,000 4,000 4,000 5,000 6 500 7 000 7,000 7,000 7,000 8,500 6,500
Development Loan 7/......... 4,607 4,406 3,254 2,136 - 2,450710/ - - - - - - 14,403111/
NAFCO Equity 8/............ 1,974 1,888 1,394 915 - - - - - - - - 6,171
Cash from Preceding Year ....... - 2,499 1,085 779 1.010 200 310 440 468 133 935 990
Total Source 13.080 17.879 17.727 17.361 17.300 23.010 22.715 24.143 24,808 25,610 28.290 26.169
APPLICATION
Livestock Purchases.......... 4,000 6,500 8,300 9,300 11,300 12,400 13,100 14,000 15,000 15,000 15,000 15,000
Physical Investment.......... 6,581 6,294 4,648 3,051 - - - - - - -
RepaymentWorking Capital............4,000 4,000 4,000 4,000 5,000 6,500 7,000 7,000 7,000 7,000 8,300
Deve lopment Loan 9/..........- - - 1,800 1,800 2,675 2,675 2,675 2,675 1,800 1,803 20,574
Cumuslative Cash Surplus ........ ,499 1,085 779 1,010 200 310 440 468 133 935 990 866
Replacement 12/ ............ - - - - - 3.500 - - - - 3,500 -
Total Uses 13.080 17,879 17,727 17,361 17.300 23,010 22,715 24,143 24.808 25,610 28,290 26,169
1/ From Consolidated Cost/Revenue table, TLMC.2/ 207. deduction allowed on new investment.3/ One-twelfth of the tocal annual Purchases valued at an average of Tsh 500/anis,l represents the working capital required. Int.rest compiled at 8Jk7. per annum.
4/At 407. of net income . Losses can be carried forward ad inifinitum.5/Added back as it is a non-cash expense. See table on Consolidated Cost/Revenue.
T/ At 84k( to be repaid the following year for purchase of livestock necessary to cover time lag between expenditure and, receipt.
7/077. of total investment.~/307. equity contribution by NAFCO. 9/At 8k%. four-year grace, 12-year maturity.
10/ Medium-term loan for replacing farm machinery at 847 one-year grace, five-year maturity.
711/ Excluding the replacement loan in year 6.
12/ Machinery replaced in the sixth year, eleventh year.
JulY 1.7, 1972

ANNEXTable ll
T A N Z A N I A
SECOND LIVESTOCK DEVELOPMENT PROJECT
Model - Markets: Tanzania Livestock Marketing Company
Operating Expense Projection(Tsh '000)
UnitUnits Cost 1 2 3 4 5-20
A. I[EADQUARTERS
Manager .................... 1 36 36 36 36 36 36Administrative Assistant ... 1 18 18 18 18 18 18Accountant 1/ ...... ........ 1 210 210 210 210 210 36Planning Officer ........... 1 24 24 24 24 24 24Accounting Clerks .......... 2 12 24 24 24 24 24Secretary ........ .......... 2 8 16 16 16 16 16Driver ..................... 1 4 4 4 4 4 4
Administrative Expenses .... - - 93 106 ]L22 125 130
Sub-total 425 438 454 457 288
B. ZONAL OFFICES 2/
Zonal Manager ...... ........ 4 24 72 72 96 96 96lHead Buyer 3/ ...... ........ 2 24 48 48 48 48 48Clerks ........... 9.......... 12 60 84 108 108 108Typist ..................... 4 5 15 15 20 20 20Driver ..................... 4 4 12 12 16 16 16Auction Market Personnel 4/. 24 0.5 12 - - -
Administrative Expenses .... - - 41 61 76 84 90
Sub-total 260 292 364 372 378
Total Expenses 685 730 818 829 666
C. MARKET AND BUYER TEAMS .ost PerMarket Team
Market TeamMarket Master ...... ...... 1 12 12Auctioner ....... ......... 1 10 10Clerks ................... 2 5 10Auction Market Personnel.. 10 3 30Miscellaneous (Annually).. 18 18
Sub- total 80
Buying Team bu TeamBuyer .................... 1 20 20Driver ................... 1 5 5Drovers .................. 3 2 6Miscellaneous ...... ...... - 9 9Fuel, Oil, Repairs ....... 18000 miles 30 30
Sub-total 70
Total Market and Buyer Teams 150
1 Expatriate to set up an accounting system for the Company. Financed for four years and replacedby a Tanzanian in Year 5.
2/ Four offices, one in each region (Central, Southern, Northern, and Western).3/ Only for the Central and the Western zones.4/ Used in auction marlets during first year that market is operated by the Zonal Administration.
June 30, 1972


ANNEX 4Page 1
TANZANIA
SECOND LIVESTOCK DEVELOPMENT PROJECT
Meat Processing
A. Introduction
Background
1. Apart from purely home killing, slaughtering is currently carriedout in Tanzania by some 62 district and municipal abattoirs, by three ranchabattoirs, by licensed rural butchers, and by Tanganyika Packers Ltd. (TPL)at their plant near Dar es Salaam. The TPL plant, built in 1950 and owned51% by Government and 49% by Brooke Bond Liebig of London, not only suppliesthe rapidly expanding Dar es Salaam meat market but is the only export meatpacking plant operating in Tanzania at the present time. It has an annualslaughter capacity of 300,000 head, including 200,000 head processed intocanned meat, and Brooke Bond Liebig has responsibility for marketing allexported processed meat, the bulk of which is sold in the UJnited Kingdom.
Scope of Project
2. The meat processing component of the Project involves (a) extensivesanitary improvements to the TPL plant to assure its approval by the UKveterinary authorities and continued entry of its produce iLnto the UK market;(b) the construction of two new plants--one in the city of Mbeya, 580 milessouthwest of Dar es Salaam and the other near the city of Shinyanga, 638 mileswest of Dar es Salaam. Each of these plants would have a slaughtering capacityof 50,000 head per year and would increase offtake from the traditional sectorby providing an outlet for cull cows and bulls.
3. Tanganyika Packers Ltd. Plant. The TPL plant is located 10 milesnorth of Dar es Salaam, with access by road only. Cattle received by railunload at Pugu 15 miles east and are trekked the rest of the way. The plantstarted operating in 1950 and is equipped to slaughter about 300,000 headyearly, which includes 200,000 head for canned corned beef in 12-oz and 7-ozcans. It also produces meat and bone extract for export and canned petfood.Inedible offal is processed into meat and bone meal, tallow, and hoof andhorn meal. Hides are salted but blood is wasted as there are no dryingfacilities. Table 1 shows the projected investment for the TPL plant andTable 2 the sales and operating expenses.
4. Slaughtering, boning, canning, and edible and inedible offalprocessing are carried out in a large two-story concrete st:ructure. Exceptfor the inedible rendering facilities, the plant and its equipment are in

ANNEX 4Page 2
good condition. Although layout and product flow is functional, modernsanitary standards of design and layout are lacking, making remodellingnecessary immediately to meet UK processing and hygiene standards for plantsexporting processed meats to the UK market.
5. Mbeya Plant. The Mbeya plant, located in the southwestern zone,would have a planned throughput of 28,000 head per year, including 5,000head of good quality steers for export to Zambia. The good quality cattlewould be supplied from the National Agricultural Company (NACO) and DistrictDevelopment Council ranches in the area to be financed under the Project.Table 3 shows the projected investment for the Mbeya plant and Table 4 thesales and operating expenses.
6. Shinyanga Plant. The Shinyanga plant, located in the Central Zone,would have an estimated annual volume of 33,500 head, including 20,000 headof good quality cattle from the NACO ranches in the West Lake area for canningat TPL. This outlet would yield the next best return since export to Zambiawould not be possible because the zone is not FID free, a basic Zambiarequirement. Table 5 shows the projected investment for the Shinyanga plantand Table 6 the sales and operating expenses.
B. Investment
7. Total Project costs of the meat processing component are estimatedat US$5.4 million, detailed as follows:
Total Investment Foreign Component…____--…(US$ '000)…- …
TPL Sanitary Improvements 1,622 1,216Mbeya Plant 1,796 1,106Shinyanga Plant 1,965 1,195National Agriculture andFood Company (NAFCO) -Tanzania Meat ProcessingCompany 26 21
Total US$ 5 409 3 538
8. The original request to IDA was for US$14.8 million, but investmentcosts were reduced by making the following main changes:
(a) a separate construction for all inedible processing would bebuilt for TPL rather than the separate slaughtering buildingoriginally requested, which would be considerably moreexpensive;

ANNEX 4Page 3
(b) no canning facilities would be constructed at the Shinyangaplant. Since the TPL plant in Dar es Salaam has a functionalcanning operation, frozen meat would be sent there from theShinyanga plant for processing;
(c) no working capital for cattle purchases for the two newplants would be financed;
(d) the Arusha plant would not be remodelled as the work couldnot be justified.
C. Project Works
TPL Plant
9. The reconstruction work at the Tanganyika Packers Ltd. plant wouldbe phased over three years with that needed to meet UK sanitary requirementsto be carried out in the first year.
(a) Work to be Carried out in Project Year 1
(i) relocate bone cooking equipment to the soup handlingarea on the first floor;
(ii) close off the existing loading funnels for melters onthe second floor and install mechanized loading on thefirst floor;
(iii) erect two insulated beef coolers (capacity 350 cattle),with rails and evaporator coils on area ma,de vacantby (i);
(iv) install a third cooler on the first floor (capacity350 cattle);
(v) install two inclined conveyors for lowering carcassesfrom slaughter floor to cooler on the first floor andto local sales area, and for elevating carcassesfrom the cooler to the boning room on the second floor;
(vi) completely separate the killing floor and cookroom fromthe boning room, which should be designed and equipped(wash basins and sterilizing equipment) to requiredsanitation standards; and
(vii) carry out improvement works to meet required standardsfor lighting, ventilation, and insect and rodent control.

ANNEX 4Page 4
(b) Work to be Carried out in Project Years 2 and 3. All works underthis Project would meet the specification and sanitary codesrequired by the US, UK, and EEC.
(i) remodel killing floor, separating the bleeding areafrom the skinning and dressing areas, and installfacilities for on-the-rail dressing;
(ii) install conveyor rail enabling carcasses to be spacedand avoiding contact between healthy and diseasedcarcasses;
(iii) provide for identification of head, viscera, and carcassuntil final inspection;
(iv) install controlled access points to edible-product areasto ensure that all personnel undergo a hygiene routinebefore entering the killing floor;
(v) construct additional coolers and a freezer store on theground floor of the main building to hold frozen meatfrom the Shinyanga and Nbeya plants after relocating theexisting inedible rendering equipment to a new buildingon the east side of the main building;
(vi) replace any melters that need removing and install ablood drier;
(vii) provide facilities, including cattle pens and autopsyroom, for slaughtering sick and condemned animalsseparately;
(viii) carry out necessary repairs on cattle pen floors andinstall sanitary curbs and drains; and
(ix) ensure that all equipment and surfaces in contact withmeat products are stainless steel, providing stainlesssteel basins, sterilizers, and bench surfaces in theproduct area.
Shinyanga and Mbeya Plants
10. Civil Works and Sanitary Standards. The plants would be designed,built, and equipped to meet the meat inspection sanitary standards of the US,UK and EEC. This applies particularly to the layout and product flow, whichdetermine the shape of the buildings.
11. All slaughtering and edible product handling would be carried outin a single-story building, with a flat concrete ceiling and cement blockwalls finished on the inside to give an impervious washable surface. Concrete

ANNEX 4Page 5
floors would be pitched and finished with abrasion- and impact-resistantsurface and standard drains would be provided. All openLngs would bescreened. Mechanical ventilation and standard levels of illumination inwork and inspection areas would be provided. Two insulated beef coolers(200-head capacity each) would be installed within the main building, alongwith rails and refrigerating equipment. A store with freezer capacity for15 days' production would also be supplied.
12. The processing of inedible by-products would be carried out in aseparate shed-type building, having concrete floor and b:Lock walls, designedon a modular plan to allow for possible future expansion,. The roof would beconstructed of corrugated galvanized sheeting on supporting structures. Thebuilding required to house utilities and provide storage space for hideswould be of similar construction, while the building to house offices,cafeteria, laboratory, and infirmary would have a concrete roof and concreteblock walls. Shaded cattle pens would have pitched concrete floors withindividual drains, sanitary curbs, and water trough. A standard inspectionpen and a race with footbath leading to the killing floor would also beprovided as would storage space for frozen products (two weeks' production),inedible products (two weeks' production), and hides (six weeks' production).
13. Processing Capacity. Buildings would be desigrned for a cattleslaughtering rate of 25 head per hour by one eight-hour shift per day.Equipment would be purchased to handle the projected kill of about 160 headper day and extra equipment could be added as required for increasedthroughput.
14. Killing Floor and Complementary Areas. All equipment that wouldcome in contact with meat products would be of stainless steel. On-the-walldressing and mechanical skinning knives are not recommended. Provisionwould be made for identification of the viscera, head, and carcass untilfinal inspection, and lock stops would be used on the rail to preventcontact between carcasses. Washbasins and sterilizers would be carefullylocated and access to the processing area would be confined to controlledpoints, using a strict hygiene routine. An autopsy room, emergency slaughterroom, and crematory tank for rendering dead and condemned beasts would alsobe provided.
15. Boning and Curring Room. This area would be windowless andinsulated and its temperature maintained at 70C. Stainless steel boningtables and trucking equipment and bandsaw for dissecting quarters into primalcuts would be used. Stainless steel belt conveyors are not considerednecessary but stainless steel sterilizers and washbasins would be installed.Consideration would be given to using plate freezers placed inside the boningroom for freezing the boneless meat.
16. By-products. Processing equipment for by-products would includeconventional mechanized rendering equipment, hasher-washer for soft materialand a grinder for hard material, melter-driers, expellers, grinders, mills,percolating pans, and tallow tanks.

ANDNEX 4Page 6
17. Transport of Frozen Heat. Frozen meat blocks would be transportedto TPL in insulated trucks. A hauling contract would be arranged with theNational Cold Storage Company, owners and operators of the necessary equipment,to service a widely dispersed cold storage chain. The feasibility of usingthis method of transport was established during appraisal. In addition, amedium-size truck would be provided.
18. Utilities. Package-type steam generators would be used. Arefrigeration plant with ancillary equipment, fuel storage, and equipmentfor water treatment would be provided. The present electric power supply isinadequate and, although plans have been made to increase it in Shinyanga,the time schedule is vague and it was, therefore, deemed prudent to makeprovisions for installing diesel generating sets. The water supply wouldcome from a new dam to be built on the Ningwa River about 4 km from theproposed site. The dam could provide up to 300,000 gallons per day to theplant, which is more than adequate. The financing of this dam is, at present,being negotiated with Sweden. Settling tanks, rapid filters, and chlorinat-ing equipment would be provided at the plant since the water supply for thedam will not be treated.
19. Effluent. Effluent disposal tanks would allow primary separationof solid material and fat and subsequent anaerobic fermentation in a largepond, and provision would be made for effluent disposal by percolation intothe ground.
20. Basic data for the two plants is summarized below:

ANNEX 4Page 7
Mbeya Plant Shinyanga Plant
1. Location About 10 miles from lbeya About 10 miles fromCity on the road to Zambia. Shinyanga City.
2. Processing Capacity 200 head per eight-hour day. 200 head per eight-hour day.
3. Product Mix -8,000 head for local 10,000 head for localmarket. market.
-15,000 frozen boneless -20,000 frozen bonelesscull cow and bull carcass- cull cow and bulles quartered and shipped carcasses quarteredto TPL for canning at the and shipped to TPLplant. Eor canning at the
plant.-5,000 head of good average -3,500 head of GAQ/FAQquality/fair average animals also sent asquality (GAQ/FAQ) animals frozen meat to TPL.exported to Zambia asfrozen boneless quarters.
-Edible offal in excess of -Edible offal in excessquantity sold locally of quantity sold locallyfrozen and sent to TPL. frozen and sent to
TCPL.-Salted hides, tallow, meat -Salted hides, tallow,and bone meal, and hoof meat and bone meal,and horn meal. and hoof and horn meal.
4. Investment Cost- Physical Investment US$1.706 million IJS$1.84 million- Working Capital US$0.126 million US$0.169 million
Implementation and Management
21. The three plants under the Project would be ownted by the TanzaniaMeat Processing Company, a proposed subsidiary of NAFCO, with headquartersin Dar es Salaam and branches at Hbeya and Shinyanga. The manager of thecompany would be responsible for implementation of the meat processingcomponent of the Project, and he would be assisted by an expatriate specialistin meat processing, financed under the Project. Investment and projectedoperating expenses for the company are included in Table 7.

ANNEX 4Page 8
D. Financial Projections
22. Financial projections for the Meat Processing Company (Table 8) showsthat the short-term loan for comparatively small investments would be repaidin Year 5, after which a substantial cash surplus would begin to accumulate,amounting to US$2.4 million in the tenth year. The profit and loss pro-jections (Table 9) anticipate a positive cash flow in the third year andan annual cash flow of about US$1 million after the fourth year, allowingan adequate margin for the repayment of long-term debt.
23. By Project Year 4, the total foreign exchange generated from theincremental meat exports over that estimated for Year 1 after appraisal wouldbe as follows:
Year 1 Year 4 Exports Foreign NetAfter After/1 Incremental Component of2 ForeignAppraisal Approval - Value Operating Cost- Exchange-------- head------- --------------… US$---------------------
TPL 50,000 70,000 1,834,000 45,000 s 1,789,000Mbeya - 20,000 2,166,000 114,000 2,052,000Shinyanga - 23,500 2,433,000 149,000 2,284,000NAFCO-TanzaniaMeat Processing /4Company - - - 15±202' 15,000
50,000 113,500 6,433,000 323,000 6,110,000
/1 Corresponds to Year 5 after appraisal.7W 15%, exclusive of cattle purchases.73 Comparatively low as incremental in fixed expenses practically nil,74 50% of expatriate expert salary in local currency.
October 16, 1972

TANZANiA ;Tabe
5S1CCD0 LIVESTOCK DEVUOPtNT PROJECT
Model: Sanitery loorovnts for Coned Meat Production at TPL - Der as Ssla
Imovtut Prolsotioc(Tsh OCO)
- Yor I ----- ------ Year 2 - ------- Ys 3 ----- Total% Cost 7. Cost 7 Cost Cost
INVESTHl ITEMT j/Find
PNI'SE I (Urgent) _/
CIVIL XONSTRUCTiOCDtals Ebisting all.. Vacets Space OD 2nd floor Hain BuLlding 100 110 - - - - 110lost Carcass coolers on 2nd floor Main Suilding 100 560 - - _ _ 560
ost Carcass Cooler on let Ploor Ho it Bilding 80 224 20 56 - - 200Pertition Wall. sod Insulation BoniS Root 2nd Floot Hlo Building Tho 420 - - - - 420I,tproronsDt it Lighting, Vrtiletion, Inaott and Rodent Control, Drains Ho 168 20 42 2 - 210
Sub-total 1.482 98 1 580
MACHINERY AND 0Q01P2004Coolar Rails sd Suppttia Srttuctcro - I.cliued Co---yors 80 224 20 56 - - 280Rafrigrsating Squipant. Compresaors. Evaporator and Handling Equipment 80 392 20 98 - - 490WOahabsine, Stedrliser, Wo'tabls. ott. s0 168 20 42 - 210Reloatioc Existing Proosesing Eqoipeot, 2nd Floor Hai Suilding 100 140 - - - - 140ttiscsllaooou. so 55 20 22 - - 110
Sub-total 1.012 218 _ 2 30
ENCINEERING AND OVERHEAD - Total 1/ - ISO - 20 - - 200
S0b-total - 2.674 - 336 - - 3.010
Phyoical C6rtin0occiea 4/ - 436 78 - - 714
TOTAL POISE I 3,310 404 - 3,724
PNASE 11
CItIL CENSTRUCTIONRaeod lcing Rilliog Floor 100 350 350EmedelIcg Offal. .od, sod Trips Sotiions - -10 140 - - 140Renodoloing Dressng Roots and Toilets 50 55 50 55 110HwodIlicg E..rg.noy Slsughter sd Autopy Roon 40 56 60 84 140Saoitary Improv_nt. Cattle Pns - 20 70 80 280 350N_ Shod Typ C.on trottioc for By-product Roedoring 100 210 - - 210
VotSpr.Rel'ostiog Moltere. etc., let Floor Main Building -- 100 10 - 110Beef Carr.s Coolar on lt Floor Hai Buildiog and ,re..sn Store - 80 672 20 168 040Co.-r on Potabls Water Re-roir and Chlorinator. - - 100 110 lloImprorements in Lighting, Ventilation, Insect od Rodent ControL, nd DrSirs - 40 65 60 102 1 70
4th-total _ 1.721 000 2.071
MACHIlKERY AND WUIPIDINTtillion Floor. on-rbe-rail-draing, Visu.ra Idontifir-tioc _ - 80 040 20 210 1,050
Convsyorised Sol. Wsshbboins, Steriliser, tc.Offal, Hood, Trips Handling Equlpet 80 56 20 14 70Brinles. nstol Meat Hsndling SqaIptt _ 30 105 70 245 550Cool r Rails ad Rrrigsrstig Equipen-t 35) 147 70 343 490Stailess Steel Moat Cookers. etc. for Cancing sod Extract Steriliesre .- 100 280 2800HRpl.ce Dtsriorsotd sy-produats d Ptfood Eqipnt sod Xit..ll ou- - _ 60 226 40 224 560
Huh-total - . - T r: 2.800
IDSIHEER2HI'iS OAND OVEtIUAD - Total 3/ - 350 - 150 500
Bub-totel _ - - 3156i 2.265 5.830
PhysIcal Contin8nais 4/ - _ - e45 538 1 ;83
THTAL PHASE 11 - _ - 4 410 _ 2.803 7.213
TOTAL INVSSTHaNCS WITHOUT PRICE ONTINGENCIES 0/ - 3,310 - 4,824 - 2,S03 10,937
IsTennt its conidded are essentially only thoo required dirootly or irdirsotly to soot inttrnational stardard of aanitat,Lou snd asrure approval from UK. Inspectorssod acoepteno of TN! produc for eport: CCB Host htraut.lte- include cratiog, freight ad reotiocD/ Su t0 de-ds fro tb U.K. Inspctor thi Phass orsos ssoontilly the facilities for chillina s11 curcssose prior to boning and parforicg the boricg sd tr1mndng inn enclod refrigsratod roo. This wo should be initiated ithin tho y_r of appreisal ad finished d-ring the buheaquect yees.
Inginasrin nd overhed ar- tompsrativoly mell as TN! tc determine nd supsovis- th-b olvee a loroe portion of the sanitary ip -ro onts.E .In rpair ieprov nt end rmodelling wok, - gr_atr prcntctag of uoforneeen wok is apt to deIvlop.
5/ Ho orking c.pital is iovolvd as tho ProJact i-volos physical ionasteot to kacep n oetiug ecterpris n toprratirn.6/ Thor Is no Import can on qoipetn for this Pruj3ct.
July 17, 1972

TANZANIA
SECOND LIVESTOCK DEVELOPMENT PROJECT
Model: Sanitary Improvements for Canned Meat Production at TPL Plant - Dar es Salaam
Sales and Operating Exopenses(Tsh 'OOO)
---------------------------- Year --------------------------------Category 1 2 3 4 5
VOLUME: Head of Cattle 1/ 50,000 head 55,000 head 60,000 head 65,000 head 70,000 head
SALESExport Canned Meat Sales 2/ 31,356 34,572 37,628 40,858 43,898Local Petfood and Offal 3/ 2,032 2,200 2,438 2,600 2,844Local By-product Salesl/ 2,941 3/190 3,529 3,772 0 4118
Total Sales: 36,329 39,962 43,595 47,228 50,8605uU3ss =_ ==r == ==:= 2XzuS
OPERATING EXPENSES
DIRECT: Cattle Purchases A/ 21,467 23,613 25,760 27,907 30,054Labor 2,880 2,880 2,860 2,880 2,880Salt 125 138 150 163 175Packaging Materials, including Cans 3,975 4,273 4,771 L,928 5,565Freight - - - -Miscellaneous Materials 200 _ 20Q 240 2LO 280
Total Direct: 28,647 31,104 33,801 36,118 38,954
OVERHEAD: Factory Expenses 2,500 2,500 2,600 2,650 2,700Employee Costs 3,900 3,900 3,900 3.900 3.900Administration Expenses 1,100 1 ,1C 1,200 1,250 1,300
Total Overhead 5/ 7,50u 7,500 7,700 7,800 7,900
TOTAL EXPENSES 36,147 38,604 41,501 43,918 46,854zzcz.: :=_=Z== = =22==z ==::== XSx-:=:
l/ Considers exclusively the volume involved for canning and corresponding sales of offal and by-products.It is assumed, as indicated in the tables on projected sales and operating expenses that the localbutchery trade involving 100,000 head yearly will operate on a full cost break-even basis including ashare of overhead and depreciation.
2/ Based on current CCB and meat extract prices as credited by Brooke Bond and Liebig to TPL H3/ No change in price Anticipated for petfood and by-products, however, offal prices based on No. 54
Ordinance and increased bv 40.8% to tiake TPL break-even at full cost on its butchery trade to DDC.4/ Based on new cattle prices established by TPL, February 1972.5/ 1971 overhead amounted to Tsh 8,567,000 according to TPL's own assess&"ent; Tah 7,500,000 corresponds to
the canning operation.
June 30. 1972

TANZANIA
SECONCC LNESTOCK DEvElLOPMET PROJECT
]:/
Model: tfbeys Meat Processing Plant - Daily Capacity - 200 Henao of Cattle
Iswestinent ProjeotLoc(Tsh 000)
I" I-Y i1 __ Ya es 2- Capacity or Totl
r.ITF.TMFNT !TEMS Coot DeR UnIt Cost aCot Total Units Coot
si /OP I N4'03..NPNT 2/
LANDloonl (ro oornmont-ovnasd)
Prep-ration, Rond, 100 234 234
'1:1,1 234 -34
''ItVII. (' :NT,THIPI'gI 10( 2',i"le P-s, Plant Yr-ds, T.frasaract-re 120/m 10ou 3b _ 3,2.1 m 0:'
ha: l'r:coooaloo MoIldidg (Sloghterlng, Offal,
"oat ltIaog, Irlllng, L-ling Drck, DressIng 72r/m2 Lr 72o
-o-r:, 'rs'r, Storage, Complete 1,30a0 m0 503 ,is.
nellIedi Hy-l'r'>do;rtc Incoindlog Hide Shed 430/n2 100 2430 Ox2
AOn! liorA Hoildlnno acd Ati.tnlo,tl.o b/ 100 480 803 a"
ol'!' lon Irnc 700/a2
100 -350 - 531 a
Total 2,360
'o; ::t-en iro-rato-c ood A-xlUary 70 539 3C 231 -x 30- hp
' .icooe Po=er i,-n-rator- cod A-olliary 70 517 30 C22 2 302 ', o-
Iterl Trent..ct and Sopply 70 bb5 :° 235 153,20 aA gal/too
tfOloent Treatment 63 95 40 b3 230,01 dgl/day l5
S,r-lc- LInen, mait.nasne -Equipmet 90 203 10 22 5
Total 2,019 823 2,042
MACHHINEFY ALrD E1)IP MrT
""EgI iHiFand Moat Pro-s-ng Eqolpasot Complete 70 714 0 30b 25 hd/hr l,
KMot Prodoct Handling EqoLpmect b2 149 4.0 99
Waohbasinn, stsrit-ers. _ad Heaters 03 97 hO 65 2 o ' 000
Hrfrigernticg tqn:paeat 70 592 0 2542
'soy Ren eeing EquIpment 73 53b 10 229 2 meltert
Tollo Tanks, Landry 7 3H 110 lI
Rio: lrvyig, Crematory Tabk 70 139 :1 59 2 -- iekl
'late Freseore nO 84 10 56 2 L4
Total 2,349 1,034 3,3
Hc for Workers 100 70 2 17
PLnot VehIcles 50 70 50 7 4 I4)
CttIle Tr4ckt 111O 90 2 j
Pr rigerted Trank __ 110 70 "I
Totat 70 30J 37
ATMINISTHATI0N, ETC.ciflire, laboratory, Cafeteria Parliltiso 70 -7 230C)
IN<OINFEPPN OVERHFAD (TOTAL) -3/ 70 4033 30 'I0 -2"
Sob-total M,02q 2,44 '0,1475
Ojynica- Contig-eoic- c90 017
Total FIned 1aveetent 4/2 i.372
WORKING CAPITLL 2/
LA3F 43 -3
SALT - 10 1J
PACKAGING MATERIALS - 143 143
FREI4H7 - 3b 3L
MISCELLANEOUS MATERIALS - 2 2
UTILITIES 63 r3
MArNTENANCE - 50 5C
S.LARES 225 225
ADMINISTTATIO EXPENSES - 50 57
IMANA4EMENT CONTRACT - 90 yo
MISCELLAMEOUS OVERHEAD - 23 23
Sob-total - 735 735
Plhysial Coatlnge-niec - 63 S3
Total Working Capital 79 73d
Total I-ets-t.nas _, 1.
W/ Work l fhedale75f-earF 57- bs/eik, H hones/day: nflSVn S.'T6expanlo= g decigned for 20D ho-e/dsy (50,003 head/peso);quaipamet that is sodloer proided for 1hO hocr/day pealk Volbin, ith seas- nal floctaution- permits the 28,000 head/yearly throaghpot
proje-ted; prodact sLo: cnreas. beef, bless .eats nd offal chilled anc/oe f.o.ea; Se1td hides, asat-saL. and dry blood, etc.
E tni_ca provid tes pl pnt designed to met sanitary standrds foe expfort; alL items inolade crtning, faight and ret .
-- Co Itroototf ths plact shoold he based n isaternatisna. h iddlag onat.rkdy delivery; til linits the o1ients cagiaericgo_ganicntion is a couple of Inspecting engineers dorEig design, ep.reatim of spn.uieftiso, ereetAi, andt trtl runs.
4/ There is cc import ta on eqoipment for this Prnj-ct. In-est-mnts daring YTar 2 correspond arninly to m-dular eqoiposst, vshicles, and
o;-tstsodlng bills rnm- YTsr 1.
5/ PRaed on 90 dyps reqoire-est. Cattle p-rohses to be fi-anoad vIth short-te- loans.
JuLy 17, 1972

TANZANIA Table 4
SECOND LIVESTOCK DEVELOPMENT PROJECT
Model: Mbeya Meat Processing Plant - Daily Capacity - 200 Head of Cattle
Sales and Operating Expenses(Tsh '000)
-------------------- Year-------- - - - -1 2 3 4-20
VOLUME: Head of Cattle Yearly 1/ - 15,000 head 21,500 head 28,000 head
SALES=port Canning Sales - 3,265 6,529 9,794Local Canning Sales 2/ - 89 178 267Export Meat Sales 3 F - 2,147 3,757 5,367Local Meat Sales 4/ - 3,706 3,706 3,706By-products Sales-5/ - 936 1 361 1,785
Total Sales: - 15.531
OPERATI f_EXPENSESDirect: Cattle Purchases 6/ - 6,186 9'Q34 11,881
Labor - 173 216 270Salt - 39 57 75Packaging Materials 7/ - 571 1,124 1,677Freight 8/ - 1h3 271 400Miscellaneous Materials - 6 9 13
Total Direct: - 11T
overhead: Utilities - 250 320 390Mlaintenance - 200 2h0 280Salaries - 900 940 1,010Administration Expenses - 200 220 2h0Management Contract - 360 360 360Miscellaneous - 90 120 180
Total Overhead at Mbeya - 2,00 ,20 ...
Additional overhead at TPL 9/ - 134 268 403
TOTAL EXPENSES: 9,252 13,179 17,179_ m -
1/ Includes 8,000 head (IAQ) yearly for local consumption in Mbeya; Year 2 - 5,000 head(LAQ) for canning at TPL and 2,000 head (FAQ/GAQ) for Zambia; Year 3 - 10,000 and3,500 head - yearly 15,000 and 5,000 head, respectively.
2/ Edible offal from kill destined for canning exceeds local demand and is shipped frozento TPL for petfood canning.
3/ Based on prices indicated in Phase II Project, in turn based on trial shipments madeto Zambia in 1971: LAQ: 6.50IAg; FAQ 7.35 L/kg (CIF) boneless meat and offal.
4/ Based on prices in Ordinance No. 54 (6/3/70) - increased by 40.8%, required for TPLplant to cover full cost on its DSM local wholesale trade.
5/ Involves salted hides, tallow, bone-meat meal, hoof horn meal, dry blood, and beeffat and prices current TPL.
6/ Based on new cattle prices according to Government Decree of February 1972:average IAQ, Tsh 347 per head; average FAQ/GAQ, Tsh 578 per head.
7/ Includes wrapping for frozen meat blocks shipped to TPL and Zambia and cans andcartons for canning and packing at TPL.
8/ Mbeya to Lusaka, and Mbeya to TPL materials to Mbeya.9/ Materials to Mbeya and meat blocks from Mbeya to Dar es Salaam.
NOTE: LAQ quality average 264 kg per head; FAQ/GAQ, 413 kg per head liveweight.
June 30, 197^

TAhWIA A.'ITEX 4
SECOND LrVESTOCK LlVMLPHIIIT PHOJEOT
Model: Sbiny- Mast Processing Plant . Deily Capacity - 20 HRed of Cattle j/T -ection
INVESTMENT ITEMSCoat ---- Yeas 1 ------ fa_ P - Capacity
FPXED INVESTMENTS: 2/ Pfs T TootalLAND unita Cost C _t Total Unit. C_ t
Lard (Goverest Owned) - 2S1tt Proparation, Roads 100 220 - 22
T~~~~t.l ~~~~~~- 255 22
CIVIL CONSTRUCTIONCattle Peas nd Plant Yards, Infratrucl.ure 120/.t 100 42o 3,500/r 420Mnto Pro-cen.i Building ( tSeughterig, rfal, Meat, 720/g22Cutting, Holding, Loading Dock, Dressing Roes, etc) 100 720 - - 1,000/n 720
Cuolern, Freener, Stor ge, Cnrtpl;te 1,400 2 100 650 6-00/, 6541oediblr 3y-pr-ducta Inclding Ride Shed 0/ 100 -2-0 Za~ 40A-niliary Ruildingo and Adfinint-ation 600/a 100 480 - _ BO/ni 4l00Staff II-aring ioo/w 100
Totni2B6 21b
TIT ILTIErPackage Stoan -Ieneratore nd A.niliary _ 70 539 30 231 2x300 hp 770Portage Poner cen.rator- and Auciliary _ 70 517 30 222 2x300 ki 739WRtor Treatment nd Supply - 70 990 30 428 150,000 3/0-4ka pipeline ,426Et fluent Tretent 60 95 40 63 200,000 O/D 158lorcio Ilice, Ralotenance REqoipaent - 90 220 10 24 - 214
10101l _ _ - - 3.337
NIAEIRIICs Y AN1 EQtIIPHENTMSAIiu6tecln, Neai rounnEing Equip-nt Complete - 70 714 30 306 25 head/hr 1,0o0
Meat Product Handling iquip.eet _ 60 164 40 108 272'4,cnIbssihnn l terillteco and Heter - 60 97 4t 65 - 162Ic-riR,osting Fquipw.ent - 70 651 30 279 2 x 50 trn. 9tOlopy Ilecdcilg tquipseot _ 70 590 30 252 2 mtors 842Iun 'loink-, laundry - 70 38 30 16 - 514blusoI !ry log Cxrenatory Tanko - 70 139 30 59 2 ve9selsI .I .te lrresr _ 60 8,4 40 2 140
Tutu- - 2 477 - 11 _ ' -TI,AMSR)0'T'
M,j fur W-rierk - - - 100 70 2 701,1-t Vehicles _ 50 70 50 70 4 140'ol ti r 'I -ln ck - loO 90 2 91)
-ulutc Izduc - -T- 100 140 2 140Tutwl - -Td - -
AtOcio,trat:oe, etc. - Office Laboratory, Cafeteria facilities _ 70 67 30 29 - 96
knItelneerlod and Over0oad Total 3/ - 70 490 30 210 - 700
ot-t otal - - 8,553 - 2.718 11.071
sGtl on.nreticies - - 7008 224 - 37
TOTAL FIXED INVESTMEnR 3/ - - - 2
rI'KINq rApirA1 5/ _ _ _ _ ~~~~ ~ ~~~~~~~~~~~~~~~~~~~~~~~~~~~~~~~52 _ 2IOu ,1 - - - 51 - 1 '.l,nlt - - - - ~~~~ ~ ~~~~~~~~~~~~~~~~~~~~~~~~~~~~~~~~~~~~~~~13 - -.
Uktgiog M-erlaln - - _ _ 250 - 250Freight - - - _ 56 - S6MI ie.lonocile Materlal - - 1 - 1
tiLlt leo - - - _ 80 - c0Men ntcennce - _ _ _ 60 _ 60':luurle -- - - -_ 235 - 235Ic) 4wil utrat InOnIJcpeocen _ _ - 55 55
MOnov,f-entt CoItract - - _ _ 90 - 90e,olaoo,c.nesusoverieadt - - - - 30 - 30Adllltiool Overh-Ad at TPL 6 3 - 63 - 63
ob totl - 985
1)1 In) 'lll tiongOOOlOO - -- -1t49 -t
20TAI. WORK0 NG CAPrrAL - - -A2 1 1 1
T TAL INVESTtMRNS _ _ 9,26i 4,088 - 13,269
Work Schedule 250 dayn/Year; 5 dsy/oeek; 8 i,/day: Allocing for epatn.om, biuldingt donigned for 200 head/dsy (50,000 head/yer). Equipment tiat In nodulsa provided for160/180 head/dsy peak -omae; with seasonal fn.ttion Permits the 33,500 hend yesarly. Thrnghput pro-jsted rdunt sin: arenas beef, boule.. meats, and offal fro..n,naIted hid.o, smat meal, dry blood, etc.2/ -tinte provides for a plant designed to meet oanitary standards for woport; all itmo includs orating, freight and erection.C -ontr-ntion of the plant ebnuld be based on intermational bidding on a b=nOW delirery, thie linits the clients engineering nYganisatina to a cnuple of inspectingengineers during design.T/ Thre iS m iwport t en equipment for this Project. I-a.tmesat during Year 2 eonrespond evinly to messir equipment, sbhicls and outstanding bills fon YTer 1 bills.
5/ Rased _n 90 days requiresents. Catele pwnhebata be fs neat with sharsin lama.
tuly 17, 1972

TANZANIA ANMEI 1
SECOND LIVESTOCK DEVELOPMENT PROJECT Table 6
Model: Shinyanga Meat Processing Plant - Daily Capacity - 200 Head of Cattle
Sales and perating Expenses
(Tsh 1000) --------- Year-----------------
Category 1 2 3 4-20
VOLU,ME: Head of Cattle Yearly / - 20,000 head 28,000 head 33,500 head
SALESExport Canning Sales 2 - 6,529 13,201 11,033Local Canning Sales 3 178 321 419Local Meat Sales 4 _ 4,797 4,951 5,045By-products Sales / - 1 189 1,750 2,091
Total Sales: _ 20,223 24,588
OPERATING EXPENSESDirect: Cattle Purchases 3 _ 7,542 11,282 13,477
Labor / 209 270 346Salt 50 73 87Packing Materials and Cans - 999 2,o26 2,550Freight 21 224 484 621Mliscellaneous Materials - 5 8 10
Total Direct: _9029 14,143 17,091
Overhead: Utilities 320 390 440Maintenance 240 280 310Salaries 940 1,010 1,040Admrinistration Expenses - 220 240 250Management Contract 360 360 360Miscellaneous - 120 180 220
Total Overhead at Shinyanga - 2,200 2,460 2,620Additional Overhead at TPL 10/ _ 250 500 700
Total Overhead: - 2,450 2,960 3,320
TOTAL EXPENSES - 11,479 17,103 20,411
/ Includes 10,000 head (LAQ -yearly for local consumption in Shinyanga - balance tobe shipped frozen boneless to TPL for canning and export.
2 Based on current CCB and meat extract prices as credited by Brooke Bond Liebig toTPL.
3/ Edible of'al from kill destined for canning exceeds local demand and is shippedfrozen to TPL for petfood canning.
4 Wholesale bone-in carcass prices: basic Ordinance No. rlh price increased by 40.8%to allow TPL to cover full cost on its local trade to the DDC.
5/ Involves salted hides, tallow, bone-meat meal, hoof horn meal, dry blood, beef fat,orices current at TPL.
6/ Based on new cattle prices according to TPL new scale of February 1972: average
TAD. Tsh h)i7 ner heid: average FAVJGA2, Tsh 579 per hc-ad.-/ Only Shinyanga labor included, as surplus labor at TPL can handle the additional
%volvne involved.i ±ncludes wrapping for frozen meat blocks shipped to TPL and cans and cartons for.'ann1i9.- ari nd packign at ,'Il.V' 1!'roKials ;sa Shinyanga and meat blocks from Shinyanga to Dar-es-Salaam.
L1U Tnl- auddi~ional overhead at TPL, utilities, mainterance, and administration expenses.
June 30, 1972

ANNEX 4Table 7
TANZANIA
SECOND LIVESTOCK DEVELOPMENT PROJECT
Model: Tanzania Meat Processing Company
Investment and Operatina Expense Projection(Teh tO00)
VehicleReplnement
CATEGORY Year 1 Year 2 Toal Tear 8 & 15
Investment ItemsOffice Furniture and Equipment: Head Office DL 20 10 30
Branch Office Mbeya Plant 10 5 15Branch Office Shinyanga Plant 10 5 15
Vehicles: Head Office D.S.M. I Units 35 - 35 35Branch Office Mbeya Plant 1 35 _ 35 35Branch Office Shinyanga Plant 1 35 35 35
Sub- total 145 20 165 105
Contingercies 15 2 17 11
TOTAL INVESTMENTS 160 22 182 116
Operatina Expenses
Head Office,* D9M - Salaries: IManager-Accountant 36 361 Meat Processing Expert (Expatriate) 210 210IPlant Engineer 34 341 Clerk-Driver 6 61 Secretary-Typist 8 8
Rent: 4 Rooms 35 35- Administration Expenses 15 20- Air Travel 15 20- Vehicle Maintenance 20 25
Branch Office, Mbeya Plant -Salaries: 1 Manager-Processing Engineer 34 341 Secretary-Typist 8 8
-Rent 2 Rooms 20 20-Administration Expenses 5 7- Air Travel 5 5- Vehicle Maintenance 25 30
Branch Office,Shinyanga Plant - Salaries: 1 Manager-Procassing Engineer 34 341 Secretary-Typist 8 8
- Rent 2 Rooms 20 20- Administration Expenses 5 7- Air Travel 5 5- Vehicle Maintenance 25 30
TOTAL OPERATING EXPENSES 573 602
August 8, 1972

; A2.4AN I A
_ECOr.D LIVEtOCz DtEVEL0OPMLn PROJECT
Model: Ta--ania Meat Processing Company
Financial Projections
(Tah '000)
--------- _---------------------------------_-_--__------------------ Y E A R S ---------------------------------------------------------------------
1 2 3 4 5 6 7 8 9 10 11 12 13-14 15 16-20
CASHS INF LOW
1. Total Sales as Collcted
(a) FPom TPL 36,329 39,054 42,687 46,320 49,952 50,860 50,860 50,860 50,860 50,860 50,860 50,860 50,860 50,860 50,860
(b) From Mheya Plant - 7,607 14,184 19,572 20,919 20,919 20,919 20,919 20,919 20,919 20,919 20,919 20,919 20,919 20,919
(c) From Shinyanga Plant - 9,722 18,408 23,497 24,588 24,588 24,588 24,588 24,588 24,588 24,588 24,588 24,588 24,588 24,588
2. Investments
(a) NAFCO Equity 207. 4,250 24457 561 - - - - - - - - - - -
(b) Long-tear Loan: IDA 70%; NAFCO 10% 17,032 9,626 2,242
3. Short-Tern Financial Resources
(a) Short-term Loan551 3,758 3,2466 2,189 -
TOTAL CASH INFLOW 58,170 72,424 81,5148 91,578 95,459 96,367 96,367 96,367 96,367 96,367 96,367 96,367 96,367 96,367 96,367
CA3S! OUITLC4
1. Investments(a) NAFCO - TMPC 160 22 - 116 - - - - - 116
(b) Pi-ed TPL P1s-t 3,310 4,824 2,803 - -
(c) Fixed Mbeya Plant 8,719 2,653 -
(d) FiPed Shinyanga Plant 9,261 2,942 - - - -
2. Ope-ating Costs
(a) NAFCO - TMPC 573 602 602 602 602 602 602 602 602 602 602 602 602 602 602
(b) of TPl Plant 36,147 38,604 41,501 43,918 46,854 46,854 46,854 46,854 46,854 46,854 46,854 46,854 46,854 46,854 46,854
(c) Of Mlbeya Plant - 9,252 13,179 17,179 17,179 17,179 17,179 17,179 17,179 17,179 17,179 17,179 17,179 17,179 17,179
(a) Of Shinyanga Plant - 11,479 17,103 20,411 20,411 20,411 20,411 20,411 20,411 20,411 20,411 20,411 20,411 20,411 20,411
3. Debt Service
(a) Short-term Loan 'nterest 8b - 47 3W 295 186 - - - - - - - - - -(b) Short-team Loan Repayment - 551 3,758 3,466 2,189 - - - - - -
(c) Consolidated Long-term LoanInterest 8 - 1,448 2.283 2,04 2,199 1,924 1,649 1,374 1,099 825 550 275
(d) Consolidated Long-term Loan
Aaortiz&tion - - - 3,233 3,233 3,233 3,233 3,233 3,233 3,233 3,233 3,233 - - -
t. Corporation Income Iam - - - - 530 3,179 3,289 3,399 3,509 3,619 3,729 3,839 3,948 3,948 3,948
TOTAL EXPECTED CASH OC'TFLOW 58,170 72,424 81,548 91,578 93,383 93.382 93,217 93.168 92,887 92,723 92,558 92,393 88,994 89,110 86,994
CASH SURFLUS AT YEAR END - - - - 2,076 2.965 3,150 3,199 3,480 3,644 3,809 3,974 7,373 x 2 7,257 7,373 x 5
CUMULATIVE CASH SRWLUS - - - - 2,076 5,061 8,211 11,410 14,890 18,534 22,343 26,317 241,063 48,320 85,185
C .onparativelw small i-rvcsmerts for NAFCO - TMPC, gill 8e finarned wit- snort-term lean.
Alugu3t 5, 1972

SECOND LIVESTOCIt DELOPMNT PROJECT
Model: Tnzania Megt Processing Cmmauv
Profit d i" f ectionS
1 2 3 4 5 6 7 8 9 10 11 12 13-14 15 16-20
DeC06
Tot.l8aU as iollectad(a) Conaoiidatad (TPL -
hbeya - Shinyanga) 36,329 56,383 75,279 89,389 95,459 96,367. 96,367 96,367 96,367 96,367 96,367 96,367 96,367 96,367 96,367
EXPENSES
Operating(a) Consolidated (?FL.
b<ya - Shinyrynga) 36,147 59,335 71,783 81,508 84,444 84,444 84,444 84,444 84,444 84,444 84,444 64,444 84,444 84,444 84,44
(b) NAFCO - 1MPC 573 602 602 602 602 602 602 602 602 602 602 602 602 602 602
Interest(a) Short-term Interest,8J7% - 47 319 295 186 - - - - - - - -
(b) Consolidated Long-term Intereat,8j1 - 1,.448 2,283 2,1474 2,199 1,924 1,649 1,374 1,099 825 550 275
DeDreciation(a) Consolidated (SP! - I*eya -
Shinyanga) 208 1,345 1,420 1,496 1,496 1,413 1,413 1,413 1,413 1,413 1,413 1.413 1,413 1,413 1,413
(b) NAFCO - TtW 36 36 36 36 36 36 36 36 36 36 36 36 36 36 36
TOrAL EXPENSES 36,964 62,,81d 76,a3 86,411 t8,963 oo,419 88.1.44 81,869 87,594 87,320 87,045 86,770 86,495 86,495 8t,495
OPERATING INCOtlE ( 635) (6,430) (1,164) 2,978 6,496 7,94.8 8,223 8,498 8,773 9,047 9.322 9,597 9,872 9,872 9,872
Tax Loss Carry Forward ( 635) (7T065) (8,229 (5,251) - - - - - - - - - -
CO8PORATr(ON IWXMETax INCQI _ - - 498 3,179 3,289 3,399 3,509 3,619 3,729 3,839 3,948 3,948 3,948
MET INCOtt - - - 2,978 5,998 h,769 4,,934 5,099 5,261 5,b28 5,593 5,755 5,924 5,924 5,924
NET INCOKE PLUS DEPRECIATION ( 391) (5,049) 292 4,510 7,530 6,218 6,383 6,5108 6,713 6,877 7,012 7,204 7,373 7,373 7,373
August 8, 1972


ANNEX 5Page 1
TANZANIA
SECOND LIVESTOCK DEVELOPMENT PROJECT
Financial Institutions and Agricultural Credit
General
1. Tanzanian lending institutions are wholly Government owned, thebanking system consisting of the Bank of Tanzania; two commercial banks, theNational Bank of Commerce and the Peoples Bank of Zanzibar; 1/ and twodevelopment banks, the Tanzania Investment Bank and the Tanzania RuralDevelopment Bank. There is also a variety of financial institutions suchas the Tanganyika Development Finance Company Ltd., the National InsuranceCorporation, Permanent Housing Finance Company, Diamond Jubilee InvestmentCo., and Investment Promotion Services. Since these entities, however, bearno direct relation to the Project, they have not been covered in thisdiscussion.
The Bank of Tanzania
2. The Bank of Tanzania was created by Act of Parliament in 1965 andamended in 1971, to function as a central bank, issuing currency, regulatingbanking and credit, acting as banker to the commercial banks and to Government,and serving as fiscal advisor to Government. A Governor administers bankoperations in accordance with policy as prescribed by the Board of Directors,which consists of the Governor, Chairman; the Director General, deputychairman; the Principal Secretary to the Treasury; and eight to ten directors.The Governor and the Director General are appointed by the President of theRepublic, while the directors are appointed by the Minister of Finance.The Governor and the Director General hold office for the period specifiedin the instrument by which they are appointed, while the directors areappointed for three-year terms.
3. There are 10 departments in the bank -- Banking, Foreign, ExchangeControl, Import Control, Currency, Security, Accounts, Audit, Research andStatistics, and Administration. The Banking Department provides a domesticbanking service to Government, maintaining its accounts and those of theinternal revenue offices throughout the country as well as; those of the twocommercial banks, while the Foreign Department has as one of its prime tasksthe preservation of Tanzania's foreign exchange position, and deals alsowith investment and relations with international institutions. The ExchangeControl Department insures that rules and regulations regarding external
1/ This bank operates only in the island of Zanzibar.

ANNEX 5Page 2
payments for imports and other remittances are observed, and the ImportControl Department regulates the flow of goods into tile country accordingto available foreign exchange. The other departments perform supportservices, as indicated by their names.
4. The authorized (and paid-in) capital of the bank is Tsh 20 million,while total assets on June 30, 1971 amounted to Tsh 1,300 million. The bankrealized a net profit of Tsh 42 million during 1970/71, which was Tsh 2million higher than that achieved in the previous year, and credited it toGovernment (Tsh 33 million) and to the General Reserve Fund (Tsh 9 million).
National Bank of Commerce
5. The National Bank of Commerce (NBC) was created on February 7, 1967by Act of Parliament to take over the banking business of a.ine foreign banksafter their nationalization, one of its main purposes being to mobilizedomestic savings. Lending operations extend into agriculture, industry,construction, transport, trade, tourism, mining, and marketing, with loansgranted to both the private and the public sectors.
6. NBC is governed by a Board of Directors, comprising a Chairmanand Managing Director, appointed by the President of the Republic, and Eiveto nine members, appointed by the Minister of Finance. A General Managersappointed by the Board, is responsible to the Managing Director for day-to-dayoperations of the nine headquarters departments and the 130 branches andagencies that make up its countrywide network.
7. NBC is in good financial condition. Authorized capital is Tsih 175million and paid-up capital amounts to Tsh 50 million. Total assets were overTsh 1,800 million as of June 30, 1971 and by the end of the year had risen tomore than Tsh 2,175 million. Net profits for the financial year 1970/71 wereTsh 37 million as against Tsh 23 million in 1969/70. Funds for short-termoperations come mainly from public deposits, which reached about Tsh 1,600million on June 30, 1971, with Tsh 1 million deposited in current accountsand the balance in fixed and short-term deposits and in savings accounts.Another source of funds, however, is the Bank of Tanzania, which can makeadvances to NBC against the security of crop finance bills. These arepromissory notes executed by borrowers to the extent of the facilitiesused. The Bank of Tanzania charges an interest rate of 5% per annum onthese advances.
13 Except for long-term loans to the Tanzania Investment Bank forportfolio taken over, all loans are granted on short-term basis, usually upto 180 days. NBC's financial support to agriculture and livestock at the endof 1971 amounted to Tsh 81 million for production purposes (mainly seasonaladvances for planting and harvesting) and Tsh 397 million for marketing ofagricultural products. Under the Second Livestock Development Project, NBCwould provide short-term loans to the various parastatals involved. Rates ofinterest vary in relation to the type of borrower and the purpose of theloan - 6-1/2% to cooperatives; 7% to sisal growers and ranchers; 7% to 8%

ANNEX 5Page 3
to parastatal organizations; 7-1/2% to 8-1/2% to exporters, industries, dadagricultural enterprises (other than sisal producers); 8% to 9% to importers,retail trademen, building contractors, and the like; 9% on secured personalloans; and 10% on unsecured personal loans.
Tanzania Investment Bank
9. The Tanzania Investment Bank (TIB) was established by an Act ofParliament in October 1970 to specialize in the provision of medium- and long-term credit for industrial development in such fields as manufacturing,assembly, processing, engineering, construction, transportation, tourism,and mining, as well as for development of large-scale corporate agriculture,ranching, forestry, and fishing. TIB's other activities can be broadlysummarized under guarantee operations, equity participation, specialfunds administration, trusteeship operations, and technical assistance.
10. The Board of Directors consists of the Chairman and Managing Director,who is the Principal Secretary to the Treasury, and six members. The Chairmanand three directors are appointed by the President of the Republic, threeDirectors are appointed by the Minister of Finance, two are appointed by theNational Bank of Commerce, and one by the National Insurance Corporation. AGeneral Manager, appointed by the Minister of Finance for a term of five years,is in overall charge of the bank's four departments: Operation, Finance,Economic Research, and Secretariat and Administration.
11. The authorized share capital of TIB is Tsh 100 million, dividedequally into paid-up shares and callable shares. The paiLd-up capital of thebank is Tsh 50 million, divided among Government, Tsh 30 million (60%7);National Bank of Commerce, Tsh 15 million (30%); and National InsuranceCorp., Tsh 5 million (10%). The value of the portfolio as of June 30, 1971amounted to some Tsh 100 million, composed mainly of loans granted by theNational Bank of Commerce and transferred to TIB. Net profit on June 30, 1971was Tsh 0.8 million. Interest charges are 9% per annum in long-term loansand 9-1/2% per annum in short-term working capital loans.,
Tanzania Rural Development Bank
12. Background. The Tanzania Rural Development Bank (TRDB) was createdby the Tanzania Rural Development Bank Act, 1971, with the followingobjectives: to provide long- and medium-term finance for rural development;to provide technical assistance for the purpose of promoting rural develop-ment; to administer such special funds as may from time to time be placedat its disposal; to finance the purchase of agricultural inputs; to undertakeother activities as may be necessary for the purpose of furthering the fore-going objectives. IDA approved the creation of TRDB through an amendingagreement (April 28, 1971).
13. Several rural credit measures had been adopted by Government beforethe passage of the TRDB Act. Among them were measures authorizing theestablishment of the Land Bank of Tanganyika (1947-1962), the Agricultural

ANhNEX 5Page 4
Credit Agency (1962-1964), and the National Development Credit Agency(1964-1971).
14. TRDB inherited some assets and liabilities as well as certainoperations from the National Development Credit Agency (NDCA), includingIDA Credits 80-TA (US$5 million, general agricultural credit) and 217-TA(US$6 million, flue-cured tobacco). Bad debts worth about Tsh 31 million(US$4,350,000) were not transferred to TRDB. Nearly all of NDCA's staffwere absorbed into TRDB and most of them retained their previous assignments.
15. Organization and Management. TRDB is controlled by a board ofdirectors, including the chairman and managing director appointed by thePresident of the Republic, and eight other members appointed by the M}inisterof Finance and chosen from among persons with knowledge and experience ofeconomic and financial matters, rural development, agriculture, ujamaavillages, or cooperatives. The general manager, who is appointed by theMinister of Finance for a term of five years, manages the bank throughits five departments and various committees. TRDB has one head officein Dar es Salaam and 12 regional offices, which will be increased to 18to cover every region in the country.
16. There were four departments: development, finance, administration,and operation. The posts of chief accountant and financial analyst havebeen filled with expatriate officers, with IDA's approval, under Credits80-TA and 217-TA. It is intended also that TRDB will receive up to sixUNDP-FAO technical experts, one for each aspect of rural development, insupport of TRDB's regional representatives. Local experts will replace theUNDP-FAO team after a three-year training period.
17. TRDB has an authorized capital of Tsh 100 million, divided into100 equal shares, the Government being the sole authorized shareholder.Issues paid in shares in February 1972 were Tsh 30 million, including Tsh 25million tangible assets transferred from NDCA when TRDB came into operationin May 1971, and Tsh 5 million paid by the Government in January 1972.General reserves as of December 31, 1971, amounted to some Tsh 1.6 million,including a surplus of about Tsh 1 million resulting from operations overthe period July-December 1971 (Table 1). Other TRDB resources compriseshort-term deposits of Tsh 6 million, IDA funds of Tsh 35 million andTsh 45 million (IDA Credits 80-TA and 217-TA, respectively), and NationalBank of Commerce's overdrafts for Tsh 3 million. TRDB also administersa loan of Tsh 2.1 million from SIDA for grain stores and a loan of Tsh 8million for the purchase of Swedish trucks. There is also a bank overdraftof Tsh 7 million incurred by TRDB's predecessor for the purchase of tractors.Negotiations are being conducted with Government for its liquidation, however,as most of the loans are in default and TRDM has received verbal assurancethat Government will assume responsibility.
18. TRDB also has authority to accept and administer special funds forthe purpose of making loans on concessionary terms (para 21).

ANNEX 5Page 5
19. Technical Services. TRDB is committed to provide technical assist-ance to borrowers. This job is performed by 12 regional representatives, allof whom are graduates in either economics or agriculture, some having beentrained overseas. Seminars and short courses are included in the trainingprogram, the first of which was conducted early this year in Dar es Salaam.In addition, negotiations are underway to recruit six UNDP/FAO experts asrequested by Government. Three of them are expected to arrive this yearand the remainder in 1973.
20. Lending Operations. TRDB makes short- and medium-term loans up tofive years and long-term loans up to 15 years. Eligible borrowers arecooperative unions and societies, district development corporations, ujamaavillages and registered associations, corporations and individuals, and anyborrower whose needs fell within the scope of any agreement under which TRDBhas borrowed funds. Project loans should be technically and financiallyviable and should be consistent with national economic development priorities.TRDB secures its loans by either a first mortgage on imiovable property or achattel mortgage on movable property and values security at 75% of theappraised value of the mortgaged property. TRDB does not undertake anyforeign exchange risk. Short term loans are generally rade at 8-1/2% interestp.a. There is also an application fee of Tsh 5 to Tsh 500.
21. Source of Funds. TRDB has two main classes of loans -- those madefrom ordinary funds and those made from special funds. Ordinary funds arederived from the issuance of share capital, deposits, bank overdrafts, andGovernment loans. Included in this category are IDA Credits 80-TA and132-TA and loans from SIDA (Sweden) for grain storage facilities and trucks.TRDB is also expected to receive special funds from Government or othersources to grant loans on concessionary terms. These funds shall be recordedand maintained separately from ordinary capital resources, nor shall profitsand losses between ordinary or special funds be chargeable to each other.
22. Results of Operation and Financial Condition. Total portfolio asof February 29, 1972 has grown to over Tsh 102 million .as against only Tsh 71million in May 1971. Recoveries from the old portfolio for the same periodamounted to some Tsh 43 million, principal and interest included. TRDB'sprofit before taxation was Tsh 1 million on December 31, 1971. While TRDB'soperating policies are satisfactory, accounts recently received indicate asharp rise in overdues - from Tsh 15.5 million as of May 1971 to Tsh 25.3million as of September 1972. TRDB's loan portfolio increased by 63% duringthis period and although overdues have remained constant (21% of total) theprovision for bad debts increased by 11% only from Tsh 11.4 million to Tsh12.7 million. Accordingly, it would be a condition of credit effectivenessthat an analysis of such overdues and a statement of measures which TRDBwould take to reduce them to acceptable levels would first have been receivedby IDA. In order to facilitate the strengthening of TRDB's financial positionand to enable it to build up reserves, IDA funds would be made available toit at 4% annually, the rate applying under the first livestock projectand would on-lend to final beneficiaries at 8-1/2% annually (its currentlending rate) giving TRDB a margin of 4-1/2% annually. TRDB administers

ANNEX 5Page 6
US$6.4 million under the Flue-Cured Tobacco Project. Another IDA credit fortea development recently approved is channeled through TRDB. With theimplementation of these two projects and the proposed Second LivestockDevelopment Project, TRDB should be in a sound financial position.
23. TRDB's accounting system is satisfactory. Auditing is performedby the Tanzania Audit Corporation (TAC), which already has audited itsbalance sheet for the two-month period ended June 30, 1971. However, thecorresponding certificate and report were not yet available. TRDB would berequired to submit to IDA its audited annual accounts not later than sixmonths after the close of its financial year.
24. Project Participation. TRDB would act as the credit channel exceptfor the funds to Government for technical services and the Tsetse Control Unit.It would channel funds for the following loan beneficiaries: ujanhaa coopera-tives, DDC corporate ranches, Tanzania Livestock Marketing Company andTanzania Meat Processing Company, and National Agricultural Company (NACO).
25. TRDB would receive the Project funds at 4% interest for a term of16 years, with an eight-year grace period, and on-lend them at 8-1/2 interestrate.
26. In the case of all the ranches, TRDB's security would consist ofa lien over the livestock held on the ranch and the ranch itself untiloutstanding loans are repaid. All animals would be branded with a ranchbrand. All livestock purchases and sales would have to bo approved byTRDB. Wherever possible, loans would be repaid by a deduction of the saleprice of each animal brought to the marketing company and this would beremitted directly to TRDB by this company.
27. TRDB would hire, within six months of credit effectiveness, alivestock credit expert for a minimum period of two years. Appointment tothis position would be made in consultation with IDA. TRDB is also expectedto hire not less than 10 local professionals capable of performing as live-stock credit officers, all of whom would be engaged exclusively in Projectimplementation. TRDB would conduct a training program for these officers.
28. TRDB is also the channel for finance under the Agricultural CreditProject (IDA Credit 80-TA), currently fully disbursed, and the Flue-CuredTobacco Project (IDA Credit 217-TA), US$547,000 disbursed (Feb. 28th, 1973),a function which it took over from NDCA, with IDA's agreement. TRDB is alsothe channel for the Smallholder Tea Development Project recently for US$10.8million, with US$375,000 disbursed (Feb. 28th, 1973).
29. Ex NDCA overdue loans as of February 1972 totaled Tsh 22 million,or 30% of total outstanding loans. Since it is assumed that a substantialpart of this portfolio would be very difficult to collect and that part of itwould be uncollectible, it would be advisable for TRDB to create a specialsection devoted exclusively to recovery operations. A thorough analysis ofthis portfolio would also be conducted to define more accurately the estimatedpercentage of funds susceptible of collection and the comparative cost to beincurred by TRDB for this purpose.

AIaNEX 5Table I
TANZANIA
SECOND LIVESTOCK DEVELOPMENT PROJECT
Tanzinia Rural Developnment Bank
Convarative Balance Sheets
As at June 30. 1971 and December 31. 197:1(Tih '000)
Assets June 30. 1971 December 31, 1971
Loans (Less Provision for Bad Debts) 54,927 89,825Sundry Debtors 1,192 2,451Cash and Banks 15,500 23Fixed Assets 785 893
Total Assets 72,40 93,190
Liabilities
a. Current 9s934 25,210b. Medium- and Long-Term 36,7h3 -41,401Issued Share Capital. 25,000 25,000General Resem,e 661 661Profit 66 1.018
72.4043, 2290
Authorized Capital - Tsh 100 million
2/ Unauditedi/ Before taxation
Source: IBaDApril 1972
June 30, 1972


ANNEx 6
T A NZARN I ATalI
SECCRI LIVESTOCK DKVELOFME8T FROJECT
Ndl A IO and DIC Corporate Ereeding/Fittaning Ranch - 40.000 ha
flerd Proiecden-
.... - ----------------------- End d o flRnchYac-------------------- - -----Defere
352D -:C9MP01TION bioliomnt *j 2 3 4 3 6 7 8 9 10 11-20
l:eeiing Cow$s.................4,000 4,891 4,891 4.891 4,891 4,891 4,891 4,891 4,891 4,891 4,891. ................................. 200 245 245 245 245 245 245 245 245 245 245
Calves.-- 1,600 1,956 2,446 2,690 2,933 3,179 3,424 3,424 3,424 3,424Hollers 9-24 months.- ~~~~~~ ~~~~1,095 448 768 939 1,174 1,291 1,409 1.526 1,643 1,643 1,643
Stee.rs 9-24 moths................- - 769 939 1,174 1,291 1,409 1,526 1,643 1,643 1,643Steer 24-36 moths ............ 737 902 1.127 1 240 32S 1.6 Li~j 1.578
-ota N-mbers - 5.295 5,584 6,672 7,751 8,383 8,945 9,192 9,540 9,882 10,000 10,000ToalAimals) - .295 7.184 8.628 10.197 11.075 11.780 1Jj,72 1296 13,311 1342 13,424
Sub-total AU 5,295 5,584 6,670 7,751 8,385 8,845 9,192 9,540 9,887 10,000 10,000Pur-chased Steers ..............- 2.00 2.500 2.000 1.000 1.000 1.000 808 460 113 --
Totl ll1 -I.8 8.08 8.672 8.751 9.&385 9.845 1L0,
0010.000 10 002 1022 IMO
!Kz: uitN
8-ee-Lg C-ev..........-........160 196 196 196 196 196 196 196 196 19654,......................8.. 10 10 10 10 10 10 10 10 104c-ero ... I.............-...-...64 79 98 108 117 127 137 137 137Heijert 9-24 s-the.-.......-.......44 18 31 38 47 52 56 61 66 66Steers........................- - 31 38 47 52 36 61 66 66Steers 24-36 months ............-...-.. 29 36 45 50 54 59 63
Sub-total (emaleding weaners) -- 212 224 268 310 356 354 368 382 395 400Purchase.d Steers. ......................... wn 1..an 80 40 40 40 32 18 5-
Total -- 312 324 348 550 376 394 400 400 400 400
PUROCHASES
Os-asaHelfers.................1,095 448 - - - - - - - --
Rr-edisg-Age Heifers..............I4,000 - - - - - - - - - -
Sal.- ...................... 200 53.I 10 33 69 68 68 68 68 68 68
Sub-total - 5,295 501 10 33 68 68 68 68 68 68 68Steers.-......................g L..%2 L220 1.000 1.000 1.000 808 460 113 - -
Total1 2.22 L.2_ .MQ .L_2W aM £,_j 876 59 181l 68 68
SALES0
Bal.- -........................ 23 59 59 59 59 59 59 59,all Helfers 9-24 montha .- -.........-.. 74 90 113 124 135 146 158 158
Seles24-36 moth.- - - 233 146 349 450 552 653 755 755Otner 24-3 mots. - - - 708 865 1,082 1,190 1,298 1,406 1,515
FaLttening CallFe Ya.-.......-.......235 235 470 470 _470 470 470 470 470
Sob-total1 235 565 1,472 1,855 2,184 2,405 2,626 2,647 2,955P-rah-d Stesr .-............. 2.400 2340D 1.920 860 960 960 775 442 108
Total - .40 2.635 21.495 2&.432 2.15 3L44
3.181 3.068 295295
TECHSCAI. COEPPIICl0MS
Qeaning Rate % ........ .......... 60.00 40.00 40.00 50.00 55.00 60.00 65.00 70.00 70.00 70.00 70.00
,lol Mortality 7............... .- 19.00 10.00 10.01 10.00 10.00 10.00 10.00 10.00 10.00 10.00 10.00A4olt Mortality 7........ ......... 4.00 4.00 4.00 4.00 4.00 4.00 4.00 4.00 4.00 4.00 4.00
Istr-ctiss kate 7........ .........- - 3.92 7.29 17.56 20.98 27.76 25.21 26.56 28.47 29.55
To.tal ostpat Rate 7.................3.52 7.29 17.56 20,98 22.76 25.21 26.56 29.47 29.55
',ows/Total herd %................75.55 68.08 56.69 47.97 44.16 41.52 36.53 37.73 36.74 36.44 36.44
Sa11/Ca. Ratio 7.................5.00 5.90 5.00 5.90 3.00 5.00 1.00 3.00 5.00 3.00 5.00
Cow Calling Rate %................- - 3.130 5.00 10.00 10.00 10.00 10.00 10.07 10.00 10.00
'Sell Calling Rate 7..............-...10.00 25.00 25.00 21.00 25.00 25.00 25.00 25.00
Seiter CallIng Rate 7.....-...........10.00 10.00 10.00 li'.00 10.00 10.00 10.00 10.00
3troklsg Rate ha/AlS!...............5.13 4.95 4.61 4.57 4.26 4.06 4.00 4.00 4.00 4.00 4.00
ltocking Rate AU/ha ............... 0.19 0.20 0.22 0.22 0.23 0.25 C.25 0.25 0.25 0.25 0.25
Ce.rrylcg Cap. All.................10,000 10,000 10,000 10,000 10,000 10,000 10,000 10,000 10,000 10,000 10,000
j?srahaaina Prices/Head
lastare lieflers................280 280 280 280 280 280 280 280 280 280 280h,reodlng-Age Heifersa..............388 380 380 380 380 380 380 380 380 380 380
Bal.- ..................... 1,000 1,009 1,000 1,000 1,000 1,000 1,000 1,000 1,000 1,000 1,000
Sellina Prlcea/HeadBul.- 8.................... 40 84 840 840 840 840 840 840 840 840 840
Call Hiflera 9-4 mnh-280 280 280 280 340 540 340 340 540 400 400
eles2-36 matha.-450 450 450 450 500 500 500 500 500 560 560
Steers 24-36 moothe...........490 490 490 490 640 640 640 640 720 720 720
Fattening Call Pm................450 430 450 450 500 500 500 500 300 560 360
1/ Animnal SUnit is any animal over mon year old.
Julos 32, 1972

SA _rt AN IA
SEt LIVESTO& DgvKIRT 70j
b6el - MM0 td MC Cooorate reead. Fatteat lanb - 40.000 ha
lr*t_aSt Cost-(Tab.)
- Yea, I ------ ------ Yea 2 ---
UrSt H?ler uder Total Total
I! 1 C01LS/ UOIL Coat UOstta Cot Units Gost gUtto Cost
PIXOD IslV8SThU
Ftrebre.ks nd Road.Firebrek ............ . 500 240 120,000 - - 240 120.000
Roado . ,. s. 2,000 to 20.000 - _ 10 20 000
S.b-total . 140,000 140.000
Water DevelopnentSorebole ......... ............ No. 90,500 1 90,500 - - I 90,500
Storage ....... ............ No. 10,000 1 10,000 - - I 10,000
DrLnkiog Trough .............. No. 1,000 6 6.000 -D 6 6,DOO
IPping . ..................... o. .. 12,400 3 37,200 - - 3 37,200
Water Pcods (Iarge) '/ -. --. No. 40,000 4 160,000 - _ 4 160,000
Water Ponds (Osolt) Al , No. 20,000 4 80,g-_ 4 80,040
Sub-tot.l - ............ , 383-100 383.700
Stock Ha.diioo FsrlItico
Dpo .. .. ................ No. 15,000 1 15,000 1 15,000 2 30,D00
Corrol-Ctuoh . ................ No. 5,000 I 5,D00 1 S,000 2 10,000
So 1/ ......... 0............ o., 3,000 4 12.000 - - 4 12,000
Sub-tot1.l 32.000 20.000 52 000
ftoainO
Nanag.r's House. No. 75,000 1 J5,00 - I 75,000
As.l.t.nt Mager Ho" ....Soa No. 30,000 - - I 30,000 1 30,D00
Worlaos H-ouse ..... o......... No. ,000 50 50.000 50 50,000 100 100,000
Offce/Storo ...... ........... No. 10,000 1 10,D00 - - ; 10,000
shed. ._._ ................ No. 5.000 - _ 1 5.000 1 5,000
sub-t.ro . 135,000 85.0D 220.000
*hrale as Zatrsint4-Wh..l Drti Va hi. .T ........ Y.- 26,000 1 26,000 1 26.000 2 5t,000
Tsctor ......... .............. N. 29,000 1 29,000 - - 1 29,000
Ertgio Pup .i . ............... No. 6.000 1 6.000 I 6,000
plouh ........ ............... N. 5.000 1 5,000 - - 1 5,000
N-rou ... o , 3.,500 1 3,500 - - 1 3.500
Triler .... o................. - 7,000 1 7,000 - - I 7,000
lsaeIllmeous Toole 4/ .......1 Set 8,000 I 8,000 I - ' 8,000
Furolt.r . ............. S..... set 5,000 I 5.000 - - I 5.000
S.b-total -1.5..5 26.00D ItS.SD0
Sub-total Floed los.atot. 78a.200 131.000 911,200
Costligeaola 10%. ............ 78 020 13.100 91.120
T.ta.l Otoad 1,t tt...85LI2201 4 0
ItWUTAL lUll COITAL
twttot Harf. N o. . 280 1,095 306,550 448 IZ5336 1,543 432.086
treading feifers .............. No. 380 4,000 1.520.D00 - - 4,000 1.520,000
Il1l. *............I.- No. 1,DO0 200 200,000 53 53,000 253 253.000
Stee-s o.. 385 2.500 9462500 - - 2,500 962.500
Sob-total 2.989.050 17S.536 3.167.5b6
Vsgae 0 _ . ,,,,,,,,,, - S82,000 - - 182,000
Y:htneo" .areciatton - - - 23,000 - - - 23,000
Land t ntal - -4.000 - - - 4,000
Fve1 Ott VehIle .......... - - 13,400 - - 13,i0D
Repairs ad allntant -VehIte -.- 9.600 - - - 9,600
Sob-total 232.000 232.000
V^IMa Usalt .............. 8U 10 7.795 77.9S0 - - - 77,950
Dlippiog. .. 5 7.795 3t.975 - _ - 38,975
Telpanasom b.s........ A1 7,195 31.180 - -- 3,8146,105 148,105
cotlcaaty 101 ofOperating pse .3. .. 3St.010
Total Ope-atita eSe-. 41t.115 41?.115
Total Ir-ewental lDoAig Capital 407.165 178,536 3.585.701
Total Ineet_t-n 4.265.3?35 322.6362
11 Ctcity - 24,000 tu ydil Cspelty - 12,D00o - t3/ LtS t poe fat eattle - 1600 - feo -e
41 Rs*d Tolm. Spa .ra -A Nd Spra,eo0 frsdImg loms
Jome 30. 1972

v ~~~~~~~~~~~~~~~~~~~~~~~T A N Z A N I A
SECOND L VESTOCK DEVELOPMENT PROJECT
Model - NACO and DDC Corporate Breeding/fPttening Ranch - 40.000 ha
Sales and Operating Expenses(Tsh. '000)
------- -------------------------------------------- End of Ranch Year ---------------------Before
Development 1 2 3 4 5 6 7 8 9 10 11-Z'
SALES _ - 1,260 1,366 1,273 1,403 1,628 2,879 2,020 2,033 2,010 2,040
OPERATING EXPENSES
FixedWages .................................. 182 182 182 182 182 182 182 182 182 182 182
Repair and Maintenance 1/ ..... .......... - - 25 25 25 25 25 25 25 25 25 25
Machinery Depreciation .................. - 23 23 23 23 23 23 23 23 23 23 23
Reneal of Land ........ ........ - 4 4 4 4 4 4 4 4 4 4 4
Fuel and Oil ................ ... - 13 19 19 19 19 19 19 19 19 19 19
Repair and Maintenance 2/ ............... , 10 13 13 1; 13 13 13 13 13 13 13
Sub-total - 232 266 266 266 266 266 266 266 266 266 266
VariableAnimal Health ....... .................... - 78 81 87 88 94 98 100 100 100 100 100
Dipping ............... - 39 40 43 44 47 49 50 50 50 50 50
Triponasome Drug ........................ - 31 32 35 35 38 39 40 40 40 40 40
Sub-total - 148 153 165 lb7 179 186 190 190 190 190 190
Contingency 10% _ .. ............... - 38 42 43 43 44 45 46 46 46 46 46
Total Operating Expenses - 418 461 474 476 489 497 502 50Z 502 502 502
1/ Of Physical Assets at 2,5% of value. ._
2/ Of 4ehicle and other equipment.

T A N Z A N I A
SECOND LIVESTOCK DEVELOPMENT PROJECT
Model - NhCO and DDC Corporate Breeding/Fattening Ranch - 40,000 ha
Financial Projection(Tsh. '000)
- -------------------------------------------- Year ------Before
INCOME STATEMENT Development 1 2 3 4 5 6 7 8 9 10 11-20
Total Sales .- - 1,260 1,366 1,273 1,403 1,628 1,879 2,020 2,033 2,010 2,040Less: Operating Expenses 1/ _ 418 462 474 475 488 498 502 502 502 502 502
Income from own Sources .- (418) 798 892 798 915 1.130 A 7 1.518 1_531 1.508 1.538
FUND FLOW STATEMENT
SOURCES
Income from Own Sources . (418) 798 892 798 915 1,130 1,377 1,518 1,531 1,508 1,538
BorrowingDevelopment Loan 2/ .................... - 2,986 226 - - - - - - - - -Short-term Loan 3/ ..................... - - 418 614 559 417 48 130
NAFCO Contribution 4j .................... - 1,279 96 - - - - _- - - _
Previous Year's Balance.-- - - - - - - 125 606 -
Total Sources - 3,847 1_538 1_506 1.357 1,332 1.178 1,507 1,518 1,656 2,114 1.538
USES
Fixed Investment ......................... - 858 144 - - - - - - - -Heifer, Bull Purchases . . - 2,027 178 10 33 68 68 68 68 68 68 68
Steer Purchases . .- 962 962 770 385 385 385 311 177 43 - -
RepaymentDevelopment Loan 5/ .- - - - - - - 803 803 803 803Short-term Loar .- - - 418 614 559 417 48 130 - -
Interest PaymentDevelopment Loan ..................... - - 254 273 273 273 273 273 204 136 68
Short-term Los. .- - - 35 52 47 35 4 11 - -
Cumulative Cash Surplus.. -.. .- - - - - 125 606 1.175
Total Uses - 3,847 1.538 1.506 37 .332 1.178 1.507 L5 656 2.114
1/ Includes 1DA. contingeocy and allowance for replacemctt t of Ynnchiner) and e i,ptwent>2/ Includes 701. of totail infvstmptOt in physical works and bull, heifer p:1-ha-s t for initia] two years; 707. of stecr poeshcsr- and opcrating espenIces d,,rins Year i
3/ Fronm TRDB at S2'Z p.a., interest and princ*pal repaid in the foll,wing year.
4/ Inclides 30'8 of toLal investmntis in physical works b1l; hull * hoifor purhlics fol- init-t i two years; 30Y. of steer perch e as.l opetr ating expe7,es dc l rg Yc r
5/ At 8'i. p.a., with s:"-year grace and twleve-year maltu,rit-
WIre 30, 1972

TA N Z AN I A aT
SECOND 2.IVOOOOCD 0!EOIME KPOJECT
Model - NdACO Breedleb RId, (_0aka,KsL-4-u 200 ~'a
Before 1100Rt l'121OSITION Ouleet 1 2 3 4 5 6 7
.l-~~~~~~~u0ing Couc -~~~~~~~~~~~~~~~~~~~4.000O 7,760 8,122 9,122 6,122 0,122 8,L2) 6,21 6 02, 8 z-.... 200 388 406 406 406 406 406 406, 406 4'2,
1,7,,,,.~~~~~~~~~~~~~~....- 1,600 3,104 4,061 4,467 4,873 5,280 5,606 5 686 5,631-71:11 '(-24 o~~~~~~~~~~~~~~~.7l.- ~~~~~~2 000 701 768 3ia. 1
0A 1.365 1.385 140 44
TotoL Nulb1.r -6,200 8,649 9,296 9,828 9,d74 9,894 9,913 9,q(33 99-(T.rt-l Ani,rsls) -6.200 10,44~9 l200 1', ' 4 707 i3 1
Total AlU 1 6,200 089 926 909 00' 0 1 3
1779 PAL TY~~~~~~~~~~~~~~~~~~~~~~~~~~~~~~"49 " 2S_'=9- -
.04'.. - ~~~~ ~~~~ ~~~~ ~~~~~~~~ ~~~~ ~ ~~~~~160 51 35 11 325 7. 7 77 -71,1,.- - 8 09 iv~~~~~~~~~~~~~~~~~~~~~~~~~~~~~~~~~~~~~j 16 16 1 6 11 7
- - 64 ~~~~ ~~~~ ~~~~ ~~~124 162 179 195 277 1114.',2 .. . ... .. . ... .. . 80) 28 31 52 64 7 7S
T~~~~~~~j r. - .~~~~~~~~~~~~~~~~~~~~~~~~~~~ 48 254 372 ~~93 395 .19....._
. ...... . .lI...e.....2,000 701 - --
Hr~1-gArIeilr-, ........ I.....4,000 2,000 441 - - -lull.,.- ~~~~ ~~~~ ~~~ ~~~~ ~~~~ ~~~~ ~~~~~~200 196 71 114 11L4 14 14 77 7
-'t~~~~~~~~~~~~~~~~ - 21~~~~~~~~~~6o 2897 - 52 1-14 11LI4 11L4 .,4 1
- - - ~~~ ~~~~ ~~~ ~~~37 91' 9 7 97 97 97 971 9714etr Y.eritu9s.- - - ~~~~ ~~~~~~ ~~~~~~ ~~~~~~ ~~~~~~ ~~~~850 1,552 2,030 2,233 2,486 2,6319 ,,042 2.842
cull Rtellere 9-24 etnth,..........74 143 187 206 225 243 262O,,rr,-224 -.eths . ....-....... 190 604 779 955 1,130 7o,306 1,306
lrrlwCo1l Fe,.--...........80 780 780 780 705 10 2902
"(H - - - 837 2 09' 5 654 4 077 4 474 4 821 5 260 5 207~~~~~~~~~~~~~~~~~~~ 5 4,77 4A44 81 21 2
C. 10!AL COEF0 lICIETS
l.:O ......a.e.... 40.00 40.00 40.00 50.00 55.00 60.00 65.00 714 00 70.00 70.00l ll -t,lailtv . ...... 10.00 10.00 10.00 10.00 10.00 10.00 10.546 1.01')O 10.,00 10,0~ tMortaltty' . ......... 4.00 4.00 4.00 4.00 4.00 4.00 4.00 4.00 4.00O 4 00
E,tra,tior Rate 2. ..... ........- - 9.01 27.40 37.01 41.20 45.13 471.(4 52.95 13~11'Toal.tpa7 6atu %. - - 9.01 27.40 37.01 41.20 45.-17 49.04 52.93 53.12
11-dae... .......r...... 64.52 74.27 65.50 58.48 56.64 53.00 53.46 52.01 51.94 51.94',7'.1,v ot 7.-..........5,00 5.00 5 00 5.00 5.00 5.00 5.017 5.00 1.00 5.00
C.0 C-ling Rate % ..............- - - 10.00 10.00 10.00 10.00 10.00 10.00 10.00loll lulling Rate 7.....-....... - 00.50 23.90 25.00 25.00 25.00 25.00 25.02 25.00Helefo r Coing Rete . - 10.00 10.00 10.00 10.00 00.72 1(,1,0 10.00 7 0.00 C',t-ckt,g Rate h./AO ............. 6.45 4.52 4.30 4.07 4.05. 4.04 4,114. 4.03 4.02 4.0-74t~cking lAte AlI/ha-.....-........0.16 0.22 0.23 0.25 0.25 0.25 0.25 0.25 0.25 71. 21Carrying Cap. AU ....7...- ..... 7,8000 10,000 10.00 10,000 10,000 10.00C 10.000 10,000 00.0009 10 ,000"
Purchasing Prices/OleadI-e,t-r Heia- .-....... ....... 280 280 280 380 280 280 280 200 700 280Breedleg-Age Heifers............ 380 580 380 380 380 580 580 38(2 380 380Bulls .....-..... .......... 1,000 1,000 1,000 1.000 1,DO0 1,000 1,000 1.000 1,000 1,000
Selling Prices/letadBulls..................... 840 840 840 840 840 840 840 640 840 840Kale Yearlings........-...... .. - 280 280 280 280 340 340 340 340 409 400Cull Hiefers 9-24 -nrth,s............280 280 280 280 340 340 340 340 400 400Reifers 9-24 eo.rl ..-......... ... 260 280 280 280 340 240 340 340 400 400Fattening Cull Hetfers ......... 450 450 450 450 500 500 500 500 560 560
I/ AnImnal Unsit is any anlsmal ove- -ne year old.
Jone )O, 1972

Tabl ct
T A N Z A N I A
SECOND LIVESTOCK DEVELOP3tN' PROJECT
Model - NACo Breeding Ranch (Dakawa) - 40,000 ha
Investment Costs(Tsh.)
----- Year I ----- ----- Year 2 -----
Unit Nurber N=ber TotalIhVI CsF'r CATEGORY Unit Cost Units Cost Units Cost Units
[L260 INVESJMENT
Pi_rsos-eakaand RoadsF5rtbro-k .s .an ..... K.. 500 240 120,000 _ _ 240 120,0 00R<,ad s ....... ............ Km. 2,000 10 20,000 _ _ 10 20000
S.b-tAl . 140 000
4acsa Dleve Lopn ent.r ..l... .................... No. 90,500 1 90,500 - 1 90,500
St-rae ............ ................ No. 10,000 1 10,000 - - I 10,000Drtnkisig Trough .............. ,.,,. No. 1,000 6 6,000 - - 6 6,00CPiping .......... K. 12,400 3 37,200 - - 3 37,200W,eL Pnnds ( srge) 1/ ..... ........ No. 40,000 4 160,000 - - 4 160,00(warer Ponds (small) 2/ ..... ........ No. 20,000 4 80000 - 4 8 0 00
5Ljb,- cntajl........................ 383,7DO 383,7 00
Stoak liand_i 0jFacilitiesiapo. ......................... No. 15,000 1 15,000 1 15,000 2 30, 00
C- rrai-0rois ........... , ... No. 5,000 1 5,000 1 5,000 2 10,0000o-, ............ ................ No. 3,000 4 12,000 - - 4 12 000
up-total 32,000 20,000 052,00
Manaier's tipre . .... .................... No. 75,000 1 75,000 - - 1 75,000A..istant ManagerUs , ..........e. No. 30,000 - - 1 30,000 1 30,000WorlkMan' Hos ........................ No. 1,000 50 50,000 50 50,000 100 100,000Offioe/Store ........ ............... No. 10,000 1 10,000 - - I 10,0000hed0 .. ............................. No. 5,000 - - 1 5.00G i ',G05
1. - total .I ........................ 135.000 85.000 2zG,000'
Veliclaos and Etuipment4-lWheel Drive Vehicle .............. No. 26,000 1 26,000 1 26,000 2 52,o00Ta'-ossor-....... I ................ No. 29,000 1 29,000 - - 5 29,000Fog- 'UGP ........ ................. No. 6,000 1 6,000 - - I 6,0C0
t , o1. ....... ,.,.,.. No. 5,000 1 5,000 _ 1 5,1)0O.i.sr ow. N o . ...................... .No. 3,500 1 3,500 _ 1 3,500
*taile .............................. No. 7,000 1 7.000 - - 1 7,0C0Mi-,eila.eoo5 Tools 4/ ..... ........ Set 8,000 I 8,000 _ 1 8,01,,Fuonitur ............ .............. Set 5,000 1 5,000 - - I 000
SRb-total 89,500 26.000 li5,500
Sub-total Fi..d Investment 780,200 131,000 9i11200
.oltingencies 10 0 78,020 13,100 __5,,,2L
Tot.1 Fined Investment 6586220 144,1002¾! 3,G
LNCqF!iTN'. 'VRWING CAPITAL
Ll F,~kOrcha.es- -n,, irf- . ................... N. 280 2,000 560,000 701 196,000 2,701 756,00C
8Ot.-ing-Age Hters ... .............. No. 380 4,000 1,520,000 2,000 760,000 6,000 2,26.S,00iRu.', .. , I , No. 1,000 200 200.000 ! 96 196,000 396 _3)60 I
S'b -sotsi 2,280,000 1.152,000 3,432,000
0o,,rat 1nR jiPJ(rS55 5/Culrs *ottt 256,000 290,000 54b,000
V-I.able Costs . 100,000 142,000 242,000Contingency 10 0 35.000 43.000 78.000
,,: -r >aal ~~~~~~~~~~~~~~~~~~~~~~391.000 475,000 866.00(
'-ro -..-entul Working Capita1 2671.000 1.627,000 4 298.000
Tot.L '-, s-sn, 3 529-220 1.771.100 5 _300 320
2 / ''oal v- 24,000 on ydC/ Iay' s-y .000 cr yd
3/ Nl&1 t oss 0-ar cattle i4,800 m Fence/Boma)4 is, Spanner ar,ad Rand Sprayers
s' o.d Operu.Lng Expenses Table
-ek(:3',

T A N Z A N I A
SECOND LIVESTOCK DEVELOPMENT PRWECT
Model - XACO Breeding Ranch (Dakawa) - 40.000 ha
Sales and Operating Expenses(Tsh. '000)
--------------------------------------------- End of Ranch Year ----------------------
BeforeDevelopment 1 2 3 4 5 6 7 8 9 10-20
SALES - - 255 941 1.416 1_560 1.695 1 830 2 ,275 2 282
OPERATING EXPENSES
FixedWages .......... ........................ - 182 182 182 182 182 182 182 182 182 182
Repair and Maintenance Fixed 1/ ........ - - 25 25 25 25 25 25 25 25 25
Machinery Depreciation 2/ .... .......... - 23 23 23 23 23 23 23 23 23 23
Fuel and il Vehicles 3/ ...... ......... - 13 19 19 19 19 19 19 19 19 19
Repair and Maintenance Vehicles 4/ ..... - 10 13 1" 13 13 13 13 13 13 13
Tse-tse Charge S/ ...... ................ - 24 24 24 24 24 24 24 24 24 24
Land Rental ............................ - 4 4 4 4 4 4 4 4 4
Sub-total - 256 290 290 290 290 290 290 290 290 290
VariableAnimal Health .......................... - 62 88 93 98 99 99 99 99 99 99
Dipping ...... ,.- ...................... 31 44 46 49 49 49 49 49 49 49
Miscellaneous . . .. ... - 7 10 13 20 25 25 25 25 25 25
Sub-total - 100 142 152 167 173 173 173 173 173 173
Contingencies 107 .................- ..... 35 43 44 46 46 46 46 46 46 46
Total Operating Expenses - 392 475 486 503 509 509 509 509 509 509
1/ 2.5% of Fixed Assets/year |
2/ 20% of Total Value/year3/ 4-Wheel Drive, 18000 km @ 0.30 Sh/km; Tractor, 1000 hr @ 8 Sh/hr
4/ 4-Wheel Drive, 18000 km @ 0.20 Sh/km; Tractor, 1000 hr @ 6 Sh/hr
5/ At 24,000 p.a. computed as an annuity at 8% over 20 years to recover Governmrsnt expenses on Tse-tse Clearance.
June 30, 1972

_T A N Z A N I A
SECOND LIVESTOCK DEVELOPMENT PROJECT
Model - NACO Breeding Ranch (Dakawa) - 40,000 ha
Financial Projections(Tsh. '000)
- ----------------------------- _____---- year ---------Before
INCOME STAIEMENT Development 1 2 3 4 5 6 7 8 9 10 11-20
Total Sales ........... ................ - - 255 941 1,416 1,560 1,695 1,830 2,275 2,282 2,282Less: Operating Expenses .... ......... 392 475 486 503 509 509 509 509 509 509 509
Income from Own Sources .- (392) 5 (230) 438 907 1. 051 1 1321 1.186 1, 1766 1,773
FUND FLOW STATEMENT
SOURCES
Income from Own Sources .- (392) (475) (230) 438 907 1,051 1,186 1,321 1,766 1,773 1,773
BorrowingDevelopment Loan 1/ ............... - 2,470 1,240 - - - - - - - - -Short-term Loan ................... - 210 614 824 416 - 20
NAFCO Contribution 2/ ..... .......... - 1,060 531 230 _- - -Previous Year's Brlance ... .......... -- - - 186 15 58 624
Total Sources - 3.138 1 506 14 16262 1, 3 1.051 1.372 1,336 1 824 2,397
USES
Fixed Investment .................... - 858 144Livestock Purchases ..... ............ - 2,280 1,152 71 281 114 114 114 114 114 114 114
RepaysentDevelopment Loan 3/ ............... - - - - - - - 928 928 928 926 -Short-term Loan 4/ ..... ........... - - - 210 614 824 416 - - -
Interest PaymentsDevelopment Loan ................. - - 210 315 315 315 315 315 236 158 79Short-term Loan ................ , - - - 18 52 70 20 - - - -
Cumulative Cash Surplus ............. .... ..- - - 186 15 58 624 1X28 -
Tca31 Uses _ _14 1.6323 051 372 1 336 1824 2 397 114
Ci)1/ 70 of Fixei 2nvxestment, Livestock Purchases arld Opernting Fxpense s during initial two years.2/ 30. of Fixed 'nvo,tment, wivestock Furchases and C; eating Fxpens:.s during initial two years and 100' of Operating Expenses d\ring Year 3.31 At 8V. p. . six-year ;rCC, ten-year natirity,
A; At 8 p.,. prIn-Ipal .S sterest repaid the - - 2)fin& year.
~s. ,1-c3

TANZCANITA ,
SECOND L.IVESTOCiC D~EVECOFRUICPROJECT
Model-- N 48000 BeeiaFteiORRnhIuiaana _992.
'9111 l.>1P%lhiI 7 O~~~~~~~~~~~ ~ ~ ~ ~ ~~~evlnple.t I 2 3 4. 5 6
.......... 647 2,621 3,913 3,913 3,913 3,913 31,903 3,413 3iS1. 1,311 j"IJ.......... ....... ~~~~29 131 196 199 196 .196 196 146 19t. I941 I A
... 117 259 1,048 1,956 2,152 2,348 ! VI S 2,739 2.234 2.7139 .319 9~tt 9- '. so ..h .... 1.566 372 503 934 1,033 .12? 1,221 1,319 1.315 1,315
1l.t. 9-4 ou1, .tl...16 124 503 939 1,033 ,172l 1,221 1,315 1,313 1,315,-,'.4.36 months ...... ...... 54 119 483 902 942 j,082 1_172 .L79 _iE_26
1:1.3155,73 626 4,394 4,658 3,234 6,470 2,076 7,354 7,632 7,910 8,000 8,020uli A.je-i:,. 793 4.653 j_707 7J.191 62 1. ja : i.,97 .92_3J7 12..649 _LO_ ._fl9 10 734
hOh-t,tal AU 676 4,394 6,658 5,'294 6,479 3,076 7,354 3,632 7,910 9,000 8,000h-as, 7 St,..... .... 2 635 2.635 2 63 M 2.65 LO 9_24 446 3-6-8 _.j~ ---
[-i t A1:1 I 3311 7,029 7293 2,869 01: 00 8000 8031l' bj 9 ___
0,,idto,, it." ..............'.. 24 26 lOS 157 1157 157 .57 157 45" .15 IV7. ...... .1......... 1 7 8 8 8 0 4 9
Color' ... ....... 1.....-.-__.......W- -. ................... 5 10 42 78 46 9'. 102 117 't3 ~ 1twic. ;- 9.24 mitu;-' ............ - 63 15 00 38 41 45 uq 91_Scer- 9-14 sooth'.-... ...-....... 2 5 20 38 41 45 45 53 Ž-See-ru'h.-36 -echts.............. 77 - - 2 9 19 36 _40 _3 I7
Suh-t::11 ou-Iddiog tonsers) 102 22 176 186 209 259 283 244 301 314 ;zpt, 9i-t ........ I .103... 105 10 3 o 105 _5 61 37 26 _ 12 _4
Totol ~~~~~~~~ ~~~~ ~~~~ ~~~~~~~207 132 21 21 314 320 30 30 35 32 3
['moot ii l . ro. .. .. .- 1,530 24W I13--'E,7- Ac', 910-i.f................ 671 2,000 - - 9Si - - - .
B'! 1 . .... .... ... .... . I. .... .... ... 30 103 82 55 55 55 55 55 5 3 5 5
701 3,633 330 55 152 55 55 55 5'. 55 55,
IXtOl ~~~~~~~~~~~~~~~~~~~~~~~~_1 6.268 2~965 IJ_690 1.682 9_79 0 -2 -4 55
bul.-.........-........13 47 47 47 47 41 - 47 22
Cull be-fecs 9-24 months ........... - 12 48 90 99 108 i1[; 124 524Nd cio- 24-36 mouths.-...............- - 279 260 441 523 604 604OScur,. 74-36 mnh.................52 114 464 865 952 1,0339 1,123 1,212Plttooiog Cull Fern.-.......-.......126 188 376 328 376 376 -37t,, 374 376
Oub-total -138 299 585 1,256 1,748 1,924 2,101 2,278 2,364etch, u..o coors ~. .3............ 2558 2,530 2.530 2,5.20 j
4,530 1.469 887 620 302_ 87 -
Total ~~~~~~ ~~~~~ ~~~~~ ~~~~~ ~~~2.155 2 530 2 668 2,829 3j.115 2."725 2 635 254 27454 23164 2 304
__93001I41. COEFF'ICIFNST
Wo-ing Rate 7................ 40.00 40,00 48.00 50.90 55.00 60.00 85.00 70.00 70.00 70.00 70.00Calf Moerallry 'I................ 10.00 19.00 10.00 10.00 10.08 10.30 10.00 10.00 10.00 10.00 10.00Adult Mortality 7/.4.05............ 4.00 4.00 4.00 4.00 4.00 4.00 4.OC 400 4.00 4.00 4.00EoCca-Lin Rate 7 ...............- 2.97 5.71 9.95 17.75 23.76 25.21 26.56 28.47 29.55
TotL1 Outpao Rate 7 ......... I.... - 2.97 3.71 9.05 17.73 23.76 25.71 26.56 20.47 29.59CosTta -ed 1............... 81.59 56.33 68.57 54.12 45.58 41.52 39.53 37.73 36,70 36.44 3~6.44
Boll/Coo Ratio 7............... 5.00 5.00 5.00 5.00 5.00 5.00 5.00 -5,010 5.09 5.00 5.00Cu.. Coiling Rate 7.............. - 5.00 2.09 10.00 10.00 10.00 10.00 10.00 10.00 10.30
Bull1 CullIng Rote . ..............-- 18.00 25,00 25.00 25.00 25.00 25.00 25,07) 2 5.07 25.300geifee Culling uRet 7.............. - 10.00 10.00 10.00 00.00 10.00 10.00 10.00 10.00Stnoklng Rate ha/Ar.............. 9.66 4.51 4.39 4.07 4.00 4,00 4.00 4.00 4.00 4.00 4.300Stouking late AI1'ha.............. 0.10 0.22 0.23 0,25 0,25 0.25 0.25 0.25 0,25 0.25 0.25
Carrying cap. Au .. .... .... ... 6,009 8,000 8,000 8,000 8,000 8,000 8,000 8,000 8,000 8,000o 8,000
Pornhasleg Frions/HeadIsimature Heifern .............. 280 280 280 280 280 280 280 280 280 280Breeding-Age Neitee . ........... 380 380 380 388 380 380 390 380 380 390Bulls......... ..... 1.000 1,000 1,000 1,008 1,000 1,000 1,000 1,000 1,000 0,000
Nulls ..................... 840 840 840 840 840 840 840 040 840 840Co~Il el.fecs 9-24 months. .......... 280 280 280 260 340 340 340 34r3 400 400H.eifers 24-36 months ............. 450 450 450 450 500 500 500 300i 560 380Suners 24-36 months..............490 490 490 498 640 640 640 640 720 770
Fatte-Ing Cull Fan .-............ 450 450 450 450 500 300 500 507 560 363l
1/ Anlual Unit is usy animal oer one year old.
t-o . 1, 1372

ANNEx 6
T A NZ AN I A
SECOND LIVESTOCK DEVELOPMENT PROJECT
Mossil N ACD B-edi.e/F.tte.i.g Rasoh (S-sb.w,ng.) 32.000 6.
1.ve.t.tntt Co ts
(CnN.)
---- eYar I---- --- Year 2----
Unit Betorn Nuslbhr ,N-b- T.tL1 Total
Unit Co-t O-evElannnt Units Co- Units Cost Units osC VSP, ATEGORY
F-rbesl.gs and RoadsFirrbtr-ks............... K. 500 - 200 100.000 -- 200 l00,000
. . .. .. ... .. .. ... .. .. R . 2,000 20,000 - ------ L
slb-tota1 20 000 100 000 100 000
Sa~t- Oe-Iop-sntB-rsol ............... os. 90,500 90,500 - -- --
storage PTois............. o. 10,000 10.00- --
D,ink-og Tros.gh ........... No. 1,000 3,000 ---
plo. so................. K. 12,400 24,800 - ----
r'OOdn has) 1/......... N. 40,000 - - 80,000 - -e,0oo
(Omls) 2/ -........... No. 20,000 20,000 2 40.000 40 000
Sob-totaL 14,0 120.000 120 000
.p...... ........ No. 15.000 15,000 1 15.000 - 1 15,000
Cor-.I-Crs.sh............. No. 5,2000 5,000 1 5,000 I 5,000
Ro 0........I....... No. 2,000 3,000 3 9.0D0O 3 9,000
.0 0.......s....... K. 1,900 57.000 - -
S,0.lrsl 9~~~~~~~~~~~~~~~~~~~0.000 29.000 29.000
....... ...... No. 75,000 75,000 ---
...... No. 50,200 00,002 - ---- I' ,O .o........... No. 1.000 30,000 40 40,000 -40 40,000
F,,~ .. .. -.... I.... o. 10,2000 10,000 - - -
.. . .. .. .. . .. . . .. . . No. 5,000 5,000 -.--
.b0 ...... .... t...Io... N 200,000 200,000 ---
( soii. Rc s.............. o. 100,000 100,000------............ No. 10,000 .J9,000. ___
ob to's' ~~~~~~~~~~~~~~~~~~490.000 40.00 40 000
co Oivo V~lOelsc...I..... o. 26,000 26,000 0 26,000 -- 1 24,000
....- os. 290.00 29.000 1 29.000 -- 29,500)
Ctog'- -sd Pansy........... os. 6,5000 6,000 - -.-~~-11 -1 .. .... .. .... .. ... los. 6.000 6.000 - ---
pl-h ............... Nos. 5,000 - 1 5,000 -- 1 5.000
SOatoso.............. 5o. 3,500 - 1 3,500 3 ,502Tr,oirr.l~~~ ~ ~~~~~~ ~~os. 7,000 7,000 - -- -
;Os,1, sToo-ls 4f . Se5t 8,200 - I 8.000 - 9000
.r ................ Set 5,DO0O 1 5*,,0QQ - -- (
2i.0.cotsi ~~~~~~~~~~~~~~~~~~74.000 76.500 16 500
Sob-total. Fi-es 1-vt,n-t 812.500 365.500 3505.50
'2-0r-.4-y. 107 . ............. 36.550 3_6 012
1-ta Flo-d _812,0300 40.2.050 402.05
Oer. .......... No. 280 1 0530 428,4-00 247 69.160 1777 497.56U
OrrlooO.Ar 0nl0e~......0... N. 380 -2,000 760,000 - - 2000 760,000
...... ........... 5f. 1,200 - 105 103.000 82 P,2 000 185 105 000
-oa rnosa1 W5orkisg Capi-al - 1.291.40 151.160 1.442,56D
-tel lovnsteeos ~~~~~~~~~~~~~812_300 Iai22_410116 1.84.61
li capacIty 2'. .10. -s yd2Caslr-12,000 -o yel
OsN,Lot 'n-. ior cattle 14,8000 on Fssefsnom)0a.c
To' 20 2.5005 50 Is-
0Sp.-y-

T A N Z A N I A
SECOND LIVESTOCK DEVELOPMENT PROJECT
Model - NACO Breeding/Fattening Ranch (Sumbawanga) - 32,000 ha
Sales and Operating Expenses(Tsh. 'OOQ)
-------------------------------------------------- End of Ranch Year -----------------------------------------------Before
Development 1 2 3 4 5 6 7 8 9 10-20
SALES 1.343 1.328 1.395 1.480 _ 614 1,431 1,395 1348
1 43I I 4i1 143 8
OPERATING EXPENSES
FixedWages 1/ ............................... 130 130 159 159 159 159 159 159 159 159 159
Repair and Maintenance 2/ .... .......... - 25 25 25 25 25 25 25 25 25 25
Machinery Depreciation . ....... 18 23 23 23 23 23 23 23 23 23
Fuel and Oil Vehicles .................. 10 10 19 19 19 19 19 19 19 19 19
Repair and Maintenance 3/ ..... ......... 13 13 13 13 13 13 13 13 13 13 13
Land Rental ............ 3 3 3 3 3 3 3 3 3 3 3Tse-tse Charge 4/ ...... 20 20 20 20 20 20 20 20 20 20 20
Sub-total 176 219 262 262 262 262 262 262 262 262 262
VariableAnimal Health 5/ ....................... 33 70 73 79 80 80 80 80 80 80 80
Dipping 6/ ............................. 17 35 36 39 40 40 40 40 40 40 40
Miscellaneous ....... ................... 41 40 43 45 50 50 50 50 50 50 50
Sub-total 91 145 152 163 170 170 170 170 170 170 170
Contingency 107. .. . 27 36 41 43 43 43 43 43 43 43 43
Total Operating Expenses 294 400 455 468 475 475 475 475 475 475 475
1/ Manager 25,000 Sh/year, Assistant Manager 15,000 Sh/year, Skilled Labor 5,600 Sh/year, Cattle Foreman 5,200 Sh/year, Unskilled I.abor 1,500 Sh/year.
2/ For physical structures.3/ Vehicles and equipment.4/ At 20,000 Sh/annum. Computed as an annuity at 4% per annum to recover Govornment expenoiture on tse-tse clearance. e o
5/ 10 Sh/AU. o
6/ 5 Sh/AU.
June 30, 1972

T A N Z A N I A
SECOND LIVESTOCK DEVELOPMENT PROJECT
Model - NACO BreedinE/Fattening R.nch (Sumbawanga) - 32,000 ha
Financial Projections(Tsh. '000)
-------------------------------------------- Year ------------------------------------------------Before
Development 1 2 3 4 5 6 7 8 9 10 11-20INCOME STATEMENT
Total Sales .......... , 1,343 1,328 1,395 1,480 1,614 1,431 1,395 1,348 1,431 1,431 1,438 1,438Less; Operating Expenses 1/ .......... 294 400 455 468 475 475 475 475 475 475 475 475Less: Heifer, Bull Purchases la/ ..... - - - 55 92 55 55 55 55 55 55 55
Income from Own Sources ..... .......... 1,049 928 940 957 1,047 901 865 818 901 901 908 908
FUND FLOW STATEMENT
SOURCES
Income from Own Sources ..... ........ 1,049 928 940 957 1,047 901 865 818 901 901 908 908
BorrowingDevelopment Loan 2/ ............... - 1,185 106 - - - - - - - - -Short-term Loan 3/ ..... ........... 250 357 562 777 495 317 34
NAFCO Contribution 4/ ..... .......... - 508 45 - - -Previous Year's Balance .............- - 351 947 1596 -
Total Sources 2,978 1,653 1 734 1 542 1 218 899 BI 5 1848 2 908
USES
Fixed Investment ................ 402 -Heifer, Bull Purchases ............... 285 1,291 151 - - - - - - - - -Steer Purchases ...................... 1,014 1,014 1,014 1,014 589 356 249 142 35 - -
RepaymentDevelopment Loan 5/ ..... ........... - - - - - 215 215 215 215 215 216Short-term Loan ...... .............. - 250 357 562 777 495 317 34 - -
Intere PaenltDevelopment Loan ................. , - 101 110 110 110 91 73 55 37 18Short-term Loan .................... - 21 30 48 66 42 27 3 - - -
Cumulative Cash Surplus .............. - - - - - - 351 947 1.596 2,270
Total U ses 1299 2978 1,.653 1.734 1542 1.218 899 818 1,252 1842 2504
1/ Includes 10% Contingency and Allowance for Replacement of Machinery and Equipment.Ta,'For the initial two years, these appear in the Fund Flow Statement.2/ Incluides 707. of Total Investment in Fixed Investment and Heifer, Bull Purchases for initial two years. "o3/ Borrowed from TRDB at 83% p.a. with interest and principal repaid the following year.4/ 30' of Total Investment in Fixed Investment and iHeifer, Bull ,rchases for initial two years.5/ At 8i' p.a. with four-year grace and ten-y-ar s,aturity.
June 30. 1972

ANNIa 11Tabl,o 13
_tA NZ A NIA
SECOND LIVESTOCK DEVEL0PMEW2 PROJECT
Mode1 - NACO B-edi.g/F.ttenlloo R-nh fll-aoo) - 40,000 h.
U-d Projection
-------------------------- End of R-nch Yle---- ---------------
C.."c............ 3So 2.480 4,646 4,446 4,644 4,b440 4,040 4,61,4 4.6442, i, 4,,Bol I...................... 34 124 232 23.2 232 232 21 22 .'I'
'Ivc...................... 258 200 992 2,323 2,556 2,788 37020 1,251 :- 'l 2.-ui 'Ic 124m-nh~, ......... ..... 2,124 436 476 1,105 1.227 1,338 2,4',0 ,561 1,51 . I
St ?r -24 moth,. .... ......... 124 94 476 1,115 1,222 2,328 .1,'50 2,502 .51 2.5I42~bObo 4_30 mon th .-............... 2_19 __92 457 2O 02 1728 2~ 28 392 14_99 1_ 952
TalN-b-cr 534 4,852 5.530 5,923 7,566 8,403 8,7-3 9,043 0,393 '2,5224 9,5022(ThIol Oolnalsl 2~~ ~ ~~~~~~~~~~~~~~~~92 5 052 6 522 8 247 10 22222 11191 22 253 12_ 325, 12,645 12 _5 3 22 _792
i,-llIAll 534 4.852 5.530 5,923 2,544 8,403 8,733 9.2343 9,393 9,500 9,500
2cl,.,d St............... .0 4 50 2~Q - - -_934
All, 221 1.534 7 000 8 030 72923 9.500 8 403 8,793 904b3 1 393 9 590 991
II-12'COc................ .. 25 20 99 286 286 186 186 186 186 186 284
- ....... .. .... ...... :...:2 1 5 9 9 9 9 9 9 9 9..... -....... .: , .. 25 -
W-a,: ...........-......... 0 8 40 93 102 112 1222 130 230 210
.-c 9-, ' -, 0 atO.............. - - 85 17 19 45 49 54 50 62 62S(100, 5-24 ...nth .............. 20 - 5 4 19 45 49 54 58 62 02
Sito,- c 24-36 -oth . ...............- 5 4 18 _ 43 43~ _5I 54 40
So.b-ctal. (...c1odig ...nareS 46 21 194 221 237 303 3136 349 363 324 322232Pac-haoc0 St tor............... 20 40 86 100 80 277 --
3t.,l 68 61 280~1 321 0127 3_80 2316 3_49 363 3_24 303
loocI llif- ....[........... 2,000 340 - - - - - - --
lc,-,IIgcA0-c iftif-co. ............ 525 2,000 346 - 221 - - - - --
8,l. .................... 35 91 125 65 65 65 63 65 40 65 65
S,.b-1,1.1 560 4,091 812 65 286 45 65 65 65 65 65
Steco.0..................... 1000 2.148 2.500 2.000 2 934 - - - - -
'N't , I 1 1_~~~~~~60 6_240 3_311 2,0_,5 1_ 19 ___65 65 45 65 65 43-
9,,11e ~ ~ ~~ ~ ~~~ ~~~ ~~~ ~~~ ~~~ ~~~~ ~~~ ~ ~~~~~- 17 56 56 94 56 56 62 ~ 2
(12IcIlc -9-24 t oIhe - 9 44 202 228 128 I'll I,,( 1522II icIo24- 34 -eehe..............- - 332 420 524 4122 I? 127
.. c... .4-3f, -oth. ............... 114 88 439 1,028 2,139 1,233 1.I214 ,43-2
rolee-iog c.1l Fn .-............. 119 223 446 446 446 _4t4 44 6 __4 4
S,,4-0,,tal - - ~~~~ ~~~~ ~~~~ ~~~~~~ ~~~~~~ ~~~~~~~131 403 636 1,379 2,075 2,285 2,495 2,205 2,827ste,,20, Sta................ 480 9269 2 042 240 4.920a 1 856 - -
Ta4t. I 480W 9_60 2_193 2_803 2_556 3 2_36 2 025 - 2_285 2 4_95 2 00O7
T%CHNICAI, COEFFlICEfNTS
,2-.ielg Rate, 7......... ......... 40.00 40.00 40.00 50,00 55.00 60.00 65.00 20.00 30.00 70.00 70.00Calf M.rtlI1ty 7 ....... ........ 10.00 00.00 10.00 10,00 10.00 11.00 10.00 10.00 10.00 10.00 10.00
Ad oLL MentalitY 7 ............. . 4,00 4.00 4.00 4.00 4.00 4,00 4,00 4,00 4.00 4.00 4.03llnt-attle Rate 7 ........ ....... - - 2.37 6.80 8.41 16.41 23.76 25.21 26.36 20.42 29 .35Ttota2 Ontpa t Rate 7.............. - - 2,37 6,80 8.41 16,41 2t3.76 25,21 26.56 21.42 29.55C-MIsTtl1 Herd 7............... 63.13 48.09 21.25 56.34 45.91 41.52 :19.53 37.73 36.24 36.44 36.44BIl/Co- Ra tio 7............... 5.00 5,00 5.00 5.00 5.00 0.00 0.00 5.00 5.00 5,00 3.70tow Co1iig Bate 7.............. - - 5.00 5.00 10.00 10.00 [0,00 10.00 10.00 17.00 10.00Boll1 Colliog Rate 7............. 10.00 25.00 25.00 25.00 25.00 25.00 05.00 25.90 25.04Heifer CWiling Rate .............. - 00.00 10.00 10.00 [0.00 10,00 10.00 10.00 10.2ISt.cking Rate ha/All............. 74.91 5.22. 4.98 0.00 4.21 4.76 4.58 4.41 4.26 4.21 4.24St-ckieg Rato AU/ha. ..... I....... 0.01 0.12 0.20 0,20 0,24 0.21 0.22 0.23 0.23 0.24 2Cac-yleng Cap. AIJ............... 2,000 2 ,000 9,500 9,500 9,500 9.500 9, 500 9,500 9,500 9,500 9.552
Ianntare H.ietfe -... I.........- 280 280 280 280 280 280 280 280 280 21'3BreedIng-Age Heif-a..... .. 3B0 380 380 380 380 380 380 380 380 3222Bal1s.- 1,000 1,000 1,000 1,000 1,000 1,000 1,000 1,000 1,000 1,000Stnee.- 385 385 385 385 3805 383 3805 385 385 385
Seall on ftit-n/RedBan.-1.................... 840 840 4 840 840 840 840 840 840 04404Cal1 Haliers 9-24 nentha. ........... 280 280 280 280 340 340 340 340 400 400Hellece 4-36 notha.-.............450 450 450 450 500 500 S00 590 560 560
Steea2-36 nths .............. 490 493 490 490 640 640 640 440 720 72.0
Ea1t.ti.g Call F ..-............ 450 450 450 450 500 500 50oo 500 560 560
1/Animal Unit in any anImal oven on- year old.
Jore 30, 4972

AM= 6
TANZANIA %sr
SECOND LEM=TOE DRVLPW? Pt03T
m.dsl - Nw Nrsedln*hlttesl.NR Ranh (OssnuS - 40,000 ha
In.es~t Costs(Tab.)
Unit NeoeNt..Ir N,hs,, Total TotalUnit Cs slent Units Cos Unit. Cast Units Cost
1WNXETsn CATEGOtY
FIXED !NVEDTENDTS
PFreb-a- and RoadsFr-eb-eks. .............. . 500 - 240 120,000 - 260 120,000Roads I......I..........K. 2,000 60- -00 - - -
Boo- w~~~~~~~~~~~~~~~~~~6.DD 120 0001200
date Dove oneBorehole .............. No. 90,500 -1 90,500 -I 90,500Storag Tack.............. No. 10,000 - I 10,000 I 10,000Dr inking T_oagh........o...- M. I,000 - I 3,000 -- 3 3,DOOPiping..........s....... Y. 12,400 - 1 12,400 -1 12,400
Water Ponds lce 1 1/.No 40,000 - 2 8000 -- 2 8,RotorPods (sna 7/ No. 20,000 -2 M a,00 Sob-total____ 235.9002390
Stock Handling Fac1iiteDii ........................ No. 15,000 -2 30,000 -- 2 30,000
Cor-a end Croak.. .......- NO. 5,000 - 1 5,000 -- 1 5,000
0-.,3 .................. No. 300W 3,000 3 9,000 -- 3 9000O
So> oa 3000O 44,000 441000
lorags&oeaooe.No ~~~~~~ ~~75,000 75,000 - - -
Ys & .-:tltnge- Honor ...... N.. 30)000 - 1 30,000 -- 13,11;g y'.-.............No. 1,000 16,000 70 70,000 -70P 70,0042(iss t.No....I.... ... 10 000 - I 10,000 -I 10,000
.... ............... No. 5.000 -I 1,000 -- 15,030-.............ose... No. 10,000 - 1 10000 - -D jQ,000
So-ototl 91.000 125.000 12Z5 000
i-llleel Jivc Vhini......... No. 26,000 26,000 1 26.00 - 26,000
Trocto.~............... No. 29,000 29,000 - - - -
ngine sod Pom............ No. 6.000 - I 6,000 - 1 6,000
_logh .......... oI...... f. 3,000 -1 5.000 -- 1 5,000
bors.. ....... ..... N.. 3,500 -1 3,540 - 1 3,500Tro .........ter...... N.. 7,00 700 - - -- -
TMiseell...o...Tools.... Set 0,000 I 8,00 -- 8,000
ro-iso-e.........e...... St 5.000 - 1 3,000 -- 15.000
Sob-total 6200 53.500 5,0
5<5I-total Pined Ineestinnts 216.000 578.4005740
Totl Fioed io--tn.tra 216&00 636.240 634.240
IS,CIFEI5IITAL WORKING CAPITAl
. ....t..r....i...r.. No. 280 2,000 560,000 340 95,000 2,3160 655,000Ssodahio Ortern.No.......... t. 380 7,000 760,000 346 131,000 2,346 691,000
B-I -..................... No. 1,000 -91 9i,000 125 125.000 216 216,000Stree.................. N. 585 -2,148 821,000 2,500 943,000 4,848 1,790,000
TotnilereeotalWorking Capital 2.238.000 1.314.000 3,552.000
Total lovearssett 216.000 ~~~~~~~~~ ~ ~~~~~~2A674j.240 AO1.00d.i.4
>slv-24,0 oydCaUv-12,0 naI yd
3/ Nigh t Ten for rattle (4,800 *FenceIB-)4/ Had Tool., Spaose- and land Sp-ayec
tet30, 1972

T A N Z A N I A
SECOND LIVESTOCK DEVELOPMENT PROJECT
Model - NACO Breeding/Fattening Ranch (Usangu) - 40,000 ha
Sales and Operating Expenses(Tsh. '000)
------------------------------------------------- End of Ranch Year -------------------------------------------------
BeforeDevelopment 1 2 3 4 5 6 7 8 9 10-20
SALES 252 504 1.146 1 65 1,318 1.707 I12 1.238 1.4j5 !_614 1,680
OPERATING EXPENSES
FixedWages ................................... 100 182 182 182 182 182 182 182 182 182 182
Repair and Maintenance 1/ ..... .......... 15 21 21 21 21 21 21 21 21 21 21
Machinery Depreciation ..... ............. 18 15 23 23 23 23 23 23 23 23 23
Land Rental ......... .................... 4 4 4 4 4 4 4 4 4 4 4
Fuel and oil Vehicles ...... ............. 10 19 19 19 19 19 19 19 19 19 19
Repair and Maintenance 2/ ..... .......... 10 13 13 13 13 13 13 13 13 13 13
Sub-total 147 254 262 262 262 262 262 262 262 262 262
VariableAnimal Health 3/ ...... .................. 15 70 80 80 95 95 95 95 95 95 95
Dipping 4/ ........ ...................... 7 35 40 40 48 48 48 48 48 48 48
Triponasome Drug 5/ ..................... 6 28 32 32 38 38 38 38 38 38 38
Miscellaneous .................... .. 8 15 35 45 45 45 45 45 45 45 45
Sub-total 36 148 187 197 226 226 226 226 226 226 226
Contingency 10% ....... .................. 18 40 45 46 49 49 _ 49 _49 49 49 49
Total Operating Expenses 201 442 494 505 537 537 537 5J7 537 537 537
1/ For physical structures.2/ For vehicles and machinery.3/ At 10 Sh/AU.4/ At 5 Sh/AU.5/ At 11 Sh/AU.
June 30, 1972

T A N Z A N I_A
SECOND LIVESTOCK DEVELOPMXNT PROJECT
Model - NACO Breeding/Fattening Ranch (Usangu) - 40,000 ha
Financial Projections(Tsh. '000)
BeforeDevelopment 1 2 3 4 5 6 7 8 9 10 11-20
INCOME STATEMENT
Total Sales ....... ..................... 252 504 1,146 1,465 1,318 1,707 1,120 1,238 1,455 1,614 1,680 1,680Less: Operating Expenses .............. 201 442 494 505 537 537 537 537 537 537 537 537
Income from Own Sources ...... ........... 51 62 652 960 781 1.170 583 701 918 1_077 1.143 1_143
FUND FLOW STATEMENT
SOURCES
Income from Own Sources ..... ......... 51 62 652 960 781 1,170 583 701 918 1,077 1,143 1,143
BorrowingDevelopment Loan 1/ ..... .......... - 2,012 919 - - - - - -Short-term Loan ...... ............. 569 555 121 255 555 -
NAFCO Contribution 2/ ............... - 862 394 - - - - - - - -Previous Year's Balance .... ......... _ - - - - 254 523 177 110 265
Total Sources 620 3,491 2 086 1.215 1.336 1.170 837 1.224 1j095 1 187 1.408
USES
Fixed Investment .... I .............. - 636 - - - - - - -Hteifer, Bull Purchases .............. 235 1,411 351 65 65 65 65 65 65 65 65 65Steer Purchases ...... ............... 385 827 962 770 745 - - - - - -
RepaymentDevelopment Loan 3/ ............... -- - - - - - 733 733 733 732Short-term Loan 4/ ................ - 569 555 121 255 555 - - - - -
Interest PaymentDevelopment Loan .................. - - 171 249 249 249 .249 249 187 124 62Short-term Loan ............... ,.,. - 48 47 10 22 47 - - - - -
Cumulative Cash Surplus ...... ....... - - - - 254 523 177 110 265 549
Total tlses 620 3,491 2.086 1 215 1.336 170 837 1 224 1.095 1 187 1,408
1/ 70% of Fixed Investment, and for Purchase of Bulls, Heifers and Steers during the initial two years.2/ 30% of Fixed Investment and Livestock Purchases fox initial two years.3/ At 83k7 p.a. with six-year grace and ten-year maturity.4/ At 8W% p.a. interest and principal repaid in the following year.
June 30, 1972

ANNEX 6m~ie 19
TANZANIA
SEIXNE LITFAIDOC DEEVKIPMNT FiiJ0CT
Model - Kltolo lateu- R-nh - 9.200 ha
Herd and flock PeeJectan-
---- --- --- --- ---- --- --- --- ---- --- --- --- --- - E d of Ran h YTear - -- -- - - - - - - - -- - - - - - - -- - - - - - - -
I. HRDEEPIJECTIOO Reeelocewt 1 2 3 1. 5 6 7 8 9 10 11-20
HRED NEK90SOTI0N
Dcli 34. 98 0. il 11.3 177 1926 213 171 i71 171 171
Bree a Co- 952 1778 2652 31.07 4.263 5187 5554. 5901 5056 4.971 1.971 1971
Calee-W.-nd 360 380 711 1193 1701, 2315 3112 3988 a81. 101.5 3977 3977
Heifer 9-24. moth, 182 1Ho 182 31.1 572 818 1125 1193 1685 1929 19,29 19729
Stee 9-24. sothe 192 187 187 31.1 572 919 1.125 11.93 1999 1929 1979 1929
Total Aciu-al 1730 2590 3911 5393 7291 931.5 1-1112 129898 1361.1 1301.5 12977 12977
Total Aclea Unite, Cattle 1350 2200 3100 4.200 9590 7090 6930 9000 9000 9000 9000 9009
PU3RCHAESR
DoIle 32 39 1.6 57 67 60 63 8 36 38 38
On-Calf low or Hetfere 799 999 959 1029 1010 367 -- ---
Total P-ohbses 8 839 908 1005 1092 19Y77 1.27 63 8 36 39 39
MRne1 ITT
Roll 1 1 2 3 4. 6 0 a 6 5 9 0
Rra.i. Ice, and Eapleceeta 38 38 71 106 136 171 208 227 171. 192 11.9 11.9
Hetf-re9-24 .eothe 8 9 8 1l 71. 31 1. 63 59 69 60 59St-ar9-21.eo thlo 8 9 8 19 20 31. 1.9 63 59 70 61 60
He.ifera2-3 yeo 7 7 7 7 11. 23 33 1.5 1.9 57 59 59
Steen 2-3 Y.0' 71 7 7 7 11. .2 33 .. 5i 45.Ž. 57i -. 2 .
Total ortality 69 69 103 152 217 -291 376 1.6 389 1.10 391 389
I.11 Bo11e 7 7 11 16 21 27 31. 38 4.1 31. 33 33
Ccli Ice, 91 91 171 259 327 109 1.98 427 675 599 979 579S-rplos Retfa- 9-241. Oth. - - - - - - - - - 322 33 -
Sorplce Steer, 9-241.moths - - - - - - - - 322 33 -Coil oatter 2-3 Year 1.6 19 19 19 33 59 79 108 11.9 183 197 187
Fat Steers 2-3 par 175 179 179 175 327 509 785 io9o 111.9 1929 1971 1871
So-pic Beeding KW-fer 2-3 y-cr - - - - - - - 76 575 917 996 956
So-pl- Bredlog tCa 7 - 6314 72--
TotalSale 1 9 7 11 2 0 1396 1729 3509 1.267 3692 3 62
TEHIRNOICA (S3EFICXI1TS
CAIree Wead % 1.0 10 10 1.5 50 99 60 70 60 Bo 83 80
Mc-tlty % 4. 4. . I 4. 1. 1 4 3 3 3 3Colll& Aag Botaoll% 20 20 20 20 20 20 20 20 20 70 20 20
0.aflng RateRreediogtC-e% 10 10 10 10 10 13 10 9 12 12 12 12
Calling Rate Etf.re 2-3 par -8 10 10 la 10 10 10 10 10 10 10 10 10
BoUlsas %cfRB-.dog F ... le 3.1 3 3 3 3 3 3 3 3 3 3 3
Stocking Rate, Cattle, AU/h. 0.10 0.21. 0.31. 0.1.6 0.66 0.76 0.97 0.99 0.98 0.98 0.98 0.98
00. 810Cf FREJECTION
FLOCK COMPOSITION
Roe. 250 250 2500 290 200 290 290 200 290 290 250 290
Se-ding ne- 12500 12500 12500 12590 12900 12500 12500 12590 12903 12500 12900 12500
E-, Lbeh, Weand 3250 3750 3290 3750 3750 3100 3100O 3100 3100 3100 3100 31300
Rem leeh, Weaned 200 703 200 200 200 200 200 200 200 200 200 200
Total Aninale 16200 16200 16200 16200 16200 16090 16059 16000 16090 16050 16090 16090
Total Aot.al Unite, Sh.ep 2550 2550 2950 2990 2590 2550 2990 7500 259 250 25; 590 2990
PORIHASCO
Roes5 18 IS 10 18 19 16 16 16 i 16 16 16
Total P-rhaaea 18 10 10 19 15 16 16 16 16 16 16 16
Em- 10 12 10 10 10 9 9 8 8 9 9 9
Breedlog Re-, 530 500 500 900 500 375 379 305 379 379 375 379
B.. Lake, Weand 325 329 375 3295 329 760 210 24.8 21.9 219 21. 21.
Ran Land,, Woaned 20 20 20 20 20 16 16 16 i6 16 16 16
Total Mortality 995 950 959 995 859 699 61.7 61.7 61.7 6u7 61. 61.7
SAIES
ClRc 19 1.9 1.8 La 1.9 1.9 1.9 19 1.9 1.8 18 1.9
Cull Sae, 2100 21.00 2100 21.00 2a00 2.75 2170 21.o9 2425 2175 71.20 21.25
Fat lobe, 6550 6550 6550 7171. 7900 8571 9200 9200 9200 9000 9200 91000
Mla-llaec- 165 165 169 165 165 331 196 106 196 196 196 196,
Total Sales 9163 9163 9163 9797 101.13 11391 11863 118B69 11869 11863 11869 11969
Wool (Kg.) 95779 095775 90779 95775 95775 105032 101.21.9 101.21. 101719 10121.9 101.719 101.21.
TEr0NIIAL NEEFUOOOIENTS
Iab. Weaned% 90 80 80 95 00 95 100 100 100 100 100 100
Ado1t M-Wity % 1 1. . 1. 1 3 3 3 3 3 3 3
Weaner o-toltty % 10 10 10 10 10 9 8 9 8 8 8 8
OCllog RateReee 0 0 20 20 20 73 21 20 20 20 20 20 20
CUl.lg Rat. W..eR 20 20, 70 20 70 20 20 20 20 20 20 20
R-aiao 0, cf RBedtng Foecal- 7 7 7 0 7 7 2 0 2 7 2 2
Wool tg/Haad 9 5 0 9 5 0.9 0.0 9.9 0.0 0. 5. 5.5
Stocking Rote, Sheep, RE/ho 0~~.28 0.28 0.78 0.28 0.29 0.28 0.29~ 0.29 0.28 0.28 0.28 0.28
TOTBL AN(01(AL UNITS, CATTLE PITS SHEE 300 175 9650 6750 8100 9550 10500 11550 ii550 11953 11550 11550
00MBSEDE S20000G EATE, CATTLR PLUS SHEEP, AU/ho 0.1 0.12 o.62 0.01. 0.98 1.01. 1.1 1.26 1.26 1.26 1.26 1.26
AJ oorel Unit (AS), Cattle. Rook leas.t on proolder in eqi-alent to-n -it.
1.2 1aa1o Unit (AU), Sheep. Fti- cheep on par or od- a- equealot to on ict.
Joo 30, 0972

8 a 3 8 ~~~~~~~~~0a ~~~~~aaa -~~ft -9 a *a0-
3Ž 8 ,~~~*00 Oaaa ~ ~ ~ ~ a a a ~~1 a~~-'~, a
a ~~~~~~~888 a
3388 3885
0 0 0r: . . . . . . . . . .
'-0.3 - 00i-~~~~~~~~~~~~ ~ ~ ... .00 .
08 8888 ooS2 ~~~ P.

4010 60
am lJy iOCK MEZYKOMIN M=Ur
Model - titl3 Pleeaso l3ch - 9,200 ha.
Spls md Operating l.ee Prloectioo iYsh)
----------------------------- ,----s----------_----- Mad <,r R- -ri ---------------- ----------------------------eO.r
D .. lsmt 1 2 3 4 5 6 7 a 9 10 1-20
Cull EullI 1/ b,00 4,900 7,700 11,200 lb,700 23,760 29,920 33,bb0 36,o80 33,320 32,340 32,3b0Cu. Cues " 4Cu,OhO b0C040 75,240 112,200 13h3.80 233,130 283,960 2b3,390 384,750 43.2,300 WOO,30 4105.300%culoe Ha Ten 9-2 seot 3/ - - - - 128,800 13,200 -ure Oere 9-2b. srtha _7 - - -t- 132,020 13,530
c0u1 8cfan 2-3 yearej/ 194.00 7,200 7,200 7,200 13,200 26,b00 37,920 5,9b40 69,600 102,480 1%,720 104,720F.a OItoor 2-3 Y.af / 5k,00 84,BOO 84,000 84 30 156,960 356,850 510,250 702,000 941.200 ,1.62,400 1,496,800 1,L96,800S.rp..a nEnediog eif.re 2-3 oare I/ - - - - - - W,9880 362.250 64l,900 669,200 669,200Surplus Breeding Cus y _ - - - _ - _ - 380,6O 13,920 - -
S,ub-Total 14.734O 13610.1 174.140 2Vh.600 328.7bQ 640,140 861.950 l.i78,550 2,174,520 2.gS7,1bO 2,735,090 2,708,360
Cull Race Z/ 6.720 6,720 6,720 6,720 6,720 7,200 7,i^0 7,300 7,200 8,160 a,160 8,160Cull ee 10/ i'.000 192,000 192,000 192,000 192,000 242,503 2b1.7 10 72,500 242,500 291,000 291,000 291,000Pat .Si a' 655,10 655,000 655,000 717,400 780 COO 1,028,680 1,1Oi.203 11..3O 3.10l,000 1,288,000 1,288,000 1,288,000Misc-,leoneue j/ 19,300 19,800 19,800 19,800 198,03 h6,760 ?7,1b00 23,_4 27,440 31,360 31,360 31,360
S3b- tel 873.5?0 873,520 873.S20 935. 920 998.520 1,325.340 1,381,u 1.381.1140 i.3781.140 .610.520 1,618,520 1.618,520
Houl ad Hides
W?oul / 670,425 670.425 670,425 670,125 670,175 T35,?21. 729,713 729,7b3 729,743 729,7L3 729,743 729,743HNd 1,035 1,035 1 545 2,280 3,255 4,365 5,6.0 6,690 5,820 6,150 5,865 5,8359kin. jj/ 4,275 4,275 4,275 4,275 4,275 3,295 3,235 3,235 3,35 3,235 3,235 3,235
Sab-Totl 675.7t5 67C,751 676.2kS 676i9io 677.9CS 7b2.88L 73S.618 739.668 738.798 739,128 738,843 738,813
TOTAL SillS 1,696,595 1.605,395 1,723,905 1,827,500 2,005,215 2,708,364 2,981,708 3,199,358 4.294,458 5,311,788 $,092,h53 5,065,693.:.... ..... . .... ......... ......... ............ .: .............. ... ._.... ....
0P90071110 WIZS
ILxed Co t
.sger'; Salry 25,000 25,000 25,000 25,000 25,000 25,000 25,000 25,000 25,000 25,000 25,020 25,000.seietsnt Mangera' 3Eaios (2) 30,000 30,000 30,000 30,000 30,000 30,000 30,000 30,000 30,00 30,000 30,000 30,000
Wage.s Headen 16/ 5.200 5,200 7,800 7,800 10.400 10,400 13.000 15,600 15.600 15,600 15,600 15.600H rd""'7/ 21,00 25,500 30,000 36,000 42,000 51,000 55,000 60,000 60,000 60,000 63,000 60,000iId1i Traitor Urivre 18/ 5,600 8,400 11,200 14,000 14,000 14,000 .l,OO 74,000 l,Oo0 14,000 1L,OOO 13,000Crwler Tractor DrIvrs 39/ 5.00 10,000 10,000 10,2OO l,O00 10,000 10,300 10,200 10,000 10,000 10,000 10,000Ktah,i./Ptttr / 4,000 ,000 4,000 4, D ,000 1,000L 1,0oo 1,0 L, 1,00 4,000 L,000 4,000Oeursl HBd. 21f 6,000 7,500 9,000 10 500 12 000 15 000 16 500 16 ,500 16,500 16,500 16,500 16.500
Trotor Ihpeneec, IitiTrutor 4,/ 12,000 63 000 84,000 105,000 105,000 105,000 105,000 105,O00 105,000 105,000 109.000 105,000Craler fraoture f 64,o0o 128,000 128,000 128 Q Oo,000 128,000 96,000 96,000 96,000 96,000 96,000 96,000
Law Borer hnDoswe / 0,300 27,000 45,000 54,l Sk° 54,000 54,000 51.300 54,000 54,000 54,000 51,000 54,0002.epulr a-d Moiinoe 35/ 20.000 32,567 42,885 9o,580 53,695 55,715 55,715 55,715 55,715 55,715 55,715 95,705P.er ar 261 183.000 181,000 180.000 1500, 20 300,000 120,300 948,00 948,000 948,000 918,000 910,000 948,0001,,I EeR talfr l1 920 920 920 920 920 920 923 920 920 920 920 920Hv1r,erM RonIr- it fL/ 10,000 90,800 123,600 150,300 150,300 150,300 150,300 150,300 150,300 150,300 150,300 150,300
80.b 00- 01 427,720 637,887 731,405 806,lio 939,315 1,073,335 1,577, 35 1,565,035 1,585,035 .,585,035 1,585,035 1,585,035
1&rLIe GCutaVeterInary 8Lpesn e / 39,000 47,500 56,500 67,500 81,0o0 95,50o 105,500 115,5oo 115,500 105,500 115,000 115,500OCtt1. Dippinog 9 6,750 11,003 15,500 21,000 27,750 35,000 ODOO 410 5,000 15.000 5.0000 45,000 L5,0o0marotong Chrerg _ 32,593 32,145 33,489 36,785 42,567 50,783 57,943 63,271 91,735 103,879 04,679 93,623
hub-To.l 16,3 43 90,645 105,489 125,285 151,317 181,283 2T3,363 223,371 252,235 264,379 255,179 254,123
Lirtostk Pordo,e.e
ihl1, _. 8,000 - - - - - 75.°00 78,750 10,OO 54,00c 57,000 57,Q3OLn :sir >7wsS1eirvr ( _ _ _ _ _ 227,~~~~~~~~~~~~~~7540L,. _,fi r 36,0 36,000 36,000 36.0D0 36,000 37,00 32, 000 37.00Q 32,000 320 , 32,000
,n Tonal 11 ~~~ ~ ~~~~~~000 06000 0000 06000 CO6 00 3000 33152 DM 10.70 1200 4100 - 900. .19t.b.'M-l 4~~~~~~~~~_4 _ooO 36,Qo 36,oo 360ooo ___36,ooo 32, 00 33L,4 sb5 110750 42 0_ 86,ooo 89,000 &S4000
1b-T.t.nl OperatLng Tapnare. 553,063 764,532 872,894 967,385 1,126,632 1,286,618 2,115,418 1.919,556 1,879,270 1,935,414 1,929,214 1,928,1'58
cunti±oge..ice & 25.303 36,1.4 41,844 46,569 54,531 62,730 89,o43 90,440 91,96 .g,4270 92.010 91.957
TOTAL O7ERAT?10b 62SES 575,366 800,958 914,738 1,013,9501 1,181,163 1,349,348 0,204,361 2,009,996 1,971,135 2,027,864 2,021,224 2,020,115
2SE OP'ERAING INCOM 0 1,L21,229 884,437 809,167 813,546 824,052 1,359,016 777,247 1,189,362 2,323,325 3,286,904 3,071,229 3,845,578
'rice/He"d Yew 1-4, 700 aht Year 5-8 880 hl; Year 9-20, 980 .8 20 Avrage cage 4,000 sh/r.T Ice/Hd, ler 1-4, 440 h T S.r 5-8 570 h; Tewr 9-20, 700 at,.' Arage ega 1,500 sh/yr.
1/Price/3Head, 40e. h: / Easd on 8 /w-rking hr feel, oil, greae pluo 6 sh/hr slint-ene-; 1,500 hra/yr.ia/ooed; 410 at heed on 16 e/earlking br feel, oil, grea plue 16 eloba etc *.; Year 1-5,
5/ Oice/Hq, Ye.w 1-4, 400 iht Yew 5-8, 490 sht Yeir 9-20, 560 sh. 2,000 hr/yr; Yer 6-20, 1,500 Irehr.r7toa Hed, Year r71-4, 630 ehi Yewr 5-8, 650 at, 3'r 9-20, ees of f. Bd eiita a iig iffL, oil, gras e, sd atdnmn 18,090 kr/yca
cei/Headt erw 7-84, 630 at; e 6 r 9-2 0, 800 it . 2 hd f / of f,d oil,.t-t. dig triectort d LJd R10 0hi0h haptrdItria/Hed, 610 ih. separatel (se.e foototai 22. 23 ad 24).'rice/Head, Year 1-4, L40 h,; Yor 5-8, 150 ih; lao 9-20, 170 .h. 6/ a.aiag macaL mlQco of 190-200 k0/ha trtplo aWrphophtr or aqoil-at at0.riae/Hed: Yew 1-4, 80 aht Yar 5-8, 100 ai; Yer 9-20, 120 ah. 600 it/ton 0.
'rie/Heed, Yewar 1-4, 100 it 1 Yaw 5-8, 120 ah; Tar 9-20, 140 ah. 27/ At etadard Ocoroewt rental of 106/baPrice/Heed; era 1-4, 120 dh; rear 5-8, 140 iht rear 9-20, 160 ih. W/ 20% oa valse ,of hiiloc, trantora and equlpimeet.Pric-/. 7 ih. EBasd oo 10 h/At f-r drxga srd saccrs*,
1/ PricelHtdes 15 b. at hed oc 5 h/An for d,iiaale._ / Prioe/Sin: 5 ioh. y Caloltd on btais ao 16 at/bot rketd cd 3 oh/chep varketed.
;Ieragi wage 2,600 t/yr. P Pricaead; Yw 1-4, 1,00 ah; lear 5-8, 1,250 ih; Year 9-20, 1,500 ah.;inrge wge 1,500 io/yr. / Price/Heod, 620 ah.
bver.ge wage 2,800 at/yr. Pritoe/Hed. 2,000 ih.&-crsge wage 5,O00 it/yr. 5% of Operating lImaa .. Wlding li-eetoCk purte,aes.
Jone 30, 1972

TANAN IA
SECOND LIVESTOCK DEVELOPMENT PROJECT
Model - Kitulo Plateau Ranch - 9.200 ha.
Piosecrial Pro jections(Tsh.)
Bef-r --------------------------------------------------------------------------- Yee- --------------------------------------------------------------------------Development 1 2 3 4 5 6 7 8 9 10 11 12-20
INCOME STATEMENT
Total Dales 1,696,595 1,685,395 1,723,905 1,827,500 2,005,215 2,708,364 2,981,708 3,199,358 4,294,458 5,314,788 5,092,453 5,065,693 5,0650693Less: Operating Expenses 575366 _800956 914738 1013954 1 181 1
6 31349 348 2.204.461 2,009.996 12971,133 2.027,884 2 021_224 2,020 115 2t020f 115
Ien fsProm Oat leareca 1,121,229 884,437 809,167 813,546 824,052 1,359,016 777,247 1,189,362 2,323,325 3,286,904 3,071,229 3,045,578 3,045,578
FUND FLOW STATEMENT
Rosrces:Iceans from Ows S-o rrc 1,121,229 884,437 809,167 813,546 824,052 1,359,016 777,247 1,169,362 2,323,325 3,286,904 3,071,229 3,045,578 3,045,578
Borrowing:Development Loan - 1,106,100 1,003,200 1,012,800 920,600 964,700 - - - - - -
NAFCO Contrhibtie - 47_4100 43_0,000 434,000 394,50 41_3400 360,578 112,313 - --- -_
Total Soarees 1,121,229 2,464,637 2,242,367 2,260,346 2,139,152 2,737,116 1,137,825 1,301,675 2,323,325 3,286,904 3,071,229 3,045,578 3,045,578
USES
Fixed Investsent - 1,097,500 644,500 832,500 645,200 601,500 - - - - -Incre-enta1 Workiag Capital - 482,700 588,700 614,300 669,900 776,600 - - - - - - -Repayment of Deelopisent Loan - - - 276,525 527,525 780,525 1,010,675 975,325 724,525 471,325 241,175Interest Payments en Development Lean - - 94,000 179,300 265,400 320,100 357,300 291,000 205,000 122,100 60,600 20,500 -Cash Surples (Defieit) 1.12L229 8_4,437 715,167 634_246 282.127 51_191 - - 1,143.000 2,440.279 2,539,304 2,783,903 , 3045.57
Total Uses 1,121,229 2,464,637 2,242,367 2,260,346 2,139,152 2,737,116 1,137,825 1,301,675 2,323,325 3,286,904 3,071,229 3,045,578 3,045,578
June 30, 1972

T A N Z AN I A
SECOND LIVESTOCK DEVEIDPMET PROJECT
Mbdel - NAOO Fattening Ranch (1ilagarasi) - 40,000 ha
Herd Projection
------------- End of Ranch Year ----------------Before
Development 1 2 3-20HgtD COMPOSITIOd
Steers 9-24 months .............. - 6,000 6,0oo 6,o00Steers 2-3 years ....... 52580......... - .580
Total AU 1/ 6.o00 __580 ll.g80
PURCHASES
Steers 9-24 months .............. 6 ,0 6jOo 6
IDRThIITY
Steers 9-24 months .............. - - 420 420Steers 2-3 years .................. - - 167
Total Mortality - -420
SAI_S
Steers 3+ years ................. - - 5,413
TECHNICAL COEFFICIENTS
Mortality Steers 9-24 months % .. - 7 7 7 3 _
Mortality Steers 2-3 years % .... - 3 3 3 z NStocking Rate ha/AU ............. 6.7 3.4 3.4 CD
1/An-imal Unit is any animal over one year old.June 30, 1972

hiNf 6
TANZAN IA
SECOND LIRETOCK DKEIOONEN PROJECT
Mo~del WACOM~ Fattening Rtanch (Kalagarasi)- 40.000 ha
Investment Costs(Tah.)
----- year I --- --- Yea 2 ----
Unit Number Number Total TotalINVESTMENT CATF.XORY Unit CotUisotUnt Cost Untot-
fIXED INVPSTMMN
Fir.breaks ard RoadsFireb-eaks. ........... K. 500 240 120,000 -- 240 120,000Roads............... K. 2,000 10 20 000 10 _20 000
S.b-totl.1 ......... 4,0 4,0
Boreboic. ........... No. 90,500 1 90,500 -- 1 90,500St-rg.& ........... No. 10,000 1 10,000 I 10,000Drinking Trough ........ No. 1,000 6 6,000 - 6 6,000PiP4,,g.............. Y. 12,400 3 37.200 -- 3 37,200
t~~t- ft~~~d ar 4500160,000 -ciotoc Ponds 2' ... :: 4:88 4 - - _____
S.b-total ............ 33O0 383.700
Dips ............ NO. 15,000 1 15,000 1 15,000 2 30,000Cerea-Cr-ok.......... No. 5,000 1 5,000 1 5,000 2 10,000B-o3na j............ No. 3,000 4 12.00 - -4 12 000
24-ego.Ro -Sos........ No. 75,000 1 75,000 - - 1 75,000A-sinn-t Monagern lSouse ... No. 30,000 - - 1 30,000 1 30,000
H.... ..- ....oose. No. 1,000 s0 50,000 50 50,000 100 100,000offSirelStso-.......... No. 10,DO0O 10,000 - - I 16,0(10SScdo ............. No. 5,000 - 1 50 1 -0
Sob-T,tal ........... 150008_0 2,
VehiEl_es and 3_psioment4-'ih,el Sci- Vehiclo ..... No. 26,000 1 26,000 1 26,000 2 52,000T.ror............. NO. 29,000 I29,000 - - 1 .19,000
t0sFoP- .......... No. 6,000 1 6,000 - -1 6,000
Poi............. No. 0,000 1 5,000 - -1 5,000s-oso............. No. 3,500 5 3,500 - -1 3,500
....... ........ No. 7,000 1 7,000 - -1 7.000mt,-c-'aneno, -ools 4/ .... Set 6,000 1 8,000 - -1 9,000F-~it-re. ........... at 5,000 1 5.000 - -1 5.000
`,b -.......... 69.500 260011,0
Sub-tot.1 Fined lnvestment. 780,200 131,000 911,200
Contt±ge-oi- 107,....... 78.020 .J.13,00911
Total Flo-d 1,nvestmnt....858.220 144200 ,0,2
INCRENTEAL WbOXING CAP ITA2,
S-eers 9-24 -oths. ...... No. 245 6,000 1,470.000 6,00,0 1,7,0 12,000 2,940 000
F.d Oges 3.tig .p- - 182,000 - 182.000 - 364,000Rekpairs and Maintena..ce Fi.ed -- - 2 5,058 25.058Machine Replacement ......... 17,900 -23,100 -41,000
Foel a-d 01.............13,400 -18,800 -32,200
RepaIr- and Maintenance -Vehicles .-............ 092600 13.2D. 2280
Sob-total j~~~~~~~~~~~~~~~~~~~j2290 262J5 485,058
C-sing-nntes 10% ...... 22,290 26,25 4_50
Total Fined Operating E.penses 24,9 268.373 533 563
La-d Rental --- 4.000 4-00 - 0(
variable Operating ExpensesMedirlee..............60,000 -115.800 -175,800
DipFin.g-.......30..000.....57.900 87.920
Sob-total 9000 13.026._00
Tot.', In-emesetsI Working Capital 1.809 190 1.936.073 37____26_
Tot.1 Investment 2.667,410 _2 L080.173 ,4.
I/ Ca?acity -24,000 cu ydCoro-ity -1.2000 c. yd
2/ lgbt eon fen -attle (4,800 m Fenoe/8oms)-1s-d 7TonIc, Spanner and Hland Sprayers
7 -o fo- aboot 1,051 Animal Units
I P'-'2

AN1,1X :Table 2,
T A N Z A N I A
SECOND LIVESTOCK DEVELOPMENT PROJECT
Model - NACO Fattening Ranch (Malagarasi) - 40,000 Ia
Sales and Operating Expense Projection(Tsh)
---------------------- End of Ranch Year ------
BeforeDevelopment 1 2 3-20
SALES
Steers 1/ ................................... - - - 3 12330i
OPERATING EXPENSES
Livestock PurchasesSteers 9-24 months 2/ .................... - 1,470,000 1,470,000 1,470.000
FixedWages ......... ........................... - 182,000 182,000 182,000Repair and Maintenance Fixed 3/ .......... - - 25,058 25,058
Machine Replacement 4/ ................... - 17,900 2,1,100 23,800Fuel and Oil Vehicles 5/ ................. - 13,400 18,800 18,800
Repair and Maintenance Vehicles 6/ ....... - 9,600 13,200 13,200
Sub-total - 222,900 262,158 262,158
Contingency 10% ......... ................. - 22,290 26,215 26,215
Total Fixed Operating Expenses - 245,190 288,373 288,373
Land Rental - 4, ooo 4 ,c00 4,O
VariableMedicine 7/ ......... - 60,000 115,800 115,800
Merketing Charge 8/ -....................... - - 86,608
Dipping 9! ................................ - 30,000 579005
Sub-total - 9g0,00 173,700260,308
Total Operating Expenses _ 1,809,19C 1,936,073 2 022681
1/ Price, 577 Sh/head; Weight, 750 lb/head2/ Price, Steers 9-24 months, 245 Sh/head; Weight, 350 lb/head3/ 2.5% of Fixed Assets/year4/ 20°/ of Total Value/year5/ Four-wheel drive, 18000 km @ 0.30 Sh/km; Tractor, 1000 hr @ 8 Sh/hr6/ Four-wheel drive, 18000 km @ 0.20 Sh/km; Tractor, 1000 hr @ 6 Sh/hr7/ Drugs, Vaccines, Drenches and Minerals, 10 Sh/Animal Unit8/ 16 Sh/Animal Sold9/ 5 Sh/AU
June 30, 1972

. 4 U Ii i A . ''| 'iS%i ts a '' l' i' i ~~~~~~~~~i
.~ ^* U , 4
H 3 S ~~~i9ttiti
°st~~~~~~~~~~~~~I~ , E ^1i i"ij ' 1a
>4il,~~ a 2 1 9Ii 31
a a! W4, ,j4 ,ti,, }
1''~~~~ i'' I

TANZANIA
SECOND LIVESTOCK DMVEWPNSNT PROJECT
Model - NAOO Fattening Ranch (Hkata II) - 4o,ooo ha.
Herd Projection
-------------------- End of Ranch Year ------------------Before
HRMD COMPOSITION Development 1 2 3-20
Steers 9-24 months ......- 7,000 7,000 7,000Steers 2-3 years ........ 6,510 * .*0
Total AU ........... 7000 13,1 1 1
PURCHASES
Steers 9-24 months - 7,000 7.000
MORTALITY
Steers 9-24 months ..... -490 490Steers 2-3 years ...... - 19
Total Nortality _490 685- ~ ~ ~ ~ ~ ~ ~ ~
SAIRS
Steers 3+ years ................ 61315
TECHNICAL COEFFICIENTS
Mortality Steers 9-24 months %.. 7 7 7Mortality Steers 2-3 years % ...... 3 3 3Stocking Rate ha/AU ... 5.7 3.0 3.0
1/ Animal Unit is any animal over one year old.June 30, 1972

T AP ZA N I A
SECOND LIVESTOCK DEVKWPNI PROJECT
Model1 NACO F.tte.i.g Ilsoc (Mkat. II) - 40.000 ha
nvestment Costs(T.h.)
Y-Ya 1 ---- --- Y 2 ---
Unit N-mb.r N,mher Tot.l T.t.1IINVEST?TNT CATEOORY Unit Coot UnItS Coot unit. Coot Unit. Cost
FLIXED INVESYYEN
Foeb-roko -........... 500 240 120,00 - . 240 120,000Rads .. E_ .......... K. 2,000 10 20 000 - 10 20 000
Sob-total .......... 140 000 140 000
Water D-Iejon-tB-rhol ............ N.. 90,500 1 90,500 -- 1 90,500storge ............ N.. 10,000 1 10,oDo I 10,000Drinking T-oghs........ N.. 1,000 6 6,000 -- 6 6,000Pipig .............. K. 12,400 3 37,200 - 3 32,200W.t-r Pond. (la-g) ..... N.. 40,000 4 160,000 -- 4 160.000Roter Fo-ds (-.aI) ..... N.. 20,000 4 60 000 -- 4 SO 000
S,b-.t.1........... 383.700 __ 383,200
Dips .. .......... N.. 10,000 1 15,000 1 15.000 2 30.000Cor-ol-Cr-sh.......o... . 5,DDO 1 5,000 1 5,000 2 10,000B... 3/ .................. No. 3,DO0 4 12 000 - - 4 12.000
Sob-totl ......... 32.00 20 000 52.000
tioeasir ............ N.. 75,000 1 75,000 - 1 73,000Sols to,'. Rt Hsgecs goos N.. 30.000 - 1 30.000 1 30,000
.............s . N.. 1,000 50 50,000 NO 50.000 100o 100,000............... N.. 10,000 1 I0,O00 - 1 10,000
Sh,sle............... N. 5,000 - - 1 5,0 1 3,000
............... 135.000 80.000 220 000
4-A-1o Drjo- Vehiole .... N.. 26,000 1 26,000 1 26,000 2 52,000:r o............. N.. 29.000 1 29,000 - 1 29,000
5041 ?-P ............ N.. 6,000 1 6,00 - 1 6,000PI-loo -- ........ . No. 5,000 1 5.000 - -5,000
H.- ............. N.. 3,500 1 35,000 1 3,500b-il- ......r.... No. 7,000 1 7,000 -1 7,000Mltei- an-eon /........ SI . St 8,000 1 8.000 I 8,000y
o-nt- ......e. .. Set 5,000 1 5~00 - 1 00
So ...-total....89.5010 26 000 115 500
Sob-total Fi.ed Inveatont. 780,2D0 131,000 911,200
Cortiege-ol- 107-...... 78,020 13.100912
T.t.1 Fioed I-veto-t ... 856 220 144 100 1.002 320
INCREMSI,IFAL WORKING CAPITAL,
Livenrok Pse-h....Stere 9-T4 -oth.J ..... N.. 280 7,000 1.0.0 7,000 1.960..000 14,000 3.920.000
Fiend Op.r.tina p.....eWage ................ 182,000 - 182,000 - 364,000
pi.-ed 6/..........- 25.058 - 23,058M-ohien- Repl--eest 7/ - 17.900 -23,100 41,000Fo-i -d 0il - Vehil-lnO 13,400 -18,800 - 32,200
Vrhio lee 9/............9,600 -13,200 - 22,800Te-tae Cleo-ra.......... .- 24,400 -24,400 - 46,800Land Renta.1............4,00 - 4.000 - 00
Sob-total 251.300 290.5585488
Varidble reetise Up,-seNediognell2/ . ~~~~All 10 7,000 70,000 13,510 135,100 205,100
Dipping.All...5 7.000 35.000 13,510 67.550 -1250
5.b-t.t.1 105.000 202,650 307.650
Sob-total IForating feponoe 356.300 493.208 950
C-ioe8-eny 107 ....... 35 630 49 320 84.950
Total Uperation Eapenoe 391.930 54Z.5289445
Tota I.-.,e,ta1 Woelki,g Capital 2.551.930 2.503528 4.886458
1/ capseSty - 24-,o00 e ydcTc lapaoiV - 2,OOO er ydlNight P.-s for 0ettl. (4,800 no Fenoeoodmsa)W _od Tools, Spannor aand Hasad Spayr
>2 Feod- St.o-, Yea- 1-4g, 280 Shr(350 .bAud); ea 5-8, 34aO aflhsad (15 lb/head); Ye"r 9-20, 400 Sb/head (500 TbhAsad)5>2.5R of Fined An...t./yoe-
7/ 217 of Totol Valon/yNear-~/ For-heo Roe, 070 ksVyear e 0.30 5h/Im; Traotor, 1000 1r/year 0 8 S/hAr2!Fo -.oe i-sro, 10000 mo/year 0 0.20 Oh/ISo; Tractor, I h r/year 0 6 Sh/hr
i ". is-ut Vacoloo, Trnh-eoeo, and Minerals, 10 ShAndaT3. Unit

TANZA NIA
SECOND LIVESTOCK DEVELOPMENT PROJECT
Model - NACO Fattenina Ranch OMkata II) - 40.000 ha
Sales and Operating Expense Projection(Tsh.)
------------------------------------------------ End of Ranch Year -------------------Before
CATZEOR Development 1 2 3 4 5 6 7 8 9-20
SALES
Steers / ............ ...................... - - - 4.041.600 4,041,600 4,546,800 4.546.800 4.546.800 4.546.800 502.000
OPERATING EXPENSES
Livestock PurchasesSteers 9-24 months 2/ .................... - 1,960,000 1,960,000 1,960,000 1,960,000 2,380.000 2.380,000 2,380.000 2.380.000 2.800. 000
Fixed
Wages ..................................... - 182,000 182,000 182,000 182,000 182,000 182,000 182,000 182,000 182,000Repair and Maintenance Fixed 3/ .......... - - 25,058 25,058 25,058 25,058 25,058 25,058 25,058 25,058Machinery Replacement 4/ ..... ............ - 17,900 23,100 23,100 23,100 23,100 23,100 23,100 23,100 23,100Fuel and Oil Vehicles 5/ ................. - 13,400 18,800 18,800 18,800 18,800 18,800 18,800 18,800 18,800Repair and Maintenance Vehicles 6/ ....... - 9,600 13,200 13,200 13,200 13,200 13,200 13,200 13,200 13,200Tse-tse Clearance .............. - 24,404 24,400 24,400 24,400 24,400 24,400 24,400 24,400 24,400Land Rental ......................I...... - 4 4.000
Sub-total - 251,300 290.558 290.558 290,558 290.558 290.558 290,558 290.558 290.558
VariableMedicine 7/ .............................. - 70,000 135,100 135,100 135,100 135,100 135,100 135,100 135,100 135,100Marketing Charge -/ ...... ................ - - - 101,040 101,040 101,040 101,040 101,040 101,040 101,040Dipping 9/ ............................... - 35,000 670550 67.550 67 550 67,550 67 550 67.550 67 550 67 550
Sub-total - 105,000 202,650 303.690 303690 303.69 303.690 303.690 303.690 33Q690
Contingency 10% .............. I ........... - 35,63J 49.320 59.424 59.424 59.424 ,24 59,424 59.424 59,424
Sub-total Operating Expenses - .391;2 930 542 %?g 653.672 6__6g72 653.672 653.672 653 672 653.672 653.672
Total Operating Expenses - 2"351L930 6 2613.672 2,613 672 3,033 3672 72 3.033.672 3.033.672 3.453,672
1/ Price, Year 1-4, 640 Sh/head; Year 5-8, 720 Sh/head; Year 9-20, 800 Sh/head2/ Feeder Steers, Year 1-4, 280 Sh (350 lb/head); Year 5-8, 340 Sh/head (425 lb/head); Year 9-20, 400 Sh/head (500 lb/head)3/ 2.5% of Fixed Assets/year4/ 20% of Total Value/year5/ Four-wheel drive, 18000 km/year @ 0.30 Sh/km; Tractor, 1000 hr/year @ 8 Sh/hr6/ Four-wheel drive, 18000 km/year @ 0.20 Sh/km; Tractor, 1000 hr/year @ 6 Sh/hr7/ Drugs, Vaccines, Drenches, and Minerals, 10 Sh/Animal Unit8/ 16 Sh/Animal Sold9/ 5 Sh/AUJune 30, 1972

SECOND LIVESTOCK DEVBOPMNT PROJECT
Model - NACO Fattenint Ranch (Nkata II) - 40.000 ha
Financial Proiection(Tsh. '000)
--------------------------------------------------- Year -----------------------------------------------Before
Develoennt 1 2 3 4 5 6 7 8 9-20IN6C0ME STATNNE2IT
Total Sales. .,. - - - 4,041.6 4,041.6 4,546.8 4,546.8 4,546.8 4,546.8 5,052.0Less: Operatin8 Expenses . ,, - 2,351.9 2.502.5 2,613.7 2,613.7 3,033,7 3,033.7 3,033.7 3,033.7 3,453.7
Income from Own Sources ,,,,,. ,,,,,, - - - 1.427,9 1,427.9 L.513.1 _ 513_1 1 513.1 1,513.1 1.59813
FUND QWLU STAJKTT
SORCES
Income from Own Sources . .. ,. - - - 1,427.9 1,427.9 1,513.1 1,513.1 1,513.1 1,513.1 1,598.3
BorrowinaDevelopment Loan 1/ .- 2,247.1 1,852.6 - - - - -Short-term Loan , - - 191.0 152.7 24.1NAYCO Contribution 2/ ,.,. ,, - 963,1 794.0
Previous Year Balance -, ,, ,-,, - _ - 287.9
Total Sources - 3,210.2 2,837.6 1580.6 1.452.0 1.51331 1.801.0
USES
Fixed Investment 858.2 1 1 ,, , . .. .. - 858,2 144 1Incremental Working Capital . - 2,352.0 2,5025 - - - -5
RepaymentDevelopment Loan 3/ ,. .,, . , - - - 1,024.9 1,024.9 1,024.9 1,025.0Short-term Loan .......................... - - 191.0 152.7 24.1 -
Interest PaymentDevelopment Loan ,,,,,.,,...........- 191.0 348.5 261.4 174.2 87.1Short-term Loan 4/ ,. .. ,.-.- - 16.2 13.0 2.0 -
Cumulative Cash Surplus ,,,.,,,,,,.,,,,.,, - 287.9 688.9
Total Uses - 3210,2 2 837 .6 1.580 6 1 45 1,513,1 ,1801,0
1/ 70% of Fixed Investment and Incremental Working Capital (includes Livestock Purchases and Operating Expenses) for initial two years.2/ 30% of Fixed Investment and Incremental Working Capital for initial two years.3/ Loan term of six years including two years of grace, 8j% interest p.a.4/ At 8h7 p.a.
june 30, 1972 LIE

T.able 29T A NZ AN I A
SECOND LIVESTOCK DEVELOPMENT PROJECT
M4odel - Ulooaa Breeding Ranch - 10.000 ha
Herd Prolectron
Be foreHL_IRD COMPIS'.0 1 10 De-elnePent 1 2 3 4 5 6_ 7 8- 9-20
RrrodlnI Gnu....................1,300 1,370 1,370 1,370 1,370 1,37U 1,330 1,370 1,370BoIls....... ................ 65 68 60 68 68 68 60 68 68Cal- ......... I......- ......- 520 685 753 822 890 890 890 890Hinfers 9-24 months...............192 126 250 329 362 294 427 427 427Str.rr 9-24 ..onths ...............- - 250 329 362 794 427 427 427Steer. 24-36 months .............. 240 316 298 366 410 410
Total Ncs,b-rs 1,557 1,564 1,937 2,335 2,477 2,525 2,658 2,703 2,703(Ttote Animal.) 1 55 208 2 822 3 088 3.299 3 41 4 3 593 3_s93
Sub-total AlU 1,557 1,564 1,937 2,335 2,477 2,525 2,650 2,203 2,703P,-rh-sd Stes.- .............. 768 500 900 165 - - - -
T,,tsl AlU1 2 325 2 064 2.437 2.500 2.477 2 6 25 2 658 2703 2 0
MORtALI118
Breeding Cows. .................. 52 55 55 55 55 55 555
We....rs ......................- 21 27 30 33 36 36 36Heiotrs 9-24 sonth ............... 8 5 10 13 14 16 17 17Steer 9-24 .onths ................- - 10 13 14 16 17 17Steers 24-36 months ............. I....- 10 13 12 13 16
S.b-total (e.cI.ding weanera)-- 63 63 77 93 99 101 106 108Puo-hased Steers................. 31 20 20 7 __- ___ ___ -
ToteSl 94 83 97 100 99 101 106 106
PURCHASES
Imm,ature Selifers .........- ...... 192 126 - - - - - - -Ore-disg-Age Heisers.-..............1,300 - - - - - - -
Bu1ll...................... -7- 65 6 9 19 19 1L9 19 19 19
Sub-total -1,557 132 9 19 19 19 19 19 19Steers.-....................768 300 500 165 - - - - -
Total - 2a32 632 509 184 19 9 19 19 i9
SALES
Bull .-.....................- - 7 16 16 16 16 16 16Cull felfers 9-24 months...............- 24 32 35 38 41 41Leon Steers 9-24 .netb .-..............- - - 41 13 - -H.if.rs 24-36 -oths.-................- 29 98 126 155 183 2,83Steers 24-36 months .................- - 230 303 286 351 394F~attening Cull Pem.-...........62 66 131 131 131 131 131 131
Sob-total - - ~~~ ~~~ ~~~~ ~~~~ ~~~~62 72 201 507 661 640 723 766SPurchale ter. 738 480 480 158 _ - - - -
Tot.l1 - 8_00 5152 681B _663 661 640 723 764
CBEHNTCAT, COEFRFTICENTS
Weaning Rote 7 ........ .......... 40.00 40.00 50.00 57.00 60.00 65.00 65.00 65.00 63.00Calf Mortality % ....... .......... 10.00 10.00 10.00 11.00 10.00 10.00 10.00 10.00 10.00Adult Mortality 7 .... .. ......... 4.00 4.00 4.00 4.00 4.00 4.00 4.00 4.00 4.00Extraction Rate 7 ....... .........- 3.89 3.73 8.62 20.48 26.17 24.06 26.74 28.33
Total Oatput Rate % ................ 3.99 3.73 8.62 20.48 26.17 24.06 26.74 28.33Cows/Total Herd 7'........ ......... 03.51 65.73 52.23 44.35 41.52 40.10 38.60 38.12 38.12Bull/Cow Ratio ................. 5.08 5.80 5.00 5.00 5.00 5.00 5.00 5.00 5.00Cow Culling Rate 7 ........... . .- 3.08 5.00 5.00 10.00 10.00 10.00 10.00 10.00 10.00Bull Coiling Rate % ...............- - 10.00 25.00 25.00 25.00 25.00 25.00 25.00Helfer Calling Rate % ......... .... - 10.00 10.00 10.00 10.05 10.00 10.80 10.00St-cking Rota h./AUI...............4.30 4.85 4.10 4.00 4.84 3.96 3.76 3.70 3.70Sto.king Rate AUl/ha ............... 0.23 0.21 0.24 0.25 0.25 0.23 0.27 0.27 0.27Carryi,ng Cap. AIl.................2,325 2,500 2,500 2,500 2,500 2,500 2,632 2,703 2,703
Pur-hasing Pri.es/HeadImasture Heifers................350 330 330 350 350 350 350 398 350Breeding-Age Heiferse..............380 380 380 380 380 380 380 380 380Bulls ..................... 1,001 1,000 1,000 1,030 1,000 7,000 1.000 1,000 1.000Steers.....................245 245 245 245 245 245 245 245 245
Selling Prices/HaodBull .-.................... 840 840 840 840 840 840 840 840 841Cull Heifers 9-24 months............280 280 280 280 315 315 315 315 400Lean Steers 9-24 -noths ............ 515 315 315 315 315 315 315 315 315Heifers 24.56 months..............500 500 500 500 505 500 500 500 500Steers 24-36 months .............. 490 490 490 490 640 640 640 640 720l'altenieg Cull Pn.-.............4350 450 450 450 490 490 490 490 560
A/ i,La. Unit is any aroIa near on,ye" or ldl.
JtBfl 30, 1972

A.N0X 6TabNO 30
r A 11_2A tl I A
SECOND LIVESTOCX DEVLOPIET PROJECT
Model - UVama Brdins Ranch - 10.000 ha
Inveareent Cost.(Tah.)
Unit Y Nbe Nueber Total TotalUnit Coae Uits Co t Units Cost Unit Cost
Firebreaks and RoadaFirebreaks. .. . 500 50 25,000 - 50 25.000
Roods .K... K. 2,000 5 10.000 - - 5 10000
Sob-total 35 000
Water Dcv. lonnntWater Ponds (large) 1/ . No. 40,000 2 80,000 - - 2 80,000
Water Ponds (*m=11)2/ .. ... . No. 20,000 - 2 40,000 2 40.000
Sab-totl 8_!000 40,000 120,000
StQ.k K-ndlina F-cliti.gCattle Uip. ., , .,,. No. 15,000 1 15,000 - -1 15,000
Crush .. . . ., No. 2,000 1 2,000 - 1 2,000
Bon 3/ . No. 3.000 2 6_000 2 6 000 4 12_000
S.b-to.tl 23 000 6.000 29.00q
Hoouinz9^amer'a Ilo.se .,o . 1,000 30 30,000 30 30,000 60 60,000
Poremo'se H.o.e,. . .. . No. 6,000 1 6,000 - - ' 6,000_ .fioe/Sto.e. . . . . .. No. 4,000 1 4.000 - 1 4_000
Sob-tot.l 40.000 30,000 70.000
Vehicles and EquicPentTractor (15 hP). o. 29,000 - - 1 29,000 1 29,000
Tractor Trailer . . 7,000 - - 1 7,000 1 7,000
Plough .. eo. 5,000 -I 5,000 1 5,000
Harrowm .... .... . No 3,500 - 1 3,500 1 3,500
ox Cart .. .. . No. 1.600 - - 1 1,600 1 1,600
Tool Set 4/ ................. o. 2,000 - 1 2,000 1 2,000
Office Fornit.ra . a.. . . . Set 3,000 1 3,000 - - 1 3,000
Ve.sriosry Eq.ip-set . . et 3,000 - - 1 3,000 1 3,000
S.b-total 3.000 51 000 54_100
Bob-total Fixed InveStmerts 181,000 137-:Tw 308,100
Contingency 10% ,. . .8 .. ,,,,..100 12.710 30.820
SBb-tota1 199 100 139.810 338 910
INCREMHNTKL WOlfIll CPITAL.
,iveetock Purch-sea J16 89,040
ioature Heifers .N,... . Mo. 280 192 53,760 126 35,280 10 89,040
Brsedi.g Heifers . .. No. 350 1,300 455,000 - 71,300 57,000
Bull . ,. No. 1,000 63 65,000 6 6,000 768 8S 160
Steers . ,, ...... No. 243 768 188.160 - 768 __6
Sob-total 761 920 41.DO 03,200
Oporatinm Ena"spag
Wages ,,,, ,,,, ,,,,,,, 10,000 10,000 28,030
M-rhinery P..1 and Oil ,. . 14,000 14,000 0.000
Repair and Maint.nMoc .o......- 5,000 5,00
Ceotral unit Charge 2 ... a,oO 19,000 27,000
miscellaneous . .................. .. 2,000 10,000 12,000
Machinary Depreciation . - 19,000 12 000
T *-to. Charge 61 . , 6.000 6.000
Sub-total 401000 83.00Q 123 000
Vsriabls 4,oAaim.l Health 7/ 23.00 21.000 22 000
Dlipping I................12.000 10.00022.0
Sub- totl 35.000 31000 66.000
Ccotitgency 10% . . . 8.000 11000 19.000
Total Operating Ripen8es 83.000 125.000 208 000
Total Iscrenurt1 WorktnS Capital 844.920 166,000 1."010.92
Total Iovestment 1,044,020 305,810 1,349,830
I/ Capacity - 24,000 tu yd2/ Capacity - 12,00O to yd3/ Night Pens (0400 m fence/Bova)4/ hlnd Tools, Spanners, Hand Spr-yar.5/ Paid to the Igisa Central Unit for the various services provided.6/ Charge paid to the Govsrrant. It coats 159B/ha, total cost of olaeriri 10,000 hb is 150,000sh. This ... t recovered as an conLty at 42 i. 6,018 ih/annum.
7/ Vaccine., Dron.he. and Misrcal.
October 16, 1972

TANZANIA
SECOND LIVESTOCK DEVELOPMENT PROJECT
Model - Ulamaa Breeding Ranch - 10,000 ha
Sales and Operating Expenses
(Tsh. '000)
Before ----------------------------------------- Year ---------------------------------------------Develoement 1 2 3 4 5 6 7 8 9-20
SALES - - 312 220 285 365 387 386 444 515
OPERATrNG EXPENSES
Fixed
Wages ..- 10 10 10 10 10 10 10 10 10Machinery - Fuel and Oil .- 14 14 14 14 14 14 14 14 14Repair and Maintenance . - - 12 20 20 20 20 20 20 20
Miscellaneous . ..... ......- 10 15 15 15 15 15 15 15 15Machitnery Depreciation . - - 23 27 27 25 25 25 25 25
Tsetse Charge / .- 6 6 6 6 6 6 6 6 6
Sub-total - 40 80 92 92 90 90 90 90 90
Variable
Animal Health . - 23 21 24 25 25 25 27 29 29Dipping .- 12 13 14 16 16 17 17 17 17
Sub-total 35 34 38 41 41 42 44 46 46
Contingency (about 1070)... . - 8 12 13 13 15 15 15 15 15
Total Operating Expenses - 83 126 143 146 146 147 149 151
1/ Charge paid to the Government for Tsetse clearance.
October 16, 1972 d3

T A N Z A N I A
SECOND LIVESTOCK DEVELORMeNT PROJECT
Model - Uiamaa Breeding Ranch - 10,000 ha
Financial Projections(Tsh. '000)
---------------------------- - - Year -------------------------
Before 1/INCOME STATE2ENT Development- 1 2 3 4 5 6 7 8 9 10 11 12 13-20
Total Sales. - 312 220 285 365 387 386 444 515 515 515 515 515Other Income 2/ . ,,. ,,. ,,,.- 36 36 36 36 36 36 - - - - - _ -
Sub-total - 36 348 256 321 401 423 386 444 515 515 515 515 515
Less: Operating Expenses. 83 126 143 146 146 147 149 151 151 151 151 151 151
Income from Own Sources .- (47) 222 113 175 255 276 237 293 364 364 364 364 364
FUND FLOW STATEMENT
SOURCES
Income from Ovn Sources ..- (47) 222 113 175 255 276 237 293 364 364 364 364 364
BorrowingDevelopment Loan 3/ . ..- 984 289 - - - - - - - - - - -Short-term Loan ........ ,,.- - - 56 88 2 - 24 88 69 31 - -
Particigant Contribution 4/ - 143 22 - - - - - - -Previous Year s Bas nce - - - 106 - - - 112 - - - - 28 -
Total Sources - 1 080 533 275 263 257 276 373 381 433 9 364 392 364
USES
Fixed investment .- 282 144 - - - - - - - - - -Breeding Stock Purchase . ,.- 574 41 9 19 19 19 19 19 19 19 19 19 19Steer Purchase .- 188 123 123 40 - - - - -Partiepants' Living Expenses 5/ - 36 36 36 36 36 36 36 36 36 36 36 36 36
RepaymentDevelopment Loan 6/ .- -- - - - 211 211 211 211 211 211 -Short-term Loan .- - - - 56 88 2 - 24 88 69 31 -
Interest PaymentsDevelopment Loan 7/ ,. . .- - 83 107 107 107 107 107 89 72 54 36 18Short-term Loan ..... ,,,, .,,.- - - - 5 7 - - 2 7 6 3 -
Cumulative Cash Surplus .-- 106 - - - 112 - _ _ _ 28 10
Total Uses - 1.080 533 275 263 257 276 373 381 433 395 364 392 55
1/ It is assumed that purticipants are engaged in agricultural activities in a different area prior to participation in Project,2/ Goverment subsidy for first aix years of 600 Sh/family.3/ Includes 90% investment in physical works, 807. of purchase of breeding stock during initial two years; 1007. purchase of steers in Year 1; 1007 of operating expenses
during first two years.4/ Participant contributes 107. of physical investment by hiB labor and 207. of breeding stock. It is eassumed that he brings the breeding stock from his prior vork. 5/ At the rate of 600 Sh/fiily. wl6/ From TRDB at 87. p.a. with interest and principal repaid the following years.7/ At 87 vith six-year grace and tvelve-year maturity; interest ccmputed on loan outstanding in the preceding year.
Oetober 16, 19T2

ANNEX 6
T AN Z AN I A
SECOND LIVESTOCK DEVELOPMENT PROJECT
Model - Masai Ul1aae Breeding Ranch - 4.000 ha
Herd Projection
-------------------------- ---------- End of Ranch Year -----------------------------------------
BeforeDeveloymont 1 2 3 4 5 6 7 8-20
HERD COMPOSITION
Bulls . . 15 241, 23 28 30 26 26 26 26
Cows ........ ... I, 300 480- 461 397 450 454 458 461 464
Heifers 9-24 months. . 48 - 116 123 128 97 77 73 73
Heifers 2-3 years .. . 47 - - 113 70 70 70 70 66
Bulls 9-24 months . .48 - 116 123 129 153 169 170 172
Bull. 2-3 year . .47 - - - - - - - -
Steer. 9-24 monthe . .. . 46 - - - - - - - -
Calve ....... I.. .. 105 250 264 277 331 364 366 370 372
Total AnflrIja 610 754 980 1061 1138 1164 1166 1170 1173
Total AU 2/ 505 504 716 858 807 800 800 800 801
DEATHS
Bulls . 1 1 1 1 1 1 1 1 1
Cows .. 12 20 19 18 20 21 21 21 21
Heifer. 9-24 months .4 - 9 9 10 12 13 13 13
Heiferc 2-3 years .. ,,.,,,,,.1 - - 3 4 4 3 2 2
Bulls 9-24 months .4 - 9 9 10 12 13 13 13
Bulls 2-3 years , - - - 3 4 4 5 6 b
Steers 9-24 months . - -_ _ _ _ _
Total Deaths 22 21 38 43 49 54 56 56 56
SALES
Cull Bulls.1 , - 5 7 7 6 6 6
Cull Cow. . 30 _ - 46 40 45 45 46 46
Surplus Heifers 9-24 months - - - - 57 92 97 99
Surplum Heifer.. -, ,,..._ - - 49 54 24 5 5
Bull. 2-3 years ,, ,,,. . , 47_ 113 119 125 148 163 164
Total Sales 78 - - 164 215 266 315 317 320
PURCHASES
ilreraibs helferi :: 2 205 _ 11 10 4 7 7 7
Total Purchases 2 25 - 11 10 7 7 7
TECHNICAL COEFPICIBNTS
Calves Weaned % .35 5S 55 60 65 70 70 70 70
Mortality Adult % .4 4 4 4 4 4 4 4 4
Mortaltty Heifers 9-24 months .. 7 7 7 7 7 7 7 7 7
Mortality Heifers 2-3 years . . 3 3 3 3 3 3 3 3 3
Cull Rats Breeder. . 10 0 0 10 10 10 10 10 10
Cull Rate Bull. 7 .10 0 0 25 25 25 25 25 25
Stocking Rate ha/AU .. 12.9 8 5.6 4.6 5 5 5 5
1/ 300 In calf heifers contcibute4 by farters.
2/ AniMAL Unit is any animal over one year old.
October 16, 1972


ANNEX 7Page 1
TANZANIA
SECOND LIVESTOCK DEVELOPMENT PROJECT
The National Agricultural Company Ltd. (NACO)
General
1. The National Agricultural and Food Corporation (NAFCO) was establishedin April 1969 under the Public Corporation Act of 1969 to promote agriculturaldevelopment and the production of food. It is governed by a board of directors,whose Chairman is appointed by the Minister of Agriculture. The General Manageris appointed by the President on the recommendation of the Mlinister ofAgriculture. The four operating departments are Planning, Finance, Operationsand Administration. However, it operates through several subsidiaries whichenjoy substantial autonomy, not only on day-to-day matters but also on majorpolicy items. One of its subsidiaries is the National Agricultural CompanyLtd. (NACO), a parastatal company, incorporated on tay 22, 1968 under theCompanies Ordinance of Tanzania. It has an authorized capital of Tsh 50million divided into 50,000 ordinary shares fully subscribed and owned byNAFCO. NACO is the implementing agency for IDA Credit 132-TA (Beef RanchingDevelopment Project).
2. NACO's main objectives and functions are to:
Ca) purchase or otherwise acquire a right of occupancy overlands and to sell, let or mortgage these lands;
(b) carry on the business of ranching and keeping cattle,sheep, pigs, and other livestock and to sell, breed,deal, and trade in stock, either live or dead;
(c) plant, grow, and deal in agricultural crops;
(d) issue and accept promissory notes and other negotiableinstruments and raise money in such manner as thecompany shall think fit;
(e) enter into arrangements with Government or other authori-ties or companies or persons that may seem cornducive toachievement of the company's objectives; and
(f) carry out such other operations as may be necessary tofurther livestock and agricultural development.

ANNEX 7Page 2
Organization and MIanagement
3. General policies and regulations are set for NACO by a board ofdirectors appointed by the National Agriculutral and Food Corporation (NAFCO).This board is currently composed of the Director of Agriculture (Ministry ofAgriculture), Chairman; the General Manager of NAFCO; the General Managerof the National Bank of Commerce; the General Manager of the Tanzania SisalCorporation, and the Commissioner of Lands.
4. NACO's manager is appointed by the board of directors, with theapproval of the Minister of Agriculture. He is responsible for implementingthe development plans approved by the board and provides that body withprogress reports. During the disbursement period of IDA Credit 132-TA,any appointment to that position would be subject to IDA approval.
5. A Chief Development Officer advises NACO's manager on operationand management of enterprises and planning and development, and his appoint-ment is also currently subject to IDA approval, a requirement that wouldremain in effect during the disbursement period of the proposed Project.The Chief Veterinary Officer, responsible for establishing and implementingveterinary procedures, is assisted by three veterinary officers, two ofwhom operate on a zonal basis. Under IDA Credit 132-TA Project Agreement,the appointment of the Chief Veterinary Officer is subject to IDA approval.The Chief Accountant is responsible for the operation of a centralizedaccounting service for all the ranches, for producing annual budgets, andfor operating a system of budgetary control.
6. NACO's head office is in Dar es Salaam. It has one field officeand 12 ranch-farm enterprises, five of which are currently financed throughIDA Credit 132-TA. NACO's organization is shown in Appendix 1.
Source of Funds
7. NACO's financial resources are provided by NAFCO through equityparticipation and/or through short- and long-term loans. Proceeds of IDACredit 132-TA are on-lent by NAFCO at 7% interest while NAFCO's own resourcesare lent to NACO at 7-1/2% interest for short-term loans and 8% interestfor long-term loans. NACO also overdrafts from the National Bank of Commerceat 7-1/2%.
Ranch-Farm Operations
8. NACO's 12 ranch-farm enterprises have a total cattle herd of about86,000 animals (as of June 1971), including a small number of dairy cows.One of the enterprises is a sheep ranch and one is a pig unit. Five beefcattle ranches are financed under IDA Credit 132-TA. The general policy asdirected from the head office is implemented by ranch managers, whosetechnical knowledge has been increased through training. Four technicalranch officers have recently been recruited from Australia to furtherstrengthen NACO's management.

ANNEX 7Page 3
Financial Condition
9. Prior to May 1968, NACO was the agriculture department of theNational Development Corporation (NDC). It was incorporated with an authorizedcapital of Tsh 50 million, total assets of Tsh 22 million, and paid-up capitalof Tsh 21 million. Accumulated losses grew to Tsh 5.7 mi:Llion (US$798,000)at the end of 1971 as against only Tsh 0.3 million in 1968.
10. Losses incurred by NACO can be attributed to several external andinternal factors. Among those not under NACO's control was the low fixedmeat price prevailing in Tanzania. Because of an acute meat shortage inDar es Salaam, NACO was forced in 1971 to sell steers before they were fedout to higher weights. Severe drought conditions resulted in high cattlemortality on one ranch and political problems with a neighboring countryled to cattle rustling and unexpected transfers of stock from one ranch toanother. Poor ranch management on two ranches and NACO's involvement in anunprofitable dairy and mixed farm, as well as the delay in completing arrarige-ments for the Zambia market, also contributed to the poor results. A sum-mary of NACO's balance sheets for the last four years is shown in Table 1.
11. Over the past few years, NACO's ranching operations have undergonea transition period, with a rapid build-up in total stock number to about80,000 head on the ranches financed under Credit 132-TA (para 8). Thebuild-up in breeding cow numbers has been particularly si.gnificant and,after 1972, feeder cattle will no longer have to be purchased for theseranches. At present, livestock are undervalued by about Tsh 5.5 million onNACO's books. The projected consolidated cash flow for NACO without andwith proposed development under the Project are detailed in Tables 2 and 3and show that NACO's operations are profitable over the long term.
Performance Under the First Project
12. IDA Credit 132-TA was declared effective on January 15, 1969for US$1.3 million to cover 65% of a beef ranching development project, witha total cost of US$2 million. Closing date is December 31, 1973. Theprincipal objectives of the Project are to increase the output of beef andto expand the production of improved breeding stock in Tanzania. To accom.-plish its aims, the Project would develop five cattle ranches and providetechnical services and a training program for ranch management.
13. IDA funds are on-lent by Government to NAFCO at 4% and transferredby NAFCO to NACO at 7% per annum for a term of 12 years, including a graceperiod of five years.
14. Disbursements of IDA funds to February 28, 1973 were on schedulewith a total of US$1.2 million, or 92% of total credit. Development on NACO'sranches is close to schedule.


ANNEX 7Table 1
TANZANIA
SECOND LIVESTOCK DEVELOPMENT PROJECT
National Agricultural Company Limited
Comparative Balance Sheet as of December 31 for Years 1968-1970
(Tsh'000)
1963 1969 1970 1971ASSETS
Cash and Banks 913 116 322 165Debtors and Prepayments 753 498 717 1,919Livestock - Ranches 13,895 14,483 18,538 21,618Stores 364 365 667 753Fixed Assets (after depreciation) 6,264 8,191 11,759 15,938Accumulated Losses 305 732 3,055 5,835
TOTAL ASSETS 22,494 24,385 35,355 ______
LIABILITIES
Bank Overdraft _ 270 1,907 7,593Creditors and Accrued Charges 1,064 1,512 1,170 1,335NAFCA Equity/Loans - 1,340 7,308 7,811NAFCO (IDA Funds) - - 3,722 5,163General Reserve 260 93 78 137Paid-Up Capital 21,170 21,170 21,170 24,189
TOTAL LIABILITIES 22,494 24,385 35,355 46,228
Source: NACO
March 12, 1973

TANZANIA
Second Livestock Development Pr,oject
Consolidated Cash Flow - NACO Expansion Program
BeforeINCOME STATI ET Development 1 2 3 4 5 6 7 8 9 10 11 12
Gross Sales(Phas. II) 3,517 5,525 8,659 14,840 20,633 21,058 23,966 26,489 29,600 28,181 28,677 23,691Less: Operating expenses (PhaseII)- 2,592 3,168 6,471 3,718 11,443 13,392 13,422 12,811 12,264 11,812 12,102 12,102
Headquarter expenses_. 700 700 700 700 700 300 300 300 300 300 300 300Interest on:
Development loar./ - 595 1,695 2,801 3,261 3,350 3,350 2,792 2,233 1,675 340Short term 1oan_/ 645 479 197 - - -
Investment deduction_/ 599 884 797 215 120 - -Depre tiation
MachineryL/ 1,075 1,075 1,075 1,075 1,075 1,075 1,075 1,075 1,075 1,075 1,075 1,075InfrastructurJ/ 1,251 1251 1,251 1,251 1,251 1,251 1,251 1,251 1,251 1,251 1,251 1,251
Net income before tax (Phase II) (3,345) (2, 627) (3,527) 80 2, 783 1,690 4,568 8,260 12,477 12,068 13,609 13,963Plus: Net income from Phase I and
non-IDA ranches_/ (2,679) 2,374 4,085 4,328 4,422 4,517 4,612 4,706 4,801 4,801 4,801 4,801 4,801Cumulative losses from precedingyears 10/ (3.044) (5 723) (6 694) (5,236) (4,435) - - - - - -
Total net income before taxes- -2,79) t971) 1,458 801 67 7,300 6,302 9,274 13,061 17,278 16,b69 18,410 18,764Less: Provision for taxesil/ - - - - 27 2 920 2 521 3 710 5,224 6 911 6.748 7.364 7,506Net income after tax t72,57) (971) T 4 801 4 ,;B 8,7 ,54 7,837 1C,367 10,121 11,046 11,25BlPlus: Depreciation and Investment
deduction 1.287 2,925 3,210 3,123 2,54] 2,446 2,326 2,326 2,326 2,326 2,326 2.326 2,326
FUND FL(0, STATET4EN'Sources
Equals; Funds from onw rescrces (1,392) 1,954 4,668 3,924 2,5B 6,826 6,107 7,890 10,163 12,693 17,447 13,372 13,584Borrowing:
Development Loan (70%) 12/ 6,997 12,944 13,012 5,410 1,049Short term 7,593 5,639 2,324 -
NAFCO Contribution (30%) 2,998 5,547 5,577 2,319 450From Current Assets 1 467 467 467 7 691 4,913 3,040 1,757 2,747 6,270 1,761 9,882
Total Sources 8,060 18,05 2_5,4 22,980 11.02 ,016 11,02 10,930 11,920 15.440 18,717 15,133 23,466
U SF. S
Fixed investment 2,994 4,421 3,983 1,077 601Bull/Herfer purchaEes 5,192 7,570 6,137 1,010 831Steer purchases 1,789 5,320 7,o86 5,039 -Operating Cost.2/ 20 1,180 1,383 601 67
Sub-total (9,995) (18,491) (18,589) (7,729) (1,499)Equipment Replacement (PhaseII) 2,069Equipment Replacement (Phase II) 3,307Maintenance Of Infrastructure 1,251 1,251 1,251 1,251 1,251 1,251 1,251 1,251 1,251
Repayment: Development loan (Phase II)Development Loan2-j/ (Phase II) 6,569 6,569 6,569 15,705 4,000Short term Loan 1,353 1,353 1,353 1,353 1,353 1,353 1,353 1,353
Current Assets 1.5/ 7,593 7,593 5,639 2,324C467 467 46 , 714 691 4,913 3,040 1,757 2,747 6,270 1,761 9.882 22,215
Total Uses 10 2950 22,90 112 01 1102 10930 1120 150. 1 17 11
V/ Phase II includes the seven ranches to be financed under the Second Livestock Project -- Kitub, Dakawa, Usangu, Smbawanga, Missenyi East, Mkata II, Malagarasi, and four NACO ranchesin Mwisa.
2/ Fxcluding depreciation and those expenses -- livestock purchases and snoe operating costs -- which are financed by the credit.3/ Incremental headquarter expenses, the decline in year 6 occurs when Tanzanians replace expatriates.
At BYX per annum, nix-year grace, 11 year maturity with labor payents in yeers 10 crd 11.5 / At 842% per a...., priscipat and interest repaid in the following vear.
At 20% investment deduction is alloned for investment in fixed assets and machine installatimas in the year In which investment is jude.7/ At an average 20% depreciation peryear for that entire NACO operation.
At 5% depreciation per year for that entire NACO operation.9/ Not incame from the remaining NACO ranches: Kitengule, Missenyi West, W. Kilimanjaro, Mkata, Mzeri (IDA Phase I); and Ruvu, Kongwa, Rhogai Dairy, Ngerengere Dairy aid Kongwa pig unit.
Operating cost includes interest em development loan, headquarter expenses (Tsh. 1.2 million); excludes interest on short-term and depreciation which isincluded under depreciation,and interest on short-term.
10/ Sinon losses can be carried forward and infinitum, provisions for taxes beccme positive only when accumulated losses become zero.TV/ Forty percent of income after deductions. Losses can be carried forward ad infinitum.12/ Short-term loan outstanding.17/ The depreciation in infrastructure is used for maintenance purpose frpm year four onwards.71/ Existing repayment schedule pn Phase I loan.71/ Includes cash and deposits. Should be maintained at a positive level.
October 16, 1972

T,a;Z,!;IA
SEC(ND LIV2STOCK PRSJoCT
Consolidated Gash-rlew - NiOO Without Phase II
0 1 2 3 4 5 6 7 8 9-20-- ---------- -------------(1000 T.sh) - --- _ -…-- -____________
INCOFE STATEMIT
Gross saleaY/(Pha e I) 15855 17317 17317 17317 17317 17317 17317 17317 17317Less, operating cost 12818 12617 12469 12469 12469 12469 12469 12469 12469
Interest on:Development loa 663 615 520 426 331 236 142 47Short term loanW 645 498 308 82 - - - - -
Depreciation - Machineryv 661 661 661 661 661 661 661 661 661- Infrastructure 626 626 626 626 626 626 626 626 626
Squals, net income before taxes (2679) 442 2300 2733 3053 3230 3325 3419 35114 3561Less, Losses from preceding yearI$/ (3044) (5723) (5281) (2981) (248) - - - - -
Provision for taxes2f - - - - 3122 1292 1330 1368 1406 1424Equals, net income after tax (2679) 442 2300 2733 1663 1938 1995 2051 2108 2137Plus, Depreciation 1287 1287 1287 1287 1287 1287 1287 1287 1287 1287
FUND FLCOW STATEMENT
Sources
Ecuals, Fhnds from own resources (1392) 1729 3587 4020 2970 3225 32e2 3338 3395 3424Borrowing: short term 7593 5864 3630 963 - - - - - -
From general reserve 1859 467 467 467 467 1121 2993 1615 3600
Total Souroes 2
Uses
Ilepayment:Developnent loan - - 1353 1353 1353 1353 1353 1353 1350Short term loan 7593 7593 5864 3630 963 - - - -
Equipment replacement - - - - - 3307 - -General reserve 467 467 467 467 1121 2993 1615 3600 5645
Total uses B060 66 764 5450 7 275 3 9
/ Includes five Phase I and the rexaining non-Phase I ranches.3 Includes headquarter expenses, excludes depreciation and interest cost3/ At existing amortization schedule.
At 8Cl% per aninuixm iterest and principal repaid the following year. X av At 20 per annum,
A at 5% per annum.j Income tax is not due unless curmnlative losses are reduced to zerc./ At 40k of net incnar after dedictiori. Losocs can be carried forward ad infinitum.
June 30, 1972

a - Rate or a,n qm cn Pgam
1 8 3 4, 5 6 7 8 9 10 11 12 13 14 15 16 17 :10 19 20
Groat "lot 15,8055 2731 17,31? 17,317 17,317 17,317 17,317 17,317 17,317 17,317 17.317 17,317 17,317 17,31? 17,317 17,31? 17,317 17,317 17,317
Opasaiag 0Coa 12,818 12,617 12,617 12,469 12,469 12,b69 12,469 12,469 12,b69 12,469 12,b69 12,469 12,469 12,469 12,469 12,46S 12,4 9 12,I69 12,469R1 looamt C.sta - . . . 3,207 - - - - 3,307 - * * *
m bot,o 6Two 498 3 82 - - - - - - - - - - - - - - -0P 1olas ,t ta I 2C41PItAlSd _OO Ou flet ogh now . s 2.I in b.R CIS b.S 1. b.OW 4.0b 4 4. 4 1.@ 4.W h.M 4. b. b.S1 ILAN
8. 1mgo UAK
3.% sn B....eraris Tvmma (9n) 1,4D am 67 7,300 6,302 9,27b 13,061 17,278 16,869 10,410 18,761 18,761 10,7* 18,764 18,769 IS,7 10,764 18,764P1,,a.,
leits ad ftSmt)/DooMtio 2,925 3,710 3,123 2,Sbl 2,Sb6 2,326 2,326 2,326 2,326 2,326 2,326 2,326 2,326 2,326 2,326 2,326 2,326 2,326 2,326bAtost an Iboyl._ 1bum - 5SS 1,69S 2,800 3,261 3,350 3,350 2,792 2,233 1,675 3D - - -
Intasot a. balt Tom. 69 79 197 -- - - - - -- -----
3.PlsMmt oat 5- - - ,376 - * _ 5,376 -* 5,j76Sos-mt Ont 9,SSS 10,4S1 18,09 7,729 1,4SS - - - - - - - - * - - -
Pia, i 11,d2mmue1&.M
c. (1,0 na) y(17,90) (17.707) (7,086) 6,660 5,061 10,102 13,331 16,989 16,022 :2,228 14,173 16,242 16,242 16,242 16,242 16,21,2 11.173 16,242 100,239
1. Pbradal aUs ofrsWz% -total Szwo.ina_t 2 17.4 p_roet
2. Paybelk period Y o
.L/ Th ltao vl. 1s aoutlastd at the capitalisad ealts of *t not now Wmrotod tw t atota th dis:at rate td is 10% ad the litf in agmud an 50 jmrm.
L/ ?m o0aftllated. oea ftl eel1 - lliC unZ. Itliuds luum frot Plan I end oat. rm-mI ranah..
L/ Thom ar rAn emb i,tm.
LI "id will ho Sanluded la bi %tmz' to *t eqta 1antd.
L/ Dltowou botess "I a" wod1, amtmm.
L/ ?w7 ta suoad -141.6.octebor 16, 1972

TANZANIA
SECOND LIVESTOCK DEVELOPMENT PROJECT
Organization Chart of the National Agricultural Company Limited
BOARD OF DIRECTORS
MANAGER
*ASSISTANT MANAGER
CIFDVLOPMEN1 I CHIEF VETERINARY | HEF ADMINISRTV SUPPLIES OFFICER
OFFCE Pt| OFFICES | ACUTANT OFCE _
EN LOPMDEV VETEAINARYL
R OFFICER BRANCH STAFF A | EADGUARTIER SUPPLIESO
LIVESTOCK HFR
H ~~~~~~~~~~MARFlKETING ANDIMNAE
TRANS PORTATION
S T A F F| F I E D OCFSFISTN ADC~TRTV SU ASSSTA
Position not tilled at this limo OFFICE STANCF STAFF F OFr CESUTPLIFES
Joe 30, 1972
World B..k.6919(R)


ANNEX 8Page 1
TANZANIA
SECOND LIVESTOCK DEVELOPMENT PROJECT
Preparation of the Third Livestock Development Projectand Technical Services
Preparation of Third Livestock Development Project
1. Responsibility for preparing the Third Livestock Development Projectwould rest with the Ministry of Agriculture, whose planning unit would performthe detailed work. At present, this unit is fairly well staffed and includesan experienced agricultural economist seconded from FAO. It can also obtaintechnical assistance from USAID and UNDP missions to Tanzania as well as fromexperts within the Ministry, NACO and other parastatals. It is desirable,however, that short-term foreign consultants also be engaged to assist inpreparation in specialized fields. The specialists required would be approxi-mately as follows:
Livestock Production Specialist 2 man-months
Livestock Marketing Specialist 2 man-months
Economist with experience in meatprocessing and marketing 2 man-months
Agronomist with experience inmaize and cereal crop production 2 man-months
Total 8 man-months
Total cost is estimated at about US$50,000 including subsistence, interna-tional travel, and travel within Tanzania.
2. The Third Project would continue development of the Livestocksub-sector along lines established under the proposed Second Project, withthe main emphasis on increasing production through further expansion ofNACO, DDC, and ujamaa ranching operations. Preparation work would include:
(a) identification of suitable ranch development areas, herdprojections, investment costs, sales and oper-ating expenseprojections, and financial viability;
(b) evaluation of the relative merits of using these organizationsfor future ranch development, both in terms of operatingefficiency and providing access to further development of thetraditional livestock sector:

ANNEX 8Page 2
(c) exploration of cooperative development of beef ranchingin Masai land, since the proposed Second Project isrestricted to small ujamaa developments withinranching associations;
(d) determination of the feasibility of developing mixedenterprises such as maize production or pig and poultryproduction based on maize produced on the ujamaa ranchas well as the feasibility of reducing the slaughterage of ranch-bred cattle by using improved pastureand/or maize supplementation;
(e) evaluation of the marketing system financed under theproposed Second Project, with emphasis on the adequacyof existing facilities, the need for additionalfacilities, and overall efficiency of the marketingstock route/holding ground operations, and recommendationsfor improvement when serious deficiencies exist;
(f) evaluation of the performance of the Tanzanian MeatProcessing Company, with special reference to theefficiency of its operations and their effect on theprice paid for cattle to the producer. The need forexpanding existing facilities or constructing newfacilities should be specified and estimated. Attentionshould also be focused on the product mix most suitablefor Tanzania, marketing requirements, and investmentrequired if changes are recommended.
Technical Services
3. The technical services to be supported under the proposed SecondProject are outlined in the following table.

TANZANIA
SECOND LIVESTOCK DEVELOPMENT PROJECT
Proiect Management and Technical Services
Investment Projection
--------------------------- Project Year --------------------Number (Tsh.'000)Units 1 2 3 4 5 Total Cost
_ _ _ _ ~~~~~~~~~~~~~~~~(US$' 000)INVESTMENT CATEGORY
Project Vehicles I/ ....... ..................... 3 78 - - - - 78 10.9Fuel, Oil and Maintenance .................... - 14 14 15 15 - 58 8.1
Salaries and AllowancesSpecialists 2/ ........................ I ...... 32 Man Years 1,680 1,680 1,680 1,680 - 6,720 941.2Ranch Technical Officers 3/ ................. 16 Man Years - 420 420 420 420 1,680 235.3
Foreign Trainin 4Graduate Training 4/ ......................... 0Technician Training 5/ ..................... - - 35 35 35 - 105 14.7
Local Training 6 . ............................ . - 25 25 25 - 75 10.5Investigational Work 7/ ...... .................. - - 350 350 350 - 1,050 147.0Consultancy and Project Preparation 81 ........ , 765 179 178 - - 1,122 157.0
Total 2.537 2.903 2,903 2,525 420 11,288 1,580.7
1/ Central Project Unit.2/ Chief and Senior Development Officers (NACO); Credit Specialist (TRDB)> Project Manager, Economist, Range Management and
Water Specialist (Central Project Unit*; Accountant (Marketing Comoany); Meat Technologist (Meat Processing Conmpany).3/ Four Ranch Technical Officers (NACO).4/ Four Fellowships, each of two years duration for overseas training and study for selected graduates in Range Management,
Range Water Development, Meat Technology and Economics.5/ Five three-year fellowships to Edgarton College, Enjora, Kenya - Diplorae in Range Management, Ranige Water Engineering and Agriculture Economics.6/ To cover fees for correspondence courses and textbooks for bookkeepers, senior clerks ard storekcepers selected by project manager.7/ Investigational work on scrub and weed control,ranch management technLiques, supplementary fee-as, fertilizer response and intensity of herding,
and introduction of improved forages.8/ Consultancy for meat processing and preparation of Third Livestock Develop!licut Project., ar1d FDI typing Inboratory.
March 12, 1973


ANNEX 9
TANZANIA
Phasing of Investment Cost
(Tsh.'000)
1 2 3 4 5 Total
Ranches 18,060 28,380 31,726 6,107 1,378 85,650Heat Plant 21,190 12,490 2,878 - - 36,558Livestock Marketing 6,531 6,294 4,6h8 3,051 - 20,574
Technical Services 2,537 2,903 2,903 2,525 420 11o288
Subtotal 48,368 50,067 42,154 11,683 1,798 154,070
Price Contingencies 3,418 6,721 7,823 3,587 700 22,249
Total with PriceContingencies 51,786 56,788 49,977 15,270 2,498 176:3-19
March 12, 1973

ANNEX 10
TANZANIA
SECOND LIVESTOCK DEVELOPMENT PROJECT
Estimated Schedule of Disbursement of IDA Credit
IDA Fiscal Year End of Cumulative Balanceand Quarter Quarter Amount Disbursed of Credit
(us$ 'o5o)0 18,500
1973/74 1 500 18,0002 1,500 17,0003 3,000 15,5004 5,000 13,500
1974/75 1 6,000 12,5002 8,000 10,5003 9,000 9,5004 10,000 8,500
1975/76 1 11,000 7,5002 12,500 6,0003 14,000 4,5004 15,000 3,500
1976/77 1 15,500 3,0002 16,000 2,5003 16,500 2,0004 17,000 1,500
1977/78 1 17,500 1,0002 18,000 5003 18,250 2504 18,500 -
March 12, 1973

C~ ~~~ N0 -N0 '0 N441 t ~0 C Ns
Ce OF en A - 0- 4. (4 N-I°I °11 °
~~ O u I 0 11 ° I IDi 0. ~ ~ ~ ~ ~ ~ ~ ~ r '-I I Io v0 11 r 4
-~~~~~~ -4-Il o r
Uss io~~4-1 I O r ll 0101
C. N Uo I I _ ~I .O| I t I ac
o , E D, en r1 r _ t I J
en F r0 0~ N r I2II*1
0 4 en0 O leI O 0 Ce R °
N 0 Y 11 Y n 011|.
4-4o- en en 0b
'4 4 0- 4 O , -0.1
en S E HS XKI o•o3H - |eD I S :I IcEI 1
0~ ~ ~~~I os 0440 0>t> Q Ul
|; | 6 0 rol c =OE: l % |°00C011t}
0 r H r I 14-il

ANNEX 12
TANZANIA
SECOND LIVESTOCK DEVELOPMENT PROJECT
Financial Rate of Return
i, The rates of return reported in Tables 1 and 2 are internal ratesof return on total investments. The financial returns on participant'sequity have not been computed since, for most ujamaa ranches, the returnon own equity is not likely to be a good indicator of financial incentive.The same is true for the parastatal sector, which is essentially anextension of the Government.
2. A pre-development income level is assumed only for Kitulo, asit is the only operation currently underway on a significant scale.The other on-going ranches-Sumbawanga and Usangu--are in a very earlystage of development and the ujamaa ranches are new so it is assumed Lhata pre-development income level does not exist. Because potential part_cipartsare currently at the subsistence level, the effect of the investments istherefore judged against that baseline. Additionally, a capitalized incomestream at 10% discount rate is used instead of the liquidation value ofthe herd.
3. The sales, cost, and investment estimates are derived from theindividual models and detailed assumptions are indicated in the differentmodels.

Ai0tT7 12271814 1
T A N Z A N I
;m LIVSS K D.L01F PRO1JEO
F nan6iol Rat. of Rabrm (oo Total lnvtaot.)
Modal 1 2 3 4 5f a f 8 9 10 1i 12 13-19 20(T.ah. 1000)
1. NACO/LDC 3/F Model
Phyil-1 I.v-t .. rt 8s8 1644 Liosatock Porchue.s 2,989 1,362 7800 6189 653 653 379 245 Il1 60 68 68 68Dp.ratinR CoSt 18 4662 909 527 535 533 506 513 502 5;02 502 552 68
Gross Sa1. - 1,260 1,366 1,273 1,403 1,628 1,879 2,020 2,033 2,010 2,o40 2,040 2,040 _
-c-rco,ontol Not Cash flo (4,2L2) (463) 100 351 438 665 1,017 1,285 1,443 1,463 1,493 1,L93 1,493
qata of R.t- - 36.4h
2. .ka.. Model
Physical -.. st,t 8a8 164 - - - - - - - - - - -Liv0 to.k Prtho.e. 2,280 1,152 71 281 114 116 114 114 116 114 114 114 114 114Op.rati.g Cost 392 475 504 555 579 529 509 511 509 509 509 509 509 509
Gross .1.. - - 255 941 1,416 1,560 1,695 1,830 2,275 2,282 2,282 2,282 2,282 8,878
Thcr~r.t-a3 Not Cash l,, (3,507) (1,748) (297) 128 746 940 1,095 1,228 1,675 1,682 1,682 1,632 1,632 8,278
Rata of R.to,n - 16.4%
3. bOobaongv Md0.1
Physical Iv.-ato.t 402Liea,took P-chavar 2,305 1,165 1,069 604 411 304 197 90 55 55 55 55 55 55Opti.g COst 621 4385 96 541 517 502 478 475 475 475 475 475 u75 475
()-os S1a.. 1,328 1,395 1,480 1,614 1,431 1,395 1,3io 1,431 1,631 1,438 1,438 i,436 1,438 3,390
ITc-t.ohs1 Net Cash Plo (1,817) (267) (117) 380 491 577 661 BS4 889 896 896 896 896 2,6.0
Rate of R.t=ro 21.39
4. VsnR,a Modwl
Physical IO,stoont 636 - - - - - - - - - - _ - _Lil.atock Proht... 2,238 1,313 835 810 65 65 n65 65 65 65 65 65 65 65Op2atig C0.t 490 541 919 559 984 537 537 537 537 537 537 537 537 537
2,os. ales 504 1,146 1,465 1,318 1,707 1,120 1,238 1,455 1,614 1,680 1,680 1,600 1,6d0 5,726
Iocrs,mot.l Not Cash Dlo,, (2,806) (708) 115 (51) 1,060 518 636 853 1,012 1,078 1,078 1,076 1,078 5,124
Rot, of uRatN, - 16.4%
5. Ula5. Ood.1
Phystial In. vtmt 282 144 - - - - - - - - - - _LIO.atOk P,,ro.hsa. 762 166 131 99 19 19 19 19 19 19 19 19 19 1Op.-rtlo Cost 75 126 143 191 153 147 149 151 151 151 151 5l1 i57 15i
3roas Alsa - 312 220 285- 365 387 386 400 515 515 515 515 5i 2,175
crb.-.tal Not Cash Nof (1,119) (103) (31) 98 216 214 279 295 361 362 365 368 366 2,028
Rata of R turn * 16.56%
6. Kitulo Mod.l
Gross Solos i,609 1,729 1,828 2,009 2,708 2,982 3,199 6,294 5,314, 5,092 5,066 568660 5,066 6Oparatidg Cost 801 915 1,014 1,181 1,349 2,204 2,010 1,971 2,028 2,021 2,022 2,022 2,022 SCooat..sot Cost 1,580 1,434 1.447 1,315 1.378 - - - - _ 2 2 2Nost Cash Fle if (696) (625) (633) (491) (19) 778) 1,189 2,323 3,286 3,071 3,044 3,044 3,044 i6.5366Incroors t.1 Not Cad, floe (1,18 (1767 (1.3 ,795 (1,613 (1,419) (346) 67 1 201 2,164 1,949 1, 922 1,922 1,922 16,363
Rats of ROtrn - 13.2S
7. ftlalareal Fattens.a Ranch
Gros s aSa.. - 3,123 3,123 3,123 3,123 3,123 3,123 3,123 1,123 3,123 3,123 3,123 _Oporatirg Cost 1,809 1,936 2,023 2,023 2,023 2,023 2,023 2,023 2,023 2,023 2,023 2,023 2.023 _T." t.-b t Cost 858 146 - - - - - _ _ _ _ _ _list Cash 710,, (2,667) (2,080) 1,100 1,100 1,100 1,100 1,100 1,100 1,100 10 1 100 9,365
Rat. of R torm * 21.1%
8. Iit- II fat-a,ig Raech
(20.s Sal,, - - 4 042 4,062 4,547 4,547 4,547 4 547 4 547 1,547 4,547 4,507 4,547 -Operating Cost 2,352 '2U903 2,614 2,616 3,034 3,034 3,034 3,034 3,034 :"034 3,034 3,034 3,034 _In0atoet Coat 858 144 - - - - _ _ _ _ _ _ _ _Nat Cash Plo (3,210) (2,667) 1,428 1,428 1,513 1,513 1,513 1,513 1,513 ',513 1,513 1,513 1,513 12,882
Rat, of Rot-ro - 22.9%
Gross Sa3.I - - 127 16" 216 234 237 230 2S3 253 253 253 2S3Op.ratiog Cost 68 80 107 109 95 102 112 103 127 107 107 107 127lovost,,sot Cost 579 - - - -Not C"h Flow (647) (80) 20 5S 121 132 135 136 146 1.6 146 146 146 1,243
Rats of Rst-r. - 1.2%
1, gho Iitulo Rat nh is on-gong and 1. geooratig * a4t boom, of bout Voh 1.122 =illion Thi7 I, asas.d so the pr--d-vo1.p-.i coti at, t. d d,dtcd fOr, the not cooh floto get that inoroo.otal impact of 15 th lotont.
J-n, 30, 1472

LaLc ial _:ate of Peturn (on Total In!ecut ,,e)
Model 1 22 _ 9 0 _1 -12 -19 20(Tah 1000)
MEFAT PRtOrE.SI(G
1. Mbeva Plant 1 2 3 4 5 6 7 8 9 10 11 12 13-19 20
Total Sales 7,607 10,184 19,672 20,919 20,919 20,919 20,919 20.919 20,919 20,919 20,919 20,919 20,919 20,919Total Investments 9,152 3,570 - - - - - - - - - - - -Total Operating Expenses 9,252 13,179 19,297 17,295 17,280 17,190 17,179 17,179 17,179 17,179 17,179 17,179 17,179 17,179
Incremental Net Cash Flow (9,152) (5,215) 887 2,277 3,639 3,729 3,740 3,740 3,740 3,740 3,740 3,740 3,740 3,740
Financial ROR - 18.07%
2. adnymxa Plant
Total Sales - -9,722 18,408 23,497 24,588 24,588 24,588 24,588 24,588 24,588 24,588 24,588 24,588 24,588Total Investments 9,751 4,281 - - - - - - - - - -
Total Operating Exp,as - 11,479 17,208 20,495 20,452 20,411 20,411 20,411 20,411 20,411 20,411 20,411 20,411 20,411
Incremental Net Cash Flow (9,751) (6,038) 1,200 3,002 4,136 4,177 4,177 4,177 -4,177 4,177 4,177 4,177 4,177 4,177
Financial ROR - 19.03%
3. TPL Plant
Total Sales 36,329 39,054 42,687 46,320 49,952 50,860 50,860 50,860 50,860 50,860 50,860 50,860 50,860 50,860Total Investments 3,383 5,181 3,022 - - - - - - - - - - -
Total Operating Expenses 36,147 38,604 41,501 43,918 46,854 46,854 46,854 46,854 46,854 46,854 46,854 46,854 46,854 46,854
Incremental Net Cash Flw (3,201) (4,731) (1,836) 2,402 3,096 4,oo6 4,006 4,006 4,006 4,006 4,oo6 4,oo6 4,006 4,006
Financial ROR * 26.60%
4. TPV
Total Sales 36,349 56,383 75,279 89,389 95,459 95,459 95,459 95,459 95,459 95,459 94,459 95,459 95,459 95*459,Total Investents 22,446 11,090 3,022 - - - - 116 - - - - - -
Totea Operating Expenses 36,720 59,984 72,693 82,403 85,257 85,046 85,o46 85,046 85,046 85,046 85,046 85,046 85,o46 85;o0466
Incremental Net Cash Flow (?2,837) (14,691) (436) 6,986 10,202 11,321 11,321 11,305 11,321 11,321 11,321 11,321 11,321 11,321
Financial ROR - 19.56%
Iive tock Market nx
Total Revenue 7,202 7,249 9,076 9,754 10,622 11,359 11,957 12,584 13,188 13,188 13,188 13,188 13.188 13.188Less: Total Expenses 4,703 5,772 6,816 7,480 7,406 7,579 7,737 7,825 7,893 7,893 7,957 7,936 7,851 7.851Investment Coat 6,581 5,294 4,648 3,051 - - - - - - - -Replacement Cost - - - - - 3,511 - 3.50 -
Net Cash Flow (4,082) (3,817) (2,388) (777) 3,216 281 4,220 1 4759 5 295 5,295 1,731 5,252 5,337 5,337
Rate of Return (%) 21.6
July 17, 1972

ANNEX 13
TANZANIA
SECOND LIVESTOCK DEVELOPMENT PROJECT
Economic Analysis
1. The economic analysis is based on the following adjustment to thefinancial analysis:
(a) Unskilled labor which accounts for about 30 petrcent ofoperating costs, is valued at Tsh 77 per man nwnth, whichis the estimated per family income in the subsistence sector;it compares to a market wage of Tsh 120 per mnrl month;
(b) Foreign exchange costs and benefits are valued at Tsh 10per US$; the official exchange rate is Tsh 7.14 per US$;
(c) Production is valued at international prices iadjusted fortransport cost; and
(d) Price contingencies are excluded from the cost estimates.
2. Based on the assumptions, the economic rate of return was estimatedto be 35 percent; the calculations are given in Table 1 and basic data forthe Table is obtained from Annexes 3, 4, 6, 8 and 9. To test the sensitivityof the rate of return to a number of variables, it was also estimated underthe following alternative assumptions:
Alternative Rate of Return(x)
(a) Costs and benefits valued at market prices 14.2(b) Investment cost increased by 10% 32(c) Investment cost increased by 20% 30(d) Gross revenue decreased by 10% 25(e) Unskilled labor valued at market prices 27
Table 2 gives the details of the sensitivity analysis.


SECOID LIVISl1CK DEMIPhEhT PILRo
Eeon.,c Rat. of R.etnrD
2 2 3 4 5 6 7 8 9 10 11 12 13-19 20-40
(Tah 1000)
0. sing lmarket Pricea 1/
0rose Sale. 47 048 71,041 97,270 121,697 135.480 138,396 3143.090 14.7306 152,034 151.264 151,977 151,975 151,975Less. Operating Cost 55,967 93,788 107,799 111,079 112,065 110,050 110,093 109,838 lC9,406 109,138 109,279 109,172 109,087
i,osessent Cost 4/19,536 4.9,890 1.3,736 1Io.837 4.,229 - - - - - -
Replaceent Cost - - - - - 8.12. - - - - 8121.Net Cashb Fl I l72.637) (5h.265) (4.21U I9.86 10 222 32.997 37,468 42.628 42.126 M.
Rate of Retoon, 14.4%
B. Using Shadow Pricea W
Cros Soles 47,048 71,041 97,270 121,697 135,480 138,396 143,090 147,306 152,034 151,264 151,977 151,975 151,975
LesS, Operating Cost 49,951 83 706 96,211 99 138 100,018 98,220 98,259 98,030 97,645 97,406 97,532 97,436 97,360
Inveatzert Cost 58,266 58,683 51, W. 17,452 4,974 _ _ - - - _ _ _Reploes-ent Cost - - -- - 11,378 - - - 11.378 -
Net Cash tla 1 (61;169) (7134 - - 50L, ) 5,149 53,000 54.445 43161 54,61570
Rats of Rt.rn 18.28%
1/ Asnuoin shadow prioss are eqoal to sorket prices.
2/ Includi4g technical serviesa.
2/ Capttolizod -oal. of net ctah flo at 10% dlsoasnt rate amer 20 years.
4/ Uttkilled laotr 010d at Trn 7l7o o.nth, ins arket rot is Th 120 por "th Val1..ic foroite ocohonte at T.h 10 per USS, the official rots ie Tah 7.114 per US$.
5/ Mo8tly foreign e-hange and re-valued at Tah 10 per US0.
July 17, 1972

TANZA.NIA
SECON1 LYVE SlGCh_EV DR W9T PROJECT
lco,,oelo Rate of htrn - S..
1 2 3 , 6 7 8 9 10 11 12 13-19 20
T. lJoskilled labor Valued at Market Price.Foralan Etange at ~adou riom
Net Cash Fl-ur II 1/ (61,169) (71,348) (50,385) 5,107 30,4b8 28,798 4L,832 49,276 5,,389 53,858 54,445 43 161 54,615 464,970AdJ.ustent for Labor (6,016) (10,082) (1l,588) (',941) (11,9d) (11,830) (11,835) (l1,l1dO) (11,761) (11,732) (11,747) (11,736) (11,727) (99,838)
Uet Cash Flov III (67,185) (81,436Y (61.97 )L . 68 3 18,441 _ 32,997 37,468 1628 42,126 2-698 31,425 42.888 365,132
Rate of Return 12.77%
IT. Ineest-ent Coat lacreased b' 10%
Net Cash Fl-. II (61,169) (71,348) (50,385) 5,107 30,888 28,798 44,832 49,276 58,389 53,858 54,445 43,161 54,615 464,970Adjate.ent for Inveesatet Coat (5,827) (5,868) (5,188) (1,745) (497) - _ - _ - - -
Net Cash Floe IV (.996 577.216) (5,529) 3,362 29,991 28,79b J 032 49/
27
6548,389 53,858 54.445 n3161 548615 464.970
Rate of Return 17.06%
lII,G3lra Revenue Re.dued by 112
Net Cash Flow II (61,169) (71,348) (8o,385) 5,107 30,488 26,798 48,832 49,276 54,389 53,858 54,445 43,161 54,615 464,970Adjust.eat for Groes Revenue (4,705) (7,108) (9,727) (12,170) (13,5483 (13,840) (14,309) (18,731) (15,203) (185126) (15,198) (i,198) (15,198) (129,390)
Net C.ah Flov V (651 74) (78,452) (60,112) k7,063) 16, 30,523 34,545 39,156 38,732 39,247 27.963 39.417 3
Rate of Return 12.14%
1/ Frem knnex 13, Table 1
Jaly 17, 1972

; , g S (f TC R'~~~~~~~~~~~~~~~~~~~~~~~~~~~~~~~~~~~~~~h R IC,
U&A DA : 0- i:iD TANZANIA
4 PA B>> K E N Y A SECOND LIVESTOCK DEVELOPMENT PROJECT
A BWSRC Y~J AM*AR rANCHES NACO RANCHES HC RANCHES.
222 ~~~~~~~~~Y~~~~8 A1 ~ ~ ~~~brm- BLHEMBA 2K. IC3212 03 MS,O ZO-2C,I
Loliondo -t _SARA LOIIO 542 2 0/! S, n A0 A ININCA Id42
K ILO PLATEAU - 24215b,
Bih.-dmuot (ii9Ealt C4-2-' v INA/
N5AkROC < [-I 9gMASWA K.okesyNro R>S) - 4 RACHN KT PROE BANCAS Hr
~~)Nll - - - -R - -SERYWE-
9 b r % E Q NCkonoz ~~~~~~~~~~~~~~~~~~~~S- U A _97° < RLJSHA lKA -tO b YI7S-Ek
I~~~~~~~~~~~~~~~~~~H enS 4WNTKIINAHI1
./ B [D/[CR1LUEAGA aMbulur suL EI>L MA I C
-. /1 BUKENE KI - lNYANGIRI L ibotl HRoberero 1R1TS C .: [ ERSCIINI HOLDING bROUNDS
1515 HAS TINC STOCK ROUTER
WI----- i A N . …- PROPOSED STOCK ° gITES
UCHO {¢ ) ) T 0 /<KOrA - 2\E Nt _ X t IP-OtKiAHRA @® 0040 h ARY MRA5E>E\USI,II 'aMpgndc sP/RuoARA L RA PAAA AM
'r, KOW ' A
2 1-ES 90 SSINO PLARTS
E.-~ ~ ~ ~ ~ ~~> LL7- ®'' M*yo rLhIA _ ______\_k_olS
X/ t AZA
/1. ~~~~~~~PRIMROA ROOTS, 00V00
IKOLA ALATO ~ ~ ~ ~ ~ ~ ~ ~ ~ ~~~~~~~~~-- PRIPAR RCAAS, BC 50 PAVED
(F DODOA 5 KOgA /Mku'k H S0: 70 !F 9LBAR5 5EI 0R tE-ANLt Xt0TtE
><MADABA 99 & t~~~~~~~~~~~~~~~~~~~~~~~~~~~~~~~~~~~~~~~ 1 1HZ5L siR
p C'-"'6 - - - - - TANZAR A -M- ?A BAIL LIRE
patd cS . T UC NAT ONRAL / N0D /A'N
TPyk \ A ;OCFA-SALAAM
,,, ~~~~~~~~~~~~~~~~~~~~~~~~~~~~~~~~~Ci. 4 g*R . r s KrA, [,, , OROj F?
L_N
N~~~~~~~~~~~~~~~~~~~~~~~I
4~~~~~~~~~~~~~~~~~~~~~~~~~~~~~~¶1
MALACABA
P k-bk.SJEIS
AFII'II
. '0 BJMECOIA OWARA / ND/AA
Afrtcct~~~~~~~~~~~~~~~~p, KIOETR
OCA N
b. B"~~~~~~~~~~~~~~40
p 4~~~~~~~~~~~~~Q


![ITI] FILE COPY - CiteSeerX](https://static.fdokumen.com/doc/165x107/632c409c7b8f8552bd07ddea/iti-file-copy-citeseerx.jpg)