FIFA World Cup: Factors that explain the performances of ...
30
Claremont Colleges Scholarship @ Claremont CMC Senior eses CMC Student Scholarship 2018 FIFA World Cup: Factors that explain the performances of National Football Teams Shivaan Seth is Open Access Senior esis is brought to you by Scholarship@Claremont. It has been accepted for inclusion in this collection by an authorized administrator. For more information, please contact [email protected]. Recommended Citation Seth, Shivaan, "FIFA World Cup: Factors that explain the performances of National Football Teams" (2018). CMC Senior eses. 1919. hp://scholarship.claremont.edu/cmc_theses/1919
-
Upload
khangminh22 -
Category
Documents
-
view
1 -
download
0
Transcript of FIFA World Cup: Factors that explain the performances of ...

Claremont CollegesScholarship @ Claremont
CMC Senior Theses CMC Student Scholarship
2018
FIFA World Cup: Factors that explain theperformances of National Football TeamsShivaan Seth
This Open Access Senior Thesis is brought to you by Scholarship@Claremont. It has been accepted for inclusion in this collection by an authorizedadministrator. For more information, please contact [email protected].
Recommended CitationSeth, Shivaan, "FIFA World Cup: Factors that explain the performances of National Football Teams" (2018). CMC Senior Theses. 1919.http://scholarship.claremont.edu/cmc_theses/1919

Claremont McKenna College
FIFA World Cup: Factors that explain the performances of National Football Teams
Submitted to Professor Yaron Raviv
By
Shivaan Seth For
Senior Thesis Spring 2018
April 23, 2018

This page is intentionally left blank

Acknowledgements Firstly, I would like to thank Professor Yaron Raviv for reading my thesis and guiding me through the entire process. I would also like to thank Professor Yong Kim for his insights and advice. I am thankful to all the professors and tutors I have interacted with over the last four years, all of whom have contributed to my education. I would not have been able to do this without my parents, and my brother Sharan, whose guidance has been unwavering. Lastly, I would like to thank all my friends, who have supported me in all my endeavors and have forever been by my side.

Abstract This paper examines the determinants of FIFA World Cup performances of nations. The study incorporates socioeconomic, cultural, demographic and football-specific factors to investigate how World Cup results can be explained. A linear regression is used to study the last five tournaments, and the model finds that being seeded for the draw, and the host country effect are statistically significant variables. Additionally, I discover two new variables – namely, having a star player and having become a member of FIFA before 1924, as being statistically significant in my analysis.

Table of Contents
I. Introduction 1
II. Background 4
III. Literature Review 6
IV. Data 10
V. Model & Methodology 13
VI. Results 16
VII. Conclusion 21
VIII. References 23

1
I. Introduction
Football, or soccer, is undeniably the most popular sport in the world. FIFA or the
Fédération Internationale de Football Association is the governing body of the sport around
the world and has a total of 211 members; it is often referred to as the “United Nations of
Football” (FIFA n.d.). According to FIFA’s Big Count in 2006, an estimated 265 million
worldwide people play the game across all levels – close to 4% of the world’s population
(FIFA 2007). While playing and access to the sport is fairly easy, in that all one needs is a
few willing bodies and anything that resembles a ball they can kick, watching the sport has
in the recent past become increasingly accessible. With technological advancements, such
as satellite TV and internet streaming, the sport has spread even farther across the world.
Domestic European leagues are broadcasted in remote corners of Africa and Asia, and in-
home audiences for the last World Cup in 2014 reached a total of 3.2 billion (almost half
the world’s population), with at least some part of the final match being watched by over a
billion people (FIFA 2015).
FIFA organizes the World Cup every four years, and all member nations take part
in preliminary qualifying rounds leading up to the tournament. A total of 32 teams make it
to the final World Cup tournament, competing to be crowned champions of the world.
Bragging rights are not the only thing that nations are competing for at each World Cup;
tournament prize money for the national football federations has steadily increased over
the last few decades. This year, in Russia, teams will be awarded a total of $400 million in
prize money; the winning nation will walk away with around $38 million. Making it to the
final 32 teams, is in itself, a significant achievement, in not just footballing terms but also
financial. The teams that are eliminated in the group stage will receive a total of $8 million

2
each (FIFA 2017). Additionally, young and upcoming football stars seek to present
themselves on the world stage in the hopes of being recruited by big clubs, while the big
names in the game aim to win the grandest title of all – the World Cup itself. The
tournament is not just important for the players and participating nations. Fans around the
world look to cash in by betting on the World Cup. In 2014, analysts estimated that fans in
Britain would spend more than a billion pounds gambling on the World Cup (Benedictus
2014). Alpha Sports Betting, which is a website that provides sports betting tips to fans,
estimated that FIFA earned around $1.8 billion from their 5% commission on bookmakers,
implying that the bookmakers themselves earned approximately $36 billion from the 2014
World Cup (Camilleri 2017).
Monks and Husch (2009) examined the impact of seeding, host country and home
continent effects on World Cup results. Hoffman, Ging and Ramasamy (2002) examined
the socioeconomic and political determinants of international football performances. Their
study measured FIFA ranking points and not specifically World Cup performance like
Monks and Husch’s, or this study. Papanikos’ (2015) model studied the 2014 World Cup
in Brazil and predicted the goal difference of each of the 63 matches that were played at
the tournament. His model examined the relative strength of each nation compared to its
opponents in each game in economic, political and demographic terms. I aim to analyze
the determinants of World Cup performances of teams – I use socioeconomic, cultural,
demographic factors, as well as tournament-specific and football-specific variables, in
order to create a model that draws on these past studies. My study will use a linear
regression model, and the inclusion of these several variables will add to the previous
literature in that it will help better understand the factors that influence World Cup

3
performances. With this goal in mind, my analysis will provide those who aim to forecast
World Cup results additional variables to consider in making their predictions.
My study finds that none of the socioeconomic or demographic variables are
statistically significant in determining performances. In other words, it does not matter
whether a country is rich or poor, big or small, or hot or cold. Factors other than these are
significant in explaining World Cup results. Two of the variables – Star-Player and FIFA
membership before 1924 – are my original additions and have not been used in prior
studies. My model suggests that being seeded, having a star player, and having become a
member of FIFA before 1924 are the variables that influence a team’s results at the World
Cup. Additionally, in a varied specification, along with the aforementioned variables, the
host country effect is also statistically significant.
The next section discusses the recent history of the FIFA World Cup, while the
third surveys the literature that investigates the same and related topics. The fourth section
describes the data that I have used in this study and the model I use to conduct the analysis.
The fifth section describes my findings and the final section concludes the study and also
points to opportunities for further research in this field.

4
II. Background
The World Cup tournament is held every four years and the 32 teams that make it
are not evenly distributed among the different confederations within FIFA – this year there
will be 14 European, five Asian, five African, five South American and three North and
Central American teams at the World Cup in Russia. The teams are drawn into eight groups
of four teams each. The eight top ranked teams are seeded and all drawn into separate
groups (Goal.com 2017). This is done so as not to make the group stage extremely unfair,
and to prevent these heavyweight teams from facing each other too early on in the
tournament. The host nation(s) is also always seeded. This naturally provides them with a
better draw for the group stage than they would otherwise have, but only if they are not
among the top ranked teams. The format consists of an initial group stage, where teams
play the other teams in their group once. From each group, the top two teams advance to
the round of 16, after which it is a simple bracket knockout competition. In the group stage,
a team is awarded three points for a win and one for a tie. This 32-team format has been
around since 1998, before which the tournament had a similar format but with 24 teams.
In the last five World Cups (1998-2014), there have been five different winners:
France, Brazil, Italy, Spain and Germany respectively. Football, and more specifically the
World Cup, is always full of surprises. Nothing is more thrilling for a neutral fan than
seeing an underdog emerge victorious against clear favorites. Furthermore, teams seem to
have that little extra in them when playing in front of their home crowds (although this was
not the case back in 2014 when Brazil were beat 7-1 by Germany at home). Host nations
have generally fared better than they were expected to. Recent records show this: in 1998,
France won at home; in 2002, South Korea made it to the semi-finals; in 2006, Germany
5
reached the final. Brazil’s performance in 2014 does not fall under this category as they
were heavy favorites to win the tournament. Before 2010 – when Spain won in South Africa
– Brazil were the only country to have won the tournament outside of their home continent.
Moreover, certain Western European and Latin American nations have historically fared
better than others at football, evidenced by the fact that only eight different teams have
won the World Cup – all exclusively from the aforementioned group – since it was first
held in 1930 (FIFA n.d.).
Nations’ footballing performances are so variable that this year, Italy and
Netherlands – two teams that are considered footballing heavyweights – have not made it
to the final 32, while Iceland, with a population of just around 300,000, will be making
history by being the smallest ever nation at the FIFA World Cup. The aim of my study is
to understand the factors that explain the performances of nations at the World Cup.
6
III. Literature Review
Although Sports Economics has become a popular field of study, there have been
few studies that seek to understand the determinants of World Cup performances. The
studies that investigate the World Cup focus primarily on the impact of hosting on host
countries and tourist activities (see Monks and Husch 2009). In contrast, there is a
considerable amount of literature that studies Olympic medal tallies and countries’
performance at the Games (Hoffmann et al. 2002). I follow the studies that examine World
Cup performances and Olympic success of nations, in order to explain the factors that
influence World Cup performances.
Bernard and Busse (2000) investigate the relationship between socioeconomic
variables such as population, GDP, political history, and Olympic success. This paper is
relevant to my study as it assesses the impact of various socioeconomic factors on a
nation’s sporting performance. Their initial model studies solely how population affects
the medal share of a nation, with a simple hypothesis that a larger population will have a
larger talent pool and therefore, each country is expected to win a share of medals
proportional to the size of its population. While the model does have explanatory power, it
“fails to adequately explain the distribution of medals across countries” (Bernard and Busse
2000). They then expand their model to include real GDP per capita, a Soviet dummy
variable, a host variable, a variable for planned economies, and a lagged medal share
variable. This model suggests that more than population, it is the economic resources of a
nation that influence Olympic success – GDP in particular. Beyond a nation’s medal share
that GDP would predict, Bernard and Busse find that host nations exceed their expected

7
medal share by 1.8%, and the Soviet Union and Eastern Bloc nations exceed their share by
three percentage points.
Monks and Husch (2009) study the impact of hosting, seeding and home continent
on World Cup results. Their data includes seven World Cups between 1982 and 2006, and
their dependent variable is each nation’s World Cup rank – between 1 and 24 or 32,
depending on the format used in each World Cup. They find that home continent and
seeding have a statistically significant impact – home continent improves a nations World
Cup rank by around 2.7 places (-2.7), while seeding improves it by around 5 places (-5).
The coefficient on the host country variable was not significant. In one specification that
excluded the Korea-Japan 2002 tournament, the host country effect went from -2.9 to -1.1.
It shows that their 2002 performances in particular were disproportionately influencing the
host country effect in the original model. Monks and Husch (2009) also run separate
regressions for the 24-team and 32-team formats. The 32-team format regression is most
relevant to this study, as it looks at the same tournaments, although this study also includes
results from the 2010 and 2014 World Cups. The results from this are similar to their
original regression.
Hoffman et al. (2002) examine the determinants of international football
performance in general. They do not limit their study to World Cup results. Rather, they
choose to study the effects of socioeconomic and cultural factors on a country’s FIFA
ranking points as of January 2001. They follow the Bernard and Busse model and adapt it
to study international football. While they do include population, GNP per capita and a
host country dummy, they also include a climate variable hypothesizing that there is an
ideal temperature – 14℃ – for outdoor athletics and some countries have climates better
8
suited to facilitate sporting development than others. They also include a dummy variable
to measure footballing culture – Latin – which includes all Central and South American
countries, Spain and Portugal. They find that the GNP and host variables are statistically
significant at the 5% level, while the GNP squared and temperature deviation variables are
significant at the 10% level. The latter set of results confirm their hypotheses that: 1) an
increase in GNP per capita has a positive effect at a decreasing rate until a certain point,
after which its effect will be negative, and 2) a country's maximum ranking points will be
reached when its average temperature deviation from 14℃ is zero. Their interaction
variable is significant at the 5% level too, implying that for those specific “Latin” nations,
an increase in population could have a positive impact on their FIFA ranking points. This
follows from the fact that within these nations in particular, football participation increases
with an increase in population, since it is far more popular than other sports.
Papanikos’ (2015) model seeks to explain the goal differences of the matches at the
2014 World Cup in Brazil. His model takes into account the differences in each team that
can be measured in economic, political, and demographic terms. The dependent variable
in the regression is the goal difference for the game, and the explanatory variables are the
relative economic, political and demographic strength of the two teams. The model also
includes a few dummy variables such as Brazil’s host advantage, climactic conditions, the
confederation a team belongs to and the round of the match. He finds that a higher relative
population and GDP per capita than one’s opponent should have a statistically significant
positive impact on a team’s goal difference. Specifically, “countries with 5 times higher
per capita income than their opponents will have a goal difference of one goal relative to
match results between teams with similar per capita income” (Papanikos 2015).
9
Additionally, FIFA rankings are found to have a significant and non-linear positive impact
on goal differences. The study also concludes that countries have are more open
democracies than their opponents have better goal differences. For Brazil’s case in 2014,
he finds that they did not have any significant host country advantage. The model correctly
predicted the result of 51 matches out of a total 63. In terms of goal difference, with its
predicted goal difference being no more than 1.5 more than the actual goal difference, the
model was correct in 48 instances from the 63 matches.
Similar to the above studies, I examine how socioeconomic, cultural and
demographic factors as well as variables directly related to the tournament and the sport
impact a country's performance at the FIFA World Cup. Previous studies in this field have
exclusively focused either on socioeconomic and political factors, or on tournament-
specific variables. Additionally, some studies have not specifically examined World Cup
performances of nations, which is what my study aims to do. In contrast, the model used
in this study, by combining these several variables, aims to encompass as many factors that
impact World Cup performances as possible. Specifically, my model is the first to
incorporate a range of factors that are socioeconomic, demographic, cultural and football-
specific in nature, while measuring the results of all teams at the FIFA World Cup.
10
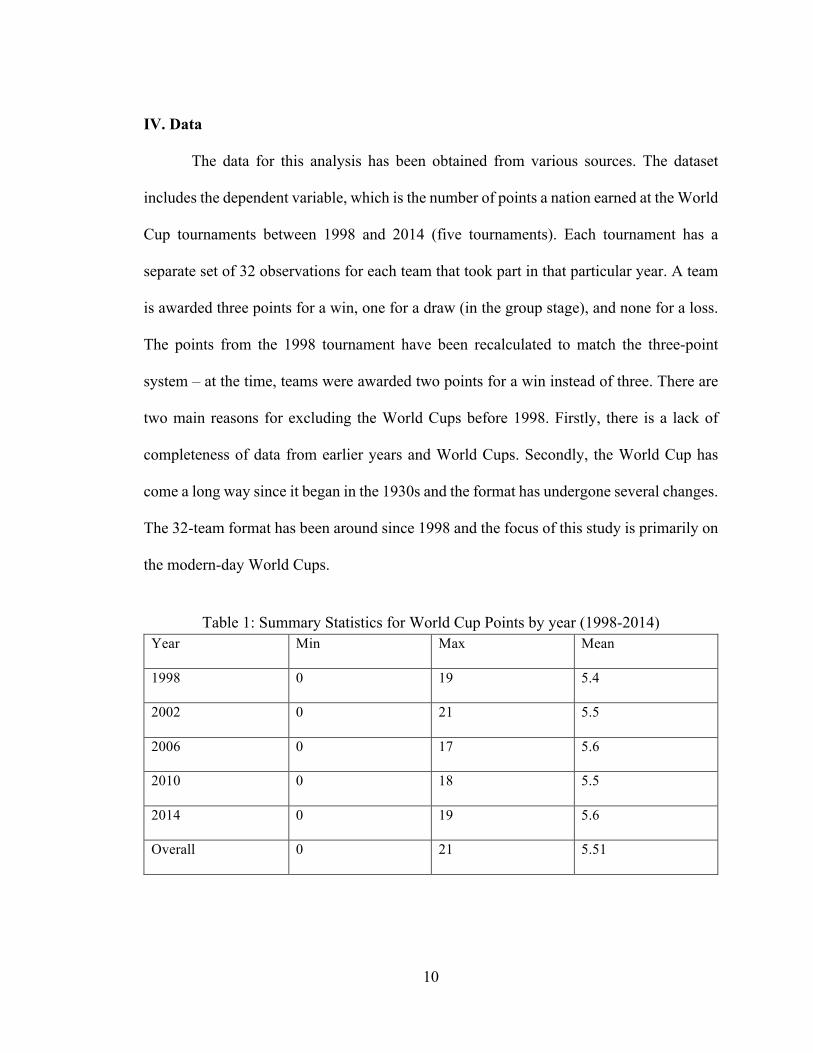
IV. Data
The data for this analysis has been obtained from various sources. The dataset
includes the dependent variable, which is the number of points a nation earned at the World
Cup tournaments between 1998 and 2014 (five tournaments). Each tournament has a
separate set of 32 observations for each team that took part in that particular year. A team
is awarded three points for a win, one for a draw (in the group stage), and none for a loss.
The points from the 1998 tournament have been recalculated to match the three-point
system – at the time, teams were awarded two points for a win instead of three. There are
two main reasons for excluding the World Cups before 1998. Firstly, there is a lack of
completeness of data from earlier years and World Cups. Secondly, the World Cup has
come a long way since it began in the 1930s and the format has undergone several changes.
The 32-team format has been around since 1998 and the focus of this study is primarily on
the modern-day World Cups.
Table 1: Summary Statistics for World Cup Points by year (1998-2014)
Year Min Max Mean
1998 0 19 5.4
2002 0 21 5.5
2006 0 17 5.6
2010 0 18 5.5
2014 0 19 5.6
Overall 0 21 5.51

11
The data for points was obtained from Planet World Cup. The maximum number
of points in this dataset is that of Brazil at the Korea-Japan 2002 World Cup – they had 21
points, with seven wins from seven games. On average, teams have obtained around 5.5
points in the last five World Cups. This figure might seem relatively low but the
explanation is that half (16) the teams are knocked out of the tournament after the first three
matches of the group stage, after which a loss leads to a team being knocked out of the
tournament. Only the last four teams play a total of seven games.
The independent variables can be split into two types: non-football-specific, and
football-specific. For the former, the population and GDP per capita information was
downloaded from the World Bank website. There are a few missing values for this data
from countries, such as North Korea in 2010, Yugoslavia in 1998, and Scotland in 1998.
Additionally, population and GDP per capita data for the whole of the United Kingdom
have been used for England in all five of its observations. Following Hoffmann et al.
(2002), I include a climate variable, which measures the squared deviation of the capital
cities’ temperature from 14°C. Climate data for all capital cities has been downloaded from
Weatherbase. My proxy for sporting standards in a country is the number of medals each
country won at the summer Olympics two years prior to any of the World Cups in my data.
Medal tallies for all of these competitions have been obtained from ESPN’s website.
As for the variables specific to the sport, the data on host country, home continent
and seeding has been sourced from FIFA’s official website and various articles published
by them. Following Monks and Husch (2009), my analysis combines all North, Central
and South American countries as the ‘Americas’ for the continent variable. Although, this

12
only impacts the data for the Brazil 2014 World Cup, since the others were held in Asia
(2002), Africa (2010) and Europe (1998, 2006).
There is a dummy variable for the countries that became members of FIFA within
the first twenty years of its founding (1904-1923). FIFA’s official website contains
information regarding each national football federation and when they first affiliated with
the organization. In 1904, the seven founding member nations were: France, Belgium,
Denmark, Netherlands, Spain, Sweden, and Switzerland. It is interesting to note that while
the sport had emerged from England in the late 19th century, the English Football
Association was not one of the founding members, and neither were any Latin American
countries. Nevertheless, these nations did soon jump on board. This variable is included as
a proxy for a deep-rooted footballing culture in the nations that, despite World War I, were
concerned enough to join FIFA early on. When looking at the data for this variable, it is
hard to miss the trend of early membership, especially among those nations that are
considered footballing heavyweights today. Other than the founding nations
aforementioned, some examples of these countries are Germany, England, Argentina,
Brazil and Portugal. At the last five World Cups, these nations have been fairly regular,
but some have not always fared well, as is usually expected of them. It was only after 1924
that most African, Asian and other Eastern European nations began affiliating with FIFA.
The data for the Star-Player variable was obtained from the ‘Rec Sports Soccer
Statistics Foundation’. The RSSSF provides information on FIFA’s World Player of the
Year award for the last several years including the rankings for each year. My Star-Player
variable looks at the award for the two years prior to each World Cup year and gives a
country a ‘1’ value if a player from that country was in the top three ranks in either of the

13
two prior years. For example, in the 2014 observations, the countries that had a star player
by my definition are: Argentina (for Lionel Messi in 2012, 2013), Portugal (for Cristiano
Ronaldo in 2013), Spain (for Xavi Hernandez in 2012 and Andres Iniesta in 2013), and
France (for Franck Ribery in 2013). The assumption here is that the players that are winning
these awards will be present at the World Cup representing their nations in the following
one or two years. With their entire nations’ expectations on their shoulders, the players are
under astronomical pressure to perform and are often able to deliver on the field as well as
give their teammates the extra ‘kick’ they need.
V. Model and Methodology
This study most closely resembles the Monks and Husch (2009) study, in that the
dependent variable is directly measuring the performance of the nations at the World Cup.
While Monks and Husch (2009) study the World Cups from 1982 to 2006, this study
investigates those from 1998 to 2014. The equation of the first specification of this model
takes the following form:
𝑊𝐶𝑃𝑜𝑖𝑛𝑡𝑠!! = 𝛽! + 𝛽!𝑃𝑜𝑝𝑢𝑙𝑎𝑡𝑖𝑜𝑛!! + 𝛽!𝐺𝐷𝑃𝑃𝑒𝑟𝐶𝑎𝑝𝑖𝑡𝑎!! +
𝛽!𝐺𝐷𝑃𝑃𝑒𝑟𝐶𝑎𝑝𝑖𝑡𝑎𝑆𝑞!! + 𝛽!𝐶𝑙𝑖𝑚𝑎𝑡𝑒𝑠𝑞!! + 𝛽!𝑂𝑙𝑦𝑚𝑝𝑖𝑐𝑀𝑒𝑑𝑎𝑙𝑠!! +
𝛽!𝐻𝑜𝑠𝑡𝐶𝑜𝑢𝑛𝑡𝑟𝑦!! + 𝛽!𝐻𝑜𝑚𝑒𝐶𝑜𝑛𝑡𝑖𝑛𝑒𝑛𝑡!! + 𝛽!𝑃𝑟𝑒1924!! + 𝛽!𝑆𝑡𝑎𝑟𝑃𝑙𝑎𝑦𝑒𝑟!! +
𝛽!"𝑆𝑒𝑒𝑑𝑖𝑛𝑔!! + 𝜀!! (1)
The main aim of this study is to investigate the factors that determine the World
Cup performance of countries. Of all the explanatory variables, only the seeding variable
14
is one that directly measures the past footballing performances of these nations. By
including seeding, the model effectively explains the World Cup performances based on
how teams have done in the recent past. This is because the seeded teams are the top ranked
teams in the year prior to the World Cup and are naturally poised to perform well at the
tournament.
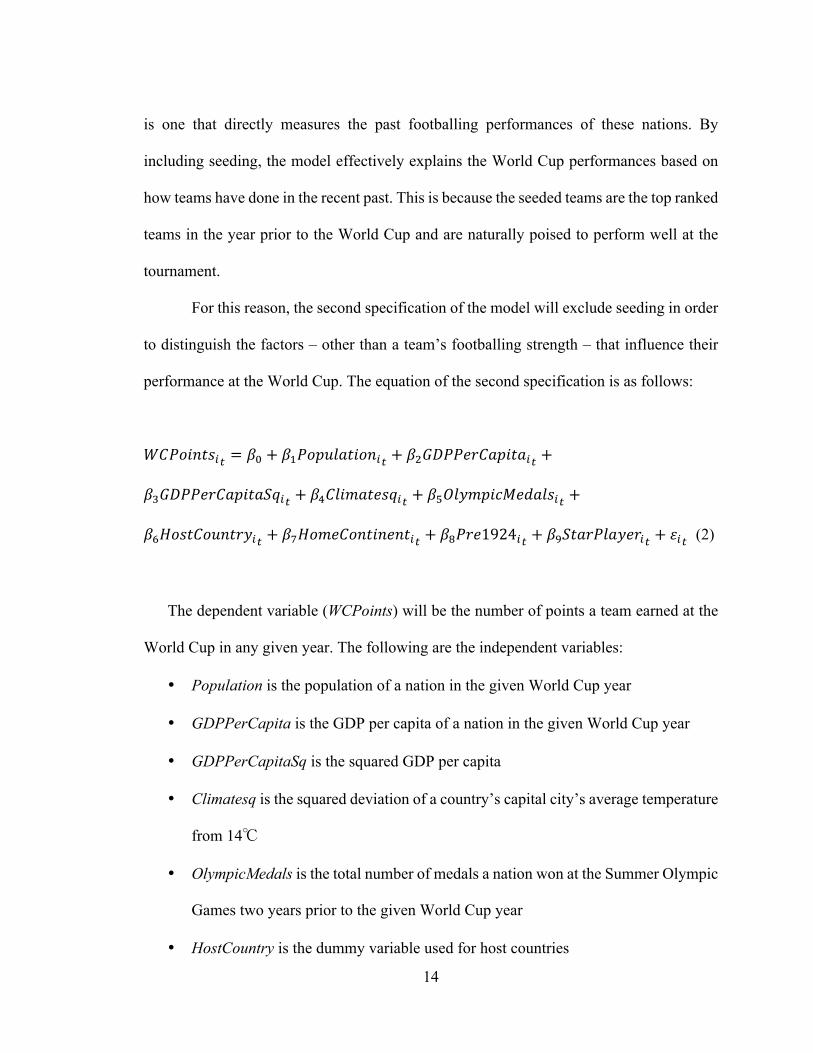
For this reason, the second specification of the model will exclude seeding in order
to distinguish the factors – other than a team’s footballing strength – that influence their
performance at the World Cup. The equation of the second specification is as follows:
𝑊𝐶𝑃𝑜𝑖𝑛𝑡𝑠!! = 𝛽! + 𝛽!𝑃𝑜𝑝𝑢𝑙𝑎𝑡𝑖𝑜𝑛!! + 𝛽!𝐺𝐷𝑃𝑃𝑒𝑟𝐶𝑎𝑝𝑖𝑡𝑎!! +
𝛽!𝐺𝐷𝑃𝑃𝑒𝑟𝐶𝑎𝑝𝑖𝑡𝑎𝑆𝑞!! + 𝛽!𝐶𝑙𝑖𝑚𝑎𝑡𝑒𝑠𝑞!! + 𝛽!𝑂𝑙𝑦𝑚𝑝𝑖𝑐𝑀𝑒𝑑𝑎𝑙𝑠!! +
𝛽!𝐻𝑜𝑠𝑡𝐶𝑜𝑢𝑛𝑡𝑟𝑦!! + 𝛽!𝐻𝑜𝑚𝑒𝐶𝑜𝑛𝑡𝑖𝑛𝑒𝑛𝑡!! + 𝛽!𝑃𝑟𝑒1924!! + 𝛽!𝑆𝑡𝑎𝑟𝑃𝑙𝑎𝑦𝑒𝑟!! + 𝜀!! (2)
The dependent variable (WCPoints) will be the number of points a team earned at the
World Cup in any given year. The following are the independent variables:
• Population is the population of a nation in the given World Cup year
• GDPPerCapita is the GDP per capita of a nation in the given World Cup year
• GDPPerCapitaSq is the squared GDP per capita
• Climatesq is the squared deviation of a country’s capital city’s average temperature
from 14℃
• OlympicMedals is the total number of medals a nation won at the Summer Olympic
Games two years prior to the given World Cup year
• HostCountry is the dummy variable used for host countries

15
• HomeContinent is the dummy variable used for all participating countries from the
continent of the host
• Pre1924 is the dummy variable for all countries that became members of FIFA
before 1924
• Star-Player is a dummy variable for countries that had a player placed in the top
three of FIFA’s World Player of the Year award, in either of the two years prior to
the given World Cup year
• Seeding is the dummy variable for teams that were seeded for the group stage of
the given tournament
OlympicMedals, Pre1924 and Star-Player are three variables that are my original additions
to the study of World Cup results.

16
VI. Results
The results of my regression model are shown in Table 2 below.
Table 2: Regression Results for World Cup Points Variable (1)
WCPoints (2)
WCPoints (3)
WCPoints (4)
WCPoints Population -1.45e-09
(3.06e-09) -1.77e-09 (3.40e-09)
-9.70e-10 (2.83e-09)
-1.72e-09 (3.29e-09)
GDPPerCapita .00004 (.00006)
4.08e-06 (.00006)
.00004 (.00005)
-3.28e-06 (0.00006)
GDPPerCapitaSq -3.09e-10 (8.44e-10)
1.02e-10 (9.35e-10)
-4.47e-10 (7.86e-10)
1.14e-10 (9.04e-10)
Climatesq .001 (.005)
-.002 (.005)
.002 (.0048)
-.002 (.0054)
OlympicMedals -.0137 (.0179)
-.0131 (.0199)
-.012 (.0167)
-.015 (.0192)
HostCountry 1.529 (1.709)
4.853*** ( 1.794)
1.641 (1.592)
4.885*** (1.735)
HomeContinent .481 (.696)
.788 (.771)
.234 (.6558)
.904 (.1465)
Pre1924 1.448* (.845)
3.255*** (.875)
1.458* (.7877)
3.209*** (.8464)
Star-Player 3.116*** (.956)
4.236*** (1.041)
3.229*** (.889)
4.349*** (1.007)
Seeding 4.914*** (.829)
5.179*** (.7736)
Constant 2.744*** (.683)
3.194*** (.754)
2.529*** (.6384)
3.258*** (.729)
R2 Adj. R2
0.464 0.427
0.334 0.293
0.513 0.479
0.349 0.309
Note: Dependent variable for both regressions is World Cup points. ***, **, * indicate significance at the 1%, 5% and 10% respectively. Standard Errors in parentheses.
Table 2 shows that in the first specification, there are two variables that are statistically
significant at the 1% level. According to the model, a team that is seeded is expected to
earn an additional 4.9 points. Naturally, given that the seeded teams are those that are well
ranked at the time of the group stage draw, such a result is expected. This means is that the
teams that have fared well in international football over the few years prior to each World

17
Cup are the ones that are seeded, and therefore expected to do well at the World Cup. As
aforementioned, the host nation is also always seeded. The seeded nations, other than when
hosts are countries such as Korea, Japan or South Africa, are generally footballing
heavyweights such as Brazil, Germany, and Spain to name a few. Although, occasionally
teams such as Switzerland and Colombia also manage to sneak onto the list of seeded
teams. According to my model, seeded teams earn 4.9 points more than they would without
being seeded.
The second variable that is significant at the 1% level is Star-Player. This means
that when the strength of the teams is taken into account, the star player on a team will still
have an additional positive impact on the number of points they earn at the tournament.
Examples of star players in my dataset are Zinedine Zidane (1997, 2000),Ronaldinho
(2004, 2005) and Lionel Messi (2008, 2009, 2012, 2013). These are players who can (or
could) single handedly turn a game on its head and influence the result. Naturally, the
awards from the World Cup year were not considered, as the tournament itself would
heavily influence the awards; data from the two years prior to each World cup were used.
The model suggests that having one of these star players on a team could earn them an
additional 3.1 points on average. Their sporting talent notwithstanding, many of these
players are (or were) also exceptional leaders on the pitch and had the ability to bring out
the best from their teammates. It is important to note, however, that while these star players
are able to positively influence results and the points earned by a team in the World Cup,
it does by no means suggest these star players can single-handedly win their country a
World Cup, as was very well evidenced by Ronaldo (Brazil) in 1998, Zidane (France) in
2006, and Messi (Argentina) in 2014.
18
Other than Star-Player, my second original variable – Pre1924 – is significant at
the 10% level. The model suggests that nations that joined FIFA before 1924 – within the
first 20 years of its inception in 1904 – are expected to earn an additional 1.4 points.
Furthermore, the result of this specification is in line with Monks and Husch (2009)
with regard to the host country effect. They found that “the host team does not experience
advantages beyond the benefits of seeding and the continental effect” (Monks and Husch
2009). Our model does not, however, suggest that the continental effect is significant either.
One possible explanation of this difference in these results is that the datasets are not the
same and that the World Cups examined in the two studies differ as well. The host and
continental effects are important to note because FIFA has recently made efforts to award
hosting rights to countries that have not historically been good at the sport (South Africa
2010, Russia 2018, Qatar 2022) and it will be interesting to see how these nations,
especially Qatar, perform in front of their home crowds. The R2 in my model is 0.464 –
46% of the variation in World Cup points can be explained by my model.
When seeding is excluded, we find three variables that are statistically significant.
The first is the host country effect. According to my model, holding all other variables
constant, the host country will be expected to earn, on average, an additional 4.8 points on
account of hosting the tournament. Second, my variable for countries that were members
of FIFA before 1924 is significant, also at the 1% level. This variable is a proxy for
‘footballing-culture’ in a country, in the sense that there was a certain subset of countries
that first began playing the sport in the late 19th and early 20th centuries. These were the
countries that joined FIFA early on and where the sport has been immensely popular for
the better part of a century now. These countries are expected to earn a total of 3.26 points
19
more than other teams on average. Lastly, my variable for Star-Player was also significant
at the 1% in this specification. The coefficient on it increased after I dropped the seeding
variable. Now, a star player is expected to earn their team an additional 4.23 points – up
from 3.1 in the first specification. The R2 here is 0.33, which means that 33% of the
variation in World Cup points is explained by my model. This specification is relevant to
the study primarily because there is a high degree of correlation between the WCPoints and
Seeding variables. Other than seeding, these three variables are the ones that have a
significant impact on a country’s World Cup performance, according to my model.
Contrary to what my model suggests, Monks and Husch (2009) find that there is no
statistically significant advantage of hosting the tournament. This might be because my
second specification excludes the seeding variable, while all their regressions include it.
According to my model, when seeding or recent performances and team strength are
excluded from the data, the host country effect is statistically significant.
Robustness Check
In order to check the robustness of the results, I first derived the standardized
residuals for all the observations. The three influential observations were then removed
from my model for the next regression to check whether or not the model was robust. The
regression results shown in columns 3 and 4 of Table 2 indicate that the model is in fact
robust. I ran both specifications (3,4) of my model without the influential observations and
found that the same explanatory variables are statistically significant.
Specifications 3 and 4 exclude the influential observations and therefore are better
indicators of the factors that determine World Cup performances. According to the third

20
specification, the Pre-1924 effect is significant at the 10% level, while the Star-Player and
Seeding effects are significant at the 1% level.
The model suggests that a team will earn an additional 1.5 points if they became
members of FIFA before 1924. The Star Player coefficient is now 3.23, suggesting that a
team with a Star Player (by my definition) will earn those many more points than they
would without one. The seeding effect is now 5.18 points. In specification 4, I find that the
Host Country effect is significant, with the coefficient being almost 5.0, suggesting that the
host nation will earn an additional 5.0 points than they would otherwise be expected to
obtain. The Pre-1924 and Star-Player variables are still significant, mirroring the
comparison between specifications 1 and 2, in that the same variables are found to be
significant.
The four different specifications of the model indicate the factors that are
significant in determining World Cup performances. Furthermore, the third and fourth
specifications confirm that my results are indeed robust. My analysis suggests that being
seeded, having a Star Player, and having become a member of FIFA before 1924 are the
factors that impact the World Cup performances of nations. Additionally, when I excluded
the seeding variable – in order to investigate factors other than a team’s strength and their
recent performances – I find that hosting the tournament also has a significant impact on
their performance. This result is similar to what Monks and Husch (2009) found in that the
host country did not have any advantage over and above the seeding effect (evidenced by
the fact that the host effect was insignificant when seeding is included). Specification 3 of
my model is the most reliable, as it excludes the influential variables and is the most
inclusive in terms of explanatory variables.

21
Star-Player and Pre1924 are both statistically significant when explaining World
Cup results. It is extremely difficult it is to pick out one team that is a very clear favorite
to win the World Cup. Even within the usual shortlist of about four or five teams that are
generally tipped to win, the nature of football is such that big upsets can never be
completely written off. With my Star-Player variable being highly significant in all
specifications of my model, my study adds to the literature that exists in this field while
also giving direction to future studies. My model suggests that none of the socioeconomic
or demographic factors are significant in explaining World Cup results. Instead, it is the
football-specific variables such as Seeding, Star-Player as well as FIFA affiliation before
1924 that are important.
VII. Conclusion
The 2018 World Cup in Russia is just a few months away, and speculation about
the tournament favorites is rife among football fans and pundits. If I were to make a
prediction based on my model and the variables that are significant, I would first narrow
down based on the seeded teams. Looking at the seven seeded teams other than hosts
Russia, who realistically, are highly unlikely to emerge winners (as is evidenced by
bookmakers placing 40/1 odds that Russia win the World Cup), I would take into account
the rankings of the 2016 and 2017 FIFA awards for the best player in the world (SkyBet
2018). This would leave me with: Portugal, Argentina, Brazil and France. Popular opinion
(and bookmakers’ odds) in the run up to the World Cup says that apart from Portugal, the
other three teams are indeed favorites to emerge victorious. However, it would be naïve to
discount footballing heavyweights Germany and Spain, who not only have immense depth

22
in their squads, but have also been in form recently. Although Brazil, Argentina and France
have the Star Players, Germany and Spain are known for their smooth-flowing style of play
that rarely ever lets them down. Keeping this in mind and by coupling my own knowledge
of the game and my intuition, my wide-ranging prediction is that it will be either Brazil,
Argentina or Germany to lift the World Cup in Russia this summer.
This study has used a new regression model. By incorporating variables that are
socioeconomic, cultural, and demographic in nature along with those that are specific to
the sport of football, I investigate a range of factors that have the potential to impact World
Cup results. I found that the Seeding, Star-Player, Pre1924 and HostCountry variables are
significant. Given these results, future studies that seek to investigate the determinants of
World Cup performances could focus more on factors directly related to the sport and the
tournament. Additionally, as FIFA plans to increase the size of the tournament to 48 teams,
it would be interesting to see the effect of a larger World Cup in a similar study in the
future. A similar model could be used to study other tournaments such as the UEFA
Champions League, which is the most elite club-level competition in the world, and where
the financial implications for teams far outreach those of the World Cup.

23
VIII. References
2010 FIFA World Cup South Africa™ Final Draw Procedure. 2010. Ebook.
https://www.fifa.com/mm/document/tournament/finaldraw/01/14/22/91/fwc2010_final_d
raw_procedure_en_021209.pdf.
"2014 FIFA World Cup™ Reached 3.2 Billion Viewers, One Billion Watched Final".
2015. FIFA.Com. http://www.fifa.com/worldcup/news/y=2015/m=12/news=2014-fifa-
world-cuptm-reached-3-2-billion-viewers-one-billion-watched--2745519.html.
"Atlanta 1996 - Medal Table". 2018. ESPN.Co.Uk. Accessed March 1.
http://en.espn.co.uk/espn/sport/story/142366.html.
Benedictus, Leo. 2014. "World Cup 2014: Who's Cashing In?". The Guardian.
https://www.theguardian.com/sport/2014/jun/02/cashing-in-world-cup-profit-brazil.
Bernard, Andrew B., and Meghan R. Busse. 2004. "Who Wins The Olympic Games:
Economic Resources And Medal Totals". Review Of Economics And Statistics 86 (1): 413-
417. doi:10.1162/003465304774201824.
Camilleri, Maria. 2017. "How To Bet On The World Cup 2018 In Russia (Betting Tips &
Predictions)". Alpha Sports Betting. https://alphasportsbetting.com/sports-betting-
tactics/how-to-bet-on-the-world-cup-2018.
"FIFA Associations And Confederations - FIFA.Com". 2018. FIFA.Com. Accessed April
1. http://www.fifa.com/associations/.
"FIFA Awards". 2018. Rsssf.Com. http://www.rsssf.com/miscellaneous/fifa-awards.html.
"FIFA Big Count". 2006.
http://www.fifa.com/mm/document/fifafacts/bcoffsurv/emaga_9384_10704.pdf.
"FIFA Council Confirms Contributions For FIFA World Cup Participants". 2017.
FIFA.Com. http://www.fifa.com/about-fifa/news/y=2017/m=10/news=fifa-council-
confirms-contributions-for-fifa-world-cup-participants-2917806.html.
Goldblatt, David. 2008. The Ball Is Round. New York: Riverhead Books.
History Of The World Cup Draw. 2018. Ebook. Accessed March 1.
https://www.fifa.com/mm/document/fifafacts/mcwc/ip-201_10e_fwcdraw-
history_8842.pdf.

24
Hoffmann, Robert, Lee Chew Ging, and Bala Ramasamy. 2002. "The Socioeconomic
Determinants Of International Soccer Performance". Journal Of Applied Economics 05 (2):
253-272. doi:Print ISSN 1514-0326 (Other).
Monks, James, and Jared Husch. 2009. "The Impact Of Seeding, Home Continent, And
Hosting On FIFA World Cup Results". Journal Of Sports Economics 10 (4): 391-408.
doi:10.1177/1527002508328757.
Murphy, Chris. CNN. 2013. "2014 World Cup: How The Draw Works". CNN.
http://edition.cnn.com/2013/12/05/sport/football/2014-world-cup-draw-brazil/index.html.
Papanikos, Gregory T. 2015. "Economic, Population And Political Determinants Of The
2014 World Cup Match Results". Soccer & Society 18 (4): 516-532.
doi:10.1080/14660970.2015.1067799.
"Planet World Cup". 2018. Planetworldcup.Com.
http://www.planetworldcup.com/index.html.
"Statistics And Records - FIFA World Cup™ - Teams - FIFA.Com". 2018. FIFA.Com.
Accessed March 22. http://www.fifa.com/fifa-tournaments/statistics-and-
records/worldcup/teams/index.html.
"World Cup 2018 Seeding: All You Need To Know Ahead Of The Draw | Goal.Com".
2017. Goal.Com. http://www.goal.com/en-us/news/world-cup-2018-seeding-pots-
procedure-all-you-need-to-know-ahead-/76h460tngg911m214y8fmv3bp.
"World Cup 2018 Winner Betting | Football | Sky Bet Mobile | £5 Free Bet Every Week".
2018. M.Skybet.Com. https://m.skybet.com/football/world-cup-2018/event/16742642.