
Fiber and Integrated Optics Multiple Soaking with Different Solution Concentration in Doped Silica...
17
This article was downloaded by: [Multimedia University Melaka], [salah Aljamimi] On: 15 June 2014, At: 23:57 Publisher: Taylor & Francis Informa Ltd Registered in England and Wales Registered Number: 1072954 Registered office: Mortimer House, 37-41 Mortimer Street, London W1T 3JH, UK Fiber and Integrated Optics Publication details, including instructions for authors and subscription information: http://www.tandfonline.com/loi/ufio20 Multiple Soaking with Different Solution Concentration in Doped Silica Preform Fabrication Using Modified Chemical Vapor Deposition and Solution Doping S. M. Aljamimi a , M. S. Khairul Anuar b , S. Z. Muhamad-Yassin b , M. I. Zulkifli b , S. Hanif b , N. Tamchek c , Z. Yusoff a & H. A. Abdul-Rashid a a Faculty of Engineering, Multimedia University, Cyberjaya, Selangor, Malaysia b Photonics Department, Telekom Research & Development, Cyberjaya, Selangor, Malaysia c Faculty of Science, Universiti Putra Malaysia, Serdang, Selangor, Malaysia Published online: 23 May 2014. To cite this article: S. M. Aljamimi, M. S. Khairul Anuar, S. Z. Muhamad-Yassin, M. I. Zulkifli, S. Hanif, N. Tamchek, Z. Yusoff & H. A. Abdul-Rashid (2014) Multiple Soaking with Different Solution Concentration in Doped Silica Preform Fabrication Using Modified Chemical Vapor Deposition and Solution Doping, Fiber and Integrated Optics, 33:1-2, 105-119, DOI: 10.1080/01468030.2013.879238 To link to this article: http://dx.doi.org/10.1080/01468030.2013.879238 PLEASE SCROLL DOWN FOR ARTICLE Taylor & Francis makes every effort to ensure the accuracy of all the information (the “Content”) contained in the publications on our platform. However, Taylor & Francis, our agents, and our licensors make no representations or warranties whatsoever as to the accuracy, completeness, or suitability for any purpose of the Content. Any opinions and views expressed in this publication are the opinions and views of the authors, and are not the views of or endorsed by Taylor & Francis. The accuracy of the Content should not be relied upon and should be independently verified with primary sources of information. Taylor and Francis shall not be liable for any losses, actions, claims, proceedings, demands, costs, expenses, damages, and other liabilities whatsoever or howsoever caused arising directly or indirectly in connection with, in relation to or arising out of the use of the Content. This article may be used for research, teaching, and private study purposes. Any substantial or systematic reproduction, redistribution, reselling, loan, sub-licensing, systematic supply, or distribution in any form to anyone is expressly forbidden. Terms &
Transcript of Fiber and Integrated Optics Multiple Soaking with Different Solution Concentration in Doped Silica...
This article was downloaded by: [Multimedia University Melaka], [salah Aljamimi]On: 15 June 2014, At: 23:57Publisher: Taylor & FrancisInforma Ltd Registered in England and Wales Registered Number: 1072954 Registeredoffice: Mortimer House, 37-41 Mortimer Street, London W1T 3JH, UK
Fiber and Integrated OpticsPublication details, including instructions for authors andsubscription information:http://www.tandfonline.com/loi/ufio20
Multiple Soaking with Different SolutionConcentration in Doped Silica PreformFabrication Using Modified ChemicalVapor Deposition and Solution DopingS. M. Aljamimia, M. S. Khairul Anuarb, S. Z. Muhamad-Yassinb, M. I.Zulkiflib, S. Hanifb, N. Tamchekc, Z. Yusoffa & H. A. Abdul-Rashida
a Faculty of Engineering, Multimedia University, Cyberjaya, Selangor,Malaysiab Photonics Department, Telekom Research & Development,Cyberjaya, Selangor, Malaysiac Faculty of Science, Universiti Putra Malaysia, Serdang, Selangor,MalaysiaPublished online: 23 May 2014.
To cite this article: S. M. Aljamimi, M. S. Khairul Anuar, S. Z. Muhamad-Yassin, M. I. Zulkifli, S.Hanif, N. Tamchek, Z. Yusoff & H. A. Abdul-Rashid (2014) Multiple Soaking with Different SolutionConcentration in Doped Silica Preform Fabrication Using Modified Chemical Vapor Deposition andSolution Doping, Fiber and Integrated Optics, 33:1-2, 105-119, DOI: 10.1080/01468030.2013.879238
To link to this article: http://dx.doi.org/10.1080/01468030.2013.879238
PLEASE SCROLL DOWN FOR ARTICLE
Taylor & Francis makes every effort to ensure the accuracy of all the information (the“Content”) contained in the publications on our platform. However, Taylor & Francis,our agents, and our licensors make no representations or warranties whatsoever as tothe accuracy, completeness, or suitability for any purpose of the Content. Any opinionsand views expressed in this publication are the opinions and views of the authors,and are not the views of or endorsed by Taylor & Francis. The accuracy of the Contentshould not be relied upon and should be independently verified with primary sourcesof information. Taylor and Francis shall not be liable for any losses, actions, claims,proceedings, demands, costs, expenses, damages, and other liabilities whatsoever orhowsoever caused arising directly or indirectly in connection with, in relation to or arisingout of the use of the Content.
This article may be used for research, teaching, and private study purposes. Anysubstantial or systematic reproduction, redistribution, reselling, loan, sub-licensing,systematic supply, or distribution in any form to anyone is expressly forbidden. Terms &

Conditions of access and use can be found at http://www.tandfonline.com/page/terms-and-conditions
Dow
nloa
ded
by [
Mul
timed
ia U
nive
rsity
Mel
aka]
, [sa
lah
Alja
mim
i] a
t 23:
57 1
5 Ju
ne 2
014
Fiber and Integrated Optics, 33:105–119, 2014
Copyright © Taylor & Francis Group, LLC
ISSN: 0146-8030 print/1096-4681 online
DOI: 10.1080/01468030.2013.879238
Multiple Soaking with Different Solution
Concentration in Doped Silica Preform Fabrication
Using Modified Chemical Vapor Deposition andSolution Doping
S. M. ALJAMIMI,1 M. S. KHAIRUL ANUAR,2
S. Z. MUHAMAD-YASSIN,2 M. I. ZULKIFLI,2 S. HANIF,2
N. TAMCHEK,3 Z. YUSOFF,1 and H. A. ABDUL-RASHID 1
1Faculty of Engineering, Multimedia University, Cyberjaya, Selangor, Malaysia2Photonics Department, Telekom Research & Development, Cyberjaya,
Selangor, Malaysia3Faculty of Science, Universiti Putra Malaysia, Serdang, Selangor, Malaysia
Abstract Incorporation of alumina (Al2O3) into a silica matrix by modified chemical
vapor deposition and a solution doping technique is investigated in this study. Multiplesoaking cycles were used to increase the aluminum content in the core layer. The effect
of alumina retention in silica matrix soot is focused by multiple cycles of soakingwith different solution concentrations, while the effect of the adsorption mechanism is
fixed by maintaining the soot deposition process (such as temperature [1,800ıC],precursor, total gas flow, and soaking time). The deposited soot is examined for
porosity characteristics and effective surface area by a gas adsorption techniquewith Brunauer–Emett–Teller surface area analysis and the surface and cross-section
morphology using scanning electron microscopy. Three different concentrations areused in this work (0.3, 0.7, and 1.2 M) with multiple cycles of soaking. Sintering
and the collapsing process is controlled for each preform. The result shows thatthe alumina content is increased substantially as the number of soaking processes
is increased, which may be due to the retention effect as only a small amount ofadsorption process takes place as indicated by the slight decrease in the surface
area of soot. The collapsed preforms are analyzed using a preform analyzer. Energydispersive x-ray spectrometry is used to check aluminum content and distribution into
the core layer.
Keywords gas adsorption technique with Brunauer–Emett–Teller analysis, modifiedchemical vapor deposition, multiple solution doping process, refractive index profile,scanning electron microscopy–energy dispersive x-ray
Introduction
Incorporation of rare earth (RE) ions in silica optical fiber has been studied since 1964
after Koester and Snitzer published their study on neodymium fiber lasers [1]. One of the
Received 7 October 2013; accepted 23 December 2013.Address correspondence to S. M. Aljamimi, Faculty of Engineering, Multimedia University,
Jalan Multimedia, Cyberjaya, Selangor, 63100, Malaysia. E-mail: [email protected] versions ofone or more of the figures in the article can be found online at www.tandfonline.
com/ufio.
105
Dow
nloa
ded
by [
Mul
timed
ia U
nive
rsity
Mel
aka]
, [sa
lah
Alja
mim
i] a
t 23:
57 1
5 Ju
ne 2
014
106 S. M. Aljamimi et al.
most common techniques of producing silica optical fiber is by using a modified chemical
vapor deposition (MCVD) process. There are generally two methods of incorporating RE
ions into a silica matrix using the MCVD process: the vapor phase and the nonvapor
phase. The vapor phase method is usually much more complex due to the fact that the
desired precursor of dopants (e.g., RE chlorides [RECl3]) has relatively low vapor pressure
compared to the standard precursor of MCVD. The second method is the nonvapor
process, i.e., the liquid phase solution doping process. This technique was first reported by
Stone and Burrus [2] and was further improved by Poole et al. [3]. This technique is used
in this study to incorporate dopants, such as aluminum, into silica matrix since aluminum
increases the solubility of RE ions into the host silica to allow high incorporation of RE
without clustering [4]. In addition, pure silica has high phonon energy that stimulates
non-radiative transitions and leads to shorter fluorescence lifetime. All of this will degrade
the amplification performance of an S-band using thulium-doped silica fiber. Aluminum,
being a glass modifier, can modify the host environment of Si–O bonds and improve
the quantum efficiency of the S-band transition. A higher concentration of aluminum has
been shown to reduce the phonon energy of silica host [5].
In the MCVD process, such precursors as SiCl4 are delivered to a quartz substrate
tube, and these mixtures are oxidized and deposited to the inner tube wall by a high
temperature (1,100ıC–2,100ıC) [4, 6].
For the solution doping process, there are a number of parameters that play a
significant role in determining Al2O3 incorporation inside silica matrix, for example, the
type of solvent, concentration of solution, composition (Al/RE ratio) [7], soaking time [8],
soaking temperature [9, 10], and mechanism by which dopants ions are incorporated into
the soot layer whether by chemical adsorption [11] or by solution retention in a porous
soot layer [12]. In addition, oxidation (after soaking) is also a very important process for
providing better quality and productivity of the fabricated preform.
In RE-doped silica, Al2O3 is the most effective dopant as an index raiser due to the
process simplicity compared to GeO2, the standard index raiser dopant in MCVD. Other
reasons include the ability of Al atoms to dilute the RE in silica matrix, the high vapor
pressure of Al2O3, and less evaporation compared to GeO2 during process [4].
In this article, the study of the aluminum solution penetration/impregnation mech-
anism into the soot is analyzed by chemical adsorption and retention effect. A gas
adsorption technique with Brunauer–Emett–Teller (BET) surface area analysis is used
to examine the surface area, porosity, and pores size distribution of the soot deposited
at 1,800ıC. Multiple soaking processes are used to investigate the incorporation and
retention effect of Al ions into the porous layer. Soot morphology properties are also
analyzed by scanning electron microscopy (SEM). In addition, the effect of different
solution concentrations (0.3, 0.7, and 1.2 M) and relative Al2O3 distribution across the
core of the preform is analyzed using a preform profiler (refractive index profile [RIP]).
This is done while maintaining the deposition temperature, SiCl4 flow, soaking time, and
drying time. Elemental analysis using energy dispersive x-ray spectrometry (EDX) is
used to investigate the aluminum distribution and content across the core layer for each
solution concentration and each soaking cycle.
Experimental Procedure
Several Al2O3-doped silica preforms were prepared using MCVD with a solution doping
process. A high-quality silica tube (Heraeus suprasil [F300] Heraeus Group, Hanau,
Germany) with outer diameter of 25 mm and inner diameter of 19 mm was mounted on the
Dow
nloa
ded
by [
Mul
timed
ia U
nive
rsity
Mel
aka]
, [sa
lah
Alja
mim
i] a
t 23:
57 1
5 Ju
ne 2
014
salah jamimi
Pencil
MCVD and Multiple Solution Doping Process 107
lathe as the initial step in the fabrication process. The inner surface of the substrate tube
was cleaned by several etching passes using sulfur hexafluoride (SF6). The fabrication
process was followed by deposition of silicon tetra-chloride (SiCl4) and oxygen (O2) at a
high temperature (2,120ıC) by slowly moving an oxygen–hydrogen burner (110 mm/min)
in the same direction of reactant flow and fully sintered into transparent glass, which
makes a thin cladding layer “barrier layer.” This process was followed by the deposition
of a 50-cm-long porous core layer (soot), which consists of the same mixture of SiCl4and O2 with the same burner speed but at a lower deposition temperature of 1,800ıC.
Ethanolic solutions were prepared using aluminum chloride hexahydrate (AlCl3.6H2O)
with three different concentrations of 0.3, 0.7, and 1.2 M. The substrate tube was then
carefully removed from the lathe and vertically soaked in the prepared solutions. The
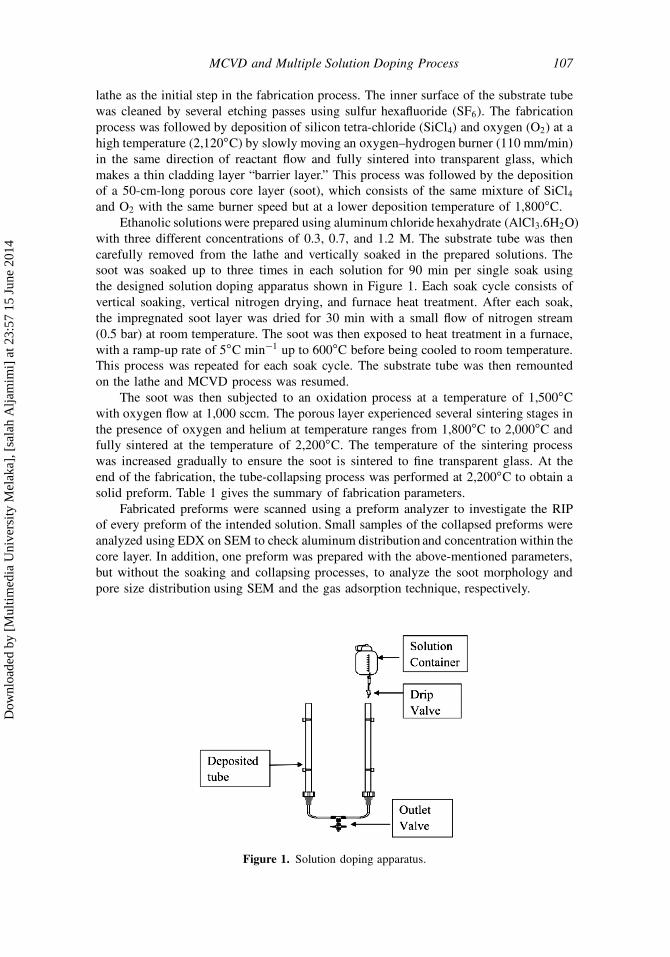
soot was soaked up to three times in each solution for 90 min per single soak using
the designed solution doping apparatus shown in Figure 1. Each soak cycle consists of
vertical soaking, vertical nitrogen drying, and furnace heat treatment. After each soak,
the impregnated soot layer was dried for 30 min with a small flow of nitrogen stream
(0.5 bar) at room temperature. The soot was then exposed to heat treatment in a furnace,
with a ramp-up rate of 5ıC min�1 up to 600ıC before being cooled to room temperature.
This process was repeated for each soak cycle. The substrate tube was then remounted
on the lathe and MCVD process was resumed.
The soot was then subjected to an oxidation process at a temperature of 1,500ıC
with oxygen flow at 1,000 sccm. The porous layer experienced several sintering stages in
the presence of oxygen and helium at temperature ranges from 1,800ıC to 2,000ıC and
fully sintered at the temperature of 2,200ıC. The temperature of the sintering process
was increased gradually to ensure the soot is sintered to fine transparent glass. At the
end of the fabrication, the tube-collapsing process was performed at 2,200ıC to obtain a
solid preform. Table 1 gives the summary of fabrication parameters.
Fabricated preforms were scanned using a preform analyzer to investigate the RIP
of every preform of the intended solution. Small samples of the collapsed preforms were
analyzed using EDX on SEM to check aluminum distribution and concentration within the
core layer. In addition, one preform was prepared with the above-mentioned parameters,
but without the soaking and collapsing processes, to analyze the soot morphology and
pore size distribution using SEM and the gas adsorption technique, respectively.
Figure 1. Solution doping apparatus.
Dow
nloa
ded
by [
Mul
timed
ia U
nive
rsity
Mel
aka]
, [sa
lah
Alja
mim
i] a
t 23:
57 1
5 Ju
ne 2
014
108 S. M. Aljamimi et al.
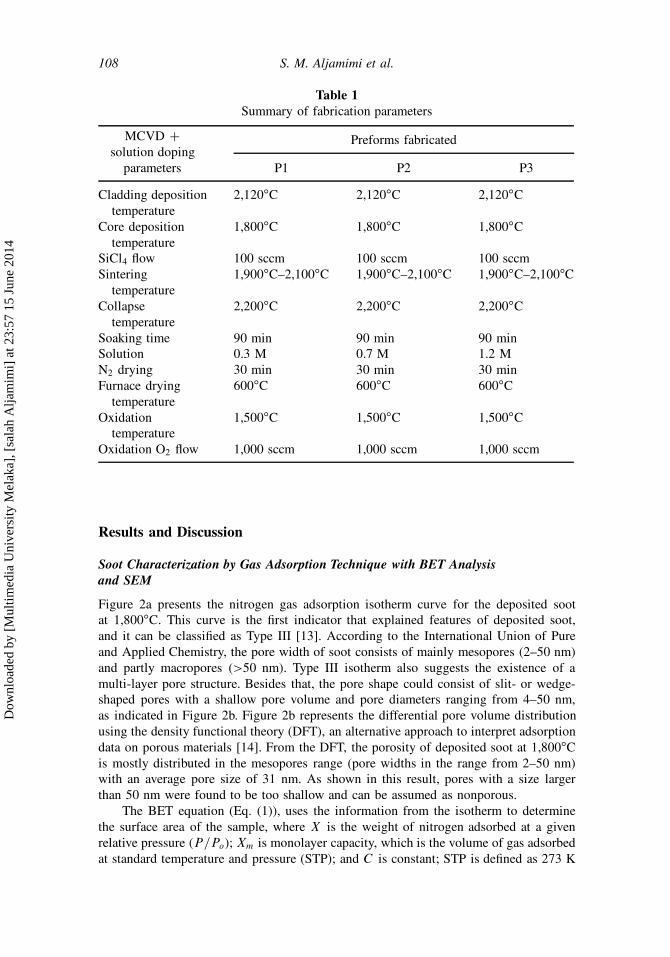
Table 1
Summary of fabrication parameters
Preforms fabricatedMCVD C
solution doping
parameters P1 P2 P3
Cladding deposition
temperature
2,120ıC 2,120ıC 2,120ıC
Core deposition
temperature
1,800ıC 1,800ıC 1,800ıC
SiCl4 flow 100 sccm 100 sccm 100 sccm
Sintering
temperature
1,900ıC–2,100ıC 1,900ıC–2,100ıC 1,900ıC–2,100ıC
Collapse
temperature
2,200ıC 2,200ıC 2,200ıC
Soaking time 90 min 90 min 90 min
Solution 0.3 M 0.7 M 1.2 M
N2 drying 30 min 30 min 30 min
Furnace drying
temperature
600ıC 600ıC 600ıC
Oxidation
temperature
1,500ıC 1,500ıC 1,500ıC
Oxidation O2 flow 1,000 sccm 1,000 sccm 1,000 sccm
Results and Discussion
Soot Characterization by Gas Adsorption Technique with BET Analysis
and SEM
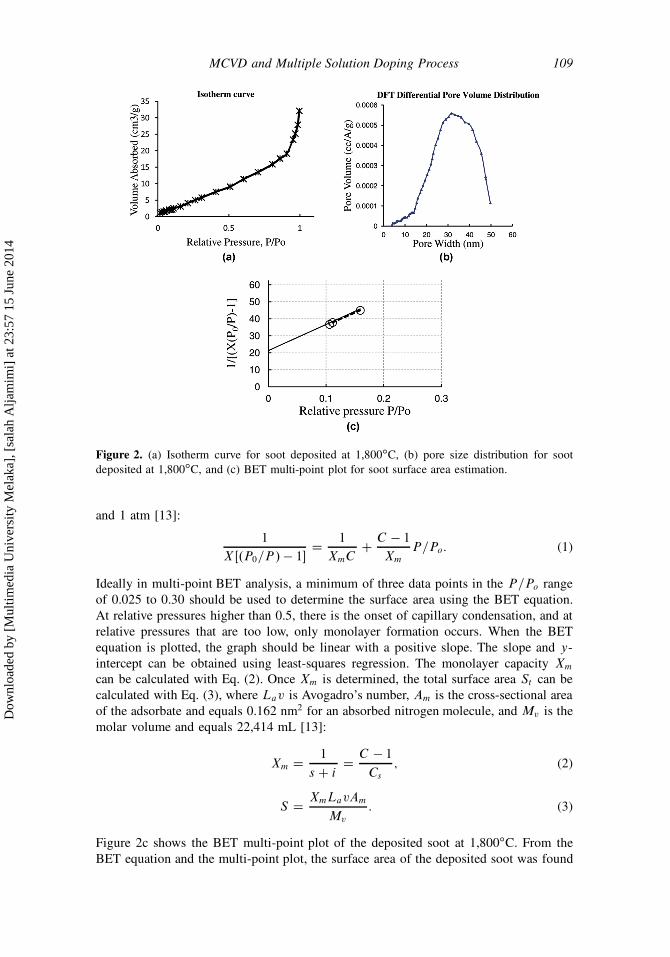
Figure 2a presents the nitrogen gas adsorption isotherm curve for the deposited soot
at 1,800ıC. This curve is the first indicator that explained features of deposited soot,
and it can be classified as Type III [13]. According to the International Union of Pure
and Applied Chemistry, the pore width of soot consists of mainly mesopores (2–50 nm)
and partly macropores (>50 nm). Type III isotherm also suggests the existence of a
multi-layer pore structure. Besides that, the pore shape could consist of slit- or wedge-
shaped pores with a shallow pore volume and pore diameters ranging from 4–50 nm,
as indicated in Figure 2b. Figure 2b represents the differential pore volume distribution
using the density functional theory (DFT), an alternative approach to interpret adsorption
data on porous materials [14]. From the DFT, the porosity of deposited soot at 1,800ıC
is mostly distributed in the mesopores range (pore widths in the range from 2–50 nm)
with an average pore size of 31 nm. As shown in this result, pores with a size larger
than 50 nm were found to be too shallow and can be assumed as nonporous.
The BET equation (Eq. (1)), uses the information from the isotherm to determine
the surface area of the sample, where X is the weight of nitrogen adsorbed at a given
relative pressure (P=Po); Xm is monolayer capacity, which is the volume of gas adsorbed
at standard temperature and pressure (STP); and C is constant; STP is defined as 273 K
Dow
nloa
ded
by [
Mul
timed
ia U
nive
rsity
Mel
aka]
, [sa
lah
Alja
mim
i] a
t 23:
57 1
5 Ju
ne 2
014
MCVD and Multiple Solution Doping Process 109
Figure 2. (a) Isotherm curve for soot deposited at 1,800ıC, (b) pore size distribution for soot
deposited at 1,800ıC, and (c) BET multi-point plot for soot surface area estimation.
and 1 atm [13]:
1
XŒ.P0=P / � 1�D
1
XmCC
C � 1
Xm
P=Po: (1)
Ideally in multi-point BET analysis, a minimum of three data points in the P=Po range
of 0.025 to 0.30 should be used to determine the surface area using the BET equation.
At relative pressures higher than 0.5, there is the onset of capillary condensation, and at
relative pressures that are too low, only monolayer formation occurs. When the BET
equation is plotted, the graph should be linear with a positive slope. The slope and y-
intercept can be obtained using least-squares regression. The monolayer capacity Xm
can be calculated with Eq. (2). Once Xm is determined, the total surface area St can be
calculated with Eq. (3), where Lav is Avogadro’s number, Am is the cross-sectional area
of the adsorbate and equals 0.162 nm2 for an absorbed nitrogen molecule, and Mv is the
molar volume and equals 22,414 mL [13]:
Xm D1
s C iD
C � 1
Cs
; (2)
S DXmLavAm
Mv
: (3)
Figure 2c shows the BET multi-point plot of the deposited soot at 1,800ıC. From the
BET equation and the multi-point plot, the surface area of the deposited soot was found
Dow
nloa
ded
by [
Mul
timed
ia U
nive
rsity
Mel
aka]
, [sa
lah
Alja
mim
i] a
t 23:
57 1
5 Ju
ne 2
014

110 S. M. Aljamimi et al.
to be 20.14 m2g�1. This number is relatively low compared to the soot surface area
reported from Dhar et al. [15] and classical data for mesoporus silica [16]. Both reported
values are in the range of 112.00 to 195.01 m2g�1. In the Dhar et al. case, the soot
was deposited at 1,200ıC, while in this work, the deposition temperature is much higher
(1,800ıC) and with no POCl3 involved. POCl3 usually is used to reduce the viscosity
of the glass during the MCVD process, which could lead to a different surface area
value. Furthermore, the deposition direction in this work is in the forward direction;
thus, the effect of temperature is higher compared to [15]. At higher temperatures, the
deposited soot was found to be of finer particles, averaging a size from hundreds of
nanometers to a few microns, as reported by Cheung et al. [17] with simulation results
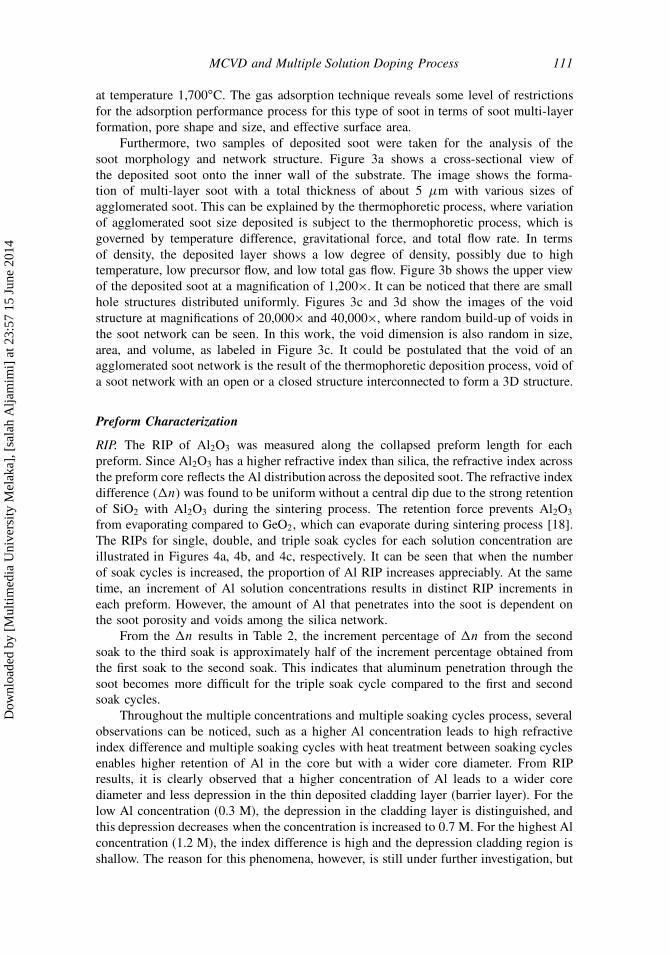
Figure 3. (a) Cross-sectional view on substrate tube, (b) agglomerated soot with random distri-
bution in size and structure, (c) close-up image of soot surface (magnification of 20,000�), and
(d) close-up image of soot surface (magnification of 40,000�).
Dow
nloa
ded
by [
Mul
timed
ia U
nive
rsity
Mel
aka]
, [sa
lah
Alja
mim
i] a
t 23:
57 1
5 Ju
ne 2
014
MCVD and Multiple Solution Doping Process 111
at temperature 1,700ıC. The gas adsorption technique reveals some level of restrictions
for the adsorption performance process for this type of soot in terms of soot multi-layer
formation, pore shape and size, and effective surface area.
Furthermore, two samples of deposited soot were taken for the analysis of the
soot morphology and network structure. Figure 3a shows a cross-sectional view of
the deposited soot onto the inner wall of the substrate. The image shows the forma-
tion of multi-layer soot with a total thickness of about 5 �m with various sizes of
agglomerated soot. This can be explained by the thermophoretic process, where variation
of agglomerated soot size deposited is subject to the thermophoretic process, which is
governed by temperature difference, gravitational force, and total flow rate. In terms
of density, the deposited layer shows a low degree of density, possibly due to high
temperature, low precursor flow, and low total gas flow. Figure 3b shows the upper view
of the deposited soot at a magnification of 1,200�. It can be noticed that there are small
hole structures distributed uniformly. Figures 3c and 3d show the images of the void
structure at magnifications of 20,000� and 40,000�, where random build-up of voids in
the soot network can be seen. In this work, the void dimension is also random in size,
area, and volume, as labeled in Figure 3c. It could be postulated that the void of an
agglomerated soot network is the result of the thermophoretic deposition process, void of
a soot network with an open or a closed structure interconnected to form a 3D structure.
Preform Characterization
RIP. The RIP of Al2O3 was measured along the collapsed preform length for each
preform. Since Al2O3 has a higher refractive index than silica, the refractive index across
the preform core reflects the Al distribution across the deposited soot. The refractive index
difference (�n) was found to be uniform without a central dip due to the strong retention
of SiO2 with Al2O3 during the sintering process. The retention force prevents Al2O3
from evaporating compared to GeO2, which can evaporate during sintering process [18].
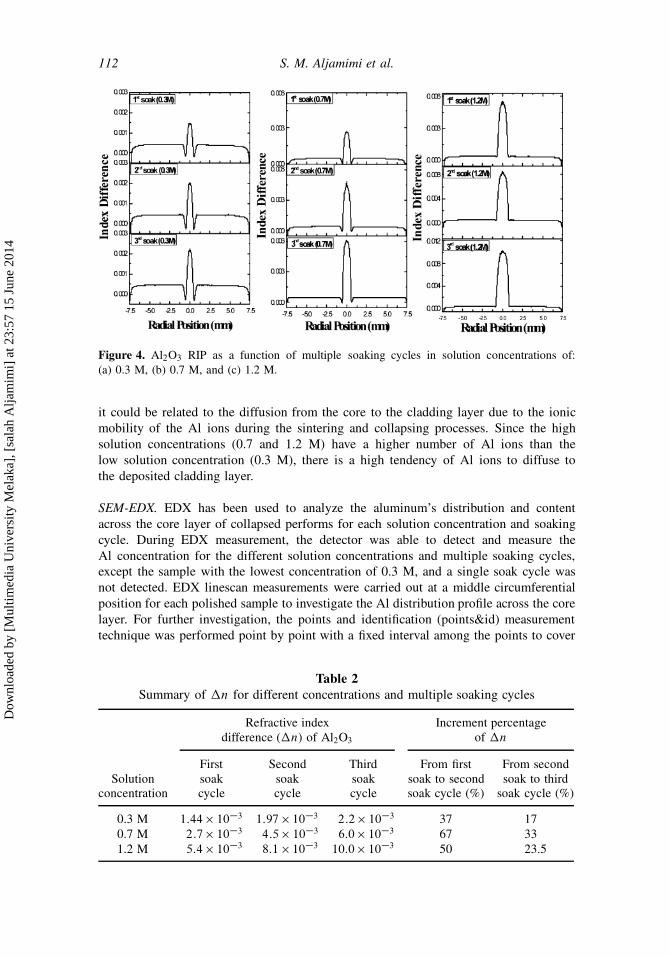
The RIPs for single, double, and triple soak cycles for each solution concentration are
illustrated in Figures 4a, 4b, and 4c, respectively. It can be seen that when the number
of soak cycles is increased, the proportion of Al RIP increases appreciably. At the same
time, an increment of Al solution concentrations results in distinct RIP increments in
each preform. However, the amount of Al that penetrates into the soot is dependent on
the soot porosity and voids among the silica network.
From the �n results in Table 2, the increment percentage of �n from the second
soak to the third soak is approximately half of the increment percentage obtained from
the first soak to the second soak. This indicates that aluminum penetration through the
soot becomes more difficult for the triple soak cycle compared to the first and second
soak cycles.
Throughout the multiple concentrations and multiple soaking cycles process, several
observations can be noticed, such as a higher Al concentration leads to high refractive
index difference and multiple soaking cycles with heat treatment between soaking cycles
enables higher retention of Al in the core but with a wider core diameter. From RIP
results, it is clearly observed that a higher concentration of Al leads to a wider core
diameter and less depression in the thin deposited cladding layer (barrier layer). For the
low Al concentration (0.3 M), the depression in the cladding layer is distinguished, and
this depression decreases when the concentration is increased to 0.7 M. For the highest Al
concentration (1.2 M), the index difference is high and the depression cladding region is
shallow. The reason for this phenomena, however, is still under further investigation, but
Dow
nloa
ded
by [
Mul
timed
ia U
nive
rsity
Mel
aka]
, [sa
lah
Alja
mim
i] a
t 23:
57 1
5 Ju
ne 2
014
112 S. M. Aljamimi et al.
Figure 4. Al2O3 RIP as a function of multiple soaking cycles in solution concentrations of:
(a) 0.3 M, (b) 0.7 M, and (c) 1.2 M.
it could be related to the diffusion from the core to the cladding layer due to the ionic
mobility of the Al ions during the sintering and collapsing processes. Since the high
solution concentrations (0.7 and 1.2 M) have a higher number of Al ions than the
low solution concentration (0.3 M), there is a high tendency of Al ions to diffuse to
the deposited cladding layer.
SEM-EDX. EDX has been used to analyze the aluminum’s distribution and content
across the core layer of collapsed performs for each solution concentration and soaking
cycle. During EDX measurement, the detector was able to detect and measure the
Al concentration for the different solution concentrations and multiple soaking cycles,
except the sample with the lowest concentration of 0.3 M, and a single soak cycle was
not detected. EDX linescan measurements were carried out at a middle circumferential
position for each polished sample to investigate the Al distribution profile across the core
layer. For further investigation, the points and identification (points&id) measurement
technique was performed point by point with a fixed interval among the points to cover
Table 2
Summary of �n for different concentrations and multiple soaking cycles
Refractive index
difference (�n) of Al2O3
Increment percentage
of �n
Solution
concentration
First
soak
cycle
Second
soak
cycle
Third
soak
cycle
From first
soak to second
soak cycle (%)
From second
soak to third
soak cycle (%)
0.3 M 1:44 � 10�3
1:97 � 10�3
2:2 � 10�3 37 17
0.7 M 2:7 � 10�3
4:5 � 10�3
6:0 � 10�3 67 33
1.2 M 5:4 � 10�3
8:1 � 10�3
10:0 � 10�3 50 23.5
Dow
nloa
ded
by [
Mul
timed
ia U
nive
rsity
Mel
aka]
, [sa
lah
Alja
mim
i] a
t 23:
57 1
5 Ju
ne 2
014
MCVD and Multiple Solution Doping Process 113
the whole length of the core diameter. The purpose of this measurement is to check the
aluminum retained as weight percentage in the collapsed core layer.
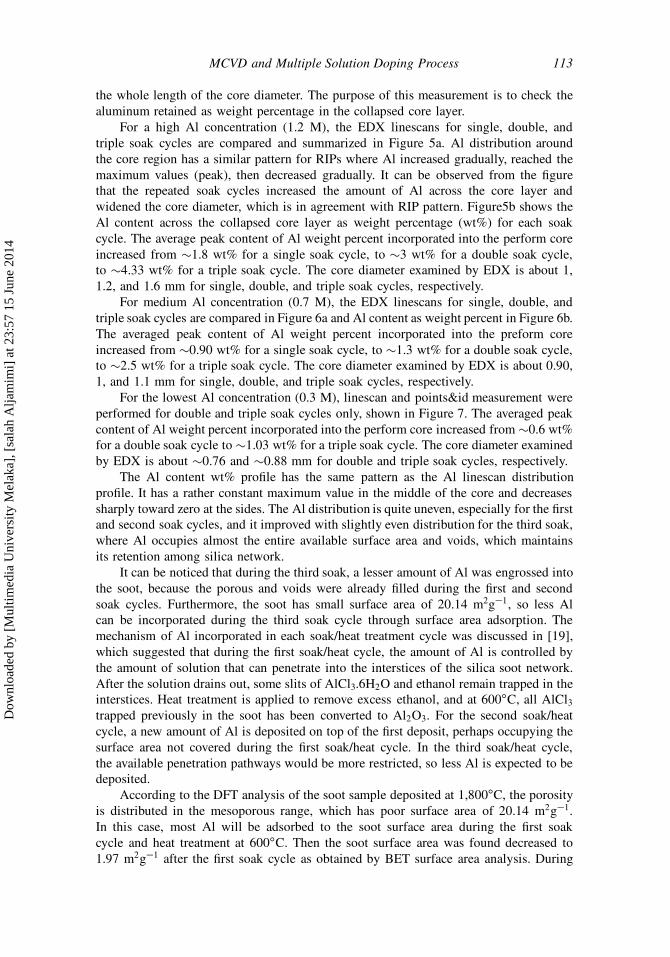
For a high Al concentration (1.2 M), the EDX linescans for single, double, and
triple soak cycles are compared and summarized in Figure 5a. Al distribution around
the core region has a similar pattern for RIPs where Al increased gradually, reached the
maximum values (peak), then decreased gradually. It can be observed from the figure
that the repeated soak cycles increased the amount of Al across the core layer and
widened the core diameter, which is in agreement with RIP pattern. Figure5b shows the
Al content across the collapsed core layer as weight percentage (wt%) for each soak
cycle. The average peak content of Al weight percent incorporated into the perform core
increased from �1.8 wt% for a single soak cycle, to �3 wt% for a double soak cycle,
to �4.33 wt% for a triple soak cycle. The core diameter examined by EDX is about 1,
1.2, and 1.6 mm for single, double, and triple soak cycles, respectively.
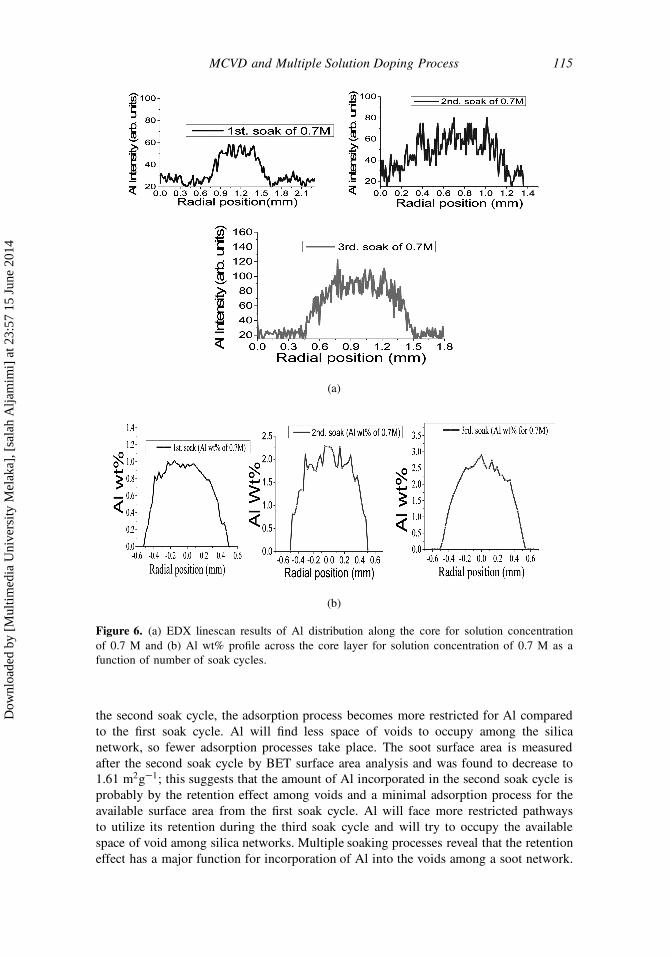
For medium Al concentration (0.7 M), the EDX linescans for single, double, and
triple soak cycles are compared in Figure 6a and Al content as weight percent in Figure 6b.
The averaged peak content of Al weight percent incorporated into the preform core
increased from �0.90 wt% for a single soak cycle, to �1.3 wt% for a double soak cycle,
to �2.5 wt% for a triple soak cycle. The core diameter examined by EDX is about 0.90,
1, and 1.1 mm for single, double, and triple soak cycles, respectively.
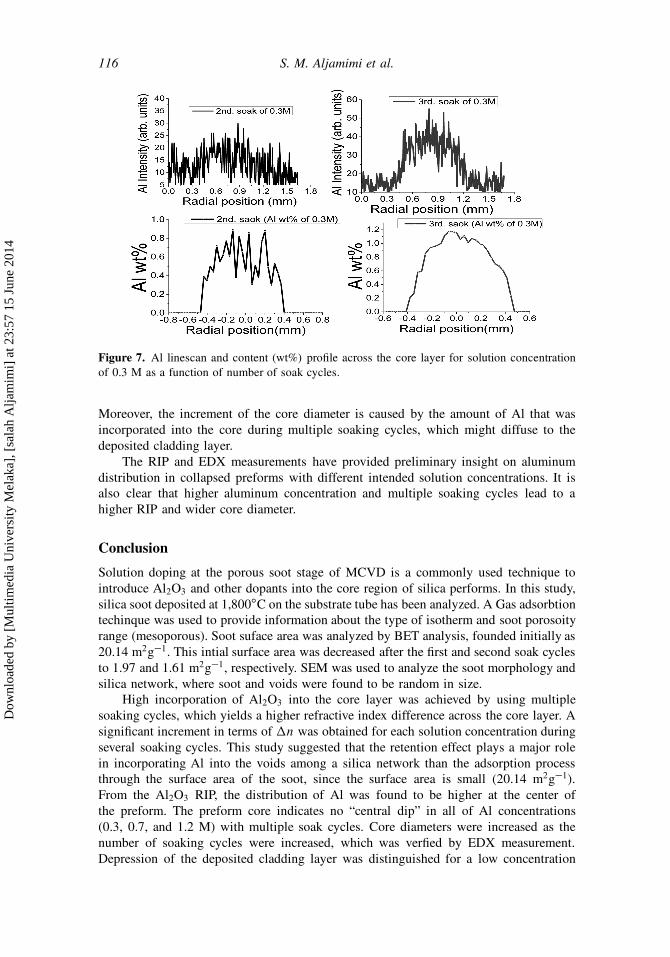
For the lowest Al concentration (0.3 M), linescan and points&id measurement were
performed for double and triple soak cycles only, shown in Figure 7. The averaged peak
content of Al weight percent incorporated into the perform core increased from �0.6 wt%
for a double soak cycle to �1.03 wt% for a triple soak cycle. The core diameter examined
by EDX is about �0.76 and �0.88 mm for double and triple soak cycles, respectively.
The Al content wt% profile has the same pattern as the Al linescan distribution
profile. It has a rather constant maximum value in the middle of the core and decreases
sharply toward zero at the sides. The Al distribution is quite uneven, especially for the first
and second soak cycles, and it improved with slightly even distribution for the third soak,
where Al occupies almost the entire available surface area and voids, which maintains
its retention among silica network.
It can be noticed that during the third soak, a lesser amount of Al was engrossed into
the soot, because the porous and voids were already filled during the first and second
soak cycles. Furthermore, the soot has small surface area of 20.14 m2g�1, so less Al
can be incorporated during the third soak cycle through surface area adsorption. The
mechanism of Al incorporated in each soak/heat treatment cycle was discussed in [19],
which suggested that during the first soak/heat cycle, the amount of Al is controlled by
the amount of solution that can penetrate into the interstices of the silica soot network.
After the solution drains out, some slits of AlCl3.6H2O and ethanol remain trapped in the
interstices. Heat treatment is applied to remove excess ethanol, and at 600ıC, all AlCl3trapped previously in the soot has been converted to Al2O3. For the second soak/heat
cycle, a new amount of Al is deposited on top of the first deposit, perhaps occupying the
surface area not covered during the first soak/heat cycle. In the third soak/heat cycle,
the available penetration pathways would be more restricted, so less Al is expected to be
deposited.
According to the DFT analysis of the soot sample deposited at 1,800ıC, the porosity
is distributed in the mesoporous range, which has poor surface area of 20.14 m2g�1.
In this case, most Al will be adsorbed to the soot surface area during the first soak
cycle and heat treatment at 600ıC. Then the soot surface area was found decreased to
1.97 m2g�1 after the first soak cycle as obtained by BET surface area analysis. During
Dow
nloa
ded
by [
Mul
timed
ia U
nive
rsity
Mel
aka]
, [sa
lah
Alja
mim
i] a
t 23:
57 1
5 Ju
ne 2
014

114 S. M. Aljamimi et al.
(a)
(b)
Figure 5. (a) EDX line-scans results of Al distribution across the core layer for solution
concentration of 1.2 M and (b) Al wt% profile across the core layer for solution concentration
of 1.2 M as a function of number of soak cycles.
Dow
nloa
ded
by [
Mul
timed
ia U
nive
rsity
Mel
aka]
, [sa
lah
Alja
mim
i] a
t 23:
57 1
5 Ju
ne 2
014
MCVD and Multiple Solution Doping Process 115
(a)
(b)
Figure 6. (a) EDX linescan results of Al distribution along the core for solution concentration
of 0.7 M and (b) Al wt% profile across the core layer for solution concentration of 0.7 M as a
function of number of soak cycles.
the second soak cycle, the adsorption process becomes more restricted for Al compared
to the first soak cycle. Al will find less space of voids to occupy among the silica
network, so fewer adsorption processes take place. The soot surface area is measured
after the second soak cycle by BET surface area analysis and was found to decrease to
1.61 m2g�1; this suggests that the amount of Al incorporated in the second soak cycle is
probably by the retention effect among voids and a minimal adsorption process for the
available surface area from the first soak cycle. Al will face more restricted pathways
to utilize its retention during the third soak cycle and will try to occupy the available
space of void among silica networks. Multiple soaking processes reveal that the retention
effect has a major function for incorporation of Al into the voids among a soot network.
Dow
nloa
ded
by [
Mul
timed
ia U
nive
rsity
Mel
aka]
, [sa
lah
Alja
mim
i] a
t 23:
57 1
5 Ju
ne 2
014
116 S. M. Aljamimi et al.
Figure 7. Al linescan and content (wt%) profile across the core layer for solution concentration
of 0.3 M as a function of number of soak cycles.
Moreover, the increment of the core diameter is caused by the amount of Al that was
incorporated into the core during multiple soaking cycles, which might diffuse to the
deposited cladding layer.
The RIP and EDX measurements have provided preliminary insight on aluminum
distribution in collapsed preforms with different intended solution concentrations. It is
also clear that higher aluminum concentration and multiple soaking cycles lead to a
higher RIP and wider core diameter.
Conclusion
Solution doping at the porous soot stage of MCVD is a commonly used technique to
introduce Al2O3 and other dopants into the core region of silica performs. In this study,
silica soot deposited at 1,800ıC on the substrate tube has been analyzed. A Gas adsorbtion
techinque was used to provide information about the type of isotherm and soot porosoity
range (mesoporous). Soot suface area was analyzed by BET analysis, founded initially as
20.14 m2g�1. This intial surface area was decreased after the first and second soak cycles
to 1.97 and 1.61 m2g�1, respectively. SEM was used to analyze the soot morphology and
silica network, where soot and voids were found to be random in size.
High incorporation of Al2O3 into the core layer was achieved by using multiple
soaking cycles, which yields a higher refractive index difference across the core layer. A
significant increment in terms of �n was obtained for each solution concentration during
several soaking cycles. This study suggested that the retention effect plays a major role
in incorporating Al into the voids among a silica network than the adsorption process
through the surface area of the soot, since the surface area is small (20.14 m2g�1).
From the Al2O3 RIP, the distribution of Al was found to be higher at the center of
the preform. The preform core indicates no “central dip” in all of Al concentrations
(0.3, 0.7, and 1.2 M) with multiple soak cycles. Core diameters were increased as the
number of soaking cycles were increased, which was verfied by EDX measurement.
Depression of the deposited cladding layer was distinguished for a low concentration
Dow
nloa
ded
by [
Mul
timed
ia U
nive
rsity
Mel
aka]
, [sa
lah
Alja
mim
i] a
t 23:
57 1
5 Ju
ne 2
014
MCVD and Multiple Solution Doping Process 117
(0.3 M) and tended to decrease as the solution concentrations and the number of soaking
cycles were increased.
The effective result and analysis of this study is important to provide full informa-
tion about solution doping parameters, multiple soaking cycle procedures, the effect of
different solution concentration on RIP, and the Al distribution profile across the core
layer, which can enhance the quality of fabricated performs.
Funding
The authors would like to thank Telekom Research & Development for providing the
funding (RDTC 11076) to perform this work.
References
1. Koester, C. J., and Snitzer, E. 1964. Amplification in a fiber laser. Applied Optics 3(10):1182–
1186.
2. Stone, J., and Burrus, C. A. 1973. Neodymium-doped silica lasers in end-pumped fiber
geometery. Applied Physics Letters 23(7):388–389.
3. Poole, S. B., Payne, D. N., and Fermann, M. E. 1985. Fabrication of low loss optical fibers
containing rare earth ions. Electronics Letters 21:737–738.
4. Ainslie, B. J. 1991. A review of the fabrication and properties of erbium doped fibers for
optical amplifiers. Journal of Lightwave Technology 9(2):220–227.
5. Simpson, D. A. 2008. Spectroscopy of thulium doped silica glass. Ph.D. Thesis, Victoria
University, Australia.
6. Binnners, M., and Jug, K. 2000. The formation of a SiO2 from the reaction SiCl4(g)CO2(g) !
2SiO2(s)C2Cl2(g). European Journal of Inorganic Chemistry 2000:1127–1138.
7. Sen, R., and Dhar, A. 2012. An improved method of fabricating rare earth doped optical
fiber. In: Selected Topics on Optical Fiber Technology, chapter 3, Moh. Yasin, Sulaiman
W. Harun, and Hamzah Arof (Eds.). InTech, pp. 73–94. Accessed from www.intechopen.
com/books/selected-topics-on-optical-fiber-technology/an-improved-method-of-fabricating-
rare-earth-doped-optical-fiber.
8. Khopin, F., Umnikov, A. A., Gur’yanov, A. N., Bubnov, M. M., Senatorv, A. K., and Dianov,
E. M. 2005. Doping of optical fiber preforms via porous silica layer infiltration with salt
solutions. Inorganic Materials 41(3):303–307.
9. Kim, Y. H., Paek, U. C., and Han, W. T. 2001. Effect of soaking temperature on concentrations
of rare-earth ions in optical fiber core in solution doping process. Proceedings of SPIE 4282,
Rare-Earth-Doped Materials and Devices V, San Jose, CA, January 20, pp. 123–132.
10. Kliveri, P., and Tammela, S. 2000. Design and fabrication of erbium-doped fibers for optical
amplifiers. Optical Engineering 39(7):1943–1950.
11. Townsend, J. E., Poole, S. B., and Payne, D. N. 1987. Solution doping technique for fabrication
of rare earth doped optical fibers. Electronics Letters 23(7):329.
12. Khopin, V. F., Umnikov, A. A., Gur’yanov, A. N., Bubnov, M. M., and Mater, I. 2005.
Doping of optical fiber preforms via porous silica layer infiltration with salt solution. Inorganic
Materials 41(3):303–307.
13. Thommes, M. 2010. Physical adsorption characterization of nanoporous materials. Chemie
Ingenieur Technik 82(7):1059–1073.
14. Gregg, S. J., and Sing, K. S. W. 1982. Adsorption Surface Area and Porosity, 2nd ed.,
Chapters 1–2. New York: Academic Press, pp. 2–104.
15. Dhar, A., Mukul, C. P., Pal, M., Mondal, A. K., Sen, S., Maiti, H. S., and Sen, R. 2006.
Characterization of porous core layer for controlling rare earth incorporation in optical fiber.
Optic Express 14(20):9006–9015.
16. Groen, J. C. 2003. Porosity and surface area: Assessment by physical characterization tech-
niques. Delft Solids Solution B.V, Delft, Netherlands.
Dow
nloa
ded
by [
Mul
timed
ia U
nive
rsity
Mel
aka]
, [sa
lah
Alja
mim
i] a
t 23:
57 1
5 Ju
ne 2
014
118 S. M. Aljamimi et al.
17. Cheung, C. K. W., Haley, D., Fletcher, D. F., Barton, G. W., and McNamara, P. 2007. Simulation
of particle-vortex interactions in the modified chemical vapor deposition process. Journal of
Non-Crystalline Solids 353:4066–4075.
18. Dhar, A., Das, S., Maiti, H. S., and Sen, R. 2010. Fabrication of high aluminum containing rare
earth doped fiber without core-clad interface defects. Optics Communications 283:2344–2349.
19. Tang, F. Z., McNamara, P., Barton, G. W., and Ringer, S. P. 2007. Multiple solution-doping in
optical fiber fabrication I—aluminium doping. Journal of Non-Crystalline Solids 354:927–937.
Biographies
S. M. Aljamimi received his B.Eng. in electronics engineering, majoring in telecom-
munication, from Multimedia University Malaysia in 2011. He is working toward his
M.Eng.Sc. in optical fiber fabrication and photonics while working as a research officer
at Multimedia University.
M. S. Khairul Anuar received his B.Sc and M.Sc. in physics from University
Malaya in 2000 and 2004, respectively. He joined Telekom Research & Development in
2004 under the Optical Material Devices Group (Optical Fibre) for 2 years and switched
to the Laser Diode Fabrication (LD Group). From 2007 to the present, he joined the
MCVD Group due to his interest in optical fibers. His work focuses on understanding
the fabrication of optical fiber preforms, including chemistry, thermophoretic of particle
transport, fluid flow, and preforms characterization.
S. Z. Muhamad-Yassin graduated from University of Malaya in 2004 with a bach-
elors in science physics with honors. In 2009, received his M.Eng.Sc. from Universiti
Teknologi Mara in optical amplifiers. From 2009 until now, he is a research officer at
Telekom Research & Development. Most of his research involves the evolution of the
fabrication and characterization of rare earth optical fiber performs.
M. I. Zulkifli graduated from University of Malaya in 1999 with a bachelors in
science physics with honors. He then joined the same university as a tutor at the Center
for Science Foundation for 6 years. He joined Telekom Research & Development in 2005,
focusing on optical fiber preforms using the MCVD technique. He is now serving as a
research officer at Telekom Research & Development, and most of his research involves
the fabrication and characterization of rare earth optical fiber performs.
S. Hanif received his diploma in electronic engineering from Polytechnic of Kota
Bharu, Kelantan, in 1999. He joined Telekom Research & Development in 2001 in the
Calibration Unit; in 2008, he joined the Telekom Malaysia Research and Development–
Multimedia University laboratory as a Technical Assistant.
N. Tamchek received his B.S. (in 2001) in physics from Kanazawa University,
Japan, and his M.Sc. (in 2004) and Ph.D. (in 2010) in photonics from the University of
Malaya, Kuala Lumpur, Malaysia. He is currently a lecturer at the Department of Physics,
University Putra Malaysia. He joined the MCVD Laboratory at Telekom Research &
Development in 2009. His work has focused on development and fabrication of photonics
devices using flame hydrolysis deposition and MCVD system. He is also involved with
the development of photonic devices for telecommunication and sensors.
Z. Yusoff received his B.Eng. in electronics and communications from the University
of York, UK, in 1999. He then completed his Ph.D. in optical communications from the
University of Southampton, UK, in 2004. He has been a member of the academic staff of
the Faculty of Engineering, Multimedia University (MMU), since 1999. He is currently
an associate professor, the Chairman for Center for Advanced Devices and Systems, and
the Deputy Director of Research Management Center. He is a recipient of a number
Dow
nloa
ded
by [
Mul
timed
ia U
nive
rsity
Mel
aka]
, [sa
lah
Alja
mim
i] a
t 23:
57 1
5 Ju
ne 2
014

MCVD and Multiple Solution Doping Process 119
of research grants from various sources worth almost RM 6 million. To date, he has
published over 60 research papers in international journals and conferences.
H. A. Abdul-Rashid received his B.Eng. in electrical and electronic engineering
from University College, London, in 1997 and his M.Eng.Sc. in signal processing from
Multimedia University in 2002. He later received his Ph.D. from Multimedia University
in optical communication systems in 2007. He has been with the Faculty of Engineering,
Multimedia University, since 1998. He currently lectures at the faculty besides leading
a research team at the Center for Photonics and Electronic Devices (CPED) in specialty
fiber fabrication, optical amplifiers, fiber sensors, and fiber lasers.
Dow
nloa
ded
by [
Mul
timed
ia U
nive
rsity
Mel
aka]
, [sa
lah
Alja
mim
i] a
t 23:
57 1
5 Ju
ne 2
014