FHWA/TX-98/1304-3 Texas Department of Transportation ...
194
Form DOT F 1700.7 (8-72) Reproduction of completed page authorized 1. Report No. FHWA/TX-98/1304-3 2. Government Accession No. 3. Recipient’s Catalog No. 4. Title and Subtitle AN EXPERIMENTAL STUDY OF ELASTOMERIC BRIDGE BEARINGS 5. Report Date OCTOBER 1995 WITH DESIGN RECOMMENDATIONS 6. Performing Organization Code 7. Author(s) J.V. MUSCARELLA AND J.A. YURA 8. Performing Organization Report No. RESEARCH REPORT 1304-3 9. Performing Organization Name and Address Center for Transportation Research The University of Texas at Austin 10. Work Unit No. (TRAIS) 3208 Red River, Suite 200 Austin, Texas 78705-2650 11. Contract or Grant No. Research Study 3-5-92/4-1304 13. type of Report and Period Covered 12. Sponsoring Agency Name and Address Texas Department of Transportation Research and Technology Transfer Office Interim P.O. Box 5080 Austin, Texas 78763-5080 14. Sponsoring Agency Code 15. Supplementary Notes Study conducted in cooperation with the U.S. Department of Transportation, Federal Highway Administration Research Study Title: “Elastomeric Bearings.” 16. Abstract Recent AASHTO specifications have placed a number of restrictions on the use of elastomeric bridge bearings. Elastomeric bearings with tapers built in to accommodate span end elevation differences were disallowed by the most current specifications even though no previous research into elastomeric bearing performance has included tests on tapered pads. The purpose of this study was to analyze elastomeric bearing performance on the basis of elastomer hardness, shape factor, reinforcing shim orientation, degree of taper and compressive stress level with the goal of developing a simple design procedure which standardizes as many of those parameters as possible. Particular emphasis was placed on comparing the behavior of flat and tapered bearings. Experimentation included shear, compressive, and rotational stiffness tests, shear and compression fatigue loading, long-term compressive loading, and tests to determine compressive stress limits. In many cases, bearings were intentionally loaded non-uniformly to define safe limits for bearing/girder slope mismatches. Research showed that tapered elastomeric bearings performed equally as well as flat bearings and that manufacturing tapered bearings with steel shims oriented parallel to one another offers several benefits over spacing shims radially. Additionally, bearings made from elastomers with lower hardness ratings displayed several advantages over those made from harder elastomers, particularly rotation capacity far in excess of the current AASHTO limitation. More highly reinforced bearings performed better in compression fatigue and creep tests and easily accommodated compressive stresses in excess of 6.9 MPa (1000 psi). Mismatches between the slope of the girder and the bearing taper had little effect on performance. Also, a field and laboratory investigation was performed into bearing slip and anchorage by friction. Bearings that had slipped while in service were subjected to comparable conditions in a laboratory test apparatus to study their behavior. Research showed that secretion of antiozonant waxes to the bearings’ surfaces caused a dramatic lowering of the bearing’s friction coefficient and resulted in slipping. Several tests were performed that established friction coefficients for natural rubber against a variety of steel and concrete surfaces. A standard design for Texas bearings is recommended. Recommended changes to the current AASHTO specification are presented. 17. Key Words: bridges, design, behavior, bearings, elastomers, neoprene, rubber 18. Distribution Statement No restrictions. This document is available to the public through the National Technical Information Services, Springfield, Virginia 22161 19. Security Classif. (of this report) Unclassified 20. Security Classif. (of this page) Unclassified 21. No. of Pages 192 22. Price
-
Upload
khangminh22 -
Category
Documents
-
view
1 -
download
0
Transcript of FHWA/TX-98/1304-3 Texas Department of Transportation ...

7HFKQLFDO�5HSRUW�'RFXPHQWDWLRQ�3DJH
Form DOT F 1700.7 (8-72) Reproduction of completed page authorized
1. Report No.
FHWA/TX-98/1304-3
2. Government Accession No. 3. Recipient’s Catalog No.
4. Title and Subtitle
AN EXPERIMENTAL STUDY OF ELASTOMERIC BRIDGE BEARINGS
5. Report Date
OCTOBER 1995WITH DESIGN RECOMMENDATIONS 6. Performing Organization Code
7. Author(s)
J.V. MUSCARELLA AND J.A. YURA
8. Performing Organization Report No.
RESEARCH REPORT 1304-39. Performing Organization Name and Address
Center for Transportation ResearchThe University of Texas at Austin
10. Work Unit No. (TRAIS)
3208 Red River, Suite 200Austin, Texas 78705-2650
11. Contract or Grant No.
Research Study 3-5-92/4-1304
13. type of Report and Period Covered12. Sponsoring Agency Name and Address
Texas Department of TransportationResearch and Technology Transfer Office
Interim
P.O. Box 5080Austin, Texas 78763-5080
14. Sponsoring Agency Code
15. Supplementary NotesStudy conducted in cooperation with the U.S. Department of Transportation, Federal Highway Administration Research Study Title:“Elastomeric Bearings.”
16. Abstract
Recent AASHTO specifications have placed a number of restrictions on the use of elastomeric bridge bearings. Elastomeric bearingswith tapers built in to accommodate span end elevation differences were disallowed by the most current specifications even though noprevious research into elastomeric bearing performance has included tests on tapered pads.
The purpose of this study was to analyze elastomeric bearing performance on the basis of elastomer hardness, shape factor,reinforcing shim orientation, degree of taper and compressive stress level with the goal of developing a simple design procedurewhich standardizes as many of those parameters as possible. Particular emphasis was placed on comparing the behavior of flat andtapered bearings. Experimentation included shear, compressive, and rotational stiffness tests, shear and compression fatigueloading, long-term compressive loading, and tests to determine compressive stress limits. In many cases, bearings were intentionallyloaded non-uniformly to define safe limits for bearing/girder slope mismatches.
Research showed that tapered elastomeric bearings performed equally as well as flat bearings and that manufacturing taperedbearings with steel shims oriented parallel to one another offers several benefits over spacing shims radially. Additionally, bearingsmade from elastomers with lower hardness ratings displayed several advantages over those made from harder elastomers,particularly rotation capacity far in excess of the current AASHTO limitation. More highly reinforced bearings performed better incompression fatigue and creep tests and easily accommodated compressive stresses in excess of 6.9 MPa (1000 psi). Mismatchesbetween the slope of the girder and the bearing taper had little effect on performance.
Also, a field and laboratory investigation was performed into bearing slip and anchorage by friction. Bearings that had slipped while inservice were subjected to comparable conditions in a laboratory test apparatus to study their behavior. Research showed thatsecretion of antiozonant waxes to the bearings’ surfaces caused a dramatic lowering of the bearing’s friction coefficient and resulted inslipping. Several tests were performed that established friction coefficients for natural rubber against a variety of steel and concretesurfaces. A standard design for Texas bearings is recommended. Recommended changes to the current AASHTO specification arepresented.
17. Key Words:
bridges, design, behavior, bearings, elastomers,neoprene, rubber
18. Distribution Statement
No restrictions. This document is available to the publicthrough the National Technical Information Services,Springfield, Virginia 22161
19. Security Classif. (of this report)
Unclassified
20. Security Classif. (of this page)
Unclassified
21. No. of Pages
192
22. Price


AN EXPERIMENTAL STUDY OF ELASTOMERIC BRIDGEBEARINGS WITH DESIGN RECOMMENDATIONS
by
J.V. Muscarella and J.A. Yura
Research Report No. 1304-3
Research Project 3-5-92/4-1304
“ELASTOMERIC BEARINGS”
conducted for the
Texas Department of Transportation
in cooperation with the
U.S. Department of TransportationFederal Highway Administration
by the
CENTER FOR TRANSPORTATION RESEARCHBUREAU OF ENGINEERING RESEARCHTHE UNIVERSITY OF TEXAS AT AUSTIN
OCTOBER 1995


i i i
IMPLEMENTATION
This research shows that tapered elastomeric bearings of up to 6% slope should be allowed bythe AASHTO Specification. The report includes proposed changes to the AASHTOSpecification, which TxDOT should begin to process through for national adoption. TxDOTshould continue the ban on the use of natural rubber bearing pads because of the wax thatblooms to the surface of such bearings. Standard bearing designs utilizing 50 durometermaterial with a greater amount of steel reinforcement than is generally used are shown to givevery good performance.
Prepared in cooperation with the Texas Department of Transportation and the U.S. Departmentof Transportation, Federal Highway Administration.
The contents of this report reflect the views of the authors, who are responsible for the factsand the accuracy of the data presented herein. The contents do not necessarily reflect theofficial view or policies of the Federal Highway Administration or the Texas Department ofTransportation. This report does not constitute a standard, specification, or regulation.
NO INTENDED FOR CONSTRUCTION,BIDDING, OR PERMIT PURPOSES
Joseph A. Yura, P.E. #29859
Research Supervisors

iv
v
TABLE OF CONTENTS
CHAPTER 1 — INTRODUCTION ...................................................................................................................... 1
1.1 BACKGROUND ...................................................................................................................... 1
1.2 ELASTOMERIC BEARING TERMINOLOGY ...................................................................... 1
Bearing Dimensions and Components....................................................................................... 1
Elastomer type ...................................................................................................................... 2
Elastomer hardness/shear modulus ............................................................................................ 2
Maximum shear strain ............................................................................................................... 3
Maximum compressive stress .................................................................................................... 4
Number of reinforcing steel shims............................................................................................. 5
Thickness of steel shims ............................................................................................................ 5
Rotation capacity ...................................................................................................................... 5
Maximum allowable mismatch between the bridge girder and the bearing ............................... 6
Maximum taper ...................................................................................................................... 6
Fatigue limits ...................................................................................................................... 6
Fabrication tolerances................................................................................................................ 6
1.3 HISTORICAL PROBLEMS WITH ELASTOMERIC BEARINGS......................................... 6
1.3.1 Bearing Slip................................................................................................................. 6
1.3.2 Delamination. .............................................................................................................. 8
1.3.3 Ozone Degradation...................................................................................................... 8
1.3.4 Low Temperature Stiffening ....................................................................................... 8
1.4 LITERATURE REVIEW.......................................................................................................... 8
1.4.1 Early Uses: 19th Century to 1961 ................................................................................ 9
Pare and Keiner (1958) - Joint, State of Rhode Island and Charles A. Maguireand Associates (19) ..................................................................................................... 9
E. I. du Pont de Nemours & Co. (1959) (6) ............................................................. 9
Ozell and Diniz (1959) - The University of Florida, Gainsville (18) .......................... 9
Clark and Moultrap (1959) - Joint, Enjay Laboratories and The University ofRhode Island (5)........................................................................................................ 10
Fairbanks (1960) - Master’s Thesis, Texas A & M University (8)............................ 10
1.4.2 Use with Minimum Guidance: 1961-1985 ................................................................ 10
Suter and Collins (1964) - University of Toronto (37).............................................. 10
Minor and Egan (1970) - Batelle Memorial Institute (17) ........................................ 10
Stanton and Roeder (1982) - University of Washington (33).................................... 11
1.4.3 Explicit design procedures: 1985-Present ................................................................. 11
Roeder and Stanton (1987) - University of Washington (25).................................... 11
Roeder and Stanton (1988) - University of Washington (24).................................... 12
1.5 RESEARCH GOALS .............................................................................................................. 12
Quantify the “walking out” phenomenon................................................................................. 12
Define Tapered Bearing Limits ............................................................................................... 12
Develop a Tapered Bearing Design Procedure........................................................................ 12
1.6 RESEARCH SCOPE............................................................................................................... 13
Application .................................................................................................................... 13

vi
Material .................................................................................................................... 13
Shape factor .................................................................................................................... 13
Reinforcement .................................................................................................................... 13
Anchorage .................................................................................................................... 13
Environment .................................................................................................................... 13
Stability .................................................................................................................... 14
1.7 LIMITATIONS OF CURRENT AASHTO SPECIFICATION .............................................. 14
1.8 ORGANIZATION OF STUDY .............................................................................................. 14
1.9 SUMMARY .................................................................................................................... 15
CHAPTER 2 — EXPERIMENTAL PROGRAM ............................................................................................... 17
2.1 BEARING SHEAR TEST MACHINE ................................................................................... 17
2.1.2 Middle Platen Design................................................................................................ 21
X-Axis Leveling Mechanism..................................................................................... 21
Z-Axis Stabilization .................................................................................................. 21
2.1.3 Instrumentation/Data Acquisition.............................................................................. 24
2.2 TEST SPECIMEN DESIGN AND FABRICATION.............................................................. 25
2.2.1 Field Study Bearings ................................................................................................. 25
Slaughter Creek Bridge, Austin................................................................................. 25
Valley Ridge Bridge, Dallas...................................................................................... 25
2.2.2 Test Specimen Design............................................................................................... 25
Elastomer Properties ................................................................................................. 25
2.2.3 Specified Dimensions................................................................................................ 26
2.2.4 Steel-Reinforcing Shims............................................................................................ 26
Number of Shims....................................................................................................... 26
Steel Properties ......................................................................................................... 26
Shim Orientation ....................................................................................................... 27
2.2.5 Fabrication Accuracy And Precision Of Test Specimens.......................................... 28
Shear Modulus/Hardness........................................................................................... 28
Wax Content.............................................................................................................. 28
Dimensions................................................................................................................ 29
Taper .................................................................................................................... 30
Steel Shims................................................................................................................ 31
CHAPTER 3 — INVESTIGATION INTO BEARING SLIP ............................................................................. 33
3.1 DEFLECTIONS UNDER VERTICAL LOAD ALONE......................................................... 33
3.1.1 Experimental Test Program....................................................................................... 34
3.1.2 Test Results ............................................................................................................... 35
Horizontal Forces ...................................................................................................... 35
Horizontal Deflections .............................................................................................. 38
Influence of Reinforcing Shim Orientation on Horizontal Force and Displace-ment .................................................................................................................... 40
3.1.3 Discussion of Horizontal Force and Deflection Tests ............................................... 41
Conclusions ............................................................................................................... 42
3.2 BEARING SLIP INVESTIGATION ...................................................................................... 42
3.2.1 Field Studies.............................................................................................................. 43

vii
Slaughter Creek Bridge, Austin................................................................................. 44
Valley Ridge Bridge, Dallas...................................................................................... 47
3.2.2 Laboratory Investigation ........................................................................................... 47
Wax Additive ............................................................................................................ 47
Slip Tests on Slaughter Creek Natural Rubber Bearings........................................... 48
Explanation of Slip Test Results ............................................................................... 48
Slip Tests on Valley Ridge Natural Rubber Bearings ............................................... 52
Mechanics of the “Walking Out” Phenomenon......................................................... 52
3.2.3 Direct Friction Tests.................................................................................................. 54
3.2.4 Conclusions From Slip Tests..................................................................................... 55
Wax Additive ............................................................................................................ 55
“Walking out” Phenomenon...................................................................................... 55
Anchorage by Friction............................................................................................... 55
CHAPTER 4 — BEARING STIFFNESS TESTS............................................................................................... 57
4.1 SHEAR STIFFNESS/MODULUS TESTS ............................................................................. 57
4.1.1 Test Program............................................................................................................. 57
4.1.2 Results of Shear Stiffness/Modulus Tests ................................................................. 59
4.1.2.1 Matched Slope Tests................................................................................... 59
Influence of Taper on Shear Modulus......................................................... 60
Influence of Compressive Stress on Shear Modulus ................................... 61
Influence of Shape Factor on Shear Modulus ............................................. 62
Influence of Steel Shim Orientation on Shear Modulus.............................. 62
4.1.2.2 Non-uniform Loading Tests ........................................................................ 63
4.1.3 Comparison with Shear Modulus Tests on Plain Specimens..................................... 68
4.2 COMPRESSIVE STIFFNESS/MODULUS TESTS ............................................................... 68
4.2.1 Test Program............................................................................................................. 68
4.2.2 Results .................................................................................................................... 69
Effect of Increasing Hardness/Shear Modulus on Compressive Modulus................. 71
Effect of Increasing Shape Factor on Compressive Modulus.................................... 71
Effect of Tapering on Compressive Modulus............................................................ 71
Influence of Reinforcing Shim Orientation on Compressive Modulus andDeformation .............................................................................................................. 74
4.2.3 Experimental versus Calculated Values .................................................................... 74
4.3 ROTATIONAL STIFFNESS TESTS ..................................................................................... 76
4.3.1 Test Program............................................................................................................. 76
4.3.2 Test Results ............................................................................................................... 77
Influence of Hardness/Shear Modulus on Rotation Capacity/Stiffness ..................... 81
Influence of Shape Factor on Rotational Behavior.................................................... 82
Effect of Tapering on Rotational Behavior ............................................................... 82
Effect of Reinforcing Shim Orientation on Rotational Behavior............................... 84
4.3.3 Summary of Rotational Behavior Tests..................................................................... 84
4.4 DISCUSSION OF STIFFNESS TEST RESULTS.................................................................. 88
Shear Modulus/Stiffness Tests................................................................................................. 88
Compressive Modulus/Stiffness Tests ..................................................................................... 89

viii
Rotational Stiffness Tests ........................................................................................................ 89
Common Factors .................................................................................................................... 89
CHAPTER 5 — COMPRESSIVE CREEP BEHAVIOR .................................................................................... 91
5.1 TEST PROGRAM................................................................................................................... 91
Logarithmic Prediction ............................................................................................................ 92
Southwell Plot Prediction ........................................................................................................ 93
5.2 TEST RESULTS .................................................................................................................... 93
Analysis of Creep Deformations.............................................................................................. 93
Influence of Shape Factor on Compressive Creep Behavior ................................................... 94
Influence of Hardness on Compressive Creep Behavior ......................................................... 95
Influence of Taper on Compressive Creep Behavior............................................................... 95
5.3 DISCUSSION OF CREEP TEST RESULTS ......................................................................... 96
Design Implications................................................................................................................. 97
CHAPTER 6 — FATIGUE TESTS .................................................................................................................... 99
6.1 SHEAR FATIGUE TESTS ..................................................................................................... 99
6.1.1 Test Program............................................................................................................. 99
6.1.2 Test Results ............................................................................................................. 100
Fatigue damage ....................................................................................................... 100
Loss of Shear Stiffness ............................................................................................ 101
6.2 COMPRESSION FATIGUE TESTS .................................................................................... 103
6.2.1 Test Program........................................................................................................... 103
6.2.2 Test Results ............................................................................................................. 104
Fatigue Damage....................................................................................................... 104
Loss of Compressive Stiffness ................................................................................ 105
6.3 DISCUSSION OF FATIGUE TESTS................................................................................... 106
Shear Fatigue .................................................................................................................. 106
Compression Fatigue ............................................................................................................. 106
Common Factors .................................................................................................................. 107
CHAPTER 7 — DETERMINATION OF FAILURE STRESSES .................................................................... 109
7.1 COMPRESSION FAILURE TESTS..................................................................................... 109
7.1.1 Test Program........................................................................................................... 109
7.1.2 Test Results ............................................................................................................. 110
Unreinforced Bearings ............................................................................................ 110
Reinforced Bearings................................................................................................ 112
Comparison of Experimental and Theoretical Results ............................................ 113
7.2 SHEAR FAILURE TEST...................................................................................................... 115
7.2.1 Test Procedure.............................................................................................................. 116
7.2.2 Test Results .................................................................................................................. 116
7.3 DISCUSSION OF FAILURE TESTS ................................................................................... 117
Compression Failure.............................................................................................................. 117
Shear Failure .................................................................................................................. 117
CHAPTER 8 — CONCLUSIONS AND RECOMMENDATION .................................................................... 119
8.1 CONCLUSIONS .................................................................................................................. 119
8.1.1 Bearing Slip............................................................................................................. 119
ix
Antiozonant Additives............................................................................................. 119
Contact Surfaces...................................................................................................... 119
8.1.2 Common Design Considerations ............................................................................. 119
Shear Modulus Determination................................................................................. 119
Manufacturing Precision and Accuracy................................................................... 120
Elastomer Hardness................................................................................................. 120
Shape Factor............................................................................................................ 121
Compressive Stress ................................................................................................. 121
Rotation Capacity.................................................................................................... 121
Steel Shims.............................................................................................................. 122
Cover Layers ........................................................................................................... 122
8.1.3 Design of Tapered Bearings.................................................................................... 122
Maximum Taper...................................................................................................... 122
Slope Mismatch....................................................................................................... 122
Compressive Deformations ..................................................................................... 123
Horizontal Deflections ............................................................................................ 123
Orientation of Steel Shims....................................................................................... 123
8.2 RECOMMENDATIONS....................................................................................................... 124
8.2.1 Recommendations to Preclude Bearing Slip ........................................................... 124
8.2.2 Recommendations Common to All Elastomeric Bearings....................................... 124
8.2.3 Recommendations for Tapered Bearings ................................................................ 127
8.3 SUGGESTED FUTURE RESEARCH.................................................................................. 128
Performance at Higher Compressive Stresses ....................................................................... 128
Ozone Degradation Testing ................................................................................................... 128
CHAPTER 9 — RECOMMENDED DESIGN PROCEDURE ......................................................................... 129
Standard Design Parameters ................................................................................................................ 129
APPENDIX A — PROPOSED SPECIFICATION ........................................................................................... 133
APPENDIX B — DESIGN EXAMPLES USING METHOD C SPECIFICATIONS....................................... 145
APPENDIX C — SELECTED PROPERTIES OF NATURAL RUBBER ....................................................... 153
APPENDIX D — NOTATION .................................................................................................................. 155
APPENDIX E — INDIVIDUAL TEST RESULTS .......................................................................................... 157
GLOSSARY ............................................................................................................................................... 177
REFERENCES ............................................................................................................................................... 179

x

xi
LIST OF FIGURES
Figure 1- 1 Girder/bearing configurations.................................................................................................... 1Figure 1- 2 Elastomeric bearing nomenclature............................................................................................. 2Figure 1- 3 Forces on elastomeric bearing during shear............................................................................... 3Figure 1- 4 Unreinforced elastomeric pad under compressive load ............................................................. 4Figure 1- 5 Reinforcement limiting bulging of the elastomeric pad ............................................................. 4Figure 1- 6 Tensile forces on reinforcing shims from elastomer compression............................................. 5Figure 1- 7 Rotation capacity of elastomeric bearing................................................................................... 5Figure 1- 8 Non-uniform loading of elastomeric bearing............................................................................. 6Figure 1- 9 Extreme examples of bearing “walking out” phenomenon ........................................................ 7Figure 2- 1 Bearings being tested in the shear test machine....................................................................... 17Figure 2- 2 Schematic of the elastomeric bearing test setup ...................................................................... 18Figure 2- 3 Constant compressive force system ......................................................................................... 19Figure 2- 4 Steel dead weights .................................................................................................................. 19Figure 2- 5 311-kN (35-ton) screw jacks ................................................................................................... 20Figure 2- 6 Electronic controller/motor/reduction gear system.................................................................. 20Figure 2- 7 Middle platen detail................................................................................................................. 21Figure 2- 8 Data acquisition system ........................................................................................................... 22Figure 2- 9 Optron with light source directed toward bearing ................................................................... 23Figure 2- 10 Optron tracking a target on a bearing ...................................................................................... 23Figure 2- 11 ptron target as seen through the optron view finder................................................................. 24Figure 2- 12 Spacing of steel shims in tapered bearing specimens .............................................................. 27Figure 2- 13 Tapered bearing with parallel steel shims................................................................................ 27Figure 2- 14 Steel shims bent during manufacturing process....................................................................... 31Figure 2- 15 Misoriented steel shims ........................................................................................................... 31Figure 3- 1 Bearing under girder dead weight............................................................................................ 33Figure 3- 2 Bearings shearing due to girder dead weight ........................................................................... 33Figure 3- 3 Test setup for measuring horizontal forces.............................................................................. 34Figure 3- 4 Horizontal to compressive force ratio vs. middle platen slope ................................................ 35Figure 3- 5 Actual and predicted P-∆ curves for a 57-durometer 3-shim 6% taper bearing....................... 36Figure 3- 6 Actual and predicted P-D curves for a 70-durometer 6-shim 6% taper bearing ...................... 39Figure 3- 7 Geometry of displaced bearing............................................................................................... 39!Figure 3.8 Sliding gage for measurement of girder movement ................................................................. 43Figure 3- 9 Girder expansion/contraction measurement gage .................................................................... 43Figure 3- 10 Reference marks under girder.................................................................................................. 44Figure 3- 11 Restraining devices to prevent bearing movement .................................................................. 45Figure 3- 12 Bridge lifting system................................................................................................................ 45Figure 3- 13 Steam cleaning the girders and bearing seats with degreasing agent ....................................... 46Figure 3- 14 Movement of neoprene bearing pads from June 1993 to April 1994 ...................................... 46Figure 3- 15 Movement of neoprene bearing pads since April 1994 ........................................................... 47Figure 3- 16 Initial load-displacement curve and optron plot ...................................................................... 49Figure 3- 17 Load-displacement curve with bearing stationary ................................................................... 50Figure 3- 18 Bearing walking out slowly ..................................................................................................... 50Figure 3- 19 Bearing walking out significantly ............................................................................................ 51Figure 3- 20 Final load-displacement and slip curves .................................................................................. 51Figure 3- 21 Bearing under girder dead weight alone .................................................................................. 52Figure 3- 22 Forces on bearing during girder expansion.............................................................................. 52Figure 3- 23 Forces on bearing during girder contraction............................................................................ 53Figure 3- 24 Load displacement curves from direct friction tests ................................................................ 56Figure 4- 1 Concrete platens with surface accumulation............................................................................ 58

xii
Figure 4- 2 Cleaning of concrete platens.................................................................................................... 58Figure 4- 3 Shear load-displacement curve for a flat bearing..................................................................... 59Figure 4- 4 Horizontal load vs. displacement at 100% strain..................................................................... 60Figure 4- 5 Load-displacement curve for a tapered bearing at 50% shear strain........................................ 61Figure 4- 6 Flat bearing loaded non-uniformly at low compressive stress ................................................. 65Figure 4- 7 Tapered bearing loaded non-uniformly on the thin end........................................................... 66Figure 4- 8 Bearing under non-uniform loading at 3.85 MPa (550 psi) ..................................................... 66Figure 4- 9 Bearing under non-uniform loading at 7.69 MPa (1100 psi) ................................................... 67Figure 4- 10 Typical shear stress-strain curve from ASTM 4014 test.......................................................... 67Figure 4- 11 Compressive stress-strain relationship for plain pad ............................................................... 69Figure 4- 12 Flat 6 shim bearing loaded to 14 MPa (2000 psi) in compression........................................... 72Figure 4- 13 apered 6 shim bearing loaded to 3.5 MPa (500 psi) ................................................................ 72Figure 4- 14 Tapered 6 shim bearing loaded to 14 MPa (2000 psi)............................................................. 73Figure 4- 15 Stress-strain curves for 70 durometer flat and tapered 3 shim bearings.................................. 73Figure 4- 16 Stress-strain curves for 54 durometer flat and tapered 6 shim bearings................................... 74Figure 4- 17 Stress-strain curves for flat and tapered bearings of 55 and 70 durometer .............................. 76Figure 4- 18 Schematic diagram of rotational stiffness test setup ............................................................... 77Figure 4- 19 Rotational stiffness test instrumentation ................................................................................. 77Figure 4- 20 Moment-rotation curve - flat 54 Durometer 3 shim bearing at 7.69 MPa............................... 78Figure 4- 21 Moment-rotation curve - flat 69 Durometer 6 shim bearing at 3.85 MPa................................ 78Figure 4- 22 Bearing exhibiting lift-off at 3.85 MPa (550 psi) .................................................................... 80Figure 4- 23 Bearing exhibiting lift-off at 7.69 MPa (1100 psi) .................................................................. 80Figure 4- 24 Typical moment-rotation relationship for a tapered bearing.................................................... 82Figure 4- 25 Tapered bearing at lever arm lift-off........................................................................................ 83Figure 4- 26 Comparison of flat bearing designs ......................................................................................... 85Figure 4- 27 Comparison of flat and tapered designs................................................................................... 85Figure 5- 1 Compressive creep apparatus .................................................................................................. 91Figure 5- 2 Standard creep relationship ..................................................................................................... 92Figure 5- 3 Logarithmic prediction of long-term creep.............................................................................. 92Figure 5- 4 Southwell plot predictionof long-term creep ........................................................................... 93Figure 5- 5 Comparison of total compressive deformation in 3 versus 6 shim specimens ......................... 94Figure 6- 1 Shear fatigue apparatus.......................................................................................................... 100Figure 6- 2 Bearing with three reinforcing shims at 10.35 MPa (1500 psi) ............................................. 101Figure 6-3 Fretting damage on bearing surface....................................................................................... 102Figure 6-4 Bearing with six reinforcing shims at 10.35 MPa (1500 psi) ................................................ 104Figure 6- 5 Bearing with six reinforcing shims at 10.35 MPa (1500 psi) ................................................ 104Figure 7- 1 Compression failure test apparatus ........................................................................................ 110Figure 7- 2 Unreinforced bearing under 31.0 MPa (4500 psi) compressive stress................................... 111Figure 7- 3 Stress-strain relationship for a plain pad loaded to 31.0 MPa (4500 psi) .............................. 111Figure 7- 4 Reinforced bearing compression test stress-strain relationship ............................................. 112Figure 7- 5 Elastomer tearing/delamination ............................................................................................. 114Figure 7- 6 Fractured reinforcing steel shims........................................................................................... 114Figure 7- 7 Specimen with steel shims yielded in shear ........................................................................... 116

xiii
LIST OF TABLES
Table 1- 1 Values of Shear Modulus Based Upon Elastomer Hardness ..................................................... 3Table 2- 1 As delivered hardness measurements ...................................................................................... 28Table 2- 2 Average shear moduli as determined from testing................................................................... 29Table 2- 3 Average elastomer thickness measurements ............................................................................ 30Table 2- 4 As delivered bearing tapers ..................................................................................................... 30Table 3- 1 Schedule of horizontal to compressive force ratio tests........................................................... 34Table 3- 2 Influence of compressive force level on ratio of horizontal to compressive force................... 36Table 3- 3 Influence of shear modulus on horizontal to compressive force ratio...................................... 36Table 3- 4 Influence of shear modulus on horizontal to compressive force ratio...................................... 37Table 3- 5 Average horizontal force produced by compressive force of 311 kN and 622 kN .................. 37Table 3- 6 Ratio of horizontal to compressive force from displacement tests .......................................... 38Table 3- 7 Comparison of actual and predicted horizontal displacements................................................ 40Table 3- 8 Influence of steel shim orientation on horizontal force and displacement ............................... 40Table 3- 10 Friction coefficients from slip tests.......................................................................................... 48Table 3- 11 Coefficients of friction from direct friction tests ..................................................................... 54Table 4- 1 Influence of bearing taper on shear modulus ........................................................................... 61Table 4- 2 Influence of compressive stress on shear modulus .................................................................. 62Table 4- 3 Influence of shape factor on shear modulus............................................................................. 62Table 4- 4 Influence of steel shim orientation on shear modulus.............................................................. 62Table 4- 5 Effect of non-uniform loading at low compressive stress ........................................................ 64Table 4- 6 Influence of shape factor on shear modulus in non-uniform loading at low compressive
stress ........................................................................................................................................ 64Table 4- 7 Effect of non-uniform loading at higher compressive stress.................................................... 64Table 4- 8 Influence of shape factor on shear modulus in non-uniform loading at high compressive
stress ........................................................................................................................................ 65Table 4- 9 Comparison of ASTM and full-scale shear modulus tests - Manufacturer A .......................... 65Table 4- 10 Comparison of ASTM and full-scale shear modulus tests, Manufacturers B and C ................ 68Table 4- 11 Compressive stiffness test results ............................................................................................ 70Table 4- 12 Effect of increasing shape factor on compressive modulus ..................................................... 70Table 4- 13 Effect of increasing shape factor on compressive modulus ..................................................... 70Table 4- 14 Influence of taper on compressive stiffness ............................................................................. 71Table 4- 15 Influence of reinforcing shim orientation on cmpressive modulus and deformation ............... 74Table 4- 16 Experimental vs. calculated compressive modulus.................................................................. 75Table 4- 17 Actual and predicted changes in compression modulus........................................................... 75Table 4- 18 Average rotational stiffnesses.................................................................................................. 79Table 4- 19 Average rotation capacities of bearings................................................................................... 79Table 4- 20 Influence of compressive stress on rotational stiffness and rotation capacity.......................... 81Table 4- 21 Effect of increasing hardness on rotational behavior............................................................... 81Table 4- 22 Effect of increasing shape factor on rotational behavior ......................................................... 82Table 4- 23 Influence of taper on rotational behavior................................................................................. 84Table 4- 24 Influence of steel shim orientation on rotational behavior....................................................... 84Table 4- 25 Comparison of rotation test results and theoretical calculations.............................................. 87Table 5- 1 Two-week creep deformations................................................................................................. 94Table 5- 2 Influence of shape factor on long-term compressive creep behavior....................................... 94Table 5- 3 Influence of hardness on compressive creep behavior............................................................. 95Table 5- 4 Influence of bearing taper on compressive creep behavior...................................................... 95Table 5- 5 Comparison of creep test results.............................................................................................. 96Table 6- 1 Loss of shear stiffness due to shear fatigue loading............................................................... 102Table 6- 2 Loss of compressive stiffness due to compression fatigue loading........................................ 105

xiv
Table 6- 3 Comparison of shear fatigue test results ................................................................................ 106Table 7- 1 Results of reinforced bearing compression tests.................................................................... 113Table 7- 2 Comparison of theoretical yield stresses and experimental stiffness loss stress .................... 115Table 9- 1 Compressive deformation for 55 durometer bearings of S = 10 ............................................ 130Table 9- 2 Standard tapered bearing ranges............................................................................................ 131
1
CHAPTER 1INTRODUCTION
1.1 BACKGROUND
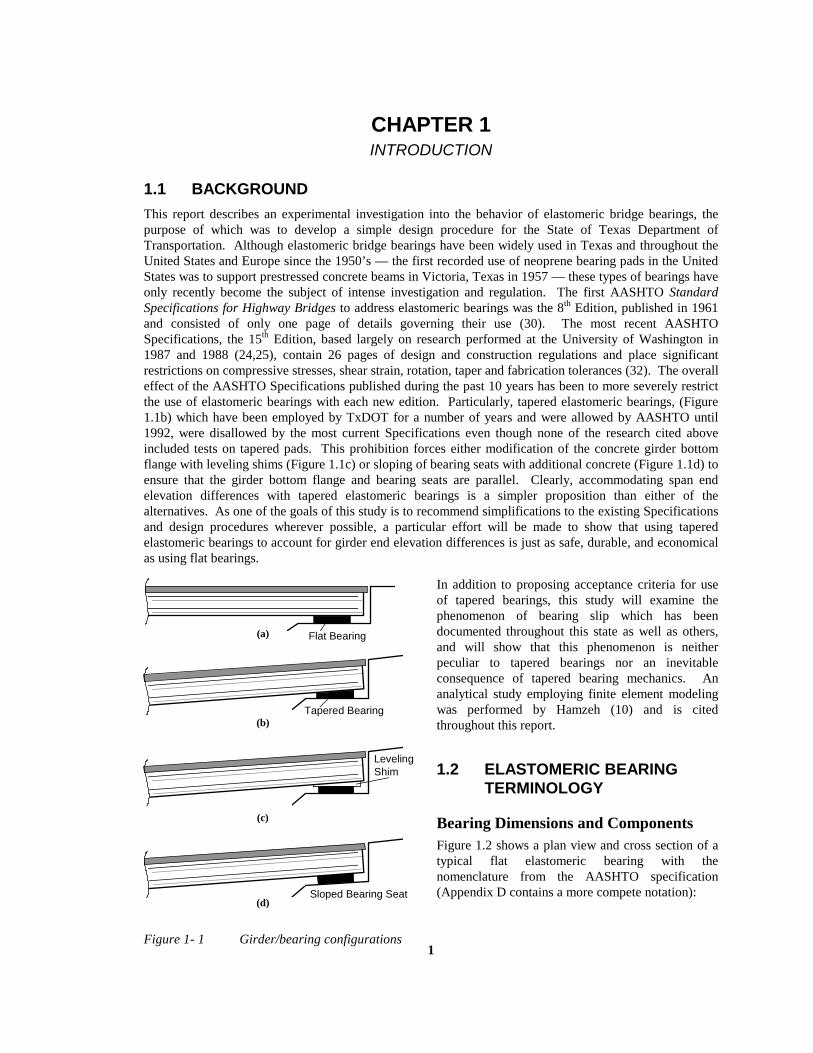
This report describes an experimental investigation into the behavior of elastomeric bridge bearings, thepurpose of which was to develop a simple design procedure for the State of Texas Department ofTransportation. Although elastomeric bridge bearings have been widely used in Texas and throughout theUnited States and Europe since the 1950’s — the first recorded use of neoprene bearing pads in the UnitedStates was to support prestressed concrete beams in Victoria, Texas in 1957 — these types of bearings haveonly recently become the subject of intense investigation and regulation. The first AASHTO StandardSpecifications for Highway Bridges to address elastomeric bearings was the 8th Edition, published in 1961and consisted of only one page of details governing their use (30). The most recent AASHTOSpecifications, the 15th Edition, based largely on research performed at the University of Washington in1987 and 1988 (24,25), contain 26 pages of design and construction regulations and place significantrestrictions on compressive stresses, shear strain, rotation, taper and fabrication tolerances (32). The overalleffect of the AASHTO Specifications published during the past 10 years has been to more severely restrictthe use of elastomeric bearings with each new edition. Particularly, tapered elastomeric bearings, (Figure1.1b) which have been employed by TxDOT for a number of years and were allowed by AASHTO until1992, were disallowed by the most current Specifications even though none of the research cited aboveincluded tests on tapered pads. This prohibition forces either modification of the concrete girder bottomflange with leveling shims (Figure 1.1c) or sloping of bearing seats with additional concrete (Figure 1.1d) toensure that the girder bottom flange and bearing seats are parallel. Clearly, accommodating span endelevation differences with tapered elastomeric bearings is a simpler proposition than either of thealternatives. As one of the goals of this study is to recommend simplifications to the existing Specificationsand design procedures wherever possible, a particular effort will be made to show that using taperedelastomeric bearings to account for girder end elevation differences is just as safe, durable, and economicalas using flat bearings.
In addition to proposing acceptance criteria for useof tapered bearings, this study will examine thephenomenon of bearing slip which has beendocumented throughout this state as well as others,and will show that this phenomenon is neitherpeculiar to tapered bearings nor an inevitableconsequence of tapered bearing mechanics. Ananalytical study employing finite element modelingwas performed by Hamzeh (10) and is citedthroughout this report.
1.2 ELASTOMERIC BEARINGTERMINOLOGY
Bearing Dimensions and ComponentsFigure 1.2 shows a plan view and cross section of atypical flat elastomeric bearing with thenomenclature from the AASHTO specification(Appendix D contains a more compete notation):
Tapered Bearing
Flat Bearing
Sloped Bearing Seat
LevelingShim
(d)
(c)
(b)
(a)
Figure 1- 1 Girder/bearing configurations

2
Elastomer typeA number of elastomeric materials can be used for bearings: natural rubber; and man-made materials suchas neoprene, butyl rubber, urethane, and ethylene propylene dimonomer (EPDM). Natural rubber andneoprene are by far, however, the most common compounds. Although neoprene was the first elastomericbearing material (the 1961 AASHTO Specifications named neoprene as the only acceptable elastomericcompound) and remains the most common material in use today, natural rubber, imported mainly fromMalaysia, has recently challenged neoprene’s dominance in the field due to its (of late) lower cost. According to bearing manufacturers, a natural rubber bearing pad (finished product) can be provided to theuser for approximately 75 percent of the cost of a neoprene pad of the same design. Thus, as long as thereservations concerning the use of natural rubber can be overcome, i.e. ozone degradation and the “walkingout” phenomenon (to be discussed later), a significant reduction in the cost of elastomeric bearings can beachieved. A so-called “standard” TxDOT bearing of 228.6 mm (9 inches) in length, 558.8 mm (22 inches)in width and 63.5 mm (2.5 inches) in total height with five 2.66-mm (12-gage) steel reinforcing shims wasquoted by one manufacturer as costing $94.75 if made from neoprene and $72.80 if made from naturalrubber. Though chemically different, rubber manufacturers claim that the engineering properties of the twomaterials, at least as they apply to structural bearings, are the same. The literature shows that while GreatBritain and Australia use natural rubber for bearing pads (38), Germany has prohibited its use and allowsonly neoprene (9).
Elastomer hardness/shear modulusHardness, defined as the “reversible, elastic deformation produced by a specially-shaped indentor under aspecified load” (13) is most commonly measured in International Rubber Hardness Degrees (IHRD) orShore “A” Durometer points, which are approximately the same in the ranges discussed in this study (45 to65). The instrument used to perform this measurement is called a Durometer and gives readings to agenerally accepted repeatability of ±3 points. Although hardness can give an indication of shear modulus
WIDTH (W)
x
z
z
x LENGTH (L)
Reinforcing Steel
Elastomeric Material
thickness = s
hri
Cover Layer
h
(a) (b)
Longitudinal Axis (z-axis) = Axis parallel to the longitudinal axis of the bridge girder
Transverse Axis (x-axis) = Axis perpendicular to the longitudinal axis
hri = Thickness of elastomer layer number i
hrt = Total elastomer thickness of the bearing = Σ hri
hs = Thickness of reinforcing steel shim
W = Width, Gross dimension of the bearing parallel to the transverse axis
L = Length, Gross dimension of the bearing parallel to the longitudinal axis
Figure 1- 2 Elastomeric bearing nomenclature

3
range, it cannot be used in engineering calculations. However, according to manufacturers and references, areasonably narrow range of shear moduli (0.21-0.28 MPa, 30-40 psi) can be assumed given a specificelastomer hardness (13,15,32). Table 1.1 gives values of shear modulus at 50 percent strain based onhardness from past research (13). It should be pointed out that these shear moduli are determined throughtests on unreinforced vulcanized rubber and may not reflect the actual shear modulus of an elastomericbearing in use.
Obviously, the shear modulus of a bridge bearing is important since that property influences the shear forcewhich can be transmitted to the girder flange and the bridge abutment. Additionally, if the shear force
produced by the bearing exceeds the staticfriction force between the bearing surfaces andthe girder or abutment slip will occur.
Maximum shear strainAs the bridge girder goes through its thermalcycle, the bearing must shear from its originalorientation by the same amount as the girderexpands or contracts (See Figure 1.3). Thebearings’ shear deformation divided by theoriginal elastomer thickness before compressiveloading is the shear strain. The magnitude of theshear strain, γ, (∆s divided by hrt) along with theplan area of the bearing and the shear modulus,G, determines the shear force transmitted to thegirder flange and the abutment:
H = γ G A (1.1)
The greater the shear strain, the greater the shear force and the greater the possibility of slip. Additionally,rubber technologists recommend a limit on shear strain to keep elastomer stresses low (13). Currently, theAASHTO limit on shear strain is 50 percent of the pre-loading elastomer thickness. Thus, the magnitude ofthe thermal deformation dictates the total thickness of the elastomer in the bridge bearing:
hrt = 2 ∆s (1.2)
where the subscript, rt, represents the summation of the thicknesses of elastomer in all layers between steelreinforcing shims plus cover layers. (See Figure 1.2.)
Maximum compressive stressTwo factors limit the maximum compressive stress allowed on the bearing: compressive deformation andshears strains which result from compression. The first factor is the compressive deformation of thebearing, most of which results from the bulging of the elastomer under compressive load. There is actuallyvery little volume change in elastomeric materials of lower hardness ratings but, as the hardness of theelastomer increases, the volume change of the material becomes more significant.
Table 1- 1 Values of Shear Modulus Based Upon Elastomer Hardness
HARDNESS 45-55 55-65 65-75
Shear Modulus (MPa) 0.53-0.75 0.75-1.05 1.05-1.40
Shear Modulus (psi) 77-110 110-150 150-200
H
H
∆ ∆
W
W
s s
Figure 1- 3 Forces on elastomeric bearingduring shear

4
This tendency to bulge under compressive load can be described by a quantity known as the shape factor, S,the ratio of the loaded plan area, divided by the area free to bulge (calculated for each layer if thicknessesvary):
S = (L x W)
2h (L + W)ri (1.3)
The actual compressive deformation of the bearing can be estimated by first calculating the compressionmodulus of the pad, which is a function of the shear modulus, G, the shape factor, S, and a factor, k, basedupon the elastomer hardness, which takes into account the volume change of the material itself (SeeAppendix D for values of k based on hardness):
Ec G kS= +
3 1 2 2 (1.4)
and then using the standard relationship for calculating axial deformations in elastic materials:
∆ cPhrtAEc
= (1.5)
The second limitation on compressive stress is derived from the elastomer’s ability to withstand the shearstresses created in the material itself from the bulging due to compressive load. This limitation comes fromresearch performed by elastomer technologists rather than from engineers. The only ways to limitcompressive deformation are to use an elastomer formulated for greater hardness or to increase the shapefactor by bonding into the elastomer reinforcing shims of steel or other axially stiff material oriented on aplane perpendicular to the compressive load. This reduces the elastomer’s ability to bulge and thereforelimits the compressive deformation as shown in Figures 1.4 and 1.5. Shear stress can be reduced byincreasing the shape factor as explained below.
P
P
Figure 1- 4 Unreinforced elastomericpad under compressiveload
P
P
Figure 1- 5 Reinforcement limitingbulging of the elastomericpad

5
Number of reinforcing steel shimsWhile the minimum required thickness of the elastomeric material in the bearing is determined bycalculating the expected expansion and contraction of the bearing from thermal and other sources, thenumber of reinforcing shims must be determined by the amount of axial deformation which will be allowedas well as the amount of elastomer shear stress to which the material is restricted according to currentSpecifications. According to AASHTO, the relationship
σc ≤ GS (1.6)
which dictates an increase in the bearing’s shape factor at higher compressive stresses ensures that shearstresses due to compression “will not cause serious damage” (32). In a bearing of a given total elastomerthickness, the greater the number of the steel reinforcing shims, the lower the shear stresses in the elastomerand the lower the axial deformation under load. Steel shims increase cost, so the minimum number of shims that results in an acceptable design should be prescribed. In this study, bearings with 6 shims cost 10-15% more than bearings with 3 shims.
Thickness of steel shimsThe primary purpose of the reinforcing shims in the bearing is to restrict the bulging of the elastomer.Although bending stresses occur in the shims due to bearing shear, the most significant stresses are thetransverse tensile stresses transferred to the steel due to elastomer bulging. Therefore, the steel need onlybe thick enough to withstand the tensile stresses produced under the given loading condition. Thicker shimsare more costly and unnecessary.
Rotation capacityJust as elastomeric materials deform in shear, compression, and tension, they are capable of absorbingsignificant rotations of the girder. This rotation capacity is a function of the axial stiffness of the bearing.When the rotation of the girder exceeds the rotation capacity of the bearing, the girder will begin to pivot onthe still loaded section of the bearing and “lift-off” will occur. Existing Specifications require that thiscondition be controlled by placing limitations on the amount of end rotation that the bearing is allowed toaccommodate so that it does not experience “lift-off” (15,25,32,33). The current AASHTO rotationlimitation is discussed in Section 1.7.
P
P
Figure 1- 6 Tensile forces onreinforcing shims fromelastomer compression
Figure 1- 7 Rotation capacity ofelastomeric bearing

6
Maximum allowable mismatch between thebridge girder and the bearingDirectly related to the rotation capacity of the bearing is themaximum allowable mismatch between the bridge girderand the top of the bearing. This is commonly referred to as“non-uniform loading.” If the mismatch is severe enough,the loading medium, i.e. the girder may lift off from the topof the bearing. In the case of non-uniform loading this willbe a permanent condition unless the bearing is able todeform to accommodate the orientation of the load.
Maximum taperAs bearing taper is increased to accommodate greater span end elevation differences, the forces on thebearing change. Horizontal as well as vertical displacements are produced which introduce immediateshear strains before any thermal cycle is considered. As the taper increases so does the horizontaldisplacement. These displacements are discussed in more detail in Chapter 3. Currently, bearings with upto 6% taper are employed, but, due to horizontal displacements, there may be need to place a restriction onthe degree of taper allowed.
Fatigue limitsBearings can undergo significant fatigue loading. In a 55-year service life, bearings may be subjected to20,000 cycles of up to 50% shear strain and millions of cycles of compressive stress. This loading cancause delamination of the elastomer-steel bond, tearing of the elastomer and loss of axial or shear stiffness. Bearing parameters such as thickness of elastomer layers, hardness, and degree of non-uniform loading mayinfluence the bearing’s ability to withstand fatigue loading.
Fabrication tolerancesElastomeric bearing fabrication is not an exact science. Each bearing is individually molded from pre-vulcanized sheets of varying shapes and thicknesses. While it is assumed that the bearing as delivered hasthe required thickness to accommodate the shear deformations, the hardness to produce the correct shearmodulus, and the correct taper to accommodate the slope of the girder, this may not be the case. Chapter 2will show how bearings ordered for this study varied from their specifications.
1.3 HISTORICAL PROBLEMS WITH ELASTOMERIC BEARINGS
While elastomeric bearings have been used successfully for almost 50 years, there have been some instancesof less than ideal performance in the past.
1.3.1 BEARING SLIP
Since 1992, the state of Texas has experienced several instances of elastomeric bridge bearings slipping(moving in rigid-body motion) along with the bridge girder rather than remaining in their original locationand accommodating the bridge movement by elastomer deformation. In many instances, pads have beenobserved to completely “walk out” from underneath bridge girders. (See Figures 1.9a and b.) In all cases,the bearings in question were constructed of natural rubber, the spans were at least 30.48 m (100 feet) longand the bridges were subject to significant thermal expansion and contraction. Current attempts to remedythis problem include lifting the bridge end and replacing the bearings or constructing steel collars aroundthe bearings to limit their movement. The former method is expensive, disruptive,
Figure 1- 8 Non-uniform loading ofelastomeric bearing

7
(a)
(b)
Figure 1- 9 Extreme examples of bearing “walking out” phenomenon

8
potentially dangerous, and not always successful. On several occasions, bridges with bearing slip problemswere lifted and the bearings were reset, only to “walk out” again. The latter method, although simple, canresult in damage to the bearings when they continue to slip and come in contact with the restraints. Inseveral such cases, bearings have become severely damaged due to the shear and bending forces to whichthey are subjected when they are pushed against the restraints. In extreme cases, these bearings must bereplaced, resulting in the same difficulties as described above. In the investigation reported herein, onlynatural rubber pads have slipped. Neoprene bearing pads have not experienced this problem.
Additionally, all of the bridges where “walking out” was documented used tapered pads raising seriousconcern about the use of sloped natural rubber bearings.
1.3.2 DELAMINATION
Although in-service failure of well-manufactured elastomeric material itself is very rare, separation of theelastomer-steel bond—the most often cited failure mechanism—must be considered when using laminatedelastomeric bearings. Delamination is a result of essentially two causes: 1) poor bond between theelastomer and the steel shim during the vulcanization process and 2) loading of the bearing to stressesbeyond the capacity of even a good bond. Depending upon the degree of delamination, the bearing willlose some or all of its ability to carry compressive load without significant deformation. While this does notmean failure of the bridge, the magnitude of the additional deformation, which could easily surpass 100 to200 percent of the original deformation, may require replacement of the pad.
1.3.3 OZONE DEGRADATION
Elastomeric materials, especially natural rubber, are susceptible to degradation from the effects ofatmospheric chemicals and solar radiation (13). In the case of natural rubber, ozone attack at normalatmospheric concentrations (about 1 part per hundred million) can cause significant surface cracking withina few weeks (13). While neoprene has an intrinsic resistance to the effects of ozone, natural rubbercompounds must be protected with additives known as chemical antiozonants and antiozonant waxes inorder to pass the ozone resistance provisions of the AASHTO specification—no cracking when subjected to25 parts per hundred million of ozone at 38o C (100o F) for 48 hours while strained to 20 percentelongation.
1.3.4 LOW TEMPERATURE STIFFENING
Natural rubber and neoprene both become stiffer when subjected to extremely cold environments. Tests to -30o C (24,37) have shown that exposure to temperatures below 0o Celsius will increase shear stiffness to asmuch as 20 times that at normal temperature (26o C). The increase in stiffness is greater at lowertemperatures and longer exposures to the colder environment. This tendency can introduce an additionalconsideration into the calculation of forces transmitted to the bridge girder and abutment by the elastomericbearing.
1.4 LITERATURE REVIEW
Although the reference on elastomeric bearings cite uses dating to before this century, the vast majority ofthe written record of their employment and research starts in the 1950’s. This literature review has beendivided into chronological periods based upon the state of elastomeric bearing advancement at the time.While the studies described here are all either US or Canadian, much research has been performed inBritain, France, and Germany which has been incorporated into the studies cited below.

9
1.4.1 EARLY USES: 19TH CENTURY TO 1961
Lindley (14) recounts the first use of rubber as a bearing material to support a viaduct in Australia in 1889.Examination of these structural bearings, which were still in use as of 1982, showed them to be fullyfunctional but suffering from some environmental degradation to a depth of approximately one millimeter.Modern use of elastomeric materials as currently formulated dates to the late 1940’s in France (20), 1955 inGreat Britain (14), and 1957 in the United States (2) and Canada (16). Research from that time period wasconducted primarily on plain neoprene or natural rubber pads to evaluate their shear, compressive, creepand fatigue properties. Attempts were made to correlate hardness to shear and compressive modulus. Durability of the material itself was more of a concern than the development of design provisions for thedesign of the bearing based upon the loading case. Although ASSHO (now AASHTO) provided an interimspecification in 1958 which allowed the use of elastomeric bearings, it was very brief (8). Researchconducted directly following the publication of the interim specification and successful field evaluations tothis point culminated in the acceptance by AASTHO of the material as a legitimate bearing option. TheSpecification of 1961 (30), which was now more thorough, allowed the use of elastomeric bearing padswith very few restrictions. Significant contributions to the early knowledge base concerning elastomericpads were made by the following researchers:
Pare and Keiner (1958) - Joint, State of Rhode Island and Charles A. Maguire andAssociates (19)Tests were performed on 152.4-mm (6-inch) by 304.8-mm (12-inch) plain neoprene pads of 12.7-mm (0.5-inch), 25.4-mm (1.0-inch), and 38.1-mm (1.5-inch). Results showed that: the shear and compressivestiffnesses of the pads were directly proportional to the durometer; compressive stress and plan shape hadvery little effect on the shear stiffness; compressive creep under repeated shearing was approximately 50percent greater than under static loading; and the coefficient of friction on concrete should be taken asapproximately 0.2. Although shear modulus could be determined from stiffness test results, this report, likeother early studies, did not calculate shear modulus or refer to it as a design parameter. It is interesting tonote that the authors suggested that girder slopes may be accommodated by ensuring that the pad selectedwas thick enough to deform sufficiently so that the entire bearing was deformed, rather than only a portionof it.
E. I. du Pont de Nemours & Co. (1959) (6)The du Pont company, the manufacturer of neoprene, conducted tests on neoprene pads and developed adesign for plain or reinforced bearings. Design curves for compressive deformations based upon durometerand shape factor were presented, as well as estimates of long-term compressive creep by hardness. A shearstrain of 50 percent was recommended and shear moduli were given for 50, 60, and 70 durometer neoprene(0.77, 1.12, 1.50 MPa (110, 160, 215 psi) respectively). Additionally, factors were provided to modifythese shear moduli for temperatures from -7o C (+20o F) to -29o C (-20o F). Again, the coefficient of frictionagainst concrete was given as 0.2. The du Pont research was instrumental in the publication of the 1958tentative addition to the AASHTO specification.
Ozell and Diniz (1959) - The University of Florida, Gainsville (18)The authors conducted shear fatigue tests on 25.4-mm (1.0-inch) plain neoprene pads of various lengths andwidths under compression up to 5.62 MPa (815 psi). Bearings were subjected to as many as 1,090,000cycles of up to 45% shear strain at 120 cycles per minute. A number of failures (extensive cracking) werereported, but du Pont engineers explained this as resulting from the excessive rate of fatigue loading thatwould never have occurred under normal service conditions (18).

10
Clark and Moultrap (1959) - Joint, Enjay Laboratories and The University ofRhode Island (5)Tests were performed on plain neoprene, butyl rubber, and chlorinated butyl rubber pads 25.4 mm (1.0inches) thick, 152.4 mm (6 inches) long and 304.8 mm (12 inches) wide. These are the first recorded testswhich evaluated elastomeric bearing pads at temperatures as low as -43o C (-45o F) and under acceleratedaging (5 to 10 days at 121o C (250o F) conditions). Results showed that neoprene stiffened under lowtemperature conditions to a greater extent than the other two materials and that neoprene also became morebrittle under accelerated aging.
Fairbanks (1960) - Master’s Thesis, Texas A & M University (8)The author conducted tests on 6.35-mm (0.25-inch), 12.7-mm (0.5-inch) and 19.1-mm (0.75-inch) thick 127mm (5 inches) long by 190.5 mm (7.5 inches) wide neoprene pads as bearing systems for wide-flange steelsections. Although his main purpose for testing was to evaluate the effect of the bearing system on the steelbeam itself, several conclusions as to the limitations of elastomeric pads could be made. When beamrotations were introduced into the system, the beam end tended to lift-off the thinner bearing pads. This didnot occur when the 190.5-mm (0.75-inch) pads were used. Additionally, several instances of bearing slipwere noted when pad shear strain surpassed 25 percent, leading the author to conclude that this strain was alimiting factor. However, the author did not calculate the friction coefficient at which the slip occurred. Had he done this, he would have found that slipping started at a friction coefficient of 0.3-0.35 under 2.76MPa (400 psi) and 0.25 to 0.30 at 5.69 MPa (825 psi) which is consistent with results from the studyreported herein.
1.4.2 USE WITH MINIMUM GUIDANCE: 1961-1985
During this period of research, the trend was to show that elastomeric bearings were extremely adaptable toany condition and that they were capable of accommodating a variety of end conditions and bridgemovements without failure. More attention was paid to controlling the quality of the manufacturing processthan restricting the use of the pads. The specification governing their use essentially did not change from itsintroduction in 1961 until the interim specification of 1985. Although numerous studies were conductedduring this period, a few are particularly noteworthy:
Suter and Collins (1964) - University of Toronto (37)Static and dynamic tests at normal and low temperatures were conducted on plain and reinforced pads 25.4mm (1.0 inch) thick, 152.4 mm (6 inches) long and 304.8 mm (12 inches) wide of neoprene, natural rubber,urethane, and butyl. Reinforced pads were of neoprene only and consisted of two layers of 25.4-mm (1.0-inch) material. The study shows that all materials tested performed well in both static and fatigue teststhroughout the entire range of temperatures, and that neoprene displayed more low-temperature stiffeningthan natural rubber (as measured by increase in durometer), as did 70-durometer material versus 60durometer material (as measured by shear stiffness). Additionally, the laminated bearing design displayedless tendency to creep, and (according to the authors) “exhibits more desirable stress/strain properties withrespect to both static and dynamic loading than a homogeneous bearing.” Also, the authors found thatcompressive stress has little influence on shear properties. Most significantly, the authors found that under4.14 and 6.90 MPa (600 and 1000 psi) at -37o C (-35o F), at a ratio of shear force to compressive force of0.4, none of the bearings slipped over their concrete contact surfaces during testing.
Minor and Egan (1970) - Batelle Memorial Institute (17)In what was clearly the most comprehensive US study to date (NCHRP Report #109), researchers tested awide range of neoprene, natural rubber, neoprene-dacron mix and ethylene propylene dimonomer (EPDM)specimens in lengths from 76.2 mm (3 inches) to 304.8 mm (12 inches), widths from 76.2 mm (3 inches) to685.8 mm (27 inches) and elastomer layer thicknesses from 6.35 mm (0.25 inch) to 25.4 mm (1.0 inch). Plain and reinforced bearings having one to 18 layers were tested. Hardness ratings ranged from 50 to 70

11
durometer. Many of the specimens were “off the shelf” commercial bearings. That was the first studywhich consistently determined and referred to shear modulus rather than simply to hardness as a designparameter. Significant among the findings and recommendations were: that lower durometer material is lesseffected by lower temperature and creeps less than higher durometer material; that shear fatigue up to100,000 cycles resulted in an average 6% reduction in shear modulus — more for higher durometer material— less for lower durometer material; and that AASHTO’s concern over ozone attack may be unfounded asno evidence had ever been presented that ozone effects anything but the outer surface of a bearing. Additionally, the authors compared theoretical and experimental results and developed an exponentialequation for compressive deformations. No further restrictions were recommended on the use ofelastomeric bearings, however the authors pointed out that quality control during the fabrication of bearingsand physical testing of the finished products are of extreme importance to ascertain the actual materialproperties.
Stanton and Roeder (1982) - University of Washington (33)This study dealt with NCHRP Project 10-20 (and was published as NCHRP Report 248), was not anexperimental study but rather was an analysis of current practice in the US and throughout the world. Codes from Britain and Europe were analyzed and recommendations for changes to the AASHTOSpecifications were made. These revisions became part of the Specifications with the publication of theinterim 1985 AASHTO Specifications. Based upon the authors’ analysis of foreign codes and practice: theallowable stress for reinforced bearings was raised from 5.52 MPa (800 psi) to 6.90 MPa (1000 psi); thecompressive deformation limit of 7% of the elastomer thickness was removed - no limit was stated;compressive stresses in plain bearings and cover layers of reinforced bearings were required to bemultiplied by a factor (β) of 1.8 and 1.4 respectively to account for the greater stresses in the elastomer dueto bulging (a method used by the British); a rotation restriction of twice the compressive deformationdivided by the bearing dimension perpendicular to the axis of rotation was stipulated — also based upon aBritish code and common practice; a worst-case friction coefficient of 0.2 was recommended for designpurposes; and the use of tapered elastomer layers was discouraged as “their behavior is not wellunderstood.”
1.4.3 EXPLICIT DESIGN PROCEDURES: 1985-PRESENT
Based upon the work of Stanton and Roeder cited above, a second and third phase of NCHRP Project 10-20was undertaken by the same authors. This included an extensive series of laboratory tests on elastomericbearings of all shapes and sizes, and was reported in NCHRP Reports 298 and 325. The final result of thetest program was to give a choice of two design methods, a simple restrictive one, (Method A), and another(Method B) based more on theoretical calculations which required additional testing of the elastomer so thatits material properties would be well defined. The reports formed the basis of the current 1992 AASHTOspecification.
Roeder and Stanton (1987) - University of Washington (25) This research was performed on bearings of natural rubber and neoprene of many different shape factors,laminate thicknesses and layers, and plan shapes (including square, rectangular and circular). Both steel-and fiberglass-reinforced specimens were examined. Tests were conducted for shear modulusdetermination, compressive failure, stability limits, rotational stiffness, shear fatigue, and compressionfatigue. An attempt was made to correlate experimental results with finite element analyses as well astheoretical models to determine recommended limiting values for various parameters such as shear strain,compressive stress, rotation, aspect ratio, and reinforcement thickness. As in previous research by theauthors, British code limits were referred to and used as the basis for some of the recommended strainbounds. Based upon these codes and experimental results, the authors decided upon a limitation of theoverall shear strain of 3.0 from all loads such that:

12
γc + γs + γr � 3.0 (1.6)
where the subscripts c, s, and r, designate shear strain due to compression, direct shear, and rotationrespectively. Assuming a direct shear strain of 50%, and using theoretical relationships to relate shear straindue to compression and rotation, the authors arrived at an expression governing the interaction of these twostresses in terms of compressive stress and rotation in radians. Additionally, compressive failure test resultsshowed that two improperly manufactured specimens with non-parallel reinforcing shims failed at lowerstress levels than otherwise identical specimens with uniform elastomer layers. On the basis of these testresults, even though the bearings tested were flat with misoriented steel shims, all bearings with taperedelastomer layers were prohibited by AASHTO, thus effectively disallowing the use of tapered bearings.
Roeder and Stanton (1988) - University of Washington (24)In their most recent NCHRP Report, the authors tested 101.6-mm (4-inch) square laminated bearings ofneoprene and natural rubber with two 10.2-mm (0.4-inch) elastomer layers and 4.76-mm (0.1875- inch)steel shims separating them and as bonded cover plates. Tests were conducted from room temperature to aslow as -45o C (-50o F). A range of durometer ratings from 50 to 65 was examined. In agreement withprevious tests at low temperatures, the authors noted that natural rubber bearings stiffened (as measured byshear modulus) less than neoprene bearings of the same hardness, and that compounds of lower hardnessstiffen (by the same measure) less than those of higher hardness. Also included in this report wererecommended acceptance criteria that tightened the fabrication tolerance on laminated bearing layerthickness from ±3.175 mm (0.125 inch) to ±20% of the design thickness. For example if the designthickness is 6.35 mm (0.25 inch), the manufacturer must fabricate the layer within 1.27 mm (± 0.05 inch).
1.5 RESEARCH GOALS
The goals of the research described here are threefold:
Quantify the “walking out” phenomenonWhile many pads have been observed to slip out from under bridge girders, no quantifiable study has yetbeen performed which explains the reason for and the mechanics of the phenomenon. The first goal of thisstudy is to describe this behavior in terms of the forces and environment required to initiate bearing slip andto understand the reason why bearings slip in some instances and not in others.
Define Tapered Bearing LimitsInsofar as elastomeric bearings have been in wide spread use throughout the world with great success, thisstudy will concentrate on a comparison between bearings with the standard flat design described in thecurrent AASHTO Specifications, and comparable tapered bearings. In all cases, specimens are fabricatedso that all parameters to be studied were duplicated in both flat and tapered models, thus allowing for adirect comparison between flat and tapered bearing behavior.
Develop a Tapered Bearing Design ProcedureAs a result of the extensive testing on flat and tapered bearings, the final goal of the study is to produce asimple design procedure that would specify a suitable, durable and economical tapered bearing conformingto the recommended limits on the parameters described above. This procedure takes into account the abilityof elastomeric bearings to accommodate the inconsistencies of span ends, and it standardizes as many of thedesign parameters as possible.

13
1.6 RESEARCH SCOPE
Since their inception, use of elastomeric bearings has become accepted (32) as an alternative to morecomplicated and costly bearing designs. Currently such bearings are found in practically every shape, size,man-made elastomeric material, reinforcing and anchorage scheme imaginable. With this in mind, thescope of the research was limited to the following:
ApplicationAlthough elastomeric bearing pads are widely used in applications that require them to be extremely largein plan or very thick, the bearings tested in this program were intended to be analogous to those used in themost typical configuration for 30.48-m (100-foot) or greater prestressed girders with bottom flanges up to609.6 mm (24 inches) in width. Some circular bearings were tested, but the standard specimen wasrectangular in plan, and no attempt was made to determine differences in bearing performance based uponplan dimensions or shapes.
MaterialMost of the research project was devoted to the study of natural rubber bearings with the intention ofshowing that this elastomeric material was a viable alternative to neoprene. Furthermore, although thelessons learned from this study can be applied to other types of elastomeric bearing pads, no attempt hasbeen made to study the numerous variations of pads, such as random fiber reinforced pads (ROF) or butylrubber pads.
Shape factorTest specimens were all identical in length and width and total elastomer thickness, so the influence of thesevariables was not investigated. The only influence on the shape factor was the steel reinforcing schemewhich was either 2, 3 or 6 steel reinforcing shims.
ReinforcementOnly reinforced bearings were examined, since many of the applications for elastomeric bearings in Texasbridges result in compressive stresses well beyond the ranges recommended for unreinforced pads. Allreinforcement was internal; elastomeric material covered all steel shims except where intentionally removedfor observation purposes. Additionally, only steel reinforcement was used although elastomeric bearingswith fiberglass or cotton-fiber duck fabric reinforcement are currently marketed.
AnchorageIn the combined compression/shear performance portion of this study, all bearings were anchored toconcrete surfaces by friction alone. No attempt was made to determine the effect upon theircompression/shear behavior of gluing or otherwise bonding bearings to girder bottoms or to bearing seats. No bearings with fabricated holes to accommodate dowels were tested.
EnvironmentBearings were tested at room temperature, and were not subjected to any adverse weathering conditions. Fatigue tests were conducted at frequencies that were low enough to preclude overheating the elastomericmaterial.
StabilityAll test specimens were well within the current AASHTO limits for stability of reinforced rectangularbearings: total height less than one third the smallest of the length or width.

14
1.7 LIMITATIONS OF CURRENT AASHTO SPECIFICATION
The current AASHTO Specifications are restrictive in a number of ways and, as a result of theserestrictions, fail to take full advantage of the versatility of reinforced elastomeric bearings.
There is no specific description in the specification of the reasoning for disallowing tapered elastomerlayers except that “they cause large shear strains and bearings made from them fail prematurely because ofdelamination or rupture of the reinforcement” (32). This study will report test results comparing bearingswith uniform and tapered elastomer layers on the basis of delamination, and fracture of reinforcing steelshims.
The magnitude of girder end rotations that elastomeric bearings are allowed to accommodate is restrictedconsiderably under the current specification. According to the AASHTO specification, bearing rotationsare allowed as follows:
θ TLc
L=
2∆ (1.7)
where θ is the rotation that the bearing can accommodate, ∆c is the instantaneous compressive deformationof the bearing, and L is the dimension of the bearing parallel to the length of the girder. Given thespecification’s guide for compressive deformations, a 50 durometer 228.6-mm (9-inch) x 355.6-mm (14-inch) bearing with a shape factor of eleven compressed under 7.0 MPa (1000 psi) would have aninstantaneous deformation of approximately 1.27-mm (0.05-inch) and would be allowed a rotation of0.0111 radians or a 1.11% slope. In this study, bearings with this design were intentionally subjected torotations as much as three times that allowed by the current AASTHO Specifications.
The current Specification allows for two design methods for elastomeric bridge bearings. Under Method A,which does not require any material testing be performed by the manufacturer or user other than that calledfor in the fabrication criteria, compressive stress due to all loads is limited to 6.90 MPa (1000 psi) for steelreinforced bearings. If extensive testing is performed, Method B may be used which will allow for bearingsto be subjected to 11.0 MPa (1600 psi) from all loads. Additionally, cover layers of reinforced bearingsmust be intentionally constructed thinner than internal layers due to the β - factor which is intended to limitthe shear strain on that layer:
σβcTL
GS≤ (1.8)
where G is the shear modulus of the elastomer and S is the shape factor of the bearing. The shape factor forthe cover layers must be reduced by β = 1.4. As a result of this requirement, under high compressivestresses, the cover layer must be so thin as to inhibit it from accommodating the irregularities of the bearingseat. Many of the test specimens used in this study were designed to evaluate the behavior of cover layersthicker than currently allowed.
1.8 ORGANIZATION OF STUDY
This report is organized into nine chapters, five appendices, and a glossary. Chapter 1 describes thebackground of elastomeric bearings as well current problems associated with their use. Chapter 1 alsodiscusses the pertinent research that has been performed in this field to date as well as the evolution of theAASHTO Specifications since 1961. Additionally, it defines the parameters that were studied in theresearch project and the scope of that research. Also, the limitations of the current AASHTO specificationare discussed. Chapter 2 contains a description of the major test apparatus designed and constructed for thisstudy as well as a description of the test specimens and the precision and accuracy to which they werefabricated. Chapter 3 describes the displacements produced in tapered bearings under dead load which arepeculiar to them due to their geometry and gives an explanation of the investigation into bearing slip.

15
Chapter 4 describes the experimental program used to define of tapered bearing stiffness and gives theresults of those tests. Chapter 5 gives results of compression creep tests. Chapter 6 gives the results ofshear and compression fatigue tests and Chapter 7 gives the results of tests to compressive and shear failure. Chapter 8 contains the conclusions arrived at through analysis of the test results as well asrecommendations for elastomeric bearing design and use. Chapter 9 is a proposed design procedure. Appendix A contains proposed specifications and Appendix B contains design examples. Appendix C is atable of elastomeric material properties, which are referred to in this study or may be of general interest tothe reader. Appendix D contains a listing of the notation used in this report. Appendix E gives the resultsof individual tests by specimen. A glossary of terms peculiar to the study of elastomers which will aid thereader who is not familiar with this field is presented following Appendix E.
1.9 SUMMARY
The purpose of this study is to perform a rigorous examination of elastomeric bearings concentrating ontapered, natural rubber pads with the end product being a simple design procedure for proportioningelastomeric flat and tapered bearings. A strong attempt has been made to determine the performance,limitations, and tolerances of the bearings in their intended mode of employment.

16

17
CHAPTER 2
EXPERIMENTAL PROGRAM
2.1 BEARING SHEAR TEST MACHINE
As a major part of the project, a test machine, shown in Figures 2.1 and 2.2, was designed and constructedwhich could duplicate the dead weight and daily thermal deformation response of the bridge girder,subjecting the bearings to the same compressive and shear stresses and strains as those in service. Thepurpose of the test machine was to study bearing behavior under typical field conditions including thoseresponsible for causing walking out. Pursuant to this goal, the test machine could be configured to subjectbearings to both uniform and non-uniform loading, and to enable and measure bearing slip. Bearings wereset in pairs between the platens as shown in Figure 2.2 and sheared under various conditions dependingupon the objectives of the particular test. All major components of the apparatus were bolted so thatadjustments could easily be made to accommodate the various different sizes of the bearings that weretested.
Figure 2- 1 Bearings being tested in the shear test machine

18
A compression force was applied by means of a 5340-kN (600-ton) hydraulic ram. To ensure that thecompressive stress on the bearings remained constant during the tests (some of which lasted for severalweeks), a system shown schematically in Figure 2.3 was designed to provide a constant pressure to thecompression ram. Steel weights of various sizes (see Figure 2.4) were suspended from a small hydraulicpiston which introduced a pressure into the hydraulic line leading to the pressure inlet side of the 5340-kN(600-ton) ram. Regardless of the movement of the bearings or the middle platen in the apparatus, the deadweight would always maintain the same pressure in the inlet line thus allowing the compression ram toprovide a constant force. This was especially important due to the bearings’ propensity for compressivecreep during shearing. Without the system, pressure would have gradually been lost.
The expansion and contraction of the bridge was duplicated by 311-kN (35-ton) screw-type jacks as shownin Figure 2.5 which provided the force to translate the middle platen thus shearing the bearings. The jackswere driven by a 0.56-kW (0.75-HP) electric variable speed reversible motor/288:1 ratio reduction gearsystem that was controlled by a programmable electronic controller (See Figure 2.6) and timer. The systemthus could be programmed for any magnitude of a repeatable thermal cycle. The horizontal forceapplication system could be raised or lowered to match the level of the middle platen, which was dependentupon the thickness of the bearings being tested. See Figure 2.2.
600 TonHydraulic Ram
Bottom Platen
Piston
Middle Platen
ScrewJack
Load Cell
Side View of the Elastomeric Bearing Test Setup
X-AxisLevelling
Mechanism
Z-AxisDouble ActingHydraulic Ram
Top Platen
Figure 2- 2 Schematic of the elastomeric bearing test setup

19
W
Open
Compression
Steel Weight
Ram
Figure 2- 3 Constant compressive force system
Figure 2- 4 Steel dead weights

20
Figure 2- 5 311-kN (35-ton) screw jacks
Figure 2- 6 Electronic controller/motor/reduction gear system

21
2.1.2 MIDDLE PLATEN DESIGN
Top, bottom and middle platens were removable so that various materials such as concrete, steel andPlexiglas could be used as bearing surfaces for the tests. In cases where tapered bearings were tested,aluminum plates were machined to matching slopes to accommodate the pads. These plates were designedsuch that the various platens could be attached to them creating a wedge-shaped middle platen as shown inFigure 2.7.
Two systems were designed to prevent the middle platen from rotating due to bearing misalignments. These systems were extremely important because any significant rotation of the middle platen might haveresulted in severe damage to the screw jacks, the most expensive components of the apparatus.
X-Axis Leveling MechanismWhen tests to characterize bearing walking out were proposed, the possibility had to be considered that thetop and bottom specimens could walk out unequally thus creating a couple which would tend to rotate themiddle platen about the bearings’ x-axis. Therefore, a mechanism was designed which permitted middleplaten translation and elevation, but not rotation. Figure 2.2 shows the leveling mechanism as it wasconfigured for the test program. Each joint where members of the mechanism were connected wasconstructed with roller bearings so that even if a couple was produced, rotation could be limited withoutcausing additional horizontal force to be read by the load cells (other than friction in the roller bearings). The size of the members of the mechanism was determined by calculating the force that would result fromthe greatest possible compressive force and bearing misalignment.
Z-Axis StabilizationIn anticipation that the bearings might also slip in the direction of their x-axis, another stabilizing devicewas designed which again permitted translation and elevation but prevented the middle platen from rotatingabout the bearings’ z-axis. Two double acting hydraulic rams (see Figure 2.2) were attached to the middleplaten and were cross linked so that they could not extend or retract independently from one another. Because very little force was required to extend or retract the rams together, no significant additionalhorizontal force was read by the load cells as the middle platen translated. The rams could be preventedfrom extending or retracting by stopping the oil flow between them via a globe valve installed in thehydraulic line. Thus in addition to their stabilization function, they were also used to hold the middle platenin place while changing specimens.
Concrete or Plexiglas
Concrete or Plexiglas
Aluminum Shim
Aluminum Shim
to Screw
Jacks
ConnectionConnection
to
Motion
Transducer
Steel Plate zx
y
Figure 2- 7 Middle platen detail

22
(a)
(b)
Figure 2- 8 Data acquisition system

23
Figure 2- 9 Optron with light source directed toward bearing
Figure 2- 10 Optron tracking a target on a bearing

24
2.1.3 INSTRUMENTATION/DATA ACQUISITION
Instrumentation consisted of two 222-kN (50-kip) load cells connected with fittings to the screw jack shaftsand the middle platen as shown in Figure 2.1 and electronic motion transducers to measure the middleplaten translation. Data acquisition was provided by personal computer with data acquisition software andplotters as shown in Figures 2.8a and b.
Bearing slip was measured by an optical instrumentation system known as an Optron, which is shown inFigure 2.9. This instrument is essentially a light meter capable of converting an increase or decrease in thelight reflected from a small target on the object to be tracked (in this case a bearing—see Figure 2.10) into avoltage increase or decrease which can be sent via signal cable to a data acquisition system in the samemanner as any other electronic instrument (load cells, linear potentiometers, etc.). The voltage output canbe calibrated to the target movement by measuring the Optron field of view as projected onto the object tobe tracked. For a target whose edge is originally located at the midpoint of the Optron’s field of view, avoltage increase or decrease of 5 volts represents a movement of the object a through a distance of 50% ofthe projected field of view. See Figure 2.11.
In the case shown in Figure 2.11, where the dimensions are typical of those during the tests, a movement ofthe bearing 11 mm in either direction would result in a voltage increase or decrease of 5 volts. The Optronis capable of continuing to track the target to 60% of the field of view in either direction before losing thesignal.
229mm (9")
typ 22mm
Figure 2- 11 Optron target as seen through the optron view finder
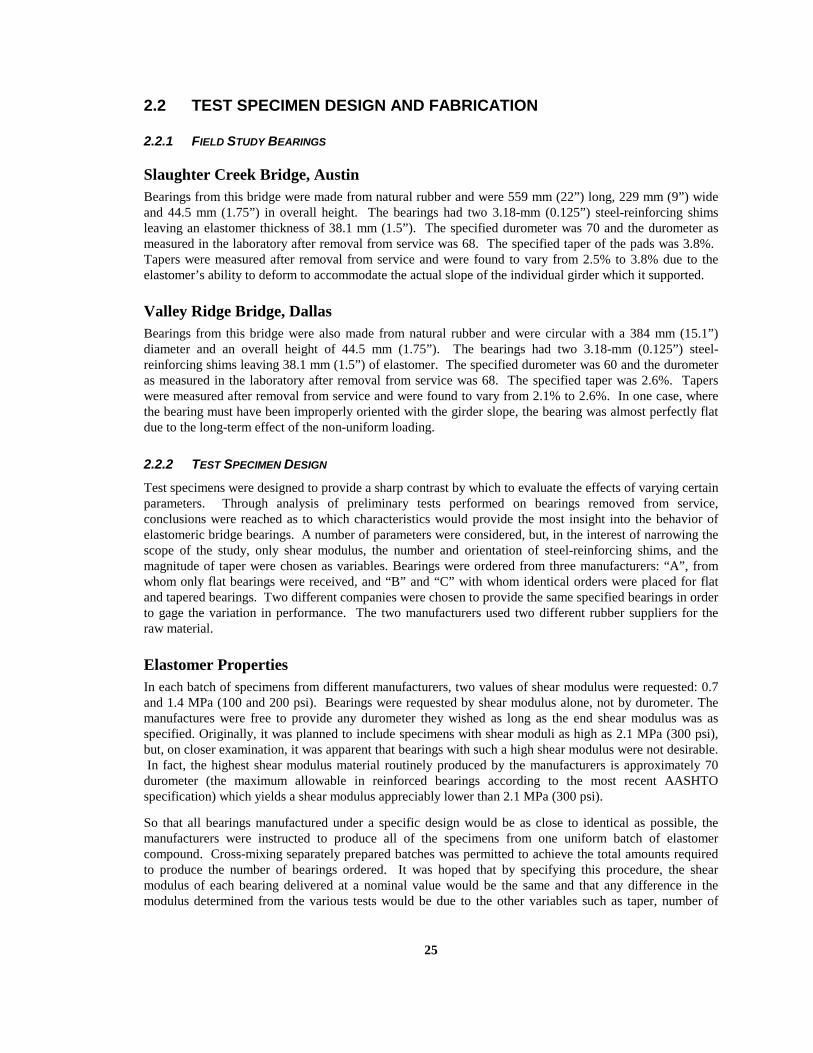
25
2.2 TEST SPECIMEN DESIGN AND FABRICATION
2.2.1 FIELD STUDY BEARINGS
Slaughter Creek Bridge, AustinBearings from this bridge were made from natural rubber and were 559 mm (22”) long, 229 mm (9”) wideand 44.5 mm (1.75”) in overall height. The bearings had two 3.18-mm (0.125”) steel-reinforcing shimsleaving an elastomer thickness of 38.1 mm (1.5”). The specified durometer was 70 and the durometer asmeasured in the laboratory after removal from service was 68. The specified taper of the pads was 3.8%. Tapers were measured after removal from service and were found to vary from 2.5% to 3.8% due to theelastomer’s ability to deform to accommodate the actual slope of the individual girder which it supported.
Valley Ridge Bridge, DallasBearings from this bridge were also made from natural rubber and were circular with a 384 mm (15.1”)diameter and an overall height of 44.5 mm (1.75”). The bearings had two 3.18-mm (0.125”) steel-reinforcing shims leaving 38.1 mm (1.5”) of elastomer. The specified durometer was 60 and the durometeras measured in the laboratory after removal from service was 68. The specified taper was 2.6%. Taperswere measured after removal from service and were found to vary from 2.1% to 2.6%. In one case, wherethe bearing must have been improperly oriented with the girder slope, the bearing was almost perfectly flatdue to the long-term effect of the non-uniform loading.
2.2.2 TEST SPECIMEN DESIGN
Test specimens were designed to provide a sharp contrast by which to evaluate the effects of varying certainparameters. Through analysis of preliminary tests performed on bearings removed from service,conclusions were reached as to which characteristics would provide the most insight into the behavior ofelastomeric bridge bearings. A number of parameters were considered, but, in the interest of narrowing thescope of the study, only shear modulus, the number and orientation of steel-reinforcing shims, and themagnitude of taper were chosen as variables. Bearings were ordered from three manufacturers: “A”, fromwhom only flat bearings were received, and “B” and “C” with whom identical orders were placed for flatand tapered bearings. Two different companies were chosen to provide the same specified bearings in orderto gage the variation in performance. The two manufacturers used two different rubber suppliers for theraw material.
Elastomer PropertiesIn each batch of specimens from different manufacturers, two values of shear modulus were requested: 0.7and 1.4 MPa (100 and 200 psi). Bearings were requested by shear modulus alone, not by durometer. Themanufactures were free to provide any durometer they wished as long as the end shear modulus was asspecified. Originally, it was planned to include specimens with shear moduli as high as 2.1 MPa (300 psi),but, on closer examination, it was apparent that bearings with such a high shear modulus were not desirable. In fact, the highest shear modulus material routinely produced by the manufacturers is approximately 70durometer (the maximum allowable in reinforced bearings according to the most recent AASHTOspecification) which yields a shear modulus appreciably lower than 2.1 MPa (300 psi).
So that all bearings manufactured under a specific design would be as close to identical as possible, themanufacturers were instructed to produce all of the specimens from one uniform batch of elastomercompound. Cross-mixing separately prepared batches was permitted to achieve the total amounts requiredto produce the number of bearings ordered. It was hoped that by specifying this procedure, the shearmodulus of each bearing delivered at a nominal value would be the same and that any difference in themodulus determined from the various tests would be due to the other variables such as taper, number of

26
steel shims, compressive stress and non-uniform loading. In addition to the bearings themselves, one plainpad of vulcanized natural rubber from each compound used to fabricate the specimens was requested so thatmaterial property tests could be conducted.
As explained earlier, waxes are added to the natural rubber compound to satisfy the ozone exposurespecification. These additives contain varying percentages of paraffin and microcrystalline waxes, theformer being the most aggressive in secreting and building up on the bearing surface. Due to the slippingproblems associated with the paraffin based waxes, all of the specimens were requested with onlymicrocrystalline wax to ensure that the test results would not be influenced by bearing slip.
2.2.3 SPECIFIED DIMENSIONS
All pads were ordered 229 mm (9”) long and 711 mm (28”) wide. The length corresponds with themajority of the bearings in service throughout the state. Bearing width is most often determined by theflange width of the girder it is supporting. The test apparatus described earlier was capable ofaccommodating bearings up to 559 mm (22 inches), but smaller specimens can be just as representative ofbearing performance. A standard width of 356 mm (14 inches) was selected based upon the various testapparatus’ ability to load the specimens to the stresses desired. For fatigue and compression failure tests,this dimension was further reduced to 229 mm (9 inches) for the same reason. Specimens were ordered in711 mm (28 inch) widths so that they could be cut in two or three sections with identical properties.
In order to compare results with the analytical study performed by Hamzeh (10), a standard elastomerthickness of 44.5 mm (1.75 inches) was specified. Regardless of the number of reinforcing steel shims, thethickness of the elastomer was not varied. Overall bearing thickness was simply greater in bearings withmore steel shims. In tapered specimens, the 44.5-mm (1.75- inch) dimension was to be taken at the mid-length of the bearing. The average total thickness of the bearings was 51.3 mm (2.02”), 52.4 mm (2.06”),and 60.4 mm (2.38”) for 2, 3, and 6 shim bearings respectively.
Three degrees of bearing taper were examined: flat bearings (no taper) which would be subjected to thesame tests as the tapered specimens to establish a “baseline” performance; a nominal 4% taper, and anominal 6% taper, the maximum taper currently employed by TxDOT.
2.2.4 STEEL-REINFORCING SHIMS
Number of ShimsThe number of reinforcing shims has a significant influence on the axial and rotational stiffness of thebearing. From Manufacturer “A,” plain bearings (no reinforcement) and bearings with two steel-reinforcingshims were requested which, based upon a standard 229-mm x 236-mm (9” x 14”) specimen, yielded shapefactors of 1.57 and 4.70 respectively. From tests on those specimens, it was clear that such lightlyreinforced bearings would deform excessively under the compressive stresses that were planned for thetapered bearing test program. Therefore, from Manufacturers “B” and “C,” more heavily reinforcedbearings were ordered. The reinforcing schedule was specified as 3 or 6 steel shims yielding shape factorsof 6.26 and 10.96 respectively.
Steel PropertiesThe standard steel for reinforcing shims, according to all three manufacturers, is A570, Grade 40. Manufacturer B provided a Mill report which gave the results of two tensile tests showing yield strengths of276 MPa (40.3 ksi) and 339 MPa (49.1 ksi) and ultimate strengths of 340 MPa (56.5 ksi) and 459 MPa(66.6 ksi). No independent tensile tests were performed for this study. The thickness of the reinforcingplates was determined through analysis of the tensile forces that would be produced by the hydrostaticpressure from the compression of the elastomer. (See Figure 1.6.) The maximum expected compressive

27
stress on the bearings was 1100 psi (7.59 MPa) and the analysis of the required steel shim thicknessaccording to AASHTO specification 14.4.2.6 is as follows:
hshr hr c TL
Fy≥
+1 5 1 2. ( ) ,σ(2.1)
where hs is the required thickness of the steel shim, hr1 and hr2 are the thicknesses of the surroundingelastomer layers, Fy is the yield strength of the shim (assumed to be 276 MPa (40.0 ksi), and σc,TL is thecompressive stress on the bearing. The equation includes a factor of safety of 2. Based upon thiscalculation, for the specimens with 3 steel shims, and elastomer layers of 11.1 mm (0.438 inches), the steelshim thickness should be a minimum of 1.02 mm (0.04 inches). Although this thickness would suffice, themanufacturers felt that shims thinner than 2.66 mm (12 gage (0.1046 inches)) would most likely deformseverely during the vulcanization process. Therefore, the 12 gage thickness was used in all bearings. (Manufacturer A’s bearings, which were supplied before this analysis was performed, were fabricated with3.42-mm (0.1345” (10-gage)) shims).
Shim OrientationReinforcing shims for flat bearings were requested to be equally spaced throughout the length of thebearing. In most of the tapered specimens, the shims were to be equally spaced at each point along thelength. (See Figure 2.12.)
One set of bearings with a nominal 6% taper, 3 steel shims and 0.7 MPa (100 psi) shear modulus wasordered from Manufacturer B with steel shims parallel as shown in Figure 2.13 so that the effect of varyingthe shim orientation could be observed. The dimension “c” is equal to dimension “a” plus 229 mm(9 inches) times the bearing taper in radians.
a
a
a
a
b
b
b
b
229mm (9")
Figure 2- 12 Spacing of steel shims in tapered bearingspecimens
a
a
a
a
229mm (9")
a
a
a
c
Figure 2- 13 Tapered bearing with parallel steel shims

28
2.2.5 FABRICATION ACCURACY AND PRECISION OF TEST SPECIMENS
As described above, a number of parameters were specified to the manufacturers. No special tolerancesother than those given in the AASHTO specification however, were demanded. One of the reasons fordoing this was to determine the “as manufactured” properties and dimensions of the bearings to betterunderstand the fabrication process as well as to study first hand what the engineer specifying a certainbearing design is most likely to receive. In some cases, the manufactured product varied significantly fromthat which was requested. These variations are described below:
Shear Modulus/HardnessHardness measurements were taken with a Shore “A” Durometer on the 25.4-mm (1-inch) plain pads thatwere delivered with each shipment. The results of those measurements are shown in Table 2.1. Thecolumn labeled “stated” indicates the hardness that the manufacturer targeted to achieve the requested shearmodulus:
The results of shear modulus determination tests on the reinforced bearings are discussed in greater detail inChapter 4, but overall average shear moduli are presented in Table 2.2. Two values for shear modulus areshown, one is the modulus between zero and 25% strain (the range used in ASTM 4014) and the other is themodulus between zero and 50% strain.
Only Manufacturer B expressed concern about producing 1.4 MPa (200 psi) shear modulus material. Theirorder was delayed due to attempts to produce the desired modulus as determined by the test procedurespecified in ASTM 4014. According to Manufacturer B, bearings of this modulus are rarely called for andtheir standard 70-durometer material (the highest allowed by AASHTO in reinforced bearings) would yielda shear modulus of approximately 1.03 MPa (150 psi). The manufacturer was given permission to providetheir standard 70-durometer material without modification.
Wax ContentAs stated earlier, the manufacturers were specifically instructed to use a microcrystalline wax. ManufacturerA complied with this instruction and produced bearings that had (according to the manufacturer) onlymicrocrystalline wax. When delivered, absolutely no residue could be removed from the surface of thesebearings. When tested, they showed no evidence of slipping over any concrete surface at shear strains up to100%. However, after nine months, the bearings were examined again and very small quantities of waxcould be removed their surfaces. Manufacturer B’s first delivery was clearly impregnated with paraffin waxas evidenced by the accumulation of waxy material on the bearing surface when delivered. Themanufacturer was contacted concerning this problem and stated that the rubber supplier had been informedof the specification and had reported that the material was in compliance. Manufacturer C deliveredbearings that were compounded (according to the manufacturer) exclusively with microcrystalline wax. Inthis case, some residue was noted and removed form the surface of the bearings, but the texture of the
Table 2- 1 As delivered hardness measurements
Specified Shear ModulusMPa (psi)
Manufacturer AStated Actual
Manufacturer BStated Actual
Manufacturer CStated Actual
0.7 (100) None 65.1 55 57.0 50 53.9
1.4 (200) None 71.3 70 68.7 60 69.5

29
residue was completely different than that found on the surface of Manufacturer B’s bearings. The residuewas “gritty” and did not appear to be excessive or as “waxy” as the paraffin secretion. According to themanufacturer, this type of residue is consistent with microcrystalline wax. A subsequent visit toManufacturer A revealed that all microcystalline waxes employed in the industry are a blend of paraffin andmicrocrystalline waxes and that the cost of the wax is the most reliable method of determining thepercentage of microcrystalline versus paraffin, the former being much more expensive. Apparently, thereare no industry standards or specifications that apply here and wax manufacturers can call any waxmicrocrystalline however small the percentage of that ingredient. Therefore, it is presently not possible towrite a specification that would preclude having a problem caused by the wax used as an ingredient in thecompounding process.
DimensionsAlmost uniformly, the bearings were delivered at 711+3 mm (28+1/8 inch) in width and 229+0 mm (9+0inches) in length. In no cases were bearings found to be less than the specified length and width dimensions.Elastomer thickness, which was specified as 44.5 mm (1.75 inches), was reasonably consistent consideringthe process by which the bearings are manufactured, although there were a number of noteworthydiscrepancies as described below. After specimens were cut into two or three pieces depending upon thetest to be performed, the mid-length thickness was measured with calipers and recorded. The averages ofthese measurements are shown in Table 2.3. Although the thicknesses of individual layers were notrecorded, spot checks of internal and cover layers showed that elastomer layer thicknesses variedconsiderably. This was especially true of the 6 shim specimens where cover layers were frequently found tobe up to 2.54 mm (0.10 inches) greater than requested (6.35 mm (0.25 inches)), due to the difficulty ofprecisely positioning the steel shims.
According to the current AASHTO tolerances, bearings must be no less than the specified overall thicknessbut not greater than 6 mm (1/4 inch) over the specified overall thickness. Subtracting the thickness of thesteel shims from the overall thickness, the total elastomer thickness in this case must be between 44.5 mm(1.75”) and (50.8 mm (2.0”)). A number of the bearings would have failed this specification because theywere less than the minimum thickness, but none would have exceeded the maximum thickness. Clearly,Manufacturer B’s second lot targeted a thicker elastomer layer but was technically still withinspecifications. Bearings with the same design almost always had the same measured elastomer thickness asthey most likely were manufactured at the same time. There does not appear to be any inherent difficulty inmanufacturing tapered bearings to the same precision as flat ones, nor does the number of reinforcing shimsinfluence the outcome.
Table 2- 2 Average shear moduli as determined from testing
SpecifiedShear Modulus
MPa (psi)
Manufacturer AMPa (psi)
0-25% 0-50% strain strain
Manufacturer BMPa (psi)
0-25% 0-50% strain strain
Manufacturer CMPa (psi)
0-25% 0-50% strain strain
0.7 (100) 0.693(101)
0.680(98.6)
0.617(89.5)
0.604(87.5)
0.614(89.1)
0.602(87.3)
1.4 (200) 0.861(125)
0.841(122)
0.933(135)
0.910(132)
0.868(126)
0.847(123)

30
TaperBearings with 0, 4.0, and 6.0% nominal tapers were specified from the manufacturers. The firstmanufacturer provided only flat (0% taper) bearings and these were delivered with to a very close tolerance. The second and third manufacturers however, were requested to provide all three degrees of taper. Whenthe bearings were received, their actual tapers were measured with a digital inclinometer. The results of themeasurements are shown in Table 2.4.
These measured values were consistent from bearing to bearing with the same design, which would beexpected, as they would have been formed in the same molds. The only noticeable discrepancy occurredwith Manufacturer B, which was fabricated in two separate lots. Upon discussing the variations with themanufacturers, the reason for the discrepancy between ordered and delivered tapers was apparent. As eachbearing must be individually molded, and molds must be machined for a variety of bearing designs,manufacturers standardize their tapered molds in 3-mm (1/8-inch) increments over the length of the bearing.Thus, 229-mm (9-inch) long tapered bearings are manufactured in increments of 229 mm/3.18 mm(0.125”/9”) or 1.389% slopes. The tapered bearings produced according to this schedule would be: flat,
Table 2- 3 Average elastomer thickness measurements
Taper Numberof Shims
Manufacturer A
mm (in)
Manufacturer BLot A Lot B
mm (in) mm (in)
Manufacturer C
mm (in)Flat 0
236
46.7 (1.84)45.5 (1.79)
45.0 (1.77)44.5 (1.75)
46.0 (1.81)46.2 (1.82)
45.0 (1.77)45.0 (1.77)
4% (nom) 36
44.2 (1.74)43.4 (1.71)
46.5 (1.83)46.5 (1.83)
45.2 (1.78)45.0 (1.77)
6% (nom) 36
45.0 (1.77)44.5 (1.75)
47.2 (1.86)46.5 (1.83)
46.6 (1.83)45.2 (1.78)
Mean 46.1(1.82) 44.3 (1.74) 46.4 (1.83) 45.2 (1.78)StandardDeviation
Too FewSamples
0.589(0.0232)
0.585(0.0231)
0.690(0.0272)
Table 2- 4 As delivered bearing tapers
Nominal Taper (%) Manufacturer B Manufacturer C4.0 meanLot A / Lot B
4.544.18 / 4.89
4.08
4.0 Standard Deviation 0.376 0.2256.0 mean 5.68 5.846.0 Standard Deviation 0.214 0.150

31
1.39%. 2.78%, 4.17%, and 5.56% which accounts for the results of the measurements as shown above.Again, Manufacturer B’s second lot showed some discrepancy.
Steel ShimsSteel shim thicknesses were spot checked with calipers. In all cases, they were found to be at the specifiedthicknesses. The steel shim placement within the bearing however, was not generally this precise. Steelshims were found to be improperly oriented and, occasionally, actually bent (See Figures 2.14 and 2.15).While the bearing bulging pattern would, in some cases, expose the errors, in most circumstances thepattern would likely not show any obvious fault as the inconsistency is in the interior of the bearing. Theincidence of improper orientation seemed to occur more frequently in tapered than in flat bearings.
Figure 2- 14 Steel shims bent during manufacturing process
Figure 2- 15 Misoriented steel shims

32

33
CHAPTER 3
INVESTIGATION INTO BEARING SLIP
Before conducting any tests to determine slip phenomenon or tapered bearing characteristics and durability,the forces on these bearings, which are quite different than those on flat bearings, must be quantified. Experimentation showed that all bearings experience some horizontal displacement due to vertical loadalone when that load is inclined as shown in Figure 3.1. This displacement must be quantified andaccounted for in calculations of shear strain to ensure that the overall strain including that caused bythermal effects is kept below the design shear strain limit.
3.1 DEFLECTIONS UNDER VERTICAL LOAD ALONE
Figures 3.1 shows the forces on a bearing under the dead weight of a sloped girder. Although there is aforce along the surface of the bearing in contact with thegirder which must be accounted for in frictioncalculations, the forces parallel and normal to thebearing’s sloped surface yield no net horizontal force.Thus, there is no shear force produced at the bottombearing surface. Although the bearing is not subject to anexternal shear force under the dead weight of the girderalone, both field observations and laboratoryexperimentation show that the bearings experience ahorizontal deflection, ∆s, under dead load alone asillustrated in Figure 3.2.
Assuming that the girder is unrestrained against horizontal movement (since typically there is anelastomeric bearing at each end of the girder), the bearings deform in shear under the dead weight andcause the entire girder to translate in the direction of the lower support. If the girder is restrained againsthorizontal movement, then there will be a shear force in the bearing equivalent to the force required toproduce a shear displacement of ∆s.
θW
WV = 0
WsinθWcosθ
Figure 3- 1 Bearing under girder deadweight
θ
∆ s ∆ s
Figure 3- 2 Bearings shearing due to girder dead weight
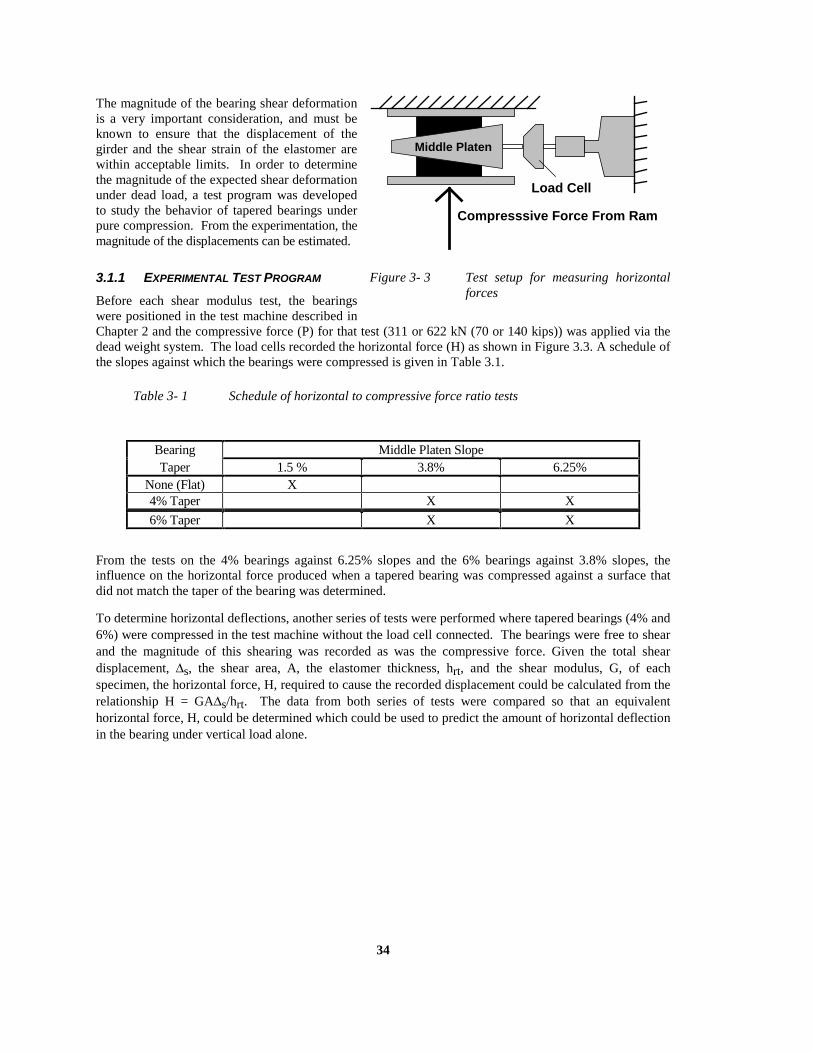
34
The magnitude of the bearing shear deformationis a very important consideration, and must beknown to ensure that the displacement of thegirder and the shear strain of the elastomer arewithin acceptable limits. In order to determinethe magnitude of the expected shear deformationunder dead load, a test program was developedto study the behavior of tapered bearings underpure compression. From the experimentation, themagnitude of the displacements can be estimated.
3.1.1 EXPERIMENTAL TEST PROGRAM
Before each shear modulus test, the bearingswere positioned in the test machine described inChapter 2 and the compressive force (P) for that test (311 or 622 kN (70 or 140 kips)) was applied via thedead weight system. The load cells recorded the horizontal force (H) as shown in Figure 3.3. A schedule ofthe slopes against which the bearings were compressed is given in Table 3.1.
6% Taper X X
From the tests on the 4% bearings against 6.25% slopes and the 6% bearings against 3.8% slopes, theinfluence on the horizontal force produced when a tapered bearing was compressed against a surface thatdid not match the taper of the bearing was determined.
To determine horizontal deflections, another series of tests were performed where tapered bearings (4% and6%) were compressed in the test machine without the load cell connected. The bearings were free to shearand the magnitude of this shearing was recorded as was the compressive force. Given the total sheardisplacement, ∆s, the shear area, A, the elastomer thickness, hrt, and the shear modulus, G, of eachspecimen, the horizontal force, H, required to cause the recorded displacement could be calculated from therelationship H = GA∆s/hrt. The data from both series of tests were compared so that an equivalenthorizontal force, H, could be determined which could be used to predict the amount of horizontal deflectionin the bearing under vertical load alone.
Compresssive Force From Ram
Load Cell
Middle Platen
Figure 3- 3 Test setup for measuring horizontalforces
Table 3- 1 Schedule of horizontal to compressive force ratio tests
Bearing Middle Platen SlopeTaper 1.5 % 3.8% 6.25%
None (Flat) X4% Taper X X

35
3.1.2 TEST RESULTS
Horizontal ForcesEach horizontal force recorded was divided by the applied compressive force and plotted against the slopeof the middle platen used during the test. The results are shown in Figure 3.4. (Tests performed on taperedbearings fabricated with shims oriented parallel to one another are intentionally omitted). The data pointsare sorted by number of reinforcing shims and the compressive force. Results plotted at 1.5% are for flatbearings only; results for tapered bearings are plotted by middle platen slope not by bearing taper. Aregression analysis was used to determine the slope of the line through all the points. The value of thisslope was calculated at 0.374. Also, lines with slopes corresponding to a slope of 0.374±30% are shown.Approximately 85% of the data points fall within these bounds. Thus it can be estimated that the ratio ofthe horizontal to compressive force is 0.374 θ, where θ is the slope of the middle platen.
As illustrated by Figure 3.5, the ratio of horizontal to compressive force increases with increasing platen(girder) taper. Table 3.2 compares the ratio of horizontal to compressive force at the two compressive forcelevels at which data were taken. At each force level, the ratio is within 6% of the average — 0.374 θ.
The results presented in Table 3.2 are for all tests combined. Additional comparisons can be made on thebasis of a number of parameters. As described earlier, the force ratios in Figure 3.5 are plotted against theslope of the middle platen used during the test rather than against the actual bearing taper. To determinewhether there was any influence on the force ratio from mismatching the platens against the bearing taper,the data were sorted according to matched and mismatched tests and is shown in Table 3.3. Table 3.3 alsocompares the results from tests on all 3 shim and 6 shim specimens.
Clearly, there is almost no influence on the force ratio from the number of reinforcing steel shims.Although there is a small difference between the results of matched versus mismatched tests, there is notrend, and the overall influence of a mismatch between the platen and the bearing taper appears small.
0
0.004
0.008
0.012
0.016
0.02
0.024
0.028
0.032
0.036
0 0.01 0.02 0.03 0.04 0.05 0.06 0.07
Middle Platen Slope (radians)
Ho
rizo
nta
l Fo
rce
: C
om
pre
ssiv
e F
orc
e
3 Shim 311 kN 3 Shim 622 kN 6 Shim 311 kN 6 Shim 622 kN
m = 0.374
+30
-30%
Figure 3- 4 Horizontal to compressive force ratio vs. middle platen slope

36
0
100
200
300
400
500
600
700
0 5 10 15 20 25
Horizontal Displacement (mm)
Co
mp
ress
ive
Fo
rce
(kN
)
Actual Displacement
Predicted Displacement
Figure 3- 5 Actual and predicted P-∆ curves for a 57-durometer 3-shim6% taper bearing
Table 3- 2 Influence of compressive force level on ratio of horizontal to compressiveforce
Slope ofMiddle Platen, θ
Horizontal to Compressive Force Ratio ÷ θ311 kN (70 kips) 622 kN (140 kips)
0% 0 01.5% 0..347 0.3243.8% 0..329 0.371
6.25% 0.356 0.392Horizontal to Compressive Force Ratio
(by regression analysis)0.353 θ 0.395 θ
Table 3- 3 Influence of shear modulus on horizontal to compressiveforce ratio
Horizontal to Compressive Force Ratio3 Shim Bearings 6 Shim Bearings
Matched Slopes 0.366 θ 0.389 θMismatched Slopes 0.378 θ 0.362 θ
All Matched plus Mismatched 0.372 θ 0.376 θRatio Matched:Mismatched 1.03 0.93

37
Thus it may be concluded that the horizontal force produced by the dead weight of the girder is a functionof the girder slope rather than the slope of the bearing.
Because two manufacturers provided bearings fabricated to the same specifications, additional comparisonscan be made on the basis of the manufacturer and the shear modulus. Table 3.4 shows the horizontal tocompressive force ratios that were calculated for each manufacturer’s specimens sorted by actual shearmodulus.
Manufacturer C’s bearings produced a higher horizontal force when compressed than did ManufacturerB’s. Although the overall average force ratio is higher for the higher shear modulus material, ManufacturerC’s lower shear modulus specimens produced a higher ratio than did Manufacturer B’s higher shearmodulus specimens. There is no obvious explanation for this behavior other than that each manufacturerused a different rubber supplier and that, although the hardness ratings and actual shear moduli were veryclose, other properties of the material itself may have some influence upon the transmission of forcesthrough the bearing.
Finally, a comparison may be made to observe the overall accuracy of assuming that a force ratio of0.374 θ can be used to estimate the horizontal force produced when an average bearing is compressed.Table 3.5 compares the average of all recorded horizontal forces to the value predicted by 0.374 θ.
From Table 3.5, it appears that assuming the horizontal force to be equal to 0.374 θ times the girder deadweight yields a reasonable estimate of the force which will actually be produced.
Table 3- 4 Influence of shear modulus on horizontal to compressive force ratio
Actual ShearModulusMPa (psi)
Ratio of Actual to SpecifiedShear Modulus
Ratio of Horizontal to Compressive Force
Mfr B Mfr C Manufacturer B Manufacturer C0.602 (87.3) 0.873 0.415 θ0.603 (87.5) 0.875 0.275 θ0.848 (123) 0.615 0.448 θ0.924 (134) 0.660 0.358 θ
Table 3- 5 Average horizontal force produced by compressive force of 311 kN and622 kN
Slope ofMiddle Platen
Horizontal Force Actual ÷ PredictedP = 311 kN (70 kips)
Horizontal Force Actual ÷ Predicted
P = 622 kN (140 kips)1.5% 0.925 0.8673.8% 0.877 0.9946.25% 0.950 1.05

38
Horizontal DeflectionsWith the relationship between compressive and horizontal forces now known, it should be a simple matterto determine the shear deformation of a bearing of a given shear modulus, area, and elastomer thickness. From the results of the horizontal deflection tests, the magnitude of the equivalent horizontal force requiredto cause that deflection was calculated by using the relationship H = GA∆/hrt, where ∆ is the measuredhorizontal displacement. The ratio of the calculated horizontal force (H) to the applied compressive force(P) was then determined. Table 3.6 gives the ratio of the equivalent horizontal force to compressive forceat 311 and 622 kN (70 and 140 kips). In these tests, only tapered specimens were used and no mismatchedtests were performed.
These ratios are clearly greater than those presented in Table 3.2 (the calculated slope is 0.471 vs. 0.374)which indicates that the bearings sheared more than they would have been expected to when subjected to ahorizontal force of 0.374 θP. Visual observation of the bearings in compression and analyzing the plot ofthe compressive force-horizontal displacement relationship showed the movement of the middle platencaused the compressive load to become eccentric. As a result a P-∆ effect is introduced due to the bearing’sdisplacement. Reference 25 gives an equation derived by Gent for the critical buckling load for reinforcedbearings that are free to translate but not to rotate:
PcrGAs EIfr
GAs hrt= +
−
φ πφ2
14
21 (3.1)
where:
φ = total bearing thickness (including steel) divided by total elastomer thickness, hrt
As = shear area of the bearing
fr = ending stiffness coefficient = 1.0 + 0.575 S2
E = 3G
The recorded displacements were assumed to be magnified displacements based upon the critical bucklingload for each bearing. From the displacement magnification relationship
∆∆
totalinitial
PPcr
=−1
(3.2)
Table 3- 6 Ratio of horizontal to compressive force from displacement tests
Slope ofMiddle Platen
Ratio of Horizontal to Compressive ForceP = 311 kN (70 kips) P = 622 kN (140 kips)
0% 0 03.8% 0.455 θ 0.492 θ6.25% 0.466 θ 0.488 θ

39
the values of the initial displacementswere calculated and then the equivalenthorizontal force required to cause themwas calculated as before. Figures 3.5and 3.6 show typical compressive force- horizontal displacement (P-∆) curvesfrom tests on 3 and 6 shim bearingscompared to the predicted P-∆relationships based upon ∆initial =0.374θPhrt/GA and ∆total as determinedby Equation 3.2.
While the predicted P-∆ curve for the 3shim bearing is almost exact, thepredicted P-∆ relationship for the 6shim bearing yields approximately a30% error. In most cases, thepredictions for 3 shim bearings werewithin ±15% of the actualdisplacements but the predictions for 6shim bearings were only withinapproximately ±50%. Overall however,the average of all of the tests yieldsreasonable agreement between recordeddisplacements and those predicted by
an initial displacement produced by H=0.374 θP magnified by Equation 3.2. The results of all tests sortedby taper, number of steel shims, manufacturer and specified shear modulus are given in Table 3.7. Thevalue given is the average of the ratios of the actual displacement recorded to the total displacementpredicted at 311 and 622 kN (70 and 140 kips).
Although the results show much scatter, especially for the 6 shim specimens, the average of all of the testsis 1.005, which appears to indicate that the basic method is correct. Based upon the calculations of the
0
100
200
300
400
500
600
700
0 5 10 15
Horizontal Displacement (mm)
Co
mp
ress
ive
Fo
rce
(kN
)
Predicted Displacement
Actual Displacement
Figure 3- 6 Actual and predicted P-D curves for a 70-durometer 6-shim 6%taper bearing
∆ s
∆s
L
YY
2
1
H H2 1
∆c
∆c
h2h1
where:
∆c = The total vertical deflection of the bearing due tocompression and sidesway (same on both ends of thebearing)
= δc , the vertical deflection due to compression + δs , thevertical deflection due to sway
H1,2 = Original height of each end of the bearingh1,2 = Original height of each end of the bearing minus δc.Y1,2 = The original height of each end of the bearing minus
δc and δs.
∆s = The horizontal deflection of the bearing (same on bothends)
Figure 3- 7 Geometry of displaced bearing

40
horizontal force required to produce the initial displacements, new horizontal to compressive force ratioswere determined. The results are given in Table 3.8.
When these points are plotted versus taper, the best fit regression line has a slope of 0.392 which is muchcloser to the original value of 0.374 based upon the recorded horizontal forces when the bearings wererestrained from moving. Because the primary interest is to determine horizontal deflections, and forsimplicity of calculations, a horizontal to compressive force ratio of 0.4 θ would appear to be a reasonablefactor to use to estimate the initial horizontal deflection of a bearing when compressed under a slopedgirder. The total deflection can be determined by magnifying the initial deflection to take into account P-∆effects.
Influence of Reinforcing Shim Orientation on Horizontal Force and DisplacementDuring the course of the displacement tests, it was noted that some bearings of similar slope and shearmodulus sheared to different magnitudes. Upon closer examination, it was observed that the steelreinforcing shims of some bearings were less perfectly radially spaced than others. The best example of theinfluence of steel shim orientation on deflection and equivalent horizontal force is given by comparing thebehavior of the bearings with radially spaced reinforcing shims to those with reinforcing shims orientedparallel to one another. Table 3.9 gives the recorded horizontal forces and displacements from the tests
Table 3- 7 Comparison of actual and predicted horizontal displacements
Specified Shear Displacements Actual ÷ PredictedModulus 4% Bearings 6% Bearings
3 Shim 6 Shim 3 Shim 6 Shim
Manufacturer B 0.7 MPa (100 psi) 0.60 0.25 0.99 0.761.4 MPa (200 psi) 0.90 0.69 1.14 0.83
Manufacturer C 0.7 MPa (100 psi) 1.01 1.47 1.03 1.461.4 MPa (200 psi) 1.17 1.50 0.94 1.32
Average 0.92 0.98 1.03 1.09
Table 3- 8 Ratio of horizontal to compressive force considering P-∆ effect
Slope of Middle Platen 311 kN (70 kips) 622 kN (140 kips)
0% 0 03.8% 0.0138 0.01326.25% 0.0258 0.0236
Table 3- 9 Influence of steel shim orientation on horizontal force and displacement
Horizontal Force - kN (kips) Horizontal Displacement - mm (in)
P = 311 kN P = 622 kN P = 311 kN P = 622 kN
Radial Shims 6.81 (1.53) 15.3 (3.43) 7.87 (0.310) 19.2 (0.754)Parallel Shims 5.07 (1.14) 10.4 (2.33) 4.75 (0.187) 11.4 (0.450)
Ratio Parallel:Radial 0.75 0.68 0.60 0.60
Value Predicted byH=0.4 θP
7.79 (1.75) 15.6 (3.50) 7.32 (0.288) not magnified
14.6 (0.575)not magnified

41
performed on the nominal 6% taper, 3 steel shim, 0.7 MPa (100 psi) shear modulus specimens atcompressive force levels of 311 and 622 kN (70 and 140 kips).
From the results of these tests, it appears that orienting the reinforcing shims parallel to one another willreduce substantially, but not eliminate the horizontal force and deflection. Subsequent chapters willdescribe the influence of steel shim orientation upon other behavior such as shear, compressive androtational stiffness.
3.1.3 DISCUSSION OF HORIZONTAL FORCE AND DEFLECTION TESTS
Although the horizontal displacement of the bearings cannot be explained in terms of external forces actingupon them, an explanation can offered that the bearings displace due their dissymmetry. In tapered bearingdesigns, the steel shims are generally radially spaced creating a system with a greater axial stiffness on thethin end and a lesser axial stiffness on the thick end. If the bearing were free to rotate under the verticalload, the thick end would compress more than the thin end. However, bearings supporting a bridge girdercannot rotate to reach equilibrium but can translate to do so. The magnitude of the horizontal translation isdirectly proportional to the magnitude of the difference in stiffness between the thin end and the thick end. Figure 3.7 shows the geometric relationships describing the movement.
From Figure 3.7 it is shown that
(hn)2 = (∆s)2 + (Yn)2 (3.3)
where hn = Hn - δcn and Yn = Hn - δcn - δsn. Substituting into equation 3.3 and rearranging:
(∆s)2 = (Hn - δcn - δsn)2
- (Hn - δcn )2 (3.4)
Expanding and simplifying:
∆s)2 = δsn ( 2Hn - 2δcn - δsn ) (3.5)
The vertical displacements of the two ends of the bearing can be expressed as:
δc1 + δs1 = δc2 + δs2 (3.6)
where the additional vertical displacement due to sway added to the original vertical displacements due tocompression result in equal vertical displacements on both ends of the bearing, which must be the case.Because the horizontal displacement of both ends of the bearing must be equal, equations in the form ofEquation 3.5 can be written for each side of the bearing and set equal to one another yielding:
δs2 ( 2H2 - 2δc2 - δs2 ) = δs1 ( 2H1 - 2δc1 - δs1 ) (3.7)
Using values for H1 and H2 and δc1 and δc2 in the ranges measured for bearings used in this study, (H2 =57.2 mm (2.25 in), H1 = 47.8 mm (1.88 in), δc2 = 2.54 to 2.67 mm (0.100 to 0.105 in), δc1 = 2.29 to 2.41mm (0.09 to 0.095 in) where δc2 and δc1 are based upon the stiffnesses of the two ends of the bearing), thevalues for δs1 and δs2 can be determined from Equations 3.6 and 3.7 which can be used in Equation 3.5 todetermine a predicted horizontal displacement. In the ranges given above, the horizontal displacementsranged from 8.07 to 11.4 mm (0.318 to 0.447 in) for the lower and greater differences in compressivedeflection for the two ends respectively. These predicted values are comparable to those recorded inexperiments on bearings free to translate horizontally 2.62 to 10.6 mm (0.103 to 0.416 in). From thesecalculations, the predicted horizontal displacement increases with increasing relative difference in verticaldisplacement due to compression of the thin end versus the thick end of the bearing.

42
ConclusionsCompressing a bearing pad under the dead weight of a girder sloped at an angle θ will cause a taperedbearing to displace in the direction of its thin end and a flat bearing to displace in the direction of its morecompressed end. If the girder is unrestrained, as is the normal practice, the magnitude of the horizontaldeflection can be estimated by assuming an equivalent horizontal force H approximately equal to 0.4θP,where P is the compressive force, which will result in an initial deflection of Hhrt/GA. The bearing’scritical buckling load must be calculated according to Equation 3.1 and the calculated initial deflectionmust be magnified according to Equation 3.2 to determine the final deflection. Because each bearing isindividually fabricated, there are distinct differences from bearing to bearing which cause the magnitude ofthe displacement to differ greatly even when all design parameters such as shear modulus, taper, and shapefactor are the same. Therefore the horizontal deflection can only be estimated within ±30%. From theexperimentation, the greatest influences upon the magnitude of the horizontal force produced or thehorizontal deflection recorded are the orientation of the reinforcing shims and the degree of the slope of theapplied compressive load.
Although the majority of the bearings tested in this study were tapered, the results showed very clearly thata flat bearing loaded by a girder on a slope will also displace horizontally. Since the current AASHTOSpecification allows the use of flat bearings when the girder is sloped up to 1%, horizontal deflectionsshould be a consideration. From the results of the tests presented in this chapter, it can be predicted that themagnitude of the horizontal displacement will be less if a flat or tapered bearing with steel shims orientedparallel to one another or is used rather than using a tapered bearing with radially spaced shims. Orientingthe reinforcing steel shims in a tapered bearing parallel to one another can reduce the horizontal deflectionby 30-40% as shown in Table 3.9. Although for this shim orientation, there may be additional horizontaldeflection due to second order effects, the total horizontal deflection is less than that predicted by H=0.4θP. Therefore, the deflection predicted by H=0.4θP can be regarded as a maximum to be expected and there isno utility in calculating a critical buckling load and magnifying the expected deflection if parallel shims areemployed.
A reasonable assumption as to the horizontal deflection expected can also be made by the method describedearlier in this section. As long as the dimensions of the bearing’s cross section and the reinforcing schemeis known, an estimate can be made of the vertical deflection due to compression and the relationships givenin Equations 3.5, 3.6 and 3.7 used to calculate a predicted horizontal displacement for the bearing.
3.2 BEARING SLIP INVESTIGATIONTo investigate the bearing “walking out” phenomenon, a test program was developed with the purpose ofcharacterizing the friction coefficient of rubber on a number of surfaces and duplicating in the laboratorythe daily thermal expansion and contraction of the concrete bridge girder at various amplitudes.Additionally, several field studies of bridges throughout the state of Texas were conducted to record theactual magnitudes of the thermal cycles as well their effect upon the movement of the associated bridgebearings. Two of those studies are described below. Slip tests were performed on the bearings that wereremoved from service on these two bridges.

43
3.2.1 FIELD STUDIES
As part of the research, bridges were instrumented and observed over a period of three years. Gages asshown in Figures3.8 and 3.9 were attached to measure the maximum movement of the girder end where thebearings in question were located. Reference marks as shown in Figure 3.10 were established on thebottom of the girders to measure actual bearing movement, which was determined by taking a tape measuredistance from the reference mark to the edge of the bearing.
Abutment
Girder
Girder Movement Indicator
Attached to GirderMaximumExpansion
MaximumContraction
Marker
Marker
1 2 3 4 5
Figure 3- 8 Sliding gage for measurement of girder movement
Figure 3- 9 Girder expansion/contraction measurement gage

44
Slaughter Creek Bridge, AustinThe Slaughter Creek Bridge is a 109.7-m (360-ft) bridge that carries the west (southbound) frontage roadfor IH-35 over Slaughter Creek in south Austin. The bridge is divided into three approximately 36.6-m(120-ft) spans and each end span is comprised of six prestressed concrete girders approximately 1.22 m (4ft) in depth. The deck is continuous over the three spans. Each girder has a reaction of approximately 400kN (90 kips). Originally, this bridge was constructed with new, nominal 70 durometer (68 durometermeasured) natural rubber bearings pads which were installed as normally done under the girders. Thebearings were 228 mm x 559 mm x 44.5 mm (9”x22”x1.75”) with two steel shims of 3.18 mm (0.125 in)each yielding a 38.1-mm (1.50-in) elastomer thickness. Within a few months, the bearings had “walkedout” significantly at the north abutment. When slipping was discovered, a restraining device as shown inFigure 3.11 was installed around these bearings to preclude walking out.
The six bearings on the south abutment were left unrestrained so that they could be studied over a period ofthree years to describe their movement due to thermal cycle of the bridge. The expansion/contraction ofthe girders was measured to be between 6.35 mm (0.25 in) and 12.7 mm (0.50 in) depending upon the timeof year. As part of this research project, the south end of the bridge was lifted with hydraulic jacks asshown in Figure 3.12, the bearings were reset at their original locations and their movement charted over aperiod of six months. In October 1992, the bearings were reset again, and their movement again charted. In November 1992, the original rubber bearings were removed from the bridge and replaced with neoprenebearings of the same length and width but with an overall thickness of 50.8 mm (2.0 in) and four 3.18-mm(0.125-in) steel shims for a total elastomer thickness of 38.1 mm (1.50 in) as before. These bearingsseemed to perform as required until June 1993 at which time they also were observed to begin walking out.The movement of these bearings was charted for almost one year until April 1994 (See Figure 3.14) whenthe bridge was lifted for a final time, the bearings were removed (See Figure 3.12), the bearings, bearing
Figure 3- 10 Reference marks under girder

45
Figure 3- 11 Restraining devices to prevent bearing movement
Figure 3- 12 Bridge lifting system

46
Figure 3- 13 Steam cleaning the girders and bearing seats with degreasing agent
0.00
5.00
10.00
15.00
20.00
25.00
30.00
35.00
40.00
45.00
13-M
ar-9
3
13-A
pr-9
3
14-M
ay-9
3
14-J
un-9
3
15-J
ul-9
3
15-A
ug-9
3
15-S
ep-9
3
16-O
ct-9
3
16-N
ov-9
3
17-D
ec-9
3
17-J
an-9
4
17-F
eb-9
4
20-M
ar-9
4
20-A
pr-9
4
21-M
ay-9
4
Date
Dis
plac
emen
t (m
m)
Bearing 6Bearing 5Bearing 4Bearing 3Bearing 2Bearing 1
Figure 3- 14 Movement of neoprene bearing pads from June 1993 to April 1994

47
seats, and the girders were cleaned of all residue (See Figure 3.13), and the bearings were reset. Nosignificant movement has been noted since May 1994. (See Figure 3.15)
Valley Ridge Bridge, DallasIn addition to charting the bearing movement at the Slaughter Creek Bridge in Austin, the Valley RidgeBridge over IH-35 in Dallas was also monitored for a period of three years albeit not as closely as was theAustin bridge. This investigation was nonetheless enlightening as only half of the original natural rubberbearings that walked out (See Figure 1.9) were replaced with neoprene pads. As part of the replacementprocedure, the girders and bearing seats where the neoprene pads were installed were cleaned but those leftwith natural rubber pads were not. The natural rubber pads were, however, reset when the neoprene padswere installed. Over the course of the charting period, the natural rubber pads were noted to slip assignificantly as before, but the neoprene pads maintained their original locations and simply sheared asintended. This observation is significant in that it shows that the bearing walking out phenomenon shouldbe regarded as a function of the bearing itself rather than of the bridge.
3.2.2 LABORATORY INVESTIGATION
Wax AdditiveAs stated in section 1.3.3, natural rubber is susceptible to attack from atmospheric ozone. Severalingredients are added to the raw rubber during the compounding process to preclude this degradation and toensure that the vulcanate can pass the ozone exposure test required by the ASTM specification. One ofthose ingredients is antiozonant wax of any number of variants. This wax migrates to the surface of therubber part and blocks the penetration of ozone into the exposed faces of the material. Unfortunately, in
0.00
5.00
10.00
15.00
20.00
25.00
30.00
35.00
40.00
45.00
22-A
pr-9
4
23-M
ay-9
4
23-J
un-9
4
24-J
ul-9
4
24-A
ug-9
4
24-S
ep-9
4
25-O
ct-9
4
25-N
ov-9
4
26-D
ec-9
4
26-J
an-9
5
26-F
eb-9
5
29-M
ar-9
5
29-A
pr-9
5
30-M
ay-9
5
Date
Dis
plac
emen
t (m
m)
Bearing 6
Bearing 5
Bearing 4
Bearing 3
Bearing 2
Bearing 1
Figure 3- 15 Movement of neoprene bearing pads since April 1994

48
the case of natural rubber bearing pads, the effect of this wax migration is to coat the entire bearing surfacewith a viscous (liquid exhibiting flow under shear stress) material. While it was reasonably clear that thiswax could be the cause of the walking out phenomenon, a laboratory investigation to quantify the effect ofthe waxy bearing surface was undertaken and is described below. Pursuant to this goal, natural rubberbearings, which had been removed from the Slaughter Creek and Valley Ridge bridges, were tested onconcrete and Plexiglas surfaces to determine the circumstances required to initiate the walking outphenomenon. The purpose of the Plexiglas surfaces was to provide a medium for the rapid deposit andaccumulation of the wax that had coated the bearing surfaces.
Slip Tests on Slaughter Creek Natural Rubber BearingsThe bearings that are described in Section 3.1.1 were tested against Plexiglas and then concrete surfaces. During tests on Plexiglas surfaces, the thermal cycle controller was set to subject the bearings to a smallshear strain then to gradually increase the shear strain until the bearing showed a tendency to walk out oraccumulate slip in one direction. Once this occurred the magnitude of the shear cycle was decreased to justbelow the determined threshold and gradually brought back up to the same magnitude that resulted inuncontrolled slip to determine the repeatability of the phenomenon. The test was performed at 2.76 and5.17 MPa (400 and 750 psi) compressive stress to observe the influence of compressive stress on slip. Thehorizontal force required to initiate uncontrolled slipping was divided by the compressive force used duringthe test to determine a friction coefficient (µ = Η/Ν). The Optron, described in Chapter 2, was used to trackthe displacement of a target on the bottom bearing in the apparatus. The results of the tests shown in Table3.10, indicate that the wax build up on the surface of the bearings has a clear effect upon the frictioncoefficient of the bearing against the Plexiglas. Additionally, the results are consistent with publishedresearch (28) on the friction properties of elastomers and results from direct friction tests in this study (Seesection 3.2.3) which show that as the compressive stress increase, the friction coefficient decreases. Fromthe load-displacement curves and the plot of bearing movement (Optron output) versus middle platendisplacement, the phenomenon can be shown to occur very abruptly as soon as the shear strain in thebearing causes the shear force to exceed the friction force.
Explanation of Slip Test ResultsFigure 3.16 shows the load-displacement curve (bottom) and Optron output versus platen displacement(top) from the start of the test. The bearings were subjected simultaneously to a 2.76 MPa (400 psi)compressive stress and a shear strain cycle of 18.6% in either direction. Although the Optron plot shows atarget movement from the start of the test, the bearing is not actually slipping until much later. What theOptron is detecting at this point is the cover layer of elastomer shearing, not rigid body motion. Thisshearing is observed in all Optron plots even when the bearing shows no sign of slipping during the cycle.(See Figure 3.17.) The Optron plot shows that the bearings actually began to slip when they shearedapproximately 4 mm (0.157 in), a shear strain 10.5%. The load-displacement relationship shows that at
Table 3- 10 Friction coefficients from slip tests
σcMPa (psi)
Plexiglas Platen SurfaceBearing With Wax Clean Bearing
Concrete Surface Clean Bearing
2.76 (400) 0.104 0.132 0.2975.17 (750) 0.054 0.079 0.201

49
-2
0
2
4
6
8
10
12
-8 -6 -4 -2 0 2 4 6 8
Middle Platen Displacement (mm)
Bea
rin
g S
lip (
mm
)Bearing Slip
-30
-20
-10
0
10
20
30
40
-8 -6 -4 -2 0 2 4 6 8
Middle Platen Displacement (mm)
Lo
ad (
kN)
Figure 3- 16 Initial load-displacement curve and optron plot
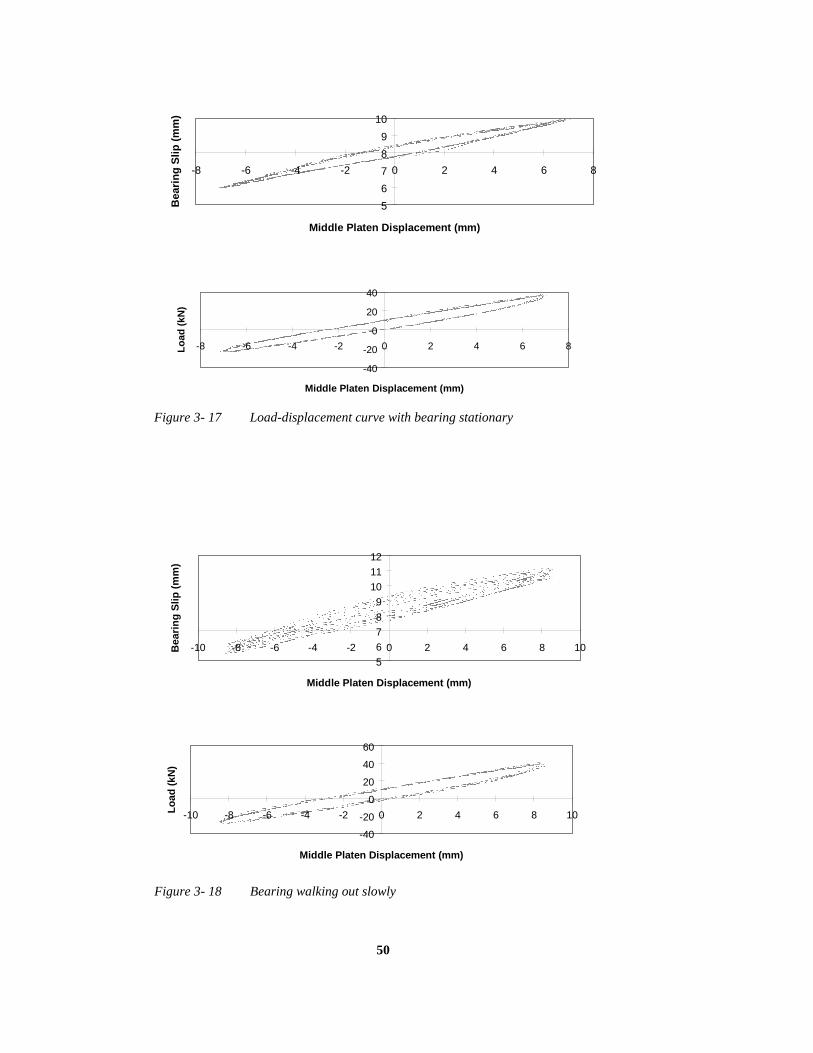
50
5
6
7
8
9
10
-8 -6 -4 -2 0 2 4 6 8
Middle Platen Displacement (mm)
Bea
rin
g S
lip (
mm
)
-40
-20
0
20
40
-8 -6 -4 -2 0 2 4 6 8
Middle Platen Displacement (mm)
Lo
ad (
kN)
Figure 3- 17 Load-displacement curve with bearing stationary
5
6
78
9
10
11
12
-10 -8 -6 -4 -2 0 2 4 6 8 10
Middle Platen Displacement (mm)
Bea
rin
g S
lip (
mm
)
-40
-20
0
20
40
60
-10 -8 -6 -4 -2 0 2 4 6 8 10
Middle Platen Displacement (mm)
Lo
ad (
kN)
Figure 3- 18 Bearing walking out slowly

51
8
10
12
14
16
18
-10 -8 -6 -4 -2 0 2 4 6 8 10
Middle Platen Displacement (mm)B
eari
ng
Slip
(m
m)
-40
-20
0
20
40
60
-10 -8 -6 -4 -2 0 2 4 6 8 10
Middle Platen Displacement (mm)
Lo
ad (
kN)
Figure 3- 19 Bearing walking out significantly
10
15
20
25
30
-10 -8 -6 -4 -2 0 2 4 6 8 10
Middle Platen Displacement (mm)
Bea
rin
g S
lip (
mm
)
-40
-20
0
20
40
60
-10 -5 0 5 10
Middle Platen Displacement (mm)
Lo
ad (
kN)
Figure 3- 20 Final load-displacement and slip curves
52
that same point (4 mm) the curve flattens out signifying that the middle platen is displacing withoutresulting in any additional load to the system. Therefore, the bearing is no longer undergoing additionalshear strain as the platen moves. The Optron plot shows that the edge of the target, which is located at thecenterline of the bearing length, has moved approximately 2 mm after each cycle from its position at thestart of the cycle.
After five cycles at 18.6% strain, the bearing reached an equilibrium position and remained in place for anumber of additional cycles. (See Figure 3.17.) At this point, the thermal cycle was increased to 23.5%strain and the bearings began a steady slip of 0.1 mm per cycle as shown in Figure 3.18. The thermal cyclewas then increased to 26.0% strain and the bearings began uncontrolled slipping as shown in Figure 3.19. The thermal cycle was decreased back to 23.5% strain, but slip continued. Finally, the strain was reduced to15.6% and the bearings stabilized once more, also shown in Figure 3.19. A number of cycles were run at15.6%, 18.2%, and 20.8% strain with no net slip occurring. The strain was increased to 24.0% as shown inFigure 3.20 and uncontrolled slip commenced again. The test was terminated with the conclusion that anystrain greater than 20.8% would result in the bearings slowly walking out. At greater strains thephenomenon would occur much more dramatically. The same tests were repeated at 5.24 MPa (750 psi)where the bearings were found to begin walking out at strains over 13.0%. The Plexiglas platens and thesame bearings were thoroughly cleaned of wax and the test repeated. During these tests, the walking outthreshold strain was 31.3% and 26.0% at 2.76 MPa (400 psi) and 5.17 MPa (750 psi) respectively. Finally, the same clean bearings were tested against cleaned, smooth concrete surfaces. In these tests, walking outdid not occur. Strains of 75% and 65% were reached at 2.76 MPa (400 psi) and 5.17 MPa (750 psi)respectively before the load displacement curves showed any signs of nonlinearity.
Slip Tests on Valley Ridge Natural Rubber BearingsIn addition to the Slaughter Creek rectangular bearing tests described above, circular natural rubberbearings from the Valley Ridge Bridge in Dallas were tested in the apparatus against smooth concretesurfaces at a compressive pressure of 3.12 MPa (446 psi). The bearings were nominal 60 durometerhardness (68 durometer measured), 384 mm (15.1 in) indiameter and 45.0 mm (1.77 in) in overall thickness (38.1 mm(1.50 in) of rubber and two 3.18-mm (0.125-in) steel shims) witha 2.6% taper. The surface of the bearings was obviouslysaturated with wax when delivered to the laboratory. The load-displacement curve started to show slipping had begun at a strainof 25.5% which translated to a friction coefficient of 0.107comparing very closely to that of the waxy Slaughter Creekbearings at similar compressive stress on Plexiglas. Walking outoccurred readily at a strain of 40% but the bearing stabilizedwith some slipping back and forth but no walking out at a strainof 33.9%. After five cycles at 40% strain, the bearings hadwalked out 8.54 mm (0.336 in).
Mechanics of the “Walking Out” PhenomenonFrom the load-displacement and bearing slip plots, themechanics of the walking out phenomenon for tapered bearingscan be deduced. As explained earlier, the dead weight of thegirder causes the bearing to shear somewhat as shown in Figure3.21.
As the girder (in the case of these tests, the middle platen)expands, a horizontal force, H, is produced as a result of thebearing shearing as shown in Figure 3.22.
θW
W
Figure 3- 21 Bearing under girderdead weight alone
θW
W
H
Vtop
Vbottom
Figure 3- 22 Forces on bearingduring girderexpansion

53
The force on the bottom of the bearing, Vbottom, is equal to H.
Vbottom = H (3.8)
and the ratio of the horizontal to normal force on the bottom of the bearing is as shown below:
HW
(3.9)
The force on the top of the bearing, Vtop, is as shown below:
Vtop H W= −cos sinθ θ (3.10)
Which, for small values of θ, reduces to:
Vtop H W= − θ (3.11)
The force normal to the top of the bearing, N, is also a function of the shear force, H, and the girder weight,W:
N W H= +cos sinθ θ (3.12)
Which reduces to:
N W H= + θ (3.13)
For the typical girder slopes and horizontal forces under consideration, the magnitude of Hθ is much lessthan the magnitude of W making the ratio of horizontal to normal force on the top of the bearing asfollows:
H WW− θ
(3.14)
Therefore it is clear that the ratio of the horizontal to normal forces on the bottom of the bearing willexceed that required to overcome static friction before the forces on the bearing top will. The load-displacement plot becomes flat at this point and the Optron shows the bottom face of the bearing slippingalong the bottom platen. When the girder contractshowever, the forces are quite different. See Figure 3.23.
As the girder contracts, the same horizontal force, H, isagain produced as a result of the bearing shearing. Theforce on the bottom of the bearing, Vbottom, is again equalto H but now acts in the opposite direction as before, andthe ratio of horizontal to normal force is as shown:
HW
(3.15)
The force on the top of the bearing has also changed andis as shown below:
Vtop H W= +cos sinθ θ (3.16)
Which reduces to:
θW
W
H
V top
V bottom
Figure 3- 23 Forces on bearing duringgirder contraction
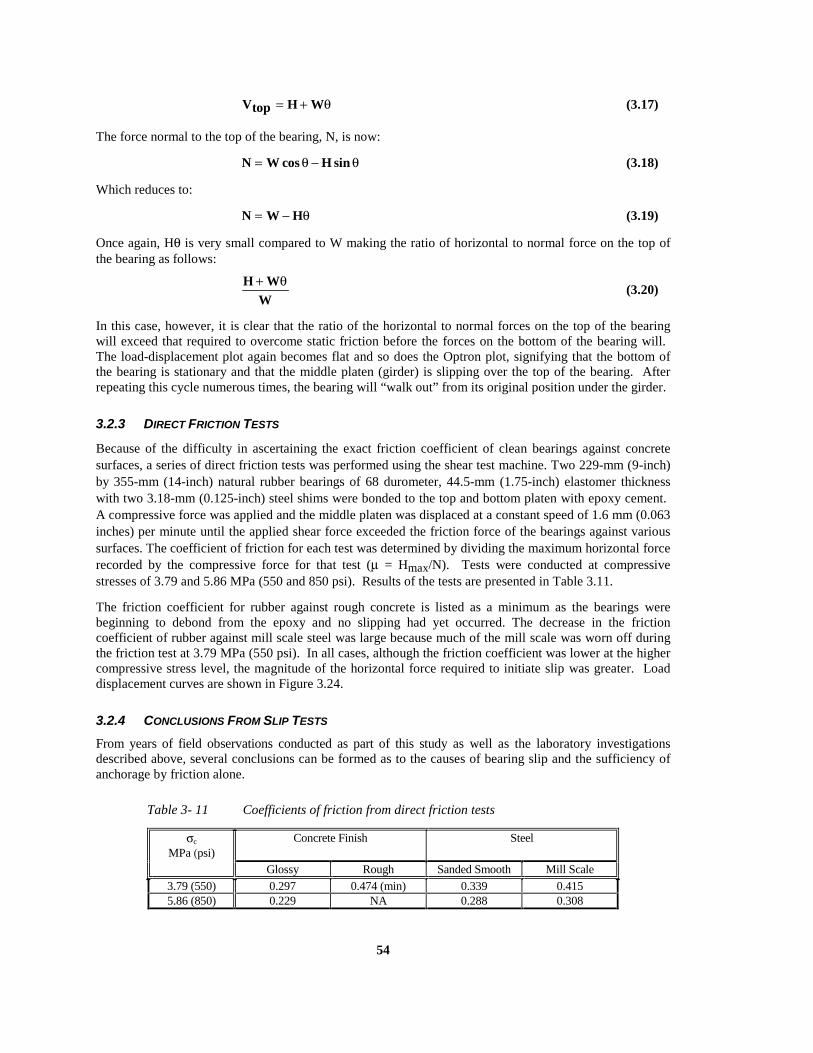
54
Vtop H W= + θ (3.17)
The force normal to the top of the bearing, N, is now:
N W H= −cos sinθ θ (3.18)
Which reduces to:
N W H= − θ (3.19)
Once again, Hθ is very small compared to W making the ratio of horizontal to normal force on the top ofthe bearing as follows:
H WW+ θ
(3.20)
In this case, however, it is clear that the ratio of the horizontal to normal forces on the top of the bearingwill exceed that required to overcome static friction before the forces on the bottom of the bearing will. The load-displacement plot again becomes flat and so does the Optron plot, signifying that the bottom ofthe bearing is stationary and that the middle platen (girder) is slipping over the top of the bearing. Afterrepeating this cycle numerous times, the bearing will “walk out” from its original position under the girder.
3.2.3 DIRECT FRICTION TESTS
Because of the difficulty in ascertaining the exact friction coefficient of clean bearings against concretesurfaces, a series of direct friction tests was performed using the shear test machine. Two 229-mm (9-inch)by 355-mm (14-inch) natural rubber bearings of 68 durometer, 44.5-mm (1.75-inch) elastomer thicknesswith two 3.18-mm (0.125-inch) steel shims were bonded to the top and bottom platen with epoxy cement. A compressive force was applied and the middle platen was displaced at a constant speed of 1.6 mm (0.063inches) per minute until the applied shear force exceeded the friction force of the bearings against varioussurfaces. The coefficient of friction for each test was determined by dividing the maximum horizontal forcerecorded by the compressive force for that test (µ = Hmax/N). Tests were conducted at compressivestresses of 3.79 and 5.86 MPa (550 and 850 psi). Results of the tests are presented in Table 3.11.
The friction coefficient for rubber against rough concrete is listed as a minimum as the bearings werebeginning to debond from the epoxy and no slipping had yet occurred. The decrease in the frictioncoefficient of rubber against mill scale steel was large because much of the mill scale was worn off duringthe friction test at 3.79 MPa (550 psi). In all cases, although the friction coefficient was lower at the highercompressive stress level, the magnitude of the horizontal force required to initiate slip was greater. Loaddisplacement curves are shown in Figure 3.24.
3.2.4 CONCLUSIONS FROM SLIP TESTS
From years of field observations conducted as part of this study as well as the laboratory investigationsdescribed above, several conclusions can be formed as to the causes of bearing slip and the sufficiency ofanchorage by friction alone.
Table 3- 11 Coefficients of friction from direct friction tests
σc
MPa (psi)Concrete Finish Steel
Glossy Rough Sanded Smooth Mill Scale
3.79 (550) 0.297 0.474 (min) 0.339 0.4155.86 (850) 0.229 NA 0.288 0.308
55
Wax AdditiveThe wax additive used by manufacturers in an attempt to ensure that natural rubber can meet the ASTMozone resistance specification causes a viscous (liquid exhibiting flow under shear stress) coating toaccumulate on the surface of the bearings, which significantly lowers their coefficient of friction against thegirder and bearing seat. In the absence of this coating, the same bearings behave as designed and exhibit notendency to slip under expected service conditions. In fact, bearings made from any elastomer can exhibitthe same behavior if they are compounded with antiozanant waxes. One manufacturer contacted duringthis study stated that it is the practice of some fabricators to add antiozonant waxes to neoprene compoundsdespite their inherent ozone resistance. If neoprene is specified to preclude the slipping problem, it must bemade clear to the manufacturer that antiozonant wax shall not be used.
“Walking out” PhenomenonThere is nothing mysterious about this phenomenon and it has nothing to due with natural rubber itself. Itoccurs when the horizontal force on the bearing exceeds the coefficient of friction between the bearing andthe surfaces against which it is in contact. There is a threshold strain below which the phenomenon doesnot occur which is the reason why bearings can be observed to behave perfectly for a number of months butthen dramatically slip several inches in just a few days. The reason why the bearing actually walks out is adue to the girder slope and the extremely waxy bearing surface. Without the wax, walking out does nothappen. This is also shown through analytical studies performed by Hamzeh (10), which included finiteelement modeling of bearing movements considering viscosity. That study concluded that walking outwould not occur under normal circumstances (without wax). There is also no reason to conclude that thisphenomenon must be peculiar to tapered bearings. From the mechanics of the process, it is shown that aslong as the girder is sloped (by current specifications, flat bearings can be employed when the bridge issloped up to 0.01 radians), the forces can develop such that a flat pad with wax coated surfaces would walkout.
Anchorage by FrictionA conservative friction coefficient to use for all surfaces is 0.2. This has been shown not only in this studybut in numerous others as referenced in Chapter 1. From the tests reported in this study, glossy concretesurfaces are apt to come close to this limit and therefore must be avoided. As long as the designer checksthat the expected horizontal forces are less than 20% of the girder dead load, sufficient anchorage byfriction will be provided to preclude bearings from slipping under normal conditions. Roughened concretesurfaces as normally provided for bearing seats will perform exceptionally well.

56
0
20
40
60
80
100
120
140
160
0 20 40 60 80 100Middle Platen Displacement (mm)
Lo
ad (
kN)
Smooth Steel 3.79MPa Smooth Steel 5.86MPaMill Scale Steel 3.79MPa Mill Scale Steel 5.86MPaGlossy Concrete 3.79MPa Glossy Concrete 5.86MPaRough Concrete 3.79MPa
Figure 3- 24 Load displacement curves from direct friction tests

57
CHAPTER 4BEARING STIFFNESS TESTS
The purpose of these tests was to determine the shear, compression and rotational stiffnesses of the variousdesigns and to evaluate the relative merits of those designs based upon test results. Additionally, comparisonsare made to theoretical stiffness calculations.
4.1 SHEAR STIFFNESS/MODULUS TESTS
Over 100 shear stiffness tests were performed on the specimens ordered for this study using the apparatusdescribed in Chapter 2. Each bearing design was tested at nominal compressive stresses of 3.85 MPa (550 psi)and 7.69 MPa (1100 psi) with the apparatus configured to match the bearing taper as precisely as possible andalso under intentionally mismatched slope conditions to simulate non-uniform loading. The actual tapers of thealuminum plates described in section 2.1.2 were 3.8% and 6.25% versus the average tapers of the specimens,which were 4.17% and 5.5%. The reason for this discrepancy was that one set of plates (3.8%) was already onhand from an earlier series of tests and approximated the requested taper of 4.17% closely enough and the otherset of plates (6.25%) was machined based upon the taper requested from the manufacturers - 6.25%. The upperand lower platens of the test machine were parallel to within a 0.25% slope ensuring that, for matched slopetests, there would never be more than a 1% mismatch. The bottom and top platen bearing contact surfaces werewood trowel finished concrete to simulate the bearing seat and the middle platen contact surfaces were steeltrowel finished concrete to simulate the girder bottom. In both cases, any surface paste that would result in a“glossy” finish was removed after curing. Because the bearings were clearly delivered with wax on theirsurfaces, each specimen was thoroughly degreased with a steam cleaner before being set in the test frame. Eventhough this was done, some residue accumulated on the concrete platens as shown in Figure 4.1. Although thisaccumulation was not actually chemically tested, water would bead up on the surface unless the substance waswashed off. Therefore, after every four tests on the concrete surfaces, each platen was removed from theapparatus and thoroughly degreased with a steam cleaner and chemical degreasing agents as shown in Figure4.2.
4.1.1 TEST PROGRAM
In the matched slope tests, the shear modulus of the bearings was determined under conditions that were as idealas possible so that the true modulus of the material delivered by the manufactures could be compared to therequested modulus. The test apparatus was configured so that the bearing tapers were matched within 1%. Thebearing pairs were centered over the middle of the compressive ram piston and the required compressive forcewas applied with the middle platen disconnected from the horizontal load cells. The middle platen and loadcells were then reconnected, the compressive force removed and then reapplied so that the load cells couldrecord the horizontal load applied to the bearings as a result of the compressive force (as described inChapter 3). The test apparatus was set to strain the bearings through 50% shear or 22.2 mm (0.875 inches) inapproximately 14 minutes, a rate of 1.6 mm (0.0633 inches) per minute. At the point of 50% strain, the timerreversed the motor and the bearings were sheared to 50% strain in the other direction. The Optron, described inChapter 2, was also used for each test to evaluate the slip tendency of the specimen. After subjecting thebearings to four cycles at 50% strain, the amplitude of the cycles was increased to 100% strain or 44.5 mm (1.75inches) for two cycles. The slope of the load displacement curve on the fourth 50% strain cycle from the zeromiddle platen displacement point to the 50% strain point was used to determine the shear stiffness. Thedisplacement of a bearing centerline reference mark with respect to a reference mark on the platen was recordedat 50% and 100% strain in either direction.

58
Figure 4- 1 Concrete platens with surface accumulation
Figure 4- 2 Cleaning of concrete platens

59
Additionally, during a second set of tests on the same set of bearings, the specimens were intentionally“mismatched” with the platens to obtain a 1.5 to 2.0% mismatch. In tests on flat bearings, a specially machinedaluminum shim with a slope of 1.5% was employed to simulate non-uniform loading on a standard flatspecimen. Nominal 6% slope bearings were tested against 3.8% slope platens and the nominal 4% bearingswere tested against the 6.25% slope platens. The Optron was used in each test to determine bearing slip, if any.The shear stiffness was determined in the same manner as described above, as was the displacement of thereference marks on the bearing with regard to the reference marks on the platens.
4.1.2 RESULTS OF SHEAR STIFFNESS/MODULUS TESTS
4.1.2.1 Matched Slope TestsA typical horizontal load-displacement relationship for a 57 durometer, flat, 6 steel shim bearing at 50% strain,under 3.85 MPa (550 psi) is shown in Figure 4.3.
The slope of the load-displacement relationship calculated between zero and +50% strain is 1.174 kN/mm (6.7kips/in) and the shear modulus based on a 44.5-mm (1.75-inch) elastomer thickness and a 0.0814m2 (126 in2)area is calculated at 0.652 MPa (93.21 psi) by using Equation 4.1:
GHhrtA s
=∆
(4.1)
The same calculation made for zero strain to -50% strain yields a stiffness of 1.170 kN/mm (6.68 kips/in) and ashear modulus of 0.639 MPa(92.8 psi) which shows good agreement. When the shear strain is increased to100% as shown in Figure 4.4, the stiffness calculation shows a decrease which is not due to slipping (note thelinearity) but is a well-documented phenomenon of elastomer properties, lower shear modulus at greater strains(13). (The last cycle at 50% strain is also shown in Figure 4.4 so that a comparison may be made). From zero to
-30
-20
-10
0
10
20
30
40
-25 -20 -15 -10 -5 0 5 10 15 20 25
Middle Platen Displacement (mm)
Ho
rizo
nta
l Lo
ad (
kN)
Slope used for Modulus Determination
50 % strain
50 % strain
Figure 4- 3 Shear load-displacement curve for a flat bearing

60
+100% strain, the stiffness is 1.04 kN/mm (5.94 kips/in)and the shear modulus is 0.572 MPa (83.0 psi). Fromzero to -100% strain the stiffness is 1.03 kN/mm (5.88 kips/in) and the shear modulus is 0.566 MPa (82.2 psi).Results of these tests were compiled to provide a comparison of the influence of the following variables on thecomputed shear modulus:
• Taper
• Number of Steel Shims (Shape Factor)
• Orientation of Steel Shims
• Compressive Stress
Influence of Taper on Shear ModulusThe key aspect of this study was to compare tapered and flat bearings. Assuming that the manufacturers weresuccessful in fabricating all bearings uniformly, differences in shear modulus calculations for flat and taperedspecimens should be a function of only that parameter and not shape factor, shear modulus or steel shimorientation. Figure 4.5 shows the load-displacement curve for a 57 durometer, 6% taper bearing with 6reinforcing shims at 50% strain under 3.85 MPa (550 psi) compressive stress. Although there is an initialhorizontal force of 5.40 kN (1.21 kips) due to the taper of the bearing, (as explained in Chapter 3) when thebearing is sheared the same amount of force is required to move it through 50% strain in either direction (H+ =H-). The shear stiffness for this bearing in the +50% strain range was 1.198 kN/mm (6.840 kips/in) and in the-50% strain range it was 1.196 kN/mm (6.824 kips/in), a 0.2% difference. The shear modulus, calculated on thebasis of the elastomer thickness at mid-length was 0.655 MPa (95.0 psi) which compares very closely (0.652MPa (93.2 psi)) to the previous flat bearing example. The only difference between the two bearings is the taper.
Table 4.1 shows the results of shear modulus calculations for flat and tapered bearings by nominal hardness. The values reported include an average four shear modulus tests — both 3 and 6 reinforcing steel shimspecimens tested at both compressive stress levels — so that the greatest possible sample could be obtained.
-60
-40
-20
0
20
40
60
-50 -40 -30 -20 -10 0 10 20 30 40 50
Middle Platen Displacement (mm)
Lo
ad (
kN)
100% strain
100% strain
Slope at 50% strain
Figure 4- 4 Horizontal load vs. displacement at 100% strain

61
Typically, the shear moduli determined for bearings of the same hardness and shape factor fall within a range of±5% from their average. Therefore, the results presented above show no significant deviation from the flatspecimens other than at 70 durometer, which has no obvious explanation.
Influence of Compressive Stress on Shear ModulusEach specimen was tested at both 3.85 and 7.69 MPa (550 and 1100 psi) to study the effect of compressivestress on shear modulus. Table 4.2 shows the average results of tests performed with matched slopes at the twostress levels.
As shown above, the higher durometer specimens seemed to decrease in calculated shear modulus less than thelower durometer specimens. The average drop of all hardnesses is 5.75% compared to an average reduction of3% found by Hamzeh in the finite element study. The phenomenon is explained by Porter and Meinecke (20) asonly an apparent drop in shear modulus with increasing compressive stress. When they factored in the internalshear force produced in the rubber due to compressive loading, the resulting shear modulus was identical atvarying compressive stress levels. In bridges however, the magnitude of the horizontal forces transferred to thebridge by shearing the bearings is of interest and this quantity is shown to decrease slightly with increasingcompressive stress. Lindley (13) also shows that application of a compressive force will decrease the shearstiffness of the material.
Table 4- 1 Influence of bearing taper on shear modulus
MeasuredHardness
SpecifiedShear Modulus
MPa (psi)
Shear ModulusFlat Specimens
MPa (psi )
4 % Nominal TaperPercent Change from
Flat
6 % Nominal TaperPercent Change from
Flat54 0.7 (100) 0.610 (87.2) +1.9 +1.657 0.7 (100) 0.608 (86.9) -5.1 -0.270 1.4 (200) 0.832 (119.0) +5.5 +0.369 1.4 (200) 0.977 (139.8) -9.6 -7.3
-30
-20
-10
0
10
20
30
40
-30 -20 -10 0 10 20 30
Middle Platen Displacement (mm)
Ho
rizo
nta
l Lo
ad (
kN)
Initial Force Due to Taper
H+
H-
Figure 4- 5 Load-displacement curve for a tapered bearing at50% shear strain

62
Influence of Shape Factor on Shear ModulusTable 4.3 shows the results of shear modulus calculations for 3 and 6 shim bearings (shape factors of 6.26 and10.96 respectively) of all tapers and compressive stresses averaged within hardness categories. Although theavailable literature claims that the shear modulus is a function of the elastomer thickness alone, the results of thetests for this study show a difference in shear modulus based upon reinforcement.
It appears reasonably consistent that increasing the number of steel shims in a bearing will increase the shearstiffness. The overall average 6.9% increase in shear modulus in bearings with 6 steel shims is consistent withthe finite element study (10), which shows the increase to be 5%.
Influence of Steel Shim Orientation on Shear ModulusTwo sets of specimens as described in section 2.2.4 were compared on the basis of steel shim orientation(parallel vs. radial) with all other parameters the same. Results are shown in Table 4.4.
If the results from the tests at both compressive stress levels are averaged, the difference between the shearmoduli for the two designs is approximately 2%. Given that any two shear moduli tests on the same specimen atthe same compressive stress have varied by as much as 3%, it probably can be assumed that shim orientation haslittle effect on shear modulus. Additionally, the two specimens were produced by the manufacturer from batchescompounded with the same formula 5 months apart, which shows the repeatability of the compounding
Table 4- 2 Influence of compressive stress on shear modulus
MeasuredHardness
3.85 MPa (550 psi)Shear Modulus
MPa (psi)
7.69 MPa (1100 psi)Shear Modulus
MPa (psi)
PercentChange
54 0.634 (90.68) 0.587 (83.88) -7.557 0.632 (90.42) 0.592 (84.64) -6.470 0.875 (125.13) 0.843 (120.53) -3.769 0.948 (135.61) 0.897 (128.30) -5.4
Table 4- 3 Influence of shape factor on shear modulus
Measured Hardness 3 Shims S = 6.26MPa (psi)
6 Shims S = 10.96MPa (psi)
Percent Change6 shim/3 shim
54 0.605 (86.5) 0.618 (88.5) +2.357 0.585 (83.6) 0.639 (91.4) +9.370 0.813 (116.2) 0.885 (126.5) +8.869 0.892 (127.5) 0.954 (136.4) +7.0
Table 4- 4 Influence of steel shim orientation on shear modulus
Compressive StressMPa (psi)
Parallel Shim ModulusMPa (psi)
Radial Shim ModulusMPa (psi)
3.85 (550) 0.609 (88.03) 0.607 (86.86)7.69 (1100) 0.574 (83.31) 0.567 (81.04)

63
procedure. Although this only represents one set of tests, analytical studies by Hamzeh (10) come to the sameconclusion.
4.1.2.2 Non-uniform Loading TestsResults of these tests were intended to provide a basis for comparison of the effects of non-uniform loading onthe various bearing designs. Comparisons of shear modulus calculations for mismatched slope tests were madeto tests on the same bearings at matching slopes. As stated earlier, flat bearings were tested against 1.5% slopes,4% bearings against 6.25% slopes, and 6% bearings against 3.8% slopes. This procedure allowed for additionalcomparisons to be made on the basis of how the mismatch was imposed as well as simply between uniformlyand non-uniformly loaded specimens. Table 4.6 shows the results of non-uniform loading at 3.85 MPa (550psi):
Overall, the effect of non-uniform loading is to lower the calculated shear modulus by 6.2% over that calculatedat matched slope conditions. Compressing the thick end of the 6% bearings more than the thin end has less of aneffect than compressing the flat bearings more on either end or the 4% bearings on the thin end. Figures 4.6 and4.7 show how non-uniform loading on flat and 4% bearings results in a lesser loaded area than does uniformloading. (Note how a slip of paper is inserted between the top of the bearing and the middle platen. Verticallines are spaced 20 mm apart). The reason for the lower shear modulus calculation is illustrated by therelationship
H = GAγ (4.2)
where G is the actual shear modulus of the material, A is the loaded area (which is smaller when bearings areloaded non-uniformly) and γ is the shear strain ( which is the same in all tests). Because the area, A is smaller,and G and γ are the same, the force required to shear the specimen is lower. When this lower value of V is usedto determine the shear modulus by the relationship
GV
A=
γ(4.3)
but the area, A is assumed to still be the total plan area, the shear modulus, G appears to decrease. When theresults of the tests are sorted by number of steel reinforcing shims (shape factor), the influence of axial stiffnessbecomes clear and is shown in Table 4.6.
Clearly, the more axially stiff bearings (more steel shims) have more difficulty in accommodating the non-uniform loading at lower compressive stresses than do the less axially stiff specimens.
It was shown in Table 4.5 that the overall effect of non-uniform loading at 3.85 MPa (550 psi) was to lower thecalculated shear modulus by 6.2 percent. When the compressive stress is increased to 7.69 MPa (1100psi) moreof the bearings’ plan area is in contact with the girder requiring more force to shear the bearing through the samestrain. Table 4.7 shows the percentage change in calculated shear moduli at 7.69 MPa (1100 psi) from matchedto mismatched conditions. Values in parentheses are the results from tests at 3.85 MPa (550psi) so that acomparison can be made.
The overall average decrease in shear modulus at the higher compressive stress level is only 2%, which isinconsequential. Table 4.8 shows that even the more axially stiff bearings show a lesser decrease in shearmodulus under the higher compressive stress due to the higher compressive stress resulting in a greater loadedarea. Figures 4.8 and 4.9 show the same bearing under non-uniform loading at low and high compressive stress. Note the decrease in separation between the bearing and the girder (the paper does not penetrate as far) at thehigher stress level.

64
Table 4- 5 Effect of non-uniform loading at low compressive stress
Percent Change from Shear Modulus at Matched SlopesMeasured Hardness Flat Bearings 4% Nominal Taper 6% Nominal Taper Overall
54 -2.2 -12.2 +2.5 -4.057 -5.1 -9.3 -5.8 -6.770 -7.7 -18.5 +2.2 -8.069 -10.9 -1.5 -6.3 -6.2
Average -6.5 -10.4 -1.9 -6.2
Table 4- 6 Influence of shape factor on shear modulus in non-uniformloading at low compressive stress
Percent Change in Shear Modulus from Matched SlopeMeasuredHardness
3 Steel ShimsS = 6.26
6 Steel ShimsS = 10.96
54 -1.5 -8.757 -4.8 -7.170 -6.5 -9.669 -3.5 -9.1
Average -4.1 -8.6
Table 4- 7 Effect of non-uniform loading at higher compressive stress
Percent Change From Shear Modulus at Matched SlopesMeasuredHardness
Flat Bearings 4% Nominal Taper 6% Nominal Taper Overall
54 +1.5 (-2.2)* -6.4 (-12.2)+2.6 (+2.5)
-0.6 (-4.0)
57 -4.2 (-5.1) -7.7 (-9.3) -0.8 (-5.8) -4.2 (-6.7)70 -3.5 (-7.7) -8.0 (-18.5) +3.5 (+2.2) -2.7 (-8.0)69 +0.6 (-1.5) -1.3 (-1.5) -0.7 (-6.3) -0.5 (-6.2)
*values in parentheses are for lower compressive stress

65
Table 4- 8 Influence of shape factor on shear modulus in non-uniform loading at highcompressive stress
Measured Hardness Percent Change in Shear Modulusfrom Matched Slope Tests
3 steel shims (S = 6.26) 6 steel shims (S = 10.96)54 -0.7 (-1.5 )* -0.8 (-8.7)57 -4.1 (-4.8) -3.3 (-7.1)70 -2.2 (-6.5) -3.3 (-9.6)69 +1.7 (-3.5) -4.0 (-9.1)
∗ values in parentheses are for lower compressive stress
Table 4- 9 Comparison of ASTM and full-scale shear modulus tests - Manufacturer A
Shear Modulus MPa (psi)Nominal Shear
ModulusMPa (psi)
50.8x50.8x12.7 mm(2”x2”x0.5”)
101.6x101.6x25.4 mm(4”x4”x1”)
Full-ScaleSpecimens
(0 to 50% strain)0.7 (100) 0.891 (127.5) 0.825 (118) 0.6808 (98.6)1.4 (200) 1.29 (184.5) 1.13 (162) 0.841 (122)
Figure 4- 6 Flat bearing loaded non-uniformly at low compressive stress

66
Figure 4- 7 Tapered bearing loaded non-uniformly on the thin end
Figure 4- 8 Bearing under non-uniform loading at 3.85 MPa (550 psi)

67
Figure 4- 9 Bearing under non-uniform loading at 7.69 MPa (1100 psi)
0
0.05
0.1
0.15
0.2
0.25
0.3
0.35
0.4
0.45
0.5
0 10 20 30 40 50 60
Strain (%)
Str
ess
(MP
a)
1st Loading Cycle
6th Loading Cycle
ASTM 4014
20-40% Strain
ASTM 4014: G = 0.937 MPa (136 psi)
20-40% Strain: G = 0.80 MPa (116 psi)
Figure 4- 10 Typical shear stress-strain curve from ASTM 4014 test
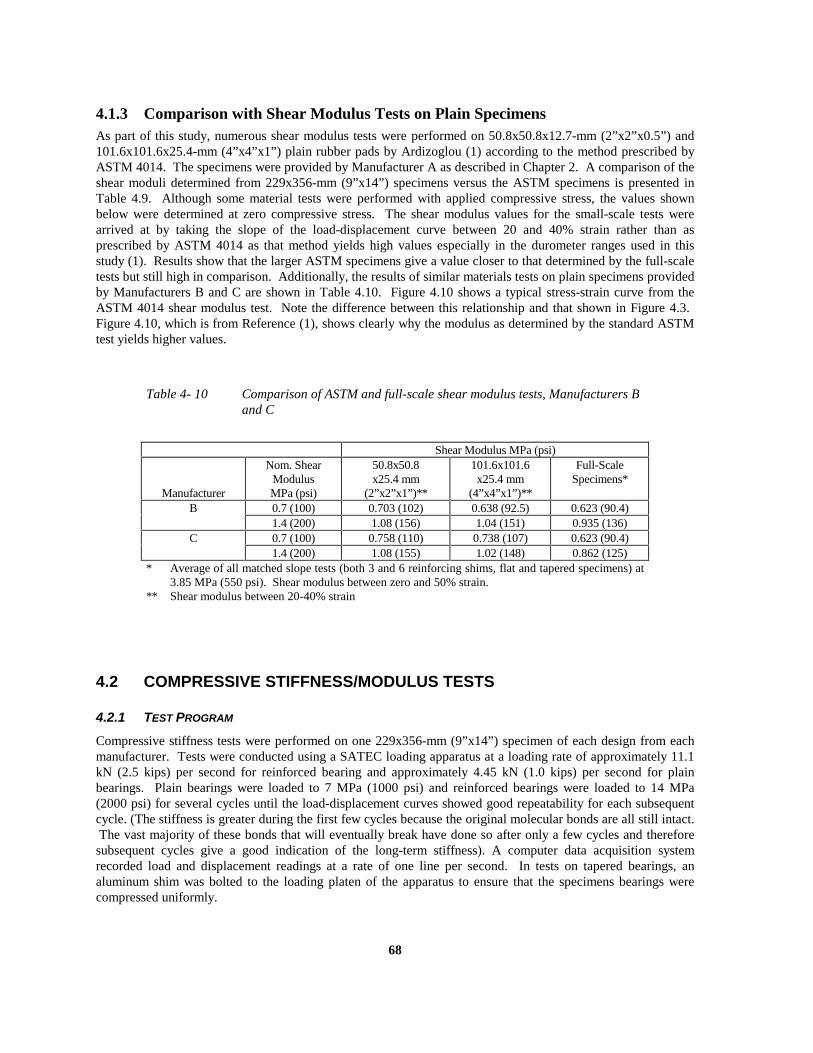
68
4.1.3 Comparison with Shear Modulus Tests on Plain SpecimensAs part of this study, numerous shear modulus tests were performed on 50.8x50.8x12.7-mm (2”x2”x0.5”) and101.6x101.6x25.4-mm (4”x4”x1”) plain rubber pads by Ardizoglou (1) according to the method prescribed byASTM 4014. The specimens were provided by Manufacturer A as described in Chapter 2. A comparison of theshear moduli determined from 229x356-mm (9”x14”) specimens versus the ASTM specimens is presented inTable 4.9. Although some material tests were performed with applied compressive stress, the values shownbelow were determined at zero compressive stress. The shear modulus values for the small-scale tests werearrived at by taking the slope of the load-displacement curve between 20 and 40% strain rather than asprescribed by ASTM 4014 as that method yields high values especially in the durometer ranges used in thisstudy (1). Results show that the larger ASTM specimens give a value closer to that determined by the full-scaletests but still high in comparison. Additionally, the results of similar materials tests on plain specimens providedby Manufacturers B and C are shown in Table 4.10. Figure 4.10 shows a typical stress-strain curve from theASTM 4014 shear modulus test. Note the difference between this relationship and that shown in Figure 4.3. Figure 4.10, which is from Reference (1), shows clearly why the modulus as determined by the standard ASTMtest yields higher values.
4.2 COMPRESSIVE STIFFNESS/MODULUS TESTS
4.2.1 TEST PROGRAM
Compressive stiffness tests were performed on one 229x356-mm (9”x14”) specimen of each design from eachmanufacturer. Tests were conducted using a SATEC loading apparatus at a loading rate of approximately 11.1kN (2.5 kips) per second for reinforced bearing and approximately 4.45 kN (1.0 kips) per second for plainbearings. Plain bearings were loaded to 7 MPa (1000 psi) and reinforced bearings were loaded to 14 MPa(2000 psi) for several cycles until the load-displacement curves showed good repeatability for each subsequentcycle. (The stiffness is greater during the first few cycles because the original molecular bonds are all still intact. The vast majority of these bonds that will eventually break have done so after only a few cycles and thereforesubsequent cycles give a good indication of the long-term stiffness). A computer data acquisition systemrecorded load and displacement readings at a rate of one line per second. In tests on tapered bearings, analuminum shim was bolted to the loading platen of the apparatus to ensure that the specimens bearings werecompressed uniformly.
Table 4- 10 Comparison of ASTM and full-scale shear modulus tests, Manufacturers Band C
Shear Modulus MPa (psi)
Manufacturer
Nom. ShearModulusMPa (psi)
50.8x50.8x25.4 mm
(2”x2”x1”)**
101.6x101.6x25.4 mm
(4”x4”x1”)**
Full-ScaleSpecimens*
B 0.7 (100) 0.703 (102) 0.638 (92.5) 0.623 (90.4)1.4 (200) 1.08 (156) 1.04 (151) 0.935 (136)
C 0.7 (100) 0.758 (110) 0.738 (107) 0.623 (90.4)1.4 (200) 1.08 (155) 1.02 (148) 0.862 (125)
* Average of all matched slope tests (both 3 and 6 reinforcing shims, flat and tapered specimens) at3.85 MPa (550 psi). Shear modulus between zero and 50% strain.
** Shear modulus between 20-40% strain

69
The compressive stiffness for reinforced bearings was determined by using a computer regression analysis onthe data points between 3.45 and 10.35 MPa (500 and 1500 psi). These limits were chosen because theycorrespond to the most common working ranges for bearings typical of those in use. (There is no standardASTM test for compressive modulus determination). Extrapolation of the slope appears to give a reasonableestimate of the load-displacement relationship at stresses lower than 3.45 MPa (500 psi) as well. The samestress limits were used for all reinforced bearing specimens although various reinforcing schemes would, ofcourse, not realize the same strains at the same stresses. Additionally, these stress limits are the same as thoseused in the compression fatigue experiments performed in this study. Due to the behavior of plain bearings, (seesection 4.2.2), the compressive stiffness determination was made at lower stress levels by a regression analysisbetween zero and 1.72 MPa (250 psi). At stresses above this level the curves are non-linear.
4.2.2 RESULTS
Before any tests were performed on reinforced bearings, plain rubber pads provided by Manufacturer A weretested for compressive stiffness. A stress-strain relationship for a nominal 0.7 MPa (100) psi shear modulus padis shown in Figure 4.11.
The results show a decrease in stiffness for the first few cycles. The slope of the load displacement curve inFigure 4.11 above was found to be 27.6 kN/mm (157.7) kips/in) which, when converted to compressive modulus
with hrt = 46.5 mm (1.83”) and A = 0.0813 m2 (126 in2) yields Ec = 15.8 MPa (2,291 psi). As soon as anyreinforcing steel shims are added to the specimen, the stiffness increases dramatically. A nominal 0.7 MPa (100psi) shear modulus reinforced (2 steel shims) bearing also from Manufacturer A yielded a load-displacementcurve with a slope of 181 kN/mm (1033 k/in) between 3.45 and 10.35 MPa (500 and 1500 psi) and acompressive modulus of 101.2 MPa (14,675 psi), a significant increase over the unreinforced specimen. Theresults of the tests on specimens from Manufacturers B and C are shown Table 4.11, which gives the slopes ofthe load-displacement relationships between 3.45 and 10.35 MPa (500 and 1500psi). Although there is somescatter, when the data are averaged within general categories, clear trends can be observed.
0
1
2
3
4
5
6
7
8
9
0 5 10 15 20 25 30 35
Compressive Strain (%)
Co
mp
ress
ive
Str
ess
(MP
a)
1.72 MPa (250 psi)
Kc
Figure 4- 11 Compressive stress-strain relationship for plain pad

70
Table 4- 11 Compressive stiffness test results
NominalTaper (%)
SteelShims
Stiffness kN/mm (kips/in)Manufacturer B
Measured Durometer
Stiffness kN/mm (kips/in) Manufacturer C Measured Durometer
57 69 54 70Flat 3 203 (1163) 293 (1672) 209 (1194) 285 (1629)
6 664 (3795) 741 (4237) 547 (3127) 747 (4268)4 3 234 (1338) 244 (1396) 204 (1166) 232 (1328)
6 623 (3564) 802 (4586) 415 (2370) 485 (2772)6 3 220 (1260) 283 (1620) 259 (1481) 273 (1561)
6 579 (3310) 823 (4705) 440 (2517) 618 (3534)Average 3 219 (1253) 273 (1563) 224 (1280) 264 (1506)
6 622 (3556) 789 (4509) 467 (2671) 617 (3525)
Table 4- 12 Effect of increasing shape factor on compressive modulus
Nominal 0.7 MPa (100 psi ) Nominal 1.4 MPa (200 psi) Percent IncreaseSteelShims(ShapeFactor)
AverageCompressive
StiffnesskN/mm(kips/in)
Average ShearModulus
MPa(psi)
AverageCompressive
StiffnesskN/mm(kips/in)
Average ShearModulus
MPa(psi)
Comp.Stiffness
ShearModulus
3(6.26)
222(1266)
0.619(88.5)
268(1535)
0.867(124)
21 40
6(11.0)
545(3114)
0.650(93)
703(4017)
0.944(135)
29 45
Table 4- 13 Effect of increasing shape factor on compressive modulus
Nominal (0.7 MPa) 100 psi Nominal 1.4 MPa (200 psi)Steel Shims
(Shape Factor)Average Compressive Stiffness
kN/mm (kips/in)Average Compressive Stiffness
kN/mm (kips/in)3 (6.26) 242 (1266) 268 (1535)6 (11.0) 545 (3114) 703 (4017)
Percent Increase 145 162

71
The compressive stiffnesses of the unreinforced pads provided by Manufacturer A were 27.6 kN/mm (158kips/in) for 65 durometer material and 28.7 kN/mm (164 kips/in) for 71 durometer material. The tests show thatincreasing the hardness of the elastomer has a much lesser effect upon the compressive stiffness than doesincreasing the shape factor by using more shims.
Effect of Increasing Hardness/Shear Modulus on Compressive ModulusTable 4.12 shows the effect of increasing the elastomer hardness on the specimen’s compressive stiffness. Because the shear moduli as determined from the shear modulus tests showed that the nominal 50 and 55durometer materials were very close in shear modulus and the nominal 60 and 70 durometer materials were alsovery close in shear modulus, the compressive stiffnesses from these two hardness ranges were averaged togetherand listed as nominal 0.7 and 1.4 MPa (100 and 200 psi) shear modulus respectively.
Effect of Increasing Shape Factor on Compressive ModulusIf the same averaging technique is used to compare increases in shape factor at the same hardness/shearmodulus, the results show a much more dramatic increase in compressive stiffness as shown in Table 4.13.Clearly, increasing the number of reinforcing shims has a dramatic effect on the compressive stiffness incomparison to increasing the hardness of the elastomer.
Effect of Tapering on Compressive ModulusTable 4.14 shows the average of all bearings tested in the categories listed. Table 4.14 shows that tapering thebearing has a very small effect upon the compressive stiffness of bearings with only 3 reinforcing shims. Theeffect on bearings with 6 shims however is to lower the compressive stiffness by 11.3% over a flat design. Thereason for this disparity is that the lightly reinforced bearings have very thick elastomer layers in either flat ortapered designs. Once any initial compressive force is applied to them, they behave similarly, which is to bulgeexcessively and deflect significantly. The behavior of the 6 shim bearings is quite different. The flat 6 shimbearings show almost no sign of significant bulging or deformation when loaded even up to 14 MPa (2000psi). As shown in Figure 4.12, these bearings are very stiff axially.
When a tapered 6 shim bearing is loaded, although the bearing does not bulge very much between steel shims,the bearing as a whole bulges in the direction of the thick end. Figures 4.13 and 4.14 show this behavior.
The typical stress-strain relationships for a 3 shim flat bearing and a 3 shim 4 % tapered bearing (Figure 4.15)are very similar while those for a 6 shim flat bearing and a 6 shim 6% tapered bearing (Figure 4.16) clearly showthat the tapered bearing is less axially stiff.
Table 4- 14 Influence of taper on compressive stiffness
Steel Shims(Shape Factor)
Stiffness kN/mm (kips/in)
Flat Bearings Tapered Bearings3 shims (6.26) 247 (1415) 244 (1394)6 shims (11.0) 675 (3857) 599 (3420)

72
Figure 4- 12 Flat 6 shim bearing loaded to 14 MPa (2000 psi) in compression
Figure 4- 13 Tapered 6 shim bearing loaded to 3.5 MPa (500 psi)

73
Figure 4- 14 Tapered 6 shim bearing loaded to 14 MPa (2000 psi)
0
2
4
6
8
10
12
14
0 2 4 6 8 10
Compressive Strain (%)
Co
mp
ress
ive
Str
ess
(MP
a)
3.45 to 10.3 MPa(500 to 1500 psi)
Flat Bearing
TaperedBearing
Figure 4- 15 Stress-strain curves for 70 durometer flat and tapered 3 shim bearings

74
Influence of Reinforcing Shim Orientation on Compressive Modulus and DeformationWhen the one 57 durometer, 6% taper, 3 shimspecimen with steel shims oriented parallel toone another is compared to the 54 and 57durometer, 6% taper 3 radially oriented steelshim specimens the compressive modulus anddeformations were very similar. Results areshown in Table 4.15.
While the specimen with parallel steel shimsappears to be less stiff axially as exhibited byboth compressive modulus and deformations,the difference between the two designs issmall which will produce little influence on compressive behavior. The marginal increase in deformation in theparallel shim specimen may be due to the greater bulging of the large wedge of unreinforced elastomer.
4.2.3 EXPERIMENTAL VERSUS CALCULATED VALUES
As explained in Chapter 1, the most accepted method of determining compressive modulus, Ec, is from
Ec = 3G(1+2kS2) (4.4)
which is also given by AASHTO. A comparison of experimentally determined and calculated compressivemoduli is presented in Table 4.16.
The comparison shows that Equation 4.4 yields increasingly more accurate results as the shape factor of thespecimen increases. One reason for this disparity could be that Equation 4.4 includes a correction for materialcompressibility, k, which assumes that the harder the elastomer, the greater the deformation due to compressionof the elastomer itself. (In calculations made for Table 4.16, k=0.675, 0.575, and 0.55 for 55, 65, and 70durometer material respectively). It has been suggested by Lindley (13) that this factor may not really benecessary. If k is set equal to 1.0 for the calculation for the plain and 2 shim bearings, the result is a much more
0
2
4
6
8
10
12
14
0 1 2 3 4 5 6 7 8 9 10
CompressiveStrain (%)
Co
mp
ress
ive
Str
ess
(MP
a)
3.45 to 10.3 MPa(500 to 1500 psi)
Flat Bearing TaperedBearing
Figure 4- 16 Stress-strain curves for 54 durometer flat and tapered 6 shim bearings
Table 4- 15 Influence of reinforcing shim orientationon compressive modulus and deformation
Parallel Shims Radial ShimsCompressive Modulus
MPa (ksi)133.1
(19.30)134.3
(19.48)Compressive Strain (%)
3.45 MPa (500 psi)6.90 MPa (1000 psi)10.35 MPa (1500 psi)
3.86.58.9
3.76.18.3

75
accurate estimate of the compression modulus at low shape factors but a poor estimate of the compressivemodulus for higher shape factors (values shown in parentheses in column 4 above). Fortunately, the AASHTOformula (Equation 4.4) gives reasonable results for shape factors most commonly used for bridge bearings.
Analysis of experimental results also shows that the empirical formula (Equation. 4.4) gives a better predictionof the increase in compression modulus due to an increase in material hardness/shear modulus or shape factor. A comparison of experimental results and calculated predictions is shown in Table 4.17.
Table 4- 17 Actual and predicted changes in compression modulus
Change in Design229x356 mm (9”x14”)
Specimens
Actual Increasein Modulus (%)
Predicted Increasein Modulus (%)
Increase Shear ModulusFrom 0.62 to 0.90 MPa
3 Shims 21 17
(90 to 130 psi) 6 Shims 29 21Increase Shape Factor 0.7 MPa (100 psi) 145 208
From 6.26 to 11.0 1.4 MPa (200 psi) 162 208
Although AASHTO allows the use of Equation 4.4 to determine the compressive modulus for use indeformation calculations, the straight line modulus is not accurate for predicting the actual deformation at agiven stress. For that reason, there are a number of stress-strain curves published in various references(AASHTO among them) that predict a strain for a bearing of a given shape factor and hardness at a range ofstresses. The stress-strain data generated from this study for flat bearings agree reasonably well with thosepublished by AASHTO (32) and other sources (6,7,13) but show some deviation from the stress-strain curveswhich assume a linear stress-strain relationship. As none of these curves consider tapered bearings, a series ofsuch relationships was produced from the data recorded during this study and is presented in Figure 4.17.
The stress-strain data were averaged together for all tapered bearings within the durometer and hardnesscategory as the 6% bearings deflected only slightly more than the 4% bearing at a given stress level. Again, the3 shim bearings, whether tapered or not, behaved reasonably similarly. The dashed lines represent the stress-strain relationship based upon Equation 4.4.
Table 4- 16 Experimental vs. calculated compressive modulus
BearingDesign
Compressive ModulusMPa (psi)
Experimental Calculated
RatioCalculated:
Experimental
Plain 0.7 MPa (100 psi) 16.0 (2295) 7.42 (1061) 0.46 (0.71)*
Plain 1.4 MPa (200 psi) 16.6 (2369) 9.06 (1295) 0.55 (0.85)*
2 shim 0.7 MPa (100 psi) 102.6 (14675) 53.1 (7592) 0.52 (0.84)*
2 shim 1.4 MPa (200 psi) 100.8 (14421) 61.8 (8833) 0.61 (1.08)*
Mfr B 3 shim 0.7 MPa (100 psi) 122.9 (17577) 100.4 (14353) 0.82 (1.20)*
Mfr C 3 shim 0.7 MPa (100 psi) 125.5 (17951) 100.4 (14353) 0.80 (1.18)*
Mfr B 3 shim 1.4 MPa (200 psi) 159.0 (22737) 114.9 (16437) 0.72 (1.30)*
Mfr C 3 shim 1.4 MPa (200 psi) 150.7 (21474) 109.9 (15715) 0.73 (1.32)*
Mfr B 6 shim 0.7 MPa (100 psi) 340.8 (48734) 317.6 (45418) 0.93 (1.38)*
Mfr C 6 shim 0.7 MPa (100 psi) 260.4 (37243) 306.9 (43889) 1.18 (1.74)*
Mfr B 6 shim 1.4 MPa (200 psi) 458.8 (65611) 346.1 (49497) 0.75 (1.37)*
Mfr C 6 shim 1.4 MPa (200 psi) 350.2 (50072) 333.6 (47705) 0.95 (1.73)*

76
4.3 ROTATIONAL STIFFNESS TESTS
Rotational stiffness tests were conducted to evaluate the ability of each bearing design to accommodate girderrotations. Tests were performed to establish a moment-rotation relationship for each bearing design as well as todetermine the point at which the lever arm (girder) lifted-off from the bearing. Additionally, the bottom cornersof the bearing’s less compressed edge were observed for any sign of uplift, a term applied to describe a netupward movement of any point on the bearing during rotational loading (12,25,32,33).
4.3.1 TEST PROGRAM
The same pair of nominal 50- and 70-durometer (54 and 69 measured) bearings which were used for the shearmodulus tests were rotated through 1.9 degrees in either direction using the test set up shown schematically inFigure 4.18. Comparisons of performance were made based on hardness/shear modulus, shape factor, and taperat compressive stresses of 3.85 MPa (550 psi) and 7.69 MPa (1100 psi).
Pressure was applied to the double acting ram via a hydraulic hand pump so that the bearings would be rotatedas slowly as possible. Three cycles of rotation in either direction were completed. Linear potentiometerspositioned 114 mm (4.5 inches) from the bearing center line were used to measure the rotation of the lever armelectronically. A digital inclinometer was employed to visually identify the point at which the desired rotationhad been achieved as shown in Figure 4.19.
0
2
4
6
8
10
12
0 2 4 6 8 10 12
Compressive Strain (%)
Co
mp
ress
ive
Str
ess
(MP
a)
70 Duro S = 11 Flat
55 Duro S = 11 Tapered
55 Duro S = 11 Flat
70 Duro S = 6 Flat
70 Duro S = 6 Tapered
55 Duro S = 6 Flat
55 Duro S = 6 Tapered
ε = σ/Ec
55 DuroS = 6
ε = σ/Ec
70 DuroS = 6
ε = σ/Ec
70DuroS = 11
ε = σ/Ec
55 DuroS = 11
70 Duro S = 11Tapered
Figure 4- 17 Stress-strain curves for flat and tapered bearings of 55 and 70durometer

77
4.3.2 TEST RESULTS
Analysis of the test results showed a significantdifference in the moment-rotation relationshipsof the axially stiff and the axially flexiblebearings especially when compared at the twodifferent compressive stress levels. Figures4.20 and 4.21 show the moment-rotation curvesfor the least stiff bearing - 54 durometer 3reinforcing shim - at 7.69 MPa (1100 psi) andthe stiffest bearing - 69 durometer 6 reinforcingshim - at 3.85 MPa (550 psi). Note thedifferences in linearity.
The slopes of the linear portions of therelationships were taken in each direction andaveraged to compare the rotational stiffnessesof the various designs and are given in Table4.18. In an attempt to calculate the rotation atwhich lift-off might be starting, the point where
the moment-rotation relationship became non-linear was recorded for comparison. This was accomplished bycomputing the slope of the curve from the zero rotation point to every subsequent point on the line. The point atwhich the slope started to decrease was identified as the “rotation capacity”. This method was used because itwas very difficult to visually observe the start of lift-off. However, photographic records were made of everybearing at the rotation where lift-off exceeded approximately 20 mm. Table 4.19 shows the average rotationcapacities calculated from the tests. A zero indicates that the moment-rotation curve was non-linear from theorigin.
COMPRESSION
Aluminum Shims
1.22 m (48")
Concrete
Concrete
Double Acting Ram to provide Moment
Load Cell
Lever Arm
Gage Stand
LinearPotentiometers
RAM
Figure 4- 18 Schematic diagram of rotational stiffnesstest setup
Figure 4- 19 Rotational stiffness test instrumentation

78
-40
-30
-20
-10
0
10
20
30
40
-0.04 -0.03 -0.02 -0.01 0 0.01 0.02 0.03 0.04
Rotation (radians)
Mo
men
t (k
N-m
)
Figure 4- 20 Moment-rotation curve - flat 54 Durometer 3 shim bearing at 7.69 MPa
-50
-40
-30
-20
-10
0
10
20
30
40
50
-0.04 -0.03 -0.02 -0.01 0 0.01 0.02 0.03 0.04
Rotation (radians)
Mo
men
t (k
N-m
)
Figure 4- 21 Moment-rotation curve - flat 69 Durometer 6 shim bearing at 3.85 MPa

79
Table 4- 18 Average rotational stiffnesses
Rotational Stiffness N-m/radian (K-in/degree)54 Durometer 69 Durometer
Bearing Design 3.85 MPa(550 psi)
7.69 MPa(1100 psi)
3.85 MPa(550 psi)
7.69 MPa(1100 psi)
Flat 3 shim 408(63.1)
479(74.0)
538(83.2)
545(84.2)
6 shim 829(128)
845(131)
865(134)
1132(175)
4%Taper
3 shim 450(69.5)
471(72.7)
390(60.2)
522(80.6)
6shim 780(121)
830(128)
962(149)
1072(166)
6%Taper
3shim 386(59.6)
405(62.6)
390(60.3)
438(67.7)
6shim 856(132)
856(132)
975(151)
1085(168)
Table 4- 19 Average rotation capacities of bearings
Rotation Capacity Radians (Degrees)54 Durometer 69 Durometer
Bearing Design 3.85 MPa(550 psi)
7.69 MPa(1100 psi)
3.85 MPa(550 psi)
7.69 MPa(1100 psi)
Flat 3 shim 0.013(0.745)
0.0332(1.9)
0.0066(0.38)
0.0332(1.9)
6 shim 0(0)
0.0192(1.1)
0 (0)
0.00436(0.25)
4%Taper
3 shim 0.0168(0.96)
0.0332(1.9)
0.0244(1.4)
0.0332(1.9)
6shim 0.0107(0.615)
0.0171(0.98)
0.00585(0.335)
0.0162(0.93)
6%Taper
3shim 0.0227(1.3)
0.0332(1.9)
0.0244 (1.4) 0.0332(1.9)
6shim 0.0087(0.5)
0.0185(1.06)
0.00812(0.465)
0.0112(0.64)

80
Figure 4- 22 Bearing exhibiting lift-off at 3.85 MPa (550 psi)
Figure 4- 23 Bearing exhibiting lift-off at 7.69 MPa (1100 psi)

81
The data presented was analyzed to determine the effect of compressive stress on rotational stiffness androtation capacity. Figures 4.22 and 4.23 show the same bearing at the point where the lever arm has lifted off. In Figure 4.22 the bearing is being compressed at 3.85 MPa (550 psi) and in Figure 4.23 the compressive stressis 7.69 MPa (1100 psi). The slip of paper inserted between the top of the bearing and the lever arm shows theextent to the lever arm lift-off from the bearing. Note that there is no observable uplift of the bearing’s lesscompressed corners. They are clearly still in contact with the concrete surface and are still in compression.
Table 4.20 summarizes the effect of a change incompressive stress from 3.85 MPa (550 psi) to7.69 MPa (1100 psi) on rotation capacity androtational stiffness. Overall, doubling thecompressive stress resulted in an average 10.8%increase in rotational stiffness and a 120%increase in rotation capacity. These findings aresignificant in that the rotation capacity allowed inthe current AASHTO specification (twice thecompressive deformation divided by the length)can be shown to be overly conservative by thefollowing example. Consider the case of a flat 54durometer bearing under 7.69 MPa (1100 psi) compressive stress:
Calculate compressive deformation: Use Figure 4.18 ∆c = 1.27 mm (0.050 inches)
Calculate allowable rotation by to AASHTO: θ = 2∆c/L = 2 (1.27 mm)/229 mm = 0.011radians
From Table 4.19, the average rotation capacity as defined in this study for this bearing at this compressive stressis 0.0192 radians (1.1 degrees). Photographic records show that even when rotated as far as 0.0293 radians,only approximately a 20-mm length of lift-off was observed. Furthermore, there is no experimental evidence thatthis small degree of lift-off is actually detrimental to the bearing. Results of the rotation capacity tests presentedabove will be considered in making recommendations for design specifications to be given later in this report.
Influence of Hardness/Shear Modulus on Rotation Capacity/StiffnessTable 4.21 shows the effect of increasing the elastomer hardness from 54 durometer to 69 durometer (shearmodulus 0.62 MPa (90 psi) to 0.90 MPa (130 psi)) upon rotational behavior. Results appear logical with thepossible exception of a harder 3 shim bearing producing more rotation capacity, but a 2.0 % change shouldreally be regarded as indicating no influence rather than being a sign of a clear trend. It does seem clearhowever, that the higher durometer 6 shim bearings have poor rotational behavior (greater rotational stiffnessand lower rotation capacity.)
Table 4- 20 Influence of compressive stress onrotational stiffness and rotationcapacity
Bearing Design Rotational StiffnessIncrease (%)
RotationCapacity
Increase (%)3 Shim 11.6 84.56 Shim 10.0 155.2
50 Durometer 5.83 135.670 Durometer 15.7 104.0
Table 4- 21 Effect of increasing hardness on rotational behavior
Change in Rotational Stiffness(%)
Change in Rotation Capacity(%)
3 Shim + 8.63 + 2.06 Shim + 21.9 - 38.2

82
Influence of Shape Factor on Rotational BehaviorTable 4.22 shows how increasing the shape factor of the specimens effected their rotational behavior. Onceagain, the 69 durometer hardness material shows a less desirable trend than does the softer material.
Effect of Tapering on Rotational BehaviorFigure 4.24 shows a typical moment-rotation relationship for a 54 durometer, 6 steel shim, 6% tapered bearingat 7.69 MPa (1100 psi) compressive stress. The shape of the curve is typical of all of the highly reinforced lowdurometer bearings at the higher compressive stress level. The only variation from the relationship observed forflat bearings is that there is an initial moment due to the lever arm restraining the bearings’ natural tendency torotate toward their thick end when compressed. Figures 4.25a and 4.25b show the same tapered bearing under7.69 MPa (1100 psi) at the point where the lever arm has lifted off from the bearing.
Table 4- 22 Effect of increasing shape factor on rotational behavior
Steel ShimsRotational StiffnesskN-m/rad (K-in/deg)
Rotation CapacityRadians (Degrees)
(Shape Factor) 54 Durometer 69 Durometer 54 Durometer 69 Durometer3 Shim(6.26)
433.1(66.9)
470.7(72.7)
0.0253(1.45)
0.0258(1.48)
6 Shim(11.0)
832.6(128.6)
1015(156.8)
0.0124(0.71)
0.00768(0.44)
Change (%) +92.3 +115.8 -51.1 -70.4
-60
-40
-20
0
20
40
60
-0.04 -0.03 -0.02 -0.01 0 0.01 0.02 0.03 0.04
Rotation (radians)
Mo
men
t (k
N-m
)
K r
Rotation Capacity
K r
Figure 4- 24 Typical moment-rotation relationship for a taperedbearing

83
(a)
(b)
Figure 4- 25 Tapered bearing at lever arm lift-off

84
Table 4.23 gives the percentage change in rotational stiffness and rotation capacity for tapered bearings versusflat bearings of the same design. (Results for all tapered bearings are averaged together).
Although the trend is clear in change in rotation capacity, the average loss of rotational stiffness, which is lessthan 5% does not indicate any significant change. The change in rotation capacity may be less a reflection of thecapacity of tapered bearings as it is the lack of capacity of flat bearings which appeared to show very lowrotation capacity especially under 3.85 MPa (550 psi) compressive stress. In no way do the test results indicateany reason why the use of tapered bearings would not be recommended. In fact, as shown in Table 4.19 taperedbearings exhibited more rotation capacity than flat bearings with all other parameters the same.
Effect of Reinforcing Shim Orientation on Rotational BehaviorAs described in Chapter 2, one 57 durometer, 3 shim, 6% taper specimen was fabricated with steel shimsparallel to one another rather than radially oriented. This design was tested in the same manner as all others anda comparison to similar tapered bearing designs (54 durometer, 3shim) is made in Table 4.24. Although themeasured hardness of this specimen is different from the 54 durometer specimens, recall from Section 4.1 thatthe actual shear modulus of the nominal 50 durometer and 55 durometer specimens was almost identical. Forthis reason a direct comparison can be made.
The fact that the parallel orientation design produced a lower rotational stiffness is not surprising considering thethickness of the unreinforced wedge of elastomer that provides the taper to accommodate the girder slope. Thereason for the rotation capacity at the higher compressive stress being lower than that of bearings with theradially oriented shims is not apparent and could be due to a test anomaly.
4.3.3 SUMMARY OF ROTATIONAL BEHAVIOR TESTS
Figure 4.26 shows a graphical display of the moment-rotation relationships of the flat bearings tested as part ofthis study. From this comparison, the increase in rotational stiffness due to increases in material hardness, shapefactor, and compressive stress can be seen readily. Figure 4.27 shows a comparison of typical
Table 4- 23 Influence of taper on rotational behavior
Bearing Design Change in Rotational Stiffness(%)
Change in Rotation Capacity(%)
3 Shim -12.4 +28.56 Shim +1.0 +104.0
54 Durometer -1.77 +23.069 Durometer -5.29 +77.0
Table 4- 24 Influence of steel shim orientation on rotational behavior
Shim Orientation Rotational StiffnesskN-m/rad (k-in/deg)
Rotation Capacityradians (degrees)
3.85 MPa(550 psi)
7.69 MPa (1100psi)
3.85 MPa(550 psi)
7.69 MPa (1100psi)
Radial Orientation 417(64.5)
438(67.7)
0.0197(1.13)
0.0332(1.90)
Parallel Orientation 335(51.8)
385(59.5)
0.0216(1.24)
0.0267(1.53)
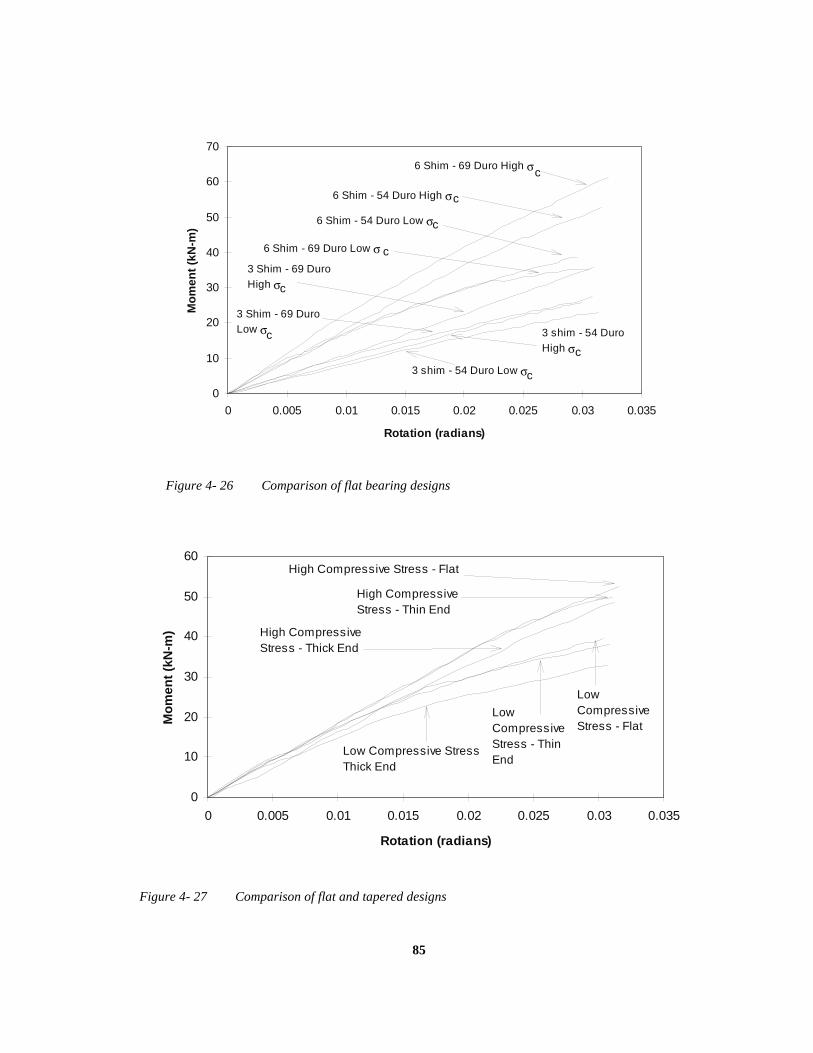
85
0
10
20
30
40
50
60
70
0 0.005 0.01 0.015 0.02 0.025 0.03 0.035
Rotation (radians)
Mo
men
t (k
N-m
)
3 shim - 54 Duro Low σ
3 shim - 54 DuroHigh σ
6 Shim - 69 Duro High σ
6 Shim - 54 Duro High σ
6 Shim - 54 Duro Low σ
6 Shim - 69 Duro Low σ
3 Shim - 69 DuroHigh σ
3 Shim - 69 Duro Low σc
c
c
c
c
c
c
c
Figure 4- 26 Comparison of flat bearing designs
0
10
20
30
40
50
60
0 0.005 0.01 0.015 0.02 0.025 0.03 0.035
Rotation (radians)
Mo
men
t (k
N-m
)
Low Compressive Stress Thick End
Low Compressive Stress - Thin End
Low Compressive Stress - Flat
High Compressive Stress - Thick End
High Compressive Stress - Thin End
High Compressive Stress - Flat
Figure 4- 27 Comparison of flat and tapered designs

86
relationships for 6 shim, 54 durometer tapered bearings versus a 6 shim, 54 durometer flat bearing at bothcompressive stress levels. Note the similarity in performance between the flat and tapered designs for this lowerdurometer material. Predictably, the thick end of the tapered bearing shows less stiffness than does the thin endand either end of a flat bearing.
Three sources were used to make comparisons of experimental results and theoretical predictions of therotational stiffness for the specimens tested. Lindley (13) gives the “tilting stiffness” of a single elastomer layeras shown below:
K t Gk r PL Q
t
At
= +
3 2 0 062 2
2.
(4.5)
where:
Kt = Tilting Stiffness, kN-m/radian
G = shear modulus, MPa
kr = radius of gyration about tilting axis, mm
P = numerical factor based on plan shape (P = 1 if square, P = 1.33 if W > > L), P=1 in Eq. 4.5
L = Length, mm
Q = numerical factor based on plan shape (Q = 0.75 if square, increases with W/L), Q=0.859 in Eq. 4.5
t = thickness of one elastomer layer, mm
A = Plan area, m2
Rejcha (23) gives a “moment corresponding to a rotation” as shown below:
M e CMG eL W
teα α=
5
3 (4.6)
where:
Mαe = moment required to rotate one elastomer layer αe radians, kN-m
CM = a numerical factor based upon the L/W ratio
G = shear modulus, MPa
αe = rotation of one elastomer layer, radians
L = length, mm
W = width, mm
te = thickness of one elastomer layer, mm
Also, section 14.6.2 of the current AASHTO specifications (32) give the “moment induced by bending of arectangular bearing about an axis parallel to its long side” as
( )M
Ec I TL xhrt
=0 5. ,θ
(4.7)
where:

87
I = moment of inertia about the x-axis, mm4
Ec = compressive modulus from Equation 4.3, kN/mm2
Predictions of the rotational stiffness for the various designs are given in Table 4.25 below along with theaverage rotational stiffnesses for all tests performed including flat and tapered specimens.
Other than for the most axially stiff designs, all methods give a reasonably accurate estimate of the rotationalstiffnesses determined in the laboratory. AASHTO’s equation is no exception, giving good results for the lowershape factor but poor results for the higher shape factor. Overall however, there are significant differencesbetween test and theory; generally, the theory overestimates the bearing stiffness for higher shape factors.
By current AASHTO Specifications, rotations for the 6 steel shim nominal 0.7 MPa (100 psi) bearings tested inthis study would be restricted to approximately 0.010 radians. As shown in Section 4.3, these bearings weresubjected to rotations of as much as 0.03 radians with no adverse effects noted. As described in Chapter 1, thebasis for the current AASHTO limitations on shear, compression and rotation is given by the followingrelationship (25):
γs + γc + γr ≤ 3.0 (4.8)
This relationship requires that the total amount of shear strain from all sources be limited to 3.0. Since thecurrent limitation on shear strain due to shear is 0.5, the strain due to compression and rotation combined mustbe limited to 2.5 (according to AASHTO). The shear strain due to compression can be expressed by thefollowing relationship (25):
gc = 6 S ec (4.9)
For the 6 shim bearings (S = 10.96) described above, the compressive strain at 6.9 MPa (1000 psi) isapproximately 2.5 %, yielding a shear strain due to compression of 1.64. Assuming the maximum shear straindue to shear (0.5), the shear strain due to rotation would be required to be less than 0.856 to conform to basis forthe AASHTO Specification. The shear strain due to rotation can be expressed as (25):
γ θr CrSLhrt
=2
(4.10)
Table 4- 25 Comparison of rotation test results and theoretical calculations
Bearing Design Rotational Stiffness kN-m/radian (k-in/degrees)Lindley* Rejcha* AASHTO* Experimental
54 Durometer 3 shim 341(52.6)
314(48.4)
384(59.3)
430(66.9)
54 Durometer 6 shim 1032(159)
984(152)
1173(181)
836(130)
69 Durometer 3 shim 446(68.8)
411(63.4)
413(63.7)
468(72.7)
69 Durometer 6 shim 1413(218)
1342(207)
1329(205)
1087(169)
∗ Shear moduli used in Equations 4.4, 4.5 and 4.6 were as determined from full-scale shear modulustests
88
where Cr is a constant, the value of which is dependent upon the bearing’s length to width ratio. For the
bearings used in this study, the value of Cr is 3.13. Setting γr equal to 0.856 and solving for θ using hrt=44.5mm (1.75”) and L=229 mm (9”), the allowable rotation for the bearing is 0.010 radians. If there were no shearstrain due to shear (as in the rotational stiffness tests), the allowable rotation would have been 0.015 radians. Therefore, the bearings tested in rotation at 6.9 MPa (1000 psi) compressive stress were subjected to rotations 2times that deemed allowable by AASHTO with no damage noted. A computation of the actual shear strain in abearing of the same design as those tested here undergoing a rotation of 0.03 radians, a shear deformation of
50% hrt and a compressive stress of 6.9 MPa (1000 psi) yields a magnitude of 4.73. Although this exceeds thecurrent AASHTO limit, both British and European international codes have allowed this magnitude of shearstrain (33).
4.4 DISCUSSION OF STIFFNESS TEST RESULTS
Shear Modulus/Stiffness TestsManufacturing - Although manufacturers appear to be more comfortable quoting hardness rather than shearmodulus, they were capable of providing the requested shear modulus at the low value with a good degree ofaccuracy. It is interesting to note that three different manufacturers all were able to supply 0.7 MPa (100 psi)shear modulus material within about 13 percent at three different either nominal or actual hardness ratings. (Durometer/Shear Moduli averages were: Manufacturer A - 65 durometer/0.680 MPa (98.6 psi); ManufacturerB - 57 durometer/0.604 MPa (87.5 psi); Manufacturer C - 54 durometer/0.602 MPa (87.3 psi)). However,manufacturers were not capable of producing the requested higher shear modulus material with any degree ofaccuracy. The user should assume that even when the manufacturer is well practiced in producing bearings witha specific shear modulus, a variation of ±5 % from bearing to bearing should be expected and is certainly notdetrimental.
Effect of Tapering - Taper does not appear to have any effect on the shear modulus of the bearing at least atlower hardness ratings. In these tests, only the 69 durometer tapered bearings showed any measurably differentperformance from comparable flat bearings. In none of the tests under matched or mismatched slope conditionsdid any of the tapered bearings show any tendency whatsoever to slip.
Shape Factor - Although the literature claims that shape factor should have no influence on shear modulus, boththe experimental and analytical studies showed an increase in shear modulus with an increase in shape factor. One reason for this might be that at 50% strain, the specimens with only 3 shims were not sheared to the pointwere the shims would start bending significantly and providing any measurable resistance to the horizontalforce. This is not the case with the 6 shim specimens which displayed steel shim bending early in the shearstrain cycle. Additionally, the elastomer layer between the steel shims is much thinner in the 6 shim specimensthan in the 3 shim specimens. If the elastomer between the steel is considered bonded, from the materialsproperties tests performed by Ardizoglou (1), it would be predicted that the thinner layers would produce thehigher shear modulus. In any case, although lower shear modulus is more desirable, the higher shape factordoes not increase the stiffness more than about 7% which is not appreciable.
Non-Uniform Loading - Non-uniform loading tends to decrease the shear modulus of the bearing and produce agap between the top of the bearing and the bottom of the girder. This effect is greater in bearings that havegreater axial stiffness.
Effect of Compressive Stress - It appears that increased compressive stress would be beneficial insofar as it tendsto lower the force produced by the same amount of shearing. Additionally, even though axially stiff bearingsdisplayed difficulty accommodating non-uniform loading at low compressive stresses, when the compressivestress on these bearings is increased, they are less prone to exhibit any gap between the girder and the bearingthan when they are loaded non-uniformly under low compressive stress.
89
Compressive Modulus/Stiffness TestsFactors Effecting Compressive Stiffness - The greatest influence on compressive stiffness is the shape factor. Increasing elastomer hardness without increasing the shape factor has only a marginal effect on increasing axialstiffness. Although there is an additional cost to the user when shims are added to the design, it is not verylarge. The 6 shim bearings ordered for this study cost approximately 12% more than the 3 shim bearings.
Effect of Taper - Taper does not appear to have any discernible effect upon compressive stiffness in lower shapefactor bearings. As the shape factor increases, the taper appears to cause a lower compressive stiffness andgreater deformations. For bearings with a shape factor of 10.96, the loss of stiffness was in the range of 11%,and the additional deformation was in the range of 30 to 60% over the flat design with the 6% tapered bearingsdeflecting more than the 4% tapered bearings. However, the absolute magnitude of the deformations was only inthe range of 1.27 mm (0.50”) to 2.54 mm (0.10”), which is not very significant.
Empirical Formula for Compressive Modulus Determination - The most commonly employed formula forcompressive modulus (Equation 4.4) gives better results at higher rather than lower shape factors. As thetendency within the past several years has been to design bearings with shape factors over 5, the formula can beused to predict compressive modulus with a reasonably high degree of certainty.
Deformations - The compressive modulus formula cannot precisely estimate the axial deformation at a givenstress level because the stress-strain relationship is not linear, especially in bearings with higher shape factors. For this reason, a number of stress-strain relationships are given by various sources and should be used toestimate compressive deformations. Stress-strain relationships for tapered bearings by hardness and shapefactor are presented in this chapter.
Rotational Stiffness TestsEffect of Hardness/Shape Factor on Rotational Behavior - Increasing either of these parameters increases therotational stiffness and decreases the rotation capacity (except in the case of rotation capacity of low shapefactor bearings), a generally undesirable trend. The worst possible rotational behavior performance would befrom a high shape factor, high hardness design.
Effect of Compressive Stress - Increasing the compressive stress causes an increase in rotational stiffness androtation capacity. While increased rotational stiffness may not be desirable, the increase is only in the 10%range but the increase in rotation capacity, which is most definitely desirable, is in the range of 120%. Thismeans that lift-off due to girder rotation is much less likely to occur. For high shape factor bearings made fromlow durometer material, the effect of increasing the compressive stress is to allow this design to achieveapproximately 60% of the rotation capacity of the lower shape factor bearings.
Formulas for prediction of Rotational Stiffness - While not generally published in the most common literatureon elastomeric bearings Equations 4.5 and 4.6 given by Lindley (13) and Rejcha (23) appear to give betteragreement with the results from this study but the difference between test and theory is about 20%. TheAASHTO equation (4.6) gives better results for lower shape factors than it does for higher shape factors.
Limits on Rotation Capacity - From the calculation of rotation capacity and photographic records of the tests,elastomeric bearings can absorb a significantly larger imposed rotation than is suggested by current guidelines. Calculations of the shear strains due to rotation sustained by the bearings tested in this study indicate that thebearings were subjected to 50% more strain than would be allowed by the current AASHTO Specificationwithout observable damage. Furthermore, other codes (33) have allowed rotations and shear strains far inexcess of those currently allowed by AASHTO.
Common FactorsDegree of taper - With the exception of compressive deformations, the degree of taper (up to the 5.5% used inthis study), did not appear to influence bearing behavior. While there were some differences noted between flat

90
and tapered bearings overall, the only measurable differences in behavior between 4% nominal and 6% nominaldesigns was in compressive deformation.
High Hardness Not Desirable - In terms of forces transmitted to the girder and abutment, and in lower rotationcapacity, especially at low compressive stress levels, higher hardness material appears to be undesirable.
Benefits of Higher Compressive Stress - Allowing bearings to be subjected to higher compressive stressesappears to have several benefits. The horizontal forces produced through shearing are reduced, the rotationcapacity before lift-off is increased, the bearing can adapt to non-uniform loading more readily and a smallerbearing can be used (as long as the situation permits).
Shim Orientation - At least within the limits of this study, (low durometer, 3 steel shim, 6% bearing taper), shimorientation does not appear to have any significant effect upon stiffness behavior. Almost all differences notedbetween the designs with parallel shim orientation versus radial shim orientation are well within the 5% rangeand must be regarded as due to experimental margins of accuracy.
Cover Layer Thickness - According to the current AASHTO Specification, the cover layers of the 6 shim (S =10.96) 0.7 MPa (100 psi) nominal bearings were too thick (6.35 mm (0.25 in)) to carry more than 6.80 MPa(986 psi) because they would bulge excessively and thereby become too highly stressed in shear. In both theshear modulus and rotational stiffness tests, bearings with this design were subjected to 7.59 MPa (1100 psi)routinely and their cover layers never showed any signs of excessive bulging (see Figures 4.9, 4.23, and 4.25). Additionally, the same bearings were subjected to 13.8 MPa (2000 psi) in the compression stiffness tests and thecover layers still did not show any excessive bulging (see Figures 4.12 and 4.14). In many cases, the coverlayers were fabricated as much as 2.54 mm (0.10 in) thicker than specified yielding layers of 8.89 mm (0.35 in),but were not observed to bulge excessively.

91
CHAPTER 5COMPRESSIVE CREEP BEHAVIOR
Compressive creep is an important consideration in bearings constructed of elastomers because of the well-recorded propensity for these materials to exhibit creep behavior and the long-term nature of the bearings’ use. Although creep must be factored into the design, results from this study will show that compressive creep inreinforced bearings will not become a critical consideration.
5.1 TEST PROGRAM
One bearing of each design from each manufacturer was subjected to a constant compressive pressure of 5.17MPa (750 psi) for two weeks to determine its long-term creep behavior. Pressure was applied by an 8900-kN(2000-kip) hydraulic ram shown in Figure 5.1 and was kept steady by the same type of constant pressure systemused in the shear test apparatus (see Figure 2.3). An aluminum shim was used to match the slope of the bearingwhen tapered specimens were tested.
Figure 5- 1 Compressive creep apparatus

92
The specimen was positioned in the apparatus and the platen was raised by a hydraulic pump until the bearingcould not move freely. The hydraulic pump was then disconnected from the system and the long-term pressurewas applied instantaneously by the dead weight system. The instantaneous deformation was measured with 3dial gages and a electronic motion transducer and averaged to determine a final value. Deformation readingswere taken each minute for the first ten minutes, then at 15, 20, 30, 45, 60 and 90 minutes. Additional readingswere taken each hour for several hours during the first day and then once every 24 hours thereafter. Creep at anytime was determined by dividing the change in deformation by the instantaneous deformation to obtain a valuefor creep in percent of initial deformation. Figures 5.2, 5.3, and 5.4 show various representations of creepbehavior for a 55 durometer 6% tapered bearing with three reinforcing steel shims. Figure 5.2 is a standardcreep plot while Figures 5.3 and 5.4 show the two methods which were used in this study to predict long-termcreep. Those methods are described below:
Logarithmic PredictionA plot of creep (percent of initial deformation) against time in hours on a logarithmic scale is shown in Figure5.3. Although some sources (6,13) claim that creep deformation is linear when plotted against time on a logscale, this behavior was rarely observed beyond the one-hour reading in the vast majority of the tests. Therefore,
0
10
20
30
40
50
60
0 50 100 150 200 250 300 350
Time (hrs)
Cre
ep (
% In
itia
l D
efo
rmat
ion
)
Southwell Plot Predictionof Long-Term Creep
Figure 5- 2 Standard creep relationship
0
10
20
30
40
50
60
1E-02 1E-01 1E+00 1E+01 1E+02 1E+03 1E+04 1E+05 1E+06
Time (Hrs)
Cre
ep (
% In
itia
l D
efo
rmat
ion
)
50 years
Creep at 50 years
Figure 5- 3 Logarithmic prediction of long-term creep

93
determination of the slope of the line used to predict 50-year creep deformation was limited to creep valuesbetween one minute and one hour only. The points between time equal to one minute and time equal to one hourwere used to calculate the slope of the line and the creep value corresponding to one hour was used as the y-intercept for extrapolating the value of total creep at 50 years.
Southwell Plot PredictionThe Southwell plot, a method generally used to predict buckling loads, gives time divided by cumulative creepat that point plotted against time as shown in Figure 5.4. The inverse of the slope of this line was taken as thelong-term creep prediction. For the vast majority of tests, this relationship showed excellent linearity from the50-hour mark onward, varying only a few percentage points from day to day through the end of the test period.
According to theoretical analysis (39) the Southwell plot should be capable of predicting the true buckling load
within 3% as long as the applied load is 80% of Pcr. In the case of long-term creep prediction, provided the testcontinues to the point where more than 80% of the total creep is realized, the Southwell plot should predict thetrue creep value within 3%. In tests performed by duPont over several years (7), it was concluded that 85% ofthe long-term creep in elastomeric pads is realized within two weeks of initial loading. Thus, the Southwell plotshould provide a highly accurate method of predicting long-term creep behavior.
5.2 TEST RESULTS
Analysis of Creep DeformationsTable 5.1 gives a summation of the actual creep deformations recorded during the 2-week tests by category. (54-57-durometer and 69-70-durometer specimens are grouped into 55- and 70-durometer categoriesrespectively). The results are reasonably consistent and the data show very little scatter.
The only major trend that is illustrated above is the difference between the 3 shim and the 6 shim bearings, thecreep deformation of the former being approximately 3.5 times that of the later. Lower shape factor taperedspecimens displayed 14% more creep deformation than comparable flat specimens while 55- durometerspecimens deformed about 20% more than comparable 70-durometer specimens. Neither of these comparisonsis significant in light of the actual magnitude of the deformations.
0
1
2
3
4
5
6
7
0 50 100 150 200 250 300 350
Time (Hrs)
Tim
e/C
reep
(H
rs/%
Init
ial
Def
orm
atio
n)
1
Long-Term Creep
Figure 5- 4 Southwell plot prediction of long-term creep
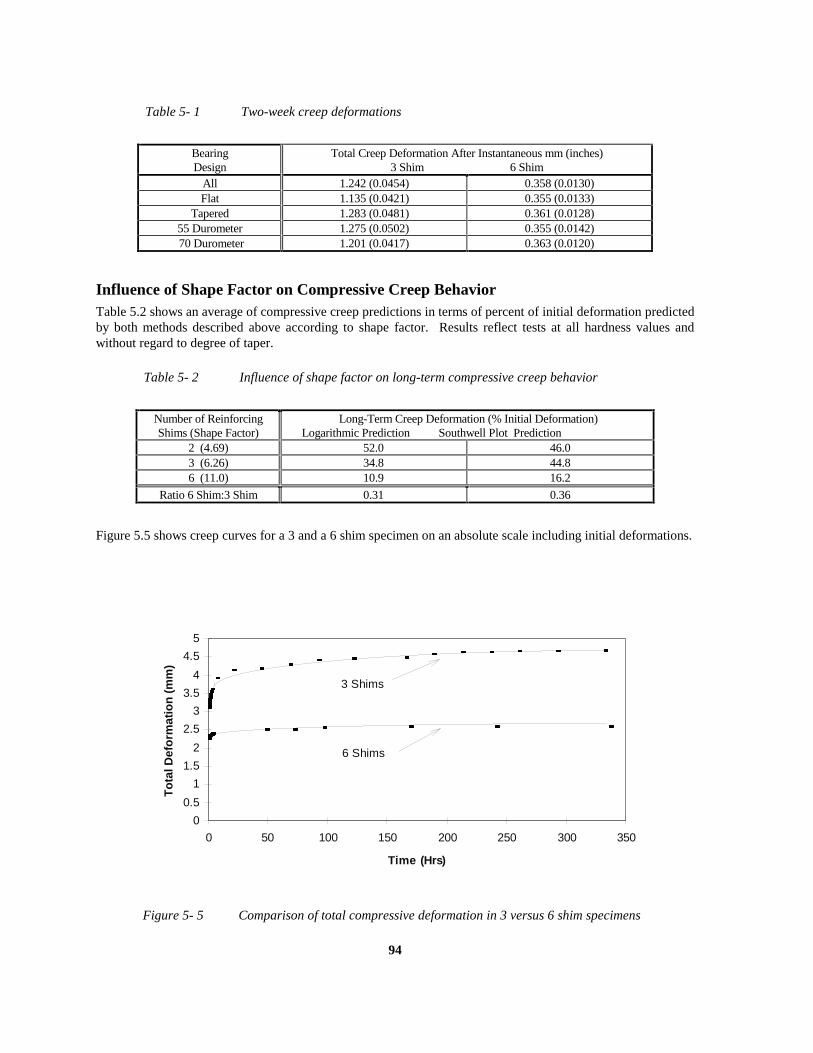
94
Influence of Shape Factor on Compressive Creep BehaviorTable 5.2 shows an average of compressive creep predictions in terms of percent of initial deformation predictedby both methods described above according to shape factor. Results reflect tests at all hardness values andwithout regard to degree of taper.
Figure 5.5 shows creep curves for a 3 and a 6 shim specimen on an absolute scale including initial deformations.
Table 5- 1 Two-week creep deformations
BearingDesign
Total Creep Deformation After Instantaneous mm (inches)3 Shim 6 Shim
All 1.242 (0.0454) 0.358 (0.0130)Flat 1.135 (0.0421) 0.355 (0.0133)
Tapered 1.283 (0.0481) 0.361 (0.0128)55 Durometer 1.275 (0.0502) 0.355 (0.0142) 70 Durometer 1.201 (0.0417) 0.363 (0.0120)
Table 5- 2 Influence of shape factor on long-term compressive creep behavior
Number of ReinforcingShims (Shape Factor)
Long-Term Creep Deformation (% Initial Deformation) Logarithmic Prediction Southwell Plot Prediction
2 (4.69) 52.0 46.03 (6.26) 34.8 44.86 (11.0) 10.9 16.2
Ratio 6 Shim:3 Shim 0.31 0.36
0
0.5
1
1.5
2
2.5
3
3.5
4
4.5
5
0 50 100 150 200 250 300 350
Time (Hrs)
To
tal D
efo
rmat
ion
(m
m)
6 Shims
3 Shims
Figure 5- 5 Comparison of total compressive deformation in 3 versus 6 shim specimens

95
The results show that shape factor has a clear effect upon long-term creep. The only reference to this behavioris that in the AASHTO Specification (32) where it is stated that plain bearings creep more than reinforced onesdue to slip at the interface. However, Figure 5.5 illustrates very clearly that the absolute magnitude of thedeformations for the two shape factors is still quite small. Considering that the magnitude of the initialdeflection for these shape factors at 5.17 MPa (750 psi) is between 1.91 mm (0.075 inches) and 4.45 mm (0.175inches), the difference in methods yields an extremely small variation on an absolute scale -- 0.267 mm (0.0105inches) for the lowest shape factor and 0.109 mm (0.00420 inches) for the highest shape factor.
Influence of Hardness on Compressive Creep BehaviorTable 5.3 below shows test results according to hardness (3 and 6 reinforcing shim specimens have beenaveraged together within hardness ratings to achieve the greatest number of samples). As reported earlier in thisstudy, because all of the specimens from Manufacturers B and C were delivered at approximately 55 or 70durometer, results from the tests are averaged within those hardness values.
The results show good agreement between the two methods except in the 70-durometer category. The reason forthis discrepancy is that the 70-durometer specimens displayed much less creep during the first hour of the testthan did the 55-durometer specimens. When long-term creep was estimated by the Southwell plot method, theresults showed that durometer had no clear effect on creep behavior with the both hardnesses creeping similarlyin both 3 and 6 shim specimens. Other studies (6,7) have shown that creep is greater in harder elastomersbecause the initial deformation is lower and the actual long-term deformation is very similar. Thus, as apercentage of initial deformation, harder elastomers creep more.
Influence of Taper on Compressive Creep BehaviorTable 5.4 shows the results of the creep tests sorted by bearing cross-sectional geometry and by shape factor. Nodifferences were noted in the creep behavior of the nominal 4% specimens versus the nominal 6% specimens,therefore these tests were averaged together into one “tapered” category.
Table 5- 3 Influence of hardness on compressive creep behavior
Hardness Long-Term Compressive Creep Deformation(% Initial Deformation)
Logarithmic Prediction Southwell Plot Prediction55 Durometer 28.2 30.570 Durometer 18.4 30.6
Table 5- 4 Influence of bearing taper on compressive creep behavior
Cross-Section
ReinforcingShims
(Shape Factor)
Long-Term Compressive Creep Deformation(% Initial Deformation)
Logarithmic Prediction Southwell Plot PredictionFlat 3 shim (6.26) 38.2 40.0
6 shim (11.0) 13.4 15.3Tapered 3 shim (6.26) 32.9 48.2
6 shim (11.0) 9.5 16.7
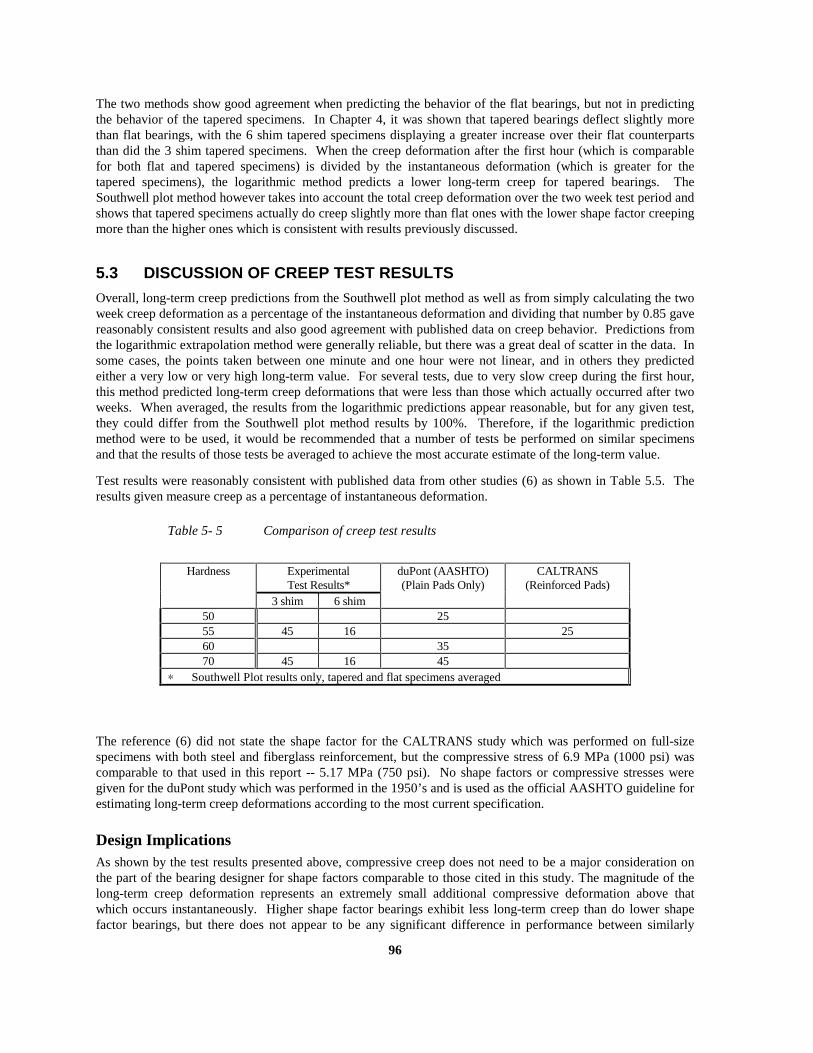
96
The two methods show good agreement when predicting the behavior of the flat bearings, but not in predictingthe behavior of the tapered specimens. In Chapter 4, it was shown that tapered bearings deflect slightly morethan flat bearings, with the 6 shim tapered specimens displaying a greater increase over their flat counterpartsthan did the 3 shim tapered specimens. When the creep deformation after the first hour (which is comparablefor both flat and tapered specimens) is divided by the instantaneous deformation (which is greater for thetapered specimens), the logarithmic method predicts a lower long-term creep for tapered bearings. TheSouthwell plot method however takes into account the total creep deformation over the two week test period andshows that tapered specimens actually do creep slightly more than flat ones with the lower shape factor creepingmore than the higher ones which is consistent with results previously discussed.
5.3 DISCUSSION OF CREEP TEST RESULTS
Overall, long-term creep predictions from the Southwell plot method as well as from simply calculating the twoweek creep deformation as a percentage of the instantaneous deformation and dividing that number by 0.85 gavereasonably consistent results and also good agreement with published data on creep behavior. Predictions fromthe logarithmic extrapolation method were generally reliable, but there was a great deal of scatter in the data. Insome cases, the points taken between one minute and one hour were not linear, and in others they predictedeither a very low or very high long-term value. For several tests, due to very slow creep during the first hour,this method predicted long-term creep deformations that were less than those which actually occurred after twoweeks. When averaged, the results from the logarithmic predictions appear reasonable, but for any given test,they could differ from the Southwell plot method results by 100%. Therefore, if the logarithmic predictionmethod were to be used, it would be recommended that a number of tests be performed on similar specimensand that the results of those tests be averaged to achieve the most accurate estimate of the long-term value.
Test results were reasonably consistent with published data from other studies (6) as shown in Table 5.5. Theresults given measure creep as a percentage of instantaneous deformation.
The reference (6) did not state the shape factor for the CALTRANS study which was performed on full-sizespecimens with both steel and fiberglass reinforcement, but the compressive stress of 6.9 MPa (1000 psi) wascomparable to that used in this report -- 5.17 MPa (750 psi). No shape factors or compressive stresses weregiven for the duPont study which was performed in the 1950’s and is used as the official AASHTO guideline forestimating long-term creep deformations according to the most current specification.
Design ImplicationsAs shown by the test results presented above, compressive creep does not need to be a major consideration onthe part of the bearing designer for shape factors comparable to those cited in this study. The magnitude of thelong-term creep deformation represents an extremely small additional compressive deformation above thatwhich occurs instantaneously. Higher shape factor bearings exhibit less long-term creep than do lower shapefactor bearings, but there does not appear to be any significant difference in performance between similarly
Table 5- 5 Comparison of creep test results
Hardness ExperimentalTest Results*
duPont (AASHTO)(Plain Pads Only)
CALTRANS(Reinforced Pads)
3 shim 6 shim50 2555 45 16 2560 3570 45 16 45
∗ Southwell Plot results only, tapered and flat specimens averaged

97
reinforced bearings of different hardness ratings (although other sources give a greater creep deformation forelastomers of higher hardness) or between flat and tapered designs. Overall, creep must be considered in athorough design but due to its very small magnitude will most likely not influence the outcome.

98

99
CHAPTER 6FATIGUE TESTS
During its service life the typical bearing may be subjected to thousands of shear and compressionfatigue cycles. Shear fatigue occurs primarily as a result of thermal expansion and contraction whilecompression fatigue is a result of traffic loading, particularly heavy truck traffic. Elastomeric bearingshould be capable of resisting fatigue loading without excessive degradation of performance andwithout significant physical damage. Replacing “worn out” bearings is not a desirable task. Todetermine the optimum design for resistance to fatigue loadings, specimens were subjected torepeated shear and compression loadings that were designed to exceed those expected in the field. Atotal of 24 fatigue tests were conducted, 12 shear fatigue and 12 compression fatigue.
6.1 SHEAR FATIGUE TESTS
Although traffic loading also results in shear stress to the bearing when repeated stopping and startingis considered, the thermal expansion and contraction of the bridge girders which is of a much greatermagnitude must be considered the major source of shear fatigue. While current specifications allowshear strains up to 50%, this limitation takes into consideration all expansion or contraction duringthe entire service life of the bridge including creep and shrinkage as well as yearly thermal extremes.Therefore, on a daily basis, it would be expected that bearings are sheared through a much lesserpercent strain. In field studies associated with the project, daily shear strains in the range of less than20% were typical. To ensure that specimens tested during this study were subjected to the mostrigorous standards, however, a daily shear strain of 50% was presumed for the entire service life ofthe bearing.
6.1.1 TEST PROGRAM
One set of bearings representing each possible design (shear modulus, taper, shape factor) wassubjected to 20,000 cycles—which corresponds to a 55-year service life—at 50% shear strain under3.45 MPa (500 psi) compressive stress to observe their tendency to delaminate or crack. Load-displacement measurements were taken throughout the test to determine if the specimen lost shearstiffness during the course of the repeated cycling. Figure 6.1 shows the shear fatigue apparatus usedin this study. The shear strain was imposed by a double-acting hydraulic ram regulated by anelectronic load controller, which was adjusted to maintain a constant sinusoidal load at a rate of 0.2cycles/second. Because the control unit was load sensitive, a motion transducer was connected to themiddle platen and the maximum load setting was adjusted until the specimen strain was at 50% ineither direction. Due the difficulty of maintaining a constant compressive stress while the bearingswere shearing, pressure maintaining system similar to that described in Chapter 3 was employed andcan be observed in Figure 6.1.
One 229-mm x 711-mm (9” x 28”) was cut into three 229-mm x 229-mm (9” x 9”) sections forfatigue testing. Steel shims were intentionally exposed so that any delamination would be readilyobserved. Two sections were tested simultaneously in shear fatigue and the third in compression

100
fatigue. Prior to testing, each specimen was thoroughly examined for pre-existing flaws which werenoted so as not to be assumed as being caused by fatigue loading when the tests was completed.Specimens were bonded on their bottom surfaces with epoxy to 6.35-mm (0.25”) steel plates topreclude their slipping during the test and then positioned in the test apparatus as shown in Figure6.2. For tests on tapered specimens aluminum shims which matched the slope of the bearings wereemployed. The compressive force was then applied via the dead weight hydraulic system.
Immediately upon starting the test, the total load and actual displacements from -50% to +50% strainwere recorded to obtain a starting shear stiffness for the specimen. These measurements wererepeated throughout the test (which normally lasted approximately 28 hours) and recorded to keeptrack of shear stiffness loss.
6.1.2 TEST RESULTS
Fatigue damageThroughout the testing, the specimens were visually examined for damage due to shear fatigue. Nocracking of the elastomeric material itself was ever noted in any of the tests. In fact, one specimen,prior to the start of the test, was discovered to have an elliptical shaped flaw in the elastomer whichwas measured precisely during the inspection and was found not to have increased in size after beingsubjected to 20,000 shear cycles. The only physical damage to the bearings was “fretting” of theelastomeric material on the top and bottom surfaces due to the repeated rubbing against the platens.Figure 6.3 shows typical “fretting” damage on the surface of a test specimen.
Figure 6- 1 Shear fatigue apparatus

101
Loss of Shear StiffnessShear stiffness loss was noted and is shown in Table 6.1.
Figure 6- 2 Bearings in shear fatigue apparatus

102
Figure 6- 3 Fretting damage on bearing surface
Table 6- 1 Loss of shear stiffness due to shear fatigue loading
Design Parameters Loss of Shear Stiffness (%)
3 Steel Shims* 7.3
6 Steel Shims* 7.5
Flat 5.6
Tapered 8.1
55† Durometer* 3.4
70‡ Durometer* 10.8
Average 7.4
∗ all flat and tapered specimens, † all 54-57 durometer specimens,‡ all 69-70 durometer specimens

103
A degree of stiffness loss is expected as a result of repeated shearing due to the breaking of molecularbonds between polymers. The results show that the only obvious influence upon loss of shearstiffness during fatigue loading is hardness (shear modulus) which should not be surprising given thatthe harder specimens have a higher shear stiffness to start with and therefore can realize the greatestreduction. Although the results above show that tapered bearings lost more stiffness than flatbearings, the difference is not significant enough to show a real trend.
6.2 COMPRESSION FATIGUE TESTS
The source of compression fatigue loads is heavy truck traffic. During the service life of a bearing,millions of cycles of such loading may be realized. The magnitude of the stress above that which iscaused by dead weight, assuming that the entire load from one half of a 142-kN (32-kip) axle isapplied to one bearing which is 229 mm x 559 mm (9”x22”), is in the range of 0.557 MPa (80 psi).Therefore, a representative compression fatigue test would consist of several million interval loads ata low compressive stress range. Since this was not practical, tests performed in this study weredesigned to be as conservative as possible and subjected specimens to much greater stress ranges athigher frequencies for fewer cycles. Clear differences in performance between bearing designs werenoted.
6.2.1 TEST PROGRAM
One bearing representing each possible design was subjected to 500,000 compression fatigue cyclesat a frequency of one cycle per second with a mean stress 6.9 MPa (1000 psi) and a stress range of6.9 MPa (1000 psi) to observe physical damage and to record loss of compressive stiffness. As in theshear fatigue tests, each 229x229-mm (9”x9”) specimen was thoroughly inspected before testing sothat damage due to fatigue would be properly catalogued. Specimens were bonded to a 6.35-mm(0.25”) steel plate with epoxy cement and then bolted into position in the test apparatus. Acompressive load-displacement curve from zero to 13.8 MPa (2000 psi) was recorded before the startof the test. The compressive force was applied via a 3115-kN (700-kip) hydraulic ram regulated by anelectronic load controller adjusted for the mean and cyclic loads described above. At the end of eachtest another load-displacement curve was recorded so that the before and after stiffnesses might becompared. For tests on 4% tapered bearings, an aluminum shim machined to precisely match thebearing slope was employed. For tests on 6% tapered bearings however, rather than using a matchedaluminum shim, the same 4% shim was employed to force a relative rotation between the top andbottom surfaces of the bearing in addition to the compressive displacement. As described in Section4.3, shear strains due to compression and rotation can be calculated. By using Equations 4.9 and4.10, it was determined that the lower durometer 3 and 6 shim 6% bearings were subjected to amaximum shear strain of 5.33 and 3.86 respectively for 500,000 cycles. The higher durometer 3 and6 shim bearings realized shear strains of 5.42 and 3.65 respectively. These stresses are far in excessof the current AASHTO limitation.

104
6.2.2 TEST RESULTS
Fatigue DamageBecause all bearings were subjected to the same stresses, the deformations realized by the lowershape factor specimens were far greater than were those realized by the higher shape factor specimenswhich resulted in significant fatigue damage to bearings with 3 steel shims but no observable damageto those with 6 steel shims. Examples are shown in Figures 6.4 and 6.5.
Typically, extensive delamination was noted in the 3 shim specimens at approximately 250,000cycles, but in some cases as early as 150,000 cycles. No delamination was ever noted in the 6 shimspecimens.
Figure 6- 4 Bearing with three reinforcing shims at 10.35 MPa (1500 psi)
Figure 6- 5 Bearing with six reinforcing shims at 10.35 MPa (1500 psi)

105
Loss of Compressive StiffnessResults of stiffness tests reflect the behavior described above. Table 6.2 shows the loss ofcompressive stiffness after 500,000 cycles according to the various design parameters.
The results show that the only parameter that has a definite impact upon the loss of stiffness due tocompression fatigue loading is the shape factor because of the greater shear strains in the lessreinforced bearings. Hardness does not appear to influence the results nor does the reduction instiffness due to taper appear to be significant enough to cause alarm. As far as the influence ofrepetitive non-uniform loading is concerned, when the results from the tests on the 4% taperedbearings (which were loaded uniformly) are compared to those of the 6% tapered bearings (whichwere loaded non-uniformly), the 4% specimens actually lost more stiffness than the 6% specimens.This is probably not the sign of a clear trend, but rather an indication that non-uniform loading has noimpact upon loss of compressive stiffness due to fatigue. Following completion of all scheduledtests, a 55 durometer 6 shim 6% taper bearing was tested for an additional 1,500,000 cycles todetermine the point at which the more highly reinforced specimens would begin to exhibit fatiguedamage. This 6% bearing was loaded non-uniformly with a 4% platen as before so that it would besubjected to fatigue in rotation as well as in compression. For this specimen, at 649,000 cycles,rubber was noted to have started splitting from repeated bulging between the steel shims on one side.At 946,500 cycles, this splitting was noted to have increased and some delamination at therubber/steel interface was also noted. At 1,373,000 cycles delamination was observed to haveprogressed to the point where the rubber was bulging 1-2 mm out from around the steel shims at mid-height and -length of the cross-section. From this point through 2,000,000 cycles, the surface areashowing this delamination increased to about 50% on both exposed faces. A load-displacement curvewas recorded at the completion of 2,000,000 cycles and a 9% loss of compressive stiffness was noted,which is still significantly less stiffness loss than the 3 shim bearings realized after only 500,000cycles.
Table 6- 2 Loss of compressive stiffness due to compressionfatigue loading
Design Parameters Loss of Compressive Stiffness (%)
3 Steel Shims* 13.5
6 Steel Shims* 3.8
Flat 6.6
Tapered 9.7
55† Durometer* 8.2
70‡ Durometer* 9.1
Average All Specimens 8.65
∗ all flat and tapered specimens, † all 54-57 durometer specimens, ‡all 69-70 durometer specimens

106
6.3 DISCUSSION OF FATIGUE TESTS
Shear FatigueRepetitive shear strain does not appear to result in any lasting damage to elastomeric bearings whentested under service stresses. In the worst case, higher hardness bearings lost an average of 10% oftheir original shear stiffness but there are no detrimental effects upon elastomeric bearingperformance due to a small reduction in shear stiffness without delamination. Results of the testsperformed as part of this study are consistent with tests performed at the Battelle Memorial Institute in1970 (17) where neoprene and natural rubber specimens were subjected to 100,000 shear cycles at±50% strain and research performed at the University of Washington (24) where neoprene and naturalrubber bearings were subjected to 20,000 cycles at ±50% strain. Results are shown in Table 6.3.Because specimens in the other studies represented as a more continuous range of hardnesses and shearmoduli, the data presented in those studies have been divided as best as possible according to hardnessand shear modulus values used in this study so that a better comparison may be made with the resultspresented herein.
Compression FatigueCompression fatigue loading can result in damage to bearings based upon the tests described above.However, these tests were performed at stress levels that were far in excess of those found underservice conditions. Based upon these tests, bearings with a higher shape factor are less likely tosuffer fatigue damage because they do not bulge as much under load as do bearings with lower shapefactors. This finding is consistent with the analytical study (10) which found that, in 3 shim bearingsunder pure compression, the elastomer shear stresses at the rubber/steel shim interface were morethan twice the magnitude of those in 6 shim bearings. Repetitive non-uniform compressive loadinghas no adverse effect on elastomeric bearings out of proportion to the damage that would be realizedhad the bearing been loaded uniformly. Based upon the calculated shear strains due to compressionand rotation, a total strain of as much as 3.86 for 500,000 cycles did not results in any observable
Table 6- 3 Comparison of shear fatigue test results
Hardness or
Shear Modulus MPa (psi)
Loss of Shear Stiffness (%)
Test Results Battelle Memorial University of
Institute Washington
< 0.69 (100) 3.4 2.0
50-57 Durometer 3.4 4.1
> 0.69 (100) 10.8 7.0
58-70 Durometer 10.8 1.4

107
damage. In the test program at the University of Washington (24), a compressive fatigue study wasperformed on flat bearings with shape factors slightly lower than the 3 shim specimens used in thisreport, all of which had similar hardness ratings (approximately 52). The results of those testsshowed that the average loss of compressive stiffness was 11.0% after an average of 1,000,000 cyclesat similar mean stresses and stress ranges.
Common FactorsBearings with tapered elastomeric layers do not realize fatigue damage or loss of stiffness at a ratesignificantly higher than do bearings with only uniform elastomeric layers.

108

109
CHAPTER 7DETERMINATION OF FAILURE STRESSES
Although failure of elastomeric bearings is much more likely to be defined in terms of deteriorationor slipping, the study would not be complete without a determination of the stresses at which failurein the more traditional senses (yield, fracture, etc.) occur. For this reason, a number of tests wereperformed to evaluate the behavior of the specimens under the greatest possible compressive andshear stresses. Even though tensile forces may be produced in elastomeric bearings due tocompression and shear loading, unbonded bearings would never be placed in direct tension andtherefore no tests of bearings in tension were performed.
7.1 COMPRESSION FAILURE TESTS
The most current AASHTO specifications allow reinforced elastomeric bearings to be subjected to amaximum compressive stress of 11.0 MPa (1600 psi). The design procedure calls for an analysis ofthe hydrostatic force produced by the elastomeric material bulging and thereby exerting tensilestresses on the reinforcing steel shims. As long as the shims are thick enough to resist this stresswithout yielding, the design is acceptable. Compressive failure tests which were intended to identifythe stresses at which the reinforcing steel yielded and then fractured were performed on 37 specimensrepresenting a cross-section of the numerous designs examined in this study. Due to the magnitude ofthe forces required to bring the most axially stiff specimens to fracture, not all of the specimens weretaken to this level. The results do however provide a clear basis for comparison of the influence ofvarious design parameters upon the bearings’ ability to resist substantial compressive stresses. Inaddition to testing reinforced bearings, two plain specimens were also tested to observe the behaviorof the elastomer itself when subjected to the most extreme compressive forces possible.
7.1.1 TEST PROGRAM
Figure 7.1 shows the compression failure test apparatus which consisted of an 8900-kN (2000- kip)hydraulic ram attached to a self-reacting steel frame capable of withstanding the maximum force thatthe ram could apply. A fixed steel upper platen was bolted to the ram piston and a steel lower platenwas bolted to the heavily reinforced concrete pedestal as shown below.
One 229-mm x 711-mm (9” x 28”) bearing was cut into three 229-mm x 229-mm (9” x 9”)specimens, each of which was subjected to increasing compressive force until the reinforcing shimsfractured, the elastomer debonded from the steel shims or split, or the capacity of the test machinewas reached. For tests on tapered specimens, a machined aluminum shim was bolted to the upperplaten. Tapered bearings were subjected to compression under matched slope and intentionallymismatched slope conditions to determine the effects of non-uniform loading (4% bearings against6.25% platens and 6% bearings against 4.17% platens). Compressive force was determined bymultiplying the ram area by the hydraulic line pressure measured by a pressure transducer. Verticaldeflection was measured by a linear potentiometer. Data were recorded by computer data acquisitionsystem.

110
7.1.2 TEST RESULTS
Unreinforced BearingsThe first tests were performed on unreinforced specimens to observe whether permanent materialdamage could be caused through excessive compressive loading. Figure 7.2 shows an unreinforcedbearing loaded to approximately 31.0 MPa (4500 psi).
Figure 7.3 shows the accompanying stress-strain curve for the plain pad 229 mm x 356 mm x46.5 mm (9”x14”x1.83”). The relationship shows that after the compressive stress reached 13.8 MPa(2000 psi), there was very little additional deflection despite a more than doubling of the stress.
Figure 7- 1 Compression failure test apparatus

111
Figure 7- 2 Unreinforced bearing under 31.0 MPa (4500 psi) compressive stress
0
5
10
15
20
25
30
35
0 10 20 30 40 50 60
Compressive Strain (%)
Co
mp
ress
ive
Str
ess
(MP
a)
13.8 MPa (2000 psi)
Figure 7- 3 Stress-strain relationship for a plain pad loaded to 31.0 MPa(4500 psi)

112
At a certain point, the material appears to become practically incompressible. When unloaded, thespecimen showed no sign of any damage or permanent deformation and appeared to regain itsoriginal shape immediately.
Reinforced BearingsSubsequent tests on reinforced bearings gave a wide variety of results. The best conclusion whichcan be reached is that while one can expect comparable results from each specimen cut from the sameoriginal bearing, there need not be any similarity between bearings of similar designs, nor is there anypredictable trend by which to predict the failure mechanism. Reinforcement yielding, and fracture, aswell as delamination and elastomer tearing appear to be functions of the individual bearing at highercompressive stresses, but a reasonable conclusion can be made as to a minimum expected safe levelof compressive loading. Figure 7.4 shows a reinforced bearing stress-strain relationship that includesa number of the failure mechanisms observed during these tests. At first, the bearing shows areasonably linear stress-strain relationship. At approximately 55.2 MPa (8000 psi) the slopedecreases. This was interpreted as the point were yielding of the steel shims became significantenough to cause a decrease in compressive stiffness. The same interpretation was made byresearchers as The University of Washington (33). At 86.2 MPa (12,500 psi) and at 105 MPa(15,250 psi) sharp drop-offs in the stress with accompanying increases in strain occurred, which wereinterpreted as signifying elastomer tearing or debonding along the rubber/steel interface. In mostcases, debonding was easily observed with specimens still in the test machine. At very high stresslevels, even if debonding has occurred in some regions, where the elastomer/steel bond is still intact,the reinforcement approaches fracture. At 124 MPa (18,000 psi), when fracture finally occurs, asignificant drop in the stress is observed, along with a substantial increase in strain.
0
20
40
60
80
100
120
140
0 10 20 30 40 50 60
Compressive Strain (%)
Co
mp
ress
ive
Str
ess
(MP
a)
Loss of Stiffness
Delamination
Delamination
Steel Fracture
Figure 7- 4 Reinforced bearing compression test stress-strain relationship

113
Figures 7.5 and 7.6 show specimens with severe elastomer tearing/delamination and with fracturedreinforcing steel shims.
A summation of the results from the compression tests on reinforced bearings is presented in Table7.1. In most cases, specimens with 6 reinforcing steel shims could not be brought to the point offracture before exceeding the capacity of the test apparatus. It seems reasonably clear that the only*flat and tapered specimens, **not included in ave or other categories, †54-57 durometer specimensdiscernible trend is that the 2 shim specimens lost stiffness and fractured much earlier than the 3 and6 shim specimens. Additionally, because both 3 and 6 shim specimens lost stiffness at almost thesame stress and fractured at almost the same stress, 6 shim specimens strain less at both levels ofstress than do 3 shim specimens. It also appears clear that non-uniform loading does not effect thecompression behavior of tapered bearings nor does orientation of reinforcing shims. No realconclusion can be reached concerning the influence of hardness. One reason for tapered bearingsappearing to strain more than flat bearings at both stress levels is that the displacement recorded ismost likely increased slightly due to the specimen slipping out somewhat during the test.
Comparison of Experimental and Theoretical ResultsEquation 2.1 gave an expression for the minimum steel shim thickness required to preclude yieldingbased upon the design compressive stress for the bearing. Equation 7.1 shows Equation 2.1rearranged to give the compressive stress required to cause the reinforcing shims to yield in a bearingwith shims of a known yield strength and thickness (no factor of safety is included).
σ cFyhs
hr hr=
+
4
3 1 2( )(7.1)
Table 7- 1 Results of reinforced bearing compression tests
Design Parameter Stiffness Loss Stress Strain MPa (psi) %
Fracture Stress Strain MPa (psi) %
2 Steel Shim** 45.2 (6550) 35 67.4 (9770) 503 Steel Shim* 71.0 (10300) 36 117.2 (17000) 566 Steel Shim* 77.9 (11300) 22 128.3 (18600) 36
55† Durometer* 75.9 (11000) 32 118.6 (17200) 5269 Durometer* 70.3 (10200) 27 122.1 (17700) 47
Flat 70.0 (10000) 25 123.4 (17900) 43Tapered (all) 76.6 (11100) 33 117.9 (17100) 56
Tapered (non-uniform load) 77.2 (11200) 36 119.5 (17300) 56Parallel Steel Shims** 82.7 (12000) 40 123.4 (17900) 55
Average 73.7 (10700) 30 120.4 (17500) 49

114
Figure 7- 5 Elastomer tearing/delamination
Figure 7- 6 Fractured reinforcing steel shims
115
where hs is the thickness of the steel shim and hr1 and hr2 are the thicknesses of the elastomer layersaround the steel. This equation is based upon theory which applies to bearings with W >> L (25). For bearings with W < 2L (as were all specimens tested here), and also with no factor of safetyapplied, the theoretical compressive stress to cause first yield is presented by Rejcha (23) as
σcFy hs
hr=
1 99. (7.2)
where hr is the thickness of the elastomer layers above and below the steel plate (assuming that theelastomer layers are of equal thickness). Table 7.2 compares the experimental stress at whichcompressive stiffness loss was first observed and the theoretical value of compressive stress requiredto cause yield assuming a yield stress of 310 MPa (45 ksi), the average yield stress given in the Millreport from the manufacturer who fabricated the vast majority of the compression test specimens.
Obviously, the theoretical calculation suggests that yielding will occur much earlier than the observedcompressive stiffness loss. This may be due to the fact that the theoretical calculation gives the pointat which the stress in the steel plate(s) reaches yield at its center alone. For yielding to progressbeyond this point, additional compressive stress would be required. Therefore, it is possible thatyielding had begun at the theoretical value of compressive stress but stiffness loss was only noticeableon the stress-strain curve much later. This may account for the fact that several specimens wereloaded beyond the theoretical stress values given above and unloaded without observing anypermanent deformation. There does not appear to be any other clear explanation of the discrepancybetween the values presented above.
7.2 SHEAR FAILURE TEST
Although failure by reinforcing steel yielding or by delamination caused be excessive shear strain isextremely unlikely in elastomeric bearings anchored by friction alone, one such test was performed toevaluate the conditions required to initiate this type of failure.
Table 7- 2 Comparison of theoretical yield stresses and experimental stiffness loss stress
Number of Reinforcing Steel Shims
Theoretical First YieldMPa (psi)
Experimental StressMPa (psi)
2 Shim* 35.8 (5190) 45.9 (6650)3 Shim 37.1 (5400) 71.0 (10300)6 Shim 64.8 (9410) 77.9 (11300)
∗ 3.4-mm (10 gage) shims vs. 2.7-mm (12 gage) for 3 and 6 shim specimens
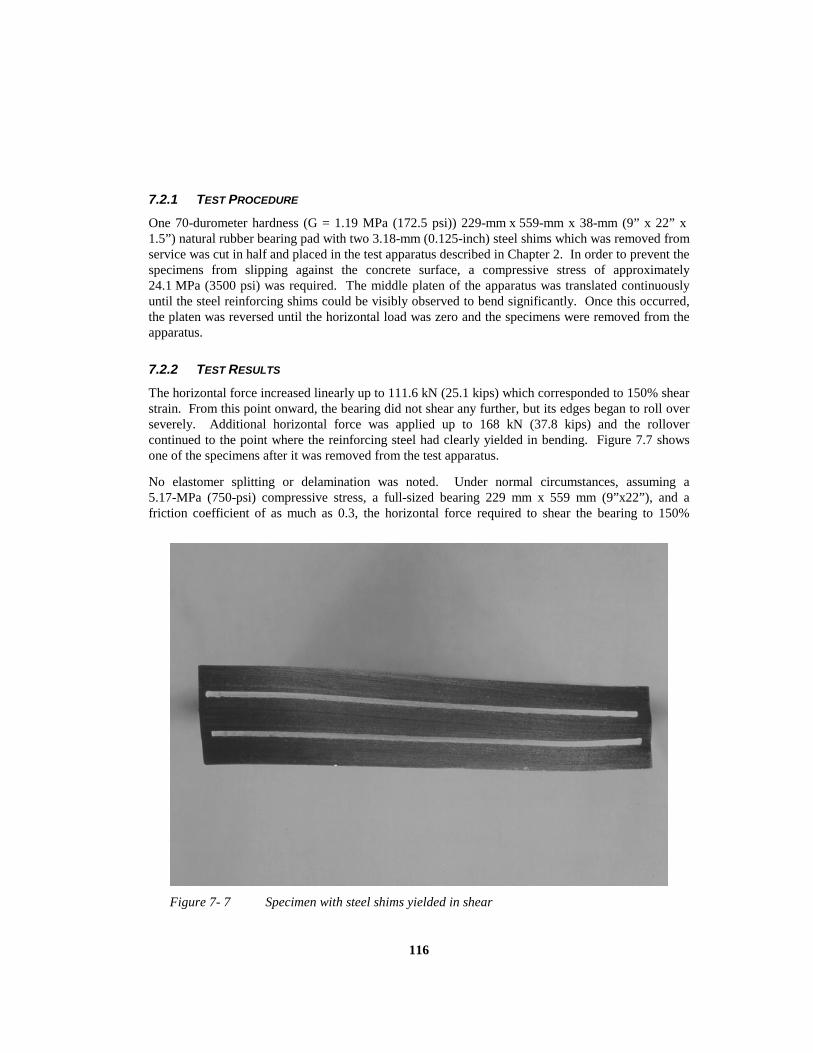
116
7.2.1 TEST PROCEDURE
One 70-durometer hardness (G = 1.19 MPa (172.5 psi)) 229-mm x 559-mm x 38-mm (9” x 22” x 1.5”) natural rubber bearing pad with two 3.18-mm (0.125-inch) steel shims which was removed fromservice was cut in half and placed in the test apparatus described in Chapter 2. In order to prevent thespecimens from slipping against the concrete surface, a compressive stress of approximately24.1 MPa (3500 psi) was required. The middle platen of the apparatus was translated continuouslyuntil the steel reinforcing shims could be visibly observed to bend significantly. Once this occurred,the platen was reversed until the horizontal load was zero and the specimens were removed from theapparatus.
7.2.2 TEST RESULTS
The horizontal force increased linearly up to 111.6 kN (25.1 kips) which corresponded to 150% shearstrain. From this point onward, the bearing did not shear any further, but its edges began to roll overseverely. Additional horizontal force was applied up to 168 kN (37.8 kips) and the rollovercontinued to the point where the reinforcing steel had clearly yielded in bending. Figure 7.7 showsone of the specimens after it was removed from the test apparatus.
No elastomer splitting or delamination was noted. Under normal circumstances, assuming a5.17-MPa (750-psi) compressive stress, a full-sized bearing 229 mm x 559 mm (9”x22”), and afriction coefficient of as much as 0.3, the horizontal force required to shear the bearing to 150%
Figure 7- 7 Specimen with steel shims yielded in shear

117
strain would never have been realized as slipping would have occurred at a much lower strain makingsteel yield impossible.
7.3 DISCUSSION OF FAILURE TESTS
Compression FailureFailure of elastomeric bearings in compression is very unlikely given the current compressive stressrestrictions given by AASHTO. Tests performed in this study indicate that, as long as the elastomeris well constructed, there will be no delamination prior to yield of the reinforcing. Therefore, thetheoretical calculations for the compressive stress required to produce steel yield represent the loweststress level at which any damage to the bearing would be expected. This is good because it affordsthe designer the ability to preclude failure due to compressive stress with a reasonably conservativeestimate. According to the most liberal design method allowed by AASHTO, the 55 durometer 6shim bearings tested in this study could be subjected to a compressive stress of 9.31 MPa (1350 psi). During testing, the worst of these bearings did not show any loss of compressive stiffness until thecompressive stress reached 59.6 MPa (8640 psi) which is reasonably comparable to the predictedstress level of 64.8 MPa (9410 psi) given in Table 7.2. This represents a factor of safety againstcompressive failure of more than 6. Clearly, allowable compressive stresses can be increased withvery little concern.
Shear FailureShear strains much greater than 100% are required to fail a bearing by yielding the reinforcement inbending. Given that only a gross design miscalculation would result in a bearing realizing suchstrains, failure in shear is a very unlikely occurrence. It is much more likely that slipping will occurbefore shear failure.

118

119
CHAPTER 8CONCLUSIONS AND RECOMMENDATIONS
8.1 CONCLUSIONSBased upon the results from this study, the existing literature, and numerous discussions with bearingmanufacturers a number of conclusions can be reached regarding the performance of elastomericbearings under various conditions.
8.1.1 BEARING SLIP
Antiozonant AdditivesWaxes used by manufacturers to ensure that natural rubber bearings satisfy the ozone degradationtest migrate to the surfaces of the bearings and severely reduce the coefficient of friction against thebearing seat and the girder bottom. In numerous cases where excessive slip has been observed, thebearings concerned have been analyzed and been shown to be saturated with wax. Although waxesare occasionally included in neoprene compounds, neoprene does not require a wax additive to guardagainst ozone degradation and no neoprene bearings have been observed to walk out. Without thewaxy coating, the coefficient of friction of natural rubber against typical concrete surfaces can beconservatively taken as 0.2 and an analysis can be performed to determine the normal force requiredto prevent slip from occurring. By current specifications covering the bearing manufacturingindustry, it would be impossible for the engineer to differentiate between waxes that are the mostaggressive in migrating to the bearings’ surface and those that migrate less or more slowly.
Contact SurfacesThe nature of the contact surface is a factor that is closely associated with the slip analysis. In testson both concrete and steel contact surfaces, the coefficient of friction was substantially higher whenthe surface was roughened and non-glossy. In concrete surfaces, a glossy finish even if rough causeda substantial decrease in the coefficient of friction. Roughened, non-glossy steel or concrete surfacesresulted in friction coefficients well in excess of 0.2.
8.1.2 COMMON DESIGN CONSIDERATIONS
Shear Modulus DeterminationA reasonable assumption as to the shear modulus of the bearing can be made from the hardnessrating. However, in no way should it be expected that a precise shear modulus can be determinedwithout physical testing. In this study, durometer ratings from 53 to 65 produced shear moduli of0.586 MPa (85 psi) to 0.70 MPa (100 psi) while durometer ratings of 68 to 72 produced shear moduliof 0.793 MPa (115 psi) to 1.00 MPa (145 psi). There are numerous published guidelines for shearmodulus estimation based upon hardness, but the manufacturer is the best source for reliable shearmodulus information. The ASTM 4014 shear modulus determination test on plain elastomer

120
specimens yields very high results compared to those given by direct shear tests of bearings undercompressive stresses in the 3.45 MPa (500 psi) to 6.90 MPa (1000 psi) range. This is especially truewhen the specimens used in the ASTM procedure are small and thin. In this study, bearings madefrom nominal 0.70 MPa (100 psi) and 1.4 MPa (200 psi) elastomer tested at shear moduli of0.680 MPa (98.6 psi) and 0.841 MPa (122 psi) respectively. ASTM 4014 tests on the plain elastomeryielded shear moduli of 0.959 MPa (139 psi) and 1.32 MPa (192 psi) respectively when102 x 102 x 25.4-mm (4” x 4” x 1”) specimens were used and 1.02 MPa (148 psi) and 1.45 MPa (210psi) respectively when 51 x 51 x 12.7-mm (2” x 2” x 0.5”) specimens were used. However, if theshear modulus is determined using the linear portion of the load-displacement curve from the ASTMtest rather than by the secant modulus procedure, the results are closer to those determined from fullscale tests. In this study, when the shear modulus was determined using the slope of the ASTM testload-displacement curve between 20 and 40% shear strain for the 102 x 102 x 25.4-mm(4” x 4” x 1”) specimens, the shear moduli were 0.814 MPa (118 psi) and 1.12 MPa (162 psi)respectively. While still high in comparison to the full-scale tests, the results are much closer thanthose determined by the standard ASTM procedure.
Manufacturing Precision and AccuracyManufacturers were fully capable of supplying the requested shear modulus within 13% when askedfor 0.7 MPa (100 psi) material. They were not, however, capable of providing material in the 1.4MPa (200 psi) range as this level is rarely requested. Suppliers were also adept at reproducing thesame compound over time so that each bearing produced could be expected to have the same shearmodulus ±5%. Overall, manufacturers supplied bearings at the correct plan dimensions almostexactly and the correct elastomer thickness within 3.5%, although one entire shipment was fabricatedwith an elastomer thickness almost 5% higher than requested. Due to the difficulty of positioningsteel shims precisely in every bearing, the thicknesses of the various elastomer layers were prone towider variations. Tapered bearings are generally produced at discrete slopes to limit themanufacturer’s inventory of sloped molding platens. The manufacturer can quote the standard slopesavailable prior to fabrication. In this study, tapered bearings were provided at 4.17 and 5.5% slopes.
Elastomer HardnessIn this study, increasing hardness from 55 to 70 durometer resulted in increased shear stiffness,compressive stiffness and rotational stiffness. However, the percentage increase in compressivestiffness (25%) and rotational stiffness (15%) was less than the percentage increase in shear stiffness(43%). Harder bearings produce a greater horizontal force when sheared, resulting in greater forcesbeing transferred to the bridge abutment and girder. The friction force required to restrain thebearing must be greater, thereby increasing the possibility of slipping. Harder bearings with highshape factors have limited ability to deform axially, and therefore have very little rotation capacity. Harder bearings also tended to lose more shear stiffness in fatigue after 20,000 cycles at 50% strainthan did lower durometer bearings. Hardness did not appear to influence creep, loss of compressivestiffness, and fracture point in tests to compressive failure, or loss of compressive stiffness in fatigueafter 500,000 cycles at a mean stress of 6.9 MPa (1000 psi) and a stress range of 6.9 MPa (1000 psi).However, there are some beneficial aspects to harder elastomers, which are discussed in Section8.1.3.
121
Shape FactorIn this study, increasing the shape factor from 6.26 to 10.96 resulted in increased shear, compressive,and rotational stiffness. The greatest increase was in compressive stiffness (150%) followed byrotation (22%) and then shear (7%). As they were more axially stiff, bearings with higher shapefactors showed an average 60% decrease in rotation capacity over those with lower shape factors. The more highly reinforced specimens showed better performance in compression fatigue tests asmeasured by delamination and loss of compressive stiffness. They tended to creep less underconstant compressive load, and withstood more compressive stress before loss of compressivestiffness and fracture in compressive failure tests. Shape factor did not appear to influence loss ofshear stiffness in fatigue.
Compressive StressDuring the shear and rotational stiffness portions of this study, specimens were tested at 3.85 and7.69 MPa (550 and 1100 psi). The effect of increasing compressive stress was to lower the shearstiffness by 6%, increase rotational stiffness by 10%, and increase rotational capacity by 120%.Higher compressive stress also tended to reduce the effect of non-uniform loading. Additionally,greater compressive stress makes bearing slip less likely. (Although the friction coefficient of rubberdecreases with increasing compressive stress, the net friction force is greater at higher stress levelsthan at lower stress levels). Compressive stress was not observed to damage even the most lightlyreinforced specimens at levels below 34.5 MPa (5000 psi).
Rotation CapacityRotational stiffness tests showed that elastomeric bearings can be subjected to far greater rotationsthan allowed under the current AASHTO Specifications without sustaining any visible damage. InChapter 1, Equation 1.7 gave the AASHTO limitation for allowable bearing rotations as twice thecompressive deformation divided by the plan dimension perpendicular to the axis of rotation. Theintent of this limitation is to ensure that the girder never lifts off from the bearing. Additionally,AASHTO limits the total shear strain in the elastomer from shear, compression and rotation to 3.0 asgiven in Equation 1.6. Based on the AASHTO Specifications, bearings of both hardness ratings with6 shims would be allowed rotations of from 0.004 radians (0.235 degrees) at 3.85 MPa (550 psi) to0.010 radians (0.573 degrees) at 7.7 MPa (1100 psi). During rotational stiffness tests in this studybearings were routinely subjected to rotations of 0.033 radians (1.9 degrees). In no case was there anyobservable sign of damage to the specimen. Lift-off to a 20-30-mm (0.79-1.2”) depth of separationbetween the bearing surface and the lever arm was noted at a rotation of 0.0176 radians (1.01degrees) under 3.85 MPa (550 psi) compressive stress for the 69 durometer bearings and 0.0293radians (1.68 degrees) for the 54 durometer bearings at 7.7 MPa (1100 psi). In none of the tests wasany uplift of the bearing from the bearing seat noted although this is cited as one of the key reasonsfor the restrictive specifications concerning rotations (32). If total shear strain of 3.0 is used as acriterion for limiting compressive stresses and rotations (as is the underlying AASHTO assumption),and lift-off is disregarded, the bearings described above would be allowed to sustain rotations offrom 0.011 radians (0.653 degrees) for the 54 durometer bearings at 7.7 MPa (1100 psi) to0.0212 radians (1.21 degrees) for the 69 durometer bearings at 3.85 MPa (550 psi). If, however, atotal shear strain of 5.0 were allowed as in some foreign codes (33) the bearings would be allowed tosustain rotations of from 0.034 radians (1.95 degrees) for the 54 durometer bearings at 7.7 MPa(1100 psi) to 0.044 radians (2.52 degrees) for the 69 durometer bearings at 3.85 MPa (550 psi). Therewould be, of course, substantial lift-off, but whether or not this would actually cause an eventual
122
failure in the bearing is subject to interpretation. The magnitude of total shear strain to be allowed forbearings designed in the US can be set at a safe level based upon further testing, but in compressionfatigue tests performed in this study, bearings were subjected to 500,000 cycles of combinedcompression and rotation fatigue at a maximum shear strain of 3.86 with no observable damage.
Steel ShimsSteel shims used in most of the specimens in this study were 2.7 mm (0.1046”) thick Grade A570with Fy = 276 MPa (40 ksi). This was the minimum thickness that manufacturers felt confident inusing to preclude damage during vulcanization. None of the tests showed any results that wouldindicate a need to increase the thickness of the shims beyond this size.
Cover LayersThe β-factor, as currently specified by AASHTO, results in an overly conservative design for thecover layers of bearings with high shape factors. For the test specimens used in this study withS = 10.96, the elastomer cover layer was approximately 6.35 mm (0.25”). Observation of thesespecimens during shear modulus tests at 7.69 MPa (1100 psi) showed no indication of excessivebulging of the cover layer. Based on this shape factor, current specifications would have required aβ-factor to be applied, reducing the thickness of this layer to 4.52 mm (0.18”) to carry thecompressive stress. Given the results of physical examinations of the bearings, it is unlikely that thesmaller thickness could have been precisely maintained during the fabrication process.
8.1.3 DESIGN OF TAPERED BEARINGS
Maximum TaperIn this study, bearings with 4% and 6% nominal tapers were tested. With the exception of themagnitude of compressive deformations, none of the test results showed any difference inperformance between the 4% and 6% specimens even in cases where a difference was observedbetween flat and tapered bearings. Although no specimens with greater than a 6% taper were tested,this slope is clearly significant and will result in a great deal of horizontal displacement under deadload alone (before thermal expansion or contraction) as explained in Chapter 3. Therefore, extremecare must be taken by the designer to calculate the expected bearing deformation due to taper.
Slope MismatchDuring shear modulus tests, bearings were intentionally compressed against platens that were 1.5%to 2% out of parallel with the bearing surface. Based upon observation of the test specimenssubjected to shear strains at 50% elastomer thickness, this degree of mismatching had no obviousdetrimental effect upon the bearings’ performance. When the mismatch tended to compress the thinend of a tapered bearing or either end of a flat bearing, there was a resulting very thin gap betweenthe platen and the bearing. In the worst case, the length of the gap was measured at approximately45 mm (1.77”) which represented only 20% of the bearing’s surface area. This was most obvious inaxially stiff bearings at 3.85 MPa (550 psi). When the compressive stress was increased to 7.69 MPa(1100 psi), the gap was almost completely closed.

123
Compressive DeformationsTapered bearings deflected more than flat bearings of the same hardness and reinforcement scheme. The magnitude of the additional deformation ranged from 10 to 20% for the 6.26 shape factorspecimens and 30 to 60% for the 10.96 shape factor specimens in the 3.45 MPa (500 psi) to 6.9 MPa(1000 psi) compressive stress range. The finite element study by Hamzeh (10) found a 25% increasein deformation for 55 durometer tapered bearings with a shape factor of 10.96. Additionaldeformations were influenced by degree of taper. For the lower shape factor tapered specimens a 4%bearing deformed approximately 10% more than a flat bearing and a 6% bearing deformedapproximately 20% more than a flat design. At the higher shape factor, the 4% bearings deformedclose to 30% more than their flat counterparts and the 6% tapered specimens deformed an average of60% more.
Horizontal DeflectionsTapered bearings deflect horizontally under girder dead load alone. The magnitude of the horizontaldeflection can be estimated by calculating the shear deformation which would occur given a shearforce of 0.4θP where θ is the bridge slope and P is the compressive force on the bearing.Additionally, the bearing’s critical buckling load must be calculated and the initial deflectionmagnified accordingly. Harder tapered bearings deform less under dead load than do comparablelower durometer bearings. This is an important design consideration especially when larger slopesare involved. In tests performed in this study, 70 durometer bearings of lower shape factor deflectedhorizontally 30% less and harder bearings of higher shape factor deflected horizontally 43% lessunder dead load than did comparably designed 55 durometer bearings.
Orientation of Steel ShimsIn all cases but one, steel shims in tapered bearings were oriented radially, with equal spacing at eachpoint along the length of the cross-section. One tapered specimen with shims oriented parallel to oneanother was tested for comparison to the others. The performance of the specimen with parallelshims was essentially identical to that of the specimens with radial shims with one importantexception. As stated above, tapered bearings deflect horizontally under girder dead load in directproportion to the magnitude of the girder slope and dead load. In tests designed to measure thehorizontal displacement under dead load, the specimen with parallel shims displaced 40% less thandid the comparable (same slope and shear modulus) specimen with radially spaced shims. Thisbehavior is extremely significant because girders are typically unrestrained horizontally and aretherefore free to displace with the bearing. Limiting this displacement to the smallest magnitudepossible is highly desirable.
8.2 RECOMMENDATIONSIn light of the conclusions stated above, the following recommendations are made concerning thedesign and employment of elastomeric bearings.
8.2.1 RECOMMENDATIONS TO PRECLUDE BEARING SLIP
1. Elimination or Relaxation of the Ozone Resistance Specification — There is ampleevidence that natural rubber bearings would not be adversely effected if the ozone

124
specification were relaxed or even eliminated. Previous studies have questioned the effectof ozone on bearings (17,33) and the accuracy of accelerated aging tests (9) and others haveshown that ozone damage even after one hundred years of exposure is restricted to only afew millimeters of surface penetration (13). A relaxation of the specification would allowbearing manufacturers to eliminate wax antiozonants and to pass the specification by usingchemical antiozonants alone, which do not result in a viscous surface coating and reductionof the friction coefficient.
2. No Surface Coating — Whether the ozone specification is relaxed or not, a simpleperformance specification stating that no material may accumulate on the surface of thebearing is absolutely essential. As there is almost no way of telling what is actually in thebearing, the designer must require that the surface remain free from any material whichcould cause a slipping problem to occur. Although the problem has been associated withnatural rubber bearings, some manufacturers have stated that it is common practice toinclude waxes in neoprene even though that material should be able to pass the specificationwithout them. Therefore, banning the use of natural rubber is not a panacea.
3. Bearing Contact Surfaces — Bearing seat concrete surfaces must be rough (wood screedfinish) and must not have a glossy finish. Although it would be advisable to roughen thebottom of the girder as well, this may be difficult and not cost effective. Ensuring that thebearing seat is properly finished will at least guarantee that one surface will be slip-resistant.
8.2.2 RECOMMENDATIONS COMMON TO ALL ELASTOMERIC BEARINGS
4. Shear Modulus Determination — The shear modulus of the bearings must be known duringthe design process. The best way to determine the shear modulus is to test full-scalereinforced specimens in direct shear under the design compressive stress. If this is notpossible, the ASTM 4014 test can be performed on the plain elastomer using 102x102x25.4-mm (4”x4”x1”) specimens and the slope of the linear portion of the load-displacement curveused to determine the shear modulus. This will give a shear modulus, which exceeds, but ismuch closer to, that determined in full-scale testing.
5. Hardness/Shear Modulus — From analysis of the results of hundreds of tests and ofnumerous previous studies, it is recommended that bearing material be of 50 to 55durometer hardness which commonly results in a shear modulus of 0.55 to 0.66 MPa (80 to95 psi) at normal temperatures -- 23oC (73oF). The reasons for this recommendation aregiven below:
Lower Shear Forces Produced - Regardless of the shear stiffness of the bearing, it willstrain depending upon the expansion and contraction of the girder. The lower the shearstiffness, the lower the shear forces produced and transmitted to the abutment and girder andthe less likely that these forces will overcome those of friction keeping the bearing fromslipping.
More Capable of Accommodating Non-Uniform Loading and Rotations - As shown by theresults of tests performed in this study, lower hardness specimens were much more capableof distorting to accommodate the irregularities of the loading medium than were harder

125
specimens. The rotational stiffness is generally lower, a desirable trait, and the ability toabsorb girder rotations, especially at higher shape factors is significantly greater.
Less Loss of Stiffness in Shear Fatigue - Although lower shear stiffness is desirable, thedesigner would like to know that the bearing will exhibit the same properties after 20 yearsin service as it did when it was new.
Less Low-Temperature Stiffening - Other studies (17,23) have shown that lower hardnessmaterials have a much lesser tendency to stiffen at low temperatures. This is an extremelydesirable trait considering the consequences of creating greater shear forces as describedabove. Additionally, natural rubber has been found to be more resistant to low temperaturestiffening than other materials (5,24)
Lesser Effect of Aging - Elastomeric materials of all hardness ratings stiffen equally withage. Therefore it is better to start with the lowest possible hardness to keep the effects ofstiffening with age to a minimum.
6. Shape Factor — From the tests results, bearings with a higher shape factor appear to out-perform those with a lower shape factor. Therefore, it is recommended that the shape factorfall within the range of 8 to 11 in bearings designed for use in most typical applications. Reasons for this recommendation are given below:
Resistance to Compression Fatigue - In compression fatigue tests, the specimens with thehigher shape factor withstood fatigue loading far in excess of that expected during typicalservice life without physical damage or loss of stiffness. Lower shape factor bearingssustained substantial physical damage and loss of compressive stiffness. The reason for thisbehavior is that the higher shape factor bearings are subjected to much less shear strain atthe steel shim elastomer interface than are the lower shape factor bearings.
Significantly Lower Axial Deformations - Higher shape factor bearings even of low hardnessmaterial can withstand compressive stresses on the order of 6.9 MPa (1000 psi) with axialdeformations on the order of 4.5% strain.
Lower Compressive Creep - While compressive creep is not a major design consideration,the more highly reinforced bearings exhibited such low creep that the initial deformationcan, for all intents and purposes, be considered the long-term deformation.
7. Compressive Stress Level — Based upon the test results, it is recommended that bearings bedesigned to accommodate the greatest compressive stress possible up to 6.9 MPa (1000 psi)under dead load alone and that, unless the engineer foresees a significant live load, theeffects of live load need not be considered. A shape factor within the range of 8 to 11 willensure that this level of compressive stress can be sustained. Additionally, the designshould ensure a minimum compressive stress of 3.45 MPa (500 psi) under dead load. Thereasons for these recommendations are given below:
Better Slip Resistance - The greater normal force will result in a lesser tendency for thebearing to ever slip. Additionally, the higher compressive stress results in a lower shearstiffness thus creating a lesser horizontal force during shear.
Better Accommodation of Rotations and Mismatched Loading - Test results clearly showthat at 7.69 MPa (1100 psi), even the highly reinforced bearings of low hardness show

126
excellent ability to accommodate rotations and mismatched loading and even equal theperformance of the lower shape factor bearings of low hardness at 3.85 MPa (550 psi). Ifminimizing the effects of mismatched loading or significant rotations are of greatest concernto the designer, proportioning the bearing so that the compressive stress is maximized is thebest course of action.
Live Load Not a Factor - Compression fatigue tests have shown that the higher shape factorbearings are almost unaffected by cyclic loading at a mean stress of 6.9 MPa (1000 psi) anda stress range of 6.9 MPa (1000 psi). Additionally, as described in Chapter 6, even in theworst case, a live load from a truck wheel would increase the stress on a single bearing byless than 0.69 MPa (100 psi). Assuming a total load equal to the dead load should result in aconservative design.
Significant Factor of Safety - On the basis of compression failure tests for higher shapefactor specimens, the worst specimen exhibited loss of compressive stiffness at 59.6 MPa(8640 psi). If the maximum compressive stress allowed by the AASHTO method wereapplied, the factor of safety against steel yielding would be more than 6. Obviously, therewill be little danger of compression failure.
8. Non-Uniform Loading/Bridge End Rotations — Given the standard design of a bearing witha shape factor of 10 and 50 to 55 durometer hardness, it is recommended that that thecurrent AASHTO rotation restrictions to prevent lift-off be removed and that total shearstrain be used as a criterion to limit the stresses from all sources. Based upon testsperformed in this study, bearings like those described above can be subjected to rotations of0.024 radians at 3.85 MPa (550 psi) and 0.030 radians at 7.7 MPa (1100 psi) with onlyminimal lift off (15-20%). If bridge end rotations are expected to exceed these magnitudes,the designer should ensure that the area of the bearing remaining loaded is not subjected tomore compressive stress than could be safely accommodated.
9. Elastomer Cover Layer — Based upon observations of performance during shear modulustests and physical examination of tests specimens, it is recommended that no β-factor beapplied to elastomer cover layers 9.5 mm (3�8”) thick or less. In most cases, the thickness ofelastomer layers can be determined by dividing the total elastomer thickness (as dictated byshear strain limitations) by the number of steel shims plus one (as determined by the shapefactor = 10). Considering a 229-mmx559-mm (9”x22”) bearing with 63.5 mm (2.5”) ofelastomer and a shape factor of 10, the cover layer would be only 2.32 mm (0.091”) thickerthan if the β-factor were applied. Test results show that cover layers less than 8.89 mm(0.35”) do not bulge excessively and that manufacturing tolerances may not permit suchprecision in any case.
8.2.3 RECOMMENDATIONS FOR TAPERED BEARINGS
10. Maximum Taper — It is recommended that tapered bearings be allowed with the provisionthat the engineer calculate the horizontal displacement of the bearing/girder system anddeem them acceptable for his design. In this study, bearings with tapers up to 5.5% weretested and performed satisfactorily. There is no indication that this is actually an upperbound.

127
11. Slope Mismatch — As described in Chapter 2, manufacturers typically produce taperedbearings in discrete increments to limit their inventory of sloped mold platens. For thisreason, there will always be a slight mismatch between the taper of the bearing and the slopeof the bridge girder. For a 229-mm (9”) long bearing, a length commonly used, taperedpads are available in 1.39% increments. The amount of non-uniform loading (mismatch)need never be greater than half this amount as long as the slope of the bridge is correctlycalculated. As the current AASHTO specification allows 0.01 radians of girder/flat bearingmismatch, it is recommended that the mismatch between tapered bearing top surfaces andgirders be allowed up to 0.01 radians. Based upon test results, this degree of mismatch willnot result in a significant separation between the bearing and the girder as long ascompressive stresses above 3.45 MPa (500 psi) are maintained.
12. Compressive Deformations — Based upon test results and the finite element study byHamzeh (10), it is recommended that for the standard bearing design suggested in this report(50-55 durometer, Shape Factor = 10) that the compressive deformation of the taperedbearing should be determined by using the stress-strain relationships given by AASHTO forflat bearings and increasing the strain by 10% for each 0.01 radian of taper. In the absenceof a precise theoretical analysis, this will yield a reasonable estimate of the compressivedeformation for tapered bearings conforming to the standard design given above.
13. Controlling Horizontal Deflections — If tapered bearings are being designed toaccommodate a significant bridge slope (4.5 to 5.5%), it is recommended that the designeruse a harder elastomer (with a higher shear modulus) to reduce horizontal deflections underthe bridge dead load alone. Additionally, horizontal deflections can be reduced by orientingreinforcing shims parallel to one another as described in recommendation 14.
14. Steel Shim Orientation — It is recommended that tapered bearings be designed so that steelreinforcing shims are oriented parallel to one another and that the taper be created by usinga solid cover layer of elastomeric material. In both the experimental and analytical study,there was no significant difference in performance between bearings with radially orientedand parallel shims. Bearings with parallel shims are easier to fabricate and the shims areless likely to be bent or misoriented during vulcanization. Most significantly, taperedbearings with parallel shims deflect horizontally under dead load significantly less than dothose with radially spaced shims. As long as parallel shims are specified, the horizontaldeflection under dead load (P) can be estimated using an equivalent horizontal force of0.4θP without magnification for P-∆ effects, because the initial deflection will actually beless than would result from H = 0.4θP. The thickness of the cover layer of taperedelastomeric material will be taken at mid-bearing length to determine if the β-factor shouldbe applied to that layer.
8.3 SUGGESTED FUTURE RESEARCH
Performance at Higher Compressive StressesThis study showed that highly reinforced bearings have no difficulty performing well at compressivestresses of 7.69 MPa (1100 psi) and, in fact, benefit in several ways from the higher stress. Additional research could show that acceptable performance may be possible at compressive stressesmuch greater than 7.69 MPa (1100 psi) with the appropriate shape factor.

128
Ozone Degradation TestingSeveral sources have suggested that ozone attack on bearings is insignificant. To justify eliminatingor relaxing the ozone degradation specification, ozone exposure tests should be performed on full-scale bearings rather than on elastomer samples to determine whether ozone attack actually damagesmore than just the surface of the pad.

129
CHAPTER 9RECOMMENDED DESIGN PROCEDURE
The purpose of this section is to describe a simple design procedure based upon a collation ofexperimental test results, comparisons with the finite element study and information from previousresearch. Emphasis has been placed on standardizing as many of the design parameters as possible tofacilitate the procedure and ensure excellent performance as described earlier. The method isapplicable to steel reinforced flat and tapered rectangular bearings.
Standard Design Parameters
As recommended in Chapter 8, the standard design parameters shall be as given below:
Elastomer hardness: 50 to 55 durometer
Shape factor: 9.5 < S < 10.5
Steel reinforcing shims: 2.7 mm (12 gage), Grade A570 steel, Fy = 276 MPa (40 ksi)
Compressive stress level: 3.45 MPa (500 psi) ≤ σc ≤ 6.9 MPa (1000 psi)
Total Height ≤ L/3 and W/3 (Ensures Stability according to AASHTO specification)
The expected shear modulus for 50-55 durometer hardness material with S ≈ 10 is 0.64 MPa (93 psi)at 3.45 MPa (500 psi) compressive stress and 0.6 MPa (87 psi) at 6.9 MPa (1000 psi) compressivestress. Considering that any particular bearing could be delivered at ±5% of these values, an averageshear modulus of 0.62 MPa (90 psi) shall be used.
1. Determine Plan Dimensions/Calculate Compressive Stress
The goal of the bearing design is to arrive at plan dimensions that will result in a dead loadcompressive stress of 6.9 MPa (1000 psi). Although this will result in excellent performance, thegirder geometry and reaction may not permit the designer to attain this compressive stress level. For example, if a girder with a 610-mm (24”) wide flange has a dead load reaction of 445 kN(100 kips), the designer may want to specify a bearing width of at least 457 mm (18”) and alength of 229 mm (9”) so that the girders will be well-supported during construction. This wouldresult in a compressive stress of 4.31 MPa (625 psi) rather 6.9 MPa (1000 psi). In all caseshowever, a minimum compressive stress of 3.45 MPa (500 psi) shall be maintained to ensureanchorage by friction and minimize lift-off due to rotation and non-uniform loading.
2. Determine Required Elastomer Thickness
No change is recommended from the current standard of 50% elastomer shear strain fromexpansion/contraction over the life of the bridge. Therefore, the minimum required elastomerthickness shall still be twice the anticipated total expansion or contraction of the bridgeconsidering the yearly thermal cycle. For many short to medium span bridges, the minimumrequired thickness would result in a very thin bearing pod. Since bearings are relatively cheap, a
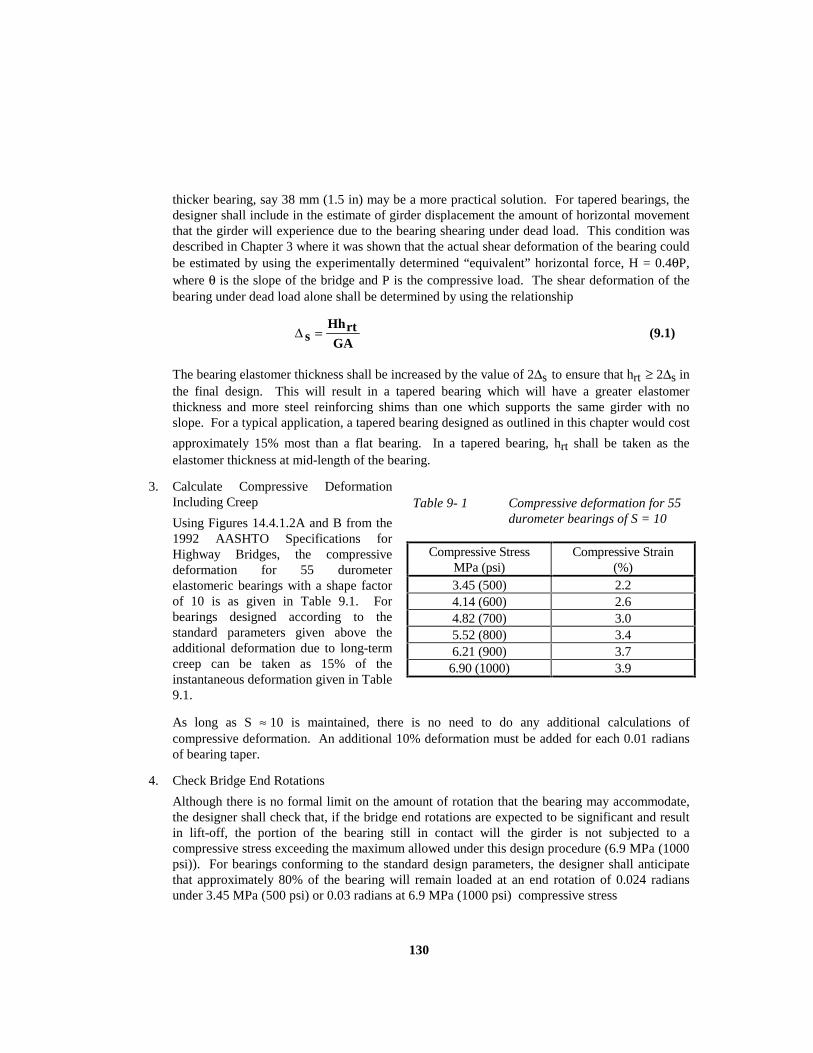
130
thicker bearing, say 38 mm (1.5 in) may be a more practical solution. For tapered bearings, thedesigner shall include in the estimate of girder displacement the amount of horizontal movementthat the girder will experience due to the bearing shearing under dead load. This condition wasdescribed in Chapter 3 where it was shown that the actual shear deformation of the bearing couldbe estimated by using the experimentally determined “equivalent” horizontal force, H = 0.4θP,where θ is the slope of the bridge and P is the compressive load. The shear deformation of thebearing under dead load alone shall be determined by using the relationship
∆ sHhrtGA
= (9.1)
The bearing elastomer thickness shall be increased by the value of 2∆s to ensure that hrt ≥ 2∆s inthe final design. This will result in a tapered bearing which will have a greater elastomerthickness and more steel reinforcing shims than one which supports the same girder with noslope. For a typical application, a tapered bearing designed as outlined in this chapter would cost
approximately 15% most than a flat bearing. In a tapered bearing, hrt shall be taken as theelastomer thickness at mid-length of the bearing.
3. Calculate Compressive DeformationIncluding Creep
Using Figures 14.4.1.2A and B from the1992 AASHTO Specifications forHighway Bridges, the compressivedeformation for 55 durometerelastomeric bearings with a shape factorof 10 is as given in Table 9.1. Forbearings designed according to thestandard parameters given above theadditional deformation due to long-termcreep can be taken as 15% of theinstantaneous deformation given in Table9.1.
As long as S ≈ 10 is maintained, there is no need to do any additional calculations ofcompressive deformation. An additional 10% deformation must be added for each 0.01 radiansof bearing taper.
4. Check Bridge End Rotations
Although there is no formal limit on the amount of rotation that the bearing may accommodate,the designer shall check that, if the bridge end rotations are expected to be significant and resultin lift-off, the portion of the bearing still in contact will the girder is not subjected to acompressive stress exceeding the maximum allowed under this design procedure (6.9 MPa (1000psi)). For bearings conforming to the standard design parameters, the designer shall anticipatethat approximately 80% of the bearing will remain loaded at an end rotation of 0.024 radiansunder 3.45 MPa (500 psi) or 0.03 radians at 6.9 MPa (1000 psi) compressive stress
Table 9- 1 Compressive deformation for 55durometer bearings of S = 10
Compressive StressMPa (psi)
Compressive Strain(%)
3.45 (500) 2.24.14 (600) 2.64.82 (700) 3.05.52 (800) 3.46.21 (900) 3.7
6.90 (1000) 3.9

131
5. Specify Bearing Taper — The correct bearing taper to request from the manufacturer shall bebased upon the bridge slope as shown in Table 9.2, which gives a recommended range of use forspecific bearing tapers assuming a 229-mm (9”) length and 3.175-mm (0.125”) increments intaper across the length. These standardtapers are based upon informationprovided by one of the manufacturers oftest specimens used in this study. Testresults indicating acceptable mismatchesbetween bearings and girders are takeninto account.
The intention of these guidelines is toallow maximum use of flat bearings andthen to limit the unavoidable mismatch asmuch as possible. If a bearing length other than 229 mm (9”) is used, the standard tapers willvary. The manufacturer shall be required to quote to the designer the precise tapers that arefabricated.
6. Specify Steel Reinforcement/Elastomer Layer Thickness
The required number of reinforcing steel shims shall be determined according to the followingrelationship:
nSh L W
LWrt=
+−
21
( )(9.2)
where S = 10 for the standard design. The result will be rounded up or down to the closest wholenumber, which will change the shape factor slightly. A subsequent calculation of the shapefactor shall be performed to ensure that it is between 9.5 and 10.5. As stated above, the standardreinforcing steel shim shall be 2.7-mm (12 gage), A570 steel with Fy = 276 MPa (40 ksi). Theelastomer layer thickness shall be determined by dividing the total elastomer thickness requiredby the number of steel layers plus one (n+1). Generally the layer thickness should be rounded tothe nearest 1�8” (3.18 mm) because the builk material used to manufacture the bearings isapproximately 1�8” (3.18 mm) thick. If the cover layer is 9.5 mm (3�8”) or less, no β- factor needbe applied. From the relationship between shim thickness, yield strength and elastomer layerthickness given in Equation 2.1 (which includes a factor of safety of 2), the designer shall assumethat if S = 10 and the compressive stress is 6.9 MPa (1000 psi) or less, the steel will not yieldunless the elastomer layer thickness is greater than 35.3 mm (1.39”), a very unlikely occurrence. The manufacturer may recommend increasing the thickness of the shims for bearings with verylarge plan dimensions to prevent bending during vulcanization. For tapered bearings, the steelreinforcing shims shall be oriented parallel to one another and the taper shall be created by using
a solid cover layer of elastomeric material. The total elastomer thickness hrt to be used inEquation 9.2 shall be taken at mid-length. The thickness of the cover layer of taperedelastomeric material shall be taken at mid-bearing length to determine if the β-factor must beapplied to that layer.
7. Ensure No Slip
Table 9- 2 Standard tapered bearing ranges
Bridge Slope Bearing Taper (%)0 - 1.0% Zero (Flat)
1.0 - 2.08 % 1.392.09 - 3.47 % 2.783.48 - 4.86 % 4.174.87 - 6.25 % 5.56
132
The designer shall assume a friction coefficient of 0.2 and calculate the horizontal forceproduced by the bearing shearing through 50% strain according to the relationship H = GAγ,where A is the plan area of the bearing. For the standard design described in this section, G, theshear modulus shall be assumed to be 0.62 MPa (90 psi), and the horizontal force produced bythe bearing shearing through 50% strain is H= 0.00155A kN (0.225A kips). To ensure that Nµ >H, the designer must check that
N > 0.00155A kN (0.225A kips) (9.3)
N shall include only dead load and not be factored. For a girder with a typical 445 kN (100 kip)dead load reaction, as long as A is less than 0.286 m2 (444 in2) slip will not occur.

133
APPENDIX APROPOSED SPECIFICATIONS
This Appendix gives proposed specifications based upon the results of tests performed in this study.In many cases, the existing specifications can be broadened without risk to the safety of elastomericbearing design. Division I - Design specifications are reproduced in their entirety with proposedrevisions noted and commentary included to explain the rationale behind the change. For Division II- Construction specifications only paragraphs where changes are proposed are shown along with theircorresponding commentary.
DIVISION I - DESIGN
14.1 GENERAL
An elastomeric bridge bearing is a deviceconstructed partially or wholly fromelastomer, the purpose of which is to transmitloads and accommodate movements betweena bridge and its supporting structure. Thissection of the Specification covers the designof plain pads (consisting of elastomer only)and reinforced bearings (consisting ofalternate layers of steel or fabricreinforcement and elastomer, bondedtogether). Tapered elastomer layers inreinforced bearings are not permitted. Spanslopes greater than 0.01 radians may beaccommodated with bearings with a built intaper. Such taper shall be limited to 0.055radians. In addition to any internalreinforcement, bearings may have externalsteel load plates bonded to the upper or lowerelastomer layers or both.
Two Three design procedures are provided inthis section. Bearings reinforced with steelmay be designed either by the proceduresdefined in 14.4.1, 14.4.2 or the one in 14.4.3.Bearings with fabric reinforcement orunreinforced pads shall be designed by 14.4.1Both All of the design procedures are based
on service loads and require that no impactfraction be added to the live load. Thematerials, fabrication, and installation of thebearings shall be in accordance with therequirements of Section 18.2 of Division II ofthe Specification.
C14.1 GENERAL
Two Three design methods are included.Method A is generally simpler but results inmore conservative designs. Bearingsdesigned according to Method B willgenerally be more highly stressed but aresubject to more stringent test requirements.Method C applies to flat and taperedrectangular bearings which meet specificcriteria as outlined in paragraph 14.4.3.
Tapered layers in reinforced bearings areexpressly prohibited because they cause largeshear strains, and bearings made with themfail prematurely because of delamination orrupture of reinforcement.
14.2 DEFINITIONS
LongitudinalAxis
= The axis of the bearingsparallel to thelongitudinal axis of thebridge girder(s)
Lot = A group of bearings

134
made from the samebatch of materials
TransverseAxis
= The axis of the bearingperpendicular to thelongitudinal axis
A = Gross plan area of thebearing
bf = Width of flange of steelgirder (in.)
D = Gross diameter of acircular bearing (in.)
Ec = Effective compressivemodulus of theelastomer, taking accountof restraint of bulging =3G(1+2kS2) (psi)
Fy = Yield strength of thesteel reinforcement (psi)
Fyg = Yield strength of thesteel girder (psi)
G = Shear modulus of theelastomer (psi) at 73oF
H = Design shear force onbear (lb) = G A ∆h/hrt
hrt = Total elastomer thicknessof the bearing (in.) = Σhri
(measured at mid-lengthfor bearings with built-in tapers)
hri = Thickness of elastomerlayer number i (in.)
hs = Thickness of one steelreinforcement layer (in.)
k = Constant dependent onelastomer hardness (seeTable 14.3.1 for values)
L = Gross dimension ofrectangular bearingparallel to thelongitudinal axis (in.)
n = Number of reinforcinglayers
P = Compressive load on thebearing (lb)
S = Shape factor of one layer
of a bearing= Plan Area
Area of Perimeter Free toBulge
= LW / 2hri (L + W)for rectangular withoutholes
tf = Thickness of steel girderflange (in.)
W = Gross dimension ofrectangular bearingparallel to the transverseaxis
β = Modifying factor havinga value of 1.0 for internallayers of reinforcedbearings, 1.4 for coverlayers, and 1.8 for planpads. If slip is preventedfrom occurring at thesurface of plain pads orouter layers of reinforcedbearings under allcircumstances, or if thecover layer of reinforcedbearings is 3�8 in. or less,β factors smaller thanthose defined above maybe used at the discretionof the Engineer. β shallnever be taken as lessthan 1.0
∆c = Instantaneouscompressive deflectionof bearing (in.)
∆h = Total horizontalmovement ofsuperstructure, measuredfrom state at whichbearing is undeformed(in.)
∆s = Shear deformation of thebearing in one directionfrom the undeformedstate, accounting for
135
support flexibility (in.)εci = Instantaneous
compressive strain inelastomer layer number i(change in thicknessdivided by the unstressedthickness)
θ = Relative rotation of topand bottom surfaces ofbearing (in.)
θb = Built-in bearing taper(radians)
Subscripts:
DL = dead loadTL = total loadLL = live loadx = about transverse axisz = about longitudinal axis
σc = P/A = average compressive stress onthe bearing caused by the dead andlive load, excluding impact
C14.2 DEFINITIONS
The compressive stress allowed by designMethod A (Article 14.4.1) is now expressedas a single function of S/β for all bearings, butuse of the appropriate value of β causes theallowable stress on a plain pad to be 56percent of that of a reinforced bearing layer ofthe same dimensions if it is limited by GS/β. Cover layers of reinforced bearings aretreated similarly except that β = 1.4. In caseswhere the cover layer of a reinforcedbearing is less than 0.333 inches, theβ−factor need not be applied because coverlayers this thin do not show any propensityto bulge excessively. Design Methods B andC (Articles 14.4.2 and 14.4.3) covers onlysteel reinforced bearings, for which β =1.0 orβ = 1.4 (outer cover layers greater than 0.333inches thick).
14.3 MATERIAL PROPERTIES
The shear modulus at 73oF shall be used asthe basis for design. If the material isspecified explicitly by its shear modulus, thatvalue shall be used in the design and the otherproperties shall be obtained from Table14.3.1. If the material is specified by itshardness, the shear modulus shall be taken asthe value from the range for that hardnessgiven in Table 14.3.1, which is mostconservative for each part of the design. Intermediate values shall in all cases beobtained by interpolation.
Material with a shear modulus greater than200 psi or a nominal hardness greater than 60shall not be used for reinforced bearings. Under no circumstances shall the nominalhardness exceed 70 or the shear modulusexceed 300 psi.
For the purposes of bearing design, all bridgesites shall be classified as being intemperature zone A, B, C, D, or E. The zonesare defined by their extreme low temperaturesor the largest number of consecutive days forwhich the temperature has ever remainedbelow 32oF, whichever gives the more severecondition. Values are given in Table 14.3.2. In the absence of more precise information,Figure 14.3.1 may be used as a guide inselecting the zone required for a given region.

136
Table 14.3.1 Elastomer properties atdifferent hardnesses
Hardness (Shore ‘A’) 50 60 70Shear Modulus (psi)at 73 degrees F (MPa)
95-1300.68-0.93
130-200
0.93-1.43
200-300
1.43-2.14
Creep deflection - 25 yr 25% 35% 45%
Instantaneous Defl.
k 0.75 0.6 0.55
Table 14.3.2 Low Temperature zones andelastomer grades
Low TemperatureZone
A B C D E
50 Year LowTemperature (oF)
0 -20
-30
-45 AllOther
sMaximum number ofconsecutive days whenthe temperature doesnot rise above 32 oF
3 7 14 N/A N/A
Minimum Low Temp-era ture ElastomerGrade Without SpecialProvisions
0 2 3 4 5
Minimum Low Temp-erature ElastomerGrade With SpecialProvisions
0 0 2 3 5
Bearings shall be made from AASHTO lowtemperature grades of elastomer required foreach low temperature zone as defined inSection 18.2 of Division II. The minimumgrade of elastomer required for each lowtemperature zone is specified in Table 14.3.2.The special provisions required in Table14.3.2 are that either a positive slip apparatusbe installed and the bridge components shallbe able to withstand forces arising from abearing force equal to twice the design shearforce or that the components of the bridge be
able to resist forces arising from a bearingforce four times the design shear force asdefined in Section 14.6
14.4 BEARING DESIGN METHODS
14.4.1 Method A - DesignProcedure for SteelReinforced, FabricReinforced or Plain Bearings
14.4.1.1 Compressive StressUnless shear deformation is prevented, the
average compressive stress σc in any layershall satisfy:
σc,TL ≤ GS/β
and σc,TL ≤ 1,000 psi for steel-reinforced bearings
or σc,TL ≤ 800 psi, for plain pads or fabric reinforced bearings
These stress limits may be increased by 10percent where shear deformation is prevented.In bearings consisting of layers of differentthickness, the value of S used shall be thatwhich produces the smallest S/β.
14.4.1.2 Compressive Deflection
The compressive deflection, ∆c, of thebearing shall be so limited as to ensure theserviceability of the bridge. Deflections dueto total load and to live load alone shall beconsidered separately.
Figure 14.3.1 Map of low temperaturezones

137
Instantaneous deflection shall be calculated as
∆c = Σ εcihri
Values for εci shall be obtained from designaids based on tests such as presented inFigures 14.4.1.2A and 14.4.1.2B, by testingor by an approved analysis method. Figures14.4.1.2A and 14.4.1.2B are for internallayers of reinforced pads or cover layers ofreinforced bearings if S is replaced by S/β.
The effects of creep of the elastomer shall beadded to the instantaneous deflection whenconsidering long-term deflections. They shallbe computed from information relevant to theelastomeric compound used if it is available. If not, the values given in Article 14.3 shall beused.
14.4.1.3 ShearThe horizontal bridge movement shall betaken as the maximum possible deformationcaused by creep, shrinkage, and post-tensioning, combined with thermal effectscomputed in accordance with Section 3.16.The maximum shear deformation of the
bearing, ∆s, shall be taken as the horizontalbridge movement, modified to account for thepier flexibility and construction procedures.
If a positive slip apparatus is installed, ∆sneed not be taken larger than the deformationcorresponding to first slip.
The bearing shall be designed so that h ≥ 2∆s.
14.4.1.4 RotationThe rotational deformations about each axisshall be taken as the maximum possiblerotation between the top and bottom of thebearing caused by initial lack of parallelismand the girder rotation. They shall be limitedby:
θTL, x ≤ 2∆c/L
and θTL,z ≤ 2∆c/W, for rectangular bearings
or (θ2TL,x + θ2
TL,z)½ ≤ 2∆c for circular bearings
14.4.1.5 StabilityTo ensure stability, the total thickness of thebearing shall not exceed the smallest of:
L/5, W/5 or D/6 for plain pads L/3, W/3, orD/4 for reinforced bearings
Figure 14.4.1.2A Compressive stress vs.strain for 50 durome-ter steel-reinforcedbearings
Figure 14.4.1.2B Compressive stress vs.strain for 60 durometersteel-reinforced bear-ings
138
14.4.1.6 ReinforcementThe reinforcement shall be fabric or steel andits resistance in pounds per linear inch atworking stress levels in each direction shallnot be less than
1,400 hri for fabric
1,700 hri for steel
For these purposes hri shall be taken as themean thickness of the two layers of theelastomer bonded to the reinforcement if theyare of different thicknesses. The resistanceper linear inch is given by the product of thematerial thickness of the reinforcement andthe allowable stress. The allowable stressshall be calculated taking into account fatigueloading but ignoring holes in thereinforcement. Holes shall be prohibited infabric reinforcement. They are notrecommended in steel reinforcement; but, ifthey exist, the steel thickness shall beincreased by a factor (2 X gross width)/(netwidth).
14.4.2 Method B - OptionalDesign Procedure forSteel Reinforced Bearings
Bearings shall not be designed by theprovisions of Section 14.4.2 unless they aresubsequently tested in accordance with therequirements of Section 18.2.7 of Division IIof this specification.
14.4.2.1 Compressive StressIn any layer, the average compressive stressshall satisfy
σc,TL ≤ 1,600 psiσc,TL ≤ 1.66 GS/β
σc,LL ≤ 0.66 GS/β
for bearings fixed against shear deformations
σc,TL ≤ 1,600 psiσc,TL ≤ 2.00 GS/β
σc,LL ≤ 1.00 GS/β
where β = 1.0 for internal layers and 1.4 forcover layers greater than 3�8 inches thick.
14.4.2.2 Compressive Deflection
Same as 14.4.1.2
14.4.2.3 Shear
Same as 14.4.1.3
14.4.2.4 Rotation and CombinedRotation andCompression
The rotational deformations about each axisshall be taken as the maximum possiblerotation between the top and bottom of thebearing caused by initial lack of parallelismand girder end rotation. They shall be limitedby:
θTL,x ≤ 2∆c/L
and θTL,z ≤ 2∆c/W, for rectangular bearings
or (θ2TL,x + θ2
TL,z)½ ≤ 2∆c/D for circular bearings
In bearings subjected to both compression androtation about the transverse axis of thebearing, the average compressive stress shallsatisfy, for bearings subject to sheardeformations

139
σβ
θc TLTL x
c
GSL,
,
. /≤
+
166
14∆
or, for bearings fixed against sheardeformations
σβ
θc TLTL x
c
GSL,
,
. /≤
+
2 0
14∆
where θTL,x is the total rotation about thetransverse axis of the bearing, including theeffects of initial lack of parallelism, creep,shrinkage, and temperature.
Reduced stress levels for rotations about thelongitudinal axis of the bearing shall becomputed by a rational method.
14.4.2.5 StabilityThe bearing shall be proportioned to preventstability failure. The average compressivestress due to total dead load and live load onrectangular bearings shall satisfy:
if the bridge deck is free to translatehorizontally
σc TLrtG
h L
S L W S(S L W, /. ( / )
/
.
/ )≤
+−
+ +
384
1 2
267
2)(1 4
or, if the bridge deck is not free to translatehorizontally
σc TLrtG
h L
S L W S(S L W, /. / )
/
.
/ )≤
+−
+ +
192(
1 2
267
2)(1 4
If L is greater than W for a rectangularbearing, stability shall be checked by theabove formula with L and W interchanged.
The stability of circular bearings may beevaluated by using the equations for a squarebearing with W = L = 0.8D.
14.4.2.6 Reinforcement
The thickness of the reinforcement hs. shallsatisfy
hh h
Fsr r c TL
y
≥+15 1 2. ( ) ,σ
, for total load
hh h
Fsr r c LL
sr
≥+15 1 2. ( ) ,σ
, for live load
where Fsr, is the allowable stress range based
on fatigue loading. Fsr shall be taken from Table 10.3.1A of Division I of thisspecification using category A for aNonredundant Load Path Structure. If holesexist, the minimum thickness shall beincreased by a factor
2 x gross width
net width
14.4.3 Method C - Simplified DesignProcedure for Standard Flat andTapered Steel Reinforced Bearings
This procedure shall apply only torectangular steel reinforced bearingswithout holes which meet the followingcriteria:
Hardness: 50-55 durometer
85 ≤ G ≤ 95 psi
9.5 < S < 10.5
σc,DL ≥ 500 psi

140
For bearings with built in taper, S shall becalculated based on the thickness of theinternal elastomer layers.
14.4.3.1 Compressive StressThe average compressive stress in any layershall satisfy:
σc,DL, ≤ 1,000 psi
A β−factor need not be applied to coverlayers providing that such layers are nogreater than 3�8 inches thick.
14.4.3.2 Compressive Deflection
The compressive deflection, ∆c, of thebearing shall be so limited as to ensure theserviceability of the bridge. Deflections dueto total load and to live load alone shall beconsidered separately.
Instantaneous deflection shall be calculatedas
∆c = Σ εci hri
Values for εci shall be obtained from designaids based on tests such as presented inFigures 14.4.1.2A and 14.4.1.2B, by testingor by an approved analysis method. Figures14.4.1.2A and 14.4.1.2B are for internallayers of reinforced pads or cover layers ofreinforced bearings if S is replaced byS/β when required..
Instantaneous deflections for bearings withbuilt in tapers shall be assumed to be 10percent greater per 0.01 radians of taperthan instantaneous deflections for flatbearings
The effects of creep of the elastomer shall beadded to the instantaneous deflection whenconsidering long-term deflections. Forreinforced bearings which satisfy the
requirements of this design procedure, thevalue of the long-term deflection may betaken as 15 percent of the instantaneousdeflection.
C 14.4.3.2 Compressive DeflectionTests and analyses of bearings with built intapers show that these bearings deflect onthe average 10 percent more than flatbearings for every 0.01 radians of taper. This is due to the entire bearing bulging inthe direction of the thick end of the pads. For bearings meeting the criteria of thisdesign method, this additional deflection isnot significant.
Creep tests show that for highly reinforcedbearings of low hardness/shear modulus, thevalue of long-term creep is approximately 15percent of initial deflection.
14.4.3.3 ShearThe horizontal bridge movement shall betaken as the maximum possible deformationcaused by creep, shrinkage, and post-tensioning, combined with thermal effectscomputed in accordance with Section 3.16for bearings with mounting platespermanently attached to the top and bottomelastomeric layers. For bearings withoutmounting plates, only thermal effects needbe considered. The maximum shear
deformation of the bearing, ∆s, shall betaken as the horizontal bridge movement,modified to account for the pier flexibilityand construction procedures. If a positiveslip apparatus is installed, ∆s need not betaken larger than the deformationcorresponding to first slip.
The bearing shall be designed so that
hrt ≥ 2∆s.

141
For bearings with built in tapers, thehorizontal deflection due to the girder deadweight acting on the sloped surface shall becalculated as
∆s = 0.4θb P hrt / GA
and shall be included in the horizontalbridge movement used to determine the
required hrt..
C14.4.3.3 ShearTests and analyses of tapered bearings showthat a horizontal deflection is produced inbearings with a built in taper under the deadload of the girder alone. The magnitude ofthe horizontal deflection has beenempirically determined as shown above.
The engineer must first calculate hrt basedupon shortening and then use this value to
determine ∆h due to the dead weight basedupon G and A. The value of this deflection
should be added to ∆s so that the bearing
will satisfy the 2∆s ≤ hrt limitation.
14.4.3.4 RotationThe rotational deformations about each axisshall be taken as the maximum possiblerotation between the top and bottom of thebearing caused by initial lack of parallelismand the girder rotation. Permissiblerotations are not formally limited, howeverthe designer shall ensure that if bridge endrotations greater than 0.024 radians at 500psi or 0.030 radians at 1000 psi compressivestress are anticipated, that the compressivestress on the bearing be assumed to act ononly 80% of the plan are due to lift off.
For bearings with a built in taper, such tapershall not exceed 0.055 radians. In caseswhere the bearing taper does not preciselymatch the bridge slope, such mismatch shall
not exceed 0.01 radians and the value of themismatch shall be subtracted from themaximum allowable bearing rotation givenabove.
C14.4.3.4 RotationDue to the axial flexibility of bearingsmeeting the criteria of this design method,the rotation capacity can be assumed to beas given in Article 14.4.3.4.
Because bearings with built in tapers arenormally fabricated in discrete incrementsby manufacturers, some small lack ofparallelism between the girder bottom andthe bearing top surface is to be expected, butwill not adversely effect the bearing’sperformance if the guidelines in Article14.4.3.4 are followed.
14.4.3.5 StabilitySame as Paragraph 14.4.1.5
14.4.3.6 ReinforcementThe reinforcement shall be steel and itsresistance in pounds per linear inch atworking stress levels in each direction shall
not be less than 1,700 hri .
For these purposes hri shall be taken as themean thickness of the two layers of theelastomer bonded to the reinforcement ifthey are of different thicknesses. If bearingswith a built in taper are used, reinforcingsteel shims shall be oriented parallel to oneanother and the taper created by using asolid cover layer of elastomeric material. The thickness of the cover layer of taperedelastomeric material shall be taken at mid-bearing length to determine if the β-factormust be applied. The resistance per linearinch is given by the product of the materialthickness of the reinforcement and theallowable stress. The allowable stress shall

142
be calculated taking into account fatigueloading.
C14.4.3.6 ReinforcementIn bearings with a built in taper, orientingreinforcing shims parallel to one anotherfacilitates fabrication, reduces the likelihoodof shim misorientation or bending duringvulcanization, and reduces horizontaldeflection under dead load.
14.5 ANCHORAGE
If the design shear force, H, due to bearingdeformation exceeds one-fifth of thecompressive force P due to dead load alone,the bearing shall be secured against horizontalmovement. The bearing shall not bepermitted to sustain uplift force.
14.6 DESIGN FORCES FORSUPPORTING STRUCTURE
The forces imposed by the bearing on thesubstructure are a function of the stiffness ofthe bearing and the flexibility of thesubstructure. Maximum forces to be appliedby the bearing (for a rigid substructure) maybe computed in accordance with Section14.6.1 for shear and in accordance with 14.6.2for moment.
14.6.1 Shear ForceIf a positive slip apparatus is installed, Hshall be taken as the largest force which canbe transmitted by the apparatus. If nopositive slip apparatus is installed, the designshear force shall be taken as not less
than H=G A ∆h/hrt, where ∆h is the horizontalmovement of the bridge superstructurerelative to conditions when the bearing isundeformed and G is the shear modulus of theelastomer at 73oF.
14.6.2 MomentThe moment induced by bending of arectangular bearing about an axis parallel toits long side shall be taken as not less than
M = (0.5 Ec) I θTL,x/hrt, where I = WL3/12.
14.7 STIFFENERS FOR STEELBEAMS AND GIRDERS
The flanges of steel members seated onelastomeric bearings must be flexurally stiffenough not to risk damage to the bearing. Any necessary stiffening may be accom-plished by means of a sole plate or a verticalstiffener. The stiffening requirements of thissection do not replace any others in thisspecification, but should be read in conjunc-tion with them.
Single-webbed beams and girders symmetricabout their minor axis and placedsymmetrically on the bearing need noadditional stiffening if
b
t
Ff
f
yg
c2 34<
. σ
where bf = total flange width, tf = thickness offlange or combined flange and sole plate, andFyg = yield stress of the girder steel.
14.8 PROVISIONS FORINSTALLATION EFFECTS
Allowance shall be made during design formisalignment in bridge girders due tofabrication and erection tolerance, camber,and other sources. The bearings shall belocated and installed in such a way as topermit subsequent replacement.

143
DIVISION II - CONSTRUCTION
18.2 ELASTOMERIC BEARINGS
18.2.3 Materials
18.2.3.1 Properties of theElastomer
Add to the existing specification:
Under no circumstances will any residualforeign matter accumulate on the bearingsurface due to secretion from within theelastomer. Antiozonant waxes whichmigrate to the surface of the bearing for thepurpose of guarding against ozonedegradation are expressly prohibited as aningredient in the elastomer compound.
TABLE 18.2.3.1A and TABLE18.2.3.1BDelete:
OZONED 1149
C18.2.3.1 Properties of theElastomer
Add to the current commentary:
Recent research has proven thataccumulation of viscous materials onbearings surfaces due to secretion ofadditives in the elastomer compound havecaused severe slipping and requiredreplacement of the bearings. The source ofthis secretion is antiozonant waxes whichare used by manufacturers to ensure that thecompound will pass the ozone specification.There is no known satisfactory level of thissubstance and, according to manufacturers,during the service life of the bearing, all of
the wax will eventually migrate to thebearing surface. For this reason, waxesmust be categorically prohibited as aningredient in elastomer compounds.
There is no evidence that ozone attackdamages any part of the bearing other thanthe surface to a depth of approximately onemillimeter. For this reason, the ozonespecification has been deleted.
18.2.5 Fabrication TolerancesPlain pads and laminated bearings shall bebuilt to the specified dimension within thefollowing tolerances:
4. Parallelism with Opposite Face
Parallelism with Opposite Face /
Deviation from Design Taper Top
and Bottom Sides
0.005 radians
0.02 radians
C18.2.5 Fabrication TolerancesSome of the tolerances have been changed torelative values, because an absolute valuesuch as 1/16 in. may be overly large for asmall bearing and unrealistically small for alarge bearing. Parallelism of the two faces ofa single layer is controlled by the limitationon thickness at any point.
18.2.7.3 Ambient TemperatureTests on the Elastomer
The elastomer used shall at least satisfy thelimits in the appropriate Table 18.2.3.1A or Bfor durometer hardness, tensile strength,ultimate elongation, heat resistance, andcompression set. and ozone resistance.

144
C18.2.7 TestingAdd to the existing specification:
The ozone resistance test is no longerrequired.
18.2.8 InstallationBearings shall be placed on surfaces that areplane to within 1/16 in. and, unless thebearings are placed in opposing pairs,horizontal to within 0.01 radians. Any lack ofparallelism between the top and bottom of thebearing and the underside of the girder thatexceeds 0.01 radians shall be accommodatedby employing a bearing with a built in taper,or corrected by grouting or as otherwisedirected by the Engineer.
C18.2.8 InstallationIf the bearing seat is not horizontal, gravityloads will cause shear in the elastomer. Theunderside of the girder and the top surfaces ofthe bearing must also be parallel to avoidexcessive rotation and the stresses it causes inthe bearing. Employing elastomeric bearingswith a built in taper (up to 0.055 radians)that matches the girder slope within 0.01radians is an acceptable method ofaccommodating bridge grades.

145
APPENDIX B
DESIGN EXAMPLES USING METHOD C SPECIFICATIONS
The purpose of the section is to give design examples based upon the procedure proposed inChapter 9 of this report. The examples are intended to illustrate the simplicity of the method due tothe standardization of a number of design parameters. Example 1 shows the design of a bearing for abridge with no grade. Example 2 shows how the bearing design would be modified if the same bridgewere on a 3.5% grade. The bearings do not have mounting plates. Horizontal displacement due toshrinkage and creep are not considered in the bearing design because these permanent deformationscan be accommodated by one-time slip between girder and bearing.
B. 1 STANDARD PARAMETERS
The standard design parameters as recommended in Chapters 8 and 9 are as follows:
HARDNESS: 50-55 DUROMETER
Shear Modulus: 0.586 MPa (85 psi) < G < 0.655 MPa (95 psi) (use 0.62 MPa -- 90 psi forcalcualations)
SHAPE FACTOR: 8.5 < S < 11
Compressive Stress due to Dead Load: σc ≥ 3.45 MPa (500 psi)
Reinforcing steel shims: A570 steel Fy = 276 MPa (40 ksi), hs = 2.7 mm (12 gage)
B.2 EXAMPLE 1: BRIDGE WITHOUT GRADE
Bridge: Prestressed Concrete Girder, α = 9.9 x 10⁻⁶ mm/mm/oC (5.5 x 10⁻⁶ in/in/oF)
Span Length: 36.6 m (120’)
Dead load reaction: P = 534 kN (120 kips)
Bridge Grade: None
Yearly high temperature: 49oC (120oF)
Yearly low temperature: -6.7oC (20oF)
Girder flange width: 610 mm (24")
Maximum rotation due to live load and thermal effects: 0.003 radians
1. Determine Plan Dimensions/Calculate Compressive Stress:Assume L = 229mm (9")
Use W = 458 mm (18") to ensure stability of girders during erection
A = 0.105 m2 (162 in2)
σc = 5.11 MPa (741 psi) ∴OK

146
2. Determine Required Elastomer Thickness:
∆ts = (9.9 x 10⁻⁶mm/mm/oC)(36600 mm)(56oC) = 20.3 mm (0.80")
∆h = Thermal contraction = 20.3 mm (0.80")
Assume half of contraction/expansion occurs at each bearing: ∆s = 10.2 mm(0.40")
Minimum required hrt=2(10.2 mm) = 20.3 mm (0.80 in)
Specify hrt = 38 mm (1.5") for practical reasons (lower shear stress, better ability tohandle slope mismatches due to camber and sweep)
3. Calculate Compressive Deformation Including Creep
Based on σc = 5.11 MPa (741 psi):
From Table 9.1, εc = 3.2%
∴ ∆c = (0.032)(38 mm) = 1.22 mm (0.048")
Long-term Deformation = 1.15(∆c) = 1.40 mm (0.055")
4. Check Bridge End RotationRotation = 0.003 radians ∴upward displacement = 0.003 (229/2) = 0.34mm < 1.4mm so no uplift expected for σc=5.11 Mpa (741 psi)
5. Specify Steel Reinforcement/Elastomer Layer ThicknessStart with S = 10, use Equation 9.2 to calculate n, number of reinforcing shims
n = ((2 S hrt (L+W))/LW) -1 = 4
Use 4, Grade A570 steel shims, 2.67 mm (12 gage)
Calculate hri: hri = 38 mm/5 layers = 7.6 mm (0.3") Use 6.4 mm (1�4") cover layersand 9.5 mm (3�8") for the three interior layers
Recalculate S: S = 8 ∴ OK since it is within the target range. If values less than 8
are used, then check that σc ≤ 1.66GS
6. Ensure No SlipCheck for N > 0.00155 A (kN):
0.00155 A = 0.00155(457 mm)(229 mm) = 162.2 kN (36.5 kips) < 534 kN (120kips) ∴ OK

147
Final DesignG = 90 psi (50-55 durometer)
S = 8
L = 229 mm (9") W = 457 mm (18")
hrt = 41.3 mm (1.625") hrcover = 6.4 mm (1�4"), hri = 9.5 mm (3�8")
4 Grade A570 2.67 mm (12 gage) steel shims
Total height = 52 mm (2.05")
B.3 EXAMPLE 2: BRIDGE ON 3.5% GRADE
ALL SPECIFICATIONS ARE THE SAME EXCEPT THAT THE BRIDGE IS ON A 3.5% GRADE
1. Determine Plan Dimensions/Calculate Compressive Stress:Use same dimensions as Example 1:
L = 229 mm (9"), W = 457 mm (18")
A = 0.105 m2 (162 in2)
σc = 5.11 MPa (741 psi)
2. Determine Required Elastomer Thickness:
∆ts = (9.9 x 10⁻⁶ mm/mm/oC)(36600mm)(56oC) = 20.3 mm (0.80")
∆h = 20.3 mm = (0.80")
Assume half of contraction/expansion occurs at each bearing: ∆s = 10.2 mm (0.40")
Determine ∆s,DL from girder dead due to 3.5% slope load assuming hrt = 38 mm(1.5")
∆s,DL = 0.4θbPhrt/GA = 0.4(0.035)(534 kN)(38 mm)/(0.621MPa)(0.105 m2)
= 4.36 mm (0.172")
Min hrt = 2(10.2 mm + 4.4 mm) = 29.2 mm (1.15") < 38 mm (1.5") ∴ OK
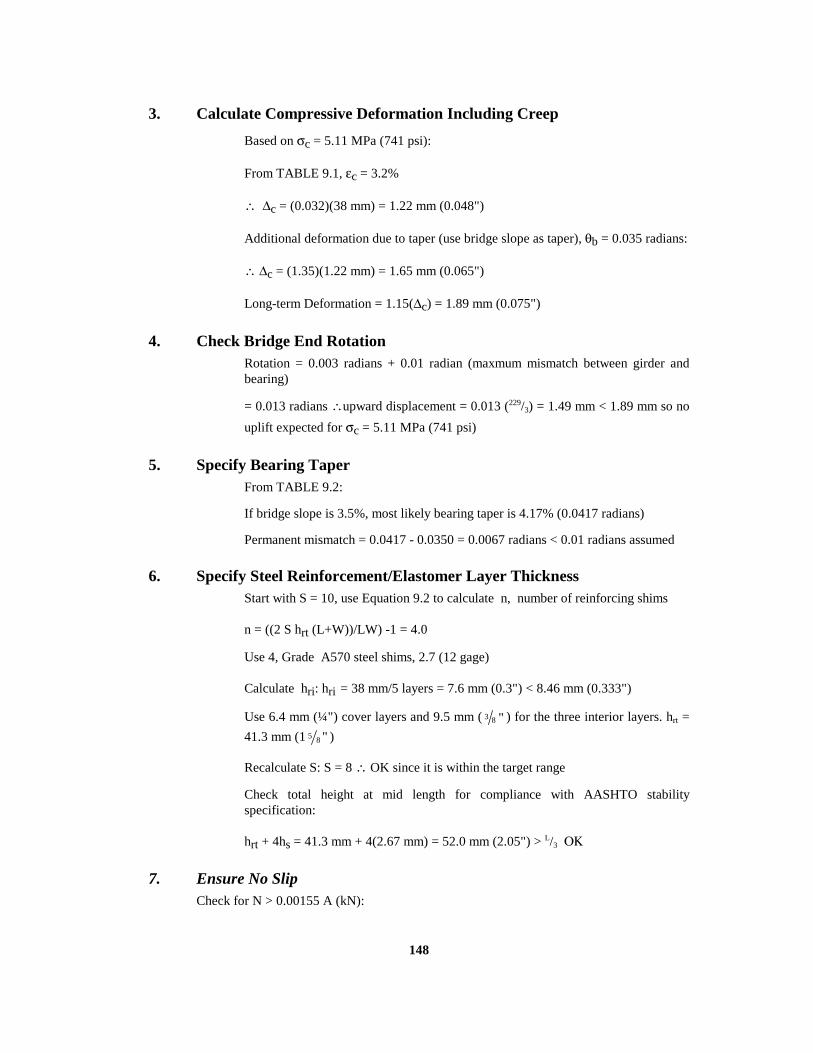
148
3. Calculate Compressive Deformation Including Creep
Based on σc = 5.11 MPa (741 psi):
From TABLE 9.1, εc = 3.2%
∴ ∆c = (0.032)(38 mm) = 1.22 mm (0.048")
Additional deformation due to taper (use bridge slope as taper), θb = 0.035 radians:
∴ ∆c = (1.35)(1.22 mm) = 1.65 mm (0.065")
Long-term Deformation = 1.15(∆c) = 1.89 mm (0.075")
4. Check Bridge End RotationRotation = 0.003 radians + 0.01 radian (maxmum mismatch between girder andbearing)
= 0.013 radians ∴upward displacement = 0.013 (229/3) = 1.49 mm < 1.89 mm so no
uplift expected for σc = 5.11 MPa (741 psi)
5. Specify Bearing TaperFrom TABLE 9.2:
If bridge slope is 3.5%, most likely bearing taper is 4.17% (0.0417 radians)
Permanent mismatch = 0.0417 - 0.0350 = 0.0067 radians < 0.01 radians assumed
6. Specify Steel Reinforcement/Elastomer Layer ThicknessStart with S = 10, use Equation 9.2 to calculate n, number of reinforcing shims
n = ((2 S hrt (L+W))/LW) -1 = 4.0
Use 4, Grade A570 steel shims, 2.7 (12 gage)
Calculate hri: hri = 38 mm/5 layers = 7.6 mm (0.3") < 8.46 mm (0.333")
Use 6.4 mm (¼") cover layers and 9.5 mm ( "83 ) for the three interior layers. hrt =
41.3 mm (1 "85 )
Recalculate S: S = 8 ∴ OK since it is within the target range
Check total height at mid length for compliance with AASHTO stabilityspecification:
hrt + 4hs = 41.3 mm + 4(2.67 mm) = 52.0 mm (2.05") > L/3 ΟΚ
7. Ensure No SlipCheck for N > 0.00155 A (kN):
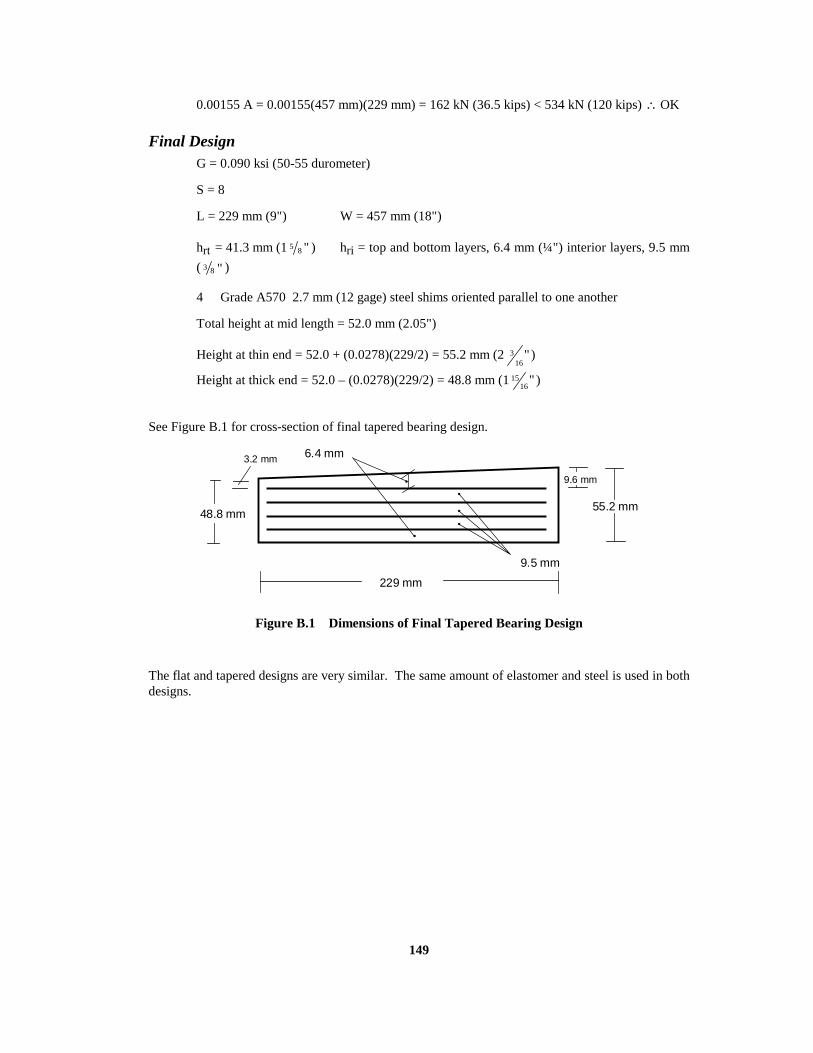
149
0.00155 A = 0.00155(457 mm)(229 mm) = 162 kN (36.5 kips) < 534 kN (120 kips) ∴ OK
Final DesignG = 0.090 ksi (50-55 durometer)
S = 8
L = 229 mm (9") W = 457 mm (18")
hrt = 41.3 mm (1 "85 ) hri = top and bottom layers, 6.4 mm (¼") interior layers, 9.5 mm
( "83 )
4 Grade A570 2.7 mm (12 gage) steel shims oriented parallel to one another
Total height at mid length = 52.0 mm (2.05")
Height at thin end = 52.0 + (0.0278)(229/2) = 55.2 mm (2 "16
3 )
Height at thick end = 52.0 – (0.0278)(229/2) = 48.8 mm (1 "16
15 )
See Figure B.1 for cross-section of final tapered bearing design.
48.8 mm55.2 mm
9.5 mm
229 mm
9.6 mm
6.4 mm3.2 mm
•
•
••
•
Figure B.1 Dimensions of Final Tapered Bearing Design
The flat and tapered designs are very similar. The same amount of elastomer and steel is used in bothdesigns.

150

151
APPENDIX C
SELECTED PROPERTIES OF NATURAL RUBBER
The mechanical properties given are those of filled rubber vulcanizates and not are confined tobearing applications alone.
C.1 MECHANICAL PROPERTIESHardness (International Rubber Hardness Degrees scale range 0-100): 45 - 80Density: 1.15 Mg/m3 (71.6 lbs/ft3)Poisson’s Ratio: 0.4997Bulk Modulus: 2000 - 2200 MPa (290-319 ksi) directly proportional to hardness
Compressive Qualities:Compressive Modulus - a function of (directly proportional) to hardness and shape factorCompressive Strength (approximate): 1000 MPa (145 Ksi)
Tensile Qualities:Tensile Modulus - a function of (directly proportional to) hardness and shape factor
- at low strains, equal to the compressive modulusTensile Strength: 15-30 MPa (2175 - 4350 psi) indirectly proportional to hardness
(A = original cross section)Elongation at Break: 200-600% directly proportional to hardness
Shear Qualities:For 45-80 durometer hardnessShear Modulus at 2% strain: 0.5-4.0 MPa (72.5 - 580 psi) directly proportional to hardnessShear Modulus at 50% strain: 0.5-1.6 MPa (72.5 - 232 psi) directly prportional to hardness
C.2 THERMAL PROPERTIESSpecific Heat: 1.5kJ/kg/ o CCoefficient of volume expansion: 53x10-5/ o CTemperature at which stiffening begins to occur: -20oCLow-temperature crystallization point: -25oCGlass transition temperature: -60oCVulcanization temperature: 120-220oCTemperature at which molecular breakdown occurs: 300oC

152
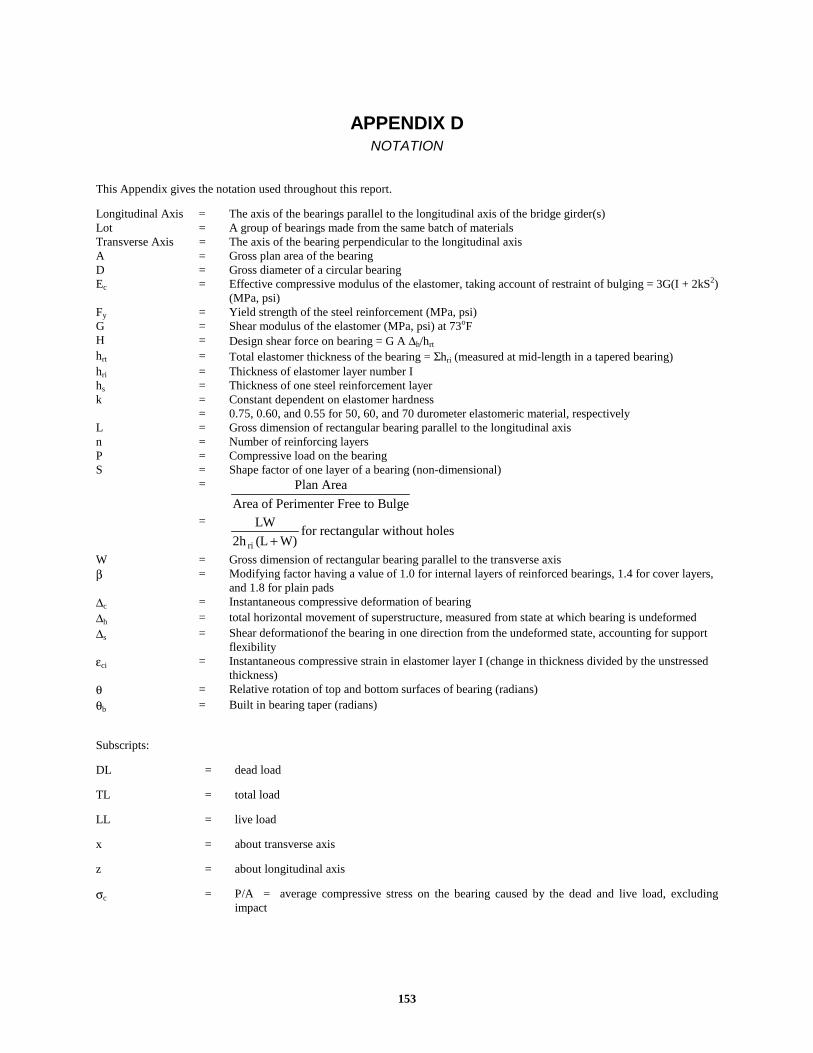
153
APPENDIX DNOTATION
This Appendix gives the notation used throughout this report.
Longitudinal Axis = The axis of the bearings parallel to the longitudinal axis of the bridge girder(s)Lot = A group of bearings made from the same batch of materialsTransverse Axis = The axis of the bearing perpendicular to the longitudinal axisA = Gross plan area of the bearingD = Gross diameter of a circular bearingEc = Effective compressive modulus of the elastomer, taking account of restraint of bulging = 3G(I + 2kS2)
(MPa, psi)Fy = Yield strength of the steel reinforcement (MPa, psi)G = Shear modulus of the elastomer (MPa, psi) at 73oFH = Design shear force on bearing = G A ∆h/hrt
hrt = Total elastomer thickness of the bearing = Σhri (measured at mid-length in a tapered bearing)hri = Thickness of elastomer layer number Ihs = Thickness of one steel reinforcement layerk = Constant dependent on elastomer hardness
= 0.75, 0.60, and 0.55 for 50, 60, and 70 durometer elastomeric material, respectivelyL = Gross dimension of rectangular bearing parallel to the longitudinal axisn = Number of reinforcing layersP = Compressive load on the bearingS = Shape factor of one layer of a bearing (non-dimensional)
= Plan Area
Area of Perimenter Free to Bulge= LW
2h (L W)for rectangular without holes
ri +W = Gross dimension of rectangular bearing parallel to the transverse axisβ = Modifying factor having a value of 1.0 for internal layers of reinforced bearings, 1.4 for cover layers,
and 1.8 for plain pads∆c = Instantaneous compressive deformation of bearing∆h = total horizontal movement of superstructure, measured from state at which bearing is undeformed∆s = Shear deformationof the bearing in one direction from the undeformed state, accounting for support
flexibilityεci = Instantaneous compressive strain in elastomer layer I (change in thickness divided by the unstressed
thickness)θ = Relative rotation of top and bottom surfaces of bearing (radians)θb = Built in bearing taper (radians)
Subscripts:
DL = dead load
TL = total load
LL = live load
x = about transverse axis
z = about longitudinal axis
σc = P/A = average compressive stress on the bearing caused by the dead and live load, excludingimpact

154

155
APPENDIX EINDIVIDUAL TEST RESULTS
This Appendix gives the results of individual shear modulus, compressive stiffness, rotational stiffness, compressivecreep, shear and compression fatigue, and compression failure tests by specimen.
NOTES:
• Specimen Code: First Letter - Manufacturer
100,200 - Specified Shear Modulus - 0.7 MPa (100 psi), 1.4 MPa (200 psi)
2,3,6 - Number of reinforcing steel shims
0,4,6 - Requested Taper, Flat, 4%, 6%
** - denotes replicate test (on different specimen of same design)
• Manufacturer A provided only a limited number of specimens which were tested for shear andcompressive stiffness, compressive creep and compression failure.
• Manufacturers B & C provided 3 each 229x711-mm (9”x28”) bearings which were tested as follows:
TABLE E.1 DISTRIBUTION OF TEST SPECIMENS FROM MANUFACTURERS B AND C
Test Manufacturer B Manufacturer C
Shear Modulus Bearing #1 cut in half Bearing #1 cut in half
Compressive Stiffness One half of Bearing #2 One half of Bearing #2
Rotational Stiffness Bearing #1
(Shear Modulus Specimen)
Bearing #1
(Shear Modulus Specimen)
Compressive Creep Other half of Bearing #2 Other half of Bearing #2
Compression Fatigue only two tested One third of Bearing #3
Shear Fatigue only one tested Other two thirds of
Bearing #3 cut in half
Compression Failure Bearing #3 cut in thirds only one tested

156
E.1 SHEAR MODULUS TESTS
NOTES:
• Shear area (A) = 0.0813 m2 (126 in2) for all specimens
• Shear moduli listed are an average of simultaneous tests on two specimens (See Figure 2.2)
• Shear modulus is based on the slope of the load-displacement relationship from 0-50% strain
TABLE E.2 SHEAR MODULUS TESTS ON SPECIMENS FROM MANUFACTURER A
Specimen
Shore A
Durometer
Hardness
Total Elastomer
Thickness
mm(in)
Measured
Taper
(%)
Shear Modulus MPa (psi)
G=Hhrt/∆sA
At σc= 4.39 MPa (637 psi)
A100-0-0 65 47.5 (1.87) 0 0.703 (102)
A100-2-0 62 45.5 (1.79) 0 0.658 (95.5)
A200-2-0 68
70
69
46.0 (1.81)
45.5 (1.79)
45.7 (1.80)
0 0.841 (122)
0.825 (118)**
0.869 (126)**
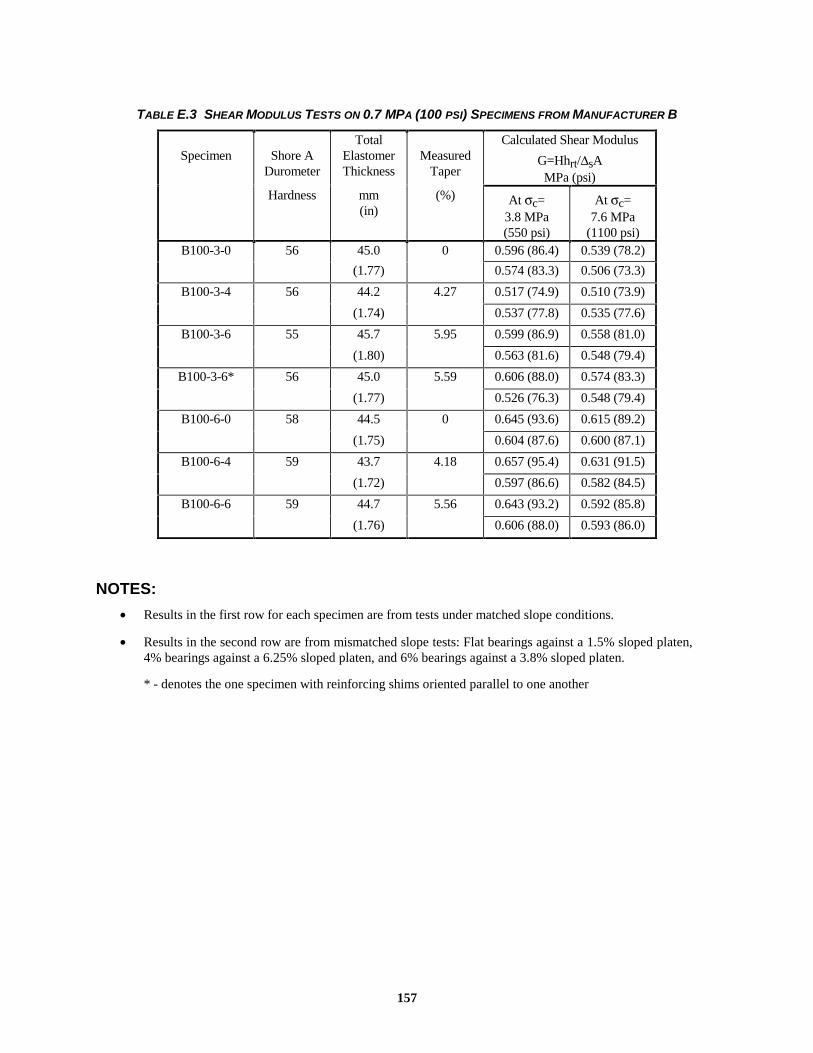
157
TABLE E.3 SHEAR MODULUS TESTS ON 0.7 MPA (100 PSI) SPECIMENS FROM MANUFACTURER B
Specimen Shore ADurometer
TotalElastomerThickness
MeasuredTaper
Calculated Shear Modulus
G=Hhrt/∆sAMPa (psi)
Hardness mm(in)
(%) At σc=3.8 MPa(550 psi)
At σc=7.6 MPa
(1100 psi)B100-3-0 56 45.0 0 0.596 (86.4) 0.539 (78.2)
(1.77) 0.574 (83.3) 0.506 (73.3)
B100-3-4 56 44.2 4.27 0.517 (74.9) 0.510 (73.9)
(1.74) 0.537 (77.8) 0.535 (77.6)
B100-3-6 55 45.7 5.95 0.599 (86.9) 0.558 (81.0)
(1.80) 0.563 (81.6) 0.548 (79.4)
B100-3-6* 56 45.0 5.59 0.606 (88.0) 0.574 (83.3)
(1.77) 0.526 (76.3) 0.548 (79.4)
B100-6-0 58 44.5 0 0.645 (93.6) 0.615 (89.2)
(1.75) 0.604 (87.6) 0.600 (87.1)
B100-6-4 59 43.7 4.18 0.657 (95.4) 0.631 (91.5)
(1.72) 0.597 (86.6) 0.582 (84.5)
B100-6-6 59 44.7 5.56 0.643 (93.2) 0.592 (85.8)
(1.76) 0.606 (88.0) 0.593 (86.0)
NOTES:
• Results in the first row for each specimen are from tests under matched slope conditions.
• Results in the second row are from mismatched slope tests: Flat bearings against a 1.5% sloped platen,4% bearings against a 6.25% sloped platen, and 6% bearings against a 3.8% sloped platen.
* - denotes the one specimen with reinforcing shims oriented parallel to one another

158
TABLE E.4 SHEAR MODULUS TESTS ON 1.4 MPA (200 PSI) SPECIMENS FROM MANUFACTURER B
SpecimenShore A
DurometerHardness
TotalElastomerThickness
MeasuredTaper
Calculated Shear Modulus
G=Hhrt/∆sAMPa (psi)
mm(in)
(%) At σc=3.8 MPa(550 psi)
At σc=7.6 MPa
(1100 psi)B200-3-0 72 46.0 0 0.986 (143) 0.876 (127)
(1.81) 0.903 (131) 0.931 (135)
B200-3-4 69 46.2 4.78 0.848 (123) 0.834 (121)
(1.82) 0.862 (125) 0.841 (122)
B200-3-6 69 47.8 5.41 0.876 (127) 0.855 (124)
(1.88) 0.848 (123) 0.876 (127)
B200-6-0 72 46.2 0 1.02 (148) 0.979 (142)
(1.82) 0.882 (128) 0.931 (135)
B200-6-4 70 46.2 4.89 0.924 (134) 0.876 (127)
(1.82) 0.882 (128) 0.848 (123)
B200-6-6 71 46.5 5.75 0.959 (139) 0.890 (129)
(1.83) 0.869 (126) 0.855 (124)

159
TABLE E.5 SHEAR MODULUS TESTS ON 0.7 MPA (100 PSI) SPECIMENS FROM MANUFACTURER C
SpecimenShore A
DurometerHardness
TotalElastomerThickness
MeasuredTaper
Calculated Shear Modulus
G=Hhrt/∆sAMPa (psi)
mm(in) (%) At σc=3.79 MPa(550 psi)
At σc=7.59 MPa(1100 psi)
C100-3-0 55 44.5 0 0.630 (91.4) 0.570 (82.6)
(1.75) 0.615 (89.3) 0.575 (83.4)
C100-3-4 55 45.0 4.10 0.640 (92.9) 0.592 (85.8)
(1.77) 0.602 (87.3) 0.562 (81.5)
C100-3-6 54 45.0 5.80 0.589 (85.5) 0.557 (80.8)
(1.77) 0.613 (88.9) 0.569 (82.5)
C100-6-0 55 44.5 0 0.658 (95.4) 0.605 (87.7)
(1.75) 0.637 (92.3) 0.617 (89.4)
C100-6-4 54 44.5 4.00 0.637 (92.3) 0.583 (84.5)
(1.75) 0.519 (75.3) 0.537 (77.9)
C100-6-6 55 44.7 5.70 0.630 (91.4) 0.591 (85.7)
(1.76) 0.637 (92.4) 0.609 (88.3)

160
TABLE E.6 SHEAR MODULUS TESTS ON 1.4 MPA (200 PSI) SPECIMENS FROM MANUFACTURER C
SpecimenShore A
DurometerHardness
TotalElastomerThickness
MeasuredTaper
Calculated Shear Modulus
G=Hhrt/∆sAMPa (psi)
mm(in) (%) At σc=3.79 MPa(550 psi)
At σc=7.59 MPa(1100 psi)
C200-3-0 65 46.5 0 0.786 (114) 0.786 (114)
(1.83) 0.786 (114) 0.786 (114)
C200-3-4 66 45.5 3.68 0.841 (122) 0.821 (119)
(1.79) 0.703 (102) 0.772 (112)
C200-3-6 68 45.7 6.02 0.800 (116) 0.779 (113)
(1.80) 0.807 (117) 0.807 (117)
C200-6-0 68 45.0 0 0.876 (127) 0.834 (121)
(1.77) 0.786 (114) 0.807 (117)
C200-6-4 68 45.0 3.93 0.924 (134) 0.883 (128)
(1.77) 0.731 (106) 0.793 (115)
C200-6-6 67 45.2 5.65 0.876 (127) 0.841 (122)
(1.78) 0.903 (131) 0.869 (126)

161
E.2 HORIZONTAL FORCES AND DISPLACEMENTS FROM COMPRESSIONLOADS ALONE
NOTES:
• All specimens were those used for shear modulus tests. Plan area= 0.0813 m2 (126 in2)
• Horizontal displacement tests were performed only on tapered bearings at matched slopes
• Horizontal forces were determined by preventing horizontal displacements. See Chapter 3, Section 3.1.
TABLE E. 7 HORIZONTAL FORCE & DISPLACEMENT TESTS - 0.7 MPA (100 PSI) SPECIMENS -MANUFACTURER B
Horizontal Force, H kN (kips)Specimen Shore A
TotalElast. Meas.
MiddlePlaten Horizontal Displ., ∆s mm(in) †
DurometerHardness
Thick.mm(in)
Taper(%)
Slope(%)
At σc=3.8 MPa(550 psi)
At σc=7.6 MPa(1100 psi)
B100-3-0 56 45.0 0 1.5 1.73 (0.391) 3.37 (0.758)
(1.77)
B100-3-4 56 44.2 4.27 3.8 4.32 (0.971) 5.79 (1.30)
(1.74) 2.74 (0.108) † 6.55 (0.258) †
6.25 5.53 (1.24) 11.6 (2.60)
B100-3-6 55 45.7 5.95 6.25 6.81 (1.53) 15.3 (3.41)
(1.80) 7.87 (0.310) † 19.2 (0.754) †
3.8 4.16 (0.935) 9.27 (2.08)
B100-3-6* 56 45.0 5.59 6.25 5.07 (1.14) 10.4 (2.33)
Parallel (1.77) 4.75 (0.187) † 11.4 (0.450) †
Shims 3.8 2.18 (0.490) 5.79 (1.30)
B100-6-0 58 44.5 0 1.5 1.84 (0.414) 2.84 (0.639)
(1.75)
B100-6-4 59 43.7 4.18 3.8 1.32 (0.296) 1.69 (0.379)
(1.72) 1.08 (0.0424)† 2.35 (0.0927)†
6.25 4.27 (0.958) 8.48 (1.91)
B100-6-6 59 44.7 5.56 6.25 5.43 (1.22) 10.4 (2.34)
(1.76) 5.49 (0.216) † 11.4 (0.450) †
3.8 1.79 (0.403) 3.63 (0.817)
* denotes the one specimen with reinforcing shims oriented parallel to one another† horizontal displacement data are given in the shaded cells

162
TABLE E.8 HORIZONTAL FORCE & DISPLACEMENT TESTS - 1.4 MPA (200 PSI) SPECIMENS -MANUFACTURER B
Horizontal Force kN (kips)Specimen Shore A
TotalElast. Meas.
MiddlePlaten Horizontal Displ. mm(in) †
DurometerHardness
Thick.mm(in)
Taper(%)
Slope(%)
At σc=3.8 MPa(550 psi)
At σc=7.6 MPa(1100 psi)
B200-3-0 72 46.0 0 1.5 1.40 (0.313) 3.00 (0.675)
(1.81)
B200-3-4 69 46.2 4.78 3.8 4.00 (0.900) 8.85 (1.99)
(1.82) 2.62 (0.103) † 6.43 (0.253) †
6.25 6.48 (1.46) 14.5 (3.27)
B200-3-6 69 47.8 5.41 6.25 6.48 (1.46) 15.3 (3.43)
(1.88) 5.92 (0.233) † 12.3 (0.486) †
3.8 3.63 (0.816) 9.48 (2.13)
B200-6-0 72 46.2 0 1.5 1.16 (0.260) 2.77 (0.621)
(1.82)
B200-6-4 70 46.2 4.89 3.8 3.48 (0.781) 9.80 (2.20)
(1.82) 1.78 (0.070) † 4.67 (0.184) †
6.25 6.48 (1.46) 14.8 (3.32)
B200-6-6 71 46.5 5.75 6.25 5.64 (1.27) 14.0 (3.15)
(1.83) 4.06 (0.160) † 8.05 (0.317) †
3.8 3.42 (0.769) 8.64 (1.94)
† horizontal displacement data are given in the shaded cells

163
TABLE E.9 HORIZONTAL FORCE & DISPLACEMENT TESTS - 0.7 MPA (100 PSI) SPECIMENS -MANUFACTURER C
Horizontal Force kN (kips)Specimen Shore A
TotalElast. Meas.
MiddlePlaten Horizontal Displ. mm(in) †
DurometerHardness
Thick.mm(in)
Taper(%)
Slope(%)
At σc=3.8 MPa(550 psi)
At σc=7.6 MPa(1100 psi)
C100-3-0 55 44.5 0 1.5 1.79 (0.402) 2.97 (0.669)
(1.75)
C100-3-4 55 45.0 4.10 3.8 4.48 (1.01) 9.48 (2.13)
(1.77) 5.03 (0.198) † 10.6 (0.416) †
6.25 7.88 (1.77) 16.4 (3.69)
C100-3-6 54 45.0 5.80 6.25 6.58 (1.48) 14.6 (3.29)
(1.77) 8.41 (0.331) † 17.5 (0.688) †
3.8 4.00 (0.900) 8.64 (1.94)
C100-6-0 55 44.5 0 1.5 1.53 (0.343) 4.00 (0.900)
(1.75)
C100-6-4 54 44.5 4.00 3.8 4.00 (0.900) 9.16 (2.06)
(1.75) 6.38 (0.251) † 13.6 (0.535) †
6.25 6.48 (1.46) 14.4 (3.24)
C100-6-6 55 44.7 5.70 6.25 10.1 (2.27) 19.2 (4.32)
(1.76) 10.8 (0.425) † 21.3 (0.837) †
3.8 5.65 (1.27) 12.6 (2.83)
† horizontal displacement data are given in the shaded cells

164
TABLE E.10 HORIZONTAL FORCE & DISPLACEMENT TESTS - 1.4 MPA(200 PSI) SPECIMENS -MANUFACTURER C
Horizontal Force kN (kips)Specimen Shore A
TotalElast. Meas.
MiddlePlaten Horizontal Displ. mm(in) †
DurometerHardness
Thick.mm(in)
Taper(%)
Slope(%)
At σc=3.8 MPa(550 psi)
At σc=7.6 MPa(1100 psi)
C200-3-0 65 46.5 0 1.5 1.53 (0.343) 1.92 (0.432)
(1.83)
C200-3-4 66 45.5 3.68 3.8 4.79 (1.08) 10.3 (2.32)
(1.79) 3.91 (0.154) † 7.97 (0.314) †
6.25 7.53 (1.69) 17.5 (3.93)
C200-3-6 68 45.7 6.02 6.25 6.37 (1.43) 15.2 (3.41)
(1.80) 5.00 (0.197) † 10.7 (0.423) †
3.8 3.37 (0.758) 8.43 (1.89)
C200-6-0 68 45.0 0 1.5 1.84 (0.414) 3.11 (0.698)
(1.77)
C200-6-4 68 45.0 3.93 3.8 5.58 (1.25) 13.2 (2.96)
(1.77) 4.72 (0.186) † 9.04 (0.356) †
6.25 9.53 (2.14) 20.9 (4.69)
C200-6-6 67 45.2 5.65 6.25 8.23 (1.85) 19.1 (4.30)
(1.78) 6.65 (0.262) † 13.6 (0.534) †
3.8 3.63 (0.817) 10.5 (2.37)
† horizontal displacement data are given in the shaded cells
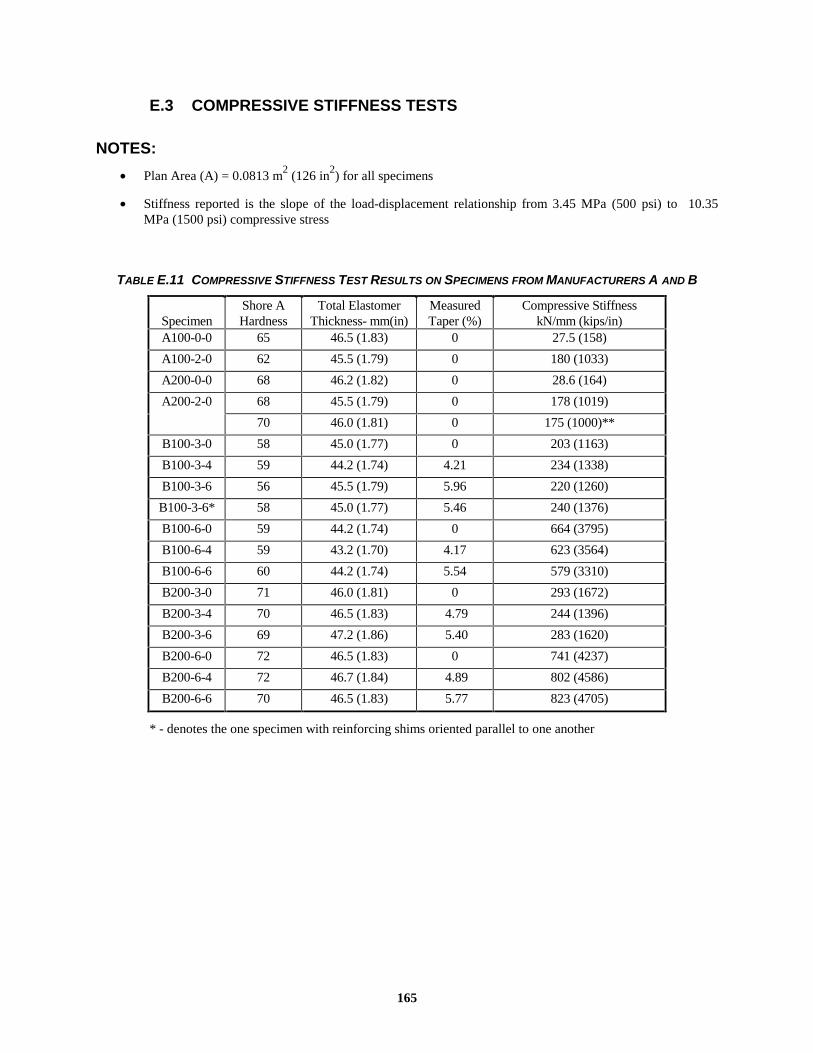
165
E.3 COMPRESSIVE STIFFNESS TESTS
NOTES:
• Plan Area (A) = 0.0813 m2 (126 in2) for all specimens
• Stiffness reported is the slope of the load-displacement relationship from 3.45 MPa (500 psi) to 10.35MPa (1500 psi) compressive stress
TABLE E.11 COMPRESSIVE STIFFNESS TEST RESULTS ON SPECIMENS FROM MANUFACTURERS A AND B
SpecimenShore AHardness
Total ElastomerThickness- mm(in)
MeasuredTaper (%)
Compressive StiffnesskN/mm (kips/in)
A100-0-0 65 46.5 (1.83) 0 27.5 (158)
A100-2-0 62 45.5 (1.79) 0 180 (1033)
A200-0-0 68 46.2 (1.82) 0 28.6 (164)
A200-2-0 68 45.5 (1.79) 0 178 (1019)
70 46.0 (1.81) 0 175 (1000)**
B100-3-0 58 45.0 (1.77) 0 203 (1163)
B100-3-4 59 44.2 (1.74) 4.21 234 (1338)
B100-3-6 56 45.5 (1.79) 5.96 220 (1260)
B100-3-6* 58 45.0 (1.77) 5.46 240 (1376)
B100-6-0 59 44.2 (1.74) 0 664 (3795)
B100-6-4 59 43.2 (1.70) 4.17 623 (3564)
B100-6-6 60 44.2 (1.74) 5.54 579 (3310)
B200-3-0 71 46.0 (1.81) 0 293 (1672)
B200-3-4 70 46.5 (1.83) 4.79 244 (1396)
B200-3-6 69 47.2 (1.86) 5.40 283 (1620)
B200-6-0 72 46.5 (1.83) 0 741 (4237)
B200-6-4 72 46.7 (1.84) 4.89 802 (4586)
B200-6-6 70 46.5 (1.83) 5.77 823 (4705)
* - denotes the one specimen with reinforcing shims oriented parallel to one another

166
TABLE E.12 COMPRESSIVE STIFFNESS TEST RESULTS ON SPECIMENS FROM MANUFACTURER C
SpecimenShore A
DurometerHardness
TotalElastomerThicknessmm (in)
MeasuredTaper(%)
Compressive StiffnesskN/mm (kips/in)
C100-3-0 54 44.5 (1.75) 0 209 (1194)
C100-3-4 55 44.7 (1.76) 4.50 204 (1166)
C100-3-6 55 45.5 (1.79) 5.80 259 (1481)
C100-6-0 55 44.5 (1.75) 0 547 (3127)
C100-6-4 55 44.5 (1.75) 4.10 415 (2370)
C100-6-6 54 45.0 (1.77) 5.80 440 (2517)
C200-3-0 68 45.5(1.79) 0 285 (1629)
C200-3-4 68 45.5(1.79) 4.00 232 (1328)
C200-3-6 68 46.0(1.81) 6.08 273 (1561)
C200-6-0 70 45.5(1.79) 0 747 (4268)
C200-6-4 69 45.7(1.80) 3.82 485 (2772)
C200-6-6 68 45.2(1.78) 5.65 618 (3534)

167
E.4 ROTATIONAL STIFFNESS TESTS
NOTES:
• Rotational stiffness reported is the slope of the linear portion of the moment rotation curve.
• Shear area (A) = 0.0813 m2 (126 in2) for all specimens
TABLE E.13 ROTATIONAL STIFFNESS TESTS ON SPECIMENS FROM MANUFACTURERS B AND C
Specimen Shore ATotal
ElastomerMeasured
TaperRotational Stiffness
N-m/radian (K-in/degree)DurometerHardness
Thicknessmm (in)
(%) At σc=3.8 MPa(550 psi)
At σc=7.6 MPa
(1100 psi)C100-3-0 55 44.5 (1.75) 0 408 (63.1) 479 (74.0)
C100-3-4 55 45.0 (1.77) 4.10 450 (69.5) 471 (72.7)
C100-3-6 54 45.0 (1.77) 5.80 386 (59.6) 405 (62.6)
B100-3-6* 56 45.0 (1.77) 5.59 335 (51.8) 385 (59.5)
C100-6-0 55 44.5 (1.75) 0 829 (128) 845 (131)
C100-6-4 54 44.5 (1.75) 4.00 780 (121) 830 (128)
C100-6-6 55 44.7 (1.76) 5.70 856 (132) 856 (132)
B200-3-0 72 46.0 (1.81) 0 538 (83.2) 545 (84.2)
B200-3-4 69 46.2 (1.82) 4.78 390 (60.2) 522 (80.6)
B200-3-6 69 47.8 (1.88) 5.41 390 (60.2) 438 (67.7)
B200-6-0 72 46.2 (1.82) 0 865 (134) 1132 (175)
B200-6-4 70 46.2 (1.82) 4.89 962 (149) 1072 (166)
B200-6-6 71 46.5 (1.83) 5.75 975 (151) 1085 (168)
* - denotes the one specimen with reinforcing shims oriented parallel to one another

168
E.5 COMPRESSIVE CREEP TESTS
TABLE E.14 COMPRESSIVE CREEP TESTS ON SPECIMENS FROM MANUFACTURERS A, AND B
SpecimenShore A
DurometerHardness
TotalElastomerThicknessmm (in)
MeasuredTaper(%)
CreepPercent Initial Deflection
Southwell Logarithmic Prediction Prediction
A100-2-0 62 46.5 (1.83) 0 43.0 46.2
A200-2-0 68 45.5 (1.79) 0 49.5 58.0
B100-3-0 58 45.0 (1.77) 0 45.0 34.5
B100-3-4 59 44.2 (1.74) 4.21 41.5 44.2
B100-3-6 56 45.5 (1.79) 5.96 55.5 37.1
B100-3-6* 58 45.0 (1.77) 5.46 50.5 67.5
B100-6-0 59 44.2 (1.74) 0 12.0 17.5
B100-6-4 59 43.2 (1.70) 4.17 17.5 16.4
B100-6-6 60 44.2 (1.74) 5.54 15.5 15.3
B200-3-0 71 46.0 (1.81) 0 40.4 32.5
B200-3-4 70 46.5 (1.83) 4.79 42.7 21.4
B200-3-6 69 47.2 (1.86) 5.40 47.0 24.1
B200-6-0 72 46.5 (1.83) 0 11.3 5.25
B200-6-4 72 46.7 (1.84) 4.89 14.0 6.47
B200-6-6 70 46.5 (1.83) 5.77 15.3 6.78
* - denotes the one specimen with reinforcing shims oriented parallel to one another

169
TABLE E.15 COMPRESSIVE CREEP TESTS ON SPECIMENS FROM MANUFACTURER C
SpecimenShore A
DurometerHardness
TotalElastomerThicknessmm (in)
MeasuredTaper(%)
CreepPercent Initial Deflection
Logarithmic Southwell Prediction Prediction
C100-3-0 54 44.5 (1.75) 0 35.0 47.0
C100-3-4 55 44.7 (1.76) 4.50 47.5 46.0
C100-3-6 55 45.5 (1.79) 5.80 X X
C100-6-0 55 44.5 (1.75) 0 17.0 15.5
C100-6-4 55 44.5 (1.75) 4.10 18.0 8.00
C100-6-6 54 45.0 (1.77) 5.80 X X
C200-3-0 68 45.5(1.79) 0 35.5 38.8
C200-3-4 68 45.5(1.79) 4.00 42.5 23.4
C200-3-6 68 46.0(1.81) 6.08 60.5 34.0
C200-6-0 70 45.5(1.79) 0 21.0 15.2
C200-6-4 69 45.7(1.80) 3.82 16.5 5.60
C200-6-6 68 45.2(1.78) 5.65 20.0 7.60
X - Bearings slipped out during creep test yielding additional deformations above creepamount

170
E.6 FATIGUE TESTS
NOTES:•
Plan area on all fatigue specimens = 0.0523 m2 (81 in2)
TABLE E.16 SHEAR FATIGUE TESTS ON SPECIMENS FROM MANUFACTURERS B AND C
SpecimenShore A
DurometerHardness
Total ElastomerThickness
mm(in)
MeasuredTaper(%)
Shear StiffnesskN/mm (kips/in)
Starting EndingC100-3-0 53 44.5 (1.75) 0 0.895 (5.10) 0.857 (4.89)
C100-3-4 53 45.0 (1.77) 4.19 0.885 (5.05) 0.842 (4.81)
C100-3-6 53 45.5 (1.79) 5.99 0.875 (4.99) 0.863 (4.93)
B100-6-0 60 44.5 (1.75) 0 Lost Data Lost Data
C100-6-4 67 44.7 (1.76) 4.16 0.937 (5.35) 0.930 (5.30)
C100-6-6 68 45.2 (1.78) 5.73 0.972 (5.55) 0.930 (5.30)
C200-3-0 67 45.2 (1.78) 0 1.24 (7.05) 1.15 (6.55)
C200-3-4 68 45.7 (1.80) 4.18 1.35 (7.70) 1.17 (6.65)
C200-3-6 67 48.0 (1.89) 5.93 1.31 (7.45) 1.14 (6.50)
C200-6-0 69 45.5 (1.79) 0 1.33 (7.55) 1.26 (7.15)
C200-6-4 69 45.2 (1.78) 4.06 1.42 (8.10) 1.22 (6.95)
C200-6-6 67 45.7 (1.80) 5.83 1.31 (7.45) 1.14 (6.50)

171
TABLE E.17 COMPRESSION FATIGUE TESTS ON SPECIMENS FROM MANUFACTURERS B AND C
SpecimenShore A
DurometerHardness
Total ElastomerThickness
mm(in)
MeasuredTaper(%)
Compressive StiffnesskN/mm (kips/in)
Starting EndingB100-3-0 58 44.5 (1.75) 0 111 (636) 102 (583)
C100-3-4 53 45.0 (1.77) 4.19 114 (650) 98.1 (560)
C100-3-6 53 45.5 (1.79) 5.99 102 (580) 90.2 (515)
B100-6-0 60 44.5 (1.75) 0 214 (1223) 207 (1179)
C100-6-4 54 44.7 (1.76) 4.16 202 (1155) 177 (1010)
C100-6-6 55 45.2 (1.78) 5.73 173 (990) 173 (990)
C200-3-0 67 45.2 (1.78) 0 132 (755) 113 (645)
C200-3-4 68 45.7 (1.80) 4.18 143 (816) 114 (650)
C200-3-6 67 48.0 (1.89) 5.93 117 (669) 102 (584)
C200-6-0 69 45.5 (1.79) 0 234 (1334) 234 (1334)
C200-6-4 69 45.2 (1.78) 4.06 251 (1432) 234 (1333)
C200-6-6 67 45.7 (1.80) 5.83 242 (1383) 242 (1383)

172
E.7 COMPRESSION FAILURE TESTS
NOTES:
• Plan area on all specimens from Manufacturers B and C = 0.0523 m2 (81 in2)
TABLE E. 18 COMPRESSION FAILURE TESTS ON 3 STEEL SHIM SPECIMENS FROM MANUFACTURER B
Specimen Shore ADurometerHardness
TotalElast.Thick.mm(in)
Meas.Taper(%)
Stress at Loss of Fracture Stiffness Strain Stress Strain MPa (psi) (%) MPa (psi) (%)
B100-3-0a
b
57 1.78 0 76.6 (11100)
84.8 (12300)
35
40
140 (20300)
140 (20300)
56
59
B100-3-4a
b
c
56 1.87 4.16 72.4 (10500)
72.4 (10500)
68.1 (9870)
42
41
44
121 (17500)
117 (16900)
117 (17000)
60
57
66
B100-3-6a
b
c
55 1.80 6.00 72.4 (10500)
73.8 (10700)
76.6 (11100)
43
43
44
112 (16200)
103 (14900)
121 (17600)
60
57
59
B100-3-6*
b
c
56 1.76 5.59 86.9 (12600)
80.7 (11700)
85.5 (12400)
41
41
37
121 (17600)
112 (16200)
130 (18900)
56
55
52
B200-3-0a
b
c
71 1.81 0 55.3 (8020)
54.5 (7900)
53.2 (7720)
23
23
25
108 (15700)
121 (17600)
112 (16200)
41
49
68
B200-3-4a
b
c
69 1.82 5.08 59.6 (8640)
78.6 (11400)
78.6 (11400)
26
34
35
105 (15200)
129 (18700)
129 (18700)
53
54
B200-3-6a
b
c
70 1.83 5.53 75.2 (10900)
63.9 (9260)
86.2 (12500)
39
33
34
106 (15400)
102 (14800)
111 (16100)
56
50
44

173
TABLE E. 19 COMPRESSION FAILURE TESTS ON 6 STEEL SHIM SPECIMENS - MANUFACTURERS B AND C
SpecimenShore A
DurometerHardness
TotalElast.Thick.mm(in)
Meas.Taper(%)
Stress at Loss of Fracture Stiffness Strain Stress Strain MPa (psi) (%) MPa (psi) (%)
B200-6-0a
b
c
71 1.81 0 82.3 (12000)
76.6 (11100)
78.6 (11400)
18
18
17
144 (20900)
155 (22500)
146 (21200)
32
34
36
B100-6-4a
b
c
57 1.71 4.11 80.9 (11700)
80.9 (11700)
76.6 (11100)
20
20
25
No Fracture
No Fracture
No Fracture
B100-6-6a
b
c
56 1.74 5.53 85.5 (12400)
97.9 (14200)
80.9 (11700)
26
30
21
No Fracture
161 (23400)
No Fracture
51
C100-6-0a
b
c
55 1.79 0 63.9 (9260)
73.8 (10700)
59.6 (8640)
20
23
19
81.4 (11800)
117 (17000)
92.4 (13400)
26
41
29
NOTES:
• Specimens “a”, “b”, and “c” were all 229x229 mm (9”x9”) sections from one 229x711 mm (9”x28”)bearing
• Tests on specimens “a” and “b” for tapered bearings were performed at matched slopes
• Tests on specimens “c” for tapered bearings were performed at mismatched slopes: 4% bearings werecompressed to failure against 6.25% platens and 6% bearings were compressed to failure against 4.17% platens.
• Tests marked “No Fracture” were discontinued when the compressive stress reached 155 MPa(22500 psi)

174
TABLE E.20 COMPRESSION FAILURE TESTS ON 2 STEEL SHIM SPECIMENS FROM MANUFACTURER A
SpecimenShore A
DurometerHardness
TotalElast.Thick.mm(in)
Meas.Taper(%)
Stress at Loss of Fracture Stiffness Strain Stress Strain MPa (psi) (%) MPa (psi) (%)
A100-2-0 63 1.81 0 52.0 (7540) 39 75.2 (10900) 53
A200-0-0 71 1.80 0 38.3 (5560) 31 59.7 (8659) 46
NOTE:
• Plan area on all specimens from Manufacturer A = 0.0813 m2 (126 in2)

175
GLOSSARY
The sources of the definitions given below are primarily References (13) and (33).
Antioxidant—chemicals added to an elastomeric compound to reduce physical changes caused by chemical reaction withoxygen.
Antiozonant—chemicals added to an elastomeric compound to reduce changes in physical properties caused by chemicalreaction with ozone.
Antiozonant Waxes—waxes added to an elastomeric compound for the purpose of migrating to the rubber surface andblocking ozone attack.
β-factor—a factor intended to account for the fact that unbonded elastomer layers (plain pads and cover layers ofreinforced bearings) bulge more that internal layers of reinforced bearings. The shape factor of the pad or layer is dividedby β to reflect the additional bulging. Equal to 1.8 for plain pads and 1.4 for cover layers of reinforced pads.
Bearing seat—the surface on the bridge abutment, normally concrete, upon which the bearing is positioned.
Bulk Modulus—a measurement of compressibility
Chloroprene—monomer compound formed by the reaction of vinylacetylene with hydrogen chloride. Generallypolymerized to form polychloroprene (neoprene).
Compound—substance whose constituent elements are chemically bonded together. Also a term used by manufacturerswhen referring to a particular mix of ingredients.
Compressive Modulus—Ec = σc/εc = 3G(1 + 2kS2)
Creep—continued deformation under constant load
Crystallization—phase change of elastomer during which segments of the long-chain molecules gradually becomereoriented with reference to each other resulting in an increase in stiffness and hardness.
Delamination—separation of elastomer and reinforcement.
Durometer—instrument for measuring the hardness of an elastomer.
Elastomer—any member of a class of polymeric substances possessing rubberlike qualities, especially the ability toregain shape almost completely after large deformation. Generally applied only to vulcanized materials. See Polymer.
Filler—material, not possessing rubberlike qualities, included in the elastomer compound. Carbon black is mostcommonly used and its addition tends to increase hardness, shear stiffness, and bulk modulus. It delays slightly the onsetof low-temperature crystallization, and, because it is cheaper than raw polymer, it reduces the cost of the compoundedelastomer.
Glass transition temperature—temperature at which natural rubber experiences a rapid increase in stiffness and becomesglass-like and brittle. Approximately -60oC.
Gum Rubber—unfilled, vulcanized rubber.
hydrostatic compression
change in volume

176
Hardness—mechanical property of a material which describes its resistance to indentation of a standard device (e.g., adurometer). Measured in degrees on several scales (International Rubber Hardness, Shore ‘A’, Shore ‘B’), each of whichis based on the use of a different-shaped indentor. Measurements show considerable scatter, and numerical values on allscales are about the same for materials suitable for bridge bearings (i.e., 45-65)
Hydrostatic stress—direct stress having the same value in all directions.
IHRD - International Rubber Hardness Degrees (see hardness).
Laminate—layer of reinforcing material bonded to rubber in order to prevent its lateral expansion.
Low-temperature crystallization—crystallization caused by temperatures below -25 degrees C.
Natural Rubber (polyisoprene) -- polymer occurring naturally in the sap of plants, particularly Hevea brasiliensis.
Neoprene—any class of elastomers made by polymerization of chloroprene. Notable properties are good resistance toabrasion, oxidation and chemical attack. Neoprene (capitalized) has been used by the duPont company for many years todescribe a particular product of the company.
Ozone resistance test—standard test (e.g., ASTM D1149) to determine the ability of a material to retain its originalproperties when subjected to high concentrations of ozone for a given period of time.
Polychloroprene—polymerized form of the monomer chloroprene. Chemical name for neoprene.
Polyisoprene—chemical name for natural rubber.
Polymer—a material made of long-chains of molecules consisting of linked smaller molecules or monomers. Rubbers area class of polymer which have the potential for large elastic deformations under load. (i.e., those)
Polymerization—the process of forming long chains of molecules by joining a number of smaller molecules ormonomers.
Relaxation—decrease of stress with time under constant deformation.
Rollover—local deformation other than due to simple shear at corners of an elastomer subjected to shear deformation.
Rubber—natural or synthetic organic polymer able to undergo very large deformations and then return to its originalshape on removal of the load. The term is applied both to the raw polymer an to the compounded and vulcanizedelastomer.
Set (or permanent set) - deformation not recovered after a load is removed
Shape Factor—dimentionless geometric factor defined as
It gives an indication of the compressive stiffness of an elastomeric bearing, regardless of the shape in plan.
Shore Hardness -- (see hardness)
Vulcanizate—polymer which has been vulcanized
Vulcanization—process of inducing cross-links in a polymer by chemical reaction. Requires heat, pressure, and often avulcanizing agent that varies with the polymer used.
area of one loaded surface
total area free to bulge

177
REFERENCES
1. Arditzoglou, Yorgho, “Tests on Rubber,” Master’s Thesis, University of Texas at Austin, May 1994. 84 pp.
2. Bell, L. W., Shloss, A. L. and Subramanian, N. S., “Additional Design Data on Full-Size Bridge Bearing Pads ofNeoprene,” Special Publication SP-70, American Concrete Institute. Detroit, Michigan, 1982, pp. 1087-1099.
3. “Bridge Bearings,” National Cooperative Highway Research Program Synthesis of Highway Practice #41, NationalResearch Council, Washington, D.C., 1977, 53 pp.
4. “Bridge Bearings,” Memo to Designers 7-1, California Department of Transportation, June 1994, 69 pp.
5. Clark, Earl V. and Moultrop, Kendall, “Load-Deformation Characteristics of Elastomeric Bridge Bearing Pads,”Highway Research Record #34, Highway Research Board, Washington, D.C., 1963, pp. 90-116.
6. “Design of Neoprene Bearing Pads,” E. I. duPont de Nemours and Company (Inc.), Elastomers Division,Wilmington, Delaware, August 1983, 13 pp.
7. “Engineering Properties of Neoprene Bridge Bearings,” E. I. duPont de Nemours and Company (Inc.), ElastomerChemicals Department, Wilmington, Delaware, 1959, 26 pp.
8. Fairbanks, Hardy E., “The Use of Elastomeric Pads as Bearings for Steel Beams,” Master’s Thesis, Agricultural andMechanical College of Texas, August 1960, 114 pp.
9. Grote, Jupp, “Over 20 Years of Elastomeric Bearings Without Trouble: A Scheme for Safety and Reliability,”Special Publication SP-70, American Concrete Institute, Detroit, 1982, pp. 865-886.
10. Hamzeh, Osama, “Finite Element Analysis of Elastomeric Bridge Bearings,” Ph.D. Dissertation, The University ofTexas at Austin, August 1995.
11. Iverson, James K. and Pfeifer, Donald W., “New PCI Bearing Pad Design Recommendations,” Special PublicationSP94-14, American Concrete Institute, Detroit, 1982, pp. 233-246.
12. Lee, David J., The Theory and Practice of Bearings and Expansion Joints, Cement and Concrete Association, UK,1971, 65 pp.
13. Lindley, Peter B., Engineering Design with Natural Rubber, Malaysian Rubber Producers’ Research Association,Hertford, England, 1992, 33 pp.
14. Lindley, Peter B., “Natural Rubber Structural Bearings,” Special Publication SP-70, American Concrete Institute,Detroit, 1982, pp. 353-379.
15. Long, J. E., Bearings in Structural Engineering, Newnes-Butterworths Publishing, London, 1974. 161 pp.
16. Manning, D. and Bassi, K., “Bridge Bearing Performance in Ontario,” Special Publication SP94-59, AmericanConcrete Institute, Detroit, 1982, pp. 1017-1036.
17. Minor, John C. and Egen, Richard A., “Elastomeric Bearing Research,” National Cooperative Highway ResearchProgram Report #109, Transportation Research Board, National Research Council, Washington, D.C., 1970, 62pp.
18. Ozell, A. M. and Diniz, J. F., “Report on Tests of Neoprene Pads Under Repeated Shear Loads,” HighwayResearch Board Bulletin #242, National Research Council, Washington, D.C., 1960, pp. 20-27.
19. Pare, R. L. and Keiner, E. P., “Elastomeric Bridge Bearings,” Highway Research Board Bulletin #242, NationalResearch Council, Washington, D.C., 1960, pp. 1-19.
20. Pare, Robert Lee, “Neoprene Elastomer Bearings - Ten years Experience Proves Their Importance,” CivilEngineering, November 1967, pp. 37-39.

178
21. Porter, L. S. and Meinecke, E. A., “Influence of Compression Upon the Shear Properties of Bonded RubberBlocks,” Rubber Chemistry and Technology, V. 53. pp. 1133-1144.
22. Purkiss, C. W., “New Design Parameters for Elastomeric Bridge Bearings: What They Mean in Terms ofPerformance,” Special Publication SP-70, American Concrete Institute, Detroit, 1982, pp. 379-387.
23. Rejcha, Charles, “Design of Elastomer Bearings,” PCI Journal, October 1964, pp. 62-78.
24. Roeder, C. W., Stanton, J. F. and Feller, T., “Low-Temperature Behavior and Acceptance Criteria for ElastomericBridge Bearings,” National Cooperative Highway Research Program Report #325, Transportation Research Board,National Research Council, Washington, D.C., December 1989, 69 pp.
25. Roeder, C. W., Stanton, J. F. and Taylor, A. W., “Performance of Elastomeric Bearings,” National CooperativeHighway Research Program Report #298, Transportation Research Board, National Research Council, Washington,D.C., October 1987, 100 pp.
26. Roeder, Charles W., Stanton, John F. and Taylor, Andrew W., “Failure Modes of Elastomeric Bearings and theInfluence of Manufacturing Methods,” Special Publication SP94-17, American Concrete Institute, Detroit, 1986,pp. 279-295.
27. Roeder, Charles W., Stanton, John F., “State-of-the-Art Elastomeric Bridge Bearing Design,” ACI StructuralJournal 88-S5, January-February 1991, pp. 31-41.
28. Schrage, I., “Anchorage of Bearing Pads by Friction,” Special Publication SP-70, American Concrete Institute,Detroit, 1981, pp. 197-213.
29. Sestak, J. J., Aldridge, W. W. and Fears, F. K., “A Comparative Study of Elastomeric Materials for Bridge BearingPads,” The University of Oklahoma Research Institute, Norman, Oklahoma, March 1967, 111 pp.
30. Standard Specifications for Highway Bridges, 8th Edition, AASHTO, Washington D.C., 1961.
31. Standard Specifications for Highway Bridges, 13th Edition, AASHTO, Washington D.C., 1985.
32. Standard Specifications for Highway Bridges, 15th Edition, AASHTO, Washington D.C., 1992.
33. Stanton, J. F. and Roeder, C. W., “Elastomeric Bearings Design, Construction, and Materials,” NationalCooperative Highway Research Program Report #248, Transportation Research Board, National Research Council,Washington, D.C., August 1982, 82 pp.
34. Stanton, John F. and Roeder, Charles W., “Elastomeric Bridge Bearings Specifications: Review of the Present andProposals for the Future,” ACI Journal, Nov-Dec 1983, pg. 514.
35. Stanton, John F. and Roeder, Charles W., “Elastomeric Bearings: An Overview,” Concrete International: Designand Construction, V.14, No 1, January 1992, pp. 41-46.
36. Stevenson, A. and Price, A. R., “A Case Study of Elastomeric Bridge Bearings After 20 Years of Service,” SpecialPublication SP94-6, American Concrete Institute, Detroit, 1986, pp. 113-136.
37. Suter, G. T. and Collins, R. A., “Static and Dynamic Elastomeric Bridge Bearing Tests at Normal and LowTemperatures,” Ontario Joint Highway Research Program Report #24, Department of Civil Engineering, Universityof Toronto, September 1964. 101 pp.
38. Taylor, Andrew W., Lin, Albert N. and Martin, Jonathan W., “Performance of Elastomers in Isolation Bearings: ALiterature Review,” Earthquake Spectra, Vol. 8, No. 2, 1992, pp. 279-303.
39. Yura, Joseph A., personal communication.