FGL Holdings 9.30.2020 Financial Supplement Ex. 99.2 Final
20
Exhibit 99.2 FGL Holdings (“F&G”) - An Operating Segment of Fidelity National Financial, Inc. (NYSE:FNF) Financial Supplement September 30, 2020 (Year Ended December 31) The financial statements and financial exhibits included herein are unaudited. F&G is an operating segment of FNF and these financial statements and exhibits should be read in conjunction with the Company's periodic reports on Form 10-K, Form 10-Q and Form 8-K. F&G (formerly NYSE:FG) was acquired by FNF (the "Business Combination") on June 1, 2020 ("Closing Date"). As a result of the Business Combination, F&G delisted from the NYSE and became a subsidiary of FNF. Our financial statement presentation includes the financial statements of F&G and its subsidiaries as a standalone entity ("Pre-Merger") for the periods prior to the completion of the Business Combination, and F&G and its subsidiaries as an operating segment of FNF ("Post-Merger") for periods from and after the Closing Date. All dollar amounts are presented in millions. Non-GAAP Financial Measures This document contains certain non-GAAP financial measures commonly used in our industry that, together with the relevant GAAP measures, may enhance a user’s ability to analyze the Company's operating performance and capital position for the periods presented. These measures should be considered supplementary to our results in accordance with GAAP and should not be viewed as a substitute for the GAAP measures and are not intended to replace GAAP financial results. Our non-GAAP measures may not be comparable to similarly titled measures of other organizations because other organizations may not calculate such non-GAAP measures in the same manner. 1
-
Upload
khangminh22 -
Category
Documents
-
view
3 -
download
0
Transcript of FGL Holdings 9.30.2020 Financial Supplement Ex. 99.2 Final

Exhibit 99.2
FGL Holdings (“F&G”) - An Operating Segment of Fidelity National Financial, Inc. (NYSE:FNF) Financial Supplement September 30, 2020 (Year Ended December 31)
The financial statements and financial exhibits included herein are unaudited. F&G is an operating segment of FNF and these financial statements and exhibits should be read in conjunction with the Company's periodic reports on Form 10-K, Form 10-Q and Form 8-K.
F&G (formerly NYSE:FG) was acquired by FNF (the "Business Combination") on June 1, 2020 ("Closing Date"). As a result of the Business Combination, F&G delisted from the NYSE and became a subsidiary of FNF. Our financial statement presentation includes the financial statements of F&G and its subsidiaries as a standalone entity ("Pre-Merger") for the periods prior to the completion of the Business Combination, and F&G and its subsidiaries as an operating segment of FNF ("Post-Merger") for periods from and after the Closing Date.
All dollar amounts are presented in millions.
Non-GAAP Financial Measures
This document contains certain non-GAAP financial measures commonly used in our industry that, together with the relevant GAAP measures, may enhance a user’s ability to analyze the Company's operating performance and capital position for the periods presented. These measures should be considered supplementary to our results in accordance with GAAP and should not be viewed as a substitute for the GAAP measures and are not intended to replace GAAP financial results. Our non-GAAP measures may not be comparable to similarly titled measures of other organizations because other organizations may not calculate such non-GAAP measures in the same manner.
1

PageA. Financial Highlights
Consolidated Financial Highlights . . . . . . . . . . . . . . . . . . . . . . . . . . . . . . . . . . . . . . . . . . . . . . . . . . . . . . . . . . . . . . . . . . . . . . . . . . . . . . . . . . . . . . . . . . . . . . . . 3Appendix to Consolidated Financial Highlights . . . . . . . . . . . . . . . . . . . . . . . . . . . . . . . . . . . . . . . . . . . . . . . . . . . . . . . . . . . . . . . . . . . . . . . . . . . . . . . . . . . . . . 4Condensed Consolidated Balance Sheets . . . . . . . . . . . . . . . . . . . . . . . . . . . . . . . . . . . . . . . . . . . . . . . . . . . . . . . . . . . . . . . . . . . . . . . . . . . . . . . . . . . . . . . . . . . 5Reconciliation of Total Shareholders' Equity to Common Shareholders' Equity Excluding AOCI . . . . . . . . . . . . . . . . . . . . . . . . . . . . . . . . . . . . . . . . . . . . . . . 6Condensed Consolidated Statements of Operations . . . . . . . . . . . . . . . . . . . . . . . . . . . . . . . . . . . . . . . . . . . . . . . . . . . . . . . . . . . . . . . . . . . . . . . . . . . . . . . . . . . 7Reconciliation from Net Earnings (Loss) to Adjusted Net Earnings . . . . . . . . . . . . . . . . . . . . . . . . . . . . . . . . . . . . . . . . . . . . . . . . . . . . . . . . . . . . . . . . . . . . . . 8Notable Items . . . . . . . . . . . . . . . . . . . . . . . . . . . . . . . . . . . . . . . . . . . . . . . . . . . . . . . . . . . . . . . . . . . . . . . . . . . . . . . . . . . . . . . . . . . . . . . . . . . . . . . . . . . . . . . . . 8Adjusted Net Earnings Statement . . . . . . . . . . . . . . . . . . . . . . . . . . . . . . . . . . . . . . . . . . . . . . . . . . . . . . . . . . . . . . . . . . . . . . . . . . . . . . . . . . . . . . . . . . . . . . . . . 9Financial Strength Ratings . . . . . . . . . . . . . . . . . . . . . . . . . . . . . . . . . . . . . . . . . . . . . . . . . . . . . . . . . . . . . . . . . . . . . . . . . . . . . . . . . . . . . . . . . . . . . . . . . . . . . . 10Total Product Net Investment Spread . . . . . . . . . . . . . . . . . . . . . . . . . . . . . . . . . . . . . . . . . . . . . . . . . . . . . . . . . . . . . . . . . . . . . . . . . . . . . . . . . . . . . . . . . . . . . . 11FIA Net Investment Spread . . . . . . . . . . . . . . . . . . . . . . . . . . . . . . . . . . . . . . . . . . . . . . . . . . . . . . . . . . . . . . . . . . . . . . . . . . . . . . . . . . . . . . . . . . . . . . . . . . . . . . 12
B. Product Summary Average Assets Under Management Rollforward . . . . . . . . . . . . . . . . . . . . . . . . . . . . . . . . . . . . . . . . . . . . . . . . . . . . . . . . . . . . . . . . . . . . . . . . . . . . . . . . . . . . . 13Annuity Account Balance Rollforward . . . . . . . . . . . . . . . . . . . . . . . . . . . . . . . . . . . . . . . . . . . . . . . . . . . . . . . . . . . . . . . . . . . . . . . . . . . . . . . . . . . . . . . . . . . . . 13Annuity Liability Characteristics . . . . . . . . . . . . . . . . . . . . . . . . . . . . . . . . . . . . . . . . . . . . . . . . . . . . . . . . . . . . . . . . . . . . . . . . . . . . . . . . . . . . . . . . . . . . . . . . . 14
C. Investment Summary Summary of Invested Assets by Asset Class . . . . . . . . . . . . . . . . . . . . . . . . . . . . . . . . . . . . . . . . . . . . . . . . . . . . . . . . . . . . . . . . . . . . . . . . . . . . . . . . . . . . . . . . . 15Credit Quality of Fixed Maturity Securities . . . . . . . . . . . . . . . . . . . . . . . . . . . . . . . . . . . . . . . . . . . . . . . . . . . . . . . . . . . . . . . . . . . . . . . . . . . . . . . . . . . . . . . . . 16Summary of Residential Mortgage Backed Securities by Collateral Type and NAIC Designation . . . . . . . . . . . . . . . . . . . . . . . . . . . . . . . . . . . . . . . . . . . . . . . 17
D. Counterparty RiskTop 10 Holdings by Issuers . . . . . . . . . . . . . . . . . . . . . . . . . . . . . . . . . . . . . . . . . . . . . . . . . . . . . . . . . . . . . . . . . . . . . . . . . . . . . . . . . . . . . . . . . . . . . . . . . . . . . . 18Top 5 Reinsurers . . . . . . . . . . . . . . . . . . . . . . . . . . . . . . . . . . . . . . . . . . . . . . . . . . . . . . . . . . . . . . . . . . . . . . . . . . . . . . . . . . . . . . . . . . . . . . . . . . . . . . . . . . . . . . 18
E. Non-GAAP Financial Measures Definitions 19
F&G - An Operating Segment of FNFFinancial Supplement - September 30, 2020 (All periods are unaudited)
2

Consolidated Financial Highlights
Three months ended
One month ended
Two months ended Three months ended
September 30, 2020
June 30, 2020 May 31, 2020
March 31, 2020
December 31, 2019
September 30, 2019
Post-Merger Post-Merger Pre-Merger Pre-Merger Pre-Merger Pre-Merger(Unaudited) (Unaudited) (Unaudited) (Unaudited) (Unaudited) (Unaudited)
Select Income Statement Data:Net earnings (loss) attributable to common shareholders 38 (39) 19 (346) 217 58
Adjusted net earnings (loss) attributable to common shareholders (1) 74 33 40 33 94 79
Select Metrics:
Average Assets Under Management ("AAUM") (1) 26,990 26,582 29,285 28,924 28,332 27,871
Net investment spread (1) 2.62 % 3.50 % 1.92 % 2.24 % 2.41 % 2.05 %
SalesFIA 815 244 622 831 795 590 Fixed rate annuities (MYGA) 253 14 33 114 126 107 Institutional spread based — — — 100 — 100 Total annuity 1,068 258 655 1,045 921 797 Index universal life 14 4 8 11 11 9 Flow reinsurance 51 34 108 122 122 108 Total Sales $ 1,133 $ 296 $ 771 $ 1,178 $ 1,054 $ 914 (1) Refer to "Non-GAAP Financial Measures Definitions"
F&G - An Operating Segment of FNFFinancial Supplement - September 30, 2020 (All periods are unaudited)
3

Appendix to Consolidated Financial HighlightsEffective June 1, 2020, certain blocks of business were designated as discontinued operations by FNF. Amounts related to these blocks of business are presented herein as adjustments to key financial metrics, solely for comparison between Pre-Merger and Post-Merger periods. See FNF 10Q for further discussion on discontinued operations.
Three months ended One month ended Two months ended Three months ended
September 30, 2020 June 30, 2020 May 31, 2020 March 31, 2020 December 31, 2019 September 30, 2019
Post-Merger Post-Merger Pre-Merger Pre-Merger Pre-Merger Pre-Merger(Unaudited) (Unaudited) (Unaudited) (Unaudited) (Unaudited) (Unaudited)
Select Income Statement Data:Net earnings (loss) attributable to common shareholders 38 (39) 19 (346) 217 $ 58
Less: discontinued operations [(earnings)/loss] 28 (5) (22) 155 (46) (14) As adjusted for discontinued operations 66 (44) (3) (191) 171 44
Adjusted net earnings (loss) attributable to common shareholders (1) 74 33 40 33 94 79 Less: discontinued operations [(earnings)/loss] — — 8 26 (4) (18)
As adjusted for discontinued operations 74 33 48 59 90 61 Less: Notable items [(unfavorable)/favorable] (2) 10 8 5 (6) 15 2
As adjusted for discontinued operations and notable items $ 64 $ 25 $ 43 $ 65 $ 75 $ 59
Select Metrics:
AAUM (1) 26,990 26,582 29,285 28,924 28,332 27,871 Less: discontinued operations — — (2,236) (2,266) (2,183) (2,040)
As adjusted for discontinued operations 26,990 26,582 27,049 26,658 26,149 25,831
Net investment spread (1) 2.62 % 3.50 % 1.92 % 2.24 % 2.41 % 2.05 % Less: discontinued operations [(earnings)/loss] (3) — % — % 0.13 % 0.09 % 0.03 % 0.07 %
As adjusted for discontinued operations 2.62 % 3.50 % 2.05 % 2.33 % 2.44 % 2.12 %(1) Refer to "Non-GAAP Financial Measures Definitions" (2) Notable items from continuing operations. For full list of notable items, refer to page 8 "Notable Items"(3) Subsequent to the release of the Quarterly Financial Supplement dated August 4, 2020, management identified an immaterial adjustment that was needed to reflect the correct amount in the prior period. Periods affected were the two months ended May 31, 2020 and the three months ended March 31, 2020 and September 30, 2019
F&G - An Operating Segment of FNFFinancial Supplement - September 30, 2020 (All periods are unaudited)
4

Condensed Consolidated Balance Sheets
September 30, 2020 June 30, 2020
March 31, 2020
December 31,2019
September 30, 2019
Post-Merger Post-Merger Pre-Merger Pre-Merger Pre-Merger(Unaudited) (Unaudited) (Unaudited) (Unaudited) (Unaudited)
AssetsInvestments:
Fixed maturity securities available for sale, at fair value, net of allowance for credit losses of $13 at September 30, 2020 $ 24,218 $ 23,014 $ 21,140 $ 23,726 $ 23,907 Preferred securities, at fair value 917 875 873 1,001 1,027 Equity securities, at fair value 54 54 42 70 70 Derivative investments 381 333 188 587 454 Mortgage loans, net of allowance for credit losses of $35 at September 30, 2020 1,614 1,749 1,769 1,267 836 Investments in unconsolidated affiliates (a) 1,125 1,045 1,071 1,013 923 Other long-term investments 438 432 421 289 155 Short-term investments 34 38 36 38 37
Total investments $ 28,781 27,540 25,540 27,991 27,409 Cash and cash equivalents 1,014 909 740 931 953 Trade and notes receivables 2 2 1 1 1 Funds withheld for reinsurance receivable, at fair value — — 2,050 2,172 2,045 Reinsurance recoverable, net of allowance for credit losses of $22 at September 30, 2020 3,152 3,182 3,186 3,213 3,250 Goodwill (a) 1,731 1,725 467 467 467 Prepaid expenses and other assets 448 381 384 355 435 Lease assets 7 8 9 9 3 Other intangible assets, net (a) 1,956 2,060 2,070 1,495 1,438 Property and equipment, net 7 2 2 2 1 Income taxes receivable 19 24 23 15 21 Deferred tax asset (a) 107 180 264 61 92 Assets of discontinued operations 2,618 2,502 — — —
Total assets $ 39,842 $ 38,515 $ 34,736 $ 36,712 $ 36,115 (a) These line items included adjustments that were recorded during the remeasurement period subsequent to the June 1, 2020 acquisition. The following adjustments were recorded as of the opening balance sheet at June 1, 2020 during the quarter ending, September 30, 2020: Investment in unconsolidated affiliates, $31, Goodwill, $6, Other intangible assets, net, ($37), and Deferred tax asset, ($3).
F&G - An Operating Segment of FNFFinancial Supplement - September 30, 2020 (All periods are unaudited)
5

Condensed Consolidated Balance Sheets (continued)
September 30, 2020 June 30, 2020
March 31, 2020
December 31,2019
September 30, 2019
Post-Merger Post-Merger Pre-Merger Pre-Merger Pre-Merger(Unaudited) (Unaudited) (Unaudited) (Unaudited) (Unaudited)
Liabilities and Shareholders' EquityContractholder funds (a) 27,488 26,628 26,226 25,684 25,355 Future policy benefits 4,048 4,092 5,658 5,735 5,714 Accounts payable and accrued liabilities 1,056 983 1,007 1,167 1,088 Notes payable 589 589 543 542 542 Funds withheld for reinsurance liabilities 814 817 821 831 838 Lease liabilities 12 13 9 9 3 Liabilities of discontinued operations 2,462 2,347 — — —
Total liabilities 36,469 35,469 34,264 33,968 33,540
Shareholders' equity:Additional paid-in-capital 2,739 2,737 2,041 2,032 2,022 Retained earnings (accumulated deficit) (1) (39) (72) 300 85 Accumulated other comprehensive income (loss) 635 348 (1,428) 481 520 Treasury stock — — (69) (69) (52)
Total shareholders' equity 3,373 3,046 472 2,744 2,575 Total liabilities and shareholders' equity $ 39,842 $ 38,515 $ 34,736 $ 36,712 $ 36,115
(a) This line item included a $3 adjustment that was recorded as of the opening balance sheet at June 1, 2020 during the quarter ending, September 30, 2020.
Reconciliation of Total Shareholders' Equity to Common Shareholders' Equity Excluding AOCISeptember
30, 2020 June 30, 2020March 31,
2020December 31,
2019September
30, 2019Post-Merger Post-Merger Pre-Merger Pre-Merger Pre-Merger(Unaudited) (Unaudited) (Unaudited) (Unaudited) (Unaudited)
Total shareholders' equity 3,373 3,046 472 2,744 2,575 Equity attributable to preferred shareholders (1) — — 446 438 430 Common shareholders' equity (1) 3,373 3,046 26 2,306 2,145 AOCI 635 348 (1,428) 481 520 Total common shareholders' equity excluding AOCI (1) (b) $ 2,738 $ 2,698 $ 1,454 $ 1,825 $ 1,625 (1) Refer to "Non-GAAP Financial Measures Definitions" (b) Subsequent to filing, we identified an immaterial update to this calculation which is reflected above
F&G - An Operating Segment of FNFFinancial Supplement - September 30, 2020 (All periods are unaudited)
6
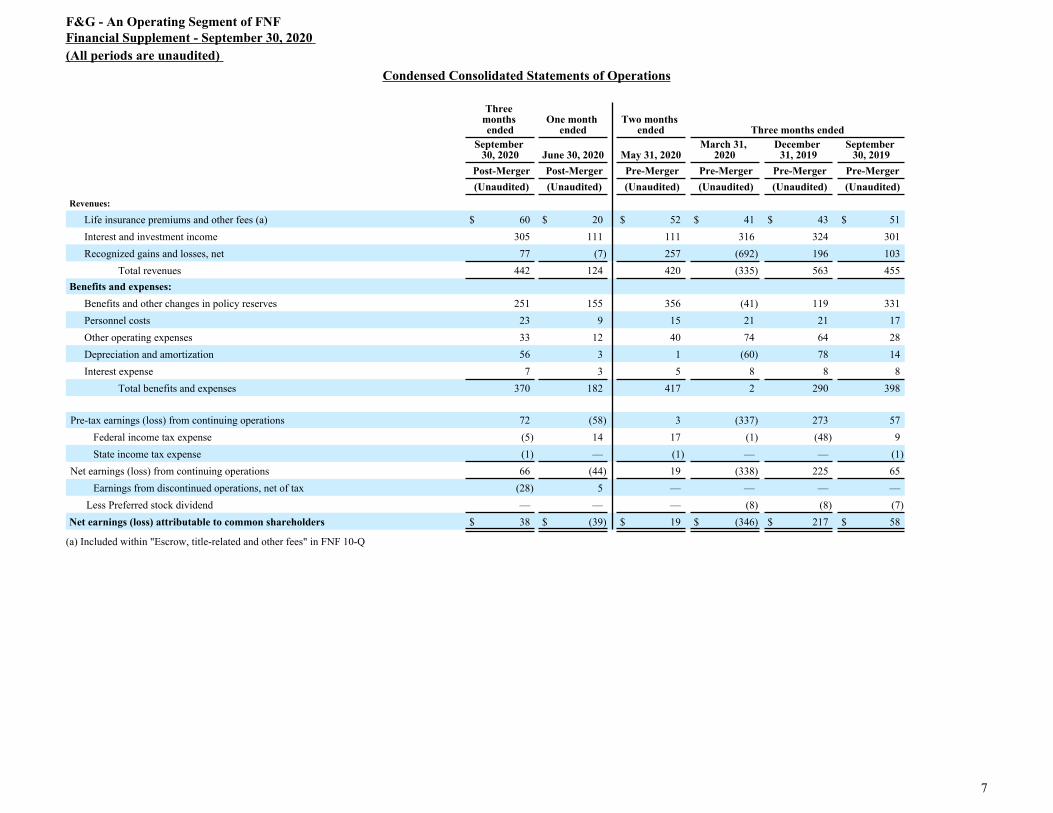
Condensed Consolidated Statements of Operations
Three months ended
One month ended
Two months ended Three months ended
September 30, 2020 June 30, 2020 May 31, 2020
March 31, 2020
December 31, 2019
September 30, 2019
Post-Merger Post-Merger Pre-Merger Pre-Merger Pre-Merger Pre-Merger(Unaudited) (Unaudited) (Unaudited) (Unaudited) (Unaudited) (Unaudited)
Revenues:
Life insurance premiums and other fees (a) $ 60 $ 20 $ 52 $ 41 $ 43 $ 51 Interest and investment income 305 111 111 316 324 301 Recognized gains and losses, net 77 (7) 257 (692) 196 103
Total revenues 442 124 420 (335) 563 455 Benefits and expenses:
Benefits and other changes in policy reserves 251 155 356 (41) 119 331 Personnel costs 23 9 15 21 21 17 Other operating expenses 33 12 40 74 64 28 Depreciation and amortization 56 3 1 (60) 78 14 Interest expense 7 3 5 8 8 8
Total benefits and expenses 370 182 417 2 290 398
Pre-tax earnings (loss) from continuing operations 72 (58) 3 (337) 273 57 Federal income tax expense (5) 14 17 (1) (48) 9 State income tax expense (1) — (1) — — (1)
Net earnings (loss) from continuing operations 66 (44) 19 (338) 225 65 Earnings from discontinued operations, net of tax (28) 5 — — — — Less Preferred stock dividend — — — (8) (8) (7)
Net earnings (loss) attributable to common shareholders $ 38 $ (39) $ 19 $ (346) $ 217 $ 58
(a) Included within "Escrow, title-related and other fees" in FNF 10-Q
F&G - An Operating Segment of FNFFinancial Supplement - September 30, 2020 (All periods are unaudited)
7
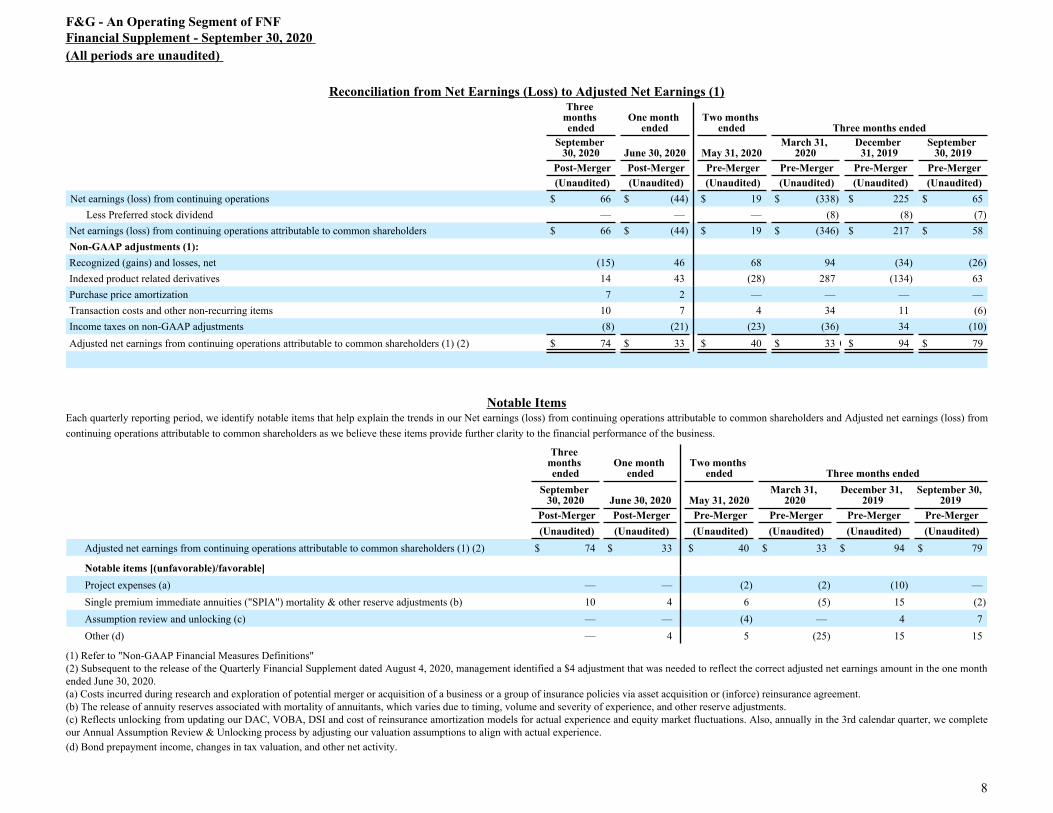
Reconciliation from Net Earnings (Loss) to Adjusted Net Earnings (1)Three
months ended
One month ended
Two months ended Three months ended
September 30, 2020 June 30, 2020 May 31, 2020
March 31, 2020
December 31, 2019
September 30, 2019
Post-Merger Post-Merger Pre-Merger Pre-Merger Pre-Merger Pre-Merger(Unaudited) (Unaudited) (Unaudited) (Unaudited) (Unaudited) (Unaudited)
Net earnings (loss) from continuing operations $ 66 $ (44) $ 19 $ (338) $ 225 $ 65 Less Preferred stock dividend — — — (8) (8) (7)
Net earnings (loss) from continuing operations attributable to common shareholders $ 66 $ (44) $ 19 $ (346) $ 217 $ 58 Non-GAAP adjustments (1):Recognized (gains) and losses, net (15) 46 68 94 (34) (26) Indexed product related derivatives 14 43 (28) 287 (134) 63 Purchase price amortization 7 2 — — — — Transaction costs and other non-recurring items 10 7 4 34 11 (6) Income taxes on non-GAAP adjustments (8) (21) (23) (36) 34 (10) Adjusted net earnings from continuing operations attributable to common shareholders (1) (2) $ 74 $ 33 $ 40 $ 33 0 $ 94 $ 79
Notable ItemsEach quarterly reporting period, we identify notable items that help explain the trends in our Net earnings (loss) from continuing operations attributable to common shareholders and Adjusted net earnings (loss) from continuing operations attributable to common shareholders as we believe these items provide further clarity to the financial performance of the business.
Three months ended
One month ended
Two months ended Three months ended
September 30, 2020 June 30, 2020 May 31, 2020
March 31, 2020
December 31, 2019
September 30, 2019
Post-Merger Post-Merger Pre-Merger Pre-Merger Pre-Merger Pre-Merger(Unaudited) (Unaudited) (Unaudited) (Unaudited) (Unaudited) (Unaudited)
Adjusted net earnings from continuing operations attributable to common shareholders (1) (2) $ 74 $ 33 $ 40 $ 33 $ 94 $ 79
Notable items [(unfavorable)/favorable]Project expenses (a) — — (2) (2) (10) — Single premium immediate annuities ("SPIA") mortality & other reserve adjustments (b) 10 4 6 (5) 15 (2) Assumption review and unlocking (c) — — (4) — 4 7 Other (d) — 4 5 (25) 15 15
(1) Refer to "Non-GAAP Financial Measures Definitions"(2) Subsequent to the release of the Quarterly Financial Supplement dated August 4, 2020, management identified a $4 adjustment that was needed to reflect the correct adjusted net earnings amount in the one month ended June 30, 2020.(a) Costs incurred during research and exploration of potential merger or acquisition of a business or a group of insurance policies via asset acquisition or (inforce) reinsurance agreement. (b) The release of annuity reserves associated with mortality of annuitants, which varies due to timing, volume and severity of experience, and other reserve adjustments. (c) Reflects unlocking from updating our DAC, VOBA, DSI and cost of reinsurance amortization models for actual experience and equity market fluctuations. Also, annually in the 3rd calendar quarter, we complete our Annual Assumption Review & Unlocking process by adjusting our valuation assumptions to align with actual experience. (d) Bond prepayment income, changes in tax valuation, and other net activity.
F&G - An Operating Segment of FNFFinancial Supplement - September 30, 2020 (All periods are unaudited)
8
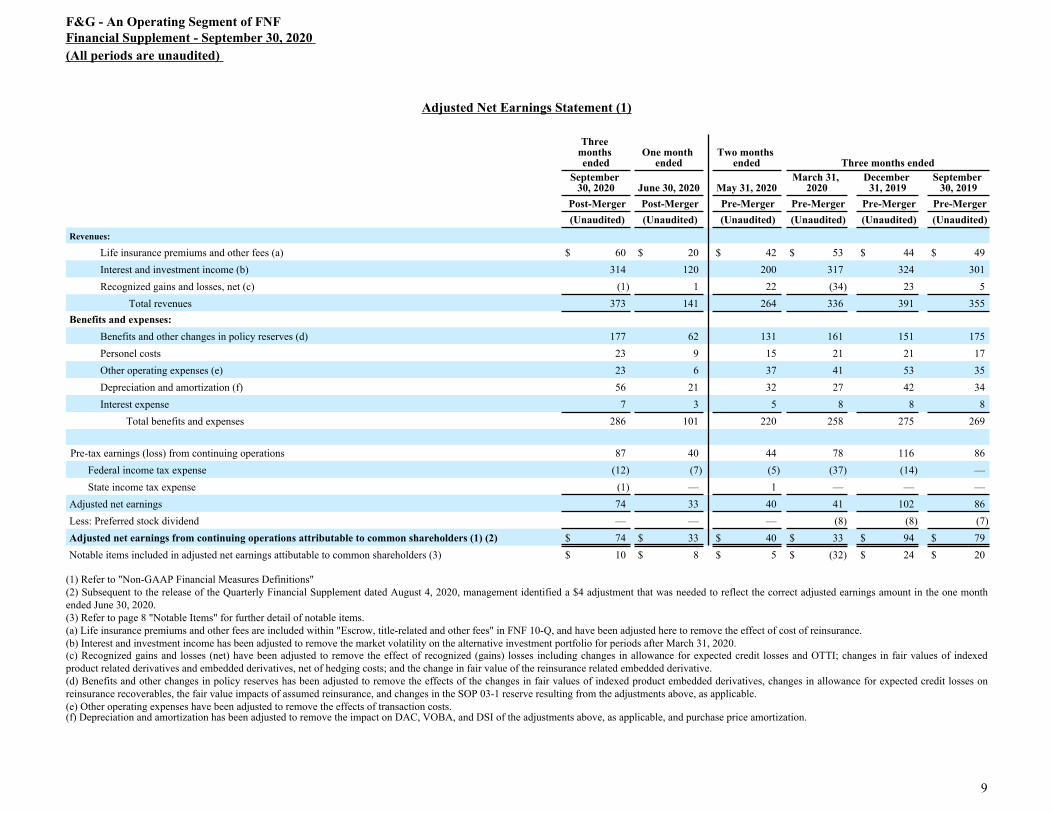
Adjusted Net Earnings Statement (1)
Three months ended
One month ended
Two months ended Three months ended
September 30, 2020 June 30, 2020 May 31, 2020
March 31, 2020
December 31, 2019
September 30, 2019
Post-Merger Post-Merger Pre-Merger Pre-Merger Pre-Merger Pre-Merger(Unaudited) (Unaudited) (Unaudited) (Unaudited) (Unaudited) (Unaudited)
Revenues:
Life insurance premiums and other fees (a) $ 60 $ 20 $ 42 $ 53 $ 44 $ 49 Interest and investment income (b) 314 120 200 317 324 301 Recognized gains and losses, net (c) (1) 1 22 (34) 23 5
Total revenues 373 141 264 336 391 355 Benefits and expenses:
Benefits and other changes in policy reserves (d) 177 62 131 161 151 175 Personel costs 23 9 15 21 21 17 Other operating expenses (e) 23 6 37 41 53 35 Depreciation and amortization (f) 56 21 32 27 42 34 Interest expense 7 3 5 8 8 8
Total benefits and expenses 286 101 220 258 275 269
Pre-tax earnings (loss) from continuing operations 87 40 44 78 116 86 Federal income tax expense (12) (7) (5) (37) (14) — State income tax expense (1) — 1 — — —
Adjusted net earnings 74 33 40 41 102 86 Less: Preferred stock dividend — — — (8) (8) (7) Adjusted net earnings from continuing operations attributable to common shareholders (1) (2) $ 74 $ 33 $ 40 $ 33 $ 94 $ 79 Notable items included in adjusted net earnings attibutable to common shareholders (3) $ 10 $ 8 $ 5 $ (32) $ 24 $ 20
(1) Refer to "Non-GAAP Financial Measures Definitions"(2) Subsequent to the release of the Quarterly Financial Supplement dated August 4, 2020, management identified a $4 adjustment that was needed to reflect the correct adjusted earnings amount in the one month ended June 30, 2020.(3) Refer to page 8 "Notable Items" for further detail of notable items.(a) Life insurance premiums and other fees are included within "Escrow, title-related and other fees" in FNF 10-Q, and have been adjusted here to remove the effect of cost of reinsurance. (b) Interest and investment income has been adjusted to remove the market volatility on the alternative investment portfolio for periods after March 31, 2020.(c) Recognized gains and losses (net) have been adjusted to remove the effect of recognized (gains) losses including changes in allowance for expected credit losses and OTTI; changes in fair values of indexed product related derivatives and embedded derivatives, net of hedging costs; and the change in fair value of the reinsurance related embedded derivative. (d) Benefits and other changes in policy reserves has been adjusted to remove the effects of the changes in fair values of indexed product embedded derivatives, changes in allowance for expected credit losses on reinsurance recoverables, the fair value impacts of assumed reinsurance, and changes in the SOP 03-1 reserve resulting from the adjustments above, as applicable. (e) Other operating expenses have been adjusted to remove the effects of transaction costs.(f) Depreciation and amortization has been adjusted to remove the impact on DAC, VOBA, and DSI of the adjustments above, as applicable, and purchase price amortization.
F&G - An Operating Segment of FNFFinancial Supplement - September 30, 2020 (All periods are unaudited)
9

Financial Strength RatingsA.M. Best S&P Moody's Fitch
Holding Company RatingsFGL Holdings
Issuer Credit / Default Rating Not Rated BBB- Ba2 BBB
Outlook Stable Stable Stable
CF Bermuda Holdings Limited
Issuer Credit / Default Rating Not Rated BBB- Ba1 BBB
Outlook Stable Stable Stable
Fidelity & Guaranty Life Holdings, Inc.
Issuer Credit / Default Rating bbb- BBB- Not Rated BBB
Outlook Stable Stable Stable
Senior Unsecured Notes bbb- BBB Baa2 BBB
Outlook Stable Stable
Operating Subsidiary RatingsFidelity & Guaranty Life Insurance Company
Financial Strength Rating A- A- Baa1 A-
Outlook Stable Stable Stable Stable
Fidelity & Guaranty Life Insurance Company of New York
Financial Strength Rating A- A- Not Rated A-
Outlook Stable Stable Stable
F&G Life Re Ltd
Financial Strength Rating Not Rated A- Baa1 A-
Outlook Stable Stable Stable
F&G Cayman Re Ltd
Financial Strength Rating Not Rated Not Rated Not Rated A-
Outlook Stable
F&G Reinsurance Ltd (1)
Financial Strength Rating A- Not Rated Not Rated BBB
Outlook Under Review Evolving
(1) Rating outlook reflects classification of F&G Reinsurance Ltd as discontinued operations in 2Q20
F&G - An Operating Segment of FNFFinancial Supplement - September 30, 2020 (All periods are unaudited)
10
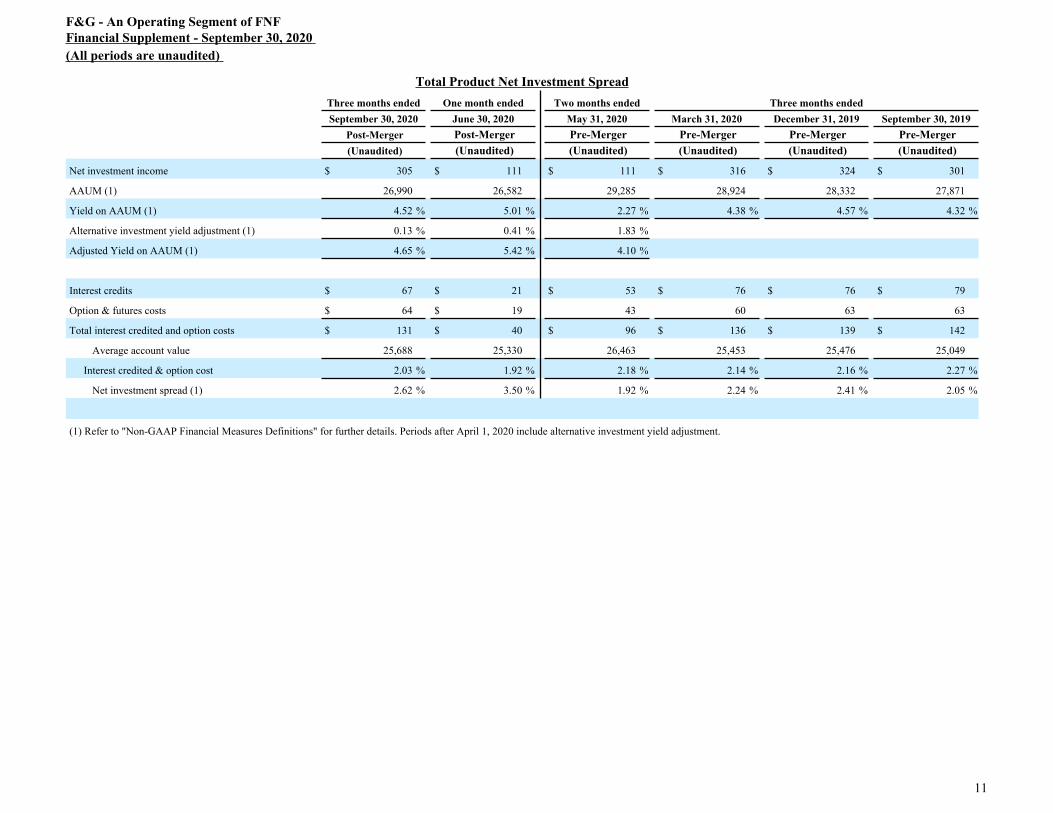
Total Product Net Investment SpreadThree months ended One month ended Two months ended Three months endedSeptember 30, 2020 June 30, 2020 May 31, 2020 March 31, 2020 December 31, 2019 September 30, 2019
Post-Merger Post-Merger Pre-Merger Pre-Merger Pre-Merger Pre-Merger(Unaudited) (Unaudited) (Unaudited) (Unaudited) (Unaudited) (Unaudited)
Net investment income $ 305 $ 111 $ 111 $ 316 $ 324 $ 301
AAUM (1) 26,990 26,582 29,285 28,924 28,332 27,871
Yield on AAUM (1) 4.52 % 5.01 % 2.27 % 4.38 % 4.57 % 4.32 %
Alternative investment yield adjustment (1) 0.13 % 0.41 % 1.83 %
Adjusted Yield on AAUM (1) 4.65 % 5.42 % 4.10 %
Interest credits $ 67 $ 21 $ 53 $ 76 $ 76 $ 79
Option & futures costs $ 64 $ 19 43 60 63 63
Total interest credited and option costs $ 131 $ 40 $ 96 $ 136 $ 139 $ 142
Average account value 25,688 25,330 26,463 25,453 25,476 25,049
Interest credited & option cost 2.03 % 1.92 % 2.18 % 2.14 % 2.16 % 2.27 %
Net investment spread (1) 2.62 % 3.50 % 1.92 % 2.24 % 2.41 % 2.05 %
(1) Refer to "Non-GAAP Financial Measures Definitions" for further details. Periods after April 1, 2020 include alternative investment yield adjustment.
F&G - An Operating Segment of FNFFinancial Supplement - September 30, 2020 (All periods are unaudited)
11

FIA Net Investment SpreadThree months ended One month ended Two months ended Three months endedSeptember 30, 2020 June 30, 2020 May 31, 2020 March 31, 2020 December 31, 2019 September 30, 2019
Post-Merger Post-Merger Pre-Merger Pre-Merger Pre-Merger Pre-Merger(Unaudited) (Unaudited) (Unaudited) (Unaudited) (Unaudited) (Unaudited)
Net investment income $ 229 $ 68 $ 57 $ 216 $ 223 $ 196
AAUM (1) 18,312 18,267 18,623 18,111 17,628 17,120
Yield on AAUM (1) 5.00 % 4.47 % 1.84 % 4.77 % 5.06 % 4.57 %
Alternative investment yield adjustment (1) (a) 0.20 % 0.59 % 2.67 %
Adjusted Yield on AAUM (1) 5.20 % 5.06 % 4.51 %
Interest credits $ 14 $ 4 $ 8 $ 13 $ 14 $ 13
Option & futures costs $ 64 $ 19 $ 43 $ 60 $ 63 $ 63
Total interest credited and option costs 78 23 51 73 77 76
Average account value 17,948 17,688 17,501 17,065 16,565 16,213
Interest credited & option cost 1.73 % 1.59 % 1.76 % 1.72 % 1.85 % 1.88 %
Net investment spread 3.47 % 3.47 % 2.75 % 3.05 % 3.21 % 2.69 %
(1) Refer to "Non-GAAP Financial Measures Definitions" for further details. Periods after April 1, 2020 include alternative investment yield adjustment.
F&G - An Operating Segment of FNFFinancial Supplement - September 30, 2020 (All periods are unaudited)
12
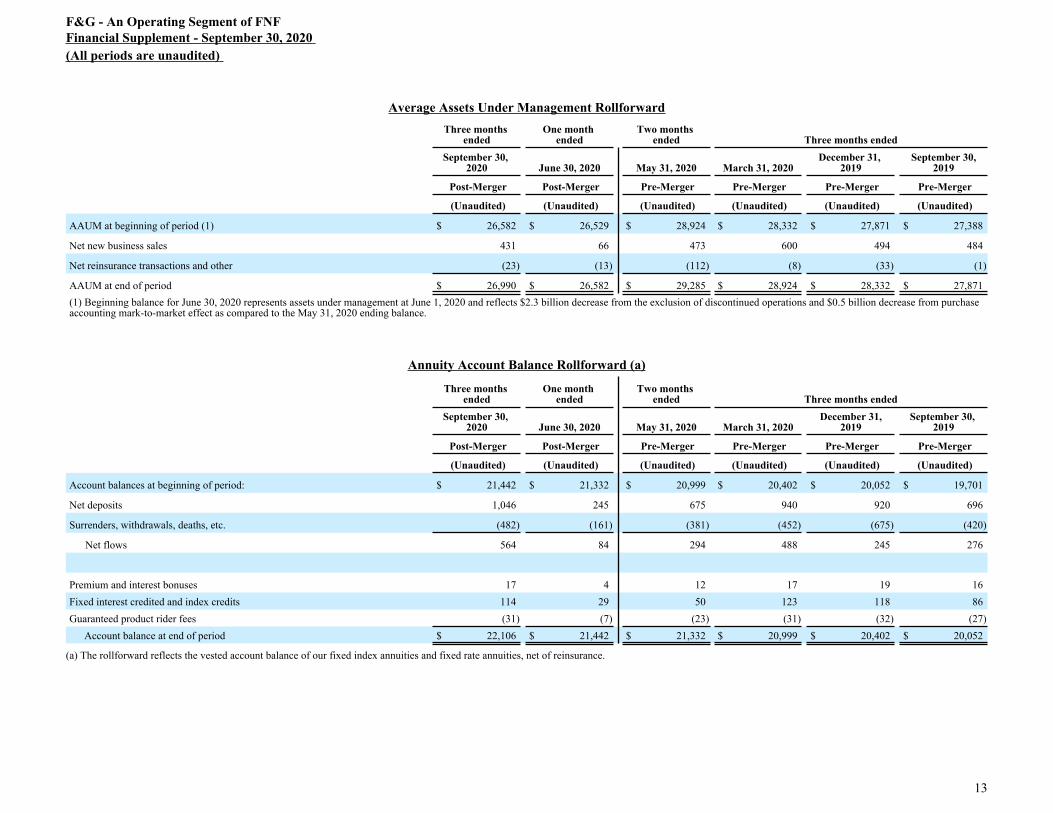
Average Assets Under Management RollforwardThree months
endedOne month
endedTwo months
ended Three months endedSeptember 30,
2020 June 30, 2020 May 31, 2020 March 31, 2020December 31,
2019September 30,
2019
Post-Merger Post-Merger Pre-Merger Pre-Merger Pre-Merger Pre-Merger
(Unaudited) (Unaudited) (Unaudited) (Unaudited) (Unaudited) (Unaudited)
AAUM at beginning of period (1) $ 26,582 $ 26,529 $ 28,924 $ 28,332 $ 27,871 $ 27,388
Net new business sales 431 66 473 600 494 484
Net reinsurance transactions and other (23) (13) (112) (8) (33) (1)
AAUM at end of period $ 26,990 $ 26,582 $ 29,285 $ 28,924 $ 28,332 $ 27,871 (1) Beginning balance for June 30, 2020 represents assets under management at June 1, 2020 and reflects $2.3 billion decrease from the exclusion of discontinued operations and $0.5 billion decrease from purchase accounting mark-to-market effect as compared to the May 31, 2020 ending balance.
Annuity Account Balance Rollforward (a)
Three months ended
One month ended
Two months ended Three months ended
September 30, 2020 June 30, 2020 May 31, 2020 March 31, 2020
December 31,2019
September 30, 2019
Post-Merger Post-Merger Pre-Merger Pre-Merger Pre-Merger Pre-Merger
(Unaudited) (Unaudited) (Unaudited) (Unaudited) (Unaudited) (Unaudited)
Account balances at beginning of period: $ 21,442 $ 21,332 $ 20,999 $ 20,402 $ 20,052 $ 19,701
Net deposits 1,046 245 675 940 920 696
Surrenders, withdrawals, deaths, etc. (482) (161) (381) (452) (675) (420)
Net flows 564 84 294 488 245 276
Premium and interest bonuses 17 4 12 17 19 16 Fixed interest credited and index credits 114 29 50 123 118 86 Guaranteed product rider fees (31) (7) (23) (31) (32) (27)
Account balance at end of period $ 22,106 $ 21,442 $ 21,332 $ 20,999 $ 20,402 $ 20,052
(a) The rollforward reflects the vested account balance of our fixed index annuities and fixed rate annuities, net of reinsurance.
F&G - An Operating Segment of FNFFinancial Supplement - September 30, 2020 (All periods are unaudited)
13

Annuity Liability Characteristics
Fixed Annuities
Account Value
Fixed Index Annuities
Account ValueSeptember 30, 2020
(Unaudited)SURRENDER CHARGE PERCENTAGES:No surrender charge $ 408 $ 2,335 0.0% < 2.0% 8 44 2.0% < 4.0% 20 433 4.0% < 6.0% 585 1,631 6.0% < 8.0% 1,392 2,237 8.0% < 10.0% 1,534 4,396 10.0% or greater 2 7,081
$ 3,949 $ 18,157
Fixed Annuities
Account Value
Fixed Index Annuities
Account ValueSeptember 30, 2020
(Unaudited)
CREDITED RATE (INCLUDING BONUS INTEREST) VS. ULTIMATE MINIMUM GUARANTEED RATE DIFFERENTIAL:No differential $ 489 $ 1,274 0.0% - 1.0% 216 1,425 1.0% - 2.0% 950 33 2.0% - 3.0% 2,294 1 Allocated to index strategies — 15,424
$ 3,949 $ 18,157
F&G - An Operating Segment of FNFFinancial Supplement - September 30, 2020 (All periods are unaudited)
14
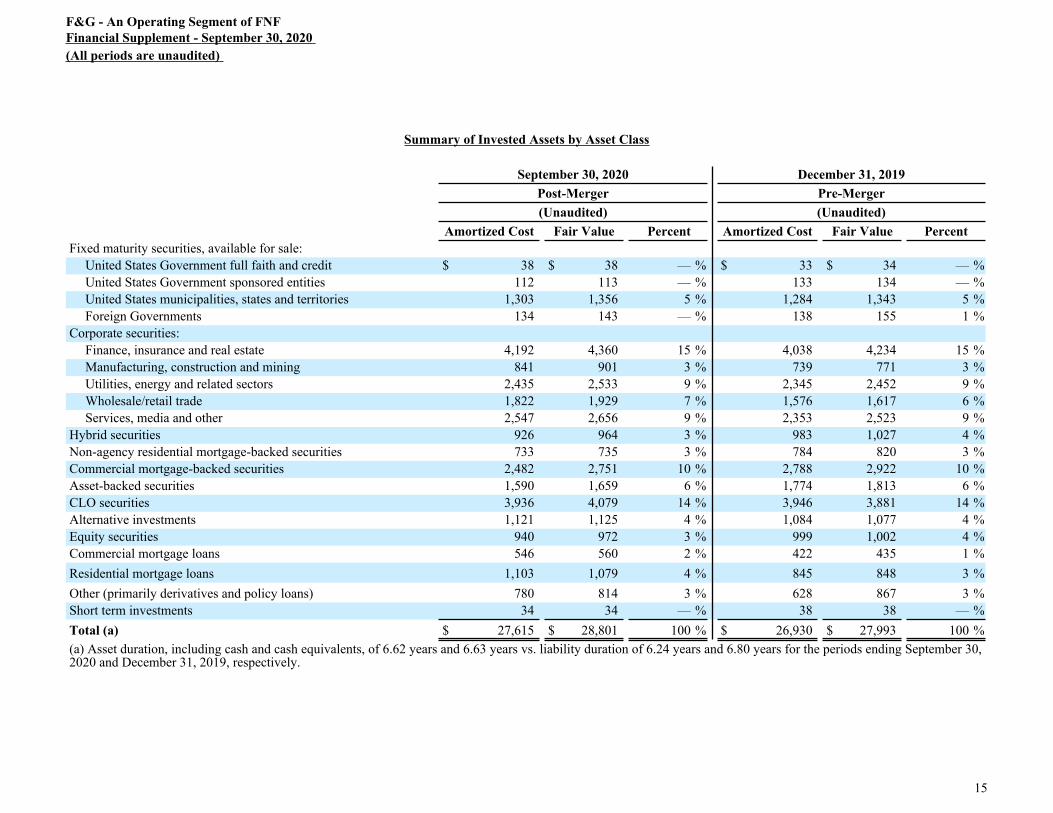
Summary of Invested Assets by Asset Class
September 30, 2020 December 31, 2019Post-Merger Pre-Merger(Unaudited) (Unaudited)
Amortized Cost Fair Value Percent Amortized Cost Fair Value PercentFixed maturity securities, available for sale:
United States Government full faith and credit $ 38 $ 38 — % $ 33 $ 34 — %United States Government sponsored entities 112 113 — % 133 134 — %United States municipalities, states and territories 1,303 1,356 5 % 1,284 1,343 5 %Foreign Governments 134 143 — % 138 155 1 %
Corporate securities:Finance, insurance and real estate 4,192 4,360 15 % 4,038 4,234 15 %Manufacturing, construction and mining 841 901 3 % 739 771 3 %Utilities, energy and related sectors 2,435 2,533 9 % 2,345 2,452 9 %Wholesale/retail trade 1,822 1,929 7 % 1,576 1,617 6 %Services, media and other 2,547 2,656 9 % 2,353 2,523 9 %
Hybrid securities 926 964 3 % 983 1,027 4 %Non-agency residential mortgage-backed securities 733 735 3 % 784 820 3 %Commercial mortgage-backed securities 2,482 2,751 10 % 2,788 2,922 10 %Asset-backed securities 1,590 1,659 6 % 1,774 1,813 6 %CLO securities 3,936 4,079 14 % 3,946 3,881 14 %Alternative investments 1,121 1,125 4 % 1,084 1,077 4 %Equity securities 940 972 3 % 999 1,002 4 %Commercial mortgage loans 546 560 2 % 422 435 1 %Residential mortgage loans 1,103 1,079 4 % 845 848 3 %Other (primarily derivatives and policy loans) 780 814 3 % 628 867 3 %Short term investments 34 34 — % 38 38 — %Total (a) $ 27,615 $ 28,801 100 % $ 26,930 $ 27,993 100 %(a) Asset duration, including cash and cash equivalents, of 6.62 years and 6.63 years vs. liability duration of 6.24 years and 6.80 years for the periods ending September 30, 2020 and December 31, 2019, respectively.
F&G - An Operating Segment of FNFFinancial Supplement - September 30, 2020 (All periods are unaudited)
15

Credit Quality of Fixed Maturity SecuritiesSeptember 30, 2020
(Unaudited)NAIC Designation Fair Value Percent
1 $ 12,659 52 %2 9,712 40 %3 1,335 6 %4 374 2 %5 137 — %6 1 — %
$ 24,218 100 %
September 30, 2020(Unaudited)
Rating Agency Rating Fair Value PercentAAA $ 530 2 %AA 1,602 7 %A 6,576 27 %BBB 8,977 37 %Not rated 4,266 18 %Total investment grade 21,951 91 %BB 1,581 7 %B and below 570 2 %Not rated 116 — %Total below investment grade 2,267 9 %
$ 24,218 100 %
F&G - An Operating Segment of FNFFinancial Supplement - September 30, 2020 (All periods are unaudited)
16

Summary of Residential Mortgage Backed Securities by Collateral Type and NAIC Designation
September 30, 2020(Unaudited)
Total by collateral type Amortized Cost Fair ValueGovernment agency $ 111 $ 111 Prime 546 547 Subprime 77 77 Alt-A 112 113
$ 846 $ 848
September 30, 2020(Unaudited)
Total by NAIC designation Amortized Cost Fair Value1 $ 817 $ 818 2 19 19 3 1 1 4 9 10 5 — —
$ 846 $ 848
F&G - An Operating Segment of FNFFinancial Supplement - September 30, 2020 (All periods are unaudited)
17

Top 10 Holdings by Issuers
September 30, 2020(Unaudited)
Issuer (a): Fair ValuePercentage of Total
Invested AssetsHP Enterprise Co $ 136 0.5 %HSBC Holdings 131 0.4 %Verizon Communications Inc. 114 0.4 %Entergy Corp 114 0.4 %AT&T Inc. 112 0.4 %Metropolitan Transportation Authority (NY) 110 0.4 %Nationwide Mutual Insurance Company 109 0.4 %Blackstone Div Alt Issuer 108 0.4 %CVI CVF III Master Fund II LL 106 0.4 %Catholic Health Initiatives 105 0.4 %
(a) Issuers excluding U.S. Governmental securities.Top 5 Reinsurers
September 30, 2020(Unaudited)
Financial Strength Rating
Parent Company/Principal ReinsurersReinsurance
Recoverable (a) AM Best S&P Fitch Moody's Wilton Re $ 1,467 A+ Not Rated A+ Not Rated Kubera Insurance (SAC) Ltd 821 Not Rated Not Rated Not Rated Not RatedSecurity Life of Denver 152 Not Rated A+ A A3Hannover Re 128 A+ AA- Not Rated Not RatedLondon Life 125 A+ Not Rated Not Rated Not Rated
(a) Reinsurance recoverables do not include unearned ceded premiums that would be recovered in the event of early termination of certain traditional life policies.
F&G - An Operating Segment of FNFFinancial Supplement - September 30, 2020 (All periods are unaudited)
18

Non-GAAP Financial Measures Definitions
The following represents the definitions of non-GAAP measures used by F&G, as an operating segment of FNF:
Adjusted Net EarningsAdjusted Net Earnings is a non-GAAP economic measure we use to evaluate financial performance each period. Adjusted net earnings is calculated by adjusting net earnings (loss) from continuing operations to eliminate:
(i) Recognized (gains) and losses, net: the impact of net investment gains/losses, including changes in allowance for expected credit losses and other than temporary impairment ("OTTI") losses, recognized in operations; the impact of market volatility on the alternative asset portfolio; and the effect of changes in fair value of the reinsurance related embedded derivative;(ii) Indexed product related derivatives: the impacts related to changes in the fair value, including both realized and unrealized gains and losses, of index product related derivatives and embedded derivatives, net of hedging cost, and the fair value accounting impact of assumed reinsurance, (iii) Purchase price amortization: the impacts related to the amortization of certain intangibles (internally developed software, trademarks and value of distribution asset (VODA)) recognized as a result of acquisition activities, and (iv) Transaction costs: the impacts related to acquisition, integration and merger related items.
Adjustments to Adjusted Net Earnings are net of the corresponding impact on amortization of intangibles, as appropriate. The income tax impact related to these adjustments is measured using an effective tax rate, as appropriate by tax jurisdiction. While these adjustments are an integral part of the overall performance of F&G, market conditions and/or the non-operating nature of these items can overshadow the underlying performance of the core business. Accordingly, management considers this to be a useful measure internally and to investors and analysts in analyzing the trends of our operations. Effective April 1, 2020, F&G changed their definition of Adjusted Earnings to exclude the impact of market volatility on the alternative asset portfolio. Alternative investment valuations and GAAP net income can reflect significant non-cash impacts of market and economic conditions that are not indicative of expected returns over the life of the investments. Management invests in alternative investments to back future policyholder obligations consistent with its asset liability management strategy. Management evaluates the performance of the alternative investments and calculates Adjusted Earnings using a rate of return that is consistent with its investment strategy and indicative of expected returns. Management believes this change provides users of the financial statements and other financial communications a more representative view of the results of the core business of F&G for the periods after April 1, 2020. Previous periods have not been adjusted.
Adjusted Net Earnings from Continuing Operations Attributable to Common Shareholders
Adjusted Net Earnings from continuing operations attributable to common shareholders is a non-GAAP economic measure we use to evaluate financial performance attributable to our common shareholders each period. Adjusted net earnings from continuing operations attributable to common shareholders is calculated by adjusting net earnings (loss) available to common shareholders to eliminate the same items as described in the Adjusted Net Earnings paragraph above. While these adjustments are an integral part of the overall performance of the Company, market conditions and/or the non-operating nature of these items can overshadow the underlying performance of the core business. Accordingly, Management considers this to be a useful measure internally and to investors and analysts in analyzing the trends of our operations.
Common Shareholders’ Equity
Common Shareholders’ Equity is based on Total Shareholders’ Equity excluding Equity Available to Preferred Shareholders. Management considers this to be a useful measure internally and to investors to assess the level of equity that is attributable common stock holders.
Common Shareholders’ Equity Excluding AOCI
Common Shareholders’ Equity Excluding AOCI is based on Common Shareholders' Equity excluding the effect of AOCI. Since AOCI fluctuates from quarter to quarter due to unrealized changes in the fair value of available for sale investments, Management considers this non-GAAP financial measure to provide useful supplemental information internally and to investors and analysts assessing the level of earned equity on common equity.
F&G - An Operating Segment of FNFFinancial Supplement - September 30, 2020 (All periods are unaudited)
19
Equity Attributable to Preferred Shareholders
Equity attributable to preferred shareholders is equal to the product of (a) the number of preferred shares outstanding plus share dividends declared but not yet issued and (b) the original liquidation preference amount per share. Management considers this non-GAAP measure to provide useful information internally and to investors and analysts to assess the level of equity that is attributable to preferred stock holders. (Note: F&G no longer has any preferred shareholders following the Business Combination)
Average Assets Under Management (AAUM)
AAUM is calculated as the sum of:(i) total invested assets at amortized cost, excluding derivatives; (ii) related party loans and investments; (iii) accrued investment income; (iv) the net payable/receivable for the purchase/sale of investments, and (v) cash and cash equivalents, excluding derivative collateral, at the beginning of the period and the end of each month in the period, divided by the total number of months in the period plus one.
Management considers this non-GAAP financial measure to be useful internally and to investors and analysts when assessing the rate of return on assets available for reinvestment.
Yield on AAUM
Yield on AAUM is calculated by dividing annualized net investment income by AAUM. Management considers this non-GAAP financial measure to be useful internally and to investors and analysts when assessing the level of return earned on AAUM.
Alternative Investment Yield Adjustment
Alternative investment yield adjustment is the current period yield impact of market volatility on the alternative investment portfolio. Management considers this non-GAAP financial measure to be useful internally and to investors and analysts when assessing the level of return earned on AAUM.
Adjusted Yield on AAUM
Adjusted Yield on AAUM is calculated by dividing annualized net investment income by AAUM, plus or minus the alternative investment yield adjustment. Management considers this non-GAAP financial measure to be useful internally and to investors and analysts when assessing the level of return earned on AAUM.
Net Investment Spread
Net investment spread is the excess of net investment income, adjusted for market volatility on the alternative asset investment portfolio, earned over the sum of interest credited to policyholders and the cost of hedging our risk on indexed product policies. Management considers this non-GAAP financial measure to be useful internally and to investors and analysts when assessing the performance of the Company’s invested assets against the level of investment return provided to policyholders, inclusive of hedging costs.
F&G - An Operating Segment of FNFFinancial Supplement - September 30, 2020 (All periods are unaudited)
20