Intumescent Silicate Coatings with the Addition of Alkali ...
Upload
svuniversityCategory
view
3download
0
This article was downloaded by: [Pukyong National University]On: 05 December 2011, At: 17:41Publisher: Taylor & FrancisInforma Ltd Registered in England and Wales Registered Number: 1072954 Registeredoffice: Mortimer House, 37-41 Mortimer Street, London W1T 3JH, UK
Ferroelectrics Letters SectionPublication details, including instructions for authors andsubscription information:http://www.tandfonline.com/loi/gfel20
Structural, Thermal and DielectricProperties of Lithium Zinc SilicateCeramic Powders by Sol-Gel MethodB. Chandra Babu a , V. Naresh a , B. Jaya Prakash a & S. Buddhudu aa Department of Physics, Sri Venkateswara University, Tirupati,-517502, A.P, India
Available online: 22 Nov 2011
To cite this article: B. Chandra Babu, V. Naresh, B. Jaya Prakash & S. Buddhudu (2011): Structural,Thermal and Dielectric Properties of Lithium Zinc Silicate Ceramic Powders by Sol-Gel Method,Ferroelectrics Letters Section, 38:4-6, 114-127
To link to this article: http://dx.doi.org/10.1080/07315171.2011.623610
PLEASE SCROLL DOWN FOR ARTICLE
Full terms and conditions of use: http://www.tandfonline.com/page/terms-and-conditions
This article may be used for research, teaching, and private study purposes. Anysubstantial or systematic reproduction, redistribution, reselling, loan, sub-licensing,systematic supply, or distribution in any form to anyone is expressly forbidden.
The publisher does not give any warranty express or implied or make any representationthat the contents will be complete or accurate or up to date. The accuracy of anyinstructions, formulae, and drug doses should be independently verified with primarysources. The publisher shall not be liable for any loss, actions, claims, proceedings,demand, or costs or damages whatsoever or howsoever caused arising directly orindirectly in connection with or arising out of the use of this material.
Ferroelectrics Letters, 38:114–127, 2011Copyright © Taylor & Francis Group, LLCISSN: 0731-5171 print / 1563-5228 onlineDOI: 10.1080/07315171.2011.623610
Structural, Thermal and Dielectric Propertiesof Lithium Zinc Silicate Ceramic Powders
by Sol-Gel Method
B. CHANDRA BABU, V. NARESH, B. JAYA PRAKASH,AND S. BUDDHUDU∗
Department of Physics, Sri Venkateswara University, Tirupati-517502,A.P., India
Communicated by Professor Jinzo Kobayashi(Received in final form August 13, 2011)
We have developed novel cathode materials in the chemical composition of Li2ZnSiO4,Li1.5Zn1.5SiO4, Li1Zn2Sio4, Li0.5Zn2.5SiO4 and Zn2SiO4 by a sol-gel method. Structuraland thermal properties of these materials have been carried out from the measurementof their XRD, FTIR, and TG-DTA profiles. For the Zn2SiO4 sample, the optimized syn-thesis temperature has been found to be 900◦C and maintaining this temperature; theremaining other samples have also been developed for their analysis. The ac conduc-tivity, dielectric constant, dielectric loss values have been obtained and their trendshave been explained on the basis of the distribution of Li+ ions in them because of theirdisplay of Maxwell- Wagner interfacial- type polarization.
Keywords Sol-gel method; dielectric ceramic materials; analysis
1. Induction
Over the past several years, sol-gel technique has been considered as a versatile procedure,in the production of a wide variety of optical materials [1] and it offers a clear advantageover the other methods in the achieving the dopant ions distribution so much uniformlyin the host matrices at lower temperatures [2]. Zinc silicate (willemite, Zn2SiO4) has longbeen identified as a good host matrix for dopant rare earth and transition metal ions, in thedisplay of encouraging luminescent properties in three primary colors of blue, green and red[3–5]. Several repots have earlier been made towards the preparation of zinc orthosilicatesin various forms [6–9]. Thus, the investigations on lithium zinc silicate ceramics havebeen considered to be technologically important. Such materials possess good mechanicalstrength, electrical conductivity, thermal conductivity, low coefficient of thermal expansionand dielectric properties depending upon the presence of the property modifying salts likeLi2O, Na2O and ZnO [10, 11]. In the present work, Zn2SiO4 ceramic powder has been
∗Corresponding author. E-mail: [email protected]
114
Dow
nloa
ded
by [
Puky
ong
Nat
iona
l Uni
vers
ity]
at 1
7:41
05
Dec
embe
r 20
11
Lithium Zinc Silicate Ceramic Powders 115
added with Li+ ions in different concentration to evaluate their influence on the structural,thermal, dielectric properties and electrical conductivity of the host matrix.
2. Experimental Studies
All the chemicals used in the experimental were of analytical and high pure grade fromM/s Merck and Sigma Aldrich. The precursors were TEOS (SiOC2H5)4 (99% Aldrich) asSiO2 Source, Zinc nitrate (Zn(NO3)2 as ZnO source, and Lithium nitrate Li (NO3)2 as Liions, high pure ethanol (EtOH) as the solvent and a 0.2 ml of HCl as the catalyst.
2.1 Samples Preparation
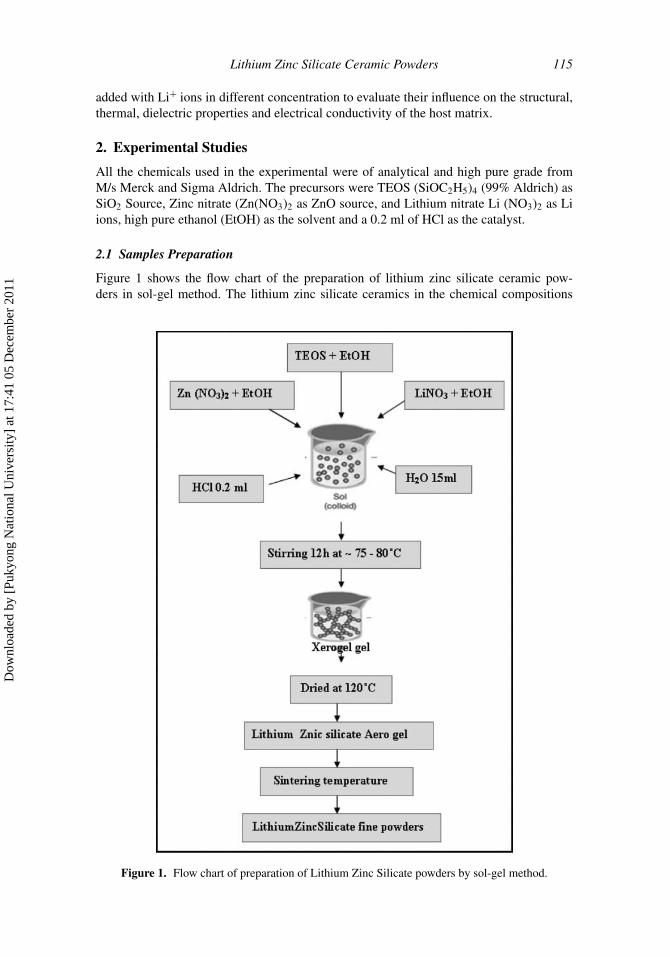
Figure 1 shows the flow chart of the preparation of lithium zinc silicate ceramic pow-ders in sol-gel method. The lithium zinc silicate ceramics in the chemical compositions
Figure 1. Flow chart of preparation of Lithium Zinc Silicate powders by sol-gel method.
Dow
nloa
ded
by [
Puky
ong
Nat
iona
l Uni
vers
ity]
at 1
7:41
05
Dec
embe
r 20
11
116 B. Chandra Babu et al.
of Li2ZnSiO4, Li1.5Zn1.5SiO4, Li1Zn2Sio4, Li0.5Zn2.5SiO4 and Zn2SiO4 (molar ratio) wereprepared through a sol-gel process. Firstly, Zn(NO3)2 and Si(OC2H5)4 were weighed accu-rately by maintaining the 2:1 molar ratio and those were separately dissolved in appropriateamounts of ethyl alcohol and after that each of these solutions was stirred for 15 min.Weighting of (2, 1.5, 1.0, 0.5 and 0 wt%) of Lithium Nitrates was done to dissolve thoseseparately in ethyl alcohol, each of those was then stirred for about 10 min. Secondly, TheZinc sol and Lithium sol solution were added drop wise into the container of SiO2 solution.Thus, a required amount of 0.2 ml HCl was added as the catalyst for the hydrolysis ofTEOS, after few minutes of stirring, again each of which was continuously stirred for about12 hrs at 70–80◦C and this solution was cooled to room temperature and after 24 hrs later,all transparent xero-gels were obtained from those solutions. With and with out Li(NO3)2
containing Zn2SiO4 solutions were prepared and obtained dry gels upon their baking at120◦C for 12 hrs. Thus, with and without lithium ions, Zinc silicate fine powders weresintered at different temperatures for 2 hrs and all of those ceramic powders were sinteredat 900◦C for 2 hrs.
2.2 Characterization
Thermal analysis of the as prepared sample was carried out; differential thermal analysis(DTA) and thermo gravimetric analysis (TGA) were measured for the precursor in N2
atmosphere upon heating it at the rate of 10◦C/min on a Netzesch STA 409 SimultaneousThermal Analyzer. The prepared sol-gel powder ceramics were characterized by using a3003 TT SEIFERT X-ray diffraction system with CuKα line (λ = 1.5418 Å) of radiation,XRD patterns were recorded in the 2θ range of 10–80◦ with a scanning rate of 0.02◦/sand the peaks were analyzed by using the standard JCPDS card. The crystallite size of thesample was calculated using full width at half maxima (FWHM) by using Deby- Scherrer’sformula [12].
Dcystallite = kλ
βcosθ(1)
Where D was the crystallite size, k was Scherer’s constant = 0.9, λ = 1.5406 Å (X-ray wavelength), and β was full width at half maxima at diffraction angle 2θ . The FT-IR spectrum of powder sample was recorded on a thermo Nicotet. Avator 360 FT-IRSpectrophotometer using KBr pellet. For measuring the dielectric properties, cylindricalpellets having the diameter of 1.22 mm to 1.24 msm and later on those were coated ontheir surface with Silver paste, thereby forming a parallel plate capacitor geometry. Thedielectric measurements were measured in the frequency range from 100 Hz to 1 MHzusing a Phase Sensitive Millimeter (PSM 1700) LCR meter. Dielectric constant (ε′) wascalculated from the formula [13].
ε′ = Cd
εoA(2)
Where εo is permittivity in the vacuum which is equivalent to 0.0885 pF/cm2, C is thecapacitance, d is the sample thickness and A is the cross–sectional area of the pellet.
The dielectric loss tangent (tan δ) of the samples were obtained from:
tanδ = ε′′
ε′ (3)
Where ε′′ is the imaginary part and ε′ is the real part of the dielectric constant.
Dow
nloa
ded
by [
Puky
ong
Nat
iona
l Uni
vers
ity]
at 1
7:41
05
Dec
embe
r 20
11
Lithium Zinc Silicate Ceramic Powders 117
The real part of ac conductivity (σ ac) was calculated using the measured impedancespectrum data at the room temperature in the frequency range 100 Hz–1 MHz was calculatedusing the following formula [10].
σac = d
A
(Z′
(Z′2+Z′′2)
)(4)
Where d is the thickness of sample, A is effective area, Z′ is the real part of the compleximpedance and Z′′ is the imaginary pat of the impedance.
3. Results and Discussion
3.1 Structures
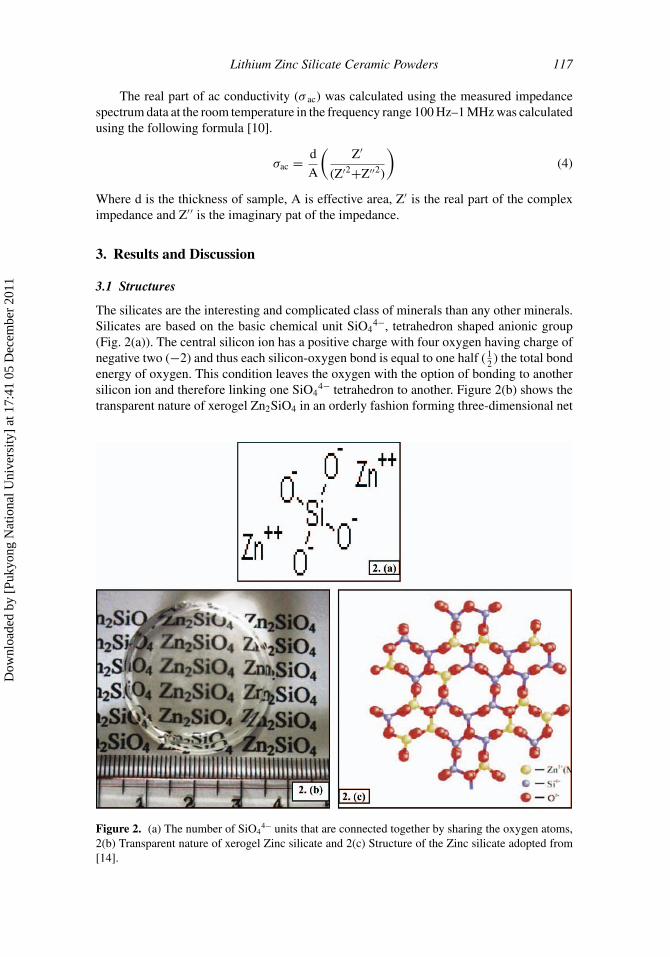
The silicates are the interesting and complicated class of minerals than any other minerals.Silicates are based on the basic chemical unit SiO4
4−, tetrahedron shaped anionic group(Fig. 2(a)). The central silicon ion has a positive charge with four oxygen having charge ofnegative two (−2) and thus each silicon-oxygen bond is equal to one half ( 1
2 ) the total bondenergy of oxygen. This condition leaves the oxygen with the option of bonding to anothersilicon ion and therefore linking one SiO4
4− tetrahedron to another. Figure 2(b) shows thetransparent nature of xerogel Zn2SiO4 in an orderly fashion forming three-dimensional net
Figure 2. (a) The number of SiO44− units that are connected together by sharing the oxygen atoms,
2(b) Transparent nature of xerogel Zinc silicate and 2(c) Structure of the Zinc silicate adopted from[14].
Dow
nloa
ded
by [
Puky
ong
Nat
iona
l Uni
vers
ity]
at 1
7:41
05
Dec
embe
r 20
11
118 B. Chandra Babu et al.
work. Figure 2(c) provides the structure under ordinary conditions Zn2SiO4 (willemite)crystallizes in the rhombohedral pace group R ¯(3) (No.148) adopted following the reference[14].
3.2 TG-DTA Analysis
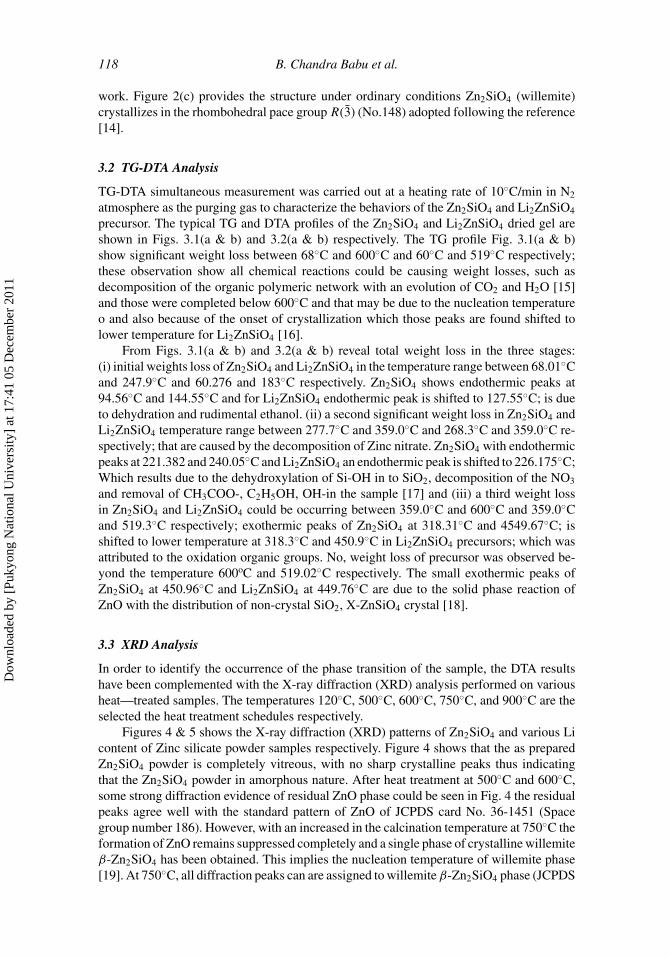
TG-DTA simultaneous measurement was carried out at a heating rate of 10◦C/min in N2
atmosphere as the purging gas to characterize the behaviors of the Zn2SiO4 and Li2ZnSiO4
precursor. The typical TG and DTA profiles of the Zn2SiO4 and Li2ZnSiO4 dried gel areshown in Figs. 3.1(a & b) and 3.2(a & b) respectively. The TG profile Fig. 3.1(a & b)show significant weight loss between 68◦C and 600◦C and 60◦C and 519◦C respectively;these observation show all chemical reactions could be causing weight losses, such asdecomposition of the organic polymeric network with an evolution of CO2 and H2O [15]and those were completed below 600◦C and that may be due to the nucleation temperatureo and also because of the onset of crystallization which those peaks are found shifted tolower temperature for Li2ZnSiO4 [16].
From Figs. 3.1(a & b) and 3.2(a & b) reveal total weight loss in the three stages:(i) initial weights loss of Zn2SiO4 and Li2ZnSiO4 in the temperature range between 68.01◦Cand 247.9◦C and 60.276 and 183◦C respectively. Zn2SiO4 shows endothermic peaks at94.56◦C and 144.55◦C and for Li2ZnSiO4 endothermic peak is shifted to 127.55◦C; is dueto dehydration and rudimental ethanol. (ii) a second significant weight loss in Zn2SiO4 andLi2ZnSiO4 temperature range between 277.7◦C and 359.0◦C and 268.3◦C and 359.0◦C re-spectively; that are caused by the decomposition of Zinc nitrate. Zn2SiO4 with endothermicpeaks at 221.382 and 240.05◦C and Li2ZnSiO4 an endothermic peak is shifted to 226.175◦C;Which results due to the dehydroxylation of Si-OH in to SiO2, decomposition of the NO3
and removal of CH3COO-, C2H5OH, OH-in the sample [17] and (iii) a third weight lossin Zn2SiO4 and Li2ZnSiO4 could be occurring between 359.0◦C and 600◦C and 359.0◦Cand 519.3◦C respectively; exothermic peaks of Zn2SiO4 at 318.31◦C and 4549.67◦C; isshifted to lower temperature at 318.3◦C and 450.9◦C in Li2ZnSiO4 precursors; which wasattributed to the oxidation organic groups. No, weight loss of precursor was observed be-yond the temperature 600oC and 519.02◦C respectively. The small exothermic peaks ofZn2SiO4 at 450.96◦C and Li2ZnSiO4 at 449.76◦C are due to the solid phase reaction ofZnO with the distribution of non-crystal SiO2, X-ZnSiO4 crystal [18].
3.3 XRD Analysis
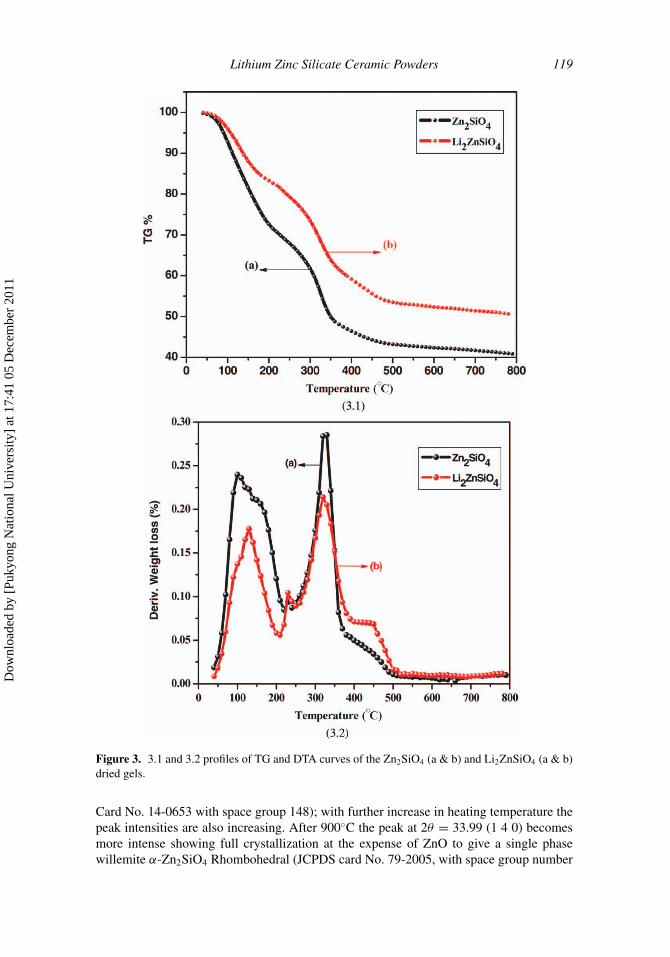
In order to identify the occurrence of the phase transition of the sample, the DTA resultshave been complemented with the X-ray diffraction (XRD) analysis performed on variousheat—treated samples. The temperatures 120◦C, 500◦C, 600◦C, 750◦C, and 900◦C are theselected the heat treatment schedules respectively.
Figures 4 & 5 shows the X-ray diffraction (XRD) patterns of Zn2SiO4 and various Licontent of Zinc silicate powder samples respectively. Figure 4 shows that the as preparedZn2SiO4 powder is completely vitreous, with no sharp crystalline peaks thus indicatingthat the Zn2SiO4 powder in amorphous nature. After heat treatment at 500◦C and 600◦C,some strong diffraction evidence of residual ZnO phase could be seen in Fig. 4 the residualpeaks agree well with the standard pattern of ZnO of JCPDS card No. 36-1451 (Spacegroup number 186). However, with an increased in the calcination temperature at 750◦C theformation of ZnO remains suppressed completely and a single phase of crystalline willemiteβ-Zn2SiO4 has been obtained. This implies the nucleation temperature of willemite phase[19]. At 750◦C, all diffraction peaks can are assigned to willemite β-Zn2SiO4 phase (JCPDS
Dow
nloa
ded
by [
Puky
ong
Nat
iona
l Uni
vers
ity]
at 1
7:41
05
Dec
embe
r 20
11
Lithium Zinc Silicate Ceramic Powders 119
Figure 3. 3.1 and 3.2 profiles of TG and DTA curves of the Zn2SiO4 (a & b) and Li2ZnSiO4 (a & b)dried gels.
Card No. 14-0653 with space group 148); with further increase in heating temperature thepeak intensities are also increasing. After 900◦C the peak at 2θ = 33.99 (1 4 0) becomesmore intense showing full crystallization at the expense of ZnO to give a single phasewillemite α-Zn2SiO4 Rhombohedral (JCPDS card No. 79-2005, with space group number
Dow
nloa
ded
by [
Puky
ong
Nat
iona
l Uni
vers
ity]
at 1
7:41
05
Dec
embe
r 20
11
120 B. Chandra Babu et al.
Figure 4. XRD profiles of Zn2SiO4 powder samples at different temperatures.
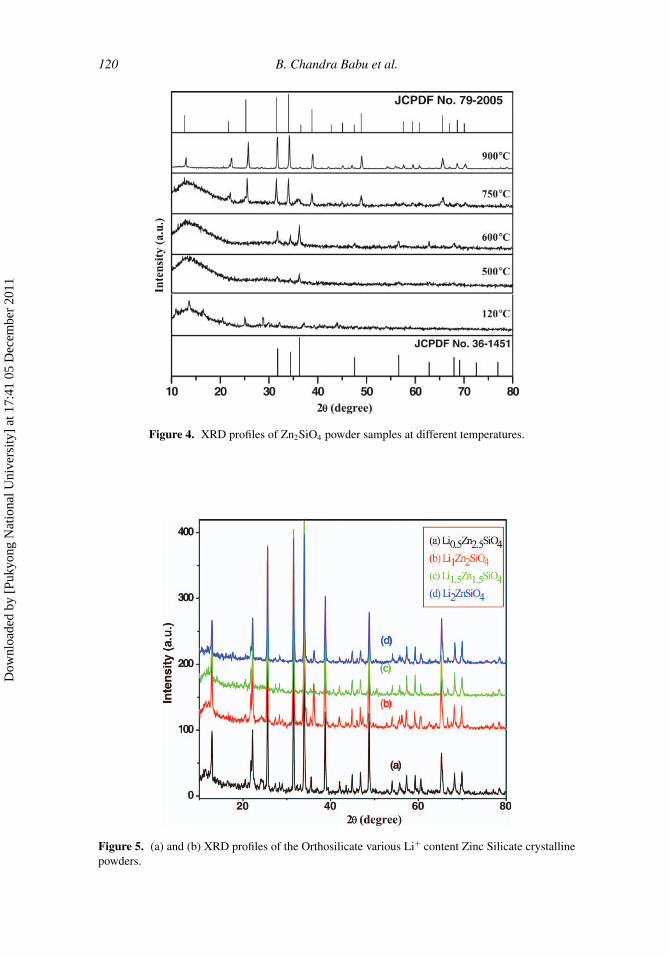
Figure 5. (a) and (b) XRD profiles of the Orthosilicate various Li+ content Zinc Silicate crystallinepowders.
Dow
nloa
ded
by [
Puky
ong
Nat
iona
l Uni
vers
ity]
at 1
7:41
05
Dec
embe
r 20
11
Lithium Zinc Silicate Ceramic Powders 121
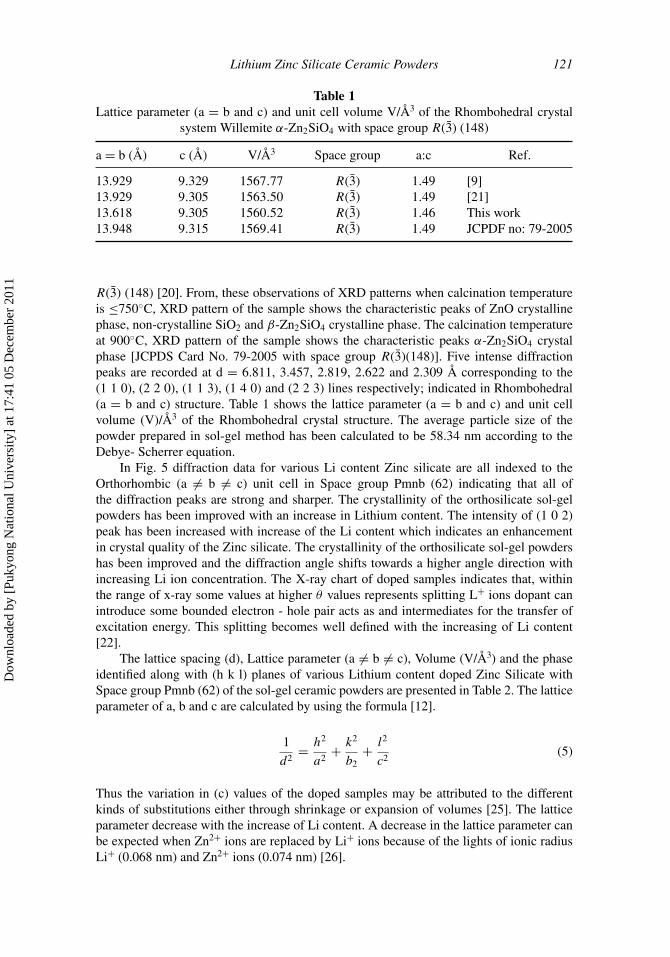
Table 1Lattice parameter (a = b and c) and unit cell volume V/Å3 of the Rhombohedral crystal
system Willemite α-Zn2SiO4 with space group R ¯(3) (148)
a = b (Å) c (Å) V/Å3 Space group a:c Ref.
13.929 9.329 1567.77 R ¯(3) 1.49 [9]13.929 9.305 1563.50 R ¯(3) 1.49 [21]13.618 9.305 1560.52 R ¯(3) 1.46 This work13.948 9.315 1569.41 R ¯(3) 1.49 JCPDF no: 79-2005
R(3) (148) [20]. From, these observations of XRD patterns when calcination temperatureis ≤750◦C, XRD pattern of the sample shows the characteristic peaks of ZnO crystallinephase, non-crystalline SiO2 and β-Zn2SiO4 crystalline phase. The calcination temperatureat 900◦C, XRD pattern of the sample shows the characteristic peaks α-Zn2SiO4 crystalphase [JCPDS Card No. 79-2005 with space group R(3)(148)]. Five intense diffractionpeaks are recorded at d = 6.811, 3.457, 2.819, 2.622 and 2.309 Å corresponding to the(1 1 0), (2 2 0), (1 1 3), (1 4 0) and (2 2 3) lines respectively; indicated in Rhombohedral(a = b and c) structure. Table 1 shows the lattice parameter (a = b and c) and unit cellvolume (V)/Å3 of the Rhombohedral crystal structure. The average particle size of thepowder prepared in sol-gel method has been calculated to be 58.34 nm according to theDebye- Scherrer equation.
In Fig. 5 diffraction data for various Li content Zinc silicate are all indexed to theOrthorhombic (a �= b �= c) unit cell in Space group Pmnb (62) indicating that all ofthe diffraction peaks are strong and sharper. The crystallinity of the orthosilicate sol-gelpowders has been improved with an increase in Lithium content. The intensity of (1 0 2)peak has been increased with increase of the Li content which indicates an enhancementin crystal quality of the Zinc silicate. The crystallinity of the orthosilicate sol-gel powdershas been improved and the diffraction angle shifts towards a higher angle direction withincreasing Li ion concentration. The X-ray chart of doped samples indicates that, withinthe range of x-ray some values at higher θ values represents splitting L+ ions dopant canintroduce some bounded electron - hole pair acts as and intermediates for the transfer ofexcitation energy. This splitting becomes well defined with the increasing of Li content[22].
The lattice spacing (d), Lattice parameter (a �= b �= c), Volume (V/Å3) and the phaseidentified along with (h k l) planes of various Lithium content doped Zinc Silicate withSpace group Pmnb (62) of the sol-gel ceramic powders are presented in Table 2. The latticeparameter of a, b and c are calculated by using the formula [12].
1
d2= h2
a2+ k2
b2+ l2
c2(5)
Thus the variation in (c) values of the doped samples may be attributed to the differentkinds of substitutions either through shrinkage or expansion of volumes [25]. The latticeparameter decrease with the increase of Li content. A decrease in the lattice parameter canbe expected when Zn2+ ions are replaced by Li+ ions because of the lights of ionic radiusLi+ (0.068 nm) and Zn2+ ions (0.074 nm) [26].
Dow
nloa
ded
by [
Puky
ong
Nat
iona
l Uni
vers
ity]
at 1
7:41
05
Dec
embe
r 20
11
122 B. Chandra Babu et al.
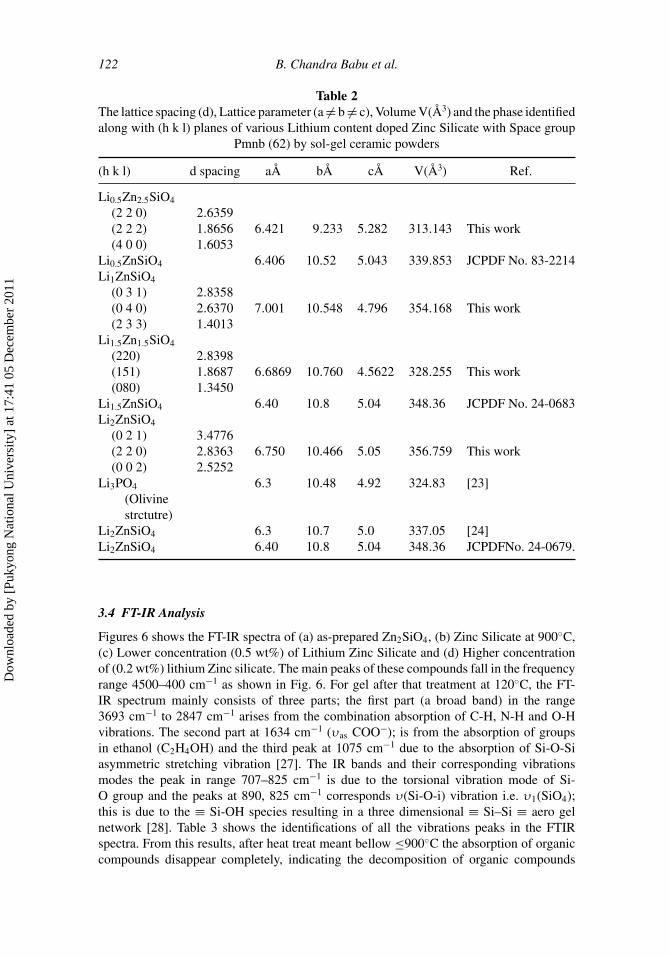
Table 2The lattice spacing (d), Lattice parameter (a �= b �= c), Volume V(Å3) and the phase identifiedalong with (h k l) planes of various Lithium content doped Zinc Silicate with Space group
Pmnb (62) by sol-gel ceramic powders
(h k l) d spacing aÅ bÅ cÅ V(Å3) Ref.
Li0.5Zn2.5SiO4
(2 2 0) 2.6359(2 2 2) 1.8656 6.421 9.233 5.282 313.143 This work(4 0 0) 1.6053
Li0.5ZnSiO4 6.406 10.52 5.043 339.853 JCPDF No. 83-2214Li1ZnSiO4
(0 3 1) 2.8358(0 4 0) 2.6370 7.001 10.548 4.796 354.168 This work(2 3 3) 1.4013
Li1.5Zn1.5SiO4
(220) 2.8398(151) 1.8687 6.6869 10.760 4.5622 328.255 This work(080) 1.3450
Li1.5ZnSiO4 6.40 10.8 5.04 348.36 JCPDF No. 24-0683Li2ZnSiO4
(0 2 1) 3.4776(2 2 0) 2.8363 6.750 10.466 5.05 356.759 This work(0 0 2) 2.5252
Li3PO4 6.3 10.48 4.92 324.83 [23](Olivinestrctutre)
Li2ZnSiO4 6.3 10.7 5.0 337.05 [24]Li2ZnSiO4 6.40 10.8 5.04 348.36 JCPDFNo. 24-0679.
3.4 FT-IR Analysis
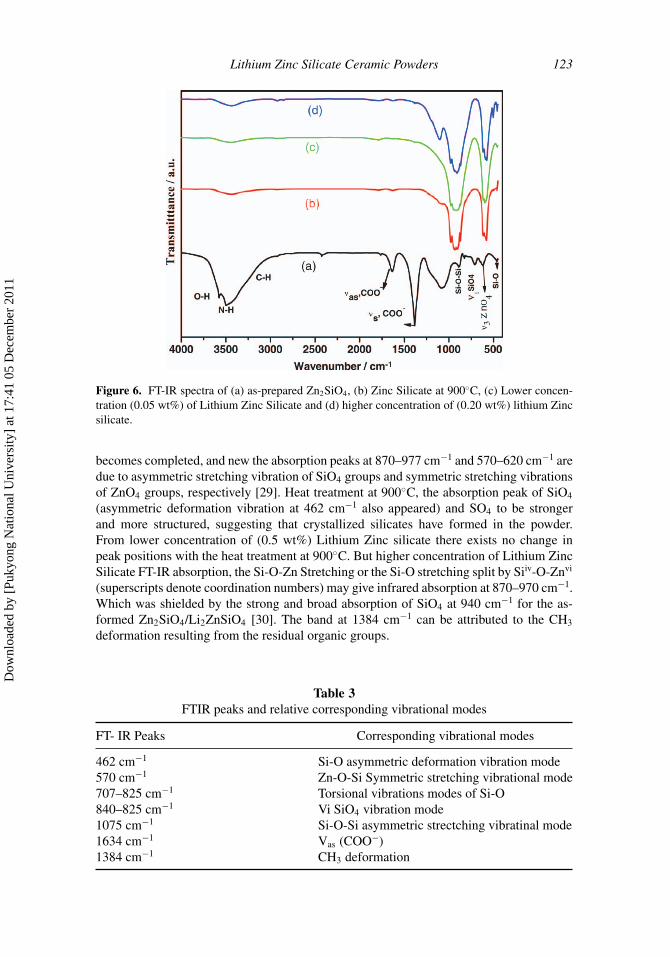
Figures 6 shows the FT-IR spectra of (a) as-prepared Zn2SiO4, (b) Zinc Silicate at 900◦C,(c) Lower concentration (0.5 wt%) of Lithium Zinc Silicate and (d) Higher concentrationof (0.2 wt%) lithium Zinc silicate. The main peaks of these compounds fall in the frequencyrange 4500–400 cm−1 as shown in Fig. 6. For gel after that treatment at 120◦C, the FT-IR spectrum mainly consists of three parts; the first part (a broad band) in the range3693 cm−1 to 2847 cm−1 arises from the combination absorption of C-H, N-H and O-Hvibrations. The second part at 1634 cm−1 (υas COO−); is from the absorption of groupsin ethanol (C2H4OH) and the third peak at 1075 cm−1 due to the absorption of Si-O-Siasymmetric stretching vibration [27]. The IR bands and their corresponding vibrationsmodes the peak in range 707–825 cm−1 is due to the torsional vibration mode of Si-O group and the peaks at 890, 825 cm−1 corresponds υ(Si-O-i) vibration i.e. υ1(SiO4);this is due to the ≡ Si-OH species resulting in a three dimensional ≡ Si–Si ≡ aero gelnetwork [28]. Table 3 shows the identifications of all the vibrations peaks in the FTIRspectra. From this results, after heat treat meant bellow ≤900◦C the absorption of organiccompounds disappear completely, indicating the decomposition of organic compounds
Dow
nloa
ded
by [
Puky
ong
Nat
iona
l Uni
vers
ity]
at 1
7:41
05
Dec
embe
r 20
11
Lithium Zinc Silicate Ceramic Powders 123
Figure 6. FT-IR spectra of (a) as-prepared Zn2SiO4, (b) Zinc Silicate at 900◦C, (c) Lower concen-tration (0.05 wt%) of Lithium Zinc Silicate and (d) higher concentration of (0.20 wt%) lithium Zincsilicate.
becomes completed, and new the absorption peaks at 870–977 cm−1 and 570–620 cm−1 aredue to asymmetric stretching vibration of SiO4 groups and symmetric stretching vibrationsof ZnO4 groups, respectively [29]. Heat treatment at 900◦C, the absorption peak of SiO4
(asymmetric deformation vibration at 462 cm−1 also appeared) and SO4 to be strongerand more structured, suggesting that crystallized silicates have formed in the powder.From lower concentration of (0.5 wt%) Lithium Zinc silicate there exists no change inpeak positions with the heat treatment at 900◦C. But higher concentration of Lithium ZincSilicate FT-IR absorption, the Si-O-Zn Stretching or the Si-O stretching split by Siiv-O-Znvi
(superscripts denote coordination numbers) may give infrared absorption at 870–970 cm−1.Which was shielded by the strong and broad absorption of SiO4 at 940 cm−1 for the as-formed Zn2SiO4/Li2ZnSiO4 [30]. The band at 1384 cm−1 can be attributed to the CH3
deformation resulting from the residual organic groups.
Table 3FTIR peaks and relative corresponding vibrational modes
FT- IR Peaks Corresponding vibrational modes
462 cm−1 Si-O asymmetric deformation vibration mode570 cm−1 Zn-O-Si Symmetric stretching vibrational mode707–825 cm−1 Torsional vibrations modes of Si-O840–825 cm−1 Vi SiO4 vibration mode1075 cm−1 Si-O-Si asymmetric strectching vibratinal mode1634 cm−1 Vas (COO−)1384 cm−1 CH3 deformation
Dow
nloa
ded
by [
Puky
ong
Nat
iona
l Uni
vers
ity]
at 1
7:41
05
Dec
embe
r 20
11
124 B. Chandra Babu et al.
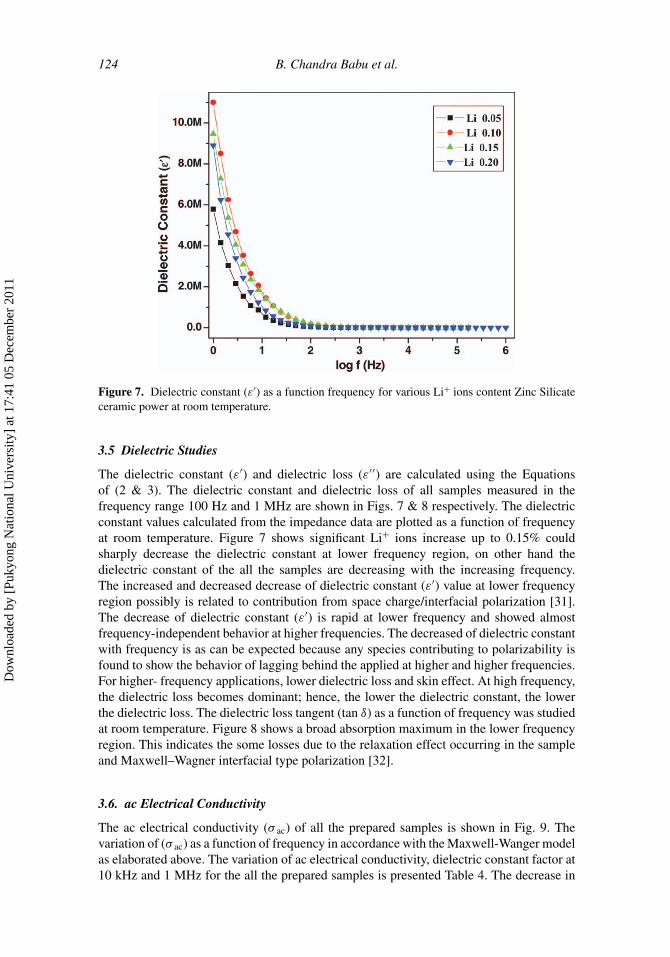
Figure 7. Dielectric constant (ε′) as a function frequency for various Li+ ions content Zinc Silicateceramic power at room temperature.
3.5 Dielectric Studies
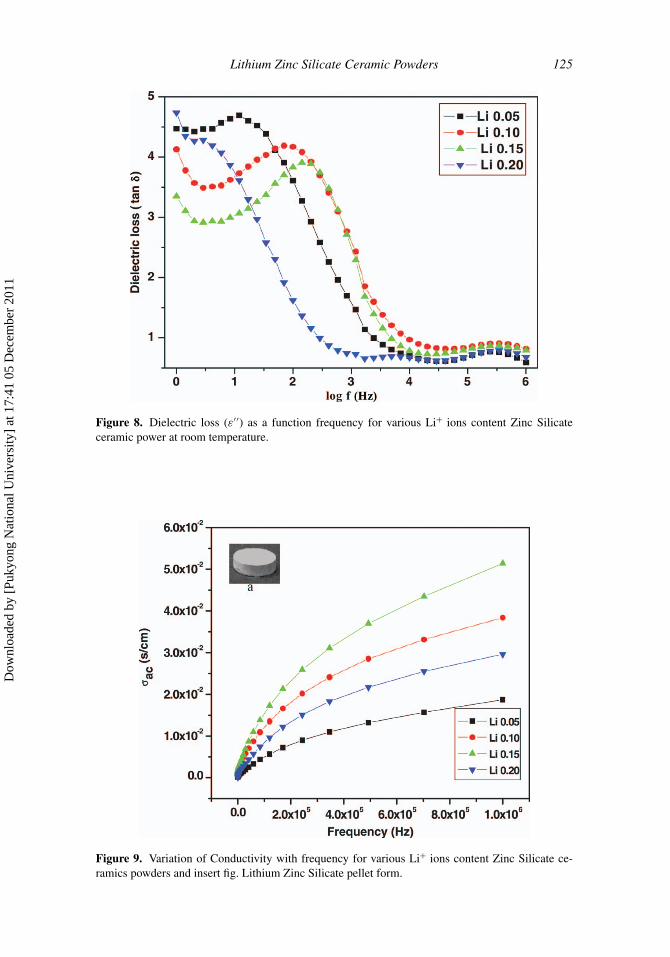
The dielectric constant (ε′) and dielectric loss (ε′′) are calculated using the Equationsof (2 & 3). The dielectric constant and dielectric loss of all samples measured in thefrequency range 100 Hz and 1 MHz are shown in Figs. 7 & 8 respectively. The dielectricconstant values calculated from the impedance data are plotted as a function of frequencyat room temperature. Figure 7 shows significant Li+ ions increase up to 0.15% couldsharply decrease the dielectric constant at lower frequency region, on other hand thedielectric constant of the all the samples are decreasing with the increasing frequency.The increased and decreased decrease of dielectric constant (ε′) value at lower frequencyregion possibly is related to contribution from space charge/interfacial polarization [31].The decrease of dielectric constant (ε′) is rapid at lower frequency and showed almostfrequency-independent behavior at higher frequencies. The decreased of dielectric constantwith frequency is as can be expected because any species contributing to polarizability isfound to show the behavior of lagging behind the applied at higher and higher frequencies.For higher- frequency applications, lower dielectric loss and skin effect. At high frequency,the dielectric loss becomes dominant; hence, the lower the dielectric constant, the lowerthe dielectric loss. The dielectric loss tangent (tan δ) as a function of frequency was studiedat room temperature. Figure 8 shows a broad absorption maximum in the lower frequencyregion. This indicates the some losses due to the relaxation effect occurring in the sampleand Maxwell–Wagner interfacial type polarization [32].
3.6. ac Electrical Conductivity
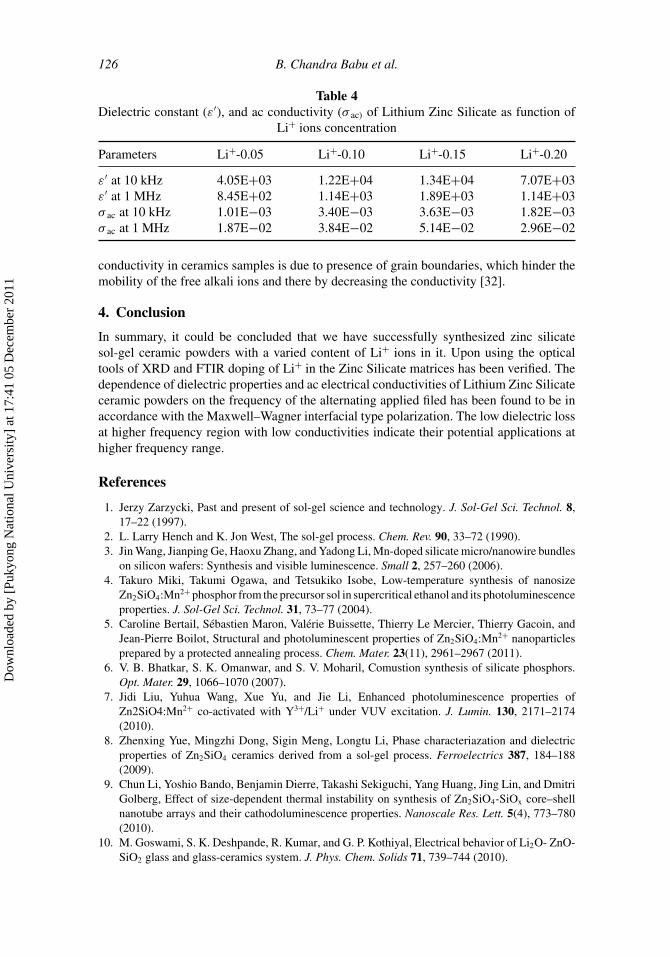
The ac electrical conductivity (σ ac) of all the prepared samples is shown in Fig. 9. Thevariation of (σ ac) as a function of frequency in accordance with the Maxwell-Wanger modelas elaborated above. The variation of ac electrical conductivity, dielectric constant factor at10 kHz and 1 MHz for the all the prepared samples is presented Table 4. The decrease in
Dow
nloa
ded
by [
Puky
ong
Nat
iona
l Uni
vers
ity]
at 1
7:41
05
Dec
embe
r 20
11
Lithium Zinc Silicate Ceramic Powders 125
Figure 8. Dielectric loss (ε′ ′) as a function frequency for various Li+ ions content Zinc Silicateceramic power at room temperature.
Figure 9. Variation of Conductivity with frequency for various Li+ ions content Zinc Silicate ce-ramics powders and insert fig. Lithium Zinc Silicate pellet form.
Dow
nloa
ded
by [
Puky
ong
Nat
iona
l Uni
vers
ity]
at 1
7:41
05
Dec
embe
r 20
11
126 B. Chandra Babu et al.
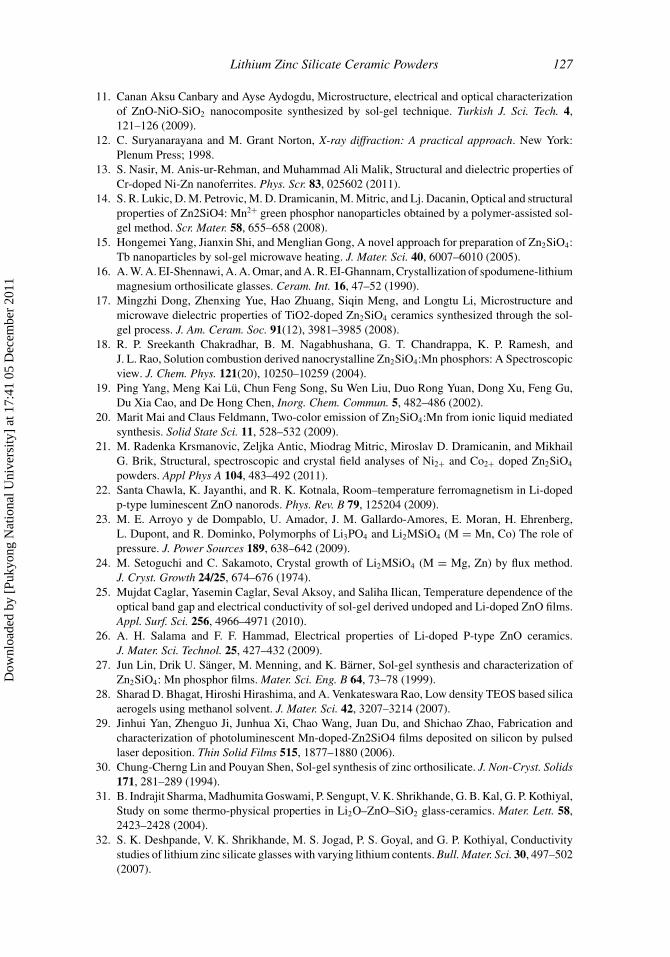
Table 4Dielectric constant (ε′), and ac conductivity (σ ac) of Lithium Zinc Silicate as function of
Li+ ions concentration
Parameters Li+-0.05 Li+-0.10 Li+-0.15 Li+-0.20
ε′ at 10 kHz 4.05E+03 1.22E+04 1.34E+04 7.07E+03ε′ at 1 MHz 8.45E+02 1.14E+03 1.89E+03 1.14E+03σ ac at 10 kHz 1.01E−03 3.40E−03 3.63E−03 1.82E−03σ ac at 1 MHz 1.87E−02 3.84E−02 5.14E−02 2.96E−02
conductivity in ceramics samples is due to presence of grain boundaries, which hinder themobility of the free alkali ions and there by decreasing the conductivity [32].
4. Conclusion
In summary, it could be concluded that we have successfully synthesized zinc silicatesol-gel ceramic powders with a varied content of Li+ ions in it. Upon using the opticaltools of XRD and FTIR doping of Li+ in the Zinc Silicate matrices has been verified. Thedependence of dielectric properties and ac electrical conductivities of Lithium Zinc Silicateceramic powders on the frequency of the alternating applied filed has been found to be inaccordance with the Maxwell–Wagner interfacial type polarization. The low dielectric lossat higher frequency region with low conductivities indicate their potential applications athigher frequency range.
References
1. Jerzy Zarzycki, Past and present of sol-gel science and technology. J. Sol-Gel Sci. Technol. 8,17–22 (1997).
2. L. Larry Hench and K. Jon West, The sol-gel process. Chem. Rev. 90, 33–72 (1990).3. Jin Wang, Jianping Ge, Haoxu Zhang, and Yadong Li, Mn-doped silicate micro/nanowire bundles
on silicon wafers: Synthesis and visible luminescence. Small 2, 257–260 (2006).4. Takuro Miki, Takumi Ogawa, and Tetsukiko Isobe, Low-temperature synthesis of nanosize
Zn2SiO4:Mn2+ phosphor from the precursor sol in supercritical ethanol and its photoluminescenceproperties. J. Sol-Gel Sci. Technol. 31, 73–77 (2004).
5. Caroline Bertail, Sebastien Maron, Valerie Buissette, Thierry Le Mercier, Thierry Gacoin, andJean-Pierre Boilot, Structural and photoluminescent properties of Zn2SiO4:Mn2+ nanoparticlesprepared by a protected annealing process. Chem. Mater. 23(11), 2961–2967 (2011).
6. V. B. Bhatkar, S. K. Omanwar, and S. V. Moharil, Comustion synthesis of silicate phosphors.Opt. Mater. 29, 1066–1070 (2007).
7. Jidi Liu, Yuhua Wang, Xue Yu, and Jie Li, Enhanced photoluminescence properties ofZn2SiO4:Mn2+ co-activated with Y3+/Li+ under VUV excitation. J. Lumin. 130, 2171–2174(2010).
8. Zhenxing Yue, Mingzhi Dong, Sigin Meng, Longtu Li, Phase characteriazation and dielectricproperties of Zn2SiO4 ceramics derived from a sol-gel process. Ferroelectrics 387, 184–188(2009).
9. Chun Li, Yoshio Bando, Benjamin Dierre, Takashi Sekiguchi, Yang Huang, Jing Lin, and DmitriGolberg, Effect of size-dependent thermal instability on synthesis of Zn2SiO4-SiOx core–shellnanotube arrays and their cathodoluminescence properties. Nanoscale Res. Lett. 5(4), 773–780(2010).
10. M. Goswami, S. K. Deshpande, R. Kumar, and G. P. Kothiyal, Electrical behavior of Li2O- ZnO-SiO2 glass and glass-ceramics system. J. Phys. Chem. Solids 71, 739–744 (2010).
Dow
nloa
ded
by [
Puky
ong
Nat
iona
l Uni
vers
ity]
at 1
7:41
05
Dec
embe
r 20
11
Lithium Zinc Silicate Ceramic Powders 127
11. Canan Aksu Canbary and Ayse Aydogdu, Microstructure, electrical and optical characterizationof ZnO-NiO-SiO2 nanocomposite synthesized by sol-gel technique. Turkish J. Sci. Tech. 4,121–126 (2009).
12. C. Suryanarayana and M. Grant Norton, X-ray diffraction: A practical approach. New York:Plenum Press; 1998.
13. S. Nasir, M. Anis-ur-Rehman, and Muhammad Ali Malik, Structural and dielectric properties ofCr-doped Ni-Zn nanoferrites. Phys. Scr. 83, 025602 (2011).
14. S. R. Lukic, D. M. Petrovic, M. D. Dramicanin, M. Mitric, and Lj. Dacanin, Optical and structuralproperties of Zn2SiO4: Mn2+ green phosphor nanoparticles obtained by a polymer-assisted sol-gel method. Scr. Mater. 58, 655–658 (2008).
15. Hongemei Yang, Jianxin Shi, and Menglian Gong, A novel approach for preparation of Zn2SiO4:Tb nanoparticles by sol-gel microwave heating. J. Mater. Sci. 40, 6007–6010 (2005).
16. A. W. A. EI-Shennawi, A. A. Omar, and A. R. EI-Ghannam, Crystallization of spodumene-lithiummagnesium orthosilicate glasses. Ceram. Int. 16, 47–52 (1990).
17. Mingzhi Dong, Zhenxing Yue, Hao Zhuang, Siqin Meng, and Longtu Li, Microstructure andmicrowave dielectric properties of TiO2-doped Zn2SiO4 ceramics synthesized through the sol-gel process. J. Am. Ceram. Soc. 91(12), 3981–3985 (2008).
18. R. P. Sreekanth Chakradhar, B. M. Nagabhushana, G. T. Chandrappa, K. P. Ramesh, andJ. L. Rao, Solution combustion derived nanocrystalline Zn2SiO4:Mn phosphors: A Spectroscopicview. J. Chem. Phys. 121(20), 10250–10259 (2004).
19. Ping Yang, Meng Kai Lu, Chun Feng Song, Su Wen Liu, Duo Rong Yuan, Dong Xu, Feng Gu,Du Xia Cao, and De Hong Chen, Inorg. Chem. Commun. 5, 482–486 (2002).
20. Marit Mai and Claus Feldmann, Two-color emission of Zn2SiO4:Mn from ionic liquid mediatedsynthesis. Solid State Sci. 11, 528–532 (2009).
21. M. Radenka Krsmanovic, Zeljka Antic, Miodrag Mitric, Miroslav D. Dramicanin, and MikhailG. Brik, Structural, spectroscopic and crystal field analyses of Ni2+ and Co2+ doped Zn2SiO4
powders. Appl Phys A 104, 483–492 (2011).22. Santa Chawla, K. Jayanthi, and R. K. Kotnala, Room–temperature ferromagnetism in Li-doped
p-type luminescent ZnO nanorods. Phys. Rev. B 79, 125204 (2009).23. M. E. Arroyo y de Dompablo, U. Amador, J. M. Gallardo-Amores, E. Moran, H. Ehrenberg,
L. Dupont, and R. Dominko, Polymorphs of Li3PO4 and Li2MSiO4 (M = Mn, Co) The role ofpressure. J. Power Sources 189, 638–642 (2009).
24. M. Setoguchi and C. Sakamoto, Crystal growth of Li2MSiO4 (M = Mg, Zn) by flux method.J. Cryst. Growth 24/25, 674–676 (1974).
25. Mujdat Caglar, Yasemin Caglar, Seval Aksoy, and Saliha Ilican, Temperature dependence of theoptical band gap and electrical conductivity of sol-gel derived undoped and Li-doped ZnO films.Appl. Surf. Sci. 256, 4966–4971 (2010).
26. A. H. Salama and F. F. Hammad, Electrical properties of Li-doped P-type ZnO ceramics.J. Mater. Sci. Technol. 25, 427–432 (2009).
27. Jun Lin, Drik U. Sanger, M. Menning, and K. Barner, Sol-gel synthesis and characterization ofZn2SiO4: Mn phosphor films. Mater. Sci. Eng. B 64, 73–78 (1999).
28. Sharad D. Bhagat, Hiroshi Hirashima, and A. Venkateswara Rao, Low density TEOS based silicaaerogels using methanol solvent. J. Mater. Sci. 42, 3207–3214 (2007).
29. Jinhui Yan, Zhenguo Ji, Junhua Xi, Chao Wang, Juan Du, and Shichao Zhao, Fabrication andcharacterization of photoluminescent Mn-doped-Zn2SiO4 films deposited on silicon by pulsedlaser deposition. Thin Solid Films 515, 1877–1880 (2006).
30. Chung-Cherng Lin and Pouyan Shen, Sol-gel synthesis of zinc orthosilicate. J. Non-Cryst. Solids171, 281–289 (1994).
31. B. Indrajit Sharma, Madhumita Goswami, P. Sengupt, V. K. Shrikhande, G. B. Kal, G. P. Kothiyal,Study on some thermo-physical properties in Li2O–ZnO–SiO2 glass-ceramics. Mater. Lett. 58,2423–2428 (2004).
32. S. K. Deshpande, V. K. Shrikhande, M. S. Jogad, P. S. Goyal, and G. P. Kothiyal, Conductivitystudies of lithium zinc silicate glasses with varying lithium contents. Bull. Mater. Sci. 30, 497–502(2007).
Dow
nloa
ded
by [
Puky
ong
Nat
iona
l Uni
vers
ity]
at 1
7:41
05
Dec
embe
r 20
11
Copyright © 2022 FDOKUMEN