Ferreira J Nanopart Res 15 (2013) 1923 TNTs dyes
15
RESEARCH PAPER New hybrid titanate elongated nanostructures through organic dye molecules sensitization V. C. Ferreira • O. C. Monteiro Received: 30 January 2013 / Accepted: 8 August 2013 / Published online: 21 August 2013 Ó Springer Science+Business Media Dordrecht 2013 Abstract This study reports on a novel chemical route to synthesize new elongated titanates nanostruc- tured hybrid materials by the combination of titanate nanofibers (TNFs) with organic dye molecules. The influence of the sodium/proton replacement on the adsorption and intercalation characteristics of the TNFs materials was analysed. Depending on the sodium/proton content, materials with surface areas in the 21.08–38.90 m 2 /g range were obtained. Due to their molecule size and shape, and anticipating their intercalation between the TiO 6 layers, the cationic molecules chosen for this study were thionine, meth- ylene blue, crystal violet and rhodamine 6G. The sample with the highest sodium content was the best material on up taking dyes from aqueous media. The amount of the immobilized dyes was higher than the one predictable for the formation of a monolayer in an adsorption process. The intercalation of thionine, methylene blue and crystal violet between the TiO 6 layers was accomplished. The characterisation results obtained by adsorption, XRD and FTIR are in agreement with the production of these new hybrid structures, with the organic molecules located within the TiO 6 layers. The results also demonstrate that only the thionine was incorporated in the protonated titanate structure, due to the smaller distance between the layers. The optical characterisation of the prepared materials by DRS also indicates that intercalated and adsorbed dyes have strong influence on the optical properties of the new hybrid materials prepared. Keywords Elongated titanate nanostructures Á Organic dyes Á Dye adsorption Á Organic molecules intercalation Á Nano-hybrid materials Introduction Although the titanium oxide (TiO 2 ) or titania (anatase and rutile) being the titanium compound most com- monly used in several applications, including photo- catalysis (Luis et al. 2011), the nanostructured titanates, either protonated or doped with sodium ions, with general formula Na 2-x H x Ti 3 O 7 ÁnH 2 O, with 0 B x B 2 have gained considerable research interest (Bavykin et al. 2009; Zhang et al. 2005). The generalized chemical formula of the elongated sodium titanates is assumed to be Na 2 Ti 3 O 7 , while the protonated titanates is thought to be H 2 Ti n O (2n?1) ÁxH 2 O. The titanate nanotubular structures have a character- istic multilayered arrangement consisting of edge- and corner-sharing TiO 6 octahedra, having an arrangement Electronic supplementary material The online version of this article (doi:10.1007/s11051-013-1923-8) contains supple- mentary material, which is available to authorized users. V. C. Ferreira Á O. C. Monteiro (&) Department of Chemistry and Biochemistry and CQB, Faculty of Sciences, University of Lisbon, Campo Grande, 1749-016 Lisbon, Portugal e-mail: [email protected] 123 J Nanopart Res (2013) 15:1923 DOI 10.1007/s11051-013-1923-8
Transcript of Ferreira J Nanopart Res 15 (2013) 1923 TNTs dyes
RESEARCH PAPER
New hybrid titanate elongated nanostructures throughorganic dye molecules sensitization
V. C. Ferreira • O. C. Monteiro
Received: 30 January 2013 / Accepted: 8 August 2013 / Published online: 21 August 2013
� Springer Science+Business Media Dordrecht 2013
Abstract This study reports on a novel chemical
route to synthesize new elongated titanates nanostruc-
tured hybrid materials by the combination of titanate
nanofibers (TNFs) with organic dye molecules. The
influence of the sodium/proton replacement on the
adsorption and intercalation characteristics of the
TNFs materials was analysed. Depending on the
sodium/proton content, materials with surface areas
in the 21.08–38.90 m2/g range were obtained. Due to
their molecule size and shape, and anticipating their
intercalation between the TiO6 layers, the cationic
molecules chosen for this study were thionine, meth-
ylene blue, crystal violet and rhodamine 6G. The
sample with the highest sodium content was the best
material on up taking dyes from aqueous media. The
amount of the immobilized dyes was higher than the
one predictable for the formation of a monolayer in an
adsorption process. The intercalation of thionine,
methylene blue and crystal violet between the TiO6
layers was accomplished. The characterisation results
obtained by adsorption, XRD and FTIR are in
agreement with the production of these new hybrid
structures, with the organic molecules located within
the TiO6 layers. The results also demonstrate that only
the thionine was incorporated in the protonated
titanate structure, due to the smaller distance between
the layers. The optical characterisation of the prepared
materials by DRS also indicates that intercalated and
adsorbed dyes have strong influence on the optical
properties of the new hybrid materials prepared.
Keywords Elongated titanate nanostructures �Organic dyes � Dye adsorption � Organic
molecules intercalation � Nano-hybrid materials
Introduction
Although the titanium oxide (TiO2) or titania (anatase
and rutile) being the titanium compound most com-
monly used in several applications, including photo-
catalysis (Luis et al. 2011), the nanostructured
titanates, either protonated or doped with sodium ions,
with general formula Na2-xHxTi3O7�nH2O, with
0 B x B 2 have gained considerable research interest
(Bavykin et al. 2009; Zhang et al. 2005).
The generalized chemical formula of the elongated
sodium titanates is assumed to be Na2Ti3O7, while the
protonated titanates is thought to be H2TinO(2n?1)�xH2O.
The titanate nanotubular structures have a character-
istic multilayered arrangement consisting of edge- and
corner-sharing TiO6 octahedra, having an arrangement
Electronic supplementary material The online version ofthis article (doi:10.1007/s11051-013-1923-8) contains supple-mentary material, which is available to authorized users.
V. C. Ferreira � O. C. Monteiro (&)
Department of Chemistry and Biochemistry and CQB,
Faculty of Sciences, University of Lisbon, Campo Grande,
1749-016 Lisbon, Portugal
e-mail: [email protected]
123
J Nanopart Res (2013) 15:1923
DOI 10.1007/s11051-013-1923-8

forming layers with negative electrical charges between
them. This arrangement makes these nanotubes highly
efficient for ion-exchange processes and if submitted to
weak acid conditions, the sodium ions can be partial or
completely replaced by protons. The crystalline structures
of layered Na2Ti3O7 and H2Ti3O7 are similar. The main
difference between these two structures is the position of
the interlayer cations, H? and Na?: the H? ions are
adsorbed on the titanate layers, but the Na? ions are free
between the layers (Zhang et al. 2005).
Alkali metals (Viana et al. 2011), metals, alkylam-
monium molecules and dyes have been used to replace
the sodium ions in the TNFs structure. The diffusion of
alkali metals (e.g. Li?, Na?, K? and Cs?) probably
occurs along the nanotubes length (Bavykin and
Walsh 2007), hence depending on the nanotubes size.
The typical interlayer distance of titanates is about
0.74–0.9 nm (Bavykin et al. 2006; Ma et al. 2005),
which is higher than the size of most alkali metal
cations. Consequently no change in the interlayer
spacing would be expected upon cation exchange, as
observed for Li?, Na?, K?, Rb? and Cs?, up to
*70 % substitution (Ma et al. 2005). However, XRD
analysis have shown expansion of the titanate layers
(ca. 0.3 nm) and no selectivity was found between
Li?, Na?, K? and Cs? (Bavykin and Walsh 2007).
Moreover, the simple exchange of sodium by protons,
upon acid treatment, is expected to affect this param-
eter as indicated by the d(200) diffraction peak in the
XRD pattern for the H2Ti3O7 and Na2Ti3O7. In
accordance with this, an increase of ca. 0.9 and
1.28 nm was detected by XRD after intercalation of
alkylammonium and cyanide dye molecules, respec-
tively (Miyamoto et al. 2004).
The typical values for the titanate nanotubes’
surface area are 200–300 m2/g and for other elongated
nano titanates 20–50 m2/g (Bavykin et al. 2009;
Kasuga et al. 1998). These materials have a band gap
energy close to that of TiO2 nanocrystalline anatase
(*3.2 eV) (Riss et al. 2007), and they present high
facility to be doped with different cationic ions, e.g.
Li?, Cs?, Na?, K? and dyes (Bavykin and Walsh
2007; Miyamoto et al. 2004; Xiao et al. 2008). This
TNFs’ ion-exchangeable ability makes them attractive
for new photosensitive, adsorbing, solar cells and
catalytic materials platforms development (Bavykin
et al. 2006; Xiao et al. 2008). Additionally, TiO2-based
nanotubular structures are known to be biocompatible
and nontoxic to cells and have been studied to
immobilize, transport and delivery of proteins and
related biological entities. Recent studies have shown
that myoglobin and cytochrome c can be successfully
immobilized on hydrogen titanate (Ray et al. 2011).
The combination of inorganic host lattices with
organics, not only by intercalation but also following
the grafting and sol–gel procedures, has been a
promising synthesis methodology for designed
organic–inorganic materials provided with multifunc-
tional performance for future technological applica-
tions (Matsuo and Konishi 2012). On the other hand,
recently has been reported that after sodium titanate
nanotubes and organic acids interaction, at high
temperatures, the nanoparticles exhibited changes in
their composition, crystalline structure and morphol-
ogy, due to a Na? ? H? ion exchange reaction. At
room temperature, the nanotubes stability depends on
the nature of the acid used. For instance for benzoic
acid, the morphology and structure of the nanoparti-
cles were maintained, but their chemical composition
was different (Rodrigues et al. 2010).
Several works have been published related with this
issue including co-sensitization with semiconductor
nanoparticles and zinc porphyrin (Li et al. 2012) or
phthalocyanin-sensitization (Cheng et al. 2010).
A large group of heterocyclic poly-aromatic com-
pounds, such as methylene blue (MB) and rhodamine
6G (R6G), have been intercalated through ion-
exchange processes. The intercalation of organic dyes
into V205 gels to produce nanocomposite materials of
potential interest as photoactive or electro-photoactive
systems was one of the first reports related with this
subject (Ackermans et al. 1996). The most interesting
feature in the visible spectra of cationic dyes such as
MB when intercalated, e.g. in clays, is the meta-
chromasy effect. This effect consists in a decrease of
the absorption intensity bands assigned to isolated
species (dye monomers), accompanied by an increase
in the intensity bands at higher energies assigned to the
formation of dyes aggregates. This effect that has been
spectroscopically deduced for several adsorbed cat-
ionic dyes is related to a self-aggregation process in
order to give dimers, trimers and higher aggregates.
Such aggregates can play an important role as
photosensitizers; since, they can transfer triplet energy
to the monomer form of the dye, which can serve as an
active participant in the energy conversion process.
Page 2 of 15 J Nanopart Res (2013) 15:1923
123
In the present work, different Na2-xHxTi3O7�nH2O
nanocrystalline elongated particles were synthesized
and their interaction with the cationic organic dyes,
mainly thionine (Th), methylene blue (MB) and
crystal violet (CV), was studied. The results demon-
strate that the dye immobilization ability was depen-
dent on the samples sodium-content and on the dyes
properties. Considering the very high amounts of dye
immobilized in the NaTNF samples, the dyes interca-
lation possibility was analysed. The obtained results
evidence the occurrence of some of the organic
molecules intercalation, between the TiO6 layers.
The optical properties of the hybrid materials prepared
were also analysed and discussed based on the dyes
intercalation phenomenon.
Experimental
All reagents were of analytical grade (Aldrich and
Fluka) and were used as received without further
purification. The solutions were prepared using bi-
distillated water.
Materials and methods
TNFs synthesis
The TNFs precursor was prepared using a procedure
previously reported (Nunes et al. 2008). A titanium
trichloride solution (10 wt% in 20–30 wt% HCl) was
diluted in a ratio of 1:2 in a standard HCl solution
(37 %). A 4 M ammonia aqueous solution was added
drop-wise to this violet dark solution, under vigorous
stirring, until complete precipitation of a white solid
(TNFs precursor). The resulting suspension was kept
overnight at room temperature and then filtered and
washed several times with deionised water.
The TNFs samples were obtained by a hydrother-
mal method using a suspension of *6 g of this
precursor, in ca. 60 ml of NaOH 10 M aqueous
solution (Ylhainen et al. 2012). The samples were
prepared at 200 �C using an autoclave dwell time of
12 h. After cooling, the suspensions were filtrated and
the white solid was washed systematically with water:
the sample was dispersed in *150 mL of water and
magnetically stirred for 1 h. Then, the suspension was
filtered and the pH of the filtrate measured for
reference. This procedure was repeated until filtrate
solution reached pH = 7. The white solid was after-
wards dried and stored. The wet-solid NaTNF,
obtained from 6 g of precursor, was also used to
prepare a protonated sample (HTNF) by dispersing
and stirring it in 100 mL of a HNO3 0.1 M aqueous
solution (pH 1.2) for 1 h. Next, the solid was washed
with water until a filtrate with pH = 5 was obtained.
This solid (HTNF) was then dried and stored.
Dye adsorption
The adsorption studies were carried out using a dye-
TNFs aqueous suspension (1 g L-1) under stirring for
2 h in dark conditions. After centrifugation, the dyes
concentrations were estimated by measuring the
absorbance at each dye chromophoric peak. When
different dyes concentrations (5–250 mg L-1) were
used, the TNFs samples were label as dye(I)-TNFs,
dye(II)-TNFs and dye(S)-TNFs, being the dye con-
centration dye(I) \ dye(II) \ dye(S); the dye(S)-
TNFs corresponds to the dye saturation situation.
In order to better understand the surface phenomena
involved in the adsorption process, different organic
dyes, with distinct molecule dimensions, were used.
The following dyes were tested: thionine (Th), crystal
violet (CV), rhodamine 6G (R6G) and methylene blue
(MB). The solutions’ pH was 5.7 for Th, 5.5 for CV
and MB and 5.4 for the R6G solution.
Characterisation
X-ray powder diffraction was performed using a
Philips X-ray diffractometer (PW 1730) with auto-
matic data acquisition (APD Philips v3.6B), using Cu
Ka radiation (k = 0.15406 nm) and working at 40 kV/
30 mA. The diffraction patterns were collected in the
range 2h = 7�–60� with a 0.02� step size and an
acquisition time of 2.0 s/step. Optical characterisation
of the samples was carried out by UV–Vis diffuse
reflectance using a Shimadzu UV-2600PC spectro-
photometer. Diffuse reflectance spectra (DRS) were
recorded in the wavelength range of 220–1,400 nm
using an ISR 2600plus integration sphere. Transmis-
sion electron microscopy (TEM) and high resolution
transmission electron microscopy (HRTEM) were
carried out using a JEOL 200CX microscope operating
at 200 kV. Specific surface areas were obtained by the
BET method, from nitrogen (Air Liquide, 99.999 %)
adsorption data at -196 �C, using a volumetric
J Nanopart Res (2013) 15:1923 Page 3 of 15
123

apparatus from Quantachrome mod NOVA 2200e.
The samples, weighing between 40 and 60 mg, were
previously degassed for 2.5 h at 150 �C at a pressure
lower than 0.133 Pa. Zeta potentials of the samples
were measured with an electrophoresis instrument
(Model ELS-8000, Otsuka, Japan). An electrolyte
solution (1 mM KCl) was used to keep the ionic
strength constant, while the pH value was varied by
adding 0.01 N KOH or HCl into the solution. The pH
of the suspension was taken as the isoelectric point
(IEP) at which the zeta potential was zero.
Results and discussion
NaTNF and HTNF characterisation
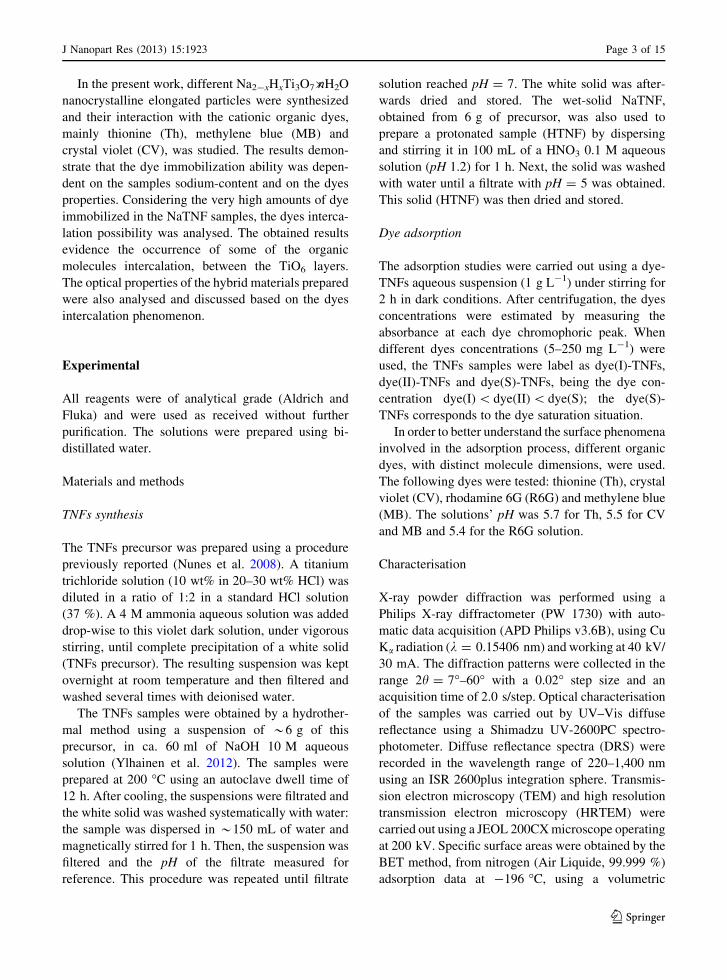
The NaTNF and HTNF samples prepared at 200 �C
during 12 h were analysed by XRD and the results are
presented in Fig. 1. The XRD patterns are in agree-
ment with the existence of a NaxH2-xTi3O7 titanate
layered crystalline structure in both samples. The
peaks at 24.58, 28.68 and 48.68 are characteristic
of tri-titanate 1D nanomaterials (Wong et al. 2011).
The diffraction peak at 2h *108 is related with the
interlayer distance between the TiO6 layers and can
vary depending on the amount, size and nature of the
intercalated ion/species. When the reference pH
decreases, from 7 to 5 (NaTNF and HTNF samples,
respectively), the peaks at *108 shifts to higher 2hvalues. In addition to this shift, a broadening of these
peaks was also observed with the decrease of the
reference pH. These structural features are related with
different sodium contents in the samples, and are
indicative of a Na? ? H? substitution process in the
interlayer region (Wong et al. 2011). The decrease in
the interlayer dimension is also supported by the
release of several water molecules that were surround-
ing the Na? ions, during the ion-exchange process
(Bavykin and Walsh 2010). Moreover, the decrease of
a characteristic Na2Ti3O7 peak intensity (e.g.
2h = 25.78) also indicates the sodium/proton replace-
ment in the crystalline structure. The XRD and EDS
analyses (not shown) are consistent with a gradual
sodium/proton replacement that increases with the
number of washing steps. Furthermore, the results
obtained for the HTNF sample agree with a total
sodium substitution.
The NaTNF and HTNF samples were analysed by
TEM and elongated nanofiber morphology was
observed for the two samples (Fig. 1—inset). The
surface areas were measured using the BET method-
ology and values of 21.08 and 38.90 m2/g were
obtained for the NaTNF and HTNF samples, respec-
tively. The higher value obtained for the HTNF
surface area is in agreement with previous reported
works (Wong et al. 2011) and it is related with the fact
that the removal of the sodium ions turns the interlayer
space more accessible for the N2 molecules during the
BET measurements. After total sodium replacement,
the material (HTNF) displays a higher surface area
without modifying its external morphology.
UV–Vis photo-response
The optical characterisation of the samples was
performed by measuring their diffuse reflectance
(R) spectra at room temperature. R is correlated with
the absorption Kubelka–Munk function, FKM, by the
relation FKM(R) = (1 - R)2/2R, being FKM propor-
tional to the absorption coefficient. Figure 2 shows the
FKM absorption spectra for both samples. A slight red-
shift in the optical absorption band edge can be
observed for the HTNF sample when compared with
the NaTNF. The optical band gap energies of the two
samples were calculated by plotting the function
fKM = (FKM ht)0.5 versus energy (Tauc plot), where
h stands for the Planck constant and t for the
frequency. The linear part of the curve was extrapo-
lated to fKM = 0 to get the indirect band gap energy for
each material (Diamandescu et al. 2008). The esti-
mated Eg values were 3.54 eV for NaTNF and 3.30 eV
for the HTNF sample, and are in accordance with
previously published ones (Bem et al. 2012).
Point of zero charge
Considering the influence of the surface charge in
adsorption processes, the point of zero charge
(p.z.c.) of the TNFs samples was evaluated. The
pH values at which the surface carries no net charge
(p.z.c.) were 3.4 and 4.1 for the NaTNF and HTNF
samples, respectively. These results are in agree-
ment with reported values for similar titanate
nanotubular structures (Bem et al. 2012). The lower
p.z.c. value obtained for NaTNF agrees with the
Page 4 of 15 J Nanopart Res (2013) 15:1923
123
existence of some ion-exchange ability for this
sample, since it has Na? ions remaining in the
structure that can be exchanged by cationic species.
The shift observed in the p.z.c. value for the HTNF
sample, when compared with the NaTNF, is indic-
ative of its higher acidic character.
Dye uptake
Since titanate nanotubular materials (TNFs) have been
suggested as adsorbents for cationic species, the
prepared samples capability to hold up organic dyes
from aqueous solutions was investigated. Aiming to
500 nm
5 15 25 35 45 55
Cou
nts
2 teta (º)
HTNF
NaTNF
Fig. 1 XRD pattern of the NaTNF and HNT sample; inset TEM micrograph of the NaTNF sample
Fig. 2 Absorption spectra
of the NaTNF and HTNF
samples; inset Tauc plots for
the TNFs samples
synthesized. The optical
band gap energies were
estimated by extrapolating
the linear portion of the
curve to zero absorption
J Nanopart Res (2013) 15:1923 Page 5 of 15
123
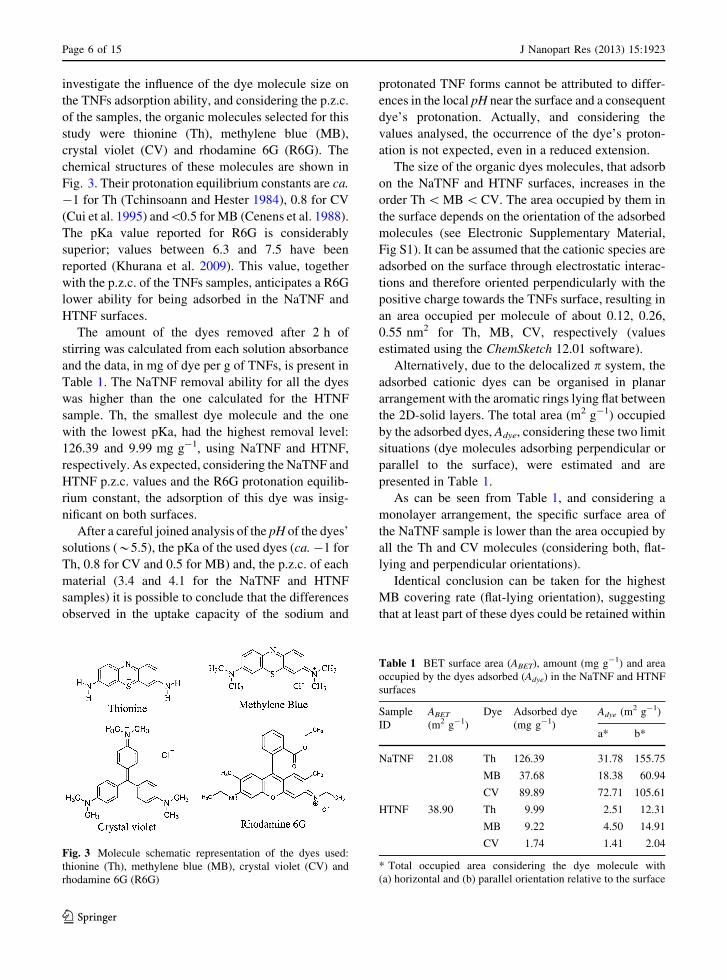
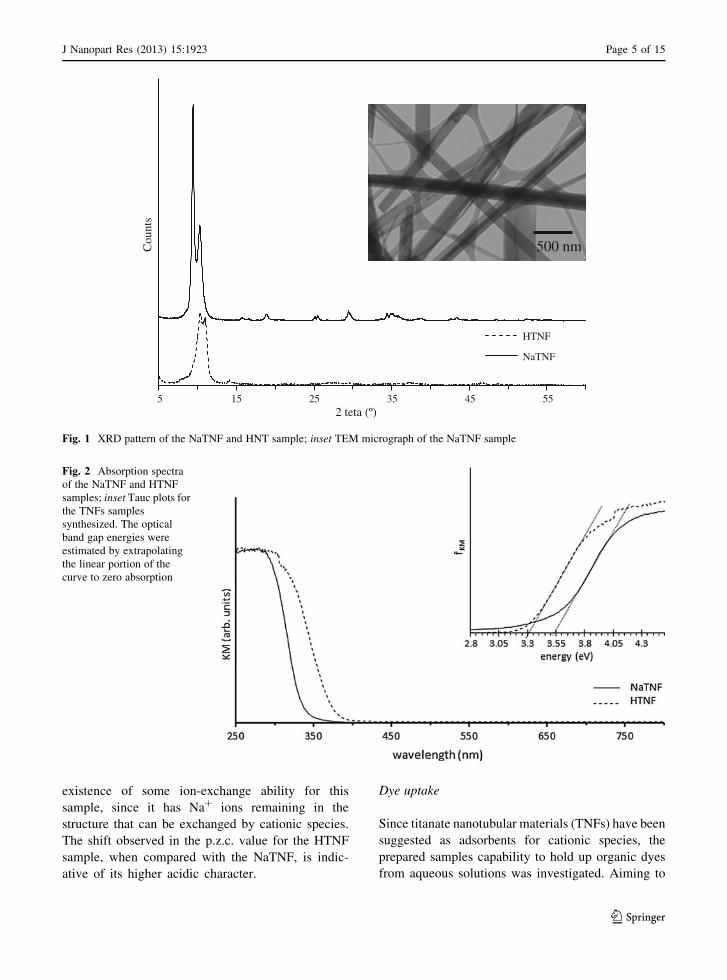
investigate the influence of the dye molecule size on
the TNFs adsorption ability, and considering the p.z.c.
of the samples, the organic molecules selected for this
study were thionine (Th), methylene blue (MB),
crystal violet (CV) and rhodamine 6G (R6G). The
chemical structures of these molecules are shown in
Fig. 3. Their protonation equilibrium constants are ca.
-1 for Th (Tchinsoann and Hester 1984), 0.8 for CV
(Cui et al. 1995) and\0.5 for MB (Cenens et al. 1988).
The pKa value reported for R6G is considerably
superior; values between 6.3 and 7.5 have been
reported (Khurana et al. 2009). This value, together
with the p.z.c. of the TNFs samples, anticipates a R6G
lower ability for being adsorbed in the NaTNF and
HTNF surfaces.
The amount of the dyes removed after 2 h of
stirring was calculated from each solution absorbance
and the data, in mg of dye per g of TNFs, is present in
Table 1. The NaTNF removal ability for all the dyes
was higher than the one calculated for the HTNF
sample. Th, the smallest dye molecule and the one
with the lowest pKa, had the highest removal level:
126.39 and 9.99 mg g-1, using NaTNF and HTNF,
respectively. As expected, considering the NaTNF and
HTNF p.z.c. values and the R6G protonation equilib-
rium constant, the adsorption of this dye was insig-
nificant on both surfaces.
After a careful joined analysis of the pH of the dyes’
solutions (*5.5), the pKa of the used dyes (ca. -1 for
Th, 0.8 for CV and 0.5 for MB) and, the p.z.c. of each
material (3.4 and 4.1 for the NaTNF and HTNF
samples) it is possible to conclude that the differences
observed in the uptake capacity of the sodium and
protonated TNF forms cannot be attributed to differ-
ences in the local pH near the surface and a consequent
dye’s protonation. Actually, and considering the
values analysed, the occurrence of the dye’s proton-
ation is not expected, even in a reduced extension.
The size of the organic dyes molecules, that adsorb
on the NaTNF and HTNF surfaces, increases in the
order Th \ MB \ CV. The area occupied by them in
the surface depends on the orientation of the adsorbed
molecules (see Electronic Supplementary Material,
Fig S1). It can be assumed that the cationic species are
adsorbed on the surface through electrostatic interac-
tions and therefore oriented perpendicularly with the
positive charge towards the TNFs surface, resulting in
an area occupied per molecule of about 0.12, 0.26,
0.55 nm2 for Th, MB, CV, respectively (values
estimated using the ChemSketch 12.01 software).
Alternatively, due to the delocalized p system, the
adsorbed cationic dyes can be organised in planar
arrangement with the aromatic rings lying flat between
the 2D-solid layers. The total area (m2 g-1) occupied
by the adsorbed dyes, Adye, considering these two limit
situations (dye molecules adsorbing perpendicular or
parallel to the surface), were estimated and are
presented in Table 1.
As can be seen from Table 1, and considering a
monolayer arrangement, the specific surface area of
the NaTNF sample is lower than the area occupied by
all the Th and CV molecules (considering both, flat-
lying and perpendicular orientations).
Identical conclusion can be taken for the highest
MB covering rate (flat-lying orientation), suggesting
that at least part of these dyes could be retained within
Fig. 3 Molecule schematic representation of the dyes used:
thionine (Th), methylene blue (MB), crystal violet (CV) and
rhodamine 6G (R6G)
Table 1 BET surface area (ABET), amount (mg g-1) and area
occupied by the dyes adsorbed (Adye) in the NaTNF and HTNF
surfaces
Sample
ID
ABET
(m2 g-1)
Dye Adsorbed dye
(mg g-1)
Adye (m2 g-1)
a* b*
NaTNF 21.08 Th 126.39 31.78 155.75
MB 37.68 18.38 60.94
CV 89.89 72.71 105.61
HTNF 38.90 Th 9.99 2.51 12.31
MB 9.22 4.50 14.91
CV 1.74 1.41 2.04
* Total occupied area considering the dye molecule with
(a) horizontal and (b) parallel orientation relative to the surface
Page 6 of 15 J Nanopart Res (2013) 15:1923
123
the NaTNF lamellar structure. The organic dyes
intercalation between the TiO6 layers is feasible for
the NaTNF, since this sample possesses sodium ions
available to be exchanged in the interlayer space. In
fact it has been reported that cationic dyes can be
intercalated in the interlayer spacing of layered
materials such as clays (Czımerova et al. 2004) and
nanostructured titanates (Miyamoto et al. 2004). This
also seems to be a reasonable assumption as the dyes
molecule dimensions and the TNF’s interlayer dis-
tance (8.554 A for the protonated TNFs and 9.403 A
for the NaTNFs) are in agreement with the dye
intercalation occurring with the molecules in a parallel
position relatively to the TiO6 layers (Fig S1).
In contrast, the HTNF specific surface area is higher
than the one required for accommodating all the dyes
molecules adsorbed. This is true even considering the
highest surface coverage (perpendicular molecule
orientation).
In order to conclude about the formation of new
hybrid TNFs materials through these cationic organic
molecules intercalation, studies involving XRD,
TEM, DRS and FTIR analyses were carried out.
NaTNF hybrid materials structural
characterisation
The structural characterisation of the NaTNF samples
after dyes sensitization was performed mainly by XRD
(Fig. 4).
With Thionine (Th)
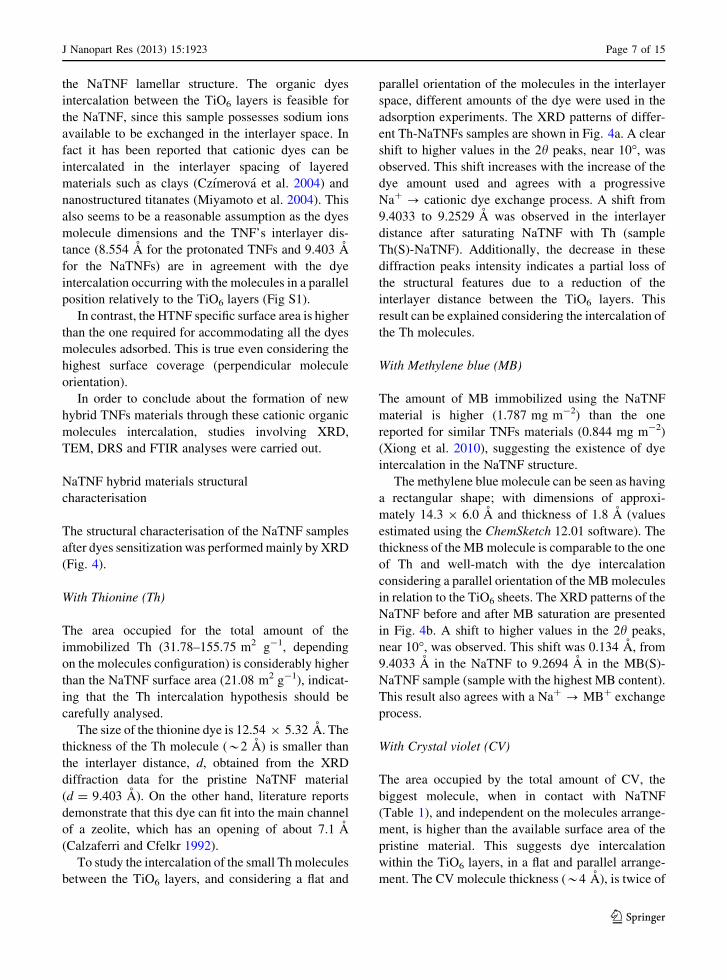
The area occupied for the total amount of the
immobilized Th (31.78–155.75 m2 g-1, depending
on the molecules configuration) is considerably higher
than the NaTNF surface area (21.08 m2 g-1), indicat-
ing that the Th intercalation hypothesis should be
carefully analysed.
The size of the thionine dye is 12.54 9 5.32 A. The
thickness of the Th molecule (*2 A) is smaller than
the interlayer distance, d, obtained from the XRD
diffraction data for the pristine NaTNF material
(d = 9.403 A). On the other hand, literature reports
demonstrate that this dye can fit into the main channel
of a zeolite, which has an opening of about 7.1 A
(Calzaferri and Cfelkr 1992).
To study the intercalation of the small Th molecules
between the TiO6 layers, and considering a flat and
parallel orientation of the molecules in the interlayer
space, different amounts of the dye were used in the
adsorption experiments. The XRD patterns of differ-
ent Th-NaTNFs samples are shown in Fig. 4a. A clear
shift to higher values in the 2h peaks, near 10�, was
observed. This shift increases with the increase of the
dye amount used and agrees with a progressive
Na? ? cationic dye exchange process. A shift from
9.4033 to 9.2529 A was observed in the interlayer
distance after saturating NaTNF with Th (sample
Th(S)-NaTNF). Additionally, the decrease in these
diffraction peaks intensity indicates a partial loss of
the structural features due to a reduction of the
interlayer distance between the TiO6 layers. This
result can be explained considering the intercalation of
the Th molecules.
With Methylene blue (MB)
The amount of MB immobilized using the NaTNF
material is higher (1.787 mg m-2) than the one
reported for similar TNFs materials (0.844 mg m-2)
(Xiong et al. 2010), suggesting the existence of dye
intercalation in the NaTNF structure.
The methylene blue molecule can be seen as having
a rectangular shape; with dimensions of approxi-
mately 14.3 9 6.0 A and thickness of 1.8 A (values
estimated using the ChemSketch 12.01 software). The
thickness of the MB molecule is comparable to the one
of Th and well-match with the dye intercalation
considering a parallel orientation of the MB molecules
in relation to the TiO6 sheets. The XRD patterns of the
NaTNF before and after MB saturation are presented
in Fig. 4b. A shift to higher values in the 2h peaks,
near 10�, was observed. This shift was 0.134 A, from
9.4033 A in the NaTNF to 9.2694 A in the MB(S)-
NaTNF sample (sample with the highest MB content).
This result also agrees with a Na? ? MB? exchange
process.
With Crystal violet (CV)
The area occupied by the total amount of CV, the
biggest molecule, when in contact with NaTNF
(Table 1), and independent on the molecules arrange-
ment, is higher than the available surface area of the
pristine material. This suggests dye intercalation
within the TiO6 layers, in a flat and parallel arrange-
ment. The CV molecule thickness (*4 A), is twice of
J Nanopart Res (2013) 15:1923 Page 7 of 15
123

Fig. 4 XRD patterns of the
NaTNF sample before and
after a—Th, b—MB and
c—CV treatment
Page 8 of 15 J Nanopart Res (2013) 15:1923
123
the Th one. However it is smaller enough to be
compatible with the interlayer distance available in the
NaTNF structure. The XRD patterns of different CV-
NaTNFs, prepared using different amount of this dye,
are shown in Fig. 4c. The hybrid CV(S)-NaTNF
material, with the highest amount of incorporated
CV (dye saturation) presents a structure with an
interlayer distance, d, of 9.2859 A. As in the Th(S)-
NaTNF and MB(S)-NaTNF materials, the gradual
shift in the 2h *108, with the increase of the amount
of immobilized dye, suggests the progressive CV
intercalation between the TiO6 layers.
HTNF hybrid materials structural characterisation
The main difference between the NaTNF and the
HTNF samples is the total replacement of the sodium
ions by protons and consequent adjustment in the
interlayer dimension between the TiO6 layers,
together with some changes in the acidity character
of the material. It is reported that the protonation and
aggregation of the organic dyes strongly depends on
the size and acidity of the nanochannels and/or
nanocavities of the hosts (Senthilkumar et al. 2010).
Independent of which dye is being used, the absence
of intercalation is predictable for the HTNF sample
since its surface area is compatible with the dyes
adsorption process alone. Figure 5a shows the HTNF
XRD patterns obtained before and after saturation with
this dye (sample Th(S)-HTNF). The absence of a shift
in the peaks at *10� and the preservation of the curve
profile suggest the occurrence of dye adsorption only.
Conversely, a decrease and broadening in these peaks
indicate some modifications, with possible partial loss
or reduction of the lamellar structure, after dye
treatment. The XRD results obtained for the MB(S)-
HTNF sample (Fig. 5b) were similar to the ones
obtained for Th(S)-HTNF. The XRD and adsorption
results are not conclusive about the possibility of these
dyes being intercalated in the HTNF material. But since
no 2h shift was observed, if intercalation occurs it must
not imply any changes in the TiO6 interlayer distance.
On the other hand, distinct results were obtained
using CV as intercalating compound. Figure 5c shows
the XRD patterns obtained before and after CV saturation
and no shift in the peak at *10� was observed.
However, it is interesting to note that in this material,
and contrary to the Th(S)-HTNF and MB(S)-HTNF
samples, no changes in the shape and intensity of this
peak was visualized. This indicates no changes in the
interlayer region, with the protons still between the
TiO6 layers. This suggests no CV intercalation. This
result can be explained considering that, from the three
studied dyes, the CV molecule is the one with the
biggest size.
Hybrid materials characterisation by UV–Vis
diffuse reflectance spectroscopy
The optical properties of titanate nanotubes can be
modified in a controlled way using ion-exchange
reactions. This methodology is suitable for searching
modifications in the chemical bonds of the structure,
thus, allowing to recognize the titanate nanotubular
composition and structure (Xiao et al. 2008). Since UV–
Vis spectroscopy is considered a powerful technique for
obtaining information about coloured organic–inor-
ganic materials, the prepared materials were studied by
diffuse reflectance spectroscopy (DRS). The absorption
spectra of the HTNF sample before and after MB and
CV saturation (samples MB(S)-HTNF and CV(S)-
HTNF, respectively) are presented in Fig. 6. The HTNF
band edge absorption (400–300 nm) shifts to higher
energies after the dyes immobilization. This blue shift is
higher for the MB-HTNF material. The band gap energy
increase was from 3.14 eV (HTNF) to 3.32 eV for
MB(S)-HTNF and to 3.24 eV for CV(S)-HTNF. The
MB(S)-HTNF absorption spectrum profile, in the
visible range, is indicative of MB adsorbed in the HTNF
surface, in monomeric and polymeric forms (Yan et al.
2005). The presence of a small amount of CV over the
HTNF surface can be inferred by the analysis of the
CV(S)-HTNF spectrum. After the analysis of the
adsorption, XRD and DRS results for these two
materials (CV(S)-HTNF and MB(S)-HTNF), it can be
concluded that no intercalation occurs in these systems,
with the adsorption as the unique process involved in
these dyes removal.
The absorption spectra of the NaTNF, Th(S)-
NaTNF, MB(S)-NaTNF and CV(S)-NaTNF samples
are presented in Fig. 7. For comparative purposes, the
aqueous dyes’ absorption spectra are also presented.
As it can be seen, the absorption spectra of the hybrid
materials are similar and practically independent of
the dye in use. After combination with the cationic
species, a clear decrease in the NaTNF absorption
band intensity (*350 nm) was observed. This indi-
cates a strong modification on the absorption
J Nanopart Res (2013) 15:1923 Page 9 of 15
123
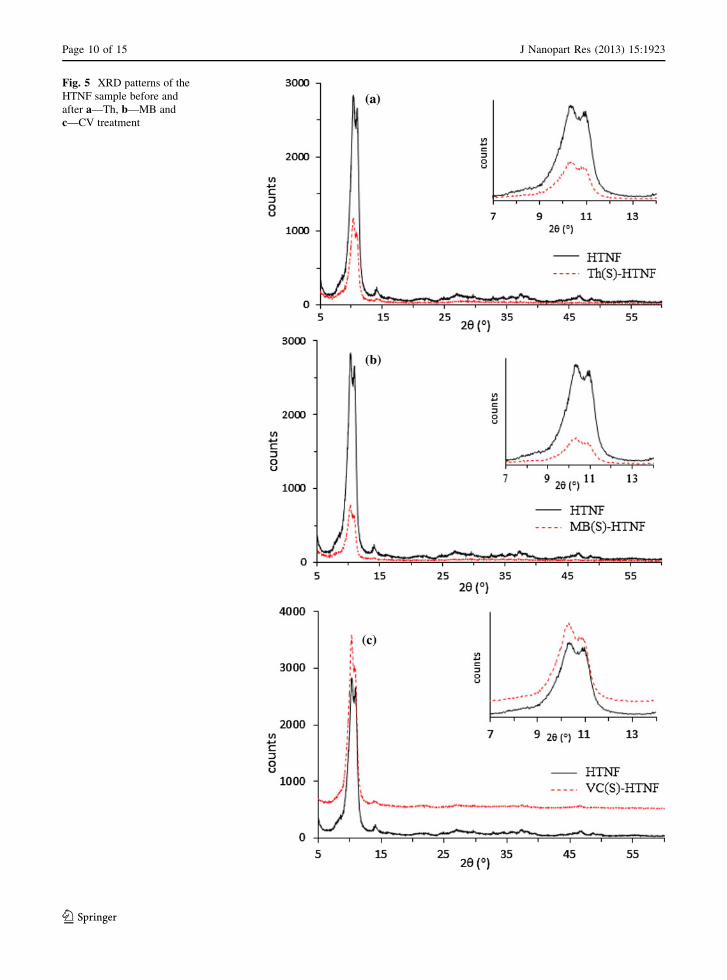
Fig. 5 XRD patterns of the
HTNF sample before and
after a—Th, b—MB and
c—CV treatment
Page 10 of 15 J Nanopart Res (2013) 15:1923
123

properties of the semiconductor material. The above
alterations cannot be completely explained by a
surface adsorption process and should be attributed
to the dyes intercalation between the TiO6 layers in the
NaTNF elongated structure. The absorption of visible
radiation, by these new hybrid materials, can be
attributed to the presence of dye aggregates, mainly
H-aggregates (Czımerova et al. 2004; Miyamoto et al.
2004). Due to the similarity observed for all the dye-
NaTNF absorption profiles, the contribution of these
new build hybrid structures in this absorption behav-
iour cannot be completely ruled out.
The optical behaviour of the Th(S)-NaTNF and
Th(S)-HTNF samples are similar (Fig. 7—inset), sug-
gesting the presence of materials with the same
structure. That can be explained by the occurrence of
dye intercalation in both materials. Comparing these
samples, a slight red shift in the 350 nm band edge for
the Th(S)-HTNF sample was observed. It is interesting
to note that this 350 nm red-shift is identical to the one
previously observed for the pristine materials, NaTNF
and HTNF (Fig. 2a). Considering these results, the Th
intercalation in the HTNF sample can be acknowledged,
even in a small scale, since the interlayer distance
obtained for the protonated TNFs (8.554 A) is compat-
ible with the small Th molecules intercalation. Due to its
reduced size, the introduction of such species between
the TiO6 layers can occur without changes in the
interlayer distance, as predictable by the XRD results.
MB-NaTNF
MB is an organic compound often used to study in
detail the adsorption properties of semiconductor
nanomaterials (Albuquerque et al. 2008; Bavykin
et al. 2010; Xiong et al. 2010, 2011). The sensitization
of the NaTNF with MB was analysed in more detail by
DRS, in order to contribute to the clarification of the
adsorption and intercalation processes rate.
The optical spectra of several MB sensitized TNFs
powders, obtained using different MB amounts, are
presented in Fig. 8. The optical spectrum of the
powder with the lowest MB amount (MB(I)-NaTNF)
is similar to the one of the saturated MB(S)-HTNF
sample (Fig. 8—inset). It is interesting to notice that
these two absorption spectra are similar, mainly in the
UV-range. The MB(S)-NaTNF spectrum in the
visible range presents a broad peak centred at
*550 nm and a shoulder at 665 nm. These bands,
at lower wavelengths than the MB chromophoric
peak, are usually associated with the presence of
H-aggregates of the dye adsorbed over the matrix
surface. The similarity between the MB(I)-NaTNF
and MB(S)-HTNF spectra suggests that the adsorp-
tion of the dye in the NaTNF surface is the most
relevant process in this stage. The formation of
dimmers of the dye on the surface of nanofibers can
be inferred and could suggest the formation of a
multi-layered coating.
Fig. 6 Absorption spectra
of the HTNF, MB(S)-HTNF
and CV(S)-HTNF prepared
samples. The absorption
spectra of a MB and CV
aqueous solutions
(5 mg L-1) are present for
comparative purposes
J Nanopart Res (2013) 15:1923 Page 11 of 15
123
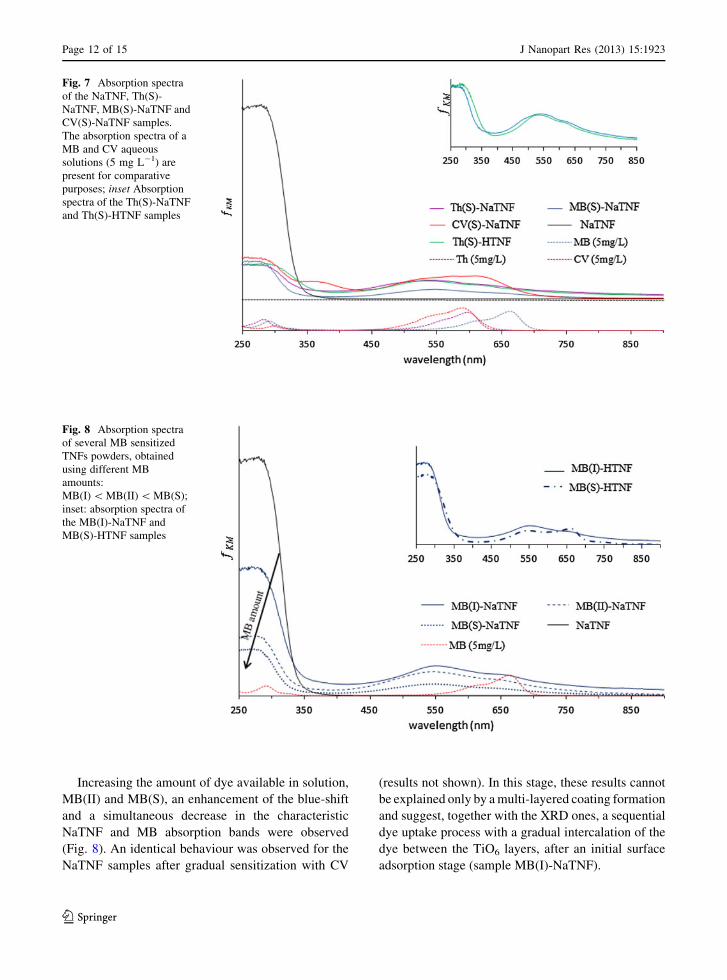
Increasing the amount of dye available in solution,
MB(II) and MB(S), an enhancement of the blue-shift
and a simultaneous decrease in the characteristic
NaTNF and MB absorption bands were observed
(Fig. 8). An identical behaviour was observed for the
NaTNF samples after gradual sensitization with CV
(results not shown). In this stage, these results cannot
be explained only by a multi-layered coating formation
and suggest, together with the XRD ones, a sequential
dye uptake process with a gradual intercalation of the
dye between the TiO6 layers, after an initial surface
adsorption stage (sample MB(I)-NaTNF).
Fig. 7 Absorption spectra
of the NaTNF, Th(S)-
NaTNF, MB(S)-NaTNF and
CV(S)-NaTNF samples.
The absorption spectra of a
MB and CV aqueous
solutions (5 mg L-1) are
present for comparative
purposes; inset Absorption
spectra of the Th(S)-NaTNF
and Th(S)-HTNF samples
Fig. 8 Absorption spectra
of several MB sensitized
TNFs powders, obtained
using different MB
amounts:
MB(I) \ MB(II) \ MB(S);
inset: absorption spectra of
the MB(I)-NaTNF and
MB(S)-HTNF samples
Page 12 of 15 J Nanopart Res (2013) 15:1923
123

Hybrid materials characterisation by Fourier
transform infrared spectroscopy
To verify the incorporation of the organic dyes
molecules within the TiO6 layers, FTIR was used to
characterise the NaTNF and HTNF hybrid materials
(Fig. 9). The presence of crystallographic water mol-
ecules in the surface of NaTNF (and HTNF) was
confirmed by the appearance of the characteristic peak
at 1,630 cm-1, that can be assigned to the H–O–H
deformation mode (dH–O–H). The broad intense bands at
3,420 cm-1 and 3,180 cm-1 can be attributed to
surface OH symmetrical and asymmetrical stretching
vibrations. A shoulder at 3,180 cm-1 from Ti–OH
bonds was observed as a consequence of the strong
interaction between Ti ions and OH groups within the
tubular structure (Bavykin and Walsh 2010). These OH
groups’ spectra features are less pronounced, or even
inexistent, in the HTNF spectrum (Fig. 9), since this
sample was submitted to an acid treatment. The wide
Fig. 9 FTIR spectra of the
HTNF, NaTNF, MB(S)-
NaTNF, Th(S)-NaTNF and
MB(S)-NaTNF samples
Fig. 10 FTIR spectra of the
NaTNF sample before and
after MB sensitization;
amount of MB immobilized:
MB(I) \ MB(II) \ MB(S)
J Nanopart Res (2013) 15:1923 Page 13 of 15
123

band at 463 cm-1, in the NaTNF and HTNF spectra can
be assigned to the crystal lattice vibration of TiO6
octahedra. This band can be affected by the incorpo-
ration of ions (via ion-exchange) into the titanate
structure, or by the alteration of the elongated mor-
phology. A decrease was observed for the peak at
1,630 cm-1 suggesting the release of some water
molecules due to the introduction of the dyes in the
interlayer space. The NaTNF’s broad bands at
3,420 cm-1 and 3,180 cm-1, attributed to surface OH
groups, decrease after the dyes’ treatments. This result
indicates the adsorption of dye molecules in the NaTNF
surface. A decrease in the band at 914 cm-1 and a
narrowing of the 463 cm-1 bandwidth were observed
for all the hybrid dye-NaTNF samples, suggesting an
identical uptake process for all the organic molecules.
The dyes presence in the samples structure was also
confirmed by the appearance of new bands at
1,600–1,100 cm-1. That can be assigned with the
aromatic rings of the dyes’ molecules and they are
present only in the dye-modified NaTNF spectra. No
modifications in the FTIR spectra were observed for the
HTNF samples, after dyes sensitization (not shown).
For the MB-NaTNF samples (Fig. 10), a narrowing
effect in the 463 cm-1 band width, related with the
vibration of TiO6 octahedra, is clearly seen with the
increase of the MB amount immobilized. The absorp-
tion band at 914 cm-1 can be assigned to the
stretching vibration of short Ti–O bonds, involving
non-bridging oxygen coordinated with sodium ions
(Dias et al. 2012). A gradual decrease in this band
intensity, for the NaTNF modified samples, was
observed with the increase of the MB amount uptake.
These results are in agreement with a sodium-cationic
dye exchange process, with the progressive intercala-
tion of the cationic dye into the NaTNF interlayer
space. The TEM images for all the modified NaTNF
materials showed the preservation of the elongated
morphology in opposition to published works, indi-
cating the total collapse of the tubular morphology
after organic acid and bases treatments (Rodrigues
et al. 2010).
Conclusions
New titanates nanostructured hybrid materials were
easily and successfully prepared through the combi-
nation of elongated titanate nanostructures (TNFs)
with cationic organic molecules. The intercalation of
the organic dyes was dependent on the ion exchange
ability of the TNFs and on the organic molecules size
and protonation equilibrium constants. The sample
with the highest sodium content (NaTNF) was the best
dyes up taking material and the intercalation of
thionine, methylene blue and crystal violet between
the TiO6 layers was achieved. The characterisation
results obtained by adsorption, XRD and FTIR are in
agreement with the production of new hybrid struc-
tures, where the organic molecules are located
amongst the TiO6 layers. Due to the smaller dimension
of the HTNF interlayers, only the thionine molecules
demonstrate to have the size required to be incorpo-
rated in the structure without changes in the interlayer
distance. Using the protonated titanates (HTNF), the
removal of the other dyes from solution was only
achieved by surface adsorption. The optical charac-
terisation of the prepared materials by DRS agrees
with the dyes intercalation and additionally point out
the influence of the dyes inserted in the lamellar
assembly in the final absorption properties of the
prepared hybrid materials.
Acknowledgments This study was supported by Fundacao
para a Ciencia e a Tecnologia (PTDC/CTM NAN/113021/
2009). O.C. Monteiro acknowledges PEst-OE/QUI/UI0612/
2013 and Programme Ciencia 2007.
References
Ackermans B, Schoonheydt RA, Ruiz-Hitzky E (1996) Inter-
calation of methylene blue into vanadium pentoxide gels.
J Chem Soc Faraday Trans 92(22):4479–4484
Albuquerque R, Neves MC, Mendonca MH, Trindade T,
Monteiro OC (2008) Adsorption and catalytic properties of
SiO2/Bi2S3 nanocomposites on the methylene blue photo-
decolorization process—colloids and surfaces A: phys-
icochem. Eng Aspects 328:107–113
Bavykin DV, Walsh FC (2007) Kinetics of alkali metal ion
exchange into nanotubular and nanofibrous titanates.
J Phys Chem C 111:14644–14651
Bavykin DV, Walsh FC (2009) Elongated titanate nanostruc-
tures and their applications. Eur J Inorg Chem 997 and
references cited therein
Bavykin DV, Walsh FC (2010) Titanate and titania nanotubes:
synhtesis, properties and applications—RSC nanoscience
& nanothecnology. RSC Publishing, Cambridge
Bavykin DV, Friedrich JM, Walsh FC (2006) Protonated ti-
tanates and TiO2 nanostructured materials: synthesis,
properties, and applications. Adv Mater 18:2807–2824
Bavykin DV, Redmond KE, Nias BP, Kulak AN, Walsh FC
(2010) The effect of ionic charge on the adsorption of
Page 14 of 15 J Nanopart Res (2013) 15:1923
123
organic dyes onto titanate nanotubes. Aust J Chem 63:
270–275
Bem V, Neves MC, Nunes MR, Silvestre AJ, Monteiro OC
(2012) Influence of the sodium/proton replacement on the
structural, morphological and photocatalytic properties of
titanate nanotubes. J Photochem Photobiol A 232:50–56
Calzaferri C, Cfelkr N (1992) Thionine in the cage of zeolite L.
J Phys Chem 96:3428–3435
Cenens J, Schoonheydt RA (1988) Visible spectroscopy of
methylene blue on hectorite, laponite B, and barasym in
aqueous suspension. Clay Clay Miner 36:214–224
Cheng W, Shen Y, Wu G, Gu F, Wang JZL (2010) Preparation
and properties of a phthalocyanine-sensitized TiO2 nano-
tube array for dye-sensitized solar cells. Semicond Sci
Technol 25:125014–125018
Cui H, Dwight K, Soled S, Wold A (1995) Surface acidity and
photocatalytic activity of Nb2O5/TiO2 photocatalysts.
J Solid State Chem 115:187–191
Czımerova A, Jankovic L, Bujdak J (2004) Effect of the
exchangeable cations on the spectral properties of methy-
lene blue in clay dispersions. J Coll Interf Sci 274:126–132
Diamandescu L, Vasiliu F, Tarabasanu-Mihaila D, Feder M,
Vlaicu AM, Teodorescu CM, Macovei D, Enculescu I,
Parvulescu V, Vasile E (2008) Structural and photocata-
lytic properties of iron- and europium-doped TiO2 nano-
particles obtained under hydrothermal conditions. Mater
Chem Phys 112:146–153
Dias CFB, Araujo-Chaves JC, Mugnol KCU, Trindade FJ, Alves
OL, Caires ACF, Brochsztain S, Crespilho FN, Matos JR,
Nascimento OR, Nantes IL (2012) Photo-induced electron
transfer in supramolecular materials of titania nanostruc-
tures and cytochrome c. RSC Advances 2:7417–7426
Kasuga T, Hiramatsu M, Hoson A, Sekino T, Niihara K (1998)
Formation of titanium oxide nanotube. Langmuir 14:
3160–3163
Khurana TK, Santiago JG (2009) Effects of carbon dioxide on
peak mode isotachophoresis: simultaneous preconcentra-
tion and separation. Lab Chip 9:1377–1384
Li X, Liu L, Kang S-Z, Mu J, Li G (2012) Titanate nanotubes co-
sensitized with cadmium sulfide nanoparticles and por-
phyrin zinc. Catal Commun 17:136–139
Luis AM, Neves MC, Mendonca MH, Monteiro OC (2011)
Influence of calcination parameters on the TiO2 photocat-
alytic properties. Mat Chem Phys 125:20–25
Ma R, Sasaki T, Bando Y (2005) Alkali metal cation interca-
lation properties of titanate nanotubes. Chem. Commun
948–950
Matsuo Y, Konishi K (2012) Intercalation of various organic
molecules into pillared carbon. Carbon 50:2280–2286
Miyamoto KNK, Ogawa M (2004) Visible light induced elec-
tron transfer and long-lived charge separated state in cya-
nine dye/layered titanate intercalation compounds. J Phys
Chem B 108:4268–4274
Nunes MR, Monteiro OC, Castro AL, Vasconcelos DA, Sil-
vestre AJ (2008) A new chemical route to synthesise TM-
doped (TM = Co, Fe) TiO2 nanoparticles. Eur J Inorg
Chem 28:961–965
Ray M, Chatterjee S, Das T, Bhattacharyya S, Ayyub P,
Mazumdar S (2011) Conjugation of cytochrome c with
hydrogen titanate nanotubes: novel conformational state
with implications for apoptosis. Nanotechnology 22:
415705–415712
Riss A, Berger T, Grothe H, Bernardi J, Diwald O, Knozinger E
(2007) Chemical control of photoexcited states in titanate
nanostructures. Nano Lett 7:433–438
Rodrigues CM, Ferreira OP, Alves OL (2010) Interaction of
sodium titanate nanotubes with organic acids and base:
chemical, structural and morphological stabilities. J Braz
Chem Soc 21:1341–1348
Senthilkumar K, Paul P, Selvaraju C, Natarajan P (2010)
Preparation, characterization, and photophysical study of
thiazine dyes within the nanotubes and nanocavities of
silicate host: influence of titanium dioxide nanoparticle on
the protonation and aggregation of dyes. J Phys Chem C
114:7085–7094
Tchinsoann K, Hester D (1984) Raman spectroscopic studies of
a thionine-modified electrode. J Chem Soc Faraday Trans I
80:2053–2071
Viana BC, Ferreira OP, Souza Filho AG, Hidalgo AA, Mendes
Filho J, Alves OL (2011) Alkali metal intercalated titanate
nanotubes:a vibrational spectroscopy study. Vib Spectrosc
55:183–187
Wong CL, Tan YN, Mohamed A (2011) A review on the for-
mation of titania nanotube photocatalysts by hydrothermal
treatment. J Environ Manag 92:1669–1680
Xiao MW, Wang LS, Wu YD, Huang XJ, Dang Z (2008)
Electrochemical study of methylene blue/titanate nano-
tubes nanocomposite and its layer-by-layer assembly
multilayer films. J Solid State Electrochem 12:1159–1166
Xiong L, Yang Y, Mai J, Sun W, Zhang C, Wei D, Chen Q, Ni J
(2010) Adsorption behavior of methylene blue onto tita-
nate nanotubes. Chem Eng J 156:313–320
Xiong L, Sun W, Yang Y, Chen C, Ni J (2011) Heterogeneous
photocatalysis of methylene blue over titanate nanotubes:
effect of adsorption. J Colloid Interface Sci 356:211–216
Yan Y, Zhang M, Gong K, Su L, Guo Z, Mao L (2005)
Adsorption of methylene blue dye onto carbon nanotubes:
a route to an electrochemically functional nanostructure
and its layer-by-layer assembled nanocomposite. Chem
Mater 17:3457–3463
Ylhainen EK, Nunes MR, Silvestre AJ, Monteiro OC (2012) Tita-
nia-free synthesis of titanate nanostructures and their adsorp-
tion/photocatalytic properties. J Mater Sci 47:4305–4312
Zhang S, Chen Q, Peng L-M (2005) Structure and formation of
H2Ti3O7 nanotubes in an alkali environment. Phys Rev B
71:014104–014115
J Nanopart Res (2013) 15:1923 Page 15 of 15
123