Female Empowerment as a Core Driver of Democratic Development: A Dynamic Panel Model from 1980 to...
21
Female Empowerment as a Core Driver of Democratic Development: A Dynamic Panel Model from 1980 to 2005 PAULA WYNDOW Curtin University, Perth, Australia Telethon Institute for Child Health Research, Centre for Child Health Research, The University of Western Australia, Australia JIANGHONG LI WZB Berlin Social Research Center, Berlin, Germany Telethon Institute for Child Health Research, Centre for Child Health Research, The University of Western Australia, Australia and EUGEN MATTES * Telethon Institute for Child Health Research, Centre for Child Health Research, The University of Western Australia, Australia Summary. — We investigated the causal effects of female empowerment (female educational attainment, female labor force participa- tion, and total fertility rates) on democratic development for 97 countries from 1980 to 2005. Using Polity IV as an indicator of levels of democracy, our results show that female empowerment was strongly associated with democratic development over this period. The effect of female education increased with lags of 5 and 10 years, suggesting that democracy is more likely to occur in nations with a his- tory of educating girls and a longer experience of the social and economic conditions that have occurred because of this investment. Ó 2013 Elsevier Ltd. All rights reserved. Key words — democracy, gender equality, economic development, modernization theory, social institutions, gender theory, cross-nation 1. INTRODUCTION In the latter part of the 20th century many countries moved away from autocratic rule toward more democratic regimes. During this period women’s economic and social rights also improved, with greater access to education (Barro & Lee, 2010) and employment (UN, 2000), and a world wide fall in fer- tility rates (World Bank, 2011). The general presumption has been that democracy leads to improvements in these aspects of gender equality. However, insufficient attention has been paid to the possibility that a causal relationship may operate in the opposite direction. Hence, the absence of empirical stud- ies investigating the role played by improvements in women’s rights in advancing democracy is a significant gap in the re- search literature. Existing literature on the social and economic determinants of democracy has tended to focus on income and factors closely associated with it, such as mass education and urbanization (Barro, 1999; Bollen, 1979; Epstein, Bates, Gold- stone, Kristensen, & O’Halloran, 2006; Glaeser, Ponzetto, & Shleifer, 2007; Lipset, 1994; Londregan & Poole, 1996; Papa- ioannou & Siourounis, 2008). However, there are still many wealthy countries that have not become democratic, particu- larly throughout the Middle-East. This challenges the assump- tion that wealth automatically leads to more democratic regimes, and suggests a possible role for gender equality and fe- male empowerment in advancing democracy. While we recognize that there are many factors that contrib- ute to the democratic development process, the purpose of this paper is to address the “gender lacuna” (Baldez, 2010) or gen- der gap in comparative politics and to incorporate a gendered perspective into democratic development theory. Specifically, this cross-national study investigates the causal relationship between female empowerment and democratic development from 1980 to 2005 for countries that began the period as non- democratic. Democracy is measured on a continuum using the Polity IV dataset and democratic development refers to a country’s temporal movement toward democracy. Three indi- cators representing the empowerment of women are female educational attainment, fertility rates, and female labor force participation, and they reflect the interplay between women’s productive and reproductive activities. A dynamic panel mod- el with a System Generalized Method of Moments (GMM) estimator is employed to account for the possibility that the relationship between female empowerment and democratic development is influenced by endogeneity and autocorrelation. * This paper has benefited enormously from comments and proofreading by Dr. Siobhan Austen from Curtin University, plus two anonymous re- viewers, as well as statistical assistance from Dr. Felix Chan, Dr. Max Bulsara, Dr. Peter Jacoby, and Dr. Vasilis Sarafidis. I would also like to acknowledge Curtin University for funding this research through an APA and CUPS scholarship during my Ph.D. candidacy, and the Telethon Institute for Child Health Research for its financial and practical assist- ance. I am also in receipt of a Stan and Jean Perron top-up award. Final revision accepted: June 18, 2013. World Development Vol. 52, pp. 34–54, 2013 Ó 2013 Elsevier Ltd. All rights reserved. 0305-750X/$ - see front matter www.elsevier.com/locate/worlddev http://dx.doi.org/10.1016/j.worlddev.2013.06.004 34
-
Upload
independent -
Category
Documents
-
view
2 -
download
0
Transcript of Female Empowerment as a Core Driver of Democratic Development: A Dynamic Panel Model from 1980 to...
World Development Vol. 52, pp. 34–54, 2013� 2013 Elsevier Ltd. All rights reserved.
0305-750X/$ - see front matter
www.elsevier.com/locate/worlddevhttp://dx.doi.org/10.1016/j.worlddev.2013.06.004
Female Empowerment as a Core Driver of Democratic Development:
A Dynamic Panel Model from 1980 to 2005
PAULA WYNDOWCurtin University, Perth, Australia
Telethon Institute for Child Health Research, Centre for Child Health Research,The University of Western Australia, Australia
JIANGHONG LIWZB Berlin Social Research Center, Berlin, Germany
Telethon Institute for Child Health Research, Centre for Child Health Research,The University of Western Australia, Australia
and
EUGEN MATTES *
Telethon Institute for Child Health Research, Centre for Child Health Research,The University of Western Australia, Australia
Summary. — We investigated the causal effects of female empowerment (female educational attainment, female labor force participa-tion, and total fertility rates) on democratic development for 97 countries from 1980 to 2005. Using Polity IV as an indicator of levelsof democracy, our results show that female empowerment was strongly associated with democratic development over this period. Theeffect of female education increased with lags of 5 and 10 years, suggesting that democracy is more likely to occur in nations with a his-tory of educating girls and a longer experience of the social and economic conditions that have occurred because of this investment.� 2013 Elsevier Ltd. All rights reserved.
Key words — democracy, gender equality, economic development, modernization theory, social institutions, gender theory, cross-nation
* This paper has benefited enormously from comments and proofreading
by Dr. Siobhan Austen from Curtin University, plus two anonymous re-
viewers, as well as statistical assistance from Dr. Felix Chan, Dr. Max
Bulsara, Dr. Peter Jacoby, and Dr. Vasilis Sarafidis. I would also like to
acknowledge Curtin University for funding this research through an APA
and CUPS scholarship during my Ph.D. candidacy, and the Telethon
Institute for Child Health Research for its financial and practical assist-
ance. I am also in receipt of a Stan and Jean Perron top-up award. Finalrevision accepted: June 18, 2013.
1. INTRODUCTION
In the latter part of the 20th century many countries movedaway from autocratic rule toward more democratic regimes.During this period women’s economic and social rights alsoimproved, with greater access to education (Barro & Lee,2010) and employment (UN, 2000), and a world wide fall in fer-tility rates (World Bank, 2011). The general presumption hasbeen that democracy leads to improvements in these aspectsof gender equality. However, insufficient attention has beenpaid to the possibility that a causal relationship may operatein the opposite direction. Hence, the absence of empirical stud-ies investigating the role played by improvements in women’srights in advancing democracy is a significant gap in the re-search literature. Existing literature on the social and economicdeterminants of democracy has tended to focus on income andfactors closely associated with it, such as mass education andurbanization (Barro, 1999; Bollen, 1979; Epstein, Bates, Gold-stone, Kristensen, & O’Halloran, 2006; Glaeser, Ponzetto, &Shleifer, 2007; Lipset, 1994; Londregan & Poole, 1996; Papa-ioannou & Siourounis, 2008). However, there are still manywealthy countries that have not become democratic, particu-larly throughout the Middle-East. This challenges the assump-tion that wealth automatically leads to more democraticregimes, and suggests a possible role for gender equality and fe-male empowerment in advancing democracy.
While we recognize that there are many factors that contrib-ute to the democratic development process, the purpose of this
34
paper is to address the “gender lacuna” (Baldez, 2010) or gen-der gap in comparative politics and to incorporate a genderedperspective into democratic development theory. Specifically,this cross-national study investigates the causal relationshipbetween female empowerment and democratic developmentfrom 1980 to 2005 for countries that began the period as non-democratic. Democracy is measured on a continuum using thePolity IV dataset and democratic development refers to acountry’s temporal movement toward democracy. Three indi-cators representing the empowerment of women are femaleeducational attainment, fertility rates, and female labor forceparticipation, and they reflect the interplay between women’sproductive and reproductive activities. A dynamic panel mod-el with a System Generalized Method of Moments (GMM)estimator is employed to account for the possibility that therelationship between female empowerment and democraticdevelopment is influenced by endogeneity and autocorrelation.
FEMALE EMPOWERMENT AS A CORE DRIVER OF DEMOCRATIC DEVELOPMENT 35
Our results show that improvements in female empowermentwere associated with democratic development over this period,with female education and female labor force participation hav-ing a significant positive and causal effect on these movements.The magnitude of the effect of female education increased withlags of 5 and 10 years, suggesting that democracy is more likelyto occur in countries with a history of educating girls and possi-bly a longer experience of the social and economic conditionsthat have occurred because of this investment. Moreover, it ap-pears that all three empowerment indicators were requisites fordemocracy to occur, with deficits in any area hindering demo-cratic development. This highlights the importance of recogniz-ing the interplay between women’s productive and reproductiveactivities for advancing democracy.
2. THE DETERMINANTS OF DEMOCRACY
With countries moving away from autocracy toward moredemocratic regimes in the latter part of the 20th century manyscholars have sought to understand the preconditions requiredfor democracy to emerge and be sustained. According to themodernization theory democracy is more likely to occur inaffluent and educated societies (Lipset, 1959, 1994). Lipset(1959) conceptualized modernization as changes in the factorsof industrialization, urbanization, wealth, and education whichare so closely interrelated as to form one common factor. Thepositive association between income and democracy (Barro,1999; Bollen, 1979; Epstein, Bates, Goldstone, Kristensen, &O’Halloran, 2006; Glaeser et al., 2007; Lipset, 1994; Londregan& Poole, 1996; Papaioannou & Siourounis, 2008), and a coun-try’s average education level and democracy (Barro, 1999;Feng & Zak, 1999; Glaeser et al., 2007; Lutz, Cuaresma, &Abbasi-Shavazi 2010; Papaioannou & Siourounis, 2008; Pers-son & Tabellini, 2009) is an empirical regularity in the democ-ratization literature. However, the effect of urbanization ondemocratization appears to be negligible or negative (Barro,1999; Epstein et al., 2006; Ross, 2001), except when establisheddemocracies are removed from the analyses (Castello-Climent,2008), then urbanization has a positive effect. 1
Despite strong evidence supporting the modernization the-ory, others argue that income and education have no causaleffect on democracy. Acemoglu, Johnson, Robinson, andYared (2005, 2008) found no evidence of a causal relationshipbetween income and democracy or between total educationand democracy, once country fixed effects were controlledfor. However, others questioned their statistical methodsand argued that the Blundell–Bond system GMM estimatorwas more appropriate to use when variables were highly per-sistent, rather than the Arellano-Bond first difference GMMestimator (Bobba & Coviello, 2007; Castello-Climent, 2008).In doing so, these authors found that total education wascausally related to democracy. Moreover, in a seminal pieceof work Przeworski and Limongi (1996) argued that the maineffect of income on political change was to sustain democra-cies once they transitioned via other means. 2 However, subse-quent critiques of Przeworski et al.’s findings and furtheranalyses by Boix and Stokes (2003) and Epstein et al. (2006)showed that the modernization theory still held. Hadeniusand Teorell (2005) found that while income had a positive ef-fect among the more democratic countries and countries stillin transition, their results showed that income had no signif-icant effect on regime change in fully autocratic countries.This suggests that other factors over and above economicdevelopment are required for democratic development to oc-cur in these countries.
Recent studies suggest that in countries where total increases inwealth results in a more equal distribution of education and or in-come, democracy is more likely to emerge (Boix & Stokes, 2003;Castello-Climent, 2008; Muller, 1995). Moreover, a study by Lutzet al. (2010) showed that while total education attainment wassignificant, increases in female education was also a core driverof democracy. Thus, while total levels of income and educationare associated with higher levels of democracy, it appears that tran-sitions out of autocracy may require a more equal distribution ofeconomic and social resources between socio-economic groupsand between genders. This suggests a possible role for genderequality and female empowerment in advancing democracy.
3. GENDER EQUALITY AND DEMOCRACY
Inglehart and Baker (2000) and Inglehart and Welzel (2009,2010) make an important contribution to the democratizationliterature by attempting to explain the causal mechanismthrough which modernization creates the desire or demandfor democracy. They propose that gains in economic securityand development shift people’s focus from survival to self-expression values, such as trust, tolerance, political activism,support for gender equality, and emphasis on freedom ofexpression. Rather than being a consequence of democratictransition, these authors suggest that gender equality is animportant part of the broad cultural changes taking place thatsupports the spread of democracy (Inglehart, Norris, & Wel-zel, 2002). Implicit in these studies is the presumption thatboth gender equality and democratic development occur as aconsequence of economic development. However, others haveargued that economic development does not always improvethe status of women (Boserup, 1970; Marchand & Parpart,1995), particularly where patriarchal institutions still existand where cultural norms, laws, and traditions restrict wo-men’s access to resources (Morrisson & Jutting, 2005).
Studies which test these assumptions are scarce. Using cross-sectional data to examine the causal link between Islam andauthoritarianism, Fish (2002) identified the subordinate statusof women as a factor contributing to the democratic deficit inMuslim countries. Specifically, gender literacy gaps, sex ratioimbalances (more males than females in the population), lowpercentages of women in government and a low genderempowerment score (GEM) 3 were significantly correlatedwith more authoritarian regimes. Moreover, all these factorsreduced the association between Islam and authoritarianism.Donno and Russett (2004) first replicated and then expandedFish’s study (Fish, 2002), using a more sophisticated model totest the causal link between women’s status and democracy.They found that the indicators of women’s rights (excludingthe proportion of women in government) had no causal orindependent effect on regime type. Additionally, their resultsshowed that the negative impact of Islam on democracy wasattributed to being an Arab country, rather than being an Is-lamic country. Both studies include democratic and nondemo-cratic countries and thus have difficulty (as Fish concedes) inidentifying the direction of causation between gender equalityand democracy. Donno and Russett’s findings are further lim-ited to the period of time toward the end of the 1990s andmany of the countries included in their sample were alreadydemocratic prior to this period. Finally, studies linking mod-ernization, democracy, and gender equality (Beer, 2009; Don-no and Russett (2004), Fish, 2002; Inglehart et al., 2002) arefurther complicated by the lack of consensus over the mean-ings and measurement of democracy, women’s status, and fe-male empowerment. Accordingly, we address these issues next.
36 WORLD DEVELOPMENT
(a) Conceptualizing democracy
Democracy is a highly complex, multi-faceted concept thatis contested at many levels. Firstly, there is disagreement asto whether democracy is a binary concept (Alvarez, Cheibub,Limongi, & Przeworski, 1996; Boix & Stokes, 2003) or a con-tinuous concept (Bollen & Jackman, 1989; Jaggers & Gurr,1995). Others call for the recognition of the hybrid regimewhere countries may have elements of both democratic andautocratic regimes (Diamond, 2002; Epstein et al., 2006). Inthe democratization literature the definition and measurementof democracy largely follows Dahl’s narrow view of “polyar-chy” rather than democracy. Its key characteristics are theexistence of free, fair, and competitive elections, and the abilityof its citizens to formulate and signify their preferences (Dahl,1971). While narrow definitions of democracy have been crit-icized for being too minimalist and not including other attri-butes, such as measures of social and economic equality, ithas also been argued that using an all-encompassing measureof democracy makes it difficult to separate social or economicprogress from political progress (Di Palma, 1990; Munck &Verkuilen, 2002), and to test the effects of one element on an-other.
As the focus of this study is the causal effect of femaleempowerment on democratic development a narrow definitionof democracy is used to separate political rights from social oreconomic rights. Consequently, democracy is conceptualizedas a system of governance that allows free and fair elections,where there are constraints on executive power, and wherethere is universal suffrage. It is viewed as being on a continuumwith countries embracing some or all of the elements of thissystem of governance.
(b) Conceptualizing female empowerment
The Beijing Declaration and Platform for Action set anagenda for the empowerment of women, and reaffirmed“women’s rights as human rights.” This document stressesthat the empowerment of women and the equalization ofmen and women’s rights are of critical concern for “achievingpolitical, social, economic, cultural, and environmental secu-rity among all peoples” (United Nations, 1995). Since then,the term “empowerment” has been freely used, with many at-tempts to conceptualize and define this term. Ibrahim andAlkire (2007) identified more than 20 definitions of “empower-ment” in the literature. The commonality in these descriptionsis the relationship between a woman’s individual agency andthe macro-social structures or institutions that enhance or re-strict a woman’s ability to exercise that agency. Furthermore,empowerment is generally conceptualized as a process, where,over time, an individual moves from a lesser state to higherone (Kabeer, 1999; Rowlands, 1995).
This study is particularly interested in the transformativepower of agency or “enabling factors” (Kishor, 2000) thatchallenge existing structures of patriarchy, particularly inauthoritarian regimes. These include female education, fe-male labor force participation, and fertility rates. We concedethat aggregate measures fail to capture the efficacy of each ofthese items as tools for empowerment in different contextsand at different points in a woman’s life course (Mason,1986). However, the value of these three aggregate measuresis that they enable us to measure female empowerment as aprocess because they are readily available for many countriesover a long period of time, making cross-country compari-sons possible. Moreover, the inclusion of all three variablestogether represents a significant cultural shift in gender roles
within a country and enables us to examine if and how def-icits in one or more areas may hinder democratic develop-ment.
4. FEMALE EMPOWERMENT AND DEMOCRATICDEVELOPMENT
Intuitively, the relationship between gender equality anddemocracy appears axiomatic. Since the UN Decade for Wo-men (1975–85) international strategies and conventions, suchas the Convention on the Elimination of All Forms of Dis-crimination against Women (CEDAW) and the MillenniumDevelopment Goals, have created a strong mandate to ensurethat gender equality and women’s empowerment are an essen-tial component of development and democracy. But what isthe causal mechanism underpinning such a relationship andwhy would female empowerment in particular, promote dem-ocratic development?
The preamble from the Universal Declaration of Rights(1948) declares that democracy is based on the “freely ex-pressed will of the people to determine their own political, eco-nomic, social, and cultural systems, and their full participationin all aspects of their lives.” However, as women bear a dispro-portionate level of the world’s poverty (UNDP, 1995), wo-men’s ability to shape their own lives and that of society islimited unless women gain access to and control over re-sources that are tools for empowerment. These include, butare not limited to, education, reproduction, and employment. 4
As women become less burdened by childbearing and childre-aring, are more educated and as they enter the work force,they become increasingly conscious of the gender inequalitiesthat exist in society. Over time, women realize that their de-mands for gender equality are linked to a political regime thatis more responsive to their needs (Arat, 1994), thus a push forboth gender equality and democracy ensues. 5
Empowering women through education and employmentmay have a causal effect on democratic development by raisingthe benefits of political participation and expanding the broadbase of support for democracy. “It is more appealing to partic-ipate in a collective activity the more educated a person is, andthe more educated the other participants are” (Glaeser et al.,2007, p. 8). These authors suggest that anything that promotescollective action will also promote democracy. In 2006 the“One Million Signatures Campaign” was established in Iranto achieve two main goals. The first was to raise women’sawareness of their individual human rights; the second wasto demand legal changes to discriminatory laws against wo-men. At the same time, the campaign strengthened the demo-cratic reform agenda as women raised their voices with menadvocating for change (Jahanshahrad, 2012). Hence, we arguethat the increased participation of women in education willmotivate both women and men to be more involved in grassroots political activism, thus expanding the broad base of sup-port for democracy.
(a) Female education
Educating both boys and girls is acknowledged as a univer-sal human right with benefits for individuals and society.However, educating girls indirectly advances democraticdevelopment by producing other socio-economic gains, aboveand beyond educating boys. These include reduced fertility,(Lehr, 2009; Lena & London, 1993), lower child mortality(Cleland & van Ginneken, 1988), and increased female laborforce participation (Bloom, Canning, Fink, & Finlay, 2009).
FEMALE EMPOWERMENT AS A CORE DRIVER OF DEMOCRATIC DEVELOPMENT 37
Likewise, educating girls builds the human capital of the cur-rent and future generations of one half of the population,which in turn reduces the fertility rate of the next generation(Blumberg, 1989), and promotes long-term economic growth(Galor & Weil, 1996; Psacharopoulos & Patrinos, 2004). Edu-cating girls also reduces gender inequalities as educated wo-men are also more likely than noneducated women toeducate their sons and daughters, thus increasing the overalldistribution of education (Basu, 2002).
(b) Female labor force participation
The expansion of economic rights for women is an impor-tant tool for female empowerment and raising women’s status(Blumberg, 1984, 2007; Chafetz, 1990; Collins, Chafetz, Blum-berg, Coltrane, & Turner, 1993). While others have questionedits validity as a tool for empowering women in developingcountries, particularly within the domestic sphere (Malhotra& Mather, 1997), female labor force participation, like educa-tion, appears to play an important role in raising women’spolitical consciousness (Iversen & Rosenbluth, 2008; Ross,2006; Staeheli & Cope, 1994). Women’s entry into the workforce creates the impetus for democratic transition as womenare increasingly exposed to gender discrimination, and try tojuggle the demands of both work and home. Regular associa-tion with other women at work creates opportunities to sharegrievances and discusses strategies to overcome them. Thismay be lobbying unions to improve their working conditionsor forming organizations to protest against discriminatorylaws and practices. Concomitantly, working women’s policyinterests change as their challenges become increasingly dispa-rate to those of the males in their family (Iversen & Rosenb-luth, 2006). Conversely, women in the traditional role ofwife and mother are less likely to agitate for change or mobi-lize politically. Women’s exclusion from the labor force ap-pears to be a key factor in explaining the persistence ofautocratic regimes in Muslim countries (Ross, 2008).
Women’s participation in the labor force is also importantfor democratic development because it gives women individualautonomy and disperses the concentration of power from menin society. The importance of women’s struggle for full citizen-ship—that is participation across all domains—contributes tochanges in the relationship between the state and the citizen(Moghadam, 2007). The presence of more women in formalemployment, in parliament, in the judiciary, and in leadershippositions ensures that women’s struggle for equal rights be-comes highly visible as it is played out in the public sphere(Kazemi, 2000). This weakens the strength of the elites andcreates opportunities for democratic development to occur.
Finally, women’s economic participation is important fordemocratic development because it changes the social struc-ture of society from a pyramid, with a large lower class, to adiamond with a growing middle class. Additionally, womenare more likely than men to save and to reinvest their earningsback in to the health and education of their families (Jowett,2000; Sinha, Raju, & Morrison, 2007), further expanding thehuman capital base of the middle class in the current and fu-ture generations. Consequently, a stronger middle classemerges, creating a greater impetus for political change.
(c) Fertility rates
There is scant theoretical and empirical literature on the di-rect relationship between fertility rates and political regimes.Przeworski, Alvarez, Cheibub, and Limongi (2000, p. 233)found that falling birth rates are associated with transitions
from dictatorships to democracies, and rising birth rates areassociated with democratic reversals. Moreover, they foundthat stable dictatorships record higher rates of fertility thanstable democracies. In a recent, longitudinal study examiningthe effect of demography and education on democratization,Lutz et al. found that fertility declines had an independentand direct effect on democratic development (Lutz et al.,2010). 6 These authors concluded that a falling fertility rate af-fects the population age structure by decreasing the youthdependency ratio. This favorable demographic constellationis referred to as a “demographic gift” where the working pop-ulation will grow much faster than the overall population andenhance economic growth through increased savings, capitalaccumulation, and productivity, (Bloom & Canning, 2003;Bloom & Williamson, 1998). These factors are believed to beconducive to democratic development.
We argue that the main effect of fertility declines on demo-cratic development is by directly transforming the lives of wo-men. As falls in fertility are generally accompanied by falls inmortality rates and increases in life expectancy, women’s livesare no longer solely devoted to childbearing and childrearing(Malhotra, 2012). This frees women to pursue other activitiesoutside the home, such as further education and employment,particularly in countries where these opportunities exist. Fur-thermore, smaller families reduce the domestic workload, givingwomen the time and space to engage in other informal politicalactivities, such as voluntary associations and women’s move-ments (Huber, 1991), thus contributing to democratic develop-ment. In contrast, high fertility rates impair women’s health andtheir capacity for education, employment, and participation indecision-making in both the family and the community (Blum-berg, 1989; UNDP, 1995). 7 The social, cultural, economic, andpolitical contexts of women’s lives are critical in determining theextent to which fertility declines have the capacity to transformgender relations and thus improve women’s lives (Blumberg,2007). However, it appears that, overall, achieving low fertilityrates is an important determinant of a female’s life prospectsand consequently her society’s advancement.
(d) Civil society, NGOs, INGOs, and women’s movements
Globally, civil society has increased substantially with anexplosion of Non Government Organizations (NGOs) and so-cial movements of varying sizes and causes. 8 A strong civilsociety has been credited in the struggle against authoritarianregimes (Mainwaring, 1989) and is considered an essential partof a democratic state (Diamond, 1994). Waylen (1994), Baldez(2003), and Moghadam (2003) have highlighted the role of wo-men’s movements in Latin America, Europe, and throughoutthe Middle East in advancing democracy in the 1970s and1980s. By demanding equality and greater opportunities, wo-men recognized that a more liberal political regime was neededto guarantee and protect the freedoms they were campaigningfor (Arat, 1994; Safa, 1990). Women’s participation and influ-ence in these organizations and movements has risen as wo-men become less burdened with childbearing, more educatedand as they enter the formal work force. Concomitantly, sup-port from transnational networks has legitimized their con-cerns (Safa, 1990). This widening of the informal politicalspace in civil society creates an important link between femaleempowerment and democratic development.
This paper contributes to the existing literature in several as-pects. Firstly, it introduces a gendered perspective to demo-cratic development theory. We hypothesize that femaleempowerment as represented by female education, female la-bor force participation, and fertility rates, was a core driver

38 WORLD DEVELOPMENT
of democratic development during 1980–2005. Secondly, weinvestigate the causal effect of these indicators on regime statususing the most sophisticated modeling techniques. Finally, weexamine the interplay between women’s productive and repro-ductive activities and its influence on democratic developmentby estimating interactions between female education, fertilityrates, and female labor force participation.
5. METHODS
(a) Dependent variable—Levels of democracy
The Polity IV dataset was used to measure the level ofdemocracy for each country from 1980 to 2005 annually (Mar-shall & Jaggers, 2009). It consists of six components that mea-sure executive recruitment, constraints on executive authority,and political competition. Executive recruitment reflects howthe governments are elected and how regulated, open, andcompetitive this process is. Constraints on executive authorityrefer to the extent of institutionalized constraints on the deci-sion-making powers of chief executives. Finally, political com-petition reflects the extent to which citizens can influence thedecisions of the elite through political participation and com-petition. Implicit in these measures is a degree of civil interac-tion so countries where all citizens are excluded from thepolitical process will score poorly on both components.
The Polity data were developed to examine the authoritypatterns that characterize any social units, including nationalpolitical systems. Dahl (1971, p. 1) states that one of the keycharacteristics of democracy is, “the continuing responsivenessof the government to the preferences of its citizens, consideredas political equals.” Thus, the relationship between a demo-cratic government and its citizens should be one of mutual rec-iprocity and equality. Thus, while the Polity database has beencriticized for weighting heavily the constraints on executivepower (Gleditsch & Ward, 1997), we feel that this is one ofthe most important factors reflecting a more equal relationshipbetween the state and its citizens.
We use the Polity2 indicator in the Polity IV dataset (Mar-shall & Jaggers, 2010) because it is a composite measure ofboth democracy and autocracy. It is a continuous variableon a 21 point scale, where 10 represents a full democracyand �10 a full autocracy. The value of using this continuousmeasure is that it enables us to look at gradations in politicalregime type instead of categorical measures that tell us very lit-tle about the degree of democratic development in a country.
The ongoing debate about the definition and measurementof democracy has resulted in the construction of many politi-cal datasets. Paxton (2008) highlights the way that universalsuffrage is implied in various definitions of democracy, but ar-gues that participation or inclusion is often not measured, forexample, the Polity IV database. However, the developers ofthe Polity database state that, “competitive political participa-tion and regulation of political participation are intended tomeasure participation, but are neutral on the issue of suf-frage.” 9 As this study focuses on the period from 1980 on-wards the omission of universal suffrage in this dataset hasno impact on the Polity2 scores.
Together with the Polity IV dataset the Freedom HousePolitical Rights Index is the most widely used dataset in thedemocratization literature (Acemoglu et al., 2005, 2008; Bar-ro, 1999; Castello-Climent, 2008; Donno & Russett, 2004;Fish, 2002). However, some of the methods of coding regimeshave been criticized for not being transparent (Hadenius &Teorell, 2005) and for favoring some regions (Bollen, 1993).
The Freedom House Index has also been criticized for includ-ing measures of socioeconomic rights (Gastil, 1991, pp. 32–33;Ryan, 1994, pp. 10–11, in Munck and Verkuilen (2002)).These measures may be linked with other aspects of develop-ment, rather than political development. Other datasets widelyused in the literature were rejected because they use categoricalmeasures and thus fail to consider “mixed” or “hybrid re-gimes.” They include Gasiorowski’s Political Regime ChangeDataset (PRCD), Vanahanen’s Index of Democratization(ID), and Przeworski et al.’s dichotomous measure (PACL)(Przeworski et al., 2000). 10
(b) Independent variables
Several indexes try to distill female empowerment into neatcomposite measures. They include the Gender DevelopmentIndex, the Gender Empowerment Index, and the Global Gen-der Gap Index. These three indexes are unavailable for manycountries over a long period of time, which makes themunsuitable for this study.
(i) Female educationThe average level of total female educational attainment
(aged over 15) was accessed from the Barro and Lee dataset,(Barro & Lee, 2011). Previous studies have used adult literacyrates, 11 school enrollment rates for girls and gender gaps ineducation (Barro, 1999; Donno & Russett, 2004; Fish, 2002;Lutz et al., 2010; Ross, 2001; Wejnert, 2005). However, adultliteracy rates do not take into account other aspects of educa-tion such as numeracy, logical, and analytical reasoning (Bar-ro & Lee, 1993) nor capture the social benefits that occur justby attending school (Glaeser et al., 2007). School enrollmentstatistics are collected at the beginning of the year so theydo not reflect accurately the number of children who actuallyattended school throughout the year. This is particularly rele-vant in developing countries as large numbers of children re-peat grades or are late entrants (UNESCO, 1983).Enrollment figures may also be inflated to obtain more re-sources and supplies for the schools (Barro & Lee, 1993)and are also a reflection of the expansion of education ratherthan actual educational achievement (Benavot, 1996). Whilegender gaps in education reflect the inequalities in educationalachievement between men and women it is not suitable for thisstudy as it does not measure the number of years of educationachieved. The focus of this study is female education as a toolfor social and political transformation, independently and inconjunction with fertility rates and female labor force partici-pation. We interpolated the 5 year education data to createannual female educational attainment data from 1980 to 2005.
(ii) Fertility ratesTotal fertility rates is defined as “the average number of chil-
dren that a woman gives birth to in her lifetime, assuming thatthe prevailing birth rate for each age category remains un-changed” (World Bank, 2011). Annual total fertility ratesfor all countries in our study were accessed from the WorldDevelopment Indicators Database (World Bank, 2011) andwere available for every year.
(iii) Female labor force participationThe data for female labor force participation were accessed
from the World Development Indicators Database and con-tains the most comprehensive cross-national information since1980. Female labor force participation rate is defined as “theproportion of the female population aged 15 and older thatis economically active: all females who supply labor for the

FEMALE EMPOWERMENT AS A CORE DRIVER OF DEMOCRATIC DEVELOPMENT 39
production of goods and services during a specified period”(World Bank, 2011). In practice labor force participation re-fers to women in paid employment.
(iv) Control variablesThe models were adjusted for widely used measures of mod-
ernization including urbanization, level of economic develop-ment in 1980, economic growth, and population density.Urbanization is the percentage of the population living in ur-ban areas accessed from the World Development Indicators(World Bank, 2011). To measure income and compare livingstandards across countries the log of GDP per capita adjustedfor Purchasing Power Parity (PPP) was used (World Bank,2011). GDP in each country is measured in current interna-tional dollars and the PPP adjustment is made to avoid thebias in the GDP comparison caused by exchange rate fluctua-tions (Central Intelligence Agency (CIA), 2008). The level ofinitial GDP is taken from 1980 or the first available time point.Economic growth is measured by calculating the percentagechange in GDP, which is mathematically equivalent to the firstdifference in the log of GDP. 12 Population density measuresthe number of people per sq. km of land area and was accessedfrom the World Development Indicators (World Bank, 2011).Total education as a measure of modernization was also exam-ined together with female employment and fertility rates butseparately from female education due to their high correlation.
(c) Statistical analyses
(i) SampleAll sovereign countries were included for which Polity2 data
were available for the period from 1980 to 2005. 13 Taiwan hadno fertility or female labor force participation data so it wasremoved from the analyses. Germany was removed as WestGermany was a democracy the entire period and Yemen wasalso removed as it was unclear whether data collected forthe explanatory variables reflected North or South Yemen.This left 155 countries. For the descriptive statistics 24 coun-tries with no education data for this period were also removed,leaving a total of 131 countries. These countries were Angola,Bhutan, Burkina Faso, Chad, Comoros, Democratic Republicof Korea, Djibouti, Eritrea, Equatorial Guinea, Ethiopia,Guinea, Guinea-Bissau, Lebanon, Macedonia, Madagascar,Nigeria, Oman, Solomon Islands, and Somalia (19). Addition-ally, five of the post-Soviet countries were also without educa-tion data. They were Azerbaijan, Belarus, Georgia,Turkmenistan, and Uzbekistan.
Using the recommendations for regime classification (Mar-shall & Jaggers, 2009), we then categorized countries with aPolity2 score of �10 to �6 as being autocratic, those with ascore of �5 to 5 as being anocratic, and countries with Polity2score of 6–10 as being democratic. Descriptive statistics wereobtained to assess the nature of the longitudinal data and toexamine the trends over the 25-year period. Each country’sPolity2 change was then tracked over the 25 year period,and then classified as follows:
(1) Not democratic—countries that remained autocratic oranocratic over the period from 1980 to 2005 (n = 51)(2) Democratic transition—countries that developed dem-ocratically over this period, that is they began the periodas nondemocratic but recorded a Polity2 score of six andabove by 2005 (n = 46)(3) Democratic—countries that began and finished the per-iod with a Polity2 score above six (n = 34)
Each category was then graphed against each of the femaleempowerment variables to show the changes that occurred
from 1980 to 2005. All graphs are reported with 95% confi-dence intervals. See Appendix, Table 4 for the full list of coun-tries by category.
(ii) Dynamic panel modelTo control for reverse causation in the regression analyses
we removed all countries that recorded a Polity2 score of sixand above in every time period. 14 These countries includeAustralia, Austria, Belgium, Botswana, Canada, Colombia,Costa Rica, Cyprus, Denmark, Dominican Republic, 15 Ecua-dor, Finland, France, Greece, India, Ireland, Israel, Italy, Ja-maica, Japan, Mauritius, Netherlands, New Zealand, Norway,Portugal, Spain, Sweden, Switzerland, Trinidad, United King-dom, United States, and Venezuela (n = 32). We also removedthree countries with large amounts of missing Polity2 data(Lebanon, Cambodia, and Afghanistan). This resulted in astrongly balanced panel of 97 countries with 26 time periodsfrom 1980 to 2005 and a total of 2,522 observations. SeeAppendix, Table 5 for a full list of countries. The analyseswere run again with an extended sample, including the afore-mentioned countries with missing education and Polity2 data.This resulted in a strongly balanced panel of 123 countrieswith 26 time periods and a total of 3198 observations. SeeAppendix, Table 6 for a full list of countries. Summary statis-tics are available for both samples. See Appendix, Tables 7and 8.
The following dynamic model was estimated:
Democracy i; t ¼ aDemocracy i; t-Tþ b Xit-Tþ ei; t ð1Þ
bXit ¼ b1femeduc i; t-T b2fertility i; t-Tþ b3labor i; t-T
þ b4urban i; t-Tþ b5d:lngdp i; tþ b6lngdp80
þ b7 lnðpopÞ i; t-T
e i; t ¼ liþ mi; t
where i is the country, t is the time period, and x is the vector ofthe explanatory variables and the controls. The coefficient ofinterest is b which reflects whether female educational attain-ment, fertility rates, or female labor force participation hadany causal effect on political status over a 25 year period during1980–2005, independent of modernization. The error term con-sists of the fixed effects (li) and idiosyncratic shocks (mi, t). Theadvantage of using a dynamic panel model is that it allows foreach additional time period to be independent of previous timeperiods by adjusting the standard errors (Cameron & Trivedi,2009), and we can control for unobserved country-specific char-acteristics (Castello-Climent, 2008). We chose the System Gen-eralized Method of Moments (GMM) estimator as itaccommodates multiple endogenous variables (Roodman,2008). This estimator also controls for fixed effects, as recom-mended by Acemoglu et al. (2005), and it shows better perfor-mance than the first difference estimator when variables arehighly persistent (Castello-Climent, 2008). To be able to capturethe causal relationships in question a lag structure was em-ployed. The dependent variable, Polity2, was lagged by 1 yearto capture the persistency of democracy (Bobba & Coviello,2007), and the independent variables were lagged by 5 and10 years to acknowledge that the effects of these variablesmay take time to manifest. Time dummies were also includedin the model to prevent contemporaneous correlation (Rood-man, 2006, p. 33) and to take into account any common varia-tions in the dependent variable (Sarafidis & Robertson, 2009).
Multivariate analyses were run with the independent vari-ables lagged by 0, 5 and then 10 years. Next, interactions wererun between the three female empowerment variables to high-
4
5
6
7
wom
an
40 WORLD DEVELOPMENT
light the importance of the interplay between women’s pro-ductive and reproductive activities for democratic develop-ment. These models were run again with an extendedsample, including countries with no female education dataand some missing Polity2 data to see if the exclusion of thesecountries would affect our results.
0
1
2
3
1980 2005
Year
birt
hs p
er
not democratic(n=51)
democratictransition (n=46)
always democratic(n=34)
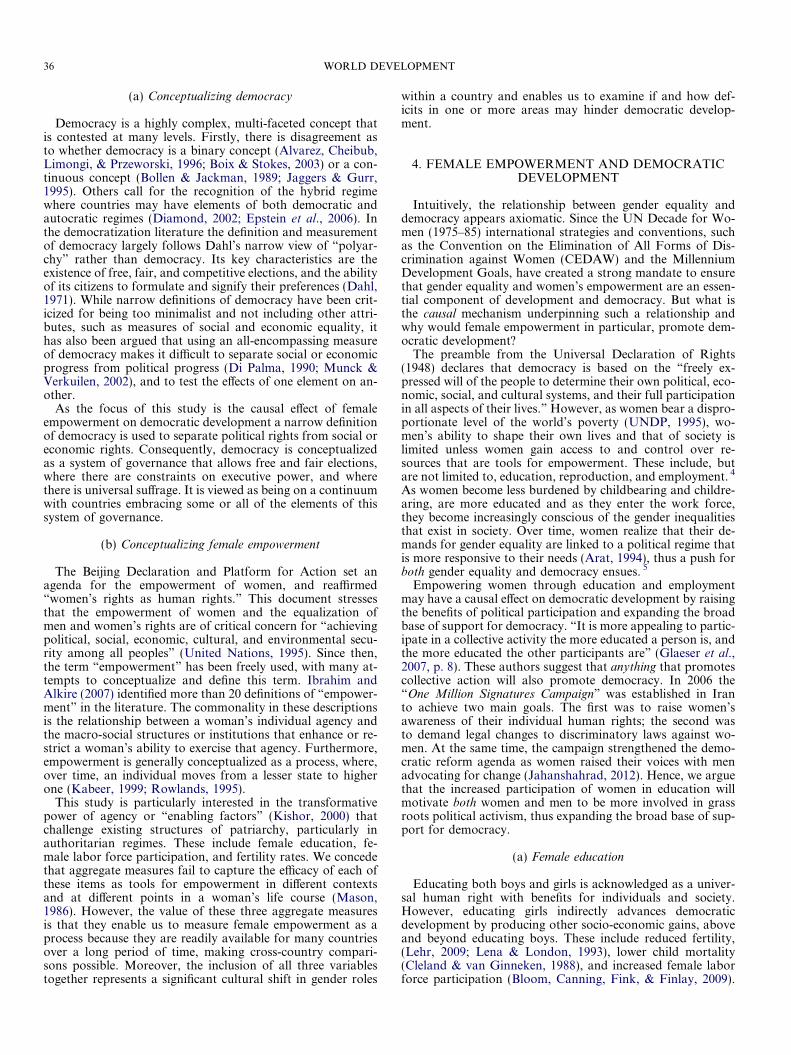
Figure 2. Mean fertility rates from 1980 to 2005 by Polity change.
Mean female labor force participationfrom 1980 to 2005 by polity change
0
5
10
15
20
25
30
35
40
45
50
1980 2005Year
% o
f wom
en in
em
ploy
men
t
not democratic(n=47)
democratictransition(n=40)
alwaysdemocratic(n=34)
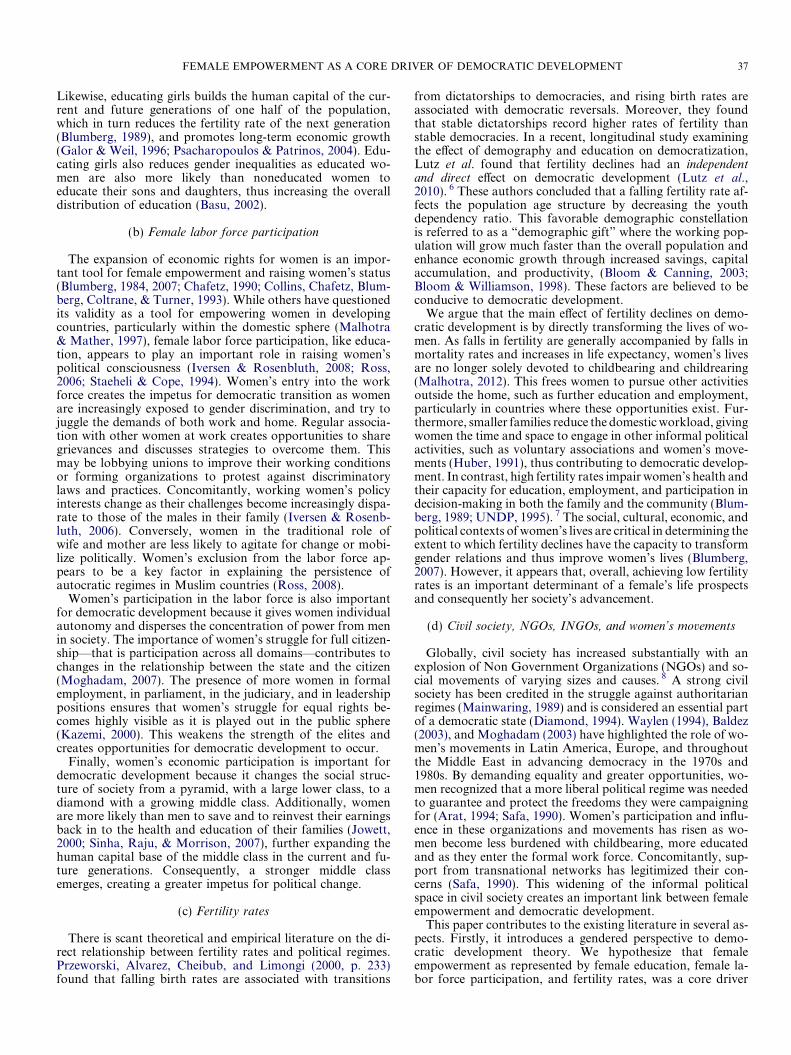
Figure 3. Mean female labor force participation from 1980 to 2005 by
6. RESULTS
There was a substantial shift toward democracy from 1980to 2005. In 1980, 73 countries were classified as being auto-cratic; in 2005 this had fallen to 19. In 1980 there were 37democracies; in 2005 the number had increased to 80 andthe number of anocracies increased by 11, with most of theshift being from autocratic countries. Only two countries suf-fered democratic reversal by the end of the period. These wereSri Lanka (�6 to �5) and Gambia (8 to �5). Iran recorded areversal from anocracy to autocracy (�2 to �6).
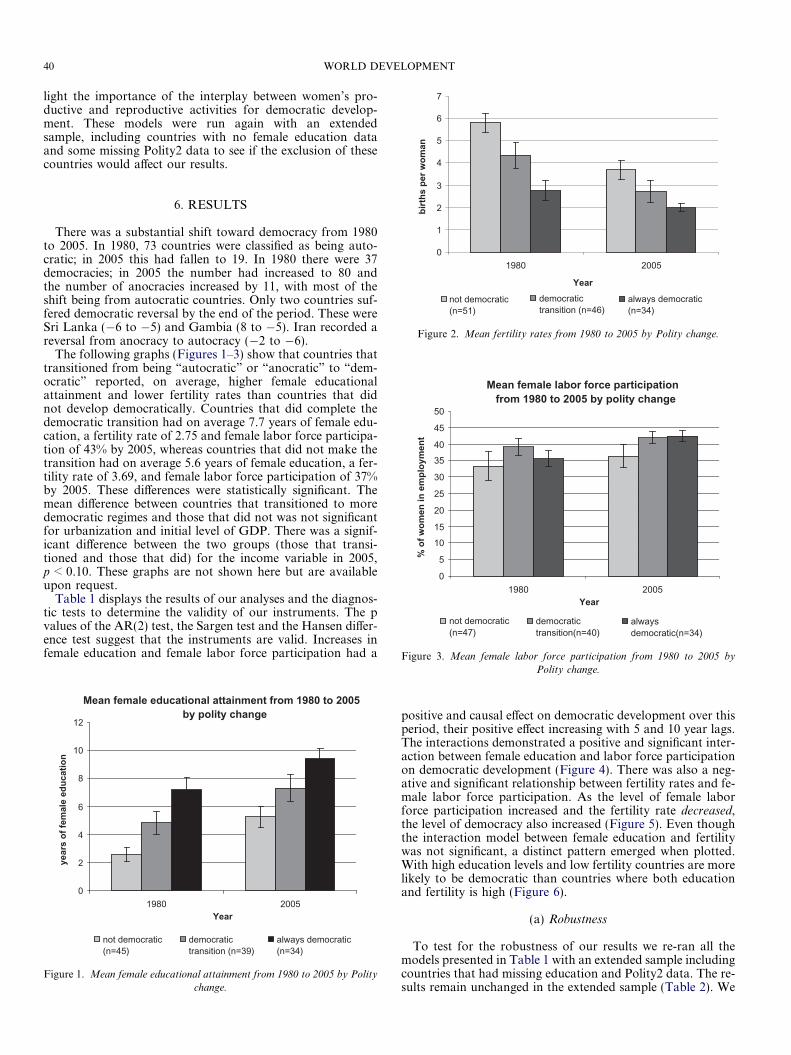
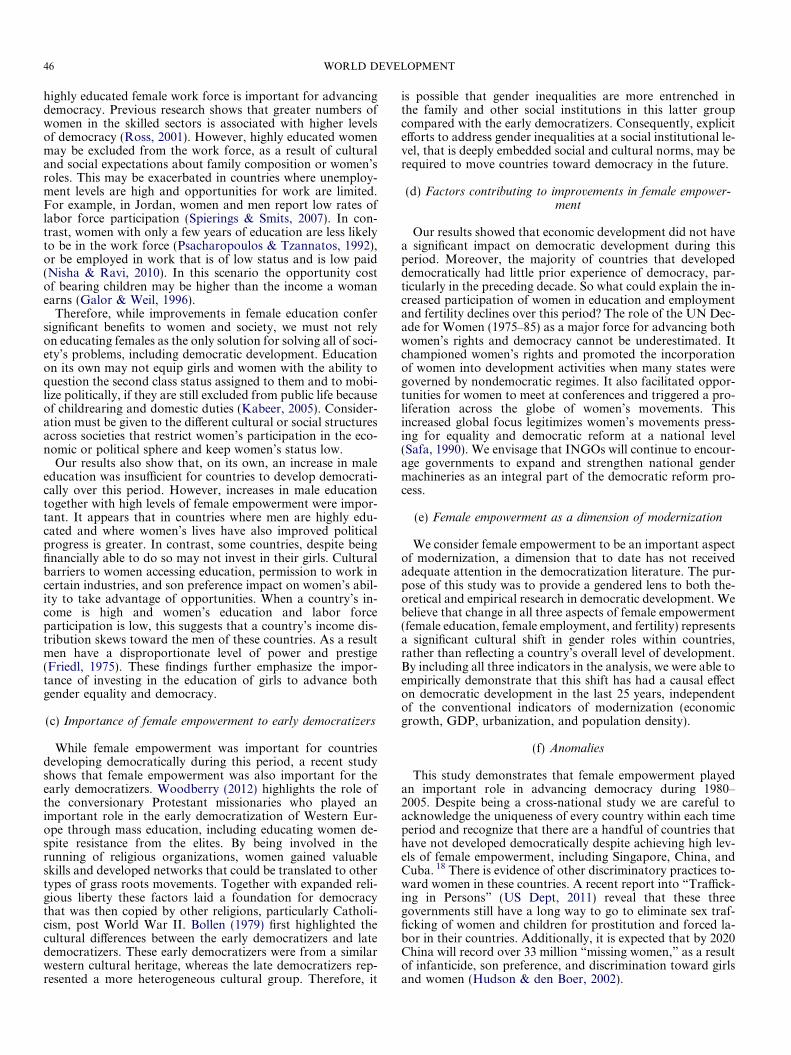
The following graphs (Figures 1–3) show that countries thattransitioned from being “autocratic” or “anocratic” to “dem-ocratic” reported, on average, higher female educationalattainment and lower fertility rates than countries that didnot develop democratically. Countries that did complete thedemocratic transition had on average 7.7 years of female edu-cation, a fertility rate of 2.75 and female labor force participa-tion of 43% by 2005, whereas countries that did not make thetransition had on average 5.6 years of female education, a fer-tility rate of 3.69, and female labor force participation of 37%by 2005. These differences were statistically significant. Themean difference between countries that transitioned to moredemocratic regimes and those that did not was not significantfor urbanization and initial level of GDP. There was a signif-icant difference between the two groups (those that transi-tioned and those that did) for the income variable in 2005,p < 0.10. These graphs are not shown here but are availableupon request.
Table 1 displays the results of our analyses and the diagnos-tic tests to determine the validity of our instruments. The pvalues of the AR(2) test, the Sargen test and the Hansen differ-ence test suggest that the instruments are valid. Increases infemale education and female labor force participation had a
Mean female educational attainment from 1980 to 2005 by polity change
0
2
4
6
8
10
12
1980 2005Year
year
s of
fem
ale
educ
atio
n
not democratic(n=45)
democratictransition (n=39)
always democratic(n=34)
Figure 1. Mean female educational attainment from 1980 to 2005 by Polity
change.
Polity change.
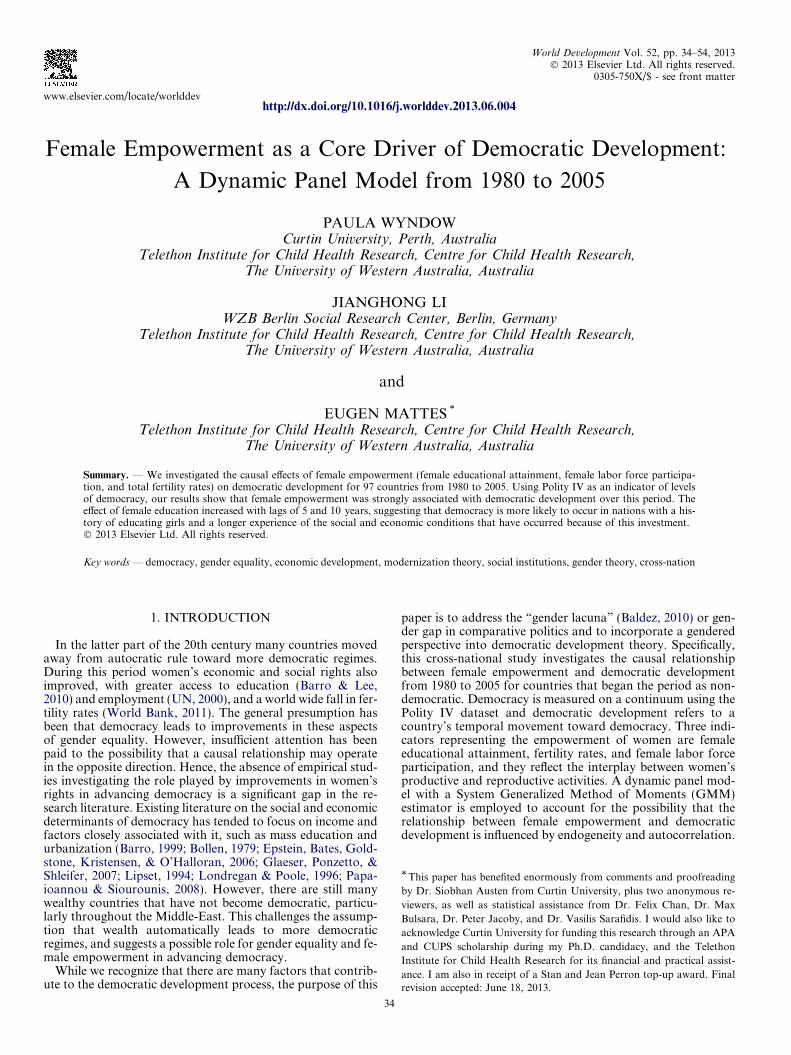
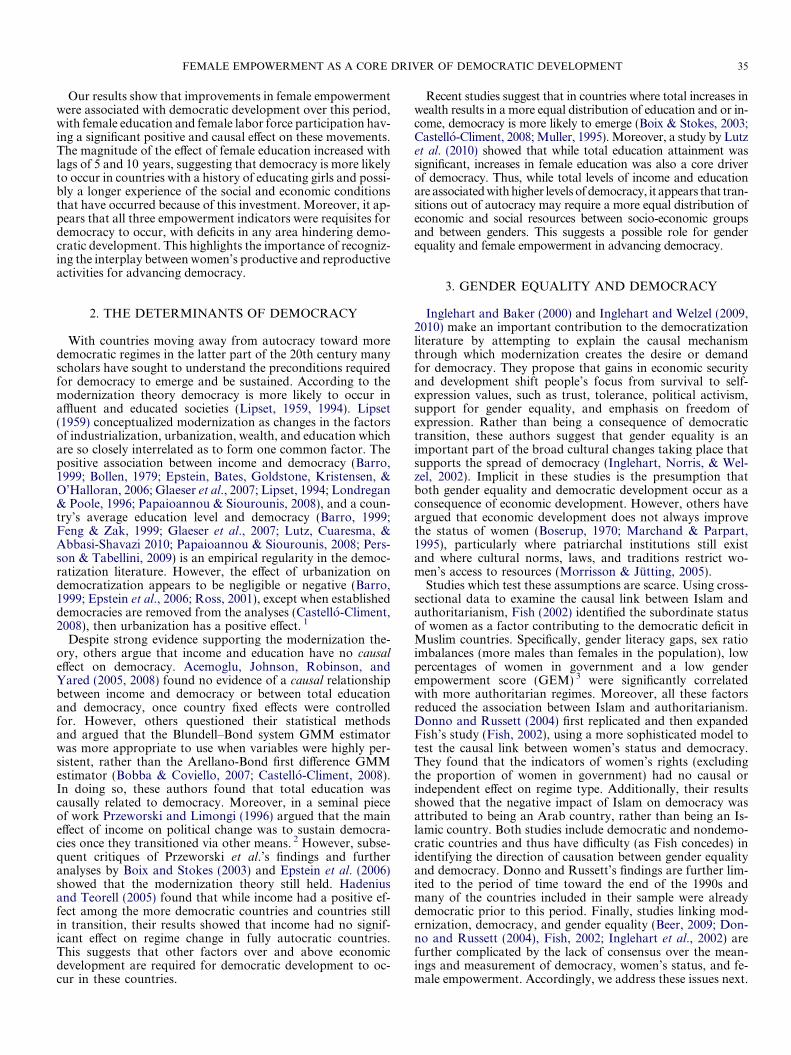
positive and causal effect on democratic development over thisperiod, their positive effect increasing with 5 and 10 year lags.The interactions demonstrated a positive and significant inter-action between female education and labor force participationon democratic development (Figure 4). There was also a neg-ative and significant relationship between fertility rates and fe-male labor force participation. As the level of female laborforce participation increased and the fertility rate decreased,the level of democracy also increased (Figure 5). Even thoughthe interaction model between female education and fertilitywas not significant, a distinct pattern emerged when plotted.With high education levels and low fertility countries are morelikely to be democratic than countries where both educationand fertility is high (Figure 6).
(a) Robustness
To test for the robustness of our results we re-ran all themodels presented in Table 1 with an extended sample includingcountries that had missing education and Polity2 data. The re-sults remain unchanged in the extended sample (Table 2). We

Table 1. System GMM dynamic panel model; a fully balanced sample with 97 countries (N = 2,522 country-year observations)
Polity2 (i) b (ii) b (iii) b (iv) b (v) b (vi) b (vii) b (viii) b (ix)
(s.e) (s.e) (s.e) (s.e) (s.e) (s.e) (s.e) (s.e) (s.e)
Polityt-1 0.873*** 0.860*** 0.876*** 0.876*** 0.862*** 0.811*** 0.881*** 0.882*** 0.884***
(0.048) (0.052) (0.047) (0.049) (0.052) (0.052) (0.047) (0.047) (0.047)
Female education 0.168** 0.079* 0.075* 0.073 0.071
(0.060) (0.047) (0.044) (0.046) (0.045)
Fertility rates �0.278** �0.113 �0.149 �0.085 �0.092
(0.113) (0.089) (0.093) (0.083) (0.083)
% Female labor 0.032** 0.020** 0.016** 0.027** 0.024**
Force participation (0.012) (0.009) (0.008) (0.009) (0.009)
Female education 0.089*
t-5 (0.053)
Fertility rates �0.162
t-5 (0.109)
% Female labor 0.019**
Force t-5 (0.009)
Female education 0.134**
t-10 (0.068)
fertility rates �0.220
t-10 (0.155)
% Female labor 0.027**
Force t-10 (0.011)
Urbanization 0.007 0.001 0.009 0.006 �0.006 �0.006 0.006 0.007 0.007
(0.006) (0.006) (0.006) (0.005) (0.006) (0.007) (0.004) (0.005) (0.005)
Economic growth �0.130 �0.345 0.121 �0.230 �0.477 �0.287 �0.240 �0.233 �0.221
(0.993) (0.972) (0.984) (0.985) (1.066) (1.153) (0.979) (0.985) (0.987)
lngdp80 �0.296* �0.166 0.052 �0.169 �0.219 �0.339* �0.189 �0.174 �0.185
(0.159) (0.163) (0.121) (0.137) (0.154) (0.199) (0.132) (0.126) (0.134)
lnpop �0.032 �0.086 0.002 �0.052 �0.063 �0.111 �0.059 �0.037 �0.038
(0.050) (0.061) (0.061) (0.053) (0.062) (0.083) (0.053) (0.049) (0.049)
Femeduc � fertility �0.026
(0.016)
Femeduc � labor 0.005**
(0.002)
Fertility � labor �0.008**
(0.004)
Time dummies Yes Yes Yes Yes Yes Yes Yes Yes Yes
No of observations 2,127 2,104 2,127 2,104 1,807 1,413 2,104 2,104 2,104
No of countries 94 94 94 94 94 94 94 94 94
No of instruments 53 53 53 55 48 38 56 56 56
AR(1) 0.000 0.000 0.000 0.000 0.000 0.000 0.000 0.000 0.000
AR(2) 0.271 0.258 0.278 0.262 0.473 0.560 0.263 0.263 0.263
Sargen test 0.546 0.471 0.547 0.440 0.401 0.727 0.451 0.454 0.450
Hansen diff test 0.415 0.378 0.405 0.288 0.270 0.431 0.292 0.265 0.270
(i) Bivariate analysis female education; (ii) bivariate analysis fertility rates; (iii) bivariate analysis female labor force participation; (iv) multivariateanalyses—contemporaneous; (v) lagged explanatory variables t-5; (vi) lagged explanatory variables t-10; (vii) femeduc � fertility; (viii) femeduc � labor;(ix) fertility � labor.* p < 0.10 robust standard errors are reported in parentheses.** p < 0.05 robust standard errors are reported in parentheses.*** p < 0.01 robust standard errors are reported in parentheses.
FEMALE EMPOWERMENT AS A CORE DRIVER OF DEMOCRATIC DEVELOPMENT 41
also adjusted our multivariate models for other covariatesincluding level of foreign aid, debt servicing, and Muslimmajority countries. Typically, Islamic countries have more con-servative attitudes toward women’s role in society (Inglehart &Norris, 2003), thus it is likely that women’s level of empower-ment in these countries is lower. A dummy variable was createdfor countries where more than 50% of the population is Muslim(Pew Research Centre, 2009). See Appendix, Table 9 for list ofMuslim majority countries. Further analyses were run substi-tuting alternative measures of female education such as thegap between male and female education and female secondaryenrollments. Moreover, to provide further evidence of thesignificance of increases in female education, rather than maleeducation or overall education, we also tested for the effect of
total education, male education, and male secondary enroll-ments on democratic development. 16
Adjusting for foreign aid, debt servicing, and Muslim major-ity reduced the size of the female education coefficient slightly,but its positive and significant effect still held when female edu-cation was lagged by 5 and 10 years. However, the effect of fe-male labor force participation on democracy was reduced andwas no longer significant (Table 3 models i–iii). Female sec-ondary enrollment had a positive and significant effect ondemocratic development when it was lagged by 10 years. Also,it had a significant interaction with female labor force partic-ipation, but not with fertility rates, consistent with the resultswhen female education was used (see the main findings in Ta-ble 1).

The interac�on effect of fer�lity rates and female labor force par�cipa�on on democra�c development
-3
-2.5
-2
-1.5
-1
-0.5
0
0 5 10 15 20 25 30 35 40 45 50 55 60
female labor force par�cipa�on %
Polit
y2
lowfer�lity(2)
mediumfer�lity(4)
highfer�lity(6)
p<0.05
Figure 5. The interaction effect of fertility rates and female labor force
participation on democratic development.
The interac�on effect of female educa�on and female labor force par�cipa�on on democra�c development
0
1
2
3
4
5
6
7
0 2 4 6 8 10 12
average yrs of female educa�on
Polit
y2
low femalelabor force(20%)
medium femalelabor force(40%)
high femalelabor force(60%)
p<0.05
Figure 4. The interaction effect of female education by percentage of women
in the labor force on democratic development.
The interac�on effect of female educa�on and fer�lity rates on democra�c development
-3
-2.5
-2
-1.5
-1
-0.5
0
0 2 4 6 8 10 12
average yrs of female educa�on
Polit
y2
lowfer�lity(2)
mediumfer�lity(4)
highfer�lity(6)
p>0.10
Figure 6. The interaction effect of female education and fertility rates on
democratic development.
42 WORLD DEVELOPMENT
The results from the interactions between male educationand the female empowerment measures on democratic devel-opment suggest that male education on its own was insufficientto promote democratic development, and high levels of femaleeducation and female labor force participation must occur be-fore male education can move a country toward democracy(Table 3 and Figures 7–9). Further, at low to medium levelsof female education or at medium to high levels of fertilityrates, male education was negatively associated with demo-cratic development. The gender gap in education was not sig-nificant in any model. Further analysis showed that total
education did not have a significant effect on democratic devel-opment, except when it was lagged by 10 years (results avail-able upon request). Whereas, female education wassignificant even when not lagged and displayed larger coeffi-cients than total education, indicating a stronger and a moreimmediate influence on democratic development.
All models in Table 3 were re-run with an extended sampleincluding countries with missing education and Polity2 data.The results were very similar when controlling for foreignaid, debt, and Muslim majority. None of the alternative mea-sures of female education was significant. To address the po-tential bias caused by the exclusion of the countries withmissing education data (24 countries), we ran the three multi-variate models (iv, v, vi) in Table 1 again, removing femaleeducation from the analyses. Both fertility rates and female la-bor force participation remained significant at the 5% levelacross all three models. 17
It is possible that the countries that made the greatest pro-gress in female empowerment were already moving towarddemocracy in the period leading up to the 1980s, or had priorexperience of democracy. Consequently, further models wererun lagging Polity2 by 2, 3, 5, and 10 years. Female educationand female labor force participation remained significant withthese lagged Polity variables. However, from a statistical pointof view lagging Polity2 by more than 1 year was problematicas it rendered the tests of autocorrelation and the Sargen testinvalid. Furthermore, once we lagged Polity2 by 3 years ormore it became negatively associated with the dependent var-iable, Polity2. Accordingly, we created graphs showing the le-vel of Polity2 annually from 1960 onward for the 32 countriesthat transitioned from autocracy in 1980 to democracy by2005. Only five countries had some prior experience of democ-racy. They were Uruguay (1960–70), Chile (1964–72), Argen-tina (1973–75), Ghana (1979–80), and Lesotho (1966–69).The remainder of countries recorded low Polity2 scoresthroughout the 1970s and 1980s. Two countries from eachcontinent were graphed as an example (Appendix, FiguresA1–A8). The remaining graphs are available upon request.Out of the 14 countries that transitioned from anocracy todemocracy only Brazil and Turkey had any prior experienceof democracy.
7. DISCUSSION
(a) Main findings
This study has demonstrated that improvements in femaleempowerment were strongly associated with democratic devel-opment during this period. Specifically, increases in femaleeducation and female labor force participation had a positiveand causal effect on movement toward democracy. Moreover,the effect of female education increased with lags of 5 and10 years, suggesting that democracy is more likely to occurin countries with a history of educating girls and possibly alonger experience of the social and economic conditions thatmay have occurred because of this investment. The descriptivestatistics show that countries that began the period with higherlevels of female educational attainment and female labor forceparticipation, and lower fertility rates made greater politicalgains than countries that made such improvements later inthe period. It appears that all three empowerment variablesneeded to be strong for a country to develop democraticallyover this period. This was confirmed with results from thedynamic panel models testing the multivariate interactions be-tween the three empowerment variables: female education had
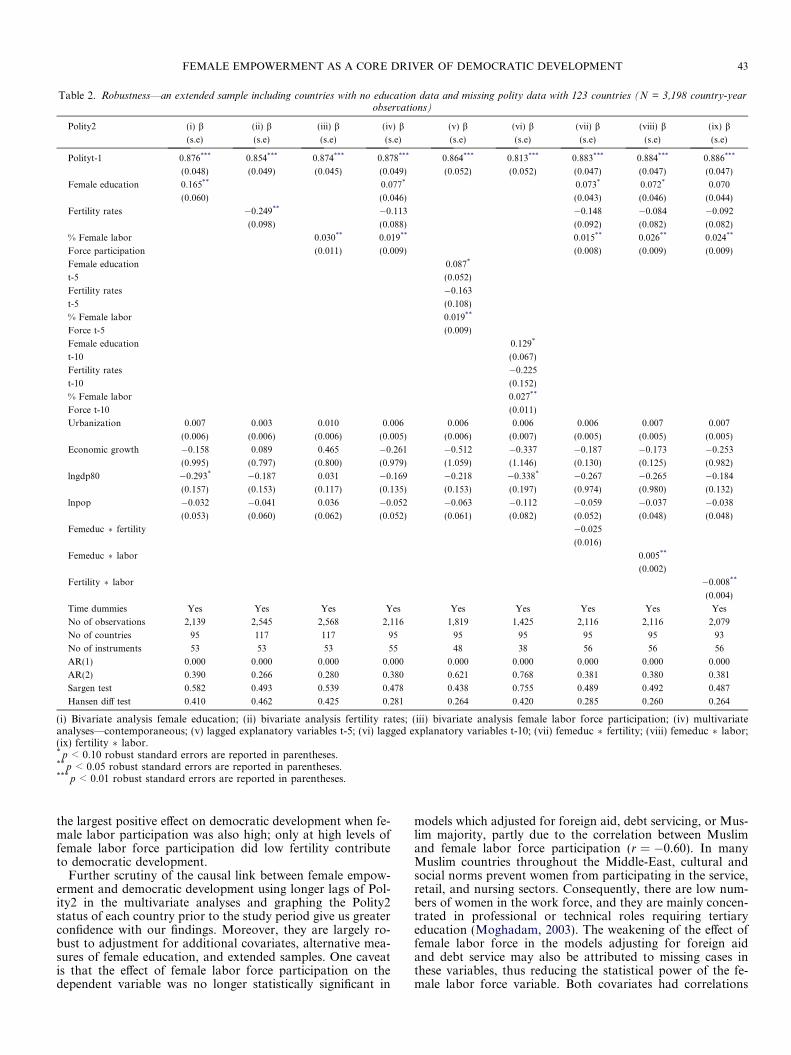
Table 2. Robustness—an extended sample including countries with no education data and missing polity data with 123 countries (N = 3,198 country-yearobservations)
Polity2 (i) b (ii) b (iii) b (iv) b (v) b (vi) b (vii) b (viii) b (ix) b
(s.e) (s.e) (s.e) (s.e) (s.e) (s.e) (s.e) (s.e) (s.e)
Polityt-1 0.876*** 0.854*** 0.874*** 0.878*** 0.864*** 0.813*** 0.883*** 0.884*** 0.886***
(0.048) (0.049) (0.045) (0.049) (0.052) (0.052) (0.047) (0.047) (0.047)
Female education 0.165** 0.077* 0.073* 0.072* 0.070
(0.060) (0.046) (0.043) (0.046) (0.044)
Fertility rates �0.249** �0.113 �0.148 �0.084 �0.092
(0.098) (0.088) (0.092) (0.082) (0.082)
% Female labor 0.030** 0.019** 0.015** 0.026** 0.024**
Force participation (0.011) (0.009) (0.008) (0.009) (0.009)
Female education 0.087*
t-5 (0.052)
Fertility rates �0.163
t-5 (0.108)
% Female labor 0.019**
Force t-5 (0.009)
Female education 0.129*
t-10 (0.067)
Fertility rates �0.225
t-10 (0.152)
% Female labor 0.027**
Force t-10 (0.011)
Urbanization 0.007 0.003 0.010 0.006 0.006 0.006 0.006 0.007 0.007
(0.006) (0.006) (0.006) (0.005) (0.006) (0.007) (0.005) (0.005) (0.005)
Economic growth �0.158 0.089 0.465 �0.261 �0.512 �0.337 �0.187 �0.173 �0.253
(0.995) (0.797) (0.800) (0.979) (1.059) (1.146) (0.130) (0.125) (0.982)
lngdp80 �0.293* �0.187 0.031 �0.169 �0.218 �0.338* �0.267 �0.265 �0.184
(0.157) (0.153) (0.117) (0.135) (0.153) (0.197) (0.974) (0.980) (0.132)
lnpop �0.032 �0.041 0.036 �0.052 �0.063 �0.112 �0.059 �0.037 �0.038
(0.053) (0.060) (0.062) (0.052) (0.061) (0.082) (0.052) (0.048) (0.048)
Femeduc � fertility �0.025
(0.016)
Femeduc � labor 0.005**
(0.002)
Fertility � labor �0.008**
(0.004)
Time dummies Yes Yes Yes Yes Yes Yes Yes Yes Yes
No of observations 2,139 2,545 2,568 2,116 1,819 1,425 2,116 2,116 2,079
No of countries 95 117 117 95 95 95 95 95 93
No of instruments 53 53 53 55 48 38 56 56 56
AR(1) 0.000 0.000 0.000 0.000 0.000 0.000 0.000 0.000 0.000
AR(2) 0.390 0.266 0.280 0.380 0.621 0.768 0.381 0.380 0.381
Sargen test 0.582 0.493 0.539 0.478 0.438 0.755 0.489 0.492 0.487
Hansen diff test 0.410 0.462 0.425 0.281 0.264 0.420 0.285 0.260 0.264
(i) Bivariate analysis female education; (ii) bivariate analysis fertility rates; (iii) bivariate analysis female labor force participation; (iv) multivariateanalyses—contemporaneous; (v) lagged explanatory variables t-5; (vi) lagged explanatory variables t-10; (vii) femeduc � fertility; (viii) femeduc � labor;(ix) fertility � labor.* p < 0.10 robust standard errors are reported in parentheses.** p < 0.05 robust standard errors are reported in parentheses.*** p < 0.01 robust standard errors are reported in parentheses.
FEMALE EMPOWERMENT AS A CORE DRIVER OF DEMOCRATIC DEVELOPMENT 43
the largest positive effect on democratic development when fe-male labor participation was also high; only at high levels offemale labor force participation did low fertility contributeto democratic development.
Further scrutiny of the causal link between female empow-erment and democratic development using longer lags of Pol-ity2 in the multivariate analyses and graphing the Polity2status of each country prior to the study period give us greaterconfidence with our findings. Moreover, they are largely ro-bust to adjustment for additional covariates, alternative mea-sures of female education, and extended samples. One caveatis that the effect of female labor force participation on thedependent variable was no longer statistically significant in
models which adjusted for foreign aid, debt servicing, or Mus-lim majority, partly due to the correlation between Muslimand female labor force participation (r = �0.60). In manyMuslim countries throughout the Middle-East, cultural andsocial norms prevent women from participating in the service,retail, and nursing sectors. Consequently, there are low num-bers of women in the work force, and they are mainly concen-trated in professional or technical roles requiring tertiaryeducation (Moghadam, 2003). The weakening of the effect offemale labor force in the models adjusting for foreign aidand debt service may also be attributed to missing cases inthese variables, thus reducing the statistical power of the fe-male labor force variable. Both covariates had correlations
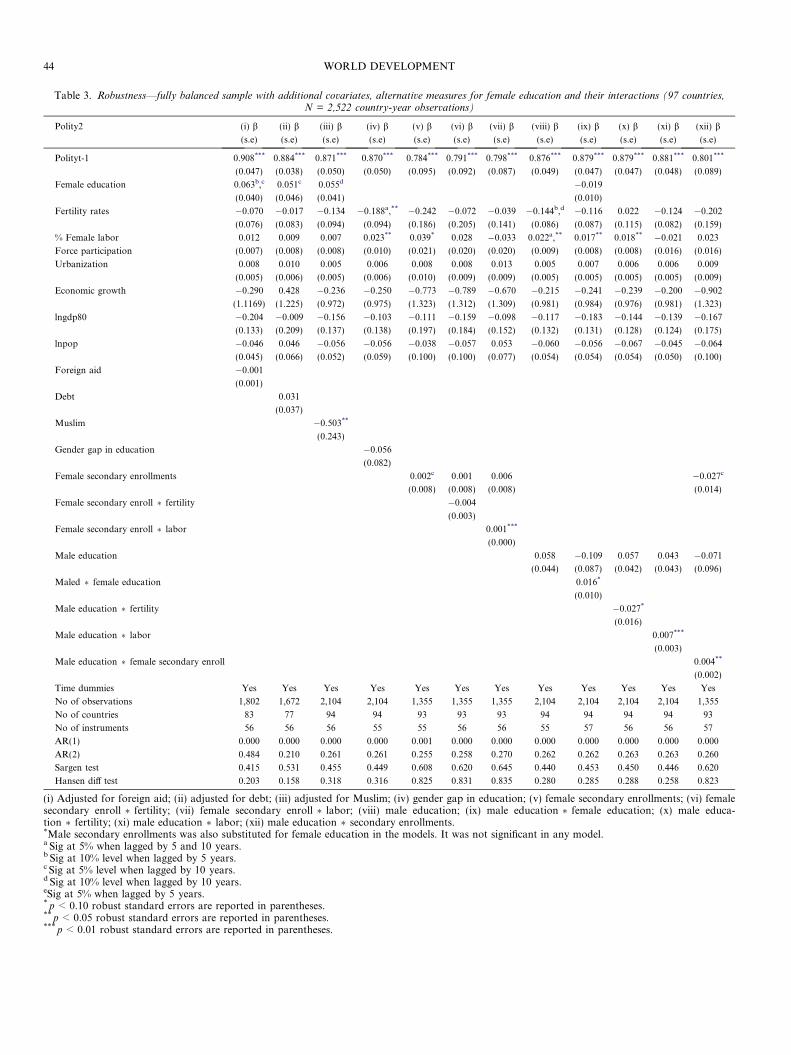
Table 3. Robustness—fully balanced sample with additional covariates, alternative measures for female education and their interactions (97 countries,N = 2,522 country-year observations)
Polity2 (i) b (ii) b (iii) b (iv) b (v) b (vi) b (vii) b (viii) b (ix) b (x) b (xi) b (xii) b
(s.e) (s.e) (s.e) (s.e) (s.e) (s.e) (s.e) (s.e) (s.e) (s.e) (s.e) (s.e)
Polityt-1 0.908*** 0.884*** 0.871*** 0.870*** 0.784*** 0.791*** 0.798*** 0.876*** 0.879*** 0.879*** 0.881*** 0.801***
(0.047) (0.038) (0.050) (0.050) (0.095) (0.092) (0.087) (0.049) (0.047) (0.047) (0.048) (0.089)
Female education 0.063b,c 0.051c 0.055d �0.019
(0.040) (0.046) (0.041) (0.010)
Fertility rates �0.070 �0.017 �0.134 �0.188a,** �0.242 �0.072 �0.039 �0.144b,d �0.116 0.022 �0.124 �0.202
(0.076) (0.083) (0.094) (0.094) (0.186) (0.205) (0.141) (0.086) (0.087) (0.115) (0.082) (0.159)
% Female labor 0.012 0.009 0.007 0.023** 0.039* 0.028 �0.033 0.022a,** 0.017** 0.018** �0.021 0.023
Force participation (0.007) (0.008) (0.008) (0.010) (0.021) (0.020) (0.020) (0.009) (0.008) (0.008) (0.016) (0.016)
Urbanization 0.008 0.010 0.005 0.006 0.008 0.008 0.013 0.005 0.007 0.006 0.006 0.009
(0.005) (0.006) (0.005) (0.006) (0.010) (0.009) (0.009) (0.005) (0.005) (0.005) (0.005) (0.009)
Economic growth �0.290 0.428 �0.236 �0.250 �0.773 �0.789 �0.670 �0.215 �0.241 �0.239 �0.200 �0.902
(1.1169) (1.225) (0.972) (0.975) (1.323) (1.312) (1.309) (0.981) (0.984) (0.976) (0.981) (1.323)
lngdp80 �0.204 �0.009 �0.156 �0.103 �0.111 �0.159 �0.098 �0.117 �0.183 �0.144 �0.139 �0.167
(0.133) (0.209) (0.137) (0.138) (0.197) (0.184) (0.152) (0.132) (0.131) (0.128) (0.124) (0.175)
lnpop �0.046 0.046 �0.056 �0.056 �0.038 �0.057 0.053 �0.060 �0.056 �0.067 �0.045 �0.064
(0.045) (0.066) (0.052) (0.059) (0.100) (0.100) (0.077) (0.054) (0.054) (0.054) (0.050) (0.100)
Foreign aid �0.001
(0.001)
Debt 0.031
(0.037)
Muslim �0.503**
(0.243)
Gender gap in education �0.056
(0.082)
Female secondary enrollments 0.002c 0.001 0.006 �0.027c
(0.008) (0.008) (0.008) (0.014)
Female secondary enroll � fertility �0.004
(0.003)
Female secondary enroll � labor 0.001***
(0.000)
Male education 0.058 �0.109 0.057 0.043 �0.071
(0.044) (0.087) (0.042) (0.043) (0.096)
Maled � female education 0.016*
(0.010)
Male education � fertility �0.027*
(0.016)
Male education � labor 0.007***
(0.003)
Male education � female secondary enroll 0.004**
(0.002)
Time dummies Yes Yes Yes Yes Yes Yes Yes Yes Yes Yes Yes Yes
No of observations 1,802 1,672 2,104 2,104 1,355 1,355 1,355 2,104 2,104 2,104 2,104 1,355
No of countries 83 77 94 94 93 93 93 94 94 94 94 93
No of instruments 56 56 56 55 55 56 56 55 57 56 56 57
AR(1) 0.000 0.000 0.000 0.000 0.001 0.000 0.000 0.000 0.000 0.000 0.000 0.000
AR(2) 0.484 0.210 0.261 0.261 0.255 0.258 0.270 0.262 0.262 0.263 0.263 0.260
Sargen test 0.415 0.531 0.455 0.449 0.608 0.620 0.645 0.440 0.453 0.450 0.446 0.620
Hansen diff test 0.203 0.158 0.318 0.316 0.825 0.831 0.835 0.280 0.285 0.288 0.258 0.823
(i) Adjusted for foreign aid; (ii) adjusted for debt; (iii) adjusted for Muslim; (iv) gender gap in education; (v) female secondary enrollments; (vi) femalesecondary enroll � fertility; (vii) female secondary enroll � labor; (viii) male education; (ix) male education � female education; (x) male educa-tion � fertility; (xi) male education � labor; (xii) male education � secondary enrollments.*Male secondary enrollments was also substituted for female education in the models. It was not significant in any model.a Sig at 5% when lagged by 5 and 10 years.b Sig at 10% level when lagged by 5 years.c Sig at 5% level when lagged by 10 years.d Sig at 10% level when lagged by 10 years.eSig at 5% when lagged by 5 years.* p < 0.10 robust standard errors are reported in parentheses.** p < 0.05 robust standard errors are reported in parentheses.*** p < 0.01 robust standard errors are reported in parentheses.
44 WORLD DEVELOPMENT

The interac�on effect of male educa�on and female educa�on on democra�c development
-1.6
-1.4
-1.2
-1
-0.8
-0.6
-0.4
-0.2
0
0 2 4 6 8 10 12
average yrs of male educa�on
Polit
y2
lowfemaleeduca�on(2) mediumfemaleeduca�on(5)highfemaleeduca�on
p<0.10
Figure 7. The interaction effect of male and female education on democratic
development.
The interac�on effect of male educa�on and fer�lity rates on democra�c development
-2.5
-2
-1.5
-1
-0.5
0
0 2 4 6 8 10 12
average yrs of male educa�on
Polit
y2
lowfer�lity(2)
mediumfer�lity(4)
highfer�lity(6)
p<0.10
Figure 8. The interaction effect of male education and fertility rates on
democratic development.
The interac�on effect of male educa�on and female labor force par�cipa�on on democra�c development
-2
-1
0
1
2
3
4
5
6
7
0 2 4 6 8 10 12
average yrs of male educa�on
Polit
y2
low femalelabor force(20%)
medium femalelabor force(40%)
high femalelabor force(60%)
p<0.05
Figure 9. The interaction effect of male education and female labor force
participation on democratic development.
FEMALE EMPOWERMENT AS A CORE DRIVER OF DEMOCRATIC DEVELOPMENT 45
with Polity2 close to zero and low correlations with female la-bor force participation.
(b) Why and how does female education drive democraticdevelopment?
One of the main outcomes from educating girls is to delaymarriage as women seek alternative pathways outside thehome in the form of further education or employment. Withincreased education girls are exposed to democratic valuessuch as equality, freedom, and tolerance. However, the ability
to challenge political institutions may not take full effect untilthey leave school and reach voting age. Through work andother informal networks women are then able to developand practice the necessary cognitive and communication skillsthat enable them to agitate for political change. With two in-comes parents have surplus income to invest back into theirfamilies, thus building the human capital of the next genera-tion. Moreover, families where both parents are educatedare more likely to educate their sons and daughters, againbuilding the human capital of the next generation and expand-ing support for democracy.
Our results also highlight the interplay between women’sproductive and reproductive activities. Typically, fertility ishigh in regimes where human capital is low, but low in regimeswhere investment in human capital is high (Becker, Murphy,& Tamura, 1990). However, when we look more closely atthe temporality of these two factors across different regionsa different story emerges. Countries commencing their demo-graphic transition report smaller differentials in fertility ratesbetween the most highly educated and the least educatedgroups than countries in the middle stages of transition. Also,education does not reduce fertility rates where only a few yearsof primary education have been achieved (Lehr, 2009). Per-haps there is a tipping point where a certain number of yearsof schooling reduce fertility rates substantially in order for sig-nificant transformations in women’s lives to occur. Our resultsshow that countries that did develop democratically began theperiod with a higher level of female education (5.2 years) andlower fertility rates (4.34 births per woman). By the end of theperiod these countries had achieved on average 7.7 years of fe-male education, and a fertility rate of 2.75. This suggests thatover and beyond economic development, there is an optimallevel of female empowerment that countries need to achievebefore political transformation occurs. Further research is re-quired to test this theory.
Over the last 25 years, the majority of nondemocraticcountries that invested early in all three domains of femaleempowerment and achieved progress in all these domains,that is at or above the threshold, developed democraticallyby 2005; whereas countries that failed in one or more ofthese elements remained autocratic or anocratic. Almost allcountries that began the period with very high rates of bothfemale education and low fertility rates achieved Polity2scores of six and above by 2005, and these were representedmainly by the former communist and socialist countries (withthe exception of South Korea, Panama, and Uruguay). Twocountries (China and Cuba) remained persistently autocratic,and Kazakhstan experienced varying periods of politicalinstability and political progress. Armenia’s trajectory hasalso been unstable, but in recent years the political regimehas liberalized.
There was another group of countries that were strong onall three female empowerment indicators by the end of thestudy period, but did not develop democratically. One of thesecountries, Gabon has made recent democratic progress with achange in Polity2 score from �9 to 3 in 2009–10. This seems tohold promise for continual political progress in the future. An-other country, Malaysia became democratic in 2010; and threeother countries remain nondemocratic today (Singapore, Swa-ziland, and Zimbabwe). Persistent cultural factors such asConfucianism and royal nepotism, the HIV/AIDS epidemic,and wide spread poverty may have prevented these countriesfrom making greater democratic progress. See Table 10 inthe Appendix for a comparison of these three groups.
The significant interaction between female education and fe-male labor force participation (Figure 4) shows that a more
46 WORLD DEVELOPMENT
highly educated female work force is important for advancingdemocracy. Previous research shows that greater numbers ofwomen in the skilled sectors is associated with higher levelsof democracy (Ross, 2001). However, highly educated womenmay be excluded from the work force, as a result of culturaland social expectations about family composition or women’sroles. This may be exacerbated in countries where unemploy-ment levels are high and opportunities for work are limited.For example, in Jordan, women and men report low rates oflabor force participation (Spierings & Smits, 2007). In con-trast, women with only a few years of education are less likelyto be in the work force (Psacharopoulos & Tzannatos, 1992),or be employed in work that is of low status and is low paid(Nisha & Ravi, 2010). In this scenario the opportunity costof bearing children may be higher than the income a womanearns (Galor & Weil, 1996).
Therefore, while improvements in female education confersignificant benefits to women and society, we must not relyon educating females as the only solution for solving all of soci-ety’s problems, including democratic development. Educationon its own may not equip girls and women with the ability toquestion the second class status assigned to them and to mobi-lize politically, if they are still excluded from public life becauseof childrearing and domestic duties (Kabeer, 2005). Consider-ation must be given to the different cultural or social structuresacross societies that restrict women’s participation in the eco-nomic or political sphere and keep women’s status low.
Our results also show that, on its own, an increase in maleeducation was insufficient for countries to develop democrati-cally over this period. However, increases in male educationtogether with high levels of female empowerment were impor-tant. It appears that in countries where men are highly edu-cated and where women’s lives have also improved politicalprogress is greater. In contrast, some countries, despite beingfinancially able to do so may not invest in their girls. Culturalbarriers to women accessing education, permission to work incertain industries, and son preference impact on women’s abil-ity to take advantage of opportunities. When a country’s in-come is high and women’s education and labor forceparticipation is low, this suggests that a country’s income dis-tribution skews toward the men of these countries. As a resultmen have a disproportionate level of power and prestige(Friedl, 1975). These findings further emphasize the impor-tance of investing in the education of girls to advance bothgender equality and democracy.
(c) Importance of female empowerment to early democratizers
While female empowerment was important for countriesdeveloping democratically during this period, a recent studyshows that female empowerment was also important for theearly democratizers. Woodberry (2012) highlights the role ofthe conversionary Protestant missionaries who played animportant role in the early democratization of Western Eur-ope through mass education, including educating women de-spite resistance from the elites. By being involved in therunning of religious organizations, women gained valuableskills and developed networks that could be translated to othertypes of grass roots movements. Together with expanded reli-gious liberty these factors laid a foundation for democracythat was then copied by other religions, particularly Catholi-cism, post World War II. Bollen (1979) first highlighted thecultural differences between the early democratizers and latedemocratizers. These early democratizers were from a similarwestern cultural heritage, whereas the late democratizers rep-resented a more heterogeneous cultural group. Therefore, it
is possible that gender inequalities are more entrenched inthe family and other social institutions in this latter groupcompared with the early democratizers. Consequently, explicitefforts to address gender inequalities at a social institutional le-vel, that is deeply embedded social and cultural norms, may berequired to move countries toward democracy in the future.
(d) Factors contributing to improvements in female empower-ment
Our results showed that economic development did not havea significant impact on democratic development during thisperiod. Moreover, the majority of countries that developeddemocratically had little prior experience of democracy, par-ticularly in the preceding decade. So what could explain the in-creased participation of women in education and employmentand fertility declines over this period? The role of the UN Dec-ade for Women (1975–85) as a major force for advancing bothwomen’s rights and democracy cannot be underestimated. Itchampioned women’s rights and promoted the incorporationof women into development activities when many states weregoverned by nondemocratic regimes. It also facilitated oppor-tunities for women to meet at conferences and triggered a pro-liferation across the globe of women’s movements. Thisincreased global focus legitimizes women’s movements press-ing for equality and democratic reform at a national level(Safa, 1990). We envisage that INGOs will continue to encour-age governments to expand and strengthen national gendermachineries as an integral part of the democratic reform pro-cess.
(e) Female empowerment as a dimension of modernization
We consider female empowerment to be an important aspectof modernization, a dimension that to date has not receivedadequate attention in the democratization literature. The pur-pose of this study was to provide a gendered lens to both the-oretical and empirical research in democratic development. Webelieve that change in all three aspects of female empowerment(female education, female employment, and fertility) representsa significant cultural shift in gender roles within countries,rather than reflecting a country’s overall level of development.By including all three indicators in the analysis, we were able toempirically demonstrate that this shift has had a causal effecton democratic development in the last 25 years, independentof the conventional indicators of modernization (economicgrowth, GDP, urbanization, and population density).
(f) Anomalies
This study demonstrates that female empowerment playedan important role in advancing democracy during 1980–2005. Despite being a cross-national study we are careful toacknowledge the uniqueness of every country within each timeperiod and recognize that there are a handful of countries thathave not developed democratically despite achieving high lev-els of female empowerment, including Singapore, China, andCuba. 18 There is evidence of other discriminatory practices to-ward women in these countries. A recent report into “Traffick-ing in Persons” (US Dept, 2011) reveal that these threegovernments still have a long way to go to eliminate sex traf-ficking of women and children for prostitution and forced la-bor in their countries. Additionally, it is expected that by 2020China will record over 33 million “missing women,” as a resultof infanticide, son preference, and discrimination toward girlsand women (Hudson & den Boer, 2002).
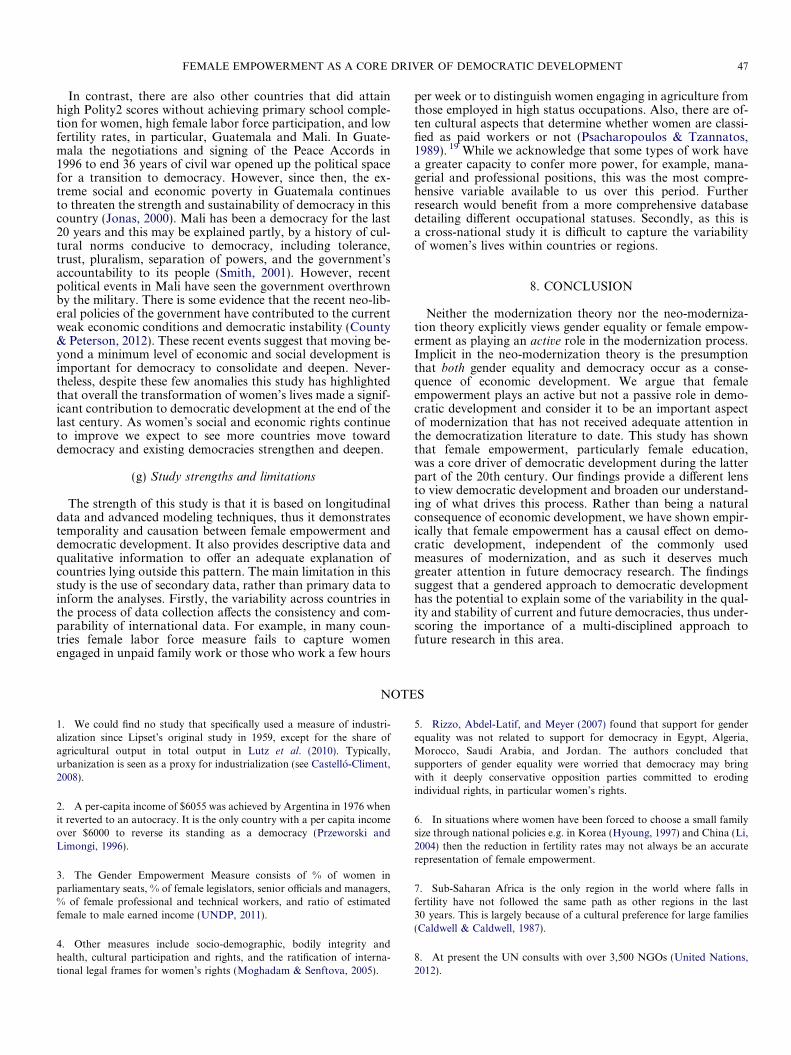
FEMALE EMPOWERMENT AS A CORE DRIVER OF DEMOCRATIC DEVELOPMENT 47
In contrast, there are also other countries that did attainhigh Polity2 scores without achieving primary school comple-tion for women, high female labor force participation, and lowfertility rates, in particular, Guatemala and Mali. In Guate-mala the negotiations and signing of the Peace Accords in1996 to end 36 years of civil war opened up the political spacefor a transition to democracy. However, since then, the ex-treme social and economic poverty in Guatemala continuesto threaten the strength and sustainability of democracy in thiscountry (Jonas, 2000). Mali has been a democracy for the last20 years and this may be explained partly, by a history of cul-tural norms conducive to democracy, including tolerance,trust, pluralism, separation of powers, and the government’saccountability to its people (Smith, 2001). However, recentpolitical events in Mali have seen the government overthrownby the military. There is some evidence that the recent neo-lib-eral policies of the government have contributed to the currentweak economic conditions and democratic instability (County& Peterson, 2012). These recent events suggest that moving be-yond a minimum level of economic and social development isimportant for democracy to consolidate and deepen. Never-theless, despite these few anomalies this study has highlightedthat overall the transformation of women’s lives made a signif-icant contribution to democratic development at the end of thelast century. As women’s social and economic rights continueto improve we expect to see more countries move towarddemocracy and existing democracies strengthen and deepen.
(g) Study strengths and limitations
The strength of this study is that it is based on longitudinaldata and advanced modeling techniques, thus it demonstratestemporality and causation between female empowerment anddemocratic development. It also provides descriptive data andqualitative information to offer an adequate explanation ofcountries lying outside this pattern. The main limitation in thisstudy is the use of secondary data, rather than primary data toinform the analyses. Firstly, the variability across countries inthe process of data collection affects the consistency and com-parability of international data. For example, in many coun-tries female labor force measure fails to capture womenengaged in unpaid family work or those who work a few hours
per week or to distinguish women engaging in agriculture fromthose employed in high status occupations. Also, there are of-ten cultural aspects that determine whether women are classi-fied as paid workers or not (Psacharopoulos & Tzannatos,1989). 19 While we acknowledge that some types of work havea greater capacity to confer more power, for example, mana-gerial and professional positions, this was the most compre-hensive variable available to us over this period. Furtherresearch would benefit from a more comprehensive databasedetailing different occupational statuses. Secondly, as this isa cross-national study it is difficult to capture the variabilityof women’s lives within countries or regions.
8. CONCLUSION
Neither the modernization theory nor the neo-moderniza-tion theory explicitly views gender equality or female empow-erment as playing an active role in the modernization process.Implicit in the neo-modernization theory is the presumptionthat both gender equality and democracy occur as a conse-quence of economic development. We argue that femaleempowerment plays an active but not a passive role in demo-cratic development and consider it to be an important aspectof modernization that has not received adequate attention inthe democratization literature to date. This study has shownthat female empowerment, particularly female education,was a core driver of democratic development during the latterpart of the 20th century. Our findings provide a different lensto view democratic development and broaden our understand-ing of what drives this process. Rather than being a naturalconsequence of economic development, we have shown empir-ically that female empowerment has a causal effect on demo-cratic development, independent of the commonly usedmeasures of modernization, and as such it deserves muchgreater attention in future democracy research. The findingssuggest that a gendered approach to democratic developmenthas the potential to explain some of the variability in the qual-ity and stability of current and future democracies, thus under-scoring the importance of a multi-disciplined approach tofuture research in this area.
NOTES
1. We could find no study that specifically used a measure of industri-alization since Lipset’s original study in 1959, except for the share ofagricultural output in total output in Lutz et al. (2010). Typically,urbanization is seen as a proxy for industrialization (see Castello-Climent,2008).
2. A per-capita income of $6055 was achieved by Argentina in 1976 whenit reverted to an autocracy. It is the only country with a per capita incomeover $6000 to reverse its standing as a democracy (Przeworski andLimongi, 1996).
3. The Gender Empowerment Measure consists of % of women inparliamentary seats, % of female legislators, senior officials and managers,% of female professional and technical workers, and ratio of estimatedfemale to male earned income (UNDP, 2011).
4. Other measures include socio-demographic, bodily integrity andhealth, cultural participation and rights, and the ratification of interna-tional legal frames for women’s rights (Moghadam & Senftova, 2005).
5. Rizzo, Abdel-Latif, and Meyer (2007) found that support for genderequality was not related to support for democracy in Egypt, Algeria,Morocco, Saudi Arabia, and Jordan. The authors concluded thatsupporters of gender equality were worried that democracy may bringwith it deeply conservative opposition parties committed to erodingindividual rights, in particular women’s rights.
6. In situations where women have been forced to choose a small familysize through national policies e.g. in Korea (Hyoung, 1997) and China (Li,2004) then the reduction in fertility rates may not always be an accuraterepresentation of female empowerment.
7. Sub-Saharan Africa is the only region in the world where falls infertility have not followed the same path as other regions in the last30 years. This is largely because of a cultural preference for large families(Caldwell & Caldwell, 1987).
8. At present the UN consults with over 3,500 NGOs (United Nations,2012).
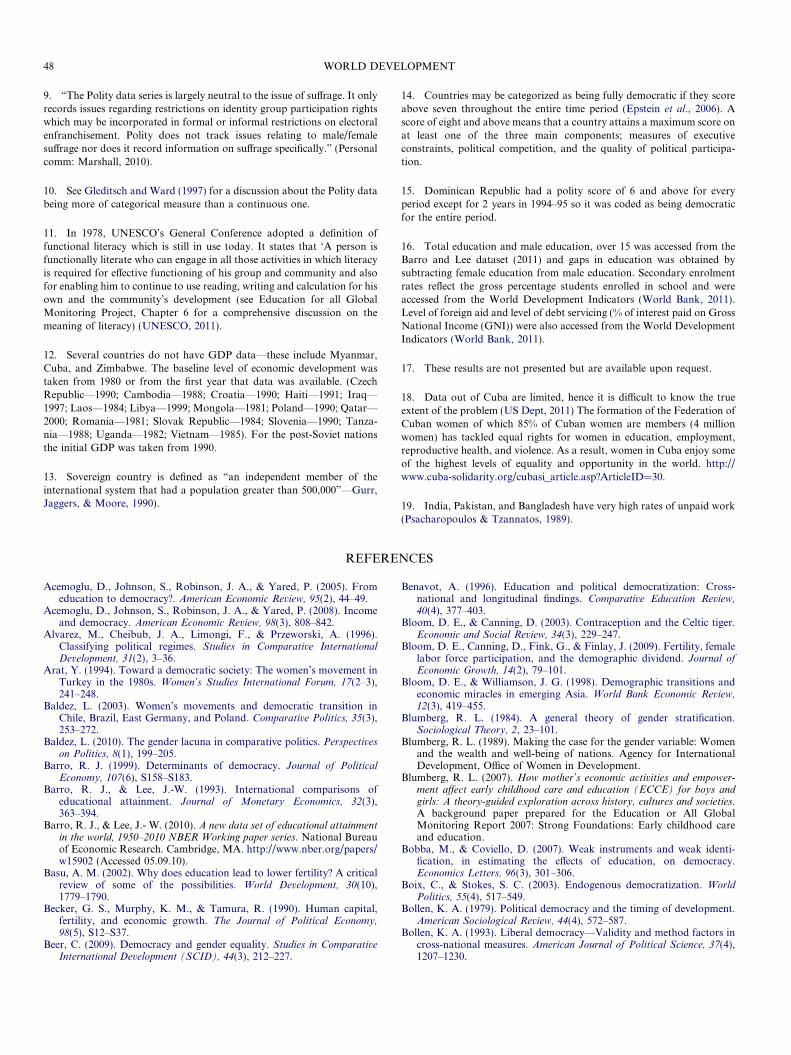
48 WORLD DEVELOPMENT
9. “The Polity data series is largely neutral to the issue of suffrage. It onlyrecords issues regarding restrictions on identity group participation rightswhich may be incorporated in formal or informal restrictions on electoralenfranchisement. Polity does not track issues relating to male/femalesuffrage nor does it record information on suffrage specifically.” (Personalcomm: Marshall, 2010).
10. See Gleditsch and Ward (1997) for a discussion about the Polity databeing more of categorical measure than a continuous one.
11. In 1978, UNESCO’s General Conference adopted a definition offunctional literacy which is still in use today. It states that ‘A person isfunctionally literate who can engage in all those activities in which literacyis required for effective functioning of his group and community and alsofor enabling him to continue to use reading, writing and calculation for hisown and the community’s development (see Education for all GlobalMonitoring Project, Chapter 6 for a comprehensive discussion on themeaning of literacy) (UNESCO, 2011).
12. Several countries do not have GDP data—these include Myanmar,Cuba, and Zimbabwe. The baseline level of economic development wastaken from 1980 or from the first year that data was available. (CzechRepublic—1990; Cambodia—1988; Croatia—1990; Haiti—1991; Iraq—1997; Laos—1984; Libya—1999; Mongola—1981; Poland—1990; Qatar—2000; Romania—1981; Slovak Republic—1984; Slovenia—1990; Tanza-nia—1988; Uganda—1982; Vietnam—1985). For the post-Soviet nationsthe initial GDP was taken from 1990.
13. Sovereign country is defined as “an independent member of theinternational system that had a population greater than 500,000”—Gurr,Jaggers, & Moore, 1990).
14. Countries may be categorized as being fully democratic if they scoreabove seven throughout the entire time period (Epstein et al., 2006). Ascore of eight and above means that a country attains a maximum score onat least one of the three main components; measures of executiveconstraints, political competition, and the quality of political participa-tion.
15. Dominican Republic had a polity score of 6 and above for everyperiod except for 2 years in 1994–95 so it was coded as being democraticfor the entire period.
16. Total education and male education, over 15 was accessed from theBarro and Lee dataset (2011) and gaps in education was obtained bysubtracting female education from male education. Secondary enrolmentrates reflect the gross percentage students enrolled in school and wereaccessed from the World Development Indicators (World Bank, 2011).Level of foreign aid and level of debt servicing (% of interest paid on GrossNational Income (GNI)) were also accessed from the World DevelopmentIndicators (World Bank, 2011).
17. These results are not presented but are available upon request.
18. Data out of Cuba are limited, hence it is difficult to know the trueextent of the problem (US Dept, 2011) The formation of the Federation ofCuban women of which 85% of Cuban women are members (4 millionwomen) has tackled equal rights for women in education, employment,reproductive health, and violence. As a result, women in Cuba enjoy someof the highest levels of equality and opportunity in the world. http://www.cuba-solidarity.org/cubasi_article.asp?ArticleID=30.
19. India, Pakistan, and Bangladesh have very high rates of unpaid work(Psacharopoulos & Tzannatos, 1989).
REFERENCES
Acemoglu, D., Johnson, S., Robinson, J. A., & Yared, P. (2005). Fromeducation to democracy?. American Economic Review, 95(2), 44–49.
Acemoglu, D., Johnson, S., Robinson, J. A., & Yared, P. (2008). Incomeand democracy. American Economic Review, 98(3), 808–842.
Alvarez, M., Cheibub, J. A., Limongi, F., & Przeworski, A. (1996).Classifying political regimes. Studies in Comparative InternationalDevelopment, 31(2), 3–36.
Arat, Y. (1994). Toward a democratic society: The women’s movement inTurkey in the 1980s. Women’s Studies International Forum, 17(2–3),241–248.
Baldez, L. (2003). Women’s movements and democratic transition inChile, Brazil, East Germany, and Poland. Comparative Politics, 35(3),253–272.
Baldez, L. (2010). The gender lacuna in comparative politics. Perspectiveson Politics, 8(1), 199–205.
Barro, R. J. (1999). Determinants of democracy. Journal of PoliticalEconomy, 107(6), S158–S183.
Barro, R. J., & Lee, J.-W. (1993). International comparisons ofeducational attainment. Journal of Monetary Economics, 32(3),363–394.
Barro, R. J., & Lee, J.- W. (2010). A new data set of educational attainmentin the world, 1950–2010 NBER Working paper series. National Bureauof Economic Research. Cambridge, MA. http://www.nber.org/papers/w15902 (Accessed 05.09.10).
Basu, A. M. (2002). Why does education lead to lower fertility? A criticalreview of some of the possibilities. World Development, 30(10),1779–1790.
Becker, G. S., Murphy, K. M., & Tamura, R. (1990). Human capital,fertility, and economic growth. The Journal of Political Economy,98(5), S12–S37.
Beer, C. (2009). Democracy and gender equality. Studies in ComparativeInternational Development (SCID), 44(3), 212–227.
Benavot, A. (1996). Education and political democratization: Cross-national and longitudinal findings. Comparative Education Review,40(4), 377–403.
Bloom, D. E., & Canning, D. (2003). Contraception and the Celtic tiger.Economic and Social Review, 34(3), 229–247.
Bloom, D. E., Canning, D., Fink, G., & Finlay, J. (2009). Fertility, femalelabor force participation, and the demographic dividend. Journal ofEconomic Growth, 14(2), 79–101.
Bloom, D. E., & Williamson, J. G. (1998). Demographic transitions andeconomic miracles in emerging Asia. World Bank Economic Review,12(3), 419–455.
Blumberg, R. L. (1984). A general theory of gender stratification.Sociological Theory, 2, 23–101.
Blumberg, R. L. (1989). Making the case for the gender variable: Womenand the wealth and well-being of nations. Agency for InternationalDevelopment, Office of Women in Development.
Blumberg, R. L. (2007). How mother’s economic activities and empower-ment affect early childhood care and education (ECCE) for boys andgirls: A theory-guided exploration across history, cultures and societies.A background paper prepared for the Education or All GlobalMonitoring Report 2007: Strong Foundations: Early childhood careand education.
Bobba, M., & Coviello, D. (2007). Weak instruments and weak identi-fication, in estimating the effects of education, on democracy.Economics Letters, 96(3), 301–306.
Boix, C., & Stokes, S. C. (2003). Endogenous democratization. WorldPolitics, 55(4), 517–549.
Bollen, K. A. (1979). Political democracy and the timing of development.American Sociological Review, 44(4), 572–587.
Bollen, K. A. (1993). Liberal democracy—Validity and method factors incross-national measures. American Journal of Political Science, 37(4),1207–1230.
FEMALE EMPOWERMENT AS A CORE DRIVER OF DEMOCRATIC DEVELOPMENT 49
Bollen, K. A., & Jackman, R. W. (1989). Democracy, stability, anddichotomies. American Sociological Review, 54(4), 612–621.
Boserup, E. (1970). Woman’s role in economic development. London: Allen& Unwin.
Cameron, A. C., & Trivedi, P. K. (2009). Microeconometrics using Stata.Texas: Stata Press.
Caldwell, J. C., & Caldwell, P. (1987). The cultural context of high fertilityin sub-Saharan Africa. Population and Development Review, 13(3),409–437.
Castello-Climent, A. (2008). On the distribution of education anddemocracy. Journal of Development Economics, 87(2), 179–190.
Central Intelligence Agency (CIA). (2008). The world factbook. https://www.cia.gov/library/publications/the-world-factbook/rankorder/2001rank.html (Accessed 04.04.11).
Chafetz, J. S. (1990). Gender equity. An integrated theory of stability andchange. California: Sage Publications.
Cleland, J., & van Ginneken, J. (1988). Maternal education and childsurvival in developing countries: The search for pathways of influence.Social Science & Medicine, 27(12), 1357–1368.
Collins, R., Chafetz, Janet Saltzman, Blumberg, R. L., Coltrane, S., &Turner, J. H. (1993). Toward an integrated theory of genderstratification. Sociological Perspectives, 36(3), 185–216.
County, B., & Peterson, B. (2012). Mali: Hungry for democracy—Thepeasantry and the coup. http://allafrica.com/stories/201204030227.html(Accessed 06.05.12).
Dahl, R. A. (1971). Polyarchy: Participation and opposition. New Haven:Yale University Press.
Di Palma, G. (1990). To craft democracies: An essay on democratictransitions. Berkeley: University of California Press.
Diamond, L. (1994). Toward democratic consolidation. Journal ofDemocracy, 5(3), 4–17.
Diamond, L. (2002). Thinking about hybrid regimes. Journal of Democ-racy, 13(2), 21–35.
Donno, D., & Russett, B. (2004). Islam, authoritarianism, and femaleempowerment—What are the linkages?. World Politics, 56(4), 582.
Epstein, D. L., Bates, R., Goldstone, J., Kristensen, I., & O’Halloran, S.(2006). Democratic transitions. American Journal of Political Science,50(3), 551–569.
Feng, Y., & Zak, P. J. (1999). The determinants of democratic transitions.The Journal of Conflict Resolution, 43(2), 162–177.
Fish, M. S. (2002). Islam and authoritarianism. World Politics, 55(1),4–37.
Friedl, E. (1975). Women and men: An anthropologist’s view. New York:Holt, Rinehart and Winston.
Galor, O., & Weil, D. N. (1996). The gender gap, fertility, and growth. TheAmerican Economic Review, 86(3), 374–387.
Gastil, R. D. (1991). The comparative survey of freedom: Experiences andsuggestions. On Measuring Democracy: Its Consequences and Concom-itants, 21–46.
Glaeser, E. L., Ponzetto, G. A. M., & Shleifer, A. (2007). Why doesdemocracy need education?. Journal of Economic Growth, 12(2), 77–99.
Gleditsch, K. S., & Ward, M. D. (1997). Double take: A reexamination ofdemocracy and autocracy in modern polities. The Journal of ConflictResolution, 41(3), 361–383.
Gurr, T., Jaggers, K., & Moore, W. (1990). The transformation of thewestern state: The growth of democracy, autocracy, and state powersince 1800. Studies in Comparative International Development (SCID),25(1), 73–108.
Hadenius, A., & Teorell, J. (2005). Cultural and economic prerequisites ofdemocracy: Reassessing recent evidence. Studies in ComparativeInternational Development, 39(4), 87–106.
Huber, J. (1991). Macro–micro links in gender stratification. Macro–microlinkages in sociology. Newbury Park, CA: Sage Publications, pp. 11–25.
Hudson, V. M., & den Boer, A. M. (2002). A surplus of men, a deficit ofpeace: Security and sex ratios in Asia’s largest states. InternationalSecurity, 26(4), 5–38.
Hyoung, C. (1997). Fertility control, reproductive rights, and women’sempowerment in Korea. Asian Journal of Women’s Studies, 3(1),103–132.
Ibrahim, S., & Alkire, S. (2007). Agency and empowerment: A proposalfor internationally comparable indicators. Oxford Development Stud-ies, 35(4), 379–403.
Inglehart, R., & Baker, W. E. (2000). Modernization, cultural change, andthe persistence of traditional values. American Sociological Review,65(1), 19–51.
Inglehart, R., & Norris, P. (2003). The true clash of civilizations. ForeignPolicy, 135, 62–70.
Inglehart, R., Norris, P., & Welzel, C. (2002). Gender equality anddemocracy. Comparative Sociology, 1(3–4), 321–346.
Inglehart, R., & Welzel, C. (2009). How development leads to democracy.Foreign Affairs, 88(2), 33–48.
Inglehart, R., & Welzel, C. (2010). Changing mass priorities: The linkbetween modernization and democracy. Perspectives on Politics, 8(2),551–567.
Iversen, T., & Rosenbluth, F. (2006). The political economy of gender:Explaining cross-national variation in the gender division of labor andthe gender voting gap. American Journal of Political Science, 50(1),1–19.
Iversen, T., & Rosenbluth, F. (2008). Work and power: The connectionbetween female labor force participation and female political repre-sentation. Annual Review of Political Science, 11, 479–495.
Jaggers, K., & Gurr, T. (1995). Tracking democracy’s 3rd wave with thepolity-III data. Journal of Peace Research, 32(4), 469–482.
Jahanshahrad, H. (2012). A genuine civil society and its implications forthe Iranian women’s movement. Women’s History Review, 21(2),233–252.
Jonas, S. (2000). Democratization through peace: The difficult case ofGuatemala. Journal of InterAmerican Studies & World Affairs, 42(4),9.
Jowett, M. (2000). Safe motherhood interventions in low-income coun-tries: An economic justification and evidence of cost effectiveness.Health Policy, 53(3), 201–228.
Kabeer, N. (1999). Resources, agency, achievements: Reflections on themeasurement of women’s empowerment. Development and Change,30(3), 435–464.
Kabeer, N. (2005). Gender equality and women’s empowerment: A criticalanalysis of the third Millennium development goal. Gender andDevelopment, 13(1), 13–24.
Kazemi, F. (2000). Gender, Islam, and politics. Social Research, 67(2),439–474.
Kishor, S. (2000). Empowerment of women in Egypt and links to thesurvival and health of their infants. In Harriet Presser, & Gita Sen(Eds.), Women’s empowerment and demographic processes: Movingbeyond Cairo. New York: Oxford University Press.
Lehr, C. S. (2009). Evidence on the demographic transition. Review ofEconomics and Statistics, 91(4), 871–887.
Lena, H. F., & London, B. (1993). The political and economic determi-nants of health outcomes: A cross- national analysis. InternationalJournal of Health Services, 23(3), 585–602.
Li, J. (2004). Gender inequality, family planning, and maternal and childcare in a rural Chinese county. Social Science and Medicine, 59(4),695–708.
Lipset, S. M. (1959). Some social requisites of democracy—Economicdevelopment and political legitimacy. The American Political ScienceReview, 53(1), 69–105.
Lipset, S. M. (1994). The social requisites of democracy revisited—1993Presidential address. American Sociological Review, 59(1), 1–22.
Londregan, J. B., & Poole, K. T. (1996). Does high income promotedemocracy?. World Politics, 49(1), 1–30.
Lutz, W., Cuaresma, J. C., & Abbasi-Shavazi, M. J. (2010). Demography,education, and democracy: Global trends and the case of Iran.Population and Development Review, 36(2), 253–281.
Mainwaring, S. (1989). Transitions to democracy and democratic consol-idation: Theoretical and comparative issues. Working paper—HelenKellogg Institute for International Studies, p. 130.
Malhotra, A. (2012). Remobilizing the gender and fertility connection:The case for examining the impact of fertility control and fertilitydeclines on gender equality. International center for research onwomen fertility and empowerment work paper series, 001-2012-ICRW-FE, pp. 1–38.
Malhotra, A., & Mather, M. (1997). Do schooling and work empowerwomen in developing countries? Gender and domestic decisions in SriLanka. Sociological Forum, 12(4), 599–630.
Marchand, M. H., & Parpart, J. L. (1995). Feminism/postmodernism/development. London: Routledge.

50 WORLD DEVELOPMENT
Marshall, M.G., & Jaggers. K. (2009). Polity IV project. Political regimecharacteristics and transitions, 1800–2008. http://www.systemic-peace.org/polity/polity4.htm (Accessed 11.05.09).
Mason, K. O. (1986). The status of women: Conceptual and methodo-logical issues in demographic studies. Sociological Forum, 1(2),284–300.
Moghadam, V. M. (2003). Modernizing women: Gender and social changein the Middle East (2nd ed.). London: Lynne Rienner Publishers.
Moghadam, V. M. (2007). Governance and women’s citizenship in theMiddle East and North Africa. Paper presented at the IDRC MENAregional consultation, women’s rights and citizenship, Cairo, Egypt.
Moghadam, V. M., & Senftova, L. (2005). Measuring women’s empow-erment: Participation and rights in civil, political, social, economic,and cultural domains. International Social Science Journal, 57(184),389–412.
Morrisson, C., & Jutting, J. P. (2005). Women’s discrimination indeveloping countries: A new data set for better policies. WorldDevelopment, 33(7), 1065–1081.
Muller, E. N. (1995). Economic determinants of democracy. AmericanSociological Review, 60(6), 966–982.
Munck, G. L., & Verkuilen, J. (2002). Conceptualizing and measuringdemocracy: Evaluating alternative indices. Comparative PoliticalStudies, 35(1), 5–34.
Nisha, S., & Ravi, S. (2010). Women, work, and employment outcomes inrural India. Economic and Political Weekly, 45(28), 49–60.
Papaioannou, E., & Siourounis, G. (2008). Economic and social factorsdriving the third wave of democratization. Journal of ComparativeEconomics, 36(3), 365–387.
Paxton, P. (2008). Gendering democracy. In A. M. Goetz, & A. Mazur(Eds.), Politics, gender and concepts. Cambridge: Cambridge UniversityPress.
Persson, T., & Tabellini, G. (2009). Democratic capital: The nexus ofpolitical and economic change. American Economic Journal, 1(2),88–126.
Przeworski, A., Alvarez, M. E., Cheibub, J. A., & Limongi, F. (2000).Democracy and development: Political institutions and well-being in theworld, 1950–1990. New York: Cambridge University Press.
Przeworski, A., & Limongi, F. (1996). Modernization: Theories and facts.World Politics, 49(2), 155–183.
Psacharopoulos, G., & Patrinos, H. A. (2004). Returns to investmentin education: A further update. Education Economics, 12(2),111–134.
Psacharopoulos, G., & Tzannatos, Z. (1989). Female labor force partic-ipation: An international perspective. The World Bank ResearchObserver, 4(2), 187–201.
Psacharopoulos, G., & Tzannatos, Z. (1992). Latin American women’searnings and participation in the labor force. World Bank. http://www-wds.worldbank.org/servlet/WDSContentServer/WDSP/IB/1992/02/01/000009265_3961002093302/Rendered/PDF/multi_page.pdf. (Ac-cessed 20.07.11).
Rizzo, H., Abdel-Latif, A. H., & Meyer, K. (2007). The relationshipbetween gender equality and democracy: A comparison of Arab versusnon-Arab Muslim societies. Sociology—The Journal of the BritishSociological Association, 41(6), 1151–1170.
Roodman, D. (2006). How to do xtabond2: An introduction to “Difference”and “System” GMM in Stata. Centre for Global Development.Working paper 103. http://www.cgdev.org/sites/default/files/11619_file_HowtoDoxtabond8_with_foreword_0.pdf (Accessed27.01.11).
Roodman, D. (2008). A note on the theme of too many instruments. Centerfor Global Development. Working paper no. 125. http://www.cgde-v.org/sites/default/files/14256_file_Instruments.pdf (Accessed27.01.11).
Ross, M. L. (2001). Does oil hinder democracy?. World Politics, 53(3),325–361.
Ross, M. L. (2006). Is democracy good for the poor?. American Journal ofPolitical Science, 50(4), 860–874.
Ross, M. L. (2008). Oil, Islam, and women. American Political ScienceReview, 102(1), 107–123.
Rowlands, J. (1995). Empowerment examined. Development in Practice,5(2), 101–107.
Ryan, J. E. (1994). Survey methodology. Freedom Review, 25(1), 9–13.Safa, H. I. (1990). Women’s social movements in Latin America. Gender &
Society, 4(3), 354–369.Sarafidis, V., & Robertson, D. (2009). On the impact of error cross-
sectional dependence in short dynamic panel estimation. EconometricsJournal, 12(1), 62–81.
Sinha, N., Raju, D., & Morrison, A. R. (2007). Gender equality, povertyand economic growth. World bank policy research working paper no.4349. http://ssrn.com/abstract=1014233. (Accessed 11.03.12).
Smith, Z. K. (2001). Mali’s decade of democracy. Journal of Democracy,12(3), 73–79.
Spierings, N., & Smits, J. (2007). Women’s labour market participation inEgypt, Jordan, Morocco, Syria & Tunisia: A three-level analysis. Paperprepared for the IZA-world bank conference on employment anddevelopment, June 8th/9th in Bonn. http://www.genderclearing-house.org/upload/Assets/Documents/pdf/women%27%27s%20labour%20market%20participation%20in%20egypt.pdf (Accessed 30.04.12).
Staeheli, L. A., & Cope, M. S. (1994). Empowering women’s citizenship.Political Geography, 13(5), 443–460.
UNDP. (1995). Human development report 1995. http://hdr.undp.org/en/media/hdr_1995_en_overview.pdf (Accessed 18.08.11).
UNDP. (2011). Measuring inequality: Gender-related development index(GDI) and gender empowerment measure (GEM). http://hdr.und-p.org/en/statistics/indices/gdi_gem/ (Accessed 17.02.12).
UNESCO (1983). Training seminars on education statistics. Statistics ofeducation in developing countries. Book 3. An introduction to theircollection and analysis. http://unesdoc.unesco.org/images/0005/000548/054881eo.pdf (Accessed 23.11.11).
UNESCO (2011). Education for all global monitoring project, Chapter 6:Understandings of literacy. http://www.unesco.org/education/GMR2006/full/chapt6_eng.pdf (Accessed 23.11.11).
United Nations. (1995). Beijing Declaration and Platform for Action,fourth World Conference on Women, Beijing, China, 4–15 September1995. NY: United Nations http://www.un.org/womenwatch/daw/bei-jing/platform/plat1.htm#statement (Accessed 03.10.10).
United Nations. (2000). World’s women 2000: Trends and statistics (Vol.16). New York: United Nations Publications.
United Nations. (2012). NGO branch, department of economic and socialaffairs. http://csonet.org/ (Accessed 25.09.12).
U.S. Department of State. (2011). Trafficking in persons report 2011.http://www.state.gov/j/tip/rls/tiprpt/2011/index.htm (Accessed16.03.12).
Waylen, G. (1994). Women and democratization: Conceptualizing genderrelations in transition politics. World Politics, 46(3), 327–354.
Wejnert, B. (2005). Diffusion, development, and democracy, 1800–1999.American Sociological Review, 70(1), 53–81.
Woodberry, R. D. (2012). The missionary roots of liberal democracy.American Political Science Review, 106(2), 244–274.
Statistical Sources
Barro, R. J., & Lee, J.- W. (2011). Barro-Lee educational attainmentdataset. http://www.barrolee.com/ (Accessed 16.11.11).
Pew Research Centre. (2009). A report on the size and distribution of theworld’s Muslim population. http://www.pewforum.org/Muslim/Map-ping-the-Global-Muslim-Population(18).aspx (Accessed 18.11.11).
Marshall, M. G., & Jaggers, K. (2010). Polity IV Project. Political RegimeCharacteristics and Transitions, 1800–2010. http://www.systemic-peace.org/polity/polity4.htm.
World Bank. (2011). World development indicators. http://databank.worldbank.org/data/views/variableSelection/selectvariables.aspx?source=world-development-indicators (Accessed 17.11.11).
APPENDIX A.

Polity of Chile from 1960 to 2010
-10-8-6-4-202468
10
1960 1970 1980 1990 2000 2010Time
Polit
y
Figure A1. Latin America—Chile.
Polity of Mali from 1960 to 2010
-10-8-6-4-202468
10
1960 1970 1980 1990 2000 2010
Time
Polit
y
Figure A5. Sub-Saharan Africa—Mali.
Polity of Indonesia from 1960 to 2010
-10-8-6-4-202468
10
1960 1970 1980 1990 2000 2010
Time
Polit
y
Figure A7. Asia—Indonesia.
Polity of Albania from 1980 to 2010
-10-8-6-4-202468
10
1960 1970 1980 1990 2000 2010
Time
Polit
y
Figure A4. Eastern Europe—Albania.
Polity of Hungary from 1960 to 2010
-10-8-6-4-202468
10
1960 1970 1980 1990 2000 2010Time
Polit
y
Figure A3. Eastern Europe—Hungary.
Polity of Ghana from 1960 to 2010
-10-8-6-4-202468
10
1960 1970 1980 1990 2000 2010
Time
Pol
ity
Figure A6. Sub-Sahara—Ghana.
Polity of Bolivia from 1960 to 2010
-10-8-6-4-202468
10
1960 1970 1980 1990 2000 2010
Time
Polit
y
Figure A2. Latin America—Bolivia.
Polity of Republic of Korea from 1960 to 2010
-10-8-6-4-202468
10
1960 1970 1980 1990 2000 2010
Time
Polit
y
Figure A8. Asia—Republic of Korea.
FEMALE EMPOWERMENT AS A CORE DRIVER OF DEMOCRATIC DEVELOPMENT 51
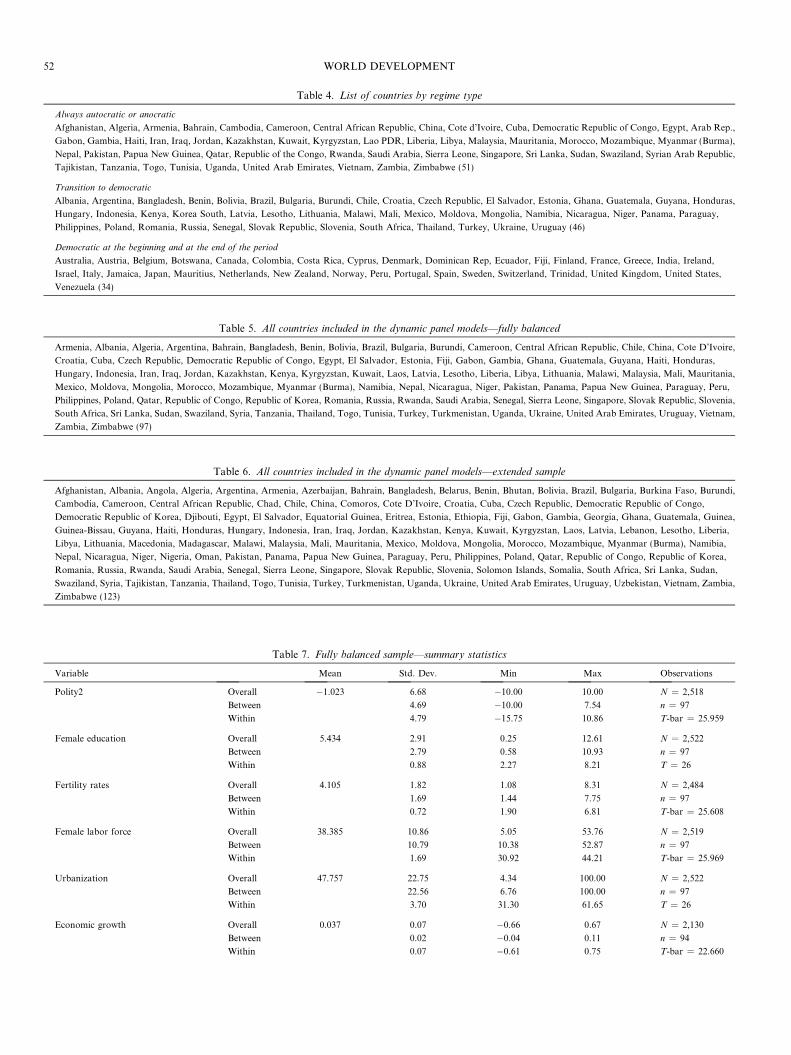
Table 4. List of countries by regime type
Always autocratic or anocratic
Afghanistan, Algeria, Armenia, Bahrain, Cambodia, Cameroon, Central African Republic, China, Cote d’Ivoire, Cuba, Democratic Republic of Congo, Egypt, Arab Rep.,
Gabon, Gambia, Haiti, Iran, Iraq, Jordan, Kazakhstan, Kuwait, Kyrgyzstan, Lao PDR, Liberia, Libya, Malaysia, Mauritania, Morocco, Mozambique, Myanmar (Burma),
Nepal, Pakistan, Papua New Guinea, Qatar, Republic of the Congo, Rwanda, Saudi Arabia, Sierra Leone, Singapore, Sri Lanka, Sudan, Swaziland, Syrian Arab Republic,
Tajikistan, Tanzania, Togo, Tunisia, Uganda, United Arab Emirates, Vietnam, Zambia, Zimbabwe (51)
Transition to democratic
Albania, Argentina, Bangladesh, Benin, Bolivia, Brazil, Bulgaria, Burundi, Chile, Croatia, Czech Republic, El Salvador, Estonia, Ghana, Guatemala, Guyana, Honduras,
Hungary, Indonesia, Kenya, Korea South, Latvia, Lesotho, Lithuania, Malawi, Mali, Mexico, Moldova, Mongolia, Namibia, Nicaragua, Niger, Panama, Paraguay,
Philippines, Poland, Romania, Russia, Senegal, Slovak Republic, Slovenia, South Africa, Thailand, Turkey, Ukraine, Uruguay (46)
Democratic at the beginning and at the end of the period
Australia, Austria, Belgium, Botswana, Canada, Colombia, Costa Rica, Cyprus, Denmark, Dominican Rep, Ecuador, Fiji, Finland, France, Greece, India, Ireland,
Israel, Italy, Jamaica, Japan, Mauritius, Netherlands, New Zealand, Norway, Peru, Portugal, Spain, Sweden, Switzerland, Trinidad, United Kingdom, United States,
Venezuela (34)
Table 7. Fully balanced sample—summary statistics
Variable Mean Std. Dev. Min Max Observations
Polity2 Overall �1.023 6.68 �10.00 10.00 N = 2,518
Between 4.69 �10.00 7.54 n = 97
Within 4.79 �15.75 10.86 T-bar = 25.959
Female education Overall 5.434 2.91 0.25 12.61 N = 2,522
Between 2.79 0.58 10.93 n = 97
Within 0.88 2.27 8.21 T = 26
Fertility rates Overall 4.105 1.82 1.08 8.31 N = 2,484
Between 1.69 1.44 7.75 n = 97
Within 0.72 1.90 6.81 T-bar = 25.608
Female labor force Overall 38.385 10.86 5.05 53.76 N = 2,519
Between 10.79 10.38 52.87 n = 97
Within 1.69 30.92 44.21 T-bar = 25.969
Urbanization Overall 47.757 22.75 4.34 100.00 N = 2,522
Between 22.56 6.76 100.00 n = 97
Within 3.70 31.30 61.65 T = 26
Economic growth Overall 0.037 0.07 �0.66 0.67 N = 2,130
Between 0.02 �0.04 0.11 n = 94
Within 0.07 �0.61 0.75 T-bar = 22.660
Table 6. All countries included in the dynamic panel models—extended sample
Afghanistan, Albania, Angola, Algeria, Argentina, Armenia, Azerbaijan, Bahrain, Bangladesh, Belarus, Benin, Bhutan, Bolivia, Brazil, Bulgaria, Burkina Faso, Burundi,
Cambodia, Cameroon, Central African Republic, Chad, Chile, China, Comoros, Cote D’Ivoire, Croatia, Cuba, Czech Republic, Democratic Republic of Congo,
Democratic Republic of Korea, Djibouti, Egypt, El Salvador, Equatorial Guinea, Eritrea, Estonia, Ethiopia, Fiji, Gabon, Gambia, Georgia, Ghana, Guatemala, Guinea,
Guinea-Bissau, Guyana, Haiti, Honduras, Hungary, Indonesia, Iran, Iraq, Jordan, Kazakhstan, Kenya, Kuwait, Kyrgyzstan, Laos, Latvia, Lebanon, Lesotho, Liberia,
Libya, Lithuania, Macedonia, Madagascar, Malawi, Malaysia, Mali, Mauritania, Mexico, Moldova, Mongolia, Morocco, Mozambique, Myanmar (Burma), Namibia,
Nepal, Nicaragua, Niger, Nigeria, Oman, Pakistan, Panama, Papua New Guinea, Paraguay, Peru, Philippines, Poland, Qatar, Republic of Congo, Republic of Korea,
Romania, Russia, Rwanda, Saudi Arabia, Senegal, Sierra Leone, Singapore, Slovak Republic, Slovenia, Solomon Islands, Somalia, South Africa, Sri Lanka, Sudan,
Swaziland, Syria, Tajikistan, Tanzania, Thailand, Togo, Tunisia, Turkey, Turkmenistan, Uganda, Ukraine, United Arab Emirates, Uruguay, Uzbekistan, Vietnam, Zambia,
Zimbabwe (123)
Table 5. All countries included in the dynamic panel models—fully balanced
Armenia, Albania, Algeria, Argentina, Bahrain, Bangladesh, Benin, Bolivia, Brazil, Bulgaria, Burundi, Cameroon, Central African Republic, Chile, China, Cote D’Ivoire,
Croatia, Cuba, Czech Republic, Democratic Republic of Congo, Egypt, El Salvador, Estonia, Fiji, Gabon, Gambia, Ghana, Guatemala, Guyana, Haiti, Honduras,
Hungary, Indonesia, Iran, Iraq, Jordan, Kazakhstan, Kenya, Kyrgyzstan, Kuwait, Laos, Latvia, Lesotho, Liberia, Libya, Lithuania, Malawi, Malaysia, Mali, Mauritania,
Mexico, Moldova, Mongolia, Morocco, Mozambique, Myanmar (Burma), Namibia, Nepal, Nicaragua, Niger, Pakistan, Panama, Papua New Guinea, Paraguay, Peru,
Philippines, Poland, Qatar, Republic of Congo, Republic of Korea, Romania, Russia, Rwanda, Saudi Arabia, Senegal, Sierra Leone, Singapore, Slovak Republic, Slovenia,
South Africa, Sri Lanka, Sudan, Swaziland, Syria, Tanzania, Thailand, Togo, Tunisia, Turkey, Turkmenistan, Uganda, Ukraine, United Arab Emirates, Uruguay, Vietnam,
Zambia, Zimbabwe (97)
52 WORLD DEVELOPMENT
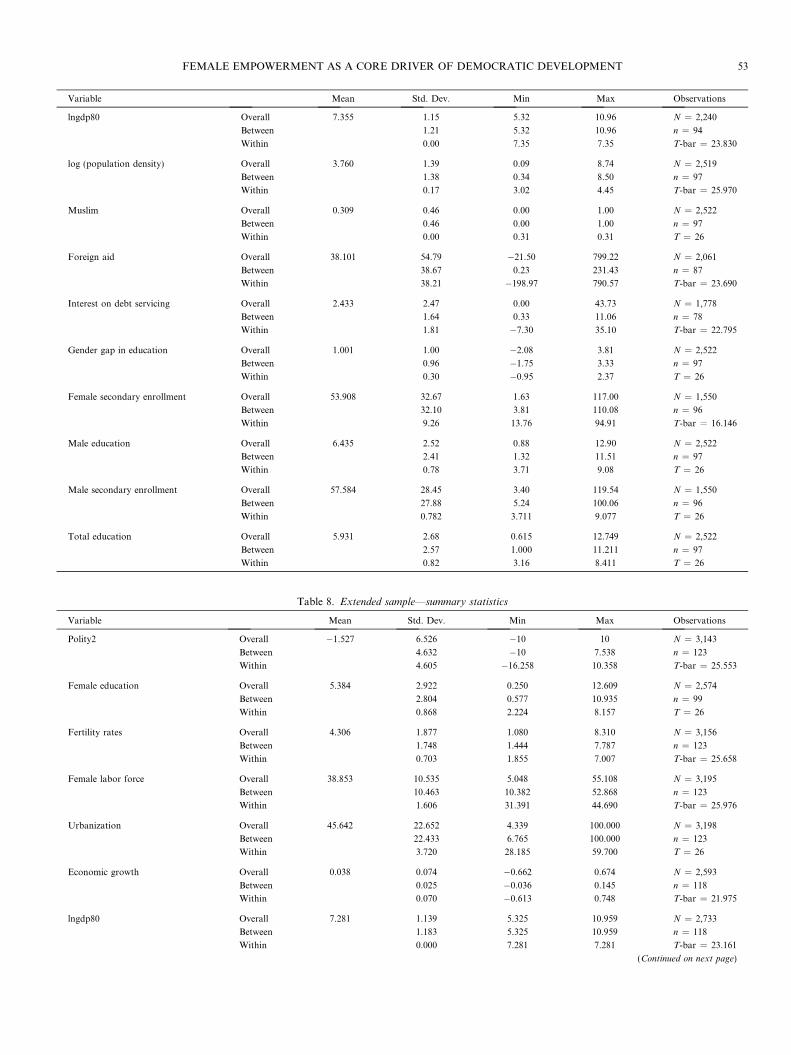
Variable Mean Std. Dev. Min Max Observations
lngdp80 Overall 7.355 1.15 5.32 10.96 N = 2,240
Between 1.21 5.32 10.96 n = 94
Within 0.00 7.35 7.35 T-bar = 23.830
log (population density) Overall 3.760 1.39 0.09 8.74 N = 2,519
Between 1.38 0.34 8.50 n = 97
Within 0.17 3.02 4.45 T-bar = 25.970
Muslim Overall 0.309 0.46 0.00 1.00 N = 2,522
Between 0.46 0.00 1.00 n = 97
Within 0.00 0.31 0.31 T = 26
Foreign aid Overall 38.101 54.79 �21.50 799.22 N = 2,061
Between 38.67 0.23 231.43 n = 87
Within 38.21 �198.97 790.57 T-bar = 23.690
Interest on debt servicing Overall 2.433 2.47 0.00 43.73 N = 1,778
Between 1.64 0.33 11.06 n = 78
Within 1.81 �7.30 35.10 T-bar = 22.795
Gender gap in education Overall 1.001 1.00 �2.08 3.81 N = 2,522
Between 0.96 �1.75 3.33 n = 97
Within 0.30 �0.95 2.37 T = 26
Female secondary enrollment Overall 53.908 32.67 1.63 117.00 N = 1,550
Between 32.10 3.81 110.08 n = 96
Within 9.26 13.76 94.91 T-bar = 16.146
Male education Overall 6.435 2.52 0.88 12.90 N = 2,522
Between 2.41 1.32 11.51 n = 97
Within 0.78 3.71 9.08 T = 26
Male secondary enrollment Overall 57.584 28.45 3.40 119.54 N = 1,550
Between 27.88 5.24 100.06 n = 96
Within 0.782 3.711 9.077 T = 26
Total education Overall 5.931 2.68 0.615 12.749 N = 2,522
Between 2.57 1.000 11.211 n = 97
Within 0.82 3.16 8.411 T = 26
Table 8. Extended sample—summary statistics
Variable Mean Std. Dev. Min Max Observations
Polity2 Overall �1.527 6.526 �10 10 N = 3,143
Between 4.632 �10 7.538 n = 123
Within 4.605 �16.258 10.358 T-bar = 25.553
Female education Overall 5.384 2.922 0.250 12.609 N = 2,574
Between 2.804 0.577 10.935 n = 99
Within 0.868 2.224 8.157 T = 26
Fertility rates Overall 4.306 1.877 1.080 8.310 N = 3,156
Between 1.748 1.444 7.787 n = 123
Within 0.703 1.855 7.007 T-bar = 25.658
Female labor force Overall 38.853 10.535 5.048 55.108 N = 3,195
Between 10.463 10.382 52.868 n = 123
Within 1.606 31.391 44.690 T-bar = 25.976
Urbanization Overall 45.642 22.652 4.339 100.000 N = 3,198
Between 22.433 6.765 100.000 n = 123
Within 3.720 28.185 59.700 T = 26
Economic growth Overall 0.038 0.074 �0.662 0.674 N = 2,593
Between 0.025 �0.036 0.145 n = 118
Within 0.070 �0.613 0.748 T-bar = 21.975
lngdp80 Overall 7.281 1.139 5.325 10.959 N = 2,733
Between 1.183 5.325 10.959 n = 118
Within 0.000 7.281 7.281 T-bar = 23.161
(Continued on next page)
FEMALE EMPOWERMENT AS A CORE DRIVER OF DEMOCRATIC DEVELOPMENT 53
Variable Mean Std. Dev. Min Max Observations
log (population density) Overall 3.709 1.335 0.086 8.744 N = 3,195
Between 1.329 0.336 8.497 n = 123
Within 0.170 2.974 4.404 T-bar = 25.976
Muslim Overall 0.333 0.471 0 1 N = 3,198
Between 0.473 0 1 n = 123
Within 0.000 0.333 0.333 T = 26
Foreign aid Overall 41.098 55.018 �21.498 799.215 N = 2,645
Between 39.893 0.232 231.429 n = 113
Within 37.168 �195.977 793.567 T-bar = 23.407
Interest on debt servicing Overall 2.217 2.352 0.002 43.728 N = 2,195
Between 1.577 0.331 11.057 n = 100
Within 1.688 �7.516 34.888 T-bar = 21.95
Gender gap in education Overall 1.017 1.006 �2.077 4.371 N = 2,574
Between 0.962 �1.747 3.328 n = 99
Within 0.307 �0.933 2.695 T = 26
Female secondary enrollment Overall 50.548 33.485 0.000 116.998 N = 1,848
Between 32.945 3.808 110.080 n = 120
Within 9.234 10.399 91.550 T-bar = 15.4
Male education Overall 6.401 2.516 0.879 12.899 N = 2,574
Between 2.404 1.317 11.512 n = 99
Within 0.781 3.677 9.043 T = 26
Male secondary enrollment Overall 54.760 29.322 2.966 124.497 N = 1,848
Between 28.778 5.237 100.062 n = 120
Within 8.362 15.961 91.501 T-bar = 15.4
Total education Overall 5.889 2.68 0.615 12.749 N = 2,574
Between 2.57 1.000 11.211 n = 97
Within 0.81 3.11 8.369 T = 26
Table 10. Comparison of countries that developed democratically by their level of female education and low fertility§
Countries that did develop democratically (Polity2 scores 6–10)
Began period with female education over
6 years
Over 6 years of education achieved during this period Below 6 years of education achieved during this period
A B C
Albania, Bulgaria, Chile, Croatia,
Czech Republic, Estonia, Guyana,
Hungary, South Korea,
Latvia, Lithuania, Moldova,
Panama, Russia, Slovak Republic,
Slovenia, Ukraine, and Uruguay
Bolivia, Brazil, El Salvador, Honduras, Lesotho, Mongolia,
Mexico, Namibia, Paraguay, South Africa, and Thailand
Bangladesh (4.85), Nicaragua (5.27), and Turkey* (5.5)
Countries that did not develop democratically (Polity2 score less than 6)
Began period with female education over
6 years
Over 6 years of education achieved during this period Below 6 years of education achieved during this period
D E F
Armenia, China, Cuba, and Kazakhstan Algeria*, Bahrain*, Gabon, Iran*, Jordan*, Kuwait*, Libya*,
Malaysia, Qatar*, Saudi Arabia*, Singapore, Swaziland, UAE*,
and Zimbabwe
Cambodia, Egypt*, Haiti, Laos, Morocco*,
Myanmar, Nepal, Pakistan*, Syria*, Tunisia*, Vietnam
§ Al countries in the table achieved a low fertility rate (<4 children per woman).* These countries have very low female labor force participation rates below 30%. Countries without * had achieved female labor force participation above30%.
Table 9. Muslim majority countries
Albania, Algeria, Azerbaijan, Bahrain, Bangladesh, Egypt, Gambia, Indonesia, Iran, Iraq, Jordan, Kazakhstan, Kuwait, Kyrgyzstan, Libya, Malaysia, Mali, Mauritania,
Morocco, Niger, Pakistan, Qatar, Saudi Arabia, Senegal, Sierra Leone, Sudan, Syria, Tajikistan, Tunisia, Turkey, Turkmenistan, United Arab Emirates, Uzbekistan (33)
54 WORLD DEVELOPMENT