Les bases culturelles de la parenté (The cultural grounding of kinship: A paradigm shift)

Molecular Ecology (2008) 17, 1361–1374 doi: 10.1111/j.1365-294X.2008.03670.x
© 2008 The AuthorsJournal compilation © 2008 Blackwell Publishing Ltd
Blackwell Publishing LtdFemale dispersal and male kinship–based association in southern hairy-nosed wombats (Lasiorhinus latifrons)
FAITH M. WALKER, ANDREA C. TAYLOR and PAUL SUNNUCKSAustralian Centre for Biodiversity, School of Biological Sciences, Monash University, Clayton 3800, Victoria, Australia
Abstract
Generalizations about sociobiology require investigations of species with diverse ecologicalroles and phylogenetic affiliations. The southern hairy-nosed wombat (Lasiorhinus lati-frons) is valuable here, in that it is a marsupial of semi-arid habitat, and one of the largestburrowing herbivores (commonly attaining 26 kg). Its sociobiology is poorly understoodbecause the species is nocturnal, shy, and difficult to observe or capture nondisruptively. Toinvestigate aspects of the species’ sociobiology in continuous habitat, we applied high-intensity, temporally replicated, noninvasive sampling and genotyping of hairs to identifyindividuals and their sex. Spatial relatedness (kinship) structure was estimated, and relatedto patterns of burrow-use. To understand the association of kinship with burrow/warren-sharing and preferential colocation between wombats, > 100 genetically ‘tagged’ individualsat Brookfield Conservation Park (Murraylands, South Australia) were ‘tracked’ throughmultiple seasons between 1999 and 2001. Dispersal was female-biased, and may be performedby females after breeding. Conversely, males were philopatric. Male kin relationships werecharacterized by preferential burrow- and warren-sharing among closely related males,often in associations lasting for years. In contrast, females under-associated with their closefemale relatives and did not form matrilineal groupings with potential for favourable kininteractions. This fundamental departure from the predominant mammalian pattern raisesquestions about the origins and maintenance of the system, which is now known from allthree species of wombat. The present study provides starting points to address those questionsby adding to our knowledge of longitudinal spatiotemporal associations and habitat use of amarsupial with the unusual system of female-biased dispersal, and by outlining robustmethodologies.
Keywords: dispersal, kinship, marsupial, microsatellites, molecular ecology
Received 10 August 2007; revision accepted 4 December 2007
Introduction
Kinship may influence sociality, mating systems, anddispersal. Aggregations of individuals tend to form as aconsequence of the distribution of critical resources or as ameans to decrease predation, and routes to sociality encom-pass cooperative behaviours as well as those associatedwith competition for resources (Alexander 1974). In mostwell-studied mammalian systems to date, female relatednessis the cornerstone of sociality, and kinship among females
in conjunction with male response is the proximatedeterminant of the social system (e.g. Michener 1983;Armitage 1986). Sociality and sex-biased dispersal likelycoevolve, and therefore should not be considered in isolationfrom one another. Most evolutionary models explainingsex-biased dispersal fall into those based on avoidance ofinbreeding (e.g. Dobson 1982), competition by relatedmales for mates (e.g. Moore & Ali 1984), and competitionby related females for resources (e.g. Greenwood 1980).Overwhelmingly, dispersal is natal and male-biased inplacental and marsupial mammals (Greenwood 1980;Dobson 1982; Waser & Jones 1983; Kraaijeveld-Smit et al.2002; Pope et al. 2005; Hazlitt et al. 2006; LawsonHandley & Perrin 2007). Studies of species with unusualkinship and dispersal patterns provide new levels of
Correspondence: Faith M. Walker, 2700 Woodlands VillageBoulevard, Suite 300-407, Flagstaff, AZ 86001, USA. Fax: (928)773-9201; E-mail: [email protected]

1362 F. M . WA L K E R , A . C . TAY L O R and P. S U N N U C K S
© 2008 The AuthorsJournal compilation © 2008 Blackwell Publishing Ltd
complexity to these general models (Pusey & Packer1987).
The marsupial southern hairy-nosed wombat (Lasi-orhinus latifrons) is large-bodied, herbivorous and burrow-dependent, occupying a range mostly restricted to semi-aridareas of the state of South Australia. Patterns of dispersalare uncharacterized and the importance of kinship to spa-tial and behavioural relationships is unknown, despiteradio-telemetry (Finlayson et al. 2005) and intensive yetminimally productive observational studies (Gaughwin1981). This burrowing marsupial is notoriously difficult toobserve: it is nocturnal, difficult to approach, and problem-atic to capture without a high level of disturbance. Further-more, determination of kin relationships among interactingwombats has not been undertaken to date. Althoughindividuals are suggested to avoid each other temporallyand spatially above and below ground (Gaughwin 1981;Evans 2000), ingredients for the evolution of somedegree of sociality are present: (i) individuals live inmixed-sex groups in interconnected burrows (‘warrens’);(ii) burrow-sharing occurs within nights (Walker et al. 2006),the animals are long-lived (in captivity: L. latifrons, 30+years; Lasiorhinus krefftii, 33+ years); and (iii) warren tenureis prolonged (at least 8 years for both sexes; Gaughwin1981).
In the Murraylands of South Australia, a hard calcareoussoil layer close to the surface appears to represent a con-straint against digging by wombats, causing an increase inwarren and group size, with impacts on social organizationand relatedness structure (Walker et al. 2007). Southernhairy-nosed wombats regularly use one to seven warrens(mean 1.45) to which they have high fidelity across years,share warrens (not necessarily simultaneously) with up to10 wombats, and have a home range area of less than 8 ha(Walker et al. 2006). The sexes do not differ in theseparameters, and there is some evidence that space use ofboth sexes increases when sufficient rains promote aspring mating season (Walker et al. 2006). Wombatreproduction is linked to plant growth and overwhelm-ingly involves a single offspring born to females eachyear or every other year (Gaughwin 1981; Gaughwin et al.1998).
Attributes of animal dispersal and their mating systemsdrive spatial structuring of genetic relatedness in popula-tions. Often relatives of one sex are clustered, and kinshipmay underlie patterns of affiliation owing to the effects ofkin selection (Hamilton 1963; Maynard Smith 1964). Byexamining spatial genetic structuring and relatednessdifferences between various classes of individuals, it isfeasible to deduce within-population processes (dispersal,relatedness structure, mating system) (Ross 2001; Lacey &Wieczorek 2004; Fredsted et al. 2005).
Although dispersal can be estimated by ecological tools(e.g. observation, trapping, and radio-tracking), this is
typically problematic for reasons including low probabilityof detecting events, cost, and time constraints (Stenseth &Lidicker 1992; Stow et al. 2001). A genetic approach canhelp alleviate these problems. For instance, dispersalbetween habitat patches by rock wallabies (Petrogale lateralis)was identified using molecular tools, but would have beenlogistically and financially infeasible to determine byradio-tracking because of the rarity of emigration and thelarge spatial and temporal scales over which it occurs(Eldridge et al. 2001). In addition, DNA analysis makescryptic or rare species amenable to study — without alteringbehaviour — because minimally invasive means can beemployed (Lorenzini et al. 2004; Bellemain et al. 2005;Walker et al. 2006), the methodology for which has comeof age (Piggott & Taylor 2003; Bonin et al. 2004; Waits &Paetkau 2005). Furthermore, genotypic data used for‘tagging’ individuals can also be used to estimate kin-ship, reproductive success, and gene flow (Sunnucks2000).
In the other two wombat species, the northern hairy-nosed(L. krefftii) and common wombat (Vombatus ursinus), dis-persal is female-biased (Banks et al. 2002; Walker 2004), andthere is radio-tracking, trapping and genetic evidencethat adult females disperse after breeding (Johnson &Crossman 1991; Banks et al. 2002). In these species, andthe few other species in which female dispersal after abreeding event (hereafter referred to as ‘breeding dis-persal’; sensu Greenwood 1980) has been documented,this form of dispersal has been hypothesized to enableoffspring to inherit an important resource that wouldotherwise be difficult to obtain (Harris & Murie 1984;Price & Boutin 1993; Berteaux & Bortin 2000). Under thisargument, by dispersing, adult females increase theirinclusive fitness via increased survivorship of off-spring. In northern hairy-nosed wombats, it has beensuggested that breeding dispersal effectively ‘bequeaths’established burrows to juveniles, and may thereby representa form of maternal investment (Johnson & Crossman1991). Burrow-sharing by kin has been examined in theendangered and demographically disrupted northernhairy-nosed wombat: same-sex but not opposite-sexoccupants of burrow-clusters were highly related (Tayloret al. 1997). Whether southern hairy-nosed wombats dolikewise is unknown.
The southern hairy-nosed wombat is an ideal candidatefor a noninvasive genetic approach to investigate dispersal— since, unlike with other methodologies, it is feasible tosample nearly all wombats that use a study area (Walkeret al. 2006, 2007). Here we present the results of a multiyearstudy of burrow- and warren-sharing in continuous habitat.In addition to dispersal, we infer whether an essentialresource like the burrow is likely to promote some degreeof sociality and whether associations among warrenmembers are kin-based.

S O U T H E R N H A I RY- N O S E D W O M B AT R E L AT E D N E S S S T R U C T U R E 1363
© 2008 The AuthorsJournal compilation © 2008 Blackwell Publishing Ltd
Methods
Study site, sampling, and genotyping
Brookfield Conservation Park (BCP), in the Murraylandsof South Australia, contains a large population of southernhairy-nosed wombats in relatively continuous habitat (theMurraylands has approximately 34 000 wombats within3500 km2; McGregor & Wells 1998; St John 1998). Between1999 and 2001, BCP wombats were remotely sampled byemploying a biannual hair-sampling regime within a1.8 × 0.5 km area with a burrow density of 262/km2 (Walkeret al. 2006). Double-sided adhesive tape was suspendedacross all burrow entrances (39 warrens consisting of 1–44burrows each), followed by checking and replacing tapesdaily for 5–7 days. Three sampling periods (September1999, October 2000, and September 2001) were in spring(the mating season; Gaughwin et al. 1998), and two werein autumn (March 2000 and April 2001). Genotyping wasperformed on single-hair extracts using 15 highly poly-morphic microsatellite markers and a sexing marker(details in Walker et al. 2006). DNA quantity and qualityare not significantly limiting as in many noninvasivesampling studies, because the protocol uses freshly plucked,large hair follicles that air-dry rapidly, with an efficientDNA extraction performed soon after in the field (Sloaneet al. 2000). The procedure has been fully validated viarigorous testing, gives a genotyping error rate of only ~0.3%,and is subject to stringent quality control procedures(Sloane et al. 2000; Banks et al. 2003; Piggott & Taylor 2003;Walker et al. 2006). Only DNA extracts with 100% allelesharing over a subset of the five most discriminating loci(mean HE = 0.74) and the sexing marker (SRY, Watson et al.1998) were attributed to the same wombat: less than onein a million randomly selected wombat pairs could beexpected to share the same multilocus genotype over thesefive loci (PID = 5.40 × 10⁻⁶; Waits et al. 2001). Subsequently,to obtain high-resolution estimates of relatedness andparentage, genotyping proceeded on a single representativeextract for each individual, for the remaining 10 loci. All
loci adhered to Hardy–Weinberg expectations and therewas no evidence of linkage disequilibrium between locuspairs (program genepop 3.3; Raymond & Rousset 1995).The sexing procedure, involving simultaneous polymerasechain reaction (PCR) amplification of a larger microsatelliteacting as an internal control for PCR success, was replicatedand unambiguous. Over 100 individuals (63 females, 39males) (Table 1) were detected, representing most if not allwombats frequenting the study area (as determined bya detection model and analyses analogous to capture–mark–recapture that produced very small 95% confidenceintervals around estimates of the number of wombats,Walker et al. 2006). Genotypes of individuals, the numberof detections per individual, and the sampling periods inwhich individuals were detected are available as Table S1,Supplementary material.
To obtain as much information as possible on relativeages of individuals — useful for identifying putativeyoung-at-foot ( juveniles approximately 6–12 months of age,no longer in the pouch but still dependent on the mother,Wells 1973) and directionality of first-order relationships —efforts were made to link genotypes with footprints underthe assumption that much younger wombats leave muchsmaller footprints than much older wombats. This wasachieved during the last three sampling periods by sprin-kling flour at the interior of burrows each time hairtapeswere set, and measuring new footprints. An individualwith genotype X was assumed to have made (for example)a large footprint if on at least two separate occasions geno-type X was the only one detected at a burrow when theonly fresh footprints were large.
Investigation of dispersal and philopatry
Genetic tools can provide measures of dispersal of thecategories indirect genic (via population allele frequencydata), direct genotypic (e.g. assignment tests of individuals),and indirect genotypic (e.g. mean pairwise relatedness orspatial autocorrelation over groups of individuals) (Stowet al. 2001; Prugnolle & de Meeus 2002; Telfer et al. 2003).The first of these, the classic approach, is incapable ofdiscriminating between current and historical gene flow.However, the recent development of genotypic dispersalestimators enables evaluation of short-term dispersal(Goudet et al. 2002; Berry et al. 2004). Four approaches wereapplied as outlined below.
Analysis of spatial genetic structure. To examine the rela-tionship between genetic and geographic distance for eachsex, spatial autocorrelation analysis was applied (programgenalex version 5.1; Peakall & Smouse 2001). Thisrequired that each individual be assigned a single point inspace, chosen as the arithmetic mean of the X and Y GPScoordinates of detections. Harmonic mean or other methods
Table 1 Number and sex of wombats detected each samplingperiod at BCP. The study site increased in size until the thirdsampling period
Sampling period
No. of females
No. of males
Total samples
Individuals detected multiple sampling periods (%)
September 1999 9 9 18 89March 2000 22 11 33 88October 2000 30 18 48 90April 2001 30 15 45 84September 2001 33 21 54 67

1364 F. M . WA L K E R , A . C . TAY L O R and P. S U N N U C K S
© 2008 The AuthorsJournal compilation © 2008 Blackwell Publishing Ltd
were not employed because of an insufficient numberof detections. Pairwise genetic distances were calculatedfrom genotypic data and transformed to an autocorrelation(‘relationship’) coefficient ‘r’, which has similar resolutionto Queller & Goodnight’s (1989) R, but is not directlycomparable (Smouse & Peakall 1999; P. Smouse, personalcommunication). Data from each sampling period andfrom the pooled analysis were explored at geographicdistance intervals ranging from 50 to 400 m. We presentdata from 250-m intervals because this distance providedthe greatest resolution, yielded good sample sizes in eachbin, and is approximately the average distance betweenwarrens.
Statistical significance was tested by permutatingindividual genotypes among locations 1000 times, aftereach of which r was recalculated, yielding 2.5% and 97.5%confidence limits: observed values outside this range areconsidered significant. Permutation testing is powerfuland not particularly sensitive to sample size (Peakall et al.2003). In addition, bootstrap testing was used to test whetherspatial genetic structure differed between male and femalewombats, since nonoverlapping bootstrap error barsindicate statistical significance (Peakall et al. 2003). In thisapproach, r was estimated by drawing with replacementfollowing Noreen (1989). A bootstrap r value was calculatedat each distance class, for 1000 bootstraps, and significancedetermined as above.
Assignment tests. To evaluate whether there was a sex-biasin dispersal, assignment tests were executed via theprogram geneclass (Cornuet et al. 1999), which performswell even when only one population is sampled or the truesource population is not sampled (Maudet et al. 2002).It employs population allele frequencies to assess thelikelihood of each individual’s genotype arising in asampled population, and was applied with the Bayesianapproach of Rannala & Mountain (1997), using the ‘leave-one-out’ option. Observed BCP allele frequencies were usedto simulate a population of 10 000 genotypes to whichindividual likelihoods were compared. Only individualsscored for more than 10 loci were included in the analysis.Randomization tests were employed to determine whetherthere was a sex-bias in assignment P values (10 000 permu-tations via resampling stats 5.0.2; Simon 1990). Thisprocedure is conservative where individual ages areunknown, because predispersal juveniles will tend to reduceany sex difference. To minimize this bias, putative young-at-foot, as suggested by parentage, burrow-use, number ofdetections, and/or footprint measurements were excludedfrom analysis when possible.
Parentage estimation. The most likely mother and/orfather of each individual were identified using the log-likelihood-based program cervus 2.0 (Marshall et al. 1998).
The average probability of excluding a randomly selectedunrelated wombat from parentage was > 0.999. The appli-cability of allele frequencies calculated from all individualsdetected during the study for parentage determination ineach sampling period was confirmed by testing for allelefrequency differentiation of each sampling period from thetotal sample (via genepop 3.3; Raymond & Rousset 1995).Since there was no prior knowledge of maternity, eachindividual (candidate offspring) was examined with allfemales (candidate mothers) as well as all males (candidatefathers), in separate simulations involving 10 000 cycles.Parameters were set at 50% of candidate parents sampled,95% of loci typed, and an error rate of 0.3% (the upper errorrate quantified for the present protocol, Sloane et al. 2000).Parentage was assigned when all of the following criteriawere satisfied: (i) LOD > 3.0 (Marshall et al. 1998); (ii) delta> 95% (Marshall et al. 1998); (iii) a maximum of one allelemismatched, and by no more than two base pairs; and (iv)said mismatch was associated with difficulty in scoring
The directionality of the relationship between parent–offspring pairs was ascertainable only for mother–father–offspring triads, or when convincing footprint informationwas available.
Analysis of pairwise relatedness. Pairwise genetic relatednesswas estimated from multilocus genotypes using theprogram kinship 1.2 (Goodnight et al. 1998). To investigatepatterns of relatedness within and between sex classes, meanpairwise relatedness of potentially interacting individualswas examined at three spatial and temporal levels, describedbelow and summarized in Table 2.
Investigation of association and kinship
We first determined which pairs of wombat were associatedwith one another more than expected by chance, and theninvestigated whether burrow–sharing and association (i.e.sharing a warren) were correlated with kinship.
Analysis of association. Pairs of individuals were consideredto be ‘associating’ if they were sampled in a warren duringthe same night. The simple ratio index (essentially thenumber of observations where a pair was coincidentdivided by the number of opportunities for this; Cairns &Schwager 1987) was employed for analysis of the degree ofassociation between wombat pairs. It performs well whenassociations are determined by group membership, and isstatistically unbiased relative to other association indices(Ginsberg & Young 1992). Values ranged from zero(wombats never detected in the same warren on the samenight) to unity (wombats always detected together). Theprogram socprog 1.3 (Whitehead & Default 1999; White-head 1999a; Whitehead et al. 2005) was used to test overalland pairwise associations for significant deviations from

SO
UT
HE
RN
HA
IRY
-NO
SE
D W
OM
BA
T R
EL
AT
ED
NE
SS
ST
RU
CT
UR
E1365
© 2008 T
he Authors
Journal compilation ©
2008 Blackw
ell Publishing Ltd
Table 2 Summary of mean pairwise relatedness investigation of wombat warren members of each sex
Spatial and temporal levelComparison between warren members Terminology in text Outcomes Interpretations
I. Burrow within nights Used same burrow entrance during same night vs. did not (feasible when two single-hair samples taken from tape originated from different wombats, n = 68)*
Within-night burrow sharer vs. nonsharer
Male P = 0.11 Female P = 0.29
Sharers similarly related to nonsharers
II. Burrow among nights Used same burrow entrance during sampling period vs. did not*
Among-night burrow sharer vs. nonsharer
Male P = 0.02 Female P = 0.42
Male sharers more related than nonsharers
III. Warren among nights (A) Significantly positively associated (shared the same warren during the same night) vs. could have (by virtue of inhabiting the same warren during the sampling period) but did not*
Associate vs. nonassociate Male P = 0.0001 Female P = 0.008
Male associating pairs more related and female associating pairs less related than were non-associating pairs
(B) Relationship between all pairwise association results (i.e. not restricted to only significantly associating pairs) and pairwise relatedness for each sex-class, employing three methods †‡§. Results from September 2001 presented, as this was the sampling period with the greatest activity, and hence detection of associating wombats
NA Male†P < 0.001‡§Significant
Female†P = 0.02‡§Significant
Males were positively associated according to their level of relatedness, irrespective of geographic distance; the reverse was true for females
*Significance tested by permutation (resampling stats 5.0.2).†Mantel testing (Smouse et al. 1986) involving 999 permutations of the data (program genalex version 5.1, Peakall & Smouse 2001) was employed to elucidate the general trend.‡Excel add-in poptools 2.5.5 (www.cse.csiro.au/poptools) was used to perform 10 000 randomizations of the relatedness and association matrices, computing each time mean association in the range of cells corresponding to specified relatedness classes. Significance within each relatedness class was ascribed if observed mean association was greater than 97.5% or less than 2.5% of randomizations.§Partial Mantel testing (Smouse et al. 1986), which compares two factors while controlling for a third by performing Mantel tests on residual matrices (program fstat 2.9.3; Goudet 1995), was used to examine the relationship between relatedness and association while factoring out geographic distance. This approach enables one to distinguish whether relatives preferentially associate or whether the association patterns observed are simply a reflection of the relatedness structure and dispersal system.NA, not applicable.

1366 F. M . WA L K E R , A . C . TAY L O R and P. S U N N U C K S
© 2008 The AuthorsJournal compilation © 2008 Blackwell Publishing Ltd
randomness by implementing permutations according toa Monte Carlo method (Manly 1995; Bejder et al. 1998;Whitehead 1999b). The permutations maintain populationsize, warren membership, and individual activity level.We wished to identify significantly associating pairs ofindividuals, as well as generate matrices of associationvalues, to facilitate an overlay of relatedness. We performed10 000 permutations for analysis of overall association, and100 000 permutations to define significantly associatingpairs (two-tailed P < 0.05). In the present study, data fromthe four 2000 and 2001 sampling periods were examined(September 1999 was excluded due to smaller sample size).
Relationship between burrow-sharing, association and kinshipof warren members. Permutation tests carried out inresampling stats 5.0.2 were used to examine kinship ofwarren-sharing wombat pairs of each sex class, at threespatial and temporal levels: the burrow within nights, theburrow among nights, and the warren among nights(Table 2). At the first level, mean pairwise relatedness ofwombats that shared burrow entrances during the samenight were compared to those that did not (this waspossible when both single-hair samples taken from a tapeoriginated from different wombats). At the second level,mean pairwise relatedness of wombats that sharedburrows during the sampling period were compared tothose that did not. At the third level, mean pairwiserelatedness of wombats that associated significantly wascompared to those that did not (i.e. those that inhabited thesame warren during the sampling period but did not sharewarrens significantly on the same nights). Further, threemethods were used to examine how kinship was relatedto all pairwise association results (i.e. not restricted tosignificantly associating pairs). To test for a generalrelationship, Mantel testing (Smouse et al. 1986) employing999 permutations (program genalex version 5.1) wasused. To determine the relatedness levels that drovethe results, a randomization procedure (poptools 2.5.5,www.cse.csiro.au/poptools) was performed in which therelatedness and association matrices were permuted 10 000times, each time computing the mean association in therange of cells corresponding to specified relatedness classes(N. B. classes were not standardized because of the inherentskew in relatedness between the sexes, and the decreasedsample size when the analysis was limited to associatingpairs only), and ascribing significance within each related-ness class when the observed mean association valuewas greater than that of 97.5% or less than 2.5% of therandomizations. To establish that these results were notsimply a reflection of the relatedness structure and dispersalsystem, we examined the relationship between relatednessand association while factoring out geographic distance bypartial Mantel testing (Smouse et al. 1986; program fstat2.9.3, Goudet 1995).
Results
Evidence for female-biased dispersal
Four lines of evidence, dealt with in detail below, betweenthem suggest female-biased dispersal, contrasting withstrong male philopatry that tends to lead to a relativelyhigh incidence of fathers and sons being colocated inwarrens.
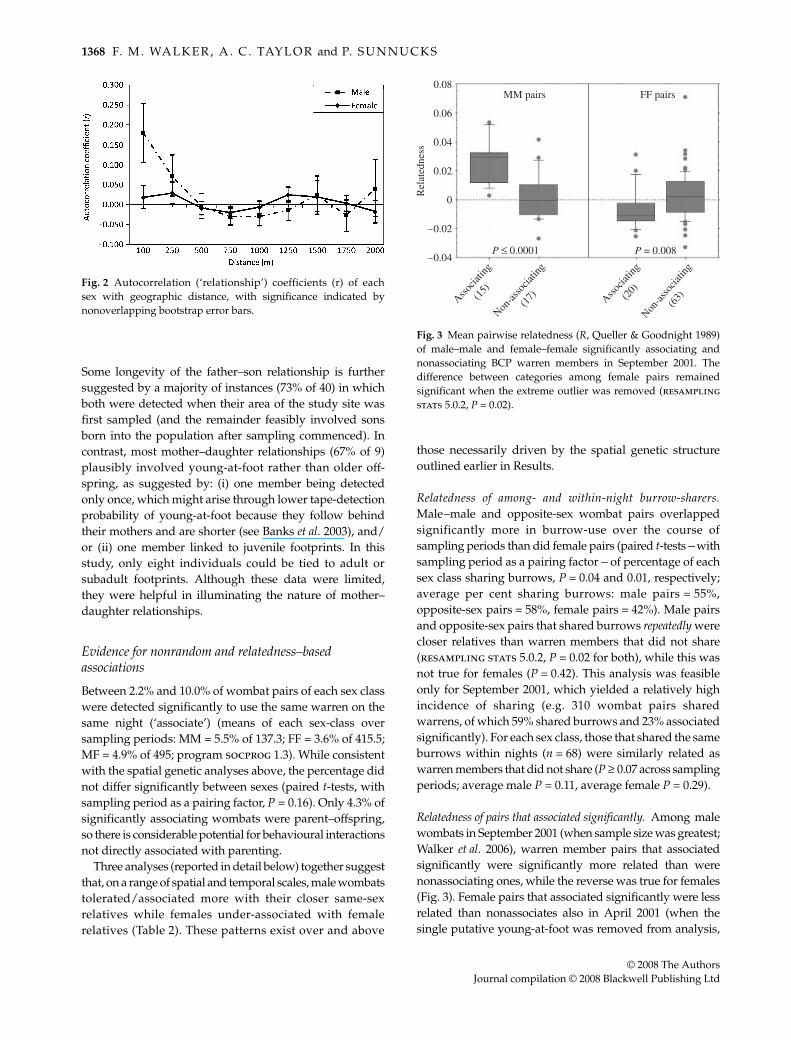
Spatial genetic structure. Results from each sampling periodwere similar to each other; thus, representative pooledanalyses (with each individual included only once) arepresented here. Male wombats were genetically similar tolocal rather than distant males: pairs exhibited significantpositive spatial genetic structure at 0–250 m but not at501–1000 m (Fig. 1). This result seems general across malerelatedness classes, since it did not change markedly whenassigned father–son pairs (below) were removed from theanalysis (at 0–100 m, the P value remained 0.001; at 101–250 m, the P value increased to 0.07). In contrast, femalewombats were more genetically similar to geographicallydistant females (Fig. 1, significant peaks at 101–250 m and1001–1250 m). The significant correlation at 101–250 m alsoappears in individual sampling periods, and seems to bedominated by moderately related pairs, whereas the peakat 1001–1250 m is not persistent and may not be biologicallymeaningful. Individual sampling periods are noninde-pendent in as much as 17% of females were detected in allsampling periods and an average of 82% of individualswere detected in > 1 sampling period. Overall, male pairshad more pronounced genetic structure than did femalepairs at the shortest distance class (0–100 m), as indicatedby significantly lower spatial autocorrelation coefficientsof females (Fig. 2: bootstrap tests, after Peakall et al. 2003).
Opposite-sex wombat pairs, as for males, exhibitedsignificantly positive spatial genetic structure at distancesup to 100 m but significantly negative structure at 400–800 m(Fig. 1). The former was caused by proximity of opposite-sexparent–offspring: although only 8% of pairs within 250 mof each other were inferred to be parent–offspring (below),the significantly positive spatial genetic structure at theshortest distance class became nonsignificant when thesepairs were removed from the analysis. In all sex classes,the oscillations near or around zero following signifi-cantly negative spatial structure indicate that samplingwas on a sufficient spatial scale to capture the extent ofspatial genetic structure in this population (Epperson & Li1997).
Assignment tests and sex differences in relatedness. Male wom-bats were more likely to have been born in the locale atwhich they were sampled (i.e. be philopatric) than werefemales, as estimated by significantly higher assignment

S O U T H E R N H A I RY- N O S E D W O M B AT R E L AT E D N E S S S T R U C T U R E 1367
© 2008 The AuthorsJournal compilation © 2008 Blackwell Publishing Ltd
values of males in the global analysis (resampling stats5.0.2, P = 0.05). This pattern was also seen in three individualsampling periods (P = 0.005 to 0.04). Female wombat pairswere on average significantly less related than were malepairs (P < 0.0001, global analysis).
Analysis of parentage. The delta criterion (Marshall et al.1998) was 3.79 at the 95% confidence level and 1.91 at the80% confidence level. Forty-three pairs (12 father–son, 9mother–daughter, and 22 father–daughter/mother–son) metthe parent–offspring criteria, five mother–father–offspringtriads were detected, and a third generation was identified.Two males were each inferred (from triad information)to have mated with two different females, althoughthe timescale over which this occurred could not bedetermined. Where parents were assigned, there were noother genetically compatible wombats in the sample. All43 accepted parent–offspring pairs shared an allele at allloci.
Parent–offspring burrow-use and longevity of colocation.Nearly all (89%) parent–offspring pairs shared warrens,and members were within 400 m of each other in theinstances where warren-use was not detected to overlap.All members of triads also shared warrens. Most (86%)father–son pairs overlapped in burrow-use, as well asrubbing-sites (objects such as trees, rocks or posts, uponwhich wombats rubbed themselves) (Walker et al. 2006), inall cases where both members were detected to use any.Half of all father–son pairs detected were members ofadditional parent–offspring relationships. One male was amember of four different parent–offspring relationships(with three other males and one female); at least three werehis offspring, and all frequented the same warren.
There was some evidence that father–son colocationswere longer-lasting than mother–daughter ones. Allinstances of significant father–son association lasted at leastuntil sons reached adulthood; sons were a minimum of2–3 years old as ascertained by sampling early in the study.
Fig. 1 Spatial genetic structure correlograms for each pairwise sex-class of southern hairy-nosed wombats at BCP. The sample size at eachdistance class is provided above each correlogram. The scale for the autocorrelation coefficients is not standardized because of the inherentskew in relatedness between the sexes.
1368 F. M . WA L K E R , A . C . TAY L O R and P. S U N N U C K S
© 2008 The AuthorsJournal compilation © 2008 Blackwell Publishing Ltd
Some longevity of the father–son relationship is furthersuggested by a majority of instances (73% of 40) in whichboth were detected when their area of the study site wasfirst sampled (and the remainder feasibly involved sonsborn into the population after sampling commenced). Incontrast, most mother–daughter relationships (67% of 9)plausibly involved young-at-foot rather than older off-spring, as suggested by: (i) one member being detectedonly once, which might arise through lower tape-detectionprobability of young-at-foot because they follow behindtheir mothers and are shorter (see Banks et al. 2003), and/or (ii) one member linked to juvenile footprints. In thisstudy, only eight individuals could be tied to adult orsubadult footprints. Although these data were limited,they were helpful in illuminating the nature of mother–daughter relationships.
Evidence for nonrandom and relatedness–based associations
Between 2.2% and 10.0% of wombat pairs of each sex classwere detected significantly to use the same warren on thesame night (‘associate’) (means of each sex-class oversampling periods: MM = 5.5% of 137.3; FF = 3.6% of 415.5;MF = 4.9% of 495; program socprog 1.3). While consistentwith the spatial genetic analyses above, the percentage didnot differ significantly between sexes (paired t-tests, withsampling period as a pairing factor, P = 0.16). Only 4.3% ofsignificantly associating wombats were parent–offspring,so there is considerable potential for behavioural interactionsnot directly associated with parenting.
Three analyses (reported in detail below) together suggestthat, on a range of spatial and temporal scales, male wombatstolerated/associated more with their closer same-sexrelatives while females under-associated with femalerelatives (Table 2). These patterns exist over and above
those necessarily driven by the spatial genetic structureoutlined earlier in Results.
Relatedness of among- and within-night burrow-sharers.Male–male and opposite-sex wombat pairs overlappedsignificantly more in burrow-use over the course ofsampling periods than did female pairs (paired t-tests — withsampling period as a pairing factor — of percentage of eachsex class sharing burrows, P = 0.04 and 0.01, respectively;average per cent sharing burrows: male pairs = 55%,opposite-sex pairs = 58%, female pairs = 42%). Male pairsand opposite-sex pairs that shared burrows repeatedly werecloser relatives than warren members that did not share(resampling stats 5.0.2, P = 0.02 for both), while this wasnot true for females (P = 0.42). This analysis was feasibleonly for September 2001, which yielded a relatively highincidence of sharing (e.g. 310 wombat pairs sharedwarrens, of which 59% shared burrows and 23% associatedsignificantly). For each sex class, those that shared the sameburrows within nights (n = 68) were similarly related aswarren members that did not share (P ≥ 0.07 across samplingperiods; average male P = 0.11, average female P = 0.29).
Relatedness of pairs that associated significantly. Among malewombats in September 2001 (when sample size was greatest;Walker et al. 2006), warren member pairs that associatedsignificantly were significantly more related than werenonassociating ones, while the reverse was true for females(Fig. 3). Female pairs that associated significantly were lessrelated than nonassociates also in April 2001 (when thesingle putative young-at-foot was removed from analysis,
Fig. 2 Autocorrelation (‘relationship’) coefficients (r) of eachsex with geographic distance, with significance indicated bynonoverlapping bootstrap error bars.
Fig. 3 Mean pairwise relatedness (R, Queller & Goodnight 1989)of male–male and female–female significantly associating andnonassociating BCP warren members in September 2001. Thedifference between categories among female pairs remainedsignificant when the extreme outlier was removed (resamplingstats 5.0.2, P = 0.02).

S O U T H E R N H A I RY- N O S E D W O M B AT R E L AT E D N E S S S T R U C T U R E 1369
© 2008 The AuthorsJournal compilation © 2008 Blackwell Publishing Ltd
P = 0.02). In all other sampling periods, differences were notstatistically significant. Finally, in all sampling periods,opposite-sex pairs that associated significantly did not differin relatedness from pairs that did not associate.
Correlation between relatedness and association. Male wombatpairs of higher relatedness associated to a greater extent(Mantel test, Table 2, † footnote; P < 0.001): pairs withQueller & Goodnight (1989) R = –0.24–0 showed significantunder association while those with R = 0.26–0.75 signifi-cantly over-associated (poptools randomization procedure,Table 2, ‡ footnote; Fig. 4). This pattern is consistent amongthe set of male wombats that associated positively.Furthermore, males associated more with male relativeseven on a distance-matched basis, i.e. when geographic
organization of individuals is factored out by partial Manteltesting (significant partial correlation between associationand relatedness, P = 0.02, R2 = 0.41, Table 2, § footnote).This remained true even within the subset of associatingmales (P = 0.03, R2 = 0.20).
In contrast to the pattern in males, female wombatsassociated with less-related females (Mantel test; P = 0.02).The negative relationship between mean association andrelatedness (poptools randomization procedure; Fig. 4) islikely a reflection of female dispersal. The spike of over-association in the highest relatedness category (R > 0.31)was driven by three of eight female pairs with R of around0.3 exhibiting high levels of association. Even amongassociating females, there was a tendency to associate lesswith closer relatives (Fig. 4). These patterns persisted when
Fig. 4 The relationship between relatedness (R, Queller & Goodnight 1989) and association among same-sex and opposite-sex wombatpairs at BCP. Sample sizes and P values (where significant) are provided above each bin, where significant, i.e. outside the dotted linesrepresenting the 97.5% and 2.5% confidence intervals for each distance class. Relatedness bins are not standardized because of the skew inrelatedness between the sexes and the need to maintain sample sizes; data were examined to ensure that choice of category would notchange biological inferences.

1370 F. M . WA L K E R , A . C . TAY L O R and P. S U N N U C K S
© 2008 The AuthorsJournal compilation © 2008 Blackwell Publishing Ltd
geographic distance was factored out (Table 2, § footnote).Results were significant when the relationship was bro-ken into distance bins (Table 3), but were not significantoverall (P = 0.10, R2 = 0.44), reflecting a nonlinear relation-ship. These patterns that females avoided female relativeson a distance-matched basis may reflect a fine-grainedprocess, such as females tending to share burrows withnonrelatives rather than available relatives in the samewarren.
Relatedness structure is likely to be responsible for theoverall moderate increase in average association withrelatedness among all opposite-sex pairs (poptools rand-omization procedure; Fig. 4). The decline in associationamong the most related group of opposite-sex associates isthe pattern expected under inbreeding avoidance.
Discussion
Female bias in dispersal in southern hairy-nosed wombatsis suggested by spatial genetic structure, assignment tests,parentage data, and pairwise relatedness with respect toburrow–sharing and association. Males were clearly morelikely to have been born locally, while females were morelikely to have immigrated into the sampled area. This ispresumably a general feature of the species’ biology sinceit was also found in another population in continuous habitat(Walker et al. 2007). Although female-biased dispersal isvery rare among mammals (notably in California mouse,Peromyscus californicus, Ribble 1992; chimpanzee, Pantroglodytes, Morin et al. 1994; hamadryas baboon, Papiohamadryas, Hammond et al. 2006; greater white-toothedshrew, Crocidura russula, Favre et al. 1997; North Americanporcupine, Erethizon dorsatum, Sweitzer & Berger 1998; bush
hyrax, Heterohyrax brucei, Gerlach & Hoeck 2001), thisresult is concordant with what has been found for the othertwo wombat species (northern hairy-nosed wombat,Lasiorhinus krefftii, Johnson & Crossman 1991; Taylor et al.1997; Walker 2004; common wombat, Vombatus ursinus,Banks et al. 2002) and shows the phenomenon to be typicalfor wombats. This consistency was far from a foregoneconclusion, because L. krefftii is known only from a singlepopulation in tropical grassy woodland, and V. ursinus isa morphologically distinct species that occupies muchwetter and often higher-altitude habitat than either of thehairy-nosed wombats. The occurrence of female-biaseddispersal in a third and semi-arid-adapted wombat speciesindicates that the system operates over a wide range ofecological conditions. Thus, it seems that there are consistentecological factors and/or phylogenetic constraint promotingfemale dispersal in wombats.
Male philopatry and relationships between males
Male relatives were highly spatially clustered, indicatingthat philopatry is pronounced in male southern hairy-nosedwombats. Male philopatry is rare in mammals (e.g. NorthAmerican pikas Ochotona princeps Brandt 1989; Ethiopianwolves Canis simensis, Sillero-Zubiri et al. 1996; Randallet al. 2007; greater white-toothed shrews Crocidura russula,Favre et al. 1997; some primates, Sterck 1998; Gerloff et al.1999; some bottleneck dolphin Tursiops truncatus popula-tions, Parsons et al. 2003). Philopatry is thought to conferadvantages such as reduced dispersal-related predationand associated energetic costs, familiarity with the natalrange, and favourable interactions with relatives(Greenwood 1980).
Table 3 The relationship between pairwiserelatedness and association (sharing awarren on the same nights) of BCP wombats— controlling for geographic distance — asdetermined by partial Mantel tests.R, Queller & Goodnight’s (1989) relatedness;GGD, geographic distance. For each distancecategory, the first P value refers to therelatedness variable with geographicdistance factored out, and the second tothe geographic distance variable withrelatedness factored out
Pairs within(Partial) correlation R2 N P value
Male 0–100 m R –0.24 0.08 15 0.53log GGD –0.16 0.55
0–200 m R 0.16 0.04 28 0.39log GGD –0.10 0.60
0–300 m R 0.36 0.20 41 0.08log GGD –0.28 0.08
0–500 m R 0.40 0.31 65 0.05log GGD –0.38 0.002
Female 0–100 m R –0.39 0.19 38 0.01log GGD –0.20 0.23
0–200 m R –0.28 0.23 57 0.04log GGD –0.38 0.004
0–300 m R –0.18 0.31 97 0.07log GGD –0.53 0.0001
0–500 m R –0.14 0.35 148 0.10log GGD –0.58 0.0001

S O U T H E R N H A I RY- N O S E D W O M B AT R E L AT E D N E S S S T R U C T U R E 1371
© 2008 The AuthorsJournal compilation © 2008 Blackwell Publishing Ltd
Male Lasiorhinus latifrons associated with their close malekin. First-order male relatives overlapped in burrow- andwarren-use and were involved in long–term spatiotemporalassociation. Related male wombats tended to share burrowsand highly related male pairs associated most frequently,even when controlling for the inevitable proximity causedby membership in the same warren: males that associatedwere even more related than average for the warren. It doesnot seem plausible that factors such as disturbance bypotential predators driving correlated warren-use couldgenerate relatedness-specific patterns within warrens.Thus, it seems most likely that male wombats showed somepreference for physical proximity and/or burrow-sharingwith their close male kin. In the absence of some coincidentalkin-biased organizing factor, this might reflect kin-basedtolerance among males. The longevity of wombats andapparent long-lasting association between close malerelatives present prerequisites for development of toler-ance. Among mammals, association between male relativesas opposed to nonrelatives has been attributed to inclusivefitness benefits gained from cooperative behaviour. Forinstance, African lion (Panthera leo) brothers may establisha pride together despite competing for matings (Packeret al. 1991).
Male philopatry is unusual, and in southern hairy-nosedwombats, it is seen alongside excess associations betweenclose male relatives. To explain this pattern, an obviouscandidate selective advantage for future testing is whethermales share burrows/warrens with male relatives becauseburrows are important resources for potential femalemates, and are more easily maintained and defended withassistance (Johnson 1998). This tendency may be exaggeratedat BCP since subsurface sheet calcrete in this area appearsto have constrained the number of sites at which burrowscan be constructed (Walker et al. 2007), and therefore,burrows and warrens may be a limited resource.
Female dispersal and relationships between females
Female L. latifrons relatives were less spatially clusteredthan males, as would be expected when dispersal isfemale-biased. A consistent relatedness peak of females (inthe range 0.2–0.4, spanning that expected for half-sibs upto sibs or mother–daughter; Queller & Goodnight 1989)occurred, separated by 101–250 m, the typical distancebetween warrens. Also, females associated with less-relatedmembers of their sex. These observations are unusual foranimal species, and candidate explanations demand someexploration. The patterns could be contributed to by nataldispersal, although there is little evidence for dispersal byjuveniles in the other species of wombat (Johnson &Crossman 1991; Banks et al. 2002). The data are alsoconsistent with the breeding dispersal hypothesis posed byJohnson & Crossman (1991) for L. krefftii, formulated on the
basis of radio-tracking and trapping. At present, it isinconclusive whether one or both of these hypotheses arecorrect for L. latifrons. Natal dispersal is commonplace inanimals and could apply here. Breeding dispersal inanimals has been observed where offspring survival is tiedto a resource that is problematic for them to secure alone(references in Introduction). Such a situation pertains towombats: burrow construction is energetically expensive,and adult, female L. krefftii successfully undergo dispersalto new burrow systems (Banks et al. 2003; Johnson &Crossman 1991). To substantiate the presence of breedingdispersal and examine its characteristics, long-termelectronic and/or genetic tracking of a substantial numberof females could be applied. This is occurring for L. krefftiivia the ongoing census by remote hair collection andgenotyping (Banks et al. 2003). A similar approach could beapplied to L. latifrons.
Synthesis with evolutionary models for sex-biased dispersal
A simple, single evolutionary model is very unlikely toexplain the direction of sex-biased dispersal in the majorityof species, and seems even more unlikely to explain it in theexceptional cases, of which wombats are clearly one.Discerning studies of sex-biased dispersal (e.g. Hammondet al. 2006; Randall et al. 2007) have shown that there islikely to be a balance between two or more modelled forces.Models commonly predict that in polygynous matingsystems high local mate competition should foster male-biased dispersal, while in monogamous systems high localresource competition should cause female-biased dispersal.Wombats appear to be polygynous (lack of paternal care,mating with multiple females; Banks et al. 2002; this study),yet exhibit a female dispersal bias. They also displayevidence of inbreeding avoidance, suggested as a pre-dominant cause of sex-biased dispersal (Greenwood 1980;Moore & Ali 1984; Pusey 1987). Male philopatry andfemale-biased dispersal should tend to lead to lowrelatedness among potential mates, as was the case in thepresent study once parent–offspring pairs (potentiallypredispersal) were removed from consideration. If theseparent–offspring pairs are subsequently separated bydispersal, the genetic structure detected is consistent withreduced potential for inbreeding through female-biaseddispersal. In addition, heterosexual neighbours of higherrelatedness tended to be more avoiding of each other.
Owing to the limited behavioural and ecological infor-mation for L. latifrons, it is difficult to assess inbreedingavoidance and resource and mate competition modelsto explain female-biased dispersal in wombats. The mostobviously atypical attributes of wombats as mammals isthat they are very large burrowers with a diet of low qualityforage (Evans 2000). Burrow dependence together with the

1372 F. M . WA L K E R , A . C . TAY L O R and P. S U N N U C K S
© 2008 The AuthorsJournal compilation © 2008 Blackwell Publishing Ltd
likely high cost of digging them relative to the animal’sresources is the type of idiosyncratic factor that could over-turn model generalities. Understanding more about therelative costs and benefits of female and male dispersal, themating system (including the details of assumed polygyny),and the costs and benefits of different resources for bothsexes and life stages (e.g. adult vs. juvenile), is key to movingbeyond speculation about the forces favouring female-biased dispersal in this system. We suggest approaches toinvestigations of two main issues that may be central tounderstanding female-biased dispersal and male philopatryin wombats: (i) the costs of female dispersal relative to thefitness benefits of bequeathal of burrows to offspring, and(ii) the fitness benefits accrued by philopatric males vialocal resource defence and/or cooperation. Additionally,comparing among the three wombat species, and differentpopulations within species, has some potential to shedlight on the issue.
Conclusions
Male southern hairy-nosed wombats are the philopatric,kinship-based, preferentially associating sex. This is afundamental departure from the predominant mammalianpattern, and raises intriguing questions about the originsand maintenance of the system. All three wombat speciesare now known to show this pattern, suggesting importantdrivers to be phylogenetic constraint and/or commonecological pressures, such as dependence on energeticallyexpensive burrows. This work illustrates the utility offusing noninvasive genetic sampling with analyticaladvances as a means to investigate components ofsociobiology in a species that has hitherto proven barelytractable to study in the field.
Acknowledgements
The National Geographic Society and Mark Mitchell Fund providedfunding for this project, and Monash University awarded a LoganResearch Fellowship to A.C.T., and Monash Graduate, Inter-national Postgraduate, and Doctoral Completion Scholarships toF.M.W. We thank P. Smouse for statistical advice, M. Bruford, M.Eldridge, F. S. Dobson, C. Nunn and seven anonymous referees forcomments on earlier versions of this manuscript, H. Whitehead foradvice regarding program socprog 1.3, B. & J. Cleaver for accessto captive wombats for footprint measurements, and the SouthAustralian Department of Environment and Heritage for permissionto work at Brookfield Conservation Park. This is a publication ofthe Australian Centre for Biodiversity.
References
Alexander RD (1974) The evolution of social behaviour. AnnualReview of Ecology and Systematics, 5, 325–383.
Armitage KB (1986) Marmot polygyny revisited: determinants of
male and female reproductive strategies. In: Ecological Aspects ofSocial Evolution (eds Rubenstein DI, Wrangham RW), pp. 303–331.Princeton University Press, Princeton, New Jersey.
Banks SC, Skerratt LF, Taylor AC (2002) Female dispersal andrelatedness structure in common wombats (Vombatus ursinus).Journal of Zoology, 256, 389–399.
Banks SC, Hoyle SD, Horsup AB, Sunnucks P, Taylor AC (2003)Demographic monitoring of an entire species by genetic analysisof non-invasively collected material. Animal Conservation, 6, 101–107.
Bejder L, Fletcher D, Brager S (1998) A method for testing associationpatterns of social animals. Animal Behaviour, 56, 719–725.
Bellemain E, Swenson JE, Tallmon DA, Brunberg S, Taberlet P(2005) Estimating population size of elusive animals with DNAfrom hunter-collected feces: four methods for brown bears.Conservation Biology, 19, 150–161.
Berry O, Tocher MD, Sarre SD (2004) Can assignment tests measuredispersal? Molecular Ecology, 13, 551–561.
Berteaux D, Bortin S (2000) Breeding dispersal in female NorthAmerican red squirrels. Ecology, 81, 1311–1326.
Bonin A, Bellemain E, Bronken Eidensen P, Pompanon F, Broch-mann C, Taberlet P (2004) How to track and assess genotypingerrors in population genetic studies. Molecular Ecology, 13, 3261–3273.
Brandt CA (1989) Mate choice and reproductive success of pikas.Animal Behaviour, 37, 118–132.
Cairns SJ, Schwager SJ (1987) A comparison of association indices.Animal Behaviour, 35, 1454–1469.
Cornuet JM, Piry S, Luikart G, Estoup A, Solignac M (1999) Newmethods employing multilocus genotypes to select or excludepopulations as origins of individuals. Genetics, 153, 1989–2000.
Dobson FS (1982) Competition for mates and predominantjuvenile male dispersal in mammals. Animal Behaviour, 30,1183–1192.
Eldridge MDB, Kinnear JE, Onus ML (2001) Source population ofdispersing rock wallabies (Petrogale lateralis) identified byassignment tests on multilocus genotypic data. Molecular Ecology,10, 2867–2876.
Epperson BK, Li TQ (1997) Gene dispersal and spatial geneticstructure. Evolution, 51, 672–681.
Evans MC (2000) Ecological energetics of wombats. PhD Thesis,University of New England, NSW, Australia.
Favre L, Balloux F, Goudet J, Perrin N (1997) Female-biaseddispersal in the monogamous mammal Crocidura russula:evidence from field data and microsatellite patterns. Proceedingsof the Royal Society B: Biological Sciences, 264, 127–132.
Finlayson GR, Shimmin GA, Temple-Smith PD, Handasyde KA,Taggart DA (2005) Burrow use and ranging behaviour of thesouthern hairy-nosed wombat (Lasiorhinus latifrons) in theMurraylands, South Australia. Journal of Zoology, 265, 189–200.
Fredsted T, Pertoldi C, Schierup MH, Kappeler PM (2005) Micro-satellite analyses reveal fine-scale genetic structure in grey mouselemur (Microcebus murinus). Molecular Ecology, 14, 2363–2372.
Gaughwin MD (1981) Socio-ecology of the hairy-nosed wombat(Lasiorhinus latifrons) in the Blanche Town region of SouthAustralia. PhD Thesis, University of Adelaide, SA, Australia.
Gaughwin MD, Breed WG, Wells RT (1998) Seasonal reproductionin a population of southern hairy-nosed wombats Lasiorhinuslatifrons in the Blanchetown region of South Australia. In:Wombats (eds Wells RT, Pridmore PA), pp. 109–112. SurreyBeatty & Sons, Chipping Norton, NSW, Australia.

S O U T H E R N H A I RY- N O S E D W O M B AT R E L AT E D N E S S S T R U C T U R E 1373
© 2008 The AuthorsJournal compilation © 2008 Blackwell Publishing Ltd
Gerlach G, Hoeck HN (2001) Islands on the plains: metapopulationdynamics and female biased dispersal in hyraxes (Hyracoidea) inthe Serengeti National Park. Molecular Ecology, 10, 2307–2317.
Gerloff U, Hartung B, Fruth B, Hohmann G, Tautz D (1999) Intra-community relationships, dispersal pattern and paternitysuccess in a wild living community of Bonobos (Pan paniscus)determined from DNA analysis of faecal samples. Proceedings ofthe Royal Society B: Biological Sciences, 266, 1189–1195.
Ginsberg JR, Young TP (1992) Measuring association betweenindividuals or groups in behavioural studies. Animal Behaviour,44, 377–379.
Goodnight KF, Queller DC, Poznansky T (1998) KINSHIP 1.2. GoodnightSoftware. Rice University, Houston, Texas.
Goudet J (1995) fstat (version 1.2): a computer program to calculateF-statistics. Journal of Heredity, 86, 485–486.
Goudet J, Perrin N, Waser P (2002) Tests for sex-biased dispersalusing bi-parentally inherited genetic markers. Molecular Ecology,11, 103–1114.
Greenwood PJ (1980) Mating systems, philopatry and dispersal inbirds and mammals. Animal Behaviour, 28, 1140–1162.
Hamilton WD (1963) The evolution of altruistic behavior. AmericanNaturalist, 97, 354–356.
Hammond RL, Lawson Handley LJ, Winney BJ, Bruford MW,Perrin N (2006) Genetic evidence for female-biased dispersaland gene flow in a polygynous primate. Proceedings of the RoyalSociety B: Biological Sciences, 276, 479–484.
Harris MA, Murie JO (1984) Inheritance of nest sites in femaleColumbian ground squirrels. Behavioral Ecology and Sociobiology,15, 97–102.
Hazlitt SL, Sigg DP, Eldridge MDB, Goldizen AW (2006) Restrictedmating dispersal and strong breeding group structure in amid-sized marsupial mammal (Petrogale penicillata). MolecularEcology, 15, 2997–3007.
Johnson CN (1998) The evolutionary ecology of wombats. In:Wombats (eds Wells RT, Pridmore PA), pp. 34–41. Surrey Beatty& Sons, Chipping Norton, NSW, Australia.
Johnson CN, Crossman DG (1991) Dispersal and social organizationof the northern hairy-nosed wombat, Lasiorhinus krefftii. Journal ofZoology, 225, 605–613.
Kraaijeveld-Smit FJL, Lindenmayer DB, Taylor AC (2002) Dispersalpatterns and population structure in a small marsupial, Antechinusagilis, from two forests analysed using microsatellite markers.Australian Journal of Zoology, 50, 325–338.
Lacey EA, Wieczorek JR (2004) Kinship in colonial tuco-tucos:evidence from group composition and population structure.Behavioral Ecology, 15, 988–996.
Lawson Handley LJ, Perrin N (2007) Advances in our understandingof mammalian sex-biased dispersal. Molecular Ecology, 16, 1559–1578.
Lorenzini R, Posillico M, Lovari S, Petrella A (2004) Non-invasivegenotyping of the endangered Apennine brown bear: a casestudy not to let one’s hair down. Animal Conservation, 7, 199–209.
Manly BFJ (1995) A note on the analysis of species co-occurrences.Ecology, 76, 1109–1116.
Marshall TC, Slate J, Kruuk LEB, Pemberton JM (1998) Statisticalconfidence for likelihood-based paternity inference in naturalpopulations. Molecular Ecology, 7, 639–655.
Maudet C, Miller CH, Bassano B et al. (2002) Microsatellite DNAand recent statistical methods in wildlife conservationmanagement: applications in Alpine ibex [Capra ibex (ibex)].Molecular Ecology, 11, 421–436.
Maynard Smith J (1964) Group selection and kin selection. Nature,201, 1145–1147.
McGregor F, Wells RT (1998) Population status of the southernhairy-nosed wombat Lasiorhinus latifrons in the Murraylandsof South Australia. In: Wombats (eds Wells RT, Pridmore PA),pp. 228 –242, Surrey Beatty & Sons, Chipping Norton, NSW,Australia.
Michener GR (1983) Kin identification, matriarchies, and theevolution of sociality in ground-dwelling sciurids. In:Advances in the Study of Mammalian Behaviour. Special PublicationNo. 7 (eds Eisenberg JF, Kleiman DG), pp. 528–572. AmericanSociety of Mammalogists, Shippensberg, Pennsylvania.
Moore J, Ali R (1984) Are dispersal and inbreeding avoidancerelated? Animal Behaviour, 32, 94–112.
Morin PA, Moore JJ, Chakraborty R, Jin L, Goodall J, Woodruff DS(1994) Kin selection, social structure, gene flow, and the evolutionof chimpanzees. Science, 265, 1193–1201.
Noreen EW (1989) Computer Intensive Methods for Testing Hypotheses:An Introduction. John Wiley & Sons, New York.
Packer C, Gilbert DA, Pusey AE, O’Brien SJ (1991) A moleculargenetic analysis of kinship and cooperation in African lions.Nature, 351, 562–565.
Parsons KM, Durban JW, Claridge DE, Balcomb KC, Noble JC,Thompson PM (2003) Kinship as a basis for alliance formationbetween male bottlenose dolphins, Tursiops truncatus, in theBahamas. Animal Behaviour, 66, 185–194.
Peakall R, Smouse PE (2001) genalex version 5: genetic analysisin Excel. Population Genetic Software for Teaching and Research.Australian National University, Canberra.
Peakall R, Ruibal M, Lindenmayer DB (2003) Spatial autocorrela-tion analysis offers new insights into gene flow in the Australianbush rat, Rattus fuscipes. Evolution, 57, 1182–1195.
Piggott MP, Taylor AC (2003) Remote collection of animal DNAand its applications in conservation management and under-standing the population biology of rare and cryptic species.Wildlife Research, 30, 1–13.
Pope LC, Blair D, Johnson CN (2005) Dispersal and populationstructure of the rufous bettong, Aepyprymnus rufescens (Marsu-pialia: Potoroidae). Austral Ecology, 30, 572–580.
Price K, Boutin S (1993) Territory bequeathal by red squirrel mothers.Behavioral Ecology, 4, 144–150.
Prugnolle F, de Meeus T (2002) Inferring sex-biased dispersal frompopulation genetic tools: a review. Heredity, 88, 161–165.
Pusey AE (1987) Sex-biased dispersal and inbreeding avoidancein birds and mammals. Trends in Ecology & Evolution, 2, 295–299.
Pusey AE, Packer C (1987) Dispersal and philopatry. In: PrimateSocieties (eds Smuts BB, Cheney DL, Seyfarth RM, WranghamRW, Struhsaker TT), pp. 250–266. University of Chicago Press,Chicago, Illinois.
Queller DC, Goodnight KF (1989) Estimating relatedness usinggenetic markers. Evolution, 43, 258–275.
Randall DA, Pollinger JP, Wayne RK, Tallents LA, Johnson PJ,Macdonald DW (2007) Inbreeding is reduced by female-biaseddispersal and mating behavior in Ethiopian wolves. BehavioralEcology, 18, 579–589.
Rannala B, Mountain JL (1997) Detecting immigration by usingmultilocus genotypes. Proceedings of the National Academy ofSciences, USA, 94, 9197–9221.
Raymond M, Rousset F (1995) genepop (version 1.2): populationgenetics software for exact tests and ecumenicism. Journal ofHeredity, 86, 248–250.

1374 F. M . WA L K E R , A . C . TAY L O R and P. S U N N U C K S
© 2008 The AuthorsJournal compilation © 2008 Blackwell Publishing Ltd
Ribble DO (1992) Dispersal in a monogamous rodent, Peromyscuscalifornicus. Ecology, 73, 859–866.
Ross KG (2001) Molecular ecology of social behaviour: analyses ofbreeding systems and genetic structure. Molecular Ecology, 10,265–284.
Sillero-Zubiri C, Gottelli D, Macdonald DW (1996) Male philopatry,extra-pack copulations and inbreeding avoidance in Ethiopianwolves (Canis simensis). Behavioral Ecology and Sociobiology, 38,331–340.
Simon JL (1990) resampling stats 5.0.2. Resampling Stats, Inc.,http://www.resample.com.
Sloane MA, Sunnucks P, Alpers DL, Beheregaray LB, Taylor AC(2000) Highly reliable genetic identification of individual northernhairy-nosed wombats from remotely collected hairs: a feasiblecensusing method. Molecular Ecology, 9, 1233–1240.
Smouse PE, Long JC, Sokal RR (1986) Multiple regression and cor-relation extensions of the Mantel test of matrix correspondence.Systematic Zoology, 35, 627–632.
Smouse PE, Peakall R (1999) Spatial autocorrelation analysis ofindividual multiallele and multilocus genetic structure. Heredity,82, 561–573.
St John BJ (1998) Management of southern hairy-nosed wombatsLasiorhinus latifrons in South Australia. In: Wombats (eds WellsRT, Pridmore PA), pp. 228–242. Surrey Beatty & Sons, ChippingNorton, NSW, Australia.
Stenseth NC, Lidicker WZ (1992) Where do we stand methodolo-gically about experimental design and methods of analysis inthe study of dispersal? In: Animal Dispersal: Small Mammals asa Model (eds Stenseth NC, Lidicker WZ), pp. 295–318. Chapman& Hall, London.
Sterck EHM (1998) Female dispersal, social organization, andinfanticide in langurs: are they linked to human disturbance?American Journal of Primatology, 44, 235–254.
Stow AJ, Sunnucks P, Briscoe DA, Gardner MG (2001) Theimpact of habitat fragmentation on dispersal of Cunningham’sskink (Egernia cunninghami): evidence from allelic and geno-typic analyses of microsatellites. Molecular Ecology, 10, 867–878.
Sunnucks P (2000) Efficient genetic markers for populationbiology. Trends in Ecology & Evolution, 15, 199–203.
Sweitzer RA, Berger J (1998) Evidence for female-biased dispersalin North American porcupines (Erethizon dorsatum). Journal ofZoology, 244, 159–166.
Taylor AC, Horsup A, Johnson CN, Sunnucks P, Sherwin B (1997)Relatedness structure detected by microsatellite analysis andattempted pedigree reconstruction in an endangered marsupial,the northern hairy-nosed wombat Lasiorhinus krefftii. MolecularEcology, 6, 9–19.
Telfer S, Piertney SB, Dallas JF et al. (2003) Parentage assignmentdetects frequent and large-scale dispersal in water voles. MolecularEcology, 12, 1939–1949.
Waits LP, Luikart G, Taberlet P (2001) Estimating the probability ofidentity among genotypes in natural populations: cautions andguidelines. Molecular Ecology, 10, 249–256.
Waits LP, Paetkau D (2005) New non-invasive genetic samplingtools for wildlife biologists: a review of applications and recom-mendations for accurate data collection. Journal of WildlifeManagement, 69, 1419–1433.
Walker FM (2004) Sociobiology inferred from relatedness structure via
remotely-collected DNA in southern hairy-nosed wombats (Lasiorhinuslatifrons). PhD Thesis, Monash University, Victoria, Australia.
Walker FM, Sunnucks P, Taylor AC (2006) Genotyping of ‘captured’hairs reveals burrow use and ranging behavior of southernhairy-nosed wombats. Journal of Mammalogy, 87, 690–699.
Walker FM, Taylor AC, Sunnucks P (2007) Does soil type drivesocial organization in southern hairy-nosed wombats? MolecularEcology, 16, 199–208.
Waser PM, Jones WT (1983) Natal philopatry among solitarymammals. Quarterly Review of Biology, 58, 355–390.
Watson CM, Margan SH, Johnston PG (1998) Sex-chromosomeelimination in the bandicoot Isoodon macrourus using Y-linkedmarkers. Cytogenetics and Cell Genetics, 81, 54–59.
Wells RT (1973) Physiological and behavioural adaptations of the hairy-nosed wombat (Lasiorhinus latifrons Owen) to its arid environment.PhD Thesis, University of Adelaide, SA, Australia.
Whitehead H (1999a) SOCPROG 1.2 (for MATLAB 5.1): Programs for Analys-ing Social Structure. Dalhousie University, Nova Scotia, Canada.
Whitehead H (1999b) Testing association patterns of socialanimals. Animal Behaviour, 57, F26–F29.
Whitehead H, Default S (1999) Techniques for analyzing verte-brate social structure using identified individuals: review andrecommendations. Advances in the Study of Behavior, 28, 33–74.
Whitehead H, Bejder L, Ottensmeyer (2005) Testing associationpatterns: issues arising and extensions. Animal Behaviour, 69,e1–e6.
This is one of a quartet of primary data papers resulting fromFaith Walker’s PhD research, which aimed to understand aspectsof the southern hairy-nosed wombat’s sociobiology under naturalconditions and under human-caused perturbation by employinglarge-scale noninvasive sampling of hairs to secure genotype.Andrea Taylor is a Senior Research Follow who has for many yearsfocussed on applying molecular genetic analysis to a variety ofquestions in marsupial biology and conservation. Paul Sunnucksis a Reader in Zoology, whose collaborative research programmesconcentrate on the application of molecular population biology tostructure and function of natural and human-influenced animalpopulations.
Supplementary material
The following supplementary material is available for this article:
Table S1 Genotypes and sex of all wombats detected at BCP.
This material is available as part of the online article from:http://www.blackwell-synergy.com/doi/abs/10.1111/j.1365-294X.2008.03670.x(This link will take you to the article abstract).
Please note: Blackwell Publishing are not responsible for thecontent or functionality of any supplementary materials suppliedby the authors. Any queries (other than missing material) shouldbe directed to the corresponding author for the article.
Copyright © 2022 FDOKUMEN