Feeding biology of two functionally different foregut-fermenting mammals, the marsupial red kangaroo...
12
Feeding biology of two functionally different foregut-fermenting mammals, the marsupial red kangaroo and the ruminant sheep: how physiological ecology can inform land management A. J. Munn 1,2 , T. J. Dawson 3 & S. R. McLeod 4 1 School of Biological Sciences, The University of Sydney, Sydney, NSW, Australia 2 Faculty of Veterinary Science, The University of Sydney, Sydney, NSW, Australia 3 School of Biological, Earth and Environmental Sciences, The University of New South Wales, Sydney, NSW, Australia 4 Industry & Investment New South Wales, Orange Agricultural Institute, New South Wales, Orange, Australia Keywords foregut fermentation; red kangaroo; sheep; ruminant; foraging; behaviour; saltbush; grazing. Correspondence Dr Adam John Munn, Ecological Physiology School of Biological Sciences, Faculty of Science, The University of Wollongong, Wollongong, NSW, Australia. Email: [email protected] Editor: Virginia Hayssen Received 11 February 2010; revised 23 June 2010; accepted 28 June 2010 doi:10.1111/j.1469-7998.2010.00740.x Abstract Fermentative digestion in an expanded foregut region has evolved independently among Australia’s marsupial kangaroos as well as among placental ruminants. However, notable differences occur in the form and function of the kangaroo and ruminant forestomachs, the main site of fermentation; kangaroos possess a tubi- form forestomach, reminiscent of the horse colon, whereas ruminants possess a large vat-like structure. How these differences in gut form might influence kangaroo and sheep ecologies is uncertain. We compared diet choice, apparent digestibility (dry matter), food intake and grazing behaviour of Australia’s largest kangaroo, the red kangaroo Macropus rufus and the ruminant sheep Ovis aries. Digestive efficiencies were comparable with other studies, 52% for kangaroos and 59% for sheep, but were not significantly different. Per animal, the smaller red kangaroos (body mass 24 kg) ingested less food than the larger sheep (50 kg), but both species engaged in food harvesting for the same length of time each day (c. 10 h). However, sheep spend additional time re-processing ingesta via rumination, a strategy not used by kangaroos. Kangaroos were more selective in their diet, having a narrower niche compared with sheep. The tubiform forestomach of kangaroos appears to support long foraging bouts, mainly in the evening and early morning; kangaroos rested during the hottest parts of the day. Conversely, sheep feed in short bursts, and gut-filling during feeding bouts is partly dependent on the animal freeing forestomach space by ruminating previous meals, possibly increas- ing water requirements of sheep through activity and thermal loads associated with more frequent feeding. Water use (L day 1 ) by kangaroos was just 13% that of sheep, and kangaroos were able to concentrate their urine more effectively than sheep, even though the kangaroos’ diet contained a high amount of high-salt chenopods, providing further support for potentially lower grazing impacts of kangaroos compared with domestic sheep in Australia’s arid rangelands. Introduction Kangaroos (Family Macropodidae) are the largest of the extant marsupials (Dawson, 1995). Various species of kan- garoos, together with their many smaller relatives, are the primary native terrestrial herbivores in Australia and they occupy diverse habitats. As such, they are often considered analogous to placental, ruminant ungulates on other con- tinents (Dawson, 1995). This comparison is accentuated by the apparent independent evolution of digestive systems based on microbial fermentation of fibrous plant material in an enlarged forestomach, proximal to their acid-secreting hindstomach and small intestine (Foot & Romberg, 1965; Hume, 1974, 1978; Hume & Warner, 1980). While macro- podids and ruminants are primarily ‘foregut fermenters’, in both groups, an expanded caecum in the hindgut also provides supplementary fermentation (Stevens & Hume, 1995). Foregut fermentation as a method of food processing may confer higher levels of digestive efficiency compared with hindgut fermentation in herbivores such as horses (Stevens & Hume, 1995). Indeed, the evolutionary success of the ruminants relative to the hindgut fermenters that occurred during the Miocene has been attributed to the ruminants’ superior digestive efficiencies in the face of expand- ing grasslands, because grasses have more hard-to-digest Journal of Zoology Journal of Zoology 282 (2010) 226–237 c 2010 The Authors. Journal of Zoology c 2010 The Zoological Society of London 226 Journal of Zoology. Print ISSN 0952-8369
-
Upload
independent -
Category
Documents
-
view
2 -
download
0
Transcript of Feeding biology of two functionally different foregut-fermenting mammals, the marsupial red kangaroo...

Feeding biology of two functionally differentforegut-fermenting mammals, the marsupial red kangarooand the ruminant sheep: how physiological ecology caninform land management
A. J. Munn1,2, T. J. Dawson3 & S. R. McLeod4
1 School of Biological Sciences, The University of Sydney, Sydney, NSW, Australia
2 Faculty of Veterinary Science, The University of Sydney, Sydney, NSW, Australia
3 School of Biological, Earth and Environmental Sciences, The University of New South Wales, Sydney, NSW, Australia
4 Industry & Investment New South Wales, Orange Agricultural Institute, New South Wales, Orange, Australia
Keywords
foregut fermentation; red kangaroo; sheep;
ruminant; foraging; behaviour; saltbush;
grazing.
Correspondence
Dr Adam John Munn, Ecological Physiology
School of Biological Sciences, Faculty of
Science, The University of Wollongong,
Wollongong, NSW, Australia.
Email: [email protected]
Editor: Virginia Hayssen
Received 11 February 2010; revised 23 June
2010; accepted 28 June 2010
doi:10.1111/j.1469-7998.2010.00740.x
Abstract
Fermentative digestion in an expanded foregut region has evolved independently
among Australia’s marsupial kangaroos as well as among placental ruminants.
However, notable differences occur in the form and function of the kangaroo and
ruminant forestomachs, the main site of fermentation; kangaroos possess a tubi-
form forestomach, reminiscent of the horse colon, whereas ruminants possess a
large vat-like structure. How these differences in gut form might influence
kangaroo and sheep ecologies is uncertain. We compared diet choice, apparent
digestibility (dry matter), food intake and grazing behaviour of Australia’s largest
kangaroo, the red kangaroo Macropus rufus and the ruminant sheep Ovis aries.
Digestive efficiencies were comparable with other studies, 52% for kangaroos and
59% for sheep, but were not significantly different. Per animal, the smaller red
kangaroos (body mass 24kg) ingested less food than the larger sheep (50kg), but
both species engaged in food harvesting for the same length of time each day
(c. 10 h). However, sheep spend additional time re-processing ingesta via rumination,
a strategy not used by kangaroos. Kangaroos were more selective in their diet,
having a narrower niche compared with sheep. The tubiform forestomach of
kangaroos appears to support long foraging bouts, mainly in the evening and early
morning; kangaroos rested during the hottest parts of the day. Conversely, sheep
feed in short bursts, and gut-filling during feeding bouts is partly dependent on the
animal freeing forestomach space by ruminating previous meals, possibly increas-
ing water requirements of sheep through activity and thermal loads associated with
more frequent feeding. Water use (L day�1) by kangaroos was just 13% that of
sheep, and kangaroos were able to concentrate their urine more effectively than
sheep, even though the kangaroos’ diet contained a high amount of high-salt
chenopods, providing further support for potentially lower grazing impacts of
kangaroos compared with domestic sheep in Australia’s arid rangelands.
Introduction
Kangaroos (Family Macropodidae) are the largest of the
extant marsupials (Dawson, 1995). Various species of kan-
garoos, together with their many smaller relatives, are the
primary native terrestrial herbivores in Australia and they
occupy diverse habitats. As such, they are often considered
analogous to placental, ruminant ungulates on other con-
tinents (Dawson, 1995). This comparison is accentuated by
the apparent independent evolution of digestive systems
based on microbial fermentation of fibrous plant material
in an enlarged forestomach, proximal to their acid-secreting
hindstomach and small intestine (Foot & Romberg, 1965;
Hume, 1974, 1978; Hume & Warner, 1980). While macro-
podids and ruminants are primarily ‘foregut fermenters’, in
both groups, an expanded caecum in the hindgut also
provides supplementary fermentation (Stevens & Hume,
1995).
Foregut fermentation as a method of food processing
may confer higher levels of digestive efficiency compared
with hindgut fermentation in herbivores such as horses
(Stevens & Hume, 1995). Indeed, the evolutionary success
of the ruminants relative to the hindgut fermenters that
occurred during the Miocene has been attributed to the
ruminants’ superior digestive efficiencies in the face of expand-
ing grasslands, because grasses have more hard-to-digest
Journal of Zoology
Journal of Zoology 282 (2010) 226–237 c� 2010 The Authors. Journal of Zoology c� 2010 The Zoological Society of London226
Journal of Zoology. Print ISSN 0952-8369

fibre compared with browse and shrubs (Janis, 1976; Illius &
Gordon, 1992). A similar pattern of foregut herbivore radia-
tion occurred in Australia during the mid-Miocene and
Pliocene, where a major radiation of the Macropodidae is
coincident with a reduced diversity of equivalent-sized herbi-
vorous, quadrupedal marsupials that were probably hindgut
fermenters (Clemens, Richardson& Braverstock, 1989;Hume,
1999; Dawson, 2006).
While foregut fermentation seems to have general advan-
tages as a digestive strategy for larger mammalian herbi-
vores, the foregut morphology and physiology differ
between the kangaroos and ruminants such as sheep (Hume,
1999). In form and function, the tubiform forestomach of
kangaroos appears more like an equine colon than the vat-
like structure of ruminants (Stevens & Hume, 1995; Hume,
1999). Functionally, the large forestomach of the macro-
podids is a modified plug-flow system, where digesta are
transferred distally in rather discrete boluses, with chewing
occurring only at initial ingestion (Stevens & Hume, 1995).
Ruminants, on the other hand, have a large sacculated
forestomach, the ‘rumen’, which has been described as a
continuous-flow stirred tank (Stevens & Hume, 1995). Here,
the ingested material is mixed and fermented continually,
aided by frequent regurgitation and re-chewing (rumina-
tion). Differences between the kangaroo and ruminant
systems have been postulated to have consequences for
relative digestive efficiencies (Hume, 1999; Munn et al.,
2008) and, presumably, also for foraging strategies.
Europeans introduced ruminants, mainly sheep and cat-
tle, as domestic stock into Australia about 200 years ago.
The impacts of sheep and cattle in Australia have been
marked, and the farming practices associated with these
ruminants are seen as a major factor in the decline of several
native species (Fisher, Blomberg & Owens, 2003; Johnson,
2006). Although laboratory studies suggest that sheep are
more efficient than kangaroos at digesting fibrous vegeta-
tion (e.g. McIntosh, 1966; Hume, 1974), kangaroos persist
in high numbers, especially in the semi-arid rangelands,
despite the intensive stocking of domestic ruminants (Daw-
son, 1995). This situation provides an avenue to assess the
relative functional efficiency of herbivory in these distinctive
groups.
Initially, we demonstrated that field metabolic rates
(FMRs) of red kangaroos Macropus rufus were markedly
lower than those of sheep Ovis aries (merino breed) in a
natural rangeland situation (Munn et al., 2009). However,
basic measures of energy and water requirements only partly
contribute to our understanding of herbivore ecologies or
potential environmental impacts. In this study, we have
investigated a range of factors that influence kangaroo and
sheep activities in a typical Australian rangeland. Specifi-
cally, do kangaroos and sheep differ in their digestive
efficiencies, diet choices and diet overlap, and what impacts
could these have on their urine electrolyte levels, urine
concentrations, feeding behaviours and associated energy
and water needs? Together, answers to these questions
provide a clearer picture of how kangaroos and sheep, with
their different foregut fermentation systems, interact in
Australia’s arid and semi-arid rangelands. Moreover, our
study presents a timely example of how physiology can be
applied to evaluate and inform large-scale management of
grazing systems, particularly for mitigating environmental
damage associated with overgrazing.
Materials and methods
Study site and climatic conditions
The study was conducted at Fowlers Gap (311050S,1411430E), the Arid Zone Research Station of the University
of New SouthWales, located c. 112 km north-east of the city
of Broken Hill, NSW, Australia. The station covers ap-
proximately 39 200 ha, with vegetation dominated by low
woody shrubs (o1m) of the family Chenopodiaceae. A
commercial sheep enterprise operates concurrently with
research activities; also persisting on the station are large
uncontrolled populations of four kangaroo species: the red
kangaroo M. rufus, western grey kangaroo Macropus fuligi-
nosus, eastern grey kangaroo Macropus giganteus and the
euro Macropus robustus erubescens. Rainfall is variable,
with a yearly average (� SEM) of 238� 21mm per annum
and a co-efficient of variation of 54% (1969–2006 inclusive;
SILO Patched Point Dataset, Bureau of Meteorology and
NHMQLD; data patched for 1971, and February and April
2000). This study was conducted during a mild autumn
between 2April and 10April 2007. In the 6months before
the study, the research station received a total of 49.2mm of
rain, with the bulk occurring in January (18mm) andMarch
(15mm) 2007 (Bureau of Meteorology, Australia).
Experimental design and animal enclosure
The aim of this study was to compare the feeding behaviour
and resource-use patterns of the dominant native Australian
arid-zone herbivore, the red kangaroo, with that of a major
domestic herbivore, the merino sheep, grazed together in a
typical rangeland environment. The experiment was carried
out in a large (16 ha), herbivore-proof enclosure, situated on
an alluvial rise and naturally vegetated with chenopod
shrubs (mainly saltbushes) and sparse grasses; scattered
small trees (Casuarina sp.) provided shade for the experi-
mental animals. The enclosure had not been grazed by
kangaroos for over 5 years and had been free from sheep or
other herbivores (e.g. rabbit, goat, cattle) for 420 years. At
the beginning of the experiment (i.e. after 3-weeks acclima-
tion of animals), vegetation was examined by point sam-
pling along 20 randomly chosen transects (100m). Point
samples were taken every metre along transects using a
5-mm-diameter metal spike; n = 2000 points were sampled.
Each point was categorized as bare (including litter) or
belonging to the following plant groups: grass, flat cheno-
pod (saltbushes), round chenopod (bluebushes and copper
burrs), forb (herbaceous dicots – often annuals), malva-
ceaous sub-shrub and trees (Dawson & Ellis, 1994). Grass
was considered dry, most plants having o15% green
material (and most were completely dry). The height of
Journal of Zoology 282 (2010) 226–237 c� 2010 The Authors. Journal of Zoology c� 2010 The Zoological Society of London 227
Feeding biology of kangaroos and sheepA. J. Munn, T. J. Dawson and S. R. McLeod

plants in transects was recorded and the relative cover was
subsequently estimated after correction for the size of the
spike (5mm diameter in our case; Dawson & Ellis, 1994).
The biomass of each plant category was calculated using per
cent cover and plant height (Edwards, Dawson & Croft,
1995); the total biomass was estimated to be 44� 30 g dry
matterm�2. The average (� SEM) standing plant biomass
was estimated from 60 randomized clipped plots of 0.25m2
to be 44� 8 g dry matterm�2; this level of biomass was
markedly higher than levels outside the enclosure (pers.
obs.). Water was provided ad libitum via a refilling trough
that was used by all experimental animals. A centrally
placed 7m tower provided a platform from which beha-
vioural observations were performed.
Study animals
Wild red kangaroos (n=7) were captured using a CO2-
powered tranquilizer rifle (darts were loaded with Zoletil
100, 10mg kg�1), fitted with identifying ear tags and poly-
vinyl collars (2.5 cm wide, marked with patterns of coloured
reflective tape), transferred to the experimental enclosure,
and allowed to acclimate for at least 3weeks. Sheep (merino
breed) (n=7) were introduced into the enclosure 2weeks
before data collection. All animals were mature, non-repro-
ductive (non-lactating or pregnant) females. At the begin-
ning of the experiment, kangaroos and sheep had an average
body mass of 23.4� 0.8 and 47.8� 2.8 kg, respectively;
sheep had 5months wool, and so their measured body
masses were corrected by subtracting 3.6 kg (Edwards, Croft
& Dawson, 1996). In a concurrent study, we measured the
energy and water turnover of these animals over 5–9 days
following the acclimation period (Munn et al., 2009). At the
end of the experiment, animals were humanely killed (ani-
mal ethics approval, UNSWACEC 06/85A; NSWNational
Parks and Wildlife Scientific Licence S12054). Kangaroos
were killed while feeding at night by rifle shot to the head
destroying the brain, following the code of practice for the
humane shooting of kangaroos (DEWHA, 2008). Sheep
were first mustered to a holding pen and killed by rifle shot
to the back of the head destroying the brain (Standing
Committee on Agriculture and Resource Management,
1991). Blood and urine samples were immediately taken for
electrolyte analysis; blood was also used for FMR and water
turnover measurements (Munn et al., 2009). Forestomach
and faecal (distal colon) samples were taken for diet analysis
and estimation of dry matter (DM) digestibility and dry
matter intake (DMI).
Behaviour
Three days were dedicated to 24 h behavioural observations.
We used a point-sampling technique (Dunbar, 1976) to
quantify kangaroo and sheep behaviours. Scans were per-
formed every 10min during the day, but every 20min at
night when observations were more difficult. Night observa-
tions were performed using a weak spotlight and Nikon
10� 70 marine binoculars (Nikon, Nikon on Broadway,
Sydney, Australia). The behaviour of each species was
categorized into three broad types:
Foraging
When the animal was consuming or searching for food, which
included eating (cropping and chewing), slow searching (i.e. the
movement while feeding within a patch, requiring one or two
steps) and fast searching (usually walking fast between food
patches), interspersed with periods of cropping and chewing.
Resting/ruminating
All non-active behaviour when the animal appeared relaxed,
which included lying, crouching and standing. In kangar-
oos, periods of lying or crouching were considered ‘resting’,
but for sheep, sitting or lying can include bouts of rumina-
tion. We were unable to measure rumination directly and
periods of inactivity by sheep sitting or lying must be
considered as either resting or ruminating; most impor-
tantly, they do not include periods of active locomotion
(including standing) or foraging.
Other
Miscellaneous behaviours, which were uncommon, such as
grooming, drinking and locomotion associated with drink-
ing at the water trough (i.e. moving to and from water). This
included all other active non-foraging behaviours (e.g.
locomotion or standing alert, sometimes in response to a
disturbance).
Osmolalitiy of blood and urineand urine electrolytes
Urine samples were taken from the bladders of kangaroos
(n=5) and sheep (n=6) following postmortem eviscera-
tion; samples were unavailable from two kangaroos and one
sheep (i.e. bladders were empty). These were immediately
stored on ice in an insulated box and were frozen within 1 h
of collection. Urine sub-samples were later thawed and
analysed for osmolality, along with plasma samples from
blood collected via heart puncture on deceased animals.
Osmolality of urine and plasma was determined using a
freezing-point depression osmometer (Gonotec Osmomat
030; Gallay Scientific, Melbourne, Vic., Australia).
Concentrations of electrolytes in urine, including sodium
(Na+), potassium (K+), chloride (Cl�), magnesium
(Mg++) and calcium (Ca++) were quantified using Induc-
tively Coupled Plasma Optical Emission Spectrometry (Per-
kin Elmer 5300DV ICP-OES; Sydney Analytical Services,
Seven Hills, NSW, Australia), and concentrations of Cl�
were determined using an Ag/AgS Ion Specific Electrode
(Sydney Analytical Services, Seven Hills, NSW, Australia).
Urine sub-samples were diluted for electrolyte analysis at
the following ratios: 1:100 (Na+ and K+), 1:10 (Mg++,
Ca++ and sheep Cl�) and 1:20 (kangaroo Cl�). Electrolyte
Journal of Zoology 282 (2010) 226–237 c� 2010 The Authors. Journal of Zoology c� 2010 The Zoological Society of London228
Feeding biology of kangaroos and sheep A. J. Munn, T. J. Dawson and S. R. McLeod

concentrations were not available from blood as samples
were used for labelled water analysis (see Munn et al., 2009).
Diets
At dissection samples from the kangaroo, forestomach
(n=7) and sheep rumen (n=7) were collected near the
oesophageal opening and were stored on ice before freezing
(within 1 h). Diet was assessed via micro-histological identi-
fication of plant fragments (Dawson & Ellis, 1994; Edwards
et al., 1995). Fragments were identified as grass, flat cheno-
pod, round chenopod, forb, malvaceaous sub-shrub or tree.
Samples of gut material (10mL) were washed through two
sieves, yielding particles 4500mm and between 500 and
125mm. Particles smaller than 125mm were discarded be-
cause they were mostly dust and microhairs. The relative
volumes of the two size classes were determined by centrifu-
gation. Five sub-samples of each size class were spread on
separate microscope slides. Random horizontal transects
were chosen and the first 20 particles on transects were
identified. For each size class, 100 particles were examined,
that is, 200 in total per animal. Identification of plant
particles was performed using an extensive reference collec-
tion (Dawson & Ellis, 1994). The total proportion of plant
categories in the diet was determined according to the ratio
of particle size classes in each sample.
Diet overlap between sheep and kangaroos was determined
using a proportional similarity index (PSI; Feinsinger, Spears
& Poole, 1981), which compares the relative proportions of
diet items found in kangaroo and sheep forestomach. The
dietary niche breadths of each species were also determined
using PSIs, with the relative proportion of each diet item in
kangaroo and sheep forestomach, respectively, being com-
pared with that available in the environment (i.e. % biomass;
Feinsinger et al., 1981). Diet overlap PSI and niche breadths
PSIs were examined statistically usingMantel tests (Dawson&
Ellis, 1994) and software by Bonnet & Van de Peer (2002; ZT
Version 1.1). Diet preferences of kangaroos and sheep for each
encountered diet item were examined using relativized electiv-
ity indices (�E ), following Vanderploeg & Scavia (1979a,b, but
see equations 6 and 7 in Lechowicz, 1982).
Diet digestibility
Apparent digestibilities of DM from kangaroo and sheep
forestomachs were estimated using manganese (Mn) as a
naturally occurring, indigestible marker (Nagy, 1977). Di-
gestibility was estimated using Mn concentrations from
forestomach samples taken adjacent to the oesophageal
opening and compared with that in faeces collected as pellets
formed in the distal colon. Digestibility was estimated
according to
Apparent digestibilityð%Þ ¼ 1�Md
Mf
� �� 100 ð1Þ
where Md is the concentration of Mn in the forestomach
sample (per unit DM) and Mf is the concentration of Mn
faeces (per unit DM).
Forestomach (as above) and faecal (distal colon) samples
(c. 70 g) were collected at dissection, immediately stored on
ice and frozen within 1 h. Forestomach material and faeces
(c. 20 g wet mass) were later dried at 60 1C to constant mass
and milled through a 1mmmesh (Glen Creston c. 580 micro
hammer mill, Glen Creston, London, UK). Sub-samples
(0.6–1.0 gDM) of ground material were digested in nitric
acid (10mL; 70%) using a Milestone Microwave Digestion
System (Milestone MLS-1200 MEGA; Program 1; Milestone,
Shelton, CT, USA) according to the manufacturer’s instruc-
tions. Digesta were weighed, diluted to 25mL with deio-
nized water and allowed to settle overnight. The supernatant
was drawn off and analysed for Mn content using an
Inductively Coupled Plasma Atomic Emission Spectrometer
(ICP-AES; Vista AX, Varian; CA, USA).
DMIs
Gross DMI by sheep and kangaroos were estimated in
relation to daily energy needs (Nagy, 2001). These were
taken from FMRs (kJ day�1) obtained concurrently with
this study (Munn et al., 2009). Gross food intakes were
estimated assuming that the gross energy content of sheep
and kangaroo diets was 18 kJ g�1DM (Robbins, 2001).
Robbins (2001) reported gross energy contents of herbac-
eous material of 16.3–21.3 kJ g�1DM, comparable to that
reported for perennial grasses and saltbushes (Corbett,
1990; see also Golley, 1961). Thus, assuming that each
animal’s coefficient of DM digestibility was similar to
energy digestibility (Moir, 1961; Rittenhouse, Streeter &
Clanton, 1971), we estimated that the digestible energy
content of whole diets ingested by kangaroos and sheep
was 9.4� 0.7 and 10.6� 0.4 kJ g�1DM, respectively. These
levels of digestible energy content were similar to those
measured using in vitro acid–pepsin digestions of forbs,
grasses and shrubs at our Fowlers Gap study site (the range
of mean was 9–14 kJ g�1 DM for all plant types from winter
and summer for sheep and kangaroos; McLeod, 1996).
Statistical analysis
Unless stated otherwise, we used one-way ANOVAs or
repeated-measures ANOVAs for between- and within-spe-
cies comparisons. Assumptions for ANOVA were tested
using the Kolmogorov–Smirnov test for normality
(a=0.05) and Levene’s test for homogeneity of variances
(a=0.05). Heteroscedastic data were log10 transformed
(blood osmolality, urine osmolality, urine concentrations
for Mg2+ and Cl�). When ANOVAs yielded significant
differences, post hoc comparisons using Tukey’s honest
significant differences (HSD) were applied. The proportions
of time that kangaroos and sheep spent engaged in different
behaviours over 24 h were compared using nested ANO-
VAs, with species nested in time. Diel time-use of kangaroos
and sheep was analysed using Tukey’s HSD to compare
patterns within and between species in 20-min blocks.
Proportional data were arcsine transformed. Diet contents
from kangaroo and sheep forestomach were not normally
Journal of Zoology 282 (2010) 226–237 c� 2010 The Authors. Journal of Zoology c� 2010 The Zoological Society of London 229
Feeding biology of kangaroos and sheepA. J. Munn, T. J. Dawson and S. R. McLeod

distributed or homoscedastic. Thus, a Wilcoxon–Mann–
Whitney test was used to compare the contents of specific
diet items between species. Within species, differences in the
proportions of different diet items were compared using
Kruskal–Wallis tests. Of note, repeated-measures ANOVAs
on the proportional diet contents within each species,
followed by Tukey’s HSD, yielded identical outcomes re-
garding statistical significance. Results are presented as
mean� standard error of the mean (SEM) and a was set at
0.05.
Results
Animals
Kangaroos maintained body mass throughout the experi-
ment (% initial body mass change was 0.20� 0.21%day�1;
which was not significantly different from zero; Z=0.97,
P=0.34). Sheep lost body mass on average (� SEM) (%
initial body mass change was �0.73� 0.16%day�1, which
was significantly different from zero, Z=�3.75, Po0.001).
However, this level of mass loss was not considered as
biologically significant because sheep can drink 8–10% of
their body mass in a single bout (Squires, 1981), and this
level of body mass change was consistent with that generally
observed for sheep over comparable periods (Midwood
et al., 1994). Moreover, initial body masses for sheep were
measured in the afternoon, after animals had visited water,
but final measurements were made in the morning, before
sheep were able to drink (pers. obs.).
Behaviour
The proportions of time that kangaroos and sheep foraged
each day did not differ (F2,46=0.028, P=0.87). They spent
on average 10.4 h day�1 (i.e. 43.5% of each day) engaged in
activities associated with food harvesting (i.e. searching and
moving, cropping and chewing). Similarly, sheep and kan-
garoo did not differ in the amount of time spent resting or
resting/ruminating (c. 12 h day�1; F2,46=0.036, P=0.85).
However, in other studies, sheep have been found to spend
8–10 h day�1 ruminating, that is food processing by re-
chewing (Hulet, Alexander & Hafez, 1975), but kangaroos
do not ruminate (Hume, 1999).
The diel time-use patterns of kangaroos and sheep dif-
fered (Fig. 1a). Red kangaroos spent the greater portion of
each evening and early morning harvesting food, with lulls
in feeding between midnight and 04:00 h (Fig. 1a), with a
distinct rest period between 08:00 and 15:00 h (F2,46=5.99,
Po0.001, nested ANOVA, Tukey’s HSD Po0.05; Fig. 1a).
Conversely, sheep had regular feeding bouts throughout the
day, punctuated by periods of rest/rumination at around
06:00, 10:00 and 19:00–20:00 h (Tukey’s HSD Po0.05; Fig.
1b). Sheep showed a distinct rest period in the early morning
between 01:00 and 03:00 h (Tukey’s HSD Po0.05; Fig. 1b).
Diets
Flat-leafed chenopds comprised the most abundant food
source available for kangaroos and sheep and were nearly
75% of the aboveground plant biomass within the enclosure
(Table 1). Round-leafed chenopods were the next most
Red kangaroo
0%
20%
40%
60%
80%
100%
0 1 2 3 4 5 6 7 8 9 10 11 12 13 14 15 16 17 18 19 20 21 22 23
(b)
0%
20%
40%
60%
80%
100%
0 1 2 3 4 5 6 7 8 9 10 11 12 13 14 15 16 17 18 19 20 21 22 23Diel time (h)
Other Resting Foraging
Sheep
(a)
Figure 1 Diel time-use by red kangaroos Macropus rufus (a) and sheep Ovis aries (b) grazing together in a semi-arid rangeland during a mild
autumn.
Journal of Zoology 282 (2010) 226–237 c� 2010 The Authors. Journal of Zoology c� 2010 The Zoological Society of London230
Feeding biology of kangaroos and sheep A. J. Munn, T. J. Dawson and S. R. McLeod
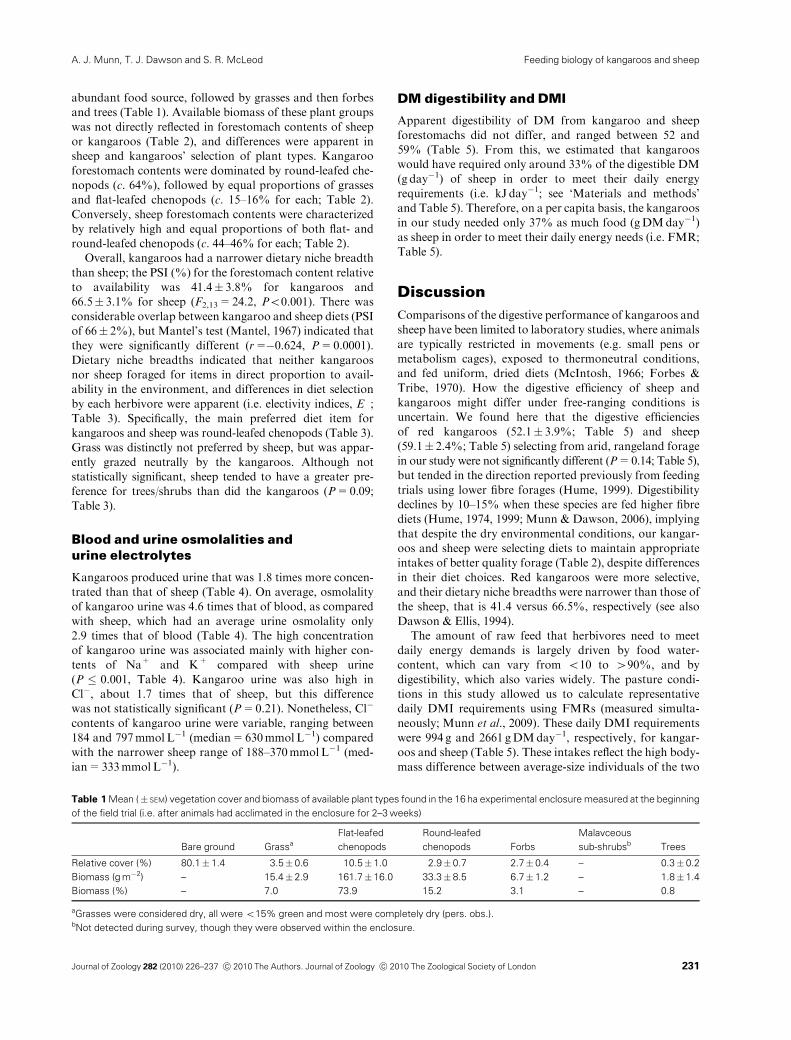
abundant food source, followed by grasses and then forbes
and trees (Table 1). Available biomass of these plant groups
was not directly reflected in forestomach contents of sheep
or kangaroos (Table 2), and differences were apparent in
sheep and kangaroos’ selection of plant types. Kangaroo
forestomach contents were dominated by round-leafed che-
nopods (c. 64%), followed by equal proportions of grasses
and flat-leafed chenopods (c. 15–16% for each; Table 2).
Conversely, sheep forestomach contents were characterized
by relatively high and equal proportions of both flat- and
round-leafed chenopods (c. 44–46% for each; Table 2).
Overall, kangaroos had a narrower dietary niche breadth
than sheep; the PSI (%) for the forestomach content relative
to availability was 41.4� 3.8% for kangaroos and
66.5� 3.1% for sheep (F2,13=24.2, Po0.001). There was
considerable overlap between kangaroo and sheep diets (PSI
of 66� 2%), but Mantel’s test (Mantel, 1967) indicated that
they were significantly different (r=�0.624, P=0.0001).
Dietary niche breadths indicated that neither kangaroos
nor sheep foraged for items in direct proportion to avail-
ability in the environment, and differences in diet selection
by each herbivore were apparent (i.e. electivity indices, E�;Table 3). Specifically, the main preferred diet item for
kangaroos and sheep was round-leafed chenopods (Table 3).
Grass was distinctly not preferred by sheep, but was appar-
ently grazed neutrally by the kangaroos. Although not
statistically significant, sheep tended to have a greater pre-
ference for trees/shrubs than did the kangaroos (P=0.09;
Table 3).
Blood and urine osmolalities andurine electrolytes
Kangaroos produced urine that was 1.8 times more concen-
trated than that of sheep (Table 4). On average, osmolality
of kangaroo urine was 4.6 times that of blood, as compared
with sheep, which had an average urine osmolality only
2.9 times that of blood (Table 4). The high concentration
of kangaroo urine was associated mainly with higher con-
tents of Na+ and K+ compared with sheep urine
(P � 0.001, Table 4). Kangaroo urine was also high in
Cl�, about 1.7 times that of sheep, but this difference
was not statistically significant (P=0.21). Nonetheless, Cl�
contents of kangaroo urine were variable, ranging between
184 and 797mmol L�1 (median=630mmol L�1) compared
with the narrower sheep range of 188–370mmol L�1 (med-
ian=333mmol L�1).
DM digestibility and DMI
Apparent digestibility of DM from kangaroo and sheep
forestomachs did not differ, and ranged between 52 and
59% (Table 5). From this, we estimated that kangaroos
would have required only around 33% of the digestible DM
(g day�1) of sheep in order to meet their daily energy
requirements (i.e. kJ day�1; see ‘Materials and methods’
and Table 5). Therefore, on a per capita basis, the kangaroos
in our study needed only 37% as much food (gDMday�1)
as sheep in order to meet their daily energy needs (i.e. FMR;
Table 5).
Discussion
Comparisons of the digestive performance of kangaroos and
sheep have been limited to laboratory studies, where animals
are typically restricted in movements (e.g. small pens or
metabolism cages), exposed to thermoneutral conditions,
and fed uniform, dried diets (McIntosh, 1966; Forbes &
Tribe, 1970). How the digestive efficiency of sheep and
kangaroos might differ under free-ranging conditions is
uncertain. We found here that the digestive efficiencies
of red kangaroos (52.1� 3.9%; Table 5) and sheep
(59.1� 2.4%; Table 5) selecting from arid, rangeland forage
in our study were not significantly different (P=0.14; Table 5),
but tended in the direction reported previously from feeding
trials using lower fibre forages (Hume, 1999). Digestibility
declines by 10–15% when these species are fed higher fibre
diets (Hume, 1974, 1999; Munn & Dawson, 2006), implying
that despite the dry environmental conditions, our kangar-
oos and sheep were selecting diets to maintain appropriate
intakes of better quality forage (Table 2), despite differences
in their diet choices. Red kangaroos were more selective,
and their dietary niche breadths were narrower than those of
the sheep, that is 41.4 versus 66.5%, respectively (see also
Dawson & Ellis, 1994).
The amount of raw feed that herbivores need to meet
daily energy demands is largely driven by food water-
content, which can vary from o10 to 490%, and by
digestibility, which also varies widely. The pasture condi-
tions in this study allowed us to calculate representative
daily DMI requirements using FMRs (measured simulta-
neously; Munn et al., 2009). These daily DMI requirements
were 994 g and 2661 gDMday�1, respectively, for kangar-
oos and sheep (Table 5). These intakes reflect the high body-
mass difference between average-size individuals of the two
Table 1 Mean (� SEM) vegetation cover and biomass of available plant types found in the 16 ha experimental enclosure measured at the beginning
of the field trial (i.e. after animals had acclimated in the enclosure for 2–3 weeks)
Bare ground Grassa
Flat-leafed
chenopods
Round-leafed
chenopods Forbs
Malavceous
sub-shrubsb Trees
Relative cover (%) 80.1� 1.4 3.5� 0.6 10.5� 1.0 2.9� 0.7 2.7� 0.4 – 0.3� 0.2
Biomass (g m�2) – 15.4� 2.9 161.7� 16.0 33.3� 8.5 6.7� 1.2 – 1.8� 1.4
Biomass (%) – 7.0 73.9 15.2 3.1 – 0.8
aGrasses were considered dry, all were o15% green and most were completely dry (pers. obs.).bNot detected during survey, though they were observed within the enclosure.
Journal of Zoology 282 (2010) 226–237 c� 2010 The Authors. Journal of Zoology c� 2010 The Zoological Society of London 231
Feeding biology of kangaroos and sheepA. J. Munn, T. J. Dawson and S. R. McLeod

species (Table 5) as well as fundamental metabolic differ-
ences and possible differences in feeding costs. Of note, large
male red kangaroos exceed sheep in body mass and can be
over 90 kg in body mass, and have higher absolute food
requirements than mature female kangaroos, but large
males are uncommon in kangaroo populations (Dawson,
1995).
Information about the daily dry-food requirements of
kangaroos compared with sheep has implications for the
grazing management of Australia’s rangelands, and high-
lights the importance of considering digestive efficiencies of
different herbivores when considering their grazing impacts.
For example, relative grazing pressures of herbivores in
Australia are typically assessed against that of a ‘standard’
merino sheep, a core animal to Australia’s rangeland in-
dustries (Dawson & Munn, 2007). The energy requirements
of a standard mature sheep, known as a ‘dry-sheep-equiva-
lent’ (DSE), are those pertaining to a 45 kg non-reproduc-
tive/non-lactating (dry) ewe or wether (Dawson & Munn,
2007; Munn et al., 2009). DSEs have become the staple
measure for comparing herbivore-grazing pressures in Aus-
tralia (Landsberg & Stol, 1996; SoE, 2006; Kirkpatrick,
Bridle & Leith, 2007). Recent studies reported a DSE of
0.35 for a mature, dry kangaroo of average mass (25 kg),
based on direct comparisons of kangaroo and sheep FMRs
(kJ day�1; Munn et al., 2009); that is, the kangaroo uses only
35% of the energy of the sheep. Thus, if digestive efficiencies
of the kangaroos and sheep were identical, then the propor-
tional grazing impact of kangaroos relative to sheep and in
terms of dry feed also would be 0.35. However, differences
in digestive efficiency could markedly change the relative
DSE of a kangaroo. If we were to accept that the small
difference in digestive efficiencies that we measured between
kangaroos and sheep was biologically relevant (i.e. 52% for
kangaroos, 59% for sheep; Table 5), then we would predict a
kangaroo DSE of 0.42 (Table 5). Such a calculation draws
attention to the fact that in different regions and seasons,
differences in available diets and diet qualities will
Table 2 Mean (� SEM) forestomach contents of red kangaroos (n=7) and sheep (n=7) as a proportion (%) of all identified particles
Grass Flat-leafed chenopods Round-leafed chenopods Malavceous sub-shrubs Forbs Trees
Red kangaroo 15.1�3.2B 16.0� 4.0B 64.3� 5.0A 0.6� 0.2C 2.4�0.3C 1.5� 0.4C
Sheep 2.0�0.6B, C 46.3� 3.1A 44.8� 3.4A 0.6� 0.1C 2.3�0.3B, C 3.9� 1.0B
Species effect
U-statistic 77 28 72 54 56 39
P-value 0.002 0.022 0.015 0.89 0.71 0.10
Between species effects for diet items were tested using Wilcoxon-Mann-Whitney test (U-statistic); Superscripts denote significant difference
within species, Kruskal–Wallis (d.f.=5; Kangaroo w2=36.8, Sheep w2=32.1, and Tukey’s HSD post hoc; ABCPo0.05.
Table 3 Mean (� SEM) electivity indices for diet items identified from the forestomach of red kangaroos (n=7) and sheep (n=7) grazing chenopod
shrublands
Grass Flat-leafed chenopods Round-leafed chenopods Malavceous sub-shrubs Forbs Trees
Red kangaroo 0.03� 0.07� �0.79� 0.05� 0.38� 0.05� – �0.41� 0.06� �0.09� 0.12�
Sheep �0.73� 0.09� �0.48� 0.05� 0.22� 0.08� – �0.42� 0.09� 0.27� 0.16�
Species effect
U-statistic 77 31 65 – 56 37
P-value 0.002 0.007 0.12 – 0.70 0.06
Between species effects for diet items were tested using Wilcoxon–Mann–Whitney test (U-statistic). Kruskal–Wallis (d.f.=4; Kangaroo w=28.0,
Sheep w=23.1, and Tukey’s HSD post hoc.�Po0.05.
Table 4 Mean (� SEM) urine electrolytes and urine and blood omsolality for red kangaroos (n=5) and sheep (n=6) grazing chenopod shrublands
Sodium
(mmol L�1)
Potassium
(mmol L�1)
Calcium
(mmol L�1)
Magnesium
(mmol L�1)
Chloride
(mmol L�1)
Urine osmolality
(mOsmol kg�1)
aBlood osmolality
(mOsmol kg�1)
Red kangaroo 644� 41 165� 14 1.3� 0.5 27� 8 499� 120 1852� 204 407� 23
Sheep 382� 37 97� 14 1.6� 0.6 11� 1 296� 33 1000� 96 349� 8
Species effect
F-statistic 22.3 11.8 0.13 6.17 1.86 16.1 7.1
P-value 0.001 0.007 0.72 0.04 0.21 0.003 0.02
Species effects were tested using ANOVA.aSample sizes for whole blood were n=6 for red kangaroos and n=7 for sheep.
Journal of Zoology 282 (2010) 226–237 c� 2010 The Authors. Journal of Zoology c� 2010 The Zoological Society of London232
Feeding biology of kangaroos and sheep A. J. Munn, T. J. Dawson and S. R. McLeod

undoubtedly affect herbivore digestive efficiencies, and thus
affect any predicted food intake requirements and subse-
quent grazing pressures.
That the sheep satisfied their higher gross feed require-
ments by foraging for the same time each day as the
kangaroos is initially surprising, because the red kangaroos
ingested only one-third as much food (DM). Foraging-time
patterns were, however, markedly different between species
(Fig. 1), with sheep using more but shorter foraging bouts.
What can these observations tell us about the ecology of
foraging by sheep and kangaroos, and how might this
further influence their relative grazing pressures? Compared
with kangaroos, sheep appear to be less selective, bulk
feeders (this study; Dawson & Ellis, 1994). They have
proportionally bigger bites (relatively wider mouths) than
those of the smaller, more slender-jawed red kangaroo
(Belovsky et al., 1991). Sheep feeding on chenopod shrubs
have an average bite size of 0.42 g DM as compared with
only 0.16 g for red kangaroos, but their rates of biting while
cropping are comparable at 18 bitesmin�1 (Belovsky et al.,
1991). This focuses on the ability of sheep to harvest higher
quantities of food in the same period as kangaroos, but it
overlooks processing the larger bite with more stem and, as
such, more hard-to-digest fibre.
The fundamental difference between kangaroos and
sheep lies with the additional feed-breakdown processes by
sheep via rumination. Kangaroos do not ruminate and they
complete the oral processing of feed at the time of ingestion.
In sheep, food processing is not complete post-ingestion,
and food is extensively re-processed by re-chewing and re-
ingestion during inter-feed bouts. Rumination offers sheep
the benefits of increased mechanical processing after inges-
tion and thus increased digestibilities, but this has a cost; it is
time-intensive. Rumination by sheep can comprise up to
8–10 h of resting/non-feeding bouts (Hulet et al., 1975).
Detailed behavioural observations confirm such estimates
for sheep at our study site, with free-ranging sheep ruminat-
ing for 7 h day�1; this was half of the time spent ‘resting’
(T. J. Dawson andD.M.Watson, unpubl. data). Time spent
ruminating by sheep should be included with time spent
actively feeding to fully estimate their total temporal invest-
ment in energy acquisition. If we assume that sheep rumi-
nate for 50% of resting time, then they spent 60%more time
than red kangaroos in feed acquisition and processing, that
is 16.5 against 10.4 h day�1. Does this time ruminating have
an impact on the overall daily energy budget of sheep
relative to that of kangaroos? This is a complex question
because of differences in basal metabolism, modes of loco-
motion as well as differences in digestive strategies. How-
ever, the FMR of the kangaroos was 2.3 times their BMR
while that of the sheep was 3.8 times BMR (Munn et al.,
2009). During the long period of the day when the kangar-
oos rested, they spent considerable time lying, apparently
asleep, which contrasts with the sheep and their more
numerous and shorter rumination/resting periods. These
different patterns should contribute significantly to the
overall differences in the FMR of kangaroos and sheep.
One important difference between kangaroos and sheep
concerns their modes of locomotion. Kangaroos are exem-
plified by their unique bipedal hopping at higher speeds,
which is more energetically efficient than quadrupedal
locomotion at comparable speeds (Dawson & Taylor,
1973), as seen in sheep. However, at lower speeds, kangar-
oos use a different, more energetically expensive form of
locomotion, the pentapedal gait (Dawson & Taylor, 1973).
Pentapedal movement uses all four limbs in addition to the
tail to propel the animal, and is used by kangaroos foraging
within patches. It has been suggested that the expense of
pentapedal locomotion forces kangaroos to be highly selec-
tive feeders (Clancy & Croft, 1991). Sheep, on the other
hand, may move between food patches more cheaply, and so
Table 5 Mean (� SEM) body weights, apparent dry matter (DM)
digestibility of forestomach contents, and dry feed intakes of red
kangaroos (n=6) and sheep (n=5) grazing chenopod shrublands
Species effect
F-statistic P-value
Body weight
Red kangaroo 23.6� 0.8aSheep 50.2� 2.2 205 o0.001
Apparent DM digestibility
(%)
Red kangaroo 52.1� 3.9
Sheep 59.1� 2.4 2.5 0.14bDigestible DM (g day�1)
required to meet
daily energy
requirements (FMRc)
Red kangaroo 518� 31
Sheep 1572� 124 77.3 o0.001
Gross DM (g day�1) required to
meet daily energy requirements (FMRc)
Red kangaroo 994� 60
Sheep 2661� 210 65.1 o0.001dGross DM (g day�1) required
to meet basal metabolic
energy requirements (BMR)
Red kangaroo 437� 11
Sheep 692� 22 52.8 o0.001eGross DM (g day�1) required
to meet daily energy requirements (FMRc)
for a ‘standard’ animal
25 kg red kangaroo 1039
45 kg sheep 2449 – –
aFleece-free weight.bAssuming energy digestibility is equal to dry matter digestibility.cFMR, field metabolic rate (kJ day�1), after Munn et al. (2009),
kangaroo=4872� 364kJ day�1, sheep=16 664� 1314 kJ day�1.dPredicted according to measured BMRs (kJ kg�0.75 day�1) for ma-
ture, dry Australian merino ewes (230 kJ kg�0.75 day�1; Marston,
1948) and for mature, dry red kangaroo females (200 kJ kg�0.75 day�1;
Dawson et al., 2000).eEstimated using an FMR:BMR of 2.3 and 3.8 for a standard (mature,
dry) 25 kg red kangaroo and a 45 kg sheep, respectively, according to
Munn et al. (2009).
Journal of Zoology 282 (2010) 226–237 c� 2010 The Authors. Journal of Zoology c� 2010 The Zoological Society of London 233
Feeding biology of kangaroos and sheepA. J. Munn, T. J. Dawson and S. R. McLeod

may be less selective in their diets. Nonetheless, this is
probably simplistic and empirical comparisons of the energy
used by sheep and kangaroos during fine-scale feeding are
lacking. Factors such as body size, phylogeny, oral and
digestive morphology and vegetation structures probably
exert dominant impacts on feeding strategies. The complex-
ity of this point is highlighted by seasonal changes in food
types and availability and the subsequent responses of sheep
and kangaroos. These issues are also important for under-
standing the role of these herbivores in landscape function
and grazing management.
During seasons when grasses are available, both sheep
and kangaroos typically eat them, but the level of selection
for grasses is stronger by kangaroos (Dawson & Ellis, 1994;
Edwards et al., 1995, 1996). As conditions deteriorate,
kangaroos largely maintain their strong preference for
grasses, but sheep switch to more available forage, usually
chenopod shrubs in the rangelands of our study (Dawson &
Ellis, 1994; Edwards et al., 1995, 1996). However, our study
was conducted during an extended dry period when grass
(particularly green grass) was scarce (Table 1). Our kangar-
oos fed mainly on round-leafed (bluebush) and, to a lesser
extent, flat-leafed (saltbush) chenopods (Table 2). High
intakes of chenopods by kangaroos during dry conditions
have been reported in other studies (Griffiths & Barker,
1966; Bailey, Martensz & Barker 1971; Barker, 1987), but
the kangaroos in our study did not lose body mass through-
out the experiment (Table 5). As such, adult red kangaroos
appear to be capable of meeting their maintenance needs
even when their usually selected diet of grasses is not
available. The ability of red kangaroos to switch diets in
this manner may further reflect differences in how the
kangaroo and ruminant foregut systems operate in Austra-
lia’s arid rangelands.
Sheep in Australia’s rangelands are capable of consider-
able diet switching (Ellis et al., 1977; Squires, 1981; Dawson
& Ellis, 1994; Edwards et al., 1996), but they face challenges
associated with particle outflow from the rumen. In parti-
cular, a major consequence of the ruminant system is a
potential limit to food intake resulting from bulky plant
material filling the gut (Stevens & Hume, 1995). That is, in
order to free gut space for further intake, sheep first must re-
chew previously harvested material to facilitate rumen
emptying, and only then can sheep continue feeding. This
was evident in our study, where sheep were observed to feed
in bursts, interspersed with periods of rest and rumination
(Fig. 1b). The ability of kangaroos to feed for longer periods
may be associated with the tubiform nature of their forest-
omach. Flow of material from the tubiform forestomach of
kangaroos is not restricted by particle size as it is in sheep,
and numerous haustrations of the kangaroo forestomach
support gut expansibility (Munn & Dawson, 2006), which
probably assist kangaroos in sustaining food intakes during
long feeding bouts. Moreover, the extensive separation of
small and large particles in the kangaroo foregut (Dellow,
1982; Hume, 1999), where finer particles are promoted more
rapidly for further processing in the caecum and proximal
colon, may assist gut filling during single foraging bouts.
This digestive arrangement offers kangaroos further advan-
tages for their feeding ecology, particularly with respect to
water conservation. Because kangaroos are capable of long
feeding bouts (Watson & Dawson, 1993; this study), they
can focus on feeding when thermal conditions are favour-
able, as was seen here. Red kangaroos generally rested under
shade trees during the hottest parts of the day (Fig. 1a;
Watson & Dawson, 1993; Dawson et al., 2006), a behaviour
that reduces their need for evaporative cooling (Dawson &
Denny, 1969; Dawson et al., 2006).
The kangaroos in our study used just 13% of the water
used by sheep (1.5 vs. 12 Lday�1 for kangaroos and sheep
respectively; Munn et al., 2009). This stark difference in
water usage has been observed in other studies (e.g. Dawson
et al., 1975). However, in all previous studies, the water
turnover of red kangaroos has been measured in animals
feeding mainly on grasses (e.g. Dawson et al., 1975, 2006).
Unique to our study is the finding of comparatively low
water turnover rates for kangaroos even when ingesting high
quantities of chenopod shrubs (Maireana spp.; Table 2).
Unlike grasses, chenopods are typically high in electro-
lytes, particularly Na+ and Cl� (Macfarlane, Howard &
Siebert, 1967; Dawson et al., 1975). Excessive amounts of
these minerals must be eliminated, usually through the
kidneys. On a diet of over 80% chenopods (Table 2), our
red kangaroos not only showed their considerable urine
concentrating abilities (Table 4) but also had comparatively
low water turnover rates (Munn et al., 2009). Concentration
of sheep urine (mOsmol kg�1) was less than half that of
kangaroos and was similar to that reported for merinos
feeding on saltbushes (c. 1000mOsmol kg�1; Macfarlane
et al., 1967). Our data are therefore consistent with conclu-
sions that sheep grazing in Australia’s chenopod shrublands
rely heavily on access to free water (Macfarlane et al., 1967;
Wilson, 1974; Dawson et al., 1975). When sheep switch from
low-salt grasses and forbs to high-salt chenopods, their
water use dramatically increases from near 6 to
10–12Lday�1 (Wilson, 1974; Squires, 1981; Munn et al.,
2009 and this study). Indeed, the focus of sheep grazing
around watering points is a major factor reducing biodiver-
sity and increasing land degradation in these areas (Landsberg
et al., 1997; James, Landsberg &Morton, 1999; Fisher et al.,
2003). Red kangaroos are not water focused in their grazing
patterns (Montague-Drake & Croft, 2004; Fukuda et al.,
2009), and thus, their impact on the rangelands is more
broadly spaced.
Acknowledgements
We thank Fowlers Gap Arid Zone Research Station, Uni-
versity of New South Wales. This project was funded by
ARC Grant (LP0668879) to A.J.M. with Professors Chris
Dickman and Michael Thompson (School of Biological
Sciences, University of Sydney) and with support from
NSW Department of Environment and Climate Change
Kangaroo Management Program (N. Payne), the SA
Department for Environment and Heritage (L. Farroway),
Journal of Zoology 282 (2010) 226–237 c� 2010 The Authors. Journal of Zoology c� 2010 The Zoological Society of London234
Feeding biology of kangaroos and sheep A. J. Munn, T. J. Dawson and S. R. McLeod

the WA Department of Environment and Conservation
(P. Mawson), the NSW Western Catchment Management
Authority and the NSW Department of Primary Industries.
Thanks are due to the two anonymous reviewers, whose
comments improved the paper.
References
Bailey, P.T., Martensz, P.N. & Barker, R. (1971). The red
kangaroo,Megaleia rufa (Desmarest), in north-western
New South Wales. II. Food. CSIRO Wild. Res. 16, 29–39.
Barker, R.D. (1987). The diet of herbivores in the sheep
rangelands. In Kangaroos, their ecology and management in
sheep rangelands of Australia: 69–83. Caughley, G., Shep-
herd, N. & Short, J. (Eds). Cambridge: Cambridge Uni-
versity Press.
Belovsky, G.E., Schmitz, O.J., Slade, J.B. & Dawson, T.J.
(1991). Effects of spines and thorns on Australian arid zone
herbivores of different body masses. Oecologia 88,
521–528.
Bonnet, E. & Van de Peer, Y (2002). zt: a software tool for
simple and partial Mantel tests. J. Statistical Soft. 7, 1–12.
Clancy, T.F. & Croft, D.B. (1991). Differences in habitat use
and grouping behavior between macropods and eutherian
herbivores. J. Mammal. 72, 441–449.
Clemens, W.A., Richardson, B.J. & Braverstock, P.R. (1989).
Biogeography and phylogeny of the metatheria. In Fauna
of Australia. Mammalia: 527–548. Walton, D.W. & Ri-
chardson, B.J. (Eds). 1B. Canberra: Austrlalian Govern-
ment Publishing Service.
Corbett, J.C. (1990). Standing committee on agriculture, rumi-
nants subcommittee. Feeding standards for Australian live-
stock: ruminants. Melbourne: CSIRO.
Dawson, L. (2006). An ecophysiological approach to the
extinction of large marsupial herbivores in middle and late
PleistoceneAustralia.Alcheringa (Special issue 1), 30, 89–114.
Dawson, T.J. (1995). Kangaroos: biology of the largest marsu-
pials. Sydney: UNSW Press.
Dawson, T.J., Blaney, C.E., Munn, A.J., Krockenberger, A.
& Maloney, S.K. (2000). Thermoregulation by kangaroos
from mesic and arid habitats: influence of temperature on
routes of heat loss in eastern grey kangaroos (Macropus
giganteus) and Red Kangaroos (Macropus rufus). Physiol.
Biochem. Zool. 73, 374–381.
Dawson, T.J. & Denny, M.J.S. (1969). A bioclimatological
comparison of the summer day microenvironments of two
species of arid zone kangaroo. Ecology 50, 328–332.
Dawson, T.J., Denny, M.J.S., Russell, E.M. & Ellis, B. (1975).
Water usage and diet preferences of free ranging kangar-
oos, sheep and feral goats in the Australian arid zone
during summer. J. Zool. (Lond.) 177, 1–23.
Dawson, T.J. & Ellis, B.A. (1994). Diets of mammalian
herbivores in Australian arid shrublands: seasonal affects
on overlap between red kangaroos, sheep and rabbits and
on dietary niche breadths and electivities. J. Arid Environ.
26, 257–271.
Dawson, T.J.,McTavish, K.J.,Munn, A.J. & Holloway, J. (2006).
Water use and thermoregulatory behaviour of kangaroos in
arid regions: insights into colonisation of arid rangelands in
Australia by the eastern grey kangaroo (Macropus giganteus).
J. Comp. Physiol. B Biochem Syst Environ. Physiol. 176, 45–53
(Online DOI: 10.1007/s00360-005-0030-2).
Dawson, T.J. &Munn, A.J. (2007). Howmuch do kangaroos of
differing age and size eat relative to domestic stock?: implica-
tions for the arid rangelands. In Animals of arid Australia:
99–101. Dickman, C., Lunney, D. & Burgin, S. (Eds).
Sydney: Royal zoological society of New South Wales.
Dawson, T.J. & Taylor, C.R (1973). Energetic costs of
locomotion in kangaroos. Nature 246, 313–314.
Dellow, D.W. (1982). Studies on the nutrition of macropodine
marsupials. III. The flow of digesta through the stomach
aned intestine of macropodines and sheep. Aust. J. Zool.
30, 751–765.
DEWHA. (2008). National code of practice for the humane
shooting of kangaroos and wallabies for non-commercial
purposes. Canberra: Australian Government Department
of the Environment, Water, Heritage and the Arts.
Dunbar, R.I.M. (1976). Some aspects of research design and
their implications in the observational study of behaviour.
Behaviour 58, 78–98.
Edwards, G.P., Croft, D.B. & Dawson, T.J. (1996). Competi-
tion between red kangaroos (Macropus rufus) and sheep
(Ovis aries) in the arid rangelands of Australia. Aust. J.
Ecol. 21, 165–172.
Edwards, G.P., Dawson, T.J. & Croft, D.B. (1995). The
dietary overlap between red kangaroos (Macropus rufus)
and sheep (Ovis aries) in the arid rangelands of Australia.
Aust. J. Ecol. 20, 324–334.
Ellis, B.A., Russell, E.M., Dawson, T.J. & Harrop, C.J.F.
(1977). Seasonal changes in diet preferences of free ranging
red kangaroos, euros and sheep in western New South
Wales. Aust. Wildl. Res. 4, 127–144.
Feinsinger, P., Spears, E.E. & Poole, R.W. (1981). A simple
measure of niche breadth. Ecology 62, 27–32.
Fisher, D.O., Blomberg, S.P. & Owens, I.P.F. (2003). Extrin-
sic versus intrinsic factors in the decline and extinction of
Australian marsupials. Proceedings of the Royal Society of
London. Series B. Biol. Sci. 270, 1801–1808. (Online DOI:
10.1098/rspb.2003.2447).
Foot, J.Z. & Romberg, B. (1965). The utilisation of roughage
by sheep and the red kangaroo,Macropus rufus (Desmarest).
Aust. J. Agric. Res. 16, 429–435.
Forbes, D.K. & Tribe, D.E. (1970). The utilization of roughages
by sheep and kangaroos. Aust. J. Zool. 18, 247–256.
Fukuda, Y., McCallum, H.I., Grigg, G.C. & Pople, A.R.
(2009). Fencing artificial waterpoints failed to influence
density and distribution of red kangaroos (Macropus rufus).
Wild. Res. 36, 457–465.
Golley, F.B. (1961). Energy values of ecological materials.
Ecology 42, 581–584.
Griffiths, M. & Barker, R. (1966). The plants eaten by
sheep and by kangaroos grazing together in a paddock in
Journal of Zoology 282 (2010) 226–237 c� 2010 The Authors. Journal of Zoology c� 2010 The Zoological Society of London 235
Feeding biology of kangaroos and sheepA. J. Munn, T. J. Dawson and S. R. McLeod

south-western Queensland. CSIRO Wildl. Res. 11,
145–167.
Hulet, C.V., Alexander, G. & Hafez, E.S.E. (1975). The
behaviour of sheep. In The behaviour of domestic animals:
246–294. Hafez, E.S.E. (Ed.). London: Bailliere Tindall.
Hume, I.D. (1974). Nitrogen and sulphur retention and fibre
digestion by euros, red kangaroos and sheep. Aust. J. Zool.
22, 13–23.
Hume, I.D. (1978). Evolution of the macropodidae digestive
system. Aust Mammal. 2, 37–42.
Hume, I.D. (1999). Marsupial nutrition. Cambridge: Cam-
bridge University Press.
Hume, I.D. & Warner, A.C.I. (1980). Evolution of microbial
digestion in mammals. In Digestive physiology and metabo-
lism in ruminants: 665–684. Ruckebusch, Y. & Thivend, P.
(Eds) Lancaster: MTP Press.
Illius, A.W. & Gordon, I.J. (1992). Modelling the nutritional
ecology of ungulate herbivores: evolution of body size and
competitive interactions. Oecologia 89, 428–434.
James, C.D., Landsberg, J. & Morton, S.R. (1999). Provision
of watering points in the Australian arid zone: a review of
effects on biota. J. Arid Environ. 44, 87–121.
Janis, C. (1976). The evolutionary strategy of the equidae and
the origins of rumen and cecal digestion. Evolution 30,
757–774.
Johnson, C. (2006). Australia’s mammal extinctions: a 50,000
year history. Melbourne: Cambridge University Press.
Kirkpatrick, J.B., Bridle, K.L. & Leith, P. (2007). Managing
the run country for production. In People, sheep and
nature conservation: the Tasmanian experience: 45–98.
Kirkpatrick, J.B. & Bridle, K. (Eds). Melbourne: CSIRO
Publishing.
Landsberg, J. & Stol, J. (1996). Spatial distribution of sheep,
feral goats and kangaroos in woody rangeland paddocks.
Rangeland J. 18, 270–291. (Online DOI: 10.1071/
RJ9960270).
Landsberg, J.L., James, C.D., Morton, S.R., Hobbs, T.J.,
Stol, J., Drew, A. & Tongway, H. (1997). The effects of
artificial sources of water on rangeland biodiversity.
Canberra: Environment Australia & CSIRO,
Commonwealth of Australia.
Lechowicz, M.J. (1982). The sampling characteristics of
electivity indices. Oecologia 52, 22–30.
Macfarlane, W.V., Howard, B. & Siebert, B.D. (1967). Water
metabolism of merino and border Leicester sheep grazing
saltbush. Aust. J. Agric. Res. 18, 947–958.
Mantel, N. (1967). The detection of disease clustering
and a generalised regression approach. Cancer Res. 27,
209–220.
Marston, H.R. (1948). Energy transactions in the sheep. I.
The basal heat production and heat increment. Aust. J. Sci.
Res. 1, 93–129.
McIntosh, D.L. (1966). The digestibility of two roughages
and the rates of passage of their residues by the red
kangaroo, Megaleia rufa (Desmarest), and the merino
sheep. CSIRO Wildl. Res. 11, 125–135.
McLeod, S. (1996). The foraging behaviour of the arid zone
herbivores the red kangaroo (Macropus rufus) and sheep
(Ovis aries) and its role in their competitive interaction,
population dynamics and life-history strategies. PhD thesis,
The University of New South Wales.
Midwood, A.J., Haggarty, P., Mcgaw, B.A., Mollison, G.S.,
Milne, E. & Duncan, G.J. (1994). Validation in sheep of the
doubly labeled water method for estimating CO2 produc-
tion. Am. J. Physiol. 266, R169–R178.
Moir, R.J. (1961). A note on the relationship between the
digestible dry matter and digestible energy content of
ruminant diets. Aust. J. Exp. Agr. Anim. Husb. 1,
24–26.
Montague-Drake, R. & Croft, D.B. (2004). Do kangaroos
exhibit water-focussed grazing patterns in arid New South
Wales? A case study in Sturt National Park. Aust. Mammal.
26, 87–100.
Munn, A.J. & Dawson, T.J. (2006). Forage fibre digestion,
rates of feed passage and gut fill in juvenile and adult red
kangaroos (Macropus rufus): why body size matters.
J. Exp. Biol. 209, 1535–1547.
Munn, A.J., Dawson, T.J., McLeod, S.R., Croft, D.B.,
Thompson, M.B. &Dickman, C.R. (2009). Field metabolic
rate and water turnover of red kangaroos and sheep in an
arid rangeland: an empirically derived dry-sheep-equiva-
lent for kangaroos. Aust. J. Zool. 57, 23–28.
Munn, A.J., Jurgen Streich, W., Hummel, J. & Clauss, M.
(2008). Modelling digestive constraints in non-ruminant
and ruminant foregut-fermenting mammals. Comp.
Biochem. Physiol. A. 151, 78–84.
Nagy, K. (1977). Cellulose digestion and nutrient assimilation
in Sauromalus obesus, a plant-eating lizard. Copeia 2,
355–362.
Nagy, K.A. (2001). Food requirements of wild animals:
predictive equations for free-living mammals, reptiles, and
birds. Nutr. Abst. Rev. Ser. B 71, 21R–31R.
Rittenhouse, L.R., Streeter, C.L. & Clanton, D.C. (1971).
Estimating digestible energy from digestible dry and
organic matter in diets of grazing cattle. J. Range Mgmt.
24, 73–75.
Robbins, C.T. (2001). Wildlife feeding and nutrition. New
York: Academic Press.
Standing Committee on Agriculture and Resource Manage-
ment. (1991). Model code of practice for the welfare of
animals: the sheep. Report No. 29. CSIRO, Canberra.
SoE. (2006). Australian State of the Environment Committee
Australia State of the Environment 2006, Environment
Research and Information Branch Department of the
Environment and Heritage, Commonwealth of Australia.
Available at http://www.environment.gov.au/soe/2006/
index.html (accessed 23 June 2010).
Squires, V. (1981). Livestock management in the arid zone.
Melbourne: Inkata Press.
Stevens, C.E. & Hume, I.D. (1995).Comparative physiology of
the vertebrate digestive system, 2nd edn. Cambridge:
Cambridge University Press.
Journal of Zoology 282 (2010) 226–237 c� 2010 The Authors. Journal of Zoology c� 2010 The Zoological Society of London236
Feeding biology of kangaroos and sheep A. J. Munn, T. J. Dawson and S. R. McLeod

Vanderploeg, H.A. & Scavia, D. (1979a). Calculation and use
of selectivity coefficients of feeding: zooplankton grazing.
Ecol. Model. 7, 135–149.
Vanderploeg, H.A. & Scavia, D. (1979b). Two electivity
indices for feeding with special reference to zoo-
plankton grazing. J. Fish. Res. Board Can. 36,
362–365.
Watson, D.M. & Dawson, T.J. (1993). The effects of age, sex,
reproductive status, and temporal factors on the time-use
of free-ranging red kangaroos (Macropus rufus) in western
new South Wales. Wildl. Res. 20, 785–801.
Wilson, A.D. (1974). Water consumption and water turnover
of sheep grazing semiarid pasture communities in New
South Wales. Aust.J. Agric. Res. 25, 339–347.
Journal of Zoology 282 (2010) 226–237 c� 2010 The Authors. Journal of Zoology c� 2010 The Zoological Society of London 237
Feeding biology of kangaroos and sheepA. J. Munn, T. J. Dawson and S. R. McLeod