Federal Reform Outcome: Influence of Modified Institutions on the Investment Climate in the Regions
210
Consortium for Economic Policy Research and Advice WCER Canadian International Development Agency Association of Universities and Colleges of Canada Institute for the Economy in Transition Working Center for Economic Reform Academy of National Economy Federal Reform Outcome: Influence of Modified Institutions on the Investment Climate in the Regions Moscow 2007
Transcript of Federal Reform Outcome: Influence of Modified Institutions on the Investment Climate in the Regions
Consortium for Economic Policy Research and Advice
WCER
Canadian
International Development
Agency
Association of Universities and Colleges
of Canada
Institute for the Economy
in Transition
Working Center
for Economic Reform
Academy of National Economy
Federal Reform Outcome: Influence of Modified Institutions
on the Investment Climate in the Regions
Moscow 2007
UDC BBC
F33
332.15:330.322 65.263.2�21 Federal Reform Outcome: Influence of Modified Institutions on the Investment Climate in the Regions / Consortium for Economic Policy Research and Advice ; [Yanovskiy K. et al.]. – Moscow : IET, 2007. – 210 p. : il. – ISBN 978�5�93255�215�5. Agency CIP RSL Authors: Yanovskiy K., Zhavoronkov S., Litarchuk V., Reva E., Shakin D., Shulgin S., Cherny D., Kucherinenko V. This publication is aimed at studying the modification of institutions of regional state power in the Russian Federation and its influence on the investment climate in the regions, including regional peculiarities of the investment climate and predictability of the policy of regional authorities headed by appointed governors. Examples of political confrontation between regional and provincial authorities in Canada allow us to illustrate the influence of normal federative democracy on business environment. JEL Classification: D72, D74, H5 Translated from the Russian by Anna and Alexey Yurasovsky. Page setting: Yudichev V. The research and the publication were undertaken in the framework of CEPRA (Consortium for Economic Policy Re�search and Advice) project funded by the Canadian Agency for International Development (CIDA).
UDC 332.15:330.322 BBC 65.263.2�21
ISBN 978�5�93255�215�5 5, Gazetny per., Moscow, 125993 Russia Tel. (495) 629�67�36, Fax (495) 203�88�16 [email protected], http://www.iet.ru
Contents
Introduction ................................................................................................5
1. The Problem State ...............................................................................7
2. Statistical Analysis of the Disappearing Distinctions ............................................................................ 13
2.1. A Comparison with the Methodology of the 2001–2002 Projects..................................................... 13 2.2. The Description of the Methodology................................. 14 2.3. The Tested Hypotheses................................................... 16 2.4. Data .............................................................................. 18 2.5. The Main Results of Statistical Analysis............................. 21 2.6. Informal comments to the statistical analysis outcomes ................................................................ 23
3. Federal State Institutions in the Russia and in the Canada: the Source of Instability or Flexibility? ............ 27
3.1. Russia: the Final Wave of Gubernatorial Elections in the Regions......................................................... 27 3.2. The Problems of Guaranteeing the Quality of State Governance at the Regional Level............................... 30 3.3. The Negative and Positive Trends at the Regional Political Markets of Russia............................... 33 3.4. On the Way towards a Unitary State: Benefits and Losses .............................................................. 35 3.5. The regions of Russia consolidation processes as the problem of political� economic competition ........................................................... 43 3.6. Regional authorities and the challenges of terrorism .......................................................................... 45 3.7. Canadian National Energy Program (NEP) 1980........................................................................... 49 3.8. Parties' Conflicts on the Federal� Provincial Level in Canadian Post�War History.......................... 89
Bibliography........................................................................................... 120
Annex 1 Comparative Table of RF Subjects’ Budget regulations main features............................................. 124
Annex 2 Canadian provincial and federal elections' outcome statistics 1945–2006 .................................. 138
Annex 3 Main outcomes of calculations ................................................. 151
Annex 4 Regional conflicts ................................................................... 163
Annex 5 Table of Variables (Data for Calculations) .......................................... 190
Introduction
2005 became the first year of performance for the new administra�tive system in Russia. This system was the result of the federative rela�tions reform (mainly, replacement of electing governors with their ap�pointment1 and cancellation of elections in constituencies to the State Duma).
This period allows us to analyze the first outcome of the new system performance and demonstrate the first reform results on the perform�ance of both regional and federal officials. First observations over the development of legislation, legal practice and political life in the regions permit us to evaluate the influence of the new norms on the transpar�ency of the government and business environment.
This project will continue CEPRA research, which was started in 2001–2002 and related to the formal analysis and comparative descrip�tion of the institutions in the Russian regions (courts, mass media, NGO, etc.) and research started in 2004, which was dedicated to the analysis of mechanisms and incentives for import of institutions by the regions.
The subjects of the report analysis is: − the dynamics of institutional environment in the Russian regions,
focusing on the states before and after the administrative reform; − experience of the most successful countries with transition econo�
mies and Canada of solving political and economic contradictions between different levels of government with the minimization of the negative effect for the investment climate.
Available data demonstrates that over passed year peoples confi�dence in the court system and law enforcement agencies did not in�crease. The vast majority of the appointed governors represent already acting governors, who very often could not be elected for another term. This fact undermines arguments of the fathers of the reform who stated
1 See Federal law of 11 December 2004 No. 159�FZ “On Introducing Changes in the Fed�eral Law ‘On the General Principles of Organization of Legislative (Representative) and Executive Bodies of Government of the Subjects of the Russian Federation’ and in the Federal Law ‘On Main Guarantees of the Voting Right of the Citizens of the Russian Fed�eration’, and Presidential Decree of 9 March 2004 No. 314 ‘On the system and Structure of the Federal Bodies of Executive Power’”.
6
that elected governors were not qualified for the job and their moral qualities were very low. They insisted on the need to increase the effi�ciency of the legal system with the help of “strengthening administrative vertical”.
Passed year also provides possibilities to verify suspicions of those who opposed changing the legislation about undermining incentives of the regional authorities to provide quality public goods to the popula�tion.
Thus, although changes in the legislation did not have major effect, they as an experiment gave substance for comparative analysis and created demand (although postponed till the energy price fall) on policy advice on improving the situation (even the federal authorities are dis�satisfied with the situation, although they proposed the system of nomi�nating candidates for a governor proposed by a party, which won the elections in the regional legislative assembly).
Research is aimed at demonstrating the influence proceeding from the change, which is taking place in the system of the regional govern�ment bodies in the Russian Federation, as well as on the investment climate in the regions including regional differences (in case they re�main) in the investment climate and predictability of regional authorities policy headed by appointed governors.
1. The Problem State
The study “Political and Legal Sources of Investment Risks in the Russian Regions” (by V. Mau, S. Zhavoronkov, K. Yanovskiy et al., 2002) addresses different approaches to determining the sources of political and legal investment risks, as well as the associated factors of economic growth. The approach based only on distinguishing the eco�nomic freedoms and property guarantees has been augmented by in�cluding the indices that reflect the situation that exists in the sphere of basic human rights, which are associated primarily with the guarantees of the inviolability of the person, as well as the population’s demand for such institutes.
The results obtained in course of this study, indicative of the signifi�cant ways in which the guarantees of rights and liberties influence the entrepreneurial climate, have demonstrated the great importance of the individual assessments of risks in the decision�making concerning in�vestments.
In this connection, the significance and explanatory capacities of in�dependent variables was increasing noticeably in certain combinations. The combination “judicial protection of the inviolability of the person – activity of human rights organizations” (outside which the judicial statis�tical data were found to be statistically insignificant with the 95% inter�val) could provide explanations for up to 16% of the variations of the employment dynamics index in the sphere of small�size businesses. Even more efficient (with the explanatory capacity of up to 31%) was the combination of the judicial statistics of punishments applied for crimes against justice (unlawful detainment, falsified evidence, etc.) with the freedom of speech rating for the year 2000 in providing explanations as to the share of employment in small�size businesses in 2001 in Russian regions.
Vast literature is devoted to the analysis of the institutes of federal�ism, and even a brief overview of the latter would go beyond the frame�work of the present study. We should note only such key characteristics of the institutes of federalism as the possibility of interregional competi�tion between the institutions and politics of regional authorities, and also their ability to alter – both in the positive and negative direction –
8
the law enforcement practices and reforms carried out by the federal authorities in the legal and law�enforcement context of a region.
In order for the system to be developing along exactly such lines, it is necessary to guarantee the existence of the rule of law regime. Thus, the decentralized system of government increases efficiency in the course of observing the following important and sufficient demands of market federalism (Weingast 1995; Montinola, Qian, and Weingast 1995): − considerable regulatory duties are delegated to subnational gov�
ernments; − intergovernmental regional and regional�federal relations are based
on the procedures prescribed by the law and are isolated from po�litical influences in such a way that regional governments become subjected to rigid budget constraints and are forced to operate within their framework (the constraints imposed on the actions of subnational governments coordinate local politics and prevent the consequences of one�move games, similar to a prisoner’s di�lemma);
− the common market is preserved in such a way that goods and pro�duction factors can move freely throughout the whole country;
− both power and the liabilities are divided between the levels of gov�ernment on a stable and reliable basis (so as to inspire confidence on the part of market agents).
According to Qian and Roland (Qian and Roland 1998), the signifi�cance of any efforts being made by regional authorities and regional legislation in order to improve the investment attractiveness of a coun�try as a whole is negligible. But, at the same time, the importance of this factor is very significant for the distribution of investments between the regions. As indicated by our studies undertaken in the years 2001 and 2002, the significance of an efficient regional authority based on the voter’s choice, is higher in a country with the economy in transition than under conditions of a stable legal democracy.
It is true that in the 1990s Russia experienced a sequence of radical reforms and deep crises. And while the reforms were more frequently impeded rather than supported at the regional level, the crises were undoubtedly endured there with more ease, owing to the “redistribution of the burden” between the regions and the center. Both at the national
9
and at the regional level the voter was forced to share the responsibility (at least to a certain extent) for what was going on, which increased the political stability of the system.
Buchanan and Congleton2 single out one more important condition for federalism to be efficient: the possibility to achieve different stan�dards, within the framework of one state, in respect to the provision of some social services (this inequality is actively fought against, for ex�ample, in Canada and Germany).
In their study concerned with regional institutional specificities, Yanovskiy, Zhavoronkov and Chernyi 2001 analyze, in particular, tax benefits, singling out the benefits established by decisions of regional legislative authorities and (this latter practice being rather widespread) by the decisions of the head of an executive authority. Alongside a gov�ernor’s ability to pass such decisions through “his own” legislative as�sembly, such powers become both a means to extract the administra�tive rent and a means to secure the prolongation of a governor’s term in office. The influence of such powers (the imposition of taxes by the monarchs’ decisions) on the long�term conditions for economic growth in Europe is written about by T. Eggertsson in his prominent overview of neoinstitutional theory3.
The conditions under which decentralization (in this case – fiscal de�centralization) turns out to be efficient are focused on in the work by R. Enikolopov and E. Zhuravskaya 2003. The authors have come to the conclusion that strong political parties and the direct subordination of subordinate bodies to superior ones can exert positive influence on the course of financial decentralization in the developing countries. It should be noted, however, that the sample includes, alongside truly democratic countries (the Czech Republic, Hungary, Israel), also the countries where blatantly falsified elections are a common practice, such as Azerbaijan and a number of African countries, as well as China. The sample comprises the countries which are incompatible in princi�ple. In some countries (democratic and legal), political parties repre�sent an institute which reduces the voters’ costs of collecting informa�tion on the candidates, and the candidates’ costs of delivering this in�formation to the voters. In other countries, political parties primarily re�
2 Buchanan, Conglenton, 1998. 3 Eggertsson, 2001, pp. 364–371.
10
duce the costs of organizing direct confrontations with their opponents. And finally, in totalitarian countries (the Chinese version), there are no political parties at all (to class the CPC with the strong parties would be simply ridiculous – the authors measure the strength of a party system by the period of existence of the major political parties and by the frac�tionalization of the governing parties). The choice of such a sample se�riously reduces the explanatory capability of the model and puts under question the validity of the authors’ conclusions.
As is noted in S. Shulgin’s dissertation (2006), the generation of governors who came to power in the regions in the late 1980s – early 1990s, which marked the watershed between the Soviet period and the beginning of reforms, sustained heavy losses as a result of the 1994–98 election. But, starting from the late 1990s (that is, in the 1999–2001 elections), the incumbent governors, as a rule, have been renewing their mandates. It is these persons who still form the core of Russian governors nowadays.
The study by Yegorov, Guriev and Sonin 2006 is devoted to the analysis of the ability of a government (in this case an authoritarian one) to conduct efficient governance (2006). The authors emphasize that the choice between the natural mechanism for checking information and its artificial state substitutes is of vital importance for the majority of con�temporary rulers. Especially worth mentioning is the authors’ generally successful attempt to reflect in their model the situation when the au�thorities are capable to redeem themselves, by means of a rent, from the ever growing problems they are faced with, which is typical of a number of post – Soviet countries and, first of all, of Russia.
The model considered by the authors in Chapters 2 and 3 (theoreti�cal analysis) does not seem to be comprehensive, to say the least.
Thus, the authors do not take into consideration the important inde�pendent value, for an authoritarian ruler, of eradicating the freedom of speech. Apart from breaking down the mechanism for coordinating op�position activity, this eradication manifests itself in propaganda which is necessary for the stabilization and legitimization of the regime. The contemporary Russian state uses the main TV channels exactly for the purpose of propaganda, and in so doing encounters a problem familiar from Soviet times. The conversion of the mass media into an exclusively propaganda apparatus can solve, for a time being, some problems of
11
stabilizing the regime, but at the expense of the informational function. As a result, the leadership’s own propaganda images start to compete for their attention with the crumbs of actual information (Bendukidze 07.11.2006).
When the authorities do not have any instrument for checking the administrative sources of information, these sources obtain a stimulus for falsifying such information in order to present themselves in favor�able light and to pull the resources over to themselves (Niskanen), or to convince the bosses in their loyalty. However, this also represents a somewhat different system of stimuli for the agents (the dictator, the special services, and the bureaucrat).
It is less risky for the corrupt employees of the special services (V. Volkov 2002; see, for example, pp. 245–249) to make money through protection racket (that is, formally, by protecting the “clients” from ille�gal influences, than by extracting the rent from fulfilling their control functions as such). And they collect their rent directly from economic subjects, and not indirectly, via other bureaucrats. However, it should be noted that the mechanism for rent extraction is undoubtedly less important in itself than the consequences of losing the channel of reli�able information for the taking of adequate decisions.
It is also necessary to take into account that for a rational leader, the criterion of efficiency, at least within the framework of the basic as�sumptions of the theory of public choice, is, ultimately, the prolongation of the period of his staying in power, and not the quality or the volume of provided social benefits.
In those societies where the authority of the regime is based on the rule of force (see Mau et al. 2003), the concept of the State being the provider of public benefits is almost irrelevant. In this case, the State is an analogue of what the Mongol Chan was for Mediaeval Russia. The Chan is to be paid off, time and again, by tribute (but nobody in his right mind would dare to demand from him any protection from other roving bandits or the performance of the function of a court of appeal, etc. (see V. Mau 2006).
The authors’ major idea concerning the relationship between the freedom of speech and the informational efficiency of the alternative “special” channels, on the one hand, and the decline in the “sensitivity” and efficiency of the authorities obtaining a high centralized rent for the

12
extraction of natural resources (it is relatively easy to control a pipe line in contrast to nonferrous metals or fisheries), on the other, has found a sound confirmation in the statistical analysis based on the data on 121 countries. The statistical verification is not linked to any specific model describing the behavior of agents, with specific assumptions, which increases the “viability” of e results and conclusions.
2. Statistical Analysis of the Disappearing Distinctions
2.1. A Comparison with the Methodology of the 2001–2002 Projects
At the previous stage of the project4, the dependence of the regions’ state of economy on various political and economic indices was exam�ined by applying regression analysis in combination with factor analysis in order to select, from a large number of variables, a relatively small number of major explanatory factors. In the present work (for further details concerning the methodology applied, see below), it was decided that factor analysis should be used no more, the reasons for which were as follows.
On the one hand, the singling out of major components (when the latter can be indisputably interpreted) helps to select, from among a large number of variables, a limited number of factors which can be subsequently used within the framework of regression analysis. The lesser is the number of observations in the initial sample, the more im�portant becomes this possibility. As the number of observations in this situation has been relatively small (78), this approach seems to be quite acceptable for purposes of getting rid of redundant variables.
On the other hand, apart from the above�mentioned advantages, the preliminary selection of variables by means of factor analysis has a number of considerable drawbacks. The major disadvantage is the dif�ficulty of interpreting the obtained results. Even when it becomes clear as to which specific variables have made a major contribution to a cer�tain factor, there still remains the problem of interpretation.
This drawback can be most vividly illustrated by the example of the methodology applied in our previous work. Then, regression analysis was performed on the basis of 9 major factors, obtained by means of factor analysis. In particular, when analyzing the relationships between economic growth in the regions and various political and economic fac�tors, the second factor was interpreted as that representing the index of independence of the mass media in a region, while the tenth factor – as an index of the existing situation in terms of the protection of human 4 See Mau et al, “Politicheskie i pravovye istochniki riskov v rossiiskikh regionakh” (The political and legal sources of risks in Russian regions), Moscow, 2002.
14
rights and the presence of individual tax benefits5. It is apparent that the interpretation of the tenth factor on the basis of the most significant fac�tors included in the latter has turned out to be rather vague. But the greatest problem, so far as this example is concerned, is the “price” to be paid for the achievement of the formal orthogonality (or linear inde�pendence) of the major components. By their construction, the applied factors are orthogonal. Together with the suggested interpretation, this directly leads to the conclusion that the “independence of the mass media” (major component 3) and the activity of human right organiza�tions (major component 2) are not correlated. But it is evident that in reality these two indices are indeed correlated. Thus, the suggested interpretation of the said factors is contrary to the actual state of affairs, which, in its turn, casts certain doubt onto the results of the subse�quently performed regression analysis.
As mentioned above, the problems of interpretation are not the only drawback of factor analysis. Among other drawbacks, one should point to the “wrong criterion of selection”. In fact, in the case of regression analysis, the explanatory variables are selected (among other things) by their greater explanatory capability with regard to the dependent vari�able (that is, all other factors being equal, the regression where the value of R2 is higher will be preferable). At the same time, factor analysis selects major factors on the basis of the best explanation of the inde�pendent variables’ dispersion. Since the factor analysis was based on a wrong criterion when the factors were being selected, the final regres�sion will include wrong variables.
Bearing in mind the afore – said considerations, it was decided that the sphere of application of factor analysis should be restricted.
2.2. The Description of the Methodology In this work, the examination of statistical dependencies was based
on a multi�dimensional regression analysis. In particular, the procedure of performing the following regression equation is postulated:
yi=x’iв+ei,
5 Ibid., pp.11–12.
15
where xi is the vector column of explanatory variables, yi –dependent variable, ei –shock, with E[ei|xi]=0. In particular, no conditional homo�scedasticity is suggested in the model.
For assessing the vector of coefficients в, the least square procedure was applied, while for obtaining standard errors and, for testing the hy�potheses, the asymptotic approach was applied with the use of the ro�bust appraisal of the asymptotic dispersion matrix in White’s form. Be�cause of the small number of observations (76–78), the asymptotic ap�proach might not be able to produce adequate results for some equita�tions, owing to the inadequate approximation, by theoretical analogues, of the distributions of the statistical data we are interested in. There�fore, in addition to the results of asymptotic inference, the p�values ob�tained with the help of the bootstrap approach are also presented. To be more precise, the module of t�statistics was bootstrapped for a cor�responding regression coefficient by means of the so�called “wild boot�strap”6. We applied the regular asymptotic approach applied for the cases with restricted set of independent variables. We imposed some restrictions for these cases initially by reasons of logical and economic nature of the phenomenon.
For selecting the regressors, the following procedure was used. Ini�tially, the regression equation included all the available explanatory variables, which were subsequently excluded one by one on the basis of their degrees of significance. The process went on until each of the re�maining variables was no more significant at the 10% level. This level of significance was chosen, firstly, because the number of observations was small, and secondly, in the course of the further exclusion of the variables (for example, to the 5% level of significance), the informa�tional criteria (AIC and BIC) began to increase, which testifies to a sub�stantial loss of information in the course of the exclusion of these vari�ables.
Apart from this, in order to test their joint significance within the re�gression equation, the Wald test was carried out in respect to the groups of variables which were of interest to us. For each of the final regressions, the index of the quality of fitting (the adjusted R2) was pre�
6 See. Liu. R.Y., “Bootstrap procedures under some non�i.i.d. models”, Annals of Statis�tics, 16, 1988, pp.1696–1708.
16
sented. All the calculations were done in the EViews 4.1 and GAUSS 6 (bootstrap) packages.
In order to guarantee the compatibility with the results of the calcula�tions from the years 2001–2002, the independent variables, which were frequently (and not always in a clear way) linearly dependent on one another, were “grouped” into major components.
Unlike the previous project, the project under consideration was to be to a higher degree focused on the substantial political and economic relationships existing between the variables, which may fall far short of being direct.
Thus, it would be quite reasonable to expect that there does exist some relationship between the indices of wellbeing with the indices of business climate, which, in their turn, relate to the indices that charac�terize the qualities of the institutes in the regions and the demand for some or other institutes (the institutional packages offered by political parties at the time of elections) displayed by economic agents. It means that, at different stages, some of the variables are dealt with and ap�plied as those being dependent (explained), and then as independent ones.
2.3. The Tested Hypotheses In course of the project, we attempted to estimate the influence on
the business climate of tax privileges and trade barriers. We also tested the hypotheses as to the existence of any influence of the budget poli�cies being implemented in a region (regional budget expenditure, budget deficit) on the business climate.
In their turn, budget expenditure and budget deficit were tested for the existence of any connection to the number of civil servants in a re�gion (in a way, it was a test of Niskanen’s hypothesis concerning the maximization by bureaucracy of the resources being distributed).
Both common sense and the results of the projects implemented in the years 2001–2002 and addressing factors influencing economic growth and the business climate have led us to the testing of the hy�pothesis as to the dependence of employment (or its dynamics) in the sphere of small�size business on political and legal risks. We tested, just as we had done five years previously, the influence of the business cli�mate of the ability of the legal system to protect itself from direct en�
17
croachments (or crimes against justice) and to protect citizens from crimes against human rights. The statistical data on sentences pro�nounced under the corresponding articles in the year 2004 have shown that this ability is rather restricted and compatible with both the state�ments made by human rights activists that there exists no control over law�enforcement agencies on the part of society and the guarded atti�tude of society itself to its “defenders against crime”. We attempted to assess society’s ability to protect citizens’ rights through the activities of human rights organizations and the independent press (see below).
Since we knew from the interviews with entrepreneurs and civil ser�vants that in recent years big businesses sometimes have resorted to the practice of transferring their assets to formally independent small�size companies, we also tested the hypothesis of the existence of a cor�relation between the dynamics of employment in small�size business and the number of known conflicts with big businesses in regions.
Also, as a measure against potential “contamination” of the index of employment in small�size businesses, we tested theoretically the index of employment at second jobs and employment on temporary con�tracts, which is complementary to the index of main employment.
As in the previous projects, the statistical connection was tested be�tween the investment climate indices and electoral statistics, which we attempted to interpret, as before, as an index of the population’s de�mand for some or other institutional packages – both friendly and hos�tile to business.
Both main indices of the business climate in regions – foreign direct investments and employment in small�size businesses – were tested for the presence of any connections with the same index of the year 2002. In all respects, this factor was found to be obviously the most significant one. Foreign investors also may, when making decisions, be guided by the entrepreneurial activity of local businesses. Low activity and with�drawal of businesses or capital outflow is an index of the existence of an unfavorable situation for a foreign investor (with the exception of those investors who are strongly inclined toward risky enterprises, e. g., based on friendly relations with key officials).
And finally, we tested the dependence of a number of indices re�flecting the levels of incomes, consumption and welfare in regions on budget expenditure and the indices of the business climate.
18
So, the tested hypotheses is: Budget expenditure and budget deficit can be explained through the
number of civil servants with a vested interest in expenditure growth (Niskanen’s bureaucracy model).
Budget expenditure and budget deficit may influence the business climate and also have a direct impact on the population’s incomes.
The ability of a legal system and society to protect themselves from crimes against justice and from crimes against human rights, respec�tively, and the level of activity of human rights organizations (when they win cases in courts of justice), may all lower the existing risks for busi�ness activity and improve the business climate.
Electoral behavior (the support, by a region’s population, of either pro�market or anti�market parties, and consequently, the support of respective institutes) may influence the business climate in a region.
Under conditions when the independence of courts of justice is being restricted, the centralization of law�enforcement agencies is increasing, elections of heads of regions’ executive authorities have been abolished, the presence of the opposition�minded mass media is diminishing, fol�lowed by lowering competitiveness on regional media markets, and nu�merous restrictions are being imposed on political competition during elections, the diversity of regional institutes is decreasing, together with the significance of a majority of institutional variables.
The dynamics and level of welfare indices in a region may be signifi�cantly dependent on the business climate (that is, on employment op�portunities and the opportunities for starting one’s own business).
2.4. Data Invoked for analyzing were the data of judicial statistics for the year
2004 (subdivided by region), the formalized data of the work of inde�pendent mass medias and human rights organizations in Russian re�gions, regional legislation, law enforcement practices, and also the data concerning the stability of political power and the data on the conflicts between the authorities of different levels as reflected in mass media. The indicators characterizing the development of small businesses and direct foreign investments were taken from the existing collections of official socio�economic statistics. The data on the execution of regional
19
budgets were obtained from the official website of the RF Federal Treasury.
The explained variables were taken from the collections of official socio�economic statistics (concerning the employment of people).
Chechnia and the autonomous okrugs were excluded from the analysis, because the set of data necessary for an adequate analysis to be performed (first of all, those relating to socio�economic statistics) was not available as regards these territories.
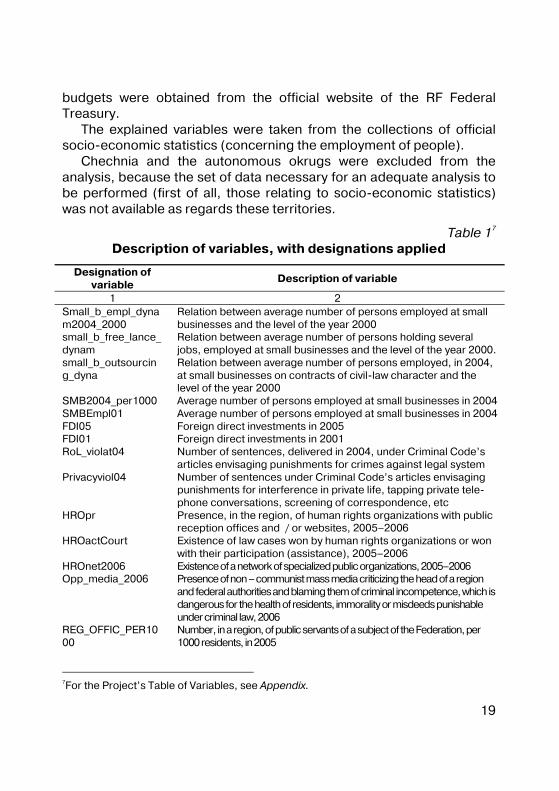
Table 17 Description of variables, with designations applied
Designation of variable
Description of variable
1 2 Small_b_empl_dynam2004_2000
Relation between average number of persons employed at small businesses and the level of the year 2000
small_b_free_lance_dynam
Relation between average number of persons holding several jobs, employed at small businesses and the level of the year 2000.
small_b_outsourcing_dyna
Relation between average number of persons employed, in 2004, at small businesses on contracts of civil�law character and the level of the year 2000
SMB2004_per1000 Average number of persons employed at small businesses in 2004SMBEmpl01 Average number of persons employed at small businesses in 2004FDI05 Foreign direct investments in 2005 FDI01 Foreign direct investments in 2001 RoL_violat04 Number of sentences, delivered in 2004, under Criminal Code’s
articles envisaging punishments for crimes against legal system Privacyviol04 Number of sentences under Criminal Code’s articles envisaging
punishments for interference in private life, tapping private tele�phone conversations, screening of correspondence, etc
HROpr Presence, in the region, of human rights organizations with public reception offices and / or websites, 2005–2006
HROactCourt Existence of law cases won by human rights organizations or won with their participation (assistance), 2005–2006
HROnet2006 Existence of a network of specialized public organizations, 2005–2006 Opp_media_2006 Presence of non – communist mass media criticizing the head of a region
and federal authorities and blaming them of criminal incompetence, which is dangerous for the health of residents, immorality or misdeeds punishable under criminal law, 2006
REG_OFFIC_PER1000
Number, in a region, of public servants of a subject of the Federation, per 1000 residents, in 2005
7For the Project’s Table of Variables, see Appendix.
20
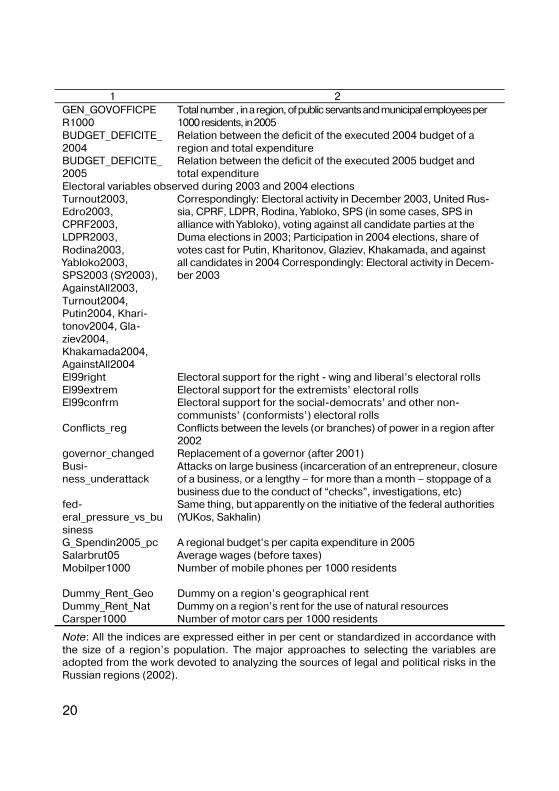
1 2 GEN_GOVOFFICPER1000
Total number , in a region, of public servants and municipal employees per 1000 residents, in 2005
BUDGET_DEFICITE_2004
Relation between the deficit of the executed 2004 budget of a region and total expenditure
BUDGET_DEFICITE_2005
Relation between the deficit of the executed 2005 budget and total expenditure
Electoral variables observed during 2003 and 2004 elections Turnout2003, Edro2003, CPRF2003, LDPR2003, Rodina2003, Yabloko2003, SPS2003 (SY2003), AgainstAll2003, Turnout2004, Putin2004, Khari�tonov2004, Gla�ziev2004, Khakamada2004, AgainstAll2004
Correspondingly: Electoral activity in December 2003, United Rus�sia, CPRF, LDPR, Rodina, Yabloko, SPS (in some cases, SPS in alliance with Yabloko), voting against all candidate parties at the Duma elections in 2003; Participation in 2004 elections, share of votes cast for Putin, Kharitonov, Glaziev, Khakamada, and against all candidates in 2004 Correspondingly: Electoral activity in Decem�ber 2003
El99right Electoral support for the right � wing and liberal’s electoral rolls El99extrem Electoral support for the extremists’ electoral rolls El99confrm Electoral support for the social�democrats’ and other non�
communists’ (conformists’) electoral rolls Conflicts_reg Conflicts between the levels (or branches) of power in a region after
2002 governor_changed Replacement of a governor (after 2001) Busi�ness_underattack
Attacks on large business (incarceration of an entrepreneur, closure of a business, or a lengthy – for more than a month – stoppage of a business due to the conduct of “checks”, investigations, etc)
fed�eral_pressure_vs_business
Same thing, but apparently on the initiative of the federal authorities (YUKos, Sakhalin)
G_Spendin2005_pc A regional budget’s per capita expenditure in 2005 Salarbrut05 Average wages (before taxes) Mobilper1000 Number of mobile phones per 1000 residents Dummy_Rent_Geo Dummy on a region’s geographical rent Dummy_Rent_Nat Dummy on a region’s rent for the use of natural resources Carsper1000 Number of motor cars per 1000 residents
Note: All the indices are expressed either in per cent or standardized in accordance with the size of a region’s population. The major approaches to selecting the variables are adopted from the work devoted to analyzing the sources of legal and political risks in the Russian regions (2002).
21
2.5. The Main Results of Statistical Analysis As is shown by the results of the conducted statistical analysis (in�
cluding the major stages of the estimations presented in the Annex 1), the hypothesis for the decrease in the significance of institutional fac�tors cannot be rejected.
As early as at the first stage of analyzing the collected data, we were faced with rather surprising results: the majority of relationships, which had previously been statistically significant and had had a high explana�tory capability (as regards the data from the years 2001–2002), were simply “inoperative” with regard to the new data.
This compelled us to change the methodology (see above), and to examine each assumed relation between the indices, rather than to di�rectly analyze the dependence of welfare indices on the institutions or on the electoral demand for them. However, despite the adoption of a refined methodology and of a step�by�step algorithm applied for the identification of relationships, which involved the analysis of only those relationships that represented, beyond any doubt, economically ra�tional direct connections, easily interpreted at the micro�economic level, it became much more difficult to explain, by means of the institu�tions, all the regional variations in the static and the dynamics of the in�vestment climate indices and welfare.
Thus, the indices of development of small businesses are no longer significantly influenced by some of the indices of judicial statistics (ex�cept for the index of sentences for intrusion in private life, singled out into a separate variable; it represents the only formal components of crimes violating citizens’ rights and crimes against legal system, with regard to which the number of sentences passed in 2004 did rise by comparison with the years 2000 and 2001).
The relation between the dynamics of small businesses and the ac�tivity of civil rights organizations became weaker – the only vestige of it is limited to a lowly significant index with R2 0.08% (see relationship 1 in Table 2).
However, all this has given no grounds to affirm that the institutional factors, which reflect people’s choice in electoral statistics do not influ�ence the business climate. The most significant relationship turned out to be the relationship between the business climate quality index and its
22
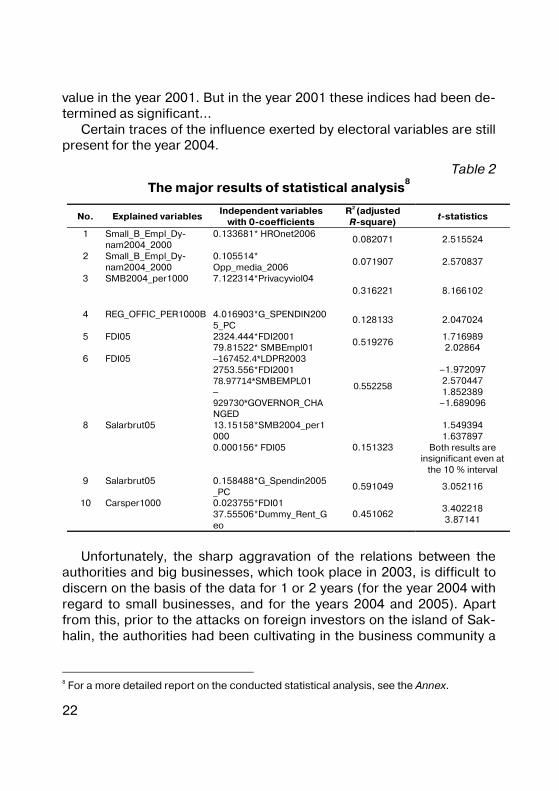
value in the year 2001. But in the year 2001 these indices had been de�termined as significant…
Certain traces of the influence exerted by electoral variables are still present for the year 2004.
Table 2 The major results of statistical analysis
8
No. Explained variables Independent variables
with 0�coefficients R2 (adjusted R�square)
t�statistics
1 Small_B_Empl_Dy�nam2004_2000
0.133681* HROnet2006 0.082071 2.515524
2 Small_B_Empl_Dy�nam2004_2000
0.105514* Opp_media_2006
0.071907 2.570837
3 SMB2004_per1000 7.122314*Privacyviol04 0.316221 8.166102
4 REG_OFFIC_PER1000B 4.016903*G_SPENDIN2005_PC
0.128133 2.047024
5 FDI05 2324.444*FDI2001 79.81522* SMBEmpl01
0.519276 1.716989 2.02864
6 FDI05 –167452.4*LDPR2003 2753.556*FDI2001 78.97714*SMBEMPL01 –929730*GOVERNOR_CHANGED
0.552258
–1.972097 2.570447 1.852389
–1.689096
8 Salarbrut05 13.15158*SMB2004_per1000 0.000156* FDI05 0.151323
1.549394 1.637897
Both results are insignificant even at
the 10 % interval 9 Salarbrut05 0.158488*G_Spendin2005
_PC 0.591049 3.052116
10 Carsper1000 0.023755*FDI01 37.55506*Dummy_Rent_Geo
0.451062 3.402218 3.87141
Unfortunately, the sharp aggravation of the relations between the
authorities and big businesses, which took place in 2003, is difficult to discern on the basis of the data for 1 or 2 years (for the year 2004 with regard to small businesses, and for the years 2004 and 2005). Apart from this, prior to the attacks on foreign investors on the island of Sak�halin, the authorities had been cultivating in the business community a
8 For a more detailed report on the conducted statistical analysis, see the Annex.
23
certain illusion that everybody who did not interfere in politics was safe�guarded from repressions (as regards Sakhalin, see below).
Thus, after checking the relationship between the indices of the state and dynamics of the business climate (employment in small busi�nesses and the adjacent parameters – the numbers of persons tempo�rarily employed on civil law contracts and persons combining jobs) and the attacks on business in the regions, we found no proof of the hy�pothesis that business instantaneously should react to such cases (see Annex). And it is not surprising. In the majority of cases, it is impossible to roll back the investments in the course of a few weeks and even months without incurring large losses; sometimes it takes years for a business to be re�oriented to fulfilling new tasks in another region or even in another country.
2.6. Informal comments to the statistical analysis outcomes
From the quantitative point of view, all the three indices of the activity of human� rights organizations have significantly improved. There was a growth in the number of such organizations. There was a considerable growth in the number of regions where human�rights organizations managed to win cases in the courts of justice, which have become es�pecially difficult in recent years. Also, there was a significant growth in the number of regions where networks of specialized human�rights or�ganizations emerged in recent years (the Republic of Komi, Kemerovo, Kursk, and Penza Oblasts, etc.).
However, there were noteworthy cases (in seven regions) of non�governmental organizations engaged in human�rights activity being banned by court decision. This is an absolutely new phenomenon, ap�parently inspired by corresponding signals from the top political leader�ship. One of such signals is the campaign against the most prominent civil�rights organizations (“the English Stone”), which the authorities still do not dare to shut down, while another one is the adoption of new leg�islation on not�for�profit organizations, which provides the authorities with instruments for exerting pressure on independent nongovernmen�tal organizations. Simultaneously, we are witnessing the emergence and growth of GONGOs, governmentally organized NGOs typical of So�viet times.
24
One of the “centers of gravity” of fictitious public opinion has be�come the so�called “Public Chamber”. The meaning of its activity in the sphere of lawmaking is not quite clear (it cannot improve, in absence of any strong opposition, the quality of decisions being adopted by the Duma deprived of independence – first of all, because of possessing no real powers or opportunities for exerting any significant moral influence in absence of strong and independent mass media).
However, the “quasi�parliament” did successfully test the new sys�tem of financing. In contrast to a normal parliament, which takes deci�sions on taxes and the budget, this body began to distribute a rather insignificant part of rent revenues. Thus, in September 2006, the results of a contest were announced, where the “Chamber” had played the role of a jury. The amount of 250 million rubles from budget funds was to be distributed. A large number of human rights organizations had applied for participation in the contest in order, just in case, to check the seri�ousness of the intent of the Putin administration to assist human�rights activities. This fact, by the way, is testimony to the existence of a gen�eral problem, which is typical not only of Russian human�rights activists alone. They usually feed sympathetic toward the leftist extremist ideas, according to which only state financing “independent of private inter�ests and capitalist greed” can guarantee the true observation of human rights. The results of the contest have given us some reasons to hope for a certain sobering up of Russian human�rights activists. None of the prominent human�rights organizations among those that had applied for state support became winners in the contest. But on the other hand, the list of winners includes no less than 17 not�for�profit organizations, headed by the members of the “Public Chamber” themselves. There is unlikely to be any better Russian illustration of the very concept of GONGO.
It should be noted that some of the regions where NGOs are being closed by a court ruling are, on the whole, by no means the worst, either from the point of view of the incidence of violations of human rights there or in terms of the level of development of the institutes of civil so�ciety. Among such regions there are Moscow, the Republic of Komi, Archangelsk Oblast and Nizhnii� Novgorod Oblast.
Among the least satisfactory ones are the Republic of Adygeya and the Republic of Kalmykia.
25
The situation in regions as regards the mass media that are opposi�tional in accordance with our definition has become significantly worse. This index was especially significant (that is, the estimate changed from 1 to �1, the first value demonstrating the presence of the clearly opposi�tional mass media, while the second one – their equally clear absence) in ten regions:
The Republic of Kalmykia, Primorskii Krai, Vladimir Oblast, Omsk Oblast, Rostov Oblast, Sakhalin Oblast, Tver Oblast, Tula Oblast, Tu�men Oblast and Chita Oblast. However, in three regions – the Republics of Yakutia, Tatarstan and Chuvashia – the situation changed in the op�posite direction with the same degree of significance.
On the whole, the sum of estimates changed from +42 in the years 2001–2002 to +15 in the years 2005–2006.
A superficial glance on judicial statistics may notice a marked growth, in 2004, of the number of sentences pronounced for the falsifi�cation of evidence. In combination with the obvious weakening of the independent press and weaker guarantees of the independence of judges, this may be indicative, most probably, of either an increasing struggle going on between different groups inside law�enforcement agencies, or of the lowering quality of performance of those same agencies.
The number of verdicts issued for creating impediments to the pro�fessional activity of a journalist (Article 144) – 2, including impediments created by an official – 1; in 2000, there were 6 verdicts issued under Article 144, in 2002 – 1; in other words, the judicial protection of the independent press does not appear to be rational as a strategy, be�cause of the negligibly low probability of success.
Article 305 (the pronouncement of a sentence known to be unjust), Article 299 (the bringing to criminal responsibility of a person known to be innocent), Article 301 (unlawful detainment or temporary confine�ment under guard, or confinement under guard), Article 302 (testimony under duress, with use of violence of torture) have, in fact, always been and still remain “sleeping” norms. The highest number of sentences under Article 302 (7) was pronounced in 2000.
In 2004, two sentences were pronounced under Article 299, one – under Article 301, and none under Article 302. Under Article 305 (Part

26
1), one sentence was pronounced (which is quite compatible with the observed trend – no sentences in 2000 and two sentences in 2001).
Once more, in combination with the absence of due guarantees of the independence of judges and the lack of strict control on the part of the independent press, actively competing for the attention of readers and spectators, this situation can be regarded as a proof the absence of judicial guarantees of the inviolability of the person and the protec�tion of the person against the most grave and dangerous violations of this fundamental right by the State itself.
3. Federal State Institutions in the Russia and in the Canada: the Source of Instability or Flexibility?
3.1. Russia: the Final Wave of Gubernatorial Elections in the Regions
December 19, 2004 was the date on which the final “series” of gu�bernatorial elections prior to the cancellation of direct elections took place. The “penultimate” five Russian regions did elect their leaders. In the process, the candidates put forward or supported by “United Rus�sia” won in four regions, and only in Kamchatka the incumbent gover�nor, the former communist Michael Mashkovtsev, did manage to keep his post.
The Governor of Kamchatka Oblast, former CPRF member Michael Mashkovtsev, succeeded in achieving this result by soundly defeating in the second round his old rival Boris Nevzorov, head of Ust�Kamchatka raion, who was balloting as a candidate of “United Russia”. According to preliminary results, the latter got only 37.6% of votes, while the Gover�nor obtained 49.7%. Mashkovtsev’s success can be explained by his popular image as the “people’s governor” (his supporters affirm that he lives in an ordinary five�storey apartment block, and even pasted his leaflets himself). Mashkovtsev focused his efforts on Petropavlovsk�Kamchatskii, the place of residence of more than fifty percent of Kam�chatka voters, and also “organized the promotion for the balloting of his ally – the fish trader Oleg Kozhemiako. Kozhemiako, the candidate of “Rodina” came third in the first round, while in the second round he supported Mashkovtsev.
The Kurgan Governor Oleg Bogomolov also managed to retain his post, by obtaining 49.1% of votes. His rival, the former member of the State Duma from “Yabloko” Yevgenii Sobakin, got 40.1%. On the eve of the elections, he had joined “United Russia”, while Sobakin had been balloting as a candidate of the SPS (the United Right – Wing Forces). Before the second round, he even joined this party, but three days be�fore the voting took place he, too, announced his decision to become a member of “United Russia”. Sobakin was supported by Petr Nazarov, chairman of the Oblast’s Federation of Ttrade Unions, who took the
28
third place, and by the Sverdlovsk entrepreneur Sergei Kapchuk, the candidate of “Rodina” who had been disqualified before the first round. One of the organizers of Sobakin’s campaign was the member of the State Duma Anton Bakov, a well known Urals politician, who had re�cently joined the SPS. It can be assumed that “if the Bakov – Sobakin – Kapchuk – Nazarov coalition had had one more week for campaigning, they would have finished off Bogomolov”9.
As it had been expected, a sound victory in Khabarovsk Krai was achieved by Viktor Ishaev, member of the Supreme Council of “United Russia”, who had been heading this region since 1991. He did not have any serious rival, and was returned by 85.3% of votes.
Also returned, by 56.5% of votes, was President of Marii El Michael Markelov, backed by “United Russia”. He had no serious rivals, either.
Also predictable was the result of elections in Briansk Oblast, where Governor Yurii Lodkin, a communist, had been disqualified before the first round by a court decision. Nikolai Denin, the leader of “United Rus�sia”’s Briansk organization and a member of the State Duma, got 43.5% of votes in the first round and as much as 77.8% in the second round. Denin’s rival was the SPS candidate and the employee of the Clearing House’s apparatus Evgenii Zelenko, who obtained 12.7% of votes in the first round. In the second round, only 10.3% of the electorate cast their votes in his favor.
Afterwards, Yuri Volkov, the head of of the Central Executive Com�mittee of “United Russia”, posted a statement on the party website to the effect that he was “especially overjoyed by the most convincing vic�tory in Briansk”; according to Volkov, Denin’s success – “is a clear indi�cator of the Party’s successful personnel policy”.
On the one hand, the successes achieved by the right – wing forces including their participation in the second round of voting in Kurgan and Briansk, can be regarded as a deserved victory. On the other hand, it should be taken into consideration that the SPS managed to achieve their success by, in fact, abandoning right – wing ideology. The SPS candidates (Zelenko and Sobakin) campaigned under leftist protest slogans, and in particular, both of them demanded that the results of privatization be revised.
9 Vedomosti [Gazette], 21 December 2004. “Kandidaty ne portiat borosdy” [“The candi�dates do not mess up the furrow” – Cf. An old ox makes a straight furrow].
29
It can be concluded that it is not the candidates of “United Russia” or the members of any other political party who win or lose: the persons who win are either energetic active governors or candidates who have managed to consolidate anti�gubernatorial attitudes of the elites and the electorate, while party membership, as indicated by the examples of Mashkovtsev and Denin, is not of principal importance.
Presented below are some other examples of electoral campaign�ing, which demonstrate that party membership is not to be considered as one of decisive factors.
The Ulianovsk Oblast Court of Justice disqualified the SPS candi�date, Sergei Gerasimov, General Director of the Ulianovsk Refregiration Plant. In the first round of gubernatorial elections on 5 December 2004, he had managed to get 21.9% of votes and was to be balloted in the second round. The initiator of Gerasimov’s disqualification was the other participant in the second round, the former mayor of Dimitrovgrad and the official candidate of “United Russia”, Sergei Morozov. He ac�cused his rival of bribing the voters – in the course of the elections, the milk plant “Milan”, whose Chairman of the Board of Directors was Gera�simov, had reduced the prices of sour cream and kefir.
In the second round Morozov was to compete with a fellow party member, Margarita Barzhanova, who was balloting despite the official decision of the General Council of “United Russia” and had gained 15% of votes in the first round. It cannot be excluded that Gerasimov was disqualified because he could defeat Morozov. M. Barzhanova also had chances to win, but after the first round her activity sharply declined, and the “official” candidate won with relative ease.
The existing regime has decided to entrust the residents of Nenets Autonomous Okrug with the mission of completing the ten�year period of direct gubernatorial elections. And it is interesting that these last elections were lost by the regime.
The independent candidate Aleksey Barinov was elected Governor after getting nearly fifty percent of the votes cast by the electorate. The loser was Igor Koshin, a thirty�year old, who had been excluded from “United Russia” for disobedience. The candidates of the party of power had not even managed to reach the finals after losing in the first round. But there will be no more losers in the future – hereinafter the heads of
30
the regions are to be approved by local parliaments on the President’s recommendation10.
In the first round, Barinov and the then fallen out of favor Koshin from “United Russia” dashed the electoral hopes of Aleksandr Shma�kov, the official candidate of “United Russia”, despite his hints that the General Council of “United Russia” was not the only instance in Moscow that was supporting him. The current winner Barinov also hinted at his being supported at the top, but did it more cautiously. And he was bet�ter heard by the voter on this occasion.
Aleksey Barinov: “Today I have reasons to say that the President supports me. However, I am not doing this, because the President has forbidden me to refer to any administrative resources. There is only one President for all of us. We have elected him, the whole of Russia has elected him, and I respect and love him”.
It should also be noted that about 20% of the Nenets electorate cast their votes “against all”. At the next elections, members of the local par�liament will have the right only to refrain from voting. The epoch of di�rect gubernatorial elections in Russia is over.
3.2. The Problems of Guaranteeing the Quality of State Governance at the Regional Level
The problem of the provision of public benefits by those authorities who are best prepared for this task is being solved in Russia, as any other country, not in accordance with textbooks on the theory of eco�nomics, but in accordance with the balance of forces and groups of special interests. Regional authorities are interested in receiving budget funds on a preferential basis. The lobbyists in the rich city of Moscow are no less active in struggle for federal funding than the representa�tives of poor regions. To transfer less money to the federal budget and to redistribute more on your own – those are the rules of the game. In
10 That is, according to the formal definition suggested by A. Przeworski (Przeworski et. al., 2000, p. 54) for a precise classification of democracies and dictatorships (the former are regimes are those under which the politician in power should either resign after having lost elections, while all the latter fall within a different category) and considering the now typical situation when a legislative assembly is controlled by a governor, it can be con�cluded that democracy at the regional level in Russia has been liquidated as an institute.
31
accordance with the Niskanen model11, every rational official would be striving to maximize the amount of resources to be redistributed under his leadership. Therefore, an official from the capital is sure of his supe�rior level of education and training, while a regional or a local one would be sure of his knowledge of local specific features being of paramount importance.
Regional priorities in the spending of budget funds are determined by the standard of living. For example, in Moscow these funds can be needed for reconstructing highways and for building churches, in Sam�ara Oblast – for preserving another thousand jobs at the Volga Automo�bile Plant and for the gasification of rural villages, while in the Republic of Altai – for the payment of pensions and children’s allowances to the population. Also, the resources must not be stolen or squandered on projects known in advance to be inefficient. It should be added that prior to the cancellation of direct gubernatorial elections, there existed certain motivations to sustain inefficient works in order to preserve jobs, etc., so as to improve the chances of the head of a region to be re�elected. Of course, there could also be some short�term corrupt schemes aimed at increasing the incomes of persons loyal to the gov�ernor, including the schemes for providing him with financial resources for electoral campaigning. After the cancellation of direct gubernatorial elections, the first type of motivation was weakened, though did not disappear completely. On the contrary, the second type was much strengthened, because under the conditions of non�transparency and arbitrariness of the new procedures for obtaining a gubernatorial post, the incentives for most blatant corruption became much stronger.
The afore – noted uneven character of both the economic and insti�tutional development of the regions raises the question of their being classed as those in constant need of transfers, those temporarily in need of transfers and those in no need of transfers.
In most of the subjects of the Federation, regional authorities are confronted with more acute problems with the personnel reserves and with obtaining qualified expert opinion, than their federal counterparts are. For example, the majority of civil servants employed by regional agencies are not capable, say, of composing an adequate tender code or of correctly estimating the incoming revenues of a regional budget, 11 Niskanen 1971.
32
or of assessing the feasibility of a business plan of a subsidized enter�prise, or of regulating the relations with creditors. Since highly profes�sional lawyers and economists prefer to cast their lot with the private sector, a solution to this problem can be found in cooperation and the sharing of best practices, as well as in the use of standard regional leg�islation. In many regions, regional legislative assemblies have been controlled by the governors since the mid 1990s; at present, there re�main practically no region with legislative assemblies in opposition to local governors. This means that if a governor has enough political will, it is almost guaranteed that any law he needs will be adopted.
Also, the regions frequently need support from the center in order to attract investments. Although some regions have already independently and quite successfully entered the international investment market (Moscow and St Petersburg, Moscow, Leningrad, Novgorod, Perm, Nizhnii Novgorod, Samara and some other oblasts), many regions have no chances of following their example even with regard to the Russian investment market. Of course, the simplest thing to do is to request the right to issue Eurobonds. This right as well as other privileges, must be granted only if the policy of a subject of the Federation complies with certain criteria, including non�economic ones, developed by the center. In this connection, the experience of the RF Ministry of Finance is worth mentioning, which developed, in the years 2000 and 2001, a number of methodological recommendations for selecting the regions best fit to be candidates for receiving loans from the World Bank; these recom�mendations encourage the granting of loans to those regions that dis�play the best, and not the worst, economic and institutional indicators. And finally, the authorities of any region will always strive to form a sin�gle hierarchical team, being interested in their confederates being ap�pointed to the posts within the federal “vertical of power”.
The stimuli for the opportunistic behavior of civil servants of the Fed�eration’s subjects may be substantially weakened if regional authorities are to be restricted in their activity by the following measures, which could also be useful at the federal level as well: − the introduction, in the statutory provisions, of a norm prohibiting
budget deficit, and correspondingly, prohibiting any redemption from the federal budget of the arrears emerging at the regional level;
33
− the prohibition of any economic activity on the part of regional au�thorities, including the crediting of commercial projects.
3.3. The Negative and Positive Trends at the Regional Political Markets of Russia
As is shown in Chapter 2, the problems of institutional development in the regions, which have become chronic � owing, among other things, to the inadequacy of political markets (low civic and political qualification of the electorate, caused by a lack of the required quantity of corresponding “transactions” and, even more so, of any experience of positive influence of the democratic process on the quality of life), do, indeed, block the way to improving the quality of state governance. Thus, even when having complete information at their disposal on the best legal solutions and law�enforcement practices, the heads of re�gions may lack any stimuli to apply them, and even, on the contrary, be interested in adopting the worst practices and laws.
The major consequences of the low quality of the political markets existing in the Federation’s subjects, may be, rather conventionally, subdivided into political and economic ones.
Among the most negative phenomena in political life, one can note the formation of rigid authoritarian regimes suppressing dissent; the presence, in legislation, of blatant violations of the Federal Constitution and laws; the fusion, in a region, of the regional leader’s team and the regional representatives of the federal vertical of power (a regional agency of the Ministry of Internal Affairs, a regional agency of the FSB (Federal Security Service), the office of public prosecution, the Com�mittee for Property Management, a regional office of the Russian Fund for Federal Property, the tax services, the anti�monopoly committee, the Representative of the RF President (or a federal inspector) in a re�gion, a regional state�run TV and radio broadcasting company); the suppression of the independent mass media; the infringement on local self – government or its total absence (Tatarstan, Bashkortostan, Kabardino�Balkaria, Ingushetia); the interpenetration of regional offi�cialdom and criminalized business (prominent in this respect are not only the republics of North Caucasus but also, for example, Tver Oblast, where three vice�governors were arrested in the course of two years); the conduct of anti�government agitation on the part of the authorities
34
of a region; the creation of a system of privileges for the representatives of a certain corporate group (usually these privileges are granted to representatives of the titular nation in a national republic, or to the Communists, or to a very narrow group of entrepreneurs in a region whose governor is indebted to them for his having been elected) who, accordingly, will be granted jobs in the state apparatus irrespective of their actual professional qualities, offices, protection in business, etc.
There are even more numerous examples of irresponsible economic policy. One could quote the high rates of regional taxes (Moscow), the practice of widespread granting of individual tax benefits (Bashkor�tostan, Dagestan, Kalmykia, Kurgan Oblast), the formation of unrealis�tic deficit�ridden regional budgets (Gornyi Altai, Tyva) and / or the cov�ering of deficits by the expansion of debt liabilities, money surrogates; the over�regulation of the prices of goods and services; the unjust regu�lation of power rates, land tax, transport tariffs and public services in the interests of certain enterprises and against the interests of other enterprises and structures of federal subordination; the expansion of regional licensing to the extent of limiting the interregional movement of goods or of imposing a total ban on the movement of certain types of products, first of all, agricultural produce or alcoholic beverages (which contradicts the RF Constitution); the total discontinuation of the privati�zation of republican, oblast, or municipal property; the adoption of a course towards consolidating, in the ownership of a subject of the Fed�eration, the blocks of shares managed by the Federal Ministry of State Property (now the Federal Agency for the Management of Federal Property, under the Ministry of Trade and Economic Development); the large�scale subsidizing of inefficient enterprises; the discontinuation of land reform and the disinclination to consolidate shares in land property to the peasants as envisaged by the President’s decrees; the discon�tinuation of reform in the housing and utilities sector; the rejection of all contest�based transparent procedures for distributing state contracts and the abandonment of the rights to serving regional budget accounts; the failure to support investments, small businesses and farmers, the violation of property rights – for example, in Leningrad Oblast, which is adjacent to the Baltic Sea, where the Vyborg Pulp and Paper Plant (nearly at the very border with Finland, where such a situation would have been unthinkable), has been under the control of a group of illegal
35
captors for a period of three years, that group partly consisting of the enterprise’s employees. They did not have any documented rights to this property (nor even a small amount of shares). The managers ap�pointed by the legal owners were not allowed to enter the territory of the plant. The enterprise was used for the production of counterfeited vodka, and only when the region’s governor was replaced, the police helped the owners to establish their control over the plant.
It seems that the following criteria of a positive policy of regional au�thorities could be singled out (any opposite criteria could be considered negative): the readiness to function within the framework of democratic institutions under control of federal authorities, and to observe the ba�sic provisions of legislation. As regards the sphere of economics, to implement reform of the housing and utilities sector and land reform, to introduce land turnover, to reduce social liabilities, to restructure ineffi�cient enterprises, to privatize non�strategic state property, especially when the latter is unprofitable, to introduce open tender mechanisms, especially those involving the direct numerical parameters for deter�mining the winner, to support investments, small businesses and farm�ers; to form a reasonably balanced regional budget, to reduce adminis�trative interference in the activity of economic agents, and to prevent violations of federal legislation.
3.4. On the Way towards a Unitary State: Benefits and Losses
As is noted in the work concerned with the inter�regional borrowing of institutions, which has been taking place in Russia in recent years (Mau, Zhavoronkov 2005), the replacement, in the mid 1990s, of the principle of appointing the governors with the principle of electing them did not result in any deterioration of the quality of inter�regional borrow�ings, while the reverse replacement 10 years later did not result in an improvement of the quality of such borrowings. There are no signs of the federal center’s encouraging the proliferation of the best practices which, in theory, could have balanced the losses from the mechanism of the natural proliferation of efficient norms being dismantled (pro�vided that the illegal borrowings conducing to corresponding reelec�tions would have been blocked by the federal judicial system).
36
The system of a unitary state with appointed governors could have some advantages. But such a model must be well planned in advance, or, better still, be naturally developed. Under Russian conditions it could have been developing as follows: the appointed governor is bal�anced by the members of the Council of the Federation, elected by the population, and by a strong local self�government, whose head is also elected by general voting. The scheme for the appointment of a gover�nor is that envisaged in the Law “On Local Self�Government”, i.e., the scheme for appointing a manager on the basis of the candidate’s ex�perience and the program for the development of a corresponding re�gion, submitted by him.
From the point of view of ordinary people, some of the elected gov�ernors (see above) are clearly not paragons of honesty and compe�tence. As a means of influencing the voter, the regime introduces a the�sis that electoral results depend just on money and political technolo�gies. Then there arises the question: what will be changed after the in�stallation of the system of appointments? It is quite possible that the “tariffs” for each bureaucratic action – the inclusion in a list, the coordi�nation with a federal okrug and, as it is reputed in the press – with each of the entrances of the Presidential Administration and with the Presi�dent personally – will remain. There will be only one difference: if an ap�pointed representative of the elite does not satisfy the needs of the population, voters will not blame themselves, but instead will blame the people who have appointed him, that is, the federal authorities. Citizens will have nobody to blame but themselves for an elected thief or fool. But for an appointed thief or a fool they will blame the President.
The stability of market and democratic institutions in many respects depends on the so�called “dispersed knowledge”. An entrepreneur, in response to prices reflecting the changes in supply and demand, can saturate the market with goods and services. In party politics, public associations and groups of influence are competing with one another, and if this competition takes place within a space delimited by the guar�antees of basic personal rights, these associations and groups will find a solution that will at least not worsen significantly the welfare of the majority of the citizens.
But even authoritarianism which, as we know, can be quite efficient during the periods of transition, must have its own logic. First of all,
37
there must be some well�formulated goals and adequately selected personnel, and a person in charge must be personally responsible for the work allotted to him. Another most important guarantee of success is the ability to delegate powers to a subordinate level, because no�body, even the most gifted person, can be expert in all spheres, and cannot penetrate into every question.
Despite the declared goal of administrative reform – that of achiev�ing a switchover to the system of financing the agencies by the results of their performance – no criteria of assessing the results have emerged as yet. It has been promised that these criteria will be devel�oped later on. It is being said that sociological studies can be the crite�rion of the efficiency of budget – funded services. But in politics, at pre�sent, everything is moving in the opposite direction – because it is an honest election with no administrative resource being used and no pressure from the state electronic mass media being exerted, which represents the above�mentioned study of managerial efficiency.
In the past, there existed a system of checks and balances, when a governor was balanced by an unfriendly representative of the President in a region, by a pro�Moscow mayor of a regional center, or by a public procurator. This system has been destroyed. It has now been replaced with a system of collective guarantees and of filtered information being sent to the superiors. A system where the adoption of numerous deci�sions depends on one person is a weak system. Not infrequently, rather comical miffs take place between the prime minister and the other min�isters in the course of a government meeting, because the necessity of a final solution to be made by the President means that before the deci�sion is made one can take the boldest measures, and that the final de�cision is not predictable.
The Kremlin and its supporters justify the constitutionality of the President’s proposals by the fact that the mechanism for electing the bodies of authority in the regions is not directly specified in the Consti�tution. It is stated in Item 1 of Article 77 of the Constitution that the sys�tem of bodies of power of the subjects is to be established by them in�dependently, but in accordance with a federal law. Thus, it is possible that any mechanism will be specified in this law, and that the subjects will later correspondingly adjust their legislation. Also, in the second part of Item 2 of the same article, it is said that the executive bodies of
38
authority of the Federation and its subjects “shall form the single sys�tem of executive power in the Russian Federation”. And it is being af�firmed that the President’s proposals are nothing else but the realiza�tion of this very principle.
The second part of Item 2 of Article 77 gives rise to some doubts. The point is that in the first part of Item 2 of Article 77 it is unequivocally stated that the federal and local bodies of authority do not constitute, in general, a single system of power, but constitute it only in the part of implementing the powers of the federation as regards the subjects in its exclusive or joint jurisdiction. And what President Putin proposes is to create a uniform system for dealing with all the matters of jurisdiction.
It is true that the Constitution envisages the establishment, in a fed�eral law, of uniform principles concerning the election of local authori�ties. But it does not envisage any participation whatsoever of the Presi�dent and other bodies of federal authority in the procedure of forming the bodies of local authority.
Thus, in Item 2 of Article 11, which determines the realization of the principle of federalism, it is clearly stated: “State power in the subjects of the Russian Federation shall be exercised by the organs of state au�thority formed by them”. Chapter 11 stipulates that state power in the Russian Federation shall be exercised by the federal bodies of state authority (Item 1), and that the state power in the subjects of the Rus�sian Federation – by the bodies of state authority of the subjects, while the delimitation of these two types of powers shall be carried out by way of delimiting the matters of jurisdiction of the two branches of authority. And the mechanism of such a delimitation of powers is clearly specified: the organs of state authority shall be “formed” by the subjects of the Russian Federation on their own. And it is absolutely clear, because what will be the point to delimitating the matters of jurisdiction of the Federation and the subjects if the federal bodies of authority could also be able to form the bodies of state authority of the subjects?
As Item 2 of Article 11 indicates that the bodies of state power of the subjects shall be formed by the subjects themselves, let us consider the following simple question:
Will it be possible for a subject of the Russian Federation to inde�pendently and with no participation of the federal authorities form the
39
bodies of its authority in the situation of the new “federalist” policy? The answer will definitely be “no”.
Moreover, under the new version of the law on the major guarantees of the electoral rights of the citizens, which has abolished the citizens’ right to directly elect the heads of regions, the new procedure cannot be classified as being “elections” at all. It simply replicates the proce�dure for the appointment of the Prime Minister. Thus, Article 111 of the Constitution reads: “The Chairman of the Government of the Russian Federation shall be appointed by the President of the Russian Federa�tion with the consent of the State Duma” (that same is said in sub�Item “a” of Article 83). This means that under the new procedure, the head of a subject of the Russian Federation shall be appointed by the President with the consent of an appropriate regional representative body of state authority.
How can this be changed into the process of being “formed by them” (that is, by the subjects), mentioned in Article 11? Can it be rec�onciled that the body of authority of a subject is simultaneously formed by this subject and appointed by the President?
It should also be noted that Article 11 belongs to Chapter 1 of the Constitution, which specifies “the fundamentals of the Constitutional System”, and that it is said in Article 16 of this Chapter that no other provisions of this Constitution may contravene the provisions of Chapter 1. Its provisions are to have priority over everything else. And it is, in principle, impossible to refer to the provisions of Article 77 and to inter�pret them as not contravening Article 11. And finally, Article 83 of the Constitution presents a complete list of the President’s powers with re�gard to the bodies of executive and judicial authority: whom he is enti�tled to appoint and dismiss, whom he has the power to represent, etc. Nothing is said there with regard to the heads of executive authority, although the plenipotentiary representatives of the President in the sub�jects of the Russian Federation are indeed mentioned (for example, in sub�Item “k”). Therefore, the existing Russian Constitution does not empower the RF President to put forward the candidacy for the post of governor, let alone to appoint or dismiss a governor. Accordingly, Arti�cle 84 lists the powers of the President as regards the issues of legisla�tive authority. Here again, the right to dissolve the State Duma is men�
40
tioned, but absolutely nothing is said concerning the right to dissolve regional legislative assemblies.
This power, which, in effect, gives the President the right to annul the results of a free expression of popular will on the part of the citizens who have elected their legislative assemblies, can be determined in no other way but constitutionally. But this subject already deals with the second part of violations resulting from the President’s initiative.
Apart from the principle of federalism, the federal reform also vio�lates the second crucial principle of the Constitution – the principle of democracy. The principle of democracy is expressed in Article 3 of the Constitution, which defines the people as the vehicle of sovereignty and the only source of power, and the referendum and free elections – as the supreme manifestation of this power. This suggests that there exists no body within the state system which could deprive the people of the right to have direct elections. Strictly speaking, in accordance with the principle of democracy, which recognizes elections to be the supreme manifestation of people’s power, it should be reasonable to conduct 88 referendums (one in each of the subjects of the Federation) on the is�sue of changing the procedure for electing the head of a subject of the Federation.
From the point of view of a citizen, a direct election of the head of a subject of the Federation is one of the forms of realizing the right envis�aged in Item 2 of Article 32 of the Constitution (“Citizens of the Russian Federation shall have the right to elect and to be elected to bodies of state governance and to organs of local self – government, as well as to take part in a referendum”). The President’s initiatives suggest that the citizens will be deprived of this form of exercising the afore�said right. But Item 2 of Article 55 reads as follows: “No laws denying or belittling human and civil rights may be issued in the Russian Federation”. The President’s initiatives do not abolish the right itself to elect and to be elected, but they undoubtedly reduce the scope of the realization of this right, and thereby belittle it. Even the lawyers most loyal to the Presi�dent’s idea, such as Mr. Chirkin, have been forced to admit this fact.
In order to justify the innovations, the supporters of the party of power usually refer to two facts. After the adoption of the Constitution in the year 1993, members of the Council of the Federation were at first elected, and then these elections were cancelled and replaced with ap�
41
pointments. This reference is incorrect: the above�mentioned proce�dure for the formation of the Council of the Federation of the first con�vocation was directly envisaged by the transitory provisions of Section II of the Constitution. The same was true of the appointment of governors in the first years after the adoption of the Constitution. There was simply no legislation establishing the procedure for electing the head of a re�gion – neither any regional laws, nor the Federal Law “On the General Principles for the Organization of Legislative and Executive Bodies of State Power in the Russian Federation”. The heads of regions began to be elected after a law to this effect was adopted by a regional parlia�ment, and prior to that they had been appointed. But this does not mean that the norm concerning the appointment of a governor can be now prescribed in the chapters of the legal acts regulating the proce�dure for electing the heads of regions. In fact, it contravenes with the afore�mentioned provisions of the Constitution (the Constitutional Court had to exert a lot of effort to avoid getting into conflict with the executive authorities when considering the corresponding query).
Nowadays, the legal dispute concerning the constitutionality of the President’s proposals is taking place exclusively along the following lines: some are saying that these proposals contradict the Constitution, while others are saying that they contradict the spirit but not the letter thereof. The question of whether something can contradict the spirit of a legal document while not contradicting its letter is interesting in itself. Apparently, this question should testify either to the extent of the juridi�cal competence of the interpreters or to the quality of the document itself. Because the essence of a legal document consists in the fact that a document’s spirit is expressed in its letter. To one degree or an�other, the initiatives concerning the abolition of direct election of governors, and what is more, by a decision of the Federal Parlia�ment, violate a number of articles of the Russian Constitution: Ar�ticle 11, Item 2 – and therefore contravene Articles 73 and 77, Item 2, and also Articles 83 and 84; violate Article 55, Item 2 in connection with Article 32, Item 2 – and therefore contravene Article 3.
t is not surprising that so many articles turn out to contravene the re�form which has abolished direct election of governors. The President’s proposals contradict the spirit of the Constitution and therefore contra�vene many of its literary provisions.
42
First of all, they deliver a direct blow against one of the major princi�ples – the principle of federalism. One can be a supporter of federalism or a supporter of unitarism. It is not important in this case. The existing Russian Constitution describes the federal model of statehood.
The costs of changing the Constitution are not simply rather high from the point of view of organization and technology. In the present situation, these problems can be solved with unprecedented ease. The main component of the costs of changing the fundamental law of a country (especially of rapidly changing it12) is connected with its influ�ence, by country, on investment risks. All other factors being equal, these risks will be noticeably higher in a country with a “changeable constitution” than in a country with an invariable fundamental law.
The recommendations following from the above criticism of the fed�eral reform are evident. The restoration of gubernatorial elections is necessary in order to at least de�stimulate the governors’ opportunistic behavior by the threat of elections, or by the threat of persecution in the case of their being defeated thereat. In a situation when the heads of regions are appointed, the risks dealing with corruption in the absence of political competition are considerably lower, with the facts of dishon�est behavior on the part of an apolitical leader being revealed on the initiative of private persons (oppositionists) interested in displacing and replacing their disgraced foe.
It should be noted that the weakness of the influence exerted by a candidate’s qualities and his political background on the chances to win an election (revealed by us in Chapter 2), and therefore the weakness of the influence exerted by elections as a political mechanism for posi�tive selection, can be easily explained by the “consumer inexperience” of the population. The number of transactions on the ordinary commod�ity market is sufficient for a consumer to acquire all the necessary skills in one or two years. It is evident that in politics, the number of the “transactions” which make it possible for a voter to assess the effi�ciency or the erroneousness of his decisions is much smaller. Therefore
12 R. Cooter (Cooter 2000) points to the practice of frequent amendments to the Constitu�tion of Russia that had existed prior to December 1993 as an example deserving condem�nation. His attitude to such practices can be illustrated by his own reference to one Rus�sian joke of that time: a customer at a bookshop, when asking for a copy of the Constitu�tion, was given the following answer: “We do not trade in periodicals”.
43
voting in accordance with a family tradition is rather widespread and seems to be a rational practice in developed countries. The experience which can restrain people from voting for a likeable con artist, or even for a person who is simply good but unable to balance a city budget, takes generations to accumulate. And any gap in the tradition of elec�tions can only postpones the “maturation” of the electorate, and does not replace it.
The sooner the Russian voter attains his “one hundred years of age”, the sooner the democratic mechanisms for guaranteeing the qualified demand for leaders and safeguarding the transparency of the spending of public funds will start to manifest their economic advantages.
3.5. The regions of Russia consolidation processes as the problem of political�economic competition
Russian Federation Constitution of 1993 enlisted 89 regions differes each other enormously. Initial variations of economic, political and cul�tural development, population, and stocks of capitals were huge. Very few of them could balance the regional budget even before shift of taxation base from regiona to Federal Center since 2000.
So, discussion about option of consolidation started many years ago and provided both political and economic reasoning for this idea de�fense. Hevily populated Moscow (up to 9 mln people) comparision with Evenkiyskiy okrug (12 thousand) caused political speculation about two seats in Federal Council, for example.
As the federal power made the choice for unification and consolida�tion of the regions, some of leaders tried to strengthen their position demonstrating support to this idea. The key motivation could be chance for new redistribution of the resources.
A lot of judicial obstacles and barriers should be overcamed for uni�fication choice realization. 2003–2004 years political dynamics pro�vided federal executive power by unic possibility to decide any prob�lems, including federal constitutional laws passing and, even the Constitution amending.
There are few models of unification. Permskiy kray (Permskaya oblast, rich and heavily populated – 3 mln
population and underdeveloped Komy�Permyackiy okrug, 150 thou�sand population). The okrug’s representative in the oblast Duma leaded
44
movement for the unification. The governor of the okrug was opposed by okrugs’ Duma. So deeply devided elite couldn’t oppose the idea. So, this case become the first and “pilot project” to demonstrate “voluntary consolidation” best practice.
Tumenskaya oblast and Hanty�Mansy and Yamalo�Nenetsky ok�rugs – the opposite example. Populated okrugs, enjoing the richest oil and gas resources. Okrugs’ Gross regional product excels the rest of the oblast GRP 7�fold.
The oblast governor was very interested in consolidation, but ok�rug’s elites opposed furiously. The Presidential administration pressed them to support the unification. Yamal governor Yu.Neelov was pressed by detailed examination his activity by police and prosecutor’s office. So Yamal’ s leaders were close to surrender. The Hanty�Mansy okrug governer A.Filipenko appeared to be lucky to be received by president Putin and could gain his support to idea of treaty between the oblast and the okrugs, guaranteeing for okrugs their sources of income inde�pendence. The treaty undermined oblast government incentives to take up the okrugs and the consolidation failed here.
Krasnoyarskiy kray and its’ okrugs The Taymyr okrug in Krasnoyarskiy kray – the largest source of non�
ferrous metals so this small region was quite all�sufficient economically. So the case looks like Tumen not like Perm example. The peculiarity of the political situation formed by the fact, Taymyr governor and Norilskiy Nikel ex�manager Khloponin won the Krasnoyarkiy kray governatorial election and appeared to be strong and influential enough to consoli�date both – kray and the okrug elites under his leadership. So the proc�ess not looked as the okrug taking up by the kray.
Nenetsky okrug in the Arkhangelskaya oblast could survive because strong and consolidated opposition of the elite (inspite the governor Barinov arrest). The new governor obtains the similar treaty with oblast as in the Khanty�Mansy case and prevented the taking up.
Altay and Adygeya republics beated back offensive. Both regions are underdeveloped. The ethnic minority elites represent minor part of population even in both their “republics” but they could mobilize sup�port inside small but well organized tribes and endangered the Federal Center by massive unrest. It was risky strategy and president of Ady�geya H.Sovmen lost his struggle for re�appointment, but the ethnic el�
45
ites as the special interest groups, struggling for federal grants and subsidies appeared to be well motivated and won.
3.6. Regional authorities and the challenges of terrorism The challenges of terrorist violence and the requirements to improve
the quality and reliability of providing the citizens of Russia with the key public good known as “security” were the main reason for starting the reform of Russia’s federal state system. Let us consider how adequate the adopted measures are from the point of view of the individual ra�tional stimuli of persons responsible for safeguarding security.
To begin with, it should be noted that the chosen route of reforming is, in a sense, both natural and rational. But not from the point of view of guaranteeing the security of citizens.
It could be possible to prevent a terrorist act like the Beslan, one provided that certain technical measures are combined with a reason�able policy. And it would be practically inevitable if the voter expresses a will to punish the politicians incapable of safeguarding his security, as it happens, sometimes, in democratic countries (Israel, the USA).
In Russia it does not happen as yet. The voter does not express de�mand for being protected. Will he begin to express it after Beslan has unfortunately not become clear so far. And this explains the decisions being taken by the authorities. It could have been expected from the very beginning that the authorities would take measures which would, on the one hand, increase the possibility of eliminating the leaders of the terrorists and, on the other hand, would improve the safety of the leader of the state. A payment was promised for the heads of Mask�hadov and Basaev. And it was likely to be quite a reasonable measure. But it is typical that all the adopted measures are not aimed at guaran�teeing the safety of the electorate.
How will the abolition of the electiveness of governors help to com�bat terrorism? Formally, the power structures are not subordinated to the heads of regions, but in fact the governors influence the security situation. It is absolutely clear that if they will be answerable not to their voters but only to the top leadership of the country, there will be no doubt as to whose safety they will be eager to safeguard as rational politicians. This does not mean that now all the governors will ignore the needs of guaranteeing the safety of their regions’ population. But this
46
means that they are being prodded in this direction by the creation of such a system of stimuli that will make them pay less attention to their voters, and more attention to those to whom they owe their appoint�ment.
The consequences of such a policy are well explained by the logic of rational behavior, and the Russian voter, who has not demanded from his leaders to be protected, bears his share of responsibility for the possible sad consequences for himself.
As repeatedly noted by researchers13, the idea of regional and local authorities influencing the measures designed to ensure the safety of the population was strongly discredited by the practice of such interfer�ence in the 1990s. However, it should be noted that in that period, inter�ference was permitted as a part of the opportunistic compromise be�tween the central authorities and regional elites. Even the present calls of the authorities to increase the activity of society in the struggle against terror emphasize the impossibility to solve the problem by di�recting this struggle from a single center alone, no matter how compe�tent and well equipped it may be.
Stable stimuli to protect citizens from terrorists can emerge on the part of officials (both appointed state servants and elected officials), as indicated by the practice of developed countries and, correspondingly, of legal states, in the process of applying two different approaches.
The first approach is to delegate some of the responsibility to the lo�cal (or regional) level – and to back it up with corresponding resources. The US police is quite efficient, organized and much less corrupt than its Russian counterpart, although it is subordinated to three levels of power: municipal authorities (the police of cities, counties, and dis�tricts); regional authorities (state police), and federal authorities (the Federal Bureau of Investigation and other federal law�enforcement agencies).
The second approach can be represented by the Israeli model. In the unitary Israel, the police is under centralized control. But alongside the police, there exist armed self�defense detachments, organized by the bodies of local self�government, or even on the initiative of individ�ual citizens. Also, there exists a network of armed security structures of commercial companies – in commerce, public catering, and in the 13 See, for example, Zhavoronkov, Yanovskiy 2001.
47
transport industry. And finally, many officials, including school teach�ers, are encouraged to acquire fire arms and to get trained in their use.
Let us imagine the raid on Beslan having happened in the presence of a police unit controlled by the local authorities (such a unit appears to be more sensitive to the demands voiced by the local population – at least when its direct employer is elected by the population). It is much less likely that such a unit would permit a school to be crammed with arms and explosives. It would rapidly come to the place where a serious incident involving the use of arms is taking place. It would cooperate rather than compete with the neighbors, the armed civilians. Some of them, the teachers, would carry the brunt of the initial assault, being armed citizens instead of helpless victims. And the advantages of an assault rifle versus a pistol are considerably leveled under conditions when a terrorist does not know where he would encounter resistance and what its nature would be.
The federal unit, on arriving at the place of action, would be capable of preventing a mass slaughter, being adequately prepared to such a course of events. This capability could be achieved by the Feds, in par�ticular, by focusing on a narrow range of the most difficult tasks (such as responding to the challenges and threats of the Dubrovka and Beslan scope) and by being released from the task of investigating, for example, domestic homicides, or combating drug dealers and den keepers.
Such a division of powers and responsibilities could be achieved on the basis of Articles 72 and 73 of the Constitution – for example, by conducting the division by article of the Criminal Code (or by group of articles, or by chapter).
Below, there is an example of a possible division of the major re�sponsibility spheres of the law�enforcement agencies by article of the Criminal Code.
The apparently “municipal” problems are hooliganism (Article 213), deception of customers (Article 200), violation of public order (Articles 116, 118, 121, 130), insult (Articles 244, 245), etc., and also adminis�trative violations.
The sphere of responsibility of the police of a subject of the Federa�tion could be the articles of Chapter 18 of the Criminal Code dealing with crimes against sexual inviolability and sexual freedom of the per�
48
son, Chapter 20 – crimes against minors, Articles 105 and 106 – various types of homicide, etc.
Crimes against justice, terrorism, and actions directed towards a forcible seizure of power represent a natural sphere of responsibility of the truly elite federal structures, which are quite few in their number.
For a number of obvious reasons, if there existed a multi�tier struc�ture, the long discussed and acutely necessary restriction and regula�tion of the interference of the law�enforcement bodies with the activity of economic agents, and the introduction of such an interference (apart from the events strictly limited by the necessity to suppress violent ac�tions) into the framework of existing legislation could easily be material�ized. Local and regional services would automatically switch over to the standard regime of checks. The federal service would be physically in�capable of “protecting” hundreds of thousands of shops, transport fa�cilities, construction businesses, etc. As a result, there would be a con�siderable reduction of risks and transaction costs in the country’s economy.
Analysis of relations between the Canadian Federal government and Provincial governments: applications to Russia
This study deals with interactions between the Canadian federal and provincial governments. It includes a description of the legal framework that provides the most efficient structure for supporting productive rela�tions among all branches of government under conditions of market democracy, multiparty system and transparency in decision�making.
In what follows the key case studies reveal the willingness of the Ca�nadian political parties to compromise for the benefit of all Canadians. Most activities are affected by the state of the federal�provincial rela�tions and, therefore, it is of prime importance to harmonize and improve them accordingly. That is why Canada over the years has developed a wide range of experience with regard to inner�governmental relations that is worth studying for all emerging democracies around the world including Russia.
This research reviews major developments and challenges on the federal�provincial scene, and relates them to ongoing issues and trends within the Canadian society. Currently Russia is overseeing major ad�ministrative reforms aimed at strengthening the government. To move Russia closer to understanding how the democratic process of deci�
49
sion�making and problem�solving works at the federal�provincial level in the mature market economy is seen as extremely beneficial. This re�lates well to demonstrating advantages and efficiencies of elected re�gional governments as they are right now in Canada over being directly appointed and held accountable to directly to the Central authorities, as is the case currently in Russia.
The most interesting case that illustrates the effectiveness of com�promises between various political parties is the analysis of negotiations of the Canadian Liberal Federal Government with Conservative Provin�cial Governments in the 1980s with regards to Energy problems and the study of conditions under which the New Energy Program (NEP) was implemented. It is considered to be very useful in the context of the cur�rent Russian federal relations reform.
3.7. Canadian National Energy Program (NEP) 1980 The return to power of a Liberal government led by Pierre Trudeau in
1980 inaugurated a period during which many of the tensions charac�teristic of executive federalism erupted in overt conflict. During the early 1980s, the federal government showed an increased willingness to re�sort to unilateral action in the absence of federal�provincial agreement, notably in the threat to patriate the Constitution and in the introduction of the National Energy Program in 1980.
Between 1973 and 1978, the price of oil and natural gas in Canada rose quickly through agreements reached between the federal gov�ernment and the producing provinces, but did not reach world levels. By mid�1978 the gap between domestic and international prices had closed to less than $3 per barrel. In the wake of the 1979 Iranian Revo�lution, however, world prices increased by 150% and the federal gov�ernment renounced its intention of ensuring eventual parity between domestic and world prices. This left Canadian prices far below interna�tional ones and created difficult strains between Alberta and the federal government.
The 1979 increase in world oil prices aggravated some of the prob�lems Canada already faced. First, it represented a large transfer of wealth from consumers to producers. In Canada this wealth transfer had 2 significant dimensions: a large interregional transfer of wealth from the provinces of Ontario and Quebec (which together accounted
50
for 58% of domestic oil consumption in 1980) to Alberta (which pro�duced 86% of Canada's oil)14, and an international transfer of wealth from Canada to the US as a result of the high level of American owner�ship of the Canadian oil and gas industry.
Second, the rapid increase in international prices made it difficult for the federal government to manage the national economy. It aggravated inflation and strained an equalization payments system (cash payments from the federal government to provincial governments with the objec�tive of offsetting differences in available revenue). It contributed to the federal deficit as well, because the federal government continued to subsidize oil imports to maintain a uniform domestic price across the country. Western Canada produced a large amount of oil, however, the cost to transport this oil to Eastern Canada is expensive. As a result, large amounts of oil were imported into Canada. A rise in international oil prices caused these imports to be expensive. The government's pol�icy proposal was an attempt to shelter the Canadian economy from high import costs.
The increase in the world oil price, however, also represented an opportunity to achieve a higher level of oil self�sufficiency through the development of high�cost oil in the frontier and increased synthetic production from the tar sands.
In 1980 the federal government introduced the National Energy Pro�gram15. Its objectives were to increase Canadian ownership of the oil industry, to achieve oil self�sufficiency and gain a greater share of en�ergy revenues. Although all 3 objectives were controversial to some de�gree, the third aroused the most debate because it raised the concerns of the producing provinces and the oil industry that “their” revenues would be reduced if the federal government increased its share. The means chosen to advance the NEP's objectives also proved contentious because they represented an unprecedented degree of federal inter�vention and were imposed without prior consultation with industry or with the producing provinces.
For example, to “Canadianize” the industry, the federal government introduced a tax to fund acquisitions for government company Petro�
14 Franзois Bregha The Canadian Encyclopedia. 15 Canada, Department of Energy, Mines and Resources, The National Energy Program (1980).
51
Canada and favored Canadian�owned companies when distributing ex�ploration grants. In addition, the federal government continued to hold domestic oil prices below international ones. Finally, to achieve oil self�sufficiency, the government sponsored expensive frontier exploration and instituted a system of grants to encourage consumers to conserve energy and switch to alternative fuels.
The first goal of the NEP was to have Canadian energy security by 1990, but focused primarily on oil because Canada was self�sufficient in natural gas. Oil self�sufficiency would be accomplished through the expansion of domestic oil production, oil conservation, the use of alternate energy sources, and a reduction of oil imports. By making Canada completely self�sufficient in terms of oil, Canada would not have to rely on the world oil market and potentially high prices.
The second goal was to redistribute revenue from the industry and lessen the cost of oil for Eastern Canada. Redistribution would move the federal government's revenue share from 10% to 25%, leaving the oil producing provinces with 43% and the industry with 33%16. To lessen the oil cost for Eastern Canada, a blended pricing scheme would also be introduced. A second factor behind the NEP's formulation was rooted in nationalist views within Canada and Canadianization. Concern over foreign ownership in Canada was not new and there was fear of losing Canadian control of the oil and gas industry. Continued control of the industry by foreign owned companies would allow them to dictate the pace of growth for Canada's oil and gas industry while threatening Canada's sovereignty over the industry. Foreign�owned companies are also more apt to employ foreign managerial staff and use less Canadian products as opposed to foreign products. Two main methods exist to counter foreign control: increased regulation and greater Canadian ownership17. Ottawa pushed for both in the National Energy Program. Increased domestication of the oil and gas industry could be met by increasing domestic oil production in places such as Western Canada and Atlantic Canada. Moreover, by increasing Canadian participation in the industry and lessening foreign ownership, Ottawa would begin to
16 David Leyton�Brown, Weathering the Storm: Canadian�U.S. Relations, 1980�83. Cana�dian American Committee, 1985, p. 26. 17 Edward A. Carmichael and James K. Stewart. Lessons from the National Energy Pro�gram. C.D. Howe Institute, 1983, p. 25.

52
receive the benefits of higher oil and gas prices as opposed to foreign owned companies and gain direct control of the industry.
The third goal of Canadianization was the most controversial. Its primary purpose was to increase Canadian participation in the oil and gas industry by reducing foreign ownership and gaining Canadian control over large foreign owned firms. To do this, the NEP would restrict permits for production in Canada to only those companies with at least 50% Canadian ownership. Moreover, grants would be given out to Canadian firms in a program called the Petroleum Incentives Program (PIP). The PIP would give out subsidies to oil and gas firms based on their percentage of Canadian ownership. All firms would also be required to purchase Canadian goods and services for oil and gas production and exploration. This aspect of the National Energy Program would leave Ottawa in complete control over the industry. Crown corporations such as Petro Canada were labeled to take a more active role in this industry and a special tax was to be created to help Ottawa purchase foreign�owned firms. A Crown Interest provision was also introduced which calls for any company holding an oil or gas lease, whether Canadian or foreign owned, to pay 25% interest on the lease to Ottawa. The controversial part of this interest provision was the fact that it applied to both future and current developments. Developments that were already discovered, but not in production would still be subject to the interest.
Even though the National Energy program was a Liberal initiative, it was strongly supported by the NDPs. The national Progressive Conservatives, under leader Joe Clark, opposed the Program.
The introduction of the National Energy Program (NEP) in the October 1980 federal budget followed a series of unsuccessful meetings between provincial Conservative government of Alberta and the federal Liberal government to arrive at a mutually agreeable energy policy. These discussions focused on the price at which oil and natural gas products should be sold and the appropriate distribution of economic rents (between Ottawa, the producing provinces and industry) generated by oil and gas sales. Pricing, revenue sharing and, ultimately, control of natural resources were not new issues�they had plagued relations between Alberta and the federal government after the
53
oil price shocks in 1973 and 1979. Never before, however, had they been so bitterly contested.
These contentious negotiations are better appreciated and understood by placing them in the larger Canadian constitutional and political context. As Cairns notes, "One way in which Canada is unusual as a federation is the degree of power of the provincial governments over natural resource policy”18.
Whereas the commerce clause in the U.S. has been interpreted to give the federal government a wide range of power over natural resources, Canadian provinces have asserted their right to control natural resource management by relying especially on section 109 of the constitution, which stipulates that “All Lands, Mines, Minerals and Royalties belonging to the several Provinces of Canada...shall belong to the several Provinces...”19. However, the federal government in Canada has justified its influence in natural resource policy by its constitutional power to “regulate trade and commerce” and to raise money by “any mode or system of taxation”. Given these federal and provincial constitutional powers and the constitutional prohibition against one level of government taxing the other level (section 125), along with the reality that resource management, trade, and taxation are interdependent, there is potential for conflict20.
Not surprisingly, prior to the 1970s there were periodic disputes between the federal government and the provinces over natural resources. For a variety of reasons, though, these disputes were not as persistent or vitriolic as they were in the 1970s and early 1980s, when rising oil and gas prices would lead to the clash between energy producing provinces, particularly Alberta, and the federal government.
Canada's executive�centered form of parliamentary government and the lack of effective provincial representation in the federal parliament
18 Cairns, Robert D. 1992. “Natural Resources and Canadian Federalism, Decen�tralization, Recurring Conflict and Resolution”. Publius 22: 55–70. 19 Section 109, which was included in the original constitution of 1867, was extended to the Prairie Provinces by way of constitutional amendment in 1930. Thus, from the time the Prairie Provinces joined Confederation (Manitoba, 1871; Alberta, 1905 and Saskatche�wan, 1905) until 1930, the federal government had managed resources in these prov�inces. 20 Cairns, Robert D. 1992. “Natural Resources and Canadian Federalism, Decentraliza�tion, Recurring Conflict and Resolution”. Publius 22: 55–70.
54
also help to explain why such disputes are carried out through intergovernmental bargaining. In contrast to the United States, for example, senators in Canada are appointed by the prime minister and representation in the Senate is based on a regional distribution of seats, which particularly disadvantages the western provinces. Energy conflict is usually played out between the federal government and the provinces because of strong regional distinctiveness in Canada, the relatively small number of provincial governments (ten), the constitutional powers of the provinces, executive�dominated parliamentary government, and the lack of effective provincial representation in the federal Parliament.
Against this political and constitutional backdrop, it is easy to understand how rapidly rising oil and gas prices in the 1970s could lead to acrimonious bargaining between the federal government and Alberta. The federal government's desire to control oil and gas pricing and to capture a greater percentage of the rents flowing from the sale of oil and gas stemmed from its political need to balance “producer” and “consumer” provincial interests and to ensure that the treasuries of some provinces did not grow so large relative to the federal government that it would be impossible to formulate effective national policy in any policy area. On the other hand, Alberta's political need to control pricing and retain resource rents derived from Conservative Premier Peter Lougheed's desire to use resource rents to diversify and decentralize Alberta's economy.
Alberta had the large and expanding Heritage Trust Fund ($14.4 bln in 2006) that provided economic security. On the other hand, the Liberal's 1980 election victory and the perception that it had little western support to lose made the Liberal Federal government equally confident and unwilling to make concessions. Furthermore, federal officials advocated a tough approach towards Alberta.
Natura l gas export tax Alberta officials were suspicious that the federal government would
not conduct “real” negotiations until Ottawa had unilaterally changed the rules on revenue sharing. Under the existing rules, Ottawa was left with a weak negotiating base (less than 10 percent went to the federal government with the rest being split about equally between the
55
producing provinces and the producing companies)21. Much of the contention over revenue sharing centered on Alberta's income from the sale of natural gas (about $8 bln annually by 1980), particularly the revenue it derived from natural gas exports to the U.S.
The Alberta government had adamantly opposed an export tax on natural gas proposed by the federal Conservatives in 1979 and continued to oppose such a tax when proposed by the Liberals. Federal intentions toward gas export revenues were described by Lougheed as tantamount to a "declaration of war". Alberta's energy minister, Merv Leitch, declared that provincial control of Lands, Mines, Minerals and Royalties set out in sec. 109 of the British North America (BNA) Act (extended to western provinces in 1930) and the provincial ability to make laws in relation to “the management and sale of the public lands belonging to the province” (sec. 92 (5)) gave the provinces broad power over natural resources, including the ability to determine the prices at which those resources were sold and to control the revenue derived from those resources.
By this time, however, the Liberals' new energy policy had already been decided upon. The National Energy Program was announced as part of the budget on October 28, 1980. One of the NEP's objectives was to increase the federal government's share of oil and gas revenues to 25 percent. This would be accomplished primarily by two controversial taxes�an 8% Petroleum and Gas Revenue Tax (PGRT) on net revenue and a Natural Gas and Gas Liquids Tax (NGGLT) of 30 cents per 1000 cubic feet.
The governments of Alberta and British Columbia have strongly opposed a natural gas export tax. They have argued that such a tax is an intrusion on the resource ownership rights. The Government of Canada rejects these arguments. There is no doubt of the federal government's constitutional right to impose export taxes on any commodity. To deny this is to attempt to extend provincial powers well beyond their present constitutional limits22.
21 Foster, Peter. 1982. The Sorcerer's Apprentices: Canada's Super�Bureaucrats and the Energy Mess p.165. Toronto: Collins. 22 Government of Canada. 1980, 33–34. The National Energy Program. Ottawa: Supply and Services.
56
The federal government provided the oil export tax introduced in 1974 as an example of its taxation power, but declared there was a need for “flexibility” so the government was “not proceeding with a natural gas export tax”. The federal government introduced an amendment to the Excise Tax Act that provided that a tax “shall be imposed, levied and collected on the receipt of marketable pipeline gas by a distributor”. The tax was binding on the Crown in the right of Canada or of a Province. An exporter who had not paid tax was deemed to be a distributor and to have received the gas at the time of export.
Albertan premier Lougheed (Conservative) claimed that the NEP was “an outright attempt to take over the resources of this province” and Energy Minister Leitch condemned the NEP as a “massive and discriminatory attack on Alberta”23. The Alberta government had been made aware of most of the NEP provisions during their pre�NEP bargaining sessions and was therefore ready to respond two days later. The Lougheed government announced a three�prong retaliation to the NEP: Alberta would reduce crude oil production over nine months in three stages, with each stage amounting to a reduction of 60,000 barrels a day; the Alberta government would withhold approval of the Alsands and Cold Lake mega�projects; and, finally, Alberta would launch a constitutional challenge to the natural gas export tax.
The A lberta Exported Gas Tax Reference Once it became clear early during the pre�NEP negotiations that the
Liberals were planning to introduce a natural gas export tax, a committee formed by Premier Lougheed to develop methods of fighting “Ottawa's intention to takeover natural resources” conceived of a constitutional challenge to such a measure. The scope of this legal challenge was purposely kept quite narrow. Using its Reference power, the Alberta government would ask its Court of Appeal if a federal tax on natural gas owned solely by the Province of Alberta and sold directly to a company in the U.S. was ultra vires by virtue of sec. 125 of the BNA Act, which prohibited one level of government from taxing another level of government. By September 1980 the Lougheed task force had carefully prepared a factual background for the test case by choosing a piece of government�owned land in the Smith Coulee area.
23 James 1993, 36; Globe and Mail 3 November 1980, A1.
57
Therefore, very soon after the announcement of the NEP, the Alberta government was prepared to refer to Alberta's Court of Appeal the question of the constitutionality of the NGGLT as applied to exports of provincially�owned natural gas. Under its Constitutional Questions Act, the Alberta government directed the Court to make its decision on a strategically specified set of facts. The Court was asked to assume that during the month of September 1980, the Province of Alberta drilled a well on land owned by the Crown in the right of Alberta that resulted in the production of natural gas in commercial quantities. The Court was also to assume that the Province of Alberta entered into commercial agreements to have the said natural gas gathered, compressed, and processed and then to have it transported by a natural gas pipeline for export sale by the Province of Alberta to a purchaser in the U.S. The natural gas pipeline was to be assumed to be wholly within the Province of Alberta extending twenty miles to the USA, Montana border and was unconnected with any other pipeline in the Province. Finally, the Court was asked to assume that “the Province of Alberta maintains sole ownership of the said natural gas until it is delivered to the purchaser on the State of Montana side of the border” (Reference Re Proposed Federal Tax, 71).
The Alberta Court of Appeal released its decision in March 1981. In a unanimous (5–0) per curiam decision, the Court declared the federal natural gas tax ultra vires as it applied to the specific fact situation contained in the Reference. The Court considered the natural gas tax to be for revenue raising purposes only and not a regulatory instrument; therefore, the tax did not fall under the ambit of the federal “trade and commerce” power (Reference Re Proposed Federal Tax, 54–57). The Court rejected the argument that the province was not protected by sec. 125 because the tax applied to a transaction or movement. The Court claimed that the proposed tax “differs little from a tax on the property itself. We do not agree that the plain purpose of sec. 125 can be avoided by such a simple device” (Reference Re Proposed Federal Tax, 60). Finally, the Court rejected the federal argument that the amount of “industry” applied to commercially sell the gas removed Alberta from the protection of sec. 125. In doing so, the Court rejected the federal “extreme case” argument that warned of the province
58
nationalizing all enterprise within its borders to escape federal taxation (Reference Re Proposed Federal Tax, 65–66).
The federal government's response to the decision was low key and indicated that the decision would likely be appealed to the Supreme Court. Leitch observed that the decision was strong by virtue of its unanimity, but he refused to speculate publicly what effect the decision would have upon negotiations that were scheduled to start with the federal government on April 13 in Winnipeg24.
The September 1981 Energy Agreement The initial meeting in April provided the basis for further negotiations
throughout the summer of 1981 that culminated in the September 1, 1981 Energy Agreement. The principle trade�off in the deal was that the federal government dropped the natural gas export tax and Alberta dropped the tie�in to world oil prices. The federal government actually stipulated it had the right to tax gas exports, but the tax rate was set at 0%. Alberta, in the face of the unfavorable status quo introduced by the NEP, had managed to end the taxation of gas exports and had gained federal affirmation of the provincial ownership of natural resources.
Alberta's decision to engage in micro�constitutional politics in the Exported Gas Tax Reference suggests that theories of why interest groups litigate (or do not litigate) can help us understand why governments sometimes opt for strategic litigation as a political tactic.
An important predictor of interest group use of litigation is the relative distribution of legal and political resources between the two opponents. Before the NEP was announced, Alberta believed it had superior political resources in the form of the Alberta Heritage Trust Fund, the unconventional oil mega�projects and superior political leadership. Litigation would not be a preferred option. Once the NEP was implemented, however, the Alberta government found itself in an inferior political position responding to a policy that dramatically shifted control of resources to the federal government.
The Alberta government also realized that its political counter�measures to the NEP had their limitations. Withholding approval of the unconventional oil mega�projects was described as a “paper threat”. The oil production cutbacks were “troublesome and difficult” and made
24 Zacharias, Yvonne. “Federal Gas Tax”. Calgary Herald. 1981, 21 March, A1–A2.
59
less threatening by the plentiful amount of oil available on world markets. Regardless, neither of these two responses specifically addressed the gas export tax. As for a political response to the gas export tax, the Alberta government rejected cutting back natural gas production. Unlike the oil industry, the natural gas industry was dominated by small and midsize Canadian firms, thereby making a gas production cutback even more politically and economically risky than the oil production cutback.
The Alberta government found itself trying to battle a tax it had vigorously objected to during the summer of 1980 with few viable political options. This led the Lougheed government to perceive its political resources to be nearly zero on this issue vis�а�vis the federal government.
The Supreme Court's division of powers jurisprudence in the decade preceding the NEP also likely contributed to the decision to undertake litigation. The balance found in the Supreme Court's division of power decisions throughout the 1970s and early 1980s�both quantitatively and qualitatively likely encouraged litigation by offering a reasonable chance of success. Notwithstanding periodic provincial calls for input into the selection of provincial superior court judges and Supreme Court judges, Alberta and the other provinces had reason to believe that federally appointed judges to the Supreme Court and the provincial appellate courts were sufficiently independent when rendering federalism decisions to make victory possible. While believing it had little to lose, the Lougheed government hoped to gain political resources through a successful court challenge to the gas export tax.
The reference mechanism offers governments in Canada distinct advantages in using strategic litigation that interests groups do not enjoy. It allows governments to avoid the requirement of standing because it authorizes governments to refer questions of law to the courts. The Alberta Exported Gas Tax Reference demonstrates that the reference power gives governments greater ability to manage and control test cases than interest groups enjoy. Alberta's prompt legal response to the NEP, for example, illustrates the capability governments have to control the timing with which cases are brought to the court through the reference procedure. A related advantage of the reference procedure is that it allows provincial governments to have
60
immediate access to their courts of appeal and the federal government to have immediate access to the Supreme Court. Avoiding the trial stage of the judicial process reduces unpredictability and expenses for governments undertaking litigation.
Alberta chose to go to the courts during a period of intense conflict over energy issues with a regular opponent�Ottawa. Alberta had been struggling with the federal government over energy policy since at least the early 1970s at both the bureaucratic and political levels. During this time Alberta had been adamantly opposed to an export tax on natural gas.
On the other hand, the framework may also help to explain why governments�with easy and flexible access to the courts and the organizational resources necessary for litigation�do not always choose litigation as a strategy. Normally both levels of government are endowed with generous political and legal resources, which often make their ratios of political to legal resources quite similar. Furthermore, long periods of intense conflict as existed between Alberta and the federal government for most of the 1970s and early 1980s are unusual. With the onset of depressed oil prices, for example, Alberta and the federal government subsequently found themselves cooperating rather than fighting over energy policy.
The Exported Gas Tax Reference, however, is also partially explained by the relationship between micro� and macro�constitutional politics; that is, the interdependency between litigation and formal amendment as methods of altering constitutional rules. Alberta's decision to litigate as a response to the NEP can be seen as a reflection of Alberta's failure to obtain formal constitutional amendments at the macro level that would have strengthened its control over natural resources. In its 1978 constitutional position paper, the Alberta government noted that the producing provinces were frustrated by the federal government's decision to make provincial royalty payments nondeductible for federal income tax purposes and the federal government's decision to join the Canadian Industrial Gas and oil Limited Company (CIGOL) as a co�plaintiff challenging the constitutionality of Saskatchewan's resource legislation. Alberta called for the strengthening of sections of the BNA Act protecting provincial ownership and control of natural resources. The Alberta government
61
also recommended that the BNA Act be clarified to reaffirm the provinces' ability to tax and collect royalties from the sale and management of natural resources. The Alberta government also called for a special “Constitutional Court” representative of all regions whose members would be selected by the federal government from lists of candidates supplied by the provinces. Alberta's position stemmed from its general concern over centralist decisions by the Supreme Court and, more specifically, because of Alberta's suspicion that the federal government was wrestling resource control away from the provinces through the Supreme Court). Had Alberta achieved these macro�constitutional objectives, these enhanced constitutional resources presumably would have deterred Ottawa from introducing the NEP. Once the NEP was announced, Alberta's only remaining option was to try to achieve a similar outcome through litigation, i.e. micro�constitutional politics.
One of the reasons Alberta and other producing provinces called for the formal strengthening of their constitutional control over resources in 1978 was because of the Supreme Court's 1977 CIGOL decision that ruled part of Saskatchewan's province resource legislation to be unconstitutional. The CIGOL decision also cast doubt upon the constitutionality of Alberta's resource legislation. The Alberta government had intervened to support Saskatchewan's provincial government position in CIGOL and subsequently responded to this “loss” at the micro�constitutional level by recommending formal constitutional change.
To summarize, Alberta's decision to litigate can be understood as a response to a bitterly contested and long�standing political conflict with the federal government in which the province had little political leverage (partly because it had not been successful in getting formal changes to the constitution), but had the organizational resources to undertake litigation and the potential for success with section 125 of the BNA Act. Furthermore, the reference procedure gave the Alberta government easy access to the courts and the ability to manage the litigation process.
Effect iveness When negotiations to settle the energy stalemate began in April 1981
the Alberta government found itself in an inferior bargaining position
62
responding to a new, unfavorable status quo introduced by the NEP. With the exception of its constitutional challenge, Alberta's responses to the NEP were proving ineffective. The oil production cutbacks were proving more harmful to Albertans than other Canadians and withholding approval of the mega�projects was described as an obvious “paper threat” by Alberta government insiders. Also, the Alberta government was fighting a policy that enjoyed widespread popularity among the public, especially its Canadianization feature.
Nevertheless the federal government also faced pressure to arrive at an agreement. A deteriorating economy, rising interest rates, the need to prepare a fall budget, and central Canadian consumers unhappy at paying more for imported oil contributed to the federal government's willingness to negotiate.
The Alberta government also explored other options to effectively utilize the Court of Appeal decision. A week after the Court's decision, Leitch told delegates at a Progressive Conservative convention in Calgary that the province could possibly take its royalties in the form of gas instead of money, thereby making all gas within the system the potential property of the province to be protected by sec. 12525. Thus, while the federal government thought it unlikely that the Alberta government would nationalize the oil and gas industry, it is clear that the federal government could not dismiss the possibility that the Lougheed government would make every effort to use the Court of Appeal decision to avoid paying the gas export tax.
Suffice it to say that the constitutional decision gave the Lougheed government legal resources that could be used as political resources in bargaining with the federal government. Alberta entered into negotiations in April 1981 with a relatively weaker negotiating base than the federal government, yet emerged with a compromise energy agreement that reaffirmed provincial ownership of resources, featured higher prices and, most importantly, effectively eliminated the gas export tax. Alberta and other provinces then succeeded in having provincial control over the exploration, development, conservation, and management of non�renewable resources explicitly entrenched in the constitution (sec. 92A) during the negotiations that led to the patriation of the constitution in 1982. Although sec. 92A would not directly prohibit 25 Byfield, Ted. 1981. “The McGillivary Decision”. Alberta Report (March 27).
63
the federal government from imposing another export tax, it provides a legal and symbolic context that would likely make it more difficult for the federal government to impose another such tax.
The long�term impact of Alberta's litigation efforts was consolidated further by the Supreme Court's 1982, ruling in the Exported Gas Tax Reference, which upheld the Alberta Court of Appeal decision. Alberta claimed that it would change the structure of natural gas ownership in the province if the federal government tried again to collect a gas export tax after the Energy Agreement expired in 1986.
An understanding between Alberta and Ottawa was only reached when the federal government substantially altered the NEP's pricing and taxation provisions to bring domestic prices closer to world levels. Although this agreement put an end to the political conflict, it failed to bring stability in energy policy.
Adjustments to the NEP and provincial fiscal regimes were required almost immediately in response to the 1983 drop in world oil prices, the fall in gas exports and the recession. The 1984 election of a market�oriented Conservative government led to more dramatic changes as most of the NEP's interventionist policies – price controls, consumer subsidies, exploration incentives, production taxes and the 25% crown share on federal lands, or “back�in” – were gradually eliminated.
Although both the oil industry and the western provinces welcomed these changes, they soon had to confront an even greater threat than the NEP: the 50% drop in world oil prices in 1986. The collapse in inter�national prices forced the cancellation of energy investments across the country and battered the economy of the western provinces. It also led to renewed calls for government intervention to stabilize prices and revenues.
3.7.1. Analysis of the conditions under which NEP was dismantled
There were three main reasons why NEP was finally abandoned. First it was rancour in federal�provincial relations. Secondly, the world oil prices collapsed. Lastly, there was strong pressure from the USA against NEP.
The NEP was introduced in the wake of the energy crises of the 1970s, and was designed to promote oil self�sufficiency for Canada,
64
maintain the oil supply, particularly for the industrial base in Eastern Canada, promote Canadian ownership of the energy industry, promote lower prices, promote exploration for oil in Canada, promote alternative energy sources, and increase government revenues from oil sales through a variety of taxes and agreements. At the status quo even with transfer/equalization payments, there was still a flow of wealth from the eastern oil�dependent provinces, particularly Ontario and Quebec, to the western oil�producing provinces.
The program was extremely unpopular in Western Canada, where most of Canada's oil is produced, and heightened distrust of the federal government, especially in Alberta, British Columbia and Saskatchewan. Many Albertans believed that the NEP was an unjustified intrusion of the federal government into an area of provincial jurisdiction and was de�signed to strip their province of its natural wealth. By keeping the oil prices below world market prices, it was essentially subsidizing the eastern provinces. The NEP's Petroleum Gas Revenue Tax (PGRT) insti�tuted a heavy double�taxation mechanism that did not apply to other commodities, such as gold, copper, etc. The prices of these commodi�ties were also escalating rapidly at the time.
In federal elections held in September 1984, the Progressive Con�servative Party won a landslide victory, and its leader, Brian Mulroney, became prime minister. Mulroney had campaigned against the policy in the 1984 election. Mulroney's approach to government differed greatly from that of Trudeau. In federal�provincial relations he sought to avoid the bitterness and rancour that had marked Trudeau's dealings with the provincial premiers. Accords were negotiated with Newfoundland and Alberta that ended the crisis over federal energy policy and dismantled the NEP.
In November 1984 Mulroney's finance minister, Michael Wilson, an�nounced that the government would adopt a new approach to eco�nomic and fiscal matters to encourage private, including foreign, in�vestment, to bring down the national debt, to review social programs, and to privatize crown corporations.
High prices, off�oil switching by consumers, and the worst recession to hit the Western world since the 1930s had reduced world oil demand by more than 8% in two years. Large new oil supplies in the North Sea, Alaska, Mexico, and else where had loosened OPEC's monopoly grip
65
and its ability to seemingly command what it wanted for its oil. Invento�ries of oil, bulked up because of jitters over possible further disruptions to Middle East oil supplies, were now being drawn down at rates up to four million barrels a day, adding more downward pressure on prices. Instead of climbing to $80 a barrel as expected, the price of oil was on a steady eight�year skid from nearly $45 to $19 per barrel.
On March 28, 1985 Carney, Mulroney's energy minister and the en�ergy ministers of the Western provinces signed the Western accord. It abolished oil and gas price controls, effective June 1. Five federal NEP taxes were abolished immediately, while the annual 82.5�bln petroleum and gas revenue taxes were phased out over 3.5 years. No more PIP grants were to be issued, but those already approved were continued. Tax incentives to some extent replaced the PIP grants and ended the PIP discrimination against foreign investment and exploration expendi�tures in Western Canada. PetroCanada's contentious 25% back�in privi�lege on Canada Lands was abolished. The changes were expected to cost the federal treasury half a billion dollars in 1985 but add $3 bln to oil company revenues. The industry gains didn't last long: the following year, the now decontrolled benchmark price for Canadian oil, in step with world prices, collapsed from $37 to $20.
A high degree of interdependence exists between Canada and the United States making it essential to have effective management of the relationship. To effectively manage a relationship such as the one be�tween Canada and the US, both procedure and substance must be maintained. Procedure requires good communication traits such as prior notification, consultation, and accommodation. Substance re�flects a balance between national and joint interests. Both must be taken into account during policy formulation to solve problems of differ�ing opinions.
Both U.S. corporations and the U.S. government were unhappy that the Canadian government was attempting to increase Canadian influ�ence in the oil industry. Over the next several months after NEP intro�duction, several bills surfaced in the U.S. Congress aimed at pressuring the Canadian government to rethink its new energy program.
The US took its strongest stance against the third policy goal of the NEP, Canadianization. They felt not only did items such as the Petro�leum Incentives Program (PIP) grants and the purchasing of Canadian
66
goods and services discriminate against US firms, but it more impor�tantly violated international standards concerning foreign investment as set out in the General Agreement on Trade and Tariffs (GATT). Cana�dian suppliers of goods and services would be favored and the principle of national treatment would therefore not be applied. In 1980’s about 2/3 of all Canadian international trade was with the USA.
The first main approach taken by the US in response to the NEP was through diplomacy and bilateral negotiations. The US attempted to broaden the agenda for the diplomatic talks by grouping objections to the NEP with previous objections to the Foreign Investment and Review Agency (FIRA). Frustrated with poor negotiations, the US began ex�pressing its concerns over the NEP with public pronouncements and diplomatic correspondence that not only outlined concerns, but also addressed how Canada could alter its policy to align with US views.
Once it was clear what the US concerns were, however, Canada took a contrasting role to its usual flexible position by standing firm in its po�sition showing its lack of willingness to accommodate.
The US also pursued a multi�lateral approach in hopes to alter the Canadian policy. Their claims that Canadianization deviated from the principle of national interest were brought before OECD committees. The US argued that Canada's failure to adhere to the principle would undermine the OECD and its future growth by lessening its acceptance by developing countries.
The US also lodged a complaint with the International Energy Agency (IEA) over questions about the NEP's pricing, taxation, and production policies. One of the fundamental principles of the IEA is a reliance on market forces in an effort to increase production in energy sectors. The US argued that regulations in the NEP violated the outlined market forces principles. Finally, the US asked for an international panel to give a binding decision on whether the NEP violated the principle of national treatment as outlined in the GATT articles. A decision was reached that in fact the NEP did contradict principles of national treatment leaving Canada with little choice but to modify the NEP to allow for Canadian goods and services to be assessed on a competitive basis with other suppliers first. Aside from this minor alteration of the NEP, the multi�lateral approach did little to alter the Canadian policy.
67
After strong Canadian resistance to change in the NEP in bilateral negotiations and multi�lateral disputes, the US resorted to unilateral retaliation threats. The administration's first threat was to rewrite the AutoPact that had been negotiated with Canada. Following this, the US stated that Canada was not living up to its international trade commit�ments and would not be allowed to participate in the International Trade Ministers meeting scheduled for January 198226.
The administration's threats were never turned into action however and Canada was allowed to attend the meeting. The US Congress was the second body to threaten Canada when it felt the administration was having no effect on altering the NEP and Canadian takeover attempts began hurting US firms in Canada. Congress maintained the position that the administration was too weak and began issuing legislation aimed to aid US companies suffering from the NEP. In addition, Con�gress threatened to deny Canadian firms access to leases for oil and gas production on US federal lands with the establishment of a US agency replicating Canada's FIRA to screen foreign investment27. This issue rolled into a larger policy struggle between the executive and leg�islature because denying leases could be seen as being painful for the US as well. The feeling that retaliation would end up hurting US interests became eminent and no retaliatory actions stemmed from the various threats.
The Americans understand that the Canadian NEP diverted oil away from their markets to Ontario manufacturers, thus both denying Ameri�can industrial customers a crucial source, and unfairly subsidizing Ca�nadian manufacturers with below�market prices for oil. They are also cognizant of the fury that continues to reside in Alberta in the wake of the NEP.
The Canadian auto manufacturing industry far outperformed the American auto industry in the 1980s mostly as a result of this energy subsidy, and lucrative Canadian jobs were created at the expense of American jobs. This result was what initially created the American's de�mand for a Free Trade Agreement with Canada, the crucial electoral
26 Leyton�Brown, David. “Weathering the Storm: Canadian�U.S. Relations”, 1980–83. Canadian American Committee, 1985. 27 Wonder, Edward. “The US Government Response to the Canadian National Energy Program”, Canadian Public Policy (1982).
68
issue in the federal general election of 1984, which swept conservative Brian Mulroney to power.
Canada not took the US interests into account in the NEP's formula�tion. As a result of ineffective relationship management, the special re�lationship between the US and Canada declined and problems arose over the NEP's creation.
The Conservatives, condemned the NEP in both theory and practice for deterring foreign investors and for giving Canada an inhospitable reputation throughout the business world. After his election in Septem�ber of 1984, Prime Minister Mulroney began actively pursuing renewed liberal trade ties with the United States. He promised to remove FIRA and replace it with the Investment Canada Act so as to attract new for�eign capital, especially U.S. investment, to Canada. Foreign investment means foreign capital and that makes for an expanding economy which can only benefit Canada, argued the Conservatives.
The NEP, one of the most sweeping government policies ever under�taken in Canada, was completely dismantled by the Progressive Con�servatives after their 1984 election victory. Although the NEP did reduce Canadian dependence on oil and foreign ownership of the oil industry, its legacy also was one of distrust of the federal government by the western provinces.
Analysis of Conservatives and Liberal’s position toward the Kyoto protocol and the future of coal and nuclear electricity generation sta�tions in Canada
The Kyoto Protocol is an agreement made under the United Nations Framework Convention on Climate Change (UNFCCC). Countries that ratify this protocol commit to reduce their emissions of carbon dioxide and five other greenhouse gases, or engage in emissions trading if they maintain or increase emissions of these gases.
Canada was among the first countries to ratify the 1992 Framework Convention on Climate Change (FCCC), under which it committed itself to reducing its greenhouse gas emissions to a level 6% below that of 1990 within the time period 2008–2012. Canada ratified the Kyoto pro�tocol in 2002.
All countries are not treated equally by Kyoto. Canada, for instance, has committed to reduce its greenhouse gas emissions by 6%. The U.S. target was 7% reduction. But in 2001, one of the first acts of
69
newly�elected President George W. Bush was to formally withdraw the U.S. from Kyoto. The U.S. would not ratify the treaty because it would damage the U.S. economy and major developing nations like China and India were not covered by its provisions.
Much of the criticism around the Kyoto Protocol is over political re�alities and the limitations of the treaty. Critics say 5% cut will accom�plish little, especially with the United States as not a participant. Some Canadian critics say our economy will pay a heavy price for meeting our Kyoto commitments because we'll have to compete with an American economy that faces no such restrictions.
Alberta Conservative Provincial Government files a formal objection to the federal government's plans to implement the Kyoto accord and reduce greenhouse gas emissions. Alberta has long opposed the Kyoto accord, saying it will hurt the province's lucrative oil and gas industry. Provincial Environment Minister Guy Boutilier says that Alberta should be allowed to put its own legislation in place to regulate greenhouse gas emissions.
A barrel of oil from bitumen produces about two to three times the carbon from conventionally pumped oil. By 2020, 80% of Canada’s oil will come from the tar sands (mostly from Alberta). Alberta has the sec�ond largest proven oil reserves in the world with 176 bln barrels, of which 174 billion barrels are bitumen reserves. With improvement in technology that number could reach 300 bln barrels or more in years to come28. Production from the oil sands – which now supply about one million barrels of crude oil a day – is now on its way to four million bar�rels by 2015.
If nothing is done to radically change the capturing of carbon from producing all that oil, Canada’s greenhouse gases will rise, and rise sharply. The Natural Resources Canada reports, that the future mix of oil in Canada will be he heavier, thereby requiring more processing, which, in turn, will produce more emissions.
28 2005/2006 Annual Report, Ministry of Energy, Alberta, Canada.
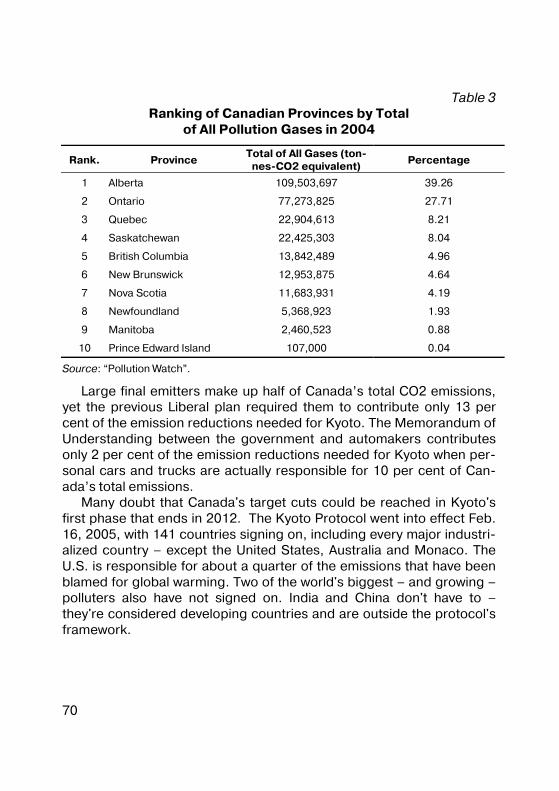
70
Table 3 Ranking of Canadian Provinces by Total
of All Pollution Gases in 2004
Rank. Province Total of All Gases (ton�
nes�CO2 equivalent) Percentage
1 Alberta 109,503,697 39.26
2 Ontario 77,273,825 27.71
3 Quebec 22,904,613 8.21
4 Saskatchewan 22,425,303 8.04
5 British Columbia 13,842,489 4.96
6 New Brunswick 12,953,875 4.64
7 Nova Scotia 11,683,931 4.19
8 Newfoundland 5,368,923 1.93
9 Manitoba 2,460,523 0.88
10 Prince Edward Island 107,000 0.04
Source: “Pollution Watch”.
Large final emitters make up half of Canada’s total CO2 emissions, yet the previous Liberal plan required them to contribute only 13 per cent of the emission reductions needed for Kyoto. The Memorandum of Understanding between the government and automakers contributes only 2 per cent of the emission reductions needed for Kyoto when per�sonal cars and trucks are actually responsible for 10 per cent of Can�ada’s total emissions.
Many doubt that Canada's target cuts could be reached in Kyoto's first phase that ends in 2012. The Kyoto Protocol went into effect Feb. 16, 2005, with 141 countries signing on, including every major industri�alized country – except the United States, Australia and Monaco. The U.S. is responsible for about a quarter of the emissions that have been blamed for global warming. Two of the world's biggest – and growing – polluters also have not signed on. India and China don't have to – they're considered developing countries and are outside the protocol's framework.
71
Canadian Concervat ive Federal Government (2006) and Kyoto commitments
Canada was one of the first countries to sign the Kyoto Protocol, but Canada's continued participation in Kyoto seemed certain to end with the election of a minority Conservative government on Jan. 23, 2006. Dispite of good intensions, since 1990 to 2005 the level of greenhouse gases in Canada have rosen to 35%, and a part of the party's platform was to ditch Kyoto and come up with new approach to reducing the emissions blamed for global warming.
In April 2005, then prime minister Paul Martin and his Liberal gov�ernment unveiled what they called Moving Forward on Climate Change: A Plan for Honouring Canadian Kyoto Commitment. Under their revised plan, the Liberals pledged to spend $10 bln over seven years to help Canada cut its average greenhouse gas emissions by 270 megatonnes a year from 2008 to 2012.
However, when Prime Minister Stephen Harper and the Conservative government tabled the federal budget in May 2006, there wasn't a sin�gle mention of the Kyoto Protocol. Finance Minister Jim Flaherty re�peated his pledge to develop a $2�bln, five�year climate change plan, but there were no details. The budget also set aside $370 mln over two years for a new tax credit that would benefit commuters who buy monthly transit passes.
In September 2006, Environment Minister Rona Ambrose an�nounced that Canada had no chance of meeting its targets under the Kyoto Protocol. She accused the Liberals of wasting $1 bln on emis�sion�reduction efforts without keeping the country on track to meet its promises under the international agreement. Ambrose said that the government would instead act on greenhouse gases and other pollution with new targets in a proposed clean air act, announced in October 2006.
The Clean Air Act targets would be “intensity�based”, meaning that environmental emissions would be relative to the economic output of various industries. That means even though individual emission limits for each barrel of oil or piece of coal could be lowered, if production increases, the overall amount of greenhouse gas emissions and air pol�lutants could grow.
72
Critics of intensity�based targets say the approach allows heavily polluting industries, such as Alberta's oilsands, to continue to grow and pollute while remaining under government�imposed limitations. The bill does not set short�term targets to cut greenhouse gas emissions, and its emissions regulations on large polluters don't take effect until 2010.
Greenhouse gases in 2005 rose to 35% above 1990 levels, putting Canada’s commitment out of reach. Natural Resources Canada pre�dicted that emissions would be 828 megatonnes by 2010 (758 mega�tonnes in 2004). Therefore, to fulfill Kyoto, Canada would need to re�duce emissions in the next two to six years by 265 megatonnes to 6% below the 1990 level of 599 megatonnes, or 563 megatonnes. That re�duction is absolutely impossible. Kyoto targets could be met only by purchasing international credits, but the cost would be billions of dol�lars. According to current Canadian Environment Minister Rona Ambrose, “electricity prices in British Columbia would increase by 40%, in Ontario by 65%, natural gases prises would increase by over 300% in Alberta and over 130% in Ontario. These are the kind of impacts of en�forcing the Kyoto target on Canada’s industry today,” she said29.
Ms. Ambrose comfirmed, companies will be allowed to trade credits between themselves as a way of complying with new mandatory limits on greenhouse�gas emissions. But unlike the Liberal plan, Ms. Ambrose said the Conservatives will not contribute tax dollars to the system, nor will it will purchase any form of international credits. Emis�sions trading was part of the previous Liberal government’s plan to comply with Kyoto, but the plan had yet to be set up when Liberals was defeated in January 2006.
The three opposition parties all support the regulation and trading of carbon dioxide. But the approach would likely be unpopulat in Alberta, where the Conservatives hold all the federal seats.
In October 2006 Rona Ambrose, Minister of the Environment, gave Canadians the first and central component of Canada's New Govern�ment's environmental Agenda when she introduced Canada's Clean Air Act. The Act and subsequent Notice of Intent to regulate demonstrate a commitment to the establishment of short�, medium� and long�term industrial air pollution targets. These fixed targets would compel pollut�ers to respect emissions limits and will be at least as stringent as those 29 The Globe and Mail, A4, October 6, 2006.

73
in other leading environmental countries. Short�term intensity based greenhouse gas reduction targets would be set in consultation with provinces and territories and all affected industry sectors. This dynamic approach will ensure better results for the environment.
The Government is committed to achieving an absolute reduction in GHG emissions between 45 and 65% from 2003 levels by 205030. Greenhouse�gas reductions would be intensity based until at least 2020 before switching to absolute reductions.
Under the Clean Air Regulatory Agenda, over the next twelve months, the Government will introduce new regulations pursuant to the Canadian Environmental Protection Act, 1999 to address air pollutants from certain consumer products and vehicles.
Over the next three years, new regulations, targets and timelines will be discussed and set. They will lead to significant and long�term reduc�tions in air pollution and greenhouse gas emissions from industry, transportation and consumer products, as well as new standards for energy efficiency in a wide range of everyday products and appliances.
The Act also supports expanded use of equivalency agreements with provinces and territories to allow for regulatory cooperation and avoid overlap and duplication. Finally, it gives the Government enhanced powers to monitor polluters and also requires all environmental fines levied for non�compliance go into an environmental damages fund that will be applied directly to cleaning up the environment.
Given Canada’s position as an energy�producing nation, those plans may be a realistic recognition that short�term reductions are virtually impossible. Industrial sectors such as coal�fired electricity plants and upstream oil and gas producers churn out more than half of Canada’s air pollution and 47% of its greenhouse�gas emission.
All three opposition parties said they would vote against the bill, casting doubt on whether it will ever become law. The bill replaces Can�ada’s commitment under the international Kyoto Protocol to start re�ducing greenhouse gases by 2008 with a new target to cut such emis�sions in half by 2050.
Future of coal and nuclear electricity generation stations in Canada
30 Speaking Notes for the Honourable Rona Ambrose, Minister of the Environment of Canada October 19, 2006, Ministry of Environment.
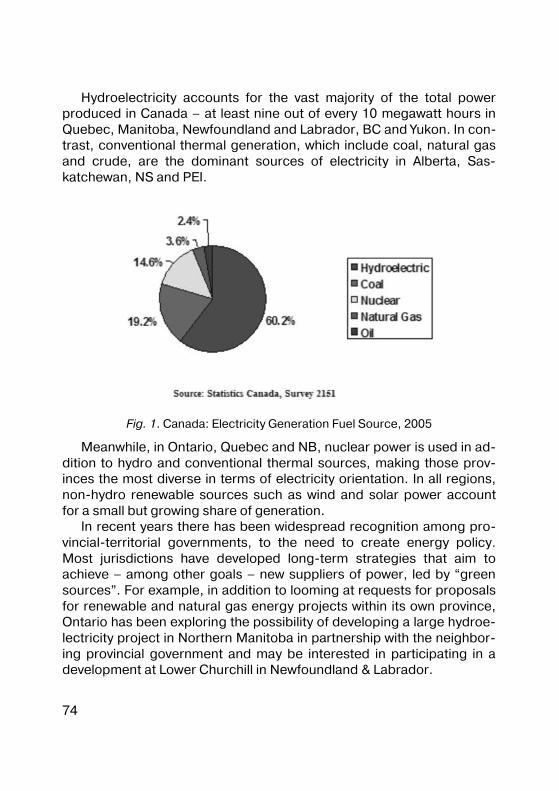
74
Hydroelectricity accounts for the vast majority of the total power produced in Canada – at least nine out of every 10 megawatt hours in Quebec, Manitoba, Newfoundland and Labrador, BC and Yukon. In con�trast, conventional thermal generation, which include coal, natural gas and crude, are the dominant sources of electricity in Alberta, Sas�katchewan, NS and PEI.
Fig. 1. Canada: Electricity Generation Fuel Source, 2005
Meanwhile, in Ontario, Quebec and NB, nuclear power is used in ad�dition to hydro and conventional thermal sources, making those prov�inces the most diverse in terms of electricity orientation. In all regions, non�hydro renewable sources such as wind and solar power account for a small but growing share of generation.
In recent years there has been widespread recognition among pro�vincial�territorial governments, to the need to create energy policy. Most jurisdictions have developed long�term strategies that aim to achieve – among other goals – new suppliers of power, led by “green sources”. For example, in addition to looming at requests for proposals for renewable and natural gas energy projects within its own province, Ontario has been exploring the possibility of developing a large hydroe�lectricity project in Northern Manitoba in partnership with the neighbor�ing provincial government and may be interested in participating in a development at Lower Churchill in Newfoundland & Labrador.

75
Above all, there is an acknowledgement by governments – and in some cases backed by initiatives – that a good part of the solution to eliminating emerging gaps between power supply and demand rests in demand�side management (DSM). The objective of DSM is to reduce demand for electricity and/or shift demand from peak to off�peak times.
Ontario will actively use DSM as part of its strategy to address its looming tight supply/demand balance. The province plans to install “smart meters” in 800,000 homes by the year 2008 and in 4 mln homes and small businesses by 2010. The smart meters will record the amount of power consumed and the hours at which it is drawn from the system. The pricing of electricity will be modified to reflect different demand at different times of day. A change in consumption habits would reduce the need for new power plants, which are intended to meet demands at peak periods.
Other provinces also have some DSM initiatives. Coal�fired generation is a low�cost technology, but generates GHG
along with emission of nitrogen oxide, sulphur dioxide and lead. On the plus side, there is effort underway in both Canada and USA to develop new technologies that would greatly reduce the emissions from the burning of coal.
In 2001, the industry, with the support of the governments of Alberta, Saskatchewan and the federal government, formed a coalition to de�velop projects that will demonstrate the technology that will reduce all emissions in existing facilities or for use in new plants. Phase 1 of that project was completed in 2004. It showed that the carbon dioxide emis�sions from coal�powered plants could be reduced to the equivalent of those emitted by natural gas power plants. However, the cost will be at least 50% higher than the current rates. The next phase of the project will concentrate on this technology. At the moment, the project appears to be suitable for new projects, rather than for retrofitting existing plants.
Canada holds close to 10 billion tones of coal reserves, more energy than all of Canadian oil, natural gas and oil sands combined31. Produc�tion in 2004 totaled approximately 66 million tones. Coal provides about 56000 direct and indirect jobs in Canada and contributes approximately 31 The Coal Association of Canada, www.coal.ca.
76
$5 bln to the Canadian economy. Total domestic consumption for 2004 was 59 mln tones, of which 55 mln tones went to electricity generation. Canada currently has almost 17000MW of coal�fired generating capac�ity, located primarily in Alberta, Saskatchewan, Ontario, Nova Scotia and New Brunswick. This represents 18% of the country’s total generating capacity.
The use of coal in USA and Canada has contributed to environmental problems, particularly that of acid rain. In Ontario about 50% of all air pollution is from the USA (mostly from the coal electricity generating stations) and the rest is mostly from local coal electricity generating stations and auto transport. As a result, some Alberta coal producers have demanded that they supply central Canada, partly because Al�berta coal contains 8 times less sulphur (the main ingredient of acid rain) than American coal.
The province contains 70% of Canada’s coal reserves and 45% of coal mined in Canada is from Alberta32. However, the counterargument is that Alberta coal is too expensive.
In the past, the mining industry has played an important role in Nova Scotia, both as a source of jobs and as a part of local culture. Today, due partly to the relatively low price of coal on the world market, Nova Scotia Power (NSP) and New Brunswick Power (NBP) rely on imported coal for electricity generation in the region. NSP in particular relies upon coal for 80% of its power generation.
Conservative government of Nova Scotia believes that renewable energy sources can account for an additional 300 megawatts of electri�cal generation capacity in Nova Scotia. Nova Scotia has one of the best wind power generating regimes in Canada. There are currently com�mitments to develop about 100 megawatts of wind power in Nova Sco�tia. It's possible to add another 280 megawatts of wind power, with the proper federal incentives and changes to the transmission system.
Biomass power�generating electricity from the by�products of Nova Scotia vital forestry sector also has great potential33. Meanwhile, to ret�rofit a coal plant for natural gas, while it is technologically possible to do so, it is not economic to do so. In Nova Scotia it makes a lot more sense
32 2005/2006 Annual Report Ministry of Energy, Alberta. 33 Government of Nova Scotia, Ministry of Energy, Smart Choices for Cleaner Energy – The Green Energy Framework | Announcement October 12, 2005.
77
to start with a new plant and have it designed to use natural gas. Nova Scotia can also reach its reduction targets through conservation, better use of public transit and retrofit programs, among other things.
The biggest obstacle to shutting down coal�fired generators is the absence of a suitable alternative. The province has no major rivers to produce hydroelectric power and going nuclear isn't an option.
Meanwhile, Nova Scotia's energy strategy is committed to revival of the coal industry in Cape Breton, traditional Nova Scotia coal producer, where the province recently announced it was seeking interest from companies willing to develop the defunct Donkin Mine. If the under�ground colliery is re�opened, Nova Scotia Power is expected to be a big customer.
3.7.2. Nuclear energy
More than 30 years nuclear energy has contributed to avoid a sig�nificant amount of GHG emissions in Canada. Although there are a number of challenges currently facing the nuclear option, it is clear that nuclear is well positioned to continue to play an important role in meet�ing Canada's energy needs, as well as its air quality and climate change commitments. High oil, gas and coal prices, surging electricity demand, all argue in favour of reassessing of nuclear power. The new generation of rectors is better designed, and more economical to build and oper�ate. It’s also better for the environment, because it produces no green�house�gas emissions and no air or water pollution.
The federal government was always deeply involved in the develop�ment of nuclear energy. The government strengthened its control over uranium resources in 1946 with the passage of the Atomic Energy Con�trol Act, which transferred jurisdiction over uranium from provincial to federal authorities and regulated the production and uses of uranium in Canada. Two important federal crown corporations have been involved in atomic energy: Atomic Energy of Canada Ltd. (AECL) and ELDO�RADO Nuclear Ltd. The former is responsible for nuclear research; the latter for the mining and refining of uranium.
Canada's nuclear energy program was born in 1953 when feasibility studies on the CANDU reactor design were initiated. Although the first commercial CANDU reactor began operations only in 1971 in Pickering, Ontario, by 1980 nuclear energy accounted for 38% of Ontario's elec�

78
tricity consumption. In 1985 there were nuclear power plants in Ontario, Quebec and New Brunswick.
In Canada, the nuclear energy option grew out of a desire by Cana�dian electrical utilities to achieve self�sufficiency in base�load electricity supply when imported coal was the only available option. The cost of coal was relatively high in the 1960s and early 1970s, which made the economics of nuclear energy attractive.
The most important benefit of the federal investment in nuclear re�search and development has been the development of a world�class technology for providing low�cost and reliable electrical energy for base load power needs. Twenty�two CANDU reactors, owned and operated by utilities in Ontario (20), Quebec (1) and New Brunswick (1), provide, on average, about 15% of Canada's electricity (60% Canada’s energy is hydro�power)34.
The industry employs about 21,000 people directly and 10,000 indi�rectly. Canada’s nuclear energy production peaked in 1994 at 102.4 TWh, declined to 67 TWh by 1998 as reactors were mothballed, and in�creased to 85.6 TWh in 2005 due to improved reactor performance and refurbishment35.
In 2005, 17of 22 CANDU reactors were in service, generating 15% of Canada’s electricity. Saskatchewan is the world’s largest uranium pro�ducer. About 30% of the world’s uranium production comes from this province. Recently there has been renewed interest in nuclear energy, spurred by increasing demand (particularly within Ontario), and the de�sire to comply with Canada’s Kyoto Agreement obligations.
The province of Ontario dominates Canada’s nuclear industry, con�taining the vast majority of the country’s nuclear power generating ca�pacity. Ontario reactors provide up to 50% of the province’s electricity. According to Ontario’s Independent Electricity System Operator (IESO), the province faces a significant electricity shortfall in the next few years as coal plants are retired and some nuclear plants reach the end of their useful life. Demand, meanwhile, is expected to grow at an average an�nual rate of 1% as Ontario’s population increases and its economy ex�pands. Meeting this demand is becoming increasingly challenging. Al�ready Ontario’s electricity system is showing signs of strain.
34 Natural Resources Canada. 35 Canadian Nuclear Association.

79
A new all�time record for electricity demand in Ontario was set on 13 July 2005, with demand peaking at 26,160 megawatts (MW). Ontario’s existing installed generation capacity is 30,114 MW, though in practice it is not possible to generate this much power at any given moment due to such factors as unscheduled outages, planned maintenance and weather conditions. Ontario has five nuclear stations with a total in�stalled capacity of 14,000 megawatts36. However, in 2005 only 11,400 megawatts were operating. Through the summer, the IESO issued 12 public appeals asking customers across Ontario to reduce their use of electricity. Despite this, the IESO was forced to reduce voltage by 5% on 3 and 4 August in order to maintain the system’s reliability. Some industrial and institutional consumers were negatively affected.
Insufficient generating capacity in Ontario has also increased the province’s reliance on costly electricity imports from neighboring juris�dictions with which Ontario is interconnected, particularly during peri�ods of high demand. The share of electricity imports as a percentage of Ontario’s total electricity consumption has increased in recent years, topping 6% in 2003 and 2004, up from the 3–4% range in the previous six years37.
The current Provincial Liberal government is now seeking a balance between private and public involvement in Ontario’s electricity sector and has set up the Ontario Power Authority (OPA) to oversee and guide developments in the coming years. Important new investments in both generation and transmission are urgently needed as the government moves ahead with its plan to shut down the province’s remaining coal�fired generating stations in an effort to improve air quality and provide up to half of Ontario’s greenhouse�gas reduction contributions under the Kyoto Protocol.
The Government of Ontario has pledged to close all existing coal�fired generating stations by 2009 in an effort to clean up Ontario’s air and reduce greenhouse gas emissions, which are linked to climate change. These power plants, and the Nanticoke generating station in particular, are amongst the most important sources of pollution in North
36 Independent Electricity Market Operator. 18�Month Outlook: An Assessment of the Reliability of the Ontario Electricity System From January 2005 to June 2006, January 3, 2005. 37 National Energy Board. Electricity Exports and Imports.
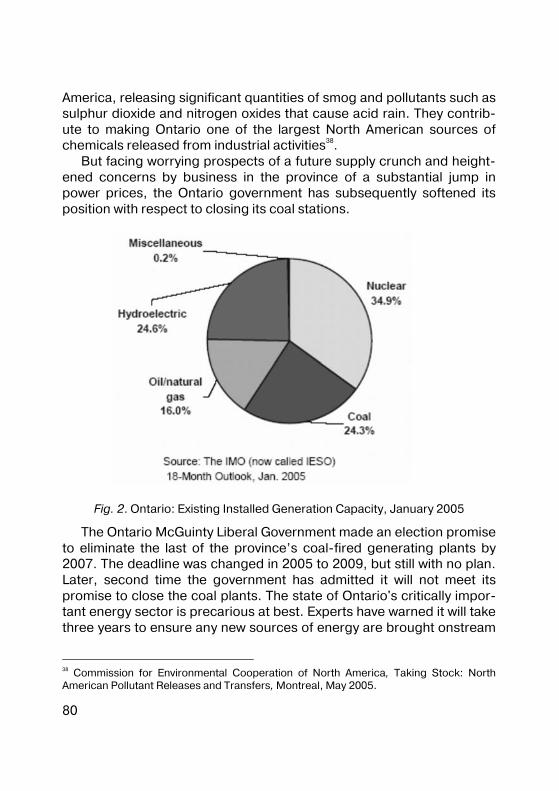
80
America, releasing significant quantities of smog and pollutants such as sulphur dioxide and nitrogen oxides that cause acid rain. They contrib�ute to making Ontario one of the largest North American sources of chemicals released from industrial activities38.
But facing worrying prospects of a future supply crunch and height�ened concerns by business in the province of a substantial jump in power prices, the Ontario government has subsequently softened its position with respect to closing its coal stations.
Fig. 2. Ontario: Existing Installed Generation Capacity, January 2005
The Ontario McGuinty Liberal Government made an election promise to eliminate the last of the province’s coal�fired generating plants by 2007. The deadline was changed in 2005 to 2009, but still with no plan. Later, second time the government has admitted it will not meet its promise to close the coal plants. The state of Ontario's critically impor�tant energy sector is precarious at best. Experts have warned it will take three years to ensure any new sources of energy are brought onstream
38 Commission for Environmental Cooperation of North America, Taking Stock: North American Pollutant Releases and Transfers, Montreal, May 2005.

81
to replace the coal�burning plants that are to be phased out by 2009. That's a tight schedule. Meanwhile, the threat of power outages in the province is particularly acute. Another hot summer could see much of Ontario threatened with brownouts and blackouts. And that is just one aspect of a far bigger problem.
Any refurbishment of nuclear facilities is subject to a federal envi�ronmental review process, as established by the Canadian Nuclear Safety Commission. It takes approximately two years for the environ�mental assessment to be completed. It can take up to five years to re�furbish a reactor and up to 10 years to build a new one. It could be a year or two before the government locks in contracts with Atomic En�ergy of Canada Ltd. or any other bidder for the projects.
The New Democrats have already indicated they will put up a tough fight if the government decides to rely too heavily on nuclear power in the future. They warn of nuclear power's history of cost overruns and delays. The NDP has also criticized the decision to raise electricity rates to bring them closer to the real cost of production.
In a long�awaited response to recommendations released in De�cember 2005, on how Ontario can avoid a future electricity crisis, En�ergy Minister Dwight Duncan's plans call for roughly $70 bln in spend�ing by 2025, including inflation, on a host of nuclear, wind and conser�vation projects.
That plan would then need the approval of the Ontario Energy Board in a review that could take 12 months – or in other words, three months or more beyond the next Ontario election in October 2007. That means citizens will get to vote on the Liberals' energy strategy even though at that point no new nuclear construction will have yet begun.
The Ontario government's suggestion that it will consider foreign nu�clear companies for the construction of new power plants is a bargain�ing tactic aimed at getting federal government to cover any financial risks of sticking with CANDY technology. Government officials began hinting, that choosing CANDU technology from Atomic Energy of Can�ada Ltd., a federal Crown corporation, is not a certainty and that reactor designs from countries such as France and the United States will also be explored.
The Ontario Power Authority recommended to the provincial Ministry of Energy that nuclear power remain 50% of the province's energy mix

82
over 20 years, requiring an estimated $40 billion be spent to refurbish aging plants and build new ones as coal generators are shut.
But critics said that figure could end up much higher if history re�peats itself. For example, the province expected to pay about $4 billion for the Darlington nuclear station but the price tag surpassed $14 bln by the time it was completed in the early 1990s. The former Ontario Hydro assumed all the risk.
The Ontario Liberal government has no intention of carrying such a burden again. Getting the federal government to offer upfront subsidies or indirectly guarantee a fixed rate from AECL could be a way for the Ontario government to make new nuclear plants more palatable for tax�payers.
In New Brunswick, Premier Bernard Lord also has suggested the federal government could help it meet its Kyoto targets by contributing $400 mln toward refurbishment of the Point Lepreau nuclear plant. New Brunswick eventually signed with AECL, but its contract with AECL stipulates that 90% of the cost of the refurbishment be fixed so that Ot�tawa indirectly covers any unexpected cost overruns.
Such a contract structure is potentially more valuable for the prov�ince than upfront subsidies, because it creates more certainty and low�ers the financial risk for any province that has been hit financially in the past.
AECL spokesperson Dale Coffin said it's now standard practice to offer fixed�price contracts.
Rivals to AECL and its CANDU technology include U.S.�based Gen�eral Electric Co. and Westinghouse Electric Company LLC, and France's AREVA SA. But there are about 30,000 nuclear industry jobs in Ontario. As well, the hiring of a foreign company would likely lead to significant job losses at AECL, which employs about 4,000.
While taking the unpatriotic approach of choosing a foreign technol�ogy would likely come with its own set of uncertainties and risks, the AECL's next�generation CANDU technology has its own question marks and risks, making it impossible to accurately predict costs.
Twelve public forums took place only in February 2006 for Ontario residents to express their concerns about the province's future energy supply needs and the possibility of controversial new nuclear power projects. The consultations offer the public a chance to debate a recent
83
report recommending a $70�bln expansion of the province's electricity generation capacity – most of it for new nuclear plants and reactor re�furbishments.
The province needs to refurbish, rebuild, or replace 25,000 mega�watts of existing generation capacity over the next 15 years to ensure the province has enough supply – partly because of government com�mitments to close its four remaining coal�fired plants by 2009.
The report, issued in December by the Ontario Power Authority, pre�dicted the province's power grid could be “overwhelmed” by 2013 with�out new power generation sources.
NDP, Bloc Quebecois and Green Party position towards subsidizing Ontario's nuclear reactors
The NDP, Bloc Quebecois and Green Party all oppose using federal taxpayer dollars to subsidize the construction or retrofit of nuclear reac�tors in Ontario according to the results of a federal election question�naire released by the Ontario Clean Air Alliance (OCAA).
The Liberal Party position is “stands ready to work with Ontario in addressing the province’s energy needs. It is the prerogative of Ontario, however, to determine what energy supply. Canada has invested about $6 bln in nuclear R&D since 1952. Currently, the government of Canada provides approximately $100 mln annually to AECL for R&D. It also pro�vides some targeted R&D funds ($46 mln, last year) for the develop�ment of the Advanced CANDU Reactor”.
According to the Conservative Party, “we have not made a decision on this issue. We will meet with the government of Ontario to discuss its energy requirements”.
Ontario’s nuclear generating sector is currently heavily supported by direct and indirect public subsidies ranging from the assumption of more than $15 bln in unfunded nuclear�related debt by Ontario taxpay�ers and ratepayers to provincial government underwriting of multi�billion dollar plant decommissioning and waste disposal costs. Nuclear construction and retrofit projects in Ontario have consistently run hun�dreds of millions to billions of dollars over budget and years late in completion.
84
Broad support for improving renewable east�west transmission gr id
The Liberal Party, the Conservative Party, the NDP and the Green Party all support the expansion of Canada’s east�west transmission grid to permit Ontario to increase its imports of waterpower from Manitoba, Quebec and/or Labrador. According to the Liberal Party, “the final deci�sion for how to best meet electricity and environmental needs rests with the provinces themselves; however, should they choose to pursue hy�droelectricity projects of mutual interest, they would be eligible to re�ceive federal funding through the Offset System and Partnership Fund”39.
In any event, the only technology that stands a fighting charge of quickly replacing the coal units in Ontario is natural�gas�fired genera�tion. Some 600 MW of new gas�fired generation, all from private inves�tors, came on line in 2004. These gas�fired projects appeared to have received renewed momentum in the wake of the second request for proposal (RFP), which has excluded both oil and coal as fuel sources in new generating procurement argument between the supplier and the Ontario Power Authority, a new non�crown corporation.
The Ontario government has devised a multi�pronged power strat�egy, which includes major thrusts toward both encouraging conserva�tion and boosting investment in renewable sources of power.
The decisions that should be taken today concerning the timing and structure of these sizable investments in energy industry will largely de�termine the reliability and cost of Ontario’s electricity supply over the coming decades, and can thus be expected to have an important im�pact on the economic future of Canada’s most populous province.
Ontario’s challenges on the power front have captured the most at�tention but the province is far from alone in facing electricity supply over the next several years. In fact, most regions of the country are either already confronting – or could be looking at – deteriorating supply – demand positions. This appears to be the case even in provinces such as Quebec and BC, which rank as leaders in the area of hydroelectricity potential. Following a decade of under�investment, major outlays in transmission and distribution infrastructure will be required to upgrade aging fleets in most regions while in some areas, sizeable amounts of 39 Ontario Clean Air Alliance Press Releases Sept. 5, 2006.
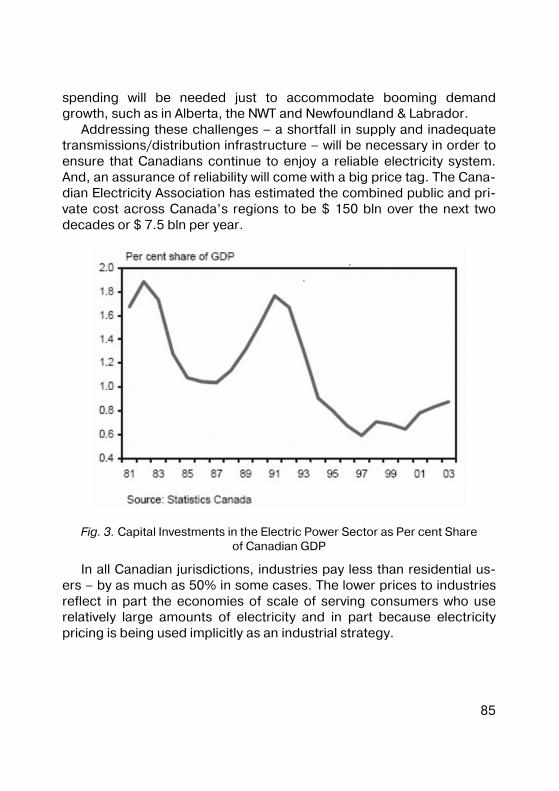
85
spending will be needed just to accommodate booming demand growth, such as in Alberta, the NWT and Newfoundland & Labrador.
Addressing these challenges – a shortfall in supply and inadequate transmissions/distribution infrastructure – will be necessary in order to ensure that Canadians continue to enjoy a reliable electricity system. And, an assurance of reliability will come with a big price tag. The Cana�dian Electricity Association has estimated the combined public and pri�vate cost across Canada’s regions to be $ 150 bln over the next two decades or $ 7.5 bln per year.
Fig. 3. Capital Investments in the Electric Power Sector as Per cent Share of Canadian GDP
In all Canadian jurisdictions, industries pay less than residential us�ers – by as much as 50% in some cases. The lower prices to industries reflect in part the economies of scale of serving consumers who use relatively large amounts of electricity and in part because electricity pricing is being used implicitly as an industrial strategy.
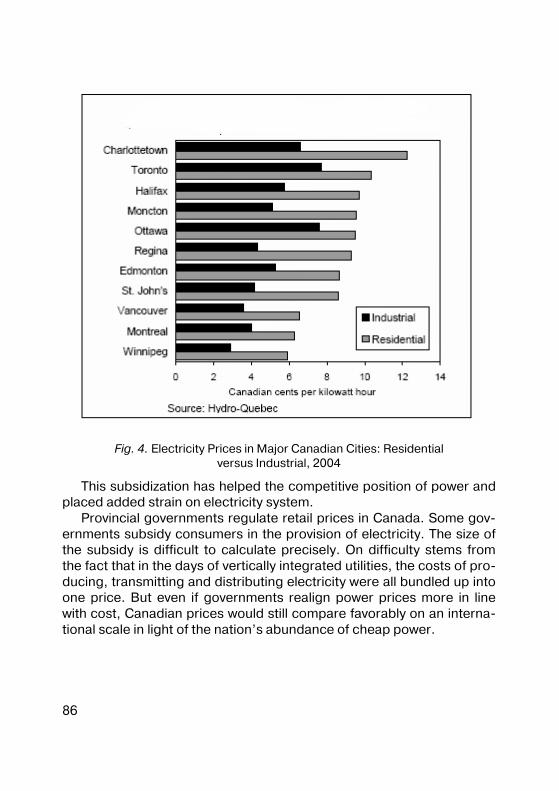
86
Fig. 4. Electricity Prices in Major Canadian Cities: Residential versus Industrial, 2004
This subsidization has helped the competitive position of power and placed added strain on electricity system.
Provincial governments regulate retail prices in Canada. Some gov�ernments subsidy consumers in the provision of electricity. The size of the subsidy is difficult to calculate precisely. On difficulty stems from the fact that in the days of vertically integrated utilities, the costs of pro�ducing, transmitting and distributing electricity were all bundled up into one price. But even if governments realign power prices more in line with cost, Canadian prices would still compare favorably on an interna�tional scale in light of the nation’s abundance of cheap power.
87
3.7.3. Lessons of Canadian National Electric Program for Provincial Governments
There is already a broad recognition among provincial�territorial governments that, first, the supply�demand picture for electricity is eroding and second, that without a reliable power system, regional economies would grind to a halt. As such, most jurisdictions have de�veloped long�term strategies that aim to address the rising risk. While the plans for actions released across the country highlight the fact that each region faces its own unique challenges, there are a number of common threads between them.
1) A need to secure new supplies of power, and in particular, “green sources” such as hydroelectricity, cogeneration, wind power and other renewables.
2) A push towards increasing trade links in order to take advantage of lower transmission costs, export opportunities and to boost reliability with more provinces likely to participate in US�initiated regional trans�mission operators, the recent trend toward regionalization of the elec�tricity market will continue, and north�south trade will contribute an over�growing share of overall provincial electricity generation. Never�theless, there is also widespread acceptance across Canadian prov�inces of the need to strengthen east�west trans�Canadian connections in order to mitigate the risk arising from possible supply disruptions from the USA.
3) An acknowledgement that a good part of the solution to eliminat�ing emerging gaps between electricity supply and demand rests in de�mand�side management (DSM).
With governments in Canada facing a growing tab for health care and already large debt�loads, leveraging the deep pockets and exper�tise of the private sector could go a long way in covering the investment requirements. And, in the case of electricity, where needed investments for generation and transmission are larger than in many other types of infrastructure, the case for private participation, in providing the com�modity as well as financing the project, could not be any clearer.
There is already quite significant private involvement across the provinces and there is a wide range in the mode of participation. In Brit�ish Columbia, the provincially owned BC Hydro provides about 80% of generation, with the remainder being provided by industries and inde�

88
pendent power producers. In Alberta about 68% of generation is ac�counted by three privately – run vertically – integrated utilities and the rest is supplied by the industrial sector and independent power produc�ers. In Nova Scotia, the NS Power Inc. is a virtual monopoly accounting for 95% of generation, transmission and distribution and is owned by Emera, a private company. In Newfoundland, the crown�owned New�foundland Labrador Hydro exists side�by�side with Newfoundland Power, a subsidiary of Fortis, an investor�owned company. Fortis also operates utilities in PEI, Ontario, Alberta and BC. In Ontario, new gas plants are entirely privately�owned and the government’s only involve�ment is a supply contract from the Ontario Power Authority.
Given the scale of investment needs, it appears that more private participation will be needed, either in the form of private ownership of electricity assets or government (provincial and federal) ownership along with the use of the private sector in designing, building, operating and/or financing initiatives. Regardless of the path taken, given that the inherent risk of investing in large�scale power projects can be formida�ble, private sector investors will require the opportunity to earn com�mercial rates of return. As such, a shift toward market�based pricing of electricity would be consistent with a goal of increasing private�sector investment in the long run. Furthermore, governments need to be mind�ful of the fact that unanticipated and sweeping changes in government policy can go a long way in stunting private�sector involvement, and hence limiting the long�term benefits to society that could otherwise have been enjoyed.
Electricity is an essential good, that the consuming public and busi�ness have little tolerance for significant price volatility that goes hand�in�hand with competitive markets, and that there is environmental im�pact in electricity generation and transmission. In this regard, govern�ment regulation of this market is unlikely to go by wayside. Economic theory suggests that competition leads to efficiency gains and thus lower prices. However, given some well�publicized failure with deregu�lation such as those of California and Ontario, there is a strong under�standing that either we embrace competition fully in all segments of electricity, or return to the old vertically integrated model.
89
3.8. Parties' Conflicts on the Federal�Provincial Level in Canadian Post�War History
In Canada, “Parties' conflicts on the federal�provincial level” are al�most entirely conflicts between the provincial and federal government.
The Canadian party system is bifurcated. Only for the New Democ�rats does membership in a provincial party automatically lead to mem�bership in the federal party. Federal and provincial leaders work to�gether to forge a common ideology and provincial leaders play a key role in selecting federal leaders. But the NDP is distinctly a minority federal party. What strength it has is at the provincial level, so it is not surprising that provincial membership is primary. The Tories (Conserva�tives) are a “confederal” party, with very limited ties between the federal and provincial parties. Each raises its own money, recruits its own can�didates, selects its own policy positions, and is effectively an autono�mous institution. The Liberals might best be described as a loose con�federation – not quite as split between federal and provincial wings as the Tories, but also not quite as unitary as the NDP.
The weak ties between federal and provincial parties lead to a pat�tern of representation that militates against party government. Party labels mean different things at different levels. And voters feel free to choose one party to represent them at the federal level and another at the provincial level – and to identify with one party in provincial politics and another in federal contests.
Between 17% and 33% of Canadians have identified with different federal and provincial parties. A bare majority are “fully consistent” identifiers, favoring the same party at both levels40. Expectedly it is not a very unusual situation for such a democratic, multicultural and bilingual country as Canada, where even the national anthem “O Canada” does not have a very identical English and French version.
Provincial politics in high degree is about a struggle for power with Ottawa over which level of government is best equipped to handle the welfare state, which is mostly funded with federal dollars but run from the provinces. The question of whether there will be an activist govern�ment has been long decided at the federal level. How active the welfare 40 Stewart, Marianne C. and Harold D, Clark. 1998. “The Dynamics of Party Identification in Federal Systems: The Canadian Case”, American Journal of Political Science, 42: 97–116, p.100.
90
state will be and who will benefit is a battle fought at both levels, as the debate in Alberta over the partial privatization of the National Health system. These issues endure regardless of party ties.
In Canada, provincial premiers feel free to back programs that they believe will benefit their constituents, regardless of which party is in power in Ottawa. This weakens the party system by divorcing federal and provincial parties from a common worldview. “Red Tory” William G. Davis, the Premier of Ontario, supported the energy policy and the at�tempt to “patriate” Canada’s Constitution by Liberal Prime Minister Pi�erre Trudeau in the 1980, even as other Premiers (and the national PC party) were fighting Trudeau fiercely.
There has never been much of a Progressive Conservative party in Quebec provincial politics, largely because the federal Tories estab�lished rapport with the Credistes (the Quebec branch of Social Credit), the Union National, and the Parti Quebecois (PQ). There are both fed�eral and provincial wings of the Liberal party in Quebec, but their close relationship ended in 1964 when they took divergent path on the issue of greater autonomy for the province.
In constitutional law, Canada is classified as a federation, but in real�ity it is more and more becoming a unitary state with Ottawa as a capi�tal. The provinces, like the states in the U.S. or the cantons in Switzer�land, are becoming mere administrative agencies of the central gov�ernment.
This transformation of the Canadian federal system began in earnest after World War II. To avoid a post�war depression the federal govern�ment, without much opposition, instituted a number of social security measures, such as unemployment insurance and family allowance. It introduced a system of federal payments to all provinces to enable even the poorest to maintain a minimum level of social services. It embarked upon economic redistribution and established what is commonly called the "welfare state."
Canada is a vast country with tremendous distances between the core and the periphery. The Prairie Provinces (Alberta, Manitoba, Sas�katchewan) have historically seen themselves as far removed – eco�nomically, socially, and politically – by their more prosperous and more powerful neighbors in Ontario and Quebec. Quebec has seen itself iso�
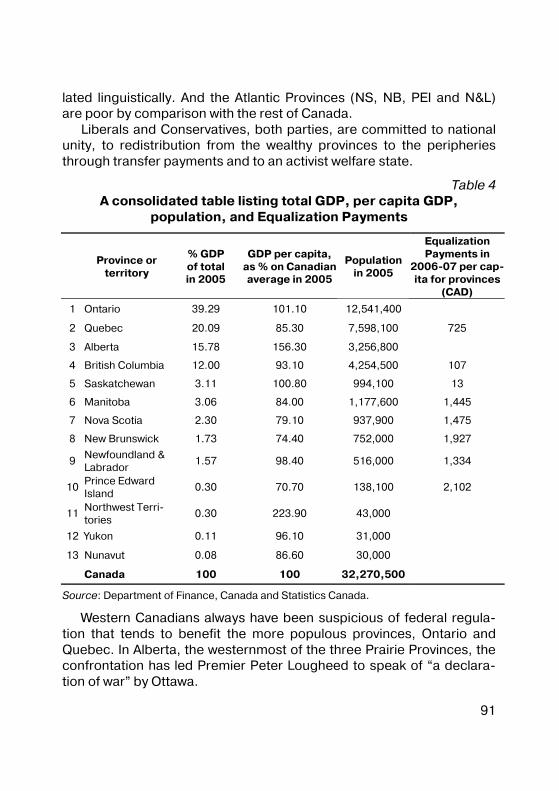
91
lated linguistically. And the Atlantic Provinces (NS, NB, PEI and N&L) are poor by comparison with the rest of Canada.
Liberals and Conservatives, both parties, are committed to national unity, to redistribution from the wealthy provinces to the peripheries through transfer payments and to an activist welfare state.
Table 4 A consolidated table listing total GDP, per capita GDP,
population, and Equalization Payments
Province or
territory
% GDP of total in 2005
GDP per capita, as % on Canadian average in 2005
Population in 2005
Equalization Payments in
2006�07 per cap�ita for provinces
(CAD)
1 Ontario 39.29 101.10 12,541,400
2 Quebec 20.09 85.30 7,598,100 725
3 Alberta 15.78 156.30 3,256,800
4 British Columbia 12.00 93.10 4,254,500 107
5 Saskatchewan 3.11 100.80 994,100 13
6 Manitoba 3.06 84.00 1,177,600 1,445
7 Nova Scotia 2.30 79.10 937,900 1,475
8 New Brunswick 1.73 74.40 752,000 1,927
9 Newfoundland & Labrador
1.57 98.40 516,000 1,334
10 Prince Edward Island
0.30 70.70 138,100 2,102
11 Northwest Terri�tories
0.30 223.90 43,000
12 Yukon 0.11 96.10 31,000
13 Nunavut 0.08 86.60 30,000
Canada 100 100 32,270,500
Source: Department of Finance, Canada and Statistics Canada.
Western Canadians always have been suspicious of federal regula�tion that tends to benefit the more populous provinces, Ontario and Quebec. In Alberta, the westernmost of the three Prairie Provinces, the confrontation has led Premier Peter Lougheed to speak of “a declara�tion of war” by Ottawa.
92
Since 1947, when oil was first discovered in the Leduc Field, Al�berta's production of crude oil and natural gas has transformed this province to a burgeoning industrial center. The rise in energy prices by OPEC since 1973 then magnified the value of Alberta's energy produc�tion, causing the center of economic gravity and prosperity to shift westward. Canadian population and investment capital are leaving the old industrial centers in the East and seeking employment and return in Alberta. With 3.3 mln people, or 10% of Canada's population, Alberta is generating 15.8% of the country's GDP, growing larger every year. The neighboring province of Saskatchewan is enjoying a similar petrodollar boom although it has smaller deposits of primarily heavy oil. So does British Columbia, which has considerable reserves of natural gas.
With billion dollar royalties rolling into the provincial coffers they are financing social improvements of long�term benefit, such as low�cost medical insurance and service, investments that establish a solid eco�nomic base, favors and subsidies for research and development, etc. In short, they are pursuing the very system of radical government inter�vention they are fighting so vigorously when conducted in Ottawa. Ca�nadian politicians sooner or later will arrive at a compromise that per�mits them all to take a little more from the producers. After all, contem�porary politics is the most practical of the arts by which property rights are sacrificed to the demands of the majority.
Many of the concerns of modern government cut across the loose jurisdictional boundaries found in the constitution. National purposes can often only be achieved with provincial co�operation; provincial goals often require federal assistance. As government roles in social, economic and other policy areas grew, then the need for co�operation and co�ordination � and the costs of failing to achieve it – also ex�panded. Through federal�provincial relations � and the related tools of inter government finance, shared cost programs and the like � the fed�eral government is deeply involved in fields largely within provincial ju�risdiction; and provinces have increasingly sought to influence federal policies in areas such as foreign trade and transportation. Thus federal�provincial relations have grown primarily in response to the changing roles of government within Canadian federalism.
They have also been sustained by more political factors. The weak�ness of mechanisms for regional representation in the federal govern�
93
ment, and the regional concentration of support for the major national parties throughout much of recent history, have strengthened the ability of provinces to act as the primary articulators of regional interests. The difficulty of achieving changes in the constitutional allocations of power has played a premium on informal mechanisms of accommodation.
Federal�provincial relations affect most of the major activities of government in Canada, and are in a state of virtually continuous evolu�tion. The 1950s and 1960s are widely described as the era of coopera�tive federalism, when steadily expanding resources and a broad fed�eral�provincial consensus about priorities favoured technical coopera�tion by officials. Low levels of conflict and the rapid expansion of cost�shared programs were characteristic of this era.
As the modern apparatus of coordinated activity took shape, how�ever, strains began to appear. Provincial concerns about distorted pri�orities imposed by federal initiatives, visible particularly in the new as�sertiveness of Quebec, emerged both because newly achieved policy capabilities at the provincial level enabled the development of distinc�tive provincial positions and because new governmental roles raised new opportunities for federal�provincial divergence. There thus emerged a second phase of federal�provincial relations – widely termed executive federalism – characterized by: the politicization of intergov�ernmental relationships; extensive federal�provincial interpenetration and interdependence; provincial assertiveness; and growing levels of conflict.
Contributing to these tensions were the financial constraints, which emerged during the 1970s, and the centralization of the administration of federal�provincial relations in the hands of process specialists, which tended to displace functional cooperation among officials sharing dis�ciplinary specialties with forms of jurisdictional competition.
The tone and style of federal�provincial relations varies considerably over time. In the postwar period, the term “co�operative federalism” referred to a pattern of federal financial and policy leadership. In the 1960s and 1970s, as the strength and assertiveness of provinces grew, relationships became more equal, and federal�provincial relations were widely seen as a vehicle for the expression of successful provincial claims for a greater share of fiscal resources, greater freedom for provincial policy initiatives, and greater provincial influence over federal
94
policies in its areas of jurisdiction. The rise of a more assertive Quebec nationalism, and later of interregional tensions of energy matters in the 1960s and 1970s, along with deep divisions over the constitution led many to see intergovernmental forms less as an arena for harmony and co�operation, and more as one for exacerbating disagreement.
The Liberal government of 1980–84, concerned with what it saw as a drift towards greater provincial power, sought to minimize the role of federal�provincial relations in shared decision making, acting unilater�ally in many areas, and seeking to establish direct relations with citizens and groups in the provinces, without going through the intermediary of the provinces. By contrast, the Conservative government made “na�tional reconciliation” a central goal, and sought to restore more harmo�nious relations, with consultation on a variety of matters.
The return to power of a Liberal government led by Pierre Trudeau in 1980 inaugurated a period during which many of the tensions character�istic of executive federalism erupted in overt conflict. During the early 1980s, the federal government showed an increased willingness to resort to unilateral action in the absence of federal�provincial agreement, nota�bly in the threat to patriate the Constitution and in the introduction of the National Energy Program in 1980. The early 1980s also saw the applica�tion of federal financial restraint measures to provincial transfers, notably by an amendment of the Fiscal Arrangements and Established Programs Financing Act in 1984 (made without consultation of the provinces) which made federal cash contributions for health and post�secondary educa�tion subject to the “6 and 5” restraint program.
During this period, also, federal concerns about the lack of visibility of federal contributions to cost�shared programs fostered a preference for the direct delivery of federal programs rather than the less visible federal funding of provincially administered programs. This shift is illus�trated by the umbrella Economic and Regional Development Agree�ments, emphasizing coordinated planning but parallel service delivery, which replaced the General Development Agreements of the 1970s, and their emphasis on joint regional development programs. An analo�gous shift occurred concerning federal funds. The Canada Health Act of 1984, for example, required that the provinces provide “appropriate recognition” for federal funding of provincial health insurance pro�grams. This Act, furthermore, illustrated a renewal of federal concern
95
about the maintenance of national standards, and a willingness to im�pose financial sanctions on provinces not meeting standards formu�lated at the federal level.
As the Trudeau era drew to a close, a fundamental question about federal�provincial relations remained unanswered. The recurring atten�tion devoted by the Trudeau administration to the possibility of major reforms of federal institutions, including the strengthening of regional representation within the federal government by means of an elected Senate, implied one response to this question. A contrasting response was apparent, before and after the 1984 election, on the part of the Progressive Conservatives.
During the 1984 election campaign, Brian Mulroney and the Pro�gressive Conservatives emphasized the importance of a renewed politi�cal commitment to federal�provincial cooperation, the value of skills of negotiation and conciliation, and the implicitly political (rather than insti�tutional) objective of national reconciliation. These themes anticipated the initial focus of the new government.
During its first few months, the Mulroney government made sub�stantial progress towards lessening federal�provincial tensions, notably in the area of energy policy agreements and the signature, with several provinces, of umbrella regional development agreements. As well, re�sponsiveness to calls for federal assistance in the agricultural sector precluded significant conflict. Finally, the conciliation skills of Prime Minister Mulroney were widely credited with the achievement, at Meech Lake on 30 April 1987, of unanimous federal�provincial agreement on a package of constitutional amendments responding to long�standing demands from Quebec.
The 1985 budget, which proposed reductions in the rate of increase of certain federal transfer payments, began a cycle in which successive federal restraint initiatives prompted more and more strident provincial protest. Other issues, such as provincial participation in free trade ne�gotiations, a cash crisis in the oil industry in 1986, and individual re�gional development decisions, also provoked conflict.
The second Mulroney government followed the broad style of fed�eral�provincial relations established by the first; however, a combination of systemic factors prevented a full return of the harmony achieved in the mid�1980s. Among these factors were lower levels of political sup�
96
port at the federal level (favoring provincial assertiveness), resentments arising from individual conflicts, and the diverging priorities of the fed�eral government and some newly elected provincial governments.
The federal government’s new spirit of accommodation did not, however, diminish the outlying provinces’ conviction that structural re�forms were required to remove centrist biases within Canada’s federal system. On the contrary, these convictions rose to new heights during this period, as was seen among proponents of Senate reform during the “Canada round” discussions of 1992. Nor did the approach to fed�eralism of the Mulroney governments apparently lessen frustrations in Quebec. Any positive impacts in that province’s approach appear to have been outweighed by unresolved constitutional dissatisfactions and economic concerns.
Two fundamental issues not resolved during the 1980s have contin�ued to affect decision�making across the range of federal�provincial relations. The first issue is national unity, which centers on long�standing dissatisfactions within Quebec, but has come to involve addi�tional concerns, notably those of Aboriginal peoples and the West. Al�though this issue has propelled cycles of constitutional politics since before the patriation of the Constitution in 1982, it has also had conse�quences for a broad range of sub�constitutional legislative and admin�istrative initiatives. These initiatives may, in some cases, reduce or de�fer pressures for constitutional change. They may also be seen as po�tential contributors to constitutional change, if by habituating Canadi�ans to new principles or practices they contribute to the levels of con�sensus necessary to achieve constitutional amendments.
The second recurring issue in Canadian federalism has to do with money – in particular the consequences for federal�provincial relations of a series of reductions to federal transfers to the provinces. The origi�nal purpose of major health, education and welfare transfers was to en�sure that nation�wide programs reflecting consistent standards could be established in these areas of provincial jurisdiction, despite the inca�pacity of many provinces to fund such programs. The reduction of the transfers has: increased pressures from the provinces for reductions in federal influence within these areas; provoked recurring cycles of fed�eral�provincial conflict over which level of government is responsible for the cutbacks in programs; and fostered proposals for reform, ranging
97
from “disentanglement” (whereby each level would raise the revenues it needed, thus minimizing transfers) to various co�management mecha�nisms. Furthermore, the drop in federal transfers to all provinces has highlighted the impact of redistributive transfers (flows of revenue from richer provinces through the federal government to poorer provinces), perhaps contributing to growing criticism of such transfers by “source” provinces.
Developments relating to national unity and fiscal federalism are dealt with separately below, although in practice there is a continuous interplay between the two.
Fiscal arrangements between the federal and provincial govern�ments involve transfers of money to the provinces, and other matters such as the collection of taxes. The two major transfers are equalization payments, intended to ensure that all provinces have the fiscal capacity to provide minimally acceptable service levels, and the Canadian Health and Social Transfer (CHST), which combines federal contributions to support post�secondary education, health care and social assistance.
It is estimated that in 2006–07, support through major transfers to provinces and territories will be approximately $62.1 bln (about $1,904 per person).
In an era when all governments remain under considerable fiscal pressure, the issue of intergovernmental transfers is predictably sensi�tive. It acquires additional sensitivity within the context of Canadian fed�eralism, however, because the federal government has traditionally used its spending power to foster programs reflecting federal priorities within provincial jurisdictions and to ensure that these meet national standards. As federal spending has been proportionally reduced, pro�vincial pressure has been increasing for a corresponding diminution of federal influence.
The sensitivity of transfer issues was amply demonstrated by provin�cial reaction to the 1995�1996 budget. This announced that existing EPF and Canada Assistance Plan transfers would be replaced by a sin�gle block�funded program, i.e., the Canadian Social Transfer (later known as the Canada Health and Social Transfer), entailing overall re�ductions of about $2.5 bln in 1996–1997 and an additional $2 bln in 1997–199841. Although initial reaction from most provincial govern� 41 Department of Finance, Canada. Federal Transfers to Provinces and Territories, 2006.
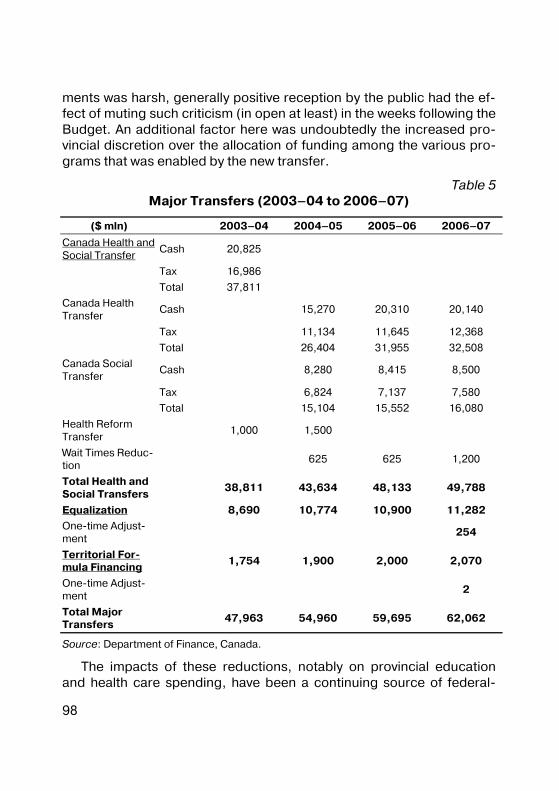
98
ments was harsh, generally positive reception by the public had the ef�fect of muting such criticism (in open at least) in the weeks following the Budget. An additional factor here was undoubtedly the increased pro�vincial discretion over the allocation of funding among the various pro�grams that was enabled by the new transfer.
Table 5 Major Transfers (2003–04 to 2006–07)
($ mln) 2003–04 2004–05 2005–06 2006–07
Canada Health and Social Transfer
Cash 20,825
Tax 16,986
Total 37,811
Canada Health Transfer
Cash 15,270 20,310 20,140
Tax 11,134 11,645 12,368
Total 26,404 31,955 32,508
Canada Social Transfer
Cash 8,280 8,415 8,500
Tax 6,824 7,137 7,580
Total 15,104 15,552 16,080
Health Reform Transfer
1,000 1,500
Wait Times Reduc�tion
625 625 1,200
Total Health and Social Transfers
38,811 43,634 48,133 49,788
Equalization 8,690 10,774 10,900 11,282
One�time Adjust�ment
254
Territorial For�mula Financing
1,754 1,900 2,000 2,070
One�time Adjust�ment
2
Total Major Transfers
47,963 54,960 59,695 62,062
Source: Department of Finance, Canada.
The impacts of these reductions, notably on provincial education and health care spending, have been a continuing source of federal�
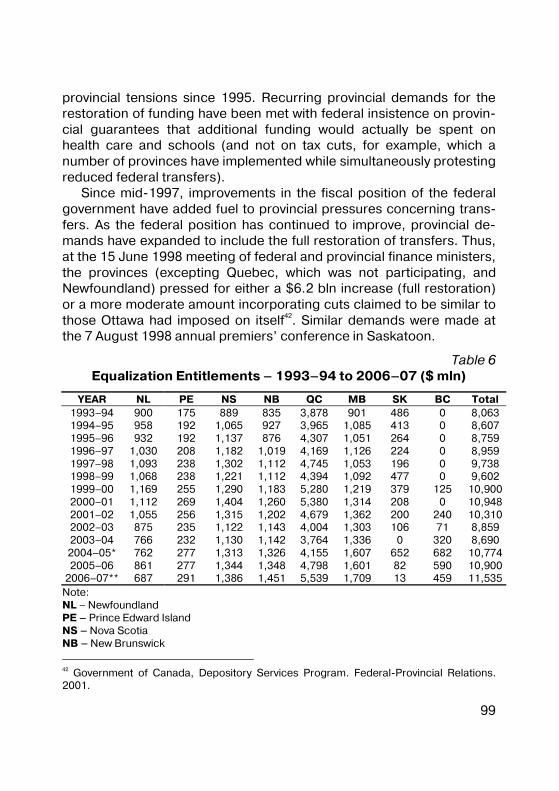
99
provincial tensions since 1995. Recurring provincial demands for the restoration of funding have been met with federal insistence on provin�cial guarantees that additional funding would actually be spent on health care and schools (and not on tax cuts, for example, which a number of provinces have implemented while simultaneously protesting reduced federal transfers).
Since mid�1997, improvements in the fiscal position of the federal government have added fuel to provincial pressures concerning trans�fers. As the federal position has continued to improve, provincial de�mands have expanded to include the full restoration of transfers. Thus, at the 15 June 1998 meeting of federal and provincial finance ministers, the provinces (excepting Quebec, which was not participating, and Newfoundland) pressed for either a $6.2 bln increase (full restoration) or a more moderate amount incorporating cuts claimed to be similar to those Ottawa had imposed on itself42. Similar demands were made at the 7 August 1998 annual premiers’ conference in Saskatoon.
Table 6 Equalization Entitlements – 1993–94 to 2006–07 ($ mln)
YEAR NL PE NS NB QC MB SK BC Total1993–94 900 175 889 835 3,878 901 486 0 8,0631994–95 958 192 1,065 927 3,965 1,085 413 0 8,6071995–96 932 192 1,137 876 4,307 1,051 264 0 8,7591996–97 1,030 208 1,182 1,019 4,169 1,126 224 0 8,9591997–98 1,093 238 1,302 1,112 4,745 1,053 196 0 9,7381998–99 1,068 238 1,221 1,112 4,394 1,092 477 0 9,6021999–00 1,169 255 1,290 1,183 5,280 1,219 379 125 10,9002000–01 1,112 269 1,404 1,260 5,380 1,314 208 0 10,9482001–02 1,055 256 1,315 1,202 4,679 1,362 200 240 10,3102002–03 875 235 1,122 1,143 4,004 1,303 106 71 8,8592003–04 766 232 1,130 1,142 3,764 1,336 0 320 8,6902004–05* 762 277 1,313 1,326 4,155 1,607 652 682 10,7742005–06 861 277 1,344 1,348 4,798 1,601 82 590 10,900
2006–07** 687 291 1,386 1,451 5,539 1,709 13 459 11,535Note: NL – Newfoundland PE – Prince Edward Island NS – Nova Scotia NB – New Brunswick
42 Government of Canada, Depository Services Program. Federal�Provincial Relations. 2001.

100
QC – Quebec MB – Manitoba SK – Saskatchewan BC – British Columbia
* Figures for 2004–05 exclude the additional $150 mln in Equalization announced in Budget 2004. ** Figures for 2006–07 are as proposed in Budget 2006 and include one�time adjust�ments. Source: Department of Finance, Canada.
In August 1999 in Quebec City, at their annual meeting, the provin�cial premiers and territorial leaders expressed their concern about the provision of health care services and their belief that these services should be accessible to everyone and be publicly funded.
In the course of the meeting, the premiers and leaders established three priorities for the health care sector: sustainability, with its compo�nents of adequate and predictable federal funding, reliable staffing to meet projected needs, and improved information systems in support of decision�making; population health, including the improvement of health of all Canadians; and clear roles and responsibilities.
The provincial and territorial leaders also called on the federal gov�ernment to fully restore Canada Health and Social Transfer (CHST) funding to 1994–1995 levels with an appropriate escalator for the CHST cash transfer that would keep pace with cost and special demand pres�sures.
At their August 2000 meeting in Winnipeg, the premiers remained very concerned about the growing imbalance between the federal and provincial/territorial governments’ ability to finance their respective program responsibilities. In their view, efficiency and equity in the provi�sion of programs and services imply that both the long�term vertical fiscal imbalance between the federal government and provinces and territories, and the horizontal fiscal imbalance among provinces and territories, need to be addressed.
The premiers noted that because of the way revenues are currently structured, the federal government’s surpluses are projected to rise quickly over the next 20 years, while the provinces and territories will collectively be hard pressed to keep their budgets in balance over this same period. They expressed their concern that their governments’ fi�nances are particularly vulnerable if cost pressures in key public ser�
101
vices increase even moderately or in the event of a slowdown in eco�nomic growth.
The premiers also called on the federal government to strengthen its commitment to the Equalization Program so that the Program can meet its constitutionally mandated objectives. In addition to restoration of the CHST and adoption of an appropriate escalator, the premiers reiterated that the federal government must immediately remove the ceiling on equalization payments.
The premiers agreed that the question of fiscal imbalance is an ur�gent financial challenge facing the federation today. They instructed their Finance Ministers to advance their work on these issues and to identify reform proposals, which would address the vertical and hori�zontal fiscal imbalance in Canada in a more lasting manner.
The meeting concluded with recognition of the need for adequate, predictable and sustainable federal funding in support of post�secondary education and skills development, and with the formulation of a detailed action plan for early childhood development.
Restraints on federal transfers have since 1995 coincided with grow�ing provincial experimentation with alternative delivery mechanisms, notably in the health care field. In a number of cases, provincial initia�tives prompted federal counter�actions to uphold federally prescribed standards or practices, leading to major conflict with individual prov�inces.
A prominent example was the disagreement between the federal and Alberta governments during 1995 and 1996 over the charging of “facil�ity fees” by private clinics; this resulted first in federal penalties and ul�timately in the provincial government’s agreement to absorb the charges on behalf of clinic users. Tabled in Alberta’s Legislative As�sembly on 2 March 2000, Bill No. 11 also stirred some controversy vis�à�vis federal�provincial relations. A number of commentators argued that the Bill did not respect the spirit of the Canada Health Act and that in the long term it opened the way to a two�tier system. The federal government, although it did not publicly oppose the Bill, did voice cer�tain reservations.
The primary aim of the legislation was to allow regional health au�thorities, with the Minister’s approval, to contract out minor surgery, which would be considered an insured service for which benefits would

102
be paid – pursuant to the Alberta Health Care Insurance Act – to private surgical facilities approved by the government. The Bill’s other important aspect is the greater regulation of private surgical facilities that offer un�insured services involving hospitalization lasting more than one day.
Differences over whether the federal government should have an exclusive role in applying national standards within areas of provincial jurisdiction have since proven to be a major element in a more general discussion about roles and responsibilities in the social policy field. The provincial position was laid out comprehensively in a December 1995 report endorsed by the premiers of all provinces except Quebec as a basis for renewing the federation, and forwarded to the Prime Minister for response at the 1996 First Ministers’ Conference. The report calls for: subjection of federal activity in areas of provincial responsibility to intergovernmental consultation and provincial/territorial agreement; fiscal disentanglement (resources to be shifted to the provinces to allow them to perform their responsibilities without depending on federal transfers); acceptance of the principle that federal spending within pro�vincial or shared jurisdictions should not allow the federal government to dictate program design; and replacement of the current federal role as the sole interpreter and enforcer of the Canada Health Act with some form of federal�provincial power�sharing.
On 4 February 1999, the Prime Minister, the premiers of all the prov�inces except Quebec, and the territorial leaders signed a new frame�work agreement on the social union. According to the federal govern�ment, the Agreement is intended to encourage equality of opportunity among Canadians, no matter where they live in Canada, and to improve their mobility. In it, the federal government makes a commitment not to introduce new Canada�wide initiatives in the social sector without the consent of a majority of the provinces, and to work with them to deter�mine what goals to pursue. The framework agreement sets out the need to increase transparency, and governments’ obligation to be ac�countable. It also provides for dispute prevention and resolution mechanisms.
Despite the Quebec government’s refusal to sign, the Social Union Agreement between the federal government and the other provincial and territorial governments marked an important step in the evolution of
103
intergovernmental relations in this country, notwithstanding its adminis�trative nature.
The Quebec government’s refusal to sign was based on the follow�ing main reasons: the legitimizing of the federal spending power in the social programs sector; and the federal government’s recourse to di�rect transfer payments to individuals and organizations to launch new Canada�wide social initiatives.
On 11 September 2000, at a federal�provincial conference, the First Ministers agreed on a vision, principles and an action plan to guide their intervention in the coming years in the fields of health care and early childhood development. The Quebec government chose not to give its support to the agreement on early childhood development, regarding it as an exclusively provincial area of constitutional jurisdiction. It did, however, agree to accept the additional funding for health care.
Through the agreements concluded by the First Ministers, the fed�eral government made a commitment to invest $23.4 bln over the next five years. Of this amount, the government will invest $21.1 bln in the CHST43. The CHST legislation has been extended so the provinces and territories can benefit from stable and predictable financial assistance until 2005–2006. The federal government will also provide targeted fi�nancial assistance of $2.3 bln to enable the provinces and territories to cope with the specific challenges confronting them in the area of health care44.
A process involving the review of federal and provincial responsibili�ties across a range of policy fields, clarification of roles, reduction of duplication and increasing efficiency, has gone forward steadily. The process has achieved tangible results, such as: agreements between the federal government and several provinces for the co�funding of business information centers; agreements with Ontario and Alberta to eliminate overlaps in international trade promotion; and a ground�breaking agreement between federal and provincial agricultural, health and fisheries ministers (those of Quebec excepted) to move toward a single food�inspection system.
43 Government of Canada, Depository Services Program. Federal�Provincial Relations. 2001. 44 Department of Finance, Canada.
104
3.8.1. Apples of discord
Canada, from the point of view of the composition and structure of its system of social benefits provided by the State, is a very specific country.
The neighborhood with the USA provides Canadians with a “safety umbrella”, which allows them to spend very little on defense and exter�nal security (the share of these expenditure items in the budget of a Dominion that used to be quite militarily robust in its historic past, hav�ing been a most active participant in the two world wars and many peace�keeping military during the post�war period, is no more than that in the budget of the constitutionally demilitarized Japan45).
Several factors are responsible for the also relatively small expendi�tures on internal security. Among these, the following ones can be pointed out: − the country’s relatively small size (although the territory itself is
vast, the population, far less numerous than that of the USA, mostly resides within 100–150 kilometers from the border with its southern neighbor);
− the high degree of social homogeneity: the highly effective selective immigration policy ensures competition for low�paid workers, while at the same time barring the inflow of parasitically�minded mi�grants; which is typical of the European countries and partly even of the USA.
As for the most energetic and enterprising Canadians, they can try their luck in the USA, with extensive opportunities for earning a good income. As for the cost of their resettlement and adaptation, it is evi�dently minimal. In such “economically and socially leveled” society it is, no doubt, much easier to maintain social order and combat crime than in the USA, as one example.
Thus, the relatively high level of taxation, indeed, generates revenue which can be spent nearly exclusively on the implementation of social projects. The discussions going on around the choice of specific pro�jects and the exact ways for them to be implemented represent an im�portant component of the domestic political agenda.
45 See the statistical data published by the Organization for Economic Cooperation and Development at www. oecd.org.
105
Agricu lture Negotiations for establishing a federally and provincially cost�shared
national farm safety net provide an illustration of the intergovernmental agreement process, including vicissitudes that can protract it. During 1996, agreements were signed by the federal government and Alberta, Ontario, Prince Edward Island, New Brunswick, Newfoundland and Nova Scotia. As 1996 drew to a close, however, Alberta reacted to long�standing criticism of the program among farmers in that province by withdrawing participation. On 7 January 1997, federal Minister of Agri�culture Ralph Goodale responded by committing the federal govern�ment to pick up Alberta’s share of the funding, thus enabling the pro�gram to continue to be fully funded. Since then, a Canada�Manitoba agreement was announced on 3 April 1997 and a Canada�Quebec agreement emerged on 24 November 1997.
On 24 February 1999 in Victoria, the federal government and the provinces reached agreement on setting up an assistance program for farmers, 60% financed by Ottawa and 40% by the provinces. At a two�day federal�provincial Agriculture Ministers’ meeting, nine provinces agreed in principle to participate in the Agricultural Income Disaster As�sistance (AIDA) program, subject to provincial approval where neces�sary. Nova Scotia was not able to make a commitment at the time, but indicated that it would be continuing to work with the federal govern�ment toward participation. The federal government agreed to contrib�ute up to $900 mln over two years, under the 60:40 cost�sharing princi�ple46. Because AIDA is a demand�driven program, the ultimate expendi�ture will depend on the extent of income problems over 1998 and 1999.
In July 2000 in Fredericton, the federal, provincial and territorial Ag�riculture Ministers reached a three�year framework agreement on farm income protection. This new agreement was designed to give greater financial stability to the agriculture sector. It paves the way for a series of programs designed to solve various problems related to farm income and resulting from a number of factors, notably price fluctuations, poor weather, and foreign subsidies. Under the agreement, the federal gov�ernment will pay out up to $3.3 bln over the next three years. The prov�inces will invest up to $2.2 bln. Shared program costs will be divided
46 Government of Canada, Depository Services Program. Federal�Provincial Relations. 2001.
106
between the federal and provincial governments in the usual 60:40 ra�tio.
The hottest debate over current agricultural policy in Canada is about the future of the Canadian Wheat Board (CWB). Stephen Harper's Conservatives are aggressively pursuing an election promise to make participation in the wheat board voluntary for western farmers.
The Canadian Wheat Board has a government�enforced monopoly on Canadian wheat. The CWB competes aggressively in the grain mar�ket by pooling all the wheat they collect from farmers, then selling from that stockpile directly to buyers. Because Canadian wheat is high qual�ity, and can only be legally purchased from the CWB, buyers are willing to pay a better price. The CWB provides farmers with a financial safety net, but many farmers want the right to walk the tightrope alone: to seek their own markets and customers, and sell when they think the market is high. Currently, it is illegal for a wheat farmer to conduct business himself, and people are actually jailed for doing so. The CWB instructs farmers to deliver a certain amount of product at a particular time, and pays a lump sum to each farmer once a year.
It is the sole marketing agency for more than 85,000 farmers in Western Canada. The board has about 20% of the world's market share in wheat, 65% in durum wheat, 30% in malting barley and 15% in feed barley. The Canadian Wheat Board handled 2.25 million tons of barley in the crop year ending July 31, 2005 compared with 13.3 million tons of wheat47.
Agriculture Minister Chuck Strahl announced in October 2006 that there will be a broad�based vote on the Wheat Board's monopoly. Strahl told a Commons committee in Ottawa the plebiscite will be held next year, with a voters' list and questions to be announced later.
The move comes just one day after Strahl released a task force re�port that recommended the federal government set up within two years a new, voluntary Canadian Wheat Board that would be completely owned by farmers. Supporters of the board's monopoly say it gives farmers the best prices in a fiercely competitive international market, while opponents counter they should have the right to try to get better prices for their grain.
47 Canadian Wheat Board. Presentation to the annual meeting of the Canada Grains Council, March 20, 2006.

107
The Alberta government opposes the monopoly. Saskatchewan and Manitoba provinces (main grain producers with NDP governments) have joined a coalition of farm groups and the wheat board executive in pressing Strahl to hold a plebiscite before taking steps to eliminate the monopoly. They say the Canadian Wheat Board Act is clear that farmers must give a mandate to remove the single desk.
Health care Federal and provincial governments have been jointly involved in the
provision of universal publicly insured and administered health care to Canadians for decades. In the early post�war decades, federal and pro�vincial governments agreed on the use of conditional intergovernmental grants as the means to build the Canada�wide set of health care ar�rangements that exist today. What was done in the 1950s, 60s and 70s, was a considerable achievement both in policy and fiscal terms and from the viewpoint of cooperative intergovernmental relations.
Today, however, there are a number of disconnects between the federal government’s approach to the financing of health care and in�tergovernmental health care relations, on one hand, and its policy role in promoting a Canada – wide system of health care for Canadians, on the other. These disconnects are contributing to provincial difficulties in reforming their health care systems and they are serious irritants in in�tergovernmental relations.
With rising costs, concern over wait times for medical procedures, and a continual federal�provincial tug�of�war over funding, health care continues to be a dominant issue in Canada.
The Liberals support a publicly funded health care system with uni�versal access. In 2006 Canadian federal elections they have guaranteed that health transfers to the provinces will grow by 6% each year for the next 10 years. As a result of the 2004 Federal�Provincial Health Accord, the provinces have agreed to benchmarks for wait times for priority medical procedures.
The Conservatives support “a mix of private and public health care delivery, as long as health care remains publicly funded and universally accessible”. The Conservatives say they would continue to implement the 2004 Federal�Provincial Health Accord. The Conservatives plan to work with the provinces to establish a Patient Wait Times Guarantee so
108
that Canadians can receive essential medical treatment within accept�able wait times or be treated in another jurisdiction.
The basic position of the Bloc Québécois is that health care should be completely under provincial control, and the federal government should increase the federal transfer of funds to Quebec.
The NDP want to stop the “creeping privatization” of health care in Canada and improve public health care. The NDP propose a Protection of Public Health Care Act.
Through the legislation and agreements with the provinces, the NDP would make stable, long�term federal transfers for health care contin�gent on a commitment that the money would not be used for a profit�making insurance system covering medically necessary services.
The primary reason for Canada's success in constraining expendi�tures in health care is that a single payer, the government, is responsi�ble for the provision of physician and hospital services. Single�payer funding allows administrative efficiencies and the necessary redirection
of spending. But Canada's restrained spending has produced long waits in emer�
gency departments for unavailable hospital beds; delays in cataract,
joint replacement and cardiac surgery; and the unavailability of needed home care services. Solving these problems will require increased commitment of resources to health care.
Many refer to the problem of maintaining equitable quality health
care as “sustainability”. By sustainability, is having mechanisms in place to ensure that Canadians, irrespective of their ability to pay, will have continued access to prompt, technologically current, competent and compassionate health care that addresses the full range of their health needs.
The political environment is dominated by acrimonious debates be�tween provincial and federal governments that misrepresent historical patterns of health care spending and feature demands by each gov�ernment that the other should allocate resources to remedy the per�ceived funding crisis. Existing funding arrangements fail to make either federal or provincial governments accountable for ensuring adequate resources for health care. For instance, the federal government's con�tribution to spending as part of the agreement that established national Medicare was originally tied to the GDP, but the federal government
109
moved away from linking transfers to national wealth during the 1980s. In 1995, the federal government unilaterally instituted large cuts in the health care funding available to the provinces.
At the same time, the provinces are able to avoid committing in�creased resources of their own to health care and effectively use the federal money to fund tax cuts. The cumulative impact of the provinces' tax cuts has reduced provincial revenue in 2001/02 by $20 bln relative to the tax regime in place in 199548.
The current situation allows both levels of government to accuse the other of being responsible for health care delivery problems and for in�adequacies in funding, while failing to address the problem.
Only a change in the current funding formula will reverse this situa�tion and ensure accountability by both levels of government. Any solu�tion must ensure that both levels of government acknowledge their re�sponsibility to provide adequate funding for universal access to needed physician, hospital and other health services, without imposing on pa�tients financial barriers to care. Further, provincial governments must acknowledge that the federal contribution to spending entitles the fed�eral government to have a say in how the money is spent. Finally, any workable solution will make transparent the relative contributions of the 2 levels of government to health care spending.
A variety of funding formulas would meet these criteria. Any solution would begin with the provincial and federal governments agreeing to establish the current funding levels as a base situation and instituting mechanisms to ensure that base funding committed to health care is actually spent on health care.
Health care financing in Canada has been characterized by stability
of per capita health care funding, by a drop in the proportion of GDP spent on public health care and by tax cuts representing forgone in�come that governments could have allocated to health care. Strength�ening Canadian health care requires a funding formula that remedies the current ability of both provincial and federal governments to cut health care funding indiscriminately and easily obfuscate the situation to mask their cuts.
The Canadian health care system bans coverage of physician and hospital core services by private insurance companies, allowing sup� 48 The fiscal balance in Canada – the facts. Ottawa: Department of Finance Canada; 2002.
110
plemental insurance only for perquisites such as private hospital rooms. This ban constrains the emergence of a parallel private medical or hos�pital sector and puts pressure on the provinces to meet the expecta�tions of middle�class Canadians. That only 70% of total health care funding in Canada comes from the public sector – less than in many European countries but considerably more than in the United States – reflects the fact that private payments are common for other expendi�tures, including drugs, dental services, optometry, and home care. Pri�vate insurance and private care are also common in niche areas, such as work�related injuries and cosmetic surgery.
Privatization of health care may include private delivery of publicly fi�nanced core services, such as elective operations and imaging studies; private financing of care through health insurance; or direct payments by patients for services. Under the Canadian constitution, the federal government has primary responsibility for taxation, but the provinces have primary responsibility for managing health care. Depending on
how it is calculated, federal funding accounts for one third or slightly more of provincial health care spending. Health spending accounts for 27 to 45% of provincial budgets. It predicts total spending on health care will hit $96 billion this year, up 5.7 per cent increase from the 2005–2006 fiscal year. On a per capita basis, the provinces and territo�ries are predicted to spend $2,931 per person on health care this year, up 4.5 per cent from the previous year. Alberta will have the highest per capita spending on health among the provinces, spending $3,315 for each of its residents, followed closely by Manitoba at $3,284 per per�son. The lowest are predicted to be Quebec with $2,581 and Prince Edward Island at $2,749. In 2005–2006, provincial and territorial gov�ernments spent an average of 38.6 per cent of their total program ex�penditures on health care49.
With the Canada Health Act of 1984, the federal government entered
into a matter of provincial jurisdiction by making its health care funding conditional. The act specified requirements that provinces must fulfill to qualify for the full federal contribution, including the provision of all medically necessary services, public administration on a nonprofit ba�sis, universal coverage, portability of coverage throughout the country, accessibility of insured services, and a lack of additional patient 49 Canadian Institute for Health Information. October 2006.
111
charges. Financial penalties – mandatory dollar�for�dollar deductions
from the federal payment – are imposed on provinces that allow “extra�billing and user charges”. However, enforcement is limited to these penalties and political persuasion. Thus, the act does not directly bar private delivery or private insurance for publicly insured services. Al�though there are laws prohibiting or curtailing private health care in some provinces, they can be changed.
Canada is anticipating an infusion of private care for core services in at least some provinces – Alberta, British Columbia, and Quebec – and various experiments combining public and private care. Such efforts aim to reduce patients' waiting times for treatment, as well as to control public spending. The belief that more change is imminent has been heightened by the victory of the Conservative Party in national elections
in January 2006, although the new government holds a minority of seats in the House of Commons.

112
Source: The Fraser Institute's survey of specialist physicians50.
Fig. 5. Median Wait from Referral by General Practitioner to Treatment in 2005, According to Province (Panel A) and Specialty (Panel B).
Although overall waiting times fell slightly from 2004 to 2005, they were 90% longer in 2005 than in 1993 and substantially longer than the times that respondents believed were clinically reasonable.
Provincial governments cannot ban private care unless they guaran�tee that the public system will meet patients' needs without excessive waits. In a 2005 opinion poll, 80% of physicians and 65% of the public thought the ruling would reduce waiting times51. The public, however, was otherwise divided: 43% agreed that it “will allow individuals choice and the ability to control their own health care”; 54% believed “it will ul�timately weaken the public health system that so many people rely on”.
50 Esmail N, Walker M. Waiting your turn: hospital waiting lists in Canada (15th edition). Vancouver, B.C., Canada: Fraser Institute, October 2005 at http://www.fraserinstitute. ca/health/index.asp?snav=he). 51 News release of the Canadian Medical Association, Ottawa, August 2005.
113
In February 2006, Quebec announced that it would improve access
within the public system to tertiary cardiology and radiation oncology services and would provide hip and knee replacements and cataract surgery within six months after they recommended by a specialist52. If these operations cannot be performed at a government�funded hospital within that time, Quebec will pay for surgery at an affiliated private clinic in the province. If the wait extends beyond nine months, patients can receive publicly funded care at a private clinic outside Quebec or even
Canada. The government will allow Quebec residents to buy private
health insurance specifically for these designated services, although the scope of such insurance may be expanded in the future. Private insur�ance must cover all the costs, including treatment of complications, re�habilitation, and home support, so that the public system will not end up subsidizing private care. Physicians can choose to practice in either the public or the private sector – not in both – as has been the case for many years.
Also in February 2006, the Alberta government proposed a new health policy framework. Referred to as the “Third Way”, it calls for a wider role for the private sector in providing medical services, including expanding the scope of private insurance, allowing patients to purchase directly certain medically necessary services, and unlike the Quebec proposal, permitting physicians to work simultaneously in both the pub�lic and private systems. Critics contend that the reforms could have a different effect – preferential treatment for wealthy patients and longer waits for everyone else. British Columbia is also expected to expand the role of private care.
Depending on what changes in Canada and how physicians, pa�tients, health care unions, and politicians respond, Medicare could be strengthened or undone. Many hope that there will be increased effi�ciency and long�awaited reforms and that Medicare will receive suffi�cient long�term public funding. Some fear that medical professionals will take better�paying positions in the private sector, helping to create a “two�tier” system based on the ability of patients to pay for preferential care. Though desirable, reducing waiting times may also increase de�mand, thereby blunting the effect of reforms. Waiting�time reduction is
52 Government of Quebec. Guaranteeing access: meeting the challenges of equity, effi�ciency and quality – consultation document. 2006.
114
also a narrow focus that may compete for attention – and government
funds – with broader approaches, such as initiatives to increase the number of physicians and nurses and to improve primary care, preven�tive care, and services for the elderly. The ferment over private health care in Canada is complex, and it represents only one of the health care system's many challenges.
There is no single “right” solution to the future role of the federal government in funding Canada – wide health care and establishing a dispute avoidance and resolution process because there are competing views about the nature of the Canadian sharing community and the Ca�nadian federation.
The fiscal relationship between the federal provincial and territorial governments should be re�thought and adjusted to better reflect a partnership. The model of federal�provincial fiscal relations from the era of the 1950s to the 1970s was characterized by tough negotiations, but with a determination to reach agreement. Returning to the earlier model of finding, as alternative that provides the provinces and territories with a greater voice in the outcomes is highly desirable.
The prospect of growing fiscal dividends at the federal level and of ever – rising health care costs at the provincial level inevitably raises issues of resource allocation. This in turn opens up a much larger de�bate about appropriate debt levels, tux burdens and other competing claims on the public purse. Improving the federal financial contribution to provincial/territorial health care programs and expanding the cover�age of nation�wide health care under the Canadian Heath Act are two options that deserve careful consideration in such a public debate.
Pharmaceut ica l po l icies in Canada Pharmaceutical policy in Canada is a set at both the federal and pro�
vincial levels of government. The federal government is responsible for intellectual property rights of manufacturers (patents) and the initial ap�proval and labeling of prescription drugs and for ensuring overall market competitiveness. The provincial government has responsibility and ju�risdiction over the funding of all health care services, including pharma�ceuticals. Various interactions between the pharmaceutical industry, the federal and provincial governments and consumers have shaped the current landscape for prescription drugs in Canada. One key failing of the system is that the federal government is almost completely insu�
115
lated from the impact of its policies because, although it regulates drug prices, it does not buy any drugs. In contrast, provincial governments have no jurisdiction over market competitiveness or pricing, yet end up paying for most of the drug expenditures incurred.
Under the Canada Health Act, a “near�universal” system of coverage
has evolved that is remarkably similar in scope across the provinces.
One exception, however, is the coverage provided for prescription
pharmaceuticals. Although all drugs needed for treatment in hospitals are provided free of charge, outpatient prescriptions or prescriptions written in physicians' offices are not universally covered. The type and level of outpatient drug coverage is determined by individual provincial legislatures and therefore varies by province. For pharmaceutical cov�erage each provincial drug plan sets specific price and other cost�containment guidelines (e.g., drug product substitution laws). More re�cently, several provinces have mandated that a cost�effectiveness analysis of each new drug be done to help determine if the drug should be added to their formularies (i.e., extend coverage under the provincial drug plan). The impact of the various regulations at each level of gov�ernment has resulted in a uniquely Canadian landscape that is some�times difficult to rationalize on efficiency grounds.
Drug substitution regulations have been in place in most provinces
for over 3 decades. With the exception of the Reference Drug Program in BC, these regulations have exclusively focused on promoting the substitution of generic drugs for brand�name drugs. Substitution to�ward the cheaper generics is typically achieved by implementing prod�uct� and price�selection rules. Product selection involves switching from a branded to a generic drug, whereas price selection involves choosing the least�costly generic available. Together, these rules direct the physician to prescribe generics and the pharmacist to dispense the cheapest generic available for all prescriptions.
The costs for drugs have been increasing steadily over the last dec�ade. They are now one of the fastest growing components of total health care expenditures in Canada, and in 1993, for the first time, drug costs exceeded payments to physicians. Given these cost pressures most provinces now conduct a second review of each new drug before it is included in the provincial drug plan as a reimbursable benefit. In this second review the new drug is typically compared with other similar
116
drugs (in contrast with the Federal Therapeutics Products Program, which typically compares new drugs with placebo) and, more impor�tantly, the economic data and cost�effectiveness of the new drug are also considered.
From the late 1960s until the introduction of Bill C�22, federal and provincial policies seemed to be working in the same direction; the fed�eral policy of compulsory licensing made cheaper generics available earlier, and the provincial substitution laws directed physicians and pharmacists to switch prescribing toward generic brands. The end re�sult was to lower expenditures on drugs. With the introduction of Bill C�22 and then Bill C�91, which led to the abolition of compulsory licensing,
federal and provincial policies have moved in opposite directions. Fed�eral regulations allow longer patent terms, higher prices and less ge�neric competition. At the same time provincial policies, such as requir�ing a cost�effectiveness justification prior to formulary listing and refer�ence pricing, seem to be attempting to contain higher and higher drug�acquisition costs.
It would appear that one of the unfortunate realities facing the Cana�dian pharmaceutical marketplace is that although Ottawa regulates drug prices and patent terms, it does not face any of consequences of its policies – the provinces and the general public must pay for drug costs and suffer the consequences of federal policies. Canadian spend�ing on medical drugs rose to almost $25 bln in 2005, up 11% over the previous year, in a trend that critics say can't be sustained53.
Drugs – mainly prescription drugs – continue to be the fastest�growing category of health spending as they have been for years. Drug spending reached 17.5% of total health spending, double the figure for 1985. But Canada remains below the median of 13 OECD countries in the amount of drug spending covered by governments. Total per capita spending was estimated at $770 in 200554, but there were big variations across the country. Public�sector spending on prescribed drugs ranged from $194 per capita in Prince Edward Island to $341 in Quebec.
Poorer provinces need federal help to ensure they can provide ade�quate drug access. Advocates of a national pharmacare program say it
53 Canadian Institute for Health Information. National health expenditure trends, 2005. Ottawa: The Institute; 2005. 54 Department of Finance, Canada. 2006.
117
would help control costs by uniting the buying power of the provinces and by ensuring that only cost�effective drugs are used.
3.8.2. Canadian Way Conflict between Regions and the “Center”
In order to coordinate intergovernmental cooperation and to provide for non�judicial conflict resolution and accommodation, a process of intergovernmental negotiations, in effect federal�provincial bargaining, has evolved as a key mechanism of policy making in Canada today.
Canadian federal system has evolved to become a tightly integrated system where decisions affecting the federation as a whole are taken through inter�jurisdictional negotiations in intergovernmental forums. The relationship among the governmental actors is asymmetrical to be sure, but it is also constantly changing as the provincial and territorial stakeholders attempt to maximize their bargaining advantage with each other and the federal government.
Intergovernmental conflict is inevitable in as diverse a federation as Canada. Most of these conflicts can be resolved through the active par�ticipation of the partners in the federation in the ongoing process of in�tergovernmental bargaining. However, it is also important to recognize that agreement cannot be achieved unless there is an underlying con�sensus. There must be a basic agreement on fundamental political val�ues and a shared acceptance of Canada as a legitimate and worthwhile political community.
Federal and provincial governments in Canada engage in a complex pattern of simultaneous conflict and cooperation, propelled by both po�litical and functional imperatives. In recent years, national unity politics, in combination with tensions resulting from fiscal constraints, have had a pervasive impact across the sphere of federal�provincial relations.
If successful, this trend may result in the strengthened management of federal�provincial relations using sub�constitutional norms, rules and principles. Such an approach could replace the relatively ad hoc ar�rangements of the past with a system more conducive to the account�ability of both levels of government to citizens. Less positively, this trend could impede established practices of functional cooperation by sub�jecting them to protracted debates about quasi�constitutional issues of power, recognition and status.
118
Federal�provincial relations are conducted centrally through execu�tive contacts that, from time to time, produce initiatives requiring ratifi�cation by legislatures. Once intergovernmental agreements have been achieved, however, the scope for parliamentary influence is normally extremely limited. Changes by one legislature could result in significant delay, or cause intergovernmental agreements to unravel.
Several mechanisms permit “front�end” input by Parliament. These include the pre�budget consultations of the Standing Committee on Finance, the special committees periodically established to consult the public on constitutional proposals, and studies by standing committees of policy issues having an intergovernmental component. Governments may, however, accept or reject such input.
General conclusions The conducted statistical and qualitative analysis of the institutions
existing in the Russian regions has revealed a considerable reduction in the diversity of these institutions. Even the much upgraded apparatus of statistical analysis has managed to register only a residual influence exerted by these institutions on the business climate in the regions.
Neither the reduction in the diversity of institutions in the Russian re�gions, taken alone, nor the present study in general can be interpreted as an unambiguous confirmation of the fact that the quality of institu�tions in Russia has been significantly declining during the four past years. Naturally, being researchers of regional institutions, we are cer�tainly interested in the preservation of these institutions and in the growth of their diversity. It does not mean, however, that both society and the citizens should necessarily share our point of view. The former model of diversity was severely criticized by us, and we recommended that measures should be taken against certain local initiatives de�scribed in our previous works, especially when these initiatives contra�dicted the Constitution.
It should be noted that some meaningful results were achieved in this direction, including the unification of budget legislation, the ar�rangement of tax benefits, the discontinuation of regional initiatives aimed at price regulation, and the lowering of barriers that had ham�pered the movement of labor force and goods (by comparison with the situation in the 1990s). Alongside the adoption of federal legislation on the deregulation of the economy, these changes did create conditions
119
for significant improvement of the business climate and for healthy economic growth. Unfortunately, these hopes were not to come true.
The reduction in diversity and even the formal transition to a unitary state in Russia (the solution we cannot consider fortunate) alongside the consolidation of the judiciary’s independence, the toughening of the procedure for selecting candidates and the transparency of this proce�dure, and the reforming of law�enforcement agencies including a sig�nificant narrowing and clarifying the tasks of each level and agency could have resulted in a considerable improvement of the situation, in a qualitative breakthrough, and to the creation of favorable conditions for long�term economic growth.
However, the process of unification of the institutions was nearly re�versed. As a result, the reduction in diversity became a totally unjustifi�able experiment, aimed at building an “original” model of democracy, which produced a predictable disbalance and incapacity of the system.
The obtained results have not made it possible to reject the hy�pothesis that the State’s ability to improve the business climate in the regions did, indeed, decrease in the past four years. Both because of the loss of prestige of regional authorities, and because of a lack of ef�fective feedback and balances, as well as owing to the “competition” when the executive authorities protect the budget from the legislative authorities, while being closely watched by the press, the specific bod�ies of state prosecution defend the position of the prosecution and the data presented by law�enforcement agencies in the courts of justice, while also being closely watched by the press and controlled by civil society. The private interests of officials, politicians, journalists, lobby�ists and businessmen more frequently change the situation to the better rather than to the worse, and make otherwise suppressed information accessible to everybody.
But at present, as is shown in the study, all these standard mecha�nisms, successfully tested in the scores of countries, are gradually los�ing their ability to change the situation to the better.
The only known solution of the issue of a successful long – term catching – up development could be found only through restoring the legal and political mechanisms of legal democracy, alongside the crea�tion of such mechanisms at the federal level.
Bibliography
Legislation The Constitution of the Russian Federation, 1993. USA Constitution. Canada Constitution Act 1867; Department of Justice Canada
http://laws.justice.gc.ca/cgi�bin/notice.pl?redirect=/en/const/index.html. Canada Constitution Act 1982; Department of Justice Canada
http://laws.justice.gc.ca/cgi�bin/notice.pl?redirect=/en/const/index.html. RF Federal Law October, 6 1999 No. 184�FZ “On General principles
of the legislatures and executives bodies organization in the Subjects of Russian Federation”.
RF Federal Law October, 6 2000 No. 131�FZ “On the general principles of the local self�government in the Russian Federation”.
The books and Articles Asselin, Robert. The Canadian Social Union: questions about the
division of powers and fiscal federalism. PRB 00�31E, Parliamentary Research Branch, Library of Parliament, March 2001.
Ayres, Matt. Baseload Generation Options for Ontario. Canadian Research Energy Institute, September 2004.
Background Document for the First Ministers’ Meeting of 20–21 June 1996. Ottawa, 1996.
Banting, Keith, Douglas M. Brown and Thomas J. Courchene, eds. The Future of Fiscal Federalism. School of Policy Studies, Queen’s University, Kingston, 1994.
H. Broadman, P. Murrell et al. Unleashing Russia's Business Potential: Lessons from the Regions for Building Market Institutions, WB, 2001 www.worldbank.org.ru/ECA/Russia.nsf/.../$FILE/Unleash_eng.pdf.
Buchanan J.M. 1993, “Public choice after socialism” // Public Choice. 77. Pp.75–83.
Buchanan M.J, Conglenton R.D. “Politics by principle, not interest. Towards non�discriminatory Democracy”, 1998 Cambridge University Press.
Canadian Clean Power Coalition. CCPC Phase 1 Executive Summary, May 2004.
121
Canada, Department of Energy, Mines and Resources, The National Energy Program (Ottawa: Supply and Services Canada, October 1980), p. 7.
Canada, Government. “Renewing the Canadian Federation: A Progress Report”.
Carmichael, Edward A. and Stewart, James K. Lessons from the National Energy Program. C.D. Howe Institute, 1983.
Canadian Manufacturers and Exporters, 2002. Pain without gain; Canada and the Kyoto Protocol.
Cairns, Alan C. Reconfigurations: Canadian Citizenship and Constitutional Change.
Canadian Institute for Health Information. National health expenditure trends, 2006.
Clarkson, Stephen. Canada and the Reagen Challenge: Crisis in the Canadian�American Relationship. Canadian Institute for Economic Policy, 1982, pp. 55–113.
Courchene, Thomas J. Access – A Convention on the Canadian Economic and Social Systems. Working Paper Prepared for the Minister of Intergovernmental Affairs.
Government of Ontario, August 1996. Department of Finance Canada. Federal transfers to Provinces and
Territories, 2006. Department of Finance Canada. The fiscal balance in Canada – the
facts, 2006. Edward A. Carmichael and James K. Stewart. Lessons from the
National Energy Program. C.D. Howe Institute, 1983, p. 25. Egorov G., Guriev S., Sonin K. “Media Freedom, Bureaucratic
incentives and the Resource Curse”, CEFIR, 2006 www.cefir.ru. Enikolopov R., Zhuravskaya, E. 2003. “Decentralization and Political
Institutions”, CEPR Discussion Papers 3857, C.E.P.R. Discussion Papers.
Government of Canada. Project Green. Moving Forward on Climate Change: A Plan for Honouring our Kyoto Commitment. Ottawa: Government of Canada, 2005.
Government of Canada. Depository Services Program. Federal�Provincial Relations. Prepared by: Jack Stilborn, Robert B. Asselin, Political and Social Affairs Division, 2001.

122
Hydro Quebec. Comparison of Electricity Prices in Major North American Cities. Quebec, various issues.
Independent Electricity Market Operator. 10�Year Outlook: An Assessment of the Adequacy of Generating and Transmissions Facilities to Meet Future Electricity Need in Ontario, From January 2005 to December 2014. April 29, 2004.
Leyton�Brown, David. Weathering the Storm: Canadian�U.S. Relations, 1980�83. Canadian American Committee, 1985, pp. 23–42.
Lutsey. Nicholas P. Impact of Canada’s Voluntary Agreement on Greenhouse Gas Emissions from Light Duty Vehicles. Davis, CA: Institute of Transportation Studies, University of California, Davis, 2006.
MacLaren, Roy. “Canadian Views on the US Government Reaction to the National Energy Program”, Canadian Public Policy, 1982.
Mau V., Yanovskiy K. “Political and Legal Factors of Economic Growth in Russian Regions” “Post�Communist Studies”, Vol.14, No. 3, 2002.
Murrell P., “Assessing the value of law in the transition countries”, 2001, Michigan University Press.
Niskanen W. Bureacracy and Representative Government. Chicago, Aldine�Altherton, 1971.
National Climate Change Process. Canada’s First National Climate Change Business Plan, October 2000.
National Energy Board. A compendium of Electric Reliability frameworks Across Canada, June 2004.
Knop, Karen, Sylvia Ostry, Richard Simeon and Katherine Swinton, eds. Rethinking Federalism: Citizens, Markets and Governments in a Changing World. UBC Press, Vancouver, 1995.
Olling, R.D. and M.W. Westmacott, eds. Perspectives on Canadian Federalism. Prentice�Hall Canada Inc, Scarborough, 1988.
Statistics Canada. Electric Power Capability and Load (Catalogue 57�204XIB).
Statistics Canada. Cansim Table 127–0001. Stilborn, Jack. National Standards and Social Programs: What the
Federal Government Can Do. Background Paper BP�379E, Parliamentary Research Branch, Library of Parliament, September 1997.
123
Wonder, Edward. “The US Government Response to the Canadian National Energy Program”, Canadian Public Policy, 1982.
Mau V., K. Yanovsky, S. Zhavoronkov, O. Fomichev, L. Lederman Politicheskye i pravovye istochniki investitsionnykh riskov v rossiyskykh regionakh. М.: IEPP, 2002.
Mau V., К. Yanovsky, D. Nastavshev et al. Importirovannye instituty v stranah s perehodnoy ekonomikoy: effektivnost’ i izdergki. Working Paper No. 68. М.: IEPP, 2003.
Mau V., S. Zhavoronkov, D.Cherny, K. Yanovsky Deregulirovaniye rossiyskoy ekonomiki. М.: IEPP, 2001.
Mau V., K. Yanovsky, S. Zhavoronkov, D.Cherny. Resultaty vyborov, kak pokazatel sprosa na instituty na primere golosovaniy v techeniye pervogo poslerevolyutsionnogo desyatiletiya v stranakh s perephodnoy ekonomikoy I molodoy demokratiyey. M., IEPP, 2001.
Mau V.A., Zhavoronkov S.G., Fomichev O.V., Shadrin A.E., Yanovsky K.E. Deregulirovanye rossiyskoy ekonomiki: mekhanizm vosproizvodstva izbytochnogo regulirovaniya I institutsionalnaya podderzhka konkurentsii na tovarnykh rynkakh. Working Paper No. 48. М.: IEPP, 2003.
Kuznetsova O. Ekonomicheskoye razvitie regionov. M. 2002. Myagkov M., Sitnikov A., Shakin D. Elektoralny landshaft Rossii М.:
Open Economy Institute, 2004. Human rights web site http://www.hro.org Human rights organization "Memorial" http://www.memo.ru Pribylovsky V. Rossia Putina: pristrastny vzglyad. M.2003. Pribylovsky V. Upravlyaemye vybory: degradatsia vyborov pri Putine.
M. 2005. Legal department under the Supreme Court of the Russian
Federation http://www.cdep.ru; http://www.cdep.ru/statistics.asp? search_frm_auto=1&dept_id=8
Fund for the protection of glasnost. Mass media monitoring http://www.gdf.ru/monitor/index.shtml
Central election committee http://www.cikrf.ru Egertson T. "Economic behavior and Institutions." Moscow, "Delo", 2001 K.Yanovsky, S.Zhavoronkov,O.Kochetkova,A.Mazhuga,D.Cherny,
P. � M. Dejardin, P. Hobson, D. Savoy. Political and Economic Problems of the Russian Regions. M., IET,
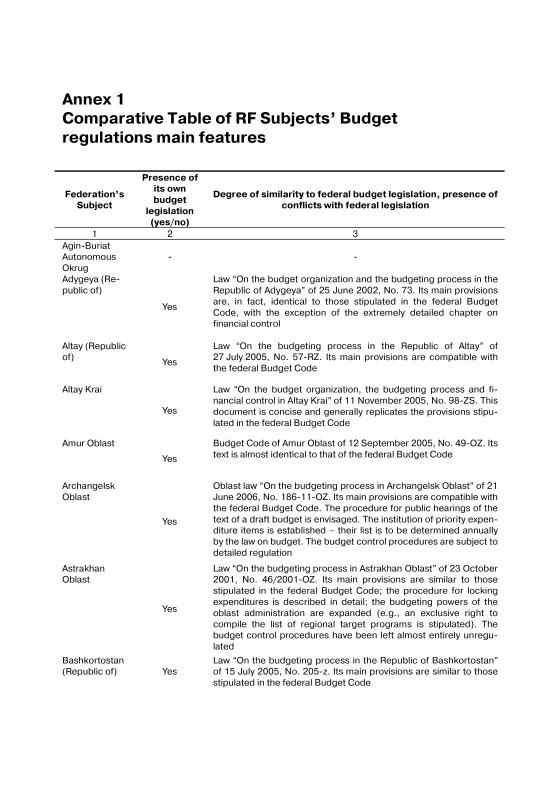
Annex 1 Comparative Table of RF Subjects’ Budget regulations main features
Federation’s Subject
Presence of its own budget
legislation (yes/no)
Degree of similarity to federal budget legislation, presence of conflicts with federal legislation
1 2 3 Agin�Buriat Autonomous Okrug
� �
Adygeya (Re�public of)
Yes
Law “On the budget organization and the budgeting process in the Republic of Adygeya” of 25 June 2002, No. 73. Its main provisions are, in fact, identical to those stipulated in the federal Budget Code, with the exception of the extremely detailed chapter on financial control
Altay (Republic of) Yes
Law “On the budgeting process in the Republic of Altay” of 27 July 2005, No. 57�RZ. Its main provisions are compatible with the federal Budget Code
Altay Krai
Yes
Law “On the budget organization, the budgeting process and fi�nancial control in Altay Krai” of 11 November 2005, No. 98�ZS. This document is concise and generally replicates the provisions stipu�lated in the federal Budget Code
Amur Oblast
Yes
Budget Code of Amur Oblast of 12 September 2005, No. 49�OZ. Its text is almost identical to that of the federal Budget Code
Archangelsk Oblast
Yes
Oblast law “On the budgeting process in Archangelsk Oblast” of 21 June 2006, No. 186�11�OZ. Its main provisions are compatible with the federal Budget Code. The procedure for public hearings of the text of a draft budget is envisaged. The institution of priority expen�diture items is established – their list is to be determined annually by the law on budget. The budget control procedures are subject to detailed regulation
Astrakhan Oblast
Yes
Law “On the budgeting process in Astrakhan Oblast” of 23 October 2001, No. 46/2001�OZ. Its main provisions are similar to those stipulated in the federal Budget Code; the procedure for locking expenditures is described in detail; the budgeting powers of the oblast administration are expanded (e.g., an exclusive right to compile the list of regional target programs is stipulated). The budget control procedures have been left almost entirely unregu�lated
Bashkortostan (Republic of) Yes
Law “On the budgeting process in the Republic of Bashkortostan” of 15 July 2005, No. 205�z. Its main provisions are similar to those stipulated in the federal Budget Code
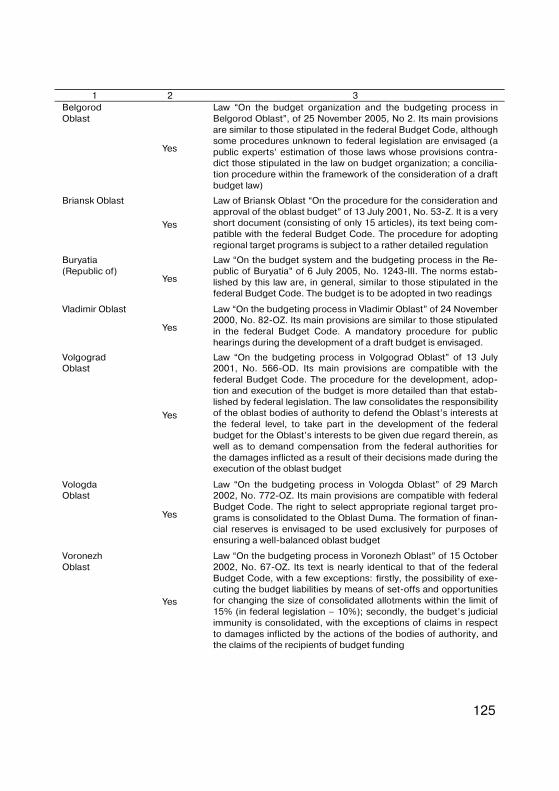
125
1 2 3 Belgorod Oblast
Yes
Law “On the budget organization and the budgeting process in Belgorod Oblast”, of 25 November 2005, No 2. Its main provisions are similar to those stipulated in the federal Budget Code, although some procedures unknown to federal legislation are envisaged (a public experts’ estimation of those laws whose provisions contra�dict those stipulated in the law on budget organization; a concilia�tion procedure within the framework of the consideration of a draft budget law)
Briansk Oblast
Yes
Law of Briansk Oblast “On the procedure for the consideration and approval of the oblast budget” of 13 July 2001, No. 53�Z. It is a very short document (consisting of only 15 articles), its text being com�patible with the federal Budget Code. The procedure for adopting regional target programs is subject to a rather detailed regulation
Buryatia (Republic of)
Yes
Law “On the budget system and the budgeting process in the Re�public of Buryatia” of 6 July 2005, No. 1243�III. The norms estab�lished by this law are, in general, similar to those stipulated in the federal Budget Code. The budget is to be adopted in two readings
Vladimir Oblast
Yes
Law “On the budgeting process in Vladimir Oblast” of 24 November 2000, No. 82�OZ. Its main provisions are similar to those stipulated in the federal Budget Code. A mandatory procedure for public hearings during the development of a draft budget is envisaged.
Volgograd Oblast
Yes
Law “On the budgeting process in Volgograd Oblast” of 13 July 2001, No. 566�OD. Its main provisions are compatible with the federal Budget Code. The procedure for the development, adop�tion and execution of the budget is more detailed than that estab�lished by federal legislation. The law consolidates the responsibility of the oblast bodies of authority to defend the Oblast’s interests at the federal level, to take part in the development of the federal budget for the Oblast’s interests to be given due regard therein, as well as to demand compensation from the federal authorities for the damages inflicted as a result of their decisions made during the execution of the oblast budget
Vologda Oblast
Yes
Law “On the budgeting process in Vologda Oblast” of 29 March 2002, No. 772�OZ. Its main provisions are compatible with federal Budget Code. The right to select appropriate regional target pro�grams is consolidated to the Oblast Duma. The formation of finan�cial reserves is envisaged to be used exclusively for purposes of ensuring a well�balanced oblast budget
Voronezh Oblast
Yes
Law “On the budgeting process in Voronezh Oblast” of 15 October 2002, No. 67�OZ. Its text is nearly identical to that of the federal Budget Code, with a few exceptions: firstly, the possibility of exe�cuting the budget liabilities by means of set�offs and opportunities for changing the size of consolidated allotments within the limit of 15% (in federal legislation – 10%); secondly, the budget’s judicial immunity is consolidated, with the exceptions of claims in respect to damages inflicted by the actions of the bodies of authority, and the claims of the recipients of budget funding
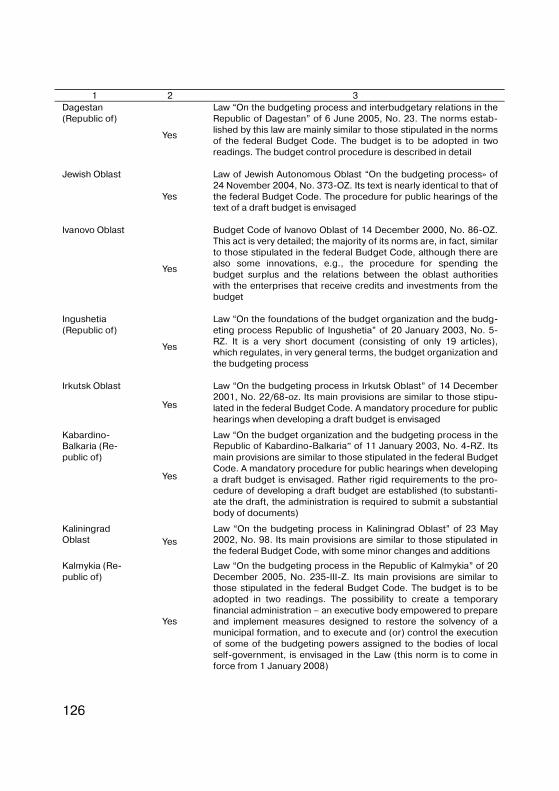
126
1 2 3 Dagestan (Republic of)
Yes
Law “On the budgeting process and interbudgetary relations in the Republic of Dagestan” of 6 June 2005, No. 23. The norms estab�lished by this law are mainly similar to those stipulated in the norms of the federal Budget Code. The budget is to be adopted in two readings. The budget control procedure is described in detail
Jewish Oblast
Yes
Law of Jewish Autonomous Oblast “On the budgeting process» of 24 November 2004, No. 373�OZ. Its text is nearly identical to that of the federal Budget Code. The procedure for public hearings of the text of a draft budget is envisaged
Ivanovo Oblast
Yes
Budget Code of Ivanovo Oblast of 14 December 2000, No. 86�OZ. This act is very detailed; the majority of its norms are, in fact, similar to those stipulated in the federal Budget Code, although there are also some innovations, e.g., the procedure for spending the budget surplus and the relations between the oblast authorities with the enterprises that receive credits and investments from the budget
Ingushetia (Republic of)
Yes
Law “On the foundations of the budget organization and the budg�eting process Republic of Ingushetia” of 20 January 2003, No. 5�RZ. It is a very short document (consisting of only 19 articles), which regulates, in very general terms, the budget organization and the budgeting process
Irkutsk Oblast
Yes
Law “On the budgeting process in Irkutsk Oblast” of 14 December 2001, No. 22/68�oz. Its main provisions are similar to those stipu�lated in the federal Budget Code. A mandatory procedure for public hearings when developing a draft budget is envisaged
Kabardino�Balkaria (Re�public of)
Yes
Law “On the budget organization and the budgeting process in the Republic of Kabardino�Balkaria” of 11 January 2003, No. 4�RZ. Its main provisions are similar to those stipulated in the federal Budget Code. A mandatory procedure for public hearings when developing a draft budget is envisaged. Rather rigid requirements to the pro�cedure of developing a draft budget are established (to substanti�ate the draft, the administration is required to submit a substantial body of documents)
Kaliningrad Oblast Yes
Law “On the budgeting process in Kaliningrad Oblast” of 23 May 2002, No. 98. Its main provisions are similar to those stipulated in the federal Budget Code, with some minor changes and additions
Kalmykia (Re�public of)
Yes
Law “On the budgeting process in the Republic of Kalmykia” of 20 December 2005, No. 235�III�Z. Its main provisions are similar to those stipulated in the federal Budget Code. The budget is to be adopted in two readings. The possibility to create a temporary financial administration – an executive body empowered to prepare and implement measures designed to restore the solvency of a municipal formation, and to execute and (or) control the execution of some of the budgeting powers assigned to the bodies of local self�government, is envisaged in the Law (this norm is to come in force from 1 January 2008)
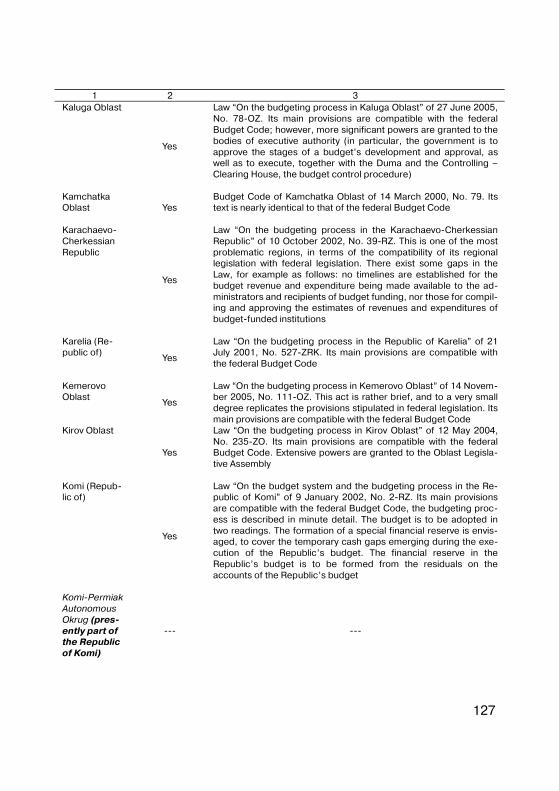
127
1 2 3 Kaluga Oblast
Yes
Law “On the budgeting process in Kaluga Oblast” of 27 June 2005, No. 78�OZ. Its main provisions are compatible with the federal Budget Code; however, more significant powers are granted to the bodies of executive authority (in particular, the government is to approve the stages of a budget’s development and approval, as well as to execute, together with the Duma and the Controlling – Clearing House, the budget control procedure)
Kamchatka Oblast Yes
Budget Code of Kamchatka Oblast of 14 March 2000, No. 79. Its text is nearly identical to that of the federal Budget Code
Karachaevo�Cherkessian Republic
Yes
Law “On the budgeting process in the Karachaevo�Cherkessian Republic” of 10 October 2002, No. 39�RZ. This is one of the most problematic regions, in terms of the compatibility of its regional legislation with federal legislation. There exist some gaps in the Law, for example as follows: no timelines are established for the budget revenue and expenditure being made available to the ad�ministrators and recipients of budget funding, nor those for compil�ing and approving the estimates of revenues and expenditures of budget�funded institutions
Karelia (Re�public of)
Yes
Law “On the budgeting process in the Republic of Karelia” of 21 July 2001, No. 527�ZRK. Its main provisions are compatible with the federal Budget Code
Kemerovo Oblast
Yes
Law “On the budgeting process in Kemerovo Oblast” of 14 Novem�ber 2005, No. 111�OZ. This act is rather brief, and to a very small degree replicates the provisions stipulated in federal legislation. Its main provisions are compatible with the federal Budget Code
Kirov Oblast
Yes
Law “On the budgeting process in Kirov Oblast” of 12 May 2004, No. 235�ZO. Its main provisions are compatible with the federal Budget Code. Extensive powers are granted to the Oblast Legisla�tive Assembly
Komi (Repub�lic of)
Yes
Law “On the budget system and the budgeting process in the Re�public of Komi” of 9 January 2002, No. 2�RZ. Its main provisions are compatible with the federal Budget Code, the budgeting proc�ess is described in minute detail. The budget is to be adopted in two readings. The formation of a special financial reserve is envis�aged, to cover the temporary cash gaps emerging during the exe�cution of the Republic’s budget. The financial reserve in the Republic’s budget is to be formed from the residuals on the accounts of the Republic’s budget
Komi�Permiak Autonomous Okrug (pres�ently part of the Republic of Komi)
��� ���
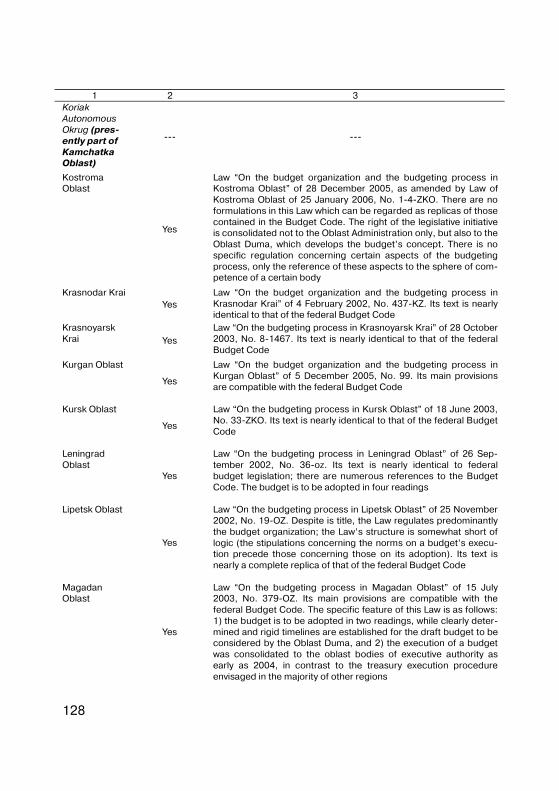
128
1 2 3 Koriak Autonomous Okrug (pres�ently part of Kamchatka Oblast)
��� ���
Kostroma Oblast
Yes
Law “On the budget organization and the budgeting process in Kostroma Oblast” of 28 December 2005, as amended by Law of Kostroma Oblast of 25 January 2006, No. 1�4�ZKO. There are no formulations in this Law which can be regarded as replicas of those contained in the Budget Code. The right of the legislative initiative is consolidated not to the Oblast Administration only, but also to the Oblast Duma, which develops the budget’s concept. There is no specific regulation concerning certain aspects of the budgeting process, only the reference of these aspects to the sphere of com�petence of a certain body
Krasnodar Krai Yes
Law “On the budget organization and the budgeting process in Krasnodar Krai” of 4 February 2002, No. 437�KZ. Its text is nearly identical to that of the federal Budget Code
Krasnoyarsk Krai Yes
Law “On the budgeting process in Krasnoyarsk Krai” of 28 October 2003, No. 8�1467. Its text is nearly identical to that of the federal Budget Code
Kurgan Oblast
Yes
Law “On the budget organization and the budgeting process in Kurgan Oblast” of 5 December 2005, No. 99. Its main provisions are compatible with the federal Budget Code
Kursk Oblast
Yes
Law “On the budgeting process in Kursk Oblast” of 18 June 2003, No. 33�ZKO. Its text is nearly identical to that of the federal Budget Code
Leningrad Oblast
Yes
Law “On the budgeting process in Leningrad Oblast” of 26 Sep�tember 2002, No. 36�oz. Its text is nearly identical to federal budget legislation; there are numerous references to the Budget Code. The budget is to be adopted in four readings
Lipetsk Oblast
Yes
Law “On the budgeting process in Lipetsk Oblast” of 25 November 2002, No. 19�OZ. Despite is title, the Law regulates predominantly the budget organization; the Law’s structure is somewhat short of logic (the stipulations concerning the norms on a budget’s execu�tion precede those concerning those on its adoption). Its text is nearly a complete replica of that of the federal Budget Code
Magadan Oblast
Yes
Law “On the budgeting process in Magadan Oblast” of 15 July 2003, No. 379�OZ. Its main provisions are compatible with the federal Budget Code. The specific feature of this Law is as follows: 1) the budget is to be adopted in two readings, while clearly deter�mined and rigid timelines are established for the draft budget to be considered by the Oblast Duma, and 2) the execution of a budget was consolidated to the oblast bodies of executive authority as early as 2004, in contrast to the treasury execution procedure envisaged in the majority of other regions
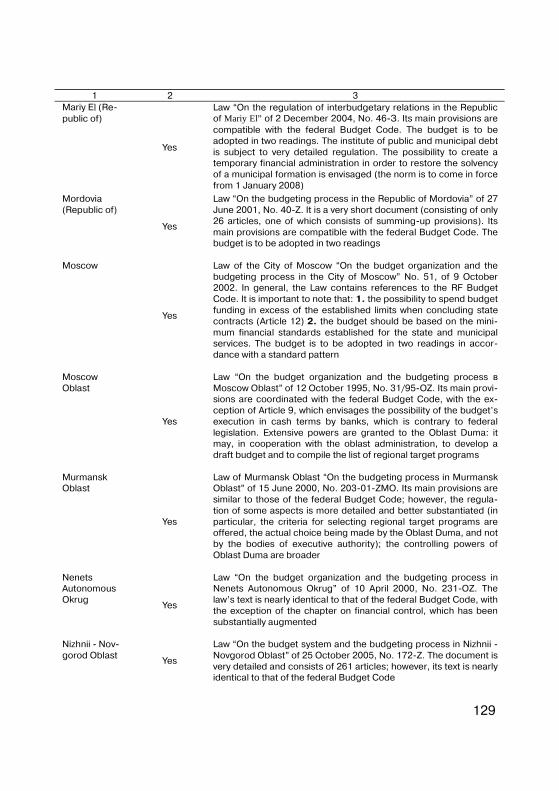
129
1 2 3 Mariy El (Re�public of)
Yes
Law “On the regulation of interbudgetary relations in the Republic of Mariy El” of 2 December 2004, No. 46�З. Its main provisions are compatible with the federal Budget Code. The budget is to be adopted in two readings. The institute of public and municipal debt is subject to very detailed regulation. The possibility to create a temporary financial administration in order to restore the solvency of a municipal formation is envisaged (the norm is to come in force from 1 January 2008)
Mordovia (Republic of)
Yes
Law “On the budgeting process in the Republic of Mordovia” of 27 June 2001, No. 40�Z. It is a very short document (consisting of only 26 articles, one of which consists of summing�up provisions). Its main provisions are compatible with the federal Budget Code. The budget is to be adopted in two readings
Moscow
Yes
Law of the City of Moscow “On the budget organization and the budgeting process in the City of Moscow” No. 51, of 9 October 2002. In general, the Law contains references to the RF Budget Code. It is important to note that: 1. the possibility to spend budget funding in excess of the established limits when concluding state contracts (Article 12) 2. the budget should be based on the mini�mum financial standards established for the state and municipal services. The budget is to be adopted in two readings in accor�dance with a standard pattern
Moscow Oblast
Yes
Law “On the budget organization and the budgeting process в Moscow Oblast” of 12 October 1995, No. 31/95�OZ. Its main provi�sions are coordinated with the federal Budget Code, with the ex�ception of Article 9, which envisages the possibility of the budget’s execution in cash terms by banks, which is contrary to federal legislation. Extensive powers are granted to the Oblast Duma: it may, in cooperation with the oblast administration, to develop a draft budget and to compile the list of regional target programs
Murmansk Oblast
Yes
Law of Murmansk Oblast “On the budgeting process in Murmansk Oblast” of 15 June 2000, No. 203�01�ZMO. Its main provisions are similar to those of the federal Budget Code; however, the regula�tion of some aspects is more detailed and better substantiated (in particular, the criteria for selecting regional target programs are offered, the actual choice being made by the Oblast Duma, and not by the bodies of executive authority); the controlling powers of Oblast Duma are broader
Nenets Autonomous Okrug
Yes
Law “On the budget organization and the budgeting process in Nenets Autonomous Okrug” of 10 April 2000, No. 231�OZ. The law’s text is nearly identical to that of the federal Budget Code, with the exception of the chapter on financial control, which has been substantially augmented
Nizhnii � Nov�gorod Oblast
Yes
Law “On the budget system and the budgeting process in Nizhnii � Novgorod Oblast” of 25 October 2005, No. 172�Z. The document is very detailed and consists of 261 articles; however, its text is nearly identical to that of the federal Budget Code
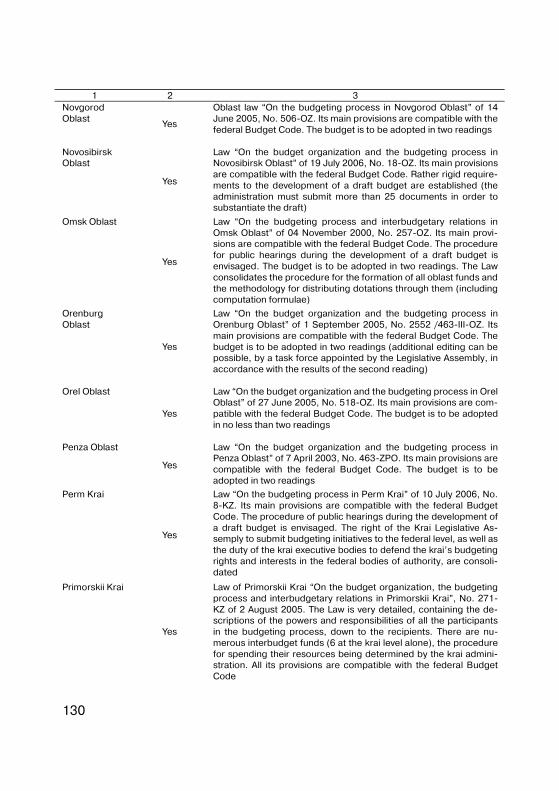
130
1 2 3 Novgorod Oblast
Yes
Oblast law “On the budgeting process in Novgorod Oblast” of 14 June 2005, No. 506�OZ. Its main provisions are compatible with the federal Budget Code. The budget is to be adopted in two readings
Novosibirsk Oblast
Yes
Law “On the budget organization and the budgeting process in Novosibirsk Oblast” of 19 July 2006, No. 18�OZ. Its main provisions are compatible with the federal Budget Code. Rather rigid require�ments to the development of a draft budget are established (the administration must submit more than 25 documents in order to substantiate the draft)
Omsk Oblast
Yes
Law “On the budgeting process and interbudgetary relations in Omsk Oblast” of 04 November 2000, No. 257�OZ. Its main provi�sions are compatible with the federal Budget Code. The procedure for public hearings during the development of a draft budget is envisaged. The budget is to be adopted in two readings. The Law consolidates the procedure for the formation of all oblast funds and the methodology for distributing dotations through them (including computation formulae)
Orenburg Oblast
Yes
Law “On the budget organization and the budgeting process in Orenburg Oblast” of 1 September 2005, No. 2552 /463�III�OZ. Its main provisions are compatible with the federal Budget Code. The budget is to be adopted in two readings (additional editing can be possible, by a task force appointed by the Legislative Assembly, in accordance with the results of the second reading)
Orel Oblast
Yes
Law “On the budget organization and the budgeting process in Orel Oblast” of 27 June 2005, No. 518�OZ. Its main provisions are com�patible with the federal Budget Code. The budget is to be adopted in no less than two readings
Penza Oblast
Yes
Law “On the budget organization and the budgeting process in Penza Oblast” of 7 April 2003, No. 463�ZPO. Its main provisions are compatible with the federal Budget Code. The budget is to be adopted in two readings
Perm Krai
Yes
Law “On the budgeting process in Perm Krai” of 10 July 2006, No. 8�KZ. Its main provisions are compatible with the federal Budget Code. The procedure of public hearings during the development of a draft budget is envisaged. The right of the Krai Legislative As�semply to submit budgeting initiatives to the federal level, as well as the duty of the krai executive bodies to defend the krai’s budgeting rights and interests in the federal bodies of authority, are consoli�dated
Primorskii Krai
Yes
Law of Primorskii Krai “On the budget organization, the budgeting process and interbudgetary relations in Primorskii Krai”, No. 271�KZ of 2 August 2005. The Law is very detailed, containing the de�scriptions of the powers and responsibilities of all the participants in the budgeting process, down to the recipients. There are nu�merous interbudget funds (6 at the krai level alone), the procedure for spending their resources being determined by the krai admini�stration. All its provisions are compatible with the federal Budget Code
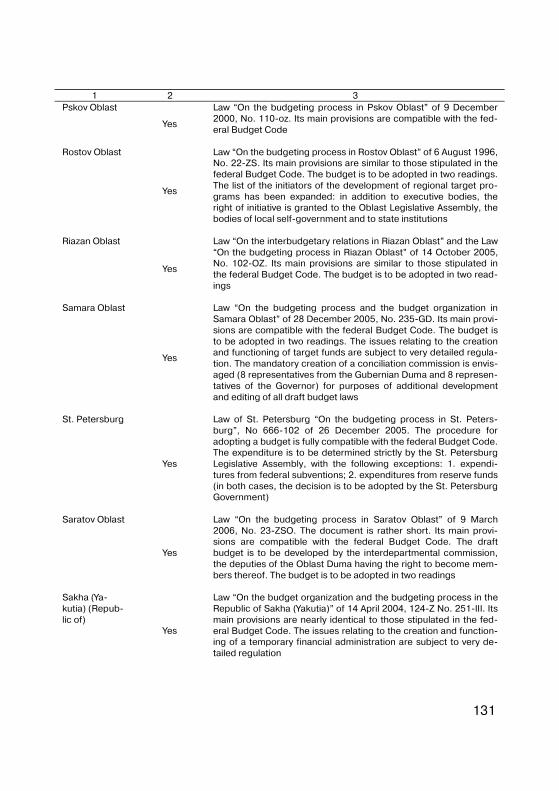
131
1 2 3 Pskov Oblast
Yes
Law “On the budgeting process in Pskov Oblast” of 9 December 2000, No. 110�oz. Its main provisions are compatible with the fed�eral Budget Code
Rostov Oblast
Yes
Law “On the budgeting process in Rostov Oblast” of 6 August 1996, No. 22�ZS. Its main provisions are similar to those stipulated in the federal Budget Code. The budget is to be adopted in two readings. The list of the initiators of the development of regional target pro�grams has been expanded: in addition to executive bodies, the right of initiative is granted to the Oblast Legislative Assembly, the bodies of local self�government and to state institutions
Riazan Oblast
Yes
Law “On the interbudgetary relations in Riazan Oblast” and the Law “On the budgeting process in Riazan Oblast” of 14 October 2005, No. 102�OZ. Its main provisions are similar to those stipulated in the federal Budget Code. The budget is to be adopted in two read�ings
Samara Oblast
Yes
Law “On the budgeting process and the budget organization in Samara Oblast” of 28 December 2005, No. 235�GD. Its main provi�sions are compatible with the federal Budget Code. The budget is to be adopted in two readings. The issues relating to the creation and functioning of target funds are subject to very detailed regula�tion. The mandatory creation of a conciliation commission is envis�aged (8 representatives from the Gubernian Duma and 8 represen�tatives of the Governor) for purposes of additional development and editing of all draft budget laws
St. Petersburg
Yes
Law of St. Petersburg “On the budgeting process in St. Peters�burg”, No 666�102 of 26 December 2005. The procedure for adopting a budget is fully compatible with the federal Budget Code. The expenditure is to be determined strictly by the St. Petersburg Legislative Assembly, with the following exceptions: 1. expendi�tures from federal subventions; 2. expenditures from reserve funds (in both cases, the decision is to be adopted by the St. Petersburg Government)
Saratov Oblast
Yes
Law “On the budgeting process in Saratov Oblast” of 9 March 2006, No. 23�ZSO. The document is rather short. Its main provi�sions are compatible with the federal Budget Code. The draft budget is to be developed by the interdepartmental commission, the deputies of the Oblast Duma having the right to become mem�bers thereof. The budget is to be adopted in two readings
Sakha (Ya�kutia) (Repub�lic of)
Yes
Law “On the budget organization and the budgeting process in the Republic of Sakha (Yakutia)” of 14 April 2004, 124�Z No. 251�III. Its main provisions are nearly identical to those stipulated in the fed�eral Budget Code. The issues relating to the creation and function�ing of a temporary financial administration are subject to very de�tailed regulation
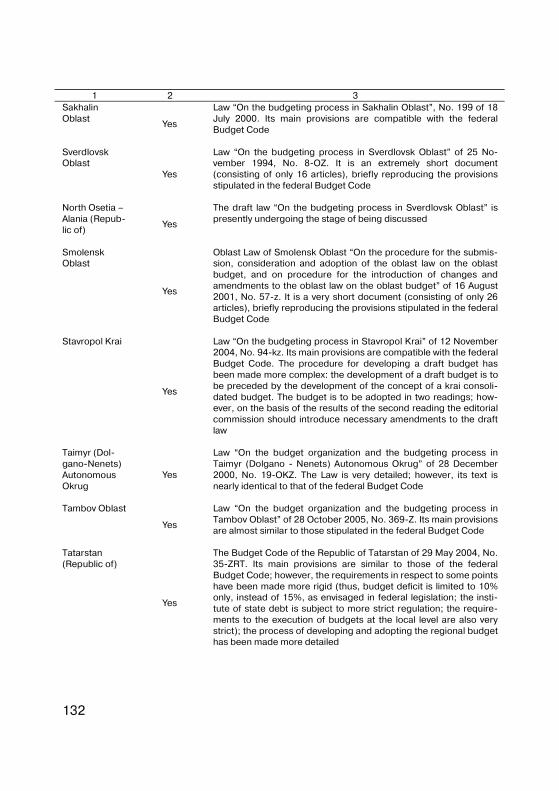
132
1 2 3 Sakhalin Oblast
Yes
Law “On the budgeting process in Sakhalin Oblast”, No. 199 of 18 July 2000. Its main provisions are compatible with the federal Budget Code
Sverdlovsk Oblast
Yes
Law “On the budgeting process in Sverdlovsk Oblast” of 25 No�vember 1994, No. 8�OZ. It is an extremely short document (consisting of only 16 articles), briefly reproducing the provisions stipulated in the federal Budget Code
North Osetia – Alania (Repub�lic of)
Yes
The draft law “On the budgeting process in Sverdlovsk Oblast” is presently undergoing the stage of being discussed
Smolensk Oblast
Yes
Oblast Law of Smolensk Oblast “On the procedure for the submis�sion, consideration and adoption of the oblast law on the oblast budget, and on procedure for the introduction of changes and amendments to the oblast law on the oblast budget” of 16 August 2001, No. 57�z. It is a very short document (consisting of only 26 articles), briefly reproducing the provisions stipulated in the federal Budget Code
Stavropol Krai
Yes
Law “On the budgeting process in Stavropol Krai” of 12 November 2004, No. 94�kz. Its main provisions are compatible with the federal Budget Code. The procedure for developing a draft budget has been made more complex: the development of a draft budget is to be preceded by the development of the concept of a krai consoli�dated budget. The budget is to be adopted in two readings; how�ever, on the basis of the results of the second reading the editorial commission should introduce necessary amendments to the draft law
Taimyr (Dol�gano�Nenets) Autonomous Okrug
Yes
Law “On the budget organization and the budgeting process in Taimyr (Dolgano � Nenets) Autonomous Okrug” of 28 December 2000, No. 19�OKZ. The Law is very detailed; however, its text is nearly identical to that of the federal Budget Code
Tambov Oblast
Yes
Law “On the budget organization and the budgeting process in Tambov Oblast” of 28 October 2005, No. 369�Z. Its main provisions are almost similar to those stipulated in the federal Budget Code
Tatarstan (Republic of)
Yes
The Budget Code of the Republic of Tatarstan of 29 May 2004, No. 35�ZRT. Its main provisions are similar to those of the federal Budget Code; however, the requirements in respect to some points have been made more rigid (thus, budget deficit is limited to 10% only, instead of 15%, as envisaged in federal legislation; the insti�tute of state debt is subject to more strict regulation; the require�ments to the execution of budgets at the local level are also very strict); the process of developing and adopting the regional budget has been made more detailed
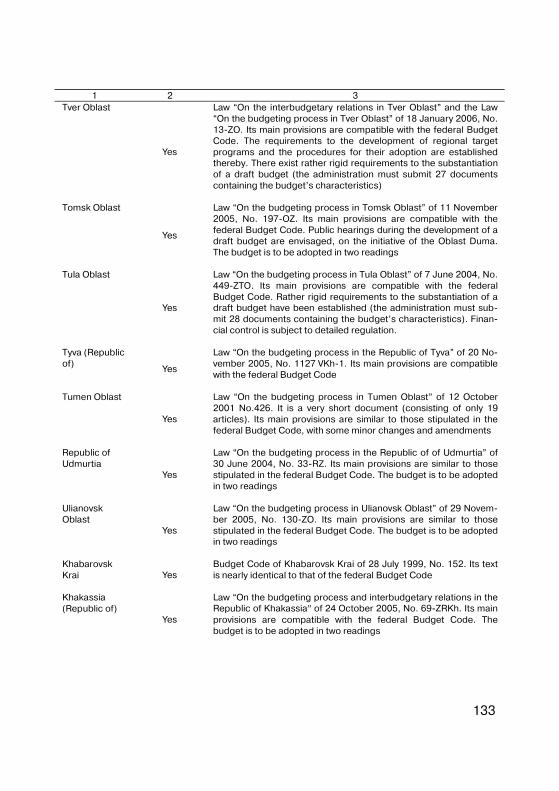
133
1 2 3 Tver Oblast
Yes
Law “On the interbudgetary relations in Tver Oblast” and the Law “On the budgeting process in Tver Oblast” of 18 January 2006, No. 13�ZO. Its main provisions are compatible with the federal Budget Code. The requirements to the development of regional target programs and the procedures for their adoption are established thereby. There exist rather rigid requirements to the substantiation of a draft budget (the administration must submit 27 documents containing the budget’s characteristics)
Tomsk Oblast
Yes
Law “On the budgeting process in Tomsk Oblast” of 11 November 2005, No. 197�OZ. Its main provisions are compatible with the federal Budget Code. Public hearings during the development of a draft budget are envisaged, on the initiative of the Oblast Duma. The budget is to be adopted in two readings
Tula Oblast
Yes
Law “On the budgeting process in Tula Oblast” of 7 June 2004, No. 449�ZTO. Its main provisions are compatible with the federal Budget Code. Rather rigid requirements to the substantiation of a draft budget have been established (the administration must sub�mit 28 documents containing the budget’s characteristics). Finan�cial control is subject to detailed regulation.
Tyva (Republic of)
Yes
Law “On the budgeting process in the Republic of Tyva” of 20 No�vember 2005, No. 1127 VKh�1. Its main provisions are compatible with the federal Budget Code
Tumen Oblast
Yes
Law “On the budgeting process in Tumen Oblast” of 12 October 2001 No.426. It is a very short document (consisting of only 19 articles). Its main provisions are similar to those stipulated in the federal Budget Code, with some minor changes and amendments
Republic of Udmurtia
Yes
Law “On the budgeting process in the Republic of of Udmurtia” of 30 June 2004, No. 33�RZ. Its main provisions are similar to those stipulated in the federal Budget Code. The budget is to be adopted in two readings
Ulianovsk Oblast
Yes
Law “On the budgeting process in Ulianovsk Oblast” of 29 Novem�ber 2005, No. 130�ZO. Its main provisions are similar to those stipulated in the federal Budget Code. The budget is to be adopted in two readings
Khabarovsk Krai Yes
Budget Code of Khabarovsk Krai of 28 July 1999, No. 152. Its text is nearly identical to that of the federal Budget Code
Khakassia (Republic of)
Yes
Law “On the budgeting process and interbudgetary relations in the Republic of Khakassia” of 24 October 2005, No. 69�ZRKh. Its main provisions are compatible with the federal Budget Code. The budget is to be adopted in two readings
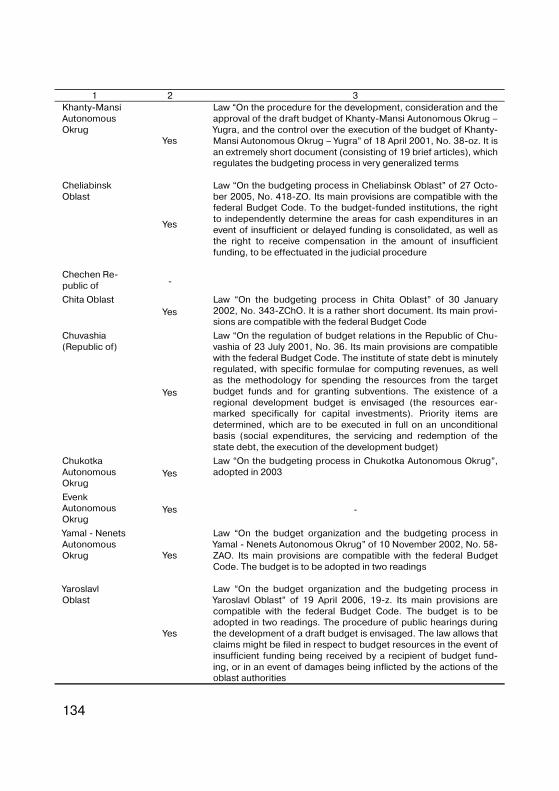
134
1 2 3 Khanty�Mansi Autonomous Okrug
Yes
Law “On the procedure for the development, consideration and the approval of the draft budget of Khanty�Mansi Autonomous Okrug – Yugra, and the control over the execution of the budget of Khanty�Mansi Autonomous Okrug – Yugra” of 18 April 2001, No. 38�oz. It is an extremely short document (consisting of 19 brief articles), which regulates the budgeting process in very generalized terms
Cheliabinsk Oblast
Yes
Law “On the budgeting process in Cheliabinsk Oblast” of 27 Octo�ber 2005, No. 418�ZO. Its main provisions are compatible with the federal Budget Code. To the budget�funded institutions, the right to independently determine the areas for cash expenditures in an event of insufficient or delayed funding is consolidated, as well as the right to receive compensation in the amount of insufficient funding, to be effectuated in the judicial procedure
Chechen Re�public of �
Chita Oblast Yes
Law “On the budgeting process in Chita Oblast” of 30 January 2002, No. 343�ZChO. It is a rather short document. Its main provi�sions are compatible with the federal Budget Code
Chuvashia (Republic of)
Yes
Law “On the regulation of budget relations in the Republic of Chu�vashia of 23 July 2001, No. 36. Its main provisions are compatible with the federal Budget Code. The institute of state debt is minutely regulated, with specific formulae for computing revenues, as well as the methodology for spending the resources from the target budget funds and for granting subventions. The existence of a regional development budget is envisaged (the resources ear�marked specifically for capital investments). Priority items are determined, which are to be executed in full on an unconditional basis (social expenditures, the servicing and redemption of the state debt, the execution of the development budget)
Chukotka Autonomous Okrug
Yes Law “On the budgeting process in Chukotka Autonomous Okrug”, adopted in 2003
Evenk Autonomous Okrug
Yes �
Yamal � Nenets Autonomous Okrug Yes
Law “On the budget organization and the budgeting process in Yamal � Nenets Autonomous Okrug” of 10 November 2002, No. 58�ZAO. Its main provisions are compatible with the federal Budget Code. The budget is to be adopted in two readings
Yaroslavl Oblast
Yes
Law “On the budget organization and the budgeting process in Yaroslavl Oblast” of 19 April 2006, 19�z. Its main provisions are compatible with the federal Budget Code. The budget is to be adopted in two readings. The procedure of public hearings during the development of a draft budget is envisaged. The law allows that claims might be filed in respect to budget resources in the event of insufficient funding being received by a recipient of budget fund�ing, or in an event of damages being inflicted by the actions of the oblast authorities
135
It should be noted that in nearly all the budget laws adopted by RF subjects the right of their legislative bodied to introduce further details into the RF budget classification is envisaged, thereby increasing the transparency of budget items.
Regional legislations have been made almost fully compatible with federal legislation, although in many cases this has been achieved by simply reproducing the provisions of the RF Budget Code, without any changes or innovations whatsoever.
Regional tax privileges in the Russian Federation
The tax system, as it has emerged in Russia since 1991, has been granting significant powers to the regions in the sphere of taxation. This standpoint was largely assumed because of the weakness of the fed�eral authority, as well as the separatist ideas that were quite widespread in some of the republics. Following the example of the Republic of Tatarstan, the agreements on the division of powers were signed with many of the federation’s subjects, which, among other things, also en�dowed these subjects with greater opportunities for implementing their own tax policies than it was established by Russia’s Constitution. In some cases, regional authorities were acting directly in violation of fed�eral legislation. Thus, in the mid�1990s, the Republic of Yakutia – Sakha suspended, for the period of two years, the transfer of tax revenues to the federal budget. The policy of granting individual tax exemptions has become quite widespread, as well as the granting of tax exemptions by decisions of both executive and representative bodies of a region, the imposition of unlawful bans on the movement of goods and services, and an unlawful administrative control over pricing.
With the adoption of the Tax Code of the Russian Federation, the powers of regional authorities in the sphere of tax policy became much narrower; a close list of taxes was established, with a ban on the grant�ing individual tax exemptions. Regional authorities, especially in those regions where the level of political culture is low and the institutes of civil society are underdeveloped, for several years have been maintain�ing certain practices that were directly forbidden by the federal laws enacted in the years 1997–1999. This problem is dealt with in more de�tail in the previous paper belonging to this series of studies.
136
Our study has demonstrated that in the period of 1999–2005 the federal authorities succeeded in nearly entirely eliminating the practice of granting individual tax exemptions in an explicit form. The Legal In�formation System “Consultant” contains no normative acts adopted by regional authorities which explicitly grant tax exemptions to individual taxpayers.
It is still too early to speak of a complete elimination of the practice of individual tax exemptions being granted at the level of municipal for�mations. One example is Decree of Makhachkala City Assembly of 3 June 2005, No. 16�3b, “On exempting the Makhachkala – based mar�kets of the Dagpotrebsoius [the Dagestan Union of Consumer Cooperatives] from the taxes transferable to the local budget in the year 2005”.
The reasons for the abolition of those normative acts that estab�lished individual tax exemptions can be placed within three main cate�gories: the expiry of the period for which an exemption had been granted, the abolition by a ruling of a court of justice, and the abolition of a normative act by decision of a body of state authority of a subject of the Federation.
Despite the neatly complete disappearance of explicit individual tax exemptions in the regional practices, it is impossible to determine any distinct timelines as to when exactly such practices actually disap�peared. As a rule, the dubious provisions were not disappearing as a result of their abolition; a more common reason was the expiry of the period for which a privileges taxation regime had been granted, nor�mally determined in the document that had introduced such a regime, this period, most often, being equal to one year.
It should be also taken into account that regional authorities have, actually, found new forms that formally do not violate federal legislation, but in fact preserve the habitual state of affairs. There does exist a rather widespread practice when a certain privilege is established for a certain category of taxpayers by a regional law, and then later, by deci�sion of a body of executive authority, the list of taxpayers belonging to that privileged category is introduced. Another possible variant is a de�cision of the head of a body of executive authority recommending to the lawmakers that tax privileges should be granted to certain categories of taxpayers.
137
Other indices, applied in the first phase of the study, have since lost their significance. The Federation’s subjects have, in some or other form, issued regional normative acts that establish the procedure for granting tax exemptions or make references to the corresponding arti�cles of federal laws, and primarily the articles of the Tax and Budget Codes. Group tax exemptions are established by all the bodies of rep�resentative authority of subjects of the Federation.
On the strength of the accumulated information, it was decided that the data concerning regional tax exemptions should not be applied in the estimation model.
In 2007, the situation in the sphere of regional tax privileges may be significantly changed by the provisions of Federal Law No. 135 “On competition”, which grant to the territorial agencies of the Anti�Monopoly Service the right to coordinate the decisions made by bodies of authority concerning the granting of state or municipal support in the part relating to the protection of competition (Article 20 of the said law).
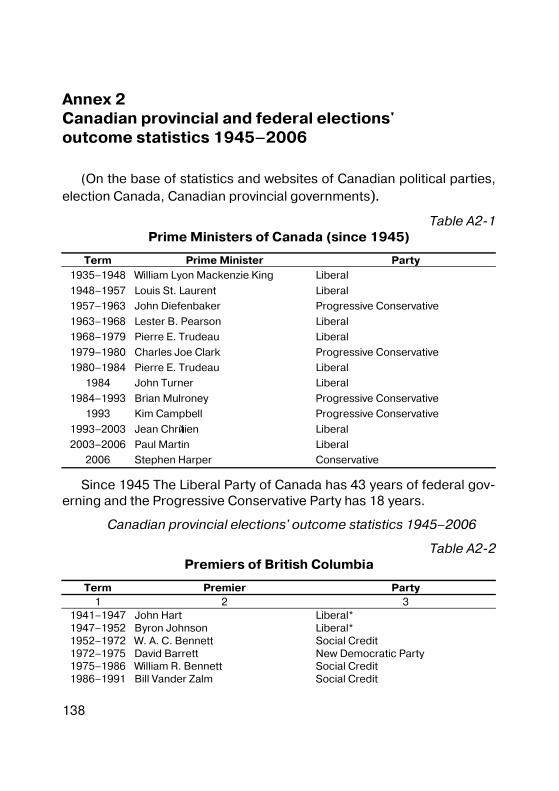
138
Annex 2 Canadian provincial and federal elections' outcome statistics 1945–2006
(On the base of statistics and websites of Canadian political parties, election Canada, Canadian provincial governments).
Table A2�1 Prime Ministers of Canada (since 1945)
Term Prime Minister Party 1935–1948 William Lyon Mackenzie King Liberal
1948–1957 Louis St. Laurent Liberal
1957–1963 John Diefenbaker Progressive Conservative
1963–1968 Lester B. Pearson Liberal
1968–1979 Pierre E. Trudeau Liberal
1979–1980 Charles Joe Clark Progressive Conservative
1980–1984 Pierre E. Trudeau Liberal
1984 John Turner Liberal
1984–1993 Brian Mulroney Progressive Conservative
1993 Kim Campbell Progressive Conservative
1993–2003 Jean Chrйtien Liberal
2003–2006 Paul Martin Liberal
2006 Stephen Harper Conservative
Since 1945 The Liberal Party of Canada has 43 years of federal gov�erning and the Progressive Conservative Party has 18 years.
Canadian provincial elections' outcome statistics 1945–2006
Table A2�2 Premiers of British Columbia
Term Premier Party 1 2 3
1941–1947 John Hart Liberal* 1947–1952 Byron Johnson Liberal* 1952–1972 W. A. C. Bennett Social Credit 1972–1975 David Barrett New Democratic Party 1975–1986 William R. Bennett Social Credit 1986–1991 Bill Vander Zalm Social Credit
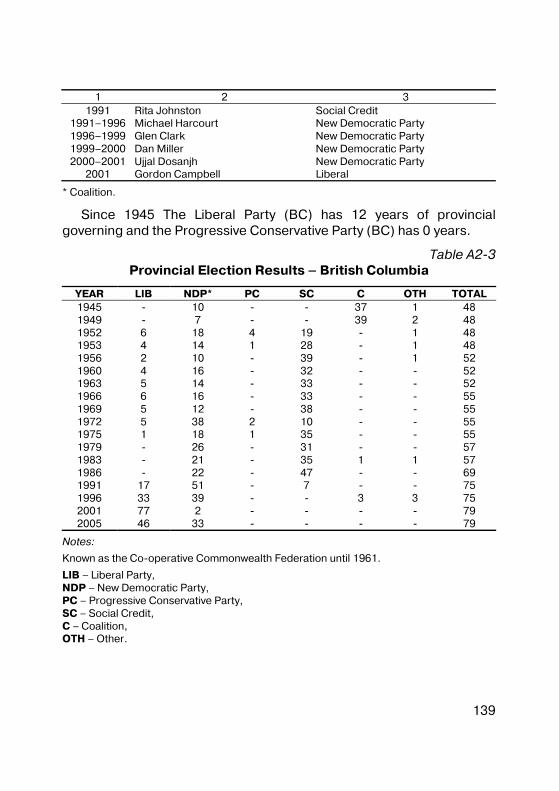
139
1 2 3 1991 Rita Johnston Social Credit
1991–1996 Michael Harcourt New Democratic Party 1996–1999 Glen Clark New Democratic Party 1999–2000 Dan Miller New Democratic Party 2000–2001 Ujjal Dosanjh New Democratic Party
2001 Gordon Campbell Liberal
* Coalition.
Since 1945 The Liberal Party (BC) has 12 years of provincial governing and the Progressive Conservative Party (BC) has 0 years.
Table A2�3 Provincial Election Results – British Columbia
YEAR LIB NDP* PC SC C OTH TOTAL 1945 � 10 � � 37 1 48 1949 � 7 � � 39 2 48 1952 6 18 4 19 � 1 48 1953 4 14 1 28 � 1 48 1956 2 10 � 39 � 1 52 1960 4 16 � 32 � � 52 1963 5 14 � 33 � � 52 1966 6 16 � 33 � � 55 1969 5 12 � 38 � � 55 1972 5 38 2 10 � � 55 1975 1 18 1 35 � � 55 1979 � 26 � 31 � � 57 1983 � 21 � 35 1 1 57 1986 � 22 � 47 � � 69 1991 17 51 � 7 � � 75 1996 33 39 � � 3 3 75 2001 77 2 � � � � 79 2005 46 33 � � � � 79
Notes:
Known as the Co�operative Commonwealth Federation until 1961.
LIB – Liberal Party, NDP – New Democratic Party, PC – Progressive Conservative Party, SC – Social Credit, C – Coalition, OTH – Other.
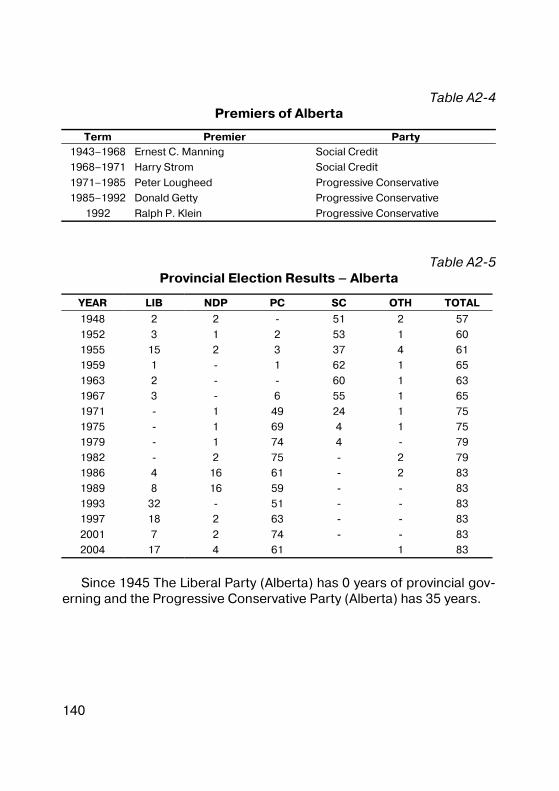
140
Table A2�4 Premiers of Alberta
Term Premier Party 1943–1968 Ernest C. Manning Social Credit
1968–1971 Harry Strom Social Credit
1971–1985 Peter Lougheed Progressive Conservative
1985–1992 Donald Getty Progressive Conservative
1992 Ralph P. Klein Progressive Conservative
Table A2�5 Provincial Election Results – Alberta
YEAR LIB NDP PC SC OTH TOTAL
1948 2 2 � 51 2 57
1952 3 1 2 53 1 60
1955 15 2 3 37 4 61
1959 1 � 1 62 1 65
1963 2 � � 60 1 63
1967 3 � 6 55 1 65
1971 � 1 49 24 1 75
1975 � 1 69 4 1 75
1979 � 1 74 4 � 79
1982 � 2 75 � 2 79
1986 4 16 61 � 2 83
1989 8 16 59 � � 83
1993 32 � 51 � � 83
1997 18 2 63 � � 83
2001 7 2 74 � � 83
2004 17 4 61 1 83
Since 1945 The Liberal Party (Alberta) has 0 years of provincial gov�
erning and the Progressive Conservative Party (Alberta) has 35 years.
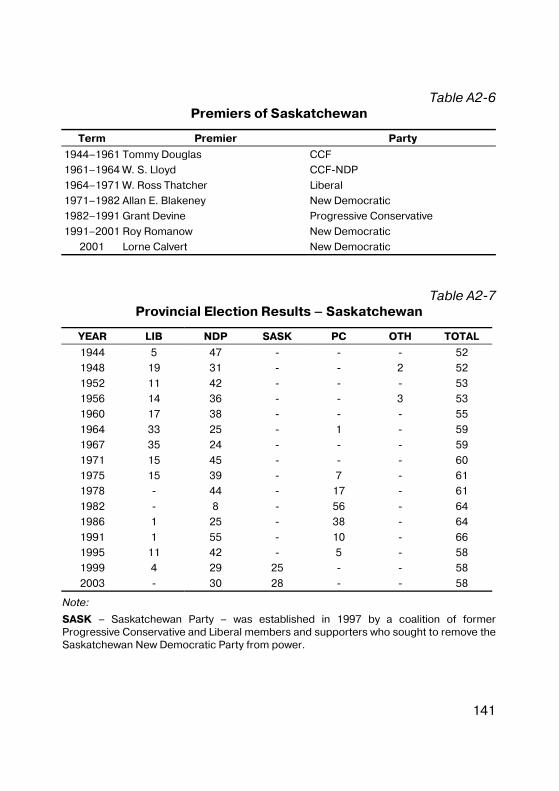
141
Table A2�6 Premiers of Saskatchewan
Term Premier Party
1944–1961 Tommy Douglas CCF
1961–1964 W. S. Lloyd CCF�NDP
1964–1971 W. Ross Thatcher Liberal
1971–1982 Allan E. Blakeney New Democratic
1982–1991 Grant Devine Progressive Conservative
1991–2001 Roy Romanow New Democratic
2001 Lorne Calvert New Democratic
Table A2�7 Provincial Election Results – Saskatchewan
YEAR LIB NDP SASK PC OTH TOTAL
1944 5 47 � � � 52
1948 19 31 � � 2 52
1952 11 42 � � � 53
1956 14 36 � � 3 53
1960 17 38 � � � 55
1964 33 25 � 1 � 59
1967 35 24 � � � 59
1971 15 45 � � � 60
1975 15 39 � 7 � 61
1978 � 44 � 17 � 61
1982 � 8 � 56 � 64
1986 1 25 � 38 � 64
1991 1 55 � 10 � 66
1995 11 42 � 5 � 58
1999 4 29 25 � � 58
2003 � 30 28 � � 58
Note:
SASK – Saskatchewan Party – was established in 1997 by a coalition of former Progressive Conservative and Liberal members and supporters who sought to remove the Saskatchewan New Democratic Party from power.
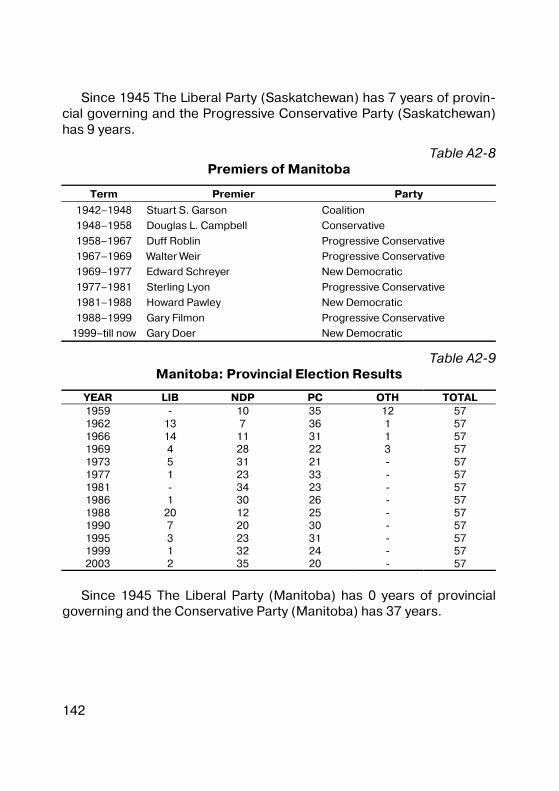
142
Since 1945 The Liberal Party (Saskatchewan) has 7 years of provin�cial governing and the Progressive Conservative Party (Saskatchewan) has 9 years.
Table A2�8 Premiers of Manitoba
Term Premier Party
1942–1948 Stuart S. Garson Coalition
1948–1958 Douglas L. Campbell Conservative
1958–1967 Duff Roblin Progressive Conservative
1967–1969 Walter Weir Progressive Conservative
1969–1977 Edward Schreyer New Democratic
1977–1981 Sterling Lyon Progressive Conservative
1981–1988 Howard Pawley New Democratic
1988–1999 Gary Filmon Progressive Conservative
1999–till now Gary Doer New Democratic
Table A2�9 Manitoba: Provincial Election Results
YEAR LIB NDP PC OTH TOTAL 1959 � 10 35 12 57 1962 13 7 36 1 57 1966 14 11 31 1 57 1969 4 28 22 3 57 1973 5 31 21 � 57 1977 1 23 33 � 57 1981 � 34 23 � 57 1986 1 30 26 � 57 1988 20 12 25 � 57 1990 7 20 30 � 57 1995 3 23 31 � 57 1999 1 32 24 � 57 2003 2 35 20 � 57
Since 1945 The Liberal Party (Manitoba) has 0 years of provincial
governing and the Conservative Party (Manitoba) has 37 years.
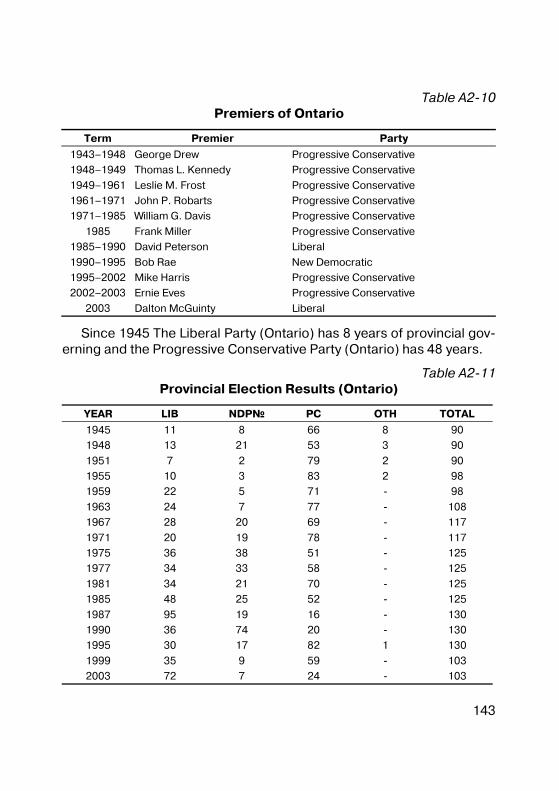
143
Table A2�10 Premiers of Ontario
Term Premier Party
1943–1948 George Drew Progressive Conservative
1948–1949 Thomas L. Kennedy Progressive Conservative
1949–1961 Leslie M. Frost Progressive Conservative
1961–1971 John P. Robarts Progressive Conservative
1971–1985 William G. Davis Progressive Conservative
1985 Frank Miller Progressive Conservative
1985–1990 David Peterson Liberal
1990–1995 Bob Rae New Democratic
1995–2002 Mike Harris Progressive Conservative
2002–2003 Ernie Eves Progressive Conservative
2003 Dalton McGuinty Liberal
Since 1945 The Liberal Party (Ontario) has 8 years of provincial gov�erning and the Progressive Conservative Party (Ontario) has 48 years.
Table A2�11 Provincial Election Results (Ontario)
YEAR LIB NDP№ PC OTH TOTAL
1945 11 8 66 8 90
1948 13 21 53 3 90
1951 7 2 79 2 90
1955 10 3 83 2 98
1959 22 5 71 � 98
1963 24 7 77 � 108
1967 28 20 69 � 117
1971 20 19 78 � 117
1975 36 38 51 � 125
1977 34 33 58 � 125
1981 34 21 70 � 125
1985 48 25 52 � 125
1987 95 19 16 � 130
1990 36 74 20 � 130
1995 30 17 82 1 130
1999 35 9 59 � 103
2003 72 7 24 � 103
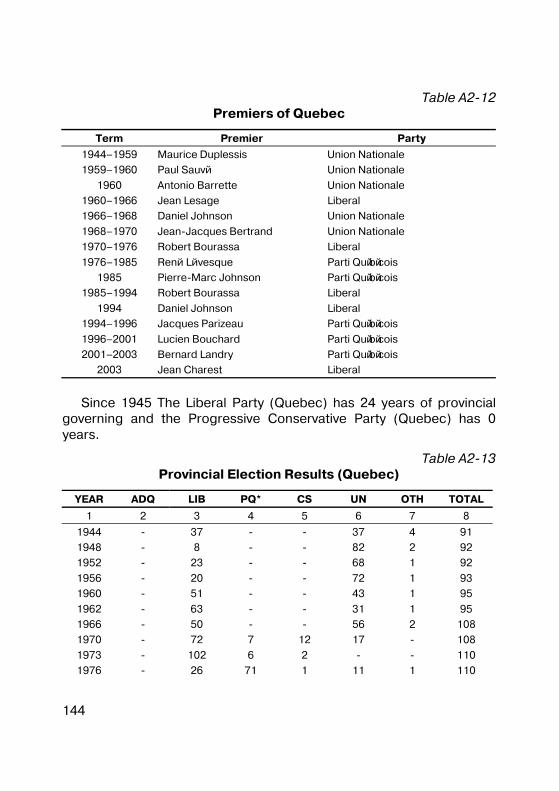
144
Table A2�12 Premiers of Quebec
Term Premier Party
1944–1959 Maurice Duplessis Union Nationale
1959–1960 Paul Sauvй Union Nationale
1960 Antonio Barrette Union Nationale
1960–1966 Jean Lesage Liberal
1966–1968 Daniel Johnson Union Nationale
1968–1970 Jean�Jacques Bertrand Union Nationale
1970–1976 Robert Bourassa Liberal
1976–1985 Renй Lйvesque Parti Quйbйcois
1985 Pierre�Marc Johnson Parti Quйbйcois
1985–1994 Robert Bourassa Liberal
1994 Daniel Johnson Liberal
1994–1996 Jacques Parizeau Parti Quйbйcois
1996–2001 Lucien Bouchard Parti Quйbйcois
2001–2003 Bernard Landry Parti Quйbйcois
2003 Jean Charest Liberal
Since 1945 The Liberal Party (Quebec) has 24 years of provincial
governing and the Progressive Conservative Party (Quebec) has 0 years.
Table A2�13 Provincial Election Results (Quebec)
YEAR ADQ LIB PQ* CS UN OTH TOTAL
1 2 3 4 5 6 7 8
1944 � 37 � � 37 4 91
1948 � 8 � � 82 2 92
1952 � 23 � � 68 1 92
1956 � 20 � � 72 1 93
1960 � 51 � � 43 1 95
1962 � 63 � � 31 1 95
1966 � 50 � � 56 2 108
1970 � 72 7 12 17 � 108
1973 � 102 6 2 � � 110
1976 � 26 71 1 11 1 110
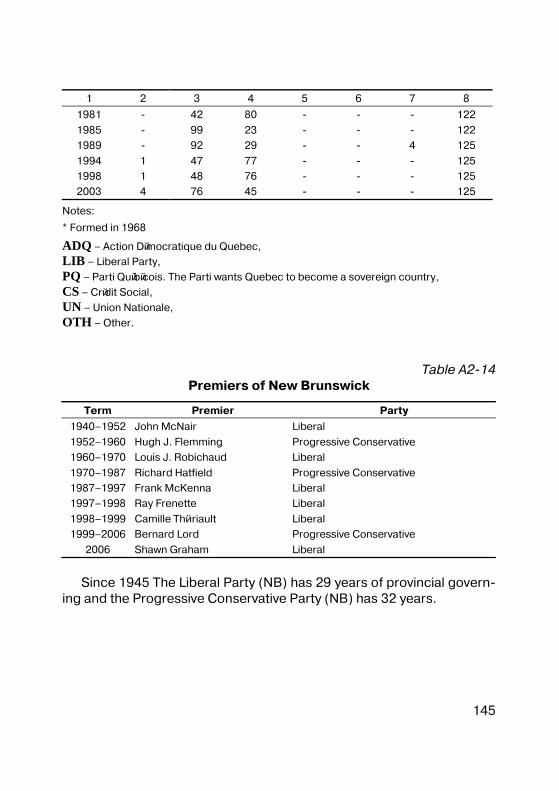
145
1 2 3 4 5 6 7 8
1981 � 42 80 � � � 122
1985 � 99 23 � � � 122
1989 � 92 29 � � 4 125
1994 1 47 77 � � � 125
1998 1 48 76 � � � 125
2003 4 76 45 � � � 125
Notes:
* Formed in 1968
ADQ – Action Dйmocratique du Quebec,
LIB – Liberal Party,
PQ – Parti Quйbйcois. The Parti wants Quebec to become a sovereign country,
CS – Crйdit Social,
UN – Union Nationale,
OTH – Other.
Table A2�14 Premiers of New Brunswick
Term Premier Party
1940–1952 John McNair Liberal
1952–1960 Hugh J. Flemming Progressive Conservative
1960–1970 Louis J. Robichaud Liberal
1970–1987 Richard Hatfield Progressive Conservative
1987–1997 Frank McKenna Liberal
1997–1998 Ray Frenette Liberal
1998–1999 Camille Thйriault Liberal
1999–2006 Bernard Lord Progressive Conservative
2006 Shawn Graham Liberal
Since 1945 The Liberal Party (NB) has 29 years of provincial govern�
ing and the Progressive Conservative Party (NB) has 32 years.
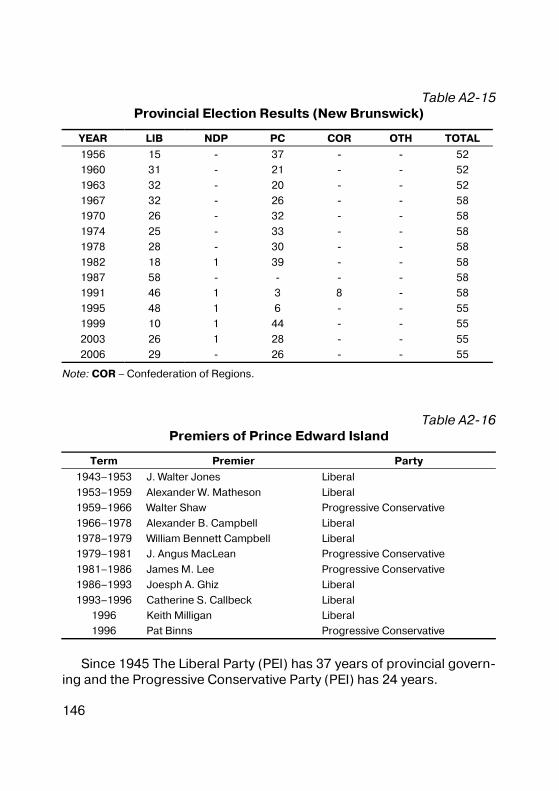
146
Table A2�15 Provincial Election Results (New Brunswick)
YEAR LIB NDP PC COR OTH TOTAL
1956 15 � 37 � � 52
1960 31 � 21 � � 52
1963 32 � 20 � � 52
1967 32 � 26 � � 58
1970 26 � 32 � � 58
1974 25 � 33 � � 58
1978 28 � 30 � � 58
1982 18 1 39 � � 58
1987 58 � � � � 58
1991 46 1 3 8 � 58
1995 48 1 6 � � 55
1999 10 1 44 � � 55
2003 26 1 28 � � 55
2006 29 � 26 � � 55
Note: COR – Confederation of Regions.
Table A2�16 Premiers of Prince Edward Island
Term Premier Party
1943–1953 J. Walter Jones Liberal
1953–1959 Alexander W. Matheson Liberal
1959–1966 Walter Shaw Progressive Conservative
1966–1978 Alexander B. Campbell Liberal
1978–1979 William Bennett Campbell Liberal
1979–1981 J. Angus MacLean Progressive Conservative
1981–1986 James M. Lee Progressive Conservative
1986–1993 Joesph A. Ghiz Liberal
1993–1996 Catherine S. Callbeck Liberal
1996 Keith Milligan Liberal
1996 Pat Binns Progressive Conservative
Since 1945 The Liberal Party (PEI) has 37 years of provincial govern�
ing and the Progressive Conservative Party (PEI) has 24 years.
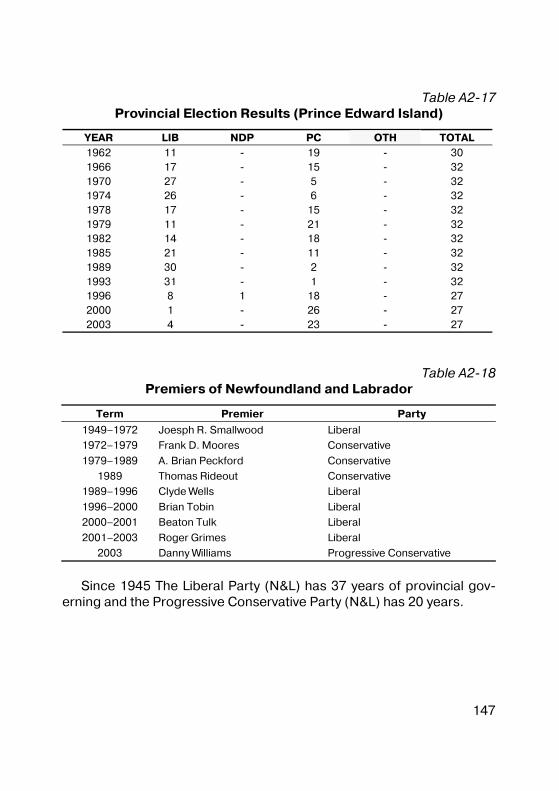
147
Table A2�17 Provincial Election Results (Prince Edward Island)
YEAR LIB NDP PC OTH TOTAL 1962 11 � 19 � 30 1966 17 � 15 � 32 1970 27 � 5 � 32 1974 26 � 6 � 32 1978 17 � 15 � 32 1979 11 � 21 � 32 1982 14 � 18 � 32 1985 21 � 11 � 32 1989 30 � 2 � 32 1993 31 � 1 � 32 1996 8 1 18 � 27 2000 1 � 26 � 27 2003 4 � 23 � 27
Table A2�18 Premiers of Newfoundland and Labrador
Term Premier Party
1949–1972 Joesph R. Smallwood Liberal
1972–1979 Frank D. Moores Conservative
1979–1989 A. Brian Peckford Conservative
1989 Thomas Rideout Conservative
1989–1996 Clyde Wells Liberal
1996–2000 Brian Tobin Liberal
2000–2001 Beaton Tulk Liberal
2001–2003 Roger Grimes Liberal
2003 Danny Williams Progressive Conservative
Since 1945 The Liberal Party (N&L) has 37 years of provincial gov�
erning and the Progressive Conservative Party (N&L) has 20 years.
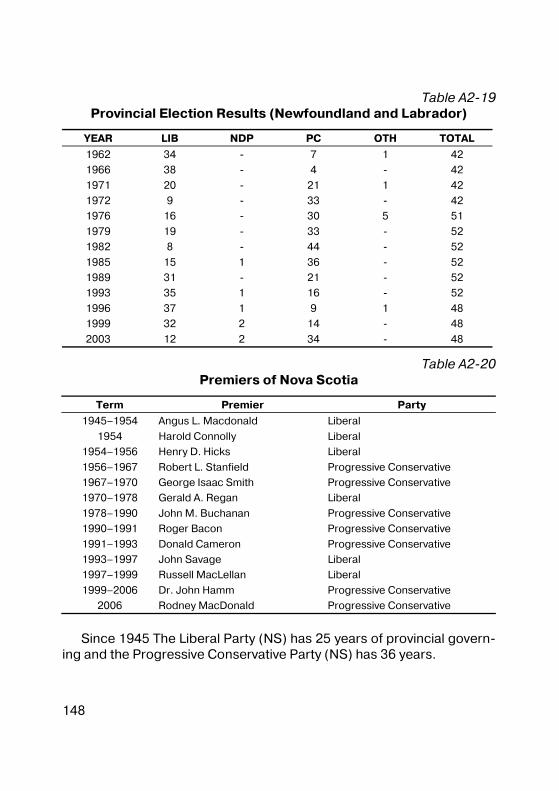
148
Table A2�19 Provincial Election Results (Newfoundland and Labrador)
YEAR LIB NDP PC OTH TOTAL
1962 34 � 7 1 42
1966 38 � 4 � 42
1971 20 � 21 1 42
1972 9 � 33 � 42
1976 16 � 30 5 51
1979 19 � 33 � 52
1982 8 � 44 � 52
1985 15 1 36 � 52
1989 31 � 21 � 52
1993 35 1 16 � 52
1996 37 1 9 1 48
1999 32 2 14 � 48
2003 12 2 34 � 48
Table A2�20 Premiers of Nova Scotia
Term Premier Party
1945–1954 Angus L. Macdonald Liberal
1954 Harold Connolly Liberal
1954–1956 Henry D. Hicks Liberal
1956–1967 Robert L. Stanfield Progressive Conservative
1967–1970 George Isaac Smith Progressive Conservative
1970–1978 Gerald A. Regan Liberal
1978–1990 John M. Buchanan Progressive Conservative
1990–1991 Roger Bacon Progressive Conservative
1991–1993 Donald Cameron Progressive Conservative
1993–1997 John Savage Liberal
1997–1999 Russell MacLellan Liberal
1999–2006 Dr. John Hamm Progressive Conservative
2006 Rodney MacDonald Progressive Conservative
Since 1945 The Liberal Party (NS) has 25 years of provincial govern�
ing and the Progressive Conservative Party (NS) has 36 years.
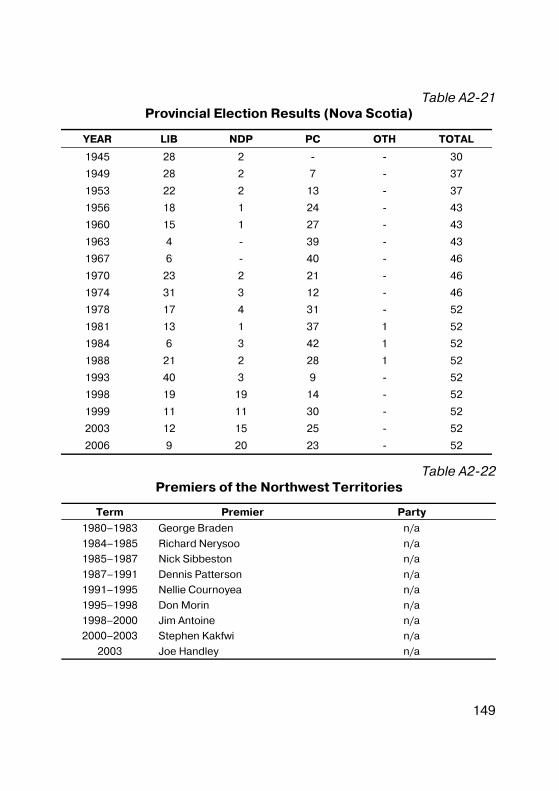
149
Table A2�21 Provincial Election Results (Nova Scotia)
YEAR LIB NDP PC OTH TOTAL
1945 28 2 � � 30
1949 28 2 7 � 37
1953 22 2 13 � 37
1956 18 1 24 � 43
1960 15 1 27 � 43
1963 4 � 39 � 43
1967 6 � 40 � 46
1970 23 2 21 � 46
1974 31 3 12 � 46
1978 17 4 31 � 52
1981 13 1 37 1 52
1984 6 3 42 1 52
1988 21 2 28 1 52
1993 40 3 9 � 52
1998 19 19 14 � 52
1999 11 11 30 � 52
2003 12 15 25 � 52
2006 9 20 23 � 52
Table A2�22 Premiers of the Northwest Territories
Term Premier Party
1980–1983 George Braden n/a
1984–1985 Richard Nerysoo n/a
1985–1987 Nick Sibbeston n/a
1987–1991 Dennis Patterson n/a
1991–1995 Nellie Cournoyea n/a
1995–1998 Don Morin n/a
1998–2000 Jim Antoine n/a
2000–2003 Stephen Kakfwi n/a
2003 Joe Handley n/a
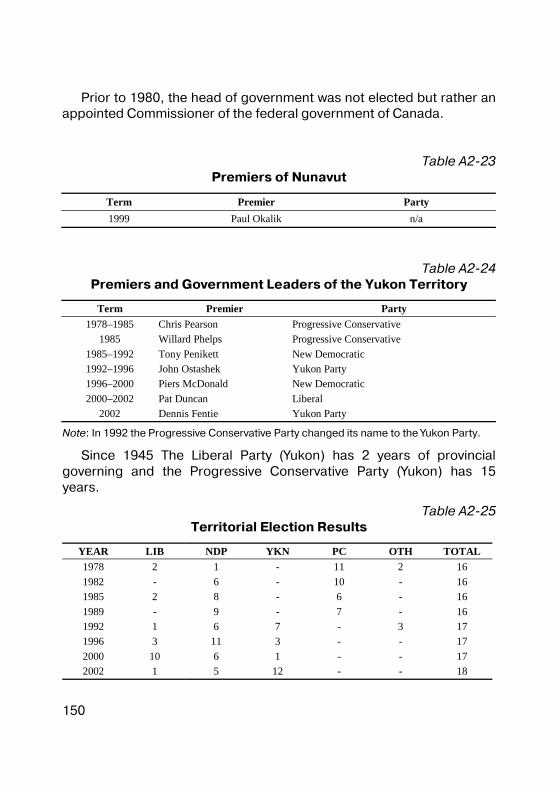
150
Prior to 1980, the head of government was not elected but rather an appointed Commissioner of the federal government of Canada.
Table A2�23 Premiers of Nunavut
Term Premier Party 1999 Paul Okalik n/a
Table A2�24 Premiers and Government Leaders of the Yukon Territory
Term Premier Party 1978–1985 Chris Pearson Progressive Conservative
1985 Willard Phelps Progressive Conservative 1985–1992 Tony Penikett New Democratic 1992–1996 John Ostashek Yukon Party 1996–2000 Piers McDonald New Democratic 2000–2002 Pat Duncan Liberal
2002 Dennis Fentie Yukon Party
Note: In 1992 the Progressive Conservative Party changed its name to the Yukon Party.
Since 1945 The Liberal Party (Yukon) has 2 years of provincial governing and the Progressive Conservative Party (Yukon) has 15 years.
Table A2�25 Territorial Election Results
YEAR LIB NDP YKN PC OTH TOTAL 1978 2 1 - 11 2 16 1982 - 6 - 10 - 16 1985 2 8 - 6 - 16 1989 - 9 - 7 - 16 1992 1 6 7 - 3 17 1996 3 11 3 - - 17 2000 10 6 1 - - 17 2002 1 5 12 - - 18
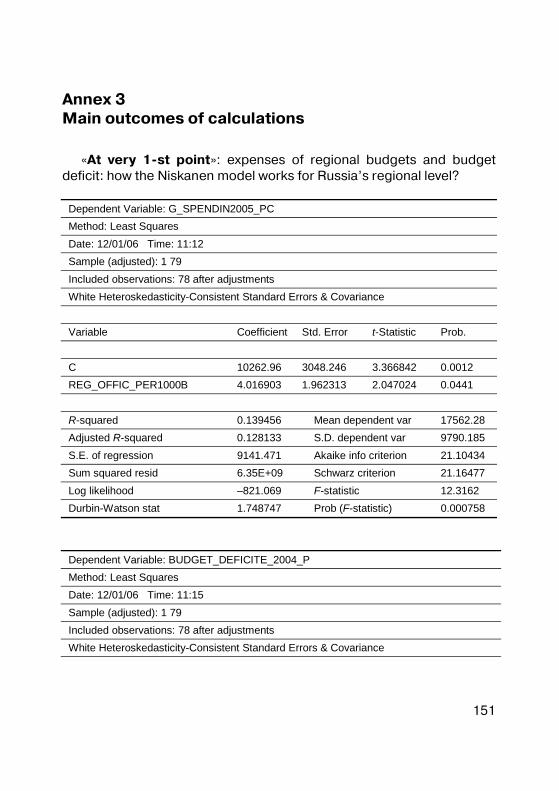
151
Annex 3 Main outcomes of calculations
«At very 1�st point»: expenses of regional budgets and budget deficit: how the Niskanen model works for Russia’s regional level?
Dependent Variable: G_SPENDIN2005_PC Method: Least Squares Date: 12/01/06 Time: 11:12 Sample (adjusted): 1 79 Included observations: 78 after adjustments White Heteroskedasticity-Consistent Standard Errors & Covariance Variable Coefficient Std. Error t-Statistic Prob. C 10262.96 3048.246 3.366842 0.0012 REG_OFFIC_PER1000B 4.016903 1.962313 2.047024 0.0441 R-squared 0.139456 Mean dependent var 17562.28 Adjusted R-squared 0.128133 S.D. dependent var 9790.185 S.E. of regression 9141.471 Akaike info criterion 21.10434 Sum squared resid 6.35E+09 Schwarz criterion 21.16477 Log likelihood –821.069 F-statistic 12.3162 Durbin-Watson stat 1.748747 Prob (F-statistic) 0.000758
Dependent Variable: BUDGET_DEFICITE_2004_P Method: Least Squares Date: 12/01/06 Time: 11:15 Sample (adjusted): 1 79 Included observations: 78 after adjustments White Heteroskedasticity-Consistent Standard Errors & Covariance
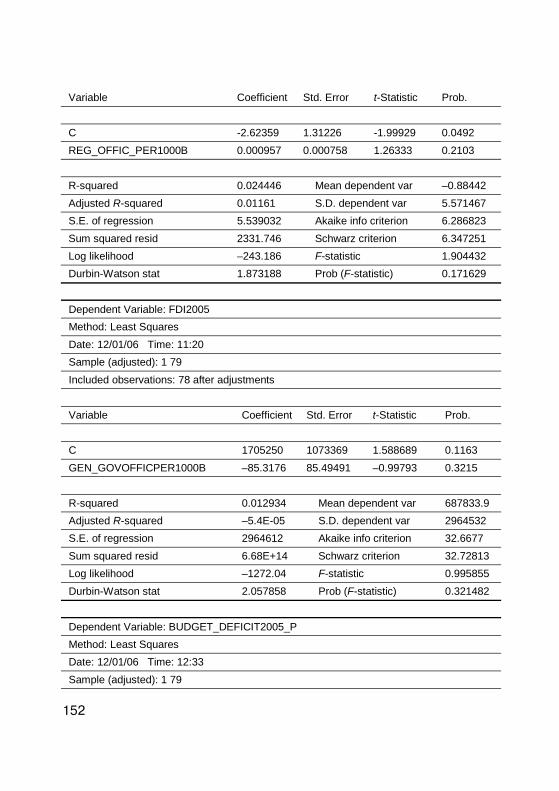
152
Variable Coefficient Std. Error t-Statistic Prob. C -2.62359 1.31226 -1.99929 0.0492 REG_OFFIC_PER1000B 0.000957 0.000758 1.26333 0.2103 R-squared 0.024446 Mean dependent var –0.88442 Adjusted R-squared 0.01161 S.D. dependent var 5.571467 S.E. of regression 5.539032 Akaike info criterion 6.286823 Sum squared resid 2331.746 Schwarz criterion 6.347251 Log likelihood –243.186 F-statistic 1.904432 Durbin-Watson stat 1.873188 Prob (F-statistic) 0.171629
Dependent Variable: FDI2005 Method: Least Squares Date: 12/01/06 Time: 11:20 Sample (adjusted): 1 79 Included observations: 78 after adjustments Variable Coefficient Std. Error t-Statistic Prob. C 1705250 1073369 1.588689 0.1163 GEN_GOVOFFICPER1000B –85.3176 85.49491 –0.99793 0.3215 R-squared 0.012934 Mean dependent var 687833.9 Adjusted R-squared –5.4E-05 S.D. dependent var 2964532 S.E. of regression 2964612 Akaike info criterion 32.6677 Sum squared resid 6.68E+14 Schwarz criterion 32.72813 Log likelihood –1272.04 F-statistic 0.995855 Durbin-Watson stat 2.057858 Prob (F-statistic) 0.321482
Dependent Variable: BUDGET_DEFICIT2005_P Method: Least Squares Date: 12/01/06 Time: 12:33 Sample (adjusted): 1 79
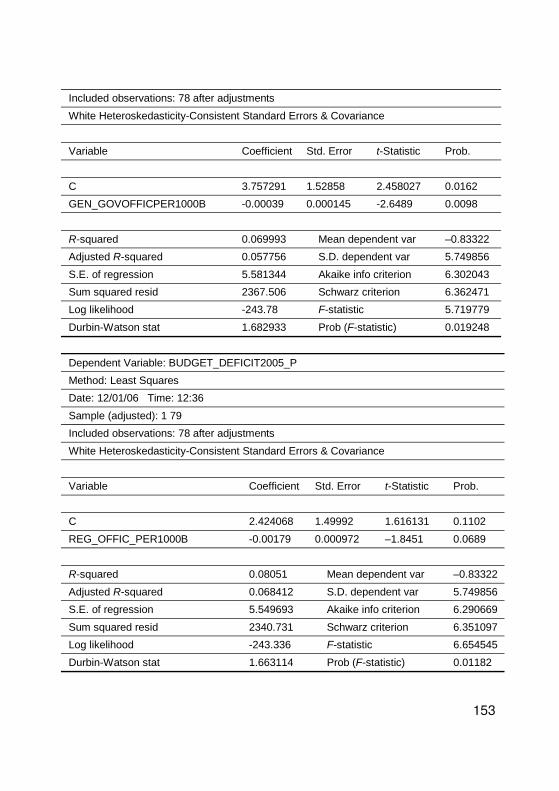
153
Included observations: 78 after adjustments White Heteroskedasticity-Consistent Standard Errors & Covariance Variable Coefficient Std. Error t-Statistic Prob. C 3.757291 1.52858 2.458027 0.0162 GEN_GOVOFFICPER1000B -0.00039 0.000145 -2.6489 0.0098 R-squared 0.069993 Mean dependent var –0.83322 Adjusted R-squared 0.057756 S.D. dependent var 5.749856 S.E. of regression 5.581344 Akaike info criterion 6.302043 Sum squared resid 2367.506 Schwarz criterion 6.362471 Log likelihood -243.78 F-statistic 5.719779 Durbin-Watson stat 1.682933 Prob (F-statistic) 0.019248
Dependent Variable: BUDGET_DEFICIT2005_P Method: Least Squares Date: 12/01/06 Time: 12:36 Sample (adjusted): 1 79 Included observations: 78 after adjustments White Heteroskedasticity-Consistent Standard Errors & Covariance Variable Coefficient Std. Error t-Statistic Prob. C 2.424068 1.49992 1.616131 0.1102 REG_OFFIC_PER1000B -0.00179 0.000972 –1.8451 0.0689 R-squared 0.08051 Mean dependent var –0.83322 Adjusted R-squared 0.068412 S.D. dependent var 5.749856 S.E. of regression 5.549693 Akaike info criterion 6.290669 Sum squared resid 2340.731 Schwarz criterion 6.351097 Log likelihood -243.336 F-statistic 6.654545 Durbin-Watson stat 1.663114 Prob (F-statistic) 0.01182
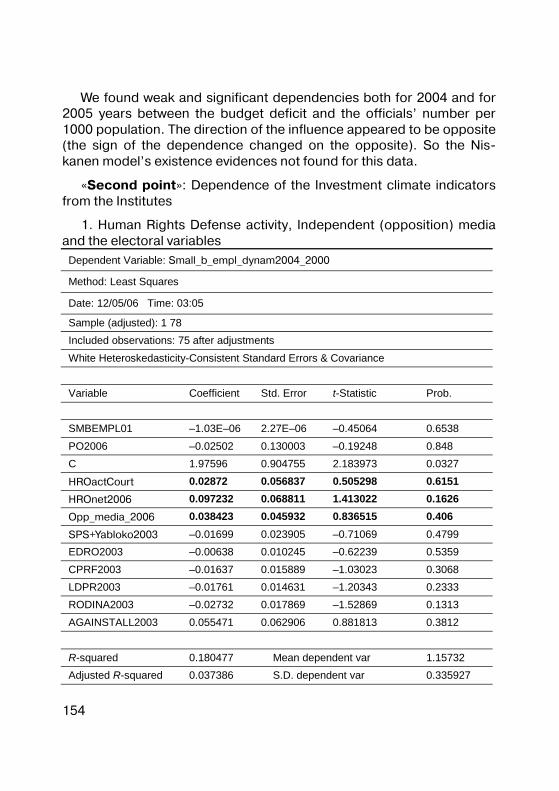
154
We found weak and significant dependencies both for 2004 and for 2005 years between the budget deficit and the officials’ number per 1000 population. The direction of the influence appeared to be opposite (the sign of the dependence changed on the opposite). So the Nis�kanen model’s existence evidences not found for this data.
«Second point»: Dependence of the Investment climate indicators from the Institutes
1. Human Rights Defense activity, Independent (opposition) media and the electoral variables
Dependent Variable: Small_b_empl_dynam2004_2000
Method: Least Squares
Date: 12/05/06 Time: 03:05
Sample (adjusted): 1 78 Included observations: 75 after adjustments White Heteroskedasticity-Consistent Standard Errors & Covariance Variable Coefficient Std. Error t-Statistic Prob. SMBEMPL01 –1.03E–06 2.27E–06 –0.45064 0.6538 PO2006 –0.02502 0.130003 –0.19248 0.848 C 1.97596 0.904755 2.183973 0.0327
HROactCourt 0.02872 0.056837 0.505298 0.6151 HROnet2006 0.097232 0.068811 1.413022 0.1626 Opp_media_2006 0.038423 0.045932 0.836515 0.406 SPS+Yabloko2003 –0.01699 0.023905 –0.71069 0.4799 EDRO2003 –0.00638 0.010245 –0.62239 0.5359 CPRF2003 –0.01637 0.015889 –1.03023 0.3068 LDPR2003 –0.01761 0.014631 –1.20343 0.2333 RODINA2003 –0.02732 0.017869 –1.52869 0.1313 AGAINSTALL2003 0.055471 0.062906 0.881813 0.3812 R-squared 0.180477 Mean dependent var 1.15732 Adjusted R-squared 0.037386 S.D. dependent var 0.335927
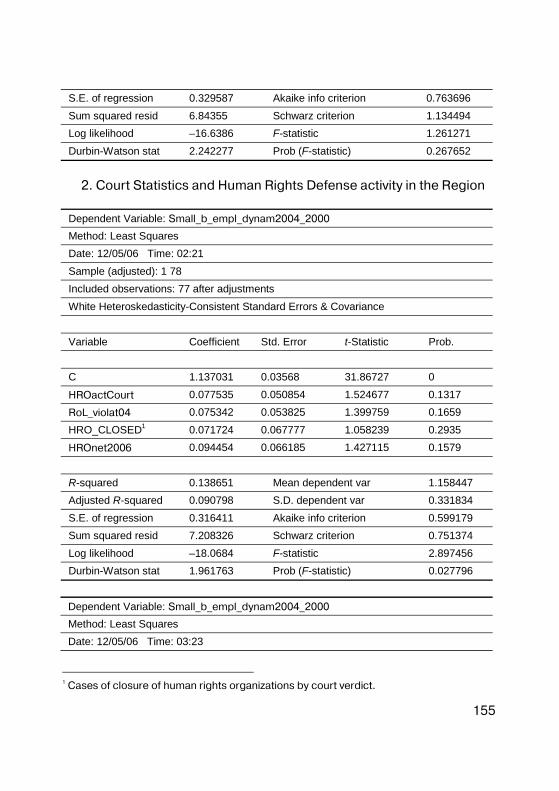
155
S.E. of regression 0.329587 Akaike info criterion 0.763696 Sum squared resid 6.84355 Schwarz criterion 1.134494 Log likelihood –16.6386 F-statistic 1.261271 Durbin-Watson stat 2.242277 Prob (F-statistic) 0.267652
2. Court Statistics and Human Rights Defense activity in the Region
Dependent Variable: Small_b_empl_dynam2004_2000 Method: Least Squares Date: 12/05/06 Time: 02:21 Sample (adjusted): 1 78 Included observations: 77 after adjustments White Heteroskedasticity-Consistent Standard Errors & Covariance Variable Coefficient Std. Error t-Statistic Prob. C 1.137031 0.03568 31.86727 0
HROactCourt 0.077535 0.050854 1.524677 0.1317
RoL_violat04 0.075342 0.053825 1.399759 0.1659 HRO_CLOSED1 0.071724 0.067777 1.058239 0.2935
HROnet2006 0.094454 0.066185 1.427115 0.1579 R-squared 0.138651 Mean dependent var 1.158447 Adjusted R-squared 0.090798 S.D. dependent var 0.331834 S.E. of regression 0.316411 Akaike info criterion 0.599179 Sum squared resid 7.208326 Schwarz criterion 0.751374 Log likelihood –18.0684 F-statistic 2.897456 Durbin-Watson stat 1.961763 Prob (F-statistic) 0.027796
Dependent Variable: Small_b_empl_dynam2004_2000 Method: Least Squares Date: 12/05/06 Time: 03:23
1 Cases of closure of human rights organizations by court verdict.
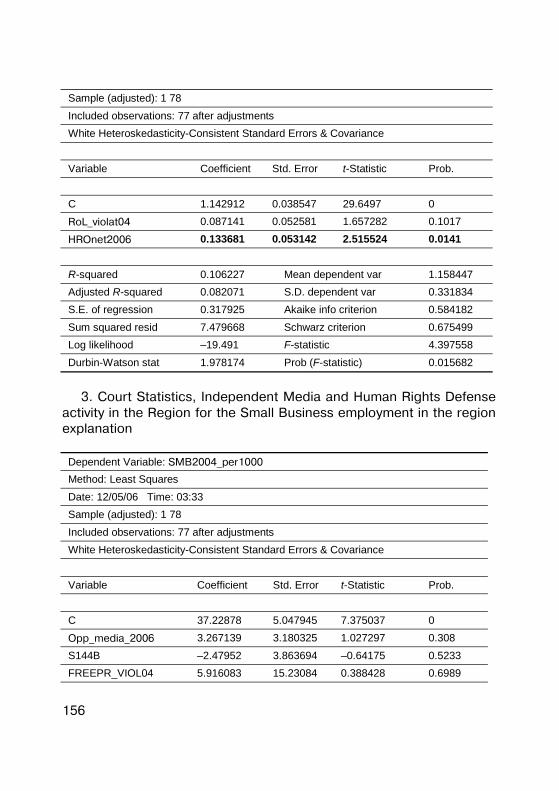
156
Sample (adjusted): 1 78 Included observations: 77 after adjustments White Heteroskedasticity-Consistent Standard Errors & Covariance Variable Coefficient Std. Error t-Statistic Prob. C 1.142912 0.038547 29.6497 0
RoL_violat04 0.087141 0.052581 1.657282 0.1017
HROnet2006 0.133681 0.053142 2.515524 0.0141 R-squared 0.106227 Mean dependent var 1.158447 Adjusted R-squared 0.082071 S.D. dependent var 0.331834 S.E. of regression 0.317925 Akaike info criterion 0.584182 Sum squared resid 7.479668 Schwarz criterion 0.675499 Log likelihood –19.491 F-statistic 4.397558 Durbin-Watson stat 1.978174 Prob (F-statistic) 0.015682
3. Court Statistics, Independent Media and Human Rights Defense
activity in the Region for the Small Business employment in the region explanation
Dependent Variable: SMB2004_per1000 Method: Least Squares Date: 12/05/06 Time: 03:33 Sample (adjusted): 1 78 Included observations: 77 after adjustments White Heteroskedasticity-Consistent Standard Errors & Covariance Variable Coefficient Std. Error t-Statistic Prob. C 37.22878 5.047945 7.375037 0
Opp_media_2006 3.267139 3.180325 1.027297 0.308 S144B –2.47952 3.863694 –0.64175 0.5233 FREEPR_VIOL04 5.916083 15.23084 0.388428 0.6989
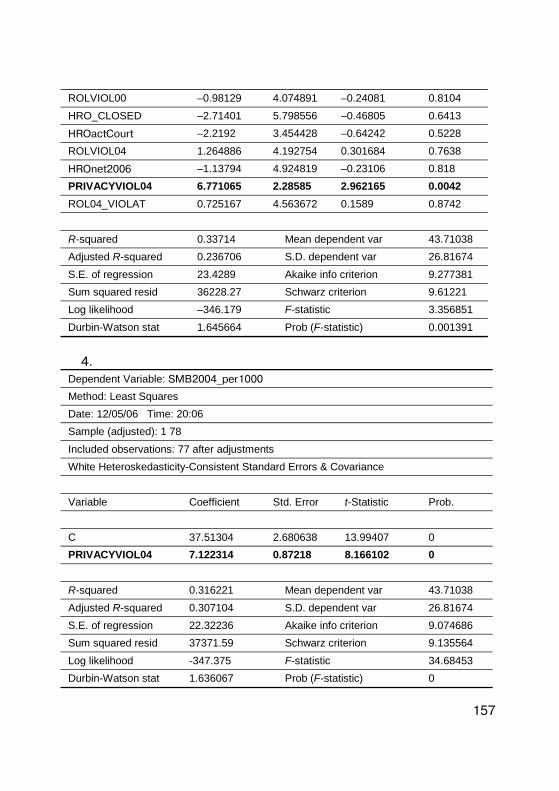
157
ROLVIOL00 –0.98129 4.074891 –0.24081 0.8104 HRO_CLOSED –2.71401 5.798556 –0.46805 0.6413
HROactCourt –2.2192 3.454428 –0.64242 0.5228 ROLVIOL04 1.264886 4.192754 0.301684 0.7638
HROnet2006 –1.13794 4.924819 –0.23106 0.818 PRIVACYVIOL04 6.771065 2.28585 2.962165 0.0042 ROL04_VIOLAT 0.725167 4.563672 0.1589 0.8742 R-squared 0.33714 Mean dependent var 43.71038 Adjusted R-squared 0.236706 S.D. dependent var 26.81674 S.E. of regression 23.4289 Akaike info criterion 9.277381 Sum squared resid 36228.27 Schwarz criterion 9.61221 Log likelihood –346.179 F-statistic 3.356851 Durbin-Watson stat 1.645664 Prob (F-statistic) 0.001391
4.
Dependent Variable: SMB2004_per1000 Method: Least Squares Date: 12/05/06 Time: 20:06 Sample (adjusted): 1 78 Included observations: 77 after adjustments White Heteroskedasticity-Consistent Standard Errors & Covariance Variable Coefficient Std. Error t-Statistic Prob. C 37.51304 2.680638 13.99407 0 PRIVACYVIOL04 7.122314 0.87218 8.166102 0 R-squared 0.316221 Mean dependent var 43.71038 Adjusted R-squared 0.307104 S.D. dependent var 26.81674 S.E. of regression 22.32236 Akaike info criterion 9.074686 Sum squared resid 37371.59 Schwarz criterion 9.135564 Log likelihood -347.375 F-statistic 34.68453 Durbin-Watson stat 1.636067 Prob (F-statistic) 0
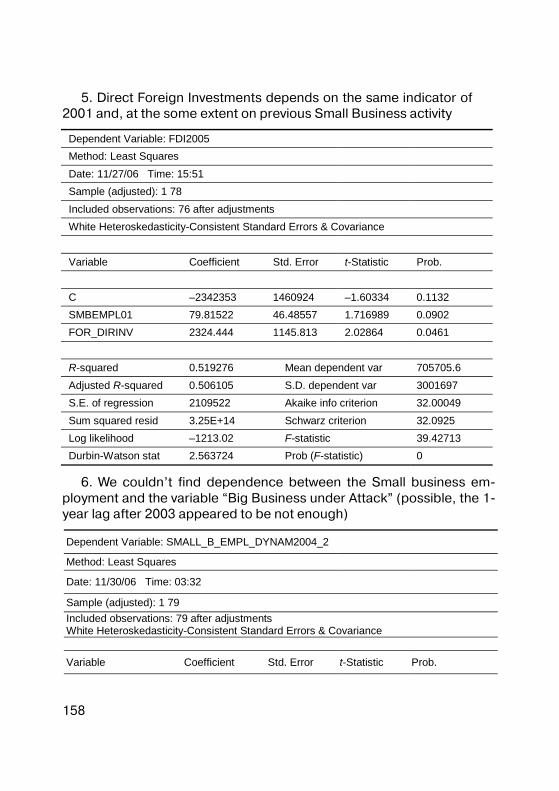
158
5. Direct Foreign Investments depends on the same indicator of 2001 and, at the some extent on previous Small Business activity
Dependent Variable: FDI2005 Method: Least Squares Date: 11/27/06 Time: 15:51 Sample (adjusted): 1 78 Included observations: 76 after adjustments White Heteroskedasticity-Consistent Standard Errors & Covariance Variable Coefficient Std. Error t-Statistic Prob. C –2342353 1460924 –1.60334 0.1132 SMBEMPL01 79.81522 46.48557 1.716989 0.0902 FOR_DIRINV 2324.444 1145.813 2.02864 0.0461 R-squared 0.519276 Mean dependent var 705705.6 Adjusted R-squared 0.506105 S.D. dependent var 3001697 S.E. of regression 2109522 Akaike info criterion 32.00049 Sum squared resid 3.25E+14 Schwarz criterion 32.0925 Log likelihood –1213.02 F-statistic 39.42713 Durbin-Watson stat 2.563724 Prob (F-statistic) 0
6. We couldn’t find dependence between the Small business em�ployment and the variable “Big Business under Attack” (possible, the 1�year lag after 2003 appeared to be not enough)
Dependent Variable: SMALL_B_EMPL_DYNAM2004_2
Method: Least Squares
Date: 11/30/06 Time: 03:32
Sample (adjusted): 1 79 Included observations: 79 after adjustments White Heteroskedasticity-Consistent Standard Errors & Covariance
Variable Coefficient Std. Error t-Statistic Prob.
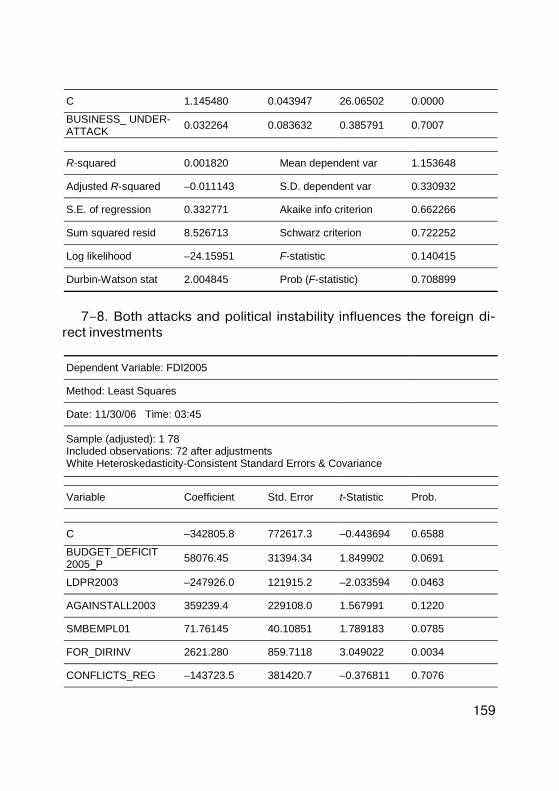
159
C 1.145480 0.043947 26.06502 0.0000
BUSINESS_ UNDER-ATTACK 0.032264 0.083632 0.385791 0.7007
R-squared 0.001820 Mean dependent var 1.153648
Adjusted R-squared –0.011143 S.D. dependent var 0.330932
S.E. of regression 0.332771 Akaike info criterion 0.662266
Sum squared resid 8.526713 Schwarz criterion 0.722252
Log likelihood –24.15951 F-statistic 0.140415
Durbin-Watson stat 2.004845 Prob (F-statistic) 0.708899
7–8. Both attacks and political instability influences the foreign di�
rect investments
Dependent Variable: FDI2005
Method: Least Squares
Date: 11/30/06 Time: 03:45
Sample (adjusted): 1 78 Included observations: 72 after adjustments White Heteroskedasticity-Consistent Standard Errors & Covariance
Variable Coefficient Std. Error t-Statistic Prob.
C –342805.8 772617.3 –0.443694 0.6588
BUDGET_DEFICIT 2005_P 58076.45 31394.34 1.849902 0.0691
LDPR2003 –247926.0 121915.2 –2.033594 0.0463
AGAINSTALL2003 359239.4 229108.0 1.567991 0.1220
SMBEMPL01 71.76145 40.10851 1.789183 0.0785
FOR_DIRINV 2621.280 859.7118 3.049022 0.0034
CONFLICTS_REG –143723.5 381420.7 –0.376811 0.7076
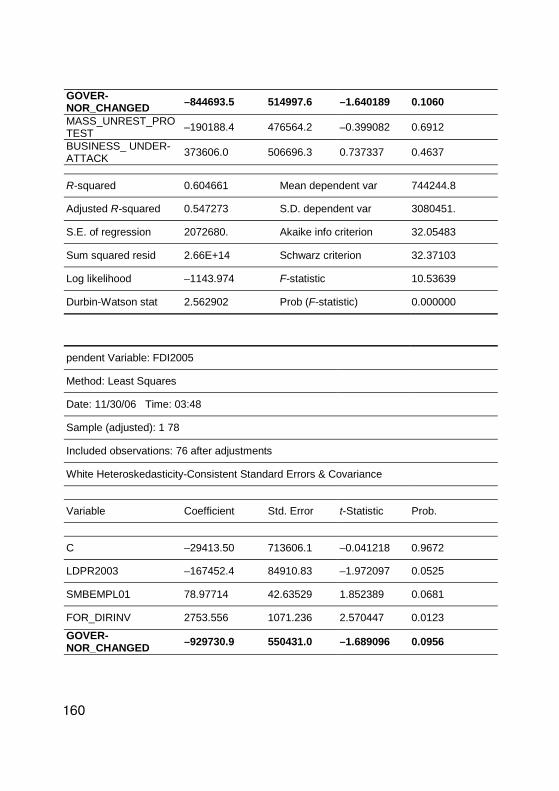
160
GOVER-NOR_CHANGED –844693.5 514997.6 –1.640189 0.1060
MASS_UNREST_PROTEST –190188.4 476564.2 –0.399082 0.6912
BUSINESS_ UNDER-ATTACK 373606.0 506696.3 0.737337 0.4637
R-squared 0.604661 Mean dependent var 744244.8
Adjusted R-squared 0.547273 S.D. dependent var 3080451.
S.E. of regression 2072680. Akaike info criterion 32.05483
Sum squared resid 2.66E+14 Schwarz criterion 32.37103
Log likelihood –1143.974 F-statistic 10.53639
Durbin-Watson stat 2.562902 Prob (F-statistic) 0.000000
pendent Variable: FDI2005
Method: Least Squares
Date: 11/30/06 Time: 03:48
Sample (adjusted): 1 78
Included observations: 76 after adjustments
White Heteroskedasticity-Consistent Standard Errors & Covariance
Variable Coefficient Std. Error t-Statistic Prob.
C –29413.50 713606.1 –0.041218 0.9672
LDPR2003 –167452.4 84910.83 –1.972097 0.0525
SMBEMPL01 78.97714 42.63529 1.852389 0.0681
FOR_DIRINV 2753.556 1071.236 2.570447 0.0123
GOVER-NOR_CHANGED –929730.9 550431.0 –1.689096 0.0956
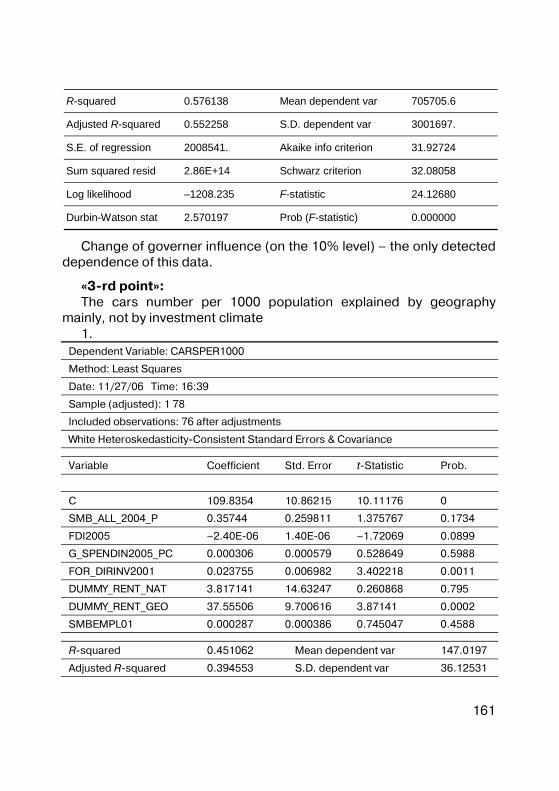
161
R-squared 0.576138 Mean dependent var 705705.6
Adjusted R-squared 0.552258 S.D. dependent var 3001697.
S.E. of regression 2008541. Akaike info criterion 31.92724
Sum squared resid 2.86E+14 Schwarz criterion 32.08058
Log likelihood –1208.235 F-statistic 24.12680
Durbin-Watson stat 2.570197 Prob (F-statistic) 0.000000
Change of governer influence (on the 10% level) – the only detected dependence of this data.
«3�rd point»: The cars number per 1000 population explained by geography
mainly, not by investment climate 1.
Dependent Variable: CARSPER1000
Method: Least Squares
Date: 11/27/06 Time: 16:39
Sample (adjusted): 1 78
Included observations: 76 after adjustments
White Heteroskedasticity�Consistent Standard Errors & Covariance
Variable Coefficient Std. Error t�Statistic Prob.
C 109.8354 10.86215 10.11176 0
SMB_ALL_2004_P 0.35744 0.259811 1.375767 0.1734
FDI2005 –2.40E�06 1.40E�06 –1.72069 0.0899
G_SPENDIN2005_PC 0.000306 0.000579 0.528649 0.5988
FOR_DIRINV2001 0.023755 0.006982 3.402218 0.0011
DUMMY_RENT_NAT 3.817141 14.63247 0.260868 0.795
DUMMY_RENT_GEO 37.55506 9.700616 3.87141 0.0002
SMBEMPL01 0.000287 0.000386 0.745047 0.4588
R�squared 0.451062 Mean dependent var 147.0197
Adjusted R�squared 0.394553 S.D. dependent var 36.12531
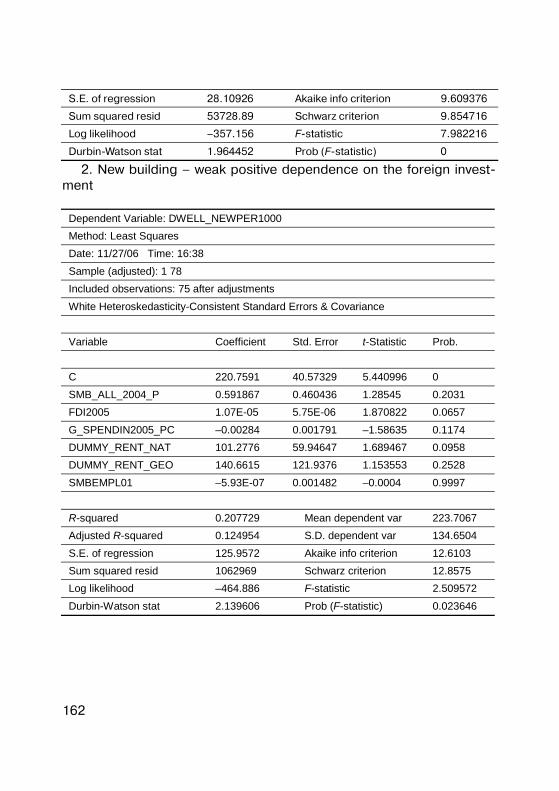
162
S.E. of regression 28.10926 Akaike info criterion 9.609376
Sum squared resid 53728.89 Schwarz criterion 9.854716
Log likelihood –357.156 F�statistic 7.982216
Durbin�Watson stat 1.964452 Prob (F�statistic) 0
2. New building – weak positive dependence on the foreign invest�ment
Dependent Variable: DWELL_NEWPER1000 Method: Least Squares Date: 11/27/06 Time: 16:38 Sample (adjusted): 1 78 Included observations: 75 after adjustments White Heteroskedasticity-Consistent Standard Errors & Covariance Variable Coefficient Std. Error t-Statistic Prob. C 220.7591 40.57329 5.440996 0 SMB_ALL_2004_P 0.591867 0.460436 1.28545 0.2031 FDI2005 1.07E-05 5.75E-06 1.870822 0.0657 G_SPENDIN2005_PC –0.00284 0.001791 –1.58635 0.1174 DUMMY_RENT_NAT 101.2776 59.94647 1.689467 0.0958 DUMMY_RENT_GEO 140.6615 121.9376 1.153553 0.2528 SMBEMPL01 –5.93E-07 0.001482 –0.0004 0.9997 R-squared 0.207729 Mean dependent var 223.7067 Adjusted R-squared 0.124954 S.D. dependent var 134.6504 S.E. of regression 125.9572 Akaike info criterion 12.6103 Sum squared resid 1062969 Schwarz criterion 12.8575 Log likelihood –464.886 F-statistic 2.509572 Durbin-Watson stat 2.139606 Prob (F-statistic) 0.023646
163
Annex 4 Regional conflicts
Conflicts and political stability in Russia’s regions during 2004–2006
This overview represents a summary of information relating to the years 2004–2006, which in many ways is different from the available information concerning the late 1990s and early 2000s that has been made use of within the framework of some of the previously imple�mented CEPRA projects. In the present paper, we discuss conflicts as�sociated with the activities of regional authorities or the instances of a confrontation existing between regional and federal authorities.
From the situation being considered here, Chechnya – as a territory where any legal order is practically nonexistent – has been excluded. Besides, we are not discussing the cities of Moscow and St. Peters�burg, because we have failed to find there any conflicts resulting from direct actions of regional authorities, while it has been very difficult to single out, among all the others, those conflicts that are quite separate from any activities of federal�level structures or from purely local events. The well�known conflicts of 2003–2006 in the oil and gas sector (“the Yukos affair”, “Sahkalin�2”, “Nortgaz”, etc.), that took place at the regional level (in Sakhalin Oblast, Tomsk Oblast and Samara Oblast, and in Khanty-Mansi and Yamal�Nenets Okrugs), while having been ob�viously initiated by Russia’s top authoprities, have not been taken into account here, either, because they have no bearing to the political and economic strategies being pursued by regional authorities, or to the ways these strategies are being perceived by economic agents.
Certain disputable cases (a vacancy resulting from a governor’s “promotion”, or death of a previous governor with a subsequent ap�pointment of one of his closest allies) are not understood here as in�stances of a governor’s rotation.
It should also be well understood that, under the specific Russian conditions of an authoritarian state and the subordination of the judicial system to the executive authority, the prosecution of some or other offi�cials mentioned in this overview reflects the complex struggles going on on the administrative market, and by no means are the consequence of
164
the execution of true justice or struggle against corruption. The struc�ture of the administrative market for the power structures is rather complex in itself. There exists a judicial vertical (through the system of qualification panels consisting of three judges from a superior court, at their highest level subordinate to the Supreme Court appointed by the RF President). The regional agencies of the public prosecutor’s office, the Ministry of Internal Affairs (MIA) and the Federal Security Service report to the corresponding departments in Moscow, while at the same time each of them may pursue its own interests and have no opportuni�ties for making their parallel subdivisions or the judicial system collabo�rate with them (this is, in effect, the origin of some of the acquittals or of the lack of any possibilities for punishing an official). Besides, the direc�tors of regional agencies of the power structures are dependent, in the commercial sphere, on governors – since those times (prior to 2002) when the coordination procedure was, in terms of the law, dependent on the latter, with whom the former are still maintaining some sort of relationship – good or bad. Therefore we perceive any prosecution of a top�level regional official as a consequence of political instability and struggle at the regional level.
This overview addresses both the election and the appointment of governors. The reason is that, beginning from January 2005, governors are appointed by V. Putin, while previously they were elected by univer�sal vote.
The party of power, “United Russia”, is understood as the organiza�tion that has under its control more than 2/3 of the federal parliament elected in 2003. Sometimes a governor at the regional level may not be a member of that party, and then the control over its regional organiza�tion represents a resource which is comparable to the control over one of a region’s key power structures.
The Republic of Adygeya
The Republic has been shaken by several conflicts at once. In 2005, Kh. Sovmen, head of the Republic, attempted to dissolve the opposi�tional regional parliament (which had failed to execute the resolution of the Constitutional Court of Adygeya, issued in 2002, concerning the recognition of some articles in the budget law as being contrary to fed�eral and republican legislation), but the interference of the plenipotenti�
165
ary representative of the RF President in the Southern Federal District (SFD), D. Kozak, protected parliament from dissolution.
On the other hand, the head of the Republic accused D. Kozak of working toward the Republic’s merger with Krasnodar Krai. The conflict ended in 2006, when D. Kozak did not submit the candidacy of the Re�public’s head for the approval by the RF President in accordance with new legislation.
The Republic of Altay
In 2004–2005, parliament put itself in opposition to the head of the Republic, M. Lapshin, and did not give its approval to various proposals concerning cadres or the budget.
The Republic’s Office of Public Prosecutor also launched several at�tacks against M. Lapshin’s ministers – criminal proceedings were initi�ated against A. Afanasiev, Minister for Emergency Situations, for his misuse of official powers when distributing housing certificates, against former Minister of Industry, Construction and Housing�and�Utilities N. Moskalev, and against the former head of the Capital Construction Agency for the Issues of Liquidating the Consequences of the Earth�quake (UKS – 2), S. Borzikhin (for abuses during the construction of objects for the victims of the earthquake). The former head of the Re�public’s Committee for the Policy in the Sphere of Information, Kubashev, was found guilty of “obstructing the lawful professional activity of journalists”. In 2005, Deputy Prosecutor General of in the Southern Federal Okrug Valentin Simuchenkov announced that the Of�fice of Prosecutor General would aim at removing Michael Lapshin from office.
In 2006, the republic was the scene of mass protests against its merger with Altai Krai. Up to five thousand persons, or ten percent of the residents of Gorno�Altaisk, repeatedly demonstrated in the streets of that city.
The Republic of Bashkortostan
In late 2003 – early 2004, the RF Central Electoral Commission re�peatedly restored the electoral rights of candidates from the opposi�tion. Thus, it restored the unregistered S. Veremeenko’s candidacy for the post of President of Bashkiria, and a number of candidacies for Par�
166
liament, while the Office of Public Prosecutor of Bashkiria repeatedly attacked the regional authorities both during the electoral process (for example, it discovered that “The World of Press” printing�house, in or�der to serve the needs of the Baskirian President’s Administration, had printed an issue of false electoral bulletins, and initiated criminal pro�ceedings after charging with this misdeed Radii Khabirov, President of the Republic). Besides, the Office of Public Prosecutor initiated many criminal proceedings concerning the illegal acquisition, by the republi�can leadership, of the state�owned block of shares in “Bashneftehzim”, withdrawn from state ownership and since then having been owned by a sequence of various open�end joint�stock companies.
In 2004–06, the republic was the scene of regular (every few months) actions, in which thousands participated, demanding the re�tirement of Bashkortostan’s President M. Rakhimov, and also protest�ing against the growth of housing�and�utilities tariffs and demanding that R. Divaev and A. Smirnov, CEOs of the Ministry of Internal Affairs, be brought to criminal responsibility for numerous instances of cruel punishment of citizens.
The Republic of Buryatia
None were noted.
The Republic of Dagestan
In 2004, a conflict was developing between the Administration of Khasaviurt and the Republic’s State Council. The Avar opposition was led by Mayor of Khasaviurt Saigidpasha Umakhanov, Champion of the 2000 Olympic Games in Sydney Saigid Murtazaliev, and Deputy of the State Duma G. Makhachev (later joined by the heads of other raions, e.g., head of Kizliar raion V. Burov). The accusation of regional authori�ties of corruption was largely supported by D. Kozak, the RF President’s plenipotentiary representative in the Southern Federal District, and as a result, in 2005, M. Magomedov, Head of the State Council, was forced to resign.
Numerous rallies took place, which were aimed against the policies pursued by the republican and raion authorities (thus, for example, in 2004 in Khasaviurt, Head of the Republic M. Magomedov was accused of having organized politically motivated murders). Many public rallies
167
and conflicts with the militia (police) were noted in Dokuzparinskii and Kumgorkalinskii raions, etc., where the core issue was the distribution of raion lands.
An active redistribution of property is going on in the region. The most notorious incident was the situation around the plant for the pro�duction of mineral waters “Ruchal�su”, which was transferred by I. Yaraliev, Dagestan’s former public prosecutor, into the management of his own relatives, the former later making an attempt, through initiating criminal cases and arrests, to take it back from them.
Ingush Republic
The year 2004 saw a confrontation between the leadership of the re�gional agency of the RF FSS (S. Koriakov) and the Republic’s public prosecutor’s office, with the latter suspecting the former of having cre�ated squadrons of death. The confrontation ended by S. Koriakov being recalled from the Republic.
In 2004–2006, the confrontation continued with the authorities of North Osetia and with the plenipotentiary representative of the RF Presi�dent in the SFD, who supported them, in respect to the issue of return�ing the Ingush refugees to the Prigorodnyi raion located near the bor�der. Many mass rallies took place in this connection.
In 2004, local citizens took over the building of the City Administra�tion in Karabulak, turning out the mayor. A representative of the Repub�lic’s leadership arrived and, instead of arguing with the population, sim�ply dismissed the mayor, I. Arsamakov, from his post (the main accusa�tion being the unjust distribution of lands).
The Republic of Kabardino�Balkaria
In October 2005, the already habitual sporadic public rallies matured into an armed uprising and fighting in Nalchik (with several hundred persons being killed as a result), which were of a mixed character – somewhere between the manifestation of Islamic extremism and armed protests against the unrestricted criminal activities of the republican militia, headed by Minister of Internal Affairs Kh. Shogenov. By repres�sive methods, the authorities curbed the activity of the ethnic opposi�tion, who had been demanding from the authorities in Nalchik that they should implement a well�balanced ethnic policy aimed at maintaining
168
the integrity of territories where ethnic minorities lived as compact enti�ties, while at the same time taking into consideration the interests of different ethnic groups when resolving the personnel issues. This op�position had repeatedly asked the authorities to pay attention to the un�just distribution of resources among the Republic’s raions and towns. As a result, the new Head of the Republic succeeded in engineering Kh. Shogenov’s resignation and then considerably softened the policy.
The Republic of Kalmykia
In 2003–2004, numerous mass protests took place. In September 2004, the adversaries of K. Ilumzhinov, President of Kalmykia, when rallying in Elista, broke through police cordons and directly approached the building of the Republic’s Government. Several hundreds of protes�tors participated in the fights with the special police units, some were killed, and more than 200 persons were arrested. The organizers of the peaceful act of protest are still being subjected to judicial prosecution.
The Republic of Karachaievo�Cherkessia
In 2004, the Republic was in the state of unrest, arising from the re�distribution of property. There was a conflict over the cement plant, owned by the Kaitov family. The junior member of this dynasty, A. Kaitov (who was also a son�in�law to the Republic’s President), killed, during negotiations, a group of his contractors, among whom there was R. Bogatyrev, a member of the Republic’s State Assembly.
Then, the relatives of those who were killed at the President’s son�in�law’s country house, with the support of other people who were also dissatisfied, twice took over the building of the Government of Kara�chaievo-Cherkessia. As for President Batdyev, he disappeared for more than 24 hours and appeared before the public only under the protection of D. Kozak, plenipotentiary representative of the RF President in the SFD. As a result, the murderer was handed over to the judiciary and later prosecuted.
However, conflicts in the commercial sphere still continued – the MIA, loyal to the President, organized checks of the outlets owned by the AZS “Rosneft” and located in the territory of Karachaievo�Cherkessia, whose top manager was I. Tekeev, the uncle of the mur�dered Deputy R. Bogatyrev.
169
Besides, in 2006 a coup�d’etat took place in Cherkessk, during which the elected mayor M. Yakush was dismissed, and the Cherkessk City Duma elected a mew mayor from among its members and made the decision that a five�year contract should be concluded with P. Korotchenko, who is now an acting mayor, for his appointment to the post of the head of city administration. (The Republic’s leadership was against this decision, but the local courts of justice sided with the usurpers).
The Republic of Karelia
In the summer of 2006, “United Russia” and the Head of Karelia were trying to push through the Petrozavodsk City Council (Petrosovet) the new Charter of the City, whereby the mayor was to be appointed. When it became too late, “United Russia” changed its tactics – its frac�tion began to disrupt the sessions on budget issues, attempting to dis�credit both Petrosovet and Mayor V. Masliakov. In the autumn of 2006, Head of Karelia S. Katanandov, who had been for a long time conflicting with Karelia’s municipality, submitted to the newly elected Legislative Assembly the decision concerning the dissolution of the current Petro�zavodsk City Council because of its failure to comply with two court de�cisions. Judicial proceedings concerning the issue of lawfulness of such a decision are now going on.
In August�September 2006, the Republic witnessed a wave of mass�scale unrest associated with nationalistic feelings, caused by several murders in the town of Kondopog committed by migrant Chechens. The majority among the population began to share the view that the reason for the incidents was solely the murderer’s ethnic origins. Some shops owned by Chechens were arsoned. As a result, the murderers gave themselves up to the authorities, and the leadership of the Republic’s law enforcement agencies was dismissed by V. Putin.
The Republic of Komi
In this RF subject, head of the self�government of the city of Sykty�vkar (the Republic’s capital), S. Katunin, supported by A. Karakchiev, leader of the regional office of “United Russia”, in 2004–2005 was in a state of permanent conflict with Head of the Republic of Komi V. Tor�lopov.
170
In 2005, Torlopov succeeded in making the deputies of the city con�cil adopt the decision that City Mayor Katunin should be dismissed from his post. In 2006, A. Karakchiev was replaced, too – by M. Istik�hovskaya, the loyal speaker of Komi’s parliament.
In 2005, the city court dismissed from his post the head of city okrug “Inta” – head of city administration V. Shakhtin, who was in opposition to the head of the Republic. The acting mayor was appointed mayor until the beginning of his sick leave, that is, his dismissal. He did not un�dergo the procedure of reappointment, and therefore was not a legiti�mate acting mayor, from the point of view of law. There also had existed a city council, which last week was dissolved by a court decision.
In 2004–2005, Syktyvkar saw mass protests against the reforming of the housing and utilities sector, but the hugst rallies, numbering more than 5,000 participants, took place in 2006 against the subordination of Ezhvinsky municipality to the city of Syktyvkar.
The Republic of Mariy El
In 2003–2004, Mayor of the city of Volzhsk and deputy of the State Assembly of the Republic of Mariy El N. Svistunov, who had declared his intention to compete during the presidential election with President L. Markelov, was first taken into custody and then prosecuted. “Purges” of the staff of all the city structures were then conducted in Volzhsk.
In 2005, Mayor of Yoshkar�Ola V. Tarkov, who was formally loyal, but probably presented inconveniences in terms of economics, was suc�cessfully dismissed from his post.
The Republic of Mordovia
None were noted.
The Republic of Sakha (Yakutia)
Head of the Republic V. Styrov and Head of the Government of Ya�kutia Ye. Borisov voiced a public accusation of the management of AL�ROSA company, headed by A. Nicheporuk, of having acquired a dia�mond deposit in Angola instead of investing in the prospective devel�opment of the Republic of Sakha. (Nicheporuk is the protege of the Federal Government, who, nevertheless, still does not possess the con�trolling block of shares in ALROSA). The republic’s authorities also ac�
171
cuse Mayor of Yakutsk I. Mikhalchuk of being sympathetic toward the federal center, and are trying to engineer his retirement.
In 2005–2006, the region saw repeated rallies against the federal center’s policy (with slogans like “Fradkov, hands off ALROSA !”, and so on), aimed at the “federalization” of that company’s controlling block of shares.
The Republic of North Osetia – Alania
In 2005, the leadership of the RF State Prosecutor’s Office began its attack on the Republic’s government – Minister of Finance of North Os�etia, K. Urtaev, and its former Prime Minister M. Shatalov were arrested; accusations were filed against Director of the Republic’s tax agency Ch. Zangiev. Observers have explained it by the struggle for power during the formation of the new Cabinet of Ministers under T. Mamsurov.
In 2004 – early 2005, the Republic was being shaken by mass rallies, demanding the retirement of President A. Dzasokhov, who was accused of a criminal failure to act during the events in Beslan. The rallies led to Dzasokhov’s early retirement.
The Republic of Tatarstan (or Tatarstan)
None were noted.
The Republic of Tyva
In 2006, the confrontation between the legislature and the Repub�lic’s President reached its peak. The deputies of the Legislative Assem�bly of Republic of Tyva adopted an appeal to V. Putin concerning the possibility of an early dismissal of Head of the Republic Sherig�ool Oorzhak. Resulting from this situation was a real political crisis, when parliament’s leadership left the party of power – “United Russia” – and joined “Just Russia”. According to preliminary data, during the autumn elections of 2006, the opposition won a majority of votes in parliament. Parliament, however, has not begun to work, and judicial proceedings are still going on in several majority districts.
The Republic of Udmurtia
Although now, in contrast to the situation characteristic of the previ�ous period, the Republic is not being shaken by public conflicts, in the
172
non�public sphere conflicts still persist. Thus, the law enforcement agencies, in conjunction with the Republic’s leadership, have initiated a criminal case against Administrative Affairs Officer of the Administration of Izhevsk A. Beltsev.
In 2004–2006, non�parliamentary opposition was very active in the Republic. Mass rallies and blockages of street traffic have become a matter of ordinary practice, and once an attack aimed at taking over the building of the Republic’s government was attempted. The rallies voice both socially�oriented demands and the demands that the Republic’s Head and the Government should be dismissed.
The Republic of Khakassia
None were noted.
The Republic of Chuvashia
Despite the consolidation of power in the Republic, the parliamen�tary opposition, led by the communists, is also very active. The main slogans at the regularly organized rallies are the demands that a refer�endum concerning the confidence in President Fedorov should be held, that the monetization of privileges should be abolished, that the prob�lems faced by the housing and utilities sector should be solved, and that people should not be evicted from their apartments in accordance with the norms stipulated in the new Housing Code.
Altay Krai
In 2004–2005, the deputies of the local legislative assembly twice appealed to President of Russia V. Putin with the demand that Governor Evdokimov should retire from his post. The governor, in response to this demand, promised that a total check of the implementation of the cur�rent laws would be organized in the krai, by that same President’s Ad�ministration and the Clearing House. The acute conflict was interrupted by the governor’s sudden death in a road accident (his car having ex�ceeded the speed limit), which, by the irony of fate, gave rise to still fur�ther public indignation.
The mass rallies, which were staged in a region with a long�standing tradition of protest, firstly, addressed social issues, voicing the follow�ing demands: that the implementation of the monetization laws should
173
be put an end to; that the free use of public transport by pensioners should be reestablished; and that the unjustly raised tariffs on the hous�ing and utilities services should be abolished. At the same time, quite unexpectedly, there were also mass � scale rallies in support of the driver of the car that had collided with the governor’s cortege, against whom an attempt had been made to accuse him of having violated the traffic regulations. As a result, he was acquitted by a court of justice.
Krasnodar Krai
The main form of internal confrontation here was the policy pursued by the governor and aimed at the subordination of the municipal au�thorities to him. During the governor’s term of office, the heads of more than a half of the krai’s municipal formations were replaced. Thus, in 2005, Mayor of the City of Krasnodar N. Priz was accused of inappro�priate spending of budget funds and dismissed from his post; later on, the same fate befell several deputies of the City Duma, including its chairman V. Kiriushin, against whom the ludicrous charges were filed that the representative body had passed a number of corrupt decisions. There were some cases of peaceful settlement of conflicts – thus, Mayor of Sochi L. Mostovoi agreed to retire voluntarily, after which he, for a certain period of time, was the region’s representative at the Council of the Federation.
Business is being actively repressed in the region. Thus, director of the Krasnodar Krai Agency of the Trade Union of Entrepreneurs “Stronghold of Russia”, Ye. Zhukov, was arrested, as well as former deputy public prosecutor of Krasnodar Krai A. Yesayan, who became a businessman after having quarreled with the former RF General Public Prosecutor V. Ustinov (after the latter’s retirement, Yesayan’s punish�ment was alleviated). Krasnoyarsk Krai
None were noted.
Perm Krai
In 2005, as a result of an attack engineered by the law enforcement agencies, Mayor of Perm A. Kamenev received a conditional sentence of three years and was dismissed from his post, and in 2006, Mayor of Solikamsk M. Bogdanov became the object of a similar attack. Interest�ingly, these attacks were staged not on behalf of the governor, but
174
against his intentions, and were the result, most probably, of the inter�nal logic of redistribution inside the municipalities.
In 2004–2006, the krai, quite unexpectedly, became one of the foci of protest and strike movement; mass rallies and stoppages of road traffic were then staged.
Primorskii Krai
The main line of confrontation was the struggle for control over property of the city of Vladivostok and control over the regional organi�zation of “United Russia” between Governor S. Darkin and Mayor of Vladivostok V. Nikolaev. As a result, the governor passed through the legislature a decision authorizing the transfer of the powers for regulat�ing the city’s lands to the krai administration. The Mayor was also being “brought to reason” by means of initiating a criminal case against Vice�Mayor of Vladivostok A. Budaev.
The main form of protest activity in 2005–2006 became the mass rallies of motorcar drivers, aimed against the possible ban, to be intro�duced in Russia, on the use of cars with right�side steering wheel, where sometimes as many as a thousand vehicles were gathered. As a result, the RF Government abolished such plans. Vladivostok also saw repeated rallies (numbering up to 5,000 persons) in protest against the dramatic increase of the housing and utilities tariffs.
Stavropol Krai
In 2004–2005, the krai was being shaken by the struggle going on between the regional branch of “United Russia”, the party of power, and the Communist Governor A. Chernogorov. In this struggle, the gov�ernor won, first having found appropriate arguments in favor of his own reappointment to his post by V. Putin, and then becoming the leader of “United Russia” after having banished his opponents.
Less successful was his struggle against the heads of the largest municipalities – the cities of Stavropol and Piatigorsk. Mayor of Stavro�pol, Kuzmin, is still, as before, one the most influential persons in the krai, while in Piatigorsk the election of a new loyal mayor was not en�sured, despite the dismissal, with the help of the power structures, of Mayor V. Shestopalov.
175
An active process of property redistribution, with the involvement of the power structures, is going on in the region. Thus, for example, Di�rector of the Mineralnye Vody Gelatin Plant V. Kuzmenko accused Dep�uty Director of the FSB A. Edelev of engineering a criminal case against him and taking over his business. Indeed, after Kuzmenko had been prosecuted, the plant was transferred into the possission of Edelev’s wife Olga. In Stavropol Krai, as a result of mass protests and road traffic blockages in 2004, all the then existing social privileges were preserved in full.
Khabarovsk Krai
None were noted.
Amur Oblast
The principal conflict here is taking place between Governor L. Korotkov and the Russian Joint�Stock Company “UES of Russia” (the governor does not want to lose his block of shares in the Bureiskaia hy�dro�electric power station, but at the same time he is not prepared to make any investments in it), as well as around the issue of tariff�setting for the oblast’s main enterprises.
In this traditionally poor region, massive campaigning is under way against reform in the housing and utilities sector.
Archangelsk Oblast
After the election of Governor of Archangelsk Oblast, N. Kiselev, in 2004, who had been relying on external support and was alien to the oblast’s elite, a conflict developed and still persists between the gover�nor and the legislature’s majority and Mayor of Arkhangelsk A. Don�skoy. Against the latter, a criminal case has been initiated by the oblast public prosecutor’s office, which is now in the phase of investigation.
Astrakhan Oblast
The relatively quiet socio�political situation in the region was aggra�vated in 2005–2006 by large�scale ethnic clashes, mostly with the Che�chen minority (the villages of Yandyki, Pody, etc.).
176
Belgorod Oblast
An open confrontation between Governor Savchenko and the com�pany “Inteko” has existed since the spring of 2005, when the company owned by the wife of the mayor of Moscow, Ye. Baturina, refused to transfer land to the oblast authorities for the construction of a railway line to the Yakovlevskii mine (which is now being constructed), owned by the company “Metall�group” (its owners are believed to be the for�mer RF Prime Minister, V. Chernomyrdin, and his son Vitalii). As a result, the company was subjected to terror – in Belgorod, A. Annenkov, ex�ecutive director of the Open�end Joint�Stock Company “Inteko� Agro”, was assaulted, while in Moscow “Inteko”’s lawyer, D. Shteinberg, was killed). “Inteko” made an attempt to join the electoral list of the Libera�Democratic Party of Russia, which is in opposition to the governor, and bought out the publishing rights to the newspaper “MK v Belgorode”, also oppositional to the governor, but managed to gain only a few seats in the local legislature, and then was forced to withdraw its business from the oblast.
Briansk Oblast
None were noted.
Vladimir Oblast
None were noted.
Volgograd Oblast
In 2006, the long�existing conflict between Governor N. Maksiuta and Mayor of Volgograd, Ye. Ishchenko, exacerbated and approached its climax. The regional organization of “United Russia” declared that it was going into opposition to the mayor, and then expelled him from its ranks. After this, the mayor was arrested on the accusation that he had been paying additional monthly bonuses to his officials, and also had been illegally participating in business activities, for which, however, no evidence was presented. This “pogrom” spread onto the City Duma – the former speaker of the Volgograd City Duma, P. Karev, who was loyal to Ishchenko, was prosecuted for lobbyism.
177
Vologda Oblast
None were noted.
Voronezh Oblast
The main confrontation here is between the dissident Mayor of Vo�ronezh, B. Skrynnikov, who was elected in 2004, Governor V. Kulakov, and “United Russia”.
Beside being unwilling to subordinate to the governor, the mayor is working against assigning plots of land for the construction of objects being lobbied by the governor’s group (for example, the electro�metallurgic mini�plant, which the holding “Maksi�Grupp” wants to con�struct).
Since 2004, the region has been shaken, every few months, by mass�scale rallies directed against the governor’s and “United Rus�sia”’s policy.
Ivanovo Oblast
In 2004–2005, the law enforcement agencies here launched an en�ergetic attack at V. Tikhonov, who was then the oblast’s governor. A criminal case was initiated against him (associated with “Ivavtodor”). This was largely a reflection of the confrontation that emerged in expec�tation of the expiry of the term of office of the standing governor and the appointment of a new one.
Irkutsk Oblast
In 2004–2005, an active struggle aimed at winning a majority in the Legislative Assembly was going on, which resulted in the opposition � leaning speaker, S. Shishkin, being replaced by V. Kruglov, who was loyal to Governor Govorin. After A. Tishanin was appointed governor in 2005, the legislature repeatedly refused to support the various initia�tives put forth by him – both in the sphere of legislation (aimed against the presence of TNK�VR) and in respect to the cadres (e.g., the ap�pointment of Yu. Paranichev to be the post of vice governor).
In 2006, the region was shaken by mass rallies in protest against the plans of “Transneft” to construct an oil pipeline along Lake Baikal’s shore. As a result, V. Putin had to make certain changes to this plan.
178
Kaliningrad Oblast
In 2005–2006, on the eve of the expiry of the term of office of Gover�nor V. Yegorov, the struggle against his reappointment began. Within its framework, Deputy Governor S. Leonov was arrested (on the accusa�tion of having participated in corruption deals). Yegorov‘s administra�tion, together with the owners of the automobile � assembly holding “Avtodor”, was struggling against the abolition, by the federal govern�ment, of the privileges then enjoyed by the holding.
After G. Boos was appointed governor, a conflict arose between him and the majority in the legislature.
Kaluga Oblast
None were noted.
Kamchatka Oblast
In 2005–2006, the public prosecutor’s office of Kamchatka Oblast was conducting a criminal case against Governor M. Mashkovtsev, who was accused of a wrong distribution of the fishing quotas. Mayor of Petropavlovsk – Kasmchatskiy Yu. Golenishchev was dismissed from his post after having been accused of a failure to adequately prepare for the heating season in the oblast, as well as of neglect and abuse of offi�cial powers. The large�scale “purge” carried out under the guidance of public prosecutor Yu. Voitovich is believed to be aimed at preventing the oblast elite from obtaining the senior executive posts in the newly cre�ated Kamchatka Krai.
Kemerovo Oblast
A conflict situation is regularly emerging between the oblast authori�ties and the management of the power engineering sector, the latter refusing to grant to the former the various privileges for both the popu�lation and the enterprises under the governor’s patronage.
The regular surges of unrest and “warning” strikes of miners, who act in conjunction with the oblast administration, are also being made use of as a means of exerting pressure – both on the companies’ own�ers and on the federal authorities.
179
Kirov Oblast
The year 2006 finally saw the anticlimax of the conflict between Gov�ernor N. Shaklein and Mayor of Kirov V. Kiselev, that had been going on for many years. Shaklein managed to draw to his side the public prose�cutor’s office, and the former city mayor was accused of having ex�ceeded his official powers and dismissed from his post. Also, a criminal case was initiated against V. Torsunov, Deputy Director of the Open�end Joint�Stock Company TGK – 5, who was standing as a candidate for the membership in the legislative body. Prosecution was also initi�ated with regard to the business activity of O. Valenchuk, owner of the holding “Sputni”, who was sponsoring the regional opposition.
The governor and his team also took an active part in the conflict over the Kirovo – Chepetskiy Chemical Combine, by merging their joint�stock capital with the other majority holders against “Gazprom”.
During 2004–2006, the region was the arena of mass rallies, mainly voicing social demands, and also directed against the former mayor of Kirov V. Kiselev.
Kostroma Oblast
The most important conflict here is between Governor V. Sher�shunov, who does not belong to any party, and the federal party of power – “United Russia”, led by the member of the State Duma A. Tre�pov. As a result of the efforts of the opposition represented by a coali�tion of parties in opposition (under the patronage of the governor) and the majority candidates, in 2005 “United Russia” lost its control over the oblast’s legislature.
Kurgan Oblast
None were noted.
Kursk Oblast
The principal conflict here took place between Governor A. Mikhailov and Mayor of Kursk S. Maltsev. However, even after the latter’s defeat at the election, the new mayor – V. Surzhikov – has been pursuing the conflict�mongering strategy that was characteristic of his predecessor, although on a less public scale.
180
Leningrad Oblast
None were noted.
Lipetsk Oblast
None were noted.
Magadan Oblast
After the governor election of 2003, where Vice Governor V. Dudov had won, he spent the next one and a half year in gradually ousting his main rival – Mayor of Magadan N. karpenko – from his post. The death of the former governor V. Tsvetkov was followed by a “purge” of the business of which he had been the patron (in particular, Tsvetkov’s ad�viser, V. Tikhacheva, was imprisoned after having been accused of an illegal acquisition of fishing quotas).
Moscow Oblast
The main source of controversy in this region were the attempts made by Governor Gromov to subordinate to himself all the oblast’s municipal formations. In 2004–2006, by a court decision, the results of the election of the head of Sergiev�Posadskii raion were declared to be null and void, which meant the dismissal of the “wrongful” A. Upyrev from the post he had been elected to.
In Shatura raion of Moscow Oblast, in order to prevent the victory of the popular candidate A. Parvitskii, the elections of the raion’s head were artificially cancelled, with the subsequent appointment of an “act�ing head’. Mayor of Dzerzhinskii, V. Dorkin, was killed, and his deputy was prevented from participating in the new election.
An active process of property redistribution is going on in the oblast. The most illustrative example is the events surrounding the Open�end Joint�Stock Company “Stupinskaia metallurgicheskaia kompania” [“Stupino Metallurgical Company”] (where the competing groups of stockholders engineered the arrest of A. Shoror, chairman of the board of directors, while a search was initiated for one of the major stockhold�ers, A. Kuiundzhich, who was accused of crimes that looked very much like “contract” ones).
The oblast has become famous as the scene of the most active mass�scale campign against the monetization of privileges (in Khimki,
181
Solnechnogorsk, etc.), the reason for which is the prominent role being played in the region’s life by commutor transport, the privileges for the use of which were then abolished. After the rallies during which their participants blocked the road traffic and took over some municipal buildings, the money compensations were very noticeably increased.
Murmansk Oblast
None were noted.
Nizhnii � Novgorod Oblast
In 2004–2005, the main conflict was taking place between Governor G. Khodyrev, backed by several prominent financia�industrial groups (including “Russkii aliuminii” [“Russian Aluminum]) and the RF Presi�dent plenipotentiary representative in the Volga Federal District, S. Kirienko. Kirienko succeeded in creating a majority in the legislature, which was rigidly opposed to the governor in respect to the issues of both legislation and cadres. The Legislative Assembly’s representatives went as far as threatening to reject the former governor’s candidacy, if V. Putin were to nominate him once again. Khodyrev was not elected; however, Kirienko did not succeed in appointing his own candidate to the governor’s post, and the region was then headed by the former Vice Mayor of Moscow, V. Shantsev. Srtiving to become the region’s om�nipotent master, he gradually subordinated to himself the majority in the leguslature and in “United Russia”, having ousted Kirienko’s sup�porters. At present, Shantsev is trying to engineer the retirement of Mayor of Nizhnii�Novgorod, V. Bulavinov.
An active process of property redistribution is going on in the oblast. The most notorious precedent was the arrest of the politically active businessman V. Klimentiev, which took place after his attempt to put forth his candidacy, as the head of a political bloc, in an election to the Legislative Assembly.
The mass protests in this region have been of a rather specific char�acter. Thus, eight thousand workers of the car manufacturing giant – the Open�end Joint�Stock Company GAZ � launched an action of pro�test at their working places (both directed against the large�scale job cuts planned by the enterprise’s owners and against the actions of the authorities, from whom it was demanded that they should not allow the
182
growth of prices of the products manufactured by the enterprise’s sub�contractors). These actions were partially successful – indeed, there were no large�scale job cuts.
Novgorod Oblast
None were noted.
Novosibirsk Oblast
None were noted.
Omsk Oblast
None were noted.
Orenburg Oblast
The major conflict in the region is between the governor, A. Cherny�shev, and the Mayor of Orenburg, V. Mishcheriakov who has twice re�tained his office in the contest with the candidates supported by the governor.
Orel Oblast
The major political conflict in the region has to do with the governor’s loss of control over the city of Orel, where the majority of the members of the city council have formed a coalition and selected their own can�didate without heeding the opinion of Ye. Stroyev. The introduction, in the year 2006, of direct voting did not help – the election was won by A. Kasianov, an opponent of the governor.
Penza Oblast
None were noted.
Pskov Oblast
In the election held in Pskov Oblast in 2004, the incumbent governor Ye. Mikhailov, who was the candidate of “United Russia” and was sup�ported by V. Putins plenipotentiary representative in the North – West�ern Federal District I. Klebanov, lost to the entrepreneur M. Kuznetsov. Since then, both “United Russia” and the Plenipotentiary Representa�tive have been equally active in trying to remove him from office – with
183
no success so far. In their struggle against the governor they are sup�ported by Mayor of Pskov, M. Khoronen.
Rostov Oblast
The major political and economic conflict of the past few years was caused by the participation of V. Chub, Governor of the Oblast, in the destruction of the largest Taganrog holding of S. Bidash, who was the owner of the Taganrog Metallurgical Plant, “Krasnyi Kotel’shchik”, and a number of other enterprises. As a result of the concerted efforts on the part of the governor, the power structures and Moscow big busi�ness, S. Bidash’s property was seized, and he himself was imprisoned.
Riazan Oblast
Governor G. Shpak, elected in 2004, has so far failed to take under his control the local branch of “United Russia”. As a result, the head of Riazan’s executive authority F. Provotorov was even excluded, by the party’s Political Council, from the ranks of “United Russia” for having refused to withdraw his candidacy in favor of the candidate put forth thereby.
Samara Oblast
In 2003, a majority opposing Governor K. Titkov was formed in the Gubernia’s Duma by the members of the “United Russia” faction and the “People’s Power” faction, unofficially headed by Mayor of Samara Georgii Limanskii, the perpetual opponent of Mr. Titkov. However, Mr. Titkov did manage to demonstrate a lot of political flexibility. He started with disavowing the SDPR’s decision to participate in the Duma elec�tions on the basis of party lists, then he supported “United Russia” at the Duma elections in December 2003, then backed G. Limanskii in his confrontation with the City Duma, and then invited S. Sychev, the head of the regional electoral headquarters of “United Russia”, to take the post of Vice�Governor. As a result, the opponents of the governor be�came completely disorganized, and in the year 2005 Titov succeeded in being reappointed as governor.
However, a group of the governor’s foes, headed by the member of the Council of the Federation V. Ishchuk, still remains influential in
184
“United Russia”, and his veteran opponent V. Trkhov was elected Mayor of Samara.
The region has become a scene of active property redistribution. Thus, enormous tax claims were filed against “Volgotanker”, and a search for its management was officially initiated, which was justly characterized by even the Gubernia’s Duma as an attempt at raider takeover on the part of Moscow financial and industrial groups.
Saratov Oblast
In 2004–06, Governor Aiatskov managed to get involved in conflicts with nearly everybody – with Mayor of Saratov Iu. Aksenenko, with the majority of members of the Oblast Duma, and with the Oblast Office of Public Prosecutor headed by A. Bondar, who regularly initiated criminal proceedings against members of the local government. As a result, P. Ipatov was appointed instead of Aiatskov, and search was initiated for the former executive officer of Sratov Oblast’s government, P. Boiko, and for Aiatskov’s wife, O. Sergeeva, the director of the hotel complex “Oktiabr’skii”. The materials of the investigation are being prepared for referring to the court.
However, the new governor, too, is engaged in a conflict with Sara�tov municipal authorities (in 2006 he succeeded in removing Iu. Akse�nenko from office) and a considerable number of local legislators.
Sakhalin Oblast
For a long time, the role of opposition at the regional level here had been played by the city authorities of Iuzhno�Sakhalinsk, headed by F. Sidorenko, the veteran opponent of Governor I. Farkhutdinov (who per�ished in 2004). After this, F. Sidorenko announced his bid for govewrnorship – it was his third attempt – and once again lost, this time to Farkhutdinov’s successor, I. Malakhov. In 2005, Sidorenko decided not to run for the office of mayor, and only then the situation became relatively stabilized. Nevertheless, a number of municipalities still re�main in opposition to the governor.
Sverdlovsk Oblast
The major conflict in the oblast is that between Governor E. Rossel and Mayor of Ekaterinburg A. Chernetskii. The conflict has been lasting
185
for more than ten years, during which they were desperately trying – to no avail – to get rid of each other. Also, Ekaterinburg continues to be the scene of property redistribution, taking place with an active in�volvement of the power structures, which resulted in the murder, in 2004, of one of the prominent Ekaterinburg businessmen, A. Khabarov, who was killed in a Ekaterinburg investigatory isolation ward, and in ini�tiating the search for another deputy, A. Varaksin.
In spite of having a relatively high standard of living, the region is characterized by regular mass protests on the part of workers com�plaining of the accumulating arrears of their wages.
Smolensk Oblast
In 2005–06, there was a significant worsening of relations between Governor V. Maslov and his erstwhile protйgй, Mayor of Smolensk V. Khaletskii (their contradictions were mainly associated with the man�agement of municipal property).
Tambov Oblast
None were noted.
Tver Oblast
After D. Zelenin was elected governor of the oblast, he made an at�tempt to place local municipal authorities, first of all the Tver municipal�ity, under his control. By tradition, the Tver Oblast Office of Public Prosecutor has always been playing a significant role in local conflicts. In 2006, Chairman of the Tver City Duma, V. Pochtarev, and several deputies were arrested, reputedly for lobbying the interests of certain financial groups in return for bribes. Criminal proceedings were also initiated against Mayor of Tver O. Lebedev, but he managed to stop them with the help of the RF Procurator – General’s Office.
Tomsk Oblast
The region was the scene of a low�intensity conflict between Gover�nor V. Kress and the mayor of Tomsk. As a result, in 2006 A. Makarov, one of the most influential regional politicians who had been Mayor of Tomsk for more than ten years, was arrested. One of the reasons for his arrest – which had increased the number of his enemies – was his join�
186
ing the competition for the top jobs in the list of “United Russia” for the forthcoming elections. At the present time, Makarov and his team are striving to preserve their control over the city, that is, to prevent the ap�pointment of “deputies” disloyal to them. They have also put forward a group of their candidates for election to the local legislature.
Tula Oblast
Prior to the appointment of V. Dudka to the post of Governor of Tula Oblast, the oblast authorities were engaged in an active confrontation with the Tula municipality, headed by S. Kozakov. Soon after the ap�pointment of Dudka, Kazakov retired from his office.
The region was rocked by mass protest of social character, taking place in “company cities” (Novomoskovsk, Yasnogorsk, etc.).
Tumen Oblast
None were noted.
Ulianovsk Oblast
After the election, in 2004, of the new governor, S. Morozov, and the new mayor of Ulianovsk, S. Yermakov, the acute confrontation between the municipal and oblast administrations came to an end. However, since the reappointment of Morozov to the post of governor in the year 2006, the preconditions for such a conflict were created once again. At the present time, a conflict associated with the distribution of budget funds is rapidly developing in the oblast.
The poverty and chronic indebtedness of oblast and city authorities gave rise to a permanent and periodically rather acute conflict with the actual creditors – the Gazprom and the Russian Joint – Stock Company “UES of Russia”.
Ulianovsk Oblast is one of the focal points of the protest movement. Mass meetings and the blocking of roads, as a rule in response to the rising of tariffs in the housing and utilities sector or in protest against the activity of regional and local authorities, take place in the region on a regular basis.
187
Cheliabinsk Oblast
For a number of years, the oblast authorities have been constantly attacked by the law – enforcement agencies aiming, as it is generally believed, at replacing the governor. Thus, in the year 2006, Deputy – Governor of Cheliabinsk Oblast, Head of the Administration, K. Bochka�rev, was arrested (on a charge of having exceeded his official author�ity), and before that, First Deputy Governor of Cheliabinsk Oblast, V. Timashov, was brought to criminal responsibility (he was charged with abuse of office and bribe�taking).
In 2005, the governor managed to force Mayor of Cheliabinsk A. Ta�rasov to retire, thus putting an end to the long�standing conflict with him over the distribution of budget funds (and over the leadership of “United Russia”.
Chita Oblast
None were noted.
Yaroslavl Oblast
In 2004, Governor A. Lisitsin leveled criticism at the policy of the RF Ministry of Finance and of Minister A. Kudrin. Very soon, criminal pro�ceedings were initiated against him – the Governor was charged with signing some reputedly harmful laws adopted by the legislature (!), and a search was announced for Vice�Governor A. Sazonov. It took two years to settle the conflict, and in 2006 the case was closed.
The governor is engaged in a permanent conflict with the municipal authorities of the city of Rybinsk. Under the governor’s pressure, Mayor V. Rubtsov retired from office, but soon afterwards the governor began to demand the retirement of his own appointee Ye. Sdvizhkov as well.
Jewish Autonomous Oblast
None were noted.
Agin�Buriat Autonomous Okrug
None were noted.
188
Koriak Autonomous Okrug
In 2005, the region was badly struck by an energy crisis. Governor V. Loginov was removed from office by President Putin, and his deputy, M. Sokolowskii, was sentenced to jail for the embezzlement of funds allo�cated to the power�engineering sector.
The new governor, O. Kozhemiako, has managed not only to im�prove the situation in power engineering, but also to establish working relations with the oppositional majority of the Okrug Duma.
Nenets Autonomous Okrug
In 2006, Governor of Nenets Autonomous Okrug A. Barinov was ar�rested as a result of his refusal to recall his representative in the RF Council of the Federation (he was charged with swindling and embez�zlement in the course of commercial activity) – he was the last publicly elected governor and had defeated Mr. V. Shmakov, the candidate of “United Russia” and the Plenipotentiary Representation of the President in the North�Western District. There were also some other reasons for the conflict, apart from the formal one, – Barinov had caused displeas�ure by his insufficient diligence concerning “Rosneft” (he himself is of “Lukoil” extraction) and by his opposition to the Plenipotentiary Repre�sentation’s plans to merge the two subjects of the Federation – the Ok�rug and Arkhangelsk Oblast.
The Okrug became the scene of mass protests against the removal from office and the subsequent arrest of A. Barinov. There were also mass actions in support of the initiative of Nenets MPs, who had pro�posed to the State Duma some amendments to the RF Budget Code designed to abolish the dependence of the Okrug budget on the Budget of Arkhangelsk Oblast.
Taimyr (Dolgano � Nenets) Autonomous Okrug
In 2003, the mayor election in Norilsk was won by V. Melnikov, the leader of the metallurgical combine trade�union, an outspoken oppo�nent of the combine’s owners. The court decision to declare the elec�toral results to be null and void availed to nothing – Melnikov won for the second time at the new election. Since then, the city has repeatedly demonstrated its independent position with regard to the Okrug au�thorities controlled by “Norilsk Nickel”.
189
In 2003–04, in the course of negotiations and warning strikes, the workers of the combine managed to achieve certain wage increases.
Ust’�Ordynskii Buriatskii Autonomous Okrug
The Okrug Duma of Ust�Ordynsk Buriat Autonomous Okrug actively protested against the Okrug’s merger with Irkutsk Oblast, demanding that its status of a national and cultural autonomy be preserved. The protests were, however, fruitless – a falsified referendum took place (with a 98�percent participation, etc.), which rubberstamped the corre�sponding decisions.
Khanty�Mansi Autonomous Okrug
None were noted.
Chukotskii Autonomous Okrug
None were noted.
Evenk Autonomous Okrug
None were noted.
Yamal�Nenets Autonomous Okrug
Since the late 1990s, there has always existed a certain tension in the relations between the okrug authorities and “Gazprom”, the owner of the major deposits of natural gas in the Okrug (the okrug authorities used to support the independent gas producers – “Nortgaz”, and espe�cially “NOVATEK”). In 2004–05, the law�enforcement agencies con�ducted repeated audits of these mentioned companies and checks of the activity of Vice�Governor I. Levinzon (these initiatives were strongly encouraged by P. Latyshev, the Plenipotentiary Representative of the RF President in the Urals Federal District, which forced them to signifi�cantly reduce their ambitions (for example, “Nortgaz” was forced to hand over its controlling block of shares to “Gazprom”, and Levinzon retired from office). The merger of the autonomous okrugs with Tiumen Oblast was also on the agenda.
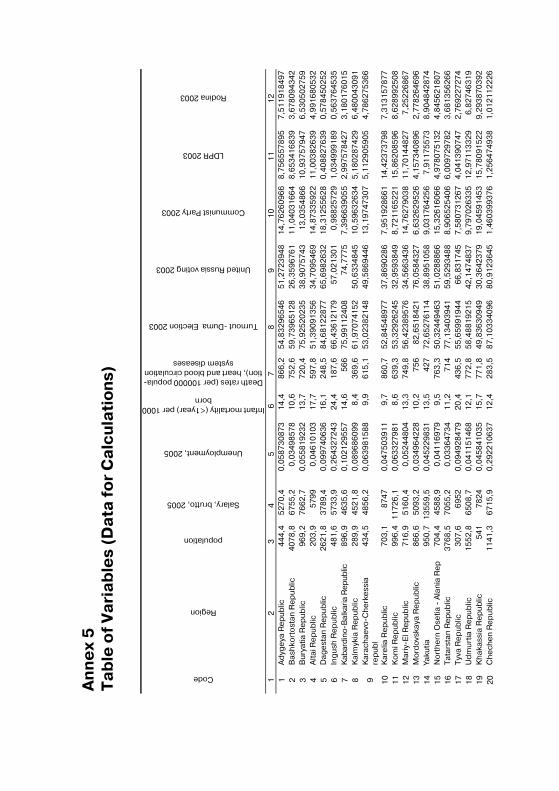
An
ne
x 5
T
ab
le o
f V
ari
ab
les
(Da
ta f
or
Ca
lcu
lati
on
s)
Code
Region
population
Salary, brutto, 2005
Unemployment, 2005
Infant mortality (<1year) per 1000 born
Death rates (per 100000 popula�tion), heart and blood circulation
system diseases
Turnout �Duma Election 2003
United Russia voting 2003
Communist Party 2003
LDPR 2003
Rodina 2003
1
2
3
4
5
6
7
8
9
10
1
1
12
1
A
dyg
eya
Re
pu
blic
4
44
,4
52
70
,4
0,0
58
73
08
73
14
,48
66
,25
4,8
32
96
54
65
1,2
72
39
48
14
,76
26
09
66
8
,75
65
57
89
5
7,5
11
91
84
97
2
Bas
hko
rto
stan
Re
pu
blic
4
07
8,8
6
75
5,2
0
,03
49
85
78
10
,67
52
,65
9,7
39
65
12
82
6,3
59
67
61
11
,04
03
16
64
8
,65
34
16
83
9
3,6
78
09
43
42
3
Bu
ryat
ia R
ep
ub
lic
96
9,2
7
66
2,7
0
,05
58
19
23
21
3,7
72
0,4
75
,92
52
02
35
38
,90
75
74
31
3,0
35
48
66
1
0,9
37
57
94
7
6,5
30
50
27
59
4
Alta
i Re
pu
blic
2
03
,9
57
99
0
,04
61
01
03
17
,75
97
,85
1,3
90
91
35
63
4,7
09
54
69
14
,87
33
59
22
1
1,0
03
82
63
9
4,9
91
68
05
32
5
Dag
est
an R
ep
ub
lic
26
21
,8
37
89
,4
0,0
99
74
06
36
16
,12
48
,58
4,6
81
22
87
76
5,6
98
26
32
18
,31
25
56
28
0
,40
88
27
63
9
0,5
78
45
02
52
6
Ing
ush
Rep
ub
lic
48
1,6
5
73
3,9
0
,26
43
27
24
32
4,4
18
7,6
66
,43
61
21
79
57
,02
13
01
0,9
88
25
72
9
1,0
34
99
91
89
0
,56
37
64
53
57
K
abar
din
o�B
alka
ria R
epub
lic
89
6,9
4
63
5,6
0
,10
21
29
55
71
4,6
56
67
5,9
91
12
40
87
4,7
77
57
,39
66
39
05
5
2,9
97
57
84
27
3
,18
01
76
01
58
K
alm
ykia
Rep
ub
lic
28
9,9
4
52
1,8
0
,08
96
86
09
98
,43
69
,66
1,9
70
74
15
25
0,6
33
48
45
10
,59
63
26
34
5
,18
02
87
42
9
6,4
80
04
30
91
9
Kar
ach
aevo
�Ch
erk
ess
ia
rep
ub
l 4
34
,5
48
56
,2
0,0
63
98
15
88
9,9
61
5,1
53
,02
38
21
48
49
,58
69
44
61
3,1
97
47
30
7
5,1
12
90
59
05
4
,78
62
75
36
6
10
K
are
lia R
ep
ub
lic
70
3,1
8
74
7
0,0
47
50
39
11
9,7
86
0,7
52
,84
54
89
77
37
,86
90
28
67
,95
19
28
66
1
14
,42
37
37
98
7
,31
31
57
87
71
1
Ko
mi R
ep
ub
lic
99
6,4
1
17
26
,1
0,0
63
32
79
81
8,6
63
9,3
53
,32
92
62
45
32
,95
93
84
98
,72
11
65
22
1
15
,86
20
85
96
8
,62
89
92
50
81
2
Mar
iy�E
l Re
pu
blic
7
16
,9
51
60
,4
0,0
52
44
80
41
3,3
74
9,8
56
,42
38
95
76
34
,56
63
43
61
4,7
62
79
03
8
11
,70
14
48
27
7
,25
22
68
67
13
M
ord
ovs
kaya
Re
pu
blic
8
66
,6
50
93
,2
0,0
34
96
42
28
10
,27
56
82
,65
18
42
17
6,0
58
43
27
6,6
32
62
95
26
4
,15
73
40
89
6
2,7
78
26
46
96
14
Ya
kutia
9
50
,7
13
55
9,5
0
,04
52
29
83
11
3,5
42
77
2,6
52
76
11
43
8,8
95
10
58
9,0
31
76
42
56
7
,91
17
55
73
8
,90
48
42
87
41
5
No
rth
ern
Ose
tia �
Ala
nia
Re
p
70
4,4
4
58
8,9
0
,04
11
69
79
9,5
76
3,3
50
,32
44
94
63
51
,02
88
86
61
5,3
26
16
06
6
4,9
78
07
51
32
4
,84
56
21
80
71
6
Tat
arst
an R
ep
ub
lic
37
68
,5
70
55
,2
0,0
33
64
73
41
1,2
71
47
7,1
34
03
94
15
9,5
29
34
88
8,9
06
52
54
06
6
,00
97
29
78
2
3,6
81
35
62
66
17
T
yva
Re
pu
blic
3
07
,6
69
52
0
,09
49
28
47
92
0,4
43
6,5
55
,65
99
19
44
66
,83
17
45
7,5
80
73
12
67
4
,04
13
90
74
7
2,7
69
22
72
74
18
U
dm
urt
ia R
ep
ub
lic
15
52
,8
65
08
,7
0,0
41
15
14
68
12
,17
72
,85
8,4
88
19
21
54
2,1
47
48
37
9,7
97
02
63
35
1
2,9
71
13
32
9
6,8
27
46
31
91
9
Kh
akas
sia
Re
pu
blic
5
41
7
82
4
0,0
45
84
10
35
15
,77
71
,84
9,8
36
30
94
93
0,3
64
23
79
19
,04
59
14
53
1
5,7
80
91
52
2
9,2
93
87
03
92
20
C
he
che
n R
ep
ub
lic
11
41
,3
67
15
,9
0,2
92
21
06
37
12
,42
83
,58
7,1
03
34
09
68
0,9
12
36
45
1,4
60
39
93
76
1
,25
64
74
93
8
1,0
12
11
22
26
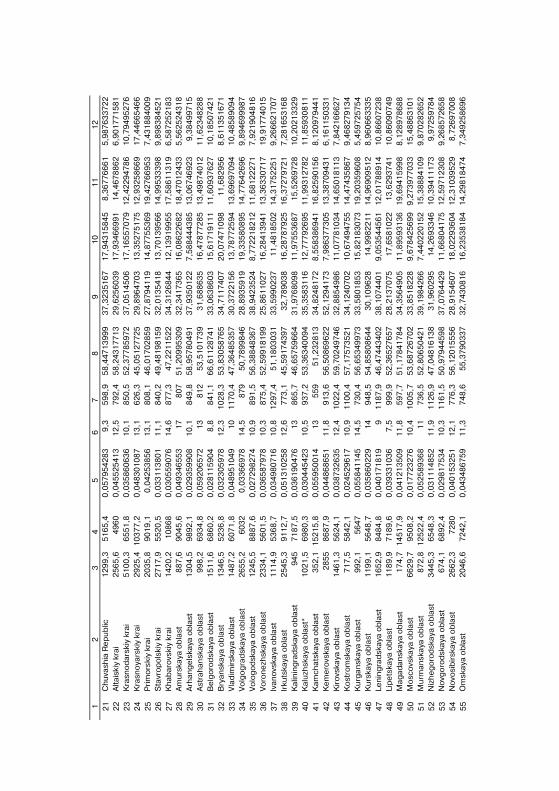
1
2
3
4
5
6
7
8
9
10
1
1
12
2
1
Ch
uvas
hia
Re
pu
blic
1
29
9,3
51
65
,4
0,0
57
95
42
83
9
,35
98
,95
8,4
47
13
99
93
7,3
23
51
67
17
,94
31
58
45
8
,36
77
66
61
5
,98
76
33
72
22
2
Alta
iski
y kr
ai
25
65
,64
96
0
0,0
45
52
54
13
1
2,5
79
2,4
58
,24
31
77
13
29
,62
56
03
91
7,9
34
66
99
1
14
,46
78
86
2
6,9
01
77
15
81
23
K
rasn
od
arsk
iy k
rai
51
00
,36
55
1,8
0
,03
58
60
63
6
10
,18
50
,55
2,3
77
85
97
23
7,0
51
45
06
17
,16
55
70
79
1
2,4
22
94
78
6
10
,79
49
52
76
24
K
rasn
oya
rski
y kr
ai
29
25
,41
03
77
,2
0,0
48
30
10
87
1
3,1
62
6,3
45
,05
12
77
25
29
,89
64
70
31
3,3
52
75
17
5
12
,93
25
86
69
1
7,4
46
65
46
62
5
Pri
mo
rski
y kr
ai
20
35
,89
01
9,1
0
,04
25
38
56
1
3,1
80
8,1
46
,01
70
28
59
27
,87
94
11
91
4,8
77
55
36
9
19
,42
76
69
53
7
,43
18
84
00
92
6
Sta
vro
po
lski
y kr
ai
27
17
,95
52
0,5
0
,03
31
13
80
1
11
,18
40
,24
9,4
81
98
15
93
2,0
13
54
18
13
,70
13
95
66
1
4,9
95
33
39
8
9,8
98
38
45
21
27
K
hab
aro
vski
y kr
ai
14
20
,21
08
68
0
,03
05
59
07
6
14
,68
77
,34
7,2
21
15
22
34
,31
26
84
41
2,1
39
19
95
5
17
,58
61
13
19
6
,58
72
52
18
32
8
Am
urs
kaya
ob
last
8
87
,69
04
5,6
0
,04
93
46
55
3
17
80
75
1,2
09
95
30
93
2,3
41
73
65
16
,08
62
26
82
1
8,4
70
12
43
3
5,5
62
52
43
18
29
A
rhan
ge
lska
ya o
bla
st
13
04
,59
89
2,1
0
,02
93
59
90
8
10
,18
49
,85
8,9
57
80
49
13
7,9
35
01
22
7,5
88
44
43
85
1
3,0
67
46
92
3
9,3
84
99
71
53
0
Ast
rah
ansk
aya
ob
last
9
98
,26
93
4,8
0
,05
92
06
57
2
13
81
25
3,5
10
17
39
31
,68
86
35
16
,47
87
72
85
1
3,4
98
74
01
2
11
,62
34
82
88
31
B
elg
oro
dsk
aya
ob
last
1
51
1,6
68
60
,2
0,0
28
11
59
04
8
,88
41
,16
6,6
11
28
74
13
3,0
63
86
03
15
,61
71
91
11
1
1,6
09
37
62
7
10
,18
50
74
21
32
B
ryan
skay
a o
bla
st
13
46
,55
23
6,8
0
,03
23
05
97
8
12
,31
02
8,3
53
,83
05
87
65
34
,71
17
40
72
0,0
74
71
09
8
11
,68
29
56
8
,61
13
51
67
13
3
Vla
dim
irsk
aya
ob
last
1
48
7,2
60
71
,8
0,0
48
95
10
49
1
01
17
0,4
47
,36
48
53
57
30
,37
22
15
61
3,7
87
72
59
4
13
,69
69
70
94
1
0,4
85
89
09
43
4
Vo
lgo
gra
dsk
aya
ob
last
2
65
5,2
60
32
0
,03
36
69
78
1
4,5
87
95
0,7
89
98
46
28
,89
35
91
91
9,3
35
80
89
5
14
,77
64
26
96
9
,89
46
99
98
73
5
Vo
log
od
skay
a o
bla
st
12
45
,58
88
7,6
0
,02
72
98
27
4
10
,98
91
,55
6,3
88
48
36
73
8,9
42
35
24
8,7
72
21
82
12
1
1,6
81
22
27
1
7,9
21
90
48
16
36
V
oro
ne
zhsk
aya
ob
last
2
33
4,1
56
01
,5
0,0
36
58
79
78
1
0,3
87
5,4
52
,59
91
81
99
25
,86
11
02
71
6,2
84
13
94
1
13
,36
33
07
17
1
9,9
17
74
01
53
7
Ivan
ovs
kaya
ob
last
1
11
4,9
53
68
,7
0,0
34
98
07
16
1
0,8
12
97
,45
1,1
80
30
31
33
,59
90
23
71
1,4
81
85
02
1
4,3
17
52
25
1
9,2
66
62
17
07
38
Ir
kuts
kaya
ob
last
2
54
5,3
91
12
,7
0,0
51
31
02
58
1
2,6
77
3,1
45
,59
17
43
97
32
,78
90
38
16
,28
78
79
25
1
6,3
72
79
72
1
7,2
81
65
31
68
39
K
alin
ing
rad
skay
a o
bla
st
94
57
18
7,5
0
,03
61
90
47
6
13
86
5,7
46
,65
75
96
64
31
,97
68
09
81
1,9
75
53
68
7
15
,52
69
72
8
10
,20
21
33
29
40
K
alu
zhsk
aya
ob
last
* 1
02
1,5
69
80
,3
0,0
30
44
54
23
1
0,5
93
7,2
53
,36
34
00
94
35
,35
83
11
61
2,7
77
92
69
5
11
,99
31
27
82
1
1,8
59
30
81
14
1
Kam
chat
skay
a o
bla
st
35
2,1
15
21
5,8
0
,05
59
50
01
4
13
55
95
1,2
32
81
33
4,8
24
81
72
8,5
58
38
69
41
1
6,8
25
90
15
6
8,1
20
97
94
41
42
K
em
ero
vska
ya o
bla
st
28
55
86
87
,9
0,0
44
86
86
51
1
1,8
91
3,6
56
,50
86
96
22
52
,12
94
17
37
,98
63
77
30
5
13
,38
70
94
31
6
,16
11
50
33
14
3
Kir
ovs
kaya
ob
last
1
46
1,3
56
24
,1
0,0
38
73
26
35
1
2,4
10
22
,45
9,7
02
49
74
63
2,8
85
49
86
11
,07
78
10
34
1
4,6
50
18
11
3
7,8
42
16
66
27
44
K
ost
rom
skay
a o
bla
st
71
7,5
58
42
,1
0,0
24
52
96
17
1
0,9
11
00
,45
7,1
75
73
52
13
4,1
24
07
02
10
,67
49
47
55
1
4,4
74
35
86
7
9,4
68
27
91
34
45
K
urg
ansk
aya
ob
last
9
92
,15
64
7
0,0
55
84
11
45
1
4,5
73
0,4
56
,65
34
99
73
33
,58
01
85
31
5,8
21
83
07
3
19
,20
35
96
08
5
,45
97
25
75
44
6
Ku
rska
ya o
bla
st
11
99
,15
64
8,7
0
,03
58
60
22
9
14
94
8,5
54
,85
80
86
44
30
,10
96
28
14
,99
82
21
1
14
,96
90
95
12
8
,96
06
63
33
54
7
Len
ing
rad
skay
a o
bla
st
16
52
,98
48
4,8
0
,04
01
71
81
9
91
18
7,9
46
,47
44
34
02
38
,10
74
40
19
,05
35
44
56
1
12
,01
78
89
14
1
0,8
66
07
23
84
8
Lip
ets
kaya
ob
last
1
18
9,9
71
89
,6
0,0
39
33
10
36
7
,59
99
,95
2,3
65
27
65
72
8,2
13
70
75
17
,65
81
02
2
13
,62
93
74
1
10
,86
09
07
49
49
M
agad
ansk
aya
ob
last
1
74
,71
45
17
,9
0,0
41
21
35
09
1
1,8
59
7,7
51
,17
84
17
84
34
,35
64
90
51
1,8
95
93
13
6
19
,69
41
59
98
8
,12
89
78
68
85
0
Mo
sco
vska
ya o
bla
st
66
29
,79
50
8,2
0
,01
77
23
27
6
10
,41
00
5,7
53
,68
72
67
02
33
,85
18
22
89
,67
84
25
69
9
9,2
73
97
70
33
1
5,4
88
63
10
15
1
Mu
rman
skay
a o
bla
st
87
2,8
12
52
2,4
0
,05
25
89
36
8
11
73
6,5
52
,80
65
04
21
39
,19
84
26
67
,44
02
20
15
2
15
,38
88
41
09
9
,87
02
82
65
25
2
Niz
he
go
rod
skay
a o
bla
st
34
45
,36
54
8,3
0
,03
11
14
85
2
11
,91
12
6,9
47
,04
81
61
38
31
,96
02
95
14
,26
93
34
6
10
,39
41
11
73
9
,97
25
97
84
53
N
ovg
oro
dsk
aya
ob
last
6
74
,16
89
2,4
0
,02
98
17
53
4
10
,31
16
1,5
50
,97
94
45
98
37
,07
64
42
91
1,6
68
04
17
5
12
,59
71
23
08
9
,26
85
72
65
85
4
No
vosi
bir
skay
a o
bla
st
26
62
,37
28
0
0,0
40
15
32
51
1
2,1
77
6,3
56
,12
01
55
56
28
,91
54
60
71
8,0
22
93
60
4
12
,31
03
95
29
8
,72
69
70
08
55
O
msk
aya
ob
last
2
04
6,6
72
42
,1
0,0
43
48
67
59
1
1,3
74
8,6
55
,37
90
33
73
2,7
43
08
16
16
,23
53
81
84
1
4,2
98
18
47
4
7,3
49
25
86
96
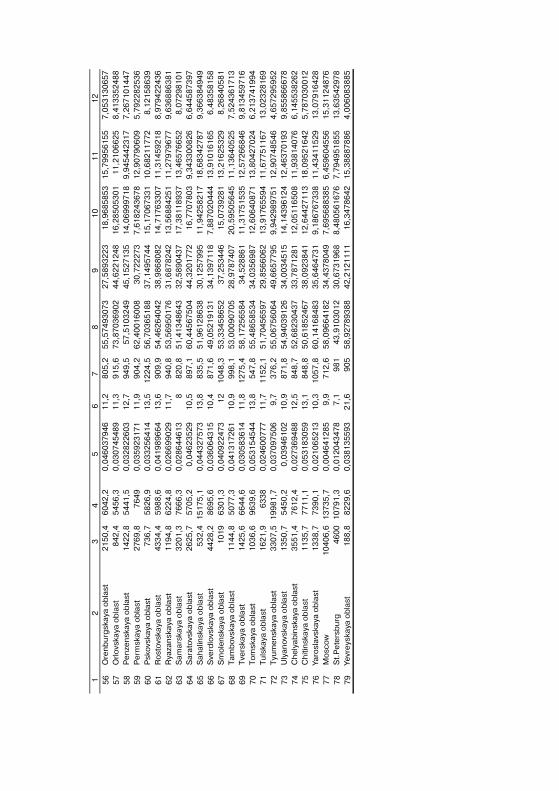
1
2
3
4
5
6
7
8
9
10
1
1
12
5
6
Ore
nb
urg
skay
a o
bla
st
21
50
,4
60
42
,2
0,0
46
03
79
46
11
,28
05
,25
5,5
74
93
07
32
7,5
89
32
23
18
,96
85
85
3
15
,79
95
61
55
7
,05
31
30
65
75
7
Orl
ovs
kaya
ob
last
8
42
,4
54
56
,3
0,0
30
74
54
89
11
,39
15
,67
3,8
70
36
90
24
4,6
22
12
48
16
,28
50
53
01
1
1,2
10
66
25
8
,41
33
52
48
85
8
Pe
nze
nsk
aya
ob
last
1
42
2,8
5
44
1,5
0
,03
28
22
60
31
2,7
94
9,5
57
,51
03
24
94
5,1
52
71
35
14
,06
99
97
18
9
,94
54
42
31
7
7,2
67
10
14
47
59
P
erm
skay
a o
bla
st
27
69
,8
76
49
0
,03
59
23
17
11
1,9
90
4,2
62
,40
01
60
08
30
,72
22
73
7,6
18
24
36
78
1
2,9
07
90
60
9
5,7
92
28
25
36
60
P
sko
vska
ya o
bla
st
73
6,7
5
82
6,9
0
,03
32
56
41
41
3,5
12
24
,55
6,7
03
65
18
83
7,1
49
57
44
15
,17
06
73
31
1
0,6
82
11
77
2
8,1
21
58
63
96
1
Ro
sto
vska
ya o
bla
st
43
34
,4
59
88
,6
0,0
41
98
96
64
13
,69
09
,95
4,4
62
64
04
23
8,9
86
80
82
14
,71
76
33
07
1
1,3
14
59
21
8
8,9
79
42
24
36
62
R
yaza
nsk
aya
ob
last
1
19
4,8
6
22
4,8
0
,02
66
99
02
91
1,7
94
0,8
53
,56
95
01
76
31
,68
78
24
21
3,5
68
84
25
1
11
,27
97
96
77
9
,63
68
86
38
16
3
Sam
arsk
aya
ob
last
3
20
1,3
7
66
6,3
0
,02
86
44
61
38
82
0,8
51
,41
34
86
43
32
,58
90
43
71
7,3
81
18
93
7
13
,46
57
66
52
8
,07
29
81
01
64
S
arat
ovs
kaya
ob
last
2
62
5,7
5
70
5,2
0
,04
62
35
29
10
,58
97
,16
0,4
45
67
50
44
4,3
20
17
72
16
,77
07
80
3
9,3
43
30
08
26
6
,64
45
87
39
76
5
Sah
alin
skay
a o
bla
st
53
2,4
1
51
75
,1
0,0
44
32
75
73
13
,88
35
,55
1,9
61
28
63
83
0,1
25
79
95
11
,94
25
82
17
1
8,6
83
42
78
7
9,3
66
38
49
49
66
S
verd
lovs
kaya
ob
last
4
42
8,2
8
69
5,6
0
,03
60
64
31
51
0,4
87
1,6
49
,05
21
91
31
34
,13
97
11
87
,88
70
20
44
4
13
,91
01
61
65
6
,48
35
81
58
67
S
mo
len
skay
a o
bla
st
10
19
6
30
1,3
0
,04
09
22
47
31
21
04
8,3
53
,33
45
86
52
37
,25
34
46
15
,07
39
28
1
13
,21
62
53
29
8
,26
84
05
81
68
T
amb
ovs
kaya
ob
last
1
14
4,8
5
07
7,3
0
,04
13
17
26
11
0,9
99
8,1
53
,00
09
07
05
28
,97
87
40
72
0,5
95
05
64
5
11
,13
64
05
25
7
,52
43
61
71
36
9
Tve
rska
ya o
bla
st
14
25
,6
66
44
,6
0,0
30
58
36
14
11
,81
27
5,4
58
,17
25
65
84
34
,52
88
61
11
,31
75
15
35
1
2,5
72
66
84
6
9,8
13
45
97
16
70
T
om
skay
a o
bla
st
10
36
,6
96
39
,6
0,0
53
15
45
44
13
,85
47
,85
5,4
86
58
53
43
4,0
35
69
87
12
,60
64
08
71
1
3,8
04
27
02
4
6,2
13
74
19
94
71
T
uls
kaya
ob
last
1
62
1,9
6
33
8
0,0
24
60
07
77
11
,71
15
2,1
51
,70
45
65
97
29
,85
66
06
21
3,9
17
65
59
4
11
,67
75
11
67
1
3,0
23
28
16
97
2
Tyu
me
nsk
aya
ob
last
3
30
7,5
1
99
81
,7
0,0
37
09
75
06
9,7
37
6,2
55
,06
75
60
64
49
,66
57
79
59
,94
29
89
75
1
12
,90
74
85
46
4
,65
72
95
95
27
3
Uly
anov
skay
a o
bla
st
13
50
,7
54
50
,2
0,0
39
46
10
21
0,9
87
1,8
54
,94
03
91
26
34
,00
34
51
51
4,1
43
96
12
4
12
,46
37
01
93
9
,85
58
66
67
87
4
Ch
elya
bin
skay
a o
bla
st
35
51
,4
76
12
,4
0,0
27
36
94
88
12
,58
48
,75
2,6
82
30
43
73
3,7
87
12
81
12
,05
11
65
08
1
1,9
38
14
07
6
6,1
45
53
82
62
75
C
hiti
nsk
aya
ob
last
1
13
5,7
7
71
1,1
0
,05
31
83
05
91
3,1
84
8,8
50
,61
85
24
67
38
,09
23
84
11
2,6
44
27
11
3
18
,09
52
16
42
5
,78
70
30
01
27
6
Yaro
slav
skay
a o
bla
st
13
38
,7
73
90
,1
0,0
21
06
52
13
10
,31
05
7,8
60
,14
16
84
83
35
,64
64
73
19
,18
67
67
33
8
11
,43
41
15
29
1
3,0
79
16
42
87
7
Mo
sco
w
10
40
6,6
1
37
35
,7
0,0
04
64
12
85
9,9
71
2,6
58
,09
66
41
82
34
,43
78
04
97
,69
56
88
38
5
6,4
59
60
45
56
1
5,3
11
24
87
67
8
St.
Pe
ters
bu
rg
46
00
1
07
91
,3
0,0
12
04
34
78
7,1
98
14
3,9
10
30
12
30
,67
31
96
88
,48
05
61
67
6
7,7
94
95
18
55
1
3,6
35
42
97
87
9
Yevr
eys
kaya
ob
last
1
88
,8
82
29
,6
0,0
38
13
55
93
21
,69
05
58
,92
78
93
88
42
,21
21
11
11
6,3
47
86
42
1
5,3
88
87
88
6
4,0
06
08
38
85
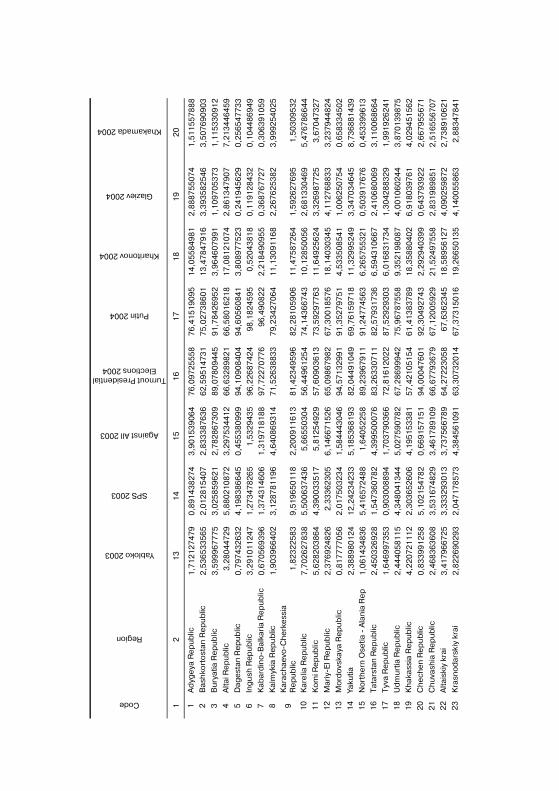
Code
Region
Yabloko 2003
SPS 2003
Against All 2003
Turnout Presidential Elections 2004
Putin 2004
Kharitonov 2004
Glaziev 2004
Khakamada 2004
1
2
13
1
4
15
1
6
17
1
8
19
2
0
1
Ad
yge
ya R
ep
ub
lic
1,7
12
12
74
79
0
,89
14
38
27
4
3,9
01
53
90
64
76
,09
72
55
58
76
,41
51
90
95
14
,05
58
49
81
2
,88
87
55
07
4
1,5
11
55
78
88
2
Bas
hko
rto
stan
Re
pu
blic
2
,53
65
33
56
5
2,0
12
81
54
07
2
,83
33
87
63
66
2,5
95
14
73
17
5,0
27
38
60
11
3,4
78
47
91
6
3,3
93
58
25
46
3
,50
76
90
90
33
B
ury
atia
Re
pu
blic
3
,59
99
67
77
5
3,0
25
85
96
21
2
,78
28
67
30
98
9,0
78
09
44
59
1,7
84
26
95
23
,96
46
07
99
1
1,1
09
70
53
73
1
,11
53
30
91
24
A
ltai R
ep
ub
lic
3,2
80
44
72
9
5,8
80
21
08
72
3
,29
75
34
41
26
6,6
32
89
82
16
6,5
80
16
21
81
7,0
81
21
07
4
2,8
61
34
79
07
7
,21
34
46
45
95
D
age
stan
Re
pu
blic
0
,79
74
32
63
2
4,1
98
38
66
45
0
,45
53
80
99
99
4,1
09
08
40
49
4,6
05
60
84
13
,80
89
77
52
3
0,2
41
94
56
29
0
,25
65
47
73
36
In
gu
sh R
epu
blic
3
,29
10
11
24
7
1,2
73
47
82
65
1
,53
29
43
59
6,2
26
87
42
49
8,1
82
45
95
0,5
20
43
81
8
0,1
19
12
84
32
0
,10
44
86
94
97
K
abar
din
o�B
alka
ria
Re
pu
blic
0
,67
05
69
39
6
1,3
74
31
46
06
1
,31
97
18
18
89
7,7
22
70
77
69
6,4
90
82
22
,21
84
90
95
5
0,3
68
76
77
27
0
,30
63
91
05
98
K
alm
ykia
Rep
ub
lic
1,9
03
96
64
02
3
,12
87
81
19
6
4,6
40
86
93
14
71
,52
63
88
33
79
,23
42
70
64
11
,13
09
11
68
2
,26
76
25
38
2
3,9
99
25
40
25
9
Kar
ach
aevo
�Ch
erk
ess
ia
Re
pu
blic
1
,82
32
25
83
9
,51
96
50
11
8
2,2
00
91
16
13
81
,42
34
95
96
82
,28
10
59
06
11
,47
58
72
64
1
,59
26
27
69
5
1,5
03
09
53
21
0
Kar
elia
Re
pu
blic
7
,70
26
27
83
8
5,5
00
63
74
36
5
,66
55
03
04
56
,44
96
12
54
74
,14
36
67
43
10
,12
85
00
56
2
,68
13
30
46
9
5,4
76
78
66
44
11
K
om
i Re
pu
blic
5
,62
82
03
86
4
4,3
90
03
35
17
5
,81
25
49
29
57
,60
90
36
13
73
,59
29
77
63
11
,64
92
56
24
3
,32
69
87
72
5
3,6
70
47
32
71
2
Mar
iy�E
l Re
pu
blic
2
,37
69
24
82
6
2,3
33
62
30
5
6,1
46
67
15
26
65
,09
86
79
82
67
,30
01
85
76
18
,14
03
03
45
4
,11
27
68
83
3
3,2
37
94
48
24
13
M
ord
ovs
kaya
Re
pu
blic
0
,81
77
77
05
6
2,0
17
50
32
34
1
,58
44
43
04
69
4,5
71
32
99
19
1,3
52
79
75
14
,53
35
08
54
1
1,0
06
25
07
54
0
,65
83
34
50
21
4
Yaku
tia
2,3
88
98
01
24
1
2,2
42
34
23
3
5,1
85
36
81
93
82
,04
49
10
49
69
,76
15
97
18
11
,32
99
52
49
3
,34
70
34
64
5
8,7
36
88
14
39
15
N
ort
he
rn O
setia
� A
lan
ia R
ep
1
,06
14
34
83
6
5,4
16
57
24
88
1
,64
05
22
58
89
,23
96
79
11
91
,24
77
45
63
6,2
65
75
53
21
0
,50
39
17
67
6
0,4
53
39
96
13
16
T
atar
stan
Re
pu
blic
2
,45
03
26
92
8
1,5
47
36
07
82
4
,39
95
00
07
68
3,2
63
30
71
18
2,5
79
31
73
66
,59
43
10
66
7
2,4
10
68
00
69
3
,11
00
68
66
41
7
Tyv
a R
ep
ub
lic
1,6
46
99
73
53
0
,90
30
08
89
4
1,7
03
79
03
66
72
,81
61
20
22
87
,52
92
93
03
6,0
16
83
17
34
1
,30
42
88
32
9
1,9
91
92
62
41
18
U
dm
urt
ia R
ep
ub
lic
2,4
44
05
81
15
4
,34
80
41
34
4
5,0
27
59
07
82
67
,28
69
99
42
75
,96
78
75
58
9,3
52
19
80
87
4
,00
10
60
24
4
3,8
70
13
98
75
19
K
hak
assi
a R
ep
ub
lic
4,2
20
72
11
12
2
,30
36
52
60
6
4,1
95
15
33
81
57
,42
10
51
54
61
,41
38
37
89
18
,35
88
04
02
6
,91
80
39
76
1
4,0
29
45
15
62
20
C
he
che
n R
ep
ub
lic
0,8
33
99
12
58
5
,10
21
54
78
2
0,6
69
15
71
51
94
,00
04
76
01
92
,30
49
27
43
2,2
92
94
03
99
0
,64
37
93
92
2
2,6
67
95
56
71
21
C
huv
ash
ia R
ep
ub
lic
2,4
68
36
36
08
3
,53
16
74
82
9
3,4
61
78
91
09
66
,67
79
36
79
67
,12
00
59
29
21
,52
49
75
58
2
,83
19
89
85
1
2,5
16
55
67
07
22
A
ltais
kiy
krai
3
,41
79
66
72
5
3,3
33
29
30
13
3
,73
75
66
78
96
4,2
72
23
05
86
7,6
36
23
45
18
,58
95
61
27
4
,09
02
59
87
2
2,7
38
91
06
21
23
K
rasn
od
arsk
iy k
rai
2,8
22
69
02
93
2
,04
71
78
57
3
4,3
84
56
10
91
63
,30
73
20
14
67
,37
31
50
16
19
,26
65
01
35
4
,14
00
55
86
3
2,8
83
47
84
1
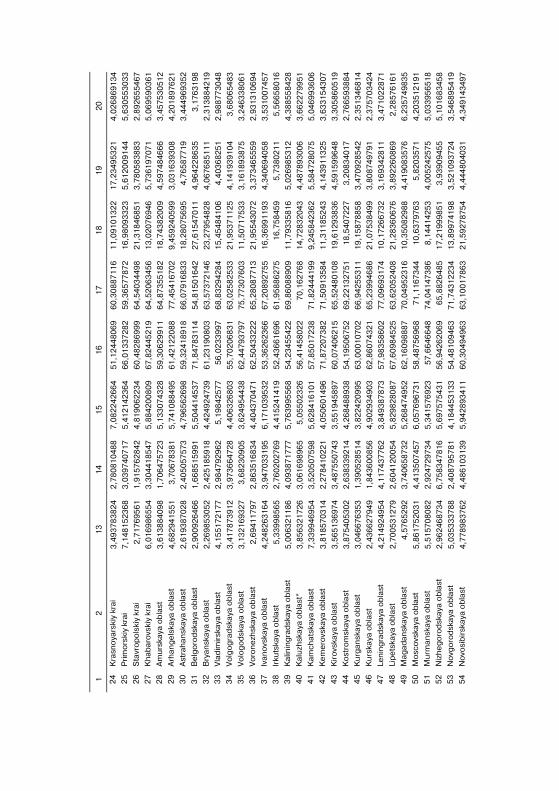
1
2
13
1
4
15
1
6
17
1
8
19
2
0
24
K
rasn
oya
rski
y kr
ai
3,4
93
78
38
24
2
,78
08
10
48
87
,08
22
42
66
45
1,1
24
48
06
96
0,3
08
87
11
61
1,0
91
01
32
2
17
,23
49
53
21
4
,02
68
69
13
42
5
Pri
mo
rski
y kr
ai
7,1
48
15
23
68
3
,03
97
40
71
75
,41
21
42
36
46
6,0
13
37
28
25
9,3
65
77
87
21
6,9
80
93
32
3
5,6
12
00
91
44
5
,63
05
53
03
32
6
Sta
vro
po
lski
y kr
ai
2,7
17
69
56
1
1,9
15
76
28
42
4,8
19
06
22
34
60
,48
28
69
99
64
,54
03
44
98
21
,31
84
68
51
3
,78
05
83
88
3
2,8
92
65
54
67
27
K
hab
aro
vski
y kr
ai
6,0
16
98
65
54
3
,30
44
18
54
75
,88
42
00
80
96
7,8
24
45
21
96
4,5
20
63
45
61
3,0
20
76
94
6
5,7
36
19
70
71
5
,06
95
90
36
12
8
Am
urs
kaya
ob
last
3
,61
38
84
09
8
1,7
06
47
57
23
5,1
33
07
43
28
59
,30
62
99
11
64
,87
35
51
82
18
,74
38
20
09
4
,59
74
84
66
6
3,4
57
53
05
12
29
A
rhan
ge
lska
ya o
bla
st
4,6
82
94
15
51
3
,70
67
83
81
5,7
41
08
84
95
61
,42
12
20
88
77
,45
41
67
02
9,4
59
24
05
99
3
,03
16
39
30
8
4,2
01
89
76
21
30
A
stra
han
skay
a o
bla
st
2,6
19
38
70
28
2
,40
50
57
57
34
,79
65
62
69
85
9,3
24
18
91
86
6,0
79
16
83
31
8,2
80
75
69
5
4,7
65
87
71
9
3,4
44
96
93
52
31
B
elg
oro
dsk
aya
ob
last
2
,90
09
26
46
6
1,6
68
51
59
91
5,5
04
41
45
37
71
,84
78
31
14
54
,81
50
16
42
27
,61
54
70
11
4
,96
42
28
63
5
3,1
76
31
98
32
B
ryan
skay
a o
bla
st
2,2
69
85
30
52
2
,42
51
85
91
84
,42
49
24
73
96
1,2
31
90
80
36
3,5
73
72
14
62
3,2
79
54
82
8
4,0
67
68
51
11
2
,31
38
84
21
93
3
Vla
dim
irsk
aya
ob
last
4
,15
51
72
17
7
2,9
84
79
29
62
5,1
98
42
57
75
6,0
23
39
97
68
,83
29
42
84
15
,45
48
41
06
4
,40
36
82
51
2
,98
87
73
04
83
4
Vo
lgo
gra
dsk
aya
ob
last
3
,41
78
73
91
2
3,9
73
66
47
28
4,4
06
32
68
03
55
,70
20
68
31
63
,02
58
25
33
21
,95
37
11
25
4
,14
19
39
10
4
3,6
80
65
48
33
5
Vo
log
od
skay
a o
bla
st
3,1
32
16
93
27
3
,68
23
09
05
3,6
24
95
44
38
62
,44
79
37
97
75
,77
30
76
03
11
,50
71
75
33
3
,16
18
93
87
5
3,2
46
33
80
61
36
V
oro
ne
zhsk
aya
ob
last
2
,69
41
17
97
2
,86
35
16
83
44
,40
43
70
47
16
2,5
04
33
22
26
5,2
80
87
71
32
1,9
55
43
07
2
3,3
73
46
55
59
2
,93
13
10
69
43
7
Ivan
ovs
kaya
ob
last
4
,24
82
63
16
4
3,9
47
03
31
95
6,1
71
03
95
32
53
,36
26
23
66
67
,20
89
27
55
16
,36
99
11
93
4
,34
06
94
05
8
3,5
31
00
74
57
38
Ir
kuts
kaya
ob
last
5
,33
99
85
65
2
,76
02
02
76
94
,41
52
41
41
95
2,4
36
61
69
66
1,9
58
86
27
51
6,7
58
45
9
5,7
38
02
11
5
,56
65
80
16
39
K
alin
ing
rad
skay
a o
bla
st
5,0
06
32
11
86
4
,09
38
71
77
75
,76
39
95
56
85
4,2
34
55
42
26
9,8
60
88
90
91
1,7
93
35
81
6
5,0
26
98
53
12
4
,38
85
58
42
84
0
Kal
uzh
skay
a o
bla
st*
3,8
56
32
17
26
3
,06
16
98
96
55
,05
50
23
26
56
,41
45
80
22
70
,16
27
68
14
,72
83
20
43
4
,48
78
93
00
6
3,6
62
27
99
51
41
K
amch
atsk
aya
ob
last
7
,33
99
46
95
4
3,5
20
50
75
98
5,6
28
41
61
01
57
,85
01
72
38
71
,82
44
41
99
9,2
45
84
23
62
5
,58
47
28
07
5
5,0
46
99
36
06
42
K
em
ero
vska
ya o
bla
st
3,8
18
57
03
14
2
,27
84
10
22
14
,05
06
01
49
67
1,8
72
07
38
27
1,5
09
13
58
41
1,3
11
85
24
3
4,1
43
91
13
25
3
,63
31
54
30
74
3
Kir
ovs
kaya
ob
last
3
,56
51
36
97
4
3,4
87
55
07
43
3,5
51
94
58
97
60
,07
40
62
15
65
,52
48
01
08
19
,61
29
38
36
4
,59
15
99
64
8
3,3
05
86
05
19
44
K
ost
rom
skay
a o
bla
st
3,8
75
40
53
02
2
,63
83
39
21
44
,26
84
88
93
85
4,1
95
06
75
26
9,2
21
32
75
11
8,5
40
72
27
3
,20
83
40
17
2
,76
65
93
88
44
5
Ku
rgan
skay
a o
bla
st
3,0
46
67
63
53
1
,39
05
28
51
43
,82
24
20
99
56
3,0
00
10
70
26
6,9
42
55
31
11
9,1
58
78
85
8
3,4
70
92
85
42
2
,35
13
46
81
44
6
Ku
rska
ya o
bla
st
2,4
36
62
79
49
1
,84
36
00
85
64
,90
29
34
90
36
2,8
60
74
32
16
5,2
39
94
68
62
1,0
75
38
49
9
3,8
08
74
97
91
2
,37
57
03
42
44
7
Len
ing
rad
skay
a o
bla
st
4,2
14
92
49
54
4
,11
74
37
76
23
,84
93
87
87
35
7,9
83
58
60
27
7,0
96
93
17
41
0,1
72
66
73
2
3,1
69
34
28
11
3
,47
10
22
87
14
8
Lip
ets
kaya
ob
last
2
,70
05
31
27
9
2,6
04
12
00
54
5,8
29
82
80
87
67
,60
98
45
25
63
,62
05
24
08
21
,28
36
06
76
3
,89
22
60
86
9
2,2
85
76
16
14
9
Mag
adan
skay
a o
bla
st
4,5
76
52
92
3
,74
06
58
73
25
,26
84
74
95
26
2,1
60
98
88
77
0,0
49
52
31
61
0,3
50
82
98
8
4,4
19
08
35
76
6
,23
57
49
83
55
0
Mo
sco
vska
ya o
bla
st
5,8
61
75
20
31
4
,41
35
07
45
76
,05
76
96
73
15
8,4
87
56
96
87
1,1
16
73
44
10
,63
79
76
3
5,8
20
35
71
4
,20
35
12
19
15
1
Mu
rman
skay
a o
bla
st
5,5
15
70
80
82
2
,92
47
29
73
45
,34
15
76
92
35
7,6
64
66
48
74
,04
14
73
86
8,1
44
14
25
3
4,0
05
24
25
75
5
,03
39
56
51
85
2
Niz
he
go
rod
skay
a o
bla
st
2,9
62
46
87
34
6
,75
83
47
81
65
,69
75
75
43
15
6,9
42
62
06
96
5,8
82
64
85
17
,21
99
98
51
3
,93
90
94
55
5
,10
16
83
45
85
3
No
vgo
rod
skay
a o
bla
st
5,0
35
33
37
88
2
,40
87
95
78
14
,18
44
53
13
35
4,4
81
09
46
37
1,7
43
12
23
41
3,8
99
74
19
8
3,5
21
09
37
24
3
,54
68
95
41
95
4
No
vosi
bir
skay
a o
bla
st
4,7
78
98
37
62
4
,48
61
03
13
95
,94
28
93
41
16
0,3
04
94
96
36
3,1
00
17
86
32
1,5
92
78
75
4
4,4
44
80
40
31
4
,34
91
43
49
7
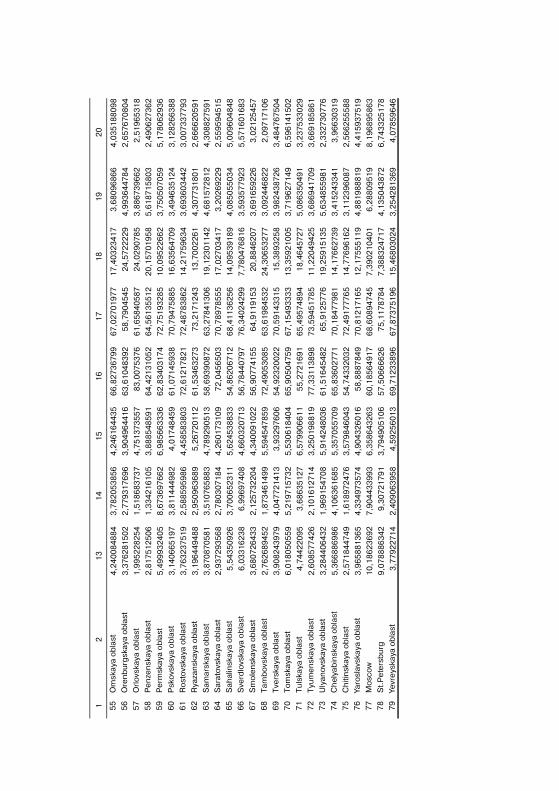
1
2
13
1
4
15
1
6
17
1
8
19
2
0
55
O
msk
aya
ob
last
4
,24
00
84
88
4
3,7
82
05
38
56
4
,24
61
64
43
56
6,8
27
36
79
96
7,0
27
01
97
71
7,4
03
23
41
7
3,6
80
96
86
6
4,0
35
18
80
98
56
O
ren
bu
rgsk
aya
ob
last
3
,37
62
81
50
2
2,7
79
31
76
96
3
,90
49
64
41
66
3,6
10
48
39
25
8,7
90
45
45
24
,57
22
22
9
4,9
93
64
47
84
2
,65
76
70
80
45
7
Orl
ovs
kaya
ob
last
1
,99
52
28
25
4
1,5
18
68
37
37
4
,75
13
73
55
78
3,0
07
53
76
61
,65
84
05
87
24
,02
90
78
5
3,8
86
73
96
62
2
,51
96
53
18
58
P
en
zen
skay
a o
bla
st
2,8
17
51
25
06
1
,33
42
16
10
5
3,8
88
54
85
91
64
,42
13
10
52
64
,56
13
55
12
20
,15
70
19
58
5
,61
87
15
80
3
2,4
90
62
73
62
59
P
erm
skay
a o
bla
st
5,4
99
93
24
05
8
,67
36
97
66
2
6,9
85
66
33
36
62
,83
40
31
74
72
,75
19
32
85
10
,09
52
26
62
3
,75
05
07
05
9
5,1
78
06
29
36
60
P
sko
vska
ya o
bla
st
3,1
40
66
51
97
3
,81
14
44
98
2
4,0
17
48
45
96
1,0
71
45
93
87
0,7
94
75
88
51
6,6
35
64
70
9
3,4
94
63
51
24
3
,12
82
66
38
86
1
Ro
sto
vska
ya o
bla
st
3,7
63
23
75
19
2
,58
85
95
98
6
4,4
58
58
38
03
72
,61
21
78
21
72
,48
78
38
62
14
,21
75
96
34
3
,69
36
03
44
2
3,0
07
33
77
93
62
R
yaza
nsk
aya
ob
last
3
,19
64
49
48
8
2,9
50
96
36
89
5
,26
72
01
12
61
,53
46
32
73
73
,21
71
24
31
3,7
00
22
61
4
,30
77
31
80
1
2,6
66
62
05
91
63
S
amar
skay
a o
bla
st
3,8
70
87
05
81
3
,51
07
65
88
3
4,7
89
29
05
13
58
,69
39
08
72
63
,27
84
13
06
19
,12
30
11
42
4
,68
15
72
81
2
4,3
08
82
75
91
64
S
arat
ovs
kaya
ob
last
2
,93
72
93
56
8
2,7
80
30
71
84
4
,26
01
73
10
97
2,0
45
65
03
70
,78
97
85
55
17
,02
70
34
17
3
,20
26
92
29
2
,55
95
94
51
56
5
Sah
alin
skay
a o
bla
st
5,5
43
50
92
6
3,7
00
65
23
11
5
,62
45
38
83
35
4,8
62
06
71
26
8,4
11
36
25
61
4,0
95
39
18
9
4,0
85
05
50
34
5
,00
96
04
84
86
6
Sve
rdlo
vska
ya o
bla
st
6,0
33
16
23
8
6,9
96
97
40
8
4,6
60
32
07
13
56
,78
44
07
97
76
,34
02
42
99
7,7
80
47
68
16
3
,59
35
77
92
3
5,5
71
60
16
83
67
S
mo
len
skay
a o
bla
st
3,6
80
72
64
33
2
,12
57
32
20
4
4,3
40
09
10
22
56
,90
77
41
55
64
,91
19
15
32
0,8
84
62
07
3
,69
16
59
22
6
3,0
21
25
45
76
8
Tam
bo
vska
ya o
bla
st
2,7
62
68
94
52
1
,87
34
61
49
9
5,5
94
54
78
59
72
,49
05
30
85
63
,61
98
45
32
24
,30
65
32
77
3
,09
24
46
82
2
2,0
97
17
10
66
9
Tve
rska
ya o
bla
st
3,9
08
24
39
79
4
,04
77
21
41
3
3,9
32
97
60
65
4,9
23
20
02
27
0,5
91
43
31
51
5,3
89
32
58
3
,98
24
38
72
6
3,4
84
76
75
04
70
T
om
skay
a o
bla
st
6,0
18
05
05
59
5
,21
97
15
73
2
5,5
30
61
84
04
65
,90
50
47
59
67
,15
49
33
33
13
,35
92
10
05
3
,71
96
27
14
9
6,5
96
14
15
02
71
T
uls
kaya
ob
last
4
,74
42
20
95
3
,68
63
51
27
6
,57
99
06
61
15
5,2
72
16
91
65
,49
57
48
94
18
,46
45
72
7
5,0
86
35
04
91
3
,23
75
33
02
97
2
Tyu
me
nsk
aya
ob
last
2
,60
85
77
42
6
2,1
01
61
27
14
3
,25
01
98
81
97
7,3
31
13
89
87
3,5
94
51
78
51
1,2
20
49
42
5
3,6
86
94
17
09
3
,66
91
85
86
17
3
Uly
anov
skay
a o
bla
st
3,2
84
40
64
32
1
,96
91
54
70
8
5,9
14
24
80
36
61
,51
64
54
82
65
,91
25
77
61
9,2
59
15
13
5
5,6
34
85
59
81
2
,33
27
30
77
67
4
Ch
elya
bin
skay
a o
bla
st
5,3
66
88
69
86
4
,10
63
61
68
5
5,3
57
05
57
09
65
,83
60
27
71
70
,18
47
79
81
14
,17
66
27
39
3
,41
52
43
34
1
3,9
66
30
31
97
5
Ch
itin
skay
a o
bla
st
2,5
71
84
47
49
1
,61
89
72
47
6
3,5
79
84
60
43
54
,74
33
20
32
72
,49
17
77
65
14
,77
69
61
62
3
,11
23
96
08
7
2,5
66
25
55
88
76
Ya
rosl
avsk
aya
ob
last
3
,96
58
81
36
5
4,3
34
97
35
74
4
,90
43
26
01
65
8,8
88
78
49
70
,81
21
71
65
12
,17
55
51
19
4
,88
19
88
81
9
4,4
15
93
75
19
77
M
osc
ow
1
0,1
86
23
69
2
7,9
04
43
39
93
6
,35
86
43
26
36
0,1
85
64
91
76
8,6
08
94
74
57
,39
02
10
40
1
6,2
88
09
51
9
8,1
96
89
58
63
78
S
t.P
ete
rsb
urg
9
,07
88
86
34
2
9,3
07
21
79
1
3,7
94
90
51
06
57
,50
66
66
26
75
,11
78
78
47
,38
83
24
71
7
4,1
35
04
38
72
6
,74
33
25
17
87
9
Yevr
eys
kaya
ob
last
3
,77
92
27
14
2
,40
90
63
95
8
4,5
92
56
01
36
9,7
12
33
89
66
7,8
73
75
19
61
5,4
68
03
02
4
3,2
54
28
13
69
4
,07
85
96
46
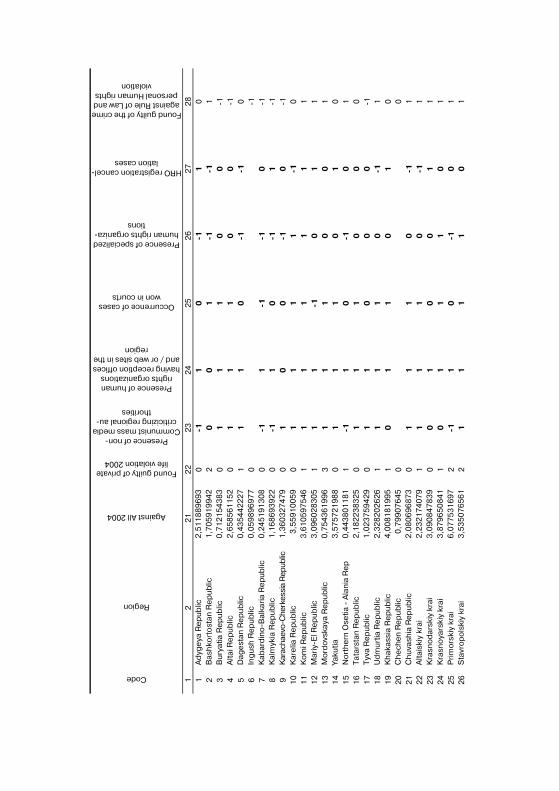
Code
Region
Against All 2004
Found guilty of private life violation 2004
Presence of non�Communist mass media criticizing regional au�
thorities
Presence of human rights organizations
having reception offices and / or web sites in the
region
Occurrence of cases won in courts
Presence of specialized human rights organiza�
tions
HRO registration cancel�lation cases
Found guilty of the crime against Rule of Law and personal Human rights
violation
1
2
21
2
2
23
2
4
25
2
6
27
2
8
1
Ad
yge
ya R
ep
ub
lic
2,5
11
88
96
93
0
�1
1
0
�1
1
0
2
B
ash
kort
ost
an R
ep
ub
lic
1,7
05
91
99
42
2
0
0
1
�1
�1
1
3
B
ury
atia
Re
pu
blic
0
,71
21
54
38
3
0
1
1
1
0
0
�1
4
Alta
i Re
pu
blic
2
,65
85
61
15
2
0
1
1
1
0
0
�1
5
Dag
est
an R
ep
ub
lic
0,4
35
44
22
27
1
1
1
0
�1
�1
0
6
In
gu
sh R
epu
blic
0
,05
98
96
97
7
0
�1
7
K
abar
din
o�B
alka
ria
Re
pu
blic
0
,24
51
91
30
8
0
�1
1
�1
�1
0
�1
8
Kal
myk
ia R
epu
blic
1
,16
86
93
92
2
0
�1
1
0
�1
1
�1
9
Kar
acha
evo�
Che
rkes
sia
Rep
ublic
1,3
60
32
74
79
0
1
0
0
�1
0
�1
1
0
Kar
elia
Re
pu
blic
3
,55
91
00
59
0
1
1
1
1
�1
0
1
1
Ko
mi R
ep
ub
lic
3,6
10
59
75
46
1
1
1
1
1
1
1
1
2
Mar
iy�E
l Re
pu
blic
3
,09
60
28
30
5
1
1
1
�1
0
1
1
13
M
ord
ovs
kaya
Re
pu
blic
0
,75
43
61
99
6
3
1
1
1
0
0
1
14
Ya
kutia
3
,57
57
21
98
8
0
1
1
1
0
1
0
15
N
ort
he
rn O
setia
� A
lan
ia R
ep
0
,44
38
01
18
1
1
�1
1
0
�1
0
1
16
T
atar
stan
Re
pu
blic
2
,18
22
38
32
5
0
1
1
1
0
0
0
17
T
yva
Re
pu
blic
1
,02
37
59
42
9
0
1
1
0
0
0
�1
18
U
dm
urt
ia R
ep
ub
lic
2,3
28
20
26
26
1
1
1
1
0
�1
1
1
9
Kh
akas
sia
Re
pu
blic
4
,00
81
81
99
5
1
0
1
1
0
1
0
20
C
he
che
n R
ep
ub
lic
0,7
99
07
64
5
0
0
2
1
Ch
uvas
hia
Re
pu
blic
2
,08
06
96
87
3
0
1
1
1
0
�1
1
22
A
ltais
kiy
krai
2
,23
21
74
07
9
1
1
1
1
0
�1
1
23
K
rasn
od
arsk
iy k
rai
3,0
90
84
78
39
0
0
1
0
0
1
1
2
4
Kra
sno
yars
kiy
krai
3
,87
96
50
84
1
1
0
1
1
1
0
1
25
P
rim
ors
kiy
krai
6
,07
75
31
69
7
2
�1
1
0
�1
0
1
26
S
tavr
op
ols
kiy
krai
3
,53
50
76
56
1
2
1
1
1
1
0
1
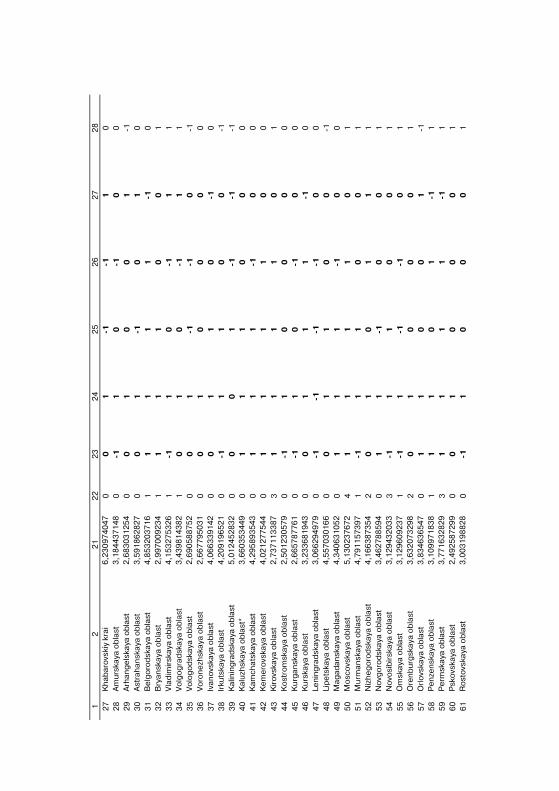
1
2
21
2
2
23
2
4
25
2
6
27
2
8
27
K
hab
aro
vski
y kr
ai
6,2
30
97
40
47
0
0
1
�1
�1
1
0
2
8
Am
urs
kaya
ob
last
3
,18
44
37
14
8
0
�1
1
0
�1
0
0
29
A
rhan
ge
lska
ya o
bla
st
2,6
83
03
12
54
0
0
1
0
0
1
�1
3
0
Ast
rah
ansk
aya
ob
last
3
,59
18
62
82
7
0
0
1
�1
0
1
0
31
B
elg
oro
dsk
aya
ob
last
4
,85
32
03
71
6
1
1
1
1
1
�1
0
32
B
ryan
skay
a o
bla
st
2,9
97
00
92
34
1
1
1
1
0
0
1
3
3
Vla
dim
irsk
aya
ob
last
4
,15
32
75
32
6
1
�1
1
0
�1
1
1
34
V
olg
og
rad
skay
a o
bla
st
3,4
39
81
43
82
1
0
1
0
�1
1
1
3
5
Vo
log
od
skay
a o
bla
st
2,6
90
58
87
52
0
0
1
�1
�1
0
�1
3
6
Vo
ron
ezh
skay
a o
bla
st
2,6
67
79
50
31
0
0
1
0
0
0
0
3
7
Ivan
ovs
kaya
ob
last
4
,06
63
39
14
2
0
0
1
1
0
�1
0
38
Ir
kuts
kaya
ob
last
4
,20
91
96
52
1
0
�1
1
1
0
0
�1
39
K
alin
ing
rad
skay
a o
bla
st
5,0
12
45
28
32
0
0
0
1
�1
�1
�1
4
0
Kal
uzh
skay
a o
bla
st*
3,6
60
35
34
49
0
1
1
1
0
0
0
4
1
Kam
chat
skay
a o
bla
st
4,2
95
89
35
43
0
1
1
1
�1
0
0
4
2
Ke
me
rovs
kaya
ob
last
4
,02
12
77
54
4
0
1
1
1
1
0
0
43
K
iro
vska
ya o
bla
st
2,7
37
11
33
87
3
1
1
1
1
0
1
4
4
Ko
stro
msk
aya
ob
last
2
,50
12
30
57
9
0
�1
1
0
0
0
0
45
K
urg
ansk
aya
ob
last
2
,66
57
87
76
1
0
�1
1
0
�1
0
0
46
K
urs
kaya
ob
last
3
,23
36
81
94
3
0
0
1
1
1
�1
0
47
Le
nin
gra
dsk
aya
ob
last
3
,06
62
94
97
9
0
�1
�1
�1
�1
0
0
48
Li
pe
tska
ya o
bla
st
4,5
57
03
01
66
0
0
1
1
0
0
�1
4
9
Mag
adan
skay
a o
bla
st
4,3
40
63
10
52
0
1
1
1
�1
0
0
5
0
Mo
sco
vska
ya o
bla
st
5,1
30
23
76
72
4
1
1
1
1
0
1
5
1
Mu
rman
skay
a o
bla
st
4,7
91
15
73
97
1
�1
1
1
0
0
1
5
2
Niz
he
go
rod
skay
a o
bla
st
4,1
66
38
73
54
2
0
1
0
1
1
1
5
3
No
vgo
rod
skay
a o
bla
st
3,4
62
78
85
94
0
1
1
�1
0
0
1
5
4
No
vosi
bir
skay
a o
bla
st
3,1
29
43
20
33
3
�1
1
1
0
0
1
5
5
Om
skay
a o
bla
st
3,1
29
60
92
37
1
�1
1
�1
�1
0
1
5
6
Ore
nb
urg
skay
a o
bla
st
3,6
32
07
32
98
2
0
1
0
0
0
1
5
7
Orl
ovs
kaya
ob
last
3
,83
46
36
54
7
0
1
1
0
0
1
�1
58
P
en
zen
skay
a o
bla
st
3,1
09
97
18
38
1
1
1
0
1
�1
1
5
9
Pe
rmsk
aya
ob
last
3
,77
16
32
82
9
3
1
1
1
1
�1
1
60
P
sko
vska
ya o
bla
st
2,4
92
58
72
99
0
0
1
0
0
0
1
6
1
Ro
sto
vska
ya o
bla
st
3,0
03
19
88
28
0
�1
1
0
0
0
1
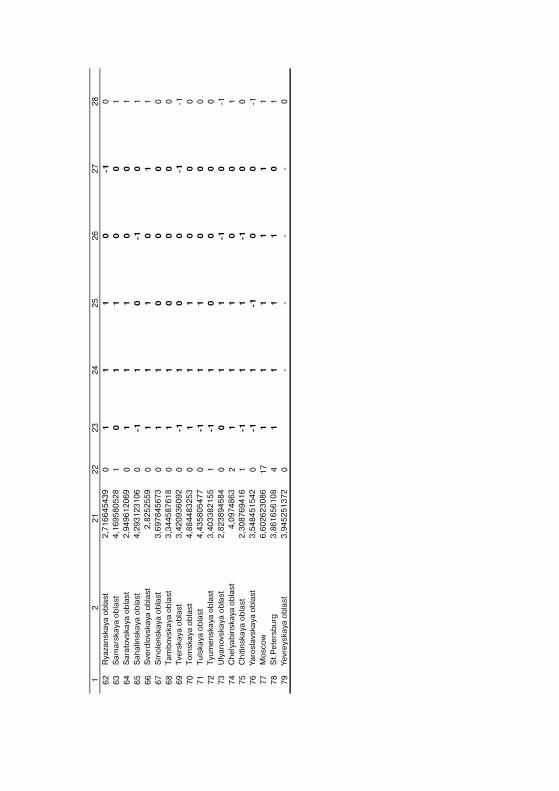
1
2
21
2
2
23
2
4
25
2
6
27
2
8
62
R
yaza
nsk
aya
ob
last
2
,71
66
45
43
9
0
1
1
1
0
�1
0
63
S
amar
skay
a o
bla
st
4,1
69
58
05
28
1
0
1
1
0
0
1
6
4
Sar
ato
vska
ya o
bla
st
2,9
49
61
20
69
0
1
1
1
0
0
1
6
5
Sah
alin
skay
a o
bla
st
4,2
93
12
31
06
0
�1
1
0
�1
0
1
6
6
Sve
rdlo
vska
ya o
bla
st
2,8
25
25
59
0
1
1
1
0
1
1
6
7
Sm
ole
nsk
aya
ob
last
3
,69
78
45
67
3
0
1
1
0
0
0
0
68
T
amb
ovs
kaya
ob
last
3
,34
45
87
61
8
0
1
1
0
0
0
0
69
T
vers
kaya
ob
last
3
,42
09
36
09
2
0
�1
1
0
0
�1
�1
70
T
om
skay
a o
bla
st
4,8
84
48
32
53
0
1
1
1
0
0
0
7
1
Tu
lska
ya o
bla
st
4,4
35
80
54
77
0
�1
1
1
0
0
0
7
2
Tyu
me
nsk
aya
ob
last
3
,40
33
82
15
5
1
�1
1
0
0
0
0
73
U
lyan
ovsk
aya
ob
last
2
,82
38
94
58
4
0
0
1
1
�1
0
�1
74
C
hel
yab
insk
aya
ob
last
4
,09
74
86
3
2
1
1
1
0
0
1
75
C
hiti
nsk
aya
ob
last
2
,30
87
69
41
6
1
�1
1
1
�1
0
0
76
Ya
rosl
avsk
aya
ob
last
3
,54
84
51
54
2
0
�1
1
�1
0
0
�1
77
M
osc
ow
6
,60
26
23
08
6
17
1
1
1
1
1
1
7
8
St.
Pe
ters
bu
rg
3,8
61
65
61
08
4
1
1
1
1
0
1
7
9
Yevr
eys
kaya
ob
last
3
,94
52
51
37
2
0
�
� �
� 0
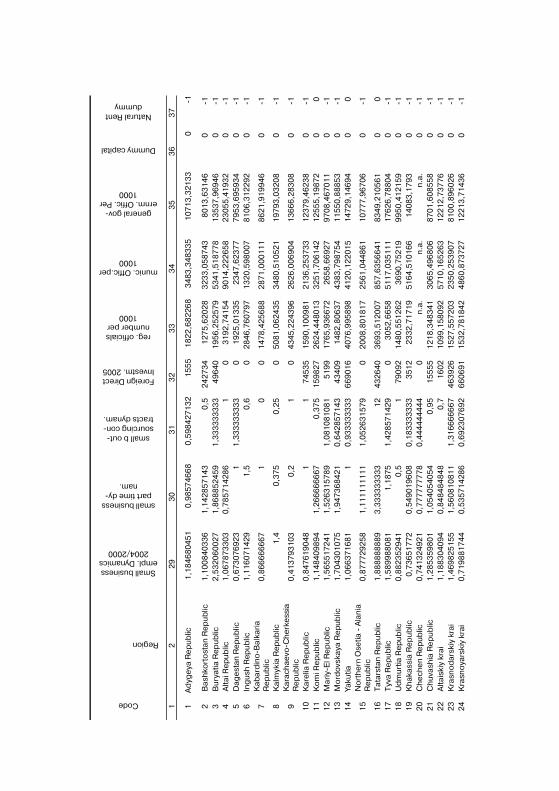
Code
Region
Small business empl. Dynamics
2004/2000
small business part time dy�
nam.
small b out�sourcing con�tracts dynam.
Foreign Direct Investm. 2005
reg. officials number per
1000
munic. Offic.per 1000
general gov�ernm. Offic. Per
1000
Dummy capital
Natural Rent dummy
1
2
29
3
0
31
3
2
33
3
4
35
3
6
37
1
Ad
yge
ya R
ep
ub
lic
1,1
84
68
04
51
0,9
85
74
66
80
,59
84
27
13
21
55
51
82
2,6
82
26
83
48
3,3
48
33
51
07
13
,32
13
30
�1
2
Bas
hko
rto
stan
Re
pu
blic
1
,10
08
40
33
61
,14
28
57
14
3
0,5
24
27
34
12
75
,62
02
83
23
3,0
58
74
38
01
3,6
31
46
0
�1
3
Bu
ryat
ia R
ep
ub
lic
2,5
32
06
00
27
1,8
68
85
24
59
1
,33
33
33
33
34
96
40
19
56
,25
25
79
53
41
,51
87
78
13
53
7,9
69
46
0
�1
4
Alta
i Re
pu
blic
1
,06
78
73
30
30
,78
57
14
28
6
10
31
92
,74
15
49
01
4,2
22
65
82
30
55
,41
93
2
0
�15
D
age
stan
Re
pu
blic
0
,67
30
76
92
31
1
,33
33
33
33
30
19
25
,01
33
52
34
7,6
23
77
79
53
,69
59
34
0
�1
6
Ing
ush
Rep
ub
lic
1,1
16
07
14
29
1,5
0
,60
28
46
,76
07
97
13
20
,59
80
07
81
06
,31
22
92
0
�1
7
Kab
ard
ino
�Bal
kari
a R
ep
ub
lic
0,8
66
66
66
67
1
00
14
78
,42
56
88
28
71
,00
01
11
86
21
,91
99
46
0
�1
8
Kal
myk
ia R
epu
blic
1
,40
,37
5
0,2
50
50
81
,06
24
35
34
80
,51
05
21
19
79
3,0
32
08
0
�1
9
Kar
ach
aevo
�Ch
erk
ess
ia
Re
pu
blic
0
,41
37
93
10
30
,2
10
43
45
,22
43
96
26
26
,00
69
04
13
66
6,2
83
08
0
�1
10
K
are
lia R
ep
ub
lic
0,8
47
61
90
48
1
17
45
35
15
90
,10
09
81
21
36
,25
37
33
12
37
9,4
62
38
0
�1
11
K
om
i Re
pu
blic
1
,14
84
09
89
41
,26
66
66
66
7
0,3
75
15
98
27
26
24
,44
80
13
32
51
,70
61
42
12
55
5,1
98
72
0
0
12
M
ariy
�El R
ep
ub
lic
1,5
65
51
72
41
1,5
26
31
57
89
1
,08
10
81
08
15
19
91
76
5,9
36
67
22
65
8,6
69
27
97
08
,46
70
11
0
�1
13
M
ord
ovs
kaya
Re
pu
blic
1
,70
43
01
07
51
,94
73
68
42
1
0,6
42
85
71
43
43
40
91
48
2,8
06
37
43
83
,79
87
54
11
55
0,8
88
53
0
�1
14
Ya
kutia
1
,06
63
71
68
11
0
,93
33
33
33
36
69
01
64
07
6,9
95
89
84
12
0,1
22
01
51
47
29
,14
69
4
0
0
15
N
ort
he
rn O
setia
� A
lan
ia
Re
pu
blic
0
,87
77
29
25
81
,11
11
11
11
1
1,0
52
63
15
79
02
00
8,8
01
81
72
56
1,0
44
86
11
07
77
,96
70
6
0
�1
16
T
atar
stan
Re
pu
blic
1
,88
88
88
88
93
,33
33
33
33
3
12
43
26
40
36
93
,51
20
07
85
7,6
35
66
41
83
49
,21
05
61
0
0
17
T
yva
Re
pu
blic
1
,58
99
88
08
11
,18
75
1
,42
85
71
42
90
30
52
,66
58
51
17
,03
51
11
17
62
6,7
88
04
0
�1
18
U
dm
urt
ia R
ep
ub
lic
0,8
82
35
29
41
0,5
1
79
09
21
48
0,5
51
26
23
69
0,7
52
19
99
50
,41
21
59
0
�1
19
K
hak
assi
a R
ep
ub
lic
0,7
36
51
77
20
,54
90
19
60
8
0,1
83
33
33
33
35
12
23
32
,71
71
95
16
4,5
10
16
61
40
83
,17
93
0
�1
20
C
he
che
n R
ep
ub
lic
0,7
41
32
49
21
0,7
77
77
77
78
0
,44
44
44
44
40
n.a
.n
.a.
n.a
. 0
�1
21
C
huv
ash
ia R
ep
ub
lic
1,2
85
35
98
01
1,0
54
05
40
54
0
,95
15
55
51
21
8,3
48
34
13
06
5,4
96
80
68
70
1,6
08
55
8
0
�12
2
Alta
iski
y kr
ai
1,1
88
30
40
94
0,8
48
48
48
48
0
,71
60
21
09
9,1
58
09
25
71
0,1
65
26
31
22
12
,73
77
6
0
�12
3
Kra
sno
dar
skiy
kra
i 1
,46
98
25
15
51
,56
08
10
81
1
1,3
16
66
66
67
46
39
26
15
27
,55
72
03
23
50
,25
39
07
81
00
,89
60
26
0
�1
24
K
rasn
oya
rski
y kr
ai
0,7
19
88
17
44
0,5
35
71
42
86
0
,69
23
07
69
26
60
69
11
53
2,7
81
84
24
86
0,8
73
72
71
22
13
,71
43
6
0
�1
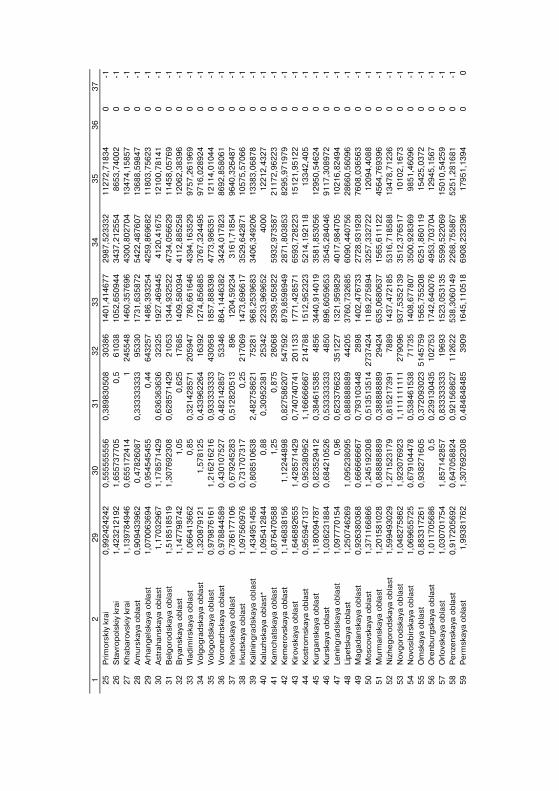
1
2
29
3
0
31
3
2
33
3
4
35
3
6
37
2
5
Pri
mo
rski
y kr
ai
0,9
92
42
42
42
0
,55
55
55
55
60
,38
98
30
50
83
03
86
14
01
,41
46
77
29
87
,52
33
32
1
12
72
,71
83
4
0�1
26
S
tavr
op
ols
kiy
krai
1
,42
32
12
19
2
1,6
55
73
77
05
0,5
61
03
81
05
2,6
50
94
43
43
7,2
12
55
4
86
53
,74
00
2
0�1
27
K
hab
aro
vski
y kr
ai
1,1
39
78
49
46
0
,65
51
72
41
41
24
55
48
14
60
,35
76
96
43
00
,80
27
04
1
34
74
,15
85
7
0�1
28
A
mu
rska
ya o
bla
st
0,9
09
43
39
62
0
,47
82
60
87
0,3
33
33
33
33
95
33
01
73
1,6
35
87
25
42
2,4
87
60
7
13
68
8,5
98
47
0
�12
9
Arh
ang
els
kaya
ob
last
1
,07
00
63
69
4
0,9
54
54
54
55
0,4
46
43
25
71
48
6,3
93
25
44
25
9,8
69
68
2
11
80
3,7
56
23
0
�13
0
Ast
rah
ansk
aya
ob
last
1
,17
03
29
67
1
,17
85
71
42
90
,63
63
63
63
63
23
25
19
27
,46
94
45
41
20
,41
67
5
12
10
0,7
81
41
0
�13
1
Be
lgo
rod
skay
a o
bla
st
1,5
18
51
85
19
1
,30
76
92
30
80
,62
85
71
42
92
10
53
13
44
,93
25
22
47
34
,05
66
29
1
14
58
,05
76
9
0�1
32
B
ryan
skay
a o
bla
st
1,1
47
79
87
42
1
,05
0,6
25
17
68
51
40
9,5
80
39
44
11
2,8
85
25
8
12
06
2,3
83
96
0
�13
3
Vla
dim
irsk
aya
ob
last
1
,06
64
13
66
2
0,8
50
,32
14
28
57
12
05
94
77
80
,66
16
46
43
94
,16
35
29
9
75
7,2
61
96
9
0�1
34
V
olg
og
rad
skay
a o
bla
st
1,3
20
87
91
21
1
,57
81
25
0,4
33
96
22
64
16
39
21
27
4,8
56
88
53
76
7,3
24
49
5
97
16
,02
89
24
0
�13
5
Vo
log
od
skay
a o
bla
st
0,9
79
87
61
61
1
,21
62
16
21
60
,93
33
33
33
34
30
95
81
85
7,8
88
39
84
77
3,9
86
35
1
12
11
4,0
10
44
0
�13
6
Vo
ron
ezh
skay
a o
bla
st
0,9
78
84
45
89
0
,43
01
07
52
70
,48
21
42
85
75
33
46
86
4,1
44
63
82
34
24
,01
78
23
8
69
2,8
58
06
1
0�1
37
Iv
ano
vska
ya o
bla
st
0,7
86
17
71
06
0
,67
92
45
28
30
,51
28
20
51
38
96
12
04
,59
23
43
16
1,7
18
54
9
64
0,3
26
48
7
0�1
38
Ir
kuts
kaya
ob
last
1
,09
75
60
97
6
0,7
31
70
73
17
0,2
52
17
06
91
47
3,6
96
61
73
52
9,6
42
87
1
10
57
5,5
70
66
0
�13
9
Kal
inin
gra
dsk
aya
ob
last
1
,43
49
51
45
6
0,8
08
51
06
38
2,4
82
75
86
21
75
28
19
68
,25
39
68
33
40
6,3
49
20
6
13
38
3,0
68
78
0
�14
0
Kal
uzh
skay
a o
bla
st*
1,0
95
41
28
44
0
,88
0,3
09
52
38
12
53
42
22
33
,96
96
52
40
00
1
22
12
,43
27
0
�14
1
Kam
chat
skay
a o
bla
st
0,8
76
47
05
88
1
,25
0,8
75
28
06
82
93
9,5
05
82
25
93
2,9
73
58
7
21
17
2,9
62
23
0
�14
2
Ke
me
rovs
kaya
ob
last
1
,14
68
38
15
6
1,1
22
44
89
80
,82
75
86
20
75
47
59
28
79
,85
98
94
92
87
1,8
03
85
3
82
95
,97
19
79
0
�14
3
Kir
ovs
kaya
ob
last
1
,64
68
92
65
5
1,4
28
57
14
29
0,7
40
74
07
41
20
11
33
17
71
,42
85
71
65
93
,72
82
23
1
51
21
,95
12
2
0�1
44
K
ost
rom
skay
a o
bla
st
0,9
55
94
71
37
0
,95
23
80
95
21
,16
66
66
66
72
14
78
81
51
2,9
52
32
35
21
4,1
92
11
8
13
34
2,4
05
0
�14
5
Ku
rgan
skay
a o
bla
st
1,1
80
09
47
87
0
,82
35
29
41
20
,38
46
15
38
54
85
63
44
0,9
14
01
93
58
1,8
53
05
6
12
95
0,5
46
24
0
�14
6
Ku
rska
ya o
bla
st
1,0
36
23
18
84
0
,68
42
10
52
60
,53
33
33
33
34
85
08
96
,60
59
65
33
54
5,2
84
04
6
91
17
,30
89
72
0
�14
7
Len
ing
rad
skay
a o
bla
st
1,0
97
77
01
54
0
,96
0,6
23
37
66
23
35
12
27
13
21
,95
98
29
40
17
,98
47
05
1
02
16
,82
49
4
0�1
48
Li
pe
tska
ya o
bla
st
1,2
50
74
62
69
1
,09
52
38
09
50
,88
88
88
88
94
42
05
37
60
,73
26
85
60
90
,44
07
56
2
86
60
,56
09
6
0�1
49
M
agad
ansk
aya
ob
last
0
,92
63
80
36
8
0,6
66
66
66
67
0,7
93
10
34
48
28
98
14
02
,47
67
33
27
28
,93
19
28
7
60
8,0
36
56
3
0�1
50
M
osc
ovs
kaya
ob
last
1
,37
11
66
86
6
1,2
45
19
23
08
0,5
13
51
35
14
27
37
42
41
18
9,2
75
89
43
25
7,3
32
72
2
12
09
4,4
08
8
0�1
51
M
urm
ansk
aya
ob
last
1
,20
15
81
02
8
0,8
88
88
88
89
0,3
88
88
88
89
29
42
46
35
,06
80
63
71
56
5,6
11
12
2
45
64
,76
93
96
0
�15
2
Niz
he
go
rod
skay
a o
bla
st
1,5
99
49
30
29
1
,27
15
23
17
90
,81
52
17
39
17
88
91
43
7,4
72
18
55
31
6,7
18
58
8
13
47
8,7
12
36
0
�15
3
No
vgo
rod
skay
a o
bla
st
1,0
48
27
58
62
1
,92
30
76
92
31
,11
11
11
11
12
79
09
69
37
,53
52
13
93
51
2,3
76
51
7
10
10
2,1
67
3
0�1
54
N
ovo
sib
irsk
aya
ob
last
1
,06
96
55
72
5
0,6
79
10
44
78
0,5
38
46
15
38
71
73
51
40
8,6
77
80
73
50
0,9
28
36
9
98
51
,46
09
6
0�1
55
O
msk
aya
ob
last
0
,88
33
17
26
1
0,9
38
27
16
05
0,3
72
09
30
23
51
45
75
91
56
5,7
55
20
86
25
1,8
60
11
9
15
42
5,0
37
2
0�1
56
O
ren
bu
rgsk
aya
ob
last
1
,01
17
05
68
6
0,5
0,2
39
13
04
35
10
27
53
17
42
,64
00
76
49
53
,70
37
04
1
29
45
,15
67
0
�15
7
Orl
ovs
kaya
ob
last
1
,03
07
01
75
4
1,8
57
14
28
57
0,8
33
33
33
33
19
69
31
52
3,0
53
13
55
59
9,5
22
06
9
15
01
0,5
42
59
0
�15
8
Pe
nze
nsk
aya
ob
last
0
,91
72
05
69
2
0,6
47
05
88
24
0,9
21
56
86
27
11
26
22
53
8,3
06
01
49
22
68
,75
58
67
5
25
1,2
81
68
1
0�1
59
P
erm
skay
a o
bla
st
1,9
93
81
76
2
1,3
07
69
23
08
0,4
84
84
84
85
39
09
16
45
,11
05
18
69
08
,23
23
96
1
79
51
,13
94
0
0
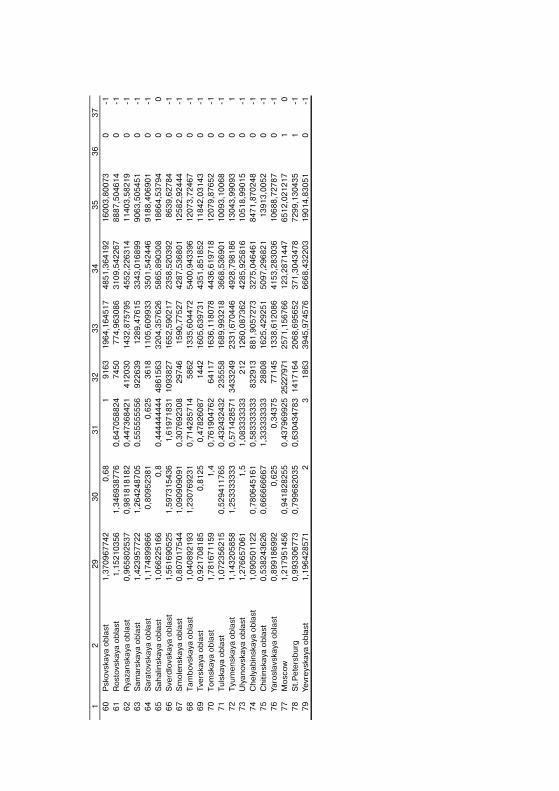
1
2
29
3
0
31
3
2
33
3
4
35
3
6
37
6
0
Psk
ovs
kaya
ob
last
1
,37
09
67
74
20
,68
1
91
63
19
64
,16
45
17
48
51
,36
41
92
16
00
3,8
00
73
0
�1
61
R
ost
ovs
kaya
ob
last
1
,15
21
03
56
1,3
46
93
87
76
0
,64
70
58
82
47
45
07
74
,96
30
86
31
09
,54
22
67
88
87
,50
46
14
0
�1
62
R
yaza
nsk
aya
ob
last
0
,96
58
02
53
70
,98
18
18
18
2
0,4
47
36
84
21
41
20
30
14
32
,87
57
95
45
52
,22
63
14
11
40
3,5
82
19
0
�1
63
S
amar
skay
a o
bla
st
1,4
23
95
77
22
1,2
64
24
87
05
0
,55
55
55
55
69
22
63
91
28
9,4
76
15
33
43
,01
68
99
90
63
,50
54
51
0
�1
64
S
arat
ovs
kaya
ob
last
1
,17
48
99
86
60
,80
95
23
81
0
,62
53
61
81
10
5,6
09
93
33
50
1,5
42
44
69
18
8,4
06
90
1
0
�16
5
Sah
alin
skay
a o
bla
st
1,0
66
22
51
66
0,8
0
,44
44
44
44
44
86
15
63
32
04
,35
76
26
58
65
,89
03
08
18
66
4,5
37
94
0
0
66
S
verd
lovs
kaya
ob
last
1
,56
16
90
52
51
,59
73
15
43
6
1,6
19
71
83
11
09
38
27
16
52
,59
02
17
23
58
,52
03
92
86
39
,62
78
4
0
�16
7
Sm
ole
nsk
aya
ob
last
0
,80
70
17
54
41
,09
09
09
09
1
0,3
07
69
23
08
29
74
61
59
0,7
75
27
42
87
,53
68
01
12
58
2,9
24
44
0
�1
68
T
amb
ovs
kaya
ob
last
1
,04
08
92
19
31
,23
07
69
23
1
0,7
14
28
57
14
58
62
13
35
,60
44
72
54
00
,94
33
96
12
07
3,7
24
67
0
�1
69
T
vers
kaya
ob
last
0
,92
17
08
18
50
,81
25
0
,47
82
60
87
14
42
16
05
,63
97
31
43
51
,85
18
52
11
84
2,0
31
43
0
�1
70
T
om
skay
a o
bla
st
1,7
81
67
11
59
1,4
0
,76
19
04
76
26
41
17
16
36
,11
80
78
44
36
,61
97
18
12
07
9,8
76
52
0
�1
71
T
uls
kaya
ob
last
1
,07
23
56
21
50
,52
94
11
76
5
0,4
32
43
24
32
23
55
58
16
89
,99
32
18
36
68
,53
69
01
10
09
3,1
00
68
0
�1
72
T
yum
en
skay
a o
bla
st
1,1
43
20
58
58
1,2
53
33
33
33
0
,57
14
28
57
13
43
32
49
23
31
,67
04
46
49
28
,79
81
86
13
04
3,9
90
93
0
1
73
U
lyan
ovsk
aya
ob
last
1
,27
66
57
06
11
,5
1,0
83
33
33
33
21
21
26
0,0
87
36
24
28
5,9
25
81
61
05
18
,99
01
5
0
�17
4
Ch
elya
bin
skay
a o
bla
st
1,0
90
50
11
22
0,7
80
64
51
61
0
,58
33
33
33
38
32
91
38
81
,90
57
27
33
27
5,0
46
46
18
47
1,8
70
24
8
0
�17
5
Ch
itin
skay
a o
bla
st
0,5
38
24
36
26
0,6
66
66
66
67
1
,33
33
33
33
32
88
08
16
25
,42
92
51
50
97
,29
68
21
13
91
3,0
05
2
0
�17
6
Yaro
slav
skay
a o
bla
st
0,8
99
18
69
92
0,6
25
0
,34
37
57
71
45
13
38
,61
20
86
41
53
,28
30
36
10
68
8,7
27
87
0
�1
77
M
osc
ow
1
,21
79
51
45
60
,94
18
28
25
5
0,4
37
96
99
25
2522
7971
25
71
,15
67
66
12
3,2
87
14
47
65
12
,02
12
17
1
0
78
S
t.P
ete
rsb
urg
0
,99
33
06
77
30
,79
96
82
03
5
0,6
30
43
47
83
14
17
16
42
06
8,6
95
65
23
71
,30
43
47
87
29
9,1
30
43
5
1
�17
9
Yevr
eys
kaya
ob
last
1
,19
64
28
57
12
3
18
63
39
45
,97
45
76
66
68
,43
22
03
19
01
4,8
30
51
0
�1
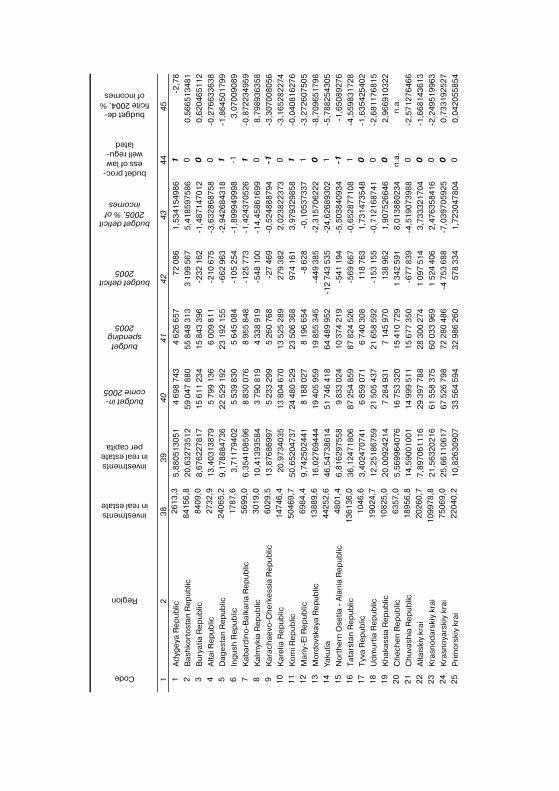
Code
Region
investments in real estate
investments in real estate
per capita
budget in�come 2005
budget spending
2005
budget deficit 2005
budget deficit 2005, % of
incomes
budet proc�ess of law well regu�
lated
budget de�ficite 2004, %
of incomes
1
2
38
3
9
40
4
1
42
4
3
44
4
5
1
Ad
yge
ya R
ep
ub
lic
26
13
,3
5,8
80
51
30
51
4 6
98
74
34
62
6 6
57
72
08
61
,53
41
54
98
6
1
�2,7
82
B
ash
kort
ost
an R
ep
ub
lic
84
15
6,8
2
0,6
32
73
51
25
9 0
47
88
05
5 8
48
31
33
19
9 5
67
5,4
18
59
75
86
0
0
,56
65
13
48
13
B
ury
atia
Re
pu
blic
8
40
9,0
8
,67
62
27
81
71
5 6
11
23
41
5 8
43
39
6�2
32
16
2�1
,48
71
47
01
2
0
0,6
20
46
51
12
4
Alta
i Re
pu
blic
2
73
2,9
1
3,4
03
13
87
95
79
9 1
36
6 0
09
81
1�2
10
67
5�3
,63
28
68
75
8
0
�0,2
76
63
36
38
5
Dag
est
an R
ep
ub
lic
24
06
5,2
9
,17
88
84
73
62
2 5
29
19
22
3 1
92
15
5�6
62
96
3�2
,94
26
84
31
8
1
�1,8
64
50
17
99
6
Ing
ush
Rep
ub
lic
17
87
,6
3,7
11
79
40
25
53
9 8
30
5 6
45
08
4�1
05
25
4�1
,89
99
49
99
8
�1
3,0
70
09
08
97
K
abar
din
o�B
alka
ria
Re
pu
blic
5
69
9,0
6
,35
41
08
59
68
83
0 0
76
8 9
55
84
8�1
25
77
3�1
,42
43
70
52
6
1
�0,8
72
23
49
59
8
Kal
myk
ia R
epu
blic
3
01
9,0
1
0,4
13
93
58
43
79
0 8
19
4 3
38
91
9�5
48
10
0�1
4,4
58
61
69
9
0
8,7
98
93
63
58
9
Kar
ach
aevo
�Ch
erk
ess
ia R
ep
ub
lic
60
29
,5
13
,87
68
69
97
5 2
33
29
95
26
0 7
68
�27
46
9�0
,52
48
88
79
4
�1
�3,3
07
00
80
56
10
K
are
lia R
ep
ub
lic
14
74
6,4
2
0,9
73
40
35
13
80
4 6
70
13
52
5 2
89
27
9 3
82
2,0
23
82
23
73
0
�3
,16
52
82
27
41
1
Ko
mi R
ep
ub
lic
50
46
9,7
5
0,6
52
04
73
72
4 4
80
52
92
3 5
06
36
89
74
16
13
,97
93
29
85
8
1
�0,0
40
81
62
76
12
M
ariy
�El R
ep
ub
lic
69
84
,4
9,7
42
50
24
41
8 1
88
02
78
19
6 6
54
�8 6
28
�0,1
05
37
33
7
1
�3,2
72
60
75
05
13
M
ord
ovs
kaya
Re
pu
blic
1
38
89
,6
16
,02
76
94
44
19
40
5 9
59
19
85
5 3
45
�44
9 3
85
�2,3
15
70
62
22
0
�8
,70
96
51
79
81
4
Yaku
tia
44
25
2,6
4
6,5
47
38
61
45
1 7
46
41
86
4 4
89
95
2�1
2 7
43
53
5�2
4,6
26
89
30
2
1
�5,7
88
25
43
05
15
N
ort
he
rn O
setia
� A
lan
ia R
ep
ub
lic
48
01
,4
6,8
16
29
75
58
9 8
33
02
41
0 3
74
21
9�5
41
19
4�5
,50
38
40
93
4
�1
�1,6
50
89
27
61
6
Tat
arst
an R
ep
ub
lic
13
61
36
,0
36
,12
47
18
06
87
25
4 8
59
87
82
4 5
26
�56
9 6
67
�0,6
52
87
71
08
1
�4
,55
98
31
72
81
7
Tyv
a R
ep
ub
lic
10
46
,6
3,4
02
47
07
41
6 8
59
07
16
74
0 3
08
11
8 7
63
1,7
31
47
35
48
0
�1
,63
54
25
40
21
8
Ud
mu
rtia
Re
pu
blic
1
90
24
,7
12
,25
18
67
59
21
50
5 4
37
21
65
8 5
92
�15
3 1
55
�0,7
12
16
87
41
0
�2
,68
11
76
81
51
9
Kh
akas
sia
Re
pu
blic
1
08
25
,0
20
,00
92
42
14
7 2
84
93
17
14
5 9
70
13
8 9
62
1,9
07
52
66
46
0
2
,96
69
10
32
22
0
Ch
ech
en
Re
pu
blic
6
35
7,0
5
,56
99
64
07
61
6 7
53
32
01
5 4
10
72
91
34
2 5
91
8,0
13
88
02
34
n
.a.
n.a
.
21
C
huv
ash
ia R
ep
ub
lic
18
95
6,8
1
4,5
90
01
00
11
4 9
99
51
11
5 6
77
35
0�6
77
83
9�4
,51
90
73
98
8
0
�2,5
71
27
64
66
22
A
ltais
kiy
krai
2
02
60
,7
7,8
97
06
11
16
29
39
7 7
88
28
30
0 2
74
1 0
97
51
43
,73
33
21
70
4
0
�1,6
68
14
36
13
23
K
rasn
od
arsk
iy k
rai
10
99
78
,8
21
,56
32
02
16
61
55
8 3
75
60
03
3 9
69
1 5
24
40
62
,47
63
58
41
6
0
�2,2
49
51
99
63
24
K
rasn
oya
rski
y kr
ai
75
06
9,0
2
5,6
61
10
61
76
7 5
26
79
87
2 2
80
48
6�4
75
3 6
88
�7,0
39
70
59
25
0
0
,73
31
92
52
72
5
Pri
mo
rski
y kr
ai
22
04
0,2
1
0,8
26
30
90
73
3 5
64
59
43
2 9
86
26
05
78
33
41
,72
30
47
80
4
0
0,0
42
05
58
54
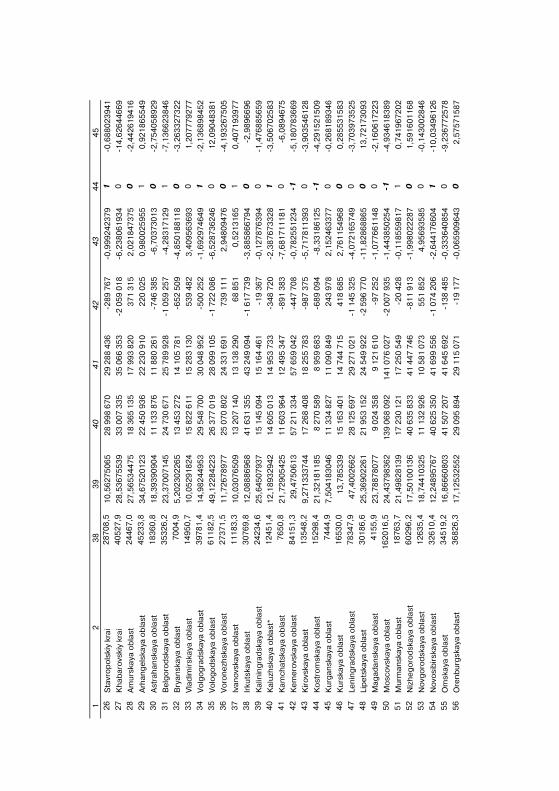
1
2
38
3
9
40
4
1
42
4
3
44
4
5
26
S
tavr
op
ols
kiy
krai
2
87
08
,5
10
,56
27
50
65
2
8 9
98
67
02
9 2
88
43
6�2
89
76
7�0
,99
92
42
37
9
1
�0,6
88
02
39
41
27
K
hab
aro
vski
y kr
ai
40
52
7,9
2
8,5
36
75
53
9
33
00
7 3
35
35
06
6 3
53
�2 0
59
01
8�6
,23
80
61
93
4
0
�14
,62
64
46
69
28
A
mu
rska
ya o
bla
st
24
46
7,0
2
7,5
65
34
47
5
18
36
5 1
35
17
99
3 8
20
37
1 3
15
2,0
21
84
73
75
0
�2
,44
26
19
41
62
9
Arh
ang
els
kaya
ob
last
4
52
33
,8
34
,67
52
01
23
2
2 4
50
93
62
2 2
30
91
02
20
02
50
,98
00
25
95
5
1
0,9
21
86
55
49
30
A
stra
han
skay
a o
bla
st
18
36
0,8
1
8,3
93
90
90
4
11
13
3 8
76
11
88
0 2
61
�74
6 3
85
�6,7
03
73
01
3
0
�2,7
54
05
89
29
31
B
elg
oro
dsk
aya
ob
last
3
53
26
,2
23
,37
00
71
45
2
4 7
30
67
12
5 7
89
92
8�1
05
9 2
57
�4,2
83
17
12
9
1
�7,1
36
62
38
46
32
B
ryan
skay
a o
bla
st
70
04
,9
5,2
02
30
22
65
1
3 4
53
27
21
4 1
05
78
1�6
52
50
9�4
,85
01
88
11
8
0
�3,2
63
32
73
22
33
V
lad
imir
skay
a o
bla
st
14
95
0,7
1
0,0
52
91
82
4
15
82
2 6
11
15
28
3 1
30
53
9 4
82
3,4
09
56
36
93
0
1
,20
77
79
27
73
4
Vo
lgo
gra
dsk
aya
ob
last
3
97
81
,4
14
,98
24
49
53
2
9 5
48
70
03
0 0
48
95
2�5
00
25
2�1
,69
29
74
64
9
1
�2,1
36
89
84
52
35
V
olo
go
dsk
aya
ob
last
6
11
82
,5
49
,12
28
42
23
2
6 3
77
01
92
8 0
99
10
5�1
72
2 0
86
�6,5
28
73
62
46
0
1
2,0
90
48
38
13
6
Vo
ron
ezh
skay
a o
bla
st
27
37
1,5
1
1,7
26
78
97
7
25
07
0 8
02
24
33
1 6
91
73
9 1
11
2,9
48
09
47
6
0
�4,1
93
26
75
05
37
Iv
ano
vska
ya o
bla
st
11
18
3,3
1
0,0
30
76
50
9
13
20
7 1
40
13
13
8 2
90
68
85
10
,52
13
16
5
1
0,4
07
19
39
77
38
Ir
kuts
kaya
ob
last
3
07
69
,8
12
,08
88
69
68
4
1 6
31
35
54
3 2
49
09
4�1
61
7 7
39
�3,8
85
86
67
94
0
�2
,98
96
69
63
9
Kal
inin
gra
dsk
aya
ob
last
2
42
34
,6
25
,64
50
79
37
1
5 1
45
09
41
5 1
64
46
1�1
9 3
67
�0,1
27
87
63
94
0
�1
,47
68
85
65
94
0
Kal
uzh
skay
a o
bla
st*
12
45
1,4
1
2,1
89
32
94
2
14
60
5 0
13
14
95
3 7
33
�34
8 7
20
�2,3
87
67
33
28
1
�3
,50
67
02
58
34
1
Kam
chat
skay
a o
bla
st
76
50
,8
21
,72
90
54
25
1
1 6
03
96
41
2 4
95
34
7�8
91
38
3�7
,68
17
11
18
1
0
�6,0
89
46
75
42
K
em
ero
vska
ya o
bla
st
84
15
1,3
2
9,4
75
06
13
5
7 2
11
33
45
7 6
59
04
2�4
47
70
8�0
,78
25
51
23
4
�1
�5,1
80
78
36
69
43
K
iro
vska
ya o
bla
st
13
54
8,2
9
,27
13
33
74
4
17
26
8 4
08
18
25
5 7
83
�98
7 3
75
�5,7
17
81
13
93
0
�3
,90
35
46
12
84
4
Ko
stro
msk
aya
ob
last
1
52
98
,4
21
,32
18
11
85
8
27
0 5
89
8 9
59
68
3�6
89
09
4�8
,33
18
61
25
�1
�4
,29
15
21
50
94
5
Ku
rgan
skay
a o
bla
st
74
44
,9
7,5
04
18
30
46
1
1 3
34
82
71
1 0
90
84
92
43
97
82
,15
24
63
37
7
0
�0,2
68
18
93
46
46
K
urs
kaya
ob
last
1
65
30
,0
13
,78
53
39
1
5 1
63
40
11
4 7
44
71
54
18
68
52
,76
11
54
96
8
0
0,2
85
53
15
83
47
Le
nin
gra
dsk
aya
ob
last
7
83
47
,9
47
,40
02
66
2
28
12
5 6
97
29
27
1 0
21
�1 1
45
32
5�4
,07
21
65
74
9
0
�3,7
03
97
35
25
48
Li
pe
tska
ya o
bla
st
30
18
6,6
2
5,3
69
02
26
1
21
95
3 1
52
24
54
9 9
22
�2 5
96
77
0�1
1,8
28
68
86
5
0
13
,72
17
30
93
49
M
agad
ansk
aya
ob
last
4
15
5,9
2
3,7
88
78
07
7
9 0
24
35
89
12
1 6
10
�97
25
2�1
,07
76
61
14
8
0
�2,1
60
61
72
23
50
M
osc
ovs
kaya
ob
last
1
62
01
6,5
2
4,4
37
98
36
2
13
9 0
68
09
21
41
07
6 0
27
�2 0
07
93
5�1
,44
38
50
25
4
�1
�4,9
34
61
83
89
51
M
urm
ansk
aya
ob
last
1
87
63
,7
21
,49
82
81
39
1
7 2
30
12
11
7 2
50
54
9�2
0 4
28
�0,1
18
55
98
17
1
0
,74
19
67
20
25
2
Niz
he
go
rod
skay
a o
bla
st
60
29
6,2
1
7,5
01
00
13
6
40
63
5 8
33
41
44
7 7
46
�81
1 9
13
�1,9
98
02
22
87
0
1
,59
16
01
16
85
3
No
vgo
rod
skay
a o
bla
st
12
63
5,4
1
8,7
44
10
32
5
11
13
2 9
26
10
58
1 0
73
55
1 8
52
4,9
56
93
58
5
0
�0,1
43
00
28
46
54
N
ovo
sib
irsk
aya
ob
last
3
26
10
,4
12
,24
89
57
67
4
0 6
25
35
04
1 6
99
55
6�1
07
4 2
06
�2,6
44
17
66
04
1
�1
0,0
34
96
12
65
5
Om
skay
a o
bla
st
34
51
9,2
1
6,8
66
60
80
3
41
50
7 2
07
41
64
5 6
92
�13
8 4
85
�0,3
33
64
08
54
0
�9
,23
67
72
57
85
6
Ore
nb
urg
skay
a o
bla
st
36
82
6,3
1
7,1
25
32
55
2
29
09
5 8
94
29
11
5 0
71
�19
17
7�0
,06
59
09
64
3
0
2,5
75
71
58
7
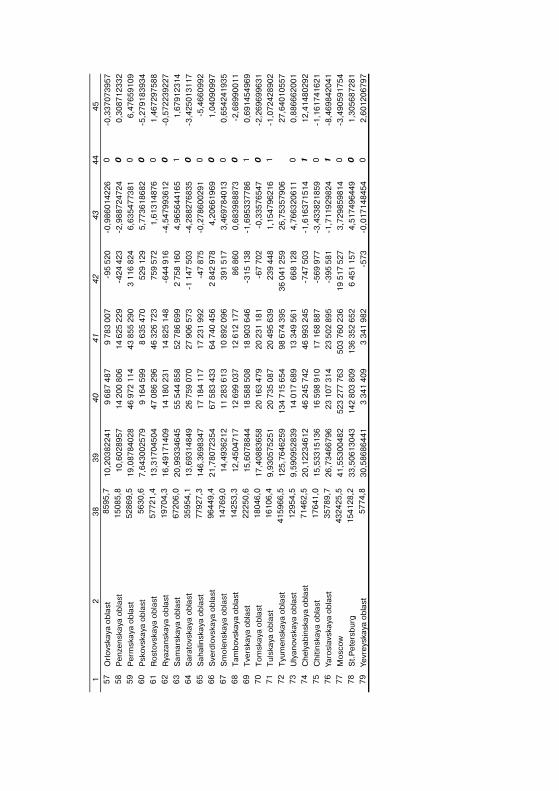
1
2
38
3
9
40
4
1
42
4
3
44
4
5
57
O
rlo
vska
ya o
bla
st
85
95
,7
10
,20
38
22
41
9 6
87
48
79
78
3 0
07
�95
52
0�0
,98
60
14
22
6
0
�0,3
37
07
39
57
58
P
en
zen
skay
a o
bla
st
15
08
5,8
1
0,6
02
89
57
14
20
0 8
06
14
62
5 2
29
�42
4 4
23
�2,9
88
72
47
24
0
0
,30
87
12
33
25
9
Pe
rmsk
aya
ob
last
5
28
69
,5
19
,08
78
40
28
46
97
2 1
14
43
85
5 2
90
3 1
16
82
46
,63
54
77
38
1
0
6,4
76
59
10
96
0
Psk
ovs
kaya
ob
last
5
63
0,6
7
,64
30
02
57
99
16
4 5
99
8 6
35
47
05
29
12
95
,77
36
18
68
2
0
�5,2
79
18
39
34
61
R
ost
ovs
kaya
ob
last
5
77
21
,4
13
,31
70
45
04
47
08
6 2
96
46
32
6 7
23
75
9 5
72
1,6
13
14
87
6
0
1,4
67
29
75
88
62
R
yaza
nsk
aya
ob
last
1
97
04
,3
16
,49
17
14
09
14
18
0 2
31
14
82
5 1
48
�64
4 9
16
�4,5
47
99
36
12
0
�0
,57
22
39
22
76
3
Sam
arsk
aya
ob
last
6
72
06
,0
20
,99
33
46
45
55
54
4 8
58
52
78
6 6
99
2 7
58
16
04
,96
56
44
16
5
1
1,6
79
12
31
46
4
Sar
ato
vska
ya o
bla
st
35
95
4,1
1
3,6
93
14
84
92
6 7
59
07
02
7 9
06
57
3�1
14
7 5
03
�4,2
88
27
68
35
0
�3
,42
50
13
11
76
5
Sah
alin
skay
a o
bla
st
77
92
7,3
1
46
,36
98
34
71
7 1
84
11
71
7 2
31
99
2�4
7 8
75
�0,2
78
60
02
91
0
�5
,46
60
99
26
6
Sve
rdlo
vska
ya o
bla
st
96
44
9,4
2
1,7
80
72
35
46
7 5
83
43
36
4 7
40
45
62
84
2 9
78
4,2
06
61
96
9
0
1,0
40
90
99
76
7
Sm
ole
nsk
aya
ob
last
1
47
69
,0
14
,49
36
21
21
1 2
83
61
31
0 8
92
09
63
91
51
73
,46
97
84
01
3
0
0,6
54
24
19
35
68
T
amb
ovs
kaya
ob
last
1
42
53
,3
12
,45
04
71
71
2 6
99
03
71
2 6
12
17
78
6 8
60
0,6
83
98
88
73
0
�2
,68
99
00
11
69
T
vers
kaya
ob
last
2
22
50
,6
15
,60
78
84
41
8 5
88
50
81
8 9
03
64
6�3
15
13
8�1
,69
53
37
78
6
1
0,6
91
45
49
69
70
T
om
skay
a o
bla
st
18
04
6,0
1
7,4
08
83
65
82
0 1
63
47
92
0 2
31
18
1�6
7 7
02
�0,3
35
76
54
7
0
�2,2
69
69
96
31
71
T
uls
kaya
ob
last
1
61
06
,4
9,9
30
57
52
51
20
73
5 0
87
20
49
5 6
39
23
9 4
48
1,1
54
79
62
16
1
�1
,07
24
28
90
27
2
Tyu
me
nsk
aya
ob
last
4
15
96
6,5
1
25
,76
46
25
91
34
71
5 6
54
98
67
4 3
95
36
04
1 2
59
26
,75
35
79
06
27
,64
01
05
57
73
U
lyan
ovsk
aya
ob
last
1
29
54
,5
9,5
90
95
28
39
14
01
7 6
89
13
34
9 5
61
66
8 1
28
4,7
66
32
06
11
0
0
,88
66
62
00
17
4
Ch
elya
bin
skay
a o
bla
st
71
46
2,5
2
0,1
22
34
61
24
6 2
45
74
24
6 9
93
24
5�7
47
50
3�1
,61
63
71
51
4
1
12
,41
48
02
92
75
C
hiti
nsk
aya
ob
last
1
76
41
,0
15
,53
31
51
36
16
59
8 9
10
17
16
8 8
87
�56
9 9
77
�3,4
33
82
18
59
0
�1
,16
17
41
62
17
6
Yaro
slav
skay
a o
bla
st
35
78
9,7
2
6,7
34
66
79
62
3 1
07
31
42
3 5
02
89
5�3
95
58
1�1
,71
19
29
82
4
1
�8,4
69
84
20
41
77
M
osc
ow
4
32
42
5,5
4
1,5
53
00
48
25
23
27
7 7
63
50
3 7
60
23
61
9 5
17
52
73
,72
98
59
81
4
0
�3,4
90
59
17
54
78
S
t.P
ete
rsb
urg
1
54
12
8,2
3
3,5
06
13
04
31
42
80
3 8
09
13
6 3
52
65
26
45
1 1
57
4,5
17
49
64
49
0
1
,30
56
87
28
17
9
Yevr
eys
kaya
ob
last
5
77
4,8
3
0,5
86
86
44
13
34
1 4
09
3 3
41
98
2�5
73
�0,0
17
14
84
54
0
2
,60
12
06
79
7
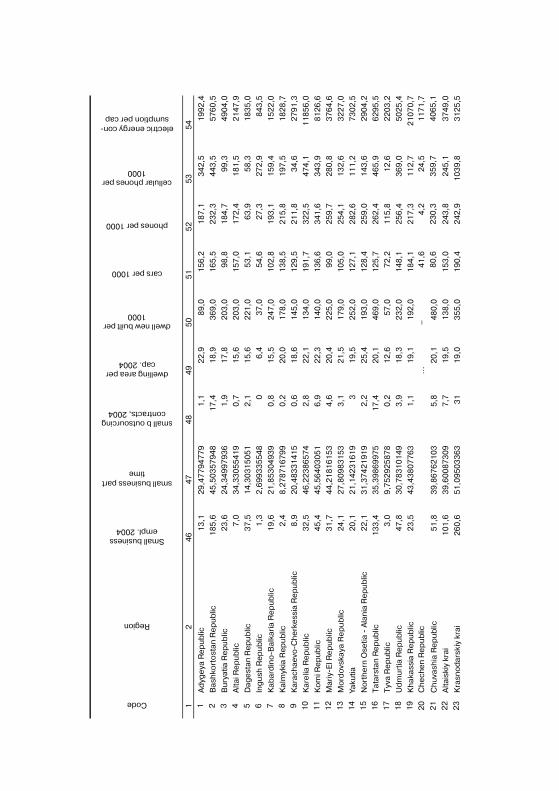
Code
Region
Small business empl. 2004
small business part time
small b outsourcing contracts, 2004
dwelling area per cap. 2004
dwell new built per 1000
cars per 1000
phones per 1000
cellular phones per 1000
electric energy con�sumption per cap
1
2
46
4
7
48
4
9
50
5
1
52
5
3
54
1
Ad
yge
ya R
ep
ub
lic
13
,1
29
,47
79
47
79
1,1
22
,98
9,0
15
6,2
18
7,1
3
42
,5
19
92
,42
B
ash
kort
ost
an R
ep
ub
lic
18
5,6
4
5,5
03
57
94
81
7,4
18
,93
69
,01
65
,52
32
,3
44
3,5
5
76
0,5
3
Bu
ryat
ia R
ep
ub
lic
23
,6
24
,34
99
79
36
1,9
17
,82
03
,09
8,8
18
4,7
9
9,3
4
90
4,0
4
Alta
i Re
pu
blic
7
,0
34
,33
05
54
19
0,7
15
,62
03
,01
57
,01
72
,4
18
1,5
2
14
7,9
5
Dag
est
an R
ep
ub
lic
37
,5
14
,30
31
50
51
2,1
15
,62
21
,05
3,1
63
,9
58
,3
18
35
,06
In
gu
sh R
epu
blic
1
,3
2,6
99
33
55
48
06
,43
7,0
54
,62
7,3
2
72
,9
84
3,5
7
Kab
ard
ino
�Bal
kari
a R
ep
ub
lic
19
,6
21
,85
30
49
39
0,8
15
,52
47
,01
02
,81
93
,1
15
9,4
1
52
2,0
8
Kal
myk
ia R
epu
blic
2
,4
8,2
78
71
67
99
0,2
20
,01
78
,01
38
,52
15
,8
19
7,5
1
82
8,7
9
Kar
ach
aevo
�Ch
erk
ess
ia R
ep
ub
lic
8,9
2
0,4
83
31
41
50
,61
8,6
14
5,0
12
9,5
21
1,8
3
4,6
2
79
1,3
10
K
are
lia R
ep
ub
lic
32
,5
46
,22
38
65
74
2,8
22
,11
34
,01
91
,73
22
,5
47
4,1
1
18
56
,01
1
Ko
mi R
ep
ub
lic
45
,4
45
,56
40
30
51
6,9
22
,31
40
,01
36
,63
41
,6
34
3,9
8
12
6,6
12
M
ariy
�El R
ep
ub
lic
31
,7
44
,21
81
61
53
4,6
20
,42
25
,09
9,0
25
9,7
2
80
,8
37
64
,61
3
Mo
rdo
vska
ya R
ep
ub
lic
24
,1
27
,80
98
31
53
3,1
21
,51
79
,01
05
,02
54
,1
13
2,6
3
22
7,0
14
Ya
kutia
2
0,1
2
1,1
42
31
61
93
19
,52
52
,01
27
,12
82
,6
11
1,2
7
30
2,5
15
N
ort
he
rn O
setia
� A
lan
ia R
ep
ub
lic
22
,1
31
,37
42
19
19
2,2
25
,41
93
,01
28
,42
59
,0
14
3,6
2
90
4,2
16
T
atar
stan
Re
pu
blic
1
33
,4
35
,39
86
99
75
17
,42
0,1
46
9,0
12
5,7
26
2,4
4
65
,9
62
95
,51
7
Tyv
a R
ep
ub
lic
3,0
9
,75
29
25
87
80
,21
2,6
57
,07
2,2
11
5,8
1
2,6
2
20
3,2
18
U
dm
urt
ia R
ep
ub
lic
47
,8
30
,78
31
01
49
3,9
18
,32
32
,01
48
,12
56
,4
36
9,0
5
02
5,4
19
K
hak
assi
a R
ep
ub
lic
23
,5
43
,43
80
77
63
1,1
19
,11
92
,01
84
,12
17
,3
11
2,7
2
10
70
,72
0
Ch
ech
en
Re
pu
blic
...
–
41
,64
,2
24
,5
11
71
,7
21
C
huv
ash
ia R
ep
ub
lic
51
,8
39
,86
76
21
03
5,8
20
,14
80
,08
0,6
23
0,3
3
59
,7
40
65
,1
22
A
ltais
kiy
krai
1
01
,6
39
,60
08
73
09
7,7
19
,51
38
,01
53
,02
43
,8
24
5,1
3
74
9,0
23
K
rasn
od
arsk
iy k
rai
26
0,6
5
1,0
95
03
36
33
11
9,0
35
5,0
19
0,4
24
2,9
1
03
9,8
3
12
5,5
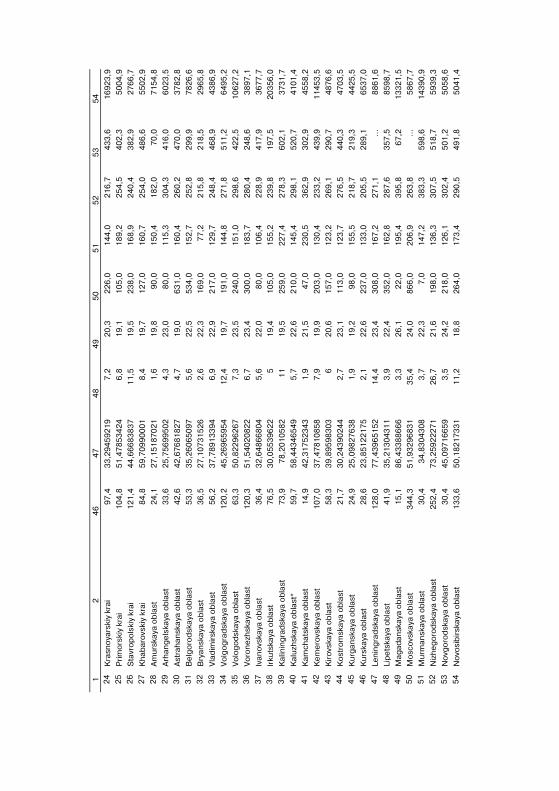
1
2
46
4
7
48
4
9
50
5
1
52
5
3
54
2
4
Kra
sno
yars
kiy
krai
9
7,4
3
3,2
94
59
21
97
,22
0,3
22
6,0
14
4,0
2
16
,7
43
3,6
1
69
23
,92
5
Pri
mo
rski
y kr
ai
10
4,8
5
1,4
78
53
42
46
,81
9,1
10
5,0
18
9,2
2
54
,5
40
2,3
5
00
4,9
26
S
tavr
op
ols
kiy
krai
1
21
,4
44
,66
68
38
37
11
,51
9,5
23
8,0
16
8,9
2
40
,4
38
2,9
2
76
6,7
27
K
hab
aro
vski
y kr
ai
84
,8
59
,70
99
00
01
8,4
19
,71
27
,01
60
,7
25
4,0
4
86
,6
55
02
,92
8
Am
urs
kaya
ob
last
2
4,1
2
7,1
51
87
02
11
,61
9,8
90
,01
50
,4
18
2,0
7
0,0
7
15
4,8
29
A
rhan
ge
lska
ya o
bla
st
33
,6
25
,75
69
95
02
4,3
23
,08
0,0
11
5,3
3
04
,3
41
6,0
6
02
3,5
30
A
stra
han
skay
a o
bla
st
42
,6
42
,67
68
18
27
4,7
19
,06
31
,01
60
,4
26
0,2
4
70
,0
37
82
,83
1
Be
lgo
rod
skay
a o
bla
st
53
,3
35
,26
06
50
97
5,6
22
,55
34
,01
52
,7
25
2,8
2
99
,9
78
26
,63
2
Bry
ansk
aya
ob
last
3
6,5
2
7,1
07
31
52
62
,62
2,3
16
9,0
77
,2
21
5,8
2
18
,5
29
65
,83
3
Vla
dim
irsk
aya
ob
last
5
6,2
3
7,7
89
13
39
46
,92
2,9
21
7,0
12
9,7
2
48
,4
46
8,9
4
38
6,9
34
V
olg
og
rad
skay
a o
bla
st
12
0,2
4
5,2
69
65
95
41
2,4
19
,71
91
,01
44
,8
27
1,8
5
11
,2
64
95
,23
5
Vo
log
od
skay
a o
bla
st
63
,3
50
,82
29
62
67
7,3
23
,52
40
,01
51
,0
29
8,6
4
22
,5
10
62
7,2
36
V
oro
ne
zhsk
aya
ob
last
1
20
,3
51
,54
02
08
22
6,7
23
,43
00
,01
83
,7
28
0,4
2
48
,6
38
97
,13
7
Ivan
ovs
kaya
ob
last
3
6,4
3
2,6
48
66
80
45
,62
2,0
80
,01
06
,4
22
8,9
4
17
,9
36
77
,73
8
Irku
tska
ya o
bla
st
76
,5
30
,05
53
96
22
51
9,4
10
5,0
15
5,2
2
39
,8
19
7,5
2
03
56
,03
9
Kal
inin
gra
dsk
aya
ob
last
7
3,9
7
8,2
01
05
82
11
19
,52
59
,02
27
,4
27
8,3
6
02
,1
37
31
,74
0
Kal
uzh
skay
a o
bla
st*
59
,7
58
,44
34
65
49
5,7
22
,62
10
,01
45
,4
29
8,1
5
20
,7
41
01
,44
1
Kam
chat
skay
a o
bla
st
14
,9
42
,31
75
23
43
1,9
21
,54
7,0
23
0,5
3
62
,9
30
2,9
4
55
8,2
42
K
em
ero
vska
ya o
bla
st
10
7,0
3
7,4
78
10
85
87
,91
9,9
20
3,0
13
0,4
2
33
,2
43
9,9
1
14
53
,54
3
Kir
ovs
kaya
ob
last
5
8,3
3
9,8
95
98
30
36
20
,61
57
,01
23
,2
26
9,1
2
90
,7
48
76
,64
4
Ko
stro
msk
aya
ob
last
2
1,7
3
0,2
43
90
24
42
,72
3,1
11
3,0
12
3,7
2
76
,5
44
0,3
4
70
3,5
45
K
urg
ansk
aya
ob
last
2
4,9
2
5,0
98
27
63
81
,91
9,2
98
,01
55
,5
21
8,7
2
19
,3
44
25
,54
6
Ku
rska
ya o
bla
st
28
,6
23
,85
12
21
75
2,1
22
,62
37
,01
33
,0
20
5,5
2
89
,1
65
37
,04
7
Len
ing
rad
skay
a o
bla
st
12
8,0
7
7,4
39
65
15
21
4,4
23
,43
08
,01
67
,2
27
1,1
..
. 8
86
1,6
48
Li
pe
tska
ya o
bla
st
41
,9
35
,21
30
43
11
3,9
22
,43
52
,01
62
,8
28
7,6
3
57
,5
85
98
,74
9
Mag
adan
skay
a o
bla
st
15
,1
86
,43
38
86
66
3,3
26
,12
2,0
19
5,4
3
95
,8
67
,2
13
32
1,5
50
M
osc
ovs
kaya
ob
last
3
44
,3
51
,93
29
68
31
35
,42
4,0
86
6,0
20
6,9
2
63
,8
...
58
67
,75
1
Mu
rman
skay
a o
bla
st
30
,4
34
,83
04
30
83
,72
2,3
7,0
14
7,2
3
83
,3
59
8,6
1
43
90
,95
2
Niz
he
go
rod
skay
a o
bla
st
25
2,4
7
3,2
59
22
27
12
6,7
21
,61
98
,01
36
,3
30
7,5
5
18
,7
59
39
,35
3
No
vgo
rod
skay
a o
bla
st
30
,4
45
,09
71
66
59
3,5
24
,22
18
,01
26
,1
30
2,4
5
01
,2
50
58
,65
4
No
vosi
bir
skay
a o
bla
st
13
3,6
5
0,1
82
17
33
11
1,2
18
,82
64
,01
73
,4
29
0,5
4
91
,8
50
41
,4
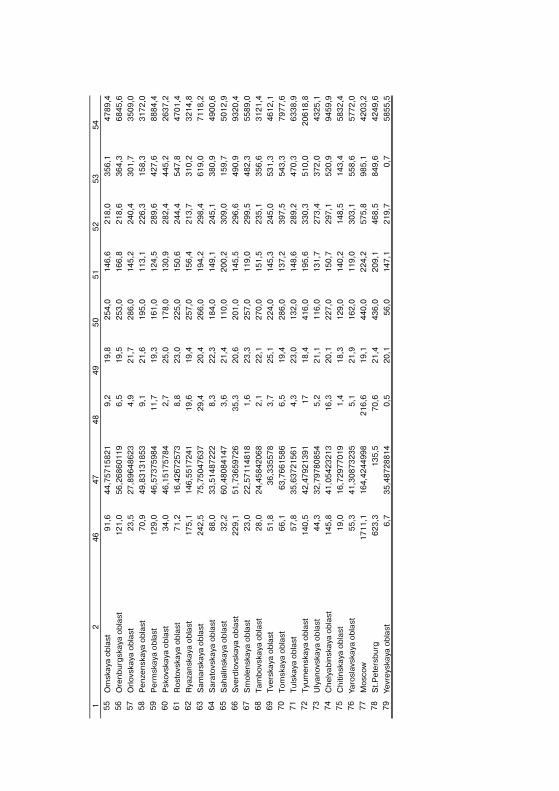
1
2
46
4
7
48
4
9
50
5
1
52
5
3
54
5
5
Om
skay
a o
bla
st
91
,6
44
,75
71
58
21
9,2
19
,82
54
,01
46
,62
18
,0
35
6,1
4
78
9,4
56
O
ren
bu
rgsk
aya
ob
last
1
21
,0
56
,26
86
01
19
6,5
19
,52
53
,01
66
,82
18
,6
36
4,3
6
84
5,6
57
O
rlo
vska
ya o
bla
st
23
,5
27
,89
64
86
23
4,9
21
,72
86
,01
45
,22
40
,4
30
1,7
3
50
9,0
58
P
en
zen
skay
a o
bla
st
70
,9
49
,83
13
18
53
9,1
21
,61
95
,01
13
,12
26
,3
15
8,3
3
17
2,0
59
P
erm
skay
a o
bla
st
12
9,0
4
6,5
73
75
98
41
1,7
19
,31
61
,01
24
,52
89
,6
42
7,6
8
88
4,4
60
P
sko
vska
ya o
bla
st
34
,0
46
,15
17
57
84
2,7
25
,01
78
,01
30
,92
82
,4
44
5,2
2
63
7,2
61
R
ost
ovs
kaya
ob
last
7
1,2
1
6,4
26
72
57
38
,82
3,0
22
5,0
15
0,6
24
4,4
5
47
,8
47
01
,46
2
Rya
zan
skay
a o
bla
st
17
5,1
1
46
,55
17
24
11
9,6
19
,42
57
,01
56
,42
13
,7
31
0,2
3
21
4,8
63
S
amar
skay
a o
bla
st
24
2,5
7
5,7
50
47
63
72
9,4
20
,42
66
,01
94
,22
98
,4
61
9,0
7
11
8,2
64
S
arat
ovs
kaya
ob
last
8
8,0
3
3,5
14
87
22
28
,32
2,3
18
4,0
14
9,1
24
5,1
3
80
,9
49
00
,66
5
Sah
alin
skay
a o
bla
st
32
,2
60
,48
08
41
47
3,6
21
,41
10
,02
00
,23
09
,0
15
9,7
5
01
2,9
66
S
verd
lovs
kaya
ob
last
2
29
,1
51
,73
65
97
26
35
,32
0,6
20
1,0
14
5,5
29
6,6
4
90
,9
93
20
,46
7
Sm
ole
nsk
aya
ob
last
2
3,0
2
2,5
71
14
81
81
,62
3,3
25
7,0
11
9,0
29
9,5
4
82
,3
55
89
,06
8
Tam
bo
vska
ya o
bla
st
28
,0
24
,45
84
20
68
2,1
22
,12
70
,01
51
,52
35
,1
35
6,6
3
12
1,4
69
T
vers
kaya
ob
last
5
1,8
3
6,3
35
57
83
,72
5,1
22
4,0
14
5,3
24
5,0
5
31
,3
46
12
,17
0
To
msk
aya
ob
last
6
6,1
6
3,7
66
15
86
6,5
19
,42
86
,01
37
,23
97
,5
54
3,3
7
97
7,6
71
T
uls
kaya
ob
last
5
7,8
3
5,6
37
21
56
14
,32
3,0
13
2,0
14
8,6
28
9,2
4
70
,3
63
38
,97
2
Tyu
me
nsk
aya
ob
last
1
40
,5
42
,47
92
13
91
17
18
,44
16
,01
95
,63
30
,3
51
0,0
2
06
18
,87
3
Uly
anov
skay
a o
bla
st
44
,3
32
,79
78
08
54
5,2
21
,11
16
,01
31
,72
73
,4
37
2,0
4
32
5,1
74
C
hel
yab
insk
aya
ob
last
1
45
,8
41
,05
42
32
13
16
,32
0,1
22
7,0
15
0,7
29
7,1
5
20
,9
94
59
,97
5
Ch
itin
skay
a o
bla
st
19
,0
16
,72
97
70
19
1,4
18
,31
29
,01
40
,21
48
,5
14
3,4
5
83
2,4
76
Ya
rosl
avsk
aya
ob
last
5
5,3
4
1,3
08
73
23
55
,12
1,9
16
2,0
11
9,0
30
3,1
5
58
,6
57
72
,07
7
Mo
sco
w
17
11
,1
16
4,4
24
49
98
21
6,6
19
,14
40
,02
24
,25
75
,8
98
5,1
4
20
3,2
78
S
t.P
ete
rsb
urg
6
23
,3
13
5,5
70
,62
1,4
43
6,0
20
9,1
46
8,5
8
49
,6
42
49
,67
9
Yevr
eys
kaya
ob
last
6
,7
35
,48
72
88
14
0,5
20
,15
6,0
14
7,1
21
9,7
0
,7
58
55
,5
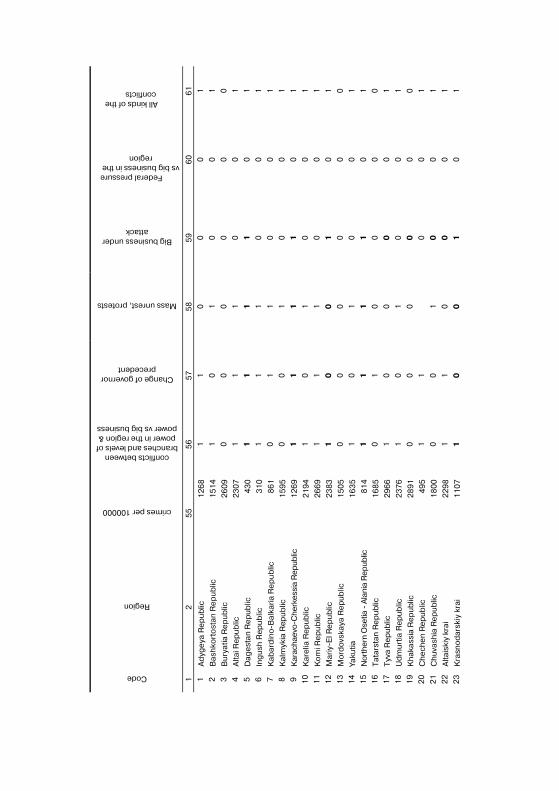
Code
Region
crimes per 100000
conflicts between branches and levels of power in the region & power vs big business
Change of governor precedent
Mass unrest, protests
Big business under attack
Federal pressure vs big business in the
region
All kinds of the conflicts
1
2
55
5
6
57
5
8
59
6
0
61
1
Ad
yge
ya R
ep
ub
lic
12
68
1
1
0
0
0
1
2
Bas
hko
rto
stan
Re
pu
blic
1
51
4
1
0
1
0
0
1
3
Bu
ryat
ia R
ep
ub
lic
26
09
0
0
0
0
0
0
4
Alta
i Re
pu
blic
2
30
7
1
1
1
0
0
1
5
Dag
est
an R
ep
ub
lic
43
0
1
1
1
1
0
1
6
Ing
ush
Rep
ub
lic
31
0
1
1
1
0
0
1
7
Kab
ard
ino
�Bal
kari
a R
ep
ub
lic
86
1
0
1
1
0
0
1
8
Kal
myk
ia R
epu
blic
1
59
5
0
0
1
0
0
1
9
Kar
acha
evo�
Che
rkes
sia
Rep
ublic
12
69
1
1
1
1
0
1
10
K
are
lia R
ep
ub
lic
21
94
1
0
1
0
0
1
11
K
om
i Re
pu
blic
2
66
9
1
1
1
0
0
1
12
M
ariy
�El R
ep
ub
lic
23
83
1
0
0
1
0
1
13
M
ord
ovs
kaya
Re
pu
blic
1
50
5
0
0
0
0
0
0
14
Ya
kutia
1
63
5
1
0
1
0
0
1
15
N
orth
ern
Ose
tia �
Ala
nia
Rep
ublic
81
4
1
1
1
1
0
1
16
T
atar
stan
Re
pu
blic
1
68
5
0
1
0
0
0
0
17
T
yva
Re
pu
blic
2
96
6
1
0
0
0
0
1
18
U
dm
urt
ia R
ep
ub
lic
23
76
1
0
1
0
0
1
19
K
hak
assi
a R
ep
ub
lic
28
91
0
0
0
0
0
0
20
C
he
che
n R
ep
ub
lic
49
5
1
1
0
0
1
21
C
huv
ash
ia R
ep
ub
lic
18
00
0
0
1
0
0
1
22
A
ltais
kiy
krai
2
29
8
1
1
0
0
0
1
23
K
rasn
od
arsk
iy k
rai
11
07
1
0
0
1
0
1
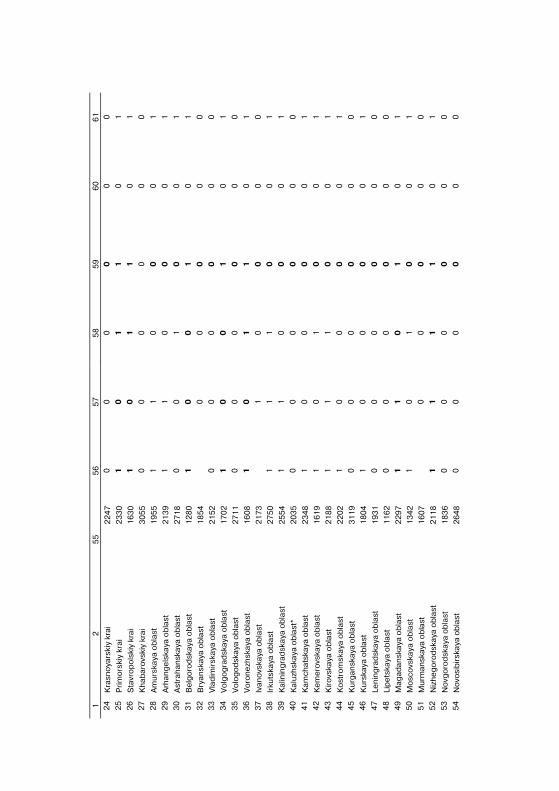
1
2
55
5
6
57
5
8
59
6
0
61
2
4
Kra
sno
yars
kiy
krai
2
24
7
0
0
0
0
0
0
25
P
rim
ors
kiy
krai
2
33
0
1
0
1
1
0
1
26
S
tavr
op
ols
kiy
krai
1
63
0
1
0
1
1
0
1
27
K
hab
aro
vski
y kr
ai
30
55
0
0
0
0
0
0
28
A
mu
rska
ya o
bla
st
19
55
1
1
0
0
0
1
29
A
rhan
ge
lska
ya o
bla
st
21
39
1
1
0
0
0
1
30
A
stra
han
skay
a o
bla
st
27
18
0
0
1
0
0
1
31
B
elg
oro
dsk
aya
ob
last
1
28
0
1
0
0
1
0
1
32
B
ryan
skay
a o
bla
st
18
54
0
0
0
0
0
33
V
lad
imir
skay
a o
bla
st
21
52
0
0
0
0
0
0
34
V
olg
og
rad
skay
a o
bla
st
17
02
1
0
0
1
0
1
35
V
olo
go
dsk
aya
ob
last
2
71
1
0
0
0
0
0
0
36
V
oro
ne
zhsk
aya
ob
last
1
60
8
1
0
1
1
0
1
37
Iv
ano
vska
ya o
bla
st
21
73
1
0
0
0
0
38
Ir
kuts
kaya
ob
last
2
75
0
1
1
1
0
0
1
39
K
alin
ing
rad
skay
a o
bla
st
25
54
1
1
0
0
0
1
40
K
alu
zhsk
aya
ob
last
* 2
03
5
0
0
0
0
0
0
41
K
amch
atsk
aya
ob
last
2
34
8
1
0
0
0
0
1
42
K
em
ero
vska
ya o
bla
st
16
19
1
0
1
0
0
1
43
K
iro
vska
ya o
bla
st
21
88
1
1
1
0
0
1
44
K
ost
rom
skay
a o
bla
st
22
02
1
0
0
0
0
1
45
K
urg
ansk
aya
ob
last
3
11
9
0
0
0
0
0
0
46
K
urs
kaya
ob
last
1
80
4
1
0
0
0
0
1
47
Le
nin
gra
dsk
aya
ob
last
1
93
1
0
0
0
0
0
0
48
Li
pe
tska
ya o
bla
st
11
62
0
0
0
0
0
0
49
M
agad
ansk
aya
ob
last
2
29
7
1
1
0
1
0
1
50
M
osc
ovs
kaya
ob
last
1
34
2
1
0
1
0
0
1
51
M
urm
ansk
aya
ob
last
1
60
7
0
0
0
0
0
52
N
izh
eg
oro
dsk
aya
ob
last
2
11
8
1
1
1
1
0
1
53
N
ovg
oro
dsk
aya
ob
last
1
83
6
0
0
0
0
0
0
54
N
ovo
sib
irsk
aya
ob
last
2
64
8
0
0
0
0
0
0
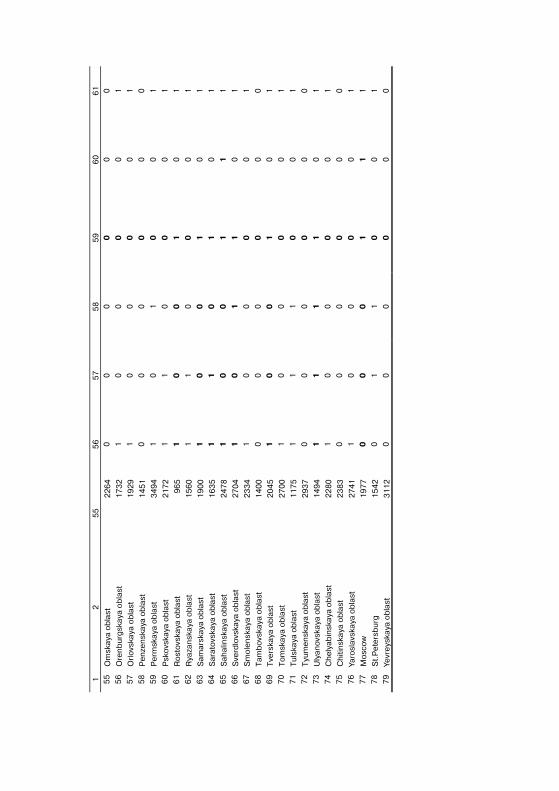
1
2
55
5
6
57
5
8
59
6
0
61
5
5
Om
skay
a o
bla
st
22
64
0
0
0
0
0
0
56
O
ren
bu
rgsk
aya
ob
last
1
73
2
1
0
0
0
0
1
57
O
rlo
vska
ya o
bla
st
19
29
1
0
0
0
0
1
58
P
en
zen
skay
a o
bla
st
14
51
0
0
0
0
0
0
59
P
erm
skay
a o
bla
st
34
94
1
0
1
0
0
1
60
P
sko
vska
ya o
bla
st
21
72
1
1
0
0
0
1
61
R
ost
ovs
kaya
ob
last
9
65
1
0
0
1
0
1
62
R
yaza
nsk
aya
ob
last
1
56
0
1
1
0
0
0
1
63
S
amar
skay
a o
bla
st
19
00
1
0
0
1
0
1
64
S
arat
ovs
kaya
ob
last
1
63
5
1
1
0
1
0
1
65
S
ahal
insk
aya
ob
last
2
47
8
1
0
0
1
1
1
66
S
verd
lovs
kaya
ob
last
2
70
4
1
0
1
1
0
1
67
S
mo
len
skay
a o
bla
st
23
34
1
0
0
0
0
1
68
T
amb
ovs
kaya
ob
last
1
40
0
0
0
0
0
0
0
69
T
vers
kaya
ob
last
2
04
5
1
0
0
1
0
1
70
T
om
skay
a o
bla
st
27
00
1
0
0
0
0
1
71
T
uls
kaya
ob
last
1
17
5
1
1
1
0
0
1
72
T
yum
en
skay
a o
bla
st
29
37
0
0
0
0
0
0
73
U
lyan
ovsk
aya
ob
last
1
49
4
1
1
1
1
0
1
74
C
hel
yab
insk
aya
ob
last
2
28
0
1
0
0
0
0
1
75
C
hiti
nsk
aya
ob
last
2
38
3
0
0
0
0
0
0
76
Ya
rosl
avsk
aya
ob
last
2
74
1
1
0
0
0
0
1
77
M
osc
ow
1
97
7
0
0
0
1
1
1
78
S
t.P
ete
rsb
urg
1
54
2
0
1
1
0
0
1
79
Ye
vre
yska
ya o
bla
st
31
12
0
0
0
0
0
0