Federal Democratic Republic of Nepal Data Collection Survey ...
410
Federal Democratic Republic of Nepal Ministry of Physical Infrastructure and Transport Department of Roads Federal Democratic Republic of Nepal Data Collection Survey on the Sindhuli Road Capacity Enhancement in Nepal Final Report February 2022 Japan International Cooperation Agency CTI Engineering International Co., Ltd. Oriental Consultants Global Co., Ltd. 4R JR 22-017
-
Upload
khangminh22 -
Category
Documents
-
view
1 -
download
0
Transcript of Federal Democratic Republic of Nepal Data Collection Survey ...
Federal Democratic Republic of Nepal
Ministry of Physical Infrastructure and Transport
Department of Roads
Federal Democratic Republic of Nepal
Data Collection Survey on the Sindhuli
Road Capacity Enhancement in Nepal
Final Report
February 2022
Japan International Cooperation Agency
CTI Engineering International Co., Ltd.
Oriental Consultants Global Co., Ltd.
4R
JR
22-017

Federal Democratic Republic of Nepal
Ministry of Physical Infrastructure and Transport
Department of Roads
Federal Democratic Republic of Nepal
Data Collection Survey on the Sindhuli
Road Capacity Enhancement in Nepal
Final Report
February 2022
Japan International Cooperation Agency
CTI Engineering International Co., Ltd.
Oriental Consultants Global Co., Ltd.


Data Collection Survey on the Sindhuli Road Capacity Enhancement in Nepal FINAL REPORT・SUMMARY
1
SUMMARY
1. Country: Federal Democratic Republic of Nepal
2. Survey Name: Data Collection Survey on the Sindhuli Road Capacity Enhancement in Nepal
3. Executing Agency: Department of Roads (DOR)
4. Survey Outline
This Survey aims to prepare and provide a roadmap to improve the Sindhuli Road that would be
useful in meeting the new demands and new expectations of the people of Nepal. Sindhuli Road
demonstrated remarkable outcome soon after its completion. The road became the shortest and fastest
corridor joining Kathmandu with Eastern Terai. Where it takes an approximate 9 plus hours to travel
from Kathmandu to Bardibas using the Kathmandu-Naubise-Mugling-Bardibas road, it only takes
about 5 plus hours through Sindhuli Road. This significant reduction in the travel time resulted into
rapid enhancement of socio-economic activities along the Sindhuli Road, thereby contributing to the
economic development of the country. However, after completion, the Sindhuli Road soon attracted
traffics increasing the volume exponentially. In about half-decade after its opening, the road is already
approaching its capacity (on average 4,000 vehicles per day). On the other hand, the objective road is
only 5.5m wide (1.5 lane) and its alignment is poor – sharp curves (hairpin curves) and steep grade.
Such geometrical conditions have limited the benefits to standard vehicles, as restrictions have been
imposed on large vehicles from plying the road as a mean to minimize traffic accidents.
Under such circumstances, people of Nepal (general road users and road agencies) began raising
concerns and added expectations for capacity enhancement of the Sindhuli Road. As is also
emphasized in the latest development plans, people are looking forward to an improved Sindhuli
Road, which is wider, smoother, faster and safer, more resilient to disaster, and more economically
friendly than the existing road. Although, the Government of Japan (GOJ) has been rendering
financial and technical assistance even after completion of the road to keep the road operational by
attending timely and adequate maintenance, it is time to consider improvement/upgradation to meet
the road users` expectations. Doing so will enhance its capacity; it will be operable without restriction
impositions; it can function as an integral part of the Asian Highway (AH) or at least serve as a strong
connectivity between the two Asian Highways, AH2 and AH42; it will bring the northeastern regions
of the country closer to Kathmandu; and it will serve as a redundant road of Kathmandu-Naubise-
Mugling-Bardibas Road and the currently under-construction Kathmandu-Terai/Madhes Expressway.
Although the Government of Nepal (GON) also acknowledges the need for the improvement, it`s
improvement is not as simple as other ordinary roads. There are sections where widening is deemed
extremely challenging. Therefore, a combination of improvement methods comprising of simple
widening, widening using structures, improvement and widening using bridges (includes loop bridge
and metal roads), bypassing and provision of tunnels need to be considered. This Survey studies the
possibilities of such combination and recommends the optimum improvement method to achieve the
objective of the Survey.

Data Collection Survey on the Sindhuli Road Capacity Enhancement in Nepal FINAL REPORT・SUMMARY
2
5. Survey Scope
i) Preparation and explanation of the Inception Report,
ii) Existing data collection and understanding of present condition in transport /road sector,
iii) Understanding operation & maintenance system of the Sindhuli Road and project
implementation system of infrastructure projects,
iv) Analysis of existing road condition,
v) Study on improvement measures for strengthening logistics capacity of the road
vi) Selection of Optimum Alternative for Tunneling at Section II of the Sindhuli Road, and
vii) Preparation and explanation of Draft Final Report
viii) Submission of the Final Report
6. Needs and Potentials of the Improvement:
(1) The environment surrounding SR is changing (development of new roads).
(2) SR is only route connecting KTM and eastern Terai directly. It is also enhancing connectivity
between KTM and northeast regions of the country including connections to border cities of
both India and China
(3) The existing traffic volume approaching capacity of 1.5 lane road,
(4) It does not accommodate large vehicles (narrow width and sharp curves).
(5) It is expected to enhance redundancy (westward route and Fast Track).
(6) ICDs are being developed (Shift of trade ⇒demand to accommodate trade transport will
increase) .
(7) Widening of National Highways to 2-lanes or more is one of the targets set in Development
Plans
(8) MOPIT/DOR`s priority: i) E-W Highway, ii) Prithvi Highway, iii) Postal Highway, iv) M-H
Highway, v) North-South Corridors, vi) Sindhuli Road
(9) MOPIT/DOR have provided positive opinions, but no sufficient concrete plans indicating the
time axis.
7. Study on Enhancement of Road Function
(1) Basic Concept
Study of the basic concept for capacity enhancement of the Sindhuli Road needs setting policies
for achieving the Sindhuli Road 2.0 Plan or envisioning the targets. In other words, the concept
can be regarded as a condition to determine road class, level of service, or road
geometry/structures. Table 1 shows the proposed basic concept. The conditions (proposed
values/goals/ideal state) set for the items, except for the target year which both the MOPIT and
the DOR requested to shorten to 2031, were agreed during the meetings with the MOPIT and the
DOR in October 2021. Following the request, the target year was agreed for review in view with
the necessary period for implementing the road function enhancement methodologies on the
entire stretch of the Sindhuli Road.

Data Collection Survey on the Sindhuli Road Capacity Enhancement in Nepal FINAL REPORT・SUMMARY
3
Table 1 Basic Concept
No. Item Proposed Value / Goal / Ideal State
1 Target Year 2031
2 Number of Lane All sections will have at least 2-lane carriageway.
3 Road Classification Class III, National Road
4 Design Speed Section I : 40 ~ 60 km/h(Rolling - Mountainous)
Section II ~ IV : 30 km/h(Mountainous - Steep)
5 Target Vehicle Trailor (common in Nepal)
6 Level of Service as of Target
Year LOS: D or above
7 Applied Design Standards for
Study Nepal Standard and Japanese Standard
8 Improvement Concept
Stepwise Improvement Scenario
(This means to improve the Sindhuli Road step by
step, or section by section.)
9 Relation and Demarcation with
Fast Truck
For the future, Sindhuli Road is responsible for;
Redundancy route for logistics and transportation
connecting between Kathmandu and India
Logistics route connecting Kathmandu, eastern area
(Province No.1) and Terai region
(2) Typical Cross Section
Typical cross sections by types of the improvement measures are shown in Figure 1 to Figure 8.
Shoulder width varies depending on the terrain. Since NRS recommends 2.0m for rolling and
mountainous terrains (40 km/h to 60 km/h) and 1.5m is for steep terrain (30 km/h).
Figure 1 Type-1: Earthwork (Cut and Fill)

Data Collection Survey on the Sindhuli Road Capacity Enhancement in Nepal FINAL REPORT・SUMMARY
4
Figure 2 Type-2A: Earthwork with Structures (Retaining Wall)
Figure 3 Type-2B:Earthwork with Structures (Retaining Wall/Slope Protection/Reinforced
Shoulder width:
1500mm is for 30km/h of design speed (Section II to IV).
2000mm is for 40km/h and 60km/h of design speed (Section I).
Data Collection Survey on the Sindhuli Road Capacity Enhancement in Nepal FINAL REPORT・SUMMARY
5
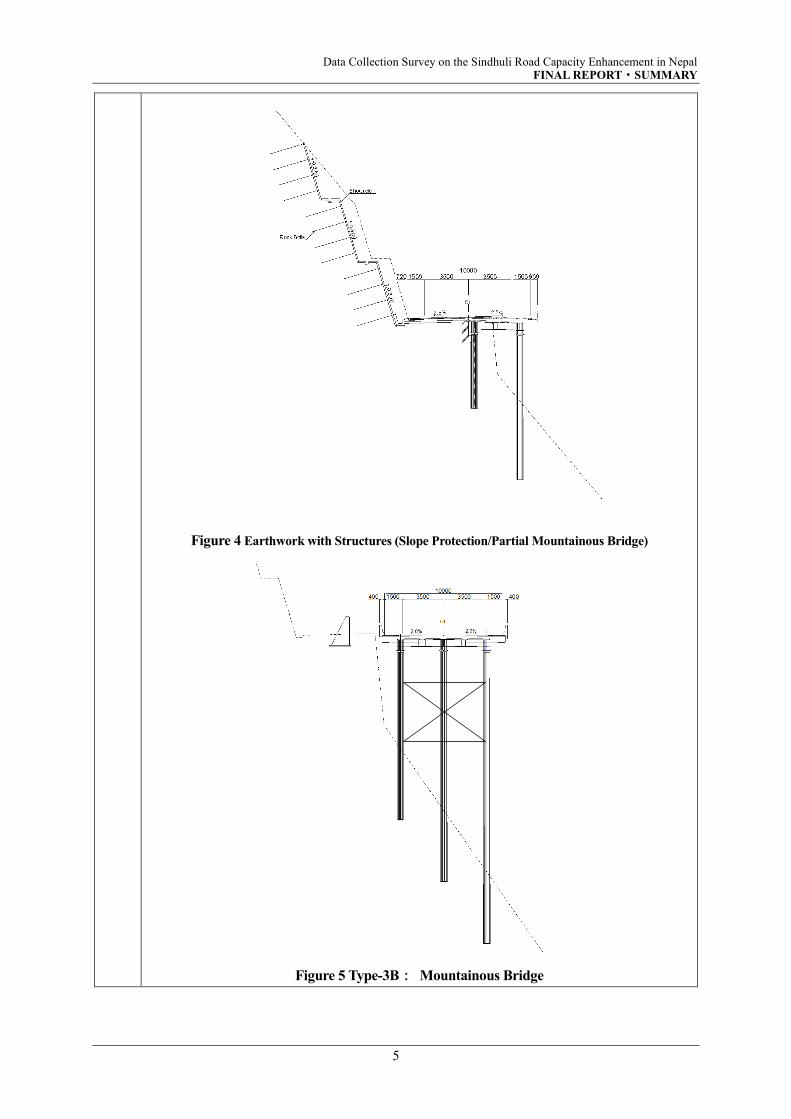
Figure 4 Earthwork with Structures (Slope Protection/Partial Mountainous Bridge)
Figure 5 Type-3B: Mountainous Bridge

Data Collection Survey on the Sindhuli Road Capacity Enhancement in Nepal FINAL REPORT・SUMMARY
6
Figure 6 Type-4A: Bridge
(I-Girder)
Figure 7 Type-4B: Bridge
(Box Girder)
Figure 8 Type-5: Tunnel
(3) Summary of Improvement Measures
Following the policy and approaches mentioned in the preceding items, improvement measures
were studied at 1km interval. Summary is shown in Table 2 and Figure 9.
Table 2 Summary of Improvement Measures
Type of Measure
Cross
Section
Type
Length (km)
Section I Section II Section III Section IV Total
Length
None or Minor Improvement - 0.4 0.0 0.0 0.5 0.9
Earthwork (Cut and Fill) Type-1 31.6 6.0 7.0 20.1 64.7
Earthwork with Structures Type-2 or 3 3.0 2.0 19.0 29.0 53.0
Mountainous Bridge / Bridge Type-4 2.0 0.0 11.0 0.0 13.0
Tunnel Type-5 0.0 28.0 0.0 0.0 28.0
Total Length 37.0 36.0 37.0 49.6 159.6
Figure 9 Share of Type of Measures
8. Study on Possibility of Tunneling at Section II
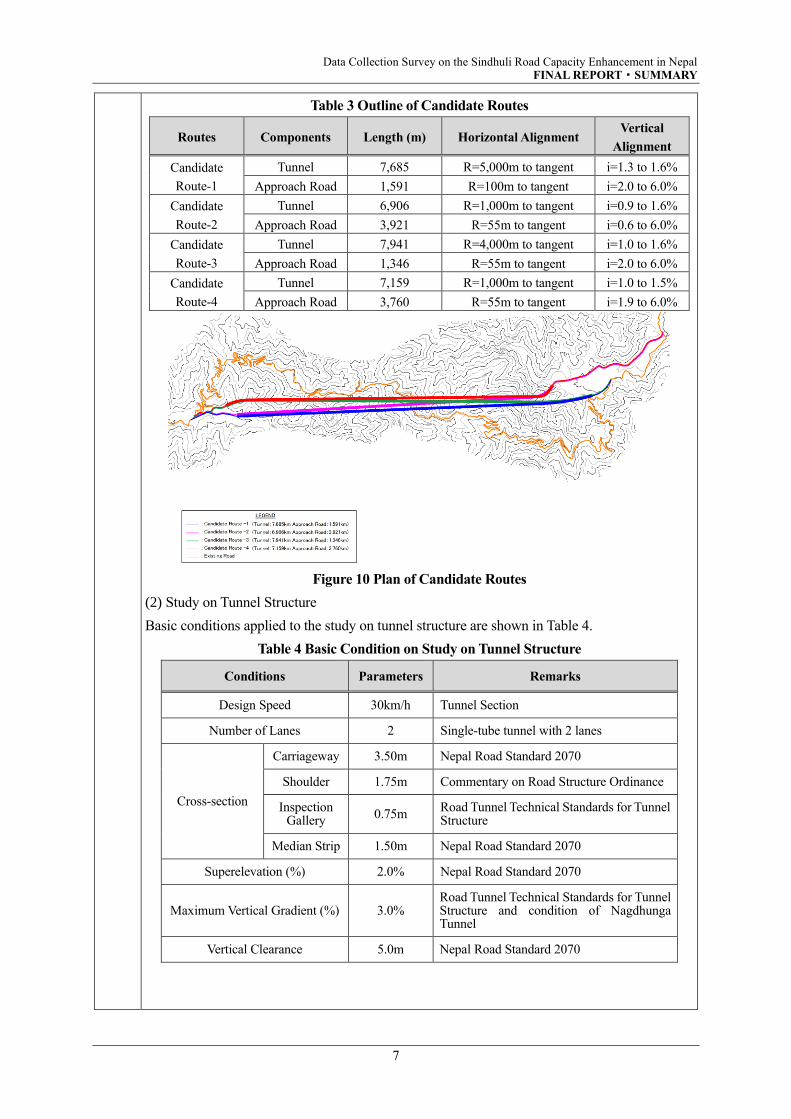
(1) Selection of Candidate Routes
4 candidate routes shown in Table 3 are planned in the Study. Plan of candidate routes are shown
in Figure 10.
1.1%1.0% 0.6%
85%
17% 19%
41% 41%
8.1%
5.6%
51.4%
58.5%
33.2%
5.4%
29.7%
8.1%
77.8%
17.5%
0%
10%
20%
30%
40%
50%
60%
70%
80%
90%
100%
Section I Section II Section III Section IV Total Length
None or Minor Improvement Type-1: Earthwork (Cut and Fill) Type-2: Earthwork with Structures
Type-3: Mountainous BridgeType-4: Bridge
Type-5: Tunnel
Data Collection Survey on the Sindhuli Road Capacity Enhancement in Nepal FINAL REPORT・SUMMARY
7
Table 3 Outline of Candidate Routes
Routes Components Length (m) Horizontal Alignment Vertical
Alignment
Candidate
Route-1
Tunnel 7,685 R=5,000m to tangent i=1.3 to 1.6%
Approach Road 1,591 R=100m to tangent i=2.0 to 6.0%
Candidate
Route-2
Tunnel 6,906 R=1,000m to tangent i=0.9 to 1.6%
Approach Road 3,921 R=55m to tangent i=0.6 to 6.0%
Candidate
Route-3
Tunnel 7,941 R=4,000m to tangent i=1.0 to 1.6%
Approach Road 1,346 R=55m to tangent i=2.0 to 6.0%
Candidate
Route-4
Tunnel 7,159 R=1,000m to tangent i=1.0 to 1.5%
Approach Road 3,760 R=55m to tangent i=1.9 to 6.0%
Figure 10 Plan of Candidate Routes
(2) Study on Tunnel Structure
Basic conditions applied to the study on tunnel structure are shown in Table 4.
Table 4 Basic Condition on Study on Tunnel Structure
Conditions Parameters Remarks
Design Speed 30km/h Tunnel Section
Number of Lanes 2 Single-tube tunnel with 2 lanes
Cross-section
Carriageway 3.50m Nepal Road Standard 2070
Shoulder 1.75m Commentary on Road Structure Ordinance
Inspection Gallery
0.75m Road Tunnel Technical Standards for Tunnel Structure
Median Strip 1.50m Nepal Road Standard 2070
Superelevation (%) 2.0% Nepal Road Standard 2070
Maximum Vertical Gradient (%) 3.0% Road Tunnel Technical Standards for Tunnel Structure and condition of Nagdhunga Tunnel
Vertical Clearance 5.0m Nepal Road Standard 2070

Data Collection Survey on the Sindhuli Road Capacity Enhancement in Nepal FINAL REPORT・SUMMARY
8
Typical tunnel cross-section is shown in Figure 11.
Figure 11 Typical Tunnel Cross-Section (DI)
9. Construction Cost Estimate
Section
Ⅰ Ⅱ Ⅲ Ⅳ Overall
Road
Improve
ment
Road
Improve
ment
Tunnel Tunnel
Approach
Road
Improve
ment
Road
Improvem
ent
Excluding
tunnel Tunnel TOTAL
Length
(km) 36.8 6.9 7.7 1.6 34.7 49.6 128.0 9.3 139.6
Cost
(million NRP) 3,923 2,634 36,002 870 21,256 11,395 39,208 36,872 76,080
Cost/Length
(million
NRP/km)
107 382 4,676 544 613 228 306 - -
Exclusive of Design cost (F/S, DD), consulting services cost, O&M cost, contingency, land
acquisition & compensation cost, taxes, inflation etc.
Source: JICA Survey Team
Data Collection Survey on the Sindhuli Road Capacity Enhancement in Nepal FINAL REPORT・SUMMARY
9
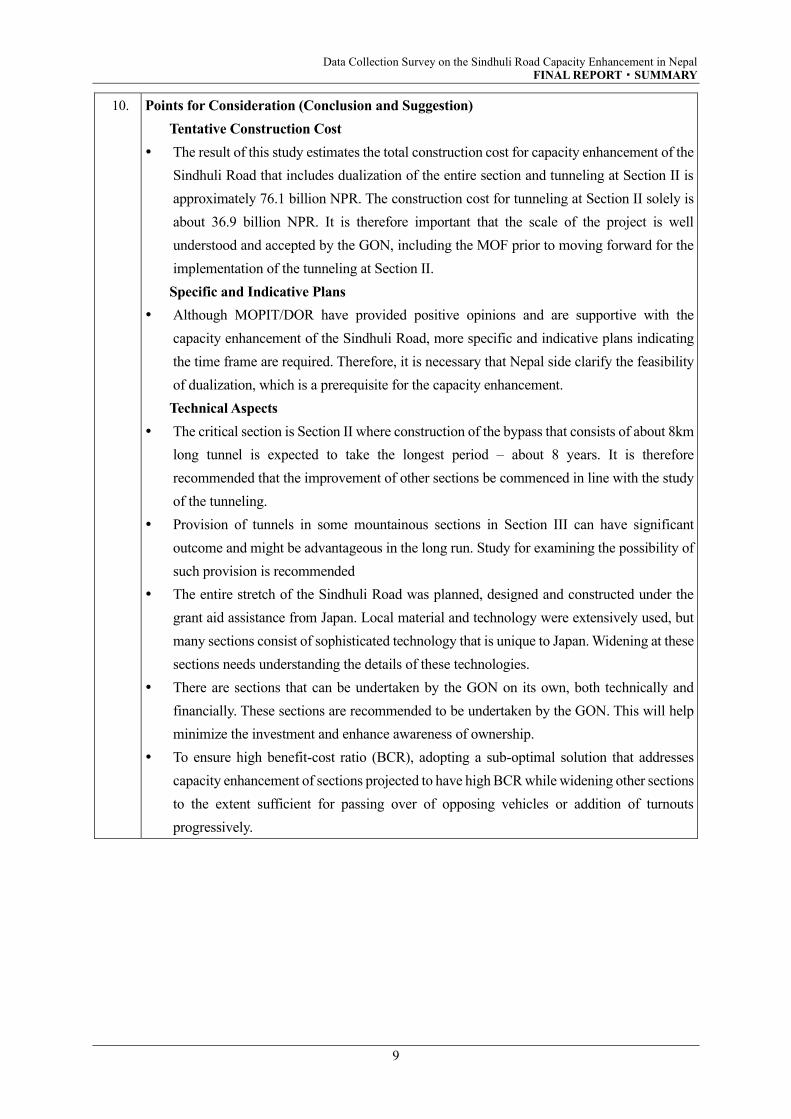
10. Points for Consideration (Conclusion and Suggestion)
Tentative Construction Cost
The result of this study estimates the total construction cost for capacity enhancement of the
Sindhuli Road that includes dualization of the entire section and tunneling at Section II is
approximately 76.1 billion NPR. The construction cost for tunneling at Section II solely is
about 36.9 billion NPR. It is therefore important that the scale of the project is well
understood and accepted by the GON, including the MOF prior to moving forward for the
implementation of the tunneling at Section II.
Specific and Indicative Plans
Although MOPIT/DOR have provided positive opinions and are supportive with the
capacity enhancement of the Sindhuli Road, more specific and indicative plans indicating
the time frame are required. Therefore, it is necessary that Nepal side clarify the feasibility
of dualization, which is a prerequisite for the capacity enhancement.
Technical Aspects
The critical section is Section II where construction of the bypass that consists of about 8km
long tunnel is expected to take the longest period – about 8 years. It is therefore
recommended that the improvement of other sections be commenced in line with the study
of the tunneling.
Provision of tunnels in some mountainous sections in Section III can have significant
outcome and might be advantageous in the long run. Study for examining the possibility of
such provision is recommended
The entire stretch of the Sindhuli Road was planned, designed and constructed under the
grant aid assistance from Japan. Local material and technology were extensively used, but
many sections consist of sophisticated technology that is unique to Japan. Widening at these
sections needs understanding the details of these technologies.
There are sections that can be undertaken by the GON on its own, both technically and
financially. These sections are recommended to be undertaken by the GON. This will help
minimize the investment and enhance awareness of ownership.
To ensure high benefit-cost ratio (BCR), adopting a sub-optimal solution that addresses
capacity enhancement of sections projected to have high BCR while widening other sections
to the extent sufficient for passing over of opposing vehicles or addition of turnouts
progressively.

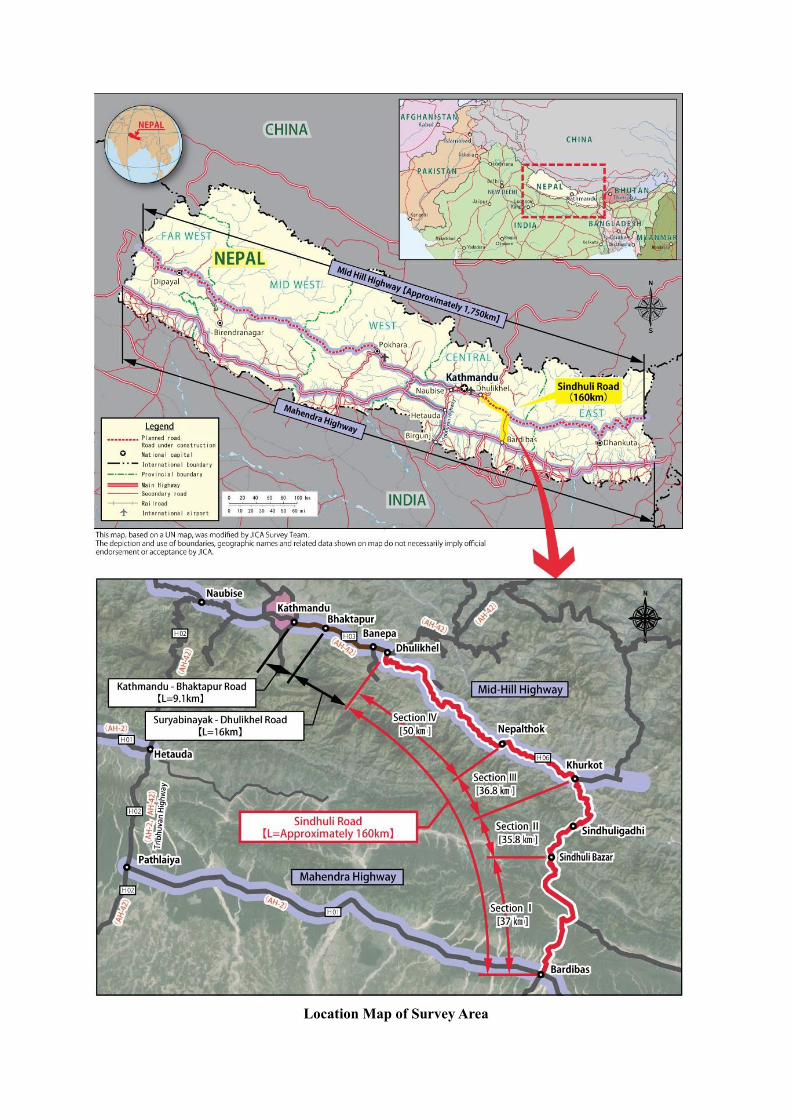
Location Map of Survey Area


i
Data Collection Survey on the Sindhuli Road Capacity Enhancement in Nepal
Final Report
Table of Contents
Summary
Location Map of Survey Area
Table of Contents
List of Figure
List of Tables
Acronyms and Abbreviations
Page
CHAPTER 1 INTRODUCTION ...................................................................................................... 1-1
1.1 SURVEY BACKGROUND ........................................................................................................... 1-2
1.2 SURVEY OBJECTIVE .................................................................................................................. 1-4
1.3 SURVEY SCOPE ........................................................................................................................... 1-4
1.4 TARGET AREA ............................................................................................................................. 1-4
1.5 STUDY APPROACH ..................................................................................................................... 1-5
1.6 RELEVANT GOVERNMENT AGENCY ..................................................................................... 1-7
1.7 SURVEY TEAM AND ASSIGNMENT SCHEDULE................................................................... 1-7
1.8 DELIVERABLES .......................................................................................................................... 1-7
1.9 BRIEF HISTORY AND BASIC UNDERSTANDING .................................................................. 1-8
1.9.1 Brief History ........................................................................................................................... 1-8
1.9.2 Basic Understanding and Concerns ........................................................................................ 1-9
1.10 GOVERNMENT STRUCTURE OF NEPAL ............................................................................ 1-11
1.10.1 Brief Political Background ................................................................................................. 1-11
1.10.2 Government Structure ........................................................................................................ 1-11
CHAPTER 2 SOCIO-ECONOMIC INDICATORS AND PROJECT PROFILE ........................ 2-1
2.1 COUNTRY OVERVIEW ............................................................................................................... 2-1
2.2 SOCIO-ECONIMIC INDICATORS .............................................................................................. 2-2
2.2.1 Population .............................................................................................................................. 2-2
2.2.2 Economy and Industry ........................................................................................................... 2-3
2.2.3 Trade Trend ............................................................................................................................ 2-8
2.2.4 Tourism ................................................................................................................................. 2-11
2.3 PROFILE OF SURVEY AREA ................................................................................................... 2-12
2.3.1 Introduction .......................................................................................................................... 2-12
2.3.2 Topography ........................................................................................................................... 2-12
2.3.3 Geology and Past Natural Disasters of Survey Area ............................................................ 2-18
2.3.4 Climate ................................................................................................................................. 2-23
ii
CHAPTER 3 DEVELOPMENT PLANS ......................................................................................... 3-1
3.1 INTRODUCTION .......................................................................................................................... 3-1
3.2 LONG-TERM VISION 2043 ......................................................................................................... 3-1
3.2.1 Vision ..................................................................................................................................... 3-1
3.2.2 Strategies ................................................................................................................................ 3-2
3.2.3 National Goals ........................................................................................................................ 3-2
3.2.4 Drivers of Transformation ...................................................................................................... 3-2
3.2.5 Major Quantitative Targets ..................................................................................................... 3-3
3.2.6 Relevancy with this Survey .................................................................................................... 3-3
3.3 NATIONAL DEVELOPMENT PLANS ........................................................................................ 3-4
3.3.1 Fourteenth Development Plan (FY 2016/17-2018/19) ........................................................... 3-4
3.3.2 Fifteenth Development Plan (2019/20-2023/24) .................................................................... 3-6
3.4 FIVE YEAR STRATEGIC PLAN (2073-2078)........................................................................... 3-19
3.4.1 Objective .............................................................................................................................. 3-19
3.4.2 Basic Concept ....................................................................................................................... 3-19
3.4.3 Relevance with this Survey .................................................................................................. 3-21
3.5 PRIORITY INVESTMENT PLAN .............................................................................................. 3-21
3.5.1 1st Priority Investment Plan .................................................................................................. 3-21
3.5.2 2nd Priority Investment Plan ................................................................................................. 3-21
3.5.3 Mid-Term Review of 2007 Priority Investment Plan ........................................................... 3-22
3.5.4 Priority Investment Plan (2023-2033) .................................................................................. 3-23
3.5.5 Relevancy with this Plan ...................................................................................................... 3-23
CHAPTER 4 TRANSPORT SECTOR OVERVIEW ..................................................................... 4-1
4.1 INTRODUCTION .......................................................................................................................... 4-1
4.2 ROAD TRANSPORT ..................................................................................................................... 4-1
4.2.1 Road Network ........................................................................................................................ 4-1
4.2.2 Expressways ........................................................................................................................... 4-8
4.2.3 Toll Roads .............................................................................................................................. 4-9
4.3 RAILWAY TRANSPORT ............................................................................................................ 4-11
4.3.1 Brief History ......................................................................................................................... 4-11
4.3.2 Current Status of Railway Network ..................................................................................... 4-11
4.3.3 Development Plans ............................................................................................................... 4-12
4.3.4 Trans-Asian Railway (TAR) ................................................................................................. 4-12
4.4 AIR TRANSPORT ....................................................................................................................... 4-12
4.5 WATER TRANSPORT ................................................................................................................. 4-14
4.6 AGENCIES RELATED TO TRANSPORT SECTOR ................................................................. 4-14
4.6.1 Ministry of Physical Infrastructure and Transport ............................................................... 4-15

iii
4.6.2 Ministry of Federal Affairs and General Administration ..................................................... 4-17
4.6.3 National Planning Commission ............................................................................................ 4-18
4.6.4 Ministry of Culture, Tourism and Civil Aviation ................................................................. 4-19
4.6.5 Department of Roads ............................................................................................................ 4-20
4.6.6 Department of Transport Management................................................................................. 4-22
4.6.7 Department of Local Infrastructure ...................................................................................... 4-23
4.6.8 Roads Board Nepal............................................................................................................... 4-24
4.6.9 Department of Railways ....................................................................................................... 4-27
4.6.10 Civil Aviation Authority of Nepal ...................................................................................... 4-28
4.6.11 Nepal Shipping Office ........................................................................................................ 4-29
4.7 INSTITUTIONAL CAPACITY of TRANSPORT AGENCIES ................................................... 4-31
4.7.1 Implementing Capacity of MOPIT and DOR ...................................................................... 4-31
CHAPTER 5 EXISTING ROAD CONDITION AND ROAD DEVELOPMENT PROJECTS .. 5-1
5.1 EXISTING ROAD CONDITION .................................................................................................. 5-1
5.1.1 Sindhuli Road ......................................................................................................................... 5-1
5.1.2 Kathmandu-Naubise-Mugling-Birgunj Road ....................................................................... 5-10
5.1.3 East-West Highway .............................................................................................................. 5-14
5.1.4 Tribhuvan Highway .............................................................................................................. 5-16
5.1.5 Arniko Highway ................................................................................................................... 5-17
5.2 GOVERNMENT FUNDED ROAD DEVELOPMENT PROJECTS .......................................... 5-18
5.2.1 Kathmandu – Terai/Madesh Expressway Project ................................................................. 5-18
5.2.2 Mid-hill Highway (Pushpa Lal Highway) ............................................................................ 5-22
5.2.3 Madan Bhandari Highway ................................................................................................... 5-24
5.2.4 North South Corridor ........................................................................................................... 5-27
5.2.5 BP Highway Re-Alignment and Diversion Road ................................................................. 5-28
5.3 DONOR FUNDED ROAD DEVELOPMENT PROJECTS/PLANS .......................................... 5-29
5.3.1 Japan Funded On-going Projects/Plans ................................................................................ 5-30
5.3.2 World Bank Funded On-going Projects/Plans ...................................................................... 5-35
5.3.3 Asian Development Bank Funded On-going Projects/Plans ................................................ 5-36
CHAPTER 6 OPERATION AND MAINTENANCE ...................................................................... 6-1
6.1 INTRODUCTION .......................................................................................................................... 6-1
6.2 OPERATION AND MAINTENANCE OF STRATEGIC ROADS ............................................... 6-1
6.2.1 Types of Maintenance ............................................................................................................ 6-1
6.2.2 Organization ........................................................................................................................... 6-2
6.2.3 Budget .................................................................................................................................... 6-2
6.2.4 Equipment .............................................................................................................................. 6-3
6.2.5 Method ................................................................................................................................... 6-3

iv
6.3 BUDGET ALLOCATION PROCEDURE BY ROADS BOARD NEPAL .................................... 6-4
6.4 OPERATION AND MAINTENANCE OF THE SINDHULI ROAD ........................................... 6-4
6.4.1 Organization ........................................................................................................................... 6-4
6.4.2 Budget .................................................................................................................................... 6-5
6.4.3 Equipment .............................................................................................................................. 6-6
6.4.4 Method ................................................................................................................................... 6-6
6.4.5 Emergency Information Systems ........................................................................................... 6-6
6.5 TECHNICAL LEVEL AND IMPLEMENTING CAPACITY ....................................................... 6-7
6.5.1 Financial Level ....................................................................................................................... 6-7
6.5.2 Equipment and Machines in Possession ................................................................................. 6-7
6.6 EXPERIENCE OF TUNNELING ON EXISTING ROAD ........................................................... 6-8
CHAPTER 7 ENGINEERING SURVEYS / INVESTIGATIONS ............................................... 7-1
7.1 INTRODUCTION .......................................................................................................................... 7-1
7.2 TOPOGRAPHY SURVEY ............................................................................................................. 7-1
7.2.1 Plan and Profile of Section I .................................................................................................. 7-3
7.2.2 Plan and Profile of Section II ................................................................................................. 7-5
7.2.3 Plan and Profile of Section III ................................................................................................ 7-7
7.2.4 Plan and Profile of Section IV ................................................................................................ 7-9
7.3 ROAD INVENTORY ................................................................................................................... 7-12
7.3.1 Visual Inspection of Road Condition ................................................................................... 7-12
7.3.2 Road Inventory Survey......................................................................................................... 7-20
7.4 GEOTECHNICAL INVESTIGATION ........................................................................................ 7-26
7.4.1 Site Reconnaissance ............................................................................................................. 7-26
7.4.2 Electrical Resistivity Tomography ....................................................................................... 7-29
7.4.3 Geological Exploration ........................................................................................................ 7-33
7.5 TRAFFIC SURVEY ..................................................................................................................... 7-36
7.6 VEHICULAR RESTRICTIONS UNDER IMPOSITION ........................................................... 7-39
7.6.1 Allowable/Permissible Load (Load Limit) ........................................................................... 7-39
7.6.2 Laws, Orders, Ordinance, Decree Relevant to Restrictions ................................................. 7-39
7.6.3 Impact and Issues of Restrictions ......................................................................................... 7-40
7.7 TRAFFIC ACCIDENTS .............................................................................................................. 7-40
CHAPTER 8 TRAFFIC STUDY ...................................................................................................... 8-1
8.1 INTRODUCTION .......................................................................................................................... 8-1
8.2 PRESENT TRAFFIC CONDITION .............................................................................................. 8-1
8.2.1 Traffic Volume ........................................................................................................................ 8-1
8.2.2 Hourly Variation of Traffic Volume...................................................................................... 8-10
8.2.3 Traffic Composition ............................................................................................................. 8-14
v
8.2.4 Shares of Day–Night Time Traffic Volume .......................................................................... 8-25
8.2.5 Comparison of Weekday-Holiday ........................................................................................ 8-26
8.2.6 Purpose of Trip ..................................................................................................................... 8-33
8.2.7 Commodity type ................................................................................................................... 8-36
8.2.8 Origin-Destination Matrix at Road....................................................................................... 8-39
8.2.9 Summary of Traffic Characteristic on Sindhuli Road .......................................................... 8-78
8.3 TRAFFIC DEMAND FORECAST .............................................................................................. 8-86
8.3.1 Approach .............................................................................................................................. 8-86
8.3.2 Impact from COVID-19 to Traffics Plying on Sindhuli Road ............................................. 8-86
8.3.3 Socio-Economic Framework ................................................................................................ 8-87
8.3.4 Traffic Growth ...................................................................................................................... 8-88
8.3.5 Traffic Demand Forecast ...................................................................................................... 8-90
CHAPTER 9 NEEDS OF THE IMPROVEMENT ......................................................................... 9-1
9.1 INTRODUCTION .......................................................................................................................... 9-1
9.2 NEEDS AND POTENTIALS OF THE IMPROVEMENT ........................................................... 9-1
9.2.1 Recognition in the Development Plans .................................................................................. 9-1
9.2.2 Roles and Expectations in the Strategic Road Network ......................................................... 9-1
9.2.3 Roles and Expectation in the Asian Highway Network ......................................................... 9-2
9.2.4 Enhancement of Traffic Capacity and Traffic Safety ............................................................. 9-3
9.2.5 Enhancement of Trade Route Redundancy ............................................................................ 9-3
9.2.6 Accommodating All Types of Vehicles .................................................................................. 9-5
9.2.7 Coping with Development of Inland Clearance Depot .......................................................... 9-5
9.3 NEED DESPITE OF TERAI / MADESH FAST TRACK ............................................................. 9-6
9.4 PERSPECTIVE OF MOPIT/DOR ................................................................................................. 9-7
CHAPTER 10 STUDY ON ENHANCEMENT OF ROAD FUNCTION .................................... 10-1
10.1 INTRODUCTION ...................................................................................................................... 10-1
10.2 STUDY APPROACH ................................................................................................................. 10-1
10.3 BASIC CONCEPT ..................................................................................................................... 10-4
10.4 EXAMINATION OF METHODOLOGY FOR ENHANCEMENT OF ROAD FUNCTION .. 10-4
10.4.1 Improvement Measures ...................................................................................................... 10-4
10.4.2 Selection and Determination of Measures .......................................................................... 10-6
10.4.3 Setting of Improvement Measures, Goals and Target Year ................................................ 10-7
10.4.4 Comparison Study and Preparation of Project List ............................................................ 10-8
10.5 DESIGN STANDARD AND ROAD GEOMETRIC CONDITION .......................................... 10-8
10.5.1 Design Standard ................................................................................................................. 10-8
10.5.2 Typical Cross Section ....................................................................................................... 10-15
10.5.3 Typical Cross Section for Existing Bridge and Causeway ............................................... 10-17

vi
10.6 CONTROL POINTS / SITE CONSTRAINTS FOR APPLYING IMPROVEMENT MEASURES
........................................................................................................................................... 10-17
10.6.1 Topographical Constraint ................................................................................................. 10-17
10.6.2 Slope Failure / Land Slide Area ....................................................................................... 10-26
10.7 IMPROVEMENT MEASURES FOR ENHANCEMENT OF ROAD FUNCTION ............... 10-32
10.7.1 Summary of Improvement Measures ............................................................................... 10-32
10.7.2 List of Improvement Measures ........................................................................................ 10-33
10.7.3 Details of Alternative Route ............................................................................................. 10-36
10.8 STEPWISE IMPROVEMENT MATRIX ................................................................................ 10-66
10.8.1 Policy in Formulating Stepwise Improvement Matrix ..................................................... 10-66
10.8.2 Preconditions .................................................................................................................... 10-66
10.8.3 Stepwise Improvement Matrix ......................................................................................... 10-67
10.9 ROADMAP OF SINDHULI ROAD 2.0 PLAN....................................................................... 10-69
CHAPTER 11 ENVIRONMENTAL AND SOCIAL CONSIDERATIONS ................................ 11-1
11.1 INTRODUCTION ...................................................................................................................... 11-1
11.2 PURPOSE AND METHODOLOGY ......................................................................................... 11-1
11.3 SITUATION OF ESC IN THE TARGET AREAS ..................................................................... 11-2
11.3.1 Land Use ............................................................................................................................ 11-2
11.3.2 Natural Environment .......................................................................................................... 11-4
11.3.3 Social Environment ............................................................................................................ 11-8
11.4 LEGAL FRAMEWORK ON ESC ............................................................................................. 11-9
11.4.1 Nepali Laws and Regulations ............................................................................................. 11-9
11.4.2 JICA Guidelines for Environmental and Social Considerations ...................................... 11-11
11.5 INSTITUTIONAL FRAMEWORK ......................................................................................... 11-17
11.5.1 Ministry of Physical Infrastructure and Transport (MOPIT) ............................................ 11-17
11.5.2 Department of Roads (DOR) ............................................................................................ 11-17
11.5.3 Ministry of Forests and Environment (MOFE) ................................................................ 11-18
11.6 SPECIFIC ESC CONDITIONS FOR SECTIONS .................................................................. 11-18
11.6.1 Section I (Bardibas - Singhuli Bazar: 37 km) .................................................................. 11-18
11.6.2 Section II (Sindhuli Bazar - Khurkot: 35.8 km) ............................................................... 11-18
11.6.3 Section III (Khurkot - Nepalthok: 36.8 km) ..................................................................... 11-22
11.6.4 Section IV (Nepalthok - Dhulikhel: 50 km) ..................................................................... 11-22
11.7 EVALUATION ......................................................................................................................... 11-23
11.7.1 Evaluation for Sensitive Areas ......................................................................................... 11-23
11.7.2 Tentative Screening .......................................................................................................... 11-24
11.7.3 Draft Pre-Scoping ............................................................................................................. 11-24
11.8 RECOMMENDATIONS FOR SUBSEQUENT SURVEYS ................................................... 11-28
11.8.1 All sections (Including Section II) .................................................................................... 11-28

vii
11.8.2 Section II .......................................................................................................................... 11-29
CHAPTER 12 REVIEW OF PRECEDING STUDIES/SURVEYS ............................................. 12-1
12.1 INTRODUCTION ...................................................................................................................... 12-1
12.2 PRECEDING STUDIES/SURVEYS ......................................................................................... 12-2
12.2.1 Desk Study on the Tunnel Design of The Sindhuli Road Capacity Enhancement Project . 12-2
12.2.2 Feasibility Study on Road Tunnels (Khurkot-Sindhuli Khanda Road Tunnel) .................. 12-5
12.3 REVIEW RESULTS................................................................................................................. 12-16
CHAPTER 13 STUDY ON POSSIBILITY OF TUNNELING AT SECTION II ....................... 13-1
13.1 INTRODUCTION ...................................................................................................................... 13-1
13.2 TOPOGRAPHICAL AND GEOLOGICAL CONDITION AT SECTION II ............................. 13-1
13.2.1 Topographical Condition around the Planned Tunnel Site ................................................. 13-1
13.2.2 Geological Condition around the Planned Tunnel Site ...................................................... 13-2
13.2.3 Seismicity around Planned Tunnel Site ............................................................................ 13-12
13.3 SITE RECONNAISSANCE AT APPROACH ROAD AND TUNNEL PORTAL ................... 13-13
13.3.1 South Portal ...................................................................................................................... 13-13
13.3.2 North Portal ...................................................................................................................... 13-18
13.4 ALTERNATIVE ROUTE WITH TUNNEL ............................................................................. 13-21
13.4.1 Policy on Tunnel Planning ............................................................................................... 13-21
13.4.2 Evaluation of Alternative Routes Studied in Preceding Projects ..................................... 13-25
13.4.3 Selection of Candidate Routes ......................................................................................... 13-27
13.5 COMPARISON OF CANDIDATE ROUTE ............................................................................ 13-34
13.6 STUDY ON TUNNEL STRUCTURE ..................................................................................... 13-36
13.6.1 Outline .............................................................................................................................. 13-36
13.6.2 Basic Conditions .............................................................................................................. 13-36
13.6.3 Rock Classification Method and Standard Support Patterns of the Tunnel ..................... 13-37
13.6.4 Tunnel Cross-Section ....................................................................................................... 13-39
13.6.5 Tunneling Method ............................................................................................................ 13-40
13.6.6 Auxiliary Method ............................................................................................................. 13-41
13.6.7 Construction Planning and Temporary Facilities and Equipment for Construction ......... 13-42
13.6.8 Facilities necessary for Tunnel ......................................................................................... 13-44
13.6.9 Power Supply Condition .................................................................................................. 13-55
CHAPTER 14 ROAD SAFETY ...................................................................................................... 14-1
14.1 INTRODUCTION ...................................................................................................................... 14-1
14.2 KEY ELEMENTS of ROAD SAFETY ..................................................................................... 14-1
14.3 ROAD SAFETY AGENCY ....................................................................................................... 14-2
14.4 ROAD SAFETY ACTION PLAN AND STRATEGIES............................................................ 14-2
14.4.1 Road Safety Action Plan .................................................................................................... 14-2
viii
14.4.2 Road Safety Strategies ....................................................................................................... 14-2
14.5 ROAD SAFETY AUDIT ........................................................................................................... 14-3
14.5.1 Audit Manual ...................................................................................................................... 14-3
14.5.2 Audit Flow .......................................................................................................................... 14-4
14.6 ROAD SAFETY BUDGET........................................................................................................ 14-4
14.7 ROAD SAFETY STATUS IN NEPAL ....................................................................................... 14-4
14.7.1 Road Safety Status ............................................................................................................. 14-4
14.7.2 Safety Initiatives Adapted .................................................................................................. 14-5
14.8 ROAD SAFETY ISSUES .......................................................................................................... 14-5
14.8.1 General Safety Issues in Nepal`s Highways....................................................................... 14-5
14.8.2 Road Safety Issues of the Sindhuli Road ........................................................................... 14-6
14.9 ACKNOWLEDGEMENT AND RECOMMENDATION ........................................................ 14-11
CHAPTER 15 STUDY ON REST AREAS .................................................................................... 15-1
15.1 INTRODUCTION ...................................................................................................................... 15-1
15.2 CURRENT SITUATION AND CANDIDATE SITES ............................................................... 15-3
15.2.1 Location Map ..................................................................................................................... 15-3
15.2.2 Current Situation ................................................................................................................ 15-4
15.3 DEVELOPMENT PLAN ........................................................................................................... 15-6
15.3.1 Development Plan .............................................................................................................. 15-6
15.3.2 Necessary Procedures ......................................................................................................... 15-6
15.4 RECOMMENDATION .............................................................................................................. 15-7
15.4.1 Installation of “Michi-No Eki “ .......................................................................................... 15-7
15.4.2 Effective Land Utilization near Tunnel Portals .................................................................. 15-7
CHAPTER 16 CONSTRUCTION PLANNING AND COST ESTIMATE ................................. 16-1
16.1 INTRODUCTION ...................................................................................................................... 16-1
16.2 CONSTRUCTION PLAN .......................................................................................................... 16-1
16.2.1 Procurement Plan ............................................................................................................... 16-1
16.2.2 Spoil Disposal Area .......................................................................................................... 16-17
16.2.3 Camp Yard and Temporary Stock Yard ............................................................................ 16-21
16.2.4 Traffic Regulation and Safety Management during Construction .................................... 16-21
16.2.5 Others ............................................................................................................................... 16-25
16.3 ESTIMATE OF TENTATIVE CONSTRUCTION COST ....................................................... 16-26
16.3.1 Outline of Each Section and General Effect to Construction cost ................................... 16-26
16.3.2 Related Items to Cost Estimate ........................................................................................ 16-27
16.3.3 Rough Construction Cost Estimate .................................................................................. 16-28
CHAPTER 17 APPLICABILITY OF ADVANCED TECHNOLOGY ........................................ 17-1
17.1 INTRODUCTION ...................................................................................................................... 17-1
ix
17.2 NECESSITY OF ADVANCED TECHNOLOGY ...................................................................... 17-1
17.2.1 Perception for the capacity of Tunnelling and Slope Management in Nepal ..................... 17-1
17.2.2 Necessity of Advanced Technology for Long Road Tunnel ............................................... 17-3
17.2.3 Necessity of Advanced Technology for the Slope Management on Mountainous Road ... 17-4
17.3 APPLICABLE ADVANCE TECHNOLOGY FOR LONG TUNNELS .................................... 17-5
17.3.1 Technology of Survey and Design Stage ............................................................................ 17-5
17.3.2 Excavation and Construction Stage .................................................................................... 17-6
17.3.3 Operation Stage .................................................................................................................. 17-8
17.4 APPLICABLE ADVANCE TECHNOLOGY FOR SLOPE MANAGEMENT ........................ 17-9
17.4.1 Slope Management ............................................................................................................. 17-9
17.4.2 High Energy Absorption Net .............................................................................................. 17-9
IMPROVEMENT EFFECT .................................................................................. 18-1
18.1 INTRODUCTION ...................................................................................................................... 18-1
18.2 TRAVEL TIME SAVING EFFECT OF THE PROJECT ........................................................... 18-1
18.2.1 Methodology ...................................................................................................................... 18-1
18.2.2 Estimation of Economic Benefit (TTC Saving) ................................................................. 18-3
18.3 SUMMARY OF ESTIMATION RESULTS ............................................................................... 18-4
CONCLUSION AND SUGGESTION ................................................................... 19-1
19.1 INTRODUCTION ...................................................................................................................... 19-1
19.2 PRE-CONDITIONS FOR IMPLEMENTATION OF THE PROJECT ...................................... 19-1
19.2.1 Capacity Enhancement of the Entire Stretch ...................................................................... 19-1
19.2.2 Timely Undertaking............................................................................................................ 19-1
19.2.3 Initiatives of Nepal Side for Project Implementation ......................................................... 19-1
19.3 RECOMMENDATIONS AND SUGGESTIONS ...................................................................... 19-2
19.3.1 Reconsideration for Division of Sections ........................................................................... 19-2
19.3.2 Tunneling at Section II ....................................................................................................... 19-3
19.3.3 Traffic Demand Forecast .................................................................................................... 19-4
19.3.4 Environmental and Social Considerations ......................................................................... 19-5
19.3.5 Construction Planning and Cost Estimate .......................................................................... 19-6
19.4 RECOMMENDATIONS ............................................................................................................ 19-6

x
APPENDICES
APPENDIX 1: DOR's Comments to the Inception Report
APPENDIX 2: Minutes of Meeting with DOR
APPENDIX 3: Minutes of Meeting with MOPIT
APPENDIX 4: Ground Slope Distribution
APPENDIX 5: Draft Environmental Screening Format
APPENDIX 6: Roadmap of Sindhuli Road 2.0 Plan

xi
List of Figures
Page
Figure 1.4-1 Target Area ....................................................................................................................... 1-5
Figure 1.5-1 Study Flow of Measures for Enhancement of Road Function of The Sindhuli Road ..... 1-6
Figure 1.10-1 Administrative Organizational Structure ..................................................................... 1-12
Figure 1.10-2 Division of Provinces and Districts ............................................................................. 1-14
Figure 2.2-1 Population (Actual vs. Projection) ................................................................................... 2-2
Figure 2.2-2 Population Growth (Actual vs. Projection) ..................................................................... 2-3
Figure 2.2-3 GDP Growth Rate ............................................................................................................ 2-4
Figure 2.2-4 Sectoral Growth Rate of GDP ......................................................................................... 2-4
Figure 2.2-5 Share of GDP by Sector ................................................................................................... 2-5
Figure 2.2-6 Composition of GDP by Industry .................................................................................... 2-5
Figure 2.2-7 Administrative Divisions by Province and District ......................................................... 2-6
Figure 2.2-8 Composition of GDP by Province ................................................................................... 2-7
Figure 2.2-9 GDP Growth Rate by Province ........................................................................................ 2-7
Figure 2.2-10 GDP Comparison by Industry (Province No.1, 2 and 3 vs. Nationwide) ...................... 2-8
Figure 2.2-11 Number of Passengers by Air and by Land ................................................................. 2-11
Figure 2.3-1 Geological Formation of Nepal ..................................................................................... 2-12
Figure 2.3-2 Nepal’s Physiographic Division .................................................................................... 2-13
Figure 2.3-3 Elevation Distribution of Survey Area .......................................................................... 2-14
Figure 2.3-4 Geological Map of Nepal (Dahal 2006) ........................................................................ 2-18
Figure 2.3-5 Schematic Cross Section of the Himalayas (Dahal 2006) ............................................. 2-19
Figure 2.3-6 Distribution of Epicenter of Gorkha Earthquake ........................................................... 2-22
Figure 2.3-7 Distribution of Epicenter of Gorkha Earthquake (Block Diagram)) ............................. 2-23
Figure 2.3-8 Average of Monthly Precipitation and Temperature for 2020 at Sindhuli Gadhi
Station ......................................................................................................................... 2-25
Figure 2.3-9 Annual Precipitation of the Survey Area (1980-2020) .................................................. 2-25
Figure 3.5-1 Classification of National Highways and Feeder Roads ............................................... 3-24
Figure 4.2-1 Classification of Road Network ....................................................................................... 4-2
Figure 4.2-2 Statistics of Strategic Road Network and Road Surface .................................................. 4-2
Figure 4.2-3 National Highway Network ............................................................................................. 4-7
Figure 4.2-4 Statistics of Local Road network (Dec. 2016) ................................................................. 4-8
Figure 4.2-5 Expressway (Fast Track) ................................................................................................. 4-9
Figure 4.2-6 Current and New Sections for Toll Collection ............................................................... 4-10
Figure 4.3-1 Railway Transport .......................................................................................................... 4-11
Figure 4.3-2 Existing Railways and Extension Plan .......................................................................... 4-12
Figure 4.4-1 Airport Network in Nepal .............................................................................................. 4-13
xii
Figure 4.6-1 Organizational Chart of MOPIT .................................................................................... 4-17
Figure 4.6-2 Organizational Chart of MOFAGA ............................................................................... 4-18
Figure 4.6-3 Organization Structure of MOCTCA ............................................................................ 4-20
Figure 4.6-4 Organizational Chart of the DOR .................................................................................. 4-21
Figure 4.6-5 Organization Chart of DOTM ...................................................................................... 4-23
Figure 4.6-6 Organization Chart of DOLI .......................................................................................... 4-24
Figure 4.6-7 Current and Tappable Revenue Source .......................................................................... 4-26
Figure 4.6-8 Flow Management ......................................................................................................... 4-26
Figure 4.6-9 Organization Chart of RBN ........................................................................................... 4-27
Figure 4.6-10 Organization Chart of DORW ..................................................................................... 4-28
Figure 4.6-11 Organization of CAAN ................................................................................................ 4-29
Figure 4.6-12 Organization Structure of NSO ................................................................................... 4-30
Figure 5.1-1 Plan and Profile of the Objective Road ........................................................................... 5-2
Figure 5.1-2 Glimpses of Section I ...................................................................................................... 5-3
Figure 5.1-3 Glimpses of Section II ..................................................................................................... 5-4
Figure 5.1-4 Glimpses of Section III .................................................................................................... 5-6
Figure 5.1-5 Glimpses of Section IV .................................................................................................... 5-7
Figure 5.1-6 Actual Travel Time .......................................................................................................... 5-7
Figure 5.1-7 Schematic Map of Major Road Network ....................................................................... 5-10
Figure 5.1-8 Picture Depicting Condition of Westward Route ........................................................... 5-12
Figure 5.1-9 Landslide Distribution along the Route ......................................................................... 5-13
Figure 5.1-10 Picture Depicting Condition of East-West Highway ................................................... 5-15
Figure 5.1-11 Picture of Pier Subsidence ........................................................................................... 5-16
Figure 5.2-1 Proposed Alignment ...................................................................................................... 5-19
Figure 5.2-2 Toll Fee .......................................................................................................................... 5-20
Figure 5.2-3 Glimpse of Progress of On-going Construction Works ................................................. 5-21
Figure 5.2-4 Mid-Hill Highway ......................................................................................................... 5-22
Figure 5.2-5 Glimpses of Madan Bhandari Highway (On-going) ...................................................... 5-25
Figure 5.2-6 Dharan-Hetauda Stretch of Madan Bhandari Highway ................................................. 5-26
Figure 5.2-7 North-South Corridors ................................................................................................... 5-28
Figure 5.2-8 BP Highway Realigned Road and Service Road ........................................................... 5-29
Figure 5.3-1 Development Assistance ................................................................................................ 5-30
Figure 5.3-2 Map of Major Projects under Assistance of Japan ......................................................... 5-31
Figure 5.3-3 Route Map and On-going Construction Work ............................................................... 5-32
Figure 5.3-4 Project Area ................................................................................................................... 5-34
Figure 5.3-5 Regional Connectivity Context of the two Improvements ............................................ 5-36
Figure 6.2-1 Maintenance Organization of SRN Roads ....................................................................... 6-2

xiii
Figure 6.4-1 Organization Chart of Maintenance Body ....................................................................... 6-5
Figure 6.4-2 Emergency Information System ...................................................................................... 6-6
Figure 7.2-1 Plan of Entire Stretch ....................................................................................................... 7-2
Figure 7.2-2 Section I -1....................................................................................................................... 7-3
Figure 7.2-3 Section I -2....................................................................................................................... 7-4
Figure 7.2-4 Section II-1 ...................................................................................................................... 7-5
Figure 7.2-5 Section II-2 ...................................................................................................................... 7-6
Figure 7.2-6 Section III -1 .................................................................................................................... 7-7
Figure 7.2-7 Section III -2 .................................................................................................................... 7-8
Figure 7.2-8 Section IV -1 .................................................................................................................... 7-9
Figure 7.2-9 Section IV -2 .................................................................................................................. 7-10
Figure 7.2-10 Section IV -3 ................................................................................................................ 7-11
Figure 7.3-1 Road Width of Sindhuli Road ........................................................................................ 7-21
Figure 7.3-2 Sample of Road Surface Conditions of Sindhuli Road.................................................. 7-22
Figure 7.3-3 Road Surface Conditions of Sindhuli Road ................................................................... 7-22
Figure 7.3-4 Distribution of Bridge Length of Sindhuli Road ........................................................... 7-23
Figure 7.3-5 Conditions of Causeways of Overflow Type in Section I and IV .................................. 7-24
Figure 7.3-6 Conditions of Causeways of Overflow Type of Sindhuli Road ..................................... 7-24
Figure 7.3-7 Conditions of Culverts of Sindhuli Road ....................................................................... 7-24
Figure 7.3-8 Location of Bridges, Causeways and Culverts .............................................................. 7-25
Figure 7.4-1 Area for Site Reconnaissance, Location of Measurement Line of ERT and Drilling
Hole (BV-1) ................................................................................................................ 7-27
Figure 7.4-2 Geological Map around the South Portal ....................................................................... 7-28
Figure 7.4-3 Result of ERT (Electric Resistivity Tomography) ......................................................... 7-32
Figure 7.4-4 Drilling Log of BV-1 ..................................................................................................... 7-34
Figure 7.4-5 Cored Sample Photo of BV-1 ........................................................................................ 7-35
Figure 7.5-1 Location of Traffic Survey Station (Traffic Volume Survey and OD Survey) .............. 7-37
Figure 7.5-2 Map of OD Zoning System ........................................................................................... 7-38
Figure 7.5-3 Traffic Survey ................................................................................................................ 7-39
Figure 7.7-1 Number of Accidents at Each Section and Analysis Results ......................................... 7-41
Figure 8.2-1 Daily Traffic Volume on Weekday, All Type (Including motorcycle) ............................. 8-2
Figure 8.2-2 Daily Traffic Volume on Weekday, Excluding Motorcycle ............................................. 8-2
Figure 8.2-3 Traffic Volume Survey at Khurkot Direction ................................................................... 8-3
Figure 8.2-4 Daily Traffic Volume on Cross Section at Khurkot Direction, All Type ......................... 8-4
Figure 8.2-5 Daily Traffic Volume on Cross Section at Khurkot Direction, Excluding
Motorcycle.................................................................................................................... 8-4
Figure 8.2-6 Daily Traffic Volume by Direction at Khurkot Direction ................................................ 8-5
Figure 8.2-7 Daily Traffic Volume by Direction at Khurkot Direction, Excluding Motorcycle .......... 8-6
xiv
Figure 8.2-8 Traffic Volumes Survey at Ghurmi Way Direction .......................................................... 8-7
Figure 8.2-9 Daily Traffic Volumes on Cross Section at Ghurmi Way Direction, All Type ................ 8-8
Figure 8.2-10 Daily Traffic Volumes on Cross Section at Ghurmi Way Direction, Excluding
Motorcycle.................................................................................................................... 8-8
Figure 8.2-11 Daily Traffic Volumes by Direction at Ghurmi Way Direction ..................................... 8-9
Figure 8.2-12 Daily Traffic Volumes by Direction at Ghurmi Way Direction, Excluding
Motorcycle.................................................................................................................. 8-10
Figure 8.2-13 Hourly Variation of Traffic Volumes ........................................................................... 8-10
Figure 8.2-14 Hourly Variation of Daily Traffic Volumes, Excluding Motorcycle ............................ 8-11
Figure 8.2-15 Hourly Variation of Traffic Volumes at Khurkot Intersection Cross Section, All
Type of Vehicle ........................................................................................................... 8-11
Figure 8.2-16 Hourly Variation of Traffic Volumes at Khurkot Intersection, Cross Section,
Excluding Motorcycle ................................................................................................ 8-12
Figure 8.2-17 Hourly Variation of Traffic Volumes at Khurkot Intersection, By Direction, All
Type of Vehicle ........................................................................................................... 8-12
Figure 8.2-18 Hourly Variation of Traffic Volumes at Khurkot Intersection, By Direction,
Excluding Motorcycle ................................................................................................ 8-12
Figure 8.2-19 Hourly Variation of Traffic Volume at Ghurmi Way Intersection Cross Section, All
Type of Vehicle ........................................................................................................... 8-13
Figure 8.2-20 Hourly Variation of Traffic Volume at Ghurmi Way Intersection, Cross Section,
Excluding Motorcycle ................................................................................................ 8-13
Figure 8.2-21 Hourly Variation of Traffic Volume at Ghurmi Way Intersection, By Direction, All
Type of Vehicle ........................................................................................................... 8-14
Figure 8.2-22 Hourly Variation of Traffic Volume at Ghurmi Way Intersection, By Direction,
Excluding Motorcycle ................................................................................................ 8-14
Figure 8.2-23 Traffic Composition at Four Survey Stations .............................................................. 8-15
Figure 8.2-24 Traffic Composition Excluding Motorcycle at Four Survey Stations ......................... 8-16
Figure 8.2-25 Shares of Heavy Vehicles of All Type Vehicles at Four Stations ................................. 8-16
Figure 8.2-26 Shares of Heavy Vehicles Excluding Motorcycle at Four Survey Stations ................. 8-17
Figure 8.2-27 Traffic Composition on Cross Section at Khurkot Intersection ................................... 8-18
Figure 8.2-28 Traffic Composition on Cross Section at Khurkot Intersection, Excluding
Motorcycle.................................................................................................................. 8-18
Figure 8.2-29 Hourly Share of Heavy Vehicle on Cross Section at Khurkot Intersection ................. 8-18
Figure 8.2-30 Hourly Share of Heavy Vehicle on Cross Section at Khurkot Intersection,
Excluding Motorcycle ................................................................................................ 8-19
Figure 8.2-31 Traffic Composition of Traffic by Direction at Khurkot Intersection .......................... 8-20
Figure 8.2-32 Traffic Composition of Traffic by Direction at Khurkot Intersection, Excluding
Motorcycle.................................................................................................................. 8-20
Figure 8.2-33 Shares of Heavy Vehicles of All Type Vehicles (By Direction) ................................... 8-20
Figure 8.2-34 Shares of Heavy Vehicles of All Type Vehicles (By Direction), W/O Motorcycle...... 8-21
Figure 8.2-35 Traffic Composition on Cross Section at Ghurmi Way Intersection............................ 8-22
xv
Figure 8.2-36 Traffic Composition on Cross Section at Ghurmi Way Intersection, Excluding
Motorcycle.................................................................................................................. 8-22
Figure 8.2-37 Hourly Shares of Heavy Vehicles on Cross Section at Ghurmi Way Intersection ....... 8-22
Figure 8.2-38 Hourly Shares of Heavy Vehicles on Cross Section at Ghurmi Way Intersection,
Excluding Motorcycle ................................................................................................ 8-23
Figure 8.2-39 Traffic Composition of Traffic by Direction at Ghurmi Way Intersection .................. 8-24
Figure 8.2-40 Traffic Composition of Traffic by Direction at Ghurmi Way Intersection,
Excluding Motorcycle ................................................................................................ 8-24
Figure 8.2-41 Share of Heavy Vehicle of All Type Vehicles (By Direction) ...................................... 8-24
Figure 8.2-42 Share of Heavy Vehicle of All Type Vehicles (By Direction), W/O Motorcycle ......... 8-25
Figure 8.2-43 Comparison of Total Traffic Volume Excluding Motorcycle at Sta.1 Mangaltar ........ 8-27
Figure 8.2-44 Hourly Variation of Weekday and Holiday at Sta.1 Mangaltar ................................... 8-28
Figure 8.2-45 Comparison of Total Traffic Volume Excluding Motorcycle at Sta.4 Near
Bardibas ...................................................................................................................... 8-29
Figure 8.2-46 Hourly Variation of Weekday and Holiday at Sta.4 Near Bardibas ............................. 8-29
Figure 8.2-47 Comparison of Total Traffic Volume Excluding Motorcycle at Sta.5 Lalgadh............ 8-30
Figure 8.2-48 Hourly Variation of Weekday and Holiday at Sta.5 Lalgadh ....................................... 8-30
Figure 8.2-49 Traffic Composition of Weekday and Holiday at Sta.1 Mangaltar .............................. 8-30
Figure 8.2-50 Traffic Composition of Weekday and Holiday at Sta.4 Near Bardibas ....................... 8-31
Figure 8.2-51 Traffic Composition of Weekday and Holiday at Sta.5 Lalgadh ................................. 8-31
Figure 8.2-52 Traffic Composition of Weekday and Holiday at Sta.1 Mangaltar .............................. 8-32
Figure 8.2-53 Traffic Composition of Weekday and Holiday at Sta. 4 Near Bardibas ...................... 8-32
Figure 8.2-54 Traffic Composition of Weekday and Holiday at Sta.5 Lalgadh ................................. 8-33
Figure 8.2-55 Purpose of Trip by All Type of Vehicle Excluding Motorcycle on Weekday in
Sta.1 Manglatar .......................................................................................................... 8-33
Figure 8.2-56 Purpose of Trip by All Type of Vehicle Excluding Motorcycle on Weekday in
Sta.4 Near Bardibas .................................................................................................... 8-34
Figure 8.2-57 Purpose of Trip by All Type of Vehicle Excluding Motorcycle on Weekday in
Sta.5 Lalgadh .............................................................................................................. 8-34
Figure 8.2-58 Purpose of Trip by All Type of Vehicle Excluding Motorcycle on Weekday in
Sta.6 Nagdhunga ........................................................................................................ 8-34
Figure 8.2-59 Purpose of Trip by All Type of Vehicle Excluding Motorcycle on Holiday in Sta.1
Manglatar.................................................................................................................... 8-35
Figure 8.2-60 Purpose of Trip by All Type of Vehicle Excluding Motorcycle on Holiday in Sta.4
Near Bardibas ............................................................................................................. 8-35
Figure 8.2-61 Purpose of Trip by All Type of Vehicle Excluding Motorcycle on Holiday in Sta.5
Lalgadh ....................................................................................................................... 8-35
Figure 8.2-62 Commodity Type of Truck on Weekday in Sta.1 Manglatar ....................................... 8-36
Figure 8.2-63 Commodity Type of Truck on Weekday in Sta.4 Near Bardibas ................................. 8-36
Figure 8.2-64 Commodity Type of Truck on Weekday in Sta.5 Lalgadh ........................................... 8-37
Figure 8.2-65 Commodity Type of Truck on Weekday in Sta.6 Nagdhunga ..................................... 8-37
xvi
Figure 8.2-66 Commodity Type of Truck on Holiday in Sta.1 Manglatar ......................................... 8-38
Figure 8.2-67 Commodity Type of Truck on Holiday in Sta.4 Near Bardibas ................................... 8-38
Figure 8.2-68 Commodity Type of Truck on Holiday in Sta.5 Lalgadh ............................................. 8-39
Figure 8.2-69 Desire Line of All Type Vehicles Excluding Motorcycle on Weekday at Sta.1
Manglatar (veh./day) .................................................................................................. 8-40
Figure 8.2-70 Desire Line of All Type Vehicles Excluding Motorcycle on Weekday at Sta.1
Manglatar (%) ............................................................................................................. 8-41
Figure 8.2-71 Desire Line of All Type Vehicles Excluding Motorcycle on Holiday at Sta.1
Manglatar (veh./day) .................................................................................................. 8-41
Figure 8.2-72 Desire Line of All Type Vehicles Excluding Motorcycle on Holiday at Sta.1
Manglatar (%) ............................................................................................................. 8-42
Figure 8.2-73 The Concentrated Traffic Volume Generated by Each Type of Vehicle on
Weekday at Sta.1 Manglatar ....................................................................................... 8-42
Figure 8.2-74 The Concentrated Traffic Volume Generated by Each Type of Vehicle on Holiday
at Sta.1 Manglatar ....................................................................................................... 8-43
Figure 8.2-75 Desire Line of Passenger Car on Weekday at Sta.1 Manglatar (veh./day) .................. 8-44
Figure 8.2-76 Desire Line of Passenger Car on Weekday at Sta.1 Manglatar (%) ............................ 8-44
Figure 8.2-77 Desire Line of Passenger Car on Holiday at Sta.1 Manglatar (veh./day) .................... 8-45
Figure 8.2-78 Desire Line of Passenger Car on Holiday at Sta.1 Manglatar (%) .............................. 8-45
Figure 8.2-79 Desire Line of Bus on Weekday at Sta.1 Manglatar (veh./day) ................................... 8-46
Figure 8.2-80 Desire Line of Bus on Weekday at Sta.1 Manglatar (%) ............................................. 8-47
Figure 8.2-81 Desire Line of Bus on Holiday at Sta.1 Manglatar (veh./day) .................................... 8-47
Figure 8.2-82 Desire Line of Bus on Holiday at Sta.1 Manglatar (%) ............................................... 8-48
Figure 8.2-83 Desire Line of Truck on Weekday at Sta.1 Manglatar (veh./day) ................................ 8-49
Figure 8.2-84 Desire Line of Truck on Weekday at Sta.1 Manglatar (%) .......................................... 8-49
Figure 8.2-85 Desire Line of Truck on Holiday at Sta.1 Manglatar (veh./day) ................................. 8-50
Figure 8.2-86 Desire Line of Truck on Holiday at Sta.1 Manglatar (%) ............................................ 8-50
Figure 8.2-87 Desire Line of All Type Vehicles Excluding Motorcycle on Weekday at Sta.4 Near
Bardibas (veh./day) .................................................................................................... 8-51
Figure 8.2-88 Desire Line of All Type Vehicles Excluding Motorcycle on Weekday at Sta.4 Near
Bardibas (%) ............................................................................................................... 8-52
Figure 8.2-89 Desire Line of All Type Vehicles Excluding Motorcycle on Holiday at Sta.4 Near
Bardibas (veh./day) .................................................................................................... 8-52
Figure 8.2-90 Desire Line of All Type Vehicles Excluding Motorcycle on Holiday at Sta.4 Near
Bardibas (%) ............................................................................................................... 8-53
Figure 8.2-91 The Concentrated Traffic Volume Generated by Each Type of Vehicle on
Weekday at Sta.4 Near Bardibas ................................................................................ 8-53
Figure 8.2-92 The Concentrated Traffic Volume Generated by Each Type of Vehicle on Holiday
at Sta.4 Near Bardibas ................................................................................................ 8-54
Figure 8.2-93 Desire Line of Passenger Car on Weekday at Sta.4 Near Bardibas (veh./day) ............ 8-55
Figure 8.2-94 Desire Line of Passenger Car on Weekday at Sta.4 Near Bardibas (%) ...................... 8-55

xvii
Figure 8.2-95 Desire Line of Passenger Car on Holiday at Sta.4 Near Bardibas (veh./day) ............. 8-56
Figure 8.2-96 Desire Line of Passenger Car on Holiday at Sta.4 Near Bardibas (%) ........................ 8-56
Figure 8.2-97 Desire Line of Bus on Weekday at Sta.4 Near Bardibas (veh./day) ............................ 8-57
Figure 8.2-98 Desire Line of Bus on Weekday at Sta.4 Near Bardibas (%) ...................................... 8-58
Figure 8.2-99 Desire Line of Bus on Holiday at Sta.4 Near Bardibas (veh./day) .............................. 8-58
Figure 8.2-100 Desire Line of Bus on Holiday at Sta.4 Near Bardibas (%) ...................................... 8-59
Figure 8.2-101 Desire Line of Truck on Weekday at Sta.4 Near Bardibas r (veh./day) ..................... 8-60
Figure 8.2-102 Desire Line of Truck on Weekday at Sta.4 Near Bardibas (%) ................................. 8-60
Figure 8.2-103 Desire Line of Truck on Holiday at Sta.4 Near Bardibas (veh./day) ......................... 8-61
Figure 8.2-104 Desire Line of Truck on Holiday at Sta.4 Near Bardibas (%) ................................... 8-61
Figure 8.2-105 Desire Line of All Type Vehicles Excluding Motorcycle on Weekday at Sta.5
Lalgadh (veh./day) ...................................................................................................... 8-62
Figure 8.2-106 Desire Line of All Type Vehicles Excluding Motorcycle on Weekday at Sta.5
Lalgadh (%) ................................................................................................................ 8-63
Figure 8.2-107 Desire Line of All Type Vehicles Excluding Motorcycle on Holiday at Sta.5
Lalgadh (veh./day) ...................................................................................................... 8-63
Figure 8.2-108 Desire Line of All Type Vehicles Excluding Motorcycle on Holiday at Sta.5
Lalgadh (%) ................................................................................................................ 8-64
Figure 8.2-109 The Concentrated Traffic Volume Generated by Each Type of Vehicle on
Weekday at Sta.5 Lalgadh .......................................................................................... 8-64
Figure 8.2-110 The Concentrated Traffic Volume Generated by Each Type of Vehicle on
Holiday at Sta.5 Lalgadh ............................................................................................ 8-65
Figure 8.2-111 Desire Line of Passenger Car on Weekday at Sta.5 Lalgadh (veh./day) .................... 8-66
Figure 8.2-112 Desire Line of Passenger Car on Weekday at Sta.5 Lalgadh (%) .............................. 8-66
Figure 8.2-113 Desire Line of Passenger Car on Holiday at Sta.5 Lalgadh (veh./day)...................... 8-67
Figure 8.2-114 Desire Line of Passenger Car on Holiday at Sta.5 Lalgadh (%) ................................ 8-67
Figure 8.2-115 Desire Line of Bus on Weekday at Sta.5 Lalgadh (veh./day) .................................... 8-68
Figure 8.2-116 Desire Line of Bus on Weekday at Sta.5 Lalgadh (%) .............................................. 8-69
Figure 8.2-117 Desire Line of Bus on Holiday at Sta.5 Lalgadh s (veh./day) ................................... 8-69
Figure 8.2-118 Desire Line of Bus on Holiday at Sta.5 Lalgadh (%) ................................................ 8-69
Figure 8.2-119 Desire Line of Truck on Weekday at Sta.5 Lalgadh (veh./day) ................................. 8-71
Figure 8.2-120 Desire Line of Truck on Weekday at Sta.5 Lalgadh (%) ........................................... 8-71
Figure 8.2-121 Desire Line of Truck on Holiday at Sta.5 Lalgadh (veh./day) ................................... 8-71
Figure 8.2-122 Desire Line of Truck on Holiday at Sta.5 Lalgadh (%) ............................................. 8-72
Figure 8.2-123 Desire Line of All Type Vehicles Excluding Motorcycle on Weekday at Sta.6
Nagdhunga (veh./day) ................................................................................................ 8-73
Figure 8.2-124 Desire Line of All Type Vehicles Excluding Motorcycle on Weekday at Sta.6
Nagdhunga (%) ........................................................................................................... 8-73
Figure 8.2-125 The Concentrated Traffic Volume Generated by Each Type of Vehicle on
Weekday at Sta.6 Nagdhunga ..................................................................................... 8-74
xviii
Figure 8.2-126 Desire Line of Passenger Car on Weekday at Sta.6 Nagdhunga (veh./day) .............. 8-75
Figure 8.2-127 Desire Line of Passenger Car on Weekday at Sta.6 Nagdhunga (%)......................... 8-75
Figure 8.2-128 Desire Line of Bus on Weekday at Sta.6 Nagdhunga (veh./day) ............................... 8-76
Figure 8.2-129 Desire Line of Bus on Weekday at Sta.6 Nagdhunga (%) ......................................... 8-76
Figure 8.2-130 Desire Line of Truck on Weekday at Sta.6 Nagdhunga (veh./day) ............................ 8-77
Figure 8.2-131 Desire Line of Truck on Weekday at Sta.6 Nagdhunga (%) ...................................... 8-78
Figure 8.2-132 Location of Traffic Survey on Sindhuli Road ............................................................ 8-78
Figure 8.2-133 Daily Traffic Volume on Weekday on Sindhuli Road, All Type ................................ 8-79
Figure 8.2-134 Daily Traffic Volume on Weekday on Sindhuli Road, All Type (PCU/DAY) ........... 8-80
Figure 8.2-135 Daily Traffic Volume on Weekend day on Sindhuli Road, All Type ......................... 8-81
Figure 8.2-136 Daily Traffic Volume on Weekend on Sindhuli Road, All Type (PCU/DAY) ........... 8-81
Figure 8.2-137 Hourly Variation of Traffic Volume on Weekday on Sindhuli Road ......................... 8-82
Figure 8.2-138 Hourly Variation of Traffic Volume on Weekend on Sindhuli Road ......................... 8-83
Figure 8.2-139 Weekday OD Pair on Sindhuli Road at Manglatar, w/o Motorcycle (veh./day) ........ 8-83
Figure 8.2-140 Traffic Flow on Holiday on Sindhuli Road at Manglatar, w/o Motorcycle
(veh./day) .................................................................................................................... 8-84
Figure 8.2-141 Traffic Flow on Weekday on Sindhuli Road at Near Bardibas, w/o Motorcycle
(veh./day) .................................................................................................................... 8-85
Figure 8.2-142 Traffic Flow on Holiday on Sindhuli Road at Near Bardibas, w/o Motorcycle
(veh./day) .................................................................................................................... 8-85
Figure 8.3-1 Changes in Traffic Volume of Sindhuli Road Section ................................................... 8-87
Figure 8.3-2 Estimation Result of Passenger Vehicle ......................................................................... 8-89
Figure 8.3-3 Estimation Result of Freight Vehicle ............................................................................. 8-90
Figure 8.3-4 Procedure for Future Demand Forecast ......................................................................... 8-91
Figure 8.3-5 Traffic Volume that may Divert to the Fast Track in 2024 ............................................ 8-92
Figure 8.3-6 Traffic Volume that may dicert to the Sindhuli Road in 2041 ....................................... 8-92
Figure 8.3-7 Future Traffic Demand in Sindhuli Road Section (AADT) (PCU/day) ........................ 8-93
Figure 9.2-1 Sindhuli Road in the Strategic Road Network ................................................................. 9-2
Figure 9.2-2 Asian Highway Network in and Around Nepal ............................................................... 9-3
Figure 9.2-3 Landslide Prone Areas at Highway Corridors in Central Nepal ...................................... 9-4
Figure 9.2-4 Existing and Proposed Inland Clearance Depot (Dry Ports) ........................................... 9-5
Figure 10.2-1 Points to be Considered and Workflow at STEP-1 ...................................................... 10-2
Figure 10.2-2 Road Function Enhancement Study Policy of Each Section ....................................... 10-3
Figure 10.4-1 Flow for Determining Road Function Enhancement Measures ................................... 10-7
Figure 10.5-1 Type-1: Earthwork (Cut and Fill) .............................................................................. 10-15
Figure 10.5-2 Type-2A: Earthwork with Structures (Retaining Wall) ............................................. 10-15
Figure 10.5-3 Type-2B: Earthwork with Structures (Retaining Wall/Slope Protection/Reinforced
Earth Wall) ................................................................................................................ 10-15

xix
Figure 10.5-4 Type-3A: Earthwork with Structures (Slope Protection/Partial Mountainous
Bridge) ...................................................................................................................... 10-16
Figure 10.5-5 Type-3B: Mountainous Bridge .................................................................................. 10-16
Figure 10.5-6 Type-4A: Bridge (I-Girder) ....................................................................................... 10-17
Figure 10.5-7 Type-4B: Bridge (Box Girder) ................................................................................... 10-17
Figure 10.5-8 Type-5: Tunnel ........................................................................................................... 10-17
Figure 10.5-9 Additional Bridge ...................................................................................................... 10-17
Figure 10.6-1 Ground Slope Distribution along Sindhli Road (Section I, STA. 0km – 20km) ........ 10-18
Figure 10.6-2 Ground Slope Distribution along Sindhuli Road (Section I, STA. 20km – 37km) .... 10-19
Figure 10.6-3 Ground Slope Distribution along Sindhuli Road (Section II, STA. 37km –
72.8km)..................................................................................................................... 10-20
Figure 10.6-4 Ground Slope Distribution along Sindhuli Road (Section III, STA. 72.8km –
95km)........................................................................................................................ 10-21
Figure 10.6-5 Ground Slope Distribution along Sindhuli Road (Section III, STA. 95km –
109.6m)..................................................................................................................... 10-22
Figure 10.6-6 Ground Slope Distribution along Sindhuli Road (Section IV, STA. 109.6km –
125km)...................................................................................................................... 10-23
Figure 10.6-7 Ground Slope Distribution along Sindhuli Road (Section IV, STA. 125km –
140km)...................................................................................................................... 10-24
Figure 10.6-8 Ground Slope Distribution along Sindhuli Road (Section IV, STA. 140km –
159.6km)................................................................................................................... 10-25
Figure 10.7-1 Share of Type of Measures ........................................................................................ 10-33
Figure 10.7-2 Alternative Route No.1 (Section I: STA. 2km+300 - 3km+000) .......................... 10-38
Figure 10.7-3 Alternative Route No.2 (Section I: STA. 4km+700 - 5km+800) .......................... 10-40
Figure 10.7-4 Alternative Route No.3 (Section II: STA. 41km+700 - 43km+500) .................... 10-42
Figure 10.7-5 Alternative Route No.4 (Section III: STA. 80km+200 - 80km+800) ................... 10-44
Figure 10.7-6 Alternative Route No.5 (Section III: STA. 85km+700 - 86km+100) ................... 10-46
Figure 10.7-7 Alternative Route No.6 (Section III: STA. STA. 87km+400 – 93km+700)-1 ...... 10-48
Figure 10.7-8 Alternative Route No.6 (Section III: STA. STA. 87km+400 – 93km+700)-2 ...... 10-49
Figure 10.7-9 Alternative Route No.7 (Section III: STA. 96km+900 - 97km+300) ................... 10-51
Figure 10.7-10 Alternative Route No.8 (Section III: STA. 101km+900 - 105km+000) ............. 10-53
Figure 10.7-11 Alternative Route No.9 (Section III: STA. 106km+800 - 107km+800) ............. 10-55
Figure 10.7-12 Alternative Route No.10 (Section III: STA. 109km+400 - 110km+200) ........... 10-57
Figure 10.7-13 Alternative Route No.11 (Section IV: STA. 112km+000 - 113km+300) and
No.12 (Section IV: STA. 113km+300 - 114km+900) ......................................... 10-59
Figure 10.7-14 Alternative Route No.13 (Section IV: STA. 115km+300 - 117km+500) ........... 10-61
Figure 10.7-15 Alternative Route No.14 (Section IV: STA. 122km+600 - 124km+800) ........... 10-63
Figure 10.7-16 Alternative Route No.15 (Section IV: STA. 127km+800 - 128km+500) ........... 10-65
Figure 11.3-1 Samples of land use along the existing road ................................................................ 11-3

xx
Figure 11.3-2 Average Temperature in Sindhuli Gadhi ...................................................................... 11-4
Figure 11.3-3 Protected Areas of Nepal ............................................................................................. 11-7
Figure 11.3-4 Distribution of Original Ethnic Groups ....................................................................... 11-9
Figure 11.6-1 General Environmental Status of Section I ................................................................ 11-18
Figure 11.6-2 Photos and Image of the North Portal Areas and the Approach Alignment ............... 11-20
Figure 11.6-3 Photos and Image of the South Portal Areas and the Approach Alignment ............... 11-21
Figure 11.6-4 General Environmental Status of Section III ............................................................. 11-22
Figure 11.6-5 General Environmental Status of Section IV ............................................................. 11-23
Figure 12.1-1 Section II (Sindhuli Road) ........................................................................................... 12-2
Figure 12.1-2 Reports to be Reviewed ............................................................................................... 12-2
Figure 12.2-1 Alternative Routes with Mountain Tunnel(JICA Desk Study Project) ................... 12-4
Figure 12.2-2 Tunnel Profile (JICA Desk Study Project) ................................................................... 12-4
Figure 12.2-3 Alternative Routes with Mountain Tunnel(Nepal F/S Project) .............................. 12-6
Figure 12.2-4 Tunnel Profile (Nepal F/S Project) .............................................................................. 12-7
Figure 12.2-5 Tunnel Cross Section (Nepal F/S Project) ................................................................... 12-8
Figure 12.2-6 Location Map of Electric Resistivity Tomography (ERT) ........................................... 12-8
Figure 12.2-7 Interpretative Geological Section along ERT (ERT-1) ................................................ 12-9
Figure 12.2-8 Interpretative Geological Section along ERT (ERT-2) .............................................. 12-10
Figure 12.2-9 Interpretative Geological Section along ERT (ERT-3) .............................................. 12-11
Figure 12.2-10 Interpretative Geological Section along ERT (ERT-4) ............................................ 12-12
Figure 12.2-11 Interpretative Geological Section along ERT (ERT-5) ............................................ 12-13
Figure 12.2-12 Interpretative Geological Section along ERT (ERT-6) ............................................ 12-14
Figure 12.2-13 Interpretative Geological Section along ERT (ERT-7) ............................................ 12-15
Figure 12.3-1 Alternative Route Section .......................................................................................... 12-17
Figure 13.2-1 Topographic Condition of the Proposed Tunnel Site ................................................... 13-1
Figure 13.2-2 View around the South Tunnel Portal .......................................................................... 13-2
Figure 13.2-3 View around the North Tunnel Portal .......................................................................... 13-2
Figure 13.2-4 Geological Map of Survey Area .................................................................................. 13-4
Figure 13.2-5 Geological Longitudinal Profile of Representative Tunnel Alignment ....................... 13-5
Figure 13.2-6 Highly fractured carbonaceous phyllite ....................................................................... 13-9
Figure 13.2-7 Moderately fractured phyllite ...................................................................................... 13-9
Figure 13.2-8 Large scale of landslide topography observed on left bank of Gawan Khola ........... 13-10
Figure 13.2-9 Medium scale of landslide topography observed on right bank of Gawan Khola ..... 13-10
Figure 13.2-10 Landslide topography located near the proposed south tunnel portal ...................... 13-10
Figure 13.2-11 Result of ERT (Electric Resistivity Tomography) ................................................... 13-11
Figure 13.2-12 Distribution of Large Earthquakes around the Planned Tunnel Site ........................ 13-12
Figure 13.2-13 Seismic Hazard Map of Nepal ................................................................................. 13-13

xxi
Figure 13.3-1 Site Reconnaissance Area of south tunnel portal ....................................................... 13-14
Figure 13.3-2 Outline of Site Reconnaissance of south tunnel portal .............................................. 13-14
Figure 13.3-3 New failure near the south portal ............................................................................... 13-15
Figure 13.3-4 MBT line crossing the south portal............................................................................ 13-15
Figure 13.3-5 Candidate Portal 2 and Slope Failure ........................................................................ 13-16
Figure 13.3-6 Summary of South Portal .......................................................................................... 13-17
Figure 13.3-7 Condition of Fractured zone ...................................................................................... 13-17
Figure 13.3-8 Site Reconnaissance Area of north tunnel portal ....................................................... 13-19
Figure 13.3-9 Outline of Site Reconnaissance of north tunnel portal .............................................. 13-19
Figure 13.3-10 Condition of mountain torrents around the north portal .......................................... 13-20
Figure 13.3-11 Summary of the Findings at the North Portal .......................................................... 13-21
Figure 13.4-1 Plan of Candidate Routes .......................................................................................... 13-28
Figure 13.4-2 Plan and Profile of Candidate Route-1 ...................................................................... 13-29
Figure 13.4-3 Plan and Profile of Candidate Route-2 ...................................................................... 13-30
Figure 13.4-4 Plan and Profile of Candidate Route-3 ...................................................................... 13-31
Figure 13.4-5 Plan and Profile of Candidate Route-4 ...................................................................... 13-32
Figure 13.4-6 Plan of Portal Area (South and North) ....................................................................... 13-33
Figure 13.6-1 Typical Tunnel Cross-Section (DI) ............................................................................ 13-39
Figure 13.6-2 Long Span Fore-Piling (AGF Method) ...................................................................... 13-41
Figure 13.6-3 Construction Plan (Excavation Direction) ................................................................. 13-42
Figure 13.6-4 TBM (Open Type) ..................................................................................................... 13-42
Figure 13.6-5 Sequence of D&B Method......................................................................................... 13-43
Figure 13.6-6 Actual Cases of Japan Tunnels with/without Mechanical Ventilation ...................... 13-45
Figure 13.6-7 Tunnel Classification ................................................................................................. 13-48
Figure 13.6-8 Emergency Telephone ............................................................................................... 13-48
Figure 13.6-9 Push Button Alarm .................................................................................................... 13-49
Figure 13.6-10 Fire Detector ............................................................................................................ 13-49
Figure 13.6-11 Emergency Information Board ................................................................................ 13-50
Figure 13.6-12 Fire Extinguishers .................................................................................................... 13-50
Figure 13.6-13 Fire Hydrants ........................................................................................................... 13-50
Figure 13.6-14 Guide Board ............................................................................................................. 13-51
Figure 13.6-15 Smoke Removal System and Evacuation Route ...................................................... 13-51
Figure 13.6-16 Hydrant at Tunnel Portal ......................................................................................... 13-52
Figure 13.6-17 Wireless Radio System ............................................................................................ 13-52
Figure 13.6-18 Radio Re-Broadcasting System and Loud Speaker System .................................... 13-52
Figure 13.6-19 Monitor System ....................................................................................................... 13-53
Figure 13.6-20 Emergency Parking Bay .......................................................................................... 13-53

xxii
Figure 13.6-21 Cross-section of Evacuation Tunnel and Cross Passage ......................................... 13-54
Figure 13.6-22 Electric Power Facilities around Planned Tunnel .................................................... 13-56
Figure 13.6-23 Request Sheet of Power Supply ............................................................................... 13-57
Figure 13.6-24 Foreseen of Supply and Demand Balance of Power in Nepal ................................. 13-58
Figure 13.6-25 Transmission Line Plan ........................................................................................... 13-58
Figure 14.2-1 Key Elements (4Es) of Road Safety ............................................................................ 14-1
Figure 14.5-1 Road Safety Audit Manual........................................................................................... 14-3
Figure 14.5-2 Steps in Road Safety Audit .......................................................................................... 14-4
Figure 15.1-1 Potential Rest Areas as of 2019 (Currently Used as Rest Area) .................................. 15-1
Figure 15.1-2 Potential Rest Areas as of 2019 (Newly Suggested) .................................................... 15-2
Figure 15.2-1 Location Map of Rest Areas ........................................................................................ 15-3
Figure 15.3-1 Development Plan ........................................................................................................ 15-6
Figure 15.4-1 Location Map of Candidate Sites of Rest Areas near Tunnel Portal............................ 15-8
Figure 15.4-2 Photos of Candidate Sites of Rest Areas near Tunnel Portal ....................................... 15-8
Figure 16.2-1 Semi-Trailer for Inland Transportation (reference) ..................................................... 16-3
Figure 16.2-2 Example of Quarries along Sindhuli Road Section III to IV ..................................... 16-13
Figure 16.2-3 Import and production of cement and clinker in Nepal ............................................. 16-14
Figure 16.2-4 Example of existing structures to be dismantled ....................................................... 16-15
Figure 16.2-5 Planed Mock Disposal Area in Feasibility Study of Sindhuli Road Tunnel in
Section2 (North portal) ............................................................................................. 16-19
Figure 16.2-6 Planed Mock Disposal Area in Feasibility Study of Sindhuli Road Tunnel in
Section2 (North portal) ............................................................................................. 16-20
Figure 16.2-7 Image of Camp Yard at Section III, 94km+000 (view from zigzag road at
93km+700) ............................................................................................................. 16-21
Figure 16.2-8 Image of One-side Altering Traffic Section ............................................................... 16-22
Figure 16.2-9 Possibility of Crossing Rivers for Tenporary Traffic ................................................. 16-25
Figure 16.2-10 Location difficult to widen the road at Section 3 PK109+700 ................................ 16-26
Figure 16.3-1 Transition of Labor and Material Cost of Construction Field ................................... 16-27
Figure 16.3-2 Transition of Labor Cost of Construction Field ......................................................... 16-28
Figure 17.2-1 Comparison of Excavation Scale of Tunnel for Various Purpose ................................ 17-2
Figure 17.2-2 Collapse of Roadside Slope and Temporary Traffic at the Mid-Hill Highway ............ 17-2
Figure 17.2-3 Outflowed Restraining (wire net and rock bolts) and Pilling Huge Rock Mass .......... 17-3
Figure 17.3-1 Comparison Core of Conventional Method (upper) and Advanced High Quality
Boring Method (lower) ............................................................................................... 17-5
Figure 17.3-2 Outline of Submarine Array Microtremor Observation Survey .................................. 17-6
Figure 17.3-3 Outline of Multiple Support System ............................................................................ 17-6
Figure 17.3-4 Example of Technology for deformation control at the crossing road with shallow
overburden .................................................................................................................. 17-7
xxiii
Figure 17.3-5 Probing Method in Front of Tunnel Facing and Excavation Support System with
Visualization of AI Solution ....................................................................................... 17-8
Figure 17.3-6 On-Site Visualization of the geological information on the cutting face ..................... 17-8
Figure 17.4-1 Example of slope management record in Japan........................................................... 17-9
Figure 17.4-2 Example of High Energy Catch Net in Japan ............................................................ 17-10
Figure 18.2-1 Workflow of TTC Saving Benefit ................................................................................ 18-1
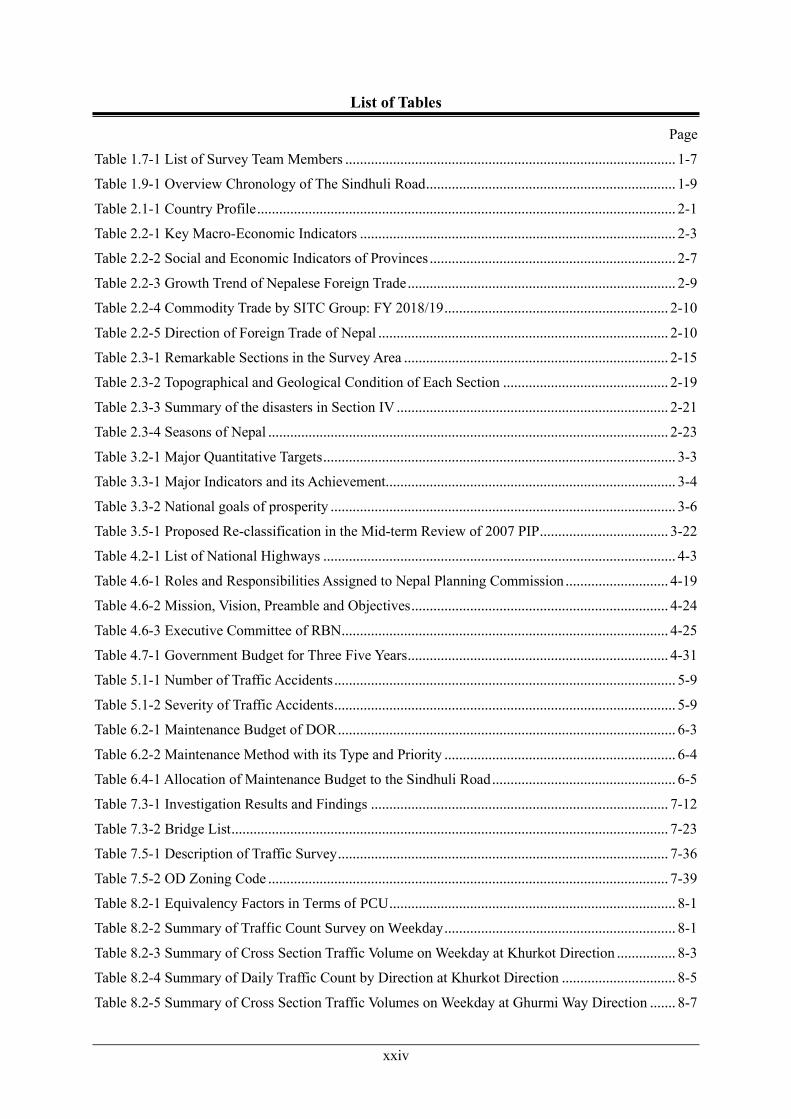
xxiv
List of Tables
Page
Table 1.7-1 List of Survey Team Members .......................................................................................... 1-7
Table 1.9-1 Overview Chronology of The Sindhuli Road .................................................................... 1-9
Table 2.1-1 Country Profile .................................................................................................................. 2-1
Table 2.2-1 Key Macro-Economic Indicators ...................................................................................... 2-3
Table 2.2-2 Social and Economic Indicators of Provinces ................................................................... 2-7
Table 2.2-3 Growth Trend of Nepalese Foreign Trade ......................................................................... 2-9
Table 2.2-4 Commodity Trade by SITC Group: FY 2018/19 ............................................................. 2-10
Table 2.2-5 Direction of Foreign Trade of Nepal ............................................................................... 2-10
Table 2.3-1 Remarkable Sections in the Survey Area ........................................................................ 2-15
Table 2.3-2 Topographical and Geological Condition of Each Section ............................................. 2-19
Table 2.3-3 Summary of the disasters in Section IV .......................................................................... 2-21
Table 2.3-4 Seasons of Nepal ............................................................................................................. 2-23
Table 3.2-1 Major Quantitative Targets ................................................................................................ 3-3
Table 3.3-1 Major Indicators and its Achievement............................................................................... 3-4
Table 3.3-2 National goals of prosperity .............................................................................................. 3-6
Table 3.5-1 Proposed Re-classification in the Mid-term Review of 2007 PIP ................................... 3-22
Table 4.2-1 List of National Highways ................................................................................................ 4-3
Table 4.6-1 Roles and Responsibilities Assigned to Nepal Planning Commission ............................ 4-19
Table 4.6-2 Mission, Vision, Preamble and Objectives ...................................................................... 4-24
Table 4.6-3 Executive Committee of RBN ......................................................................................... 4-25
Table 4.7-1 Government Budget for Three Five Years ....................................................................... 4-31
Table 5.1-1 Number of Traffic Accidents ............................................................................................. 5-9
Table 5.1-2 Severity of Traffic Accidents ............................................................................................. 5-9
Table 6.2-1 Maintenance Budget of DOR ............................................................................................ 6-3
Table 6.2-2 Maintenance Method with its Type and Priority ............................................................... 6-4
Table 6.4-1 Allocation of Maintenance Budget to the Sindhuli Road .................................................. 6-5
Table 7.3-1 Investigation Results and Findings ................................................................................. 7-12
Table 7.3-2 Bridge List ....................................................................................................................... 7-23
Table 7.5-1 Description of Traffic Survey .......................................................................................... 7-36
Table 7.5-2 OD Zoning Code ............................................................................................................. 7-39
Table 8.2-1 Equivalency Factors in Terms of PCU .............................................................................. 8-1
Table 8.2-2 Summary of Traffic Count Survey on Weekday ............................................................... 8-1
Table 8.2-3 Summary of Cross Section Traffic Volume on Weekday at Khurkot Direction ................ 8-3
Table 8.2-4 Summary of Daily Traffic Count by Direction at Khurkot Direction ............................... 8-5
Table 8.2-5 Summary of Cross Section Traffic Volumes on Weekday at Ghurmi Way Direction ....... 8-7
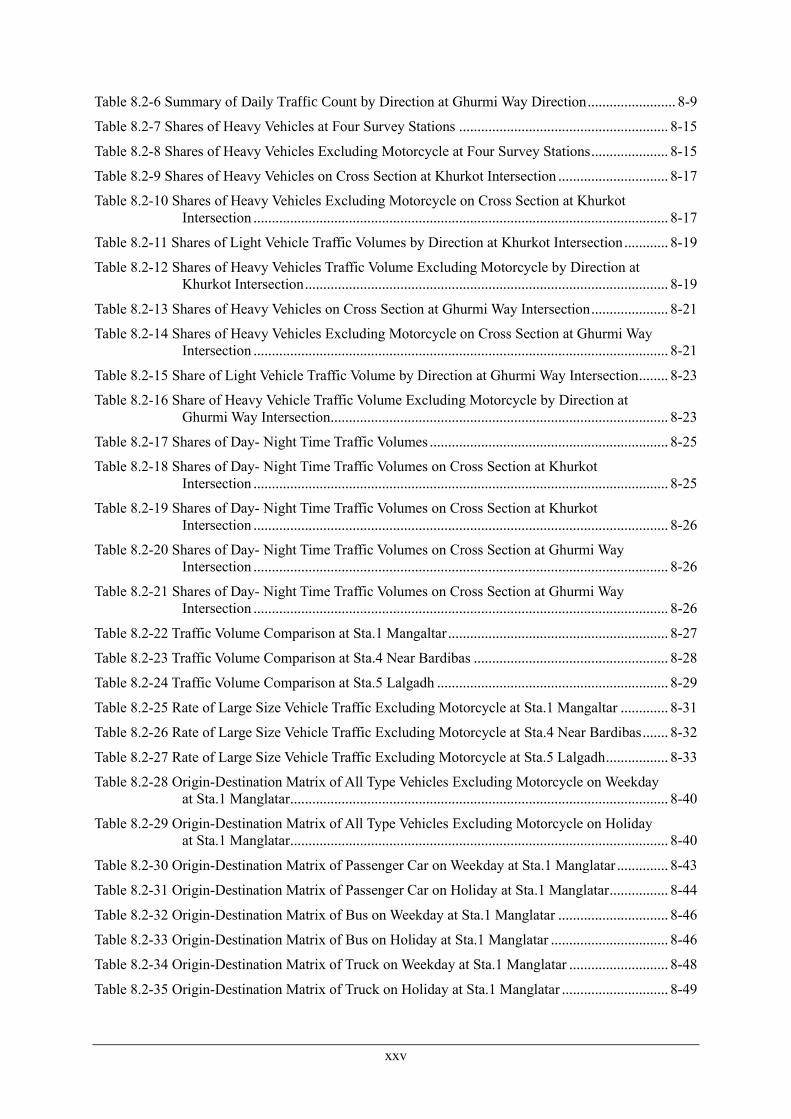
xxv
Table 8.2-6 Summary of Daily Traffic Count by Direction at Ghurmi Way Direction ........................ 8-9
Table 8.2-7 Shares of Heavy Vehicles at Four Survey Stations ......................................................... 8-15
Table 8.2-8 Shares of Heavy Vehicles Excluding Motorcycle at Four Survey Stations ..................... 8-15
Table 8.2-9 Shares of Heavy Vehicles on Cross Section at Khurkot Intersection .............................. 8-17
Table 8.2-10 Shares of Heavy Vehicles Excluding Motorcycle on Cross Section at Khurkot
Intersection ................................................................................................................. 8-17
Table 8.2-11 Shares of Light Vehicle Traffic Volumes by Direction at Khurkot Intersection ............ 8-19
Table 8.2-12 Shares of Heavy Vehicles Traffic Volume Excluding Motorcycle by Direction at
Khurkot Intersection ................................................................................................... 8-19
Table 8.2-13 Shares of Heavy Vehicles on Cross Section at Ghurmi Way Intersection ..................... 8-21
Table 8.2-14 Shares of Heavy Vehicles Excluding Motorcycle on Cross Section at Ghurmi Way
Intersection ................................................................................................................. 8-21
Table 8.2-15 Share of Light Vehicle Traffic Volume by Direction at Ghurmi Way Intersection ........ 8-23
Table 8.2-16 Share of Heavy Vehicle Traffic Volume Excluding Motorcycle by Direction at
Ghurmi Way Intersection ............................................................................................ 8-23
Table 8.2-17 Shares of Day- Night Time Traffic Volumes ................................................................. 8-25
Table 8.2-18 Shares of Day- Night Time Traffic Volumes on Cross Section at Khurkot
Intersection ................................................................................................................. 8-25
Table 8.2-19 Shares of Day- Night Time Traffic Volumes on Cross Section at Khurkot
Intersection ................................................................................................................. 8-26
Table 8.2-20 Shares of Day- Night Time Traffic Volumes on Cross Section at Ghurmi Way
Intersection ................................................................................................................. 8-26
Table 8.2-21 Shares of Day- Night Time Traffic Volumes on Cross Section at Ghurmi Way
Intersection ................................................................................................................. 8-26
Table 8.2-22 Traffic Volume Comparison at Sta.1 Mangaltar ............................................................ 8-27
Table 8.2-23 Traffic Volume Comparison at Sta.4 Near Bardibas ..................................................... 8-28
Table 8.2-24 Traffic Volume Comparison at Sta.5 Lalgadh ............................................................... 8-29
Table 8.2-25 Rate of Large Size Vehicle Traffic Excluding Motorcycle at Sta.1 Mangaltar ............. 8-31
Table 8.2-26 Rate of Large Size Vehicle Traffic Excluding Motorcycle at Sta.4 Near Bardibas ....... 8-32
Table 8.2-27 Rate of Large Size Vehicle Traffic Excluding Motorcycle at Sta.5 Lalgadh ................. 8-33
Table 8.2-28 Origin-Destination Matrix of All Type Vehicles Excluding Motorcycle on Weekday
at Sta.1 Manglatar ....................................................................................................... 8-40
Table 8.2-29 Origin-Destination Matrix of All Type Vehicles Excluding Motorcycle on Holiday
at Sta.1 Manglatar ....................................................................................................... 8-40
Table 8.2-30 Origin-Destination Matrix of Passenger Car on Weekday at Sta.1 Manglatar .............. 8-43
Table 8.2-31 Origin-Destination Matrix of Passenger Car on Holiday at Sta.1 Manglatar ................ 8-44
Table 8.2-32 Origin-Destination Matrix of Bus on Weekday at Sta.1 Manglatar .............................. 8-46
Table 8.2-33 Origin-Destination Matrix of Bus on Holiday at Sta.1 Manglatar ................................ 8-46
Table 8.2-34 Origin-Destination Matrix of Truck on Weekday at Sta.1 Manglatar ........................... 8-48
Table 8.2-35 Origin-Destination Matrix of Truck on Holiday at Sta.1 Manglatar ............................. 8-49
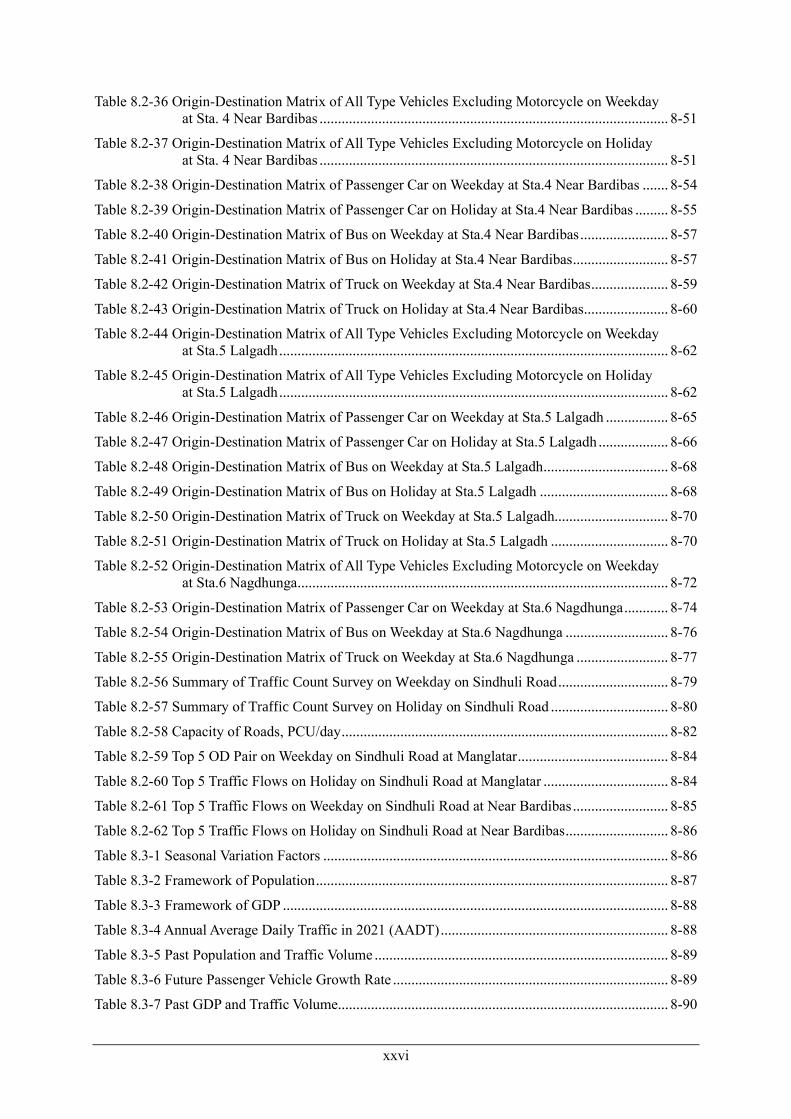
xxvi
Table 8.2-36 Origin-Destination Matrix of All Type Vehicles Excluding Motorcycle on Weekday
at Sta. 4 Near Bardibas ............................................................................................... 8-51
Table 8.2-37 Origin-Destination Matrix of All Type Vehicles Excluding Motorcycle on Holiday
at Sta. 4 Near Bardibas ............................................................................................... 8-51
Table 8.2-38 Origin-Destination Matrix of Passenger Car on Weekday at Sta.4 Near Bardibas ....... 8-54
Table 8.2-39 Origin-Destination Matrix of Passenger Car on Holiday at Sta.4 Near Bardibas ......... 8-55
Table 8.2-40 Origin-Destination Matrix of Bus on Weekday at Sta.4 Near Bardibas ........................ 8-57
Table 8.2-41 Origin-Destination Matrix of Bus on Holiday at Sta.4 Near Bardibas .......................... 8-57
Table 8.2-42 Origin-Destination Matrix of Truck on Weekday at Sta.4 Near Bardibas ..................... 8-59
Table 8.2-43 Origin-Destination Matrix of Truck on Holiday at Sta.4 Near Bardibas....................... 8-60
Table 8.2-44 Origin-Destination Matrix of All Type Vehicles Excluding Motorcycle on Weekday
at Sta.5 Lalgadh .......................................................................................................... 8-62
Table 8.2-45 Origin-Destination Matrix of All Type Vehicles Excluding Motorcycle on Holiday
at Sta.5 Lalgadh .......................................................................................................... 8-62
Table 8.2-46 Origin-Destination Matrix of Passenger Car on Weekday at Sta.5 Lalgadh ................. 8-65
Table 8.2-47 Origin-Destination Matrix of Passenger Car on Holiday at Sta.5 Lalgadh ................... 8-66
Table 8.2-48 Origin-Destination Matrix of Bus on Weekday at Sta.5 Lalgadh .................................. 8-68
Table 8.2-49 Origin-Destination Matrix of Bus on Holiday at Sta.5 Lalgadh ................................... 8-68
Table 8.2-50 Origin-Destination Matrix of Truck on Weekday at Sta.5 Lalgadh............................... 8-70
Table 8.2-51 Origin-Destination Matrix of Truck on Holiday at Sta.5 Lalgadh ................................ 8-70
Table 8.2-52 Origin-Destination Matrix of All Type Vehicles Excluding Motorcycle on Weekday
at Sta.6 Nagdhunga ..................................................................................................... 8-72
Table 8.2-53 Origin-Destination Matrix of Passenger Car on Weekday at Sta.6 Nagdhunga ............ 8-74
Table 8.2-54 Origin-Destination Matrix of Bus on Weekday at Sta.6 Nagdhunga ............................ 8-76
Table 8.2-55 Origin-Destination Matrix of Truck on Weekday at Sta.6 Nagdhunga ......................... 8-77
Table 8.2-56 Summary of Traffic Count Survey on Weekday on Sindhuli Road .............................. 8-79
Table 8.2-57 Summary of Traffic Count Survey on Holiday on Sindhuli Road ................................ 8-80
Table 8.2-58 Capacity of Roads, PCU/day ......................................................................................... 8-82
Table 8.2-59 Top 5 OD Pair on Weekday on Sindhuli Road at Manglatar ......................................... 8-84
Table 8.2-60 Top 5 Traffic Flows on Holiday on Sindhuli Road at Manglatar .................................. 8-84
Table 8.2-61 Top 5 Traffic Flows on Weekday on Sindhuli Road at Near Bardibas .......................... 8-85
Table 8.2-62 Top 5 Traffic Flows on Holiday on Sindhuli Road at Near Bardibas ............................ 8-86
Table 8.3-1 Seasonal Variation Factors .............................................................................................. 8-86
Table 8.3-2 Framework of Population ................................................................................................ 8-87
Table 8.3-3 Framework of GDP ......................................................................................................... 8-88
Table 8.3-4 Annual Average Daily Traffic in 2021 (AADT) .............................................................. 8-88
Table 8.3-5 Past Population and Traffic Volume ................................................................................ 8-89
Table 8.3-6 Future Passenger Vehicle Growth Rate ........................................................................... 8-89
Table 8.3-7 Past GDP and Traffic Volume.......................................................................................... 8-90
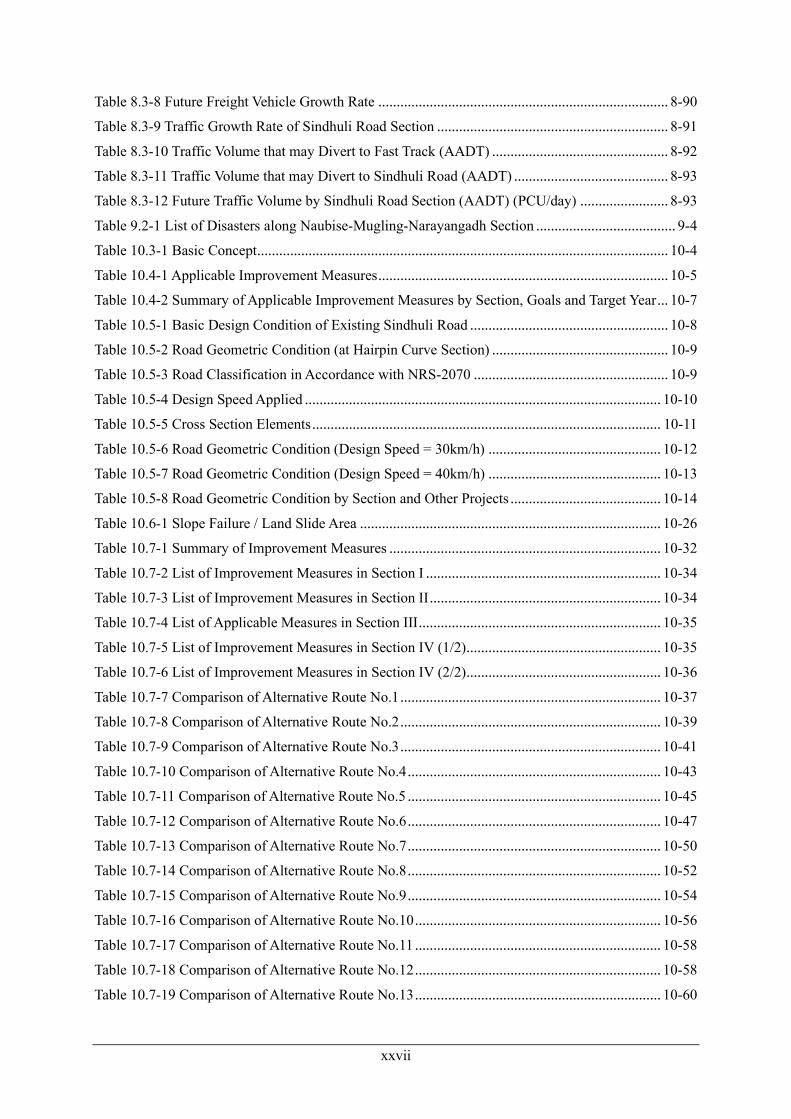
xxvii
Table 8.3-8 Future Freight Vehicle Growth Rate ............................................................................... 8-90
Table 8.3-9 Traffic Growth Rate of Sindhuli Road Section ............................................................... 8-91
Table 8.3-10 Traffic Volume that may Divert to Fast Track (AADT) ................................................ 8-92
Table 8.3-11 Traffic Volume that may Divert to Sindhuli Road (AADT) .......................................... 8-93
Table 8.3-12 Future Traffic Volume by Sindhuli Road Section (AADT) (PCU/day) ........................ 8-93
Table 9.2-1 List of Disasters along Naubise-Mugling-Narayangadh Section ...................................... 9-4
Table 10.3-1 Basic Concept ................................................................................................................ 10-4
Table 10.4-1 Applicable Improvement Measures ............................................................................... 10-5
Table 10.4-2 Summary of Applicable Improvement Measures by Section, Goals and Target Year ... 10-7
Table 10.5-1 Basic Design Condition of Existing Sindhuli Road ...................................................... 10-8
Table 10.5-2 Road Geometric Condition (at Hairpin Curve Section) ................................................ 10-9
Table 10.5-3 Road Classification in Accordance with NRS-2070 ..................................................... 10-9
Table 10.5-4 Design Speed Applied ................................................................................................. 10-10
Table 10.5-5 Cross Section Elements ............................................................................................... 10-11
Table 10.5-6 Road Geometric Condition (Design Speed = 30km/h) ............................................... 10-12
Table 10.5-7 Road Geometric Condition (Design Speed = 40km/h) ............................................... 10-13
Table 10.5-8 Road Geometric Condition by Section and Other Projects ......................................... 10-14
Table 10.6-1 Slope Failure / Land Slide Area .................................................................................. 10-26
Table 10.7-1 Summary of Improvement Measures .......................................................................... 10-32
Table 10.7-2 List of Improvement Measures in Section I ................................................................ 10-34
Table 10.7-3 List of Improvement Measures in Section II ............................................................... 10-34
Table 10.7-4 List of Applicable Measures in Section III .................................................................. 10-35
Table 10.7-5 List of Improvement Measures in Section IV (1/2) ..................................................... 10-35
Table 10.7-6 List of Improvement Measures in Section IV (2/2) ..................................................... 10-36
Table 10.7-7 Comparison of Alternative Route No.1 ....................................................................... 10-37
Table 10.7-8 Comparison of Alternative Route No.2 ....................................................................... 10-39
Table 10.7-9 Comparison of Alternative Route No.3 ....................................................................... 10-41
Table 10.7-10 Comparison of Alternative Route No.4 ..................................................................... 10-43
Table 10.7-11 Comparison of Alternative Route No.5 ..................................................................... 10-45
Table 10.7-12 Comparison of Alternative Route No.6 ..................................................................... 10-47
Table 10.7-13 Comparison of Alternative Route No.7 ..................................................................... 10-50
Table 10.7-14 Comparison of Alternative Route No.8 ..................................................................... 10-52
Table 10.7-15 Comparison of Alternative Route No.9 ..................................................................... 10-54
Table 10.7-16 Comparison of Alternative Route No.10 ................................................................... 10-56
Table 10.7-17 Comparison of Alternative Route No.11 ................................................................... 10-58
Table 10.7-18 Comparison of Alternative Route No.12 ................................................................... 10-58
Table 10.7-19 Comparison of Alternative Route No.13 ................................................................... 10-60

xxviii
Table 10.7-20 Comparison of Alternative Route No.14 ................................................................... 10-62
Table 10.7-21 Comparison of Alternative Route No.15 ................................................................... 10-64
Table 11.2-1 Purpose and Methodology of ESC ................................................................................ 11-1
Table 11.2-2 Field Surveys ................................................................................................................. 11-2
Table 11.2-3 Key Persons (Resource Persons) in the Field Surveys .................................................. 11-2
Table 11.3-1 Major Settlement Areas along the Road Alignment ...................................................... 11-3
Table 11.3-2 Average Temperature and Rainfall of Project Area ...................................................... 11-4
Table 11.3-3 Monthly Rainfall at Sindhuli Bazar .............................................................................. 11-4
Table 11.3-4 Forest distribution and land use status along the Sindhuli Road .................................. 11-5
Table 11.3-5 Observed Species near the Project Areas ..................................................................... 11-6
Table 11.3-6 Types of Protected Areas Defined by the Nepal National Parks and Wildlife
Conservation Act (NPWCA), 1973 * ......................................................................... 11-8
Table 11.4-1 Policy Gap between JIGA Guidelines and Nepalese Regulations (EIA) .................... 11-12
Table 11.4-2 Policy Gap between JICA Guidelines and Nepali Country System (RAP) ................. 11-15
Table 11.6-1 Approximate Areas of Land Acquisition and Numbers of Affected Structures ........... 11-19
Table 11.6-2 Common environmental and social situations for all alternatives ............................... 11-21
Table 11.7-1 Check List for JICA’s Screening for "Sensitive Areas" ............................................... 11-23
Table 11.7-2 Draft Pre-Scoping ........................................................................................................ 11-25
Table 11.8-1 General Recommendation ........................................................................................... 11-28
Table 11.8-2 The Other Recommendation for the Section II ........................................................... 11-29
Table 12.2-1 Outline of Alternative Routes with Mountain Tunnel(Nepal F/S Project) ............... 12-5
Table 12.2-2 Outline of ERT .............................................................................................................. 12-8
Table 12.3-1 Review Results ............................................................................................................ 12-16
Table 13.2-1 Stratigraphic Subdivisions of the Survey Area .............................................................. 13-3
Table 13.4-1 Comparison of Lane Operation Method ...................................................................... 13-24
Table 13.4-2 Comparison of Alternative Routes Studied in Preceding Projects .............................. 13-26
Table 13.4-3 Outline of Candidate Routes ....................................................................................... 13-27
Table 13.5-1 Comparison of Candidate Routes ................................................................................ 13-35
Table 13.6-1 List of Applied Japanese Standards for Study on Tunnel Structure ............................ 13-36
Table 13.6-2 Basic Condition on Study on Tunnel Structure ........................................................... 13-36
Table 13.6-3 Rock Mass Classification System ............................................................................... 13-37
Table 13.6-4 Standard Support Patterns for Two-Lane Tunnels (Width of Inner Section 8.5-
12.5m)....................................................................................................................... 13-38
Table 13.6-5 Standard Support Patterns for Two-Lane Tunnels (Large Section Tunnel: Width of
Inner Section 12.5-14.0m) ........................................................................................ 13-38
Table 13.6-6 List of Support Patterns Length of Candidate Routes ................................................. 13-39
Table 13.6-7 Classification and Characteristics of Standard Excavation Method ............................ 13-40
Table 13.6-8 Facilities to be Installed Tunnel .................................................................................. 13-44
xxix
Table 13.6-9 Installation Standard of Emergency Facilities ............................................................. 13-47
Table 13.6-10 Description of Tunnel Management Office and Electric Room ................................ 13-54
Table 14.6-1 Budget Allocated for Road Safety for Past Three Fiscal Years ..................................... 14-4
Table 15.2-1 Current Situation of Potential Areas .............................................................................. 15-4
Table 15.3-1 Necessary Procedures .................................................................................................... 15-7
Table 16.2-1 Labor Unit Price (Kavrepalanchok district) .................................................................. 16-3
Table 16.2-2 Material Procurement (1/2) ........................................................................................... 16-4
Table 16.2-3 Material Procurement (2/2) ........................................................................................... 16-5
Table 16.2-4 Equipment Procurement (1/2) ....................................................................................... 16-6
Table 16.2-5 Equipment Procurement (2/2) ....................................................................................... 16-7
Table 16.2-6 Rate of Plant and Machinery (1/2) ................................................................................ 16-8
Table 16.2-7 Rate of Plant and Machinery (2/2) ................................................................................ 16-9
Table 16.2-8 Synopsis of the Areas for the Mining of Construction Materials in Sindhuli District 16-10
Table 16.2-9 Quarry Sites of Nepal .................................................................................................. 16-12
Table 16.2-10 Quantities of structure of original Sindhuli road development project ..................... 16-15
Table 16.2-11 Recycle of Construction Materials (Japan) ............................................................... 16-16
Table 16.2-12 Disposal area plan in the FS report ........................................................................... 16-18
Table 16.2-13 Calculation Example of One-side Altering Traffic(-:failure) ............................ 16-23
Table 16.3-1 Locations of improvement of alignment ..................................................................... 16-29
Table 16.3-2 Result of Cost Estimation ............................................................................................ 16-30
Table 18.2-1 Unit Travel Time Cost, W/O Motorcycle ...................................................................... 18-2
Table 18.2-2 Average Number of Passengers by Type of Vehicle ...................................................... 18-2
Table 18.2-3 Average Loading Weight of Heavy Truck on Weekday ................................................ 18-2
Table 18.2-4 Average Loading Weight of Heavy Truck on Holiday .................................................. 18-3
Table 18.2-5 Estimation Case ............................................................................................................. 18-3
Table 18.2-6 Travel Time Using Existing Road in 2041 (Case 1) ...................................................... 18-3
Table 18.2-7 Travel Time Using Existing Road and Tunnel in 2041 (Case2) .................................... 18-4
Table 18.2-8 TTC Saving Using Existing Road in 2041 (Case 1) (Million NPR / year) ................... 18-4
Table 18.2-9 TTC Saving Using Existing Road and Tunnel in 2041 (Case 2) (Million NPR /
year) ............................................................................................................................ 18-4
Table 18.3-1 Summary of Estimation Results .................................................................................... 18-4
Table 19.3-1 General Recommendation ............................................................................................. 19-5
Table 19.3-2 The Other Recommendation for the Section II ............................................................. 19-5
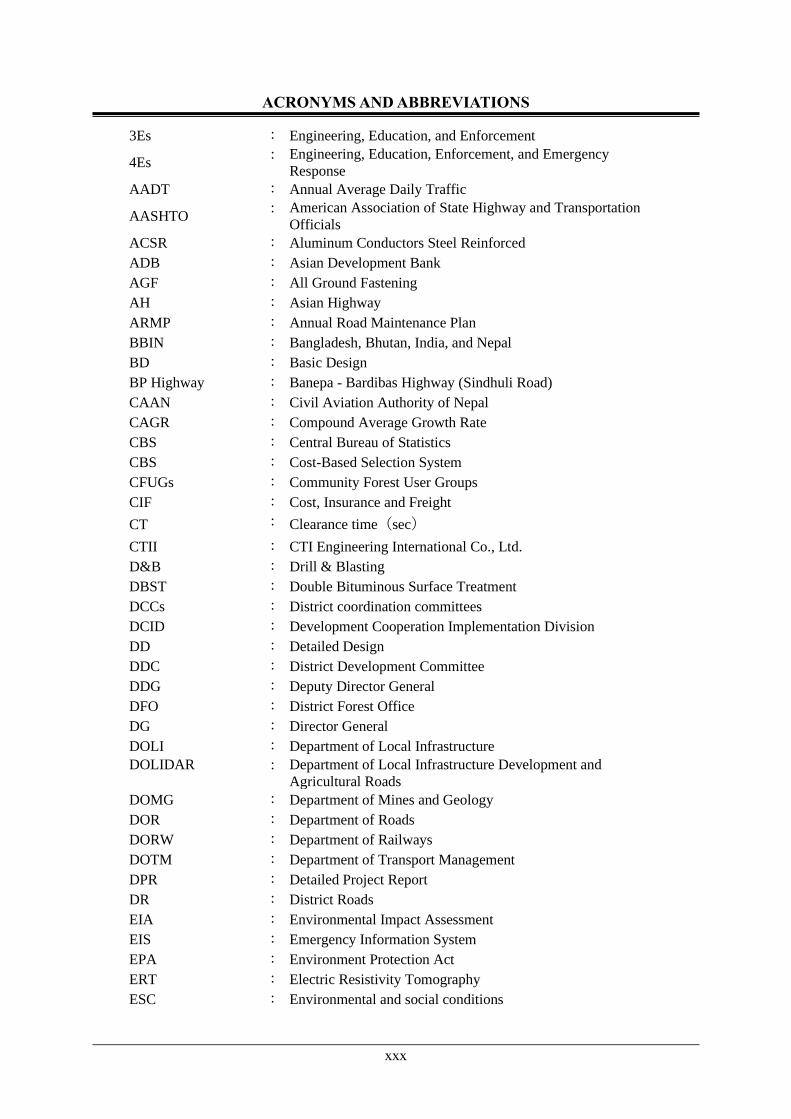
xxx
ACRONYMS AND ABBREVIATIONS
3Es : Engineering, Education, and Enforcement
4Es : Engineering, Education, Enforcement, and Emergency
Response
AADT : Annual Average Daily Traffic
AASHTO : American Association of State Highway and Transportation
Officials
ACSR : Aluminum Conductors Steel Reinforced
ADB : Asian Development Bank
AGF : All Ground Fastening
AH : Asian Highway
ARMP : Annual Road Maintenance Plan
BBIN : Bangladesh, Bhutan, India, and Nepal
BD : Basic Design
BP Highway : Banepa - Bardibas Highway (Sindhuli Road)
CAAN : Civil Aviation Authority of Nepal
CAGR : Compound Average Growth Rate
CBS : Central Bureau of Statistics
CBS : Cost-Based Selection System
CFUGs : Community Forest User Groups
CIF : Cost, Insurance and Freight
CT : Clearance time(sec)
CTII : CTI Engineering International Co., Ltd.
D&B : Drill & Blasting
DBST : Double Bituminous Surface Treatment
DCCs : District coordination committees
DCID : Development Cooperation Implementation Division
DD : Detailed Design
DDC : District Development Committee
DDG : Deputy Director General
DFO : District Forest Office
DG : Director General
DOLI : Department of Local Infrastructure
DOLIDAR : Department of Local Infrastructure Development and
Agricultural Roads
DOMG : Department of Mines and Geology
DOR : Department of Roads
DORW : Department of Railways
DOTM : Department of Transport Management
DPR : Detailed Project Report
DR : District Roads
EIA : Environmental Impact Assessment
EIS : Emergency Information System
EPA : Environment Protection Act
ERT : Electric Resistivity Tomography
ESC : Environmental and social conditions
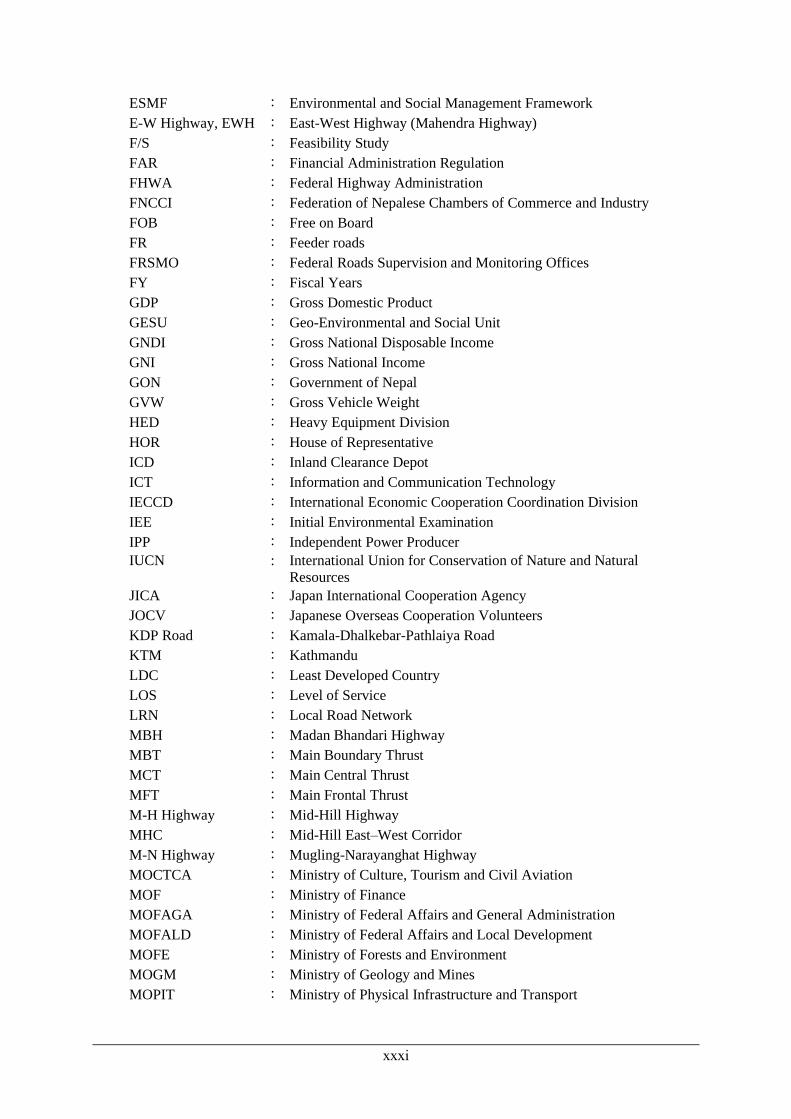
xxxi
ESMF : Environmental and Social Management Framework
E-W Highway, EWH : East-West Highway (Mahendra Highway)
F/S : Feasibility Study
FAR : Financial Administration Regulation
FHWA : Federal Highway Administration
FNCCI : Federation of Nepalese Chambers of Commerce and Industry
FOB : Free on Board
FR : Feeder roads
FRSMO : Federal Roads Supervision and Monitoring Offices
FY : Fiscal Years
GDP : Gross Domestic Product
GESU : Geo-Environmental and Social Unit
GNDI : Gross National Disposable Income
GNI : Gross National Income
GON : Government of Nepal
GVW : Gross Vehicle Weight
HED : Heavy Equipment Division
HOR : House of Representative
ICD : Inland Clearance Depot
ICT : Information and Communication Technology
IECCD : International Economic Cooperation Coordination Division
IEE : Initial Environmental Examination
IPP : Independent Power Producer
IUCN : International Union for Conservation of Nature and Natural
Resources
JICA : Japan International Cooperation Agency
JOCV : Japanese Overseas Cooperation Volunteers
KDP Road : Kamala-Dhalkebar-Pathlaiya Road
KTM : Kathmandu
LDC : Least Developed Country
LOS : Level of Service
LRN : Local Road Network
MBH : Madan Bhandari Highway
MBT : Main Boundary Thrust
MCT : Main Central Thrust
MFT : Main Frontal Thrust
M-H Highway : Mid-Hill Highway
MHC : Mid-Hill East–West Corridor
M-N Highway : Mugling-Narayanghat Highway
MOCTCA : Ministry of Culture, Tourism and Civil Aviation
MOF : Ministry of Finance
MOFAGA : Ministry of Federal Affairs and General Administration
MOFALD : Ministry of Federal Affairs and Local Development
MOFE : Ministry of Forests and Environment
MOGM : Ministry of Geology and Mines
MOPIT : Ministry of Physical Infrastructure and Transport
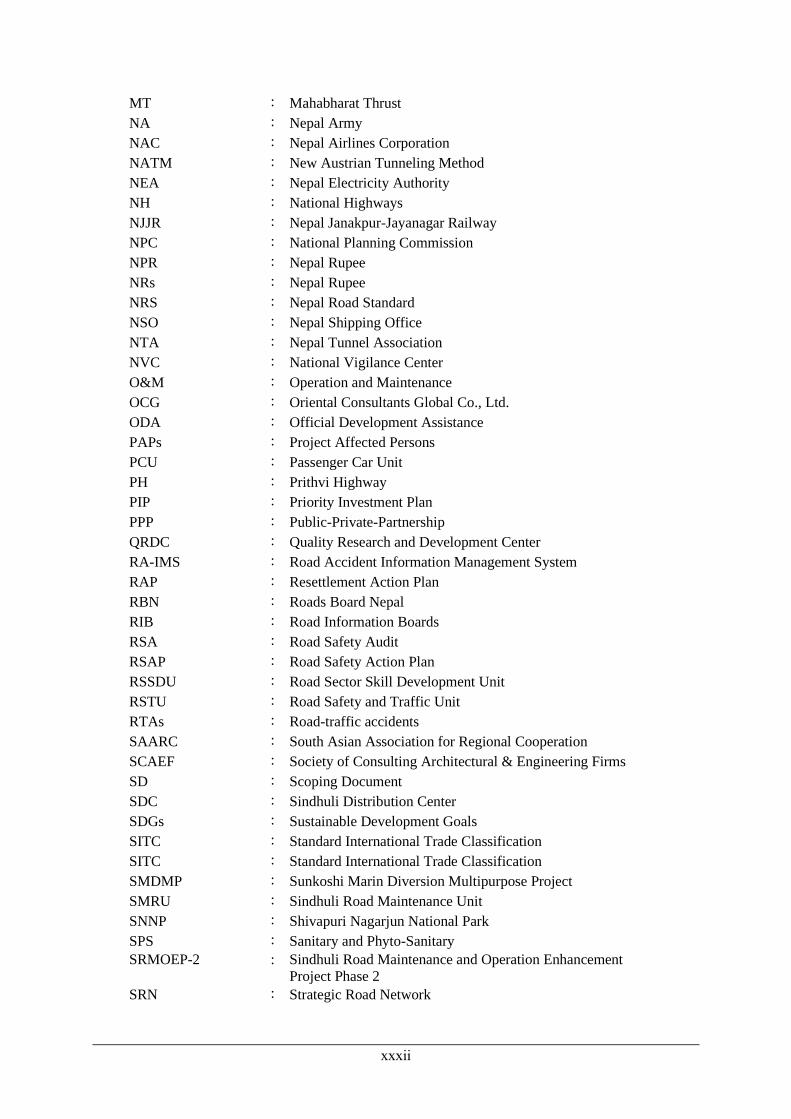
xxxii
MT : Mahabharat Thrust
NA : Nepal Army
NAC : Nepal Airlines Corporation
NATM : New Austrian Tunneling Method
NEA : Nepal Electricity Authority
NH : National Highways
NJJR : Nepal Janakpur-Jayanagar Railway
NPC : National Planning Commission
NPR : Nepal Rupee
NRs : Nepal Rupee
NRS : Nepal Road Standard
NSO : Nepal Shipping Office
NTA : Nepal Tunnel Association
NVC : National Vigilance Center
O&M : Operation and Maintenance
OCG : Oriental Consultants Global Co., Ltd.
ODA : Official Development Assistance
PAPs : Project Affected Persons
PCU : Passenger Car Unit
PH : Prithvi Highway
PIP : Priority Investment Plan
PPP : Public-Private-Partnership
QRDC : Quality Research and Development Center
RA-IMS : Road Accident Information Management System
RAP : Resettlement Action Plan
RBN : Roads Board Nepal
RIB : Road Information Boards
RSA : Road Safety Audit
RSAP : Road Safety Action Plan
RSSDU : Road Sector Skill Development Unit
RSTU : Road Safety and Traffic Unit
RTAs : Road-traffic accidents
SAARC : South Asian Association for Regional Cooperation
SCAEF : Society of Consulting Architectural & Engineering Firms
SD : Scoping Document
SDC : Sindhuli Distribution Center
SDGs : Sustainable Development Goals
SITC : Standard International Trade Classification
SITC : Standard International Trade Classification
SMDMP : Sunkoshi Marin Diversion Multipurpose Project
SMRU : Sindhuli Road Maintenance Unit
SNNP : Shivapuri Nagarjun National Park
SPS : Sanitary and Phyto-Sanitary
SRMOEP-2 : Sindhuli Road Maintenance and Operation Enhancement
Project Phase 2
SRN : Strategic Road Network
xxxiii
SRS : Study and Research Section
TAR : Trans-Asian Railways
TBM : Tunnel Boring Machine
TESU : Traffic Engineering and Safety Unit
TIA : Tribhuvan International Airport
TIACAO : Tribhuvan International Airport Civil Aviation Office
ToR : Terms of Reference
TTC : Travel Time Cost
UNESCAP : United Nations Economic and Social Commission for Asia and
the Pacific
UR : Urban Roads
VDC : Village Development Committee
VR : Village Roads
VUCL : Vidhyut Utpadan Company Limited
WB : World Bank


Data Collection Survey on the Sindhuli Road Capacity Enhancement in Nepal FINAL REPORT
1-1
CHAPTER 1 INTRODUCTION
This Final Report for Data Collection Survey on the Sindhuli Road Capacity Enhancement in Nepal
compiles the result of the desk study of available documents, analysis of data and information gathered
through procurement from relevant sources and discussions/hearings with authorities concerned to the
study on the current condition of the Sindhuli Road, including perspective with regards to future
improvements. It also reflects the results of surveys (road inventory, traffic count survey, findings of
environmental and social considerations).
This Survey aims to prepare and provide a roadmap to improve the Sindhuli Road that would be useful in
meeting the new demands and new expectations of the people of Nepal. Sindhuli Road demonstrated
remarkable outcome soon after its completion. The road became the shortest and fastest corridor joining
Kathmandu with Eastern Terai. Where it took an approximate 9 plus hours to travel from Kathmandu to
Bardibas using the Kathmandu-Naubise-Mugling-Bardibas road, it only took about 5 plus hours through
Sindhuli Road. This significant reduction in the travel time resulted into rapid enhancement of socio-
economic activities along the Sindhuli Road, thereby contributing to the economic development of the
country. However, after completion, the Sindhuli Road soon attracted traffics increasing the volume
exponentially. In about half-decade after its opening, the road is already approaching its capacity (on
average 4,000 vehicles per day). On the other hand, the objective road is only 5.5m wide (1.5 lane) and its
alignment is poor – sharp curves (hairpin curves) and steep grade. Such geometrical conditions have
limited the benefits to standard vehicles, as restrictions have been imposed on large vehicles from plying
the road as a mean to minimize traffic accidents.
Under such circumstances, people of Nepal (general road users and road agencies) began raising concerns
and added expectations for a better Sindhuli Road. As is also emphasized in the latest development plans,
people are looking forward to an improved Sindhuli Road, which is wider, smoother, faster and safer, more
resilient to disaster, and more economically friendly than the existing road. Although, the Government of
Japan (GOJ) has been rendering financial and technical assistance even after completion of the road to
keep the road operational by attending timely and adequate maintenance, it is time to consider
improvement/upgradation to meet the road users` expectations. By doing so, the road will enhance its
capacity; it will be operable without restriction impositions; it can function as an integral part of the Asian
Highway (AH) or at least serve as a strong connectivity between the two Asian Highways, AH2 and AH42;
it will bring the northeastern regions of the country closer to Kathmandu; and it will serve as a redundant
road of Kathmandu-Naubise-Mugling-Bardibas Road and the currently under-construction Kathmandu-
Terai/Madhes Expressway.
Although the Government of Nepal (GON) also acknowledges the need for the improvement, it`s
improvement is not as simple as other ordinary roads. There are sections where widening is deemed
extremely challenging. Therefore, a combination of improvement methods comprising of simple widening,
widening using structures, improvement and widening using bridges (includes loop bridge and metal
roads), bypassing and provision of tunnels need to be considered. This Survey studies the possibilities of

Data Collection Survey on the Sindhuli Road Capacity Enhancement in Nepal FINAL REPORT
1-2
such combination and recommends the optimum improvement method to achieve the objective of the
Survey.
1.1 SURVEY BACKGROUND
The Federal Democratic Republic of Nepal (hereunder "Nepal") is a landlocked country, located in
between two giant countries, India and China. It shares its border with China in the north and India on the
other three sides. Geographically, Nepal can be divided almost horizontally into three regions.
Mountainous region (the Himalayas) in the north, hilly region in the middle and low land (Terai plains) in
the south. About 80% of the country is occupied by mountains and hills and the rest by Terai region. Terai
plains in the south is the main agricultural area of the country and is home to about half the country’s
population.
Nepal’s trade is heavily dependent on road transport, which accounts to 90% of the country’s domestic and
international transport of passenger and cargo goods. Expansion of road network and sustainable
improvement of existing roads between Kathmandu and the Indian border via the Terai Plains is inevitable
to enhance stable and efficient transportation of people, goods, and socio-economic activity of the country.
For nearly half a century, transport of goods and people from/to the capital Kathmandu have been serving
by a single route (trunk road) 1. This route extends to about 110km towards the west from Kathmandu and
goes down southward passing almost perpendicularly through the Mahabharat range to meet with the East-
West Highway that connects the Terai plains from the east to the west. The route consists of several
highways; in sequence as it starts from Kathmandu are the Tribhuvan Highway, the Prithvi Highway, the
Mugling-Narayanghat Highway (M-N Highway), and East-West Highway (E-W Highway, Mahendra
Highway). For convenience, this route will be referred to as the “Westward Route” in this report. The
Westward Route was the only route connecting Kathmandu and the Terai Plains and was the lifeline or
vertebra supporting the socio-economic activities of the corridor and the capital city until the Sindhuli
Road, commonly known as the BP Highway2, constructed under the grant aid assistance from Japan, was
completed in 2015. The Sindhuli Road is now serving as the second all-season highway that connects the
capital city directly with the eastern Terai region.
Shortly after the opening in 2015 and even during partial openings of each Sections, the Sindhuli Road
began contributing to the economic activities as demonstrated by the rapid development along its corridor
and the sharp increase of the traffic volume. According to a traffic survey conducted in 2019 under the
Sindhuli Road Maintenance and Operation Enhancement Project Phase 2 (SRMOEP-2), daily traffic at
1 Prior to the Westward Route, all vehicles coming in and out of Kathmandu Valley used the Tribhuvan Highway, which is the first
road that provided serviceable road connection between Kathmandu Valley and the Indian Border town. Popularly known as
‘Byroad’, the road commences in Kathmandu extends west and turns south at Naubise passes Hetauda and all the way up to
Birgunj/Raxaul. After the Westward Route came in service, due to its gentle geometry compared to Tribhuvan Highway, where
the width is narrow and compounded with unending series of climbs and descents through the Siwalik (south of Kathmandu), it
soon became the game changer by attracting almost all traffics from the Tribhuvan Highway. The highway is now in extremely
deteriorated situation.
2 The highway is named after the first democratically elected prime minister who led the Nepali Congress Party, Late Bisheswor
Prasad Koirala.
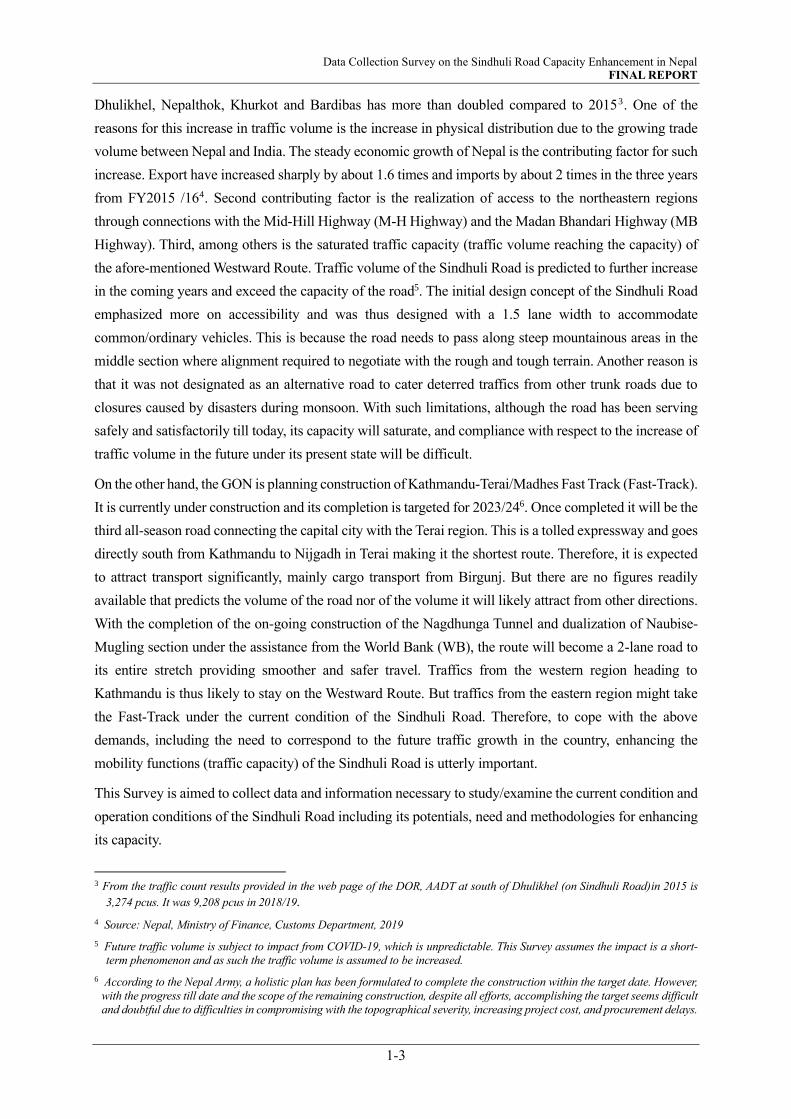
Data Collection Survey on the Sindhuli Road Capacity Enhancement in Nepal FINAL REPORT
1-3
Dhulikhel, Nepalthok, Khurkot and Bardibas has more than doubled compared to 20153 . One of the
reasons for this increase in traffic volume is the increase in physical distribution due to the growing trade
volume between Nepal and India. The steady economic growth of Nepal is the contributing factor for such
increase. Export have increased sharply by about 1.6 times and imports by about 2 times in the three years
from FY2015 /164 . Second contributing factor is the realization of access to the northeastern regions
through connections with the Mid-Hill Highway (M-H Highway) and the Madan Bhandari Highway (MB
Highway). Third, among others is the saturated traffic capacity (traffic volume reaching the capacity) of
the afore-mentioned Westward Route. Traffic volume of the Sindhuli Road is predicted to further increase
in the coming years and exceed the capacity of the road5. The initial design concept of the Sindhuli Road
emphasized more on accessibility and was thus designed with a 1.5 lane width to accommodate
common/ordinary vehicles. This is because the road needs to pass along steep mountainous areas in the
middle section where alignment required to negotiate with the rough and tough terrain. Another reason is
that it was not designated as an alternative road to cater deterred traffics from other trunk roads due to
closures caused by disasters during monsoon. With such limitations, although the road has been serving
safely and satisfactorily till today, its capacity will saturate, and compliance with respect to the increase of
traffic volume in the future under its present state will be difficult.
On the other hand, the GON is planning construction of Kathmandu-Terai/Madhes Fast Track (Fast-Track).
It is currently under construction and its completion is targeted for 2023/246. Once completed it will be the
third all-season road connecting the capital city with the Terai region. This is a tolled expressway and goes
directly south from Kathmandu to Nijgadh in Terai making it the shortest route. Therefore, it is expected
to attract transport significantly, mainly cargo transport from Birgunj. But there are no figures readily
available that predicts the volume of the road nor of the volume it will likely attract from other directions.
With the completion of the on-going construction of the Nagdhunga Tunnel and dualization of Naubise-
Mugling section under the assistance from the World Bank (WB), the route will become a 2-lane road to
its entire stretch providing smoother and safer travel. Traffics from the western region heading to
Kathmandu is thus likely to stay on the Westward Route. But traffics from the eastern region might take
the Fast-Track under the current condition of the Sindhuli Road. Therefore, to cope with the above
demands, including the need to correspond to the future traffic growth in the country, enhancing the
mobility functions (traffic capacity) of the Sindhuli Road is utterly important.
This Survey is aimed to collect data and information necessary to study/examine the current condition and
operation conditions of the Sindhuli Road including its potentials, need and methodologies for enhancing
its capacity.
3 From the traffic count results provided in the web page of the DOR, AADT at south of Dhulikhel (on Sindhuli Road)in 2015 is
3,274 pcus. It was 9,208 pcus in 2018/19.
4 Source: Nepal, Ministry of Finance, Customs Department, 2019
5 Future traffic volume is subject to impact from COVID-19, which is unpredictable. This Survey assumes the impact is a short-
term phenomenon and as such the traffic volume is assumed to be increased.
6 According to the Nepal Army, a holistic plan has been formulated to complete the construction within the target date. However,
with the progress till date and the scope of the remaining construction, despite all efforts, accomplishing the target seems difficult
and doubtful due to difficulties in compromising with the topographical severity, increasing project cost, and procurement delays.
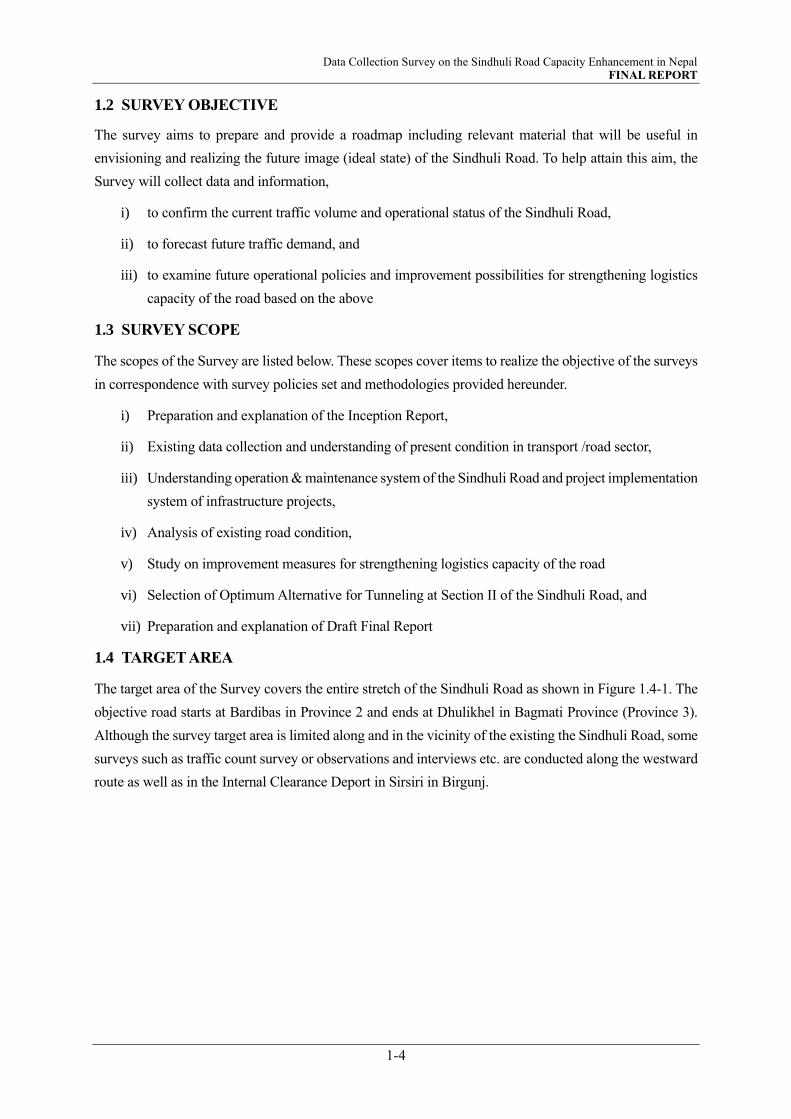
Data Collection Survey on the Sindhuli Road Capacity Enhancement in Nepal FINAL REPORT
1-4
1.2 SURVEY OBJECTIVE
The survey aims to prepare and provide a roadmap including relevant material that will be useful in
envisioning and realizing the future image (ideal state) of the Sindhuli Road. To help attain this aim, the
Survey will collect data and information,
i) to confirm the current traffic volume and operational status of the Sindhuli Road,
ii) to forecast future traffic demand, and
iii) to examine future operational policies and improvement possibilities for strengthening logistics
capacity of the road based on the above
1.3 SURVEY SCOPE
The scopes of the Survey are listed below. These scopes cover items to realize the objective of the surveys
in correspondence with survey policies set and methodologies provided hereunder.
i) Preparation and explanation of the Inception Report,
ii) Existing data collection and understanding of present condition in transport /road sector,
iii) Understanding operation & maintenance system of the Sindhuli Road and project implementation
system of infrastructure projects,
iv) Analysis of existing road condition,
v) Study on improvement measures for strengthening logistics capacity of the road
vi) Selection of Optimum Alternative for Tunneling at Section II of the Sindhuli Road, and
vii) Preparation and explanation of Draft Final Report
1.4 TARGET AREA
The target area of the Survey covers the entire stretch of the Sindhuli Road as shown in Figure 1.4-1. The
objective road starts at Bardibas in Province 2 and ends at Dhulikhel in Bagmati Province (Province 3).
Although the survey target area is limited along and in the vicinity of the existing the Sindhuli Road, some
surveys such as traffic count survey or observations and interviews etc. are conducted along the westward
route as well as in the Internal Clearance Deport in Sirsiri in Birgunj.

Data Collection Survey on the Sindhuli Road Capacity Enhancement in Nepal FINAL REPORT
1-5
Source: JICA Survey Team
Figure 1.4-1 Target Area
1.5 STUDY APPROACH
Enhancing road function of the Sindhuli Road literally means the road will be entering into a new stage,
as it will have new roles and values. Understanding the goals, policies, basic concepts, and perspectives of
the GON including the Provincial Government with respect to enhancement of medium to long term road
functions are indispensable in the process. Wide perspective as of a global transport master plan and
approaches that addresses all the requirements (what, where, when, how etc.) are important factors to be
considered. Setting “Sindhuli Road 2.0 Plan” as the basic concept, the Team will study the measures based
on the flow indicated in the three steps (stages) shown in Figure 1.5-1 and with specific policies including
points provided hereunder.
Detailed study approach and its results are summarized in Chapter 10.
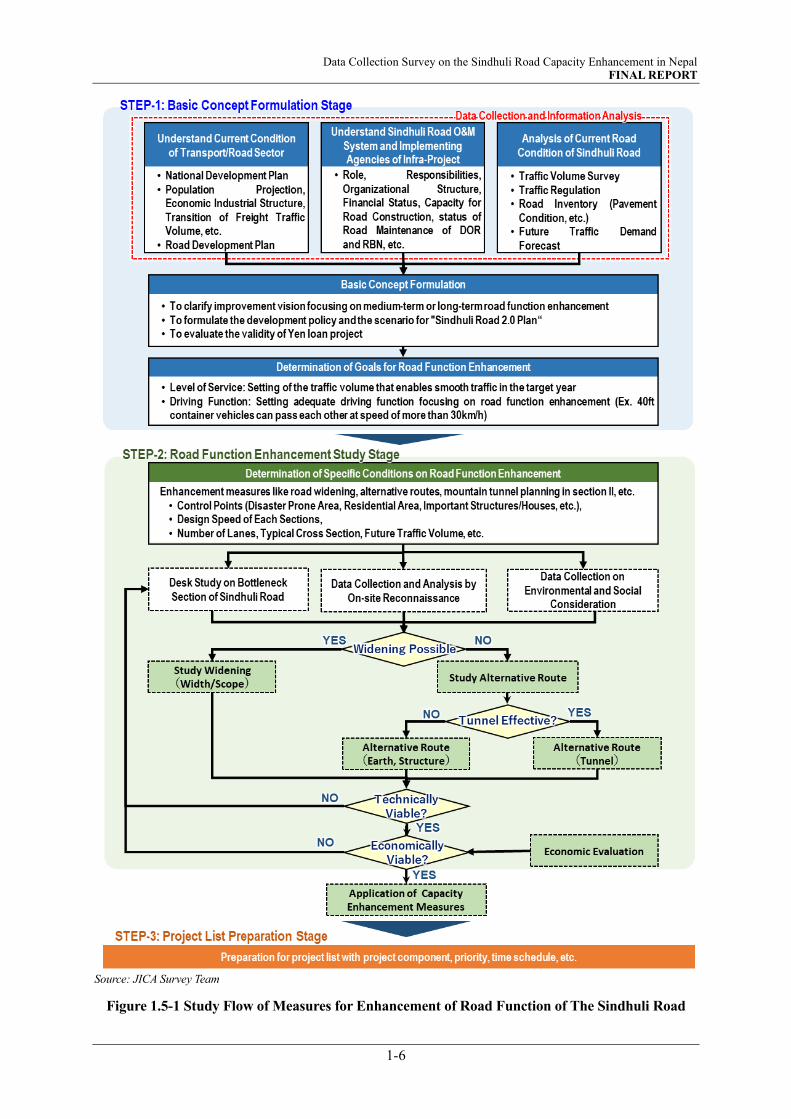
Data Collection Survey on the Sindhuli Road Capacity Enhancement in Nepal FINAL REPORT
1-6
Source: JICA Survey Team
Figure 1.5-1 Study Flow of Measures for Enhancement of Road Function of The Sindhuli Road
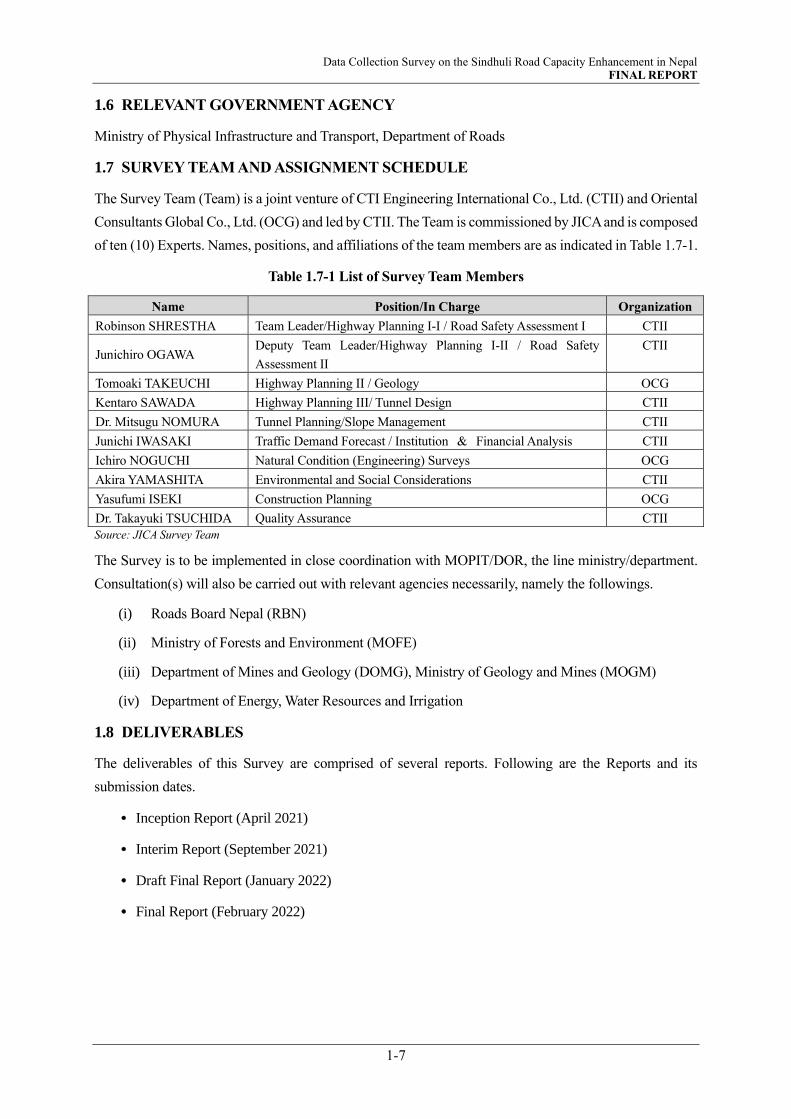
Data Collection Survey on the Sindhuli Road Capacity Enhancement in Nepal FINAL REPORT
1-7
1.6 RELEVANT GOVERNMENT AGENCY
Ministry of Physical Infrastructure and Transport, Department of Roads
1.7 SURVEY TEAM AND ASSIGNMENT SCHEDULE
The Survey Team (Team) is a joint venture of CTI Engineering International Co., Ltd. (CTII) and Oriental
Consultants Global Co., Ltd. (OCG) and led by CTII. The Team is commissioned by JICA and is composed
of ten (10) Experts. Names, positions, and affiliations of the team members are as indicated in Table 1.7-1.
Table 1.7-1 List of Survey Team Members
Name Position/In Charge Organization
Robinson SHRESTHA Team Leader/Highway Planning I-I / Road Safety Assessment I CTII
Junichiro OGAWA Deputy Team Leader/Highway Planning I-II / Road Safety
Assessment II
CTII
Tomoaki TAKEUCHI Highway Planning II / Geology OCG
Kentaro SAWADA Highway Planning III/ Tunnel Design CTII
Dr. Mitsugu NOMURA Tunnel Planning/Slope Management CTII
Junichi IWASAKI Traffic Demand Forecast / Institution & Financial Analysis CTII
Ichiro NOGUCHI Natural Condition (Engineering) Surveys OCG
Akira YAMASHITA Environmental and Social Considerations CTII
Yasufumi ISEKI Construction Planning OCG
Dr. Takayuki TSUCHIDA Quality Assurance CTII
Source: JICA Survey Team
The Survey is to be implemented in close coordination with MOPIT/DOR, the line ministry/department.
Consultation(s) will also be carried out with relevant agencies necessarily, namely the followings.
(i) Roads Board Nepal (RBN)
(ii) Ministry of Forests and Environment (MOFE)
(iii) Department of Mines and Geology (DOMG), Ministry of Geology and Mines (MOGM)
(iv) Department of Energy, Water Resources and Irrigation
1.8 DELIVERABLES
The deliverables of this Survey are comprised of several reports. Following are the Reports and its
submission dates.
Inception Report (April 2021)
Interim Report (September 2021)
Draft Final Report (January 2022)
Final Report (February 2022)
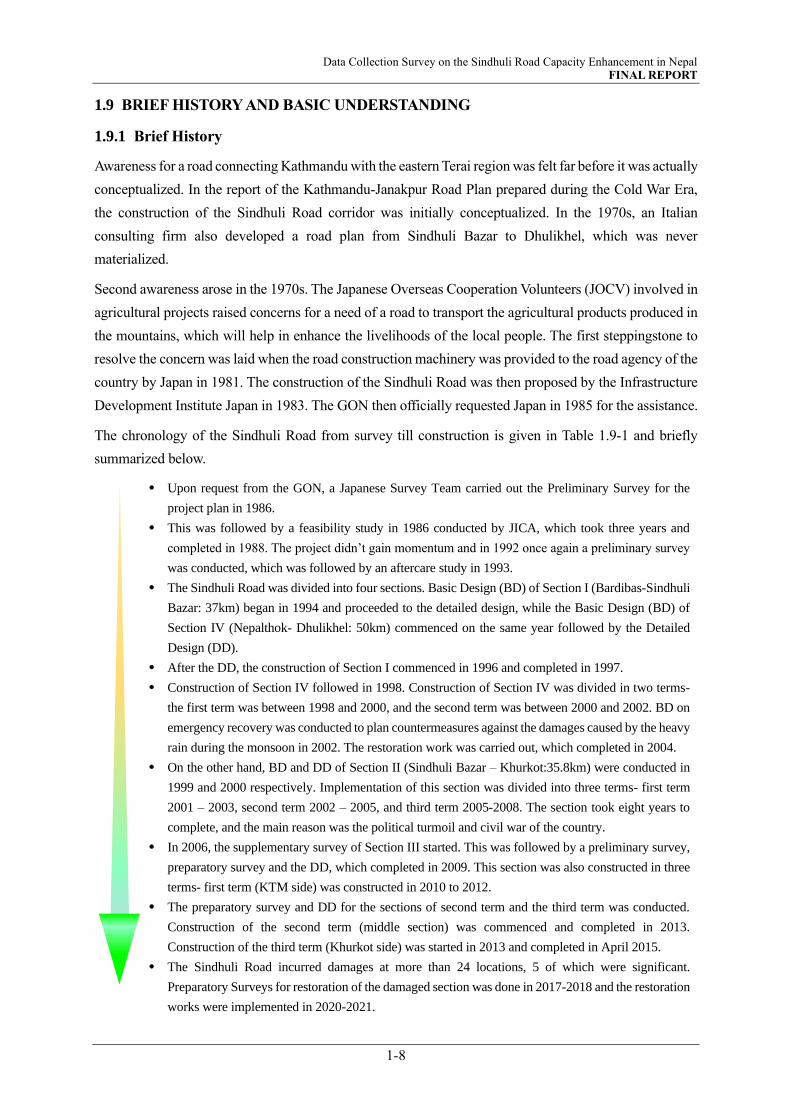
Data Collection Survey on the Sindhuli Road Capacity Enhancement in Nepal FINAL REPORT
1-8
1.9 BRIEF HISTORY AND BASIC UNDERSTANDING
1.9.1 Brief History
Awareness for a road connecting Kathmandu with the eastern Terai region was felt far before it was actually
conceptualized. In the report of the Kathmandu-Janakpur Road Plan prepared during the Cold War Era,
the construction of the Sindhuli Road corridor was initially conceptualized. In the 1970s, an Italian
consulting firm also developed a road plan from Sindhuli Bazar to Dhulikhel, which was never
materialized.
Second awareness arose in the 1970s. The Japanese Overseas Cooperation Volunteers (JOCV) involved in
agricultural projects raised concerns for a need of a road to transport the agricultural products produced in
the mountains, which will help in enhance the livelihoods of the local people. The first steppingstone to
resolve the concern was laid when the road construction machinery was provided to the road agency of the
country by Japan in 1981. The construction of the Sindhuli Road was then proposed by the Infrastructure
Development Institute Japan in 1983. The GON then officially requested Japan in 1985 for the assistance.
The chronology of the Sindhuli Road from survey till construction is given in Table 1.9-1 and briefly
summarized below.
Upon request from the GON, a Japanese Survey Team carried out the Preliminary Survey for the
project plan in 1986.
This was followed by a feasibility study in 1986 conducted by JICA, which took three years and
completed in 1988. The project didn’t gain momentum and in 1992 once again a preliminary survey
was conducted, which was followed by an aftercare study in 1993.
The Sindhuli Road was divided into four sections. Basic Design (BD) of Section I (Bardibas-Sindhuli
Bazar: 37km) began in 1994 and proceeded to the detailed design, while the Basic Design (BD) of
Section IV (Nepalthok- Dhulikhel: 50km) commenced on the same year followed by the Detailed
Design (DD).
After the DD, the construction of Section I commenced in 1996 and completed in 1997.
Construction of Section IV followed in 1998. Construction of Section IV was divided in two terms-
the first term was between 1998 and 2000, and the second term was between 2000 and 2002. BD on
emergency recovery was conducted to plan countermeasures against the damages caused by the heavy
rain during the monsoon in 2002. The restoration work was carried out, which completed in 2004. On the other hand, BD and DD of Section II (Sindhuli Bazar – Khurkot:35.8km) were conducted in
1999 and 2000 respectively. Implementation of this section was divided into three terms- first term
2001 – 2003, second term 2002 – 2005, and third term 2005-2008. The section took eight years to
complete, and the main reason was the political turmoil and civil war of the country. In 2006, the supplementary survey of Section III started. This was followed by a preliminary survey,
preparatory survey and the DD, which completed in 2009. This section was also constructed in three
terms- first term (KTM side) was constructed in 2010 to 2012. The preparatory survey and DD for the sections of second term and the third term was conducted.
Construction of the second term (middle section) was commenced and completed in 2013.
Construction of the third term (Khurkot side) was started in 2013 and completed in April 2015. The Sindhuli Road incurred damages at more than 24 locations, 5 of which were significant.
Preparatory Surveys for restoration of the damaged section was done in 2017-2018 and the restoration
works were implemented in 2020-2021.

Data Collection Survey on the Sindhuli Road Capacity Enhancement in Nepal FINAL REPORT
1-9
Table 1.9-1 Overview Chronology of The Sindhuli Road
Source: JICA Survey Team
1.9.2 Basic Understanding and Concerns
The Sindhuli Road is a 160km long road and is the first and only major exit bound south-east from
Kathmandu. This road is regarded as a symbol of Japan’s official development assistance (ODA). Initial
surveys started in the 1980s followed by its construction between 1996 and completed in 2015.
Construction of the road and development of its connecting roads have made possible direct vehicular
access between Kathmandu and the breadbasket area of east Terai including the northeastern regions in
Sindhuli, Dolkha and Ramechhap District, which were remotely accessible before. The completion of
eastern side M-H Highway and portions of MB Highway 7 has further enhanced access to eastern regions
7 An approximately 1,248km long road, which starts at Shantinagar in Jhapa District of Province No.1 and runs through Inner
Terai (Chure-bhawar) connecting Chure and Bhitri Madhes (Inner Terai) to reach Dadeldhura District of Sudurpashchim
Province (Province No.7) in the west.
Section I
1984
1985
1986
1987
1988
1989
1990
1991
1992
1993
1994 Basic Design
1995 Detailed Design
1996
1997
1998
1999
2000
2001
2002 Heavy Rain Disaster, July
2003
2004
2005 Project Formulation Study (EIA)
2006
2007
2008
2009
2010
2011
2012
2013 Term-2
2014
2015 Earthquake Disaster, April
2016
2017
2018
2019
2020
2021
2022
YearSindhuli Road 160 km
RemarksSection IV Section III Section II
Preliminary Survey
Feasibility Study
Preliminary Survey
Aftercare Study
Basic Design
ConstructionDetailed Design
Construction Term-1 Basic Design
Construction
Term-2
Detailed Design
Construction
Term-1
Construction
Term-2Restoration Work
Construction
Term-3
Supplemental Survey
Preliminary Study
Capacity Development Project-2
(O&M) & its Formulation Study
Detailed Design
Restoration Work
Preparatory Survey
Detailed DesignCapacity Development Project-1
(O&M) & its Formulation StudyConstruction
Term-1Preparatory Survey Promotion Project for High
Value Agriculture along
Sindhuli Road & its
Formation Study
Detailed Design Detailed Design
Construction
Term-3
Restoration Work
Basic Design (Emergency Recovery)
Preparatory Survey-1 (Slope Protection)
Preparatory Survey-2 (Slope Protection)
Preparatory Survey (Earthquake Disaster)

Data Collection Survey on the Sindhuli Road Capacity Enhancement in Nepal FINAL REPORT
1-10
bringing the area closer to the once-remote capital. The road has reduced the travel distance between
Kathmandu and Bardibas and the cities in the east by 200km (approximately 5 hours shortened) compared
to the Westward Route.
Involvement in the planning to construction of the project has also enhanced capacity of the implementing
agency and other related agencies on the implementation and management of the projects including
technology transfer to individuals, domestic construction companies, construction workers, and consultant
staffs.
During the 2015 Gurkha Earthquake, the road was subject to minimal damage and was rather functioning
for emergency evacuation and relief purposes. With the completion of the permanent recovery works of
the portions damaged by the quake in March 2021, disaster resiliency of the road has further enhanced and
expectations for the road to function for emergency evacuation is high.
Emphasis during planning of the Sindhuli Road was on two aspects, i) connectivity (emphasis on access),
and ii) corridor opening (new road connection between Kathmandu and Terai). Based on these aspects, the
road was designed as a 1.5 lane with understanding of and consent from the responsible road agency of
Nepal to allow such stricter geometric standards (sub-standard) and large-scale repairs periodically. In
other words, despite being a one-digit National Highway (NH-06)8 in Nepal, the accessibility and not the
mobility function (trunk road for transport purpose) was initially prioritized and was subjected instead for
strengthening progressively in the future. Another important factor taken into consideration was the
optimization of cost implication by using local materials and technology suitable for the circumstances in
Nepal, while considering the design to prevent the risk of landslide.
Nevertheless, socio-economic impact of the project was significant even when the road was partially
opened after sections of the road was completed. Buses started service between Bardibas and Sindhuli
Bazar soon after Section I was completed (extended to Khurkot later). Similar outcome was prominent,
when Section IV was completed raising accessibility convenience between Kathmandu and Nepalthok.
When the entire stretch was completed in April 2015, the outcome soon began exceeding the initial targets
or predictions. In a short period of 4 years, traffic volume has increased two-folds. On the negative side,
traffic accidents are increasing every year. These as the background, people’s awareness and the outcry for
improvement, upgradation began to increase.
The demand for the improvement is also being strongly sought by the transport owners, especially buses
and trucks so that the convenience can be enjoyed equally, as currently these vehicles are restricted from
plying the road. Some other reasons pointed out for the need of an improvement are, but not limited to,
i) The road is already serving as community service road for local traffic and products,
ii) The road has high potential to function as a trade route with India, particularly to the eastern
region, and
iii) It has potential to transport commodity goods imported from China through Tatopani border to
8 Based on previous Highway Nodes. Currently, the highway is classified as NH-13 after re-classification approved by the GON,
Cabinet of Ministers on May 20, 2019
Data Collection Survey on the Sindhuli Road Capacity Enhancement in Nepal FINAL REPORT
1-11
the Terai region.
The Sindhuli Road was initially classified as NH06. In terms of hierarchy, the objective road was on the
higher tier, which means the road is strategically important and its maintenance would be prioritized.
However, following Cabinet decision, it is now re-classified to NH13, meaning the road is now in the 13th
position and its priority level for maintenance may have lowered, if not unknown. At least, what is known
is that the re-classification has identified many roads as highways consequently increasing the total number
and length. Will the level of priority for maintenance remain same as before or will it be changed - or in
other words, will there be substantial increase in the allocation of the maintenance budget to cover all these
highways is a point of concern.
Another concern is the development of other roads namely, the Fast-Track, Mid-Hill Highway (M-H
Highway), MB Highway (Dharan-Hetauda section) upgradation of E-W Highway etc. The
construction/improvement of these roads is expected to have impact on the Sindhuli Road.
1.10 GOVERNMENT STRUCTURE OF NEPAL
1.10.1 Brief Political Background
Nepal’s 240-year-old monarchy that exercised a unitary and centralized system, became a constitutional
monarchy in November 19909 , after the Jana Andolan (nationwide people’s movement or nationwide
unrest) that forced the then king to accept the formation of a multiparty parliamentary system. A new
constitution (Interim) promulgated on November 9, 1990, greatly reduced the power of the monarchy. The
king remained the head of state, but effective executive power was given to the Council of Ministers,
headed by the prime minister. Under the terms of the interim constitution, the new constitution was to be
promulgated by April 28, 2010. But failure among the parties to reach to agree on its contents, temporary
dissolvement, and differences on key issues including system of governance, judicial system and
federation issues like number, name and areas of the states to be carved the constitution could not be
finalized and promulgated in time. Finally on September 20, 2015, the constitution was promulgated. This
established Nepal as a federal secular parliamentary republic that divided into seven (7) provinces.
It also defines the country as having multi-ethnic, multi-lingual, multi-religious, multi-cultural
characteristics with common aspirations of people living in diverse geographical regions and being
committed to and united by a bond of allegiance to the national independence, territorial integrity, national
interest, and prosperity of Nepal.
1.10.2 Government Structure
1.10.2.1 Federal Structure
The constitution of Nepal promulgated in 2015 adopts a three-tier system of federalism. As illustrated in
Figure 1.10-1, the government comprises of federal government under which lies the provincial
government. The country is divided into seven (7) provinces which is administered by the federal
government. The district coordination committees are the local government and is the third (lowest) level
9 The idea of federalism was mooted at this time but did not get sufficient limelight until for another 2 decades when, following
the second people’s movement, the monarchy was officially abolished on 28 May 2008 by the 1st Constituent Assembly to declare
the Federal Democratic Republic of Nepal.

Data Collection Survey on the Sindhuli Road Capacity Enhancement in Nepal FINAL REPORT
1-12
of government division. This consists of six metropolitan cities, 11 sub-metropolitan cities, 276
municipalities and 460 village.
Source: JICA Survey Team
Figure 1.10-1 Administrative Organizational Structure
(1) Federal Government
The government of Nepal is an executive body and the central government of Nepal. The government
is on the top-most tier and functions allocated consists of tasks that need national integrity, currency
and monetary affairs, national security and defense, regulation. Setting of standards, external relations,
inter-provincial nature of work, including projects and infrastructure, research and development etc.
1) Head of State
The President serves as the head of state and also the commander in chief and is the supreme leader of
the country. The head of state is elected by the parliament and the tenure is five (5) years. The Vice
President represent the roles in the absence of the President. The role of the head of the President is
mainly ceremonial. The President appoints the head of the constitutional body with recommendations
from the Constitutional Council.
2) Executive
The Prime Minister is the head of the government and exercises executive power and also heads the
cabinet of ministers. The Prime Minister is also elected by parliament and the tenure is five (5) years.
The Attorney General is recommended by the Prime Minister for appointment by the President.
3) Head of Legislative
Head of Legislative are the Speaker of House of Representative (HOR) and Chairman of National
Assembly. There is no tenure but mandatory retirement at the age of 65. HOR and National Assembly
consist of 10 and 4 thematic committees respectively.
Data Collection Survey on the Sindhuli Road Capacity Enhancement in Nepal FINAL REPORT
1-13
House of Representatives National Assembly
Finance
International Relations
Industry, Commerce, Labour and Consumer Interest
Law, Justice, and Human Rights
Agriculture, Cooperative and Natural Resources
Women and Social
State Affairs
Development and Technology
Education and Health
Public Account
Sustainable Development and Good
Governance
Legislative Management
Delegated Legislation and Government
Assurances
National Interest and coordination among
members
Source: JICA Survey Team
4) Head of Judiciary
Head of Judiciary is Chief Justice of the Supreme Court.
(2) Provincial Government
There are seven provinces. Each province has a capital. Names of the provinces and its capitals are as
shown in Figure 1.10-2. Each province has a unicameral provincial legislature, varying in size
according to the population of the province. The members are elected through first-past-the-post voting
and party-list proportional representation for a term of five years, unless dissolved sooner. The most
recent provincial election was held on 24 November and 7 December 2017. The head of the provincial
government is the Chief Minister, who is the parliamentary party leader of the party with the majority
or the highest number of seats in the assembly. The Chief Minister appoints a Provincial Cabinet. The
members of the Provincial Cabinet are responsible for the various departments of the provincial
administration.
(3) Local Government
Local government in Nepal is the third level of government division in Nepal, which is administered
by the provincial governments which in turn is beneath the federal government. The new constitution
has completely restructured the local government. All old municipalities and villages (about 3,900)
have been redistributed. The former 75 district development committees (DDCs) have been replaced
by 77 new district co-ordination committees (DCCs), which, however, have no administrative powers.
These are in turn divided into 6 “Metropolitan Cities”, 11 “Sub-Metropolitan Cities”, 276
“Municipalities” and 460 “Village Councils”. They consist of 6,473 constituencies, so-called “wards”.
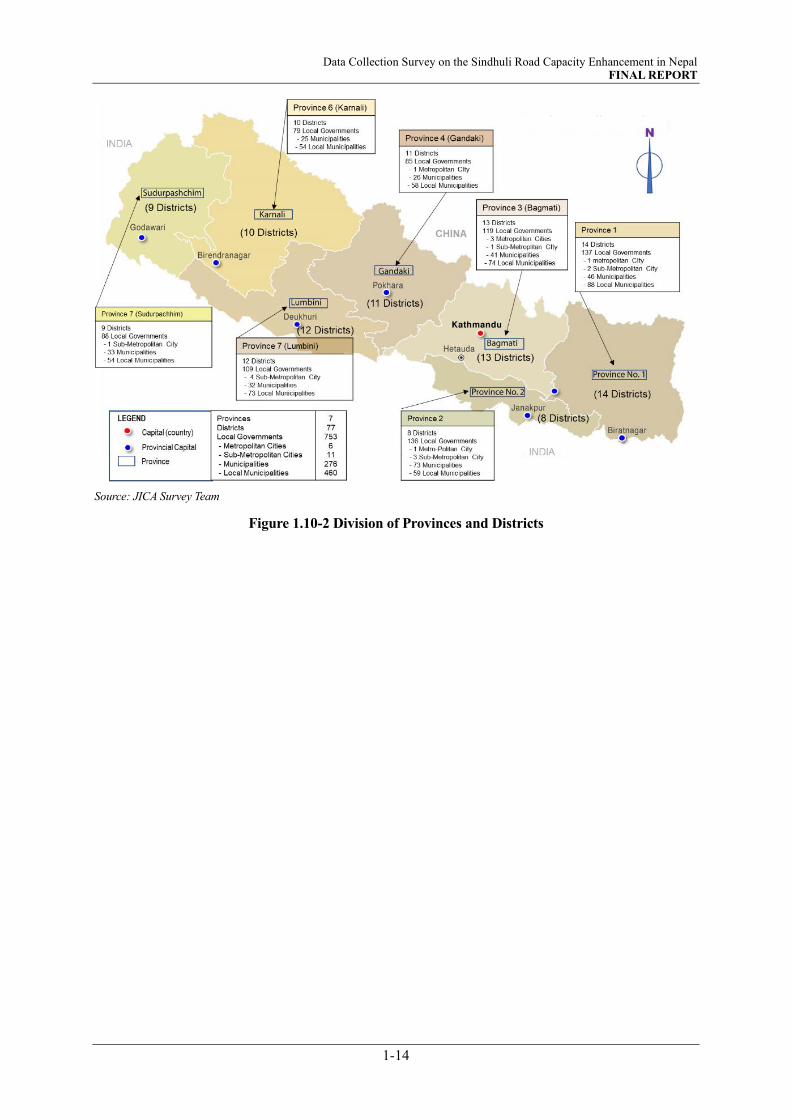
Data Collection Survey on the Sindhuli Road Capacity Enhancement in Nepal FINAL REPORT
1-14
Source: JICA Survey Team
Figure 1.10-2 Division of Provinces and Districts

Data Collection Survey on the Sindhuli Road Capacity Enhancement in Nepal FINAL REPORT
2-1
CHAPTER 2 SOCIO-ECONOMIC INDICATORS AND PROJECT
PROFILE
2.1 COUNTRY OVERVIEW
Nepal occupies 0.03 % and 0.3% land area of the World and the Asian continent respectively. It has a total
area of 147,181 square kilometers (about 2.5 times smaller than Japan). It stretches from east to west with an
average length of 1,000 kilometers and widens from north to south with an average breadth of 193 kilometers.
Geographically, Nepal has three east-to-west elongated climatic zones. The northern mountain belt is
naturally decorated by an unbroken range of Himalayas (in Sanskrit it means abode of snow), which contains
eight peaks higher than 8,000 meters, including the world's highest peak Mt. Everest (8,848.86 meters). The
altitude of the belt varies between 3,000 and 8,848m and has a sub-alpine/alpine climate. Middle hilly belt is
enriched by hills, valleys and lakes. It is situated in an elevation of 700m (Mahabharat Range) – 3,000m.
Kathmandu, the capital city of Nepal is situated in this region at an altitude of about 1,400m. The climate
here is moderate. Terai belt is the plain area situated in southern part of Nepal, which is usually known as the
grain house or the breadbasket of the country since most of the crops produced in Nepal are farmed in this
region. The elevation of the area varies from 60m (in Jhapa) to 700m at the Siwalik zone. Year around, the
climate of this belt is tropical/sub-tropical.
It is multicultural, multiethnic, and multilingual country as its tribe and language in use exceeds over hundred.
It is also a secular state with 81.3 percent of the population belonging to Hinduism, 9.0 percent to Buddhism,
4.4 percent to Islam, 3.1 percent to Kirat and 1.4 percent to Christianity.
According to the National Population Census 2011, the annual growth rate of population as of 2019/2020 is
1.85 percent and the total population is recorded about 30.42 million.
The preliminary estimate of GDP (Gross Domestic Product) per capita at current price stands at NPR 140,819
(US$ 1,191) for the fiscal year 2020/21.
Country profile is summarized in Table 2.1-1.
Table 2.1-1 Country Profile
Country Name Nepal (Federal Democratic Republic of Nepal)
Region South Asia
Capital Kathmandu, located in central Nepal
Population 30,416,788 (population growth 1.85 percent)
Area 147,181 square km
Altitude 8,848.86m (Mt Everest)
Standard Time GMT + 5:45 hours
Governing System Republic: multi-party parliamentary democracy with elected prime minister
accountable to the parliament as executive head; constitution promulgated in
2015.
Language Nepali, written in Devanagari script; English is widely used in business
Religion Secular state: Hinduism 81.3%, Buddhism 9.0%, Islam 4.4%, Kirat 3.1%,
Christianity 1.4%
Geography (south to north) Terai belt/region: Altitude 59-700 m
Hilly belt/region: Altitude 700-3,000 m
Mountain belt/region: Altitude 3,000-8,848 m
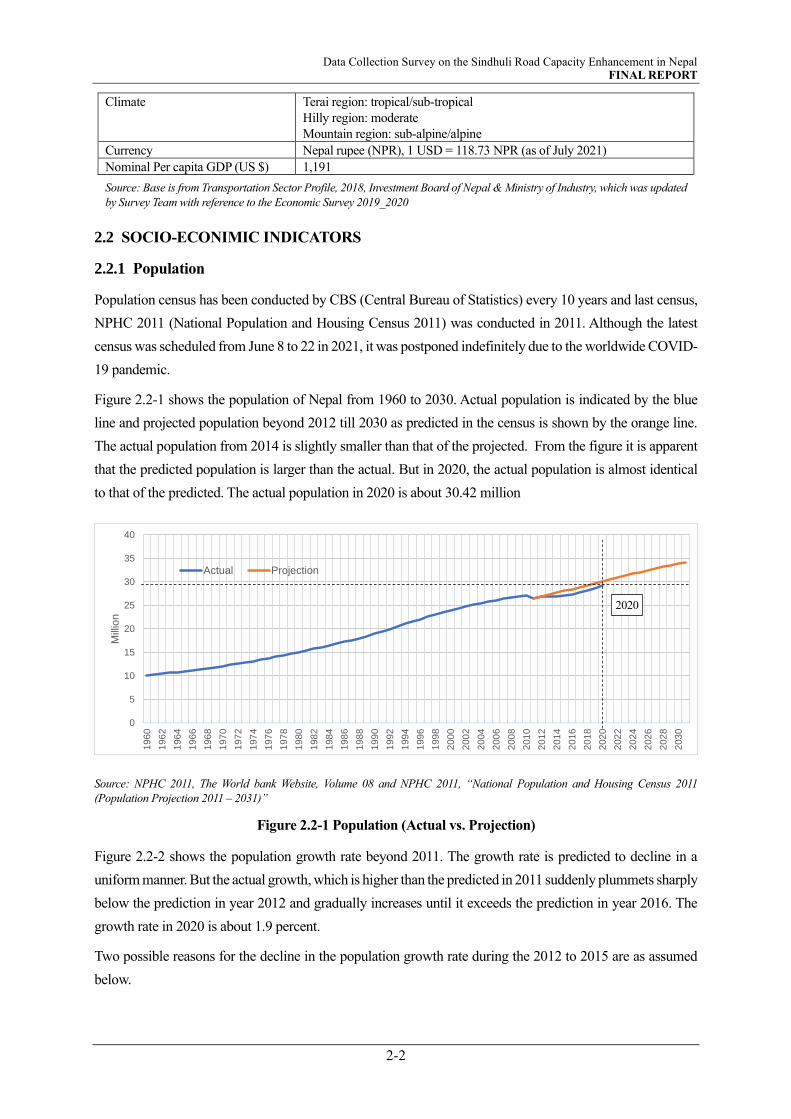
Data Collection Survey on the Sindhuli Road Capacity Enhancement in Nepal FINAL REPORT
2-2
Climate Terai region: tropical/sub-tropical
Hilly region: moderate
Mountain region: sub-alpine/alpine
Currency Nepal rupee (NPR), 1 USD = 118.73 NPR (as of July 2021)
Nominal Per capita GDP (US $) 1,191
Source: Base is from Transportation Sector Profile, 2018, Investment Board of Nepal & Ministry of Industry, which was updated
by Survey Team with reference to the Economic Survey 2019_2020
2.2 SOCIO-ECONIMIC INDICATORS
2.2.1 Population
Population census has been conducted by CBS (Central Bureau of Statistics) every 10 years and last census,
NPHC 2011 (National Population and Housing Census 2011) was conducted in 2011. Although the latest
census was scheduled from June 8 to 22 in 2021, it was postponed indefinitely due to the worldwide COVID-
19 pandemic.
Figure 2.2-1 shows the population of Nepal from 1960 to 2030. Actual population is indicated by the blue
line and projected population beyond 2012 till 2030 as predicted in the census is shown by the orange line.
The actual population from 2014 is slightly smaller than that of the projected. From the figure it is apparent
that the predicted population is larger than the actual. But in 2020, the actual population is almost identical
to that of the predicted. The actual population in 2020 is about 30.42 million
Source: NPHC 2011, The World bank Website, Volume 08 and NPHC 2011, “National Population and Housing Census 2011
(Population Projection 2011 – 2031)”
Figure 2.2-1 Population (Actual vs. Projection)
Figure 2.2-2 shows the population growth rate beyond 2011. The growth rate is predicted to decline in a
uniform manner. But the actual growth, which is higher than the predicted in 2011 suddenly plummets sharply
below the prediction in year 2012 and gradually increases until it exceeds the prediction in year 2016. The
growth rate in 2020 is about 1.9 percent.
Two possible reasons for the decline in the population growth rate during the 2012 to 2015 are as assumed
below.
0
5
10
15
20
25
30
35
40
196
0
196
2
196
4
196
6
196
8
197
0
197
2
197
4
197
6
197
8
198
0
198
2
198
4
198
6
198
8
199
0
199
2
199
4
199
6
199
8
200
0
200
2
200
4
200
6
200
8
201
0
201
2
201
4
201
6
201
8
202
0
202
2
202
4
202
6
202
8
203
0
Mill
ion
Actual Projection
2020
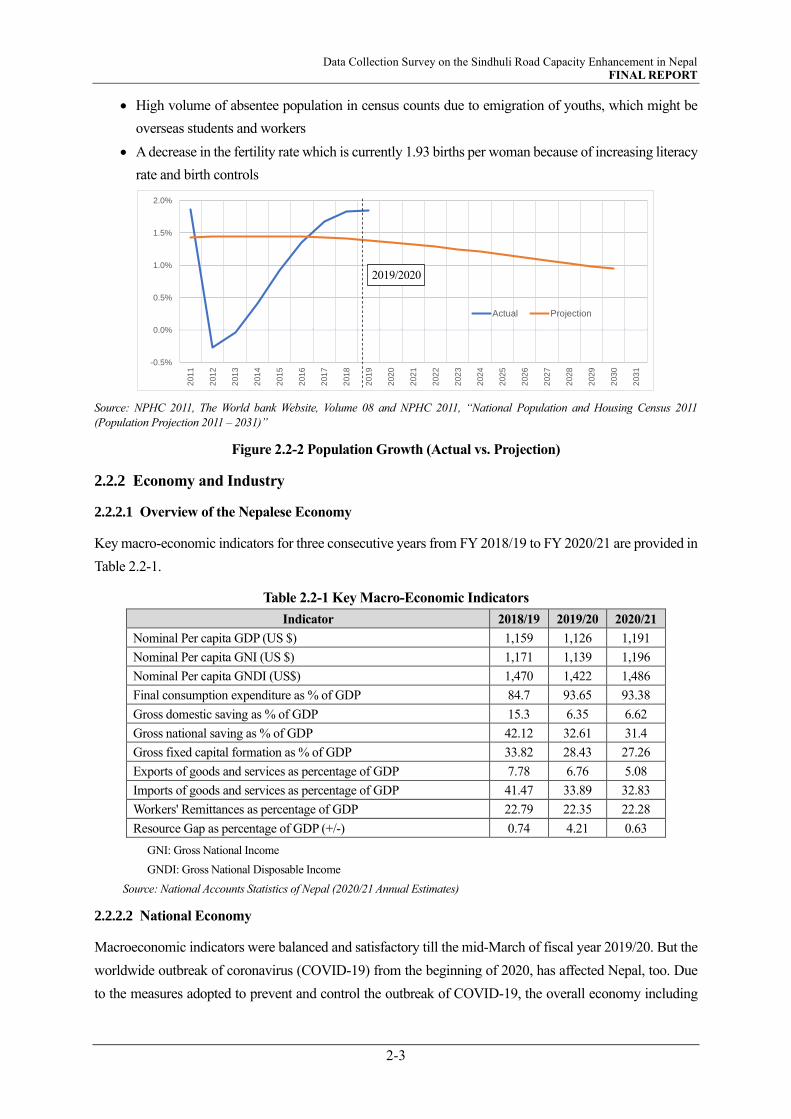
Data Collection Survey on the Sindhuli Road Capacity Enhancement in Nepal FINAL REPORT
2-3
• High volume of absentee population in census counts due to emigration of youths, which might be
overseas students and workers
• A decrease in the fertility rate which is currently 1.93 births per woman because of increasing literacy
rate and birth controls
Source: NPHC 2011, The World bank Website, Volume 08 and NPHC 2011, “National Population and Housing Census 2011
(Population Projection 2011 – 2031)”
Figure 2.2-2 Population Growth (Actual vs. Projection)
2.2.2 Economy and Industry
2.2.2.1 Overview of the Nepalese Economy
Key macro-economic indicators for three consecutive years from FY 2018/19 to FY 2020/21 are provided in
Table 2.2-1.
Table 2.2-1 Key Macro-Economic Indicators
Indicator 2018/19 2019/20 2020/21
Nominal Per capita GDP (US $) 1,159 1,126 1,191
Nominal Per capita GNI (US $) 1,171 1,139 1,196
Nominal Per capita GNDI (US$) 1,470 1,422 1,486
Final consumption expenditure as % of GDP 84.7 93.65 93.38
Gross domestic saving as % of GDP 15.3 6.35 6.62
Gross national saving as % of GDP 42.12 32.61 31.4
Gross fixed capital formation as % of GDP 33.82 28.43 27.26
Exports of goods and services as percentage of GDP 7.78 6.76 5.08
Imports of goods and services as percentage of GDP 41.47 33.89 32.83
Workers' Remittances as percentage of GDP 22.79 22.35 22.28
Resource Gap as percentage of GDP (+/-) 0.74 4.21 0.63
GNI: Gross National Income
GNDI: Gross National Disposable Income
Source: National Accounts Statistics of Nepal (2020/21 Annual Estimates)
2.2.2.2 National Economy
Macroeconomic indicators were balanced and satisfactory till the mid-March of fiscal year 2019/20. But the
worldwide outbreak of coronavirus (COVID-19) from the beginning of 2020, has affected Nepal, too. Due
to the measures adopted to prevent and control the outbreak of COVID-19, the overall economy including
-0.5%
0.0%
0.5%
1.0%
1.5%
2.0%
201
1
201
2
201
3
201
4
201
5
201
6
201
7
201
8
201
9
202
0
202
1
202
2
202
3
202
4
202
5
202
6
202
7
202
8
202
9
203
0
203
1
Actual Projection
2019/2020
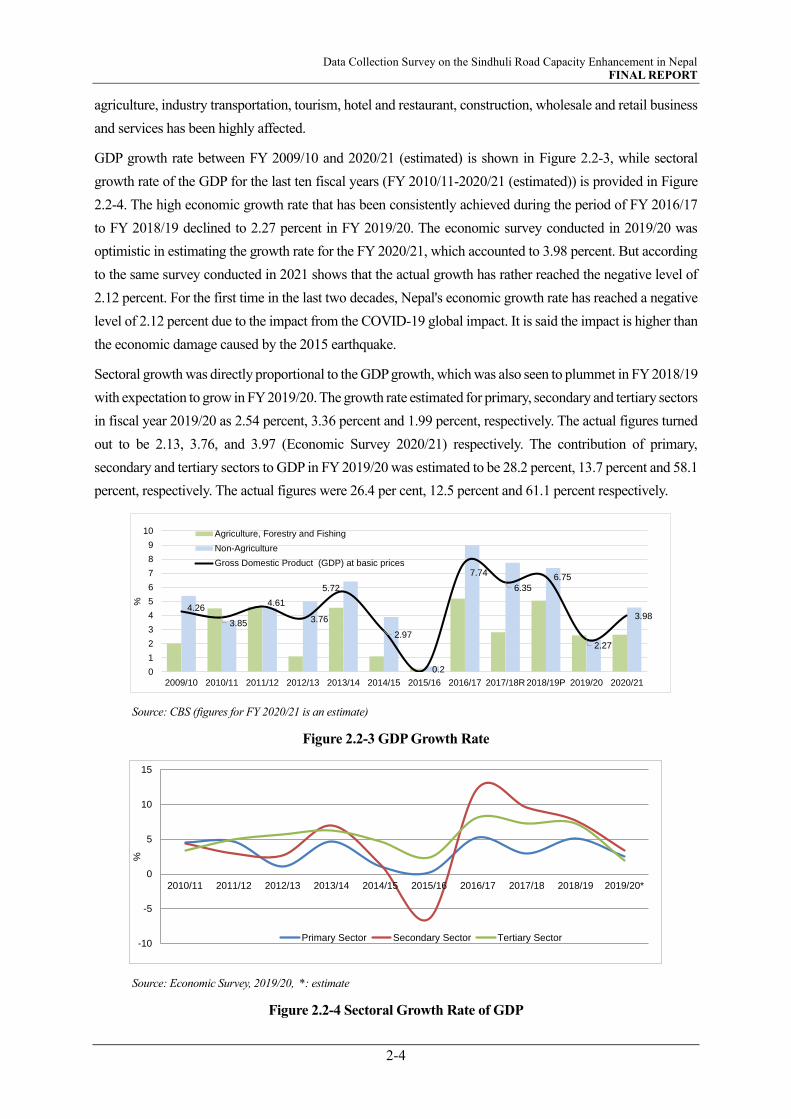
Data Collection Survey on the Sindhuli Road Capacity Enhancement in Nepal FINAL REPORT
2-4
agriculture, industry transportation, tourism, hotel and restaurant, construction, wholesale and retail business
and services has been highly affected.
GDP growth rate between FY 2009/10 and 2020/21 (estimated) is shown in Figure 2.2-3, while sectoral
growth rate of the GDP for the last ten fiscal years (FY 2010/11-2020/21 (estimated)) is provided in Figure
2.2-4. The high economic growth rate that has been consistently achieved during the period of FY 2016/17
to FY 2018/19 declined to 2.27 percent in FY 2019/20. The economic survey conducted in 2019/20 was
optimistic in estimating the growth rate for the FY 2020/21, which accounted to 3.98 percent. But according
to the same survey conducted in 2021 shows that the actual growth has rather reached the negative level of
2.12 percent. For the first time in the last two decades, Nepal's economic growth rate has reached a negative
level of 2.12 percent due to the impact from the COVID-19 global impact. It is said the impact is higher than
the economic damage caused by the 2015 earthquake.
Sectoral growth was directly proportional to the GDP growth, which was also seen to plummet in FY 2018/19
with expectation to grow in FY 2019/20. The growth rate estimated for primary, secondary and tertiary sectors
in fiscal year 2019/20 as 2.54 percent, 3.36 percent and 1.99 percent, respectively. The actual figures turned
out to be 2.13, 3.76, and 3.97 (Economic Survey 2020/21) respectively. The contribution of primary,
secondary and tertiary sectors to GDP in FY 2019/20 was estimated to be 28.2 percent, 13.7 percent and 58.1
percent, respectively. The actual figures were 26.4 per cent, 12.5 percent and 61.1 percent respectively.
Source: CBS (figures for FY 2020/21 is an estimate)
Figure 2.2-3 GDP Growth Rate
Source: Economic Survey, 2019/20, *: estimate
Figure 2.2-4 Sectoral Growth Rate of GDP
4.26
3.85
4.61
3.76
5.72
2.97
0.2
7.74
6.35
6.75
2.27
3.98
0
1
2
3
4
5
6
7
8
9
10
2009/10 2010/11 2011/12 2012/13 2013/14 2014/15 2015/16 2016/17 2017/18R 2018/19P 2019/20 2020/21
%
Agriculture, Forestry and Fishing
Non-Agriculture
Gross Domestic Product (GDP) at basic prices
-10
-5
0
5
10
15
2010/11 2011/12 2012/13 2013/14 2014/15 2015/16 2016/17 2017/18 2018/19 2019/20*
%
Primary Sector Secondary Sector Tertiary Sector
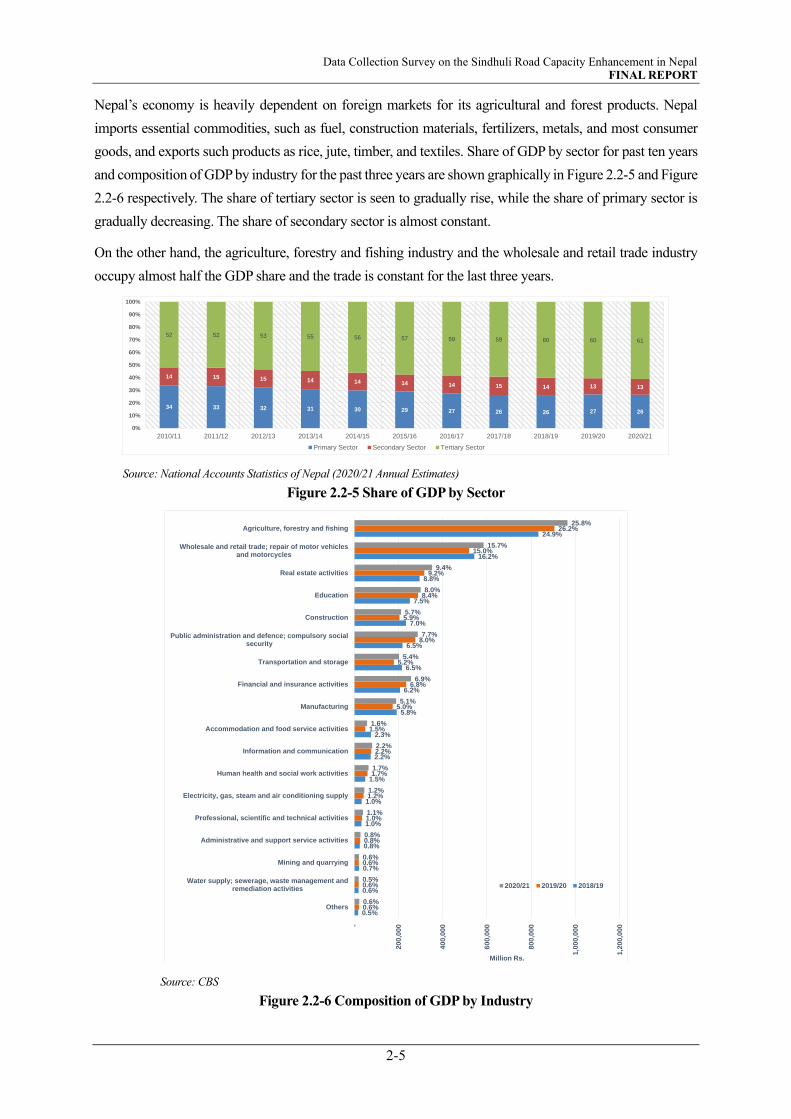
Data Collection Survey on the Sindhuli Road Capacity Enhancement in Nepal FINAL REPORT
2-5
Nepal’s economy is heavily dependent on foreign markets for its agricultural and forest products. Nepal
imports essential commodities, such as fuel, construction materials, fertilizers, metals, and most consumer
goods, and exports such products as rice, jute, timber, and textiles. Share of GDP by sector for past ten years
and composition of GDP by industry for the past three years are shown graphically in Figure 2.2-5 and Figure
2.2-6 respectively. The share of tertiary sector is seen to gradually rise, while the share of primary sector is
gradually decreasing. The share of secondary sector is almost constant.
On the other hand, the agriculture, forestry and fishing industry and the wholesale and retail trade industry
occupy almost half the GDP share and the trade is constant for the last three years.
Source: National Accounts Statistics of Nepal (2020/21 Annual Estimates)
Figure 2.2-5 Share of GDP by Sector
Source: CBS
Figure 2.2-6 Composition of GDP by Industry
34 33 32 31 30 29 27 26 26 27 26
14 15 15 14 14 14 14 15 14 13 13
52 52 53 55 56 57 59 59 60 60 61
0%
10%
20%
30%
40%
50%
60%
70%
80%
90%
100%
2010/11 2011/12 2012/13 2013/14 2014/15 2015/16 2016/17 2017/18 2018/19 2019/20 2020/21
Primary Sector Secondary Sector Tertiary Sector
0.5%
0.6%
0.7%
0.8%
1.0%
1.0%
1.5%
2.2%
2.3%
5.8%
6.2%
6.5%
6.5%
7.0%
7.5%
8.8%
16.2%
24.9%
0.6%
0.6%
0.6%
0.8%
1.0%
1.2%
1.7%
2.2%
1.5%
5.0%
6.8%
5.2%
8.0%
5.9%
8.4%
9.2%
15.0%
26.2%
0.6%
0.5%
0.6%
0.8%
1.1%
1.2%
1.7%
2.2%
1.6%
5.1%
6.9%
5.4%
7.7%
5.7%
8.0%
9.4%
15.7%
25.8%
-
200
,00
0
400
,00
0
600
,00
0
800
,00
0
1,0
00
,000
1,2
00
,000
Others
Water supply; sewerage, waste management andremediation activities
Mining and quarrying
Administrative and support service activities
Professional, scientific and technical activities
Electricity, gas, steam and air conditioning supply
Human health and social work activities
Information and communication
Accommodation and food service activities
Manufacturing
Financial and insurance activities
Transportation and storage
Public administration and defence; compulsory socialsecurity
Construction
Education
Real estate activities
Wholesale and retail trade; repair of motor vehiclesand motorcycles
Agriculture, forestry and fishing
Million Rs.
2020/21 2019/20 2018/19
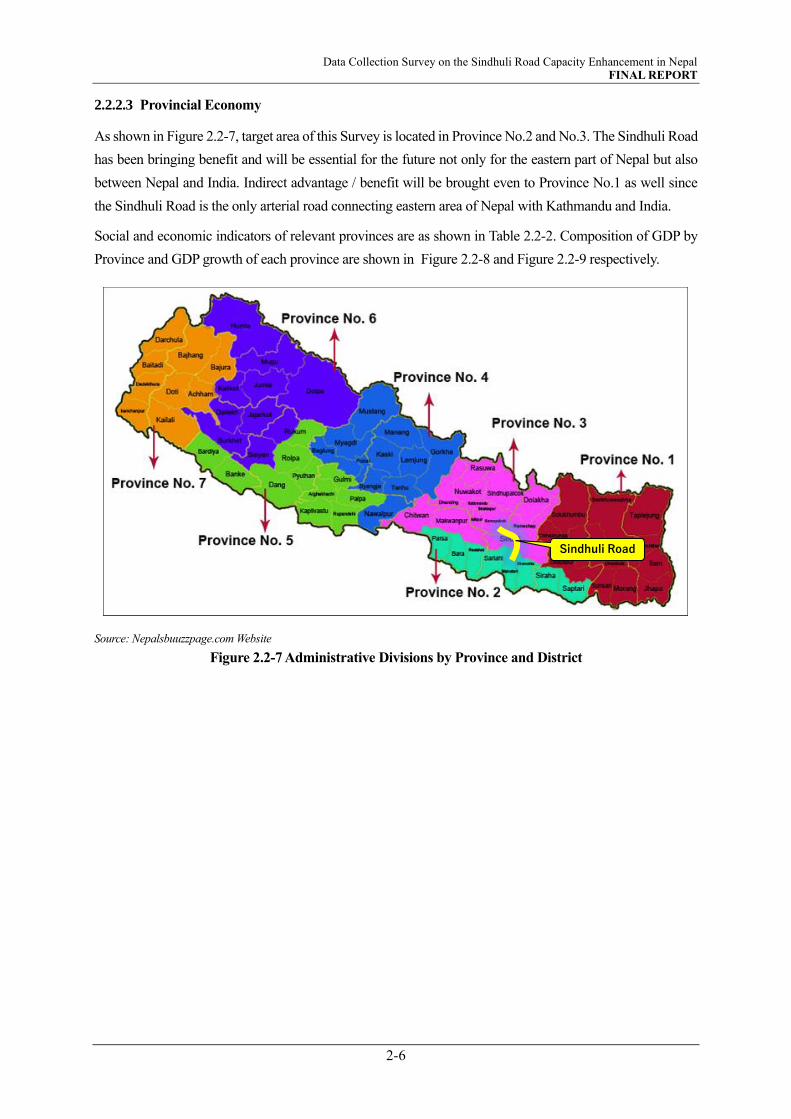
Data Collection Survey on the Sindhuli Road Capacity Enhancement in Nepal FINAL REPORT
2-6
2.2.2.3 Provincial Economy
As shown in Figure 2.2-7, target area of this Survey is located in Province No.2 and No.3. The Sindhuli Road
has been bringing benefit and will be essential for the future not only for the eastern part of Nepal but also
between Nepal and India. Indirect advantage / benefit will be brought even to Province No.1 as well since
the Sindhuli Road is the only arterial road connecting eastern area of Nepal with Kathmandu and India.
Social and economic indicators of relevant provinces are as shown in Table 2.2-2. Composition of GDP by
Province and GDP growth of each province are shown in Figure 2.2-8 and Figure 2.2-9 respectively.
Source: Nepalsbuuzzpage.com Website
Figure 2.2-7 Administrative Divisions by Province and District
Sindhuli Road

Data Collection Survey on the Sindhuli Road Capacity Enhancement in Nepal FINAL REPORT
2-7
Table 2.2-2 Social and Economic Indicators of Provinces
Indicators Nepal Province
No.1
Province
No.2
Province
No.3
Province
No.4
Province
No.5
Province
No.6
Province
No.7
Administrative and Demographic Status
Number of Local
Level 753 137 136 119 85 109 79 88
Population(in %) 100 17 20 21 9 17 6 10
Population Density per
Sq. km 175 559 272 112 202 56 131
Area (In %) 100 18 7 14 15 12 22 13
Economic and Social Sector
Economic Growth
Rate (at basic price) In
percentage
4 4 4 5 4 4 4 4
Provincial
Contribution to GDP
(at basic price)
100 16 13 38 9 14 4 7
Number of Registered
Industry 8,384 791 564 5,450 773 612 78 116
Hydropower (MW) 1,386 280 13 472 527 31 11 52
Local Road Network
(km) 63,577 12,782 5,965 15,692 11,494 9,051 3,266 5,326
School Numbers 35,674 6,958 4,164 7,054 4,349 5,728 3,191 4,230
Financial Sector
Branches of Banks and
Financial Institutions 10,430 1,652 1,574 2,677 1,340 2,026 406 755
Per Branch Population 2,913 3,018 4,035 2,443 1,887 2,549 4,522 3,938
Source: CBS
Source: CBS
Figure 2.2-8 Composition of GDP by Province
Figure 2.2-9 GDP Growth Rate by Province
GDP by industry of nationwide and Province No.1, 2 and 3 is compared as illustrated in Figure 2.2-10. From
this, it is found that GDP of Province No.1, 2 and 3 contribute to Nepal’s economy more than 50%.
Province No.115%
Province No.213%
Province No.338%
Province No.49%
Province No.514%
Province No.64%
Province No.77%
-6
-4
-2
0
2
4
6
8
10
No
.1
No
.2
No
.3
No
.4
No
.5
No
.6
No
.7
%
2018/19 2019/20 2020/21

Data Collection Survey on the Sindhuli Road Capacity Enhancement in Nepal FINAL REPORT
2-8
“Others” consist of arts, entertainment, and recreation; Other service activities; and Activities of households as
employers; undifferentiated goods- and services-producing activities of households for own use.
Source: CBS
Figure 2.2-10 GDP Comparison by Industry (Province No.1, 2 and 3 vs. Nationwide)
2.2.3 Trade Trend
2.2.3.1 Growth of Nepalese Foreign Trade
Before 1951, Nepal's trade relation was only with India and Tibet. The trade relation of Nepal expanded with
many other countries after the decline of the Rana dynasty1 but to it took many years to expand its trade
relation with other countries as well as improve the trade trend due to lack of proper infrastructure and
geographic constraints. Nepal formulated many strategies to enhance its trade trend but was and still depends
more on import.
Table 2.2-3 shows the growth trend of Nepal’s foreign trade for FY 2000/01 and between 2011/12 and
2018/19 including the share of export and import as given in the parenthesis. The volume of trade in FY
2000/01, at the initial stage of construction of the Sindhuli Road, was 17,134 Crore2 NPR. The share of export
1 Rana Dynasty: the dynasty thatruled the Kingdom of Nepal from 1846 until 1951, reducing the Shah monarch to a figurehead and
making Prime Minister and other government positions held by the Ranas hereditary
2 1 Crore is the unit commonly used in Nepal and is equivalent to Ten Million
72%
59%
61%
87%
81%
59%
55%
65%
59%
72%
79%
73%
47%
54%
53%
84%
79%
58%
100.0%
100.0%
100.0%
100.0%
100.0%
100.0%
100.0%
100.0%
100.0%
100.0%
100.0%
100.0%
100.0%
100.0%
100.0%
100.0%
100.0%
100.0%
0%
20%
40%
60%
80%
100
%
120
%
Others
Water supply; sewerage, waste management and remediation activities
Mining and quarrying
Administrative and support service activities
Professional, scientific and technical activities
Electricity, gas, steam and air conditioning supply
Human health and social work activities
Information and communication
Accommodation and food service activities
Manufacturing
Financial and insurance activities
Transportation and storage
Public administration and defence; compulsory social security
Construction
Education
Real estate activities
Wholesale and retail trade; repair of motor vehicles and motorcycles
Agriculture, forestry and fishing
% Nationwide Province No.1 - 3
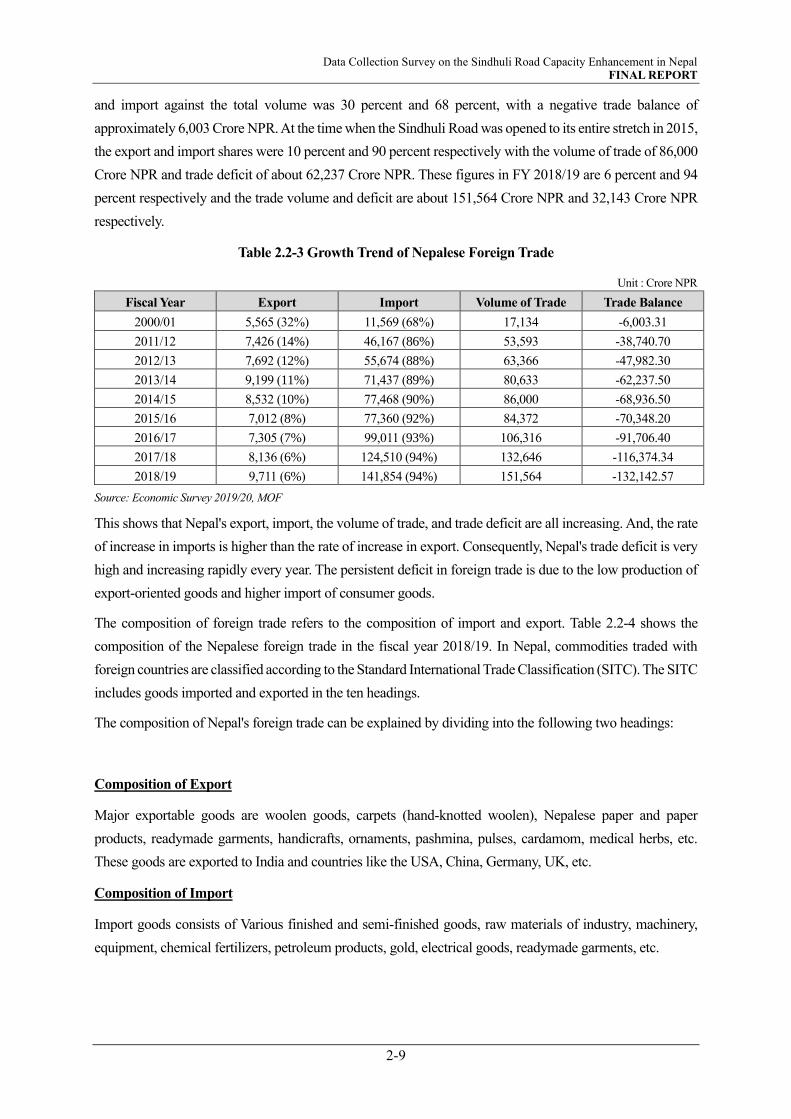
Data Collection Survey on the Sindhuli Road Capacity Enhancement in Nepal FINAL REPORT
2-9
and import against the total volume was 30 percent and 68 percent, with a negative trade balance of
approximately 6,003 Crore NPR. At the time when the Sindhuli Road was opened to its entire stretch in 2015,
the export and import shares were 10 percent and 90 percent respectively with the volume of trade of 86,000
Crore NPR and trade deficit of about 62,237 Crore NPR. These figures in FY 2018/19 are 6 percent and 94
percent respectively and the trade volume and deficit are about 151,564 Crore NPR and 32,143 Crore NPR
respectively.
Table 2.2-3 Growth Trend of Nepalese Foreign Trade
Unit : Crore NPR
Fiscal Year Export Import Volume of Trade Trade Balance
2000/01 5,565 (32%) 11,569 (68%) 17,134 -6,003.31
2011/12 7,426 (14%) 46,167 (86%) 53,593 -38,740.70
2012/13 7,692 (12%) 55,674 (88%) 63,366 -47,982.30
2013/14 9,199 (11%) 71,437 (89%) 80,633 -62,237.50
2014/15 8,532 (10%) 77,468 (90%) 86,000 -68,936.50
2015/16 7,012 (8%) 77,360 (92%) 84,372 -70,348.20
2016/17 7,305 (7%) 99,011 (93%) 106,316 -91,706.40
2017/18 8,136 (6%) 124,510 (94%) 132,646 -116,374.34
2018/19 9,711 (6%) 141,854 (94%) 151,564 -132,142.57
Source: Economic Survey 2019/20, MOF
This shows that Nepal's export, import, the volume of trade, and trade deficit are all increasing. And, the rate
of increase in imports is higher than the rate of increase in export. Consequently, Nepal's trade deficit is very
high and increasing rapidly every year. The persistent deficit in foreign trade is due to the low production of
export-oriented goods and higher import of consumer goods.
The composition of foreign trade refers to the composition of import and export. Table 2.2-4 shows the
composition of the Nepalese foreign trade in the fiscal year 2018/19. In Nepal, commodities traded with
foreign countries are classified according to the Standard International Trade Classification (SITC). The SITC
includes goods imported and exported in the ten headings.
The composition of Nepal's foreign trade can be explained by dividing into the following two headings:
Composition of Export
Major exportable goods are woolen goods, carpets (hand-knotted woolen), Nepalese paper and paper
products, readymade garments, handicrafts, ornaments, pashmina, pulses, cardamom, medical herbs, etc.
These goods are exported to India and countries like the USA, China, Germany, UK, etc.
Composition of Import
Import goods consists of Various finished and semi-finished goods, raw materials of industry, machinery,
equipment, chemical fertilizers, petroleum products, gold, electrical goods, readymade garments, etc.

Data Collection Survey on the Sindhuli Road Capacity Enhancement in Nepal FINAL REPORT
2-10
Table 2.2-4 Commodity Trade by SITC Group: FY 2018/19
Class Category Exports Imports
Crore NPR In percentage Crore NPR In percentage
0 Food and live animals 1,995.0 20.5% 16,158.6 11.4%
1 Tobacco and beverage 25.4 0.3% 874.1 0.6%
2 Crude materials and inedible 451.7 4.7% 5,097.0 3.6%
3 Minerals, fuels, and lubricants 0.1 0.0% 25,396.7 17.9%
4 Animals &vegetable oil/ fats 1,294.9 13.3% 3,608.6 2.5%
5 Chemical and drugs 435.6 4.5% 14,238.4 10.0%
6 Classified by materials 4,047.0 41.7% 31,110.4 21.9%
7 Machinery & transport equipment 82.4 0.8% 32,432.9 22.9%
8 Misc. manufactured articles 1,378.3 14.2% 9,473.1 6.7%
- Not classified 0.6 0.0% 3,463.8 2.4% Total 9,710.9 100% 141,853.5 100%
* Standard International Trade Classification
Source: Economic Survey 2019/20, MOF
2.2.3.2 Direction of Foreign Trade of Nepal
Table 2.2-5 shows the direction of the Nepalese foreign trade since the FY 2012/13 to 2018/19.
Table 2.2-5 Direction of Foreign Trade of Nepal
Unit : Crore NPR
Description 2012/13 2013/14 2014/15 2015/16 2016/17 2017/18 2018/19
Export (FOB*) 7,691.70 9,199.10 8,531.91 7,011.70 7,011.70 8,135.98 9,710.95
India 5,100.00 5,961.40 5,586.46 3,949.40 4,144.90 4,671.98 6,273.18
China 208.60 284.10 223.00 168.20 170.10 243.77 210.98
Other countries 2,383.20 2,953.70 2,722.50 2,894.20 2,989.80 3,220.23 3,226.79
Import (CIF**) 55,674.00 71,436.60 77,468.42 77,359.90 99,011.30 124,510.3
2
141,853.5
3
India 36,703.10 47,794.70 49,165.99 47,721.30 63,367.00 81,410.16 91,790.93
China 6,245.10 7,331.90 10,016.60 11,569.40 12,724.50 15,998.71 20,552.74
Other countries 12,725.80 16,310.00 18,286.20 18,069.20 22,919.90 27,101.45 29,509.86
Total Trade 63,365.80 80,635.70 86,000.30 84,371.60 1,063,316.20 132,646.30 151,564.48
India 41,803.10 53,756.10 54,752.10 51,670.60 67,511.90 86,082.14 98,064.11
China 6,453.70 7,615.90 10,239.60 11,737.60 12,894.70 16,242.48 20,763.72
Other countries 15,108.90 19,263.70 21,008.70 20,963.40 25,909.70 30,321.68 32,736.65
Total Trade Share (%) 100 100 100 100 100 100 100
India 66 66.7 63.7 61.2 63.5 64.9 64.7
China 10.2 9.4 11.9 13.9 12.1 12.2 13.7
Other countries 23.8 23.9 24.4 24.8 24.4 22.9 21.6
* FOB: Free On Board
** CIF: Cost, Insurance and Freight
Source: Economic Survey 2019/20, MOF
From the table, it is clear that more than 60 percent of the total trade is with India. It shows that Nepal has
not been very successful in the field of country-wise trade diversification. Although, the share of trade with
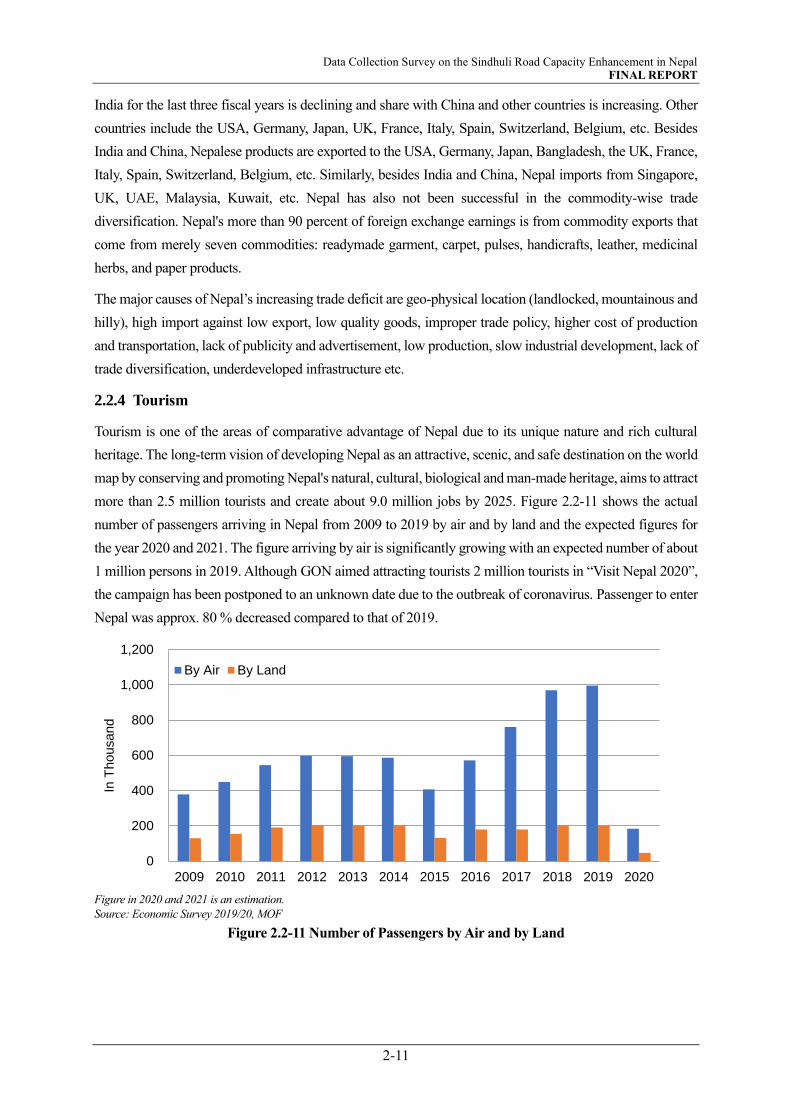
Data Collection Survey on the Sindhuli Road Capacity Enhancement in Nepal FINAL REPORT
2-11
India for the last three fiscal years is declining and share with China and other countries is increasing. Other
countries include the USA, Germany, Japan, UK, France, Italy, Spain, Switzerland, Belgium, etc. Besides
India and China, Nepalese products are exported to the USA, Germany, Japan, Bangladesh, the UK, France,
Italy, Spain, Switzerland, Belgium, etc. Similarly, besides India and China, Nepal imports from Singapore,
UK, UAE, Malaysia, Kuwait, etc. Nepal has also not been successful in the commodity-wise trade
diversification. Nepal's more than 90 percent of foreign exchange earnings is from commodity exports that
come from merely seven commodities: readymade garment, carpet, pulses, handicrafts, leather, medicinal
herbs, and paper products.
The major causes of Nepal’s increasing trade deficit are geo-physical location (landlocked, mountainous and
hilly), high import against low export, low quality goods, improper trade policy, higher cost of production
and transportation, lack of publicity and advertisement, low production, slow industrial development, lack of
trade diversification, underdeveloped infrastructure etc.
2.2.4 Tourism
Tourism is one of the areas of comparative advantage of Nepal due to its unique nature and rich cultural
heritage. The long-term vision of developing Nepal as an attractive, scenic, and safe destination on the world
map by conserving and promoting Nepal's natural, cultural, biological and man-made heritage, aims to attract
more than 2.5 million tourists and create about 9.0 million jobs by 2025. Figure 2.2-11 shows the actual
number of passengers arriving in Nepal from 2009 to 2019 by air and by land and the expected figures for
the year 2020 and 2021. The figure arriving by air is significantly growing with an expected number of about
1 million persons in 2019. Although GON aimed attracting tourists 2 million tourists in “Visit Nepal 2020”,
the campaign has been postponed to an unknown date due to the outbreak of coronavirus. Passenger to enter
Nepal was approx. 80 % decreased compared to that of 2019.
Figure in 2020 and 2021 is an estimation.
Source: Economic Survey 2019/20, MOF
Figure 2.2-11 Number of Passengers by Air and by Land
0
200
400
600
800
1,000
1,200
2009 2010 2011 2012 2013 2014 2015 2016 2017 2018 2019 2020
In T
housand
By Air By Land

Data Collection Survey on the Sindhuli Road Capacity Enhancement in Nepal FINAL REPORT
2-12
2.3 PROFILE OF SURVEY AREA
2.3.1 Introduction
Nepal is a mountainous country where the elevation ranges from 60 meter to the summit of the world (Mt
Everest 8,848.86m). The mountains in the north extend continuously from the eastern edge to the western
edge and is often termed as the garland of snow as they are snow-capped throughout the year. Below the
mountains are the hills, which can be divided into high and middle mountain. South to this lies the Siwalik
and then the plain area, the Terai. There are thousands of rivers flowing from north to south forming gorges,
river basins and valleys. There are maximum relative relief, steep slope and geographical structures that have
resulted distinct landforms and topography. In terms of physiography the country is divided from north to
south as high Himalayas, high mountain, middle mountain, Siwaliks and terai form north to south as shown
in Figure 2.3-1.
Source: WWF 2005
Figure 2.3-1 Geological Formation of Nepal
2.3.2 Topography
Figure 2.3-2 illustrates Nepal’s Physiographic Division. Terai lies in the southern part. It is the plain land of
altitude below 300 meters. The alluvial deposit forms it. The Siwaliks lies just north of Terai, formed with
conglomerates. The altitude is between 300 and 700m. Then the middle mountain extends widely. It lies
between 700 to 2,000 meters altitudes. It has spurs, hills, river basins and valleys like Kathmandu and Pokhara.
The high mountain also has steep and dissected landforms. The high Himalaya is in the northernmost part at
an elevation exceeding 2,500m, where hundreds of snow-peaks are found.
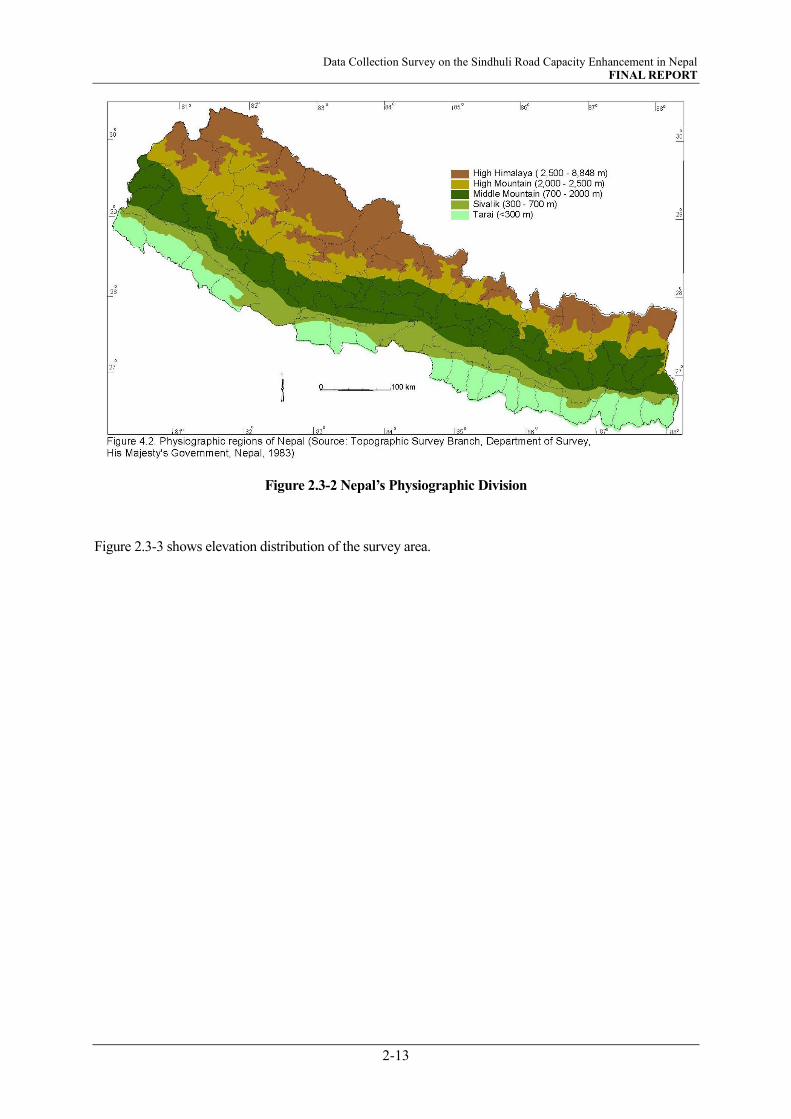
Data Collection Survey on the Sindhuli Road Capacity Enhancement in Nepal FINAL REPORT
2-13
Figure 2.3-2 Nepal’s Physiographic Division
Figure 2.3-3 shows elevation distribution of the survey area.
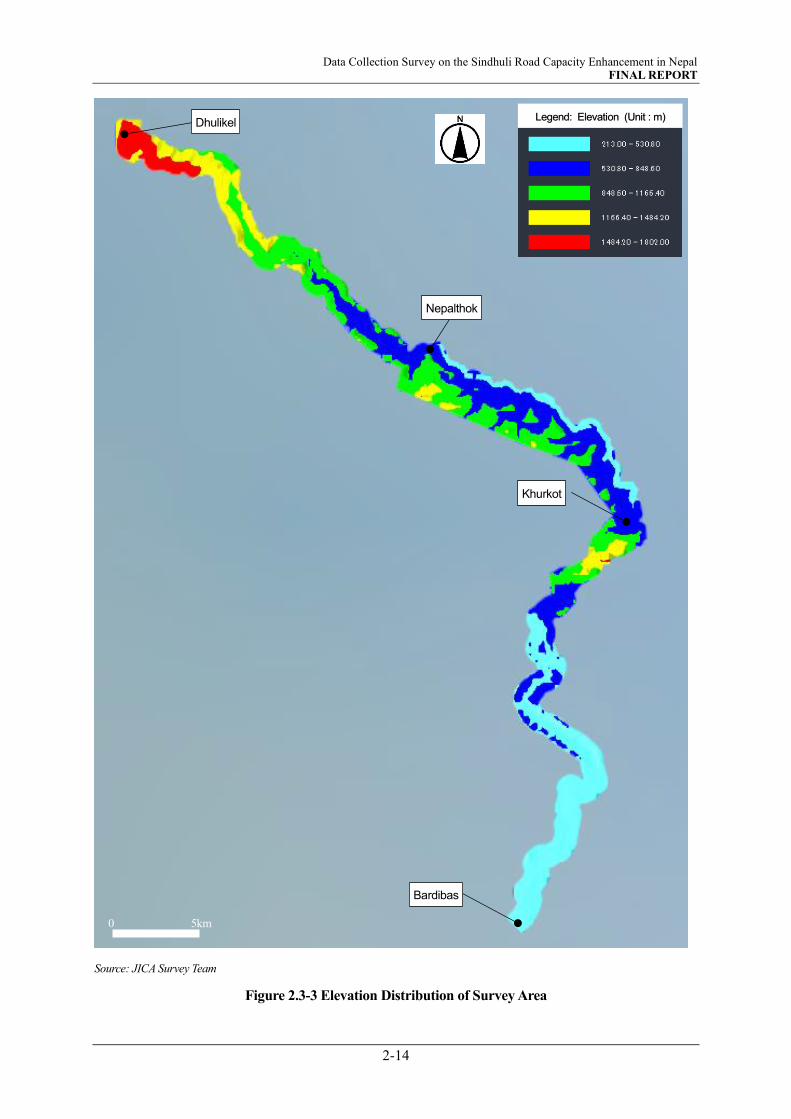
Data Collection Survey on the Sindhuli Road Capacity Enhancement in Nepal FINAL REPORT
2-14
Source: JICA Survey Team
Figure 2.3-3 Elevation Distribution of Survey Area
Legend: Elevation (Unit : m) Dhulikel
Bardibas
0 5km
Nepalthok
Khurkot

Data Collection Survey on the Sindhuli Road Capacity Enhancement in Nepal FINAL REPORT
2-15
Remarkable sections in the survey area are described in Table 2.3-1.
Table 2.3-1 Remarkable Sections in the Survey Area
Around 30km : Running on steep slop along Guang River.
Around 40 - 45km : Difficult to widen the existing Sindhuli Road in the Zig-zag section
Around 45 - 50km : Difficult to widen the existing Sindhuli Road on Trail
Sindhuli Road
Sindhuli Road
Sindhuli Road
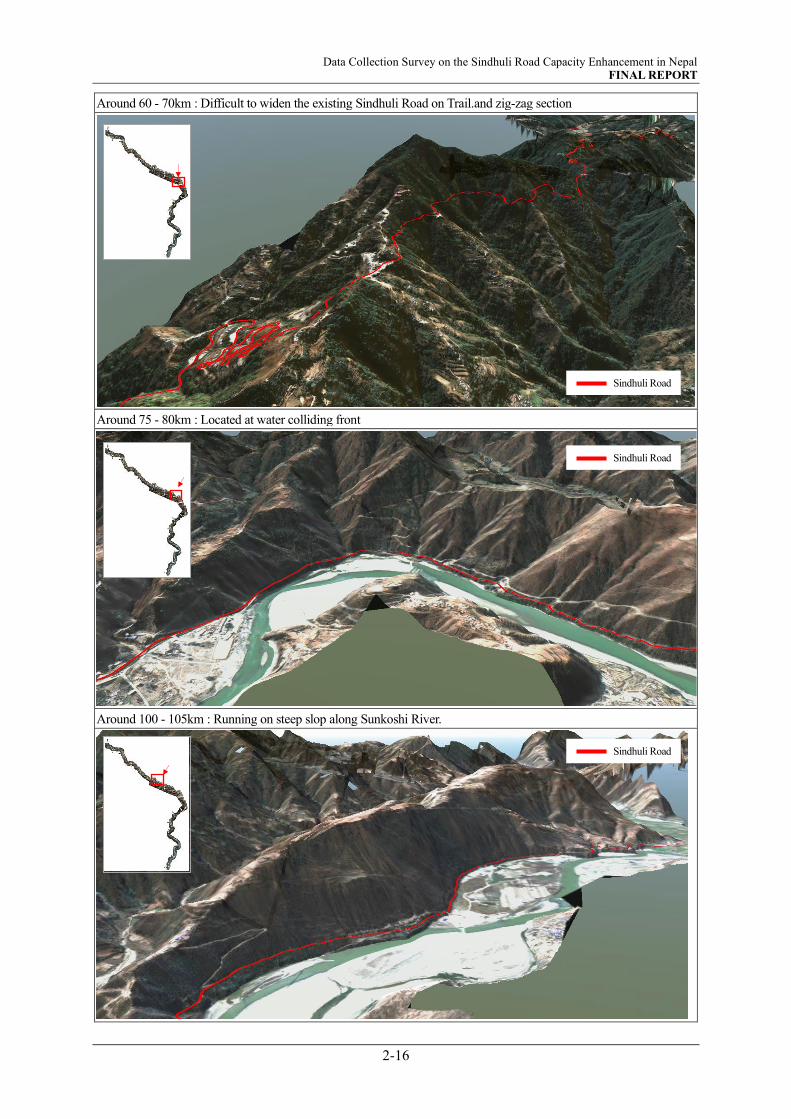
Data Collection Survey on the Sindhuli Road Capacity Enhancement in Nepal FINAL REPORT
2-16
Around 60 - 70km : Difficult to widen the existing Sindhuli Road on Trail.and zig-zag section
Around 75 - 80km : Located at water colliding front
Around 100 - 105km : Running on steep slop along Sunkoshi River.
Sindhuli Road
Sindhuli Road
Sindhuli Road
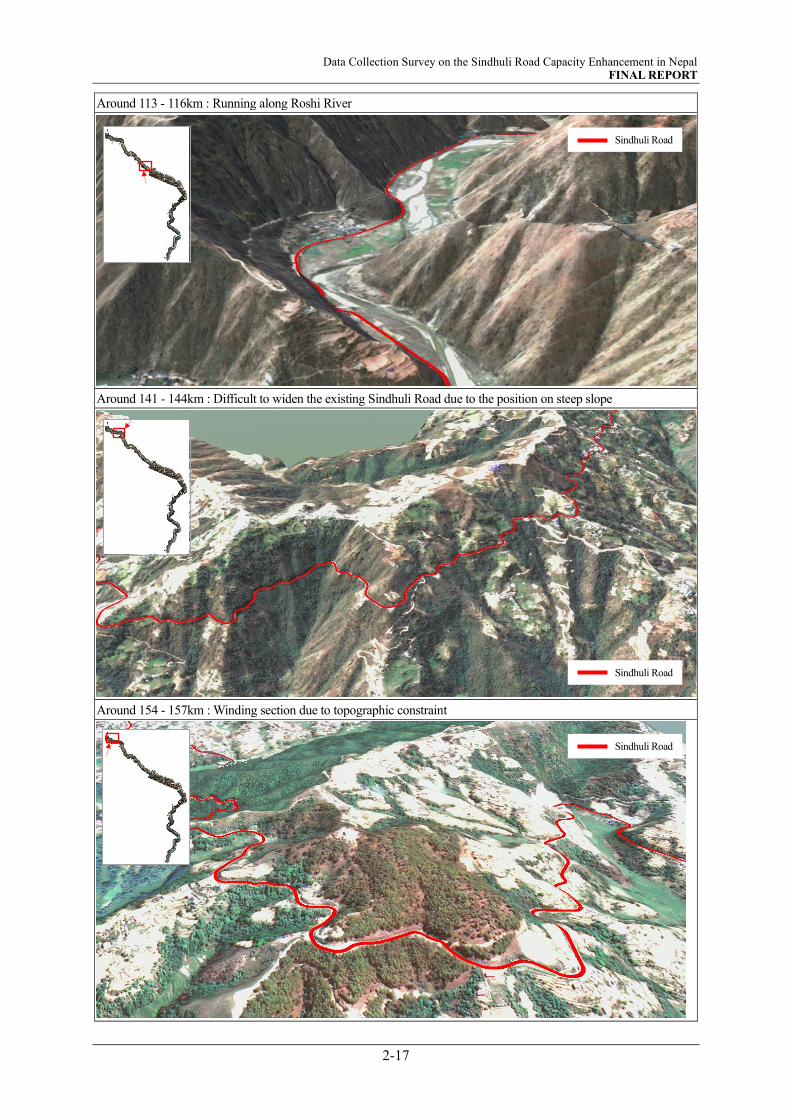
Data Collection Survey on the Sindhuli Road Capacity Enhancement in Nepal FINAL REPORT
2-17
Around 113 - 116km : Running along Roshi River
Around 141 - 144km : Difficult to widen the existing Sindhuli Road due to the position on steep slope
Around 154 - 157km : Winding section due to topographic constraint
Sindhuli Road
Sindhuli Road
Sindhuli Road
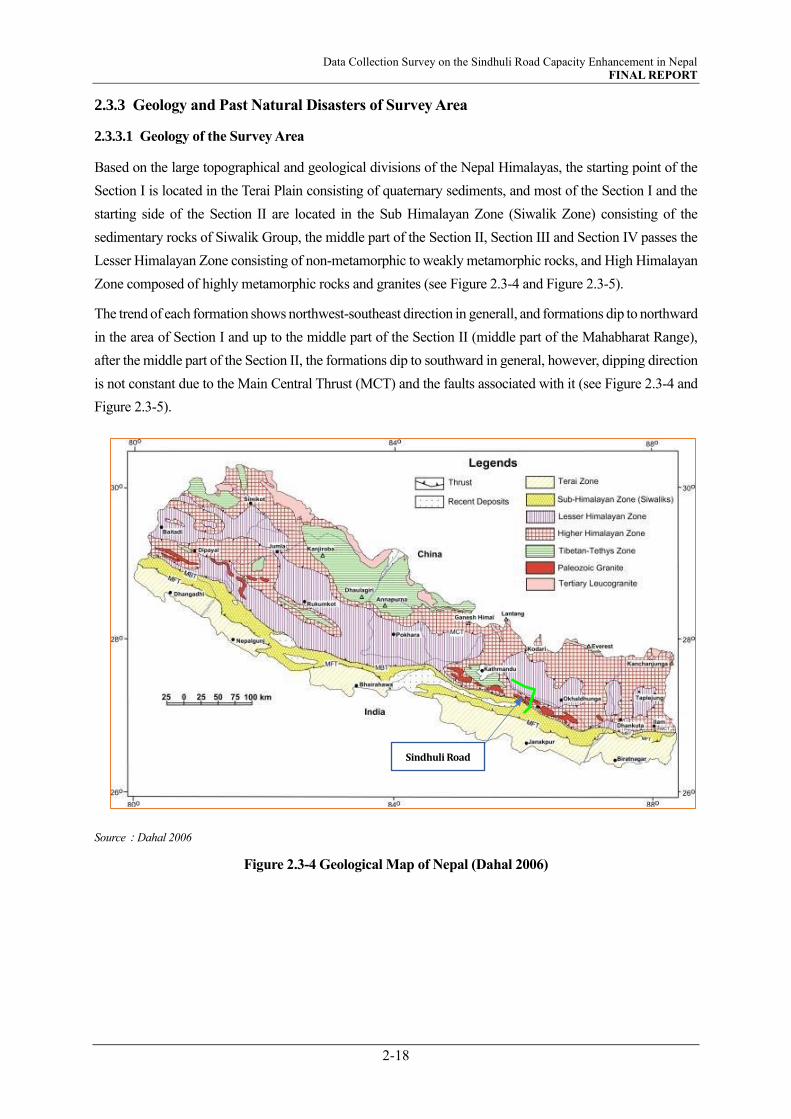
Data Collection Survey on the Sindhuli Road Capacity Enhancement in Nepal FINAL REPORT
2-18
2.3.3 Geology and Past Natural Disasters of Survey Area
2.3.3.1 Geology of the Survey Area
Based on the large topographical and geological divisions of the Nepal Himalayas, the starting point of the
Section I is located in the Terai Plain consisting of quaternary sediments, and most of the Section I and the
starting side of the Section II are located in the Sub Himalayan Zone (Siwalik Zone) consisting of the
sedimentary rocks of Siwalik Group, the middle part of the Section II, Section III and Section IV passes the
Lesser Himalayan Zone consisting of non-metamorphic to weakly metamorphic rocks, and High Himalayan
Zone composed of highly metamorphic rocks and granites (see Figure 2.3-4 and Figure 2.3-5).
The trend of each formation shows northwest-southeast direction in generall, and formations dip to northward
in the area of Section I and up to the middle part of the Section II (middle part of the Mahabharat Range),
after the middle part of the Section II, the formations dip to southward in general, however, dipping direction
is not constant due to the Main Central Thrust (MCT) and the faults associated with it (see Figure 2.3-4 and
Figure 2.3-5).
Source:Dahal 2006
Figure 2.3-4 Geological Map of Nepal (Dahal 2006)
Sindhuli Road

Data Collection Survey on the Sindhuli Road Capacity Enhancement in Nepal FINAL REPORT
2-19
Source: Rainfall Induced Landslides in Nepal (Dr. Ranjan Dahal, 2012)
Figure 2.3-5 Schematic Cross Section of the Himalayas (Dahal 2006)
Table 2.3-2 summarizes the relationship between topographical and geological conditions of each section.
Table 2.3-2 Topographical and Geological Condition of Each Section
Topographical Zone Geological Classification Boundary Fault Section
Ⅰ Terai Plane
Alluvium
<gravel, silt, clay>
(Quaternary)
I Main Frontal Thrust
(MFT)
Ⅱ Sub Himalaya
(Siwalik Hill)
Siwalik Group
<sandstone, mudstone, conglomerate>
(Neogene)
II Main Boundary Thrust
(MBT)
Ⅲ Lesser Himalaya
Sedimentary rocks, non-metamorphic to
weakly metamorphic rocks
<slate, phyllite, schist, quartzite, limestone>
(Precambrian)
II
III
IV
Main Central Thrust
(MCT)
Ⅳ Higher Himalaya
High metamorphic rock
<gneiss, schist, marble>
(Precambrian)
Granites (Paleozoic)
Source: JICA Survey Team
The topography and geological conditions of each section are described below.
(1) Section I
The Section I (L=37km) starting from Bardibas on the East-West Highway, going north on the Siwalik
Hills, and reaching the Sindhuli Bazaar. The altitude of the starting point is about 225m, and the altitude
of the ending point is about 500m. The altitude is a relatively gentle section as a whole, and the altitude
gradually increases from the starting point to the ending point.
The vicinity of the starting point is located on the Terai Plain, which consists of Quaternary sediments,
and from a point about 400 m from the starting point, it enters the Siwalik Hill, which is composed of the
sedimentary rock of Siwalik Group. It is estimated that the Main Frontal Thrust (MFT) is located near
the boundary between the Terai Plain and the Siwalik Hill.
Section I Section IISection III & IV
Data Collection Survey on the Sindhuli Road Capacity Enhancement in Nepal FINAL REPORT
2-20
Section I passes gentle slope in a hilly area with a relatively small height difference, so there are no large-
scale cut slopes or embankments, and there are not so many road disasters compared with that of other
sections.
(2) Section II
The Section II (L=36km) starting from Sindhuli Bazaar to Khurkot, which crosses the Mahabharat Range
and reaches to the Sunkoshi River. The elevation of starting point is about 500m above sea level, the
highest altitude in the Mahabharat Range which is located in the middle part of the Section II, is about
1,365m, and the ending point is about 500m above sea level, and the first half is an uphill road and the
second half is a downhill road.
The starting point side is a hilly area (elevation 500m to 900m) consisting of sedimentary rocks of the
Siwalik Group, and the middle part to the ending point side is a steep mountainous area that crosses the
Mahabharat Range. In the mountainous area, the slope angle is 65 ° or more, and there are many large-
scale cut slopes and embankment sections.
In the middle of the Section II, two major boundary fault, the Main Boundary Thrust (MBT), which is
the boundary fault between the Sub Himalaya Zone and the Lessor Himalaya Zone, and the Main Central
Thrust (MCT), which is the boundary fault between the Lessor Himalaya Zone and the Higher Himalaya
Zone are distributed.
And large-scale landslides and slope failures are often distributed in the area where the Sindhuli Road
pass through these faults, due to very poor rock condition of their share zones and the deep weathering.
(3) Section III
The Section II (L=37km) is starting from Khurkot located on the right bank of the Sunkoshi River and
goes to the northwest direction to Nepalthok.
The altitude of the start point is about 500m, the maximum altitude of the middle part is about 600 m,
and the altitude of the end point is about 550m. Therefore, the Section III is the section with a small height
difference compared to other sections.
Section III passes through steep hillsides and right bank of the Sunkoshi River where slope failures and
landslides are distributed on the slopes, because, the road runs along the Main Central Thrust (MCT) and
associated faults with share zones. Furthermore, the Section III caught the noticeable damages by the
2015 Gorkha earthquake.
(4) Section IV
Section IV (L=50km) is starting from Nepalthok, leaving the Sunkoshi River and heading northwest to
Khurkot where about 31km east direction of Kathmandu. The road from Nepalthok to the 23km point is
along the Rosi River which is a tributary of the Sunkoshi River, and from the 23km point to the end road
passes the hilly area. The altitude of the starting point is about 550m above the sea level, and the altitude
of the ending point is about 1,545m, and Section IV is a relatively steep section.
Section IV is composed of Higher Himalayan metamorphic rocks, and rock condition is rather fragile,
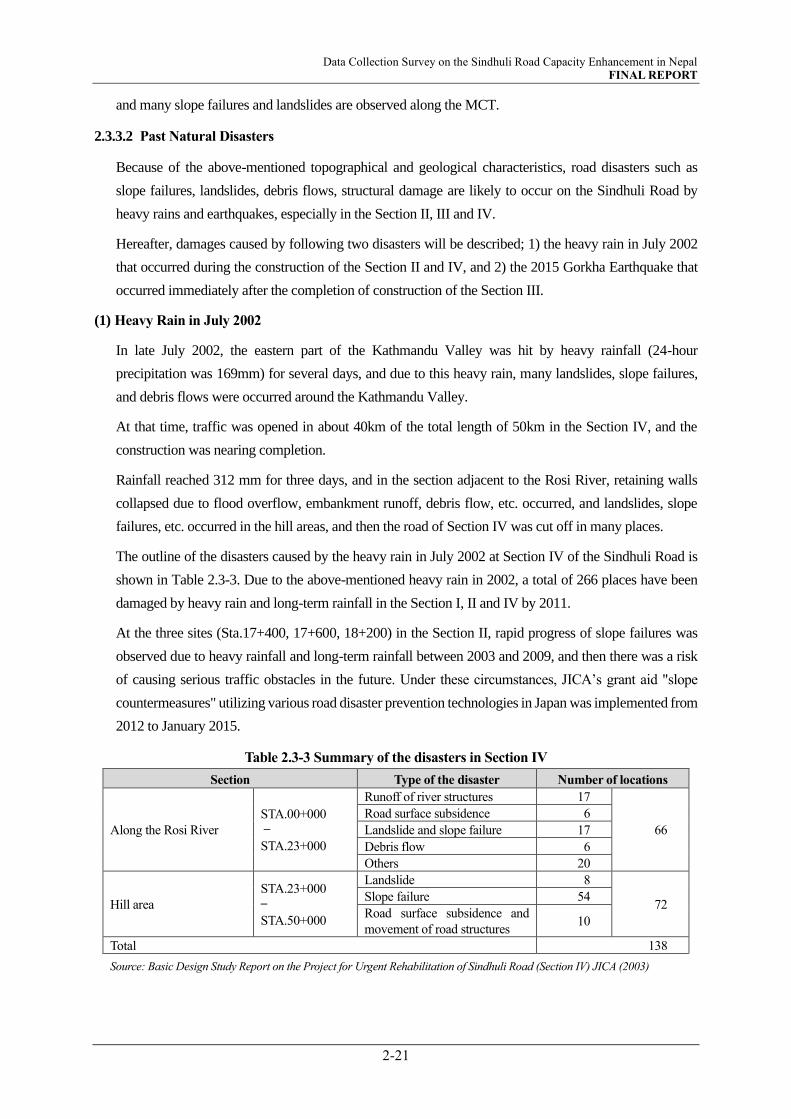
Data Collection Survey on the Sindhuli Road Capacity Enhancement in Nepal FINAL REPORT
2-21
and many slope failures and landslides are observed along the MCT.
2.3.3.2 Past Natural Disasters
Because of the above-mentioned topographical and geological characteristics, road disasters such as
slope failures, landslides, debris flows, structural damage are likely to occur on the Sindhuli Road by
heavy rains and earthquakes, especially in the Section II, III and IV.
Hereafter, damages caused by following two disasters will be described; 1) the heavy rain in July 2002
that occurred during the construction of the Section II and IV, and 2) the 2015 Gorkha Earthquake that
occurred immediately after the completion of construction of the Section III.
(1) Heavy Rain in July 2002
In late July 2002, the eastern part of the Kathmandu Valley was hit by heavy rainfall (24-hour
precipitation was 169mm) for several days, and due to this heavy rain, many landslides, slope failures,
and debris flows were occurred around the Kathmandu Valley.
At that time, traffic was opened in about 40km of the total length of 50km in the Section IV, and the
construction was nearing completion.
Rainfall reached 312 mm for three days, and in the section adjacent to the Rosi River, retaining walls
collapsed due to flood overflow, embankment runoff, debris flow, etc. occurred, and landslides, slope
failures, etc. occurred in the hill areas, and then the road of Section IV was cut off in many places.
The outline of the disasters caused by the heavy rain in July 2002 at Section IV of the Sindhuli Road is
shown in Table 2.3-3. Due to the above-mentioned heavy rain in 2002, a total of 266 places have been
damaged by heavy rain and long-term rainfall in the Section I, II and IV by 2011.
At the three sites (Sta.17+400, 17+600, 18+200) in the Section II, rapid progress of slope failures was
observed due to heavy rainfall and long-term rainfall between 2003 and 2009, and then there was a risk
of causing serious traffic obstacles in the future. Under these circumstances, JICA’s grant aid "slope
countermeasures" utilizing various road disaster prevention technologies in Japan was implemented from
2012 to January 2015.
Table 2.3-3 Summary of the disasters in Section IV
Section Type of the disaster Number of locations
Along the Rosi River
STA.00+000
— STA.23+000
Runoff of river structures 17
66
Road surface subsidence 6
Landslide and slope failure 17
Debris flow 6
Others 20
Hill area
STA.23+000
— STA.50+000
Landslide 8
72 Slope failure 54
Road surface subsidence and
movement of road structures 10
Total 138
Source: Basic Design Study Report on the Project for Urgent Rehabilitation of Sindhuli Road (Section IV) JICA (2003)

Data Collection Survey on the Sindhuli Road Capacity Enhancement in Nepal FINAL REPORT
2-22
(2) Earthquake
Immediately after the completion of the entire the Sindhuli Road, a magnitude 7.8 Gorkha earthquake struck
on April 25, 2015, with the epicenter in Gorkha District, about 77 km northwest of Kathmandu. On May 12,
17 days after the Gorkha earthquake, a major aftershock with magnitude of 7.3 occurred in Sindhupalchowk
District, about 86 km northeast of Kathmandu (see Figure 2.3-6 and Figure 2.3-7).
Due to these earthquakes, the Sindhuli Road was damaged in a total of 25 places, including road surface
subsidence, cracks, and slope failures. At the 12 places among of 25 places, JICA has supported emergency
restoration work since June 2015, immediately after the disaster. In addition, “Preparatory survey for the
project for the Sindhuli road earthquake rehabilitation” was conducted from July 2017 to April 2018 in order
to carry out full-scale restoration, and restoration components (JICA Grant Aid) were proposed at three
locations (STA.17+400, 33+400, 33+695) in the Section II and two locations (STA.11 + 620, 15 + 520) in
the Section III.
Source: JICA Survey Team
Figure 2.3-6 Distribution of Epicenter of Gorkha Earthquake
SindhuliRoad

Data Collection Survey on the Sindhuli Road Capacity Enhancement in Nepal FINAL REPORT
2-23
出典:Dahal (2015)
Figure 2.3-7 Distribution of Epicenter of Gorkha Earthquake (Block Diagram))
2.3.4 Climate
Generally, there are 4 seasons in most of the countries in the world. But Nepal boasts 6 seasons, commonly
known as Ritus. Names of the Ritus and the months that belong to each Ritu are shown along with its
equivalent seasons and months in Gregorian calendar (English) in Table 2.3-4.
Table 2.3-4 Seasons of Nepal
S.N. Name of Season Months in Calendar
Nepali English Nepali English
1 Basanta Ritu Spring Chaitra and Baisakh mid-March – mid-May
2 Grishma Ritu Summer Jestha and Ashad mid-May – mid-July
3 Barsha Ritu Rainy Shrawan and Bhadra mid-July – mid-September
4 Sharad Ritu Autumn Ashoj and Kartik mid-September - mid-November
5 Hemanta Ritu Pre-winter Mangshir and Poush mid-November -mid-January
6 Shishir Ritu Winter Magh and Falgun mid-January – mid-March
Source: JICA Survey Team
The six seasons division of Nepal are results of the geography of the country. Geographically, Nepal is
divided into five climatic zones, which broadly correspond to the altitudes. The tropical and subtropical zones
lie below 1,200 meters, the temperate zone 1,200 to 2,400 meters, the cold zone 2,400 to 3,600 meters, the
subarctic zone 3,600 to 4,400 meters, and the Arctic zone above 4,400 meters.
This produces a variation of climate patterns throughout the country, even during the same season. Himalayan
range in the northern region experience harsh winters whereas temperatures in the southern plains (Terai) are
not extreme. On the other hand, during the summer, temperatures in the Terai rises up to between 40 - 45
degree Celsius (°C), while the hills and mountainous regions experience moderate temperatures.
M7.8 (25/04/15)
M7.3 (12/05/15)

Data Collection Survey on the Sindhuli Road Capacity Enhancement in Nepal FINAL REPORT
2-24
Basanta Ritu (Spring)
Basanta Ritu (Spring) spans for a period between Mid-March to Mid-May (Chaitra and Baisakh). The
weather during this season is warm and is generally stable but windy, warmer, and light rainfall in some
regions. In Basanta ritu the fields are mainly covered with potato farming, maize farming, and wheat farming.
The flowers start to blossoms in this season.
Grishma Ritu (Summer)
Grishma Ritu (Summer) entails the hottest season in Nepal. This season sees harsh temperature in all parts
of Nepal. This lies between mid-May and mid-July (Jestha and Ashad). Farmers prepare paddy in this season.
Barsha Ritu (Rainy)
Barsha in Nepali language means rain. Weather is still hot and humid in this season. Lasting from mid of July
to mid of September (Shrawan and Bhadra), this season sees most of the regions of Nepal experience light
to heavy rainfall daily. A region which is not affected much by this season is the Trans Himalayan Region
Nepal faces landslides and floods in the hilly and terai regions during this season.
Sharad Ritu (Autumn)
Autumn in the local culture of Nepal is referred to as Sharad. This spans across mid-September to mid-
November (Ashwin and Kartik). This season sees rapid changes in the landscape of Nepal and even in the
urban centers as it is also the festival season. Autumn season is most wanted season for the people of Nepal
because weather is very cool during these days. Monsoon becomes deactivated and sky go clear during these
days. This season is the season of biggest festivals in Nepal i.e. Dashain and Tihar. Farmers are busy in
harvesting rice and potato in this season.
Hemanta Ritu (Pre-Winter)
Winter in Nepal is divided into two parts, pre-winter and Winter. Hemanta Ritu is the onset of the cold season.
Weather in this season is relatively cold. The duration between mid-November and mid-January (Mangsir
and Poush). For the native farmers of the region, pre-winter is also the harvesting season, farmers make sure
to collect their crops and store them for the upcoming winter.
Shishir Ritu (Winter)
Winter season in Nepali is Shishir Ritu. This falls between mid-January and mid-March (Magh and Falgun).
This is the coldest season of all. The temperature falls to less than zero around the capital city Kathmandu.
Farmers are busy in starting to cultivate cash crop potato in this season.
The objective road falls in two climatic zones. Bardibas to Nepalthok falls in tropical to sub-tropical climatic
zones and Nepalthok to Dhulikhel in the temperate climatic zone.
Figure 2.3-8 shows the average of monthly precipitation and temperature for 2020. These data are provided
from the Sindhuli Gadhi Station, which is located on the eastern neighbor of Marin Khola basin at an altitude
of El. 1,463m. According to the figure, the area receives most of its rainfall from April to October. Highest
precipitation is however recorded in July where it reaches 599.3 mm. The data provides a clear picture of the

Data Collection Survey on the Sindhuli Road Capacity Enhancement in Nepal FINAL REPORT
2-25
contrast of rainfall between the dry and the wet season as can be observed from the fact that rainfall is light
to null between November to March. Although in general Nepal’s monsoon lies between mid-June to mid-
September, rainy season in Sindhuli area can be defined between May to September, in which period the area
receives most of its annual precipitation.
There is a big difference in the maximum and minimum temperatures. Maximum temperature is almost stable
and are in the range between 22.7°C to 32.6°C, but the minimum temperature fluctuates from 7.8°C to 23.5°C.
Maximum temperature exceeds 30°C from April to October. Minimum temperature plummets below 10°C
in the months between November to February signifying that the morning and evening time hours are
relatively cold.
Source: Sindhuli Gadhi Station
Figure 2.3-8 Average of Monthly Precipitation and Temperature for 2020 at Sindhuli Gadhi Station
Figure 2.3-9 gives the annual precipitation from 1980 to 2020. This is also from the Sindhuli Gadhi Station.
Highest amount of annual rainfall was recorded in 1984 and 1985, which exceeded 3,500mm. Lowest in
1989 where the area only received about 1,700mm. Since 1985, rainfall exceeding 3,000mm was recorded
only once – in 2004. Reasons unknown, but the annual rainfall intensity is seen to decrease drastically since
2009. Maximum rainfall received after 2009 was in 2020, where the record shows an amount of 2,500mm.
Source: Sindhuli Gadhi Station
Figure 2.3-9 Annual Precipitation of the Survey Area (1980-2020)
7.3 16.7 28.681.5
228.7
345.9
599.3
420.9382.4
74.1
3.1 3.5
22.725.7
29.832.6 32.2 32.4 31.3 31.7 31.2 30.4
27.9
24.5
7.810.1
14.0
17.820.8
23.1 23.5 23.3 22.7
18.6
13.2
8.8
-15
-10
-5
0
5
10
15
20
25
30
35
40
0
100
200
300
400
500
600
700
800
900
1000
1100
Jan Feb Mar Apr May Jun Jul Aug Sep Oct Nov Dec
Tem
per
atu
re (℃
)
Pre
cip
itat
ion
(m
m)
Month
Average of Monthly Precipitation and Temperature at Sindhuli Gadhi(from Jan-2011 to Aug-2021)
Monthly Precipitation (Average) Maximum Tempreture (Average) Mimimum Tempreture (Average)
0
500
1,000
1,500
2,000
2,500
3,000
3,500
4,000
1980 1985 1990 1995 2000 2005 2010 2015 2020
An
nu
al P
erti
cip
atio
n (
mm
)
Year
Annual Perticipation at Sindhuli Gadhi (1980-2020)


Data Collection Survey on the Sindhuli Road Capacity Enhancement in Nepal FINAL REPORT
3-1
CHAPTER 3 DEVELOPMENT PLANS
3.1 INTRODUCTION
Nepal formulated its first development plan, which was initiated with the Five-Year Plan in 1956 and has
been continuously executing them. So far, Nepal has completed fourteen (14) plans till 2019 under the
leadership of National Planning Commission (NPC) - nine (9) five-year and five (5) three-year plans.
Three-year plans were extended from 1962 to 1965, 2007 to 2010, 2010 to 2013, 2013 to 2016 and 2016
to 2019. In this six decade of planned development, all plans have not been found of the same pattern
because of the changing socio-political condition and demand of time regarding the switch in economic
policies. Despite of this, although progress was made in some important areas like education, health,
drinking water, social security, road transportation, information and communication technology and urban
infrastructure, the expected achievement could not be realized, mainly in ensuring stable macroeconomic
growth and overall welfare of the people by raising their living standard and taking the country out of the
category of ’least developed countries’ under international norms. Nepal is still in ranking of a least
developed countries among the 46 countries1 in global race of development. Nepal’s latest national
development plan is the Fifteenth Development Plan (2019/20 to 2023/24), implementation of which has
just begun. This has come into effect with the background to address the weak reality with the national
vision of ‘Prosperous Nepal, Happy Nepali’.
3.2 LONG-TERM VISION 2043
3.2.1 Vision
Achievement of political stability symbolized by successful elections for all three tiers (federal, provincial
and local) of the new state architecture defined by the 2015 constitutions, long-term visions are now the
basis for setting of national goals that address peoples’ aspiration for an improvement in living standards,
including a modern, resourceful, and happy life.
The 25-year vision is formulated to make Nepal a developing country within first three years and aims to,
i) achieve economic growth and formation of quality of human capital, and
ii) achieve the Sustainable Development Goals (SDGs).
While the former achievement foresees graduation from the least developed country (LDC) to a developing
country by 2022, the second achievement foresees graduation to an upper middle-income country by 2030.
The long-term vision is to achieve ‘Prosperous Nepal, Happy Nepali’ by achieving a prosperous,
independent, and socialism-oriented economy with a happy, healthy, and educated citizens enjoying
equality of opportunities, dignity and high living standards.
1 Based on List of Least Developed Countries listed by United Nation (https://www.un.org/development/desa/dpad/wp-
content/uploads/sites/45/publication/ldc_list.pdf)

Data Collection Survey on the Sindhuli Road Capacity Enhancement in Nepal FINAL REPORT
3-2
3.2.2 Strategies
• To achieve rapid, sustainable and employment-oriented economic growth,
• To ensure affordable and quality health care and education,
• To develop internal and international interconnectivity and sustainable cities/settlements,
• To increase production and productivity,
• To provide a comprehensive, sustainable, and productive social security and protection
• To build a just society characterized by poverty alleviation and socio-economic equality,
• To conserve and utilize natural resources and improve resilience, and
• To strengthen public services, enhance balanced provincial development, and promote national
unity.
3.2.3 National Goals
3.2.4 Drivers of Transformation
Following drivers of socio-economic transformation have been identified to achieve the national goals.
i) High-quality and integrated transport system, information technology and communication
infrastructure, and massive networking,
ii) Quality human capital and entrepreneurial work culture and full utilization of potential,
iii) Growth in hydroelectricity production and promotion of green economy,
iv) Increase in production, productivity, and competitiveness,
v) Development and expansion of quality tourism services,
vi) Modern, sustainable and systematic urbanization, housing and settlement development,
1. Accessible modern infrastructure and intensive connectivity
2. Development and full utilization of human capital potentials
3. High and sustainable production and productivity
4. High and equitable national income
Prosperity
1. Well-being and decent life
2. Safe, civilized and just society
3. Healthy and balanced environment
4. Good governance
5. Comprehensive democracy
6. National unity, security, and dignity
Happiness

Data Collection Survey on the Sindhuli Road Capacity Enhancement in Nepal FINAL REPORT
3-3
vii) Development and strengthening of the provincial and local economy and expansion of the
formal sector,
viii) Guarantee to social protection and social security, and
ix) Governance reform and good governance
3.2.5 Major Quantitative Targets
Major quantitative targets of the long-term vision are presented in Table 3.2-1.
Table 3.2-1 Major Quantitative Targets
S.N National Goals, Targets and Indicators Unit Status in FY
2018/19
Target for FY
2043/44
1. Economic growth (average) Percent 6.8 10.5
2. Per capita national income US dollar 1,047 12,100
3. Population under the poverty line Percent 18.7 0
4. Families with access to motor transport within
30 minutes of travel
Percent 82 99
5. National and provincial highways (2lanes) Kilometers 7,794 33,000
6. National highways (more than 2 lanes) Kilometers 96 3,000
7. Railroads Kilometers 42 2,200
8. Households with access to electricity Percent 88 100
Source: JICA Survey Team
3.2.6 Relevancy with this Survey
Long-term Vision targets 2-digits economic growth, upgrading all existing national highways to 2 lanes or
more including extension of the national highway network. By the target year (2043), the followings would
have been realized, among others.
i) Expansion of E-W Highway to 4-lanes,
ii) Current Jainagar (India) – Jaleswor (Nepal) railway would be extended up to Bardibas,
iii) Operation of the Biratnagar and Kakarbhitta Inland Clearance Depot,
iv) Agreement by Bangladesh to use seaports in Chittagong and Mongla, in Bangladesh with
respect to the initiatives aimed at both soft and hard constraints within and cross border guided
by the common goal of increasing sub-regional connectivity and trade under the South Asian
Growth Quadrangle between Bangladesh, Bhutan, India, and Nepal (BBIN).
Realization of all developments and/or improvements mentioned above facilitate trade from the eastern
side of the country. This will significantly increase the trade transport. Improvement of the Sindhuli Road
will further shorten travel time to Kathmandu and the mid-northern regions significantly compared to
the Westward Route thereby, contributing to shouldering portions of trade transport to and from
Bangladesh, Bhutan and eastern regions of India. It can also contribute to extending the present bus
service between Ayodhya in India and Janakpur in Nepal (two major sacred cities for the Hindus) to
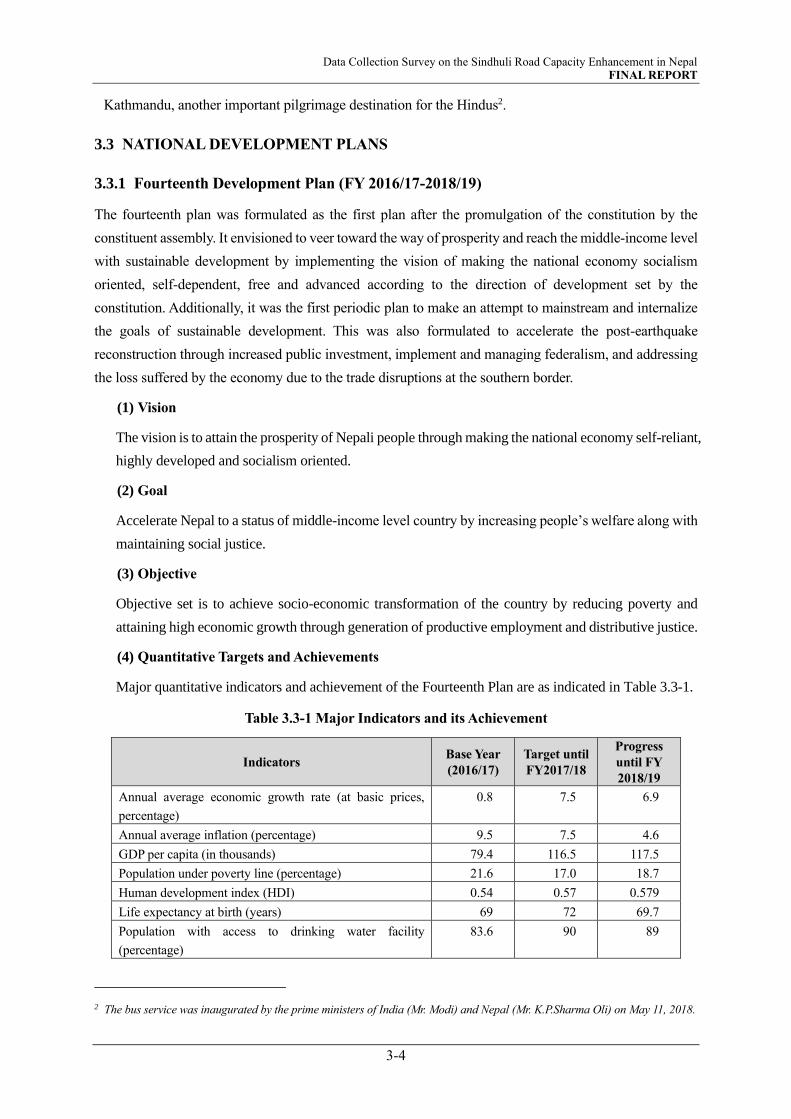
Data Collection Survey on the Sindhuli Road Capacity Enhancement in Nepal FINAL REPORT
3-4
Kathmandu, another important pilgrimage destination for the Hindus2.
3.3 NATIONAL DEVELOPMENT PLANS
3.3.1 Fourteenth Development Plan (FY 2016/17-2018/19)
The fourteenth plan was formulated as the first plan after the promulgation of the constitution by the
constituent assembly. It envisioned to veer toward the way of prosperity and reach the middle-income level
with sustainable development by implementing the vision of making the national economy socialism
oriented, self-dependent, free and advanced according to the direction of development set by the
constitution. Additionally, it was the first periodic plan to make an attempt to mainstream and internalize
the goals of sustainable development. This was also formulated to accelerate the post-earthquake
reconstruction through increased public investment, implement and managing federalism, and addressing
the loss suffered by the economy due to the trade disruptions at the southern border.
(1) Vision
The vision is to attain the prosperity of Nepali people through making the national economy self-reliant,
highly developed and socialism oriented.
(2) Goal
Accelerate Nepal to a status of middle-income level country by increasing people’s welfare along with
maintaining social justice.
(3) Objective
Objective set is to achieve socio-economic transformation of the country by reducing poverty and
attaining high economic growth through generation of productive employment and distributive justice.
(4) Quantitative Targets and Achievements
Major quantitative indicators and achievement of the Fourteenth Plan are as indicated in Table 3.3-1.
Table 3.3-1 Major Indicators and its Achievement
Indicators Base Year
(2016/17)
Target until
FY2017/18
Progress
until FY
2018/19
Annual average economic growth rate (at basic prices,
percentage)
0.8 7.5 6.9
Annual average inflation (percentage) 9.5 7.5 4.6
GDP per capita (in thousands) 79.4 116.5 117.5
Population under poverty line (percentage) 21.6 17.0 18.7
Human development index (HDI) 0.54 0.57 0.579
Life expectancy at birth (years) 69 72 69.7
Population with access to drinking water facility
(percentage)
83.6 90 89
2 The bus service was inaugurated by the prime ministers of India (Mr. Modi) and Nepal (Mr. K.P.Sharma Oli) on May 11, 2018.
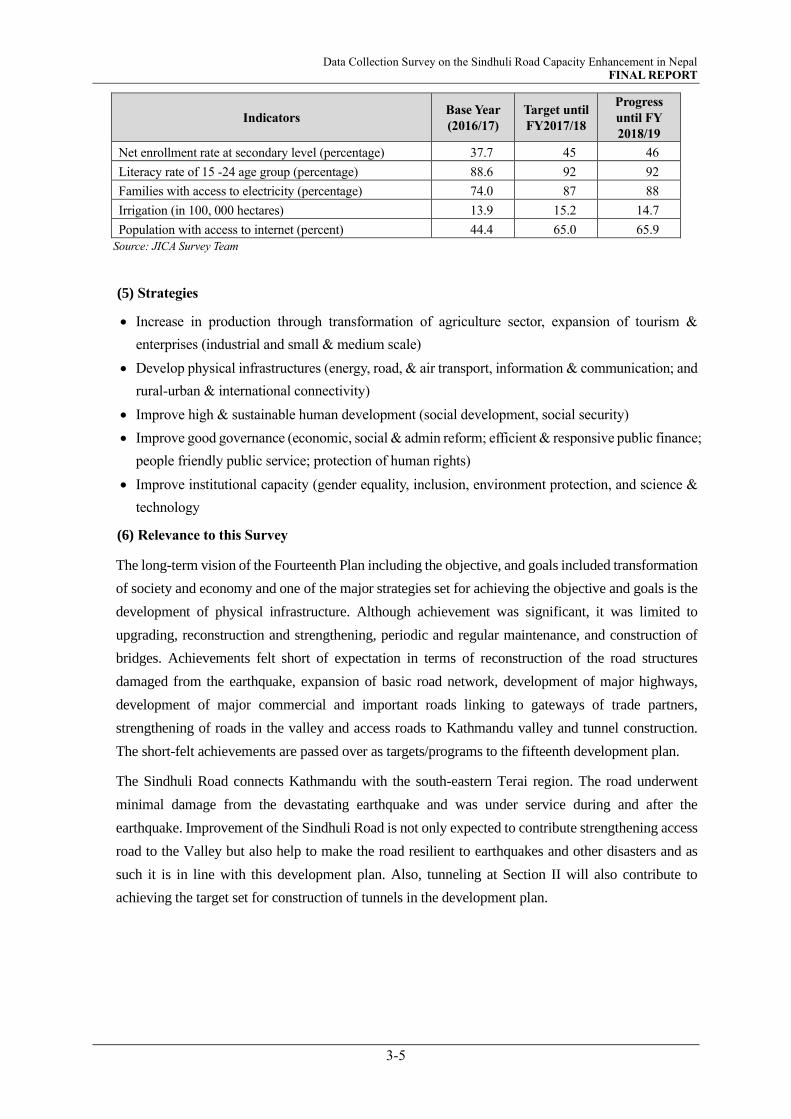
Data Collection Survey on the Sindhuli Road Capacity Enhancement in Nepal FINAL REPORT
3-5
Indicators Base Year
(2016/17)
Target until
FY2017/18
Progress
until FY
2018/19
Net enrollment rate at secondary level (percentage) 37.7 45 46
Literacy rate of 15 -24 age group (percentage) 88.6 92 92
Families with access to electricity (percentage) 74.0 87 88
Irrigation (in 100, 000 hectares) 13.9 15.2 14.7
Population with access to internet (percent) 44.4 65.0 65.9
Source: JICA Survey Team
(5) Strategies
• Increase in production through transformation of agriculture sector, expansion of tourism &
enterprises (industrial and small & medium scale)
• Develop physical infrastructures (energy, road, & air transport, information & communication; and
rural-urban & international connectivity)
• Improve high & sustainable human development (social development, social security)
• Improve good governance (economic, social & admin reform; efficient & responsive public finance;
people friendly public service; protection of human rights)
• Improve institutional capacity (gender equality, inclusion, environment protection, and science &
technology
(6) Relevance to this Survey
The long-term vision of the Fourteenth Plan including the objective, and goals included transformation
of society and economy and one of the major strategies set for achieving the objective and goals is the
development of physical infrastructure. Although achievement was significant, it was limited to
upgrading, reconstruction and strengthening, periodic and regular maintenance, and construction of
bridges. Achievements felt short of expectation in terms of reconstruction of the road structures
damaged from the earthquake, expansion of basic road network, development of major highways,
development of major commercial and important roads linking to gateways of trade partners,
strengthening of roads in the valley and access roads to Kathmandu valley and tunnel construction.
The short-felt achievements are passed over as targets/programs to the fifteenth development plan.
The Sindhuli Road connects Kathmandu with the south-eastern Terai region. The road underwent
minimal damage from the devastating earthquake and was under service during and after the
earthquake. Improvement of the Sindhuli Road is not only expected to contribute strengthening access
road to the Valley but also help to make the road resilient to earthquakes and other disasters and as
such it is in line with this development plan. Also, tunneling at Section II will also contribute to
achieving the target set for construction of tunnels in the development plan.
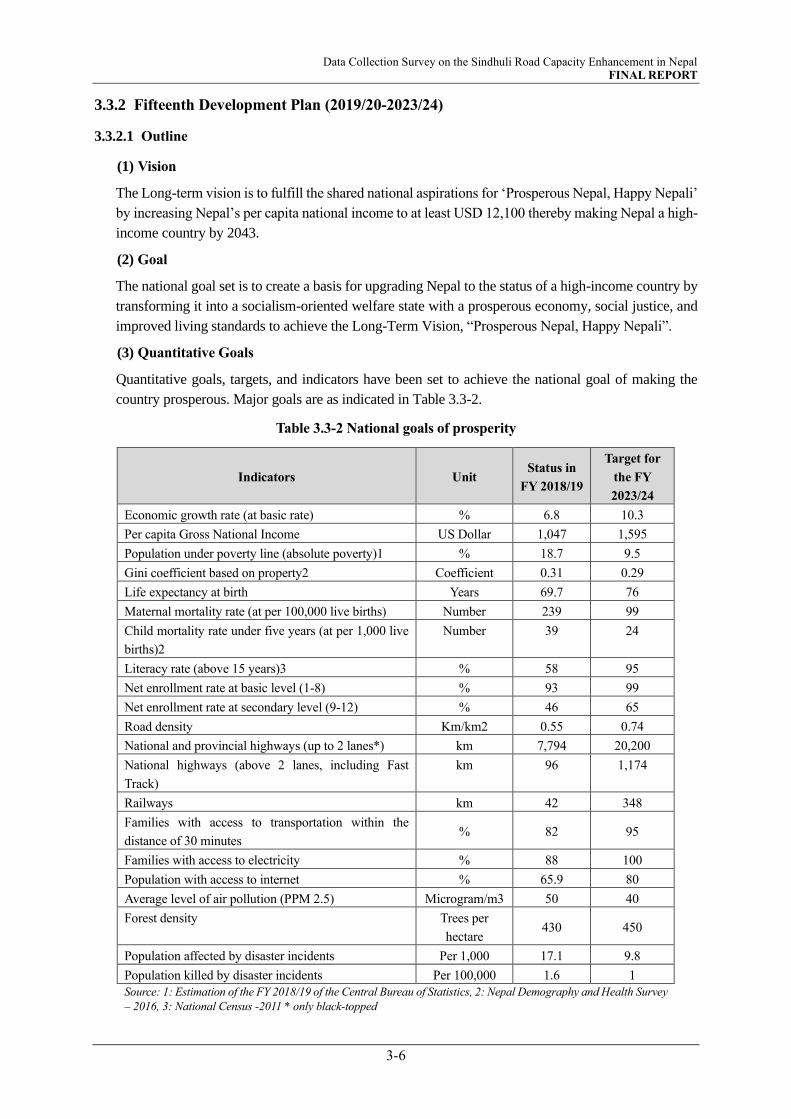
Data Collection Survey on the Sindhuli Road Capacity Enhancement in Nepal FINAL REPORT
3-6
3.3.2 Fifteenth Development Plan (2019/20-2023/24)
3.3.2.1 Outline
(1) Vision
The Long-term vision is to fulfill the shared national aspirations for ‘Prosperous Nepal, Happy Nepali’
by increasing Nepal’s per capita national income to at least USD 12,100 thereby making Nepal a high-
income country by 2043.
(2) Goal
The national goal set is to create a basis for upgrading Nepal to the status of a high-income country by
transforming it into a socialism-oriented welfare state with a prosperous economy, social justice, and
improved living standards to achieve the Long-Term Vision, “Prosperous Nepal, Happy Nepali”.
(3) Quantitative Goals
Quantitative goals, targets, and indicators have been set to achieve the national goal of making the
country prosperous. Major goals are as indicated in Table 3.3-2.
Table 3.3-2 National goals of prosperity
Indicators Unit Status in
FY 2018/19
Target for
the FY
2023/24
Economic growth rate (at basic rate) % 6.8 10.3
Per capita Gross National Income US Dollar 1,047 1,595
Population under poverty line (absolute poverty)1 % 18.7 9.5
Gini coefficient based on property2 Coefficient 0.31 0.29
Life expectancy at birth Years 69.7 76
Maternal mortality rate (at per 100,000 live births) Number 239 99
Child mortality rate under five years (at per 1,000 live
births)2
Number 39 24
Literacy rate (above 15 years)3 % 58 95
Net enrollment rate at basic level (1-8) % 93 99
Net enrollment rate at secondary level (9-12) % 46 65
Road density Km/km2 0.55 0.74
National and provincial highways (up to 2 lanes*) km 7,794 20,200
National highways (above 2 lanes, including Fast
Track)
km 96 1,174
Railways km 42 348
Families with access to transportation within the
distance of 30 minutes % 82 95
Families with access to electricity % 88 100
Population with access to internet % 65.9 80
Average level of air pollution (PPM 2.5) Microgram/m3 50 40
Forest density Trees per
hectare 430 450
Population affected by disaster incidents Per 1,000 17.1 9.8
Population killed by disaster incidents Per 100,000 1.6 1
Source: 1: Estimation of the FY 2018/19 of the Central Bureau of Statistics, 2: Nepal Demography and Health Survey
– 2016, 3: National Census -2011 * only black-topped

Data Collection Survey on the Sindhuli Road Capacity Enhancement in Nepal FINAL REPORT
3-7
(4) Objective
i) To build the basis of prosperity by constructing universally accessible, quality, and modern
infrastructure, increasing productive and decent employment, achieving high, sustainable, and
inclusive economic growth and poverty alleviation.
ii) To give citizens the feeling of well-being and decent livelihood by strengthening the federal
governance system through quality health and education, a healthy and balanced environment,
social justice, and accountable public service.
iii) To protect national interest, self-respect, and independence of the country through socio-
economic transformation and building an independent national economy.
(5) Strategies
• To achieve rapid, sustainable and employment-oriented economic growth
• To ensure universal and quality health service and education up to the local level.
• To develop internal and cross-border interconnectivity and sustainable cities/settlements.
• To increase production and productivity.
• To provide complete, sustainable and productive social and security and protection to all citizens
as ensured by the constitution and provisioned by the state.
• To build a just society with socio-economic equality and poverty alleviation
• To protect and mobilize natural resources along with building their resilience to increase
contribution to agriculture, industries, and service sectors.
• To promote national unity and provincial balance, strengthening of public service
(6) Relevance to this Survey
Development of internal and cross-border interconnectivity and sustainable cities/settlements through
construction of national, provincial, and local road network, tunnels, fast tracks, waterways, and
airports are some of the strategies set forth for attaining the objectives in the 15th Development Plan,
while dualization of national highways and provision of tunnels to improve existing alignment are
identified in the Game Changer Projects and Major Programs.
The Sindhuli Road is a national highway and is an integral part of the strategic road network of Nepal.
While the road connects the capital to the eastern Terai region, it passes through several settlements
enhancing connectivity between them. The section between Nepalthok and Khurkot connects with the
M-H Highway at four (4) locations further enhancing accessibility to/from cities in the north-eastern
region of the country. Its most critical Section II, which consists of numerous continuous sharp curves
and steep vertical grades is under consideration for improvement by provision of a tunnel, while
maintaining the existing section for tourism purpose. Therefore, improvement of the Sindhuli Road is
expected to contribute to achieving rapid, sustainable and employment-oriented economic growth
thereby pushing the country towards high-income country and achieve the goal, ‘Prosperous Nepal,
Happy Nepali’.
3.3.2.2 Transport Sector Development Plans
Transport sector plays an important role in enhancing unhindered access for the general public and

Data Collection Survey on the Sindhuli Road Capacity Enhancement in Nepal FINAL REPORT
3-8
also accelerates the socio-economic development of the country, facilitating trade, business, and
services. A well-managed network and system of transport is the pillar for boosting the socio-economic
integration and provincial balance. This requires, the development of sub-sectors withing the
transportation sector by prioritizing them. Tremendous achievement has been made in the
transportation sector, particularly in the road and aviation sector. The fifteenth plan envisages further
development of the sector to achieve the Long-Term Vision set forth in this Plan.
(1) Road
1) Vision
Development of dense, balanced, accessible, safe, quality, and sustainable road infrastructure
2) Goal
To achieve economic prosperity through socio-economic development and trade facilitation by
expanding the national road network
3) Objectives
i) To develop and expand a balanced road network so as the total transport cost is minimum.
ii) To ensure a smooth traffic movement through appropriate measures for protection
maintenance and road safety.
4) Strategies and Working Policies
Strategy-1
Develop road network based on a master plan with emphasis on provincial balance
that also includes modern infrastructure such as high-speed roads, underground
roads, and viaducts
Work Policies-1 1. Develop a long-term master plan by categorizing roads based on load-bearing
capacity, traffic volume, and contribution to the economy.
2. Categorize and standardize national highways, provincial highways, urban roads,
and local and rural roads.
3. Increase investment opportunities for national highways through involvement of
the project bank.
4. Start project implementation after preparing a comprehensive plan of action,
including preparatory activities such as land acquisition, right of way, drawing, and
approval for the utilization of forest area.
5. Upgrade the E-W Highway to Asian Highway standards and expand inter-
provincial highways based on traffic volume.
6. Develop and expand North-South Highways of Karnali and Sudurpashchim
provinces based on traffic volume ensuring domestic as well as international
connectivity.
7. Expand and strengthen the road access to administrative centers of local
governments.
8. Take into account factors such as the contribution towards provincial balance,
economic hubs, or touristic destinations while developing and expanding the road
network.
9. Develop modern road infrastructure including flyovers and underpasses in city
areas, tunnel roads in major highways, and viaducts as part of the expansion and
development of roads of strategic importance to reduce travel time.

Data Collection Survey on the Sindhuli Road Capacity Enhancement in Nepal FINAL REPORT
3-9
10. Commence development of necessary infrastructure for modern ICT-based
intelligent transport systems with detail plan for roads with high traffic volume
Strategy-2 To use modern technologies optimally by fiving high priority to the development
of institutional capacity
Work Policies-2 1. Coordinate with other infrastructure sectors for the construction of national
highways.
2. Impart high-quality training to develop practical skills of human resources related
to the road sub-sector.
3. Involve optimally the in-house staff of the road sub-sector in projects implemented
under foreign aid to help transfer knowledge, skill, and technologies.
4. Carry out necessary amendments to the law and policy improvements with high
priority.
5. Strengthen institutional capacity of the private sector involved in infrastructure
development
Strategy-3 To make arrangements for alternative sources of investment and reduce
dependence on traditional public-sector resources
Work Policies-3 1. Develop high-cost infrastructure such as national highways and inter-
provincial roads by ensuring quality through modern forms of contract,
including public-private partnership (PPP), EPC, and design-built.
2. Manage resources for the protection and promotion of road infrastructure by
also involving road users.
3. Reduce dependence on traditional public sector resources by tapping into
alternative sources of investment for finance.
Strategy-4 To emphasize the utilization of modern technologies and mechanization for
design, construction, operation and maintenance of roads and road safety.
Work Policies-4 1. Regularly monitor road maintenance based on standards of road maintenance
and responsibilities agreed for each level of government.
2. Introduce institutional reforms to make institutions accountable to users by
undertaking a review of existing institutional arrangements.
3. Develop a fully automated electronic system by facilitating access to all
information related to the development expansion, maintenance, and operation
of road infrastructure.
4. Adopt appropriate methods including bio-engineering effectively for
preventing surface soil erosion.
5. Make provision for road safety checks at various stages of the design and
construction of roads to reduce road accidents and improve safety of the SRN
(Strategic Road Network).
6. Manage resources for road maintenance through the Roads Board.
Strategy-5 To reduce possible impacts or adverse effects of natural disasters and climate
adversities
Work Policies-5 1. Adopt alternative measure to minimize road closures due to landslides and
accidents.
2. Take precautions during the design and construction of roads/bridges to
minimize impact and damage from natural calamities and climatic adversities.
Source: JICA Survey Team

Data Collection Survey on the Sindhuli Road Capacity Enhancement in Nepal FINAL REPORT
3-10
5) Major Problems
Inability to achieve integrated development of transport infrastructure as expected,
identification and selection of projects without defined standards,
implementation of projects without proper preparations,
inability to increase the professional capacity of the private sector,
lack of availability of skilled workers and other workers equipped with sectoral skill, and lack of
availability of quality construction materials and river-based construction materials under the
jurisdiction of local governments,
Lack of budget allocation and operational efficiency, enhancement of institutional, managerial,
and technical capacity and public ownership of roads as expected,
inability to adopt measures to maintain good governance in project management,
Substantial weakness in contract management
Inability to meet the increasing needs for resources for operation and maintenance with the
increase in the length of road,
lack of inter-agency coordination for land acquisition, increased encroachment of the national
highways, road boundary disputes in road expansion and obstruction from locale people
demanding compensation, and inadequate linkages between monitoring and evaluation and
results.
6) Expected Results
Following outcomes are expected during the plan period.
Number of households with access to transport within a distance of 30 minutes will have
increased from 82 to 95 percent.
Approximately 5,500 km of roads will be upgraded or improved and 13.474 km of the road will
have been blacktopped.
A total of 1,078km of national highways including E-W Highway and Fast Track will have been
upgraded/developed to four lanes or more.
Mid-Hill (Pushpalal) Highway, Postal Highway, and North-South Highway will have been
constructed and upfgraded to two-lanes.
400 concrete bridges on national and provincial highway and 1,200 concrete bridges on local
roads will have been constructed.
Standards for national and provincial highways will have been prepared and implemented.
Regular, occassional, and periodic maintenance of national highways and bridges will be
undertaken in time.
Humla District Headquarters will have been connected to the national road network.
Roads connecting to Manang, Mustand, Mugu, Dolpa, and Humla District headquarters will have
been blacktopped.
(2) Air Transport
Air transport is considered a fast and reliable means of international and regional transport connectivity.

Data Collection Survey on the Sindhuli Road Capacity Enhancement in Nepal FINAL REPORT
3-11
Due to Nepal's unique geopolitical location, air services play an important role in maintaining direct
access to the global market. Geographical diversity has made domestic air services indispensable.
1) Vision
Assurance of safe, reliable, and accessible civil aviation service.
2) Goal
To enhance access to civil aviation services through managing civil aviation services and safety
operations according to international standards.
3) Objective
To make the civil aviation sector universally accessible and safe by expanding national and
international destination networks.
4) Strategies and Working Policies
Strategy-1
Encourage collaboration and partnership between the public and private
sector for the construction, development, and management of aviation
infrastructure
Work Policies-1 1. The participation of the private sector in construction, management, and
operation of airports will be increased.
2. A strategic partner will be brought in to make the management of Nepal Airline
Corporation (NAC) efficient, strong, and competitive.
3. The construction of Gautam Buddha International Airport and Pokhara
International Airport will be completed and operational on time.
4. Considering the increasing domestic and international air traffic volume at
Tribhuvan International Airport, infrastructure will be developed and
expanded, with capacity enhanced.
5. Construction of Nijgadh International Airport will be expedited.
6. Activities related to additional regional airports will be carried out based on
studies on them.
7. Appropriate aviation activities will be encouraged in airports without regular
flights.
8. The fleet size of NAC will be increased based on the projection of demand for
external and domestic tourism, and effective private sector airlines will be
encouraged to continue their services.
9. Civil aviation will be further strengthened by upgrading domestic airports.
10. Air transport in rural areas will be made regular and accessible to the public by
effectively mobilizing the Remote Area Civil Aviation Development Fund.
11. In collaboration with the local levels, one helipad will be developed in each
ward of the local levels.
Strategy-2
To make civil aviation services safer, of higher quality, and more reliable
through the adoption of international standards on safety protocols and the
optimum utilization of innovative technologies
Work Policies-2 1. Modern aviation support equipment will be installed in airports to make the
aviation service safe. Similarly, flight safety monitoring and inspection system
will be developed to comply with international standards.
2. A permanent and independent mechanism will be established to make the
investigation of air accidents systematic, effective, and more scientific.
3. Airports of social and touristic importance will be upgraded to ensure year-
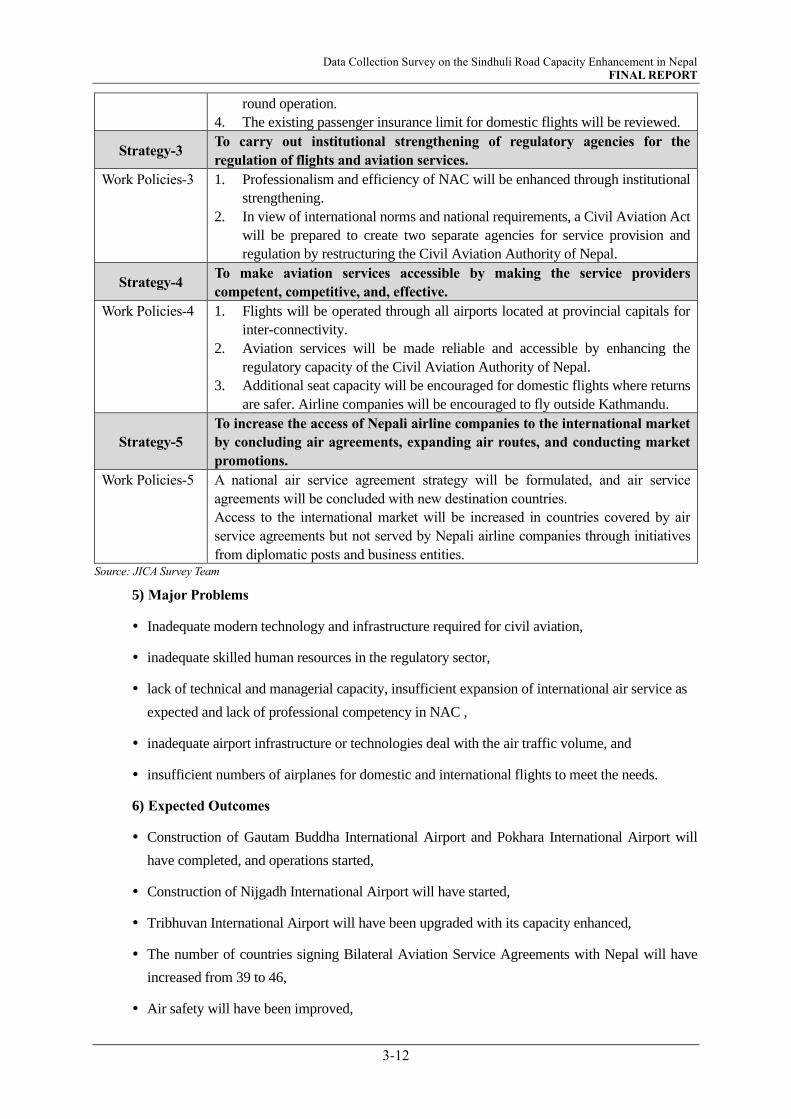
Data Collection Survey on the Sindhuli Road Capacity Enhancement in Nepal FINAL REPORT
3-12
round operation.
4. The existing passenger insurance limit for domestic flights will be reviewed.
Strategy-3 To carry out institutional strengthening of regulatory agencies for the
regulation of flights and aviation services.
Work Policies-3 1. Professionalism and efficiency of NAC will be enhanced through institutional
strengthening.
2. In view of international norms and national requirements, a Civil Aviation Act
will be prepared to create two separate agencies for service provision and
regulation by restructuring the Civil Aviation Authority of Nepal.
Strategy-4 To make aviation services accessible by making the service providers
competent, competitive, and, effective.
Work Policies-4 1. Flights will be operated through all airports located at provincial capitals for
inter-connectivity.
2. Aviation services will be made reliable and accessible by enhancing the
regulatory capacity of the Civil Aviation Authority of Nepal.
3. Additional seat capacity will be encouraged for domestic flights where returns
are safer. Airline companies will be encouraged to fly outside Kathmandu.
Strategy-5
To increase the access of Nepali airline companies to the international market
by concluding air agreements, expanding air routes, and conducting market
promotions.
Work Policies-5 A national air service agreement strategy will be formulated, and air service
agreements will be concluded with new destination countries.
Access to the international market will be increased in countries covered by air
service agreements but not served by Nepali airline companies through initiatives
from diplomatic posts and business entities. Source: JICA Survey Team
5) Major Problems
Inadequate modern technology and infrastructure required for civil aviation,
inadequate skilled human resources in the regulatory sector,
lack of technical and managerial capacity, insufficient expansion of international air service as
expected and lack of professional competency in NAC ,
inadequate airport infrastructure or technologies deal with the air traffic volume, and
insufficient numbers of airplanes for domestic and international flights to meet the needs.
6) Expected Outcomes
Construction of Gautam Buddha International Airport and Pokhara International Airport will
have completed, and operations started,
Construction of Nijgadh International Airport will have started,
Tribhuvan International Airport will have been upgraded with its capacity enhanced,
The number of countries signing Bilateral Aviation Service Agreements with Nepal will have
increased from 39 to 46,
Air safety will have been improved,
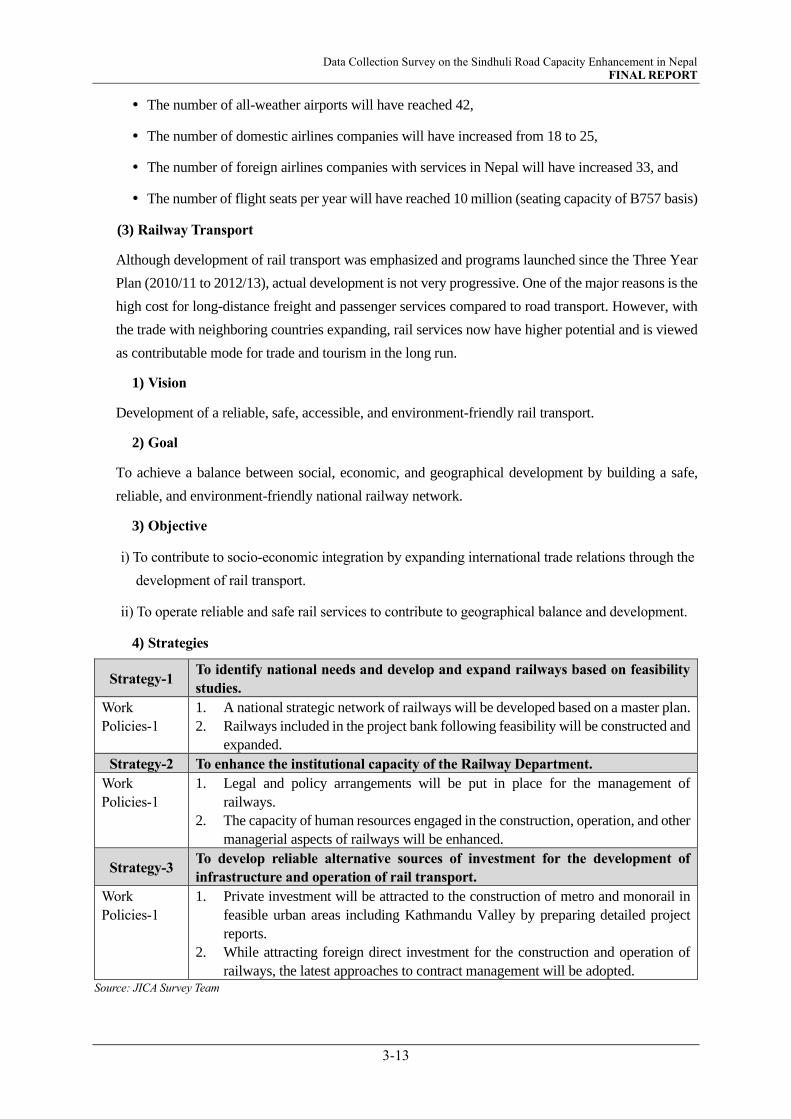
Data Collection Survey on the Sindhuli Road Capacity Enhancement in Nepal FINAL REPORT
3-13
The number of all-weather airports will have reached 42,
The number of domestic airlines companies will have increased from 18 to 25,
The number of foreign airlines companies with services in Nepal will have increased 33, and
The number of flight seats per year will have reached 10 million (seating capacity of B757 basis)
(3) Railway Transport
Although development of rail transport was emphasized and programs launched since the Three Year
Plan (2010/11 to 2012/13), actual development is not very progressive. One of the major reasons is the
high cost for long-distance freight and passenger services compared to road transport. However, with
the trade with neighboring countries expanding, rail services now have higher potential and is viewed
as contributable mode for trade and tourism in the long run.
1) Vision
Development of a reliable, safe, accessible, and environment-friendly rail transport.
2) Goal
To achieve a balance between social, economic, and geographical development by building a safe,
reliable, and environment-friendly national railway network.
3) Objective
i) To contribute to socio-economic integration by expanding international trade relations through the
development of rail transport.
ii) To operate reliable and safe rail services to contribute to geographical balance and development.
4) Strategies
Strategy-1 To identify national needs and develop and expand railways based on feasibility
studies.
Work
Policies-1
1. A national strategic network of railways will be developed based on a master plan.
2. Railways included in the project bank following feasibility will be constructed and
expanded.
Strategy-2 To enhance the institutional capacity of the Railway Department.
Work
Policies-1
1. Legal and policy arrangements will be put in place for the management of
railways.
2. The capacity of human resources engaged in the construction, operation, and other
managerial aspects of railways will be enhanced.
Strategy-3 To develop reliable alternative sources of investment for the development of
infrastructure and operation of rail transport.
Work
Policies-1
1. Private investment will be attracted to the construction of metro and monorail in
feasible urban areas including Kathmandu Valley by preparing detailed project
reports.
2. While attracting foreign direct investment for the construction and operation of
railways, the latest approaches to contract management will be adopted. Source: JICA Survey Team
Data Collection Survey on the Sindhuli Road Capacity Enhancement in Nepal FINAL REPORT
3-14
5) Major Problem
Lack of policy, legal and operational standards for the construction and operation
Difficulties in acquiring and compensating for the lands
Lack of skilled human resources related to rail transport
Absence of a plan of action for attracting and encouraging much-needed investments
6) Expected Outcome
Completion of East-West Railway project preparation including land acquisition,
Completion and operation of three sections totaling a length of 306 km (Kakarvitta – Inaruwa
section, Jayanagar – Janakpur – Bardibas – Nijgadh – Birgunj section, and Jogbani – Bathnaha –
Biratnager section)
Completion and operation of two cross-border railways (Jalpaiguri – kakadvitta, Nautanwa –
Bhairahawa, and Nepalgunj Road – Nepalgunj Railway)
Preparation of detailed project reports and modalities of investment and construction of railways
connecting Birgunj – Kathmandu, Rasuwagadhi – Kathmandu, Kathmandu – Pokhara – Lumbini,
Commencement of detailed project report for the construction of 24 km of metro railway in
Kathmandu Valley
(4) Urban Development
Building a planned, environmentally- friendly, disaster-resilient, properly-managed, inclusive,
economically dynamic, and picturesque cities equipped with modern infrastructure is necessary for a
balanced and inclusive development of the country. Emergence of new cities with increase of
municipalities has brought about migration from the surrounding villages to these cities.
3.3.2.3 Programs and Projects to be Implemented in the Fifteenth Plan
The Fifteenth Plan classifies programs and projects to be implemented in a prioritized manner and divides
the programs and projects in to five types. These programs and projects are briefly explained hereunder.
1) National Pride Projects
With a view to achieving rapid socio-economic uplifting of the country, the government of Nepal has
identified twenty-two (22) strategically important projects that focus on large-scale infrastructure
building including cultural and environmental protection and has been implementing them since the
fiscal year 2011/12. These projects are given highest priority by enduring resource allocations and
making provisions for intensive monitoring of their implementation. The Fifteenth Plan strategizes
completion of on-going implementation projects by its planned period. It also emphasizes completion
of pre-implementation works of the projects under preparation within the first two years of the plan
period in order for initiating their implementation in time. These projects are listed below.
i) Gautam Buddha Regional and International Airport
Data Collection Survey on the Sindhuli Road Capacity Enhancement in Nepal FINAL REPORT
3-15
ii) Pokhara Regional and International Airport
iii) Nijgadh International Airport, Bara
iv) Pashupati Area Development
v) Lumbini Area Development
vi) Rastrapati Chure-Terai-Madhesh Cooperation Program
vii) Melamchi Drinking Water
viii) Upper Tamakoshi Hydropower
ix) Budhigandaki Hydropower
x) West Seti Hydropower
xi) Electricity Transmission Project (Millennium Challenge Account-Nepal)
xii) Bheri-Babai Diversion Multipurpose
xiii) Babai Irrigation
xiv) Rani-Jamariya-Kularia Irrigation
xv) Sikta Irrigation
xvi) Kathmandu-Terai Expressway (Fast Track)
xvii) Mid-hill Pushpalal Highway
xviii) Postal Highway (Terai Hulaki Marg)
xix) North-south Koshi Corridor
xx) North-south Kaligandaki Corridor
xxi) North-south Karnali Corridor
xxii) East-west Railway, KTM Metro-rail
Projects that have close relation with the Sindhuli Road are Kathmandu-Terai Expressway and Mid-
hill Highway. Brief details of the projects are provided in Chapter 5.
2) Game Changer Projects
These are transformative projects that have broad impact and are of distinct nature and play an
important role in creating a basis for a strong economy at the local level and contribute to achieving
the long-term vision and the national goals set by the Fifteenth Plan. Altogether eighteen (18) new
projects have been listed as the game changer projects. Among them, number of projects related to
infrastructure are eight and are as follows.
i) Upper Arun Hydropower Project
ii) National and Cross-border Transmission Lines Program
iii) East-west Highway Upgradation Project
iv) Galchhi-Trishuli-Mailung-Syafrubesi-Rasuwagadhi Road Project
v) Provincial and Local Road Construction and Maintenance Program
vi) New City Development Projects
vii) Urban Corridor Project
viii) Digital Nepal
Among the eight infrastructure projects, East-West highway upgradation project and New City

Data Collection Survey on the Sindhuli Road Capacity Enhancement in Nepal FINAL REPORT
3-16
Development Project are relevant to the Sindhui Road. Brief explanation of these projects is provided
in Chapter 5.
3) Major Programs
Major programs have been identified and developed considering the need for sectoral and provincial
balance that are aimed for achieving the long-term vision goals and the national and sectoral goals set
in the Fifteenth Plan and listed below. This program will study, review, and implement the existing
program with necessary modifications. New major programs will be developed and implemented after
completing the preparatory works.
i) High and equitable national income
ii) Development and full utilization of human capital potentials
iii) Universally accessible modern infrastructure and dense interconnectivity
iv) Well-being and decent life
v) Safe, civilized and just society
vi) Healthy and balanced environment
vii) Good governance
viii) Comprehensive democracy
ix) National unity, security, and dignity
Programs/projects related to road sector identified are,
SN Program/Project National
Goals
Project
Period
(start and
completion)
Total
Estimated
Cost
(Mil.
Rupees)
Expected Results
1 National highway
expansion and
upgradation
program
i, iii 2018/19 –
2023/24
282,420 Naubise-Muglin (173km) and Muglin-
Pokhara sectios of Prithvi Highway will
have been upgraded to four lanes and will
have been developed as an alternative
road.
Rani-Biratnagar-Itahari-Dharan road
(49km), Jatabi-Janakpur-Dhalkebar road
(40km), Birgunj-Pathlaiya (31km),
Belahiya-Butwal road (27km), and
Mohanpur-Attariya road (14km) will
have been upgraded
Suryabinayak-Dhulikhel (22km) section
of Araniko Highway will have been
upgraded to four lanes and Dhulikhel-
Dolalghat-Barhabise-Kodari section
(87km) will have been upgraded to two
lanes and blacktopped.
Siddhartha Highway (Butwal-Palpa-
Pokhara (157km)) will have been
dualized
123km of Dobhan-Olangchungola
section will have been blacktopped
261km of Bhittamode–Bardibas-
Khurkot-Manthali-Lambagar section will
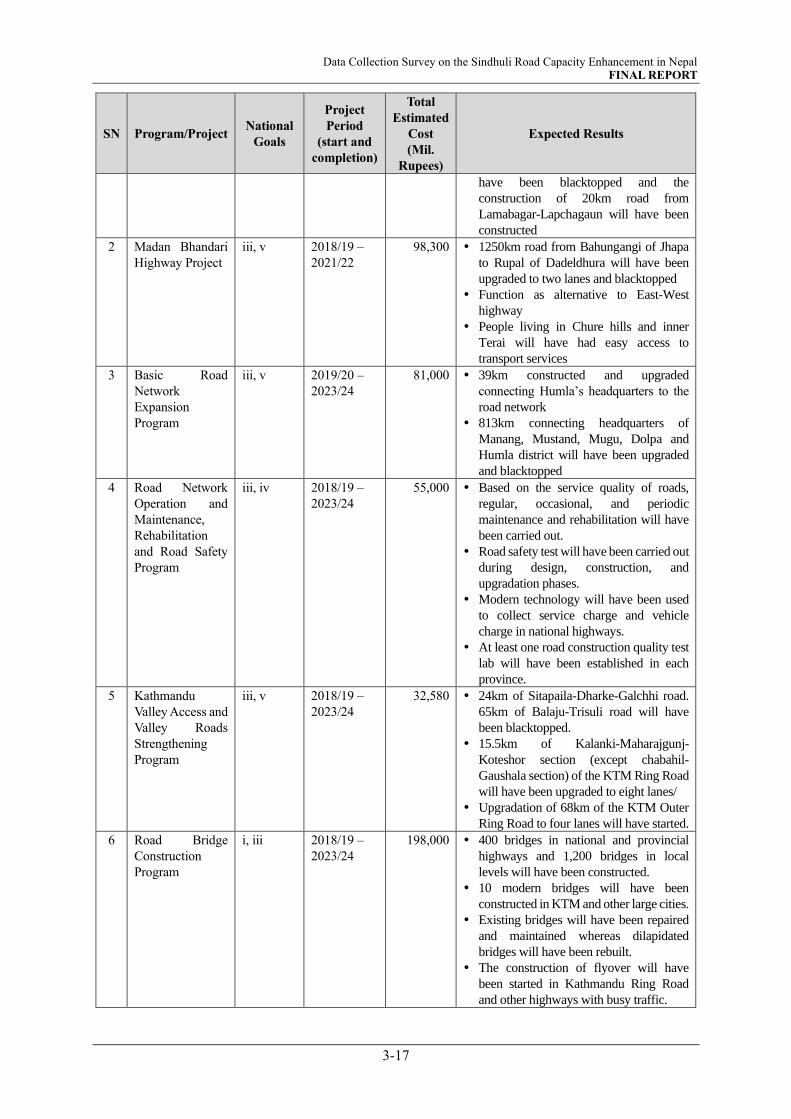
Data Collection Survey on the Sindhuli Road Capacity Enhancement in Nepal FINAL REPORT
3-17
SN Program/Project National
Goals
Project
Period
(start and
completion)
Total
Estimated
Cost
(Mil.
Rupees)
Expected Results
have been blacktopped and the
construction of 20km road from
Lamabagar-Lapchagaun will have been
constructed
2 Madan Bhandari
Highway Project
iii, v 2018/19 –
2021/22
98,300 1250km road from Bahungangi of Jhapa
to Rupal of Dadeldhura will have been
upgraded to two lanes and blacktopped
Function as alternative to East-West
highway
People living in Chure hills and inner
Terai will have had easy access to
transport services
3 Basic Road
Network
Expansion
Program
iii, v 2019/20 –
2023/24
81,000 39km constructed and upgraded
connecting Humla’s headquarters to the
road network
813km connecting headquarters of
Manang, Mustand, Mugu, Dolpa and
Humla district will have been upgraded
and blacktopped
4 Road Network
Operation and
Maintenance,
Rehabilitation
and Road Safety
Program
iii, iv 2018/19 –
2023/24
55,000 Based on the service quality of roads,
regular, occasional, and periodic
maintenance and rehabilitation will have
been carried out.
Road safety test will have been carried out
during design, construction, and
upgradation phases.
Modern technology will have been used
to collect service charge and vehicle
charge in national highways.
At least one road construction quality test
lab will have been established in each
province.
5 Kathmandu
Valley Access and
Valley Roads
Strengthening
Program
iii, v 2018/19 –
2023/24
32,580 24km of Sitapaila-Dharke-Galchhi road.
65km of Balaju-Trisuli road will have
been blacktopped.
15.5km of Kalanki-Maharajgunj-
Koteshor section (except chabahil-
Gaushala section) of the KTM Ring Road
will have been upgraded to eight lanes/
Upgradation of 68km of the KTM Outer
Ring Road to four lanes will have started.
6 Road Bridge
Construction
Program
i, iii 2018/19 –
2023/24
198,000 400 bridges in national and provincial
highways and 1,200 bridges in local
levels will have been constructed.
10 modern bridges will have been
constructed in KTM and other large cities.
Existing bridges will have been repaired
and maintained whereas dilapidated
bridges will have been rebuilt.
The construction of flyover will have
been started in Kathmandu Ring Road
and other highways with busy traffic.

Data Collection Survey on the Sindhuli Road Capacity Enhancement in Nepal FINAL REPORT
3-18
SN Program/Project National
Goals
Project
Period
(start and
completion)
Total
Estimated
Cost
(Mil.
Rupees)
Expected Results
7 Tunnel Road
Development
Program
i, iii 2019/20 –
2023/24
53,660 2.5km long tunnel will have been
constructed at Nagdhunga – Sisnekhola
section of Tribhuvan highway.
Studies will have been conducted and
detailed project reports will have been
prepared and implemented based on the
feasibility for tunnel roads in Siddhababa
section of Siddhartha highway, Tokha-
Gurje Bhanjyang section of Tokha-
Chahare-Bidur road, Betrawati-Syfrubesi
section of Galchhi-Trishuli-Mailund-
Syafrubesi-Rasuwagadhi road, Khurkot-
Chiyabari section of BP highway, Hemja-
Narapul section of Mid-hill highway,
Sahajpur section of BP nagar-khutiya-
Dipayal road, Thankot-Chitland road and
Lamabagar-Lapchegaun section of
Dolkha-Singati-Lamabagar-Lapchagaun
road
Source: JICA Survey Team
4) Major Programs of Provinces
Identified and included with support from provincial governments, these programs envisage to achieve
equitable and balanced development through collaborated and coordinated effort between federal
government and provincial governments for effective implementation. Programs of provinces that have
relevance with the Sindhuli Road are summarized hereunder. The national goals mentioned in the
details refer to those listed in the previous section 3) Major Programs.
SN Program/Project National
Goals
Project
Period
(start and
completion)
Total
Estimated
Cost
(Mil.
Rupees)
Expected Results
Province 2
1 Underground
Irrigation System
Management
Project
iv 2019/20 –
2021/22
150 Underground irrigation systems will
have been rehabilitated, operated with
irrigation facilities for agriculture.
Agricultural production and
productivity will have increased.
Province 3 (Bagmati Province)
1 Bhimphedi –
Kulekhani Tunnel
Road
iv, v 2019/20 –
2023/24
13,000 3.5km tunnel road from Bhimphedi to
Kulekhani will have been constructed
Travel duration and distance between the
provincial capital of Bagmati Province
and the federal capital will have been
reduced
Source: JICA Survey Team

Data Collection Survey on the Sindhuli Road Capacity Enhancement in Nepal FINAL REPORT
3-19
5) Major Projects under Public-Private-Partnership
The Fifteenth Plan also emphasizes development through public-private-partnership (PPP) scheme.
Projects identified focus on the construction and operation of physical and urban infrastructure, forests
and industry, and the service sector. Details of major projects that are deemed to have relevance with
the Sindhuli Road are given below. The national goals mentioned in the details refer to those mentioned
in the previous section 3) Major Programs.
SN Program/Project National
Goals
Project
Period
(start and
completion)
Total
Estimated
Cost
(Mil.
Rupees)
Expected Results
Province 2
1 Agricultural
Equipment and
Tools Installation
Industry
iv, x 2020/21 –
2027/28
15,000 Production and availability of
modern equipment suitable will
have increased.
Self-reliance of the country in the
production of essential agricultural
equipment.
Increased production and
productivity due to modernization
and commercialized of agriculture
sector.
Source: JICA Survey Team
3.4 FIVE YEAR STRATEGIC PLAN (2073-2078)
The Five Year Strategic Plan (2073-2078:2016-2021) was prepared by MOPIT (Ministry of Physical
Infrastructure and Transport) in 2015 with a view that infrastructure development paves the way for the
economic prosperity of the country as dreamt by the people after the new federal constitution was
promulgated in the country.
3.4.1 Objective
i) to make road transport service between state – state – local agencies, neighboring countries more
effective, sustainable, efficient and less costly.
ii) to manage gradual development of railway transportation
3.4.2 Basic Concept
i) Develop and reinforce the national road network
ii) Develop and make access of road transport easy, convenient, safe, and effective
iii) Connect Kathmandu and the capital of each state by a 4-lane national highway and other alternate
roads,
iv) Develop national road network to assist business expansion, diversification, and interim transit,
v) Develop and expand the road network to assist the social economic integration, industry-trade
development, tourism development, commodity and service production and distribution,
vi) Operate programs for application of commitment presented in different international platforms

Data Collection Survey on the Sindhuli Road Capacity Enhancement in Nepal FINAL REPORT
3-20
associated with the development and reinforcement of road network,
vii) All strategic roads and bridges constructed by the road department will be of 2 lanes or more,
viii) Avoid scattering of internal and external source of investment in road subdivision
ix) Develop railway transport
x) Improve the existing transportation management system and make human and goods
transportation secure, effective, and less costly,
xi) Discourage transportation with low occupancy and encourage usage of public transportation
system
xii) Develop water transport.
(1) Main Programs
To achieve the objective of the strategic plan, MOPIT has put forward following programs for the road,
railway and transport management.
1) Road
i) Programs for reconstruction/rehabilitation of earthquake affected road structures (includes
damaged sections of the Sindhuli Road).
ii) Implement construction of national highways and/or black-topping of existing road to connect the
headquarters of two left out districts
iii) Upgradation of 18 roads (654km) within 3 years and 19 more roads (1,524km) in 5 years’ time
(upgradation of the Sindhuli Road is not listed)
iv) Development of main highways (construction and upgradation).
Those related to the Sindhuli Road are as follows:
Widening E-W Highway (Kakarbhitta -
Butwal section (558km)
Construction of Dharan-Chatara-
Gaighat-Katari- Sindhuli Bazar-Hetauda
Road (318km)
Construction of Ghurmi- Chatara (169km)
of Mid-hill Highway3
Upgrading Birgunj-Narayanghat-Mugling-
KTM-Dhulikhel-Barabise-Kadari (390km)
Construction of Bhitode- Sindhuli -
Manthali-Dolkha-Lamcha road (310km,
1km long tunnel)
Upgrading Birgunj- Pathlaiya (28km) to 4
lanes
v) Study for development of the Sindhuli Road as a touristic road
2) Railway
i) Construction of railway track bed and bridges (Kakarbhitta-Bardibas-Simara-Birgunj: 130km) will be
completed in four (4) years and Jayanagar (India)-Janakpur-Bardibas in three (3) years
3) Transport Management
i) Install Intelligent Traffic System, Construct pedestrian paths in Kathmandu Valley, operation of Bus-
Rapid Transit system, establishment of bus terminals
ii) Introduction of environmental friendly vehicles
3 Ghurmi-Chatara section begins about 3.5 km from Khurkot Bazar on Sindhuli Road

Data Collection Survey on the Sindhuli Road Capacity Enhancement in Nepal FINAL REPORT
3-21
(2) Expected Achievements
Reestablishment of all roads (400km) and bridges (87) affected by the earthquake.
Reconstruction and upgrading 135km of roads as a model roads reconstruction after earthquake.
All 75-district headquarters (currently 73) will be connected by national highways.
Total length of 4 lane roads will reach 941 km (currently 45km)
Total length of 2 lane roads (expansion, construction, or upgradation) will reach 4,656 km
(currently 1,266km)
4,400 km of SRN roads will have been newly black topped.
Total number of bridges erected will reach 2,554 (currently 1,904)
M-H Highway, Dharan – Hetauda and Tulsipur – Surkhet Road will have been in operation.
Construction and improvement of 4 north-south corridors including Birgunj-Narayanghat-
Kathmandu-Tatopani road will be in operation
3.4.3 Relevance with this Survey
The objective of the plan emphasizes enhancing road transport service between state – state – local
agencies, and neighboring countries in more effective, sustainable, efficient and less costly manner, which
coincides with the objective of this Survey that aims to enhance the overall capacity of the Sindhuli Road.
The Survey objective is also in line with concepts i), ii), iv), v), vii) listed in the basic concept.
3.5 PRIORITY INVESTMENT PLAN
3.5.1 1st Priority Investment Plan
The first Priority Investment Plan (PIP) was prepared in 1997 that proposed addition of feeder roads to the
SRN, consisting of 15 National Highways and 51 feeder roads established in 1995 and comprising of
approximately 5,015km of open and operational roads, to provide connectivity to all district headquarters
and to enable balanced regional growth in an efficient and cost-effective manner. Sindhuli Road was
among one of the national highways identified in this plan.
3.5.2 2nd Priority Investment Plan
The second PIP for the road sector was established in 2007 that envisaged to reach target accessibility
levels by 2016 (87 percent of hills and 100 percent of Terai population within four-hour and two-hour of
walking time, respectively, to the nearest all-weather road). This covered a 10 year period (2007–2016)
with prioritized investments to expand the network of the SRN (approximately to 9,700km by 2016) and
maintenance strategy for the existing (and expanded) network through analysis of the existing and
committed SRN using the 4th Highway Development Model (HDM-4).
When 2007 PIP was established, construction of Section I and Section IV of the Sindhuli Road had already
been completed and were under operation. Section III was at the verge of completion. The remaining
section from Nepalthok to Dhulikhel (Section IV) was identified in the plan as one of the committed
schemes for increasing and strengthening direct links between Kathmandu and the terai regions. The plan
recognizes significant outcome of the Sindhuli Road project (significant reduction in travel distance

Data Collection Survey on the Sindhuli Road Capacity Enhancement in Nepal FINAL REPORT
3-22
between Kathmandu and the Eastern Terai) after completion of the entire section but also points out that
the full potential benefits to Eastern Region traffics will however only be obtained if the road were
constructed to full 2-lane bitumen standards and probably upgrading (widening) of the Kathmandu-
Bhaktapur-Banepa-Dhulikhel section.
3.5.3 Mid-Term Review of 2007 Priority Investment Plan
The GON (Government of Nepal) revised the second PIP (2007-2016) in 2016 that extended the plan up
to FY 2022. It has found that the SRN has been expanded significantly in excess of its planned growth and
many of those additional roads were earthen local roads connecting areas of relatively low population
density that were not prioritized during second PIP. The expansion of the SRN has been achieved by the
re-designation of existing local roads and earth tracks and by the inclusion of additional links in areas of
relatively low population density that were not previously prioritized.
This has raised substantial potential demand for the upgrading of the 6,125km of mostly newly designated
strategic roads – and a significant risk that funds and effort devoted to these activities will detract from the
primary task of maintaining the essential core elements of the national network. The PIP comprises three
elements;
Maintenance – Regular, Periodic & Rehabilitation
Upgrading – From earth/gravel to seal or higher standard
New construction – New links to Kathmandu
The priority for DOR (Department of Roads) activity and expenditure is the maintenance of the existing
network. The emphasis is on the provision of a well-maintained road surface for the highly-trafficked core
elements of the network and on asset preservation, coupled with year-round access, for the remainder.
Given the rapid expansion of network, it is important that interventions are prioritized to ensure that the
most important elements are given adequately attention. The plan points out that DOR should focus on the
strategic elements of the road system to ensure an adequate and improving network to meet the
fundamental economic needs of the nation. The primary issues of accessibility and connectivity have to
large extent been resolved and the emphasis is now on improving the reliability, efficiency and safety of
the network.
The review introduces new categories of National Highway (NH) and Feeder Road (FR) and proposes to
reclassify the existing network so that investment and expenditure can be directed towards the more
significant and important elements of the network. Table 3.5-1 shows the reclassification of National
Highways proposed in the mid-term review, while the proposed reclassification of both the NH and the FR
is indicated in Figure 3.5-1.
Table 3.5-1 Proposed Re-classification in the Mid-term Review of 2007 PIP
Class Function Highways, links Remarks
Class 1 Core network of
highways
E-W Highway, main links to Kathmandu,
Pokhara & major border crossings
Asian Highway Standards
(construction or upgrade)
Class 2 Secondary highways Links onto hills serving two or more
District HQs
Mid-Hills Corridor, the Postal
Road and access to minor
border
Source: Mid-Term Review of Sector Wide Road Study and Priority Investment Plan 2007, DOR
Data Collection Survey on the Sindhuli Road Capacity Enhancement in Nepal FINAL REPORT
3-23
The review recommends the followings;
National Highways Class 1 should be maintained to the highest standards. They will generally have
an asphaltic concrete surface as the higher traffic volumes will generate greater benefits as a result of
the investment.
The Class 1 Highway network should be progressively upgraded to Asian Highway Standards, with
particular emphasis on safety features, including safety barriers, signage, improved road markings
and overtaking lanes (where these can be safely provided).
Class 2 National Highways should be constructed and maintained to appropriate standards for their
function and location. Asphalt concrete surfacing may be justified for high traffic sections, with
DBST elsewhere: all sections should be sealed, with progressive widening to 2-lane standards for the
more heavily trafficked sections.
3.5.4 Priority Investment Plan (2023-2033)
The validity of the extended 2007 PIP will soon be expired. The succeeding PIP for the period of 2023-
2033 is scheduled to be prepared under the Master Plan for Road Connectivity Project under ADB (Asian
Development Bank).
3.5.5 Relevancy with this Plan
Sindhuli Road is not included in prioritization process of the second PIP as, according to the Plan, the road
was already included in Designated SRN (Strategic Road Network). On contrary, the plan points out that
the Sindhuli Road, when completed will provide a substantial reduction in travel distance between
Kathmandu and the Eastern Terai, although it will not benefit traffic bound directly to Hetauda, Birgunj or
India via Raxaul. The full potential benefits to Eastern Region traffic will however only be obtained if the
road were constructed to full 2-lane bitumen standards.
The Mid-term review recommends maintaining Class 2 Secondary Highways to appropriate standards and
widened to 2-lanes progressively. Sindhuli Road as a road that links onto hills serving two or more District
HQs is categorized as Class 2 and its widening/upgrading is relevant with the plan.
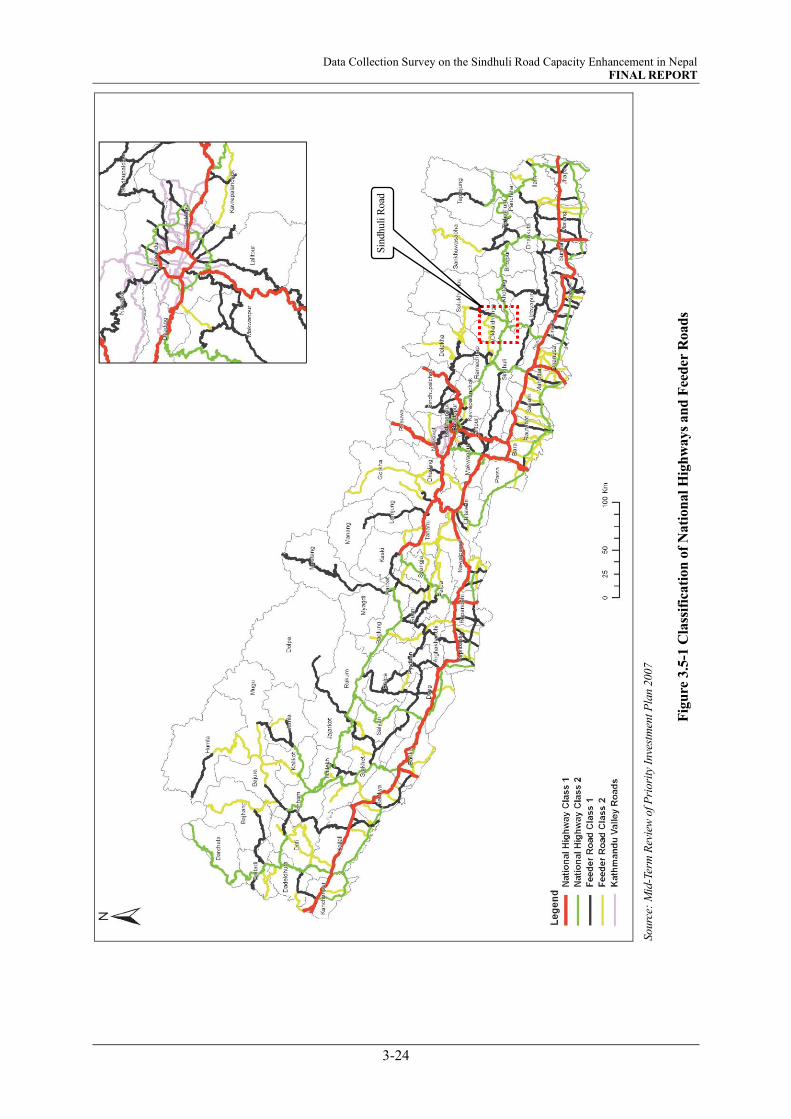
Data Collection Survey on the Sindhuli Road Capacity Enhancement in Nepal FINAL REPORT
3-24
Sourc
e: M
id-T
erm
Rev
iew
of
Pri
ori
ty I
nve
stm
ent
Pla
n 2
007
Fig
ure
3.5
-1 C
lass
ific
ati
on
of
Nati
on
al
Hig
hw
ays
an
d F
eed
er R
oad
s
Sin
dhuli
Road
Data Collection Survey on the Sindhuli Road Capacity Enhancement in Nepal FINAL REPORT
4-1
CHAPTER 4 TRANSPORT SECTOR OVERVIEW
4.1 INTRODUCTION
Nepal is a landlocked country with most part of the country having mountainous terrain, fragile geology
and tough weather conditions. Nearest outlet to the sea is Kolkata in India, which is more than a thousand
kilometers away. Agencies related are aware of the transport sector developmental needs, however, the
geography of the country poses a significant barrier for the country’s aim to improve transport. In the north
the high plains with unique terrain compounded with sophisticated geology impedes the development,
while in the southern lowland plain, rivers descending from the mountains change course frequently,
presenting another challenge.
Despite of the nation’s difficult terrain, development of road transport and aviation are somewhat
significant, and the two modes are currently the most popular modes of transportation. Others include
ropeways and railroad. Road transport, which dominates the sector accounts for almost all domestic
passenger and freight movements. Aviation sector contributes to mostly passenger movements to key
commercial and tourist destinations as well as remote areas on Nepal. Aviation section is recently second
mode of movement in the country. Efforts for development of railway is being emphasized, achievement
so far is far from the targeted indicators. Although ropeways are currently developing, it is limited to as
tourist rather than public transportation. Contribution of waterways is almost negligible.
Transport sector is however growing. The Statistical Data Yearbook 2019 indicates an average growth of
4.5 percent in the period of 2012 to 2018. In FY 2019/20, the sector accounts for 5.2 percent and in FY
2020/21 it accounts to 5.4 percent of the GDP (refer to Section 2.2.2).
4.2 ROAD TRANSPORT
Roads are the predominant mode of transport in Nepal. Remarkable progress has been made in the
development of road sector in the past two decades. National road transport network has achieved its target
of connecting the District Headquarters by national road as set in the 14 Development Plan. With view to
secure efficient, safe, smooth and reliable traffics throughout the year, agencies responsible for
development of road network the agencies responsible are dedicated in improving and expanding the road
network of the country further to meet the targets set in the 15th Development Plan and further to those set
in the long-term in the long-term vision 2043.
4.2.1 Road Network
Roads in Nepal are broadly classified into two categories – the strategic road network (SRN), which is
managed by the central level and the local road network (LRN), which is managed by the local level (refer
to Figure 4.2-1). The SRN consists of national highways and links major towns and cities, and feeder roads
providing linkages from the national highways to district headquarters. Local road consists of district (or
rural) roads, urban roads, village roads, agricultural roads and other tracks and trails. All roads, tracks and
trails put together; the total length extends to an estimated 80,000 plus km. Road density as of 2018/19 is
0.55km/km2 and is the lowest road density in South Asia.

Data Collection Survey on the Sindhuli Road Capacity Enhancement in Nepal FINAL REPORT
4-2
Source: JICA Survey Team
Figure 4.2-1 Classification of Road Network
4.2.1.1 Strategic Road Network
SRN consists of national highways (NH) and feeder roads (FR). These roads serve as the backbone for the
physical and economic integration of the country and enables year-round administrative, political and
social connectivity throughout Nepal. The principal responsibility for the development (Planning, design,
construction) and management of SRN is vested at the central level with the DOR (Department of Roads)
under the aegis of the MOPIT (Ministry of Physical Infrastructure and Transport).
Total length and the surface condition of the strategic roads for the period between 2009/10 – 2018/19 are
shown in Figure 4.2-2. The total length of SRN in 2018/19 is approximately 13,448 km. Of this, 6,979km
(51.9%), is blacktopped, 2,277km (16.9%) graveled, and 4,191km (31.2%) earth road. This implies that
nearly half of Nepal’s SRN, primarily two-lane roads remain unpaved. The poor quality of the road means
that it cannot currently support fast travel. In 2009/10, the total length was 10,835km. In 9 years 2,613km
of SRN roads have been developed.
Source: 15th National Development Plan and Statistics of Strategic Road Network 2017/2018
Figure 4.2-2 Statistics of Strategic Road Network and Road Surface
As of 2018/19, the density of the roads is 9.14km/1000km2, and the number of direct beneficiaries (or
influenced people) are 1,970.20 person/km. According to a survey conducted in 2018, forty-three percent
4,952
5,574
6,369
6,823
6,979
2,065
1,888
1,735
2,044
2,277
3,818
4,174
4,389
4,031
4,191
0 2,000 4,000 6,000 8,000 10,000 12,000 14,000 16,000
2009/10
2011/12
2013/14
2015/16
2018/19
kmBlacktopped Graveled Earthern
Total: 13,448
Total: 12,898
Total: 12,494
Total: 11,636
Total: 10,835

Data Collection Survey on the Sindhuli Road Capacity Enhancement in Nepal FINAL REPORT
4-3
(43%) of the strategic roads are in good condition, forty-two percent (42%) of the roads are in average
condition and the remaining fifteen percent (15%) of the roads are in a poor state.
(1) National Highways
1) New Designation and Reclassification of National Highways
The National Highway Network (NHN) is replacing the SRN. The jurisdiction however remains under
the DOR. New highways have been designated and added to the existing strategic road network. In
addition, the nodes of the existing national highways have been reclassified. The replacement of SRN
to NHN including addition and re-classification were presented to the Cabinet and was approved on
Ashwin 2, 2076 (September 19, 2019). Prior to approval, the number of classified national highways
were altogether 21. Now it stands to 80 highways (NH01-NH80). Names of the highways with the old
and the new nodes, where available, and approximate length of each highway are given in Table 4.2-1.
Furthermore, some of the major changes, particularly those that are closely related with Sindhuli Road
are as follows.
East-West Highway retains its Node as NH01.
Mid-Hill Highway has renumbered to NH03 from NH18.
Likewise, Postal Highway has been changed to NH05 from NH17.
Tribhuvan Highway has gone down to NH41 from NH02
Arniko Highway has been lowered to NH34 from NH03
Prithvi Highway (Naubise-Pokhara) has been renumbered as NH17 from NH04
Sindhuli Road has gone down to NH13 from NH06
Kathmandu-Terai/Madhesh Fast Track is now NH33 (earlier it was NH20)
Kathmandu Ring Road renumbered to NH39 from NH16
Outer Ring Road has been changed to NH38 from NH21
Table 4.2-1 List of National Highways
S.N Highway Node
Name of Road(s) Length
(km) Old New
1 NH01 NH01 East-West (Mahendra) Highway 1,028
2 NH07 NH02 Mechi Highway 352
3 NH18 NH03 Pushpalal (Mid Hill) Highway 1,787
4 NH04 Birtamod-Chandragadhi-Bhadrapur-Mechi bridge 15
5 NH17 NH05 Postal Highway 1,016
6 NH06 Chatara-Mulghat-Majhitar-Amarapurdanda-Ganeshchowk (Tamor
Corridor) 135
7 NH07 Pakli-New Koshipul-Rupnagar, Pakli-Nadaha-Koshipul-Chatra 66
8 NH08 NH08 Koshi Highway 320
9 NH09 Madan Bhandari Highway 1,200
10 NH10 Deurali-Mudhe-Chainpur-Bohratar 92
11 NH11 Fikal-Shriantu-Chhabise Ilam 19
12 NH12 Ghurmi-Chatara-Udaipur 163
13 NH06 NH13 Bardibas-Sindhuli-Khurkot-Dhulikhel (BP Highway) 160
14 NH19 NH14 Gaighat-Maahuli Khola-Rupani-Kunauli-Rajbiraj-Chhinnamasta Niur,
Kunauli Rajbiraj Kanchanpur Barrier-Fatehchaur-Basaha Udaypur 100

Data Collection Survey on the Sindhuli Road Capacity Enhancement in Nepal FINAL REPORT
4-4
S.N Highway Node
Name of Road(s) Length
(km) Old New
15 NH15 Gwarko-Lubhu-Lakuribhanjyang-Kushadevi-Panauti-Dahaltar 128
16 NH09 NH16 Thandi-Bhagwanpur-Lahan, Kadmahchok-Gaighat-Mahure-Kharpa-Solu 144
17 NH04 NH17 Naubise-Muglin-Pokhara (Prithvi Highway) 173
18 NH18 Balaju-Trishuli-Dhunche-Syaphrubeshi 65
19 NH19 Ridi-Balkot-Hanspur-Pyuthan, Pyuthan-Surkhet road 220
20 NH20 Madar-Chaurahawa, Golbazar Siraha Sanghure Udaipur, Mirchaiya-
Katari-Ghurmi, Hilepani-Okhaldhunga-Salleri 193
21 NH21 Sitapaila-dharke 24
22 NH22 Dhalkewar-Janakpur-Jatahi, Ghorghans-Nimchaur-Thalahighat-
Akaraharghat 48
23 NH23 Diktel-Solu-Junbensi-Khahare-Jiri Bazar-Tamakoshi-Charikot-
Khadichaur 291
24 NH24 Lalgad-Ranibaas (R. T. O. Road) -Bishmat-Bahunmara-B.P. Highway 29
25 NH25 Dumre-Beshisahar-Chame 108
26 NH26 Jamuniwas-Bateshwar-Santipur-Kurtha-Janakpur 19
27 NH27 Sitalpati Salyan Kubhinde Baluwa Sangrahi 40
28 NH28 Bhittamod-Jaleshwar-Bardibas, Khurkot-Manthali-Tamakoshi-Singti-
Lamabagar - Lapchegaun 281
29 NH29
Kanchanban-Janaki Medical College-Mithileshwar Sabaila-Siraha-
Naktajhij-
Ramlaxmanchowk-Healthpost Mahendra Highway
30
30 NH30 Janakpur (Mujelia) -Dhanushadham-Dharapani Ramayana Circuit,
Tarapatti-Pathara M.R.M. Pushpalpur 36
31 NH31 Dolalghat Chautara 25
32 NH32 Nawalpur-Malangwa-Shonvarsha 30
33 NH20 NH33 Nijgadh-Kathmandu (Kathmandu-Terai Fast Track) 76
34 NH03 NH34 Kathmandu-Dhulikhel-Dolalghat-Khadichaur-Kodari (Araniko
Highway) 112
35 NH35 Piluhawa-Manamat-Kalaiya-Martihwa 25
36 NH36 Chandranigahpur Gaur 45
37 NH37 Hetauda-Bagmati-Tikabhairav-Bhaisepati-Ekantakuna (Kanti Rajpath) 86
38 NH21 NH38 Roundabout outside Kathmandu 68
39 NH16 NH39 Kathmandu Ring Road 27
40 NH40 Samakhushi-Tokha-Gurje-Bidur 26
41 NH02 NH41 Tribhuvan Highway 155
42 NH42 Thori-Bhandara-Malekhu, Galchi-Trishuli-Betrawati-Syaphrubesi-
Rasuwagadhi 197
43 NH43 Malekhu Dhading Salyantar 57
44 NH05 NH44 Thori-Bharatpur-Mugling, abukhaireni-Gorkha-Ghyampesal, Arughat-
Sirdiwas-Roila Bhanjyang 300
45 NH45 Khairanitar Bhimaad Kawasoti 106
46 NH46 Bhumhi-parasi 9
47 NH10 NH47 Belahiya-Bhairahawa-Butwal-Ramdi-Syangja-Pokhara (Siddhartha
Highway) 184
48 NH48 Tansen-Ridi-Korla 254
49 NH49 Bartung Tansen Reidi Vamitaksar Kharwang 98
50 NH50 Jitpur-Toulihawa-Khunuwa 30
51 NH51 Taulihawa Gorusinge Sandhikharka 83
52 NH52 Kakrahawa -Rudrapur, Saljandi-Sandhikharka-Devisthan, Burtivang-
Dhorpatan 222

Data Collection Survey on the Sindhuli Road Capacity Enhancement in Nepal FINAL REPORT
4-5
S.N Highway Node
Name of Road(s) Length
(km) Old New
53 NH53 Bhaluwang Liwang Rolpa Madichaur Daarbot 130
54 NH54 Koilabas-Lamahi, Arjunkhola-Ghorahi-Holeri-Thawang-Lukum (Shahid
Marg) 211
55 NH11 NH55 Amelia-Tulsipur-Shitalpati-Tharmare-Musikot (Rapti Highway) 169
56 NH56 Tharmare-Chaurajahari-Jajarkot Khalanga-Jumla Kundari-Mugu (Rara
Highway) 263
57 NH57 Chhinchu-Kudu-Jajarkot-Dunai-Dho-Tinje-Marim (Bheri Corridor) 317
58 NH13 NH58 Jamunaha-Nepalganj-Kohalpur-Surkhet-Khulalu-Hilsa (Karnali
Highway) 538
59 NH59 Murtiya (Indian border) -Gulariya-Bhurigaon-Telpani-Surkhet-Upper
DungeshwarBank-Bayuli Nagma Road 154
60 NH60 Surkhet-Dailekh-Mahabulekh-Galje, Nagma-Gamgadhi-Nakchelagna 302
61 NH61 Surkhet Tallo Dungeshwar-Satkhamba-Dullu-Pipalkot-Khulalu-Manma-
Nagma-Jumla Road 168
62 NH62 Khakraula-Tikapur-Lamki-Lodeghat-Bayalpata, Sanfebagar-Chainpur 228
63 NH63 Sanfebagar-Martadi-Kolti 111
64 NH64 Khodpe-Chainpur (Bajhang) 108
65 NH15 NH65 Khutiya-Dipayal-Chainpur-Urai Bhanjyang 296
66 NH14 NH66 Dhangadhi-Sahajpur-Budar-Syaule, Satbanjh-Thaktoli-Darchula-Tinker 350
67 NH67 Chandni-Bhimdatta-Brahmadev-Pancheshwar-Jhulaghat 201
68 NH68 Bhimad-Rampur-Mityal-Arung River 80
69 NH69 Jagat Bhanjyang-Mandalithan-Kebre Bhanjyang-Barikuna-Kisan-
Chapakot-Gajarkot Road, Syanja 42
70 NH70 Seti Dobhan-Bejang-Panchmul-Aruchaur Ghante Deurali, Syanja 46
71 NH71 Bhaluwang-Nuwakot-Khandaha-Kharwang 170
72 NH72 Dumkibas Bahuvan Tribeni 23
73 NH73 Surunga-Sarnamati-Tangandubba-Via-Lasungunj, Jhapa 25
74 NH74 Ilam (Biplate) -Maipokhari-Sandakpur, Ilam 50
75 NH75 Golden Everest Gr. Ring Road (Okhaldhunga-Solu-Salleri-Khotang-
Diktel) 135
76 NH76 Damak-Chisapani-Rabi 44
77 NH77 Bharatpur Metropolitan Great Ring Road 105
78 NH78 Damak Muncipality Ring Road 100
79 NH79 Godar (Dhanusha) Chisapani-Mainawati-Kalapani-Dudhauli-Sindhuli 20
80 NH80 MH Bastipur chowk (Siraha) B.P. Cancer Hospital-Belsot-Katari,
Udaypur 30
Total Length 14,913
Source: JICA Survey Team
2) Network
Network diagram of national highways as of 2020/21 is provided in Figure 4.2-3. The total length of
the 80 newly classified/designated national highways extends to 14,943 km as of 2018/191. The length
of highway exceeds that of the strategic roads because of national highways inside the urban area.
Out of 14,943km of national highway, 6,000 (40.1%) km is blacktopped, 1,150km (7.7%) is graveled,
and 5,763km (38.6%) is earth road.
1 Source: News Letter Department of Roads (DOR) Vol. 25, March 2021 and Statistics of National Highway SNH 2020/21, DOR
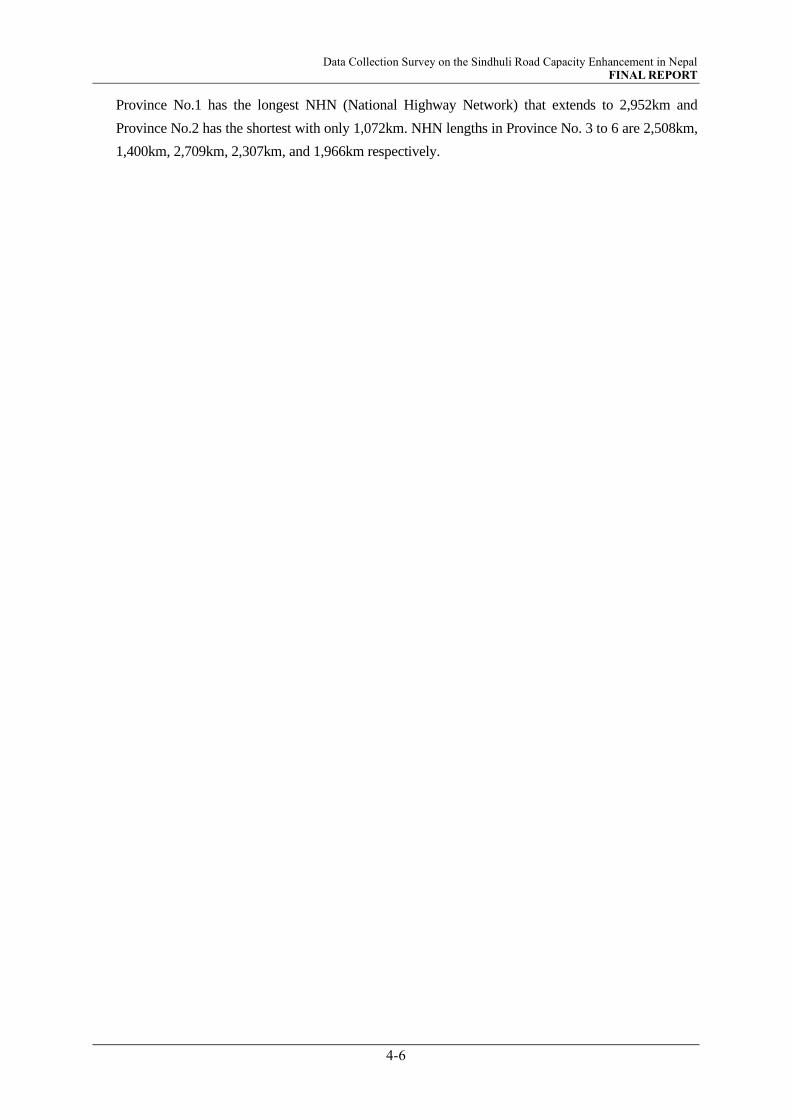
Data Collection Survey on the Sindhuli Road Capacity Enhancement in Nepal FINAL REPORT
4-6
Province No.1 has the longest NHN (National Highway Network) that extends to 2,952km and
Province No.2 has the shortest with only 1,072km. NHN lengths in Province No. 3 to 6 are 2,508km,
1,400km, 2,709km, 2,307km, and 1,966km respectively.
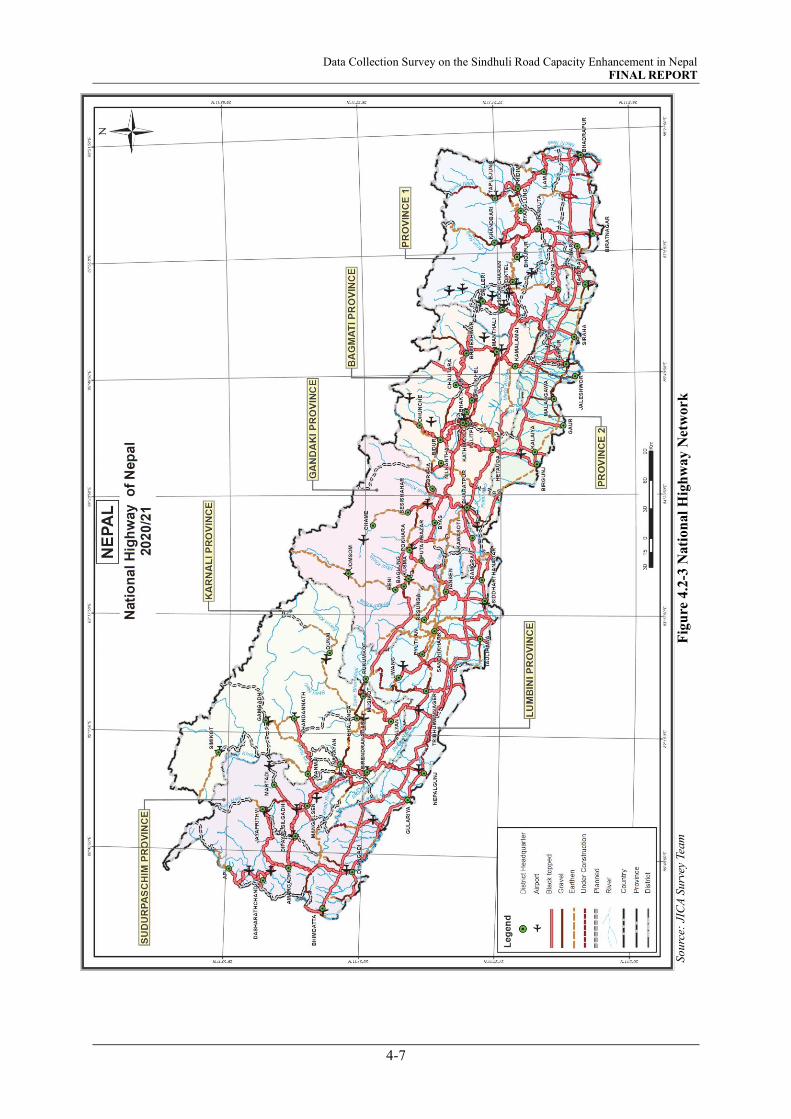
Data Collection Survey on the Sindhuli Road Capacity Enhancement in Nepal FINAL REPORT
4-7
So
urc
e: J
ICA
Su
rvey
Tea
m
F
igu
re 4
.2-3
Nati
on
al
Hig
hw
ay N
etw
ork
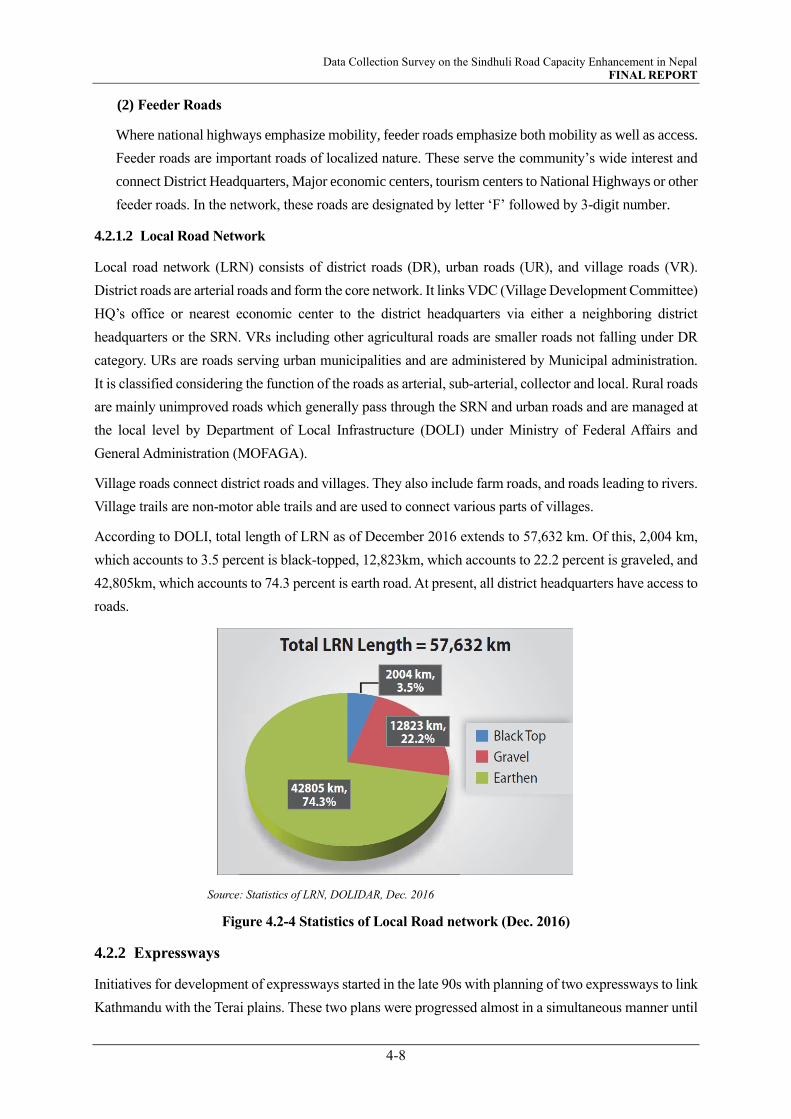
Data Collection Survey on the Sindhuli Road Capacity Enhancement in Nepal FINAL REPORT
4-8
(2) Feeder Roads
Where national highways emphasize mobility, feeder roads emphasize both mobility as well as access.
Feeder roads are important roads of localized nature. These serve the community’s wide interest and
connect District Headquarters, Major economic centers, tourism centers to National Highways or other
feeder roads. In the network, these roads are designated by letter ‘F’ followed by 3-digit number.
4.2.1.2 Local Road Network
Local road network (LRN) consists of district roads (DR), urban roads (UR), and village roads (VR).
District roads are arterial roads and form the core network. It links VDC (Village Development Committee)
HQ’s office or nearest economic center to the district headquarters via either a neighboring district
headquarters or the SRN. VRs including other agricultural roads are smaller roads not falling under DR
category. URs are roads serving urban municipalities and are administered by Municipal administration.
It is classified considering the function of the roads as arterial, sub-arterial, collector and local. Rural roads
are mainly unimproved roads which generally pass through the SRN and urban roads and are managed at
the local level by Department of Local Infrastructure (DOLI) under Ministry of Federal Affairs and
General Administration (MOFAGA).
Village roads connect district roads and villages. They also include farm roads, and roads leading to rivers.
Village trails are non-motor able trails and are used to connect various parts of villages.
According to DOLI, total length of LRN as of December 2016 extends to 57,632 km. Of this, 2,004 km,
which accounts to 3.5 percent is black-topped, 12,823km, which accounts to 22.2 percent is graveled, and
42,805km, which accounts to 74.3 percent is earth road. At present, all district headquarters have access to
roads.
Source: Statistics of LRN, DOLIDAR, Dec. 2016
Figure 4.2-4 Statistics of Local Road network (Dec. 2016)
4.2.2 Expressways
Initiatives for development of expressways started in the late 90s with planning of two expressways to link
Kathmandu with the Terai plains. These two plans were progressed almost in a simultaneous manner until

Data Collection Survey on the Sindhuli Road Capacity Enhancement in Nepal FINAL REPORT
4-9
recently when the Kathmandu-Kulekhani-Hetauda route lost momentum for not being able to attract
investors and is currently stagnant or may even have been abandoned. The Fast Track on the other hand is
currently on the construction stage, which according to the relevant agency is estimated to complete in
fiscal year 2023/24. After completion, this will be the first of its kind in the country.
Source: JICA Survey Team
Figure 4.2-5 Expressway (Fast Track)
4.2.3 Toll Roads
According to the Annual Progress Report FY 2075/76 of RBN (Roads Board Nepal), the agency that has
authority to collect road users fee, there are altogether four (4) road sections where road user’s fee is
currently being tolled. These are sections highlighted in red in Figure 4.2-6.
i) Naubise – Mugling section on Westward Route
ii) Mugling – Narayangarh section
iii) Narayangarh – Butwal section on E-W Highway
iv) Bhairawah – Bhumahi Road
Apart from the above, new sections of roads have been identified for toll collection. These new road
sections have been published in Nepal Gazette on April 15, 2019. These are sections highlighted in green
in Figure 4.2-6 and listed below.
New Sections published on Nepal Gazette (April 25, 2019) for Toll Collection
i) Kakadbhitta – Damak on E-W Highway
ii) Damak – Itahari on E-W Highway
iii) Biratnagar-Dharan
iv) Koshi – Chaiharwa on E-W Highway
v) Chaiharwa – Pathlaiya on E-W Highway
vi) Hetauda – Pathlaiya on E-W Highway
vii) Pathlaiya – Birgunj
viii) Dhulikhel – Khurkot on Sindhuli Road
ix) Khurkot – Sindhuli – Bardibas on Sindhuli Road
x) Panchkhal – Melamchi Road on AH
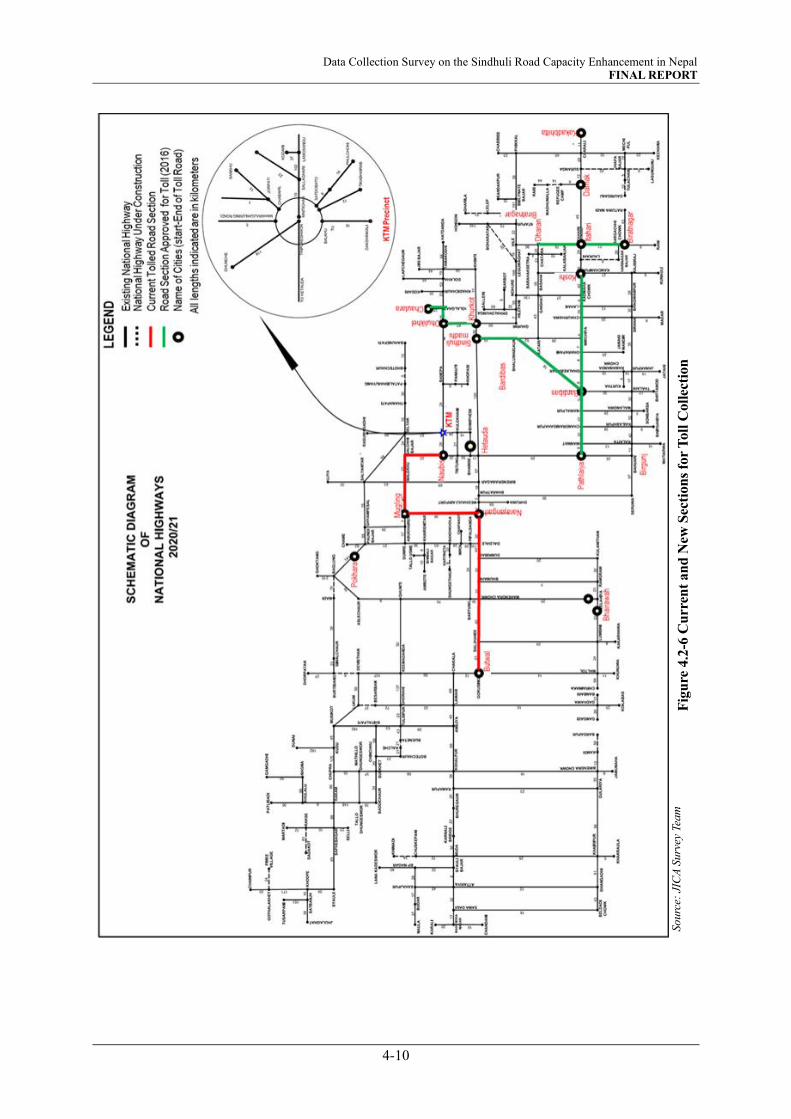
Data Collection Survey on the Sindhuli Road Capacity Enhancement in Nepal FINAL REPORT
4-10
Sourc
e: J
ICA
Surv
ey T
eam
Fig
ure
4.2
-6 C
urr
ent
an
d N
ew S
ecti
on
s fo
r T
oll
Coll
ecti
on

Data Collection Survey on the Sindhuli Road Capacity Enhancement in Nepal FINAL REPORT
4-11
It should be noted that these roads are simply integral sections of national highways (SRN) and are not
access-controlled expressways. Although the report does not mention, the Survey Team confirmed toll
collection at Mangaltar, along Dhulikhel-Nepalthok section. This was limited to public transport only.
Details on toll system is provided in the succeeding chapter.
4.3 RAILWAY TRANSPORT
4.3.1 Brief History
Railways in Nepal were built by the British. The first railway was a narrow gauge 39km long railway track
built in 1927 that connected Amlekhganj (Nepal) to Raxaul (India). This was mainly used to transport
people. This was fully operational until 1965 and was closed after the road from Birgunj to Kathmandu
(Tribhuvan Highway) was completed.
The second railway line was also a narrow-gauge railway built in 1937, which was 45km long and
connected Nepal Janakpur to Jayanagar (India) (NJJR: Nepal Janakpur-Jayanagar Railway). This was
mainly used for carrying timber from Nepal to India. The railway stopped operating in 2001 due to washout
of the railway embankment and collapse of two bridges.
4.3.2 Current Status of Railway Network
In 2005, railway track from Raxaul was converted to a broad-gauge and connected/extended to Sirsiya, in
Birgunj and is being managed by the Indian Railway Authority. The stretch is only 6 km long - 4km falling
in Nepal side. This allows carrying containers and cargos by railway transport directly into Inland
Clearance Deport (ICD) in Sirsiya, Birgunj (Nepal). Provision of the railway has facilitated access to and
from Kolkata Port and other places of India. Sirsiya, Birgunj continues to be the most important entry/exit
points for trade with India (Refer to i) Brigunj-Raxaul Railway in Figure 4.3-1). Birgunj is located 700 km
(430 mi) from the Kolkata port by railway.
On the other hand, the railway track between Janakpur and Jayanagar was converted to broad-gauge in
2018 and resumed operation and carries both people and good (Refer to ii) Janakpur-Jayanagar Railway
in Figure 4.3-1).
i) Railway Service at Sirsiya Inland Clearance Deport ii) Railway Service between Janakpur - Jayanagar
Source: JICA Survey Team
Figure 4.3-1 Railway Transport
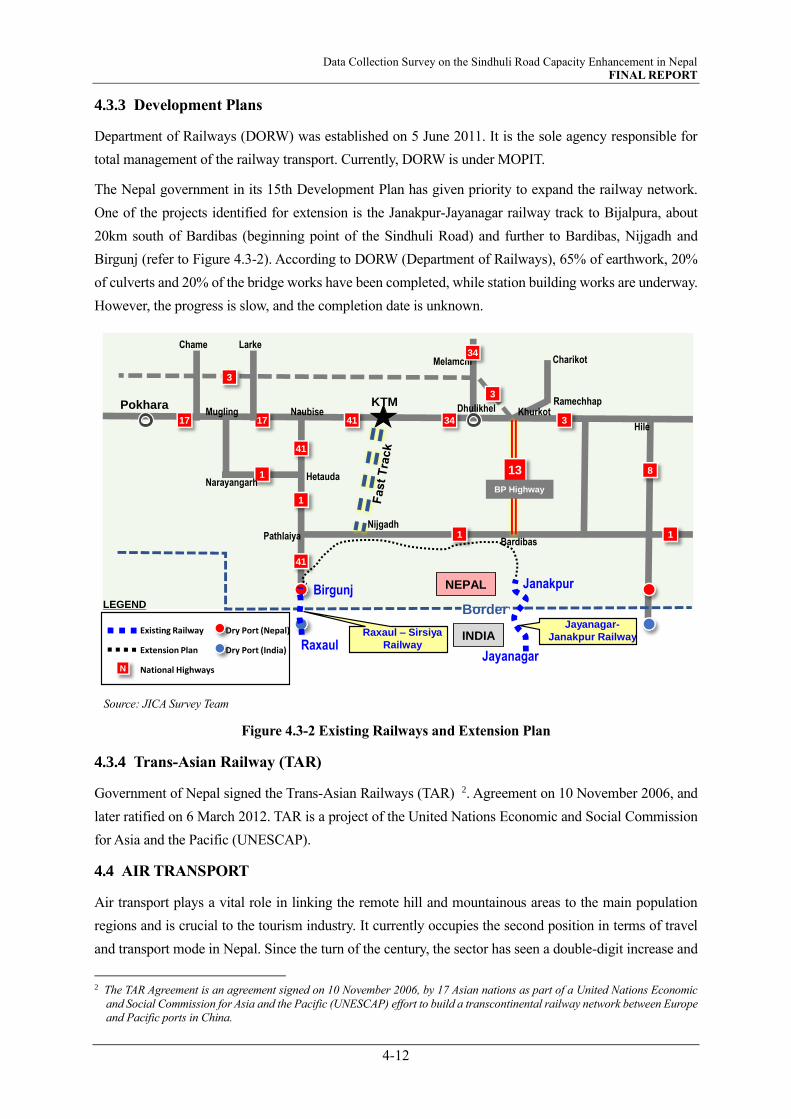
Data Collection Survey on the Sindhuli Road Capacity Enhancement in Nepal FINAL REPORT
4-12
4.3.3 Development Plans
Department of Railways (DORW) was established on 5 June 2011. It is the sole agency responsible for
total management of the railway transport. Currently, DORW is under MOPIT.
The Nepal government in its 15th Development Plan has given priority to expand the railway network.
One of the projects identified for extension is the Janakpur-Jayanagar railway track to Bijalpura, about
20km south of Bardibas (beginning point of the Sindhuli Road) and further to Bardibas, Nijgadh and
Birgunj (refer to Figure 4.3-2). According to DORW (Department of Railways), 65% of earthwork, 20%
of culverts and 20% of the bridge works have been completed, while station building works are underway.
However, the progress is slow, and the completion date is unknown.
Source: JICA Survey Team
Figure 4.3-2 Existing Railways and Extension Plan
4.3.4 Trans-Asian Railway (TAR)
Government of Nepal signed the Trans-Asian Railways (TAR) 2. Agreement on 10 November 2006, and
later ratified on 6 March 2012. TAR is a project of the United Nations Economic and Social Commission
for Asia and the Pacific (UNESCAP).
4.4 AIR TRANSPORT
Air transport plays a vital role in linking the remote hill and mountainous areas to the main population
regions and is crucial to the tourism industry. It currently occupies the second position in terms of travel
and transport mode in Nepal. Since the turn of the century, the sector has seen a double-digit increase and
2 The TAR Agreement is an agreement signed on 10 November 2006, by 17 Asian nations as part of a United Nations Economic
and Social Commission for Asia and the Pacific (UNESCAP) effort to build a transcontinental railway network between Europe
and Pacific ports in China.
1717
1
41
1
11
341 34
41
13 8
KTM
Border
3
Pokhara
INDIA
NEPAL
Jayanagar-
Janakpur Railway
BP Highway
Dhulikhel
Melamchi34
3
Hile
KhurkotRamechhap
Charikot
HetaudaNarayangarh
Mugling Naubise
BardibasPathlaiya
Chame Larke
Janakpur
Jayanagar
Birgunj
Raxaul – Sirsiya
RailwayRaxaulExisting Railway
Extension Plan
National HighwaysN
LEGEND
Dry Port (Nepal)
Dry Port (India)
Nijgadh

Data Collection Survey on the Sindhuli Road Capacity Enhancement in Nepal FINAL REPORT
4-13
the demand is still increasing for both international and domestic air service. International sector is growing
due to the continued increase of Tourists visiting Nepal and Nepalese going abroad. Increase in the
domestic sector can be attributed to the geographical diversity of the country. Where it took days to travel
by car and other means can be reached by air in less than an hour. Annual aircraft movement
(arrival/departure of both international/domestic service) in 2011 was 102,052 and passengers carried was
about 4.2 million. In 2018/19 the figures have increased to 124,255 and about 7.3 million. This shows that
the number of passengers has almost doubled in the past ten years. This trend is expected to increase further
in the coming years.
On the other side, only 11 airports have paved runway. Most are grass runways with few having graveled
runway. Some of the airports are not motor-accessible and are only accessible by foot trail or horseback.
Therefore, improvement of existing international airports as well as new construction of both international
and domestic airports are indispensable to meet the increasing demand.
4.4.1.1 Airport Network
Airport locations are shown in Figure 4.4-1. There exist 49 airports in Nepal3 . It comprises of one
international airport, four regional/domestic hub airports, and 44 domestic airports. Three international
airports and six domestic airports are under construction and one other international airport is under
planning. Airports near the objective road are Janakpur airport, Ramechhap airport, Banepa airport (under
planning) and Tribhuvan International Airport (TIA). Nijgadh Airport, which is also under planning stage
is about 65 km west of Bardibas and currently it takes about two hours by car.
Source: JICA Survey Team
Figure 4.4-1 Airport Network in Nepal
3 Source: Final Report “Data Collection Survey on Aviation Section in Federal Democratic Republic of Nepal”, Feb 2021
Data Collection Survey on the Sindhuli Road Capacity Enhancement in Nepal FINAL REPORT
4-14
4.4.1.2 Airport Development Plans
Three projects related to the aviation sector constitute the 22 recognized National Pride Projects in the 15th
Development Plan. They are construction of following international airports:
i) Gautam Buddha Regional International Airport Project,
ii) Pokhara International Airport Project, and
iii) Nijgadh Second International Airport Project.
4.5 WATER TRANSPORT
Nepal is a landlocked country and is not connected directly with seas or oceans. However, its rivers
originating from the Himalayas are snow-fed and water runs throughout the year. With this, the government
views immense potential for water resource utilization and is also aware of the need for development of
water transport to complement other transportation service in the country. As a step to this awareness Nepal
Shipping Office (NSO) was for the first time established under MOPIT on January 13, 2019. As can be
understood from the establishment date, the establishment is just the first steppingstone of the many more
to come. In other words, the country faces many challenges in the development of water transport – the
biggest is the country’s geography, which is very steep and rugged, that turns the flow of the water into
swift and sharp, which further compounds with the lack of relevant laws required for its operation. There
are controversies even inside MOPIT about the feasibility, where many are of the view that at least water
transport is not feasible from financial aspects.
4.6 AGENCIES RELATED TO TRANSPORT SECTOR
Institutional arrangement of agencies related can be classified in terms of two levels,
i) policy level and,
ii) regulatory and implementation level.
(1) Policy Level
Ministry of Physical Infrastructure and Transport (MOPIT)
Ministry of Federal Affairs and Local Development (MOFALD)
National Planning Commission (NPC)
Ministry of Culture, Tourism and Civil Aviation
(2) Regulatory level and Implementation level
Department of Roads (DOR)
Department of Transport Management (DOTM)
Department of Local Infrastructure (DOLI)
Roads Board Nepal (RBN)
Department of Railway (DORW)
Civil Aviation Authority (CAA)
Nepal Shipping Office (NSO)
Data Collection Survey on the Sindhuli Road Capacity Enhancement in Nepal FINAL REPORT
4-15
4.6.1 Ministry of Physical Infrastructure and Transport
The Ministry of Physical Infrastructure and Transport (MOPIT) is a central authority of the Government
of Nepal charged with responsibilities to oversee infrastructure developments such as roads, railways,
ropeways and waterways including transportation systems, most prominently linking rural areas, in Nepal
thereby enhancing the economic and social development of the country. . The ministry is located in Singha
Durbar, Kathmandu. It was established in 2000 in order to bring important infrastructural development
under the umbrella of a single Ministry. The main aim of organization is to harmonize the policies and
bring efficiencies and effectiveness in the provision of infrastructural services.
4.6.1.1 Goal, Vision, and Objectives
(1) Goal
To enhance the economic and social development of country by connecting different geological
and economic sectors through the national strategic transport network by developing
infrastructures such as roads, railways, waterways and ropeways.
To link rural sector to the local markets and to support different economic activities and projects
functioning in the tourism, agricultural, electrical, industrial, and other sectors.
(2) Vision
Infrastructure development for national integration, socio-economic development and peace.
(3) Objectives
Preparing draft plans, policies and programs regarding development of physical infrastructure, its
implementation, monitoring and evaluation.
Transport (Except Air Transport) and transit management and its operation related policy, draft
preparation, program implementation, monitoring, regulation and evaluation.
Inspection, approval and implementation of plans and policies related to the construction and
development of roadways, waterways, railways, subways, flyovers and ropeways.
Strategic roads (except rural roads and local roads) and bridge (except suspension bridge and local
bridge) construction, renovation and preservation.
Coordination with the international agency for the construction of roadways and ropeways.
Corporation, company and association concerning transport (except Air transport) and transit
management and operation.
Relation with international institution and organization for management, operation and inspection
of transport (except air transport) services.
Study, investigation, data collection and analysis of transport facilities.
Administer Roads Board, roads, railways and transport management departments and Engineering
council.
Railway, Metro construction, operation and maintenance.
Operation of Highway and Railway sub-groups of Nepal Engineering Services and Civil
Engineering Group.
Data Collection Survey on the Sindhuli Road Capacity Enhancement in Nepal FINAL REPORT
4-16
4.6.1.2 Activities
Major activities of the Ministry include, but not limited,
to formulate and enforce policies, plans and programs on construction and development of surface,
water, railway and ropeway transportation.
to carry out acts on construction, operation and maintenance of roads (excluding mule tracks) and
bridges (excluding suspension bridges).
to carry out construction works of various surface roads, waterways and ropeways and act as an
organization and institution dealing with engineering consultancy.
to carry out acts pertaining to contact and co-operation with international or regional organizations
in the field of housing and physical planning.
to carry out acts pertaining to contact with international organizations related with construction of
highways, waterways and ropeways.
4.6.1.3 Organization Structure
Organization structure of MOPIT is shown in Figure 4.6-1. The Physical Infrastructure and Transport
Minister is at the apex in the Ministry, whereas bureaucratically it is headed by the Secretary. The Ministry
is divided into four Divisions and twelve Sections for practical purposes. These Divisions and sections are
located within the Ministry and manned by Joint Secretary, Under Secretaries, Engineers, Section Officers,
and other supporting staffs. There are currently 95 number of staffs at the Ministry. The four divisions are,
i) Administration Division
ii) Foreign Aid and Quality Standards Division
iii) Planning Monitoring and Evaluation Division
iv) Work and Transport Division
Furthermore, the following departments and institutions are under the Ministry.
i) Department of Roads
ii) Department of Transport Management
iii) Department of Railways
iv) Roads Board Nepal
v) Nepal Shipping Office
vi) Nepal Engineering Council

Data Collection Survey on the Sindhuli Road Capacity Enhancement in Nepal FINAL REPORT
4-17
Source: JICA Survey Team
Figure 4.6-1 Organizational Chart of MOPIT
4.6.1.4 Relation with the Survey
MOPIT is the implementing agency of the Survey. All policies and plans proposed or recommended by
the Survey needs approval from MOPIT. MOPIT is also responsible for coordination with other concerned
ministries, commissions, authorities, and committees including obtaining consensus with these
stakeholders.
4.6.2 Ministry of Federal Affairs and General Administration
Ministry of Federal Affairs and General Administration, popularly MOFAGA and previously Ministry of
Federal Affairs and Local Development (MOFALD), is the ministry of Nepal accredited with the role of
coordination, cooperation, facilitation and monitoring and evaluation of activities undertaken by local
governments, regulation and management of the civil service in the country. MOFAGA is the only ministry
with direct linkage with the country's local governments, namely municipalities, rural municipalities and
provinces. It also plays direct role in implementing various e-Services in the local governments.
The main responsibility of this ministry, which is responsible for a large area of the country, is to facilitate
the development and service delivery at the local level. The ministry is currently carrying out capacity
building, facilitation and coordination of 753 local levels including 77 district coordination committees, 6
metropolitan cities, 11 sub-metropolitan cities, 276 municipalities and 460 village municipalities.
4.6.2.1 Organization Structure
Organogram of MOFAGA is provided in Figure 4.6-2. The ministry is headed by the Federal Affairs and
General Information Minister. However, bureaucratically it is the secretaries that head the organization.
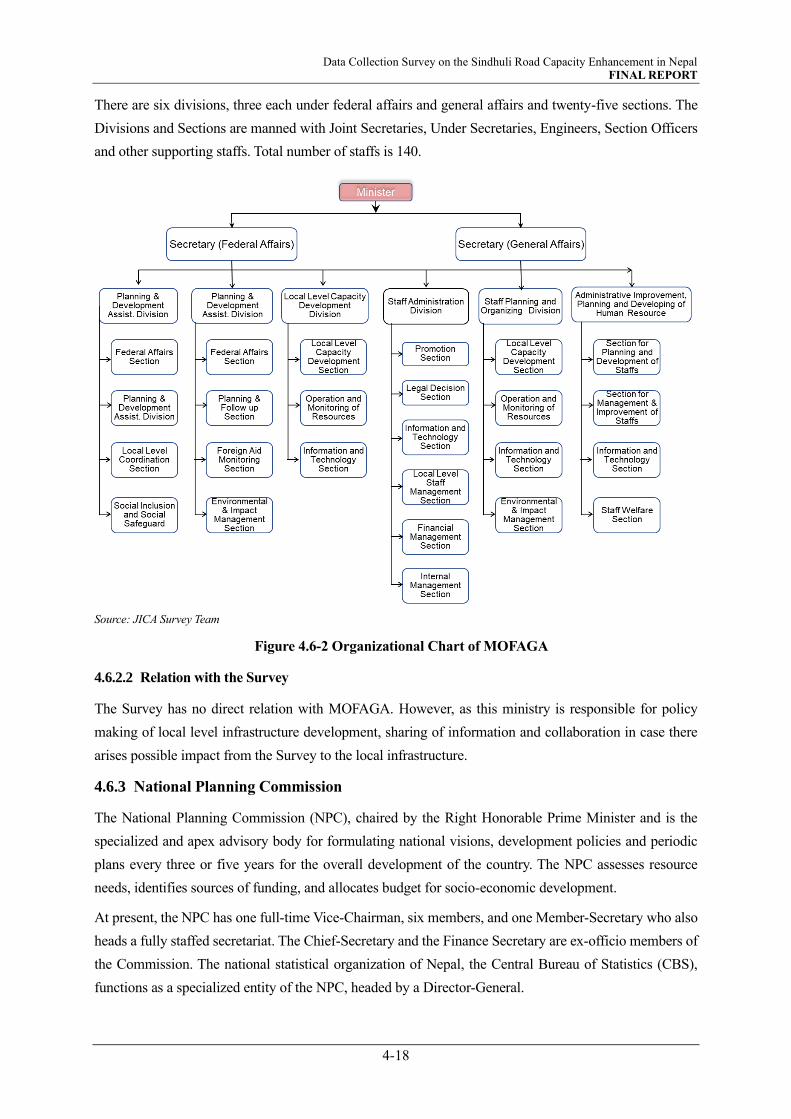
Data Collection Survey on the Sindhuli Road Capacity Enhancement in Nepal FINAL REPORT
4-18
There are six divisions, three each under federal affairs and general affairs and twenty-five sections. The
Divisions and Sections are manned with Joint Secretaries, Under Secretaries, Engineers, Section Officers
and other supporting staffs. Total number of staffs is 140.
Source: JICA Survey Team
Figure 4.6-2 Organizational Chart of MOFAGA
4.6.2.2 Relation with the Survey
The Survey has no direct relation with MOFAGA. However, as this ministry is responsible for policy
making of local level infrastructure development, sharing of information and collaboration in case there
arises possible impact from the Survey to the local infrastructure.
4.6.3 National Planning Commission
The National Planning Commission (NPC), chaired by the Right Honorable Prime Minister and is the
specialized and apex advisory body for formulating national visions, development policies and periodic
plans every three or five years for the overall development of the country. The NPC assesses resource
needs, identifies sources of funding, and allocates budget for socio-economic development.
At present, the NPC has one full-time Vice-Chairman, six members, and one Member-Secretary who also
heads a fully staffed secretariat. The Chief-Secretary and the Finance Secretary are ex-officio members of
the Commission. The national statistical organization of Nepal, the Central Bureau of Statistics (CBS),
functions as a specialized entity of the NPC, headed by a Director-General.

Data Collection Survey on the Sindhuli Road Capacity Enhancement in Nepal FINAL REPORT
4-19
NPC serves as the only organization formulating the infrastructure plan even under the changing political
system. It has recently published a five-year plan, “The fifteenth Plan (Fiscal Year 2019/20 – 2023/24)”and
a 25-year Long-Term Vision of Nepal, with a vision to graduate to a middle-income economy by 2030 and
transform the country into a developed nation by 2043.
NPC is assigned roles and responsibilities by the Government of Nepal under NPC Executive Order of
March 12, 2018 and by the Financial Administration Regulation (FAR) 1999 and are as follows.
Table 4.6-1 Roles and Responsibilities Assigned to Nepal Planning Commission
GON Assigned Roles and Responsibilities FAR Assigned Roles and Responsibilities
Formulate basic development policies and prepare
periodic development plans
Explore resources including indigenous and foreign
technology to accelerate the pace of development.
Explore innovative approaches for sustainable
development.
Formulate annual programs and assist GON in their
implementation.
Advice GON for the institutional development of
monitoring & evaluation system.
Provide guidelines, advice and suggestions to
sectoral ministries, departments, other agencies and
local bodies.
Provide guidelines to collect data and to carry out
action-oriented research necessary.
NPC has to provide guidelines on policy targets and
priorities regarding formulation of budget for the
coming fiscal year to the Ministry of Finance and
all other line ministries before the issuance of
circular on budget formulation.
Formulate a policy framework for approval of the
district level projects by the secretaries of the
ministries.
Approve Central level projects.
Set policy targets on development programmes for
the coming year within the month of December.
Provide advice to GON offices for accepting any
kind of aid in kind or cash or reaching an agreement
for foreign aid.
Source: JICA Survey Team
4.6.4 Ministry of Culture, Tourism and Civil Aviation
The ministry responsible for air transport is the Ministry of Culture, Tourism and Civil Aviation
(MOCTCA). Previously established as the Ministry of Tourism in 1978, but later incorporated civil
aviation and culture in 1982 and 2000 respectively.
MOCTCA is the governmental body for promoting tourism, culture and private sector involvement in
Nepal. It also serves as the Nepalese aviation regulatory body.
4.6.4.1 Role and Responsibilities
Ministry of Cultural, Tourism, and Civil Aviation is a government body under the government of Nepal. It
promotes tourism, culture and private sector involvement. The tourism industry, which is mainly supported
by the aviation service is one of the foreign currency earners in the country and thus makes a significant
contribution to the economy. Government of Nepal has been actively promoting tourism in Nepal and has
always encouraged the private sector for their involvement and participation.
4.6.4.2 Organization Structure
Organization structure of the MOCTCA is depicted in Figure 4.6-3. The Culture, Tourism and Civil
Aviation Minister heads the Ministry. The minister and the Secretary are supported by its private
secretariats. Like other ministries, bureaucratically, the ministry is headed by the Secretary, who manages
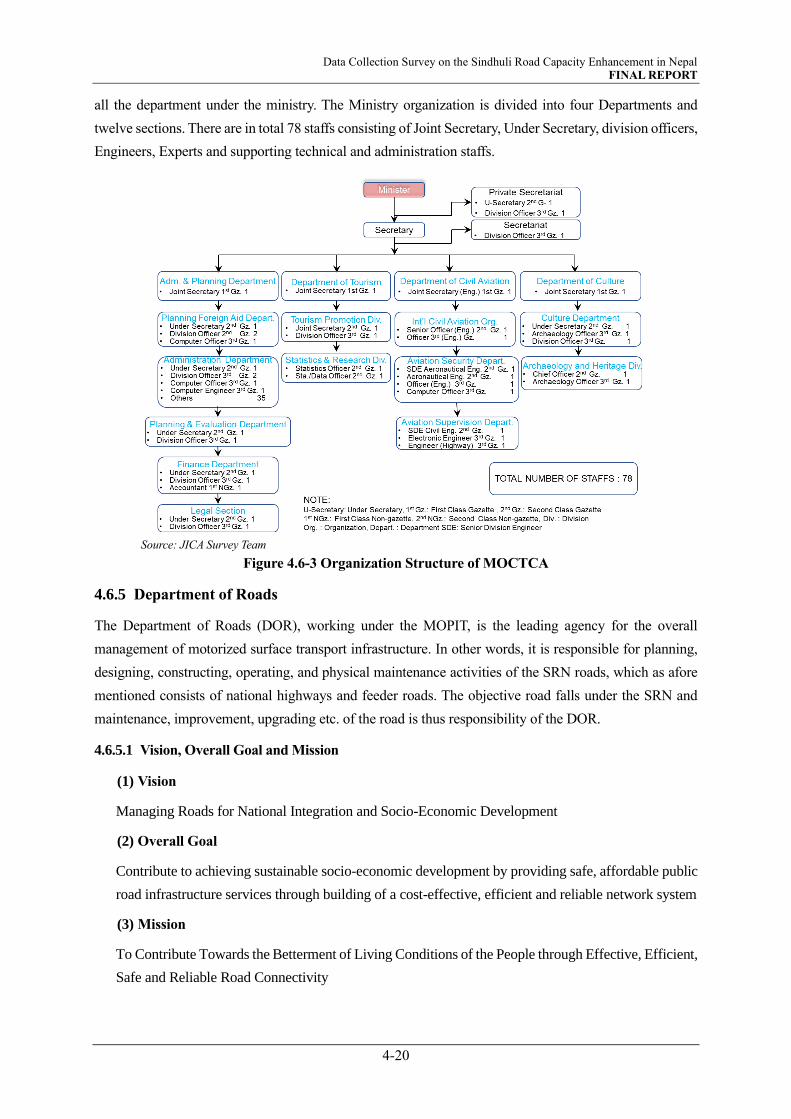
Data Collection Survey on the Sindhuli Road Capacity Enhancement in Nepal FINAL REPORT
4-20
Source: JICA Survey Team
all the department under the ministry. The Ministry organization is divided into four Departments and
twelve sections. There are in total 78 staffs consisting of Joint Secretary, Under Secretary, division officers,
Engineers, Experts and supporting technical and administration staffs.
Figure 4.6-3 Organization Structure of MOCTCA
4.6.5 Department of Roads
The Department of Roads (DOR), working under the MOPIT, is the leading agency for the overall
management of motorized surface transport infrastructure. In other words, it is responsible for planning,
designing, constructing, operating, and physical maintenance activities of the SRN roads, which as afore
mentioned consists of national highways and feeder roads. The objective road falls under the SRN and
maintenance, improvement, upgrading etc. of the road is thus responsibility of the DOR.
4.6.5.1 Vision, Overall Goal and Mission
(1) Vision
Managing Roads for National Integration and Socio-Economic Development
(2) Overall Goal
Contribute to achieving sustainable socio-economic development by providing safe, affordable public
road infrastructure services through building of a cost-effective, efficient and reliable network system
(3) Mission
To Contribute Towards the Betterment of Living Conditions of the People through Effective, Efficient,
Safe and Reliable Road Connectivity

Data Collection Survey on the Sindhuli Road Capacity Enhancement in Nepal FINAL REPORT
4-21
Source: JICA Survey Team
4.6.5.2 Objective
to develop, expand and strengthen the road network in a sustainable way for enhancing the overall socio-
economic development and integration of the country through balanced regional development by
providing due consideration for remote areas and deprived communities
4.6.5.3 Organization Structure
The DOR is headed by the Director General. At present, there are 5 Main Branches headed by Deputy
Director General. In addition, there are 4 Federal Supervision and Monitoring Offices, 33 Road Division
Offices, 8 Heavy Equipment Divisions, 1 Mechanical Training Center and 5 Mechanical Offices under the
branches. Under the DDGs, there are Senior Division Engineers, Engineers, Officers, Experts, and other
technical and administrative supporting staffs. The details of the organization have been depicted in Figure
4.6-4. Total number of staffs given in the organization chart is 727 and does not include staffs from Federal
Road Supervision and Monitoring Offices, Quality Research and Development Center, Road Divisions,
Mechanical Training Center etc. All combined, the total number of staffs of the DOR is 2,500, comprising
of 727 engineers, 425 sub-engineers and 1,348 others.
Figure 4.6-4 Organizational Chart of the DOR
DOR and MOPIT have more than 50 years of experience in the road sector and have one of the most
educated and well-trained teams in the nation. Its management capacity, planning, monitoring capability,
environmental and traffic safety practices, and control of overloading have gradually improved,
Nonetheless, the state of the roads in the country is still in poor condition.
DOLI has two decades of experience in building district and village roads, and its collaborations with
development partners expanded its areas of expertise. While most of DOLI’s rural road standards and
guideline are related to road capacity, road safety, and vehicle capacity. However, standard remain
theoretical and are hardly put into actual practice.
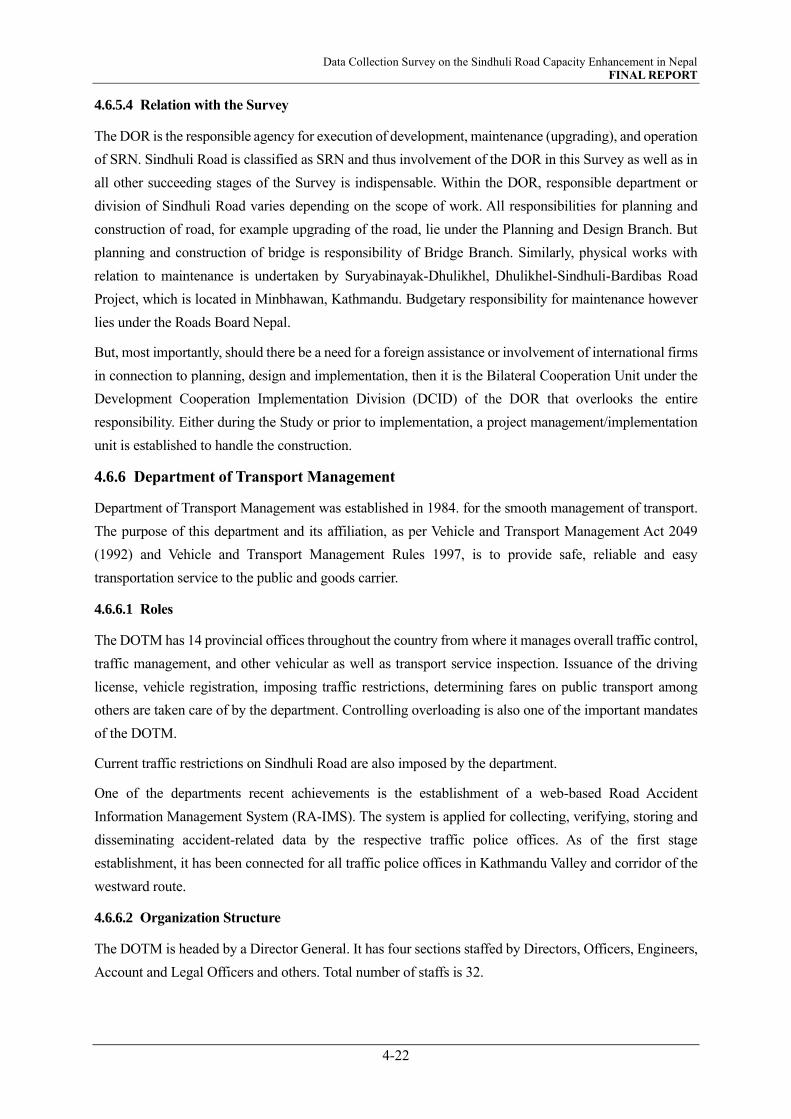
Data Collection Survey on the Sindhuli Road Capacity Enhancement in Nepal FINAL REPORT
4-22
4.6.5.4 Relation with the Survey
The DOR is the responsible agency for execution of development, maintenance (upgrading), and operation
of SRN. Sindhuli Road is classified as SRN and thus involvement of the DOR in this Survey as well as in
all other succeeding stages of the Survey is indispensable. Within the DOR, responsible department or
division of Sindhuli Road varies depending on the scope of work. All responsibilities for planning and
construction of road, for example upgrading of the road, lie under the Planning and Design Branch. But
planning and construction of bridge is responsibility of Bridge Branch. Similarly, physical works with
relation to maintenance is undertaken by Suryabinayak-Dhulikhel, Dhulikhel-Sindhuli-Bardibas Road
Project, which is located in Minbhawan, Kathmandu. Budgetary responsibility for maintenance however
lies under the Roads Board Nepal.
But, most importantly, should there be a need for a foreign assistance or involvement of international firms
in connection to planning, design and implementation, then it is the Bilateral Cooperation Unit under the
Development Cooperation Implementation Division (DCID) of the DOR that overlooks the entire
responsibility. Either during the Study or prior to implementation, a project management/implementation
unit is established to handle the construction.
4.6.6 Department of Transport Management
Department of Transport Management was established in 1984. for the smooth management of transport.
The purpose of this department and its affiliation, as per Vehicle and Transport Management Act 2049
(1992) and Vehicle and Transport Management Rules 1997, is to provide safe, reliable and easy
transportation service to the public and goods carrier.
4.6.6.1 Roles
The DOTM has 14 provincial offices throughout the country from where it manages overall traffic control,
traffic management, and other vehicular as well as transport service inspection. Issuance of the driving
license, vehicle registration, imposing traffic restrictions, determining fares on public transport among
others are taken care of by the department. Controlling overloading is also one of the important mandates
of the DOTM.
Current traffic restrictions on Sindhuli Road are also imposed by the department.
One of the departments recent achievements is the establishment of a web-based Road Accident
Information Management System (RA-IMS). The system is applied for collecting, verifying, storing and
disseminating accident-related data by the respective traffic police offices. As of the first stage
establishment, it has been connected for all traffic police offices in Kathmandu Valley and corridor of the
westward route.
4.6.6.2 Organization Structure
The DOTM is headed by a Director General. It has four sections staffed by Directors, Officers, Engineers,
Account and Legal Officers and others. Total number of staffs is 32.
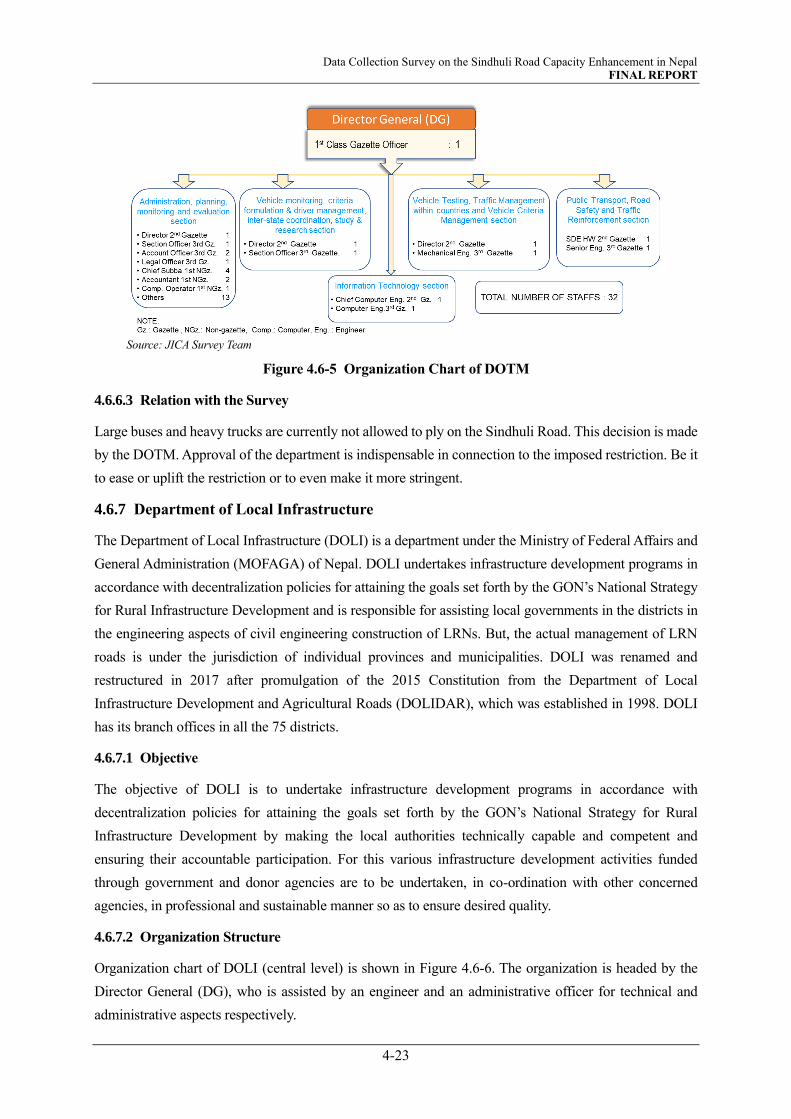
Data Collection Survey on the Sindhuli Road Capacity Enhancement in Nepal FINAL REPORT
4-23
Source: JICA Survey Team
Figure 4.6-5 Organization Chart of DOTM
4.6.6.3 Relation with the Survey
Large buses and heavy trucks are currently not allowed to ply on the Sindhuli Road. This decision is made
by the DOTM. Approval of the department is indispensable in connection to the imposed restriction. Be it
to ease or uplift the restriction or to even make it more stringent.
4.6.7 Department of Local Infrastructure
The Department of Local Infrastructure (DOLI) is a department under the Ministry of Federal Affairs and
General Administration (MOFAGA) of Nepal. DOLI undertakes infrastructure development programs in
accordance with decentralization policies for attaining the goals set forth by the GON’s National Strategy
for Rural Infrastructure Development and is responsible for assisting local governments in the districts in
the engineering aspects of civil engineering construction of LRNs. But, the actual management of LRN
roads is under the jurisdiction of individual provinces and municipalities. DOLI was renamed and
restructured in 2017 after promulgation of the 2015 Constitution from the Department of Local
Infrastructure Development and Agricultural Roads (DOLIDAR), which was established in 1998. DOLI
has its branch offices in all the 75 districts.
4.6.7.1 Objective
The objective of DOLI is to undertake infrastructure development programs in accordance with
decentralization policies for attaining the goals set forth by the GON’s National Strategy for Rural
Infrastructure Development by making the local authorities technically capable and competent and
ensuring their accountable participation. For this various infrastructure development activities funded
through government and donor agencies are to be undertaken, in co-ordination with other concerned
agencies, in professional and sustainable manner so as to ensure desired quality.
4.6.7.2 Organization Structure
Organization chart of DOLI (central level) is shown in Figure 4.6-6. The organization is headed by the
Director General (DG), who is assisted by an engineer and an administrative officer for technical and
administrative aspects respectively.

Data Collection Survey on the Sindhuli Road Capacity Enhancement in Nepal FINAL REPORT
4-24
Source: JICA Survey Team
The organization consists of four (4) technical divisions and two (2) administrative divisions. Total number
of staffs extend to 25. During DOLIDAR, it had branch offices in all 75 districts of the country.
Figure 4.6-6 Organization Chart of DOLI
4.6.8 Roads Board Nepal
RBN was established under the Road Board Act 2002 with the aim to collect manage and allocate
sustainable funds for the planned roads maintenance in all regions of the country through the road
maintenance agencies like the DOR, Municipalities, Rural Municipalities and DOLI based on the Annual
Road Maintenance Plan (ARMP) prepared by the road agencies upon request from the Board. Modeled on
‘Fee for Service’ strategy, RBN collects road user’s fee and manages road fund by prioritizing need-based
fund allocations to road agencies for maintenance.
4.6.8.1 Mission, Vision and Preamble
Mission, vision and preamble and objectives are shown in Table 4.6-2.
Table 4.6-2 Mission, Vision, Preamble and Objectives
MISSION To ensure the road users towards receiving enhanced road service with reduced
vehicle operating cost and travel time.
VISION Providing improved road network by generating self-sustainable fund through user’s
fee and channeling it to road agencies for maintenance of roads
PREAMBLE The preamble of the Roads Board Act 2058 (2002) stipulates that: “Whereas it is
expedient to make necessary provisions on repair and maintenance of roads,
minimizing the expenditures to be incurred in repairing and maintaining the roads and
making transparent and effective the repairing and maintaining works of the roads.
OBJECTIVES To generate adequate and stable fund and channel it to Road Agencies
To carryout maintenance of road assets through road agencies
To ensure safe, reliable, comfortable and economic road services to its users
To improve data management system at RAs and RBN
To develop awareness among stakeholders related to road maintenance
To reduce road maintenance expenditure
To make the maintenance activities transparent and effective
Data Collection Survey on the Sindhuli Road Capacity Enhancement in Nepal FINAL REPORT
4-25
4.6.8.2 Constitution
RBN is guided by commercialization of road management framework. As per the Roads Board Act 2059,
the Executive Committee is composed of thirteen members (refer Table 4.6-3).
The Board is chaired by the Secretary of the MOPIT. Its member constitutes of Joint Secretaries from
MOF (Ministry of Finance Japan), MOFAGA, MOS, Director General of the DOR, representatives from
FNCCI, Municipal Association, VDC (Village Development Committee) Federation, Transport
Entrepreneurs” Association, Consumer’s Association, Commercial Farmers, and Transport Expert.
Executive Director is designated as the Secretary of the Board. The Executive committee is based on PPP
model as it comprises of five members from public and eight from institutional/private sectors.
Table 4.6-3 Executive Committee of RBN
Representation Designation/Position
Secretary, MOPIT Chairperson
Joint Secretary, MOF Member
Joint Secretary, MOFAGA Member
Joint Secretary, MOS Member
Director General, DOR Member
Representative, FNCCI Member
Representative, Municipal Association Member
Representative, VDC Federation Member*
Representative, Transport Entrepreneurs’ Association Member
Representative, Consumer’s Association Member
Representative, Commercial Farmers Member
Road/Transport Expert Member
Executive Director, RBN Secretary
Note: * Representative from the VDC has been removed (Nepal Gazette4 2015/11/13 (February 25, 2016))
Source: JICA Survey Team
4.6.8.3 Revenue Source
Resources of road fund accrued for RBN as granted by Section 6 of RBN Act is listed in Figure 4.6-7. The
sources that have been accrued for are, i) fuel levy on fuel, ii) vehicle registration fee, and iii) road user
taxes. Some other possible sources are to collect fee from, i) vehicles used in Nepal but registered abroad,
ii) rule violation penalties, iii) subsidies or grants from donor agencies. Among the three resources, the
first two resources (fuel levy and vehicle registration fee) are allocated from the Ministry of Finance. The
road user taxes are toll fees collected from the toll roads mentioned in Section 4.2.3 .
4 Gazette in Nepal is a periodical publication authorized to publish public or legal notices. It is announced by the government and
is effective for compliance with legal requirements for public notice. Gazettes are published either in print, electronically, or both.

Data Collection Survey on the Sindhuli Road Capacity Enhancement in Nepal FINAL REPORT
4-26
Source: JICA Survey Team
Figure 4.6-7 Current and Tappable Revenue Source
Financial statement of Fiscal Year 2018/19 shows that the total income and expenditure were
approximately 5950.3 million Nepalese Rupee and 5258.0 million Nepalese Rupee respectively.
4.6.8.4 Road Users Fee Collection
In FY 2018/19, road user taxes (toll fees) are currently being collected from vehicles plying on four
sections of SRN as pre-mentioned. Collection of tolls is commissioned to contractors through bidding
process under cost-based selection system (CBS).
4.6.8.5 Financial Management
Road maintenance fund is managed in accordance with the RBN Act. Regular road maintenance fund is
reflected in the Red Book since FY 2002 from MOF under budget head. Fund flow mechanism is as shown
in Figure 4.6-8.
Source: Annual Progress Report FY 2075/76, RBN
Figure 4.6-8 Flow Management
4.6.8.6 Organization Structure of RBN Secretariat
RBN Secretariat is a relatively slender organization, which is governed by the executive committee. It is
comprised of seventeen (17) members/staffs headed by two Directors. It has two divisions, technical and
administration. Technical divisions are staffed with four (4) engineers, while administration sections are
Data Collection Survey on the Sindhuli Road Capacity Enhancement in Nepal FINAL REPORT
4-27
comprised of nine (9) administrative staffs (Finance and Account Officers, Accountants, Public Relations
Officer, Receptionist etc.). The Secretariat implements the decisions made by the Executive Committee
and involves in strategic planning and fund management.
Source: Annual Progress Report 2075/76, RBN
Figure 4.6-9 Organization Chart of RBN
4.6.8.7 Relation with the Survey
Since RBN’s main duty is to allocate maintenance fund to road agencies, there is no direct relation during
surveys and studies. However, if the Sindhuli Road is improved, budget for the post-improvement
maintenance may differ. It is therefore important that involvement of RBN from the survey/study stage is
inevitable to ensure sufficient allocation of maintenance budget.
4.6.9 Department of Railways
Department of Railways (DORW) under MOPIT is responsible for the development, maintenance, and
planning railways to meet the growing passenger and freight demand of the country. The department was
established in 2012 and is not even a decade old. Being an emerging agency and compounded with the
dominance of road and aviation transport, the department’s contribution in the expansion of railway
network is yet to be remarkable.
4.6.9.1 Objectives
Main objectives of the DORW are, but not limited to the followings.
i) to develop, expand and manage the railway network in an effective and efficient manner,
ii) to develop railway network to connect strategically important areas (important commercial,
industrial, religious, tourist areas) and link the capital city Kathmandu with potential destinations
of the neighboring countries thereby strengthen and enable social, economic and administrative
relations,
iii) to provide safe, stable, reliable, and low-fare service to the general public and to make the
transportation of goods economical and reliable,

Data Collection Survey on the Sindhuli Road Capacity Enhancement in Nepal FINAL REPORT
4-28
Source: JICA Survey Team
iv) to supplement other infrastructure development and effective delivery of convenience services,
v) to mobilize and encourage the participation of private organizations to build, expand, operate and
manage the network, and
vi) to integrate with international rail network and promote international market / trade.
4.6.9.2 Long Term Visions
Long term visions include.
Connecting Kathmandu by rail service from the borders (Mechi-Mahakali), Kathmandu-Pokhara-
Terai, Kathmandu-Terai, important industrial and commercial cities from the southern border
(Indian Border) and the northern border (China-Tibet). Also, to connect the railway network of
industrial and commercial cities with the railway network of East-West and Kathmandu Terai.
To connect the provincial administrative centers with the East-West and Kathmandu Terai railway
network.
4,000 km within the next 20 years. To build railway network. To achieve this goal, 1,500 km
within the next 10 years. And 750 km within the next 5 years. To build railway network.
To prepare priority investment plan (20 and 10 years).
4.6.9.3 Organization Structure
The organogram of the DORW is shown in Figure 4.6-10. The department is headed by a Director General
(DG). There is an officer and a computer operator to assist the DG. The organization structure consists of
three technical and three administrative sections under the DG.
Figure 4.6-10 Organization Chart of DORW
4.6.10 Civil Aviation Authority of Nepal
The Government of Nepal introduced its first ever Civil Aviation Policy in 2050 B.S. (1993 A.D.). This
policy made the provision of transformation of Department of Civil Aviation into an autonomous Civil
Aviation Authority. Accordingly, Civil Aviation Authority of Nepal (CAAN) was established as an
autonomous regulatory body on 31 December 1998 under Civil Aviation Act, 1996. CAAN is the regulator
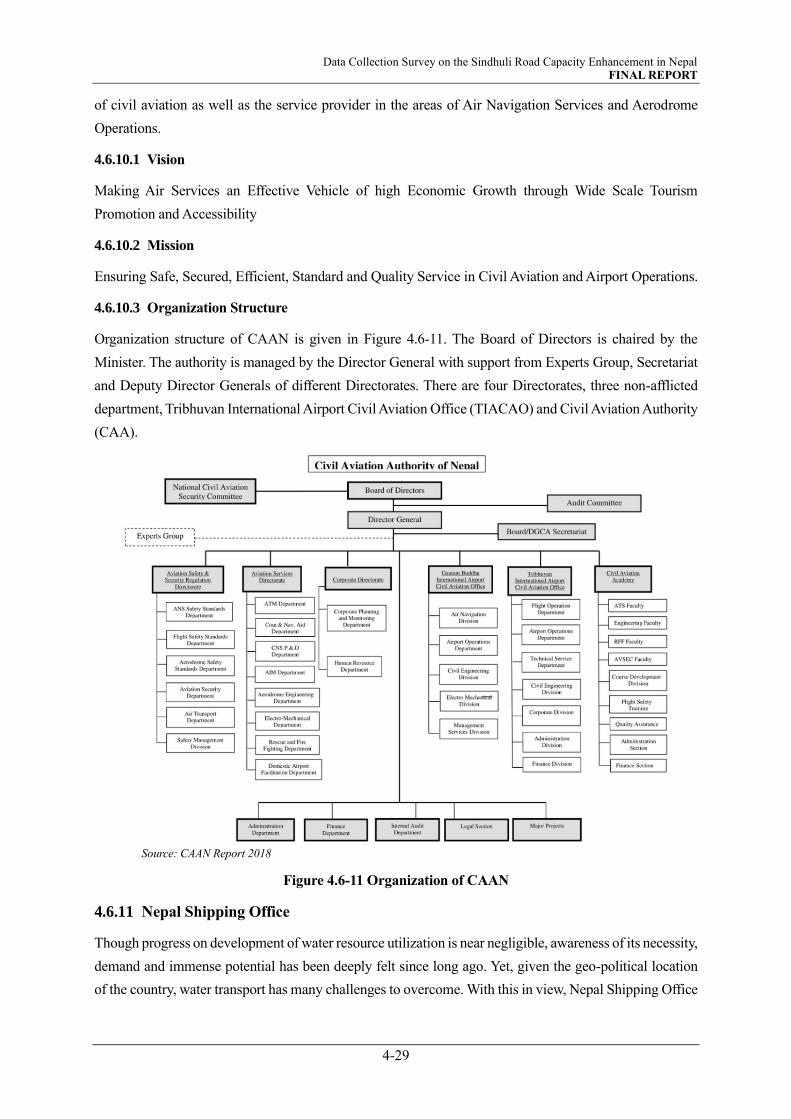
Data Collection Survey on the Sindhuli Road Capacity Enhancement in Nepal FINAL REPORT
4-29
of civil aviation as well as the service provider in the areas of Air Navigation Services and Aerodrome
Operations.
4.6.10.1 Vision
Making Air Services an Effective Vehicle of high Economic Growth through Wide Scale Tourism
Promotion and Accessibility
4.6.10.2 Mission
Ensuring Safe, Secured, Efficient, Standard and Quality Service in Civil Aviation and Airport Operations.
4.6.10.3 Organization Structure
Organization structure of CAAN is given in Figure 4.6-11. The Board of Directors is chaired by the
Minister. The authority is managed by the Director General with support from Experts Group, Secretariat
and Deputy Director Generals of different Directorates. There are four Directorates, three non-afflicted
department, Tribhuvan International Airport Civil Aviation Office (TIACAO) and Civil Aviation Authority
(CAA).
Source: CAAN Report 2018
Figure 4.6-11 Organization of CAAN
4.6.11 Nepal Shipping Office
Though progress on development of water resource utilization is near negligible, awareness of its necessity,
demand and immense potential has been deeply felt since long ago. Yet, given the geo-political location
of the country, water transport has many challenges to overcome. With this in view, Nepal Shipping Office
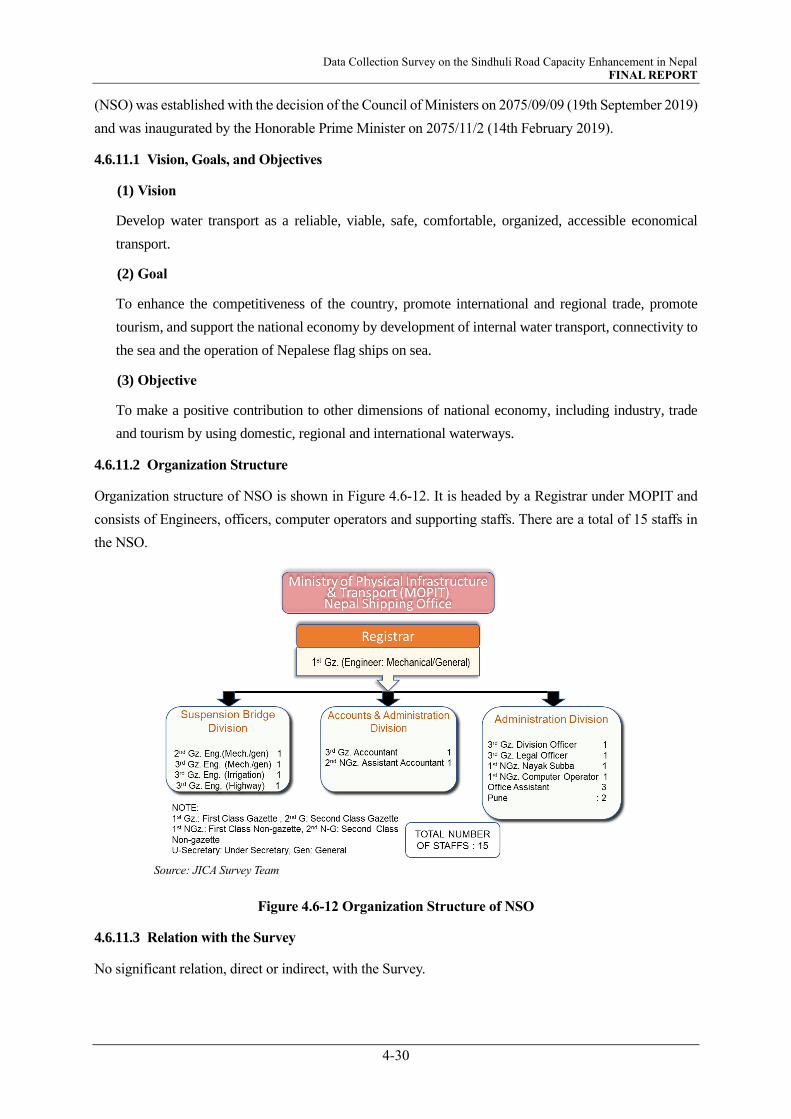
Data Collection Survey on the Sindhuli Road Capacity Enhancement in Nepal FINAL REPORT
4-30
Source: JICA Survey Team
(NSO) was established with the decision of the Council of Ministers on 2075/09/09 (19th September 2019)
and was inaugurated by the Honorable Prime Minister on 2075/11/2 (14th February 2019).
4.6.11.1 Vision, Goals, and Objectives
(1) Vision
Develop water transport as a reliable, viable, safe, comfortable, organized, accessible economical
transport.
(2) Goal
To enhance the competitiveness of the country, promote international and regional trade, promote
tourism, and support the national economy by development of internal water transport, connectivity to
the sea and the operation of Nepalese flag ships on sea.
(3) Objective
To make a positive contribution to other dimensions of national economy, including industry, trade
and tourism by using domestic, regional and international waterways.
4.6.11.2 Organization Structure
Organization structure of NSO is shown in Figure 4.6-12. It is headed by a Registrar under MOPIT and
consists of Engineers, officers, computer operators and supporting staffs. There are a total of 15 staffs in
the NSO.
Figure 4.6-12 Organization Structure of NSO
4.6.11.3 Relation with the Survey
No significant relation, direct or indirect, with the Survey.

Data Collection Survey on the Sindhuli Road Capacity Enhancement in Nepal FINAL REPORT
4-31
4.7 INSTITUTIONAL CAPACITY of TRANSPORT AGENCIES
Road and air transport, the two predominant sectors have gradually improved within the last decade. But
improvement of road sector is limited to the agencies responsible of SRN roads. The DOR and MOPIT
with their experience accumulated in the last 50 years in the road section and having one of the most
educated and well-trained teams in the nation including its nationwide expanded branches and offices have
recently enhanced the management capacity, planning, monitoring capability, environmental and traffic
safety practices, and control of overloading. Yet, it still has many weaknesses.
DOLI, the responsible organization of LRN roads lacked capacity even during the time of DOLIDAR. It
has further weakened following the restructuring in 2017, as it is now responsible for assisting local
government in the civil engineering aspects only and the actual management of the LRN roads are looked
after by individual provinces and municipalities. The provinces and municipalities are novice in the field
and significantly lack knowledge and know-hows of road management.
Other agencies, RBN, DOTM, and DOLI are also not mature enough and require significant enhancement
to ensure that road assets are properly maintained.
The Civil Aviation Authority of Nepal (CAAN), the responsible for the administration of air transport, is
also functioning reasonably well, which is evident from the almost smooth handling of the recent increase
of the air transport market. However, it will also need further institutional enhancement, especially in
operational efficiency and management, so that it can effectively handle the demands of growing air traffic
in the country.
DORW and NSO are recently established organizations and are hardly functional.
DOLI has two decades of experience in building district and village roads, and its collaborations with
development partners expanded its areas of expertise. While most of DOLI’s rural road standards and
guideline are related to road capacity, road safety, and vehicle capacity. However, standard remain
theoretical and are hardly put into actual practice.
4.7.1 Implementing Capacity of MOPIT and DOR
4.7.1.1 Budgetary Capacity
The national budget of Nepal and budget allocated to MOPIT, which is further allocated to the DOR for
FYs 2019/20 to 2021/22 is listed in Table 4.7-1.
Table 4.7-1 Government Budget for Three Five Years
Unit: Billion Nepalese Rupee
Budget 2019/20* 2020/21** 2021/22***
National Budget 1,091.333 1, 266.265 1,647.577
MOPIT
(Allocated from MOF)
Amount 84.630 98.127 162.508
Percentage 7.75% 7.76% 9.86%
DOR
(Allocated from MOPIT)
Amount 68.732 77.861 126.645
Percentage 81.21% 79.35% 76.87%
Notes: * is actual budget, ** is modified estimate budget, *** is estimated budget
Source: Red Book FY 2076/77-2078/79

Data Collection Survey on the Sindhuli Road Capacity Enhancement in Nepal FINAL REPORT
4-32
Budgets allocated to MOPIT by MOF in FY 2019/20 and FY 2020/21 are about 7.75 percent of the national
budget for each corresponding year. There is a gradual increase of 2.1% in the budget for 2021/22. While
budget allocated to MOPIT is in a gradual increase trend, budget to DOR is gradually decreasing.
Nevertheless, about 80 percent of MOPIT budget is allocated to the DOR.
There is a significant increase in the recent allocation of the budget compared to the past, particularly when
the country was in political turmoil, when the allocation only accounted to half the budget allocated to
MOPIT. In FY 2019/20 and FY 2021/22, about 97% of DOR`s budget was allocated for project
implementation.
However, the paradox of increased budget to spend and the yet poor state of the existing SRN is because
the above budget is mostly used for planning to construction of the roads under DOR and is not used for
maintenance. The maintenance budget is basically allocated by RBN and in some cases international
donors. In FY 2018/19, maintenance budget of DOR for SRN roads was 4.16 billion NRs. (3.63 billion
from RBN and 0.53 billion from international donors), which is equivalent to about 274 thousand NRs.
per kilometer. This according to DOR is about 30- 40 percent of the requirement. Other reasons include,
but not limited to,
The gap in the increase between capital expenditure and compound annual growth. During
FY2014/18, the capital expenditure on SRN increased at a compound annual growth rate of 40
percent, whereas the maintenance expenditure increased only at a CAGR of 13 percent5.
According to the DOR, the revenue for maintenance to be allocated has not been increased
despite increase of the SRN roads. According to an estimate, only forty percent of the required
budget for maintenance of SRNs are allocated, which results to huge backlog of adequate and
timely maintenance.
The process for allocation of the budget is often lengthy and by the time the budget is allocated
the severity of the damages of the road is already over-deteriorated.
4.7.1.2 Establishment of Quality Research and Development Center
The Road Sector Skill Development Unit (RSSDU) and Study and Research section (SRS) under Quality
Research and Development Center (QRDC)that was established in 2019 is responsible for planning and
executing programs to enhance capacity of the staffs at the DOR. The section and the unit were under the
Planning and design Branch before it was shifted to the QRDC. RSSDU organizes trainings every year for
the young engineers of the DOR. It also organizes on-demand programs such as trainings, seminars,
workshops, study tour in and out of Nepal under request from a specific branch.
4.7.1.3 Technical Experience
DOR has the most educated and well-trained staffs in the government organizations in Nepal. Its long-
time experience working with the international development partners have substantially enhanced the
capacity of its staffs. Also, successful implementation of projects both funded by the government of Nepal
5 Source: WB (Nepal Strategic Road Connectivity and Trade Improvement Project (P170409); Discussion with DOR)

Data Collection Survey on the Sindhuli Road Capacity Enhancement in Nepal FINAL REPORT
4-33
as well as the international donors is evident of the increased performance capacity of the implementing
agency. Unlike in the past, when assistance from the international donors was significantly allocated for
infrastructure development, the present assistances are forwarded also for enhancing capacity of
implementing agencies. One of the good examples would be the experience and knowledge gained from
technical transfer on the maintenance of roads through “the Project for Road Maintenance of Sindhuli
Road”. DOR is now utilizing the experience, knowledge, and know-hows gained through this project in
its expansion of SRNs with remarkable results.
Some of the mentionable projects that is designed and constructed by Nepalese Consultants and
Contractors under the guidance and management by the DOR include, but not limited to are,
i) Expansion and upgradation of roads within Kathmandu Valley,
ii) The Dharan-Chatara connection is the first highway undertaking designed by Nepali engineers
and executed by a Nepali contractor
iii)The Dudhkoshi Motorable Suspension Bridge, which was designed by a national consultant and
constructed by a local contractor is another such example of DOR’s enhanced capacity.
iv) The Arch bridge across Dhobikhola in Kathmandu, which was designed and constructed by the
local consultant and contractor respectively.
v) The detailed design of BP Highway Re-alignment and Diversion Road in Headworks Area of
Sunkoshi Marin Diversion Multipurpose Project, which is also being carried out by a domestic
consultant and the construction is very likely to be carried out by a local contractor.
From above, it can be judged that capacity of the DOR has enhanced its management capacity in planning
and implementing the projects significantly in the past decades.

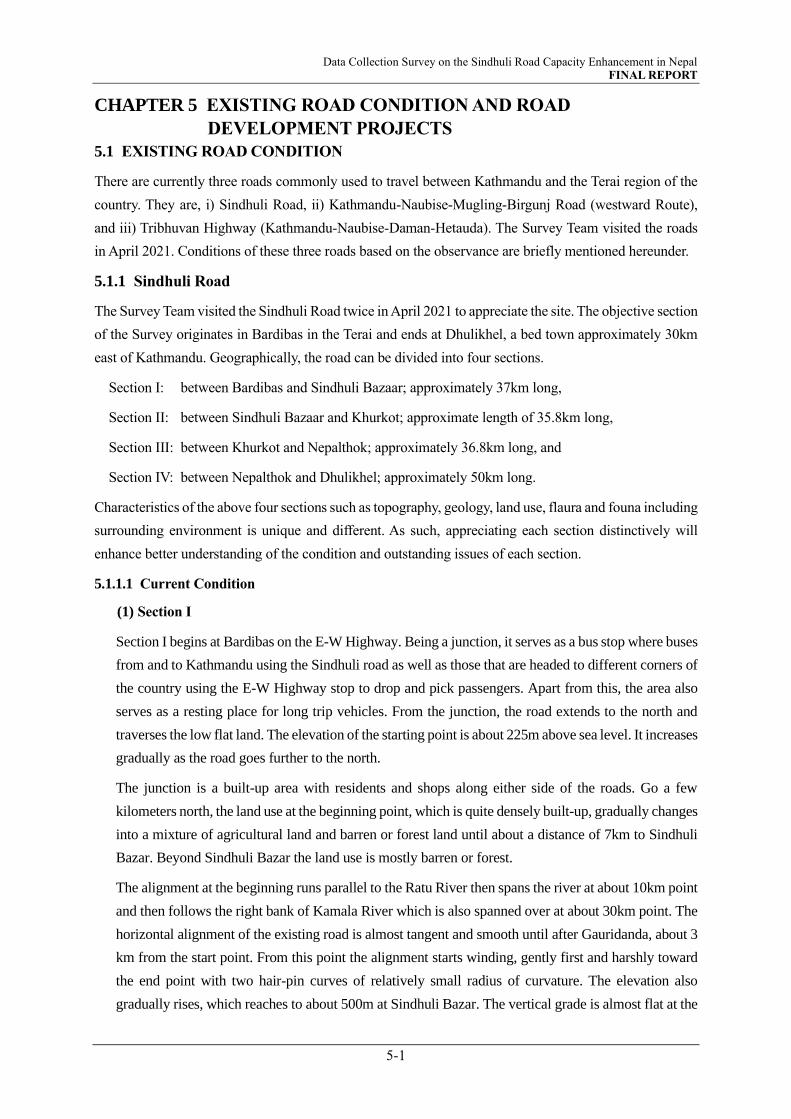
Data Collection Survey on the Sindhuli Road Capacity Enhancement in Nepal FINAL REPORT
5-1
CHAPTER 5 EXISTING ROAD CONDITION AND ROAD
DEVELOPMENT PROJECTS
5.1 EXISTING ROAD CONDITION
There are currently three roads commonly used to travel between Kathmandu and the Terai region of the
country. They are, i) Sindhuli Road, ii) Kathmandu-Naubise-Mugling-Birgunj Road (westward Route),
and iii) Tribhuvan Highway (Kathmandu-Naubise-Daman-Hetauda). The Survey Team visited the roads
in April 2021. Conditions of these three roads based on the observance are briefly mentioned hereunder.
5.1.1 Sindhuli Road
The Survey Team visited the Sindhuli Road twice in April 2021 to appreciate the site. The objective section
of the Survey originates in Bardibas in the Terai and ends at Dhulikhel, a bed town approximately 30km
east of Kathmandu. Geographically, the road can be divided into four sections.
Section I: between Bardibas and Sindhuli Bazaar; approximately 37km long,
Section II: between Sindhuli Bazaar and Khurkot; approximate length of 35.8km long,
Section III: between Khurkot and Nepalthok; approximately 36.8km long, and
Section IV: between Nepalthok and Dhulikhel; approximately 50km long.
Characteristics of the above four sections such as topography, geology, land use, flaura and founa including
surrounding environment is unique and different. As such, appreciating each section distinctively will
enhance better understanding of the condition and outstanding issues of each section.
5.1.1.1 Current Condition
(1) Section I
Section I begins at Bardibas on the E-W Highway. Being a junction, it serves as a bus stop where buses
from and to Kathmandu using the Sindhuli road as well as those that are headed to different corners of
the country using the E-W Highway stop to drop and pick passengers. Apart from this, the area also
serves as a resting place for long trip vehicles. From the junction, the road extends to the north and
traverses the low flat land. The elevation of the starting point is about 225m above sea level. It increases
gradually as the road goes further to the north.
The junction is a built-up area with residents and shops along either side of the roads. Go a few
kilometers north, the land use at the beginning point, which is quite densely built-up, gradually changes
into a mixture of agricultural land and barren or forest land until about a distance of 7km to Sindhuli
Bazar. Beyond Sindhuli Bazar the land use is mostly barren or forest.
The alignment at the beginning runs parallel to the Ratu River then spans the river at about 10km point
and then follows the right bank of Kamala River which is also spanned over at about 30km point. The
horizontal alignment of the existing road is almost tangent and smooth until after Gauridanda, about 3
km from the start point. From this point the alignment starts winding, gently first and harshly toward
the end point with two hair-pin curves of relatively small radius of curvature. The elevation also
gradually rises, which reaches to about 500m at Sindhuli Bazar. The vertical grade is almost flat at the
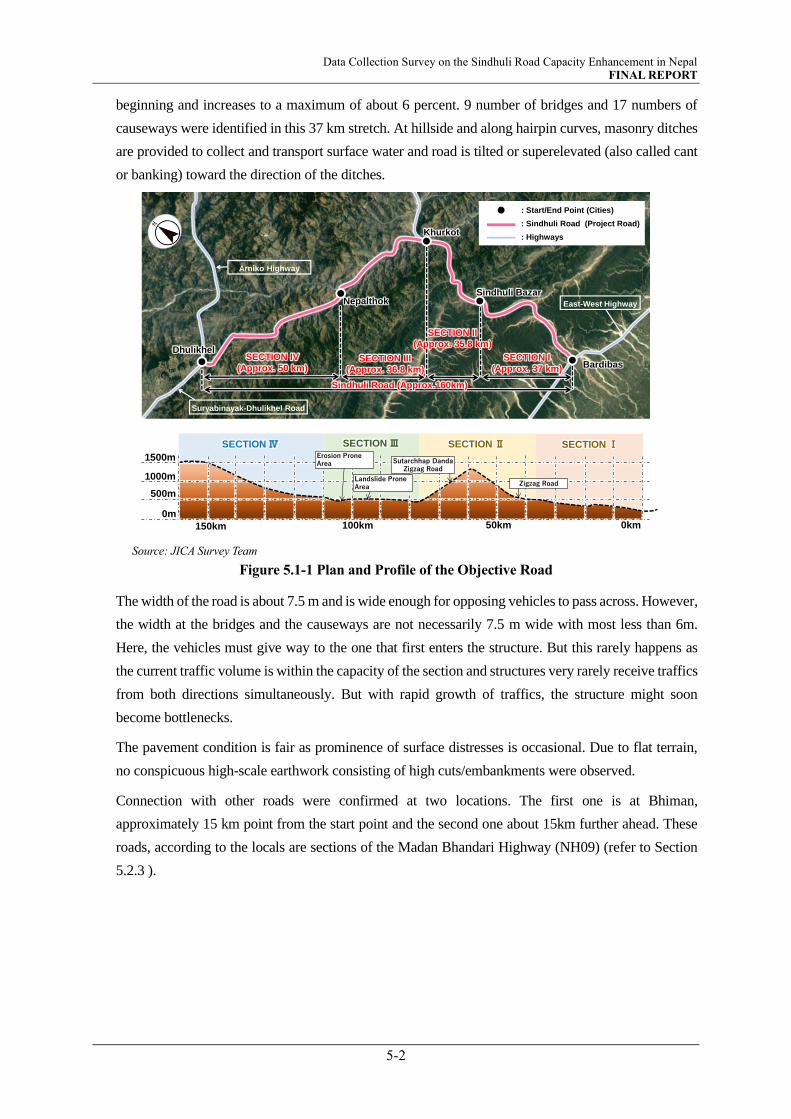
Data Collection Survey on the Sindhuli Road Capacity Enhancement in Nepal FINAL REPORT
5-2
beginning and increases to a maximum of about 6 percent. 9 number of bridges and 17 numbers of
causeways were identified in this 37 km stretch. At hillside and along hairpin curves, masonry ditches
are provided to collect and transport surface water and road is tilted or superelevated (also called cant
or banking) toward the direction of the ditches.
Source: JICA Survey Team
Figure 5.1-1 Plan and Profile of the Objective Road
The width of the road is about 7.5 m and is wide enough for opposing vehicles to pass across. However,
the width at the bridges and the causeways are not necessarily 7.5 m wide with most less than 6m.
Here, the vehicles must give way to the one that first enters the structure. But this rarely happens as
the current traffic volume is within the capacity of the section and structures very rarely receive traffics
from both directions simultaneously. But with rapid growth of traffics, the structure might soon
become bottlenecks.
The pavement condition is fair as prominence of surface distresses is occasional. Due to flat terrain,
no conspicuous high-scale earthwork consisting of high cuts/embankments were observed.
Connection with other roads were confirmed at two locations. The first one is at Bhiman,
approximately 15 km point from the start point and the second one about 15km further ahead. These
roads, according to the locals are sections of the Madan Bhandari Highway (NH09) (refer to Section
5.2.3 ).
Dhulikhel
BardibasSECTION IV
(Approx. 50 km)SECTION III
(Approx. 36.8 km)
SECTION II
(Approx. 35.8 km)
SECTION I
(Approx. 37 km)
Arniko Highway
Suryabinayak-Dhulikhel Road
East-West Highway
: Start/End Point (Cities)
Sindhuli Road (Approx.160km)
: Sindhuli Road (Project Road)
: Highways
Nepalthok
Khurkot
Sindhuli Bazar
1500m
1000m
500m
0m0km50km100km150km
SECTIONⅣ SECTIONⅢ SECTIONⅡ SECTIONⅠ
Zigzag Road
Sutarchhap DandaZigzag Road
Erosion Prone Area
Landslide Prone Area
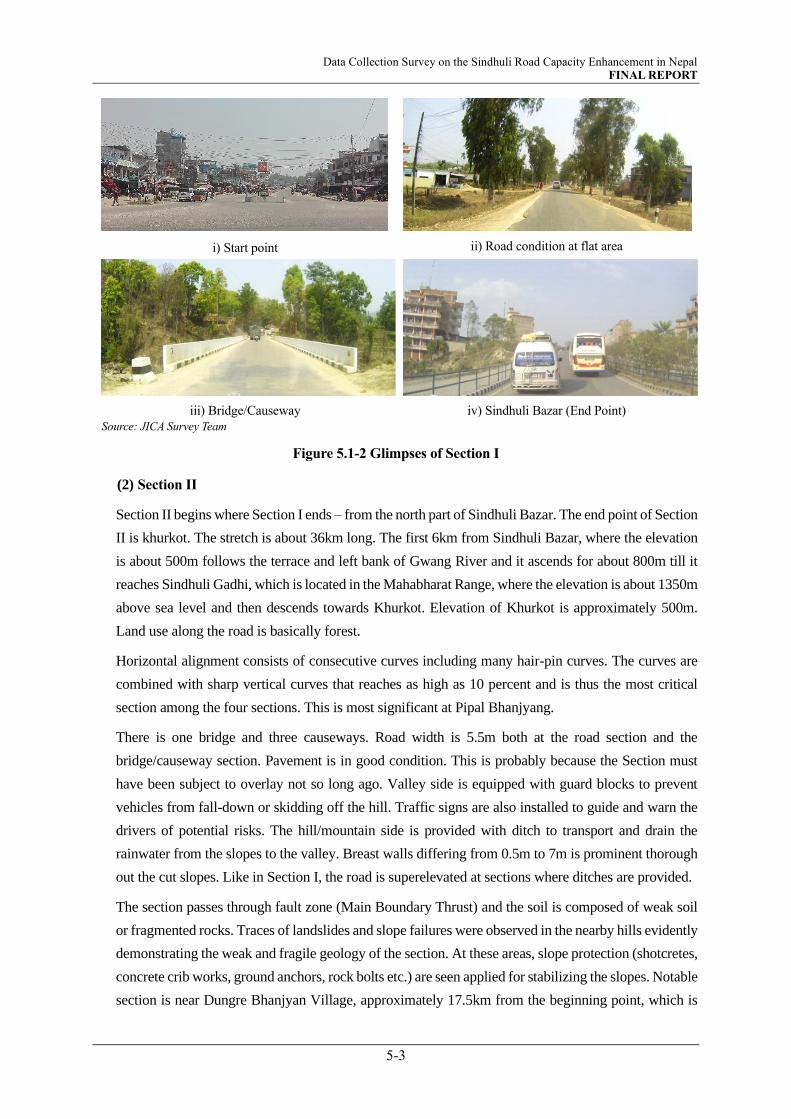
Data Collection Survey on the Sindhuli Road Capacity Enhancement in Nepal FINAL REPORT
5-3
i) Start point ii) Road condition at flat area
iii) Bridge/Causeway iv) Sindhuli Bazar (End Point)
Source: JICA Survey Team
Figure 5.1-2 Glimpses of Section I
(2) Section II
Section II begins where Section I ends – from the north part of Sindhuli Bazar. The end point of Section
II is khurkot. The stretch is about 36km long. The first 6km from Sindhuli Bazar, where the elevation
is about 500m follows the terrace and left bank of Gwang River and it ascends for about 800m till it
reaches Sindhuli Gadhi, which is located in the Mahabharat Range, where the elevation is about 1350m
above sea level and then descends towards Khurkot. Elevation of Khurkot is approximately 500m.
Land use along the road is basically forest.
Horizontal alignment consists of consecutive curves including many hair-pin curves. The curves are
combined with sharp vertical curves that reaches as high as 10 percent and is thus the most critical
section among the four sections. This is most significant at Pipal Bhanjyang.
There is one bridge and three causeways. Road width is 5.5m both at the road section and the
bridge/causeway section. Pavement is in good condition. This is probably because the Section must
have been subject to overlay not so long ago. Valley side is equipped with guard blocks to prevent
vehicles from fall-down or skidding off the hill. Traffic signs are also installed to guide and warn the
drivers of potential risks. The hill/mountain side is provided with ditch to transport and drain the
rainwater from the slopes to the valley. Breast walls differing from 0.5m to 7m is prominent thorough
out the cut slopes. Like in Section I, the road is superelevated at sections where ditches are provided.
The section passes through fault zone (Main Boundary Thrust) and the soil is composed of weak soil
or fragmented rocks. Traces of landslides and slope failures were observed in the nearby hills evidently
demonstrating the weak and fragile geology of the section. At these areas, slope protection (shotcretes,
concrete crib works, ground anchors, rock bolts etc.) are seen applied for stabilizing the slopes. Notable
section is near Dungre Bhanjyan Village, approximately 17.5km from the beginning point, which is
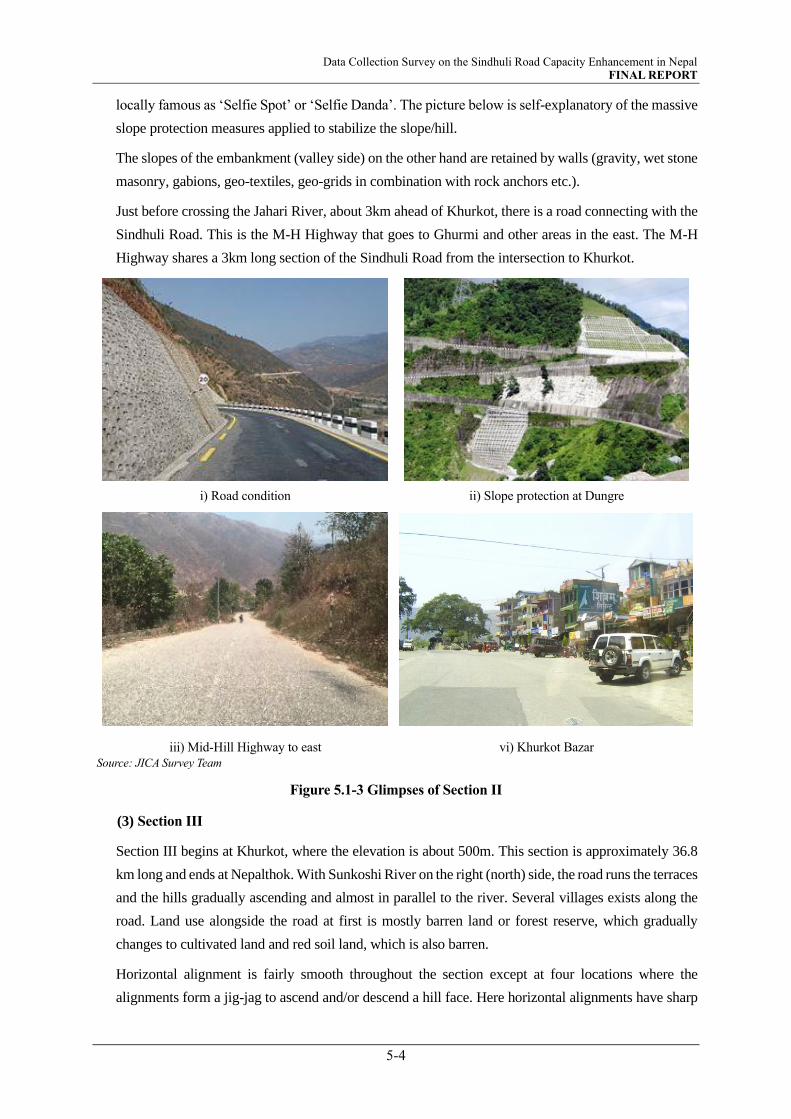
Data Collection Survey on the Sindhuli Road Capacity Enhancement in Nepal FINAL REPORT
5-4
locally famous as ‘Selfie Spot’ or ‘Selfie Danda’. The picture below is self-explanatory of the massive
slope protection measures applied to stabilize the slope/hill.
The slopes of the embankment (valley side) on the other hand are retained by walls (gravity, wet stone
masonry, gabions, geo-textiles, geo-grids in combination with rock anchors etc.).
Just before crossing the Jahari River, about 3km ahead of Khurkot, there is a road connecting with the
Sindhuli Road. This is the M-H Highway that goes to Ghurmi and other areas in the east. The M-H
Highway shares a 3km long section of the Sindhuli Road from the intersection to Khurkot.
i) Road condition ii) Slope protection at Dungre
iii) Mid-Hill Highway to east vi) Khurkot Bazar
Source: JICA Survey Team
Figure 5.1-3 Glimpses of Section II
(3) Section III
Section III begins at Khurkot, where the elevation is about 500m. This section is approximately 36.8
km long and ends at Nepalthok. With Sunkoshi River on the right (north) side, the road runs the terraces
and the hills gradually ascending and almost in parallel to the river. Several villages exists along the
road. Land use alongside the road at first is mostly barren land or forest reserve, which gradually
changes to cultivated land and red soil land, which is also barren.
Horizontal alignment is fairly smooth throughout the section except at four locations where the
alignments form a jig-jag to ascend and/or descend a hill face. Here horizontal alignments have sharp
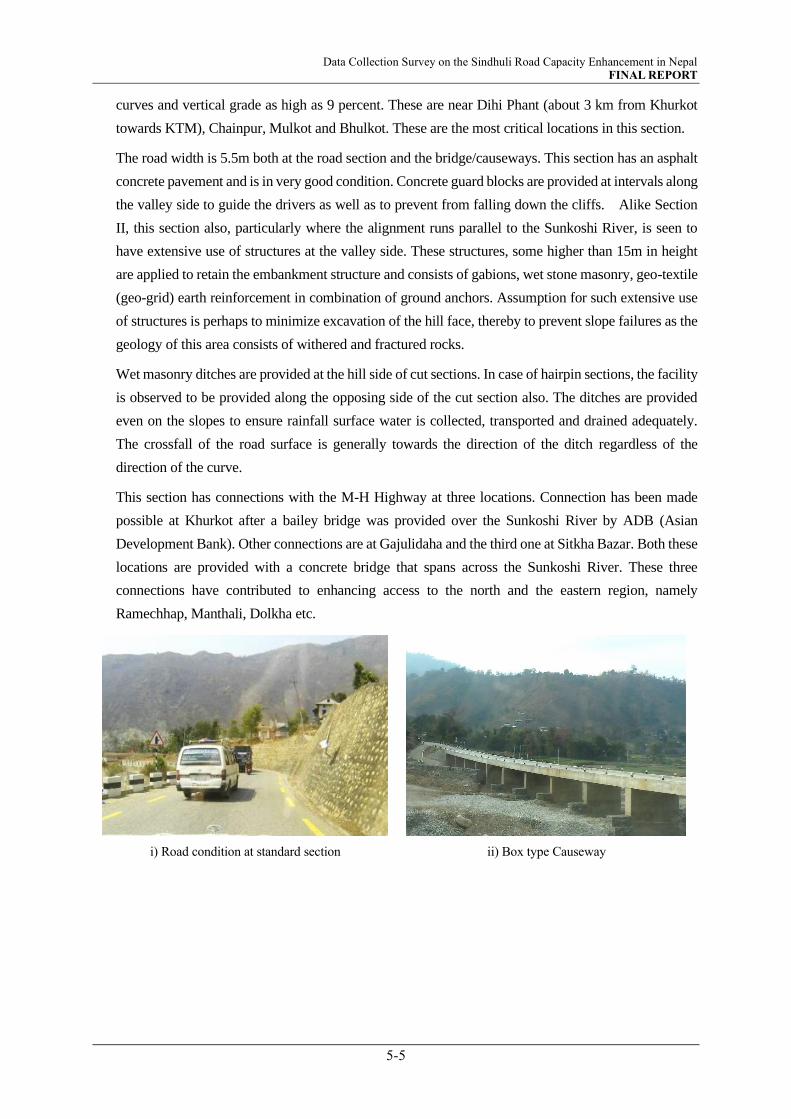
Data Collection Survey on the Sindhuli Road Capacity Enhancement in Nepal FINAL REPORT
5-5
curves and vertical grade as high as 9 percent. These are near Dihi Phant (about 3 km from Khurkot
towards KTM), Chainpur, Mulkot and Bhulkot. These are the most critical locations in this section.
The road width is 5.5m both at the road section and the bridge/causeways. This section has an asphalt
concrete pavement and is in very good condition. Concrete guard blocks are provided at intervals along
the valley side to guide the drivers as well as to prevent from falling down the cliffs. Alike Section
II, this section also, particularly where the alignment runs parallel to the Sunkoshi River, is seen to
have extensive use of structures at the valley side. These structures, some higher than 15m in height
are applied to retain the embankment structure and consists of gabions, wet stone masonry, geo-textile
(geo-grid) earth reinforcement in combination of ground anchors. Assumption for such extensive use
of structures is perhaps to minimize excavation of the hill face, thereby to prevent slope failures as the
geology of this area consists of withered and fractured rocks.
Wet masonry ditches are provided at the hill side of cut sections. In case of hairpin sections, the facility
is observed to be provided along the opposing side of the cut section also. The ditches are provided
even on the slopes to ensure rainfall surface water is collected, transported and drained adequately.
The crossfall of the road surface is generally towards the direction of the ditch regardless of the
direction of the curve.
This section has connections with the M-H Highway at three locations. Connection has been made
possible at Khurkot after a bailey bridge was provided over the Sunkoshi River by ADB (Asian
Development Bank). Other connections are at Gajulidaha and the third one at Sitkha Bazar. Both these
locations are provided with a concrete bridge that spans across the Sunkoshi River. These three
connections have contributed to enhancing access to the north and the eastern region, namely
Ramechhap, Manthali, Dolkha etc.
i) Road condition at standard section ii) Box type Causeway
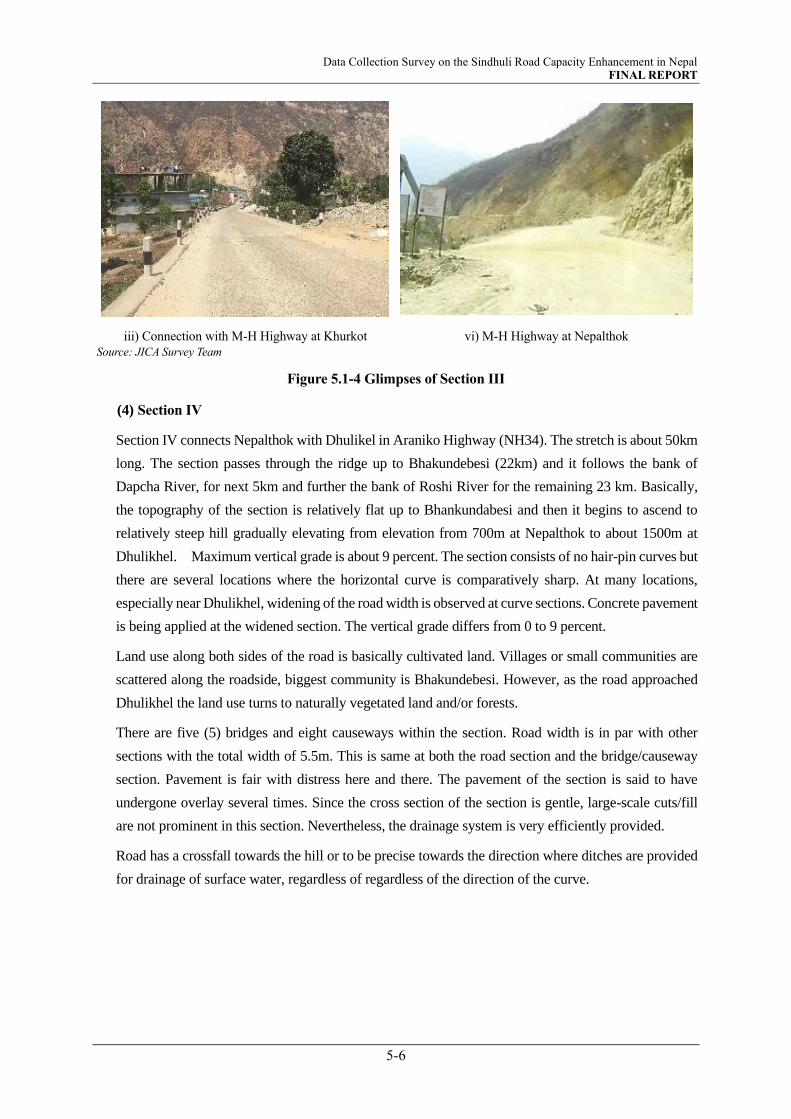
Data Collection Survey on the Sindhuli Road Capacity Enhancement in Nepal FINAL REPORT
5-6
iii) Connection with M-H Highway at Khurkot vi) M-H Highway at Nepalthok
Source: JICA Survey Team
Figure 5.1-4 Glimpses of Section III
(4) Section IV
Section IV connects Nepalthok with Dhulikel in Araniko Highway (NH34). The stretch is about 50km
long. The section passes through the ridge up to Bhakundebesi (22km) and it follows the bank of
Dapcha River, for next 5km and further the bank of Roshi River for the remaining 23 km. Basically,
the topography of the section is relatively flat up to Bhankundabesi and then it begins to ascend to
relatively steep hill gradually elevating from elevation from 700m at Nepalthok to about 1500m at
Dhulikhel. Maximum vertical grade is about 9 percent. The section consists of no hair-pin curves but
there are several locations where the horizontal curve is comparatively sharp. At many locations,
especially near Dhulikhel, widening of the road width is observed at curve sections. Concrete pavement
is being applied at the widened section. The vertical grade differs from 0 to 9 percent.
Land use along both sides of the road is basically cultivated land. Villages or small communities are
scattered along the roadside, biggest community is Bhakundebesi. However, as the road approached
Dhulikhel the land use turns to naturally vegetated land and/or forests.
There are five (5) bridges and eight causeways within the section. Road width is in par with other
sections with the total width of 5.5m. This is same at both the road section and the bridge/causeway
section. Pavement is fair with distress here and there. The pavement of the section is said to have
undergone overlay several times. Since the cross section of the section is gentle, large-scale cuts/fill
are not prominent in this section. Nevertheless, the drainage system is very efficiently provided.
Road has a crossfall towards the hill or to be precise towards the direction where ditches are provided
for drainage of surface water, regardless of regardless of the direction of the curve.

Data Collection Survey on the Sindhuli Road Capacity Enhancement in Nepal FINAL REPORT
5-7
i) Road condition at standard section ii) Road condition along river (wet masonry walls)
iii) Mid-Hill Highway to Ramechhap vi) Pass over of opposing vehicles
Source: JICA Survey Team
Figure 5.1-5 Glimpses of Section IV
5.1.1.2 Travel Time
The Survey Team measured the time taken during its visit of the site on both inbound and outbound trips.
As shown in Figure 5.1-6, the average travel time1 along the Sindhuli Road is about 5 hours.
Source: JICA Survey Team
Figure 5.1-6 Actual Travel Time
1 Average travel time recorded was for a 4-wheel Drive vehicle. Travel commenced at 08:00 hours on a weekday.

Data Collection Survey on the Sindhuli Road Capacity Enhancement in Nepal FINAL REPORT
5-8
5.1.1.3 Issues Identified
(1) Narrow Width
The road width of the entire section of the Sindhuli Road, excepting the Section from Bardibas to
Sindhuli Bazaar, is 5.5m. Two opposing vehicles, even passenger cars, are required to drop speed
substantially (almost to a halting speed) to manage passing through safely. Widening is applied on the
hairpin curves only. The available reports on the planning, design and construction of the Sindhuli
Road mentions that all hairpin curves are widened to allow heavy vehicles. Site inspection conducted
by the Survey Team in April 2021 verified the widened hair-pins. But the widening is sufficient to
allow heavy vehicles negotiate the curve by using the entire width of the road.
(2) Extensive Use of Retaining Structures
The Sindhuli Road applies structures extensively to retain earth at the valley side, some as high as 18m.
Widening the valley side in these sections to secure the standard width for 2-lane road is inconsiderable
both technically and economically. The only option is to either widened the hill side producing massive
earth excavation or provide a bypass.
(3) Reversed Superelevation
At hillside and along hairpin curves, masonry ditches are provided to collect and transport surface
water and road is tilted or superelevated (also called cant or banking) towards the direction of the
ditches, regardless of the direction of the curve (clockwise or anti-clockwise). This is very effective to
facilitate surface drainage and adequate treatment of surface drainage is very important to keep the
road from premature damage. However, providing crossfall (superelevation) in this manner produces
sections where the superelevation is reversed. For slow traffics, reverse superelevation isn’t of big
concern, but circumstances might be different for vehicles negotiating the curves in a faster speed.
Usually, roads are superelevated to interact with the centrifugal force (force acting in the outward
direction of a circular path). If the grade is reversed this will rather magnify the force resulting to
skidding and tipping of vehicles at higher speed.
(4) Hairpin Curves
Section II consists of hairpin curves with minimum horizontal radius at many locations and Section III
at two locations. Sections between these hairpin curves are horizontally so close, widening of the
existing road is literally not possible. Only option at these sections is to provide a bypass.
(5) Long and Winding Sections
The existing road, especially Section II and Section III have small curves compounded with vertical
gradient up to 9%-10%. Loaded trucks, old, and heavy vehicles are forced to run slow on these sections
often causing lagging behind of tailing vehicles for being unable to overtake due to the narrow width.
And takeover of such creeping vehicle occasionally results into severe accidents.
(6) Continued Increase of Traffic Volume
The Sindhuli Road is the shortest and fastest route to travel between Kathmandu and eastern Terai
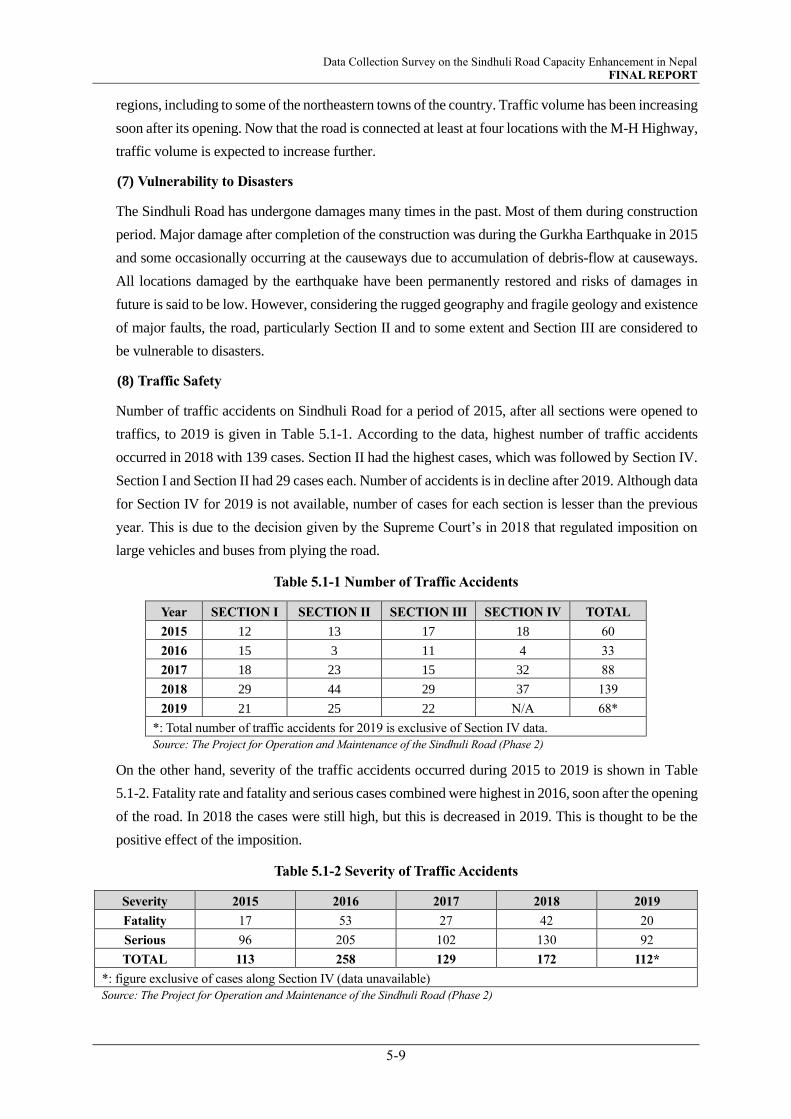
Data Collection Survey on the Sindhuli Road Capacity Enhancement in Nepal FINAL REPORT
5-9
regions, including to some of the northeastern towns of the country. Traffic volume has been increasing
soon after its opening. Now that the road is connected at least at four locations with the M-H Highway,
traffic volume is expected to increase further.
(7) Vulnerability to Disasters
The Sindhuli Road has undergone damages many times in the past. Most of them during construction
period. Major damage after completion of the construction was during the Gurkha Earthquake in 2015
and some occasionally occurring at the causeways due to accumulation of debris-flow at causeways.
All locations damaged by the earthquake have been permanently restored and risks of damages in
future is said to be low. However, considering the rugged geography and fragile geology and existence
of major faults, the road, particularly Section II and to some extent and Section III are considered to
be vulnerable to disasters.
(8) Traffic Safety
Number of traffic accidents on Sindhuli Road for a period of 2015, after all sections were opened to
traffics, to 2019 is given in Table 5.1-1. According to the data, highest number of traffic accidents
occurred in 2018 with 139 cases. Section II had the highest cases, which was followed by Section IV.
Section I and Section II had 29 cases each. Number of accidents is in decline after 2019. Although data
for Section IV for 2019 is not available, number of cases for each section is lesser than the previous
year. This is due to the decision given by the Supreme Court’s in 2018 that regulated imposition on
large vehicles and buses from plying the road.
Table 5.1-1 Number of Traffic Accidents
Year SECTION I SECTION II SECTION III SECTION IV TOTAL
2015 12 13 17 18 60
2016 15 3 11 4 33
2017 18 23 15 32 88
2018 29 44 29 37 139
2019 21 25 22 N/A 68*
*: Total number of traffic accidents for 2019 is exclusive of Section IV data.
Source: The Project for Operation and Maintenance of the Sindhuli Road (Phase 2)
On the other hand, severity of the traffic accidents occurred during 2015 to 2019 is shown in Table
5.1-2. Fatality rate and fatality and serious cases combined were highest in 2016, soon after the opening
of the road. In 2018 the cases were still high, but this is decreased in 2019. This is thought to be the
positive effect of the imposition.
Table 5.1-2 Severity of Traffic Accidents
Severity 2015 2016 2017 2018 2019
Fatality 17 53 27 42 20
Serious 96 205 102 130 92
TOTAL 113 258 129 172 112*
*: figure exclusive of cases along Section IV (data unavailable)
Source: The Project for Operation and Maintenance of the Sindhuli Road (Phase 2)
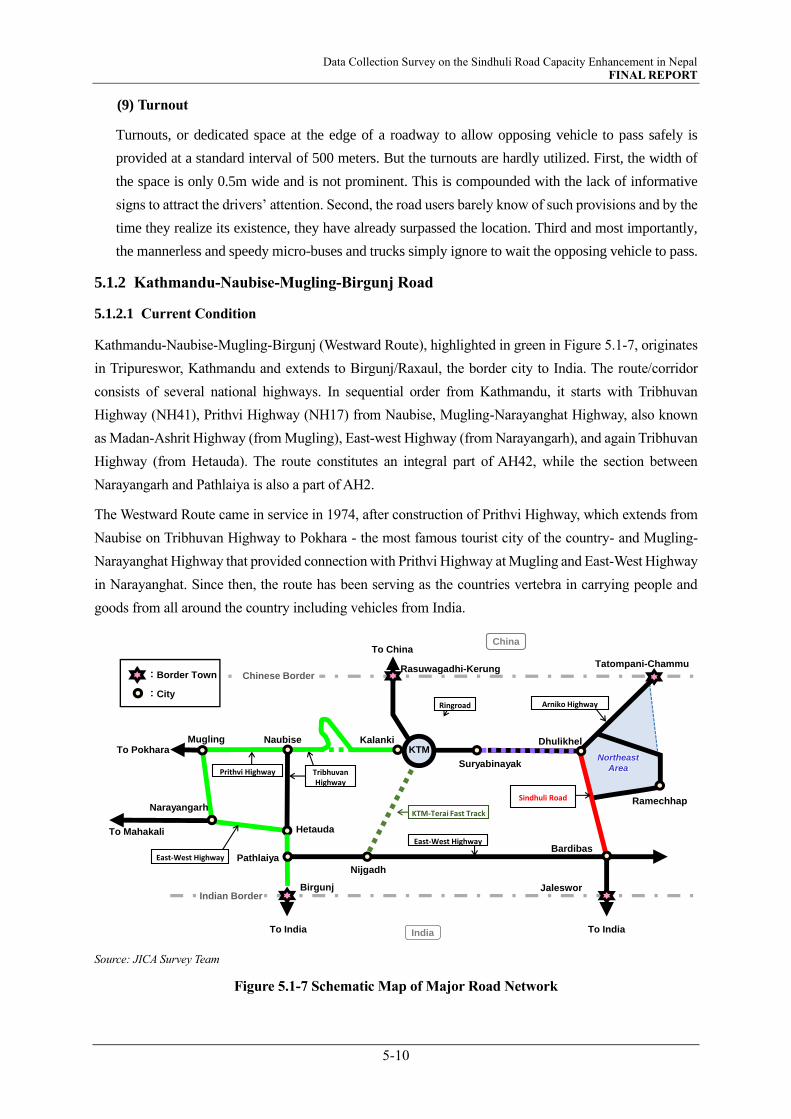
Data Collection Survey on the Sindhuli Road Capacity Enhancement in Nepal FINAL REPORT
5-10
(9) Turnout
Turnouts, or dedicated space at the edge of a roadway to allow opposing vehicle to pass safely is
provided at a standard interval of 500 meters. But the turnouts are hardly utilized. First, the width of
the space is only 0.5m wide and is not prominent. This is compounded with the lack of informative
signs to attract the drivers’ attention. Second, the road users barely know of such provisions and by the
time they realize its existence, they have already surpassed the location. Third and most importantly,
the mannerless and speedy micro-buses and trucks simply ignore to wait the opposing vehicle to pass.
5.1.2 Kathmandu-Naubise-Mugling-Birgunj Road
5.1.2.1 Current Condition
Kathmandu-Naubise-Mugling-Birgunj (Westward Route), highlighted in green in Figure 5.1-7, originates
in Tripureswor, Kathmandu and extends to Birgunj/Raxaul, the border city to India. The route/corridor
consists of several national highways. In sequential order from Kathmandu, it starts with Tribhuvan
Highway (NH41), Prithvi Highway (NH17) from Naubise, Mugling-Narayanghat Highway, also known
as Madan-Ashrit Highway (from Mugling), East-west Highway (from Narayangarh), and again Tribhuvan
Highway (from Hetauda). The route constitutes an integral part of AH42, while the section between
Narayangarh and Pathlaiya is also a part of AH2.
The Westward Route came in service in 1974, after construction of Prithvi Highway, which extends from
Naubise on Tribhuvan Highway to Pokhara - the most famous tourist city of the country- and Mugling-
Narayanghat Highway that provided connection with Prithvi Highway at Mugling and East-West Highway
in Narayanghat. Since then, the route has been serving as the countries vertebra in carrying people and
goods from all around the country including vehicles from India.
Source: JICA Survey Team
Figure 5.1-7 Schematic Map of Major Road Network
KTM
Suryabinayak
Indian Border
Rasuwagadhi-KerungTatompani-Chammu
Chinese Border
Dhulikhel
KTM-Terai Fast Track
Ringroad
Tribhuvan Highway
Naubise
Hetauda
Pathlaiya
Narayangarh
Mugling
Nijgadh
Birgunj Jaleswor
BardibasEast-West Highway
East-West Highway
Sindhuli Road Ramechhap
Arniko Highway
Kalanki
Northeast
Area
To Pokhara
:Border Town
:City
Prithvi Highway
To India To India
To ChinaChina
India
To Mahakali
Data Collection Survey on the Sindhuli Road Capacity Enhancement in Nepal FINAL REPORT
5-11
The section between Tripureswor to Nagdhunga runs across densely built-up area with houses on either
side of the road. Both the horizontal and vertical alignment of the section are smooth except at Nagdhunga,
where the curves are sharp and continuous, and the profile is steep (maximum 11%). To make the situation
worse, although the road has 2 lanes, the width of the road is about 6-7m. just sufficient for opposing
vehicles to pass. Overtaking is literally impossible, if not extremely risky and perilous. Its steep grade often
causes mechanical break-down of inbound trucks. These elements combined makes the section one of the
worst bottle necks of the route and most of the time the section is severely congested. Currently,
Nagdhunga Tunnel is being constructed. The objective of the tunnel is to provide a smooth and safe flow
at this critical section. Once completed, vehicles will be free from using the critical section by crossing the
section through the tunnel.
After passing Naubise, the road alignment passes river valley of the Mahesh Khola and Trishuli River,
initially the road alignment follows on left bank of the Mahesh Khola valley upto Galchhi before meeting
with Trishuli River. After Galchhi, road alignment follows the left bank of the river valley upto Mugling
Naubise to Mugling on Prithvi Highway runs parallel with Mahes River and Trishuli River. Initially the
road alignment follows on the left bank of Mahesh Khola valley up to Galchhi before meeting with Trishuli
River. The road crosses over hills, valleys, and alluvial deposits in the midlands of the lesser Himalaya
Zone varying in altitude from 200 to 2,000m. Rock types found are schist, phyllite, gneiss, quartize, granite,
and limestone and in most instances are heavily decomposed on the surface making it vulnerable to shallow
landslide failure. The road width of the section is 6-7m wide and the maximum vertical grade is about 6
percent. The section is provided with bituminous asphalt and the condition of the pavement is relatively
good. Drainage facilities are provided at towns and villages and at the hill side. Bridges and culverts are
also in fair condition. Mugling is famous as a ‘Dal-Bhat’ center (literally a rest area for passengers) and
nodal point with the Mugling-Narayangarh Highway.
Mugling- Narayangadh section (36km) also runs parallel to the Trishuli River. Geologically it runs across
the Siwalik Zone and Mahabharat Range in the Lesser Himalayan Zone. This is made of geologically
young sedimentary rocks including mudstone, siltstone, sandstones, shales, and conglomerates, which is
generally soft and loosely packed having greater tendency for rapid disintegration. On one side of the road
stands steep hills and on the opposite cliffs or bank of the river.
The road was widened in 2018 to dedicated 2 lanes (6m+1m shoulder) from its earlier intermediate lane
by the GON (Government of Nepal) under the assistance of the WB. It is provided with bituminous asphalt
(concrete pavement at causeways/Irish Crossings) and the pavement is in good condition.
Beyond Narayangarh to Pathlaiya, the alignment runs across low land of the Terai region and in parallel
with the Narayani River. Horizontal alignment is smooth and vertical grade is almost flat. Pavement is
mostly DBST and is rutted due to heavy vehicular load and hot temperature.
Beyond Pathlaiya, the road is being widened to 4 lanes with asphalt pavement. Service roads are provided
in residential areas.
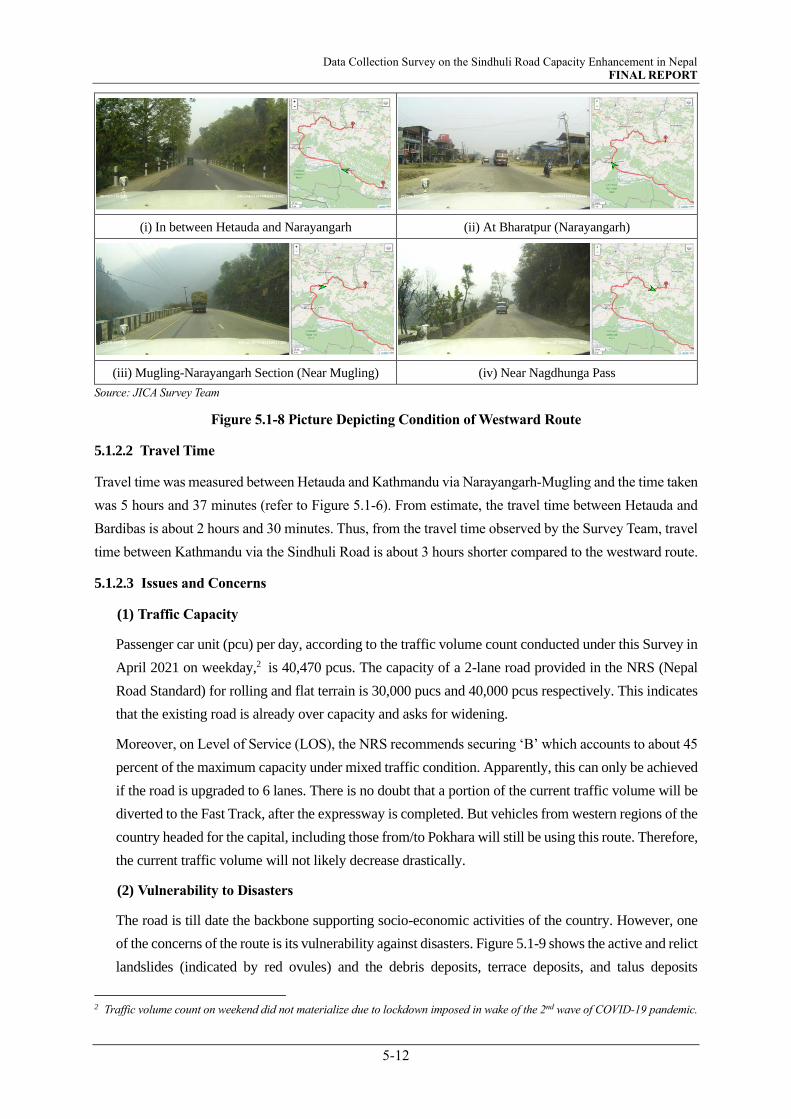
Data Collection Survey on the Sindhuli Road Capacity Enhancement in Nepal FINAL REPORT
5-12
(i) In between Hetauda and Narayangarh (ii) At Bharatpur (Narayangarh)
(iii) Mugling-Narayangarh Section (Near Mugling) (iv) Near Nagdhunga Pass
Source: JICA Survey Team
Figure 5.1-8 Picture Depicting Condition of Westward Route
5.1.2.2 Travel Time
Travel time was measured between Hetauda and Kathmandu via Narayangarh-Mugling and the time taken
was 5 hours and 37 minutes (refer to Figure 5.1-6). From estimate, the travel time between Hetauda and
Bardibas is about 2 hours and 30 minutes. Thus, from the travel time observed by the Survey Team, travel
time between Kathmandu via the Sindhuli Road is about 3 hours shorter compared to the westward route.
5.1.2.3 Issues and Concerns
(1) Traffic Capacity
Passenger car unit (pcu) per day, according to the traffic volume count conducted under this Survey in
April 2021 on weekday,2 is 40,470 pcus. The capacity of a 2-lane road provided in the NRS (Nepal
Road Standard) for rolling and flat terrain is 30,000 pucs and 40,000 pcus respectively. This indicates
that the existing road is already over capacity and asks for widening.
Moreover, on Level of Service (LOS), the NRS recommends securing ‘B’ which accounts to about 45
percent of the maximum capacity under mixed traffic condition. Apparently, this can only be achieved
if the road is upgraded to 6 lanes. There is no doubt that a portion of the current traffic volume will be
diverted to the Fast Track, after the expressway is completed. But vehicles from western regions of the
country headed for the capital, including those from/to Pokhara will still be using this route. Therefore,
the current traffic volume will not likely decrease drastically.
(2) Vulnerability to Disasters
The road is till date the backbone supporting socio-economic activities of the country. However, one
of the concerns of the route is its vulnerability against disasters. Figure 5.1-9 shows the active and relict
landslides (indicated by red ovules) and the debris deposits, terrace deposits, and talus deposits
2 Traffic volume count on weekend did not materialize due to lockdown imposed in wake of the 2nd wave of COVID-19 pandemic.
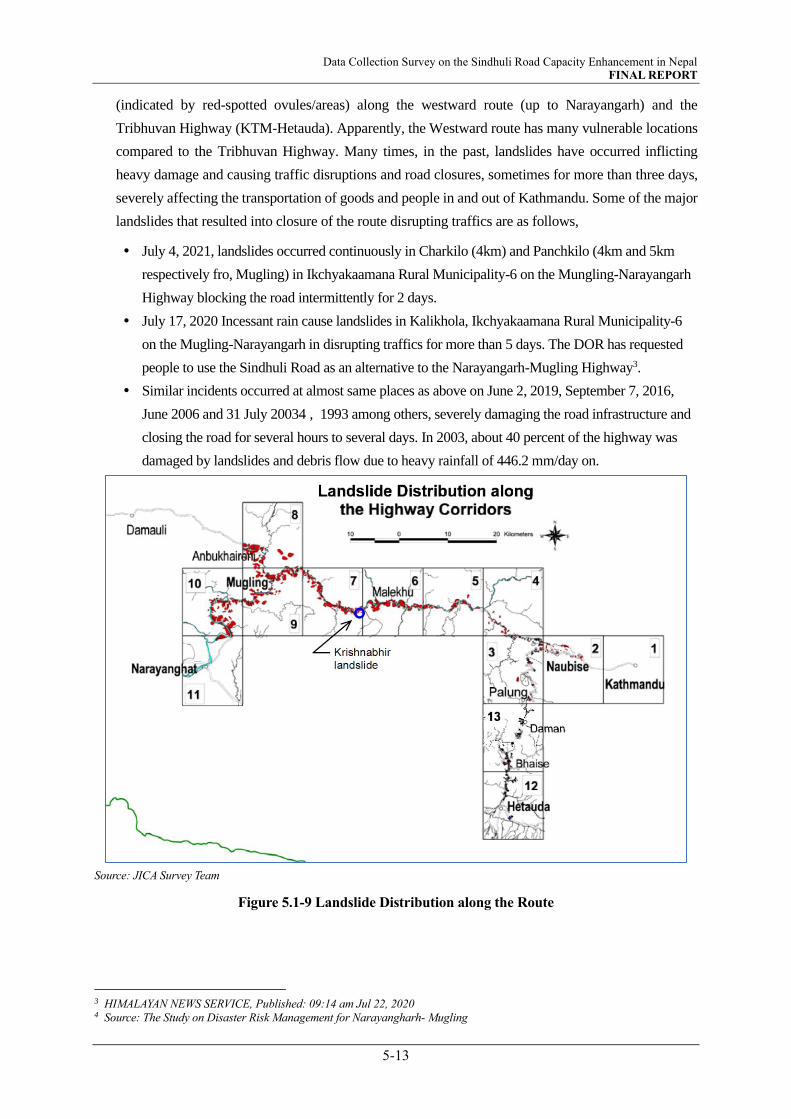
Data Collection Survey on the Sindhuli Road Capacity Enhancement in Nepal FINAL REPORT
5-13
(indicated by red-spotted ovules/areas) along the westward route (up to Narayangarh) and the
Tribhuvan Highway (KTM-Hetauda). Apparently, the Westward route has many vulnerable locations
compared to the Tribhuvan Highway. Many times, in the past, landslides have occurred inflicting
heavy damage and causing traffic disruptions and road closures, sometimes for more than three days,
severely affecting the transportation of goods and people in and out of Kathmandu. Some of the major
landslides that resulted into closure of the route disrupting traffics are as follows,
July 4, 2021, landslides occurred continuously in Charkilo (4km) and Panchkilo (4km and 5km
respectively fro, Mugling) in Ikchyakaamana Rural Municipality-6 on the Mungling-Narayangarh
Highway blocking the road intermittently for 2 days.
July 17, 2020 Incessant rain cause landslides in Kalikhola, Ikchyakaamana Rural Municipality-6
on the Mugling-Narayangarh in disrupting traffics for more than 5 days. The DOR has requested
people to use the Sindhuli Road as an alternative to the Narayangarh-Mugling Highway3.
Similar incidents occurred at almost same places as above on June 2, 2019, September 7, 2016,
June 2006 and 31 July 20034 , 1993 among others, severely damaging the road infrastructure and
closing the road for several hours to several days. In 2003, about 40 percent of the highway was
damaged by landslides and debris flow due to heavy rainfall of 446.2 mm/day on.
Source: JICA Survey Team
Figure 5.1-9 Landslide Distribution along the Route
3 HIMALAYAN NEWS SERVICE, Published: 09:14 am Jul 22, 2020 4 Source: The Study on Disaster Risk Management for Narayangharh- Mugling

Data Collection Survey on the Sindhuli Road Capacity Enhancement in Nepal FINAL REPORT
5-14
5.1.3 East-West Highway
5.1.3.1 Current Condition
Apparent from its name, the highway runs across the country from east to west and is the longest highway
(about 1027km) till date constructed under the assistance of India and in part the US. Also known as
Mahendra Highway, the road runs the low land in the south, Terai and crosses all but Karnali Province in
the west. This also constitutes an integral part of AH2 and is one of the main highways that cater the
country's main domestic and international trade. The Survey Team visited the highway in April 2021.
Hereunder is a brief overview of the findings between Bardibas to Pathlaiya (Pathlaiya-Hetauda is
explained in the Section 5.1.2 ). Figure 5.1-10 depicts the condition of the section observed.
The distance between Bardibas and Pathlaiya is about 100 km and the travel time was approximately 2
hours. Travel time up to Nijgadh (intersection with the Fast Track) was 1 hour and 48 minutes (distance is
about 86km). The earth section is fundamentally slightly elevated from the existing ground and maintains
the existing ground level at sections within settlements. The embanked carriageway acts as a flood water
barrier for rivers and streams. The elevated structure acts as a barrier embankment (dam) for rivers and
streams. The alignment is basically tangential and vertical grade is almost flat. The first 2km of the route
runs across built-up area and the rest of the stretch passes through forest. There are many rivers flowing
north south and crossing the road. Villages/communities exist along the road on both banks of the river.
Bridges are provided to span the river.
The entire stretch between Bardibas and Pathlaiya is provided with 2 lanes with exceptions at some bridges.
The road is blacktopped with asphalt pavement (DBST), which on average is in good condition although
potholes and patch works after repairing of the damaged portions exist here and there. There are more than
20 bridges, half of them longer than 100m.
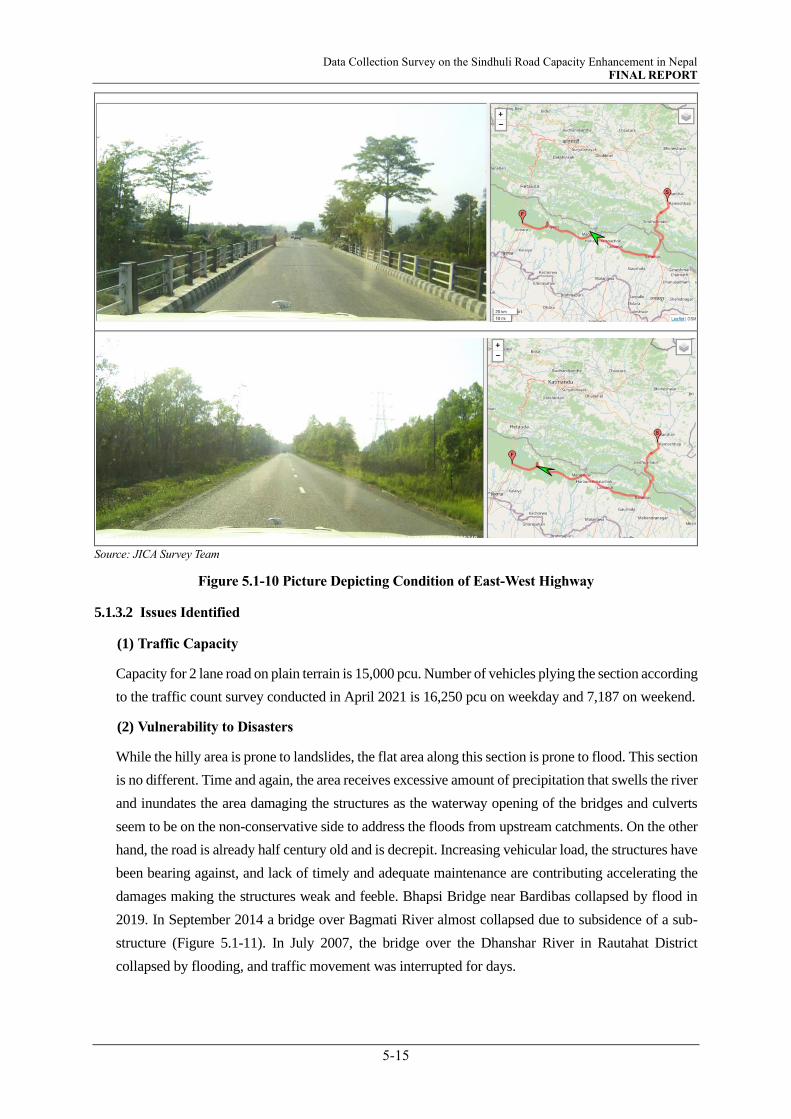
Data Collection Survey on the Sindhuli Road Capacity Enhancement in Nepal FINAL REPORT
5-15
Source: JICA Survey Team
Figure 5.1-10 Picture Depicting Condition of East-West Highway
5.1.3.2 Issues Identified
(1) Traffic Capacity
Capacity for 2 lane road on plain terrain is 15,000 pcu. Number of vehicles plying the section according
to the traffic count survey conducted in April 2021 is 16,250 pcu on weekday and 7,187 on weekend.
(2) Vulnerability to Disasters
While the hilly area is prone to landslides, the flat area along this section is prone to flood. This section
is no different. Time and again, the area receives excessive amount of precipitation that swells the river
and inundates the area damaging the structures as the waterway opening of the bridges and culverts
seem to be on the non-conservative side to address the floods from upstream catchments. On the other
hand, the road is already half century old and is decrepit. Increasing vehicular load, the structures have
been bearing against, and lack of timely and adequate maintenance are contributing accelerating the
damages making the structures weak and feeble. Bhapsi Bridge near Bardibas collapsed by flood in
2019. In September 2014 a bridge over Bagmati River almost collapsed due to subsidence of a sub-
structure (Figure 5.1-11). In July 2007, the bridge over the Dhanshar River in Rautahat District
collapsed by flooding, and traffic movement was interrupted for days.
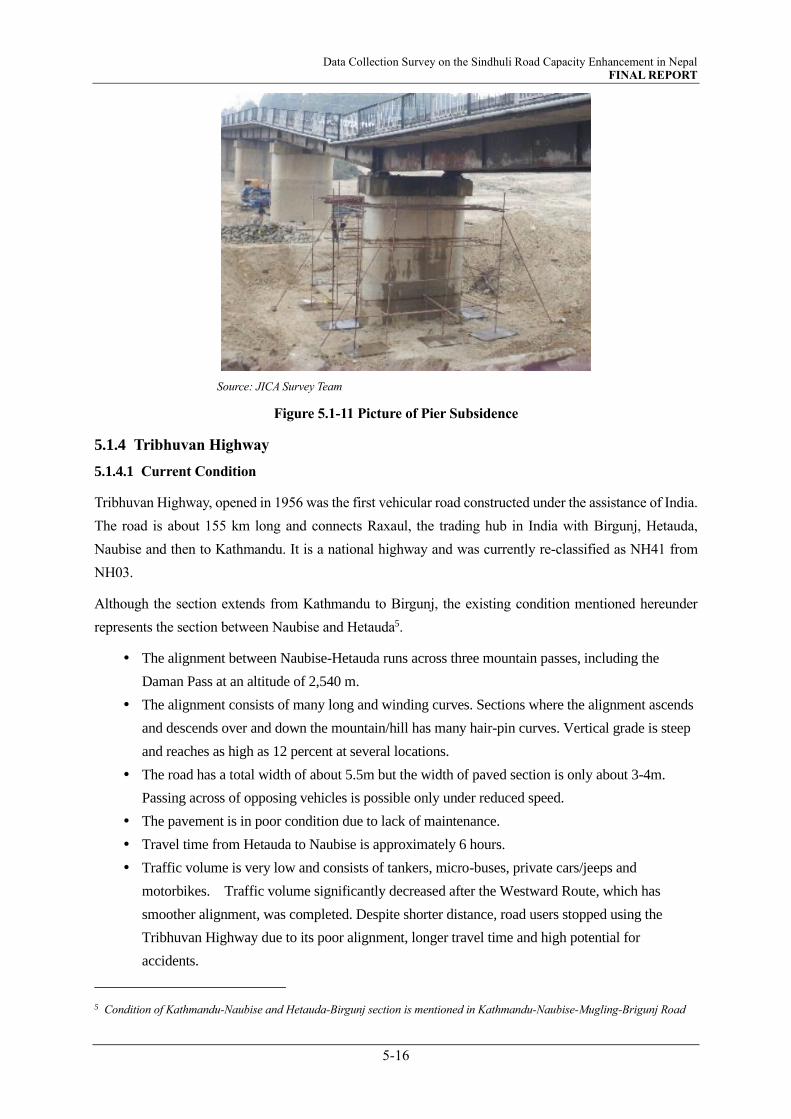
Data Collection Survey on the Sindhuli Road Capacity Enhancement in Nepal FINAL REPORT
5-16
Source: JICA Survey Team
Figure 5.1-11 Picture of Pier Subsidence
5.1.4 Tribhuvan Highway
5.1.4.1 Current Condition
Tribhuvan Highway, opened in 1956 was the first vehicular road constructed under the assistance of India.
The road is about 155 km long and connects Raxaul, the trading hub in India with Birgunj, Hetauda,
Naubise and then to Kathmandu. It is a national highway and was currently re-classified as NH41 from
NH03.
Although the section extends from Kathmandu to Birgunj, the existing condition mentioned hereunder
represents the section between Naubise and Hetauda5.
The alignment between Naubise-Hetauda runs across three mountain passes, including the
Daman Pass at an altitude of 2,540 m.
The alignment consists of many long and winding curves. Sections where the alignment ascends
and descends over and down the mountain/hill has many hair-pin curves. Vertical grade is steep
and reaches as high as 12 percent at several locations.
The road has a total width of about 5.5m but the width of paved section is only about 3-4m.
Passing across of opposing vehicles is possible only under reduced speed.
The pavement is in poor condition due to lack of maintenance.
Travel time from Hetauda to Naubise is approximately 6 hours.
Traffic volume is very low and consists of tankers, micro-buses, private cars/jeeps and
motorbikes. Traffic volume significantly decreased after the Westward Route, which has
smoother alignment, was completed. Despite shorter distance, road users stopped using the
Tribhuvan Highway due to its poor alignment, longer travel time and high potential for
accidents.
5 Condition of Kathmandu-Naubise and Hetauda-Birgunj section is mentioned in Kathmandu-Naubise-Mugling-Brigunj Road
Data Collection Survey on the Sindhuli Road Capacity Enhancement in Nepal FINAL REPORT
5-17
There are few traffic signs and facilities to prevent from accidental skidding and fall off of
vehicles.
5.1.4.2 Issues and Concerns
The section often experiences road closures due to slope failures and landslides.
Poor alignment, narrow width, continued deterioration of road surface, heavy and dense fog at high
altitudes combined with accumulation of snow in the winter season, lack of safety facilities all pose
potential risks for traffic accidents.
5.1.5 Arniko Highway
5.1.5.1 Current Condition
Arniko Highway, approximately 112km long is an asphalted road that connects Kathmandu to Nepal’s
border with China at Tatopani. This relates to the Sindhuli Road at Dhulikhel. The road is a national
highway classified as NH34 and constitutes a part of the AH42. This road is of crucial importance to Nepal
as it carries a very large amount of goods to and from China. The earthquake in 2015 and flash flood a
couple of months later had depleted the border town including the customs facilities and other
infrastructures causing closure of the border. The border was re-opened in 2019 but was again closed in
wake of the COVID-19 pandemic.
The Survey Team visited the Kathmandu-Dhulikhel section in April 2021. The condition of this section is
summarized as follows.
The alignment is basically smooth and fair except at several locations between Suryabinayak to
Sanga, and Banepa to Dhulikhel
The section between Kathmandu (Koteswor) to Suryabinayak in Bhaktapur Municipaility has four
lanes with service lanes at built-up areas6. Beyond Suryabinayak it reduces to two lanes.
The pavement of the 4-lane section is asphalt concrete and is in very good condition. The pavement
of the 2-lane section is bituminous, and the condition is fair.
Both sides of the road are aligned with houses/building. Agricultural land exists where the houses
discontinue. A section at Sanga goes through a forest.
Traffic volume is relatively high.
6 Widening of the section was conducted under the grant aid assistance of Japan and was completed in 2011.
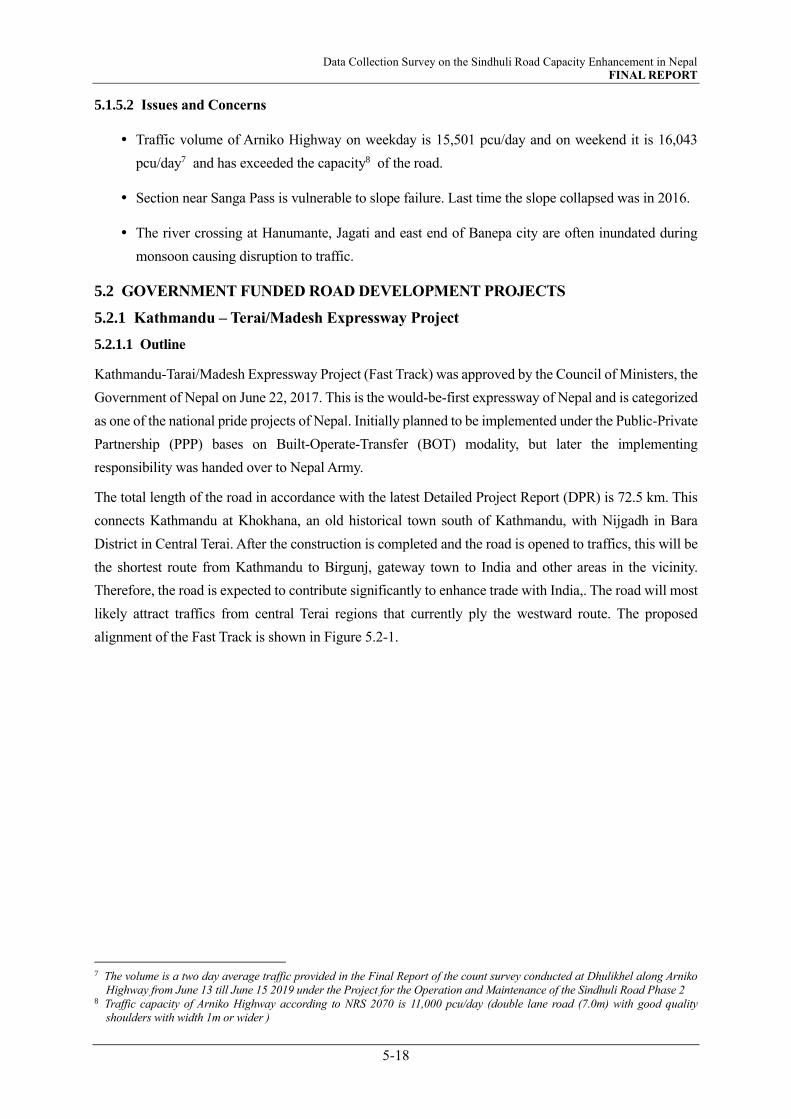
Data Collection Survey on the Sindhuli Road Capacity Enhancement in Nepal FINAL REPORT
5-18
5.1.5.2 Issues and Concerns
Traffic volume of Arniko Highway on weekday is 15,501 pcu/day and on weekend it is 16,043
pcu/day7 and has exceeded the capacity8 of the road.
Section near Sanga Pass is vulnerable to slope failure. Last time the slope collapsed was in 2016.
The river crossing at Hanumante, Jagati and east end of Banepa city are often inundated during
monsoon causing disruption to traffic.
5.2 GOVERNMENT FUNDED ROAD DEVELOPMENT PROJECTS
5.2.1 Kathmandu – Terai/Madesh Expressway Project
5.2.1.1 Outline
Kathmandu-Tarai/Madesh Expressway Project (Fast Track) was approved by the Council of Ministers, the
Government of Nepal on June 22, 2017. This is the would-be-first expressway of Nepal and is categorized
as one of the national pride projects of Nepal. Initially planned to be implemented under the Public-Private
Partnership (PPP) bases on Built-Operate-Transfer (BOT) modality, but later the implementing
responsibility was handed over to Nepal Army.
The total length of the road in accordance with the latest Detailed Project Report (DPR) is 72.5 km. This
connects Kathmandu at Khokhana, an old historical town south of Kathmandu, with Nijgadh in Bara
District in Central Terai. After the construction is completed and the road is opened to traffics, this will be
the shortest route from Kathmandu to Birgunj, gateway town to India and other areas in the vicinity.
Therefore, the road is expected to contribute significantly to enhance trade with India,. The road will most
likely attract traffics from central Terai regions that currently ply the westward route. The proposed
alignment of the Fast Track is shown in Figure 5.2-1.
7 The volume is a two day average traffic provided in the Final Report of the count survey conducted at Dhulikhel along Arniko
Highway from June 13 till June 15 2019 under the Project for the Operation and Maintenance of the Sindhuli Road Phase 2 8 Traffic capacity of Arniko Highway according to NRS 2070 is 11,000 pcu/day (double lane road (7.0m) with good quality
shoulders with width 1m or wider )
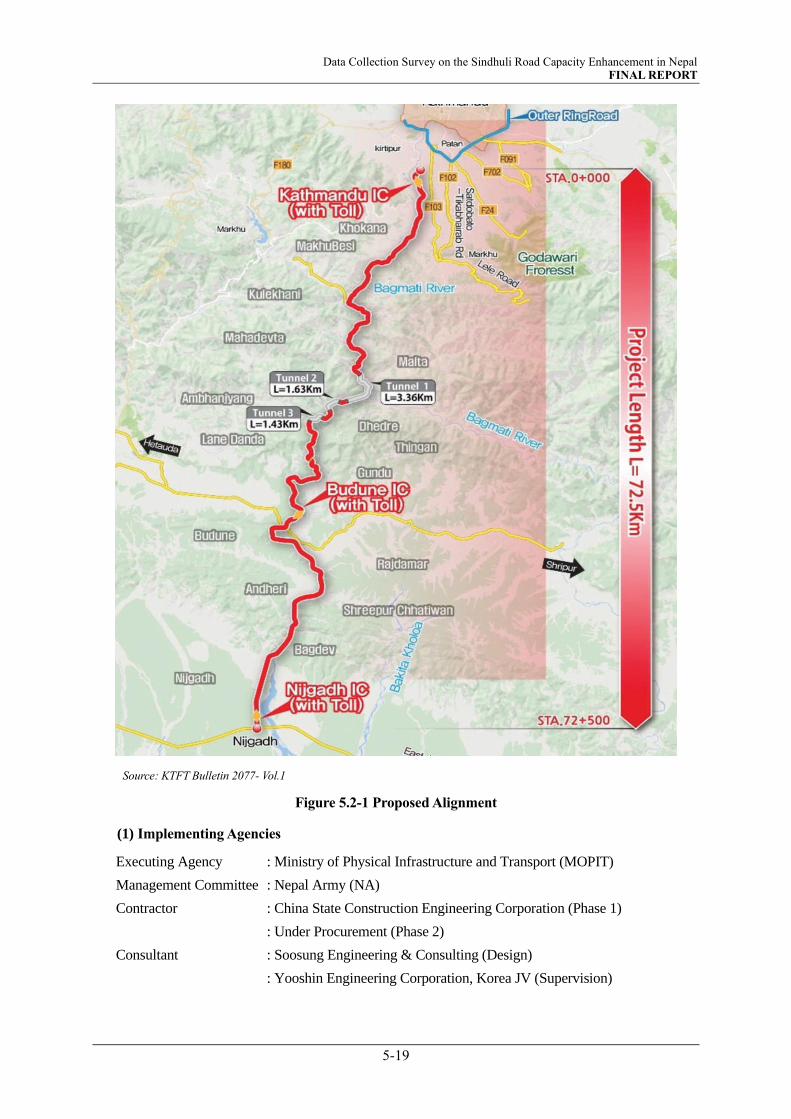
Data Collection Survey on the Sindhuli Road Capacity Enhancement in Nepal FINAL REPORT
5-19
Source: KTFT Bulletin 2077- Vol.1
Figure 5.2-1 Proposed Alignment
(1) Implementing Agencies
Executing Agency : Ministry of Physical Infrastructure and Transport (MOPIT)
Management Committee : Nepal Army (NA)
Contractor : China State Construction Engineering Corporation (Phase 1)
: Under Procurement (Phase 2)
Consultant : Soosung Engineering & Consulting (Design)
: Yooshin Engineering Corporation, Korea JV (Supervision)

Data Collection Survey on the Sindhuli Road Capacity Enhancement in Nepal FINAL REPORT
5-20
(2) Project Cost: 213.95 billion Rupees (15th Development Plan)
(3) Duration: FY 2017/18 – 2023/24 (6years)
5.2.1.2 Expected Outcome
Travel time between Kathmandu and central Terai will be possible in 72 minutes - a drastic reduction from
present 7 hours through Kathmandu-Naubise-Mugling-Pathlaiya-Nijgadh – thereby contributing to the
socio-economic activities of the Terai region and Kathmandu.
5.2.1.3 Salient Features of the Project
Salient features as defined in the latest DPR is briefly summarized below.
• Road Category : Asian Highway Primary Class
• Target Level of Service : A (Free flow)
• Starting Point : Khokhana (Lalitpur, south of Kathmandu)
• End Point : Nijgadh at the E-W Highway
• Total Length : 72.5km
• Construction Period : 4 years 6 months
• Carriageway & Lane Width : 4-lane divided carriageway, lane width 3.75m (Road)
2-lane carriageway tunnels
• Formation Width : 27m (carriageway 15, shoulder 6m, median 4m, curb 2m)
: 25m in mountainous terrain (shoulder 5m, median 3m)
• Right-of-Way : 50m (km 0+000-km 9+000), 100m (km 9+000-km 72+507)
• No. of Tunnels (Twin) : 3 (3.36km, 1.63km, 1,43km at Mahadev, Dhedre &Lane Dandas)
• No. of bridges : 16 (Special), 49 (Major-Medium), and 22 Minor
• Total Length of Bridges : 10,596m
• Interchange : 3 locations (Kathmandu, Budhune, Nijgadh)
• Toll Plaza/System : 3 locations (Khokhana, Budhune and Nijgadh), Semi-automatic
• Toll Fee9 : refer to Figure 5.2-2.
Source: Kathmandu-Terai/Madhes Fast Track (Expressway) Road Project Website (https://ktft.nepalarmy.mil.np/Home/Features)
Figure 5.2-2 Toll Fee
9 The toll fee provided is an extract from the web page. The web page however does not provide any other information as to its
source (feasibility study or detailed design study), what the calculation is based on and whether the toll fee indicated is the
actual fee that will be imposed during operation.

Data Collection Survey on the Sindhuli Road Capacity Enhancement in Nepal FINAL REPORT
5-21
5.2.1.4 Progress of Construction Work
Out of the 76.2-kilometre-long expressway, 17 km section is planned to be constructed by NA on its own.
It will hire dependable Nepali contractors for 37 km of the stretch and sign-up foreign contractors for the
remaining 22.2 km section, which will include tunnels and bridges.
Construction work is divided into two phases. Earth (embankment) sections are targeted to be constructed
under Phase 1. Construction work is in progress and the physical progress as of end of fiscal year 2019/20
is reported to be 11.11 percent. Phase 2 is yet to begin as procurement is still on-going and is likely to be
further delayed after controversies with regards to procedural flaws in the pre-qualification process for the
selection of the contractors.
The Survey Team was able to visit the site at two locations where the progress has been accounted for.
Picture 1 was taken a couple of kilometers south of Khokhana and Picture 2 near Nijgadh. The site near
Khokhana shows that the subgrade has been construction and is awaiting subbase and above. On the other
hand, construction level near Nijgadh was up to the subbase. This seems to be completed for an
approximate length of 10 km.
Source: KTFT Bulletin 2077-Vol.1
Figure 5.2-3 Glimpse of Progress of On-going Construction Works
5.2.1.5 Issues and Concerns
(1) Acquisition of Land
Total area required for the construction is estimated as 15,416 ropani equivalent to 784.27 ha. (1 ropani
is equivalent to 508.74m2). Approximately, thirty-four (34) percent (5,165 ropani) of the total required
land is privately owned. Of the 5,165 ropani land in Kathmandu, Lalitpur and Makwanpur districts
compensation has been paid for 4,357 ropani. The remaining 807 ropani (about nine percent) is at
Khokhana, where the indigenous people of the village are against receiving the compensation, if not
against give away their land.
(2) Technical Constraints and Know-hows
The construction of an expressway is the first of its kind in the country. It is therefore in-itself a
challenging task. This is further compounded with requirement to construct tunnels and high-pier
viaducts among other structures, which require high-level cutting-edge technology to maintain the
Picture-1: Progress Work at Khokhana Side Picture-2: Progress Work at Nijgadh

Data Collection Survey on the Sindhuli Road Capacity Enhancement in Nepal FINAL REPORT
5-22
quality of the structures. The tunnel is expected to face numerous issues arising from the rough and
tough geography and its sophisticated geology, as this is likely the first ever tunnel in the Siwalik
Range. The road (tunnel) will be crossing through thrusts and faults, where the rocks/soil are very weak
and fragile.
(3) Operation and Maintenance
There is no specific information with regards to entity that will be responsible for post construction
operation and maintenance. Unlike initial plan, where a Built-Operate-Transfer (BOT) model was
considered, the expressway is now being constructed under the financing from the Nepalese
Government. This implies that unless operation and maintenance of the expressway is contracted out
to a private company, the role and responsibilities will be laid upon to DOR, providing concerns
whether/how DOR will ensure timely and proper operation and maintenance when it is suffering from
severe backlogs.
5.2.2 Mid-hill Highway (Pushpa Lal Highway)
5.2.2.1 Outline
Implementation of Mid-hill Highway (M-H Highway), also known as Pushpa Lal Highway project was
started in 2064/65 (A.D. 2007/08) by the government under the 20-year road policy that aimed at
connecting all district headquarters by road. To ensure continuity and completion of the entire stretch of
the road, the policy was transferred to the current 15th Development Plan, where the project is identified
as one of the National Pride Projects. The objective of the project is to achieve balanced regional
development by expanding easy access to transportation in the mid-hill settlements.
Source: JICA Survey Team
Figure 5.2-4 Mid-Hill Highway
Data Collection Survey on the Sindhuli Road Capacity Enhancement in Nepal FINAL REPORT
5-23
The length of M-H Highway is approximately 1,879 km and runs longitudinally across the country through
different important townships, settlements and other places of importance in the mid-hill region almost in
parallel with the E-W Highway. It originates in the east end of the country at Chiyobhanjyan in Panchthat
District and ends is the west end at Jhulaghat in Baitadi District, a border town to India at River Mahakaali.
It traverses through 25 districts of the country. Different roads constructed in the past constitutes parts of
M-H Highway. But these roads are being improved to bring the road into the set standards of the M-H
Highway. All sections newly constructed including those to be constructed henceforth are envisaged to be
planned and constructed to meet the required standards.
This is the third highway, after E-W Highway and Postal Highway, to connect the east and the west ends
of the country. In the initial plan, Ghurmi - Dhulikhel section of the Sindhuli Road used to constitute as an
integral part of M-H Highway. Then, the total length of the highway was 1,750km. It then underwent
revision and the new alignment of M-H Highway overlaps with the Sindhuli Road for about a 3 km section
between intersecting point with M-H Highway at Ghurmi and Khurkot. From Khurkot, the alignment is
shifted towards the north to meet Tatopani in Arniko Highway and then to Nuwakot, north of Kathmandu
and further to Pokhara.
(1) Implementing Agency
Executing Agency : Ministry of Physical Infrastructure and Transport (MOPIT)
Implementing Agency : Department of Roads (DOR)
(2) Project Cost
Total estimated cost is 101.50 billion Rupees
(3) Duration
Construction commenced in 2007/2008 and is expected to complete in 2022/2023.
5.2.2.2 Expected Outcome
Travel time from/to the mid-hill regions will drastically reduce. People of Mid-hill region will have
easy and reliable access to transportation and thus their socio-economic activities will be enhanced.
Unlike before, the mid-hill people can now travel to various parts of the country without having to
go south to use the E-W Highway.
The highway traverse through many important townships, communities and other important places
and will thus enhance regional connectivity.
It will also contribute to the increase of service and income generation and employment
opportunities (tourism, agriculture, industry), especially to the hydropower section as the road links
with more than 12 hydropower plants.
Encourage development of new cities and rapid migration from hill to Terai will decrease.
5.2.2.3 Salient Features
Design Speed : 50km/h
Right-of-Way : 50m (25m on each side from centerline)

Data Collection Survey on the Sindhuli Road Capacity Enhancement in Nepal FINAL REPORT
5-24
Total Length : 1,879km
Carriageway Width : 7.0m (2x3.5m)
Shoulder Width : 1.0m
Number of Bridges : 129 (10 bridges longer than 100m in length)
5.2.2.4 Progress of Construction Works
Progress of construction is reported to be about 56.5 percent as of 2020/2021. Construction of the highway
commenced as early as 2007/08 but could not gain momentum (almost came to standstill) due to political
turmoil in the country. It was resumed in 2016/17 with the target date of completion in 2023/24. According
to DOR, it is doing its possible best to meet the target, but there are controversies that the construction will
go beyond the stipulated deadline. In figures, approximately 987kms of the road has been blacktopped and
630km is awaiting black topping. 99 km of the road has been completed up to the subbase. However,
325km of the stretch in particularly between Lamjung and Jajarkot in the west is yet to be constructed.
5.2.2.5 Issues and Concerns
• Construction of three bridges is Jajarkot have been stalled for more than eight (8) years. Reason
behind this is the abandonment by the contractor.
• Alignment in the west (Lamjung) passes through settlements. Local residents and the responsible
authority have not been able to come to amiable terms and as a consequence a 45km section of the
road is yet to be surveyed.
• Elapsing time is shadowing over the budget. The estimated budget is now around 101.5 billion
Rupees, which is about three times the initial budget. Further delay in implementation will have
impact in the cost implications.
5.2.3 Madan Bhandari Highway
Madan Bhandari Highway (MBH), classified as NH09, is approximately 1,248km long (761km road
section and 185 bridges), which starts at Shantinagar in Jhapa District of Province No.1 and runs through
Inner Terai (Chure-bhawar) connecting Chure and Bhitri Madhes (Inner Terai) to reach Rupal of
Shantinagar, Sindhuli, Hetauda, Gaindakot, Ramdi, Ridi, Pyuthan, Ghorahi, Surkhet, Bipinagar, Sahajpur,
Jogbudha and Dadeldhura District of Sudurpashchim Province (Province No.7) in the west. A stretch of
about 15km from Bhiman to Madhi Bazaar of Section I of the Sindhuli Road forms a part of the road.
Also termed as Madan Bhandari Inner Terai Highway the road runs almost parallel to the E-W Highway
to the south and the M-H Highway to the North and is expected to serve as an alternative of the two roads.
Although approval from the GON for the construction of the 318km section between Dharan-Hetauda
(refer to Figure 5.2-6) was obtained on May 22, 2018, initial works (track opening) of this section had
started as early as in FY 2007/08. Currently, this is being constructed as a two-lane road and the physical
progress, as of March 2021, is 38 percent. 287.5 km of road section and 75 bridges has been constructed.
Target completion date is FY 2024/25. To expedite the construction, the section is divided into two sections
- 135-km east section (from Basaha in Udayapur to Sindhuli) and 115-km west section (Bhiman-Hetauda).
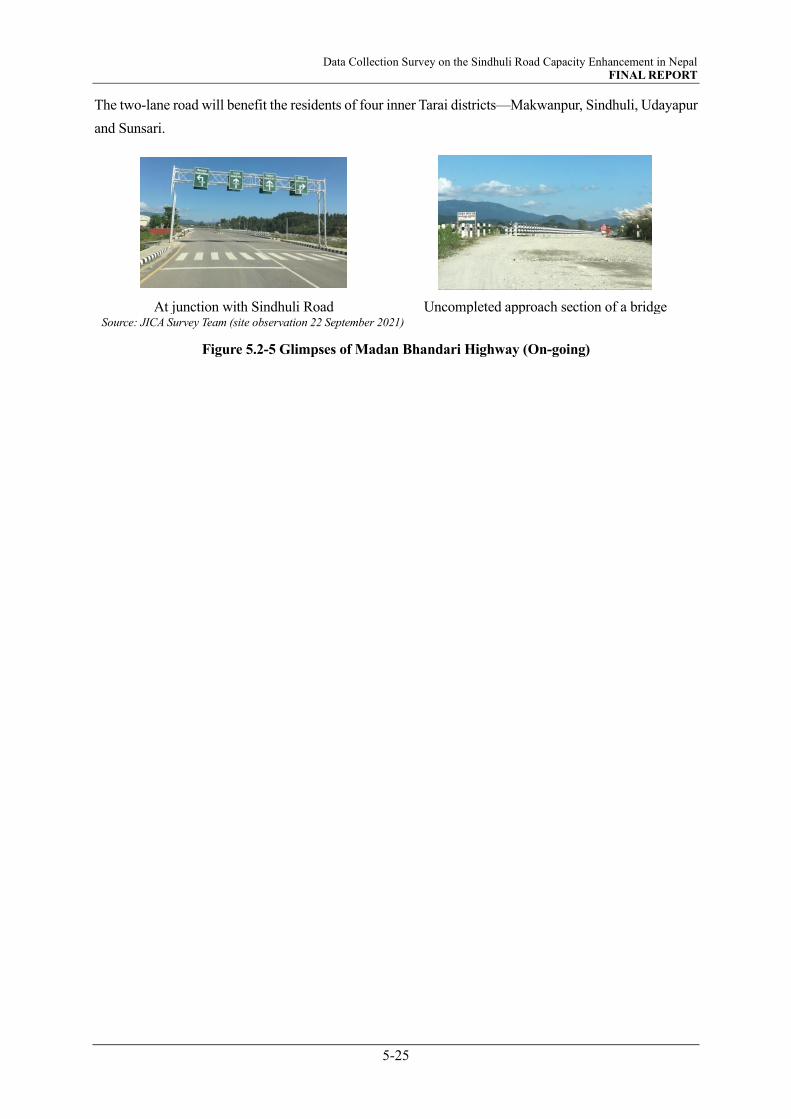
Data Collection Survey on the Sindhuli Road Capacity Enhancement in Nepal FINAL REPORT
5-25
The two-lane road will benefit the residents of four inner Tarai districts—Makwanpur, Sindhuli, Udayapur
and Sunsari.
At junction with Sindhuli Road Uncompleted approach section of a bridge Source: JICA Survey Team (site observation 22 September 2021)
Figure 5.2-5 Glimpses of Madan Bhandari Highway (On-going)

Data Collection Survey on the Sindhuli Road Capacity Enhancement in Nepal FINAL REPORT
5-26
Sourc
e: J
ICA
Surv
ey T
eam
Fig
ure
5.2
-6 D
hara
n-H
etau
da S
tret
ch o
f M
ad
an
Bh
an
dari
Hig
hw
ay

Data Collection Survey on the Sindhuli Road Capacity Enhancement in Nepal FINAL REPORT
5-27
5.2.4 North South Corridor
The North South Corridor Road shall provide easy access and improved mobility between Terai, the Hills
and Himalayan Region. By connecting India and China this road will facilitate the easy movement of
goods and people. 8 different trade and transit corridors are planned and being developed from North to
South. Out of this, corridor from Birgunj-Naubise-Kathamndu-Tatopani-Nyalam (393km) (which falls in
the central region of the country) is already operating. Initiatives are being taken to upgrade this corridor.
Likewise, the track of the corridor from Birgunj-Galchi-Rasua-Syafrubesi (340 km) has opened recently.
Among the 8 North South Corridors certain portion of some of the corridors such as the Koshi corridor,
Kali- Gandaki corridor and Karnali corridor are prioritized to be constructed by the government.
5.2.4.1 Koshi Corridor (Eastern)
Koshi Corridor has been designated as the national pride project in the 15th Development Plan. Also
known as Koshi Highway and classified as NH08, the corridor is a two-lane road and is 320 km long. The
project commenced in FY 2004/2205 and is expected to be completed in FY 2023/24. The southern section
from Rani-Biratnagar-Itahari-Dharan- Dhankuta-Hile as shown in blue in the figure below including one
bridge has been black-topped and is already open to traffic. The Kimathanka to Khandbari section, which
is 162 km long is currently being constructed. As of March 2021, 148km of the track opening has been
completed, 68 km has been graveled and bridges have been erected at 4 locations. All combined the
progress accounts to about 22.3 percent of the entire work. 14km of the remaining stretch has been
commissioned to the Nepal Army.
Once completed, the people of the mountainous and hilly region of Province No.1 will benefit from easy
access to transport, enhance development activities including hydropower development and the
development of tourist areas, agriculture, industry etc. thereby contributing to poverty alleviation,
reduction of migration to Terai and securing regional balance.
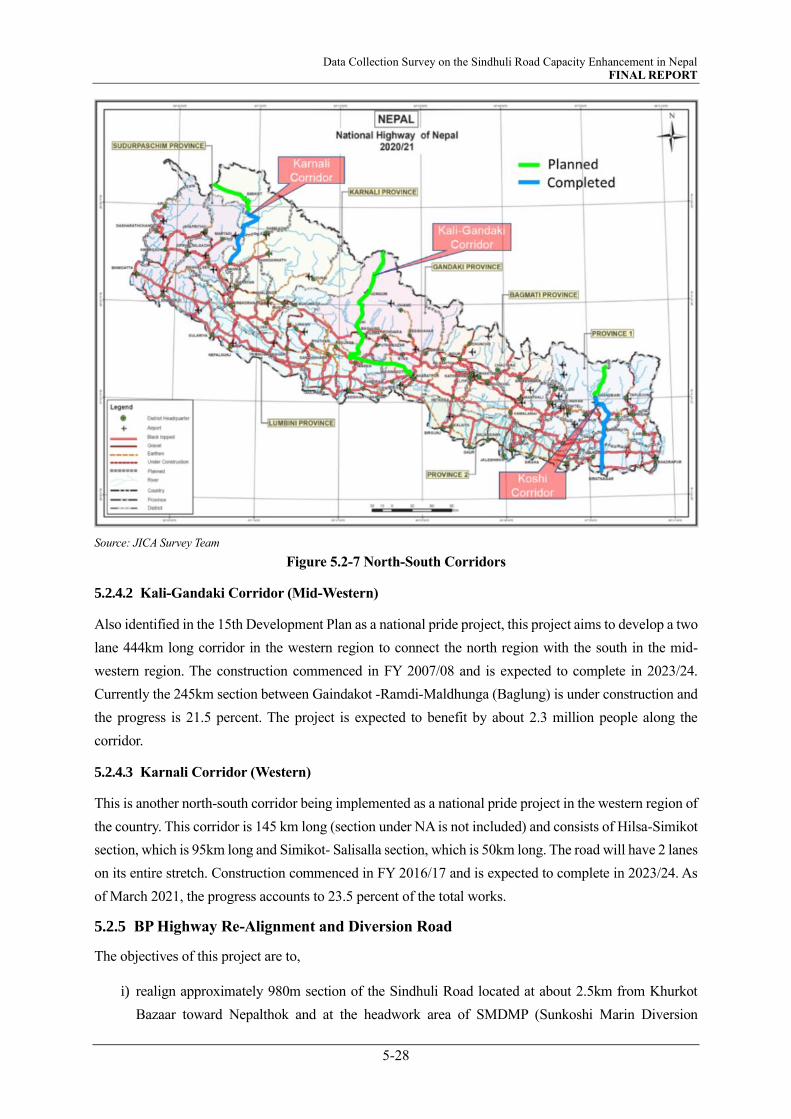
Data Collection Survey on the Sindhuli Road Capacity Enhancement in Nepal FINAL REPORT
5-28
Source: JICA Survey Team
Figure 5.2-7 North-South Corridors
5.2.4.2 Kali-Gandaki Corridor (Mid-Western)
Also identified in the 15th Development Plan as a national pride project, this project aims to develop a two
lane 444km long corridor in the western region to connect the north region with the south in the mid-
western region. The construction commenced in FY 2007/08 and is expected to complete in 2023/24.
Currently the 245km section between Gaindakot -Ramdi-Maldhunga (Baglung) is under construction and
the progress is 21.5 percent. The project is expected to benefit by about 2.3 million people along the
corridor.
5.2.4.3 Karnali Corridor (Western)
This is another north-south corridor being implemented as a national pride project in the western region of
the country. This corridor is 145 km long (section under NA is not included) and consists of Hilsa-Simikot
section, which is 95km long and Simikot- Salisalla section, which is 50km long. The road will have 2 lanes
on its entire stretch. Construction commenced in FY 2016/17 and is expected to complete in 2023/24. As
of March 2021, the progress accounts to 23.5 percent of the total works.
5.2.5 BP Highway Re-Alignment and Diversion Road
The objectives of this project are to,
i) realign approximately 980m section of the Sindhuli Road located at about 2.5km from Khurkot
Bazaar toward Nepalthok and at the headwork area of SMDMP (Sunkoshi Marin Diversion
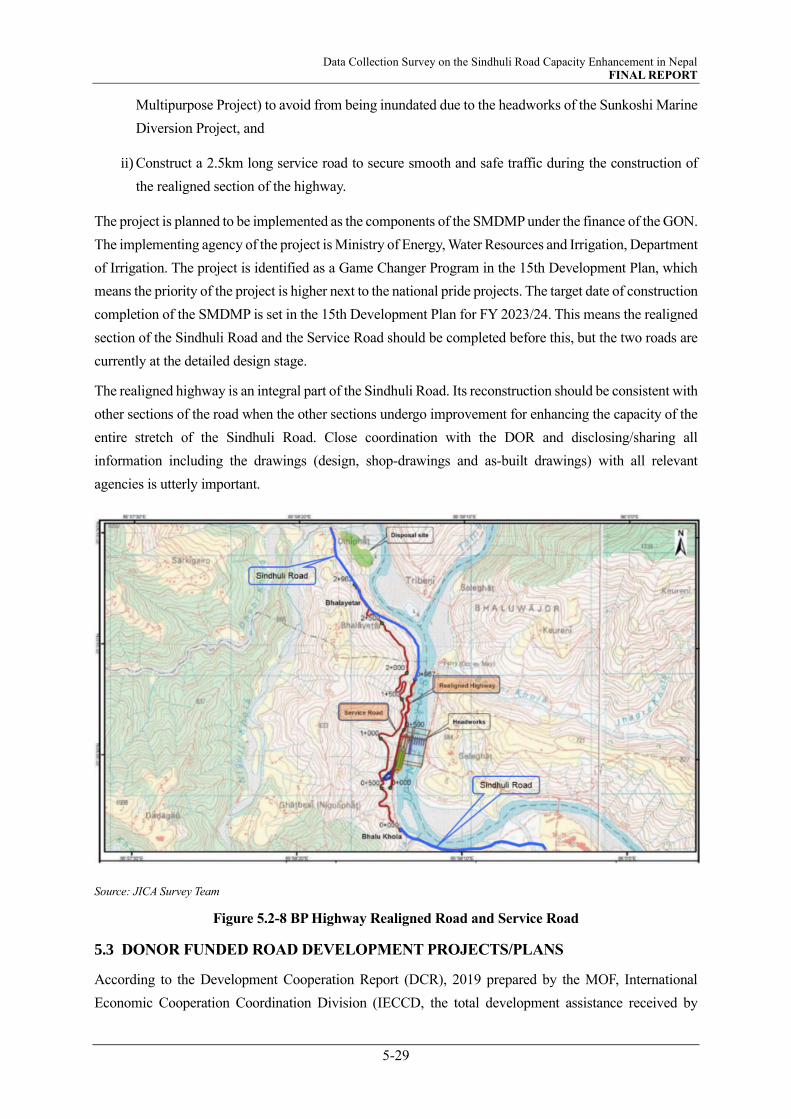
Data Collection Survey on the Sindhuli Road Capacity Enhancement in Nepal FINAL REPORT
5-29
Multipurpose Project) to avoid from being inundated due to the headworks of the Sunkoshi Marine
Diversion Project, and
ii) Construct a 2.5km long service road to secure smooth and safe traffic during the construction of
the realigned section of the highway.
The project is planned to be implemented as the components of the SMDMP under the finance of the GON.
The implementing agency of the project is Ministry of Energy, Water Resources and Irrigation, Department
of Irrigation. The project is identified as a Game Changer Program in the 15th Development Plan, which
means the priority of the project is higher next to the national pride projects. The target date of construction
completion of the SMDMP is set in the 15th Development Plan for FY 2023/24. This means the realigned
section of the Sindhuli Road and the Service Road should be completed before this, but the two roads are
currently at the detailed design stage.
The realigned highway is an integral part of the Sindhuli Road. Its reconstruction should be consistent with
other sections of the road when the other sections undergo improvement for enhancing the capacity of the
entire stretch of the Sindhuli Road. Close coordination with the DOR and disclosing/sharing all
information including the drawings (design, shop-drawings and as-built drawings) with all relevant
agencies is utterly important.
Source: JICA Survey Team
Figure 5.2-8 BP Highway Realigned Road and Service Road
5.3 DONOR FUNDED ROAD DEVELOPMENT PROJECTS/PLANS
According to the Development Cooperation Report (DCR), 2019 prepared by the MOF, International
Economic Cooperation Coordination Division (IECCD, the total development assistance received by

Data Collection Survey on the Sindhuli Road Capacity Enhancement in Nepal FINAL REPORT
5-30
Nepal increased marginally from 1,733 million USD in FY 2017/18 to 1,793 million USD, despite a 2.7%
decrease in ODA (Official Development Assistance). The majority of the ODA was provided as loans. The
ODA disbursed in FY 2018/19 comprised of 60 percent (944 million USD) loans, 27 percent (424 million
USD) grants and 13 percent (211 million USD) technical assistance.
The disbursement was shared by eight different line ministries signifying that the distribution of ODA
across sectors has changed significantly from FY 2017/18 to FY 2018/19. The highest share (54%)
disbursed in 2018/19 were education, energy, peace and reconstruction, local development and financial
reform. 40 percent of the disbursement was provided by bilateral partners10, while 60 percent was provided
by multilateral partners11 . Road sector received 78 million USD in FY 2017/18, which significantly
reduced to 38 million USD in FY 2018/19. ADB, WB and Japan were the three main actors in the assistance
on the road sector. Hereunder, on-going projects related to road sector funded by the three partners are
briefly explained.
Source: JICA Survey Team
Figure 5.3-1 Development Assistance
5.3.1 Japan Funded On-going Projects/Plans
Infrastructure projects/plans carried out under assistance from Japan for the last ten years as of July 2020
are shown in Figure 5.3-2. Road sector projects that are on-going are recently completed are briefly
explained below.
10 China, The United Kingdom, Japan, The United States of America, and India are the top five 11 The WB, the ADB, the UNCT, the EU, and the International Fund for Agricultural Development (IFAD) are the top five
i) Dev. Assistance ‘17/18-18/19 ii) ODA Disbursement FY ‘18/19
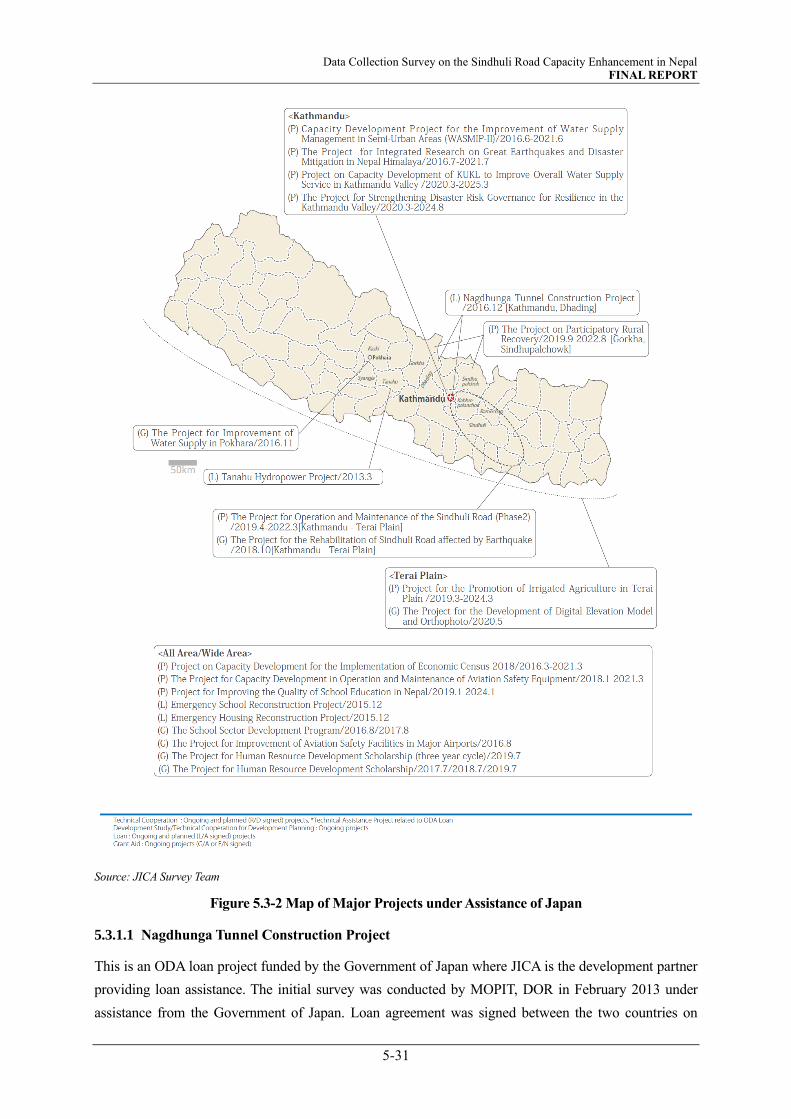
Data Collection Survey on the Sindhuli Road Capacity Enhancement in Nepal FINAL REPORT
5-31
Source: JICA Survey Team
Figure 5.3-2 Map of Major Projects under Assistance of Japan
5.3.1.1 Nagdhunga Tunnel Construction Project
This is an ODA loan project funded by the Government of Japan where JICA is the development partner
providing loan assistance. The initial survey was conducted by MOPIT, DOR in February 2013 under
assistance from the Government of Japan. Loan agreement was signed between the two countries on
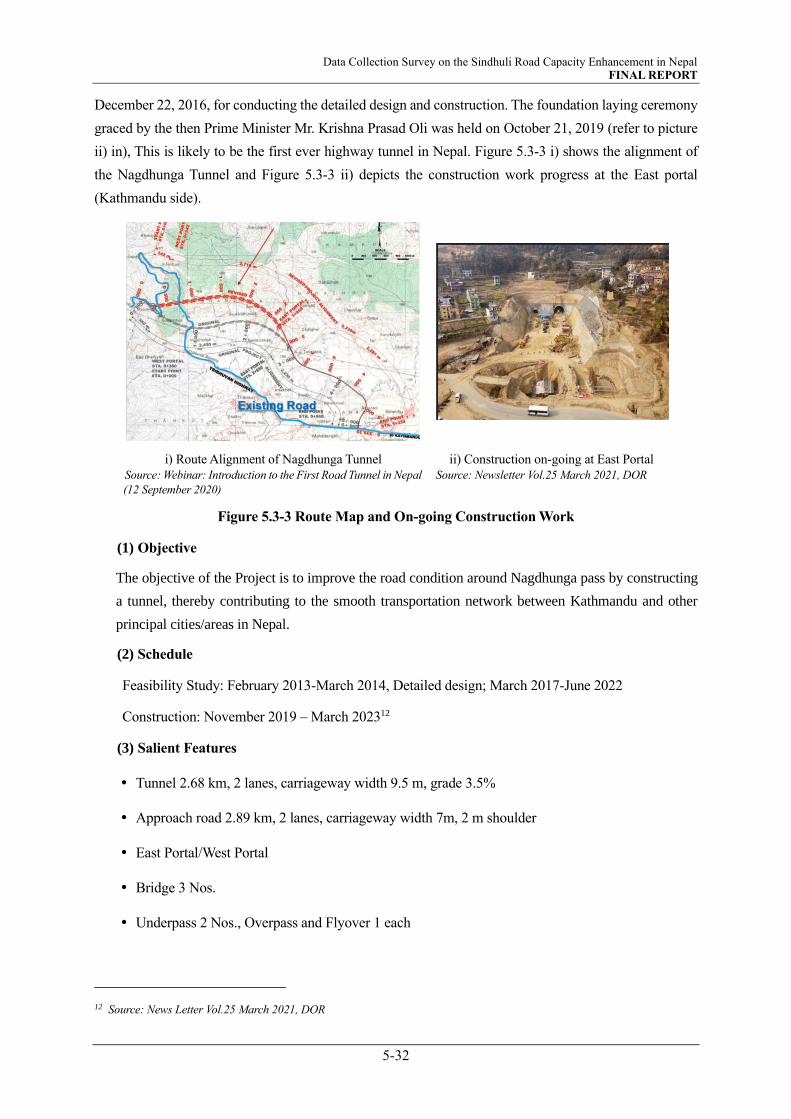
Data Collection Survey on the Sindhuli Road Capacity Enhancement in Nepal FINAL REPORT
5-32
December 22, 2016, for conducting the detailed design and construction. The foundation laying ceremony
graced by the then Prime Minister Mr. Krishna Prasad Oli was held on October 21, 2019 (refer to picture
ii) in), This is likely to be the first ever highway tunnel in Nepal. Figure 5.3-3 i) shows the alignment of
the Nagdhunga Tunnel and Figure 5.3-3 ii) depicts the construction work progress at the East portal
(Kathmandu side).
i) Route Alignment of Nagdhunga Tunnel ii) Construction on-going at East Portal
Source: Webinar: Introduction to the First Road Tunnel in Nepal
(12 September 2020)
Source: Newsletter Vol.25 March 2021, DOR
Figure 5.3-3 Route Map and On-going Construction Work
(1) Objective
The objective of the Project is to improve the road condition around Nagdhunga pass by constructing
a tunnel, thereby contributing to the smooth transportation network between Kathmandu and other
principal cities/areas in Nepal.
(2) Schedule
Feasibility Study: February 2013-March 2014, Detailed design; March 2017-June 2022
Construction: November 2019 – March 202312
(3) Salient Features
Tunnel 2.68 km, 2 lanes, carriageway width 9.5 m, grade 3.5%
Approach road 2.89 km, 2 lanes, carriageway width 7m, 2 m shoulder
East Portal/West Portal
Bridge 3 Nos.
Underpass 2 Nos., Overpass and Flyover 1 each
12 Source: News Letter Vol.25 March 2021, DOR

Data Collection Survey on the Sindhuli Road Capacity Enhancement in Nepal FINAL REPORT
5-33
Toll facility, west side 3 booths, 3 lanes each and east side 2 booths, 2 lanes each
24 hrs. ventilation (Jet Fan) and lightning System
Emergency rescue system
(4) Progress
Construction is being done from both sides of the portal (East and west)).
On the east side, 43 meters of the main tunnel and 36 meters of the evacuation tunnel have been
excavated with shotcreting and provision of steel ribs support system
On the West Portal, 135m of excavation work has been completed including shotcreting and
installation of steel ribs support system.
Construction of crib walls East portal, approach road, overpass, underpass, and culverts are on-
going
(5) Issues and Concerns
Most of the issues and concerns at this stage are more on the social environmental aspects rather than
technical. For example, delaying in demolishing the houses despite of having being duly compensated,
demanding comparatively high compensation for land, resistance from the locals in locating the
construction yard to store material etc.
5.3.1.2 Digital Elevation Model and Ortho Image Maintenance Plan
Implemented in 2020, this plan aims to reduce flood damage, etc. by developing a high-precision digital
elevation model and orthoimages that will contribute to the future development of hazard maps in flood-
vulnerable areas in the southern plains of Nepal. It contributes to the reconstruction of the earthquake
disaster, both hard and soft, and the creation of a disaster-resistant country.
With this cooperation, in 2025, four years after the completion of the project, the number of distributions
of digital elevation models will increase to 15 times, the area for creating large-scale maps will be expanded
to 300 square kilometers, and the area for creating hazard maps will be 500. In addition to expanding to
square kilometers, it is expected that the mesh spacing of digital elevation models will be improved from
50 meters to 1 meter, and more elaborate planning maps will be developed. In addition, it is expected that
disaster prevention capabilities will be strengthened by raising awareness of disaster prevention among
Nepalese government agencies, improving the accuracy of identifying flood areas, and narrowing down
candidate sites for flood control such as embankment strengthening points and flood regulation ponds.
increase.
5.3.1.3 Sindhuli Road Earthquake Rehabilitation
The location of the project area is shown in Figure 5.3-4.
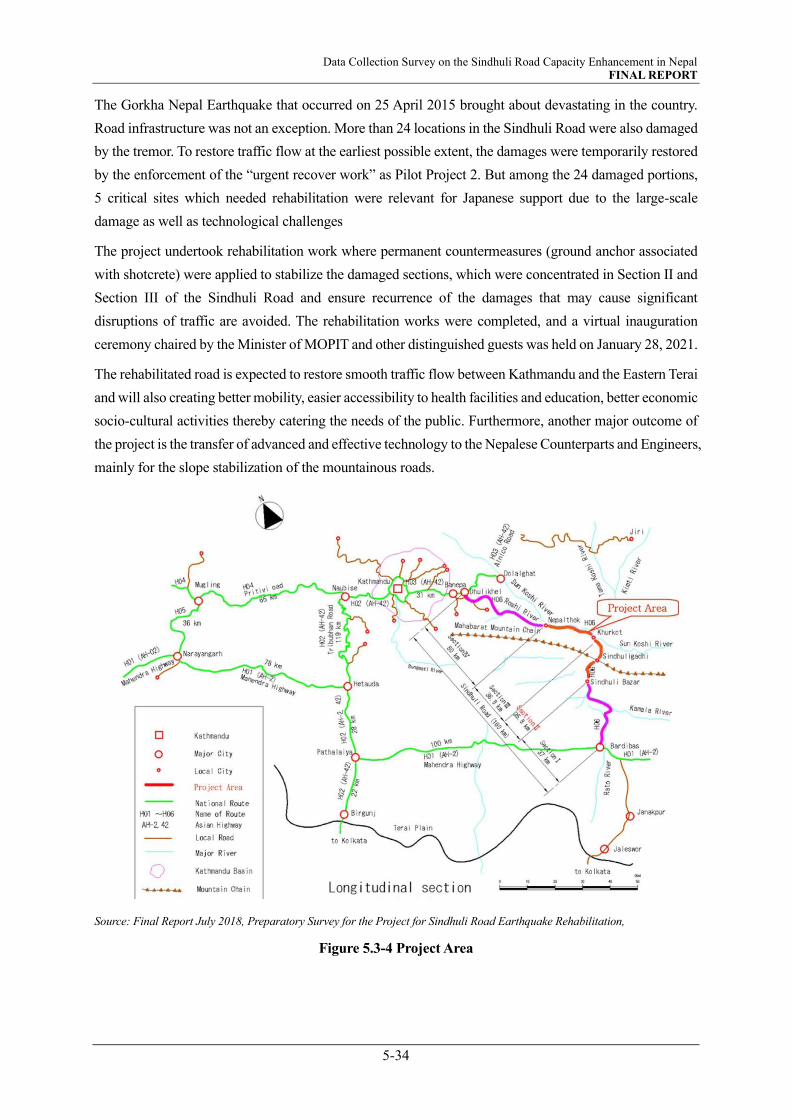
Data Collection Survey on the Sindhuli Road Capacity Enhancement in Nepal FINAL REPORT
5-34
The Gorkha Nepal Earthquake that occurred on 25 April 2015 brought about devastating in the country.
Road infrastructure was not an exception. More than 24 locations in the Sindhuli Road were also damaged
by the tremor. To restore traffic flow at the earliest possible extent, the damages were temporarily restored
by the enforcement of the “urgent recover work” as Pilot Project 2. But among the 24 damaged portions,
5 critical sites which needed rehabilitation were relevant for Japanese support due to the large-scale
damage as well as technological challenges
The project undertook rehabilitation work where permanent countermeasures (ground anchor associated
with shotcrete) were applied to stabilize the damaged sections, which were concentrated in Section II and
Section III of the Sindhuli Road and ensure recurrence of the damages that may cause significant
disruptions of traffic are avoided. The rehabilitation works were completed, and a virtual inauguration
ceremony chaired by the Minister of MOPIT and other distinguished guests was held on January 28, 2021.
The rehabilitated road is expected to restore smooth traffic flow between Kathmandu and the Eastern Terai
and will also creating better mobility, easier accessibility to health facilities and education, better economic
socio-cultural activities thereby catering the needs of the public. Furthermore, another major outcome of
the project is the transfer of advanced and effective technology to the Nepalese Counterparts and Engineers,
mainly for the slope stabilization of the mountainous roads.
Source: Final Report July 2018, Preparatory Survey for the Project for Sindhuli Road Earthquake Rehabilitation,
Figure 5.3-4 Project Area
Data Collection Survey on the Sindhuli Road Capacity Enhancement in Nepal FINAL REPORT
5-35
5.3.1.4 Project for the Operation and Maintenance of The Sindhuli Road (Phase 2)
Upon request from the MOPIT/DOR, this technical assistance project was conducted as Phase 2 of Phase
1, which was implemented for a span of four years from 2012 prior to the opening of the entire stretch of
the road, with an objective to enhance the planning and repair ability of the implementing agencies13,
particularly on the slope protection and structures like causeways and ensure safe and smooth traffic on
the Sindhuli Road. This was scheduled to complete in March 2021 but has been prolonged due to the effect
of COVID-19.
5.3.1.5 Project for Intersection Improvement at Koteshwor and Tinkune Intersections
The Preparatory Survey for the Project for Intersection Improvement of Koteshwor and Tinkune
Intersections in Kathmandu (PSPIIKT) commenced in February 2020 and is on-going. Currently, this is
one of the most congested intersections inside Kathmandu Valley. The objective intersection is a T-junction
between the Ring Road, which was currently expanded to 4 lanes main carriageway and 4 lanes service
roads, and Arniko Highway. Identified as important projects in the main Programs in the 15th Development
Plan of Nepal, the project envisages to alleviate serious traffic congestion by constructing a flyover or
underpasses at the said intersection. The responsible agencies are MOPIT/DOR.
5.3.2 World Bank Funded On-going Projects/Plans
5.3.2.1 Strategic Road Connectivity and Trade Improvement Project
This is a WB funded project, which aims to help improve roads of regional importance and set the course
for post-COVID-19 economic recovery through greater cross border trade, more jobs, and better road
safety. It expects to enhance regional road connectivity by improving the Nagdhunga-Naubise- Mugling
and upgrading the Kamala-Dhalkebar-Pathlaiya road section along the E-W Highway. The project is also
expected to enhance infrastructure, facilities, and sanitation at border crossing points to ease trade
constraints and spur agricultural exports. The project outcomes are deduction of time and cost of moving
good and boosting of Nepal’s trade, which accounts to about 40 percent of the country’s economic output.
It is aligned with the WB’s Eastern Sub-Region Connectivity Program, which since 2013 has financed a
continually evolving regional program to improve connectivity and trade between BBIN.
The project consists of four components.
Component 1: Trade Facilitation is expected to contribute in i) reducing the travel time taken for goods
transit at selected border crossing points; ii) improve capacity and efficiency for sanitary and phyto-
sanitary (SPS) management at selected locations and for targeted products, and iii) enhance capacity for
managing trade.
Component 2: Regional Road Connectivity is aimed to improve efficiency, climate resilience and safety
of movement of goods and people across two roads within two transport corridors that are key for Nepal’s
connectivity and trade with India and other countries. Improvement of existing Nagdhunga-Naubise-
Mugling road to two lanes, with one-meter paved shoulders is vital for trade between Nepal and India and
13 Comprised of staffs from the DOR, Department for Water Induced Disaster Management (DWIDM), and the RBN
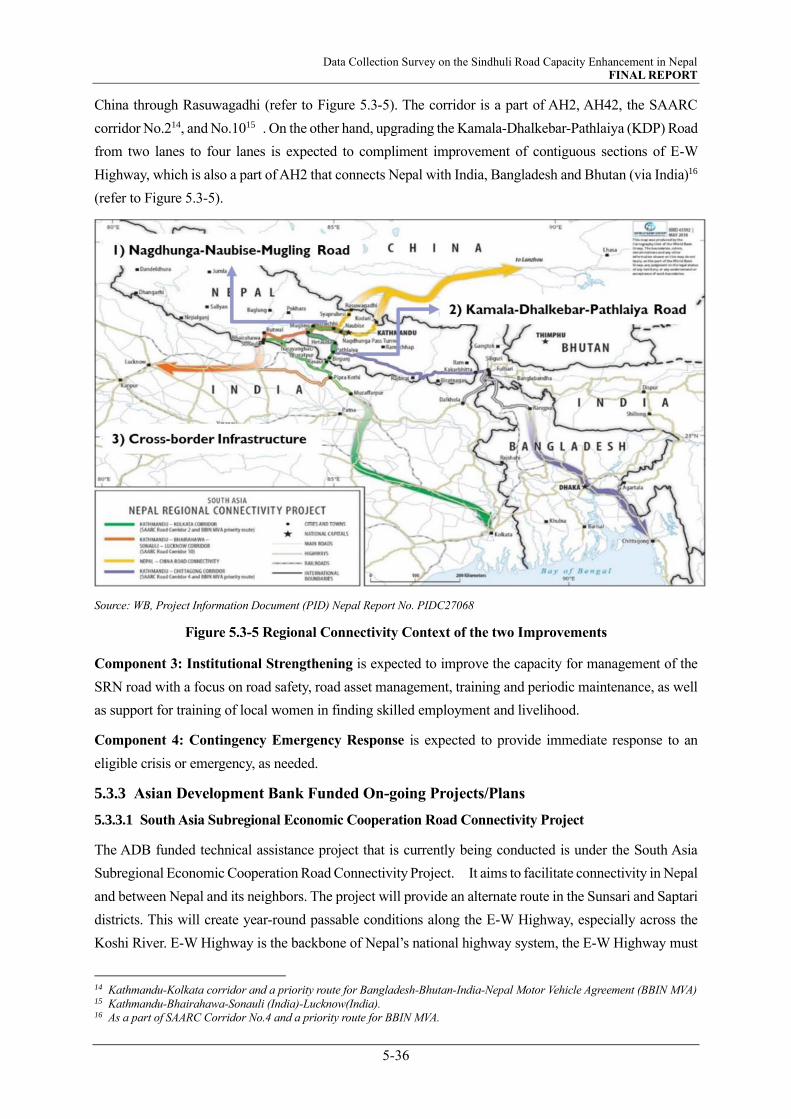
Data Collection Survey on the Sindhuli Road Capacity Enhancement in Nepal FINAL REPORT
5-36
China through Rasuwagadhi (refer to Figure 5.3-5). The corridor is a part of AH2, AH42, the SAARC
corridor No.214, and No.1015 . On the other hand, upgrading the Kamala-Dhalkebar-Pathlaiya (KDP) Road
from two lanes to four lanes is expected to compliment improvement of contiguous sections of E-W
Highway, which is also a part of AH2 that connects Nepal with India, Bangladesh and Bhutan (via India)16
(refer to Figure 5.3-5).
Source: WB, Project Information Document (PID) Nepal Report No. PIDC27068
Figure 5.3-5 Regional Connectivity Context of the two Improvements
Component 3: Institutional Strengthening is expected to improve the capacity for management of the
SRN road with a focus on road safety, road asset management, training and periodic maintenance, as well
as support for training of local women in finding skilled employment and livelihood.
Component 4: Contingency Emergency Response is expected to provide immediate response to an
eligible crisis or emergency, as needed.
5.3.3 Asian Development Bank Funded On-going Projects/Plans
5.3.3.1 South Asia Subregional Economic Cooperation Road Connectivity Project
The ADB funded technical assistance project that is currently being conducted is under the South Asia
Subregional Economic Cooperation Road Connectivity Project. It aims to facilitate connectivity in Nepal
and between Nepal and its neighbors. The project will provide an alternate route in the Sunsari and Saptari
districts. This will create year-round passable conditions along the E-W Highway, especially across the
Koshi River. E-W Highway is the backbone of Nepal’s national highway system, the E-W Highway must
14 Kathmandu-Kolkata corridor and a priority route for Bangladesh-Bhutan-India-Nepal Motor Vehicle Agreement (BBIN MVA) 15 Kathmandu-Bhairahawa-Sonauli (India)-Lucknow(India). 16 As a part of SAARC Corridor No.4 and a priority route for BBIN MVA.
Data Collection Survey on the Sindhuli Road Capacity Enhancement in Nepal FINAL REPORT
5-37
meet minimum technical standards and be passable all year round. Parts of the highway, in particular the
main Koshi Barrage in the Sunsari District, are prone to damage from heavy floods and require alternate
routes in case of closure. The E-W Highway is critical for domestic connectivity, but also key to linking
the country to India. The GON wants to improve the entire 1,700 km stretch to all-weather maintainable
standard under joint assistance from ADB and the WB. This will connect communities and provide access
to basic services. The project features among others,
(1) Road Upgrading
About 73 km of bypass roads and border roads along E-W Highway will be upgraded to two-lane
standard, and about 114 km of MHC17 to intermediate-lane standard. The road construction will
include community participation, as it will create employment for unskilled laborers, particularly
women, in the community.
(2) Regional Development
Local communities will benefit from construction employment, and will later have access to markets,
which will result in increased household income. Savings in vehicle operating costs will be passed on
to the poor through lower freight rates, lower passenger fares, and time savings. Households in remote
areas will benefit from an increase in the availability of goods and a decrease in prices.
(3) Gender Equality
Most local women who travel by foot on earthen tracks that are impassable during the rainy season
will have safer, faster, and more comfortable access once the investments are completed. Cash-
strapped subsistence farmers, including women, will benefit from other activities such as short-term
employment in road construction and maintenance.
17 Comprising three pivotal road linkages: Leguwaghat–Bhojpur in Bhojpur District; Halesi–Diktel in Khotang District; and
Manthali–Ramechhap in Ramechhap District

Data Collection Survey on the Sindhuli Road Capacity Enhancement in Nepal FINAL REPORT
6-1
CHAPTER 6 OPERATION AND MAINTENANCE
6.1 INTRODUCTION
Till recently, roads in Nepal were constructed/reconstructed through the assistance of different donors. The
road agencies did not have a design standard and/or construction specifications of its own. Therefore, the
standards applied for the design and construction of roads were dictated by donors' own standards. Some
of them are of higher standard than required. Road agencies thus were, and are still to some extent,
dependent on donor agencies. The maintenance of the road saw huge backlogs because of this and
sometimes for reasons such as economic consideration that the agencies insisted of not justifiable. But as
these roads are part and parcel of the SRN and awareness of the importance of road transport to the county
started showing adherence among the agencies, and both technical and financial capacity of the agencies
is being enhanced, the agencies are now putting much effort to ensure its roads are sustainably maintained.
However, the effort is insufficient to ensure all roads receive timely and sufficient maintenance.
Agencies responsible for operation and maintenance of roads and bridges in Nepal are the DOR
(Department of Roads) and DOLI (Department of Local Infrastructure) (in coordination with
municipalities and District Coordination Committees), RBN (Roads Board Nepal) and DOTM
(Department of Transport Management). The DOR is the responsible agency for operation and
maintenance of its strategic roads, whereas DOLI is responsible for other roads. RBN and DOTM are
related to operation and maintenance. RBN supports the maintenance activities of these agencies by
providing financial support and is also conducts monitoring and evaluation of road maintenance works
executed by road agencies. DOTM is responsible for regulating road transport. The regulation that barred
vehicles having gross vehicle weight (GVW) of 10-ton or more 4200mm wheelbase and all kinds of night
buses from plying the Sindhuli Road was imposed by the DOTM from 18th September 2015. This was
however not so much effective until the order from the Supreme Court on June 10, 2018.
The Sindhuli Road lies under the SRN. Therefore, this chapter discusses briefly on the agencies responsible
for operation and maintenance system of the SRN roads only.
6.2 OPERATION AND MAINTENANCE OF STRATEGIC ROADS
6.2.1 Types of Maintenance
DOR’s maintenance practice is predominantly based on strengthen maintenance division process where
several maintenance activities like routine maintenance, recurrent maintenance, periodic maintenance, and
emergency maintenance are planned and carried out. The actual works are in principle outsourced.
Routine maintenance - which is required continually on every road. This aims “to ensure the daily
passability and safety of existing roads in the short-run and to prevent premature deterioration of the roads.
Recurrent maintenance - which is required at intervals during the year with a frequency that depends
mostly on the volume of traffic on the road.
Periodic maintenance - which is required only at interval of several years. This aims to preserve the
structural integrity of the road. These works tend to be large scale, requiring specialized equipment and
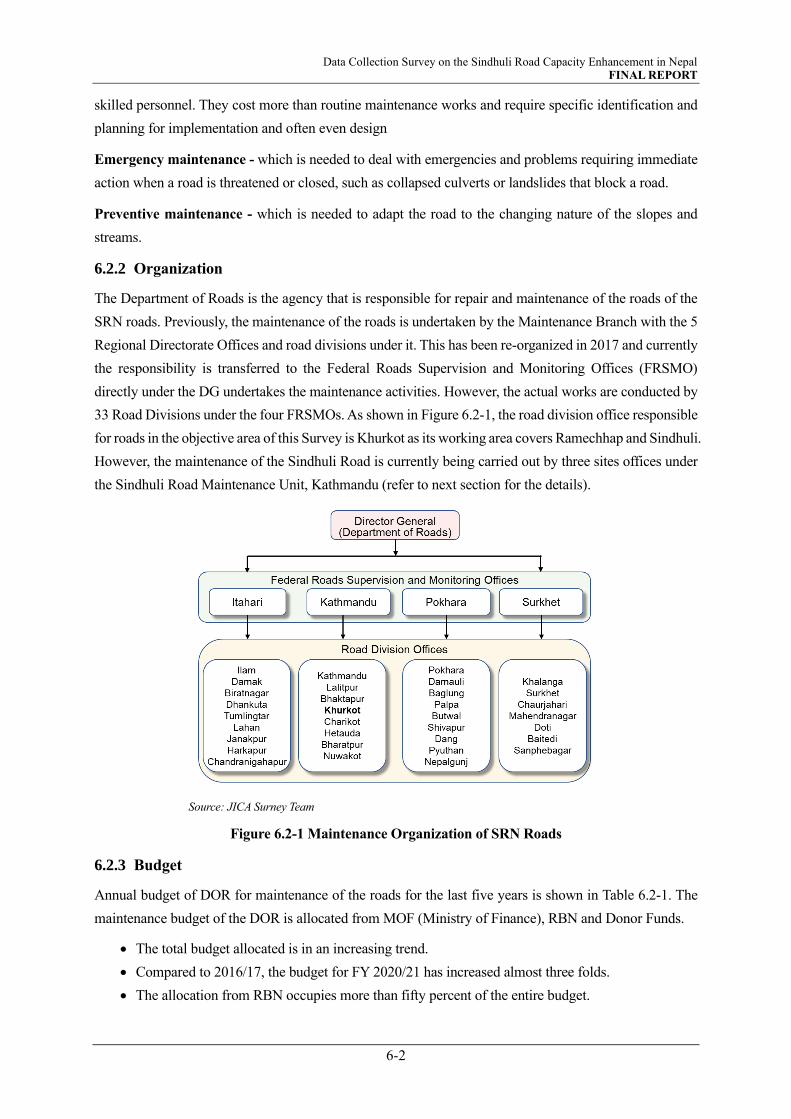
Data Collection Survey on the Sindhuli Road Capacity Enhancement in Nepal FINAL REPORT
6-2
skilled personnel. They cost more than routine maintenance works and require specific identification and
planning for implementation and often even design
Emergency maintenance - which is needed to deal with emergencies and problems requiring immediate
action when a road is threatened or closed, such as collapsed culverts or landslides that block a road.
Preventive maintenance - which is needed to adapt the road to the changing nature of the slopes and
streams.
6.2.2 Organization
The Department of Roads is the agency that is responsible for repair and maintenance of the roads of the
SRN roads. Previously, the maintenance of the roads is undertaken by the Maintenance Branch with the 5
Regional Directorate Offices and road divisions under it. This has been re-organized in 2017 and currently
the responsibility is transferred to the Federal Roads Supervision and Monitoring Offices (FRSMO)
directly under the DG undertakes the maintenance activities. However, the actual works are conducted by
33 Road Divisions under the four FRSMOs. As shown in Figure 6.2-1, the road division office responsible
for roads in the objective area of this Survey is Khurkot as its working area covers Ramechhap and Sindhuli.
However, the maintenance of the Sindhuli Road is currently being carried out by three sites offices under
the Sindhuli Road Maintenance Unit, Kathmandu (refer to next section for the details).
Source: JICA Surney Team
Figure 6.2-1 Maintenance Organization of SRN Roads
6.2.3 Budget
Annual budget of DOR for maintenance of the roads for the last five years is shown in Table 6.2-1. The
maintenance budget of the DOR is allocated from MOF (Ministry of Finance), RBN and Donor Funds.
• The total budget allocated is in an increasing trend.
• Compared to 2016/17, the budget for FY 2020/21 has increased almost three folds.
• The allocation from RBN occupies more than fifty percent of the entire budget.
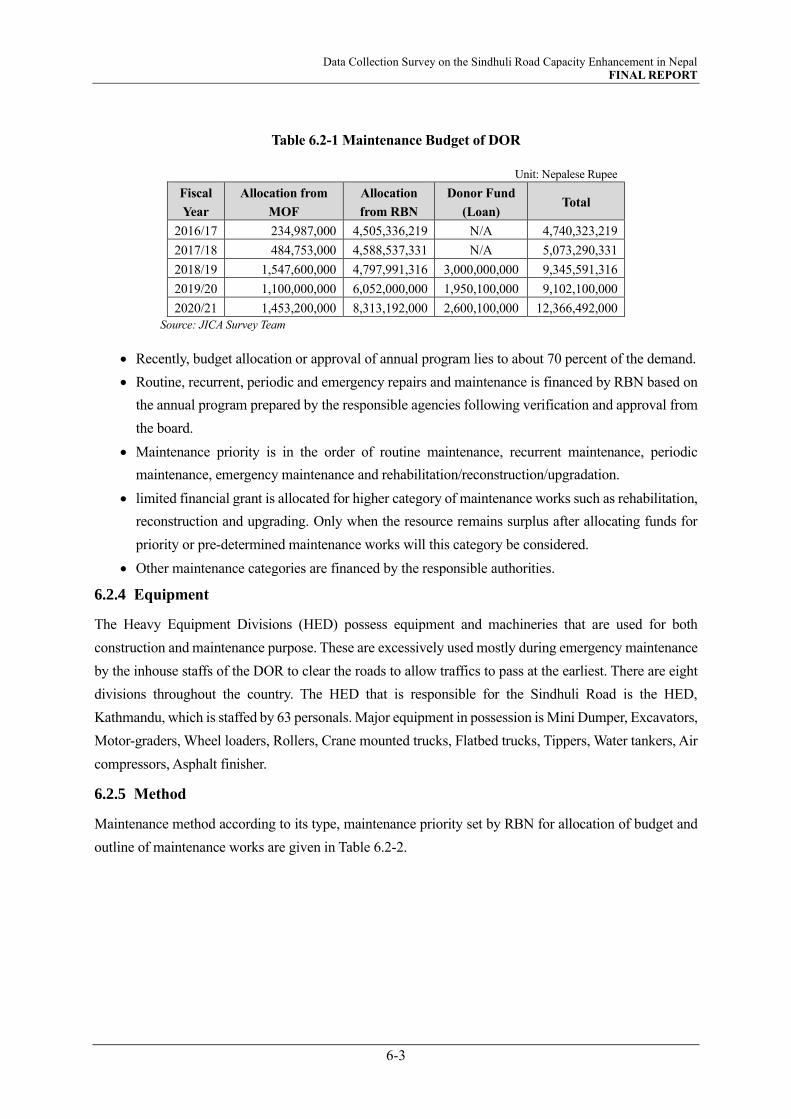
Data Collection Survey on the Sindhuli Road Capacity Enhancement in Nepal FINAL REPORT
6-3
Table 6.2-1 Maintenance Budget of DOR
Unit: Nepalese Rupee
Fiscal
Year
Allocation from
MOF
Allocation
from RBN
Donor Fund
(Loan) Total
2016/17 234,987,000 4,505,336,219 N/A 4,740,323,219
2017/18 484,753,000 4,588,537,331 N/A 5,073,290,331
2018/19 1,547,600,000 4,797,991,316 3,000,000,000 9,345,591,316
2019/20 1,100,000,000 6,052,000,000 1,950,100,000 9,102,100,000
2020/21 1,453,200,000 8,313,192,000 2,600,100,000 12,366,492,000
Source: JICA Survey Team
• Recently, budget allocation or approval of annual program lies to about 70 percent of the demand.
• Routine, recurrent, periodic and emergency repairs and maintenance is financed by RBN based on
the annual program prepared by the responsible agencies following verification and approval from
the board.
• Maintenance priority is in the order of routine maintenance, recurrent maintenance, periodic
maintenance, emergency maintenance and rehabilitation/reconstruction/upgradation.
• limited financial grant is allocated for higher category of maintenance works such as rehabilitation,
reconstruction and upgrading. Only when the resource remains surplus after allocating funds for
priority or pre-determined maintenance works will this category be considered.
• Other maintenance categories are financed by the responsible authorities.
6.2.4 Equipment
The Heavy Equipment Divisions (HED) possess equipment and machineries that are used for both
construction and maintenance purpose. These are excessively used mostly during emergency maintenance
by the inhouse staffs of the DOR to clear the roads to allow traffics to pass at the earliest. There are eight
divisions throughout the country. The HED that is responsible for the Sindhuli Road is the HED,
Kathmandu, which is staffed by 63 personals. Major equipment in possession is Mini Dumper, Excavators,
Motor-graders, Wheel loaders, Rollers, Crane mounted trucks, Flatbed trucks, Tippers, Water tankers, Air
compressors, Asphalt finisher.
6.2.5 Method
Maintenance method according to its type, maintenance priority set by RBN for allocation of budget and
outline of maintenance works are given in Table 6.2-2.
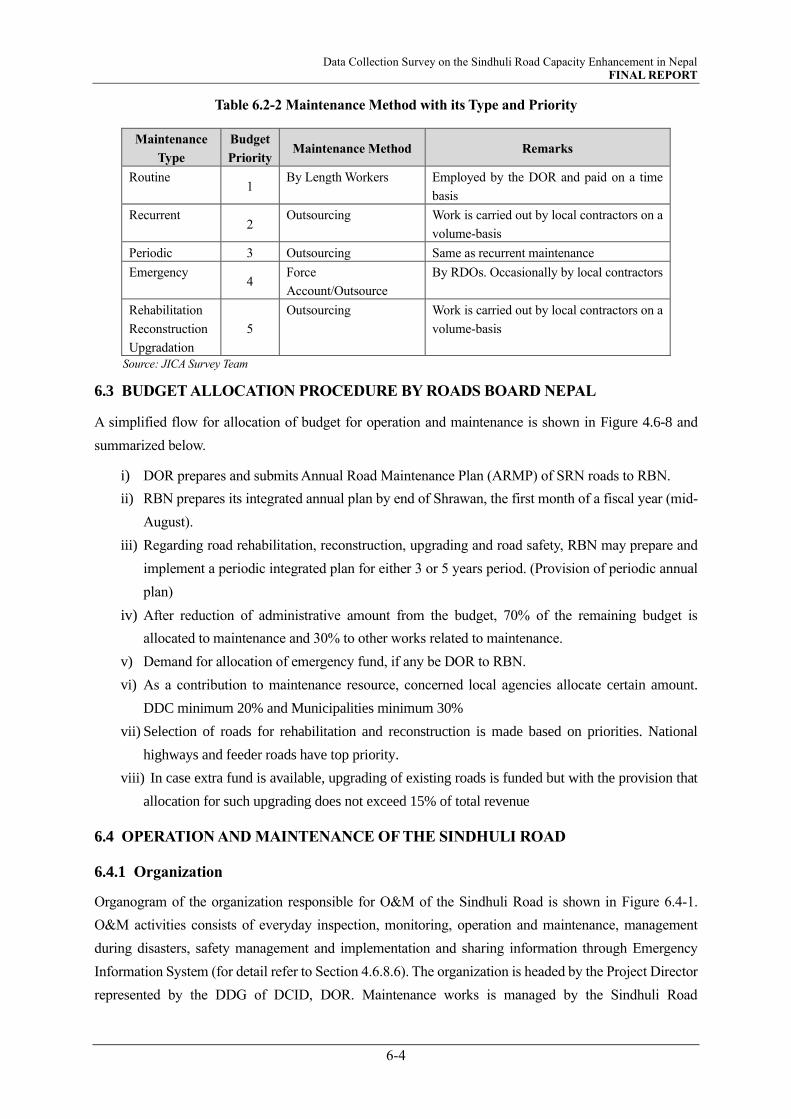
Data Collection Survey on the Sindhuli Road Capacity Enhancement in Nepal FINAL REPORT
6-4
Table 6.2-2 Maintenance Method with its Type and Priority
Maintenance
Type
Budget
Priority Maintenance Method Remarks
Routine 1
By Length Workers Employed by the DOR and paid on a time
basis
Recurrent 2
Outsourcing Work is carried out by local contractors on a
volume-basis
Periodic 3 Outsourcing Same as recurrent maintenance
Emergency 4
Force
Account/Outsource
By RDOs. Occasionally by local contractors
Rehabilitation
Reconstruction
Upgradation
5
Outsourcing Work is carried out by local contractors on a
volume-basis
Source: JICA Survey Team
6.3 BUDGET ALLOCATION PROCEDURE BY ROADS BOARD NEPAL
A simplified flow for allocation of budget for operation and maintenance is shown in Figure 4.6-8 and
summarized below.
i) DOR prepares and submits Annual Road Maintenance Plan (ARMP) of SRN roads to RBN.
ii) RBN prepares its integrated annual plan by end of Shrawan, the first month of a fiscal year (mid-
August).
iii) Regarding road rehabilitation, reconstruction, upgrading and road safety, RBN may prepare and
implement a periodic integrated plan for either 3 or 5 years period. (Provision of periodic annual
plan)
iv) After reduction of administrative amount from the budget, 70% of the remaining budget is
allocated to maintenance and 30% to other works related to maintenance.
v) Demand for allocation of emergency fund, if any be DOR to RBN.
vi) As a contribution to maintenance resource, concerned local agencies allocate certain amount.
DDC minimum 20% and Municipalities minimum 30%
vii) Selection of roads for rehabilitation and reconstruction is made based on priorities. National
highways and feeder roads have top priority.
viii) In case extra fund is available, upgrading of existing roads is funded but with the provision that
allocation for such upgrading does not exceed 15% of total revenue
6.4 OPERATION AND MAINTENANCE OF THE SINDHULI ROAD
6.4.1 Organization
Organogram of the organization responsible for O&M of the Sindhuli Road is shown in Figure 6.4-1.
O&M activities consists of everyday inspection, monitoring, operation and maintenance, management
during disasters, safety management and implementation and sharing information through Emergency
Information System (for detail refer to Section 4.6.8.6). The organization is headed by the Project Director
represented by the DDG of DCID, DOR. Maintenance works is managed by the Sindhuli Road

Data Collection Survey on the Sindhuli Road Capacity Enhancement in Nepal FINAL REPORT
6-5
Maintenance Unit (SMRU), which is stationed in Min Bhawan, Kathmandu. Project Manager is the person
in-charge. It has three site offices- i) Banepa Site Office, ii) Ramtar Site Office, and iii) Bardibas Site
Office. The organization
Banepa Site Office is responsible for O&M of Dhulikhel-Nepalthok section (Section IV). Ramtar Site
Office looks after Nepalthok-Khurkot section (Section III), and Bardibas Site Office takes care of Khurkot-
Bardibas section (Section II and I)
Source: JICA Survey Team
Figure 6.4-1 Organization Chart of Maintenance Body
6.4.2 Budget
Budget for maintenance of the Sindhuli Road is comprised from two sources1, i) direct allocation from the
MOF, ii) allocation from RBN. The budget for five consecutive years between FY 2014/15 and 2018/19
is as shown in Table 6.4-1. The budget from the GON was higher compared to the allocation after FY
2015/16. This is because a portion of the amount was used for construction purpose also. Allocation was
maximum in 2015/16. This is due to the need for recovery from the damages caused by the earthquake.
Where the allocation from the GON started decreasing, the budget from RBN is seen to be increasing. The
FY 2017/18 budget is about 242 million NPR, which accounts to about 1.5 million NPR per kilometer.
Table 6.4-1 Allocation of Maintenance Budget to the Sindhuli Road
From Allocated
Budget for FY
2014/15
Allocated
Budget for FY
2015/16
Allocated
Budget for FY
2016/17
Allocated
Budget for FY
2017/18
Allocated Budget
for FY
2018/19
RBN 82,896,600 33,973,000 132,800,000 135,572,000 N/A
GON 147,317,000 189,500,000 101,323,000 106,707,000 86,300,000
Total 230,213,600 223,473,000 234,123,000 242,279,000 86,300,000*
*: Total allocated budget for FY 2018/19 is higher than indicated as it does not include allocation from RBN.
Source: Red Book, MOF and RBN Annual Reports
1 In addition to MOF and RBN, 100 million NPR was allocated from donor fund. This is not included in the total amount.

Data Collection Survey on the Sindhuli Road Capacity Enhancement in Nepal FINAL REPORT
6-6
Unit: Nepalese Rupee
Allocation
Year
Allocation from
GON
Allocation
from Donor
Grant
Allocation
from RBN Total
2016/17 101,323,000 100,000,000 132,800,000 334,123,000
2017/18 106,707,000 100,000,000 135,572,000 342,279,000
2018/19 86,300,000 100,000,000 N/A 186,300,000
2019/20 461,800,000 500,000,000 N/A 961,800,000
2020/21 260,700,000 270,000,000 N/A 530,700,000
Source: Red Book, MOF and RBN
6.4.3 Equipment
Equipment in possession of Heavy Equipment Division, Kathmandu are used.
6.4.4 Method
Method is similar to those mentioned in Section 6.2.5 applies.
6.4.5 Emergency Information Systems
Emergency Information System (EIS) is one of the systems installed along the Sindhuli Road. The system
provides service that enables the road users to obtain important information relevant to the road condition
including real-time information of incidents like heavy rainfall, occurrence of flood, landslides, traffic
accidents and traffic congestions or road closures and when there is none such incidents, it is used to
display traffic rules/regulations and driving manners as well. The service can be accessed in advance, via
smartphones or the web site of the DOR or from the Roads Information Board installed at several locations
in and around the Sindhuli Road. The information is also made available to concerned offices of the DOR,
Municipalities & District administration and traffic police for carrying out immediate rescue operation and
clearance of the traffic blockage.
In addition to the EIS, Road Information Boards (RIB) are also installed along the Sindhuli Road.
Source: Web site, DOR
Figure 6.4-2 Emergency Information System
Data Collection Survey on the Sindhuli Road Capacity Enhancement in Nepal FINAL REPORT
6-7
6.5 TECHNICAL LEVEL AND IMPLEMENTING CAPACITY
The DOR is currently organized with 2500 staffs with more than 1150 engineers and sub-engineers. The
four Federal Roads Supervision and Monitoring Offices (FRSMO) of the DOR under the DG is responsible
for operation and maintenance of SRN roads. Actual maintenance however is undertaken by the 33 road
divisions under FRSMO and distributed throughout the country. Furthermore, the maintenance activities
are supported by the Heavy Equipment Divisions that provide equipment and machines. The equipment
and machines in possession of these divisions covers basic equipment used for maintenance work and are
in good condition.
Substantial efforts made through donor agencies have helped the DOR improve its road operation and
maintenance capacity. The DOR has been able to develop and improve its basic capabilities to better
manage the road capital and resources allocated to the sector. The WB have conducted several projects
(Road Maintenance Development Project, Sector Wide Road Programme and Priority Investment Plan for
Strategic Road Network of Nepal etc.) to enhance the maintenance capacity of the DOR. ADB and JICA
projects also had and have been assisting the DOR in enhancing maintenance capacity through various
projects.
The above implies to the technical level of the divisions/offices responsible for maintenance of the Sinduli
Road. The capacity enhancement through various pilot projects under the technical assistance projects
conducted by JICA has provided basic skills, knowledge and experience to prepare a maintenance plan on
a systematic and efficient manner. Despite of this, there remains backlog of maintenance and major
reasons are,
i) Insufficient (allocation rate is less than 70 percent of the demand) and delay in allocation of
maintenance budget,
ii) Low level or negligence of the contractors,
iii) Delays in the procurement procedure and lack of contract management, and
iv) Non-effective traffic control
6.5.1 Financial Level
The maintenance budget allocated by RBN to the DOR increased to almost two folds from 4,798 million
NPR in FY 2018/29 to 8.313 million NPR in FY 2020/21. While both allocations from MOF and Donor
reduced, allocation from RBN increased to two-folds (Table 6.2-1). The total length of SRN roads as of
FY 2018/19 is 13,448 km. This implies that only about 695,000 NPR can be earmarked per kilometer of
the road. This is said to be enough for routine maintenance and only slightly for the periodic maintenance.
The 15th Development Plan puts emphasis on expanding the SRN roads. Consistent and substantial
increase is therefore imminent to extend periodic maintenance to more roads as the SRN is expanded.
6.5.2 Equipment and Machines in Possession
Heavy equipment for construction use is managed by Mechanical Branch of DOR through its eight (8)
heavy equipment divisions throughout the country. Heavy Equipment Division, Kathmandu is mainly
responsible for SRN roads. The division has in its possession equipment such as air compressor, batching
Data Collection Survey on the Sindhuli Road Capacity Enhancement in Nepal FINAL REPORT
6-8
& mixing plant, asphalt/concrete finisher, concrete mixer, concrete pump, cranes, dozers, hot mix plant,
excavators, motor grader, pneumatic road roller, stone crusher, tractors, trucks among others. The
equipment is used for road construction and maintenance work and also for emergency recovery works of
road sections disrupted due to floods and landslides during the monsoon season.
6.6 EXPERIENCE OF TUNNELING ON EXISTING ROAD
Experience of tunneling on existing road is null till date. Nepal is yet to have a road tunnel. Nagdhunga
Tunnel, currently undergoing construction after completion will likely be the first of its kind. This tunnel
is being constructed at Nagdhunga Pass to bypass the most critical section of the Westward Route.
Technology transfer for capacity enhancement of DOR staffs including the sub-contractors is one of the
important components of the project. Therefore, experience of tunneling on existing road is still
rudimentary. However, on the optimistic side, awareness for the need of tunnels is growing and plans for
new construction of tunnels as well as improvement of existing alignments through provision of tunnels
are increasing.
Data Collection Survey on the Sindhuli Road Capacity Enhancement in Nepal FINAL REPORT
7-1
CHAPTER 7 ENGINEERING SURVEYS / INVESTIGATIONS
7.1 INTRODUCTION
Engineering surveys are activities required to support the main activities from conception to construction
including operation and maintenance. This is a data collection survey aimed at understanding the traffic
condition and operation and maintenance status of the Sindhuli Road to formulate an improvement plan.
While the data is being collected through bibliographic research, engineering surveys are also are also
conducted to supplement or even to substantiate the conditions confirmed through the research. This section
briefly describes about the surveys consisted under this survey.
7.2 TOPOGRAPHY SURVEY
The map used as the basis for planning and conceptual/preliminary design to formulate improvement
methodology under the survey was procured from a leading IT service provider in Japan. AW3D1 is a highly
precise, pre-produced digital-elevation-model 3D map of the project area. The AW3D map offers 0.5-meter
resolution for extra-detailed expression of cities and terrain. The mapping process uses a floating-point format
for height values to achieve highly accurate representations of terrain, including smooth expressions of
topography with contours at 1m interval. Compared to 2.5 m resolution, 0.5 m resolution offers fine
expression of terrain undulations. In Nepal, this was used in the disaster prevention/risk reduction project,
where hazard maps for the long-term disaster recovery plan following the Nepal Earthquake.
Plan of entire stretch is shown in Figure 7.2-1 and plan and profile of the Sindhuli Road, that is generated
based on the AW3D data are shown Figure 7.2-2 to Figure 7.2-10 by the section.
1 AW3D stands for ALOS World 3D. ALOS is the Advanced Land Observing Satellite which is a Japanese Earth-imaging satellite from
JAXA that launched on 24 January 2006 and completed its operational phase on 12 May 2011
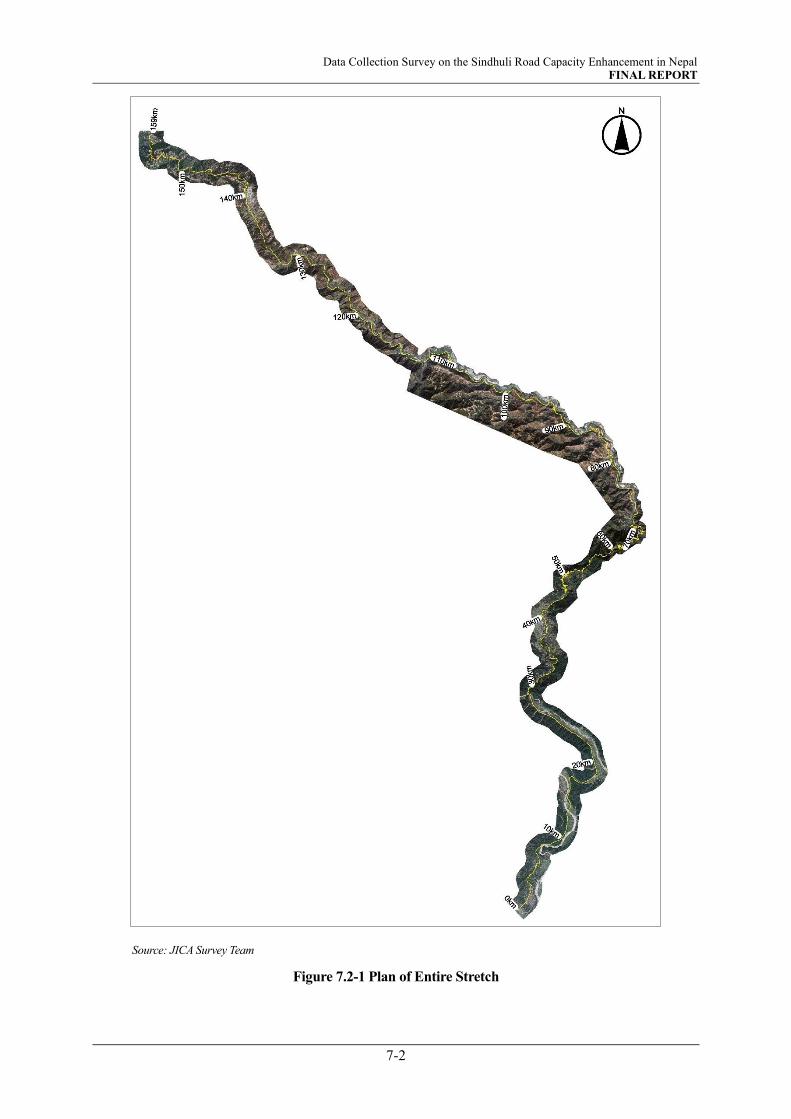
Data Collection Survey on the Sindhuli Road Capacity Enhancement in Nepal FINAL REPORT
7-2
Source: JICA Survey Team
Figure 7.2-1 Plan of Entire Stretch
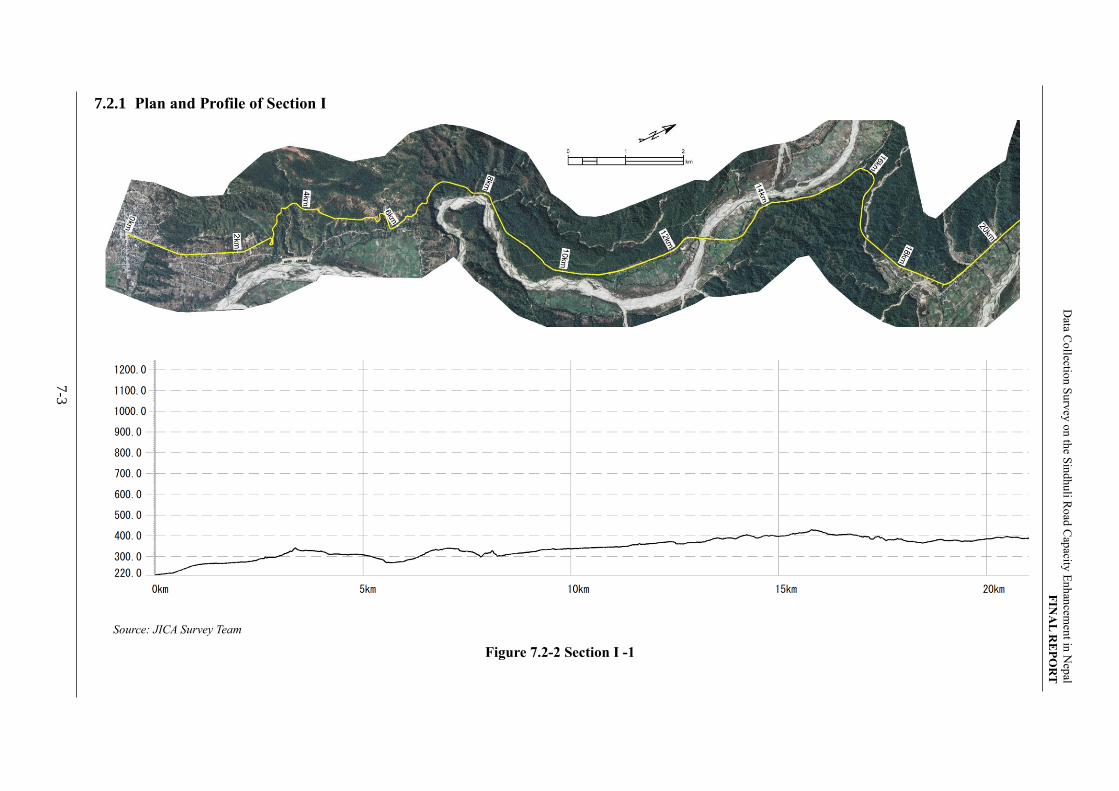
7-3
Data C
ollectio
n S
urv
ey o
n th
e Sin
dhu
li Ro
ad C
apacity
En
han
cemen
t in N
epal
FIN
AL
RE
PO
RT
7.2.1 Plan and Profile of Section I
Source: JICA Survey Team
Figure 7.2-2 Section I -1

7-4
Data C
ollectio
n S
urv
ey o
n th
e Sin
dhu
li Ro
ad C
apacity
En
han
cemen
t in N
epal
FIN
AL
RE
PO
RT
Source: JICA Survey Team
Figure 7.2-3 Section I -2
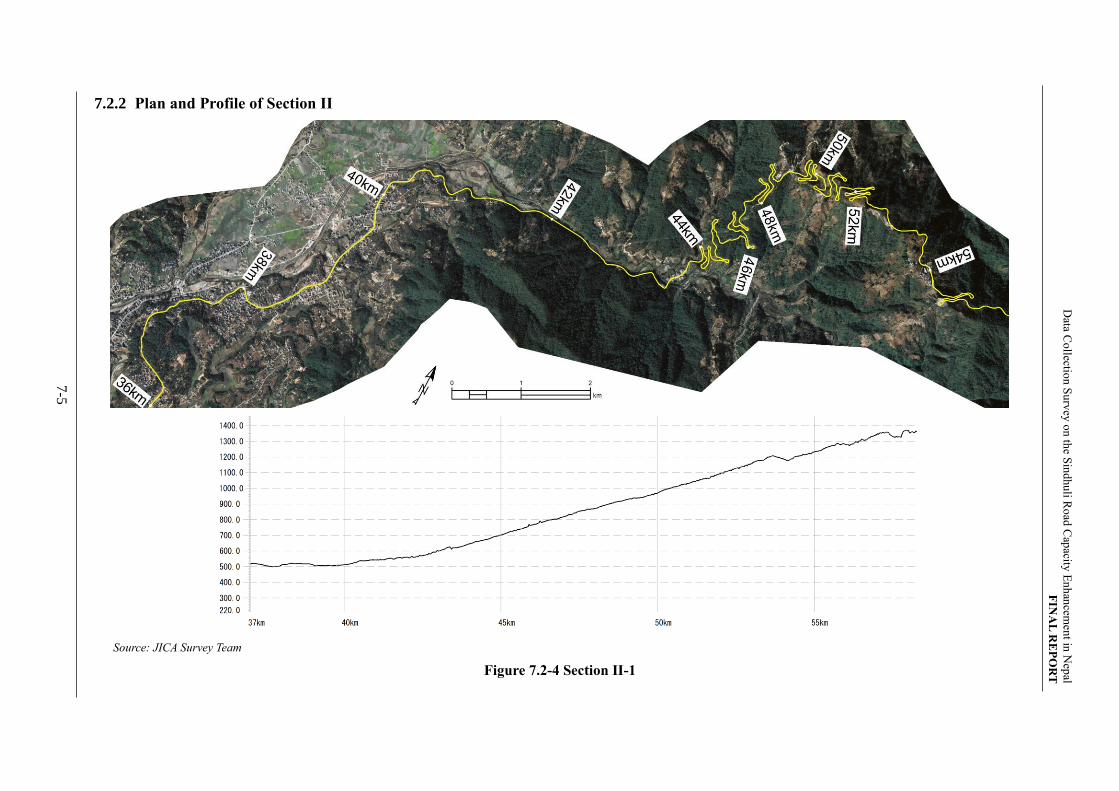
7-5
Data C
ollectio
n S
urv
ey o
n th
e Sin
dhu
li Ro
ad C
apacity
En
han
cemen
t in N
epal
FIN
AL
RE
PO
RT
7.2.2 Plan and Profile of Section II
Source: JICA Survey Team
Figure 7.2-4 Section II-1
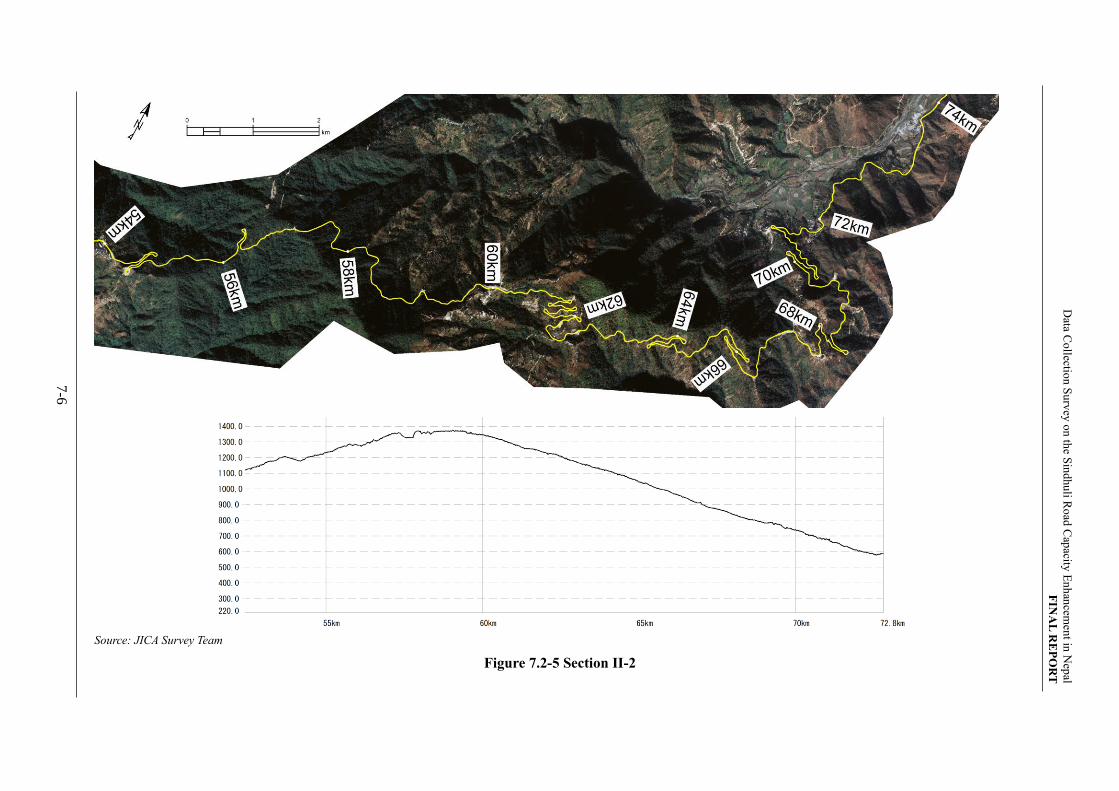
7-6
Data C
ollectio
n S
urv
ey o
n th
e Sin
dhu
li Ro
ad C
apacity
En
han
cemen
t in N
epal
FIN
AL
RE
PO
RT
Source: JICA Survey Team
Figure 7.2-5 Section II-2
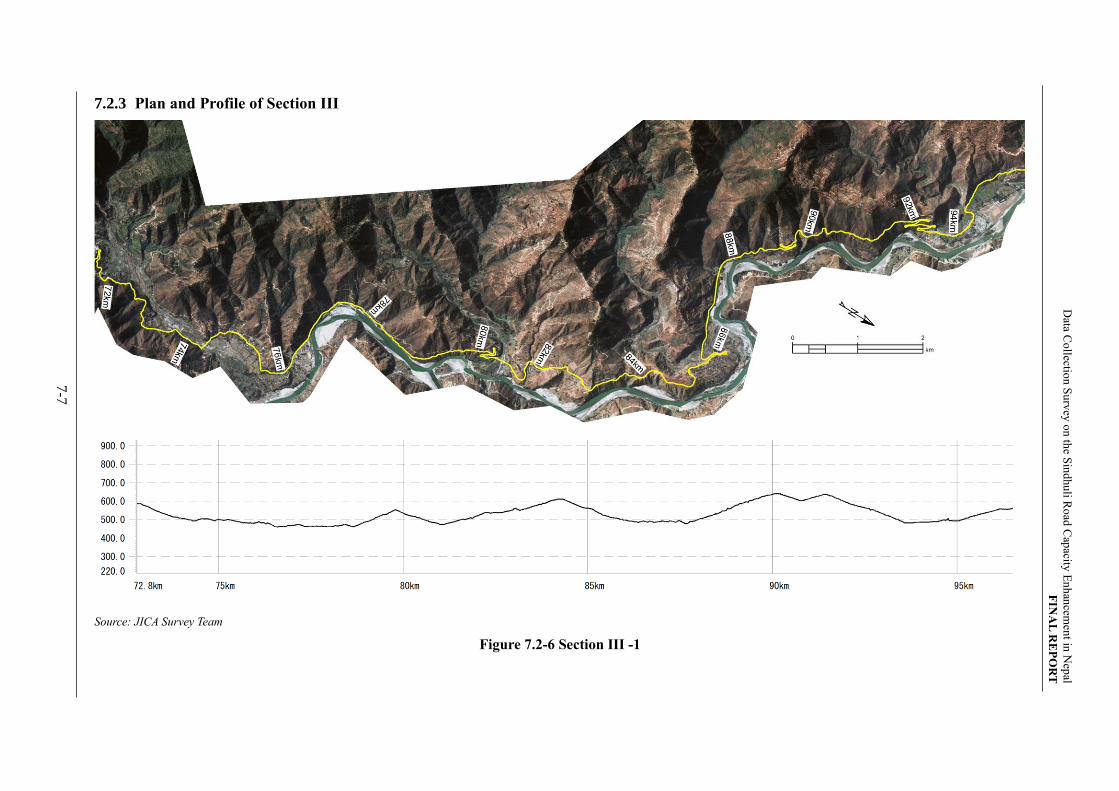
7-7
Data C
ollectio
n S
urv
ey o
n th
e Sin
dhu
li Ro
ad C
apacity
En
han
cemen
t in N
epal
FIN
AL
RE
PO
RT
7.2.3 Plan and Profile of Section III
Source: JICA Survey Team
Figure 7.2-6 Section III -1
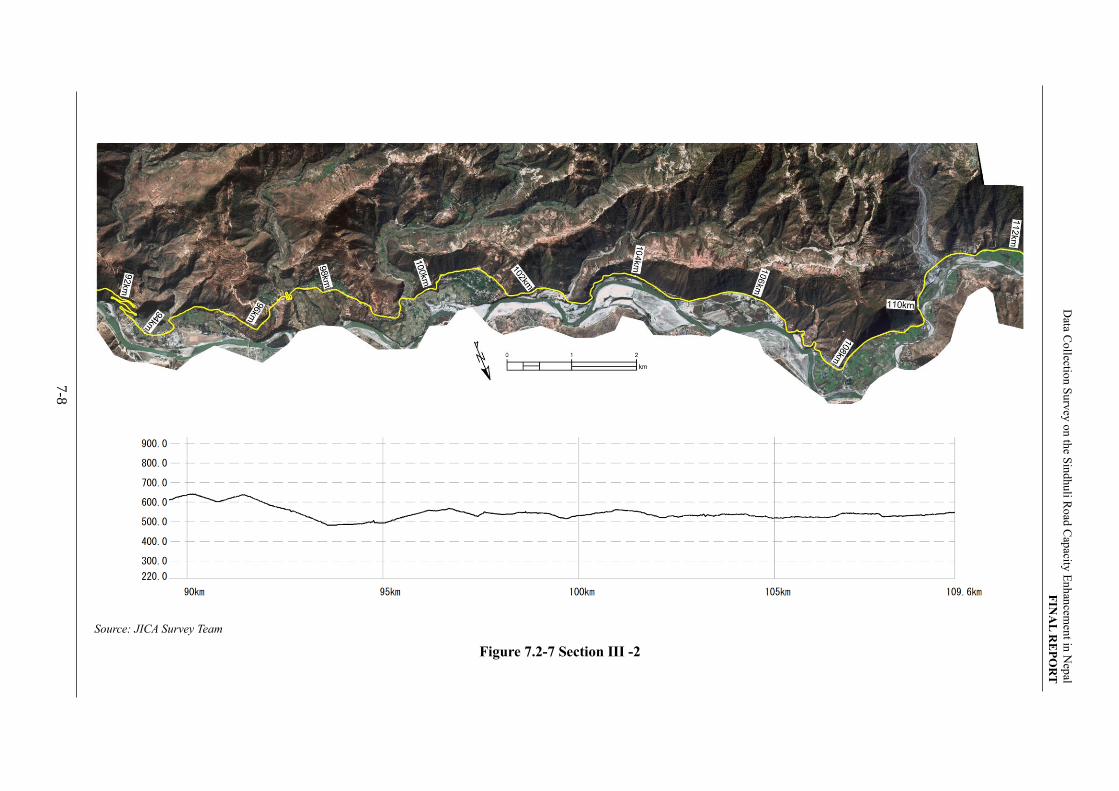
7-8
Data C
ollectio
n S
urv
ey o
n th
e Sin
dhu
li Ro
ad C
apacity
En
han
cemen
t in N
epal
FIN
AL
RE
PO
RT
Source: JICA Survey Team
Figure 7.2-7 Section III -2

7-9
Data C
ollectio
n S
urv
ey o
n th
e Sin
dhu
li Ro
ad C
apacity
En
han
cemen
t in N
epal
FIN
AL
RE
PO
RT
7.2.4 Plan and Profile of Section IV
Source: JICA Survey Team
Figure 7.2-8 Section IV -1

7-1
0
Data C
ollectio
n S
urv
ey o
n th
e Sin
dhu
li Ro
ad C
apacity
En
han
cemen
t in N
epal
FIN
AL
RE
PO
RT
Source: JICA Survey Team
Figure 7.2-9 Section IV -2

7-1
1
Data C
ollectio
n S
urv
ey o
n th
e Sin
dhu
li Ro
ad C
apacity
En
han
cemen
t in N
epal
FIN
AL
RE
PO
RT
Source: JICA Survey Team
Figure 7.2-10 Section IV -3
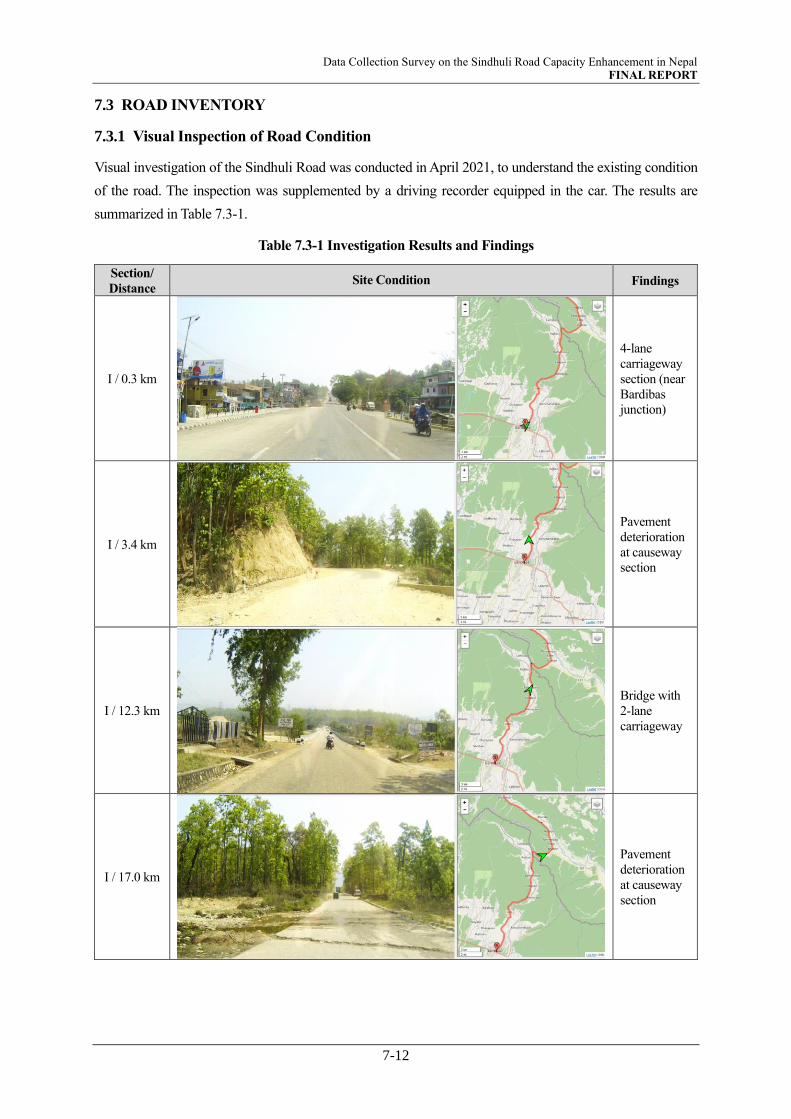
Data Collection Survey on the Sindhuli Road Capacity Enhancement in Nepal FINAL REPORT
7-12
7.3 ROAD INVENTORY
7.3.1 Visual Inspection of Road Condition
Visual investigation of the Sindhuli Road was conducted in April 2021, to understand the existing condition
of the road. The inspection was supplemented by a driving recorder equipped in the car. The results are
summarized in Table 7.3-1.
Table 7.3-1 Investigation Results and Findings
Section/
Distance Site Condition Findings
I / 0.3 km
4-lane
carriageway
section (near
Bardibas
junction)
I / 3.4 km
Pavement
deterioration
at causeway
section
I / 12.3 km
Bridge with
2-lane
carriageway
I / 17.0 km
Pavement
deterioration
at causeway
section

Data Collection Survey on the Sindhuli Road Capacity Enhancement in Nepal FINAL REPORT
7-13
Section/
Distance Site Condition Findings
I / 19.3 km
Section
undergoing
repair works
I / 23.3 km
Overtaking
of
heavy/slow
vehicle by
high speed
vehicle using
opposing
direction
observed
frequently
I / 33.4 km
Passing
across of
opposing
vehicles
available
with less
margin
(reduced
speed)
I / 35.9 km
A lot of
pedestrians in
Sindhulimadi
observed
II / 39.6 km
Section
where
overlay
(asphalt)
work is
underway
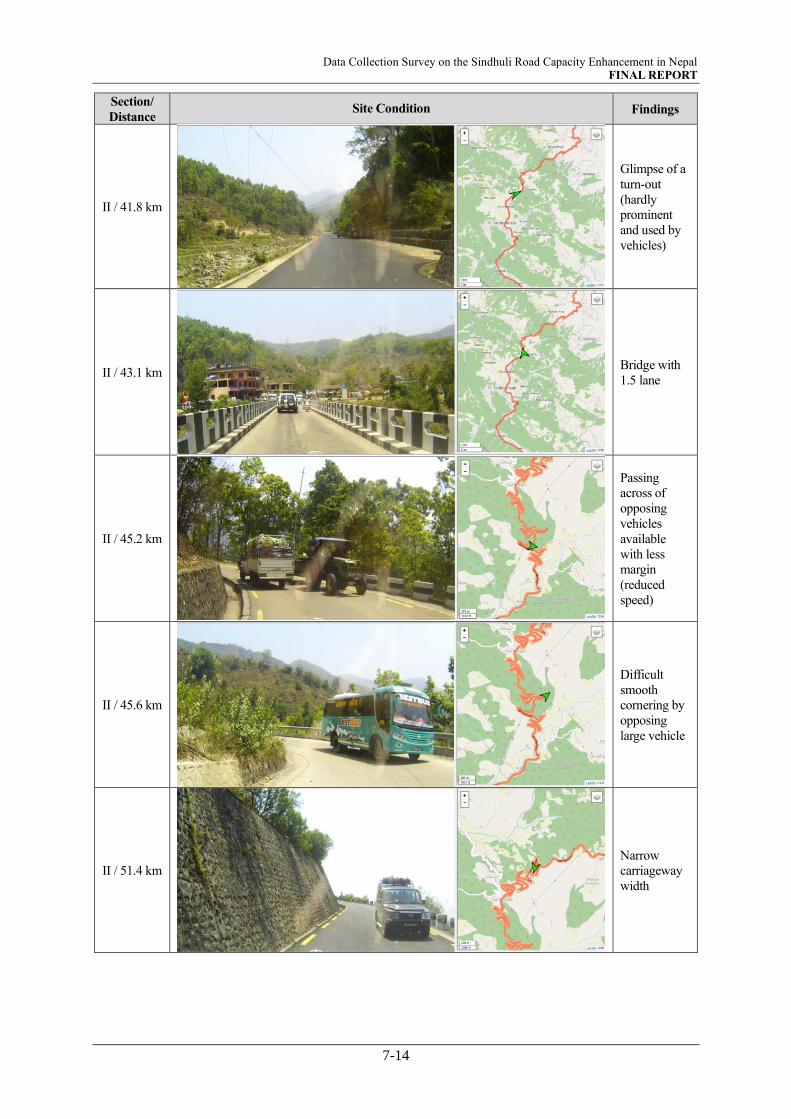
Data Collection Survey on the Sindhuli Road Capacity Enhancement in Nepal FINAL REPORT
7-14
Section/
Distance Site Condition Findings
II / 41.8 km
Glimpse of a
turn-out
(hardly
prominent
and used by
vehicles)
II / 43.1 km
Bridge with
1.5 lane
II / 45.2 km
Passing
across of
opposing
vehicles
available
with less
margin
(reduced
speed)
II / 45.6 km
Difficult
smooth
cornering by
opposing
large vehicle
II / 51.4 km
Narrow
carriageway
width

Data Collection Survey on the Sindhuli Road Capacity Enhancement in Nepal FINAL REPORT
7-15
Section/
Distance Site Condition Findings
II / 52.9 km
Passing over
of opposing
vehicles at
curves
section (high
risk)
II / 54.1 km
New
pavement
and road
markings
II / 58.0 km
Mechanical
breakdown
and stalled
vehicle (on-
street
repairing)
II / 58.8 km
The highest
point/section
(1,376.5m) in
Section II
II / 59.3 km
Rest area at
Sindhuli
Gadhi
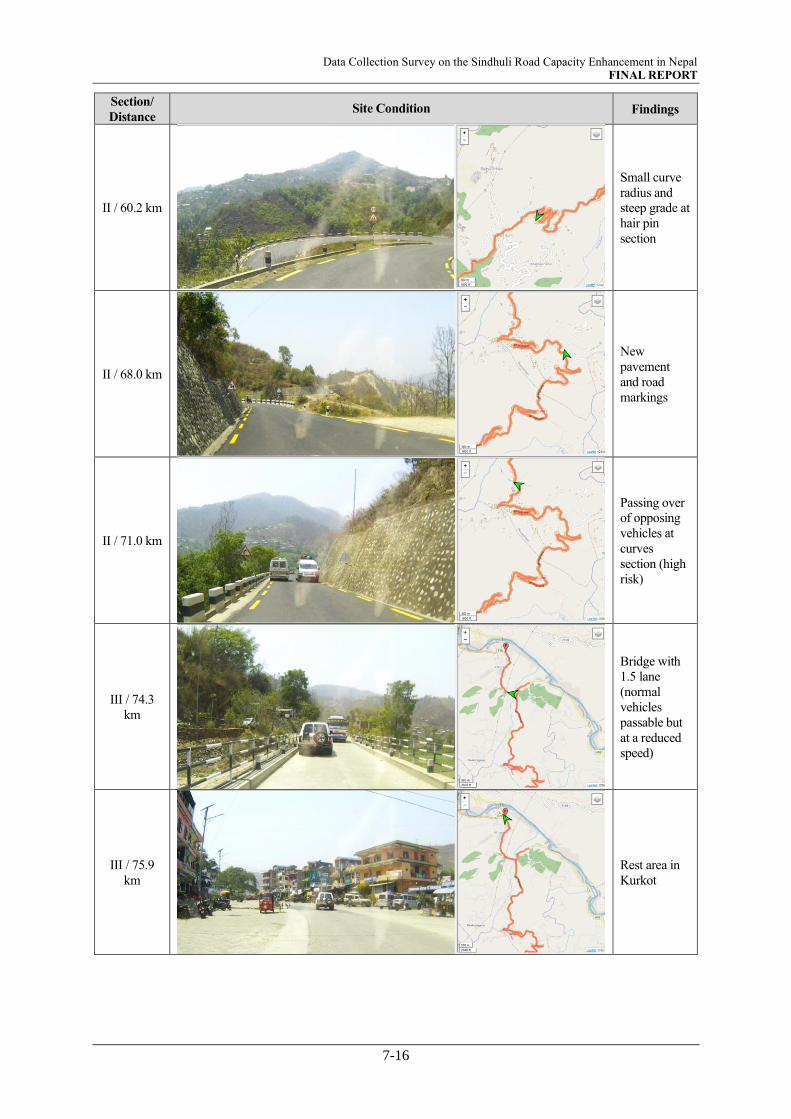
Data Collection Survey on the Sindhuli Road Capacity Enhancement in Nepal FINAL REPORT
7-16
Section/
Distance Site Condition Findings
II / 60.2 km
Small curve
radius and
steep grade at
hair pin
section
II / 68.0 km
New
pavement
and road
markings
II / 71.0 km
Passing over
of opposing
vehicles at
curves
section (high
risk)
III / 74.3
km
Bridge with
1.5 lane
(normal
vehicles
passable but
at a reduced
speed)
III / 75.9
km
Rest area in
Kurkot

Data Collection Survey on the Sindhuli Road Capacity Enhancement in Nepal FINAL REPORT
7-17
Section/
Distance Site Condition Findings
III / 77.1
km
Turn-out
provided
III / 78.0
km
Sunkoshi
Marin
Diversion
Multipurpose
Project site
III / 86.1
km
Not enough
spaces for
overtaking a
heavy/ slow
vehicle
III / 87.6
km
Bridge with
1.5 lane
III / 90.2
km
New
pavement
and road
markings
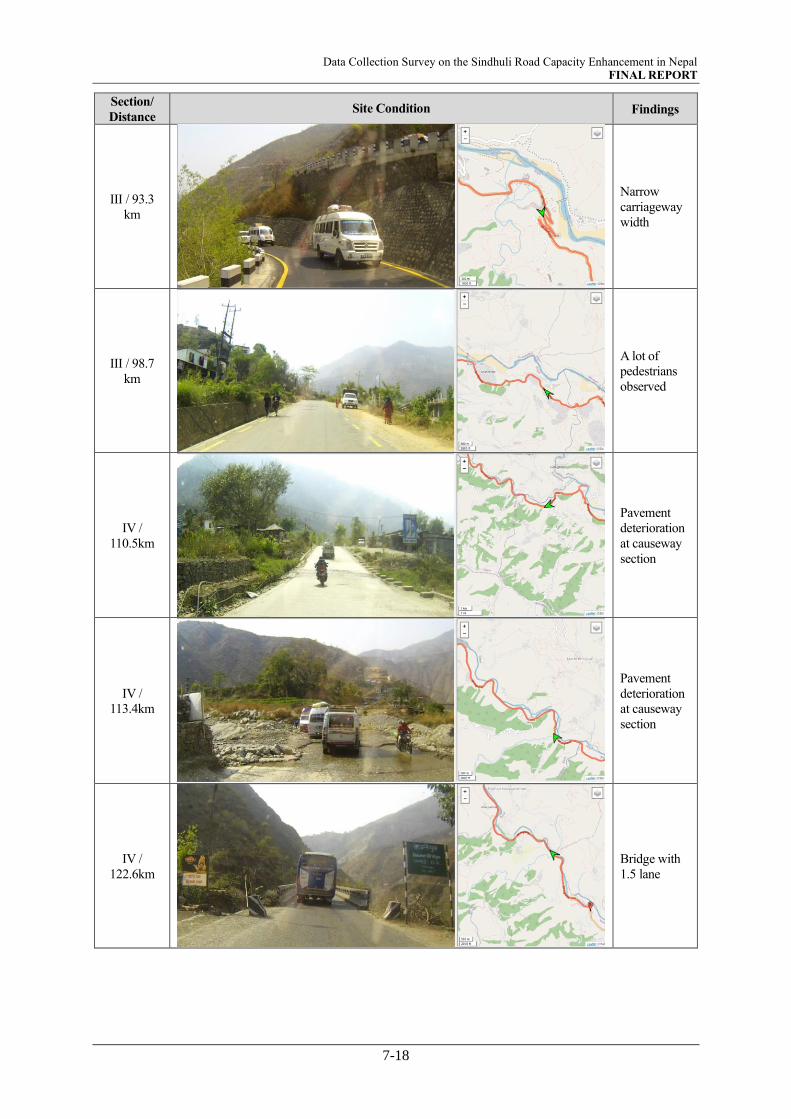
Data Collection Survey on the Sindhuli Road Capacity Enhancement in Nepal FINAL REPORT
7-18
Section/
Distance Site Condition Findings
III / 93.3
km
Narrow
carriageway
width
III / 98.7
km
A lot of
pedestrians
observed
IV /
110.5km
Pavement
deterioration
at causeway
section
IV /
113.4km
Pavement
deterioration
at causeway
section
IV /
122.6km
Bridge with
1.5 lane
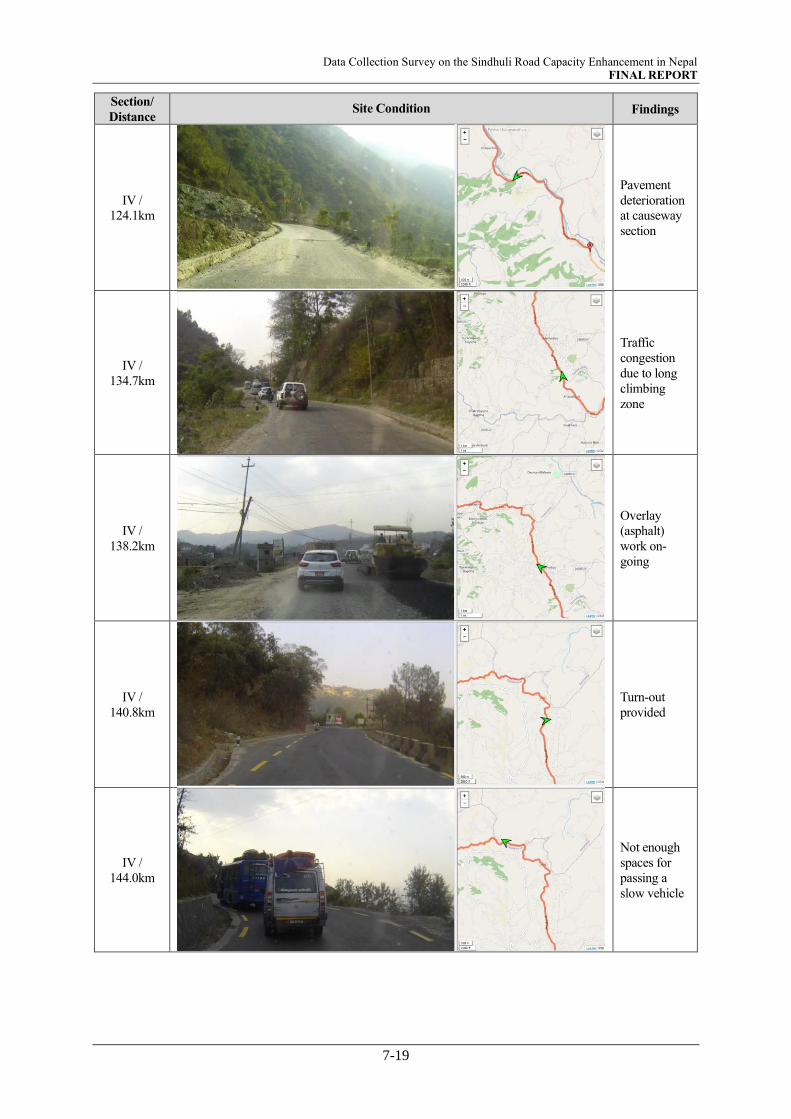
Data Collection Survey on the Sindhuli Road Capacity Enhancement in Nepal FINAL REPORT
7-19
Section/
Distance Site Condition Findings
IV /
124.1km
Pavement
deterioration
at causeway
section
IV /
134.7km
Traffic
congestion
due to long
climbing
zone
IV /
138.2km
Overlay
(asphalt)
work on-
going
IV /
140.8km
Turn-out
provided
IV /
144.0km
Not enough
spaces for
passing a
slow vehicle
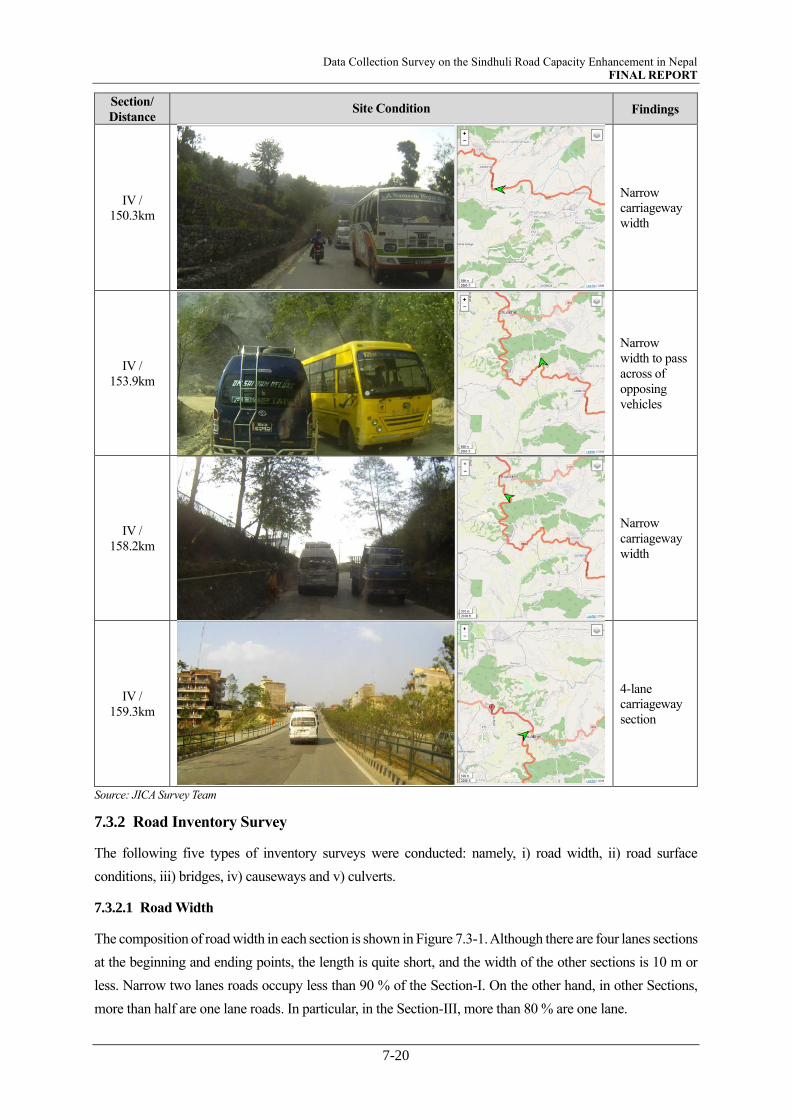
Data Collection Survey on the Sindhuli Road Capacity Enhancement in Nepal FINAL REPORT
7-20
Section/
Distance Site Condition Findings
IV /
150.3km
Narrow
carriageway
width
IV /
153.9km
Narrow
width to pass
across of
opposing
vehicles
IV /
158.2km
Narrow
carriageway
width
IV /
159.3km
4-lane
carriageway
section
Source: JICA Survey Team
7.3.2 Road Inventory Survey
The following five types of inventory surveys were conducted: namely, i) road width, ii) road surface
conditions, iii) bridges, iv) causeways and v) culverts.
7.3.2.1 Road Width
The composition of road width in each section is shown in Figure 7.3-1. Although there are four lanes sections
at the beginning and ending points, the length is quite short, and the width of the other sections is 10 m or
less. Narrow two lanes roads occupy less than 90 % of the Section-I. On the other hand, in other Sections,
more than half are one lane roads. In particular, in the Section-III, more than 80 % are one lane.
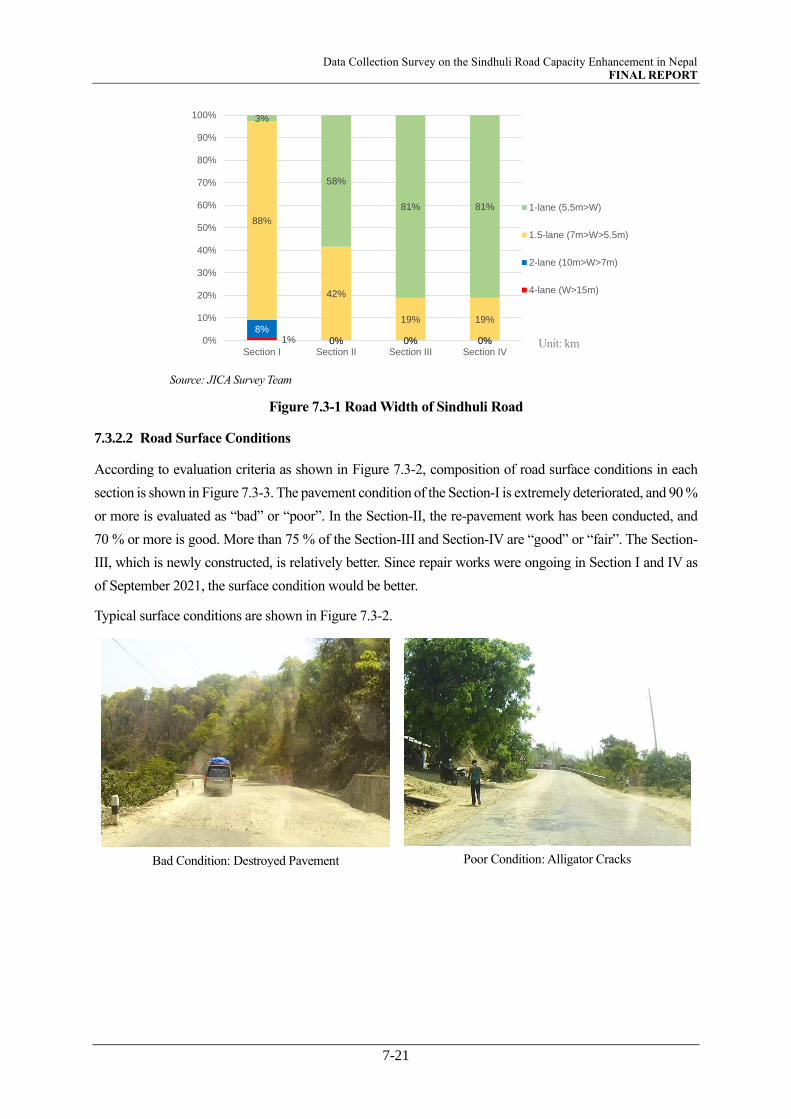
Data Collection Survey on the Sindhuli Road Capacity Enhancement in Nepal FINAL REPORT
7-21
Source: JICA Survey Team
Figure 7.3-1 Road Width of Sindhuli Road
7.3.2.2 Road Surface Conditions
According to evaluation criteria as shown in Figure 7.3-2, composition of road surface conditions in each
section is shown in Figure 7.3-3. The pavement condition of the Section-I is extremely deteriorated, and 90 %
or more is evaluated as “bad” or “poor”. In the Section-II, the re-pavement work has been conducted, and
70 % or more is good. More than 75 % of the Section-III and Section-IV are “good” or “fair”. The Section-
III, which is newly constructed, is relatively better. Since repair works were ongoing in Section I and IV as
of September 2021, the surface condition would be better.
Typical surface conditions are shown in Figure 7.3-2.
Bad Condition: Destroyed Pavement
Poor Condition: Alligator Cracks
1% 0% 0% 0%
8%
0% 0% 0%
88%
42%
19% 19%
3%
58%
81% 81%
0%
10%
20%
30%
40%
50%
60%
70%
80%
90%
100%
Section I Section II Section III Section IV
1-lane (5.5m>W)
1.5-lane (7m>W>5.5m)
2-lane (10m>W>7m)
4-lane (W>15m)
Unit: km
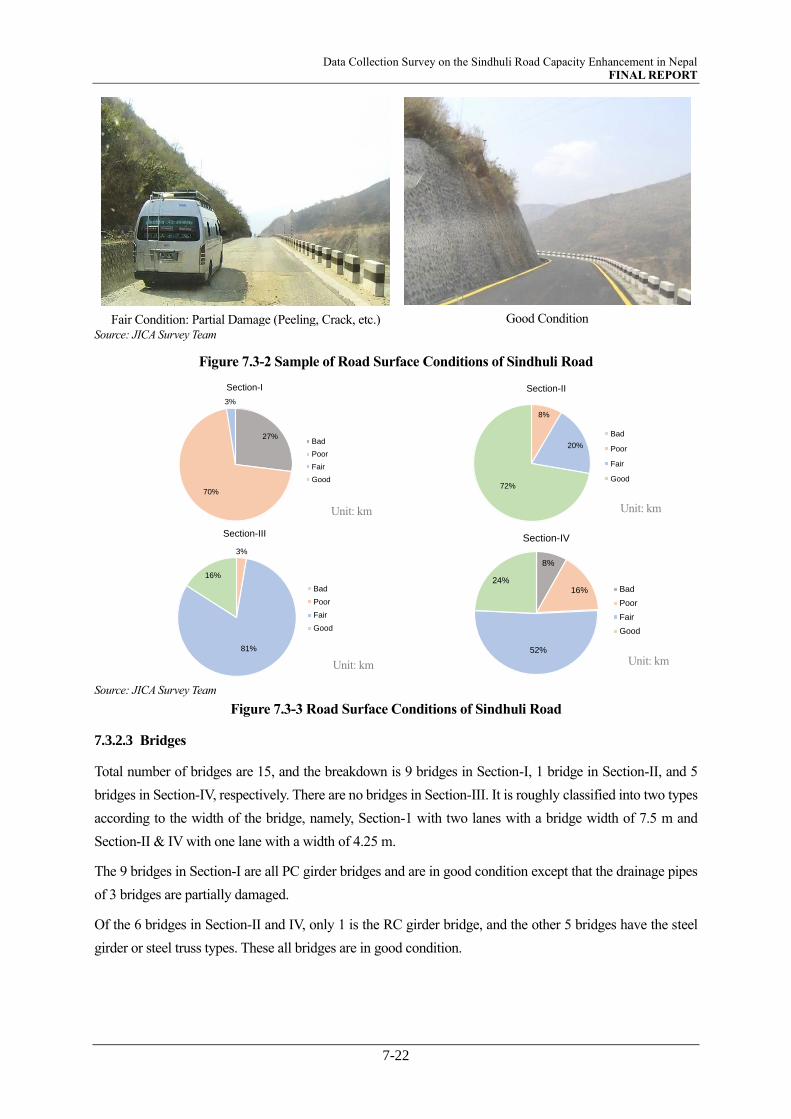
Data Collection Survey on the Sindhuli Road Capacity Enhancement in Nepal FINAL REPORT
7-22
Fair Condition: Partial Damage (Peeling, Crack, etc.)
Good Condition
Source: JICA Survey Team
Figure 7.3-2 Sample of Road Surface Conditions of Sindhuli Road
Source: JICA Survey Team
Figure 7.3-3 Road Surface Conditions of Sindhuli Road
7.3.2.3 Bridges
Total number of bridges are 15, and the breakdown is 9 bridges in Section-I, 1 bridge in Section-II, and 5
bridges in Section-IV, respectively. There are no bridges in Section-III. It is roughly classified into two types
according to the width of the bridge, namely, Section-1 with two lanes with a bridge width of 7.5 m and
Section-II & IV with one lane with a width of 4.25 m.
The 9 bridges in Section-I are all PC girder bridges and are in good condition except that the drainage pipes
of 3 bridges are partially damaged.
Of the 6 bridges in Section-II and IV, only 1 is the RC girder bridge, and the other 5 bridges have the steel
girder or steel truss types. These all bridges are in good condition.
27%
70%
3%
Section-I
Bad
Poor
Fair
Good
8%
20%
72%
Section-II
Bad
Poor
Fair
Good
3%
81%
16%
Section-III
Bad
Poor
Fair
Good
8%
16%
52%
24%
Section-IV
Bad
Poor
Fair
Good
Unit: km
Unit: km Unit: km
Unit: km

Data Collection Survey on the Sindhuli Road Capacity Enhancement in Nepal FINAL REPORT
7-23
Bridge list and distribution of bridge length is shown in Table 7.3-2 and Figure 7.3-4 respectively. The longest
bridge is Ratsu Bridge, which has 270 m long in Section-I, but almost bridges in Section-I are 50 to 60 m
long. On the other hand, almost bridges in Section-II and IV are 40 to 60 m long.
Table 7.3-2 Bridge List
S.N STA. No. Name Type Length (m) Width (m)
1 STA.7+820 Bhogate Bridge PC Girder 60 7.5
2 STA.8+220 Kare Bridge PC Girder 50 7.5
3 STA.8+310 Gangate Bridge PC Girder 30 7.5
4 STA.12+510 Ratu Bridge PC Girder 270 7.5
5 STA.28+240 Sindhure Bridge PC Girder 60 7.5
6 STA.29+40 Kamala Bridge PC Girder 120 7.5
7 STA.32+450 Phitting Bridge PC Girder 50 7.5
8 STA.34+370 Buka Bridge PC Girder 50 7.5
9 STA.35+210 Gadouli Bridge PC Girder 50 7.5
10 STA.43+380 Gwang Bridge Steel Girder 48 4.25
11 STA.122+520 Daunne Bridge Steel Girder (πtype) 53 4.25
12 STA.124+980 Narke Bridge Steel Girder (πtype) 59 4.25
13 STA.129+710 Rosi Bridge Steel Truss + RC Girder 83 4.25
14 STA.135+520 Dapcha Bridge-2 Steel Girder 25 4.25
15 STA.137+810 Dapcha Bridge-1 RC Girder 24 4.25
Source: JICA Survey Team
Source: JICA Survey Team
Figure 7.3-4 Distribution of Bridge Length of Sindhuli Road
7.3.2.4 Causeways (Overflow Type)
29 causeways of overflow type are found, and the breakdown is 17 causeways in Section-I, 12 causeways in
Section-IV. The composition of conditions of causeways of overflow type is shown in Figure 7.3-5. 7
causeways have already been deteriorated, and the reinforcing bars are exposed. Also, 7 causeways are aging,
and cracks have been confirmed.
Sec. I
Sec.-II, III, IV
0
1
2
3
4
5
6
25m>L 50m>L≧25m 100m>L≧50m L≧100m
1
6
21
2
3
Sec. I Sec.-II, III, IV
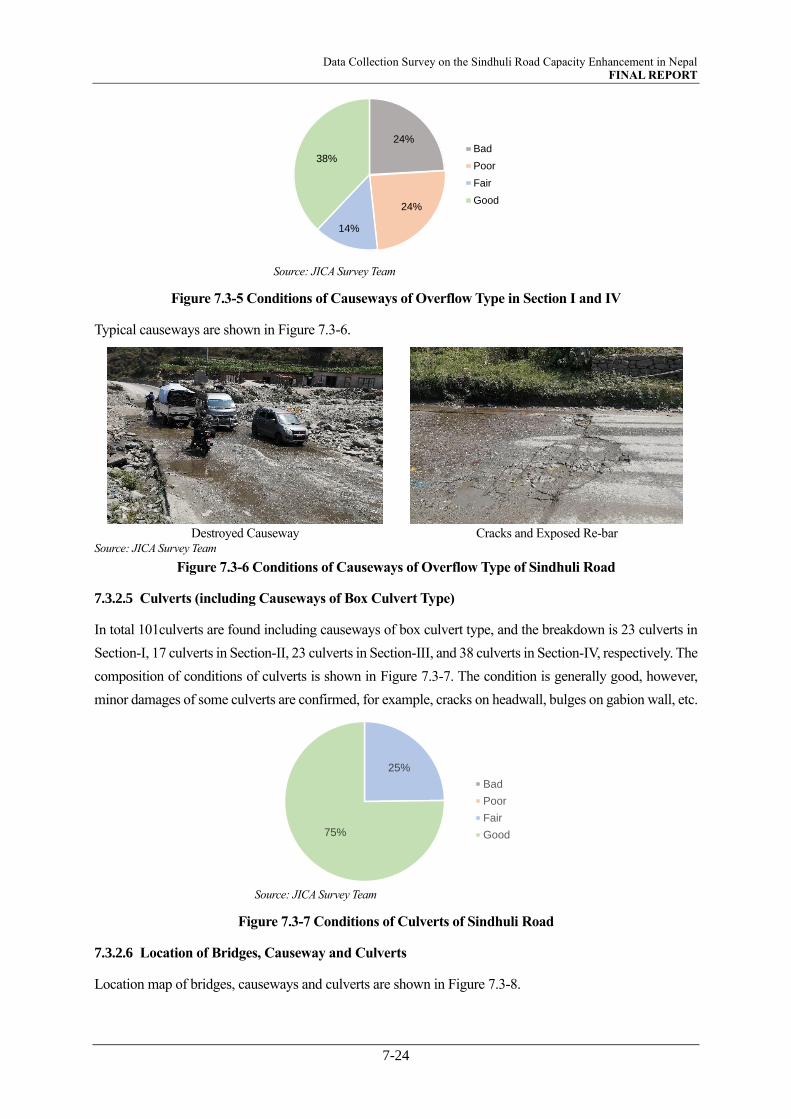
Data Collection Survey on the Sindhuli Road Capacity Enhancement in Nepal FINAL REPORT
7-24
Source: JICA Survey Team
Figure 7.3-5 Conditions of Causeways of Overflow Type in Section I and IV
Typical causeways are shown in Figure 7.3-6.
Destroyed Causeway
Cracks and Exposed Re-bar
Source: JICA Survey Team
Figure 7.3-6 Conditions of Causeways of Overflow Type of Sindhuli Road
7.3.2.5 Culverts (including Causeways of Box Culvert Type)
In total 101culverts are found including causeways of box culvert type, and the breakdown is 23 culverts in
Section-I, 17 culverts in Section-II, 23 culverts in Section-III, and 38 culverts in Section-IV, respectively. The
composition of conditions of culverts is shown in Figure 7.3-7. The condition is generally good, however,
minor damages of some culverts are confirmed, for example, cracks on headwall, bulges on gabion wall, etc.
Source: JICA Survey Team
Figure 7.3-7 Conditions of Culverts of Sindhuli Road
7.3.2.6 Location of Bridges, Causeway and Culverts
Location map of bridges, causeways and culverts are shown in Figure 7.3-8.
24%
24%
14%
38%Bad
Poor
Fair
Good
25%
75%
Bad
Poor
Fair
Good
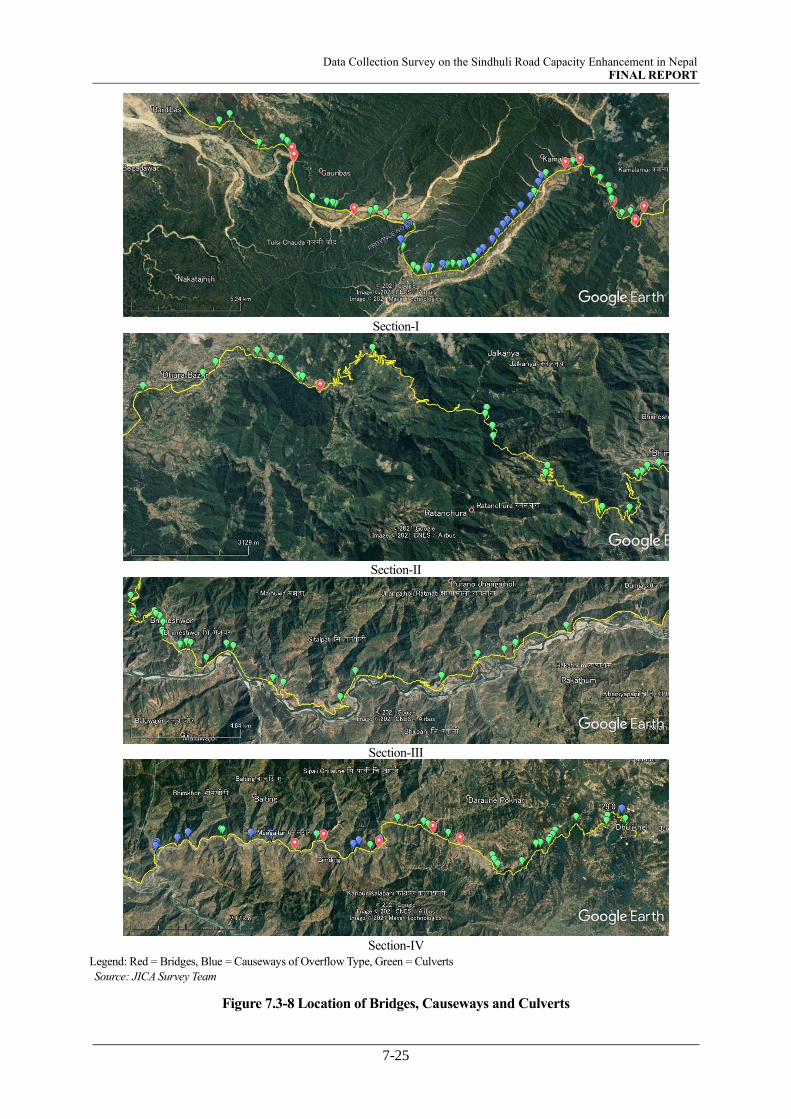
Data Collection Survey on the Sindhuli Road Capacity Enhancement in Nepal FINAL REPORT
7-25
Section-I
Section-II
Section-III
Section-IV
Legend: Red = Bridges, Blue = Causeways of Overflow Type, Green = Culverts
Source: JICA Survey Team
Figure 7.3-8 Location of Bridges, Causeways and Culverts
Data Collection Survey on the Sindhuli Road Capacity Enhancement in Nepal FINAL REPORT
7-26
7.4 GEOTECHNICAL INVESTIGATION
The project area, especially the Section II passes across the Mahabharat and Siwalik ranges where two major
thrusts (the MBT and MCT) run across the objective road. The geological condition of this area is very critical
and consists of weak rock mass zone. Whether or not the geological condition is correctly identified will have
immense impact in this section. Therefore, following investigations were planned and conducted to be
undertaken with an aim to understand the geological condition of the area.
7.4.1 Site Reconnaissance
Sub-contract of ERT includes conduction of site reconnaissance. Site reconnaissance was conducted by
geological specialist from Nepal and Japan in the proposed tunnel area. Geological specialist of the local
consultant performed a site visit and studied the geology of the area shown in Figure 7.4-1. After and based
on the briefing from the specialist, site observation was performed by the expert from the Survey Team
especially around the candidate sites of tunnel portals including the area covered by the Local Consultant.
The reconnaissance was conducted to investigate geological distribution based on interpretation of
topographic maps and satellite images. A geological mapping was prepared by walking many more or less
predetermined routes (based on desk study) from one point on the topographic map to another, plotting
geology on the way. Traverse was made along rivers, streams, road-cuts, and in some places along ridges,
where fresh and semi-continuous outcrops are expected. Effort was maintained to travel across strike of
lithological units; and active faults, shear zones, and major lithological contacts were followed wherever
possible. Final geological map will be prepared by tracing the contacts from thus prepared outcrop map.
The area for Site Reconnaissance, Measurement Line of ERT (Electric Resistivity Tomography) and location
of geological drilling are shown in Figure 7.4-1.
The results of site reconnaissance are summarized as below and geological map around the south tunnel
portal is shown in the Figure 7.4-2, and detailed information on topographical and geological condition of
the planned tunnel site are described in chapter 13.2.
• Following formation and thrusts were observed around the south tunnel portal, from lower to upper,
Upper Middle Siwalik of Siwalik Group, Main Boundary Thrust (MBT), Benighat Slates of the
Upper Nawakot Group, Mahabharat Thrust (MT), Raduwa Formation and Kalitar Formation of
Bhimphedi Group, and Gneiss.
• Gneiss is distributed in the area from Selfie Danda to Sindhuli Gadhi.
• The actual location of MBT is near the south tunnel portal and it is located approximately 700m
southward from the MBT location shown in the existing geological map.
• The actual location of the MT is almost same location shown in existing geological map.
• Due to the influence of the MBT and MT, highly to slightly fractured zone is observed with width
of approximately 800m between MBT and MT. Highly to moderately fractured zone (carbonaceous
phyllite, phyllite) and moderately to slightly fractured zone (quartzite, limestone, dolomite) are
distributed in alternately, and forming a whole of the fractured zone.
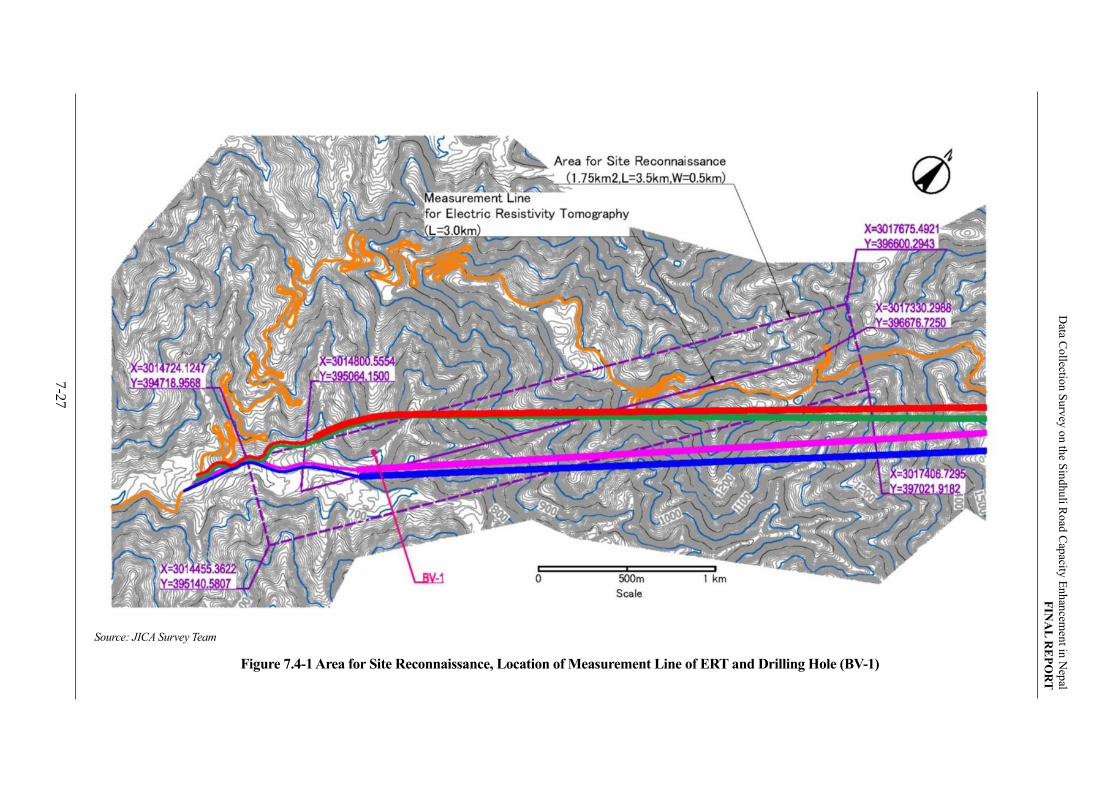
7-2
7
Data C
ollectio
n S
urv
ey o
n th
e Sin
dhu
li Ro
ad C
apacity
En
han
cemen
t in N
epal
FIN
AL
RE
PO
RT
Source: JICA Survey Team
Figure 7.4-1 Area for Site Reconnaissance, Location of Measurement Line of ERT and Drilling Hole (BV-1)
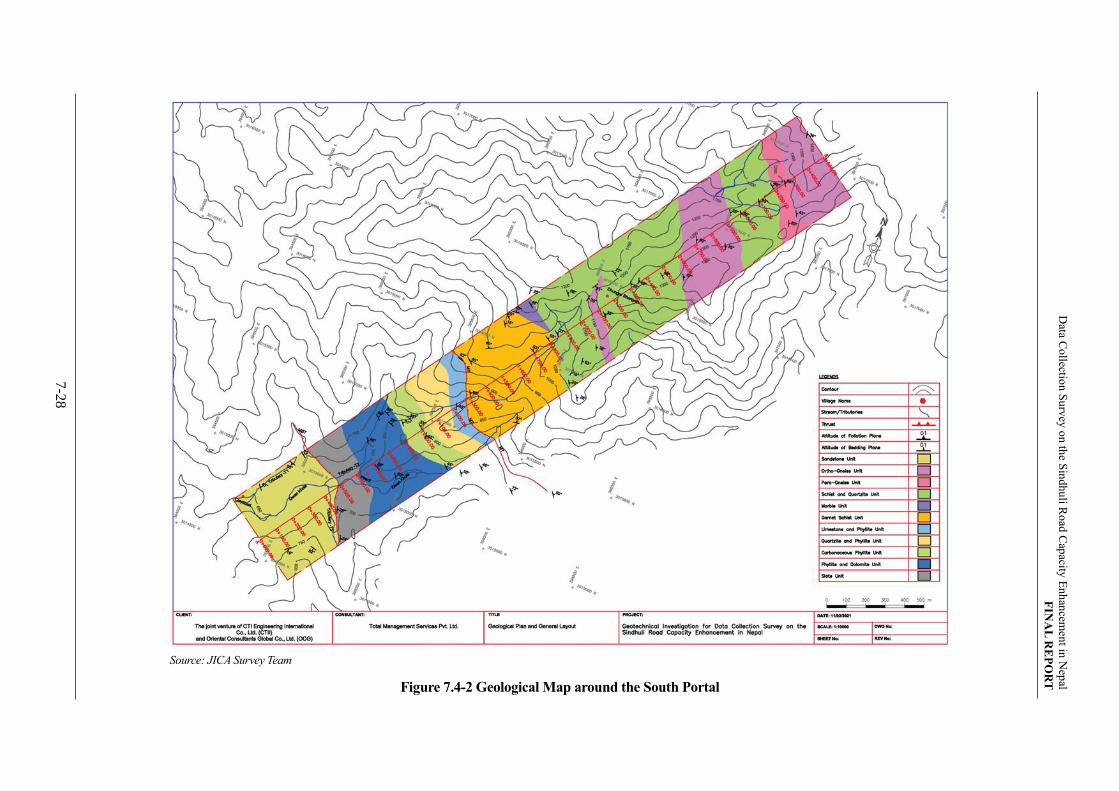
7-2
8
Data C
ollectio
n S
urv
ey o
n th
e Sin
dhu
li Ro
ad C
apacity
En
han
cemen
t in N
epal
FIN
AL
RE
PO
RT
Source: JICA Survey Team
Figure 7.4-2 Geological Map around the South Portal
Data Collection Survey on the Sindhuli Road Capacity Enhancement in Nepal FINAL REPORT
7-29
7.4.2 Electrical Resistivity Tomography
Electrical Resistivity Tomography (ERT) and drillings at portal areas were planned and conducted under the
Survey to obtain geological and geotechnical information at Section II of the Sindhuli Road, where a tunnel
is considered to be one of the effective measures for capacity enhancement of the road. Geophysical
exploration using two-dimensional (2D) ERT survey plays a significant role in determining the subsurface
resistivity distribution be making measurements on the ground surface.
ERT was planned and conducted for a length of 3km from the assumed portal location at the south side
(toward Bardibas), as shown by the purple continuous line in Figure 7.4-1.
The reasons for conducting the ERT along the proposed section are as follows.
• Commonly, Seismic Prospecting Survey (SPS) using explosives (dynamite) is applied for the
geophysical investigation of a tunnel. In Nepal, procurement process of dynamites is very length
and moreover, use of the dynamites is basically allowed only under strict monitoring by the army.
It is practically not possible to procure the dynamites and conduct the investigation within the short
duration of this Survey. Therefore, ERT was selected instead of SPS.
• Elastic wave velocity is an important factor for the design of tunnel supporting patterns. But,
obtaining this by ERT is extremely difficult. Yet, ERT result can depict the inclination of weak and
shear zones of the faults, and zones with relatively high-water content, which are also important
factors for the design of tunnels. Furthermore, the ERT result, and the surface rock condition can
interpret the velocity of elastic wave.
On the other hand, the layout plan (length and location) of the ERT measurement line is determined based on
the following conditions.
• The tunnel alignment is not fixed yet, however, the tunnel alignment, especially from the south
portal to the mid of the routes of all candidate routes converge at a same area.
• The trend of geological structure, i.e., geological formations and measure faults are distributed in
Northwest-Southeast direction, and there is no major fault and weak zone which has Southwest-
Northeast direction.
• On the other hand, candidate tunnel alignments are in Northeast-Southwest direction, and then
direction of geological structure and the candidate tunnel alignments are almost orthogonal.
• Therefore, there will be no big difference on the results of ERT, although the alignment of the ERT
easement line is not completely same as the final candidate tunnel alignment, and there is no issue
for study of tunneling.
Electrodes were installed at regular intervals on the survey line, and potential changes analyzed to estimate
the geological boundary, faults and weathered zone, and groundwater retention status. The ERT was
performed to measure apparent resistivities recorded during the fieldwork, which later will be converted to
true resistivity (resistivity profile) using appropriate computer software and further converted to subsurface
geological condition. The resistivity profiling can detect boundaries between unconsolidated materials and
rocks, identifying weathered rock from fresh rock and contact between rocks of different lithology, thus

Data Collection Survey on the Sindhuli Road Capacity Enhancement in Nepal FINAL REPORT
7-30
making it easy to identify weak rock mass zone in the host of competent rock type and to estimate the
thickness of the bedrock cover material
The main objectives of the ERT survey are;
• to establish 2D electrical resistivity sections of the ground profile showing different layers of
overburden and bedrocks.
• to find out depths of rock surface and rock mass condition up to the depth of investigation,
• to find out weak zones and water bearing zones in the specified survey areas,
• to understand the geology of the investigated area.
The type of equipments used for 2D-ERT and survey methods are followings.
• Data acquisition was carried out by using equipment known under the brand name SYSCAL R1
Plus Switch 48 manufactured by IRIS, France. It consists of three main units all housed in a single
casing: the transmitter, the receiver and the microprocessor.
• The electrically isolated transmitter sends out well-defined and regulated signal currents. The
receiver discriminates noise and measures voltages correlated with transmitted signal current. The
microprocessor monitors and controls operations and calculates results. The apparent resistivity is
calculated automatically and stored digitally.
• Stainless steel electrodes (30 cm long) were used for both current transmission and voltage
receiving. These electrodes were grounded in each profile and were connected with the Syscal by
specially designed shielded multi-core cables. Total length of the profile is 470 m; data acquisition
was carried out using Schlumberger Array with electrode spacing of 10 m.
• For each observation DC current was injected for 500 to 1,000 milliseconds setting the instrument
to display average value of 2 to 10 stacks. The stacking is used to suppress unwanted electrical
signals (noises).
• The apparent resistivity data generally contains outliers (noise) not realistic to the ground resistivity.
To remove such outliers or unwanted noise, statistical analysis is carried out using a software
PROSYS. Cluster analysis of the measured data set helps in selecting apparent resistivity data
within a narrow standard deviation.
• Pre-processing of data to obtain high quality data set is followed by tomographic inversion. Data
inversion code is another main component of the 2D-ERT method. For the inversion, RES2DINV
software by GEOTOMO was used. The software is most commonly used in resistivity data
interpretation.
• Surface geological observations during data acquisition provide a priori information. Therefore,
the processing and the interpretation must be done based on the geological/hydrogeological
condition that has been observed during the field visit. For this purpose, an experienced engineering
geologist was included in the team. During the data processing, the geologist and the geophysicist
of the team made intensive discussions to come up this report.
The results of ERT are summarized as below and shown in Figure 7.4-3.
Data Collection Survey on the Sindhuli Road Capacity Enhancement in Nepal FINAL REPORT
7-31
• Very low electrical resistivity zone was observed near MBT (Ch100m to Ch200m), and it is
considered the fractured zone of MBT.
• Relatively low electrical resistivity zone was observed at the tip of thin ridge (Ch450m to Ch550m),
and it is considered that this is the area where highly weathered Benighat slate is distributed.
• Very low electrical resistivity zone was observed near MT (Ch850m to Ch1200m), and it is
considered fractured zone of MT.
• Relatively low electrical resistivity zone was observed below Selfie Danda (Ch1650m to Ch1800m),
and it may indicate an old landslide in the area.
• Relatively low electrical resistivity zone (Ch2800m to Ch3000m) was observed in Gneiss area and
it is considered the deep weathering zone of the Gneiss layer.
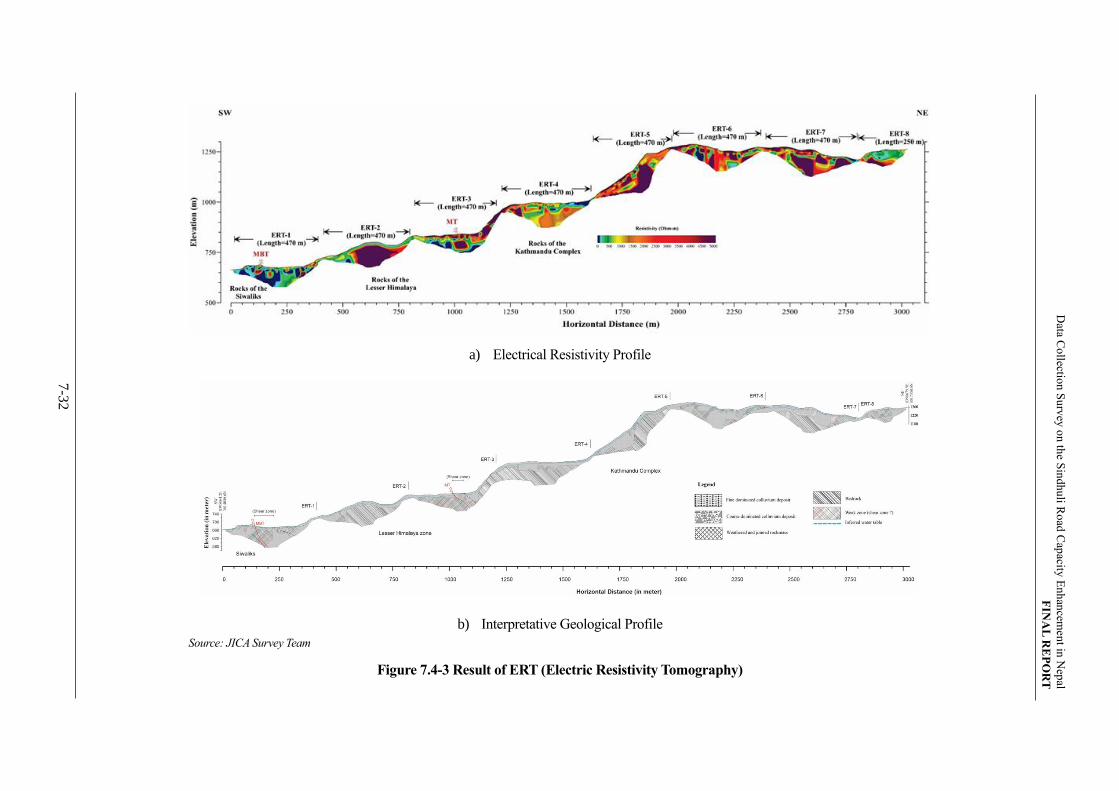
7-3
2
Data C
ollectio
n S
urv
ey o
n th
e Sin
dhu
li Ro
ad C
apacity
En
han
cemen
t in N
epal
FIN
AL
RE
PO
RT
a) Electrical Resistivity Profile
b) Interpretative Geological Profile
Source: JICA Survey Team
Figure 7.4-3 Result of ERT (Electric Resistivity Tomography)

Data Collection Survey on the Sindhuli Road Capacity Enhancement in Nepal FINAL REPORT
7-33
7.4.3 Geological Exploration
Geological exploration (boring/drilling) was also planned and conducted at Section II to identify the
geological condition, particularly the composition of the geology and the hardness of the soil and rock mass,
the existence of shear zones or the out-bursting of some isolated underground water aquifer, which might
jeopardize tunnel safety.
The geological drilling was conducted in November 2021 at one drilling location (BV-1) with depth of 30m.
The drilling location was selected at a point where influence of the thrusts associated with the MBT that runs
near the proposed location for south portal can be confirmed. On the other hand, drilling was carried out to a
depth of 30m to ensure that the base rock of depth 20m or more can be confirmed. The location of geological
drilling is shown in Figure 7.4-1. The drilling log is shown in Figure 7.4-4 and cored sample photo is shown
in Figure 7.4-5.
The results of the geological drilling are summarized as below.
• Top 1m is composed of embankment (sandy silt).
• Riverbed sediments mainly composed of sand and gravel was observed GL-2m to 8m. Big size of
boulder (φ60cm) was observed at the depth of GL-1.2m to 1.8m. SPT N vales are in the range of
10 to 22, and high N-value (N>50) were recorded when meet the gravel or boulder.
• The basement rock of slate was observed from GL-8m, and rock condition is highly weathered and
highly fractured up to GL-10m. SPT-N vales are in the range of 50/12 and 52/30.
• In the depth of GL-10m to GL-12m, slightly weathered and highly fractured slate is observed.
• In the depth of GL-12m to GL-25m, slightly weathered and moderately fractured slate was observed.
• In the depth of GL-25m to 27m, there was no core recovery and the cause is considered due to very
poor geological condition.
• Groundwater level in the bored hole was GL-7.5m.
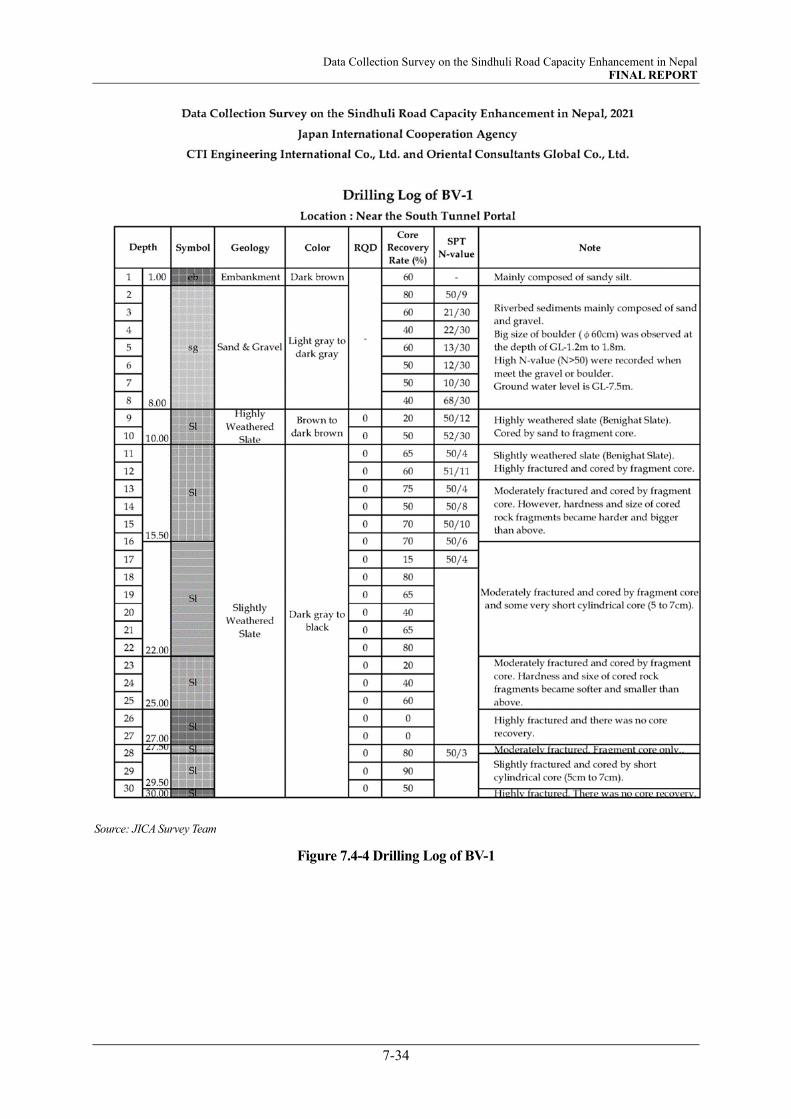
Data Collection Survey on the Sindhuli Road Capacity Enhancement in Nepal FINAL REPORT
7-34
Source: JICA Survey Team
Figure 7.4-4 Drilling Log of BV-1

Data Collection Survey on the Sindhuli Road Capacity Enhancement in Nepal FINAL REPORT
7-35
Source: JICA Survey Team
Figure 7.4-5 Cored Sample Photo of BV-1
Data Collection Survey on the Sindhuli Road Capacity Enhancement in Nepal FINAL REPORT
7-36
7.5 TRAFFIC SURVEY
The Study team conducted the traffic survey to understand the current situation of traffic characteristic and
traffic flow at Sindhuli Road.
The items, purpose and description of the surveys conducted are shown in Table 7.5-1.The locations where
the surveys were conducted are given in Figure 7.5-1.
The current traffic flow is analyzed based on the OD survey results. OD zone for analysis is conducted for
14 zones, which consist of 12 zones of Nepal and 2 zones of India and China. The locations are shown in
Figure 7.5-2 and Table 7.5-2. OD survey results are used for enlargement process using the traffic count
survey data. OD pattern is determined by examining and adjusting the survey data and converting into daily
traffic volume. This process takes into account the traffic count survey at all locations except for the holiday
traffic volume at Nagdhunga site. This data was not obtained due to the lockdown imposed in Kathmandu
from 29 April.
Table 7.5-1 Description of Traffic Survey
Survey Item Purpose Description
Traffic Volume Survey
The traffic count survey is carried out at 6 locations on the Sindhuli Road to obtain the traffic volume data and collected data is used for traffic demand forecast.
- 6 survey stations (4 Roadside and 2 Direction), - Week day: Tuesday, April 20, 2021, Sta.1(Mangaltar) Wednesday, April 21, 2021, Sta.2(Khurkot),
Sta.3(Ghurmi Way) Thursday, April 22, 2021,
Sta.4(Near Bardibas), Sta.5(Lalgadh)
Tuesday, April 27, 2021, Sta.6(Nagdhunga)
- Weekend day: Saturday, April 24, 2021 All survey stations without Sta.6(Nagdhunga) - 24-hour survey, - 10 classifications, - Manual count by direction per vehicle type and tallying of
hourly and daily traffic volume.
Roadside Origin Destination Survey (OD Survey)
The roadside OD survey is carried out to understand trip pattern of vehicle passing the plan section of Sindhuli Road. The collected data is used for basic information for traffic demand forecast.
- 4 survey stations (Nagdhunga, Mangaltar, Near Bardibas, Lalgadh)
- Week day: Tuesday, April 20, 2021, Sta.1(Mangaltar) Thursday, April 22, 2021,
Sta.4(Near Bardibas), Sta.5(Lalgadh)
Tuesday, April 27, 2021, Sta.6(Nagdhunga)
- Weekend day: Saturday, April 24, 2021 All survey stations without Sta.6(Nagdhunga) - 24-hour survey
Source: JICA Study Team
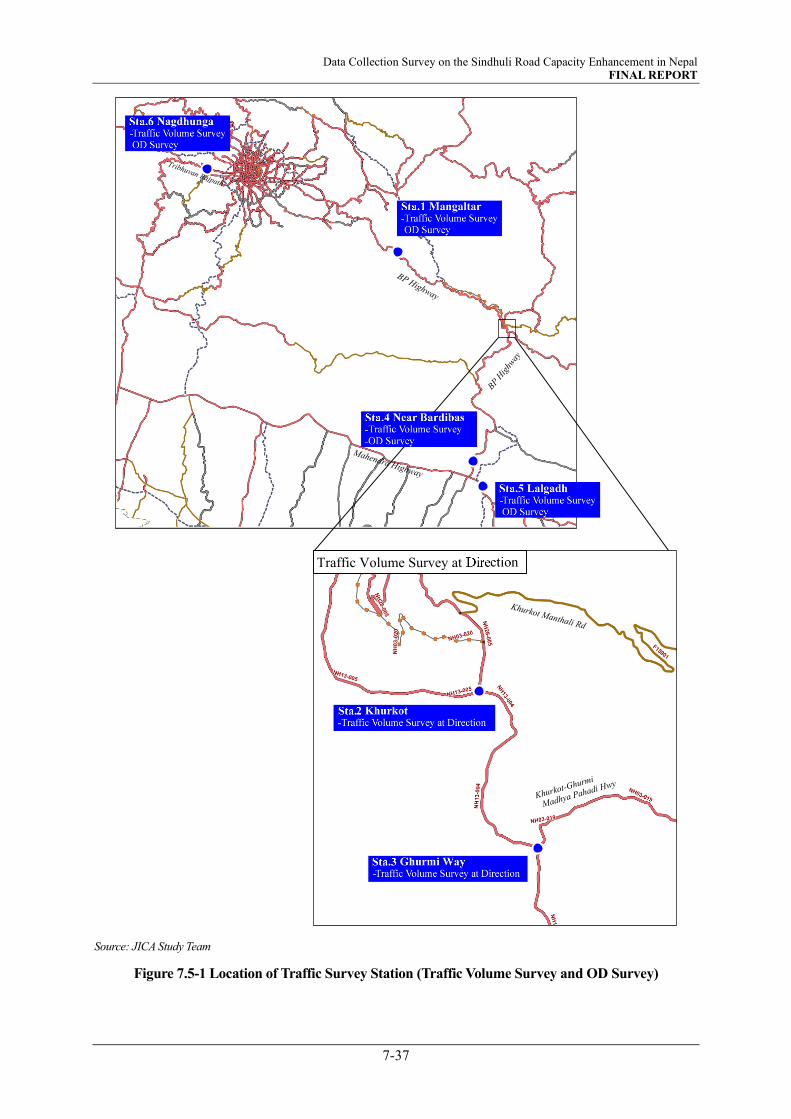
Data Collection Survey on the Sindhuli Road Capacity Enhancement in Nepal FINAL REPORT
7-37
Source: JICA Study Team
Figure 7.5-1 Location of Traffic Survey Station (Traffic Volume Survey and OD Survey)

Data Collection Survey on the Sindhuli Road Capacity Enhancement in Nepal FINAL REPORT
7-38
Source: JICA Study Team
Figure 7.5-2 Map of OD Zoning System
1. Far-Mid Western
2. Western
10. Eastern
14. China
13. India
12. Central South-East
3. Central West
11.Sindhule
5. Kathmandu&Latipur
8. Kavrepalanchok
6. Bhaktapur
9. Central North-East
4. Central North
7. Sindhupalchok
3. Central West
10. Eastern
2. Western
8. Kavrepalanchok
6. Bhaktapur
4. Central North
7. Sindhupalchok
5. Kathmandu&Latipur
12. Central South-East
11.Sindhule
9. Central North-East

Data Collection Survey on the Sindhuli Road Capacity Enhancement in Nepal FINAL REPORT
7-39
Table 7.5-2 OD Zoning Code
Source: JICA Study Team
The glimpses of the surveys are shown in Figure 7.5-3.
Source: JICA Study Team
Figure 7.5-3 Traffic Survey
7.6 VEHICULAR RESTRICTIONS UNDER IMPOSITION
7.6.1 Allowable/Permissible Load (Load Limit)
The gross vehicular weight (GVW) allowable on the Sindhuli Road is 10-tons. In case of buses, only those
with seats that accommodate less than 32 passengers are allowed. Other buses are only allowed to ply during
night-time when the traffic volume is very less. However, this does not imply to long-distance night buses.
7.6.2 Laws, Orders, Ordinance, Decree Relevant to Restrictions
The initial regulation was imposed in 2015 by the DOTM (Department of Transport Management) in the
awake of increasing traffic accidents and the damage inflicted on the road surface by the slow-moving heavy
vehicles. However, the regulation was not put effective until the Supreme Court announced the verdict on
June 10, 2018.
SQ Zone Name Region / Development Zone District / VDC/Municipality
1 Far and Mid-WesternFar-Western Region
Mid-Western RegionAll district
2 Western Western Region All district (incl. Pokhara)
3 Central WestCentral Region / Narayani zone (with
Dhading)All district, Dhading district
4 Central North - Rasuwa, Nuwakot
5 Kathmandu & Latipur - Kathmandu, Lalitpur
6 Bhaktapur - Bhaktapur
7 Sindhupalchok - Sindhupalchok
8 Kavrepalanchok - Kavrepalanchok
9 Central North-East - Dolakha, Ramechhap
10 Eastern Eastern Region All district
11 Sindhuli - Sindhuli
12 Central South-East Sarlahi, Mahottari, Dhanusa
13 India - -
14 China - -
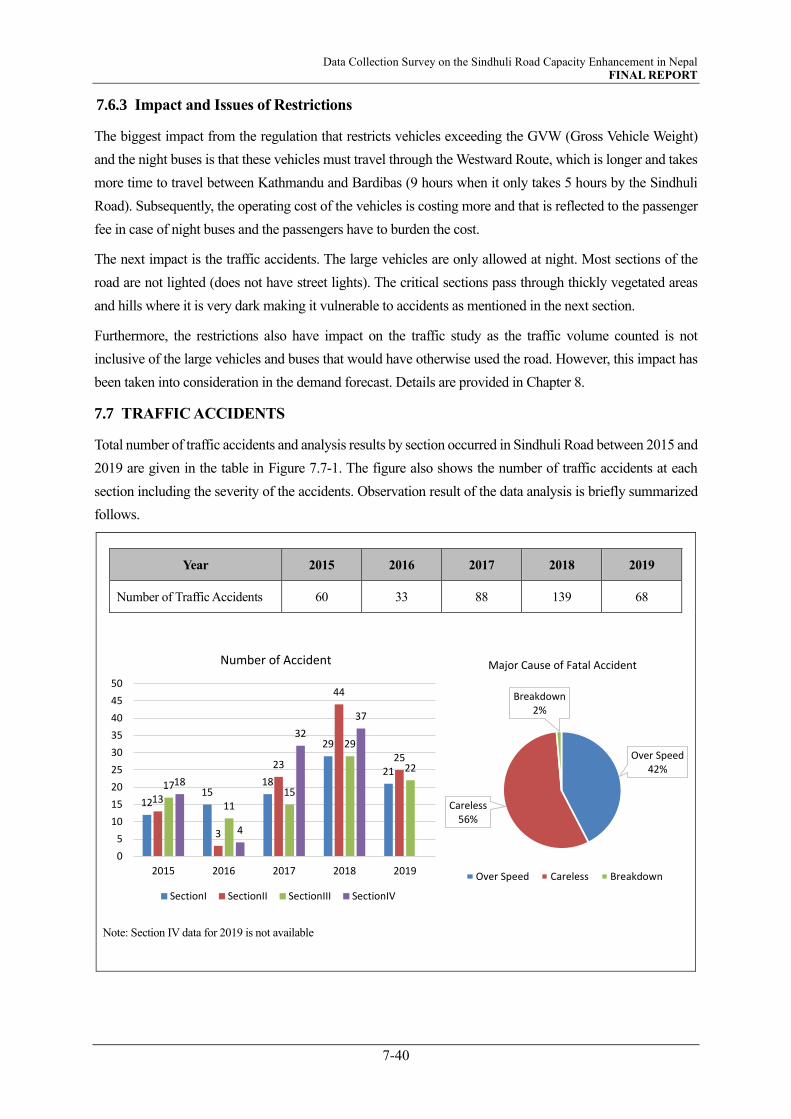
Data Collection Survey on the Sindhuli Road Capacity Enhancement in Nepal FINAL REPORT
7-40
7.6.3 Impact and Issues of Restrictions
The biggest impact from the regulation that restricts vehicles exceeding the GVW (Gross Vehicle Weight)
and the night buses is that these vehicles must travel through the Westward Route, which is longer and takes
more time to travel between Kathmandu and Bardibas (9 hours when it only takes 5 hours by the Sindhuli
Road). Subsequently, the operating cost of the vehicles is costing more and that is reflected to the passenger
fee in case of night buses and the passengers have to burden the cost.
The next impact is the traffic accidents. The large vehicles are only allowed at night. Most sections of the
road are not lighted (does not have street lights). The critical sections pass through thickly vegetated areas
and hills where it is very dark making it vulnerable to accidents as mentioned in the next section.
Furthermore, the restrictions also have impact on the traffic study as the traffic volume counted is not
inclusive of the large vehicles and buses that would have otherwise used the road. However, this impact has
been taken into consideration in the demand forecast. Details are provided in Chapter 8.
7.7 TRAFFIC ACCIDENTS
Total number of traffic accidents and analysis results by section occurred in Sindhuli Road between 2015 and
2019 are given in the table in Figure 7.7-1. The figure also shows the number of traffic accidents at each
section including the severity of the accidents. Observation result of the data analysis is briefly summarized
follows.
Year 2015 2016 2017 2018 2019
Number of Traffic Accidents 60 33 88 139 68
Note: Section IV data for 2019 is not available
1215
18
29
21
13
3
23
44
25
17
1115
29
2218
4
32
37
0
5
10
15
20
25
30
35
40
45
50
2015 2016 2017 2018 2019
Number of Accident
SectionI SectionII SectionIII SectionIV
Over Speed42%
Careless56%
Breakdown2%
Major Cause of Fatal Accident
Over Speed Careless Breakdown
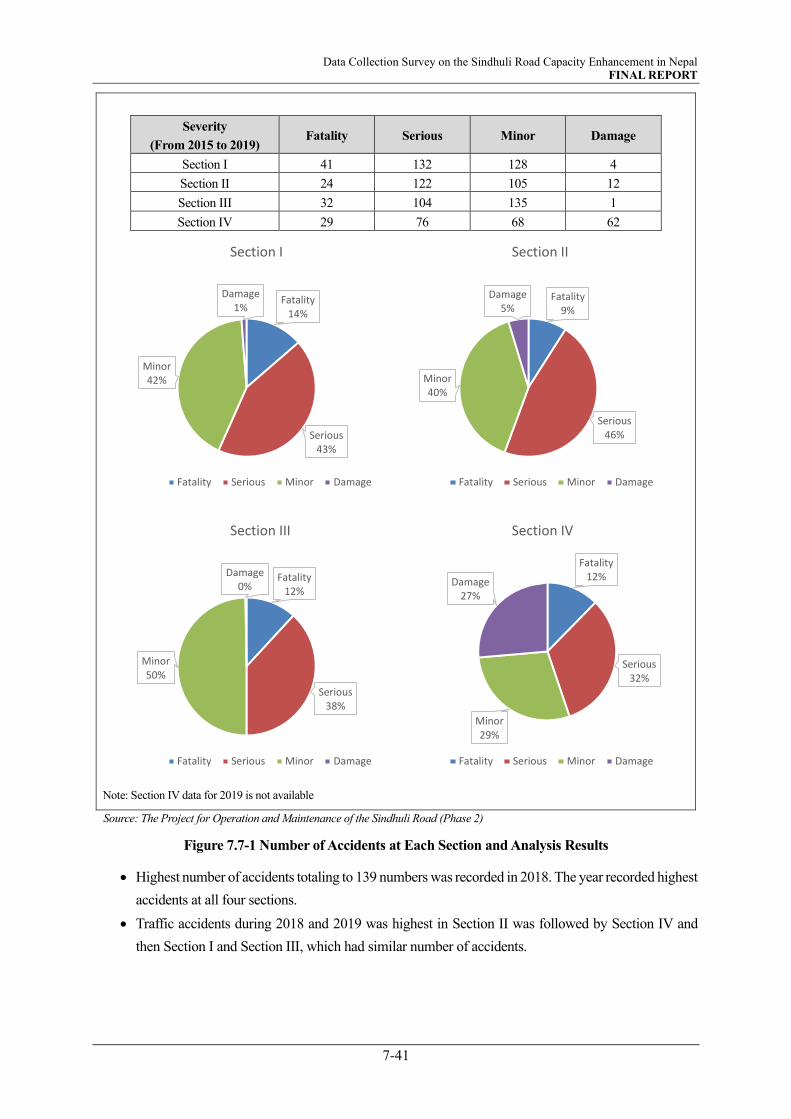
Data Collection Survey on the Sindhuli Road Capacity Enhancement in Nepal FINAL REPORT
7-41
Severity
(From 2015 to 2019) Fatality Serious Minor Damage
Section I 41 132 128 4
Section II 24 122 105 12
Section III 32 104 135 1
Section IV 29 76 68 62
Note: Section IV data for 2019 is not available
Source: The Project for Operation and Maintenance of the Sindhuli Road (Phase 2)
Figure 7.7-1 Number of Accidents at Each Section and Analysis Results
• Highest number of accidents totaling to 139 numbers was recorded in 2018. The year recorded highest
accidents at all four sections.
• Traffic accidents during 2018 and 2019 was highest in Section II was followed by Section IV and
then Section I and Section III, which had similar number of accidents.
Fatality14%
Serious43%
Minor42%
Damage1%
Section I
Fatality Serious Minor Damage
Fatality9%
Serious46%
Minor40%
Damage5%
Section II
Fatality Serious Minor Damage
Fatality12%
Serious38%
Minor50%
Damage0%
Section III
Fatality Serious Minor Damage
Fatality12%
Serious32%
Minor29%
Damage27%
Section IV
Fatality Serious Minor Damage

Data Collection Survey on the Sindhuli Road Capacity Enhancement in Nepal FINAL REPORT
7-42
• Traffic accident in 2016 is significantly low. According to the hearing result, extreme deterioration of
the road including post effect of the Great Earthquake of Nepal that occurred in April 2015 are the
contributing factors.
• Accidents having fatal consequences and serious injuries accounted to over half the total injuries.
Fatal accidents were 13 percent, while serious injuries accounted to 43 percent.
• Motorcycles and jeep including microbuses, that dominate the traffic pattern of the Sindhuli Road,
occupy the highest number of accidents. This is followed by buses.
• Major types of the accidents are in highest sequence, i) head-on collisions, ii) veer off (fall over), iii)
rear end collision, iv) during take overs, v) malfunctions, vi) hitting humans, animals and objects
(road furniture).
• Narrow road width, sharp horizontal curves, deteriorated road surface, and ill-mannered driving are
the main causes of the accidents. Besides, it is considered that passing over on potholes or deteriorated
pavement that are left unrepaired at high speed is one of the causes as steering control occasionally is
lost.
• Since there are no road markings in Section I, II and IV, there is traffic accident risk when driving at
night and rainfall.
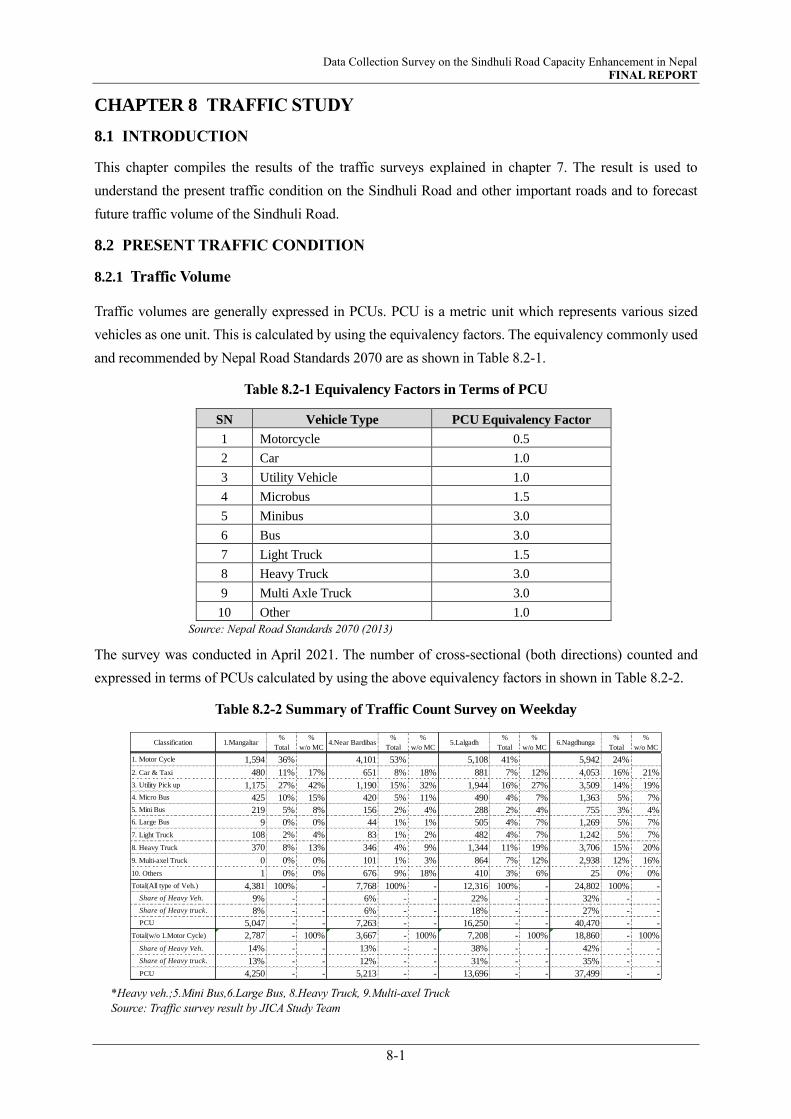
Data Collection Survey on the Sindhuli Road Capacity Enhancement in Nepal FINAL REPORT
8-1
CHAPTER 8 TRAFFIC STUDY
8.1 INTRODUCTION
This chapter compiles the results of the traffic surveys explained in chapter 7. The result is used to
understand the present traffic condition on the Sindhuli Road and other important roads and to forecast
future traffic volume of the Sindhuli Road.
8.2 PRESENT TRAFFIC CONDITION
8.2.1 Traffic Volume
Traffic volumes are generally expressed in PCUs. PCU is a metric unit which represents various sized
vehicles as one unit. This is calculated by using the equivalency factors. The equivalency commonly used
and recommended by Nepal Road Standards 2070 are as shown in Table 8.2-1.
Table 8.2-1 Equivalency Factors in Terms of PCU
SN Vehicle Type PCU Equivalency Factor
1 Motorcycle 0.5
2 Car 1.0
3 Utility Vehicle 1.0
4 Microbus 1.5
5 Minibus 3.0
6 Bus 3.0
7 Light Truck 1.5
8 Heavy Truck 3.0
9 Multi Axle Truck 3.0
10 Other 1.0
Source: Nepal Road Standards 2070 (2013)
The survey was conducted in April 2021. The number of cross-sectional (both directions) counted and
expressed in terms of PCUs calculated by using the above equivalency factors in shown in Table 8.2-2.
Table 8.2-2 Summary of Traffic Count Survey on Weekday
*Heavy veh.;5.Mini Bus,6.Large Bus, 8.Heavy Truck, 9.Multi-axel Truck
Source: Traffic survey result by JICA Study Team
Classification 1.Mangaltar%
Total
%
w/o MC4.Near Bardibas
%
Total
%
w/o MC5.Lalgadh
%
Total
%
w/o MC6.Nagdhunga
%
Total
%
w/o MC
1. Motor Cycle 1,594 36% 4,101 53% 5,108 41% 5,942 24%
2. Car & Taxi 480 11% 17% 651 8% 18% 881 7% 12% 4,053 16% 21%
3. Utility Pick up 1,175 27% 42% 1,190 15% 32% 1,944 16% 27% 3,509 14% 19%
4. Micro Bus 425 10% 15% 420 5% 11% 490 4% 7% 1,363 5% 7%
5. Mini Bus 219 5% 8% 156 2% 4% 288 2% 4% 755 3% 4%
6. Large Bus 9 0% 0% 44 1% 1% 505 4% 7% 1,269 5% 7%
7. Light Truck 108 2% 4% 83 1% 2% 482 4% 7% 1,242 5% 7%
8. Heavy Truck 370 8% 13% 346 4% 9% 1,344 11% 19% 3,706 15% 20%
9. Multi-axel Truck 0 0% 0% 101 1% 3% 864 7% 12% 2,938 12% 16%
10. Others 1 0% 0% 676 9% 18% 410 3% 6% 25 0% 0%
Total(All type of Veh.) 4,381 100% - 7,768 100% - 12,316 100% - 24,802 100% -
Share of Heavy Veh. 9% - - 6% - - 22% - - 32% - -
Share of Heavy truck. 8% - - 6% - - 18% - - 27% - -
PCU 5,047 - - 7,263 - - 16,250 - - 40,470 - -
Total(w/o 1.Motor Cycle) 2,787 - 100% 3,667 - 100% 7,208 - 100% 18,860 - 100%
Share of Heavy Veh. 14% - - 13% - - 38% - - 42% - -
Share of Heavy truck. 13% - - 12% - - 31% - - 35% - -
PCU 4,250 - - 5,213 - - 13,696 - - 37,499 - -
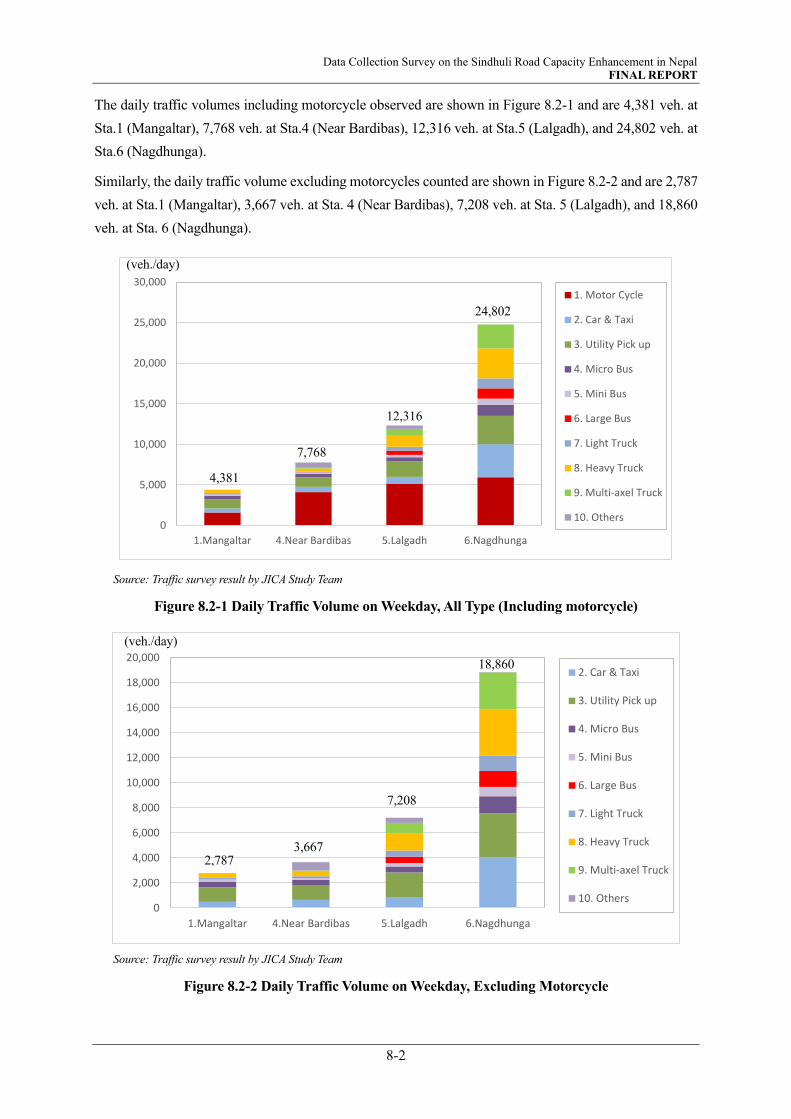
Data Collection Survey on the Sindhuli Road Capacity Enhancement in Nepal FINAL REPORT
8-2
The daily traffic volumes including motorcycle observed are shown in Figure 8.2-1 and are 4,381 veh. at
Sta.1 (Mangaltar), 7,768 veh. at Sta.4 (Near Bardibas), 12,316 veh. at Sta.5 (Lalgadh), and 24,802 veh. at
Sta.6 (Nagdhunga).
Similarly, the daily traffic volume excluding motorcycles counted are shown in Figure 8.2-2 and are 2,787
veh. at Sta.1 (Mangaltar), 3,667 veh. at Sta. 4 (Near Bardibas), 7,208 veh. at Sta. 5 (Lalgadh), and 18,860
veh. at Sta. 6 (Nagdhunga).
Source: Traffic survey result by JICA Study Team
Figure 8.2-1 Daily Traffic Volume on Weekday, All Type (Including motorcycle)
Source: Traffic survey result by JICA Study Team
Figure 8.2-2 Daily Traffic Volume on Weekday, Excluding Motorcycle
0
5,000
10,000
15,000
20,000
25,000
30,000
1.Mangaltar 4.Near Bardibas 5.Lalgadh 6.Nagdhunga
1. Motor Cycle
2. Car & Taxi
3. Utility Pick up
4. Micro Bus
5. Mini Bus
6. Large Bus
7. Light Truck
8. Heavy Truck
9. Multi-axel Truck
10. Others
0
2,000
4,000
6,000
8,000
10,000
12,000
14,000
16,000
18,000
20,000
1.Mangaltar 4.Near Bardibas 5.Lalgadh 6.Nagdhunga
2. Car & Taxi
3. Utility Pick up
4. Micro Bus
5. Mini Bus
6. Large Bus
7. Light Truck
8. Heavy Truck
9. Multi-axel Truck
10. Others
4,381
7,768
12,316
24,802
(veh./day)
(veh./day)
2,787 3,667
7,208
18,860

Data Collection Survey on the Sindhuli Road Capacity Enhancement in Nepal FINAL REPORT
8-3
Figure 8.2-3 Shows the location of the weekday traffic count survey at the intersection in Khurkot. Table
8.2-3 and Figure 8.2-4 show the result of the survey. The total daily traffic volume including motorcycle
is 2,058 veh. on Manthali Section A, 4,589 veh. on Banepa Section B, and 4,929 veh. on Bardibas Section
C. Similarly, total traffic volume excluding motorcycle are 1,214 veh. on Manthali Section A, 2,918 veh.
on Banepa Section B, and 3,080 veh. Bardibas Section C. This is shown in the graph in Figure 8.2-5.
Source: JICA Study Team
Figure 8.2-3 Traffic Volume Survey at Khurkot Direction
Table 8.2-3 Summary of Cross Section Traffic Volume on Weekday at Khurkot Direction
*Heavy veh.;5.Mini Bus,6.Large Bus, 8.Heavy Truck, 9.Multi-axel Truck
Source: JICA Study Team
ClassificationManthali
section(A)
%
Total
%
w/o MC
Banepa
section(B)
%
Total
%
w/o MC
Bardibas
section(C)
%
Total
%
w/o MC
1. Motor Cycle 844 41% 1,671 36% 1,849 38%
2. Car & Taxi 123 6% 10% 436 10% 15% 439 9% 14%
3. Utility Pick up 371 18% 31% 1,172 26% 40% 1,189 24% 39%
4. Micro Bus 62 3% 5% 452 10% 15% 452 9% 15%
5. Mini Bus 119 6% 10% 215 5% 7% 172 3% 6%
6. Large Bus 0 0% 0% 1 0% 0% 1 0% 0%
7. Light Truck 67 3% 6% 126 3% 4% 143 3% 5%
8. Heavy Truck 341 17% 28% 328 7% 11% 461 9% 15%
9. Multi-axel Truck 0 0% 0% 0 0% 0% 0 0% 0%
10. Others 131 6% 11% 188 4% 6% 223 5% 7%
Total(All type of Veh.) 2,058 100% - 4,589 100% - 4,929 100% -
Share of Heavy Veh. 22% - - 12% - - 13% - -
Share of Heavy truck. 17% - - 7% - - 9% - -
PCU 2,621 - - 5,131 - - 5,570 - -
Total(w/o 1.Motor Cycle) 1,214 - 100% 2,918 - 100% 3,080 - 100%
Share of Heavy Veh. 38% - - 19% - - 21% - -
Share of Heavy truck. 28% - - 11% - - 15% - -
PCU 2,199 - - 4,295 - - 4,646 - -
To Manthali Khurkot Mantali Road
To Banepa
Manthali Section
Banepa Section
A A
Bardibas Section B
B
To Bardibas
Sta.2 Khurkot -Traffic Volume Survey at Direction
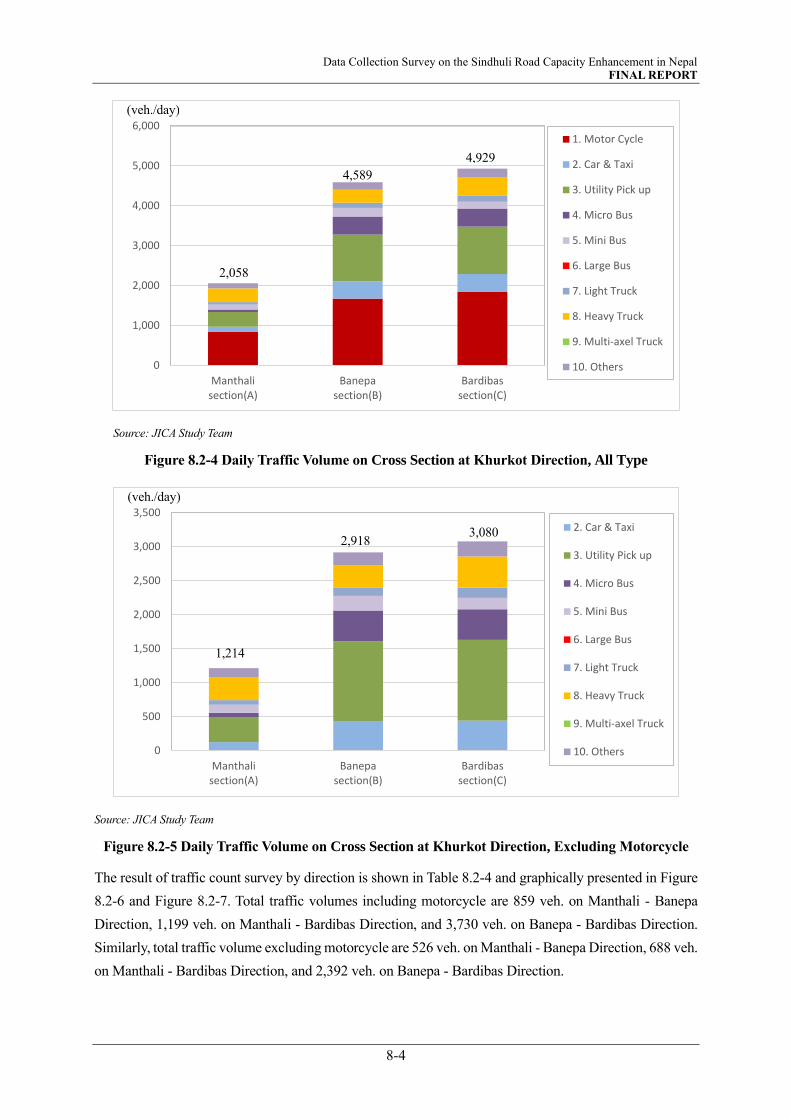
Data Collection Survey on the Sindhuli Road Capacity Enhancement in Nepal FINAL REPORT
8-4
Source: JICA Study Team
Figure 8.2-4 Daily Traffic Volume on Cross Section at Khurkot Direction, All Type
Source: JICA Study Team
Figure 8.2-5 Daily Traffic Volume on Cross Section at Khurkot Direction, Excluding Motorcycle
The result of traffic count survey by direction is shown in Table 8.2-4 and graphically presented in Figure
8.2-6 and Figure 8.2-7. Total traffic volumes including motorcycle are 859 veh. on Manthali - Banepa
Direction, 1,199 veh. on Manthali - Bardibas Direction, and 3,730 veh. on Banepa - Bardibas Direction.
Similarly, total traffic volume excluding motorcycle are 526 veh. on Manthali - Banepa Direction, 688 veh.
on Manthali - Bardibas Direction, and 2,392 veh. on Banepa - Bardibas Direction.
0
1,000
2,000
3,000
4,000
5,000
6,000
Manthalisection(A)
Banepasection(B)
Bardibassection(C)
1. Motor Cycle
2. Car & Taxi
3. Utility Pick up
4. Micro Bus
5. Mini Bus
6. Large Bus
7. Light Truck
8. Heavy Truck
9. Multi-axel Truck
10. Others
0
500
1,000
1,500
2,000
2,500
3,000
3,500
Manthalisection(A)
Banepasection(B)
Bardibassection(C)
2. Car & Taxi
3. Utility Pick up
4. Micro Bus
5. Mini Bus
6. Large Bus
7. Light Truck
8. Heavy Truck
9. Multi-axel Truck
10. Others
(veh./day)
(veh./day)
2,058
4,589
4,929
1,214
2,918 3,080
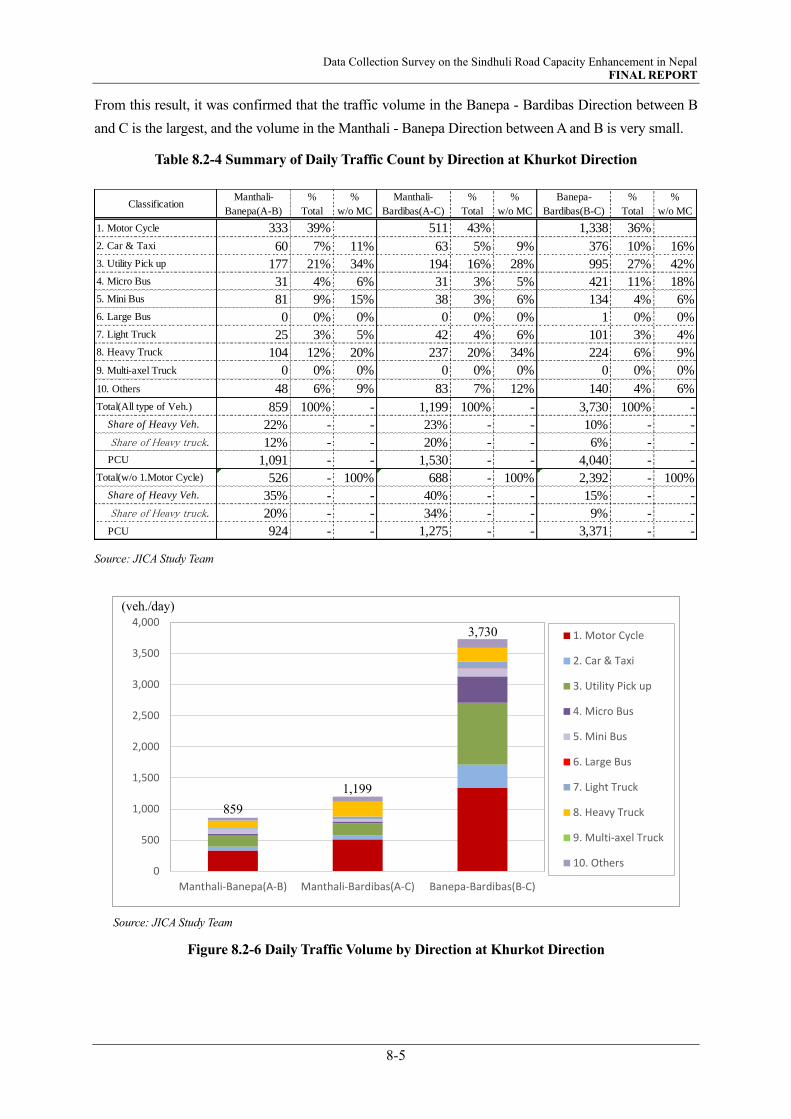
Data Collection Survey on the Sindhuli Road Capacity Enhancement in Nepal FINAL REPORT
8-5
From this result, it was confirmed that the traffic volume in the Banepa - Bardibas Direction between B
and C is the largest, and the volume in the Manthali - Banepa Direction between A and B is very small.
Table 8.2-4 Summary of Daily Traffic Count by Direction at Khurkot Direction
Source: JICA Study Team
Source: JICA Study Team
Figure 8.2-6 Daily Traffic Volume by Direction at Khurkot Direction
ClassificationManthali-
Banepa(A-B)
%
Total
%
w/o MC
Manthali-
Bardibas(A-C)
%
Total
%
w/o MC
Banepa-
Bardibas(B-C)
%
Total
%
w/o MC
1. Motor Cycle 333 39% 511 43% 1,338 36%
2. Car & Taxi 60 7% 11% 63 5% 9% 376 10% 16%
3. Utility Pick up 177 21% 34% 194 16% 28% 995 27% 42%
4. Micro Bus 31 4% 6% 31 3% 5% 421 11% 18%
5. Mini Bus 81 9% 15% 38 3% 6% 134 4% 6%
6. Large Bus 0 0% 0% 0 0% 0% 1 0% 0%
7. Light Truck 25 3% 5% 42 4% 6% 101 3% 4%
8. Heavy Truck 104 12% 20% 237 20% 34% 224 6% 9%
9. Multi-axel Truck 0 0% 0% 0 0% 0% 0 0% 0%
10. Others 48 6% 9% 83 7% 12% 140 4% 6%
Total(All type of Veh.) 859 100% - 1,199 100% - 3,730 100% -
Share of Heavy Veh. 22% - - 23% - - 10% - -
Share of Heavy truck. 12% - - 20% - - 6% - -
PCU 1,091 - - 1,530 - - 4,040 - -
Total(w/o 1.Motor Cycle) 526 - 100% 688 - 100% 2,392 - 100%
Share of Heavy Veh. 35% - - 40% - - 15% - -
Share of Heavy truck. 20% - - 34% - - 9% - -
PCU 924 - - 1,275 - - 3,371 - -
0
500
1,000
1,500
2,000
2,500
3,000
3,500
4,000
Manthali-Banepa(A-B) Manthali-Bardibas(A-C) Banepa-Bardibas(B-C)
1. Motor Cycle
2. Car & Taxi
3. Utility Pick up
4. Micro Bus
5. Mini Bus
6. Large Bus
7. Light Truck
8. Heavy Truck
9. Multi-axel Truck
10. Others
(veh./day)
859
1,199
3,730

Data Collection Survey on the Sindhuli Road Capacity Enhancement in Nepal FINAL REPORT
8-6
Source: JICA Study Team
Figure 8.2-7 Daily Traffic Volume by Direction at Khurkot Direction, Excluding Motorcycle
Table 8.2-5 shows the result of traffic count survey on weekday at an intersection 3km ahead of Khurkot
where the M-H Highway connects with the Sindhuli Road. Total daily traffic volumes including
motorcycle is 1,423 veh. at Ghurmi Section A, 4,360 veh. at Banepa Section B, and 3,561 veh. at Bardibas
Section C as shown in Figure 8.2-9. In the same way, total traffic volumes excluding the motorcycle is 814
veh. at Ghurmi Section A, 2,765 veh. at Banepa Section B, and 2,323 veh. at Bardibas Section C as shown
in Figure 8.2-10.
The result of traffic count survey by direction is shown in Table 8.2-6. Total traffic volumes including
motorcycle are 1,111 veh. on Ghurmi - Banepa Direction A-B, 312 veh. on Ghurmi - Bardibas Direction
A-C, and 3,249 veh. on Banepa - Bardibas Direction B-C as shown in Figure 8.2-11. In the same way, total
traffic volumes excluding motorcycle are 628 veh. on Ghurmi - Banepa Direction A-B, 186 veh. on Ghurmi
- Bardibas Direction A-C, and 2,137 veh. on Banepa - Bardibas Direction B-C as shown in Figure 8.2-12.
From this result, it was confirmed that the traffic volume in the Banepa - Bardibas Direction between B
and C is the largest, and the traffic volume in the Ghurmi - Bardibas Direction between A and C is very
small.
0
500
1,000
1,500
2,000
2,500
3,000
Manthali-Banepa(A-B) Manthali-Bardibas(A-C) Banepa-Bardibas(B-C)
2. Car & Taxi
3. Utility Pick up
4. Micro Bus
5. Mini Bus
6. Large Bus
7. Light Truck
8. Heavy Truck
9. Multi-axel Truck
10. Others
(veh./day)
526 688
2,392
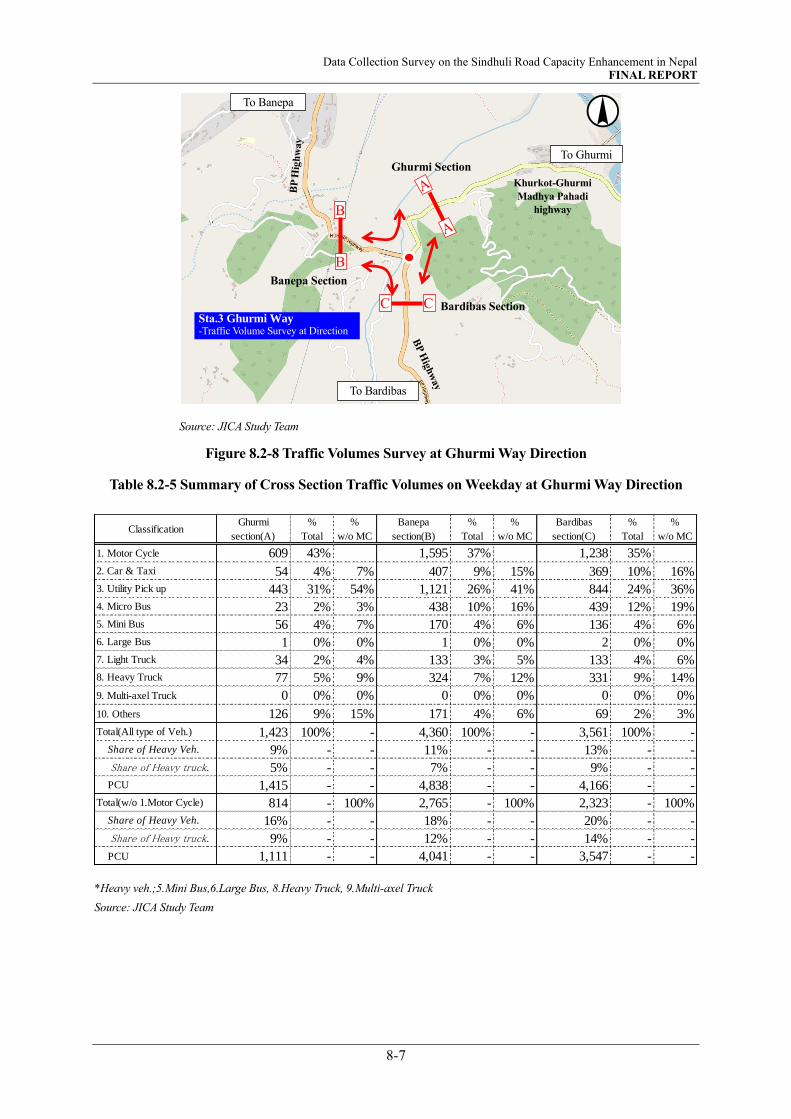
Data Collection Survey on the Sindhuli Road Capacity Enhancement in Nepal FINAL REPORT
8-7
Source: JICA Study Team
Figure 8.2-8 Traffic Volumes Survey at Ghurmi Way Direction
Table 8.2-5 Summary of Cross Section Traffic Volumes on Weekday at Ghurmi Way Direction
*Heavy veh.;5.Mini Bus,6.Large Bus, 8.Heavy Truck, 9.Multi-axel Truck
Source: JICA Study Team
ClassificationGhurmi
section(A)
%
Total
%
w/o MC
Banepa
section(B)
%
Total
%
w/o MC
Bardibas
section(C)
%
Total
%
w/o MC
1. Motor Cycle 609 43% 1,595 37% 1,238 35%
2. Car & Taxi 54 4% 7% 407 9% 15% 369 10% 16%
3. Utility Pick up 443 31% 54% 1,121 26% 41% 844 24% 36%
4. Micro Bus 23 2% 3% 438 10% 16% 439 12% 19%
5. Mini Bus 56 4% 7% 170 4% 6% 136 4% 6%
6. Large Bus 1 0% 0% 1 0% 0% 2 0% 0%
7. Light Truck 34 2% 4% 133 3% 5% 133 4% 6%
8. Heavy Truck 77 5% 9% 324 7% 12% 331 9% 14%
9. Multi-axel Truck 0 0% 0% 0 0% 0% 0 0% 0%
10. Others 126 9% 15% 171 4% 6% 69 2% 3%
Total(All type of Veh.) 1,423 100% - 4,360 100% - 3,561 100% -
Share of Heavy Veh. 9% - - 11% - - 13% - -
Share of Heavy truck. 5% - - 7% - - 9% - -
PCU 1,415 - - 4,838 - - 4,166 - -
Total(w/o 1.Motor Cycle) 814 - 100% 2,765 - 100% 2,323 - 100%
Share of Heavy Veh. 16% - - 18% - - 20% - -
Share of Heavy truck. 9% - - 12% - - 14% - -
PCU 1,111 - - 4,041 - - 3,547 - -
To Banepa
Khurkot-Ghurmi
Madhya Pahadi
highway
To Ghurmi Ghurmi Section
Banepa Section
Bardibas Section C
B
C
B
To Bardibas
Sta.3 Ghurmi Way -Traffic Volume Survey at Direction
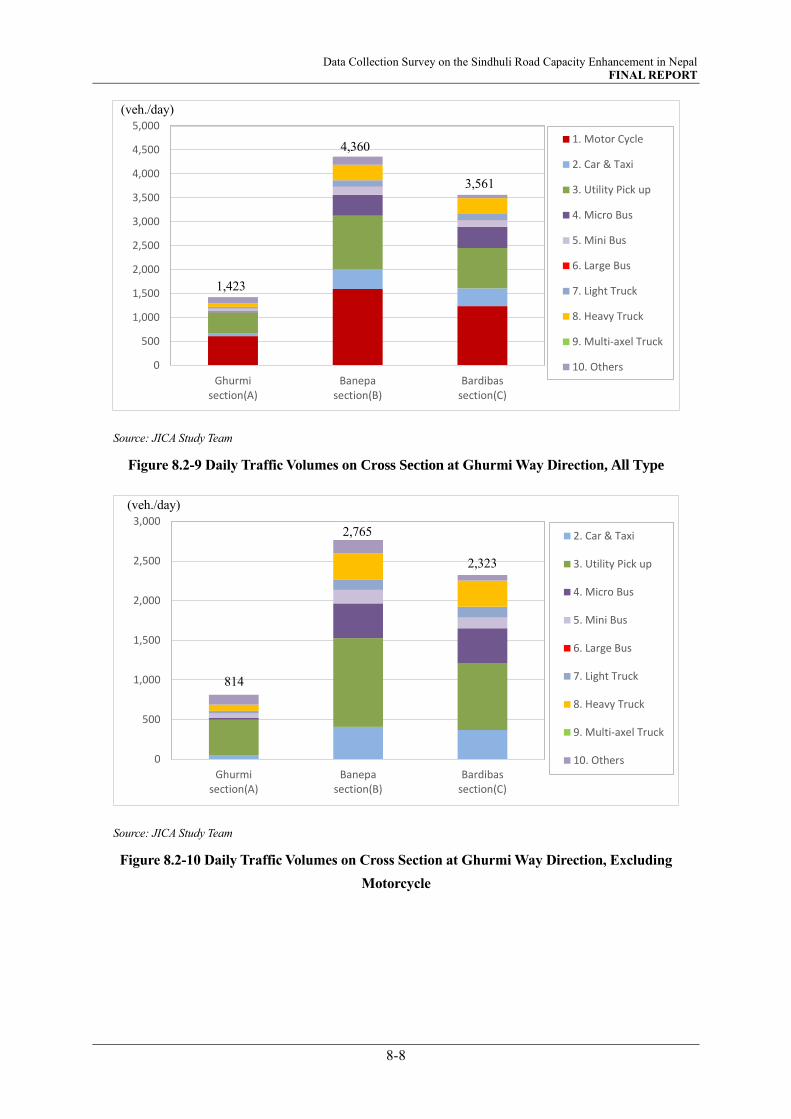
Data Collection Survey on the Sindhuli Road Capacity Enhancement in Nepal FINAL REPORT
8-8
Source: JICA Study Team
Figure 8.2-9 Daily Traffic Volumes on Cross Section at Ghurmi Way Direction, All Type
Source: JICA Study Team
Figure 8.2-10 Daily Traffic Volumes on Cross Section at Ghurmi Way Direction, Excluding
Motorcycle
0
500
1,000
1,500
2,000
2,500
3,000
3,500
4,000
4,500
5,000
Ghurmisection(A)
Banepasection(B)
Bardibassection(C)
1. Motor Cycle
2. Car & Taxi
3. Utility Pick up
4. Micro Bus
5. Mini Bus
6. Large Bus
7. Light Truck
8. Heavy Truck
9. Multi-axel Truck
10. Others
0
500
1,000
1,500
2,000
2,500
3,000
Ghurmisection(A)
Banepasection(B)
Bardibassection(C)
2. Car & Taxi
3. Utility Pick up
4. Micro Bus
5. Mini Bus
6. Large Bus
7. Light Truck
8. Heavy Truck
9. Multi-axel Truck
10. Others
(veh./day)
(veh./day)
1,423
4,360
3,561
814
2,765
2,323
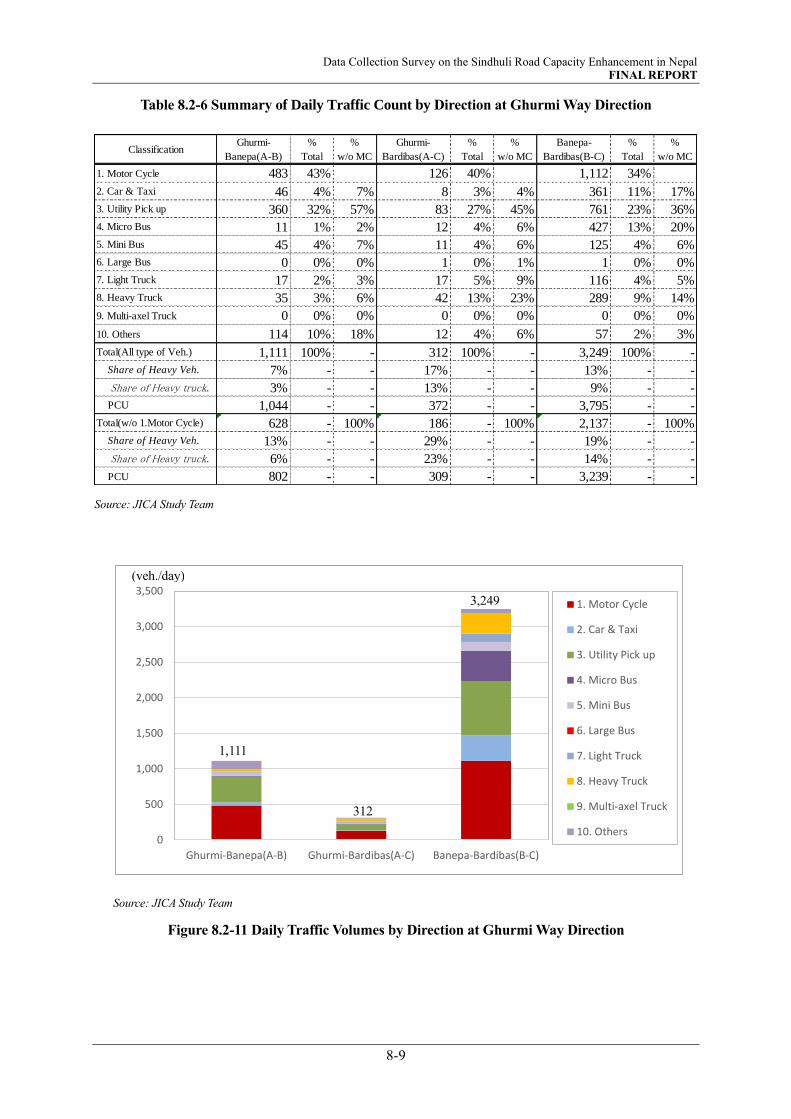
Data Collection Survey on the Sindhuli Road Capacity Enhancement in Nepal FINAL REPORT
8-9
Table 8.2-6 Summary of Daily Traffic Count by Direction at Ghurmi Way Direction
Source: JICA Study Team
Source: JICA Study Team
Figure 8.2-11 Daily Traffic Volumes by Direction at Ghurmi Way Direction
ClassificationGhurmi-
Banepa(A-B)
%
Total
%
w/o MC
Ghurmi-
Bardibas(A-C)
%
Total
%
w/o MC
Banepa-
Bardibas(B-C)
%
Total
%
w/o MC
1. Motor Cycle 483 43% 126 40% 1,112 34%
2. Car & Taxi 46 4% 7% 8 3% 4% 361 11% 17%
3. Utility Pick up 360 32% 57% 83 27% 45% 761 23% 36%
4. Micro Bus 11 1% 2% 12 4% 6% 427 13% 20%
5. Mini Bus 45 4% 7% 11 4% 6% 125 4% 6%
6. Large Bus 0 0% 0% 1 0% 1% 1 0% 0%
7. Light Truck 17 2% 3% 17 5% 9% 116 4% 5%
8. Heavy Truck 35 3% 6% 42 13% 23% 289 9% 14%
9. Multi-axel Truck 0 0% 0% 0 0% 0% 0 0% 0%
10. Others 114 10% 18% 12 4% 6% 57 2% 3%
Total(All type of Veh.) 1,111 100% - 312 100% - 3,249 100% -
Share of Heavy Veh. 7% - - 17% - - 13% - -
Share of Heavy truck. 3% - - 13% - - 9% - -
PCU 1,044 - - 372 - - 3,795 - -
Total(w/o 1.Motor Cycle) 628 - 100% 186 - 100% 2,137 - 100%
Share of Heavy Veh. 13% - - 29% - - 19% - -
Share of Heavy truck. 6% - - 23% - - 14% - -
PCU 802 - - 309 - - 3,239 - -
0
500
1,000
1,500
2,000
2,500
3,000
3,500
Ghurmi-Banepa(A-B) Ghurmi-Bardibas(A-C) Banepa-Bardibas(B-C)
1. Motor Cycle
2. Car & Taxi
3. Utility Pick up
4. Micro Bus
5. Mini Bus
6. Large Bus
7. Light Truck
8. Heavy Truck
9. Multi-axel Truck
10. Others
(veh./day)
1,111
312
3,249
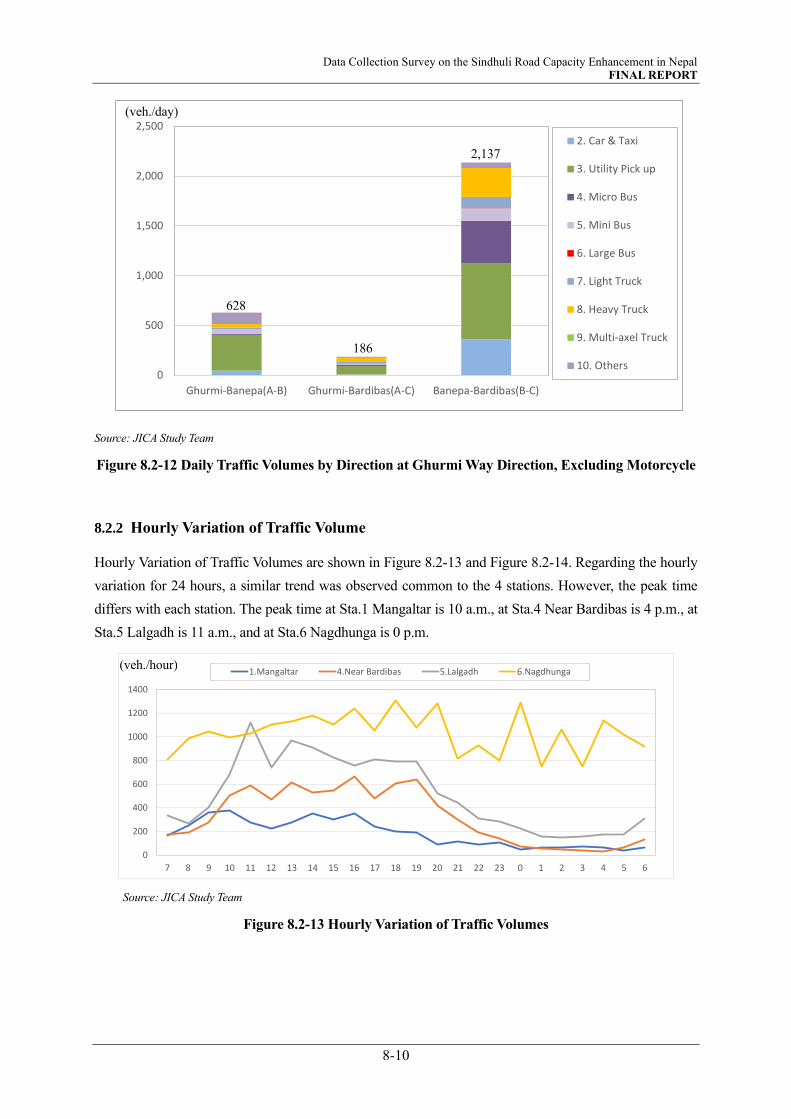
Data Collection Survey on the Sindhuli Road Capacity Enhancement in Nepal FINAL REPORT
8-10
Source: JICA Study Team
Figure 8.2-12 Daily Traffic Volumes by Direction at Ghurmi Way Direction, Excluding Motorcycle
8.2.2 Hourly Variation of Traffic Volume
Hourly Variation of Traffic Volumes are shown in Figure 8.2-13 and Figure 8.2-14. Regarding the hourly
variation for 24 hours, a similar trend was observed common to the 4 stations. However, the peak time
differs with each station. The peak time at Sta.1 Mangaltar is 10 a.m., at Sta.4 Near Bardibas is 4 p.m., at
Sta.5 Lalgadh is 11 a.m., and at Sta.6 Nagdhunga is 0 p.m.
Source: JICA Study Team
Figure 8.2-13 Hourly Variation of Traffic Volumes
0
500
1,000
1,500
2,000
2,500
Ghurmi-Banepa(A-B) Ghurmi-Bardibas(A-C) Banepa-Bardibas(B-C)
2. Car & Taxi
3. Utility Pick up
4. Micro Bus
5. Mini Bus
6. Large Bus
7. Light Truck
8. Heavy Truck
9. Multi-axel Truck
10. Others
0
200
400
600
800
1000
1200
1400
7 8 9 10 11 12 13 14 15 16 17 18 19 20 21 22 23 0 1 2 3 4 5 6
1.Mangaltar 4.Near Bardibas 5.Lalgadh 6.Nagdhunga
(veh./day)
628
186
2,137
(veh./hour)

Data Collection Survey on the Sindhuli Road Capacity Enhancement in Nepal FINAL REPORT
8-11
Source: JICA Study Team
Figure 8.2-14 Hourly Variation of Daily Traffic Volumes, Excluding Motorcycle
Next, hourly variation of traffic volume on 3 road cross section at the Khurkot intersection is shown in
Figure 8.2-15, Figure 8.2-16, Figure 8.2-17, and Figure 8.2-18. As a result of the survey, a similar trend
was observed common to 3 cross sections.
The peak time on 3 road cross section is 11 a.m. The peak time at Manthali - Banepa Direction A-B is 3
p.m., at Manthali - Bardibas Direction A-C is 8 a.m. and at Banepa - Bardibas Direction B-C are 10 a.m.
A similar tendency is also observed at all stations for the fluctuation excluding the motorcycle and their
peak time in all places are 4 p.m.
It is confirmed that the traffic volume after 6 p.m. gradually decreased, and the traffic volume between 10
p.m. and 4 a.m. at night is very low.
Source: JICA Study Team
Figure 8.2-15 Hourly Variation of Traffic Volumes at Khurkot Intersection Cross Section, All Type
of Vehicle
0
200
400
600
800
1000
1200
1400
7 8 9 10 11 12 13 14 15 16 17 18 19 20 21 22 23 0 1 2 3 4 5 6
1.Mangaltar 4.Near Bardibas 5.Lalgadh 6.Nagdhunga
0
50
100
150
200
250
300
350
400
450
500
7 8 9 10 11 12 13 14 15 16 17 18 19 20 21 22 23 0 1 2 3 4 5 6
Manthali section(A) Banepa section(B) Bardibas section(C)
A
B
A
B
Khurkot
(veh./hour)
(veh./hour)

Data Collection Survey on the Sindhuli Road Capacity Enhancement in Nepal FINAL REPORT
8-12
Source: JICA Study Team
Figure 8.2-16 Hourly Variation of Traffic Volumes at Khurkot Intersection, Cross Section,
Excluding Motorcycle
Source: JICA Study Team
Figure 8.2-17 Hourly Variation of Traffic Volumes at Khurkot Intersection, By Direction, All Type
of Vehicle
Source: JICA Study Team
Figure 8.2-18 Hourly Variation of Traffic Volumes at Khurkot Intersection, By Direction,
Excluding Motorcycle
0
50
100
150
200
250
300
7 8 9 10 11 12 13 14 15 16 17 18 19 20 21 22 23 0 1 2 3 4 5 6
Manthali section(A) Banepa section(B) Bardibas section(C)
0
50
100
150
200
250
300
350
400
7 8 9 10 11 12 13 14 15 16 17 18 19 20 21 22 23 0 1 2 3 4 5 6
Manthali-Banepa(A-B) Manthali-Bardibas(A-C) Banepa-Bardibas(B-C)
0
50
100
150
200
250
7 8 9 10 11 12 13 14 15 16 17 18 19 20 21 22 23 0 1 2 3 4 5 6
Manthali-Banepa(A-B) Manthali-Bardibas(A-C) Banepa-Bardibas(B-C)
A
B
A
B
Khurkot
A
B
A
B
Khurkot
(veh./hour)
(veh./hour)
(veh./hour)
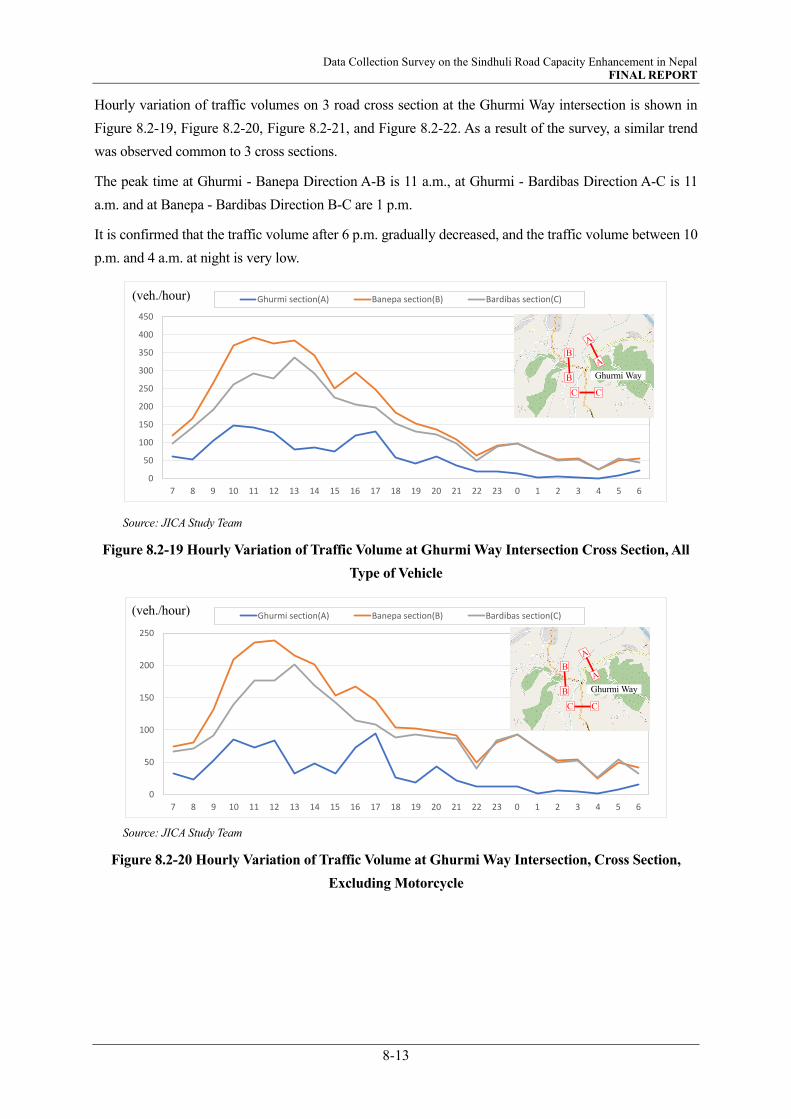
Data Collection Survey on the Sindhuli Road Capacity Enhancement in Nepal FINAL REPORT
8-13
Hourly variation of traffic volumes on 3 road cross section at the Ghurmi Way intersection is shown in
Figure 8.2-19, Figure 8.2-20, Figure 8.2-21, and Figure 8.2-22. As a result of the survey, a similar trend
was observed common to 3 cross sections.
The peak time at Ghurmi - Banepa Direction A-B is 11 a.m., at Ghurmi - Bardibas Direction A-C is 11
a.m. and at Banepa - Bardibas Direction B-C are 1 p.m.
It is confirmed that the traffic volume after 6 p.m. gradually decreased, and the traffic volume between 10
p.m. and 4 a.m. at night is very low.
Source: JICA Study Team
Figure 8.2-19 Hourly Variation of Traffic Volume at Ghurmi Way Intersection Cross Section, All
Type of Vehicle
Source: JICA Study Team
Figure 8.2-20 Hourly Variation of Traffic Volume at Ghurmi Way Intersection, Cross Section,
Excluding Motorcycle
0
50
100
150
200
250
300
350
400
450
7 8 9 10 11 12 13 14 15 16 17 18 19 20 21 22 23 0 1 2 3 4 5 6
Ghurmi section(A) Banepa section(B) Bardibas section(C)
0
50
100
150
200
250
7 8 9 10 11 12 13 14 15 16 17 18 19 20 21 22 23 0 1 2 3 4 5 6
Ghurmi section(A) Banepa section(B) Bardibas section(C)
B
B
C C
Ghurmi Way
B
B
C C
Ghurmi Way
(veh./hour)
(veh./hour)

Data Collection Survey on the Sindhuli Road Capacity Enhancement in Nepal FINAL REPORT
8-14
Source: JICA Study Team
Figure 8.2-21 Hourly Variation of Traffic Volume at Ghurmi Way Intersection, By Direction, All
Type of Vehicle
Source: JICA Study Team
Figure 8.2-22 Hourly Variation of Traffic Volume at Ghurmi Way Intersection, By Direction,
Excluding Motorcycle
8.2.3 Traffic Composition
Table 8.2-7 and Table 8.2-8 show the shares of light vehicles and heavy vehicles. Figure 8.2-19 and Figure
8.2-23 illustrate traffic composition at 4 survey stations. The heavy vehicles consist of bus including Mini-
bus, and Truck excluding light Truck.
According to the results of shares of heavy vehicles excluding motorcycles, 21 % on Sta.1 Mangaltar, 18 %
on Sta.4 Near Bardibas, 42 % on Sta.5 Lalgadh, and 46 % on Sta.6 Nagdhunga.
On the other hand, motorcycles on Sindhuli Road (Sta. 1 and 4) account for around 40%.
0
50
100
150
200
250
300
350
7 8 9 10 11 12 13 14 15 16 17 18 19 20 21 22 23 0 1 2 3 4 5 6
Ghurmi-Banepa(A-B) Ghurmi-Bardibas(A-C) Banepa-Bardibas(B-C)
0
50
100
150
200
250
7 8 9 10 11 12 13 14 15 16 17 18 19 20 21 22 23 0 1 2 3 4 5 6
Ghurmi-Banepa(A-B) Ghurmi-Bardibas(A-C) Banepa-Bardibas(B-C)
B
B
C C
Ghurmi Way
B
B
C C
Ghurmi Way
(veh./hour)
(veh./hour)
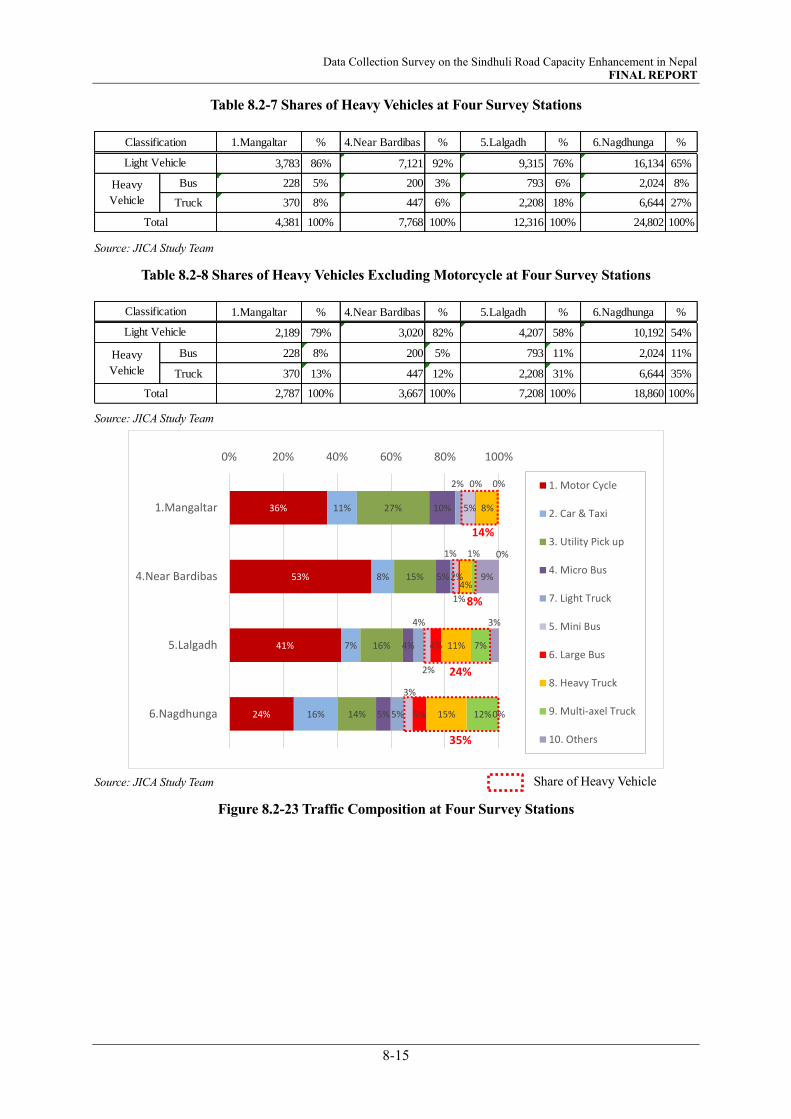
Data Collection Survey on the Sindhuli Road Capacity Enhancement in Nepal FINAL REPORT
8-15
Table 8.2-7 Shares of Heavy Vehicles at Four Survey Stations
Source: JICA Study Team
Table 8.2-8 Shares of Heavy Vehicles Excluding Motorcycle at Four Survey Stations
Source: JICA Study Team
Source: JICA Study Team
Figure 8.2-23 Traffic Composition at Four Survey Stations
1.Mangaltar % 4.Near Bardibas % 5.Lalgadh % 6.Nagdhunga %
3,783 86% 7,121 92% 9,315 76% 16,134 65%
Bus 228 5% 200 3% 793 6% 2,024 8%
Truck 370 8% 447 6% 2,208 18% 6,644 27%
4,381 100% 7,768 100% 12,316 100% 24,802 100%
Classification
Light Vehicle
Heavy
Vehicle
Total
1.Mangaltar % 4.Near Bardibas % 5.Lalgadh % 6.Nagdhunga %
2,189 79% 3,020 82% 4,207 58% 10,192 54%
Bus 228 8% 200 5% 793 11% 2,024 11%
Truck 370 13% 447 12% 2,208 31% 6,644 35%
2,787 100% 3,667 100% 7,208 100% 18,860 100%
Classification
Light Vehicle
Heavy
Vehicle
Total
36%
53%
41%
24%
11%
8%
7%
16%
27%
15%
16%
14%
10%
5%
4%
5%
2%
1%
4%
5%
5%
2%
2%
3%
0%
1%
4%
5%
8%
4%
11%
15%
0%
1%
7%
12%
0%
9%
3%
0%
0% 20% 40% 60% 80% 100%
1.Mangaltar
4.Near Bardibas
5.Lalgadh
6.Nagdhunga
1. Motor Cycle
2. Car & Taxi
3. Utility Pick up
4. Micro Bus
7. Light Truck
5. Mini Bus
6. Large Bus
8. Heavy Truck
9. Multi-axel Truck
10. Others
14%
24%
8%
35%
Share of Heavy Vehicle
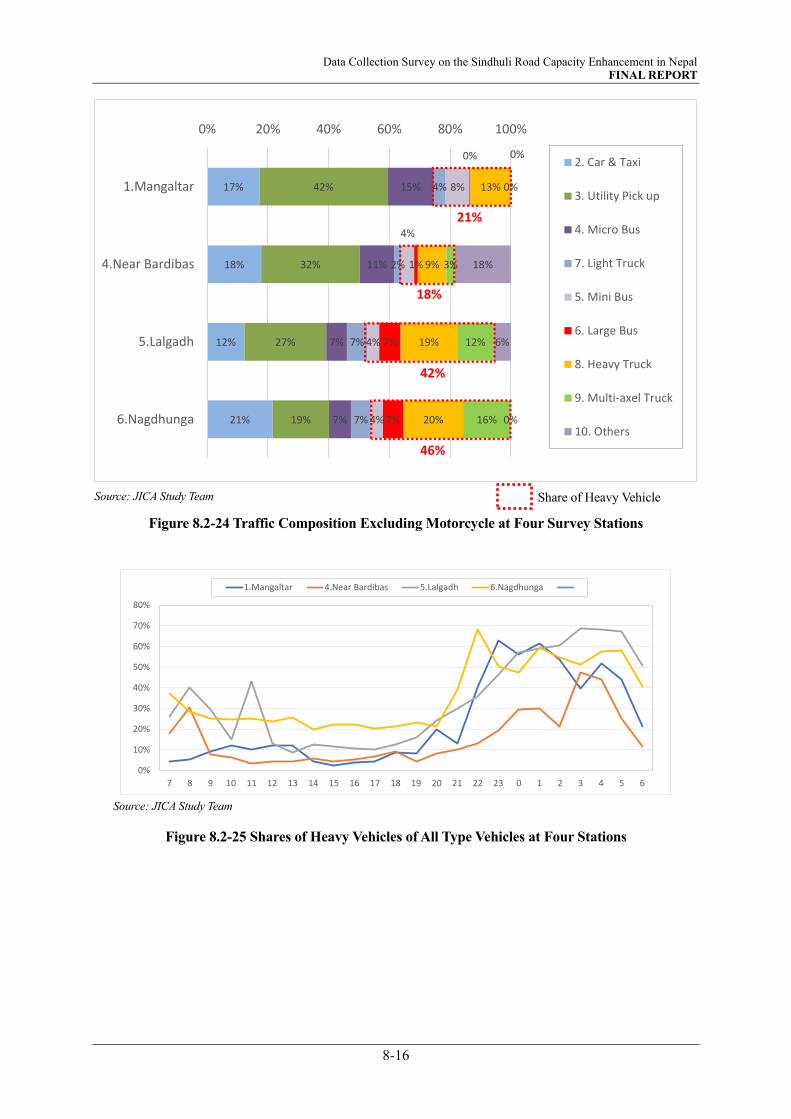
Data Collection Survey on the Sindhuli Road Capacity Enhancement in Nepal FINAL REPORT
8-16
Source: JICA Study Team
Figure 8.2-24 Traffic Composition Excluding Motorcycle at Four Survey Stations
Source: JICA Study Team
Figure 8.2-25 Shares of Heavy Vehicles of All Type Vehicles at Four Stations
17%
18%
12%
21%
42%
32%
27%
19%
15%
11%
7%
7%
4%
2%
7%
7%
8%
4%
4%
4%
0%
1%
7%
7%
13%
9%
19%
20%
0%
3%
12%
16%
0%
18%
6%
0%
0% 20% 40% 60% 80% 100%
1.Mangaltar
4.Near Bardibas
5.Lalgadh
6.Nagdhunga
2. Car & Taxi
3. Utility Pick up
4. Micro Bus
7. Light Truck
5. Mini Bus
6. Large Bus
8. Heavy Truck
9. Multi-axel Truck
10. Others
21%
18%
42%
46%
0%
10%
20%
30%
40%
50%
60%
70%
80%
7 8 9 10 11 12 13 14 15 16 17 18 19 20 21 22 23 0 1 2 3 4 5 6
1.Mangaltar 4.Near Bardibas 5.Lalgadh 6.Nagdhunga
Share of Heavy Vehicle
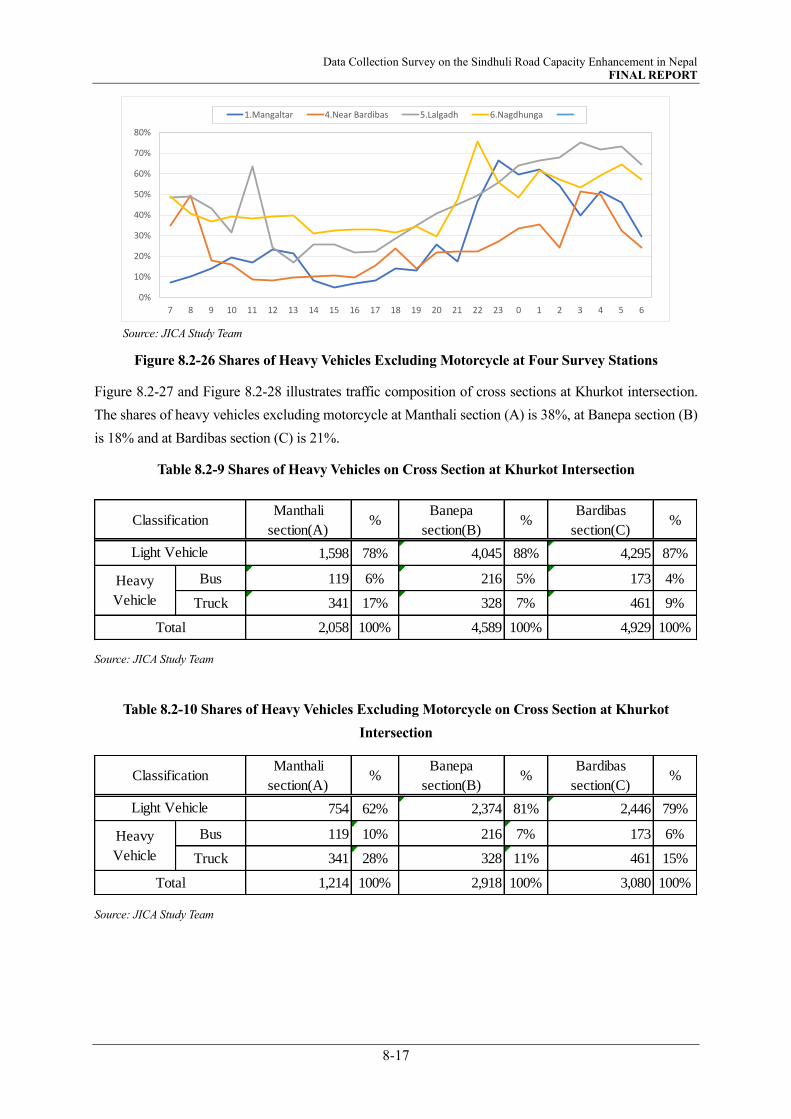
Data Collection Survey on the Sindhuli Road Capacity Enhancement in Nepal FINAL REPORT
8-17
Source: JICA Study Team
Figure 8.2-26 Shares of Heavy Vehicles Excluding Motorcycle at Four Survey Stations
Figure 8.2-27 and Figure 8.2-28 illustrates traffic composition of cross sections at Khurkot intersection.
The shares of heavy vehicles excluding motorcycle at Manthali section (A) is 38%, at Banepa section (B)
is 18% and at Bardibas section (C) is 21%.
Table 8.2-9 Shares of Heavy Vehicles on Cross Section at Khurkot Intersection
Source: JICA Study Team
Table 8.2-10 Shares of Heavy Vehicles Excluding Motorcycle on Cross Section at Khurkot
Intersection
Source: JICA Study Team
0%
10%
20%
30%
40%
50%
60%
70%
80%
7 8 9 10 11 12 13 14 15 16 17 18 19 20 21 22 23 0 1 2 3 4 5 6
1.Mangaltar 4.Near Bardibas 5.Lalgadh 6.Nagdhunga
Manthali
section(A)%
Banepa
section(B)%
Bardibas
section(C)%
1,598 78% 4,045 88% 4,295 87%
Bus 119 6% 216 5% 173 4%
Truck 341 17% 328 7% 461 9%
2,058 100% 4,589 100% 4,929 100%
Classification
Light Vehicle
Heavy
Vehicle
Total
Manthali
section(A)%
Banepa
section(B)%
Bardibas
section(C)%
754 62% 2,374 81% 2,446 79%
Bus 119 10% 216 7% 173 6%
Truck 341 28% 328 11% 461 15%
1,214 100% 2,918 100% 3,080 100%Total
Classification
Light Vehicle
Heavy
Vehicle

Data Collection Survey on the Sindhuli Road Capacity Enhancement in Nepal FINAL REPORT
8-18
Source: JICA Study Team
Figure 8.2-27 Traffic Composition on Cross Section at Khurkot Intersection
Source: JICA Study Team
Figure 8.2-28 Traffic Composition on Cross Section at Khurkot Intersection, Excluding
Motorcycle
Source: JICA Study Team
Figure 8.2-29 Hourly Share of Heavy Vehicle on Cross Section at Khurkot Intersection
41%
36%
38%
6%
10%
9%
18%
26%
24%
3%
10%
9%
3%
3%
3%
6%
5%
3%
17%
7%
9%
6%
4%
5%
0% 20% 40% 60% 80% 100%
Manthalisection(A)
Banepasection(B)
Bardibassection(C)
1. Motor Cycle
2. Car & Taxi
3. Utility Pick up
4. Micro Bus
7. Light Truck
5. Mini Bus
6. Large Bus
8. Heavy Truck
9. Multi-axel Truck
10. Others
22%
12%
13%
10%
15%
14%
31%
40%
39%
5%
15%
15%
6%
4%
5%
10%
7%
6%
28%
11%
15%
11%
6%
7%
0% 20% 40% 60% 80% 100%
Manthalisection(A)
Banepasection(B)
Bardibassection(C)
2. Car & Taxi
3. Utility Pick up
4. Micro Bus
7. Light Truck
5. Mini Bus
6. Large Bus
8. Heavy Truck
9. Multi-axel Truck
10. Others21%
38%
19%
0%
10%
20%
30%
40%
50%
60%
70%
80%
7 8 9 10 11 12 13 14 15 16 17 18 19 20 21 22 23 0 1 2 3 4 5 6
Manthali section(A) Banepa section(B) Bardibas section(C)
A
B
A
B
Khurkot
Share of Heavy Vehicle
Share of Heavy Vehicle
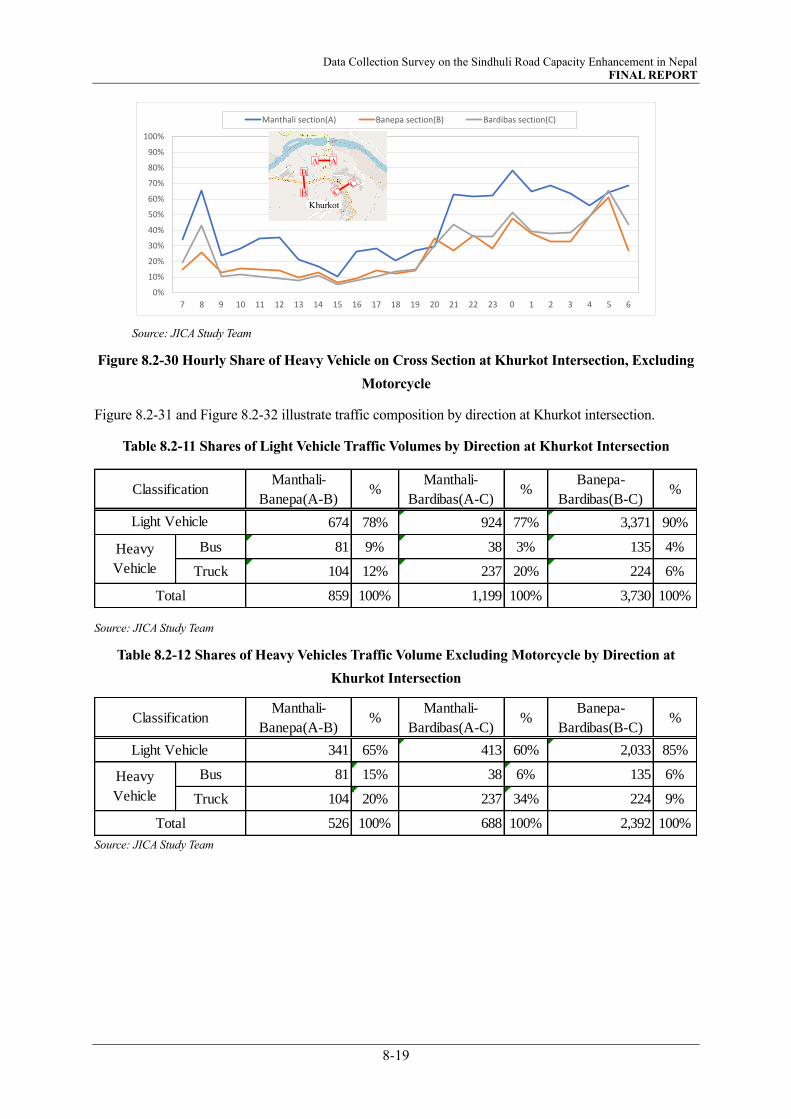
Data Collection Survey on the Sindhuli Road Capacity Enhancement in Nepal FINAL REPORT
8-19
Source: JICA Study Team
Figure 8.2-30 Hourly Share of Heavy Vehicle on Cross Section at Khurkot Intersection, Excluding
Motorcycle
Figure 8.2-31 and Figure 8.2-32 illustrate traffic composition by direction at Khurkot intersection.
Table 8.2-11 Shares of Light Vehicle Traffic Volumes by Direction at Khurkot Intersection
Source: JICA Study Team
Table 8.2-12 Shares of Heavy Vehicles Traffic Volume Excluding Motorcycle by Direction at
Khurkot Intersection
Source: JICA Study Team
0%
10%
20%
30%
40%
50%
60%
70%
80%
90%
100%
7 8 9 10 11 12 13 14 15 16 17 18 19 20 21 22 23 0 1 2 3 4 5 6
Manthali section(A) Banepa section(B) Bardibas section(C)
Manthali-
Banepa(A-B)%
Manthali-
Bardibas(A-C)%
Banepa-
Bardibas(B-C)%
674 78% 924 77% 3,371 90%
Bus 81 9% 38 3% 135 4%
Truck 104 12% 237 20% 224 6%
859 100% 1,199 100% 3,730 100%
Classification
Light Vehicle
Heavy
Vehicle
Total
Manthali-
Banepa(A-B)%
Manthali-
Bardibas(A-C)%
Banepa-
Bardibas(B-C)%
341 65% 413 60% 2,033 85%
Bus 81 15% 38 6% 135 6%
Truck 104 20% 237 34% 224 9%
526 100% 688 100% 2,392 100%
Heavy
Vehicle
Total
Classification
Light Vehicle
A
B
A
B
Khurkot

Data Collection Survey on the Sindhuli Road Capacity Enhancement in Nepal FINAL REPORT
8-20
Source: JICA Study Team
Figure 8.2-31 Traffic Composition of Traffic by Direction at Khurkot Intersection
Source: JICA Study Team
Figure 8.2-32 Traffic Composition of Traffic by Direction at Khurkot Intersection, Excluding
Motorcycle
Source: JICA Study Team
Figure 8.2-33 Shares of Heavy Vehicles of All Type Vehicles (By Direction)
39%
43%
36%
7%
5%
10%
21%
16%
27%
4%
3%
11%
3%
4%
3%
9%
3%
4%
12%
20%
6%
6%
7%
4%
0% 20% 40% 60% 80% 100%
Manthali-Banepa(A-B)
Manthali-Bardibas(A-C)
Banepa-Bardibas(B-C)
1. Motor Cycle
2. Car & Taxi
3. Utility Pick up
4. Micro Bus
7. Light Truck
5. Mini Bus
6. Large Bus
8. Heavy Truck
9. Multi-axel Truck
10. Others
22%
23%
10%
11%
9%
16%
34%
28%
42%
6%
5%
18%
5%
6%
4%
15%
6%
6%
0%
0%
0%
20%
34%
9%
9%
12%
6%
0% 20% 40% 60% 80% 100%
Manthali-Banepa(A-B)
Manthali-Bardibas(A-C)
Banepa-Bardibas(B-C)
2. Car & Taxi
3. Utility Pick up
4. Micro Bus
7. Light Truck
5. Mini Bus
6. Large Bus
8. Heavy Truck
9. Multi-axel Truck
10. Others20%
35%
40%
0%
10%
20%
30%
40%
50%
60%
70%
80%
90%
100%
7 8 9 10 11 12 13 14 15 16 17 18 19 20 21 22 23 0 1 2 3 4 5 6
Manthali-Banepa(A-B) Manthali-Bardibas(A-C) Banepa-Bardibas(B-C)
A
B
A
B
Khurkot

Data Collection Survey on the Sindhuli Road Capacity Enhancement in Nepal FINAL REPORT
8-21
Source: JICA Study Team
Figure 8.2-34 Shares of Heavy Vehicles of All Type Vehicles (By Direction), W/O Motorcycle
Figure 8.2-35 and Figure 8.2-36 illustrates traffic composition of cross sections at Ghurmi Way intersection.
The share of heavy vehicle excluding motorcycle at Manthali section (A) is 16%, at Banepa section (B) is
18% and at Bardibas section (C) is 20%.
Table 8.2-13 Shares of Heavy Vehicles on Cross Section at Ghurmi Way Intersection
Source: JICA Study Team
Table 8.2-14 Shares of Heavy Vehicles Excluding Motorcycle on Cross Section at Ghurmi Way
Intersection
Source: JICA Study Team
0%
10%
20%
30%
40%
50%
60%
70%
80%
90%
100%
7 8 9 10 11 12 13 14 15 16 17 18 19 20 21 22 23 0 1 2 3 4 5 6
Manthali-Banepa(A-B) Manthali-Bardibas(A-C) Banepa-Bardibas(B-C)
Ghurmi
section(A)%
Banepa
section(B)%
Bardibas
section(C)%
1,289 91% 3,865 89% 3,092 87%
Bus 57 4% 171 4% 138 4%
Truck 77 5% 324 7% 331 9%
1,423 100% 4,360 100% 3,561 100%
Classification
Light Vehicle
Heavy
Vehicle
Total
Ghurmi
section(A)%
Banepa
section(B)%
Bardibas
section(C)%
680 84% 2,270 82% 1,854 80%
Bus 57 7% 171 6% 138 6%
Truck 77 9% 324 12% 331 14%
814 100% 2,765 100% 2,323 100%
Heavy
Vehicle
Total
Light Vehicle
Classification
A
B
A
B
Khurkot

Data Collection Survey on the Sindhuli Road Capacity Enhancement in Nepal FINAL REPORT
8-22
Source: JICA Study Team
Figure 8.2-35 Traffic Composition on Cross Section at Ghurmi Way Intersection
Source: JICA Study Team
Figure 8.2-36 Traffic Composition on Cross Section at Ghurmi Way Intersection, Excluding
Motorcycle
Source: JICA Study Team
Figure 8.2-37 Hourly Shares of Heavy Vehicles on Cross Section at Ghurmi Way Intersection
43%
37%
35%
4%
9%
10%
31%
26%
24%
2%
10%
12%
2%
3%
4%
4%
4%
4%
0%
0%
0%
5%
7%
9%
9%
4%
2%
0% 20% 40% 60% 80% 100%
Ghurmisection(A)
Banepasection(B)
Bardibassection(C)
1. Motor Cycle
2. Car & Taxi
3. Utility Pick up
4. Micro Bus
7. Light Truck
5. Mini Bus
6. Large Bus
8. Heavy Truck
9. Multi-axel Truck
10. Others
9%
11%
13%
7%
15%
16%
54%
41%
36%
3%
16%
19%
4%
5%
6%
7%
6%
6%
0%
0%
0%
9%
12%
14%
15%
6%
3%
0% 20% 40% 60% 80% 100%
Ghurmisection(A)
Banepasection(B)
Bardibassection(C)
2. Car & Taxi
3. Utility Pick up
4. Micro Bus
7. Light Truck
5. Mini Bus
6. Large Bus
8. Heavy Truck
9. Multi-axel Truck
10. Others20%
16%
18%
0%
10%
20%
30%
40%
50%
60%
70%
80%
7 8 9 10 11 12 13 14 15 16 17 18 19 20 21 22 23 0 1 2 3 4 5 6
Ghurmi section(A) Banepa section(B) Bardibas section(C)
B
B
C C
Ghurmi Way
Share of Heavy Vehicle
Share of Heavy Vehicle
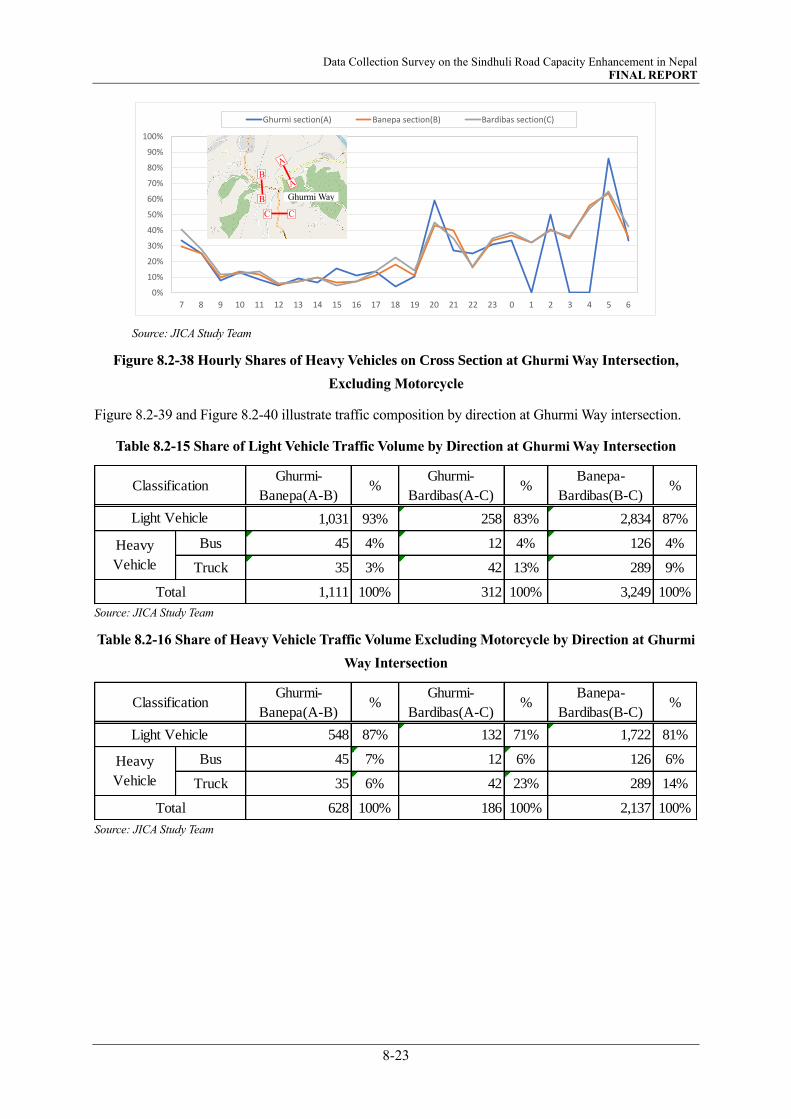
Data Collection Survey on the Sindhuli Road Capacity Enhancement in Nepal FINAL REPORT
8-23
Source: JICA Study Team
Figure 8.2-38 Hourly Shares of Heavy Vehicles on Cross Section at Ghurmi Way Intersection,
Excluding Motorcycle
Figure 8.2-39 and Figure 8.2-40 illustrate traffic composition by direction at Ghurmi Way intersection.
Table 8.2-15 Share of Light Vehicle Traffic Volume by Direction at Ghurmi Way Intersection
Source: JICA Study Team
Table 8.2-16 Share of Heavy Vehicle Traffic Volume Excluding Motorcycle by Direction at Ghurmi
Way Intersection
Source: JICA Study Team
0%
10%
20%
30%
40%
50%
60%
70%
80%
90%
100%
7 8 9 10 11 12 13 14 15 16 17 18 19 20 21 22 23 0 1 2 3 4 5 6
Ghurmi section(A) Banepa section(B) Bardibas section(C)
Ghurmi-
Banepa(A-B)%
Ghurmi-
Bardibas(A-C)%
Banepa-
Bardibas(B-C)%
1,031 93% 258 83% 2,834 87%
Bus 45 4% 12 4% 126 4%
Truck 35 3% 42 13% 289 9%
1,111 100% 312 100% 3,249 100%
Classification
Light Vehicle
Heavy
Vehicle
Total
Ghurmi-
Banepa(A-B)%
Ghurmi-
Bardibas(A-C)%
Banepa-
Bardibas(B-C)%
548 87% 132 71% 1,722 81%
Bus 45 7% 12 6% 126 6%
Truck 35 6% 42 23% 289 14%
628 100% 186 100% 2,137 100%
Classification
Light Vehicle
Heavy
Vehicle
Total
B
B
C C
Ghurmi Way
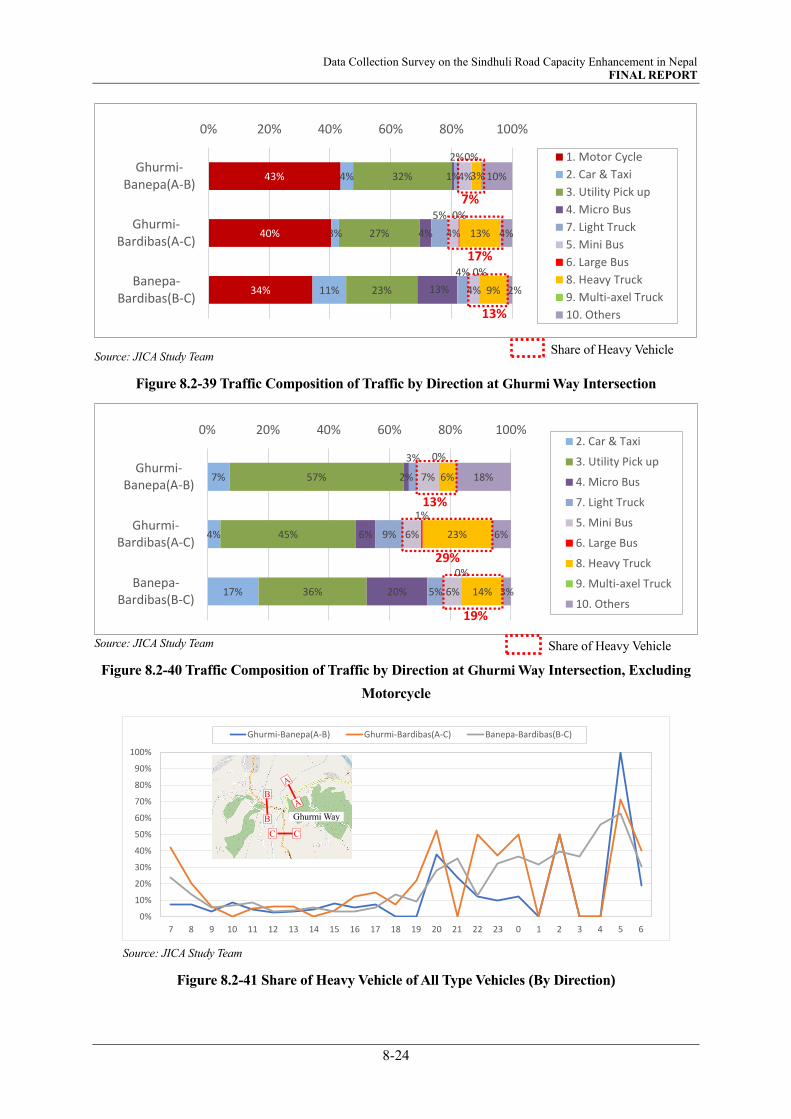
Data Collection Survey on the Sindhuli Road Capacity Enhancement in Nepal FINAL REPORT
8-24
Source: JICA Study Team
Figure 8.2-39 Traffic Composition of Traffic by Direction at Ghurmi Way Intersection
Source: JICA Study Team
Figure 8.2-40 Traffic Composition of Traffic by Direction at Ghurmi Way Intersection, Excluding
Motorcycle
Source: JICA Study Team
Figure 8.2-41 Share of Heavy Vehicle of All Type Vehicles (By Direction)
43%
40%
34%
4%
3%
11%
32%
27%
23%
1%
4%
13%
2%
5%
4%
4%
4%
4%
0%
0%
0%
3%
13%
9%
10%
4%
2%
0% 20% 40% 60% 80% 100%
Ghurmi-Banepa(A-B)
Ghurmi-Bardibas(A-C)
Banepa-Bardibas(B-C)
1. Motor Cycle
2. Car & Taxi
3. Utility Pick up
4. Micro Bus
7. Light Truck
5. Mini Bus
6. Large Bus
8. Heavy Truck
9. Multi-axel Truck
10. Others
7%
17%
13%
7%
4%
17%
57%
45%
36%
2%
6%
20%
3%
9%
5%
7%
6%
6%
0%
1%
0%
6%
23%
14%
18%
6%
3%
0% 20% 40% 60% 80% 100%
Ghurmi-Banepa(A-B)
Ghurmi-Bardibas(A-C)
Banepa-Bardibas(B-C)
2. Car & Taxi
3. Utility Pick up
4. Micro Bus
7. Light Truck
5. Mini Bus
6. Large Bus
8. Heavy Truck
9. Multi-axel Truck
10. Others19%
13%
29%
0%
10%
20%
30%
40%
50%
60%
70%
80%
90%
100%
7 8 9 10 11 12 13 14 15 16 17 18 19 20 21 22 23 0 1 2 3 4 5 6
Ghurmi-Banepa(A-B) Ghurmi-Bardibas(A-C) Banepa-Bardibas(B-C)
B
B
C C
Ghurmi Way
Share of Heavy Vehicle
Share of Heavy Vehicle

Data Collection Survey on the Sindhuli Road Capacity Enhancement in Nepal FINAL REPORT
8-25
Source: JICA Study Team
Figure 8.2-42 Share of Heavy Vehicle of All Type Vehicles (By Direction), W/O Motorcycle
8.2.4 Shares of Day–Night Time Traffic Volume
The shares of day-night time traffic volumes on 6 stations are shown in Table 8.2-17 — Table 8.2-21. The
shares of day-night time is between 1.12 and 1.77. It is relatively high at Sta.6 Nagdhunga. This means
that the traffic of nighttime is larger in comparison to other five stations.
Table 8.2-17 Shares of Day- Night Time Traffic Volumes
(veh.)
Source: JICA Study Team
Table 8.2-18 Shares of Day- Night Time Traffic Volumes on Cross Section at Khurkot Intersection
(veh.)
Source: JICA Study Team
0%
10%
20%
30%
40%
50%
60%
70%
80%
90%
100%
7 8 9 10 11 12 13 14 15 16 17 18 19 20 21 22 23 0 1 2 3 4 5 6
Ghurmi-Banepa(A-B) Ghurmi-Bardibas(A-C) Banepa-Bardibas(B-C)
1.Mangaltar 4.Near Bardibas 5.Lalgadh 6.Nagdhunga
Day time (7 am - 19 pm) 3,562 6,272 9,396 14,052
Night time (19 pm - 7 am) 819 1,496 2,920 10,750
Total 4,381 7,768 12,316 24,802
Total / Day time 1.23 1.24 1.31 1.77
Manthali
section(A)
Banepa
section(B)
Bardibas
section(C)
Day time (7 am - 19 pm) 1,666 3,801 3,953
Night time (19 pm - 7 am) 392 788 976
Total 2,058 4,589 4,929
Total / Day time 1.24 1.21 1.25
B
B
C C
Ghurmi Way
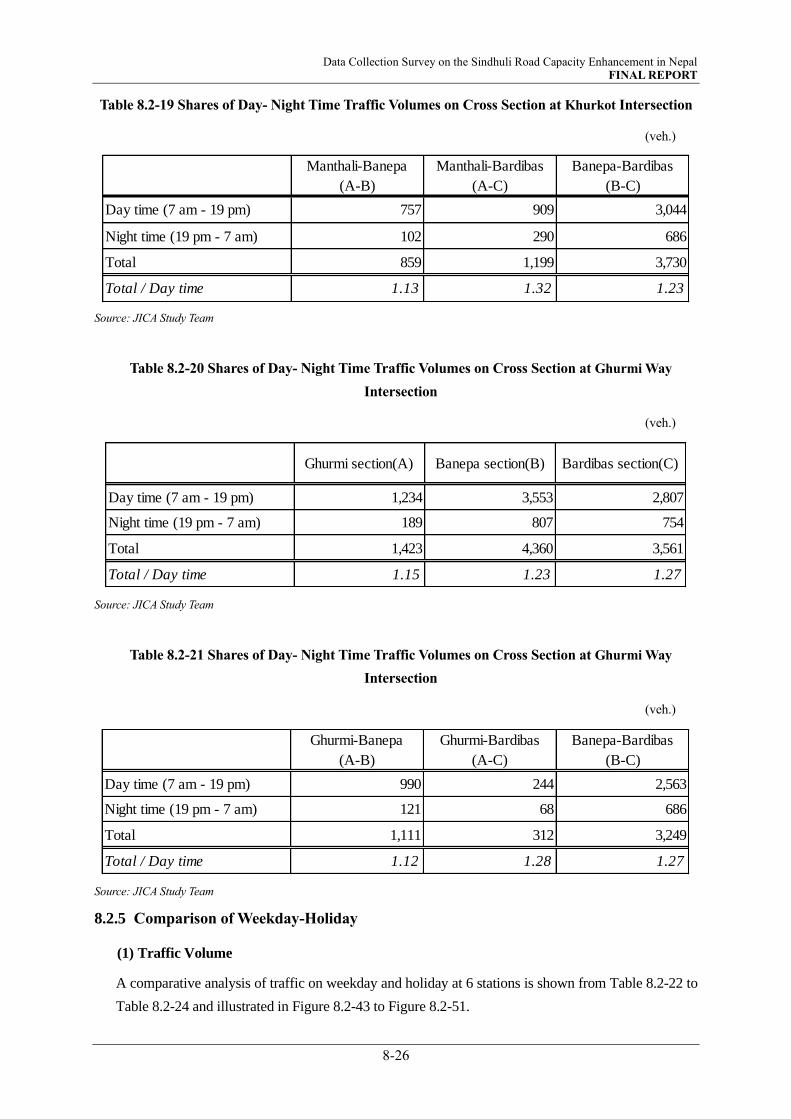
Data Collection Survey on the Sindhuli Road Capacity Enhancement in Nepal FINAL REPORT
8-26
Table 8.2-19 Shares of Day- Night Time Traffic Volumes on Cross Section at Khurkot Intersection
(veh.)
Source: JICA Study Team
Table 8.2-20 Shares of Day- Night Time Traffic Volumes on Cross Section at Ghurmi Way
Intersection
(veh.)
Source: JICA Study Team
Table 8.2-21 Shares of Day- Night Time Traffic Volumes on Cross Section at Ghurmi Way
Intersection
(veh.)
Source: JICA Study Team
8.2.5 Comparison of Weekday-Holiday
(1) Traffic Volume
A comparative analysis of traffic on weekday and holiday at 6 stations is shown from Table 8.2-22 to
Table 8.2-24 and illustrated in Figure 8.2-43 to Figure 8.2-51.
Manthali-Banepa
(A-B)
Manthali-Bardibas
(A-C)
Banepa-Bardibas
(B-C)
Day time (7 am - 19 pm) 757 909 3,044
Night time (19 pm - 7 am) 102 290 686
Total 859 1,199 3,730
Total / Day time 1.13 1.32 1.23
Ghurmi section(A) Banepa section(B) Bardibas section(C)
Day time (7 am - 19 pm) 1,234 3,553 2,807
Night time (19 pm - 7 am) 189 807 754
Total 1,423 4,360 3,561
Total / Day time 1.15 1.23 1.27
Ghurmi-Banepa
(A-B)
Ghurmi-Bardibas
(A-C)
Banepa-Bardibas
(B-C)
Day time (7 am - 19 pm) 990 244 2,563
Night time (19 pm - 7 am) 121 68 686
Total 1,111 312 3,249
Total / Day time 1.12 1.28 1.27
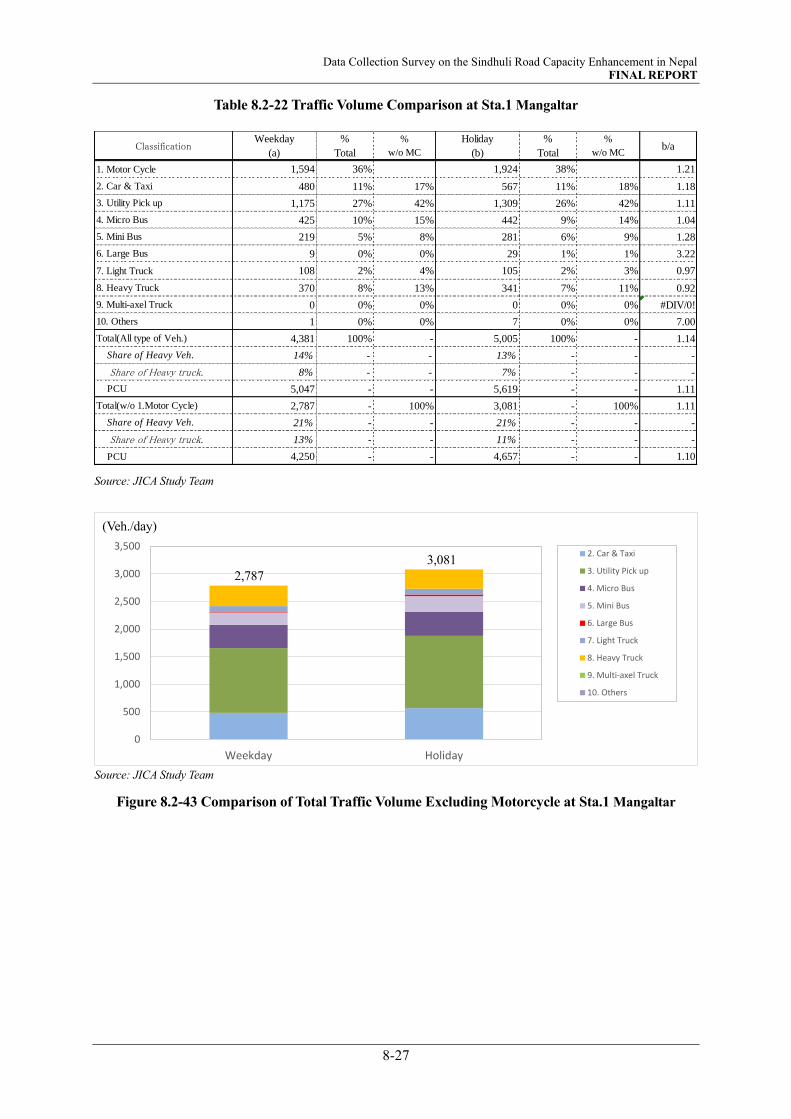
Data Collection Survey on the Sindhuli Road Capacity Enhancement in Nepal FINAL REPORT
8-27
Table 8.2-22 Traffic Volume Comparison at Sta.1 Mangaltar
Source: JICA Study Team
Source: JICA Study Team
Figure 8.2-43 Comparison of Total Traffic Volume Excluding Motorcycle at Sta.1 Mangaltar
ClassificationWeekday
(a)
%
Total
%
w/o MC
Holiday
(b)
%
Total
%
w/o MCb/a
1. Motor Cycle 1,594 36% 1,924 38% 1.21
2. Car & Taxi 480 11% 17% 567 11% 18% 1.18
3. Utility Pick up 1,175 27% 42% 1,309 26% 42% 1.11
4. Micro Bus 425 10% 15% 442 9% 14% 1.04
5. Mini Bus 219 5% 8% 281 6% 9% 1.28
6. Large Bus 9 0% 0% 29 1% 1% 3.22
7. Light Truck 108 2% 4% 105 2% 3% 0.97
8. Heavy Truck 370 8% 13% 341 7% 11% 0.92
9. Multi-axel Truck 0 0% 0% 0 0% 0% #DIV/0!
10. Others 1 0% 0% 7 0% 0% 7.00
Total(All type of Veh.) 4,381 100% - 5,005 100% - 1.14
Share of Heavy Veh. 14% - - 13% - - -
Share of Heavy truck. 8% - - 7% - - -
PCU 5,047 - - 5,619 - - 1.11
Total(w/o 1.Motor Cycle) 2,787 - 100% 3,081 - 100% 1.11
Share of Heavy Veh. 21% - - 21% - - -
Share of Heavy truck. 13% - - 11% - - -
PCU 4,250 - - 4,657 - - 1.10
0
500
1,000
1,500
2,000
2,500
3,000
3,500
Weekday Holiday
2. Car & Taxi
3. Utility Pick up
4. Micro Bus
5. Mini Bus
6. Large Bus
7. Light Truck
8. Heavy Truck
9. Multi-axel Truck
10. Others
(Veh./day)
2,787
3,081
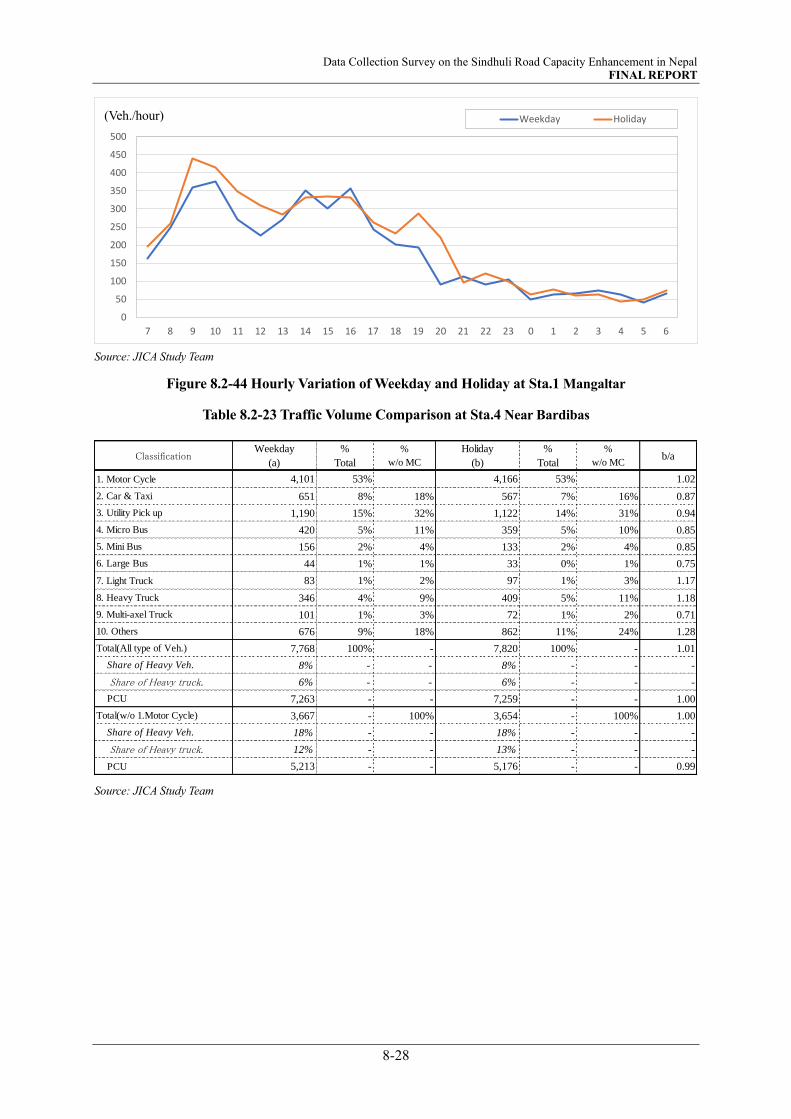
Data Collection Survey on the Sindhuli Road Capacity Enhancement in Nepal FINAL REPORT
8-28
Source: JICA Study Team
Figure 8.2-44 Hourly Variation of Weekday and Holiday at Sta.1 Mangaltar
Table 8.2-23 Traffic Volume Comparison at Sta.4 Near Bardibas
Source: JICA Study Team
0
50
100
150
200
250
300
350
400
450
500
7 8 9 10 11 12 13 14 15 16 17 18 19 20 21 22 23 0 1 2 3 4 5 6
Weekday Holiday
ClassificationWeekday
(a)
%
Total
%
w/o MC
Holiday
(b)
%
Total
%
w/o MCb/a
1. Motor Cycle 4,101 53% 4,166 53% 1.02
2. Car & Taxi 651 8% 18% 567 7% 16% 0.87
3. Utility Pick up 1,190 15% 32% 1,122 14% 31% 0.94
4. Micro Bus 420 5% 11% 359 5% 10% 0.85
5. Mini Bus 156 2% 4% 133 2% 4% 0.85
6. Large Bus 44 1% 1% 33 0% 1% 0.75
7. Light Truck 83 1% 2% 97 1% 3% 1.17
8. Heavy Truck 346 4% 9% 409 5% 11% 1.18
9. Multi-axel Truck 101 1% 3% 72 1% 2% 0.71
10. Others 676 9% 18% 862 11% 24% 1.28
Total(All type of Veh.) 7,768 100% - 7,820 100% - 1.01
Share of Heavy Veh. 8% - - 8% - - -
Share of Heavy truck. 6% - - 6% - - -
PCU 7,263 - - 7,259 - - 1.00
Total(w/o 1.Motor Cycle) 3,667 - 100% 3,654 - 100% 1.00
Share of Heavy Veh. 18% - - 18% - - -
Share of Heavy truck. 12% - - 13% - - -
PCU 5,213 - - 5,176 - - 0.99
(Veh./hour)
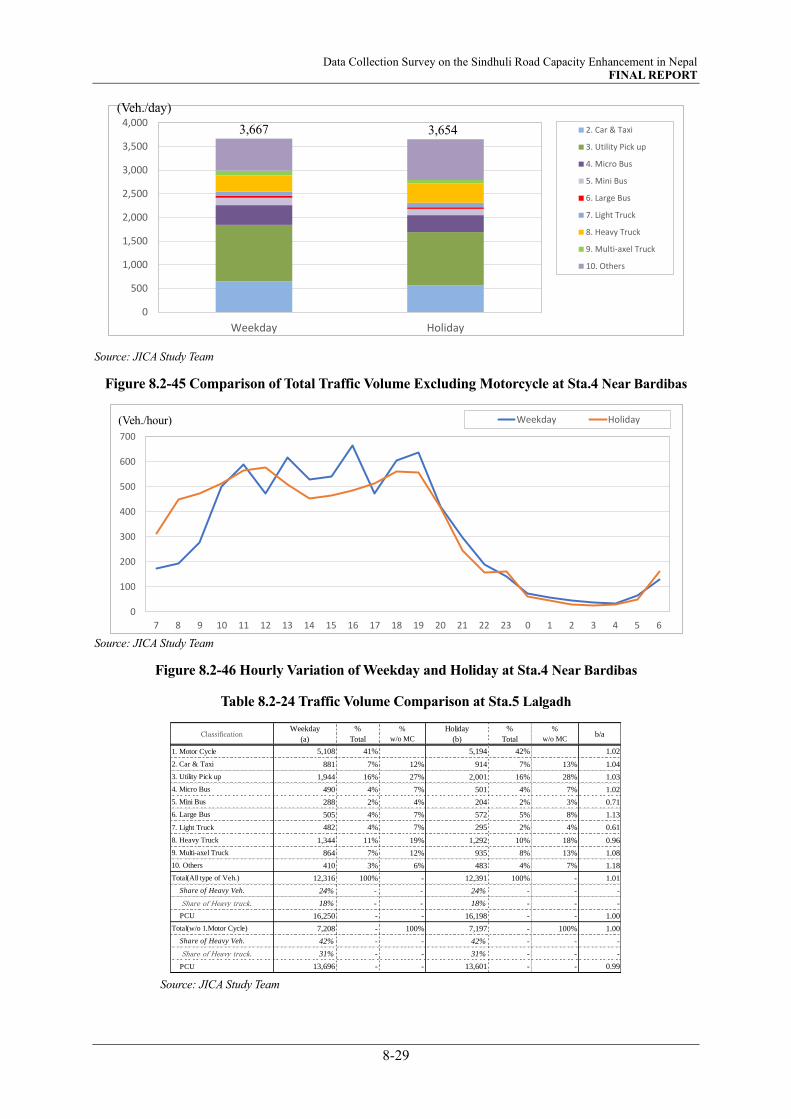
Data Collection Survey on the Sindhuli Road Capacity Enhancement in Nepal FINAL REPORT
8-29
Source: JICA Study Team
Figure 8.2-45 Comparison of Total Traffic Volume Excluding Motorcycle at Sta.4 Near Bardibas
Source: JICA Study Team
Figure 8.2-46 Hourly Variation of Weekday and Holiday at Sta.4 Near Bardibas
Table 8.2-24 Traffic Volume Comparison at Sta.5 Lalgadh
Source: JICA Study Team
0
500
1,000
1,500
2,000
2,500
3,000
3,500
4,000
Weekday Holiday
2. Car & Taxi
3. Utility Pick up
4. Micro Bus
5. Mini Bus
6. Large Bus
7. Light Truck
8. Heavy Truck
9. Multi-axel Truck
10. Others
0
100
200
300
400
500
600
700
7 8 9 10 11 12 13 14 15 16 17 18 19 20 21 22 23 0 1 2 3 4 5 6
Weekday Holiday
ClassificationWeekday
(a)
%
Total
%
w/o MC
Holiday
(b)
%
Total
%
w/o MCb/a
1. Motor Cycle 5,108 41% 5,194 42% 1.02
2. Car & Taxi 881 7% 12% 914 7% 13% 1.04
3. Utility Pick up 1,944 16% 27% 2,001 16% 28% 1.03
4. Micro Bus 490 4% 7% 501 4% 7% 1.02
5. Mini Bus 288 2% 4% 204 2% 3% 0.71
6. Large Bus 505 4% 7% 572 5% 8% 1.13
7. Light Truck 482 4% 7% 295 2% 4% 0.61
8. Heavy Truck 1,344 11% 19% 1,292 10% 18% 0.96
9. Multi-axel Truck 864 7% 12% 935 8% 13% 1.08
10. Others 410 3% 6% 483 4% 7% 1.18
Total(All type of Veh.) 12,316 100% - 12,391 100% - 1.01
Share of Heavy Veh. 24% - - 24% - - -
Share of Heavy truck. 18% - - 18% - - -
PCU 16,250 - - 16,198 - - 1.00
Total(w/o 1.Motor Cycle) 7,208 - 100% 7,197 - 100% 1.00
Share of Heavy Veh. 42% - - 42% - - -
Share of Heavy truck. 31% - - 31% - - -
PCU 13,696 - - 13,601 - - 0.99
(Veh./hour)
(Veh./day)
3,667 3,654
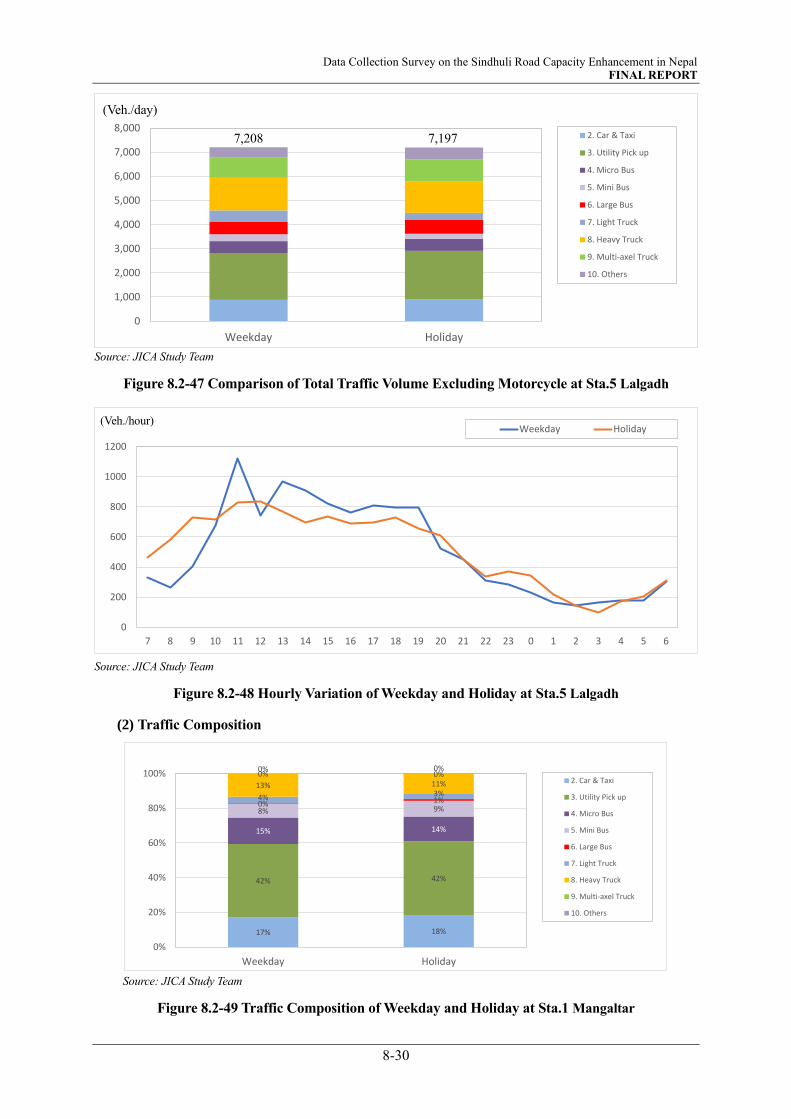
Data Collection Survey on the Sindhuli Road Capacity Enhancement in Nepal FINAL REPORT
8-30
Source: JICA Study Team
Figure 8.2-47 Comparison of Total Traffic Volume Excluding Motorcycle at Sta.5 Lalgadh
Source: JICA Study Team
Figure 8.2-48 Hourly Variation of Weekday and Holiday at Sta.5 Lalgadh
(2) Traffic Composition
Source: JICA Study Team
Figure 8.2-49 Traffic Composition of Weekday and Holiday at Sta.1 Mangaltar
0
1,000
2,000
3,000
4,000
5,000
6,000
7,000
8,000
Weekday Holiday
2. Car & Taxi
3. Utility Pick up
4. Micro Bus
5. Mini Bus
6. Large Bus
7. Light Truck
8. Heavy Truck
9. Multi-axel Truck
10. Others
0
200
400
600
800
1000
1200
7 8 9 10 11 12 13 14 15 16 17 18 19 20 21 22 23 0 1 2 3 4 5 6
Weekday Holiday
17% 18%
42% 42%
15% 14%
8% 9%0% 1%4% 3%
13% 11%0% 0%0% 0%
0%
20%
40%
60%
80%
100%
Weekday Holiday
2. Car & Taxi
3. Utility Pick up
4. Micro Bus
5. Mini Bus
6. Large Bus
7. Light Truck
8. Heavy Truck
9. Multi-axel Truck
10. Others
(Veh./hour)
(Veh./day)
7,208 7,197

Data Collection Survey on the Sindhuli Road Capacity Enhancement in Nepal FINAL REPORT
8-31
Source: JICA Study Team
Figure 8.2-50 Traffic Composition of Weekday and Holiday at Sta.4 Near Bardibas
Source: JICA Study Team
Figure 8.2-51 Traffic Composition of Weekday and Holiday at Sta.5 Lalgadh
(3) Ratio of Heavy Vehicle
The rate of heavy vehicle traffic is almost same tendency between weekday traffic and holiday traffic.
Table 8.2-25 Rate of Large Size Vehicle Traffic Excluding Motorcycle at Sta.1 Mangaltar
Source: JICA Study Team
18% 16%
32%31%
11%10%
4%4%
1%
1%
2%
3%
9%11%
3%2%
18% 24%
0%
20%
40%
60%
80%
100%
Weekday Holiday
2. Car & Taxi
3. Utility Pick up
4. Micro Bus
5. Mini Bus
6. Large Bus
7. Light Truck
8. Heavy Truck
9. Multi-axel Truck
10. Others
12% 13%
27% 28%
7% 7%4% 3%7% 8%
7% 4%
19% 18%
12% 13%
6% 7%
0%
20%
40%
60%
80%
100%
Weekday Holiday
2. Car & Taxi
3. Utility Pick up
4. Micro Bus
5. Mini Bus
6. Large Bus
7. Light Truck
8. Heavy Truck
9. Multi-axel Truck
10. Others
Weekday % Holiday %
2,189 79% 2,430 79%
Bus 228 8% 310 10%
Truck 370 13% 341 11%
2,787 100% 3,081 100%
Classification
Light Vehicle
Heavy
Vehicle
Total

Data Collection Survey on the Sindhuli Road Capacity Enhancement in Nepal FINAL REPORT
8-32
Source: JICA Study Team
Figure 8.2-52 Traffic Composition of Weekday and Holiday at Sta.1 Mangaltar
Table 8.2-26 Rate of Large Size Vehicle Traffic Excluding Motorcycle at Sta.4 Near Bardibas
Source: JICA Study Team
Source: JICA Study Team
Figure 8.2-53 Traffic Composition of Weekday and Holiday at Sta. 4 Near Bardibas
0%
10%
20%
30%
40%
50%
60%
70%
7 8 9 10 11 12 13 14 15 16 17 18 19 20 21 22 23 0 1 2 3 4 5 6
Weekday Holiday
Weekday % Holiday %
3,020 82% 3,007 82%
Bus 200 5% 166 5%
Truck 447 12% 481 13%
3,667 100% 3,654 100%
Classification
Light Vehicle
Heavy
Vehicle
Total
0%
10%
20%
30%
40%
50%
7 8 9 10 11 12 13 14 15 16 17 18 19 20 21 22 23 0 1 2 3 4 5 6
Weekday Holiday

Data Collection Survey on the Sindhuli Road Capacity Enhancement in Nepal FINAL REPORT
8-33
Table 8.2-27 Rate of Large Size Vehicle Traffic Excluding Motorcycle at Sta.5 Lalgadh
Source: JICA Study Team
Source: JICA Study Team
Figure 8.2-54 Traffic Composition of Weekday and Holiday at Sta.5 Lalgadh
8.2.6 Purpose of Trip
The results of the OD survey discussed in chapter 7 is covered hereunder. The share of travel purpose of
all types of vehicles excluding motorcycle on weekday at Sta.1 Mangaltar, Sta.4 Near Bardibas, Sta.5
Lalgadh and Sta.6 Nagdhunga are illustrated in from Figure 8.2-55 to Figure 8.2-58 and that of on holiday
are illustrated in from Figure 8.2-59 to Figure 8.2-61.
Source: JICA Study Team
Figure 8.2-55 Purpose of Trip by All Type of Vehicle Excluding Motorcycle on Weekday in Sta.1
Manglatar
Weekday % Holiday %
4,207 58% 4,194 58%
Bus 793 11% 776 11%
Truck 2,208 31% 2,227 31%
7,208 100% 7,197 100%
Classification
Light Vehicle
Heavy
Vehicle
Total
0%
10%
20%
30%
40%
50%
60%
70%
80%
7 8 9 10 11 12 13 14 15 16 17 18 19 20 21 22 23 0 1 2 3 4 5 6
Weekday Holiday
6%
0%
76%
18%
0% 0%
WORK
SCHOOL
BUSINESS
PRIVATE
LEASURE
OTHERS
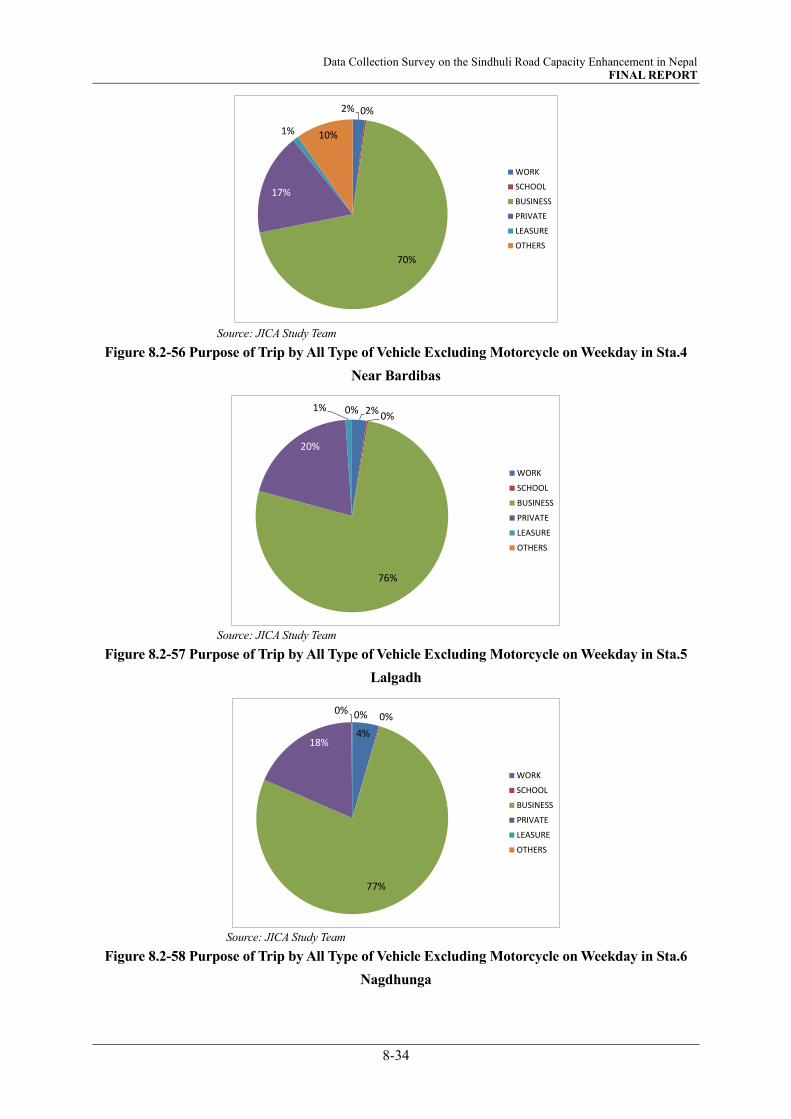
Data Collection Survey on the Sindhuli Road Capacity Enhancement in Nepal FINAL REPORT
8-34
Source: JICA Study Team
Figure 8.2-56 Purpose of Trip by All Type of Vehicle Excluding Motorcycle on Weekday in Sta.4
Near Bardibas
Source: JICA Study Team
Figure 8.2-57 Purpose of Trip by All Type of Vehicle Excluding Motorcycle on Weekday in Sta.5
Lalgadh
Source: JICA Study Team
Figure 8.2-58 Purpose of Trip by All Type of Vehicle Excluding Motorcycle on Weekday in Sta.6
Nagdhunga
2% 0%
70%
17%
1% 10%
WORK
SCHOOL
BUSINESS
PRIVATE
LEASURE
OTHERS
2% 0%
76%
20%
1% 0%
WORK
SCHOOL
BUSINESS
PRIVATE
LEASURE
OTHERS
4%
0%
77%
18%
0% 0%
WORK
SCHOOL
BUSINESS
PRIVATE
LEASURE
OTHERS

Data Collection Survey on the Sindhuli Road Capacity Enhancement in Nepal FINAL REPORT
8-35
Source: JICA Study Team
Figure 8.2-59 Purpose of Trip by All Type of Vehicle Excluding Motorcycle on Holiday in Sta.1
Manglatar
Source: JICA Study Team
Figure 8.2-60 Purpose of Trip by All Type of Vehicle Excluding Motorcycle on Holiday in Sta.4
Near Bardibas
Source: JICA Study Team
Figure 8.2-61 Purpose of Trip by All Type of Vehicle Excluding Motorcycle on Holiday in Sta.5
Lalgadh
3%
0%
72%
20%
5%
0%
WORK
SCHOOL
BUSINESS
PRIVATE
LEASURE
OTHERS
0% 0%
73%
25%
1%0%
WORK
SCHOOL
BUSINESS
PRIVATE
LEASURE
OTHERS
3%
0%
84%
12%
1% 0%
WORK
SCHOOL
BUSINESS
PRIVATE
LEASURE
OTHERS

Data Collection Survey on the Sindhuli Road Capacity Enhancement in Nepal FINAL REPORT
8-36
8.2.7 Commodity type
Commodity Type of Truck on weekday at Sta.1 Mangaltar , Sta.4 Near Bardibas , Sta.5 Lalgadh and Sta.6
Nagdhunga are illustrated in from Figure 8.2-62 to Figure 8.2-65 and that of on holiday are illustrated in
from Figure 8.2-66 to Figure 8.2-68.
*Truck; 7.Light Truck, 8.Heavy Truck, 9.Multi-axel Truck
Source: JICA Study Team
Figure 8.2-62 Commodity Type of Truck on Weekday in Sta.1 Manglatar
*Truck; 7.Light Truck, 8.Heavy Truck, 9.Multi-axel Truck
Source: JICA Study Team
Figure 8.2-63 Commodity Type of Truck on Weekday in Sta.4 Near Bardibas
10% 6%
16%15%
1%1%
54% 62%
1% 0%11% 10%
6% 6%
0%
10%
20%
30%
40%
50%
60%
70%
80%
90%
100%
Number of Volume Weigth
Fuel (Gas)
Agricultural product
Livestock products
Construction material
Machinery, Equipment
Food Product
Ohers
8% 4%
8%6%
4%
1%
48%
53%
3%3%
23%24%
6% 9%
0%
10%
20%
30%
40%
50%
60%
70%
80%
90%
100%
Number of Volume Weigth
Fuel (Gas)
Agricultural product
Livestock products
Construction material
Machinery, Equipment
Food Product
Ohers
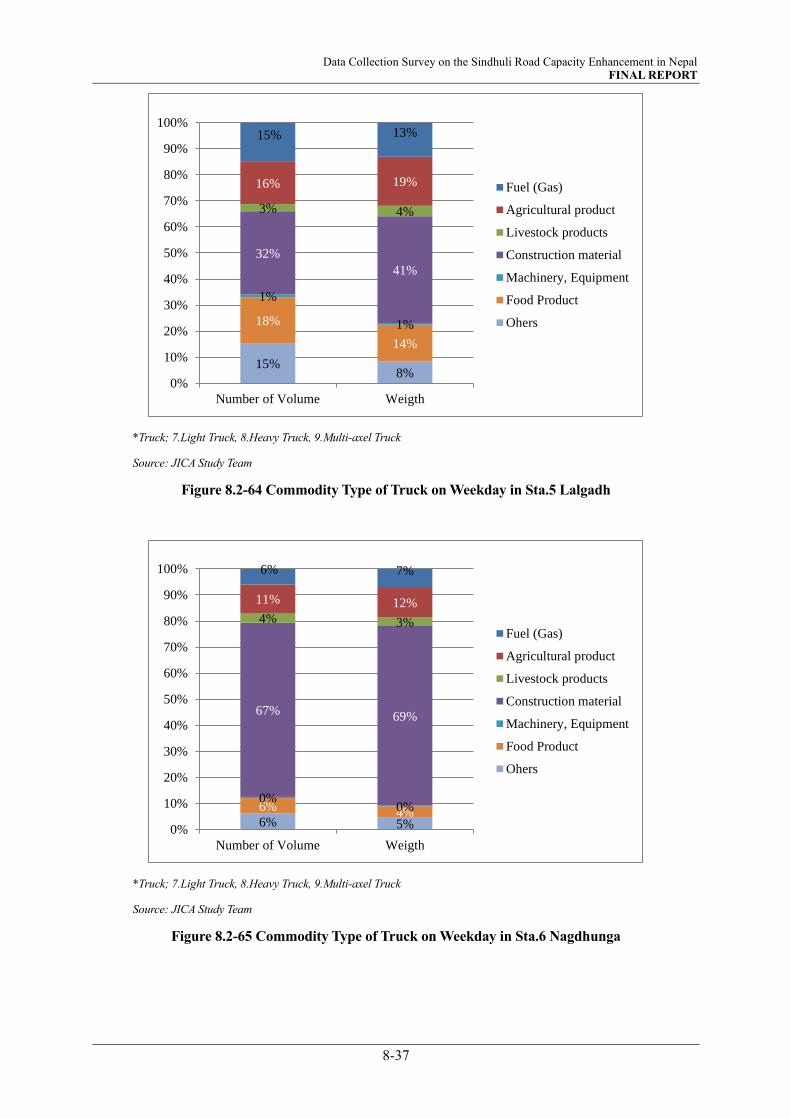
Data Collection Survey on the Sindhuli Road Capacity Enhancement in Nepal FINAL REPORT
8-37
*Truck; 7.Light Truck, 8.Heavy Truck, 9.Multi-axel Truck
Source: JICA Study Team
Figure 8.2-64 Commodity Type of Truck on Weekday in Sta.5 Lalgadh
*Truck; 7.Light Truck, 8.Heavy Truck, 9.Multi-axel Truck
Source: JICA Study Team
Figure 8.2-65 Commodity Type of Truck on Weekday in Sta.6 Nagdhunga
15%8%
18%
14%
1%
1%
32%
41%
3% 4%
16% 19%
15% 13%
0%
10%
20%
30%
40%
50%
60%
70%
80%
90%
100%
Number of Volume Weigth
Fuel (Gas)
Agricultural product
Livestock products
Construction material
Machinery, Equipment
Food Product
Ohers
6% 5%
6% 4%0%
0%
67% 69%
4% 3%
11% 12%
6% 7%
0%
10%
20%
30%
40%
50%
60%
70%
80%
90%
100%
Number of Volume Weigth
Fuel (Gas)
Agricultural product
Livestock products
Construction material
Machinery, Equipment
Food Product
Ohers
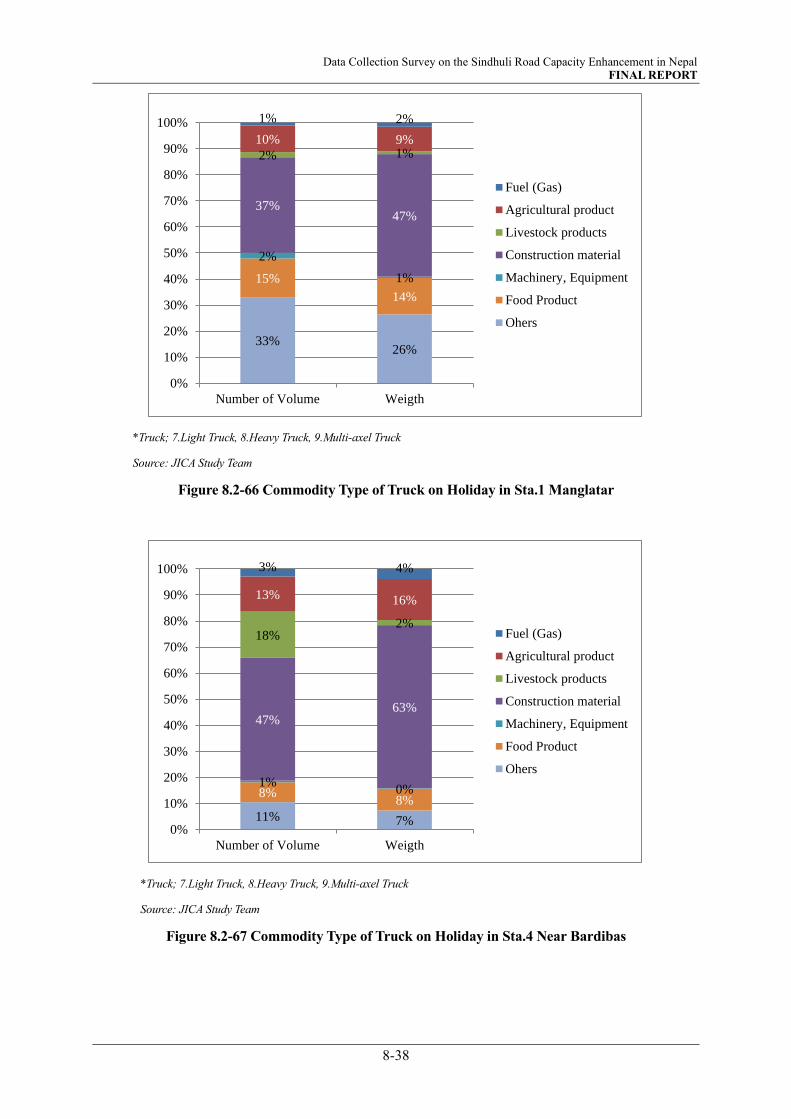
Data Collection Survey on the Sindhuli Road Capacity Enhancement in Nepal FINAL REPORT
8-38
*Truck; 7.Light Truck, 8.Heavy Truck, 9.Multi-axel Truck
Source: JICA Study Team
Figure 8.2-66 Commodity Type of Truck on Holiday in Sta.1 Manglatar
*Truck; 7.Light Truck, 8.Heavy Truck, 9.Multi-axel Truck
Source: JICA Study Team
Figure 8.2-67 Commodity Type of Truck on Holiday in Sta.4 Near Bardibas
33%26%
15%
14%
2%
1%
37%47%
2% 1%10% 9%
1% 2%
0%
10%
20%
30%
40%
50%
60%
70%
80%
90%
100%
Number of Volume Weigth
Fuel (Gas)
Agricultural product
Livestock products
Construction material
Machinery, Equipment
Food Product
Ohers
11% 7%
8%8%
1%0%
47%63%
18%2%
13% 16%
3% 4%
0%
10%
20%
30%
40%
50%
60%
70%
80%
90%
100%
Number of Volume Weigth
Fuel (Gas)
Agricultural product
Livestock products
Construction material
Machinery, Equipment
Food Product
Ohers

Data Collection Survey on the Sindhuli Road Capacity Enhancement in Nepal FINAL REPORT
8-39
*Truck; 7.Light Truck, 8.Heavy Truck, 9.Multi-axel Truck
Source: JICA Study Team
Figure 8.2-68 Commodity Type of Truck on Holiday in Sta.5 Lalgadh
8.2.8 Origin-Destination Matrix at Road
(1) Sta.1 Manglatar
Origin-Destination Matrix of All Type Vehicles Excluding Motorcycle at Sta.1 Manglatar is shown in
Table 8.2-28 and Table 8.2-29. From Origin- Destination Matrix of total traffic, the largest traffic
passing Section Ⅳ (Manglatar) is between Kathmandu & Latipur (zone 5) and Eastern (zone 10),
accounting for about 39%. And the Second Larger traffic passing is between Kathmandu & Latipur
(zone 5) and Central North-East (zone 9), accounting for about 16%. In addition, there are a lot of
traffic from Sindhuli Road Area.
From the result of desire line of All Type Vehicles, the short-length or mid-length trip is major trip.
This trend is the same on weekdays and holidays.
14% 10%
9%8%
4%
3%
53%60%
3% 2%8% 6%
8% 10%
0%
10%
20%
30%
40%
50%
60%
70%
80%
90%
100%
Number of Volume Weigth
Fuel (Gas)
Agricultural product
Livestock products
Construction material
Machinery, Equipment
Food Product
Ohers
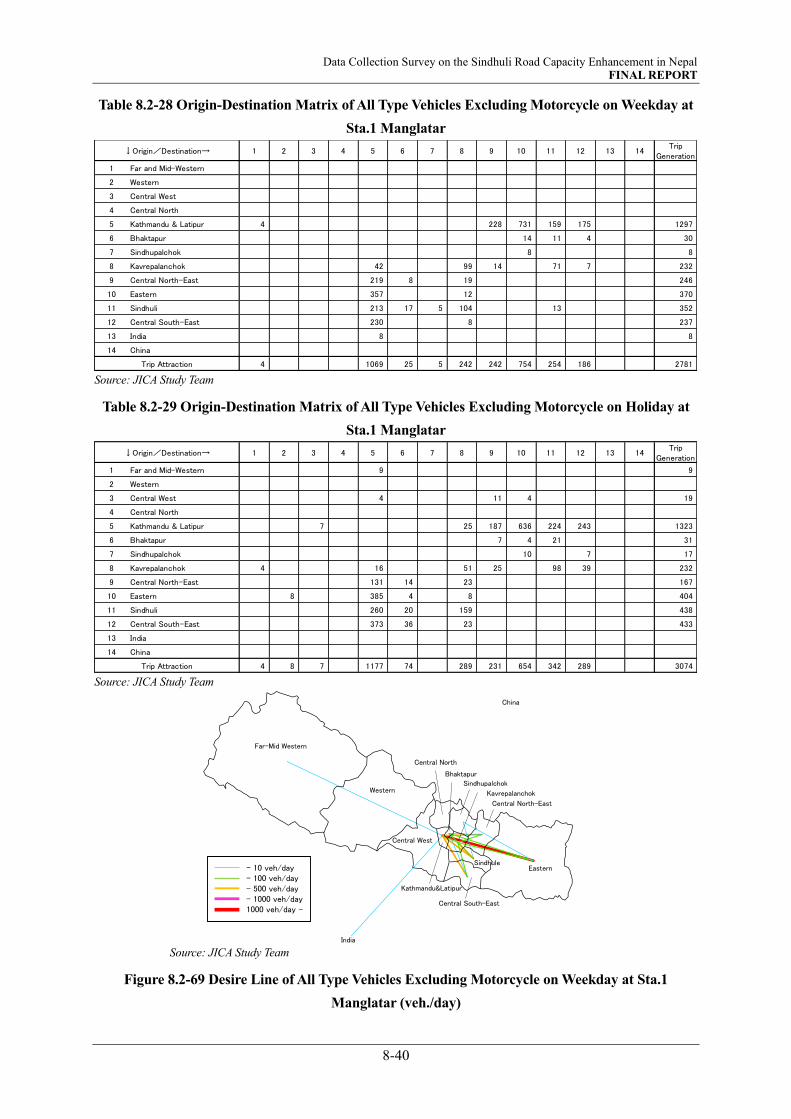
Data Collection Survey on the Sindhuli Road Capacity Enhancement in Nepal FINAL REPORT
8-40
Table 8.2-28 Origin-Destination Matrix of All Type Vehicles Excluding Motorcycle on Weekday at
Sta.1 Manglatar
Source: JICA Study Team
Table 8.2-29 Origin-Destination Matrix of All Type Vehicles Excluding Motorcycle on Holiday at
Sta.1 Manglatar
Source: JICA Study Team
Source: JICA Study Team
Figure 8.2-69 Desire Line of All Type Vehicles Excluding Motorcycle on Weekday at Sta.1
Manglatar (veh./day)
1 2 3 4 5 6 7 8 9 10 11 12 13 14Trip
Generation
1 Far and Mid-Western
2 Western
3 Central West
4 Central North
5 Kathmandu & Latipur 4 228 731 159 175 1297
6 Bhaktapur 14 11 4 30
7 Sindhupalchok 8 8
8 Kavrepalanchok 42 99 14 71 7 232
9 Central North-East 219 8 19 246
10 Eastern 357 12 370
11 Sindhuli 213 17 5 104 13 352
12 Central South-East 230 8 237
13 India 8 8
14 China
4 1069 25 5 242 242 754 254 186 2781
↓Origin/Destination→
Trip Attraction
1 2 3 4 5 6 7 8 9 10 11 12 13 14Trip
Generation
1 Far and Mid-Western 9 9
2 Western
3 Central West 4 11 4 19
4 Central North
5 Kathmandu & Latipur 7 25 187 636 224 243 1323
6 Bhaktapur 7 4 21 31
7 Sindhupalchok 10 7 17
8 Kavrepalanchok 4 16 51 25 98 39 232
9 Central North-East 131 14 23 167
10 Eastern 8 385 4 8 404
11 Sindhuli 260 20 159 438
12 Central South-East 373 36 23 433
13 India
14 China
4 8 7 1177 74 289 231 654 342 289 3074
↓Origin/Destination→
Trip Attraction
India
China
- 10 veh/day- 100 veh/day- 500 veh/day- 1000 veh/day1000 veh/day -
Eastern
Kathmandu&Latipur
Far-Mid Western
Western
Central North-East
Sindhupalchok
Kavrepalanchok
Sindhule
Central South-East
Central North
Central West
Bhaktapur
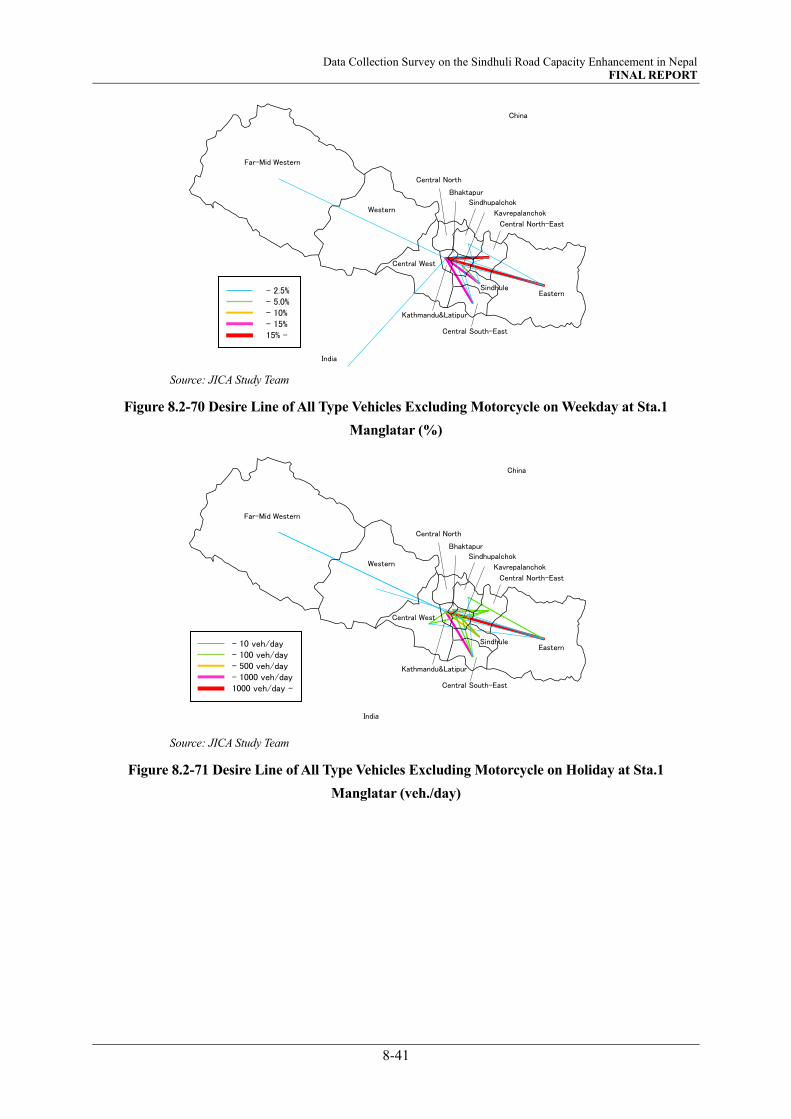
Data Collection Survey on the Sindhuli Road Capacity Enhancement in Nepal FINAL REPORT
8-41
Source: JICA Study Team
Figure 8.2-70 Desire Line of All Type Vehicles Excluding Motorcycle on Weekday at Sta.1
Manglatar (%)
Source: JICA Study Team
Figure 8.2-71 Desire Line of All Type Vehicles Excluding Motorcycle on Holiday at Sta.1
Manglatar (veh./day)
India
China
- 2.5%- 5.0%- 10%- 15%15% -
Eastern
Kathmandu&Latipur
Far-Mid Western
Western
Central North-East
Sindhupalchok
Kavrepalanchok
Sindhule
Central South-East
Central North
Central West
Bhaktapur
India
China
Eastern
Kathmandu&Latipur
Far-Mid Western
Western
Central North-East
Sindhupalchok
Kavrepalanchok
Sindhule
Central South-East
Central North
Central West
Bhaktapur
- 10 veh/day- 100 veh/day- 500 veh/day- 1000 veh/day1000 veh/day -
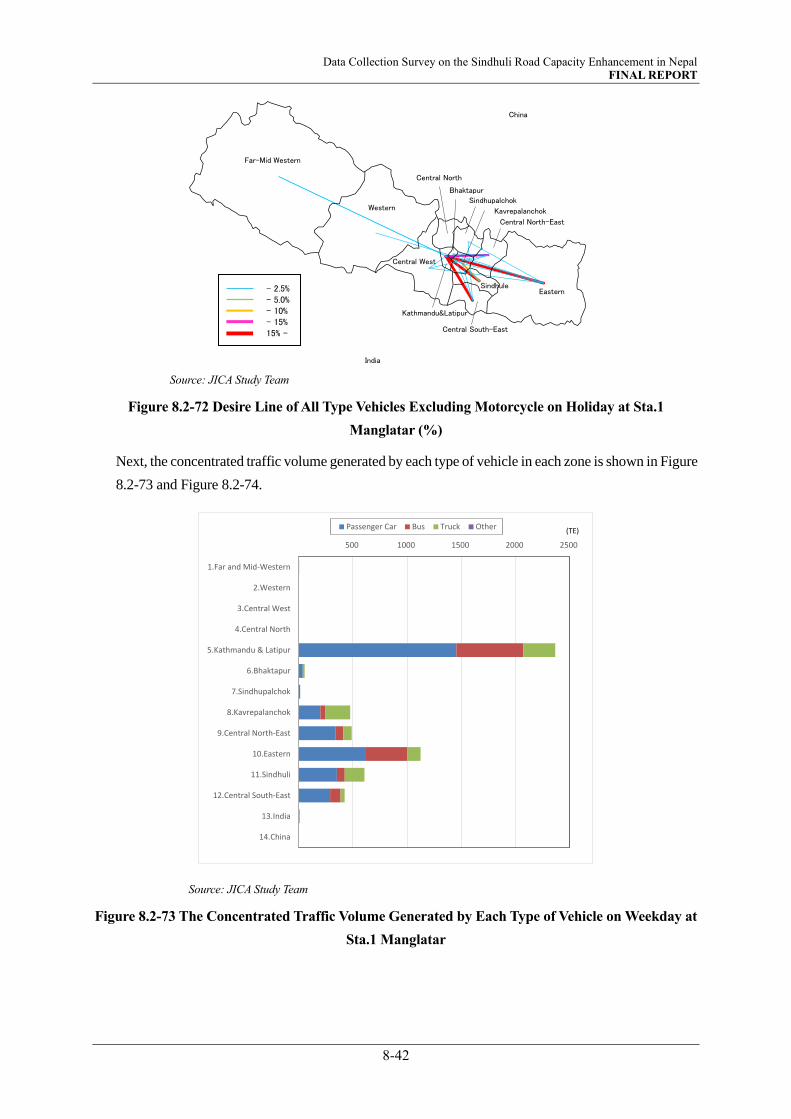
Data Collection Survey on the Sindhuli Road Capacity Enhancement in Nepal FINAL REPORT
8-42
Source: JICA Study Team
Figure 8.2-72 Desire Line of All Type Vehicles Excluding Motorcycle on Holiday at Sta.1
Manglatar (%)
Next, the concentrated traffic volume generated by each type of vehicle in each zone is shown in Figure
8.2-73 and Figure 8.2-74.
Source: JICA Study Team
Figure 8.2-73 The Concentrated Traffic Volume Generated by Each Type of Vehicle on Weekday at
Sta.1 Manglatar
India
China
- 2.5%- 5.0%- 10%- 15%15% -
Eastern
Kathmandu&Latipur
Far-Mid Western
Western
Central North-East
Sindhupalchok
Kavrepalanchok
Sindhule
Central South-East
Central North
Central West
Bhaktapur
500 1000 1500 2000 2500
1.Far and Mid-Western
2.Western
3.Central West
4.Central North
5.Kathmandu & Latipur
6.Bhaktapur
7.Sindhupalchok
8.Kavrepalanchok
9.Central North-East
10.Eastern
11.Sindhuli
12.Central South-East
13.India
14.China
Passenger Car Bus Truck Other (TE)

Data Collection Survey on the Sindhuli Road Capacity Enhancement in Nepal FINAL REPORT
8-43
Source: JICA Study Team
Figure 8.2-74 The Concentrated Traffic Volume Generated by Each Type of Vehicle on Holiday at
Sta.1 Manglatar
Origin-Destination Matrix of passenger car is shown in Table 8.2-30 and Table 8.2-31. From the result
of Origin-Destination matrix of passenger car, the short-length or mid-length trip is major trip of
passenger trip. In particular, the large OD pair is the trip in Kathmandu & Latipur (zone 5) and Eastern
(zone 10).
Table 8.2-30 Origin-Destination Matrix of Passenger Car on Weekday at Sta.1 Manglatar
Source: JICA Study Team
500 1000 1500 2000 2500 3000
1.Far and Mid-Western
2.Western
3.Central West
4.Central North
5.Kathmandu & Latipur
6.Bhaktapur
7.Sindhupalchok
8.Kavrepalanchok
9.Central North-East
10.Eastern
11.Sindhuli
12.Central South-East
13.India
14.China
Passenger Car Bus Truck Other (TE)
1 2 3 4 5 6 7 8 9 10 11 12 13 14Trip
Generation
1 Far and Mid-Western
2 Western
3 Central West
4 Central North
5 Kathmandu & Latipur 4 167 435 112 119 836
6 Bhaktapur 4 4 4 13
7 Sindhupalchok 8 8
8 Kavrepalanchok 12 44 20 4 80
9 Central North-East 167 8 174
10 Eastern 152 12 165
11 Sindhuli 123 17 5 56 8 208
12 Central South-East 156 8 163
13 India 8 8
14 China
4 618 25 5 120 167 447 144 126 1655
↓Origin/Destination→
Trip Attraction

Data Collection Survey on the Sindhuli Road Capacity Enhancement in Nepal FINAL REPORT
8-44
Table 8.2-31 Origin-Destination Matrix of Passenger Car on Holiday at Sta.1 Manglatar
Source: JICA Study Team
Source: JICA Study Team
Figure 8.2-75 Desire Line of Passenger Car on Weekday at Sta.1 Manglatar (veh./day)
Source: JICA Study Team
Figure 8.2-76 Desire Line of Passenger Car on Weekday at Sta.1 Manglatar (%)
1 2 3 4 5 6 7 8 9 10 11 12 13 14Trip
Generation
1 Far and Mid-Western
2 Western
3 Central West 7 7
4 Central North
5 Kathmandu & Latipur 7 6 116 312 181 164 786
6 Bhaktapur 7 13 20
7 Sindhupalchok 7 7
8 Kavrepalanchok 8 35 7 46 20 116
9 Central North-East 86 10 8 103
10 Eastern 8 204 8 219
11 Sindhuli 181 8 76 265
12 Central South-East 297 36 19 353
13 India
14 China
8 7 775 54 151 137 320 240 184 1876
↓Origin/Destination→
Trip Attraction
India
China
Eastern
Kathmandu&Latipur
Far-Mid Western
Western
Central North-East
Sindhupalchok
Kavrepalanchok
Sindhule
Central South-East
Central North
Central West
Bhaktapur
- 10 veh/day- 100 veh/day- 500 veh/day- 1000 veh/day1000 veh/day -
India
China
- 2.5%- 5.0%- 10%- 15%15% -
Eastern
Kathmandu&Latipur
Far-Mid Western
Western
Central North-East
Sindhupalchok
Kavrepalanchok
Sindhule
Central South-East
Central North
Central West
Bhaktapur
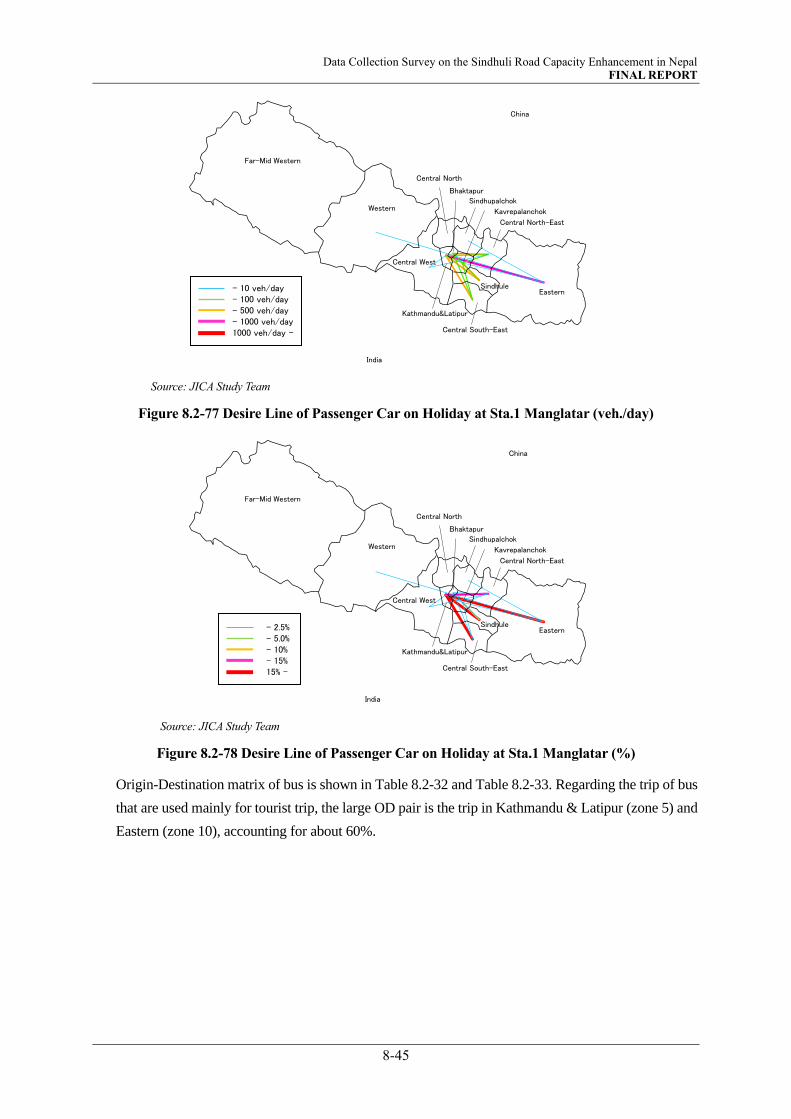
Data Collection Survey on the Sindhuli Road Capacity Enhancement in Nepal FINAL REPORT
8-45
Source: JICA Study Team
Figure 8.2-77 Desire Line of Passenger Car on Holiday at Sta.1 Manglatar (veh./day)
Source: JICA Study Team
Figure 8.2-78 Desire Line of Passenger Car on Holiday at Sta.1 Manglatar (%)
Origin-Destination matrix of bus is shown in Table 8.2-32 and Table 8.2-33. Regarding the trip of bus
that are used mainly for tourist trip, the large OD pair is the trip in Kathmandu & Latipur (zone 5) and
Eastern (zone 10), accounting for about 60%.
India
China
Eastern
Kathmandu&Latipur
Far-Mid Western
Western
Central North-East
Sindhupalchok
Kavrepalanchok
Sindhule
Central South-East
Central North
Central West
Bhaktapur
- 10 veh/day- 100 veh/day- 500 veh/day- 1000 veh/day1000 veh/day -
India
China
- 2.5%- 5.0%- 10%- 15%15% -
Eastern
Kathmandu&Latipur
Far-Mid Western
Western
Central North-East
Sindhupalchok
Kavrepalanchok
Sindhule
Central South-East
Central North
Central West
Bhaktapur
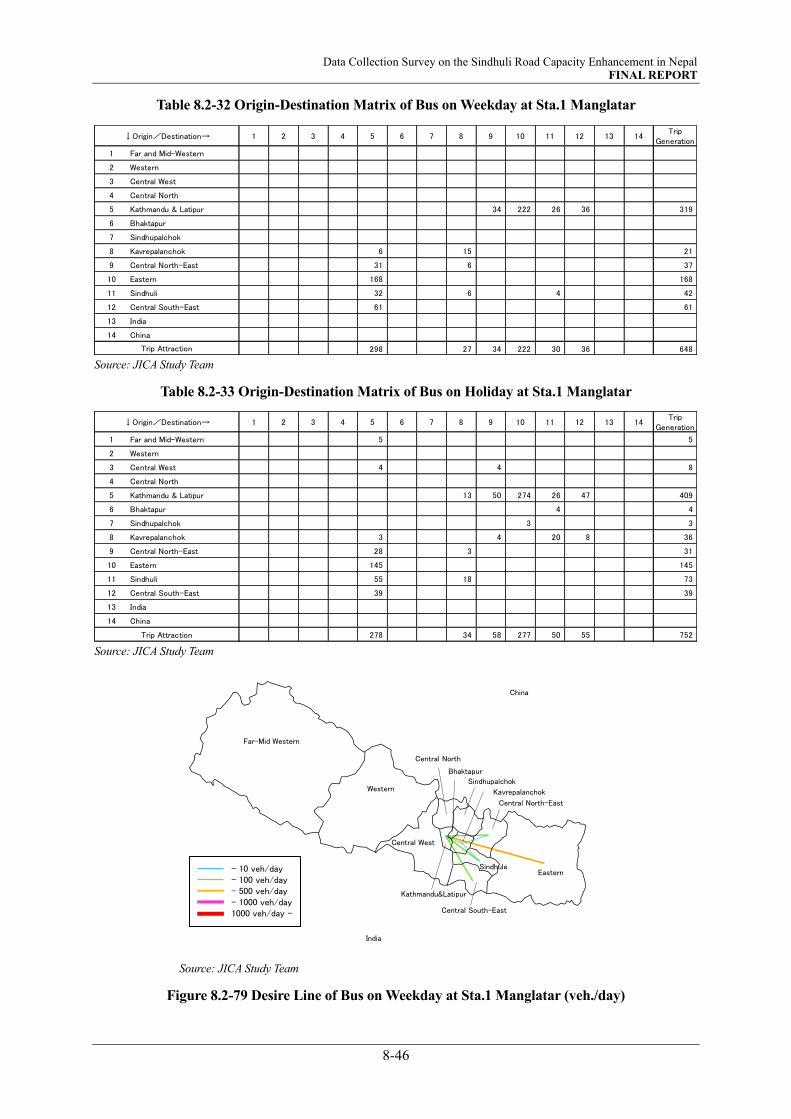
Data Collection Survey on the Sindhuli Road Capacity Enhancement in Nepal FINAL REPORT
8-46
Table 8.2-32 Origin-Destination Matrix of Bus on Weekday at Sta.1 Manglatar
Source: JICA Study Team
Table 8.2-33 Origin-Destination Matrix of Bus on Holiday at Sta.1 Manglatar
Source: JICA Study Team
Source: JICA Study Team
Figure 8.2-79 Desire Line of Bus on Weekday at Sta.1 Manglatar (veh./day)
1 2 3 4 5 6 7 8 9 10 11 12 13 14Trip
Generation
1 Far and Mid-Western
2 Western
3 Central West
4 Central North
5 Kathmandu & Latipur 34 222 26 36 319
6 Bhaktapur
7 Sindhupalchok
8 Kavrepalanchok 6 15 21
9 Central North-East 31 6 37
10 Eastern 168 168
11 Sindhuli 32 6 4 42
12 Central South-East 61 61
13 India
14 China
298 27 34 222 30 36 648
↓Origin/Destination→
Trip Attraction
1 2 3 4 5 6 7 8 9 10 11 12 13 14Trip
Generation
1 Far and Mid-Western 5 5
2 Western
3 Central West 4 4 8
4 Central North
5 Kathmandu & Latipur 13 50 274 26 47 409
6 Bhaktapur 4 4
7 Sindhupalchok 3 3
8 Kavrepalanchok 3 4 20 8 36
9 Central North-East 28 3 31
10 Eastern 145 145
11 Sindhuli 55 18 73
12 Central South-East 39 39
13 India
14 China
278 34 58 277 50 55 752
↓Origin/Destination→
Trip Attraction
India
China
Eastern
Kathmandu&Latipur
Far-Mid Western
Western
Central North-East
Sindhupalchok
Kavrepalanchok
Sindhule
Central South-East
Central North
Central West
Bhaktapur
- 10 veh/day- 100 veh/day- 500 veh/day- 1000 veh/day1000 veh/day -

Data Collection Survey on the Sindhuli Road Capacity Enhancement in Nepal FINAL REPORT
8-47
Source: JICA Study Team
Figure 8.2-80 Desire Line of Bus on Weekday at Sta.1 Manglatar (%)
Source: JICA Study Team
Figure 8.2-81 Desire Line of Bus on Holiday at Sta.1 Manglatar (veh./day)
India
China
- 2.5%- 5.0%- 10%- 15%15% -
Eastern
Kathmandu&Latipur
Far-Mid Western
Western
Central North-East
Sindhupalchok
Kavrepalanchok
Sindhule
Central South-East
Central North
Central West
Bhaktapur
India
China
Eastern
Kathmandu&Latipur
Far-Mid Western
Western
Central North-East
Sindhupalchok
Kavrepalanchok
Sindhule
Central South-East
Central North
Central West
Bhaktapur
- 10 veh/day- 100 veh/day- 500 veh/day- 1000 veh/day1000 veh/day -
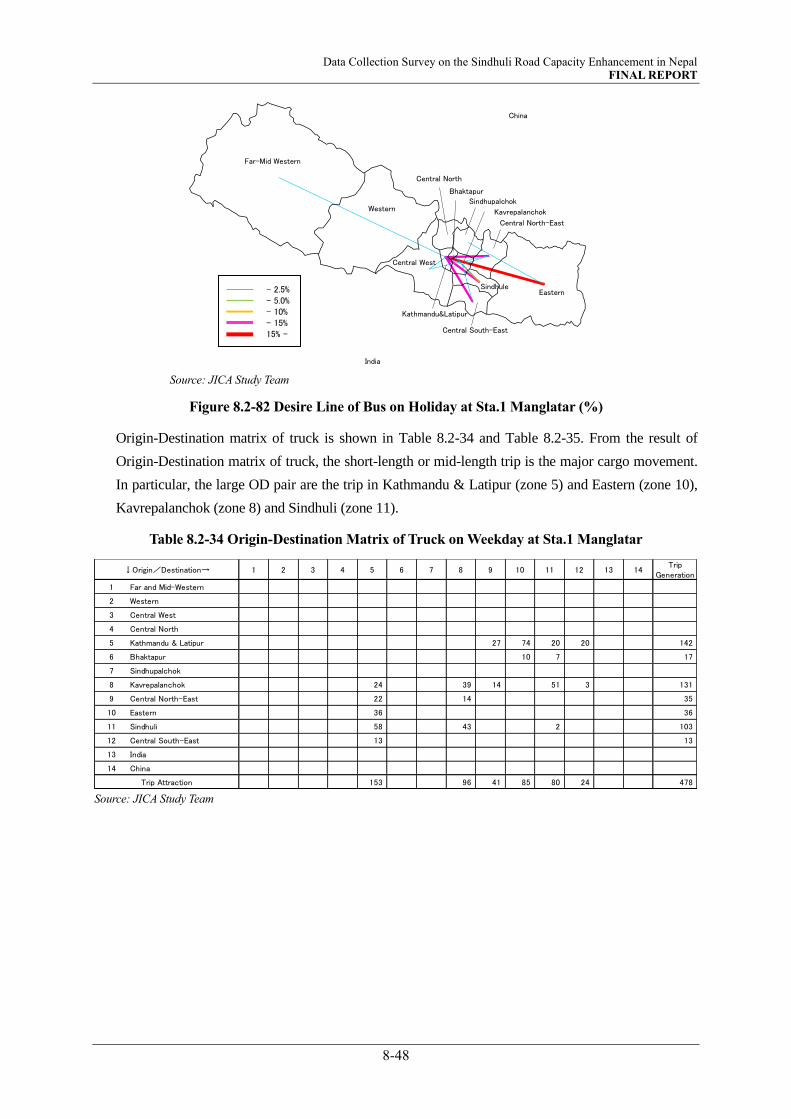
Data Collection Survey on the Sindhuli Road Capacity Enhancement in Nepal FINAL REPORT
8-48
Source: JICA Study Team
Figure 8.2-82 Desire Line of Bus on Holiday at Sta.1 Manglatar (%)
Origin-Destination matrix of truck is shown in Table 8.2-34 and Table 8.2-35. From the result of
Origin-Destination matrix of truck, the short-length or mid-length trip is the major cargo movement.
In particular, the large OD pair are the trip in Kathmandu & Latipur (zone 5) and Eastern (zone 10),
Kavrepalanchok (zone 8) and Sindhuli (zone 11).
Table 8.2-34 Origin-Destination Matrix of Truck on Weekday at Sta.1 Manglatar
Source: JICA Study Team
India
China
- 2.5%- 5.0%- 10%- 15%15% -
Eastern
Kathmandu&Latipur
Far-Mid Western
Western
Central North-East
Sindhupalchok
Kavrepalanchok
Sindhule
Central South-East
Central North
Central West
Bhaktapur
1 2 3 4 5 6 7 8 9 10 11 12 13 14Trip
Generation
1 Far and Mid-Western
2 Western
3 Central West
4 Central North
5 Kathmandu & Latipur 27 74 20 20 142
6 Bhaktapur 10 7 17
7 Sindhupalchok
8 Kavrepalanchok 24 39 14 51 3 131
9 Central North-East 22 14 35
10 Eastern 36 36
11 Sindhuli 58 43 2 103
12 Central South-East 13 13
13 India
14 China
153 96 41 85 80 24 478
↓Origin/Destination→
Trip Attraction

Data Collection Survey on the Sindhuli Road Capacity Enhancement in Nepal FINAL REPORT
8-49
Table 8.2-35 Origin-Destination Matrix of Truck on Holiday at Sta.1 Manglatar
Source: JICA Study Team
Source: JICA Study Team
Figure 8.2-83 Desire Line of Truck on Weekday at Sta.1 Manglatar (veh./day)
Source: JICA Study Team
Figure 8.2-84 Desire Line of Truck on Weekday at Sta.1 Manglatar (%)
1 2 3 4 5 6 7 8 9 10 11 12 13 14Trip
Generation
1 Far and Mid-Western 4 4
2 Western
3 Central West 4 4
4 Central North
5 Kathmandu & Latipur 7 21 50 18 32 128
6 Bhaktapur 4 4 7
7 Sindhupalchok 7 7
8 Kavrepalanchok 4 6 16 14 32 10 81
9 Central North-East 18 4 12 34
10 Eastern 37 4 41
11 Sindhuli 23 12 64 100
12 Central South-East 37 4 41
13 India
14 China
4 124 20 104 35 57 53 50 446
↓Origin/Destination→
Trip Attraction
India
China
Eastern
Kathmandu&Latipur
Far-Mid Western
Western
Central North-East
Sindhupalchok
Kavrepalanchok
Sindhule
Central South-East
Central North
Central West
Bhaktapur
- 10 veh/day- 100 veh/day- 500 veh/day- 1000 veh/day1000 veh/day -
India
China
- 2.5%- 5.0%- 10%- 15%15% -
Eastern
Kathmandu&Latipur
Far-Mid Western
Western
Central North-East
Sindhupalchok
Kavrepalanchok
Sindhule
Central South-East
Central North
Central West
Bhaktapur
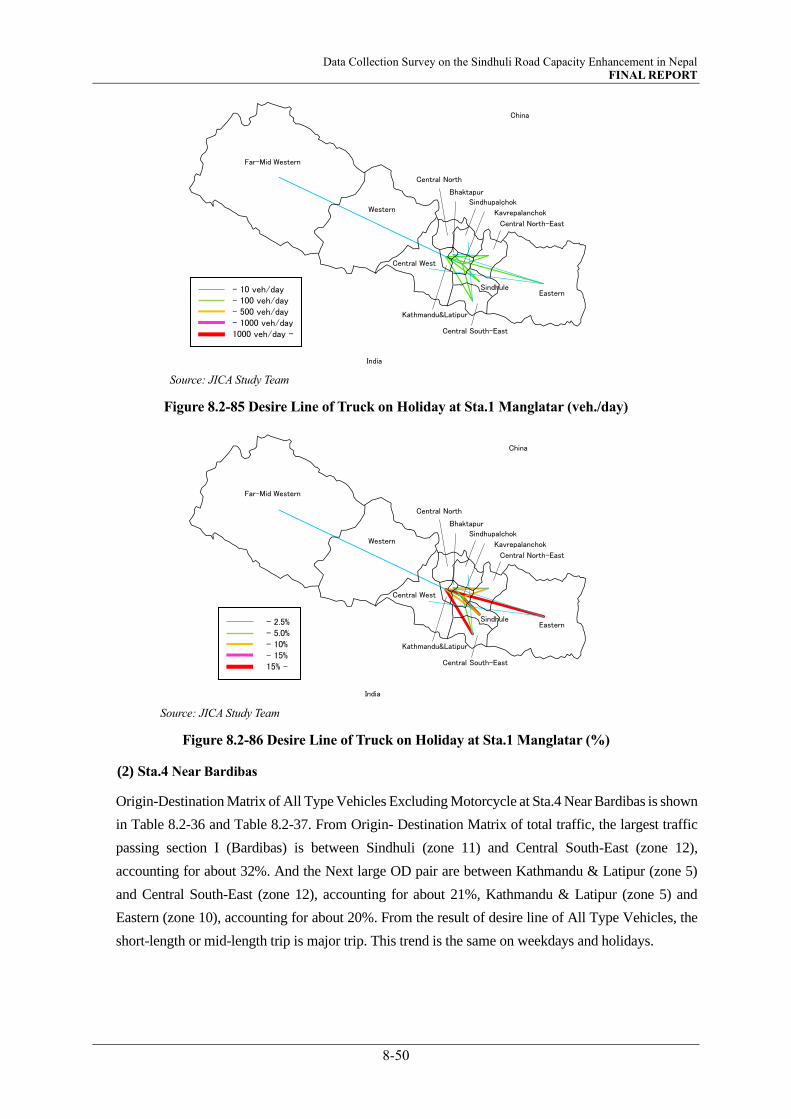
Data Collection Survey on the Sindhuli Road Capacity Enhancement in Nepal FINAL REPORT
8-50
Source: JICA Study Team
Figure 8.2-85 Desire Line of Truck on Holiday at Sta.1 Manglatar (veh./day)
Source: JICA Study Team
Figure 8.2-86 Desire Line of Truck on Holiday at Sta.1 Manglatar (%)
(2) Sta.4 Near Bardibas
Origin-Destination Matrix of All Type Vehicles Excluding Motorcycle at Sta.4 Near Bardibas is shown
in Table 8.2-36 and Table 8.2-37. From Origin- Destination Matrix of total traffic, the largest traffic
passing section Ⅰ (Bardibas) is between Sindhuli (zone 11) and Central South-East (zone 12),
accounting for about 32%. And the Next large OD pair are between Kathmandu & Latipur (zone 5)
and Central South-East (zone 12), accounting for about 21%, Kathmandu & Latipur (zone 5) and
Eastern (zone 10), accounting for about 20%. From the result of desire line of All Type Vehicles, the
short-length or mid-length trip is major trip. This trend is the same on weekdays and holidays.
India
China
Eastern
Kathmandu&Latipur
Far-Mid Western
Western
Central North-East
Sindhupalchok
Kavrepalanchok
Sindhule
Central South-East
Central North
Central West
Bhaktapur
- 10 veh/day- 100 veh/day- 500 veh/day- 1000 veh/day1000 veh/day -
India
China
- 2.5%- 5.0%- 10%- 15%15% -
Eastern
Kathmandu&Latipur
Far-Mid Western
Western
Central North-East
Sindhupalchok
Kavrepalanchok
Sindhule
Central South-East
Central North
Central West
Bhaktapur

Data Collection Survey on the Sindhuli Road Capacity Enhancement in Nepal FINAL REPORT
8-51
Table 8.2-36 Origin-Destination Matrix of All Type Vehicles Excluding Motorcycle on Weekday at
Sta. 4 Near Bardibas
Source: JICA Study Team
Table 8.2-37 Origin-Destination Matrix of All Type Vehicles Excluding Motorcycle on Holiday at
Sta. 4 Near Bardibas
Source: JICA Study Team
Source: JICA Study Team
Figure 8.2-87 Desire Line of All Type Vehicles Excluding Motorcycle on Weekday at Sta.4 Near
Bardibas (veh./day)
1 2 3 4 5 6 7 8 9 10 11 12 13 14Trip
Generation
1 Far and Mid-Western 2 10 12
2 Western 6 2 13 21
3 Central West 2 2 10 28 17 49 6 114
4 Central North
5 Kathmandu & Latipur 5 30 333 3 394 5 770
6 Bhaktapur 5 8 15 28
7 Sindhupalchok
8 Kavrepalanchok 10 15 25
9 Central North-East 23 23 50 96
10 Eastern 3 3 406 14 6 15 29 56 15 546
11 Sindhuli 3 30 4 24 2 498 562
12 Central South-East 10 389 4 25 53 15 671 326 1493
13 India
14 China
10 103 809 14 4 42 96 461 803 1320 5 3667
↓Origin/Destination→
Trip Attraction
1 2 3 4 5 6 7 8 9 10 11 12 13 14Trip
Generation
1 Far and Mid-Western 5 5
2 Western 2 2 5 9
3 Central West 25 14 14 39 92
4 Central North
5 Kathmandu & Latipur 44 268 359 670
6 Bhaktapur 1 8 9
7 Sindhupalchok 8 8
8 Kavrepalanchok 4 13 17
9 Central North-East 11 13 41 66
10 Eastern 2 16 229 7 7 95 11 367
11 Sindhuli 4 49 27 360 440
12 Central South-East 551 2 43 14 362 118 1090
13 India
14 China
6 120 805 2 7 66 350 506 910 2772
↓Origin/Destination→
Trip Attraction
India
China
Eastern
Kathmandu&Latipur
Far-Mid Western
Western
Central North-East
Sindhupalchok
Kavrepalanchok
Sindhule
Central South-East
Central North
Central West
Bhaktapur
- 10 veh/day- 100 veh/day- 500 veh/day- 1000 veh/day1000 veh/day -

Data Collection Survey on the Sindhuli Road Capacity Enhancement in Nepal FINAL REPORT
8-52
Source: JICA Study Team
Figure 8.2-88 Desire Line of All Type Vehicles Excluding Motorcycle on Weekday at Sta.4 Near
Bardibas (%)
Source: JICA Study Team
Figure 8.2-89 Desire Line of All Type Vehicles Excluding Motorcycle on Holiday at Sta.4 Near
Bardibas (veh./day)
India
China
- 2.5%- 5.0%- 10%- 15%15% -
Eastern
Kathmandu&Latipur
Far-Mid Western
Western
Central North-East
Sindhupalchok
Kavrepalanchok
Sindhule
Central South-East
Central North
Central West
Bhaktapur
India
China
Eastern
Kathmandu&Latipur
Far-Mid Western
Western
Central North-East
Sindhupalchok
Kavrepalanchok
Sindhule
Central South-East
Central North
Central West
Bhaktapur
- 10 veh/day- 100 veh/day- 500 veh/day- 1000 veh/day1000 veh/day -
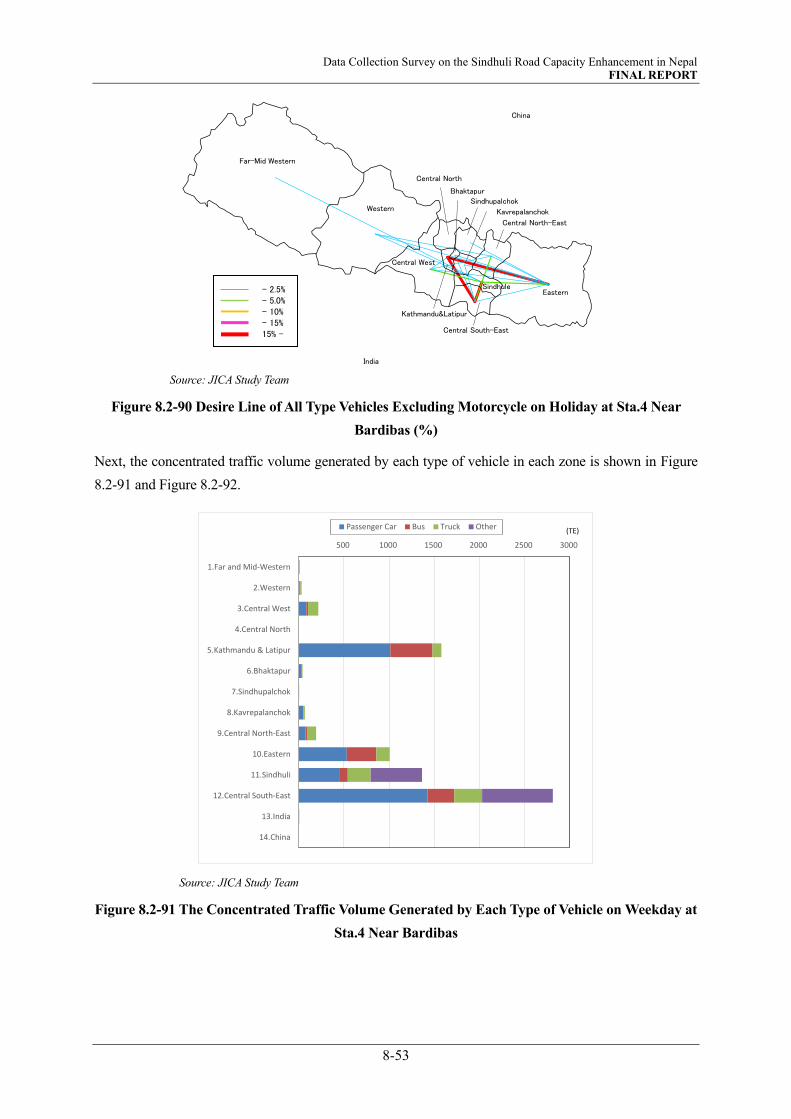
Data Collection Survey on the Sindhuli Road Capacity Enhancement in Nepal FINAL REPORT
8-53
Source: JICA Study Team
Figure 8.2-90 Desire Line of All Type Vehicles Excluding Motorcycle on Holiday at Sta.4 Near
Bardibas (%)
Next, the concentrated traffic volume generated by each type of vehicle in each zone is shown in Figure
8.2-91 and Figure 8.2-92.
Source: JICA Study Team
Figure 8.2-91 The Concentrated Traffic Volume Generated by Each Type of Vehicle on Weekday at
Sta.4 Near Bardibas
India
China
- 2.5%- 5.0%- 10%- 15%15% -
Eastern
Kathmandu&Latipur
Far-Mid Western
Western
Central North-East
Sindhupalchok
Kavrepalanchok
Sindhule
Central South-East
Central North
Central West
Bhaktapur
500 1000 1500 2000 2500 3000
1.Far and Mid-Western
2.Western
3.Central West
4.Central North
5.Kathmandu & Latipur
6.Bhaktapur
7.Sindhupalchok
8.Kavrepalanchok
9.Central North-East
10.Eastern
11.Sindhuli
12.Central South-East
13.India
14.China
Passenger Car Bus Truck Other (TE)

Data Collection Survey on the Sindhuli Road Capacity Enhancement in Nepal FINAL REPORT
8-54
Source: JICA Study Team
Figure 8.2-92 The Concentrated Traffic Volume Generated by Each Type of Vehicle on Holiday at
Sta.4 Near Bardibas
Origin-Destination Matrix of passenger car is shown in Table 8.2-38 and Table 8.2-39. From the result
of Origin-Destination matrix of passenger car, the short-length or mid-length trip is major trip of
passenger trip. In particular, the large OD pair is the trip in Kathmandu & Latipur (zone 5) and Central
South-East (zone 12).
Table 8.2-38 Origin-Destination Matrix of Passenger Car on Weekday at Sta.4 Near Bardibas
Source: JICA Study Team
500 1000 1500 2000 2500
1.Far and Mid-Western
2.Western
3.Central West
4.Central North
5.Kathmandu & Latipur
6.Bhaktapur
7.Sindhupalchok
8.Kavrepalanchok
9.Central North-East
10.Eastern
11.Sindhuli
12.Central South-East
13.India
14.China
Passenger Car Bus Truck Other (TE)
1 2 3 4 5 6 7 8 9 10 11 12 13 14Trip
Generation
1 Far and Mid-Western 6 6
2 Western 6 6
3 Central West 10 16 6 32
4 Central North
5 Kathmandu & Latipur 5 21 188 277 5 497
6 Bhaktapur 5 5 10 20
7 Sindhupalchok
8 Kavrepalanchok 5 10 15
9 Central North-East 5 15 27 48
10 Eastern 205 12 4 24 28 273
11 Sindhuli 10 4 16 158 189
12 Central South-East 10 301 4 19 26 5 209 180 755
13 India
14 China
5 52 517 12 4 33 26 259 258 668 5 1841
↓Origin/Destination→
Trip Attraction

Data Collection Survey on the Sindhuli Road Capacity Enhancement in Nepal FINAL REPORT
8-55
Table 8.2-39 Origin-Destination Matrix of Passenger Car on Holiday at Sta.4 Near Bardibas
Source: JICA Study Team
Source: JICA Study Team
Figure 8.2-93 Desire Line of Passenger Car on Weekday at Sta.4 Near Bardibas (veh./day)
Source: JICA Study Team
Figure 8.2-94 Desire Line of Passenger Car on Weekday at Sta.4 Near Bardibas (%)
1 2 3 4 5 6 7 8 9 10 11 12 13 14Trip
Generation
1 Far and Mid-Western 5 5
2 Western
3 Central West 22 11 33
4 Central North
5 Kathmandu & Latipur 27 114 284 424
6 Bhaktapur 8 8
7 Sindhupalchok 4 4
8 Kavrepalanchok 13 13
9 Central North-East 9 9
10 Eastern 134 5 5 32 176
11 Sindhuli 4 13 17 223 257
12 Central South-East 442 10 10 202 95 759
13 India
14 China
4 39 598 5 15 146 250 632 1689
↓Origin/Destination→
Trip Attraction
India
China
Eastern
Kathmandu&Latipur
Far-Mid Western
Western
Central North-East
Sindhupalchok
Kavrepalanchok
Sindhule
Central South-East
Central North
Central West
Bhaktapur
- 10 veh/day- 100 veh/day- 500 veh/day- 1000 veh/day1000 veh/day -
India
China
- 2.5%- 5.0%- 10%- 15%15% -
Eastern
Kathmandu&Latipur
Far-Mid Western
Western
Central North-East
Sindhupalchok
Kavrepalanchok
Sindhule
Central South-East
Central North
Central West
Bhaktapur
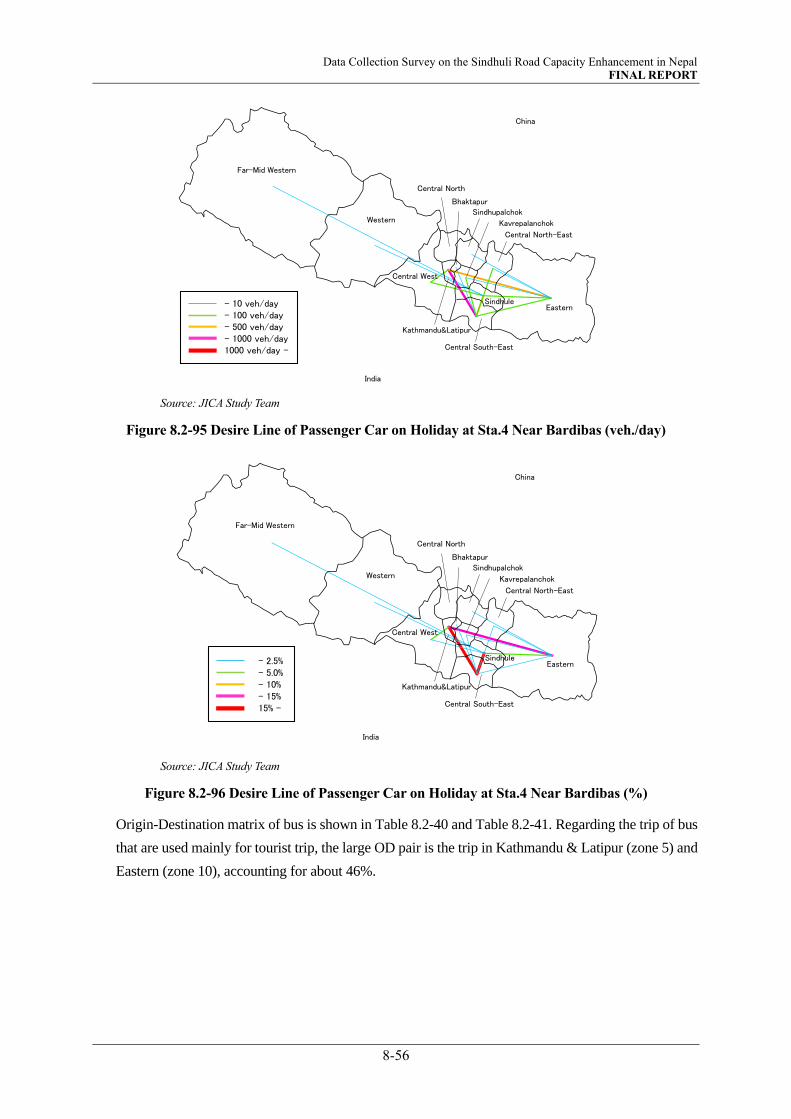
Data Collection Survey on the Sindhuli Road Capacity Enhancement in Nepal FINAL REPORT
8-56
Source: JICA Study Team
Figure 8.2-95 Desire Line of Passenger Car on Holiday at Sta.4 Near Bardibas (veh./day)
Source: JICA Study Team
Figure 8.2-96 Desire Line of Passenger Car on Holiday at Sta.4 Near Bardibas (%)
Origin-Destination matrix of bus is shown in Table 8.2-40 and Table 8.2-41. Regarding the trip of bus
that are used mainly for tourist trip, the large OD pair is the trip in Kathmandu & Latipur (zone 5) and
Eastern (zone 10), accounting for about 46%.
India
China
Eastern
Kathmandu&Latipur
Far-Mid Western
Western
Central North-East
Sindhupalchok
Kavrepalanchok
Sindhule
Central South-East
Central North
Central West
Bhaktapur
- 10 veh/day- 100 veh/day- 500 veh/day- 1000 veh/day1000 veh/day -
India
China
- 2.5%- 5.0%- 10%- 15%15% -
Eastern
Kathmandu&Latipur
Far-Mid Western
Western
Central North-East
Sindhupalchok
Kavrepalanchok
Sindhule
Central South-East
Central North
Central West
Bhaktapur

Data Collection Survey on the Sindhuli Road Capacity Enhancement in Nepal FINAL REPORT
8-57
Table 8.2-40 Origin-Destination Matrix of Bus on Weekday at Sta.4 Near Bardibas
Source: JICA Study Team
Table 8.2-41 Origin-Destination Matrix of Bus on Holiday at Sta.4 Near Bardibas
Source: JICA Study Team
Source: JICA Study Team
Figure 8.2-97 Desire Line of Bus on Weekday at Sta.4 Near Bardibas (veh./day)
1 2 3 4 5 6 7 8 9 10 11 12 13 14Trip
Generation
1 Far and Mid-Western
2 Western 4 4
3 Central West 2 11 13
4 Central North
5 Kathmandu & Latipur 116 3 110 228
6 Bhaktapur 5 5
7 Sindhupalchok
8 Kavrepalanchok 3 3
9 Central North-East 3 3 3 8
10 Eastern 3 172 2 4 5 7 2 195
11 Sindhuli 3 20 22
12 Central South-East 67 2 5 48 18 141
13 India
14 China
3 5 239 2 8 132 73 157 620
↓Origin/Destination→
Trip Attraction
1 2 3 4 5 6 7 8 9 10 11 12 13 14Trip
Generation
1 Far and Mid-Western
2 Western
3 Central West 2 2 4
4 Central North
5 Kathmandu & Latipur 7 123 60 191
6 Bhaktapur
7 Sindhupalchok
8 Kavrepalanchok 4 4
9 Central North-East 4 2 6
10 Eastern 2 95 2 2 4 2 107
11 Sindhuli 2 2 30 34
12 Central South-East 88 2 65 4 159
13 India
14 China
2 13 185 2 4 131 71 96 505
↓Origin/Destination→
Trip Attraction
India
China
Eastern
Kathmandu&Latipur
Far-Mid Western
Western
Central North-East
Sindhupalchok
Kavrepalanchok
Sindhule
Central South-East
Central North
Central West
Bhaktapur
- 10 veh/day- 100 veh/day- 500 veh/day- 1000 veh/day1000 veh/day -
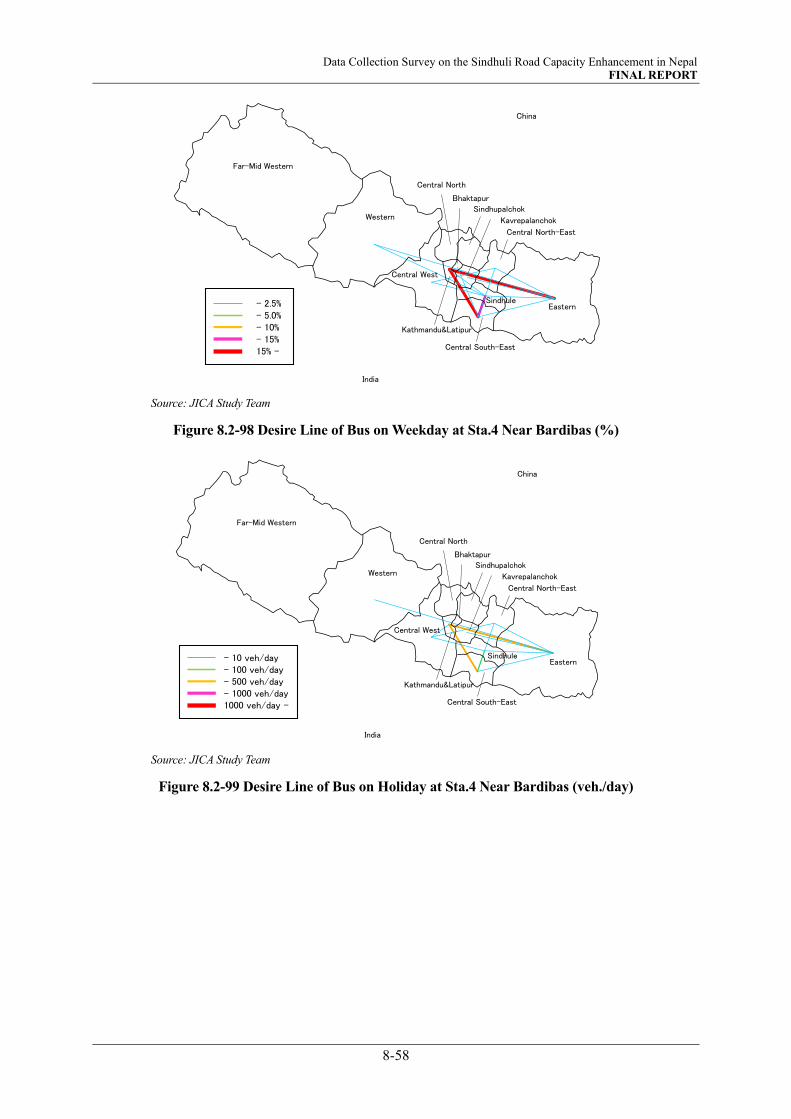
Data Collection Survey on the Sindhuli Road Capacity Enhancement in Nepal FINAL REPORT
8-58
Source: JICA Study Team
Figure 8.2-98 Desire Line of Bus on Weekday at Sta.4 Near Bardibas (%)
Source: JICA Study Team
Figure 8.2-99 Desire Line of Bus on Holiday at Sta.4 Near Bardibas (veh./day)
India
China
- 2.5%- 5.0%- 10%- 15%15% -
Eastern
Kathmandu&Latipur
Far-Mid Western
Western
Central North-East
Sindhupalchok
Kavrepalanchok
Sindhule
Central South-East
Central North
Central West
Bhaktapur
India
China
Eastern
Kathmandu&Latipur
Far-Mid Western
Western
Central North-East
Sindhupalchok
Kavrepalanchok
Sindhule
Central South-East
Central North
Central West
Bhaktapur
- 10 veh/day- 100 veh/day- 500 veh/day- 1000 veh/day1000 veh/day -
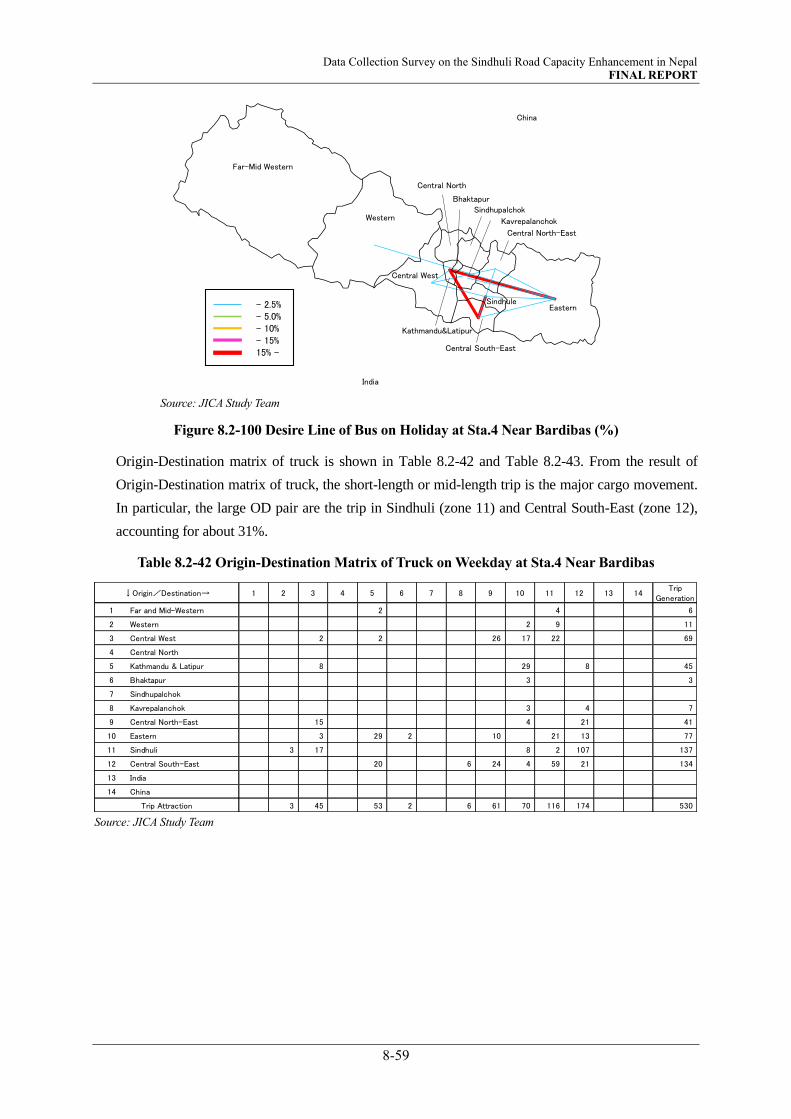
Data Collection Survey on the Sindhuli Road Capacity Enhancement in Nepal FINAL REPORT
8-59
Source: JICA Study Team
Figure 8.2-100 Desire Line of Bus on Holiday at Sta.4 Near Bardibas (%)
Origin-Destination matrix of truck is shown in Table 8.2-42 and Table 8.2-43. From the result of
Origin-Destination matrix of truck, the short-length or mid-length trip is the major cargo movement.
In particular, the large OD pair are the trip in Sindhuli (zone 11) and Central South-East (zone 12),
accounting for about 31%.
Table 8.2-42 Origin-Destination Matrix of Truck on Weekday at Sta.4 Near Bardibas
Source: JICA Study Team
India
China
- 2.5%- 5.0%- 10%- 15%15% -
Eastern
Kathmandu&Latipur
Far-Mid Western
Western
Central North-East
Sindhupalchok
Kavrepalanchok
Sindhule
Central South-East
Central North
Central West
Bhaktapur
1 2 3 4 5 6 7 8 9 10 11 12 13 14Trip
Generation
1 Far and Mid-Western 2 4 6
2 Western 2 9 11
3 Central West 2 2 26 17 22 69
4 Central North
5 Kathmandu & Latipur 8 29 8 45
6 Bhaktapur 3 3
7 Sindhupalchok
8 Kavrepalanchok 3 4 7
9 Central North-East 15 4 21 41
10 Eastern 3 29 2 10 21 13 77
11 Sindhuli 3 17 8 2 107 137
12 Central South-East 20 6 24 4 59 21 134
13 India
14 China
3 45 53 2 6 61 70 116 174 530
↓Origin/Destination→
Trip Attraction
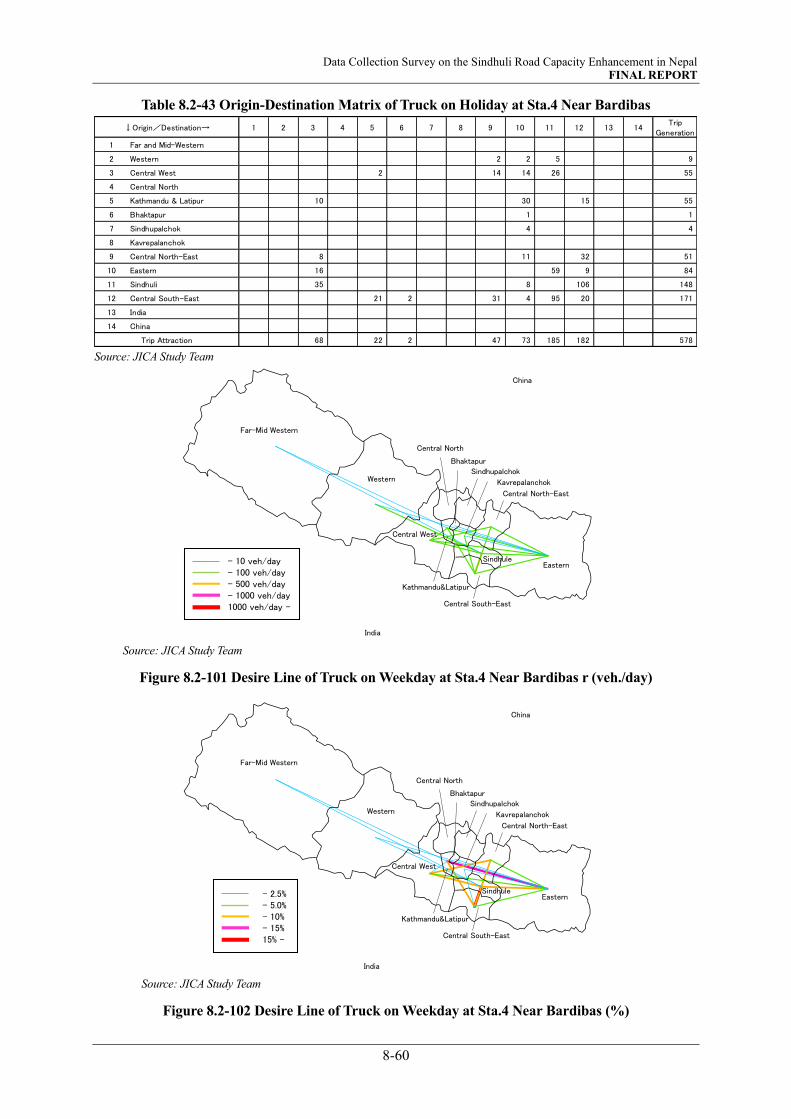
Data Collection Survey on the Sindhuli Road Capacity Enhancement in Nepal FINAL REPORT
8-60
Table 8.2-43 Origin-Destination Matrix of Truck on Holiday at Sta.4 Near Bardibas
Source: JICA Study Team
Source: JICA Study Team
Figure 8.2-101 Desire Line of Truck on Weekday at Sta.4 Near Bardibas r (veh./day)
Source: JICA Study Team
Figure 8.2-102 Desire Line of Truck on Weekday at Sta.4 Near Bardibas (%)
1 2 3 4 5 6 7 8 9 10 11 12 13 14Trip
Generation
1 Far and Mid-Western
2 Western 2 2 5 9
3 Central West 2 14 14 26 55
4 Central North
5 Kathmandu & Latipur 10 30 15 55
6 Bhaktapur 1 1
7 Sindhupalchok 4 4
8 Kavrepalanchok
9 Central North-East 8 11 32 51
10 Eastern 16 59 9 84
11 Sindhuli 35 8 106 148
12 Central South-East 21 2 31 4 95 20 171
13 India
14 China
68 22 2 47 73 185 182 578
↓Origin/Destination→
Trip Attraction
India
China
Eastern
Kathmandu&Latipur
Far-Mid Western
Western
Central North-East
Sindhupalchok
Kavrepalanchok
Sindhule
Central South-East
Central North
Central West
Bhaktapur
- 10 veh/day- 100 veh/day- 500 veh/day- 1000 veh/day1000 veh/day -
India
China
- 2.5%- 5.0%- 10%- 15%15% -
Eastern
Kathmandu&Latipur
Far-Mid Western
Western
Central North-East
Sindhupalchok
Kavrepalanchok
Sindhule
Central South-East
Central North
Central West
Bhaktapur
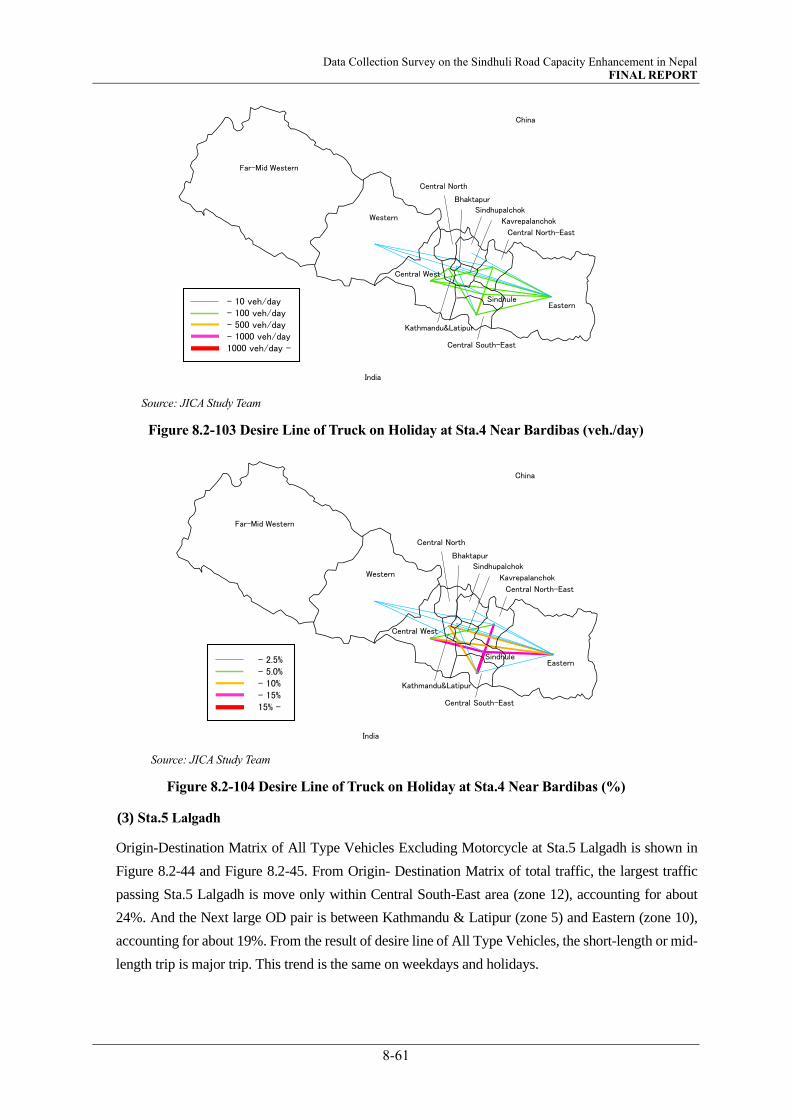
Data Collection Survey on the Sindhuli Road Capacity Enhancement in Nepal FINAL REPORT
8-61
Source: JICA Study Team
Figure 8.2-103 Desire Line of Truck on Holiday at Sta.4 Near Bardibas (veh./day)
Source: JICA Study Team
Figure 8.2-104 Desire Line of Truck on Holiday at Sta.4 Near Bardibas (%)
(3) Sta.5 Lalgadh
Origin-Destination Matrix of All Type Vehicles Excluding Motorcycle at Sta.5 Lalgadh is shown in
Figure 8.2-44 and Figure 8.2-45. From Origin- Destination Matrix of total traffic, the largest traffic
passing Sta.5 Lalgadh is move only within Central South-East area (zone 12), accounting for about
24%. And the Next large OD pair is between Kathmandu & Latipur (zone 5) and Eastern (zone 10),
accounting for about 19%. From the result of desire line of All Type Vehicles, the short-length or mid-
length trip is major trip. This trend is the same on weekdays and holidays.
India
China
Eastern
Kathmandu&Latipur
Far-Mid Western
Western
Central North-East
Sindhupalchok
Kavrepalanchok
Sindhule
Central South-East
Central North
Central West
Bhaktapur
- 10 veh/day- 100 veh/day- 500 veh/day- 1000 veh/day1000 veh/day -
India
China
- 2.5%- 5.0%- 10%- 15%15% -
Eastern
Kathmandu&Latipur
Far-Mid Western
Western
Central North-East
Sindhupalchok
Kavrepalanchok
Sindhule
Central South-East
Central North
Central West
Bhaktapur
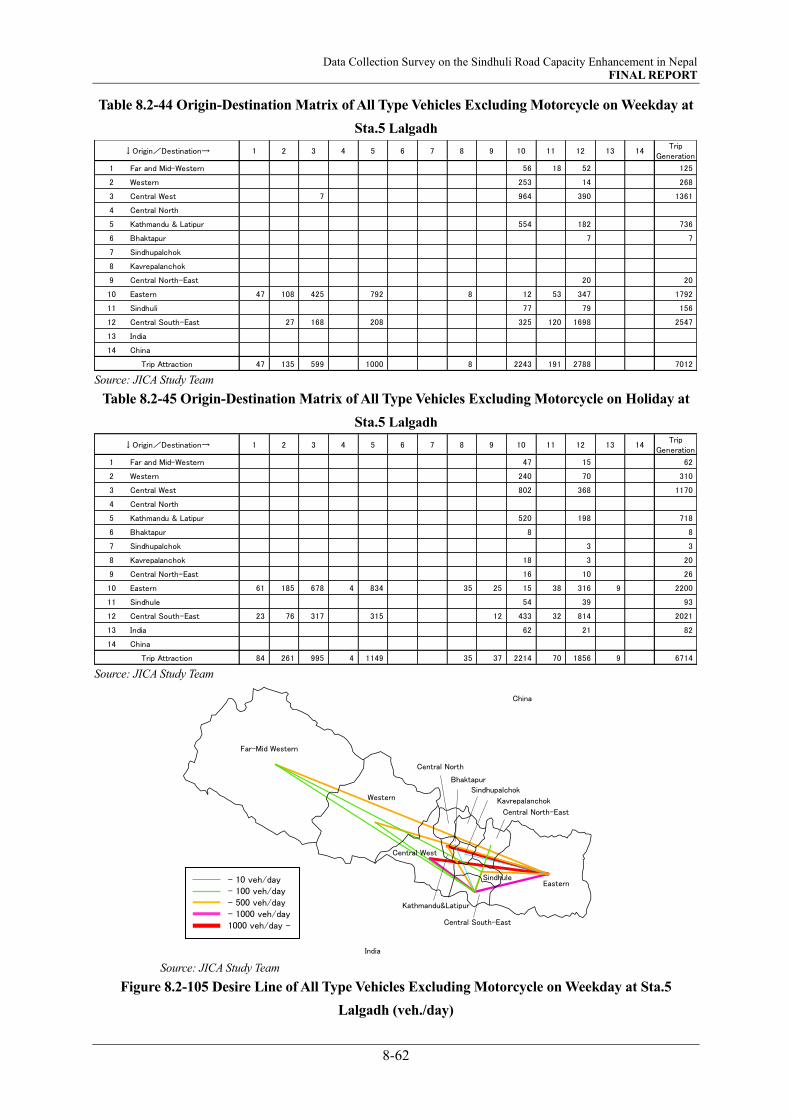
Data Collection Survey on the Sindhuli Road Capacity Enhancement in Nepal FINAL REPORT
8-62
Table 8.2-44 Origin-Destination Matrix of All Type Vehicles Excluding Motorcycle on Weekday at
Sta.5 Lalgadh
Source: JICA Study Team
Table 8.2-45 Origin-Destination Matrix of All Type Vehicles Excluding Motorcycle on Holiday at
Sta.5 Lalgadh
Source: JICA Study Team
Source: JICA Study Team
Figure 8.2-105 Desire Line of All Type Vehicles Excluding Motorcycle on Weekday at Sta.5
Lalgadh (veh./day)
1 2 3 4 5 6 7 8 9 10 11 12 13 14Trip
Generation
1 Far and Mid-Western 56 18 52 125
2 Western 253 14 268
3 Central West 7 964 390 1361
4 Central North
5 Kathmandu & Latipur 554 182 736
6 Bhaktapur 7 7
7 Sindhupalchok
8 Kavrepalanchok
9 Central North-East 20 20
10 Eastern 47 108 425 792 8 12 53 347 1792
11 Sindhuli 77 79 156
12 Central South-East 27 168 208 325 120 1698 2547
13 India
14 China
47 135 599 1000 8 2243 191 2788 7012
↓Origin/Destination→
Trip Attraction
1 2 3 4 5 6 7 8 9 10 11 12 13 14Trip
Generation
1 Far and Mid-Western 47 15 62
2 Western 240 70 310
3 Central West 802 368 1170
4 Central North
5 Kathmandu & Latipur 520 198 718
6 Bhaktapur 8 8
7 Sindhupalchok 3 3
8 Kavrepalanchok 18 3 20
9 Central North-East 16 10 26
10 Eastern 61 185 678 4 834 35 25 15 38 316 9 2200
11 Sindhule 54 39 93
12 Central South-East 23 76 317 315 12 433 32 814 2021
13 India 62 21 82
14 China
84 261 995 4 1149 35 37 2214 70 1856 9 6714
↓Origin/Destination→
Trip Attraction
India
China
Eastern
Kathmandu&Latipur
Far-Mid Western
Western
Central North-East
Sindhupalchok
Kavrepalanchok
Sindhule
Central South-East
Central North
Central West
Bhaktapur
- 10 veh/day- 100 veh/day- 500 veh/day- 1000 veh/day1000 veh/day -
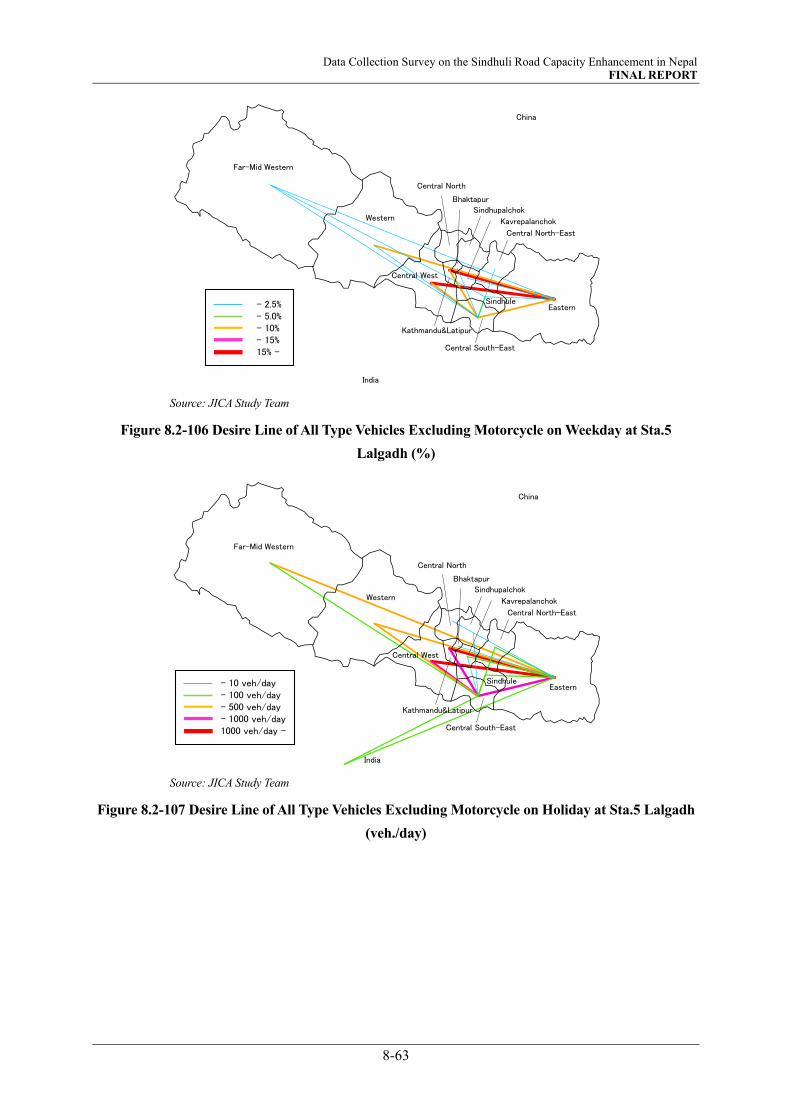
Data Collection Survey on the Sindhuli Road Capacity Enhancement in Nepal FINAL REPORT
8-63
Source: JICA Study Team
Figure 8.2-106 Desire Line of All Type Vehicles Excluding Motorcycle on Weekday at Sta.5
Lalgadh (%)
Source: JICA Study Team
Figure 8.2-107 Desire Line of All Type Vehicles Excluding Motorcycle on Holiday at Sta.5 Lalgadh
(veh./day)
India
China
- 2.5%- 5.0%- 10%- 15%15% -
Eastern
Kathmandu&Latipur
Far-Mid Western
Western
Central North-East
Sindhupalchok
Kavrepalanchok
Sindhule
Central South-East
Central North
Central West
Bhaktapur
India
China
Eastern
Kathmandu&Latipur
Far-Mid Western
Western
Central North-East
Sindhupalchok
Kavrepalanchok
Sindhule
Central South-East
Central North
Central West
Bhaktapur
- 10 veh/day- 100 veh/day- 500 veh/day- 1000 veh/day1000 veh/day -
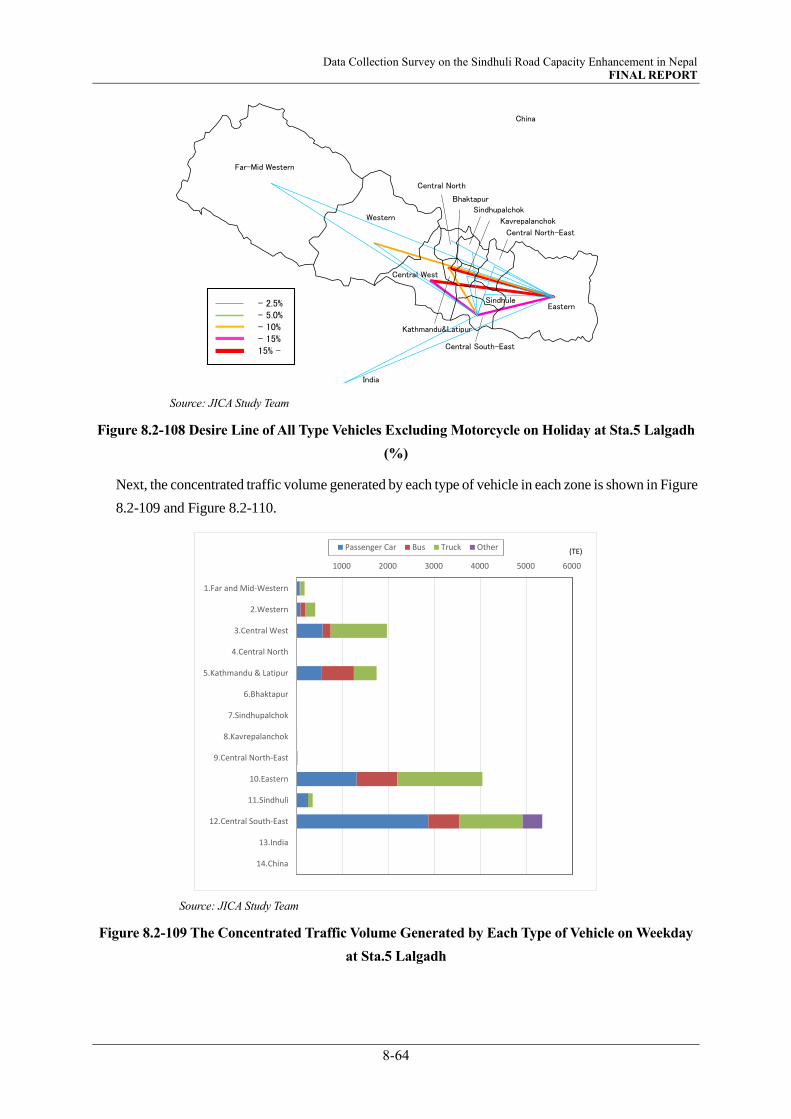
Data Collection Survey on the Sindhuli Road Capacity Enhancement in Nepal FINAL REPORT
8-64
Source: JICA Study Team
Figure 8.2-108 Desire Line of All Type Vehicles Excluding Motorcycle on Holiday at Sta.5 Lalgadh
(%)
Next, the concentrated traffic volume generated by each type of vehicle in each zone is shown in Figure
8.2-109 and Figure 8.2-110.
Source: JICA Study Team
Figure 8.2-109 The Concentrated Traffic Volume Generated by Each Type of Vehicle on Weekday
at Sta.5 Lalgadh
India
China
- 2.5%- 5.0%- 10%- 15%15% -
Eastern
Kathmandu&Latipur
Far-Mid Western
Western
Central North-East
Sindhupalchok
Kavrepalanchok
Sindhule
Central South-East
Central North
Central West
Bhaktapur
1000 2000 3000 4000 5000 6000
1.Far and Mid-Western
2.Western
3.Central West
4.Central North
5.Kathmandu & Latipur
6.Bhaktapur
7.Sindhupalchok
8.Kavrepalanchok
9.Central North-East
10.Eastern
11.Sindhuli
12.Central South-East
13.India
14.China
Passenger Car Bus Truck Other (TE)

Data Collection Survey on the Sindhuli Road Capacity Enhancement in Nepal FINAL REPORT
8-65
Source: JICA Study Team
Figure 8.2-110 The Concentrated Traffic Volume Generated by Each Type of Vehicle on Holiday at
Sta.5 Lalgadh
Origin-Destination Matrix of passenger car is shown in Table 8.2-46 and Table 8.2-47. From Origin-
Destination Matrix of passenger car, the largest traffic passing Sta.5 Lalgadh is move only within Central
South-East area (zone 12), accounting for about 35%. And the next large OD pair is between Kathmandu
& Latipur (zone 5) and Eastern (zone 10), accounting for about 14%.
Table 8.2-46 Origin-Destination Matrix of Passenger Car on Weekday at Sta.5 Lalgadh
Source: JICA Study Team
1000 2000 3000 4000 5000
1.Far and Mid-Western
2.Western
3.Central West
4.Central North
5.Kathmandu & Latipur
6.Bhaktapur
7.Sindhupalchok
8.Kavrepalanchok
9.Central North-East
10.Eastern
11.Sindhuli
12.Central South-East
13.India
14.China
Passenger Car Bus Truck Other (TE)
1 2 3 4 5 6 7 8 9 10 11 12 13 14Trip
Generation
1 Far and Mid-Western 24 18 17 58
2 Western 57 7 64
3 Central West 7 203 172 381
4 Central North
5 Kathmandu & Latipur 161 79 240
6 Bhaktapur 7 7
7 Sindhupalchok
8 Kavrepalanchok
9 Central North-East
10 Eastern 17 131 229 8 12 27 201 625
11 Sindhuli 50 50 100
12 Central South-East 45 77 172 77 978 1349
13 India
14 China
17 182 306 8 679 122 1510 2825
↓Origin/Destination→
Trip Attraction

Data Collection Survey on the Sindhuli Road Capacity Enhancement in Nepal FINAL REPORT
8-66
Table 8.2-47 Origin-Destination Matrix of Passenger Car on Holiday at Sta.5 Lalgadh
Source: JICA Study Team
Source: JICA Study Team
Figure 8.2-111 Desire Line of Passenger Car on Weekday at Sta.5 Lalgadh (veh./day)
Source: JICA Study Team
Figure 8.2-112 Desire Line of Passenger Car on Weekday at Sta.5 Lalgadh (%)
1 2 3 4 5 6 7 8 9 10 11 12 13 14Trip
Generation
1 Far and Mid-Western 8 8 16
2 Western 82 41 123
3 Central West 208 141 349
4 Central North
5 Kathmandu & Latipur 227 91 318
6 Bhaktapur 8 8
7 Sindhupalchok
8 Kavrepalanchok 8 8
9 Central North-East 8 8
10 Eastern 39 286 393 32 6 8 13 106 884
11 Sindhuli 50 17 66
12 Central South-East 15 16 142 190 220 32 518 1132
13 India
14 China
15 55 428 583 32 6 829 45 922 2915
↓Origin/Destination→
Trip Attraction
India
China
Eastern
Kathmandu&Latipur
Far-Mid Western
Western
Central North-East
Sindhupalchok
Kavrepalanchok
Sindhule
Central South-East
Central North
Central West
Bhaktapur
- 10 veh/day- 100 veh/day- 500 veh/day- 1000 veh/day1000 veh/day -
India
China
- 2.5%- 5.0%- 10%- 15%15% -
Eastern
Kathmandu&Latipur
Far-Mid Western
Western
Central North-East
Sindhupalchok
Kavrepalanchok
Sindhule
Central South-East
Central North
Central West
Bhaktapur

Data Collection Survey on the Sindhuli Road Capacity Enhancement in Nepal FINAL REPORT
8-67
Source: JICA Study Team
Figure 8.2-113 Desire Line of Passenger Car on Holiday at Sta.5 Lalgadh (veh./day)
Source: JICA Study Team
Figure 8.2-114 Desire Line of Passenger Car on Holiday at Sta.5 Lalgadh (%)
Origin-Destination matrix of bus is shown in Table 8.2-48 and Table 8.2-49. Regarding the trip of bus
that are used mainly for tourist trip, the large OD pair is the trip in Kathmandu & Latipur (zone 5) and
Eastern (zone 10), accounting for about 44%.
India
China
Eastern
Kathmandu&Latipur
Far-Mid Western
Western
Central North-East
Sindhupalchok
Kavrepalanchok
Sindhule
Central South-East
Central North
Central West
Bhaktapur
- 10 veh/day- 100 veh/day- 500 veh/day- 1000 veh/day1000 veh/day -
India
China
- 2.5%- 5.0%- 10%- 15%15% -
Eastern
Kathmandu&Latipur
Far-Mid Western
Western
Central North-East
Sindhupalchok
Kavrepalanchok
Sindhule
Central South-East
Central North
Central West
Bhaktapur
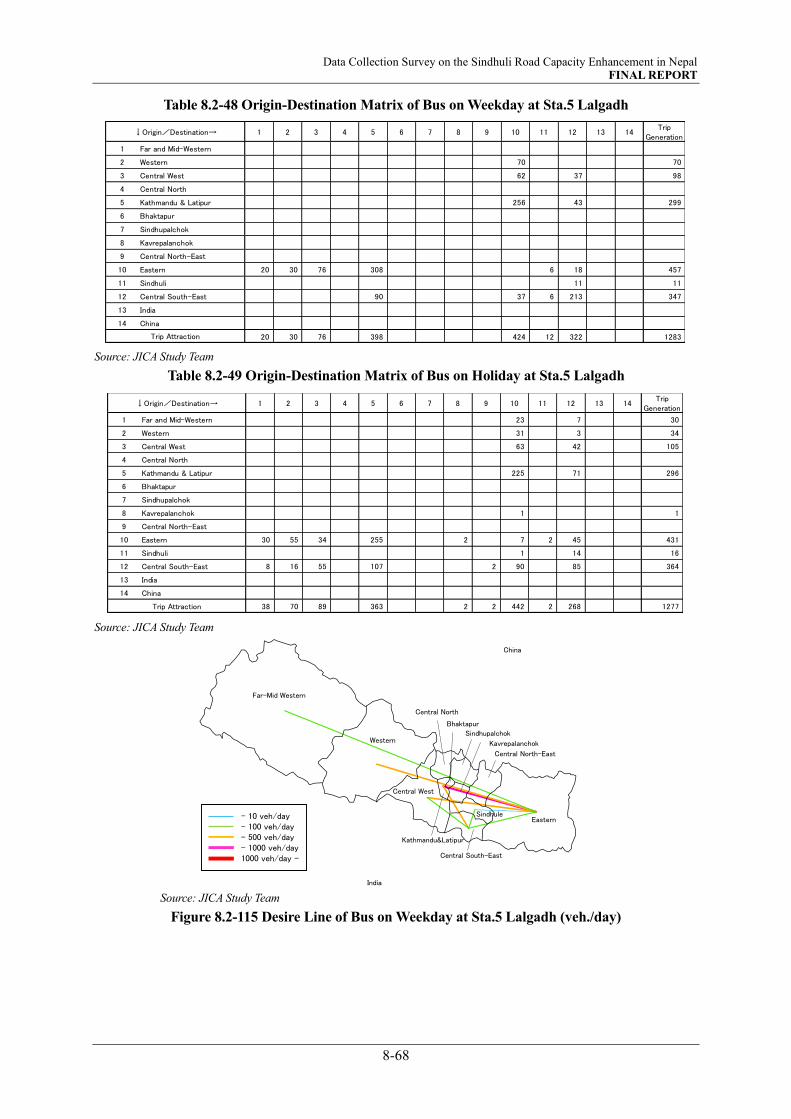
Data Collection Survey on the Sindhuli Road Capacity Enhancement in Nepal FINAL REPORT
8-68
Table 8.2-48 Origin-Destination Matrix of Bus on Weekday at Sta.5 Lalgadh
Source: JICA Study Team
Table 8.2-49 Origin-Destination Matrix of Bus on Holiday at Sta.5 Lalgadh
Source: JICA Study Team
Source: JICA Study Team
Figure 8.2-115 Desire Line of Bus on Weekday at Sta.5 Lalgadh (veh./day)
1 2 3 4 5 6 7 8 9 10 11 12 13 14Trip
Generation
1 Far and Mid-Western
2 Western 70 70
3 Central West 62 37 98
4 Central North
5 Kathmandu & Latipur 256 43 299
6 Bhaktapur
7 Sindhupalchok
8 Kavrepalanchok
9 Central North-East
10 Eastern 20 30 76 308 6 18 457
11 Sindhuli 11 11
12 Central South-East 90 37 6 213 347
13 India
14 China
20 30 76 398 424 12 322 1283
↓Origin/Destination→
Trip Attraction
1 2 3 4 5 6 7 8 9 10 11 12 13 14Trip
Generation
1 Far and Mid-Western 23 7 30
2 Western 31 3 34
3 Central West 63 42 105
4 Central North
5 Kathmandu & Latipur 225 71 296
6 Bhaktapur
7 Sindhupalchok
8 Kavrepalanchok 1 1
9 Central North-East
10 Eastern 30 55 34 255 2 7 2 45 431
11 Sindhuli 1 14 16
12 Central South-East 8 16 55 107 2 90 85 364
13 India
14 China
38 70 89 363 2 2 442 2 268 1277
↓Origin/Destination→
Trip Attraction
India
China
Eastern
Kathmandu&Latipur
Far-Mid Western
Western
Central North-East
Sindhupalchok
Kavrepalanchok
Sindhule
Central South-East
Central North
Central West
Bhaktapur
- 10 veh/day- 100 veh/day- 500 veh/day- 1000 veh/day1000 veh/day -
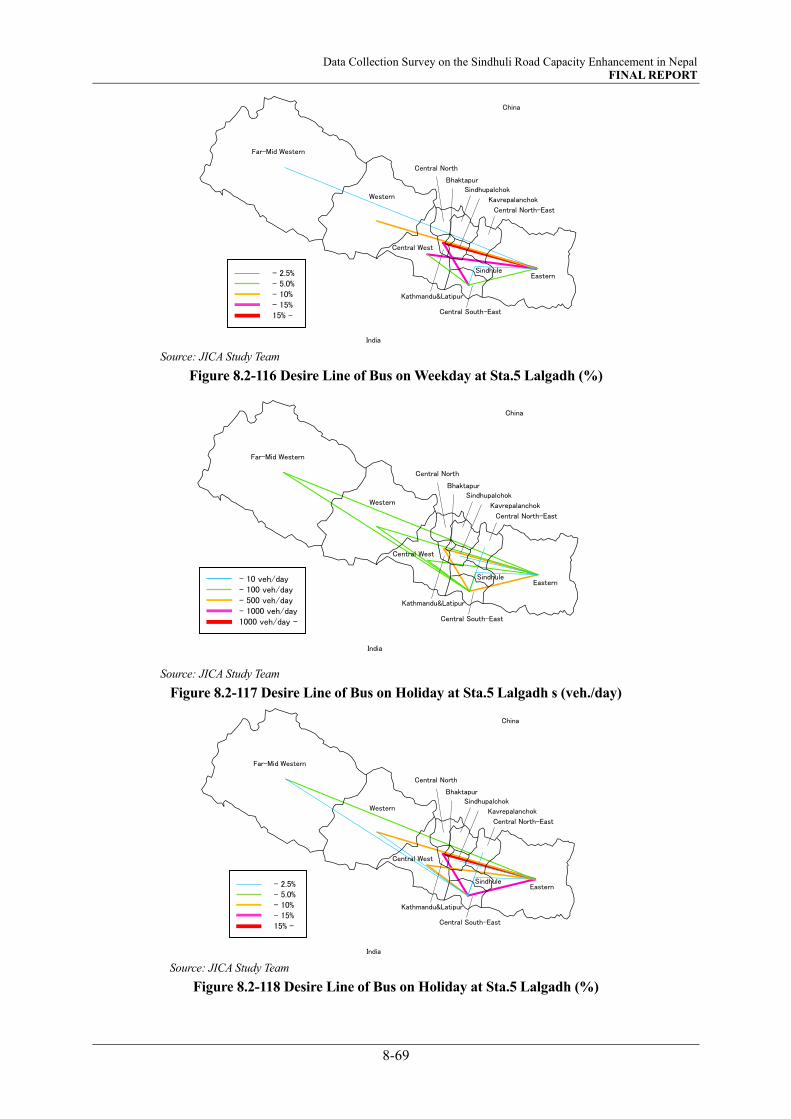
Data Collection Survey on the Sindhuli Road Capacity Enhancement in Nepal FINAL REPORT
8-69
Source: JICA Study Team
Figure 8.2-116 Desire Line of Bus on Weekday at Sta.5 Lalgadh (%)
Source: JICA Study Team
Figure 8.2-117 Desire Line of Bus on Holiday at Sta.5 Lalgadh s (veh./day)
Source: JICA Study Team
Figure 8.2-118 Desire Line of Bus on Holiday at Sta.5 Lalgadh (%)
India
China
- 2.5%- 5.0%- 10%- 15%15% -
Eastern
Kathmandu&Latipur
Far-Mid Western
Western
Central North-East
Sindhupalchok
Kavrepalanchok
Sindhule
Central South-East
Central North
Central West
Bhaktapur
India
China
Eastern
Kathmandu&Latipur
Far-Mid Western
Western
Central North-East
Sindhupalchok
Kavrepalanchok
Sindhule
Central South-East
Central North
Central West
Bhaktapur
- 10 veh/day- 100 veh/day- 500 veh/day- 1000 veh/day1000 veh/day -
India
China
- 2.5%- 5.0%- 10%- 15%15% -
Eastern
Kathmandu&Latipur
Far-Mid Western
Western
Central North-East
Sindhupalchok
Kavrepalanchok
Sindhule
Central South-East
Central North
Central West
Bhaktapur
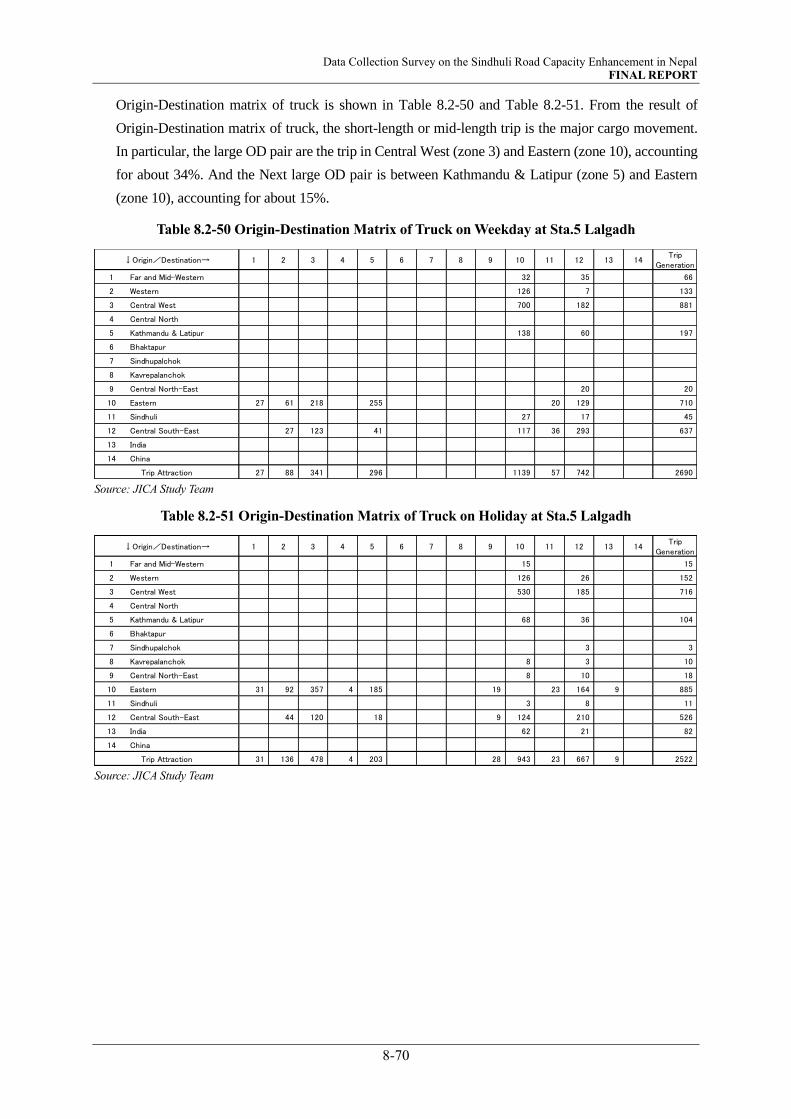
Data Collection Survey on the Sindhuli Road Capacity Enhancement in Nepal FINAL REPORT
8-70
Origin-Destination matrix of truck is shown in Table 8.2-50 and Table 8.2-51. From the result of
Origin-Destination matrix of truck, the short-length or mid-length trip is the major cargo movement.
In particular, the large OD pair are the trip in Central West (zone 3) and Eastern (zone 10), accounting
for about 34%. And the Next large OD pair is between Kathmandu & Latipur (zone 5) and Eastern
(zone 10), accounting for about 15%.
Table 8.2-50 Origin-Destination Matrix of Truck on Weekday at Sta.5 Lalgadh
Source: JICA Study Team
Table 8.2-51 Origin-Destination Matrix of Truck on Holiday at Sta.5 Lalgadh
Source: JICA Study Team
1 2 3 4 5 6 7 8 9 10 11 12 13 14Trip
Generation
1 Far and Mid-Western 32 35 66
2 Western 126 7 133
3 Central West 700 182 881
4 Central North
5 Kathmandu & Latipur 138 60 197
6 Bhaktapur
7 Sindhupalchok
8 Kavrepalanchok
9 Central North-East 20 20
10 Eastern 27 61 218 255 20 129 710
11 Sindhuli 27 17 45
12 Central South-East 27 123 41 117 36 293 637
13 India
14 China
27 88 341 296 1139 57 742 2690
↓Origin/Destination→
Trip Attraction
1 2 3 4 5 6 7 8 9 10 11 12 13 14Trip
Generation
1 Far and Mid-Western 15 15
2 Western 126 26 152
3 Central West 530 185 716
4 Central North
5 Kathmandu & Latipur 68 36 104
6 Bhaktapur
7 Sindhupalchok 3 3
8 Kavrepalanchok 8 3 10
9 Central North-East 8 10 18
10 Eastern 31 92 357 4 185 19 23 164 9 885
11 Sindhuli 3 8 11
12 Central South-East 44 120 18 9 124 210 526
13 India 62 21 82
14 China
31 136 478 4 203 28 943 23 667 9 2522
↓Origin/Destination→
Trip Attraction
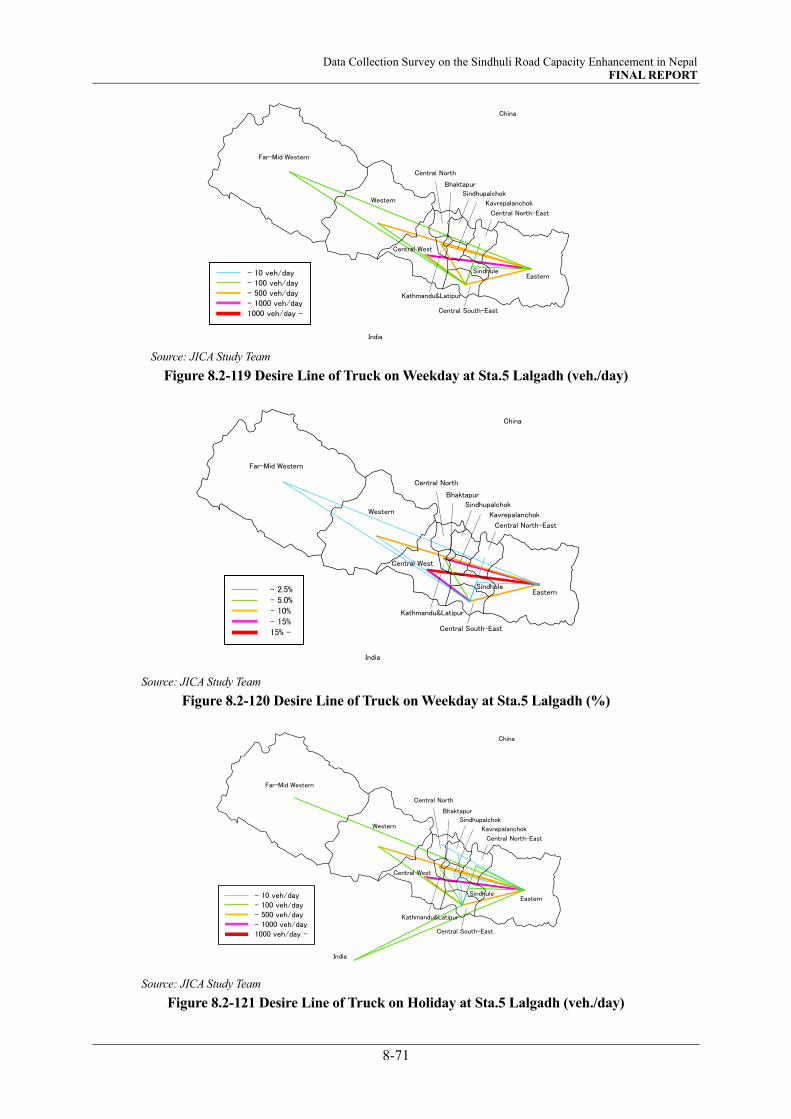
Data Collection Survey on the Sindhuli Road Capacity Enhancement in Nepal FINAL REPORT
8-71
Source: JICA Study Team
Figure 8.2-119 Desire Line of Truck on Weekday at Sta.5 Lalgadh (veh./day)
Source: JICA Study Team
Figure 8.2-120 Desire Line of Truck on Weekday at Sta.5 Lalgadh (%)
Source: JICA Study Team
Figure 8.2-121 Desire Line of Truck on Holiday at Sta.5 Lalgadh (veh./day)
India
China
Eastern
Kathmandu&Latipur
Far-Mid Western
Western
Central North-East
Sindhupalchok
Kavrepalanchok
Sindhule
Central South-East
Central North
Central West
Bhaktapur
- 10 veh/day- 100 veh/day- 500 veh/day- 1000 veh/day1000 veh/day -
India
China
- 2.5%- 5.0%- 10%- 15%15% -
Eastern
Kathmandu&Latipur
Far-Mid Western
Western
Central North-East
Sindhupalchok
Kavrepalanchok
Sindhule
Central South-East
Central North
Central West
Bhaktapur
India
China
Eastern
Kathmandu&Latipur
Far-Mid Western
Western
Central North-East
Sindhupalchok
Kavrepalanchok
Sindhule
Central South-East
Central North
Central West
Bhaktapur
- 10 veh/day- 100 veh/day- 500 veh/day- 1000 veh/day1000 veh/day -
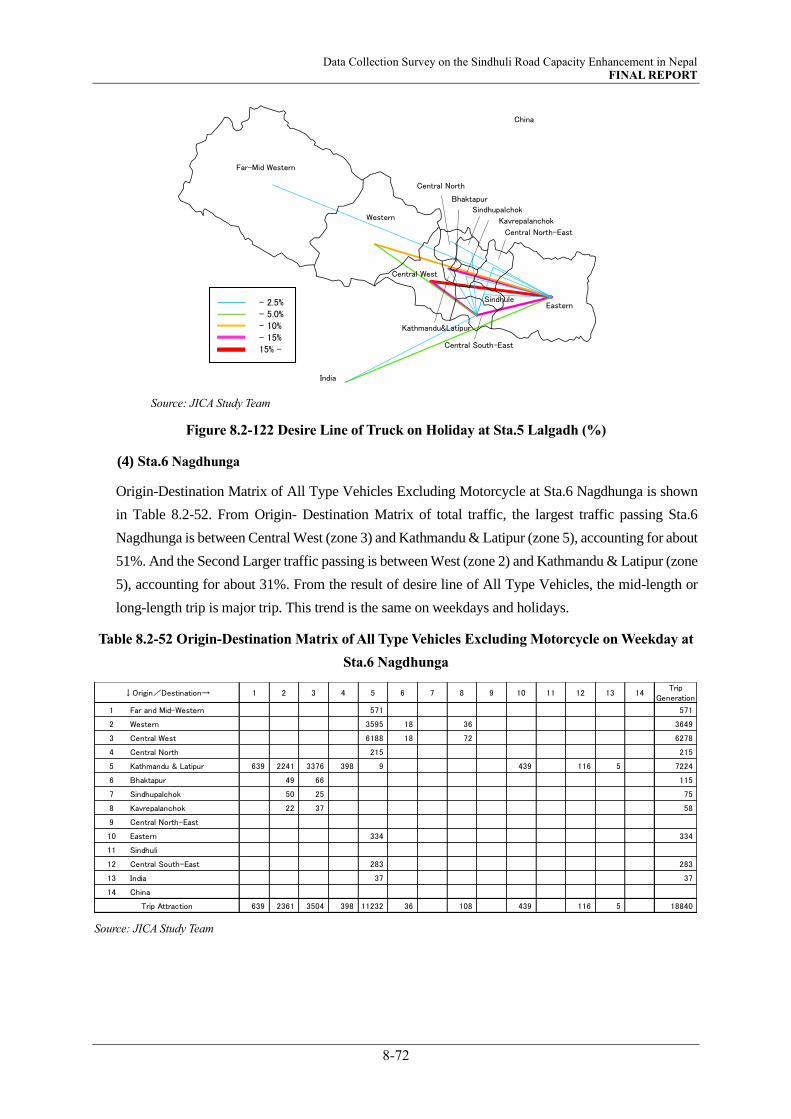
Data Collection Survey on the Sindhuli Road Capacity Enhancement in Nepal FINAL REPORT
8-72
Source: JICA Study Team
Figure 8.2-122 Desire Line of Truck on Holiday at Sta.5 Lalgadh (%)
(4) Sta.6 Nagdhunga
Origin-Destination Matrix of All Type Vehicles Excluding Motorcycle at Sta.6 Nagdhunga is shown
in Table 8.2-52. From Origin- Destination Matrix of total traffic, the largest traffic passing Sta.6
Nagdhunga is between Central West (zone 3) and Kathmandu & Latipur (zone 5), accounting for about
51%. And the Second Larger traffic passing is between West (zone 2) and Kathmandu & Latipur (zone
5), accounting for about 31%. From the result of desire line of All Type Vehicles, the mid-length or
long-length trip is major trip. This trend is the same on weekdays and holidays.
Table 8.2-52 Origin-Destination Matrix of All Type Vehicles Excluding Motorcycle on Weekday at
Sta.6 Nagdhunga
Source: JICA Study Team
India
China
- 2.5%- 5.0%- 10%- 15%15% -
Eastern
Kathmandu&Latipur
Far-Mid Western
Western
Central North-East
Sindhupalchok
Kavrepalanchok
Sindhule
Central South-East
Central North
Central West
Bhaktapur
1 2 3 4 5 6 7 8 9 10 11 12 13 14Trip
Generation
1 Far and Mid-Western 571 571
2 Western 3595 18 36 3649
3 Central West 6188 18 72 6278
4 Central North 215 215
5 Kathmandu & Latipur 639 2241 3376 398 9 439 116 5 7224
6 Bhaktapur 49 66 115
7 Sindhupalchok 50 25 75
8 Kavrepalanchok 22 37 58
9 Central North-East
10 Eastern 334 334
11 Sindhuli
12 Central South-East 283 283
13 India 37 37
14 China
639 2361 3504 398 11232 36 108 439 116 5 18840
↓Origin/Destination→
Trip Attraction

Data Collection Survey on the Sindhuli Road Capacity Enhancement in Nepal FINAL REPORT
8-73
Source: JICA Study Team
Figure 8.2-123 Desire Line of All Type Vehicles Excluding Motorcycle on Weekday at Sta.6
Nagdhunga (veh./day)
Source: JICA Study Team
Figure 8.2-124 Desire Line of All Type Vehicles Excluding Motorcycle on Weekday at Sta.6
Nagdhunga (%)
Next, the concentrated traffic volume generated by each type of vehicle in each zone is shown in Figure
8.2-125.
India
China
Eastern
Kathmandu&Latipur
Far-Mid Western
Western
Central North-East
Sindhupalchok
Kavrepalanchok
Sindhule
Central South-East
Central North
Central West
Bhaktapur
- 10 veh/day- 100 veh/day- 500 veh/day- 1000 veh/day1000 veh/day -
India
China
- 2.5%- 5.0%- 10%- 15%15% -
Eastern
Kathmandu&Latipur
Far-Mid Western
Western
Central North-East
Sindhupalchok
Kavrepalanchok
Sindhule
Central South-East
Central North
Central West
Bhaktapur
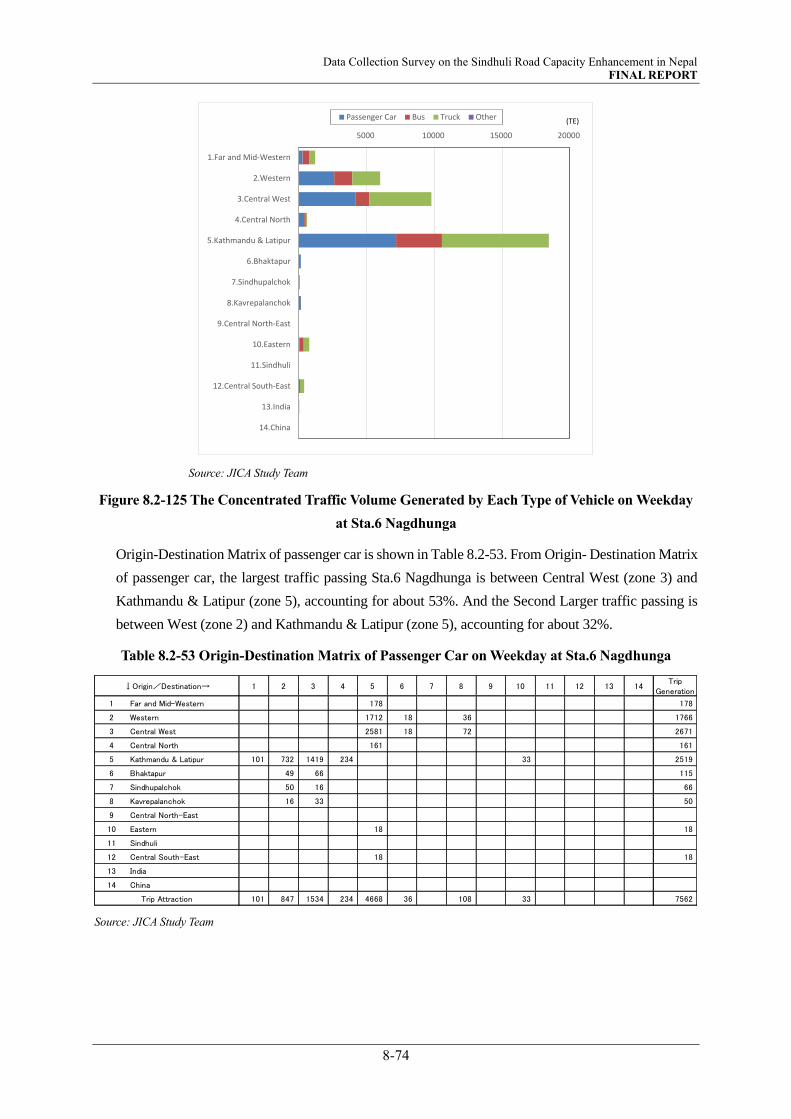
Data Collection Survey on the Sindhuli Road Capacity Enhancement in Nepal FINAL REPORT
8-74
Source: JICA Study Team
Figure 8.2-125 The Concentrated Traffic Volume Generated by Each Type of Vehicle on Weekday
at Sta.6 Nagdhunga
Origin-Destination Matrix of passenger car is shown in Table 8.2-53. From Origin- Destination Matrix
of passenger car, the largest traffic passing Sta.6 Nagdhunga is between Central West (zone 3) and
Kathmandu & Latipur (zone 5), accounting for about 53%. And the Second Larger traffic passing is
between West (zone 2) and Kathmandu & Latipur (zone 5), accounting for about 32%.
Table 8.2-53 Origin-Destination Matrix of Passenger Car on Weekday at Sta.6 Nagdhunga
Source: JICA Study Team
5000 10000 15000 20000
1.Far and Mid-Western
2.Western
3.Central West
4.Central North
5.Kathmandu & Latipur
6.Bhaktapur
7.Sindhupalchok
8.Kavrepalanchok
9.Central North-East
10.Eastern
11.Sindhuli
12.Central South-East
13.India
14.China
Passenger Car Bus Truck Other (TE)
1 2 3 4 5 6 7 8 9 10 11 12 13 14Trip
Generation
1 Far and Mid-Western 178 178
2 Western 1712 18 36 1766
3 Central West 2581 18 72 2671
4 Central North 161 161
5 Kathmandu & Latipur 101 732 1419 234 33 2519
6 Bhaktapur 49 66 115
7 Sindhupalchok 50 16 66
8 Kavrepalanchok 16 33 50
9 Central North-East
10 Eastern 18 18
11 Sindhuli
12 Central South-East 18 18
13 India
14 China
101 847 1534 234 4668 36 108 33 7562
↓Origin/Destination→
Trip Attraction

Data Collection Survey on the Sindhuli Road Capacity Enhancement in Nepal FINAL REPORT
8-75
Source: JICA Study Team
Figure 8.2-126 Desire Line of Passenger Car on Weekday at Sta.6 Nagdhunga (veh./day)
Source: JICA Study Team
Figure 8.2-127 Desire Line of Passenger Car on Weekday at Sta.6 Nagdhunga (%)
Origin-Destination matrix of bus is shown in Table 8.2-54. Regarding the trip of bus that are used
mainly for tourist trip, the large OD pair is the trip in West (zone 2) and Kathmandu & Latipur (zone
5).
India
China
Eastern
Kathmandu&Latipur
Far-Mid Western
Western
Central North-East
Sindhupalchok
Kavrepalanchok
Sindhule
Central South-East
Central North
Central West
Bhaktapur
- 10 veh/day- 100 veh/day- 500 veh/day- 1000 veh/day1000 veh/day -
India
China
- 2.5%- 5.0%- 10%- 15%15% -
Eastern
Kathmandu&Latipur
Far-Mid Western
Western
Central North-East
Sindhupalchok
Kavrepalanchok
Sindhule
Central South-East
Central North
Central West
Bhaktapur
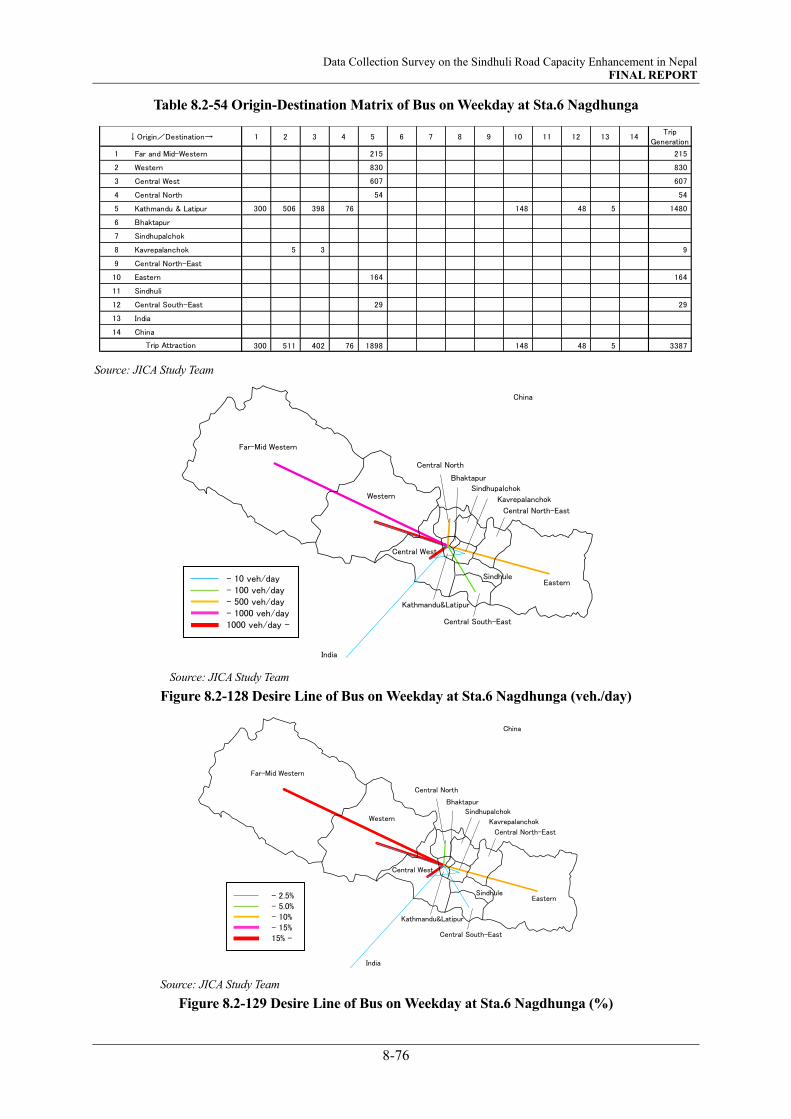
Data Collection Survey on the Sindhuli Road Capacity Enhancement in Nepal FINAL REPORT
8-76
Table 8.2-54 Origin-Destination Matrix of Bus on Weekday at Sta.6 Nagdhunga
Source: JICA Study Team
Source: JICA Study Team
Figure 8.2-128 Desire Line of Bus on Weekday at Sta.6 Nagdhunga (veh./day)
Source: JICA Study Team
Figure 8.2-129 Desire Line of Bus on Weekday at Sta.6 Nagdhunga (%)
1 2 3 4 5 6 7 8 9 10 11 12 13 14Trip
Generation
1 Far and Mid-Western 215 215
2 Western 830 830
3 Central West 607 607
4 Central North 54 54
5 Kathmandu & Latipur 300 506 398 76 148 48 5 1480
6 Bhaktapur
7 Sindhupalchok
8 Kavrepalanchok 5 3 9
9 Central North-East
10 Eastern 164 164
11 Sindhuli
12 Central South-East 29 29
13 India
14 China
300 511 402 76 1898 148 48 5 3387
↓Origin/Destination→
Trip Attraction
India
China
Eastern
Kathmandu&Latipur
Far-Mid Western
Western
Central North-East
Sindhupalchok
Kavrepalanchok
Sindhule
Central South-East
Central North
Central West
Bhaktapur
- 10 veh/day- 100 veh/day- 500 veh/day- 1000 veh/day1000 veh/day -
India
China
- 2.5%- 5.0%- 10%- 15%15% -
Eastern
Kathmandu&Latipur
Far-Mid Western
Western
Central North-East
Sindhupalchok
Kavrepalanchok
Sindhule
Central South-East
Central North
Central West
Bhaktapur
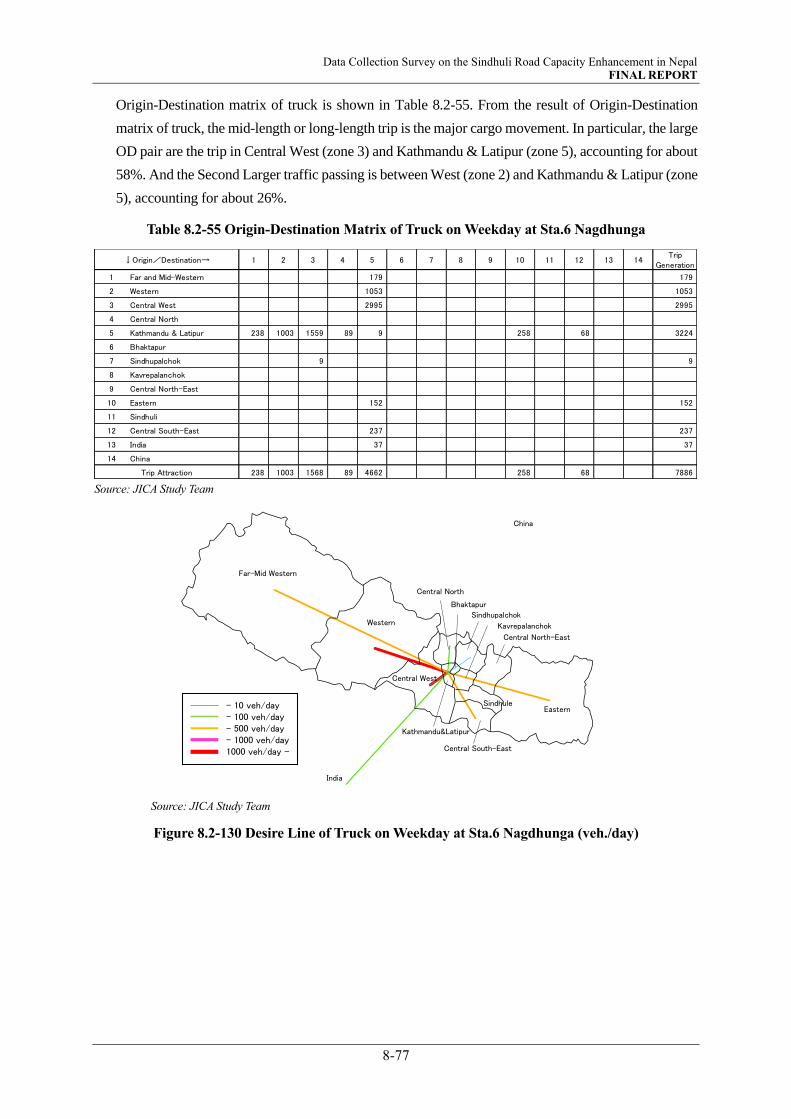
Data Collection Survey on the Sindhuli Road Capacity Enhancement in Nepal FINAL REPORT
8-77
Origin-Destination matrix of truck is shown in Table 8.2-55. From the result of Origin-Destination
matrix of truck, the mid-length or long-length trip is the major cargo movement. In particular, the large
OD pair are the trip in Central West (zone 3) and Kathmandu & Latipur (zone 5), accounting for about
58%. And the Second Larger traffic passing is between West (zone 2) and Kathmandu & Latipur (zone
5), accounting for about 26%.
Table 8.2-55 Origin-Destination Matrix of Truck on Weekday at Sta.6 Nagdhunga
Source: JICA Study Team
Source: JICA Study Team
Figure 8.2-130 Desire Line of Truck on Weekday at Sta.6 Nagdhunga (veh./day)
1 2 3 4 5 6 7 8 9 10 11 12 13 14Trip
Generation
1 Far and Mid-Western 179 179
2 Western 1053 1053
3 Central West 2995 2995
4 Central North
5 Kathmandu & Latipur 238 1003 1559 89 9 258 68 3224
6 Bhaktapur
7 Sindhupalchok 9 9
8 Kavrepalanchok
9 Central North-East
10 Eastern 152 152
11 Sindhuli
12 Central South-East 237 237
13 India 37 37
14 China
238 1003 1568 89 4662 258 68 7886
↓Origin/Destination→
Trip Attraction
India
China
Eastern
Kathmandu&Latipur
Far-Mid Western
Western
Central North-East
Sindhupalchok
Kavrepalanchok
Sindhule
Central South-East
Central North
Central West
Bhaktapur
- 10 veh/day- 100 veh/day- 500 veh/day- 1000 veh/day1000 veh/day -
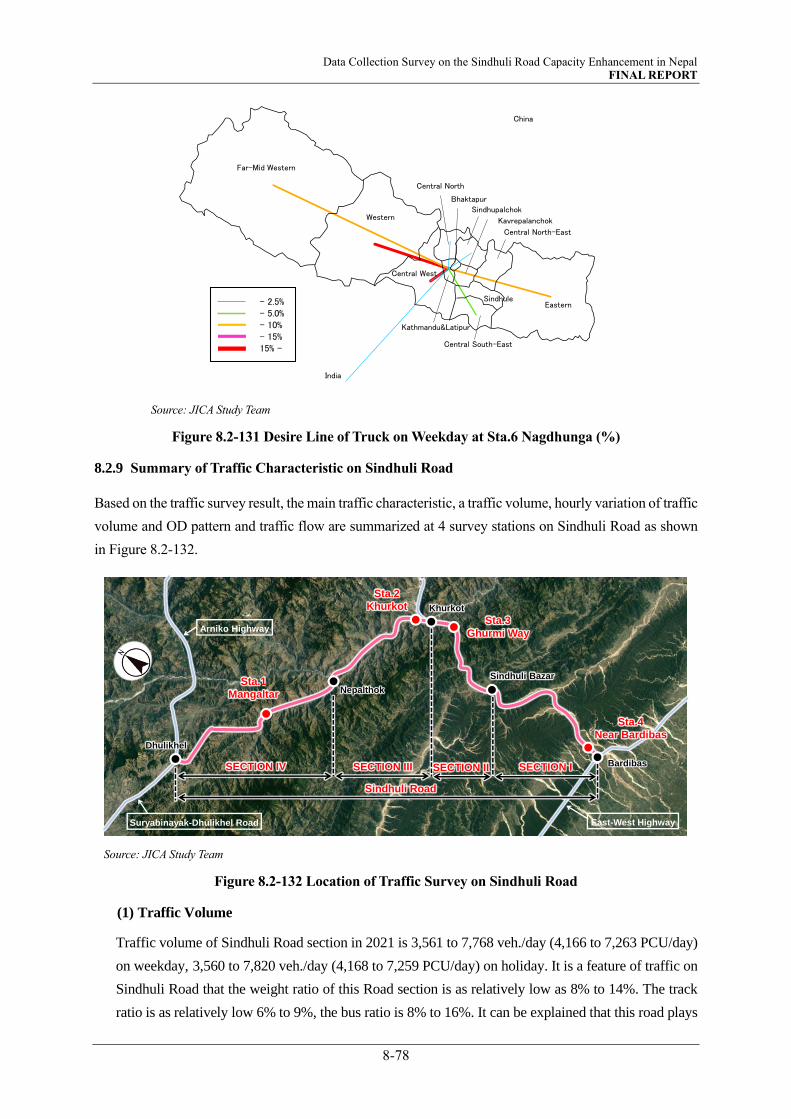
Data Collection Survey on the Sindhuli Road Capacity Enhancement in Nepal FINAL REPORT
8-78
Source: JICA Study Team
Figure 8.2-131 Desire Line of Truck on Weekday at Sta.6 Nagdhunga (%)
8.2.9 Summary of Traffic Characteristic on Sindhuli Road
Based on the traffic survey result, the main traffic characteristic, a traffic volume, hourly variation of traffic
volume and OD pattern and traffic flow are summarized at 4 survey stations on Sindhuli Road as shown
in Figure 8.2-132.
Source: JICA Study Team
Figure 8.2-132 Location of Traffic Survey on Sindhuli Road
(1) Traffic Volume
Traffic volume of Sindhuli Road section in 2021 is 3,561 to 7,768 veh./day (4,166 to 7,263 PCU/day)
on weekday, 3,560 to 7,820 veh./day (4,168 to 7,259 PCU/day) on holiday. It is a feature of traffic on
Sindhuli Road that the weight ratio of this Road section is as relatively low as 8% to 14%. The track
ratio is as relatively low 6% to 9%, the bus ratio is 8% to 16%. It can be explained that this road plays
India
China
- 2.5%- 5.0%- 10%- 15%15% -
Eastern
Kathmandu&Latipur
Far-Mid Western
Western
Central North-East
Sindhupalchok
Kavrepalanchok
Sindhule
Central South-East
Central North
Central West
Bhaktapur
Dhulikhel
BardibasSECTION IV SECTION III SECTION II SECTION I
Arniko Highway
Suryabinayak-Dhulikhel Road East-West Highway
Sindhuli Road
Nepalthok
Khurkot
Sindhuli BazarSta.1
Mangaltar
Sta.2
Khurkot
Sta.3
Ghurmi Way
Sta.4
Near Bardibas

Data Collection Survey on the Sindhuli Road Capacity Enhancement in Nepal FINAL REPORT
8-79
role as the lives of local residents.
Table 8.2-56 Summary of Traffic Count Survey on Weekday on Sindhuli Road
*Heavy veh.;5.Mini Bus,6.Large Bus, 8.Heavy Truck, 9.Multi-axel Truck
Source: Traffic survey result by JICA Study Team
Source: JICA Study Team
Figure 8.2-133 Daily Traffic Volume on Weekday on Sindhuli Road, All Type
ClassificationNear Bardibas
(SECTION Ⅰ)
%
Total
%
w/o MC
Ghurmi Way
(SECTION Ⅱ)
%
Total
%
w/o MC
Khurkot
(SECTION Ⅲ)
%
Total
%
w/o MC
Mangaltar
(SECTION Ⅳ)
%
Total
%
w/o MC
1. Motor Cycle 4,101 53% 1,238 35% 1,671 36% 1,594 36%
2. Car & Taxi 651 8% 18% 369 10% 16% 436 10% 15% 480 11% 17%
3. Utility Pick up 1,190 15% 32% 844 24% 36% 1,172 26% 40% 1,175 27% 42%
4. Micro Bus 420 5% 11% 439 12% 19% 452 10% 15% 425 10% 15%
5. Mini Bus 156 2% 4% 136 4% 6% 215 5% 7% 219 5% 8%
6. Large Bus 44 1% 1% 2 0% 0% 1 0% 0% 9 0% 0%
7. Light Truck 83 1% 2% 133 4% 6% 126 3% 4% 108 2% 4%
8. Heavy Truck 346 4% 9% 331 9% 14% 328 7% 11% 370 8% 13%
9. Multi-axel Truck 101 1% 3% 0 0% 0% 0 0% 0% 0 0% 0%
10. Others 676 9% 18% 69 2% 3% 188 4% 6% 1 0% 0%
Total(All type of Veh.) 7,768 100% - 3,561 100% - 4,589 100% - 4,381 100% -
Share of Heavy Veh. 8% - - 13% - - 12% - - 14% - -
Share of Heavy truck. 6% - - 9% - - 7% - - 8% - -
PCU 7,263 - - 4,166 - - 5,131 - - 5,047 - -
Total(w/o 1.Motor Cycle) 3,667 - 100% 2,323 - 100% 2,918 - 100% 2,787 - 100%
Share of Heavy Veh. 18% - - 20% - - 19% - - 21% - -
Share of Heavy truck. 12% - - 14% - - 11% - - 13% - -
PCU 5,213 - - 3,547 - - 4,295 - - 4,250 - -
0
1,000
2,000
3,000
4,000
5,000
6,000
7,000
8,000
Near Bardibas
(SECTION Ⅰ)
Ghurmi Way
(SECTION Ⅱ)
Khurkot
(SECTION Ⅲ)
Mangaltar
(SECTION Ⅳ)
1. Motor Cycle
2. Car & Taxi
3. Utility Pick up
4. Micro Bus
5. Mini Bus
6. Large Bus
7. Light Truck
8. Heavy Truck
9. Multi-axel Truck
10. Others
4,381 4,589
3,561
7,768 (veh./day)
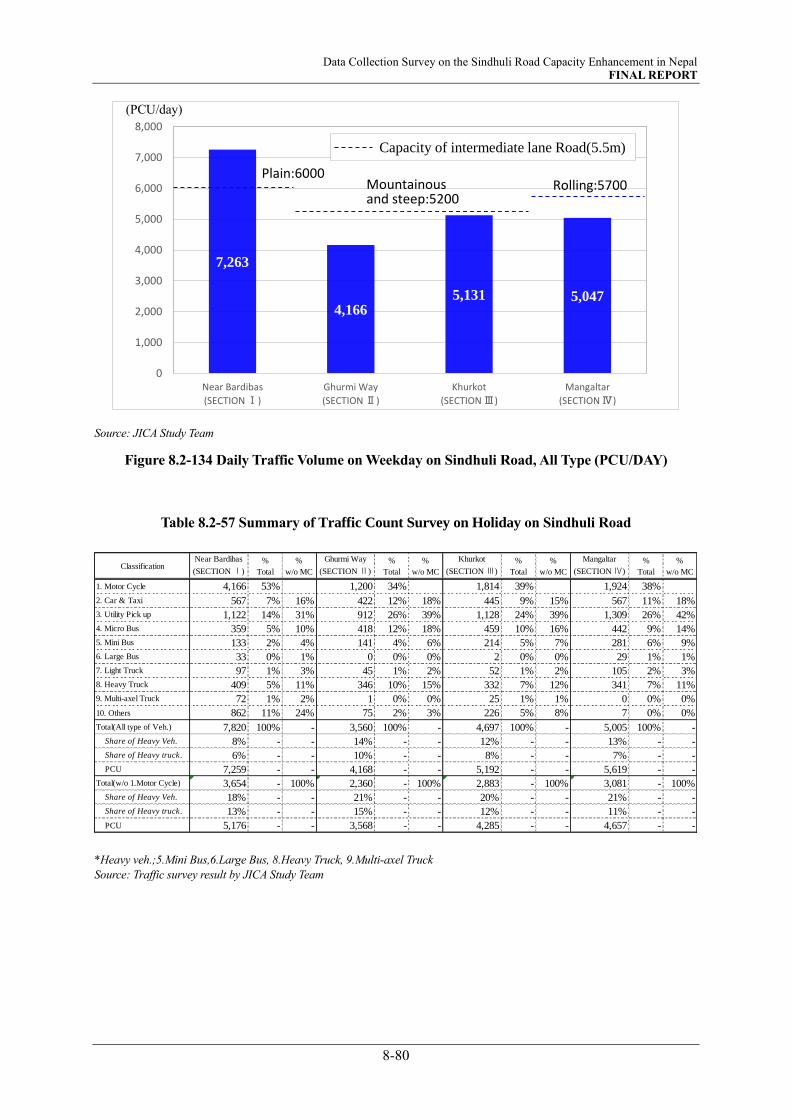
Data Collection Survey on the Sindhuli Road Capacity Enhancement in Nepal FINAL REPORT
8-80
Source: JICA Study Team
Figure 8.2-134 Daily Traffic Volume on Weekday on Sindhuli Road, All Type (PCU/DAY)
Table 8.2-57 Summary of Traffic Count Survey on Holiday on Sindhuli Road
*Heavy veh.;5.Mini Bus,6.Large Bus, 8.Heavy Truck, 9.Multi-axel Truck
Source: Traffic survey result by JICA Study Team
7,263
4,1665,131 5,047
0
1,000
2,000
3,000
4,000
5,000
6,000
7,000
8,000
Near Bardibas
(SECTION Ⅰ)
Ghurmi Way
(SECTION Ⅱ)
Khurkot
(SECTION Ⅲ)
Mangaltar
(SECTION Ⅳ)
Capacity of intermediate lane Road(5.5m)
Plain:6000Mountainousand steep:5200
Rolling:5700
ClassificationNear Bardibas
(SECTION Ⅰ)
%
Total
%
w/o MC
Ghurmi Way
(SECTION Ⅱ)
%
Total
%
w/o MC
Khurkot
(SECTION Ⅲ)
%
Total
%
w/o MC
Mangaltar
(SECTION Ⅳ)
%
Total
%
w/o MC
1. Motor Cycle 4,166 53% 1,200 34% 1,814 39% 1,924 38%
2. Car & Taxi 567 7% 16% 422 12% 18% 445 9% 15% 567 11% 18%
3. Utility Pick up 1,122 14% 31% 912 26% 39% 1,128 24% 39% 1,309 26% 42%
4. Micro Bus 359 5% 10% 418 12% 18% 459 10% 16% 442 9% 14%
5. Mini Bus 133 2% 4% 141 4% 6% 214 5% 7% 281 6% 9%
6. Large Bus 33 0% 1% 0 0% 0% 2 0% 0% 29 1% 1%
7. Light Truck 97 1% 3% 45 1% 2% 52 1% 2% 105 2% 3%
8. Heavy Truck 409 5% 11% 346 10% 15% 332 7% 12% 341 7% 11%
9. Multi-axel Truck 72 1% 2% 1 0% 0% 25 1% 1% 0 0% 0%
10. Others 862 11% 24% 75 2% 3% 226 5% 8% 7 0% 0%
Total(All type of Veh.) 7,820 100% - 3,560 100% - 4,697 100% - 5,005 100% -
Share of Heavy Veh. 8% - - 14% - - 12% - - 13% - -
Share of Heavy truck. 6% - - 10% - - 8% - - 7% - -
PCU 7,259 - - 4,168 - - 5,192 - - 5,619 - -
Total(w/o 1.Motor Cycle) 3,654 - 100% 2,360 - 100% 2,883 - 100% 3,081 - 100%
Share of Heavy Veh. 18% - - 21% - - 20% - - 21% - -
Share of Heavy truck. 13% - - 15% - - 12% - - 11% - -
PCU 5,176 - - 3,568 - - 4,285 - - 4,657 - -
(PCU/day)

Data Collection Survey on the Sindhuli Road Capacity Enhancement in Nepal FINAL REPORT
8-81
Source: JICA Study Team
Figure 8.2-135 Daily Traffic Volume on Weekend day on Sindhuli Road, All Type
Source: JICA Study Team
Figure 8.2-136 Daily Traffic Volume on Weekend on Sindhuli Road, All Type (PCU/DAY)
0
1,000
2,000
3,000
4,000
5,000
6,000
7,000
8,000
Near Bardibas
(SECTION Ⅰ)
Ghurmi Way
(SECTION Ⅱ)
Khurkot
(SECTION Ⅲ)
Mangaltar
(SECTION Ⅳ)
1. Motor Cycle
2. Car & Taxi
3. Utility Pick up
4. Micro Bus
5. Mini Bus
6. Large Bus
7. Light Truck
8. Heavy Truck
9. Multi-axel Truck
10. Others
7,259
4,1685,192
5,619
0
1,000
2,000
3,000
4,000
5,000
6,000
7,000
8,000
Near Bardibas
(SECTION Ⅰ)
Ghurmi Way
(SECTION Ⅱ)
Khurkot
(SECTION Ⅲ)
Mangaltar
(SECTION Ⅳ)
Capacity of intermediate lane Road(5.5m)
Plain:6000Mountainousand steep:5200
Rolling:5700
5,005 4,697
3,560
7,820 (veh./day)
(PCU/day)
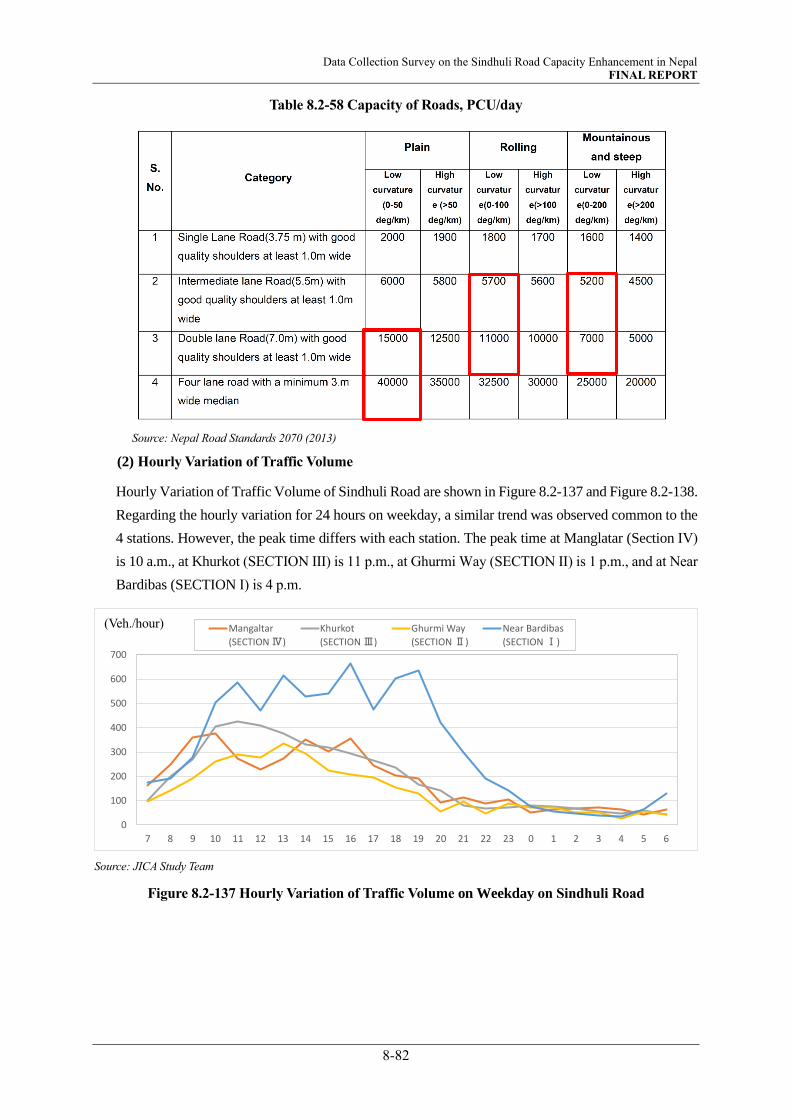
Data Collection Survey on the Sindhuli Road Capacity Enhancement in Nepal FINAL REPORT
8-82
Table 8.2-58 Capacity of Roads, PCU/day
Source: Nepal Road Standards 2070 (2013)
(2) Hourly Variation of Traffic Volume
Hourly Variation of Traffic Volume of Sindhuli Road are shown in Figure 8.2-137 and Figure 8.2-138.
Regarding the hourly variation for 24 hours on weekday, a similar trend was observed common to the
4 stations. However, the peak time differs with each station. The peak time at Manglatar (Section Ⅳ)
is 10 a.m., at Khurkot (SECTION Ⅲ) is 11 p.m., at Ghurmi Way (SECTION Ⅱ) is 1 p.m., and at Near
Bardibas (SECTION Ⅰ) is 4 p.m.
Source: JICA Study Team
Figure 8.2-137 Hourly Variation of Traffic Volume on Weekday on Sindhuli Road
0
100
200
300
400
500
600
700
7 8 9 10 11 12 13 14 15 16 17 18 19 20 21 22 23 0 1 2 3 4 5 6
Mangaltar
(SECTION Ⅳ)
Khurkot
(SECTION Ⅲ)
Ghurmi Way
(SECTION Ⅱ)
Near Bardibas
(SECTION Ⅰ)
(Veh./hour)

Data Collection Survey on the Sindhuli Road Capacity Enhancement in Nepal FINAL REPORT
8-83
Source: JICA Study Team
Figure 8.2-138 Hourly Variation of Traffic Volume on Weekend on Sindhuli Road
(3) OD Pattern
Traffics that pass Manglatar (Section Ⅳ) are mid-trip vehicles plying between Kathmandu/Latipur and
the Eastern regions. Traffics that pass Bardibas (Section Ⅰ) are short-trip or mid-trip vehicles that runs
between Sindhuli and the Central South-East regions.
Figure 8.2-139 to Figure 8.2-142 illustrates the total traffic flow of all vehicles (excluding motorcycle)
passing Sindhuli Road. On the other hand, top 5 patterns of traffic flow are listed in Table 8.2-59 to
Table 8.2-62. 85% of the total number of vehicles passing Mangaltar are originated from or destined
to Kathmandu/Lalitpur.
The pattern on the opposite side (at Bardibas) are trips to the eastern regions. 41% of the total number
of vehicles passing Bardibas (Section I) excluding motorcycles ply between Sindhuli and Central
South-East.
Source: JICA Study Team
Figure 8.2-139 Weekday OD Pair on Sindhuli Road at Manglatar, w/o Motorcycle (veh./day)
0
100
200
300
400
500
600
700
7 8 9 10 11 12 13 14 15 16 17 18 19 20 21 22 23 0 1 2 3 4 5 6
Mangaltar
(SECTION Ⅳ)
Khurkot
(SECTION Ⅲ)
Ghurmi Way
(SECTION Ⅱ)
Near Bardibas
(SECTION Ⅰ)
Border of India
Rasuwagadhi - KerungTatopani-Zhangmu
Border of China
Dhulikhel
Ring Road
Tribhuvan Highway
Naubise
Hetauda
Pathlaiya
Narayangarh
Mugling
Nijgadh
Birgunj Jaleshwar
Bardibas
East-West Highway (Mahendra Highway)
East-West Highway (Mahendra Highway)
Sindhuli Road
Ramechhap
Arniko Highway
Kalanki
Terai region (bread-basket)
To Pokhara
To Mechinagar
Prithvi Highway
To Mahakali
2360
(85%)
50
(2%)
10
(0.5%)
860
(31%)
750
(27%)420
(15%)
580
(21%)
140(5%)
330
(12%)
10
(0.3%)
Manglatar(Section Ⅳ)
2780
unit : veh./day
KTM
Fast Track
(Veh./hour)
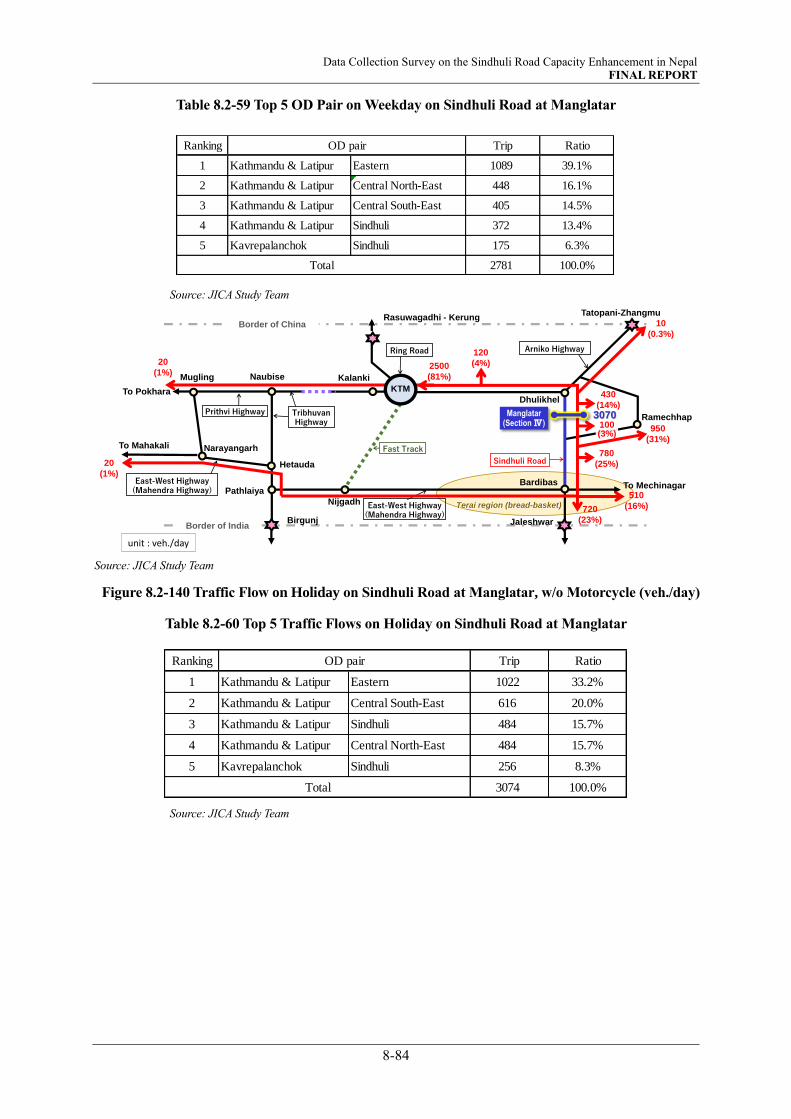
Data Collection Survey on the Sindhuli Road Capacity Enhancement in Nepal FINAL REPORT
8-84
Table 8.2-59 Top 5 OD Pair on Weekday on Sindhuli Road at Manglatar
Source: JICA Study Team
Source: JICA Study Team
Figure 8.2-140 Traffic Flow on Holiday on Sindhuli Road at Manglatar, w/o Motorcycle (veh./day)
Table 8.2-60 Top 5 Traffic Flows on Holiday on Sindhuli Road at Manglatar
Source: JICA Study Team
Ranking Trip Ratio
1 Kathmandu & Latipur Eastern 1089 39.1%
2 Kathmandu & Latipur Central North-East 448 16.1%
3 Kathmandu & Latipur Central South-East 405 14.5%
4 Kathmandu & Latipur Sindhuli 372 13.4%
5 Kavrepalanchok Sindhuli 175 6.3%
2781 100.0%Total
OD pair
Border of India
Rasuwagadhi - KerungTatopani-Zhangmu
Border of China
Dhulikhel
Ring Road
Tribhuvan Highway
Naubise
Hetauda
Pathlaiya
Narayangarh
Mugling
Nijgadh
Birgunj Jaleshwar
Bardibas
East-West Highway (Mahendra Highway)
East-West Highway (Mahendra Highway)
Sindhuli Road
Ramechhap
Arniko Highway
Kalanki
Terai region (bread-basket)
To Pokhara
To Mechinagar
Prithvi Highway
To Mahakali
2500
(81%)
120
(4%)
10
(0.3%)
950
(31%)
510
(16%)720
(23%)
780
(25%)
100(3%)
430
(14%)Manglatar
(Section Ⅳ) 3070
unit : veh./day
20
(1%)
20
(1%)
Fast Track
KTM
Ranking Trip Ratio
1 Kathmandu & Latipur Eastern 1022 33.2%
2 Kathmandu & Latipur Central South-East 616 20.0%
3 Kathmandu & Latipur Sindhuli 484 15.7%
4 Kathmandu & Latipur Central North-East 484 15.7%
5 Kavrepalanchok Sindhuli 256 8.3%
3074 100.0%
OD pair
Total

Data Collection Survey on the Sindhuli Road Capacity Enhancement in Nepal FINAL REPORT
8-85
Source: JICA Study Team
Figure 8.2-141 Traffic Flow on Weekday on Sindhuli Road at Near Bardibas, w/o Motorcycle
(veh./day)
Table 8.2-61 Top 5 Traffic Flows on Weekday on Sindhuli Road at Near Bardibas
Source: JICA Study Team
Source: JICA Study Tea
Figure 8.2-142 Traffic Flow on Holiday on Sindhuli Road at Near Bardibas, w/o Motorcycle
(veh./day)
Border of India
Rasuwagadhi - KerungTatopani-Zhangmu
Border of China
Dhulikhel
Fast Track
Ring Road
Tribhuvan Highway
Naubise
Hetauda
Pathlaiya
Narayangarh
Mugling
Nijgadh
Birgunj Jaleshwar
Bardibas
East-West Highway (Mahendra Highway)
East-West Highway (Mahendra Highway)
Sindhuli Road Ramechhap
Arniko Highway
Kalanki
Terai region (bread-basket)
To Pokhara
To Mechinagar
Prithvi Highway
To Mahakali
1580
(43%)
100
(3%)
370
(10%)
820
(22%)2140
(58%)
1510
(41%)260
(7%)
100
(3%)
10
(0.1%)
Near Bardibas
(SectionⅠ) 3670
unit : veh./day
KTM
Ranking Trip Ratio
1 Sindhuli Central South-East 1169 31.9%
2 Kathmandu & Latipur Central South-East 783 21.4%
3 Kathmandu & Latipur Eastern 739 20.2%
4 Central South-East Central South-East 326 8.9%
5 Central North-East Central South-East 103 2.8%
3667 100.0%Total
OD pair
Border of India
Rasuwagadhi - KerungTatopani-Zhangmu
Border of China
Dhulikhel
Fast Track
Ring Road
Tribhuvan Highway
Naubise
Hetauda
Pathlaiya
Narayangarh
Mugling
Nijgadh
Birgunj Jaleshwar
Bardibas
East-West Highway (Mahendra Highway)
East-West Highway (Mahendra Highway)
Sindhuli Road Ramechhap
Arniko Highway
Kalanki
Terai region (bread-basket)
To Pokhara
To Mechinagar
Prithvi Highway
To Mahakali
1480
(53%)
40
(2%)
310
(11%)
540
(19%)1760
(64%)
840
(30%)230
(8%)
100
(4%)
Near Bardibas
(SectionⅠ) 2770
unit : veh./day
KTM

Data Collection Survey on the Sindhuli Road Capacity Enhancement in Nepal FINAL REPORT
8-86
Table 8.2-62 Top 5 Traffic Flows on Holiday on Sindhuli Road at Near Bardibas
Source: JICA Study Team
8.3 TRAFFIC DEMAND FORECAST
8.3.1 Approach
In this section, the future traffic demand is estimated based on socio-economic framework of Nepal and
traffic survey conducted by the Study team. Firstly, the socio-economic framework related to traffic
demand is reviewed. Then, the traffic growth rate is calculated based on the regression analysis between
the socio-economic framework and the actual value of traffic volume. The future traffic volume based on
simple (linear) increase is estimated using the traffic growth rate and present traffic volume. In this survey,
methods parameters setting method and estimation method of the previous JICA survey (Nagdhunga
tunnel survey, SD road survey and KTM intersection survey).
8.3.2 Impact from COVID-19 to Traffics Plying on Sindhuli Road
According to the DDG (Deputy Director General), impact from COVID-19 on traffics using the Sindhuli
Road is negligible. However, the consequences of the impact were confirmed by analyzing past changes
in traffic volumes. The traffic volume survey and OD survey in this survey were conducted avoiding the
lockdowns in the urban areas. Figure 8.3-1 shows the changes in traffic volume on the Sindhuli Road. The
traffic volume used was converted from ADT to AADT (Annual Average Daily Traffic) using the seasonal
coefficient of variation (Table 8.3-1)
From this result, it is considered that the traffic volume on the Sindhuli Road is steadily increasing, and
there is almost no influence of COVID-19 during the period of the traffic volume survey and the OD
survey conducted this time.
Table 8.3-1 Seasonal Variation Factors
Source: DOR, HMIS Traffic Database
Ranking Trip Ratio
1 Kathmandu & Latipur Central South-East 909 32.8%
2 Sindhuli Central South-East 721 26.0%
3 Kathmandu & Latipur Eastern 497 17.9%
4 Eastern Sindhuli 122 4.4%
5 Central South-East Central South-East 118 4.3%
2772 100.0%
OD pair
Total
Location Jan Feb Mar Apr May Jun Jul Aug Sep Oct Nov Dec
General 0.93 0.91 0.91 0.9 0.92 0.93 1.19 1.24 1.14 1.06 1.04 0.98

Data Collection Survey on the Sindhuli Road Capacity Enhancement in Nepal FINAL REPORT
8-87
Source: JICA Study Team
Figure 8.3-1 Changes in Traffic Volume of Sindhuli Road Section
8.3.3 Socio-Economic Framework
The socio-economic frame used for forecasting future traffic demand was set based on the trends of past
statistical data and the plans of the Government of Nepal. The indicators used for forecasting future traffic
demand are the population and GDP (Gross Domestic Product) shown in Table 8.3-2. From 2011 to 2018,
the average annual growth rate of Nepal's GDP was 4.76%. Therefore, in this survey, the future growth
rate was set at 4.5% per year from 2021 to 2031 and 4.0% per year from 2032 to 2041.
Table 8.3-2 Framework of Population
Source: Study team estimation based on GON, National Population and Housing Census 2011
BP Highway
Khurkot and Ghurmi Way Intersection
2017 2019 2021
Total 3,427 5,359 5,734
Growth - 1.56 1.07
2017 2019 2021
Total 4,992 7,600 8,069
Growth 1.52 1.06
2017 2019 2021
Total - 4,261 4,628
Growth - 1.09
2017 2019 2021
Total - 4,008 4,629
Growth - - 1.15
yearCentral Region
(million)
Growth
rate
Western Region
(million)
Growth
rate
total
(million)
Growth
rate
2021 11.46 - 6.42 - 17.88 -
2026 12.25 1.3% 6.73 0.9% 18.98 1.2%
2031 12.94 1.1% 6.96 0.7% 19.90 1.0%
2036 13.65 1.1% 7.17 0.6% 20.82 0.9%
2041 14.36 1.0% 7.38 0.6% 21.74 0.9%

Data Collection Survey on the Sindhuli Road Capacity Enhancement in Nepal FINAL REPORT
8-88
Table 8.3-3 Framework of GDP
*At basic price (constant)
Source: Study team estimation
8.3.4 Traffic Growth
Economic activities such as population and GDP growth and changes will result in the increase of traffic
volume. In this section, based on a regression analysis of past traffic data and related indicators, future
traffic volume by vehicle type is estimated. As for the traffic volume, the traffic volume survey results
conducted in 2019 and the traffic survey result of 2021 conducted under this Study were used. The traffic
count surveys were conducted in April 2021. The AADT for 2021, converted from ADT using the seasonal
variation factors are shown in Table 8.3-4.
Table 8.3-4 Annual Average Daily Traffic in 2021 (AADT)
Source: JICA Study Team
(1) Passenger Vehicle
Objective vehicles are Motorcycle, Passenger Car & Taxi, Microbus, Minibus and Bus. These types
of vehicles are used for relatively short and middle trip. As an indicator related to the traffic increase,
the total population of Central and Eastern Region are selected. Past population and average traffic
volume are show in Table 8.3-5. The forecasting model was estimated as shown in Figure 8.3-2. Table
8.3-6 shows the results of determining the growth rate of future passenger vehicle using this forecasting
2011 615
2012 637.771
2013 674.227
2014 694.227
2015 695.688
2016 749.55
2017 796.784
2018 851.069
2019 889.367 4.5%
2020 929.389 4.5%
2021 975.149 4.5%
2026 1,215.214 4.5%
2031 1,505.859 4.5%
2036 1,832.099 4.0%
2041 2,216.652 4.0%
-
Real GDP
(billion Rp)
Estimated GDP
(billion Rp)AAGRyear
- 4.8%
SectionMotor
Cycle
Car &
Taxi
Utility
Pick up
Micro
Bus
Mini
Bus
Large
Bus
Light
Truck
Heavy
Truck
Multi-axel
TruckOthers
Total
(Veh./day)
Total
(PCD/day)
SectionⅠ
(Urban Area of Bardibas)4,571 705 1,307 453 168 46 95 398 106 792 8,643 8,069
SectionⅠ-Ⅱ
( Mountainous of Bardibas-Khurkot)1,367 422 953 483 152 2 128 371 0 78 3,956 4,629
SectionⅢ
(Khurkot-Nepalthok)1,888 486 1,292 504 239 1 124 365 6 217 5,123 5,714
SectionⅣ
(Nepalthok-Dhilikhel)1,844 553 1,335 476 257 14 119 405 0 2 5,006 5,734
average traffic 1,697 483 1,158 485 205 6 124 381 3 100 4,642 5,290

Data Collection Survey on the Sindhuli Road Capacity Enhancement in Nepal FINAL REPORT
8-89
model. The growth rate was estimated using the data for the second year for the following reasons.
It has not been long since the opening of the entire Sindhuli Road (2015), and the traffic volume
immediately after the opening (2015) was different from the trend in 2019 and 2021.
The latest traffic volume data available was of 2019 when the traffic volume became calm.
Table 8.3-5 Past Population and Traffic Volume
Population Passenger Vehicle AADT pcu
2019 17.2 3,717 3,619
2021 17.9 4,135 3,952
Source: JICA Study Team
Source: JICA Study Team
Figure 8.3-2 Estimation Result of Passenger Vehicle
Table 8.3-6 Future Passenger Vehicle Growth Rate
Source: JICA Study Team
(2) Freight Vehicle
Objective vehicles are trucks including light trucks, heavy trucks and multi-axle Trucks. Nepal's GDP
was used as an indicator related to the increase in freight traffic. Past GDP and traffic volume are show in
Table 8.3-7. The forecast model was estimated as shown in Figure 8.3-3. Table 8.3-8 shows the future
growth rate of freight vehicles estimated using this forecast model.
y = 8718.4ln(x) - 21187R² = 1
3,000
3,500
4,000
4,500
5,000
5,500
6,000
15.0 16.0 17.0 18.0 19.0 20.0 21.0 22.0 23.0
population (million)
Number of passenger vehicle (PCU/24h)
year Passenger vehcle (PCU/24h) Growth rate
2021 3,952 -
2026 4,473 2.5%
2031 4,886 1.8%
2036 5,280 1.6%
2041 5,658 1.4%
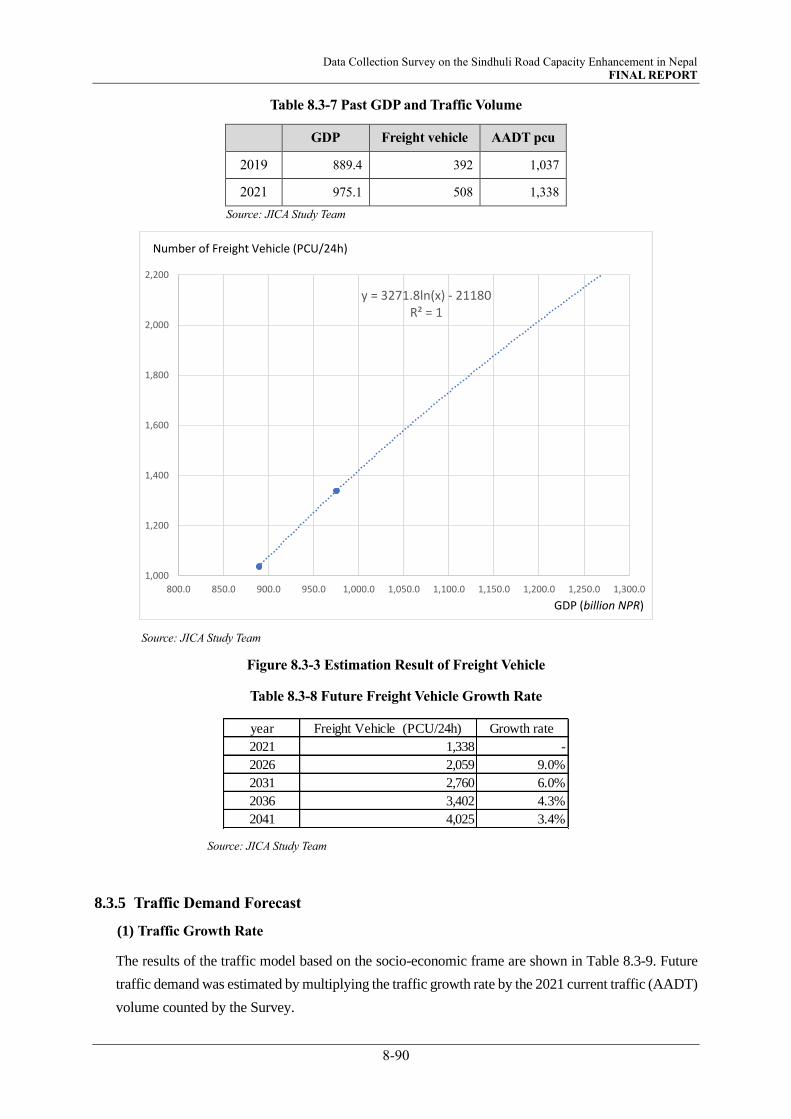
Data Collection Survey on the Sindhuli Road Capacity Enhancement in Nepal FINAL REPORT
8-90
Table 8.3-7 Past GDP and Traffic Volume
GDP Freight vehicle AADT pcu
2019 889.4 392 1,037
2021 975.1 508 1,338
Source: JICA Study Team
Source: JICA Study Team
Figure 8.3-3 Estimation Result of Freight Vehicle
Table 8.3-8 Future Freight Vehicle Growth Rate
Source: JICA Study Team
8.3.5 Traffic Demand Forecast
(1) Traffic Growth Rate
The results of the traffic model based on the socio-economic frame are shown in Table 8.3-9. Future
traffic demand was estimated by multiplying the traffic growth rate by the 2021 current traffic (AADT)
volume counted by the Survey.
y = 3271.8ln(x) - 21180R² = 1
1,000
1,200
1,400
1,600
1,800
2,000
2,200
800.0 850.0 900.0 950.0 1,000.0 1,050.0 1,100.0 1,150.0 1,200.0 1,250.0 1,300.0
Number of Freight Vehicle (PCU/24h)
GDP (billion NPR)
year Freight Vehicle (PCU/24h) Growth rate
2021 1,338 -
2026 2,059 9.0%
2031 2,760 6.0%
2036 3,402 4.3%
2041 4,025 3.4%
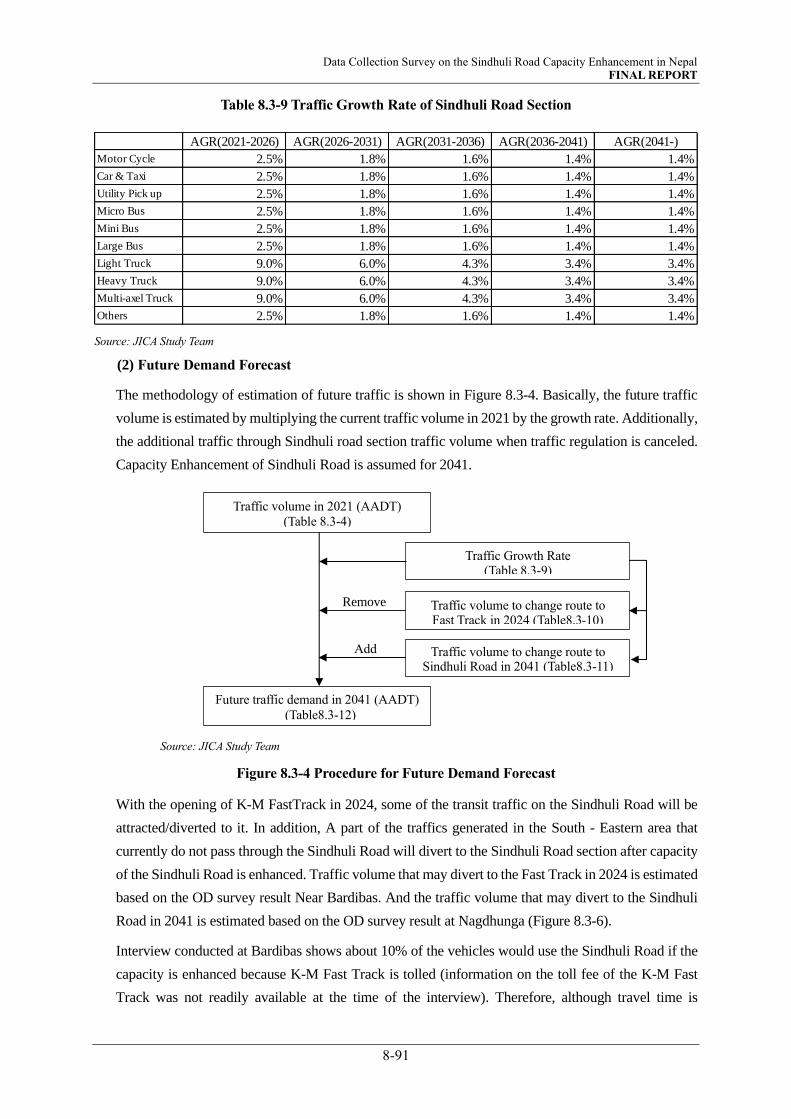
Data Collection Survey on the Sindhuli Road Capacity Enhancement in Nepal FINAL REPORT
8-91
Table 8.3-9 Traffic Growth Rate of Sindhuli Road Section
Source: JICA Study Team
(2) Future Demand Forecast
The methodology of estimation of future traffic is shown in Figure 8.3-4. Basically, the future traffic
volume is estimated by multiplying the current traffic volume in 2021 by the growth rate. Additionally,
the additional traffic through Sindhuli road section traffic volume when traffic regulation is canceled.
Capacity Enhancement of Sindhuli Road is assumed for 2041.
Source: JICA Study Team
Figure 8.3-4 Procedure for Future Demand Forecast
With the opening of K-M FastTrack in 2024, some of the transit traffic on the Sindhuli Road will be
attracted/diverted to it. In addition, A part of the traffics generated in the South - Eastern area that
currently do not pass through the Sindhuli Road will divert to the Sindhuli Road section after capacity
of the Sindhuli Road is enhanced. Traffic volume that may divert to the Fast Track in 2024 is estimated
based on the OD survey result Near Bardibas. And the traffic volume that may divert to the Sindhuli
Road in 2041 is estimated based on the OD survey result at Nagdhunga (Figure 8.3-6).
Interview conducted at Bardibas shows about 10% of the vehicles would use the Sindhuli Road if the
capacity is enhanced because K-M Fast Track is tolled (information on the toll fee of the K-M Fast
Track was not readily available at the time of the interview). Therefore, although travel time is
AGR(2021-2026) AGR(2026-2031) AGR(2031-2036) AGR(2036-2041) AGR(2041-)
Motor Cycle 2.5% 1.8% 1.6% 1.4% 1.4%
Car & Taxi 2.5% 1.8% 1.6% 1.4% 1.4%
Utility Pick up 2.5% 1.8% 1.6% 1.4% 1.4%
Micro Bus 2.5% 1.8% 1.6% 1.4% 1.4%
Mini Bus 2.5% 1.8% 1.6% 1.4% 1.4%
Large Bus 2.5% 1.8% 1.6% 1.4% 1.4%
Light Truck 9.0% 6.0% 4.3% 3.4% 3.4%
Heavy Truck 9.0% 6.0% 4.3% 3.4% 3.4%
Multi-axel Truck 9.0% 6.0% 4.3% 3.4% 3.4%
Others 2.5% 1.8% 1.6% 1.4% 1.4%
Traffic volume in 2021 (AADT)
(Table 8.3-4)
Remove
Traffic Growth Rate (Table 8.3-9)
)
Traffic volume to change route to Sindhuli Road in 2041 (Table8.3-11)
Future traffic demand in 2041 (AADT)
(Table8.3-12)
Traffic volume to change route to Fast Track in 2024 (Table8.3-10)
Add

Data Collection Survey on the Sindhuli Road Capacity Enhancement in Nepal FINAL REPORT
8-92
significantly shorter than the Sindhuli Road, about 10% of the vehicles will use the Sindhuli Road. K-
M Fast Track will open in 2024 and the capacity of the Sindhuli Road will be increased in 2041, so
this 10% of traffic will use the Sindhuli Road in 2041. The traffic volume to be converted to Sindhuli
Road will be increased until 2041 using the growth rate estimated by this study.
Source: JICA Study Team
Figure 8.3-5 Traffic Volume that may Divert to the Fast Track in 2024
Table 8.3-10 Traffic Volume that may Divert to Fast Track (AADT)
Source: JICA Study Team
Source: JICA Study Team
Figure 8.3-6 Traffic Volume that may dicert to the Sindhuli Road in 2041
Border of India
Rasuwagadhi - KerungTatopani-Zhangmu
Border of China
Dhulikhel
Fast Track
Ring Road
Naubise
Hetauda
Pathlaiya
Narayangarh
Mugling
Nijgadh
Birgunj Jaleshwar
Bardibas
Sindhuli Road
Ramechhap
Arniko Highway
Kalanki
Terai region (bread-basket)
To Pokhara
To Mechinagar
To Mahakali
unit : veh./day
Prithvi Highway Tribhuvan Highway
East-West Highway (Mahendra Highway)
East-West Highway (Mahendra Highway)
Distance : 156km
Travel Time : 163 min.
Distance : 183km
Travel Time : 323 min.
Change Route to Fast Track
Passenger Car 759
Bus 445
Truck 81
Total 1,285
PCU 1,778
KTM
Section1. Motor
Cycle
2. Car &
Taxi
3. Utility
Pick up
4. Micro
Bus
5. Mini
Bus
6. Large
Bus
7. Light
Truck
8. Heavy
Truck
9. Multi-
axel Truck10. Others
Total
(ver./day)
Total
(PCU/day)
The amount of traffic volume that
may changes the route to the Fast
track (2021)
0 197 647 401 63 30 13 77 0 0 1,428 1,975
The amount of traffic volume that
may changes the route to the Fast
track (2024)
0 212 698 433 68 32 18 101 0 0 1,563 2,192
Traffic Volume to Change Route
to Fast track (2024)0 191 628 390 62 29 16 91 0 0 1,407 1,974
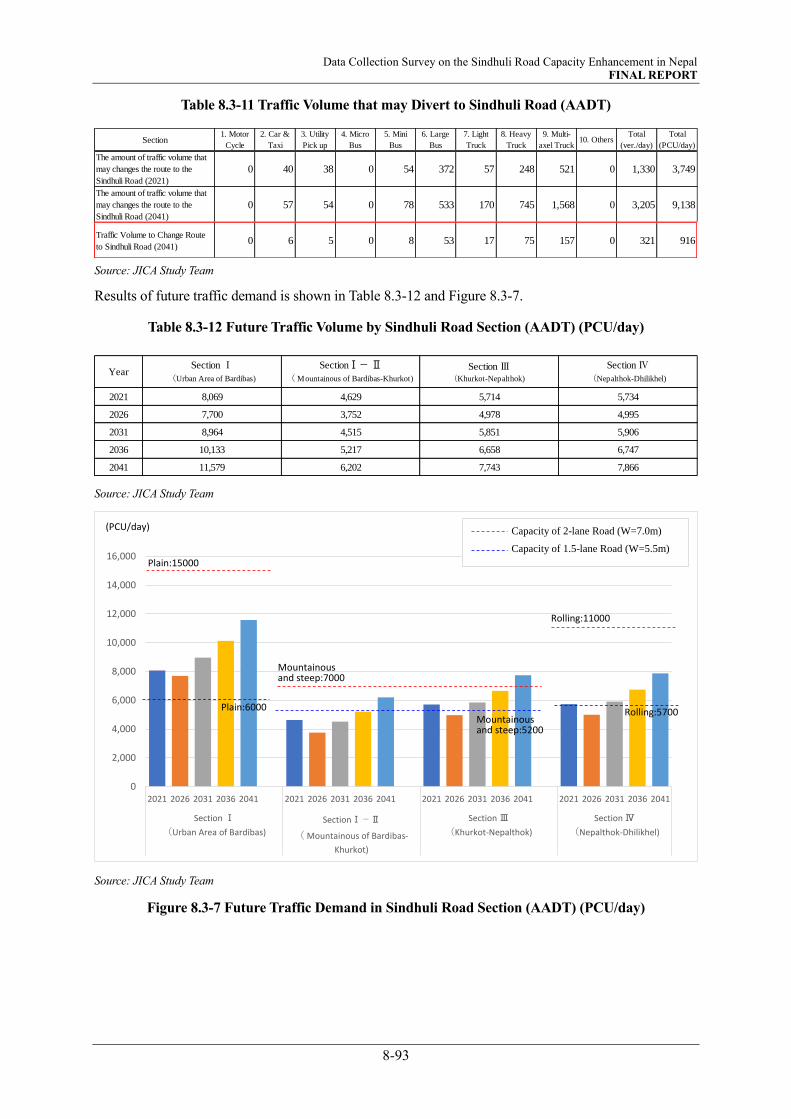
Data Collection Survey on the Sindhuli Road Capacity Enhancement in Nepal FINAL REPORT
8-93
Table 8.3-11 Traffic Volume that may Divert to Sindhuli Road (AADT)
Source: JICA Study Team
Results of future traffic demand is shown in Table 8.3-12 and Figure 8.3-7.
Table 8.3-12 Future Traffic Volume by Sindhuli Road Section (AADT) (PCU/day)
Source: JICA Study Team
Source: JICA Study Team
Figure 8.3-7 Future Traffic Demand in Sindhuli Road Section (AADT) (PCU/day)
Section1. Motor
Cycle
2. Car &
Taxi
3. Utility
Pick up
4. Micro
Bus
5. Mini
Bus
6. Large
Bus
7. Light
Truck
8. Heavy
Truck
9. Multi-
axel Truck10. Others
Total
(ver./day)
Total
(PCU/day)
The amount of traffic volume that
may changes the route to the
Sindhuli Road (2021)
0 40 38 0 54 372 57 248 521 0 1,330 3,749
The amount of traffic volume that
may changes the route to the
Sindhuli Road (2041)
0 57 54 0 78 533 170 745 1,568 0 3,205 9,138
Traffic Volume to Change Route
to Sindhuli Road (2041)0 6 5 0 8 53 17 75 157 0 321 916
YearSection Ⅰ
(Urban Area of Bardibas)
SectionⅠ- Ⅱ
( Mountainous of Bardibas-Khurkot)
Section Ⅲ(Khurkot-Nepalthok)
Section Ⅳ
(Nepalthok-Dhilikhel)
2021 8,069 4,629 5,714 5,734
2026 7,700 3,752 4,978 4,995
2031 8,964 4,515 5,851 5,906
2036 10,133 5,217 6,658 6,747
2041 11,579 6,202 7,743 7,866
0
2,000
4,000
6,000
8,000
10,000
12,000
14,000
16,000
2021 2026 2031 2036 2041 2021 2026 2031 2036 2041 2021 2026 2031 2036 2041 2021 2026 2031 2036 2041
Section Ⅰ
(Urban Area of Bardibas)
SectionⅠ-Ⅱ
(Mountainous of Bardibas-
Khurkot)
Section Ⅲ
(Khurkot-Nepalthok)
Section Ⅳ
(Nepalthok-Dhilikhel)
(PCU/day) Capacity of 2-lane Road (W=7.0m)
Capacity of 1.5-lane Road (W=5.5m)
Plain:6000Mountainousand steep:5200
Rolling:5700
Mountainousand steep:7000
Rolling:11000
Plain:15000


Data Collection Survey on the Sindhuli Road Capacity Enhancement in Nepal FINAL REPORT
9-1
CHAPTER 9 NEEDS OF THE IMPROVEMENT
9.1 INTRODUCTION
Being the shortest route connecting Kathmandu with Terai plains, outcome of Sindhuli Road was
remarkable even when the road was partially opened. When the road was fully opened to its entire stretch,
the outcome exceeded the initial targets and expectations of the stakeholders. Traffic attraction was beyond
prediction. The road is attracting more and more vehicles every year and as predicted in the previous
chapter, the increase is likely to continue in the coming years. Now, the expectation of the public is asking
for better and higher standard road - wider carriageway/roadway, gentler alignment, higher disaster-
resiliency, more environment friendly, and shorter, faster but safer better that the current road features.
This chapter briefly explains the need of the improvement including issues to be concerned.
9.2 NEEDS AND POTENTIALS OF THE IMPROVEMENT
The need of the improvement can be summarized as follows;
9.2.1 Recognition in the Development Plans
The 14th and the 15th Development Plan of Nepal targets to improve all existing strategic roads to 2-lanes
or more and recognizes this as the Game Changer Projects, which has the second highest priority. The plan
aims to expand improvement of the existing highways to 2-lane or more roads from 7,794 km in 2019 to
20,200km by 2023/24. Improvement of Sindhuli Road is included in this target and thus is in line with the
Government’s developmental plan.
On the other hand, the mid-term review of 2007 PIP (Priority Investment Plan) (refer to Chapter 3)
proposes reclassification of National Highways and Feeder Roads to prioritize the road network in
accordance with their functions and importance. While the plan prioritizes, is sequential order,
maintenance of the existing (sealed) network, upgrading to higher standards, and new construction, it does
not particularly specify upgradation of the Sindhuli Road it does recommend maintaining Class 2 National
Highways to appropriate standards and widening progressively to 2-lanes. Sindhuli Road is classified as
Class 2: Secondary Highway in the Plan.
9.2.2 Roles and Expectations in the Strategic Road Network
Major roads in and around the Sindhuli Road is shown in Figure 9.2-1. The Sindhuli Road is classified as
one of the National Highways and is an integral part of the strategic road network of Nepal. This is one of
the few highways running from north to south. It connects two highways running parallelly and traversing
the country, the E-W Highway in the south and the Pushpa Lal Highway (M-H Highway) in the central
region. Moreover, a section of Sindhuli Road between Ghurmi and Khurkot (3.5km) constitutes an integral
part of the M-H Highway. Both the E-W Highway and the M-H Highway consist of 2-lanes.
With the construction of the eastern part of the M-H Highway completed, Sindhuli Road now contributes
to enhancing access of the northern regions to both Kathmandu and the Terai regions, in addition to its till
date provision of safe, stable, and speedy access between Kathmandu and the eastern Terai regions.
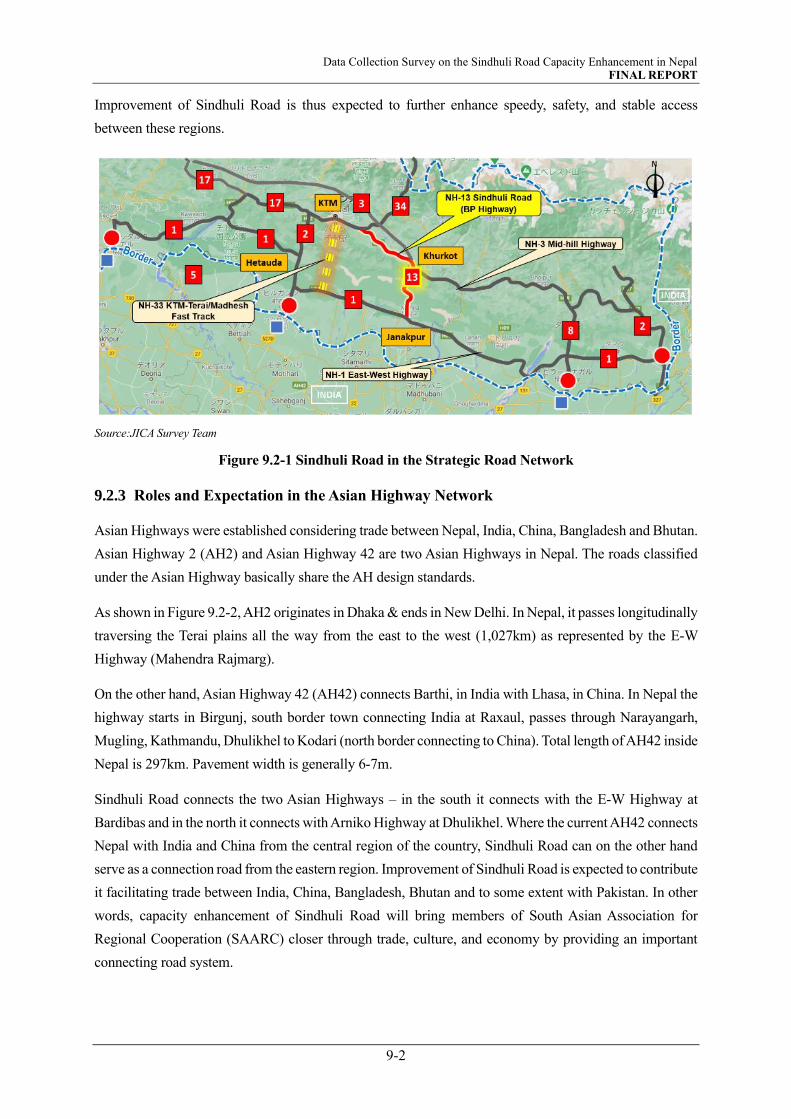
Data Collection Survey on the Sindhuli Road Capacity Enhancement in Nepal FINAL REPORT
9-2
Improvement of Sindhuli Road is thus expected to further enhance speedy, safety, and stable access
between these regions.
Source:JICA Survey Team
Figure 9.2-1 Sindhuli Road in the Strategic Road Network
9.2.3 Roles and Expectation in the Asian Highway Network
Asian Highways were established considering trade between Nepal, India, China, Bangladesh and Bhutan.
Asian Highway 2 (AH2) and Asian Highway 42 are two Asian Highways in Nepal. The roads classified
under the Asian Highway basically share the AH design standards.
As shown in Figure 9.2-2, AH2 originates in Dhaka & ends in New Delhi. In Nepal, it passes longitudinally
traversing the Terai plains all the way from the east to the west (1,027km) as represented by the E-W
Highway (Mahendra Rajmarg).
On the other hand, Asian Highway 42 (AH42) connects Barthi, in India with Lhasa, in China. In Nepal the
highway starts in Birgunj, south border town connecting India at Raxaul, passes through Narayangarh,
Mugling, Kathmandu, Dhulikhel to Kodari (north border connecting to China). Total length of AH42 inside
Nepal is 297km. Pavement width is generally 6-7m.
Sindhuli Road connects the two Asian Highways – in the south it connects with the E-W Highway at
Bardibas and in the north it connects with Arniko Highway at Dhulikhel. Where the current AH42 connects
Nepal with India and China from the central region of the country, Sindhuli Road can on the other hand
serve as a connection road from the eastern region. Improvement of Sindhuli Road is expected to contribute
it facilitating trade between India, China, Bangladesh, Bhutan and to some extent with Pakistan. In other
words, capacity enhancement of Sindhuli Road will bring members of South Asian Association for
Regional Cooperation (SAARC) closer through trade, culture, and economy by providing an important
connecting road system.

Data Collection Survey on the Sindhuli Road Capacity Enhancement in Nepal FINAL REPORT
9-3
Furthermore, one of the long-term national strategies to meet the national goals set in the 15th Development
Plan, is to develop internal and international interconnectivity and sustainable cities/settlements. It has also
highlighted increase of production and productivity to make the economy competitive and beneficial from
globalization and the high growth in its two neighboring countries as the drivers of transformation for
achieving the national goals. Capacity enhancement of Sindhuli Road is expected to contribute to
strengthening the north-south connectivity and is in line with the development plans.
Source:JICA Survey Team
Figure 9.2-2 Asian Highway Network in and Around Nepal
9.2.4 Enhancement of Traffic Capacity and Traffic Safety
According to the Nepal Road Standard 2013, the capacity of intermediate roads of width 5.5m in
mountainous and steep area is 4,000-5,200 pcu. From the traffic survey conducted in April 2021 under this
Survey, 24-hour traffic volume in terms of passenger car unit (PCU) on Sindhuli Road at all sections has
exceeded 5,000 (refer to Chapter 8.2.9). Therefore, since the existing traffic volume has already exceeded
the threshold for a 1.5 lane road. In addition, traffic accidents record for the period of 2015-2019 show that
one of the main causes of the accidents is the narrow width. Therefore, improvement of Sindhuli Road
(dualization) is utterly important to enhance the traffic capacity of the road as well as contribute to
mitigating traffic accidents and saving human lives and properties.
9.2.5 Enhancement of Trade Route Redundancy
The westward route is said to be located in a highly disaster-prone area. The hazardous section between
Thankot-Naubise is expected to be improved after the on-going Nagdhunga Tunnel construction project is
completed. However, other sections remain to be vulnerable. As mentioned in the preceding chapter and
as illustrated in the hazard map in Figure 9.2-3, section between Malekhu and Narayangadh are highly
vulnerable to landslides, slope failure, debris flow. Mugling-Narayangadh is also prone to rock fall.
On the other hand, Narayangadh-Hetauda section has less disaster-prone areas. However, deposition of
boulders at bridges along the E-W Highway is alarmingly high and poses threat to the soundness of the
bridges. In addition, there are couple of locations where massive size rock falls are frequent. And, there
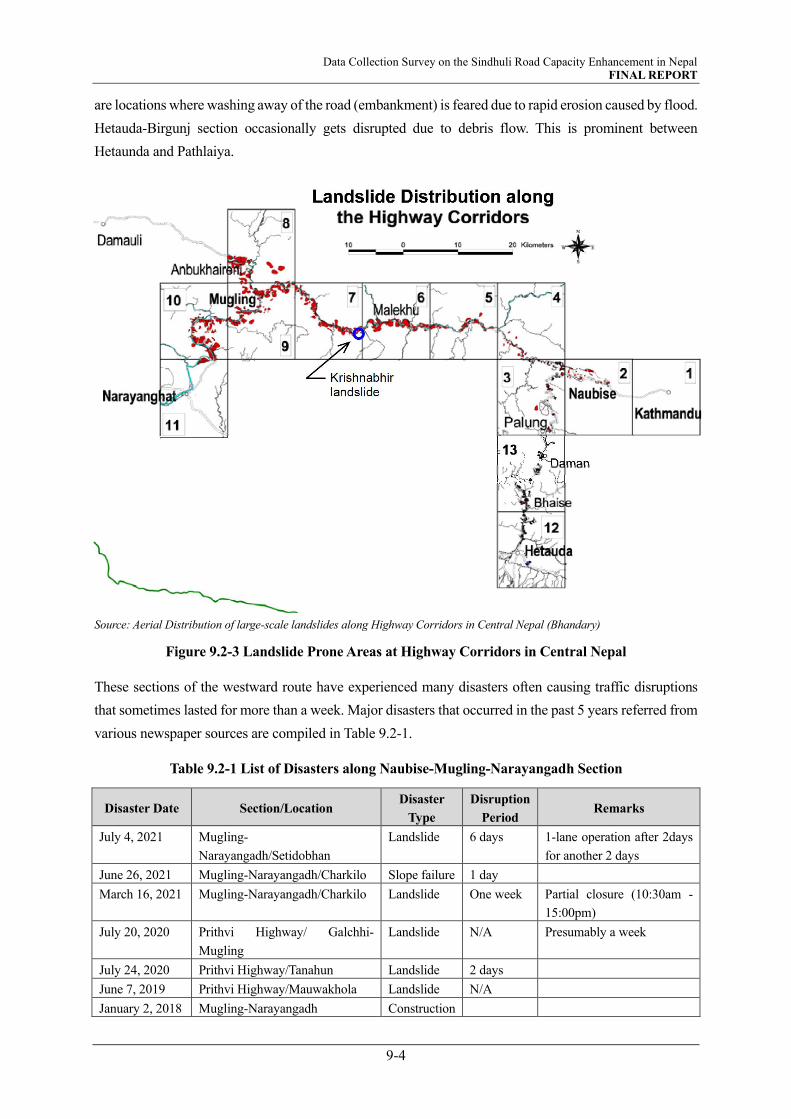
Data Collection Survey on the Sindhuli Road Capacity Enhancement in Nepal FINAL REPORT
9-4
are locations where washing away of the road (embankment) is feared due to rapid erosion caused by flood.
Hetauda-Birgunj section occasionally gets disrupted due to debris flow. This is prominent between
Hetaunda and Pathlaiya.
Source: Aerial Distribution of large-scale landslides along Highway Corridors in Central Nepal (Bhandary)
Figure 9.2-3 Landslide Prone Areas at Highway Corridors in Central Nepal
These sections of the westward route have experienced many disasters often causing traffic disruptions
that sometimes lasted for more than a week. Major disasters that occurred in the past 5 years referred from
various newspaper sources are compiled in Table 9.2-1.
Table 9.2-1 List of Disasters along Naubise-Mugling-Narayangadh Section
Disaster Date Section/Location Disaster
Type
Disruption
Period Remarks
July 4, 2021 Mugling-
Narayangadh/Setidobhan
Landslide 6 days 1-lane operation after 2days
for another 2 days
June 26, 2021 Mugling-Narayangadh/Charkilo Slope failure 1 day
March 16, 2021 Mugling-Narayangadh/Charkilo Landslide One week Partial closure (10:30am -
15:00pm)
July 20, 2020 Prithvi Highway/ Galchhi-
Mugling
Landslide N/A Presumably a week
July 24, 2020 Prithvi Highway/Tanahun Landslide 2 days
June 7, 2019 Prithvi Highway/Mauwakhola Landslide N/A
January 2, 2018 Mugling-Narayangadh Construction
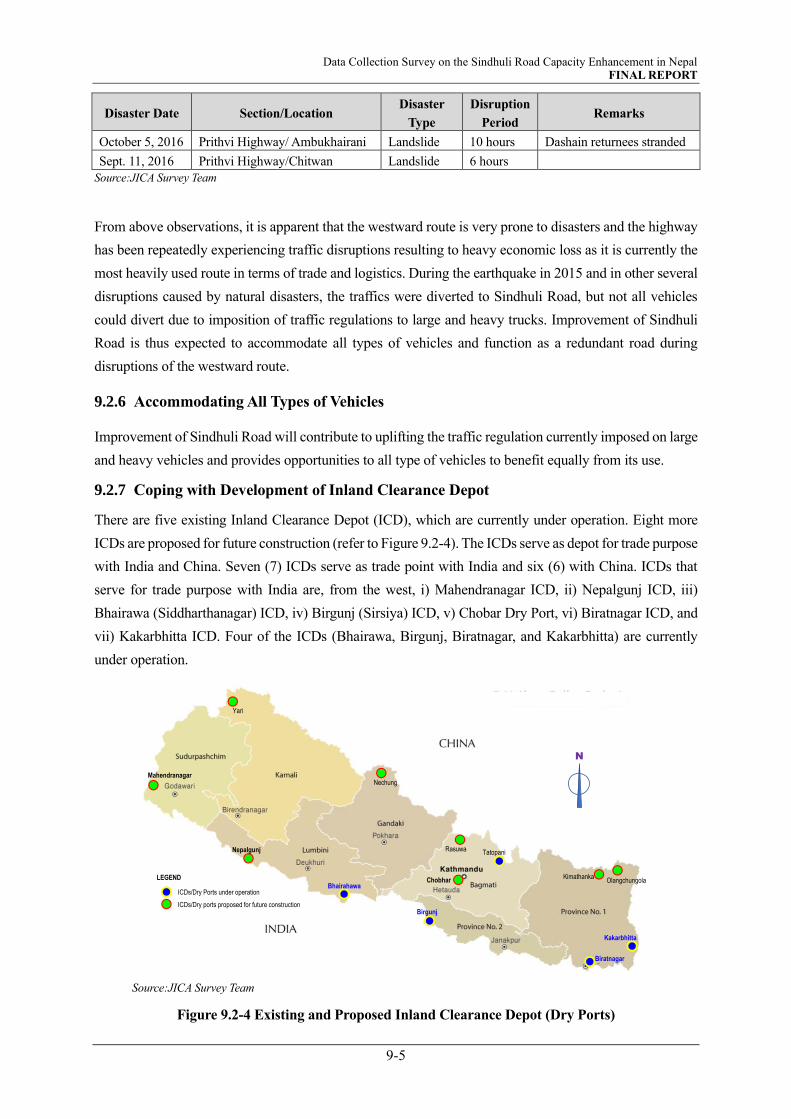
Data Collection Survey on the Sindhuli Road Capacity Enhancement in Nepal FINAL REPORT
9-5
Disaster Date Section/Location Disaster
Type
Disruption
Period Remarks
October 5, 2016 Prithvi Highway/ Ambukhairani Landslide 10 hours Dashain returnees stranded
Sept. 11, 2016 Prithvi Highway/Chitwan Landslide 6 hours
Source:JICA Survey Team
From above observations, it is apparent that the westward route is very prone to disasters and the highway
has been repeatedly experiencing traffic disruptions resulting to heavy economic loss as it is currently the
most heavily used route in terms of trade and logistics. During the earthquake in 2015 and in other several
disruptions caused by natural disasters, the traffics were diverted to Sindhuli Road, but not all vehicles
could divert due to imposition of traffic regulations to large and heavy trucks. Improvement of Sindhuli
Road is thus expected to accommodate all types of vehicles and function as a redundant road during
disruptions of the westward route.
9.2.6 Accommodating All Types of Vehicles
Improvement of Sindhuli Road will contribute to uplifting the traffic regulation currently imposed on large
and heavy vehicles and provides opportunities to all type of vehicles to benefit equally from its use.
9.2.7 Coping with Development of Inland Clearance Depot
There are five existing Inland Clearance Depot (ICD), which are currently under operation. Eight more
ICDs are proposed for future construction (refer to Figure 9.2-4). The ICDs serve as depot for trade purpose
with India and China. Seven (7) ICDs serve as trade point with India and six (6) with China. ICDs that
serve for trade purpose with India are, from the west, i) Mahendranagar ICD, ii) Nepalgunj ICD, iii)
Bhairawa (Siddharthanagar) ICD, iv) Birgunj (Sirsiya) ICD, v) Chobar Dry Port, vi) Biratnagar ICD, and
vii) Kakarbhitta ICD. Four of the ICDs (Bhairawa, Birgunj, Biratnagar, and Kakarbhitta) are currently
under operation.
Source:JICA Survey Team
Figure 9.2-4 Existing and Proposed Inland Clearance Depot (Dry Ports)
LEGEND
ICDs/Dry Ports under operation
ICDs/Dry ports proposed for future construction
N
Biratnagar
Birgunj
Bhairahawa
Nepalgunj
Mahendranagar
Kakarbhitta
Yari
Nechung
Rasuwa Tatopani
KimathankaOlangchungolaChobhar

Data Collection Survey on the Sindhuli Road Capacity Enhancement in Nepal FINAL REPORT
9-6
Among these four (4) ICDs, Birgunj ICD is mostly used where 60 percent of the total trade volume of
Nepal is being handled at present. On the other hand, Biratnagar ICD and Kakarbhitta ICD are under the
process of upgrading. Construction of the Biratnagar ICD has been completed except for the railway line,
which is currently under construction. Once Biratnagar and Kakarbhitta ICDs become fully functional,
trade volume targeted for this area that comes from east of India (Kolkata and Vishakapatnam Ports)
including trade products that are brought through Bangladesh ports (Dhaka and Mongla Ports) is more
likely to be handled at these two ICDs. The shift of trade from Birgunj to these two ICDs will use the
Sindhuli Road for transporting to Kathmandu and northeastern region of Nepal.
On the other hand, Tatopani Dry Port, which was closed following heavy damage during the Nepal
Earthquake is now operational but is yet to be fully functional as the facilities are currently being
constructed. Goods from China targeted to the northeastern region and the eastern Terai region has high
chances of being transported through Sindhuli road.
Therefore, role of the Sindhuli Road gets more important to enhance trade between both India and China
and for this improvement of the Sindhuli Road is very favorable.
9.3 NEED DESPITE OF TERAI / MADESH FAST TRACK
The Fast Track, which is currently under construction, is a 72km long expressway connecting Kathmandu
with central Terai region in Nijgadh. The expressway is targeted to be completed in 2024, if not after few
more years. Completion of the Fast Track will add one more arterial to the existing two arterials, the
Westward Route and the Sindhuli Road, that are serving to enter/exit the valley. When the Sindhuli Road
was completed, most traffics between Kathmandu and the eastern Terai regions were diverted from the
Westward Route. This is because Sindhuli Road is the shortest route that connects Kathmandu with the
eastern Terai region and travel time1 to Bardibas is approximately 5hours 18 minutes (Travel time to
Bardibas through Westward Route is approximately 8 hours 30minutes). In case of implementation of road
capacity enhancement measures that was studied in this Survey, travel time will be further reduced. This
estimation result is summarized in Chapter 18.
Similarly, when the Fast Track completes, traffics between Kathmandu and Birgunj including central Terai
regions that are currently using the Westward Route will divert, as the travel time to Birgunj (ICD) through
the Fast Track is estimated to about 3 hours (Westward Route takes about 7 hours). However, traffics
between Kathmandu and the eastern parts of the country are deemed to continue using the current routes.
Especially, those destined to the northeast regions. In future, after full resumption of Tatopani Border, trade
between China-Nepal-India enhances, demand for use of Sindhuli Road will further increase.
DOR views that the expressway is likely to be utilized by vehicles opting for toll roads and not by common
vehicles that have options to avoid toll fees. This however cannot be substantiated as at the time of the
discussion with the DOR, information on toll fee was not readily available (officially disclosed). K-M Fast
Track is the shortest route between KTM and the Terai and will attract traffics from the current existing
routes. Therefore, it is important to carry out willingness-to-pay survey and traffic survey/analysis to
1 Travel times are estimated time calculated using the Google Map. Origin at Kathmandu is taken from center of the city.

Data Collection Survey on the Sindhuli Road Capacity Enhancement in Nepal FINAL REPORT
9-7
predict the actual attraction of traffics. Moreover, traffics that will use the K-M Fast Track will be the traffic
generated from central region of the country, namely Parsa, Bara, Rautahat and Makwanpur districts,
whereas Sindhuli Road users are from the eastern region including several districts of Province No. 2. In
addition, once the dry ports in Biratnagar and Kakarbhitta come into full operation and railway tracks
extended from Jaleswor to Bardibas, the potential of Sindhuli Road will further enhance. Also note-worthy
is the fact that while the expressway provides direct access between Kathmandu and central Terai regions,
Sindhuli Road facilitates access to both Kathmandu and the northeastern regions of the country.
Realization of the Fast Track is deemed to have impact on the Sindhuli Road because it is an expressway,
and it is the shortest route between Kathmandu and Central Terai. However, for reasons afore-mentioned
and for the fact that Sindhuli Road can function as a redundant road of the Fast Track including the
westward route, capacity enhancement of Sindhuli Road is indispensable.
Therefore, from above observations, the three arterials after completion of the Fast Track will function in
the following manners,
i) Sindhuli Road: serving traffics between Kathmandu and eastern parts of the country
ii) Westward Route: serving traffics between Kathmandu and western parts of the country
iii) Fast Track: serving traffics from central terai including trade transport headed for Kathmandu
from Birgunj
9.4 PERSPECTIVE OF MOPIT/DOR
The Survey Team had several meetings with the MOPIT (Ministry of Physical Infrastructure and
Transport) and the DOR (Department of Roads) during the course of the study. The last one was held on
December 10, 2021 with MOPIT. Main views of MOPIT and DOR confirmed during the course of the
meetings that emphasize importance or need for capacity enhancement of the Sindhuli Road are, among
others.
A letter from DOR and minutes of meeting with DOR and MOPIT are attached in APPENDIX-1 to 3.
Sindhuli Road is a token of friendship between Japan and Nepal. The road has some sections
with sophisticated technologies. GON (Government of Nepal) has high expectation for further
assistance from the GOJ (Government of Japan) for improvements, if required. Particularly, at
sections that need advanced and sophisticated technologies.
According to MOPIT`s 5 Year Strategic Plan, all roads under its jurisdiction are required to have
2-lanes or more.
Widening (capacity enhancement) of the Sindhuli Road is imminent as the road is already
approaching saturation and traffic volume will soon exceed the capacity as more traffics are
being fed from new developments (M-H Highway, M-B Highway) around the Sindhuli Road.
MOPIT and DOR assures impact from Fast Track will not be very significant. Fast Track will
attract traffics but the demand of the other links to Kathmandu will still retain traffics, In case of
the Sindhuli Road, traffics from eastern region and ICD borders bound to Chinese border and
cities along will preferably take the Sindhuli Road. Another reason is that the Fast Track is a toll
road.

Data Collection Survey on the Sindhuli Road Capacity Enhancement in Nepal FINAL REPORT
9-8
MOPIT`s priority with regards to investment on its road is in sequential order, i) E-W Highway,
ii) Prithvi Highway (KTM-Pokhara), iii) Postal Road, iv) M-H Highway, and v) north-south
corridors. But in terms of connecting Kathmandu with the Indian border, Fast Track will be the
first priority and the Sindhuli Road is second in the line.
Data Collection Survey on the Sindhuli Road Capacity Enhancement in Nepal FINAL REPORT
10-1
CHAPTER 10 STUDY ON ENHANCEMENT OF ROAD FUNCTION
10.1 INTRODUCTION
As explained in “1.5 Study Approach” in Chapter 1, detailed study approach for enhancement of road
function and its results are described in this chapter.
10.2 STUDY APPROACH
The study is carried out in the three steps indicated below.
STEP-1: Basic Concept Formulation Stage
STEP-2: Road Function Enhancement Study Stage
STEP-3: Project List Preparation Stage
(1) STEP-1: Basic Concept Formulation Stage
1) Data Collection and Analyses
Information relevant to development plans, demography (population statistics, industrial structures, trade
trends etc.), land use pattern (villages, communities, cultivated/arable land, forest reserves, and
drainage/irrigation systems etc.) are collected and compiled to comprehend the present condition of the
Sindhuli Road, which is inevitable in formulating the basic concept of road function enhancement.
Following points are also considered in the process.
• Discussion with relevant agencies to confirm expected image (ideal state) of the Sindhuli Road,
• Collection of data relevant to domestic and international trade (especially with India) including
relevant plans/projects,
• Conduction of survey and reconnaissance to identify tourism resources along the objective road and
its surrounding areas and check potentials of inbound and Terai region tourism demand,
• Understand and evaluate possible changes in quality of traffic of the Sindhuli Road by forecasting
and comparing traffic demand for each case in consideration with each relevant project. This will take
into consideration, among others; i) projected completion period of proposed tunnel route in Section
II, ii) Nagdhunga Tunnel Construction project, and iii) Fast-Track under implementation by Nepal
Army
2) Basic Concept Formulation
The basic concept that focuses on strengthening transport/logistics capacity of the Sindhuli Road will be
established. Meetings focused on ideal future image of the Sindhuli Road, including analytic results of
the information collected, will be held with DOR (Department of Roads) and other relevant agencies.
Furthermore, following points will be taken into consideration.
• Logistics between Kathmandu and Terai Plains, connectivity with the northeastern regions, relevant
development projects (the E-W Highway improvement project), improvement of route to Chinese
border (the Arniko Highway), railway projects will be considered,
• Dry port locations, both existing and planned by the government, and freight/cargo connectivity
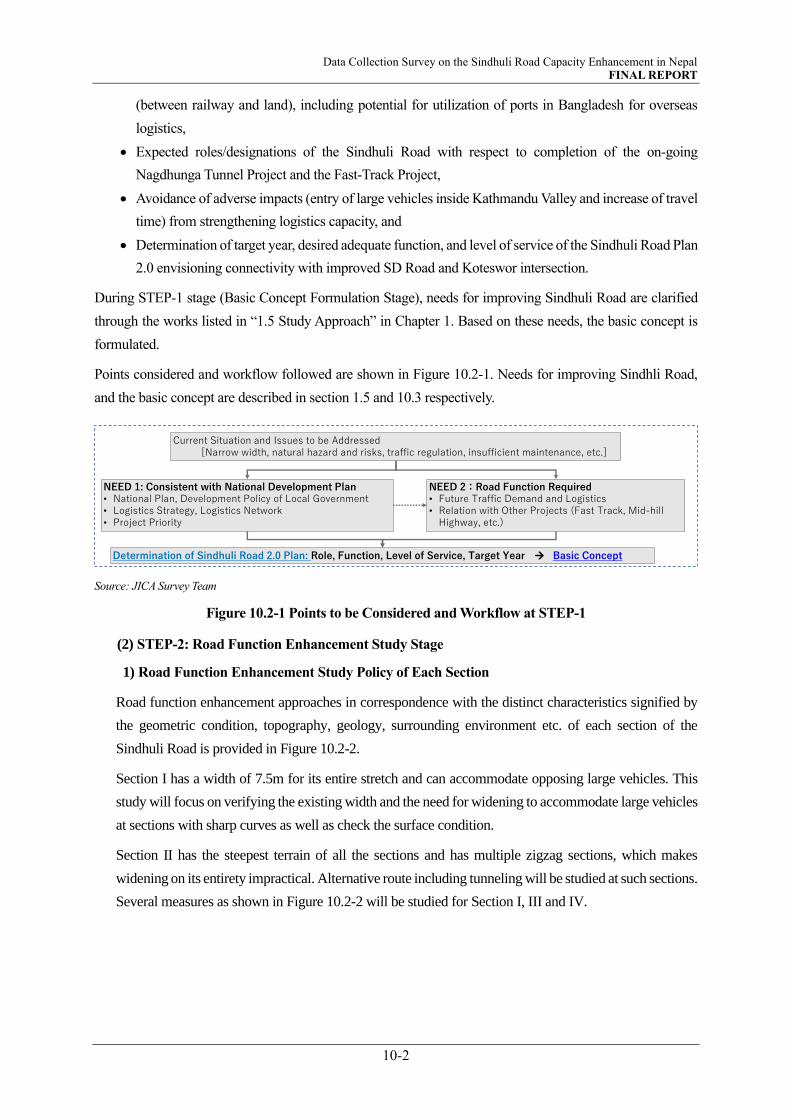
Data Collection Survey on the Sindhuli Road Capacity Enhancement in Nepal FINAL REPORT
10-2
(between railway and land), including potential for utilization of ports in Bangladesh for overseas
logistics,
• Expected roles/designations of the Sindhuli Road with respect to completion of the on-going
Nagdhunga Tunnel Project and the Fast-Track Project,
• Avoidance of adverse impacts (entry of large vehicles inside Kathmandu Valley and increase of travel
time) from strengthening logistics capacity, and
• Determination of target year, desired adequate function, and level of service of the Sindhuli Road Plan
2.0 envisioning connectivity with improved SD Road and Koteswor intersection.
During STEP-1 stage (Basic Concept Formulation Stage), needs for improving Sindhuli Road are clarified
through the works listed in “1.5 Study Approach” in Chapter 1. Based on these needs, the basic concept is
formulated.
Points considered and workflow followed are shown in Figure 10.2-1. Needs for improving Sindhli Road,
and the basic concept are described in section 1.5 and 10.3 respectively.
Source: JICA Survey Team
Figure 10.2-1 Points to be Considered and Workflow at STEP-1
(2) STEP-2: Road Function Enhancement Study Stage
1) Road Function Enhancement Study Policy of Each Section
Road function enhancement approaches in correspondence with the distinct characteristics signified by
the geometric condition, topography, geology, surrounding environment etc. of each section of the
Sindhuli Road is provided in Figure 10.2-2.
Section I has a width of 7.5m for its entire stretch and can accommodate opposing large vehicles. This
study will focus on verifying the existing width and the need for widening to accommodate large vehicles
at sections with sharp curves as well as check the surface condition.
Section II has the steepest terrain of all the sections and has multiple zigzag sections, which makes
widening on its entirety impractical. Alternative route including tunneling will be studied at such sections.
Several measures as shown in Figure 10.2-2 will be studied for Section I, III and IV.
NEED 1: Consistent with National Development Plan• National Plan, Development Policy of Local Government• Logistics Strategy, Logistics Network• Project Priority
NEED 2:Road Function Required• Future Traffic Demand and Logistics• Relation with Other Projects (Fast Track, Mid-hill
Highway, etc.)
Determination of Sindhuli Road 2.0 Plan: Role, Function, Level of Service, Target Year → Basic Concept
Current Situation and Issues to be Addressed[Narrow width, natural hazard and risks, traffic regulation, insufficient maintenance, etc.]

Data Collection Survey on the Sindhuli Road Capacity Enhancement in Nepal FINAL REPORT
10-3
Source: JICA Survey Team
Figure 10.2-2 Road Function Enhancement Study Policy of Each Section
2) Assessment of Road Function Enhancement Measures
Design criteria such as control points, design speed, number of lanes, typical cross section(s) are
established. As the design speed and the number of lanes can have great impacts on the project scale and
natural and social environment, the Team will consult with DOR and other relevant agencies on the
design criteria to be applied. This will be followed by an in-depth study of the available document,
information, data.
At STEP-2 (Road Function Enhancement Study Stage), Points in examining enhancement methods or
improvement measures of Sindhuli Road are listed below taking into consideration with zero-base
thinking since Sindhuli Road 2.0 means “next generation”.
Selection of applicable measures considering technical difficulty, cost, workability, etc. explanation
to DOR, obtaining agreement
Planning of Improvement (target area, scale, finance, expected completion year, etc.)
Verification of Improvement Effect (increase in traffic volume, contribution to local, etc.)
Risk Analysis of Disaster (road disruption due to slope failure, flooding at causeway, deterioration
of existing structures)
*Non-durable structures were used on road structures in the Sindhuli Road to economize construction
cost (one of the reasons).
Enhancement methods and applicable improvement measures are proposed in section 10.4 .
(3) STEP-3: Project List Preparation Stage
List of projects that contribute to accomplishing the ideal state of the next stage the Sindhuli Road will
be prepared. Measures for enhancing road function, estimated project cost, cost-benefit (economic
benefit), project duration (years), etc. of each section, and listing the priorities, project components,
development methods, etc. will be included.
Section IV
• No. of lanes: 1.5 (W=5.5m)
• Hairpin curves at limited locations
• Slightly Disaster prone (mountainous area)
• To evaluate the necessity and validity of
widening or provision of an alternative
route at sharp curve sections and
disaster-prone areas
Section III
• No. of lanes: 1.5 (W=5.5m)
• Several hairpin curves and steep gradient
• Disaster-prone (steep mountainous)
Section II
• No. of lanes: 1.5 (W=5.5m)
• Several hairpin curves and steep gradient
• Highly Disaster-prone (steep mountainous)
Section I
• No. of lanes: 2 (W=7.5m)
• Sharp curves at limited locations
• Less prone to disasters
• To list up sharp curve locations and check
the necessity and validity of widening for
accommodating large vehicles
• To plan an optimum alternative route or
provision of mountain tunnel (if widening
existing road faces topographical
constraints)
• To evaluate the necessity and validity of
widening or provision of an alternative
route at sharp curve sections and
disaster-prone areas
≪Current Status≫ ≪Policy on Enhancement of Logistics Capacity≫
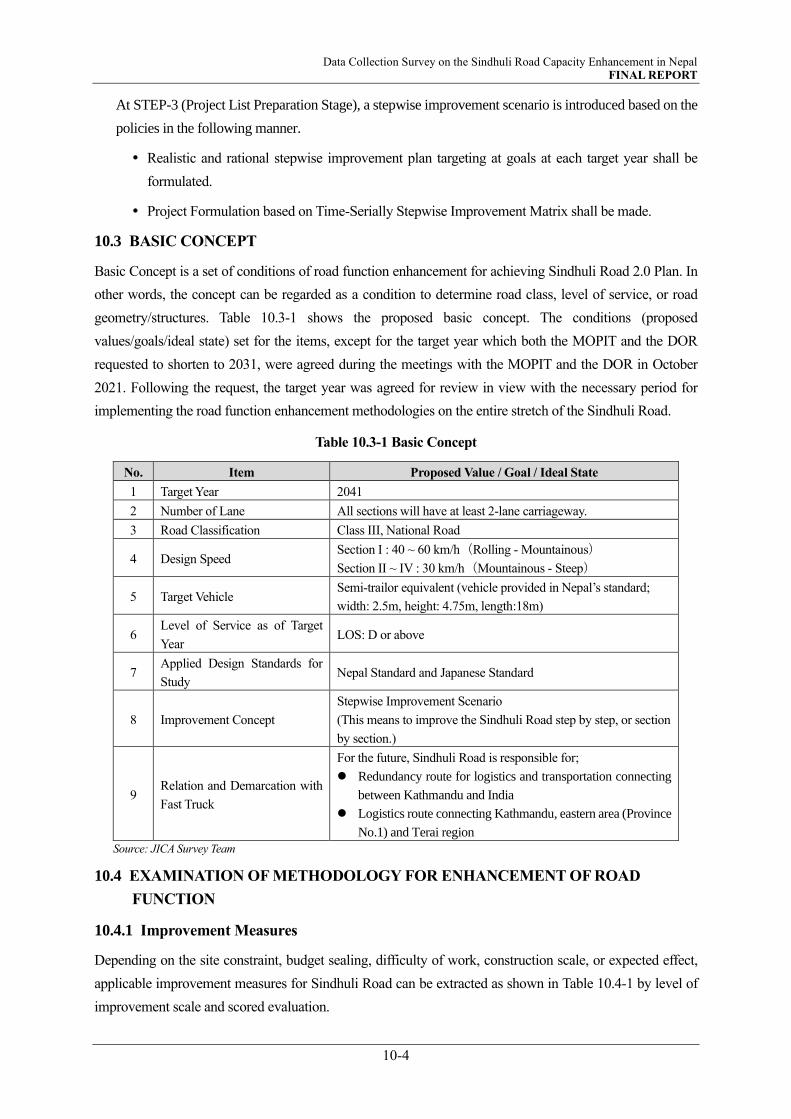
Data Collection Survey on the Sindhuli Road Capacity Enhancement in Nepal FINAL REPORT
10-4
At STEP-3 (Project List Preparation Stage), a stepwise improvement scenario is introduced based on the
policies in the following manner.
Realistic and rational stepwise improvement plan targeting at goals at each target year shall be
formulated.
Project Formulation based on Time-Serially Stepwise Improvement Matrix shall be made.
10.3 BASIC CONCEPT
Basic Concept is a set of conditions of road function enhancement for achieving Sindhuli Road 2.0 Plan. In
other words, the concept can be regarded as a condition to determine road class, level of service, or road
geometry/structures. Table 10.3-1 shows the proposed basic concept. The conditions (proposed
values/goals/ideal state) set for the items, except for the target year which both the MOPIT and the DOR
requested to shorten to 2031, were agreed during the meetings with the MOPIT and the DOR in October
2021. Following the request, the target year was agreed for review in view with the necessary period for
implementing the road function enhancement methodologies on the entire stretch of the Sindhuli Road.
Table 10.3-1 Basic Concept
No. Item Proposed Value / Goal / Ideal State
1 Target Year 2041
2 Number of Lane All sections will have at least 2-lane carriageway.
3 Road Classification Class III, National Road
4 Design Speed Section I : 40 ~ 60 km/h(Rolling - Mountainous)
Section II ~ IV : 30 km/h(Mountainous - Steep)
5 Target Vehicle Semi-trailor equivalent (vehicle provided in Nepal’s standard;
width: 2.5m, height: 4.75m, length:18m)
6 Level of Service as of Target
Year LOS: D or above
7 Applied Design Standards for
Study Nepal Standard and Japanese Standard
8 Improvement Concept
Stepwise Improvement Scenario
(This means to improve the Sindhuli Road step by step, or section
by section.)
9 Relation and Demarcation with
Fast Truck
For the future, Sindhuli Road is responsible for;
⚫ Redundancy route for logistics and transportation connecting
between Kathmandu and India
⚫ Logistics route connecting Kathmandu, eastern area (Province
No.1) and Terai region
Source: JICA Survey Team
10.4 EXAMINATION OF METHODOLOGY FOR ENHANCEMENT OF ROAD
FUNCTION
10.4.1 Improvement Measures
Depending on the site constraint, budget sealing, difficulty of work, construction scale, or expected effect,
applicable improvement measures for Sindhuli Road can be extracted as shown in Table 10.4-1 by level of
improvement scale and scored evaluation.
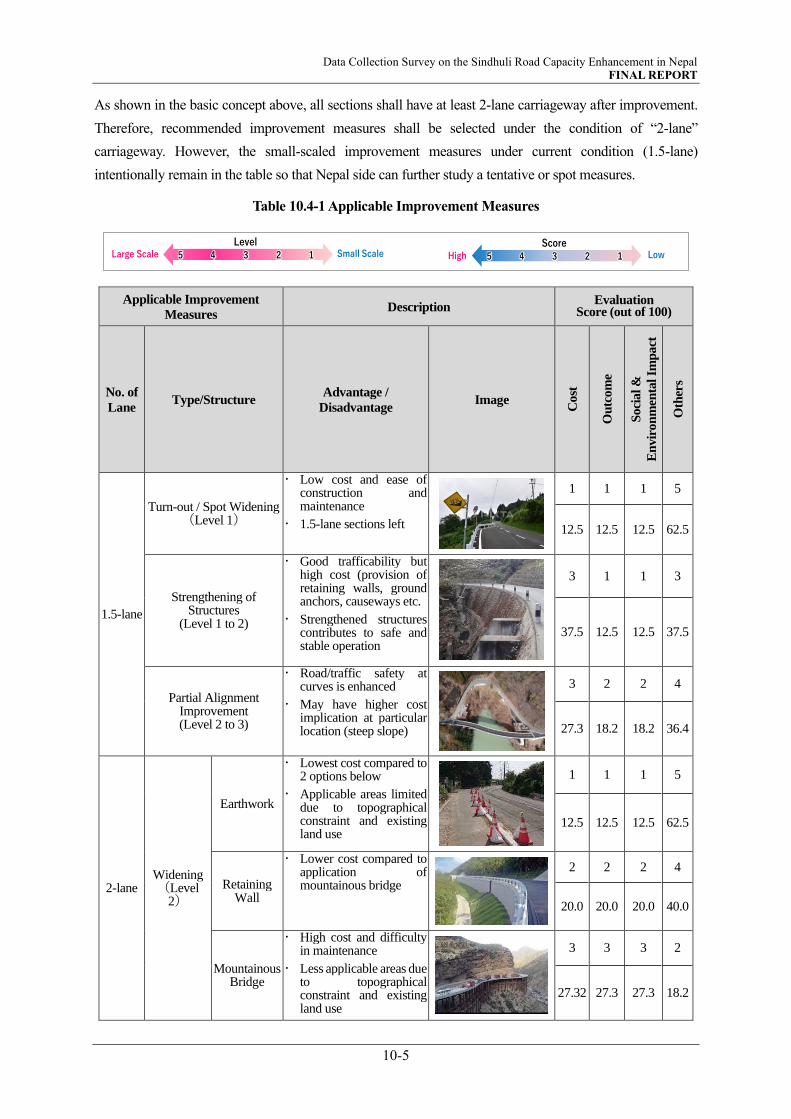
Data Collection Survey on the Sindhuli Road Capacity Enhancement in Nepal FINAL REPORT
10-5
As shown in the basic concept above, all sections shall have at least 2-lane carriageway after improvement.
Therefore, recommended improvement measures shall be selected under the condition of “2-lane”
carriageway. However, the small-scaled improvement measures under current condition (1.5-lane)
intentionally remain in the table so that Nepal side can further study a tentative or spot measures.
Table 10.4-1 Applicable Improvement Measures
Applicable Improvement
Measures Description
Evaluation Score (out of 100)
No. of
Lane Type/Structure
Advantage /
Disadvantage Image
Cost
Ou
tcom
e
Soci
al &
En
vir
on
men
tal Im
pact
Oth
ers
1.5-lane
Turn-out / Spot Widening (Level 1)
Low cost and ease of construction and maintenance
1.5-lane sections left
1 1 1 5
12.5 12.5 12.5 62.5
Strengthening of Structures
(Level 1 to 2)
Good trafficability but high cost (provision of retaining walls, ground anchors, causeways etc.
Strengthened structures contributes to safe and stable operation
3 1 1 3
37.5 12.5 12.5 37.5
Partial Alignment Improvement (Level 2 to 3)
Road/traffic safety at curves is enhanced
May have higher cost implication at particular location (steep slope)
3 2 2 4
27.3 18.2 18.2 36.4
2-lane Widening (Level
2)
Earthwork
Lowest cost compared to 2 options below
Applicable areas limited due to topographical constraint and existing land use
1 1 1 5
12.5 12.5 12.5 62.5
Retaining Wall
Lower cost compared to application of mountainous bridge
2 2 2 4
20.0 20.0 20.0 40.0
Mountainous Bridge
High cost and difficulty in maintenance
Less applicable areas due to topographical constraint and existing land use
3 3 3 2
27.32 27.3 27.3 18.2
Large Scale Small Scale5 4 3 2 1
Level
High Low5 4 3 2 1
Score
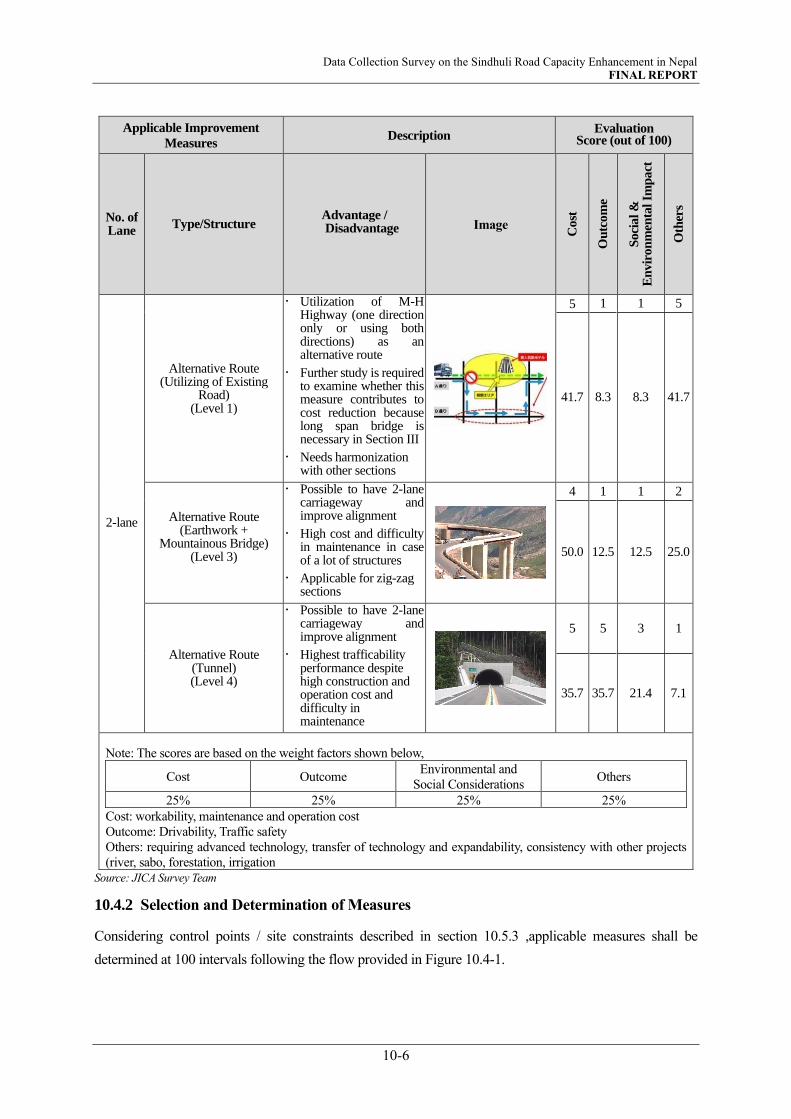
Data Collection Survey on the Sindhuli Road Capacity Enhancement in Nepal FINAL REPORT
10-6
Applicable Improvement
Measures Description
Evaluation Score (out of 100)
No. of Lane
Type/Structure Advantage / Disadvantage Image
Cost
Ou
tcom
e
Soci
al &
E
nvir
on
men
tal Im
pact
Oth
ers
Alternative Route (Utilizing of Existing
Road) (Level 1)
Utilization of M-H Highway (one direction only or using both directions) as an alternative route
Further study is required to examine whether this measure contributes to cost reduction because long span bridge is necessary in Section III
Needs harmonization with other sections
5 1 1 5
2-lane
41.7 8.3 8.3 41.7
Alternative Route (Earthwork +
Mountainous Bridge) (Level 3)
Possible to have 2-lane carriageway and improve alignment
High cost and difficulty in maintenance in case of a lot of structures
Applicable for zig-zag sections
4 1 1 2
50.0 12.5 12.5 25.0
Alternative Route (Tunnel) (Level 4)
Possible to have 2-lane carriageway and improve alignment
Highest trafficability performance despite high construction and operation cost and difficulty in maintenance
5 5 3 1
35.7 35.7 21.4 7.1
Note: The scores are based on the weight factors shown below,
Cost Outcome Environmental and
Social Considerations Others
25% 25% 25% 25%
Cost: workability, maintenance and operation cost
Outcome: Drivability, Traffic safety
Others: requiring advanced technology, transfer of technology and expandability, consistency with other projects
(river, sabo, forestation, irrigation
Source: JICA Survey Team
10.4.2 Selection and Determination of Measures
Considering control points / site constraints described in section 10.5.3 ,applicable measures shall be
determined at 100 intervals following the flow provided in Figure 10.4-1.
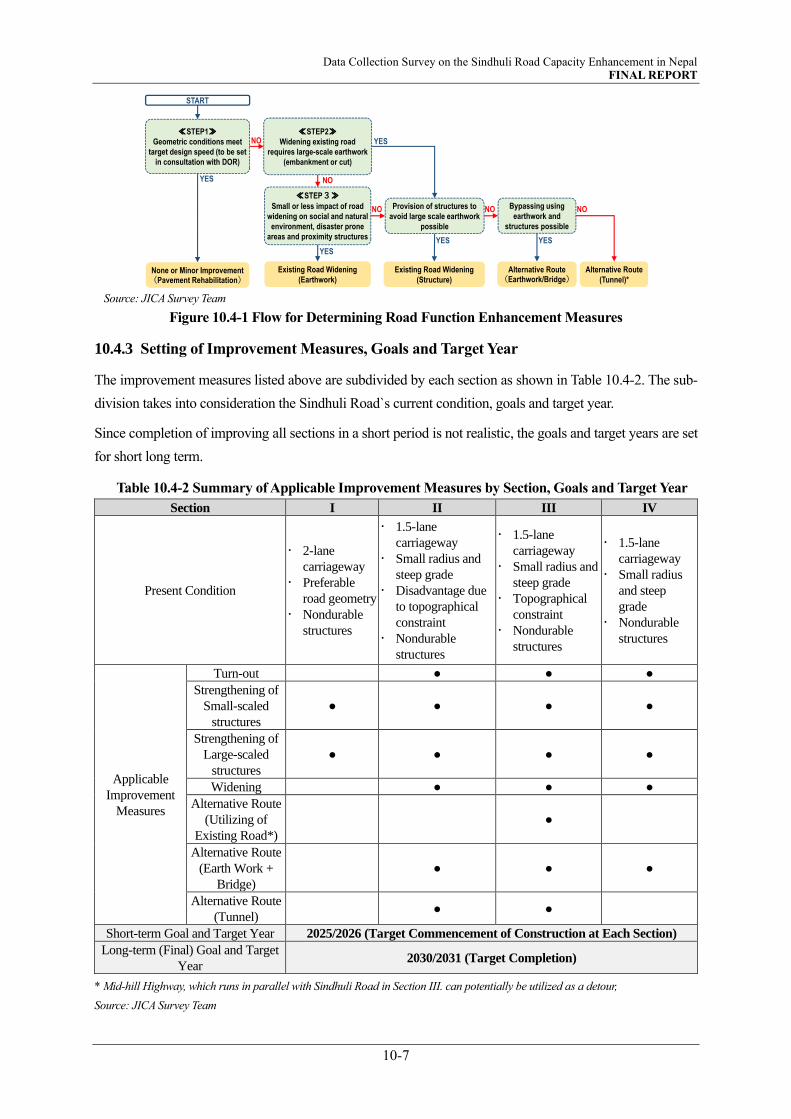
Data Collection Survey on the Sindhuli Road Capacity Enhancement in Nepal FINAL REPORT
10-7
Source: JICA Survey Team
Figure 10.4-1 Flow for Determining Road Function Enhancement Measures
10.4.3 Setting of Improvement Measures, Goals and Target Year
The improvement measures listed above are subdivided by each section as shown in Table 10.4-2. The sub-
division takes into consideration the Sindhuli Road`s current condition, goals and target year.
Since completion of improving all sections in a short period is not realistic, the goals and target years are set
for short long term.
Table 10.4-2 Summary of Applicable Improvement Measures by Section, Goals and Target Year
Section I II III IV
Present Condition
2-lane
carriageway
Preferable
road geometry
Nondurable
structures
1.5-lane
carriageway
Small radius and
steep grade
Disadvantage due
to topographical
constraint
Nondurable
structures
1.5-lane
carriageway
Small radius and
steep grade
Topographical
constraint
Nondurable
structures
1.5-lane
carriageway
Small radius
and steep
grade
Nondurable
structures
Applicable
Improvement
Measures
Turn-out ● ● ●
Strengthening of
Small-scaled
structures
● ● ● ●
Strengthening of
Large-scaled
structures
● ● ● ●
Widening ● ● ●
Alternative Route
(Utilizing of
Existing Road*)
●
Alternative Route
(Earth Work +
Bridge)
● ● ●
Alternative Route
(Tunnel) ● ●
Short-term Goal and Target Year 2025/2026 (Target Commencement of Construction at Each Section)
Long-term (Final) Goal and Target
Year 2030/2031 (Target Completion)
* Mid-hill Highway, which runs in parallel with Sindhuli Road in Section III. can potentially be utilized as a detour,
Source: JICA Survey Team
≪STEP1≫Geometric conditions meet
target design speed (to be set
in consultation with DOR)
≪STEP2≫Widening existing road
requires large-scale earthwork
(embankment or cut)
Provision of structures to
avoid large scale earthwork
possible
YES
≪STEP3≫Small or less impact of road
widening on social and natural
environment, disaster prone
areas and proximity structures
NO
YES
Existing Road Widening
(Structure)
NO
NO
Existing Road Widening
(Earthwork)
NO
Alternative Route(Earthwork/Bridge)
YES
Bypassing using
earthwork and
structures possible
Alternative Route
(Tunnel)*
YES
NO
START
None or Minor Improvement(Pavement Rehabilitation)
YES
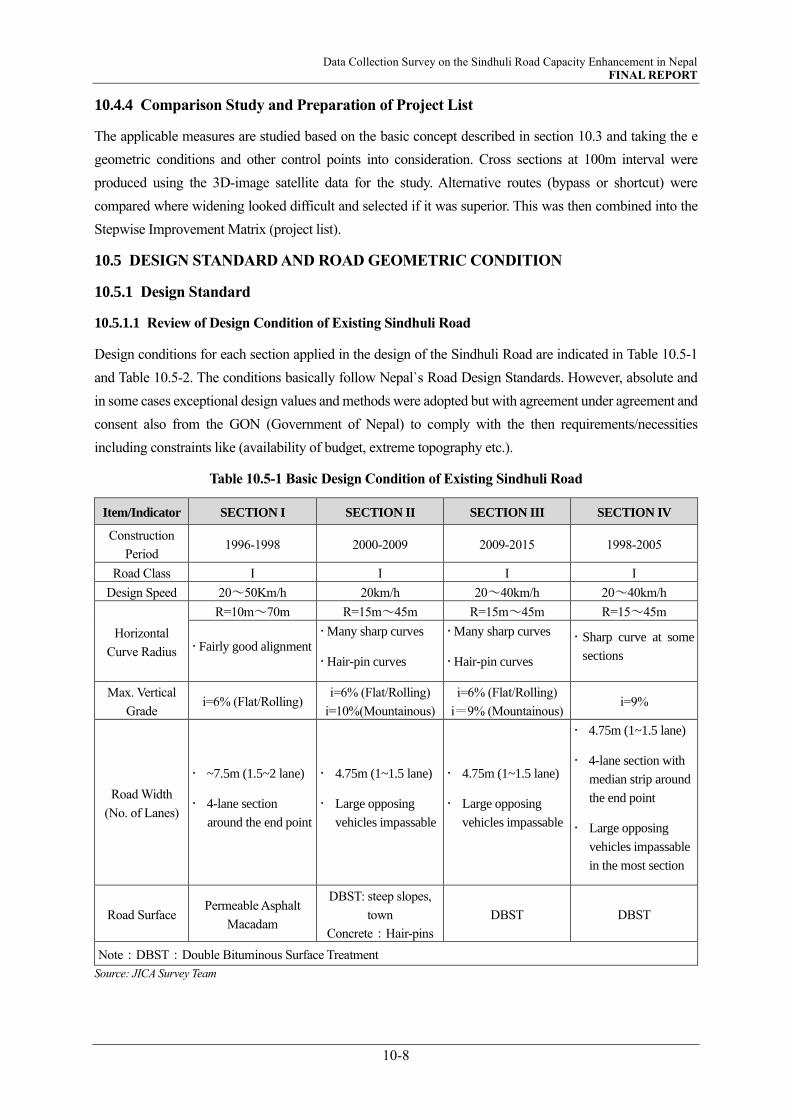
Data Collection Survey on the Sindhuli Road Capacity Enhancement in Nepal FINAL REPORT
10-8
10.4.4 Comparison Study and Preparation of Project List
The applicable measures are studied based on the basic concept described in section 10.3 and taking the e
geometric conditions and other control points into consideration. Cross sections at 100m interval were
produced using the 3D-image satellite data for the study. Alternative routes (bypass or shortcut) were
compared where widening looked difficult and selected if it was superior. This was then combined into the
Stepwise Improvement Matrix (project list).
10.5 DESIGN STANDARD AND ROAD GEOMETRIC CONDITION
10.5.1 Design Standard
10.5.1.1 Review of Design Condition of Existing Sindhuli Road
Design conditions for each section applied in the design of the Sindhuli Road are indicated in Table 10.5-1
and Table 10.5-2. The conditions basically follow Nepal`s Road Design Standards. However, absolute and
in some cases exceptional design values and methods were adopted but with agreement under agreement and
consent also from the GON (Government of Nepal) to comply with the then requirements/necessities
including constraints like (availability of budget, extreme topography etc.).
Table 10.5-1 Basic Design Condition of Existing Sindhuli Road
Item/Indicator SECTION I SECTION II SECTION III SECTION IV
Construction
Period 1996-1998 2000-2009 2009-2015 1998-2005
Road Class I I I I
Design Speed 20~50Km/h 20km/h 20~40km/h 20~40km/h
Horizontal
Curve Radius
R=10m~70m R=15m~45m R=15m~45m R=15~45m
Fairly good alignment
Many sharp curves
Hair-pin curves
Many sharp curves
Hair-pin curves
Sharp curve at some
sections
Max. Vertical
Grade i=6% (Flat/Rolling)
i=6% (Flat/Rolling)
i=10%(Mountainous)
i=6% (Flat/Rolling)
i=9% (Mountainous) i=9%
Road Width
(No. of Lanes)
~7.5m (1.5~2 lane)
4-lane section
around the end point
4.75m (1~1.5 lane)
Large opposing
vehicles impassable
4.75m (1~1.5 lane)
Large opposing
vehicles impassable
4.75m (1~1.5 lane)
4-lane section with
median strip around
the end point
Large opposing
vehicles impassable
in the most section
Road Surface Permeable Asphalt
Macadam
DBST: steep slopes,
town
Concrete:Hair-pins
DBST DBST
Note:DBST:Double Bituminous Surface Treatment
Source: JICA Survey Team
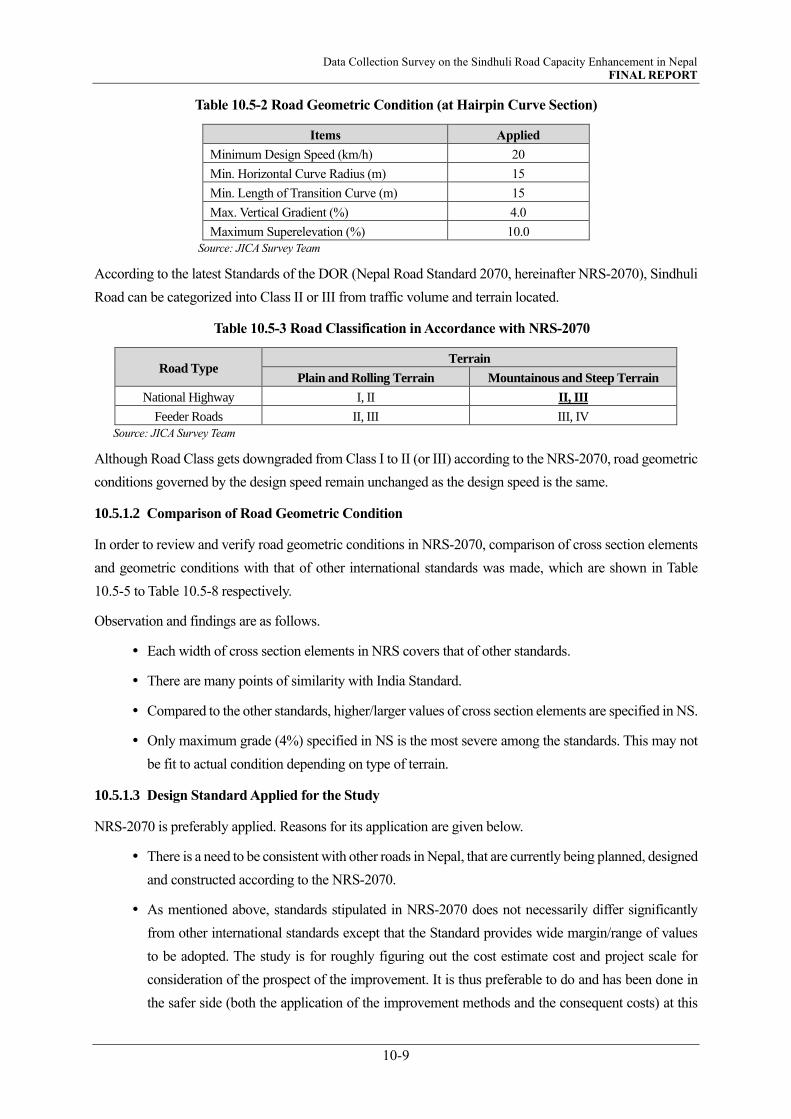
Data Collection Survey on the Sindhuli Road Capacity Enhancement in Nepal FINAL REPORT
10-9
Table 10.5-2 Road Geometric Condition (at Hairpin Curve Section)
Items Applied
Minimum Design Speed (km/h) 20
Min. Horizontal Curve Radius (m) 15
Min. Length of Transition Curve (m) 15
Max. Vertical Gradient (%) 4.0
Maximum Superelevation (%) 10.0
Source: JICA Survey Team
According to the latest Standards of the DOR (Nepal Road Standard 2070, hereinafter NRS-2070), Sindhuli
Road can be categorized into Class II or III from traffic volume and terrain located.
Table 10.5-3 Road Classification in Accordance with NRS-2070
Road Type Terrain
Plain and Rolling Terrain Mountainous and Steep Terrain
National Highway I, II II, III
Feeder Roads II, III III, IV
Source: JICA Survey Team
Although Road Class gets downgraded from Class I to II (or III) according to the NRS-2070, road geometric
conditions governed by the design speed remain unchanged as the design speed is the same.
10.5.1.2 Comparison of Road Geometric Condition
In order to review and verify road geometric conditions in NRS-2070, comparison of cross section elements
and geometric conditions with that of other international standards was made, which are shown in Table
10.5-5 to Table 10.5-8 respectively.
Observation and findings are as follows.
Each width of cross section elements in NRS covers that of other standards.
There are many points of similarity with India Standard.
Compared to the other standards, higher/larger values of cross section elements are specified in NS.
Only maximum grade (4%) specified in NS is the most severe among the standards. This may not
be fit to actual condition depending on type of terrain.
10.5.1.3 Design Standard Applied for the Study
NRS-2070 is preferably applied. Reasons for its application are given below.
There is a need to be consistent with other roads in Nepal, that are currently being planned, designed
and constructed according to the NRS-2070.
As mentioned above, standards stipulated in NRS-2070 does not necessarily differ significantly
from other international standards except that the Standard provides wide margin/range of values
to be adopted. The study is for roughly figuring out the cost estimate cost and project scale for
consideration of the prospect of the improvement. It is thus preferable to do and has been done in
the safer side (both the application of the improvement methods and the consequent costs) at this
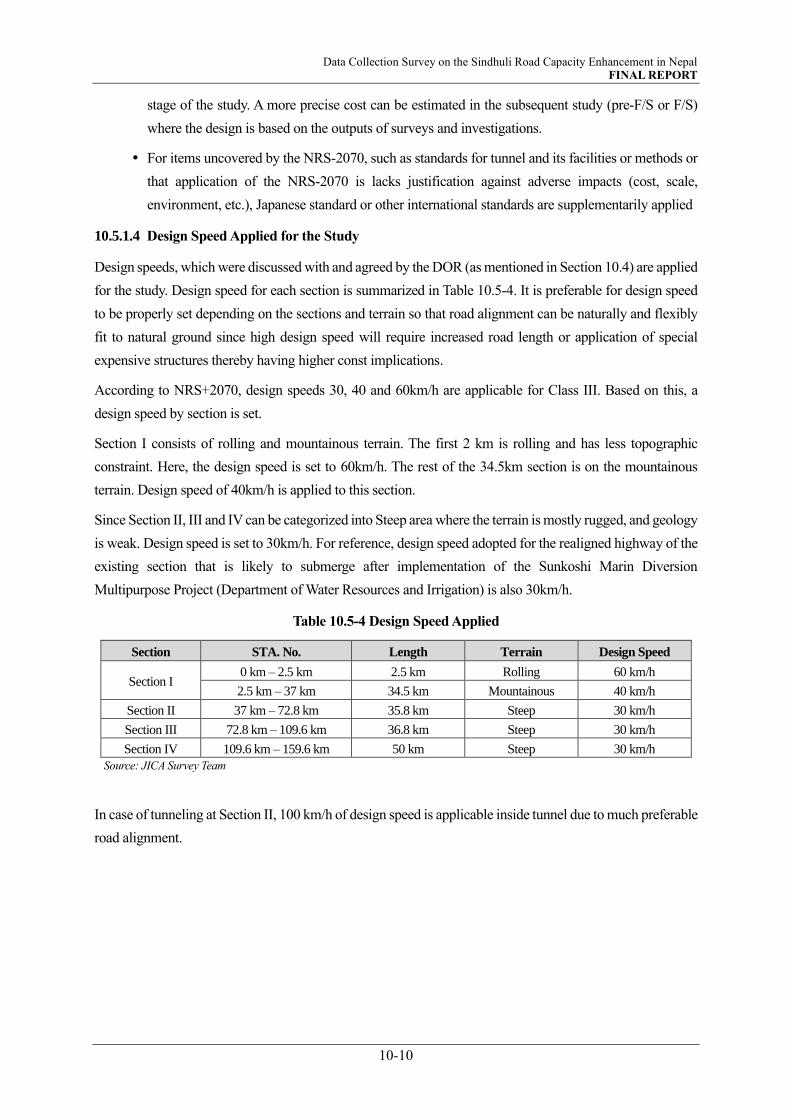
Data Collection Survey on the Sindhuli Road Capacity Enhancement in Nepal FINAL REPORT
10-10
stage of the study. A more precise cost can be estimated in the subsequent study (pre-F/S or F/S)
where the design is based on the outputs of surveys and investigations.
For items uncovered by the NRS-2070, such as standards for tunnel and its facilities or methods or
that application of the NRS-2070 is lacks justification against adverse impacts (cost, scale,
environment, etc.), Japanese standard or other international standards are supplementarily applied
10.5.1.4 Design Speed Applied for the Study
Design speeds, which were discussed with and agreed by the DOR (as mentioned in Section 10.4) are applied
for the study. Design speed for each section is summarized in Table 10.5-4. It is preferable for design speed
to be properly set depending on the sections and terrain so that road alignment can be naturally and flexibly
fit to natural ground since high design speed will require increased road length or application of special
expensive structures thereby having higher const implications.
According to NRS+2070, design speeds 30, 40 and 60km/h are applicable for Class III. Based on this, a
design speed by section is set.
Section I consists of rolling and mountainous terrain. The first 2 km is rolling and has less topographic
constraint. Here, the design speed is set to 60km/h. The rest of the 34.5km section is on the mountainous
terrain. Design speed of 40km/h is applied to this section.
Since Section II, III and IV can be categorized into Steep area where the terrain is mostly rugged, and geology
is weak. Design speed is set to 30km/h. For reference, design speed adopted for the realigned highway of the
existing section that is likely to submerge after implementation of the Sunkoshi Marin Diversion
Multipurpose Project (Department of Water Resources and Irrigation) is also 30km/h.
Table 10.5-4 Design Speed Applied
Section STA. No. Length Terrain Design Speed
Section I 0 km – 2.5 km 2.5 km Rolling 60 km/h
2.5 km – 37 km 34.5 km Mountainous 40 km/h
Section II 37 km – 72.8 km 35.8 km Steep 30 km/h
Section III 72.8 km – 109.6 km 36.8 km Steep 30 km/h
Section IV 109.6 km – 159.6 km 50 km Steep 30 km/h
Source: JICA Survey Team
In case of tunneling at Section II, 100 km/h of design speed is applicable inside tunnel due to much preferable
road alignment.
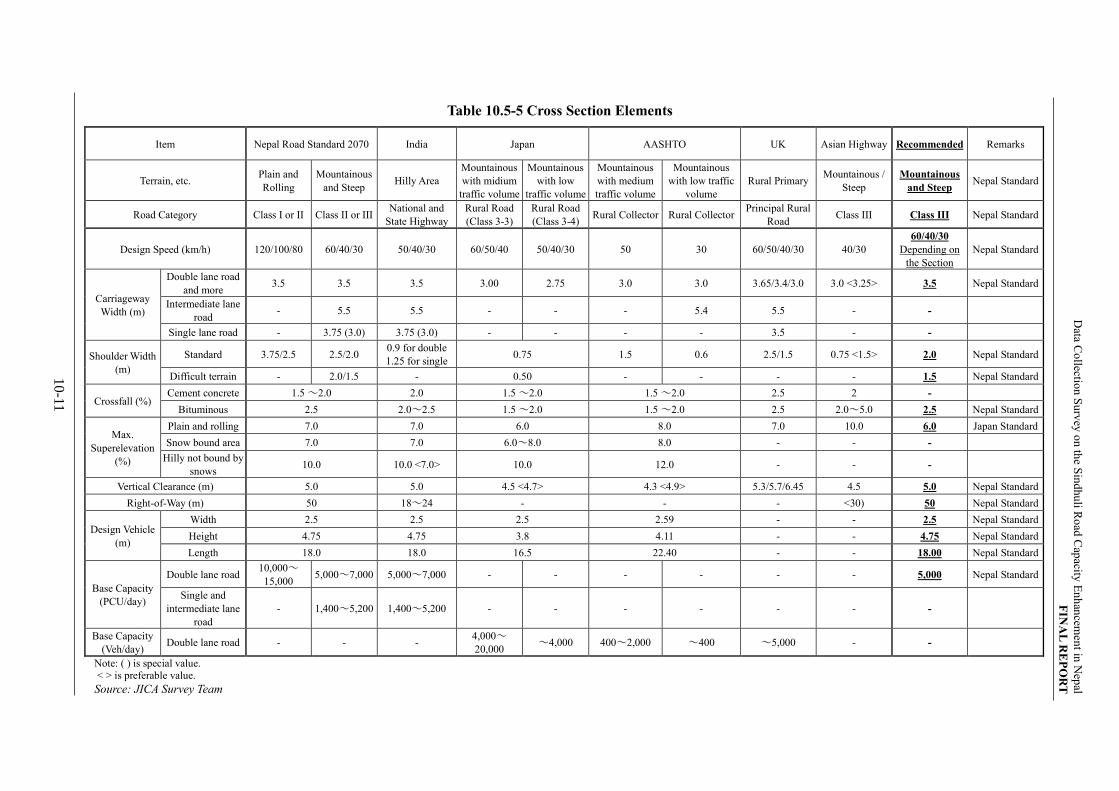
10
-11
Data C
ollectio
n S
urv
ey o
n th
e Sin
dhu
li Ro
ad C
apacity
En
han
cemen
t in N
epal
FIN
AL
RE
PO
RT
Table 10.5-5 Cross Section Elements
Item Nepal Road Standard 2070 India Japan AASHTO UK Asian Highway Recommended Remarks
Terrain, etc. Plain and
Rolling
Mountainous
and Steep Hilly Area
Mountainous
with midium
traffic volume
Mountainous
with low
traffic volume
Mountainous
with medium
traffic volume
Mountainous
with low traffic
volume
Rural Primary Mountainous /
Steep
Mountainous
and Steep Nepal Standard
Road Category Class I or II Class II or III National and
State Highway
Rural Road
(Class 3-3)
Rural Road
(Class 3-4) Rural Collector Rural Collector
Principal Rural
Road Class III Class III Nepal Standard
Design Speed (km/h) 120/100/80 60/40/30 50/40/30 60/50/40 50/40/30 50 30 60/50/40/30 40/30
60/40/30
Depending on
the Section
Nepal Standard
Carriageway
Width (m)
Double lane road
and more 3.5 3.5 3.5 3.00 2.75 3.0 3.0 3.65/3.4/3.0 3.0 <3.25> 3.5 Nepal Standard
Intermediate lane
road - 5.5 5.5 - - - 5.4 5.5 - -
Single lane road - 3.75 (3.0) 3.75 (3.0) - - - - 3.5 - -
Shoulder Width
(m)
Standard 3.75/2.5 2.5/2.0 0.9 for double
1.25 for single 0.75 1.5 0.6 2.5/1.5 0.75 <1.5> 2.0 Nepal Standard
Difficult terrain - 2.0/1.5 - 0.50 - - - - 1.5 Nepal Standard
Crossfall (%) Cement concrete 1.5 ~2.0 2.0 1.5 ~2.0 1.5 ~2.0 2.5 2 -
Bituminous 2.5 2.0~2.5 1.5 ~2.0 1.5 ~2.0 2.5 2.0~5.0 2.5 Nepal Standard
Max.
Superelevation
(%)
Plain and rolling 7.0 7.0 6.0 8.0 7.0 10.0 6.0 Japan Standard
Snow bound area 7.0 7.0 6.0~8.0 8.0 - - -
Hilly not bound by
snows 10.0 10.0 <7.0> 10.0 12.0 - - -
Vertical Clearance (m) 5.0 5.0 4.5 <4.7> 4.3 <4.9> 5.3/5.7/6.45 4.5 5.0 Nepal Standard
Right-of-Way (m) 50 18~24 - - - <30) 50 Nepal Standard
Design Vehicle
(m)
Width 2.5 2.5 2.5 2.59 - - 2.5 Nepal Standard
Height 4.75 4.75 3.8 4.11 - - 4.75 Nepal Standard
Length 18.0 18.0 16.5 22.40 - - 18.00 Nepal Standard
Base Capacity
(PCU/day)
Double lane road 10,000~
15,000 5,000~7,000 5,000~7,000 - - - - - - 5,000 Nepal Standard
Single and
intermediate lane
road
- 1,400~5,200 1,400~5,200 - - - - - - -
Base Capacity
(Veh/day) Double lane road - - -
4,000~20,000
~4,000 400~2,000 ~400 ~5,000 - -
Note: ( ) is special value. < > is preferable value.
Source: JICA Survey Team

10
-12
Data C
ollectio
n S
urv
ey o
n th
e Sin
dhu
li Ro
ad C
apacity
En
han
cemen
t in N
epal
FIN
AL
RE
PO
RT
Table 10.5-6 Road Geometric Condition (Design Speed = 30km/h)
Items Nepal Road
Standard 2070 India Japan AASHTO UK Asian Highway Recommended
Remarks Road Category Class III National and
State Highway
Rural Road
(Class 3-4) Rural Collector
Principal Rural
Road Class III Class III
Terrain Steep Hilly Area Mountainous Mountainous Steep Depending on
the Section
Crossfall (%) Bituminous 2.5 2.5 2.0 2.0 2.5 2.0 2.5
Maximum Superelevation
(%)
Hilly not bound by
snows 6.0 10.0 10.0 6.0 7.0 10.0 6.0
Minimum Stopping Sight Distance (m) 30 30 30 20 24 - 30 Nepal Standard
Minimum Horizontal
Curve Radius (m)
Preferable 50 - 65 - 65 45~60 50 Nepal Standard
Standard 20 50 30 21 16 30 25 Sindhuli Rd. Project
Special - 30 - - - - -
Minimum Horizontal Curve Radius w/o
Superelevation (m) 30 160 500 454 180 - 500 Japan Standard
Minimum Horizontal
Curve Length (m)
θ=7° or more - - 50 - - -
θ=7° or less - - 350/θ - - -
Minimum Spiral Curve Length (m) 30 20 25 17 - 25 30 Nepal Standard
Minimum Superelevation Transition Ratio - 1/60 1/75 1/125 - - 1/75 Japan Standard
Maximum Grade (%) 4.0 (~10.0) 6.0 (~8.0) 8.0 (~11.0) 12.0 8.0 7.0 7.0 AH Standard
Critical Length of Max. Grade (m) 150 100 - - - - -
Minimum K-Value (m/%) Summit 4
calculating the
curve length
- 2 2.5 - 4 Nepal Standard
Valley 6 - 6 3 - 6 Nepal Standard
Minimum Vertical Curve
Radius (m)
Summit - 250 <400> - - - -
Valley - 250 <400> - - - -
Minimum Vertical Curve Length (m) - 15 25 - - - -
Note: ( ) is special value.
< > is preferable value.
Figures highlighted represent standards that apply the values similar to the recommended value.
Source: JICA Survey Team

10
-13
Data C
ollectio
n S
urv
ey o
n th
e Sin
dhu
li Ro
ad C
apacity
En
han
cemen
t in N
epal
FIN
AL
RE
PO
RT
Table 10.5-7 Road Geometric Condition (Design Speed = 40km/h)
Items Nepal Road
Standard 2070 India Japan US (AASHTO) UK Asian Highway Recommended
Remarks Road Category Class III National and
State Highway
Rural Road
(Class 3-4) Rural Collector
Principal Rural
Road Class III Class III
Terrain Mountainous Hilly Area Mountainous Mountainous Mountainous Mountainous
Crossfall (%) Bituminous 2.5 2.5 2.0 2.0 2.5 2.5 2.5
Maximum Superelevation
(%)
Hilly not bound by
snows 6.0 10.0 10.0 6.0 7.0 10.0 6.0
Minimum Stopping Sight Distance (m) 50 45 40 50 36 - 50 Nepal Standard
Minimum Horizontal
Curve Radius (m)
Preferable 90 - 100 - 115 75~100 90 Nepal Standard
Standard 40 50 60 43 28 50 45 Sindhuli Rd. Project
Special - 30 50 - - - -
Minimum Horizontal Curve Radius w/o
Superelevation (m) 70 280 800 790 320 - 800 Japan Standard
Minimum Horizontal
Curve Length (m)
θ=7° or more - - 70 - - -
θ=7° or less - - 500/θ - - -
Minimum Spiral Curve Length (m) 35 40 35 22 - 35 35 Nepal Standard
Minimum Superelevation Transition Ratio - 1/60 1/100 1/125 - - 1/100 Japan Standard
Maximum Grade (%) 4.0 (~9.0) 6.0 (~8.0) 7.0 (~10.0) 11.0 8.0 6.0 5.0 Sindhuli Rd Project
Critical Length of Max. Grade (m) 200 100 200 - - - -
Minimum K-Value (m/%) Summit 29
calculating the
curve length
- 4 4 - 29 Nepal Standard
Valley 17 - 9 4 - 17 Nepal Standard
Minimum Vertical Curve
Radius (m)
Summit - 450 <700> - - - -
Valley - 450 <700> - - - -
Minimum Vertical Curve Length (m) - 20 35 - - - -
Note: ( ) is special value.
< > is preferable value. Figures highlighted represent standards that apply the values similar to the recommended value.
Source: JICA Survey Team
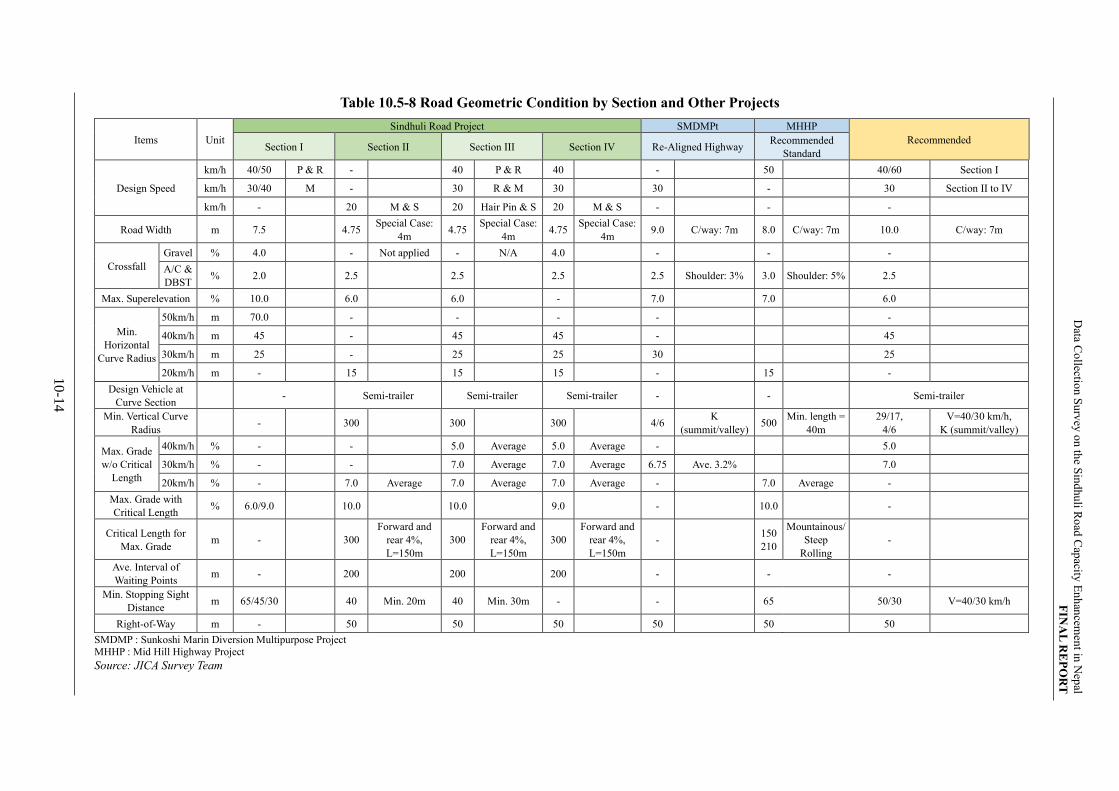
10
-14
Data C
ollectio
n S
urv
ey o
n th
e Sin
dhu
li Ro
ad C
apacity
En
han
cemen
t in N
epal
FIN
AL
RE
PO
RT
Table 10.5-8 Road Geometric Condition by Section and Other Projects
Items Unit
Sindhuli Road Project SMDMPt MHHP
Recommended Section I Section II Section III Section IV Re-Aligned Highway
Recommended
Standard
Design Speed
km/h 40/50 P & R - 40 P & R 40 - 50 40/60 Section I
km/h 30/40 M - 30 R & M 30 30 - 30 Section II to IV
km/h - 20 M & S 20 Hair Pin & S 20 M & S - - -
Road Width m 7.5 4.75 Special Case:
4m 4.75
Special Case:
4m 4.75
Special Case:
4m 9.0 C/way: 7m 8.0 C/way: 7m 10.0 C/way: 7m
Crossfall
Gravel % 4.0 - Not applied - N/A 4.0 - - -
A/C &
DBST % 2.0 2.5 2.5 2.5 2.5 Shoulder: 3% 3.0 Shoulder: 5% 2.5
Max. Superelevation % 10.0 6.0 6.0 - 7.0 7.0 6.0
Min.
Horizontal
Curve Radius
50km/h m 70.0 - - - - -
40km/h m 45 - 45 45 - 45
30km/h m 25 - 25 25 30 25
20km/h m - 15 15 15 - 15 -
Design Vehicle at
Curve Section - Semi-trailer Semi-trailer Semi-trailer - - Semi-trailer
Min. Vertical Curve
Radius - 300 300 300 4/6
K
(summit/valley) 500
Min. length =
40m
29/17,
4/6
V=40/30 km/h,
K (summit/valley)
Max. Grade
w/o Critical
Length
40km/h % - - 5.0 Average 5.0 Average - 5.0
30km/h % - - 7.0 Average 7.0 Average 6.75 Ave. 3.2% 7.0
20km/h % - 7.0 Average 7.0 Average 7.0 Average - 7.0 Average -
Max. Grade with
Critical Length % 6.0/9.0 10.0 10.0 9.0 - 10.0 -
Critical Length for
Max. Grade m - 300
Forward and
rear 4%,
L=150m
300
Forward and
rear 4%,
L=150m
300
Forward and
rear 4%,
L=150m
- 150
210
Mountainous/
Steep
Rolling
-
Ave. Interval of
Waiting Points m - 200 200 200 - - -
Min. Stopping Sight
Distance m 65/45/30 40 Min. 20m 40 Min. 30m - - 65 50/30 V=40/30 km/h
Right-of-Way m - 50 50 50 50 50 50
SMDMP : Sunkoshi Marin Diversion Multipurpose Project MHHP : Mid Hill Highway Project Source: JICA Survey Team
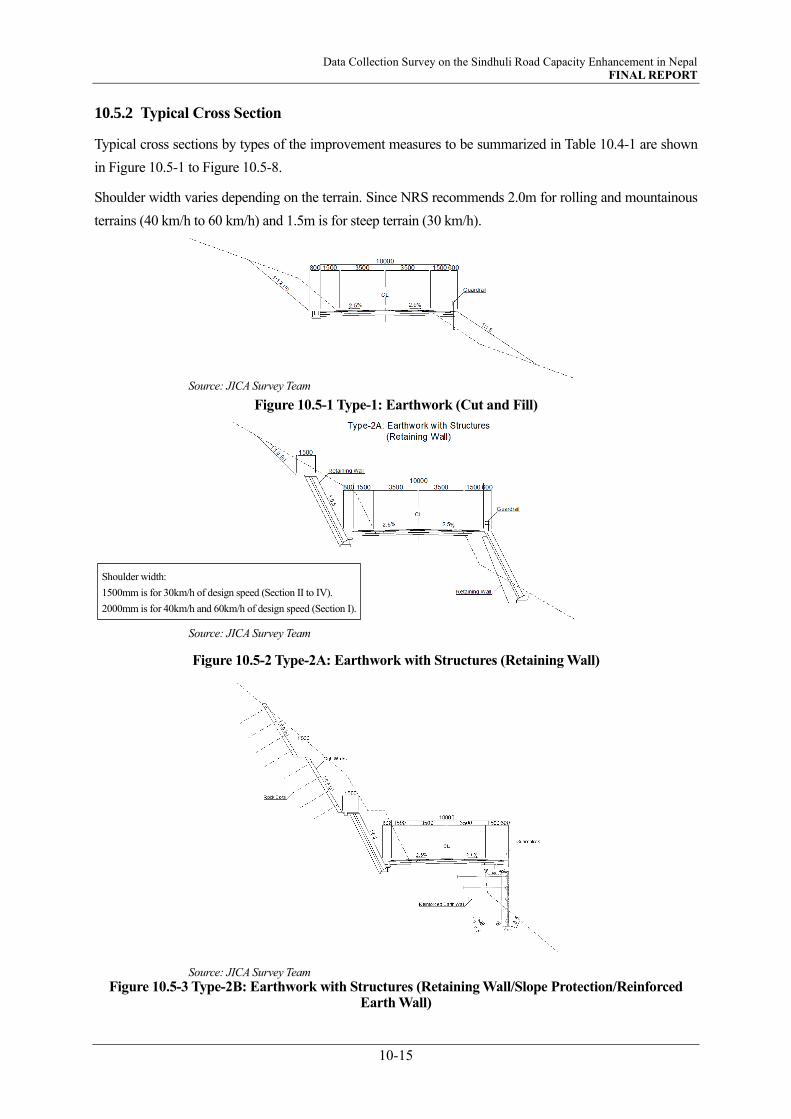
Data Collection Survey on the Sindhuli Road Capacity Enhancement in Nepal FINAL REPORT
10-15
10.5.2 Typical Cross Section
Typical cross sections by types of the improvement measures to be summarized in Table 10.4-1 are shown
in Figure 10.5-1 to Figure 10.5-8.
Shoulder width varies depending on the terrain. Since NRS recommends 2.0m for rolling and mountainous
terrains (40 km/h to 60 km/h) and 1.5m is for steep terrain (30 km/h).
Source: JICA Survey Team
Figure 10.5-1 Type-1: Earthwork (Cut and Fill)
Source: JICA Survey Team
Figure 10.5-2 Type-2A: Earthwork with Structures (Retaining Wall)
Source: JICA Survey Team
Figure 10.5-3 Type-2B: Earthwork with Structures (Retaining Wall/Slope Protection/Reinforced Earth Wall)
Shoulder width:
1500mm is for 30km/h of design speed (Section II to IV).
2000mm is for 40km/h and 60km/h of design speed (Section I).

Data Collection Survey on the Sindhuli Road Capacity Enhancement in Nepal FINAL REPORT
10-16
Source: JICA Survey Team
Figure 10.5-4 Type-3A: Earthwork with Structures (Slope Protection/Partial Mountainous Bridge)
Source: JICA Survey Team
Figure 10.5-5 Type-3B: Mountainous Bridge

Data Collection Survey on the Sindhuli Road Capacity Enhancement in Nepal FINAL REPORT
10-17
Source: JICA Survey Team
Figure 10.5-6 Type-4A: Bridge (I-
Girder)
Figure 10.5-7 Type-4B: Bridge (Box
Girder)
Figure 10.5-8 Type-5: Tunnel
10.5.3 Typical Cross Section for Existing Bridge and Causeway
Bridges in Section I currently have 2-lane carriageway and thus there
is no need for widening. Only For bridges with 1-lane carriageway in
Section II to IV, additional provision of 1-lane bridge adjacent to the
existing bridge as shown in Figure 10.5-9 will be required. On the
other hand, all causeways need to be replaced with concrete box
culvert with the same width as or bigger than that of existing.
10.6 CONTROL POINTS / SITE CONSTRAINTS FOR APPLYING IMPROVEMENT
MEASURES
10.6.1 Topographical Constraint
Figure 10.6-1 to Figure 10.6-8 indicate ground slope distribution along the Sindhuli Road (enlarged view of
the slope distribution is attached in APPENDIX-4). These figures are generated from a topographic analysis
using highly precise, pre-produced digital-elevation-model 3D map (AW3D1 1.0m resolution). The gradient
of the surrounding grounds is distinguished by the colors. The black line represents the objective road. The
locations highlighted in blue indicate that the gradient is gentle (less than 10 percent) and the locations
highlighted in red indicates the steepest gradient locations. As can be understood from these figures, the
topography along Section I and Section IV is not so steep compared to Section II and Section III where they
vary from mountainous (25% to 40%) and steep (over 60%).
Since Section II and Section III are located across steep slope area, applying improvement measures by
widening and earthwork only (without retaining walls) would have significant adverse impact to natural
ground.
1 AW3D stands for ALOS World 3D. ALOS is the Advanced Land Observing Satellite which is a Japanese Earth-imaging satellite from
JAXA that launched on 24 January 2006 and completed its operational phase on 12 May 2011
Source: JICA Survey Team
Figure 10.5-9 Additional Bridge
2250
4500
500 2250
2.5%
CL
500

Data Collection Survey on the Sindhuli Road Capacity Enhancement in Nepal FINAL REPORT
10-18
Source: JICA Survey Team
Figure 10.6-1 Ground Slope Distribution along Sindhli Road (Section I, STA. 0km – 20km)
Gradient (%) Color
0 to 10
10 to 25
25 to 40
40 to 60
Over 60
Sindhuli Road
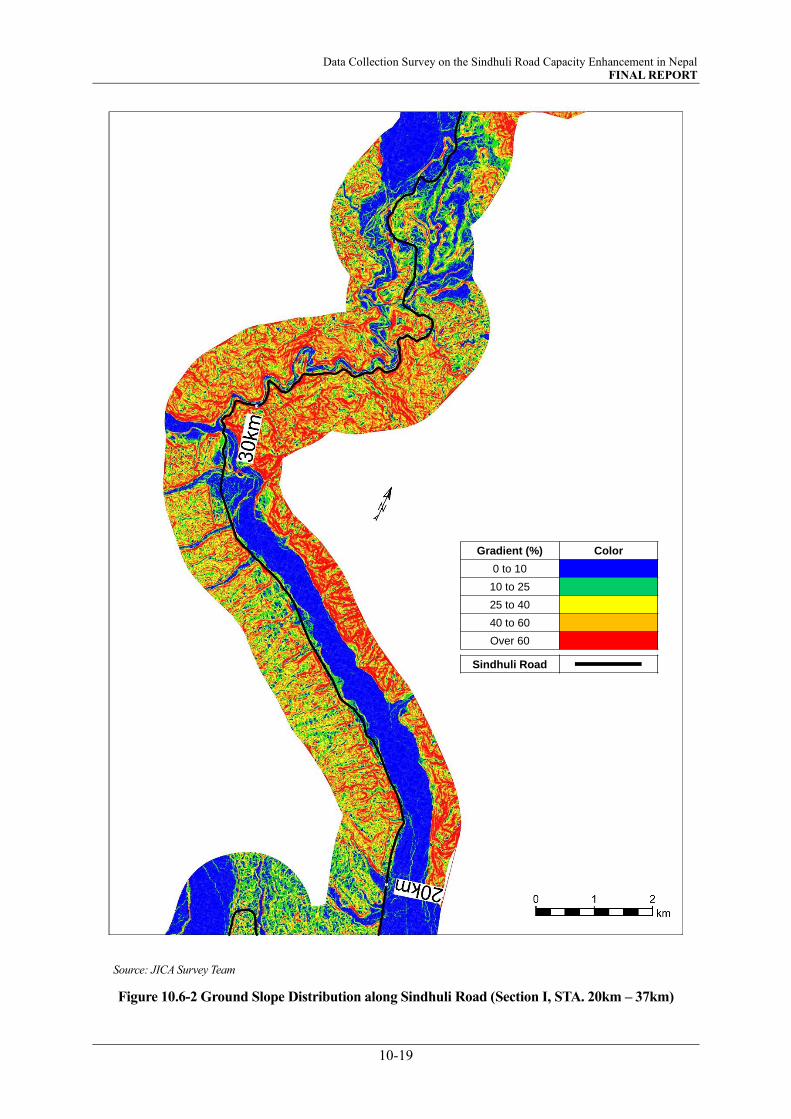
Data Collection Survey on the Sindhuli Road Capacity Enhancement in Nepal FINAL REPORT
10-19
Source: JICA Survey Team
Figure 10.6-2 Ground Slope Distribution along Sindhuli Road (Section I, STA. 20km – 37km)
Gradient (%) Color
0 to 10
10 to 25
25 to 40
40 to 60
Over 60
Sindhuli Road
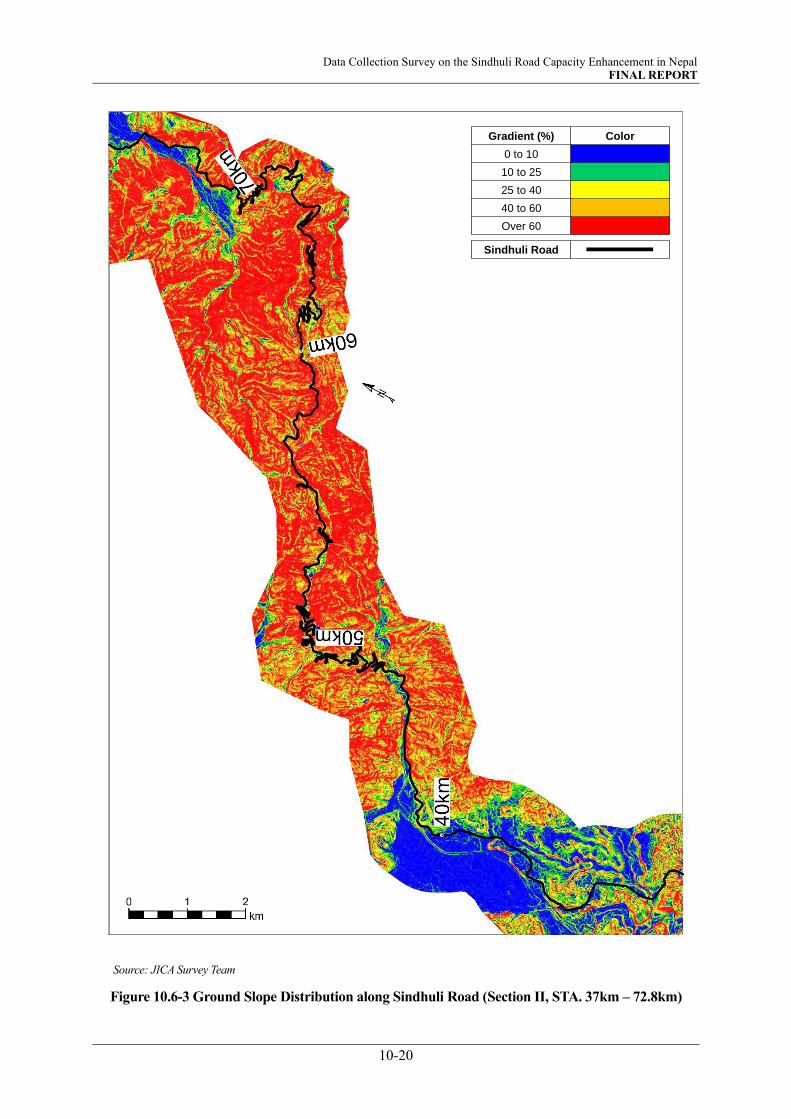
Data Collection Survey on the Sindhuli Road Capacity Enhancement in Nepal FINAL REPORT
10-20
Source: JICA Survey Team
Figure 10.6-3 Ground Slope Distribution along Sindhuli Road (Section II, STA. 37km – 72.8km)
Gradient (%) Color
0 to 10
10 to 25
25 to 40
40 to 60
Over 60
Sindhuli Road

Data Collection Survey on the Sindhuli Road Capacity Enhancement in Nepal FINAL REPORT
10-21
Source: JICA Survey Team
Figure 10.6-4 Ground Slope Distribution along Sindhuli Road (Section III, STA. 72.8km – 95km)
Gradient (%) Color
0 to 10
10 to 25
25 to 40
40 to 60
Over 60
Sindhuli Road

Data Collection Survey on the Sindhuli Road Capacity Enhancement in Nepal FINAL REPORT
10-22
Source: JICA Survey Team
Figure 10.6-5 Ground Slope Distribution along Sindhuli Road (Section III, STA. 95km – 109.6m)
Gradient (%) Color
0 to 10
10 to 25
25 to 40
40 to 60
Over 60
Sindhuli Road

Data Collection Survey on the Sindhuli Road Capacity Enhancement in Nepal FINAL REPORT
10-23
Source: JICA Survey Team
Figure 10.6-6 Ground Slope Distribution along Sindhuli Road (Section IV, STA. 109.6km – 125km)
Gradient (%) Color
0 to 10
10 to 25
25 to 40
40 to 60
Over 60
Sindhuli Road

Data Collection Survey on the Sindhuli Road Capacity Enhancement in Nepal FINAL REPORT
10-24
Source: JICA Survey Team
Figure 10.6-7 Ground Slope Distribution along Sindhuli Road (Section IV, STA. 125km – 140km)
Gradient (%) Color
0 to 10
10 to 25
25 to 40
40 to 60
Over 60
Sindhuli Road
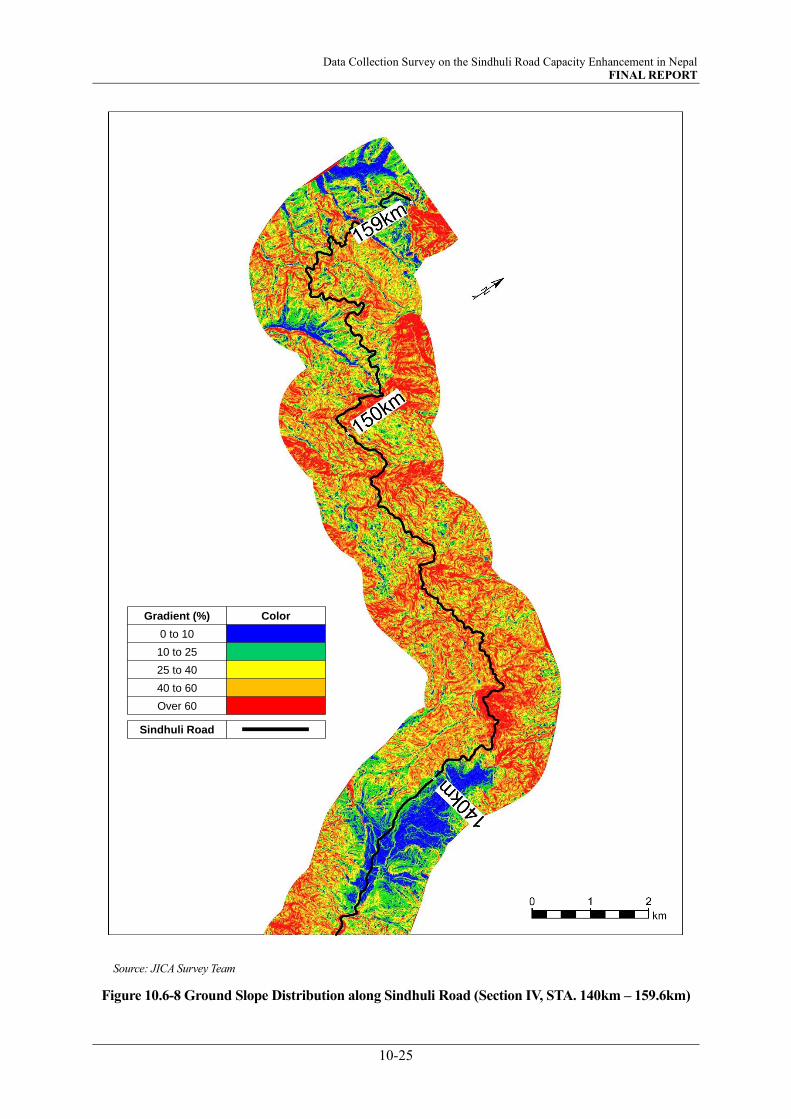
Data Collection Survey on the Sindhuli Road Capacity Enhancement in Nepal FINAL REPORT
10-25
Source: JICA Survey Team
Figure 10.6-8 Ground Slope Distribution along Sindhuli Road (Section IV, STA. 140km – 159.6km)
Gradient (%) Color
0 to 10
10 to 25
25 to 40
40 to 60
Over 60
Sindhuli Road

Data Collection Survey on the Sindhuli Road Capacity Enhancement in Nepal FINAL REPORT
10-26
10.6.2 Slope Failure / Land Slide Area
There are many locations/natural slopes along the Sindhuli Road that are prone to slope failures / land slides.
Occurrence of such disasters in the past is explained in “2.3.3 Geology and Past Natural Disasters of Survey
Area” in Chapter 2.
The locations prone to disasters as identified from the previous survey / design reports, disaster records,
contour map and site reconnaissance, are traced in the 3D map as illustrated in Table 10.6-1. The area
highlighted in purple represents such locations. The red line represents the existing Sindhuli Road.
Table 10.6-1 Slope Failure / Land Slide Area
Location Status Remarks
Section I
43km+700
Left
Section II
54km+00
Left
This area was
protected by
crib works
and ground
anchors.
Section II
58km+500
Left
Sindhuli Road
Slope Failure/Land Slide
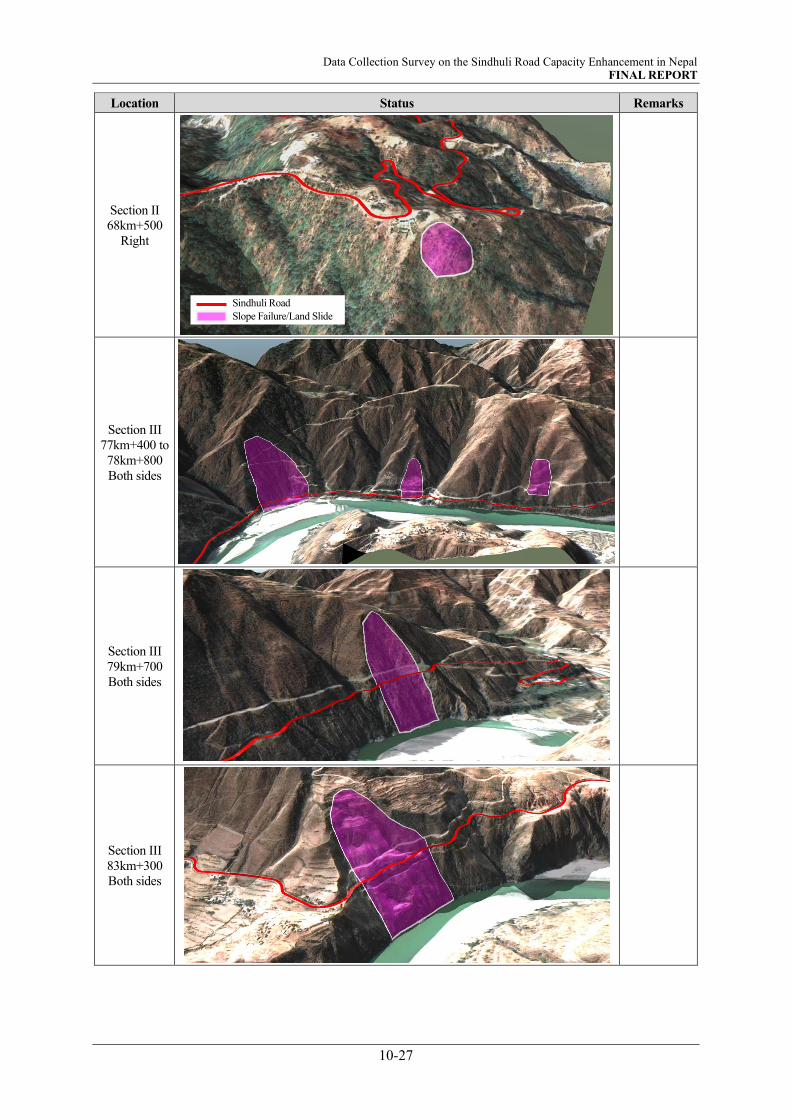
Data Collection Survey on the Sindhuli Road Capacity Enhancement in Nepal FINAL REPORT
10-27
Location Status Remarks
Section II
68km+500
Right
Section III
77km+400 to
78km+800
Both sides
Section III
79km+700
Both sides
Section III
83km+300
Both sides
Sindhuli Road
Slope Failure/Land Slide
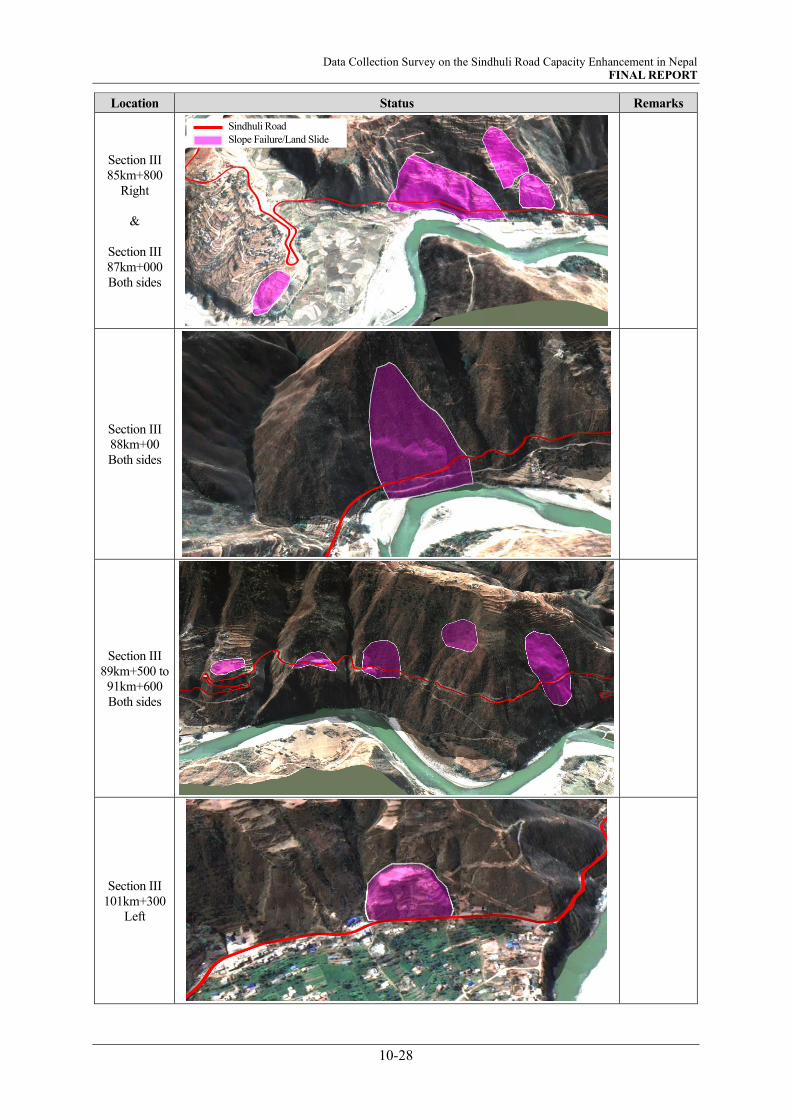
Data Collection Survey on the Sindhuli Road Capacity Enhancement in Nepal FINAL REPORT
10-28
Location Status Remarks
Section III
85km+800
Right
&
Section III
87km+000
Both sides
Section III
88km+00
Both sides
Section III
89km+500 to
91km+600
Both sides
Section III
101km+300
Left
Sindhuli Road
Slope Failure/Land Slide

Data Collection Survey on the Sindhuli Road Capacity Enhancement in Nepal FINAL REPORT
10-29
Location Status Remarks
Section III
104km+400
Left
Section III
106km+200
Left
Section III
109km+200
Left
Section IV
110km+600
Right
Sindhuli Road
Slope Failure/Land Slide
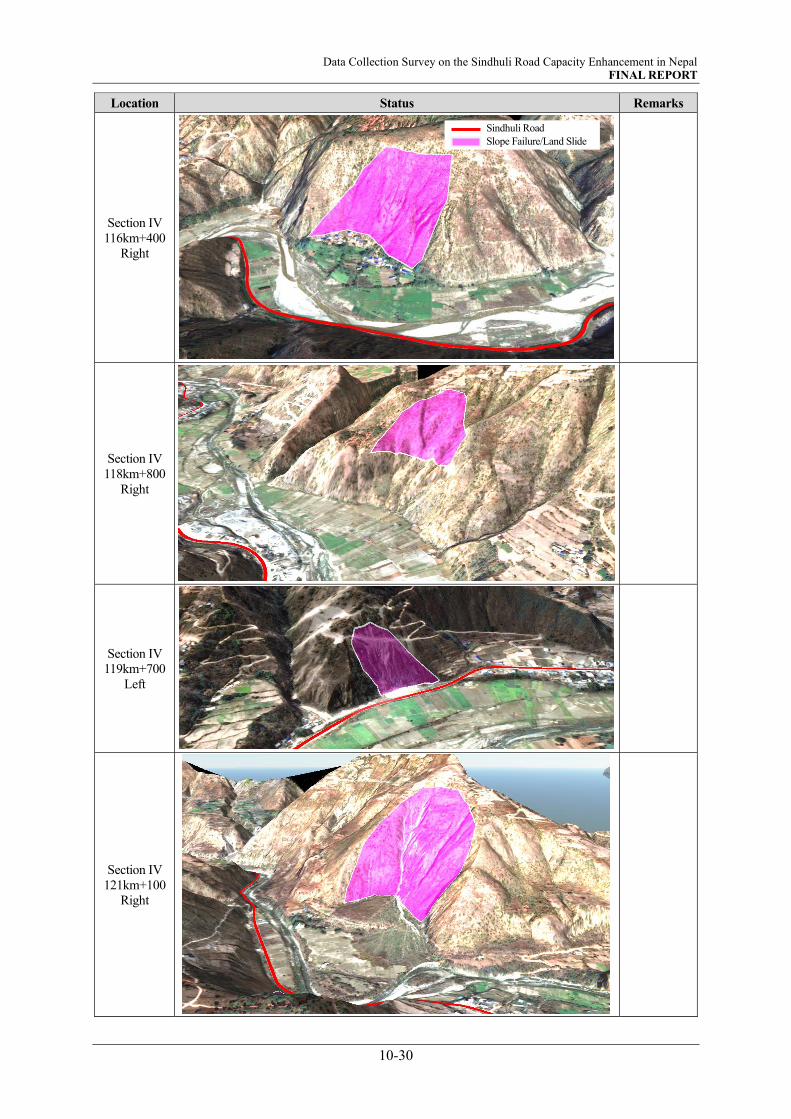
Data Collection Survey on the Sindhuli Road Capacity Enhancement in Nepal FINAL REPORT
10-30
Location Status Remarks
Section IV
116km+400
Right
Section IV
118km+800
Right
Section IV
119km+700
Left
Section IV
121km+100
Right
Sindhuli Road
Slope Failure/Land Slide

Data Collection Survey on the Sindhuli Road Capacity Enhancement in Nepal FINAL REPORT
10-31
Location Status Remarks
Section IV
121km+100
Left
Section IV
143km+500
Right
Section IV
145km+400
Both sides
Section IV
146km+900 to
147km+900
Both sides
Sindhuli Road
Slope Failure/Land Slide
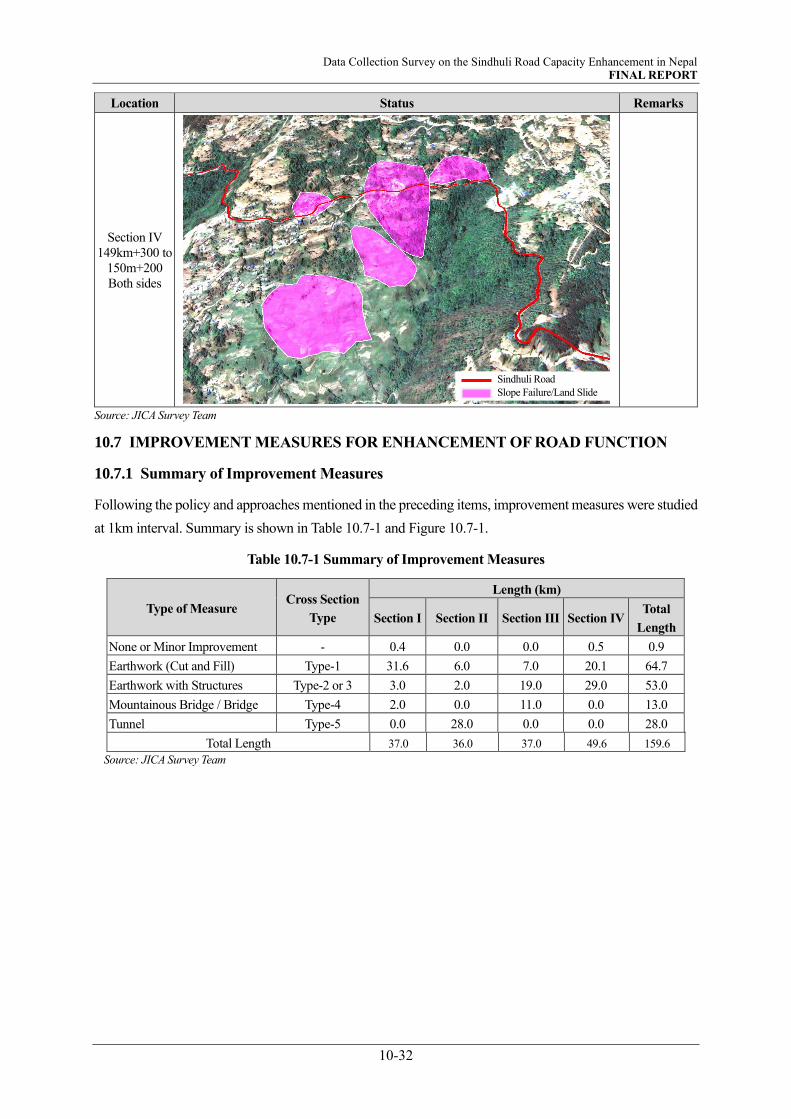
Data Collection Survey on the Sindhuli Road Capacity Enhancement in Nepal FINAL REPORT
10-32
Location Status Remarks
Section IV
149km+300 to
150m+200
Both sides
Source: JICA Survey Team
10.7 IMPROVEMENT MEASURES FOR ENHANCEMENT OF ROAD FUNCTION
10.7.1 Summary of Improvement Measures
Following the policy and approaches mentioned in the preceding items, improvement measures were studied
at 1km interval. Summary is shown in Table 10.7-1 and Figure 10.7-1.
Table 10.7-1 Summary of Improvement Measures
Type of Measure Cross Section
Type
Length (km)
Section I Section II Section III Section IV Total
Length
None or Minor Improvement - 0.4 0.0 0.0 0.5 0.9
Earthwork (Cut and Fill) Type-1 31.6 6.0 7.0 20.1 64.7
Earthwork with Structures Type-2 or 3 3.0 2.0 19.0 29.0 53.0
Mountainous Bridge / Bridge Type-4 2.0 0.0 11.0 0.0 13.0
Tunnel Type-5 0.0 28.0 0.0 0.0 28.0
Total Length 37.0 36.0 37.0 49.6 159.6
Source: JICA Survey Team
Sindhuli Road
Slope Failure/Land Slide

Data Collection Survey on the Sindhuli Road Capacity Enhancement in Nepal FINAL REPORT
10-33
Source: JICA Survey Team
Figure 10.7-1 Share of Type of Measures
This figure shows share of measures with respect to the length of the existing sections of the Sindhuli Road.
After application of improvement measures by tunnel for Section II, length of Section II reduces to 16.2km
from 35.8km (19.6km shortcut).
10.7.2 List of Improvement Measures
The recommended improvement measure to be extracted and selected after comparison study are listed in
Table 10.7-2 to Table 10.7-6.
Abbreviation in this sheet means as follows.
Y : Yes
N : No
P : Plain
R : Rolling
M1 : Mountainous (Ground slope is within 25% – 40%)
M2 : Mountainous (Ground slope is within 40% – 60%)
S : Steep
1.1%1.0% 0.6%
85%
17% 19%
41% 41%
8.1%
5.6%
51.4%
58.5%
33.2%
5.4%
29.7%
8.1%
77.8%
17.5%
0%
10%
20%
30%
40%
50%
60%
70%
80%
90%
100%
Section I Section II Section III Section IV Total Length
None or Minor Improvement Type-1: Earthwork (Cut and Fill) Type-2: Earthwork with Structures
Type-3: Mountainous BridgeType-4: Bridge
Type-5: Tunnel
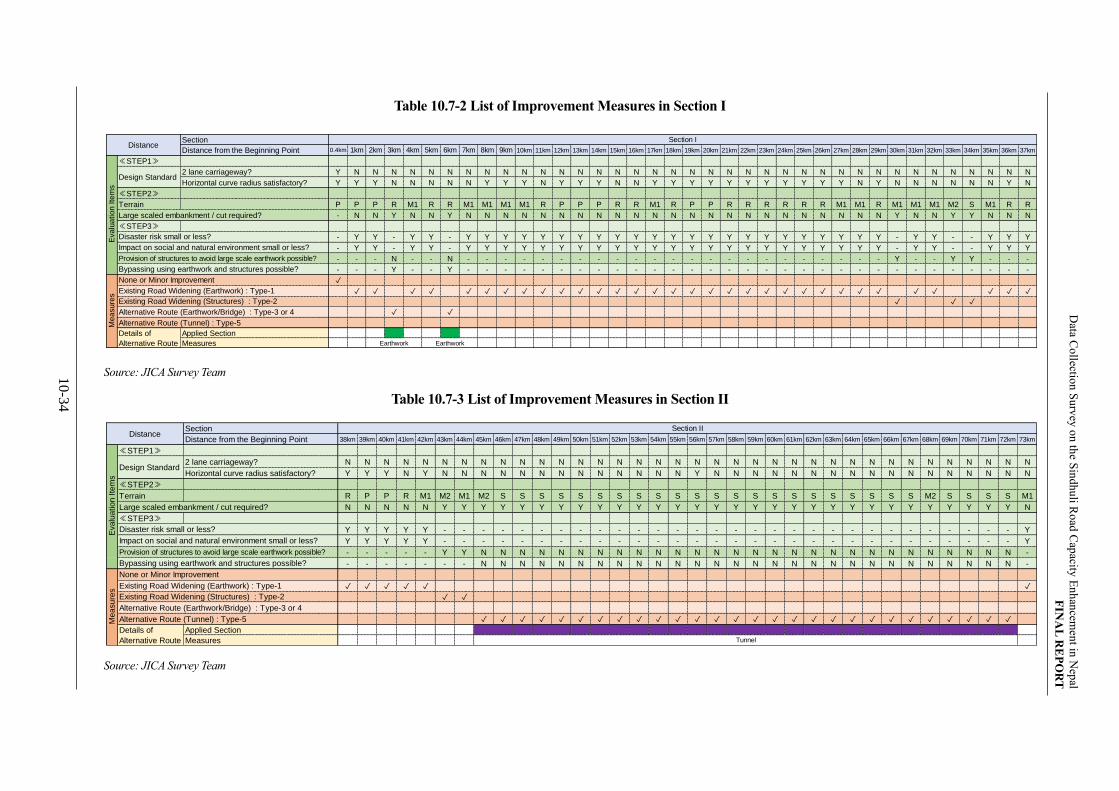
10
-34
Data C
ollectio
n S
urv
ey o
n th
e Sin
dhu
li Ro
ad C
apacity
En
han
cemen
t in N
epal
FIN
AL
RE
PO
RT
Table 10.7-2 List of Improvement Measures in Section I
Source: JICA Survey Team
Table 10.7-3 List of Improvement Measures in Section II
Source: JICA Survey Team
Section
Distance from the Beginning Point 0.4km 1km 2km 3km 4km 5km 6km 7km 8km 9km 10km 11km 12km 13km 14km 15km 16km 17km 18km 19km 20km 21km 22km 23km 24km 25km 26km 27km 28km 29km 30km 31km 32km 33km 34km 35km 36km 37km
≪STEP1≫
2 lane carriageway? Y N N N N N N N N N N N N N N N N N N N N N N N N N N N N N N N N N N N N N
Horizontal curve radius satisfactory? Y Y Y N N N N N Y Y Y N Y Y Y N N Y Y Y Y Y Y Y Y Y Y Y N Y N N N N N N Y N
≪STEP2≫
Terrain P P P R M1 R R M1 M1 M1 M1 R P P P R R M1 R P P R R R R R R M1 M1 R M1 M1 M1 M2 S M1 R R
Large scaled embankment / cut required? - N N Y N N Y N N N N N N N N N N N N N N N N N N N N N N N Y N N Y Y N N N
≪STEP3≫
- Y Y - Y Y - Y Y Y Y Y Y Y Y Y Y Y Y Y Y Y Y Y Y Y Y Y Y Y - Y Y - - Y Y Y
- Y Y - Y Y - Y Y Y Y Y Y Y Y Y Y Y Y Y Y Y Y Y Y Y Y Y Y Y - Y Y - - Y Y Y
- - - N - - N - - - - - - - - - - - - - - - - - - - - - - - Y - - Y Y - - -
- - - Y - - Y - - - - - - - - - - - - - - - - - - - - - - - - - - - - - - -
✓
✓ ✓ ✓ ✓ ✓ ✓ ✓ ✓ ✓ ✓ ✓ ✓ ✓ ✓ ✓ ✓ ✓ ✓ ✓ ✓ ✓ ✓ ✓ ✓ ✓ ✓ ✓ ✓ ✓ ✓ ✓ ✓
✓ ✓ ✓
Alternative Route (Earthwork/Bridge) : Type-3 or 4 ✓ ✓
Alternative Route (Tunnel) : Type-5
Applied Section
Measures Earthwork Earthwork
Section IDistance
Measure
sE
valu
ation Ite
ms
Provision of structures to avoid large scale earthwork possible?
Design Standard
Disaster risk small or less?
Impact on social and natural environment small or less?
Bypassing using earthwork and structures possible?
None or Minor Improvement
Existing Road Widening (Earthwork) : Type-1
Existing Road Widening (Structures) : Type-2
Details of
Alternative Route
Section
Distance from the Beginning Point 38km 39km 40km 41km 42km 43km 44km 45km 46km 47km 48km 49km 50km 51km 52km 53km 54km 55km 56km 57km 58km 59km 60km 61km 62km 63km 64km 65km 66km 67km 68km 69km 70km 71km 72km 73km
≪STEP1≫
2 lane carriageway? N N N N N N N N N N N N N N N N N N N N N N N N N N N N N N N N N N N N
Horizontal curve radius satisfactory? Y Y Y N Y N N N N N N N N N N N N N Y N N N N N N N N N N N N N N N N N
≪STEP2≫
Terrain R P P R M1 M2 M1 M2 S S S S S S S S S S S S S S S S S S S S S S M2 S S S S M1
Large scaled embankment / cut required? N N N N N Y Y Y Y Y Y Y Y Y Y Y Y Y Y Y Y Y Y Y Y Y Y Y Y Y Y Y Y Y Y N
≪STEP3≫
Y Y Y Y Y - - - - - - - - - - - - - - - - - - - - - - - - - - - - - - Y
Y Y Y Y Y - - - - - - - - - - - - - - - - - - - - - - - - - - - - - - Y
- - - - - Y Y N N N N N N N N N N N N N N N N N N N N N N N N N N N N -
- - - - - - - N N N N N N N N N N N N N N N N N N N N N N N N N N N N -
✓ ✓ ✓ ✓ ✓ ✓
✓ ✓
Alternative Route (Earthwork/Bridge) : Type-3 or 4
Alternative Route (Tunnel) : Type-5 ✓ ✓ ✓ ✓ ✓ ✓ ✓ ✓ ✓ ✓ ✓ ✓ ✓ ✓ ✓ ✓ ✓ ✓ ✓ ✓ ✓ ✓ ✓ ✓ ✓ ✓ ✓ ✓
Applied Section
Measures Tunnel
Details of
Alternative Route
Evalu
ation Ite
ms
Design Standard
Disaster risk small or less?
Impact on social and natural environment small or less?
Provision of structures to avoid large scale earthwork possible?
Bypassing using earthwork and structures possible?
Measure
s
None or Minor Improvement
Existing Road Widening (Earthwork) : Type-1
Existing Road Widening (Structures) : Type-2
DistanceSection II
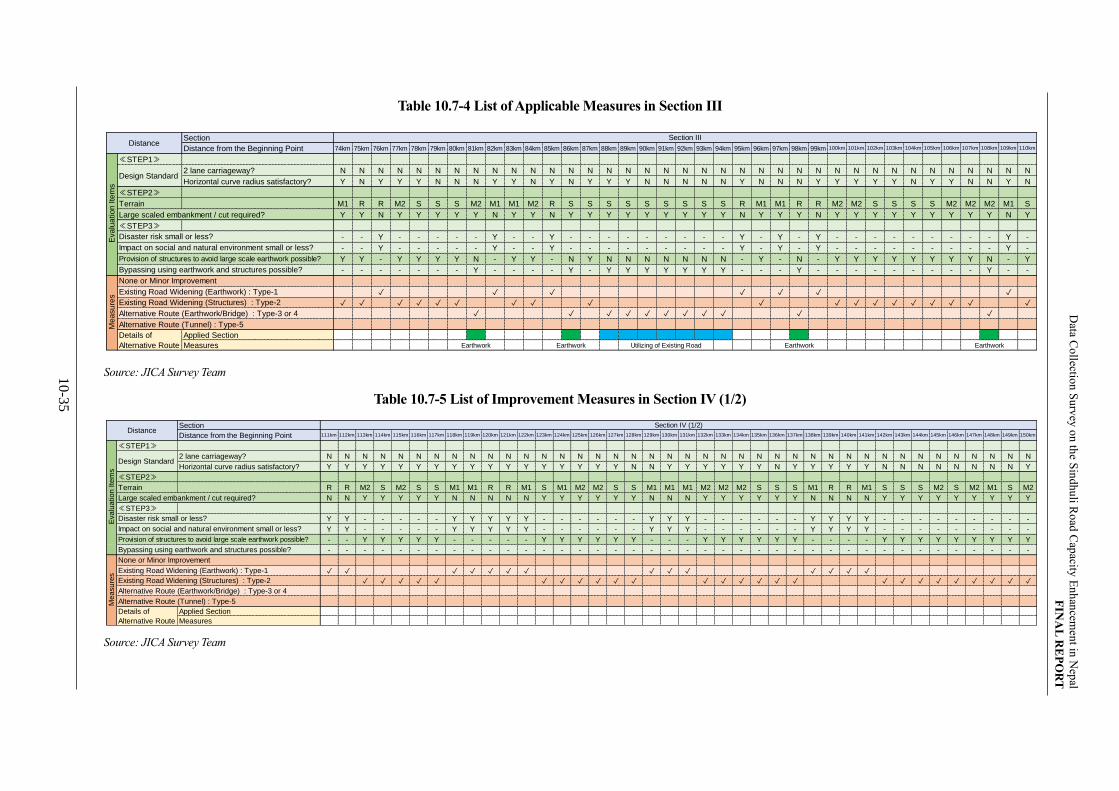
10
-35
Data C
ollectio
n S
urv
ey o
n th
e Sin
dhu
li Ro
ad C
apacity
En
han
cemen
t in N
epal
FIN
AL
RE
PO
RT
Table 10.7-4 List of Applicable Measures in Section III
Source: JICA Survey Team
Table 10.7-5 List of Improvement Measures in Section IV (1/2)
Source: JICA Survey Team
Section
Distance from the Beginning Point 74km 75km 76km 77km 78km 79km 80km 81km 82km 83km 84km 85km 86km 87km 88km 89km 90km 91km 92km 93km 94km 95km 96km 97km 98km 99km 100km 101km 102km 103km 104km 105km 106km 107km 108km 109km 110km
≪STEP1≫
2 lane carriageway? N N N N N N N N N N N N N N N N N N N N N N N N N N N N N N N N N N N N N
Horizontal curve radius satisfactory? Y N Y Y Y N N N Y Y N Y N Y Y Y N N N N N Y N N N Y Y Y Y Y N Y Y N N Y N
≪STEP2≫
Terrain M1 R R M2 S S S M2 M1 M1 M2 R S S S S S S S S S R M1 M1 R R M2 M2 S S S S M2 M2 M2 M1 S
Large scaled embankment / cut required? Y Y N Y Y Y Y Y N Y Y N Y Y Y Y Y Y Y Y Y N Y Y Y N Y Y Y Y Y Y Y Y Y N Y
≪STEP3≫
- - Y - - - - - Y - - Y - - - - - - - - - Y - Y - Y - - - - - - - - - Y -
- - Y - - - - - Y - - Y - - - - - - - - - Y - Y - Y - - - - - - - - - Y -
Y Y - Y Y Y Y N - Y Y - N Y N N N N N N N - Y - N - Y Y Y Y Y Y Y Y N - Y
- - - - - - - Y - - - - Y - Y Y Y Y Y Y Y - - - Y - - - - - - - - - Y - -
✓ ✓ ✓ ✓ ✓ ✓ ✓
✓ ✓ ✓ ✓ ✓ ✓ ✓ ✓ ✓ ✓ ✓ ✓ ✓ ✓ ✓ ✓ ✓ ✓ ✓
Alternative Route (Earthwork/Bridge) : Type-3 or 4 ✓ ✓ ✓ ✓ ✓ ✓ ✓ ✓ ✓ ✓ ✓
Alternative Route (Tunnel) : Type-5
Applied Section
Measures Earthwork Earthwork Utilizing of Existing Road Earthwork Earthwork
Provision of structures to avoid large scale earthwork possible?
Bypassing using earthwork and structures possible?
Measure
s
None or Minor Improvement
Existing Road Widening (Earthwork) : Type-1
Existing Road Widening (Structures) : Type-2
Details of
Alternative Route
Evalu
ation Ite
ms
Design Standard
Disaster risk small or less?
Impact on social and natural environment small or less?
DistanceSection III
Section
Distance from the Beginning Point 111km 112km 113km 114km 115km 116km 117km 118km 119km 120km 121km 122km 123km 124km 125km 126km 127km 128km 129km 130km 131km 132km 133km 134km 135km 136km 137km 138km 139km 140km 141km 142km 143km 144km 145km 146km 147km 148km 149km 150km
≪STEP1≫
2 lane carriageway? N N N N N N N N N N N N N N N N N N N N N N N N N N N N N N N N N N N N N N N N
Horizontal curve radius satisfactory? Y Y Y Y Y Y Y Y Y Y Y Y Y Y Y Y Y N N Y Y Y Y Y Y N Y Y Y Y Y N N N N N N N N Y
≪STEP2≫
Terrain R R M2 S M2 S S M1 M1 R R M1 S M1 M2 M2 S S M1 M1 M1 M2 M2 M2 S S S M1 R R M1 S S S M2 S M2 M1 S M2
Large scaled embankment / cut required? N N Y Y Y Y Y N N N N N Y Y Y Y Y Y N N N Y Y Y Y Y Y N N N N Y Y Y Y Y Y Y Y Y
≪STEP3≫
Y Y - - - - - Y Y Y Y Y - - - - - - Y Y Y - - - - - - Y Y Y Y - - - - - - - - -
Y Y - - - - - Y Y Y Y Y - - - - - - Y Y Y - - - - - - Y Y Y Y - - - - - - - - -
- - Y Y Y Y Y - - - - - Y Y Y Y Y Y - - - Y Y Y Y Y Y - - - - Y Y Y Y Y Y Y Y Y
- - - - - - - - - - - - - - - - - - - - - - - - - - - - - - - - - - - - - - - -
✓ ✓ ✓ ✓ ✓ ✓ ✓ ✓ ✓ ✓ ✓ ✓ ✓ ✓
✓ ✓ ✓ ✓ ✓ ✓ ✓ ✓ ✓ ✓ ✓ ✓ ✓ ✓ ✓ ✓ ✓ ✓ ✓ ✓ ✓ ✓ ✓ ✓ ✓ ✓
Alternative Route (Earthwork/Bridge) : Type-3 or 4
Alternative Route (Tunnel) : Type-5
Applied Section
Measures
Section IV (1/2)
Measure
s
None or Minor Improvement
Existing Road Widening (Earthwork) : Type-1
Existing Road Widening (Structures) : Type-2
Details of
Alternative Route
Evalu
ation Ite
ms
Design Standard
Disaster risk small or less?
Impact on social and natural environment small or less?
Bypassing using earthwork and structures possible?
Provision of structures to avoid large scale earthwork possible?
Distance

Data Collection Survey on the Sindhuli Road Capacity Enhancement in Nepal FINAL REPORT
10-36
Table 10.7-6 List of Improvement Measures in Section IV (2/2)
Source: JICA Survey Team
10.7.3 Details of Alternative Route
Table 10.7-7 to Table 10.7-21 and Figure 10.7-3 to Figure 10.7-16 show details of alternative routes (bypass)
and comparison of these alternatives at 100m interval, except for an alternative route by tunnel in Section II
that is mentioned in Chapter 13.
For convenience and easy comparison with other alternative routes, widening of the existing route is named
as “ALT – XX A” although this is not actual alternative route.
Evaluation is given by the following.
◎:Excellent, ◯:Good, △: Fair, ×:Unsatisfied/Not Applicable
Section
Distance from the Beginning Point 151km 152km 153km 154km 155km 156km 157km 158km 159km 159.1km 159.5km
≪STEP1≫
2 lane carriageway? N N N N N N N N N N Y
Horizontal curve radius satisfactory? N N Y N N N N N N Y Y
≪STEP2≫
Terrain M1 M1 M1 M2 M1 M2 M1 M1 R R P
Large scaled embankment / cut required? N N N Y N Y N Y N N -
≪STEP3≫
Y Y Y - Y - Y - Y Y -
Y Y Y - Y - Y - Y Y -
- - - Y - Y - Y - - -
- - - - - - - - - - -
✓
✓ ✓ ✓ ✓ ✓ ✓ ✓
✓ ✓ ✓
Alternative Route (Earthwork/Bridge) : Type-3 or 4
Alternative Route (Tunnel) : Type-5
Applied Section
Measures
Measure
s
None or Minor Improvement
Existing Road Widening (Earthwork) : Type-1
Existing Road Widening (Structures) : Type-2
Details of
Alternative Route
Impact on social and natural environment small or less?
Evalu
ation Ite
ms
Design Standard
Disaster risk small or less?
Bypassing using earthwork and structures possible?
Provision of structures to avoid large scale earthwork possible?
DistanceSection IV (2/2)
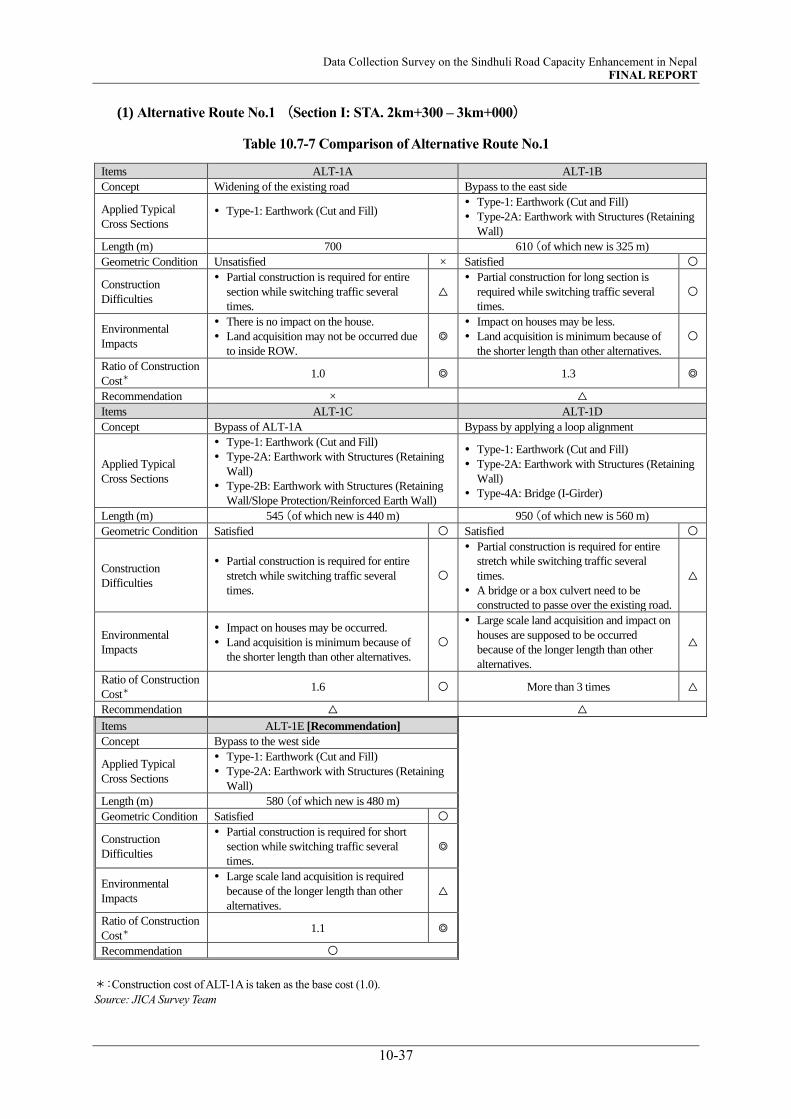
Data Collection Survey on the Sindhuli Road Capacity Enhancement in Nepal FINAL REPORT
10-37
(1) Alternative Route No.1 (Section I: STA. 2km+300 – 3km+000)
Table 10.7-7 Comparison of Alternative Route No.1
Items ALT-1A ALT-1B
Concept Widening of the existing road Bypass to the east side
Applied Typical
Cross Sections Type-1: Earthwork (Cut and Fill)
Type-1: Earthwork (Cut and Fill)
Type-2A: Earthwork with Structures (Retaining
Wall)
Length (m) 700 610 (of which new is 325 m)
Geometric Condition Unsatisfied × Satisfied 〇
Construction
Difficulties
Partial construction is required for entire
section while switching traffic several
times.
△
Partial construction for long section is
required while switching traffic several
times.
〇
Environmental
Impacts
There is no impact on the house.
Land acquisition may not be occurred due
to inside ROW.
◎
Impact on houses may be less.
Land acquisition is minimum because of
the shorter length than other alternatives.
〇
Ratio of Construction
Cost* 1.0 ◎ 1.3 ◎
Recommendation × △
Items ALT-1C ALT-1D
Concept Bypass of ALT-1A Bypass by applying a loop alignment
Applied Typical
Cross Sections
Type-1: Earthwork (Cut and Fill)
Type-2A: Earthwork with Structures (Retaining
Wall)
Type-2B: Earthwork with Structures (Retaining
Wall/Slope Protection/Reinforced Earth Wall)
Type-1: Earthwork (Cut and Fill)
Type-2A: Earthwork with Structures (Retaining
Wall)
Type-4A: Bridge (I-Girder)
Length (m) 545 (of which new is 440 m) 950 (of which new is 560 m)
Geometric Condition Satisfied 〇 Satisfied 〇
Construction
Difficulties
Partial construction is required for entire
stretch while switching traffic several
times.
〇
Partial construction is required for entire
stretch while switching traffic several
times.
A bridge or a box culvert need to be
constructed to passe over the existing road.
△
Environmental
Impacts
Impact on houses may be occurred.
Land acquisition is minimum because of
the shorter length than other alternatives.
〇
Large scale land acquisition and impact on
houses are supposed to be occurred
because of the longer length than other
alternatives.
△
Ratio of Construction
Cost* 1.6 〇 More than 3 times △
Recommendation △ △
Items ALT-1E [Recommendation]
Concept Bypass to the west side
Applied Typical
Cross Sections
Type-1: Earthwork (Cut and Fill)
Type-2A: Earthwork with Structures (Retaining
Wall)
Length (m) 580 (of which new is 480 m)
Geometric Condition Satisfied 〇
Construction
Difficulties
Partial construction is required for short
section while switching traffic several
times.
◎
Environmental
Impacts
Large scale land acquisition is required
because of the longer length than other
alternatives.
△
Ratio of Construction
Cost* 1.1 ◎
Recommendation 〇
*:Construction cost of ALT-1A is taken as the base cost (1.0).
Source: JICA Survey Team
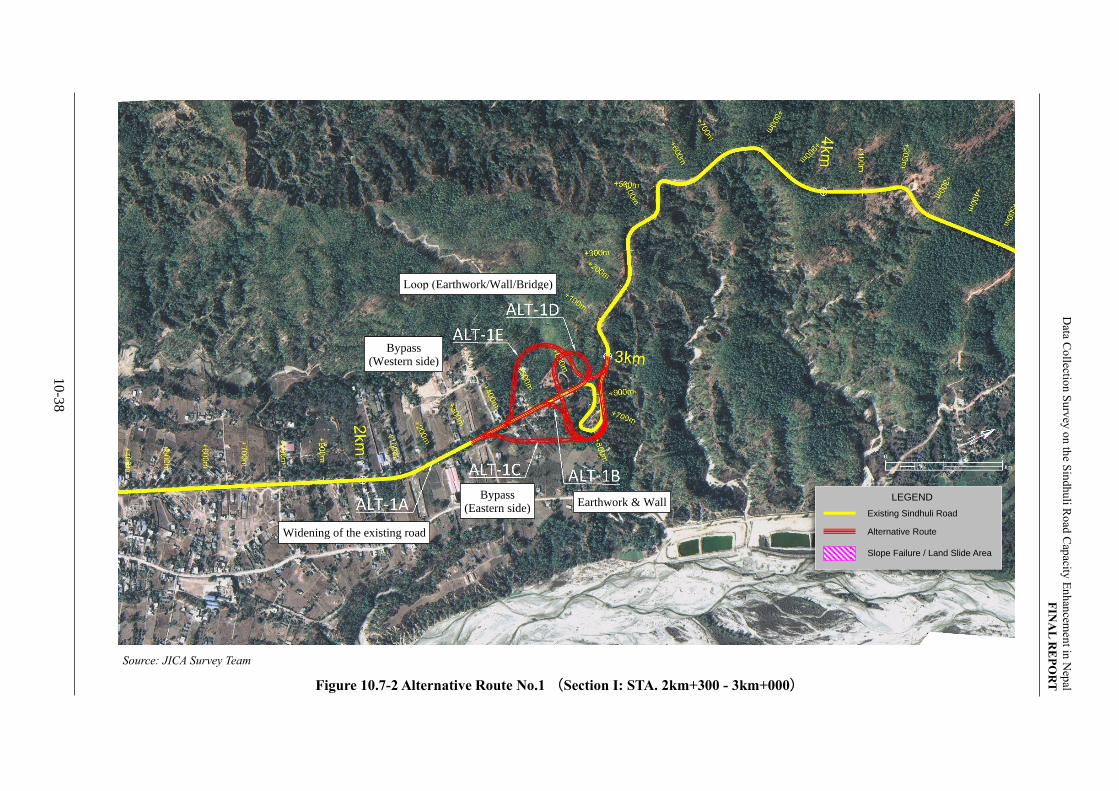
10
-38
Data C
ollectio
n S
urv
ey o
n th
e Sin
dhu
li Ro
ad C
apacity
En
han
cemen
t in N
epal
FIN
AL
RE
PO
RT
Source: JICA Survey Team
Figure 10.7-2 Alternative Route No.1 (Section I: STA. 2km+300 - 3km+000)
Loop (Earthwork/Wall/Bridge)
Bypass (Western side)
Widening of the existing road
Bypass (Eastern side)
Earthwork & Wall Existing Sindhuli Road
Alternative Route
Slope Failure / Land Slide Area
LEGEND
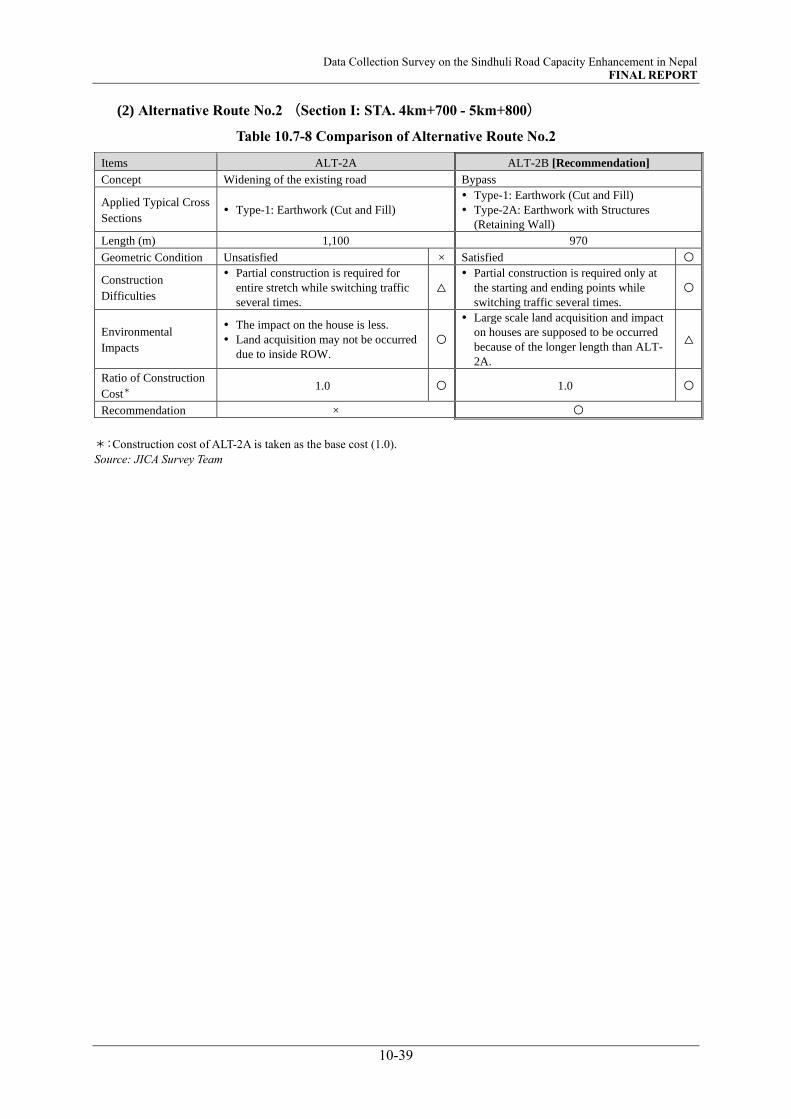
Data Collection Survey on the Sindhuli Road Capacity Enhancement in Nepal FINAL REPORT
10-39
(2) Alternative Route No.2 (Section I: STA. 4km+700 - 5km+800)
Table 10.7-8 Comparison of Alternative Route No.2
Items ALT-2A ALT-2B [Recommendation]
Concept Widening of the existing road Bypass
Applied Typical Cross
Sections Type-1: Earthwork (Cut and Fill)
Type-1: Earthwork (Cut and Fill)
Type-2A: Earthwork with Structures
(Retaining Wall)
Length (m) 1,100 970
Geometric Condition Unsatisfied × Satisfied 〇
Construction
Difficulties
Partial construction is required for
entire stretch while switching traffic
several times.
△
Partial construction is required only at
the starting and ending points while
switching traffic several times.
〇
Environmental
Impacts
The impact on the house is less.
Land acquisition may not be occurred
due to inside ROW.
〇
Large scale land acquisition and impact
on houses are supposed to be occurred
because of the longer length than ALT-
2A.
△
Ratio of Construction
Cost* 1.0 〇 1.0 〇
Recommendation × 〇
*:Construction cost of ALT-2A is taken as the base cost (1.0).
Source: JICA Survey Team
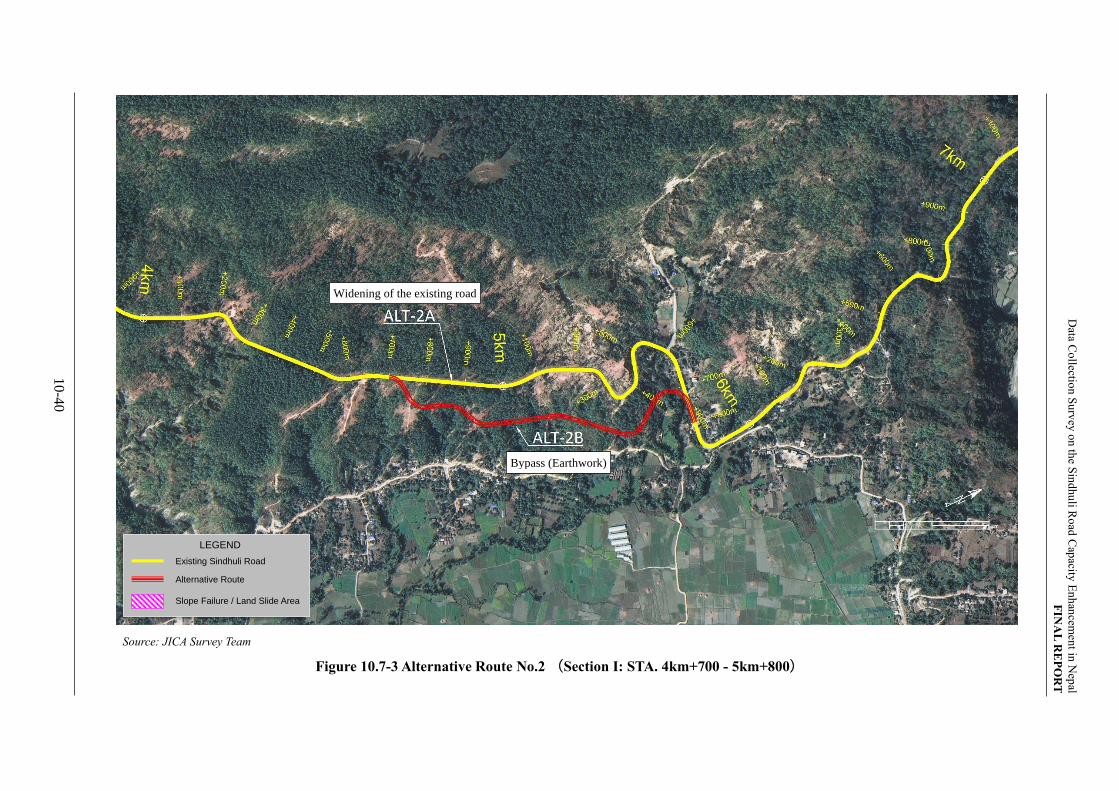
10
-40
Data C
ollectio
n S
urv
ey o
n th
e Sin
dhu
li Ro
ad C
apacity
En
han
cemen
t in N
epal
FIN
AL
RE
PO
RT
Source: JICA Survey Team
Figure 10.7-3 Alternative Route No.2 (Section I: STA. 4km+700 - 5km+800)
Bypass (Earthwork)
Widening of the existing road
Existing Sindhuli Road
Alternative Route
Slope Failure / Land Slide Area
LEGEND
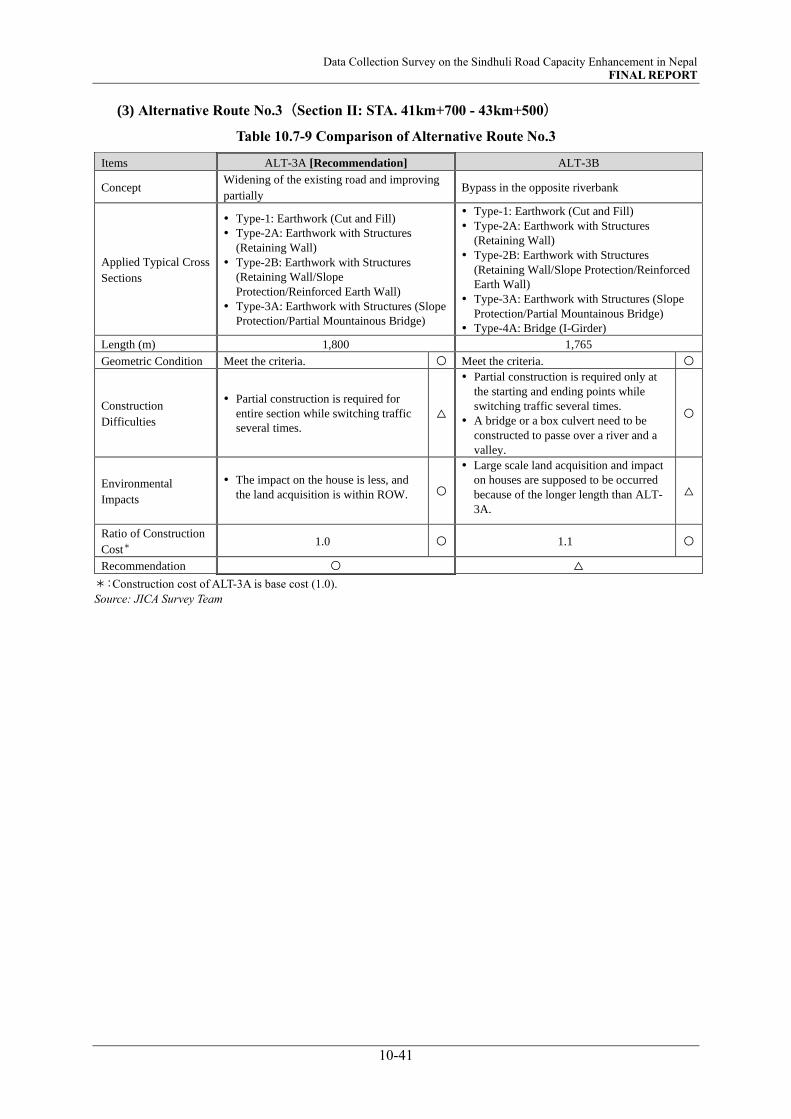
Data Collection Survey on the Sindhuli Road Capacity Enhancement in Nepal FINAL REPORT
10-41
(3) Alternative Route No.3(Section II: STA. 41km+700 - 43km+500)
Table 10.7-9 Comparison of Alternative Route No.3
Items ALT-3A [Recommendation] ALT-3B
Concept Widening of the existing road and improving
partially Bypass in the opposite riverbank
Applied Typical Cross
Sections
Type-1: Earthwork (Cut and Fill)
Type-2A: Earthwork with Structures
(Retaining Wall)
Type-2B: Earthwork with Structures
(Retaining Wall/Slope
Protection/Reinforced Earth Wall)
Type-3A: Earthwork with Structures (Slope
Protection/Partial Mountainous Bridge)
Type-1: Earthwork (Cut and Fill)
Type-2A: Earthwork with Structures
(Retaining Wall)
Type-2B: Earthwork with Structures
(Retaining Wall/Slope Protection/Reinforced
Earth Wall)
Type-3A: Earthwork with Structures (Slope
Protection/Partial Mountainous Bridge)
Type-4A: Bridge (I-Girder)
Length (m) 1,800 1,765
Geometric Condition Meet the criteria. 〇 Meet the criteria. 〇
Construction
Difficulties
Partial construction is required for
entire section while switching traffic
several times.
△
Partial construction is required only at
the starting and ending points while
switching traffic several times.
A bridge or a box culvert need to be
constructed to passe over a river and a
valley.
〇
Environmental
Impacts
The impact on the house is less, and
the land acquisition is within ROW. 〇
Large scale land acquisition and impact
on houses are supposed to be occurred
because of the longer length than ALT-
3A.
△
Ratio of Construction
Cost* 1.0 〇 1.1 〇
Recommendation 〇 △
*:Construction cost of ALT-3A is base cost (1.0).
Source: JICA Survey Team
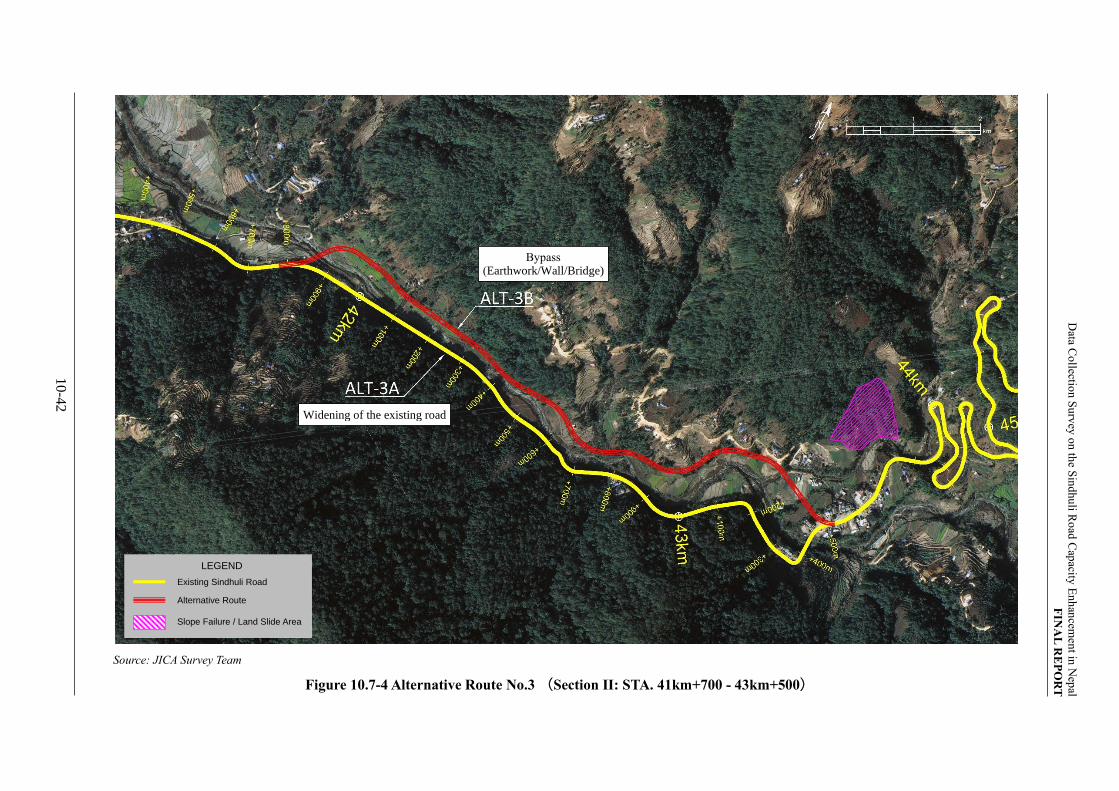
10
-42
Data C
ollectio
n S
urv
ey o
n th
e Sin
dhu
li Ro
ad C
apacity
En
han
cemen
t in N
epal
FIN
AL
RE
PO
RT
Source: JICA Survey Team
Figure 10.7-4 Alternative Route No.3 (Section II: STA. 41km+700 - 43km+500)
Bypass (Earthwork/Wall/Bridge)
Widening of the existing road
Existing Sindhuli Road
Alternative Route
Slope Failure / Land Slide Area
LEGEND

Data Collection Survey on the Sindhuli Road Capacity Enhancement in Nepal FINAL REPORT
10-43
(4) Alternative Route No.4 (Section III: STA. 80km+200 - 80km+800)
Table 10.7-10 Comparison of Alternative Route No.4
Items ALT-4A ALT-4B [Recommendation]
Concept Widening of the existing road Improvement of the existing road
Applied Typical Cross
Sections
Type-2A: Earthwork with Structures
(Retaining Wall)
Type-2B: Earthwork with Structures
(Retaining Wall/Slope
Protection/Reinforced Earth Wall)
Type-2A: Earthwork with Structures
(Retaining Wall)
Type-2B: Earthwork with Structures
(Retaining Wall/Slope Protection/Reinforced
Earth Wall)
Length (m) 600 645
Geometric Condition Unsatisfied × Satisfied 〇
Construction
Difficulties
Partial construction is required for
entire section while switching traffic
several times.
△
Partial construction is required only at
the starting and ending points while
switching traffic several times.
〇
Environmental
Impacts
There is no impact on the house.
Land acquisition may not be occurred
due to inside ROW..
〇
Large scale land acquisition and impact
on houses are supposed to be occurred
because of the longer length than ALT-
4A.
△
Ratio of Construction
Cost* 1.0 〇 1.2 〇
Recommendation × 〇
*:Construction cost of ALT-4A is taken as the base cost (1.0).
Source: JICA Survey Team
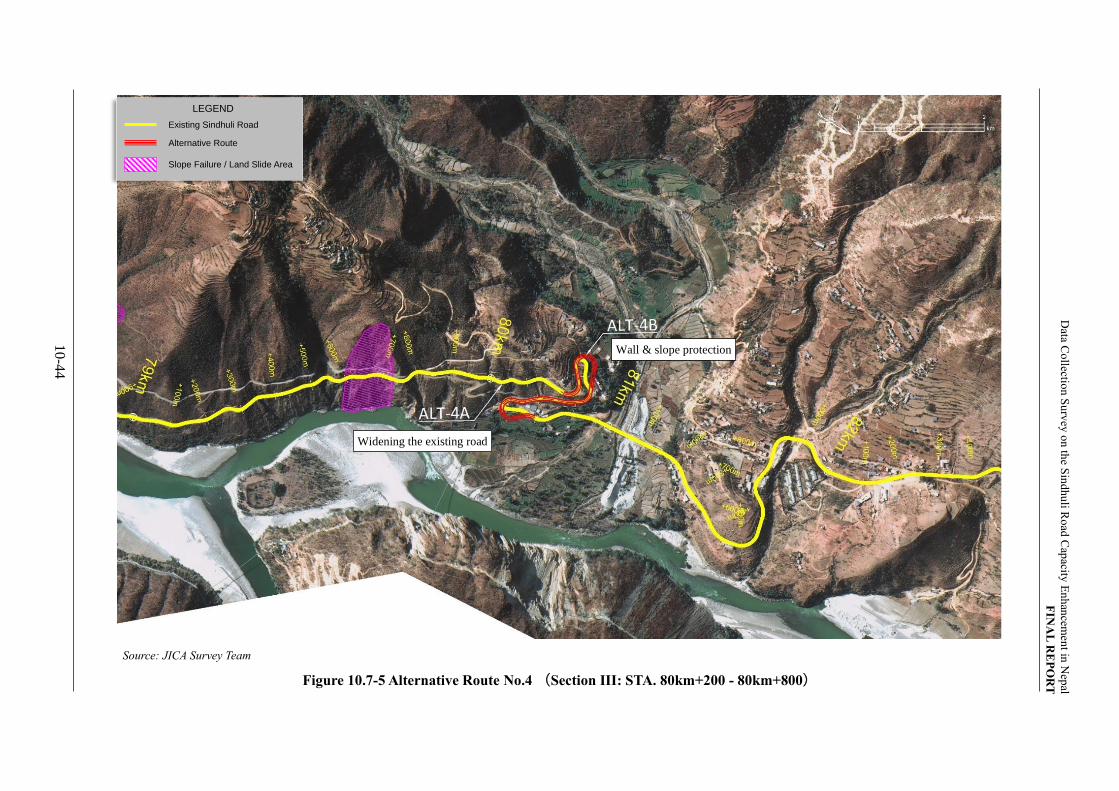
Data C
ollectio
n S
urv
ey o
n th
e Sin
dhu
li Ro
ad C
apacity
En
han
cemen
t in N
epal
FIN
AL
RE
PO
RT
10-4
4
Source: JICA Survey Team
Figure 10.7-5 Alternative Route No.4 (Section III: STA. 80km+200 - 80km+800)
Wall & slope protection
Widening the existing road
Existing Sindhuli Road
Alternative Route
Slope Failure / Land Slide Area
LEGEND
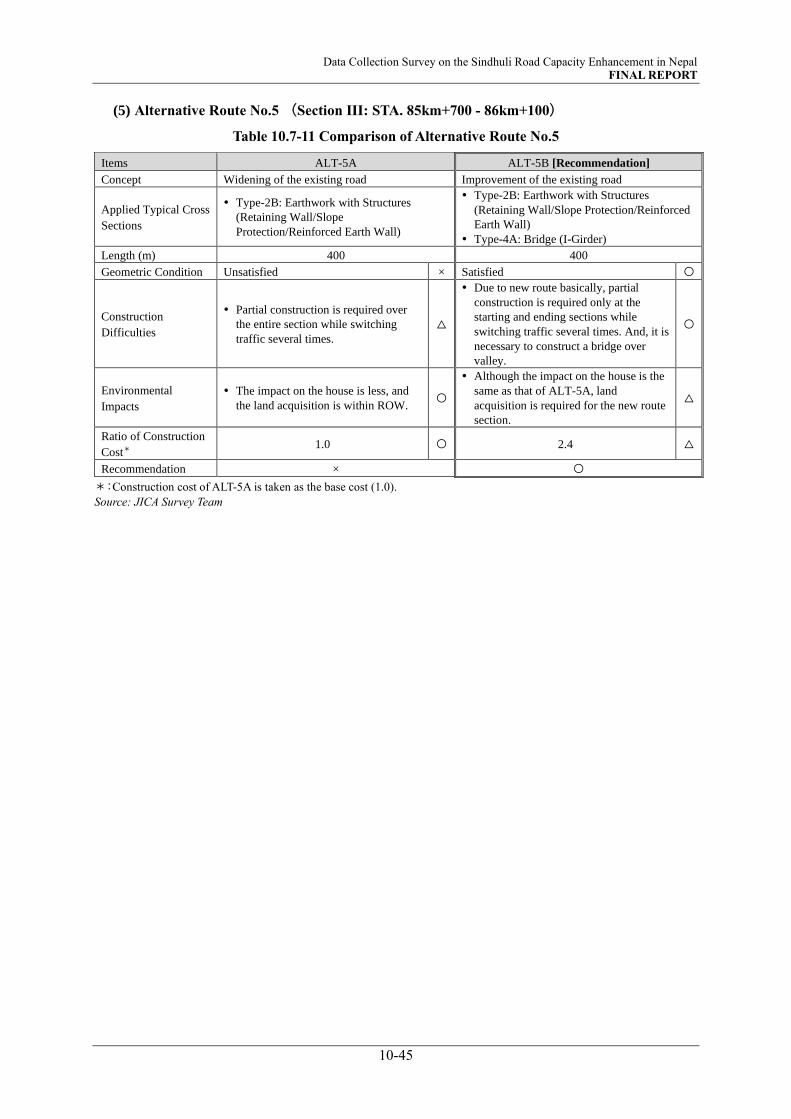
Data Collection Survey on the Sindhuli Road Capacity Enhancement in Nepal FINAL REPORT
10-45
(5) Alternative Route No.5 (Section III: STA. 85km+700 - 86km+100)
Table 10.7-11 Comparison of Alternative Route No.5
Items ALT-5A ALT-5B [Recommendation]
Concept Widening of the existing road Improvement of the existing road
Applied Typical Cross
Sections
Type-2B: Earthwork with Structures
(Retaining Wall/Slope
Protection/Reinforced Earth Wall)
Type-2B: Earthwork with Structures
(Retaining Wall/Slope Protection/Reinforced
Earth Wall)
Type-4A: Bridge (I-Girder)
Length (m) 400 400
Geometric Condition Unsatisfied × Satisfied 〇
Construction
Difficulties
Partial construction is required over
the entire section while switching
traffic several times.
△
Due to new route basically, partial
construction is required only at the
starting and ending sections while
switching traffic several times. And, it is
necessary to construct a bridge over
valley.
〇
Environmental
Impacts
The impact on the house is less, and
the land acquisition is within ROW. 〇
Although the impact on the house is the
same as that of ALT-5A, land
acquisition is required for the new route
section.
△
Ratio of Construction
Cost* 1.0 〇 2.4 △
Recommendation × 〇
*:Construction cost of ALT-5A is taken as the base cost (1.0).
Source: JICA Survey Team
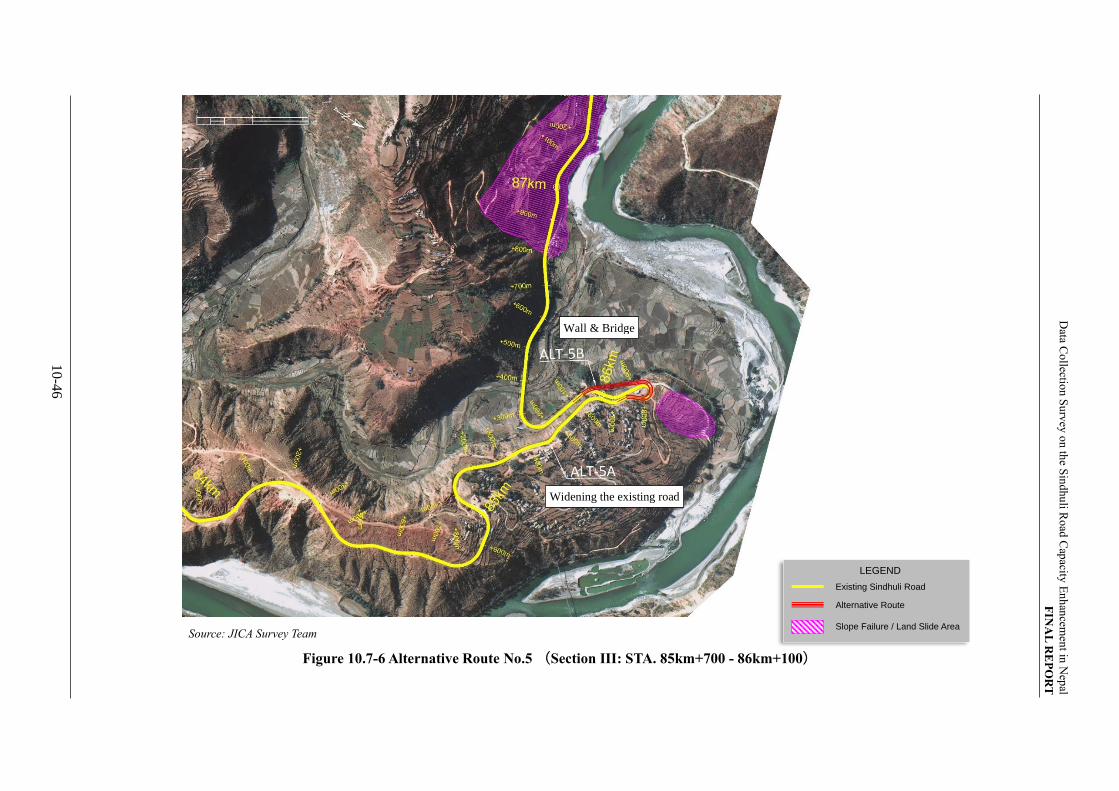
Data C
ollectio
n S
urv
ey o
n th
e Sin
dhu
li Ro
ad C
apacity
En
han
cemen
t in N
epal
FIN
AL
RE
PO
RT
10-4
6
Source: JICA Survey Team
Figure 10.7-6 Alternative Route No.5 (Section III: STA. 85km+700 - 86km+100)
Wall & Bridge
Widening the existing road
Existing Sindhuli Road
Alternative Route
Slope Failure / Land Slide Area
LEGEND
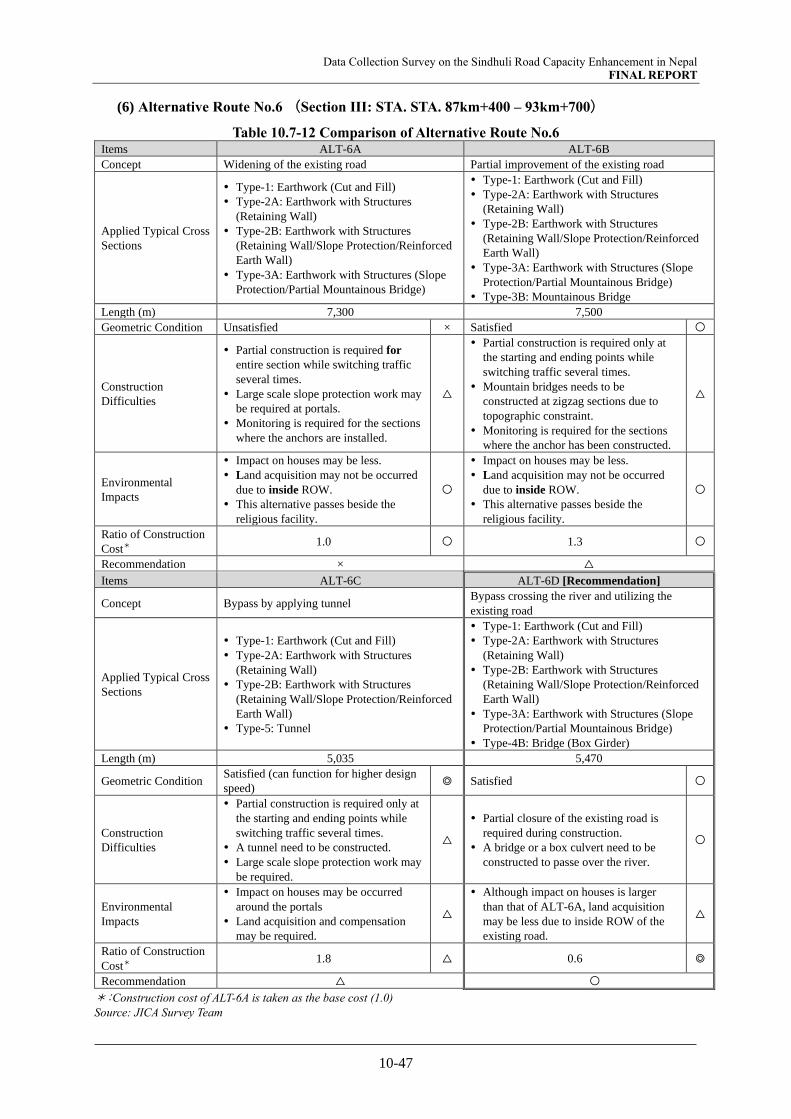
Data Collection Survey on the Sindhuli Road Capacity Enhancement in Nepal FINAL REPORT
10-47
(6) Alternative Route No.6 (Section III: STA. STA. 87km+400 – 93km+700)
Table 10.7-12 Comparison of Alternative Route No.6 Items ALT-6A ALT-6B
Concept Widening of the existing road Partial improvement of the existing road
Applied Typical Cross
Sections
Type-1: Earthwork (Cut and Fill)
Type-2A: Earthwork with Structures
(Retaining Wall)
Type-2B: Earthwork with Structures
(Retaining Wall/Slope Protection/Reinforced
Earth Wall)
Type-3A: Earthwork with Structures (Slope
Protection/Partial Mountainous Bridge)
Type-1: Earthwork (Cut and Fill)
Type-2A: Earthwork with Structures
(Retaining Wall)
Type-2B: Earthwork with Structures
(Retaining Wall/Slope Protection/Reinforced
Earth Wall)
Type-3A: Earthwork with Structures (Slope
Protection/Partial Mountainous Bridge)
Type-3B: Mountainous Bridge
Length (m) 7,300 7,500
Geometric Condition Unsatisfied × Satisfied 〇
Construction
Difficulties
Partial construction is required for
entire section while switching traffic
several times.
Large scale slope protection work may
be required at portals.
Monitoring is required for the sections
where the anchors are installed.
△
Partial construction is required only at
the starting and ending points while
switching traffic several times.
Mountain bridges needs to be
constructed at zigzag sections due to
topographic constraint.
Monitoring is required for the sections
where the anchor has been constructed.
△
Environmental
Impacts
Impact on houses may be less.
Land acquisition may not be occurred
due to inside ROW.
This alternative passes beside the
religious facility.
〇
Impact on houses may be less.
Land acquisition may not be occurred
due to inside ROW.
This alternative passes beside the
religious facility.
〇
Ratio of Construction
Cost* 1.0 〇 1.3 〇
Recommendation × △
Items ALT-6C ALT-6D [Recommendation]
Concept Bypass by applying tunnel Bypass crossing the river and utilizing the
existing road
Applied Typical Cross
Sections
Type-1: Earthwork (Cut and Fill)
Type-2A: Earthwork with Structures
(Retaining Wall)
Type-2B: Earthwork with Structures
(Retaining Wall/Slope Protection/Reinforced
Earth Wall)
Type-5: Tunnel
Type-1: Earthwork (Cut and Fill)
Type-2A: Earthwork with Structures
(Retaining Wall)
Type-2B: Earthwork with Structures
(Retaining Wall/Slope Protection/Reinforced
Earth Wall)
Type-3A: Earthwork with Structures (Slope
Protection/Partial Mountainous Bridge)
Type-4B: Bridge (Box Girder)
Length (m) 5,035 5,470
Geometric Condition Satisfied (can function for higher design
speed) ◎ Satisfied 〇
Construction
Difficulties
Partial construction is required only at
the starting and ending points while
switching traffic several times.
A tunnel need to be constructed.
Large scale slope protection work may
be required.
△
Partial closure of the existing road is
required during construction.
A bridge or a box culvert need to be
constructed to passe over the river.
〇
Environmental
Impacts
Impact on houses may be occurred
around the portals
Land acquisition and compensation
may be required.
△
Although impact on houses is larger
than that of ALT-6A, land acquisition
may be less due to inside ROW of the
existing road.
△
Ratio of Construction
Cost* 1.8 △ 0.6 ◎
Recommendation △ 〇
*:Construction cost of ALT-6A is taken as the base cost (1.0)
Source: JICA Survey Team
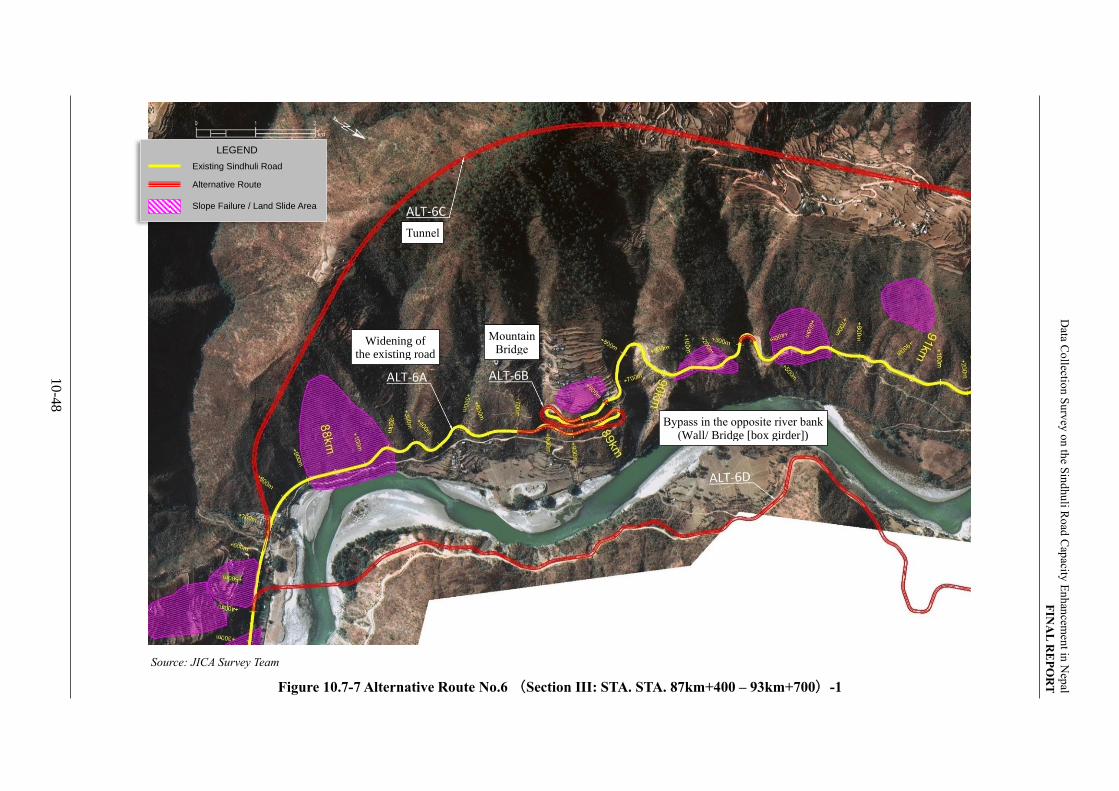
Data C
ollectio
n S
urv
ey o
n th
e Sin
dhu
li Ro
ad C
apacity
En
han
cemen
t in N
epal
FIN
AL
RE
PO
RT
10
-48
Source: JICA Survey Team
Figure 10.7-7 Alternative Route No.6 (Section III: STA. STA. 87km+400 – 93km+700)-1
Mountain Bridge
Widening of the existing road
Tunnel
Bypass in the opposite river bank (Wall/ Bridge [box girder])
Existing Sindhuli Road
Alternative Route
Slope Failure / Land Slide Area
LEGEND
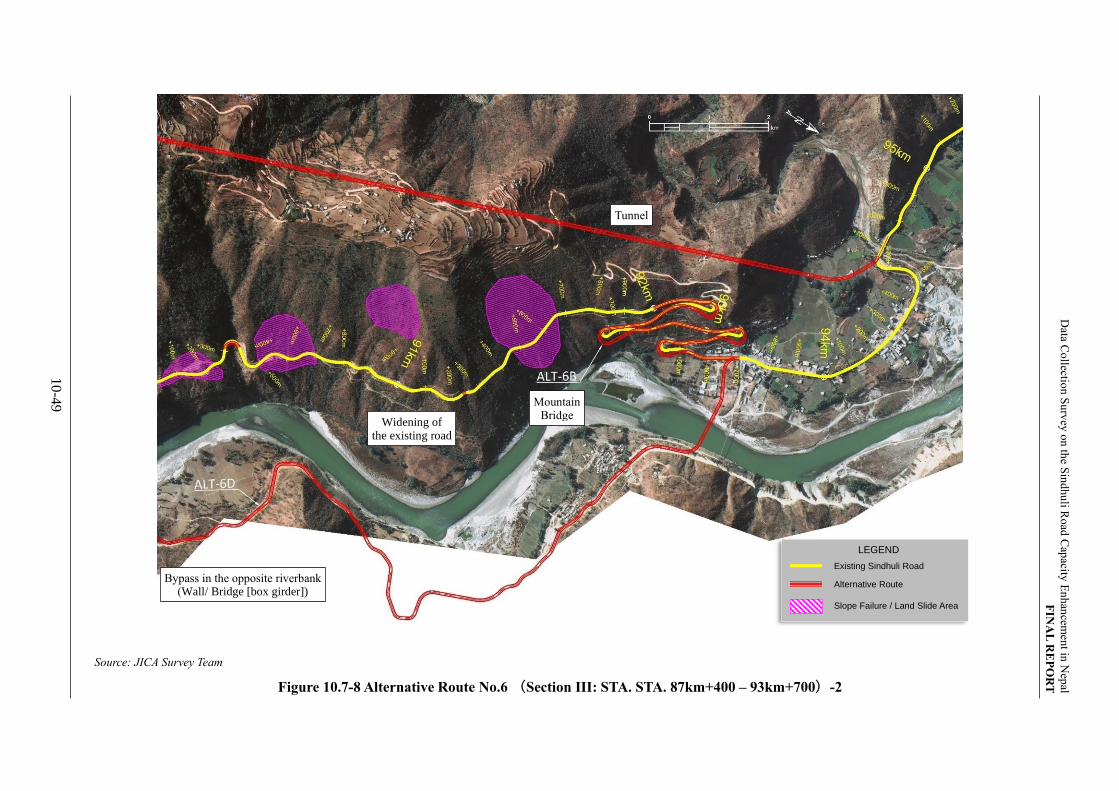
Data C
ollectio
n S
urv
ey o
n th
e Sin
dhu
li Ro
ad C
apacity
En
han
cemen
t in N
epal
FIN
AL
RE
PO
RT
10
-49
Source: JICA Survey Team
Figure 10.7-8 Alternative Route No.6 (Section III: STA. STA. 87km+400 – 93km+700)-2
Mountain Bridge
Tunnel
Bypass in the opposite riverbank (Wall/ Bridge [box girder])
Existing Sindhuli Road
Alternative Route
Slope Failure / Land Slide Area
LEGEND
Widening of the existing road
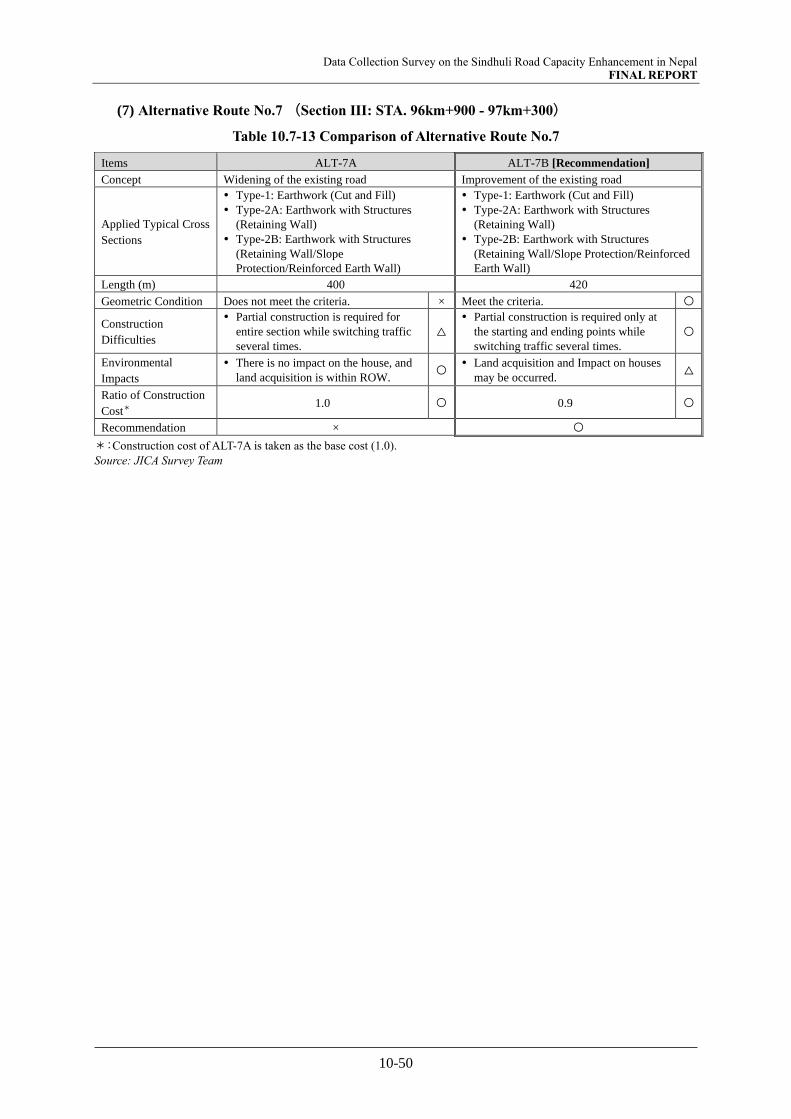
Data Collection Survey on the Sindhuli Road Capacity Enhancement in Nepal FINAL REPORT
10-50
(7) Alternative Route No.7 (Section III: STA. 96km+900 - 97km+300)
Table 10.7-13 Comparison of Alternative Route No.7
Items ALT-7A ALT-7B [Recommendation]
Concept Widening of the existing road Improvement of the existing road
Applied Typical Cross
Sections
Type-1: Earthwork (Cut and Fill)
Type-2A: Earthwork with Structures
(Retaining Wall)
Type-2B: Earthwork with Structures
(Retaining Wall/Slope
Protection/Reinforced Earth Wall)
Type-1: Earthwork (Cut and Fill)
Type-2A: Earthwork with Structures
(Retaining Wall)
Type-2B: Earthwork with Structures
(Retaining Wall/Slope Protection/Reinforced
Earth Wall)
Length (m) 400 420
Geometric Condition Does not meet the criteria. × Meet the criteria. 〇
Construction
Difficulties
Partial construction is required for
entire section while switching traffic
several times.
△
Partial construction is required only at
the starting and ending points while
switching traffic several times.
〇
Environmental
Impacts
There is no impact on the house, and
land acquisition is within ROW. 〇
Land acquisition and Impact on houses
may be occurred. △
Ratio of Construction
Cost* 1.0 〇 0.9 〇
Recommendation × 〇
*:Construction cost of ALT-7A is taken as the base cost (1.0).
Source: JICA Survey Team
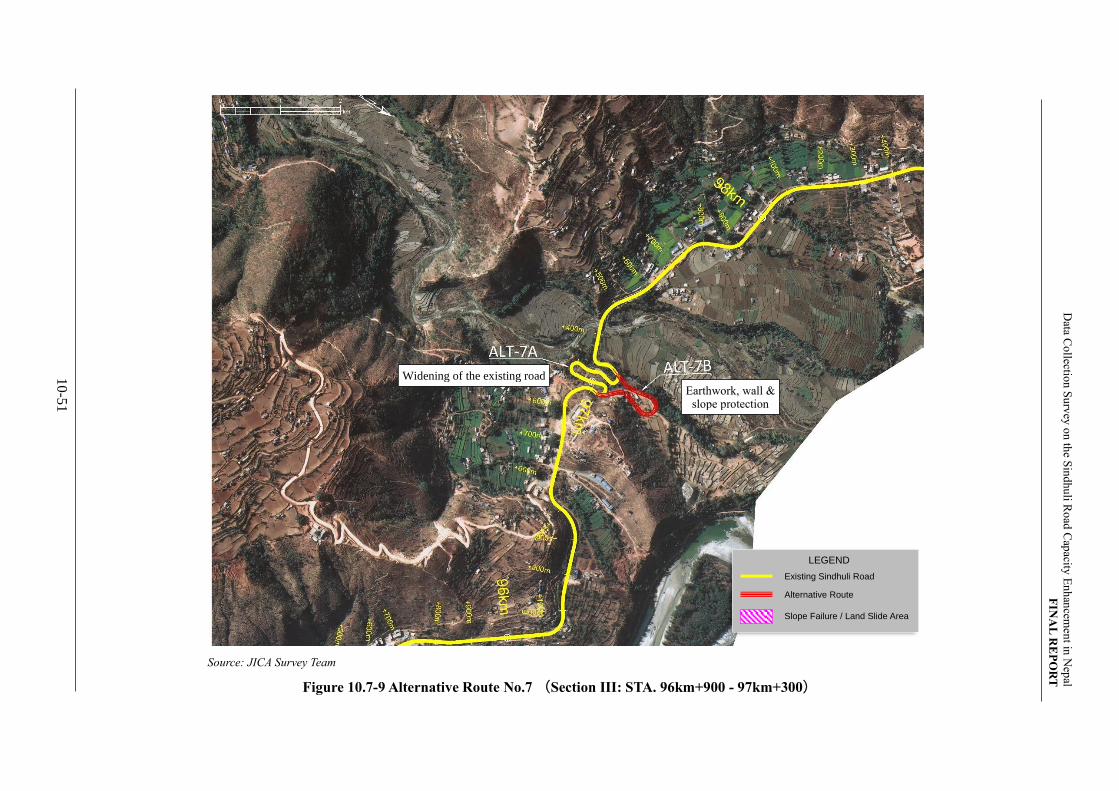
Data C
ollectio
n S
urv
ey o
n th
e Sin
dhu
li Ro
ad C
apacity
En
han
cemen
t in N
epal
FIN
AL
RE
PO
RT
10
-51
Source: JICA Survey Team
Figure 10.7-9 Alternative Route No.7 (Section III: STA. 96km+900 - 97km+300)
Widening of the existing road
Earthwork, wall & slope protection
Existing Sindhuli Road
Alternative Route
Slope Failure / Land Slide Area
LEGEND

Data Collection Survey on the Sindhuli Road Capacity Enhancement in Nepal FINAL REPORT
10-52
(8) Alternative Route No.8 (Section III: STA. 101km+900 - 105km+000)
Table 10.7-14 Comparison of Alternative Route No.8
Items ALT-8A [Recommendation] ALT-8B
Concept Widening of the existing road and partial
improvement Bypass by applying a tunnel
Applied Typical Cross
Sections
Type-1: Earthwork (Cut and Fill)
Type-2A: Earthwork with Structures
(Retaining Wall)
Type-2B: Earthwork with Structures
(Retaining Wall/Slope
Protection/Reinforced Earth Wall)
Type-3A: Earthwork with Structures (Slope
Protection/Partial Mountainous Bridge)
Type-1: Earthwork (Cut and Fill)
Type-2A: Earthwork with Structures
(Retaining Wall)
Type-2B: Earthwork with Structures
(Retaining Wall/Slope Protection/Reinforced
Earth Wall)
Type-4A: Bridge (I-Girder)
Type-5: Tunnel
Length (m) 3,100 3,100
Geometric Condition Satisfied 〇 Satisfied 〇
Construction
Difficulties
Partial construction is required for
entire section while switching traffic
several times.
△
Partial construction is required only at
the starting and ending points while
switching traffic several times.
A tunnel need to be constructed.
Large scale slope protection work may
be required at portals.
△
Environmental
Impacts
Impact on houses may be less.
Land acquisition may not be occurred
due to inside ROW.
〇
Impact on houses may be occurred
around the portals.
Land acquisition and compensation may
be required.
△
Ratio of Construction
Cost* 1.0 〇 3.0 △
Recommendation 〇 △
*:Construction cost of ALT-8A is taken as the base cost (1.0).
Source: JICA Survey Team
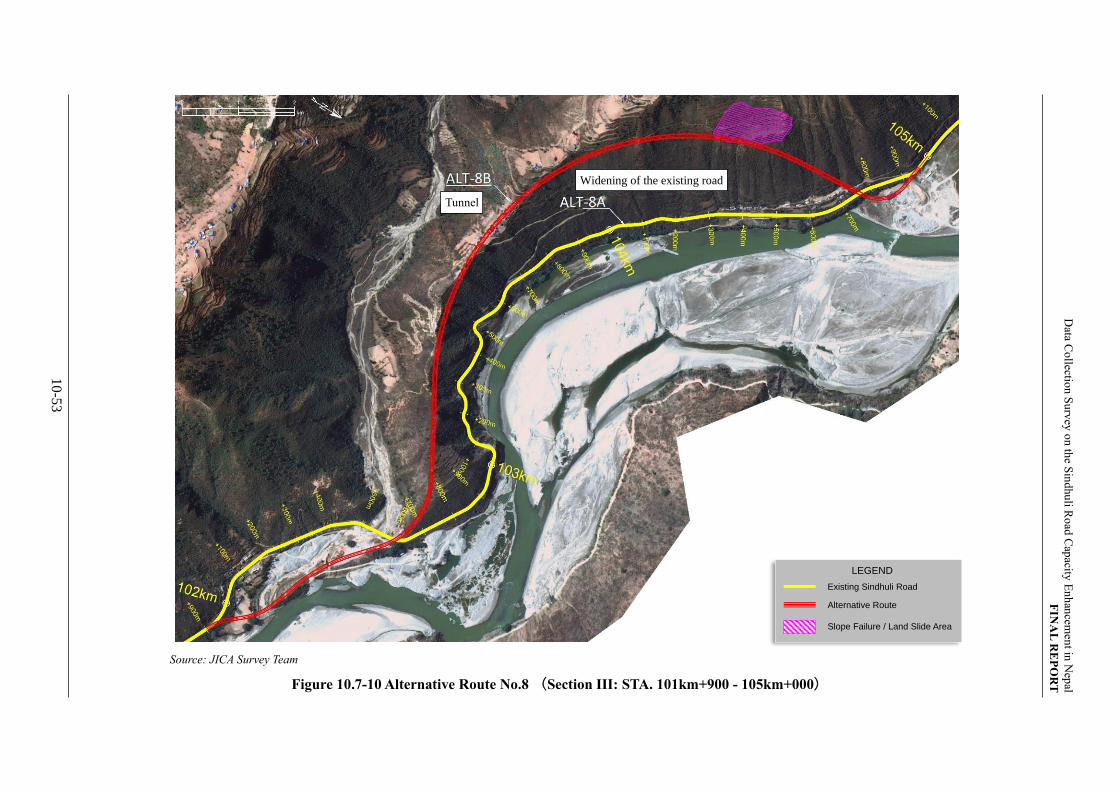
Data C
ollectio
n S
urv
ey o
n th
e Sin
dhu
li Ro
ad C
apacity
En
han
cemen
t in N
epal
FIN
AL
RE
PO
RT
10
-53
Source: JICA Survey Team
Figure 10.7-10 Alternative Route No.8 (Section III: STA. 101km+900 - 105km+000)
Tunnel
Widening of the existing road
Existing Sindhuli Road
Alternative Route
Slope Failure / Land Slide Area
LEGEND
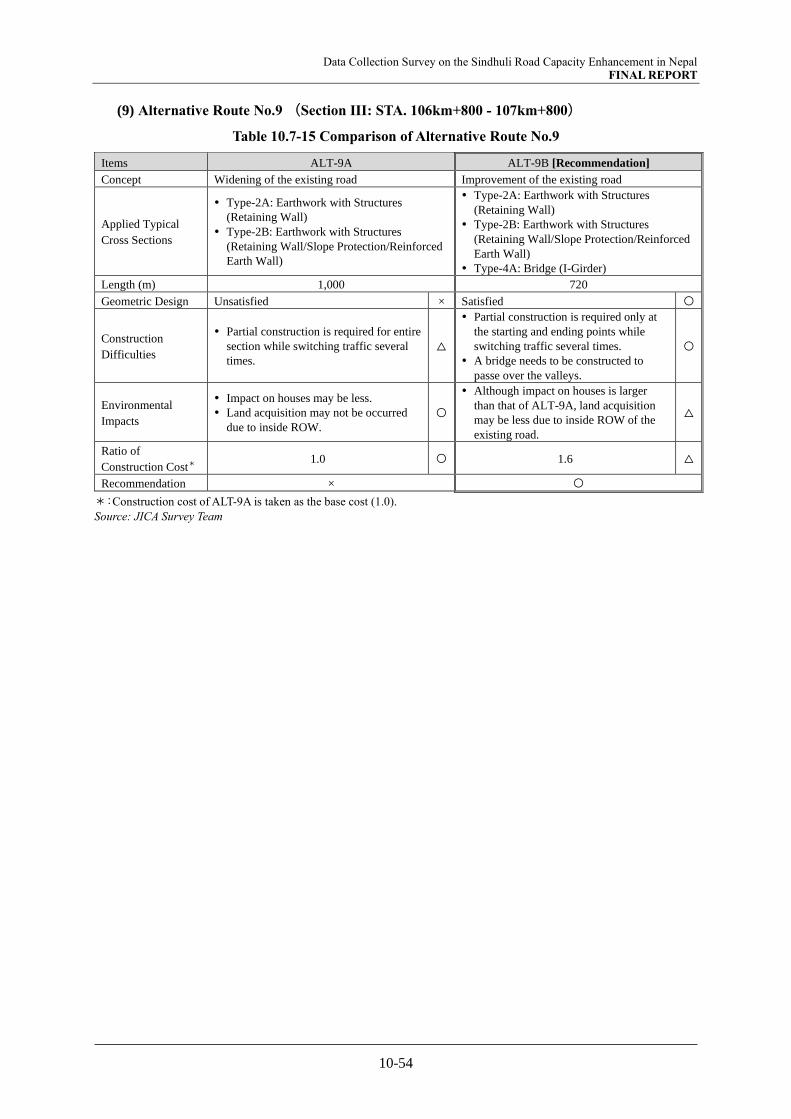
Data Collection Survey on the Sindhuli Road Capacity Enhancement in Nepal FINAL REPORT
10-54
(9) Alternative Route No.9 (Section III: STA. 106km+800 - 107km+800)
Table 10.7-15 Comparison of Alternative Route No.9
Items ALT-9A ALT-9B [Recommendation]
Concept Widening of the existing road Improvement of the existing road
Applied Typical
Cross Sections
Type-2A: Earthwork with Structures
(Retaining Wall)
Type-2B: Earthwork with Structures
(Retaining Wall/Slope Protection/Reinforced
Earth Wall)
Type-2A: Earthwork with Structures
(Retaining Wall)
Type-2B: Earthwork with Structures
(Retaining Wall/Slope Protection/Reinforced
Earth Wall)
Type-4A: Bridge (I-Girder)
Length (m) 1,000 720
Geometric Design Unsatisfied × Satisfied 〇
Construction
Difficulties
Partial construction is required for entire
section while switching traffic several
times.
△
Partial construction is required only at
the starting and ending points while
switching traffic several times.
A bridge needs to be constructed to
passe over the valleys.
〇
Environmental
Impacts
Impact on houses may be less.
Land acquisition may not be occurred
due to inside ROW.
〇
Although impact on houses is larger
than that of ALT-9A, land acquisition
may be less due to inside ROW of the
existing road.
△
Ratio of
Construction Cost* 1.0 〇 1.6 △
Recommendation × 〇
*:Construction cost of ALT-9A is taken as the base cost (1.0).
Source: JICA Survey Team

Data C
ollectio
n S
urv
ey o
n th
e Sin
dhu
li Ro
ad C
apacity
En
han
cemen
t in N
epal
FIN
AL
RE
PO
RT
10
-55
Source: JICA Survey Team
Figure 10.7-11 Alternative Route No.9 (Section III: STA. 106km+800 - 107km+800)
Widening of the existing road
Wall & bridge
Existing Sindhuli Road
Alternative Route
Slope Failure / Land Slide Area
LEGEND

Data Collection Survey on the Sindhuli Road Capacity Enhancement in Nepal FINAL REPORT
10-56
(10) Alternative Route No.10 (Section III: STA. 109km+400 - 110km+200)
Table 10.7-16 Comparison of Alternative Route No.10
Items ALT-10A [Recommendation] ALT-10B
Concept Widening of the existing road and partial
improvement Bypass by applying a tunnel
Applied Typical Cross
Sections
Type-1: Earthwork (Cut and Fill)
Type-2A: Earthwork with Structures
(Retaining Wall)
Type-2B: Earthwork with Structures
(Retaining Wall/Slope
Protection/Reinforced Earth Wall)
Type-1: Earthwork (Cut and Fill)
Type-2A: Earthwork with Structures
(Retaining Wall)
Type-5: Tunnel
Length (m) 800 690
Geometric Condition Satisfied 〇 Satisfied 〇
Construction
Difficulties
Partial construction is required for
entire section while switching traffic
several times.
△
Partial construction is required only at
the starting and ending points while
switching traffic several times.
A tunnel needs to be constructed.
Large scale slope protection work may
be required.
△
Environmental
Impacts
Impact on houses may be less.
Land acquisition may not be occurred
due to inside ROW.
The impact on the house is less, and
the land acquisition is within ROW.
It is necessary to rebuild a suspension
bridge for pedestrian.
〇
Impact on houses may be occurred
around the portals.
Land acquisition and compensation may
be required.
△
Ratio of Construction
Cost* 1.0 ◎ 3.0 or above △
Recommendation 〇 △
*:Construction cost of ALT-10A is taken as the base cost (1.0).
Source: JICA Survey Team
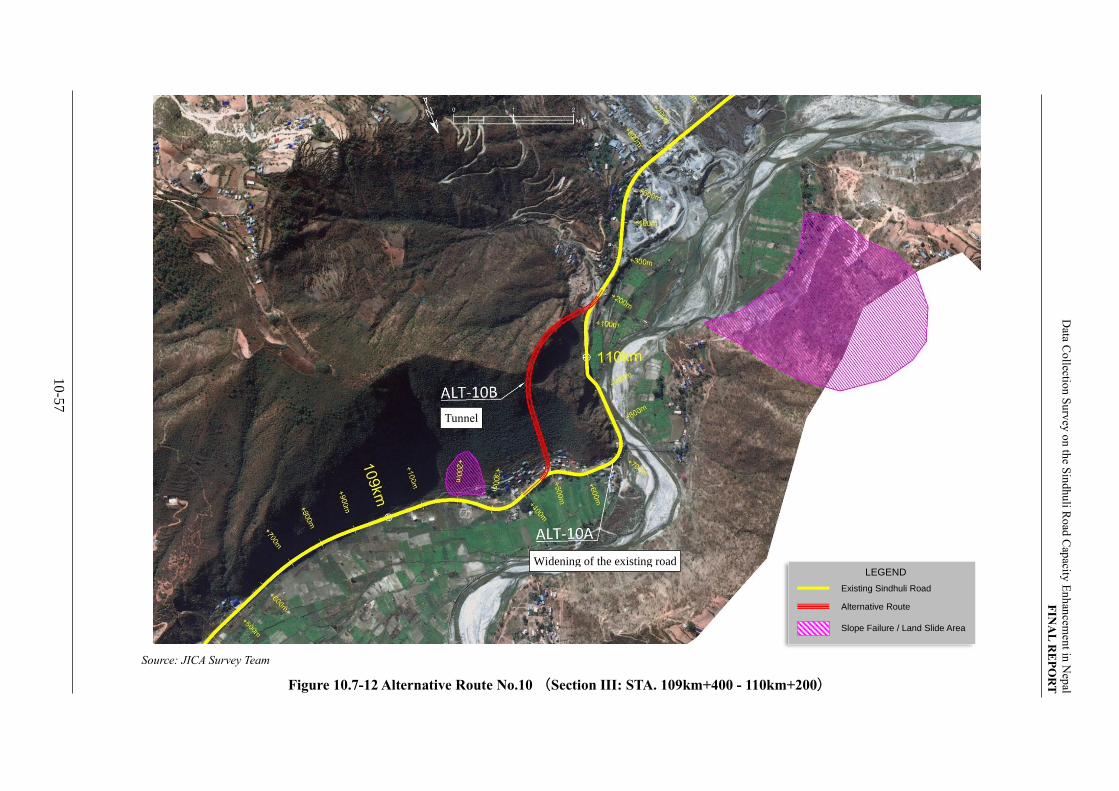
Data C
ollectio
n S
urv
ey o
n th
e Sin
dhu
li Ro
ad C
apacity
En
han
cemen
t in N
epal
FIN
AL
RE
PO
RT
10
-57
Source: JICA Survey Team
Figure 10.7-12 Alternative Route No.10 (Section III: STA. 109km+400 - 110km+200)
Widening of the existing road
Tunnel
Existing Sindhuli Road
Alternative Route
Slope Failure / Land Slide Area
LEGEND
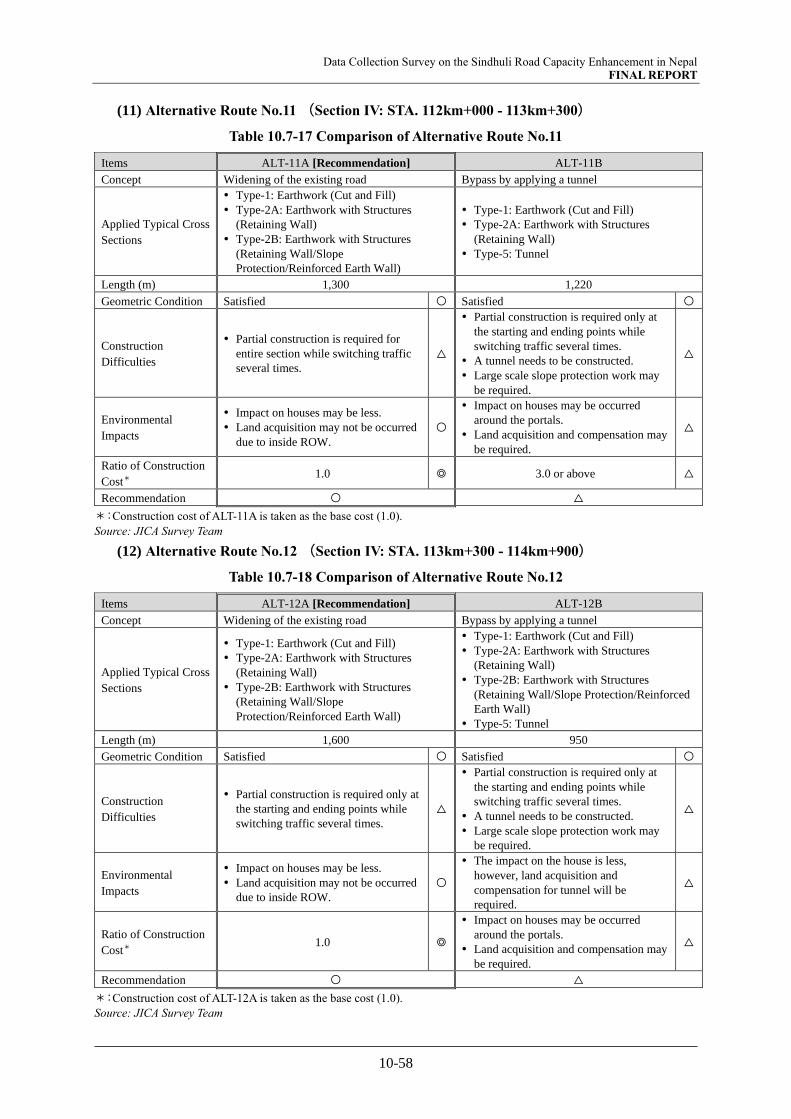
Data Collection Survey on the Sindhuli Road Capacity Enhancement in Nepal FINAL REPORT
10-58
(11) Alternative Route No.11 (Section IV: STA. 112km+000 - 113km+300)
Table 10.7-17 Comparison of Alternative Route No.11
Items ALT-11A [Recommendation] ALT-11B
Concept Widening of the existing road Bypass by applying a tunnel
Applied Typical Cross
Sections
Type-1: Earthwork (Cut and Fill)
Type-2A: Earthwork with Structures
(Retaining Wall)
Type-2B: Earthwork with Structures
(Retaining Wall/Slope
Protection/Reinforced Earth Wall)
Type-1: Earthwork (Cut and Fill)
Type-2A: Earthwork with Structures
(Retaining Wall)
Type-5: Tunnel
Length (m) 1,300 1,220
Geometric Condition Satisfied 〇 Satisfied 〇
Construction
Difficulties
Partial construction is required for
entire section while switching traffic
several times.
△
Partial construction is required only at
the starting and ending points while
switching traffic several times.
A tunnel needs to be constructed.
Large scale slope protection work may
be required.
△
Environmental
Impacts
Impact on houses may be less.
Land acquisition may not be occurred
due to inside ROW.
〇
Impact on houses may be occurred
around the portals.
Land acquisition and compensation may
be required.
△
Ratio of Construction
Cost* 1.0 ◎ 3.0 or above △
Recommendation 〇 △
*:Construction cost of ALT-11A is taken as the base cost (1.0).
Source: JICA Survey Team
(12) Alternative Route No.12 (Section IV: STA. 113km+300 - 114km+900)
Table 10.7-18 Comparison of Alternative Route No.12
Items ALT-12A [Recommendation] ALT-12B
Concept Widening of the existing road Bypass by applying a tunnel
Applied Typical Cross
Sections
Type-1: Earthwork (Cut and Fill)
Type-2A: Earthwork with Structures
(Retaining Wall)
Type-2B: Earthwork with Structures
(Retaining Wall/Slope
Protection/Reinforced Earth Wall)
Type-1: Earthwork (Cut and Fill)
Type-2A: Earthwork with Structures
(Retaining Wall)
Type-2B: Earthwork with Structures
(Retaining Wall/Slope Protection/Reinforced
Earth Wall)
Type-5: Tunnel
Length (m) 1,600 950
Geometric Condition Satisfied 〇 Satisfied 〇
Construction
Difficulties
Partial construction is required only at
the starting and ending points while
switching traffic several times.
△
Partial construction is required only at
the starting and ending points while
switching traffic several times.
A tunnel needs to be constructed.
Large scale slope protection work may
be required.
△
Environmental
Impacts
Impact on houses may be less.
Land acquisition may not be occurred
due to inside ROW.
〇
The impact on the house is less,
however, land acquisition and
compensation for tunnel will be
required.
△
Ratio of Construction
Cost* 1.0 ◎
Impact on houses may be occurred
around the portals.
Land acquisition and compensation may
be required.
△
Recommendation 〇 △
*:Construction cost of ALT-12A is taken as the base cost (1.0).
Source: JICA Survey Team
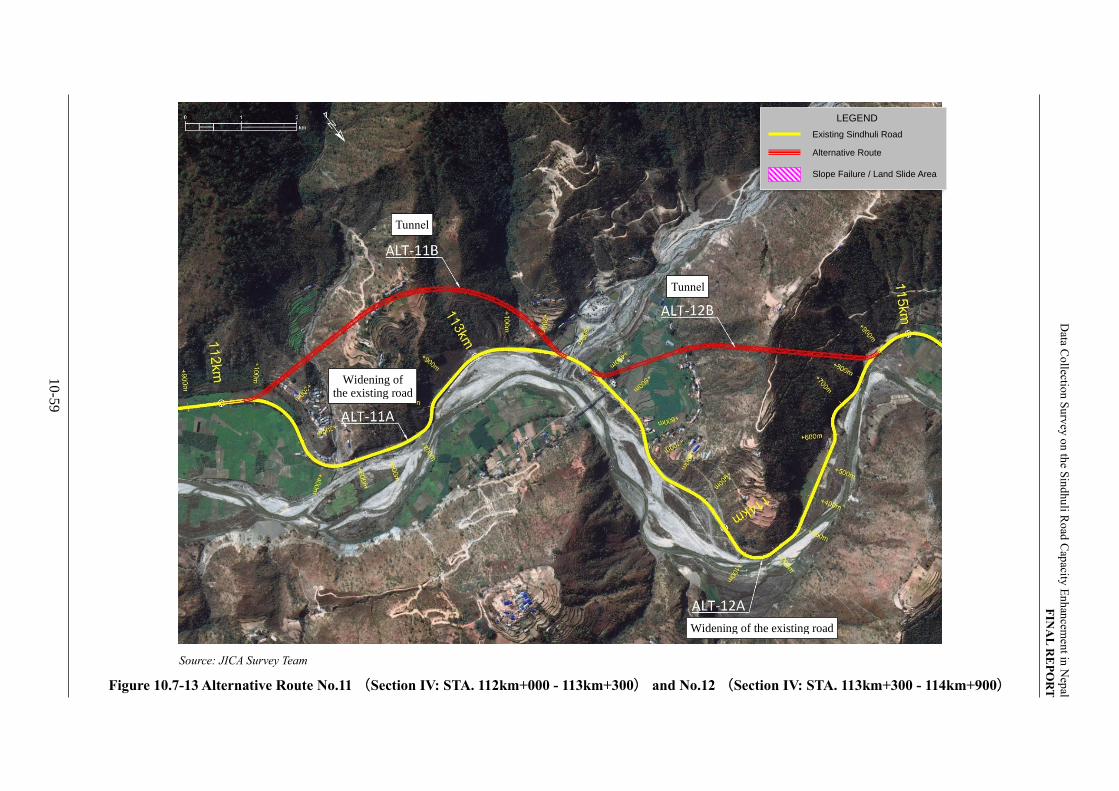
Data C
ollectio
n S
urv
ey o
n th
e Sin
dhu
li Ro
ad C
apacity
En
han
cemen
t in N
epal
FIN
AL
RE
PO
RT
10
-59
Source: JICA Survey Team
Figure 10.7-13 Alternative Route No.11 (Section IV: STA. 112km+000 - 113km+300) and No.12 (Section IV: STA. 113km+300 - 114km+900)
Widening of the existing road
Tunnel
Tunnel
Widening of the existing road
Existing Sindhuli Road
Alternative Route
Slope Failure / Land Slide Area
LEGEND
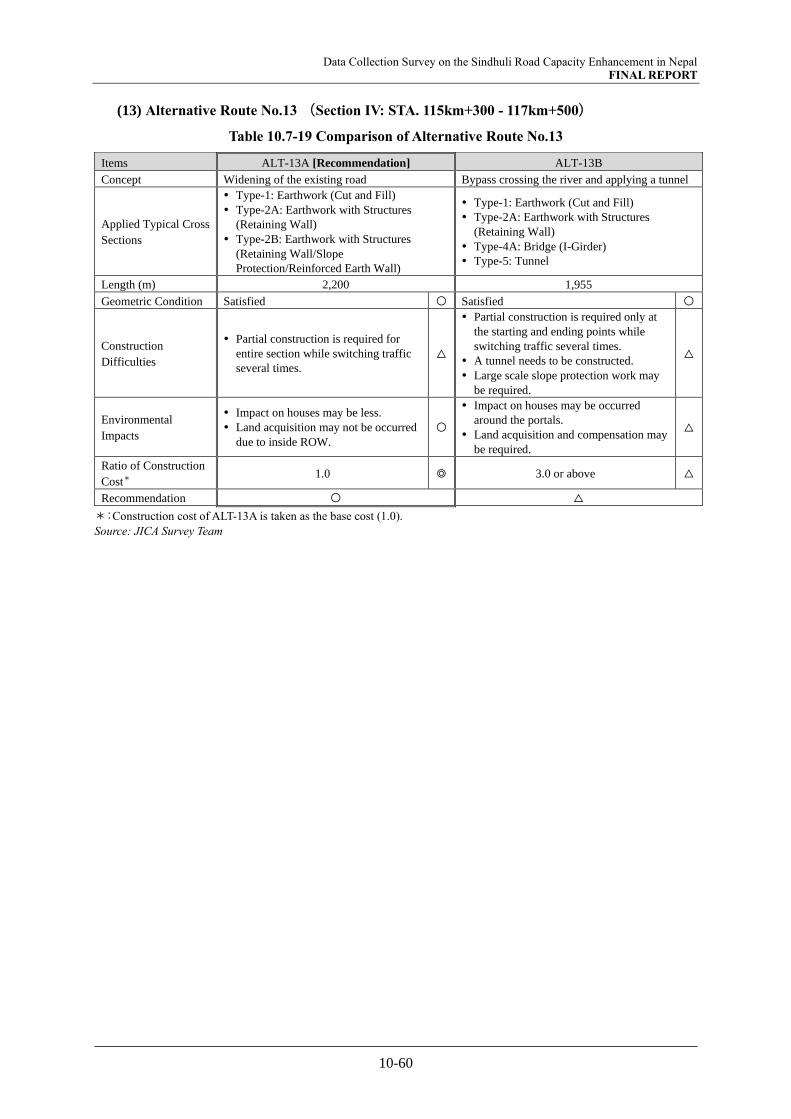
Data Collection Survey on the Sindhuli Road Capacity Enhancement in Nepal FINAL REPORT
10-60
(13) Alternative Route No.13 (Section IV: STA. 115km+300 - 117km+500)
Table 10.7-19 Comparison of Alternative Route No.13
Items ALT-13A [Recommendation] ALT-13B
Concept Widening of the existing road Bypass crossing the river and applying a tunnel
Applied Typical Cross
Sections
Type-1: Earthwork (Cut and Fill)
Type-2A: Earthwork with Structures
(Retaining Wall)
Type-2B: Earthwork with Structures
(Retaining Wall/Slope
Protection/Reinforced Earth Wall)
Type-1: Earthwork (Cut and Fill)
Type-2A: Earthwork with Structures
(Retaining Wall)
Type-4A: Bridge (I-Girder)
Type-5: Tunnel
Length (m) 2,200 1,955
Geometric Condition Satisfied 〇 Satisfied 〇
Construction
Difficulties
Partial construction is required for
entire section while switching traffic
several times.
△
Partial construction is required only at
the starting and ending points while
switching traffic several times.
A tunnel needs to be constructed.
Large scale slope protection work may
be required.
△
Environmental
Impacts
Impact on houses may be less.
Land acquisition may not be occurred
due to inside ROW.
〇
Impact on houses may be occurred
around the portals.
Land acquisition and compensation may
be required.
△
Ratio of Construction
Cost* 1.0 ◎ 3.0 or above △
Recommendation 〇 △
*:Construction cost of ALT-13A is taken as the base cost (1.0).
Source: JICA Survey Team

Data C
ollectio
n S
urv
ey o
n th
e Sin
dhu
li Ro
ad C
apacity
En
han
cemen
t in N
epal
FIN
AL
RE
PO
RT
10
-61
Source: JICA Survey Team
Figure 10.7-14 Alternative Route No.13 (Section IV: STA. 115km+300 - 117km+500)
Widening of the existing road
Bypass in the opposite riverbank (Wall/bridge)
Tunnel
Existing Sindhuli Road
Alternative Route
Slope Failure / Land Slide Area
LEGEND

Data Collection Survey on the Sindhuli Road Capacity Enhancement in Nepal FINAL REPORT
10-62
(14) Alternative Route No.14 (Section IV: STA. 122km+600 - 124km+800)
Table 10.7-20 Comparison of Alternative Route No.14
Items ALT-14A [Recommendation] ALT-14B
Concept Widening of the existing road Bypass by applying a tunnel
Applied Typical Cross
Sections
Type-1: Earthwork (Cut and Fill)
Type-2A: Earthwork with Structures
(Retaining Wall)
Type-2B: Earthwork with Structures
(Retaining Wall/Slope
Protection/Reinforced Earth Wall)
Type-1: Earthwork (Cut and Fill)
Type-2B: Earthwork with Structures
(Retaining Wall/Slope Protection/Reinforced
Earth Wall)
Type-5: Tunnel
Length (m) 2,200 2,035
Geometric Condition Satisfied 〇 Satisfied 〇
Construction
Difficulties
Partial construction is required only at
the starting and ending points while
switching traffic several times.
△
Partial construction is required only at
the starting and ending points while
switching traffic several times.
A tunnel needs to be constructed.
△
Environmental
Impacts
The impact on the house is less, and
the land acquisition is within ROW. 〇
Impact on houses may be occurred
around the portals.
Land acquisition and compensation may
be required.
△
Ratio of Construction
Cost* 1.0 ◎ More than 3 times △
Recommendation 〇 △
*:Construction cost of ALT-14A is taken as the base cost (1.0).
Source: JICA Survey Team
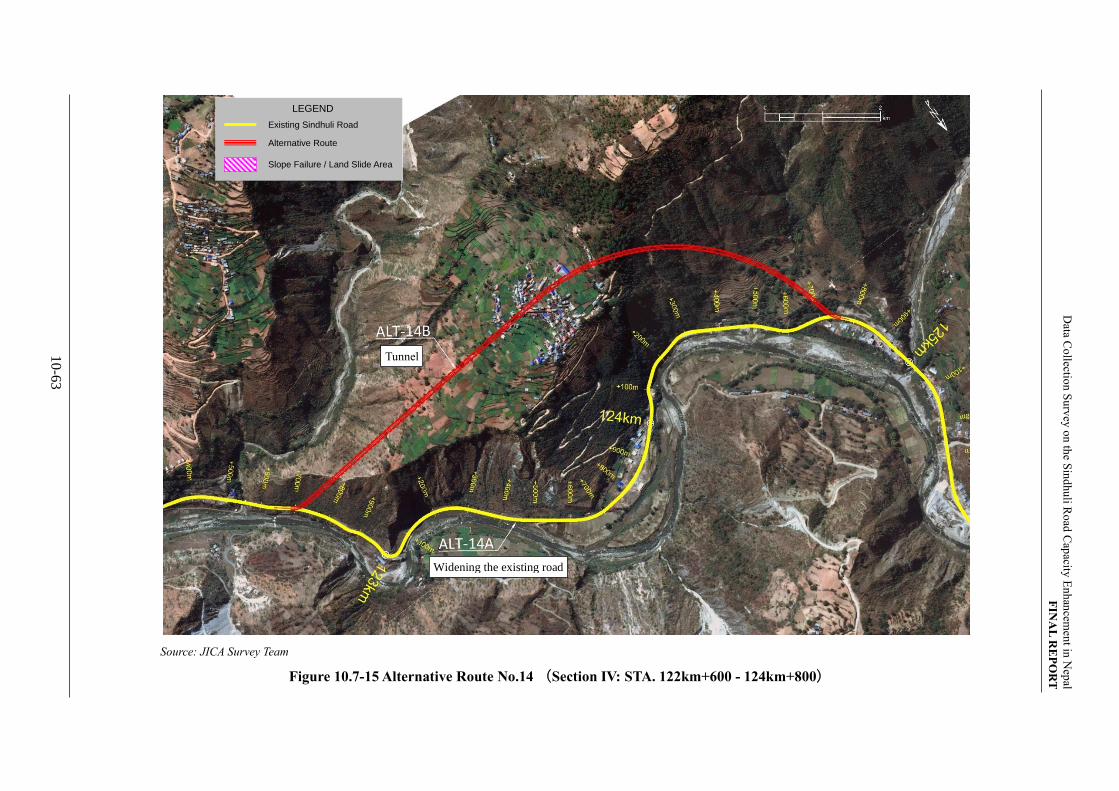
Data C
ollectio
n S
urv
ey o
n th
e Sin
dhu
li Ro
ad C
apacity
En
han
cemen
t in N
epal
FIN
AL
RE
PO
RT
10-6
3
Source: JICA Survey Team
Figure 10.7-15 Alternative Route No.14 (Section IV: STA. 122km+600 - 124km+800)
Widening the existing road
Tunnel
Existing Sindhuli Road
Alternative Route
Slope Failure / Land Slide Area
LEGEND
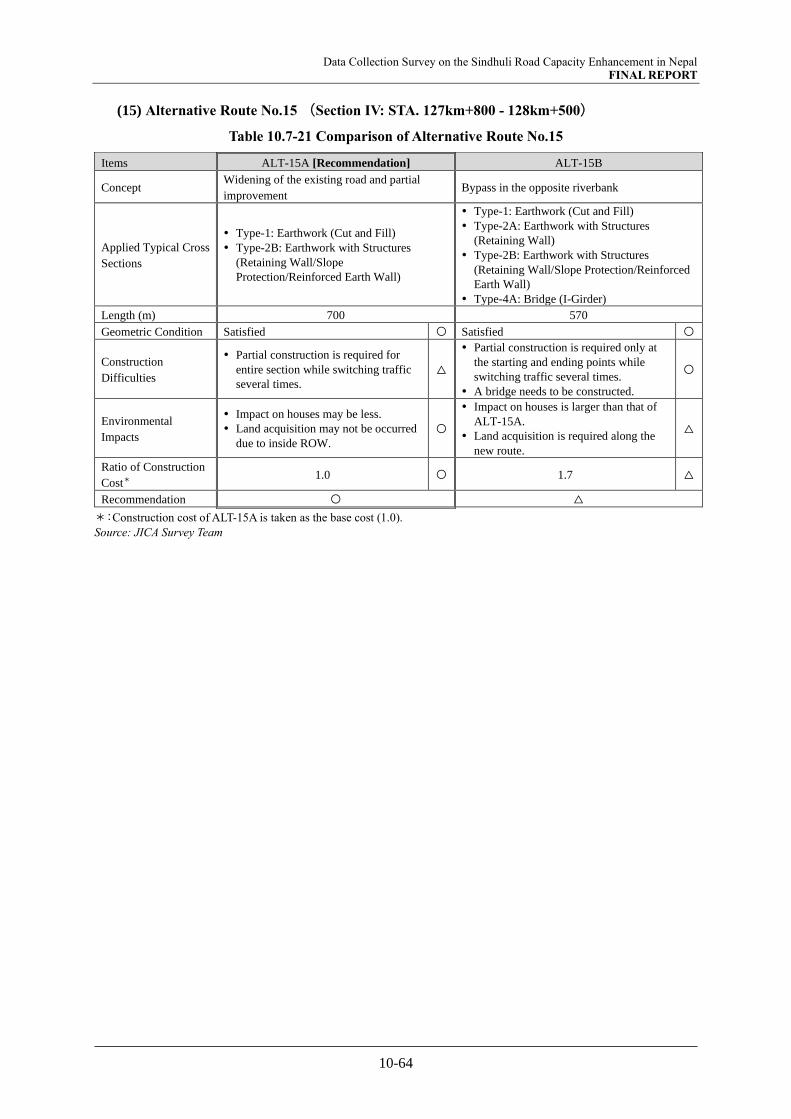
Data Collection Survey on the Sindhuli Road Capacity Enhancement in Nepal FINAL REPORT
10-64
(15) Alternative Route No.15 (Section IV: STA. 127km+800 - 128km+500)
Table 10.7-21 Comparison of Alternative Route No.15
Items ALT-15A [Recommendation] ALT-15B
Concept Widening of the existing road and partial
improvement Bypass in the opposite riverbank
Applied Typical Cross
Sections
Type-1: Earthwork (Cut and Fill)
Type-2B: Earthwork with Structures
(Retaining Wall/Slope
Protection/Reinforced Earth Wall)
Type-1: Earthwork (Cut and Fill)
Type-2A: Earthwork with Structures
(Retaining Wall)
Type-2B: Earthwork with Structures
(Retaining Wall/Slope Protection/Reinforced
Earth Wall)
Type-4A: Bridge (I-Girder)
Length (m) 700 570
Geometric Condition Satisfied 〇 Satisfied 〇
Construction
Difficulties
Partial construction is required for
entire section while switching traffic
several times.
△
Partial construction is required only at
the starting and ending points while
switching traffic several times.
A bridge needs to be constructed.
〇
Environmental
Impacts
Impact on houses may be less.
Land acquisition may not be occurred
due to inside ROW.
〇
Impact on houses is larger than that of
ALT-15A.
Land acquisition is required along the
new route.
△
Ratio of Construction
Cost* 1.0 〇 1.7 △
Recommendation 〇 △
*:Construction cost of ALT-15A is taken as the base cost (1.0).
Source: JICA Survey Team
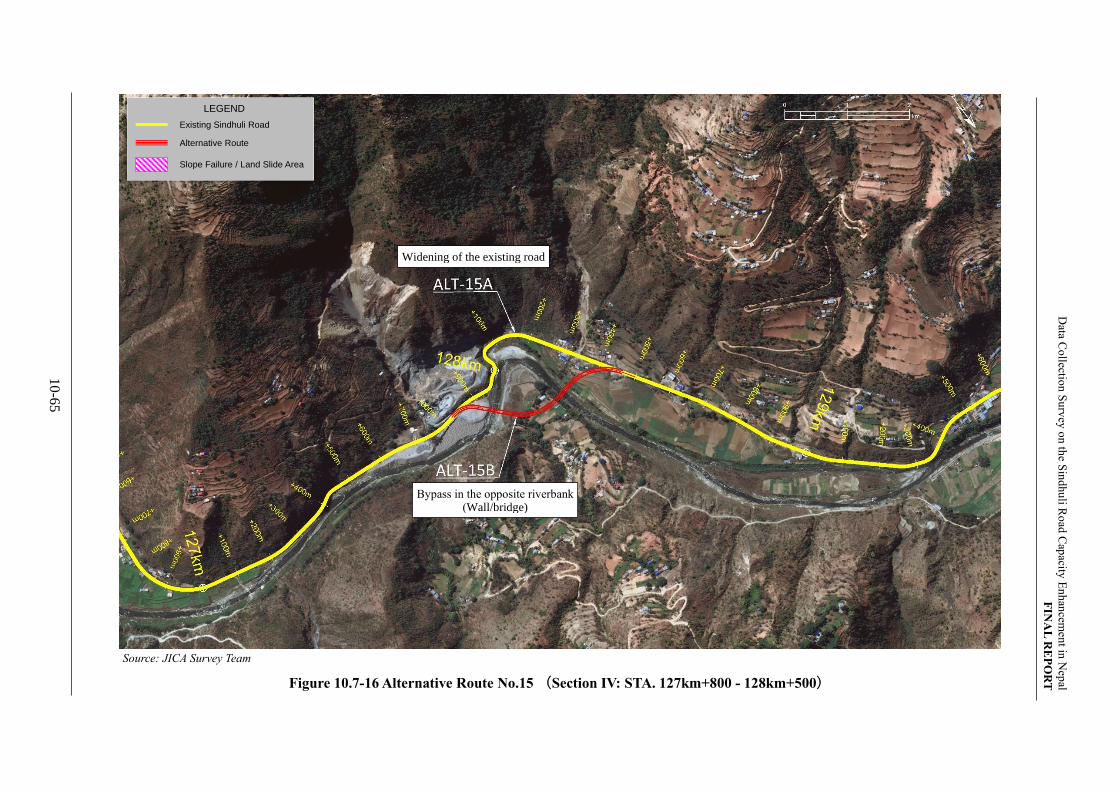
Data C
ollectio
n S
urv
ey o
n th
e Sin
dhu
li Ro
ad C
apacity
En
han
cemen
t in N
epal
FIN
AL
RE
PO
RT
10
-65
Source: JICA Survey Team
Figure 10.7-16 Alternative Route No.15 (Section IV: STA. 127km+800 - 128km+500)
Widening of the existing road
Bypass in the opposite riverbank (Wall/bridge)
Existing Sindhuli Road
Alternative Route
Slope Failure / Land Slide Area
LEGEND
Data Collection Survey on the Sindhuli Road Capacity Enhancement in Nepal FINAL REPORT
10-66
10.8 STEPWISE IMPROVEMENT MATRIX
10.8.1 Policy in Formulating Stepwise Improvement Matrix
After taking the procedure introduced above, the stepwise improvement matrix is formulated by applying
improvement measures with the time-frame based on the policies in the following manner.
i. “Projects” are formulated by packaging the recommended improvement measures by 100m sections
including the alternative routes, to meet the basic concept of Sindhuli Road 2.0 plan.
ii. Spot improvement or single section improvement would bring low effect because traffic bottleneck
will just shift before/afterward even if the issues are solved by spot improvement. Thus, consecutive
improvement or multi-section improvement plan should be the basis.
iii. Generally, “stepwise” is regarded as a gradually upgraded methodology like below, by future traffic
demand and expected effect.
[General Case]
Existing → Widening → Alignment Improvement → Bypass (Alternative Route) → Tunnel
However, in the mountainous area, methodology afore-mentioned is occasionally irrational or
unreasonable since benefit by cost will show negative during in-service period due to high
construction cost and long construction period under topographical constraint. Therefore, special case
below may be more beneficial than general case.
[Special Case]
Existing → Tunnel
Based on such viewpoints, the stepwise improvement matrix shall be formulated.
10.8.2 Preconditions
Preconditions for formulating the stepwise improvement matrix are as follows.
(1) This output was prepared without detailed surveys, investigations, and design result.
(2) Depending on the subsequent surveys, investigations, and design, other projects or alternative routes
may be preferable.
(3) This survey is limited to data collection survey and does not include design for the improvement
measures. Therefore, project periods are roughly calculated (estimated) by referring to the previous
construction project of Sindhuli Road and general information, such as;
・ Type-1 Earthwork (Cut and Fill) : 5km/year
・ Type-2A Earthwork with Structures (Retaining Wall) :4km/year
・ Type-2B Earthwork with Structures (Slope Protection/Reinforced Earth Wall) : 3km/year
・ Type-3 Earthwork with Structures (Slope Protection/Partial Mountainous Bridge) : 2km/ year
・ Type-4 Bridge: 1 – 2year/bridge
・ Type-5 Tunnel in Section II : 8 year/tunnel

Data Collection Survey on the Sindhuli Road Capacity Enhancement in Nepal FINAL REPORT
10-67
(4) Considering 4 years from FY2022/2023 to FY2025/2026 required for survey, investigation, design and
budgeting, construction shall commence from FY2026/2027.
(5) In terms of technical difficulty or funding, the sections where mainly consist of Type-2B, 3, 4 and 5 shall
be funded and implemented by the donors, and other sections shall be locally done.
10.8.3 Stepwise Improvement Matrix
Stepwise Improvement Matrix is shown in Table 10.8-1. Sindhuli Road 2.0 Plan consists of 18 projects.


Data Collection Survey on the Sindhuli Road Capacity Enhancement in Nepal FINAL REPORT
10-68
Table 10.8-1 Stepwise Improvement Matrix
0+400 - 2+300 2+300 - 3+000 3+000 - 4+700 4+700 - 5+800 5+800 - 29+000 29+000 - 35+200 35+200 - 41+700 41+700 - 43+500 43+500 - 72+300 72+300 - 74+600 - 86+400 86+400 - 93+700 93+700 - 99+700 99+700 - 112+000 - 120+700 120+700 - 137+200 137+200 - 141+400 141+400 - 159+100
Road
Bridge
Tunnel
Type-1(Earthwork)
Type-2A(Earthwork with Structures )
Type-2B (Slope Protection/Reinforced
Earth Wall)Type-3
(Slope Protection/PartialMountainous Bridge)
Type-4(Bridge)
Type-5(Tunnel)
None or Minor Improvement
Procurement ofContractor
Procurement ofContractor
Detailed Design,Cost Estimation
Procurement ofContractor
16.5 4.2
No.17No.7 No.18No.2 No.3 No.4 No.5 No.6 No.8 No.9
2.3
Widening
48%
Approach Road
5.9 8.7
Widening + ALT.Route No.11, 12
and 13
20%
12.4
Widening + ALT.Route No.8, 9, and
10
18%
Widening + ALT.Route No.4 and 5
Widening + ALT.Route No.6
20% 21%
Widening + ALT.Route No.7
28%
Widening + ALT.Route No.14 and 15 Widening
25% 12%
Procurement ofContractor
17.7
Widening
33%
0%
0%
3%
47%
17%
6
Detailed Design,Cost Estimation
Procurement ofConsultant, F/S
(Invetigation,Survey, Design)
Procurement ofConsultant, F/S(Invetigation,
Survey, Design)
Detailed Design,Cost Estimation
10% 9% 26% 2% 11%
1.5 2.5
21% 3% 44%
Section IVSection III
74+600
1.9
Widening
1.1 23.2 6.2 6.5 1.8
ALT. Route No.2 Widening Widening Widening ALT. Route No.3
Section II
112+000
11.8 7.328.8
No.13 No.14 No.15 No.16No.10 No.11 No.12
Length (km)
Project No.
STA.
- - - - - - - - L=7.7km - - -
0.7 1.7
ALT. Route No.1 Widening
No.1
Mountain bridge and2 bridges
2 5 2
19% 0%0%
Section
Estimated Required Construction Period(Year) 1 2 1
Section I
Local LocalLocal Local Donor Donor Donor Nepal
- 2 bridges 2 bridges 4 bridges 1 bridge -ImprovementMeasures
1.5 6
- - - - - -
- - - - - - - Mountain bridge and1 bridges - Mountain bridge Mountain bridge
Procurement ofConsultant, F/S
(Invetigation,Survey, Design)
Procurement ofConsultant, F/S
(Invetigation,Survey, Design)
Procurement ofConsultant, F/S(Invetigation,
Survey, Design)
Procurement ofConsultant, F/S
(Invetigation,Survey, Design)
NepalDonor LocalDonor
Detailed Design,Cost Estimation
Procurement ofContractor
Detailed Design,Cost Estimation
Procurement ofContractor
Procurement ofConsultant, F/S(Invetigation,
Survey, Design)
Procurement ofConsultant, F/S
(Invetigation,Survey, Design)
Procurement ofConsultant, F/S
(Invetigation,Survey, Design)
Detailed Design,Cost Estimation
Procurement ofContractor
Detailed Design,Cost Estimation
Nepal Nepal Nepal
9% 0% 1% 1% 0% 0% 0%
0%
6 2 5 3 6 28
Type of TypicalCross Section
0% 0% 0% 0%
2021 / 2022
LocalFund
0%
Local Local
0%0% 0% 0% 0% 2% 0% 0% 0%
0%
0% 4% 8% 0% 0% 0% 0% 0%
0% 0% 0% 0% 0% 1% 6%
0% 0% 0% 0% 0% 0% 0% 0% 48% 0% 0% 0% 0% 0% 0% 1% 1%
100% 81% 100% 90% 89% 53% 95% 11%
4%
13%
0% 0% 0% 0% 0% 0% 0% 28%
36% 16% 67% 36% 53% 34% 88%
52% 30% 24% 34% 5% 36% 26% 39% 0%
11% 21% 0% 9% 0% 1% 0%
1%
Detailed Design,Cost Estimation
Procurement ofContractor
ConstructionStage
Design Stage
2022 / 2023
2023 / 2024
2024 / 2025
2025 / 2026
2026 / 2027
2027 / 2028
2028 / 2029
2029 / 2030
2030 / 2031
2031 / 2032
2032 / 2033
2033 / 2034
Detailed Design,Cost Estimation
Procurement ofContractor
Source:JICA Survey Team

Data Collection Survey on the Sindhuli Road Capacity Enhancement in Nepal FINAL REPORT
10-69
10.9 ROADMAP OF SINDHULI ROAD 2.0 PLAN
Roadmap of Sindhuli Road 2.0 Plan is attached in APPENDIX-6.