Federal Democratic Republic of Nepal Department of Roads ...
204
EI JR 17 - 068 Federal Democratic Republic of Nepal Department of Roads (DOR) Kathmandu Valley Development Authority (KVDA) FEDERAL DEMOCRATIC REPUBLIC OF NEPAL THE PROJECT ON URBAN TRANSPORT IMPROVEMENT FOR KATHMANDU VALLEY FINAL REPORT VOLUME II MASTER PLAN AND PILOT PROJECT MAY 2017 JAPAN INTERNATIONAL COOPERATION AGENCY (JICA) EIGHT-JAPAN ENGINEERING CONSULTANTS INC. NIPPON KOEI CO., LTD. TAMANO CONSULTANTS CO., LTD.
-
Upload
khangminh22 -
Category
Documents
-
view
2 -
download
0
Transcript of Federal Democratic Republic of Nepal Department of Roads ...

EI J R
17- 068
Federal Democratic Republic of Nepal Department of Roads (DOR) Kathmandu Valley Development Authority (KVDA)
FEDERAL DEMOCRATIC REPUBLIC OF
NEPAL THE PROJECT ON URBAN TRANSPORT
IMPROVEMENT FOR KATHMANDU VALLEY
FINAL REPORT
VOLUME II
MASTER PLAN
AND
PILOT PROJECT
MAY 2017
JAPAN INTERNATIONAL COOPERATION AGENCY (JICA)
EIGHT-JAPAN ENGINEERING CONSULTANTS INC. NIPPON KOEI CO., LTD.
TAMANO CONSULTANTS CO., LTD.
The Project on Urban Transport Improvement for Kathmandu Valley in Federal Democratic Republic of Nepal Final Report May 2017
i
Volume 2 MASTER PLAN AND PILOT PROJECT Table of Contents List of Figures List of Tables Abbreviations
TABLE OF CONTENTS
CHAPTER 6 URBAN STRUCTURE PLAN ALTERNATIVES ............... 6-1 6.1 Framework ..................................................................................................................... 6-1 6.2 Vision and Target ........................................................................................................... 6-3 6.3 Basic Policy for Urban Structure ................................................................................... 6-5
6.3.1 Land Use Trend ....................................................................................................... 6-5 6.3.2 Basic Policy for Urban Structure ............................................................................ 6-6
6.4 Formulation of Urban Structure Alternative .................................................................. 6-7 6.4.1 Possible Urbanization Area ..................................................................................... 6-7 6.4.2 Urban Structure Alternative .................................................................................... 6-9 6.4.3 Evaluation of Urban Structure Alternative ............................................................ 6-14
CHAPTER 7 STRATEGIC ENVIRONMENTAL ASSESSMENT ............ 7-1 7.1 Outline of Environmental Assessment System in Nepal ............................................... 7-1 7.2 Procedure of Strategic Environmental Assessment ....................................................... 7-2 7.3 Evaluation of Urban Structure Alternative .................................................................... 7-3
7.3.1 Urban Structure Alternatives ................................................................................... 7-3 7.3.2 Screening and Scoping ............................................................................................ 7-4 7.3.3 Evaluation Result of Alternative Plans ................................................................... 7-7
7.4 Stakeholder Meeting .................................................................................................... 7-13 7.4.1 Record of Stakeholder Meetings ........................................................................... 7-13 7.4.2 Summary of Stakeholder Meetings ....................................................................... 7-18
CHAPTER 8 COMPREHENSIVE URBAN TRANSPORT MASTER PLAN WITH SECTOR PROGRAM ................................................. 8-1
8.1 Land Use Plan ................................................................................................................ 8-1 8.1.1 Urban Function Distribution Plan ........................................................................... 8-1 8.1.2 Policy on Land Use in City Center ......................................................................... 8-4 8.1.3 Land Use Plan of New Urban Areas ....................................................................... 8-7
8.2 Road Plan ..................................................................................................................... 8-19 8.2.1 Basic Policy for Road Plan ................................................................................... 8-19 8.2.2 Road Network System........................................................................................... 8-20 8.2.3 Road Layout Plan .................................................................................................. 8-20 8.2.4 Road Classification and Design Criteria ............................................................... 8-40
8.3 Public Transport Plan ................................................................................................... 8-54 8.3.1 Public Transport Strategy ...................................................................................... 8-54 8.3.2 Public Transport Network Plan ............................................................................. 8-57 8.3.3 Introduction of New Public Transportation System .............................................. 8-64 8.3.4 Definitive Public Transport Network .................................................................... 8-71 8.3.5 Organization for operation & management of BRT and AGT .............................. 8-72
8.4 Traffic Demand Management ...................................................................................... 8-73 8.4.1 Traffic Management Development Strategy ......................................................... 8-73 8.4.2 Traffic Management Projects ................................................................................ 8-75
8.5 Logistic Plan ................................................................................................................ 8-79 8.5.1 Objective of Logistic Plan ..................................................................................... 8-79 8.5.2 Development of Truck Terminal ........................................................................... 8-80
The Project on Urban Transport Improvement for Kathmandu Valley in Federal Democratic Republic of Nepal Final Report May 2017
ii
8.6 Traffic Safety Plan ....................................................................................................... 8-83 8.6.1 Traffic Safety Development Strategic Plan and Program ..................................... 8-83 8.6.2 Identification of Current Traffic Safety Issues ...................................................... 8-84 8.6.3 Traffic Safety Development Strategies ................................................................. 8-85
8.7 Non-Motorized Transport (NMT) Plan ........................................................................ 8-91 8.7.1 Counterplan for NMT ........................................................................................... 8-93
8.8 Disaster Management Plan ........................................................................................... 8-95 8.8.1 Work Flow ............................................................................................................ 8-95 8.8.2 Definition of ETRNP ............................................................................................ 8-96 8.8.3 Emergency Transportation Road Network Plan .................................................. 8-104 8.8.4 Plan of ETRN ...................................................................................................... 8-107
CHAPTER 9 TRAFFIC DEMAND FORECAST ........................................ 9-1 9.1 Future Population Distribution ....................................................................................... 9-1 9.2 Future Traffic Demand Forecast .................................................................................... 9-2
9.2.1 General .................................................................................................................... 9-2 9.2.2 Major Premises ....................................................................................................... 9-2 9.2.3 Traffic Demand Forecast ......................................................................................... 9-9
CHAPTER 10 IMPLEMENTATION PLAN ............................................ 10-1 10.1 Transport Implementation Plan .................................................................................... 10-1
10.1.1 Staging Plan .......................................................................................................... 10-1 10.1.2 Institutional Plan ................................................................................................. 10-10
10.2 Urban Management Measures ................................................................................... 10-24 10.2.1 Outline ................................................................................................................. 10-24 10.2.2 Urban Management Measures for Land Use Control ......................................... 10-25 10.2.3 Urban Management Measures for TOD .............................................................. 10-29 10.2.4 Urban Management Measures for Integrated Urban Development .................... 10-33 10.2.5 Urban Management Measures for Road Network Development ........................ 10-38 10.2.6 Summary of Proposed Urban Management Measures ........................................ 10-44 10.2.7 Upgrade of LP Program ...................................................................................... 10-44 10.2.8 Proposal of Programs and Projects for Urban Management Measures ............... 10-50
CHAPTER 11 FINANCIAL AND ECONOMIC ANALYSIS ................. 11-1 11.1 Cost Estimates .............................................................................................................. 11-1
11.1.1 Recent Road Work History and Planning ............................................................. 11-1 11.1.2 Target Projects ...................................................................................................... 11-1 11.1.3 Conditions of Cost Estimates ................................................................................ 11-2 11.1.4 Environmental Issues ............................................................................................ 11-3 11.1.5 Quantities .............................................................................................................. 11-7 11.1.6 Unit Price Established ........................................................................................... 11-9 11.1.7 Operation and Maintenance Cost ........................................................................ 11-12 11.1.8 Project Implementation Cost Estimates .............................................................. 11-13
11.2 Financial Plan ............................................................................................................. 11-19 11.2.1 Budget Allocation ............................................................................................... 11-19 11.2.2 Economic and Financial Evaluation .................................................................... 11-22
CHAPTER 12 PRIORITY ACTION PLAN ............................................. 12-1 12.1 Criteria for Selection of Priority Project ...................................................................... 12-1 12.2 Selection of Priority Projects ....................................................................................... 12-2
12.2.1 Projects to be Implemented in Phase 1.................................................................. 12-2 12.2.2 Evaluation of Priority Projects .............................................................................. 12-3 12.2.3 Result of Evaluation .............................................................................................. 12-6
12.3 Cost Estimates .............................................................................................................. 12-7 12.3.1 Selection of Pilot Project ....................................................................................... 12-8
The Project on Urban Transport Improvement for Kathmandu Valley in Federal Democratic Republic of Nepal Final Report May 2017
iii
CHAPTER 13 PRE-FEASIBILITY STUDY ON T-M FLYOVER (TRIPURESHWOR INTERSECTION – MAITIGHAR INTERSECTION) ................................................................. 13-1
13.1 Background .................................................................................................................. 13-1 13.1.1 Background ........................................................................................................... 13-1 13.1.2 Objective and Scope of the Study ......................................................................... 13-1 13.1.3 Study Area of Pilot Project ................................................................................... 13-1 13.1.4 Basis of the Study ................................................................................................. 13-2
13.2 Present Condition of Study Area ................................................................................. 13-2 13.2.1 Physical Condition ................................................................................................ 13-2 13.2.2 Traffic Condition of Study Area ........................................................................... 13-5
13.3 Design Condition ......................................................................................................... 13-9 13.3.1 Number of Lanes for T-M Flyover ....................................................................... 13-9 13.3.2 Anticipated Function of the T-M Flyover ............................................................. 13-9 13.3.3 Design Standard .................................................................................................... 13-9 13.3.4 Design Speed ....................................................................................................... 13-10 13.3.5 Pavement Structure ............................................................................................. 13-10
13.4 Pre-FS for Two-lane Flyover ..................................................................................... 13-10 13.4.2 Preliminary Engineering Design ......................................................................... 13-14 13.4.3 Traffic Analysis ................................................................................................... 13-29 13.4.4 Economic Evaluation .......................................................................................... 13-32 13.4.5 Environmental and Social Considerations .......................................................... 13-40 13.4.6 Evaluation of Plan Options ................................................................................. 13-51
13.5 Pre-FS for Four-lane Flyover ..................................................................................... 13-51 13.5.1 Preliminary Engineering Design ......................................................................... 13-51 13.5.2 Traffic Analysis ................................................................................................... 13-58 13.5.3 Economic Evaluation .......................................................................................... 13-58 13.5.4 Environmental and Social Considerations .......................................................... 13-62
13.6 Implementation Plan .................................................................................................. 13-68 13.6.1 Construction Plan and Traffic Safety and Control during Construction Stage ... 13-68 13.6.2 Construction Period ............................................................................................. 13-70 13.6.3 Subjects to be Examined at Full Scale FS ........................................................... 13-70
13.7 Study on the Effects of Increased Development on the T-M Flyover ....................... 13-70 13.7.1 Objectives ............................................................................................................ 13-70 13.7.2 Present Condition of the new Baneshwor Intersection ....................................... 13-70 13.7.3 Preliminary Engineering Design for Grade Separation ....................................... 13-71 13.7.5 Traffic Analysis ................................................................................................... 13-76 13.7.6 Economic Evaluation .......................................................................................... 13-78
13.8 Expansion Plan of the Project Method ....................................................................... 13-82 13.8.1 Background ......................................................................................................... 13-82 13.8.2 Present Condition of Kalimati Intersection ......................................................... 13-83 13.8.3 Pre-FS for Kalimati Flyover ................................................................................ 13-83 13.8.4 Traffic Analysis ................................................................................................... 13-89 13.8.5 Study on At-grade Improvement of Kalimati Intersection .................................. 13-90 13.8.6 Conclusion .......................................................................................................... 13-92
The Project on Urban Transport Improvement for Kathmandu Valley in Federal Democratic Republic of Nepal Final Report May 2017
iv
LIST OF FIGURES
Figure 6.1.1 Future Population in Three Districts ....................................................................... 6-2 Figure 6.2.1 Vision and Target of Master Plan ........................................................................... 6-3 Figure 6.3.1 Future Urban Expansion Image in 2030 without Control....................................... 6-6 Figure 6.4.1 Land Constraints Area ............................................................................................ 6-8 Figure 6.4.2 Possible Urbanization Areas ................................................................................... 6-8 Figure 6.4.3 Conceptual Plan Alternative Case ........................................................................ 6-10 Figure 6.4.4 Structure Plan Case-0 ........................................................................................... 6-11 Figure 6.4.5 Structure Plan Case-1 ........................................................................................... 6-12 Figure 6.4.6 Structure Plan Case-2 ........................................................................................... 6-13 Figure 6.4.7 Structure Plan Case-3 ........................................................................................... 6-14 Figure 6.4.8 Actual Lay-out of New Urbanized Area (Case-3) ................................................ 6-15 Figure 7.1.1 Procedure of Environmental Impact Assessment ................................................... 7-2 Figure 7.2.1 Procedure of SEA for the Master Plan ................................................................... 7-3 Figure 8.1.1 Risk Classification based on Constraint Free Mapping .......................................... 8-1 Figure 8.1.2 Risk Classification based on Constraint Free Mapping .......................................... 8-2 Figure 8.1.3 Preservation of Old Settlement ............................................................................... 8-3 Figure 8.1.4 Proposed Distribution Concept of Urban Functions ............................................... 8-4 Figure 8.1.5 Proposed location of Integrated Urban Re-development Areas ............................. 8-5 Figure 8.1.6 Regeneration of Road Network with preservation ................................................. 8-6 Figure 8.1.7 Image of Traditional Regeneration of Urban Area ................................................. 8-7 Figure 8.1.8 Proposed Location of New Urban Areas ................................................................ 8-7 Figure 8.1.9 Examples of New Urban Center of KV (Makuhari New Urban Center, Japan) ..... 8-9 Figure 8.1.10 Proposed Land Use Plan of East New Urban Area I .......................................... 8-10 Figure 8.1.11 Proposed Land Use Plan of East New Urban Area II ......................................... 8-11 Figure 8.1.12 Example of Governmental Sub-center Area (Putrajaya in Malaysia) ................ 8-12 Figure 8.1.13 Example of Governmental Sub-center Area (Saitama New Urban Center) ....... 8-13 Figure 8.1.14 Proposed Land Use Plan of South-east New Urban Area (Governmental Sub-
center Area) ........................................................................................................................ 8-14 Figure 8.1.15 Example of Major Function of Agricultural R&D Area ..................................... 8-15 Figure 8.1.16 Proposed Land Use Plan of South New Urban Area (Agricultural R&D Area) 8-15 Figure 8.1.17 Example of Major Function of South-west New Urban Area ............................ 8-17 Figure 8.1.18 Example of Major Function of West New Urban Area ...................................... 8-17 Figure 8.1.19 Proposed Land Use Plan of South-west New Urban Area ................................. 8-18 Figure 8.1.20 Proposed Land Use Plan of West New Urban Area ........................................... 8-19 Figure 8.2.1 Concept of Traffic Pattern Modification .............................................................. 8-20 Figure 8.2.2 Overall Road Development Concept on Definitive Urban Structure ................... 8-21 Figure 8.2.3 Typical Population Density in the Valley ............................................................. 8-23 Figure 8.2.4 Planning Concept of Road Network inside Ring Road ........................................ 8-24 Figure 8.2.5 Preliminary Check of Required Number of Lanes at Designated Cordon Lines .. 8-25 Figure 8.2.6 Location Map of Proposed Road Widening ......................................................... 8-26 Figure 8.2.7 Present Lane Configuration of Arniko Road ........................................................ 8-27 Figure 8.2.8 Proposed Lane Configuration of Arniko Road ..................................................... 8-27 Figure 8.2.9 Proposed Inner Ring Road .................................................................................... 8-28 Figure 8.2.10 Proposed Replacement of Bridges along Inner Ring Road ................................ 8-29 Figure 8.2.11 Saturation Ratio of Intersections inside Ring Road ............................................ 8-30 Figure 8.2.12 Road Network around Thapathali Intersection ................................................... 8-32 Figure 8.2.13 Projected Vehicle Capacity Ratio at Major Intersections in 2030 ...................... 8-32 Figure 8.2.14 Road Development around Tinkne (1991-2000) ................................................ 8-33 Figure 8.2.15 Planning Concept of Road Network outside Ring Road .................................... 8-33 Figure 8.2.16 Overall Development Concept of Road Network ............................................... 8-34 Figure 8.2.17 Location Map of Proposed New Road outside Ring Road ................................. 8-35 Figure 8.2.18 Layout Concept of New Road Network ............................................................. 8-36
The Project on Urban Transport Improvement for Kathmandu Valley in Federal Democratic Republic of Nepal Final Report May 2017
v
Figure 8.2.19 Location Map of Proposed Road Widening ....................................................... 8-37 Figure 8.2.20 Location Map of Proposed New Roads .............................................................. 8-39 Figure 8.2.21 Location Map of Proposed Road Widening ....................................................... 8-40 Figure 8.2.22 Proposed Road Network ..................................................................................... 8-40 Figure 8.2.23 Correlation between Carriageway Width and Vehicle Speed ............................ 8-43 Figure 8.2.24 Wider Outer Shoulder ......................................................................................... 8-44 Figure 8.2.25 Proposed Width of Sidewalk/Bicycle Lane ........................................................ 8-45 Figure 8.2.26 Typical Cross Section (Urban Road Class-A, Type-1)....................................... 8-46 Figure 8.2.27 Typical Cross Section (Urban Road Class-A, Type-2)....................................... 8-46 Figure 8.2.28 Typical Cross Section (Urban Road Class-A, Type-3)....................................... 8-47 Figure 8.2.29 Typical Cross Section (Urban Road Class-A, Type-5)....................................... 8-47 Figure 8.2.30 Typical Cross Section (Urban Road Class-A, Type-6)....................................... 8-48 Figure 8.2.31 Typical Cross Section (Urban Road Class-B, Type-2) ....................................... 8-49 Figure 8.2.32 Typical Cross Section (Urban Road Class-B, Type-3) ....................................... 8-50 Figure 8.2.33 Typical Cross Section (Urban Road Class-B, Type-4) ....................................... 8-50 Figure 8.2.34 Typical Cross Section (Urban Road Class-B, Type-5) ....................................... 8-51 Figure 8.2.35 Typical Cross Section (Urban Road Class-B, Type-6) ....................................... 8-51 Figure 8.2.36 Typical Cross Section (Urban Road Class-C, Type-2) ....................................... 8-52 Figure 8.2.37 Typical Cross Section (Urban Road Class-C, Type-3) ....................................... 8-52 Figure 8.2.38 Typical Cross Section (Urban Road Class-C, Type-4) ....................................... 8-53 Figure 8.2.39 Typical Cross Section (Urban Road Class-C, Type-5) ....................................... 8-53 Figure 8.3.1 Problems and Main Causes of Public Transport System ...................................... 8-54 Figure 8.3.2 Strategies of Public Transport Development ........................................................ 8-55 Figure 8.3.3 Image of Strategic Public Transport Routes ......................................................... 8-58 Figure 8.3.4 Reorganization Plan 2015-2030 ........................................................................... 8-59 Figure 8.3.5 Reorganization Plan of Network Pattern .............................................................. 8-59 Figure 8.3.6 Proposed Primary Routes ..................................................................................... 8-60 Figure 8.3.7 Proposed Transport Terminals .............................................................................. 8-61 Figure 8.3.8 Image of Central Station Plan ............................................................................... 8-63 Figure 8.3.9 Image of East Station Plan .................................................................................... 8-63 Figure 8.3.10 Timing for the First MRT Operation in Asian Mega Cities ............................... 8-64 Figure 8.3.11 Speed and Capacity of Mass Transit Mode ........................................................ 8-65 Figure 8.3.12 Mode and Characteristics of Mass Transit System ............................................. 8-66 Figure 8.3.13 Proposed New Public Transport Network .......................................................... 8-68 Figure 8.3.14 Horizontal Alignment of AGT Line-1 ................................................................ 8-69 Figure 8.3.15 Longitudinal Profile of AGT Line-1 ................................................................... 8-69 Figure 8.3.16 Horizontal Alignment of AGT Line-2 ................................................................ 8-70 Figure 8.3.17 Longitudinal Profile of AGT Line-2 ................................................................... 8-70 Figure 8.3.18 Potential Development Sites for TOD ................................................................ 8-71 Figure 8.3.19 Future Public Transport Plan .............................................................................. 8-72 Figure 8.3.20 Alternatives of Organization for AGT/BRT Operation and Management ......... 8-73 Figure 8.4.1 Image of Proposed Comprehensive Traffic Demand Management Policy .......... 8-74 Figure 8.4.2 Parking Conditions in Kathmandu Valley ............................................................ 8-76 Figure 8.5.1 Flowchart of Logistic Plan ................................................................................... 8-79 Figure 8.5.2 Freight Traffic Movement around Kathmandu Valley ......................................... 8-80 Figure 8.7.1 Mode of Trip based on PT Survey ........................................................................ 8-91 Figure 8.7.2 Surface Condition of SRN/LRN and Source of Air Pollution .............................. 8-92 Figure 8.7.3 Concept for Necessary Width for Pedestrian Sidewalk ........................................ 8-93 Figure 8.7.4 Concept for Necessary Width for Bicycle and Pedestrian Sidewalk .................... 8-94 Figure 8.8.1 Work Flow ............................................................................................................ 8-96 Figure 8.8.2 ETRN of Kawasaki City ....................................................................................... 8-97 Figure 8.8.3 ETRN in Shikoku-Chuo City ............................................................................... 8-97 Figure 8.8.4 Seismic Retrofit Promotion Plan .......................................................................... 8-98 Figure 8.8.5 Flow Chart of Earthquake Resistance of Buildings .............................................. 8-98
The Project on Urban Transport Improvement for Kathmandu Valley in Federal Democratic Republic of Nepal Final Report May 2017
vi
Figure 8.8.6 The Result of Road Blockage in Kathmandu Valley Central Business Area ..... 8-100 Figure 8.8.7 Liquefaction susceptibility of all roads in Kathmandu Valley ........................... 8-101 Figure 8.8.8 Illustration of calculation of debris width based on height of building .............. 8-101 Figure 8.8.9 Post disaster accessibility condition ................................................................... 8-102 Figure 8.8.10 Post Disaster Accessibility Modelling of Open Spaces .................................... 8-103 Figure 8.8.11 Emergency Road Network (UNDP) ................................................................. 8-103 Figure 8.8.12 Population Density by Ward (2001-2011, 2022(Projection)) ........................... 8-104 Figure 8.8.13 Work school base and residence base population ............................................. 8-105 Figure 8.8.14 Work school base and residence base population ............................................. 8-106 Figure 8.8.15 Situation of Ratio workplace or school base/Residence base ........................... 8-106 Figure 8.8.16 Existing Road Network .................................................................................... 8-107 Figure 8.8.17 Emergency Road Network (UNDP) ................................................................. 8-112 Figure 8.8.18 School Location Map ........................................................................................ 8-113 Figure 8.8.19 Cross Section and Plan of First Emergency Transportation Road .................... 8-115 Figure 8.8.20 Plan of First Emergency Transportation Road ................................................. 8-115 Figure 8.8.21 Cross Section and Plan of Second Emergency Transportation Road ............... 8-116 Figure 8.8.22 Cross Section and Plan of Second Emergency Transportation Road ............... 8-116 Figure 8.8.23 Plan of Second Emergency Transportation Road ............................................. 8-117 Figure 8.8.24 Plan of Concept Emergency Transportation Road ........................................... 8-118 Figure 8.8.25 Seismic Hazard Assessment (Liquefaction) ..................................................... 8-119 Figure 8.8.26 Seismic Hazard Assessment (Slope Failure) .................................................... 8-119 Figure 9.1.1 Relation between Population Growth Rate and Distance from City Center ........... 9-1 Figure 9.1.2 Relation between Population Growth Rate and Population Density 2011 ............. 9-1 Figure 9.2.1 Four-Step Procedure ............................................................................................... 9-2 Figure 9.2.2 Small Zones around the Ring Road(50 Zones) ................................................. 9-3 Figure 9.2.3 Zones for Traffic Assignment in Kathmandu Valley ............................................. 9-4 Figure 9.2.4 Growth Ratio of Population, GDP per Capita and Car Ownership ........................ 9-8 Figure 9.2.5 Flow Chart of Future Total Trip Generation ........................................................ 9-11 Figure 9.2.6 Desire Line of Trips between 50 Small Zones in 2011 ........................................ 9-14 Figure 9.2.7 Desire Line of Trips between 50 Small Zones in 2030 ........................................ 9-15 Figure 9.2.8 Modal Split Hierarchy .......................................................................................... 9-15 Figure 9.2.9 Comparison of Person Trips by Mode and by Case ............................................. 9-19 Figure 9.2.10 Modal Split by Mode and by Purpose ................................................................ 9-22 Figure 9.2.11 Flow Chart for Future VTOD Table Estimation ................................................. 9-22 Figure 9.2.12 Traffic Volume in 2011 Case 0 .......................................................................... 9-24 Figure 9.2.13 Traffic Volume in 2030 Case 1 .......................................................................... 9-24 Figure 9.2.14 Traffic Volume in 2030 Case 2 .......................................................................... 9-25 Figure 9.2.15 Traffic Volume in 2030 Case 3 .......................................................................... 9-25 Figure 9.2.16 Traffic Volume in 2030 Case 3, New Public Transport ..................................... 9-26 Figure 9.2.17 Number of NTS Passengers and Revenue by Fare Level ................................... 9-27 Figure 10.1.1 Target and Basic Concept for Staging Plan ........................................................ 10-2 Figure 10.1.2 Land Use Staging Plan in Short Term (2020) .................................................... 10-3 Figure 10.1.3 Land Use Staging Plan in Middle Term (2025) .................................................. 10-3 Figure 10.1.4 Land Use Staging Plan in Long Term (2030) ..................................................... 10-4 Figure 10.1.5 Road Network Staging Plan in Short Term (2020)............................................. 10-5 Figure 10.1.6 Road Network Staging Plan in Middle Term (2025) .......................................... 10-5 Figure 10.1.7 Road Network Staging Plan in Long Term (2030) ............................................. 10-6 Figure 10.1.8 Public Transport Network Staging Plan in Short Term (2020) .......................... 10-7 Figure 10.1.9 Public Transport Network Staging Plan in Middle Term (2025) ....................... 10-7 Figure 10.1.10 Public Transport Network Staging Plan in Long Term (2030) ........................ 10-8 Figure 10.1.11 V/C Ratio in Short Term .................................................................................. 10-9 Figure 10.1.12 V/C Ratio in Middle Term ................................................................................ 10-9 Figure 10.1.13 Structure of National Transport Authority ..................................................... 10-11 Figure 10.1.14 Basic Institutional Arrangement ..................................................................... 10-14
The Project on Urban Transport Improvement for Kathmandu Valley in Federal Democratic Republic of Nepal Final Report May 2017
vii
Figure 10.1.15 General Road Development and Maintenance Implementation Structure ..... 10-16 Figure 10.2.1 Orientation of Proposal of Urban Management Measure ................................. 10-24 Figure 10.2.2 Concept of Proposed Urban Management Measures for Land Use Control .... 10-25 Figure 10.2.3 Orientation of Revision of Zoning Plan of KV ................................................ 10-26 Figure 10.2.4 Orientation of Revision of Tax Rate on Real Estate ......................................... 10-27 Figure 10.2.5 Orientation of Establishment of Agricultural Support ...................................... 10-28 Figure 10.2.6 Proposed Function of New Urban Area ............................................................ 10-28 Figure 10.2.7 Concept of Integrated Urban Development based on TOD .............................. 10-29 Figure 10.2.8 Business Model A: Integrated Urban Development based on TOD ................. 10-30 Figure 10.2.9 Business Model B: Integrated Urban Development based on TOD ................. 10-30 Figure 10.2.10 Major Functions of Intermodal Facilities ....................................................... 10-31 Figure 10.2.11 Examples of Station Plaza (JR Biwajima Station).......................................... 10-31 Figure 10.2.12 Concept of Proposed Urban Management Measures for TOD ....................... 10-32 Figure 10.2.13 Candidate Areas of Integrated Urban Development ....................................... 10-33 Figure 10.2.14 Current Condition in South Station Area ........................................................ 10-34 Figure 10.2.15 Comparison of Layout Plan in South Station Area......................................... 10-35 Figure 10.2.16 Draft Land Use Plan of South Station Area .................................................... 10-35 Figure 10.2.17 Draft Land Use Plan of Eastern New Urban Area .......................................... 10-36 Figure 10.2.18 Proposed Development Measures for Eastern New Urban Area .................... 10-37 Figure 10.2.19 Proposed Organization for Implementation of TOD ...................................... 10-38 Figure 10.2.20 Proposed Urban Management Measure for Inner Ring Road Development .. 10-39 Figure 10.2.21 Concept of Proposed Urban Management Measure for Emergency Road Network
Development .................................................................................................................... 10-40 Figure 10.2.22 Control Building Height (without Road Widening) ....................................... 10-40 Figure 10.2.23 Rebuilding with Aseismic-resistance Structure (without Road Widening) .... 10-41 Figure 10.2.24 Current Measure of Road Widening and Incommodious building by the Cutting
......................................................................................................................................... 10-41 Figure 10.2.25 Development Phasing of Integrated Road Development using Land Pooling 10-42 Figure 10.2.26 Project Scheme of Integrated Road Development using Land Pooling with Land
Right Exchange ................................................................................................................ 10-43 Figure 10.2.27 Keys for Upgrading LP Program .................................................................... 10-45 Figure 10.2.28 Coordination System with Urban Planning and LP Project in Japan ............. 10-45 Figure 10.2.29 National Subsidy for City Planning Road for LR Project in Japan ................ 10-48 Figure 10.2.30 Concept of Cycling Mechanism of Economic Benefit from and to LP Project .. 10-
48 Figure 10.2.31 Combination with Prior Land Acquisition and Land Re-plotting .................. 10-49 Figure 10.2.32 Land Re-plotting for Large-scale Building ..................................................... 10-49 Figure 11.1.1 Relationship of DOR, KVRIP and Division Road Offices ................................. 11-1 Figure 11.1.2 Price Escalation in Nepal .................................................................................... 11-3 Figure 11.1.3 Distribution map of Land Acquisition Value ..................................................... 11-5 Figure 11.2.1 Budget Component and trend of the budget (MOPIT and Road Related) ...... 11-20 Figure 11.2.2 Estimated Budget Allocation up to 2030 ........................................................ 11-21 Figure 12.2.1 Location of Priority Projects ............................................................................... 12-7 Figure 13.1.1 Study Area of Pilot Project ................................................................................. 13-2 Figure 13.2.1 Sub-soil Condition of the Study Area ................................................................. 13-3 Figure 13.2.2 Water Supply Line around the Study Area ......................................................... 13-4 Figure 13.2.3 Drainage System around the Study Area ............................................................ 13-5 Figure 13.2.4 Hourly Variation of Traffic Volume at Bagmati Bridge .................................... 13-6 Figure 13.2.5 Hourly Traffic Volume by Direction at Thapathali Intersection ........................ 13-6 Figure 13.2.6 Vehicle Traffic Demand in the Study Area by With Case ................................. 13-7 Figure 13.2.7 Traffic Volume by Direction from Tribhuvan Highway and Arniko Highway in
2030.................................................................................................................................... 13-8 Figure 13.2.8 Planned AGT Route in Study Area .................................................................... 13-8 Figure 13.3.1 Alignments for Design Speeds 60km/h and 40km/h ........................................ 13-10
The Project on Urban Transport Improvement for Kathmandu Valley in Federal Democratic Republic of Nepal Final Report May 2017
viii
Figure 13.3.2 Pavement Structure Applied for Approach Road of T-M Flyover ................... 13-10 Figure 13.4.1 Preliminary Plan Options .................................................................................. 13-11 Figure 13.4.2 Established Plan Options .................................................................................. 13-12 Figure 13.4.3 Conceptual Alignment of Option-1 .................................................................. 13-13 Figure 13.4.4 Conceptual Alignment of Option-3 .................................................................. 13-14 Figure 13.4.5 Conceptual Alignment of Option-4 .................................................................. 13-14 Figure 13.4.6 Typical Cross Sections ..................................................................................... 13-16 Figure 13.4.7 Horizontal Alignment of Option 1 .................................................................... 13-16 Figure 13.4.8 Horizontal Alignment of Option 3 .................................................................... 13-17 Figure 13.4.9 Horizontal Alignment of Option 4 .................................................................... 13-18 Figure 13.4.10 Applicable Curve Radius for Span Length and Steel Girder Type ................. 13-23 Figure 13.4.11 Method of Traffic Demand Forecast for T-M Flyover ................................... 13-30 Figure 13.4.12 Disposition of Cordon Line ............................................................................ 13-30 Figure 13.4.13 Traffic Assignment Result for Options in 2030 ............................................. 13-31 Figure 13.4.14 Schematic Flow Chart of Economic Analysis ................................................ 13-33 Figure 13.4.15 Cross Section for Noise Level Assessment .................................................... 13-45 Figure 13.4.16 Evaluation Result (NOx) ................................................................................ 13-46 Figure 13.4.17 Evaluation Result (PM10) .............................................................................. 13-47 Figure 13.4.18 Evaluation Result (CO2) ................................................................................ 13-47 Figure 13.4.19 Overlaying Fly Over Section ROW on existing buildings .............................. 13-48 Figure 13.5.1 Typical Cross Section of Four-lane Flyover ..................................................... 13-52 Figure 13.5.2 Plan and Profile of T-M Flyover (4lanes) (1/2) ................................................ 13-53 Figure 13.5.3 Plan and Profile of T-M Flyover (4lanes) (2/2) ................................................ 13-53 Figure 13.5.4 Traffic Assignment Result for Four-lane Flyover in 2030 ............................... 13-58 Figure 13.5.5 Evaluation Result (NOx) .................................................................................. 13-65 Figure 13.5.6 Evaluation Result (PM10) ................................................................................ 13-65 Figure 13.5.7 Evaluation Result (CO2) .................................................................................. 13-66 Figure 13.5.8 Additional Land Acquisition Area of 4-Lane Plan ........................................... 13-67 Figure 13.5.9 Additional Obstacle Buildings 4-Lane Plan ..................................................... 13-67 Figure 13.6.1 Lane Arrangement during Construction in Tribhuvan Highway ...................... 13-68 Figure 13.6.2 Lane Arrangement for Sub-structure Construction in Tribhuvan Highway ..... 13-68 Figure 13.6.3 Construction Procedure in Tribhuvan Highway ............................................... 13-69 Figure 13.6.4 Lane Arrangement During Construction in Arniko Highway .......................... 13-69 Figure 13.6.5 Construction Image between Tripreswar Intersection and Mitighar Intersection 13-
69 Figure 13.6.6 Intersection Improvement Plan for Tripreshwor Intersection and Maitighar
Intersection ....................................................................................................................... 13-70 Figure 13.7.1 Present Condition of New Baneshwor Intersection .......................................... 13-71 Figure 13.7.2 Typical Cross Section of New Baneshwor Underpass .................................... 13-73 Figure 13.7.3 Clearance .......................................................................................................... 13-74 Figure 13.7.4 Horizontal Alignment of New Baneshwor Underpass ..................................... 13-74 Figure 13.7.5 Vertical Alignment of New Baneshwor Underpass .......................................... 13-74 Figure 13.7.6 Structure design ................................................................................................ 13-75 Figure 13.7.7 Traffic Assignment Result for Tree Cases in 2030........................................... 13-76 Figure 13.7.8 Traffic Volume by Direction at Peak Hour in 2030 ......................................... 13-77 Figure 13.7.9 Lane Arrangement at New Baneshwor Intersection of Without Case and With
Case .................................................................................................................................. 13-77 Figure 13.8.1 Maximum Entering Traffic volume Threshold by At-Grade Intersection ........ 13-82 Figure 13.8.2 Present condition of Kalimati Intersection ....................................................... 13-83 Figure 13.8.3 Typical Cross Section of Kalimati Flyover ...................................................... 13-84 Figure 13.8.4 Horizontal Alignment of Kalimati Flyover ...................................................... 13-85 Figure 13.8.5 Vertical Alignment of Kalimati Flyover ........................................................... 13-86 Figure 13.8.6 Rebuilding Plan of Bishnumati Bridge ............................................................. 13-87 Figure 13.8.7 Traffic flow during the construction ................................................................. 13-89
The Project on Urban Transport Improvement for Kathmandu Valley in Federal Democratic Republic of Nepal Final Report May 2017
ix
Figure 13.8.8 Cross section During the Construction ............................................................. 13-89 Figure 13.8.9 Traffic Assignment Result for Without Case and With Case ........................... 13-90 Figure 13.8.10 Horizontal Alignment of At-Grade Improvement of Kalimati Intersection ... 13-91 Figure 13.8.11 Comparison of Necessary Width of Intersection (Interchange
Improvement) ................................................................................................................. 13-91
The Project on Urban Transport Improvement for Kathmandu Valley in Federal Democratic Republic of Nepal Final Report May 2017
x
LIST OF TABLES
Table 6.1.1 Population Projection for Nepal based on 2001 Census .......................................... 6-1 Table 6.1.2 Future Population Projection by CBS (Nepal and Districts of Kathmandu Valley) 6-1 Table 6.1.3 Future Population Projection in Target Years of KUTMP ...................................... 6-1 Table 6.1.4 Districts Population outside of Kathmandu Valley .................................................. 6-2 Table 6.1.5 Future Population Framework of Kathmandu Valley by District ............................ 6-2 Table 6.1.6 Quantitative Target Achievement of Three Year Plan ............................................. 6-3 Table 6.3.1 Land Use Change Trend up to 2030 ........................................................................ 6-5 Table 6.4.1 Advantages and Disadvantages of Structure Plan Cases ....................................... 6-15 Table 7.1.1 EIA / IEE about Road Development Project ........................................................... 7-1 Table 7.3.1 Characteristics of Alternative Plans ......................................................................... 7-4 Table 7.3.2 Scoping Result of Physical Environment ................................................................. 7-5 Table 7.3.3 Scoping Result of Natural Environment .................................................................. 7-5 Table 7.3.4 Scoping Result of Social Environment .................................................................... 7-6 Table 7.3.5 Scoping Result of Others ......................................................................................... 7-6 Table 7.3.6 Evaluation Result of Physical Environment ............................................................ 7-7 Table 7.3.7 Evaluation Result of Natural Environment .............................................................. 7-8 Table 7.3.8 Evaluation Result of Social Environment ................................................................ 7-9 Table 7.3.9 Evaluation Result of Others ................................................................................... 7-12 Table 7.4.1 Outline of the First Stakeholder Meeting ............................................................... 7-13 Table 7.4.2 Comments from the Participants of First Stakeholder Meeting ............................. 7-14 Table 7.4.3 Outline of the Second Stakeholder Meeting .......................................................... 7-15 Table 7.4.4 Comments from the Participants of Second Stakeholder Meeting ........................ 7-16 Table 7.4.5 Outline of the Third Stakeholder Meeting ............................................................. 7-17 Table 7.4.6 Comments from the Participants of Third Stakeholder Meeting ........................... 7-17 Table 8.2.1 Proposed Road Widening inside Ring Road .......................................................... 8-25 Table 8.2.2 Issues and Improvement Measures on Existing Roads .......................................... 8-26 Table 8.2.3 Proposed Road Improvement of On-going Projects .............................................. 8-28 Table 8.2.4 Proposed Bridges along Inner Ring Road .............................................................. 8-29 Table 8.2.5 Saturation Rate of Existing Bottleneck Intersections............................................. 8-31 Table 8.2.6 Saturation Rate of Improved At-graded Intersections ........................................... 8-31 Table 8.2.7 Implementation of Grade-separated Structures ...................................................... 8-31 Table 8.2.8 Proposed Grade Separated Structures .................................................................... 8-32 Table 8.2.9 Proposed New Roads outside Ring Road .............................................................. 8-34 Table 8.2.10 Proposed Road Widening outside Ring Road ...................................................... 8-36 Table 8.2.11 Proposed New Roads for Upgrading of Existing Road Network ........................ 8-38 Table 8.2.12 Proposed Emergency Roads ................................................................................ 8-39 Table 8.2.13 Road Classification and Classes by NRS 2070 .................................................... 8-41 Table 8.2.14 Road Classification and Classes by NRS 2070 .................................................... 8-41 Table 8.2.15 Proposed Urban Road Functional Classification ................................................. 8-41 Table 8.2.16 Proposed Urban Road Functional Classification ................................................. 8-42 Table 8.2.17 Traffic Count Survey on Arniko Road ................................................................. 8-44 Table 8.2.18 Design Element of Typical Cross Sections .......................................................... 8-45 Table 8.3.1 Strategic Target of Future Public Transport System .............................................. 8-57 Table 8.3.2 Classification and Definition of Public Transport Network .................................. 8-58 Table 8.3.3 Proposed Transport Terminals ............................................................................... 8-62 Table 8.3.4 Comparison of Mass Transit System for KV ......................................................... 8-67 Table 8.3.5 Proposed AGT and BRT Lines .............................................................................. 8-68 Table 8.3.6 Staations on AGT Line-1 ....................................................................................... 8-68 Table 8.3.7 Stations on AGT Line-2 ......................................................................................... 8-69 Table 8.4.1 Traffic Demand Management (TDM) Measures ................................................... 8-74 Table 8.4.2 Main Issues and Proposed Measures ..................................................................... 8-77 Table 8.5.1 Freight Traffic Movement around Kathmandu Valley .......................................... 8-80
The Project on Urban Transport Improvement for Kathmandu Valley in Federal Democratic Republic of Nepal Final Report May 2017
xi
Table 8.5.2 Increase Rate of Traffic Volume of Truck between KV and Outside of KV ......... 8-81 Table 8.5.3 Future Freight Volume of HGV between KV and Outside Area ........................... 8-81 Table 8.5.4 Composition of Cargo Type inbound/outbound to/from Kathmandu Valley ........ 8-81 Table 8.5.5 Proportion of Person Trip Attraction inside KV .................................................... 8-82 Table 8.5.6 Freight Volume to be handled in Truck Terminal ................................................. 8-82 Table 8.5.7 Required Area for Truck Terminal in 2030 ........................................................... 8-82 Table 8.6.1 Target of the Traffic Safety Strategy and Responsible Institutions ....................... 8-83 Table 8.6.2 Summary of the Current Traffic Safety Issues and the Key Organization ............. 8-84 Table 8.6.3 Traffic Safety Development Programs .................................................................. 8-86 Table 8.7.1 Estimated Required Budget for Paving Works ...................................................... 8-92 Table 8.8.1 List of critical bridges in Kathmandu Valley ....................................................... 8-102 Table 8.8.2 List of Emergency Hospital ................................................................................. 8-108 Table 8.8.3 List of Medical Collage ...................................................................................... 8-108 Table 8.8.4 Important prevention bases (Public facilities) ..................................................... 8-109 Table 8.8.5 Open Space List ................................................................................................... 8-109 Table 9.2.1 Number of Traffic Zones for Demand Forecasting in the Survey Area ................... 9-3 Table 9.2.2 Trip Purpose Categories in Demand Forecasting..................................................... 9-5 Table 9.2.3 Travel Mode Categories in Demand Forecasting..................................................... 9-5 Table 9.2.4 Level of Service for Analysis and Demand Forecasting .......................................... 9-6 Table 9.2.5 Vehicle Ownership Rate per 1,000 People in Kathmandu Valley ........................... 9-8 Table 9.2.6 Simulation cases for Demand Forecast .................................................................... 9-9 Table 9.2.7 Transport Plans and Policy Measures by Year ........................................................ 9-9 Table 9.2.8 Trip Generation Rate by Vehicle Ownership (2011) ............................................. 9-10 Table 9.2.9 Estimated Trip Generation Total in Target Years .................................................. 9-11 Table 9.2.10 Trip Generation Model by Trip Purpose .............................................................. 9-12 Table 9.2.11 Future Trip Generation in the Target Years ......................................................... 9-13 Table 9.2.12 Trip Distribution Model (Gravity Model) ............................................................ 9-14 Table 9.2.13 Modal Split Model for Walk and Bicycle .......................................................... 9-16 Table 9.2.14 Modal Split Model for Motorcycle, Car and Bus ................................................ 9-17 Table 9.2.15 Diversion Models to the New Transport System ................................................. 9-18 Table 9.2.16 Number of Trips by Mode and by Purpose .......................................................... 9-20 Table 9.2.17 Comparison of Congestion Ratio ......................................................................... 9-23 Table 10.1.1 Basic Strategy for Land Use Staging Plan ........................................................... 10-2 Table 10.1.2 Basic Strategy for Road Development Strategy Plan .......................................... 10-4 Table 10.1.3 Basic Strategy for Public Transport Strategy Plan ............................................... 10-6 Table 10.1.4 Result of Traffic Assignment ............................................................................. 10-10 Table 10.1.5 Road Development and Maintenance ................................................................ 10-15 Table 10.1.6 Current Road Classification/Standards and Application of the Urban Road
Standards .......................................................................................................................... 10-16 Table 10.1.7 Municipalities in Kathmandu Valley ................................................................. 10-17 Table 10.1.8 Current Road Classification/Standards and Application of the Urban Road
Standards .......................................................................................................................... 10-19 Table 10.1.9 Capacity Development Plan (Draft) ................................................................... 10-23 Table 10.2.1 Categories of Candidate Areas for Business Model of TOD ............................. 10-33 Table 10.2.2 Summary of Proposed Urban Management Measures ....................................... 10-44 Table 10.2.3 Implementer of Land Pooling and Land Readjustment Project ......................... 10-46 Table 10.2.4 Scheme of Private LP Implementer in Japan and Colombia .............................. 10-47 Table 10.2.5 Proposed Programs and Projects for Establishment of Urban Management
Measures .......................................................................................................................... 10-50 Table 11.1.1 Implementation Cost Components ....................................................................... 11-2 Table 11.1.2 Valuation Range of Land in Kathmandu Valley .................................................. 11-4 Table 11.1.3 Building Valuation ............................................................................................... 11-6 Table 11.1.4 Quantities of Road Works .................................................................................... 11-7 Table 11.1.5 Quantities of AGT Lines and BRT Lines ............................................................ 11-8
The Project on Urban Transport Improvement for Kathmandu Valley in Federal Democratic Republic of Nepal Final Report May 2017
xii
Table 11.1.6 Quantities of Required Vehicle ............................................................................ 11-9 Table 11.1.7 Quantities of Transport Terminal ......................................................................... 11-9 Table 11.1.8 Unit Price for Road Works ................................................................................ 11-10 Table 11.1.9 Unit Price for AGT Introduction Works ............................................................ 11-10 Table 11.1.10 Unit price for BRT Introduction Works ........................................................... 11-11 Table 11.1.11 Unit Price for Transport Terminal Introduction Works ................................... 11-12 Table 11.1.12 Road Maintenance Items and Cost ................................................................... 11-12 Table 11.1.13 Bridge Maintenance Items and Cost ................................................................ 11-12 Table 11.1.14 AGT Operation and Maintenance Cost per km ............................................... 11-12 Table 11.1.15 BRT Operation and Maintenance Cost per km ................................................ 11-13 Table 11.1.16 Summary of Road Works Implementation Cost Estimates .............................. 11-14 Table 11.1.17 Road Works Implementation Cost Estimates for each project ........................ 11-15 Table 11.1.18 Public Transport Implementation Cost Estimates ............................................ 11-18 Table 11.2.1 Budget Allocation in Nepal (2010/11 ~ 2014/15) ............................................ 11-19 Table 11.2.2 Estimated Budget Allocation up to 2030 .......................................................... 11-20 Table 11.2.3 Percentage of the MP Project Cost to the Regional GDP ................................. 11-21 Table 11.2.4 Basic Data for Vehicle Operating Cost Calculation (2009 Price) .................... 11-23 Table 11.2.5 Basic Data for Vehicle Operating Cost Calculation (2015 Price) .................... 11-23 Table 11.2.6 Vehicle Operating Cost at 2015 Price .............................................................. 11-23 Table 11.2.7 Travel Time Cost at 2015 Price ........................................................................ 11-24 Table 11.2.8 Benefit of Case 1 and Case 2 ............................................................................ 11-24 Table 11.2.9 Result of Economic Analysis ........................................................................... 11-25 Table 11.2.10 Cost Benefit Stream (Case 1) ......................................................................... 11-26 Table 11.2.11 Cost Benefit Stream (Case 2) ......................................................................... 11-27 Table 11.2.12 Sensitivity Analysis (Case 1) .......................................................................... 11-28 Table 11.2.13 Sensitivity Analysis (Case 2) .......................................................................... 11-28 Table 11.2.14 Expected Conditions of the BRT and AGT Operation ................................... 11-29 Table 11.2.15 Financial Cash Flow (BRT and AGT) ............................................................ 11-30 Table 12.2.1 Long list of Institutional Improvement Project in 1st Phase (2016-2020) ............ 12-2 Table 12.2.2 Ranking Threshold by Evaluation Criteria for Selecting Priority Projects .......... 12-4 Table 12.2.3 Summary of Multi-criteria Analysis Results ........................................................ 12-4 Table 12.2.4 Selected High Priority Projects ............................................................................ 12-6 Table 12.3.1 Cost Estimates for Priority Projects ..................................................................... 12-7 Table 12.3.2 Candidate Pilot Project ........................................................................................ 12-8 Table 12.3.3 Evaluation of Candidate Pilot Project .................................................................. 12-8 Table 13.2.1 24 hour Traffic Volume at Bagmati Bridge ......................................................... 13-5 Table 13.3.1 Road Capacity by Type of Road for Traffic Analysis ........................................ 13-7 Table 13.3.1 Applied Traffic Demand for Two-lane analysis and Four-lane Analysis ............ 13-9 Table 13.4.1 Function of Plan Options ................................................................................... 13-11 Table 13.4.2 Preliminary Evaluation of Plan Options ............................................................ 13-11 Table 13.4.3 Geometric Design Criteria ................................................................................. 13-14 Table 13.4.4 Applicability of Superstructure Type ................................................................. 13-18 Table 13.4.5 Comparison of Alternatives for Overpass Intersection ...................................... 13-20 Table 13.4.6 Comparison of Alternatives for Standard Section (Narrow and Curved Section) 13-
22 Table 13.4.7 Applicability Criteria of Foundation Type ......................................................... 13-24 Table 13.4.8 Comparison of Alternatives for Foundation Type ............................................. 13-25 Table 13.4.9 Bridge Overview of Two-Lane T-M Flyover .................................................... 13-28 Table 13.4.10 Summary of Construction Cost Estimation for Option 1, Option 3 and Option4 13-
29 Table 13.4.11 Total Project Cost ............................................................................................ 13-29 Table 13.4.12 Forecasted Average Road Congestion Ratio, Total Travel Time and Total Travel
Distance by Traffic Assignment ...................................................................................... 13-31 Table 13.4.13 Improvement Options ...................................................................................... 13-33
The Project on Urban Transport Improvement for Kathmandu Valley in Federal Democratic Republic of Nepal Final Report May 2017
xiii
Table 13.4.14 Initial Investment Cost by Year and by Option ............................................... 13-34 Table 13.4.15 Operation and Maintenance Cost by Option .................................................... 13-34 Table 13.4.16 Travel Time Value by Vehicle Type ................................................................ 13-35 Table 13.4.17 Vehicle Operating Cost by Vehicle Type and by Travel Speed ...................... 13-35 Table 13.4.18 Estimated Time Saving and Cost Saving Benefit ............................................ 13-36 Table 13.4.19 Economic Analysis of Option 1 ....................................................................... 13-37 Table 13.4.20 Economic Analysis of Option 3 ....................................................................... 13-38 Table 13.4.21 Economic Analysis of Option 4 ....................................................................... 13-39 Table 13.4.22 Results of Economic Analysis by Option ........................................................ 13-40 Table 13.4.23 Sensitivity Analysis of Option 1 ...................................................................... 13-40 Table 13.4.24 Scoping Result ................................................................................................. 13-41 Table 13.4.25 Traffic Volume 2020 ........................................................................................ 13-43 Table 13.4.26 Traffic Volume 2025 ......................................................................................... 13-43 Table 13.4.27 Traffic Volume 2030 ........................................................................................ 13-44 Table 13.4.28 Emission Unit................................................................................................... 13-44 Table 13.4.29 Cross Section Traffic Volume 2030 ................................................................. 13-45 Table 13.4.30 Evaluation Result (NOx) .................................................................................. 13-46 Table 13.4.31 Evaluation Result (PM10) ................................................................................ 13-47 Table 13.4.32 Evaluation Result (CO2) .................................................................................. 13-47 Table 13.4.33 Evaluation Result (Noise Level) ...................................................................... 13-48 Table 13.4.34 Summary of the Existing Buildings on ROW ................................................... 13-48 Table 13.4.35 Outline of the Stakeholder Meeting ................................................................. 13-49 Table 13.4.36 Comments from the Participants of the Stakeholder Meeting ......................... 13-50 Table 13.4.37 Summary of Comments and Responses ........................................................... 13-50 Table 13.5.1 Geometric Design Criteria ................................................................................. 13-51 Table 13.5.2 Comparison of Alternatives for Superstructure ................................................. 13-54 Table 13.5.3 Summarized Countermeasures for Specific Issue of the Bridge Site ................. 13-56 Table 13.5.4 Bridge Overview of Four-lane T-M Flyover ..................................................... 13-56 Table 13.5.5 Summary of Construction Cost Estimation for Option 1, 4 Lanes Case ............ 13-57 Table 13.5.6 Total Project Cost of Four-lane Flyover ............................................................ 13-57 The result of traffic assignment is shown in. Average road congestion ratio, total travel time and
total travel distance for each option by traffic assignment is shown in Table 13.4.12. Average road congestion ration is far larger than two-lane case shown in Table 13.5.8, because maximum traffic demand is applied to this case. ............................................... 13-58
Table 13.5.9 Forecasted Average Road Congestion Ratio, Total Travel Time and Total Travel Distance by Traffic Assignment ...................................................................................... 13-58
Table 13.5.10 Initial Investment Cost of Four-lane Flyover by Year ..................................... 13-59 Table 13.5.11 Operation and Maintenance ............................................................................. 13-59 Table 13.5.12 Estimated Time Saving and Cost Saving Benefit ............................................ 13-60 Table 13.5.13 Economic Analysis of Four-lane Flyover ........................................................ 13-61 Table 13.5.14 Results of Economic Analysis of Four-lane Flyover ....................................... 13-62 Table 13.5.15 Sensitivity Analysis of Four-lane Flyover ...................................................... 13-62 Table 13.5.16 Scoping Result of Social Environment ............................................................ 13-62 Table 13.5.17 Traffic Volume 2020 ........................................................................................ 13-63 Table 13.5.18 Traffic Volume 2025 ........................................................................................ 13-64 Table 13.5.19 Traffic Volume 2030 ........................................................................................ 13-64 Table 13.5.20 Cross Section Traffic Volume 2030 ................................................................. 13-64 Table 13.5.21 Evaluation Result (NOx) .................................................................................. 13-65 Table 13.5.22 Evaluation Result (PM10) ................................................................................ 13-65 Table 13.5.23 Evaluation Result (CO2) .................................................................................. 13-66 Table 13.5.24 Evaluation Result (Noise Level) ...................................................................... 13-66 Table 13.5.25 Summary of the Existing Buildings on the Proposed ROW ............................ 13-67 Table 13.7.1 Geometric Design Parameters ............................................................................ 13-71 Table 13.7.2 Comparison of grade separation ........................................................................ 13-72

The Project on Urban Transport Improvement for Kathmandu Valley in Federal Democratic Republic of Nepal Final Report May 2017
xiv
Table 13.7.3 Summary of Construction Cost Estimation for New Baneshwor Underpass ..... 13-75 Table 13.7.4 Total Project Cost .............................................................................................. 13-75 Table 13.7.5 Forecasted Average Road Congestion Ratio, Total Travel Time and Total Travel
Distance by Traffic Assignment ...................................................................................... 13-76 Table 13.7.6 Saturation Degree of New Baneshwor Intersection in 2030 .............................. 13-77 Table 13.7.7 Initial Investment Cost of Expansion Development by Case and by Year ........ 13-78 Table 13.7.8 Operation and Maintenance Cost by Case ......................................................... 13-79 Table 13.7.9 Estimated Cost Saving and Time Saving Benefit .............................................. 13-79 Table 13.7.10 Economic Analysis of Case 2 .......................................................................... 13-80 Table 13.7.11 Economic Analysis of Case 3 .......................................................................... 13-81 Table 13.7.12 Results of Economic Analysis by Case ............................................................ 13-82 Table 13.8.1 Summary of Construction Cost Estimation for Kalimati Flyover (NRs) ........... 13-87 Table 13.8.2 Summary of Construction Cost Estimation for Rebuilding Bishnumati Bridge
(NRs) ................................................................................................................................ 13-88 Table 13.8.3 Project Cost Estimates (NRs) .............................................................................. 13-88 Table 13.8.4 Intersection Saturation Degree of With Case (Kalimati Flyover) ...................... 13-90 Table 13.8.5 Saturation Flow Rate and Normalized Traffic Volume of Kalimati Intersection .. 13-
90
The Project on Urban Transport Improvement for Kathmandu Valley in Federal Democratic Republic of Nepal Final Report May 2017
LOA-1
LIST OF ABBREVIATION
AASHTO-LRFD American Association of State Highway and Transportation Officials
Load and Resistance Factor Design
ADB Asian Development Bank
ADT Average Daily Traffic
AGT Automated Guideway Transit
B/C Benefit/Cost Ratio
BMC Bhaktapur Municipality
BRT Bus Rapid Transit
CAAN Civil Aviation Authority of Nepal
CBD Central Business District
CBS Central Bureau of Statistics
CCNN Climate Change Network Nepal
CDRC Central Disaster Relief Committee
CDRMP Comprehensive Disaster Risk Management Program
CEN Clean Energy Nepal
CO2 Carbon Dioxide
CWG Collective Working Group
DDC District Development Committee
DDG Deputy Director General
DDMP District Disaster Management Plan
DDRC District Disaster Relief Committee
DFID Department of International Development, UK
DG Director General
DLRM Department of Land Reform and Management
DMA Disaster Management Act
DMA Disaster Management Act.
DMG Department of Mines and Geology, MOI
DOA Department of Agriculture, MOAD
DOE Department of Environment, MOSTE
DOF Department of Forest, MOFSC
DOLIDAR Department of Local Infrastructure Development & Agricultural Roads,
MOFALD
DOR Department of Roads, MOPIT
DORW Department of Railways, MOPIT
DOTM Department of Transport Management, MOPIT
DPR Department of Plant Resource, MOFSC
DPR Plan Disaster Preparedness and Response Plan
DTMP District Transport Master Plan
DUDBC Department of Urban Development and Building Construction, MOUD
DWSS Department of Water Supply and Sewerage, MOUD
EIA Environmental Impact Assessment
The Project on Urban Transport Improvement for Kathmandu Valley in Federal Democratic Republic of Nepal Final Report May 2017
LOA-2
EIRR Economic Internal Rate of Returno
ENPHO Environment and Public Health Organization
EOJ Embassy of Japan
ESCAP Economic and Social Commission for Asia and Pacific
ETRN Emergency Transport Network
F/S Feasibility Study
FCB Foreign Co-operation Branch, DOR
FIRR Financial Rate of Return
FNNTE Federation of Nepalese National Transport Entrepreneurs
FR Feeder Road
FRN Feeder Road Major
FRO Feeder Road Minor
FS Feasibility Study
FY Fiscal Year
GDP Gross Domestic Product
GESU Geo-Environmental and Social Unit, DOR
GIS Geographic Information System
GLD Guided Land Development
GNDPRP Guidance Note Disaster Preparedness and Response Planning
GOC Government of China
GOJ Government of Japan
GON Government of Nepal
HCM Highway Capacity Manual
HDM Highway Development and Management Model
HGV Heavy Goods Vehicle
ICD Inland Clearance Depot
ICIMOD International Center for Integrated Mountain Development
ICR Inception Report
IDP Internally Displaced Person
IEE Initial Environmental Examination
IMF International Monetary Fund
IRC Indian Road Congress
IRR Inner Ring Road
JICA Japan International Cooperation Agency
JST JICA Study Team
KMC Kathmandu Metropolitan City
KMRTC Kathmandu Mass Rapid Transit Consortium
KSUTP Kathmandu Sustainable Urban Transport Project
KUKL Kathmandu Upatyaka Khanepani Limited
KUTMP The Project on Urban Transport Improvement for Kathmandu Valley in
Federal Democratic Republic of Nepal
KV Kathmandu Valley
KVBB Kathmandu Valley Building By-laws

The Project on Urban Transport Improvement for Kathmandu Valley in Federal Democratic Republic of Nepal Final Report May 2017
LOA-3
KVDA Kathmandu Valley Development Authority
KVRIP Kathmandu Valley Road Improvement Project
KVTDC Kathmandu Valley Town Development Committee
KVUDPP Kathmandu Valley Urban Development Plan & Programs
KVWSMB Kathmandu Valley Water Supply Management Board
LDRMPG Local Disaster Risk Management Planning Guideline
LHS Left Hand Side
LP Land Pooling Program
LRN Local Road Network
LRT Light Rail Transit
LSGA Local Self Governance Act.
LSMC Lalitpur Sub-metropolitan City
M/P Master Plan
MGV Medium Goods Vehicle
MLIT Ministry of Land, Infrastructure, Transport and Tourism (Japan)
MMI Modified Mercalli Intensity Scale
MOAD Ministry of Agricultural Development
MOCTCA Ministry of Culture, Tourism and Civil Aviation
MOFALD Ministry of Federal Affairs and Local Development
MOFSC Ministry of Forest and Soil Conservation
MOHA Ministry of Home Affairs
MOI Ministry of Industry
MOLD Ministry of Local Development (currently under MOFALD)
MOLE Ministry of Labor and Employment
MOLRM Ministry of Land Reform and Management
MOMG Ministry of Mines and Geology (currently under MOI)
MOPE Ministry of Population and Environment
MOPIT Ministry of Physical Infrastructure and Transport
MOPPW Ministry of Physical Planning and Works (currently under MOPIT)
MOSTE Ministry of Science, Technology and Environment (currently under MOPE)
MOUD Ministry of Urban Development
MRT Mass Rapid Transit
MTPD Metropolitan Traffic Police Department
MWSDB Melamchi Water Supply Development Board
N.A.C. Nepal Airline Corporation
N.P. Nagar Palica (Municipality Office)
NAAQS National Ambient Air Quality Standard
NDC Nepal Disaster Council
NDRF National Disaster Response Framework
NEA Nepal Electricity Authority
NEA Nepal Engineer’s Association
NEFEJ Nepal Forum of Environmental Journalists
NEOC National Emergency Operation Center

The Project on Urban Transport Improvement for Kathmandu Valley in Federal Democratic Republic of Nepal Final Report May 2017
LOA-4
NESC Nepal Water Supply Corporation
NH National Highway
NH National Highway
NHRA Nepal Hazard Risk Assessment
NIETTP Nepal-India Electricity Transmission and Trade Project
NLUP National Land Use Project
NMP Non-motorized Transport
NOx Nitrogen Oxide
NPC National Planning Commission
NPCS Nutrition Promotion and Consultancy Services
NPR Nepal Rupee
NPV Net Present Value
NRRC Nepal Risk Reduction Consortium
NRS Nepal Road Standards
NSC National Seismological Centre
NSDRM National Strategy for Disaster Risk Management
NSET National Society for Earthquake Technology
O&M Operation and Maintenence
OD Origin and Destination
ORR Outer Ring Road
pcu Passenger Car Unit
PD Planned Development
PHPDT Peak Hour Peak Direction Traffic
PID Project Implementation Directorate, MOUD
PIP Priority Investment Plan
PIU Project Implementation Unit
PM10 Particulate Matter 10μm
PRA Public Road Act.
PT Person Trip
Pre-FS Pre-Feasibility Study
QV Quantity - Velocity
R & D Research and Development
RBA Road Board Act.
RBN Road Board Nepal
RC Reinforced Concrete
RD Record of Discussion
RHS Right Hand Side
ROW Right of Way
RR Ring Road
RSA Road Safety Audit
RSLUP Risk Sensitive Land Use Planning
RTA Road Traffic Accidentts
RUC Road User Cost

The Project on Urban Transport Improvement for Kathmandu Valley in Federal Democratic Republic of Nepal Final Report May 2017
LOA-5
RUPSON Regional and Urban Planner’s Society of Nepal
S/C Steering Committee
SAARC South Asian Association for Regional Cooperation
SCAEF Society of Consulting Agricultural and Engineering Firms, Nepal
SCF Standard Conversion Factor
SEA Strategic Environment Assessment
SHM Stakeholder Meeting
SONA Society of Nepalese Architects
SRN Strategic Road Network
SSRN Statistics of Strategic Road Network
T-M Flyover Tripreshwor Maitighar Flyover
TDA Town Development Act.
TDC Town Development Committee
TDF Town Development Fund
TDPIC Town Development Plan Implementation Comittee
TIA Tribhuvan International Airport of Nepal
TOD Transit Oriented Development
TP Trend Pattern
TTC Travel Time Cost
TYIP Three Years Interim Plan
UNDP United Nations Development Programme
UNRSC UN Road Safety Collaboration
VDC Village Development Committee
VOC Vehicle Operating Cost
VT Vehicle Trip
VTMA Vehicle and Transportation Management Act.
VTMR Vehicle and Transportation Management Regulations
W/G Working Group
WB World Bank
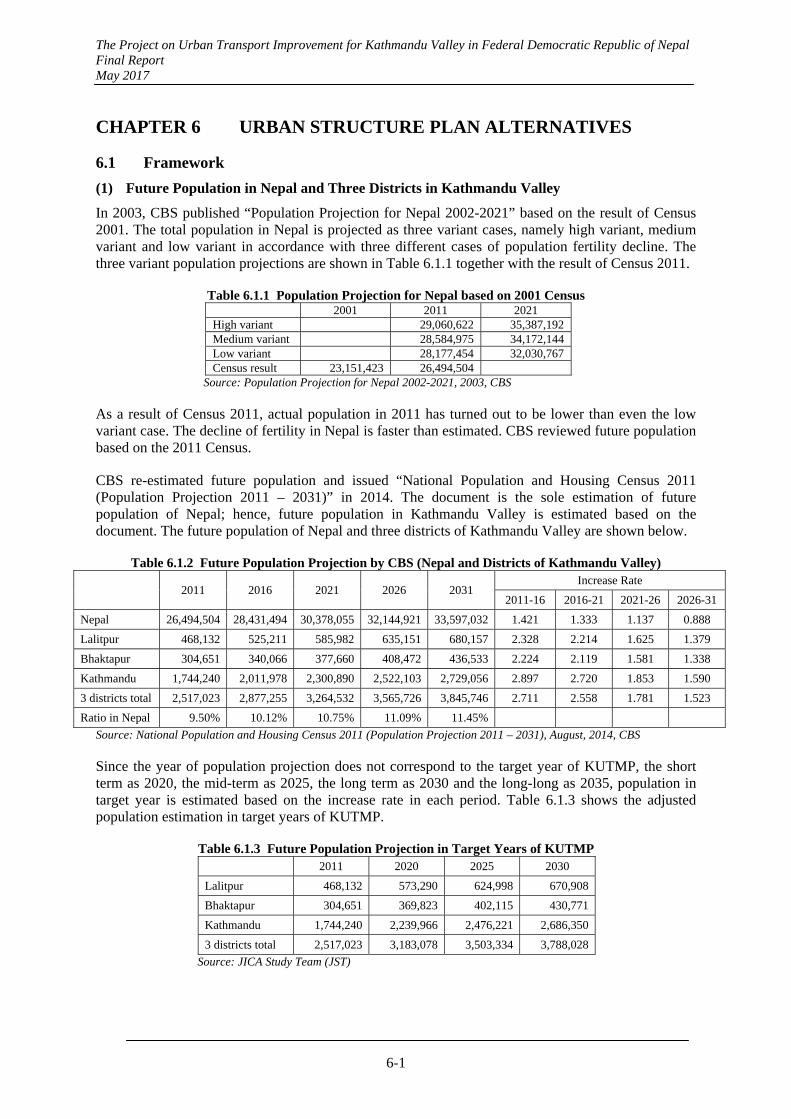
The Project on Urban Transport Improvement for Kathmandu Valley in Federal Democratic Republic of Nepal Final Report May 2017
6-1
CHAPTER 6 URBAN STRUCTURE PLAN ALTERNATIVES
6.1 Framework
(1) Future Population in Nepal and Three Districts in Kathmandu Valley
In 2003, CBS published “Population Projection for Nepal 2002-2021” based on the result of Census 2001. The total population in Nepal is projected as three variant cases, namely high variant, medium variant and low variant in accordance with three different cases of population fertility decline. The three variant population projections are shown in Table 6.1.1 together with the result of Census 2011.
Table 6.1.1 Population Projection for Nepal based on 2001 Census 2001 2011 2021
High variant 29,060,622 35,387,192 Medium variant 28,584,975 34,172,144 Low variant 28,177,454 32,030,767 Census result 23,151,423 26,494,504
Source: Population Projection for Nepal 2002-2021, 2003, CBS
As a result of Census 2011, actual population in 2011 has turned out to be lower than even the low variant case. The decline of fertility in Nepal is faster than estimated. CBS reviewed future population based on the 2011 Census.
CBS re-estimated future population and issued “National Population and Housing Census 2011 (Population Projection 2011 – 2031)” in 2014. The document is the sole estimation of future population of Nepal; hence, future population in Kathmandu Valley is estimated based on the document. The future population of Nepal and three districts of Kathmandu Valley are shown below.
Table 6.1.2 Future Population Projection by CBS (Nepal and Districts of Kathmandu Valley)
2011 2016 2021 2026 2031 Increase Rate
2011-16 2016-21 2021-26 2026-31
Nepal 26,494,504 28,431,494 30,378,055 32,144,921 33,597,032 1.421 1.333 1.137 0.888
Lalitpur 468,132 525,211 585,982 635,151 680,157 2.328 2.214 1.625 1.379
Bhaktapur 304,651 340,066 377,660 408,472 436,533 2.224 2.119 1.581 1.338
Kathmandu 1,744,240 2,011,978 2,300,890 2,522,103 2,729,056 2.897 2.720 1.853 1.590
3 districts total 2,517,023 2,877,255 3,264,532 3,565,726 3,845,746 2.711 2.558 1.781 1.523
Ratio in Nepal 9.50% 10.12% 10.75% 11.09% 11.45%
Source: National Population and Housing Census 2011 (Population Projection 2011 – 2031), August, 2014, CBS
Since the year of population projection does not correspond to the target year of KUTMP, the short term as 2020, the mid-term as 2025, the long term as 2030 and the long-long as 2035, population in target year is estimated based on the increase rate in each period. Table 6.1.3 shows the adjusted population estimation in target years of KUTMP.
Table 6.1.3 Future Population Projection in Target Years of KUTMP 2011 2020 2025 2030
Lalitpur 468,132 573,290 624,998 670,908
Bhaktapur 304,651 369,823 402,115 430,771
Kathmandu 1,744,240 2,239,966 2,476,221 2,686,350
3 districts total 2,517,023 3,183,078 3,503,334 3,788,028
Source: JICA Study Team (JST)
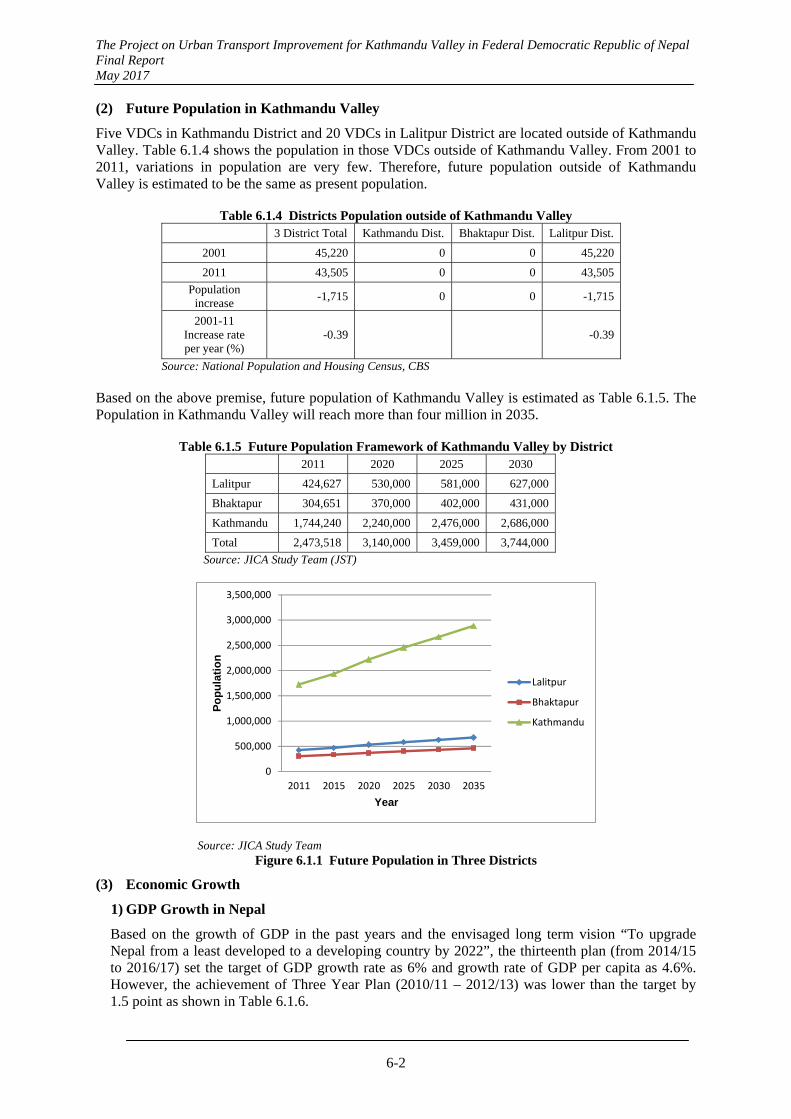
The Project on Urban Transport Improvement for Kathmandu Valley in Federal Democratic Republic of Nepal Final Report May 2017
6-2
(2) Future Population in Kathmandu Valley
Five VDCs in Kathmandu District and 20 VDCs in Lalitpur District are located outside of Kathmandu Valley. Table 6.1.4 shows the population in those VDCs outside of Kathmandu Valley. From 2001 to 2011, variations in population are very few. Therefore, future population outside of Kathmandu Valley is estimated to be the same as present population.
Table 6.1.4 Districts Population outside of Kathmandu Valley 3 District Total Kathmandu Dist. Bhaktapur Dist. Lalitpur Dist.
2001 45,220 0 0 45,220
2011 43,505 0 0 43,505
Population increase
-1,715 0 0 -1,715
2001-11 Increase rate per year (%)
-0.39 -0.39
Source: National Population and Housing Census, CBS
Based on the above premise, future population of Kathmandu Valley is estimated as Table 6.1.5. The Population in Kathmandu Valley will reach more than four million in 2035.
Table 6.1.5 Future Population Framework of Kathmandu Valley by District 2011 2020 2025 2030
Lalitpur 424,627 530,000 581,000 627,000
Bhaktapur 304,651 370,000 402,000 431,000
Kathmandu 1,744,240 2,240,000 2,476,000 2,686,000
Total 2,473,518 3,140,000 3,459,000 3,744,000
Source: JICA Study Team (JST)
0
500,000
1,000,000
1,500,000
2,000,000
2,500,000
3,000,000
3,500,000
2011 2015 2020 2025 2030 2035
Po
pu
lati
on
Year
Lalitpur
Bhaktapur
Kathmandu
Source: JICA Study Team Figure 6.1.1 Future Population in Three Districts
(3) Economic Growth
1) GDP Growth in Nepal
Based on the growth of GDP in the past years and the envisaged long term vision “To upgrade Nepal from a least developed to a developing country by 2022”, the thirteenth plan (from 2014/15 to 2016/17) set the target of GDP growth rate as 6% and growth rate of GDP per capita as 4.6%. However, the achievement of Three Year Plan (2010/11 – 2012/13) was lower than the target by 1.5 point as shown in Table 6.1.6.
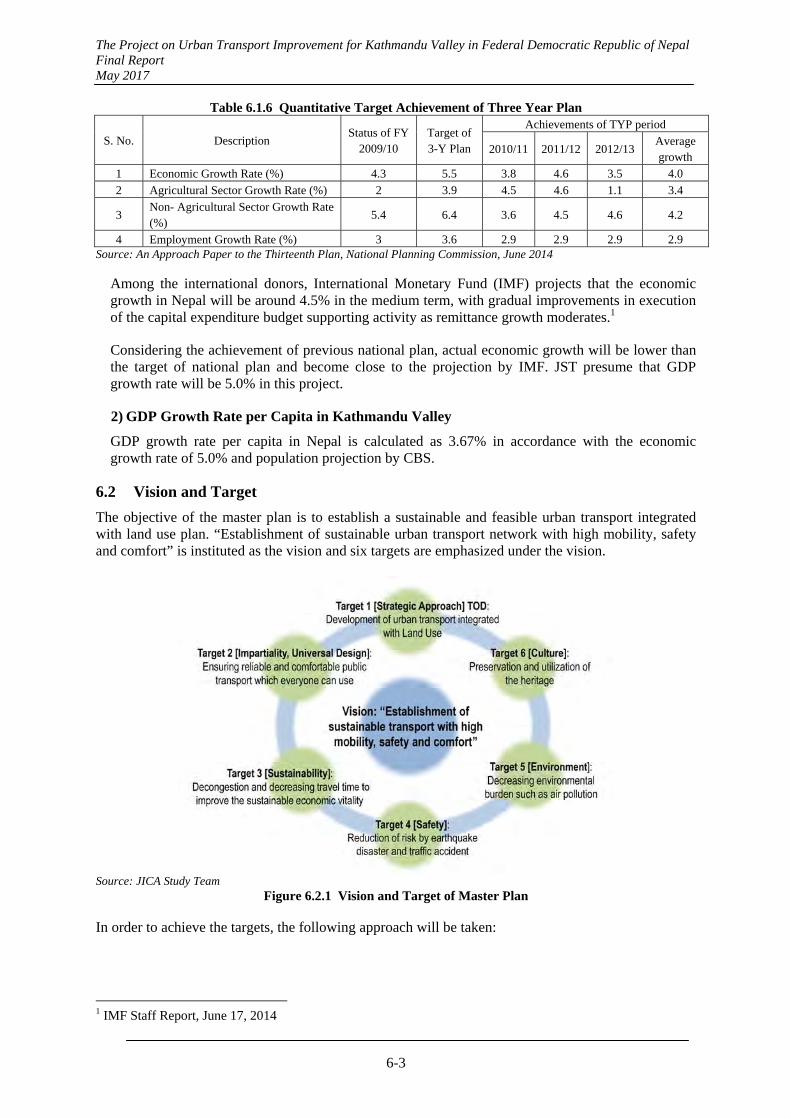
The Project on Urban Transport Improvement for Kathmandu Valley in Federal Democratic Republic of Nepal Final Report May 2017
6-3
Table 6.1.6 Quantitative Target Achievement of Three Year Plan
S. No. Description Status of FY
2009/10 Target of 3-Y Plan
Achievements of TYP period
2010/11 2011/12 2012/13 Average growth
1 Economic Growth Rate (%) 4.3 5.5 3.8 4.6 3.5 4.0
2 Agricultural Sector Growth Rate (%) 2 3.9 4.5 4.6 1.1 3.4
3 Non- Agricultural Sector Growth Rate (%)
5.4 6.4 3.6 4.5 4.6 4.2
4 Employment Growth Rate (%) 3 3.6 2.9 2.9 2.9 2.9 Source: An Approach Paper to the Thirteenth Plan, National Planning Commission, June 2014
Among the international donors, International Monetary Fund (IMF) projects that the economic growth in Nepal will be around 4.5% in the medium term, with gradual improvements in execution of the capital expenditure budget supporting activity as remittance growth moderates.1
Considering the achievement of previous national plan, actual economic growth will be lower than the target of national plan and become close to the projection by IMF. JST presume that GDP growth rate will be 5.0% in this project.
2) GDP Growth Rate per Capita in Kathmandu Valley
GDP growth rate per capita in Nepal is calculated as 3.67% in accordance with the economic growth rate of 5.0% and population projection by CBS.
6.2 Vision and Target
The objective of the master plan is to establish a sustainable and feasible urban transport integrated with land use plan. “Establishment of sustainable urban transport network with high mobility, safety and comfort” is instituted as the vision and six targets are emphasized under the vision.
Source: JICA Study Team
Figure 6.2.1 Vision and Target of Master Plan
In order to achieve the targets, the following approach will be taken:
1 IMF Staff Report, June 17, 2014
The Project on Urban Transport Improvement for Kathmandu Valley in Federal Democratic Republic of Nepal Final Report May 2017
6-4
(1) Strategic approach
Urban Transport Master Plan for the Kathmandu Valley should be implemented as a strategic Transport Oriented Development (TOD) approach both in the new town areas or suburbs and in the existing urban areas inside the Ring Road. The development and redevelopment should be promoted with appropriate transport infrastructure provisions associated with land use planning.
In addition, the master plan is implemented along a staging plan consisting of short, middle and long term plans. In particular, in the phased strategy the target of each stage should be clear and be attained by possible and practical measures.
(2) Sustainability
Sustainability is used as the key concept for every city in the world. In the Kathmandu Valley, particularly the following viewpoints should be emphasized.
- Social, economic and environmental sustainability is dependent greatly on the proper public transport system which everybody can use safely, conveniently, comfortably and environmentally-friendly.
- One of the key points in order to achieve a kind of sustainable transport system in the Kathmandu Valley, trip length should be shorter suitable for walking and bicycle. Therefore it is necessary to maintain compact urban form as much as possible and prevent urban sprawl and disorderly expansion in the suburbs.
- Another key point is the traffic management. It takes a long time to provide infrastructure and new towns. The traffic management can be applied within a short time. The traffic management tries to improve the traffic movement by utilizing as much as possible both possible supply-side and demand-side measures consisting of a variety of traffic flow regulations, traffic signal control, parking fare control, taxation for cars, car free areas for historical sites and so on. Although this master plan is focused on policy direction and long term plan, it is necessary to conduct the traffic management schemes continuously from the present to the future sustainable region.
(3) Impartiality, Universal Design
In general urban transport system should provide the opportunities for all the people including mobility impaired people such as disabled, children, older people, women, people without car or motorcycle ownership, low income people and the unemployed, to participate in the social, economic and cultural activities. In this regard, public transport has a great role to play in the provision of appropriate transport services with affordable different fares for people and priority seats. Furthermore feeder, urban and village roads should be linked well with the national road network for people living in remote places for access to bus routes, schools and hospitals
In addition, urban transport infrastructure for urban transport modes such as walking, bicycles, motorcycles, small-sized buses, large buses and aeroplanes, should be well integrated and well organized for better use by every person.
(4) Safety
Earthquake disasters and traffic accidents should be dealt with to reduce their severity. Emergency and evacuation road networks for earthquakes should be planned in combination with road network provision for improving congestion and reducing traffic accidents.
(5) Environment
Air pollution is the most related environmental issue with traffic condition. In the Kathmandu Valley, road congestion, exhaust gas from old vehicles and dust particles from unpaved roads are the main causes of air pollution from the transport sector. Air pollution leads to health complications and is a barrier to walking. If the transport management is improved, air pollution would be improved. If not
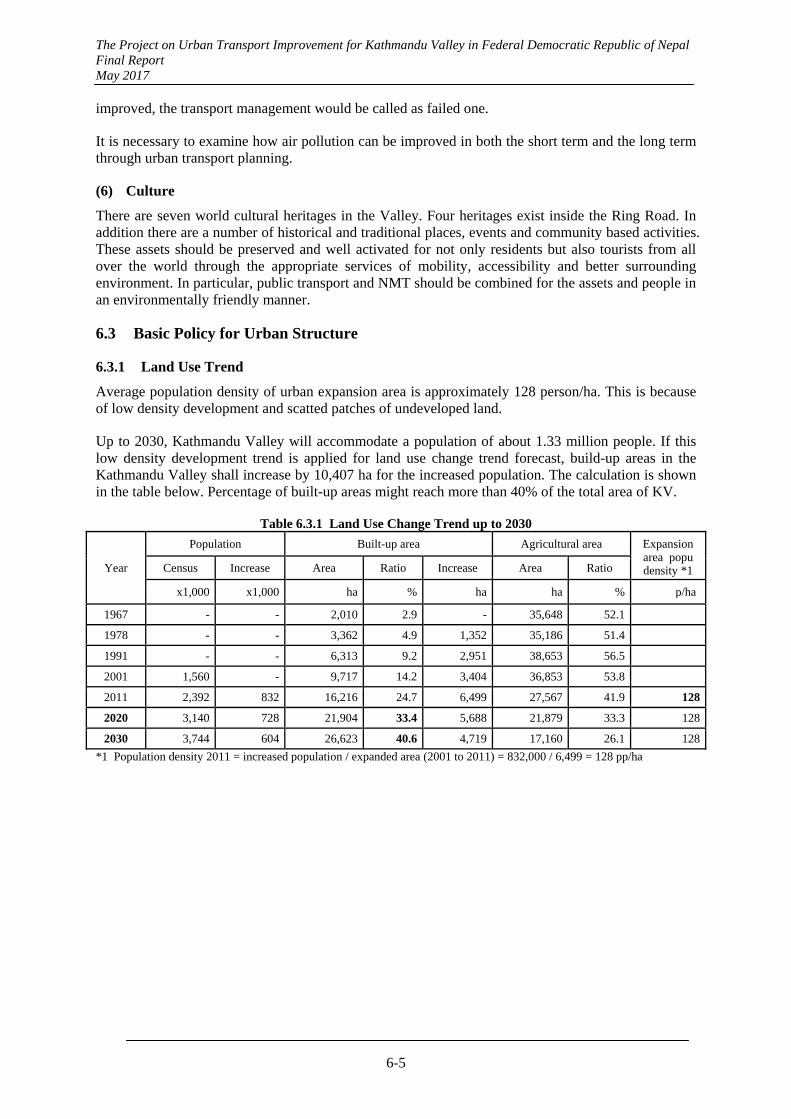
The Project on Urban Transport Improvement for Kathmandu Valley in Federal Democratic Republic of Nepal Final Report May 2017
6-5
improved, the transport management would be called as failed one.
It is necessary to examine how air pollution can be improved in both the short term and the long term through urban transport planning.
(6) Culture
There are seven world cultural heritages in the Valley. Four heritages exist inside the Ring Road. In addition there are a number of historical and traditional places, events and community based activities. These assets should be preserved and well activated for not only residents but also tourists from all over the world through the appropriate services of mobility, accessibility and better surrounding environment. In particular, public transport and NMT should be combined for the assets and people in an environmentally friendly manner.
6.3 Basic Policy for Urban Structure
6.3.1 Land Use Trend
Average population density of urban expansion area is approximately 128 person/ha. This is because of low density development and scatted patches of undeveloped land.
Up to 2030, Kathmandu Valley will accommodate a population of about 1.33 million people. If this low density development trend is applied for land use change trend forecast, build-up areas in the Kathmandu Valley shall increase by 10,407 ha for the increased population. The calculation is shown in the table below. Percentage of built-up areas might reach more than 40% of the total area of KV.
Table 6.3.1 Land Use Change Trend up to 2030
Year
Population Built-up area Agricultural area Expansion area popu density *1Census Increase Area Ratio Increase Area Ratio
x1,000 x1,000 ha % ha ha % p/ha
1967 - - 2,010 2.9 - 35,648 52.1
1978 - - 3,362 4.9 1,352 35,186 51.4
1991 - - 6,313 9.2 2,951 38,653 56.5
2001 1,560 - 9,717 14.2 3,404 36,853 53.8
2011 2,392 832 16,216 24.7 6,499 27,567 41.9 128
2020 3,140 728 21,904 33.4 5,688 21,879 33.3 128
2030 3,744 604 26,623 40.6 4,719 17,160 26.1 128
*1 Population density 2011 = increased population / expanded area (2001 to 2011) = 832,000 / 6,499 = 128 pp/ha
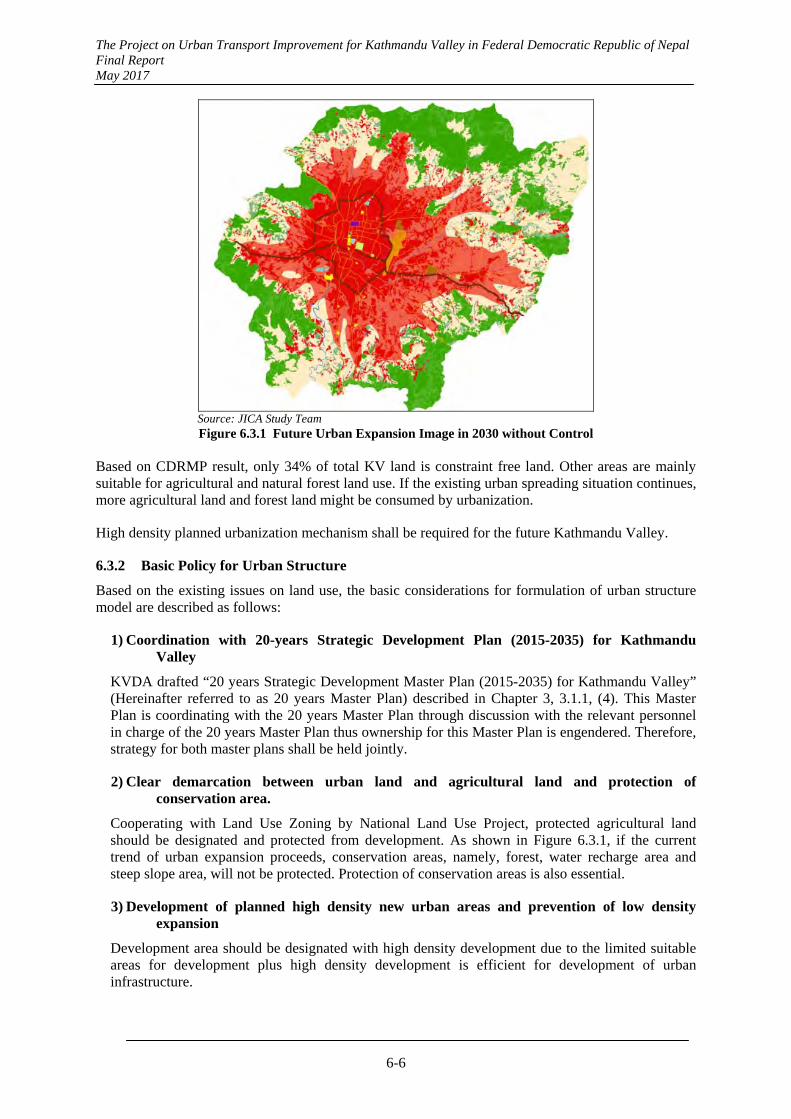
The Project on Urban Transport Improvement for Kathmandu Valley in Federal Democratic Republic of Nepal Final Report May 2017
6-6
Source: JICA Study Team Figure 6.3.1 Future Urban Expansion Image in 2030 without Control
Based on CDRMP result, only 34% of total KV land is constraint free land. Other areas are mainly suitable for agricultural and natural forest land use. If the existing urban spreading situation continues, more agricultural land and forest land might be consumed by urbanization.
High density planned urbanization mechanism shall be required for the future Kathmandu Valley.
6.3.2 Basic Policy for Urban Structure
Based on the existing issues on land use, the basic considerations for formulation of urban structure model are described as follows:
1) Coordination with 20-years Strategic Development Plan (2015-2035) for Kathmandu Valley
KVDA drafted “20 years Strategic Development Master Plan (2015-2035) for Kathmandu Valley” (Hereinafter referred to as 20 years Master Plan) described in Chapter 3, 3.1.1, (4). This Master Plan is coordinating with the 20 years Master Plan through discussion with the relevant personnel in charge of the 20 years Master Plan thus ownership for this Master Plan is engendered. Therefore, strategy for both master plans shall be held jointly.
2) Clear demarcation between urban land and agricultural land and protection of conservation area.
Cooperating with Land Use Zoning by National Land Use Project, protected agricultural land should be designated and protected from development. As shown in Figure 6.3.1, if the current trend of urban expansion proceeds, conservation areas, namely, forest, water recharge area and steep slope area, will not be protected. Protection of conservation areas is also essential.
3) Development of planned high density new urban areas and prevention of low density expansion
Development area should be designated with high density development due to the limited suitable areas for development plus high density development is efficient for development of urban infrastructure.
The Project on Urban Transport Improvement for Kathmandu Valley in Federal Democratic Republic of Nepal Final Report May 2017
6-7
4) Decentralization of urban function in the Valley
To ease concentrated urban function in Kathmandu, certain urban functions, such as government offices or education facilities, shall be relocated to outside of Kathmandu municipality area.
Existing central commercial area in Kathmandu from Durbar Square via Indrachowk to Thamel is not only the commercial center of Kathmandu Valley, but the commercial center of neighboring districts. The bustle and vitality of the area are a great attraction of Kathmandu Valley together with the world heritage sites, so the townscape and commercial function shall be maintained. Commercial function of sub-centers is to cover the commercial demand of the new urban area.
5) Creation of sub-centers in new developed urban area
In the new developed urban area, sub-centers are required for the civic service to the residents. Sub-centers will be prepared for relocating functions from the city center, thus traffic volume to city center can be decreased.
6) Transit Oriented Development (TOD)
Together with the public transportation system development, new towns shall be developed to maximize access to public transport. TOD neighborhoods have a center with a transit station or terminal surrounded by highly dense population.
7) Strengthening Disaster Preventive Development
Based on the result of CDRMP, development area should be located away from high disaster risk areas. Possible urban areas are described in below.
8) Strengthening transportation network with public transport system
Weak transportation network is the main problem in KV. Installation of public mass transit system is the key for KV development.
9) Diversion of radial road network system to radial-circumferential road network system
Existing road network in KV is mainly radial road network system except for Ring Road. This system causes traffic concentration into city center. Therefore diversion of existing network system to radial-circumferential network is crucial. Especially connecting all the links of Inner Ring Road is highly beneficial.
10) Development of arterial corridor connecting urban areas
To maintain the economic activity and livability of new urban areas, transport corridor connecting new urban areas and sub-centers to existing urban areas is needed.
6.4 Formulation of Urban Structure Alternative
6.4.1 Possible Urbanization Area
As a result of CDRMP, several land constraint areas are designated to avoid urban development. Land constraint maps are shown Figure 6.4.1 below.
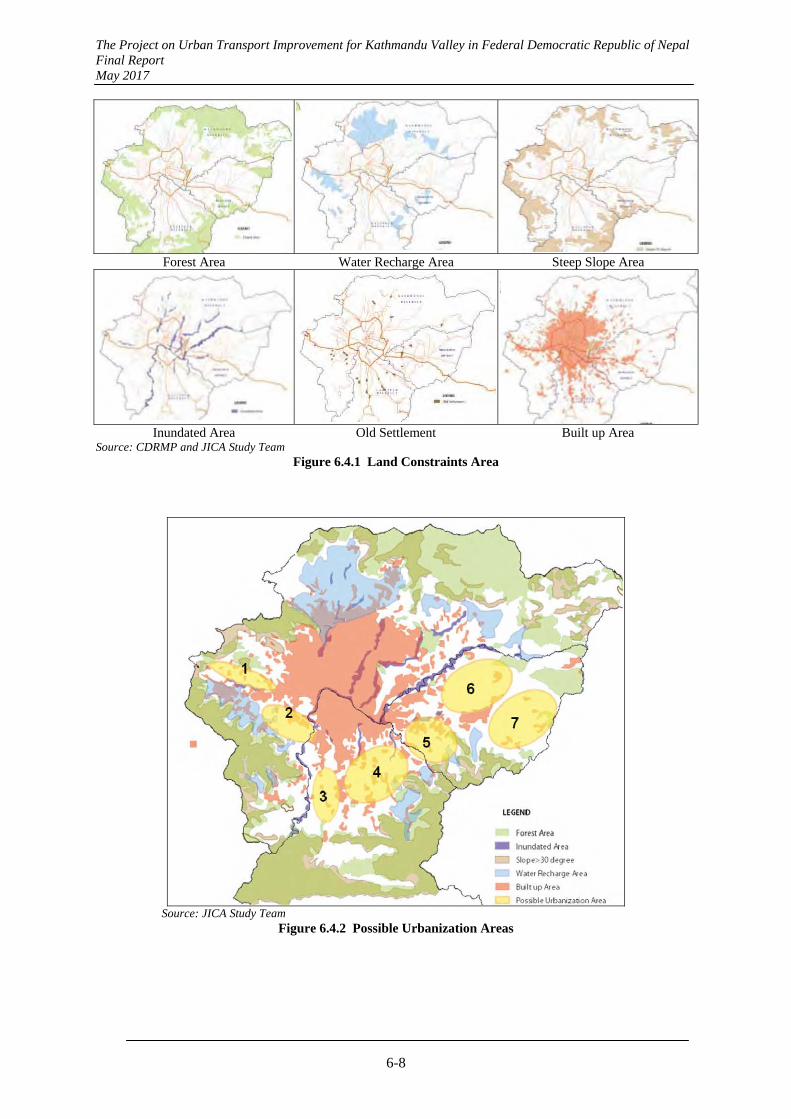
The Project on Urban Transport Improvement for Kathmandu Valley in Federal Democratic Republic of Nepal Final Report May 2017
6-8
Forest Area Water Recharge Area Steep Slope Area
Inundated Area Old Settlement Built up Area Source: CDRMP and JICA Study Team
Figure 6.4.1 Land Constraints Area
Source: JICA Study Team
Figure 6.4.2 Possible Urbanization Areas
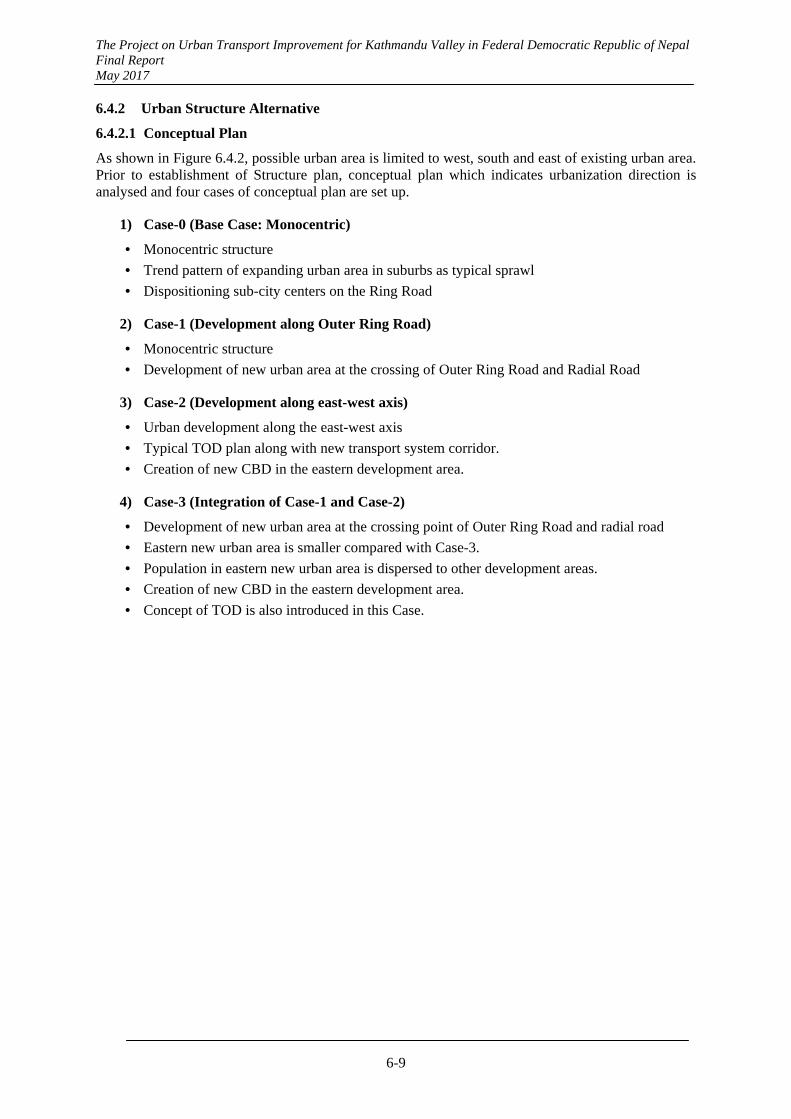
The Project on Urban Transport Improvement for Kathmandu Valley in Federal Democratic Republic of Nepal Final Report May 2017
6-9
6.4.2 Urban Structure Alternative
6.4.2.1 Conceptual Plan
As shown in Figure 6.4.2, possible urban area is limited to west, south and east of existing urban area. Prior to establishment of Structure plan, conceptual plan which indicates urbanization direction is analysed and four cases of conceptual plan are set up.
1) Case-0 (Base Case: Monocentric)
• Monocentric structure
• Trend pattern of expanding urban area in suburbs as typical sprawl
• Dispositioning sub-city centers on the Ring Road
2) Case-1 (Development along Outer Ring Road)
• Monocentric structure
• Development of new urban area at the crossing of Outer Ring Road and Radial Road
3) Case-2 (Development along east-west axis)
• Urban development along the east-west axis
• Typical TOD plan along with new transport system corridor.
• Creation of new CBD in the eastern development area.
4) Case-3 (Integration of Case-1 and Case-2)
• Development of new urban area at the crossing point of Outer Ring Road and radial road
• Eastern new urban area is smaller compared with Case-3.
• Population in eastern new urban area is dispersed to other development areas.
• Creation of new CBD in the eastern development area.
• Concept of TOD is also introduced in this Case.

The Project on Urban Transport Improvement for Kathmandu Valley in Federal Democratic Republic of Nepal Final Report May 2017
6-10
Case-0 Case-1
Case-2 Case-3
Source: JICA Study Team Figure 6.4.3 Conceptual Plan Alternative Case
6.4.2.2 Structure Plan Alternatives
(1) Case-0 (Base Case: Monocentric)
1) Land Use
• Existing city center of KV continues as the sole Center of whole area.
• Urban area extends along the major radial road showing the shape of sprawl.
• Sub-city centers are distributed at the cross point on the Ring Road and radial road.
2) Road Network
• All the route of Outer Ring Road is developed.
• Inner Ring Road is developed and Ring Road is strengthened.
• Radial roads connecting sub-centres to existing city center are strengthened.
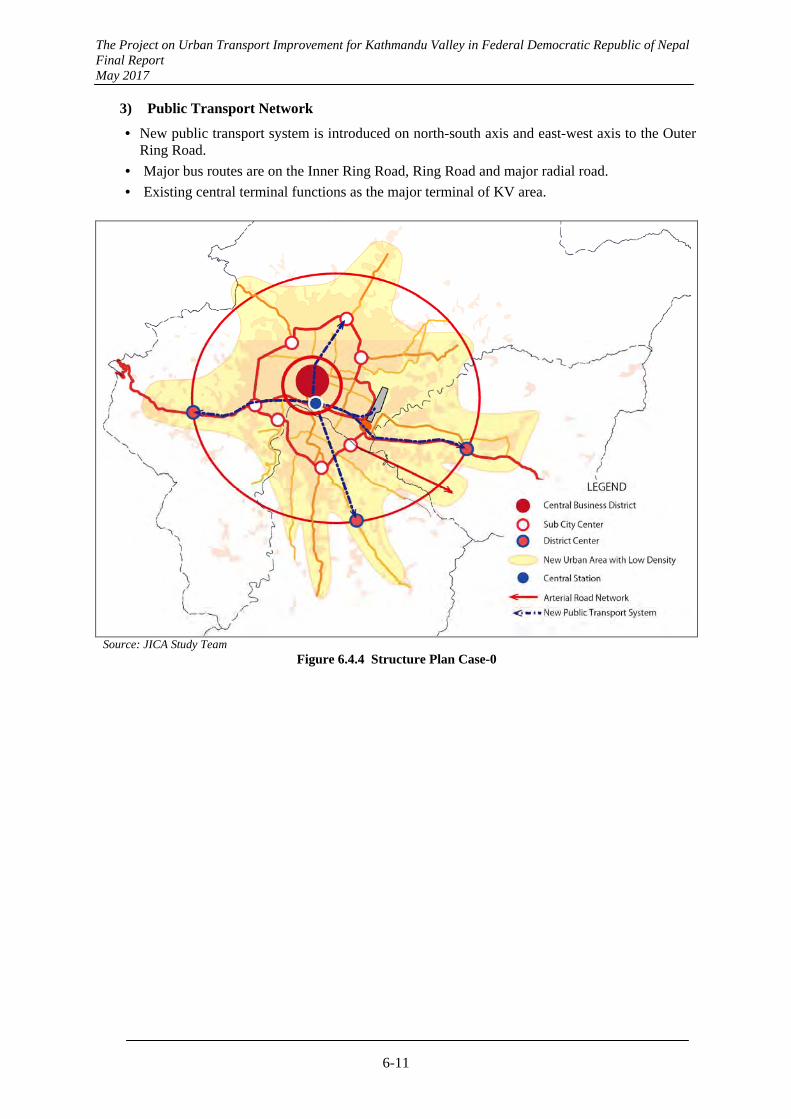
The Project on Urban Transport Improvement for Kathmandu Valley in Federal Democratic Republic of Nepal Final Report May 2017
6-11
3) Public Transport Network
• New public transport system is introduced on north-south axis and east-west axis to the Outer Ring Road.
• Major bus routes are on the Inner Ring Road, Ring Road and major radial road.
• Existing central terminal functions as the major terminal of KV area.
Source: JICA Study Team Figure 6.4.4 Structure Plan Case-0
The Project on Urban Transport Improvement for Kathmandu Valley in Federal Democratic Republic of Nepal Final Report May 2017
6-12
(2) Case-1 (Development along Outer Ring Road)
1) Land Use
• Existing city center of KV continues as the sole Center of whole area.
• Improving Trend pattern by building new towns with high density along the Outer Ring Road in the suburbs.
• Sub-city centers are distributed to new urban areas at the cross point on the Ring Road and radial roads.
2) Road Network
• Northern part of Outer Ring Road is not developed to protect the conservation area.
• Inner Ring Road is developed and Ring Road is strengthened.
• Radial roads connecting new urban area are strengthened.
3) Public Transport Network
• New public transport system is introduced on north-south axis and east-west axis to the Outer Ring Road. East end of new public transport is extended to new urban area.
• Major bus routes are on the Inner Ring Road, Ring Road and major radial roads.
• Existing central terminal functions as the major terminal of KV area. • New bus terminals are distributed to the sub-centers in new urban area.
Source: JICA Study Team Figure 6.4.5 Structure Plan Case-1
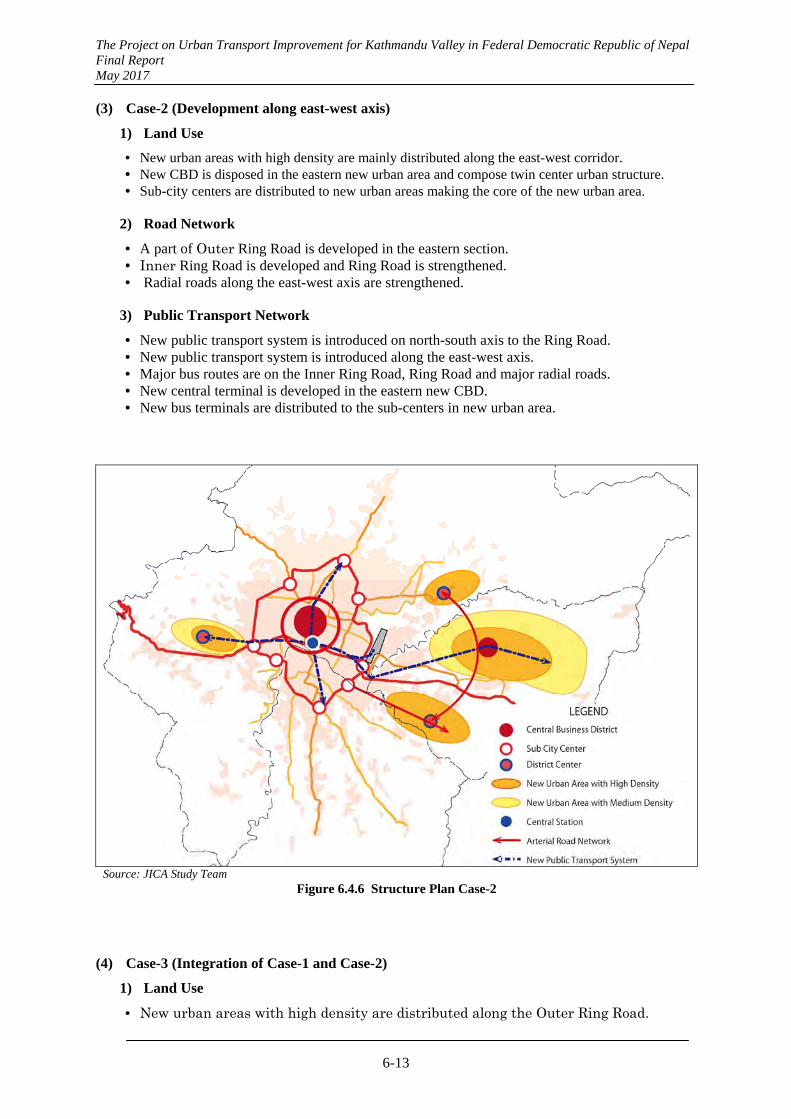
The Project on Urban Transport Improvement for Kathmandu Valley in Federal Democratic Republic of Nepal Final Report May 2017
6-13
(3) Case-2 (Development along east-west axis)
1) Land Use
• New urban areas with high density are mainly distributed along the east-west corridor. • New CBD is disposed in the eastern new urban area and compose twin center urban structure. • Sub-city centers are distributed to new urban areas making the core of the new urban area.
2) Road Network
• A part of Outer Ring Road is developed in the eastern section. • Inner Ring Road is developed and Ring Road is strengthened. • Radial roads along the east-west axis are strengthened.
3) Public Transport Network
• New public transport system is introduced on north-south axis to the Ring Road. • New public transport system is introduced along the east-west axis. • Major bus routes are on the Inner Ring Road, Ring Road and major radial roads. • New central terminal is developed in the eastern new CBD. • New bus terminals are distributed to the sub-centers in new urban area.
Source: JICA Study Team Figure 6.4.6 Structure Plan Case-2
(4) Case-3 (Integration of Case-1 and Case-2)
1) Land Use
• New urban areas with high density are distributed along the Outer Ring Road.
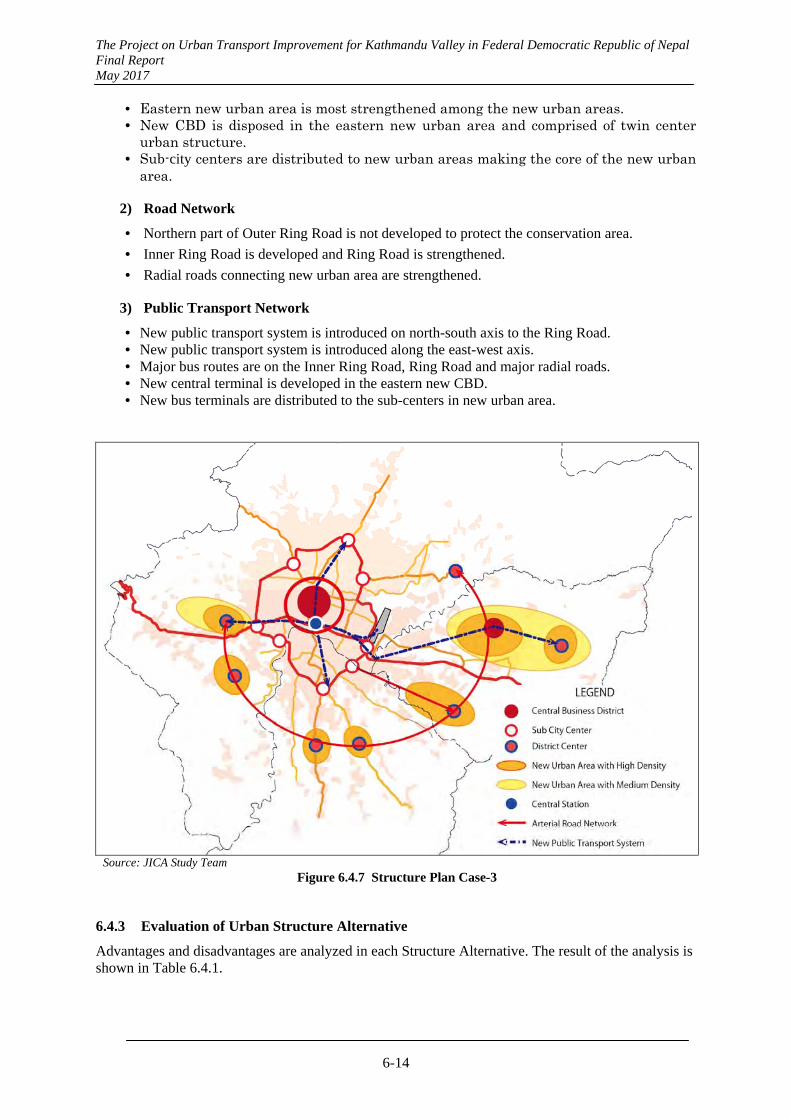
The Project on Urban Transport Improvement for Kathmandu Valley in Federal Democratic Republic of Nepal Final Report May 2017
6-14
• Eastern new urban area is most strengthened among the new urban areas. • New CBD is disposed in the eastern new urban area and comprised of twin center
urban structure. • Sub-city centers are distributed to new urban areas making the core of the new urban
area.
2) Road Network
• Northern part of Outer Ring Road is not developed to protect the conservation area.
• Inner Ring Road is developed and Ring Road is strengthened.
• Radial roads connecting new urban area are strengthened.
3) Public Transport Network
• New public transport system is introduced on north-south axis to the Ring Road. • New public transport system is introduced along the east-west axis. • Major bus routes are on the Inner Ring Road, Ring Road and major radial roads. • New central terminal is developed in the eastern new CBD. • New bus terminals are distributed to the sub-centers in new urban area.
Source: JICA Study Team Figure 6.4.7 Structure Plan Case-3
6.4.3 Evaluation of Urban Structure Alternative
Advantages and disadvantages are analyzed in each Structure Alternative. The result of the analysis is shown in Table 6.4.1.
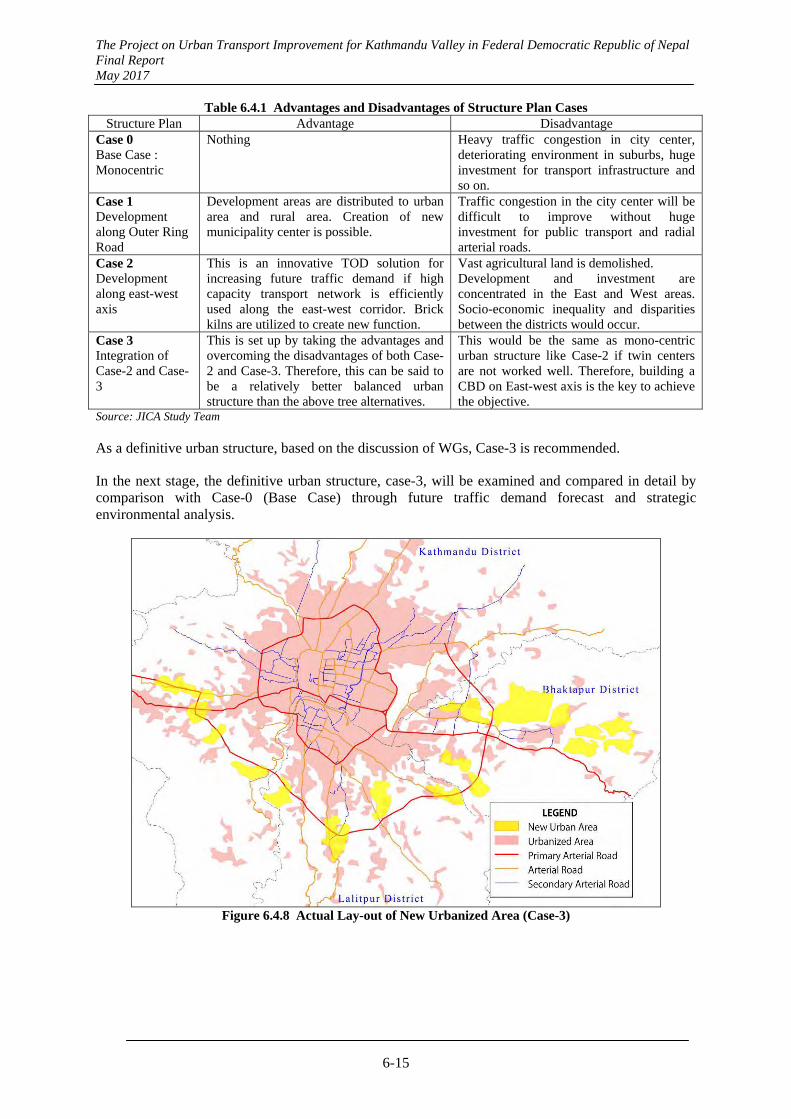
The Project on Urban Transport Improvement for Kathmandu Valley in Federal Democratic Republic of Nepal Final Report May 2017
6-15
Table 6.4.1 Advantages and Disadvantages of Structure Plan Cases Structure Plan Advantage Disadvantage
Case 0 Base Case : Monocentric
Nothing Heavy traffic congestion in city center, deteriorating environment in suburbs, huge investment for transport infrastructure and so on.
Case 1 Development along Outer Ring Road
Development areas are distributed to urban area and rural area. Creation of new municipality center is possible.
Traffic congestion in the city center will be difficult to improve without huge investment for public transport and radial arterial roads.
Case 2 Development along east-west axis
This is an innovative TOD solution for increasing future traffic demand if high capacity transport network is efficiently used along the east-west corridor. Brick kilns are utilized to create new function.
Vast agricultural land is demolished. Development and investment are concentrated in the East and West areas. Socio-economic inequality and disparities between the districts would occur.
Case 3 Integration of Case-2 and Case-3
This is set up by taking the advantages and overcoming the disadvantages of both Case-2 and Case-3. Therefore, this can be said to be a relatively better balanced urban structure than the above tree alternatives.
This would be the same as mono-centric urban structure like Case-2 if twin centers are not worked well. Therefore, building a CBD on East-west axis is the key to achieve the objective.
Source: JICA Study Team
As a definitive urban structure, based on the discussion of WGs, Case-3 is recommended.
In the next stage, the definitive urban structure, case-3, will be examined and compared in detail by comparison with Case-0 (Base Case) through future traffic demand forecast and strategic environmental analysis.
Figure 6.4.8 Actual Lay-out of New Urbanized Area (Case-3)
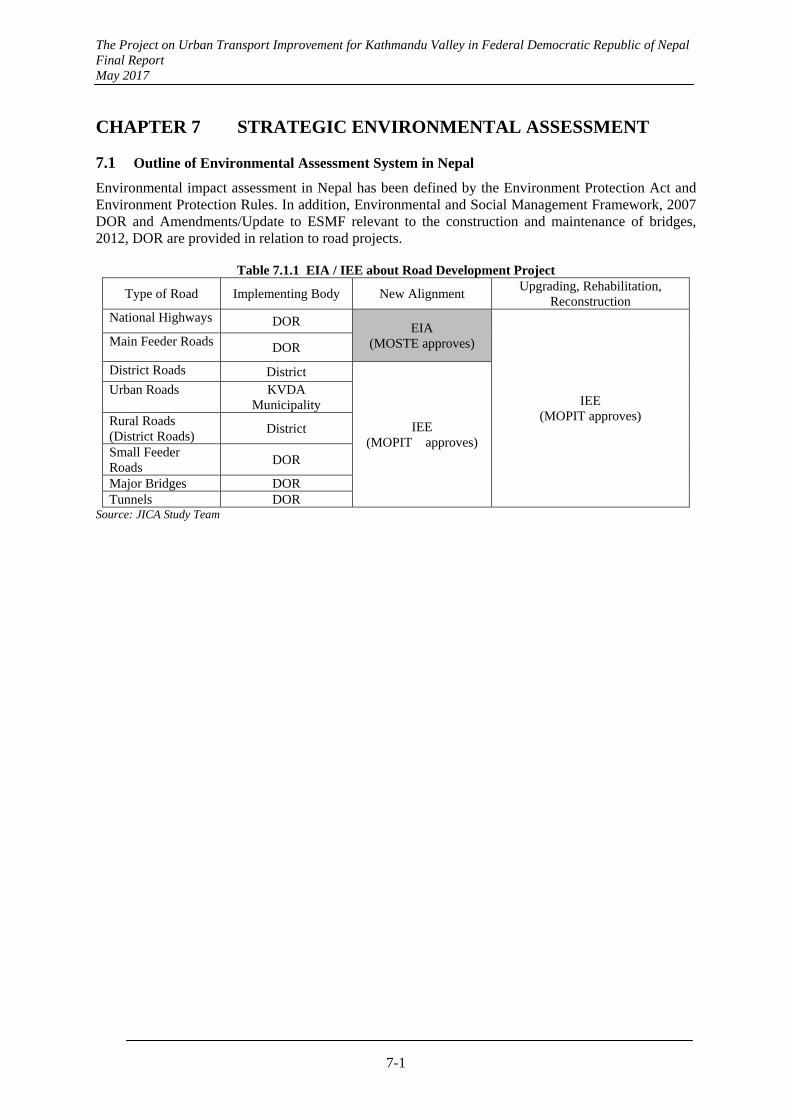
The Project on Urban Transport Improvement for Kathmandu Valley in Federal Democratic Republic of Nepal Final Report May 2017
7-1
CHAPTER 7 STRATEGIC ENVIRONMENTAL ASSESSMENT
7.1 Outline of Environmental Assessment System in Nepal
Environmental impact assessment in Nepal has been defined by the Environment Protection Act and Environment Protection Rules. In addition, Environmental and Social Management Framework, 2007 DOR and Amendments/Update to ESMF relevant to the construction and maintenance of bridges, 2012, DOR are provided in relation to road projects.
Table 7.1.1 EIA / IEE about Road Development Project
Type of Road Implementing Body New Alignment Upgrading, Rehabilitation,
Reconstruction National Highways DOR EIA
(MOSTE approves)
IEE (MOPIT approves)
Main Feeder Roads DOR
District Roads District
IEE (MOPIT approves)
Urban Roads KVDA Municipality
Rural Roads (District Roads)
District
Small Feeder Roads
DOR
Major Bridges DOR Tunnels DOR
Source: JICA Study Team
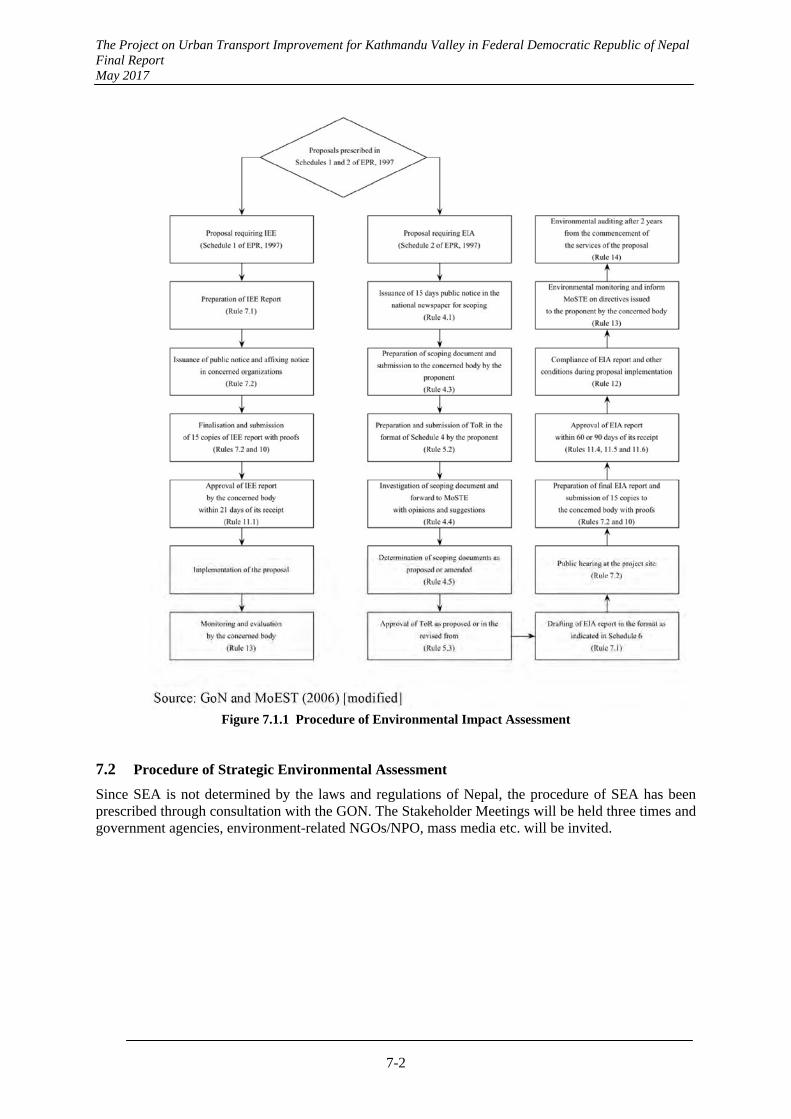
The Project on Urban Transport Improvement for Kathmandu Valley in Federal Democratic Republic of Nepal Final Report May 2017
7-2
Figure 1.9 Procedure of EIA/IEE
Figure 7.1.1 Procedure of Environmental Impact Assessment
7.2 Procedure of Strategic Environmental Assessment
Since SEA is not determined by the laws and regulations of Nepal, the procedure of SEA has been prescribed through consultation with the GON. The Stakeholder Meetings will be held three times and government agencies, environment-related NGOs/NPO, mass media etc. will be invited.
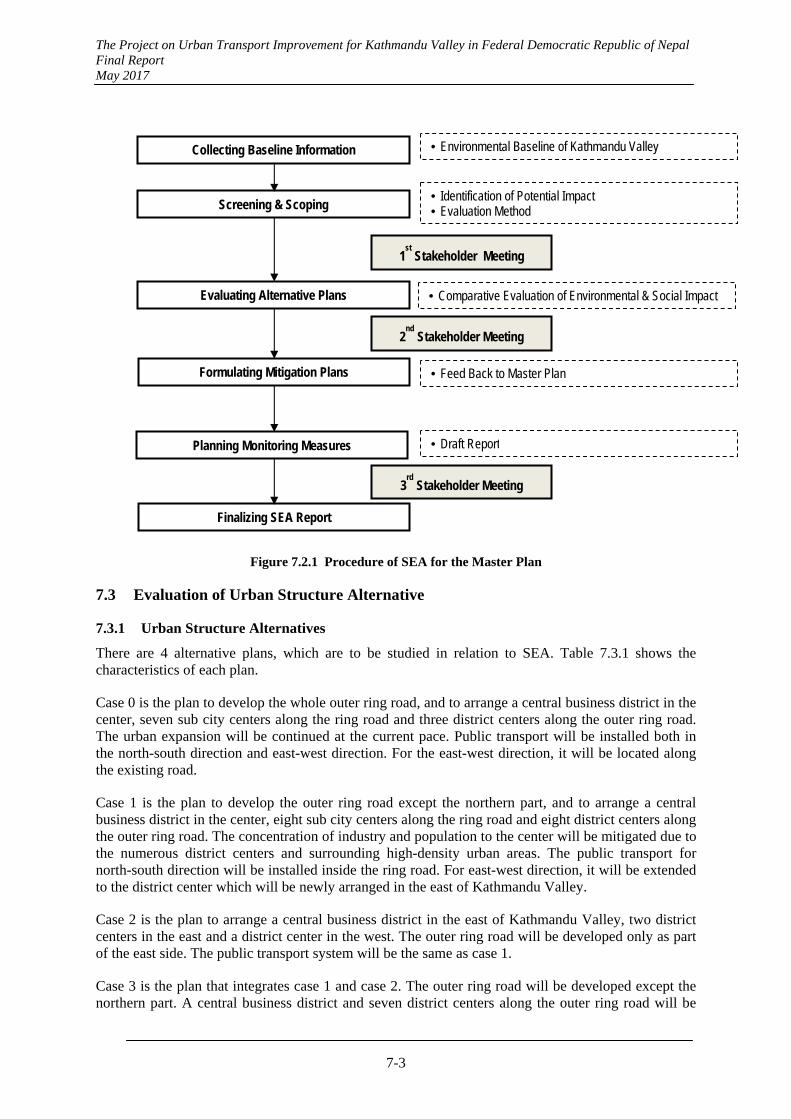
The Project on Urban Transport Improvement for Kathmandu Valley in Federal Democratic Republic of Nepal Final Report May 2017
7-3
Figure 7.2.1 Procedure of SEA for the Master Plan
7.3 Evaluation of Urban Structure Alternative
7.3.1 Urban Structure Alternatives
There are 4 alternative plans, which are to be studied in relation to SEA. Table 7.3.1 shows the characteristics of each plan.
Case 0 is the plan to develop the whole outer ring road, and to arrange a central business district in the center, seven sub city centers along the ring road and three district centers along the outer ring road. The urban expansion will be continued at the current pace. Public transport will be installed both in the north-south direction and east-west direction. For the east-west direction, it will be located along the existing road.
Case 1 is the plan to develop the outer ring road except the northern part, and to arrange a central business district in the center, eight sub city centers along the ring road and eight district centers along the outer ring road. The concentration of industry and population to the center will be mitigated due to the numerous district centers and surrounding high-density urban areas. The public transport for north-south direction will be installed inside the ring road. For east-west direction, it will be extended to the district center which will be newly arranged in the east of Kathmandu Valley.
Case 2 is the plan to arrange a central business district in the east of Kathmandu Valley, two district centers in the east and a district center in the west. The outer ring road will be developed only as part of the east side. The public transport system will be the same as case 1.
Case 3 is the plan that integrates case 1 and case 2. The outer ring road will be developed except the northern part. A central business district and seven district centers along the outer ring road will be
Collecting Baseline Information
Screening & Scoping
Evaluating Alternative Plans
Formulating Mitigation Plans
Planning Monitoring Measures
• Environmental Baseline of Kathmandu Valley
• Identification of Potential Impact • Evaluation Method
• Comparative Evaluation of Environmental & Social Impact
• Feed Back to Master Plan
• Draft Report
1st
Stakeholder Meeting
2nd
Stakeholder Meeting
3rd
Stakeholder Meeting
Finalizing SEA Report
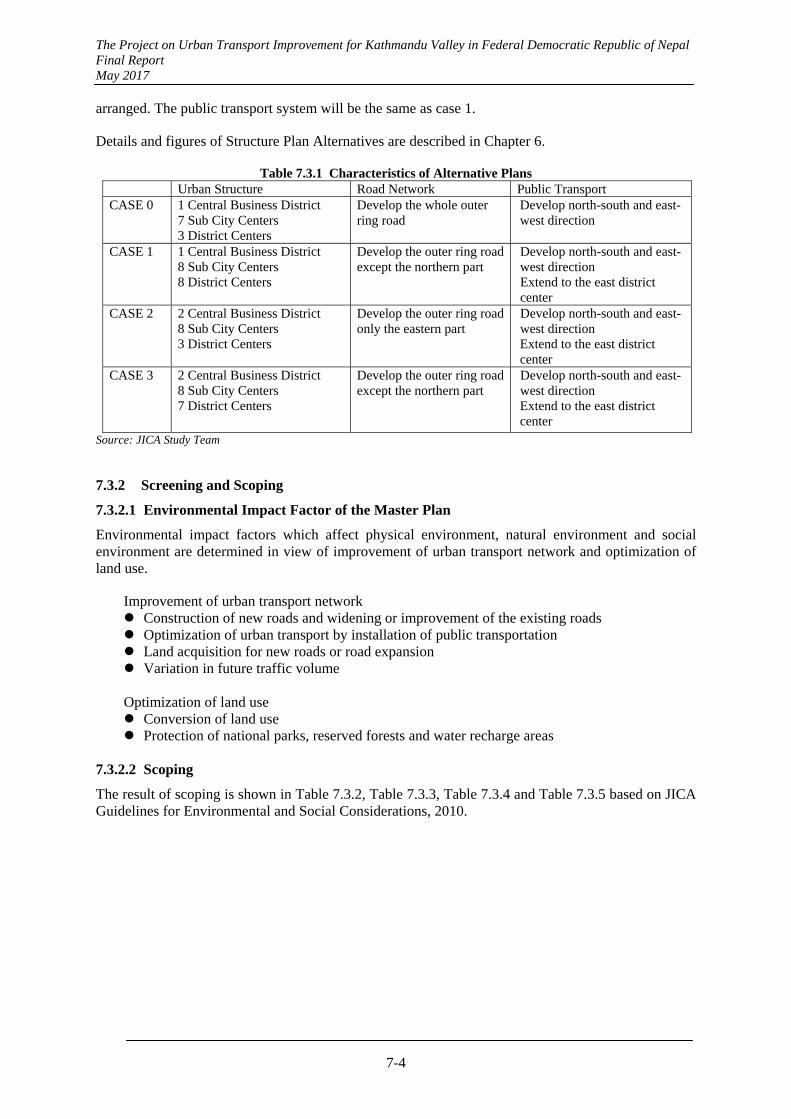
The Project on Urban Transport Improvement for Kathmandu Valley in Federal Democratic Republic of Nepal Final Report May 2017
7-4
arranged. The public transport system will be the same as case 1.
Details and figures of Structure Plan Alternatives are described in Chapter 6.
Table 7.3.1 Characteristics of Alternative Plans Urban Structure Road Network Public Transport CASE 0 1 Central Business District
7 Sub City Centers 3 District Centers
Develop the whole outer ring road
Develop north-south and east-west direction
CASE 1 1 Central Business District 8 Sub City Centers 8 District Centers
Develop the outer ring road except the northern part
Develop north-south and east-west direction Extend to the east district center
CASE 2 2 Central Business District 8 Sub City Centers 3 District Centers
Develop the outer ring road only the eastern part
Develop north-south and east-west direction Extend to the east district center
CASE 3
2 Central Business District 8 Sub City Centers 7 District Centers
Develop the outer ring road except the northern part
Develop north-south and east-west direction Extend to the east district center
Source: JICA Study Team
7.3.2 Screening and Scoping
7.3.2.1 Environmental Impact Factor of the Master Plan
Environmental impact factors which affect physical environment, natural environment and social environment are determined in view of improvement of urban transport network and optimization of land use.
Improvement of urban transport network Construction of new roads and widening or improvement of the existing roads Optimization of urban transport by installation of public transportation Land acquisition for new roads or road expansion Variation in future traffic volume Optimization of land use Conversion of land use Protection of national parks, reserved forests and water recharge areas
7.3.2.2 Scoping
The result of scoping is shown in Table 7.3.2, Table 7.3.3, Table 7.3.4 and Table 7.3.5 based on JICA Guidelines for Environmental and Social Considerations, 2010.
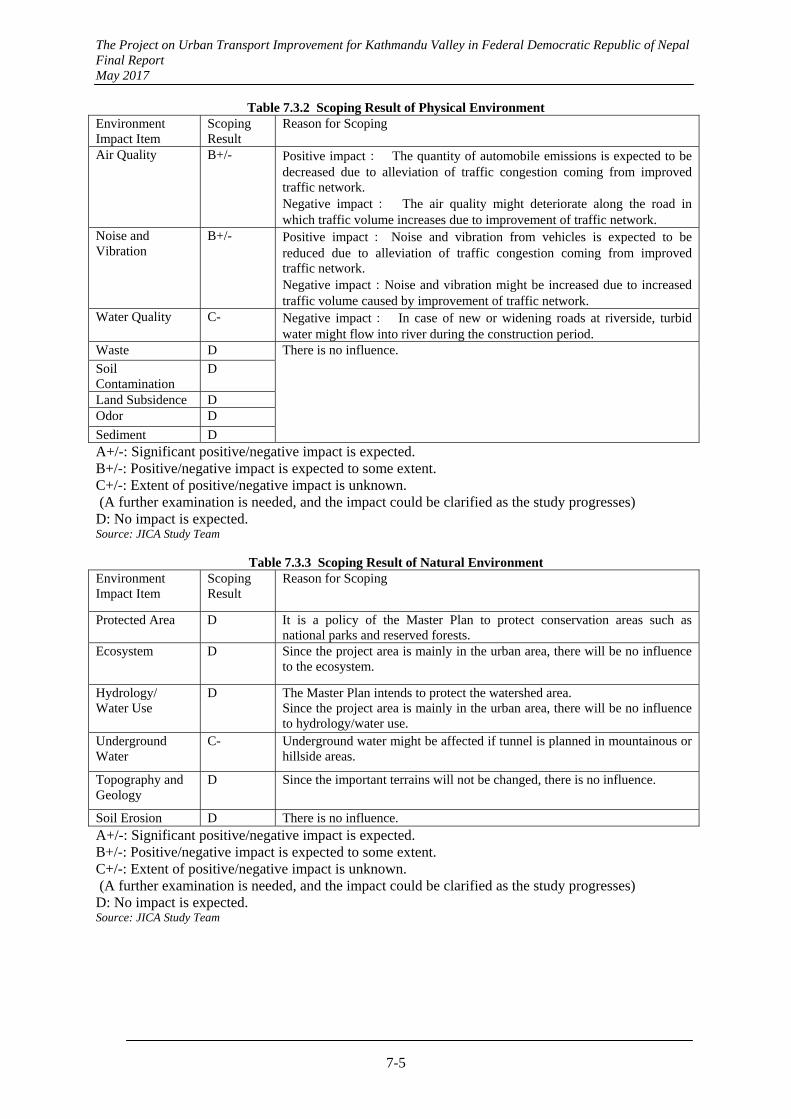
The Project on Urban Transport Improvement for Kathmandu Valley in Federal Democratic Republic of Nepal Final Report May 2017
7-5
Table 7.3.2 Scoping Result of Physical Environment Environment Impact Item
Scoping Result
Reason for Scoping
Air Quality B+/- Positive impact: The quantity of automobile emissions is expected to be decreased due to alleviation of traffic congestion coming from improved traffic network. Negative impact: The air quality might deteriorate along the road in which traffic volume increases due to improvement of traffic network.
Noise and Vibration
B+/- Positive impact: Noise and vibration from vehicles is expected to be reduced due to alleviation of traffic congestion coming from improved traffic network. Negative impact:Noise and vibration might be increased due to increased traffic volume caused by improvement of traffic network.
Water Quality C- Negative impact: In case of new or widening roads at riverside, turbid water might flow into river during the construction period.
Waste D There is no influence.
Soil Contamination
D
Land Subsidence D Odor D
Sediment D A+/-: Significant positive/negative impact is expected. B+/-: Positive/negative impact is expected to some extent. C+/-: Extent of positive/negative impact is unknown. (A further examination is needed, and the impact could be clarified as the study progresses) D: No impact is expected. Source: JICA Study Team
Table 7.3.3 Scoping Result of Natural Environment Environment Impact Item
Scoping Result
Reason for Scoping
Protected Area D It is a policy of the Master Plan to protect conservation areas such as national parks and reserved forests.
Ecosystem D Since the project area is mainly in the urban area, there will be no influence to the ecosystem.
Hydrology/ Water Use
D The Master Plan intends to protect the watershed area. Since the project area is mainly in the urban area, there will be no influence to hydrology/water use.
Underground Water
C- Underground water might be affected if tunnel is planned in mountainous or hillside areas.
Topography and Geology
D Since the important terrains will not be changed, there is no influence.
Soil Erosion D There is no influence. A+/-: Significant positive/negative impact is expected. B+/-: Positive/negative impact is expected to some extent. C+/-: Extent of positive/negative impact is unknown. (A further examination is needed, and the impact could be clarified as the study progresses) D: No impact is expected. Source: JICA Study Team
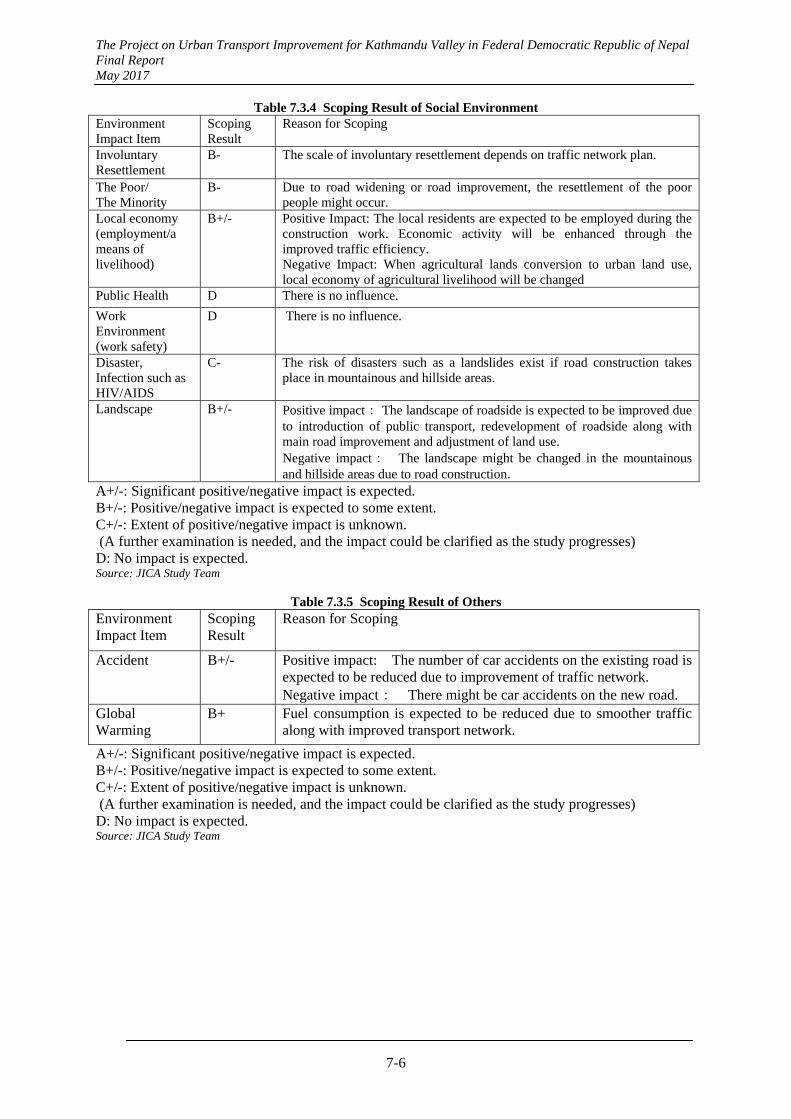
The Project on Urban Transport Improvement for Kathmandu Valley in Federal Democratic Republic of Nepal Final Report May 2017
7-6
Table 7.3.4 Scoping Result of Social Environment Environment Impact Item
Scoping Result
Reason for Scoping
Involuntary Resettlement
B- The scale of involuntary resettlement depends on traffic network plan.
The Poor/ The Minority
B- Due to road widening or road improvement, the resettlement of the poor people might occur.
Local economy (employment/a means of livelihood)
B+/- Positive Impact: The local residents are expected to be employed during the construction work. Economic activity will be enhanced through the improved traffic efficiency. Negative Impact: When agricultural lands conversion to urban land use, local economy of agricultural livelihood will be changed
Public Health D There is no influence.
Work Environment (work safety)
D There is no influence.
Disaster, Infection such as HIV/AIDS
C- The risk of disasters such as a landslides exist if road construction takes place in mountainous and hillside areas.
Landscape B+/- Positive impact: The landscape of roadside is expected to be improved due to introduction of public transport, redevelopment of roadside along with main road improvement and adjustment of land use. Negative impact: The landscape might be changed in the mountainous and hillside areas due to road construction.
A+/-: Significant positive/negative impact is expected. B+/-: Positive/negative impact is expected to some extent. C+/-: Extent of positive/negative impact is unknown. (A further examination is needed, and the impact could be clarified as the study progresses) D: No impact is expected. Source: JICA Study Team
Table 7.3.5 Scoping Result of Others Environment Impact Item
Scoping Result
Reason for Scoping
Accident B+/- Positive impact: The number of car accidents on the existing road is expected to be reduced due to improvement of traffic network. Negative impact: There might be car accidents on the new road.
Global Warming
B+ Fuel consumption is expected to be reduced due to smoother traffic along with improved transport network.
A+/-: Significant positive/negative impact is expected. B+/-: Positive/negative impact is expected to some extent. C+/-: Extent of positive/negative impact is unknown. (A further examination is needed, and the impact could be clarified as the study progresses) D: No impact is expected. Source: JICA Study Team
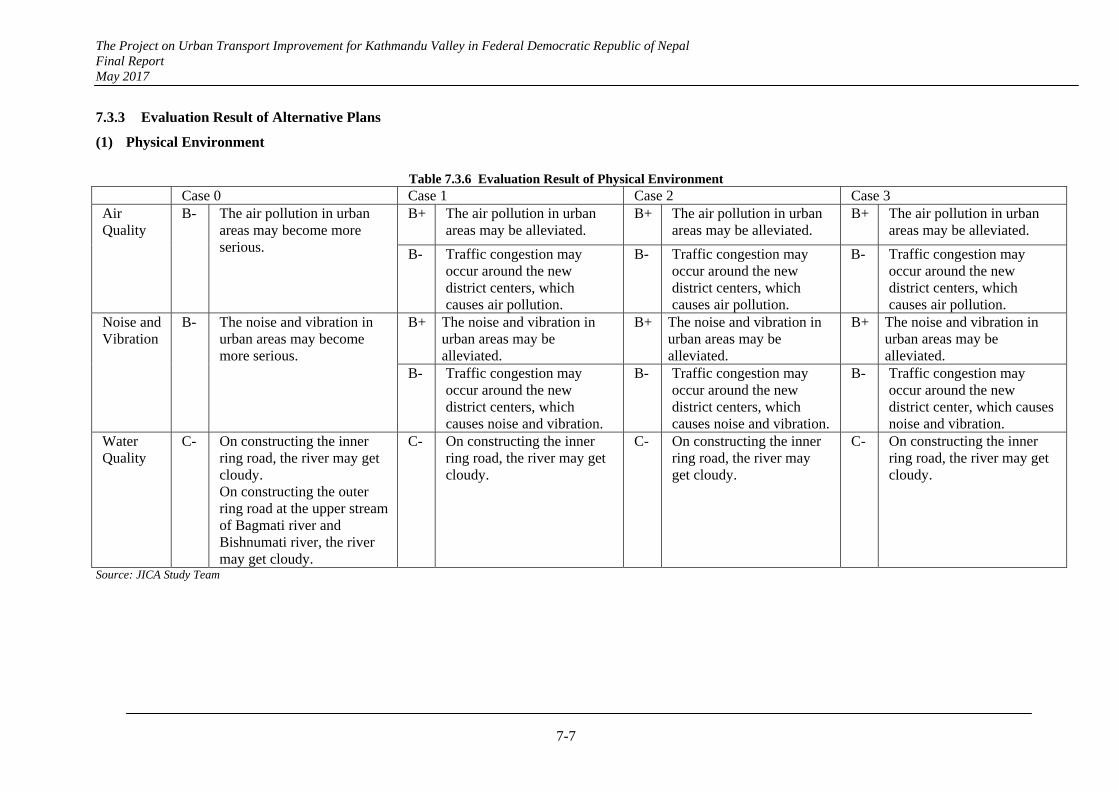
The Project on Urban Transport Improvement for Kathmandu Valley in Federal Democratic Republic of Nepal Final Report May 2017
7-7
7.3.3 Evaluation Result of Alternative Plans
(1) Physical Environment
Table 7.3.6 Evaluation Result of Physical Environment
Case 0 Case 1 Case 2 Case 3 Air Quality
B- The air pollution in urban areas may become more serious.
B+ The air pollution in urban areas may be alleviated.
B+ The air pollution in urban areas may be alleviated.
B+ The air pollution in urban areas may be alleviated.
B- Traffic congestion may occur around the new district centers, which causes air pollution.
B- Traffic congestion may occur around the new district centers, which causes air pollution.
B- Traffic congestion may occur around the new district centers, which causes air pollution.
Noise and Vibration
B- The noise and vibration in urban areas may become more serious.
B+ The noise and vibration in urban areas may be alleviated.
B+ The noise and vibration in urban areas may be alleviated.
B+ The noise and vibration in urban areas may be alleviated.
B- Traffic congestion may occur around the new district centers, which causes noise and vibration.
B- Traffic congestion may occur around the new district centers, which causes noise and vibration.
B- Traffic congestion may occur around the new district center, which causes noise and vibration.
Water Quality
C- On constructing the inner ring road, the river may get cloudy. On constructing the outer ring road at the upper stream of Bagmati river and Bishnumati river, the river may get cloudy.
C- On constructing the inner ring road, the river may get cloudy.
C- On constructing the inner ring road, the river may get cloudy.
C- On constructing the inner ring road, the river may get cloudy.
Source: JICA Study Team

The Project on Urban Transport Improvement for Kathmandu Valley in Federal Democratic Republic of Nepal Final Report May 2017
7-8
Table 7.3.7 Evaluation Result of Natural Environment Case 0 Case 1 Case 2 Case 3 Protected Area
A- Due to the outer ring road development, Shivapuri-Nagarjun National Park will be altered.
D There is no alteration to Shivapuri-Nagarjun National Park.
D There is no alteration to Shivapuri-Nagarjun National Park.
D There is no alteration to Shivapuri-Nagarjun National Park.
Ecosystem
A- The ecosystem may be affected since Shivapuri-Nagarjun National Park will be altered due to the outer ring road development.
D The ecosystem will not be affected.
D The ecosystem will not be affected.
D The ecosystem will not be affected.
Under groundwater
C- The function of watershed in north-west and west area may deteriorate due to sprawl of urban area. In case a tunnel is constructed at Shivapuri-Nagarjun National Park, ground water level and flow direction may be altered.
C- The function of watershed may deteriorate in case district center is developed in the west area (statungal) where the rich watershed is located.
D No development at rich watershed will be observed.
D No development at rich watershed will be observed.
Source: JICA Study Team
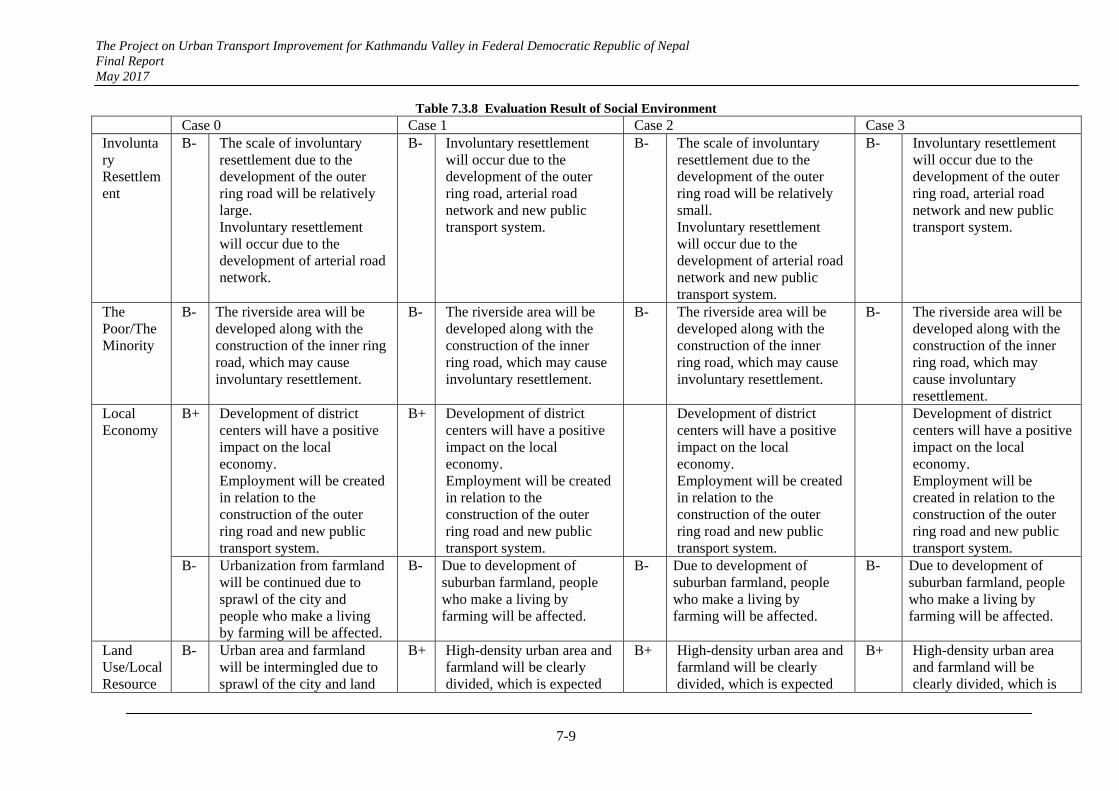
The Project on Urban Transport Improvement for Kathmandu Valley in Federal Democratic Republic of Nepal Final Report May 2017
7-9
Table 7.3.8 Evaluation Result of Social Environment Case 0 Case 1 Case 2 Case 3 Involuntary Resettlement
B- The scale of involuntary resettlement due to the development of the outer ring road will be relatively large. Involuntary resettlement will occur due to the development of arterial road network.
B- Involuntary resettlement will occur due to the development of the outer ring road, arterial road network and new public transport system.
B- The scale of involuntary resettlement due to the development of the outer ring road will be relatively small. Involuntary resettlement will occur due to the development of arterial road network and new public transport system.
B- Involuntary resettlement will occur due to the development of the outer ring road, arterial road network and new public transport system.
The Poor/The Minority
B- The riverside area will be developed along with the construction of the inner ring road, which may cause involuntary resettlement.
B- The riverside area will be developed along with the construction of the inner ring road, which may cause involuntary resettlement.
B- The riverside area will be developed along with the construction of the inner ring road, which may cause involuntary resettlement.
B- The riverside area will be developed along with the construction of the inner ring road, which may cause involuntary resettlement.
Local Economy
B+ Development of district centers will have a positive impact on the local economy. Employment will be created in relation to the construction of the outer ring road and new public transport system.
B+ Development of district centers will have a positive impact on the local economy. Employment will be created in relation to the construction of the outer ring road and new public transport system.
Development of district centers will have a positive impact on the local economy. Employment will be created in relation to the construction of the outer ring road and new public transport system.
Development of district centers will have a positive impact on the local economy. Employment will be created in relation to the construction of the outer ring road and new public transport system.
B- Urbanization from farmland will be continued due to sprawl of the city and people who make a living by farming will be affected.
B- Due to development of suburban farmland, people who make a living by farming will be affected.
B- Due to development of suburban farmland, people who make a living by farming will be affected.
B- Due to development of suburban farmland, people who make a living by farming will be affected.
Land Use/Local Resource
B- Urban area and farmland will be intermingled due to sprawl of the city and land
B+ High-density urban area and farmland will be clearly divided, which is expected
B+ High-density urban area and farmland will be clearly divided, which is expected
B+ High-density urban area and farmland will be clearly divided, which is
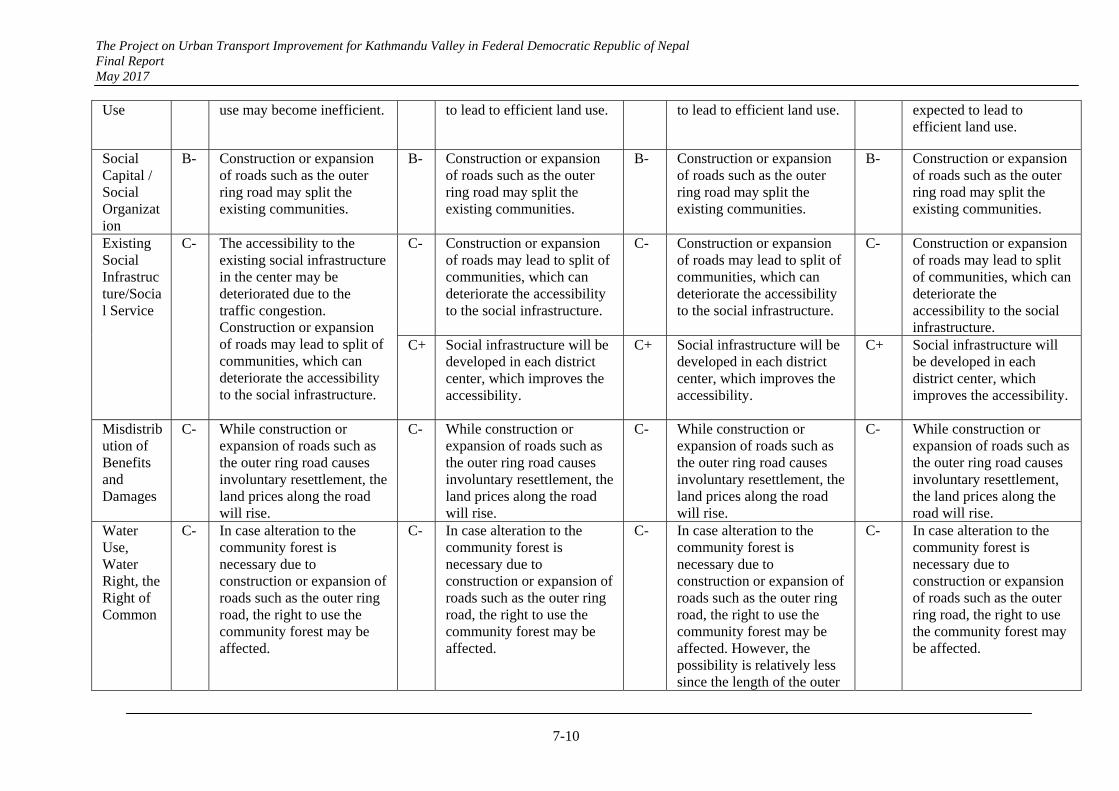
The Project on Urban Transport Improvement for Kathmandu Valley in Federal Democratic Republic of Nepal Final Report May 2017
7-10
Use
use may become inefficient. to lead to efficient land use. to lead to efficient land use. expected to lead to efficient land use.
Social Capital / Social Organization
B- Construction or expansion of roads such as the outer ring road may split the existing communities.
B- Construction or expansion of roads such as the outer ring road may split the existing communities.
B- Construction or expansion of roads such as the outer ring road may split the existing communities.
B- Construction or expansion of roads such as the outer ring road may split the existing communities.
Existing Social Infrastructure/Social Service
C- The accessibility to the existing social infrastructure in the center may be deteriorated due to the traffic congestion. Construction or expansion of roads may lead to split of communities, which can deteriorate the accessibility to the social infrastructure.
C- Construction or expansion of roads may lead to split of communities, which can deteriorate the accessibility to the social infrastructure.
C- Construction or expansion of roads may lead to split of communities, which can deteriorate the accessibility to the social infrastructure.
C- Construction or expansion of roads may lead to split of communities, which can deteriorate the accessibility to the social infrastructure.
C+ Social infrastructure will be developed in each district center, which improves the accessibility.
C+ Social infrastructure will be developed in each district center, which improves the accessibility.
C+ Social infrastructure will be developed in each district center, which improves the accessibility.
Misdistribution of Benefits and Damages
C- While construction or expansion of roads such as the outer ring road causes involuntary resettlement, the land prices along the road will rise.
C- While construction or expansion of roads such as the outer ring road causes involuntary resettlement, the land prices along the road will rise.
C- While construction or expansion of roads such as the outer ring road causes involuntary resettlement, the land prices along the road will rise.
C- While construction or expansion of roads such as the outer ring road causes involuntary resettlement, the land prices along the road will rise.
Water Use, Water Right, the Right of Common
C- In case alteration to the community forest is necessary due to construction or expansion of roads such as the outer ring road, the right to use the community forest may be affected.
C- In case alteration to the community forest is necessary due to construction or expansion of roads such as the outer ring road, the right to use the community forest may be affected.
C- In case alteration to the community forest is necessary due to construction or expansion of roads such as the outer ring road, the right to use the community forest may be affected. However, the possibility is relatively less since the length of the outer
C- In case alteration to the community forest is necessary due to construction or expansion of roads such as the outer ring road, the right to use the community forest may be affected.
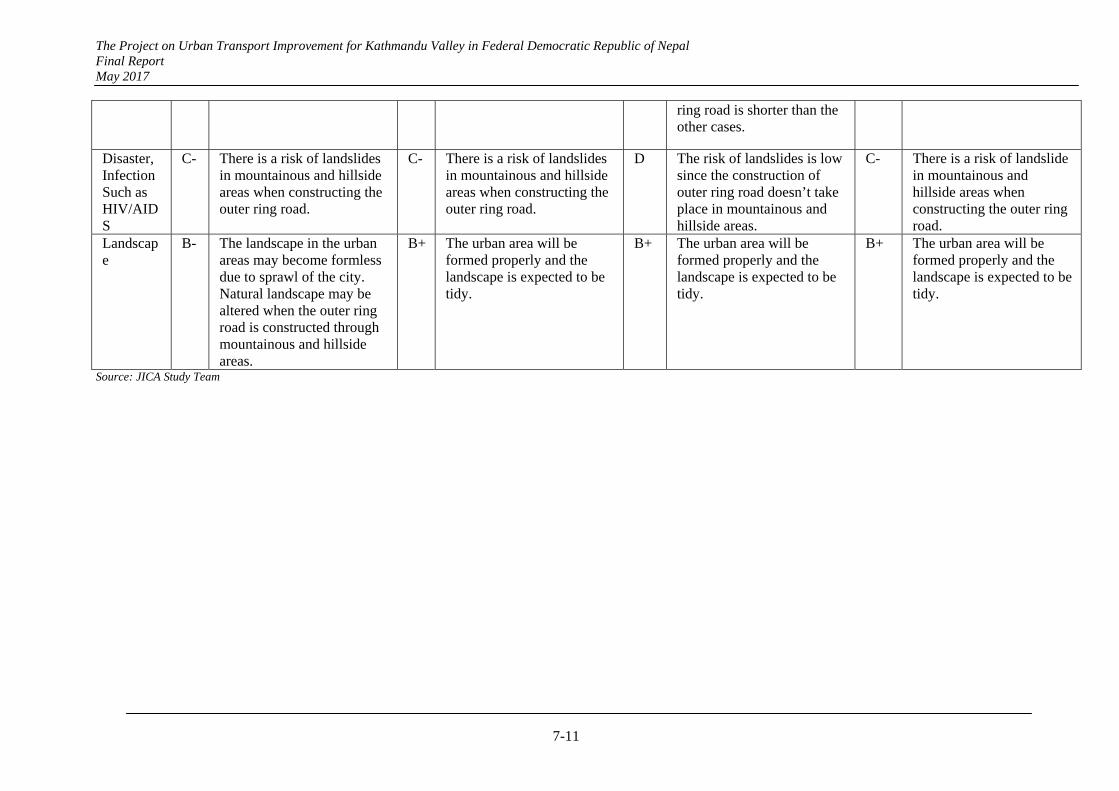
The Project on Urban Transport Improvement for Kathmandu Valley in Federal Democratic Republic of Nepal Final Report May 2017
7-11
ring road is shorter than the other cases.
Disaster, Infection Such as HIV/AIDS
C- There is a risk of landslides in mountainous and hillside areas when constructing the outer ring road.
C- There is a risk of landslides in mountainous and hillside areas when constructing the outer ring road.
D The risk of landslides is low since the construction of outer ring road doesn’t take place in mountainous and hillside areas.
C- There is a risk of landslide in mountainous and hillside areas when constructing the outer ring road.
Landscape
B- The landscape in the urban areas may become formless due to sprawl of the city. Natural landscape may be altered when the outer ring road is constructed through mountainous and hillside areas.
B+ The urban area will be formed properly and the landscape is expected to be tidy.
B+ The urban area will be formed properly and the landscape is expected to be tidy.
B+ The urban area will be formed properly and the landscape is expected to be tidy.
Source: JICA Study Team
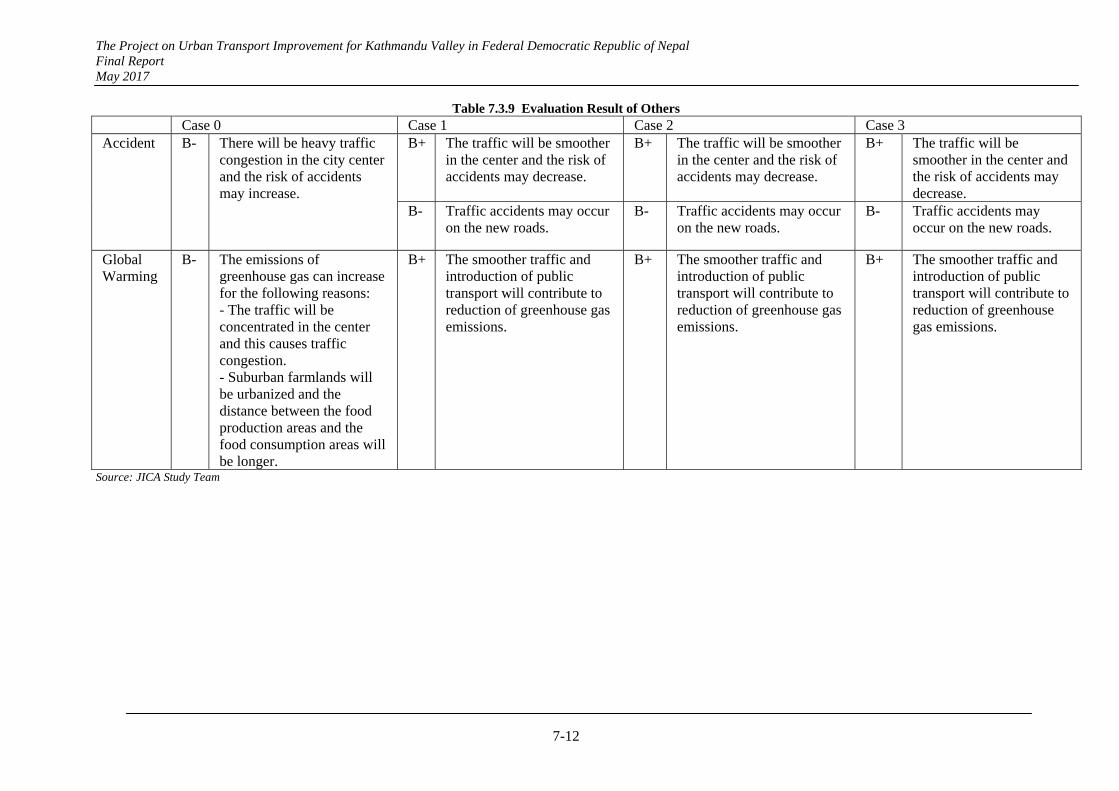
The Project on Urban Transport Improvement for Kathmandu Valley in Federal Democratic Republic of Nepal Final Report May 2017
7-12
Table 7.3.9 Evaluation Result of Others Case 0 Case 1 Case 2 Case 3 Accident B- There will be heavy traffic
congestion in the city center and the risk of accidents may increase.
B+ The traffic will be smoother in the center and the risk of accidents may decrease.
B+ The traffic will be smoother in the center and the risk of accidents may decrease.
B+ The traffic will be smoother in the center and the risk of accidents may decrease.
B- Traffic accidents may occur on the new roads.
B- Traffic accidents may occur on the new roads.
B- Traffic accidents may occur on the new roads.
Global Warming
B- The emissions of greenhouse gas can increase for the following reasons: - The traffic will be concentrated in the center and this causes traffic congestion. - Suburban farmlands will be urbanized and the distance between the food production areas and the food consumption areas will be longer.
B+ The smoother traffic and introduction of public transport will contribute to reduction of greenhouse gas emissions.
B+ The smoother traffic and introduction of public transport will contribute to reduction of greenhouse gas emissions.
B+ The smoother traffic and introduction of public transport will contribute to reduction of greenhouse gas emissions.
Source: JICA Study Team
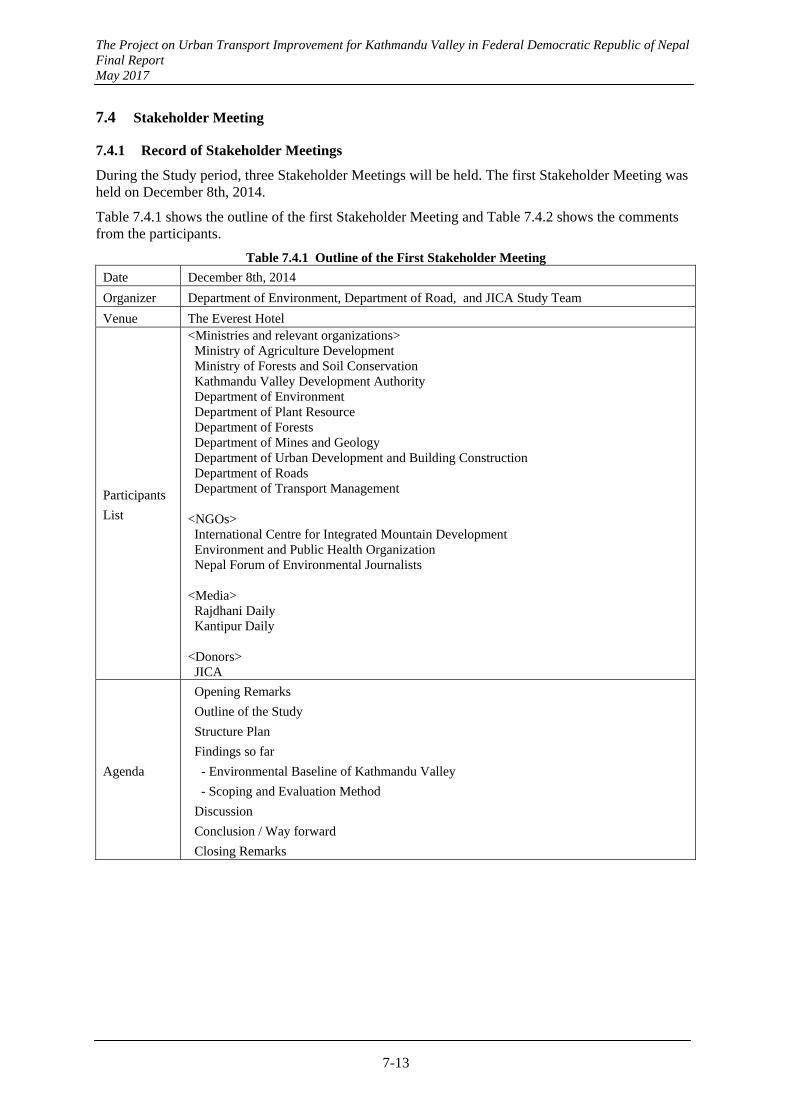
The Project on Urban Transport Improvement for Kathmandu Valley in Federal Democratic Republic of Nepal Final Report May 2017
7-13
7.4 Stakeholder Meeting
7.4.1 Record of Stakeholder Meetings
During the Study period, three Stakeholder Meetings will be held. The first Stakeholder Meeting was held on December 8th, 2014.
Table 7.4.1 shows the outline of the first Stakeholder Meeting and Table 7.4.2 shows the comments from the participants.
Table 7.4.1 Outline of the First Stakeholder Meeting
Date December 8th, 2014
Organizer Department of Environment, Department of Road, and JICA Study Team
Venue The Everest Hotel
Participants
List
<Ministries and relevant organizations> Ministry of Agriculture Development Ministry of Forests and Soil Conservation Kathmandu Valley Development Authority Department of Environment Department of Plant Resource Department of Forests Department of Mines and Geology Department of Urban Development and Building Construction Department of Roads Department of Transport Management
<NGOs> International Centre for Integrated Mountain Development Environment and Public Health Organization Nepal Forum of Environmental Journalists
<Media> Rajdhani Daily Kantipur Daily
<Donors> JICA
Agenda
Opening Remarks
Outline of the Study
Structure Plan
Findings so far
- Environmental Baseline of Kathmandu Valley
- Scoping and Evaluation Method
Discussion
Conclusion / Way forward
Closing Remarks
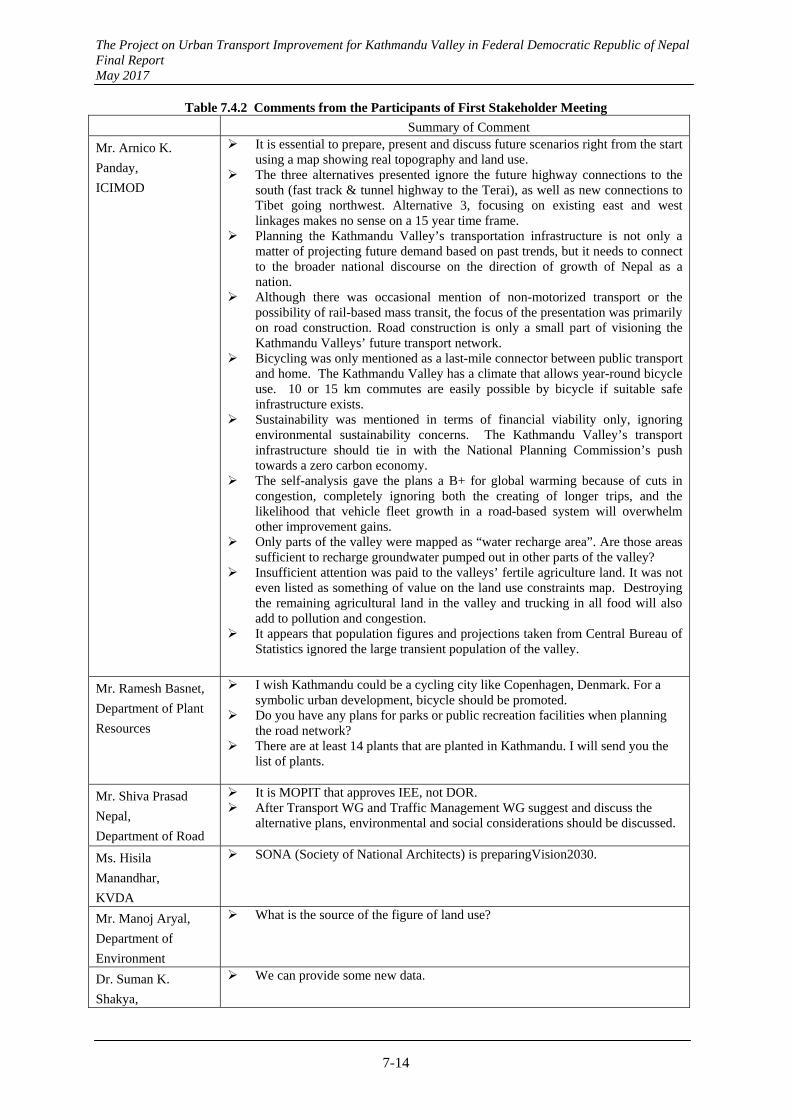
The Project on Urban Transport Improvement for Kathmandu Valley in Federal Democratic Republic of Nepal Final Report May 2017
7-14
Table 7.4.2 Comments from the Participants of First Stakeholder Meeting
Summary of Comment
Mr. Arnico K.
Panday,
ICIMOD
It is essential to prepare, present and discuss future scenarios right from the start using a map showing real topography and land use.
The three alternatives presented ignore the future highway connections to the south (fast track & tunnel highway to the Terai), as well as new connections to Tibet going northwest. Alternative 3, focusing on existing east and west linkages makes no sense on a 15 year time frame.
Planning the Kathmandu Valley’s transportation infrastructure is not only a matter of projecting future demand based on past trends, but it needs to connect to the broader national discourse on the direction of growth of Nepal as a nation.
Although there was occasional mention of non-motorized transport or the possibility of rail-based mass transit, the focus of the presentation was primarily on road construction. Road construction is only a small part of visioning the Kathmandu Valleys’ future transport network.
Bicycling was only mentioned as a last-mile connector between public transport and home. The Kathmandu Valley has a climate that allows year-round bicycle use. 10 or 15 km commutes are easily possible by bicycle if suitable safe infrastructure exists.
Sustainability was mentioned in terms of financial viability only, ignoring environmental sustainability concerns. The Kathmandu Valley’s transport infrastructure should tie in with the National Planning Commission’s push towards a zero carbon economy.
The self-analysis gave the plans a B+ for global warming because of cuts in congestion, completely ignoring both the creating of longer trips, and the likelihood that vehicle fleet growth in a road-based system will overwhelm other improvement gains.
Only parts of the valley were mapped as “water recharge area”. Are those areas sufficient to recharge groundwater pumped out in other parts of the valley?
Insufficient attention was paid to the valleys’ fertile agriculture land. It was not even listed as something of value on the land use constraints map. Destroying the remaining agricultural land in the valley and trucking in all food will also add to pollution and congestion.
It appears that population figures and projections taken from Central Bureau of Statistics ignored the large transient population of the valley.
Mr. Ramesh Basnet,
Department of Plant
Resources
I wish Kathmandu could be a cycling city like Copenhagen, Denmark. For a symbolic urban development, bicycle should be promoted.
Do you have any plans for parks or public recreation facilities when planning the road network?
There are at least 14 plants that are planted in Kathmandu. I will send you the list of plants.
Mr. Shiva Prasad
Nepal,
Department of Road
It is MOPIT that approves IEE, not DOR. After Transport WG and Traffic Management WG suggest and discuss the
alternative plans, environmental and social considerations should be discussed.
Ms. Hisila
Manandhar,
KVDA
SONA (Society of National Architects) is preparingVision2030.
Mr. Manoj Aryal,
Department of
Environment
What is the source of the figure of land use?
Dr. Suman K.
Shakya,
We can provide some new data.
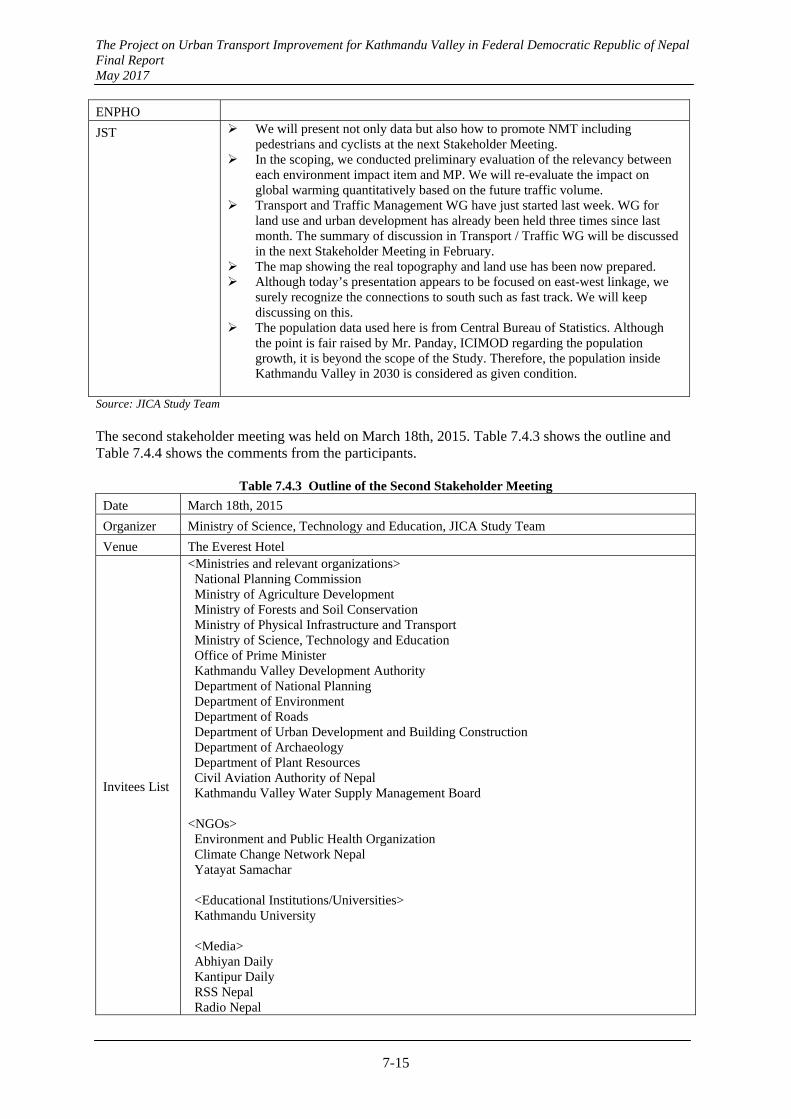
The Project on Urban Transport Improvement for Kathmandu Valley in Federal Democratic Republic of Nepal Final Report May 2017
7-15
ENPHO
JST
We will present not only data but also how to promote NMT including pedestrians and cyclists at the next Stakeholder Meeting.
In the scoping, we conducted preliminary evaluation of the relevancy between each environment impact item and MP. We will re-evaluate the impact on global warming quantitatively based on the future traffic volume.
Transport and Traffic Management WG have just started last week. WG for land use and urban development has already been held three times since last month. The summary of discussion in Transport / Traffic WG will be discussed in the next Stakeholder Meeting in February.
The map showing the real topography and land use has been now prepared. Although today’s presentation appears to be focused on east-west linkage, we
surely recognize the connections to south such as fast track. We will keep discussing on this.
The population data used here is from Central Bureau of Statistics. Although the point is fair raised by Mr. Panday, ICIMOD regarding the population growth, it is beyond the scope of the Study. Therefore, the population inside Kathmandu Valley in 2030 is considered as given condition.
Source: JICA Study Team The second stakeholder meeting was held on March 18th, 2015. Table 7.4.3 shows the outline and Table 7.4.4 shows the comments from the participants.
Table 7.4.3 Outline of the Second Stakeholder Meeting
Date March 18th, 2015
Organizer Ministry of Science, Technology and Education, JICA Study Team
Venue The Everest Hotel
Invitees List
<Ministries and relevant organizations> National Planning Commission Ministry of Agriculture Development Ministry of Forests and Soil Conservation Ministry of Physical Infrastructure and Transport Ministry of Science, Technology and Education Office of Prime Minister Kathmandu Valley Development Authority Department of National Planning Department of Environment Department of Roads Department of Urban Development and Building Construction Department of Archaeology Department of Plant Resources Civil Aviation Authority of Nepal Kathmandu Valley Water Supply Management Board
<NGOs> Environment and Public Health Organization Climate Change Network Nepal Yatayat Samachar
<Educational Institutions/Universities> Kathmandu University <Media> Abhiyan Daily Kantipur Daily RSS Nepal Radio Nepal
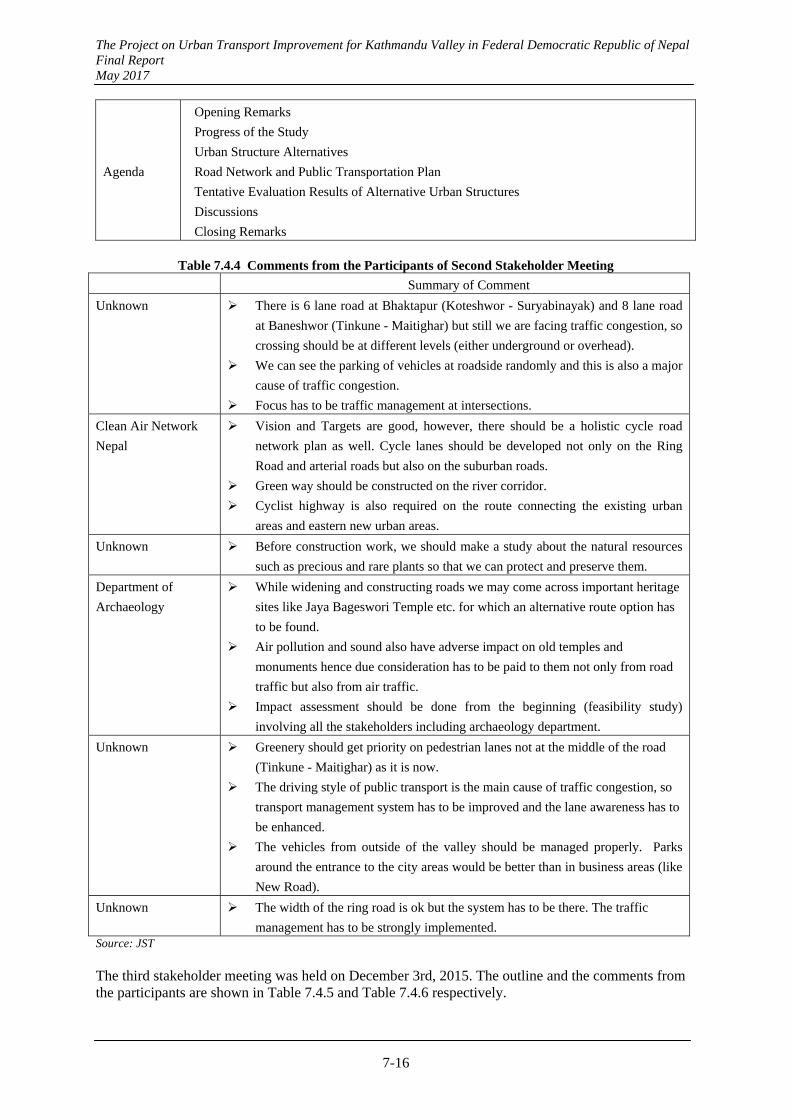
The Project on Urban Transport Improvement for Kathmandu Valley in Federal Democratic Republic of Nepal Final Report May 2017
7-16
Agenda
Opening Remarks
Progress of the Study
Urban Structure Alternatives
Road Network and Public Transportation Plan
Tentative Evaluation Results of Alternative Urban Structures
Discussions
Closing Remarks
Table 7.4.4 Comments from the Participants of Second Stakeholder Meeting
Summary of Comment
Unknown There is 6 lane road at Bhaktapur (Koteshwor - Suryabinayak) and 8 lane road
at Baneshwor (Tinkune - Maitighar) but still we are facing traffic congestion, so
crossing should be at different levels (either underground or overhead).
We can see the parking of vehicles at roadside randomly and this is also a major
cause of traffic congestion.
Focus has to be traffic management at intersections.
Clean Air Network
Nepal
Vision and Targets are good, however, there should be a holistic cycle road
network plan as well. Cycle lanes should be developed not only on the Ring
Road and arterial roads but also on the suburban roads.
Green way should be constructed on the river corridor.
Cyclist highway is also required on the route connecting the existing urban
areas and eastern new urban areas.
Unknown Before construction work, we should make a study about the natural resources
such as precious and rare plants so that we can protect and preserve them.
Department of
Archaeology
While widening and constructing roads we may come across important heritage
sites like Jaya Bageswori Temple etc. for which an alternative route option has
to be found.
Air pollution and sound also have adverse impact on old temples and
monuments hence due consideration has to be paid to them not only from road
traffic but also from air traffic.
Impact assessment should be done from the beginning (feasibility study)
involving all the stakeholders including archaeology department.
Unknown Greenery should get priority on pedestrian lanes not at the middle of the road
(Tinkune - Maitighar) as it is now.
The driving style of public transport is the main cause of traffic congestion, so
transport management system has to be improved and the lane awareness has to
be enhanced.
The vehicles from outside of the valley should be managed properly. Parks
around the entrance to the city areas would be better than in business areas (like
New Road).
Unknown The width of the ring road is ok but the system has to be there. The traffic
management has to be strongly implemented. Source: JST The third stakeholder meeting was held on December 3rd, 2015. The outline and the comments from the participants are shown in Table 7.4.5 and Table 7.4.6 respectively.
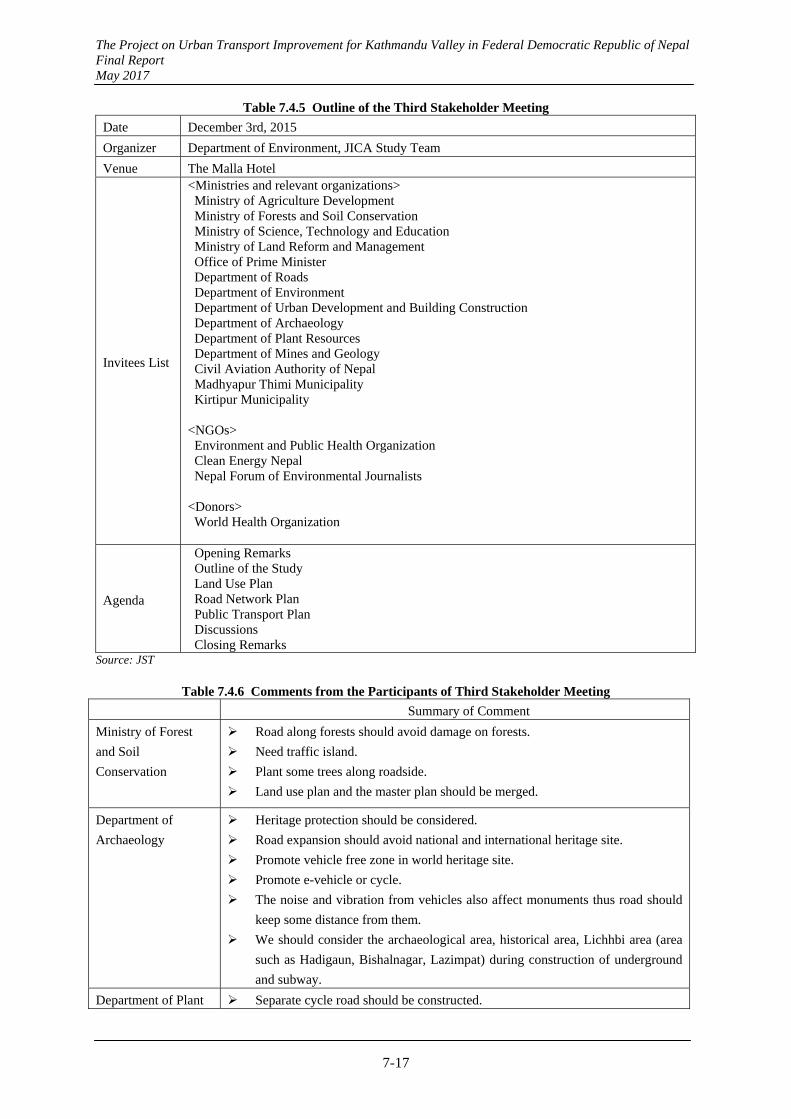
The Project on Urban Transport Improvement for Kathmandu Valley in Federal Democratic Republic of Nepal Final Report May 2017
7-17
Table 7.4.5 Outline of the Third Stakeholder Meeting
Date December 3rd, 2015
Organizer Department of Environment, JICA Study Team
Venue The Malla Hotel
Invitees List
<Ministries and relevant organizations> Ministry of Agriculture Development Ministry of Forests and Soil Conservation Ministry of Science, Technology and Education Ministry of Land Reform and Management Office of Prime Minister Department of Roads Department of Environment Department of Urban Development and Building Construction Department of Archaeology Department of Plant Resources Department of Mines and Geology Civil Aviation Authority of Nepal Madhyapur Thimi Municipality Kirtipur Municipality
<NGOs> Environment and Public Health Organization Clean Energy Nepal Nepal Forum of Environmental Journalists
<Donors> World Health Organization
Agenda
Opening Remarks Outline of the Study Land Use Plan Road Network Plan Public Transport Plan Discussions Closing Remarks
Source: JST
Table 7.4.6 Comments from the Participants of Third Stakeholder Meeting
Summary of Comment
Ministry of Forest
and Soil
Conservation
Road along forests should avoid damage on forests.
Need traffic island.
Plant some trees along roadside.
Land use plan and the master plan should be merged.
Department of
Archaeology
Heritage protection should be considered.
Road expansion should avoid national and international heritage site.
Promote vehicle free zone in world heritage site.
Promote e-vehicle or cycle.
The noise and vibration from vehicles also affect monuments thus road should
keep some distance from them.
We should consider the archaeological area, historical area, Lichhbi area (area
such as Hadigaun, Bishalnagar, Lazimpat) during construction of underground
and subway.
Department of Plant Separate cycle road should be constructed.
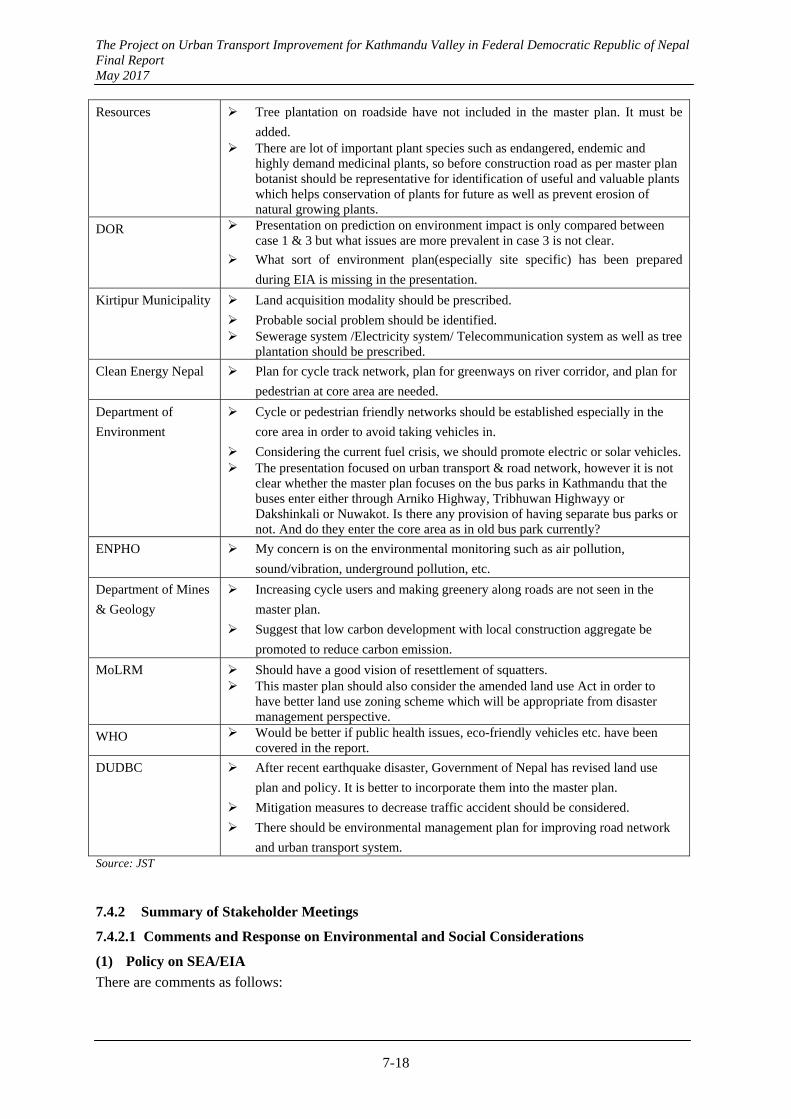
The Project on Urban Transport Improvement for Kathmandu Valley in Federal Democratic Republic of Nepal Final Report May 2017
7-18
Resources Tree plantation on roadside have not included in the master plan. It must be
added. There are lot of important plant species such as endangered, endemic and
highly demand medicinal plants, so before construction road as per master plan botanist should be representative for identification of useful and valuable plants which helps conservation of plants for future as well as prevent erosion of natural growing plants.
DOR Presentation on prediction on environment impact is only compared between case 1 & 3 but what issues are more prevalent in case 3 is not clear.
What sort of environment plan(especially site specific) has been prepared
during EIA is missing in the presentation.
Kirtipur Municipality Land acquisition modality should be prescribed.
Probable social problem should be identified. Sewerage system /Electricity system/ Telecommunication system as well as tree
plantation should be prescribed.
Clean Energy Nepal Plan for cycle track network, plan for greenways on river corridor, and plan for
pedestrian at core area are needed.
Department of
Environment
Cycle or pedestrian friendly networks should be established especially in the
core area in order to avoid taking vehicles in.
Considering the current fuel crisis, we should promote electric or solar vehicles. The presentation focused on urban transport & road network, however it is not
clear whether the master plan focuses on the bus parks in Kathmandu that the buses enter either through Arniko Highway, Tribhuwan Highwayy or Dakshinkali or Nuwakot. Is there any provision of having separate bus parks or not. And do they enter the core area as in old bus park currently?
ENPHO My concern is on the environmental monitoring such as air pollution,
sound/vibration, underground pollution, etc.
Department of Mines
& Geology
Increasing cycle users and making greenery along roads are not seen in the
master plan.
Suggest that low carbon development with local construction aggregate be
promoted to reduce carbon emission.
MoLRM Should have a good vision of resettlement of squatters. This master plan should also consider the amended land use Act in order to
have better land use zoning scheme which will be appropriate from disaster management perspective.
WHO Would be better if public health issues, eco-friendly vehicles etc. have been covered in the report.
DUDBC After recent earthquake disaster, Government of Nepal has revised land use
plan and policy. It is better to incorporate them into the master plan.
Mitigation measures to decrease traffic accident should be considered.
There should be environmental management plan for improving road network
and urban transport system. Source: JST
7.4.2 Summary of Stakeholder Meetings
7.4.2.1 Comments and Response on Environmental and Social Considerations
(1) Policy on SEA/EIA
There are comments as follows:
The Project on Urban Transport Improvement for Kathmandu Valley in Federal Democratic Republic of Nepal Final Report May 2017
7-19
What sort of environment plan (especially site specific) has been prepared during EIA is missing in the presentation.
After Transport WG and Traffic Management WG suggest and discuss the alternative plans, environmental and social considerations should be discussed.
Land acquisition modality should be prescribed. Should have a good vision of resettlement of squatters. Probable social problem should be identified.
SEA is conducted to comparatively evaluate the environmental impact by the M/P. EIA for each project will be conducted when a concrete plan for each project is established and the project requires EIA.
(2) Environmental Management and Monitoring
There are comments as follows: My concern is on the environmental monitoring such as air pollution, sound/vibration,
underground pollution, etc. There should be environmental management plan for improving road network and urban
transport system. Environmental management and monitoring should be conducted along the progress of the transport plan. When EIA is conducted for a project, environmental monitoring plan will be proposed. For instance, environmental monitoring plan for air pollution, noise and vibration shall be proposed for road development projects.
(3) Scoping Result
There is a comment as follows: The self-analysis gave the plans a B+ for global warming because of cuts in congestion,
completely ignoring both the creating of longer trips, and the likelihood that vehicle fleet growth in a road-based system will overwhelm other improvement gains. The M/P study is on the future traffic network in Kathmandu Valley including public transport development. The transport distance of the logistic vehicles will be longer due to road improvement, the negative impact is smaller than the positive impact gained from reduction of greenhouse gas emission owing to improvement of traffic condition in whole Kathmandu Valley.
(4) Natural Environment
There are comments as follows: Before construction work, we should make a study about the natural resources such as precious
and rare plants so that we can protect and preserve them. There are lot of important plant species such as endangered, endemic and highly demand
medicinal plants, so before construction road as per master plan botanist should be representative for identification of useful and valuable plants which helps conservation of plants for future as well as prevent erosion of natural growing plants. The basic policy of land use plan is to avoid development in natural parks and forests. Hence, the impact on natural environment such as forests shall be minimized. EIA for each road and land development project based on the M/P will be conducted if the project requires EIA. Impacts on the natural environment and management plan shall be clearly identified and studied in EIA.

The Project on Urban Transport Improvement for Kathmandu Valley in Federal Democratic Republic of Nepal Final Report May 2017
7-20
(5) Cultural Heritage
There are comments as follows: Impact assessment should be done from the beginning (feasibility study) involving all the
stakeholders including archaeology department. While widening and constructing roads we may come across important heritage sites like Jaya
Bageswori Temple etc. for which an alternative route option has to be found. Air pollution and sound also have adverse impact on old temples and monuments hence due
consideration has to be paid to them not only from road traffic but also from air traffic. Heritage protection should be considered. Road expansion should avoid national and international heritage site. Promote vehicle free zone in world heritage site. The noise and vibration from vehicles also affect monuments thus road should keep some
distance from them. We should consider the archaeological area, historical area, Lichhbi area (area such as Hadigaun,
Bishalnagar, Lazimpat) during construction of underground and subway. The basic policy of the land use plan is to avoid development in cultural heritage areas in order to preserve world heritages and temples. Hence, there will be little impact on cultural heritages.
7.4.2.2 Comments and Response on Structure Plan
(1) Background and Objective of Structure Plan
There are comments as follows: The three alternatives presented ignore the future highway connections to the south (fast track &
tunnel highway to the Terai), as well as new connections to Tibet going northwest. Alternative 3, focusing on existing east and west linkages makes no sense on a 15 year time frame.
Planning the Kathmandu Valley’s transportation infrastructure is not only a matter of projecting future demand based on past trends, but it needs to connect to the broader national discourse on the direction of growth of Nepal as a nation. The higher plans and the existing plans were taken into consideration when examining the structure plan. The target area of the M/P is within Kathmandu Valley.
(2) Land Use Plan
There are comments as follows: It is essential to prepare, present and discuss future scenarios right from the start using a map
showing real topography and land use. Only parts of the valley were mapped as “water recharge area”. Are those areas sufficient to
recharge groundwater pumped out in other parts of the valley? Insufficient attention was paid to the valleys’ fertile agriculture land. It was not even listed as
something of value on the land use constraints map. Destroying the remaining agricultural land in the valley and trucking in all food will also add to pollution and congestion.
This master plan should also consider the amended land use Act in order to have better land use zoning scheme which will be appropriate from disaster management perspective.
Road along forests should avoid damage on forests. After recent earthquake disaster, Government of Nepal has revised land use plan and policy. It is
better to incorporate them into the master plan.

The Project on Urban Transport Improvement for Kathmandu Valley in Federal Democratic Republic of Nepal Final Report May 2017
7-21
The land use plan is examined integrally with transport plan on the basis that development in the existing high density area, agricultural land, water recharge area, world heritage area, forests area shall be avoided. Please refer to 8.1 Land Use Plan, Chapter 8 for more details.
7.4.2.3 Comments and Response on Sector Plan
(1) Road Plan
Land use plan and the master plan should be merged. Do you have any plans for parks or public recreation facilities when planning the road network? Sewerage system /Electricity system/ Telecommunication system as well as tree plantation
should be prescribed. There are at least 14 plants that are planted in Kathmandu. I will send you the list of plants. Plant some trees along roadside. Tree plantation on roadside have not included in the master plan. It must be added. Greenery should get priority on pedestrian lanes not at the middle of the road (Tinkune -
Maitighar) as it is now. The M/P includes the land use plan in the new urban area and arterial road plan which connects Kathmandu city center and new urban area. Please refer to 8.2 Road Plan, Chapter 8 for more details. The M/P also proposes future arterial road network and cross section for each road classification. Roadside tree –planting shall be studied in each road development project.
(2) Public Transport Plan
There are comments as follows: The presentation focused on urban transport & road network, however it is not clear whether the
master plan focuses on the bus parks in Kathmandu that the buses enter either through Arniko Highway, Tribhuwan Highwayy or Dakshinkali or Nuwakot. Is there any provision of having separate bus parks or not. And do they enter the core area as in old bus park currently?
Although there was occasional mention of non-motorized transport or the possibility of rail-based mass transit, the focus of the presentation was primarily on road construction. Road construction is only a small part of visioning the Kathmandu Valleys’ future transport network. The public transport plan including new transport mode has been examined along with road network plan. Please refer to 8.3 Public Transport Plan, Chapter 8 for more details.
(3) Non-Motorized Transport Plan
There are comments as follows: Bicycling was only mentioned as a last-mile connector between public transport and home. The
Kathmandu Valley has a climate that allows year-round bicycle use. 10 or 15 km commutes are easily possible by bicycle if suitable safe infrastructure exists.
I wish Kathmandu could be a cycling city like Copenhagen, Denmark. For a symbolic urban development, bicycle should be promoted.
Vision and Targets are good, however, there should be a holistic cycle road network plan as well. Cycle lanes should be developed not only on the Ring Road and arterial roads but also on the suburban roads.
Green way should be constructed on the river corridor. Cyclist highway is also required on the route connecting the existing urban areas and eastern new
urban areas.
The Project on Urban Transport Improvement for Kathmandu Valley in Federal Democratic Republic of Nepal Final Report May 2017
7-22
Plan for cycle track network, plan for greenways on river corridor, and plan for pedestrian at core area are needed.
Cycle or pedestrian friendly networks should be established especially in the core area in order to avoid taking vehicles in.
Increasing cycle users and making greenery along roads are not seen in the master plan. Need traffic island. Separate cycle road should be constructed.
Pedestrian sidewalk is proposed to be installed along the new arterial roads in the M/P. Please refer to 8.2 Road Plan and 8.7 Non-Motorized Transport Plan, Chapter 8 for more details.
(4) Traffic Demand Management
There are comments as follows: There is 6 lane road at Bhaktapur (Koteshwor - Suryabinayak) and 8 lane road at Baneshwor
(Tinkune - Maitighar) but still we are facing traffic congestion, so crossing should be at different levels (either underground or overhead).
We can see the parking of vehicles at roadside randomly and this is also a major cause of traffic congestion.
Focus has to be traffic management at intersections The driving style of public transport is the main cause of traffic congestion, so transport
management system has to be improved and the lane awareness has to be enhanced. The vehicles from outside of the valley should be managed properly. Parks around the entrance
to the city areas would be better than in business areas (like New Road). The width of the ring road is ok but the system has to be there. The traffic management has to be
strongly implemented.
JST proposes Kathmandu Valley Parking Development Project and Kathmandu Valley Traffic Safety Program as traffic demand management projects. Please refer to 8.4 Traffic Demand Management, Chapter 8 for more details.
(5) Traffic Safety Plan
There is a comment as follows: Mitigation measures to decrease traffic accident should be considered.
JST proposes traffic safety development strategies based on the examination on traffic safety. Please refer to 8.6 Traffic Safety Plan, Chapter 8 for more details.
(6) Low Carbon Emission
There are comments as follows: Suggest that low carbon development with local construction aggregate be promoted to reduce
carbon emission. Considering the current fuel crisis, we should promote electric or solar vehicles. Would be better if public health issues, eco-friendly vehicles etc. have been covered in the report. Sustainability was mentioned in terms of financial viability only, ignoring environmental
sustainability concerns. The Kathmandu Valley’s transport infrastructure should tie in with the National Planning Commission’s push towards a zero carbon economy.
Promote e-vehicle or cycle.
The Project on Urban Transport Improvement for Kathmandu Valley in Federal Democratic Republic of Nepal Final Report May 2017
7-23
JST proposes introduction of new public transport system and promotion of NMT based on land use plan and transport plan, which will contribute to realization of low carbon society. Discussion on eco-friendly vehicles is out of the scope of the study.
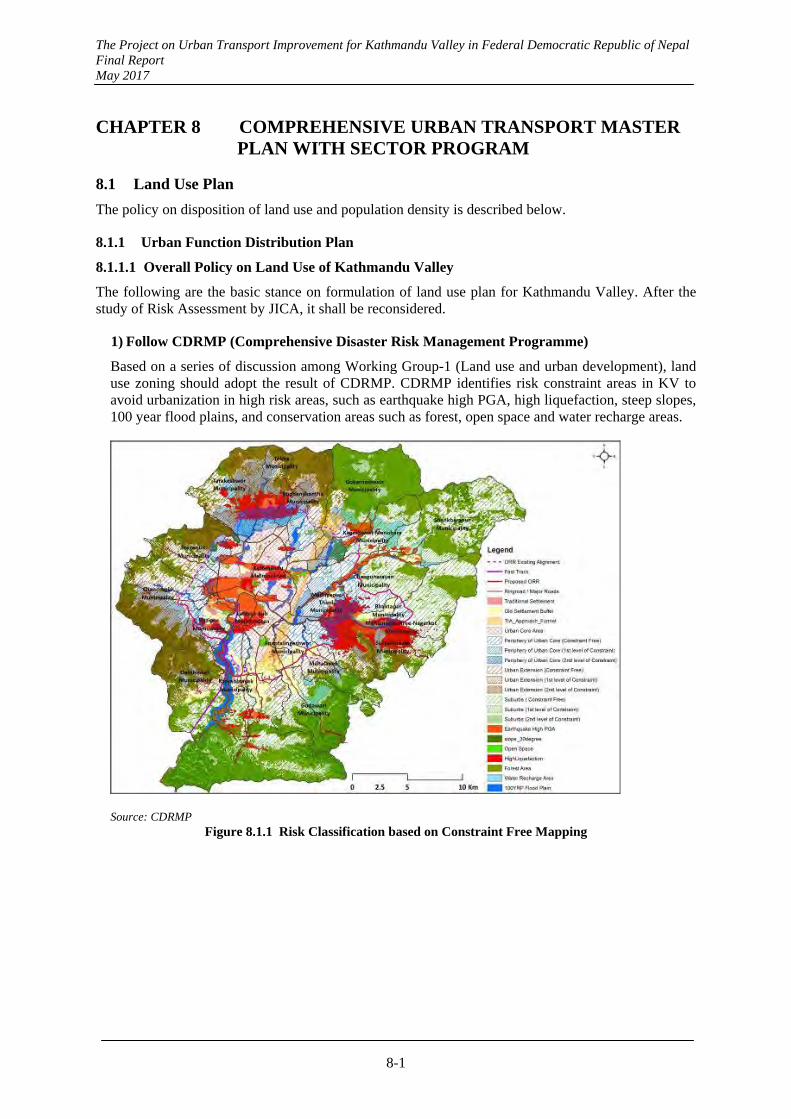
The Project on Urban Transport Improvement for Kathmandu Valley in Federal Democratic Republic of Nepal Final Report May 2017
8-1
CHAPTER 8 COMPREHENSIVE URBAN TRANSPORT MASTER PLAN WITH SECTOR PROGRAM
8.1 Land Use Plan
The policy on disposition of land use and population density is described below.
8.1.1 Urban Function Distribution Plan
8.1.1.1 Overall Policy on Land Use of Kathmandu Valley
The following are the basic stance on formulation of land use plan for Kathmandu Valley. After the study of Risk Assessment by JICA, it shall be reconsidered.
1) Follow CDRMP (Comprehensive Disaster Risk Management Programme)
Based on a series of discussion among Working Group-1 (Land use and urban development), land use zoning should adopt the result of CDRMP. CDRMP identifies risk constraint areas in KV to avoid urbanization in high risk areas, such as earthquake high PGA, high liquefaction, steep slopes, 100 year flood plains, and conservation areas such as forest, open space and water recharge areas.
Source: CDRMP Figure 8.1.1 Risk Classification based on Constraint Free Mapping
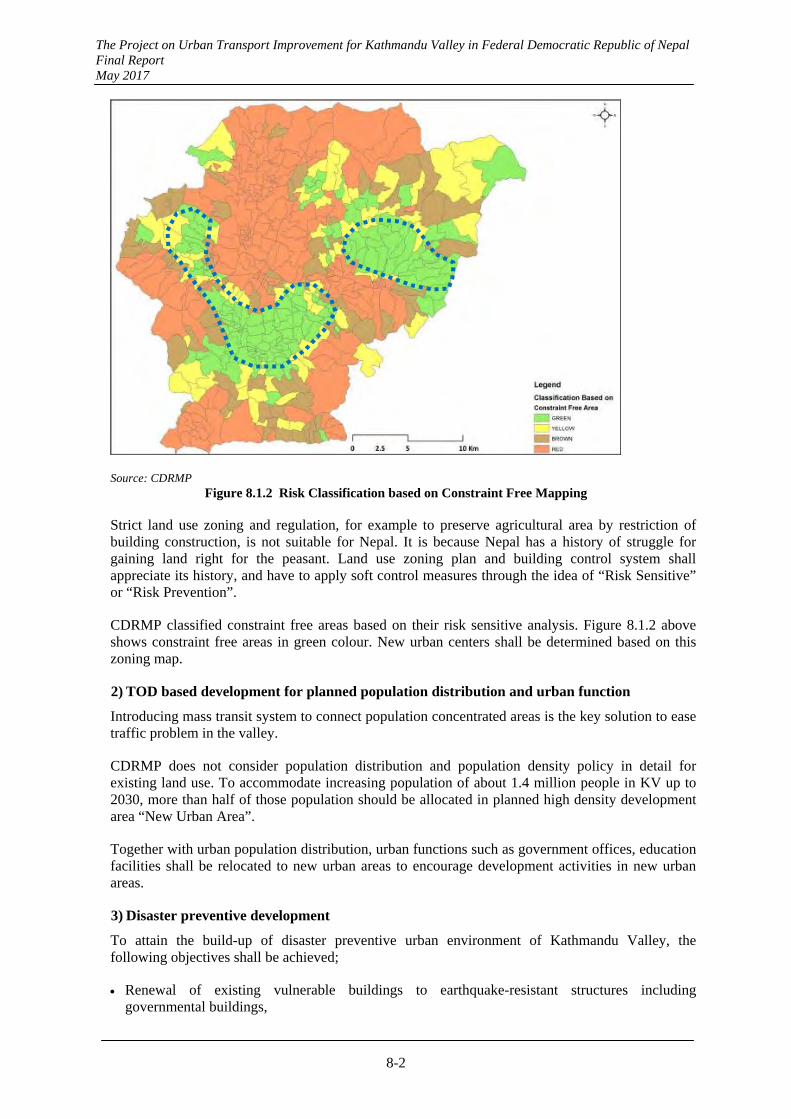
The Project on Urban Transport Improvement for Kathmandu Valley in Federal Democratic Republic of Nepal Final Report May 2017
8-2
Source: CDRMP Figure 8.1.2 Risk Classification based on Constraint Free Mapping
Strict land use zoning and regulation, for example to preserve agricultural area by restriction of building construction, is not suitable for Nepal. It is because Nepal has a history of struggle for gaining land right for the peasant. Land use zoning plan and building control system shall appreciate its history, and have to apply soft control measures through the idea of “Risk Sensitive” or “Risk Prevention”.
CDRMP classified constraint free areas based on their risk sensitive analysis. Figure 8.1.2 above shows constraint free areas in green colour. New urban centers shall be determined based on this zoning map.
2) TOD based development for planned population distribution and urban function
Introducing mass transit system to connect population concentrated areas is the key solution to ease traffic problem in the valley.
CDRMP does not consider population distribution and population density policy in detail for existing land use. To accommodate increasing population of about 1.4 million people in KV up to 2030, more than half of those population should be allocated in planned high density development area “New Urban Area”.
Together with urban population distribution, urban functions such as government offices, education facilities shall be relocated to new urban areas to encourage development activities in new urban areas.
3) Disaster preventive development
To attain the build-up of disaster preventive urban environment of Kathmandu Valley, the following objectives shall be achieved;
Renewal of existing vulnerable buildings to earthquake-resistant structures including governmental buildings,
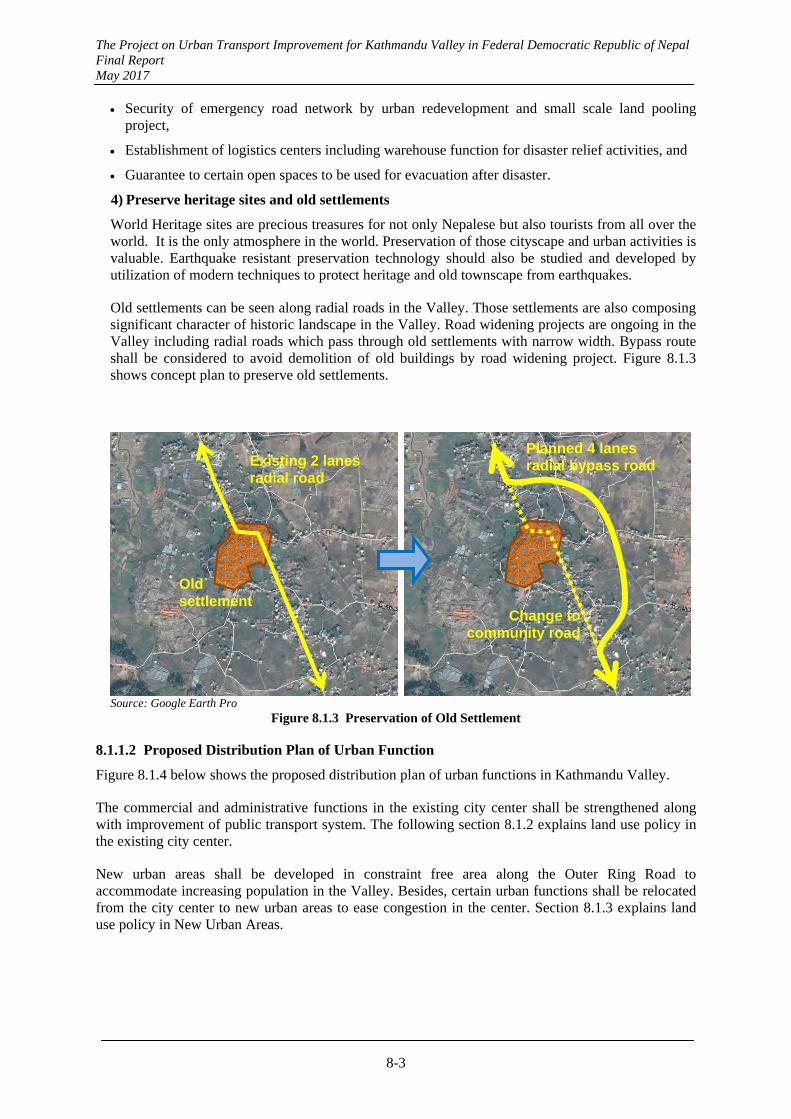
The Project on Urban Transport Improvement for Kathmandu Valley in Federal Democratic Republic of Nepal Final Report May 2017
8-3
Security of emergency road network by urban redevelopment and small scale land pooling project,
Establishment of logistics centers including warehouse function for disaster relief activities, and
Guarantee to certain open spaces to be used for evacuation after disaster.
4) Preserve heritage sites and old settlements
World Heritage sites are precious treasures for not only Nepalese but also tourists from all over the world. It is the only atmosphere in the world. Preservation of those cityscape and urban activities is valuable. Earthquake resistant preservation technology should also be studied and developed by utilization of modern techniques to protect heritage and old townscape from earthquakes.
Old settlements can be seen along radial roads in the Valley. Those settlements are also composing significant character of historic landscape in the Valley. Road widening projects are ongoing in the Valley including radial roads which pass through old settlements with narrow width. Bypass route shall be considered to avoid demolition of old buildings by road widening project. Figure 8.1.3 shows concept plan to preserve old settlements.
Source: Google Earth Pro
Figure 8.1.3 Preservation of Old Settlement
8.1.1.2 Proposed Distribution Plan of Urban Function
Figure 8.1.4 below shows the proposed distribution plan of urban functions in Kathmandu Valley.
The commercial and administrative functions in the existing city center shall be strengthened along with improvement of public transport system. The following section 8.1.2 explains land use policy in the existing city center.
New urban areas shall be developed in constraint free area along the Outer Ring Road to accommodate increasing population in the Valley. Besides, certain urban functions shall be relocated from the city center to new urban areas to ease congestion in the center. Section 8.1.3 explains land use policy in New Urban Areas.
Existing 2 lanes radial road
Planned 4 lanes radial bypass road
Old settlement
Change to community road
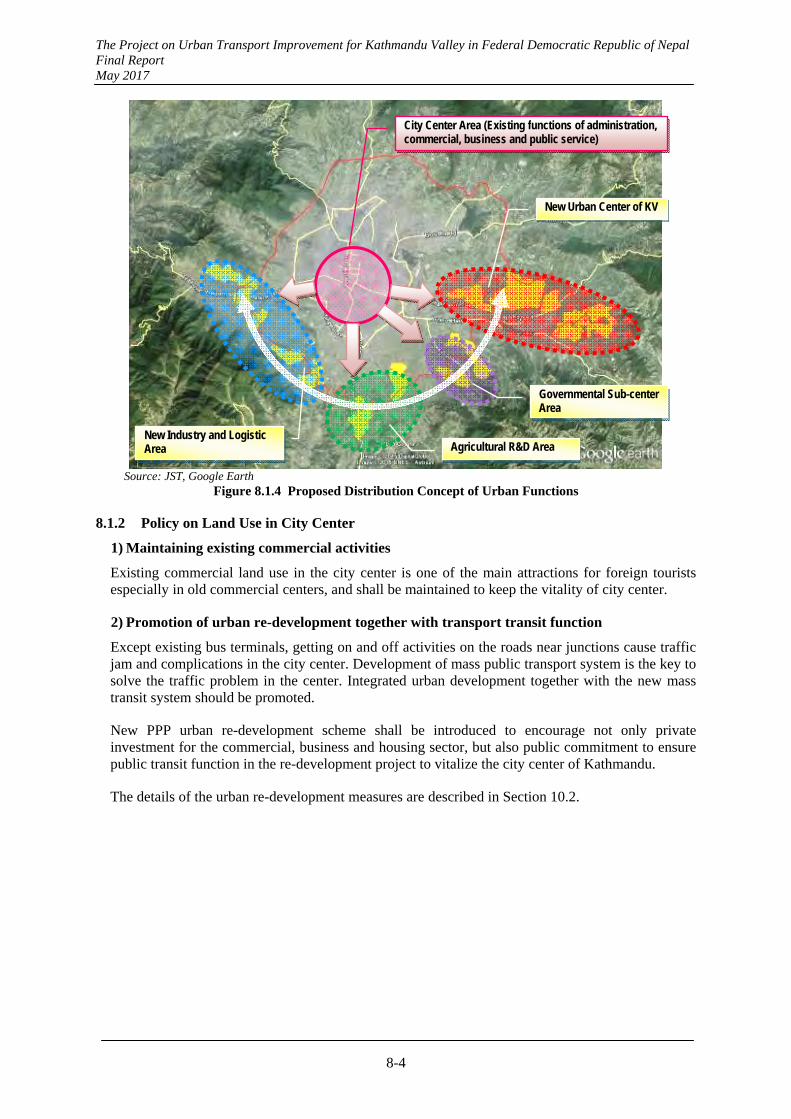
The Project on Urban Transport Improvement for Kathmandu Valley in Federal Democratic Republic of Nepal Final Report May 2017
8-4
Source: JST, Google Earth
Figure 8.1.4 Proposed Distribution Concept of Urban Functions
8.1.2 Policy on Land Use in City Center
1) Maintaining existing commercial activities
Existing commercial land use in the city center is one of the main attractions for foreign tourists especially in old commercial centers, and shall be maintained to keep the vitality of city center.
2) Promotion of urban re-development together with transport transit function
Except existing bus terminals, getting on and off activities on the roads near junctions cause traffic jam and complications in the city center. Development of mass public transport system is the key to solve the traffic problem in the center. Integrated urban development together with the new mass transit system should be promoted.
New PPP urban re-development scheme shall be introduced to encourage not only private investment for the commercial, business and housing sector, but also public commitment to ensure public transit function in the re-development project to vitalize the city center of Kathmandu.
The details of the urban re-development measures are described in Section 10.2.
New Urban Center of KV
City Center Area (Existing functions of administration, commercial, business and public service)
Governmental Sub-center Area
Agricultural R&D Area New Industry and Logistic Area
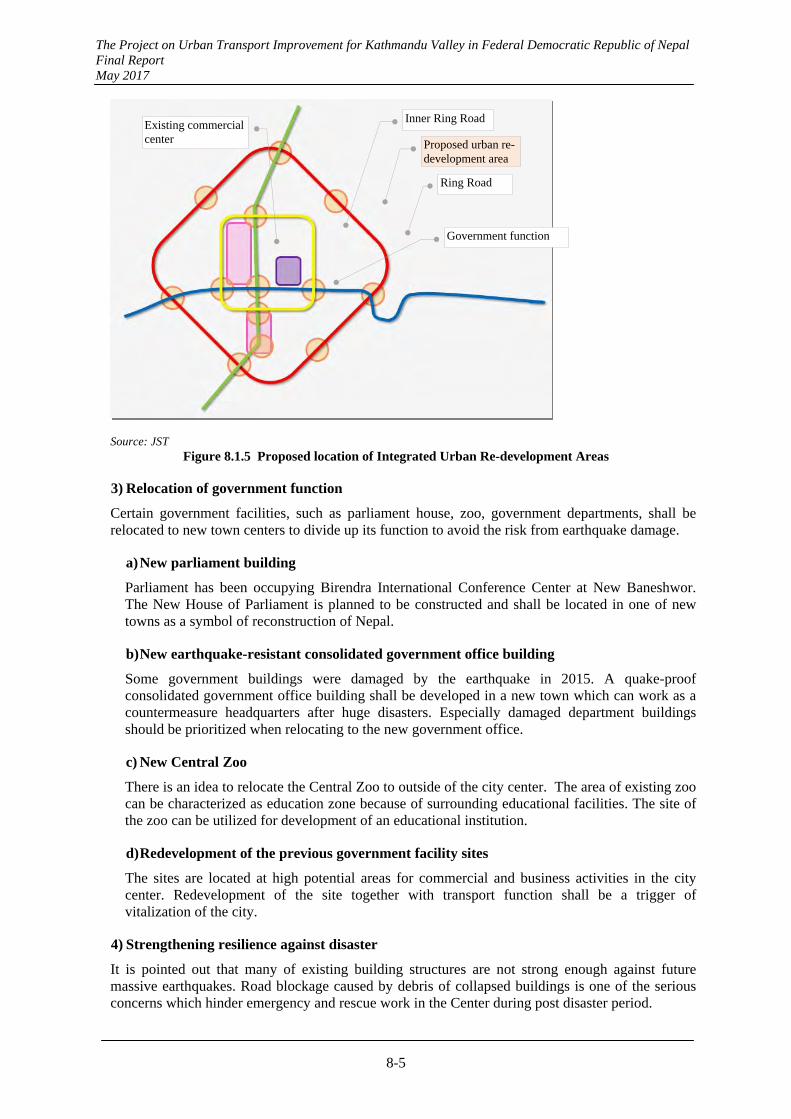
The Project on Urban Transport Improvement for Kathmandu Valley in Federal Democratic Republic of Nepal Final Report May 2017
8-5
Source: JST Figure 8.1.5 Proposed location of Integrated Urban Re-development Areas
3) Relocation of government function
Certain government facilities, such as parliament house, zoo, government departments, shall be relocated to new town centers to divide up its function to avoid the risk from earthquake damage.
a) New parliament building
Parliament has been occupying Birendra International Conference Center at New Baneshwor. The New House of Parliament is planned to be constructed and shall be located in one of new towns as a symbol of reconstruction of Nepal.
b) New earthquake-resistant consolidated government office building
Some government buildings were damaged by the earthquake in 2015. A quake-proof consolidated government office building shall be developed in a new town which can work as a countermeasure headquarters after huge disasters. Especially damaged department buildings should be prioritized when relocating to the new government office.
c) New Central Zoo
There is an idea to relocate the Central Zoo to outside of the city center. The area of existing zoo can be characterized as education zone because of surrounding educational facilities. The site of the zoo can be utilized for development of an educational institution.
d) Redevelopment of the previous government facility sites
The sites are located at high potential areas for commercial and business activities in the city center. Redevelopment of the site together with transport function shall be a trigger of vitalization of the city.
4) Strengthening resilience against disaster
It is pointed out that many of existing building structures are not strong enough against future massive earthquakes. Road blockage caused by debris of collapsed buildings is one of the serious concerns which hinder emergency and rescue work in the Center during post disaster period.
Proposed urban re-development area
Inner Ring Road
Ring Road
Existing commercial center
Government function
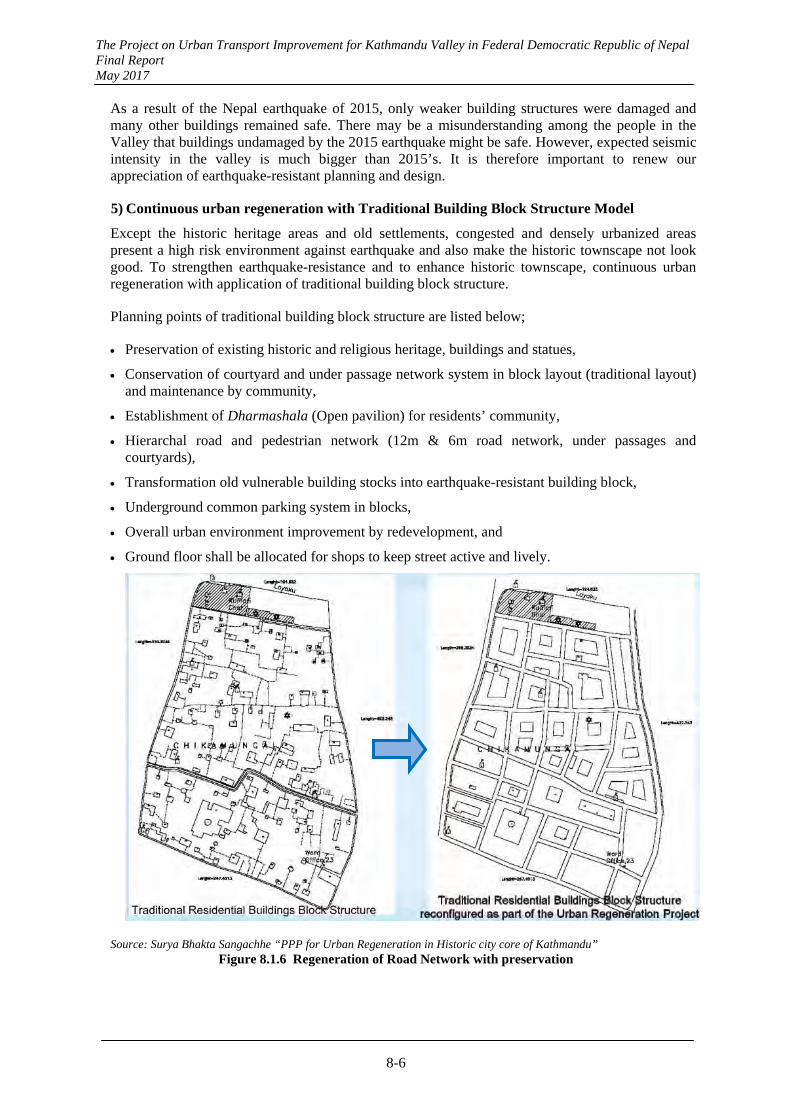
The Project on Urban Transport Improvement for Kathmandu Valley in Federal Democratic Republic of Nepal Final Report May 2017
8-6
As a result of the Nepal earthquake of 2015, only weaker building structures were damaged and many other buildings remained safe. There may be a misunderstanding among the people in the Valley that buildings undamaged by the 2015 earthquake might be safe. However, expected seismic intensity in the valley is much bigger than 2015’s. It is therefore important to renew our appreciation of earthquake-resistant planning and design.
5) Continuous urban regeneration with Traditional Building Block Structure Model
Except the historic heritage areas and old settlements, congested and densely urbanized areas present a high risk environment against earthquake and also make the historic townscape not look good. To strengthen earthquake-resistance and to enhance historic townscape, continuous urban regeneration with application of traditional building block structure.
Planning points of traditional building block structure are listed below;
Preservation of existing historic and religious heritage, buildings and statues,
Conservation of courtyard and under passage network system in block layout (traditional layout) and maintenance by community,
Establishment of Dharmashala (Open pavilion) for residents’ community,
Hierarchal road and pedestrian network (12m & 6m road network, under passages and courtyards),
Transformation old vulnerable building stocks into earthquake-resistant building block,
Underground common parking system in blocks,
Overall urban environment improvement by redevelopment, and
Ground floor shall be allocated for shops to keep street active and lively.
Source: Surya Bhakta Sangachhe “PPP for Urban Regeneration in Historic city core of Kathmandu” Figure 8.1.6 Regeneration of Road Network with preservation
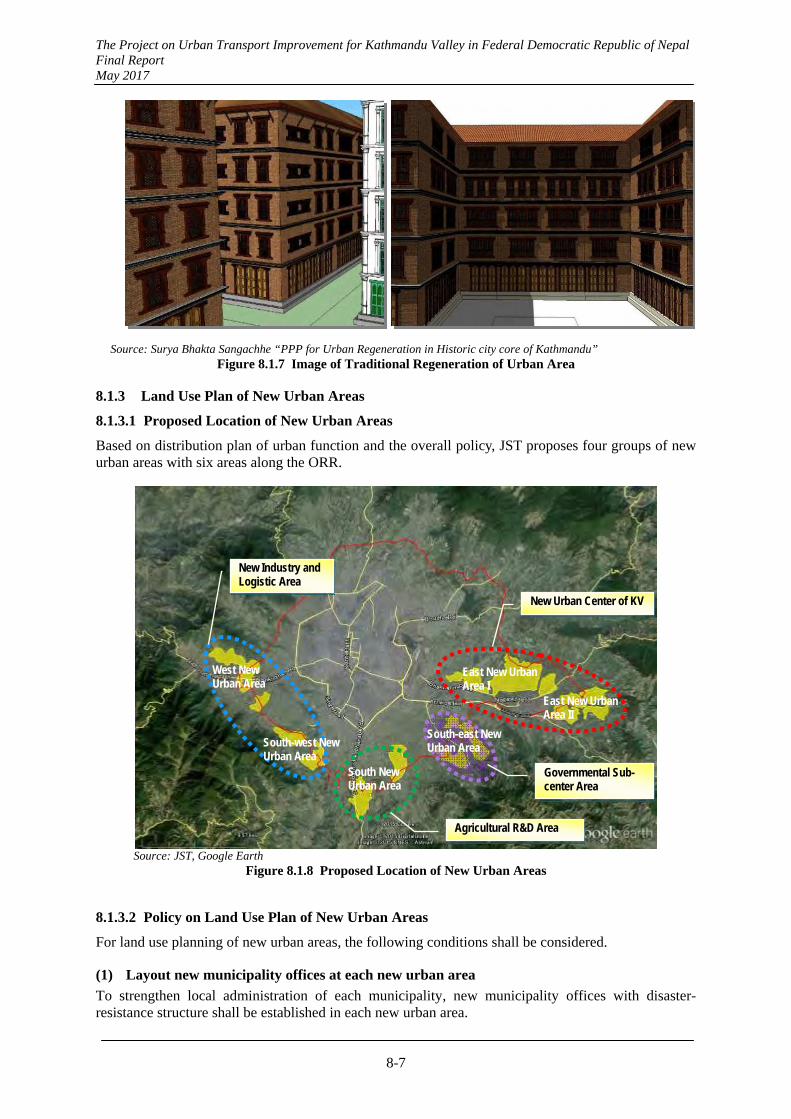
The Project on Urban Transport Improvement for Kathmandu Valley in Federal Democratic Republic of Nepal Final Report May 2017
8-7
Source: Surya Bhakta Sangachhe “PPP for Urban Regeneration in Historic city core of Kathmandu” Figure 8.1.7 Image of Traditional Regeneration of Urban Area
8.1.3 Land Use Plan of New Urban Areas
8.1.3.1 Proposed Location of New Urban Areas
Based on distribution plan of urban function and the overall policy, JST proposes four groups of new urban areas with six areas along the ORR.
Source: JST, Google Earth
Figure 8.1.8 Proposed Location of New Urban Areas
8.1.3.2 Policy on Land Use Plan of New Urban Areas
For land use planning of new urban areas, the following conditions shall be considered.
(1) Layout new municipality offices at each new urban area
To strengthen local administration of each municipality, new municipality offices with disaster-resistance structure shall be established in each new urban area.
New Urban Center of KV
Agricultural R&D Area
New Industry and Logistic Area
East New Urban Area I
East New Urban Area II
South New Urban Area
South-west New Urban Area
West New Urban Area
Governmental Sub-center Area
South-east New Urban Area

The Project on Urban Transport Improvement for Kathmandu Valley in Federal Democratic Republic of Nepal Final Report May 2017
8-8
(2) Conservation of water course and the buffer area
For the maintenance of irrigation network to surrounding agricultural activities, existing rivers flowing through the new urban area shall be conserved with buffer green area.
(3) Arrangement of large-scale green parks
For the creation of comfortable urban environment and safe evacuation space, large-scale green parks shall be laid out in the manner of covering the new urban area by a service range of 500m. In addition, pedestrian network will be laid out to connect between the green parks, center areas and the surrounding residential areas.
(4) Arrangement of commercial and business areas, and high-density residential areas along main road
Aiming at the high-traffic capacity of main roads and effective utilization of the development potential of the road side areas, commercial and business areas, and high-density residential areas shall be laid out along main roads such as arterial roads and sub-arterial roads.
(5) Adoption of TOD concept with AGT and BRT
Aiming at enhancement of development potential in the station surrounding areas of public transport, and increase in number of public transport users for urban development areas, integrated urban development with public transport system based on TOD concept shall be adopted for new urban areas. This adoption is expected for new urban centers of KV and governmental sub-center areas which have plans of new public transport system such as AGT and BRT.
8.1.3.3 Proposed Land Use Plan of New Urban Areas
(1) New Urban Center of KV
For the new urban center of KV, the concept, major functions and the land use plan are proposed as follows:
1) Concept
Concept of New Urban Center of KV is proposed as ‘Primary sub-center with new CBD and tourism site’. The concept aims that this area becomes a new urban core of KV and Nepal to strengthen its international competitiveness in terms of commercial, business and tourism. In addition, it also aims to create business opportunities, comfortable urban living spaces and amusement for citizens in KV.
2) Major Functions
According to the concept, the major urban functions are proposed as follows:
National and local government offices
Commercial and business complex
National convention center
National museum
National stadium
Accommodation for foreign visitors and tourists
Amusement areas
Large-scale green parks
New residential areas
New public transport (AGT) connecting with international airport and city center
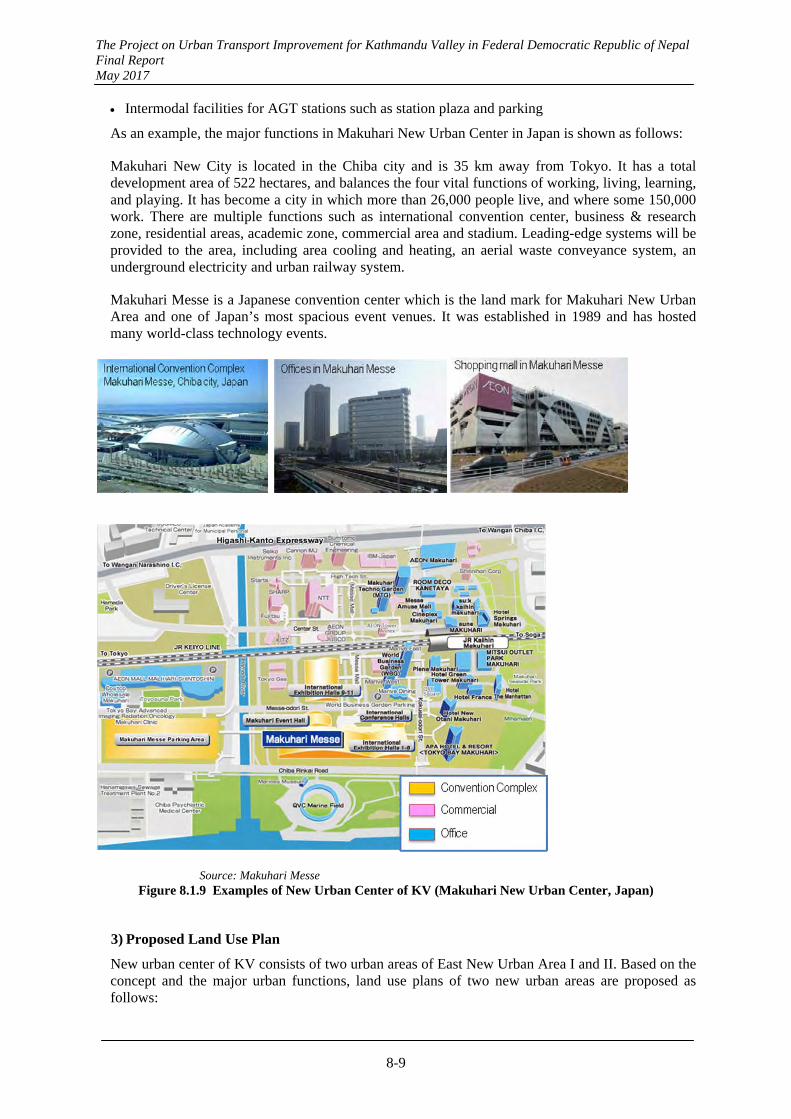
The Project on Urban Transport Improvement for Kathmandu Valley in Federal Democratic Republic of Nepal Final Report May 2017
8-9
Intermodal facilities for AGT stations such as station plaza and parking
As an example, the major functions in Makuhari New Urban Center in Japan is shown as follows:
Makuhari New City is located in the Chiba city and is 35 km away from Tokyo. It has a total development area of 522 hectares, and balances the four vital functions of working, living, learning, and playing. It has become a city in which more than 26,000 people live, and where some 150,000 work. There are multiple functions such as international convention center, business & research zone, residential areas, academic zone, commercial area and stadium. Leading-edge systems will be provided to the area, including area cooling and heating, an aerial waste conveyance system, an underground electricity and urban railway system.
Makuhari Messe is a Japanese convention center which is the land mark for Makuhari New Urban Area and one of Japan’s most spacious event venues. It was established in 1989 and has hosted many world-class technology events.
Source: Makuhari Messe Figure 8.1.9 Examples of New Urban Center of KV (Makuhari New Urban Center, Japan)
3) Proposed Land Use Plan
New urban center of KV consists of two urban areas of East New Urban Area I and II. Based on the concept and the major urban functions, land use plans of two new urban areas are proposed as follows:
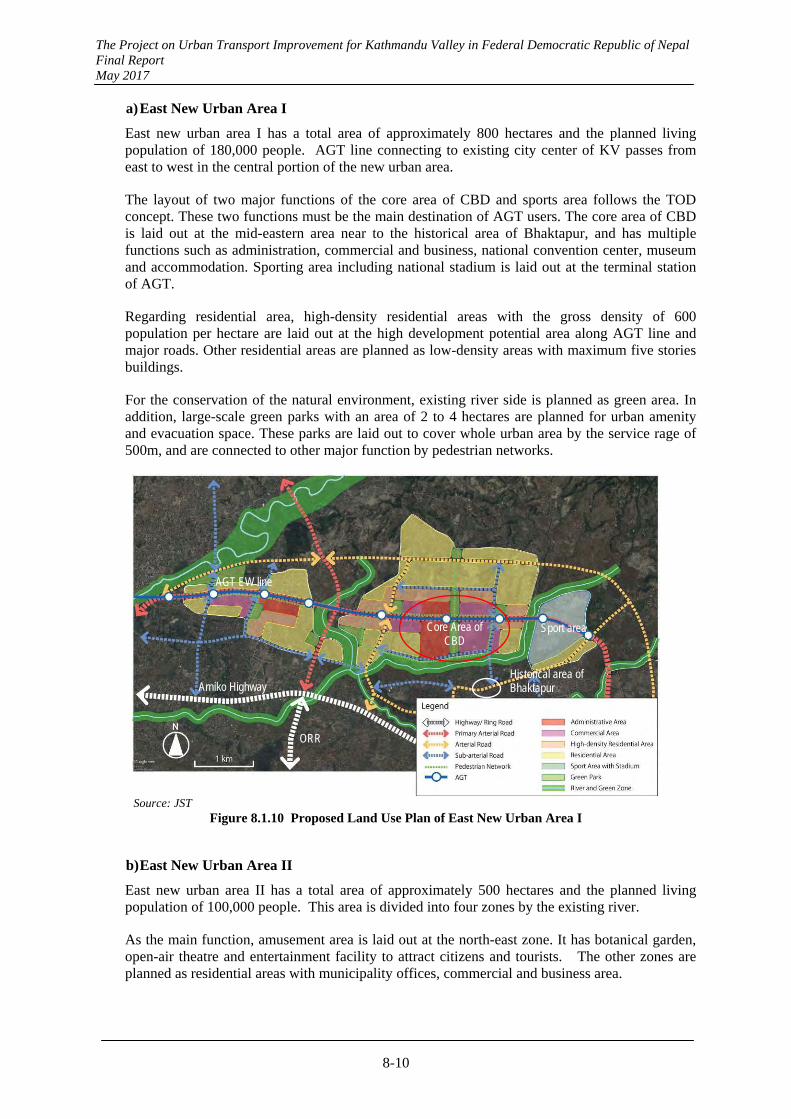
The Project on Urban Transport Improvement for Kathmandu Valley in Federal Democratic Republic of Nepal Final Report May 2017
8-10
a) East New Urban Area I
East new urban area I has a total area of approximately 800 hectares and the planned living population of 180,000 people. AGT line connecting to existing city center of KV passes from east to west in the central portion of the new urban area.
The layout of two major functions of the core area of CBD and sports area follows the TOD concept. These two functions must be the main destination of AGT users. The core area of CBD is laid out at the mid-eastern area near to the historical area of Bhaktapur, and has multiple functions such as administration, commercial and business, national convention center, museum and accommodation. Sporting area including national stadium is laid out at the terminal station of AGT.
Regarding residential area, high-density residential areas with the gross density of 600 population per hectare are laid out at the high development potential area along AGT line and major roads. Other residential areas are planned as low-density areas with maximum five stories buildings.
For the conservation of the natural environment, existing river side is planned as green area. In addition, large-scale green parks with an area of 2 to 4 hectares are planned for urban amenity and evacuation space. These parks are laid out to cover whole urban area by the service rage of 500m, and are connected to other major function by pedestrian networks.
Source: JST
Figure 8.1.10 Proposed Land Use Plan of East New Urban Area I
b) East New Urban Area II
East new urban area II has a total area of approximately 500 hectares and the planned living population of 100,000 people. This area is divided into four zones by the existing river.
As the main function, amusement area is laid out at the north-east zone. It has botanical garden, open-air theatre and entertainment facility to attract citizens and tourists. The other zones are planned as residential areas with municipality offices, commercial and business area.
Core Area of
CBD
AGT EW line
Arniko Highway
ORR
Historical area of Bhaktapur
Sport area
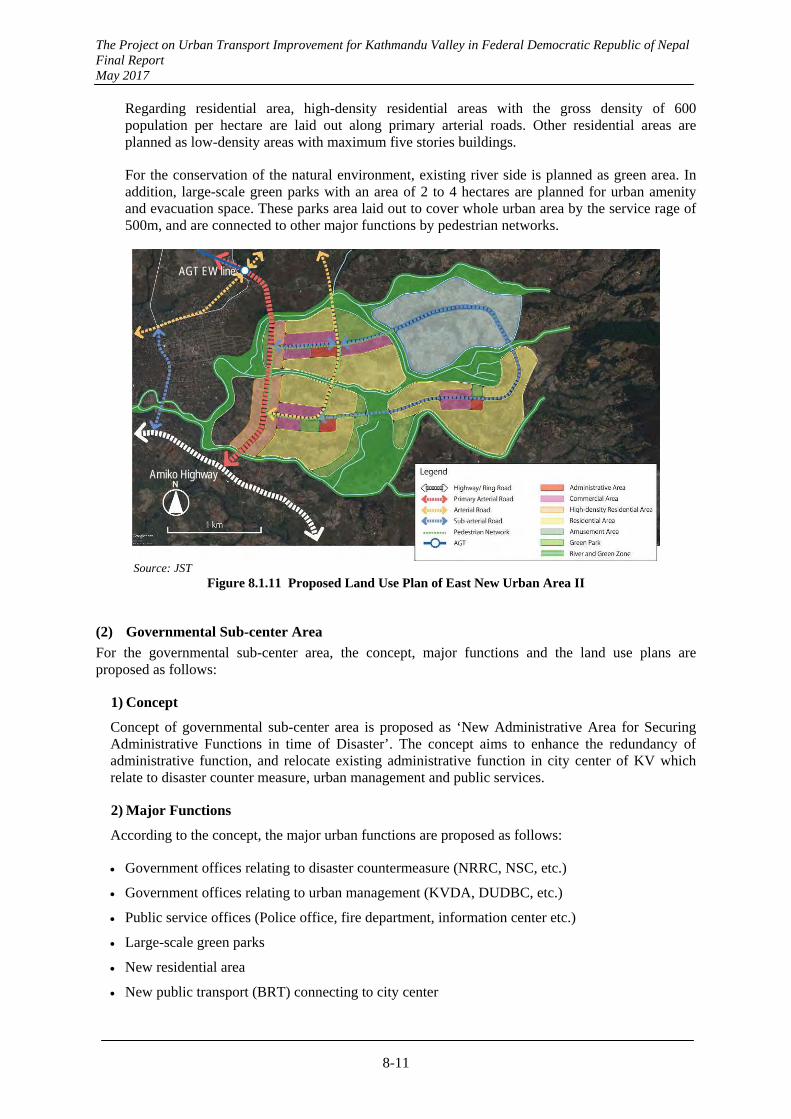
The Project on Urban Transport Improvement for Kathmandu Valley in Federal Democratic Republic of Nepal Final Report May 2017
8-11
Regarding residential area, high-density residential areas with the gross density of 600 population per hectare are laid out along primary arterial roads. Other residential areas are planned as low-density areas with maximum five stories buildings.
For the conservation of the natural environment, existing river side is planned as green area. In addition, large-scale green parks with an area of 2 to 4 hectares are planned for urban amenity and evacuation space. These parks area laid out to cover whole urban area by the service rage of 500m, and are connected to other major functions by pedestrian networks.
Source: JST
Figure 8.1.11 Proposed Land Use Plan of East New Urban Area II
(2) Governmental Sub-center Area
For the governmental sub-center area, the concept, major functions and the land use plans are proposed as follows:
1) Concept
Concept of governmental sub-center area is proposed as ‘New Administrative Area for Securing Administrative Functions in time of Disaster’. The concept aims to enhance the redundancy of administrative function, and relocate existing administrative function in city center of KV which relate to disaster counter measure, urban management and public services.
2) Major Functions
According to the concept, the major urban functions are proposed as follows:
Government offices relating to disaster countermeasure (NRRC, NSC, etc.)
Government offices relating to urban management (KVDA, DUDBC, etc.)
Public service offices (Police office, fire department, information center etc.)
Large-scale green parks
New residential area
New public transport (BRT) connecting to city center
Arniko Highway
AGT EW line
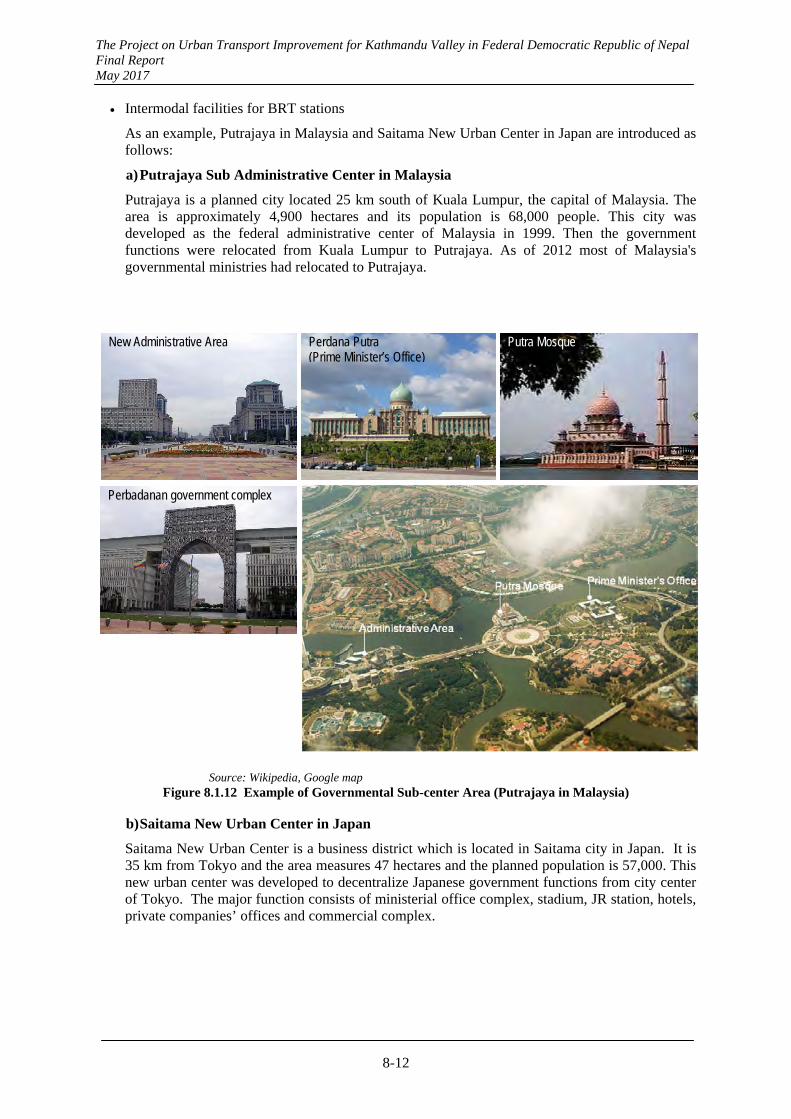
The Project on Urban Transport Improvement for Kathmandu Valley in Federal Democratic Republic of Nepal Final Report May 2017
8-12
Intermodal facilities for BRT stations
As an example, Putrajaya in Malaysia and Saitama New Urban Center in Japan are introduced as follows:
a) Putrajaya Sub Administrative Center in Malaysia
Putrajaya is a planned city located 25 km south of Kuala Lumpur, the capital of Malaysia. The area is approximately 4,900 hectares and its population is 68,000 people. This city was developed as the federal administrative center of Malaysia in 1999. Then the government functions were relocated from Kuala Lumpur to Putrajaya. As of 2012 most of Malaysia's governmental ministries had relocated to Putrajaya.
Source: Wikipedia, Google map
Figure 8.1.12 Example of Governmental Sub-center Area (Putrajaya in Malaysia)
b) Saitama New Urban Center in Japan
Saitama New Urban Center is a business district which is located in Saitama city in Japan. It is 35 km from Tokyo and the area measures 47 hectares and the planned population is 57,000. This new urban center was developed to decentralize Japanese government functions from city center of Tokyo. The major function consists of ministerial office complex, stadium, JR station, hotels, private companies’ offices and commercial complex.
New Administrative Area Perdana Putra (Prime Minister’s Office)
Putra Mosque
Perbadanan government complex
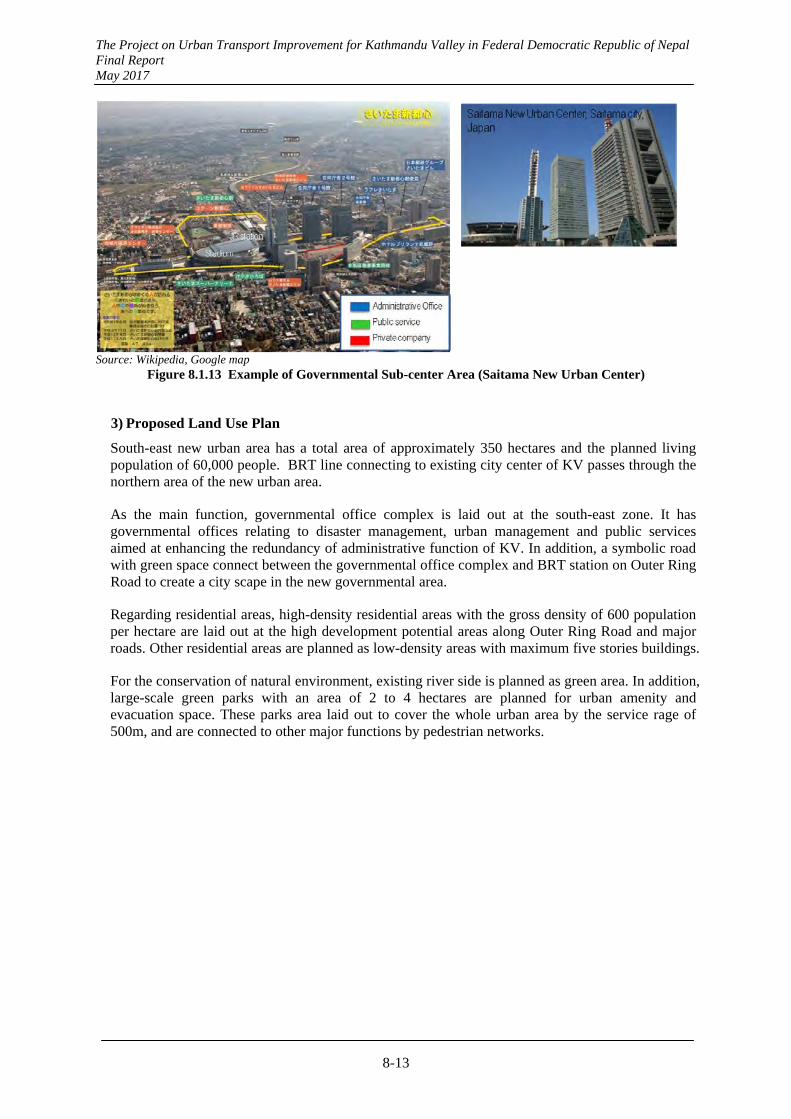
The Project on Urban Transport Improvement for Kathmandu Valley in Federal Democratic Republic of Nepal Final Report May 2017
8-13
Source: Wikipedia, Google map
Figure 8.1.13 Example of Governmental Sub-center Area (Saitama New Urban Center)
3) Proposed Land Use Plan
South-east new urban area has a total area of approximately 350 hectares and the planned living population of 60,000 people. BRT line connecting to existing city center of KV passes through the northern area of the new urban area.
As the main function, governmental office complex is laid out at the south-east zone. It has governmental offices relating to disaster management, urban management and public services aimed at enhancing the redundancy of administrative function of KV. In addition, a symbolic road with green space connect between the governmental office complex and BRT station on Outer Ring Road to create a city scape in the new governmental area.
Regarding residential areas, high-density residential areas with the gross density of 600 population per hectare are laid out at the high development potential areas along Outer Ring Road and major roads. Other residential areas are planned as low-density areas with maximum five stories buildings.
For the conservation of natural environment, existing river side is planned as green area. In addition, large-scale green parks with an area of 2 to 4 hectares are planned for urban amenity and evacuation space. These parks area laid out to cover the whole urban area by the service rage of 500m, and are connected to other major functions by pedestrian networks.
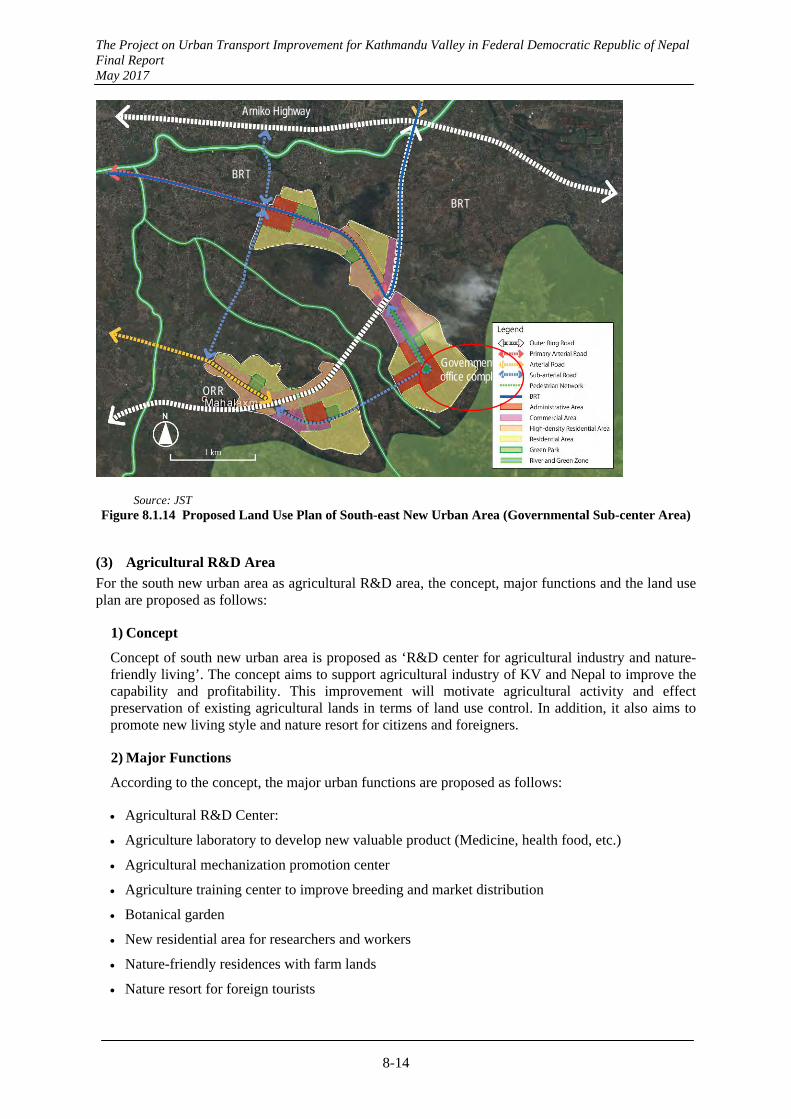
The Project on Urban Transport Improvement for Kathmandu Valley in Federal Democratic Republic of Nepal Final Report May 2017
8-14
Source: JST Figure 8.1.14 Proposed Land Use Plan of South-east New Urban Area (Governmental Sub-center Area)
(3) Agricultural R&D Area
For the south new urban area as agricultural R&D area, the concept, major functions and the land use plan are proposed as follows:
1) Concept
Concept of south new urban area is proposed as ‘R&D center for agricultural industry and nature-friendly living’. The concept aims to support agricultural industry of KV and Nepal to improve the capability and profitability. This improvement will motivate agricultural activity and effect preservation of existing agricultural lands in terms of land use control. In addition, it also aims to promote new living style and nature resort for citizens and foreigners.
2) Major Functions
According to the concept, the major urban functions are proposed as follows:
Agricultural R&D Center:
Agriculture laboratory to develop new valuable product (Medicine, health food, etc.)
Agricultural mechanization promotion center
Agriculture training center to improve breeding and market distribution
Botanical garden
New residential area for researchers and workers
Nature-friendly residences with farm lands
Nature resort for foreign tourists
ORR
Arniko Highway
BRT
BRT
Governmental office complex
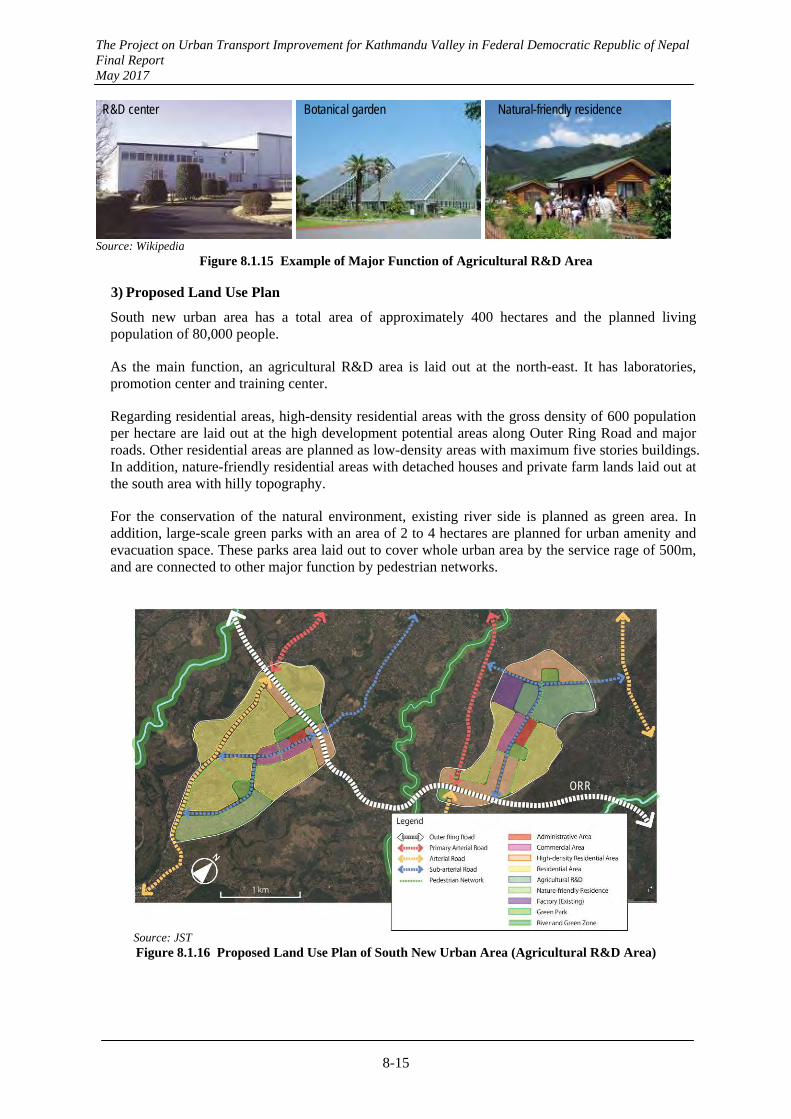
The Project on Urban Transport Improvement for Kathmandu Valley in Federal Democratic Republic of Nepal Final Report May 2017
8-15
Source: Wikipedia
Figure 8.1.15 Example of Major Function of Agricultural R&D Area
3) Proposed Land Use Plan
South new urban area has a total area of approximately 400 hectares and the planned living population of 80,000 people.
As the main function, an agricultural R&D area is laid out at the north-east. It has laboratories, promotion center and training center.
Regarding residential areas, high-density residential areas with the gross density of 600 population per hectare are laid out at the high development potential areas along Outer Ring Road and major roads. Other residential areas are planned as low-density areas with maximum five stories buildings. In addition, nature-friendly residential areas with detached houses and private farm lands laid out at the south area with hilly topography.
For the conservation of the natural environment, existing river side is planned as green area. In addition, large-scale green parks with an area of 2 to 4 hectares are planned for urban amenity and evacuation space. These parks area laid out to cover whole urban area by the service rage of 500m, and are connected to other major function by pedestrian networks.
Source: JST Figure 8.1.16 Proposed Land Use Plan of South New Urban Area (Agricultural R&D Area)
R&D center Botanical garden Natural-friendly residence
ORR
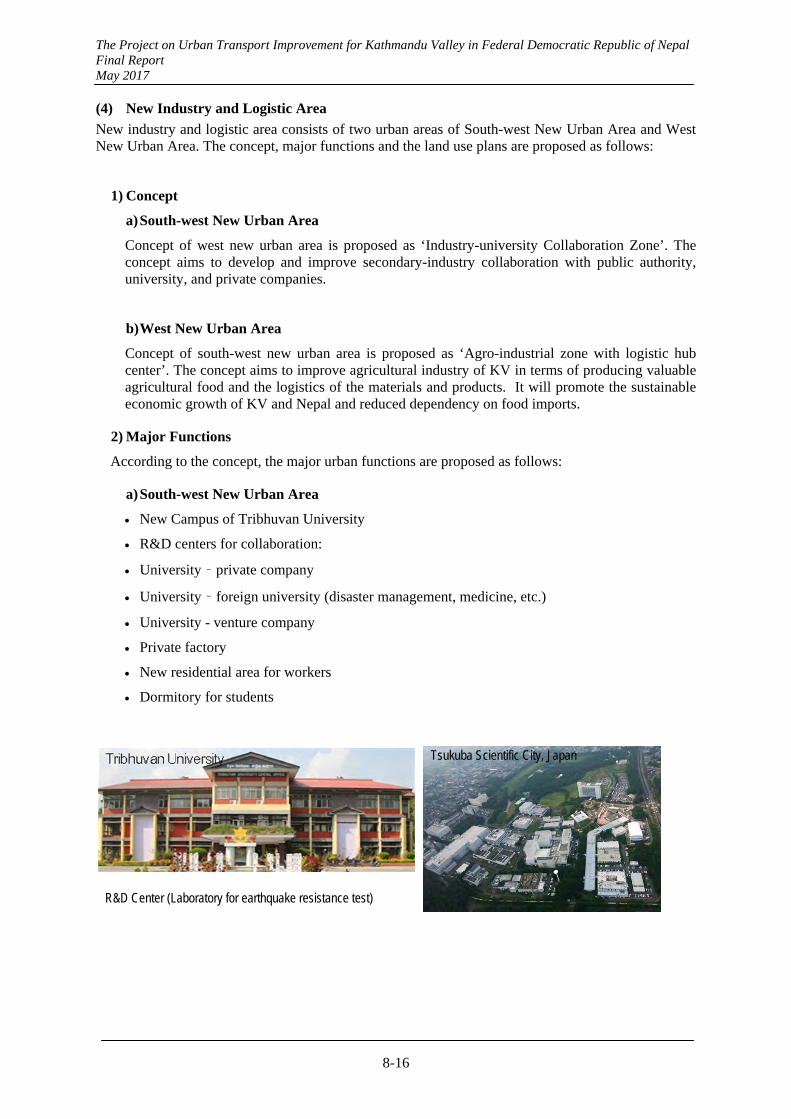
The Project on Urban Transport Improvement for Kathmandu Valley in Federal Democratic Republic of Nepal Final Report May 2017
8-16
(4) New Industry and Logistic Area
New industry and logistic area consists of two urban areas of South-west New Urban Area and West New Urban Area. The concept, major functions and the land use plans are proposed as follows:
1) Concept
a) South-west New Urban Area
Concept of west new urban area is proposed as ‘Industry-university Collaboration Zone’. The concept aims to develop and improve secondary-industry collaboration with public authority, university, and private companies.
b) West New Urban Area
Concept of south-west new urban area is proposed as ‘Agro-industrial zone with logistic hub center’. The concept aims to improve agricultural industry of KV in terms of producing valuable agricultural food and the logistics of the materials and products. It will promote the sustainable economic growth of KV and Nepal and reduced dependency on food imports.
2) Major Functions
According to the concept, the major urban functions are proposed as follows:
a) South-west New Urban Area
New Campus of Tribhuvan University
R&D centers for collaboration:
University – private company
University – foreign university (disaster management, medicine, etc.)
University - venture company
Private factory
New residential area for workers
Dormitory for students
R&D Center (Laboratory for earthquake resistance test)
Tsukuba Scientific City, Japan
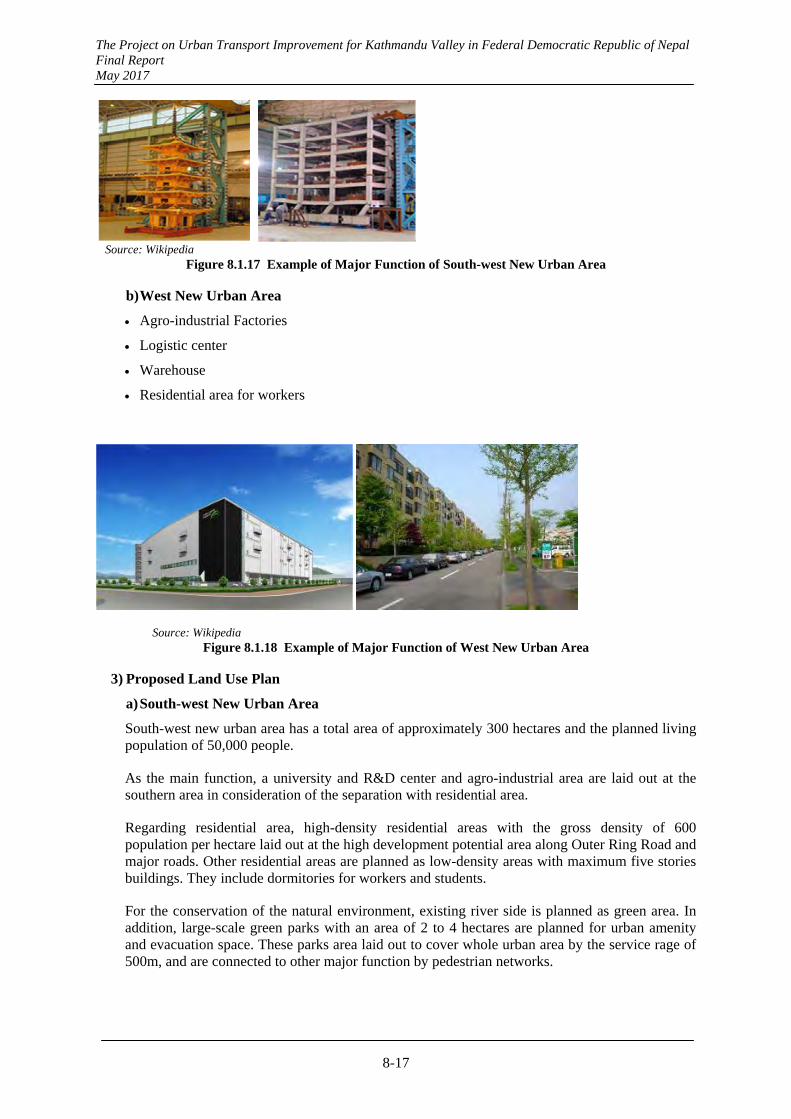
The Project on Urban Transport Improvement for Kathmandu Valley in Federal Democratic Republic of Nepal Final Report May 2017
8-17
Source: Wikipedia
Figure 8.1.17 Example of Major Function of South-west New Urban Area
b) West New Urban Area
Agro-industrial Factories
Logistic center
Warehouse
Residential area for workers
Source: Wikipedia Figure 8.1.18 Example of Major Function of West New Urban Area
3) Proposed Land Use Plan
a) South-west New Urban Area
South-west new urban area has a total area of approximately 300 hectares and the planned living population of 50,000 people.
As the main function, a university and R&D center and agro-industrial area are laid out at the southern area in consideration of the separation with residential area.
Regarding residential area, high-density residential areas with the gross density of 600 population per hectare laid out at the high development potential area along Outer Ring Road and major roads. Other residential areas are planned as low-density areas with maximum five stories buildings. They include dormitories for workers and students.
For the conservation of the natural environment, existing river side is planned as green area. In addition, large-scale green parks with an area of 2 to 4 hectares are planned for urban amenity and evacuation space. These parks area laid out to cover whole urban area by the service rage of 500m, and are connected to other major function by pedestrian networks.
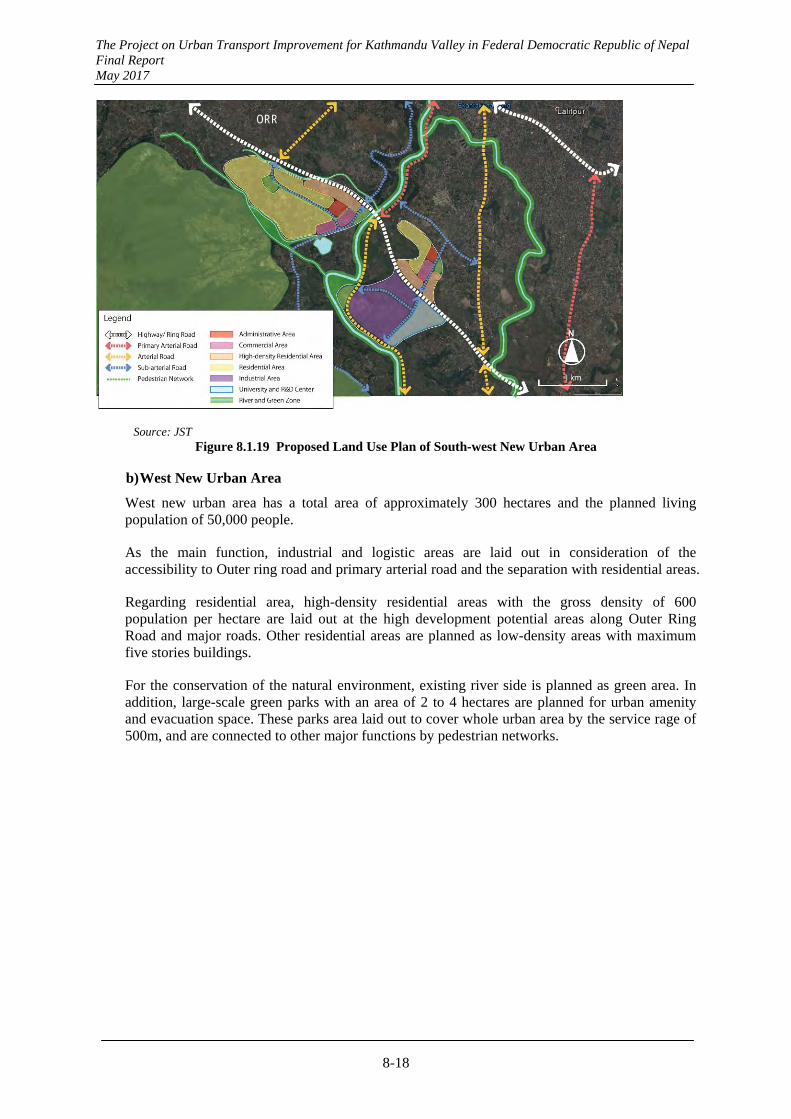
The Project on Urban Transport Improvement for Kathmandu Valley in Federal Democratic Republic of Nepal Final Report May 2017
8-18
Source: JST Figure 8.1.19 Proposed Land Use Plan of South-west New Urban Area
b) West New Urban Area
West new urban area has a total area of approximately 300 hectares and the planned living population of 50,000 people.
As the main function, industrial and logistic areas are laid out in consideration of the accessibility to Outer ring road and primary arterial road and the separation with residential areas.
Regarding residential area, high-density residential areas with the gross density of 600 population per hectare are laid out at the high development potential areas along Outer Ring Road and major roads. Other residential areas are planned as low-density areas with maximum five stories buildings.
For the conservation of the natural environment, existing river side is planned as green area. In addition, large-scale green parks with an area of 2 to 4 hectares are planned for urban amenity and evacuation space. These parks area laid out to cover whole urban area by the service rage of 500m, and are connected to other major functions by pedestrian networks.
ORR
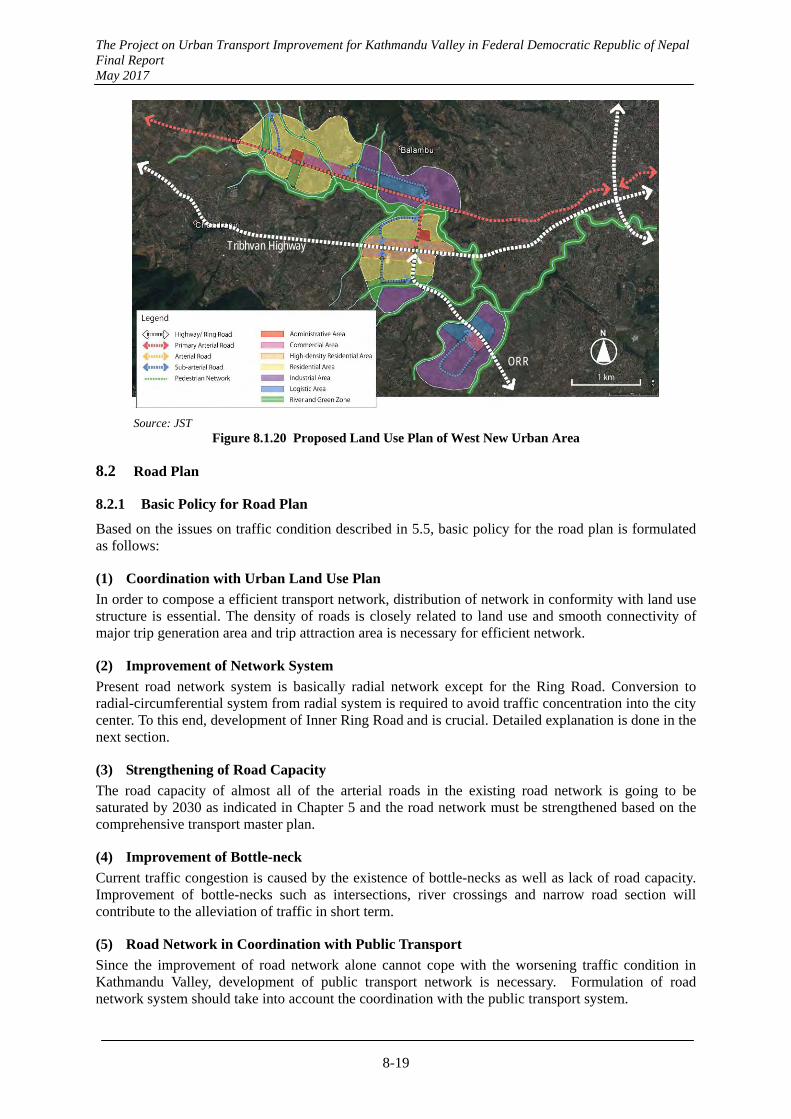
The Project on Urban Transport Improvement for Kathmandu Valley in Federal Democratic Republic of Nepal Final Report May 2017
8-19
Source: JST
Figure 8.1.20 Proposed Land Use Plan of West New Urban Area
8.2 Road Plan
8.2.1 Basic Policy for Road Plan
Based on the issues on traffic condition described in 5.5, basic policy for the road plan is formulated as follows:
(1) Coordination with Urban Land Use Plan
In order to compose a efficient transport network, distribution of network in conformity with land use structure is essential. The density of roads is closely related to land use and smooth connectivity of major trip generation area and trip attraction area is necessary for efficient network.
(2) Improvement of Network System
Present road network system is basically radial network except for the Ring Road. Conversion to radial-circumferential system from radial system is required to avoid traffic concentration into the city center. To this end, development of Inner Ring Road and is crucial. Detailed explanation is done in the next section.
(3) Strengthening of Road Capacity
The road capacity of almost all of the arterial roads in the existing road network is going to be saturated by 2030 as indicated in Chapter 5 and the road network must be strengthened based on the comprehensive transport master plan.
(4) Improvement of Bottle-neck
Current traffic congestion is caused by the existence of bottle-necks as well as lack of road capacity. Improvement of bottle-necks such as intersections, river crossings and narrow road section will contribute to the alleviation of traffic in short term.
(5) Road Network in Coordination with Public Transport
Since the improvement of road network alone cannot cope with the worsening traffic condition in Kathmandu Valley, development of public transport network is necessary. Formulation of road network system should take into account the coordination with the public transport system.
ORR
Tribhvan Highway
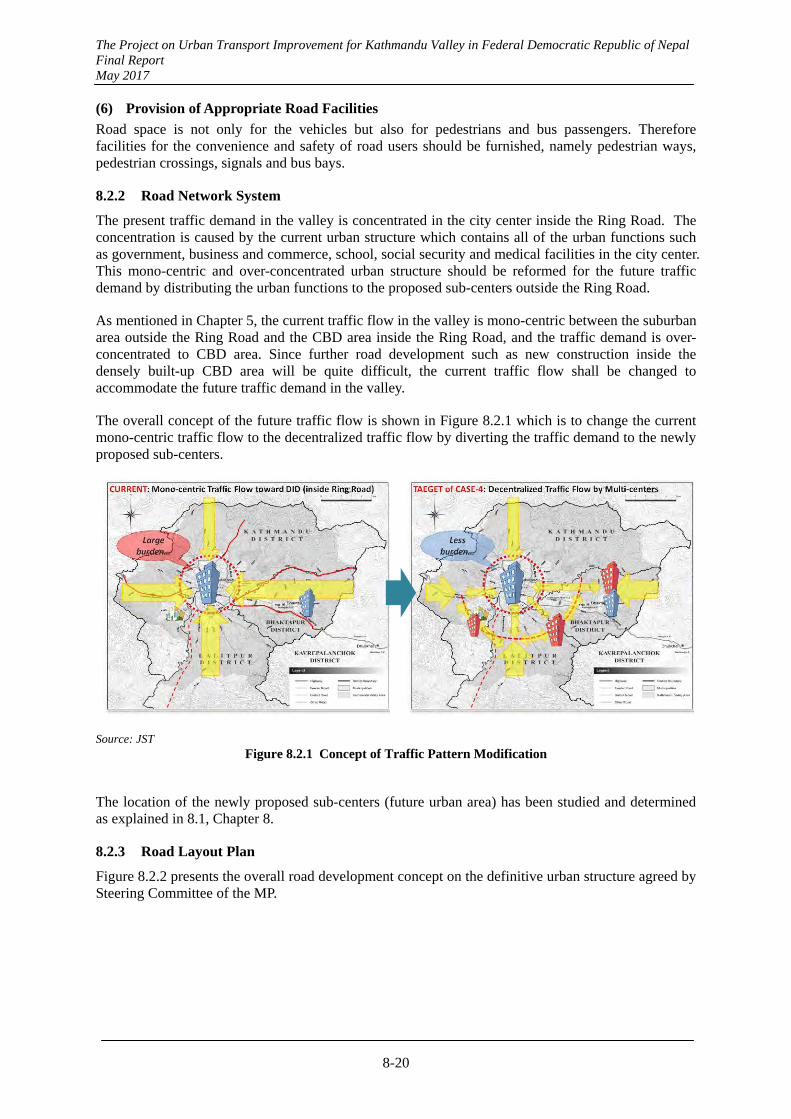
The Project on Urban Transport Improvement for Kathmandu Valley in Federal Democratic Republic of Nepal Final Report May 2017
8-20
(6) Provision of Appropriate Road Facilities
Road space is not only for the vehicles but also for pedestrians and bus passengers. Therefore facilities for the convenience and safety of road users should be furnished, namely pedestrian ways, pedestrian crossings, signals and bus bays.
8.2.2 Road Network System
The present traffic demand in the valley is concentrated in the city center inside the Ring Road. The concentration is caused by the current urban structure which contains all of the urban functions such as government, business and commerce, school, social security and medical facilities in the city center. This mono-centric and over-concentrated urban structure should be reformed for the future traffic demand by distributing the urban functions to the proposed sub-centers outside the Ring Road.
As mentioned in Chapter 5, the current traffic flow in the valley is mono-centric between the suburban area outside the Ring Road and the CBD area inside the Ring Road, and the traffic demand is over-concentrated to CBD area. Since further road development such as new construction inside the densely built-up CBD area will be quite difficult, the current traffic flow shall be changed to accommodate the future traffic demand in the valley.
The overall concept of the future traffic flow is shown in Figure 8.2.1 which is to change the current mono-centric traffic flow to the decentralized traffic flow by diverting the traffic demand to the newly proposed sub-centers.
Source: JST Figure 8.2.1 Concept of Traffic Pattern Modification
The location of the newly proposed sub-centers (future urban area) has been studied and determined as explained in 8.1, Chapter 8.
8.2.3 Road Layout Plan
Figure 8.2.2 presents the overall road development concept on the definitive urban structure agreed by Steering Committee of the MP.
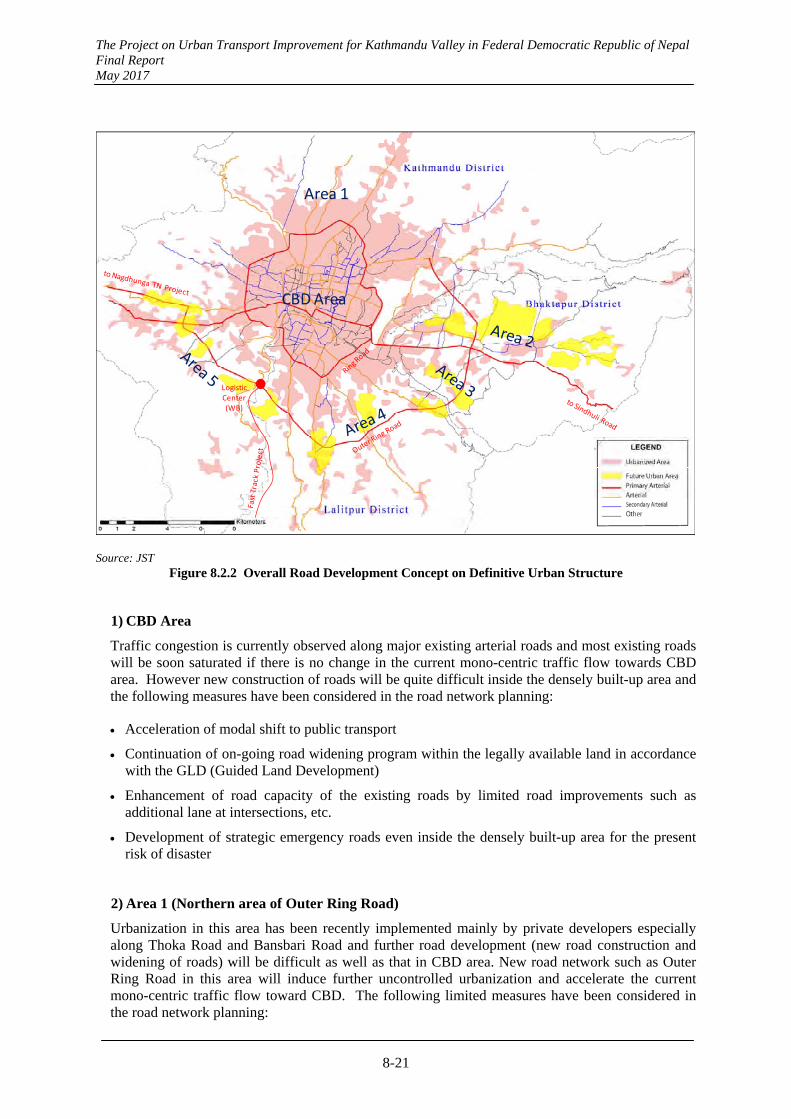
The Project on Urban Transport Improvement for Kathmandu Valley in Federal Democratic Republic of Nepal Final Report May 2017
8-21
LogisticCenter(WB)
CBD Area
Area 1
Source: JST Figure 8.2.2 Overall Road Development Concept on Definitive Urban Structure
1) CBD Area
Traffic congestion is currently observed along major existing arterial roads and most existing roads will be soon saturated if there is no change in the current mono-centric traffic flow towards CBD area. However new construction of roads will be quite difficult inside the densely built-up area and the following measures have been considered in the road network planning:
Acceleration of modal shift to public transport
Continuation of on-going road widening program within the legally available land in accordance with the GLD (Guided Land Development)
Enhancement of road capacity of the existing roads by limited road improvements such as additional lane at intersections, etc.
Development of strategic emergency roads even inside the densely built-up area for the present risk of disaster
2) Area 1 (Northern area of Outer Ring Road)
Urbanization in this area has been recently implemented mainly by private developers especially along Thoka Road and Bansbari Road and further road development (new road construction and widening of roads) will be difficult as well as that in CBD area. New road network such as Outer Ring Road in this area will induce further uncontrolled urbanization and accelerate the current mono-centric traffic flow toward CBD. The following limited measures have been considered in the road network planning:
The Project on Urban Transport Improvement for Kathmandu Valley in Federal Democratic Republic of Nepal Final Report May 2017
8-22
Acceleration of modal shift to public transport
Maintain the current road network to restrict further urbanization
Implementation of limited additional network such as emergency roads for the present risk of disaster
3) Area 2 (New sub-center in Bhaktapur District)
There still remains large space available for future urbanization and the road network shall be planned strategically according to the land use plan for the proposed new urban structure. The large-scale new urban area is expected to be developed in this area and the following measures have been considered to support the new sub-center (secondary CBD):
Construction of strategic road network (grid pattern) to support people’s activities and amenity of the new sub-center
New road network to be functioned as emergency roads in case of disaster
Synchronization with the proposed public transport system by TOD policy
4) Area 3 (New sub-center in Ananthalingeshwor District)
There still remains large space available to develop new road network. This area will be strategically located between the current urban area inside the Ring Road and the proposed new sub-center in Bhaktapur. JST recommends GON to relocate a part of government function to this area. The following measures have been considered in road network planning:
Early implementation of new road network connecting the current urban area with the proposed sub-center to accelerate the relocation of government function as a “pilot model”
Development of new wider radial road between the proposed sub-center in Ananthalingeshwor District and the current CBD area and restriction of transversal vehicle movement in the southern area in order to prevent ad-hoc urban sprawl
Connection of each proposed sub-center only by Outer Ring Road
5) Area 4 (New sub-centers along Existing Radial Roads)
New sub-centers have been proposed at the node points between the existing radial roads and the proposed Outer Ring Road.
The following measures have been considered in the road network planning:
Widening of the radial roads to prevent ad-hoc urban sprawl and accelerate the compact development only in the sub-centers
Connection of each proposed sub-center by Outer Ring Road
6) Area 5 (New sub-centers in Kirtipur)
New sub-centers will be located around the national logistic route such as Tribhuvan Highway and the proposed Fast Track.
The following measures have been considered in the road network planning:

The Project on Urban Transport Improvement for Kathmandu Valley in Federal Democratic Republic of Nepal Final Report May 2017
8-23
Limited road network to prevent ad-hoc urban sprawl and accelerate the compact development only in the proposed sub-centers
Strengthening of logistic distribution route for the valley
Connection of each proposed sub-center by Outer Ring Road
The urban development patterns in the valley are typically categorized into 2 patterns such as the densely built-up area inside the Ring Road and the area outside the Ring Road which is being developed.
Area inside Ring Road Area outside Ring Road
1,014.7 person/ha (Asan, Indrachowk) 75.7 person/ha (Tinthana VDC)
Source: KMC and Data Collection Survey (2012) by JICA Figure 8.2.3 Typical Population Density in the Valley
8.2.3.1 Road Network inside Ring Road
The area inside the Ring Road has been densely built-up. The road density inside the Ring Road is only 6% (UNCRD/MOPIT) even after hard efforts of the recent road widening program by DOR/KVDA. The further road widening and/or construction of new roads will be practically difficult due to the issues related to land acquisition and resettlement and thus modal shift to public transportation must be incarnated. Figure 8.2.4 presents the concept of road network planning based on the discussions in the Working Group (WG-2 for Transport) officially organized during the Study.
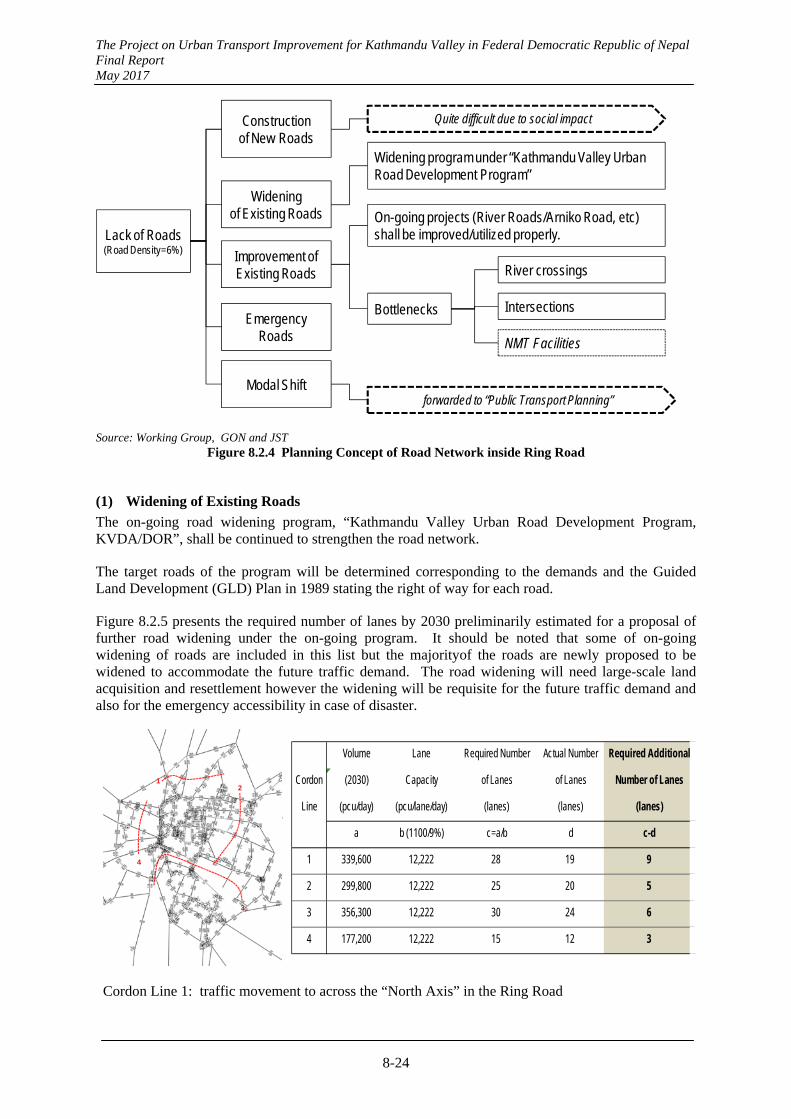
The Project on Urban Transport Improvement for Kathmandu Valley in Federal Democratic Republic of Nepal Final Report May 2017
8-24
Lack of Roads(Road Density=6%)
Constructionof New Roads
Wideningof Existing Roads
Improvement of Existing Roads
Quite difficult due to social impact
Widening program under “Kathmandu Valley Urban Road Development Program”
On-going projects (River Roads/Arniko Road, etc) shall be improved/utilized properly.
Bottlenecks Intersections
River crossings
NMT Facilities
Modal Shiftforwarded to “Public Transport Planning”
Emergency Roads
Source: Working Group, GON and JST Figure 8.2.4 Planning Concept of Road Network inside Ring Road
(1) Widening of Existing Roads
The on-going road widening program, “Kathmandu Valley Urban Road Development Program, KVDA/DOR”, shall be continued to strengthen the road network.
The target roads of the program will be determined corresponding to the demands and the Guided Land Development (GLD) Plan in 1989 stating the right of way for each road.
Figure 8.2.5 presents the required number of lanes by 2030 preliminarily estimated for a proposal of further road widening under the on-going program. It should be noted that some of on-going widening of roads are included in this list but the majorityof the roads are newly proposed to be widened to accommodate the future traffic demand. The road widening will need large-scale land acquisition and resettlement however the widening will be requisite for the future traffic demand and also for the emergency accessibility in case of disaster.
4
3
21
Volume Lane Required Number Actual Number Required Additional
Cordon (2030) Capacity of Lanes of Lanes Number of Lanes
Line (pcu/day) (pcu/lane/day) (lanes) (lanes) (lanes)
a b (1100/9%) c=a/b d c-d
1 339,600 12,222 28 19 9
2 299,800 12,222 25 20 5
3 356,300 12,222 30 24 6
4 177,200 12,222 15 12 3
Cordon Line 1: traffic movement to across the “North Axis” in the Ring Road
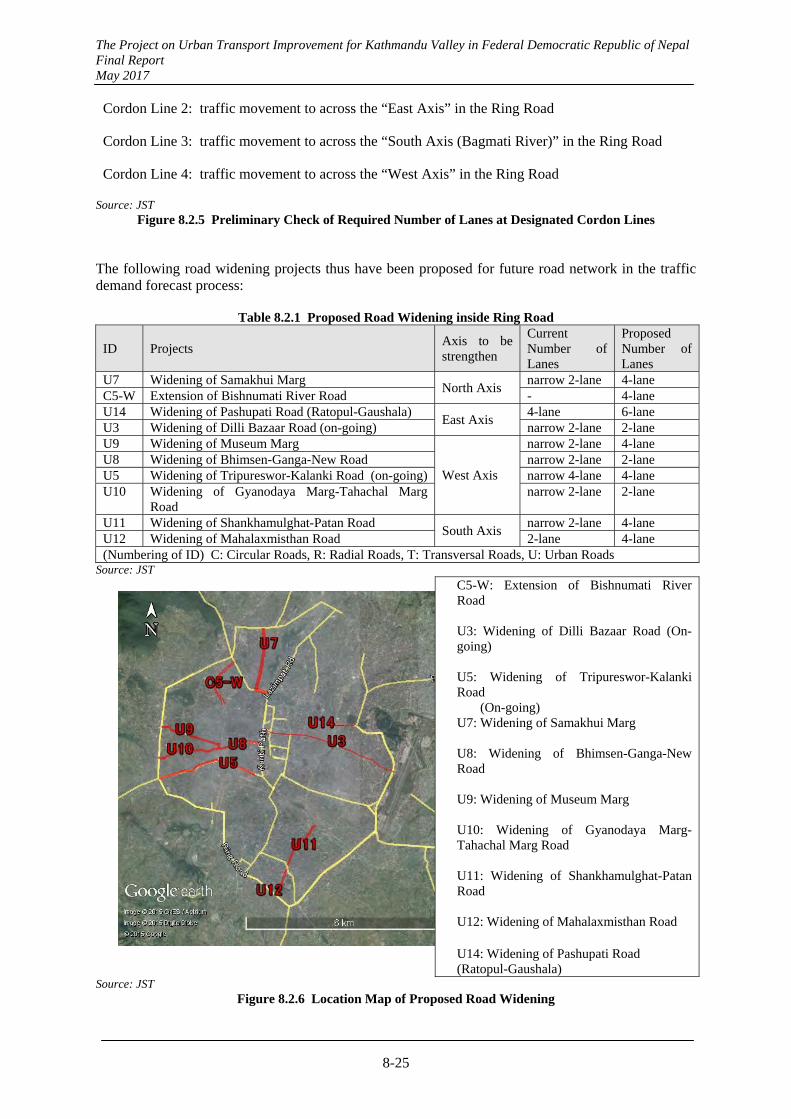
The Project on Urban Transport Improvement for Kathmandu Valley in Federal Democratic Republic of Nepal Final Report May 2017
8-25
Cordon Line 2: traffic movement to across the “East Axis” in the Ring Road
Cordon Line 3: traffic movement to across the “South Axis (Bagmati River)” in the Ring Road
Cordon Line 4: traffic movement to across the “West Axis” in the Ring Road
Source: JST Figure 8.2.5 Preliminary Check of Required Number of Lanes at Designated Cordon Lines
The following road widening projects thus have been proposed for future road network in the traffic demand forecast process:
Table 8.2.1 Proposed Road Widening inside Ring Road
ID Projects Axis to be strengthen
Current Number of Lanes
Proposed Number of Lanes
U7 Widening of Samakhui Marg North Axis
narrow 2-lane 4-lane C5-W Extension of Bishnumati River Road - 4-lane U14 Widening of Pashupati Road (Ratopul-Gaushala)
East Axis 4-lane 6-lane
U3 Widening of Dilli Bazaar Road (on-going) narrow 2-lane 2-lane U9 Widening of Museum Marg
West Axis
narrow 2-lane 4-lane U8 Widening of Bhimsen-Ganga-New Road narrow 2-lane 2-lane U5 Widening of Tripureswor-Kalanki Road (on-going) narrow 4-lane 4-lane U10 Widening of Gyanodaya Marg-Tahachal Marg
Road narrow 2-lane 2-lane
U11 Widening of Shankhamulghat-Patan Road South Axis
narrow 2-lane 4-lane U12 Widening of Mahalaxmisthan Road 2-lane 4-lane (Numbering of ID) C: Circular Roads, R: Radial Roads, T: Transversal Roads, U: Urban Roads
Source: JST C5-W: Extension of Bishnumati River Road U3: Widening of Dilli Bazaar Road (On-going) U5: Widening of Tripureswor-Kalanki Road (On-going) U7: Widening of Samakhui Marg U8: Widening of Bhimsen-Ganga-New Road U9: Widening of Museum Marg U10: Widening of Gyanodaya Marg-Tahachal Marg Road U11: Widening of Shankhamulghat-Patan Road U12: Widening of Mahalaxmisthan Road U14: Widening of Pashupati Road (Ratopul-Gaushala)
Source: JST Figure 8.2.6 Location Map of Proposed Road Widening
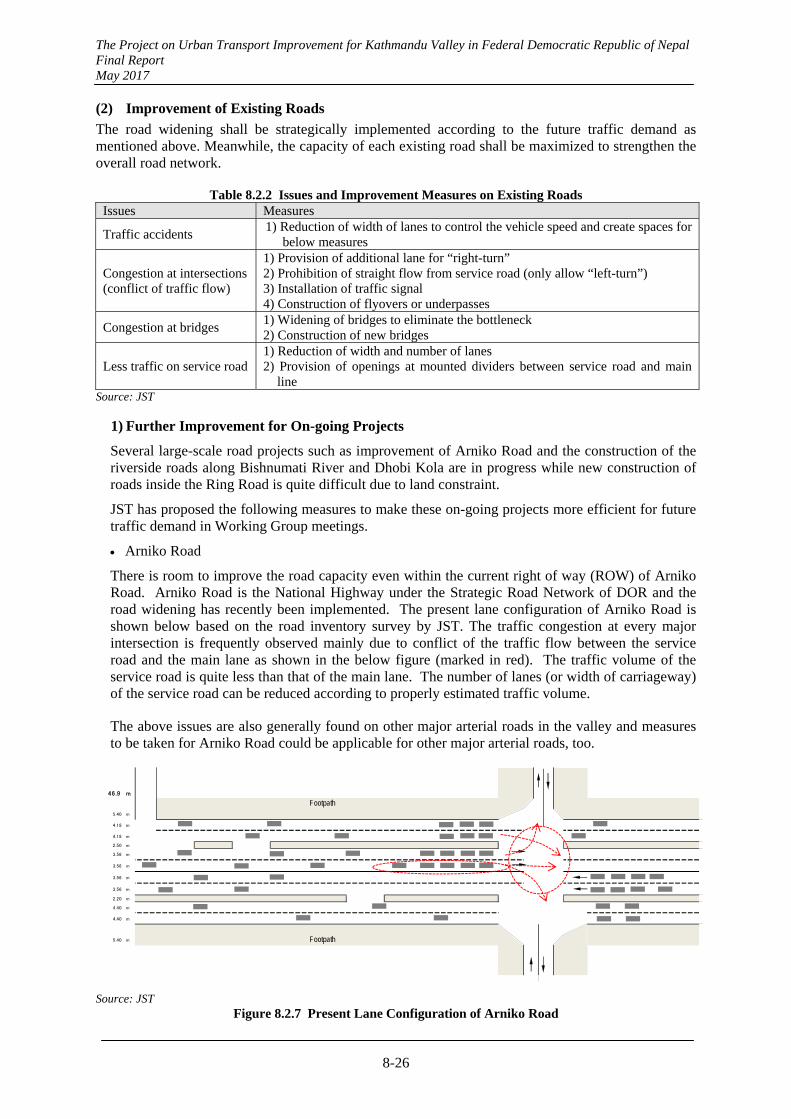
The Project on Urban Transport Improvement for Kathmandu Valley in Federal Democratic Republic of Nepal Final Report May 2017
8-26
(2) Improvement of Existing Roads
The road widening shall be strategically implemented according to the future traffic demand as mentioned above. Meanwhile, the capacity of each existing road shall be maximized to strengthen the overall road network.
Table 8.2.2 Issues and Improvement Measures on Existing Roads Issues Measures
Traffic accidents 1) Reduction of width of lanes to control the vehicle speed and create spaces for
below measures
Congestion at intersections (conflict of traffic flow)
1) Provision of additional lane for “right-turn” 2) Prohibition of straight flow from service road (only allow “left-turn”) 3) Installation of traffic signal 4) Construction of flyovers or underpasses
Congestion at bridges 1) Widening of bridges to eliminate the bottleneck 2) Construction of new bridges
Less traffic on service road 1) Reduction of width and number of lanes 2) Provision of openings at mounted dividers between service road and main
line Source: JST
1) Further Improvement for On-going Projects
Several large-scale road projects such as improvement of Arniko Road and the construction of the riverside roads along Bishnumati River and Dhobi Kola are in progress while new construction of roads inside the Ring Road is quite difficult due to land constraint.
JST has proposed the following measures to make these on-going projects more efficient for future traffic demand in Working Group meetings.
Arniko Road
There is room to improve the road capacity even within the current right of way (ROW) of Arniko Road. Arniko Road is the National Highway under the Strategic Road Network of DOR and the road widening has recently been implemented. The present lane configuration of Arniko Road is shown below based on the road inventory survey by JST. The traffic congestion at every major intersection is frequently observed mainly due to conflict of the traffic flow between the service road and the main lane as shown in the below figure (marked in red). The traffic volume of the service road is quite less than that of the main lane. The number of lanes (or width of carriageway) of the service road can be reduced according to properly estimated traffic volume.
The above issues are also generally found on other major arterial roads in the valley and measures to be taken for Arniko Road could be applicable for other major arterial roads, too.
46.9 m
Footpath5.40 m
4.18 m
4.18 m
2.50 m
3.56 m
3.56 m
3.56 m
3.56 m
2.20 m
4.40 m
4.40 m
5.40 m Footpath
Source: JST Figure 8.2.7 Present Lane Configuration of Arniko Road
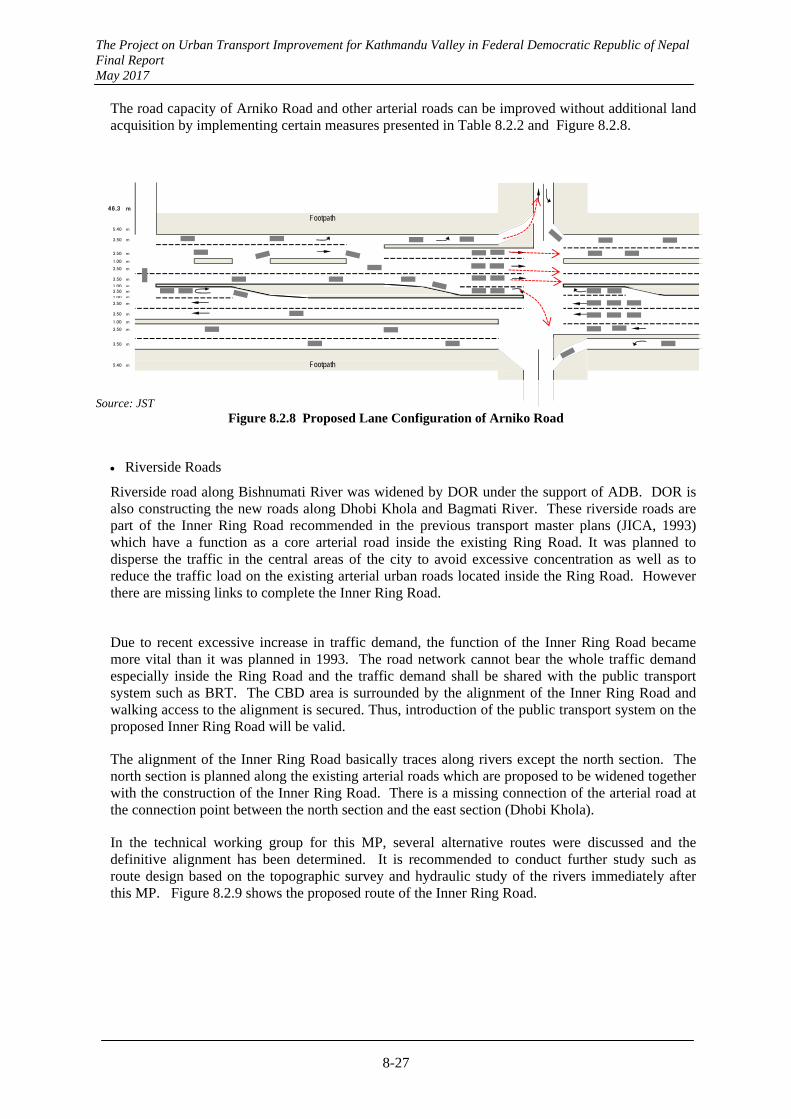
The Project on Urban Transport Improvement for Kathmandu Valley in Federal Democratic Republic of Nepal Final Report May 2017
8-27
The road capacity of Arniko Road and other arterial roads can be improved without additional land acquisition by implementing certain measures presented in Table 8.2.2 and Figure 8.2.8.
46.3 m
Footpath5.40 m
3.50 m
3.50 m
1.00 m
3.50 m
3.50 m
1 00 m3.50 m1 00 m
3.50 m
3.50 m
1.00 m
3.50 m
3.50 m
5.40 m Footpath
Source: JST Figure 8.2.8 Proposed Lane Configuration of Arniko Road
Riverside Roads
Riverside road along Bishnumati River was widened by DOR under the support of ADB. DOR is also constructing the new roads along Dhobi Khola and Bagmati River. These riverside roads are part of the Inner Ring Road recommended in the previous transport master plans (JICA, 1993) which have a function as a core arterial road inside the existing Ring Road. It was planned to disperse the traffic in the central areas of the city to avoid excessive concentration as well as to reduce the traffic load on the existing arterial urban roads located inside the Ring Road. However there are missing links to complete the Inner Ring Road.
Due to recent excessive increase in traffic demand, the function of the Inner Ring Road became more vital than it was planned in 1993. The road network cannot bear the whole traffic demand especially inside the Ring Road and the traffic demand shall be shared with the public transport system such as BRT. The CBD area is surrounded by the alignment of the Inner Ring Road and walking access to the alignment is secured. Thus, introduction of the public transport system on the proposed Inner Ring Road will be valid.
The alignment of the Inner Ring Road basically traces along rivers except the north section. The north section is planned along the existing arterial roads which are proposed to be widened together with the construction of the Inner Ring Road. There is a missing connection of the arterial road at the connection point between the north section and the east section (Dhobi Khola).
In the technical working group for this MP, several alternative routes were discussed and the definitive alignment has been determined. It is recommended to conduct further study such as route design based on the topographic survey and hydraulic study of the rivers immediately after this MP. Figure 8.2.9 shows the proposed route of the Inner Ring Road.
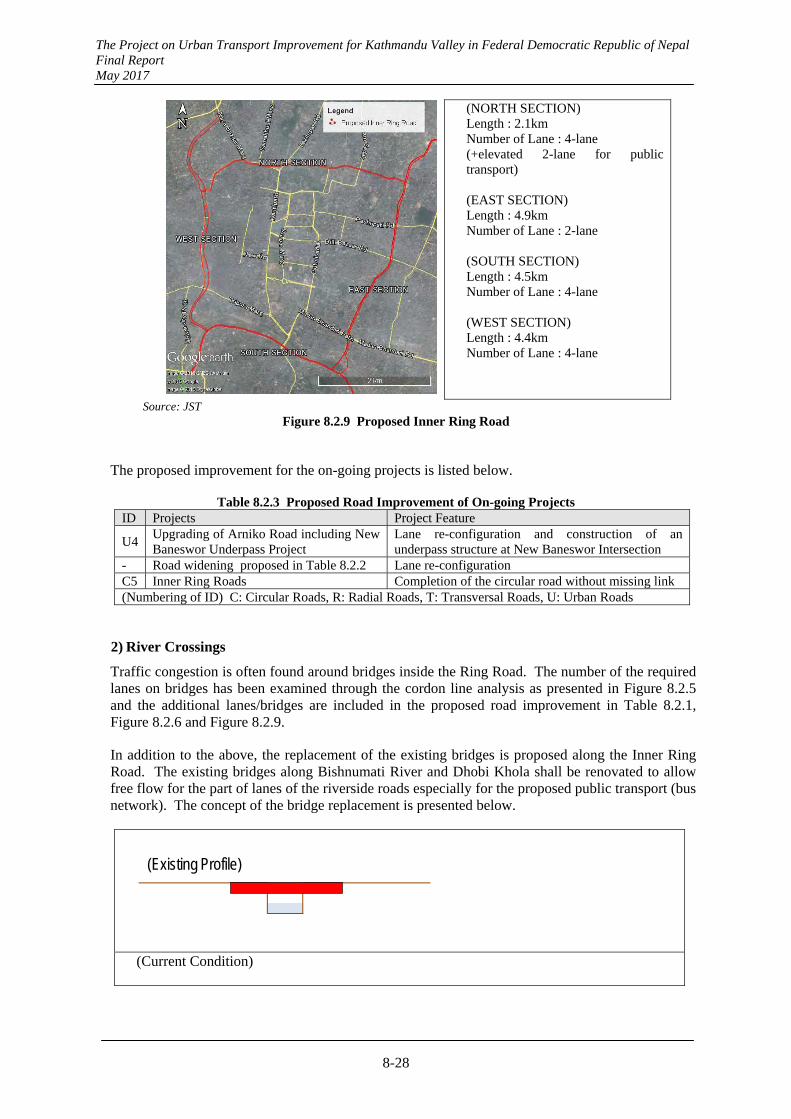
The Project on Urban Transport Improvement for Kathmandu Valley in Federal Democratic Republic of Nepal Final Report May 2017
8-28
(NORTH SECTION) Length : 2.1km Number of Lane : 4-lane (+elevated 2-lane for public transport) (EAST SECTION) Length : 4.9km Number of Lane : 2-lane (SOUTH SECTION) Length : 4.5km Number of Lane : 4-lane (WEST SECTION) Length : 4.4km Number of Lane : 4-lane
Source: JST Figure 8.2.9 Proposed Inner Ring Road
The proposed improvement for the on-going projects is listed below.
Table 8.2.3 Proposed Road Improvement of On-going Projects ID Projects Project Feature
U4 Upgrading of Arniko Road including New Baneswor Underpass Project
Lane re-configuration and construction of an underpass structure at New Baneswor Intersection
- Road widening proposed in Table 8.2.2 Lane re-configuration C5 Inner Ring Roads Completion of the circular road without missing link (Numbering of ID) C: Circular Roads, R: Radial Roads, T: Transversal Roads, U: Urban Roads
2) River Crossings
Traffic congestion is often found around bridges inside the Ring Road. The number of the required lanes on bridges has been examined through the cordon line analysis as presented in Figure 8.2.5 and the additional lanes/bridges are included in the proposed road improvement in Table 8.2.1, Figure 8.2.6 and Figure 8.2.9.
In addition to the above, the replacement of the existing bridges is proposed along the Inner Ring Road. The existing bridges along Bishnumati River and Dhobi Khola shall be renovated to allow free flow for the part of lanes of the riverside roads especially for the proposed public transport (bus network). The concept of the bridge replacement is presented below.
(Existing Profile)
(Current Condition)
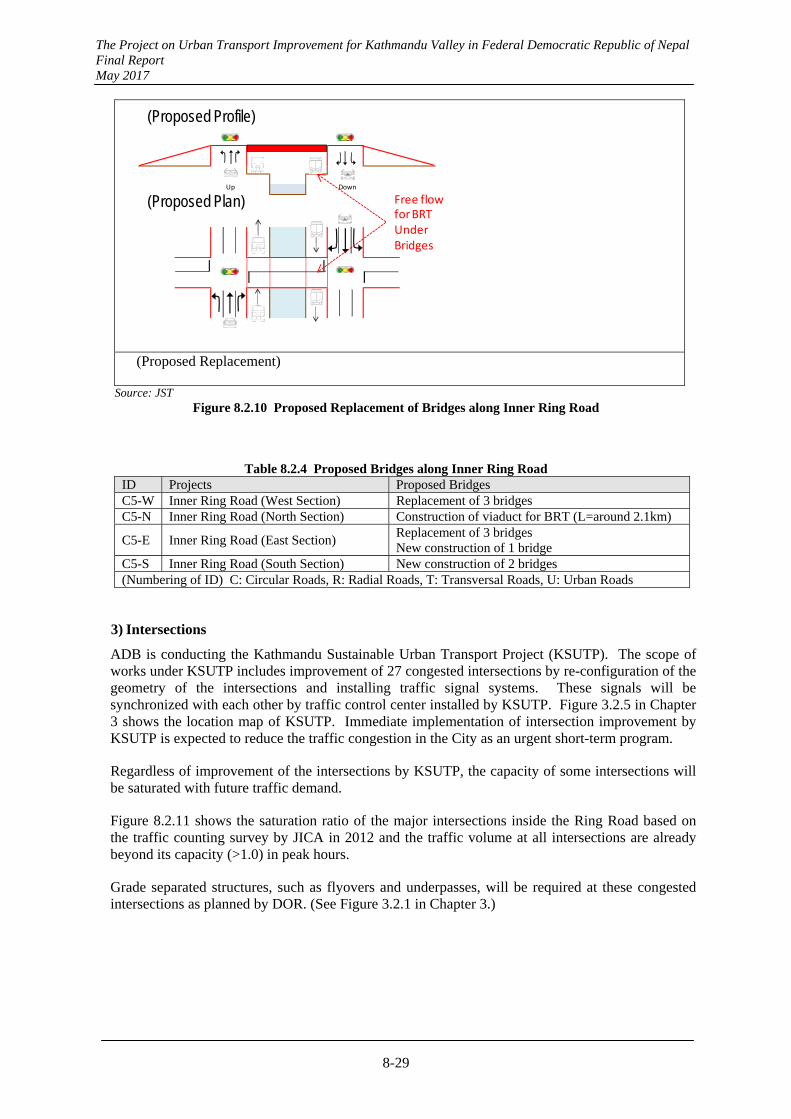
The Project on Urban Transport Improvement for Kathmandu Valley in Federal Democratic Republic of Nepal Final Report May 2017
8-29
Up Down
(Proposed Profile)
(Proposed Plan) Free flowfor BRTUnder Bridges
(Proposed Replacement)
Source: JST Figure 8.2.10 Proposed Replacement of Bridges along Inner Ring Road
Table 8.2.4 Proposed Bridges along Inner Ring Road ID Projects Proposed Bridges C5-W Inner Ring Road (West Section) Replacement of 3 bridges C5-N Inner Ring Road (North Section) Construction of viaduct for BRT (L=around 2.1km)
C5-E Inner Ring Road (East Section) Replacement of 3 bridges New construction of 1 bridge
C5-S Inner Ring Road (South Section) New construction of 2 bridges (Numbering of ID) C: Circular Roads, R: Radial Roads, T: Transversal Roads, U: Urban Roads
3) Intersections
ADB is conducting the Kathmandu Sustainable Urban Transport Project (KSUTP). The scope of works under KSUTP includes improvement of 27 congested intersections by re-configuration of the geometry of the intersections and installing traffic signal systems. These signals will be synchronized with each other by traffic control center installed by KSUTP. Figure 3.2.5 in Chapter 3 shows the location map of KSUTP. Immediate implementation of intersection improvement by KSUTP is expected to reduce the traffic congestion in the City as an urgent short-term program.
Regardless of improvement of the intersections by KSUTP, the capacity of some intersections will be saturated with future traffic demand.
Figure 8.2.11 shows the saturation ratio of the major intersections inside the Ring Road based on the traffic counting survey by JICA in 2012 and the traffic volume at all intersections are already beyond its capacity (>1.0) in peak hours.
Grade separated structures, such as flyovers and underpasses, will be required at these congested intersections as planned by DOR. (See Figure 3.2.1 in Chapter 3.)
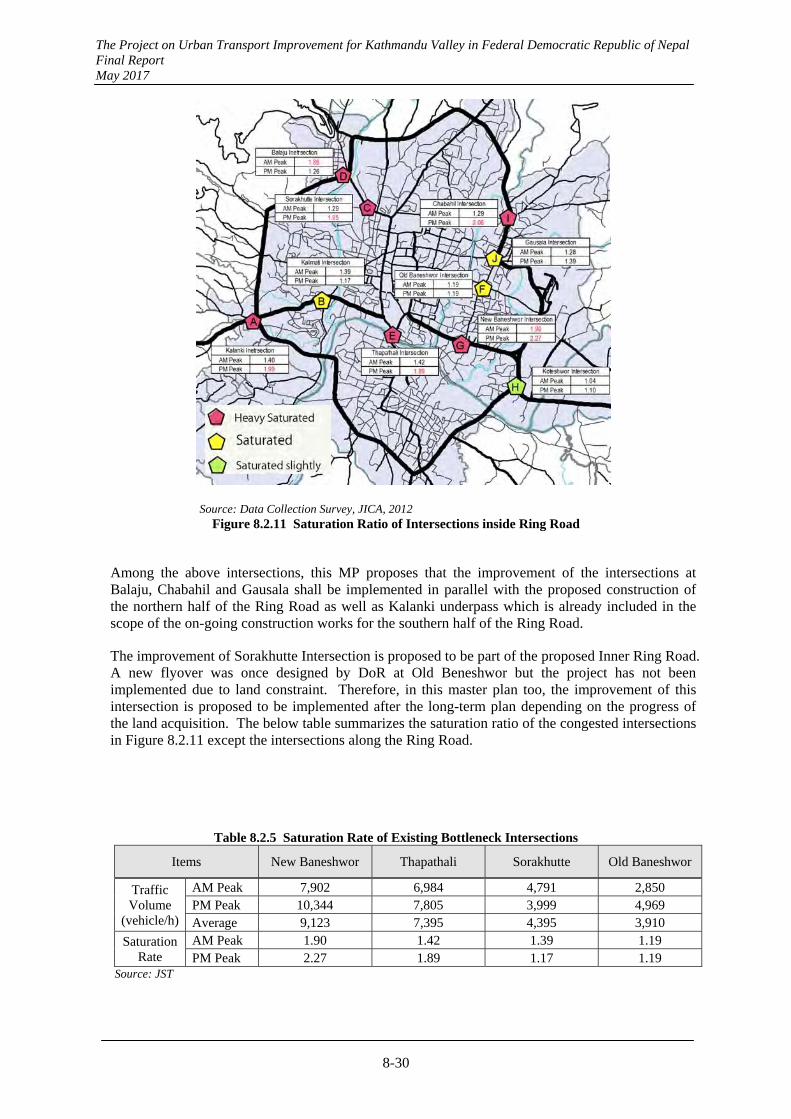
The Project on Urban Transport Improvement for Kathmandu Valley in Federal Democratic Republic of Nepal Final Report May 2017
8-30
Source: Data Collection Survey, JICA, 2012 Figure 8.2.11 Saturation Ratio of Intersections inside Ring Road
Among the above intersections, this MP proposes that the improvement of the intersections at Balaju, Chabahil and Gausala shall be implemented in parallel with the proposed construction of the northern half of the Ring Road as well as Kalanki underpass which is already included in the scope of the on-going construction works for the southern half of the Ring Road.
The improvement of Sorakhutte Intersection is proposed to be part of the proposed Inner Ring Road. A new flyover was once designed by DoR at Old Beneshwor but the project has not been implemented due to land constraint. Therefore, in this master plan too, the improvement of this intersection is proposed to be implemented after the long-term plan depending on the progress of the land acquisition. The below table summarizes the saturation ratio of the congested intersections in Figure 8.2.11 except the intersections along the Ring Road.
Table 8.2.5 Saturation Rate of Existing Bottleneck Intersections
Items New Baneshwor Thapathali Sorakhutte Old Baneshwor
Traffic Volume
(vehicle/h)
AM Peak 7,902 6,984 4,791 2,850 PM Peak 10,344 7,805 3,999 4,969 Average 9,123 7,395 4,395 3,910
Saturation Rate
AM Peak 1.90 1.42 1.39 1.19 PM Peak 2.27 1.89 1.17 1.19
Source: JST
The Project on Urban Transport Improvement for Kathmandu Valley in Federal Democratic Republic of Nepal Final Report May 2017
8-31
The new public transportation system (AGT) proposed in this MP runs from the eastern suburb to the western suburb thorough the central area of the city. Some of the congested intersections in Figure 8.2.11 are located along the proposed route of AGT. The traffic volume on these intersections is expected to be largely shifted to the passenger volume of AGT. Therefore the saturation ratio of these intersections (at-graded) has been re-examined based on the estimated future traffic network including AGT. In this re-examination, the reconfiguration of the intersection such as additional lane(s) has been considered for the intersections which have space for road widening for additional lane(s). The saturation ratio of the intersections is shown in the below table.
Table 8.2.6 Saturation Rate of Improved At-graded Intersections
Items Kalimati Koteshwor
Peak Traffic Volume (pcu/h) 4,897 9,996 Saturation Rate at Peak Hour 0.84 0.97
Source: JST Table 8.2.7 summarizes the proposed implementation schedule in this MP.
Table 8.2.7 Implementation of Grade-separated Structures Terms of
Implementation
Intersections Saturatio
n Rate
Remarks
Short -term
New Baneshwor 2.27 Serious traffic congestion is constantly observed and immediate measures will be required. Thapathali 1.89
Mid to Long -term
Sorakhutte 1.39 Improvement works will be implemented under the scope of the Inner Ring Road.
after Long -term
Koteshwor 0.97 At-grade improvement could be proposed in parallel with the construction of new public transport system. Kalimati 0.84
Old Baneshwor 1.19 Large scale relocation will be required.
Others or On-going
Chabahil 2.06 Improvement of these intersections is proposed to be implemented under the Ring Road Construction Project.
Kalanki (on-going) 1.99 Balaju 1.86 Gausala 1.39
Source: JST JST proposes to improve 2 intersections (New Baneshwor and Thapathali) as short-term program in this MP. The new public transportation system, AGT (with elevated structure), is proposed along Arniko Road across New Baneshwor Intersection. Therefore an underpass structure is proposed in this intersection. JST proposes an elevated structure to ease traffic congestion at Thapathali Intersection.
DOR proposed the elevated viaduct across Thapathali Intersection and Tripreswor Intersection as shown in Figure 3.2.1 in Chapter 3, however the proposed project has been suspended. It will be impractical to construct viaduct at Thapathali with very sharp curve and steep super elevation. JST proposes to construct the viaduct connecting Tripureswor and Maitighar. The alignment of the proposed viaduct is the current missing link of the east-west corridor of SRN (Strategic Road Network) through the city. The proposed viaduct is expected to ease traffic congestion at these intersections and Thapathali Intersection.
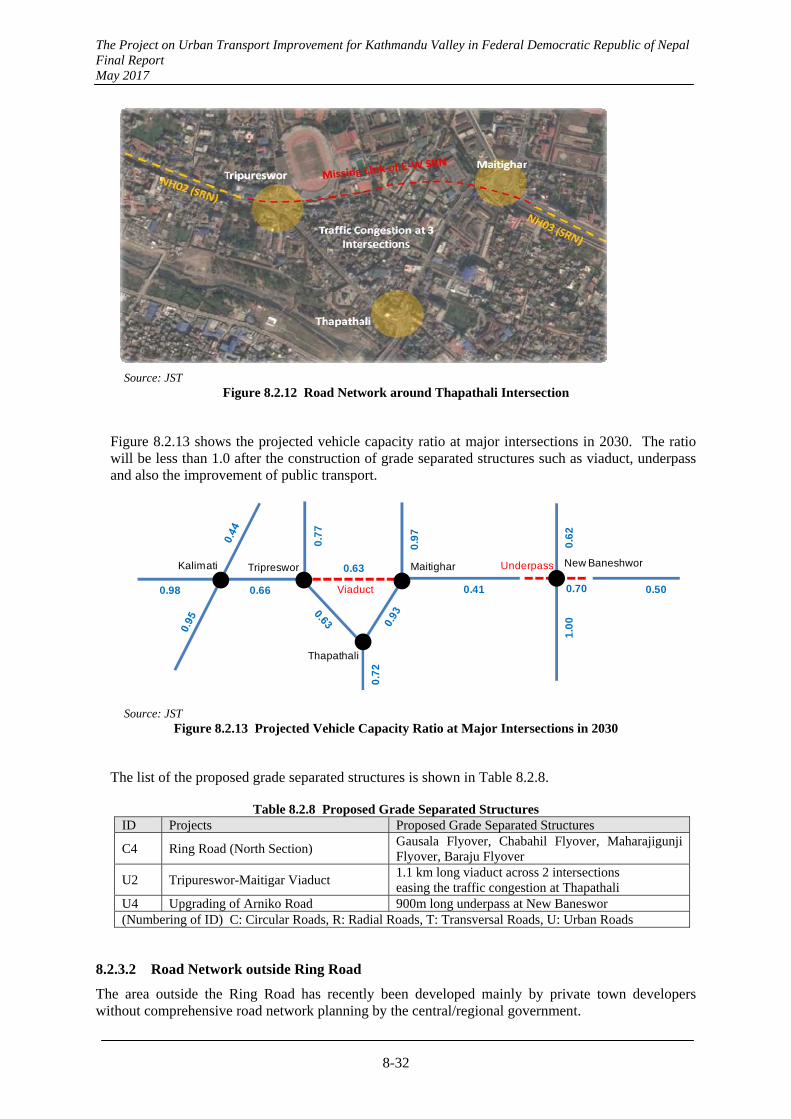
The Project on Urban Transport Improvement for Kathmandu Valley in Federal Democratic Republic of Nepal Final Report May 2017
8-32
Source: JST
Figure 8.2.12 Road Network around Thapathali Intersection
Figure 8.2.13 shows the projected vehicle capacity ratio at major intersections in 2030. The ratio will be less than 1.0 after the construction of grade separated structures such as viaduct, underpass and also the improvement of public transport.
0.63
Viaduct
Thapathali
Kalimati New BaneshworMaitigharTripreswor
0.660.98
0.7
7
0.9
7
0.41 0.50
1.0
00
.62
0.70
0.7
2
Underpass
Source: JST Figure 8.2.13 Projected Vehicle Capacity Ratio at Major Intersections in 2030
The list of the proposed grade separated structures is shown in Table 8.2.8.
Table 8.2.8 Proposed Grade Separated Structures ID Projects Proposed Grade Separated Structures
C4 Ring Road (North Section) Gausala Flyover, Chabahil Flyover, Maharajigunji Flyover, Baraju Flyover
U2 Tripureswor-Maitigar Viaduct 1.1 km long viaduct across 2 intersections easing the traffic congestion at Thapathali
U4 Upgrading of Arniko Road 900m long underpass at New Baneswor (Numbering of ID) C: Circular Roads, R: Radial Roads, T: Transversal Roads, U: Urban Roads
8.2.3.2 Road Network outside Ring Road
The area outside the Ring Road has recently been developed mainly by private town developers without comprehensive road network planning by the central/regional government.
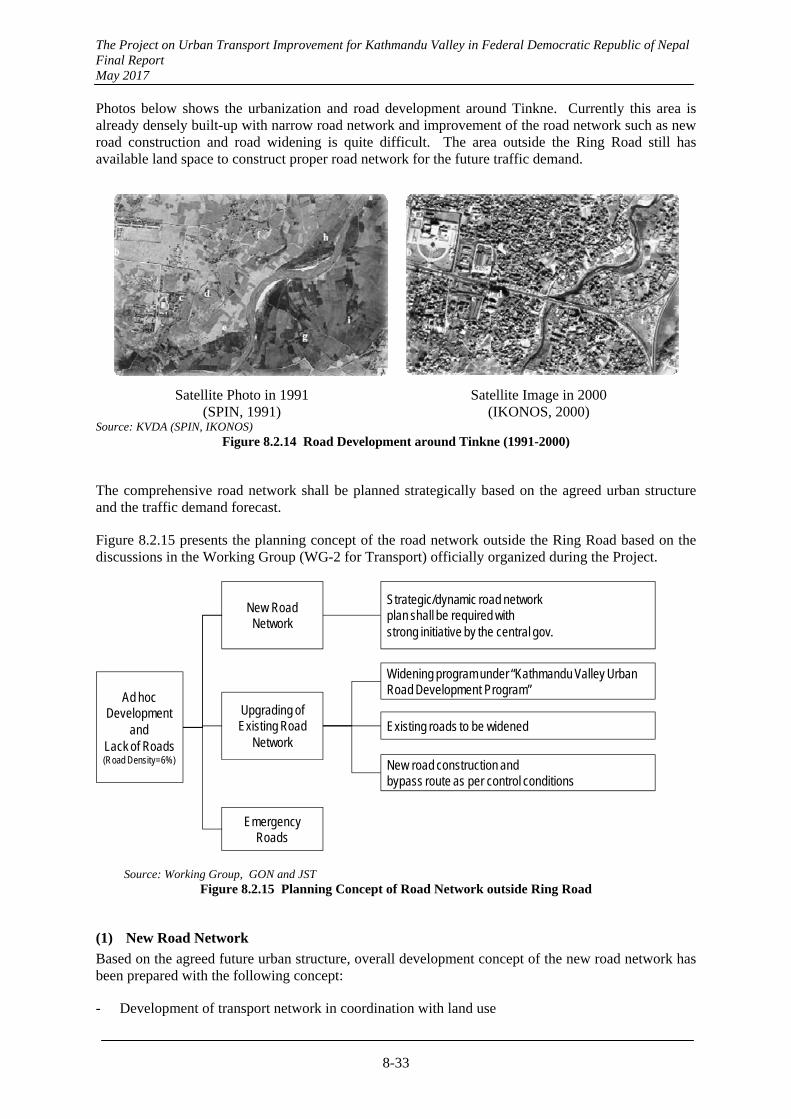
The Project on Urban Transport Improvement for Kathmandu Valley in Federal Democratic Republic of Nepal Final Report May 2017
8-33
Photos below shows the urbanization and road development around Tinkne. Currently this area is already densely built-up with narrow road network and improvement of the road network such as new road construction and road widening is quite difficult. The area outside the Ring Road still has available land space to construct proper road network for the future traffic demand.
Satellite Photo in 1991 (SPIN, 1991)
Satellite Image in 2000 (IKONOS, 2000)
Source: KVDA (SPIN, IKONOS) Figure 8.2.14 Road Development around Tinkne (1991-2000)
The comprehensive road network shall be planned strategically based on the agreed urban structure and the traffic demand forecast.
Figure 8.2.15 presents the planning concept of the road network outside the Ring Road based on the discussions in the Working Group (WG-2 for Transport) officially organized during the Project.
Ad hoc Development
andLack of Roads(Road Density=6%)
New Road Network
Upgrading of Existing Road
Network
Widening program under “Kathmandu Valley Urban Road Development Program”
Strategic/dynamic road networkplan shall be required withstrong initiative by the central gov.
Existing roads to be widened
New road construction andbypass route as per control conditions
Emergency Roads
Source: Working Group, GON and JST Figure 8.2.15 Planning Concept of Road Network outside Ring Road
(1) New Road Network
Based on the agreed future urban structure, overall development concept of the new road network has been prepared with the following concept:
- Development of transport network in coordination with land use
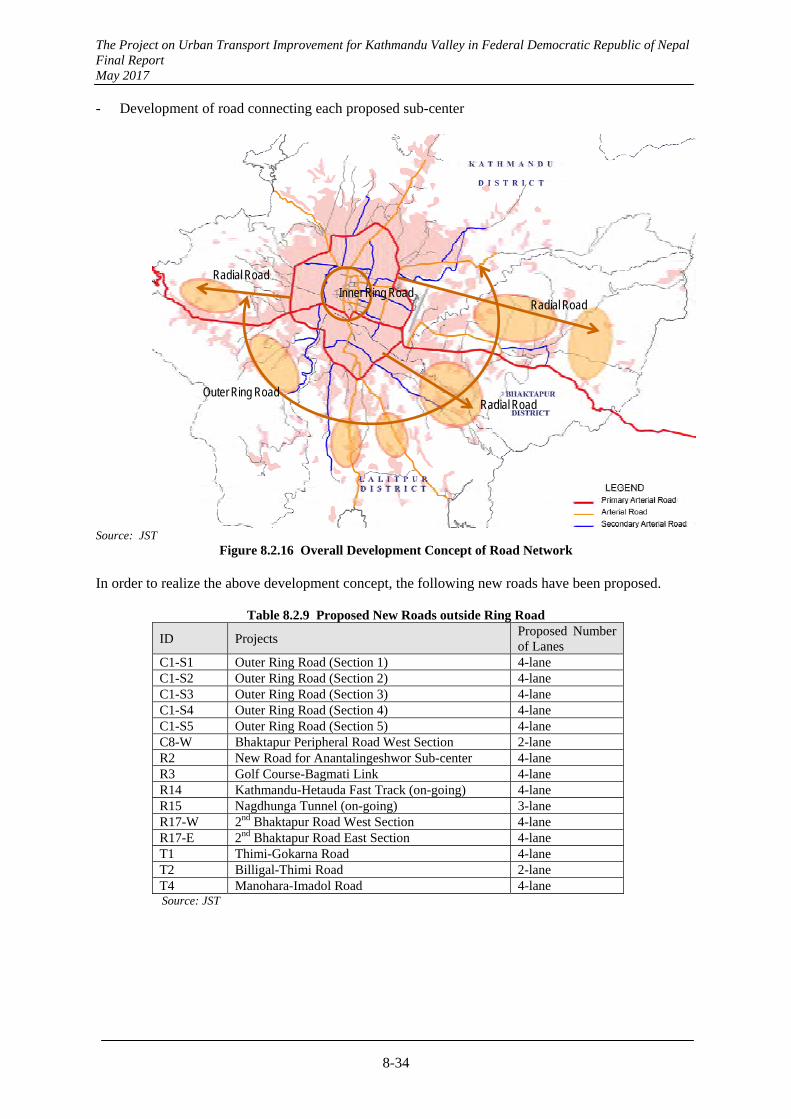
The Project on Urban Transport Improvement for Kathmandu Valley in Federal Democratic Republic of Nepal Final Report May 2017
8-34
- Development of road connecting each proposed sub-center
Radial Road
Radial Road
Radial Road
Outer Ring Road
Inner Ring Road
Source: JST
Figure 8.2.16 Overall Development Concept of Road Network In order to realize the above development concept, the following new roads have been proposed.
Table 8.2.9 Proposed New Roads outside Ring Road
ID Projects Proposed Number of Lanes
C1-S1 Outer Ring Road (Section 1) 4-lane C1-S2 Outer Ring Road (Section 2) 4-lane C1-S3 Outer Ring Road (Section 3) 4-lane C1-S4 Outer Ring Road (Section 4) 4-lane C1-S5 Outer Ring Road (Section 5) 4-lane C8-W Bhaktapur Peripheral Road West Section 2-lane R2 New Road for Anantalingeshwor Sub-center 4-lane R3 Golf Course-Bagmati Link 4-lane R14 Kathmandu-Hetauda Fast Track (on-going) 4-lane R15 Nagdhunga Tunnel (on-going) 3-lane R17-W 2nd Bhaktapur Road West Section 4-lane R17-E 2nd Bhaktapur Road East Section 4-lane T1 Thimi-Gokarna Road 4-lane T2 Billigal-Thimi Road 2-lane T4 Manohara-Imadol Road 4-lane Source: JST
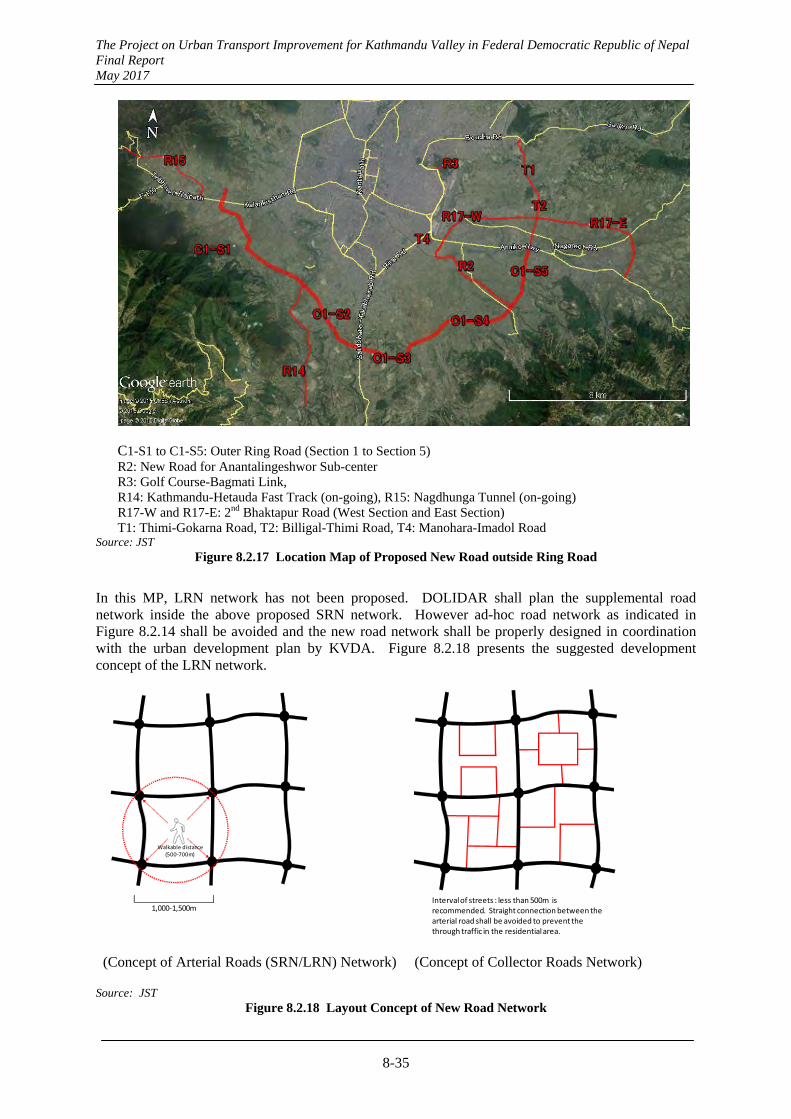
The Project on Urban Transport Improvement for Kathmandu Valley in Federal Democratic Republic of Nepal Final Report May 2017
8-35
C1-S1 to C1-S5: Outer Ring Road (Section 1 to Section 5) R2: New Road for Anantalingeshwor Sub-center R3: Golf Course-Bagmati Link, R14: Kathmandu-Hetauda Fast Track (on-going), R15: Nagdhunga Tunnel (on-going) R17-W and R17-E: 2nd Bhaktapur Road (West Section and East Section) T1: Thimi-Gokarna Road, T2: Billigal-Thimi Road, T4: Manohara-Imadol Road
Source: JST Figure 8.2.17 Location Map of Proposed New Road outside Ring Road
In this MP, LRN network has not been proposed. DOLIDAR shall plan the supplemental road network inside the above proposed SRN network. However ad-hoc road network as indicated in Figure 8.2.14 shall be avoided and the new road network shall be properly designed in coordination with the urban development plan by KVDA. Figure 8.2.18 presents the suggested development concept of the LRN network.
1,000‐1,500m
Walkable distance(500‐700m)
Interval of streets : less than 500m is recommended. Straight connection between the arterial road shall be avoided to prevent the through traffic in the residential area.
(Concept of Arterial Roads (SRN/LRN) Network) (Concept of Collector Roads Network)
Source: JST Figure 8.2.18 Layout Concept of New Road Network
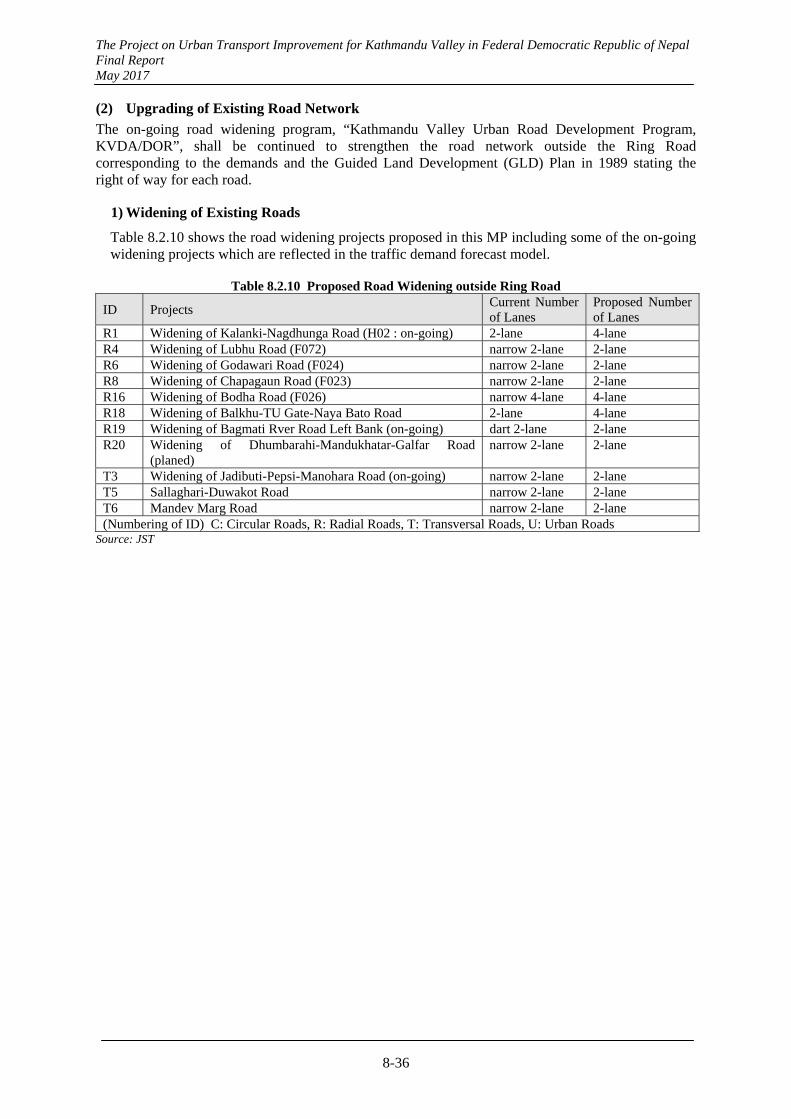
The Project on Urban Transport Improvement for Kathmandu Valley in Federal Democratic Republic of Nepal Final Report May 2017
8-36
(2) Upgrading of Existing Road Network
The on-going road widening program, “Kathmandu Valley Urban Road Development Program, KVDA/DOR”, shall be continued to strengthen the road network outside the Ring Road corresponding to the demands and the Guided Land Development (GLD) Plan in 1989 stating the right of way for each road.
1) Widening of Existing Roads
Table 8.2.10 shows the road widening projects proposed in this MP including some of the on-going widening projects which are reflected in the traffic demand forecast model.
Table 8.2.10 Proposed Road Widening outside Ring Road
ID Projects Current Number of Lanes
Proposed Number of Lanes
R1 Widening of Kalanki-Nagdhunga Road (H02 : on-going) 2-lane 4-lane R4 Widening of Lubhu Road (F072) narrow 2-lane 2-lane R6 Widening of Godawari Road (F024) narrow 2-lane 2-lane R8 Widening of Chapagaun Road (F023) narrow 2-lane 2-lane R16 Widening of Bodha Road (F026) narrow 4-lane 4-lane R18 Widening of Balkhu-TU Gate-Naya Bato Road 2-lane 4-lane R19 Widening of Bagmati Rver Road Left Bank (on-going) dart 2-lane 2-lane R20 Widening of Dhumbarahi-Mandukhatar-Galfar Road
(planed) narrow 2-lane 2-lane
T3 Widening of Jadibuti-Pepsi-Manohara Road (on-going) narrow 2-lane 2-lane T5 Sallaghari-Duwakot Road narrow 2-lane 2-lane T6 Mandev Marg Road narrow 2-lane 2-lane (Numbering of ID) C: Circular Roads, R: Radial Roads, T: Transversal Roads, U: Urban Roads
Source: JST
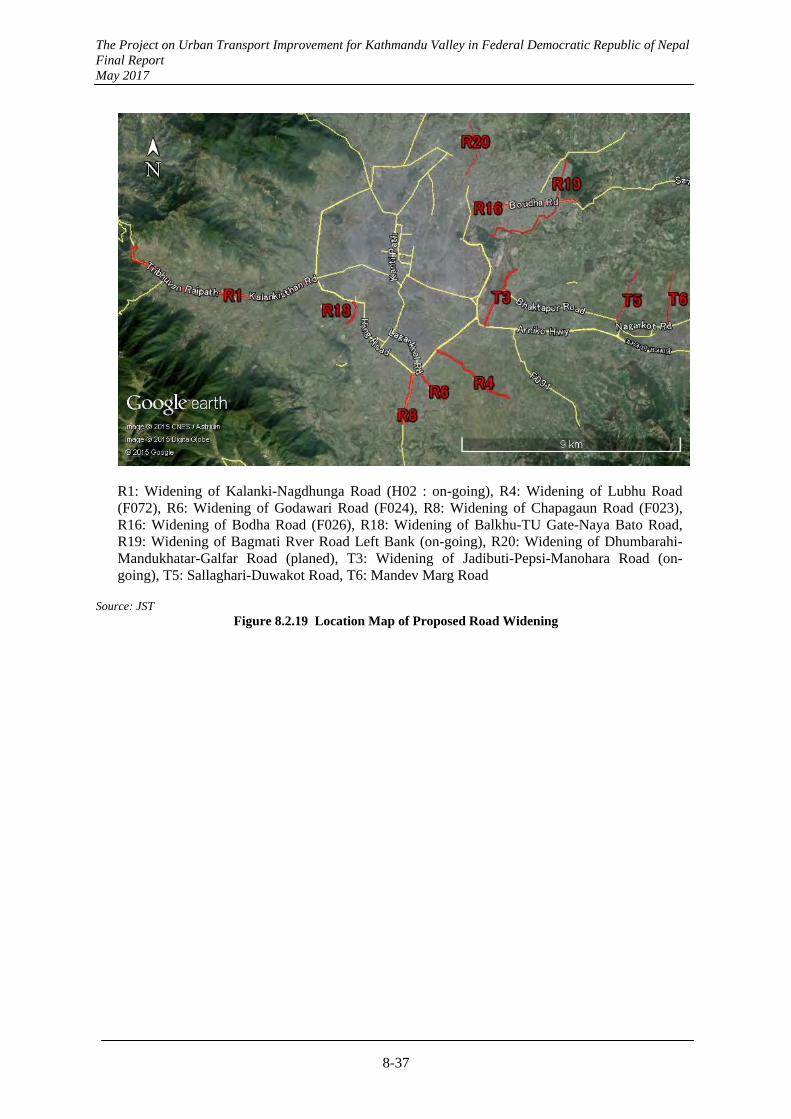
The Project on Urban Transport Improvement for Kathmandu Valley in Federal Democratic Republic of Nepal Final Report May 2017
8-37
R1: Widening of Kalanki-Nagdhunga Road (H02 : on-going), R4: Widening of Lubhu Road (F072), R6: Widening of Godawari Road (F024), R8: Widening of Chapagaun Road (F023), R16: Widening of Bodha Road (F026), R18: Widening of Balkhu-TU Gate-Naya Bato Road, R19: Widening of Bagmati Rver Road Left Bank (on-going), R20: Widening of Dhumbarahi-Mandukhatar-Galfar Road (planed), T3: Widening of Jadibuti-Pepsi-Manohara Road (on-going), T5: Sallaghari-Duwakot Road, T6: Mandev Marg Road
Source: JST Figure 8.2.19 Location Map of Proposed Road Widening

The Project on Urban Transport Improvement for Kathmandu Valley in Federal Democratic Republic of Nepal Final Report May 2017
8-38
2) Construction of New Roads for Upgrading of Existing Road Network
In parallel with the new SRN network and the road widening mentioned above, some of new roads are also proposed in this MP.
The radial road network such as Lubhu Road, Godawari Road and Chapagaun Road shall be widened to back up the proposed new sub-centers.
However there are historical villages along these radial roads. The current radial roads are passing through the villages (See photo in RHS.) with very narrow lanes (less than 2-lane) and the roads function as community roads too. Bypass roads are proposed to avoid such limitations. Solid waste management is one of the serious issues of the valley. Kathmandu Municipality and Lalitpur
Municipality
operate the waste disposal site in Okharpauwa area (Sisdol Phase I (since 2005), Sisdol Phase II (since 2011, See photo in LHS.), Aletar (since 2009)). Due to increasing solid waste from both municipalities, new final disposal site has been planned at Pancharedandda also in Okharpauwa Landfill Site. However the existing sole access road (Balaju Road) to Okharpauwa area does not have sufficient road capacity for the waste disposal vehicles and will need an alternative access.
In the north area of the valley, transversal road network connecting each radial road is insufficient. The new roads have been proposed to strengthen the road network in the northern area. These roads will have to function as the community roads as well as emergency roads in case of disaster.
Table 8.2.11 presents the proposed new roads for upgrading of the existing road network.
Table 8.2.11 Proposed New Roads for Upgrading of Existing Road Network ID Projects Proposed Number of LanesR5 Bypass Road for Lubhu Road 2-lane R7 Bypass Road for Godawari Road 2-lane R9 Bypass Road for Chapagaun Road 2-lane R11 Balaju-Jitpur-Phedi Road (access for solid waste disposal) 2-lane T7 Emergency Road 1 (Bishnumati-Dhobi) 2-lane T8 Emergency Road 2 (Dhobi-Makaibari) 2-lane (Numbering of ID) C: Circular Roads, R: Radial Roads, T: Transversal Roads, U: Urban Roads
Source: JST
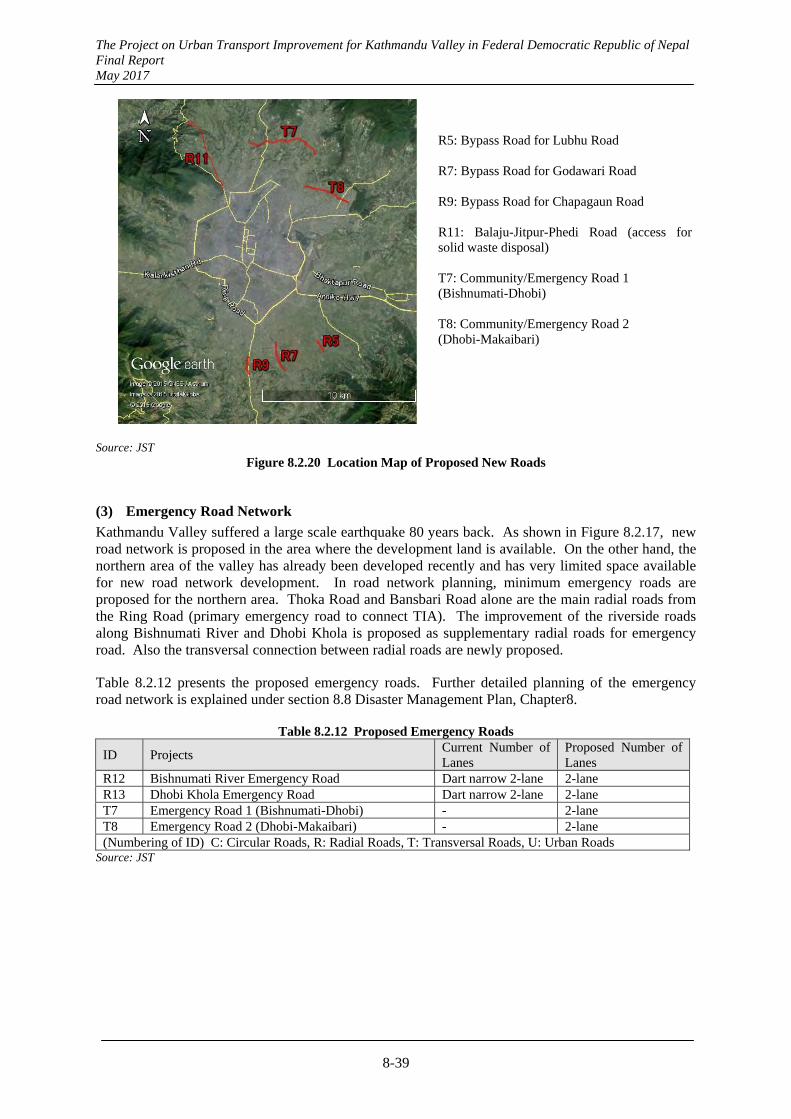
The Project on Urban Transport Improvement for Kathmandu Valley in Federal Democratic Republic of Nepal Final Report May 2017
8-39
R5: Bypass Road for Lubhu Road R7: Bypass Road for Godawari Road R9: Bypass Road for Chapagaun Road R11: Balaju-Jitpur-Phedi Road (access for solid waste disposal) T7: Community/Emergency Road 1 (Bishnumati-Dhobi) T8: Community/Emergency Road 2 (Dhobi-Makaibari)
Source: JST Figure 8.2.20 Location Map of Proposed New Roads
(3) Emergency Road Network
Kathmandu Valley suffered a large scale earthquake 80 years back. As shown in Figure 8.2.17, new road network is proposed in the area where the development land is available. On the other hand, the northern area of the valley has already been developed recently and has very limited space available for new road network development. In road network planning, minimum emergency roads are proposed for the northern area. Thoka Road and Bansbari Road alone are the main radial roads from the Ring Road (primary emergency road to connect TIA). The improvement of the riverside roads along Bishnumati River and Dhobi Khola is proposed as supplementary radial roads for emergency road. Also the transversal connection between radial roads are newly proposed.
Table 8.2.12 presents the proposed emergency roads. Further detailed planning of the emergency road network is explained under section 8.8 Disaster Management Plan, Chapter8.
Table 8.2.12 Proposed Emergency Roads
ID Projects Current Number of Lanes
Proposed Number of Lanes
R12 Bishnumati River Emergency Road Dart narrow 2-lane 2-lane R13 Dhobi Khola Emergency Road Dart narrow 2-lane 2-lane T7 Emergency Road 1 (Bishnumati-Dhobi) - 2-lane T8 Emergency Road 2 (Dhobi-Makaibari) - 2-lane (Numbering of ID) C: Circular Roads, R: Radial Roads, T: Transversal Roads, U: Urban Roads
Source: JST
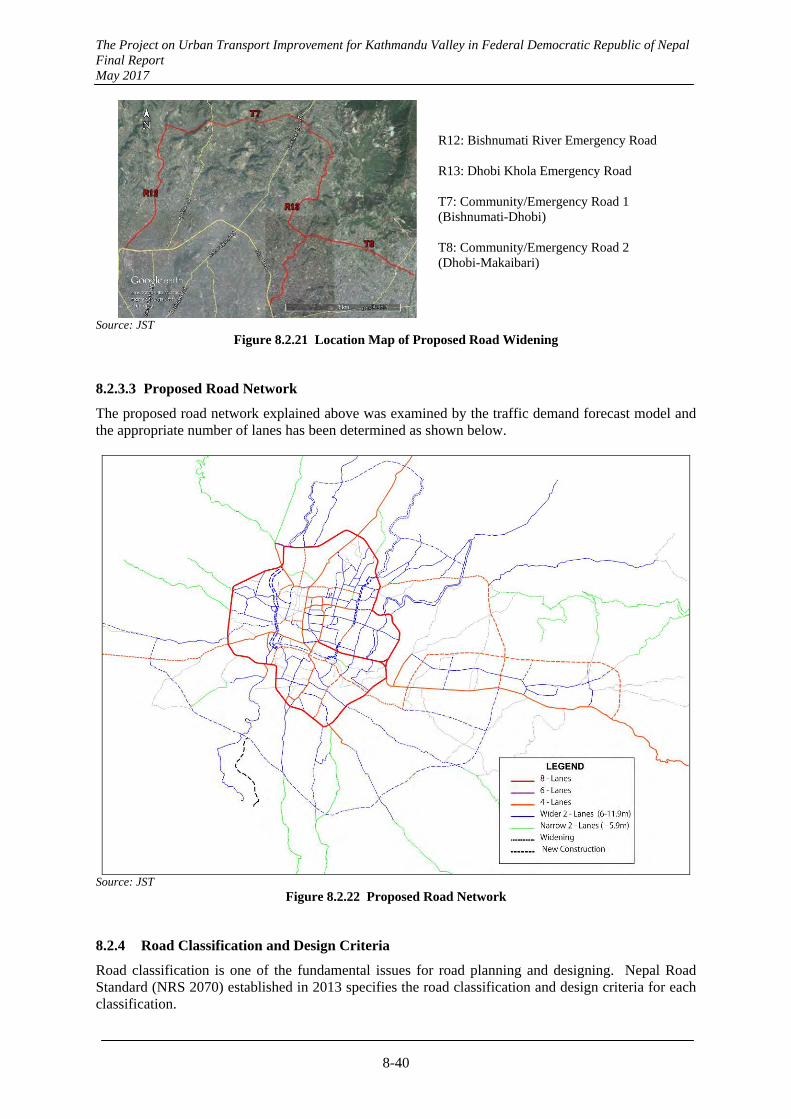
The Project on Urban Transport Improvement for Kathmandu Valley in Federal Democratic Republic of Nepal Final Report May 2017
8-40
R12: Bishnumati River Emergency Road R13: Dhobi Khola Emergency Road T7: Community/Emergency Road 1 (Bishnumati-Dhobi) T8: Community/Emergency Road 2 (Dhobi-Makaibari)
Source: JST Figure 8.2.21 Location Map of Proposed Road Widening
8.2.3.3 Proposed Road Network
The proposed road network explained above was examined by the traffic demand forecast model and the appropriate number of lanes has been determined as shown below.
Source: JST
Figure 8.2.22 Proposed Road Network
8.2.4 Road Classification and Design Criteria
Road classification is one of the fundamental issues for road planning and designing. Nepal Road Standard (NRS 2070) established in 2013 specifies the road classification and design criteria for each classification.
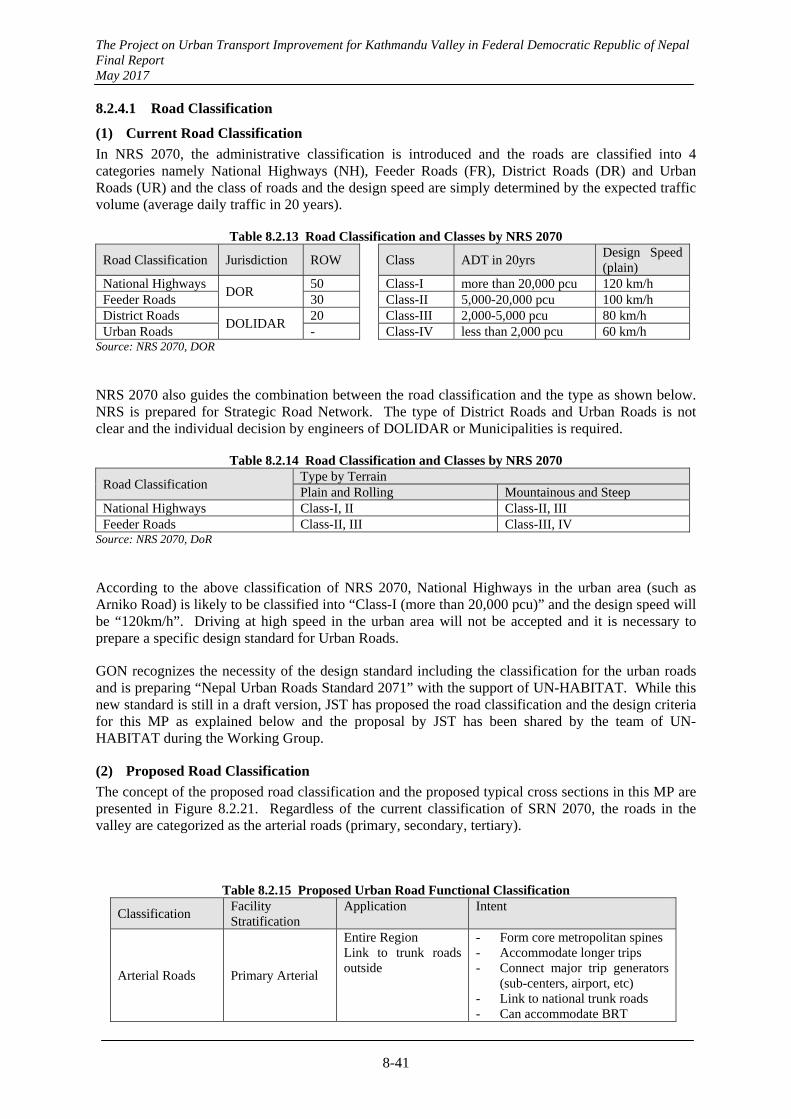
The Project on Urban Transport Improvement for Kathmandu Valley in Federal Democratic Republic of Nepal Final Report May 2017
8-41
8.2.4.1 Road Classification
(1) Current Road Classification
In NRS 2070, the administrative classification is introduced and the roads are classified into 4 categories namely National Highways (NH), Feeder Roads (FR), District Roads (DR) and Urban Roads (UR) and the class of roads and the design speed are simply determined by the expected traffic volume (average daily traffic in 20 years).
Table 8.2.13 Road Classification and Classes by NRS 2070
Road Classification Jurisdiction ROW Class ADT in 20yrs Design Speed (plain)
National Highways DOR
50 Class-I more than 20,000 pcu 120 km/h Feeder Roads 30 Class-II 5,000-20,000 pcu 100 km/h District Roads
DOLIDAR 20 Class-III 2,000-5,000 pcu 80 km/h
Urban Roads - Class-IV less than 2,000 pcu 60 km/h Source: NRS 2070, DOR
NRS 2070 also guides the combination between the road classification and the type as shown below. NRS is prepared for Strategic Road Network. The type of District Roads and Urban Roads is not clear and the individual decision by engineers of DOLIDAR or Municipalities is required.
Table 8.2.14 Road Classification and Classes by NRS 2070
Road Classification Type by Terrain Plain and Rolling Mountainous and Steep
National Highways Class-I, II Class-II, III Feeder Roads Class-II, III Class-III, IV
Source: NRS 2070, DoR
According to the above classification of NRS 2070, National Highways in the urban area (such as Arniko Road) is likely to be classified into “Class-I (more than 20,000 pcu)” and the design speed will be “120km/h”. Driving at high speed in the urban area will not be accepted and it is necessary to prepare a specific design standard for Urban Roads.
GON recognizes the necessity of the design standard including the classification for the urban roads and is preparing “Nepal Urban Roads Standard 2071” with the support of UN-HABITAT. While this new standard is still in a draft version, JST has proposed the road classification and the design criteria for this MP as explained below and the proposal by JST has been shared by the team of UN-HABITAT during the Working Group.
(2) Proposed Road Classification
The concept of the proposed road classification and the proposed typical cross sections in this MP are presented in Figure 8.2.21. Regardless of the current classification of SRN 2070, the roads in the valley are categorized as the arterial roads (primary, secondary, tertiary).
Table 8.2.15 Proposed Urban Road Functional Classification
Classification Facility Stratification
Application Intent
Arterial Roads Primary Arterial
Entire Region Link to trunk roads outside
- Form core metropolitan spines - Accommodate longer trips - Connect major trip generators
(sub-centers, airport, etc) - Link to national trunk roads - Can accommodate BRT
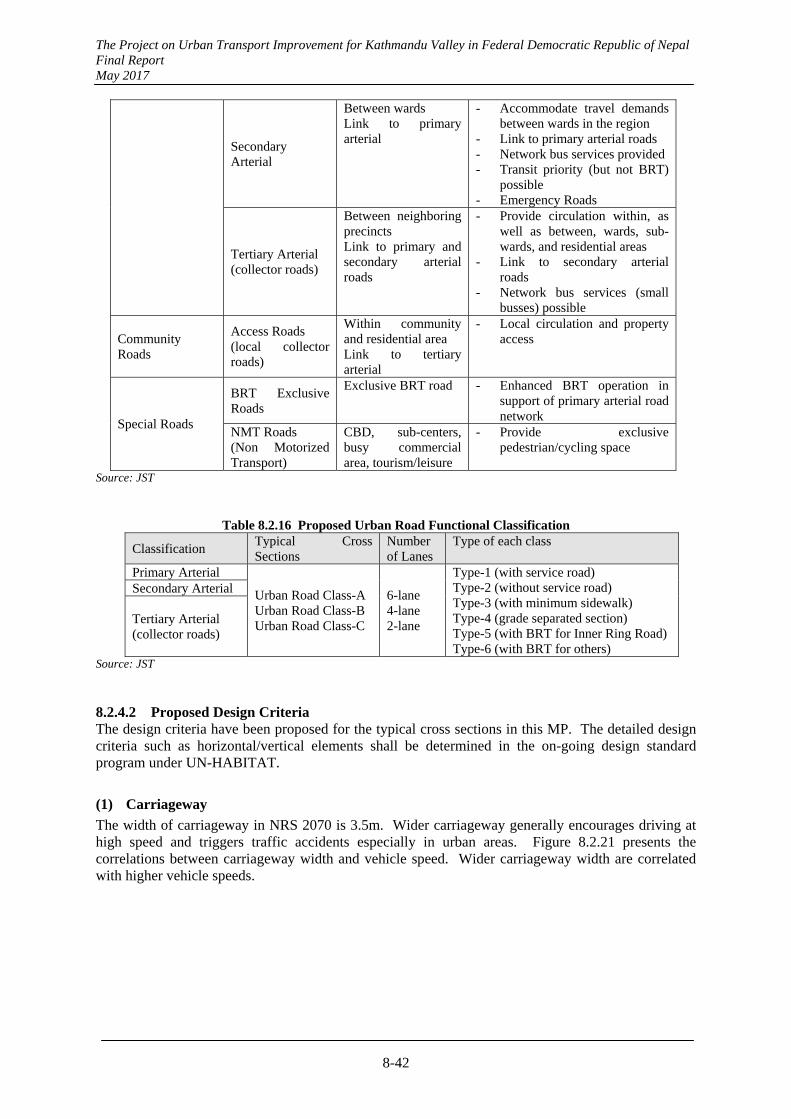
The Project on Urban Transport Improvement for Kathmandu Valley in Federal Democratic Republic of Nepal Final Report May 2017
8-42
Secondary Arterial
Between wards Link to primary arterial
- Accommodate travel demands between wards in the region
- Link to primary arterial roads - Network bus services provided- Transit priority (but not BRT)
possible - Emergency Roads
Tertiary Arterial (collector roads)
Between neighboring precincts Link to primary and secondary arterial roads
- Provide circulation within, as well as between, wards, sub-wards, and residential areas
- Link to secondary arterial roads
- Network bus services (small busses) possible
Community Roads
Access Roads (local collector roads)
Within community and residential area Link to tertiary arterial
- Local circulation and property access
Special Roads
BRT Exclusive Roads
Exclusive BRT road - Enhanced BRT operation in support of primary arterial road network
NMT Roads (Non Motorized Transport)
CBD, sub-centers, busy commercial area, tourism/leisure
- Provide exclusive pedestrian/cycling space
Source: JST
Table 8.2.16 Proposed Urban Road Functional Classification
Classification Typical Cross Sections
Number of Lanes
Type of each class
Primary Arterial
Urban Road Class-A Urban Road Class-B Urban Road Class-C
6-lane 4-lane 2-lane
Type-1 (with service road) Type-2 (without service road) Type-3 (with minimum sidewalk) Type-4 (grade separated section) Type-5 (with BRT for Inner Ring Road)Type-6 (with BRT for others)
Secondary Arterial
Tertiary Arterial (collector roads)
Source: JST
8.2.4.2 Proposed Design Criteria The design criteria have been proposed for the typical cross sections in this MP. The detailed design criteria such as horizontal/vertical elements shall be determined in the on-going design standard program under UN-HABITAT.
(1) Carriageway
The width of carriageway in NRS 2070 is 3.5m. Wider carriageway generally encourages driving at high speed and triggers traffic accidents especially in urban areas. Figure 8.2.21 presents the correlations between carriageway width and vehicle speed. Wider carriageway width are correlated with higher vehicle speeds.
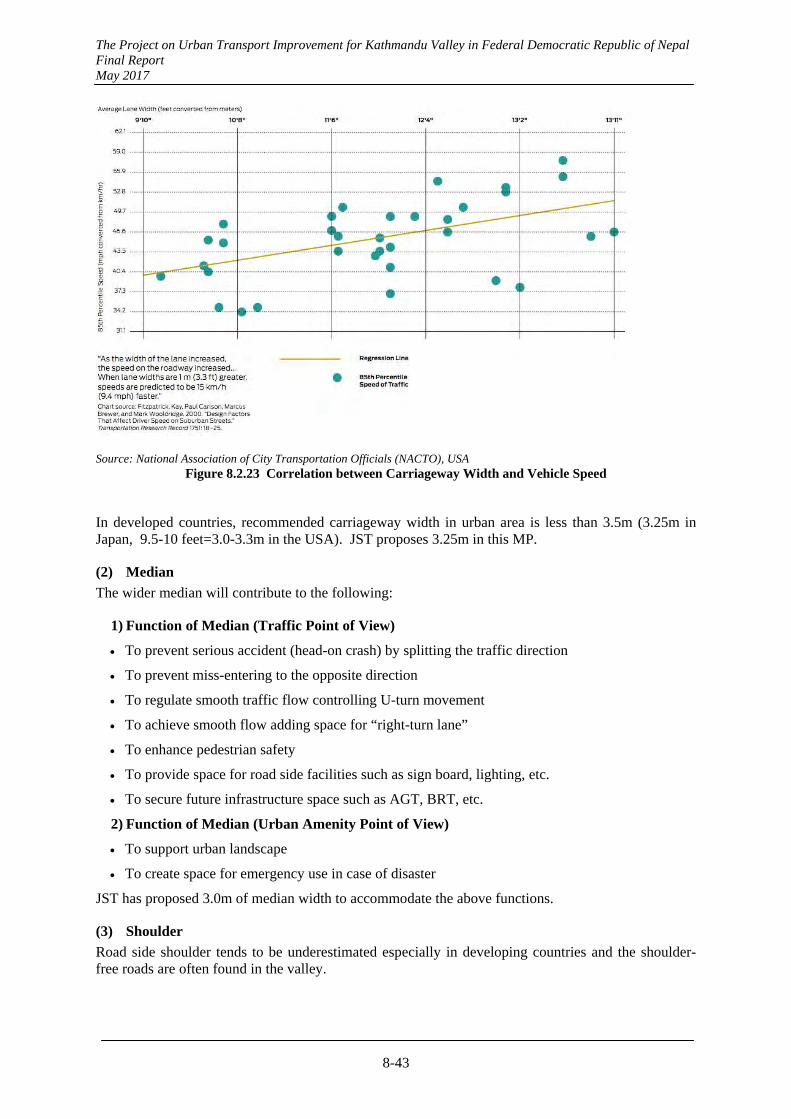
The Project on Urban Transport Improvement for Kathmandu Valley in Federal Democratic Republic of Nepal Final Report May 2017
8-43
Source: National Association of City Transportation Officials (NACTO), USA Figure 8.2.23 Correlation between Carriageway Width and Vehicle Speed
In developed countries, recommended carriageway width in urban area is less than 3.5m (3.25m in Japan, 9.5-10 feet=3.0-3.3m in the USA). JST proposes 3.25m in this MP.
(2) Median
The wider median will contribute to the following:
1) Function of Median (Traffic Point of View)
To prevent serious accident (head-on crash) by splitting the traffic direction
To prevent miss-entering to the opposite direction
To regulate smooth traffic flow controlling U-turn movement
To achieve smooth flow adding space for “right-turn lane”
To enhance pedestrian safety
To provide space for road side facilities such as sign board, lighting, etc.
To secure future infrastructure space such as AGT, BRT, etc.
2) Function of Median (Urban Amenity Point of View)
To support urban landscape
To create space for emergency use in case of disaster
JST has proposed 3.0m of median width to accommodate the above functions.
(3) Shoulder
Road side shoulder tends to be underestimated especially in developing countries and the shoulder-free roads are often found in the valley.
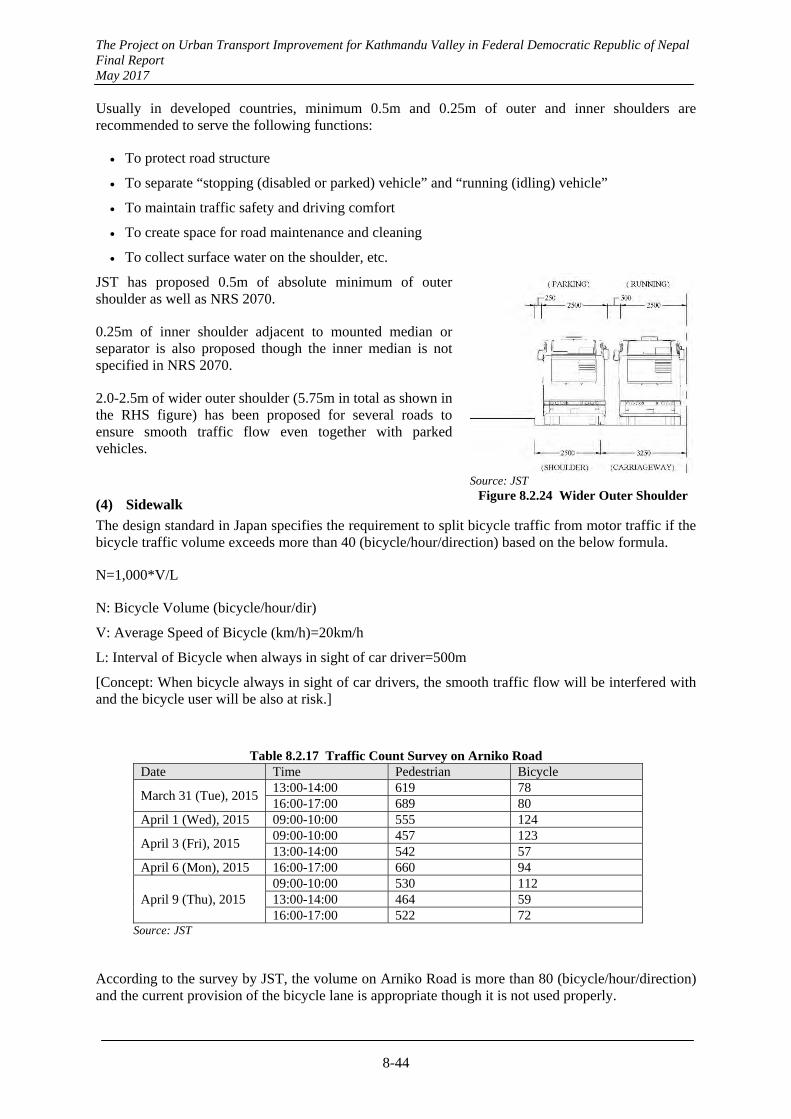
The Project on Urban Transport Improvement for Kathmandu Valley in Federal Democratic Republic of Nepal Final Report May 2017
8-44
Usually in developed countries, minimum 0.5m and 0.25m of outer and inner shoulders are recommended to serve the following functions:
To protect road structure
To separate “stopping (disabled or parked) vehicle” and “running (idling) vehicle”
To maintain traffic safety and driving comfort
To create space for road maintenance and cleaning
To collect surface water on the shoulder, etc.
JST has proposed 0.5m of absolute minimum of outer shoulder as well as NRS 2070.
0.25m of inner shoulder adjacent to mounted median or separator is also proposed though the inner median is not specified in NRS 2070.
2.0-2.5m of wider outer shoulder (5.75m in total as shown in the RHS figure) has been proposed for several roads to ensure smooth traffic flow even together with parked vehicles.
(4) Sidewalk
The design standard in Japan specifies the requirement to split bicycle traffic from motor traffic if the bicycle traffic volume exceeds more than 40 (bicycle/hour/direction) based on the below formula.
N=1,000*V/L
N: Bicycle Volume (bicycle/hour/dir)
V: Average Speed of Bicycle (km/h)=20km/h
L: Interval of Bicycle when always in sight of car driver=500m
[Concept: When bicycle always in sight of car drivers, the smooth traffic flow will be interfered with and the bicycle user will be also at risk.]
Table 8.2.17 Traffic Count Survey on Arniko Road Date Time Pedestrian Bicycle
March 31 (Tue), 2015 13:00-14:00 619 78 16:00-17:00 689 80
April 1 (Wed), 2015 09:00-10:00 555 124
April 3 (Fri), 2015 09:00-10:00 457 123 13:00-14:00 542 57
April 6 (Mon), 2015 16:00-17:00 660 94
April 9 (Thu), 2015 09:00-10:00 530 112 13:00-14:00 464 59 16:00-17:00 522 72
Source: JST
According to the survey by JST, the volume on Arniko Road is more than 80 (bicycle/hour/direction) and the current provision of the bicycle lane is appropriate though it is not used properly.
Source: JST Figure 8.2.24 Wider Outer Shoulder

The Project on Urban Transport Improvement for Kathmandu Valley in Federal Democratic Republic of Nepal Final Report May 2017
8-45
JST thus proposes provision of 4m sidewalk including bicycle lane along the newly proposed main arterial roads.
Utilization Pattern Occupied Width
Wheel Chair 1.0m
Walking with a guide dog 1.5m
Walking with a baby buggy 0.75m
Walking with an umbrella 1.0m
Walking and chatting with a friend 1.5‐2.5m
Window shopping 1.5‐2.0m
Source: JST Source: RAS-E, German and JRA, Japan Figure 8.2.25 Proposed Width of Sidewalk/Bicycle Lane
8.2.4.3 Proposed Cross Sections in the Master Plan
According to the above, the cross sectional design element has been determined and the typical cross sections have been prepared for the MP. The following table summarizes the comparison between NRS 2070 and the proposed design.
Table 8.2.18 Design Element of Typical Cross Sections Cross Section Elements NRS 2070 Proposed in this MP Width of Carriageway (Lane) 3.50m 3.25m Width of Median 3.00 – 5.00m 3.00m Width of Inner Shoulder na 0.25m Width of Outer Shoulder (standard) 0.50 – 0.75m 0.50m Width of Outer Shoulder (wider) 1.50 – 3.75m 2.50m Width of Sidewalk 1.50 – 3.00m 4.00m with bicycle lane
2.50m without bicycle lane Width of Bicycle Lane 1.20m Width of BRT Lane na 3.50m Width of BRT Station na 5.00m
Source: JST
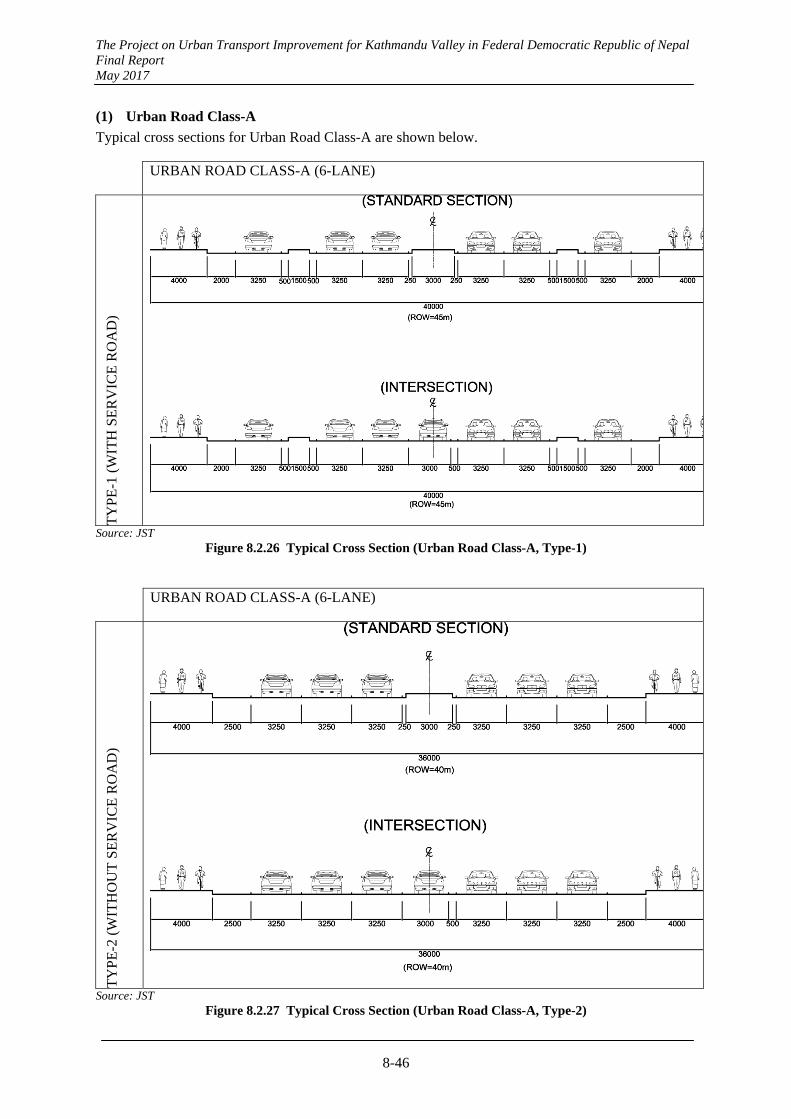
The Project on Urban Transport Improvement for Kathmandu Valley in Federal Democratic Republic of Nepal Final Report May 2017
8-46
(1) Urban Road Class-A
Typical cross sections for Urban Road Class-A are shown below.
URBAN ROAD CLASS-A (6-LANE)
TY
PE
-1 (
WIT
H S
ER
VIC
E R
OA
D)
Source: JST Figure 8.2.26 Typical Cross Section (Urban Road Class-A, Type-1)
URBAN ROAD CLASS-A (6-LANE)
TY
PE
-2 (
WIT
HO
UT
SE
RV
ICE
RO
AD
)
Source: JST Figure 8.2.27 Typical Cross Section (Urban Road Class-A, Type-2)
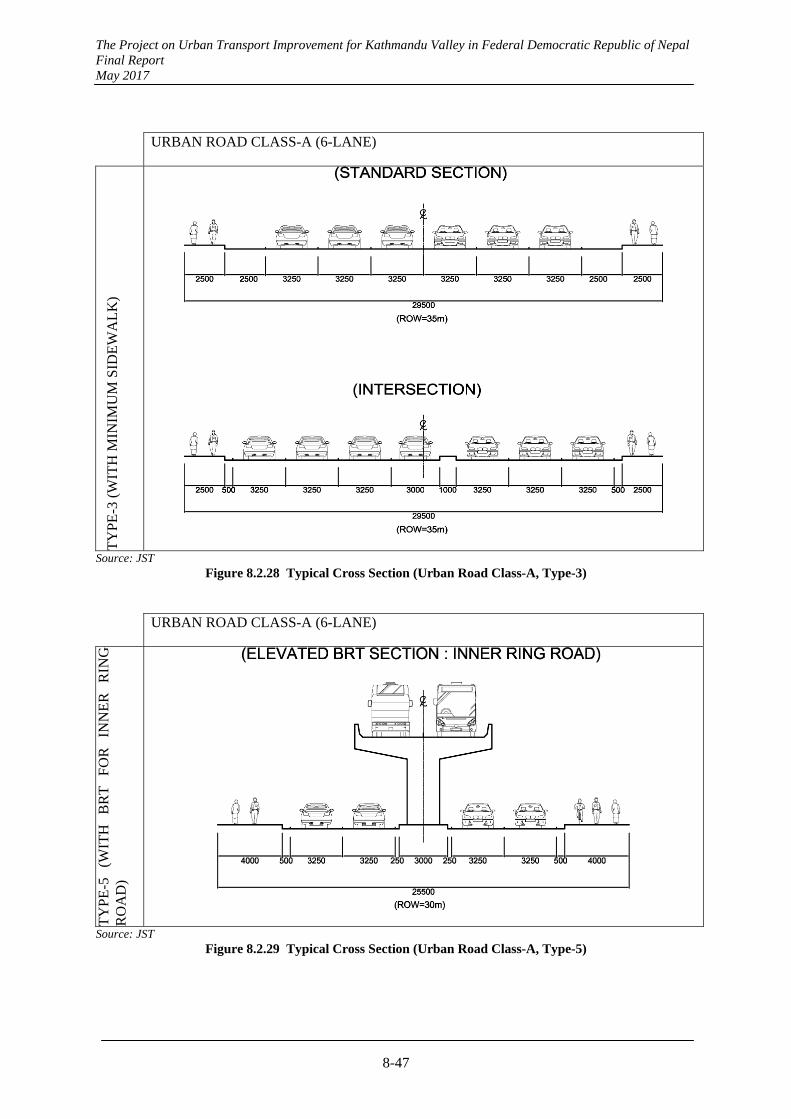
The Project on Urban Transport Improvement for Kathmandu Valley in Federal Democratic Republic of Nepal Final Report May 2017
8-47
URBAN ROAD CLASS-A (6-LANE)
TY
PE
-3 (
WIT
H M
INIM
UM
SID
EW
AL
K)
Source: JST Figure 8.2.28 Typical Cross Section (Urban Road Class-A, Type-3)
URBAN ROAD CLASS-A (6-LANE)
TY
PE
-5
(WIT
H
BR
T
FO
R
INN
ER
R
ING
R
OA
D)
Source: JST Figure 8.2.29 Typical Cross Section (Urban Road Class-A, Type-5)
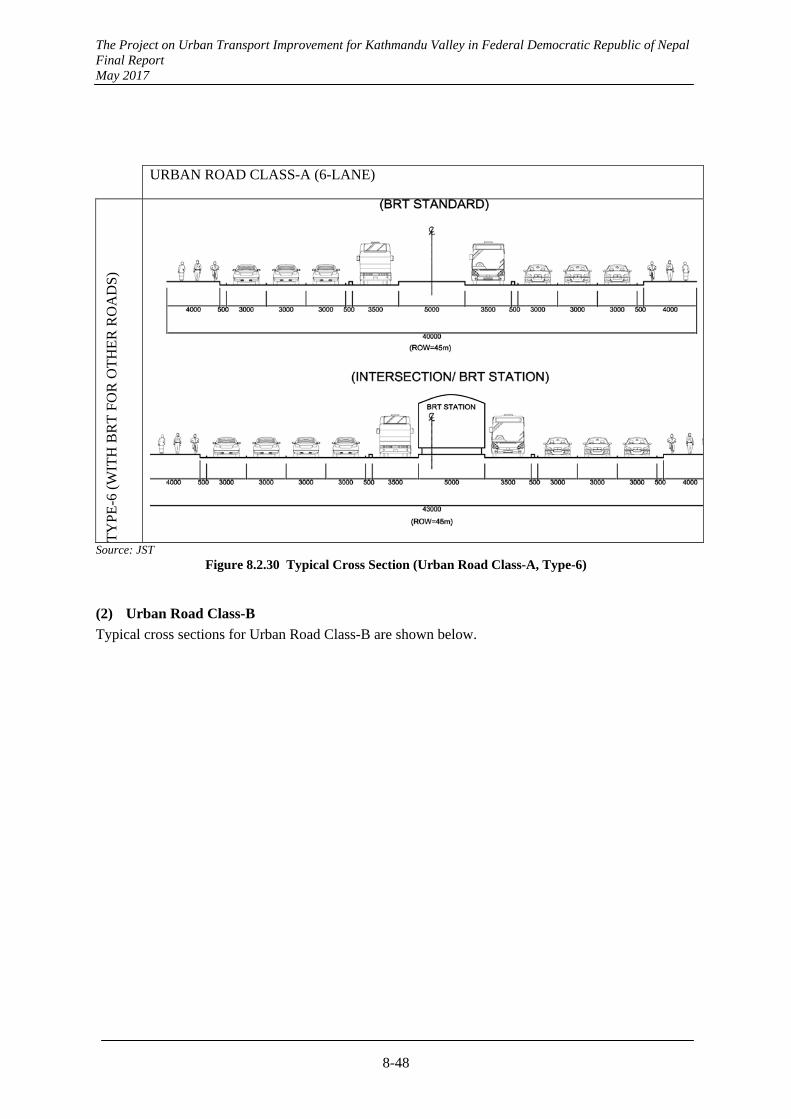
The Project on Urban Transport Improvement for Kathmandu Valley in Federal Democratic Republic of Nepal Final Report May 2017
8-48
URBAN ROAD CLASS-A (6-LANE)
TY
PE
-6 (
WIT
H B
RT
FO
R O
TH
ER
RO
AD
S)
Source: JST Figure 8.2.30 Typical Cross Section (Urban Road Class-A, Type-6)
(2) Urban Road Class-B
Typical cross sections for Urban Road Class-B are shown below.
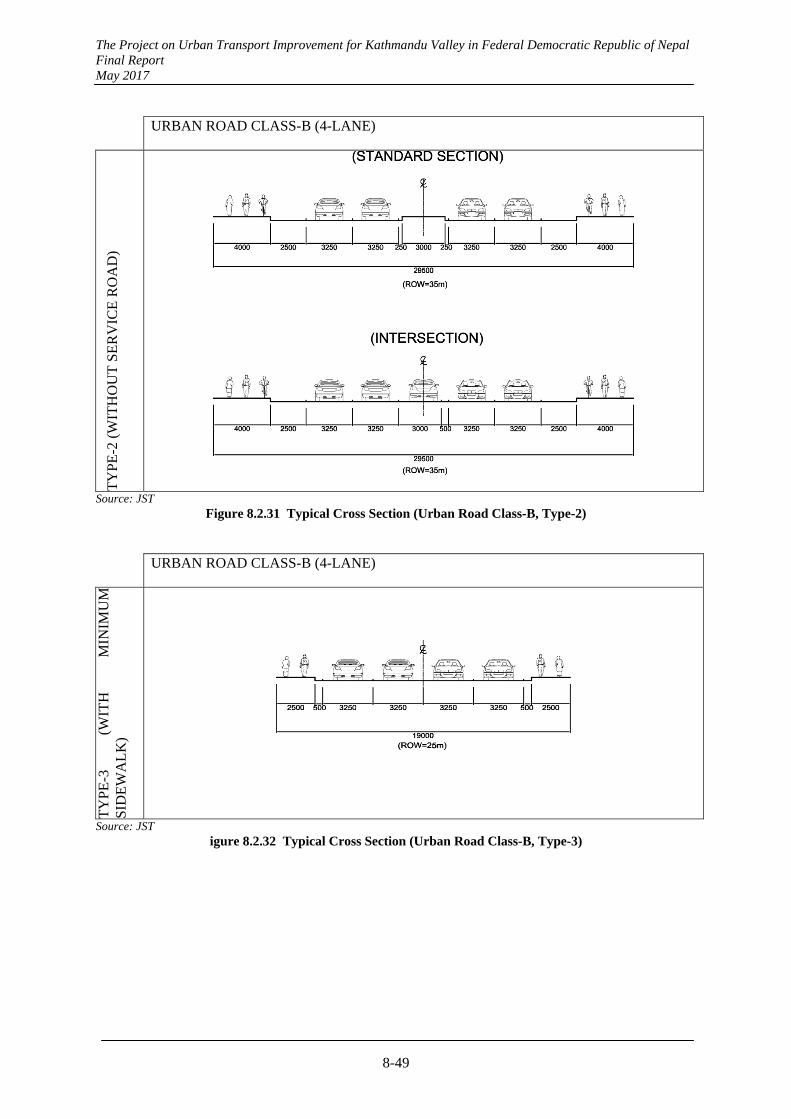
The Project on Urban Transport Improvement for Kathmandu Valley in Federal Democratic Republic of Nepal Final Report May 2017
8-49
URBAN ROAD CLASS-B (4-LANE)
TY
PE
-2 (
WIT
HO
UT
SE
RV
ICE
RO
AD
)
Source: JST Figure 8.2.31 Typical Cross Section (Urban Road Class-B, Type-2)
URBAN ROAD CLASS-B (4-LANE)
TY
PE
-3
(WIT
H
MIN
IMU
MS
IDE
WA
LK
)
Source: JST igure 8.2.32 Typical Cross Section (Urban Road Class-B, Type-3)

The Project on Urban Transport Improvement for Kathmandu Valley in Federal Democratic Republic of Nepal Final Report May 2017
8-50
URBAN ROAD CLASS-B (4-LANE) T
YP
E-4
(G
RA
DE
SE
PA
RA
TE
D S
EC
TIO
N)
Source: JST Figure 8.2.33 Typical Cross Section (Urban Road Class-B, Type-4)
URBAN ROAD CLASS-B (4-LANE)
TY
PE
-5
(WIT
H
BR
T
FO
R
INN
ER
RIN
G R
OA
D)
Source: JST Figure 8.2.34 Typical Cross Section (Urban Road Class-B, Type-5)
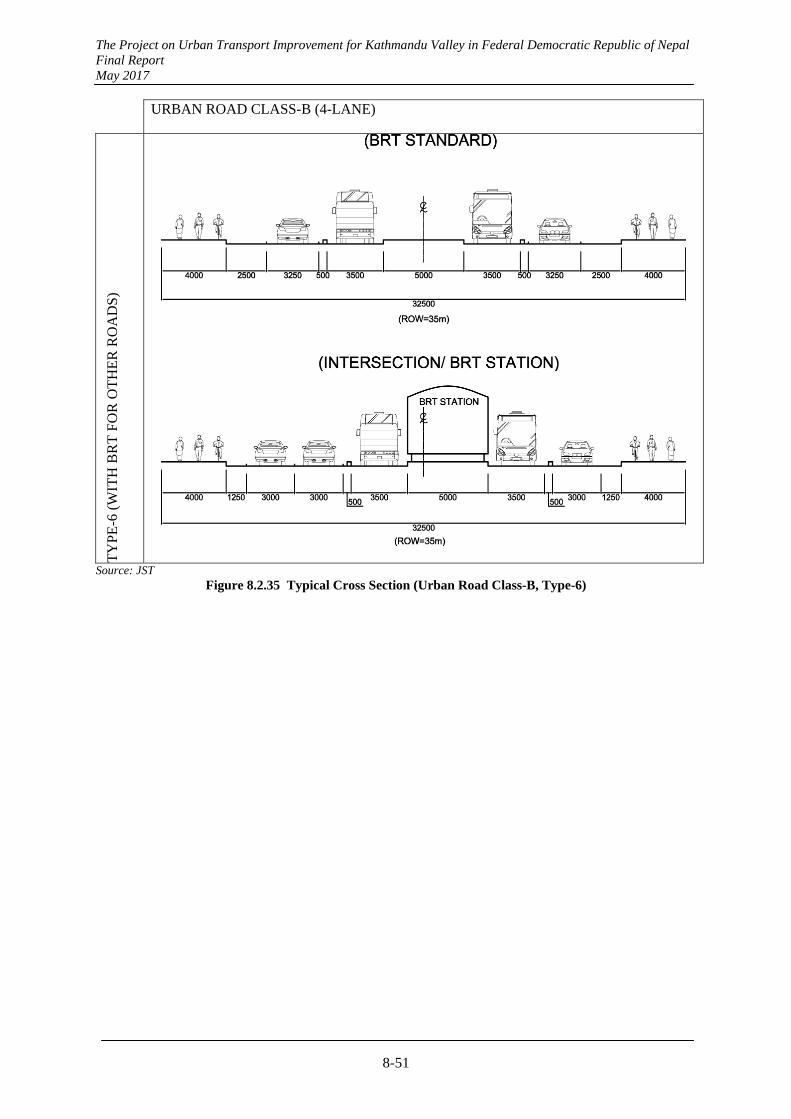
The Project on Urban Transport Improvement for Kathmandu Valley in Federal Democratic Republic of Nepal Final Report May 2017
8-51
URBAN ROAD CLASS-B (4-LANE) T
YP
E-6
(W
ITH
BR
T F
OR
OT
HE
R R
OA
DS
)
Source: JST Figure 8.2.35 Typical Cross Section (Urban Road Class-B, Type-6)
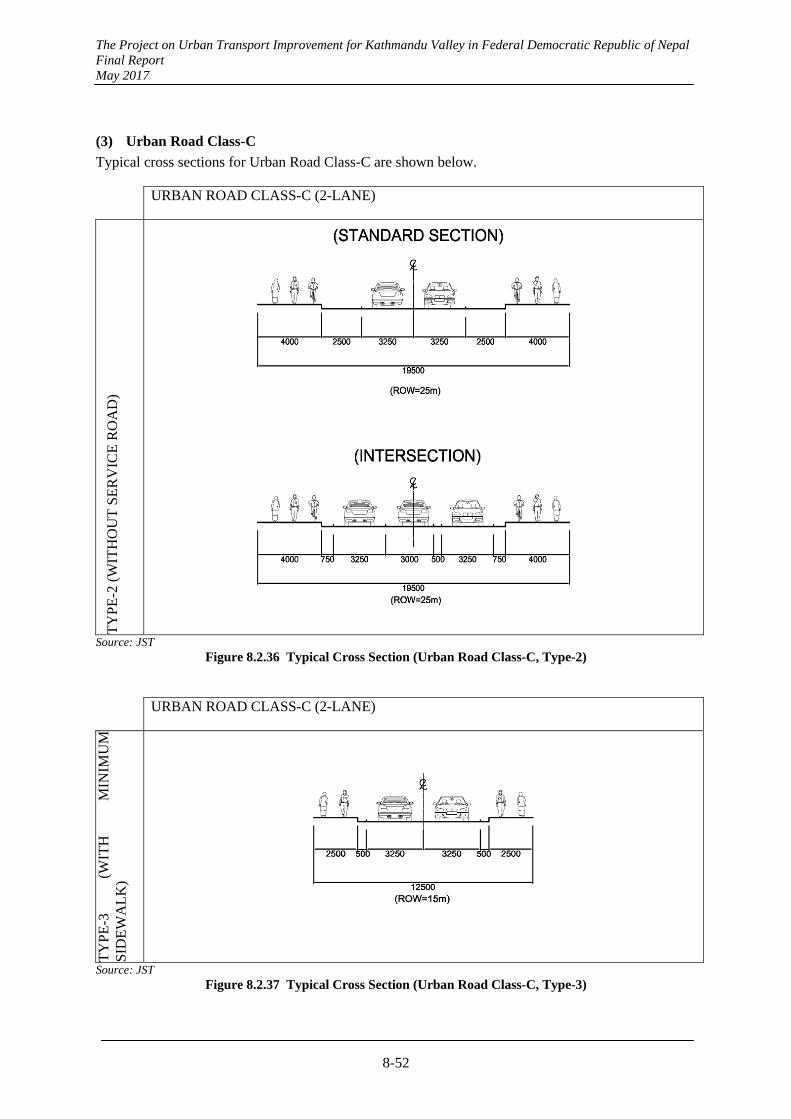
The Project on Urban Transport Improvement for Kathmandu Valley in Federal Democratic Republic of Nepal Final Report May 2017
8-52
(3) Urban Road Class-C
Typical cross sections for Urban Road Class-C are shown below.
URBAN ROAD CLASS-C (2-LANE)
TY
PE
-2 (
WIT
HO
UT
SE
RV
ICE
RO
AD
)
Source: JST Figure 8.2.36 Typical Cross Section (Urban Road Class-C, Type-2)
URBAN ROAD CLASS-C (2-LANE)
TY
PE
-3
(WIT
H
MIN
IMU
MS
IDE
WA
LK
)
Source: JST Figure 8.2.37 Typical Cross Section (Urban Road Class-C, Type-3)
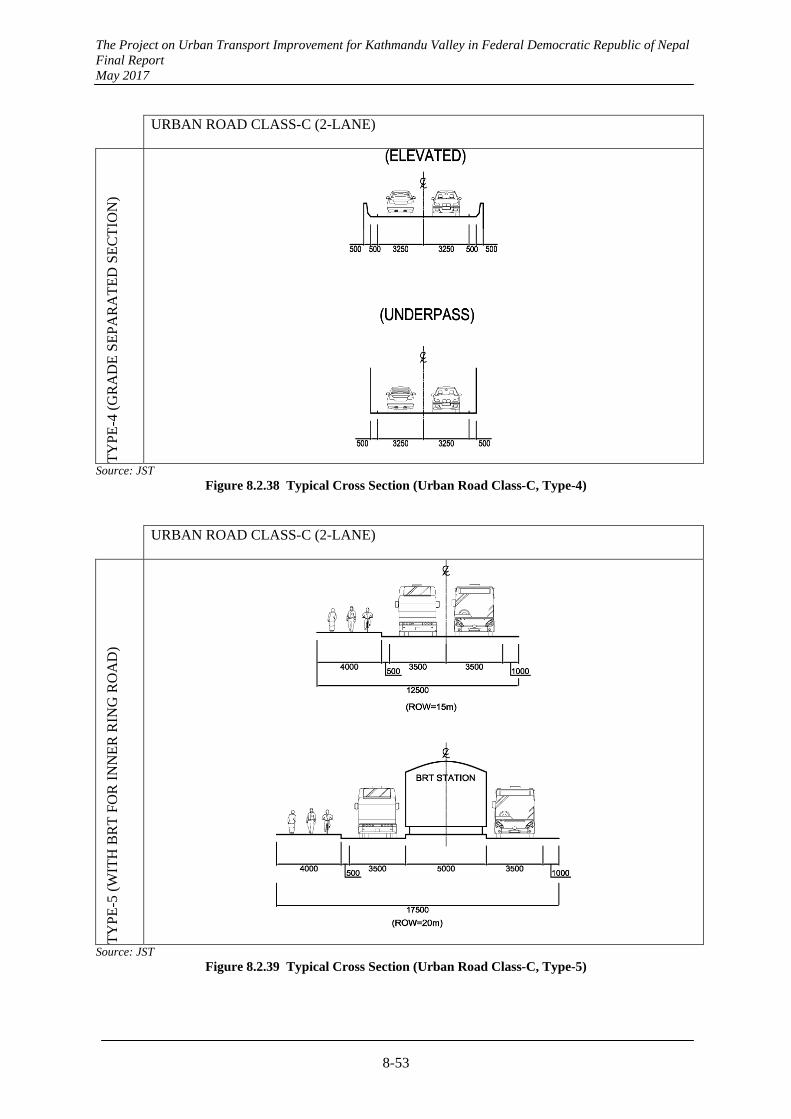
The Project on Urban Transport Improvement for Kathmandu Valley in Federal Democratic Republic of Nepal Final Report May 2017
8-53
URBAN ROAD CLASS-C (2-LANE)
TY
PE
-4 (
GR
AD
E S
EP
AR
AT
ED
SE
CT
ION
)
Source: JST Figure 8.2.38 Typical Cross Section (Urban Road Class-C, Type-4)
URBAN ROAD CLASS-C (2-LANE)
TY
PE
-5 (
WIT
H B
RT
FO
R I
NN
ER
RIN
G R
OA
D)
Source: JST Figure 8.2.39 Typical Cross Section (Urban Road Class-C, Type-5)
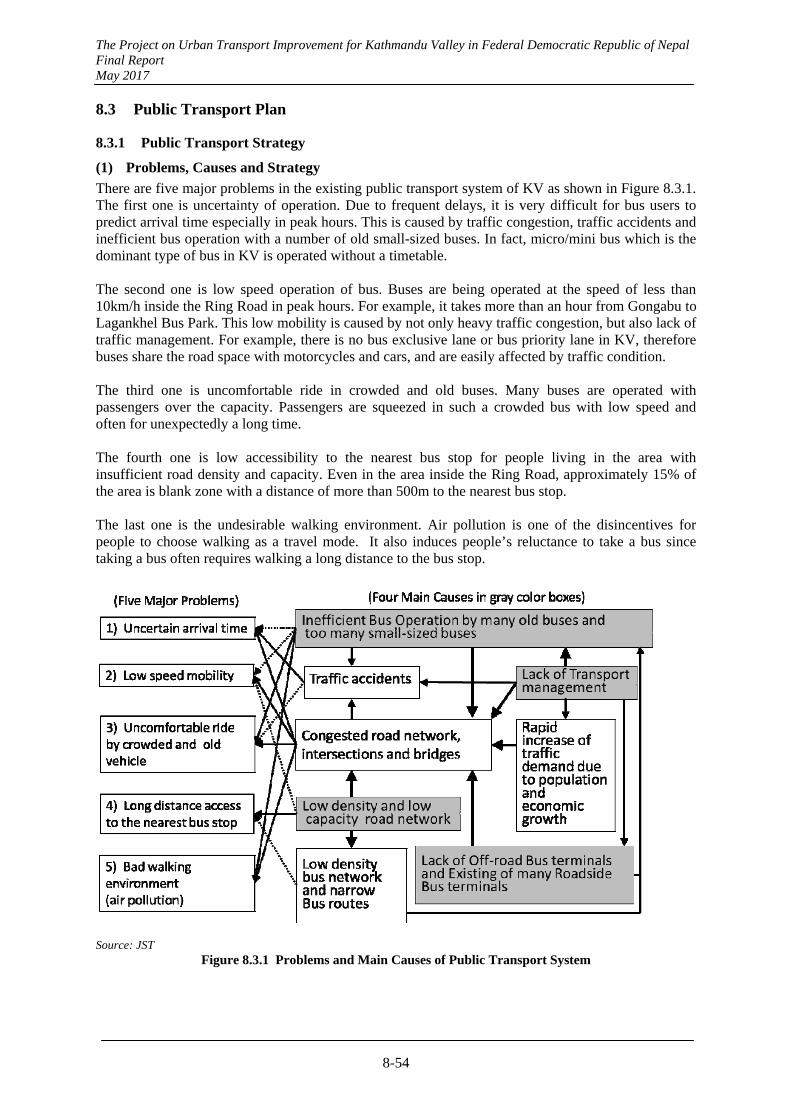
The Project on Urban Transport Improvement for Kathmandu Valley in Federal Democratic Republic of Nepal Final Report May 2017
8-54
8.3 Public Transport Plan
8.3.1 Public Transport Strategy
(1) Problems, Causes and Strategy
There are five major problems in the existing public transport system of KV as shown in Figure 8.3.1. The first one is uncertainty of operation. Due to frequent delays, it is very difficult for bus users to predict arrival time especially in peak hours. This is caused by traffic congestion, traffic accidents and inefficient bus operation with a number of old small-sized buses. In fact, micro/mini bus which is the dominant type of bus in KV is operated without a timetable. The second one is low speed operation of bus. Buses are being operated at the speed of less than 10km/h inside the Ring Road in peak hours. For example, it takes more than an hour from Gongabu to Lagankhel Bus Park. This low mobility is caused by not only heavy traffic congestion, but also lack of traffic management. For example, there is no bus exclusive lane or bus priority lane in KV, therefore buses share the road space with motorcycles and cars, and are easily affected by traffic condition. The third one is uncomfortable ride in crowded and old buses. Many buses are operated with passengers over the capacity. Passengers are squeezed in such a crowded bus with low speed and often for unexpectedly a long time. The fourth one is low accessibility to the nearest bus stop for people living in the area with insufficient road density and capacity. Even in the area inside the Ring Road, approximately 15% of the area is blank zone with a distance of more than 500m to the nearest bus stop. The last one is the undesirable walking environment. Air pollution is one of the disincentives for people to choose walking as a travel mode. It also induces people’s reluctance to take a bus since taking a bus often requires walking a long distance to the bus stop.
Source: JST Figure 8.3.1 Problems and Main Causes of Public Transport System
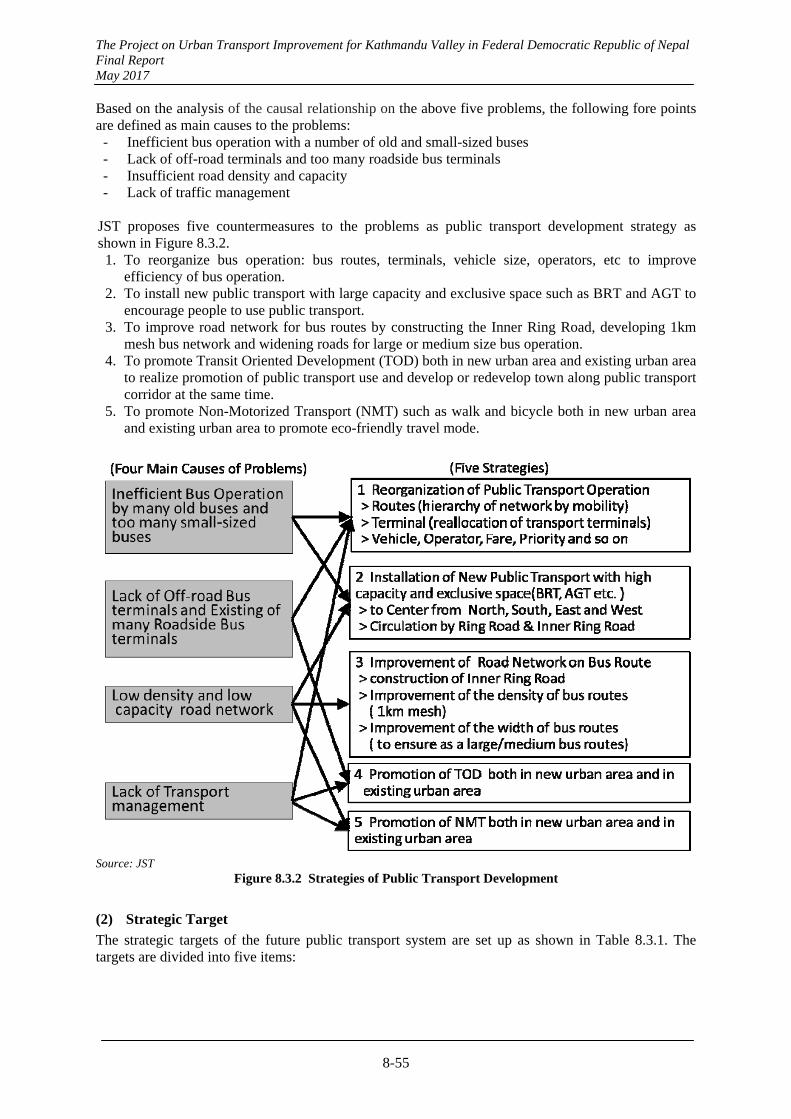
The Project on Urban Transport Improvement for Kathmandu Valley in Federal Democratic Republic of Nepal Final Report May 2017
8-55
Based on the analysis of the causal relationship on the above five problems, the following fore points are defined as main causes to the problems:
- Inefficient bus operation with a number of old and small-sized buses - Lack of off-road terminals and too many roadside bus terminals - Insufficient road density and capacity - Lack of traffic management
JST proposes five countermeasures to the problems as public transport development strategy as shown in Figure 8.3.2.
1. To reorganize bus operation: bus routes, terminals, vehicle size, operators, etc to improve efficiency of bus operation.
2. To install new public transport with large capacity and exclusive space such as BRT and AGT to encourage people to use public transport.
3. To improve road network for bus routes by constructing the Inner Ring Road, developing 1km mesh bus network and widening roads for large or medium size bus operation.
4. To promote Transit Oriented Development (TOD) both in new urban area and existing urban area to realize promotion of public transport use and develop or redevelop town along public transport corridor at the same time.
5. To promote Non-Motorized Transport (NMT) such as walk and bicycle both in new urban area and existing urban area to promote eco-friendly travel mode.
Source: JST
Figure 8.3.2 Strategies of Public Transport Development
(2) Strategic Target
The strategic targets of the future public transport system are set up as shown in Table 8.3.1. The targets are divided into five items:
The Project on Urban Transport Improvement for Kathmandu Valley in Federal Democratic Republic of Nepal Final Report May 2017
8-56
1) Mobility Mobility can be indicated as speed, frequency or operation hours. Frequency and operation hours are excluded from the indicator in this study since the target for these should be determined for each route responding to demand. Speed is set up as an indicator because modal choice highly depends on how fast a transport mode can operate. The targets are 30km/h on Primary Routes and 15km/h on others. 30km/h as travel speed is faster than private vehicles driving inside the Ring Road during peak hours. The speed of 15km/h can be the same as cars.
2) Accessibility Accessibility is represented as distance or time to the nearest public transport nodes such as bus
stop or railway station. The main travel mode to the nearest bus stop is walking in Kathmandu Valley. Distance to the nearest stop is also an indicator for network density, which is closely related to road network density. In this Study, the target for accessibility inside the Ring Road is set up as less than 500m to the nearest stop.
3) Reliability
Reliability is attained by stable and accurate operation. If a bus runs at 30 km/h, it takes 10 minutes to travel 5 km which is the average trip length at present. On the other hand, it takes 25 minutes to travel 5 km at 12 km/h, rough estimation of current bus speed. The time difference is 15 minutes. Thus the target of delay time is within 15 minutes on primary route. If a bus is delayed by 15 minutes and the travel distance is 5 km, travel time including waiting time will be 25 minutes, which is the same as the current travel time. Reliability is a very important target for public transport operators.
4) Efficiency Improvement of bus transport efficiency contributes to reduction of traffic on roads. Currently
about 90% of buses are micro/mini bus. In order to operate public transport system efficiently, smaller buses should be replaced by larger ones. The target of the average number of passengers is 14.4 passengers for micro/mini bus and 30 passengers for medium sized bus.
5) Equity Public transport services should be fairly provided to all in terms of fare, design and seat. Fare
of public transport should be cheaper than the price of petrol for a motorcycle to cover 5km. For example, if a motorcycle runs 20 km/l, it consumes 0.25l of petrol to cover 5 km. If the price of petrol is 100NPR/l, it costs 25NPR for a 5 km run. Thus the target of fare is less than 25NPR for 5km. In addition, universal design for buses and terminals is also necessary in the future such as lower floor bus and terminals with slope or elevators. Priority seats for the disabled, aged, children and women should also be provided which are insufficient on the existing buses.
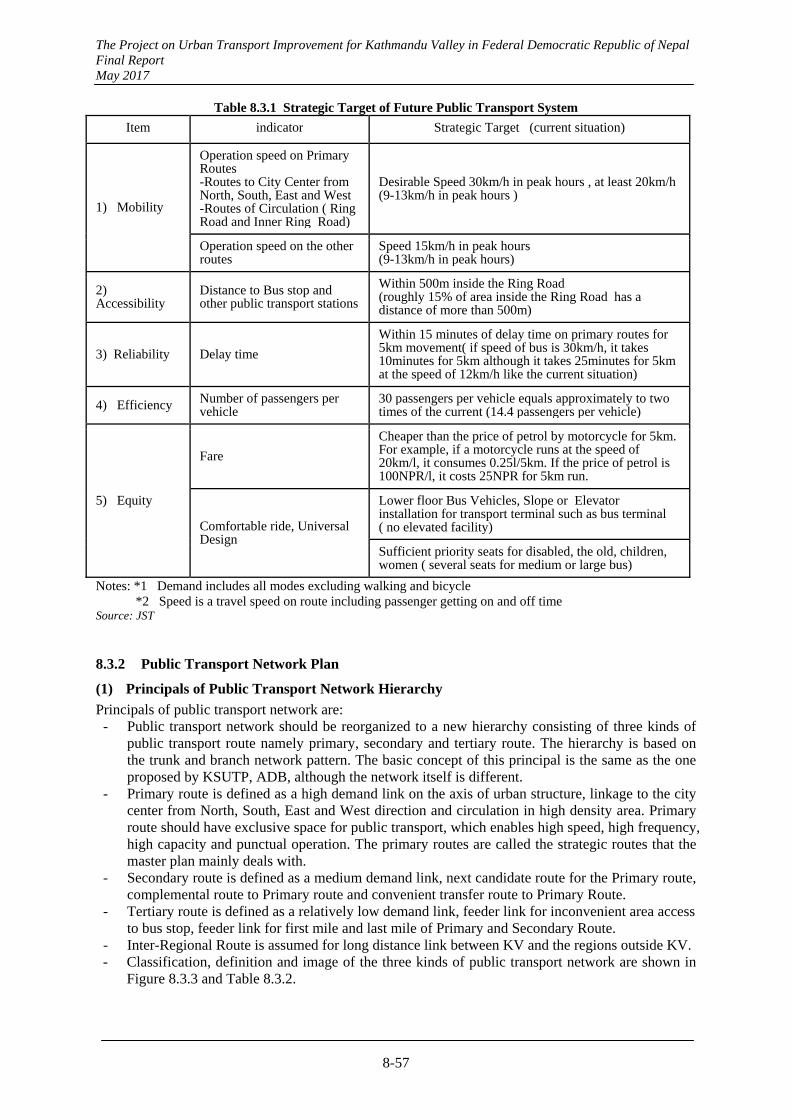
The Project on Urban Transport Improvement for Kathmandu Valley in Federal Democratic Republic of Nepal Final Report May 2017
8-57
Table 8.3.1 Strategic Target of Future Public Transport System
Item indicator Strategic Target (current situation)
1) Mobility
Operation speed on Primary Routes -Routes to City Center from North, South, East and West -Routes of Circulation ( Ring Road and Inner Ring Road)
Desirable Speed 30km/h in peak hours , at least 20km/h (9-13km/h in peak hours )
Operation speed on the other routes
Speed 15km/h in peak hours(9-13km/h in peak hours)
2) Accessibility Distance to Bus stop and
other public transport stations
Within 500m inside the Ring Road (roughly 15% of area inside the Ring Road has a distance of more than 500m)
3) Reliability Delay time Within 15 minutes of delay time on primary routes for 5km movement( if speed of bus is 30km/h, it takes 10minutes for 5km although it takes 25minutes for 5km at the speed of 12km/h like the current situation)
4) Efficiency Number of passengers per vehicle
30 passengers per vehicle equals approximately to two times of the current (14.4 passengers per vehicle)
5) Equity
Fare Cheaper than the price of petrol by motorcycle for 5km. For example, if a motorcycle runs at the speed of 20km/l, it consumes 0.25l/5km. If the price of petrol is 100NPR/l, it costs 25NPR for 5km run.
Comfortable ride, Universal Design
Lower floor Bus Vehicles, Slope or Elevator installation for transport terminal such as bus terminal ( no elevated facility)
Sufficient priority seats for disabled, the old, children, women ( several seats for medium or large bus)
Notes: *1 Demand includes all modes excluding walking and bicycle *2 Speed is a travel speed on route including passenger getting on and off time Source: JST
8.3.2 Public Transport Network Plan
(1) Principals of Public Transport Network Hierarchy
Principals of public transport network are: - Public transport network should be reorganized to a new hierarchy consisting of three kinds of
public transport route namely primary, secondary and tertiary route. The hierarchy is based on the trunk and branch network pattern. The basic concept of this principal is the same as the one proposed by KSUTP, ADB, although the network itself is different.
- Primary route is defined as a high demand link on the axis of urban structure, linkage to the city center from North, South, East and West direction and circulation in high density area. Primary route should have exclusive space for public transport, which enables high speed, high frequency, high capacity and punctual operation. The primary routes are called the strategic routes that the master plan mainly deals with.
- Secondary route is defined as a medium demand link, next candidate route for the Primary route, complemental route to Primary route and convenient transfer route to Primary Route.
- Tertiary route is defined as a relatively low demand link, feeder link for inconvenient area access to bus stop, feeder link for first mile and last mile of Primary and Secondary Route.
- Inter-Regional Route is assumed for long distance link between KV and the regions outside KV. - Classification, definition and image of the three kinds of public transport network are shown in
Figure 8.3.3 and Table 8.3.2.

The Project on Urban Transport Improvement for Kathmandu Valley in Federal Democratic Republic of Nepal Final Report May 2017
8-58
Source: JST
Figure 8.3.3 Image of Strategic Public Transport Routes
Table 8.3.2 Classification and Definition of Public Transport Network Area Classification & definition Demand on link *1 Vehicle Speed *2
Intra- Regional
Primary Route is for: -high demand link on the axis of urban structure -linkage to the city center from North,
South, East West direction and so on -circulation in high density area -link with high speed, frequency and
capacity -link with punctual operation with exclusive
space
(passengers/day) -More than 100,000 (passengers/h/direction)-More than 5,000
-BRT -AGT -Monorail
-More than 30 km/h (BRT 20km/h)
Secondary Route is for: -medium demand link -next candidate route for the Primary route -complemental route to Primary route -convenient transfer route to Primary Route
(passengers/day) -More than 50,000 and Less than 100,000 (passengers/h/direction)-More than 2,000 and Less than 5,000
-BRT -Large Bus -Medium Bus (Minibus for narrow route)
-More than 15 km/h
Tertiary Route is for: -relatively low demand link -feeder link for inconvenient area access to
bus stop -feeder link for first mile and last mile of
Primary and Secondary Route
(passengers/day) -Less than 50,000 (passengers/h/direction)-Less than 2,000
-Minibus -Microbus -Tempo
-More than 15 km/h
Inter-Regional
Inter-Regional Route is set up for:-long distance link between KV and the regions outside KV
Not specific -Large Bus Not specific
Notes: The above definition of primary, secondly and Tertiary routes are defined by JICA Study Team referring to the definition by KSUTP,ADB.
*1: Demand includes all motorized modes excluding walking and bicycle *2: Speed is a travel speed on route including passenger getting on and off time Source: JST
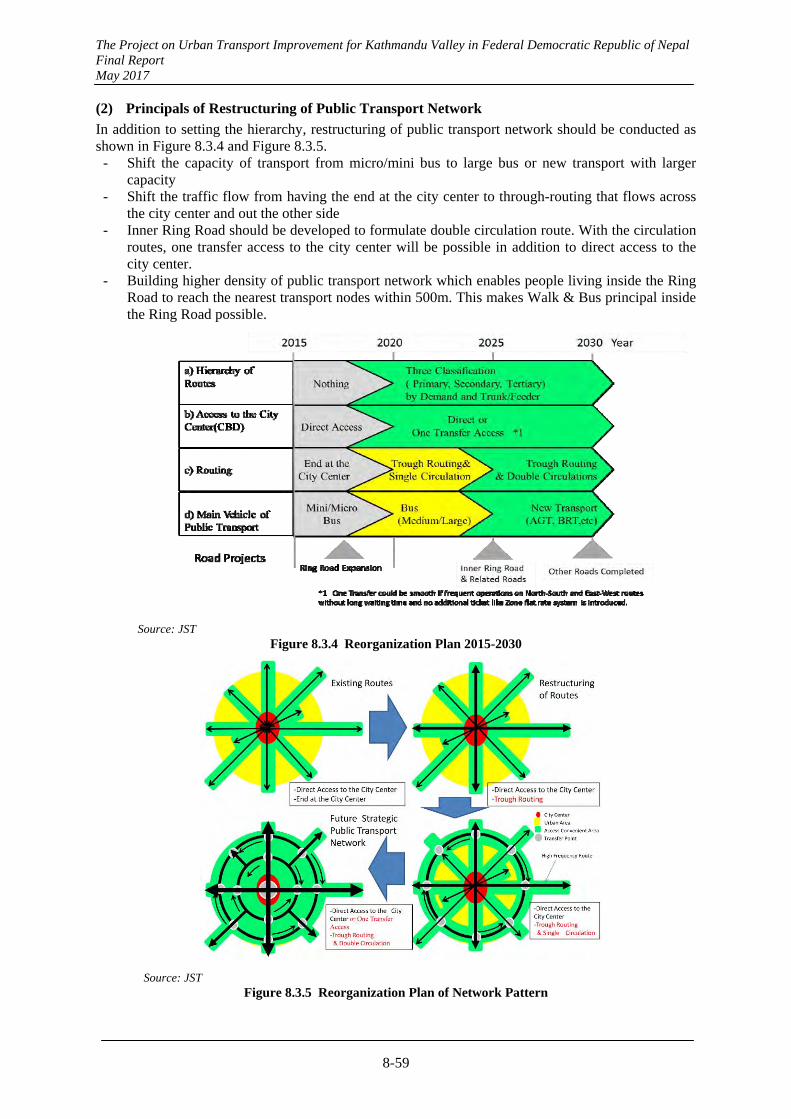
The Project on Urban Transport Improvement for Kathmandu Valley in Federal Democratic Republic of Nepal Final Report May 2017
8-59
(2) Principals of Restructuring of Public Transport Network
In addition to setting the hierarchy, restructuring of public transport network should be conducted as shown in Figure 8.3.4 and Figure 8.3.5.
- Shift the capacity of transport from micro/mini bus to large bus or new transport with larger capacity
- Shift the traffic flow from having the end at the city center to through-routing that flows across the city center and out the other side
- Inner Ring Road should be developed to formulate double circulation route. With the circulation routes, one transfer access to the city center will be possible in addition to direct access to the city center.
- Building higher density of public transport network which enables people living inside the Ring Road to reach the nearest transport nodes within 500m. This makes Walk & Bus principal inside the Ring Road possible.
Source: JST
Figure 8.3.4 Reorganization Plan 2015-2030
Source: JST Figure 8.3.5 Reorganization Plan of Network Pattern
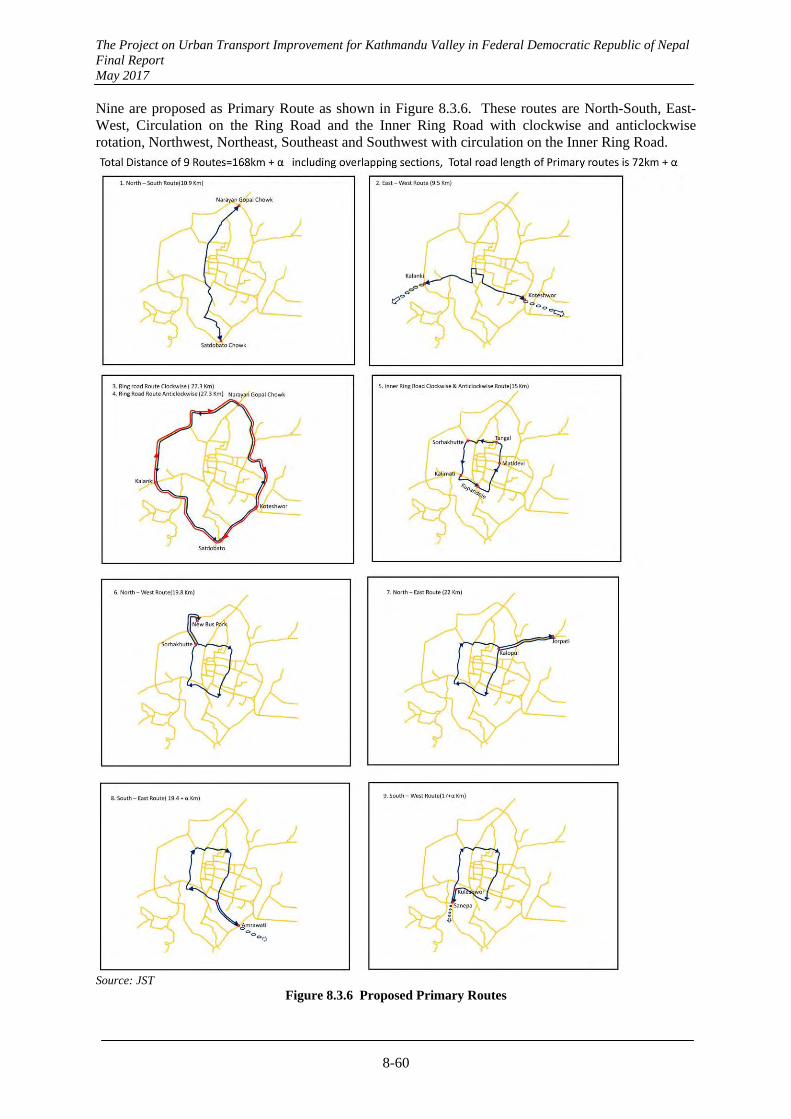
The Project on Urban Transport Improvement for Kathmandu Valley in Federal Democratic Republic of Nepal Final Report May 2017
8-60
Nine are proposed as Primary Route as shown in Figure 8.3.6. These routes are North-South, East-West, Circulation on the Ring Road and the Inner Ring Road with clockwise and anticlockwise rotation, Northwest, Northeast, Southeast and Southwest with circulation on the Inner Ring Road.
Source: JST Figure 8.3.6 Proposed Primary Routes
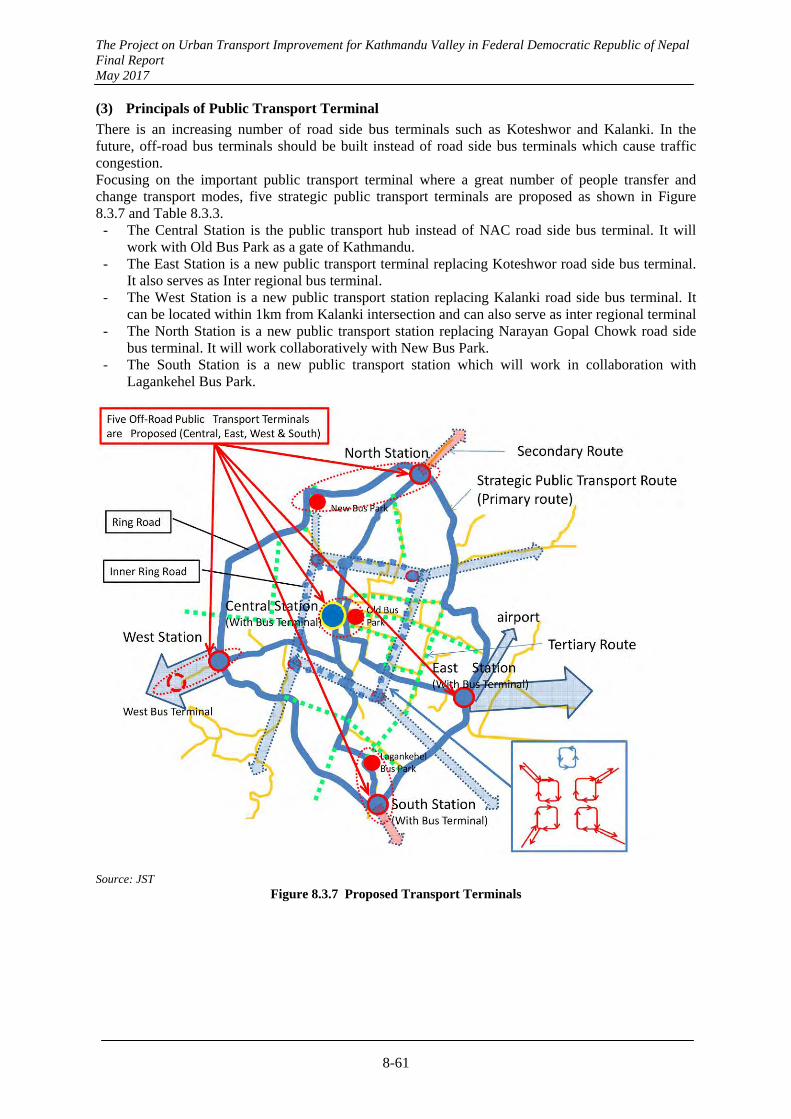
The Project on Urban Transport Improvement for Kathmandu Valley in Federal Democratic Republic of Nepal Final Report May 2017
8-61
(3) Principals of Public Transport Terminal
There is an increasing number of road side bus terminals such as Koteshwor and Kalanki. In the future, off-road bus terminals should be built instead of road side bus terminals which cause traffic congestion. Focusing on the important public transport terminal where a great number of people transfer and change transport modes, five strategic public transport terminals are proposed as shown in Figure 8.3.7 and Table 8.3.3.
- The Central Station is the public transport hub instead of NAC road side bus terminal. It will work with Old Bus Park as a gate of Kathmandu.
- The East Station is a new public transport terminal replacing Koteshwor road side bus terminal. It also serves as Inter regional bus terminal.
- The West Station is a new public transport station replacing Kalanki road side bus terminal. It can be located within 1km from Kalanki intersection and can also serve as inter regional terminal
- The North Station is a new public transport station replacing Narayan Gopal Chowk road side bus terminal. It will work collaboratively with New Bus Park.
- The South Station is a new public transport station which will work in collaboration with Lagankehel Bus Park.
Source: JST
Figure 8.3.7 Proposed Transport Terminals
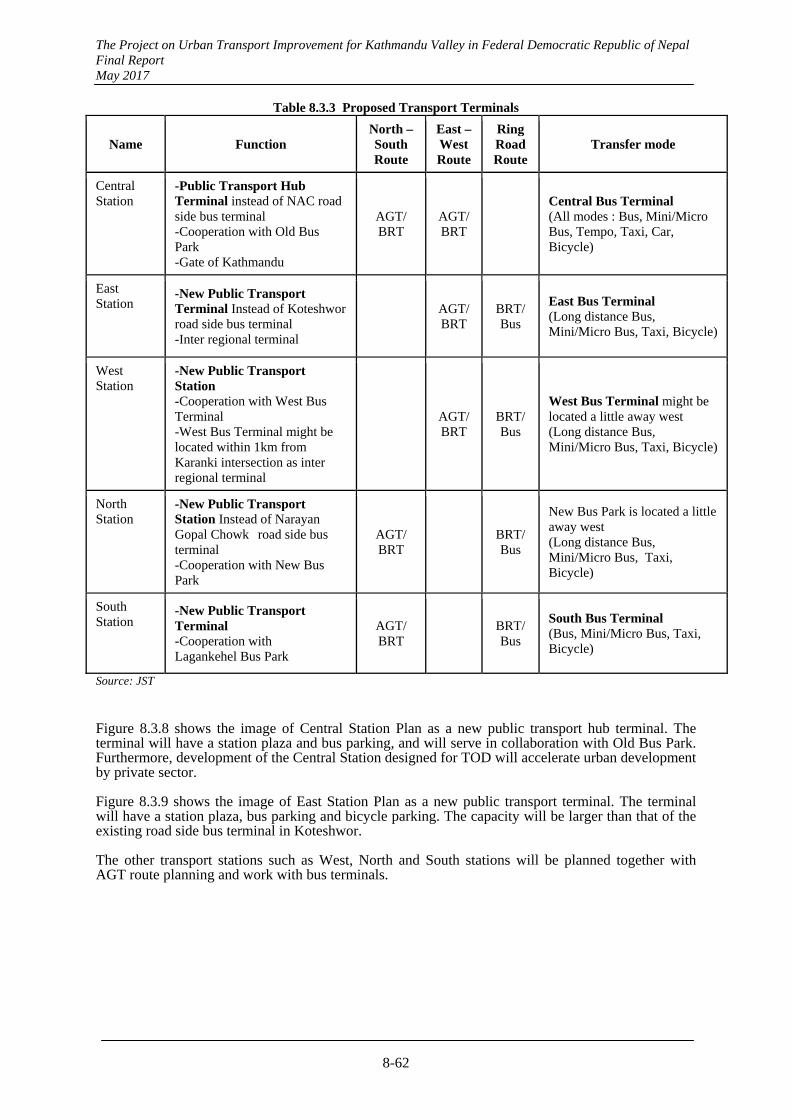
The Project on Urban Transport Improvement for Kathmandu Valley in Federal Democratic Republic of Nepal Final Report May 2017
8-62
Table 8.3.3 Proposed Transport Terminals
Name Function North –South Route
East –West Route
Ring Road Route
Transfer mode
Central Station
-Public Transport Hub Terminal instead of NAC road side bus terminal -Cooperation with Old Bus Park -Gate of Kathmandu
AGT/ BRT
AGT/ BRT
Central Bus Terminal (All modes : Bus, Mini/Micro Bus, Tempo, Taxi, Car, Bicycle)
East Station
-New Public Transport Terminal Instead of Koteshwor road side bus terminal -Inter regional terminal
AGT/ BRT
BRT/ Bus
East Bus Terminal (Long distance Bus, Mini/Micro Bus, Taxi, Bicycle)
West Station
-New Public Transport Station -Cooperation with West Bus Terminal -West Bus Terminal might be located within 1km from Karanki intersection as inter regional terminal
AGT/ BRT
BRT/ Bus
West Bus Terminal might be located a little away west (Long distance Bus, Mini/Micro Bus, Taxi, Bicycle)
North Station
-New Public Transport Station Instead of Narayan Gopal Chowk road side bus terminal -Cooperation with New Bus Park
AGT/ BRT
BRT/ Bus
New Bus Park is located a little away west (Long distance Bus, Mini/Micro Bus, Taxi, Bicycle)
South Station
-New Public Transport Terminal -Cooperation with Lagankehel Bus Park
AGT/ BRT
BRT/ Bus
South Bus Terminal (Bus, Mini/Micro Bus, Taxi, Bicycle)
Source: JST Figure 8.3.8 shows the image of Central Station Plan as a new public transport hub terminal. The terminal will have a station plaza and bus parking, and will serve in collaboration with Old Bus Park. Furthermore, development of the Central Station designed for TOD will accelerate urban development by private sector. Figure 8.3.9 shows the image of East Station Plan as a new public transport terminal. The terminal will have a station plaza, bus parking and bicycle parking. The capacity will be larger than that of the existing road side bus terminal in Koteshwor. The other transport stations such as West, North and South stations will be planned together with AGT route planning and work with bus terminals.
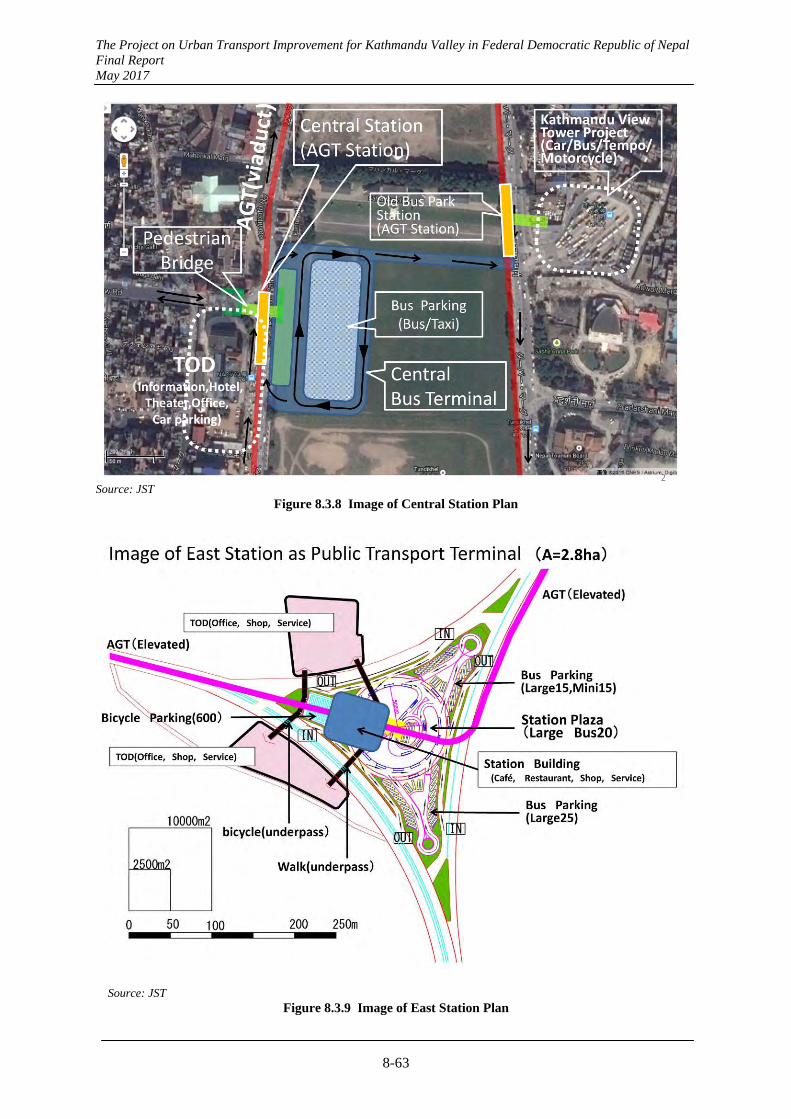
The Project on Urban Transport Improvement for Kathmandu Valley in Federal Democratic Republic of Nepal Final Report May 2017
8-63
Source: JST
Figure 8.3.8 Image of Central Station Plan
Source: JST
Figure 8.3.9 Image of East Station Plan
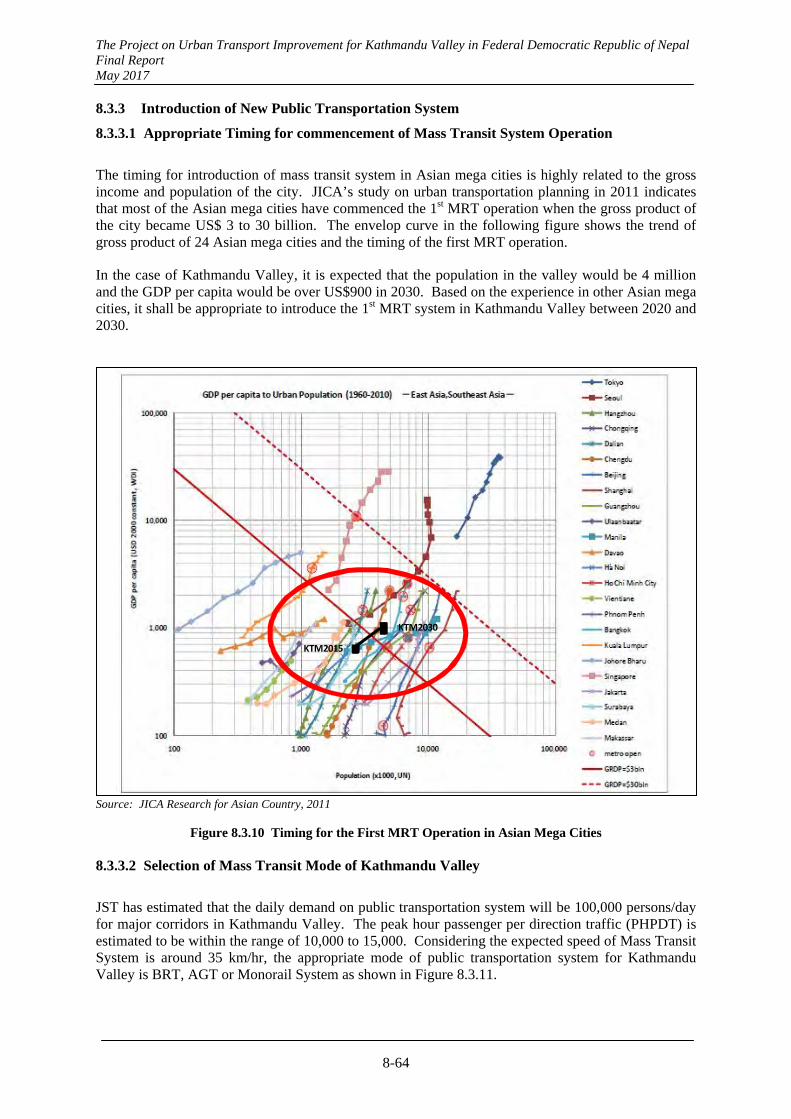
The Project on Urban Transport Improvement for Kathmandu Valley in Federal Democratic Republic of Nepal Final Report May 2017
8-64
8.3.3 Introduction of New Public Transportation System
8.3.3.1 Appropriate Timing for commencement of Mass Transit System Operation
The timing for introduction of mass transit system in Asian mega cities is highly related to the gross income and population of the city. JICA’s study on urban transportation planning in 2011 indicates that most of the Asian mega cities have commenced the 1st MRT operation when the gross product of the city became US$ 3 to 30 billion. The envelop curve in the following figure shows the trend of gross product of 24 Asian mega cities and the timing of the first MRT operation.
In the case of Kathmandu Valley, it is expected that the population in the valley would be 4 million and the GDP per capita would be over US$900 in 2030. Based on the experience in other Asian mega cities, it shall be appropriate to introduce the 1st MRT system in Kathmandu Valley between 2020 and 2030.
Source: JICA Research for Asian Country, 2011
Figure 8.3.10 Timing for the First MRT Operation in Asian Mega Cities 8.3.3.2 Selection of Mass Transit Mode of Kathmandu Valley
JST has estimated that the daily demand on public transportation system will be 100,000 persons/day for major corridors in Kathmandu Valley. The peak hour passenger per direction traffic (PHPDT) is estimated to be within the range of 10,000 to 15,000. Considering the expected speed of Mass Transit System is around 35 km/hr, the appropriate mode of public transportation system for Kathmandu Valley is BRT, AGT or Monorail System as shown in Figure 8.3.11.
KTM2015
KTM2030

The Project on Urban Transport Improvement for Kathmandu Valley in Federal Democratic Republic of Nepal Final Report May 2017
8-65
40
35
30
25
20
15
10
5
0
10 20 30 40PHPDT (Peak Hour Per Direction Trip) x 1,000/hr
MRT(Underground)MonorailAGT
BRT
Tram
BusScheduled Speed (km/hr)
Required Mass Transit System for Katmandu Valley
Current Demand
Source: JICA Study Team made this figure referring to the document written by Japan Transportation Planning Association and other related documents.
Figure 8.3.11 Speed and Capacity of Mass Transit Mode
Figure 8.3.12 compares the characteristics of the different modes of mass transit system. MRT system has the largest capacity with 25,000 to 85,000 PHPDT. Alignment of MRT is rather linear with large curve radius (minimum R = 200m) and horizontal gradient (maximum gradient = 35‰). MRT can be installed as elevated routes in sub urban area, but it is generally installed as underground routes in the center of urban area where high-rise buildings are densely built up. Monorail system has comparatively larger capacity with 10,000 to 30,000 PHPDT. Monorail is generally installed as elevated structure system. Since its major structure is beams and no slab structure is required on the alignment, the system has advantages in less impact on the right to sunshine and landscape. Furthermore, high gradient up to 60‰ can be applied since the cars run by rubber tires on both sides of the beam. It is also flexible in horizontal alignment with minimum radius of 60 to 100m. AGT system is defined as a new transit system, which is mainly used as a transport mode in major international airports of the world. Recently, it has widely spread to cities as a new and modern public transportation system. AGT system is generally driverless transit system. The cars run on the guided slab structure. Its flexible alignment can be 30-60m in minimum horizontal curve and 60‰ in maximum vertical gradient. Its capacity is estimated to be 5,000 to 23,000 PHPDT, which is almost the same or rather smaller than that of Monorail system. BRT system is known as the most economical mass transit system, which is widely accepted in the world. The dedicated lanes on the roads will be prepared on the existing roads for both directions. No heavy structure is required. Its capacity is around 5,000 to 15,000 PHPDT, which highly depends on the condition of the dedicated lanes. In Figure 8.3.11 and Figure 8.3.12, LRT or Tram is not referred as a candidate of mass transit system. LRT is usually operated on the road as same as BRT whereas AGT and Monorail are operated on the elevated structure or separated from the road horizontally. LRT has not enough capacity to carry more than 10 thousand PHPDT. In addition, LRT is not flexible and suitable for Kathmandu urban area where sharp slope and curve aliment is often required. Therefore LRT is excluded as a candidate of a new mass transit system for Kathmandu case.
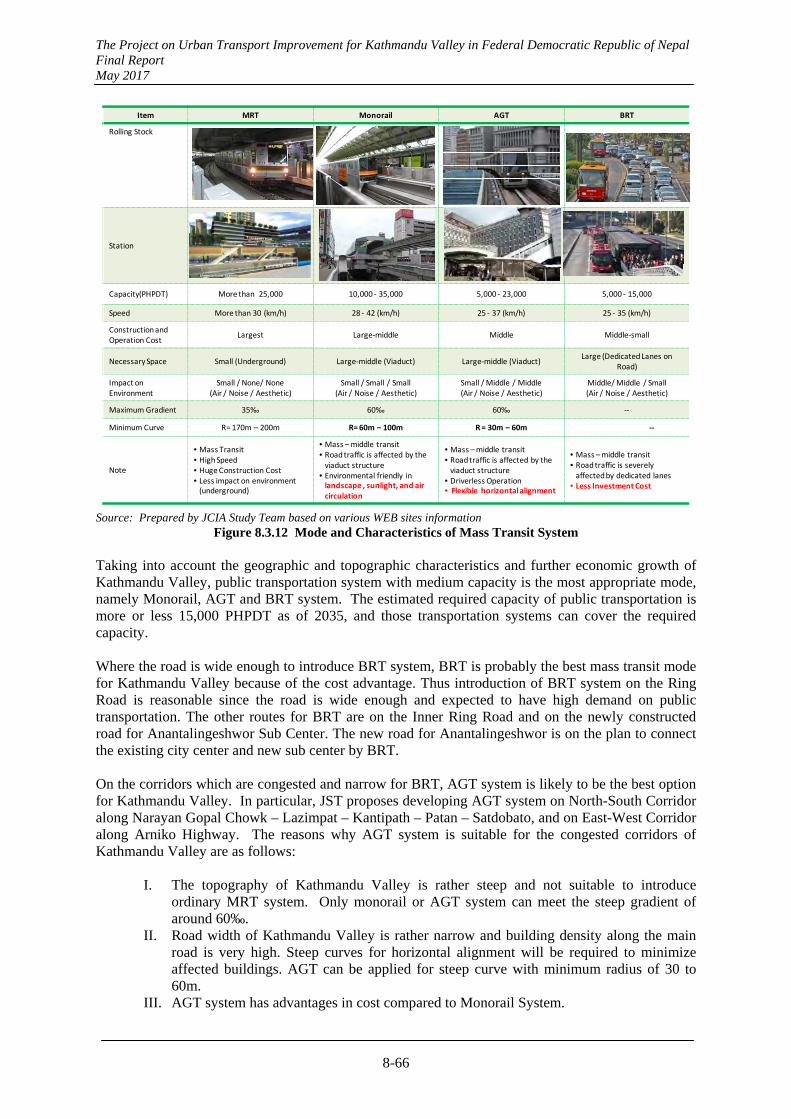
The Project on Urban Transport Improvement for Kathmandu Valley in Federal Democratic Republic of Nepal Final Report May 2017
8-66
Item MRT Monorail AGT BRT
Rolling Stock
Station
Capacity(PHPDT) More than 25,000 10,000 ‐ 35,000 5,000 ‐ 23,000 5,000 ‐ 15,000
Speed More than 30 (km/h) 28 ‐ 42 (km/h) 25 ‐ 37 (km/h) 25 ‐ 35 (km/h)
Construction and Operation Cost
Largest Large‐middle Middle Middle‐small
Necessary Space Small (Underground) Large‐middle (Viaduct) Large‐middle (Viaduct)Large (Dedicated Lanes on
Road)
Impact on Environment
Small / None/ None(Air / Noise / Aesthetic)
Small / Small / Small(Air / Noise / Aesthetic)
Small /Middle / Middle(Air / Noise / Aesthetic)
Middle/Middle / Small(Air / Noise / Aesthetic)
MaximumGradient 35‰ 60‰ 60‰ ‐‐
Minimum Curve R= 170m – 200m R= 60m – 100m R = 30m – 60m ‐‐
Note
• Mass Transit• High Speed• Huge Construction Cost• Less impact on environment (underground)
• Mass –middle transit• Road traffic is affected by the viaduct structure
• Environmental friendly in landscape , sunlight, and air circulation
• Mass –middle transit• Road traffic is affected by the viaduct structure
• Driverless Operation• Flexible horizontal alignment
• Mass –middle transit• Road traffic is severely affected by dedicated lanes
• Less Investment Cost
Source: Prepared by JCIA Study Team based on various WEB sites information
Figure 8.3.12 Mode and Characteristics of Mass Transit System
Taking into account the geographic and topographic characteristics and further economic growth of Kathmandu Valley, public transportation system with medium capacity is the most appropriate mode, namely Monorail, AGT and BRT system. The estimated required capacity of public transportation is more or less 15,000 PHPDT as of 2035, and those transportation systems can cover the required capacity. Where the road is wide enough to introduce BRT system, BRT is probably the best mass transit mode for Kathmandu Valley because of the cost advantage. Thus introduction of BRT system on the Ring Road is reasonable since the road is wide enough and expected to have high demand on public transportation. The other routes for BRT are on the Inner Ring Road and on the newly constructed road for Anantalingeshwor Sub Center. The new road for Anantalingeshwor is on the plan to connect the existing city center and new sub center by BRT. On the corridors which are congested and narrow for BRT, AGT system is likely to be the best option for Kathmandu Valley. In particular, JST proposes developing AGT system on North-South Corridor along Narayan Gopal Chowk – Lazimpat – Kantipath – Patan – Satdobato, and on East-West Corridor along Arniko Highway. The reasons why AGT system is suitable for the congested corridors of Kathmandu Valley are as follows:
I. The topography of Kathmandu Valley is rather steep and not suitable to introduce ordinary MRT system. Only monorail or AGT system can meet the steep gradient of around 60‰.
II. Road width of Kathmandu Valley is rather narrow and building density along the main road is very high. Steep curves for horizontal alignment will be required to minimize affected buildings. AGT can be applied for steep curve with minimum radius of 30 to 60m.
III. AGT system has advantages in cost compared to Monorail System.
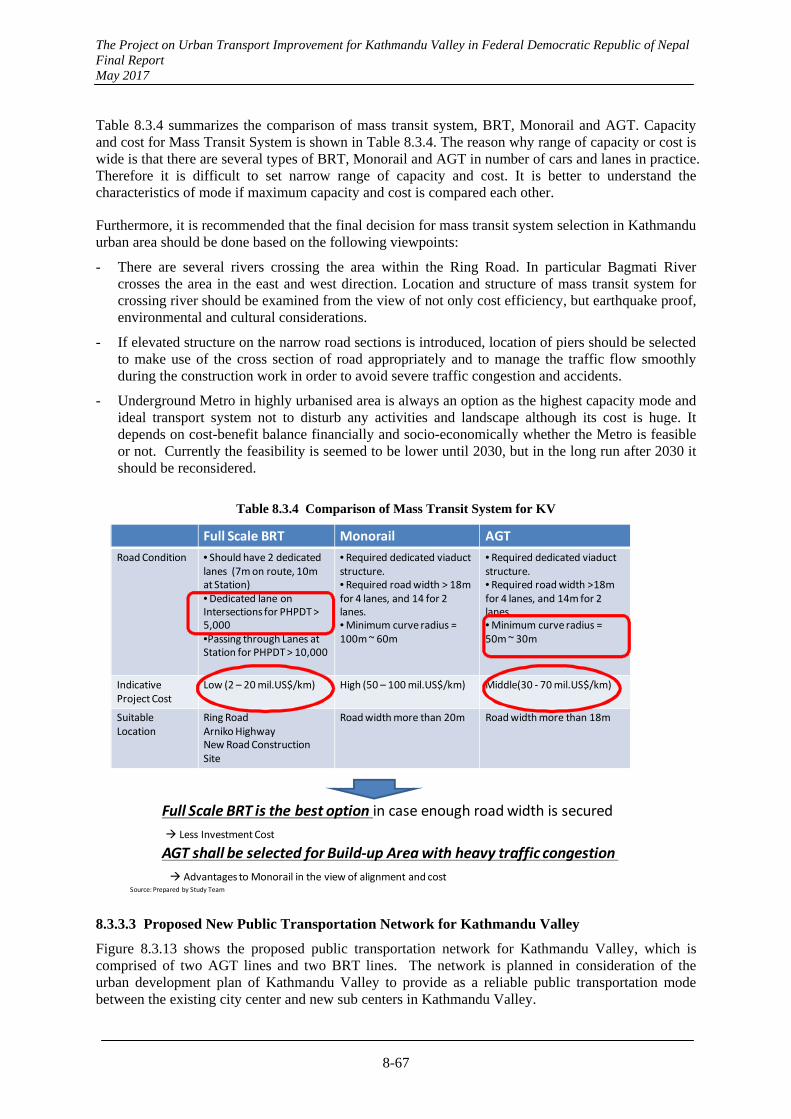
The Project on Urban Transport Improvement for Kathmandu Valley in Federal Democratic Republic of Nepal Final Report May 2017
8-67
Table 8.3.4 summarizes the comparison of mass transit system, BRT, Monorail and AGT. Capacity and cost for Mass Transit System is shown in Table 8.3.4. The reason why range of capacity or cost is wide is that there are several types of BRT, Monorail and AGT in number of cars and lanes in practice. Therefore it is difficult to set narrow range of capacity and cost. It is better to understand the characteristics of mode if maximum capacity and cost is compared each other.
Furthermore, it is recommended that the final decision for mass transit system selection in Kathmandu urban area should be done based on the following viewpoints:
- There are several rivers crossing the area within the Ring Road. In particular Bagmati River crosses the area in the east and west direction. Location and structure of mass transit system for crossing river should be examined from the view of not only cost efficiency, but earthquake proof, environmental and cultural considerations.
- If elevated structure on the narrow road sections is introduced, location of piers should be selected to make use of the cross section of road appropriately and to manage the traffic flow smoothly during the construction work in order to avoid severe traffic congestion and accidents.
- Underground Metro in highly urbanised area is always an option as the highest capacity mode and ideal transport system not to disturb any activities and landscape although its cost is huge. It depends on cost-benefit balance financially and socio-economically whether the Metro is feasible or not. Currently the feasibility is seemed to be lower until 2030, but in the long run after 2030 it should be reconsidered.
Table 8.3.4 Comparison of Mass Transit System for KV
8.3.3.3 Proposed New Public Transportation Network for Kathmandu Valley
Figure 8.3.13 shows the proposed public transportation network for Kathmandu Valley, which is comprised of two AGT lines and two BRT lines. The network is planned in consideration of the urban development plan of Kathmandu Valley to provide as a reliable public transportation mode between the existing city center and new sub centers in Kathmandu Valley.
Full Scale BRT Monorail AGT
Road Condition • Should have 2 dedicated lanes (7m on route, 10m at Station)•Dedicated lane on Intersections for PHPDT > 5,000•Passing through Lanes at Station for PHPDT > 10,000
• Required dedicated viaduct structure.• Required road width > 18m for 4 lanes, and 14 for 2 lanes.•Minimum curve radius = 100m ~ 60m
• Required dedicated viaduct structure.• Required road width >18m for 4 lanes, and 14m for 2 lanes.•Minimum curve radius = 50m ~ 30m
IndicativeProject Cost
Low (2 – 20 mil.US$/km) High (50 – 100 mil.US$/km) Middle(30 ‐ 70 mil.US$/km)
SuitableLocation
Ring RoadArnikoHighwayNew Road Construction Site
Roadwidth more than 20m Road width more than 18m
Full Scale BRT is the best option in case enough road width is secured
Less Investment Cost
AGT shall be selected for Build‐up Area with heavy traffic congestion
Advantages to Monorail in the view of alignment and costSource: Prepared by Study Team
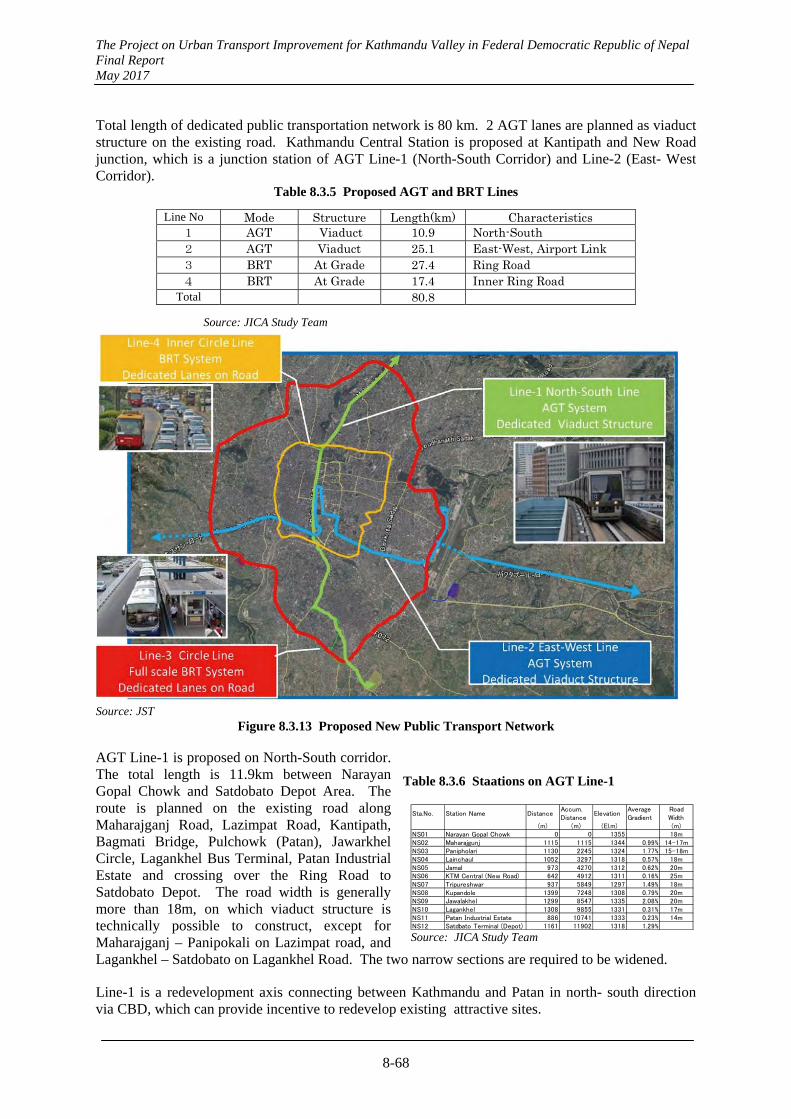
The Project on Urban Transport Improvement for Kathmandu Valley in Federal Democratic Republic of Nepal Final Report May 2017
8-68
Total length of dedicated public transportation network is 80 km. 2 AGT lanes are planned as viaduct structure on the existing road. Kathmandu Central Station is proposed at Kantipath and New Road junction, which is a junction station of AGT Line-1 (North-South Corridor) and Line-2 (East- West Corridor).
Table 8.3.5 Proposed AGT and BRT Lines
Source: JICA Study Team
Source: JST
Figure 8.3.13 Proposed New Public Transport Network
AGT Line-1 is proposed on North-South corridor. The total length is 11.9km between Narayan Gopal Chowk and Satdobato Depot Area. The route is planned on the existing road along Maharajganj Road, Lazimpat Road, Kantipath, Bagmati Bridge, Pulchowk (Patan), Jawarkhel Circle, Lagankhel Bus Terminal, Patan Industrial Estate and crossing over the Ring Road to Satdobato Depot. The road width is generally more than 18m, on which viaduct structure is technically possible to construct, except for Maharajganj – Panipokali on Lazimpat road, and Lagankhel – Satdobato on Lagankhel Road. The two narrow sections are required to be widened.
Line-1 is a redevelopment axis connecting between Kathmandu and Patan in north- south direction via CBD, which can provide incentive to redevelop existing attractive sites.
Line No Mode Structure Length(km) Characteristics 1 AGT Viaduct 10.9 North-South 2 AGT Viaduct 25.1 East-West, Airport Link 3 BRT At Grade 27.4 Ring Road 4 BRT At Grade 17.4 Inner Ring Road
Total 80.8
Sta.No. Station Name Distance
Accum.Distance
ElevationAverageGradient
RoadWidth
(m) (m) (El.m) (m)NS01 Narayan Gopal Chowk 0 0 1355 18mNS02 Maharajgunj 1115 1115 1344 0.99% 14-17mNS03 Panipholari 1130 2245 1324 1.77% 15-18mNS04 Lainchaul 1052 3297 1318 0.57% 18mNS05 Jamal 973 4270 1312 0.62% 20mNS06 KTM Central (New Road) 642 4912 1311 0.16% 25mNS07 Tripureshwar 937 5849 1297 1.49% 18mNS08 Kupandole 1399 7248 1308 0.79% 20mNS09 Jawalakhel 1299 8547 1335 2.08% 20mNS10 Lagankhel 1308 9855 1331 0.31% 17mNS11 Patan Industrial Estate 886 10741 1333 0.23% 14mNS12 Satdbato Terminal (Depot) 1161 11902 1318 1.29%
Source: JICA Study Team
Table 8.3.6 Staations on AGT Line-1
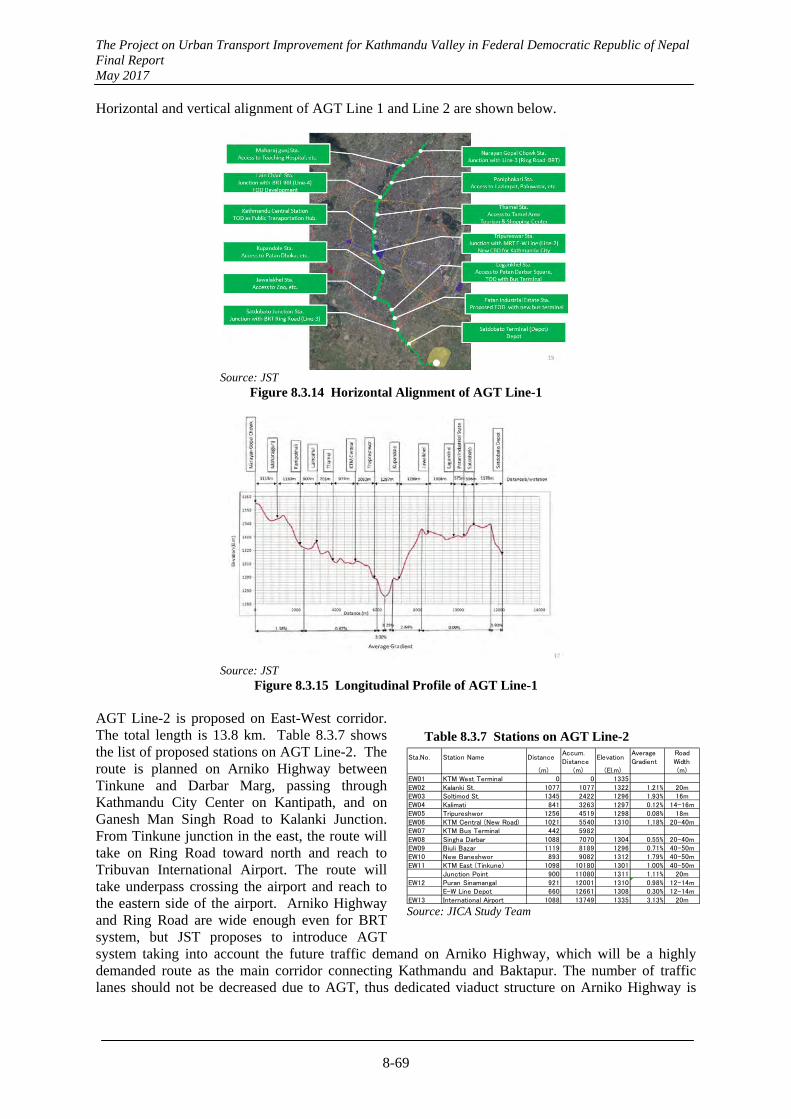
The Project on Urban Transport Improvement for Kathmandu Valley in Federal Democratic Republic of Nepal Final Report May 2017
8-69
Horizontal and vertical alignment of AGT Line 1 and Line 2 are shown below.
Source: JST
Figure 8.3.14 Horizontal Alignment of AGT Line-1
Source: JST
Figure 8.3.15 Longitudinal Profile of AGT Line-1 AGT Line-2 is proposed on East-West corridor. The total length is 13.8 km. Table 8.3.7 shows the list of proposed stations on AGT Line-2. The route is planned on Arniko Highway between Tinkune and Darbar Marg, passing through Kathmandu City Center on Kantipath, and on Ganesh Man Singh Road to Kalanki Junction. From Tinkune junction in the east, the route will take on Ring Road toward north and reach to Tribuvan International Airport. The route will take underpass crossing the airport and reach to the eastern side of the airport. Arniko Highway and Ring Road are wide enough even for BRT system, but JST proposes to introduce AGT system taking into account the future traffic demand on Arniko Highway, which will be a highly demanded route as the main corridor connecting Kathmandu and Baktapur. The number of traffic lanes should not be decreased due to AGT, thus dedicated viaduct structure on Arniko Highway is
Sta.No. Station Name DistanceAccum.Distance
ElevationAverageGradient
RoadWidth
(m) (m) (El.m) (m)EW01 KTM West Terminal 0 0 1335EW02 Kalanki St. 1077 1077 1322 1.21% 20mEW03 Soltimod St. 1345 2422 1296 1.93% 16mEW04 Kalimati 841 3263 1297 0.12% 14-16mEW05 Tripureshwor 1256 4519 1298 0.08% 18mEW06 KTM Central (New Road) 1021 5540 1310 1.18% 20-40mEW07 KTM Bus Terminal 442 5982EW08 Singha Darbar 1088 7070 1304 0.55% 20-40mEW09 Biuli Bazar 1119 8189 1296 0.71% 40-50mEW10 New Baneshwor 893 9082 1312 1.79% 40-50mEW11 KTM East (Tinkune) 1098 10180 1301 1.00% 40-50m
Junction Point 900 11080 1311 1.11% 20mEW12 Puran Sinamangal 921 12001 1310 0.98% 12-14m
E-W Line Depot 660 12661 1308 0.30% 12-14mEW13 International Airport 1088 13749 1335 3.13% 20m
Source: JICA Study Team
Table 8.3.7 Stations on AGT Line-2
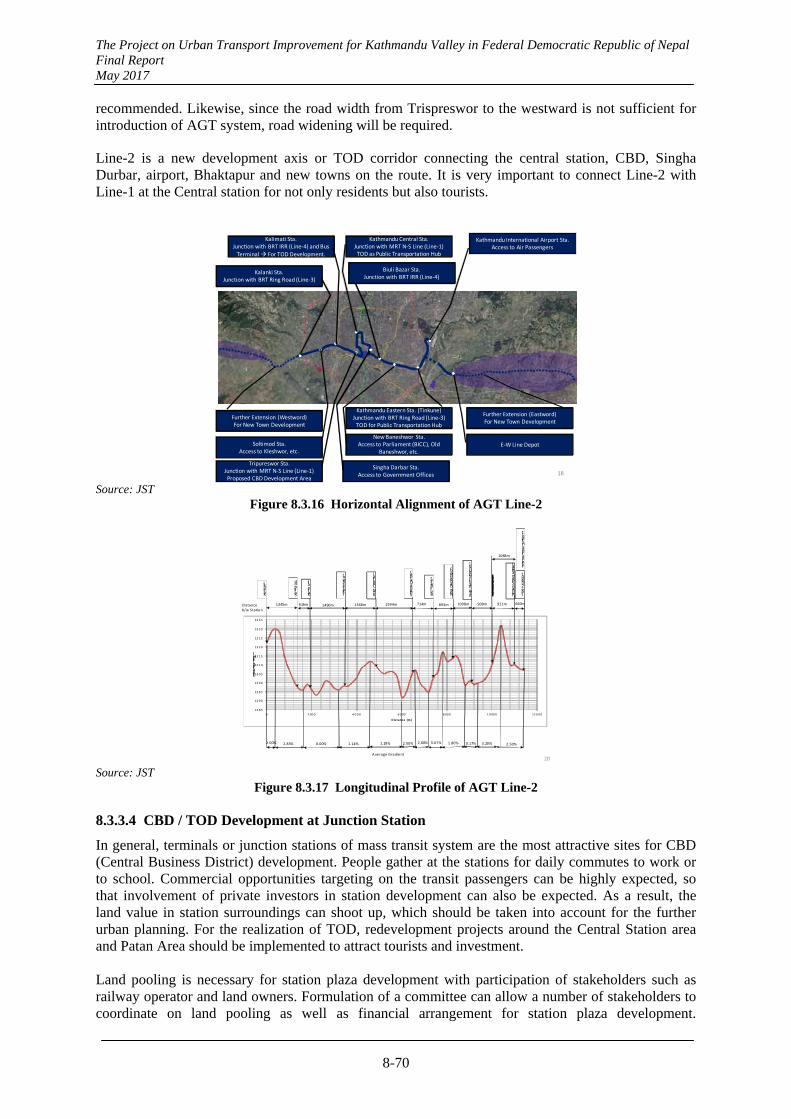
The Project on Urban Transport Improvement for Kathmandu Valley in Federal Democratic Republic of Nepal Final Report May 2017
8-70
recommended. Likewise, since the road width from Trispreswor to the westward is not sufficient for introduction of AGT system, road widening will be required.
Line-2 is a new development axis or TOD corridor connecting the central station, CBD, Singha Durbar, airport, Bhaktapur and new towns on the route. It is very important to connect Line-2 with Line-1 at the Central station for not only residents but also tourists.
Further Extension (Westword) For New Town Development
Kalanki Sta.Junction with BRT Ring Road (Line‐3)
Soltimod Sta.Access to Kleshwor, etc.
Kalimati Sta.Junction with BRT IRR (Line‐4) and Bus Terminal For TOD Development.
Singha Darbar Sta.Access to Government Offices
Kathmandu Central Sta.Junction with MRT N‐S Line (Line‐1)TOD as Public Transportation Hub
New Baneshwor Sta.Access to Parliament (BICC), Old
Baneshwor, etc.
Biuli Bazar Sta.Junction with BRT IRR (Line‐4)
Kathmandu International Airport Sta.Access to Air Passengers
Kathmandu Eastern Sta. (Tinkune)Junction with BRT Ring Road (Line‐3)TOD for Public Transportation Hub
Further Extension (Eastword)For New Town Development
E‐W Line Depot
Tripureswor Sta.Junction with MRT N‐S Line (Line‐1)Proposed CBD Development Area
18
Source: JST Figure 8.3.16 Horizontal Alignment of AGT Line-2
20
12 85
12 90
12 95
13 00
13 05
13 10
13 15
13 20
13 25
13 30
13 35
0 2000 4 00 0 6000 8000 1 0000 12 00 0
Elevation (El.m)
D is tance (m )
Kalanki
Soltimod
Kalimati
Tripreshwor
KTMCentral
SinghaDarbar
BiuliBazar
NewBaneshwor
KTMEast (Tinkune)
Line‐2Depot
InternationalAIrport
2.00% 2.83% 0.00% 1.14% 1.29% 2.50% 2.00% 3.67% 1.80% 0.17% 3.20% 2.50%
1345m 616m 1490m 1368m 1594m 714m 893m 1098m 900m 921m
1088m
Distance b/w Station
Ave rage Gradient
Jnction Point
PunanSinamangal
660m
Source: JST
Figure 8.3.17 Longitudinal Profile of AGT Line-2 8.3.3.4 CBD / TOD Development at Junction Station
In general, terminals or junction stations of mass transit system are the most attractive sites for CBD (Central Business District) development. People gather at the stations for daily commutes to work or to school. Commercial opportunities targeting on the transit passengers can be highly expected, so that involvement of private investors in station development can also be expected. As a result, the land value in station surroundings can shoot up, which should be taken into account for the further urban planning. For the realization of TOD, redevelopment projects around the Central Station area and Patan Area should be implemented to attract tourists and investment. Land pooling is necessary for station plaza development with participation of stakeholders such as railway operator and land owners. Formulation of a committee can allow a number of stakeholders to coordinate on land pooling as well as financial arrangement for station plaza development.
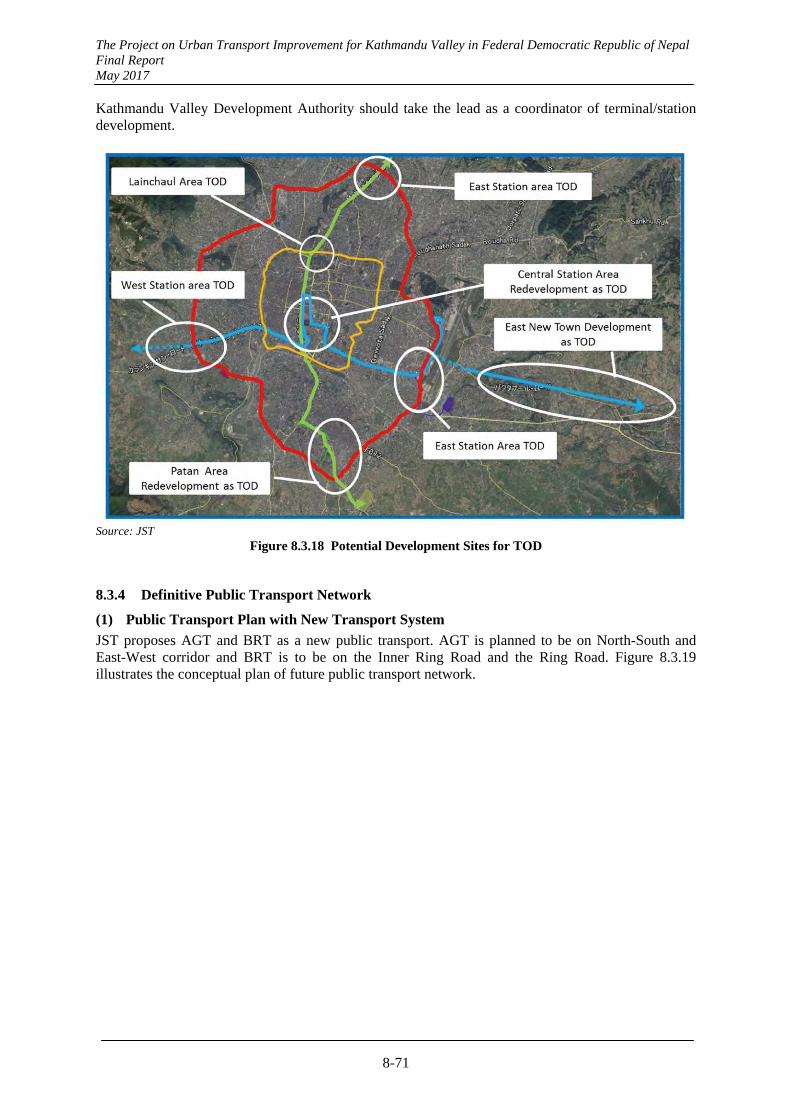
The Project on Urban Transport Improvement for Kathmandu Valley in Federal Democratic Republic of Nepal Final Report May 2017
8-71
Kathmandu Valley Development Authority should take the lead as a coordinator of terminal/station development.
Source: JST
Figure 8.3.18 Potential Development Sites for TOD
8.3.4 Definitive Public Transport Network
(1) Public Transport Plan with New Transport System
JST proposes AGT and BRT as a new public transport. AGT is planned to be on North-South and East-West corridor and BRT is to be on the Inner Ring Road and the Ring Road. Figure 8.3.19 illustrates the conceptual plan of future public transport network.

The Project on Urban Transport Improvement for Kathmandu Valley in Federal Democratic Republic of Nepal Final Report May 2017
8-72
Source: JICA Study Team
Figure 8.3.19 Future Public Transport Plan
8.3.5 Organization for operation & management of BRT and AGT
- Mass Rapid Transit System such as AGT/BRT should be installed on the primary routes as proposed in the Public Transport Plan because the demand of passengers per peak hour on the routes will be much larger than the ordinary bus capacity.
- An appropriate operator for AGT/BRT is required to manage the great number of vehicles, facilities, drivers, mechanics and other workers for frequent, punctual, and safe operation.
- KV is devoid of mass rapid transit operator and furthermore administrative organizations such as DOTM and DORW are deficient in enough capacity and experiences for managing and operating urban MRT system.
- Based on the above current situation, the following institutional and organizational alternatives are proposed.
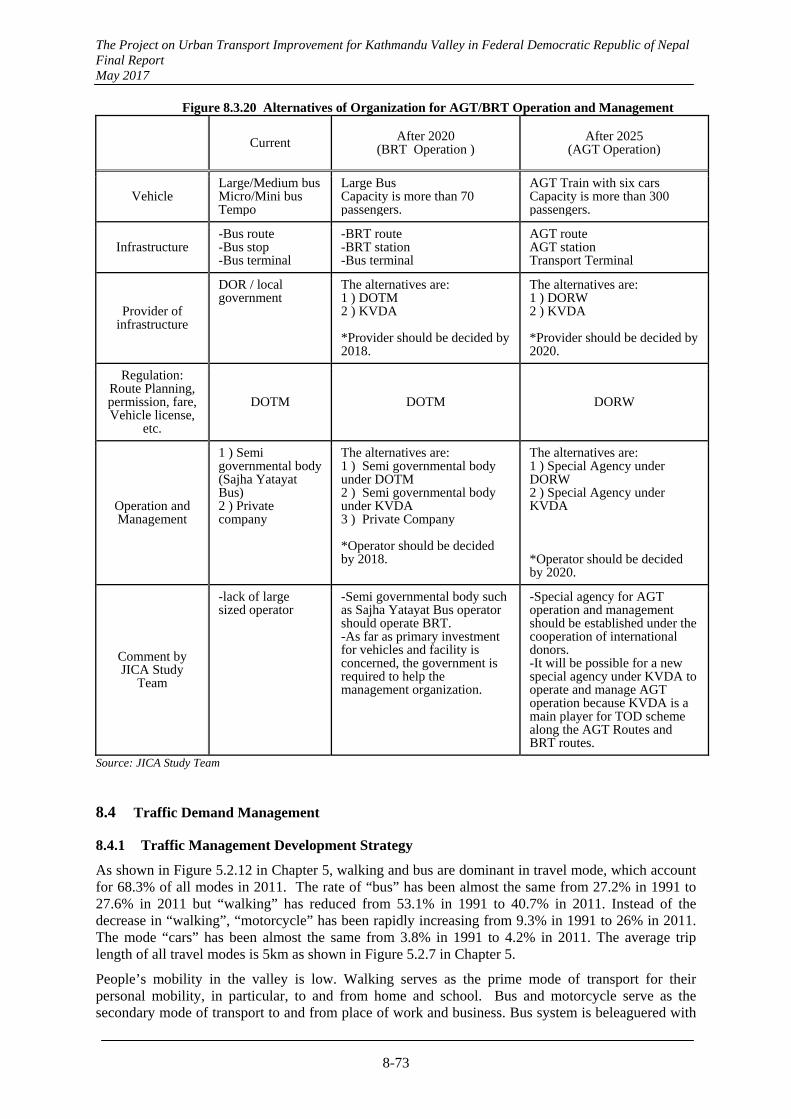
The Project on Urban Transport Improvement for Kathmandu Valley in Federal Democratic Republic of Nepal Final Report May 2017
8-73
Figure 8.3.20 Alternatives of Organization for AGT/BRT Operation and Management
Current After 2020 (BRT Operation )
After 2025 (AGT Operation)
Vehicle Large/Medium bus Micro/Mini bus Tempo
Large BusCapacity is more than 70 passengers.
AGT Train with six carsCapacity is more than 300 passengers.
Infrastructure -Bus route -Bus stop -Bus terminal
-BRT route -BRT station -Bus terminal
AGT route AGT station Transport Terminal
Provider of infrastructure
DOR / local government
The alternatives are:1 ) DOTM 2 ) KVDA *Provider should be decided by 2018.
The alternatives are: 1 ) DORW 2 ) KVDA *Provider should be decided by 2020.
Regulation: Route Planning, permission, fare, Vehicle license,
etc.
DOTM DOTM DORW
Operation and Management
1 ) Semi governmental body (Sajha Yatayat Bus) 2 ) Private company
The alternatives are:1 ) Semi governmental body under DOTM 2 ) Semi governmental body under KVDA 3 ) Private Company *Operator should be decided by 2018.
The alternatives are: 1 ) Special Agency under DORW 2 ) Special Agency under KVDA *Operator should be decided by 2020.
Comment by JICA Study
Team
-lack of large sized operator
-Semi governmental body such as Sajha Yatayat Bus operator should operate BRT. -As far as primary investment for vehicles and facility is concerned, the government is required to help the management organization.
-Special agency for AGT operation and management should be established under the cooperation of international donors. -It will be possible for a new special agency under KVDA to operate and manage AGT operation because KVDA is a main player for TOD scheme along the AGT Routes and BRT routes.
Source: JICA Study Team
8.4 Traffic Demand Management
8.4.1 Traffic Management Development Strategy
As shown in Figure 5.2.12 in Chapter 5, walking and bus are dominant in travel mode, which account for 68.3% of all modes in 2011. The rate of “bus” has been almost the same from 27.2% in 1991 to 27.6% in 2011 but “walking” has reduced from 53.1% in 1991 to 40.7% in 2011. Instead of the decrease in “walking”, “motorcycle” has been rapidly increasing from 9.3% in 1991 to 26% in 2011. The mode “cars” has been almost the same from 3.8% in 1991 to 4.2% in 2011. The average trip length of all travel modes is 5km as shown in Figure 5.2.7 in Chapter 5.
People’s mobility in the valley is low. Walking serves as the prime mode of transport for their personal mobility, in particular, to and from home and school. Bus and motorcycle serve as the secondary mode of transport to and from place of work and business. Bus system is beleaguered with

The Project on Urban Transport Improvement for Kathmandu Valley in Federal Democratic Republic of Nepal Final Report May 2017
8-74
perennial problems and services provided are often regarded as inadequate. This results in people preferring to live near their place of work, particularly in old and narrow houses around the CBD area.
Due to recent rapid sprawled urbanization and increasing people’s income, vehicle ownership and use of the motor vehicles will expectedly expand and further excessive modal shifting from busses to motorcycles will be accelerated. Increase of motorcycle will induce a shift to use of private cars along with increasing economic activities and peoples’ income.
Kathmandu Valley has common urban transport problems like other urban cities in Asia such as serious traffic congestion and accompanying air pollution, traffic accidents, among others. The shortage of available parking space in the urban center is also a serious problem. Although the respective city governments attempt to promote the use of public transportation by way of controlling or regulating the private mobility, these may not automatically result in a fast modal shift from the private to public modes due to the convenience of using private cars which provide “door-to-door” transfer of passengers. Consequently, roles of Traffic Demand Management (TDM), sometimes known as ”mobility management”, become more important as well as to be permanent and long term policy not limited to the short or temporary measures until sufficient road network be developed.
Principal TDM policy shall be to develop a comprehensive management policy in coordination with overall transport policies and urban development policy as well. The proposed comprehensive traffic management policy and TDM measures are presented below.
<Pillar 1>Maintain current trend of trip mode
(busses and walking)
<Pillar 2>Modal Shift from Private vehicle to
new public transport system
Reduce/control vehicle volume
Sustainable Development
<Foundation>Road Infrastructure Development
Improvement of bus services and NMT facilities
Institutional improvement
Infrastructure development
Institutional improvement
Road facility improvement
Intelligent traffic management
Source: JST Figure 8.4.1 Image of Proposed Comprehensive Traffic Demand Management Policy
Table 8.4.1 Traffic Demand Management (TDM) Measures
Measures Relation
with Policy (Fig. 8.4.1)
Proposed Menus
Economic Measures
Pillar 1 & 2
Taxation (fuel tax, ownership tax, cordon charging, etc)
Parking charge
Subsidizing public transport, etc.
Land Use
Land use and transportation strategies such as car-free
developments, and finding the right location for the new
developments
Park and ride (P&R) facilities, etc.
Information for Travelers
Travel information before a trip is undertaken
Car pooling, car sharing, etc.
Tele-activities and interaction
E-commerce, etc.
The Project on Urban Transport Improvement for Kathmandu Valley in Federal Democratic Republic of Nepal Final Report May 2017
8-75
Administrative Measures
Foundation, Pillar 1 & 2
Parking controls
Area licenses scheme
Pedestrian zones (on-going by ADB)
Alternative working hours, flexible-working, home working,
etc Infrastructure
Measures (except road/public transport network
construction)
Improved public transport facilities incl. P&R
Demand responsive road traffic control
Parking development
Improved NMT facilities Source: JST
8.4.2 Traffic Management Projects
Traffic demand management may not require huge amount of investment such as construction of infrastructures for road and new public transport system. The issue for the traffic management in this MP is how to provide appropriate measures responding to the changing social needs. In the short term, it is required to tackle with the existing traffic issues including traffic congestion and traffic accidents, while in the long term more radical countermeasures which will be able to change peoples’ behaviours and habits and to meet global environmental requirements. How to restrain the motorization and how to make people stay on the public transport system will be radical issues in the traffic management sector.
In accordance with the above-mentioned circumstances and the development strategy mentioned in the section 10.1, JST has proposed the projects listed below aiming to mitigate existing traffic issues as well as to strengthen various administrative functions for traffic management.
1) Traffic Congestion Mitigation Project
2) Capacity Development Project on Traffic Planning and Management
3) Kathmandu Valley Parking Development Project
4) Kathmandu Valley Traffic Safety Program
8.4.2.1 Traffic Congestion Mitigation Project
Unlike most urban cities, Kathmandu Valley controls well the issues regarding road vendors/street markets occupying busy carriageway and sidewalk. However, the main issues in the Valley are on-road parking and insufficient traffic management especially at intersections. On-road parking is an obstacle to the traffic reducing the road capacity to less than the originally designed. Most of the on-road parking in the Valley is caused by over supplied public transport (bus, mini-bus, and private taxi), trucks and motorcycles. The following photos indicate general condition of the parking issue in the Valley.
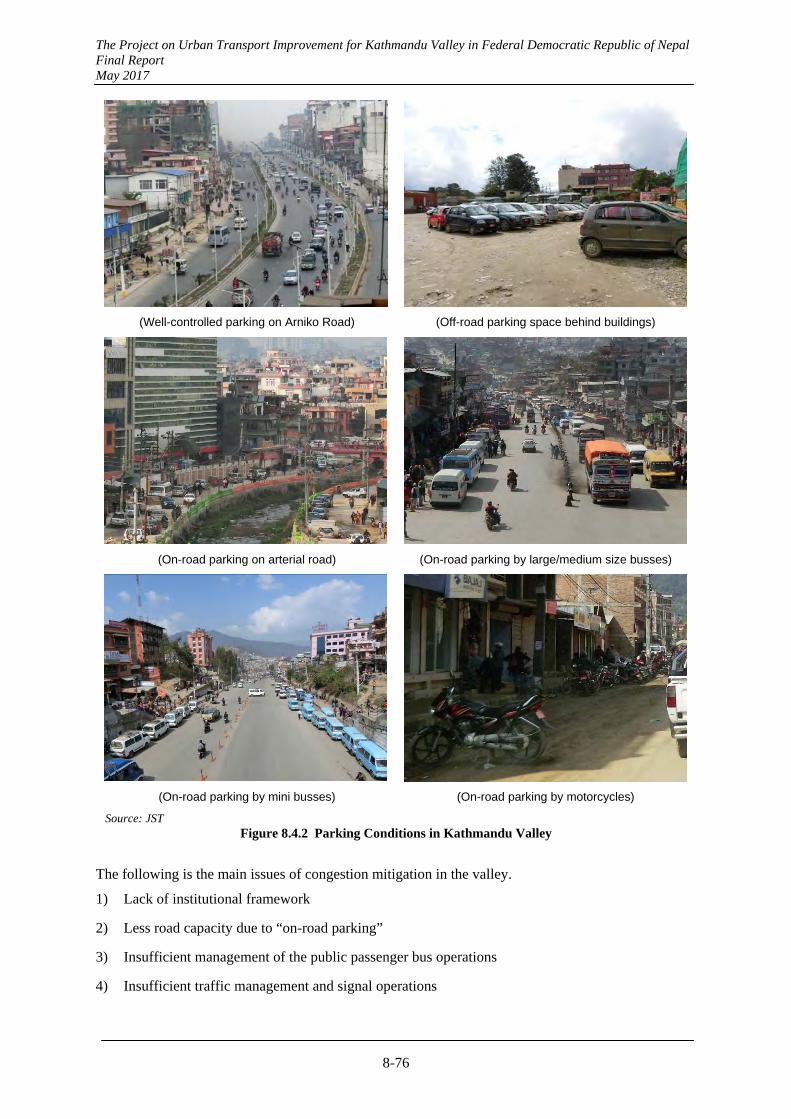
The Project on Urban Transport Improvement for Kathmandu Valley in Federal Democratic Republic of Nepal Final Report May 2017
8-76
(Well-controlled parking on Arniko Road) (Off-road parking space behind buildings)
(On-road parking on arterial road) (On-road parking by large/medium size busses)
(On-road parking by mini busses) (On-road parking by motorcycles)
Source: JST Figure 8.4.2 Parking Conditions in Kathmandu Valley
The following is the main issues of congestion mitigation in the valley.
1) Lack of institutional framework
2) Less road capacity due to “on-road parking”
3) Insufficient management of the public passenger bus operations
4) Insufficient traffic management and signal operations
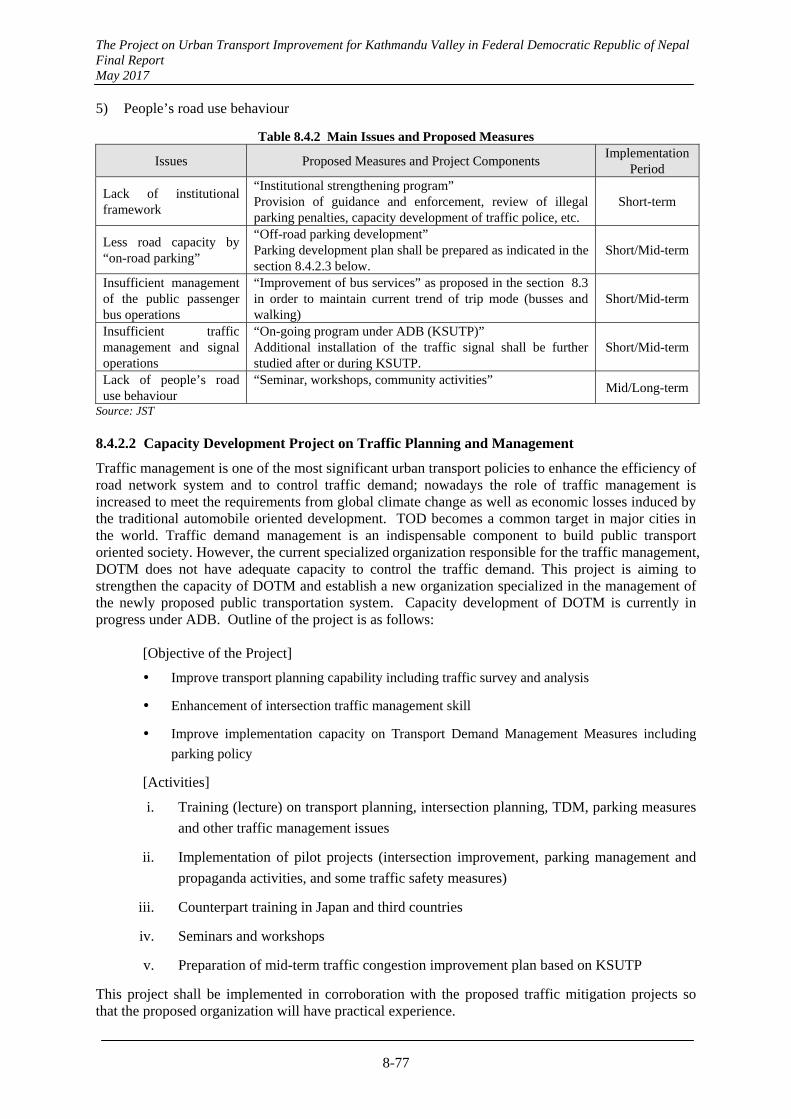
The Project on Urban Transport Improvement for Kathmandu Valley in Federal Democratic Republic of Nepal Final Report May 2017
8-77
5) People’s road use behaviour
Table 8.4.2 Main Issues and Proposed Measures
Issues Proposed Measures and Project Components Implementation
Period
Lack of institutional framework
“Institutional strengthening program” Provision of guidance and enforcement, review of illegal parking penalties, capacity development of traffic police, etc.
Short-term
Less road capacity by “on-road parking”
“Off-road parking development” Parking development plan shall be prepared as indicated in the section 8.4.2.3 below.
Short/Mid-term
Insufficient management of the public passenger bus operations
“Improvement of bus services” as proposed in the section 8.3 in order to maintain current trend of trip mode (busses and walking)
Short/Mid-term
Insufficient traffic management and signal operations
“On-going program under ADB (KSUTP)” Additional installation of the traffic signal shall be further studied after or during KSUTP.
Short/Mid-term
Lack of people’s road use behaviour
“Seminar, workshops, community activities” Mid/Long-term
Source: JST 8.4.2.2 Capacity Development Project on Traffic Planning and Management
Traffic management is one of the most significant urban transport policies to enhance the efficiency of road network system and to control traffic demand; nowadays the role of traffic management is increased to meet the requirements from global climate change as well as economic losses induced by the traditional automobile oriented development. TOD becomes a common target in major cities in the world. Traffic demand management is an indispensable component to build public transport oriented society. However, the current specialized organization responsible for the traffic management, DOTM does not have adequate capacity to control the traffic demand. This project is aiming to strengthen the capacity of DOTM and establish a new organization specialized in the management of the newly proposed public transportation system. Capacity development of DOTM is currently in progress under ADB. Outline of the project is as follows:
[Objective of the Project]
Improve transport planning capability including traffic survey and analysis
Enhancement of intersection traffic management skill
Improve implementation capacity on Transport Demand Management Measures including
parking policy
[Activities]
i. Training (lecture) on transport planning, intersection planning, TDM, parking measures
and other traffic management issues
ii. Implementation of pilot projects (intersection improvement, parking management and
propaganda activities, and some traffic safety measures)
iii. Counterpart training in Japan and third countries
iv. Seminars and workshops
v. Preparation of mid-term traffic congestion improvement plan based on KSUTP
This project shall be implemented in corroboration with the proposed traffic mitigation projects so that the proposed organization will have practical experience.
The Project on Urban Transport Improvement for Kathmandu Valley in Federal Democratic Republic of Nepal Final Report May 2017
8-78
8.4.2.3 Kathmandu Valley Parking Development Project
On-road parking causes traffic congestion due to the decrease in road capacity by the parking vehicles. And on-road parking occupies public space without due charge, while public transport users have to bear passenger fare. From the viewpoint of benefit principle, the following policy is applied for the improvement of parking condition.
a. Car owners should prepare parking space at their residence.
b. Enterprises should prepare parking space for vehicles of business use.
c. Enterprises should prepare parking space for vehicles of employer/employee.
d. Facilities which attract many guests/customers should prepare parking space for
guests/customers.
e. For the general parking demand, development of public parking is enhanced.
Based on the aforesaid policy, the following projects shall be conducted.
(1) Establishment of Parking Development Plan
The area which has serious traffic congestion due to street parking shall be identified first. Then parking survey is conducted in the identified area. Capacity of existing off-road parking lot and number of on-road and off-road parking vehicles are surveyed and parking demand is analyzed utilizing person trip data. Based on the survey and analysis, policy for parking development is established.
Forecast of parking demand in future. Analysis on method for supply of parking Institutional plan Parking development plan
(2) Institutional Plan
1) Equipment duty car park
Facilities which attract many guests/customers will be obliged to install necessary parking lot (Equipment duty car park). Type of facility which is target of the equipment duty car park will be clarified and required capacity will be analyzed. Necessary procedure for institutional arrangement will be proposed.
2) Financial aid for parking development
The public parking lot outside the parking restricted area needs to be arranged strategically. 500 m is the rough standard distance between parking lot and people’s destination such as public facilities and shopping centers. In the city center where parking demand concentrates, development of multi-story car park is expected for the efficiency of land use. However sometimes construction cost is not covered by the parking fee. Therefore financial aid such as subsidy and low-interest loan is recommended.
(3) Parking Development by the Government
The government itself should develop parking building utilizing unused and low used ground when the private investment to car park is not expected.
(4) Parking Charge Policy based on Beneficiary Charge
Parking lot business should be profitable. Parking lot inside the parking restricted area and at the fringe area should be charged. The department of the parking lot business aims to be profitable. In case of financial shortage, the parking lot should also be made under the management of the department as well collection of parking fines.
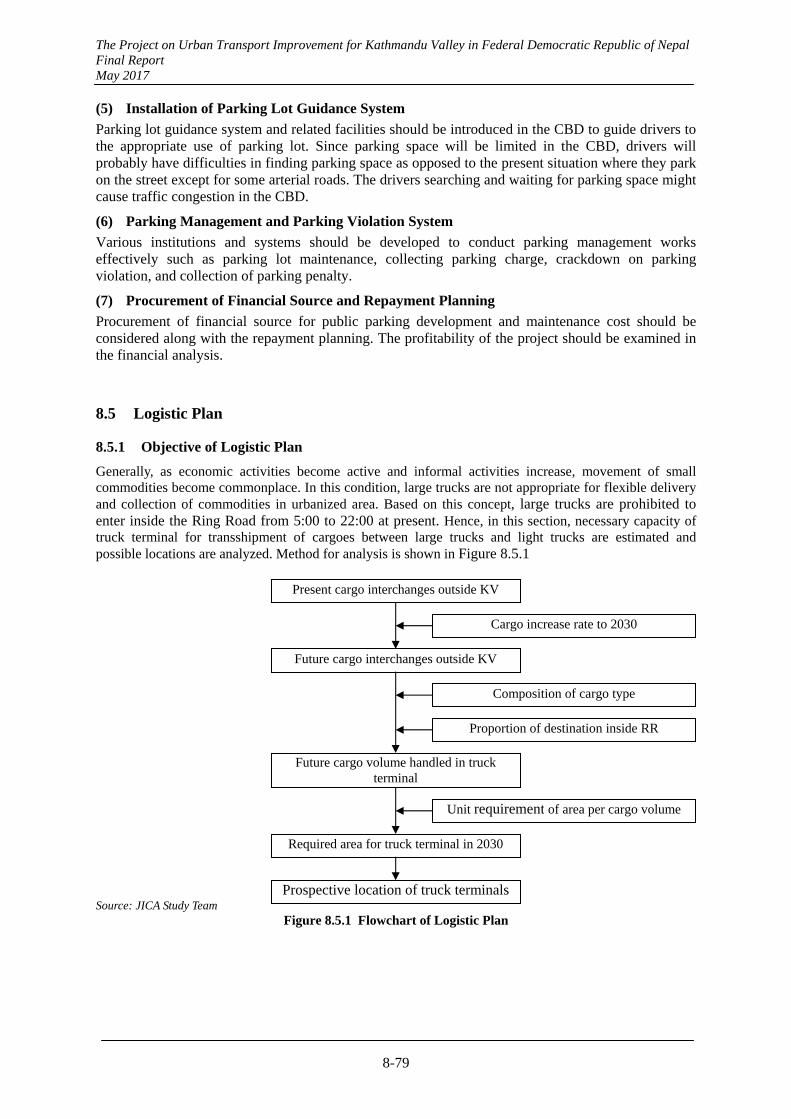
The Project on Urban Transport Improvement for Kathmandu Valley in Federal Democratic Republic of Nepal Final Report May 2017
8-79
(5) Installation of Parking Lot Guidance System
Parking lot guidance system and related facilities should be introduced in the CBD to guide drivers to the appropriate use of parking lot. Since parking space will be limited in the CBD, drivers will probably have difficulties in finding parking space as opposed to the present situation where they park on the street except for some arterial roads. The drivers searching and waiting for parking space might cause traffic congestion in the CBD.
(6) Parking Management and Parking Violation System
Various institutions and systems should be developed to conduct parking management works effectively such as parking lot maintenance, collecting parking charge, crackdown on parking violation, and collection of parking penalty.
(7) Procurement of Financial Source and Repayment Planning
Procurement of financial source for public parking development and maintenance cost should be considered along with the repayment planning. The profitability of the project should be examined in the financial analysis.
8.5 Logistic Plan
8.5.1 Objective of Logistic Plan
Generally, as economic activities become active and informal activities increase, movement of small commodities become commonplace. In this condition, large trucks are not appropriate for flexible delivery and collection of commodities in urbanized area. Based on this concept, large trucks are prohibited to enter inside the Ring Road from 5:00 to 22:00 at present. Hence, in this section, necessary capacity of truck terminal for transshipment of cargoes between large trucks and light trucks are estimated and possible locations are analyzed. Method for analysis is shown in Figure 8.5.1
Source: JICA Study Team Figure 8.5.1 Flowchart of Logistic Plan
Present cargo interchanges outside KV
Cargo increase rate to 2030
Future cargo interchanges outside KV
Composition of cargo type
Future cargo volume handled in truck terminal
Proportion of destination inside RR
Unit requirement of area per cargo volume
Required area for truck terminal in 2030
Prospective location of truck terminals
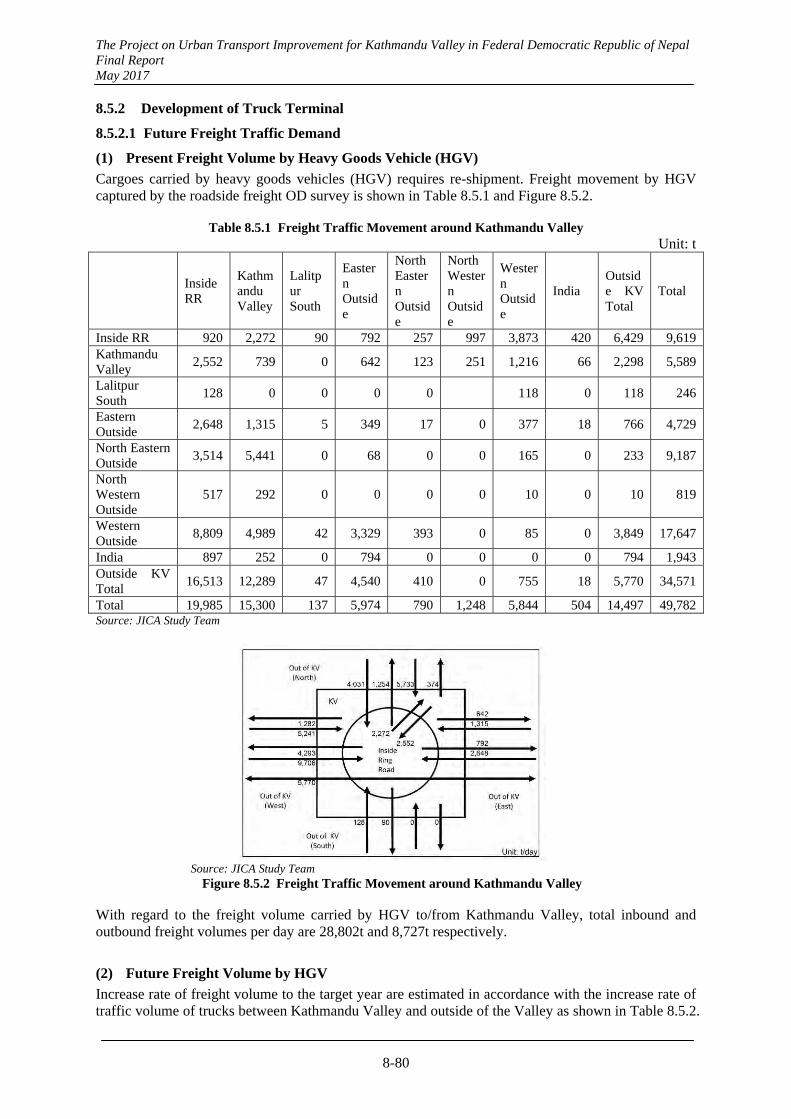
The Project on Urban Transport Improvement for Kathmandu Valley in Federal Democratic Republic of Nepal Final Report May 2017
8-80
8.5.2 Development of Truck Terminal
8.5.2.1 Future Freight Traffic Demand
(1) Present Freight Volume by Heavy Goods Vehicle (HGV)
Cargoes carried by heavy goods vehicles (HGV) requires re-shipment. Freight movement by HGV captured by the roadside freight OD survey is shown in Table 8.5.1 and Figure 8.5.2.
Table 8.5.1 Freight Traffic Movement around Kathmandu Valley Unit: t
Inside RR
Kathmandu Valley
Lalitpur South
Eastern Outside
North Eastern Outside
North Western Outside
Western Outside
India Outside KV Total
Total
Inside RR 920 2,272 90 792 257 997 3,873 420 6,429 9,619Kathmandu Valley
2,552 739 0 642 123 251 1,216 66 2,298 5,589
Lalitpur South
128 0 0 0 0 118 0 118 246
Eastern Outside
2,648 1,315 5 349 17 0 377 18 766 4,729
North Eastern Outside
3,514 5,441 0 68 0 0 165 0 233 9,187
North Western Outside
517 292 0 0 0 0 10 0 10 819
Western Outside
8,809 4,989 42 3,329 393 0 85 0 3,849 17,647
India 897 252 0 794 0 0 0 0 794 1,943Outside KV Total
16,513 12,289 47 4,540 410 0 755 18 5,770 34,571
Total 19,985 15,300 137 5,974 790 1,248 5,844 504 14,497 49,782Source: JICA Study Team
Source: JICA Study Team Figure 8.5.2 Freight Traffic Movement around Kathmandu Valley
With regard to the freight volume carried by HGV to/from Kathmandu Valley, total inbound and outbound freight volumes per day are 28,802t and 8,727t respectively.
(2) Future Freight Volume by HGV
Increase rate of freight volume to the target year are estimated in accordance with the increase rate of traffic volume of trucks between Kathmandu Valley and outside of the Valley as shown in Table 8.5.2.
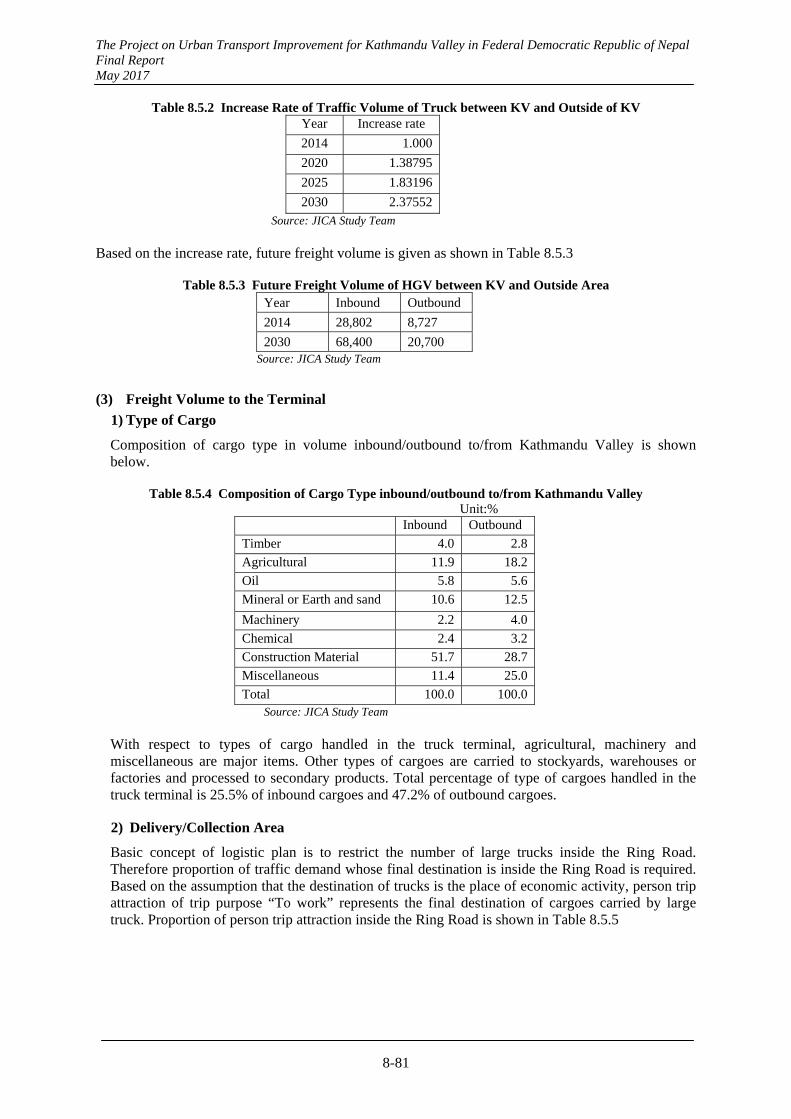
The Project on Urban Transport Improvement for Kathmandu Valley in Federal Democratic Republic of Nepal Final Report May 2017
8-81
Table 8.5.2 Increase Rate of Traffic Volume of Truck between KV and Outside of KV Year Increase rate
2014 1.000
2020 1.38795
2025 1.83196
2030 2.37552Source: JICA Study Team
Based on the increase rate, future freight volume is given as shown in Table 8.5.3
Table 8.5.3 Future Freight Volume of HGV between KV and Outside Area Year Inbound Outbound
2014 28,802 8,727
2030 68,400 20,700 Source: JICA Study Team
(3) Freight Volume to the Terminal
1) Type of Cargo
Composition of cargo type in volume inbound/outbound to/from Kathmandu Valley is shown below.
Table 8.5.4 Composition of Cargo Type inbound/outbound to/from Kathmandu Valley Unit:%
Inbound Outbound
Timber 4.0 2.8
Agricultural 11.9 18.2
Oil 5.8 5.6
Mineral or Earth and sand 10.6 12.5
Machinery 2.2 4.0
Chemical 2.4 3.2
Construction Material 51.7 28.7
Miscellaneous 11.4 25.0
Total 100.0 100.0Source: JICA Study Team
With respect to types of cargo handled in the truck terminal, agricultural, machinery and miscellaneous are major items. Other types of cargoes are carried to stockyards, warehouses or factories and processed to secondary products. Total percentage of type of cargoes handled in the truck terminal is 25.5% of inbound cargoes and 47.2% of outbound cargoes.
2) Delivery/Collection Area
Basic concept of logistic plan is to restrict the number of large trucks inside the Ring Road. Therefore proportion of traffic demand whose final destination is inside the Ring Road is required. Based on the assumption that the destination of trucks is the place of economic activity, person trip attraction of trip purpose “To work” represents the final destination of cargoes carried by large truck. Proportion of person trip attraction inside the Ring Road is shown in Table 8.5.5
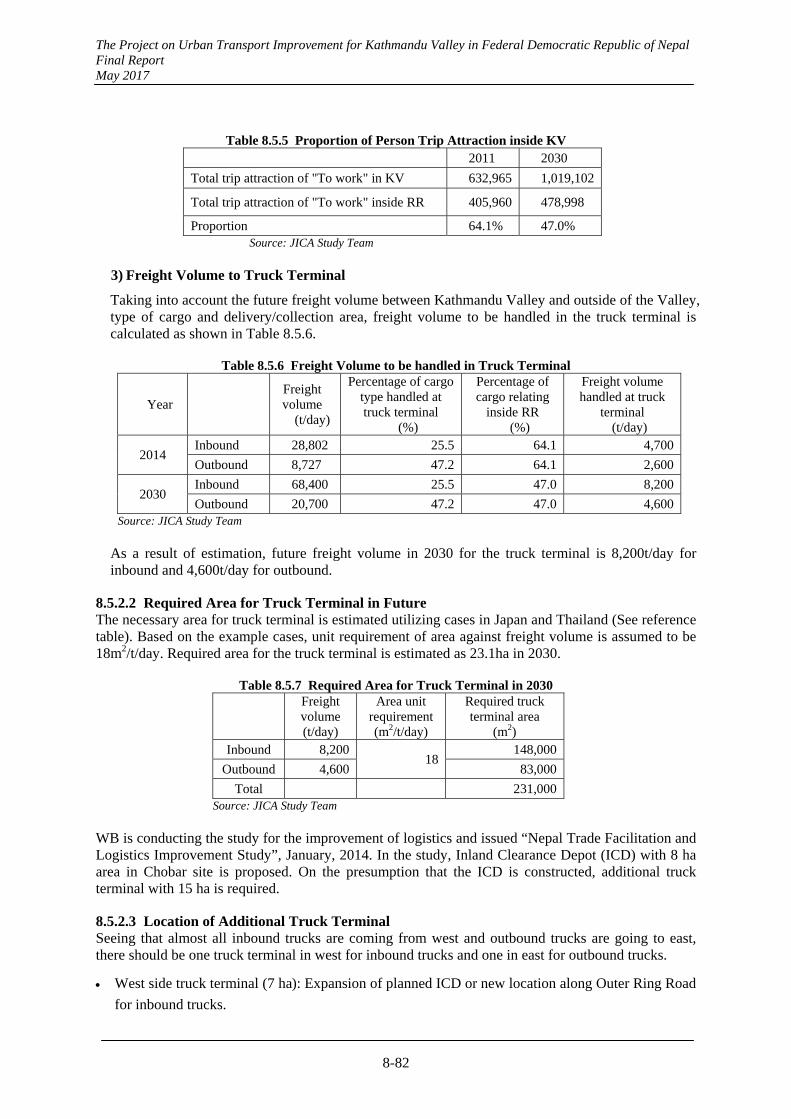
The Project on Urban Transport Improvement for Kathmandu Valley in Federal Democratic Republic of Nepal Final Report May 2017
8-82
Table 8.5.5 Proportion of Person Trip Attraction inside KV 2011 2030
Total trip attraction of "To work" in KV 632,965 1,019,102
Total trip attraction of "To work" inside RR 405,960 478,998
Proportion 64.1% 47.0% Source: JICA Study Team
3) Freight Volume to Truck Terminal
Taking into account the future freight volume between Kathmandu Valley and outside of the Valley, type of cargo and delivery/collection area, freight volume to be handled in the truck terminal is calculated as shown in Table 8.5.6.
Table 8.5.6 Freight Volume to be handled in Truck Terminal
Year
Freight volume
(t/day)
Percentage of cargo type handled at truck terminal
(%)
Percentage of cargo relating
inside RR (%)
Freight volume handled at truck
terminal (t/day)
2014 Inbound 28,802 25.5 64.1 4,700
Outbound 8,727 47.2 64.1 2,600
2030 Inbound 68,400 25.5 47.0 8,200
Outbound 20,700 47.2 47.0 4,600Source: JICA Study Team
As a result of estimation, future freight volume in 2030 for the truck terminal is 8,200t/day for inbound and 4,600t/day for outbound.
8.5.2.2 Required Area for Truck Terminal in Future The necessary area for truck terminal is estimated utilizing cases in Japan and Thailand (See reference table). Based on the example cases, unit requirement of area against freight volume is assumed to be 18m2/t/day. Required area for the truck terminal is estimated as 23.1ha in 2030.
Table 8.5.7 Required Area for Truck Terminal in 2030
Freight volume (t/day)
Area unit requirement (m2/t/day)
Required truck terminal area
(m2) Inbound 8,200
18148,000
Outbound 4,600 83,000
Total 231,000Source: JICA Study Team
WB is conducting the study for the improvement of logistics and issued “Nepal Trade Facilitation and Logistics Improvement Study”, January, 2014. In the study, Inland Clearance Depot (ICD) with 8 ha area in Chobar site is proposed. On the presumption that the ICD is constructed, additional truck terminal with 15 ha is required.
8.5.2.3 Location of Additional Truck Terminal Seeing that almost all inbound trucks are coming from west and outbound trucks are going to east, there should be one truck terminal in west for inbound trucks and one in east for outbound trucks.
West side truck terminal (7 ha): Expansion of planned ICD or new location along Outer Ring Road
for inbound trucks.
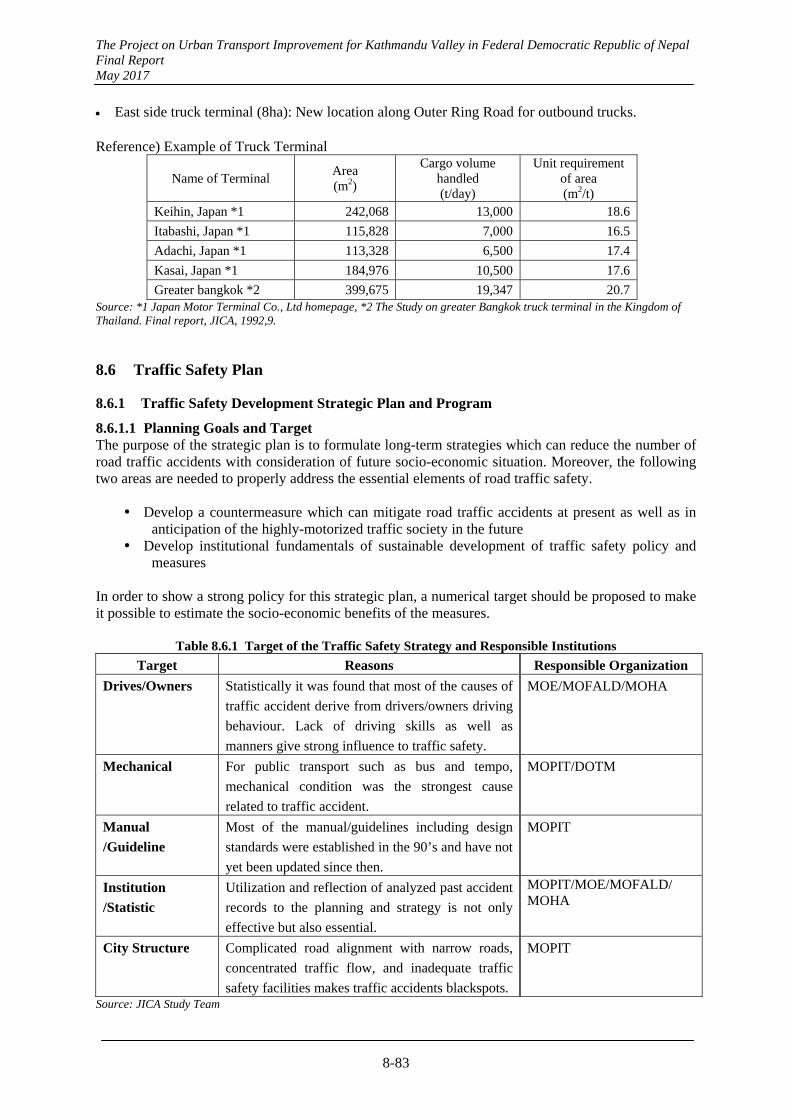
The Project on Urban Transport Improvement for Kathmandu Valley in Federal Democratic Republic of Nepal Final Report May 2017
8-83
East side truck terminal (8ha): New location along Outer Ring Road for outbound trucks. Reference) Example of Truck Terminal
Name of Terminal Area (m2)
Cargo volume handled (t/day)
Unit requirement of area (m2/t)
Keihin, Japan *1 242,068 13,000 18.6
Itabashi, Japan *1 115,828 7,000 16.5
Adachi, Japan *1 113,328 6,500 17.4
Kasai, Japan *1 184,976 10,500 17.6
Greater bangkok *2 399,675 19,347 20.7 Source: *1 Japan Motor Terminal Co., Ltd homepage, *2 The Study on greater Bangkok truck terminal in the Kingdom of Thailand. Final report, JICA, 1992,9.
8.6 Traffic Safety Plan
8.6.1 Traffic Safety Development Strategic Plan and Program
8.6.1.1 Planning Goals and Target The purpose of the strategic plan is to formulate long-term strategies which can reduce the number of road traffic accidents with consideration of future socio-economic situation. Moreover, the following two areas are needed to properly address the essential elements of road traffic safety.
Develop a countermeasure which can mitigate road traffic accidents at present as well as in anticipation of the highly-motorized traffic society in the future
Develop institutional fundamentals of sustainable development of traffic safety policy and measures
In order to show a strong policy for this strategic plan, a numerical target should be proposed to make it possible to estimate the socio-economic benefits of the measures.
Table 8.6.1 Target of the Traffic Safety Strategy and Responsible Institutions
Target Reasons Responsible Organization
Drives/Owners Statistically it was found that most of the causes of
traffic accident derive from drivers/owners driving
behaviour. Lack of driving skills as well as
manners give strong influence to traffic safety.
MOE/MOFALD/MOHA
Mechanical For public transport such as bus and tempo,
mechanical condition was the strongest cause
related to traffic accident.
MOPIT/DOTM
Manual
/Guideline
Most of the manual/guidelines including design
standards were established in the 90’s and have not
yet been updated since then.
MOPIT
Institution
/Statistic
Utilization and reflection of analyzed past accident
records to the planning and strategy is not only
effective but also essential.
MOPIT/MOE/MOFALD/ MOHA
City Structure Complicated road alignment with narrow roads,
concentrated traffic flow, and inadequate traffic
safety facilities makes traffic accidents blackspots.
MOPIT
Source: JICA Study Team

The Project on Urban Transport Improvement for Kathmandu Valley in Federal Democratic Republic of Nepal Final Report May 2017
8-84
8.6.2 Identification of Current Traffic Safety Issues
(1) Identification of traffic safety policy issues
Traffic safety issues being subjected to policy consideration and strategic planning will be identified based on the analysis of the present situation and shall be categorized into specific themes. Road traffic safety institutional capacity building which includes human and financial resources development is essential besides the development of effective road traffic safety measures. The strategic plan thus requires focus on both traffic safety and institutional development.
(2) Summary of the Existing Traffic Safety Problems
Institutional and sectorial traffic safety problems were examined to identify policy and planning issues based on present traffic safety situation in Kathmandu Valley including analysis of traffic accidents, traffic safety measures and traffic safety institutions as mentioned above. From discussion and explanation made in 5.1.4 of this report, summary of the existing traffic safety problems and issues shall be given below.
Table 8.6.2 Summary of the Current Traffic Safety Issues and the Key Organization
Categories
by UN Targets & Responsible Organization
Pillar-1
(Manage-ment)
Pillar-2 (Road
Conditions)
Pillar-3
(Vehicles)
Pillar-4 (Uses)
Pillar-5
(Post-Crash)
A: Drives/Owners (MOE/MOFALD/MOHA)
A1: Inadequate awareness to follow traffic rules A2: Inadequate training driving skills, law, culture
B: Mechanic (MOPIT/DOTM)
B1: No frequent maintenance /inspection system
C: Manual /Guideline (MOPIT)
C1: No update on Manual/ Guideline since established
D: Institutions /Statistics (MOPIT/MOE/ MOFALD/MOHA)
D1: No practical use of Accident Data. D2: No
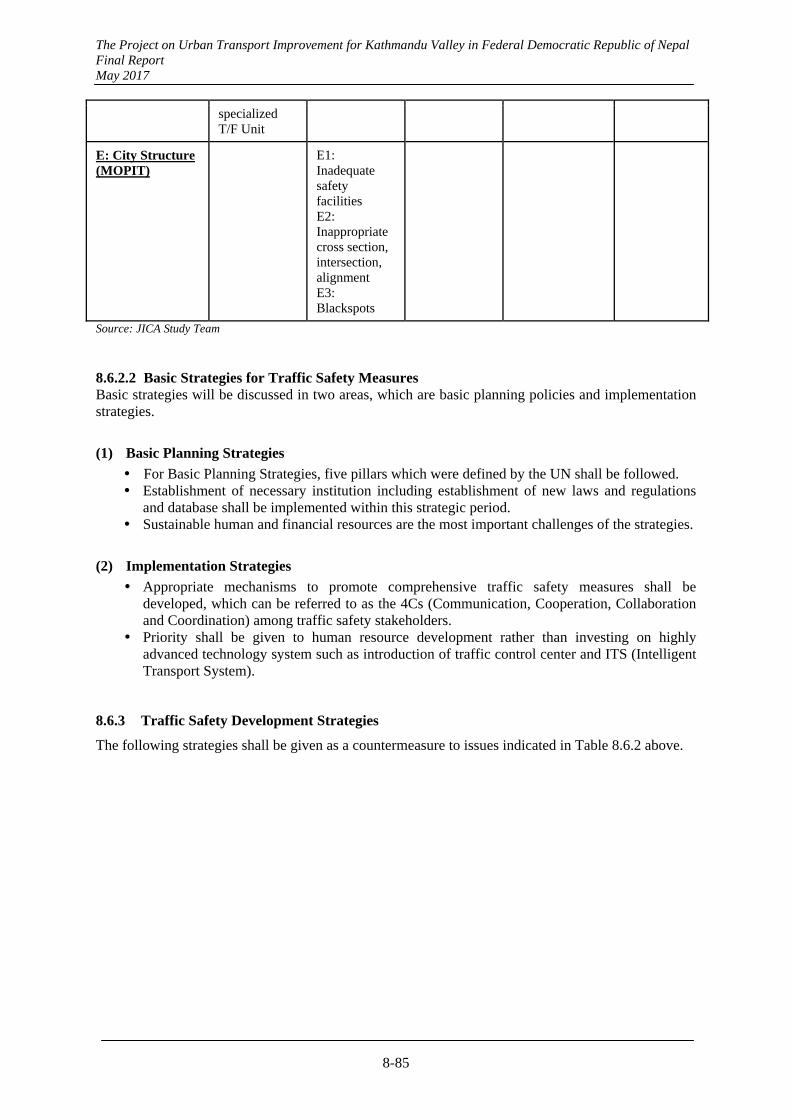
The Project on Urban Transport Improvement for Kathmandu Valley in Federal Democratic Republic of Nepal Final Report May 2017
8-85
specialized T/F Unit
E: City Structure (MOPIT)
E1: Inadequate safety facilities E2: Inappropriate cross section, intersection, alignment E3: Blackspots
Source: JICA Study Team 8.6.2.2 Basic Strategies for Traffic Safety Measures Basic strategies will be discussed in two areas, which are basic planning policies and implementation strategies.
(1) Basic Planning Strategies
For Basic Planning Strategies, five pillars which were defined by the UN shall be followed. Establishment of necessary institution including establishment of new laws and regulations
and database shall be implemented within this strategic period. Sustainable human and financial resources are the most important challenges of the strategies.
(2) Implementation Strategies
Appropriate mechanisms to promote comprehensive traffic safety measures shall be developed, which can be referred to as the 4Cs (Communication, Cooperation, Collaboration and Coordination) among traffic safety stakeholders.
Priority shall be given to human resource development rather than investing on highly advanced technology system such as introduction of traffic control center and ITS (Intelligent Transport System).
8.6.3 Traffic Safety Development Strategies
The following strategies shall be given as a countermeasure to issues indicated in Table 8.6.2 above.
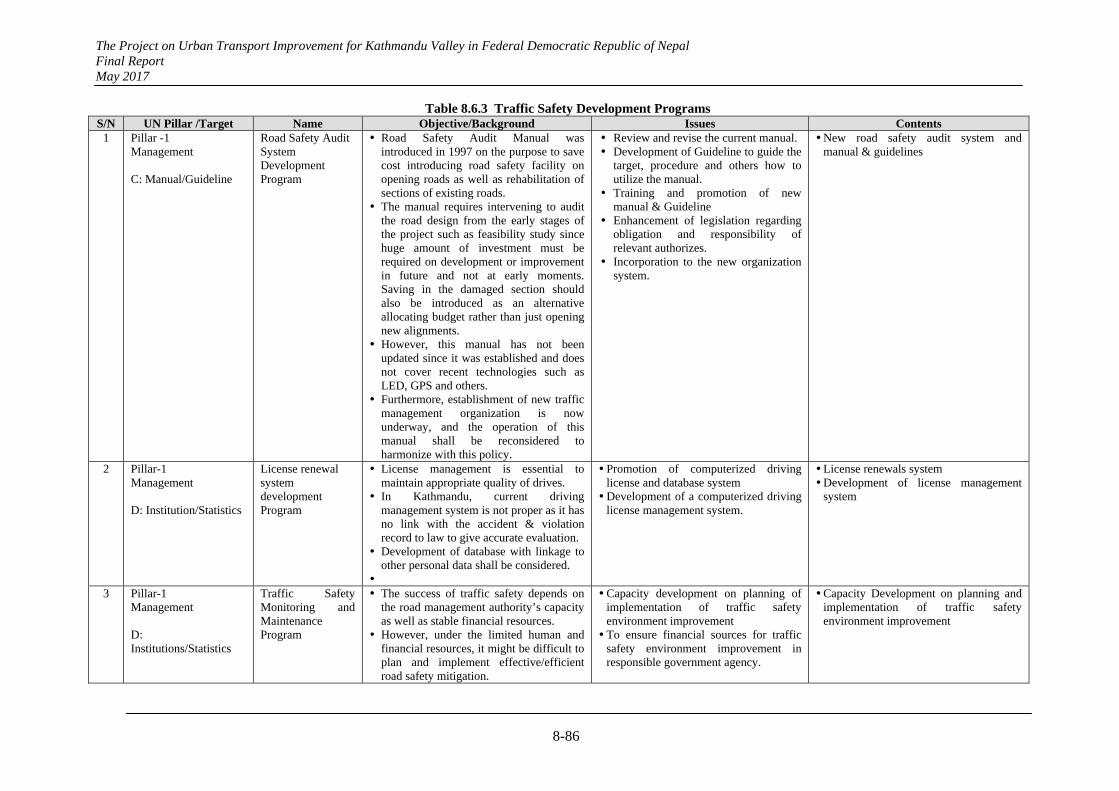
The Project on Urban Transport Improvement for Kathmandu Valley in Federal Democratic Republic of Nepal Final Report May 2017
8-86
Table 8.6.3 Traffic Safety Development Programs S/N UN Pillar /Target Name Objective/Background Issues Contents
1 Pillar -1 Management C: Manual/Guideline
Road Safety Audit System Development Program
Road Safety Audit Manual was introduced in 1997 on the purpose to save cost introducing road safety facility on opening roads as well as rehabilitation of sections of existing roads.
The manual requires intervening to audit the road design from the early stages of the project such as feasibility study since huge amount of investment must be required on development or improvement in future and not at early moments. Saving in the damaged section should also be introduced as an alternative allocating budget rather than just opening new alignments.
However, this manual has not been updated since it was established and does not cover recent technologies such as LED, GPS and others.
Furthermore, establishment of new traffic management organization is now underway, and the operation of this manual shall be reconsidered to harmonize with this policy.
Review and revise the current manual. Development of Guideline to guide the
target, procedure and others how to utilize the manual.
Training and promotion of new manual & Guideline
Enhancement of legislation regarding obligation and responsibility of relevant authorizes.
Incorporation to the new organization system.
New road safety audit system and manual & guidelines
2 Pillar-1 Management D: Institution/Statistics
License renewal system development Program
License management is essential to maintain appropriate quality of drives.
In Kathmandu, current driving management system is not proper as it has no link with the accident & violation record to law to give accurate evaluation.
Development of database with linkage to other personal data shall be considered.
Promotion of computerized driving license and database system Development of a computerized driving
license management system.
License renewals system Development of license management
system
3 Pillar-1 Management D: Institutions/Statistics
Traffic Safety Monitoring and Maintenance Program
The success of traffic safety depends on the road management authority’s capacity as well as stable financial resources.
However, under the limited human and financial resources, it might be difficult to plan and implement effective/efficient road safety mitigation.
Capacity development on planning of implementation of traffic safety environment improvement To ensure financial sources for traffic
safety environment improvement in responsible government agency.
Capacity Development on planning and implementation of traffic safety environment improvement
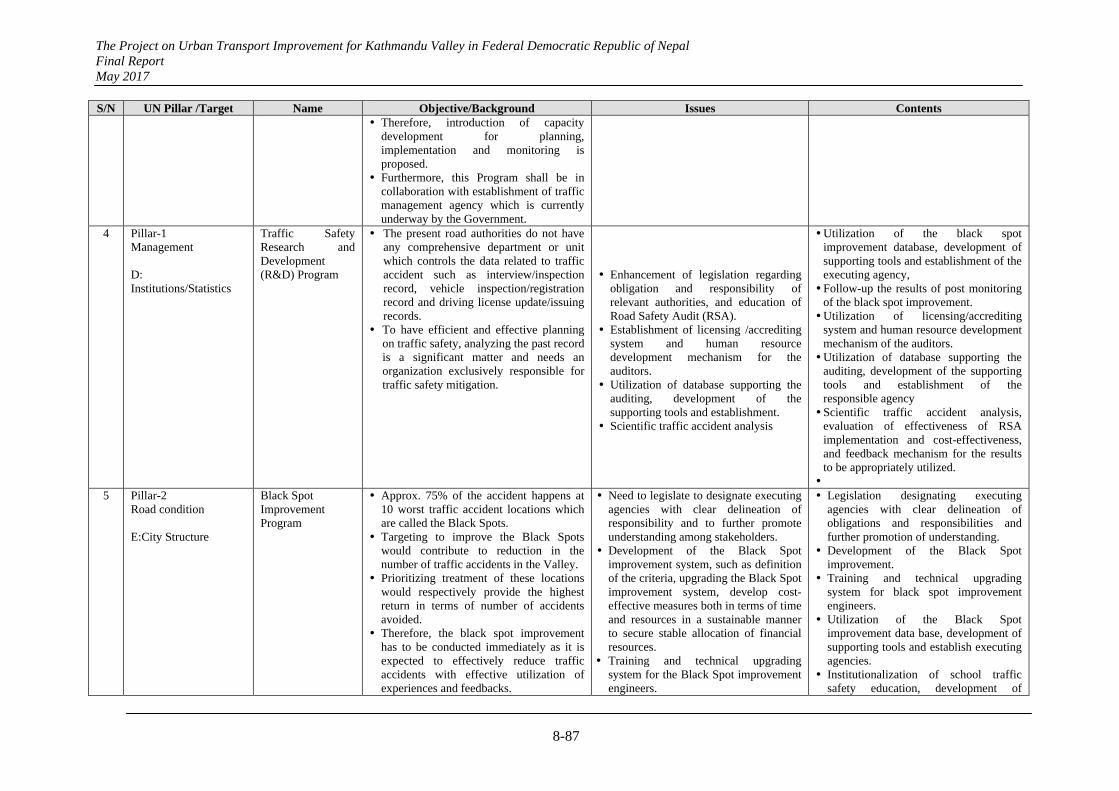
The Project on Urban Transport Improvement for Kathmandu Valley in Federal Democratic Republic of Nepal Final Report May 2017
8-87
S/N UN Pillar /Target Name Objective/Background Issues Contents Therefore, introduction of capacity
development for planning, implementation and monitoring is proposed.
Furthermore, this Program shall be in collaboration with establishment of traffic management agency which is currently underway by the Government.
4 Pillar-1 Management D: Institutions/Statistics
Traffic Safety Research and Development (R&D) Program
The present road authorities do not have any comprehensive department or unit which controls the data related to traffic accident such as interview/inspection record, vehicle inspection/registration record and driving license update/issuing records.
To have efficient and effective planning on traffic safety, analyzing the past record is a significant matter and needs an organization exclusively responsible for traffic safety mitigation.
Enhancement of legislation regarding obligation and responsibility of relevant authorities, and education of Road Safety Audit (RSA).
Establishment of licensing /accrediting system and human resource development mechanism for the auditors.
Utilization of database supporting the auditing, development of the supporting tools and establishment.
Scientific traffic accident analysis
Utilization of the black spot improvement database, development of supporting tools and establishment of the executing agency, Follow-up the results of post monitoring
of the black spot improvement. Utilization of licensing/accrediting
system and human resource development mechanism of the auditors. Utilization of database supporting the
auditing, development of the supporting tools and establishment of the responsible agency Scientific traffic accident analysis,
evaluation of effectiveness of RSA implementation and cost-effectiveness, and feedback mechanism for the results to be appropriately utilized.
5 Pillar-2 Road condition E:City Structure
Black Spot Improvement Program
Approx. 75% of the accident happens at 10 worst traffic accident locations which are called the Black Spots.
Targeting to improve the Black Spots would contribute to reduction in the number of traffic accidents in the Valley.
Prioritizing treatment of these locations would respectively provide the highest return in terms of number of accidents avoided.
Therefore, the black spot improvement has to be conducted immediately as it is expected to effectively reduce traffic accidents with effective utilization of experiences and feedbacks.
Need to legislate to designate executing agencies with clear delineation of responsibility and to further promote understanding among stakeholders.
Development of the Black Spot improvement system, such as definition of the criteria, upgrading the Black Spot improvement system, develop cost-effective measures both in terms of time and resources in a sustainable manner to secure stable allocation of financial resources.
Training and technical upgrading system for the Black Spot improvement engineers.
Legislation designating executing agencies with clear delineation of obligations and responsibilities and further promotion of understanding.
Development of the Black Spot improvement.
Training and technical upgrading system for black spot improvement engineers.
Utilization of the Black Spot improvement data base, development of supporting tools and establish executing agencies.
Institutionalization of school traffic safety education, development of
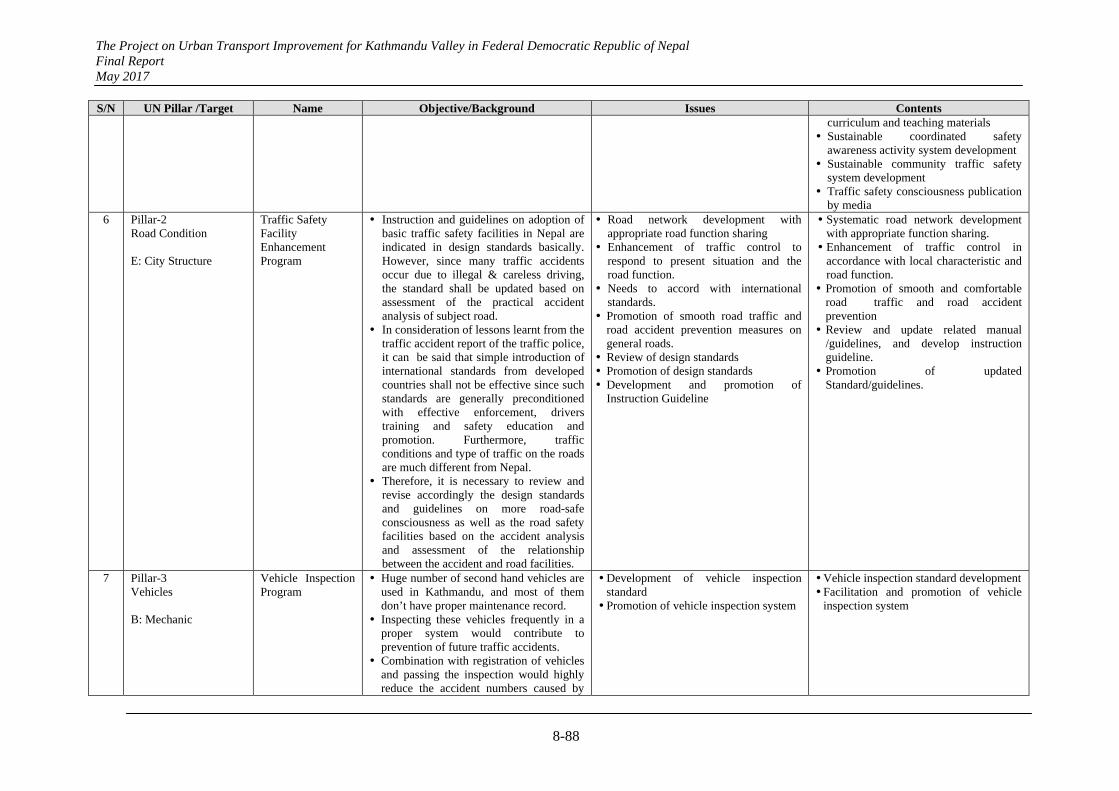
The Project on Urban Transport Improvement for Kathmandu Valley in Federal Democratic Republic of Nepal Final Report May 2017
8-88
S/N UN Pillar /Target Name Objective/Background Issues Contents curriculum and teaching materials
Sustainable coordinated safety awareness activity system development
Sustainable community traffic safety system development
Traffic safety consciousness publication by media
6 Pillar-2 Road Condition E: City Structure
Traffic Safety Facility Enhancement Program
Instruction and guidelines on adoption of basic traffic safety facilities in Nepal are indicated in design standards basically. However, since many traffic accidents occur due to illegal & careless driving, the standard shall be updated based on assessment of the practical accident analysis of subject road.
In consideration of lessons learnt from the traffic accident report of the traffic police, it can be said that simple introduction of international standards from developed countries shall not be effective since such standards are generally preconditioned with effective enforcement, drivers training and safety education and promotion. Furthermore, traffic conditions and type of traffic on the roads are much different from Nepal.
Therefore, it is necessary to review and revise accordingly the design standards and guidelines on more road-safe consciousness as well as the road safety facilities based on the accident analysis and assessment of the relationship between the accident and road facilities.
Road network development with appropriate road function sharing
Enhancement of traffic control to respond to present situation and the road function.
Needs to accord with international standards.
Promotion of smooth road traffic and road accident prevention measures on general roads.
Review of design standards Promotion of design standards Development and promotion of
Instruction Guideline
Systematic road network development with appropriate function sharing. Enhancement of traffic control in
accordance with local characteristic and road function. Promotion of smooth and comfortable
road traffic and road accident prevention Review and update related manual
/guidelines, and develop instruction guideline. Promotion of updated
Standard/guidelines.
7 Pillar-3 Vehicles B: Mechanic
Vehicle Inspection Program
Huge number of second hand vehicles are used in Kathmandu, and most of them don’t have proper maintenance record.
Inspecting these vehicles frequently in a proper system would contribute to prevention of future traffic accidents.
Combination with registration of vehicles and passing the inspection would highly reduce the accident numbers caused by
Development of vehicle inspection standard Promotion of vehicle inspection system
Vehicle inspection standard development Facilitation and promotion of vehicle
inspection system
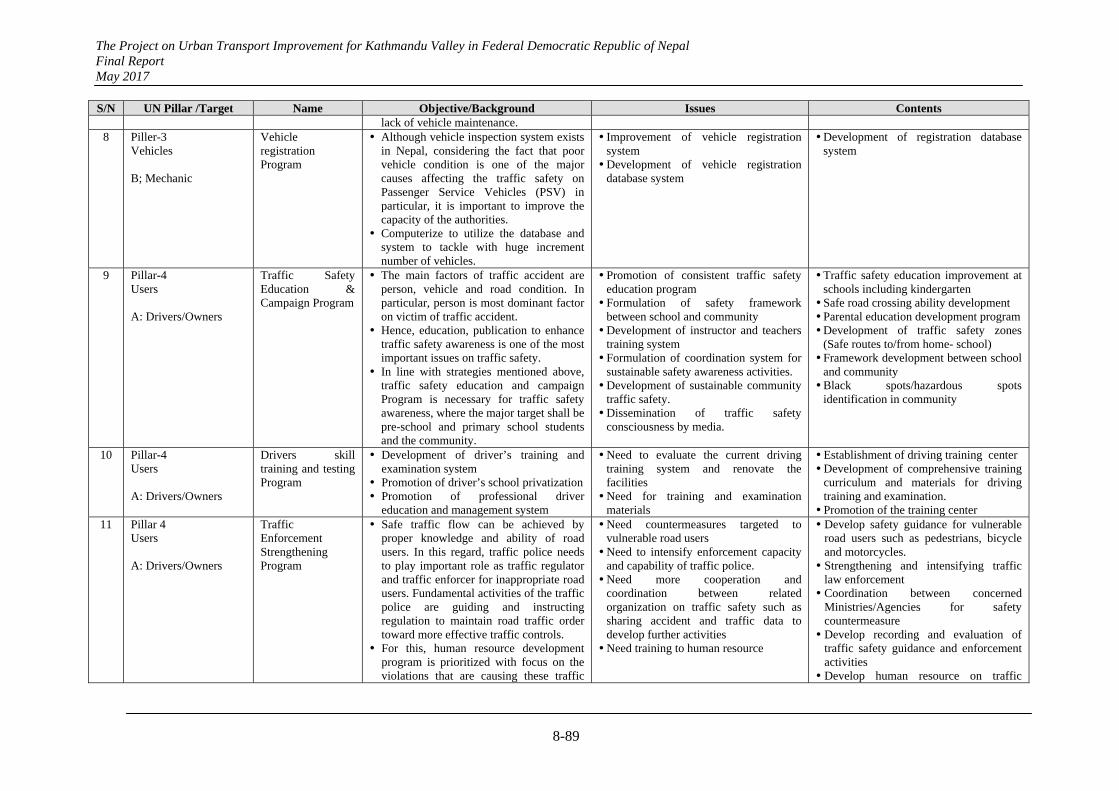
The Project on Urban Transport Improvement for Kathmandu Valley in Federal Democratic Republic of Nepal Final Report May 2017
8-89
S/N UN Pillar /Target Name Objective/Background Issues Contents lack of vehicle maintenance.
8 Piller-3 Vehicles B; Mechanic
Vehicle registration Program
Although vehicle inspection system exists in Nepal, considering the fact that poor vehicle condition is one of the major causes affecting the traffic safety on Passenger Service Vehicles (PSV) in particular, it is important to improve the capacity of the authorities.
Computerize to utilize the database and system to tackle with huge increment number of vehicles.
Improvement of vehicle registration system Development of vehicle registration
database system
Development of registration database system
9 Pillar-4 Users A: Drivers/Owners
Traffic Safety Education & Campaign Program
The main factors of traffic accident are person, vehicle and road condition. In particular, person is most dominant factor on victim of traffic accident.
Hence, education, publication to enhance traffic safety awareness is one of the most important issues on traffic safety.
In line with strategies mentioned above, traffic safety education and campaign Program is necessary for traffic safety awareness, where the major target shall be pre-school and primary school students and the community.
Promotion of consistent traffic safety education program Formulation of safety framework
between school and community Development of instructor and teachers
training system Formulation of coordination system for
sustainable safety awareness activities. Development of sustainable community
traffic safety. Dissemination of traffic safety
consciousness by media.
Traffic safety education improvement at schools including kindergarten Safe road crossing ability development Parental education development program Development of traffic safety zones
(Safe routes to/from home- school) Framework development between school
and community Black spots/hazardous spots
identification in community
10 Pillar-4 Users A: Drivers/Owners
Drivers skill training and testing Program
Development of driver’s training and examination system
Promotion of driver’s school privatization Promotion of professional driver
education and management system
Need to evaluate the current driving training system and renovate the facilities Need for training and examination
materials
Establishment of driving training center Development of comprehensive training
curriculum and materials for driving training and examination. Promotion of the training center
11 Pillar 4 Users A: Drivers/Owners
Traffic Enforcement Strengthening Program
Safe traffic flow can be achieved by proper knowledge and ability of road users. In this regard, traffic police needs to play important role as traffic regulator and traffic enforcer for inappropriate road users. Fundamental activities of the traffic police are guiding and instructing regulation to maintain road traffic order toward more effective traffic controls.
For this, human resource development program is prioritized with focus on the violations that are causing these traffic
Need countermeasures targeted to vulnerable road users Need to intensify enforcement capacity
and capability of traffic police. Need more cooperation and
coordination between related organization on traffic safety such as sharing accident and traffic data to develop further activities Need training to human resource
Develop safety guidance for vulnerable road users such as pedestrians, bicycle and motorcycles. Strengthening and intensifying traffic
law enforcement Coordination between concerned
Ministries/Agencies for safety countermeasure Develop recording and evaluation of
traffic safety guidance and enforcement activities Develop human resource on traffic
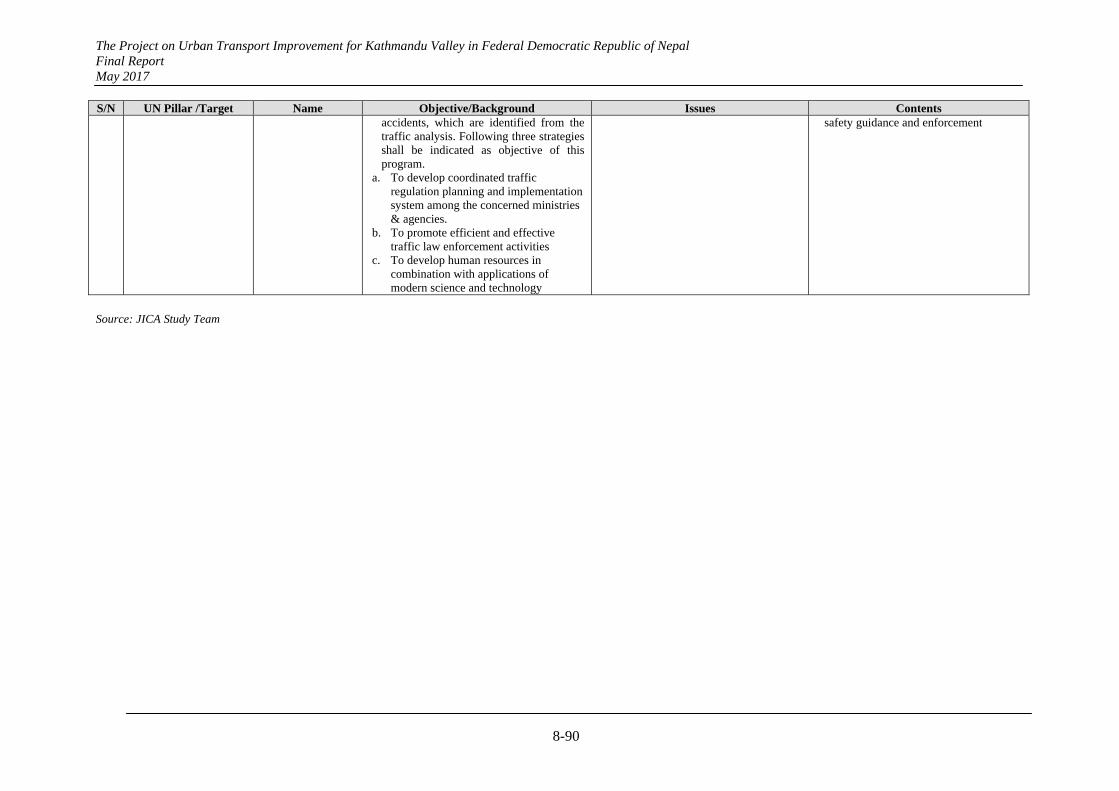
The Project on Urban Transport Improvement for Kathmandu Valley in Federal Democratic Republic of Nepal Final Report May 2017
8-90
S/N UN Pillar /Target Name Objective/Background Issues Contents accidents, which are identified from the traffic analysis. Following three strategies shall be indicated as objective of this program.
a. To develop coordinated traffic regulation planning and implementation system among the concerned ministries & agencies.
b. To promote efficient and effective traffic law enforcement activities
c. To develop human resources in combination with applications of modern science and technology
safety guidance and enforcement
Source: JICA Study Team
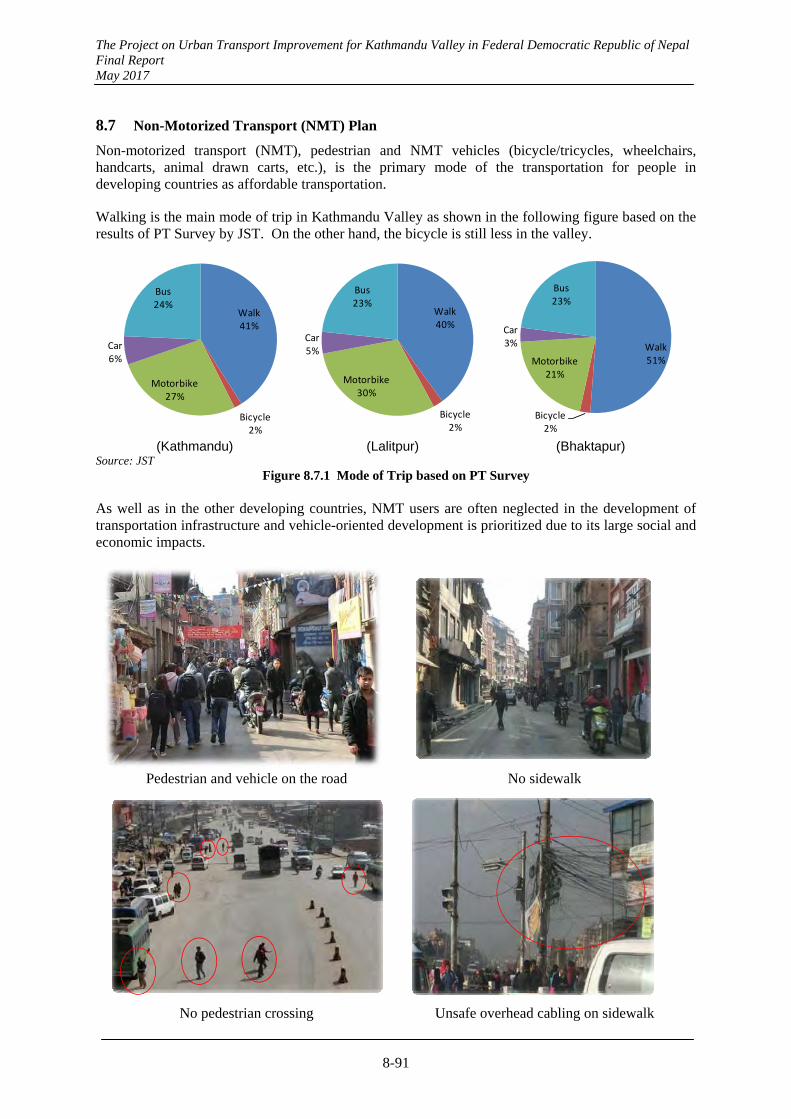
The Project on Urban Transport Improvement for Kathmandu Valley in Federal Democratic Republic of Nepal Final Report May 2017
8-91
8.7 Non-Motorized Transport (NMT) Plan
Non-motorized transport (NMT), pedestrian and NMT vehicles (bicycle/tricycles, wheelchairs, handcarts, animal drawn carts, etc.), is the primary mode of the transportation for people in developing countries as affordable transportation.
Walking is the main mode of trip in Kathmandu Valley as shown in the following figure based on the results of PT Survey by JST. On the other hand, the bicycle is still less in the valley.
Walk41%
Bicycle2%
Motorbike27%
Car6%
Bus24%
Walk40%
Bicycle2%
Motorbike30%
Car5%
Bus23%
Walk51%
Bicycle2%
Motorbike21%
Car3%
Bus23%
(Kathmandu) (Lalitpur) (Bhaktapur) Source: JST
Figure 8.7.1 Mode of Trip based on PT Survey As well as in the other developing countries, NMT users are often neglected in the development of transportation infrastructure and vehicle-oriented development is prioritized due to its large social and economic impacts.
Pedestrian and vehicle on the road No sidewalk
No pedestrian crossing Unsafe overhead cabling on sidewalk
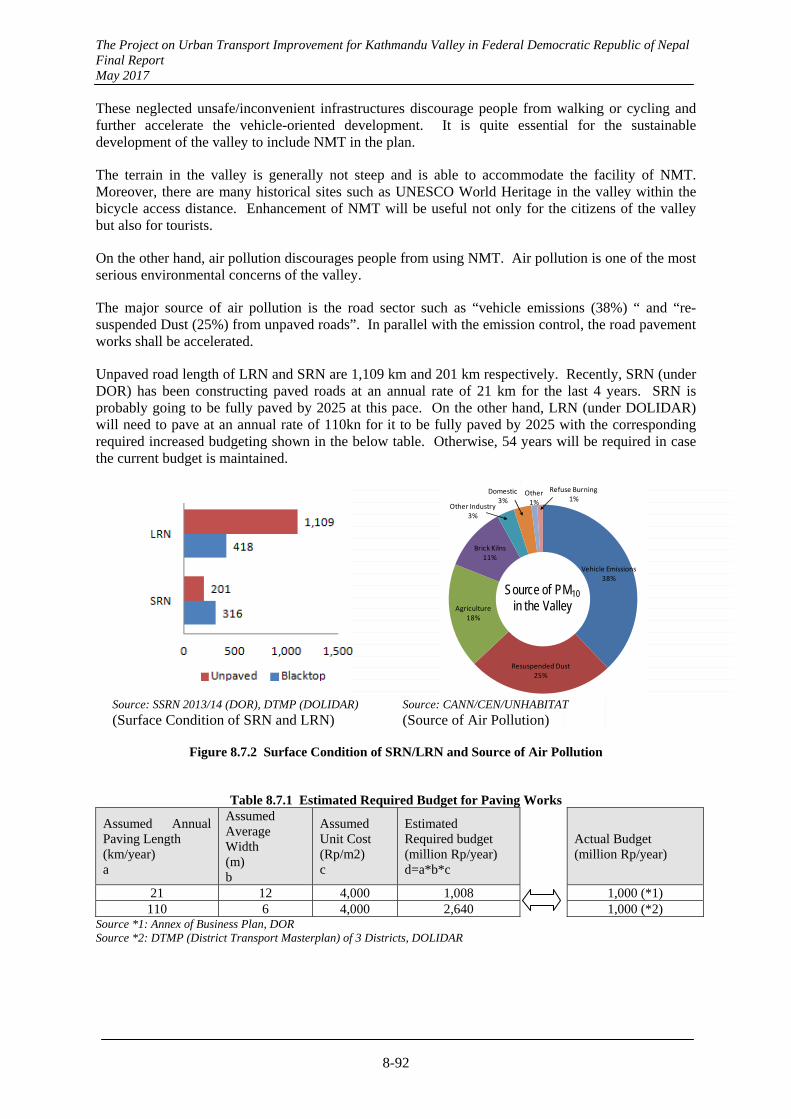
The Project on Urban Transport Improvement for Kathmandu Valley in Federal Democratic Republic of Nepal Final Report May 2017
8-92
These neglected unsafe/inconvenient infrastructures discourage people from walking or cycling and further accelerate the vehicle-oriented development. It is quite essential for the sustainable development of the valley to include NMT in the plan.
The terrain in the valley is generally not steep and is able to accommodate the facility of NMT. Moreover, there are many historical sites such as UNESCO World Heritage in the valley within the bicycle access distance. Enhancement of NMT will be useful not only for the citizens of the valley but also for tourists.
On the other hand, air pollution discourages people from using NMT. Air pollution is one of the most serious environmental concerns of the valley.
The major source of air pollution is the road sector such as “vehicle emissions (38%) “ and “re-suspended Dust (25%) from unpaved roads”. In parallel with the emission control, the road pavement works shall be accelerated.
Unpaved road length of LRN and SRN are 1,109 km and 201 km respectively. Recently, SRN (under DOR) has been constructing paved roads at an annual rate of 21 km for the last 4 years. SRN is probably going to be fully paved by 2025 at this pace. On the other hand, LRN (under DOLIDAR) will need to pave at an annual rate of 110kn for it to be fully paved by 2025 with the corresponding required increased budgeting shown in the below table. Otherwise, 54 years will be required in case the current budget is maintained.
Source: SSRN 2013/14 (DOR), DTMP (DOLIDAR)
Vehicle Emissions38%
Resuspended Dust25%
Agriculture18%
Brick Kilns11%
Other Industry3%
Domestic3%
Other1%
Refuse Burning1%
Source of PM10
in the Valley
Source: CANN/CEN/UNHABITAT
(Surface Condition of SRN and LRN) (Source of Air Pollution)
Figure 8.7.2 Surface Condition of SRN/LRN and Source of Air Pollution
Table 8.7.1 Estimated Required Budget for Paving Works
Assumed Annual Paving Length (km/year) a
Assumed Average Width (m) b
Assumed Unit Cost (Rp/m2) c
Estimated Required budget (million Rp/year) d=a*b*c
Actual Budget (million Rp/year)
21 12 4,000 1,008 1,000 (*1) 110 6 4,000 2,640 1,000 (*2)
Source *1: Annex of Business Plan, DOR Source *2: DTMP (District Transport Masterplan) of 3 Districts, DOLIDAR
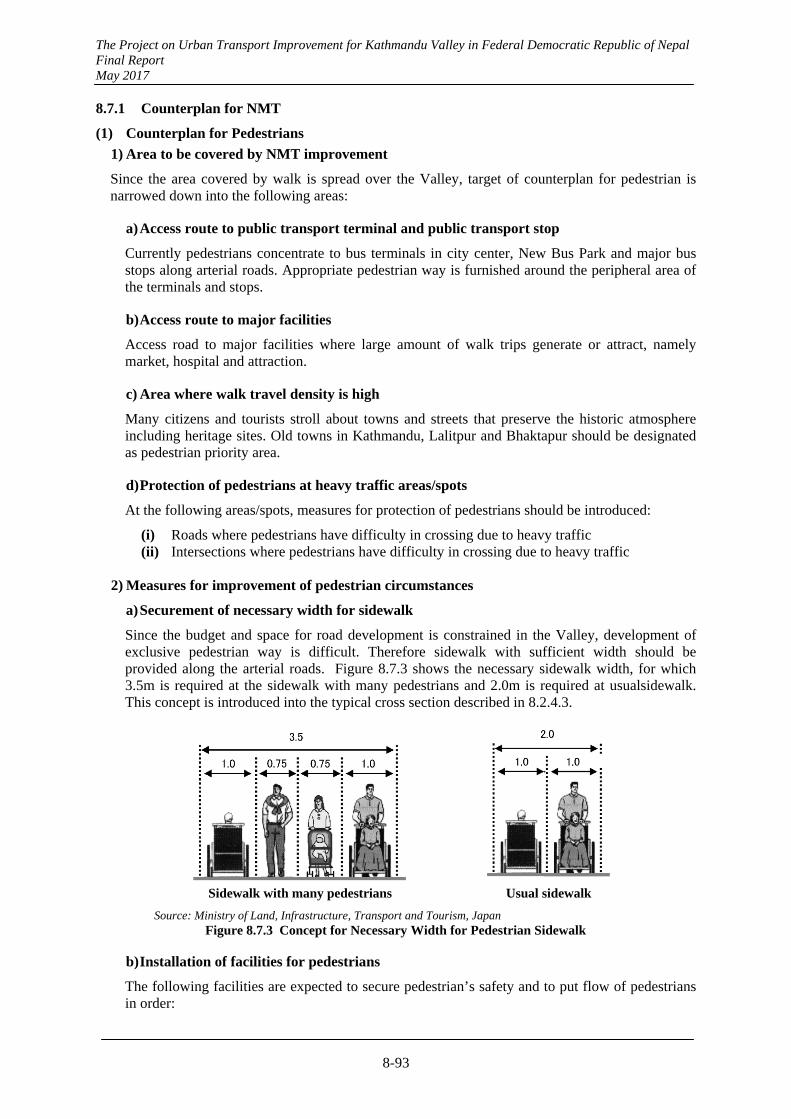
The Project on Urban Transport Improvement for Kathmandu Valley in Federal Democratic Republic of Nepal Final Report May 2017
8-93
8.7.1 Counterplan for NMT
(1) Counterplan for Pedestrians
1) Area to be covered by NMT improvement
Since the area covered by walk is spread over the Valley, target of counterplan for pedestrian is narrowed down into the following areas:
a) Access route to public transport terminal and public transport stop
Currently pedestrians concentrate to bus terminals in city center, New Bus Park and major bus stops along arterial roads. Appropriate pedestrian way is furnished around the peripheral area of the terminals and stops.
b) Access route to major facilities
Access road to major facilities where large amount of walk trips generate or attract, namely market, hospital and attraction.
c) Area where walk travel density is high
Many citizens and tourists stroll about towns and streets that preserve the historic atmosphere including heritage sites. Old towns in Kathmandu, Lalitpur and Bhaktapur should be designated as pedestrian priority area.
d) Protection of pedestrians at heavy traffic areas/spots
At the following areas/spots, measures for protection of pedestrians should be introduced:
(i) Roads where pedestrians have difficulty in crossing due to heavy traffic (ii) Intersections where pedestrians have difficulty in crossing due to heavy traffic
2) Measures for improvement of pedestrian circumstances
a) Securement of necessary width for sidewalk
Since the budget and space for road development is constrained in the Valley, development of exclusive pedestrian way is difficult. Therefore sidewalk with sufficient width should be provided along the arterial roads. Figure 8.7.3 shows the necessary sidewalk width, for which 3.5m is required at the sidewalk with many pedestrians and 2.0m is required at usualsidewalk. This concept is introduced into the typical cross section described in 8.2.4.3.
Sidewalk with many pedestrians Usual sidewalk
Source: Ministry of Land, Infrastructure, Transport and Tourism, Japan Figure 8.7.3 Concept for Necessary Width for Pedestrian Sidewalk
b) Installation of facilities for pedestrians
The following facilities are expected to secure pedestrian’s safety and to put flow of pedestrians in order:
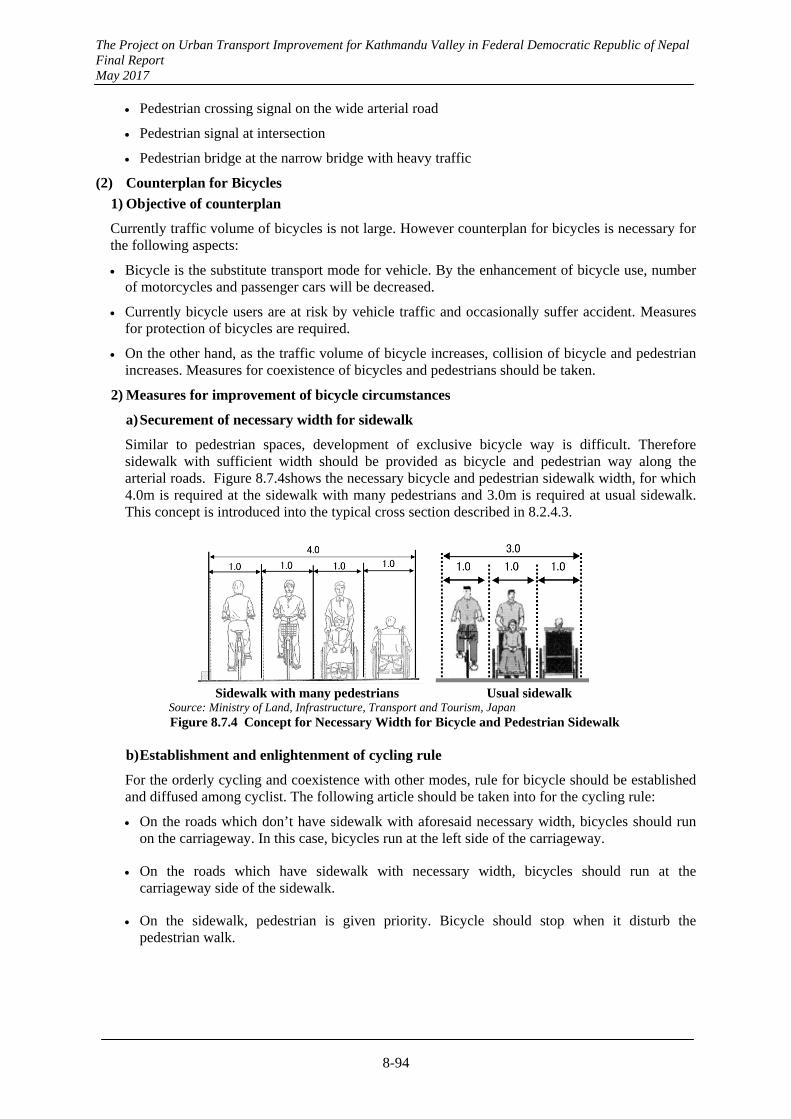
The Project on Urban Transport Improvement for Kathmandu Valley in Federal Democratic Republic of Nepal Final Report May 2017
8-94
Pedestrian crossing signal on the wide arterial road
Pedestrian signal at intersection
Pedestrian bridge at the narrow bridge with heavy traffic
(2) Counterplan for Bicycles
1) Objective of counterplan
Currently traffic volume of bicycles is not large. However counterplan for bicycles is necessary for the following aspects:
Bicycle is the substitute transport mode for vehicle. By the enhancement of bicycle use, number of motorcycles and passenger cars will be decreased.
Currently bicycle users are at risk by vehicle traffic and occasionally suffer accident. Measures for protection of bicycles are required.
On the other hand, as the traffic volume of bicycle increases, collision of bicycle and pedestrian increases. Measures for coexistence of bicycles and pedestrians should be taken.
2) Measures for improvement of bicycle circumstances
a) Securement of necessary width for sidewalk
Similar to pedestrian spaces, development of exclusive bicycle way is difficult. Therefore sidewalk with sufficient width should be provided as bicycle and pedestrian way along the arterial roads. Figure 8.7.4shows the necessary bicycle and pedestrian sidewalk width, for which 4.0m is required at the sidewalk with many pedestrians and 3.0m is required at usual sidewalk. This concept is introduced into the typical cross section described in 8.2.4.3.
Sidewalk with many pedestrians Usual sidewalk
Source: Ministry of Land, Infrastructure, Transport and Tourism, Japan Figure 8.7.4 Concept for Necessary Width for Bicycle and Pedestrian Sidewalk
b) Establishment and enlightenment of cycling rule
For the orderly cycling and coexistence with other modes, rule for bicycle should be established and diffused among cyclist. The following article should be taken into for the cycling rule:
On the roads which don’t have sidewalk with aforesaid necessary width, bicycles should run on the carriageway. In this case, bicycles run at the left side of the carriageway.
On the roads which have sidewalk with necessary width, bicycles should run at the carriageway side of the sidewalk.
On the sidewalk, pedestrian is given priority. Bicycle should stop when it disturb the pedestrian walk.
The Project on Urban Transport Improvement for Kathmandu Valley in Federal Democratic Republic of Nepal Final Report May 2017
8-95
8.8 Disaster Management Plan
8.8.1 Work Flow
This section explains how to formulate Emergency Transportation Road Network Plan (ETRNP).
1) Overview of Existing Plans (Step I)
First, existing plans and data of natural disaster in Kathmandu Valley will be reviewed in regard to the following six items and harmonizes with the report of The Project on Rehabilitation and Recovery from Nepal Earthquake (PRNE) by JICA.
Existing plans for protection against disasters (Hazard Risk Assessment, Earthquake Disaster Mitigation etc.)
Organization structure and government system for protection against natural disaster (especially earthquake disaster)
Measures of protection against disasters and reduction of the impact of natural disaster (revision of building code, disaster drill etc.)
Record of disaster drill and training for protection against natural disaster
Existing plans and record of disaster in Kathmandu Valley
Emergency transportation system (not only road network but also the location of emergency warehouse and its capacity.)
2) Points of Attention (Step II)
The following points of attention must be considered to plan ETRNP.
To understand alignments of wide lane roads such as Ring Road and Arniko Highway. (These two roads will not be blocked by debris.)
To understand locations of base hospitals (with an inpatients' ward), Open Space (84 sites decided by government) (including 84th Open Space proposed by ETRNP), New Open Space (MOHA and KVDA), governmental offices, emergency warehouses, airport and educational facilities which should be connected to or should be stood near ETRNP.
To understand the plan for Disaster Supplies Management and location of Open Space and New Open Spaces.
To understand the result of simulation about blocked roads for three scenarios (Based on the Modified Mercalli Intensity scale, a medium (VIII), large (IX) and very large (X) were used as the three scenarios.1). (source: Vulnerable Transportation Networks and Earthquakes (A Case Study of the Kathmandu Valley, Nepal; Mr. Krista Carroll, May 12th 2011)
To understand the result of simulation about blocked roads for four scenarios of earthquake.
1 Source: Vulnerable Transportation Networks and Earthquakes (A Case Study of the Kathmandu Valley, Nepal), Mr. Krista Carroll, May 12th 2011
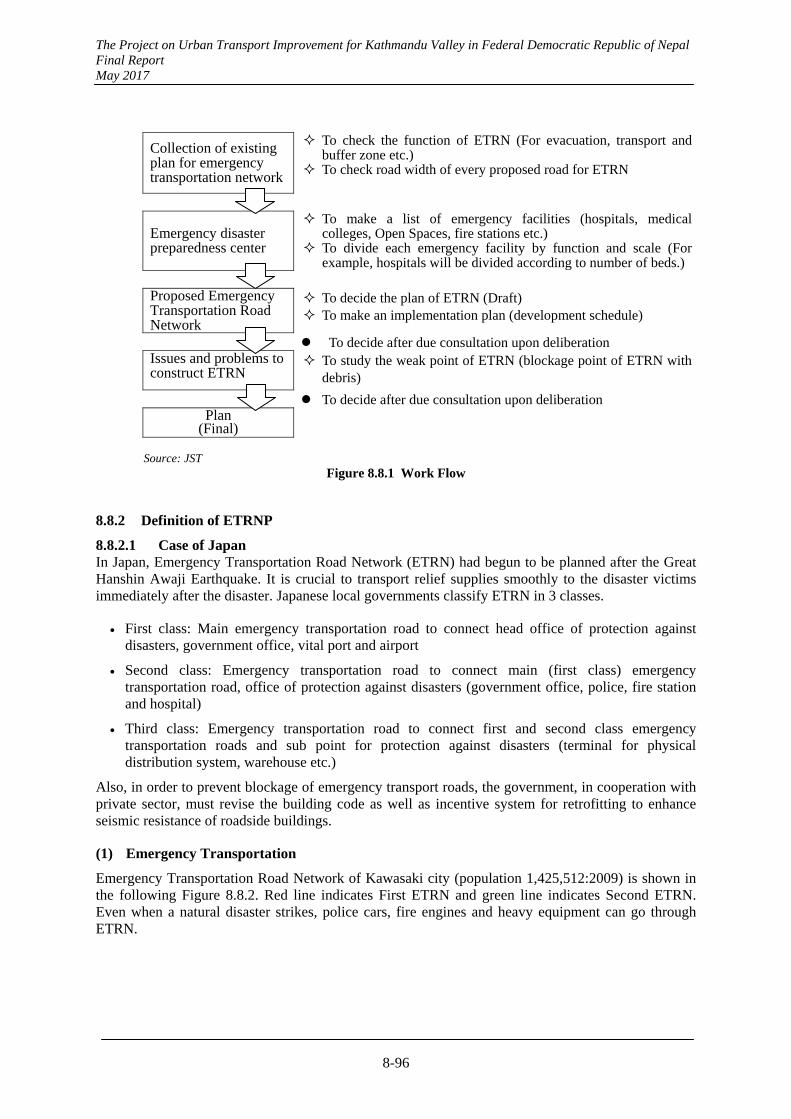
The Project on Urban Transport Improvement for Kathmandu Valley in Federal Democratic Republic of Nepal Final Report May 2017
8-96
Collection of existing plan for emergency transportation network
To check the function of ETRN (For evacuation, transport and buffer zone etc.)
To check road width of every proposed road for ETRN
Emergency disaster preparedness center
To make a list of emergency facilities (hospitals, medical colleges, Open Spaces, fire stations etc.)
To divide each emergency facility by function and scale (For example, hospitals will be divided according to number of beds.)
Proposed Emergency Transportation Road Network
To decide the plan of ETRN (Draft) To make an implementation plan (development schedule)
To decide after due consultation upon deliberation Issues and problems to construct ETRN
To study the weak point of ETRN (blockage point of ETRN with debris)
To decide after due consultation upon deliberation Plan
(Final)
Source: JST
Figure 8.8.1 Work Flow
8.8.2 Definition of ETRNP
8.8.2.1 Case of Japan In Japan, Emergency Transportation Road Network (ETRN) had begun to be planned after the Great Hanshin Awaji Earthquake. It is crucial to transport relief supplies smoothly to the disaster victims immediately after the disaster. Japanese local governments classify ETRN in 3 classes.
First class: Main emergency transportation road to connect head office of protection against disasters, government office, vital port and airport
Second class: Emergency transportation road to connect main (first class) emergency transportation road, office of protection against disasters (government office, police, fire station and hospital)
Third class: Emergency transportation road to connect first and second class emergency transportation roads and sub point for protection against disasters (terminal for physical distribution system, warehouse etc.)
Also, in order to prevent blockage of emergency transport roads, the government, in cooperation with private sector, must revise the building code as well as incentive system for retrofitting to enhance seismic resistance of roadside buildings.
(1) Emergency Transportation
Emergency Transportation Road Network of Kawasaki city (population 1,425,512:2009) is shown in the following Figure 8.8.2. Red line indicates First ETRN and green line indicates Second ETRN. Even when a natural disaster strikes, police cars, fire engines and heavy equipment can go through ETRN.
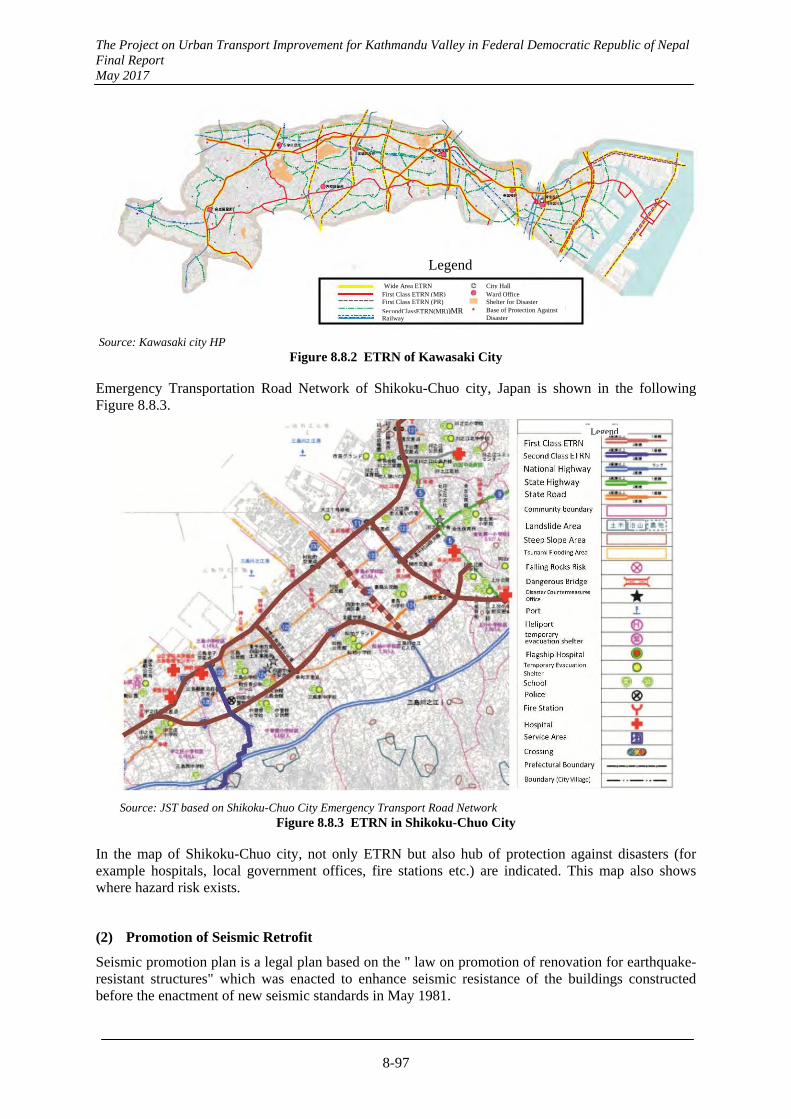
The Project on Urban Transport Improvement for Kathmandu Valley in Federal Democratic Republic of Nepal Final Report May 2017
8-97
Source: Kawasaki city HP
Figure 8.8.2 ETRN of Kawasaki City
Emergency Transportation Road Network of Shikoku-Chuo city, Japan is shown in the following Figure 8.8.3.
Source: JST based on Shikoku-Chuo City Emergency Transport Road Network Figure 8.8.3 ETRN in Shikoku-Chuo City
In the map of Shikoku-Chuo city, not only ETRN but also hub of protection against disasters (for example hospitals, local government offices, fire stations etc.) are indicated. This map also shows where hazard risk exists.
(2) Promotion of Seismic Retrofit
Seismic promotion plan is a legal plan based on the " law on promotion of renovation for earthquake-resistant structures" which was enacted to enhance seismic resistance of the buildings constructed before the enactment of new seismic standards in May 1981.
Legend
Legend Wide Area ETRN
First Class ETRN (MR) First Class ETRN (PR)
SecondClassETRN(MR))MRRailway
City Hall Ward Office Shelter for Disaster Base of Protection Against Disaster
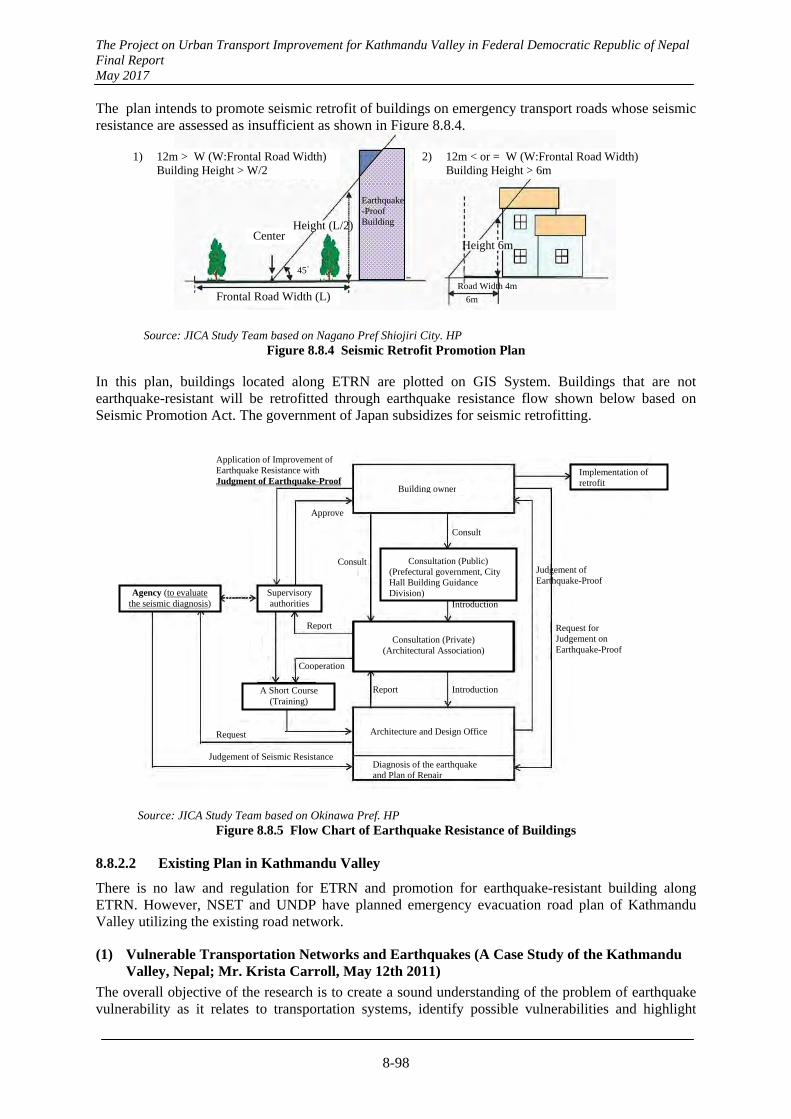
The Project on Urban Transport Improvement for Kathmandu Valley in Federal Democratic Republic of Nepal Final Report May 2017
8-98
The plan intends to promote seismic retrofit of buildings on emergency transport roads whose seismic resistance are assessed as insufficient as shown in Figure 8.8.4.
Source: JICA Study Team based on Nagano Pref Shiojiri City. HP
Figure 8.8.4 Seismic Retrofit Promotion Plan In this plan, buildings located along ETRN are plotted on GIS System. Buildings that are not earthquake-resistant will be retrofitted through earthquake resistance flow shown below based on Seismic Promotion Act. The government of Japan subsidizes for seismic retrofitting.
Source: JICA Study Team based on Okinawa Pref. HP Figure 8.8.5 Flow Chart of Earthquake Resistance of Buildings
8.8.2.2 Existing Plan in Kathmandu Valley
There is no law and regulation for ETRN and promotion for earthquake-resistant building along ETRN. However, NSET and UNDP have planned emergency evacuation road plan of Kathmandu Valley utilizing the existing road network.
(1) Vulnerable Transportation Networks and Earthquakes (A Case Study of the Kathmandu Valley, Nepal; Mr. Krista Carroll, May 12th 2011)
The overall objective of the research is to create a sound understanding of the problem of earthquake vulnerability as it relates to transportation systems, identify possible vulnerabilities and highlight
1) 12m > W (W:Frontal Road Width) Building Height > W/2
2) 12m < or = W (W:Frontal Road Width) Building Height > 6m
Center
Frontal Road Width (L)
Height 6m
Height (L/2)
45゜
Road Width 4m
6m
Earthquake-Proof Building
Approve
Consult
Consult
Building owner
Introduction
Introduction
Report
Report
Cooperation
Request
Application of Improvement of Earthquake Resistance with Judgment of Earthquake-Proof
Implementation of retrofit
Judgement of Seismic Resistance
Judgement of Earthquake-Proof
Request for Judgement on Earthquake-Proof
A Short Course (Training)
Supervisory authorities
Agency (to evaluate the seismic diagnosis)
Architecture and Design Office
Diagnosis of the earthquake and Plan of Repair
Consultation (Private)
(Architectural Association)
Consultation (Public) (Prefectural government, City Hall Building Guidance Division)
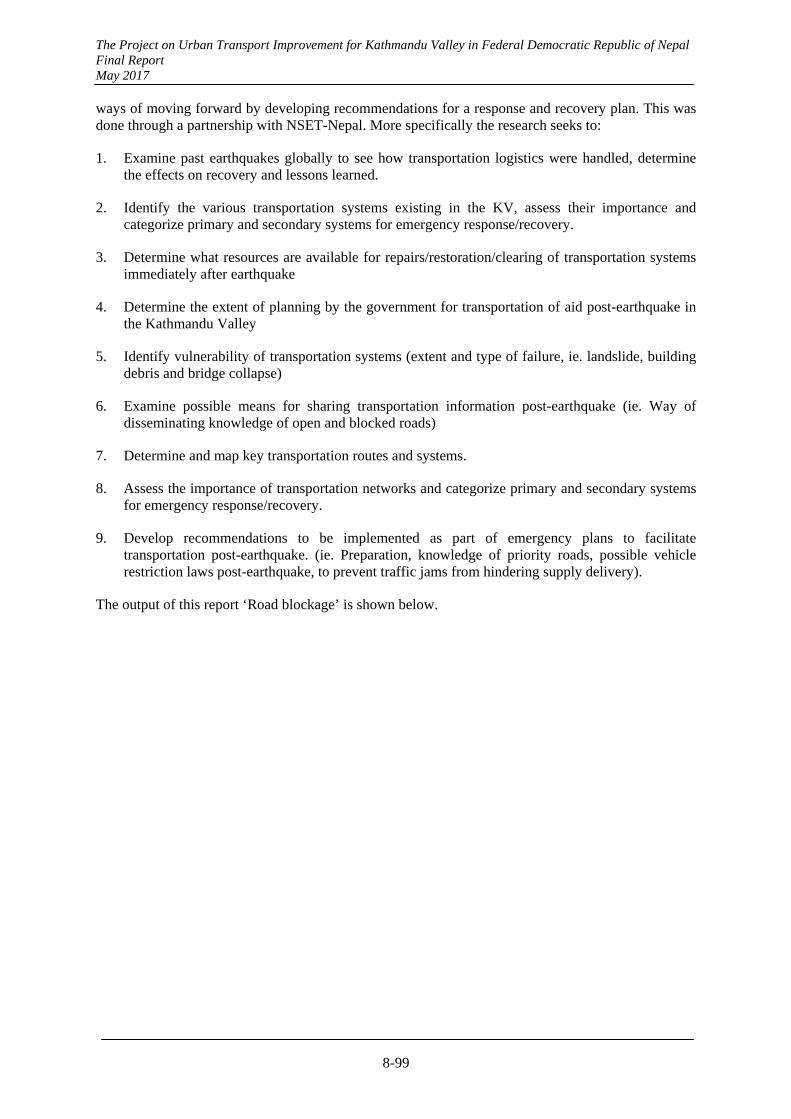
The Project on Urban Transport Improvement for Kathmandu Valley in Federal Democratic Republic of Nepal Final Report May 2017
8-99
ways of moving forward by developing recommendations for a response and recovery plan. This was done through a partnership with NSET-Nepal. More specifically the research seeks to:
1. Examine past earthquakes globally to see how transportation logistics were handled, determine the effects on recovery and lessons learned.
2. Identify the various transportation systems existing in the KV, assess their importance and categorize primary and secondary systems for emergency response/recovery.
3. Determine what resources are available for repairs/restoration/clearing of transportation systems immediately after earthquake
4. Determine the extent of planning by the government for transportation of aid post-earthquake in the Kathmandu Valley
5. Identify vulnerability of transportation systems (extent and type of failure, ie. landslide, building debris and bridge collapse)
6. Examine possible means for sharing transportation information post-earthquake (ie. Way of disseminating knowledge of open and blocked roads)
7. Determine and map key transportation routes and systems.
8. Assess the importance of transportation networks and categorize primary and secondary systems for emergency response/recovery.
9. Develop recommendations to be implemented as part of emergency plans to facilitate transportation post-earthquake. (ie. Preparation, knowledge of priority roads, possible vehicle restriction laws post-earthquake, to prevent traffic jams from hindering supply delivery).
The output of this report ‘Road blockage’ is shown below.
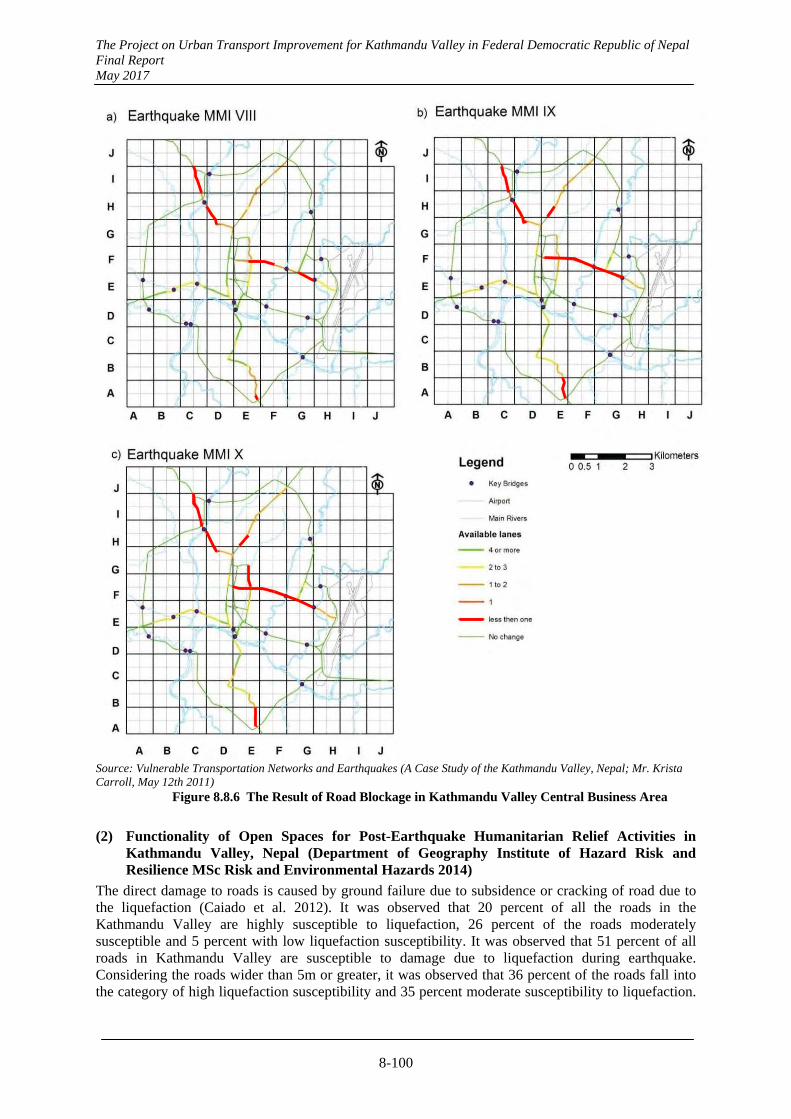
The Project on Urban Transport Improvement for Kathmandu Valley in Federal Democratic Republic of Nepal Final Report May 2017
8-100
Source: Vulnerable Transportation Networks and Earthquakes (A Case Study of the Kathmandu Valley, Nepal; Mr. Krista Carroll, May 12th 2011)
Figure 8.8.6 The Result of Road Blockage in Kathmandu Valley Central Business Area
(2) Functionality of Open Spaces for Post-Earthquake Humanitarian Relief Activities in Kathmandu Valley, Nepal (Department of Geography Institute of Hazard Risk and Resilience MSc Risk and Environmental Hazards 2014)
The direct damage to roads is caused by ground failure due to subsidence or cracking of road due to the liquefaction (Caiado et al. 2012). It was observed that 20 percent of all the roads in the Kathmandu Valley are highly susceptible to liquefaction, 26 percent of the roads moderately susceptible and 5 percent with low liquefaction susceptibility. It was observed that 51 percent of all roads in Kathmandu Valley are susceptible to damage due to liquefaction during earthquake. Considering the roads wider than 5m or greater, it was observed that 36 percent of the roads fall into the category of high liquefaction susceptibility and 35 percent moderate susceptibility to liquefaction.
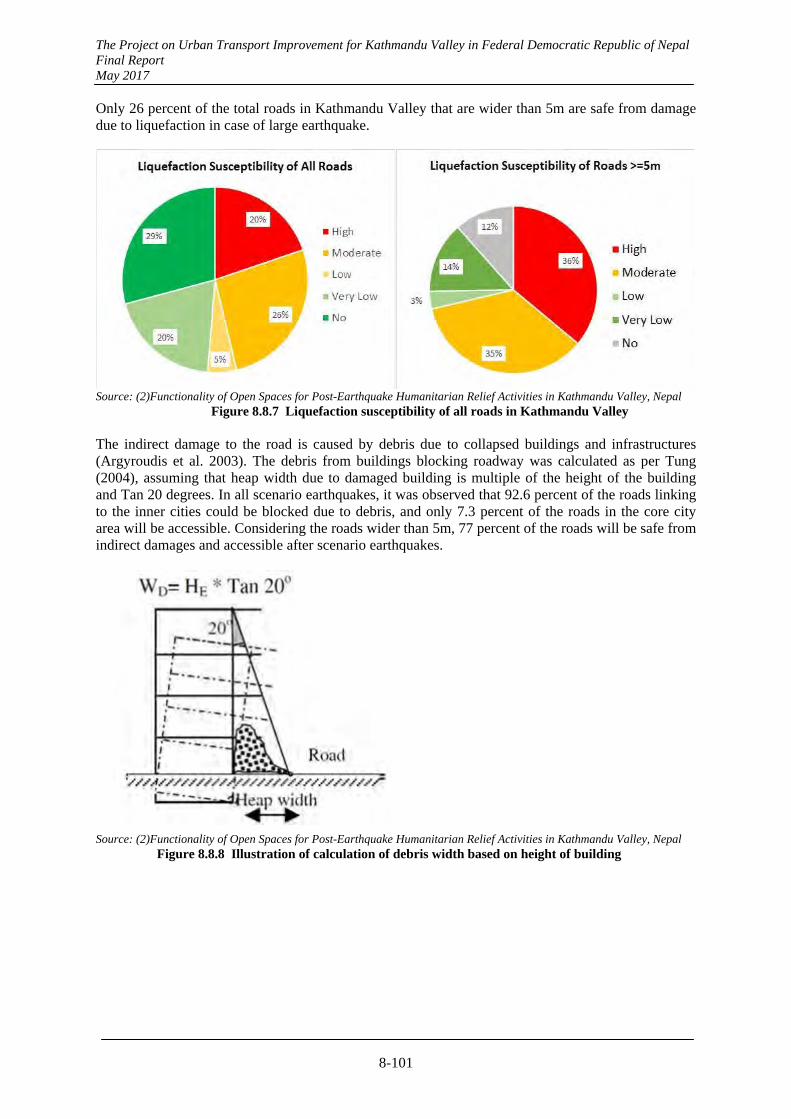
The Project on Urban Transport Improvement for Kathmandu Valley in Federal Democratic Republic of Nepal Final Report May 2017
8-101
Only 26 percent of the total roads in Kathmandu Valley that are wider than 5m are safe from damage due to liquefaction in case of large earthquake.
Source: (2)Functionality of Open Spaces for Post-Earthquake Humanitarian Relief Activities in Kathmandu Valley, Nepal
Figure 8.8.7 Liquefaction susceptibility of all roads in Kathmandu Valley The indirect damage to the road is caused by debris due to collapsed buildings and infrastructures (Argyroudis et al. 2003). The debris from buildings blocking roadway was calculated as per Tung (2004), assuming that heap width due to damaged building is multiple of the height of the building and Tan 20 degrees. In all scenario earthquakes, it was observed that 92.6 percent of the roads linking to the inner cities could be blocked due to debris, and only 7.3 percent of the roads in the core city area will be accessible. Considering the roads wider than 5m, 77 percent of the roads will be safe from indirect damages and accessible after scenario earthquakes.
Source: (2)Functionality of Open Spaces for Post-Earthquake Humanitarian Relief Activities in Kathmandu Valley, Nepal Figure 8.8.8 Illustration of calculation of debris width based on height of building
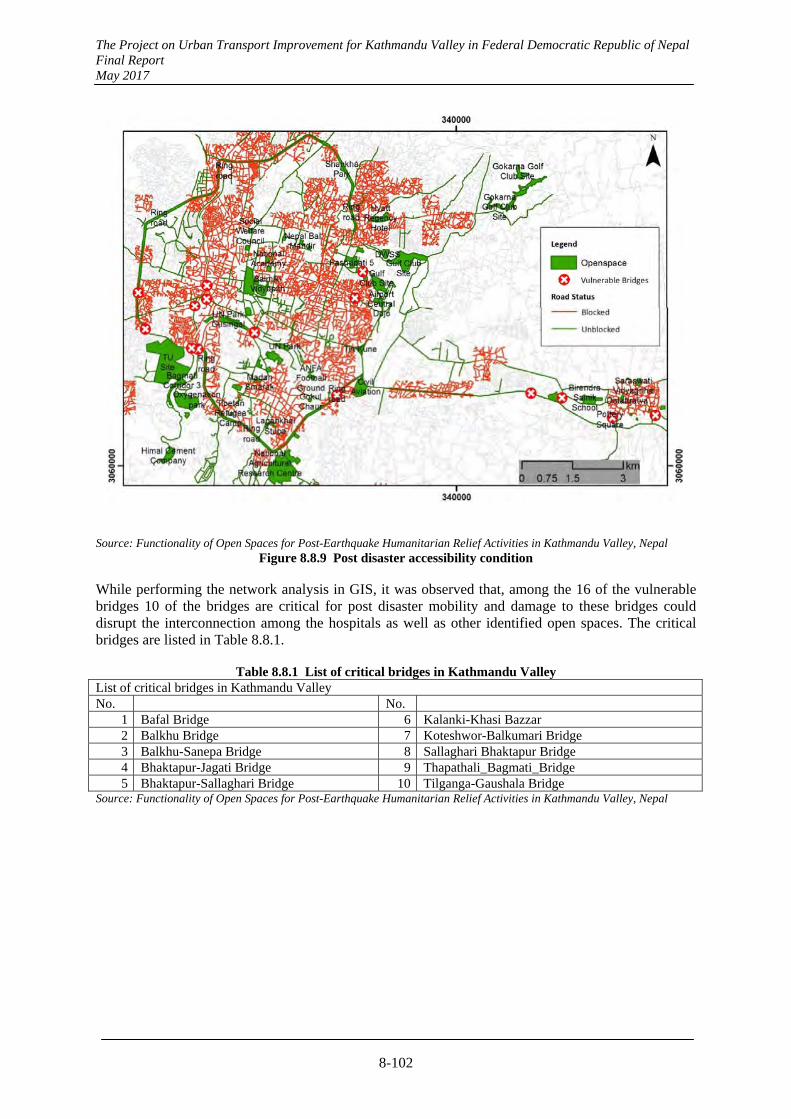
The Project on Urban Transport Improvement for Kathmandu Valley in Federal Democratic Republic of Nepal Final Report May 2017
8-102
Source: Functionality of Open Spaces for Post-Earthquake Humanitarian Relief Activities in Kathmandu Valley, Nepal Figure 8.8.9 Post disaster accessibility condition
While performing the network analysis in GIS, it was observed that, among the 16 of the vulnerable bridges 10 of the bridges are critical for post disaster mobility and damage to these bridges could disrupt the interconnection among the hospitals as well as other identified open spaces. The critical bridges are listed in Table 8.8.1.
Table 8.8.1 List of critical bridges in Kathmandu Valley List of critical bridges in Kathmandu Valley No. No.
1 Bafal Bridge 6 Kalanki-Khasi Bazzar 2 Balkhu Bridge 7 Koteshwor-Balkumari Bridge 3 Balkhu-Sanepa Bridge 8 Sallaghari Bhaktapur Bridge 4 Bhaktapur-Jagati Bridge 9 Thapathali_Bagmati_Bridge 5 Bhaktapur-Sallaghari Bridge 10 Tilganga-Gaushala Bridge
Source: Functionality of Open Spaces for Post-Earthquake Humanitarian Relief Activities in Kathmandu Valley, Nepal
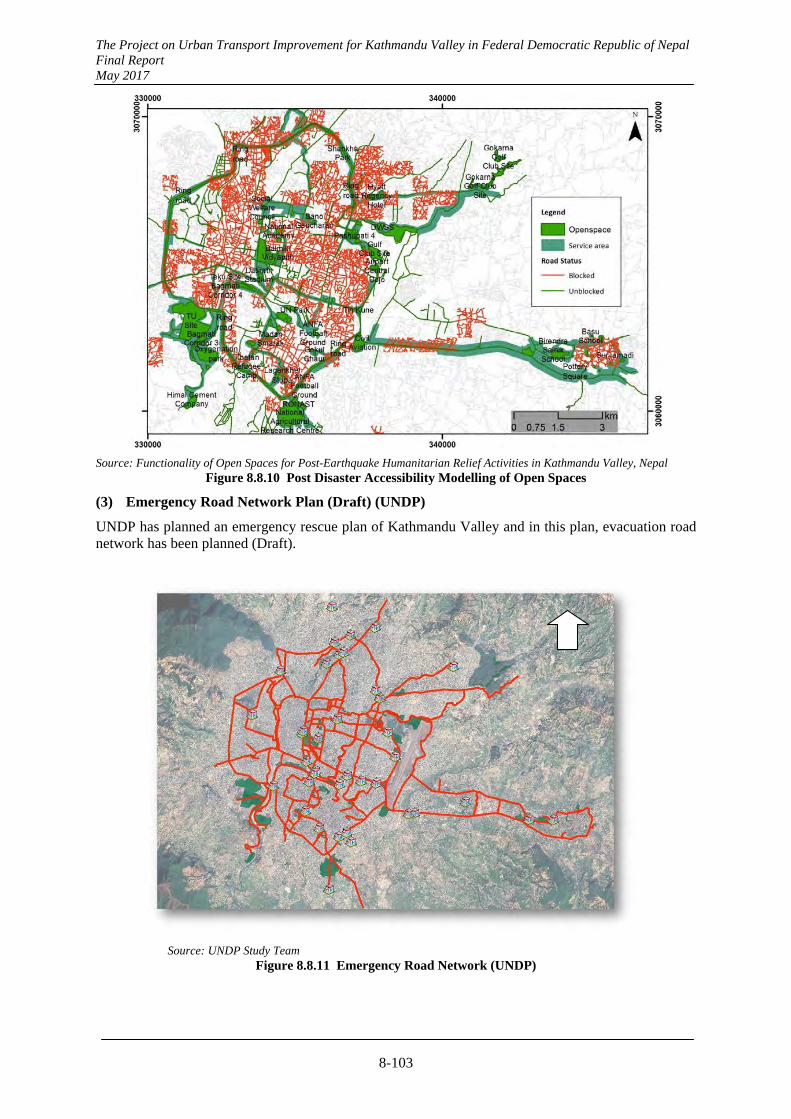
The Project on Urban Transport Improvement for Kathmandu Valley in Federal Democratic Republic of Nepal Final Report May 2017
8-103
Source: Functionality of Open Spaces for Post-Earthquake Humanitarian Relief Activities in Kathmandu Valley, Nepal Figure 8.8.10 Post Disaster Accessibility Modelling of Open Spaces
(3) Emergency Road Network Plan (Draft) (UNDP)
UNDP has planned an emergency rescue plan of Kathmandu Valley and in this plan, evacuation road network has been planned (Draft).
Source: UNDP Study Team Figure 8.8.11 Emergency Road Network (UNDP)
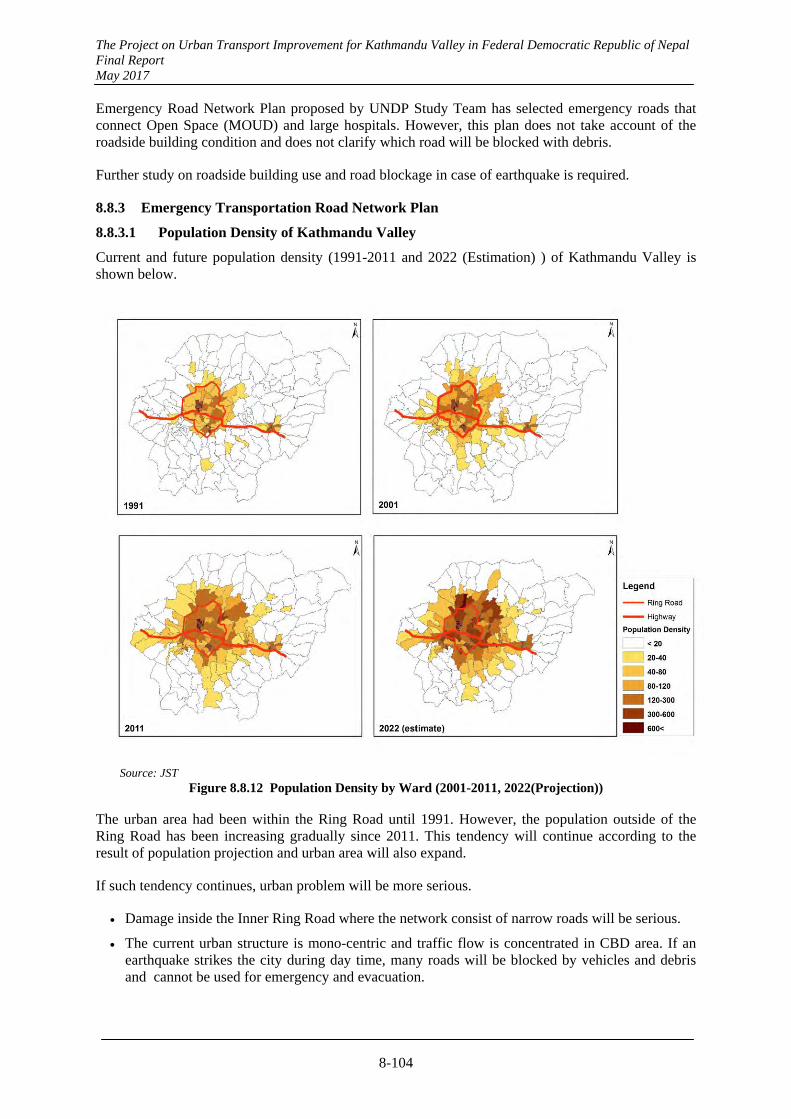
The Project on Urban Transport Improvement for Kathmandu Valley in Federal Democratic Republic of Nepal Final Report May 2017
8-104
Emergency Road Network Plan proposed by UNDP Study Team has selected emergency roads that connect Open Space (MOUD) and large hospitals. However, this plan does not take account of the roadside building condition and does not clarify which road will be blocked with debris.
Further study on roadside building use and road blockage in case of earthquake is required.
8.8.3 Emergency Transportation Road Network Plan
8.8.3.1 Population Density of Kathmandu Valley
Current and future population density (1991-2011 and 2022 (Estimation) ) of Kathmandu Valley is shown below.
Source: JST Figure 8.8.12 Population Density by Ward (2001-2011, 2022(Projection))
The urban area had been within the Ring Road until 1991. However, the population outside of the Ring Road has been increasing gradually since 2011. This tendency will continue according to the result of population projection and urban area will also expand.
If such tendency continues, urban problem will be more serious.
Damage inside the Inner Ring Road where the network consist of narrow roads will be serious.
The current urban structure is mono-centric and traffic flow is concentrated in CBD area. If an earthquake strikes the city during day time, many roads will be blocked by vehicles and debris and cannot be used for emergency and evacuation.
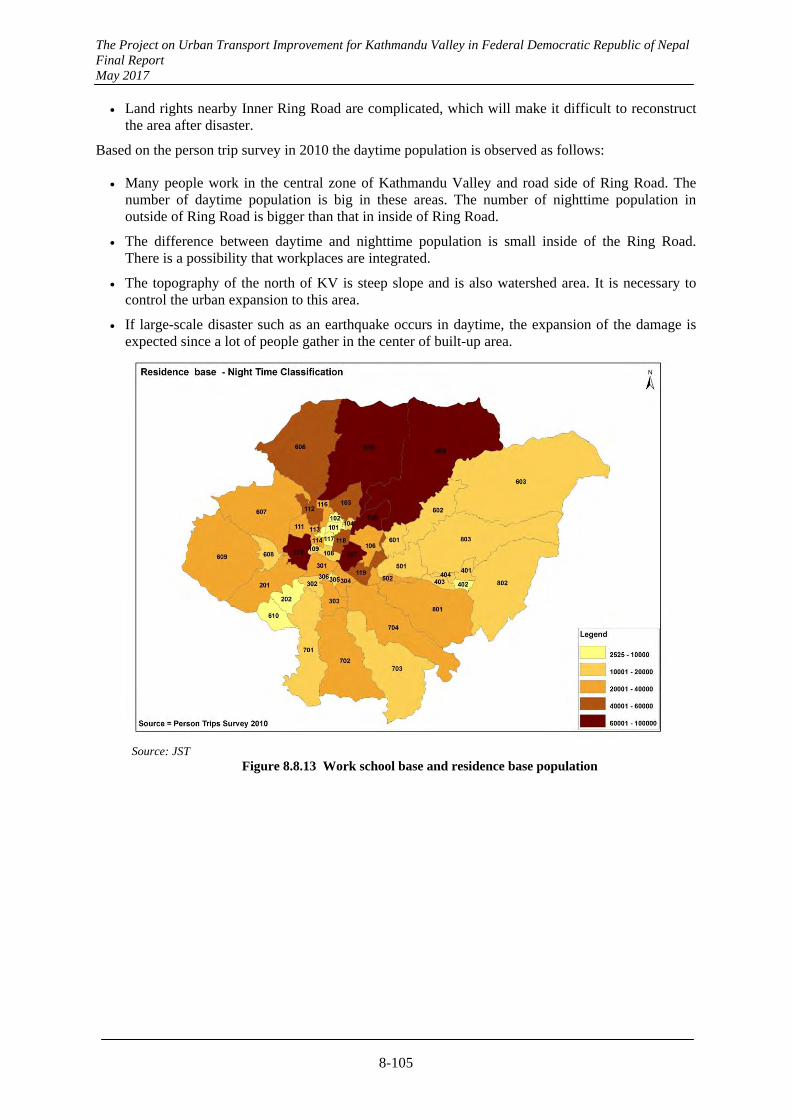
The Project on Urban Transport Improvement for Kathmandu Valley in Federal Democratic Republic of Nepal Final Report May 2017
8-105
Land rights nearby Inner Ring Road are complicated, which will make it difficult to reconstruct the area after disaster.
Based on the person trip survey in 2010 the daytime population is observed as follows:
Many people work in the central zone of Kathmandu Valley and road side of Ring Road. The number of daytime population is big in these areas. The number of nighttime population in outside of Ring Road is bigger than that in inside of Ring Road.
The difference between daytime and nighttime population is small inside of the Ring Road. There is a possibility that workplaces are integrated.
The topography of the north of KV is steep slope and is also watershed area. It is necessary to control the urban expansion to this area.
If large-scale disaster such as an earthquake occurs in daytime, the expansion of the damage is expected since a lot of people gather in the center of built-up area.
Source: JST Figure 8.8.13 Work school base and residence base population
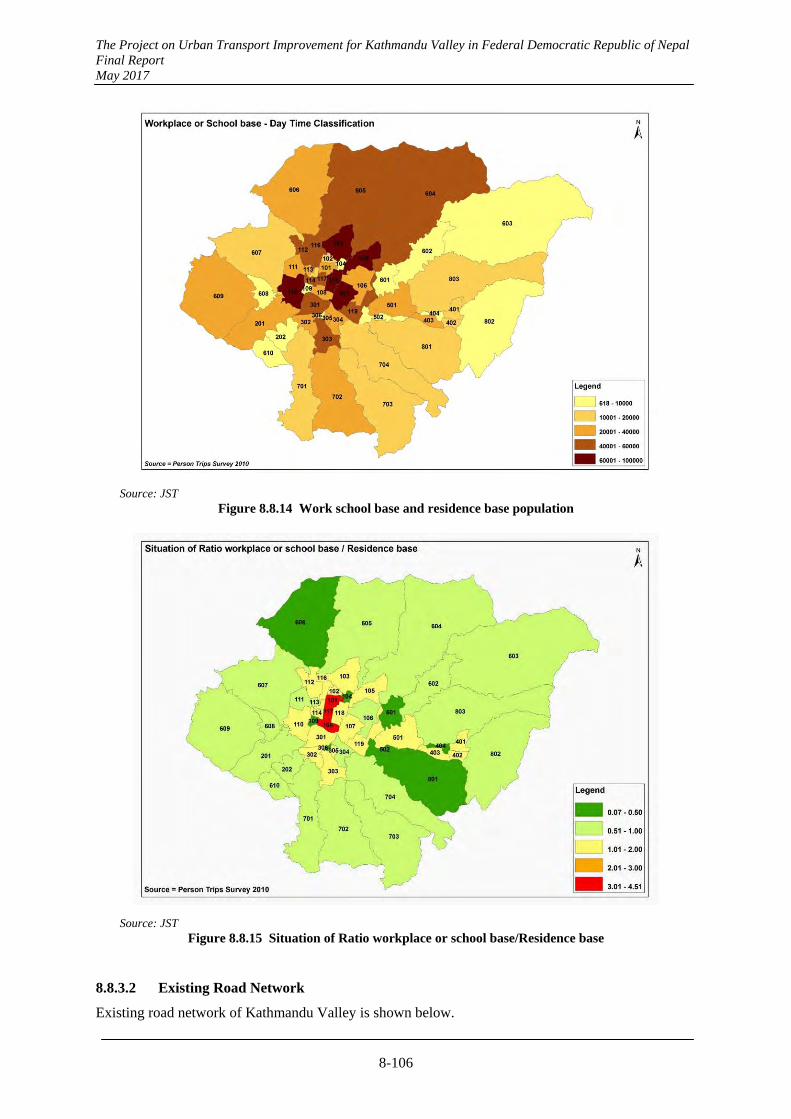
The Project on Urban Transport Improvement for Kathmandu Valley in Federal Democratic Republic of Nepal Final Report May 2017
8-106
Source: JST Figure 8.8.14 Work school base and residence base population
Source: JST Figure 8.8.15 Situation of Ratio workplace or school base/Residence base
8.8.3.2 Existing Road Network
Existing road network of Kathmandu Valley is shown below.
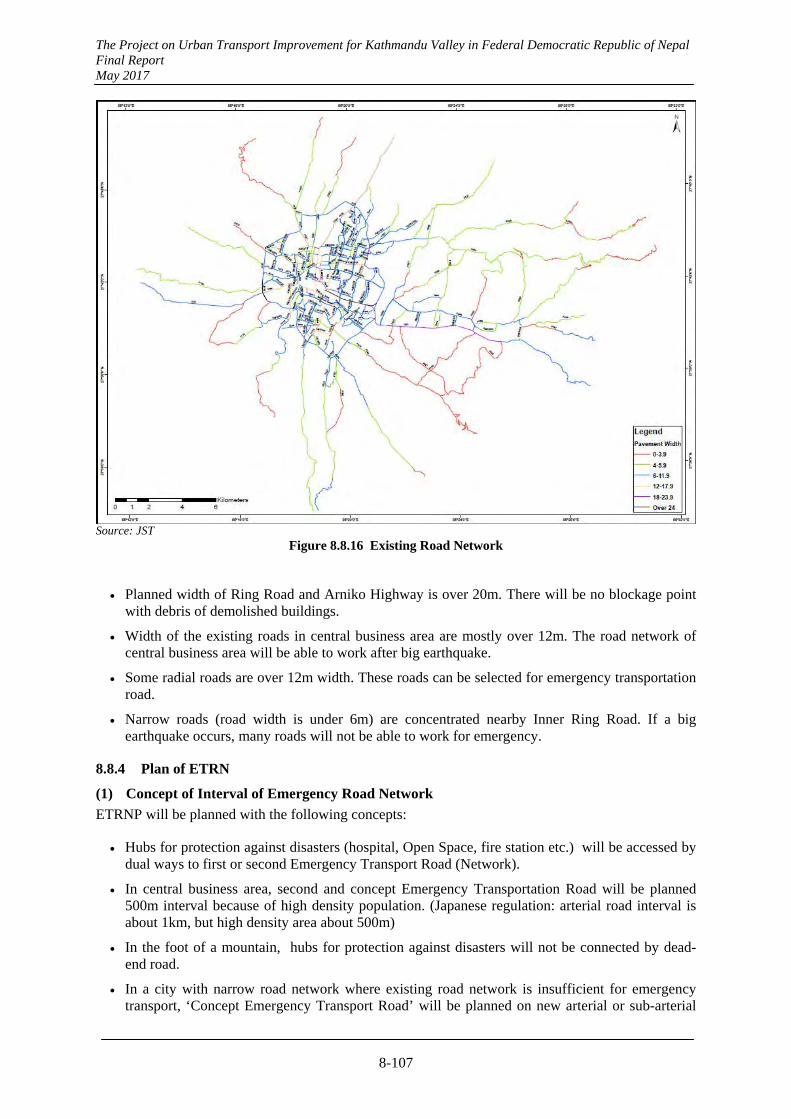
The Project on Urban Transport Improvement for Kathmandu Valley in Federal Democratic Republic of Nepal Final Report May 2017
8-107
Source: JST
Figure 8.8.16 Existing Road Network
Planned width of Ring Road and Arniko Highway is over 20m. There will be no blockage point with debris of demolished buildings.
Width of the existing roads in central business area are mostly over 12m. The road network of central business area will be able to work after big earthquake.
Some radial roads are over 12m width. These roads can be selected for emergency transportation road.
Narrow roads (road width is under 6m) are concentrated nearby Inner Ring Road. If a big earthquake occurs, many roads will not be able to work for emergency.
8.8.4 Plan of ETRN
(1) Concept of Interval of Emergency Road Network
ETRNP will be planned with the following concepts:
Hubs for protection against disasters (hospital, Open Space, fire station etc.) will be accessed by dual ways to first or second Emergency Transport Road (Network).
In central business area, second and concept Emergency Transportation Road will be planned 500m interval because of high density population. (Japanese regulation: arterial road interval is about 1km, but high density area about 500m)
In the foot of a mountain, hubs for protection against disasters will not be connected by dead-end road.
In a city with narrow road network where existing road network is insufficient for emergency transport, ‘Concept Emergency Transport Road’ will be planned on new arterial or sub-arterial
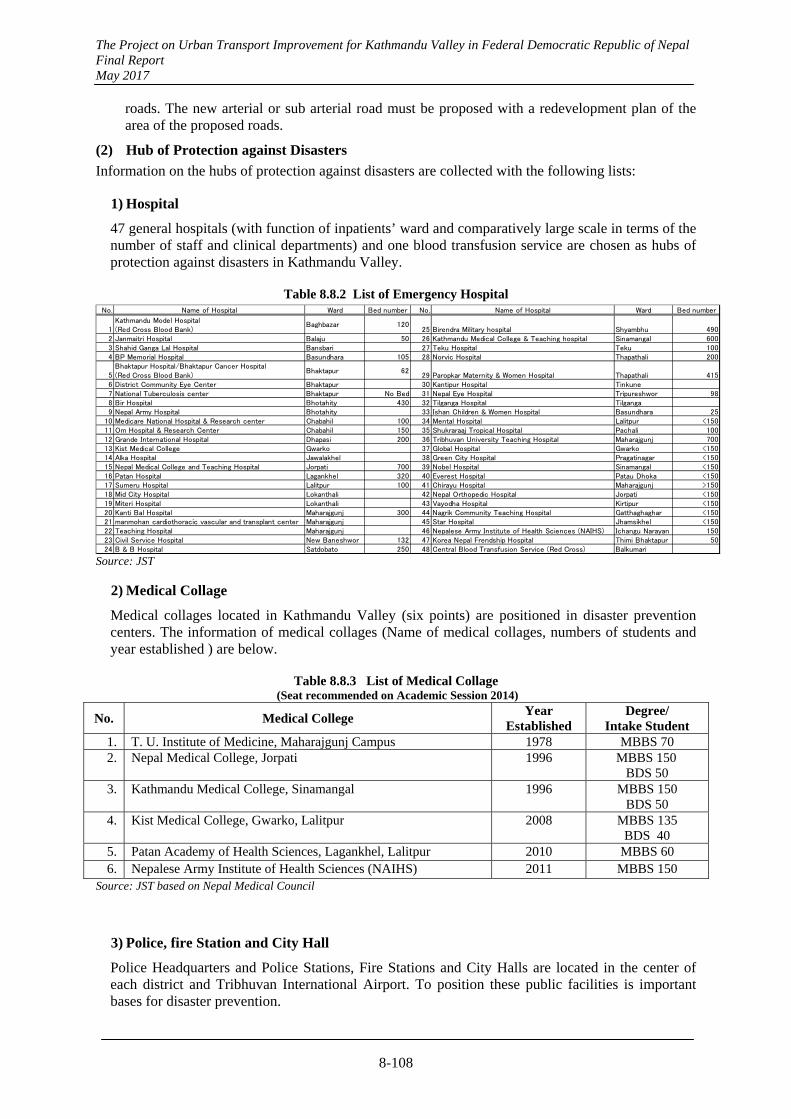
The Project on Urban Transport Improvement for Kathmandu Valley in Federal Democratic Republic of Nepal Final Report May 2017
8-108
No. Name of Hospital Ward Bed number No. Name of Hospital Ward Bed number
1Kathmandu Model Hospital(Red Cross Blood Bank)
Baghbazar 12025 Birendra Military hospital Shyambhu 490
2 Janmaitri Hospital Balaju 50 26 Kathmandu Medical College & Teaching hospital Sinamangal 6003 Shahid Ganga Lal Hospital Bansbari 27 Teku Hospital Teku 1004 BP Memorial Hospital Basundhara 105 28 Norvic Hospital Thapathali 200
5Bhaktapur Hospital/Bhaktapur Cancer Hospital(Red Cross Blood Bank)
Bhaktapur 6229 Paropkar Maternity & Women Hospital Thapathali 415
6 District Community Eye Center Bhaktapur 30 Kantipur Hospital Tinkune7 National Tuberculosis center Bhaktapur No Bed 31 Nepal Eye Hospital Tripureshwor 988 Bir Hospital Bhotahity 430 32 Tilganga Hospital Tilganga9 Nepal Army Hospital Bhotahity 33 Ishan Children & Women Hospital Basundhara 25
10 Medicare National Hospital & Research center Chabahil 100 34 Mental Hospital Lalitpur <15011 Om Hospital & Research Center Chabahil 150 35 Shukraraaj Tropical Hospital Pachali 10012 Grande International Hospital Dhapasi 200 36 Tribhuvan University Teaching Hospital Maharajgunj 70013 Kist Medical College Gwarko 37 Global Hospital Gwarko <15014 Alka Hospital Jawalakhel 38 Green City Hospital Pragatinagar <15015 Nepal Medical College and Teaching Hospital Jorpati 700 39 Nobel Hospital Sinamangal <15016 Patan Hospital Lagankhel 320 40 Everest Hospital Patau Dhoka <15017 Sumeru Hospital Lalitpur 100 41 Chirayu Hospital Maharajgunj >15018 Mid City Hospital Lokanthali 42 Nepal Orthopedic Hospital Jorpati <15019 Miteri Hospital Lokanthali 43 Vayodha Hospital Kirtipur <15020 Kanti Bal Hospital Maharajgunj 300 44 Nagrik Community Teaching Hospital Gatthaghaghar <15021 manmohan cardiothoracic vascular and transplant center Maharajgunj 45 Star Hospital Jhamsikhel <15022 Teaching Hospital Maharajgunj 46 Nepalese Army Institute of Health Sciences (NAIHS) Ichangu Narayan 15023 Civil Service Hospital New Baneshwor 132 47 Korea Nepal Frendship Hospital Thimi Bhaktapur 5024 B & B Hospital Satdobato 250 48 Central Blood Transfusion Service (Red Cross) Balkumari
roads. The new arterial or sub arterial road must be proposed with a redevelopment plan of the area of the proposed roads.
(2) Hub of Protection against Disasters
Information on the hubs of protection against disasters are collected with the following lists:
1) Hospital
47 general hospitals (with function of inpatients’ ward and comparatively large scale in terms of the number of staff and clinical departments) and one blood transfusion service are chosen as hubs of protection against disasters in Kathmandu Valley.
Table 8.8.2 List of Emergency Hospital
Source: JST
2) Medical Collage
Medical collages located in Kathmandu Valley (six points) are positioned in disaster prevention centers. The information of medical collages (Name of medical collages, numbers of students and year established ) are below.
Table 8.8.3 List of Medical Collage (Seat recommended on Academic Session 2014)
No. Medical College Year
Established Degree/
Intake Student 1. T. U. Institute of Medicine, Maharajgunj Campus 1978 MBBS 70 2. Nepal Medical College, Jorpati 1996 MBBS 150
BDS 50 3. Kathmandu Medical College, Sinamangal 1996 MBBS 150
BDS 50 4. Kist Medical College, Gwarko, Lalitpur 2008 MBBS 135
BDS 40 5. Patan Academy of Health Sciences, Lagankhel, Lalitpur 2010 MBBS 60 6. Nepalese Army Institute of Health Sciences (NAIHS) 2011 MBBS 150
Source: JST based on Nepal Medical Council
3) Police, fire Station and City Hall
Police Headquarters and Police Stations, Fire Stations and City Halls are located in the center of each district and Tribhuvan International Airport. To position these public facilities is important bases for disaster prevention.
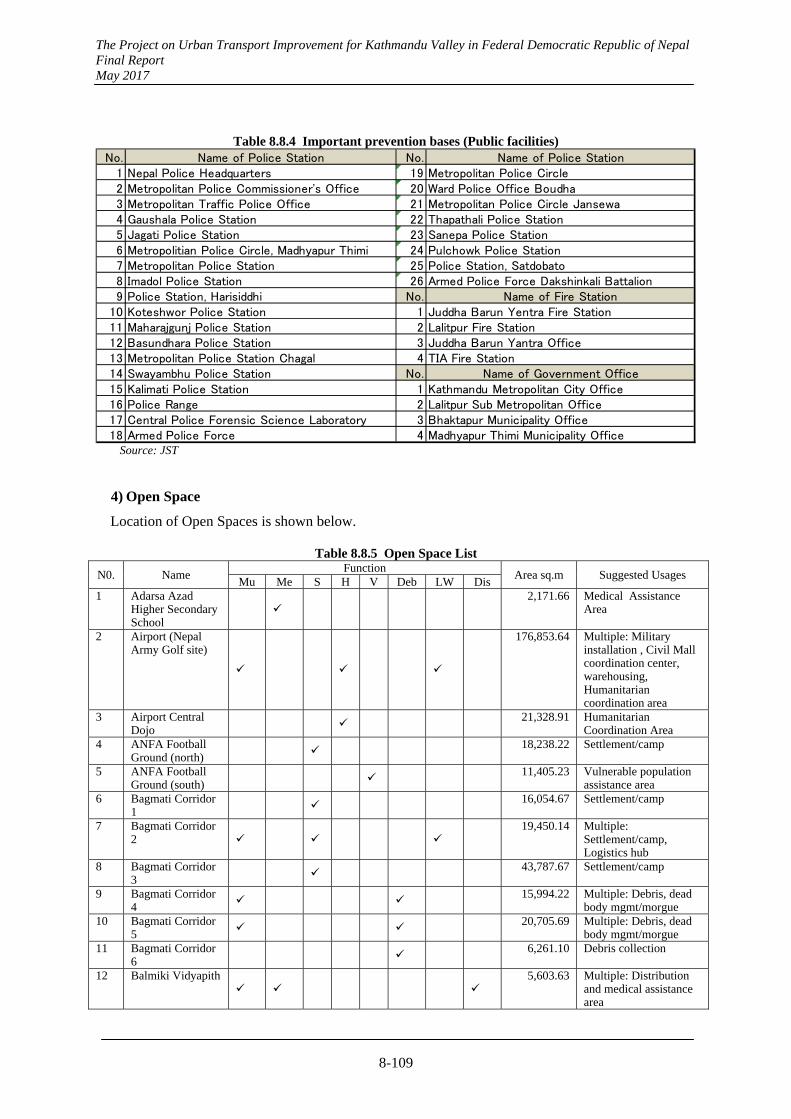
The Project on Urban Transport Improvement for Kathmandu Valley in Federal Democratic Republic of Nepal Final Report May 2017
8-109
Table 8.8.4 Important prevention bases (Public facilities) No. Name of Police Station No. Name of Police Station
1 Nepal Police Headquarters 19 Metropolitan Police Circle2 Metropolitan Police Commissioner's Office 20 Ward Police Office Boudha3 Metropolitan Traffic Police Office 21 Metropolitan Police Circle Jansewa4 Gaushala Police Station 22 Thapathali Police Station5 Jagati Police Station 23 Sanepa Police Station6 Metropolitian Police Circle, Madhyapur Thimi 24 Pulchowk Police Station7 Metropolitan Police Station 25 Police Station, Satdobato8 Imadol Police Station 26 Armed Police Force Dakshinkali Battalion9 Police Station, Harisiddhi No. Name of Fire Station
10 Koteshwor Police Station 1 Juddha Barun Yentra Fire Station11 Maharajgunj Police Station 2 Lalitpur Fire Station12 Basundhara Police Station 3 Juddha Barun Yantra Office13 Metropolitan Police Station Chagal 4 TIA Fire Station14 Swayambhu Police Station No. Name of Government Office15 Kalimati Police Station 1 Kathmandu Metropolitan City Office16 Police Range 2 Lalitpur Sub Metropolitan Office17 Central Police Forensic Science Laboratory 3 Bhaktapur Municipality Office18 Armed Police Force 4 Madhyapur Thimi Municipality Office
Source: JST
4) Open Space
Location of Open Spaces is shown below.
Table 8.8.5 Open Space List
N0. Name Function
Area sq.m Suggested Usages Mu Me S H V Deb LW Dis
1 Adarsa Azad Higher Secondary School
2,171.66 Medical Assistance Area
2 Airport (Nepal Army Golf site)
176,853.64 Multiple: Military installation , Civil Mall coordination center, warehousing, Humanitarian coordination area
3 Airport Central Dojo
21,328.91 Humanitarian Coordination Area
4 ANFA Football Ground (north)
18,238.22 Settlement/camp
5 ANFA Football Ground (south)
11,405.23 Vulnerable population assistance area
6 Bagmati Corridor 1
16,054.67 Settlement/camp
7 Bagmati Corridor 2
19,450.14 Multiple: Settlement/camp, Logistics hub
8 Bagmati Corridor 3
43,787.67 Settlement/camp
9 Bagmati Corridor 4
15,994.22 Multiple: Debris, dead body mgmt/morgue
10 Bagmati Corridor 5 20,705.69 Multiple: Debris, dead
body mgmt/morgue11 Bagmati Corridor
6
6,261.10 Debris collection
12 Balmiki Vidyapith
5,603.63 Multiple: Distribution and medical assistance area
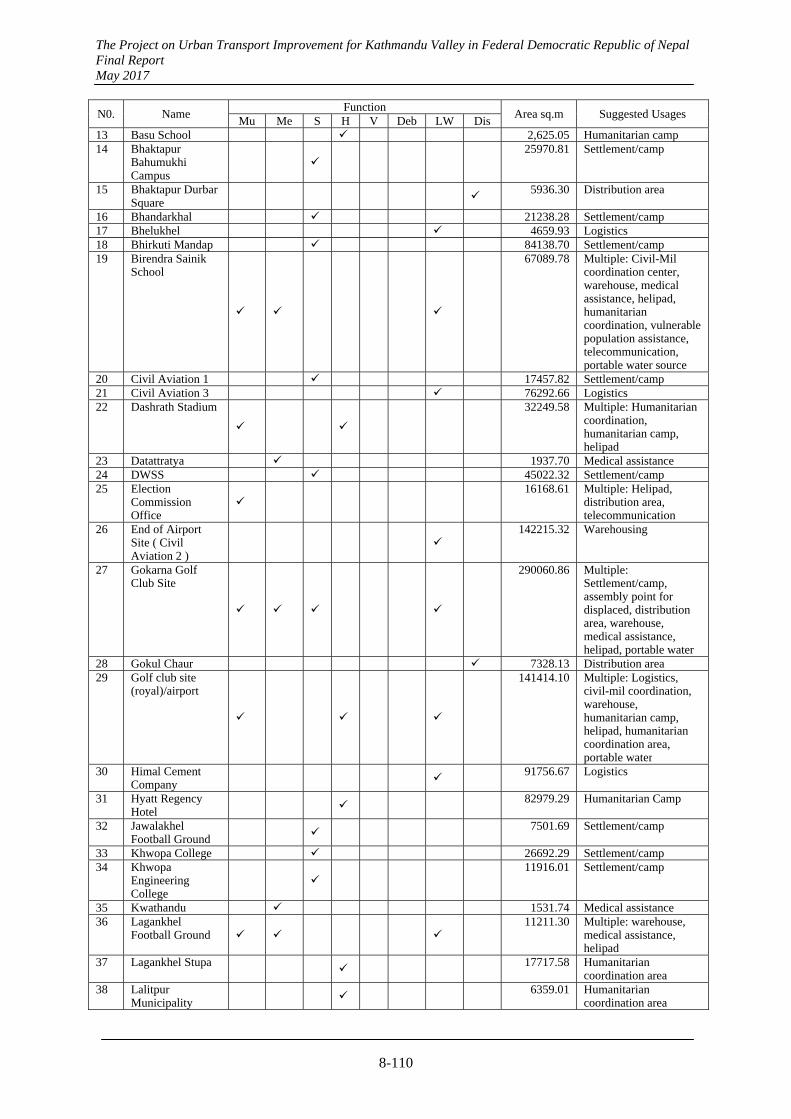
The Project on Urban Transport Improvement for Kathmandu Valley in Federal Democratic Republic of Nepal Final Report May 2017
8-110
N0. Name Function
Area sq.m Suggested Usages Mu Me S H V Deb LW Dis
13 Basu School 2,625.05 Humanitarian camp14 Bhaktapur
Bahumukhi Campus
25970.81 Settlement/camp
15 Bhaktapur Durbar Square
5936.30 Distribution area
16 Bhandarkhal 21238.28 Settlement/camp17 Bhelukhel 4659.93 Logistics 18 Bhirkuti Mandap 84138.70 Settlement/camp19 Birendra Sainik
School
67089.78 Multiple: Civil-Mil coordination center, warehouse, medical assistance, helipad, humanitarian coordination, vulnerable population assistance, telecommunication, portable water source
20 Civil Aviation 1 17457.82 Settlement/camp21 Civil Aviation 3 76292.66 Logistics 22 Dashrath Stadium
32249.58 Multiple: Humanitarian coordination, humanitarian camp, helipad
23 Datattratya 1937.70 Medical assistance24 DWSS 45022.32 Settlement/camp25 Election
Commission Office
16168.61 Multiple: Helipad,
distribution area, telecommunication
26 End of Airport Site ( Civil Aviation 2 )
142215.32 Warehousing
27 Gokarna Golf Club Site
290060.86 Multiple: Settlement/camp, assembly point for displaced, distribution area, warehouse, medical assistance, helipad, portable water
28 Gokul Chaur 7328.13 Distribution area29 Golf club site
(royal)/airport
141414.10 Multiple: Logistics, civil-mil coordination, warehouse, humanitarian camp, helipad, humanitarian coordination area, portable water
30 Himal Cement Company
91756.67 Logistics
31 Hyatt Regency Hotel
82979.29 Humanitarian Camp
32 Jawalakhel Football Ground
7501.69 Settlement/camp
33 Khwopa College 26692.29 Settlement/camp34 Khwopa
Engineering College
11916.01 Settlement/camp
35 Kwathandu 1531.74 Medical assistance36 Lagankhel
Football Ground
11211.30 Multiple: warehouse,
medical assistance, helipad
37 Lagankhel Stupa
17717.58 Humanitarian coordination area
38 Lalitpur Municipality
6359.01 Humanitarian coordination area
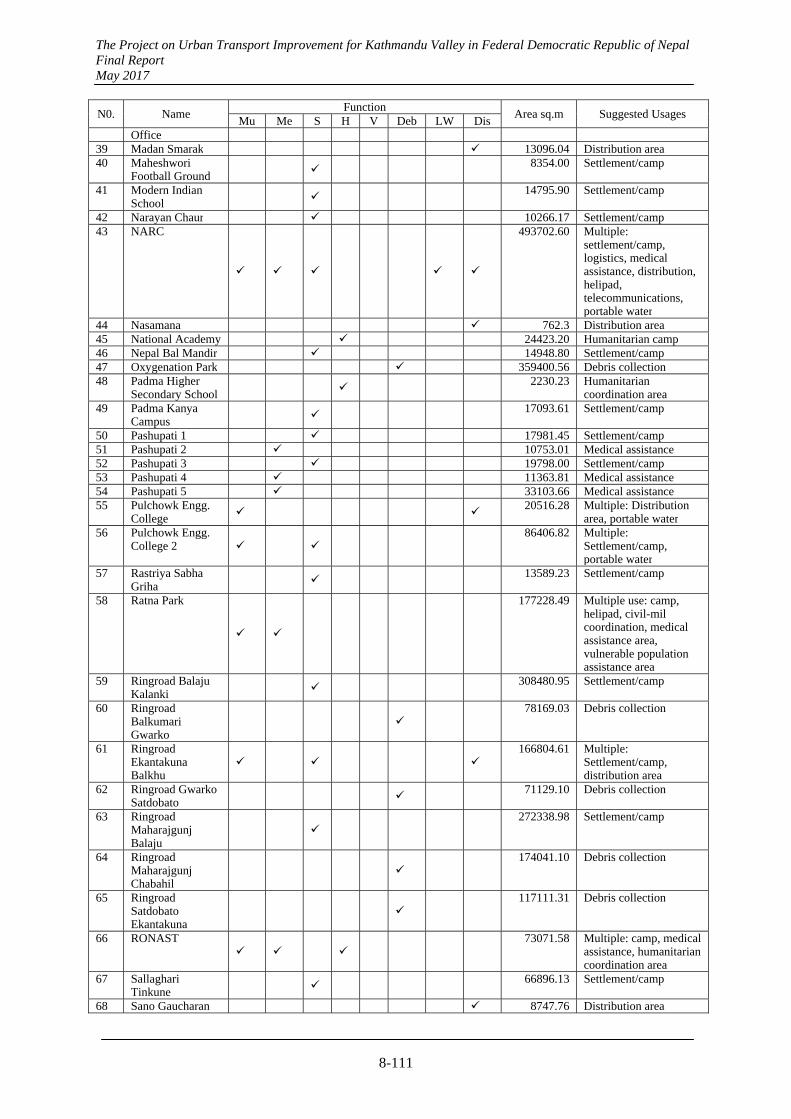
The Project on Urban Transport Improvement for Kathmandu Valley in Federal Democratic Republic of Nepal Final Report May 2017
8-111
N0. Name Function
Area sq.m Suggested Usages Mu Me S H V Deb LW Dis
Office 39 Madan Smarak 13096.04 Distribution area40 Maheshwori
Football Ground 8354.00 Settlement/camp
41 Modern Indian School
14795.90 Settlement/camp
42 Narayan Chaur 10266.17 Settlement/camp43 NARC
493702.60 Multiple: settlement/camp, logistics, medical assistance, distribution, helipad, telecommunications, portable water
44 Nasamana 762.3 Distribution area45 National Academy 24423.20 Humanitarian camp46 Nepal Bal Mandir 14948.80 Settlement/camp47 Oxygenation Park 359400.56 Debris collection48 Padma Higher
Secondary School 2230.23 Humanitarian
coordination area49 Padma Kanya
Campus 17093.61 Settlement/camp
50 Pashupati 1 17981.45 Settlement/camp51 Pashupati 2 10753.01 Medical assistance52 Pashupati 3 19798.00 Settlement/camp53 Pashupati 4 11363.81 Medical assistance54 Pashupati 5 33103.66 Medical assistance55 Pulchowk Engg.
College
20516.28 Multiple: Distribution
area, portable water56 Pulchowk Engg.
College 2
86406.82 Multiple:
Settlement/camp, portable water
57 Rastriya Sabha Griha
13589.23 Settlement/camp
58 Ratna Park
177228.49 Multiple use: camp, helipad, civil-mil coordination, medical assistance area, vulnerable population assistance area
59 Ringroad Balaju Kalanki
308480.95 Settlement/camp
60 Ringroad Balkumari Gwarko
78169.03 Debris collection
61 Ringroad Ekantakuna Balkhu
166804.61 Multiple:
Settlement/camp, distribution area
62 Ringroad Gwarko Satdobato
71129.10 Debris collection
63 Ringroad Maharajgunj Balaju
272338.98 Settlement/camp
64 Ringroad Maharajgunj Chabahil
174041.10 Debris collection
65 Ringroad Satdobato Ekantakuna
117111.31 Debris collection
66 RONAST
73071.58 Multiple: camp, medical assistance, humanitarian coordination area
67 Sallaghari Tinkune
66896.13 Settlement/camp
68 Sano Gaucharan 8747.76 Distribution area
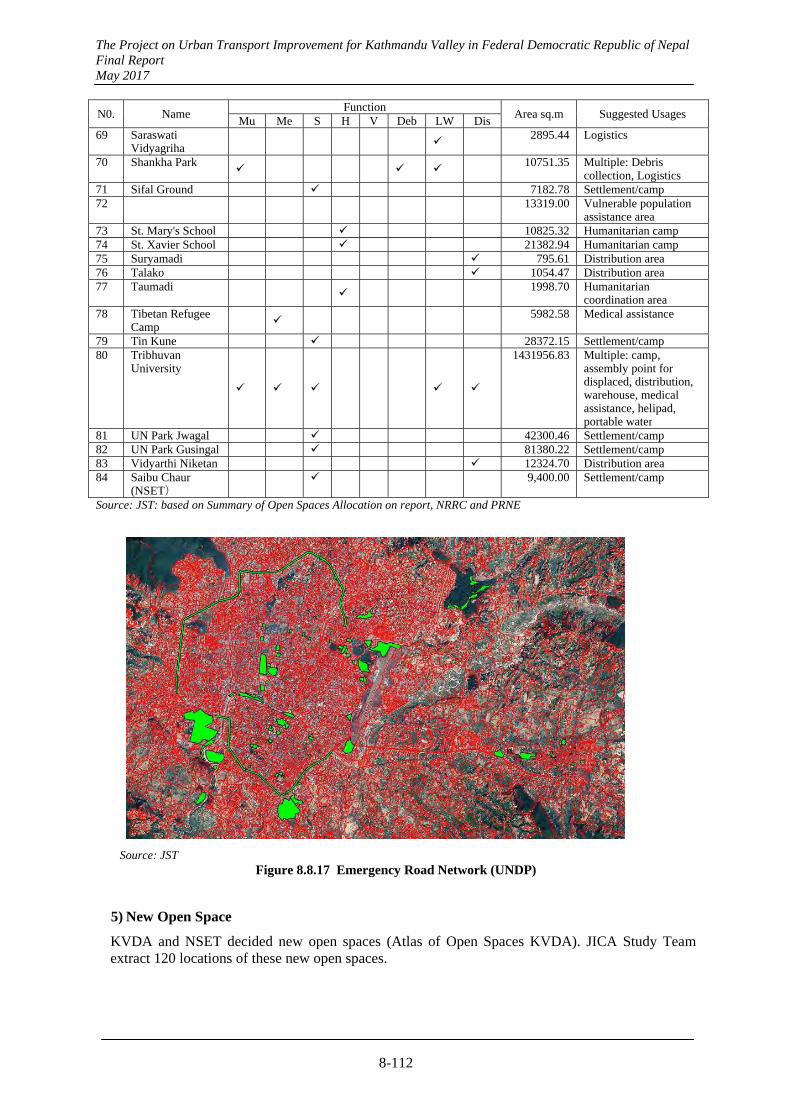
The Project on Urban Transport Improvement for Kathmandu Valley in Federal Democratic Republic of Nepal Final Report May 2017
8-112
N0. Name Function
Area sq.m Suggested Usages Mu Me S H V Deb LW Dis
69 Saraswati Vidyagriha
2895.44 Logistics
70 Shankha Park
10751.35 Multiple: Debris collection, Logistics
71 Sifal Ground 7182.78 Settlement/camp72 Social Welfare
Council 13319.00 Vulnerable population
assistance area73 St. Mary's School 10825.32 Humanitarian camp74 St. Xavier School 21382.94 Humanitarian camp75 Suryamadi 795.61 Distribution area76 Talako 1054.47 Distribution area77 Taumadi 1998.70 Humanitarian
coordination area78 Tibetan Refugee
Camp 5982.58 Medical assistance
79 Tin Kune 28372.15 Settlement/camp80 Tribhuvan
University
1431956.83 Multiple: camp, assembly point for displaced, distribution, warehouse, medical assistance, helipad, portable water
81 UN Park Jwagal 42300.46 Settlement/camp82 UN Park Gusingal 81380.22 Settlement/camp83 Vidyarthi Niketan 12324.70 Distribution area84 Saibu Chaur
(NSET) 9,400.00 Settlement/camp
Source: JST: based on Summary of Open Spaces Allocation on report, NRRC and PRNE
Source: JST Figure 8.8.17 Emergency Road Network (UNDP)
5) New Open Space
KVDA and NSET decided new open spaces (Atlas of Open Spaces KVDA). JICA Study Team extract 120 locations of these new open spaces.
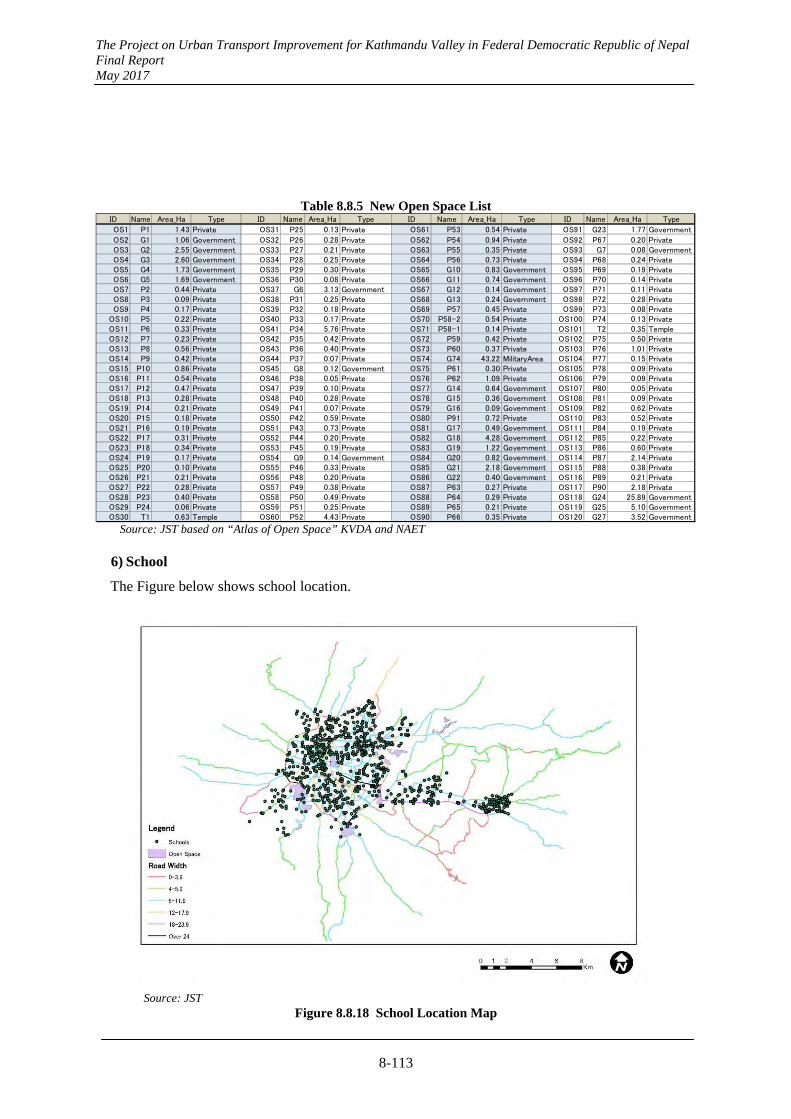
The Project on Urban Transport Improvement for Kathmandu Valley in Federal Democratic Republic of Nepal Final Report May 2017
8-113
Table 8.8.5 New Open Space List ID Name Area_Ha Type ID Name Area_Ha Type ID Name Area_Ha Type ID Name Area_Ha Type
OS1 P1 1.43 Private OS31 P25 0.13 Private OS61 P53 0.54 Private OS91 G23 1.77 Government
OS2 G1 1.06 Government OS32 P26 0.28 Private OS62 P54 0.94 Private OS92 P67 0.20 PrivateOS3 G2 2.55 Government OS33 P27 0.21 Private OS63 P55 0.35 Private OS93 G7 0.08 GovernmentOS4 G3 2.60 Government OS34 P28 0.25 Private OS64 P56 0.73 Private OS94 P68 0.24 PrivateOS5 G4 1.73 Government OS35 P29 0.30 Private OS65 G10 0.83 Government OS95 P69 0.19 PrivateOS6 G5 1.69 Government OS36 P30 0.08 Private OS66 G11 0.74 Government OS96 P70 0.14 PrivateOS7 P2 0.44 Private OS37 G6 3.13 Government OS67 G12 0.14 Government OS97 P71 0.11 PrivateOS8 P3 0.09 Private OS38 P31 0.25 Private OS68 G13 0.24 Government OS98 P72 0.28 PrivateOS9 P4 0.17 Private OS39 P32 0.18 Private OS69 P57 0.45 Private OS99 P73 0.08 Private
OS10 P5 0.22 Private OS40 P33 0.17 Private OS70 P58-2 0.54 Private OS100 P74 0.13 PrivateOS11 P6 0.33 Private OS41 P34 5.76 Private OS71 P58-1 0.14 Private OS101 T2 0.35 TempleOS12 P7 0.23 Private OS42 P35 0.42 Private OS72 P59 0.42 Private OS102 P75 0.50 PrivateOS13 P8 0.56 Private OS43 P36 0.40 Private OS73 P60 0.37 Private OS103 P76 1.01 PrivateOS14 P9 0.42 Private OS44 P37 0.07 Private OS74 G74 43.22 MilitaryArea OS104 P77 0.15 PrivateOS15 P10 0.86 Private OS45 G8 0.12 Government OS75 P61 0.30 Private OS105 P78 0.09 PrivateOS16 P11 0.54 Private OS46 P38 0.05 Private OS76 P62 1.09 Private OS106 P79 0.09 PrivateOS17 P12 0.47 Private OS47 P39 0.10 Private OS77 G14 0.64 Government OS107 P80 0.05 PrivateOS18 P13 0.28 Private OS48 P40 0.28 Private OS78 G15 0.36 Government OS108 P81 0.09 PrivateOS19 P14 0.21 Private OS49 P41 0.07 Private OS79 G16 0.09 Government OS109 P82 0.62 PrivateOS20 P15 0.18 Private OS50 P42 0.59 Private OS80 P91 0.72 Private OS110 P83 0.52 PrivateOS21 P16 0.19 Private OS51 P43 0.73 Private OS81 G17 0.49 Government OS111 P84 0.19 PrivateOS22 P17 0.31 Private OS52 P44 0.20 Private OS82 G18 4.28 Government OS112 P85 0.22 PrivateOS23 P18 0.34 Private OS53 P45 0.19 Private OS83 G19 1.22 Government OS113 P86 0.60 PrivateOS24 P19 0.17 Private OS54 G9 0.14 Government OS84 G20 0.82 Government OS114 P87 2.14 PrivateOS25 P20 0.10 Private OS55 P46 0.33 Private OS85 G21 2.18 Government OS115 P88 0.38 PrivateOS26 P21 0.21 Private OS56 P48 0.20 Private OS86 G22 0.40 Government OS116 P89 0.21 PrivateOS27 P22 0.28 Private OS57 P49 0.38 Private OS87 P63 0.27 Private OS117 P90 2.18 PrivateOS28 P23 0.40 Private OS58 P50 0.49 Private OS88 P64 0.29 Private OS118 G24 25.89 GovernmentOS29 P24 0.06 Private OS59 P51 0.25 Private OS89 P65 0.21 Private OS119 G25 5.10 GovernmentOS30 T1 0.63 Temple OS60 P52 4.43 Private OS90 P66 0.35 Private OS120 G27 3.52 Government
Source: JST based on “Atlas of Open Space” KVDA and NAET
6) School
The Figure below shows school location.
Source: JST Figure 8.8.18 School Location Map
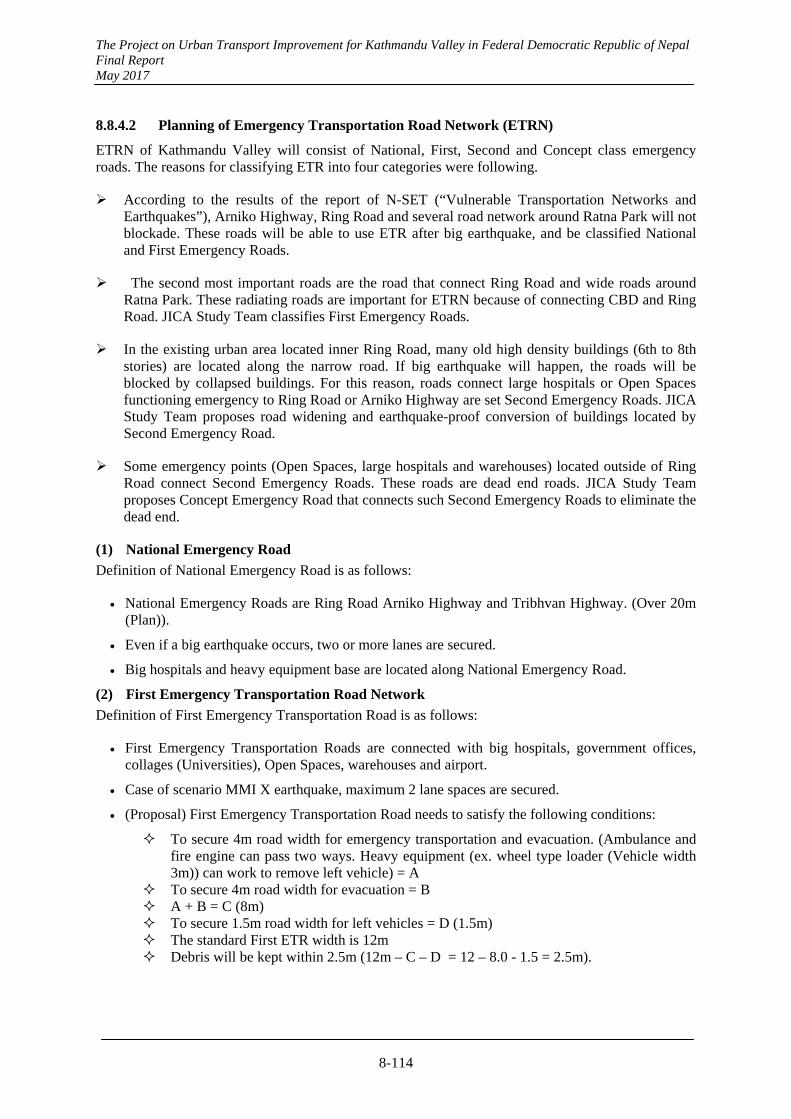
The Project on Urban Transport Improvement for Kathmandu Valley in Federal Democratic Republic of Nepal Final Report May 2017
8-114
8.8.4.2 Planning of Emergency Transportation Road Network (ETRN)
ETRN of Kathmandu Valley will consist of National, First, Second and Concept class emergency roads. The reasons for classifying ETR into four categories were following.
According to the results of the report of N-SET (“Vulnerable Transportation Networks and Earthquakes”), Arniko Highway, Ring Road and several road network around Ratna Park will not blockade. These roads will be able to use ETR after big earthquake, and be classified National and First Emergency Roads.
The second most important roads are the road that connect Ring Road and wide roads around Ratna Park. These radiating roads are important for ETRN because of connecting CBD and Ring Road. JICA Study Team classifies First Emergency Roads.
In the existing urban area located inner Ring Road, many old high density buildings (6th to 8th stories) are located along the narrow road. If big earthquake will happen, the roads will be blocked by collapsed buildings. For this reason, roads connect large hospitals or Open Spaces functioning emergency to Ring Road or Arniko Highway are set Second Emergency Roads. JICA Study Team proposes road widening and earthquake-proof conversion of buildings located by Second Emergency Road.
Some emergency points (Open Spaces, large hospitals and warehouses) located outside of Ring Road connect Second Emergency Roads. These roads are dead end roads. JICA Study Team proposes Concept Emergency Road that connects such Second Emergency Roads to eliminate the dead end.
(1) National Emergency Road
Definition of National Emergency Road is as follows:
National Emergency Roads are Ring Road Arniko Highway and Tribhvan Highway. (Over 20m (Plan)).
Even if a big earthquake occurs, two or more lanes are secured.
Big hospitals and heavy equipment base are located along National Emergency Road.
(2) First Emergency Transportation Road Network
Definition of First Emergency Transportation Road is as follows:
First Emergency Transportation Roads are connected with big hospitals, government offices, collages (Universities), Open Spaces, warehouses and airport.
Case of scenario MMI X earthquake, maximum 2 lane spaces are secured.
(Proposal) First Emergency Transportation Road needs to satisfy the following conditions:
To secure 4m road width for emergency transportation and evacuation. (Ambulance and fire engine can pass two ways. Heavy equipment (ex. wheel type loader (Vehicle width 3m)) can work to remove left vehicle) = A
To secure 4m road width for evacuation = B A + B = C (8m) To secure 1.5m road width for left vehicles = D (1.5m) The standard First ETR width is 12m Debris will be kept within 2.5m (12m – C – D = 12 – 8.0 - 1.5 = 2.5m).
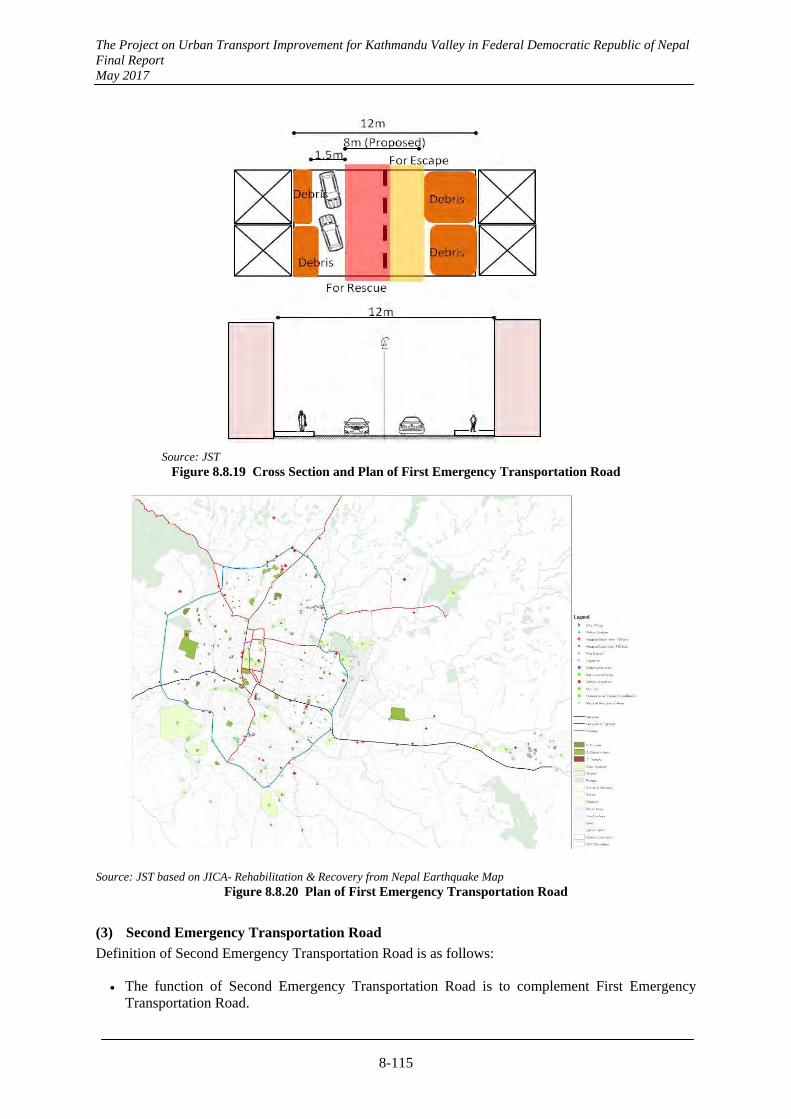
The Project on Urban Transport Improvement for Kathmandu Valley in Federal Democratic Republic of Nepal Final Report May 2017
8-115
Source: JST
Figure 8.8.19 Cross Section and Plan of First Emergency Transportation Road
Source: JST based on JICA- Rehabilitation & Recovery from Nepal Earthquake Map
Figure 8.8.20 Plan of First Emergency Transportation Road
(3) Second Emergency Transportation Road
Definition of Second Emergency Transportation Road is as follows:
The function of Second Emergency Transportation Road is to complement First Emergency Transportation Road.
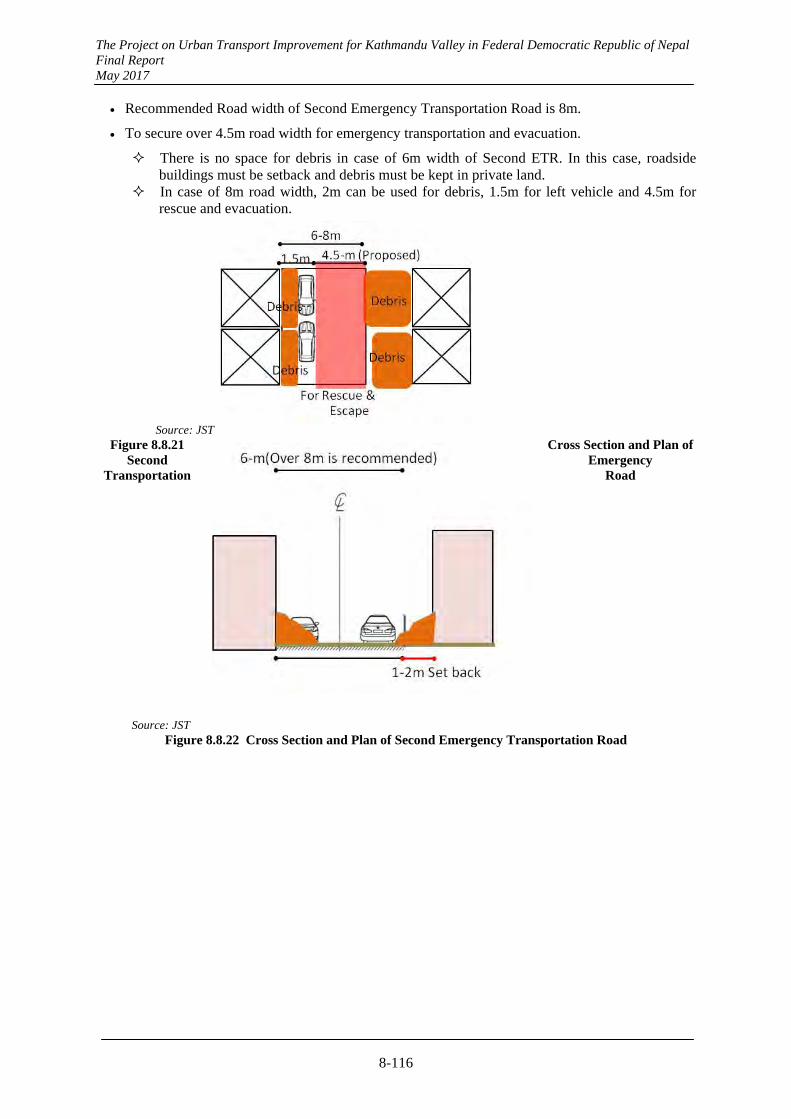
The Project on Urban Transport Improvement for Kathmandu Valley in Federal Democratic Republic of Nepal Final Report May 2017
8-116
Recommended Road width of Second Emergency Transportation Road is 8m.
To secure over 4.5m road width for emergency transportation and evacuation.
There is no space for debris in case of 6m width of Second ETR. In this case, roadside buildings must be setback and debris must be kept in private land.
In case of 8m road width, 2m can be used for debris, 1.5m for left vehicle and 4.5m for rescue and evacuation.
Source: JST Figure 8.8.21 Cross Section and Plan of
Second Emergency Transportation Road
Source: JST Figure 8.8.22 Cross Section and Plan of Second Emergency Transportation Road
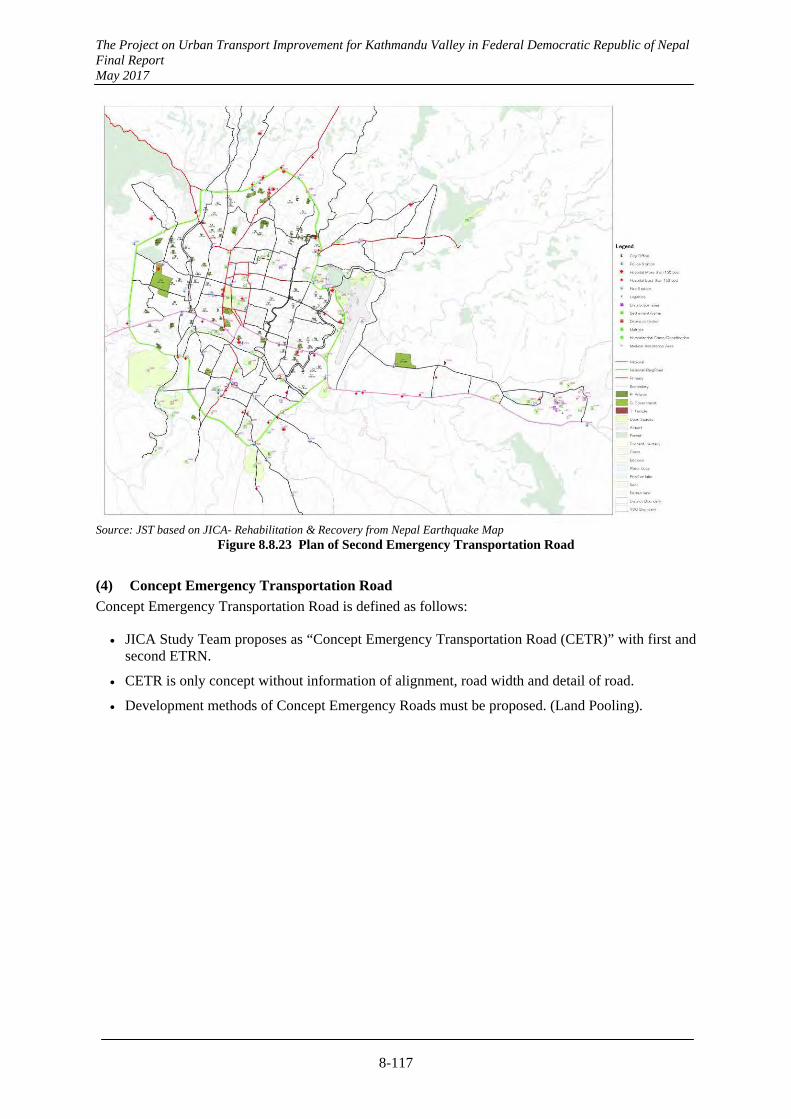
The Project on Urban Transport Improvement for Kathmandu Valley in Federal Democratic Republic of Nepal Final Report May 2017
8-117
Source: JST based on JICA- Rehabilitation & Recovery from Nepal Earthquake Map
Figure 8.8.23 Plan of Second Emergency Transportation Road
(4) Concept Emergency Transportation Road
Concept Emergency Transportation Road is defined as follows:
JICA Study Team proposes as “Concept Emergency Transportation Road (CETR)” with first and second ETRN.
CETR is only concept without information of alignment, road width and detail of road.
Development methods of Concept Emergency Roads must be proposed. (Land Pooling).
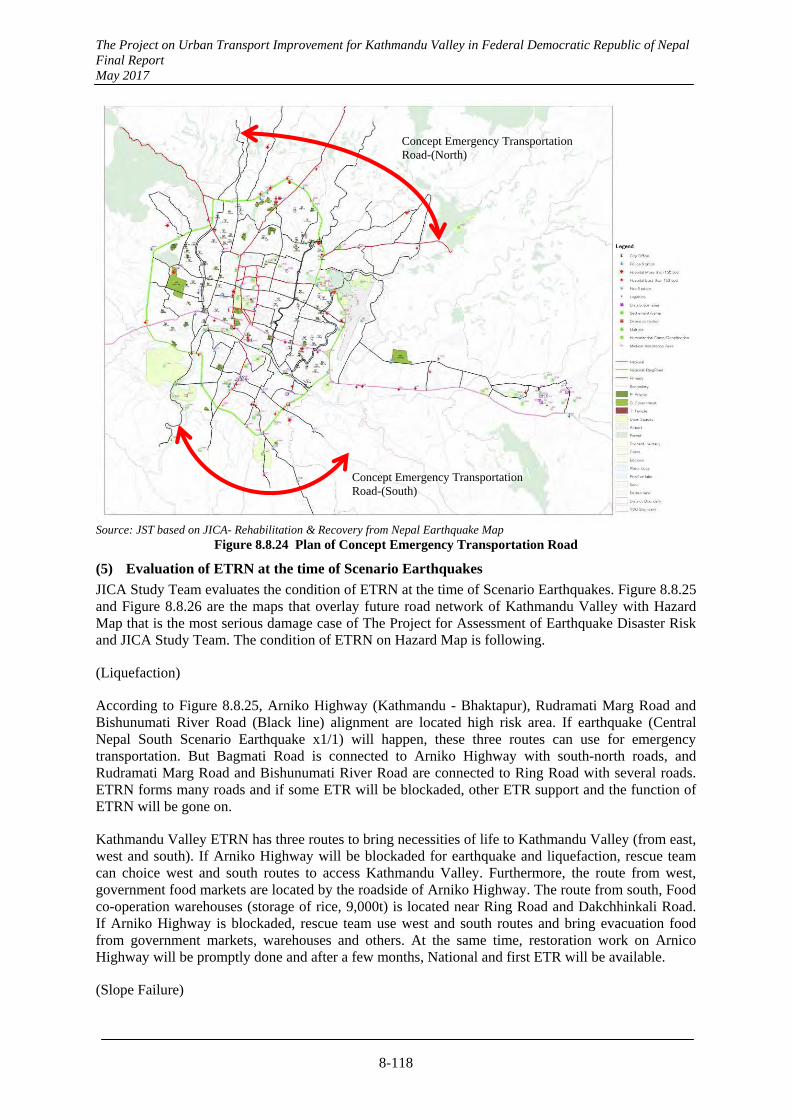
The Project on Urban Transport Improvement for Kathmandu Valley in Federal Democratic Republic of Nepal Final Report May 2017
8-118
Source: JST based on JICA- Rehabilitation & Recovery from Nepal Earthquake Map
Figure 8.8.24 Plan of Concept Emergency Transportation Road
(5) Evaluation of ETRN at the time of Scenario Earthquakes
JICA Study Team evaluates the condition of ETRN at the time of Scenario Earthquakes. Figure 8.8.25 and Figure 8.8.26 are the maps that overlay future road network of Kathmandu Valley with Hazard Map that is the most serious damage case of The Project for Assessment of Earthquake Disaster Risk and JICA Study Team. The condition of ETRN on Hazard Map is following.
(Liquefaction)
According to Figure 8.8.25, Arniko Highway (Kathmandu - Bhaktapur), Rudramati Marg Road and Bishunumati River Road (Black line) alignment are located high risk area. If earthquake (Central Nepal South Scenario Earthquake x1/1) will happen, these three routes can use for emergency transportation. But Bagmati Road is connected to Arniko Highway with south-north roads, and Rudramati Marg Road and Bishunumati River Road are connected to Ring Road with several roads. ETRN forms many roads and if some ETR will be blockaded, other ETR support and the function of ETRN will be gone on.
Kathmandu Valley ETRN has three routes to bring necessities of life to Kathmandu Valley (from east, west and south). If Arniko Highway will be blockaded for earthquake and liquefaction, rescue team can choice west and south routes to access Kathmandu Valley. Furthermore, the route from west, government food markets are located by the roadside of Arniko Highway. The route from south, Food co-operation warehouses (storage of rice, 9,000t) is located near Ring Road and Dakchhinkali Road. If Arniko Highway is blockaded, rescue team use west and south routes and bring evacuation food from government markets, warehouses and others. At the same time, restoration work on Arnico Highway will be promptly done and after a few months, National and first ETR will be available.
(Slope Failure)
Concept Emergency Transportation Road-(North)
Concept Emergency Transportation Road-(South)
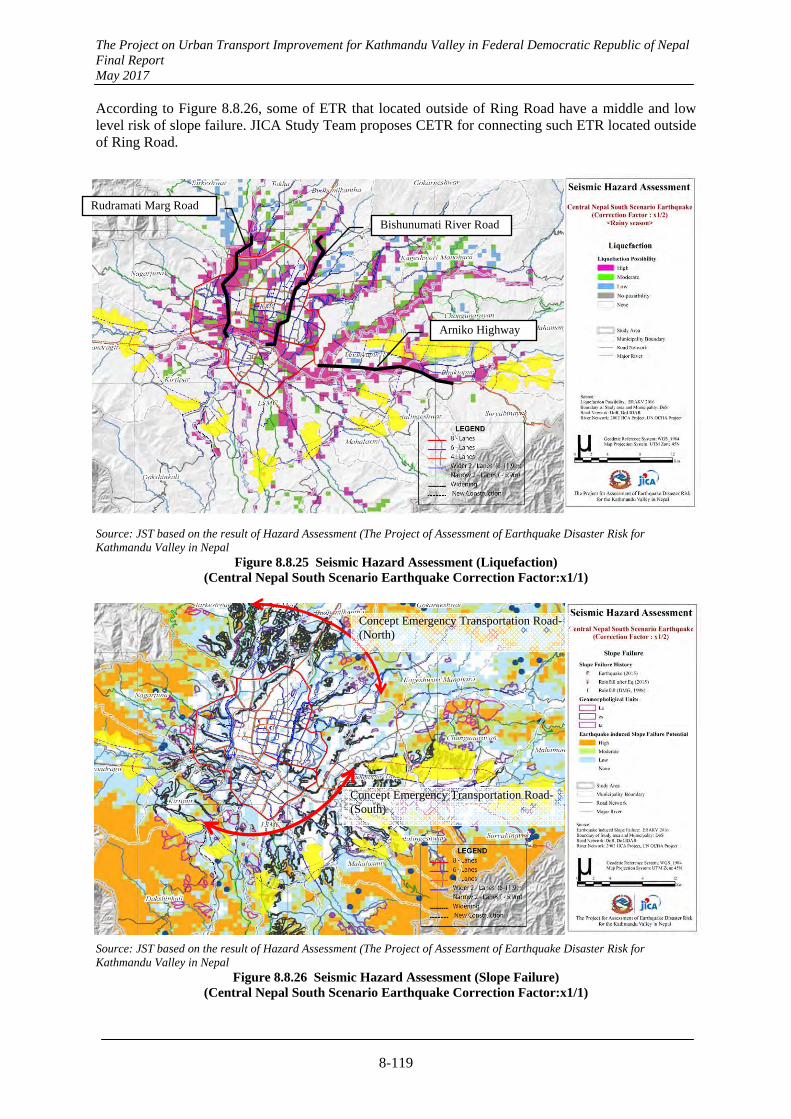
The Project on Urban Transport Improvement for Kathmandu Valley in Federal Democratic Republic of Nepal Final Report May 2017
8-119
According to Figure 8.8.26, some of ETR that located outside of Ring Road have a middle and low level risk of slope failure. JICA Study Team proposes CETR for connecting such ETR located outside of Ring Road.
Source: JST based on the result of Hazard Assessment (The Project of Assessment of Earthquake Disaster Risk for Kathmandu Valley in Nepal
Figure 8.8.25 Seismic Hazard Assessment (Liquefaction) (Central Nepal South Scenario Earthquake Correction Factor:x1/1)
Source: JST based on the result of Hazard Assessment (The Project of Assessment of Earthquake Disaster Risk for Kathmandu Valley in Nepal
Figure 8.8.26 Seismic Hazard Assessment (Slope Failure) (Central Nepal South Scenario Earthquake Correction Factor:x1/1)
Arniko Highway
Bishunumati River Road
Rudramati Marg Road
Concept Emergency Transportation Road-(North)
Concept Emergency Transportation Road-(South)
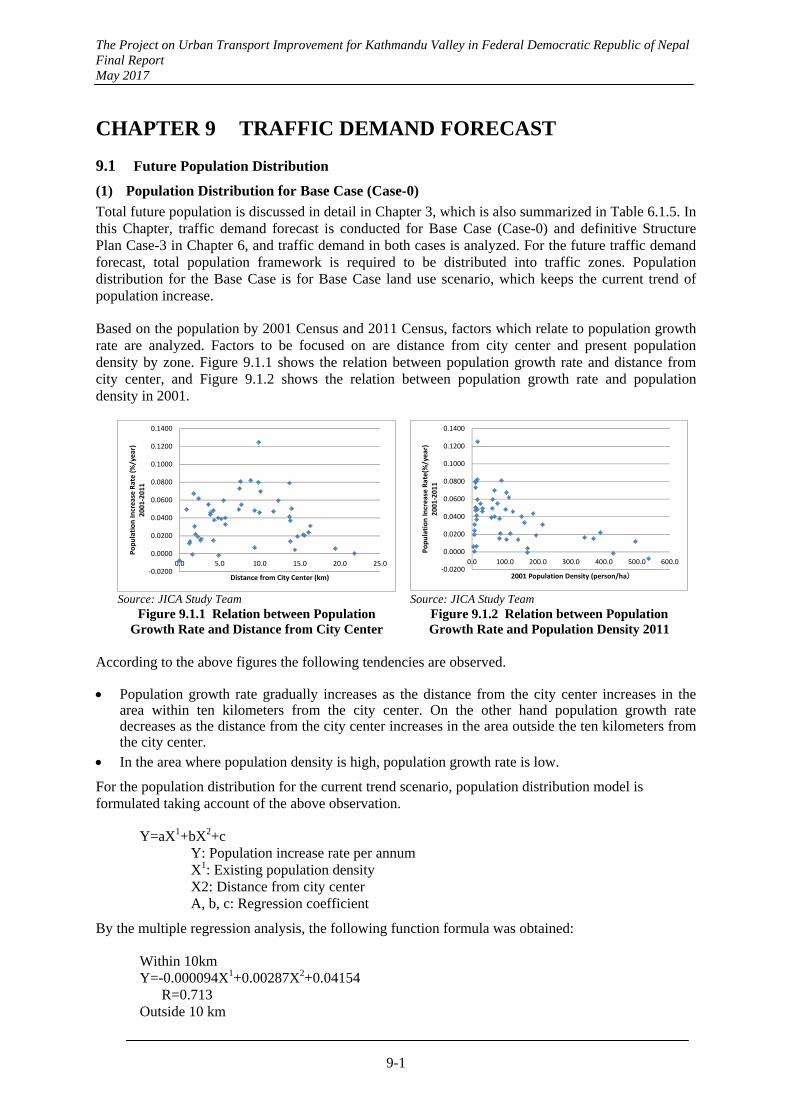
The Project on Urban Transport Improvement for Kathmandu Valley in Federal Democratic Republic of Nepal Final Report May 2017
9-1
CHAPTER 9 TRAFFIC DEMAND FORECAST
9.1 Future Population Distribution
(1) Population Distribution for Base Case (Case-0)
Total future population is discussed in detail in Chapter 3, which is also summarized in Table 6.1.5. In this Chapter, traffic demand forecast is conducted for Base Case (Case-0) and definitive Structure Plan Case-3 in Chapter 6, and traffic demand in both cases is analyzed. For the future traffic demand forecast, total population framework is required to be distributed into traffic zones. Population distribution for the Base Case is for Base Case land use scenario, which keeps the current trend of population increase.
Based on the population by 2001 Census and 2011 Census, factors which relate to population growth rate are analyzed. Factors to be focused on are distance from city center and present population density by zone. Figure 9.1.1 shows the relation between population growth rate and distance from city center, and Figure 9.1.2 shows the relation between population growth rate and population density in 2001.
‐0.0200
0.0000
0.0200
0.0400
0.0600
0.0800
0.1000
0.1200
0.1400
0.0 5.0 10.0 15.0 20.0 25.0
Population Increase Rate (%/year)
2001‐2011
Distance from City Center (km)‐0.0200
0.0000
0.0200
0.0400
0.0600
0.0800
0.1000
0.1200
0.1400
0.0 100.0 200.0 300.0 400.0 500.0 600.0
Population Increase Rate(%
/year)
2001‐2011
2001 Population Density (person/ha)
Source: JICA Study Team Figure 9.1.1 Relation between Population
Growth Rate and Distance from City Center
Source: JICA Study Team Figure 9.1.2 Relation between Population Growth Rate and Population Density 2011
According to the above figures the following tendencies are observed.
Population growth rate gradually increases as the distance from the city center increases in the area within ten kilometers from the city center. On the other hand population growth rate decreases as the distance from the city center increases in the area outside the ten kilometers from the city center.
In the area where population density is high, population growth rate is low.
For the population distribution for the current trend scenario, population distribution model is formulated taking account of the above observation.
Y=aX1+bX2+c Y: Population increase rate per annum X1: Existing population density X2: Distance from city center A, b, c: Regression coefficient
By the multiple regression analysis, the following function formula was obtained:
Within 10km Y=-0.000094X1+0.00287X2+0.04154
R=0.713 Outside 10 km
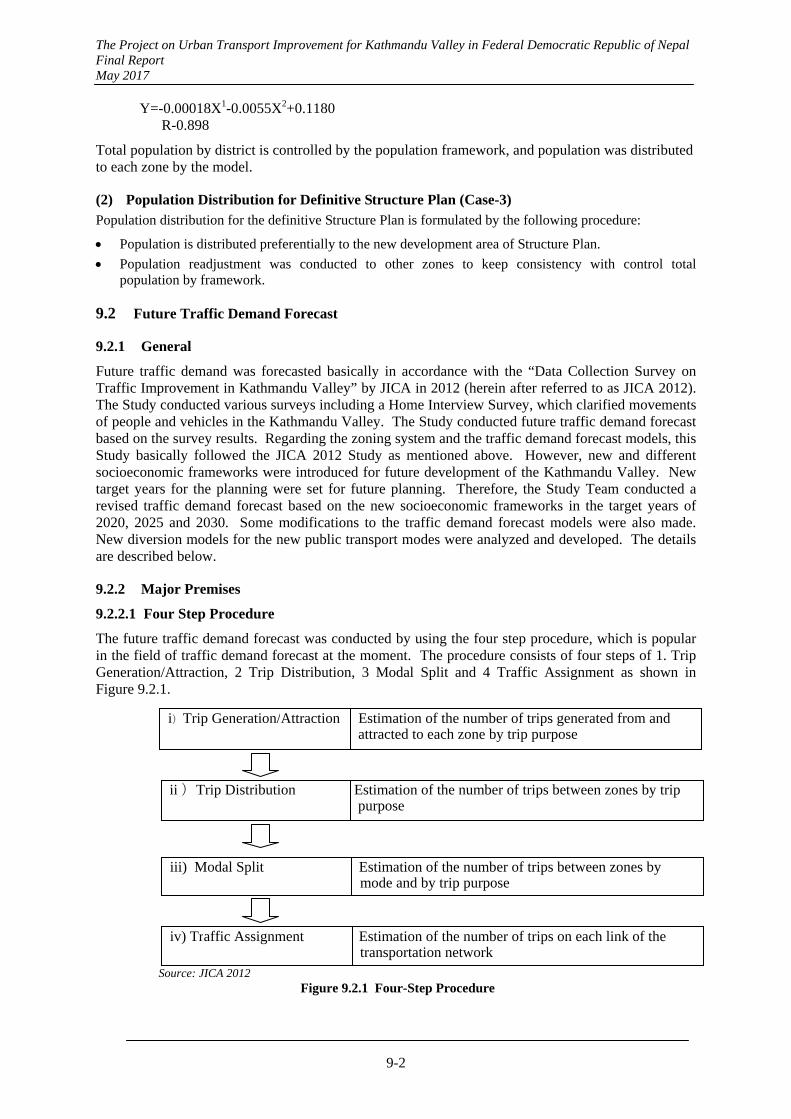
The Project on Urban Transport Improvement for Kathmandu Valley in Federal Democratic Republic of Nepal Final Report May 2017
9-2
Y=-0.00018X1-0.0055X2+0.1180 R-0.898
Total population by district is controlled by the population framework, and population was distributed to each zone by the model.
(2) Population Distribution for Definitive Structure Plan (Case-3) Population distribution for the definitive Structure Plan is formulated by the following procedure:
Population is distributed preferentially to the new development area of Structure Plan.
Population readjustment was conducted to other zones to keep consistency with control total population by framework.
9.2 Future Traffic Demand Forecast
9.2.1 General
Future traffic demand was forecasted basically in accordance with the “Data Collection Survey on Traffic Improvement in Kathmandu Valley” by JICA in 2012 (herein after referred to as JICA 2012). The Study conducted various surveys including a Home Interview Survey, which clarified movements of people and vehicles in the Kathmandu Valley. The Study conducted future traffic demand forecast based on the survey results. Regarding the zoning system and the traffic demand forecast models, this Study basically followed the JICA 2012 Study as mentioned above. However, new and different socioeconomic frameworks were introduced for future development of the Kathmandu Valley. New target years for the planning were set for future planning. Therefore, the Study Team conducted a revised traffic demand forecast based on the new socioeconomic frameworks in the target years of 2020, 2025 and 2030. Some modifications to the traffic demand forecast models were also made. New diversion models for the new public transport modes were analyzed and developed. The details are described below.
9.2.2 Major Premises
9.2.2.1 Four Step Procedure
The future traffic demand forecast was conducted by using the four step procedure, which is popular in the field of traffic demand forecast at the moment. The procedure consists of four steps of 1. Trip Generation/Attraction, 2 Trip Distribution, 3 Modal Split and 4 Traffic Assignment as shown in Figure 9.2.1.
.
Source: JICA 2012
Figure 9.2.1 Four-Step Procedure
i)Trip Generation/Attraction Estimation of the number of trips generated from and attracted to each zone by trip purpose
ii )Trip Distribution Estimation of the number of trips between zones by trip purpose
iii) Modal Split Estimation of the number of trips between zones by mode and by trip purpose
iv) Traffic Assignment Estimation of the number of trips on each link of the transportation network
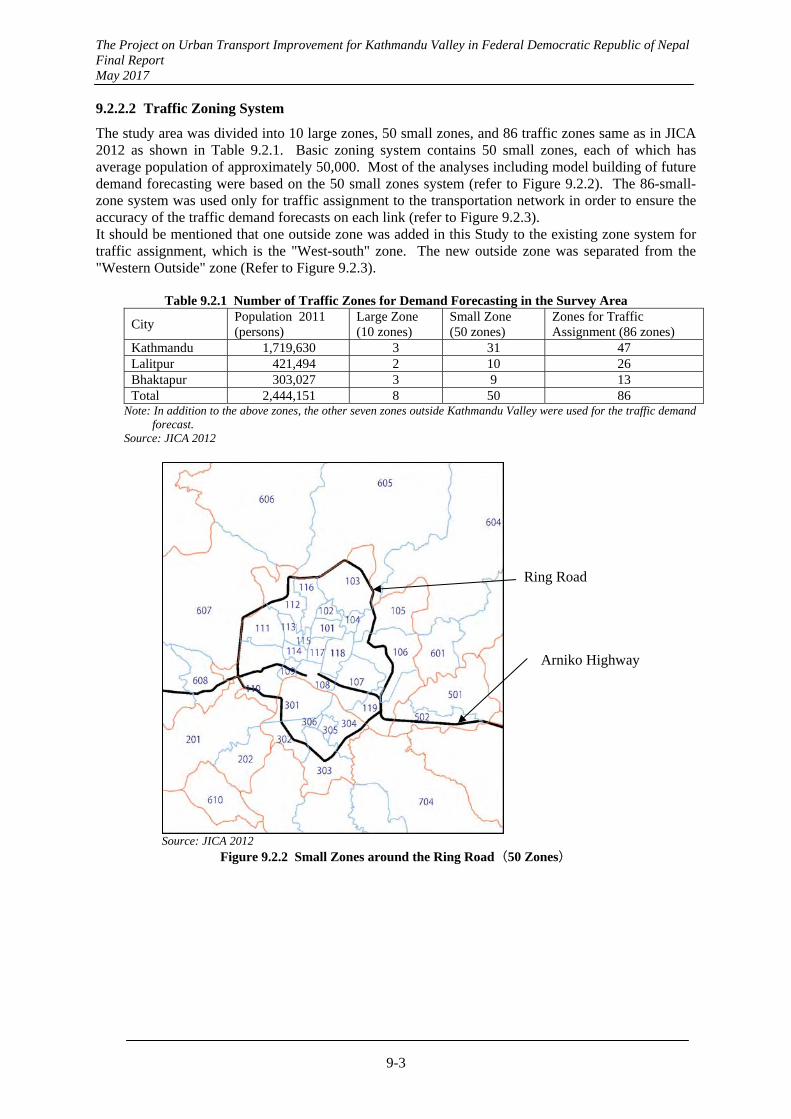
The Project on Urban Transport Improvement for Kathmandu Valley in Federal Democratic Republic of Nepal Final Report May 2017
9-3
9.2.2.2 Traffic Zoning System
The study area was divided into 10 large zones, 50 small zones, and 86 traffic zones same as in JICA 2012 as shown in Table 9.2.1. Basic zoning system contains 50 small zones, each of which has average population of approximately 50,000. Most of the analyses including model building of future demand forecasting were based on the 50 small zones system (refer to Figure 9.2.2). The 86-small-zone system was used only for traffic assignment to the transportation network in order to ensure the accuracy of the traffic demand forecasts on each link (refer to Figure 9.2.3). It should be mentioned that one outside zone was added in this Study to the existing zone system for traffic assignment, which is the "West-south" zone. The new outside zone was separated from the "Western Outside" zone (Refer to Figure 9.2.3).
Table 9.2.1 Number of Traffic Zones for Demand Forecasting in the Survey Area
City Population 2011 (persons)
Large Zone (10 zones)
Small Zone (50 zones)
Zones for Traffic Assignment (86 zones)
Kathmandu 1,719,630 3 31 47 Lalitpur 421,494 2 10 26 Bhaktapur 303,027 3 9 13 Total 2,444,151 8 50 86
Note: In addition to the above zones, the other seven zones outside Kathmandu Valley were used for the traffic demand forecast.
Source: JICA 2012
Source: JICA 2012
Figure 9.2.2 Small Zones around the Ring Road(50 Zones)
Ring Road
Arniko Highway
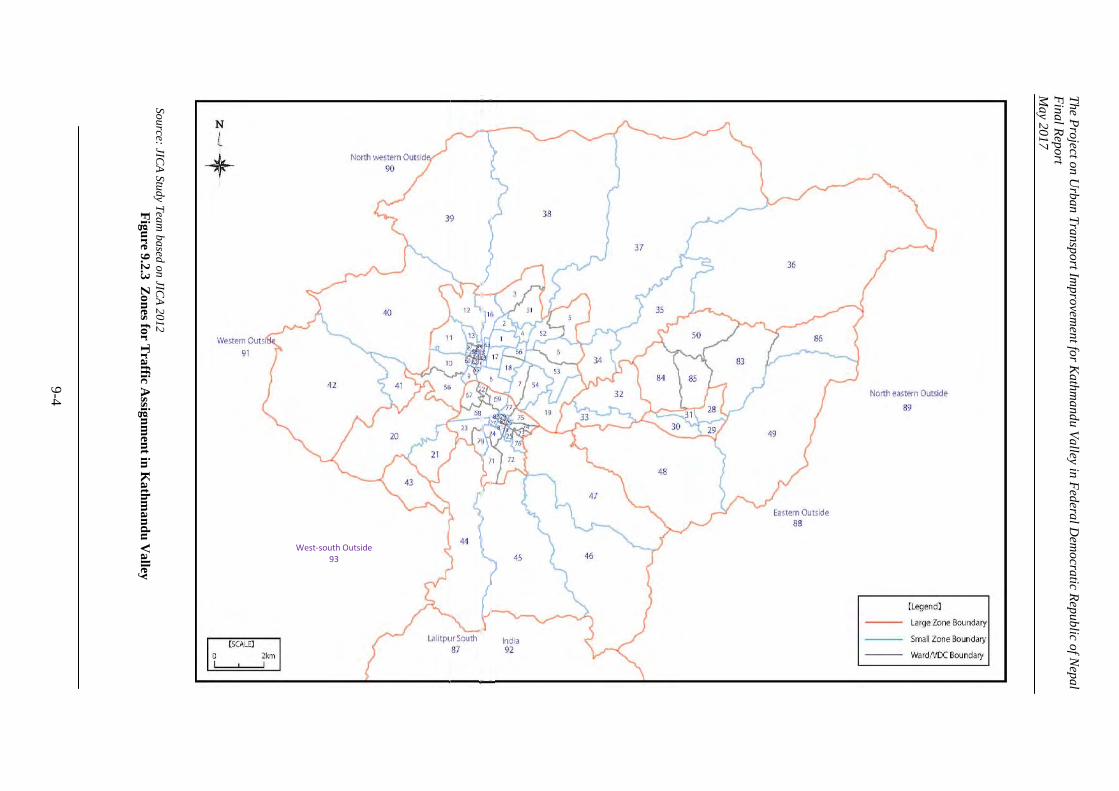
The P
roject on Urban T
ransport Improvem
ent for Kathm
andu Valley in F
ederal Dem
ocratic Republic of N
epal F
inal Report
May 2017
9-4
Source: JICA
Study Team
based on JICA
2012 F
igure 9.2.3 Z
ones for T
raffic Assign
men
t in K
athman
du
Valley
West-south Outside93
West‐south Outside93
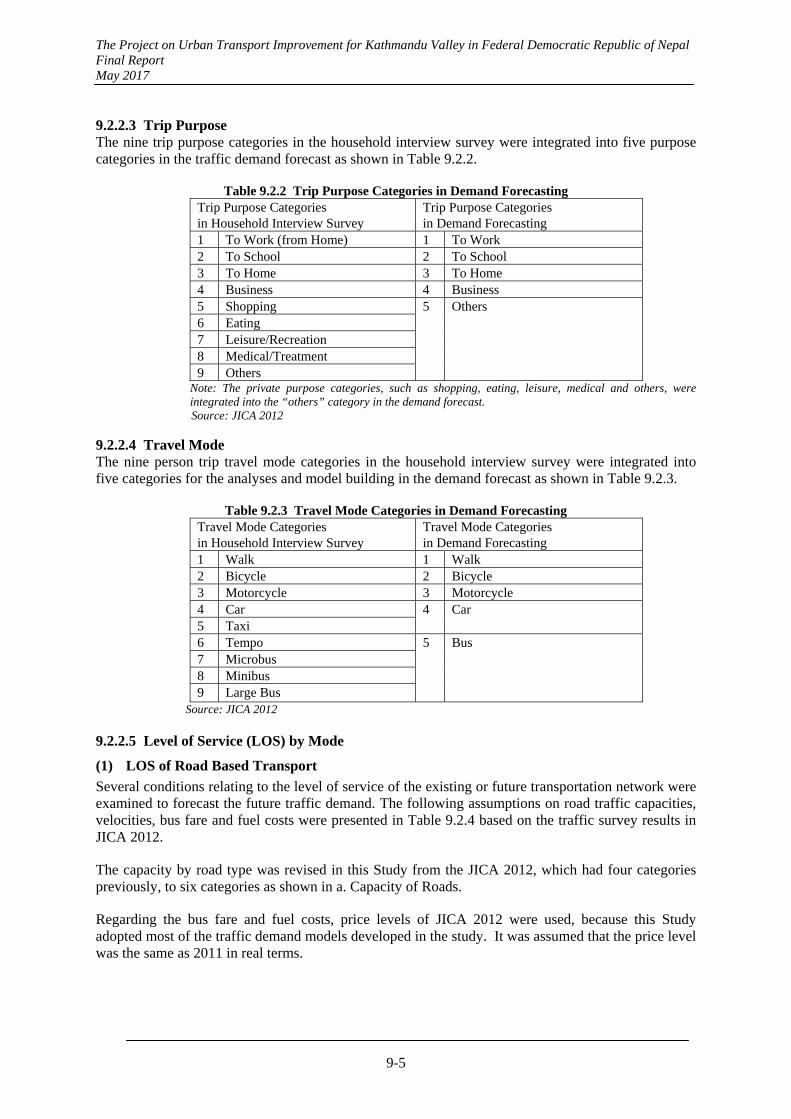
The Project on Urban Transport Improvement for Kathmandu Valley in Federal Democratic Republic of Nepal Final Report May 2017
9-5
9.2.2.3 Trip Purpose The nine trip purpose categories in the household interview survey were integrated into five purpose categories in the traffic demand forecast as shown in Table 9.2.2.
Table 9.2.2 Trip Purpose Categories in Demand Forecasting Trip Purpose Categories in Household Interview Survey
Trip Purpose Categories in Demand Forecasting
1 To Work (from Home) 1 To Work 2 To School 2 To School 3 To Home 3 To Home 4 Business 4 Business 5 Shopping 5 Others 6 Eating 7 Leisure/Recreation 8 Medical/Treatment 9 Others
Note: The private purpose categories, such as shopping, eating, leisure, medical and others, were integrated into the “others” category in the demand forecast. Source: JICA 2012
9.2.2.4 Travel Mode The nine person trip travel mode categories in the household interview survey were integrated into five categories for the analyses and model building in the demand forecast as shown in Table 9.2.3.
Table 9.2.3 Travel Mode Categories in Demand Forecasting Travel Mode Categories in Household Interview Survey
Travel Mode Categories in Demand Forecasting
1 Walk 1 Walk 2 Bicycle 2 Bicycle 3 Motorcycle 3 Motorcycle 4 Car 4 Car 5 Taxi 6 Tempo 5 Bus7 Microbus 8 Minibus 9 Large Bus
Source: JICA 2012
9.2.2.5 Level of Service (LOS) by Mode
(1) LOS of Road Based Transport
Several conditions relating to the level of service of the existing or future transportation network were examined to forecast the future traffic demand. The following assumptions on road traffic capacities, velocities, bus fare and fuel costs were presented in Table 9.2.4 based on the traffic survey results in JICA 2012.
The capacity by road type was revised in this Study from the JICA 2012, which had four categories previously, to six categories as shown in a. Capacity of Roads.
Regarding the bus fare and fuel costs, price levels of JICA 2012 were used, because this Study adopted most of the traffic demand models developed in the study. It was assumed that the price level was the same as 2011 in real terms.
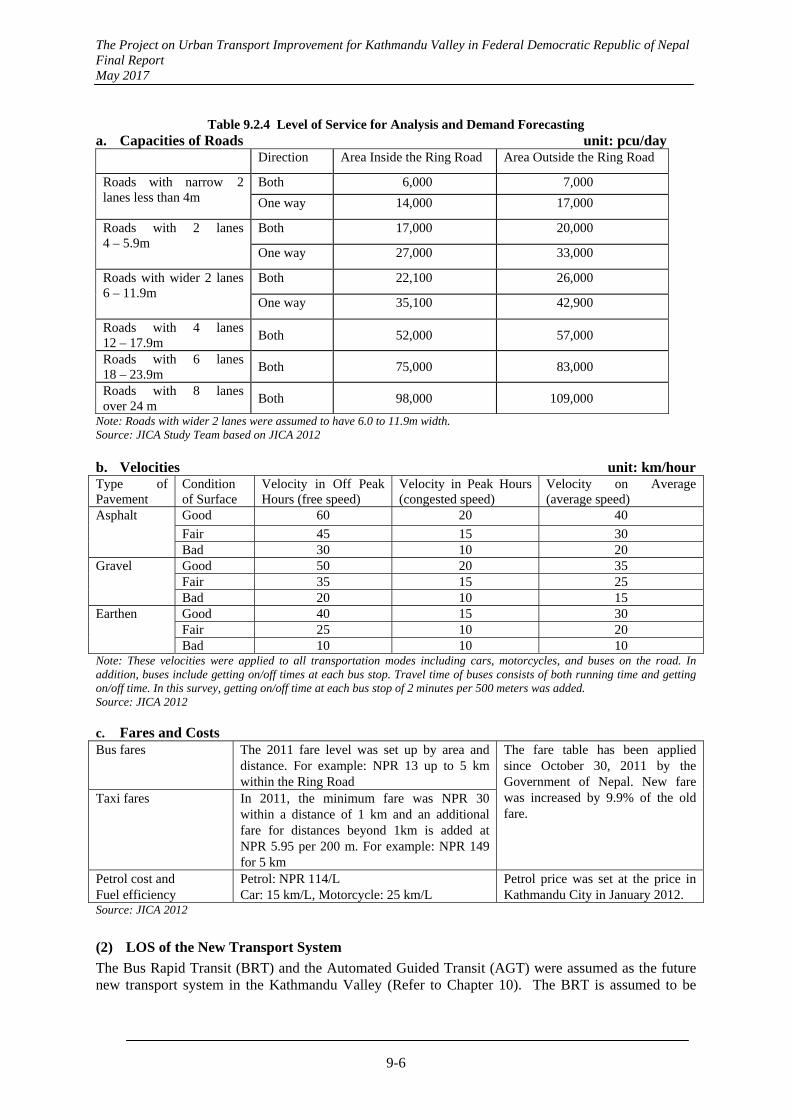
The Project on Urban Transport Improvement for Kathmandu Valley in Federal Democratic Republic of Nepal Final Report May 2017
9-6
Table 9.2.4 Level of Service for Analysis and Demand Forecasting
a. Capacities of Roads unit: pcu/day Direction Area Inside the Ring Road Area Outside the Ring Road
Roads with narrow 2 lanes less than 4m
Both 6,000 7,000
One way 14,000 17,000
Roads with 2 lanes 4 – 5.9m
Both 17,000 20,000
One way 27,000 33,000
Roads with wider 2 lanes 6 – 11.9m
Both 22,100 26,000
One way 35,100 42,900
Roads with 4 lanes 12 – 17.9m
Both 52,000 57,000
Roads with 6 lanes 18 – 23.9m
Both 75,000 83,000
Roads with 8 lanes over 24 m
Both 98,000 109,000
Note: Roads with wider 2 lanes were assumed to have 6.0 to 11.9m width. Source: JICA Study Team based on JICA 2012 b. Velocities unit: km/hour Type of Pavement
Condition of Surface
Velocity in Off Peak Hours (free speed)
Velocity in Peak Hours (congested speed)
Velocity on Average (average speed)
Asphalt Good 60 20 40
Fair 45 15 30 Bad 30 10 20
Gravel Good 50 20 35 Fair 35 15 25 Bad 20 10 15
Earthen Good 40 15 30 Fair 25 10 20 Bad 10 10 10
Note: These velocities were applied to all transportation modes including cars, motorcycles, and buses on the road. In addition, buses include getting on/off times at each bus stop. Travel time of buses consists of both running time and getting on/off time. In this survey, getting on/off time at each bus stop of 2 minutes per 500 meters was added. Source: JICA 2012 c. Fares and Costs Bus fares The 2011 fare level was set up by area and
distance. For example: NPR 13 up to 5 km within the Ring Road
The fare table has been applied since October 30, 2011 by the Government of Nepal. New fare was increased by 9.9% of the old fare.
Taxi fares In 2011, the minimum fare was NPR 30 within a distance of 1 km and an additional fare for distances beyond 1km is added at NPR 5.95 per 200 m. For example: NPR 149 for 5 km
Petrol cost and Fuel efficiency
Petrol: NPR 114/L Car: 15 km/L, Motorcycle: 25 km/L
Petrol price was set at the price in Kathmandu City in January 2012.
Source: JICA 2012
(2) LOS of the New Transport System
The Bus Rapid Transit (BRT) and the Automated Guided Transit (AGT) were assumed as the future new transport system in the Kathmandu Valley (Refer to Chapter 10). The BRT is assumed to be
The Project on Urban Transport Improvement for Kathmandu Valley in Federal Democratic Republic of Nepal Final Report May 2017
9-7
introduced in 2025, while the AGT is assumed to be in operation in 2030. Travel speed and fare level of the two systems were assumed as below.
・Operating Speed of BRT: 20 km /h (including stopping time at stations)
・Operating Speed of AGT: 30 km/h at the sections inside the Ring Road and 20 km/h at the
outside (including stopping time at stations)
・Fare level of BRT: as same as the existing bus service
・Fare level of AGT: extra 10 NPR is assumed
It should be noted that the new transport system is an integrated mode, which consists of the BRT, AGT and existing bus services. The existing bus services are used as the access/egress transport to support the new transport system. For example, new transport passengers would use the existing bus (access mode) first, then BRT and/or AGT next, and finally would use the existing bus (egress mode). Therefore, it could be said that the new transport system is the combination of the three modes. Fare is calculated by total travel length based on the existing bus service fare system, plus 10 NPR if the mode includes the AGT. Travel time is the total of the combination of the modes, including stopping time of the existing bus service of every 500 meters.
The existing bus services are used as the access/egress transport to support the new transport system. For example, new transport passengers would use the existing bus (access mode) first, then BRT and/or AGT next, and finally would use the existing bus (egress mode)
Regarding the planned route of the BRT and AGT, refer to Chapter 8.
9.2.2.6 Vehicle Ownership Car or motorcycle ownership greatly affects a person’s decision on choosing their mode of travel. Car ownership level was still low at 25 vehicles per 1,000 people, although motorcycle ownership level was getting higher at 184 motorcycles per 1,000 people in 2011. Vehicle ownership ratios in 2011 were estimated by JICA 2011 based on the household interview survey. The ownerships in 2030, which is the final target year of this Study, were estimated by the Study Team as shown in Table 9.2.5.

The Project on Urban Transport Improvement for Kathmandu Valley in Federal Democratic Republic of Nepal Final Report May 2017
9-8
Table 9.2.5 Vehicle Ownership Rate per 1,000 People in Kathmandu Valley
Note: Estimations relating to vehicle ownership above were based on the household interview survey. Source: JICA Study Team based on JICA 2012
1.56 1.98
1.20 1.61
2.44
3.21
00.51
1.52
2.53
3.5
Population inKathmandu Valley
GDP per Capita inNepal
MotorcycleOwnership per1000People in
Kathmandu Valley
Number ofMotorcycles in
Kathmandu Valley
Car Ownership per1000People in
Kathmandu Valley
Number of Cars inKathmandu Valley
Growth Ratio (2030/2011)
Source: JICA Study Team based on JICA 2012
Figure 9.2.4 Growth Ratio of Population, GDP per Capita and Car Ownership 9.2.2.7 Forecast Cases
(1) Target Years
Three target years of 2020, 2025 and 2030 were assumed for future traffic demand forecast, which correspond to highway network planning, public transport planning and land use/population distribution planning. Several land use plans, which correspond to population distribution patterns, were consolidated into one.
(2) Highway Networks
Three highway networks were planned corresponding to the three target years. Details of the plans are described in Chapter 8 and 10.
Year Motorcycle Car
2011 448,630 62,109
2030 722,465 199,486
Growth(2030/2011)
1 .610 3.212
2011 184 25
2030 221 61
Growth(2030/2011)
1 .201 2.440
Growth(2030/2011)
Growth(2030/2011)
2011
2030
Growth(2030/2011)
1 .557
1.983
28,077
55,677
1.983
Total Number ofVehic les
Number per 1 ,000people
Item
Average MonthlyIncome of
Household (NPRs)
Population
GDP per capita
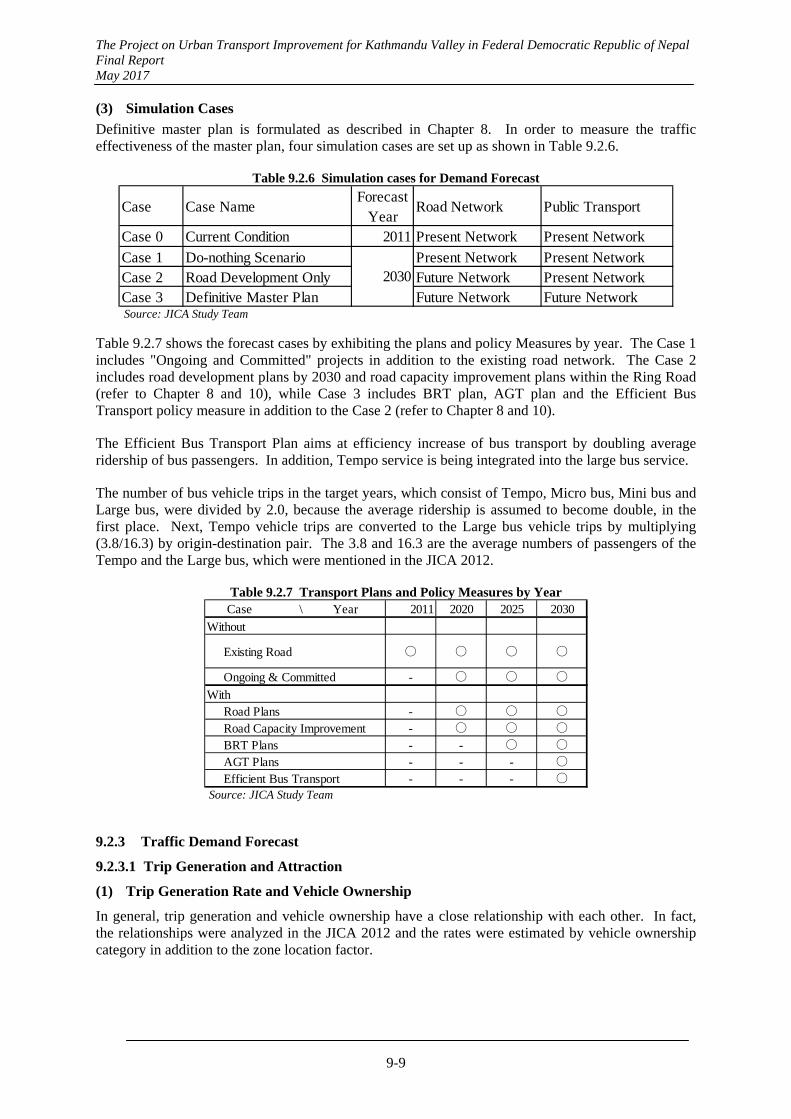
The Project on Urban Transport Improvement for Kathmandu Valley in Federal Democratic Republic of Nepal Final Report May 2017
9-9
(3) Simulation Cases
Definitive master plan is formulated as described in Chapter 8. In order to measure the traffic effectiveness of the master plan, four simulation cases are set up as shown in Table 9.2.6.
Table 9.2.6 Simulation cases for Demand Forecast
Case Case NameForecast
YearRoad Network Public Transport
Case 0 Current Condition 2011 Present Network Present Network
Case 1 Do-nothing Scenario Present Network Present NetworkCase 2 Road Development Only Future Network Present NetworkCase 3 Definitive Master Plan Future Network Future Network
2030
Source: JICA Study Team
Table 9.2.7 shows the forecast cases by exhibiting the plans and policy Measures by year. The Case 1 includes "Ongoing and Committed" projects in addition to the existing road network. The Case 2 includes road development plans by 2030 and road capacity improvement plans within the Ring Road (refer to Chapter 8 and 10), while Case 3 includes BRT plan, AGT plan and the Efficient Bus Transport policy measure in addition to the Case 2 (refer to Chapter 8 and 10).
The Efficient Bus Transport Plan aims at efficiency increase of bus transport by doubling average ridership of bus passengers. In addition, Tempo service is being integrated into the large bus service.
The number of bus vehicle trips in the target years, which consist of Tempo, Micro bus, Mini bus and Large bus, were divided by 2.0, because the average ridership is assumed to become double, in the first place. Next, Tempo vehicle trips are converted to the Large bus vehicle trips by multiplying (3.8/16.3) by origin-destination pair. The 3.8 and 16.3 are the average numbers of passengers of the Tempo and the Large bus, which were mentioned in the JICA 2012.
Table 9.2.7 Transport Plans and Policy Measures by Year Case \ Year 2011 2020 2025 2030
Without
Existing Road 〇 〇 〇 〇
Ongoing & Committed - 〇 〇 〇
With Road Plans - 〇 〇 〇
Road Capacity Improvement - 〇 〇 〇
BRT Plans - - 〇 〇
AGT Plans - - - 〇
Efficient Bus Transport - - - 〇 Source: JICA Study Team
9.2.3 Traffic Demand Forecast
9.2.3.1 Trip Generation and Attraction
(1) Trip Generation Rate and Vehicle Ownership
In general, trip generation and vehicle ownership have a close relationship with each other. In fact, the relationships were analyzed in the JICA 2012 and the rates were estimated by vehicle ownership category in addition to the zone location factor.
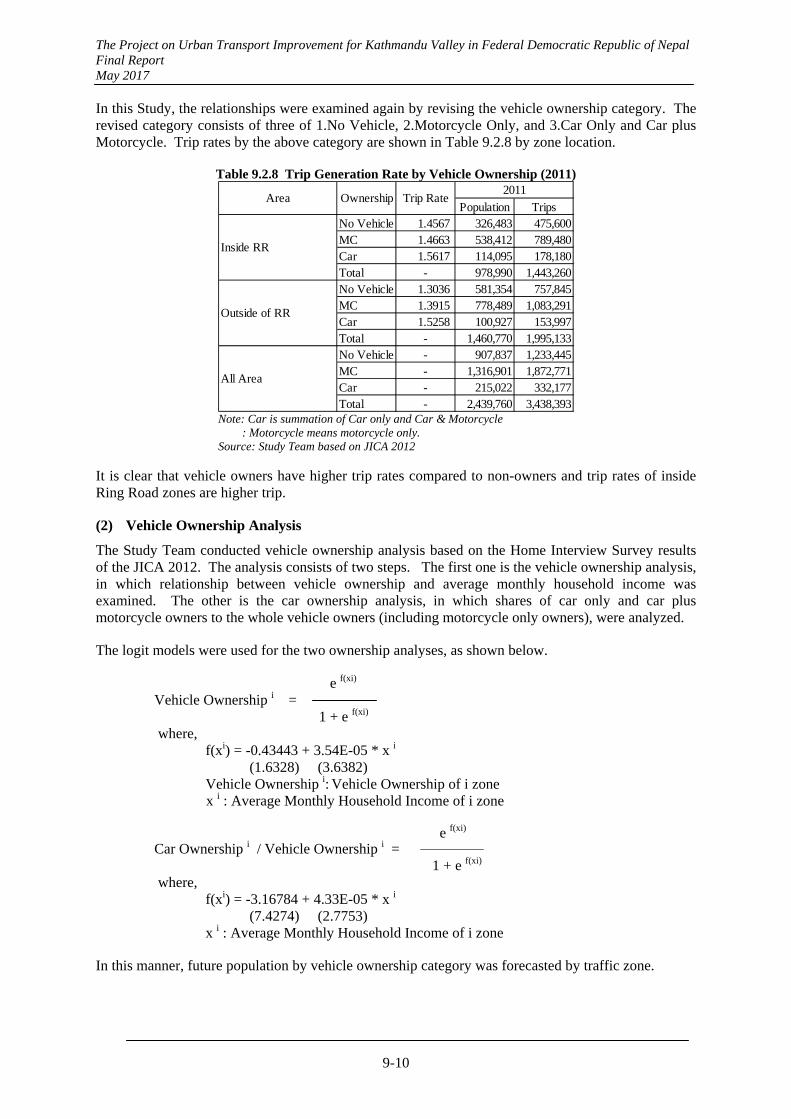
The Project on Urban Transport Improvement for Kathmandu Valley in Federal Democratic Republic of Nepal Final Report May 2017
9-10
In this Study, the relationships were examined again by revising the vehicle ownership category. The revised category consists of three of 1.No Vehicle, 2.Motorcycle Only, and 3.Car Only and Car plus Motorcycle. Trip rates by the above category are shown in Table 9.2.8 by zone location.
Table 9.2.8 Trip Generation Rate by Vehicle Ownership (2011)
Population TripsNo Vehicle 1.4567 326,483 475,600MC 1.4663 538,412 789,480Car 1.5617 114,095 178,180Total - 978,990 1,443,260No Vehicle 1.3036 581,354 757,845MC 1.3915 778,489 1,083,291Car 1.5258 100,927 153,997Total - 1,460,770 1,995,133No Vehicle - 907,837 1,233,445MC - 1,316,901 1,872,771Car - 215,022 332,177Total - 2,439,760 3,438,393
Outside of RR
All Area
Area Ownership Trip Rate2011
Inside RR
Note: Car is summation of Car only and Car & Motorcycle : Motorcycle means motorcycle only. Source: Study Team based on JICA 2012
It is clear that vehicle owners have higher trip rates compared to non-owners and trip rates of inside Ring Road zones are higher trip.
(2) Vehicle Ownership Analysis
The Study Team conducted vehicle ownership analysis based on the Home Interview Survey results of the JICA 2012. The analysis consists of two steps. The first one is the vehicle ownership analysis, in which relationship between vehicle ownership and average monthly household income was examined. The other is the car ownership analysis, in which shares of car only and car plus motorcycle owners to the whole vehicle owners (including motorcycle only owners), were analyzed.
The logit models were used for the two ownership analyses, as shown below.
e f(xi) Vehicle Ownership i =
1 + e f(xi) where, f(xi) = -0.43443 + 3.54E-05 * x i (1.6328) (3.6382) Vehicle Ownership i: Vehicle Ownership of i zone
x i : Average Monthly Household Income of i zone
e f(xi) Car Ownership i / Vehicle Ownership i =
1 + e f(xi) where, f(xi) = -3.16784 + 4.33E-05 * x i (7.4274) (2.7753) x i : Average Monthly Household Income of i zone
In this manner, future population by vehicle ownership category was forecasted by traffic zone.
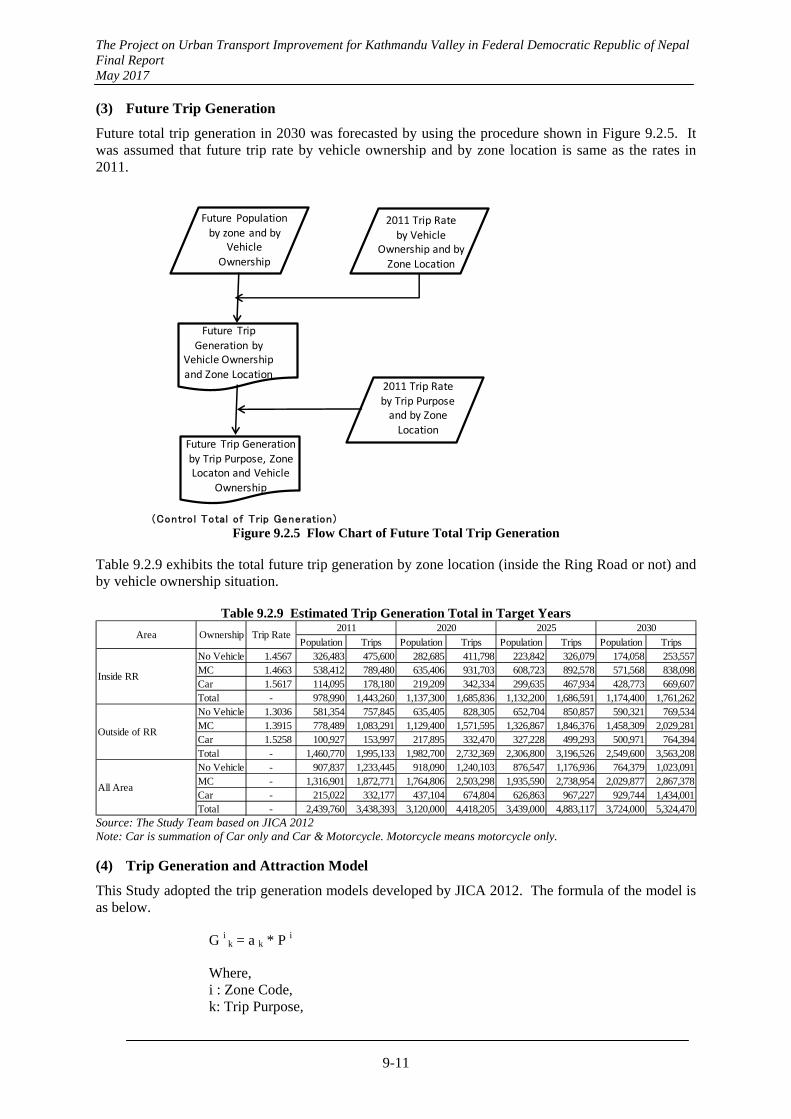
The Project on Urban Transport Improvement for Kathmandu Valley in Federal Democratic Republic of Nepal Final Report May 2017
9-11
(3) Future Trip Generation
Future total trip generation in 2030 was forecasted by using the procedure shown in Figure 9.2.5. It was assumed that future trip rate by vehicle ownership and by zone location is same as the rates in 2011.
(Control Total of Trip Generation)
Future Population
by zone and by Vehicle
Ownership
Future Trip
Generation by Vehicle Ownership
and Zone Location
2011 Trip Rate
by Vehicle Ownership and by
Zone Location
2011 Trip Rete
by Vehicle Ownership and by
Zone Location
2011 Trip Rateby Trip Purpose and by Zone Location
Future Trip Generationby Trip Purpose, Zone Locaton and Vehicle
Ownership
Figure 9.2.5 Flow Chart of Future Total Trip Generation
Table 9.2.9 exhibits the total future trip generation by zone location (inside the Ring Road or not) and by vehicle ownership situation.
Table 9.2.9 Estimated Trip Generation Total in Target Years
Population Trips Population Trips Population Trips Population TripsNo Vehicle 1.4567 326,483 475,600 282,685 411,798 223,842 326,079 174,058 253,557MC 1.4663 538,412 789,480 635,406 931,703 608,723 892,578 571,568 838,098Car 1.5617 114,095 178,180 219,209 342,334 299,635 467,934 428,773 669,607Total - 978,990 1,443,260 1,137,300 1,685,836 1,132,200 1,686,591 1,174,400 1,761,262No Vehicle 1.3036 581,354 757,845 635,405 828,305 652,704 850,857 590,321 769,534MC 1.3915 778,489 1,083,291 1,129,400 1,571,595 1,326,867 1,846,376 1,458,309 2,029,281Car 1.5258 100,927 153,997 217,895 332,470 327,228 499,293 500,971 764,394Total - 1,460,770 1,995,133 1,982,700 2,732,369 2,306,800 3,196,526 2,549,600 3,563,208No Vehicle - 907,837 1,233,445 918,090 1,240,103 876,547 1,176,936 764,379 1,023,091MC - 1,316,901 1,872,771 1,764,806 2,503,298 1,935,590 2,738,954 2,029,877 2,867,378Car - 215,022 332,177 437,104 674,804 626,863 967,227 929,744 1,434,001Total - 2,439,760 3,438,393 3,120,000 4,418,205 3,439,000 4,883,117 3,724,000 5,324,470
2025 20302011 2020
Inside RR
Outside of RR
All Area
Area Ownership Trip Rate
Source: The Study Team based on JICA 2012 Note: Car is summation of Car only and Car & Motorcycle. Motorcycle means motorcycle only. (4) Trip Generation and Attraction Model
This Study adopted the trip generation models developed by JICA 2012. The formula of the model is as below.
G i k = a k * P i
Where, i : Zone Code, k: Trip Purpose,
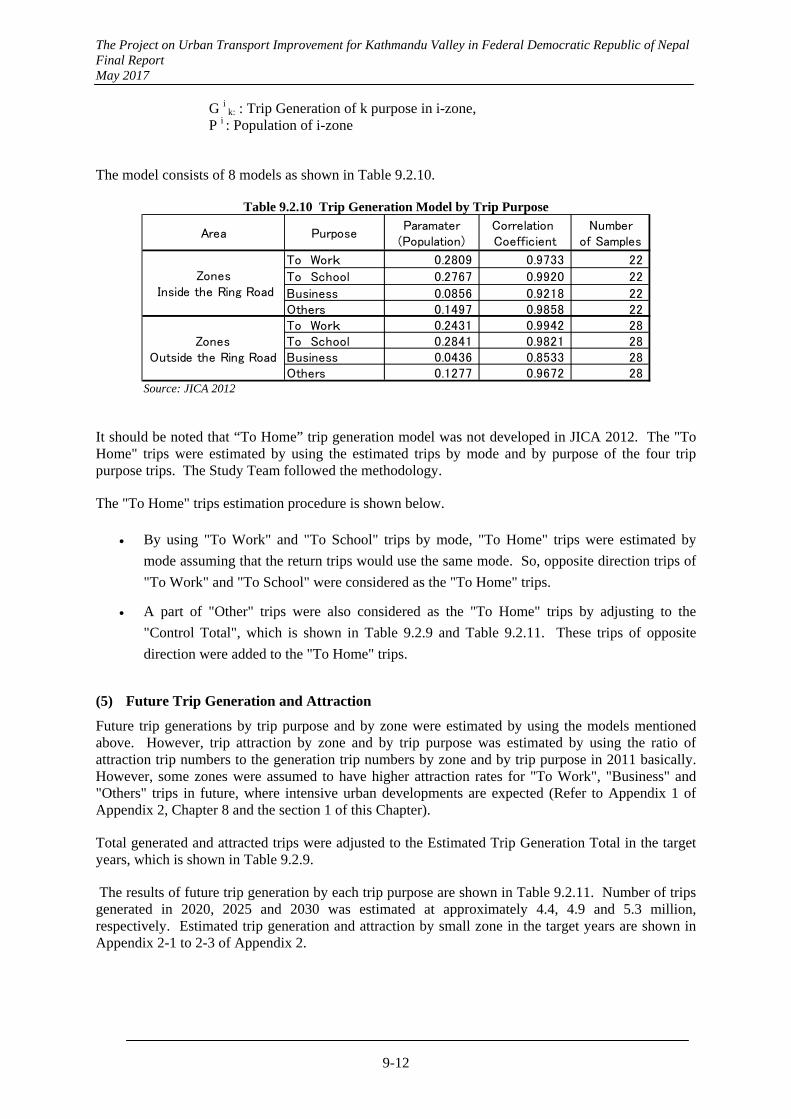
The Project on Urban Transport Improvement for Kathmandu Valley in Federal Democratic Republic of Nepal Final Report May 2017
9-12
G i k: : Trip Generation of k purpose in i-zone, P i : Population of i-zone
The model consists of 8 models as shown in Table 9.2.10.
Table 9.2.10 Trip Generation Model by Trip Purpose
Area PurposeParamater
(Population)Correlation Coefficient
Number of Samples
To Work 0.2809 0.9733 22
To School 0.2767 0.9920 22
Business 0.0856 0.9218 22Others 0.1497 0.9858 22To Work 0.2431 0.9942 28To School 0.2841 0.9821 28Business 0.0436 0.8533 28Others 0.1277 0.9672 28
Zones Inside the Ring Road
ZonesOutside the Ring Road
Source: JICA 2012
It should be noted that “To Home” trip generation model was not developed in JICA 2012. The "To Home" trips were estimated by using the estimated trips by mode and by purpose of the four trip purpose trips. The Study Team followed the methodology.
The "To Home" trips estimation procedure is shown below.
By using "To Work" and "To School" trips by mode, "To Home" trips were estimated by
mode assuming that the return trips would use the same mode. So, opposite direction trips of
"To Work" and "To School" were considered as the "To Home" trips.
A part of "Other" trips were also considered as the "To Home" trips by adjusting to the
"Control Total", which is shown in Table 9.2.9 and Table 9.2.11. These trips of opposite
direction were added to the "To Home" trips.
(5) Future Trip Generation and Attraction
Future trip generations by trip purpose and by zone were estimated by using the models mentioned above. However, trip attraction by zone and by trip purpose was estimated by using the ratio of attraction trip numbers to the generation trip numbers by zone and by trip purpose in 2011 basically. However, some zones were assumed to have higher attraction rates for "To Work", "Business" and "Others" trips in future, where intensive urban developments are expected (Refer to Appendix 1 of Appendix 2, Chapter 8 and the section 1 of this Chapter).
Total generated and attracted trips were adjusted to the Estimated Trip Generation Total in the target years, which is shown in Table 9.2.9.
The results of future trip generation by each trip purpose are shown in Table 9.2.11. Number of trips generated in 2020, 2025 and 2030 was estimated at approximately 4.4, 4.9 and 5.3 million, respectively. Estimated trip generation and attraction by small zone in the target years are shown in Appendix 2-1 to 2-3 of Appendix 2.
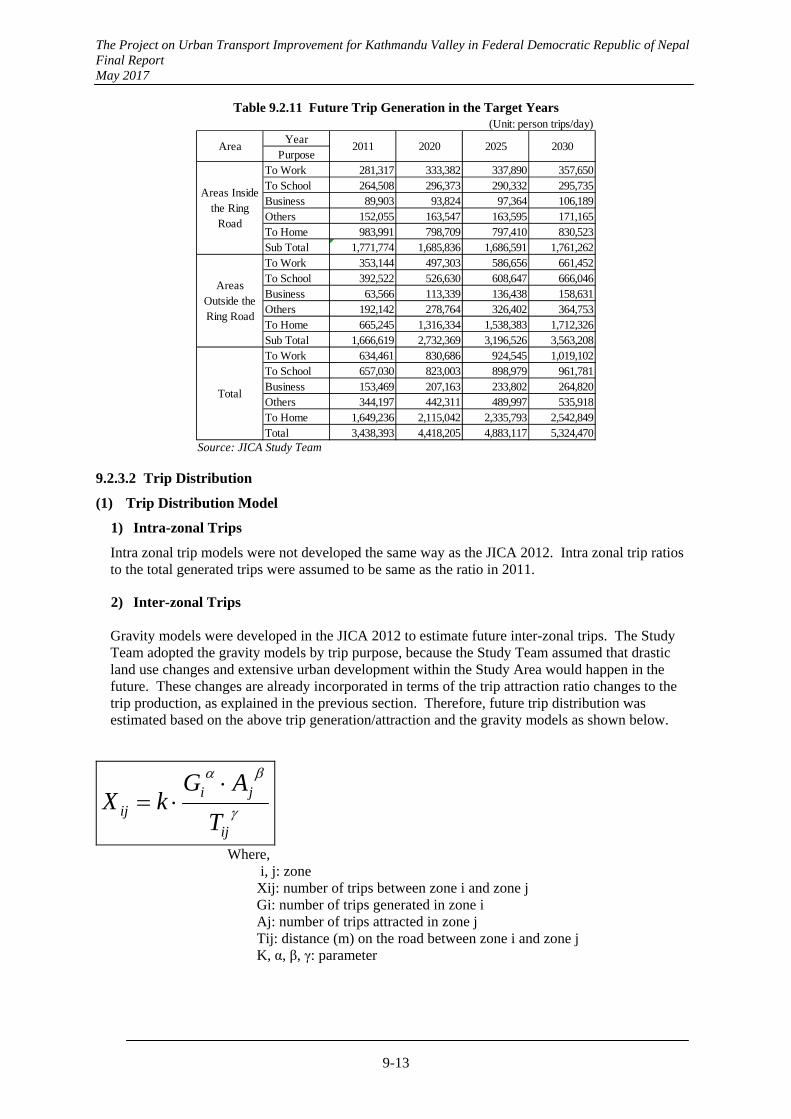
The Project on Urban Transport Improvement for Kathmandu Valley in Federal Democratic Republic of Nepal Final Report May 2017
9-13
Table 9.2.11 Future Trip Generation in the Target Years (Unit: person trips/day)
YearPurpose
To Work 281,317 333,382 337,890 357,650To School 264,508 296,373 290,332 295,735Business 89,903 93,824 97,364 106,189Others 152,055 163,547 163,595 171,165To Home 983,991 798,709 797,410 830,523Sub Total 1,771,774 1,685,836 1,686,591 1,761,262To Work 353,144 497,303 586,656 661,452To School 392,522 526,630 608,647 666,046Business 63,566 113,339 136,438 158,631Others 192,142 278,764 326,402 364,753To Home 665,245 1,316,334 1,538,383 1,712,326Sub Total 1,666,619 2,732,369 3,196,526 3,563,208To Work 634,461 830,686 924,545 1,019,102To School 657,030 823,003 898,979 961,781Business 153,469 207,163 233,802 264,820Others 344,197 442,311 489,997 535,918To Home 1,649,236 2,115,042 2,335,793 2,542,849Total 3,438,393 4,418,205 4,883,117 5,324,470
Areas Insidethe Ring
Road
AreasOutside theRing Road
Total
2011 2020 2025Area 2030
Source: JICA Study Team
9.2.3.2 Trip Distribution
(1) Trip Distribution Model
1) Intra-zonal Trips
Intra zonal trip models were not developed the same way as the JICA 2012. Intra zonal trip ratios to the total generated trips were assumed to be same as the ratio in 2011.
2) Inter-zonal Trips
Gravity models were developed in the JICA 2012 to estimate future inter-zonal trips. The Study Team adopted the gravity models by trip purpose, because the Study Team assumed that drastic land use changes and extensive urban development within the Study Area would happen in the future. These changes are already incorporated in terms of the trip attraction ratio changes to the trip production, as explained in the previous section. Therefore, future trip distribution was estimated based on the above trip generation/attraction and the gravity models as shown below.
ij
jiij
T
AGkX
Where, i, j: zone Xij: number of trips between zone i and zone j Gi: number of trips generated in zone i Aj: number of trips attracted in zone j Tij: distance (m) on the road between zone i and zone j K, α, β, γ: parameter
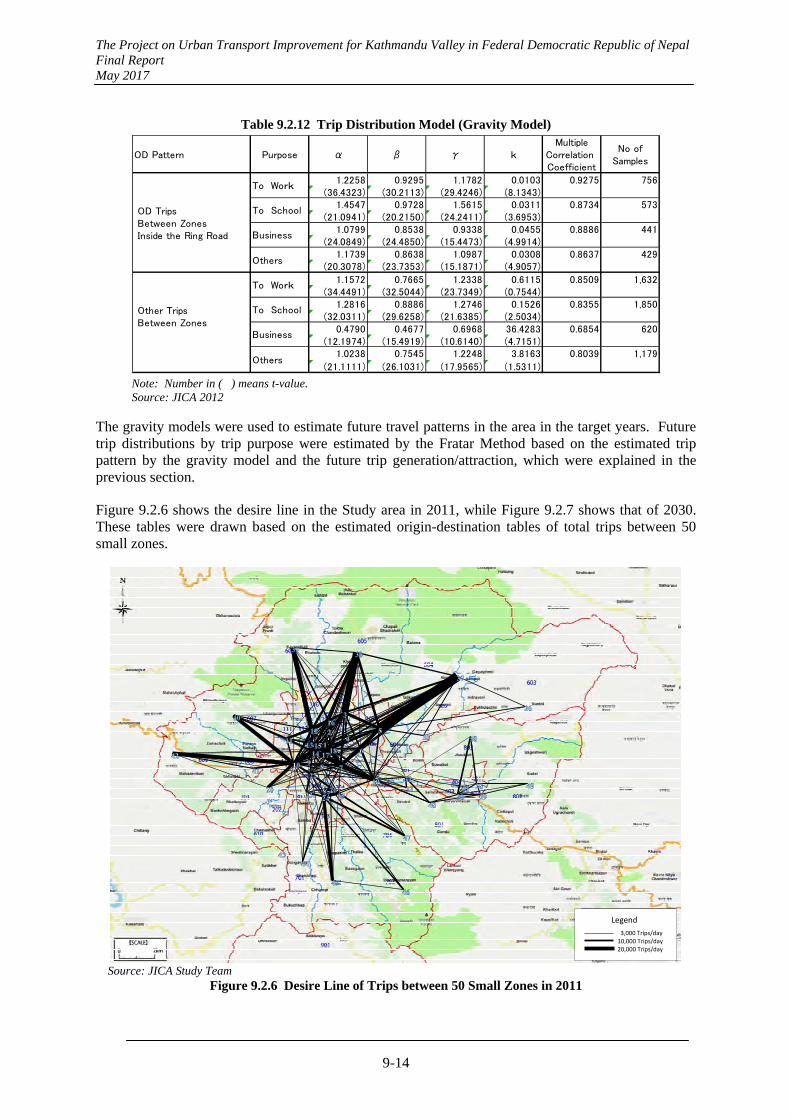
The Project on Urban Transport Improvement for Kathmandu Valley in Federal Democratic Republic of Nepal Final Report May 2017
9-14
Table 9.2.12 Trip Distribution Model (Gravity Model)
OD Pattern Purpose α β γ kMultiple
Correlation Coefficient
No ofSamples
1.2258 0.9295 1.1782 0.0103 0.9275 756(36.4323) (30.2113) (29.4246) (8.1343)
1.4547 0.9728 1.5615 0.0311 0.8734 573(21.0941) (20.2150) (24.2411) (3.6953)
1.0799 0.8538 0.9338 0.0455 0.8886 441(24.0849) (24.4850) (15.4473) (4.9914)
1.1739 0.8638 1.0987 0.0308 0.8637 429(20.3078) (23.7353) (15.1871) (4.9057)
1.1572 0.7665 1.2338 0.6115 0.8509 1,632(34.4491) (32.5044) (23.7349) (0.7544)
1.2816 0.8886 1.2746 0.1526 0.8355 1,850(32.0311) (29.6258) (21.6385) (2.5034)
0.4790 0.4677 0.6968 36.4283 0.6854 620(12.1974) (15.4919) (10.6140) (4.7151)
1.0238 0.7545 1.2248 3.8163 0.8039 1,179
(21.1111) (26.1031) (17.9565) (1.5311)
Other Trips Between Zones
To Work
To School
Business
Others
OD Trips Between Zones Inside the Ring Road
To Work
To School
Business
Others
Note: Number in ( ) means t-value. Source: JICA 2012
The gravity models were used to estimate future travel patterns in the area in the target years. Future trip distributions by trip purpose were estimated by the Fratar Method based on the estimated trip pattern by the gravity model and the future trip generation/attraction, which were explained in the previous section.
Figure 9.2.6 shows the desire line in the Study area in 2011, while Figure 9.2.7 shows that of 2030. These tables were drawn based on the estimated origin-destination tables of total trips between 50 small zones.
Legend
3,000 Trips/day10,000 Trips/day20,000 Trips/day
Source: JICA Study Team
Figure 9.2.6 Desire Line of Trips between 50 Small Zones in 2011
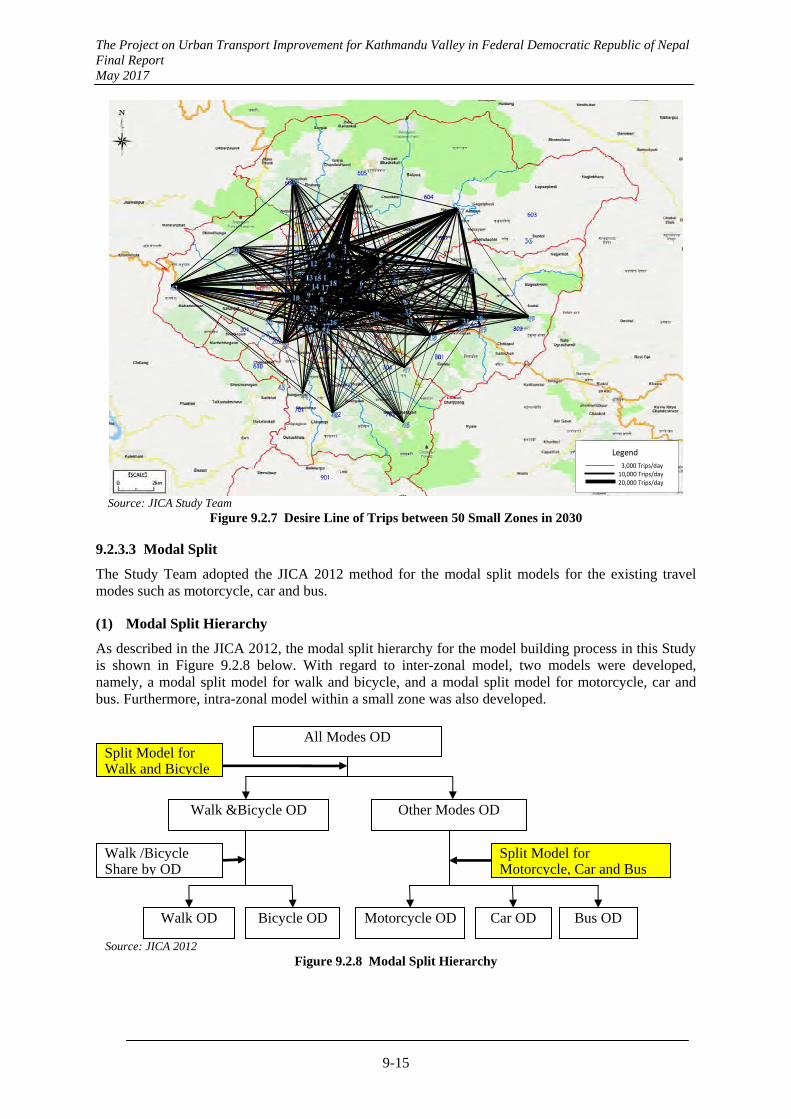
The Project on Urban Transport Improvement for Kathmandu Valley in Federal Democratic Republic of Nepal Final Report May 2017
9-15
Legend
3,000 Trips/day10,000 Trips/day20,000 Trips/day
Source: JICA Study Team
Figure 9.2.7 Desire Line of Trips between 50 Small Zones in 2030 9.2.3.3 Modal Split
The Study Team adopted the JICA 2012 method for the modal split models for the existing travel modes such as motorcycle, car and bus.
(1) Modal Split Hierarchy
As described in the JICA 2012, the modal split hierarchy for the model building process in this Study is shown in Figure 9.2.8 below. With regard to inter-zonal model, two models were developed, namely, a modal split model for walk and bicycle, and a modal split model for motorcycle, car and bus. Furthermore, intra-zonal model within a small zone was also developed.
Source: JICA 2012
Figure 9.2.8 Modal Split Hierarchy
All Modes OD
Walk &Bicycle OD Other Modes OD
Split Model for Walk and Bicycle
Walk /Bicycle Share by OD
Split Model for Motorcycle, Car and Bus
Walk OD Bicycle OD Motorcycle OD Car OD Bus OD
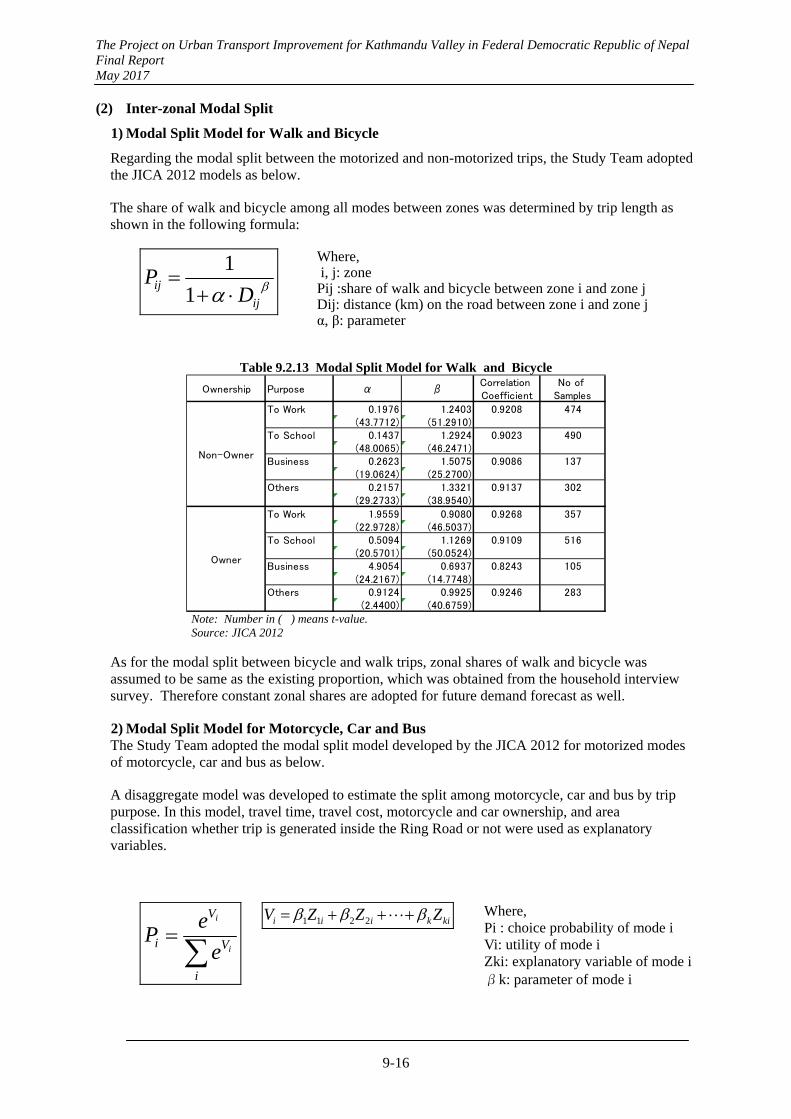
The Project on Urban Transport Improvement for Kathmandu Valley in Federal Democratic Republic of Nepal Final Report May 2017
9-16
(2) Inter-zonal Modal Split
1) Modal Split Model for Walk and Bicycle
Regarding the modal split between the motorized and non-motorized trips, the Study Team adopted the JICA 2012 models as below.
The share of walk and bicycle among all modes between zones was determined by trip length as shown in the following formula:
ij
ijD
P
1
1
Where, i, j: zone Pij :share of walk and bicycle between zone i and zone j Dij: distance (km) on the road between zone i and zone j α, β: parameter
Table 9.2.13 Modal Split Model for Walk and Bicycle
Ownership Purpose α βCorrelation Coefficient
No of Samples
To Work 0.1976 1.2403 0.9208 474(43.7712) (51.2910)
To School 0.1437 1.2924 0.9023 490(48.0065) (46.2471)
Business 0.2623 1.5075 0.9086 137(19.0624) (25.2700)
Others 0.2157 1.3321 0.9137 302(29.2733) (38.9540)
To Work 1.9559 0.9080 0.9268 357(22.9728) (46.5037)
To School 0.5094 1.1269 0.9109 516(20.5701) (50.0524)
Business 4.9054 0.6937 0.8243 105(24.2167) (14.7748)
Others 0.9124 0.9925 0.9246 283(2.4400) (40.6759)
Non-Owner
Owner
Note: Number in ( ) means t-value. Source: JICA 2012
As for the modal split between bicycle and walk trips, zonal shares of walk and bicycle was assumed to be same as the existing proportion, which was obtained from the household interview survey. Therefore constant zonal shares are adopted for future demand forecast as well.
2) Modal Split Model for Motorcycle, Car and Bus The Study Team adopted the modal split model developed by the JICA 2012 for motorized modes of motorcycle, car and bus as below.
A disaggregate model was developed to estimate the split among motorcycle, car and bus by trip purpose. In this model, travel time, travel cost, motorcycle and car ownership, and area classification whether trip is generated inside the Ring Road or not were used as explanatory variables.
i
V
V
i i
i
e
eP
kikiii ZZZV 2211 Where, Pi : choice probability of mode i Vi: utility of mode i Zki: explanatory variable of mode iβk: parameter of mode i
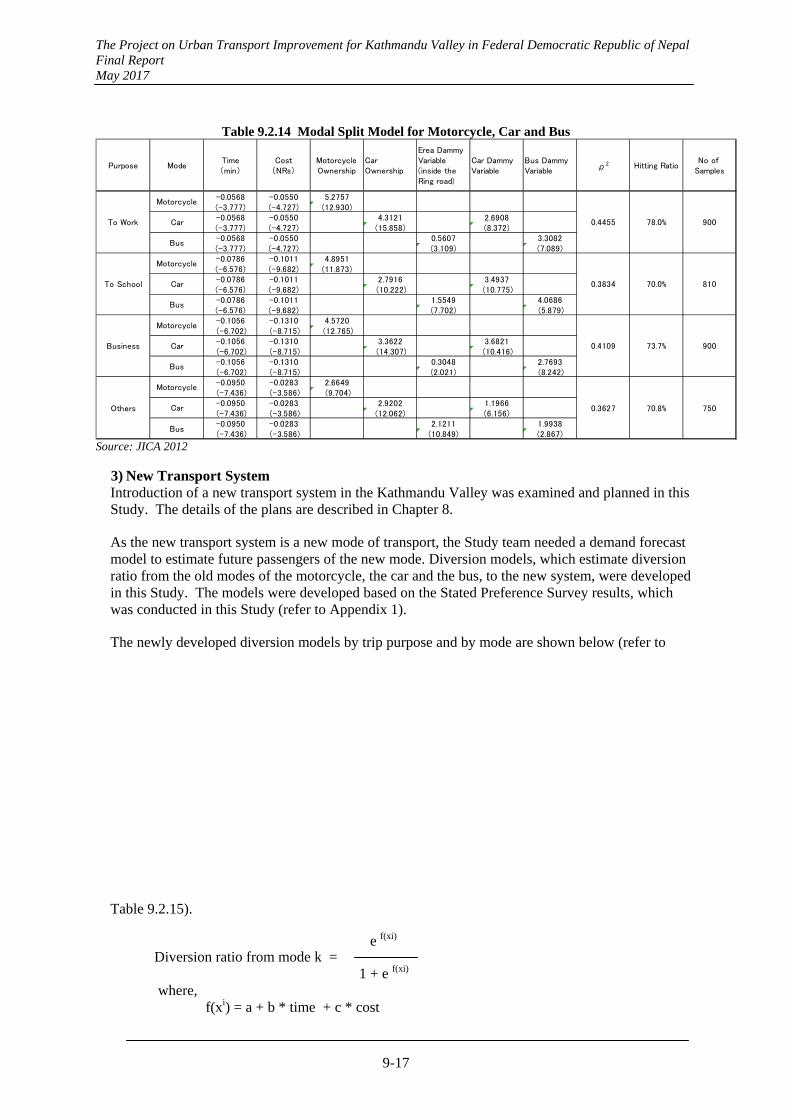
The Project on Urban Transport Improvement for Kathmandu Valley in Federal Democratic Republic of Nepal Final Report May 2017
9-17
Table 9.2.14 Modal Split Model for Motorcycle, Car and Bus
Purpose ModeTime(min)
Cost(NRs)
MotorcycleOwnership
CarOwnership
Erea Dammy Variable(inside the Ring road)
Car Dammy Variable
Bus Dammy Variable ρ2 Hitting Ratio
No of Samples
-0.0568 -0.0550 5.2757(-3.777) (-4.727) (12.930)-0.0568 -0.0550 4.3121 2.6908(-3.777) (-4.727) (15.858) (8.372)-0.0568 -0.0550 0.5607 3.3082(-3.777) (-4.727) (3.109) (7.089)-0.0786 -0.1011 4.8951(-6.576) (-9.682) (11.873)-0.0786 -0.1011 2.7916 3.4937(-6.576) (-9.682) (10.222) (10.775)-0.0786 -0.1011 1.5549 4.0686(-6.576) (-9.682) (7.702) (5.879)-0.1056 -0.1310 4.5720 (-6.702) (-8.715) (12.765)-0.1056 -0.1310 3.3622 3.6821 (-6.702) (-8.715) (14.307) (10.416)-0.1056 -0.1310 0.3048 2.7693 (-6.702) (-8.715) (2.021) (8.242)-0.0950 -0.0283 2.6649 (-7.436) (-3.586) (9.704)-0.0950 -0.0283 2.9202 1.1966 (-7.436) (-3.586) (12.062) (6.156)-0.0950 -0.0283 2.1211 1.9938 (-7.436) (-3.586) (10.849) (2.867)
Others
Motorcycle
0.3627 70.8% 750Car
Bus
Business
Motorcycle
0.4109 73.7% 900Car
Bus
To School
Motorcycle
0.3834 70.0% 810Car
Bus
To Work
Motorcycle
0.4455 78.0% 900Car
Bus
Source: JICA 2012
3) New Transport System Introduction of a new transport system in the Kathmandu Valley was examined and planned in this Study. The details of the plans are described in Chapter 8.
As the new transport system is a new mode of transport, the Study team needed a demand forecast model to estimate future passengers of the new mode. Diversion models, which estimate diversion ratio from the old modes of the motorcycle, the car and the bus, to the new system, were developed in this Study. The models were developed based on the Stated Preference Survey results, which was conducted in this Study (refer to Appendix 1).
The newly developed diversion models by trip purpose and by mode are shown below (refer to
Table 9.2.15).
e f(xi) Diversion ratio from mode k =
1 + e f(xi) where, f(xi) = a + b * time + c * cost
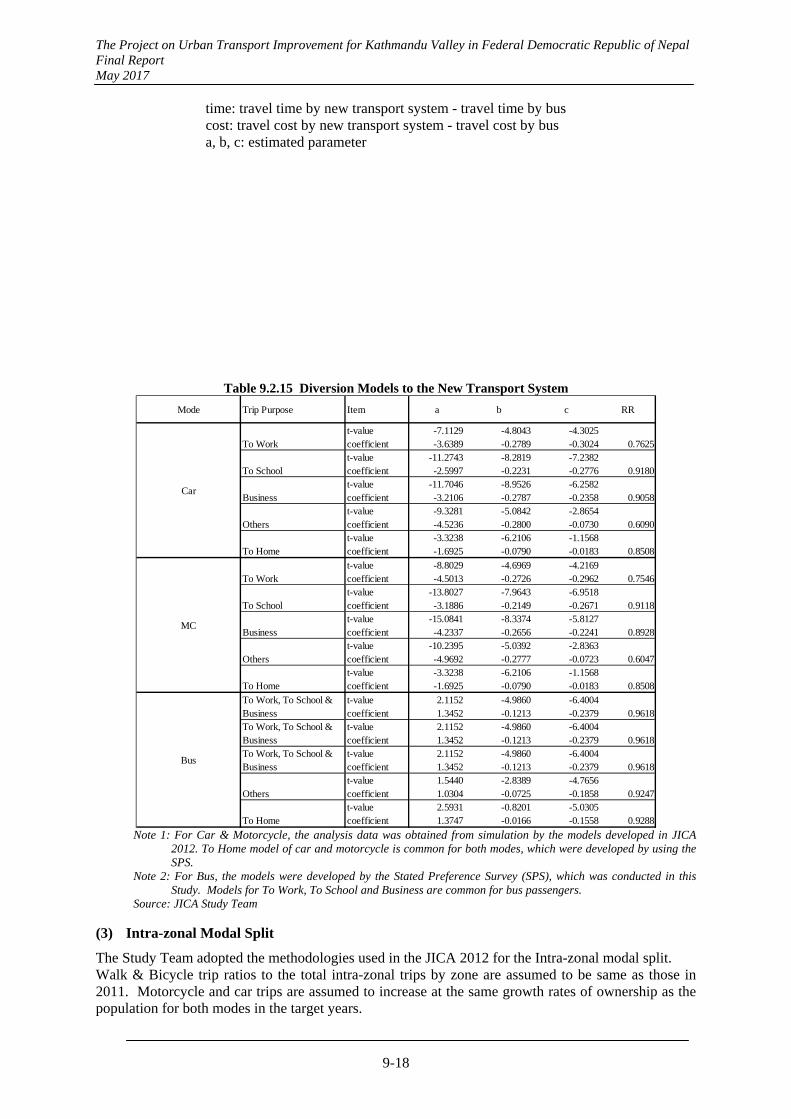
The Project on Urban Transport Improvement for Kathmandu Valley in Federal Democratic Republic of Nepal Final Report May 2017
9-18
time: travel time by new transport system - travel time by bus cost: travel cost by new transport system - travel cost by bus a, b, c: estimated parameter
Table 9.2.15 Diversion Models to the New Transport System
t-value -7.1129 -4.8043 -4.3025To Work coefficient -3.6389 -0.2789 -0.3024 0.7625
t-value -11.2743 -8.2819 -7.2382To School coefficient -2.5997 -0.2231 -0.2776 0.9180
t-value -11.7046 -8.9526 -6.2582Business coefficient -3.2106 -0.2787 -0.2358 0.9058
t-value -9.3281 -5.0842 -2.8654Others coefficient -4.5236 -0.2800 -0.0730 0.6090
t-value -3.3238 -6.2106 -1.1568To Home coefficient -1.6925 -0.0790 -0.0183 0.8508
t-value -8.8029 -4.6969 -4.2169To Work coefficient -4.5013 -0.2726 -0.2962 0.7546
t-value -13.8027 -7.9643 -6.9518To School coefficient -3.1886 -0.2149 -0.2671 0.9118
t-value -15.0841 -8.3374 -5.8127Business coefficient -4.2337 -0.2656 -0.2241 0.8928
t-value -10.2395 -5.0392 -2.8363Others coefficient -4.9692 -0.2777 -0.0723 0.6047
t-value -3.3238 -6.2106 -1.1568To Home coefficient -1.6925 -0.0790 -0.0183 0.8508
t-value 2.1152 -4.9860 -6.4004coefficient 1.3452 -0.1213 -0.2379 0.9618t-value 2.1152 -4.9860 -6.4004coefficient 1.3452 -0.1213 -0.2379 0.9618t-value 2.1152 -4.9860 -6.4004coefficient 1.3452 -0.1213 -0.2379 0.9618t-value 1.5440 -2.8389 -4.7656
Others coefficient 1.0304 -0.0725 -0.1858 0.9247t-value 2.5931 -0.8201 -5.0305
To Home coefficient 1.3747 -0.0166 -0.1558 0.9288
RRa b cTrip Purpose ItemMode
To Work, To School &Business
To Work, To School &BusinessTo Work, To School &Business
Bus
MC
Car
Note 1: For Car & Motorcycle, the analysis data was obtained from simulation by the models developed in JICA
2012. To Home model of car and motorcycle is common for both modes, which were developed by using the SPS.
Note 2: For Bus, the models were developed by the Stated Preference Survey (SPS), which was conducted in this Study. Models for To Work, To School and Business are common for bus passengers.
Source: JICA Study Team (3) Intra-zonal Modal Split
The Study Team adopted the methodologies used in the JICA 2012 for the Intra-zonal modal split. Walk & Bicycle trip ratios to the total intra-zonal trips by zone are assumed to be same as those in 2011. Motorcycle and car trips are assumed to increase at the same growth rates of ownership as the population for both modes in the target years.
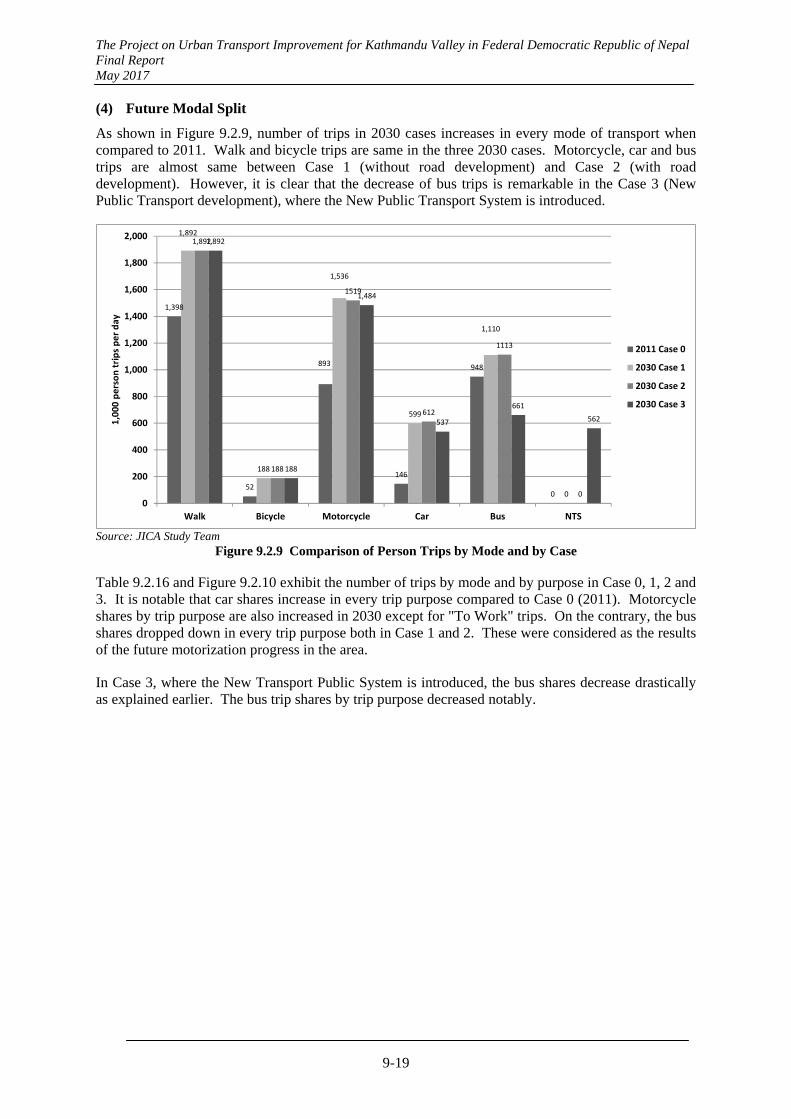
The Project on Urban Transport Improvement for Kathmandu Valley in Federal Democratic Republic of Nepal Final Report May 2017
9-19
(4) Future Modal Split
As shown in Figure 9.2.9, number of trips in 2030 cases increases in every mode of transport when compared to 2011. Walk and bicycle trips are same in the three 2030 cases. Motorcycle, car and bus trips are almost same between Case 1 (without road development) and Case 2 (with road development). However, it is clear that the decrease of bus trips is remarkable in the Case 3 (New Public Transport development), where the New Public Transport System is introduced.
1,398
52
893
146
948
0
1,892
188
1,536
599
1,110
0
1,892
188
1519
612
1113
0
1,892
188
1,484
537
661
562
0
200
400
600
800
1,000
1,200
1,400
1,600
1,800
2,000
Walk Bicycle Motorcycle Car Bus NTS
1,000 person trips per day
2011 Case 0
2030 Case 1
2030 Case 2
2030 Case 3
Source: JICA Study Team
Figure 9.2.9 Comparison of Person Trips by Mode and by Case Table 9.2.16 and Figure 9.2.10 exhibit the number of trips by mode and by purpose in Case 0, 1, 2 and 3. It is notable that car shares increase in every trip purpose compared to Case 0 (2011). Motorcycle shares by trip purpose are also increased in 2030 except for "To Work" trips. On the contrary, the bus shares dropped down in every trip purpose both in Case 1 and 2. These were considered as the results of the future motorization progress in the area.
In Case 3, where the New Transport Public System is introduced, the bus shares decrease drastically as explained earlier. The bus trip shares by trip purpose decreased notably.
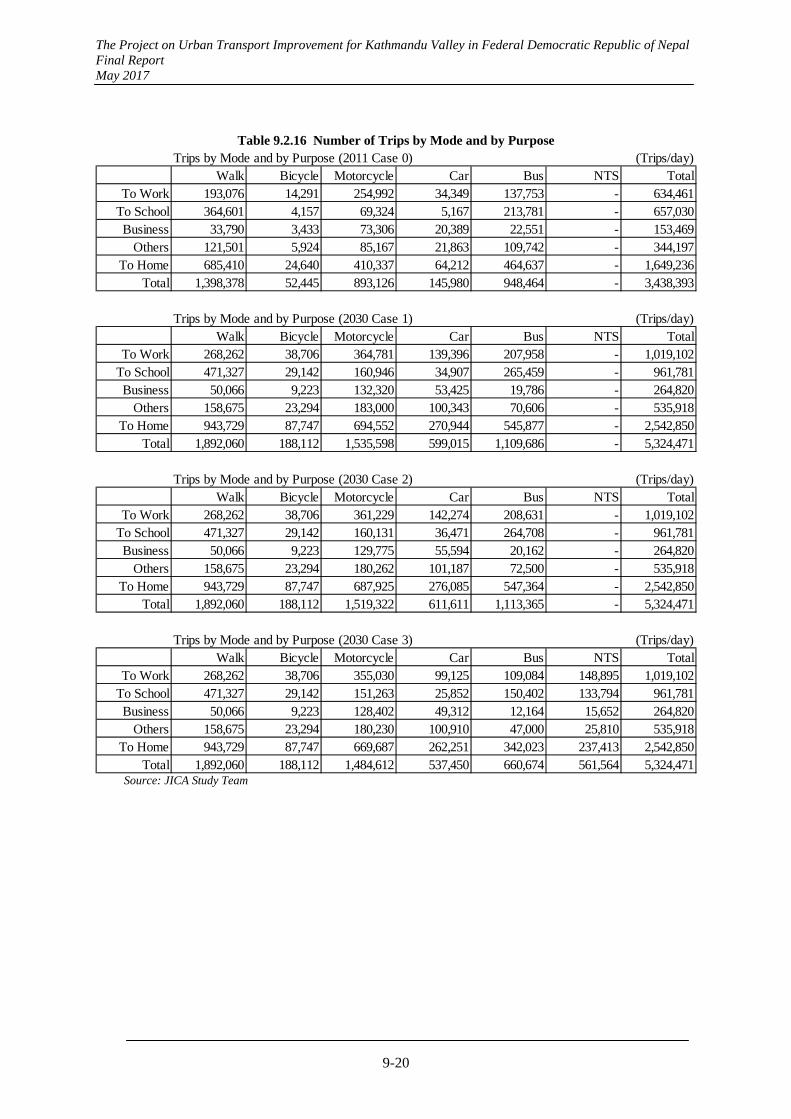
The Project on Urban Transport Improvement for Kathmandu Valley in Federal Democratic Republic of Nepal Final Report May 2017
9-20
Table 9.2.16 Number of Trips by Mode and by Purpose Trips by Mode and by Purpose (2011 Case 0) (Trips/day)
Walk Bicycle Motorcycle Car Bus NTS TotalTo Work 193,076 14,291 254,992 34,349 137,753 - 634,461
To School 364,601 4,157 69,324 5,167 213,781 - 657,030Business 33,790 3,433 73,306 20,389 22,551 - 153,469
Others 121,501 5,924 85,167 21,863 109,742 - 344,197To Home 685,410 24,640 410,337 64,212 464,637 - 1,649,236
Total 1,398,378 52,445 893,126 145,980 948,464 - 3,438,393
Trips by Mode and by Purpose (2030 Case 1) (Trips/day)Walk Bicycle Motorcycle Car Bus NTS Total
To Work 268,262 38,706 364,781 139,396 207,958 - 1,019,102To School 471,327 29,142 160,946 34,907 265,459 - 961,781Business 50,066 9,223 132,320 53,425 19,786 - 264,820
Others 158,675 23,294 183,000 100,343 70,606 - 535,918To Home 943,729 87,747 694,552 270,944 545,877 - 2,542,850
Total 1,892,060 188,112 1,535,598 599,015 1,109,686 - 5,324,471
Trips by Mode and by Purpose (2030 Case 2) (Trips/day)Walk Bicycle Motorcycle Car Bus NTS Total
To Work 268,262 38,706 361,229 142,274 208,631 - 1,019,102To School 471,327 29,142 160,131 36,471 264,708 - 961,781Business 50,066 9,223 129,775 55,594 20,162 - 264,820
Others 158,675 23,294 180,262 101,187 72,500 - 535,918To Home 943,729 87,747 687,925 276,085 547,364 - 2,542,850
Total 1,892,060 188,112 1,519,322 611,611 1,113,365 - 5,324,471
Trips by Mode and by Purpose (2030 Case 3) (Trips/day)Walk Bicycle Motorcycle Car Bus NTS Total
To Work 268,262 38,706 355,030 99,125 109,084 148,895 1,019,102To School 471,327 29,142 151,263 25,852 150,402 133,794 961,781Business 50,066 9,223 128,402 49,312 12,164 15,652 264,820
Others 158,675 23,294 180,230 100,910 47,000 25,810 535,918To Home 943,729 87,747 669,687 262,251 342,023 237,413 2,542,850
Total 1,892,060 188,112 1,484,612 537,450 660,674 561,564 5,324,471 Source: JICA Study Team
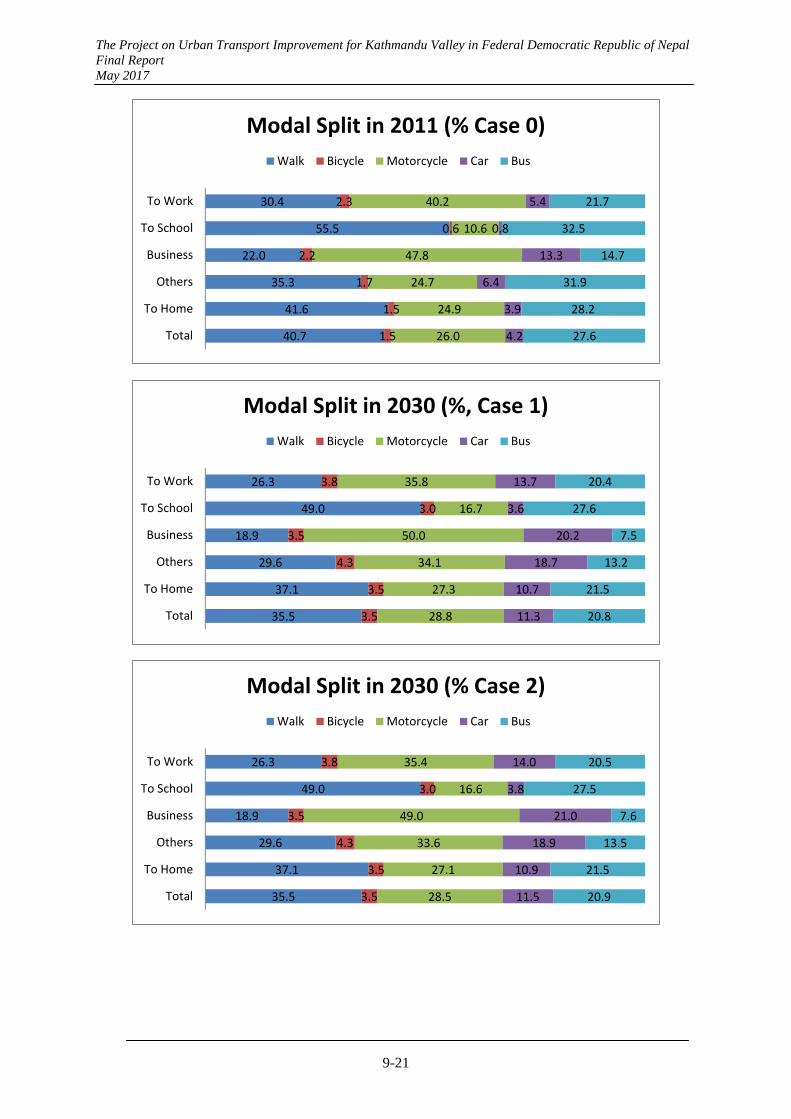
The Project on Urban Transport Improvement for Kathmandu Valley in Federal Democratic Republic of Nepal Final Report May 2017
9-21
40.7
41.6
35.3
22.0
55.5
30.4
1.5
1.5
1.7
2.2
0.6
2.3
26.0
24.9
24.7
47.8
10.6
40.2
4.2
3.9
6.4
13.3
0.8
5.4
27.6
28.2
31.9
14.7
32.5
21.7
Total
To Home
Others
Business
To School
To Work
Modal Split in 2011 (% Case 0)
Walk Bicycle Motorcycle Car Bus
35.5
37.1
29.6
18.9
49.0
26.3
3.5
3.5
4.3
3.5
3.0
3.8
28.8
27.3
34.1
50.0
16.7
35.8
11.3
10.7
18.7
20.2
3.6
13.7
20.8
21.5
13.2
7.5
27.6
20.4
Total
To Home
Others
Business
To School
To Work
Modal Split in 2030 (%, Case 1)
Walk Bicycle Motorcycle Car Bus
35.5
37.1
29.6
18.9
49.0
26.3
3.5
3.5
4.3
3.5
3.0
3.8
28.5
27.1
33.6
49.0
16.6
35.4
11.5
10.9
18.9
21.0
3.8
14.0
20.9
21.5
13.5
7.6
27.5
20.5
Total
To Home
Others
Business
To School
To Work
Modal Split in 2030 (% Case 2)
Walk Bicycle Motorcycle Car Bus
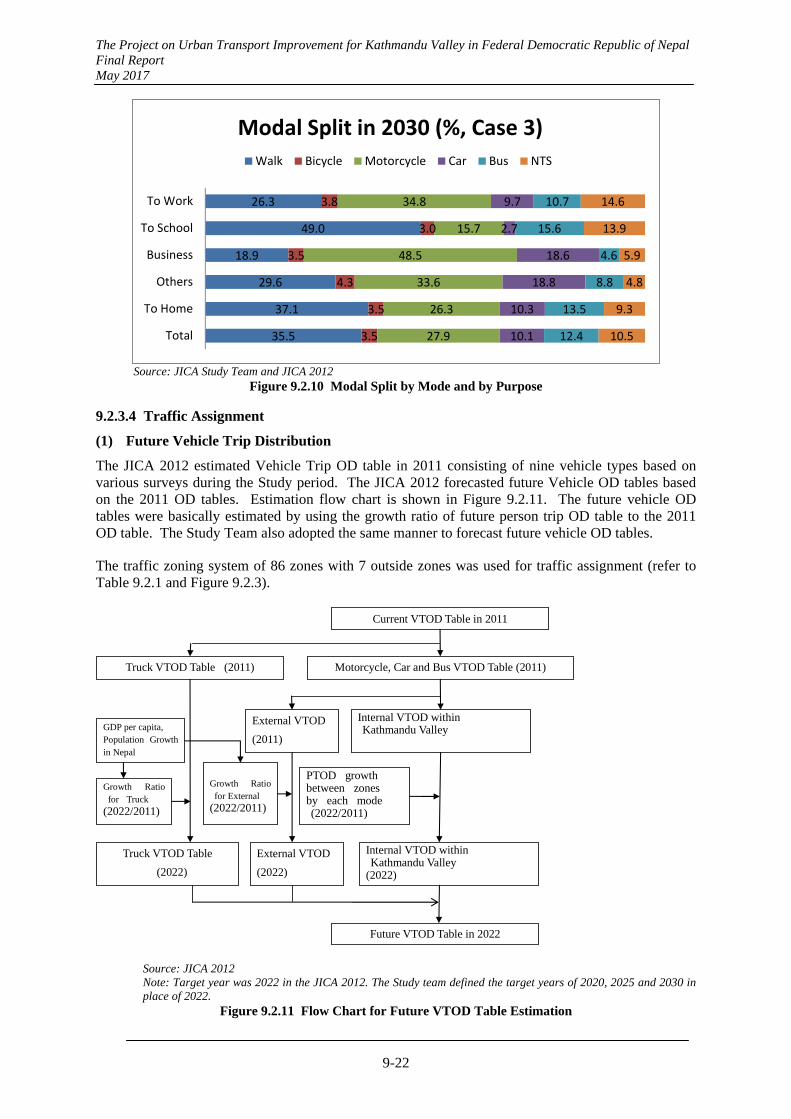
The Project on Urban Transport Improvement for Kathmandu Valley in Federal Democratic Republic of Nepal Final Report May 2017
9-22
35.5
37.1
29.6
18.9
49.0
26.3
3.5
3.5
4.3
3.5
3.0
3.8
27.9
26.3
33.6
48.5
15.7
34.8
10.1
10.3
18.8
18.6
2.7
9.7
12.4
13.5
8.8
4.6
15.6
10.7
10.5
9.3
4.8
5.9
13.9
14.6
Total
To Home
Others
Business
To School
To Work
Modal Split in 2030 (%, Case 3)
Walk Bicycle Motorcycle Car Bus NTS
Source: JICA Study Team and JICA 2012
Figure 9.2.10 Modal Split by Mode and by Purpose
9.2.3.4 Traffic Assignment
(1) Future Vehicle Trip Distribution
The JICA 2012 estimated Vehicle Trip OD table in 2011 consisting of nine vehicle types based on various surveys during the Study period. The JICA 2012 forecasted future Vehicle OD tables based on the 2011 OD tables. Estimation flow chart is shown in Figure 9.2.11. The future vehicle OD tables were basically estimated by using the growth ratio of future person trip OD table to the 2011 OD table. The Study Team also adopted the same manner to forecast future vehicle OD tables.
The traffic zoning system of 86 zones with 7 outside zones was used for traffic assignment (refer to Table 9.2.1 and Figure 9.2.3).
Current VTOD Table in 2011
Truck VTOD Table (2011) Motorcycle, Car and Bus VTOD Table (2011)
External VTOD
(2011)
Internal VTOD within Kathmandu Valley
Growth Ratio for Truck
(2022/2011)
Truck VTOD Table
(2022)
External VTOD
(2022)
PTOD growthbetween zones by each mode (2022/2011)
Internal VTOD within Kathmandu Valley (2022)
Future VTOD Table in 2022
Growth Ratio for External
(2022/2011)
GDP per capita, Population Growth in Nepal
Source: JICA 2012 Note: Target year was 2022 in the JICA 2012. The Study team defined the target years of 2020, 2025 and 2030 in place of 2022.
Figure 9.2.11 Flow Chart for Future VTOD Table Estimation

The Project on Urban Transport Improvement for Kathmandu Valley in Federal Democratic Republic of Nepal Final Report May 2017
9-23
The traffic assignment method used in the JICA 2012 was the user equilibrium assignment, which is described in the final report of the JICA 2012.
(2) Result of Traffic Assignment
The Study Team used the JICA STRADA model for the road vehicle traffic assignment just like the JICA 2012. The User Equilibrium Traffic Assignment 3.5 of the model was used for this Study. The traffic assignment procedure was done by using future Vehicle OD tables and planned future highway networks in the target years. Results of the Assignment in Case 0, Case 1, Case 2 and Case 3 in 2011 and 2030 are shown in Figure 9.2.12, Figure 9.2.13, Figure 9.2.14 and Figure 9.2.15 respectively.
Traffic assignment of the New Transport System was conducted by an all or nothing method based on the minimum path procedure by using the software developed by the Study Team. Figure 9.2.16 shows the daily passenger traffic volume of the BRT and the AGT for both directions.
It should be noted that bus vehicle trips for the access/egress trips of the New Transport System were not included in the Figure 9.2.15, which illustrates the Case 3 traffic assignment of the road vehicles, because of technical reasons. However, necessary information, such as passenger-km and passenger hour by mode, for the project evaluation was estimated for the Case 3.
Heavy traffic volume is estimated in 2030 (Case 1: without road development), in which only on-going and committed road projects are assumed. Most of the road sections are estimated to saturate in the Case 1 as shown in the Figure 9.2.13. Average congestion ratio (volume / capacity ratio) reaches 1.28 inside the Ring Road area. Nearly half of the road sections in terms of distance are estimated to have the congestion ratio of over 1.25.
In Case 2, where the road development plan is realized, the congestion ratio decreased to 0.85 and 0.76 inside the Ring Road area and in the whole study area, respectively. More than 80 per cent of the road sections are estimated to show the congestion ratio of less than 1.25. The alleviated road congestion is also exhibited in the Figure 9.2.14.
In Case 3, where the New Public Transport System is introduced and the bus transport efficiency improvement program is in operation (refer to Table 9.2.7) in addition to Case 2, the road congestion is further alleviated as shown in the Figure 9.2.15, because trips are diverted to the new transport system from the existing transport modes of car, motorcycle and bus. The road congestion ratios are also relieved further to 0.76 inside the Ring Road area and to 0.65 in the whole study area (refer to Table 9.2.17).
Regarding the average travel speed of the road network in the study area, it is estimated as 26.3 km/h, 33.0 km/h, 43.9 km/h and 45.0 km/h in the Case 0, 1, 2 and 3, respectively. Effects of the transport master plan development are clearly shown in the forecast results.
Table 9.2.17 Comparison of Congestion Ratio Indicators Area
Inside the Ring RoadAll Study Area
Length Length Length Length(km) (km) (km) (km)
Less than 0.75 62.6 0.251 55.5 0.178 231.0 0.533 260.0 0.6200.75 - 1.25 80.5 0.322 123.2 0.395 126.2 0.291 102.6 0.2451.25 - 1.75 64.9 0.260 70.3 0.226 38.8 0.090 21.8 0.052Over 1.75 41.6 0.167 62.5 0.201 37.1 0.086 35.2 0.084
Road Leght by Congestion Rank inside the Ring Road
Ratio Ratio Ratio Ratio
2030 Case 2 2030 Case 31.220.93
1.281.14
0.850.76
0.760.65
Average Congestion Ratio
2011 Case 0 2030 Case 1
Source: JICA Study Team

The Project on Urban Transport Improvement for Kathmandu Valley in Federal Democratic Republic of Nepal Final Report May 2017
9-24
West-south Outside93
Legend
10,000 PCU per Day
80,000 PCU per Day
50,000 PCU per Day
30,000 PCU per Day
0.00 < V/C ≦ 0.75
0.75 < V/C ≦ 1.25
1.25 < V/C ≦ 1.75
1.75 < V/C
Source: JICA Study Team
Figure 9.2.12 Traffic Volume in 2011 Case 0
West-south Outside93
Legend
10,000 PCU per Day
80,000 PCU per Day
50,000 PCU per Day
30,000 PCU per Day
0.00 < V/C ≦ 0.75
0.75 < V/C ≦ 1.25
1.25 < V/C ≦ 1.75
1.75 < V/C
Source: JICA Study Team
Figure 9.2.13 Traffic Volume in 2030 Case 1

The Project on Urban Transport Improvement for Kathmandu Valley in Federal Democratic Republic of Nepal Final Report May 2017
9-25
West-south Outside93
Legend
10,000 PCU per Day
80,000 PCU per Day
50,000 PCU per Day
30,000 PCU per Day
0.00 < V/C ≦ 0.75
0.75 < V/C ≦ 1.25
1.25 < V/C ≦ 1.75
1.75 < V/C
Source: JICA Study Team
Figure 9.2.14 Traffic Volume in 2030 Case 2
West-south Outside93
Legend
10,000 PCU per Day
80,000 PCU per Day
50,000 PCU per Day
30,000 PCU per Day
0.00 < V/C ≦ 0.75
0.75 < V/C ≦ 1.25
1.25 < V/C ≦ 1.75
1.75 < V/C
Source: JICA Study Team
Figure 9.2.15 Traffic Volume in 2030 Case 3
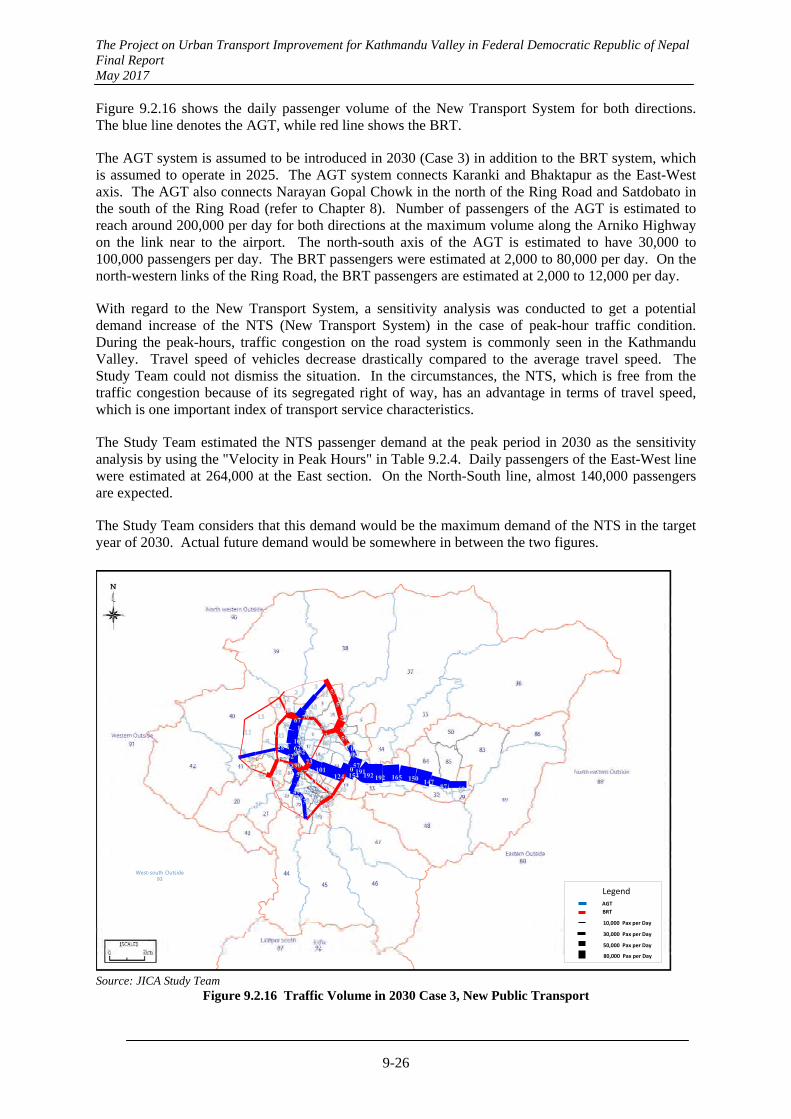
The Project on Urban Transport Improvement for Kathmandu Valley in Federal Democratic Republic of Nepal Final Report May 2017
9-26
Figure 9.2.16 shows the daily passenger volume of the New Transport System for both directions. The blue line denotes the AGT, while red line shows the BRT.
The AGT system is assumed to be introduced in 2030 (Case 3) in addition to the BRT system, which is assumed to operate in 2025. The AGT system connects Karanki and Bhaktapur as the East-West axis. The AGT also connects Narayan Gopal Chowk in the north of the Ring Road and Satdobato in the south of the Ring Road (refer to Chapter 8). Number of passengers of the AGT is estimated to reach around 200,000 per day for both directions at the maximum volume along the Arniko Highway on the link near to the airport. The north-south axis of the AGT is estimated to have 30,000 to 100,000 passengers per day. The BRT passengers were estimated at 2,000 to 80,000 per day. On the north-western links of the Ring Road, the BRT passengers are estimated at 2,000 to 12,000 per day.
With regard to the New Transport System, a sensitivity analysis was conducted to get a potential demand increase of the NTS (New Transport System) in the case of peak-hour traffic condition. During the peak-hours, traffic congestion on the road system is commonly seen in the Kathmandu Valley. Travel speed of vehicles decrease drastically compared to the average travel speed. The Study Team could not dismiss the situation. In the circumstances, the NTS, which is free from the traffic congestion because of its segregated right of way, has an advantage in terms of travel speed, which is one important index of transport service characteristics.
The Study Team estimated the NTS passenger demand at the peak period in 2030 as the sensitivity analysis by using the "Velocity in Peak Hours" in Table 9.2.4. Daily passengers of the East-West line were estimated at 264,000 at the East section. On the North-South line, almost 140,000 passengers are expected.
The Study Team considers that this demand would be the maximum demand of the NTS in the target year of 2030. Actual future demand would be somewhere in between the two figures.
West-south Outside93
Legend
10,000 Pax per Day
30,000 Pax per Day
50,000 Pax per Day
80,000 Pax per Day
AGT
BRT
Source: JICA Study Team
Figure 9.2.16 Traffic Volume in 2030 Case 3, New Public Transport
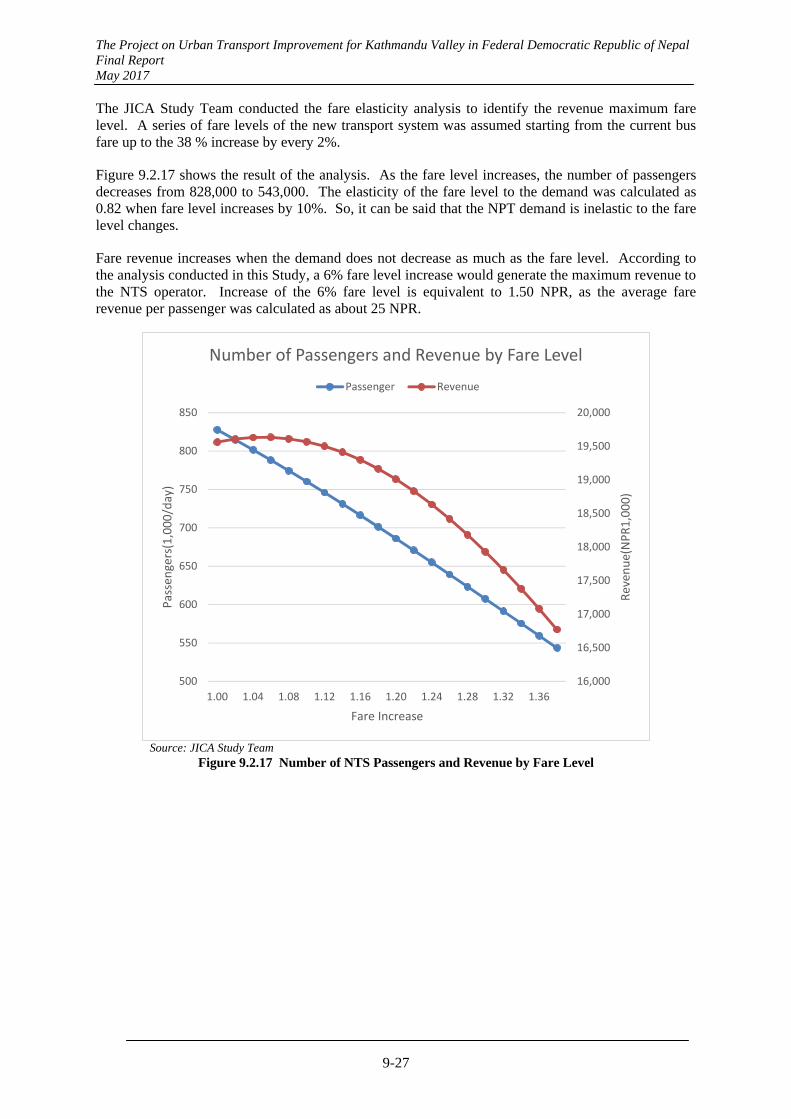
The Project on Urban Transport Improvement for Kathmandu Valley in Federal Democratic Republic of Nepal Final Report May 2017
9-27
The JICA Study Team conducted the fare elasticity analysis to identify the revenue maximum fare level. A series of fare levels of the new transport system was assumed starting from the current bus fare up to the 38 % increase by every 2%.
Figure 9.2.17 shows the result of the analysis. As the fare level increases, the number of passengers decreases from 828,000 to 543,000. The elasticity of the fare level to the demand was calculated as 0.82 when fare level increases by 10%. So, it can be said that the NPT demand is inelastic to the fare level changes.
Fare revenue increases when the demand does not decrease as much as the fare level. According to the analysis conducted in this Study, a 6% fare level increase would generate the maximum revenue to the NTS operator. Increase of the 6% fare level is equivalent to 1.50 NPR, as the average fare revenue per passenger was calculated as about 25 NPR.
16,000
16,500
17,000
17,500
18,000
18,500
19,000
19,500
20,000
500
550
600
650
700
750
800
850
1.00 1.04 1.08 1.12 1.16 1.20 1.24 1.28 1.32 1.36
Reven
ue(NPR1,000)
Passengers(1,000/day)
Fare Increase
Number of Passengers and Revenue by Fare Level
Passenger Revenue
Source: JICA Study Team
Figure 9.2.17 Number of NTS Passengers and Revenue by Fare Level