Federal-Aid Highways 2035 Transportation Plan for the ...
359
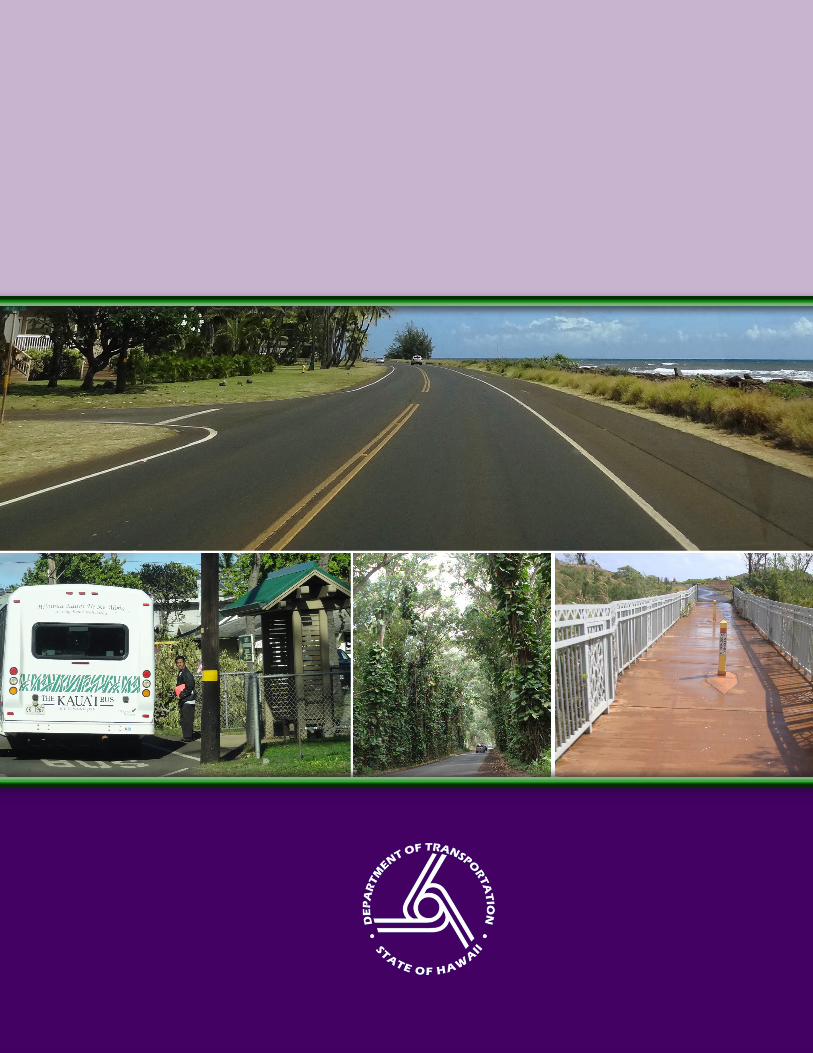
Federal-Aid Highways 2035 Transportation Plan for the District of Kauai July 2014 Prepared for: State of Hawaii Department of Transportation Highways Division
-
Upload
khangminh22 -
Category
Documents
-
view
2 -
download
0
Transcript of Federal-Aid Highways 2035 Transportation Plan for the ...

Federal-Aid Highways 2035 Transportation Plan for the District of Kauai
J u l y 2 0 1 4
Prepared for: State of Hawaii Department of Transportation Highways Division


Federal-Aid Highways 2035 Transportation Plan for the
District of Kauai
Prepared for State of Hawaii
Department of Transportation Highways Division
July 2014
Prepared by

The State of Hawaii is committed to modernizing our highway systems to meet the future needs of our people. Our state Department of Transportation has completed the Federal-Aid Highways 2035 Transportation Plan for the District of Kauai, providing a solid foundation for making informed land transportation planning decisions through the year 2035. The benefits of this present-day work will be critical to Hawaii’s future goals of modernizing our transportation systems, improving safety on our highways, and meeting our ambitious, yet obtainable, sustainability goals. Public involvement and community input were key components in the
planning effort, which embraced the unique social, cultural, and historical values of the people of Hawaii. Our sincerest thanks go to all of our citizens and stakeholders who participated in the process and provided their valuable insight. The Plan develops not only goals and objectives for transportation improvements, but also sets performance standards by which success will be measured. This performance gauge will allow for an objective and unbiased assessment of proposed improvements before they are implemented, streamlining and reducing waste throughout the process. This Plan is an important step forward towards ensuring that transportation improvements can be implemented long-term in fiscally responsible and timely fashions. We will continue our collaborative efforts in our communities statewide to meet our future needs.
Sincerely,
Neil Abercrombie Governor State of Hawaii


The federal-aid highways system is the central transportation network that allows for the efficient movement of people, goods, and services on the Island of Kauai. If the system cannot keep up with demand, we feel the effects in our schedules, our pocketbooks, and throughout our daily lives. The Federal-Aid Highways 2035 Transportation Plan for the District of Kauai is a vital addition to our Highways Division planning toolkit and will provide guidance for our long-term improvements to ensure that our highways can continue to meet future demands. The Plan will focus on increasing highway safety for freight, motorists, transit, cyclists, and pedestrians, and on supporting our local economy
and environment. It will also promote systemwide efficiency, accessibility, and mobility for all users. Setting these fundamental priorities in advance of specific planning efforts will ensure that improving our quality of life will be a central motivator in all of our projects. Development of this Plan has been driven by community members and stakeholders who participated in the planning process. We would like to extend a special mahalo to each of these individuals who took the time to contribute their experiences and input.
Sincerely, Ford Fuchigami Interim Director State of Hawaii Department of Transportation


Contents Page vii TBG0
6271
4093
019H
NL
Table of Contents Chapter Page Acronyms and Abbreviations .......................................................................................................................... ix
I. Introduction and Overview ................................................................................................................. 1-1 Plan Purpose .......................................................................................................................................... 1-1 Relationship to Statewide Transportation Planning Process ................................................................. 1-5 Plan Development Process .................................................................................................................... 1-6 Stakeholder Involvement ....................................................................................................................... 1-7
Stakeholder Groups ..................................................................................................................... 1-8
II. Goals and Objectives ............................................................................................................................ 2-1 Defining Goals and Objectives .............................................................................................................. 2-1
Consistency with Plans, Policies, and Programs ......................................................................... 2-1 Planning Factors .......................................................................................................................... 2-3 Stakeholder Input ........................................................................................................................ 2-3
III. Kauai’s Transportation Context and Needs ...................................................................................... 3-1 Plans, Policies, and Programs ................................................................................................................ 3-2 Socioeconomic Conditions .................................................................................................................... 3-2
Population.................................................................................................................................... 3-2 Households .................................................................................................................................. 3-2 Employment ................................................................................................................................ 3-3 Visitor Industry ........................................................................................................................... 3-6
Roadway System ................................................................................................................................... 3-6 Travel Demand ...................................................................................................................................... 3-7
Vehicular Volumes ...................................................................................................................... 3-7 Freight System........................................................................................................................... 3-11 Public Transit System ................................................................................................................ 3-13 Bikeway System ........................................................................................................................ 3-15 Pedestrian System ..................................................................................................................... 3-18 Emergency Response System .................................................................................................... 3-20
Land Transportation Needs ................................................................................................................. 3-21 Stakeholder Input ...................................................................................................................... 3-21 Alignment with Goals and Objectives ....................................................................................... 3-21
IV. Proposed Solutions ............................................................................................................................... 4-1 Solution Development ........................................................................................................................... 4-1 Solution Evaluation Process .................................................................................................................. 4-2
Tier 1 ........................................................................................................................................... 4-2 Tier 2 ........................................................................................................................................... 4-2
Solution Prioritization ........................................................................................................................... 4-3 Evaluation Outcomes ............................................................................................................................ 4-4
Cost Estimates ............................................................................................................................. 4-8 Recommendations ....................................................................................................................... 4-8
V. Implementation ..................................................................................................................................... 5-1 Connecting this Long-Range Plan and the Statewide Transportation Improvement Program .............. 5-1
Mid-Range Plan ........................................................................................................................... 5-1 Statewide Transportation Improvement Program ....................................................................... 5-2
Funding .................................................................................................................................................. 5-2 Federal Funding ........................................................................................................................... 5-3

Page viii Contents
State Funding ............................................................................................................................... 5-4 Inflation ....................................................................................................................................... 5-5 Future Funding ............................................................................................................................ 5-5 Supplemental Funding and Nonfunding Strategies ..................................................................... 5-6
Reducing Transportation Infrastructure Funding Needs ....................................................................... 5-7 Land Use Planning ......................................................................................................................... 5-7 Transportation Demand Management Strategies ............................................................................... 5-8
Performance Goals ................................................................................................................................ 5-8 Additional Strategies ............................................................................................................................. 5-9
VI. References ............................................................................................................................................. 6-1
Exhibits 1-1 Federal Functional Classification ........................................................................................................ 1-2 1-2 Channelization of Trips ....................................................................................................................... 1-3 1-3 Highway Functional Classification Map of Kauai .............................................................................. 1-4 1-4 Statewide Integrated Transportation Planning .................................................................................... 1-5 1-5 Plan Development Process .................................................................................................................. 1-6 1-6 Stakeholder Groups, Roles, and Responsibilities ................................................................................ 1-7 1-7 TAC Member Organizations ............................................................................................................... 1-8 1-8 CAC Member Categories .................................................................................................................... 1-9 2-1 Key Federal, State, and Local Plans Reviewed ................................................................................... 2-2 2-2 Planning Factors .................................................................................................................................. 2-4 2-3 Kauai District Goal Priority Weights .................................................................................................. 2-5 3-1 Lihue Planning District Future Land Use ............................................................................................ 3-1 3-2a 2007 Household Forecasts ................................................................................................................... 3-4 3-2b 2035 Household Forecasts ................................................................................................................... 3-4 3-3a 2007 Employment Forecasts ............................................................................................................... 3-5 3-3b 2035 Employment Forecasts ............................................................................................................... 3-5 3-4 Forecast Socioeconomic Conditions ................................................................................................... 3-6 3-5 2007 Volume-to-Capacity Ratio ......................................................................................................... 3-9 3-6 2035 Volume-to-Capacity Ratio (No Build) ..................................................................................... 3-10 3-7 2007 Freight Distribution .................................................................................................................. 3-12 3-8 2035 Freight Distribution .................................................................................................................. 3-12 3-9 Existing Transit Routes ..................................................................................................................... 3-14 3-10 Bike Facility Types ........................................................................................................................... 3-15 3-11 Benefits of Biking ............................................................................................................................. 3-16 3-12 Existing and Planned Bicycle System ............................................................................................... 3-17 3-13 Existing State Pedestrian System ...................................................................................................... 3-19 3-14 Kauai County Tsunami Hazard Critical Emergency Facilities ......................................................... 3-20 4-1 Tier 1 Evaluation Criteria .................................................................................................................... 4-3 4-2 Tier 2 Evaluation Worksheet ............................................................................................................... 4-4 4-3 Plan Cost Estimates by Funding Program ........................................................................................... 4-8 4-4 Potential Long-Range Capacity Solutions......................................................................................... 4-10 5-1 Implementation from Long-Range Plan to Statewide Transportation Improvement Program ........... 5-2 5-2 Historical Graph of Federal Contribution............................................................................................ 5-3 5-3 FY11 Breakdown of Revenues by Source........................................................................................... 5-4 5-4 Plan Cost Estimates by Funding Program ........................................................................................... 5-5 5-5 Future Funding Distribution by Program ............................................................................................ 5-5 5-6 Planning Factors and MAP-21 Performance Goals ........................................................................... 5-10
Acronyms and Abbreviations Page ix
Acronyms and Abbreviations CAC Citizen Advisory Committee
DBEDT State of Hawaii Department of Business, Economic Development, and Tourism
EJ environmental justice
FHWA Federal Highway Administration
FY fiscal year
HDOT State of Hawaii Department of Transportation
LOS Level of Service
MAP-21 Moving Ahead for Progress in the 21st Century
PC Policy Committee
SAC Stakeholder Advisory Committee
SAFETEA-LU Safe, Accountable, Flexible, Efficient Transportation Equity Act: A Legacy for Users
STIP Statewide Transportation Improvement Program
TAC Technical Advisory Committee
TAZ traffic analysis zone
TEU twenty-foot equivalent unit
USC United States Code
V/C volume-to-capacity


Chapter IIntroduction and Over view


Chapter I. Introduction and Overview Page 1-1
I . I n t r o d u c t i o n a n d O v e r v i e w
The federal-aid highways are the backbone for moving people and goods around the Island of Kauai. This roadway system is used by all modes of land transportation, including freight, motorists, transit, bicyclists, and pedestrians. It is used for commuting, shopping, recreation, freight transport, visiting family and friends down the road, sightseeing, and by the military. It not only ties together the various communities on the island so that its people can live, work, and play, but also serves as the neighborhood commercial core in many small towns. Due to its ability to carry high volumes of vehicles and freight and provide regional movements, it is critical to supporting Kauai’s economic vitality and provides a lifeline when natural disasters strike.
Plan Purpose The roadway system serves the people, the communities, the land uses, and the economy of Kauai and is vital to a sustainable Kauai. However, the resources required to address the projected land transportation needs for Kauai, and for the state as a whole, far exceed the available funds. By the year 2035, the estimated cost to address identified transportation needs would be nearly $3.1 billion (2011 dollars). With Kauai projected to receive less than $1.0 billion in future state and federal funding, the region would likely experience a funding shortfall of over $2.0 billion.
Furthermore, with recent federal legislation placing an emphasis on highway system preservation and infrastructure maintenance, this limited funding must be sensibly allocated to appropriately address transportation needs comprehensively. As a result, high-cost projects, such as those that increase capacity by adding lanes to existing roads or by constructing new roads, must be carefully compared against other, often less costly, projects.
Under this fiscal reality, it is essential to develop the Regional Federal-Aid Highways 2035 Transportation Plan for the District of Kauai (Plan) to incorporate technical input and community values and to guide decision makers in setting funding priorities.
This Plan is an update of the Kauai Long-Range Land Transportation Plan developed in 1997, and will guide land transportation decisions for the federal-aid highways on the Island of Kauai through Year 2035. By defining goals and needs and recommending context-sensitive, multimodal solutions specific to Kauai, it sets the direction for land transportation system improvements for which priorities and funding can be developed.
Not only will this Plan set the direction for Kauai, it is a federal requirement as stated in Title 23, Sections 134 and 135 of the United States Code. Section 134 governs metropolitan and regional transportation planning, while Section 135 governs statewide planning. Both sections highlight the need for statewide and regional planning efforts to be coordinated, and Section 134 specifically sets forth a policy that states:

DRAFT
Page 1-2 Chapter I. Introduction and Overview
It is in the national interest to encourage and promote the safe and efficient management, operation, and development of surface transportation systems that will serve the mobility needs of people and freight and foster economic growth and development within and between States and urbanized areas.
This regional Plan is developed in alignment with federal laws, thereby providing a link between statewide and regional planning efforts.
The Plan is further coordinated because it is based on input from the Kauai community and county land use and transportation plans, policies, and programs. This ensures it is consistent with the vision of Kauai’s communities and is functionally integrated with the county’s transportation system.
Based on a consistent set of statewide goals and objectives formulated by stakeholders and the public, stakeholders identified several goals for their land transportation system that carried more weight than others in reflecting their community’s values and priorities:
» Preserve and maintain the existing transportation system
» Maintain and improve safety for all modes
» Provide modal integration and complete streets
» Improve capacity and system efficiency
» Support evacuation and emergency access/egress during incidents
» Promote resiliency and ability to respond to climate change
» Better funding levels
This Plan only applies to the federal-aid highways on Kauai. The federal-aid highways are the National Highway System and all other public roads except those federally classified as local roads or rural minor collectors. Functional classification area map insets are included in Appendix A. These roads are critical to providing for mobility for regional movements; linking major sites such as airports, harbors, industrial areas, military facilities, major communities, and primary urban centers; and supporting commuter and freight travel.
For the federal-aid highways, federal policy directs the State of Hawaii Department of Transportation (HDOT) to establish a classification of roads, based on function, so that roadways can be improved appropriately as funding opportunities arise. This functional classification groups streets and highways into classes, or systems, according to the character of service they are intended to provide. Exhibit 1-1 shows the federal functional classification categories.
Exhibit 1-1. Federal Functional Classification Functional classification uses a common nomenclature to provide a consistently defined roadway network across the country.
Principal Arterials:
Interstate Other Freeways and Expressways Other Principal Arterials
Other types of roadways:
Minor Arterial Major Collector Minor Collector Local
All highways in the United States are functionally classified by state Departments of Transportation (in conjunction with local agencies) based on criteria established by the Federal Highway Administration (FHWA). Functional classification is used for planning, design, budgeting, programming, and fiscal management. For example, functional classification is used in determining federal, state, regional, and local priorities for roadway resurfacing or reconstruction. It also determines the eligibility for some FHWA funding categories.
State and county roadways categorized as National Highway System facilities are important federal assets. National Highway System facilities on Kauai are listed below:
» Route 50, Kaumualii Highway between Rice Street and Maluhia Road
» Route 51, Kapule Highway/Rice Street between Nawiliwili Road and Kuhio Highway

Chapter I. Introduction and Overview Page 1-3
» Route 56, Kuhio Highway between Rice Street and Mailihuna Road
» Route 58, Nawiliwili Road between Waapa Road and Kaumualii Highway
» Route 570, Ahukini Road between Kuhio Highway and 0.06 miles east of Kapule Highway
Exhibit 1-2 shows how functional classification defines the nature of how travel can be channelized within a network in a logical and efficient manner by defining the part that any particular road or street should play in serving the flow of trips through a highway network.
Exhibit 1-3 shows the highway functional classifications on Kauai.
Exhibit 1-2. Channelization of Trips

Page 1-4 Chapter I. Introduction and Overview
Exhibit 1-3. Highway Functional Classification Map of Kauai

DRAFT
Chapter I. Introduction and Overview Page 1-5
Relationship to Statewide Transportation Planning Process Each district in the state has a Regional Federal-Aid Highways 2035 Transportation Plan. It is a regional long-range land transportation plan. The Plan integrates with the overarching long-range Statewide Federal-Aid Highways 2035 Transportation Plan. The purpose of these plans is to provide a basis for making informed multimodal land transportation decisions over the next 20 years in an economic environment with limited funding.
These planning documents also fulfill federal and state requirements to formulate long-range transportation plans for the development of a multimodal transportation system within the state through a continuing, cooperative, and comprehensive statewide multimodal transportation planning process.
This Plan accomplishes specific components of the overall statewide transportation planning process. A summary of the planning process and hierarchy of components is shown on Exhibit 1-4.
Exhibit 1-4. Statewide Integrated Transportation Planning

Page 1-6 Chapter I. Introduction and Overview
The top row of the exhibit, Planning, represents high-level planning efforts. It includes the Hawaii Statewide Transportation Plan, which focuses on broad policy, goals, and objectives for all transportation modes. It provides guidance to system level and facility master plans of the three primary modes of transportation—the air, water, and land systems—as well as the nonmotorized modes and intermodal connections.
The next component in the Planning level is the statewide modal plans (orange box) that set forth overarching goals and ensures equity and consistency among the regional plans. This includes the Statewide Federal-Aid Highways 2035 Transportation Plan, Harbors Master Plan, and Airports Master Plan.
The middle row of the exhibit, Program Development (purple boxes), is where the Plan fits within the planning process as a facility master plan, in this case a regional land transportation plan. It presents recommendations, prioritizations, and documentation for mid-range and long-range components that implement the Plan. Other plans within this level include Bike Plan Hawaii and the Statewide Pedestrian Master Plan.
The bottom row of the exhibit is Project Management. This includes budgeting (that is, the Statewide Transportation Improvement Program [STIP] process) and Project Development. It is at this last step of the overall process where individual projects are permitted, designed, and constructed.
Plan Development Process The Plan was formulated through a series of milestones in an open and comprehensive process that developed goals, objectives, and strategies before identifying potential solutions. This process allowed the planning team to objectively evaluate alternative solutions and assess how well they met the goals and objectives defined by stakeholders.
Decision-makers, advisory committees, and the general public were included throughout the process to ensure quality decisions. Clearly identifying plan milestones allowed stakeholders to visualize the entire process and identify points at which to provide input. Development of the regional and statewide long-range transportation plans proceeded concurrently in an integrated process to ensure consistency among the statewide and regional plans, policies, and programs. The major plan milestones for both the Statewide Federal-Aid Highways 2035 Transportation Plan and the Regional Federal-Aid Highways 2035 Transportation Plan for the District of Kauai are shown on Exhibit 1-5.
Establish Goals and Objectives – This milestone focused on reviewing existing regulatory and policy requirements related to land transportation, and developing project goals and objectives for the long-range land transportation system.
Exhibit 1-5. Plan Development Process

Chapter I. Introduction and Overview Page 1-7
Gather Data and Develop Model – This milestone included gathering data and information related to the land transportation system and current HDOT programs. A major portion of the task included developing/updating the regional travel demand models, which were the basis for forecasting and assessing future traffic conditions.
Define Future Conditions – Based on the forecasting results and endorsed program definitions, this milestone focused on identifying future system deficiencies and developing the plan priorities and evaluation criteria.
Identify Solutions – This milestone focused on developing potential solutions to address overall plan policies, goals and objectives, and identified transportation needs and deficiencies. Funding sources, allocations, and financing strategies were also identified.
Develop and Evaluate Solutions and Create Implementation Plan – This milestone focused on evaluating the potential solutions against requirements and plan goals and objectives and creating implementation recommendations.
Draft and Refine Plans – This milestone documented the project development process, analyses, and recommendations for the Plan. The document was refined and finalized based on stakeholder comments and input.
Stakeholder Involvement Stakeholder involvement was vital to the development of the Plan. Stakeholder groups provided diverse viewpoints at specific milestones in the plan development process and helped shape the direction of the Plan. The stakeholder groups, roles, and responsibilities for this Plan are described on Exhibit 1-6.
Exhibit 1-6. Stakeholder Groups, Roles, and Responsibilities
Page 1-8 Chapter I. Introduction and Overview
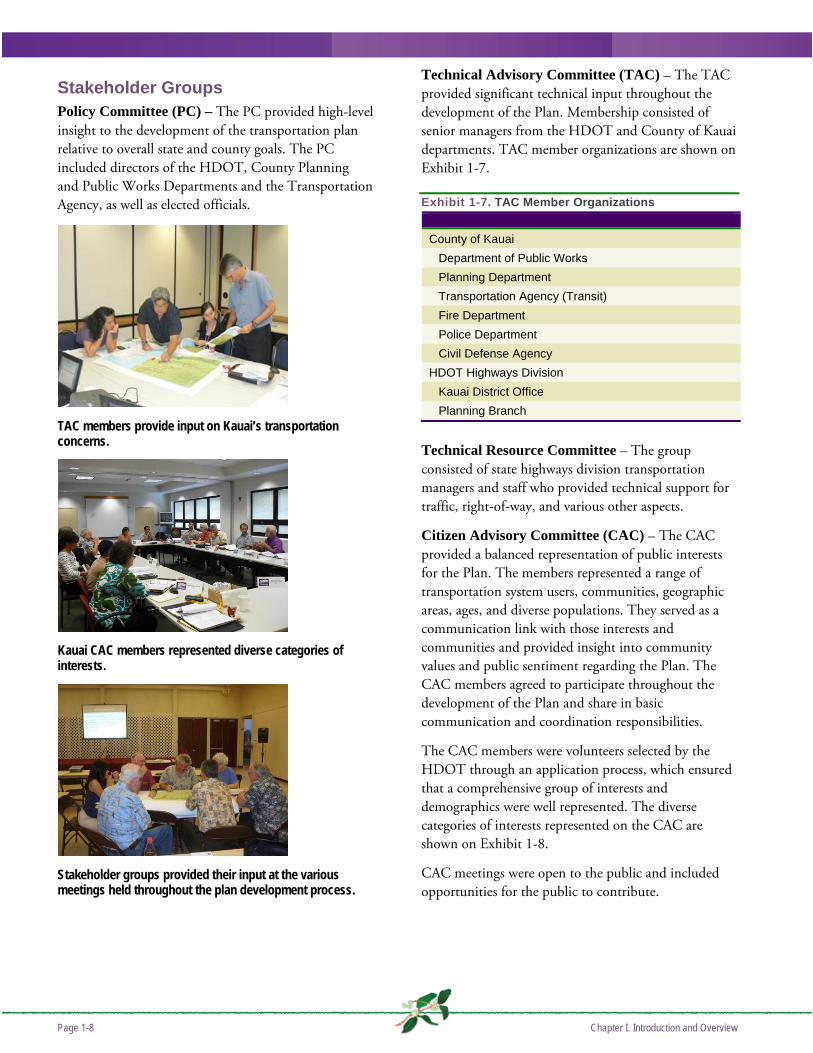
Stakeholder Groups Policy Committee (PC) – The PC provided high-level insight to the development of the transportation plan relative to overall state and county goals. The PC included directors of the HDOT, County Planning and Public Works Departments and the Transportation Agency, as well as elected officials.
TAC members provide input on Kauai’s transportation concerns.
Kauai CAC members represented diverse categories of interests.
Stakeholder groups provided their input at the various meetings held throughout the plan development process.
Technical Advisory Committee (TAC) – The TAC provided significant technical input throughout the development of the Plan. Membership consisted of senior managers from the HDOT and County of Kauai departments. TAC member organizations are shown on Exhibit 1-7.
Exhibit 1-7. TAC Member Organizations County of Kauai
Department of Public Works Planning Department Transportation Agency (Transit) Fire Department Police Department Civil Defense Agency
HDOT Highways Division Kauai District Office Planning Branch
Technical Resource Committee – The group consisted of state highways division transportation managers and staff who provided technical support for traffic, right-of-way, and various other aspects.
Citizen Advisory Committee (CAC) – The CAC provided a balanced representation of public interests for the Plan. The members represented a range of transportation system users, communities, geographic areas, ages, and diverse populations. They served as a communication link with those interests and communities and provided insight into community values and public sentiment regarding the Plan. The CAC members agreed to participate throughout the development of the Plan and share in basic communication and coordination responsibilities.
The CAC members were volunteers selected by the HDOT through an application process, which ensured that a comprehensive group of interests and demographics were well represented. The diverse categories of interests represented on the CAC are shown on Exhibit 1-8.
CAC meetings were open to the public and included opportunities for the public to contribute.

Chapter I. Introduction and Overview Page 1-9
Exhibit 1-8. CAC Member Categories
Transit Pedestrians Businesses Utilities Environmental Cultural Disabled persons Freight Bicyclists Health Residential communities Development interests Schools Sustainability Energy Visitor industry Elderly
Statewide Stakeholder Advisory Committee (SAC) – The SAC represented a wide range of transportation user categories and interest groups statewide and provided broad, overall feedback and input to district-specific issues. The SAC interest groups were the same as the CAC (as shown in Exhibit1-8), with the addition of military, car, safety, and higher education.
Public Input – The planning team used a variety of public involvement and outreach methods to communicate with the public. These techniques were intended to reach a comprehensive cross-section of the community and transportation system users and allow them to provide meaningful and broad-based input. The public involvement process was tailored to fit each island through island-specific public involvement specialists.
Public Meetings – In addition to the comprehensive committee structure, the general public provided input to shape the Plan through two public workshops, one on March 14, 2012 to identify needs and opportunities in the transportation system, and one on April 3, 2014 to review the draft Plan.
Electronic Media – A web page was developed to give the public a convenient way to stay informed about the Plan’s progress and stakeholder involvement opportunities. It included the following information:
» Overview and schedule
» Planning framework
» Plan status
» Planning information and materials
» Announcements of public meetings
The website also included a comment page, which allowed the public to submit comments directly to the planning team. In addition, a Facebook page was created to broadcast project updates to Facebook users and direct them to the project website for more information.


Chapter IIGoals and Objectives


Chapter II. Goals and Objectives Page 2-1
I I . G o a l s a n d O b j e c t i v e s
Goals and objectives set the basic vision for any planning process and provide a framework for evaluating success once the Plan has been implemented.
Defining Goals and Objectives The Regional Federal-Aid Highways 2035 Transportation Plan for the District of Kauai was developed concurrently with the Statewide Federal-Aid Highways 2035 Transportation Plan and the regional plans for districts of Maui and Hawaii.1 A single set of goals, objectives, and strategies were developed for the statewide and regional plans to ensure statewide consistency. However, goal priorities were developed by region to reflect each region’s values, and were developed using the process described below:
» Federal, state, and county plans, policies, and programs were reviewed to ensure the Plans’ compliance and alignment with adopted plans and requirements.
» The federal planning factors were used as a framework to ensure a comprehensive plan that addressed federal requirements.
» The planning team worked with the TAC and CAC to develop and refine the goal statements through an iterative process.
» The goals were weighted at a regional level to determine specific local issues important to address in regional plans.
The state began the long-range planning process when SAFETEA-LU (Safe, Accountable, Flexible, Efficient Transportation Equity Act: A Legacy for Users) was the current federal legislation. After formulation of the plan goals, MAP-21 (Moving Ahead for Progress in the 21st Century) replaced and supplemented parts of SAFETEA-LU in July 2012. Therefore, the planning team checked for consistency of the goals and objectives with MAP-21 to ensure the Plan aligned with MAP-21
1 The Oahu Metropolitan Planning Organization develops the regional plan for Oahu under a different process.
performance goals as codified in 23 United States Code (USC) 135.
Each step in the process will be described further in this section.
Consistency with Plans, Policies, and Programs The goals and objectives for the Plan are aligned with existing federal, state, and local regulatory and policy requirements. Relevant plans, policies, and programs were reviewed to identify potential focus areas of the Plan, and to understand guidance and direction for the development of goals and objectives.
Exhibit 2-1 shows the key federal, state, and local plans that were reviewed, and describes their relevance to the development of the Plan. A thorough summary of the plans, policies, and programs reviewed during the planning process is included in Appendix B.
Federal, state, and local plans were reviewed for consistency.

DRAFT
Page 2-2 Chapter II. Goals and Objectives
Exhibit 2-1. Key Federal, State, and Local Plans Reviewed Fe
dera
l Pla
ns, P
olic
ies,
and
Pro
gram
s Federal law (23 USC 134) defines the general requirements for metropolitan transportation planning. It states that long-range plans shall consider all modes of transportation, and provide for an integrated, comprehensive transportation system. The Plan addresses all modes of transportation supported by the federal-aid system. MAP-21 prescribes certain elements of transportation planning by outlining national goals and performance measures for the federal-aid system. This legislation is intended to focus or streamline investments on programs or projects that are aligned with these national goals. Plan goals are consistent with multiple national MAP-21 goals.
Other plans, policies, and programs examined include: » United States Code – Title 23 –
Highways – Section 135 Statewide Transportation Planning
» United States Code – Title 49 – Transportation – Section 5304 – Statewide Transportation Planning
» Code of Federal Regulations – Title 23 – Highways – Part 450, Subpart B – Statewide Transportation Planning
» National Response Framework – US Department of Homeland Security
» Bicycle Resolutions, 110th Congress U.S. Conference of Mayors
Stat
e Pl
ans,
Pol
icie
s, a
nd P
rogr
ams
Statewide transportation policy and planning documents primarily address statewide transportation networks, including multimodal facilities. Statewide plans and policies provide a general policy framework for transportation planning and direction for project and program implementation (including guidelines and standards) for Hawaii state roadway facilities. These plans and policies can also serve as examples for counties as they develop their policies, guidelines, and standards.
» HRS 279 A Statewide Transportation Planning
» Hawaii Statewide Transportation Plan (2011)
» Disability and Communication Access Board Policy
» Bike Plan Hawaii (2003) » Statewide Pedestrian Master
Plan (2013) » Complete Streets Task Force
(2010) » Federal-Aid and State Highway
Update: System Identification and Functional Classification (2013)
» Hawaii Strategic Highway Safety Plan 2007-2012
» State of Hawaii Multi-Hazard Mitigation Plan (2007)
» Coordinated Public Transit Human Services Transportation Plan (2008)
» Statewide Comprehensive Outdoor Recreation Plan 2008 Update
» National Wildlife Refuges » National Parks » Department of Health – Active
Living Workshops
» Hawaii 2050 Sustainability Plan (2008)
» Hawaii Tourism Authority Strategic Plan: 2010-2012
» Coastal Storms Program » Coastal Zone Management
Program » Hawaii Department of
Transportation Statewide Transportation Improvement Program (Current Update, FY 2011-2014 +2)
» Report on the State of Physical Infrastructure in Hawaii (July 2010)

Chapter II. Goals and Objectives Page 2-3
Exhibit 2-1. Key Federal, State, and Local Plans Reviewed Lo
cal P
lans
, Pol
icie
s,
and
Prog
ram
s Local plans and policies are consistent with statewide policy. However, they are more specific than federal or state plans and policies and reflect unique regional priorities. The Plan is consistent with the general direction of local plans and policies in that it strives to provide a safe, multimodal transportation system for all users.
» Kauai County General Plan (2000)
» Kauai Long-Range Land Transportation Plan (1997)
» Kauai County Multi-Hazard Mitigation Strategy (2003)
» Kauai Multimodal Land Transportation Plan (2013)
» Kauai Energy Sustainability Plan (2010)
» Lihue Town Core Urban Design Plan (2010)
» Resolution No. 2010-48 Complete Streets Policy (2010)
» Kauai Commercial Harbors 2025 Master Plan (2001)
» Lihue Airport Master Plan Update (1989)
» Port Allen Airport, Master Plan Update (2001)
» County of Kauai Capital Budget
Planning Factors The Plan is developed around a set of eight federal planning factors that are intended to address transportation comprehensively.
The goals and objectives are aligned with each of the factors and reflect the desired outcome of the Plan. More detail of the planning factors and general criteria and are described on Exhibit 2-2.
Stakeholder Input For the regional and statewide plans, the TAC and CAC developed goal statements for each of the planning factor categories. The planning team worked extensively with the stakeholders to craft and refine these goal statements until they accurately reflected the various desires of each stakeholder group. Objectives and specific strategies were also discussed and refined.
The resulting goals and objectives are consistent with the federal goals found in 23 USC 135. The planning team included a ninth category to encompass goals that are not directly associated with the federal planning factors. This coordination and process provided consistency across the regional and statewide plans while also allowing goal priorities to vary by region to reflect each district’s values. Appendix C contains the Goals, Objectives, and Strategies memorandum.
Weighting Goals for Kauai
It was critical for the Plan to be specific to Kauai, as the district’s needs and priorities are unique from the rest of the state. The regionally specific goal weighting process and outcomes help tell the story of what is important specifically to Kauai, and how best to prioritize potential recommendations in the district to meet these goals. Exhibit 2-3 shows the goals and priorities for Kauai that will help decision-makers determine programming priorities.
The Kauai TAC and CAC weighted the goals to reflect Kauai’s regional priorities. They assigned weights to the 22 goals on a scale of 100 (the total weightings must add up to 100). The individual input from all participants was averaged.
Stakeholders completed goal weighting before developing recommended solutions to create an objective process. The weights provided insight into the most important values and will help shape recommended priorities to ensure limited transportation funds are spent on projects that most accurately reflect Kauai’s specific land transportation system goals.

Page 2-4 Chapter II. Goals and Objectives
Exhibit 2-2. Planning Factors
The more important goals for Kauai, based on their higher relative weights as assigned by the stakeholders, are shown on Exhibit 2-3. These goals are:
» System preservation (maintaining the existing system) – Goal 3.2
» Safety (for all modes) – Goal 8.1
» Modal integration (complete streets) – Goal 2.1
» System efficiency management and operations (efficiency and congestion) – Goal 6.1
» Security (supporting evacuation and response to emergency events) – Goal 4.1
» Environment and sustainability (promoting resiliency to climate change) – Goal 1.5
Ability to fund potential projects – Goal 9.1

DRAFT
Chapter II. Goals and Objectives Page 2-5
Exhibit 2-3. Kauai District Goal Priority Weights
Planning Factor Plan Goal
Goal Priority Weight
1. Environment and Sustainability
1.1 Preserve and enhance the natural environment, including biological and aesthetic resources.
4%
1.2 Preserve and enhance Hawaii’s cultural resources environment, including archaeological and historical sites.
3%
1.3 Meet the relevant environmental regulations and standards set by federal, state, and county/city agencies. Maintain collaborative working relationships with agencies and comply with goals of their relevant plans and policies.
4%
1.4 Promote the use of sustainable practices in designing, constructing, operating, and maintaining transportation facilities and programs.
3%
1.5 Promote long-term resiliency relative to all hazards mitigation, namely global climate change, with considerations to reducing contributions to climate change from transportation facilities, and reducing the future impacts of climate change on the transportation system.
6%
2. Modal Integration 2.1 Provide a Complete Streets transportation system of motorized and nonmotorized options.
7%
2.2 Promote efficient travel between modes by creating connections and removing barriers.
3%
2.3 Promote safe connections between modal alternatives. 3% 3. System Preservation 3.1 Manage transportation assets and optimize investments. 3%
3.2 Maintain a safe, efficient, complete transportation system for the long term. 8% 4. Security 4.1 Plan, maintain, and operate a transportation system that supports evacuation,
response, and recovery for incidents. 6%
4.2 Improve resiliency of the state through the transportation system. 4% 5. Economic Vitality 5.1 Promote the expansion and diversification of Hawaii’s economy through the
efficient and effective use of transportation facilities including movement of people, goods, and services in a safe, energy efficient, and environmentally sound manner.
4%
6. System Efficiency Management and Operations
6.1 Improve capacity and efficiency, and reduce congestion within the existing transportation system for long-term benefit.
7%
7. Transportation Access Mobility
7.1 Provide appropriate and reliable transportation access options statewide to all users.
4%
7.2 Ensure transportation investments in programs and prioritization processes are balanced across modes and demographics (i.e., serves environmental justice [EJ] populations).
3%
8. Safety 8.1 Maintain a safe transportation system for all land transportation modes. 8% 8.2 Improve safety of the community through connectivity of the transportation
infrastructure. 4%
9. Additional Goals 9.1 Obtain sufficient and specific transportation funding. 7% 9.2 Optimize project delivery. 3% 9.3 Provide ongoing planning to assess and address statewide needs. 3% 9.4 Coordinate use of public right-of-way with other public service providers. 3%
100%


Chapter IIIKauai District’s Transportation Context and Needs


Chapter III. Kauai’s Transportation Context and Needs Page 3-1
I I I . K a u a i ’ s T r a n s p o r t a t i o n C o n t e x t a n d N e e d s
Kauai’s land transportation system is critical in supporting the movement of its people and goods throughout the island. The roadway system carries all modes of land transportation on a daily basis including passenger vehicles, buses, freight trucks, bicyclists, and pedestrians. The transportation network connects communities and allows people to live, work, and play. It also supports the economy and emergency services and provides a lifeline for residents during natural disasters.
As the island’s population grows and its economy evolves, the needs of the transportation system will change. Future development will increase the load on the region’s roads. In order to plan for the future, current conditions must be assessed with the input and involvement of stakeholders. Assessing current and future conditions helps identify needs and deficiencies, and will guide adjustments to the transportation system so it can continue to serve Kauai’s people.
This section begins with a description of the work already done in previous plans and policies that lay the foundation of the Plan. Existing socioeconomic characteristics and current land transportation network operating conditions are also summarized.
It then provides a glimpse into the future of transportation on Kauai by describing regional forecasted travel demands and system performance. Along with reviews of the existing plans and policies and input from stakeholders, this future condition assessment provides a basis for identifying land transportation needs for Kauai.
Kuhio Highway is the main roadway for the northern and western communities of Kauai.
Exhibit 3-1. Lihue Planning District Future Land Use Source: Kauai County General Plan (2000)

DRAFT
Page 3-2 Chapter III. Kauai’s Transportation Context and Needs
Plans, Policies, and Programs Relevant plans, policies, and programs were reviewed to build effectively upon previously adopted work and maintain consistency in needs identification moving forward. In addition to federal and state plans, the Kauai General Plan was reviewed. It provides policy guidance to address issues related to growth and land use development, while recognizing unique assets, in the island’s towns and communities. Exhibit 3-1 shows the Land Use Map for the Lihue Planning District from the Kauai General Plan. Specific plan areas include the North Shore, Kawaihau (including Kapaa and Wailua), Lihue, Koloa-Poipu-Kalaheo, and the West Side (including the areas west of Eleele).
Land use policies are important to transportation planning because the road system and the types of facilities are often driven by the uses. Through planning, the transportation network can be developed to provide adequate mobility while appropriately supporting adjacent land uses. Policies related to land use aim to concentrate future growth in developed urban areas such as Lihue, or resort areas such as Princeville and Poipu. Land use considerations in the Kauai General Plan were also given to preserve open spaces and maintain the agricultural nature of the island.
Policies related to transportation include providing appropriate facilities to support developments. Facilities include not just roads and bridges, but also networks of pedestrian and bicycle facilities. As referred to in Chapter 2, see Appendix B for a summary of additional plans, policies, and programs consulted.
Socioeconomic Conditions Socioeconomic characteristics influence transportation demands and need to be considered in the provision of transportation infrastructure and services. Population, household, and employment information is grouped into geographical traffic analysis zones (TAZs). These zones provide a general picture of where people live and work on the island by geographical area boundary, rather than by street location. Forecasted socioeconomic data are important because they show where growth is expected to occur, and where the transportation system could see an increase in demand. For additional information on the socioeconomic conditions, distribution into TAZs, and the travel demand model, see Appendix D.
Population Nearly 70 percent of Kauai’s current population resides on the east side of the island in Kapaa or Lihue, and on the south side in Koloa/Poipu.
Less than 20 percent of Kauai’s total population lives below the poverty line level. Communities on the north shore, east shore, and within the Koloa/Poipu area, have the highest percentage of the population considered low-income and living below the poverty line.
By 2035, the population on Kauai is expected to grow by over 30 percent. The most significant growth is expected in the Lihue and Koloa/Poipu areas.
Households The existing distribution of households on the island is similar to the population distribution with the majority of households located on the east and south sides of the island. The communities of Lihue, Kapaa, and Poipu have the highest number and density of households. Households become fewer and further between as the highways extend north and west around the island.
Exhibits 3-2a and 3-2b show the concentration of households in 2007 and in 2035 by TAZ. Distribution of households within TAZs is not shown. Areas that become darker in color between the two maps indicate growth in the number of households.
By 2035, household numbers island-wide are expected to increase by approximately 30 percent. While households will increase all along the east side of the island, the most significant growth is expected in the Lihue, Kapaa, and Poipu areas. Lihue is expected to see the most growth by 2035, with approximately 60 percent more households than today.

Chapter III. Kauai’s Transportation Context and Needs Page 3-3
Employment Lihue is the primary employment center on Kauai with almost half of all jobs located within this area. The Koloa, Poipu, and Kapaa areas also support a significant percentage of the total job opportunities on the island. The majority of jobs on Kauai are related to the service industry or retail. Military employment on Kauai (active duty, reservist and civilian employees) accounts for less than 1 percent of the island’s total employment positions.
In the future, employment positions island-wide are expected to grow by nearly 40 percent by 2035. The number of jobs increases most dramatically in Lihue, which will remain the island’s primary employment center. Jobs will grow in the Poipu area and in certain concentrated areas of Kapaa and Barking Sands on the west side of the island, as shown on Exhibits 3-3a and 3-3b.

DRAFT
Page 3-4 Chapter III. Kauai’s Transportation Context and Needs
Exhibit 3-2a. 2007 Household Forecasts Source: CH2M HILL (2012)
Exhibit 3-2b. 2035 Household Forecasts Source: CH2M HILL (2012)

Chapter III. Kauai’s Transportation Context and Needs Page 3-5
Exhibit 3-3a. 2007 Employment Forecasts Source: CH2M HILL (2012)
Exhibit 3-3b. 2035 Employment Forecasts Source: CH2M HILL (2012)

Page 3-6 Chapter III. Kauai’s Transportation Context and Needs
Visitor Industry The visitor industry is Kauai’s leading economic sector and will likely continue to be in the future. Nearly all of the visitors to Kauai arrive in Lihue, either at Lihue Airport or Nawiliwili Harbor. While many accommodations are located in Lihue, these visitors often travel via the highways to resort centers such as Princeville on the north side of the island or the Poipu area on the south shore, which is characterized by the highest number of hotel rooms on the island.
In 2007, Kauai welcomed approximately 22,200 visitors to the island on an average day. By 2035, air and harbor passenger arrivals to Kauai would increase by approximately 20 percent compared to today’s visitors.
Cruise ships arrive at Nawiliwili Harbor, Lihue.
Tourists visit shops and restaurants in Kapaa Town.
Exhibit 3-4 shows the expected increases in population, households, and employment on Kauai by the year 2035. The growth in annual visitors to the island is also shown. This growth in residents and tourists, and the anticipated increase in accommodations to support them, will result in more vehicles and freight traveling between the island’s major communities.
Exhibit 3-4. Forecast Socioeconomic Conditions
Characteristic 2007 2035 Differ-ence
Percent Growth
Population (persons)
64,300 85,200 20,900 33%
Households (units)
22,900 29,800 6,900 30%
Employment (positions)
30,400 42,200 11,800 39%
Annual Visitors (million persons)
1.30 1.56 0.26 20%
Roadway System Kauai’s roadway network includes two major highways that extend from Lihue, the hub of Kauai District, around the perimeter of the island in both directions. These highways serve as the primary belt road access between the island’s towns and communities, and are connected to a network of minor arterials and collector roadways that provide further local access.
These highways also serve as the primary commercial core or main street for many small towns. On the west side of the island, Kaumualii Highway is the regional highway but also operates as the local commercial corridor through Waimea and Kalaheo. Kuhio Highway is the sole access to the north shore but also operates as the prime neighborhood commercial street through Kapaa on the east side of the island and through Hanalei on the north shore.
The Plan encompasses solutions that are on the federal- aid highway system as shown in Chapter 1. The federal aid system includes roadways under both state and Kauai County jurisdiction classified as collectors and arterials.
To the west of Lihue, Kaumualii Highway is the sole access to the west side of the island. It is a principal arterial between Lihue and Omao. From Omao, the

Chapter III. Kauai’s Transportation Context and Needs Page 3-7
highway continues west through Hanapepe and Waimea as a minor arterial and terminates at Barking Sands. Collector roadways such as Waimea Canyon Road, Halewili Road, Koloa Road, Omao Road, and Maluhia Road extend mauka and makai from Kaumualii Highway to provide local access.
To the north of Lihue, Kuhio Highway is a principal arterial that provides access to Kapaa and Wailua. North of Kapaa, Kuhio Highway continues around the northeast perimeter of the island as a minor arterial through Anahola and Princeville. It is classified as a collector roadway from Hanalei to the west end of the road. While parallel local roads are available in some communities, Kuhio Highway is the primary and sole access road between the north shore and Lihue.
Peak hour congestion in both directions of Kuhio Highway.
Within Lihue, Ahukini Road, Kapule Highway, and Nawiliwili Road are classified as principal arterial roadways and provide local circulation to businesses, retail, and the airport and harbor.
Travel Demand With the projected growth in population and employment, and the anticipated increase in land use and development, the demand for space on Kauai’s roadways will increase in the future.
Because the federal-aid highways support all modes of travel, the impact of this increased demand is likely to affect general traffic, freight vehicles, transit, bicyclists, and pedestrians.
The following discussion compares the existing and future travel demand and the changing conditions of each travel mode. It also identifies the competing needs of the various modes as they share the same roadway.
Vehicular Volumes Traffic operations can be described by volume-to-capacity (V/C) ratios and level of service (LOS). The V/C measurement quantifies the relative vehicle demand versus the capacity of a facility. The capacity of a facility depends on a variety of factors including the number of lanes, the operating speed, and the number of driveways or intersections on a roadway. A V/C ratio of 1.0 indicates the vehicle demand is equal to the capacity of the facility, and generally correlates to LOS F.

Page 3-8 Chapter III. Kauai’s Transportation Context and Needs
The LOS generally describes operating conditions in 6 letter-grade categories. LOS A typically represents conditions with little or no delay, while LOS F indicates poor operations with long wait times or extreme congestion.
Currently, the average daily traffic volumes on Kauai are highest in and around Lihue. As the central hub of the island, vehicles travel to and from this location for work and play. Kaumualii Highway on the west side of Lihue currently carries over 36,000 vehicles per day (in both directions), while Kuhio Highway to the north currently carries over 36,000 vehicles per day. Both of these segments have a V/C of 1.0 or greater and operate at LOS F. Exhibits 3-5 and 3-6 present operating conditions.
In the future, traffic is expected to increase due to a larger population, more jobs, and new land developments on Kauai. Volumes on Kaumualii Highway between Lihue and Kalaheo are expected to increase by over 30 percent by Year 2035. This portion of the highway would see slightly greater congestion and result in LOS F conditions. Kuhio Highway between Lihue and Kapaa would see similar increases in volume and result in worse operating conditions compared to today. Travel times between communities would increase, and vehicles on both highways could experience long delays and slow travel times. Because these facilities would not be able to handle the expected traffic, they are identified as a transportation need/deficiency.

Chapter III. Kauai’s Transportation Context and Needs Page 3-9
Exhibit 3-5. 2007 Volume-to-Capacity Ratio Source: CH2M HILL (2012)

Page 3-10 Chapter III. Kauai’s Transportation Context and Needs
Exhibit 3-6. 2035 Volume-to-Capacity Ratio (No Build) Source: CH2M HILL (2012)

DRAFT
Chapter III. Kauai’s Transportation Context and Needs Page 3-11
Freight System Freight mobility is critical to the economic vitality of the islands. Although there are no specified freight routes, freight activities are concentrated around the commercial harbors and use many of the arterial roadways to transport raw materials and goods to market throughout the island. Freight cargo is handled at Lihue Airport, Nawiliwili Harbor, and Port Allen Harbor.
Currently, Nawiliwili Harbor handles nearly 90 percent of all cargo arriving into or leaving from Kauai. This is over 900,000 tons, or approximately 75,600 twenty-foot equivalent units (TEUs). Approximately 60,000 freight vehicles annually are necessary to distribute this cargo around the island.
Freight vehicles from Nawiliwili Harbor use Kaumualii Highway as the main transport route for goods destined to communities and resort areas on the south and west side of the island. Freight vehicles transporting goods to the east and north side of the island use Kuhio Highway.
Freight vehicles travel on the same roadways as all other vehicles.
Kauai’s cargo is transported from Nawiliwili Harbor to all parts of the island.
As the economy is expected to grow, cargo tonnage into and out of the island is expected to increase. By 2035, freight tonnage would increase by approximately 20 percent, resulting in over 1million tons of cargo (or approximately 90,500 TEUs) at Nawiliwili Harbor annually.
Compared to today, 12,000 additional freight vehicles would be on Kauai’s roads to deliver goods. As noted above, Kaumualii Highway and Kuhio Highway will be congested. Traffic operations need to be improved in order to avoid costly delays and economic impacts to freight vehicles. Exhibits 3-7 and 3-8 show the distribution of freight vehicles on the island’s highways.

DRAFT
Page 3-12 Chapter III. Kauai’s Transportation Context and Needs
Exhibit 3-7. 2007 Freight Distribution Source: CH2M HILL (2012)
Exhibit 3-8. 2035 Freight Distribution Source: CH2M HILL (2012)
DRAFT
Chapter III. Kauai’s Transportation Context and Needs Page 3-13
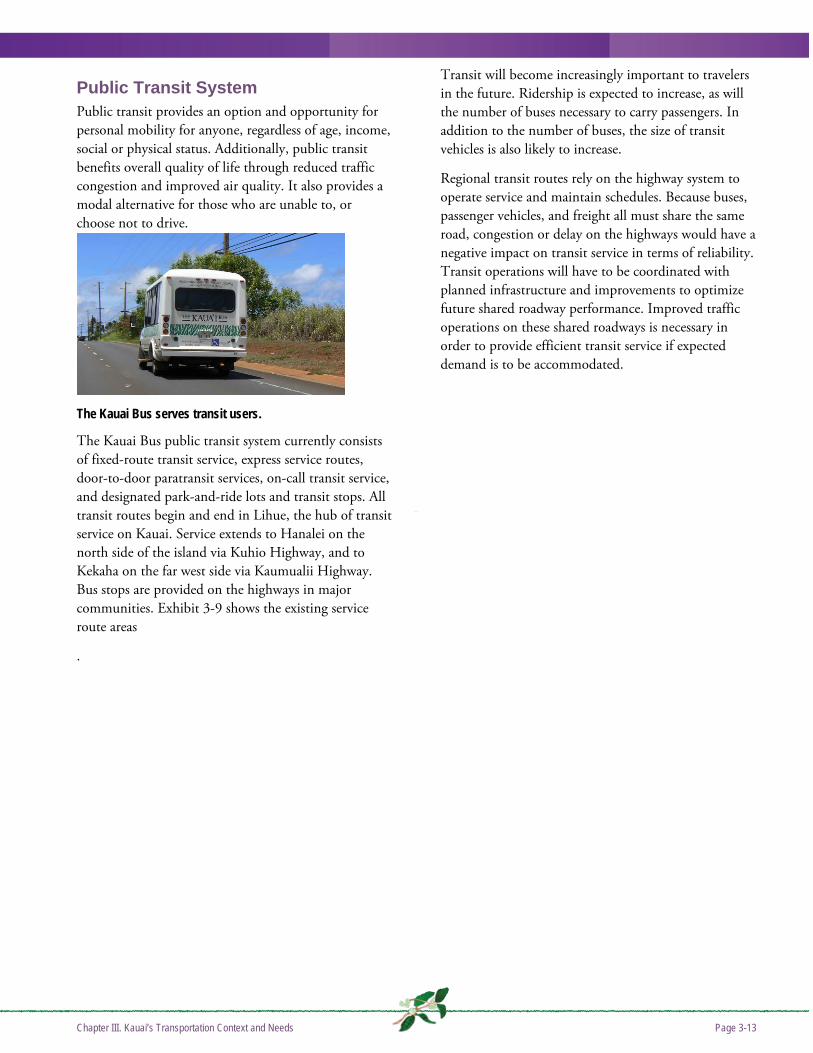
Public Transit System Public transit provides an option and opportunity for personal mobility for anyone, regardless of age, income, social or physical status. Additionally, public transit benefits overall quality of life through reduced traffic congestion and improved air quality. It also provides a modal alternative for those who are unable to, or choose not to drive.
The Kauai Bus serves transit users.
The Kauai Bus public transit system currently consists of fixed-route transit service, express service routes, door-to-door paratransit services, on-call transit service, and designated park-and-ride lots and transit stops. All transit routes begin and end in Lihue, the hub of transit service on Kauai. Service extends to Hanalei on the north side of the island via Kuhio Highway, and to Kekaha on the far west side via Kaumualii Highway. Bus stops are provided on the highways in major communities. Exhibit 3-9 shows the existing service route areas
.
Transit will become increasingly important to travelers in the future. Ridership is expected to increase, as will the number of buses necessary to carry passengers. In addition to the number of buses, the size of transit vehicles is also likely to increase.
Regional transit routes rely on the highway system to operate service and maintain schedules. Because buses, passenger vehicles, and freight all must share the same road, congestion or delay on the highways would have a negative impact on transit service in terms of reliability. Transit operations will have to be coordinated with planned infrastructure and improvements to optimize future shared roadway performance. Improved traffic operations on these shared roadways is necessary in order to provide efficient transit service if expected demand is to be accommodated.

Page 3-14 Chapter III. Kauai’s Transportation Context and Needs
Exhibit 3-9. Existing Transit Routes Source: Statewide Pedestrian Master Plan, Hawaii Department of Transportation (2013)

DRAFT
Chapter III. Kauai’s Transportation Context and Needs Page 3-15
Bikeway System Bicycles are increasingly being recognized not only as a recreational activity, but as a viable transportation mode. Bike Plan Hawaii summarizes the multifaceted benefits of bicycling, not only as a means of transportation, but also related to health, economics, community, and the environment.
Kauai has nearly 23 miles of designated bicycle facilities, which are made up of three types: paths, bike lanes, and signed shared roadways. These facilities are illustrated on Exhibit 3-10.
The American Association of State Highway and Transportation Officials (1999) define these facilities as:
» Paths or Shared-use Paths – a bikeway that is physically separated from motorized vehicular traffic by an open space or barrier. Shared-use paths may be used by pedestrians and other nonmotorized users.
» Bike Lanes – a portion of a roadway that has been designated by striping, signing, and pavement markings for the preferential or exclusive use of bicyclists
» Signed Shared Roadways – a shared roadway that has been designated by signing as a preferred route for bicycle use. This may be an existing roadway with wide curb lanes, or paved shoulders.
Bike Plan Hawaii provides an inventory of the existing bicycle system on Kauai. Exhibit 3-11 shares the benefits of biking from Bike Plan Hawaii, and Exhibit 3-12 shows these facilities.
Future needs for bicycle facilities are identified in Bike Plan Hawaii. To accommodate bicycles, paths and shared facilities intended to accommodate both bicycles and motorized vehicles on the same road are proposed on most of the island’s major highways and arterials. Upgrades to existing facilities should also be considered to provide greater separation between motorized vehicles and bicycles.
Exhibit 3-10. Bike Facility Types Source: Bike Plan Hawaii, Hawaii Department of Transportation (2003)
Bike Path
Bike Lane
Signed Shared Roadway

Page 3-16 Chapter III. Kauai’s Transportation Context and Needs
Exhibit 3-11. Benefits of Biking

Chapter III. Kauai’s Transportation Context and Needs Page 3-17
Exhibit 3-12. Existing and Planned Bicycle System Source: Bike Plan Hawaii, Hawaii Department of Transportation (2003)

Page 3-18 Chapter III. Kauai’s Transportation Context and Needs
Pedestrian System Pedestrian facilities are a critical part of the transportation system. For every trip that is made, a portion occurs as pedestrian travel. The benefits of walking are similar to those noted for bicycling: transportation, health, economics, community, and the environment.
Pedestrian facilities can generally be described as any infrastructure that is designed specifically for use by a pedestrian. These include sidewalks, crosswalks, and paths.
The Statewide Pedestrian Master Plan provides information on the existing pedestrian system, shown on Exhibit 3-13, and identifies areas of concern for the future. Kauai prefers a rural surrounding and the federal-aid highways system has few sidewalks. Most of the sidewalks are concentrated on the eastern side of the island, near Kapaa and Lihue, with a few sidewalks on the south western side in Waimea and Hanapepe. Gaps in sidewalks, narrow shoulders, and lack of crosswalks on roadways meant to be shared with pedestrians are a few examples of needs/deficiencies identified.
Pedestrians cross the street within a designated crosswalk.
Source: Statewide Pedestrian Master Plan, 2013

DRAFT
Chapter III. Kauai’s Transportation Context and Needs Page 3-19
Exhibit 3-13. Existing State Pedestrian System Source: Statewide Pedestrian Master Plan, Hawaii Department of Transportation (2013)

Page 3-20 Chapter III. Kauai’s Transportation Context and Needs
Emergency Response System The land transportation system is very important for emergency operations during any type of disaster, and for providing relief, response, and recovery. Failure of supporting emergency responses could be a great impediment to dealing with the impacts of a hazard.
The current Multi-Hazard Mitigation Strategy Plan indicates that “traffic congestion makes residents and visitors extremely vulnerable to the impacts of disasters. Congested and few arterial roads may make it difficult to evacuate risky areas.”
Due to the unique geography and belt highway system on Kauai, many of the communities located on the
perimeter of the island must use either Kuhio Highway or Kaumualii Highway to reach other parts of the island. When these highways are congested, emergency response times would be delayed and residents would be impacted. Exhibit 3-14 reflects the numerous critical emergency facilities along Kuhio Highway and Kaumualii Highway.
Future highway operations need to be improved in order to provide viable access routes during emergencies and hazard events. The condition of the roadways and bridges also need to be preserved and maintained in order to support efficient recovery or evacuation.
Exhibit 3-14. Kauai County Tsunami Hazard Critical Emergency Facilities Source: County of Kauai Multi-Hazard Mitigation Strategy, 2003

DRAFT
Chapter III. Kauai’s Transportation Context and Needs Page 3-21
Land Transportation Needs Needs and deficiencies of the land transportation system on Kauai were identified through various methods. As previously mentioned, relevant plans and policies were reviewed and future forecast demand was assessed against the transportation infrastructure. An equally important contributor to the identification of transportation needs and deficiencies were the discussions with stakeholder groups. Stakeholder groups identified regional system needs that aligned with the eight planning factors and the final goals and objectives of the Plan. This approach was used to identify the root of the issues, and allowed for comprehensively addressing deficiencies in multiple ways. A summary of the public involvement process is included in Appendix E.
Stakeholder Input Stakeholder groups represented various cross-sections of the community. Through facilitated discussions, agency and user perspectives of comprehensive land transportation needs were captured.
During these discussions, stakeholders were given maps of the islands transportation network. These maps included the existing roadway network, as well as locations of potential solutions that were previously identified through relevant plans and policies. These potential solutions were included on the maps to indicate where needs may have already been examined, so that the focus of the workshop would be on adding new locations and areas of concern to the comprehensive list of needs and deficiencies.
The stakeholders were asked to identify needs as they related to the specific group they represented, and as they related to the planning factors. Workshop participants worked together to mark up the transportation network maps with their ideas and concerns, using different colors to differentiate between needs for each of the various planning factors.
Stakeholders provided comments on the transportation system.
Stakeholders were also encouraged to share background knowledge and describe experiences at these locations to help support and explain the system need.
Stakeholders and the planning team also examined the existing and future roadway conditions maps (Exhibits 3-5 and 3-6) to identify specific needs related to roadway capacity. Where the anticipated volume of trips met or exceeded a particular roadway’s capacity (V/C of 1.0 or greater), a capacity deficiency was identified. Congestion and connectivity or access needs were also identified using the roadway V/C conditions maps.
Alignment with Goals and Objectives Identified needs and deficiencies were evaluated with respect to the overall planning factors and the goals and objectives specific to Kauai’s Plan. This ensured that the recommendations from the Plan would be consistent with statewide and federal planning regulations and the stakeholder visions and values for Kauai and could guide the development of effective potential solutions. These solutions will then address specific identified issues and fulfill the purpose of the Plan. Identifying needs in terms of the goals and objectives ensures that the transportation system is reviewed comprehensively.

DRAFT
Page 3-22 Chapter III. Kauai’s Transportation Context and Needs
For Kauai, recurring discussions related to its transportation system needs and deficiencies are listed below along with their alignment to specific planning factors:
» Addressing capacity needs and congestion - Congestion is an issue on the island’s highways and arterials, affecting residents and visitors alike. Congestion affects general vehicles, freight vehicles, and transit because they share the same roadway. Developing solutions to address congestion align with the Environment and Sustainability, System Preservation, Economic Vitality, and System Efficiency Management and Operations planning factors.
Kuhio Highway is the only option for motorists to head north.
Vehicles stuck in traffic along Kaumualii Highway.
» Providing emergency access/egress to communities – Due to the unique geography of Kauai, many of the island’s communities are located on its perimeter and connected by a single highway. Creating bypass roads or alternate routes would provide additional circulation and capacity and could help maintain operations during incidents. This solution aligns with the System Preservation, Security, and Safety planning factors.
Kapaa Stream Bridge provides the only vehicular access to communities on the north side of the island.
» Improving safety of nonmotorized modes –
Stakeholders have expressed a strong need for bicycle lanes, shared-use paths, sidewalks, and trails. Improving these facilities and increasing visibility for these users align with the Environment and Sustainability, Modal Integration, and Safety planning factors.
Ke Ala Hele Makalae Shared-used Path in East Kauai.
DRAFT
Chapter III. Kauai’s Transportation Context and Needs Page 3-23
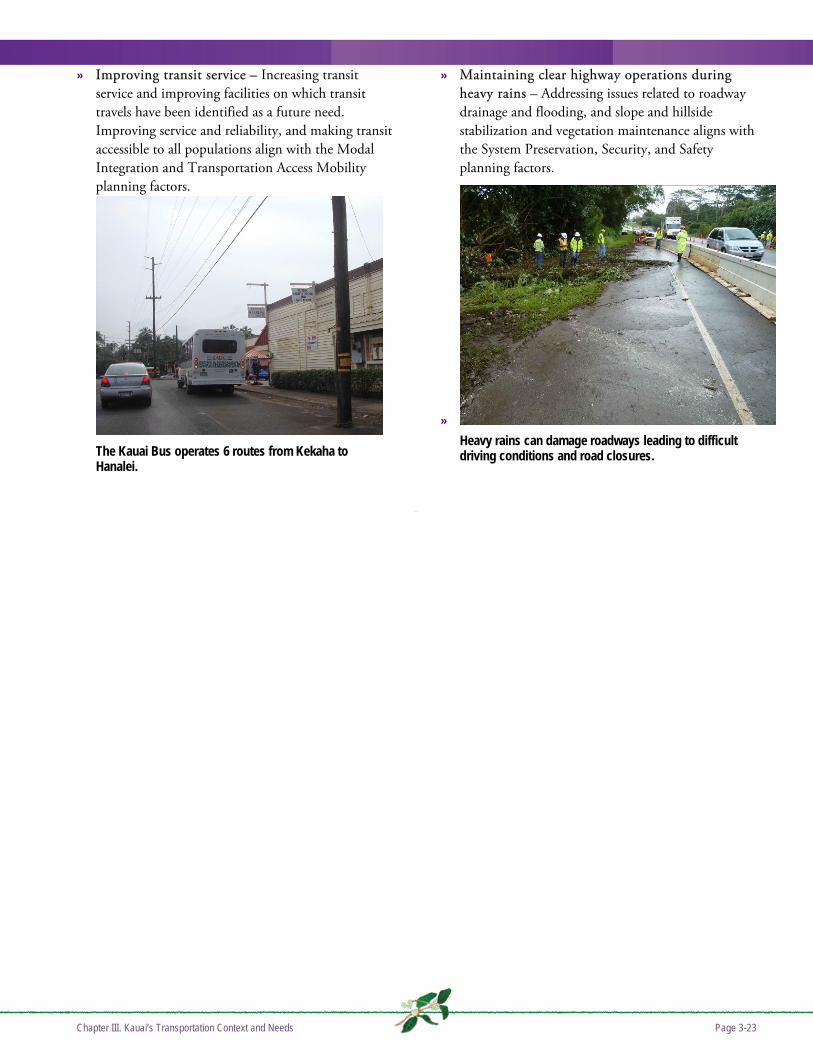
» Improving transit service – Increasing transit service and improving facilities on which transit travels have been identified as a future need. Improving service and reliability, and making transit accessible to all populations align with the Modal Integration and Transportation Access Mobility planning factors.
The Kauai Bus operates 6 routes from Kekaha to Hanalei.
» Maintaining clear highway operations during heavy rains – Addressing issues related to roadway drainage and flooding, and slope and hillside stabilization and vegetation maintenance aligns with the System Preservation, Security, and Safety planning factors.
» Heavy rains can damage roadways leading to difficult driving conditions and road closures.


Chapter IVPotential Solutions


Chapter IV. Potential Solutions Page 4-1
I V . P r o p o s e d S o l u t i o n s
Stakeholders and the planning team developed potential solutions to address the recognized needs and issues on Kauai. The planning team then evaluated the solutions against the Plan goals and objectives to prioritize program recommendations.
Solution Development After understanding the transportation issues and needs unique to Kauai, the planning team developed potential solutions. The planning team drew on a number of sources to develop the list of potential solutions:
» Plan, policy, and program reviews provided potential solutions to address previously identified deficiencies.
» Travel demand model forecasts for the future baseline years of 2020 and 2035 identified capacity or congestion issues to help guide solutions.
» Stakeholders helped to identify areas needing congestion-focused solutions.
» Stakeholders provided input, reflecting the knowledge of the groups represented, on solutions for non-capacity related needs and issues.
To generate a diverse range of potential solutions, stakeholders were asked to work in small groups and mark up roadway maps with their ideas. The interactive format encouraged stakeholders to weigh the benefits of particular solutions against impacts on their island environment. These inputs enabled the planning team to develop a broad range of potential projects and programs that would potentially address identified needs.
A public meeting was held on Kauai on March 14, 2013.
Small groups discuss various solutions.
Page 4-2 Chapter IV. Potential Solutions
Solution Evaluation Process A two-tier process was used to ensure that potential solutions are appropriate for the Plan and to narrow the list of solutions to a set of manageable options.
Tier 1 In Tier 1, each solution was evaluated against a set of six high-level criteria shown on Exhibit 4-1. These criteria were intended to eliminate solutions that were inconsistent with the fundamental goals and objectives of the Plan, conflicted with the overarching HDOT Highways mission statement, or were outside the scope and jurisdiction of the Plan.
As a potential solution was assessed for each of the six Tier 1 criteria, it was determined to “pass” or “fail.” Any solution that failed at least one criterion did not advance to the Tier 2 evaluation process, and was removed from further recommendation.
Tier 2 During the Tier 2 evaluation process, the planning team developed specific evaluation criteria for each Plan goal. The criteria were based on documented data sources, and were specifically crafted to assess a potential solution’s effectiveness in meeting the Plan’s defined goals.
For example, Chapter 2 revealed that Goal 3.2 (to maintain an efficient, complete transportation system for the long-term) is relatively important to Kauai. To evaluate potential solutions against this goal, specific system preservation and maintenance criteria were developed based on Federal Highway Administration Pavement Preservation and Bridge Preservation definitions and guidance. Criteria included preventative maintenance strategies such as sealing of cracks in asphalt or concrete, clearing of roadside vegetation and landscaping, and facilitating or improving drainage. Meeting these criteria would indicate the potential
solution supports the goal of long-term system preservation and maintenance.
Goal 8.1 (to maintain a safe transportation system for all modes) is also important to Kauai. To measure potential solutions against this goal, evaluation criteria were developed based on the Complete Streets principle of providing transportation facilities that reduce risk and support safe movement of people and goods by all modes, and on the Hawaii Strategic Highway Safety Plan’s recommended strategies. Strategic actions were directly translated into criteria, including increased visibility, separated directional traffic, minimized or reduced potential vehicle conflicts on roadways, removal of fixed objects and steep grades from roadsides. Potential solutions that met one or more of these criteria would be aligned with the Plan goal of safety for all land transportation modes.
The potential solutions were evaluated for each of the criteria and assigned a grade between -2 and +2. Detailed descriptions of the Tier 2 evaluation criteria and grade definitions may be found in Appendix F.
The grades assigned in Tier 2 evaluation measured how well a solution meets or addresses a specific Plan goal. The grades also showed the advantages and disadvantages of one solution relative to another. For stakeholders, the grades provided a means of seeing tradeoffs among solutions, thereby making the comparative function of the grades more important than the actual grades per se.
The Tier 2 evaluation criteria grades were as follows:
» 1, 2: The solution supports realization of the Plan goal
» 0: The solution is not directly related or does not impact the Plan goal
» -2, -1: The solution is contrary to the Plan goal
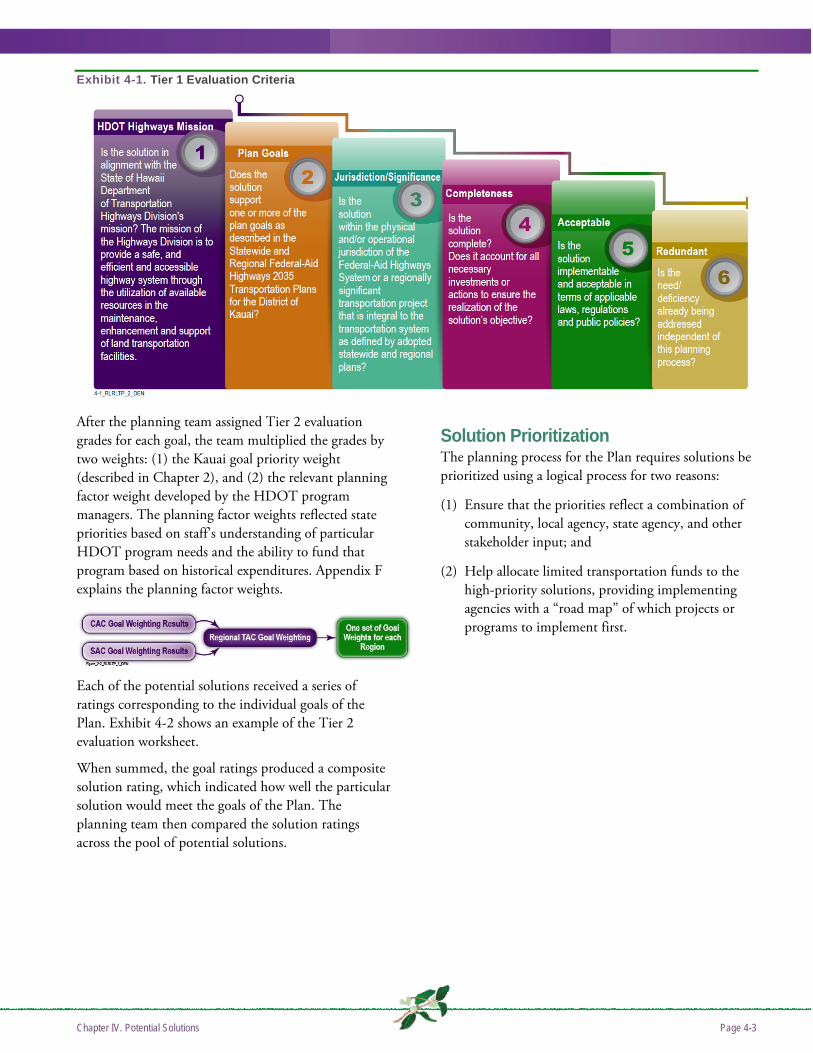
Chapter IV. Potential Solutions Page 4-3
Exhibit 4-1. Tier 1 Evaluation Criteria
After the planning team assigned Tier 2 evaluation grades for each goal, the team multiplied the grades by two weights: (1) the Kauai goal priority weight (described in Chapter 2), and (2) the relevant planning factor weight developed by the HDOT program managers. The planning factor weights reflected state priorities based on staff’s understanding of particular HDOT program needs and the ability to fund that program based on historical expenditures. Appendix F explains the planning factor weights.
Each of the potential solutions received a series of ratings corresponding to the individual goals of the Plan. Exhibit 4-2 shows an example of the Tier 2 evaluation worksheet.
When summed, the goal ratings produced a composite solution rating, which indicated how well the particular solution would meet the goals of the Plan. The planning team then compared the solution ratings across the pool of potential solutions.
Solution Prioritization The planning process for the Plan requires solutions be prioritized using a logical process for two reasons:
(1) Ensure that the priorities reflect a combination of community, local agency, state agency, and other stakeholder input; and
(2) Help allocate limited transportation funds to the high-priority solutions, providing implementing agencies with a “road map” of which projects or programs to implement first.

Page 4-4 Chapter IV. Potential Solutions
Exhibit 4-2. Tier 2 Evaluation Worksheet
The planning team reviewed projects in order from highest to lowest based on the overall solution rating. Solutions that met the Plan goal criteria better than others were listed near the top with relatively high scores. Lower-ranking solutions indicated that the solution may not have met the priority goals for Kauai as well as other evaluated solutions.
Solution ratings also helped prioritize or identify a preferred solution when there were multiple solutions that addressed the same need. The planning team considered specific solutions, or groups of solutions, that directly addressed the set of recurring identified needs and deficiencies described in Chapter 3.
Evaluation Outcomes The two-tier screening process evaluated potential solutions in terms of meeting Plan goals. The weighting process factored in regional and HDOT priorities. The evaluation process thereby yielded outcomes – the ordering of potential solutions – based on their ability to meet the goals and needs of Kauai’s federal-aid highways. The types of potential solutions related to each of Kauai’s priority goals are described below.
» System preservation and maintenance projects maintain the overall operations of the existing transportation system were a priority. These types of solutions include regular maintenance operations such as pavement resurfacing, rehabilitation, or reconstruction; bridge replacement or rehabilitation; guardrail repairs; sidewalk repairs; and bus stops, signs, and transit fleet maintenance. System preservation solutions also include drainage improvements and erosion control measures to maintain roadway operations.
Maintaining the region’s infrastructure and assets is important because the road network is the lifeline of the island. Keeping roadways and bridges in optimal form is a key factor in helping Kauai build its economy and industry and progress towards its transportation goals. System preservation projects are designated priorities for selection to the STIP for implementation.
Preserving Kauai’s transportation system supports fiscal responsibility. The transportation network is an asset, and limited resources have been spent over the years to maintain and improve this investment. By preserving the investments already made and maintaining the upkeep of current facilities, the need for new construction may be managed.
Although the potential solutions for Kauai described above were evaluated in Tier 2, specific project definitions or exact locations are not all identified or prioritized in this Plan. The HDOT and Kauai County already have system preservation programs in place to review and implement preservation solutions.
Within these programs, multiple subprograms are structured to prioritize and implement projects that are related to specific assets, such as pavement or bridges. The HDOT pavement subprograms keep track of roadway conditions on Kauai, and strive to extend the life of those roadways through various preservation actions. Specific subprograms that address pavement needs include the resurfacing, rehabilitation and repairs; reconstruction and replacement; and preventative maintenance subprograms.

DRAFT
Chapter IV. Potential Solutions Page 4-5
Bridges are important assets and can be critical facilities on Kauai. Multiple subprograms are in place to manage and maintain the island’s bridge inventory. Bridge needs can arise, for example, when a specific facility is found to be structurally deficient, or when a bridge requires attention through its regular maintenance cycle. When bridge needs are identified, system preservation solutions are addressed through one of the specific subprograms that manage bridge replacement, rehabilitation, preventative maintenance, or seismic retrofit.
While potential solutions have been developed and evaluated as part of this Plan, these suggested solutions will merely serve as input to state and county system preservation programs and subprograms.
Maintaining Kaumualii Highway is vital to the Kauai’s economy.
» Safety projects include both infrastructure and non-infrastructure projects and would benefit both vehicles and nonmotorized modes. Infrastructure project examples on Kauai include installing warning signage, lighting, or guardrail; maintaining embankments, slopes, and retaining walls; and reconfiguring intersections or roadways where high numbers of documented accidents have occurred. Potential non-infrastructure safety projects include campaigns or programs to share safety-related education and outreach.
Solutions such as improved lighting and signage at potential conflict points would benefit vehicles and nonmotorized modes by providing greater visibility
and awareness of other roadway users. Guardrail installation or embankment stabilization not only protects human life, but also preserves the integrity of the traveled roadway. Maintenance and upkeep of slopes and embankments are critical to preventing rockslides, which could damage vehicles and put drivers at risk, block traffic, and cause congestion. Stabilizing embankments adjacent to the ocean would prevent shoreline erosion and may protect against potential road failures in the event of detrimental rises in sea levels.
Existing state and county safety programs have specific subprograms that are responsible for prioritizing and implementing solutions. Safety subprograms include those focused on rockfall and slope stabilization, shoreline protection, and guardrail and shoulder improvements. These particular subprograms align with the types of identified needs and potential solutions described above.
Another safety subprogram is the Highway Safety Improvement Program, which is responsible for addressing areas where the number of accidents is higher than average and reducing the number of serious accidents. The Highway Safety Improvement Program subprogram evaluates solutions and prioritizes them based on a benefit/cost ranking system. After a project is implemented, the subprogram monitors traffic performance to further improve safety conditions.
Safety solutions were evaluated as part of this Plan, but were not prioritized as a finite list. Both the state and county have procedures within their transportation safety programs and subprograms to establish projects. Rather than duplicate this effort, this Plan is a source of additional guidance on Kauai’s safety needs based on input that surfaced through the planning process.

Page 4-6 Chapter IV. Potential Solutions
Stabilized slope along Rice Street near Harbor Mall.
Modal integration/Complete Streets projects guide development of a travelway that is balanced and provides transportation options for all users (bicyclists, pedestrians, vehicles, freight, and transit). A continuous, safe network of nonmotorized facilities considers the needs of populations that may not have the means to drive or may not be able to drive. These populations could include youth, elderly, or lower-income citizens. Improving the connectivity of nonmotorized facilities would benefit all users and could encourage a shift towards walking or bicycling as an attractive travel alternative to driving.
Examples of multimodal projects on Kauai include improved roads with new bicycle lanes, new shared paths exclusively meant for nonmotorized modes, safer connections between modes, and preservation of existing facilities. Multimodal projects are typically incorporated into other existing state or county programs such as system preservation, safety, and capacity.
Moikeha Canal Pedestrian Bridge provides pedestrians a travelway completely separated from vehicles.
» Capacity projects improve efficiency and circulation and expand the capacity of transportation facilities to accommodate additional users. Roadway infrastructure capacity solutions that ranked relatively high in Tier 2 evaluation involved additional lanes on existing highways, constructing new highways, and realigning or improving facilities for nonmotorized modes on shared roadways. Capacity solutions may also include a bypass road or alternative route for resiliency. These solutions are shown on Exhibit 4-4, and are organized by State Route number where applicable.
Based on the Tier 2 evaluation scores, the capacity projects included on the Exhibit 4-4 “short list” address the needs of the region and meet the roadway infrastructure goals of the Plan most effectively. These infrastructure solutions serve as input to the state’s existing capacity program, and should be considered (along with to safety and nonmotorized projects) to address roadway capacity deficiencies through 2035.
Some portions of Kuhio have been widened to four lanes.
» Security and resiliency projects improve the ability of Kauai’s roadways to provide reliable operations during threats or emergencies, and to support response or evacuation during natural disasters. Improving roadways to address climate change is especially important to Kauai due to recent flooding events and the limited availability of alternate routes due to topography. These needs are addressed by projects in the state and county’s System Preservation, Safety, and Capacity program categories.

DRAFT
Chapter IV. Potential Solutions Page 4-7
Kauai experiences some of the heaviest rainfall in Hawaii which causes erosion and damage to roadways.
» Transit projects are key contributors to helping Kauai achieve its future multimodal goals as well as other goals and objectives such as safety and capacity goals. Expanded and comprehensive transit systems can extend the length of bicyclist and pedestrian trips, opening up more destinations for those modes. Transit vehicles can accommodate more people per vehicle than private vehicles, potentially reducing future congestion. Fewer vehicles and less congestion can lead to improved safety on roadways.
Examples of transit solutions include additional routes, expanded service to new areas of the island, and larger coaches. Additional transit infrastructure projects to address future ridership include park-and-ride locations, upgraded bus stops, new bus shelters, improved sidewalk and bicycle connections to transit stops and major hubs from residential and commercial areas, and improved amenities or signage for transit users.
Transit service and transit-related projects are implemented by the county’s transit agency, the Kauai Transportation Agency, and is funded in part by the county and by the Federal Transit Authority. Additional funds are collected at the farebox. Even though rides are $2.00, farebox revenues are unlikely to cover much of the funding needs. These funds support transit service operations and maintenance of transit vehicles, and are tracked separately from the state’s funding mechanisms. Transit funds are accounted for separately because they primarily support the operations and maintenance of transit (verses infrastructure).
The county is responsible for the Kauai Bus, and project priorities are set by the Transportation Agency. The HDOT does not fund or set priorities for the Kauai Bus. The Kauai Bus currently operates eight fixed-route bus lines and paratransit service. The fixed-routes are broken into two types: mainline service providing regional trips, and shuttle service providing more localized trips. In 2012, weekday ridership was around 2,500 riders. The Kauai Bus has a fleet of 43 buses of varying sizes which are all wheelchair accessible and have front bicycle racks for up to two bicycles. In 2012, the total budget for the Kauai Bus was $7.4 million, with most of that budget supporting operations. The county general fund provides the majority of funding for the bus (64 percent), while 22 percent of funds were from the Federal Transit Authority, and 14 percent were from operating revenues including farebox revenue, passes, and contracts.
The Kauai Bus long-range plans include installing shelters at bus stops, improving access to stops, adding passenger amenities, implementing real-time transit tracker and information, adding wi-fi on buses and at stops, improving maps and schedules, increasing service frequencies, extending hours of service, upgrading the fleet to larger buses, and developing new park-and-rides.
While transit can support other goals of the Plan, addressing Plan goals can also support transit operations: system preservation can reduce transit travel time, reducing costs for the agency, and making transit a competitive travel option to private vehicles. Capacity and congestion projects also reduce transit vehicle travel times and help maintain schedules, as buses are currently subject to the same congestion that affects cars.
Coordination between the transit agency and the state’s existing programs occurs during planning, implementation, and operation of transit services to ensure that roadway facilities adequately support transit vehicles and amenities. By closely coordinating resources and planning efforts, an effective intermodal transportation system can be provided.

Page 4-8 Chapter IV. Potential Solutions
Cost Estimates The planning team developed planning level cost estimates for all Tier 2 potential solutions. Cost estimates are based on conceptual drawings, preliminary project descriptions, bid tabulations, typical contingencies, and average construction costs per vehicular lane mile. The team used current prices to develop estimates. Due to relatively flat growth in the State of Hawaii in recent years, these estimates reflect fiscal year 2011 prices.
Estimated planning level costs are important variables for each solution because they allow the solution to be evaluated against fiscal constraints, another tool that decision-makers can use to determine which projects move forward. Prior to being able to implement any range of solutions, the state and county must logically plan and program individual transportation improvements to address priority deficiencies and maximize investments.
Recommendations Based on the identified needs and deficiencies, the planning team first considered solutions with the highest Tier 2 evaluation ranking to include in the long-range set of solutions. The team also considered cost estimates and the degree of benefit (certain solutions may impact more users or address a more defined need compared to other solutions).
The outcome was a list of potential solutions that reflects Kauai’s unique needs and priorities. It is important to note that this list is one tool for decision-makers to use when allocating funding for transportation projects. Many of the high-ranking projects meet all of Kauai’s priority goals, but are very expensive or complex to implement. They may not be feasible to implement in the next STIP or Mid-Range Plan (described in Chapter 5), but remain on the list so that the Plan can be used as a guide to thoughtfully and deliberately apply future transportation funding and provide a long-term vision of the future of transportation on the island.
Based on current dollars, implementing the recommended list of long-range potential solutions would cost approximately $3.1 billion. This long-range set of solutions includes projects to address system preservation, safety, capacity, and congestion needs as well as multimodal infrastructure solutions. Both the HDOT and the county have funding programs that can help address these priorities.
The $3.1 billion total cost is unconstrained, meaning that potential solutions are recommended based on need and the ability to meet Plan goals, as opposed to fiscal limitations. Also, because this is a long-range plan many of the potential solutions have not been planned or designed yet, and therefore do not currently have identified or committed funding sources. The next section addresses how to use this unconstrained list to move projects forward into implementation.
The total cost of the Tier 2 solutions by funding program for projects in this Plan is included on Exhibit 4-3. System preservation projects would cost roughly $315 million, or approximately 10 percent of the total unconstrained cost, while safety related projects for all modes would cost $595 million, or nearly 19 percent of the total. Capacity projects include facilities for bicycles and pedestrians, as well as large-scale roadway infrastructure solutions. These roadway infrastructure projects often provide benefits to circulation and alternate access in addition to capacity. Unconstrained capacity solutions would cost $2.1 billion in current year dollars, or nearly 70 percent of the total cost. Potential solutions to address congestion would cost around $57 million, while other solutions, such as circulation or access studies and landscaping or aesthetic projects, would cost $10 million.
Exhibit 4-3. Plan Cost Estimates by Funding Program
Funding Program Plan Cost Estimates
System Preservation $315 M Safety $595 M Capacity (non-constrained) $2.1 B Congestion $57 M Other $10 M TOTAL $3.1 B

DRAFT
Chapter IV. Potential Solutions Page 4-9
Implementing the roadway infrastructure capacity solutions on the short/constrained list shown on Exhibit 4-4 would require nearly $1.5 billion in current-year dollars. These project solutions are identified separately due to their relatively large scale; these projects could cost more and take longer to implement than other capacity projects and projects in other programs.
But they do not represent the only priority solutions for Kauai. Capacity solutions to address bicycle and pedestrian needs and safety deficiencies are also included in this Plan and considered necessary for optimal operation of the island’s land transportation system. The cost of implementing the full array of capacity solutions to address anticipated deficiencies would be approximately $2.1 billion through 2035.
Based on the high estimated cost of addressing Kauai’s priority transportation needs, the region will need to make hard decisions about where to invest and where to allocate funding. The reality of limited funding with competing needs must be examined closely so that dollars are effectively spent to best meet the identified goals and objectives while addressing transportation system deficiencies.

Page 4-10 Chapter IV. Potential Solutions
Exhibit 4-4. Potential Long-Range Capacity Solutions
Route Number Jurisdiction Project Title Project Description
Estimated Cost
FY 2011 ($)
50 State Kaumualii Highway - Anonui Street to Kipu Road (Phase 1B)
Additional 2 travel lanes to allow for safe passage of vehicles
$22,324,000
50 State Kaumualii Highway - Kipu Road to Vicinity of Haiku Airstrip (West of Humane Society, M.P. 3.47. Phase 1C)
Additional 2 travel lanes to allow for safe passage of vehicles
$22,324,000
50 State Kaumualii Highway - Vicinity of Haiku Airstrip (West of Humane Society, M.P. 3.47) to Huleia Bridge (Phase 2)
Highway improvements $58,487,000
50 State Kaumualii Highway - Huleia Bridge to West of Kahili Mountain Park Road (Approx. 1000 ft, Phase 3)
Highway improvements $55,807,000
50 State Kaumualii Highway - Kahili Mountain Park Road to Koloa Road
Highway improvements $71,435,000
50 State Kaumualii Highway - Kalaheo Town to Koloa Road
Additional 2 travel lanes to allow for safe passage of vehicles
$33,485,000
50 State Kaumualii Highway - Hanapepe Road to Eleele Road
Additional 2 travel lanes $12,873,000
51 State Kapule Highway Additional 2 travel lanes with bike lanes and sidewalks
$98,116,000
56 State Kuhio Highway - Kapule Highway to Mailihuna Road
Additional 2 travel lanes $128,029,000
520 County Poipu Road - Lawai Road to Ala Kinoiki Road
Improve existing roadway to include bike lanes, sidewalks, and intersection improvements.
$6,725,000
570 State Ahukini Road - Kuhio Highway to Kapule Highway
Improve airport access including realignment and illumination. Additional 2 travel lanes with sidewalks and bike lanes or a bicycle path
$41,696,000
580 State Kuamoo Road - Kuhio Highway to Kamalu Road
Improve existing roadway to include bike lanes and sidewalks
$30,344,000
581 County Kamalu Road - Kuamoo Road to Olohena Road
Improve existing roadway to include bike lanes and sidewalks
$14,958,000
5860 County Kawaihau Road - Kuhio Highway to Mailihuna Road
Improve existing roadway to include bike lanes and sidewalks
$10,116,000
N/A County Lihue-Hanamaulu Bypass Road Construct a new 2-lane Lihue-Hanamaulu Bypass Road along existing agriculture road alignment
$115,415,000
N/A State Kapaa Relief Route - Kapule Highway to Kapaa Stream
Construct the Kapaa Relief Route between Kapule Highway and Kapaa Stream
$600,000,000
N/A County Northern Leg of the Western Access Road
Construct a new 2-lane, signed shared roadway from Koloa Road and the completed section of the Ala Kalanikaumaka intersection to Maluhia Road and Ala Kinoiki intersection
$20,000,000
Note: This list is organized by State Route number and not by priority. Although not listed here, capacity solutions also include safety improvements and multimodal facilities. This list is not fiscally constrained and these solutions would have to be compared against those of other necessary programs, such as system preservation and safety, when decision-makers make funding recommendations.

Chapter VImplementation


Chapter V. Implementation Page 5-1
V . I m p l e m e n t a t i o n
This Plan is the vision of what the 2035 transportation system would be absent any financial constraints over the 20-year planning horizon. How do we move forward from today to 2035?
Connecting this Long-Range Plan and the Statewide Transportation Improvement Program As mentioned earlier, this Plan sets the transportation vision and long-term land transportation plan for Kauai. The STIP is a set of identified improvements that can be reasonably expected to be completed with available funds over a 4-year period. It is one mechanism for implementing the long-range plan.
With short-range planning focused on financial necessity and long-range planning focused on system need, it is critical to provide a bridge between the two to ensure that current investment decisions are helping the region move towards its long-range goals. The Mid-Range Plan provides the link between the long-range plan and the STIP and helps the state and the regions make difficult funding decisions using an objective and transparent method.
Mid-Range Plan Solutions considered in the Plan are focused on meeting identified deficiencies by program category and are not based on fiscal constraints. It is known that available transportation resources over the planning horizon of the long-range plan will only cover approximately 20 percent of the identified needs on Kauai. This does not even include the needs of transit programs which are funded out of other transportation revenue sources. With limited funds available, it is critical to identify the high-priority programs and projects to aid in effective decision-making.
Prior to implementing the full range of solutions, the state and region need to logically plan and program individual transportation improvements to address priority deficiencies to maximize investments. The Mid-Range Plan is the link between this 20+ year long-
range plan and the four-year STIP and is intended to assist the HDOT Highways Division in meeting its long-range goals as efficiently as possible. By planning two biennia beyond the adopted STIP, the Mid-Range Plan provides a roadmap to the future that is consistent with the region’s long-range plan. The Mid-Range Plan can also serve as an opportunity to make any necessary course corrections in funding priorities in the STIP needed to achieve the long-range plan objectives.
The Mid-Range Plan can be updated as forecasts for transportation revenue change due to changing economic conditions or new transportation resources. As revenue projections change, projects can move in or out of the plan based on the overall ranking amongst all the other projects in the plan. The project list that has been created using a transparent and repeatable process that ranks solutions based on a standard set of criteria that incorporate economic, environmental, and social objectives will ensure that the mid-range plan can be adjusted readily and in a reasonable and transparent fashion.
The mid-range set of project solutions is fiscally constrained, acknowledging the limited amount of transportation funds and responsibly allocating or assigning funds to priority projects. Although financial resources are limited, funds have been set aside or programmed for implementing mid-range projects. Recognizing fiscal constraints is a critical step in converting a long-range plan into a set of implementable projects—the long-range plan can be seen as the transportation “wish list,” and the mid-range plan is what is achievable given current funding within an 8 to 10-year horizon. The fiscally constrained mid-range plan will ensure that the Highways Division has a clear set of priorities to make informed decisions with limited funding. The Mid-Range Plan will be updated more often than the long-range plan, and

Page 5-2 Chapter V. Implementation
allow the HDOT to plan, identify, and commit to projects earlier than the STIP process. It also allows more flexibility if expected funding is above or below anticipated levels, providing a venue to adjust project lists prior to STIP development.
The combination of a long-range plan based purely on need and a mid-range plan that is fiscally constrained is an important prioritization and communication tool for transportation planning. By clearly establishing a baseline of available resources for transportation investment while understanding the long-term needs of the system, data can inform discussions of future transportation resources and where they should be spent. This helps the community understand the trade-offs of investing more or less in certain transportation programs and can lead to better informed transportation investment decisions that are fully understood by a wide variety of stakeholders.
To bridge the gap between the current transportation system and the future 2035 long-range system, the state will develop a mid-range set of solutions over an 8 to 10-year period.
STIP The district long-range Plan and Mid-Range plans provide guidance to and feed projects into the STIP. The STIP connects the projects with the specific funding programs and allocates funds to implement project solutions for a 4-year period. As projects are programmed and budgeted, they move into the project delivery stage. During the project delivery stage, a more thorough engineering analysis will be conducted on the project’s feasibility and an environmental assessment of
environmental impacts will be prepared. During this time, the project will further evolve and may change from the initial analysis conducted in this Plan.
Exhibit 5-1 shows the progression of solutions through the long-range Plan, Mid-Range Plan, and STIP. It also shows how projects are narrowed from the long, aspirational list in the long-range plan, to the shorter, fiscally constrained list in the Mid-Range Plan, and finally the list of projects that can be implemented and are able to be funded given existing revenues in the STIP. The integrated statewide long-range planning processes guide the development of a priority plan where the state and regions look at how to fund solutions. The STIP and program management is where the projects are further developed through environmental, preliminary engineering, design, and move into construction.
Creating a policy framework for roadway project prioritization is geared towards preserving the National Highway System and existing federal-aid highways. MAP-21 includes provisions to support the condition and performance of the NHS to ensure that investments in highway construction help achieve performance standards and state goals including infrastructure condition, safety, mobility, or freight movement. Similarly, the FTA prioritizes maintaining and operating the existing public transportation facilities and vehicles efficiently.
Funding Identifying and matching funding to projects is a crucial step in implementing the Plan. The Hawaii Statewide Transportation Planning Process requires coordination between policy and planning activities
Exhibit 5-1. Implementation from Long-Range Plan to Statewide Transportation Improvement Program

Chapter V. Implementation Page 5-3
and funding and implementation activities. Transportation funding in the State of Hawaii comes from a combination of federal and state funds, and Hawaii, like many other states does not have unlimited transportation funding to meet all operations and maintenance costs and capital improvement costs.
There is a gap in the anticipated funding and the list of needed transportation projects. The Plan is one tool to identify regional priorities that help Kauai meet state and regional transportation goals and focuses project efforts with limited resources. The Plan also provides the basis for future transportation improvement decisions as the HDOT completes projects, identifies new needs, and develops additional projects.
The following section summarizes expected future state and federal funding sources for the State of Hawaii’s Highway Fund through 2035 as well as Kauai County fund allocations from the HDOT Highways Division Programs, potential funding shortfalls, and possible contingency measures to mitigate funding gaps.
Federal Funding
Historical Funding Levels Federal funds come from the Highway Trust Fund and are raised primarily through the federal gas tax. The United States federal excise tax is 18.4 cents per gallon on gasoline and 24.4 cents per gallon for diesel fuel. Federal funding is intended for the maintenance and construction of the federal highway system and for major arterials and collectors that feed into the highway system. Over the past decade annual federal funding has ranged from a low of $82 million in FY04 to a high of $217 million in FY09. From FY02 through FY11 the average annual federal contribution to transportation revenue in the State of Hawaii has been approximately $152 million. This is reflected in the Exhibit 5-2.
MAP-21 The adoption of Moving Ahead for Progress in the 21st Century (MAP-21) in July 2012 changed federal funding methods for future fiscal years. MAP-21 changes the way program funding is distributed to
individual states. Previously, core federal highway programs were able to distribute funds to states using individual formulas. With new legislation, a lump sum is distributed to states proportionally (based on 2012 distributions received under SAFETEA-LU), and states are able to distribute funds internally to their core programs, with flexibility to transfer funds from one program to another.
Exhibit 5-2. Federal Contribution to State of Hawaii’s Transportation Funding
$ Million
$50 Million
$100 Million
$150 Million
$200 Million
$250 Million
2002 2003 2004 2005 2006 2007 2008 2009 2010 2011
With MAP-21, funding methods and amounts through FY14 may not be aligned with the historic trend of the last decade and beyond FY14 the amount of future federal dollars that Hawaii will receive for the highway system is unknown. Therefore, in order to present a conservative estimate of available federal funds, the Plan assumes a constant average amount of approximately $152 million annually through the long-range planning period.
The Highway Trust Fund, dependent upon the gas tax, has been decreasing for all states over the past few years as the vehicle fleet becomes more fuel efficient and per capita Vehicle Miles Traveled (VMT) continues to decrease nationwide. The Congressional Budget Office estimates that the Highway Trust Fund will not be able to sustain current levels of expenditure before the end of fiscal year 2014 without additional funds.

Page 5-4 Chapter V. Implementation
State Funding State funds come from six primary sources: fuel taxes, rental/tour vehicle surcharges, weight taxes, vehicle registration fees, miscellaneous fees, and interest from invested highway funds.
» Highway Fuel License Tax – Currently, the highway fuel tax is $0.17 per gallon of gasoline and diesel oil for highway use and $0.02 per gallon of gasoline, diesel oil, and liquid petroleum gas for non-highway use. The fuel taxes are collected by the Department of Taxation and transferred to the State Highway Fund. In FY11, the highway fuel tax contributed approximately $89.0 million to the State Highway Fund.
» Vehicle Registration Fees – The state vehicle registration fee increased from $25 per vehicle to $45 per vehicle in 2011. In FY11, the registration fees contributed approximately $20.8 million to the State Highway Fund.
» Weight Taxes – All vehicles, including motor vehicles, are assessed an annual state vehicle weight tax. The tax increased in 2011 to $0.0175 per pound. The maximum charge for a vehicle increased to $300 per vehicle. The additional weight tax is expected to result in an increase in net revenues of nearly $33.0 million in FY 13. In FY11, weight taxes contributed approximately $33.4 million in revenues to the State Highway Fund.
» Rental/Tour Vehicle Surcharge – The rental/tour vehicle surcharge imposes a daily tax on the rental of all motor vehicles and tour vehicles. In FY11, the rental and tour vehicle surcharge contributed approximately $43.9 million to the State Highway Fund.
» Interest – This is income derived from the investment of Highway Special fund money held by the State. In FY11, interest income was approximately $4.0 million.
» Miscellaneous – Miscellaneous revenues include permit fees, driver license fees, inspection fees, rental fees, and other miscellaneous revenues.
Over the past decade of transportation funding, more than 60 percent of all state revenues have been generated from fuel taxes and rental/tour vehicle surcharges. Even after factoring in the impacts of the 2007-2009 recession on fuel and rental surcharges in FY09-FY10, revenue from fuel taxes, rental surcharges and registration fees have increased approximately 2 percent per year over the past decade. Exhibit 5-3 represents the breakdown of revenues by sources for FY11.
While federal funding is projected to remain constant, state funding revenues are expected to grow on an annual basis of approximately 1 percent per year. This growth rate is consistent with growth rates presented in the 2011 Highway Revenue Bonds Official Statement. The Expenditure and Funding Summary memorandum in Appendix G includes a detailed description of both state and federal revenue sources.
Exhibit 5-3. FY11 Breakdown of Revenues by Source
Based on estimated federal funding and state revenues, the total combined transportation funding for the State of Hawaii could be expected to increase to nearly $495 million annually by 2035 (FY11 total is approximately $400 million). This results in cumulative total estimated revenue of $11.10 billion from 2011 through 2035. These values are not adjusted for inflation.
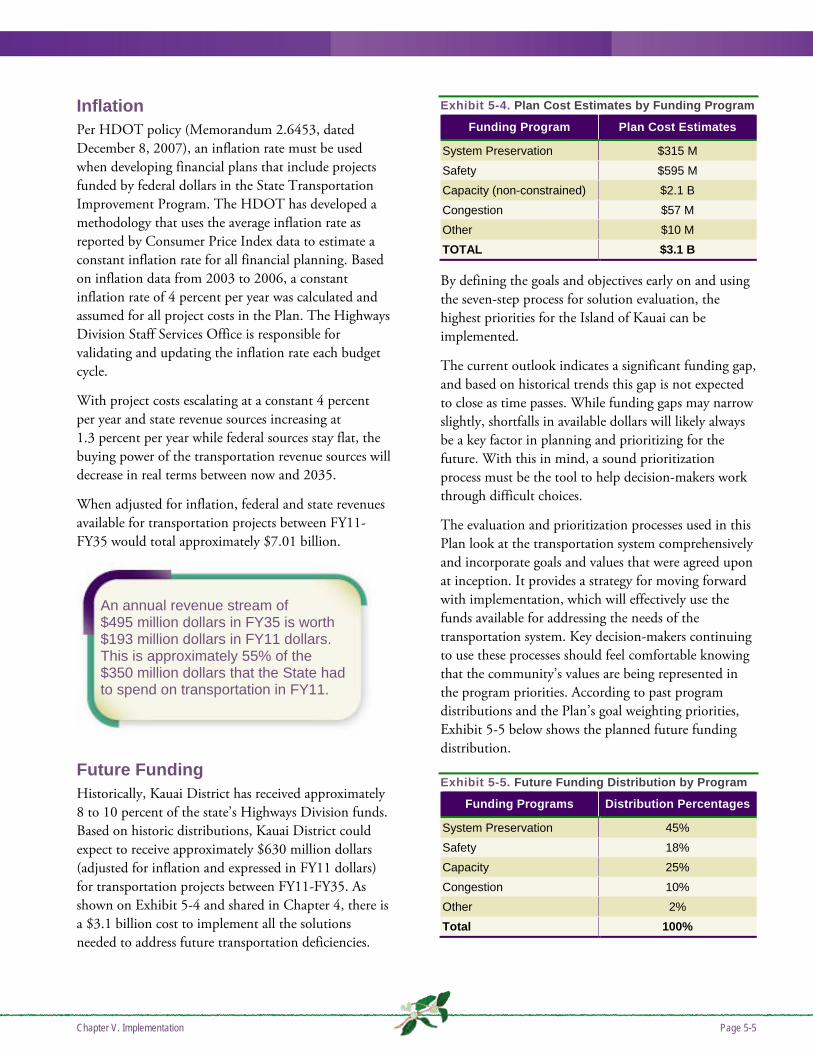
Chapter V. Implementation Page 5-5
Inflation Per HDOT policy (Memorandum 2.6453, dated December 8, 2007), an inflation rate must be used when developing financial plans that include projects funded by federal dollars in the State Transportation Improvement Program. The HDOT has developed a methodology that uses the average inflation rate as reported by Consumer Price Index data to estimate a constant inflation rate for all financial planning. Based on inflation data from 2003 to 2006, a constant inflation rate of 4 percent per year was calculated and assumed for all project costs in the Plan. The Highways Division Staff Services Office is responsible for validating and updating the inflation rate each budget cycle.
With project costs escalating at a constant 4 percent per year and state revenue sources increasing at 1.3 percent per year while federal sources stay flat, the buying power of the transportation revenue sources will decrease in real terms between now and 2035.
When adjusted for inflation, federal and state revenues available for transportation projects between FY11-FY35 would total approximately $7.01 billion.
Future Funding Historically, Kauai District has received approximately 8 to 10 percent of the state’s Highways Division funds. Based on historic distributions, Kauai District could expect to receive approximately $630 million dollars (adjusted for inflation and expressed in FY11 dollars) for transportation projects between FY11-FY35. As shown on Exhibit 5-4 and shared in Chapter 4, there is a $3.1 billion cost to implement all the solutions needed to address future transportation deficiencies.
Exhibit 5-4. Plan Cost Estimates by Funding Program
Funding Program Plan Cost Estimates
System Preservation $315 M Safety $595 M Capacity (non-constrained) $2.1 B Congestion $57 M Other $10 M TOTAL $3.1 B
By defining the goals and objectives early on and using the seven-step process for solution evaluation, the highest priorities for the Island of Kauai can be implemented.
The current outlook indicates a significant funding gap, and based on historical trends this gap is not expected to close as time passes. While funding gaps may narrow slightly, shortfalls in available dollars will likely always be a key factor in planning and prioritizing for the future. With this in mind, a sound prioritization process must be the tool to help decision-makers work through difficult choices.
The evaluation and prioritization processes used in this Plan look at the transportation system comprehensively and incorporate goals and values that were agreed upon at inception. It provides a strategy for moving forward with implementation, which will effectively use the funds available for addressing the needs of the transportation system. Key decision-makers continuing to use these processes should feel comfortable knowing that the community’s values are being represented in the program priorities. According to past program distributions and the Plan’s goal weighting priorities, Exhibit 5-5 below shows the planned future funding distribution.
Exhibit 5-5. Future Funding Distribution by Program
Funding Programs Distribution Percentages
System Preservation 45% Safety 18% Capacity 25% Congestion 10% Other 2% Total 100%
An annual revenue stream of $495 million dollars in FY35 is worth $193 million dollars in FY11 dollars. This is approximately 55% of the $350 million dollars that the State had to spend on transportation in FY11.

Page 5-6 Chapter V. Implementation
This planned distribution of future funds is consistent with the stakeholder goals mentioned in Chapter 1 of:
» Preservation of the existing system
» Safety for all modes
» Modal integration and complete streets
» Efficiency and expanded roadway capacity
» Ability to support evacuation and response to emergency events and natural disasters
» Resiliency to climate change
» Increased funding levels
Future distribution of funds is also consistent with MAP-21. While investing in the transportation system could involve new facilities, MAP-21 guidance is largely focused on improving or enhancing current assets, and preserving and maintaining the condition of existing infrastructure.
The majority of MAP-21 federal highway funds are dedicated to strengthening the National Highway System, which includes key principal arterials, through preservation and improvement of priority roadways in the existing federal-aid highways network. Additional information regarding MAP-21’s performance goals are shared later in this section.
Supplemental Funding and Nonfunding Strategies State and federal funding sources have not kept up with the demands of the highway transportation system. The fuel tax, which is the largest contributor to the state’s transportation budget, is levied based on fuel consumption and is subject to volatility in usage patterns. Consumption patterns can be impacted by improved vehicle efficiency and overall economic conditions. Other tax based revenue streams are subject to legislative approval and are not modified on a regular basis to keep pace with increasing needs and costs.
This shortfall between anticipated funding levels and funding needs is not unique to Hawaii; a consortium of states is studying alternatives to the gas tax to fund highways, and there are a number of pilot projects throughout the nation looking into road usage charges,
where drivers pay based on the miles they drive. In 2015 the state of Oregon will start a pilot program of 5,000 drivers to test a number of data collection methods and fee structures.
The state is not expected to have the funding available to implement all of the solutions recommended in the long-range plan. A funding shortage will likely mean deferral of needed projects and may delay improvements to safety, congestion relief, and infrastructure preservation. Unpredictability in funding sources for transportation projects makes it difficult to plan for future facilities. Delays to improvements in the transportation system lead to frustration among the taxpaying citizens who expect the highway infrastructure to keep up with the growing demand.
While this Plan provides critical guidance for decision-makers, especially during times when needs exceed available funding, the state may also consider a variety of methods and potential alternative revenue sources to continue to fund the needs of the transportation system. Appendix H summarizes potential future funding strategies and other revenue sources that could be considered by the Legislature and other governing bodies, including:
» Mileage-based user fees – Drivers pay a fee based on the number of miles traveled on public roadways. Private roadways would be excluded. Mileage could be tracked through various methods, and prices could be set based on congestion, location of travel, type of road, or a flat fee per mile. A number of states are implementing pilot programs to study this as a viable alternative to the gas tax.
» Special general excise tax on automotive parts and services – Taxes would be collected through the performance of specific services (such as vehicle inspections or repairs) and the sale of equipment related to motorized vehicles.
» General excise tax increase – A portion of revenue from an increase in the general sales tax could be allocated to transportation improvements and projects.
» Public/private partnerships – An agreement between a private entity and a public agency to

Chapter V. Implementation Page 5-7
deliver transportation projects, typically with greater involvement and risk taken by the private entity.
» Impact fees on new development – Private developers pay a pre-determined fee per development unit. This fee is based on the number of vehicle trips expected to be generated by the potential development.
» Bicycle registration – A bicycle licensing system could be developed, and user fees could be collected based on the type of bicycle registered. Fees could support maintenance and upkeep of bicycle lanes and shared roadways.
» Carbon tax/cap – A fee or tax could be imposed on producers of large amounts of carbon. These producers would pay a fee to ‘offset’ their carbon production.
» Increase current funding sources – Because new sources of funding are difficult to identify, increasing the existing mechanisms – such as raising the rental/tour vehicle surcharge or vehicle weight tax – could generate additional revenue.
» Tolls – Drivers pay a fee each time a specific public roadway is used or a certain bridge is crossed. Toll fees may change based on the time of day. Tolling in Hawaii would require Legislature to change the current laws that prohibit toll charges.
» Grant anticipation borrowing – This strategy allows public agencies to borrow against anticipated future federal and/or state revenues to fund capital projects that require large upfront expenditures. Existing programs include Grant Anticipation Revenue Vehicle (GARVEE) bonds for highways and Grant Anticipation Note (GAN) bonds for transit.
» State infrastructure banks and other revolving loan funds – These are lending organizations initially funded with federal grants and/or state funds and operated at the state level. These funds leverage federal and state resources by lending rather than granting federal-aid funds, and can attract nonfederal public and private investment.
» Bonds – Bonds are issued by the state or other agency to finance assets with long useful lives (such as transportation projects). The administering entity issues bonds with a set return on investment, and investors purchase the bonds to help fund transportation projects. Bonds help smooth the impact of large expensive projects by providing upfront capital, and allowing the state or county to repay over a set amount of time.
» Land swaps and donated lands – This strategy is not a funding source per se, however, right-of-way costs can be a large portion of total transportation project costs. Working with land owners to either swap land for right-of-way or to donate land for a project could be a way to reduce project costs. Donated land could also be used as a local match to leverage federal funds.
Reducing Transportation Infrastructure Funding Needs In addition to identifying and implementing transportation projects to address identified needs, there are a number of other strategies to reduce the demand on the transportation system and meeting future needs without investing directly into the vehicle transportation network. The two main strategies are described below.
Land Use Planning Transportation and land use are closely linked. Transportation demand is derived from surrounding land uses, where certain types of land uses and more intensive development are known to generate greater travel demand. The demand for auto-based travel—and the concomitant need for roadway investment—can be influenced through land use decisions and urban design. For example, the development of denser, mixed-use areas or “20-Minute Neighborhoods” often leads to greater travel options for community members. Private auto use declines when the environment is attractive to pedestrians, bicyclists, and transit users. But achieving land use changes requires zoning codes and regulations that allow for mixed uses and flexible design.

Page 5-8 Chapter V. Implementation
Transportation Demand Management Strategies Another way to reduce the need for transportation infrastructure funding is to reduce the vehicle demand on roadways. There are a number of strategies that states and counties can implement to help manage travel demand. Most strategies aim to change the mode of travel, the time of travel, or to replace the trip with other options, as described below:
» Make bicycling attractive – Require bicycle-friendly facilities, such as easily accessed and secure bike parking and storage, showers at destination locations (including employers), and other amenities.
» Make walking attractive - Require sidewalks and pedestrian infrastructure such as mid-block crossings, pedestrian activated signals, and shaded routes. Change land use patterns or zoning codes to create more walkable districts and improve connectivity among pedestrian destinations.
» Make transit attractive – Increase the number of transit routes, expand service hours, and shorten headways to improve the overall transit network. Create a transit pass program with large employers, subsidize passes for employees or residents, and create transit priority corridors to ensure transit is an attractive option to the single-occupancy vehicle.
» Make ridesharing attractive – Implement education and ride-matching programs to increase the number of people per vehicle, and reduce single-occupancy vehicles on the roadway. Work with employers and high-volume destinations to implement ridesharing programs through incentives such as preferential parking. Explore social media and mobile apps to facilitate connections between program participants.
» Make parking more expensive – Implement parking pricing in high-demand areas to increase the cost of driving alone.
» Change travel times – Work with employers to implement flexible work schedules to reduce congestion during peak travel times.
» Reduce potential trips – Work with employers to implement teleworking to reduce the amount of trips employees take to work.
Performance Goals Measuring the performance of the roadway system after projects are implemented is an important part of the overall long-range planning process. Once in place, individual projects or systemwide improvements should help to maintain or enhance operations by addressing identified needs and deficiencies. To evaluate how well a particular project is performing, the transportation system should be monitored and results should be measured against a set of predetermined performance goals or targets.
Meeting these targets would mean that the implemented project was appropriate, and value has accrued from the dollars invested; in theory, the transportation system is better because the project was constructed. If targets are not met, further changes should be investigated to continue striving towards the goal. Ongoing tracking of system performance would provide valuable information to guide future planning for evolving needs.
MAP-21 legislation supports a performance and outcome-based state highway program, and provides a set of broad national transportation performance goals intended to help states invest their limited funds efficiently.
To supplement this focus, MAP-21 performance goals include:
» Safety – significantly reduce traffic fatalities and serious injuries on all public roads.
» Infrastructure Condition – maintain highway infrastructure assets in state of good repair.
» Congestion Reduction – significantly reduce congestion on the National Highway System.
» System Reliability – improve the efficiency of the surface transportation system.
» Freight Movement and Economic Vitality – improve freight networks, strengthen the ability of rural communities to access national and

Chapter V. Implementation Page 5-9
international trade markets, and support regional economic development.
» Environmental Sustainability – enhance transportation system performance while protecting and enhancing the natural environment.
» Reduce Project Delivery Delays – reduce project costs, promote jobs and the economy, and expedite the movement of people and goods by accelerating project completion through eliminating delays in the project development and delivery process, including reducing regulatory burdens and improving agencies’ work practices.
The MAP-21 performance goals align with the planning factors of this Plan, as shown on Exhibit 5-6. The planning factors have been the framework of the Plan from the start, and have guided the creation of the goals and objectives, identification of needs, and the development of prioritized potential solutions.
The HDOT programs currently collect data for use in maintenance cycles and priority setting. Each program will set up performance measures that are consistent with their program’s goals and objectives and MAP-21.
With limited funding for all state highway programs, it is critical that investments provide value and work towards achieving the desired outcome. Because the potential solutions have been shaped around the planning factors, the investments made to implement these solutions are aligned with the MAP-21 national performance goals.
Additional Strategies This Plan provides the framework to prepare Kauai District’s land transportation system to meet the needs of its residents and visitors by 2035. In addition to prioritization processes and funding mechanisms, this Plan includes additional strategies that could provide
further benefit to Kauai District’s land transportation system. These strategies include:
» Improve coordination between jurisdictions and align efforts earlier in planning processes. By sharing information on future infrastructure or facilities well in advance, state and county funds may be identified or set aside earlier to ensure they are there for the highest priority needs.
» Incorporate policies through legislation to require planning of balanced, integrated transportation systems throughout Kauai District’s communities.
» Promote transit options and increase visibility of available transit infrastructure and service. Strive to effectively link customers and transportation services.
» Incorporate policies to designate freight routes or truck routes on roadways adjacent to airports and harbors. Provide optimum travel paths for freight vehicles to distribute cargo efficiently.
» Emphasize the functional classification of roadways and ensure that transportation facilities are appropriately sized and located. Ensure a land transportation system which allows local trips to be conducted primarily on the local roadway system in urbanized areas.
» Accelerate delivery of transportation projects and gain benefit from time and cost savings through design-build or construction-contractor partnerships. This is consistent with the FHWA’s Every Day Counts Initiative and MAP-21’s performance goal of reduced project delivery delays.

Page 5-10 Chapter V. Implementation
Exhibit 5-6. Planning Factors and MAP-21 Performance Goals
Federal Planning Factors MAP-21 Performance Goals
Environment and Sustainability – Develop solutions that meet our transportation needs without compromising the ability of future generations to meet their own needs; develop solutions that promote energy conservation, improve the quality of life, and address climate change.
Environmental Sustainability – enhance transportation system performance while protecting and enhancing the environment
Modal Integration – Expand transportation options and make connections between modes such as public transit, automobile, bicycle, and pedestrian.
System Preservation – Maintain a regular schedule of rehabilitation, reconstruction, and replacement to keep the multimodal system operating safely and efficiently.
Infrastructure Condition – maintain highway infrastructure assets in state of good repair System Reliability – Improve the efficiency of the surface transportation system
Security – Ensure the secure operation of the land transportation system by involving multiple agencies to work together to achieve common goals of risk management, incident detection, response, clearance, and preparation for and recovery from disasters.
System Reliability – Improve the efficiency of the surface transportation system
Economic Vitality – Support industry, tourism, cultural, and recreational opportunities by reducing travel time, operating costs, travel distance, crashes, and logistics inefficiencies.
Freight Movement and Economic Vitality – Improve freight networks, strengthen the ability of rural communities to access national and international trade markets, and support regional economic development.
System Efficiency Management and Operations – Optimize the performance of existing infrastructure; provide reliability and predictability within the transportation system and between modal choices.
Congestion Reduction – reduce congestion on the National Highway System System Reliability – Improve the efficiency of the surface transportation system
Transportation Access Mobility – Enhance both infrastructure and services to improve mobility, consistency, and equity.
Safety – Increase traveler safety through engineering, education, and enforcement programs and campaigns, and improve regulations and research efforts.
Safety – reduce fatalities and serious injuries on all public roads

Chapter VIReferences


DRAFT
Chapter VI. References Page 6-1
American Association of State Highway and Transportation Officials. 1999. Guide for the Development of Bicycle Facilities.
CH2M HILL. 2012a. 2020 and 2035 Forecast Land Use and Socioeconomic Data Methodology. August.
CH2M HILL. 2012b. Travel Demand Model Analysis and Results for Federal-Aid Highways 2035 Transportation Plan for the District of Kauai. May.
County of Kauai. 2000. Kauai General Plan. November.
County of Kauai Planning Department. 2012. Planning District Boundaries. March.
State of Hawaii County Assessor. 2011. Hawaii County Assessor Data. March/April 2011.
State of Hawaii Department of Business, Economic Development, and Tourism (DBEDT). 2008. Visitor Plant Inventory.
State of Hawaii Department of Business, Economic Development and Tourism (DBEDT). 2011. State of Hawaii Data Book 2010. August.
State of Hawaii Department of Labor and Industrial Relations. 2007. Second Quarter 2007.
State of Hawaii Department of Transportation (HDOT). 2003. Bike Plan Hawaii, A State of Hawaii Master Plan Abridged Version. September.
State of Hawaii Department of Transportation, Airports Division (HDOT). 2008. Calendar Year 2007 Air Traffic Statistics. June.
State of Hawaii Department of Transportation (HDOT). 2009. HPMS Database 2009.
State of Hawaii Department of Transportation (HDOT). 2010. Highway Safety Improvement Program, High Accident Listings. November.
State of Hawaii Department of Transportation (HDOT). 2011. Statewide Transportation Improvement Program: Revision #3 FFY 2011 Through 2014. September 8.
State of Hawaii Department of Transportation (HDOT). 2012. Federal-Aid and State Highway Update: System Identification and Functional Classification. December.
State of Hawaii Department of Transportation (HDOT). 2013. Statewide Pedestrian Master Plan. May.
State of Hawaii Land Use Commission (LUC). 2007. Land Use District Boundaries. Available at: http://luc.state.hi.us/maps/2007kauai.pdf. Accessed on February 20, 2012.
Transportation Research Board. 2003. Access Management Manual.
Transportation Research Board. 2010. Highway Capacity Manual.


Appendix AHighway Functional Classification Maps


KEY TO SHEETS
HIGHWAY FUNCTIONAL CLASSIFICATION MAP
PREPARED BY THE
STATE OF HAWAII
DEPARTMENT OF TRANSPORTATIONHIGHWAYS DIVISION
HIGHWAY PLANNING BRANCHIN COOPERATION WITH THE
U.S. DEPARTMENT OF TRANSPORTATION
FEDERAL HIGHWAY ADMINISTRATION
2013
N
SCALE 1" = 7,000'
07000 7000 14000 21000 FEETISLAND OF KAUAI
DATE REVISIONS
XXXXXXXX
XXXXXXXX
XXXXXXXX
XXXXXXXX
XXXXXXXX
XXXXXXXX
XXXXXXXX
XXXXXXXX
XXXXXXXX
XXXXXXXX
XXXXXXXX
XXXXXXXX
XXXXXXXX X
X
X
X
X
X
X
X
X
X
X
X
X
0 1 2 3 4 5 mi
0.00 0.25 0.50 0.75 1.00 mi
0.00 0.25 0.50 0.75 1.00 mi
0.00 0.25 0.50 0.75 1.00 mi
0.00 0.25 0.50 0.75 1.00 mi
INSET 1
INSET 2
INSET 4
INSET 3
Legend
Rural Principal Arterial - Other
Rural Minor Arterial
Rural Major Collector
Rural Minor Collector
Urban Areas
Urban Principal Arterial - Interstate
Urban Principal Arterial - Freeways/Expressways
Urban Principal Arterial - Other
Urban Minor Arterial
Urban Major Collector
Urban Minor Collector
Committed / Under Construction
PAGE 2

DATE REVISIONS
XXXXXXXX
XXXXXXXX
XXXXXXXX
XXXXXXXX
XXXXXXXX
XXXXXXXX
XXXXXXXX
XXXXXXXX
XXXXXXXX
XXXXXXXX
XXXXXXXX
XXXXXXXX
XXXXXXXX X
X
X
X
X
X
X
X
X
X
X
X
X
HIGHWAY FUNCTIONAL CLASSIFICATION MAP
PREPARED BY THE
STATE OF HAWAII
DEPARTMENT OF TRANSPORTATIONHIGHWAYS DIVISION
HIGHWAY PLANNING BRANCHIN COOPERATION WITH THE
U.S. DEPARTMENT OF TRANSPORTATION
FEDERAL HIGHWAY ADMINISTRATION
2013
SCALE 1" = 2,000'
02000 2000 4000 6000 FEET
KAPAA AND LIHUE
Island of Kauai
LOCATION MAP
N
0.00 0.25 0.50 0.75 1.00 mi
Legend
Rural Principal Arterial - Other
Rural Minor Arterial
Rural Major Collector
Rural Minor Collector
Urban Areas
Urban Principal Arterial - Interstate
Urban Principal Arterial - Freeways/Expressways
Urban Principal Arterial - Other
Urban Minor Arterial
Urban Major Collector
Urban Minor Collector
Committed / Under Construction
PAGE 3

DATE REVISIONS
XXXXXXXX
XXXXXXXX
XXXXXXXX
XXXXXXXX
XXXXXXXX
XXXXXXXX
XXXXXXXX
XXXXXXXX
XXXXXXXX
XXXXXXXX
XXXXXXXX
XXXXXXXX
XXXXXXXX X
X
X
X
X
X
X
X
X
X
X
X
X
HIGHWAY FUNCTIONAL CLASSIFICATION MAP
PREPARED BY THE
STATE OF HAWAII
DEPARTMENT OF TRANSPORTATIONHIGHWAYS DIVISION
HIGHWAY PLANNING BRANCHIN COOPERATION WITH THE
U.S. DEPARTMENT OF TRANSPORTATION
FEDERAL HIGHWAY ADMINISTRATION
2013
SCALE 1" = 2,000'
02000 2000 4000 6000 FEET
HANAPEPE AND KOLOA
N
Island of Kauai
LOCATION MAP
0.00 0.25 0.50 0.75 1.00 mi
Legend
Rural Principal Arterial - Other
Rural Minor Arterial
Rural Major Collector
Rural Minor Collector
Urban Areas
Urban Principal Arterial - Interstate
Urban Principal Arterial - Freeways/Expressways
Urban Principal Arterial - Other
Urban Minor Arterial
Urban Major Collector
Urban Minor Collector
Committed / Under Construction
PAGE 4


Highway Functional Classification: Island of Kauai
PRINCIPAL MINOR MAJOR MINOR
50 Kaumualii Highway : Rice Street (Route 5020)> Cane Haul Road (dirt road) 0.00 2.10 3Urban
NHS2.10
50 Kaumualii Highway : Cane Haul Road (dirt road) > Maluhia Road (Route 520) 2.10 6.69 3Rural
NHS4.59
50Kaumualii Highway : Maluhia Road (Route 520) > Omao bridge
(#007000500302465)6.69 8.27 4 Rural 1.58
50 Kaumualii Highway : Omao bridge (#007000500302465) > Lele Road 8.27 17.02 4 Urban 8.75
50 Kaumualii Highway : Lele Road > Waimea River Bridge (#007000500301039) 17.02 22.47 4 Rural 5.45
50Kaumualii Highway : Waimea River bridge (#007000500301039) > Bridge #4
(#007000500300570)22.47 27.21 4 Urban 4.74
50Kaumualii Highway/Lio Road/Kao Road : Bridge #4 (#007000500300570) > North
entrance gate of the Pacific Missile Range Facility27.21 32.93 4 Rural 5.72
51Waapa Road/Rice Street/Kapule Highway : Nawiliwili Road (Route 58) > Kuhio
Highway (Route 56) 0.00 3.44 3
Urban
NHS3.44
56Kuhio Highway : Rice Street/Kaumualii Hwy (Route 50) > 0.11 miles past Mailihuna
Road (Route 5870) 0.00 9.95 3
Urban
NHS9.95
56Kuhio Highway : 0.11 miles past Mailihuna Road (Route 5870) > Aliomanu Road
(North connection)9.95 15.11 4 Urban 5.16
56Kuhio Highway : Aliomanu Road > Route markers 56 and 560 (same as begin Route
560, Kuhio Hwy)15.11 28.11 4 Rural 13.00
58 Nawiliwili Road : Waapa Road (Route 51) > Kaumualii Highway (Route 50) 0.00 2.06 3Urban
NHS2.06
520 Maluhia Road : Kaumualii Highway (Route 50) > Wailaau Road 0.00 2.77 4 Rural 2.77
520 Maluhia Road/Koloa Road : Wailaau Road > Poipu Road (Route 520) 2.77 3.35 4 Urban 0.58
520 Poipu Road : Koloa Road (Route 530) > Ala Kinoiki Way (Route 522) and Pee Road 3.35 6.35 5 Urban 3.00
521 Omao Road : Kaumualii Highway (Route 50) > Koloa Road (Route 530) 0.00 2.12 6 Urban 2.12
522 Ala Kinoiki Way : Poipu Road (Route 520) > Koloa Road (Route 530) 0.00 3.32 5 Urban 3.32
523 Lawai Road : Poipu Road (Route 520) > Sprouting Horn Beach Park parking lot exit 0.00 1.90 5 Urban 1.90
523 Lawai Road : Sprouting Horn Beach Park parking lot exit > Gate at the end of route 1.90 2.35 5 Rural 0.45
525 Weliweli Road : Koloa Road (Route 526) > Ala Kinoiki Way (Route 522) 0.00 0.66 6 Urban 0.66
526 Koloa Road/Waikomo Road : Maluhia Road (Route 520) > Poipu Road (Route 520) 0.00 0.76 5 Urban 0.76
COLLECTOR
MILEAGE BY FUNCTIONAL CLASSIFICATION
INTERSTATEFREEWAY &
EXPRESSWAY
ROUTE ROADWAY NAME AND EXTENTBEGIN
MP
END
MP
HPMS
CODE
RURAL/
URBAN/
NHS
ARTERIAL
Source: Federal-Aid and State Highway Update: System Identification and Functional Classification (2013) 1

Highway Functional Classification: Island of Kauai
PRINCIPAL MINOR MAJOR MINOR
COLLECTOR
MILEAGE BY FUNCTIONAL CLASSIFICATION
INTERSTATEFREEWAY &
EXPRESSWAY
ROUTE ROADWAY NAME AND EXTENTBEGIN
MP
END
MP
HPMS
CODE
RURAL/
URBAN/
NHS
ARTERIAL
530 Koloa Road : Kaumualii Highway (Route 50) > Poipu Road (Route 520) 0.00 3.43 5 Urban 3.43
531 Papalina Road : Kaumualii Highway (Route 50) > Waha Road (Route 532) 0.00 1.21 5 Urban 1.21
532 Waha Road/Lauoho Road : Niho Road > Koloa Road (Route 530) 0.00 2.41 6 Urban 2.41
534 Puuwai Road : Kaumualii Highway (Route 50) > Kikala Road 0.00 1.45 6 Urban 1.45
536 Piko Road : Kaumualii Highway (Route 50) > Koloa Road (Route 530) 0.00 0.40 6 Urban 0.40
540Halewili Road : Kaumualii Highway (east junction)(Route 50) > Kaumualii Highway
(west junction) (Route 50)0.00 3.87 5 Rural 3.87
541Waialo Road : Kaumualii Highway (Route 50) > "End of State Highway"' sign at Port
Allen0.00 0.37 5 Urban 0.37
543 Moi Road : Kaumualii Highway (Route 50) > Gate at the end of road 0.00 1.41 6 Urban 1.41
545Hanapepe Road : Kaumualii Highway (west junction) (Route 50) > Kaumualii
Highway (east junction) (Route 50)0.00 0.98 6 Urban 0.98
550 Waimea Canyon Drive : Kaumualii Highway (Route 50) > Nele Road 0.00 0.43 5 Urban 0.43
550 Waimea Canyon Drive/Kokee Road : Nele Road > Kokee State Park 0.43 14.10 5 Rural 13.67
551Kekaha Road/Akialoa Road : Kaumualii Highway (east junction) (Route 50) >
Kaumualii Highway (west junction) (Route 50) 0.00 2.52 6 Urban 2.52
552Alae Road/Kokee Road : Kaumualii Highway (Route 50)> Waimea Canyon Drive
(Route 550)0.00 7.55 5 Rural 7.55
553 Menehune Road : Kaumualii Highway (Route 50) > Gay Road 0.00 1.10 6 Urban 1.10
554 Waimea Road : Kaumualii Highway (Route 50) > Ala Wai Road 0.00 0.20 6 Urban 0.20
560 Kuhio Highway : end of Route 56 > Aku Road (Route 563) 0.00 2.65 4 Rural 2.65
560 Kuhio Highway : Aku Road (Route 563) > Haena State Park parking lot 2.65 10.01 5 Rural 7.36
562 Kolo Road/Kilauea Road : Kuhio Highway (Route 56) > Mihi Road 0.00 1.16 5 Rural 1.16
562 Kilauea Road : Mihi Road > Kilauea National Wildlife Refuge 1.16 1.71 6 Rural 0.55
563 Aku Road : Kuhio Highway (Route 560) > Weke Road (Route 565) 0.00 0.25 5 Rural 0.25
565 Weke Road : Anae Road > Hanalei Beach Park 0.00 1.09 6 Rural 1.09
566Anahola Road/Manai Road/Kukuihale Road : Kuhio Hwy (N junction) (Route 56) >
Kuhio Hwy (S junction) (Route 56)0.00 1.68 5 Urban 1.68
570Ahukini Road : Kuhio Highway (Route 56) > 0.06 miles east of Kapule Highway
(Route 51)0.00 1.12 3
Urban
NHS1.12
Source: Federal-Aid and State Highway Update: System Identification and Functional Classification (2013) 2

Highway Functional Classification: Island of Kauai
PRINCIPAL MINOR MAJOR MINOR
COLLECTOR
MILEAGE BY FUNCTIONAL CLASSIFICATION
INTERSTATEFREEWAY &
EXPRESSWAY
ROUTE ROADWAY NAME AND EXTENTBEGIN
MP
END
MP
HPMS
CODE
RURAL/
URBAN/
NHS
ARTERIAL
580 Kuamoo Road : Kuhio Highway (Route 56) > Kamalu Road (Route 581) 0.00 2.77 4 Urban 2.77
580 Kuamoo Road : Kamalu Road (Route 581) > UH AGR. Station 2.77 4.81 5 Urban 2.04
580 Kuamoo Road : UH AGR. Station > Forest Reserve Sign (end of urban boundary) 4.81 6.46 6 Urban 1.65
580Kuamoo Road : Forest Reserve Sign (end of urban boundary) > Beginning of the
ford crossing (end of 2 lane section) 6.46 6.68 6 Rural 0.22
581 Kukui Street/Olohena Road : Kuhio Highway (Route 56) > Kamalu Road (Route 581) 0.00 3.42 5 Urban 3.42
581 Kamalu Road : Olohena Road (Route 581)> Kuamoo Road (Route 580) 3.42 5.06 6 Urban 1.64
583Maalo Road : Kuhio Highway (Route 56) > Cane Haul Road/Quarry Road (end of
urban boundary)0.00 0.92 6 Urban 0.92
5010 Puhi Road : Kaumualii Highway (Route 50) > Kaneka Street 0.00 0.36 5 Urban 0.36
5010 Puhi Road : Kaneka Street > Hulemalu Street 0.36 1.00 6 Urban 0.64
5020 Rice Street : Kapule Highway (Route 51) > Kaumualii Highway (Route 50) 0.00 1.00 4 Urban 1.00
5030 Nuhou Street : Kaumualii Highway (Route 50) > Halehaka Road 0.00 1.30 5 Urban 1.30
5035 Kalepa Street : Kaumualii Highway (Route 50) > Pikake Street 0.00 0.43 5 Urban 0.43
5040 Haleko Road : Rice Street (Route 5020) > Nawiliwili Road (Route 58) 0.00 0.68 5 Urban 0.68
5710 Umi Street : Rice Street (Route 5020) > Ahukini Road (Route 570) 0.00 0.50 6 Urban 0.50
5720 Hardy Street : Kuhio Highway (Route 56) > Rice Street (Route 5020) 0.00 0.70 5 Urban 0.70
5730 Puaole Street : Umi Street (Route 5710) > Hoolako Street 0.00 0.80 6 Urban 0.80
5740 Laukona Street : Kuhio Highway (Route 56) > Laukona Street [loop] 0.00 1.05 6 Urban 1.05
5750 Hanamalu Road : Kuhio Highway (Route 56) > Hehi Road 0.00 0.30 6 Urban 0.30
5805 Ulu Street : Kuhio Highway (Route 56) > Kukui Street (Route 581) 0.00 0.20 6 Urban 0.20
5840 Haleilio Road : Kuhio Highway (Route 56) > Kaulana Road 0.00 1.25 6 Urban 1.25
5850 Nonou Road : Haleilio Road (Route 5840) > Lanakila Road 0.00 0.57 6 Urban 0.57
5860 Kawaihau Road : Kuhio Highway (Route 56) > Kapahi Road 0.00 3.00 5 Urban 3.00
5860 Kawaihau Road/Kaapuni Road : Kapahi Road > Olohena Road (Route 581) 3.00 4.78 6 Urban 1.78
5865 Hauaala Road : Kuhio Highway (Route 56) > Kawaihau Road (Route 5860) 0.00 1.06 6 Urban 1.06
5870 Mailihuna Road : Kuhio Highway (Route 56) > Kawaihau Road (Route 5860) 0.00 0.57 5 Urban 0.57
Source: Federal-Aid and State Highway Update: System Identification and Functional Classification (2013) 3


Appendix BPlan and Policy Review


TBG062714093019HNL 1
M E M O R A N D U M Statewide Federal-Aid Highways 2035 Transportation Plan and Regional Federal-Aid Highways 2035 Transportation Plans for the Districts of Maui, Hawaii, and Kauai
Plan, Policy, and Program Review (Federal and Statewide) TO: State of Hawaii Department of Transportation (HDOT) FROM: CH2M HILL DATE: February 11, 2013
Introduction The planning team reviewed federal and state policies, plans, and programs relevant to development of the Statewide Federal-Aid Highways 2035 Transportation Plan (Plan). These reviews captured major components related to and aligned with the federal planning factors defined in the United States Code (USC) and ensured the Plan addressed modes and users comprehensively.
In addition to federal and state guidance, regional and local plans and policies were also reviewed for the districts of Maui, Hawaii, and Kauai as part of the development of the Regional Federal-Aid Highways 2035 Transportation Plans for the Districts of Maui, Hawaii, and Kauai. Along with plan and policy reviews for the District of Oahu, these regional reviews were intended to ensure the statewide Plan considered regional policies. This comprehensive approach emphasized addressing community needs and values.
The following summary of federal and state plans, policies, and programs was an important first step to ensure that the Statewide Federal-Aid Highways 2035 Transportation Plan:
• Built effectively on previously adopted plans, policies, and programs • Complied with federal and state requirements, and considered local policies • Had guidance and structure for the development of potential solutions
The plan, policy, and program summaries helped to shape the Plan goals and the definition of potential solutions.
Federal Plans, Policies, and Programs Federal transportation policy and planning programs generally provide direction and funding mechanisms for statewide or regional plans or programs. Federal transportation planning policies are intentionally broad to allow states and regions the flexibility to tailor policy implementation that works for their geography and population.

PLAN, POLICY, AND PROGRAM REVIEW
TBG062714093019HNL 2
The following plans, policies and programs were examined:
• Moving Ahead for Progress in the 21st Century (MAP-21), Federal Transportation Bill
• USC, Title 23, Highways, Section 134, Metropolitan Transportation Planning
• USC, Title 23, Highways, Section 135, Statewide Transportation Planning
• Code of Federal Regulations (CFR), Title 23, Highways, Part 450, Subpart B, Statewide Transportation Planning
• National Response Framework, United States (US) Department of Homeland Security
• Bicycle Resolutions, 110th Congress US Conference of Mayors

PLAN, POLICY, AND PROGRAM REVIEW
TBG062714093019HNL 3
Moving Ahead for Progress in the 21st Century Purpose and Content MAP-21 is the current federal transportation legislation, adopted in July 2012. It is a long-term highway authorization act and guides transportation policy at the federal level. The act includes funding for fiscal years 2013 and 2014, and outlines national goals and transportation performance targets. MAP-21 also condenses and streamlines transportation funding programs from the previous 90 into roughly 30. The act builds on and refines many of the highway, transit, bike, and pedestrian programs and policies established in 1991.
MAP-21 represents a transition to a performance and outcome-based state highway program. Performance measures in MAP-21 provide guidance for states to most efficiently invest federal funds. These measures refocus investments to align with national transportation goals, increasing the accountability and transparency of the federal-aid highway program and improving project decision-making.
States shall establish performance targets in coordination with metropolitan planning organizations (MPOs) and public transit operators (in areas not represented by MPOs). States may also develop targets specific to urbanized areas or rural areas.
State and metropolitan plans, including long-range plans, must describe these performance measures and targets used to assess system performance. Plans must also include how program and project selection will help achieve targets, once they are set (expected in fall 2014) by the United States Department of Transportation. MAP-21 includes the following national performance goals for system management:
• Safety – significantly reduce traffic fatalities and serious injuries on all public roads
• Infrastructure Condition – maintain highway infrastructure assets in state of good repair
• Congestion Reduction – significantly reduce congestion on the National Highway System
• System Reliability – improve the efficiency of the surface transportation system
• Freight Movement and Economic Vitality – improve freight networks, strengthen the ability of rural communities to access national and international trade markets, and support regional economic development
• Environmental Sustainability – enhance transportation system performance while protecting and enhancing the natural environment
• Reduce Project Delivery Delays – reduce project costs, promote jobs and the economy, and expedite the movement of people and goods by accelerating project completion through eliminating delays in the project development and delivery process, including reducing regulatory burdens and improving agencies’ work practices.
MAP-21 changes the way program funding is distributed to individual states. Previously, core highway programs were able to distribute funds to states using different individual formulas. With new legislation, formulas have been eliminated and a lump sum has been authorized to fund the core programs including the National Highway Performance

PLAN, POLICY, AND PROGRAM REVIEW
TBG062714093019HNL 4
Program, the Surface Transportation Program, the Highway Safety Improvement Program including Rail-Highway Crossings, Congestion Mitigation and Air Quality Improvement Program, and Metropolitan Planning.
A lump sum is then distributed to states proportionally (based on 2012 distributions received under the Safe, Accountable, Flexible, Efficient Transportation Equity Act: A Legacy for Users). States are able to distribute funds internally (using MAP-21 guidance on the percentage distribution) to core programs. States also have the flexibility to transfer up to 50 percent of funds from one program to another (exceptions include no transfers of Metropolitan Planning funds or funds allocated to areas based on population) to make progress towards achieving performance target goals.
Findings Related to the Plan MAP-21 makes modifications to the statewide long range planning process. Related to the shift to performance and outcome-based planning:
• The statewide planning process will establish and use a performance-based approach to transportation decision making to support the national goals.
• Each state will establish performance targets that address the performance measures, where applicable, to use in tracking progress toward attainment of critical outcomes for the State.
• The state will select performance targets in coordination with the relevant MPOs to ensure consistency, to the maximum extent practicable.
• In urbanized areas not represented by an MPO, the state will select performance targets in coordination with the providers of public transportation, to the maximum extent practicable.
• States will integrate into the statewide transportation planning process other performance-based plans and processes.
• The Secretary of Transportation shall establish criteria for the evaluation of the new performance-based planning processes.
Related to statewide long-range plans:
• The long-range plan should include a description of the performance measures and targets used in assessing system performance.
• The long-range plan should include a system performance report and subsequent updates evaluating the condition and performance of the transportation system in relation to the performance targets.
The Statewide Federal-Aid Highways 2035 Transportation Plan will support and be aligned with the new performance-based guidance outlined in MAP-21.
The Statewide Federal-Aid Highways 2035 Transportation Plan is framed around eight federal planning factors: Environment and Sustainability, Modal Integration, System Preservation, Security, Economic Vitality, System Efficiency Management and Operations, Transportation Access Mobility, and Safety. These planning factors are related to and can be aligned with the new national performance goals established by MAP-21.

PLAN, POLICY, AND PROGRAM REVIEW
TBG062714093019HNL 5
Alignment with the Planning Factors MAP-21 is in alignment with the federal planning factors as shown in the table below. Certain national goals (such as Environmental Sustainability and Safety) can be aligned directly with existing planning factors, while the goal of System Reliability can be aligned with multiple planning factors.
The national goal of System Reliability aims to improve the general efficiency of the surface transportation system. Elements of the System Preservation, System Efficiency Management and Operations, and even Security planning factors would contribute to achievement of this national goal.
Federal Planning Factors MAP-21 Performance Goals
Environment and Sustainability - Develop solutions that meet transportation needs without compromising the ability of future generations to meet their own needs; develop solutions that promote energy conservation, improve the quality of life, and address climate change.
Environmental Sustainability – enhance transportation system performance while protecting and enhancing the environment
Modal Integration - Expand transportation options and make connections between modes such as public transit, automobile, bicycle, and pedestrian.
System Preservation - Maintain a regular schedule of rehabilitation, reconstruction, and replacement to keep the multimodal system operating safely and efficiently.
Infrastructure Condition – maintain highway infrastructure assets in state of good repair
System Reliability – Improve the efficiency of the surface transportation system
Security - Ensure the secure operation of the land transportation system by involving multiple agencies to work together to achieve common goals of risk management, incident detection, response, clearance, and preparation for and recovery from disasters.
System Reliability – Improve the efficiency of the surface transportation system
Economic Vitality - Support industry, tourism, cultural, and recreational opportunities by reducing travel time, operating costs, travel distance, crashes and logistics inefficiencies.
Freight Movement and Economic Vitality – Improve freight networks, strengthen the ability of rural communities to access national and international trade markets, and support regional economic development.
System Efficiency Management and Operations - Optimize the performance of existing infrastructure; provide reliability and predictability within the transportation system and between modal choices.
Congestion Reduction – reduce congestion on the National Highway System
System Reliability – Improve the efficiency of the surface transportation system
Transportation Access Mobility - Enhance both infrastructure and services to improve mobility, consistency, and equity.
Safety - Increase traveler safety through engineering, education, and enforcement programs and campaigns, and improve regulations and research efforts.
Safety – reduce fatalities and serious injuries on all public roads

PLAN, POLICY, AND PROGRAM REVIEW
TBG062714093019HNL 6
USC Title 23, Section 134, Metropolitan Transportation Planning Purpose and Content USC Section 134 defines the designation, authority and responsibilities of MPOs. The general requirements of an MPO include development and updates of long-range plans and transportation improvement programs within their defined boundaries as follows:
Long-range Plans • Shall provide for consideration of projects and strategies that will address the planning
factors.
• Shall provide for the development, integrated management and operation of transportation systems.
• Shall provide for consideration of all modes of transportation and shall be continuing, cooperative, and comprehensive to the degree appropriate.
• The plan and plan process shall include identification of multi modal transportation facilities, mitigation activities, financial plan, operational and management strategies, capital investment and other strategies, transportation and transit enhancement activities, consultation and participation by interested parties, methods and selection of projects.
Transportation Improvement Programs • Shall be developed in cooperation with the state and any affected public transportation
operator and shall provide opportunities for interested parties to participate in the development.
• Shall provide funding estimates that are reasonable to support implementation.
• Shall include a priority list of proposed federally supported projects and strategies.
• Shall include a financial plan.
• Shall include descriptions of each project.
• Shall have consistency with long-range transportation plans.
Metropolitan transportation planning policy as defined by Section 134 encompasses the following goals:
• Encourage and promote the safe and efficient management, operation, and development of surface transportation systems that will serve the mobility needs of people and freight and foster economic growth and development within and between states and urbanized areas, while minimizing transportation related fuel consumption and air pollution through metropolitan and statewide transportation planning processes.
• Encourage the continued improvement and evolution of the metropolitan and statewide transportation planning processes by metropolitan planning organizations, state departments of transportation and public transit operators as guided by the planning factors.

PLAN, POLICY, AND PROGRAM REVIEW
TBG062714093019HNL 7
Findings Related to the Plan The Statewide Federal-Aid Highways 2035 Transportation Plan will be developed in alignment with the federal regulations outlined in Section 134 of the USC and will coordinate statewide efforts with the Oahu MPO’s long-range planning efforts and TIP development.
Planning Factors USC Section 134 defines planning factors that are the framework for the long-range planning goals.
Planning Factors
Support the economic vitality of the metropolitan area, especially by enabling global competitiveness, productivity, and efficiency.
Increase the safety of the transportation system for motorized and nonmotorized users.
Increase the security of the transportation system for motorized and nonmotorized users.
Increase the accessibility and mobility of people and for freight.
Protect and enhance the environment, promote energy conservation, improve the quality of life, and promote consistency between transportation improvements and state and local planned growth and economic development patterns.
Enhance the integration and connectivity of the transportation system, across and between modes, for people and freight.
Promote efficient system management and operation.
Emphasize the preservation of the existing transportation system.

PLAN, POLICY, AND PROGRAM REVIEW
TBG062714093019HNL 8
USC Title 23, Section 135, Statewide Transportation Planning Purpose and Content USC Section 135 defines the responsibilities of the state and their requirements for statewide transportation planning. The general requirements of the state include development of a statewide transportation plan and statewide transportation improvement program for areas subject to USC Section 135 and nonmetropolitan areas within the state.
Statewide Long-range Plans • Shall provide for the development, integrated management and operation of
transportation systems.
• Shall consider all modes of transportation and shall be continuing, cooperative, and comprehensive to the degree appropriate.
• Shall be coordinated with plans and transportation improvement programs of MPOs as well as stakeholders and agencies with jurisdictions in nonmetropolitan areas.
• Shall provide for consideration of projects, strategies and services that will address the planning factors.
• The plan and plan process shall include a minimum 20-year forecast period, mitigation activities, financial plan, operational and management strategies, capital investment and other strategies, transportation enhancement activities, consultation, and participation by interested parties and methods.
• The statewide transportation plan should include capital, operations and management strategies, investments, procedures and other measures to ensure the preservation and most efficient use of the existing transportation system.
Statewide Transportation Improvement Programs • Shall be developed in cooperation with the MPOs as well as stakeholders and agencies
with jurisdictions in non-metropolitan areas and shall provide opportunities for interested parties to participate in the development.
• Shall include federally supported surface transportation expenditures.
• Shall include regionally significant and other projects.
• Shall have consistency with the statewide and MPO long-range transportation plans.
• Shall include projects only if full funding can reasonably be anticipated.
• Shall include a financial plan.
Findings Related to the Plan The Plan will be developed in alignment with the federal regulations outlined in USC Section 135 and will coordinate statewide efforts with the Oahu MPO’s long-range planning efforts and the counties.

PLAN, POLICY, AND PROGRAM REVIEW
TBG062714093019HNL 9
Planning Factors USC Section 135 defines planning factors that shall be the framework for the long-range planning goals:
Planning Factors
Support the economic vitality of the US, states, nonmetropolitan areas, and metropolitan areas, especially by enabling global competitiveness, productivity, and efficiency.
Increase the safety of the transportation system for motorized and nonmotorized users.
Increase the security of the transportation system for motorized and nonmotorized users.
Increase the accessibility and mobility of people and for freight.
Protect and enhance the environment, promote energy conservation, improve the quality of life, and promote consistency between transportation improvements and state and local planned growth and economic development patterns.
Enhance the integration and connectivity of the transportation system, across and between modes, for people and freight.
Promote efficient system management and operation.
Emphasize the preservation of the existing transportation system.

PLAN, POLICY, AND PROGRAM REVIEW
TBG062714093019HNL 10
23 CFR 450, Planning Assistance and Standards Purpose and Content The purpose of 23 CFR 450 is to define the implementation of USC 134 and 135.
Subpart B relates to the statewide transportation planning process:
• Shall, at a minimum, explicitly address noted factors, including transportation management system efficiencies and needs, energy use goals, water pollution/coastal zone requirements, intermodal transportation facilities, sub-area connectivity, recreation travel needs, congestion management, socioeconomic consistency and effects, transportation system preservation, financing mechanisms, lifecycle costs and investment strategies.
• Shall be done in cooperation with participating organizations (agencies and transportation operators), including coordination of: data and analyses, programs and priorities, multi-jurisdictional intermodal connections and land use/transportation planning and public involvement.
• Public involvement shall be explicit, proactive, and provide for early and continuous involvement. Periodic review of the effectiveness of the public involvement process shall be performed and necessary revisions made.
• The Statewide Transportation Plan shall be intermodal, cover at least a 20-year period, reference applicable planning studies/policies and be coordinated with MPOs, transportation agencies, operators, stakeholders and the public.
• The Statewide Transportation Improvement Program (STIP) shall include a list of priority projects for 3 years (MPO transportation improvement program priorities remain intact), projects beyond the 3 years will be considered informational only. The STIP shall be consistent with the statewide transportation plan. The STIP must be financially constrained by year and must be approved every 2 years.
Findings Related to the Plan The content of and process of developing the Statewide Federal-Aid Highways 2035 Transportation Plan will be implemented consistently with the federal regulations outlined in 23 CFR 450. A comprehensive approach and outreach effort will be performed to ensure alignment with these regulations.
Alignment with the Planning Factors 23 CFR 450 defines the implementation of the statewide and metropolitan planning processes which considers and addresses all of the planning factors.

PLAN, POLICY, AND PROGRAM REVIEW
TBG062714093019HNL 11
National Response Framework, US Department of Homeland Security, January 2008 Purpose and Content The National Response Framework (NRF) is a guide that details how the nation conducts all-hazards response at various scales of incidents. This document establishes a comprehensive, national, all-hazards approach to domestic incident response. The Framework identifies the key response principles, as well as the roles and structures that organize national response. It describes how communities, and various government and nongovernmental partners apply these principles for a coordinated, effective national response. In addition, it describes special circumstances where the federal government exercises a larger role, including incidents where federal interests are involved and catastrophic incidents where a state would require significant support. It lays the groundwork for first responders, decision-makers, and supporting entities to provide a unified national response.
Findings Related to the Plan To strengthen response actions, the NRF describes three key phases: prepare, respond, and recover. Transportation is a vital component for all phases. Considerations include planning for transportation needs of incidents, especially interdependencies between key locations (that is, operational headquarters, emergency evacuation shelters, hospitals), and the ability to mobilize, activate and demobilize resources.
Alignment with the Planning Factors The Security planning factor is in alignment with the overall framework of the NRF. Specifically, the alignment occurs with the establishment of processes, roles and responsibilities between multiple agencies working together to achieve transportation security, through preparation, response and recovery.

PLAN, POLICY, AND PROGRAM REVIEW
TBG062714093019HNL 12
Bicycle Resolutions, 110th Congress, US Conference of Mayors, June 2008 Purpose and Content The Congressional Resolution 305 and the US Conference of Mayors Resolutions in 2008 recognize that increased and safe bicycle use for transportation and recreation is in the national interest. They also support policies and programs that promote and protect bicycle use, and encourage the Department of Transportation and the Mayor’s offices to provide leadership and coordination to make communities bicycle-friendly.
Findings Related to the Plan The Congressional Resolution 305 support policies that:
• Establish national target levels for increased bicycle use, reduce the number of motor vehicle-miles traveled, improve bicycle safety to be achieved within a specific timeframe, and collect data needed to monitor progress.
• Increase intermodal travel between public transportation and bicycles.
• Provide incentives for state and local governments to adopt and implement complete street policies designed to accommodate all users, including motorists, pedestrians, bicyclists, transit riders, and people of all ages and abilities.
• Encourage bicycle use in communities where significant segments of the population do not drive and where short trips are most common.
• Expand funding for core federal transportation programs that support nonmotorized infrastructure, education, and encouragement programs by:
- Safeguarding existing funding sources for nonmotorized transportation from inequitable treatment in the federal transportation funds rescission process;
- Supporting funding for core federal transportation programs that support nonmotorized travel, including transportation enhancements, safe routes to school, and recreational trails; and
- Ensuring that highway safety improvement program funds are spent in proportion to the percentage of bicyclist and pedestrian fatalities in each state.
• Facilitate the development of a coordinated system of US bicycle routes across the country that cross state borders and connect metropolitan regions.
• Create bicycle-friendly federal land protection legislation, such as national recreation areas, to encourage regulations and management practices for mountain biking as an environmentally friendly nonmotorized use of natural surface trails.
• Provide flexibility in federal transportation law that would speed up the delivery of nonmotorized infrastructure without sacrificing necessary environmental protections.
• Provide federal tax or funding incentives to:

PLAN, POLICY, AND PROGRAM REVIEW
TBG062714093019HNL 13
- States that adopt motor vehicle laws that protect the rights of bicyclists to share the road.
- Businesses that expand bicycle-friendly programs for their employees.
- The health care industry to develop more member discount programs that target increased physical activity such as bicycling and walking.
- Provide bicycle commuters the transportation fringe benefits currently provided to people who commute by car or mass transit.
• Build upon the Green the Capitol Initiative as a model, create and provide an environmentally sustainable and healthy working environment for employees that includes the promotion of bicycling as a transportation alternative.
In addition to the policies supported by the Congress, the US Conference of Mayors also encourages the following actions to be taken:
• Even absent federal incentives, governors and state-level leadership should embrace Complete Streets policies that acknowledge the contributions of bicycles as a means to reduce vehicle miles by integrating bicycle use into standard street design;
• Calls on all mayors that sign onto the Climate Protection Agreement to develop and implement action plans to incorporate bicycling programs and policies as a key component in reducing greenhouse gas emissions 80 percent by 2050.
• Every mayor strives to make their city a bicycle-friendly community.
Alignment with the Planning Factors The resolutions align with the Environment planning factor through encouraging bicycle use, which promotes energy conservation and improves the quality of life. They also align with the Modal Integration planning factor by supporting increasing intermodal travel between public transportation and bicycles. In addition, the resolutions align with the Safety planning factor by improving safety conditions for bicyclists and monitoring the progress through data collection.

PLAN, POLICY, AND PROGRAM REVIEW
TBG062714093019HNL 14
Statewide Plans and Policies Statewide transportation policy and planning documents primarily address statewide transportation networks, and some cover all modes. Statewide plans and policies provide a general policy framework for transportation planning and direction for project and program implementation (including guidelines and standards) for Hawaii state roadway facilities. These plans and policies can also serve as examples for counties to develop their own policies, guidelines and standards.
The following plans and policies were examined:
• HRS 279A Statewide Transportation Planning
• Hawaii Statewide Transportation Plan (2011)
• Disability and Communication Access Board Policy
• Bike Plan Hawaii (2003)
• Statewide Pedestrian Master Plan (2013)
• Complete Streets Task Force (2010)
• Federal-Aid and State Highway Update: System Identification and Functional Classification (2013)
• Hawaii Strategic Highway Safety Plan 2007-2012
• State of Hawaii Multi-Hazard Mitigation Plan (2007)
• Coordinated Public Transit Human Services Transportation Plan (2008)
• State Comprehensive Outdoor Recreation Plan 2008 Update
• National Wildlife Refuges
• National Parks
• Department of Health, Active Living Workshops
• Hawaii 2050 Sustainability Plan (2008)
• Hawaii Tourism Authority Strategic Plan: 2010-2012
• Coastal Storms Program
• Coastal Zone Management Program
• Hawaii Department of Transportation Statewide Transportation Improvement Program (Current Update, Fiscal Year 2011-2014 +2)
• Report on the State of Physical Infrastructure in Hawaii (July 2010)

PLAN, POLICY, AND PROGRAM REVIEW
TBG062714093019HNL 15
HRS 279A, Statewide Transportation Planning Purpose and Content HRS 279A provides a means of coordinating the state’s existing responsibilities for inter-island and major highway transportation planning/development with counties’ responsibilities for intra-island surface transportation system planning/development, in order to facilitate the ultimate production of a statewide transportation plan which optimizes intra-island and inter-island system integration.
The statute establishes a comprehensive, multimodal statewide transportation planning process that involves all levels of government in a cooperative process to develop coordinated transportation plans.
The statute also establishes a Statewide Transportation Council and defines its roles and responsibilities.
Findings Related to the Plan The statute requires the statewide transportation plan to develop a balanced, multimodal statewide transportation system that serves clearly identified social, economic and environmental objectives. The plan shall include, but not be limited to national system of interstate and defense highways and highways within the state highway system, airports, harbors, mass transit systems and county roads, with particular attention made to the interfacing of the various modes of transportation. It also requires that a financial plan be included, identifying both state and county system elements, noting the level of state financial assistance for the county elements.
Briefings will be given to the Statewide Transportation Council at defined points within the project development process.
Alignment with the Planning Factors The HRS 279A requirements support enhancing the Integration and Connectivity of the transportation system between various travel modes for people and freight.
It also stresses a balanced system, in corresponding to support of the Environment and Economic Vitality planning factors.

PLAN, POLICY, AND PROGRAM REVIEW
TBG062714093019HNL 16
Hawaii Statewide Transportation Plan, HDOT, May 2011 Purpose and Content The Hawaii Statewide Transportation Plan (HSTP) links broad policy goals with specific action items. It provides the foundation that connects these action items with the transportation planning done at the statewide, regional and local levels. The HSTP is not a listing of specific transportation projects, but rather a policy document. Its main focus is to provide guidance to system level and master plans of the three primary modes of transportation used in Hawaii (the air, water, and land systems), as well as the nonmotorized modes and inter-modal connections. The plan provides the context for the development of transportation programs that, when implemented, will help achieve one or more of Hawaii’s transportation goals. It identifies transportation directions and the range of key elements to be considered in the development, management, and operation of Hawaii’s transportation systems. The primary purposes and utility of the HSTP are:
• Establish a framework for the development, integrated management and operation of Hawaii’s multimodal transportation systems, programs, and facilities.
• Provide a foundation and identify the parameters within which the search for solutions can begin.
Findings Related to the Plan The policy direction set by the HSTP requires alignment of the goals, objectives, programs and ultimately potential solutions of the plan. The plan needs to be consistent with the statewide policy level transportation decisions. Consistency with the HSTP will best achieve the transportation system’s overall mission. The HSTP goals and objectives (May 2011) related to land transportation are listed below.
Goals Objectives
GOAL 1: Mobility and Accessibility
Create and manage an integrated multimodal transportation system that provides mobility and accessibility for people and goods.
Objective 1:
Preserve and maintain the existing air, water and land transportation systems, including motorized and nonmotorized modes and measures in good condition or better, and give comparable consideration to funding preservation capital projects as is given to expansion projects.
Objective 2:
Ensure the provision of essential and critical air, land, and water transportation operations and services for all communities throughout the islands.
Objective 3:
Ensure multimodal and inter-modal connections for passengers and commodities on the air, land and water systems; and formulate a program of multimodal and inter-modal projects, including bicycle and walking options.
Objective 4:
Address the special needs of Hawaii’s underserved populations, including the elderly, disabled and Title VI/Environmental Justice (T6/EJ) populations.
Objective 5:
Reduce congestion in the air, water and land transportation systems.

PLAN, POLICY, AND PROGRAM REVIEW
TBG062714093019HNL 17
Goals Objectives
GOAL 2: Safety
Enhance the safety of the air, land and water transportation systems.
Objective 1:
Enhance system and user safety at transportation facilities both motorized and nonmotorized, with the use of proper equipment, technology and physical hazard reduction; and implement priority safety projects for each mode.
Objective 2:
Support and collaborate with all levels of government to identify transportation routes and protocols for the safe movement of hazardous materials.
Objective 3:
Continuously conduct assessment, preparedness, and emergency response for natural disasters as part of all planning efforts.
Objective 4:
Use and consider a full range of transportation design techniques to improve personal safety for all travelers.
GOAL 3: Security
Ensure the secure operation and use of the air, land and water transportation systems.
Objective 1:
Minimize risks of disruption of transportation to, from and within Hawaii due to terrorism and other human security threats and events, as well as threats and events from natural causes.
Objective 2:
Work with federal, state, and county agencies as well as tenants to conduct vulnerability and risk assessments.
Objective 3:
Implement security policies and strategies to minimize risks and threats of disruption of or damage to the transportation systems while maintaining the intended function of the system.
Objective 4:
Provide continuous monitoring of critical infrastructure and communications systems to provide for appropriate emergency response capability.
Objective 5:
Develop a biosecurity plan and measures to protect against pests and disease.
GOAL 4: Environment
Protect Hawaii’s unique environment and quality of life and mitigate any negative impacts.
Objective 1:
Ensure that the air, land, and water transportation systems respect environmental, natural, cultural and historic resources; and adopt guidelines to conserve natural resources and alleviate environmental degradation caused by motor vehicles.
Objective 2:
Implement sustainability and livability practices in existing and new facilities, with “sustainability” defined as: “Respect the culture, character, beauty, and history of our State’s island communities; strike a balance among economic, social, and community, and environmental priorities; and meet the needs of the present without compromising the ability of future generations to meet their own needs.”
Objective 3:
Assess sustainability and livability for air, land, and water transportation facilities and operation practices.
Objective 4:
Support the programs of state and federal natural resource agencies; and support ongoing lines of communication and coordination with these agencies.
Objective 5:

PLAN, POLICY, AND PROGRAM REVIEW
TBG062714093019HNL 18
Goals Objectives
Encourage transportation systems that improve the quality of life, public health, and welfare of Hawaii’s people, and that are consistent with land use plans.
Objective 6:
Assist with streamlining environmental process by identifying categories of environmental mitigation that include but are not limited to critical habitat, environmentally sensitive areas, noise, and pollution avoidance.
Objective 7:
Adapt to the effects of global climate change and build resilience in the transportation system. Address the effects of a one meter sea level rise and extreme weather events anticipated to occur during and by the end of the 21st century on Hawaii’s air, land and water transportation facilities and provide responses to this threat in modal facility plans.
Objective 8:
Prevent and minimize the transport of invasive species (pests and diseases).
GOAL 5: Economy
Ensure that the air, land and water transportation facility systems support Hawaii’s economy and future growth objectives.
Objective 1:
Support the multimodal transportation needs in the military, tourism, agriculture, health, education, energy, and technology sectors of Hawaii’s economy; and identify sector needs, current and projected, as they relate to movement of people and goods.
Objective 2:
Create a commodity flow and freight handling system that is dependable, efficient, economical, secure and rapid for connecting the ports, land transportation facilities, and industrial/commercial land use and storage areas.
Objective 3:
Provide reliability, dependability and redundancy for commerce in the import and export goods movement system including inspection facilities at ports; address actions for security of commerce.
Objective 4:
Create modern air, land and water transportation systems that are part of a positive visitor experience.
GOAL 6: Energy
Support the state energy goal of 70% clean energy, which includes 40% produced by renewable energy and 30% from increased energy efficiency, enhancing the reliability and security of energy sources.
Objective 1:
Support the national goal to reduce transportation-related greenhouse gas emissions and reliance on foreign oil.
Objective 2:
Actively pursue actions in transportation which help to achieve the State Clean Energy Goal of 40% renewable energy by 2030; and use integrated action plans from the Department of Business, Economic Development & Tourism’s Lead by Example Energy Initiatives with priority transportation actions that would support the Hawaii Clean Energy Initiative.
Objective 3:
Identify ways to increase energy efficiency by 30% at transportation facilities; and identify projects and programs for increased efficiency of energy in support of the Hawaii Clean Energy Initiative; Leadership in Energy and Environmental Design; and other green initiatives for more efficient use of energy.
Objective 4:
Expand the use of alternative fuel and electric vehicles; provide electric recharging at transportation facilities.
Objective 5:

PLAN, POLICY, AND PROGRAM REVIEW
TBG062714093019HNL 19
Goals Objectives
Use opportunities where and when practicable and available, to use solar (heating and photovoltaic), wind, geothermal and ocean resources to supply power to create electricity for transportation facilities.
GOAL 7: Funding
Create secure, flexible and sustainable revenues and funding sources for transportation needs.
Objective 1:
Develop a statewide framework for long-range financial forecasting; and within this framework, distinguish between system preservation, capacity enhancement, and modernization needs that are funded from user-financing (Harbors and Airports) and user-tax financing (Highways and Transit).
Objective 2:
Identify sources and develop and secure funding for the sustainable delivery, maintenance, operation, rehabilitation and replacement, and expansion of the state transportation systems.
Objective 3:
Ensure funding for the safety and security of the state transportation systems.
Objective 4:
Maximize the use of federal programs and funding for needed transportation infrastructure; use federal non-recurring initiatives and funding sources such as American Recovery and Reinvestment Act and report on project and program achievements.
Objective 5:
Study the reliability and viability of future transportation financing streams and funding and consider scenarios for innovative and nontraditional financing.
Objective 6:
Achieve project readiness in support of new funding sources as they become available; and report on achievements of project completion.
GOAL 8: Planning
Implement a statewide planning process that correlates land use and transportation while supporting decision-making and programming for Hawaii’s integrated, comprehensive, multimodal transportation systems.
Objective 1:
Achieve the federal requirements for a comprehensive, cooperative and continuing (3C) transportation planning process; and continue to improve efficient and effective planning.
Objective 2:
Maintain a dynamic planning process that ensures coordination and cooperation between the state, federal, counties, private sector, and general public.
Objective 3:
Incorporate new and evolving methods of public involvement, communication and social networking to keep others informed of transportation planning efforts, opportunities for participation in decision-making and programming; continue to regularly update the DOT Public Involvement Policy.
Objective 4:
Create and implement an Integrated Subregional Area Planning initiative that links strategic planning to project implementation for all modes through a visioning process; and seek funding to begin the Integrated Subregional Area Planning for one or more areas of critical state importance.
Objective 5:
Keep abreast of current and evolving programs and regulations that affect transportation in Hawaii.
Objective 6:
Seek wider application of geospatial technologies, further develop the land use database development, and integrate visioning in transportation planning.

PLAN, POLICY, AND PROGRAM REVIEW
TBG062714093019HNL 20
Goals Objectives
Objective 7:
Develop performance measures to manage strategic goals and assets and to assist with better decision-making, communication, transparency, and accountability to stakeholders.
Alignment with Planning Factors The HSTP was developed within the same planning framework as the Statewide Federal-Aid Highways 2035 Transportation Plan. The focus of the goals and objectives for the HSTP is at a higher/policy level considering the air/water/land transportation modes. The land transportation plans will be in alignment with the HSTP transportation policy goals and will focus specifically on land transportation issues and needs.

PLAN, POLICY, AND PROGRAM REVIEW
TBG062714093019HNL 21
Disability and Communication Access Board, State of Hawaii Department of Health Purpose and Content The Disability and Communication Access Board (DCAB) is established under the State Department of Health. They perform the following duties and functions:
• Establish guidelines for the design of buildings and facilities by or on behalf of the state and counties.
• Provide review and recommendations on all state and county plans for buildings and facilities.
• Establish guidelines for the use of communication access services provided for persons who are deaf, hard-of-hearing, or deaf-blind in state programs and activities.
• Administer the statewide program for parking for disabled persons.
• Serve as public advocate of persons with disabilities by providing advice and recommendations on matters relating to access for persons with disabilities, with emphasis on legislative matters, administrative rules, policies, and procedures of the state and county governments.
• Review and assess the problems and needs relating to access for persons with disabilities in the state to provide recommendations in the improvement of laws and services.
• Serve as the designated state agency to coordinate the efforts of the state to comply with the requirements of the Americans with Disabilities Act for access to services, employment, telecommunications, and facility and site design.
• Provide technical assistance and guidance to, but not limited to, state and county entities in order to meet the requirements of state, federal, and county laws providing for access for persons with disabilities through public education programs and other voluntary compliance efforts.
• Administer funds allocated for its work, including disbursement and allocation of funds that may be available from public and private sources.
Findings Related to the Plan Coordination with DCAB will occur throughout the development of the plan to address transportation needs and requirements of the disabled, compliance with Americans with Disabilities Act and address policy that prohibits discrimination on the basis of disability.
Alignment with the Planning Factors The function of DCAB aligns with the Accessibility and Mobility planning factor, by supporting the enhancement of both infrastructure and services to improve mobility and equity.

PLAN, POLICY, AND PROGRAM REVIEW
TBG062714093019HNL 22
Bike Plan Hawaii, HDOT, 2003 Purpose and Content: Bike Plan Hawaii is a tool to integrate bicycling into the state’s transportation system. The plan outlines how the state intends to accommodate and promote bicycling. It draws on a combination of existing and future bicycle facilities, policies, and programs to ensure a successful bicycle network. The purpose of the bike plan is to establish a long-term strategy for bicycle facility improvements, enable better coordination between transportation and land-use planning, increase the ability to leverage funds for bicycle facilities, and provide a mechanism to achieve community consensus.
Findings Related to the Plan Development of the Statewide Federal-Aid Highways 2035 Transportation Plan will take into account the objectives and goals of Bike Plan Hawaii, which include promoting bicycling as a convenient means of transportation by providing a safe, shared roadway system for all modes of travel.
Alignment with the Planning Factors Bike Plan Hawaii aligns with the Environment and Sustainability and Safety planning factors through promotion of sustainable transportation mode choices by requiring safe and efficient bike routes. It also aligns with the Modal Integration planning factor by encouraging appropriately designed, safe, shared roadways for motor vehicles and bicycles.
The bike plan also aligns with the Economic Vitality planning factor because it recommends bicycle tourism and the idea that safe bike paths on scenic byways should be promoted to visitors to Hawaii through the tourism authority.

PLAN, POLICY, AND PROGRAM REVIEW
TBG062714093019HNL 23
Statewide Pedestrian Master Plan, HDOT, 2013 Purpose and Content The Statewide Pedestrian Master Plan is a current effort being developed to increase pedestrian safety and mobility and reduce pedestrian-related traffic fatalities within the state transportation system. The plan will identify the most critical needs of our highway system, including safety improvements or repairs, and will develop projects and programs to address the problems. A priority list of projects and programs will be developed to provide guidance on the most efficient and effective use of resources.
Findings Related to the Plan The draft vision and goals for the Pedestrian Master Plan are listed below: Draft Vision Statement A vision statement describes the desired future condition—what will occur if implementation of the pedestrian master plan is effective and successful. A working vision is provided below. This vision will be further refined with additional input from HDOT and the advisory committees.
Hawaii’s integrated and balanced transportation system provides a strong pedestrian network that encourages walking to reduce environmental impacts, foster healthy lifestyles and sustainable communities, strengthen economic development, and conserve energy. More people are choosing to walk in Hawaii as a result of enhanced mobility, accessibility, safety, and connectivity throughout the transportation system.
Draft Goals to Support the Vision Draft goals have been developed to support the working vision. These goals relate to the Hawaii Statewide and Regional Long Range Land Transportation Plans. There are seven principal goals. In order to support Hawaii’s safe and integrated multi-modal transportation system:
1. Enhance overall pedestrian mobility and accessibility throughout Hawaii. 2. Improve pedestrian safety. 3. Increase pedestrian connectivity in communities and activity areas.
In order to protect and enhance Hawaii’s unique environment and quality of life:
4. Promote walking as an option for reducing environmental impacts. 5. Encourage walking to foster healthy lifestyles and sustainable communities.
In order to encourage the transportation system’s support of Hawaii’s economy and future growth objectives:
6. Support smart growth and economic development by creating vibrant, pedestrian-oriented communities and activity areas.

PLAN, POLICY, AND PROGRAM REVIEW
TBG062714093019HNL 24
In order to support the state’s energy efficiency goals:
7. Promote and support walking as a viable transportation mode and enhance access to transit to reduce overall energy use.
Alignment with the Planning Factors The Statewide Pedestrian Master Plan aligns with a number of the planning factors, including:
• Increasing Safety for nonmotorized users by enhancing overall pedestrian mobility and accessibility throughout Hawaii, improving pedestrian safety and increasing pedestrian connectivity in communities and activity areas.
• Increasing Accessibility and Mobility by enhancing overall pedestrian mobility and accessibility throughout Hawaii and increasing pedestrian access options in communities and activity areas.
• Enhancing the Environment by promoting walking as an option for reducing environmental impacts and encouraging walking to foster healthy lifestyles and sustainable communities.
• Enhancing Integration and Connectivity by enhancing overall pedestrian mobility and accessibility throughout Hawaii and increasing pedestrian connectivity in communities and activity areas.
• Supporting the Economic Vitality of the metropolitan area, especially by enabling global competitiveness, productivity, and efficiency by supporting smart growth and economic development by creating vibrant, pedestrian-oriented communities and activity areas.

PLAN, POLICY, AND PROGRAM REVIEW
TBG062714093019HNL 25
Complete Streets Task Force, HDOT, 2010 Purpose and Content Act 54, SLH 2009 requires the HDOT and the county transportation departments to adopt a Complete Streets policy and establish a temporary Complete Streets Task Force (CSTF) consisting of representatives from Hawaii’s transportation stakeholders. The Complete Streets policy seeks to reasonably accommodate convenient access and mobility for all users of the public highways, roadways, and streets statewide, including pedestrians, bicyclists, transit users, motorists, and persons of all ages and abilities while providing the safe and efficient movement of people and goods. The CSTF reviewed existing state and counties highways design standards and guidelines and made recommendations to the Complete Streets policy, Complete Streets framework, design standards, performance measures, implementation, and funding strategies. The Complete Streets Legislative Report, which documents the activities and recommendations of the CSTF, was submitted to the Legislature in November 2010.
Findings Related to the Plan The CSTF recommended that Complete Streets principles shall be considered on all planning efforts, as well as development, capital improvement, and maintenance projects.
The Complete Streets principles include:
• Safety – Plan, design, and construct transportation facilities and land developments to create an environment that reduces risk and supports the safe movement of people and goods by all modes.
• Flexible design (context-sensitive solutions) – Design transportation facilities using best practices that integrate community values and recognize the importance of the surrounding context and environment.
• Accessibility and mobility for all – Plan and design transportation facilities for ease of use and access to destinations by providing an appropriate path of travel for all users, and enhance the ability to move people and goods throughout the state and its counties.
• Use and comfort of all users – Ensure all users of all abilities including bicyclists, pedestrians, transit riders, and drivers feel comfortable and safe using the transportation system.
• Consistency of design standards and guidelines – Encourage consistent use of national best practices to generate consistency in the application of striping and pavement markings for all users on all islands. References of national best practices include the Manual on Uniform Traffic Control Devices and A Policy on Geometric Design of Highways and Streets (American Association of State Highway and Transportation Officials Green Book).
• Energy efficiency – Plan, design, and construct a transportation system that offers transportation choices for residents and visitors and reduces reliance on single-occupant vehicles to improve energy efficiency in travel, and mitigates vehicle emissions.
• Health – Recognize the health benefits in providing alternative mode choices, while acknowledging that some routes may be healthier than others.

PLAN, POLICY, AND PROGRAM REVIEW
TBG062714093019HNL 26
• Appropriate funding – Support a jurisdiction’s ability to secure funding for multimodal facilities and provide a framework to consider and pursue funding sources and opportunities.
• Building partnerships with organizations statewide – Build partnerships among the HDOT, the counties, other governmental agencies, and stakeholders to implement complete streets throughout the state.
• Green Infrastructure/Streets – Use trees and landscaping as integral components of a Complete Street to provide both human and ecosystem benefits, such as shade, to reduce the urban heat island effect, vegetation for carbon sequestration, reducing/filtering non-point-source pollution and sediments, retaining stormwater, increasing groundwater recharge, and providing wildlife habitat.
Alignment with the Planning Factors The Complete Streets policy will help to support the Economic Vitality, protect and enhance the Environment, as well as improve roadway Safety and increase Accessibility and Mobility for travelers.

PLAN, POLICY, AND PROGRAM REVIEW
TBG062714093019HNL 27
Federal-Aid and State Highway Update: System Identification and Functional Classification, HDOT, 2013 Purpose and Content The state highway system is an integrated network of federal-aid highways serving the land transportation needs of the State of Hawaii. The current functionally classified public roads was developed by HDOT and the counties (and concurred with) in 1993 by the Federal Highways Administration. Since then, each county has experienced substantial changes in population, density, land use boundary amendments, subdivisions, and resorts/commercial/industrial developments. Due to these changes, reevaluation and classifying of the entire state’s public roads will be conducted.
Existing conditions and facilities will be analyzed and will include a review of current system maps, policies, regulations, and requirements and an identification of system gaps. Analysis will include an identification of current urban boundaries and recommended adjustment to the boundaries given the development and density changes since the last plan update.
Findings Related to the Plan Needs and recommendations for revisions to the urban boundaries, federal aid system map and statewide highway system map will be developed and coordinated with plan development.
Alignment with the Planning Factors Proper classification of areas and roadways based on the character of intended service or function addresses the planning factors at all levels of projects (planning, design, and operations and maintenance).

PLAN, POLICY, AND PROGRAM REVIEW
TBG062714093019HNL 28
Hawaii Strategic Highway Safety Plan 2007-2012, HDOT Purpose and Content The Hawaii Strategic Highway Safety Plan 2007-2012 addresses issues related to improving traffic safety data collection, increasing traffic safety awareness, and other crucial traffic safety issues. The vision of the plan is to have Hawaii’s road users to arrive safely at their destinations. The goal of the plan is to reduce the number traffic-related fatalities from an average of 135 a year (from 2001 to 2005) to 100 or fewer by 2012. The safety plan identifies seven emphasis areas that are particularly pertinent and pressing in Hawaii, including: aggressive driving, impaired driving, occupant protection, pedestrians and bicyclists, motorcycle and moped safety, facility design (roadway and intersection operations), and data and safety management.
Findings Related to the Plan The Safety Plan provides a background of these seven issues and suggests key policy strategies that address these issues through legislation and funding, enforcement, data needs, transportation and land use planning, education and community action, and engineering strategies. Strategies related to the Statewide Federal-Aid Highways 2035 Transportation Plan are summarized below:
Curbing Aggressive Driving • Enact legislation that enables photo enforcement and earmarks traffic citation funding. • Apply Intelligent Transportation Systems to improve traffic flow, evaluate speed limits,
and conduct road safety audits. • Use crash data to identify high-risk areas/areas to focus resources.
Combating Impaired Driving • Enact legislation that obtains and reinvests dollars to support impaired driving
programs.
• Develop a standardized accident report form, coordinated data collection and accessible crash database.
Protecting Vehicle Occupants • Enact legislation that obtains and reinvests dollars to support impaired driving
programs.
Safeguarding Pedestrians and Bicyclists • Provide funding to address enforcement shortfall and increase enforcement. • Improve and standardize data related to use and accidents. • Update zoning codes, design standards. • Prioritize nonmotorized needs. • Provide infrastructure and coordination program support at the county level.

PLAN, POLICY, AND PROGRAM REVIEW
TBG062714093019HNL 29
Ensuring Motorcycle and Moped Safety • Increase funding for motorcycle/moped safety programs.
• Improve motorcycle crash data and use to identify high-risk areas/areas to focus resources.
Building Safer Roads by Design • Implement striping and signing management systems.
• Install more visible signs (letter size) and delineators, improve slopes/ditches and obstacles, create medians and add guardrails where needed.
• Develop streamlined process for delivery of local road projects.
• Implement road features/designs that reduce conflicts.
• Coordinate with Police to incorporate safe enforcement areas.
• Pursue projects on a priority basis where safety issues are known.
• Adopt rights of way and management policies that maintain clear zones as designed.
• Develop a coordinated transportation master plan that emphasizes safety and accommodates users.
Improving Data and Safety Management Systems • Establish leadership towards long-term commitment to improve data and management
systems.
• Assess existing data, needs, and linking/integration of data.
• Obtain funding needed to improve data, information flow, and create and maintain an effective safety management system.
Alignment with Planning Factors The Hawaii Strategic Highway Safety Plan supports the Safety planning factor through setting policy and developing strategies to increase the safety of the transportation system for both motorized and nonmotorized users.

PLAN, POLICY, AND PROGRAM REVIEW
TBG062714093019HNL 30
State of Hawaii Multi-Hazard Mitigation Plan, Hawaii State Civil Defense Agency, 2007 Purpose and Content The purpose of the State of Hawaii Multi-Hazard Mitigation Plan is to protect human lives and reduce or minimize property loss during a natural hazard. Planning for hazard mitigation can also minimize economic disruption (by reducing the immediate costs of response and recovery) and ecosystem degradation caused by a natural disaster.
This update to the 2004 multihazard mitigation plan is generally based on the four county mitigation plans, and includes input from several agencies on gaps realized and lessons learned from recent natural disaster events. The plan focuses on assessing risk of certain types of natural hazards in the state, and identifying potential mitigation strategies to address these risks. Mitigation strategies should be integrated with other community needs and goals, and could include physical measures (such as improving warning systems and building structures that withstand hurricane forces) as well as regulatory measures (such as creating land planning guidelines to restrict development in high-risk hazard areas).
Findings Related to the Plan Goals and objectives of the Multi-Hazard Mitigation Plan were developed by the state in order to provide a framework or foundation for developing mitigation strategies:
• Goal 1 - Protect life and ensure safety of people in Hawaii.
• Goal 2 - Develop and implement the Statewide Hazard Mitigation Plan based on a comprehensive multihazard risk and vulnerability assessment.
• Goal 3 - Ensure the protection of the state’s natural, built, historical, and cultural assets.
• Goal 4 – Ensure the long-term viability of the state’s economy and the livelihood of the local population.
• Goal 5 - Ensure public awareness of risks, vulnerability, and multihazard mitigation actions through public education.
Objectives of the plan include:
• Improve lifelines, infrastructure, ports of entry and critical facilities, and reduce vulnerability to hazards.
• Work with the counties to assist in improvements of building codes and building inventories and assessments.
• Encourage appropriate coastal-dependent development that reduces risks from coastal hazards at all stages of development.
• Encourage and support the adoption, enforcement, training in, and updating of building codes and standards that minimize the threat to life, health, and property damage caused by natural hazards.
• Encourage and support the adoption, implementation, and updating of plans (including land use, resource management, and other state and county plans) that incorporate
PLAN, POLICY, AND PROGRAM REVIEW
TBG062714093019HNL 31
natural hazard elements (including risk and vulnerability, hazard maps, hazard mitigation best practices and standards).
• Ensure adequacy of building codes and standards, land use regulations, and zoning standards.
• Develop reconstruction and rehabilitation plans to ensure rapid recovery from disasters.
Mitigation actions include ensuring that all lifeline infrastructures are able to withstand hazard events or have contingency plans to quickly recover after a disaster, and that all emergency response critical facilities and communication systems remain operational during hazard events. The long-range plan will be developed with consideration given to the above strategies.
Alignment with the Planning Factors The multihazard mitigation plan supports the planning factors by promoting Safety, and enhancing Transportation Access and Mobility and Security during a natural hazard event.

PLAN, POLICY, AND PROGRAM REVIEW
TBG062714093019HNL 32
Coordinated Public Transit Human Services Transportation Plan, Transportation for Elderly Persons and Persons with Disabilities, Jobs Access and Reverse Commute, New Freedom; HDOT; July 3, 2008 Purpose and Content The Coordinated Service Plan (CSP) investigated coordination of transportation services for persons with special needs (elderly, disabled, low-income). The plan assessed various government, private and nonprofit programs that provide transportation services and sets the foundation for coordination and integration of services to address gaps and minimize overlaps of service.
The mission of the plan is “to provide for the safe, economic, efficient and convenient movement of people and goods.”
Findings Related to the Plan The Federal Transit Authority 5310, 5316, and 5317 programs (Transportation for Elderly Persons and Persons with Disabilities, Job Access and Reverse Commute, and New Freedom) authorize formula assistance to states that address the needs of the elderly, those with disabilities, and welfare/low income individuals.
Goals and strategies developed in the CSP present potential actions for implementation:
• Goal 1: Achieve an integrated multimodal transportation system that provides mobility and accessibility for people and goods. Proposed public and coordinated human service transport strategies to meet this goal:
− Acquiring more vehicles − Centralized operations and facilities − Expansion of fixed and paratransit services and routes − Acquiring additional accessible taxis − Expansion of services − Mobility center − Scheduler
• Goal 2: Ensure the safety and security of the air, land, and water transportation systems. Proposed public and coordinated human service transport strategies to meet this goal:
− Centralized operations and facilities − Training − Education and marketing − Tracking system
• Goal 3: Protect and enhance Hawaii’s unique environment and improve the quality of life. Proposed public and coordinated human service transport strategies to meet this goal:
− Sustainable programmatic practices − Sustainable equipment and facilities

PLAN, POLICY, AND PROGRAM REVIEW
TBG062714093019HNL 33
• Goal 4: Support Hawaii’s economic vitality. Proposed public and coordinated human service transport strategies to meet this goal:
− Acquiring more vehicles − Centralized operations and facilities − Expansion of fixed and paratransit services and routes − More efficient funds collection − Expansion of services
• Goal 5: Implement a statewide planning process that is comprehensive, cooperative, and continuing. Proposed public and coordinated human service transport strategies to meet this goal:
− Continued communication − Creation of a work group
Alignment with Planning Factors The CSP aligns and is consistent with Hawaii Statewide Transportation Plan’s primary goals, objectives, and strategies.
Goals 1 through 4 align directly with the Accessibility and Mobility, Safety, Security, and Environment planning factors.

PLAN, POLICY, AND PROGRAM REVIEW
TBG062714093019HNL 34
State Comprehensive Outdoor Recreation Plan 2008 Update, State of Hawaii, Department of Land and Natural Resources, April 2009 Purpose and Content The State Comprehensive Outdoor Recreation Plan (SCORP) is required to be eligible for Land and Water Conservation Funds assistance with the acquisition and development of public lands for outdoor recreation. Hawaii’s SCORP serves as a tool for statewide outdoor recreation planning and action. It is intended to guide federal, state, county, and private agencies in Hawaii in the planning, development, and management of Hawaii’s outdoor recreation resources. The SCORP directs Land and Water Conservation Funds grant funding into facilities that best meet the public’s outdoor recreation needs, based on the priorities set during the plan development.
The plan outlines statewide trends, provides an inventory, and identifies jurisdictions that contribute to recreational facilities as well as contributing funding sources.
The SCORP’s identified priorities include:
• Protect natural and cultural resources. • Manage recreation resources and facilities. • Meet the needs of recreation users. • Provide access to recreation resources. • Seek funding.
Findings Related to the Plan The HDOT Highways Division is responsible for administering federal funds from the former SAFETEA-LU, which authorizes reimbursements to agencies for transportation related projects, including trails, bikeways and other facilities with recreation potential.
HDOT provides recreational opportunities by developing bikeways on state highways, beautifying major highways and providing scenic roadside lookouts.
Approximately 0.3 percent of the State Fuel Tax (up to $250,000) is deposited to the Special Land and Development Fund of the Department of Land and Natural Resources for the purposes of management, maintenance and development of Na Ala Hele trails and trail accesses.
The SCORP’s strategic plan proposes actions to address priority issues. Recommendations related to HDOT and the long-range plans include the following:
• Increase the number and range of resources and facilities to support expanded participation in walking, jogging, and bicycling as healthy activities and transportation by developing a comprehensive network of safe and well-maintained linear paths and lanes.
Actions:
- Support implementation of Bike Plan Hawaii and regional plans.

PLAN, POLICY, AND PROGRAM REVIEW
TBG062714093019HNL 35
- Develop networks of nonvehicular linear paths within urban and residential areas, linking communities.
- Improve sidewalks within neighborhoods by planting shade trees and installing lighting.
• Minimize conflicts between multiple activities and user groups competing for the same recreation resources, including conflicts between visitors and residents, between youth and adult leagues, or between various trail and ocean users.
Actions:
- Provide signage and other sources of information about user rights-of-way on multiuse trails.
• Improve access to shorelines and public forest areas by protecting existing accesses, creating new accesses, and reestablishing access to areas that are currently blocked or restricted by private landownership and/or development.
Actions:
- Provide directional and entry signage to public recreation areas.
• Provide an equitable distribution of recreation resources throughout the state.
Action:
- Develop trail networks that offer easy access from urban and suburban areas to rural areas.
• Explore nonrevenue sources for supporting acquisition, recreation programs, and maintenance of recreation resources.
Action:
- Request funds for bikeway development by aggressively seeking available funding for bikeway and greenway projects.
Alignment with Planning Factors The SCORP addresses a number of the planning factors, with a focus on nonmotorized modes. These include Connectivity of communities, increasing Safety, and enhancing the Environment and quality of life.
PLAN, POLICY, AND PROGRAM REVIEW
TBG062714093019HNL 36
National Wildlife Refuges, US Fish and Wildlife Service Purpose and Content The mission of the US Fish and Wildlife Service is “working to conserve, protect, and enhance fish, wildlife, and plants and their habitats for the continuing benefit of the American people.” There are nine refuges in the State of Hawaii:
• The Big Island (Hakalau) National Wildlife Refuge Complex consists of the Hakalau Forest Unit on the windward slope of Mauna Kea and the Kona Forest Unit on the western slope of Mauna Loa.
• The Kauai Complex includes Kilauea Point National Wildlife Refuge on the north side of the island, Hanalei National Wildlife Refuge in the Hanalei River Valley, and Huleia National Wildlife Refuge on the southeast side of Kauai.
• The Oahu Complex includes the James Campbell National Wildlife Refuge on the northeast shore of Oahu, the Oahu Forest National Wildlife Refuge on the upper slopes of the Koolau Mountains, and the Pearl Harbor National Wildlife Refuge in Pearl Harbor.
• The Kakahaia National Wildlife Refuge is on the south coast of Molokai.
• The Kealia Pond National Wildlife Refuge is along the south central coast of Maui.
Findings Related to the Plan • Each of the wildlife refuges conducts a multiyear planning process to develop a 15-year
Comprehensive Conservation Plan (CCP) and environmental assessment (EA) that will guide the management of fish, wildlife, plants, habitats and public uses. The goals and objectives, and ultimately projects stemming from the plan should be consistent with these initiatives.
• Hakalau has a Draft CCP and EA (August 2010). Discussion of the draft plan is in the Plan and Policy Review (Island of Hawaii).
• The Kauai Complex of national wildlife refuges has just begun their CCP/EA processes.
• The James Campbell and Pearl Harbor National Wildlife Refuges are approximately 2 years into the planning process. Discussion of the draft plans is in the Plan and Policy Review (Island of Oahu).
• The Kakahaia and Kealia Pond National Wildlife Refuges started their planning process in 2009. Discussion of the draft plans is in the Plan and Policy Review (islands of Maui/Molokai/Lanai).
Alignment with Planning Factors Consistency with the National Wildlife Refuge long-term plans supports the Environment and Sustainability of Hawaii’s natural habitats.

PLAN, POLICY, AND PROGRAM REVIEW
TBG062714093019HNL 37
National Parks, National Park Service Purpose and Content Since 1916, the American people have entrusted the National Park Service (NPS) with the care of their national parks. With the help of volunteers and park partners, the NPS safeguards nearly 400 places with more than 275 million visitors every year.
The NPS works with tribes, local governments, nonprofit organizations, businesses, and individual citizens in revitalizing their communities, preserving local history, celebrating local heritage, and creating close to home opportunities for kids and families to get outside, be active, and have fun.
Hawaii is home to eight national parks. The parks are famous for volcanoes, beautiful landscapes and complex ecosystems that offer unusual hiking and camping opportunities. Additionally, Hawaii national parks were established to preserve native activities, history and culture both ancient and modern.
• Hawaii: Ala Kahakai National Historic Trail, Hawaii Volcanoes National Park, Kaloko-Honokohau National Historical Park, Puuhonua O Honaunau National Historic Park, and the Puukohola Heiau National Historic Site
• Maui: Haleakala National Park
• Molokai: Kalaupapa National Historic Park
• Oahu: World War II Valor in the Pacific National Monument
Findings Related to the Plan The NPS is developing General Management Plans for Hawaii Volcanoes National Park, Kalaupapa National Historic Park and Haleakala National Park. The management plans will develop visions for the future of these national parks, and guide the management of the parks for the next 15 to 20 years. The goals and objectives, and ultimately projects stemming from the plan should be consistent with these initiatives.
The Ala Kahakai National Historic Trail has a completed Comprehensive Management Plan. Discussion of the plan is in the Plan and Policy Review (Island of Hawaii).
Alignment with Planning Factors Consistency with NPS long-term plans supports the Environment and Sustainability of Hawaii’s natural habitats, as well as the Economic Vitality of the State, through attraction and accommodation of visitors.

PLAN, POLICY, AND PROGRAM REVIEW
TBG062714093019HNL 38
Active Living Workshops, State of Hawaii, Department of Health Purpose and Content The Department of Health Healthy Hawaii Initiative conducted workshops around the state to promote active living. Active living communities are designed to provide opportunities for people of all abilities to engage in routine daily physical activity and have access to healthy and affordable foods. Active living is promoted by having bicycle- and pedestrian-friendly designs, mixed-use developments, recreational facilities and schools located in walkable neighborhoods.
The initiative partnered with the Safe Routes to School program to provide an integrated approach for safety, health and transportation efficiency.
Findings Related to the Plan The initiative is focused on getting more people physically active in safe environments and creating healthy environments and neighborhoods.
Alignment with Planning Factors The initiative focuses on increasing Safety for nonmotorized modes.

PLAN, POLICY, AND PROGRAM REVIEW
TBG062714093019HNL 39
Hawaii 2050 Sustainability Plan, State of Hawaii, 2008 Purpose and Content The Hawaii 2050 Sustainability Plan provides guidance to assure that the preferred future of Hawaii is met. Recognizing a growing number of pressing issues and the threat to the quality of life for the future generations, the development of a sustainability plan to address the vital needs of Hawaii is needed. The development of the plan was initiated by the Legislature and incorporated recommendations from a 25-member task force group. The plan identified five major goals to achieve the preferred future by 2050, outlined strategic actions to achieve the goals, and specified indicators to measure the performance.
Findings Related to the Plan Five major goals to achieve the preferred future of Hawaii by 2050 provide a framework for developing strategic actions. The five major goals are:
• Goal 1: A Way of Life – Living sustainably is part of daily practice in Hawaii.
• Goal 2: The Economy – Hawaii’s diversified and globally competitive economy enables citizens to meaningfully live, work, and play in Hawaii.
• Goal 3: Environment and Natural Resources – Natural resources are responsibly and respectfully used, replenished, and preserved for future generations.
• Goal 4: Community and Social Well Being – The Hawaiian community is strong, healthy, vibrant, and nurturing, striving to provide safety nets for those in need.
• Goal 5: Kanaka Maoli and Island Values – Kanaka Maoli and island cultures and values are thriving and perpetuated.
Alignment with Planning Factors The plan supports Economic Vitality and promotes protecting and enhancing the Environment in various ways. The plan also suggests increasing Accessibility and Mobility through increasing access to public transportation, encouraging telecommuting and increasing and improving bicycle and pedestrian facilities.

PLAN, POLICY, AND PROGRAM REVIEW
TBG062714093019HNL 40
Hawaii Tourism Authority Strategic Plan: 2010-2012, Hawaii Tourism Authority
Purpose and Content The Hawaii Tourism Authority Strategic Plan: 2005-2015 identifies a shared vision for Hawaii tourism in the year 2015 by Hawaii’s tourism stakeholders. It is intended to guide stakeholders in working together to attain the state’s vision that Hawaii is the best place to live, work, and visit. The plan stresses that a successful tourism industry depends on all government agencies, community organizations and industry groups.
A Strategic Plan: 2010-2012 was developed after the completion of the Strategic Plan: 2005-2015 in response to the economic crisis. Objectives and goals were identified for the short-term (2010) and long-term (2011-2012) implementation.
Findings Related to the Plan The plan recognized the importance of maintaining and improving transportation access, infrastructure and services, and identified strategic directions to support the air, land and sea transportation systems. Strategic directions to improve the land transportation system include:
• Updating and implementing highway master plans.
• Studying the impacts of increased cruise and ferry usage on traffic and roadway infrastructure.
• Monitoring resident sentiments and visitor satisfaction data.
• Conducting periodic traffic impact assessments, and ongoing and coordinated planning to make appropriate improvements.
• Encouraging collaboration between transportation providers and accommodations and attractions providers.
• Providing better informational and directional signage.
• Prioritizing and funding targeted road improvements and creatively exploring funding sources.
• Exploring alternatives means of ground transportation.
• Exploring federally funded programs.
The plan also encourages coordination, collaboration and improved ground transportation services including improving public transportation service between airports and hotels.
Alignment with Planning Factors The plan aligns with the Economic Vitality planning factor as the overall plan strategizes to support the tourism industry. The plan also supports improving Accessibility and Mobility and enhancing the Integration and Connectivity of the transportation systems, as well as promoting Safety for both visitors and residents, and protecting and enhancing the Environment.

PLAN, POLICY, AND PROGRAM REVIEW
TBG062714093019HNL 41
Coastal Storms Program, National Oceanic and Atmospheric Administration Purpose and Content The frequency and intensity of coastal storms are intended to increase, according to current predictions. With each storm, increasing water levels will allow storm surge to reach farther inland, leading to greater impacts and damage.
The Coastal Storms Program (CSP) is a networked program with partnerships between National Oceanic and Atmospheric Administration and other federal, state, and local organizations designed to increase the resiliency of coastal communities from coastal storm impacts. The CSP is intended to develop community risk and vulnerability assessments, improved weather forecasting, observations, increased integration of outreach and existing tools.
The Pacific Islands portion of the program is currently programmed for Fiscal Year 2010 funding. Specifically, the goals and objectives include promoting improved weather observations/predictions and communication to remote communities.
Findings Related to the Plan This section is not applicable because specific areas and products have not been completed.
Alignment with Planning Factors The initiative focuses on increasing Security and Safety for communities by preparing for the hazards associated with coastal storms, earthquakes and sea level rise impacts.

PLAN, POLICY, AND PROGRAM REVIEW
TBG062714093019HNL 42
Hawaii Coastal Zone Management Program, National Oceanic and Atmospheric Administration and Office of State Planning, 1990 Purpose and Content Coastal Zone Management (CZM) is about looking at coastal areas as an ecosystem that is an interrelated whole rather than at the individual species, resources, or uses. CZM is about balancing the needs of economic development and conservation of resources in a sustainable manner. The Hawaii CZM area encompasses the entire state. What occurs on land, even on the mountains, will impact and influence the quality of the coastal waters and marine resources.
Since approval of Hawaii’s program in 1977 (Chapter 205A, Hawaii Revised Statutes), this unique federal-state partnership has proven to be a strong basis for protecting, restoring and responsibly developing the state’s important and diverse coastal communities and resources.
Hawaii’s CZM Program was enacted to provide a common focus for state and county actions dealing with land and water uses. As the state’s resource management policy umbrella, it is the guiding perspective for the design and implementation of land and water uses and activities throughout the state. Within the scopes of their authorities, agencies must assure their statutes, ordinances, rules, and actions comply with the CZM objectives and policies.
Within a framework of cooperation among federal, state, and local levels, the Hawaii CZM Program employs a wide variety of regulatory and non-regulatory techniques to address coastal issues and uphold environmental law. Among them are stewardship, planning, permitting, education and outreach, technical assistance to local governments and permit applicants, policy development and implementation, and identification of emerging issues and exploration of solutions.
Findings Related to the Plan The CZM outlines requirements and responsibilities of various agencies to support interrelated objectives and policies including:
• Recreational and Historic Resources • Scenic and Open Space Resources • Coastal and Stream Ecosystems/Water Quality Management • Economic Uses • Coastal Hazards • Managing Development
Alignment with Planning Factors The CZM objectives and policies address enhancement of the Environment through resource, land, and water quality management. The CZM encourages Modal Integration and Economic Vitality by managing and protecting coastal resources and uses supporting community, tourism, and freight.

PLAN, POLICY, AND PROGRAM REVIEW
TBG062714093019HNL 43
Accessibility and Mobility are upheld for all modes of transportation through permitting and development review/management. Integration and Connectivity of modes are also stressed as the interrelation of all activities is the focus of the CZM.

PLAN, POLICY, AND PROGRAM REVIEW
TBG062714093019HNL 44
Hawaii Statewide Transportation Improvement Program, HDOT, Current Update, Fiscal Year 2011 to 2014 (+2) Purpose and Content The Hawaii Statewide Transportation Improvement Program (STIP) is a multimodal transportation program that provides a multiyear listing of state and county projects identified for federal or special funding. The STIP is developed based on existing transportation plans and policies, and current highway, transit and transportation planning processes. It is prepared by HDOT in cooperation with the Oahu Metropolitan Planning Organization, DOT Services, City and County of Honolulu, County of Hawaii, County of Maui, and County of Kauai. To qualify for funding, STIP projects must be consistent with each county’s long-range plan and/or the Statewide Transportation Plan. In addition, STIP projects can only be located on roadways functionally classified greater than collector roads, and local neighborhood roads are not eligible for STIP funding.
Currently, HDOT is in the process of updating the STIP for the next 4-year cycle. Priorities and needs, project readiness and eligibility, and public opinion of highway and transit projects statewide have been reviewed for inclusion in the next Federal Fiscal Year 2011-2014 (+2) STIP.
Findings Related to the Plan Review of the STIP will be important to understand existing planned improvements on state facilities, which will be considered as the future baseline transportation network.
Alignment with Planning Factors The STIP projects will allow for identification of spending allocations related to the planning factors based on planned project’s alignment with HDOT programs and funding categories.

PLAN, POLICY, AND PROGRAM REVIEW
TBG062714093019HNL 45
Report on the State of Physical Infrastructure in Hawaii, Hawaii Institute for Public Affairs, July 2010 Purpose and Content The purpose of this report is to provide substantive research, data and information on Hawaii’s statewide physical infrastructure needs. The report includes a consolidated statewide summary of state and county infrastructure projects planned over a 6-year period (2010-2015) and a summary of funding requirements to maintain and/or improve them. Based on available information, findings of the report focus primarily on capital improvements projects (CIP). The report also examines Hawaii’s infrastructure resiliency in the face of natural hazards.
This report is the first of two phases. Phase II will examine issues such as land use and funding policies that impact infrastructure development.
Findings Related to the Plan The report recognizes the importance and needs of the state transportation infrastructure. Review of the needs and planned efforts in the short-term will be important to help understand existing planned improvements and validate baseline transportation network. The potential impacts from natural hazards should also be considered.
Alignment with Planning Factors The report emphasizes the importance of the state transportation infrastructure and recognizes that the transportation system is vital to the state’s Economy. The report also raises awareness on increasing Security and Safety for communities by preparing for the natural hazards.

TBG062714093019HNL 1
M E M O R A N D U M Statewide Federal-Aid Highways 2035 Transportation Plan and Regional Federal-Aid Highways 2035 Transportation Plans for the Districts of Maui, Hawaii, and Kauai
Plan and Policy Review (District of Kauai) TO: State of Hawaii Department of Transportation (HDOT) FROM: CH2M HILL DATE: January 14, 2011
Introduction The planning team reviewed regional policies and plans relevant to development of the Statewide Federal-Aid Highways 2035 Transportation Plan and the Regional Federal-Aid Highways 2035 Transportation plans for the Districts of Maui, Hawaii, and Kauai.
This summary of regional plans and policies was an important first step to ensure that the statewide and regional federal-aid plans:
• Reflect consistency through alignment of goals and objectives • Build effectively on previously adopted plans and policies. • Comply with regional requirements. • Have guidance and structure for development of potential solutions.
The plan and policy summaries help to shape the goals for the statewide and regional transportation plans and the definition of potential solutions.
Regional Plans and Policies Regional plans and policies are more specific than federal or statewide plans and policies in that they address a smaller geography and define specific projects for specific island contexts.
The regional plans and policies are consistent with statewide policy; however, they do vary based on regional priorities. These regional plans will be used to help in the development of the Statewide Federal-Aid Highways 2035 Transportation Plan and the Regional Federal-Aid Highways 2035 Transportation Plan for the District of Kauai (Plan).
The following plans and policies were examined for the District of Kauai:
• Kauai County General Plan (2000) • Kauai Long-Range Land Transportation Plan (1997) • Kauai County Multi Hazard Mitigation Strategy (2003) • Kauai Multimodal Land Transportation Plan (2013)

PLAN AND POLICY REVIEW (DISTRICT OF KAUAI)
TBG062714093019HNL 2
• Kauai Energy Sustainability Plan (2010) • Lihue Town Core Urban Design Plan (2009) • Resolution No. 2010-48 Complete Streets Policy (2010) • Kauai Commercial Harbors 2025 Master Plan (2001) • Lihue Airport Master Plan Update (1989) • Port Allen Airport Master Plan Update (2001) • County of Kauai Capital Budget FY 2011

PLAN AND POLICY REVIEW (DISTRICT OF KAUAI)
TBG062714093019HNL 3
Kauai General Plan, County of Kauai, November 2000 Purpose and Content The Kauai General Plan (General Plan) provides guidance for land use regulations, the location and character of new developments and facilities and planning for county and state facilities and services. The General Plan sets the direction for the 20-year vision for the County of Kauai and sets policies to achieve the vision.
The vision for Kauai in 2020 is:
A “garden island” of unsurpassed natural beauty;
A rural environment of towns separated by broad open spaces;
A vital modern society formed by the people and traditions of many cultures;
An island of distinctly individual towns and communities, each with its own unique history and character;
A community which values its historic places and where people practice and draw strength from ancient languages and cultural traditions.
A rural place whose population size and economy have been shaped to sustain Kauai’s natural beauty, rural environment and lifestyle.
A community which cares for its land and waters, leading the way with best management practices in the development of roads and other public facilities and in its land development and environmental regulations.
An agricultural center, producing a wide range of crops, food, and forest products for local consumption and export.
A resort destination where visitors are welcomed, supported with adequate facilities, and provided with a variety of cultural and recreational opportunities.
A resort destination whose government and industry leaders respect the island’s residents and their need to have a community life where visitors are not always present and who find effective ways to protect residents’ customary use of special places for religious and cultural observances, fishing, gathering, hunting and recreation.
An island whose government supports the labor force and small business owners, firmly holding to essential policies and regulations while eliminating unnecessary red tape.
Findings Related to the Plan Policy related to the Kauai highway system includes:
• Use General Plan policies concerning rural character, preservation of historic and scenic resources, and scenic roadway corridors as part of the criteria for long-range highway planning and design. The goal of efficient movement of through traffic should be
PLAN AND POLICY REVIEW (DISTRICT OF KAUAI)
TBG062714093019HNL 4
weighed against community goals and policies relating to community character, livability, and natural beauty.
• Consider transportation alternatives to increasing the size and capacity of roadways. Alternatives include increased use of public transit.
• Planning for the Kapaa Bypass should incorporate connector roads between the Bypass and the coastal highway and between the Bypass and roads serving the valley.
• The state and the county should jointly undertake a study of the existing roadway network and the future transportation needs within the Kapaa-Wailua homesteads area.
• Reserve corridors for future roadways as shown on the General Plan land use map. The corridors are conceptual only and are subject to environmental assessment and evaluation of alternative alignments.
The recommended General Plan list of highway infrastructure improvements are listed below.
Area Improvement
Waimea to Port Allen Not applicable.
Port Allen to Poipu Construct new two-lane connector road between Port Allen and Poipu.
Poipu to Lihue Widen Kaumualii Highway to four lanes divided (Koloa Road and Kuhio/Rice intersection). Widen Koloa Bypass/Maluhia Road to four lanes.
Lihue Widen Kapule Highway to four lanes, divided. Construct two-lane Lihue-Hanamaulu bypass road.
Kapaa Construct a new four-lane Kapaa bypass road.
Kealia to Princeville Not applicable.
Policy related to Kauai transit system includes:
• Continue to operate The Kauai Bus; seek to increase ridership and expand service, subject to the availability of funds.
• Improve bus stops to increase safety and convenience of service.
The recommended General Plan list of transit improvements includes the following:
• Increased bus service in Koloa/Poipu.
• Increased paratransit service in various regions of the island.
• Improvements to pullover areas along roadways to create safe and accessible bus stops.
• Designate areas at housing projects (particularly those with elderly and disabled residents) that provide safe and accessible paratransit stops.
• Establish an airport stop.

PLAN AND POLICY REVIEW (DISTRICT OF KAUAI)
TBG062714093019HNL 5
Policy related to Kauai bicycle system includes supporting funding to develop Kauai’s bikeway system to provide for alternative means of transportation, recreation, and visitor activities (economic development).
The General Plan references the improvements recommended in Bike Plan Hawaii 1994. The Master Plan proposes the development of 173 new bikeway miles. Of the 173 proposed bikeway miles, there are 136.4 miles of bicycle routes, 8.2 miles of bicycle lanes, and 28.4 miles of bicycle paths. The proposed additions to Kauai’s bikeway system are estimated to cost a total of approximately $39.3 million. About 103.3 miles would be under the jurisdiction of the state at a cost of $22.5 million, and 63.1 miles would be under the jurisdiction of the County of Kauai at a cost of $15.2 million. Approximately 6.6 proposed bikeway miles could fall under either jurisdiction and would cost $1.6 million.
The Regional Federal-Aid Highways 2035 Transportation Plan for the District of Kauai shall take into consideration recommendations made by the General Plan. The travel demand model, land use, and stakeholder input will address appropriateness of the recommendations.
The County General Plan focuses on maintaining a balance between natural/ historic/ cultural contexts with business/tourism. The plan lays out policy to consider transportation solutions rather than increasing roadway facility size. This focus is a shift from the Kauai Long-Range Land Transportation Plan prepared in 1997, which had a major focus increasing vehicle capacity of the transportation system. The update of long-range land transportation plan will incorporate the desire for alternative transportation solutions such as support of transit operations.
Alignment with the Planning Factors The General Plan policies set the framework for a balanced transportation system. The goal of efficient movement of people and goods is to be weighed against context including preservation of culture, environment, and community. These policies address the trade-offs between Economic Vitality and Mobility versus the Environment. Integration and Connectivity through transit and bicycle (nonmotorized) improvements are also addressed in the General Plan policies.

PLAN AND POLICY REVIEW (DISTRICT OF KAUAI)
TBG062714093019HNL 6
Kauai Long-Range Land Transportation Plan, HDOT, May 1997 Purpose and Content The Kauai Long-Range Land Transportation Plan was developed in cooperation with the County of Kauai. It serves as a guide to major surface transportation facilities and programs to year 2020. The plan is intended to identify long-range strategies and actions, as well as short-range improvements that will lead to the development of a transportation system that facilitates the efficient movement of people and goods.
The plan contains a financial element that identifies both current and potential future sources of revenue that may be available for implementation of the plan. Overall, $408.7 million in the plan period was estimated for construction (does not include the costs for engineering studies and design, rights-of-way, relocation of utilities, or environmental mitigation measures).
The long-range land transportation plan was developed in accordance with requirements of the 1991 Inter-modal Surface Transportation Efficiency Act. The plan was developed under the auspices of the Countywide Transportation Planning Process, Kauai, to involve the appropriate parties and secure their commitment and support of the recommendations.
Findings Related to the Plan The recommended implementation plan is summarized below.
Area 1996-2000 2001-2005 2006-2020 2020+
Waimea to Port Allen
- - Widen Kaumualii Highway to four lanes Waimea – Eleele.
-
Port Allen to Poipu
- Widen Kaumualii Highway to four lanes Kalaheo and Koloa Road.
Construct new road between Port Allen and Poipu.
Conduct Port Allen/Kalaheo/ Poipu Circulation Study.
Widen Kaumualii to four lanes Port Allen – Kalaheo.
Poipu to Lihue
Widen Kaumualii Highway to four lanes Koloa Road and Kuhio/Rice intersection.
Construct Phase 1 of the Poipu/Nawiliwili connector road.
Construct Phase 2 of the Poipu/Nawiliwili connector road.
Widen east Koloa/Poipu bypass road to four lanes.
Widen Poipu Road to four lanes Lawai Road and east Koloa/Poipu bypass road.
-

PLAN AND POLICY REVIEW (DISTRICT OF KAUAI)
TBG062714093019HNL 7
Area 1996-2000 2001-2005 2006-2020 2020+
Lihue - Realign Ahukini Rd to four lanes Kuhio Highway/Kapule Highway.
Widen Kuhio Highway to four lanes Ehiku Street and Eha Street.
Widen Kapule Highway to four lanes Rice Street/Kuhio Highway.
Widen Haleko Road to four lanes Rice Street/Nawiliwili Road.
Construct Lihue/Hanamaulu mauka bypass and connector roads to Ehiku Street, Nawiliwili Road, and Nuhou Road.
Conduct Lihue Circulation/Access Study.
Conduct Lihue Airport and Nawiliwili Harbor Access studies.
Kapaa Widen Kuhio Highway to four lanes at Kapule Highway/ Mailihuna Road.
Construct two-lane Wailua/Kapaa bypass road.
Widen Kuamoo Road and Olohena Road to four lanes at Kuhio Highway/Kamalu Road.
Widen Kawaihau Road to four lanes at Kuhio Highway/Mailihuna Road.
Widen Wailua/Kapaa bypass road to four lanes.
Widen Kamalu Road to four lanes at Kuamoo Road/Olohena Rd
Widen Kuhio Highway to six lanes at Lihue/Hanamaulu bypass road and south terminus of Wailua/Kapaa bypass road.
Conduct Kapaa Circulation/Access Study.
Consider new road at Maalo Road and Kuamoo Road.
Kealia to Princeville
- - - Provide passing lanes, where feasible on Kuhio Highway, Kealia, and Princeville.
The Regional Federal-Aid Highways 2035 Transportation Plan for the District of Kauai shall take into consideration project recommendations. These recommendations, however, were developed over 10 years ago and will be vetted against current conditions and long-range priorities. The travel demand model, land use, and stakeholder input will address appropriateness of the remaining recommendations.
Alignment with the Planning Factors The project recommendations focused on Economic Vitality and Mobility by providing for the efficient movement of people and goods. The recommendations also provide for Connectivity between communities and provide alternative routes between major regional areas during road closures caused by natural disasters or accidents.

PLAN AND POLICY REVIEW (DISTRICT OF KAUAI)
TBG062714093019HNL 8
Kauai Multi-Hazard Mitigation Strategy, Kauai County Civil Defense Agency and County of Kauai, 2003 Purpose and Content The purpose of the Kauai County Multi-Hazard Mitigation Strategy is to identify potential natural hazards, assess the vulnerabilities of the island, and develop mitigation measures to reduce the risks of these hazards. The mitigation plan can also be used as an educational tool to inform the public of hazards, and to help public agencies identify and improve resource sharing (such as mapping).
Based on current data, the strategy identifies risks and hazards that could potentially cost the community in terms of funds, productivity, and personal hardship. Hurricanes and high winds have been identified as the greatest risks for the island of Kauai, with landslides, erosion, and stream flooding also posing serious hazards. Potential mitigation strategies to address these risks are consistent with hazard mitigation guidance in the Kauai County General Plan and include improving land use development policies in high-risk areas, improving coastal management, reviewing building codes and infrastructure development standards, and increasing public awareness of risks and recovery resources. Identified mitigation measures also focus on critical facilities and infrastructure that could result in the protection of life, property, and resources.
Findings Related to the Plan Critical facilities and infrastructure projects that are identified by the multihazard mitigation plan that could be applicable to the long-range transportation plan include the following:
• Wailua Bridge Bypass Road – Improve a section of road to allow traffic to flow one-way at a time to bypass Wailua Bridge. Improve sight distance. Route emergency traffic on unimproved by-pass roadway.
• Alternate routes around major highway bridges (Hanalei, Waimea, Hanapepe, etc.) – Acquire land to create alternative routes or by-pass roads around these bridges to assist in evacuation or aid emergency vehicles.
• Relocate Kapaa Fire Station – Relocate building out of the tsunami evacuation zone.
These facility projects should be considered during development of the Regional Federal-Aid Highways 2035 Transportation Plan for the District of Kauai.
Alignment with the Planning Factors The multihazard mitigation plan supports the planning factors by promoting Safety, encouraging a Sustainable Environment, and enhancing Transportation Access and Mobility, and Security during a natural hazard event.

PLAN AND POLICY REVIEW (DISTRICT OF KAUAI)
TBG062714093019HNL 9
Kauai Multimodal Land Transportation Plan, County of Kauai Planning Department, September 2012 Purpose and Content The Kauai Multimodal Land Transportation Plan is guided by the 2000 County General Plan and outlines steps the County will need to take to achieve a balanced multimodal transportation system by the year 2035. The multimodal plan provides an evaluation and assessment of existing operations, determination of current and future needs, and descriptions of potential solutions and recommendations to address identified needs.
The plan compares two future potential scenarios: a baseline scenario that shows where Kauai’s multimodal system would be in 2035, given current growth trends, and a preferred scenario that assumes growth in vehicular traffic has been prevented or controlled to remain at 2010 levels by 2035. The preferred scenario achieves objectives outlined in the 2000 County General Plan.
The multimodal plan includes six programs (transit, bicycle, pedestrian, county roads, agriculture transportation, and land use) by which the multimodal plan will be implemented.
Findings Related to the Plan Goals of the Kauai Multimodal Land Transportation Plan that relate to development of the Plan include:
• Goal 1: A balanced, multimodal transportation system that provides choice, flexibility and resiliency in personal access and circulation for all.
• Goal 2: A freight transport system that supports the island’s economic sectors, including food and agriculture, health and wellness, sports and recreation, arts and culture, science and technology, and sustainable technologies and practices.
• Goal 3: A transportation system that supports economic vitality and provides affordable access to jobs and economic opportunity.
• Goal 4: A transportation system that supports and enhances public health.
• Goal 5: A transportation system that will be planned and designed to protect and enhance the island’s natural landscapes and environmental quality.
• Goal 6: A transportation system that makes efficient use of energy and is less dependent on imported petroleum.
• Goal 7: A transportation system that is maintained in a state of good repair.
• Goal 8: A transportation system that protects and enhances the cultural values of Kauai, the rural character of the island, and a high quality of life.
Needs and recommendations in the Kauai Multimodal Land Transportation Plan will be reviewed and coordinated with the Regional Federal-Aid Highways 2035 Transportation Plan for the District of Kauai.

PLAN AND POLICY REVIEW (DISTRICT OF KAUAI)
TBG062714093019HNL 10
Alignment with the Planning Factors The development of the Kauai Multimodal Land Transportation Plan follows the same planning framework as the Regional Federal-Aid Highways 2035 Transportation Plan for the District of Kauai, and specifically aligns with the Environment and Sustainability, Modal Integration, Economic Vitality, Transportation Access Mobility, and Safety planning factors.
PLAN AND POLICY REVIEW (DISTRICT OF KAUAI)
TBG062714093019HNL 11
Kauai Energy Sustainability Plan, County of Kauai, 2010 Purpose and Content The purpose of the Kauai Energy Sustainability Plan is to ensure maximum energy efficiency and conservation while facilitating Kauai’s production and use of local, sustainable energy resources in place of imported oil by the year 2030. Based on inputs from the stakeholder group and the community, the plan established vision, goals and objectives, and outlined recommendations for different sectors. Considerations of other alternative energy were also discussed.
Findings Related to the Plan Recommendations for the land transportation sector include:
• Reduce consumption of fossil fuels through:
− Passing 2 percent fossil fuel tax − Improving Kauai Bus System − Offering hybrid electric vehicle incentives − Supporting “As Needed” visitor vehicle rentals
• Increase renewable fuel production/use through:
− Purchasing five vegetable-oil presses to allow small farmers to produce straight vegetable oil
− Offering incentives to convert gasoline vehicles to gasoline/ethanol flex fuel vehicles
• Increase renewable energy use for ground transportation through:
− Offering Plug-in Hybrid Electric Vehicle incentives and support night-time charging infrastructure
Alignment with the Planning Factors The Kauai Energy Sustainability Plan supports a Sustainable Environment as it encourages production and use of renewable energy in opposition to the consumption of fossil fuels.
PLAN AND POLICY REVIEW (DISTRICT OF KAUAI)
TBG062714093019HNL 12
Lihue Town Core Urban Design Plan, County of Kauai, June 2009 Purpose and Content The purpose of the Lihue Town Core Urban Design Plan is to:
• Implement the intent and purpose of elements within the Kauai General Plan Update 2000 regarding the Lihue Town Core area and the Lihue Town Core Urban Design Plan of 2009.
• Provide more up-to-date design standards from those enumerated in the Lihue Development Plan 1976 in recognition of more detailed planning goals and objectives for the Lihue Town Core Area.
• Establish Special Planning Areas, land uses, development standards, and design guidelines to guide and regulate future development.
• Protect certain physical characteristics found to be of particular public value, as provided in Kauai County Code Section 8-9.6, Special Planning Areas.
• Provide for regulations of land use and development practices within the Lihue Town Core area.
Findings Related to the Plan Goals and objectives of the Lihue Town Core Urban Design Plan that relate to development of the plan include:
• Aesthetic improvements and beautification:
− Beautify Lihue streets, walkways, and parks.
− Build upon landscape improvements along Ahukini Road and Kapule Highway.
− Develop beautification projects for each Lihue neighborhood including unique designs for crosswalks and landscaping.
• Historic preservation:
− Maintain and enhance historic resources.
− Explore connections between Lihue and the Harbor through old railroad alignment (bike path, pedestrian path, train).
• Business and community revitalization:
− Allow true mixed-use housing where people live above commercial uses.
• Transportation networks:
− Develop transportation networks that support multimodal choices.
− Create a safe, pedestrian-friendly environment that encourages walking.
− Provide convenient bicycle network and facilities.

PLAN AND POLICY REVIEW (DISTRICT OF KAUAI)
TBG062714093019HNL 13
− Address congestion; provide uncongested yet appropriate traffic flow and circulation based on context-sensitive design.
− Provide appropriate development of parking facilities that encourages the use of multimodal transportation options.
− Develop alternatives for through-traffic such as the Lihue Bypass and dedicated community transportation routes.
− Include enhanced links and connections to periphery areas such as Nawiliwili Harbor, Kukui Grove Shopping Center, and Lihue Airport.
− Consider pedestrian bridges across Nawiliwili Stream to connect central Lihue to the residential communities on Nawiliwili Road, as well as adding a pedestrian path on Kaumualii Highway to connect central Lihue to Kukui Grove.
• Environment and natural resources:
− Protect and enhance natural resources by reducing or mitigating pollution that enters streams.
− Develop catchment systems for irrigation water.
Alignment with the Planning Factors The Lihue Town Core Urban Design Plan supports a Sustainable Environment and encourages Economic Vitality, Modal Integration, and Connectivity through development of context-sensitive transportation facilities.

PLAN AND POLICY REVIEW (DISTRICT OF KAUAI)
TBG062714093019HNL 14
Resolution No. 2010-48, Draft 1: A Resolution Establishing a Complete Streets Policy for the County of Kauai, County of Kauai Council, Adopted September 15, 2010 Purpose and Content The Kauai County Council adopted a Complete Street Policy to:
• Promote safe access.
• Encourage multiple travel modes.
• Integrate travel modes.
• Encourage healthy lifestyles.
• Provide a complete and connected network for pedestrians, bicyclists, motorists, and public transportation.
The resolution was developed in response to ACT 54, a 2009 Legislative Act requiring counties to adopt a Complete Streets policy. The resolution was also developed to align with national engineering, planning and health organizations, numerous transportation agencies throughout the United States and the County General Plan.
Findings Related to the Plan The resolution states that all roadway projects be balanced and equitable in accommodating all modes of travel including nonmotorized users of all ages and abilities in accordance with Complete Streets principles. Priority shall also be given to pedestrian travel in town centers and other densely populated areas for any new county transportation improvement projects.
The resolution also identifies exemptions from application of Complete Streets principles which include ordinary maintenance activities, disproportionate costs, safety risks, significant impacts to resources, and locations that prohibit nonmotorized use.
Alignment with the Planning Factors The Complete Streets policy addresses many of the planning factors including increasing Safety, Accessibility, and Mobility for all modes of travel with proper planning and design for all modes. The Environment and Sustainability of the county will also be enhanced, as various modes of travel are encouraged.

PLAN AND POLICY REVIEW (DISTRICT OF KAUAI)
TBG062714093019HNL 15
Kauai Commercial Harbors 2025 Master Plan, HDOT Harbors Division, September 2001 Purpose and Content The Kauai Commercial Harbors 2025 Master Plan provides a general guide to help develop, maintain, and enhance the island’s commercial harbor system, as well as map out potential infrastructure that may be required by carriers of essential commodities. It is also meant to ensure that commercial harbor operations are efficient, accessible, economical, and safe. On the island of Kauai, Nawiliwili Harbor and Port Allen Harbor handle the majority of marine cargo and passenger operations.
Nawiliwili Harbor mainly serves the cruise industry. Plans for future growth include new piers and berthing facilities to handle additional industry growth and to accommodate the island’s growing economy. The additional piers are also expected to accommodate potential cargo activities. Port Allen Harbor is smaller than Nawiliwili Harbor and is proposed to have new piers and berthing facilities to accommodate future cargo, passenger, and military vessels. This increase in capacity is expected to permit growth of the ports maritime industries.
Findings Related to the Plan Primary objectives of the harbors master plan include:
• Plan both harbors properly to provide efficient facilitation of maritime shipments for the entire island.
• Optimize the use of land and water resources committed to marine cargo, passenger, and fishing operations in an economical manner.
• Provide terminals and other harbor resources and accesses within Nawiliwili Harbor and Port Allen Harbor in a manner that best serves Kauai’s port system.
• Minimize impact on environmental quality and recreational opportunities contiguous with Kauai’s port facilities.
Development of the harbors is intended to accommodate potential increases in ocean cruise vessels, as well as support anticipated growth on the island.
Recommended roadway projects to support growth and improvements at Nawiliwili Harbor include a series of new connector roadways. A new two-lane connector roadway between Poipu and Nawiliwili was referenced in the Kauai Long-Range Land Transportation Plan. Two phases of this new connector are planned, with completion by 2020. A new roadway between Nawiliwili and Nuhou Road is also recommended by the harbor master plan to provide a western connection to harbor property.
The Statewide Federal-Aid Highways 2035 Transportation Plan will take into account the roadway needs for the harbors on Kauai so that convenient access for people and vehicles is provided, and a safe, efficient roadway network is maintained for distribution of goods from the cargo ships to the people.
PLAN AND POLICY REVIEW (DISTRICT OF KAUAI)
TBG062714093019HNL 16
Alignment with the Planning Factors The Kauai Commercial Harbors 2025 Master Plan is aligned with many long-range planning factors. The roadway improvements and recommendations outlined in the harbor plan support the Modal Integration planning factor by encouraging efficient transition between maritime and land transportation modes. It also aligns with the Economic Vitality planning factor as it embraces the potential increase in tourism through the cruise industry.

PLAN AND POLICY REVIEW (DISTRICT OF KAUAI)
TBG062714093019HNL 17
Lihue Airport Master Plan Update, HDOT Airports Division, October 1989 Purpose and Content The Lihue Airport Master Plan is part of an ongoing planning process for the airport that builds upon previously prepared airport master plans and development plans. Its purpose is to update guidelines for future airport development which will satisfy forecast aviation demand in a financially feasible manner, while addressing the community’s environmental and socioeconomic issues and concerns. The master plan is based on a 20-year planning horizon subject to updates after 5 to 10 years. This master plan was adopted in 1989 with a planning horizon of 2005.
The objectives of the master plan are to provide the following for public consideration:
• A graphic presentation of future airport development within the context of current and anticipated land uses in the airport vicinity.
• A prioritized capital improvement program and financially feasible schedule for developments proposed in the plan.
• The technical rationale and documentation of procedures used to formulate and assess alternatives in determining the proposed facilities and land use plan.
• Reaffirmation of the ongoing master planning process for the airport, including the valued input of airport users, federal, state and local agencies, and the community.
Findings Related to the Plan Annual passengers and cargo demand at Lihue is shown below.
1986 Actual 2005 Forecast
Passengers 2,541,089 4,430,000
Cargo 12,354 20,400
Aircraft Operations 143,905 193,000
Based Aircraft 35 57
To accommodate these projected demands, recommended improvements integrate long-term airfield and terminal area requirements with current and forecast aviation needs and airport access and parking needs. It provides a guide for airport development through the year 2005 and indicates possible developments beyond the planning horizon for which land should be reserved. Estimated project costs are shown in 1988 dollars.
Phase I projects are to be initiated by 1991. Phase I contains improvements related to airfield, terminal, general utilities/infrastructure, ground access and navigational needs. Land acquisition is also incorporated into Phase I. To support operations and access to/from the airport, Phase I includes parking for commuter and cargo facilities.

PLAN AND POLICY REVIEW (DISTRICT OF KAUAI)
TBG062714093019HNL 18
Improvements to internal airport access roads and the secondary airport access near the post office are also part of this phase. ($24.3 million)
Phase II projects are to be initiated by 1996. The Phase II improvements focus on additional apron, terminal and utilities/infrastructure needs. Improvements to the Ahukini Road access would occur during Phase II including realignment and illumination. ($16.7 million)
Phase III projects are to be initiated by 2005. Phase III improvements focus on additional apron, terminal and utilities/infrastructure needs. A new air-traffic control tower and aircraft rescue and firefighting building would also be included to service the improved airport facilities. To support ground access, improvements to internal access roads would occur as well as construction of a new access road to the new control tower and fire rescue facilities. ($15.7 million)
Alignment with the Planning Factors Lihue Airport improvements in general address the Economic Vitality of the state by expanding the facility to accommodate additional passengers, cargo, and overseas flights.
Improvements related to ground transportation access and ground transportation facilities acknowledge the Accessibility and Mobility planning factors and are mainly focused on vehicular access.

PLAN AND POLICY REVIEW (DISTRICT OF KAUAI)
TBG062714093019HNL 19
Port Allen Airport, Master Plan Update, HDOT Airports Division, August 2001 Purpose and Content The purpose of the Port Allen Airport Master Plan Update is to provide a plan for proposed airport improvements and to consolidate the appropriate elements of previous planning efforts. The proposed improvements are intended to provide more efficient and safer aircraft operations and allow helicopter operations and maintenance at the airport; create an aviation environment to accommodate existing and forecast aviation demand; and provide airport infrastructure to accommodate and encourage aviation in West Kauai. The proposed improvements will also provide the capability to allow emergency aviation activities to be conducted at night and enhance safety during low-visibility daylight conditions. The Master Plan Update is also intended to satisfy the requirements of Section 261-13.6, Hawaii Revised Statutes for a Helicopter Master Plan. This master plan was adopted in 2001 with a planning horizon of 2020.
Findings Related to the Plan Annual demand at the Port Allen Airport is shown below.
1998 Actual 1999 Actual 2020 Forecast
Aircraft Operations 6,324 5,892 8,900
Based Aircraft 5 5 9
To accommodate these projected demands, recommended improvements through the year 2020 include improvements for helicopter and plane parking, runway lighting, and parking/access road improvements. Associated infrastructure and utility improvements to support these projects would also be provided. Estimated project costs are $568,000.
Alignment with the Planning Factors Port Allen Airport improvements in general address the Safety of air operations in the region by providing helicopter and small plane parking, pads, and hangars. Safety is also improved with provision of runway lighting that allow nighttime air rescue operations to occur.
Improvements related to ground transportation access and ground transportation facilities acknowledge the Accessibility and Mobility planning factors, and are mainly focused on vehicular and adjacent shoreline access.

PLAN AND POLICY REVIEW (DISTRICT OF KAUAI)
TBG062714093019HNL 20
Capital Budget, County of Kauai, Fiscal Year July 1, 2010 to June 30, 2011 Purpose and Content The capital budget provides a listing of projects and services for the County of Kauai for the Fiscal Year 2011. It includes estimated costs and identified sources of funds.
Findings Related to the Plan Review of the capital budget and programs will be important to understand existing planned transportation improvements on state facilities, which could be considered as the future baseline transportation network.
Alignment with Planning Factors The capital program projects will allow for identification of spending allocations related to the planning factors based on planned project’s alignment with HDOT programs and funding categories.


Appendix CGoals, Objectives, and Strategies


M E M O R A N D U M Statewide Federal-Aid Highways 2035 Transportation Plan and Regional Federal-Aid Highways 2035 Transportation Plans for the Districts of Maui, Hawaii, and Kauai
Final Goals, Objectives, and Strategies PREPARED FOR: State of Hawaii Department of Transportation (HDOT) PREPARED BY: CH2M HILL DATE: November 29, 2012 This memorandum presents goals, objectives, and strategies for the Statewide Federal-Aid Highways 2035 Transportation Plan and the Regional Federal-Aid Highways 2035 Transportation Plans for the Districts of Maui, Hawaii, and Kauai. Goals, objectives, and strategies are organized by eight federal planning factors (plus an additional category for the purposes of the statewide and regional federal-aid plans), which include:
1. Environment and Sustainability 2. Modal Integration 3. System Preservation 4. Security 5. Economic Vitality 6. System Efficiency Management and Operations 7. Transportation Access Mobility 8. Safety 9. Additional Goals, Objectives, and Strategies
The planning factors and associated goals, objectives, and strategies are not listed in priority order. Priorities will be developed in a subsequent task in the development of the statewide and regional federal-aid transportation plans.
Goals, objectives, and strategies of the plans are aligned with existing federal, state and local regulatory and policy requirements and the mission of HDOT. The goals, objectives, and strategies were developed and refined with input from appropriate stakeholders to develop these final statements applicable to the statewide plan and each of the regional plans. Specific objectives, strategies and priorities associated with these goals may vary between regions; however, the overarching goals of the statewide and regional plans will be consistent.
Goals, objectives, and strategies aligned with each of the federal planning factors are outlined below.
HDOT Highways Mission: To provide a safe, and efficient and accessible highway system through utilization of available resources in the maintenance, enhancement and support of land
transportation facilities.
TBG062714093019HNL 1

FINAL GOALS AND OBJECTIVES
1. Environment and Sustainability By developing transportation solutions that are sustainable and environmentally friendly, not only can the needs of the current users be met, but future generations will also have the ability to meet their own needs. Solutions can generally be focused on promoting energy conservation, slowing the pace of climate change, and improving quality of life.
Environment and Sustainability Goals Objectives Strategies
1.1. Preserve and enhance the natural environment, including biological and aesthetic resources.
• Avoid, minimize, and provide reasonable measures to mitigate degradation of the natural environment caused by transportation facilities and operations.
• Construct and maintain a transportation system that complements scenic corridors and protected views.
• Provide transportation facilities that complement the natural environment and enhance quality of life.
• Review environmental assessments to identify potential degradation of the natural environment caused by transportation facilities and operations.
• Create categories of environmental mitigation to protect habitat and ecologically sensitive areas from potential impacts of transportation facilities and operations.
• Develop and maintain landscape plans that preserve the scenic environment.
• Improve the aesthetic quality of gateway roads.
• Provide educational interpretive sites regarding preserving and enhancing the natural environment for public viewing at scenic pull-offs, and park and rides.
1.2. Preserve and enhance Hawaii’s cultural resources environment, including archaeological and historical sites.
• Avoid, minimize, and provide reasonable measures to mitigate degradation of Hawaii’s cultural resources environment caused by transportation facilities and operations.
• Review environmental assessments to identify potential degradation of cultural resources caused by transportation facilities and operations.
• Create categories of environmental mitigation to protect culturally sensitive areas from potential impacts of transportation facilities and operations.
• Develop a formal consultation process with Native Hawaiian Organizations.
• Develop consistent and comprehensive processes for addressing cultural, natural, and historic resources.
• Coordinate transportation corridor and public safety needs with the preservation of historical and cultural features.
TBG062714093019HNL 2

FINAL GOALS AND OBJECTIVES
Environment and Sustainability Goals Objectives Strategies
1.3. Meet the relevant environmental regulations and standards set by federal, state, and county/city agencies. Maintain collaborative working relationships with agencies and comply with goals of their relevant plans and policies.
• Develop transportation solutions that support federal, state, and regional natural resource agency programs.
• Create transportation system solutions that meet all aesthetic, noise, air, and water quality standards.
• Periodically evaluate environmental regulation compliance, evaluate compliance goals, and prioritize improvements needed.
• Consult and collaborate with regulatory agencies to implement solutions.
1.4. Promote the use of sustainable practices in designing, constructing, operating, and maintaining transportation facilities and programs.
• Develop land use and transportation infrastructure that are coordinated and compatible to promote sustainable growth and mobility.
• Implement sustainability and livability practices in existing and new transportation facilities.
• Create transportation solutions that promote the balance of a strong diversified economy, a clean and aesthetic environment, and a healthy quality of life.
• Encourage road users to reduce impact to the environment.
• Promote the use of sustainable and renewable energy sources. Support solutions that will contribute towards achieving the State Clean Energy Goal.
• Create transportation facilities that support an increase in energy efficiency. Create projects and programs and ‘green’ initiatives to promote more efficient use of energy.
• Reserve and/or develop right-of-way width for build-out conditions of multimodal transportation facilities, and utilities.
• Develop cost effective, clean, and green alternative materials used in infrastructure.
• Use tax incentives and public acknowledgement as means to reward road users for using less fuel, producing less pollution, providing facilities for bicyclists and pedestrians.
• Develop an evaluation tool for measuring sustainability over the lifecycle of a transportation project or program.
• Use integrated action plans from the Department of Business, Economic Development & Tourism’s Lead by Example Energy Initiatives to support the Hawaii Clean Energy Initiative goal of 40 percent renewable energy by 2030.
• Provide conveniently located and an adequate number of alternative energy fueling/recharging stations.
• Pursue opportunities for developing underground utility corridors, and integrating them as separate pedestrian/bicycle paths.
1.5. Promote long-term resiliency relative to all hazards mitigation, namely global climate change, with considerations to reducing contributions to climate change from transportation facilities, and reducing the future impacts of climate change on the transportation system.
• Acknowledge that climate change will impact portions of our existing transportation infrastructure and address the potential effect of sea level rise and extreme weather changes on Hawaii’s transportation facilities.
• Orient transportation planning to incorporate strategies for adapting to climate change, including; sea-level rise, extreme weather events, energy costs, and energy supply disruption.
• Clearly identify shoreline areas affected by climate change and develop plan to preserve or relocate at-risk transportation facilities and avoid new construction in affected zones. Utilize climate change and sea level rise data consistent with State of Hawaii current policy (which forecasts a 1-meter rise by the end of the 21st century).
TBG062714093019HNL 3

FINAL GOALS AND OBJECTIVES
2. Modal Integration Increasing the availability of various transportation mode choices and providing efficient and attractive connections between modes expands transportation choices within the overall system. Access to and between air/sea transport modes, motorized modes (such as public transit and automobile traffic) and non-motorized modes (bicycle and pedestrian) should be integrated to provide seamless modal connections. Applying Complete Streets principles achieves modal integration.
Modal Integration Goals Objectives Strategies
2.1. Provide a Complete Streets transportation system of motorized and non-motorized options.
• Create transportation facilities that support all modes of travel that result in a well-connected systemwide network for travel between transport modes and between communities.
• Promote education and understanding of the benefits of bicycling and walking and laws applicable to each group.
• Coordinate modal plans for motorized, pedestrian, bicycle, and transit modes so that uses of these interconnected systems complement each other.
• Include specific training in drivers’ education courses.
• Include more questions about bicycle and pedestrian laws in the written driver’s license exam.
• Provide transit, bike ride, and walking opportunities for transportation professionals and decision-makers so they can better understand the concerns of transit riders, bicyclists, and pedestrians.
• Support programs and agencies that provide bike/pedestrian safety educational materials and courses (emphasize outreach efforts on high-risk populations such as children and the elderly).
2.2. Promote efficient travel between modes by creating connections and removing barriers.
• Promote design and development of complete, integrated multimodal street systems for all users (including freight, motorists, pedestrians, bicycles, transit, etc.) of all ages and abilities.
• Encourage transportation infrastructure and transportation service concurrency with land development.
• Provide funding mechanisms and explore alternatives to implement multimodal facility development.
• Improve agency coordination to provide practical, seamless, and safe facilities for connections between modes.
• Design transportation solutions that address issues of distance, safety, and ease of access between bus stops, non-motorized amenities, and land uses. Highlight transit and non-motorized modes as affordable, attractive, simple, and desirable options for travel.
• Promote development of park and ride stations at population centers, urban area perimeters, and bypass road intersections.
TBG062714093019HNL 4

FINAL GOALS AND OBJECTIVES
Modal Integration Goals Objectives Strategies
2.3. Promote safe connections between modal alternatives.
• Provide transportation modal options and connections that address safety considerations of all users, especially at-risk population segments (children, elderly, disabled).
• Update street design standards to support best practices for pedestrian and bicycle facilities and safety.
• Coordinate with agencies that support vulnerable populations to better understand concerns of transit riders, bicyclists, and pedestrians.
3. System Preservation A programmed schedule for regular maintenance, rehabilitation, reconstruction, and replacement of transportation facilities is integral to keep the overall transportation system operating safely and efficiently. Planned assessments, maintenance, and rehabilitation should include surveys of multimodal options.
System Preservation Goals Objectives Strategies
3.1. Manage transportation assets and optimize investments.
• Plan and implement maintenance, resurfacing, rehabilitation, and reconstruction to optimize existing transportation system improvements and spending.
• Maintain inventory of all transportation assets. Include information on current condition of assets. Maintain systems to monitor and evaluate infrastructure changes so they match regular planning investment cycles.
• Identify variations in cost for periodic maintenance versus total replacement of facilities to help prioritize projects. Consider total lifecycle costs.
• Improve use of technology to protect and preserve existing infrastructure.
• Support a strong policy of size and weight enforcement, including innovative technologies to protect and preserve the existing infrastructure.
TBG062714093019HNL 5

FINAL GOALS AND OBJECTIVES
System Preservation Goals Objectives Strategies
3.2. Maintain safe, efficient, complete transportation system for the long term.
• Plan and implement existing system improvements to effectively sustain the overall transportation system’s safe, efficient, and complete operations.
• Maintain a schedule for maintenance, replacement, and reconstruction using asset inventory information.
• Maintain and/or upgrade critical routes (i.e., routes serving as single access to communities with inadequate size/load capacity) and as key emergency evacuation and/or services corridors.
• Maintain an aggressive Preventative Maintenance Program to extend the useful life of current infrastructure.
• Improve coordination of system preservation needs with other infrastructure projects and programs.
• Include impacts related to all hazards mitigation, including global climate change, in assessment of system preservation plans.
4. Security Ensuring the secure operation of a land transportation system involves multiple agencies working together to achieve common goals of risk management, incident detection, response, clearance, and preparation for and recovery from disasters. Transportation facilities and programs should be planned with a focus on planning for and responding to potential emergencies and threats.
Security Goals Objectives Strategies
4.1. Plan, maintain, and operate a transportation system that supports evacuation, response, and recovery for incidents.
• Reduce travel time during incident responses.
• Improve incident detection and response capabilities, including access and air and sea modal connections.
• Improve coordination with emergency managers and major traffic generators and attractors during the planning and execution phases of an incident response.
• Provide adequate facilities and capacity to support the needs of emergency and evacuation routes.
• Promote and develop alternate route options for existing highways and freeways to allow efficient rerouting of traffic away from the primary incident location.
• Identify and develop strategic evacuation routes that support the multihazard plans.
• Maintain and upgrade key emergency and access routes (i.e. routes serving as single access to communities with inadequate size or load capacity).
• Improve public transportation use for emergency evacuation of non-mobile residents during incidents.
TBG062714093019HNL 6

FINAL GOALS AND OBJECTIVES
Security Goals Objectives Strategies
• Improve flow of information to the traveling public • Improve surveillance systems and upgrade detection equipment (such as cameras or loop sensors on roadways) to reduce incident detection time and response time.
• Implement multiagency training programs so staff are well educated on protocols and procedures during incident response. Ensure appropriate agencies are involved and alerted to incidents in a timely manner. Ensure that program developers and trainers are qualified to develop appropriate procedures.
• Develop a comprehensive outreach mechanism to inform agencies and traffic generators and attractors (e.g. service industries) about incidents.
• Enhance multimedia tools to provide information to the traveling public (such as radio and internet information) and information regarding where they can access information (such as “in case of emergency tune to xxx” variable message signs)
4.2. Improve resiliency of the state through the transportation system.
• Plan and design for transportation system resilience to maintain efficient and effective connectivity for communities during recovery periods, including resiliency of the utility systems along transportation corridors.
• Establish a forum with the emergency management community, utility providers, and transportation service and infrastructure users to evaluate the transportation system resiliency.
• Prioritize roads that provide connectivity in rural areas of the state.
TBG062714093019HNL 7

FINAL GOALS AND OBJECTIVES
5. Economic Vitality Transportation options and multimodal facilities need to support planned, sustainable growth in residential, industry, tourism, and cultural and recreational opportunities by reducing travel time, operating costs, travel distance, crashes and logistics inefficiencies.
Economic Vitality Goals Objectives Strategies
5.1. Promote the expansion and diversification of Hawaii’s economy through the efficient and effective use of transportation facilities including movement of people, goods, and services in a safe, energy efficient, and environmentally sound manner.
• Maintain and develop an integrated, efficient, and reliable freight system by ensuring connectivity between air, land, and water (harbor) facilities.
• Develop an integrated, efficient, and reliable multimodal transportation system that is resilient to impacts of rising oil/energy costs and that will meet future transport demands.
• Develop an integrated multimodal system of transportation facilities, services, and information systems that provide for efficient commuter and local resident trips.
• Develop an integrated multimodal system of transportation facilities, services, and information so that intrastate, interstate, and international travelers can travel easily for business and recreation.
• Improve end-user benefits by reducing operating costs and reducing freight delays.
• Maintain and operate an integrated transportation system that supports the economic vitality of all islands, especially locations that can be significantly impacted by small changes in the transportation system (such as Molokai and Lanai).
• Identify and address capacity constrained areas within the transportation system. Prioritize the capacity projects when other strategies are not appropriate.
• Consider transportation alternatives that support arrivals and departures of travelers at all hours of the day; and the communication needs of foreign travelers (multilanguage and universal signs).
• Encourage and promote concurrent improvements in transportation infrastructure to mitigate impacts of all new developments and maintain an efficient transportation system that supports economic vitality.
• Identify specific funding strategies to enhance economic vitality.
• Explore financial strategies that examine fees (revenue sources) that cover all transportation modes.
• Support efficient and effective movement along the transportation system with traveler information, such as signage and real-time multimedia announcements.
• Coordinate schedules and routes of freight transport needs with other transportation system projects to minimize delay and support economic vitality.
TBG062714093019HNL 8
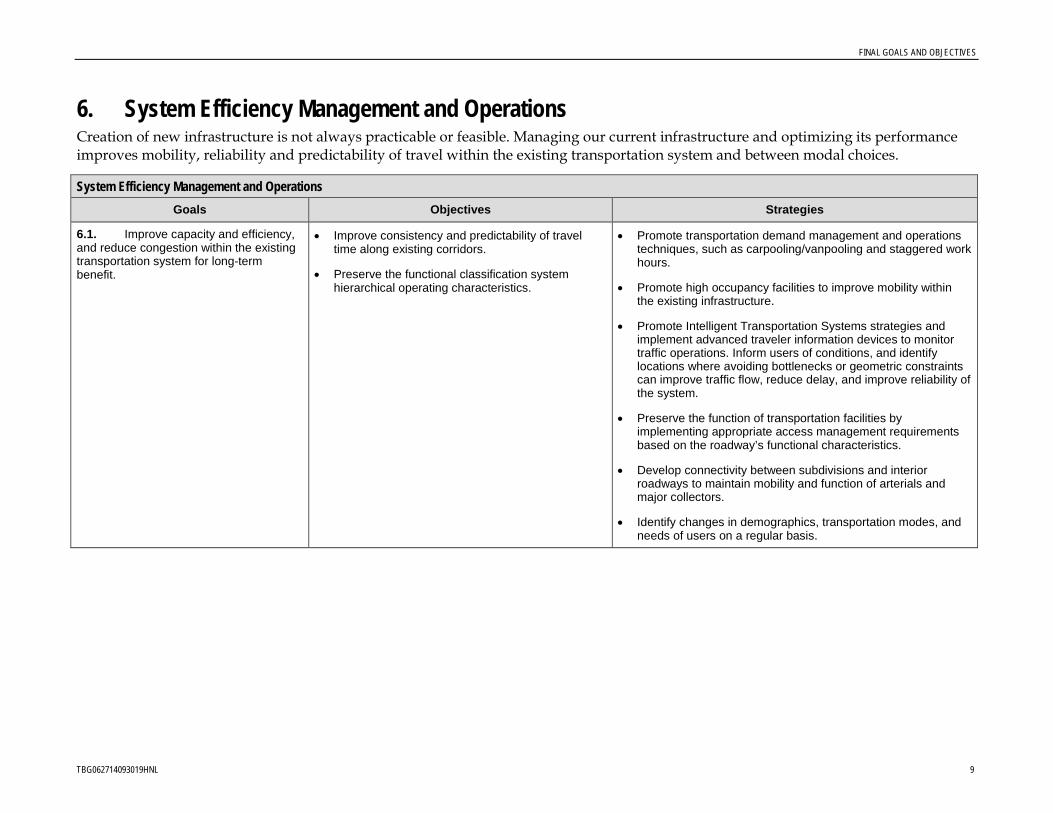
FINAL GOALS AND OBJECTIVES
6. System Efficiency Management and Operations Creation of new infrastructure is not always practicable or feasible. Managing our current infrastructure and optimizing its performance improves mobility, reliability and predictability of travel within the existing transportation system and between modal choices.
System Efficiency Management and Operations Goals Objectives Strategies
6.1. Improve capacity and efficiency, and reduce congestion within the existing transportation system for long-term benefit.
• Improve consistency and predictability of travel time along existing corridors.
• Preserve the functional classification system hierarchical operating characteristics.
• Promote transportation demand management and operations techniques, such as carpooling/vanpooling and staggered work hours.
• Promote high occupancy facilities to improve mobility within the existing infrastructure.
• Promote Intelligent Transportation Systems strategies and implement advanced traveler information devices to monitor traffic operations. Inform users of conditions, and identify locations where avoiding bottlenecks or geometric constraints can improve traffic flow, reduce delay, and improve reliability of the system.
• Preserve the function of transportation facilities by implementing appropriate access management requirements based on the roadway’s functional characteristics.
• Develop connectivity between subdivisions and interior roadways to maintain mobility and function of arterials and major collectors.
• Identify changes in demographics, transportation modes, and needs of users on a regular basis.
TBG062714093019HNL 9

FINAL GOALS AND OBJECTIVES
7. Transportation Access Mobility Transportation services and infrastructure should be accessible to all potential users. Through policy and planning efforts, services could be improved to equally serve geographic areas and diverse populations.
Transportation Access Mobility
Goals Objectives Strategies
7.1. Provide appropriate and reliable transportation access options statewide to all users.
• Provide services and infrastructure to support modal alternatives for all demographics.
• Coordinate between public and private transit and bus service providers to integrate programs, align investments, and provide affordable, streamlined services.
• Coordinate multimodal infrastructure and transit service improvements with human service agencies to determine needs of underserved populations, such as disabled, elderly, and environmental justice populations.
7.2. Ensure transportation investments in programs and prioritization processes are balanced across modes and demographics (i.e., serves environmental justice populations).
• Prioritize projects equitably to serve all modes and demographics, with attention to underserved communities.
• Provide constant and continuous information broadly to the public about expenditures on transportation infrastructure and services, and operations performance.
• Create a monitoring system to evaluate transportation projects and programs against the goals and standards that they were originally developed to achieve. Develop strategies and tools to support corrective actions.
• Promote transparent decision processes with broader citizen engagement and oversight. This can be accomplished by establishing subarea groups, advisory boards, or committees comprised of a broad spectrum of representatives for residents including underserved populations (such as disabled, elderly, and environmental justice).
Support paratransit programs that meet the needs of the disabled and elderly population.
TBG062714093019HNL 10

FINAL GOALS AND OBJECTIVES
8. Safety Safety for users of all modes can be improved through engineering (for example, evaluation of areas that have highest rates of crashes and by designing roadways with adequate sight distance for appropriate speeds), education (media campaigns), and enforcement (red-light cameras, fines).
Safety Goals Objectives Strategies
8.1. Maintain a safe transportation system for all land transportation modes.
• Address transportation safety through a mixture of education, enforcement and engineering solutions.
• Reduce the number traffic related fatalities.
• Reduce the number of collisions and crashes involving serious injuries and fatalities for all land transportation modes.
• Coordinate with the Strategic Highway Safety Plan to implement plan recommendations and monitor performance, including:
– Photo enforcement
– Prioritization of nonmotorized needs
– Improved signage
– Increased design considerations for safety of all modes (including temporary traffic control plans)
– Intelligent Transportation Systems
– Improved data reporting, assessment, and availability of information
– Impaired driving, motorcycle/moped, pedestrian and bicycle educational programs prioritizing young high risk new operators
– Increased bicycle and pedestrian educational programs
– Improved civil and criminal fines or penalties for fatalities or serious injuries
– Increased enforcement
– Safe enforcement areas
– Increased severity of sentencing for convicted repeat offenders thereby keeping them from operating a motor vehicle while in an impaired condition
• Develop solutions that reduce or prevent head-on collisions on existing infrastructure as well as new facilities.
TBG062714093019HNL 11

FINAL GOALS AND OBJECTIVES
Safety Goals Objectives Strategies
• Develop improved access for emergency service to reduce response time and evacuation time.
• Develop roadside features that enhance safety of the transportation system.
• Promote legislation, enforcement and education to reduce the risk of distracted transportation system users (all modes).
• Promote education and enforcement programs to reduce injury risk to pedestrians and passengers with disabilities.
• Develop transportation solutions that recognize and uphold the goals and strategies of safety programs supported by FHWA and AASHTO.
8.2. Improve safety of the community through connectivity of the transportation infrastructure.
• Provide emergency access to all parts of the state, especially in locations with only one road in and out.
• Consider using other roads including military access roads and plantation or cane haul roads as alternatives during an emergency especially in a weather related emergency. Identify which agency or agencies would be responsible for implementation. (Agreements with individual land owners and agencies are needed.)
TBG062714093019HNL 12

FINAL GOALS AND OBJECTIVES
9. Additional Goals, Objectives, and Strategies Initial discussions with stakeholders have identified ‘other’ goals that would benefit the long-term land transportation planning, delivery of projects and services.
Additional Goals, Objectives, and Strategies Goals Objectives Strategies
9.1. Obtain sufficient and specific transportation funding.
• Create and implement a funding mechanism that would cover the costs of providing a safe, efficient, sustainable transportation system into the future.
• Obtain diverse funding and ensure that funding set aside for transportation is used only for transportation.
• Coordinate and communicate with the counties on future transit corridors
• Supplement current transportation funding by identifying and securing diverse funding sources to support the multimodal transportation system, e.g., public and private partnerships.
• Identify and implement user fees that equitably spreads the cost burden over all modes of transportation without impacting environmental justice populations.
• Reduce the deficit in state transportation facilities with increased taxes specifically earmarked for Capital Improvements or Maintenance.
• Support policy that requires new development/growth to fund their impacts on transportation facilities (impact fees).
9.2. Optimize project delivery. • Improve coordination of plans and resources.
• Improve efficiency of planning and delivery of projects.
• Plan, develop and maintain transportation infrastructure within programmed budget amounts.
• From planning through operations, improve coordination and communication between multiple departments, public citizen groups and agencies to address needs and resources efficiently.
• Provide communications between multiple departments, public citizen groups and agencies related to status of projects.
• In areas where multiple state and/or federal agencies have authority, create a lead agency to manage overall project reducing delays, redundancies and inefficiencies. Develop procedures and protocol to monitor compliance, cooperation, communication and efficiency.
• Use transportation funds efficiently, and maximize revenues.
9.3. Provide ongoing planning to assess and address statewide needs.
• Monitor, evaluate and develop solutions, and adjust program goals on a continuing periodic coordinated basis.
• Continue to implement the 3-C planning process (comprehensive, cooperative and continuing).
TBG062714093019HNL 13

FINAL GOALS AND OBJECTIVES
Additional Goals, Objectives, and Strategies Goals Objectives Strategies
9.4. Coordinate use of public right-of-way with other public service providers.
• Continue the safe accommodation and installation of utility facilities within the right-of-way or easement along state highways and federal-aid county highways.
• Coordinate with utility service providers to work together in establishing location, design, and methods for the possible accommodation and installation of utility facilities along state highways and federal aid county highways. Considerations should include, but not be limited to safety, future widening and site specific issues.
• Coordinate and communicate transportation and utility planning efforts to enable development of a coordinated transportation and utility system.
TBG062714093019HNL 14

Appendix D
Existing and Future Baseline Assumptions and Conditions


TBG062714093019HNL 1
T E C H N I C A L M E M O R A N D U M Statewide and Regional Federal-Aid Highways 2035 Transportation Plans for the Districts of Maui, Hawaii, and Kauai
District of Kauai: Existing and Future Baseline Assumptions and Conditions PREPARED FOR: State of Hawaii Department of Transportation Regional Long-
Range Land Transportation Plan, Technical Advisory Committee, Citizens Advisory Committee, and Stakeholder Advisory Committee
PREPARED BY: Cheryl Yoshida/CH2M HILL Terry Yuen/CH2M HILL Kevin Murphy/CH2M HILL Neha Rathi/CH2M HILL
DATE: Revised March 2014
Introduction The purpose of this memorandum is to present an overview of existing and future baseline land transportation system conditions within the District of Kauai. The memorandum focuses on regional transportation infrastructure and travel demands, including descriptions of the transportation system, land use, socioeconomic characteristics, and system performance.
Existing Conditions Existing Transportation System The existing transportation system within the Island of Kauai consists of roadways, paths and transportation services that provide for the needs of multimodal users; cars, freight, transit, pedestrians, and bicyclists. The transportation system includes both state and county facilities and is the means by which the State of Hawaii Department of Transportation (HDOT) Highways Division mission is upheld.
Existing Roadway System The roadway system is the backbone for moving both people and goods around the Island of Kauai. All modes of land transportation utilize the roadway system.
The Mission of the HDOT Highways Division is to provide a safe, and efficient and accessible highway system through utilization of available resources in the maintenance, enhancement, and support of land transportation facilities.
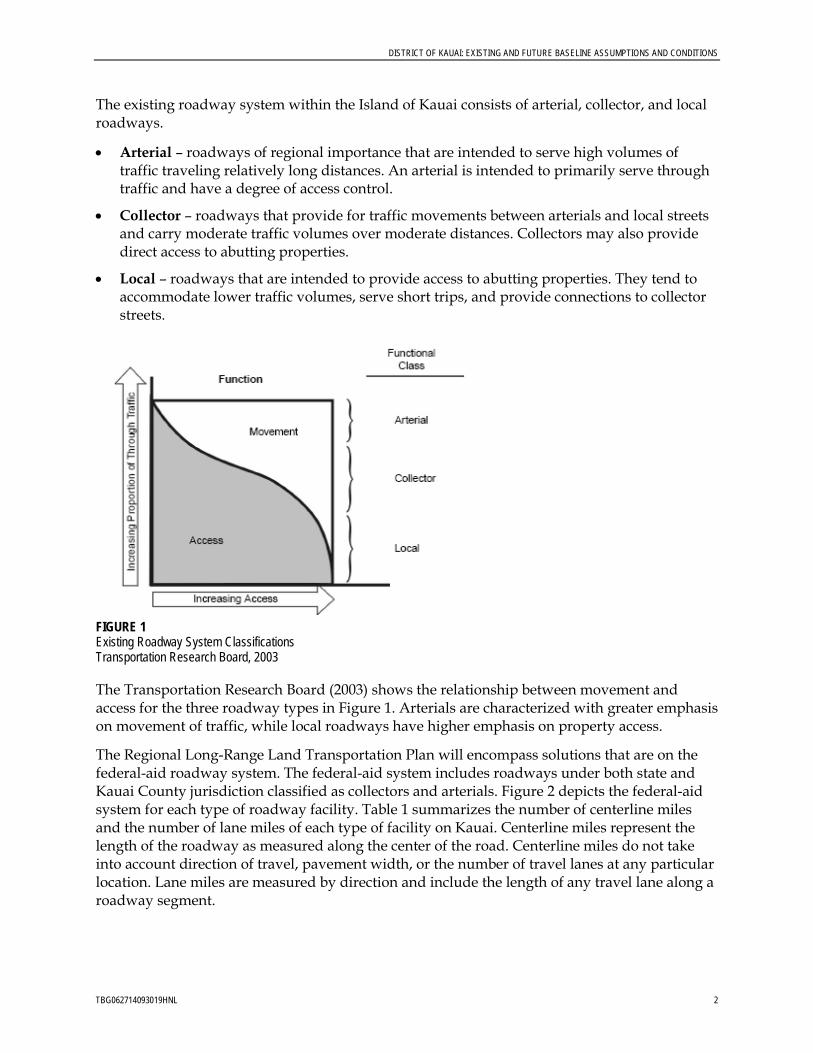
DISTRICT OF KAUAI: EXISTING AND FUTURE BASELINE ASSUMPTIONS AND CONDITIONS
TBG062714093019HNL 2
The existing roadway system within the Island of Kauai consists of arterial, collector, and local roadways.
• Arterial – roadways of regional importance that are intended to serve high volumes of traffic traveling relatively long distances. An arterial is intended to primarily serve through traffic and have a degree of access control.
• Collector – roadways that provide for traffic movements between arterials and local streets and carry moderate traffic volumes over moderate distances. Collectors may also provide direct access to abutting properties.
• Local – roadways that are intended to provide access to abutting properties. They tend to accommodate lower traffic volumes, serve short trips, and provide connections to collector streets.
FIGURE 1 Existing Roadway System Classifications Transportation Research Board, 2003
The Transportation Research Board (2003) shows the relationship between movement and access for the three roadway types in Figure 1. Arterials are characterized with greater emphasis on movement of traffic, while local roadways have higher emphasis on property access.
The Regional Long-Range Land Transportation Plan will encompass solutions that are on the federal-aid roadway system. The federal-aid system includes roadways under both state and Kauai County jurisdiction classified as collectors and arterials. Figure 2 depicts the federal-aid system for each type of roadway facility. Table 1 summarizes the number of centerline miles and the number of lane miles of each type of facility on Kauai. Centerline miles represent the length of the roadway as measured along the center of the road. Centerline miles do not take into account direction of travel, pavement width, or the number of travel lanes at any particular location. Lane miles are measured by direction and include the length of any travel lane along a roadway segment.

DISTRICT OF KAUAI: EXISTING AND FUTURE BASELINE ASSUMPTIONS AND CONDITIONS
TBG062714093019HNL 3
FIGURE 2 Existing Functional Classifications HDOT, 2012
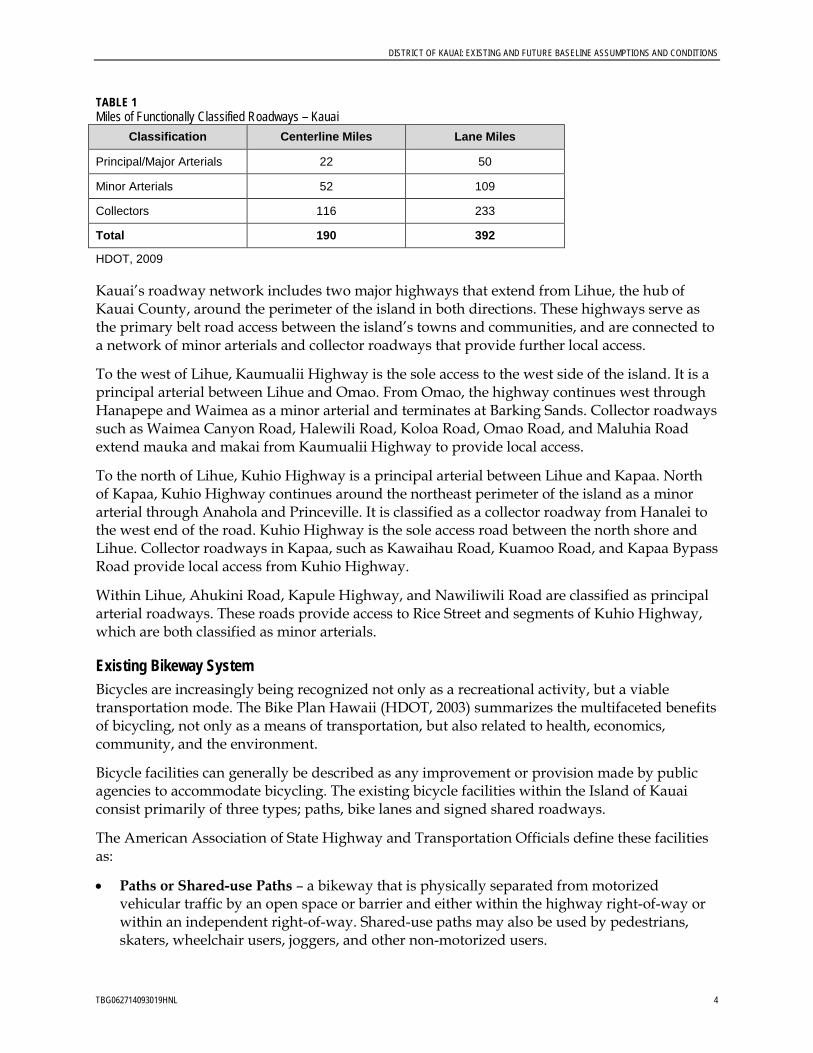
DISTRICT OF KAUAI: EXISTING AND FUTURE BASELINE ASSUMPTIONS AND CONDITIONS
TBG062714093019HNL 4
TABLE 1 Miles of Functionally Classified Roadways – Kauai
Classification Centerline Miles Lane Miles
Principal/Major Arterials 22 50
Minor Arterials 52 109
Collectors 116 233
Total 190 392
HDOT, 2009
Kauai’s roadway network includes two major highways that extend from Lihue, the hub of Kauai County, around the perimeter of the island in both directions. These highways serve as the primary belt road access between the island’s towns and communities, and are connected to a network of minor arterials and collector roadways that provide further local access.
To the west of Lihue, Kaumualii Highway is the sole access to the west side of the island. It is a principal arterial between Lihue and Omao. From Omao, the highway continues west through Hanapepe and Waimea as a minor arterial and terminates at Barking Sands. Collector roadways such as Waimea Canyon Road, Halewili Road, Koloa Road, Omao Road, and Maluhia Road extend mauka and makai from Kaumualii Highway to provide local access.
To the north of Lihue, Kuhio Highway is a principal arterial between Lihue and Kapaa. North of Kapaa, Kuhio Highway continues around the northeast perimeter of the island as a minor arterial through Anahola and Princeville. It is classified as a collector roadway from Hanalei to the west end of the road. Kuhio Highway is the sole access road between the north shore and Lihue. Collector roadways in Kapaa, such as Kawaihau Road, Kuamoo Road, and Kapaa Bypass Road provide local access from Kuhio Highway.
Within Lihue, Ahukini Road, Kapule Highway, and Nawiliwili Road are classified as principal arterial roadways. These roads provide access to Rice Street and segments of Kuhio Highway, which are both classified as minor arterials.
Existing Bikeway System Bicycles are increasingly being recognized not only as a recreational activity, but a viable transportation mode. The Bike Plan Hawaii (HDOT, 2003) summarizes the multifaceted benefits of bicycling, not only as a means of transportation, but also related to health, economics, community, and the environment.
Bicycle facilities can generally be described as any improvement or provision made by public agencies to accommodate bicycling. The existing bicycle facilities within the Island of Kauai consist primarily of three types; paths, bike lanes and signed shared roadways.
The American Association of State Highway and Transportation Officials define these facilities as:
• Paths or Shared-use Paths – a bikeway that is physically separated from motorized vehicular traffic by an open space or barrier and either within the highway right-of-way or within an independent right-of-way. Shared-use paths may also be used by pedestrians, skaters, wheelchair users, joggers, and other non-motorized users.

DISTRICT OF KAUAI: EXISTING AND FUTURE BASELINE ASSUMPTIONS AND CONDITIONS
TBG062714093019HNL 5
• Bike Lanes – a portion of a roadway that has been designated by striping, signing, and pavement markings for the preferential or exclusive use of bicyclists.
• Signed Shared Roadways – a shared roadway that has been designated by signing as a preferred route for bicycle use. This may be an existing roadway, street with wide curb lanes, or road with paved shoulders.
The Bike Plan Hawaii provides an inventory of the existing and planned bicycle system on the Island of Kauai. Figure 3 shows these facilities. The solid lines represent the existing bicycle facilities. The Island of Kauai has nearly 23 miles of designated bicycle facilities.
• Paths or Shared Use Paths – 7 miles • Bike Lanes – 1 mile • Sign Shared Roadways – 15 miles*
*In addition to the existing signed shared roadways listed in Bike Plan Hawaii, the proposed signed shared roadway along Nawiliwili Road from Kaumualii Highway to Waapa Road has been completed. The signed shared roadway is approximately 2 miles long.
Benefits of Bicycling
Transportation Bicycling is an easy way to complete short trips, while helping to reduce traffic congestion and parking requirements. For people with limited transportation options – those without a driver’s license or motor vehicle – bicycling can provide an important transportation option.
Health Bicycling is an excellent form of physical activity to prevent and/or control detrimental health conditions.
Economics Bicycling is business – retailers, repair shops, rentals and organized tours, and sporting events, all generate income. In addition, bicycling has the potential to attract a growing number of eco-tourists, people who want a more active vacation experience.
Community Bikeways can help define a community’s character and promote more social interaction among people who are out and about in their communities.
Environment Bicycling produces no pollution and doesn’t consume fossil fuels. The most frequent, comfortable, and practical trips for bicyclists – those under five miles – produce the greatest environmental benefits, since trips shorter than five miles are the least fuel efficient and produce the highest emissions per mile.
Source: HDOT, 2003
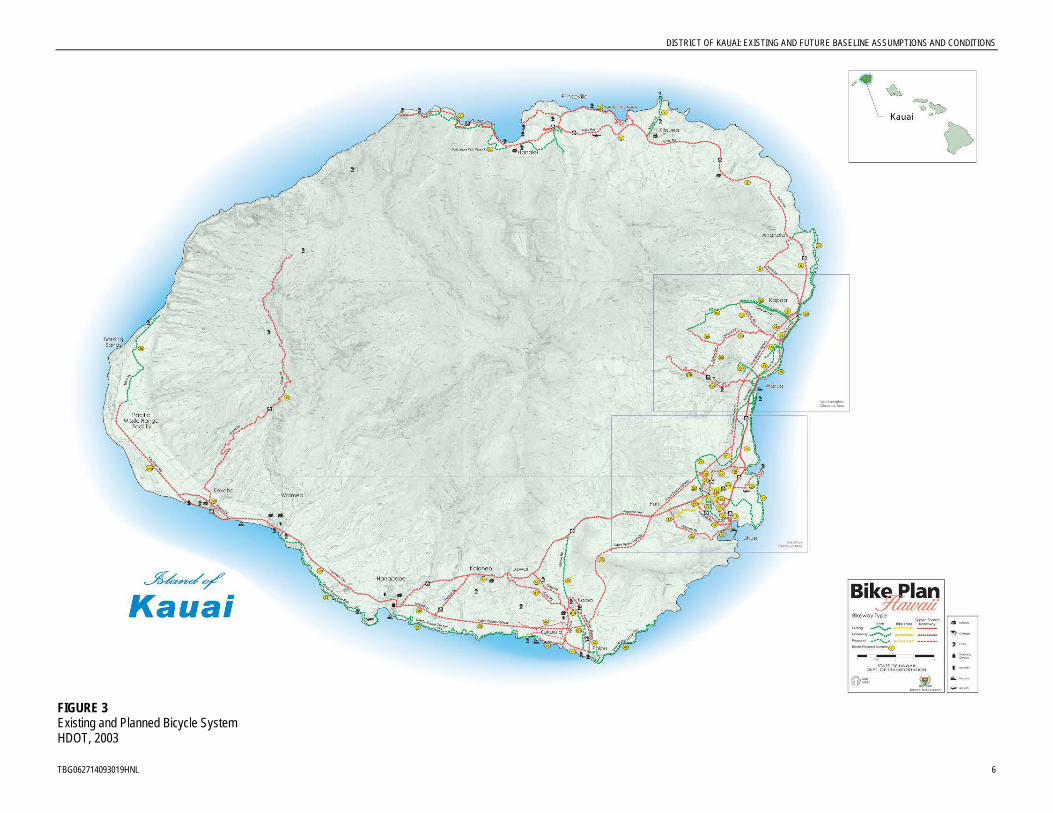
DISTRICT OF KAUAI: EXISTING AND FUTURE BASELINE ASSUMPTIONS AND CONDITIONS
TBG062714093019HNL 6
FIGURE 3 Existing and Planned Bicycle System HDOT, 2003

DISTRICT OF KAUAI: EXISTING AND FUTURE BASELINE ASSUMPTIONS AND CONDITIONS
TBG062714093019HNL 7
Existing Pedestrian System Pedestrian facilities are a critical part of the transportation system. For every trip that is made, a portion occurs as pedestrian travel. The benefits of walking are similar to those noted for bicycling; transportation, health, economics, community, and the environment. The Statewide Pedestrian Master Plan (HDOT, 2013) developed a stakeholder driven vision for the pedestrian system that promotes the pedestrian mode of transportation as well as protects those that are using the pedestrian system.
Pedestrian facilities can generally be described as any infrastructure that is designed specifically for use by a pedestrian. These include sidewalks, crosswalks, and paths.
The Statewide Pedestrian Master Plan provides information on the existing pedestrian system. Figure 4 shows the existing state pedestrian system.
Sidewalks on the Island of Kauai can be found in the urbanized areas around the island. In Lihue, Kuhio Highway has sidewalks on one or both sides of the roadway between Hala Road and Kuene Road, and also between Laukona Street and Hulei Road. Sidewalk is also provided on one side of Ahukini Road approaching Kuhio Highway and on one side of Rice Street near Nawiliwili Park. In Kapaa, sidewalks are provided on one or both sides of Kuhio Highway continuously between Pouli Road and Kawaihau Road.
Kaumualii Highway has sidewalks on one or both sides through Waimea, near Kaumakani Park, and through Hanapepe.
HDOT, 2013

DISTRICT OF KAUAI: EXISTING AND FUTURE BASELINE ASSUMPTIONS AND CONDITIONS
TBG062714093019HNL 8
FIGURE 4 Existing State Pedestrian System HDOT, 2013

DISTRICT OF KAUAI: EXISTING AND FUTURE BASELINE ASSUMPTIONS AND CONDITIONS
TBG062714093019HNL 9
Kauai General Plan policy includes: • Increasing ridership and expanding service for
The Kauai Bus • Improve bus stops to increase safety and
convenience of service of The Kauai Bus • Consider transportation alternatives to
increasing the size and capacity of roadways. Consider increased utilization of public transit
Source: County of Kauai, 2000
Existing Travel Demand Management/Transportation Systems Management Travel Demand Management (TDM) is a term used to describe strategies that reduce travel demands or redistribute travel demands to lessen impacts of peak periods. TDM measures may include measures to encourage people to switch to higher occupancy modes, such as public transit, vanpools, and carpools. TDM may also encourage people to use non-motorized modes of travel, such as walking and bicycling.
Transportation System Management (TSM) strategies enhance the capacity of the existing transportation system through operational improvements. TSM may include contraflow lanes, high-occupancy vehicle lanes, and Intelligent Transportation Systems.
The Kauai Bus system is described in the next section. There are currently no TDM or TSM programs or operations on the Island of Kauai, although it is the Kauai General Plan policy to consider alternatives to roadway size and capacity increases. Alternatives such as increased transit use, for example, could be considered in the future.
Existing Public Transit System Public transit provides an option and opportunity for personal mobility for anyone, regardless of age, income, social or physical status. Additionally public transit benefits
overall quality of life through reduced traffic congestion and improved air quality. It also provides a modal alternative for those who are unable to or choose not to drive.
The Kauai Bus public transit system consists of fixed-route transit service, express service routes, door-to-door paratransit services, on-call transit service, and designated park-and-ride lots and transit stops. Figure 5 shows the existing service route areas.
Fixed-route transit on Kauai is provided via six bus routes that serve the communities on the perimeter of the island. All routes begin and end in Lihue, the hub of all transit service on Kauai. Through transit transfers in Lihue, service is available between Kekaha on the far west side of the island and Hanalei on the north side of the island. The majority of transit routes operate daily (including weekends and holidays), and accommodate users in both directions of the route throughout the day.
The Kauai Bus operates one express bus run in the morning and one in the afternoon between Kekaha and Lihue in the major commute direction. From Kapaa, one express run is provided during the morning commuter peak into Lihue. On-call service to and from select locations is also available on certain routes.
Paratransit service is available to qualified individuals including seniors and persons with disabilities who are unable to use the fixed-route public transit. Advanced reservations for door-to-door paratransit service is required. This service operates during the same days and hours as fixed-route service, and is limited to areas within 0.75 mile from a transit route.

DISTRICT OF KAUAI: EXISTING AND FUTURE BASELINE ASSUMPTIONS AND CONDITIONS
TBG062714093019HNL 10
FIGURE 5 Existing Transit Routes HDOT, 2013
Existing Freight System Freight mobility is critical to the economic vitality of the islands. Although there are no specified freight routes, freight activities are concentrated around the commercial harbors and utilize many of the arterial roadways to transport goods to market throughout the islands.
Kauai has two commercial harbors; Nawiliwili Harbor and Port Allen Harbor. Nawiliwili Harbor is located on the west side of the island in Lihue, along Nawiliwili Road. From Nawiliwili Road, the main access to the harbor occurs from Wilcox Road/Waapa Road. Ancillary access to the harbor from Nawiliwili Road is available via Niumalu Road, which intersects with Waapa Road at the west end of the harbor facility.
Vehicles carrying freight from Nawiliwili Harbor use Nawiliwili Road and Rice Street to distribute goods to businesses within Lihue. From Lihue, Kaumualii Highway is the main transport route for freight destined to communities and resort areas on the south and west side of the island. Freight vehicles transporting goods to the east and north side of the island use Kuhio Highway.

DISTRICT OF KAUAI: EXISTING AND FUTURE BASELINE ASSUMPTIONS AND CONDITIONS
TBG062714093019HNL 11
Port Allen Harbor is located on the south side of the island in Hanapepe Bay. Waialo Road provides the main access between the harbor and Kaumualii Highway, which serves as the primary transport route for freight destined to the business, commercial, and industrial areas of the island.
Cargo received at Lihue Airport is transported to the rest of the island via Kapule Highway to Rice Street/Nawiliwili Road, Kaumualii Highway, and Kuhio Highway.
Existing State Land Use Districts The State Land Use Commission (LUC) was developed to be responsible for preserving and protecting Hawaii’s lands. The LUC establishes the district boundaries statewide. The districts comprise Urban, Rural, Agricultural, and Conservation. These district characteristics are described below, as defined by the State of Hawaii LUC. The land use districts outline allowable development and constraints that affect transportation demands, infrastructure, and services.
The Urban District generally includes lands characterized by “city-like” concentrations of people, structures, and services. This District also includes vacant areas for future development. Jurisdiction of this district lies primarily with the respective counties. Generally, lot sizes and uses permitted in the district area are established by the respective county through ordinances or rules.
Rural Districts are composed primarily of small farms intermixed with low-density residential lots with a minimum size of 0.5 acre. Jurisdiction over Rural Districts is shared by the Commission and county governments. Permitted uses include those relating or compatible to agricultural use and low-density residential lots. Variances can be obtained through the special use permitting process.
The Agricultural District includes lands for the cultivation of crops, aquaculture, raising livestock, wind energy facility, timber cultivation, agriculture-support activities (that is, mills, employee quarters, etc.), and land with significant potential for agriculture uses. Golf courses and golf-related activities may also be included in this district, provided the land is not in the highest productivity categories of the Land Study Bureau’s detailed classification system. Uses permitted in the highest productivity agricultural categories are governed by statute. Uses in the lower-productivity categories are established by the Commission.
Conservation Districts comprise primarily lands in existing forest and water reserve zones and include areas necessary for protecting watersheds and water sources; scenic and historic areas; parks, wilderness, open space, recreational areas; habitat of endemic plants, fish, and wildlife; and submerged lands seaward of the shoreline. Conservation Districts also include lands subject to flooding and soil erosion. Conservation Districts are administrated by the State Board of Land and Natural Resources and uses are governed by rules promulgated by the State Department of Land and Natural Resources.

DISTRICT OF KAUAI: EXISTING AND FUTURE BASELINE ASSUMPTIONS AND CONDITIONS
TBG062714093019HNL 12
TABLE 2 LUC Land Use Districts – Total Acreage
Island Total Area a
Classification by State Land Use Commission b
Urban Conservation Agricultural Rural
Kauai 353,900 14,558 198,769 139,320 1,253 a These totals differ somewhat from the official figures based on measurements by the Geography Division of the U.S. Bureau of the Census. b For definitions, see Hawaii Revised Statutes, Section 205-2. State of Hawaii Department of Business, Economic Development and Tourism, 2011
Approximately 39 percent of Kauai’s land use consists of agricultural district. Conservation districts comprise of approximately 56 percent of the island. Urban land use districts are approximately 4 percent of the land area, and are concentrated within the Kekaha/Waimea, Port Allen/Hanapepe, Kalaheo, Poipu, Lihue, Kapaa, and Princeville/Hanalei areas. Rural districts make up less than 1 percent of the land and are located throughout the island (west of Hanalei along Wainiha Powerhouse Road, within Wailua Homesteads, along Omao Road near Koloa, and north of Kalaheo).
Figure 6 shows the State Land Use Districts for Kauai.
Existing Community Plan Areas There are no existing documented community plans for Kauai County, but the Kauai General Plan does provide policy guidance to address issues related to growth and development, while recognizing unique assets, in the island’s towns and communities. Per the Kauai General Plan, towns and communities are divided into five distinct areas; North Shore (including Haena, Hanalei, Princeville), Kawaihau (including Kapaa, Wailua, Anahola), Lihue, Koloa-Poipu-Kalaheo, and West Side (including Waimea, Kekaha, Hanapepe, Eleele).

DISTRICT OF KAUAI: EXISTING AND FUTURE BASELINE ASSUMPTIONS AND CONDITIONS
TBG062714093019HNL 13
FIGURE 6 Existing State Land Use District Boundaries State of Hawaii LUC, 2007

DISTRICT OF KAUAI: EXISTING AND FUTURE BASELINE ASSUMPTIONS AND CONDITIONS
TBG062714093019HNL 14
The roadway and land use related policies of the five areas are summarized in Table 3.
TABLE 3 Land Transportation-related Policies
Planning Area Roadway and Land Use Policies
North Shore Maintain rural, agricultural nature of area.
Concentrate resort use and urban development in Princeville area.
Future development could be appropriate in Kilauea. Development shall be planned to enhance pedestrian and vehicular circulation and be compatible with existing character.
Develop new road to provide alternate access to/from Kuhio Highway and Kilauea National Wildlife Refuge that bypasses Kilauea Town.
Maintain historic one-lane bridges from Hanalei to Haena.
Kawaihau Concentrate new growth in and around the Waipouli-Kapaa urban center, on Department of Hawaiian Home Lands properties in Anahola, and on former sugar lands between Olohena Road and Wailua Houselots.
Avoid strip development along Kuhio Highway.
Avoid zoning changes in the Wailua and Kapaa Homestead areas that would increase residential density and impacts on public facilities and services.
Lihue Concentrate new growth in the Puhi-Lihue-Hanamaulu urban center and give priority to development of facilities that support this area of growth.
Koloa-Poipu-Kalaheo
Ensure that adequate transportation facilities are provided in conjunction with the future development of lands in the Kukuiula-Poipu area and the Kalaheo-Omao area.
Preserve the Maluhia Road tree tunnel. If capacity is needed, design lanes as second, parallel tree tunnel.
Improve circulation within and around Koloa Town.
In conjunction with development of the West Koloa Bypass Road, extend Koloa Town to the west and provide for traffic circulation between the town and the Bypass Road.
Confine commercial zoning and uses to Koloa Town; refrain from commercial development along Maluhia Road and the East Koloa By-Pass.
Develop a network of pedestrian and bicycle trails connecting Koloa, Poipu, and Kukuiula.
West Side Preserve and maintain open space.
Decommission airport at Puolo Point, redevelop as natural resource park.
County of Kauai, 2000
Existing Socioeconomic Conditions Socioeconomic characteristics of the islands also influence transportation demands, and need to be considered in the provision of transportation infrastructure and services. The socioeconomic data provide information on trip productions and attractions. Trips are typically produced from households. Trip attractions are related to activities such as employment, schools, shopping, and recreation.
The methodology used to develop and process the 2007 socioeconomic data is contained in Attachment 1. The raw data for households, employment, schools, visitor accommodations,

DISTRICT OF KAUAI: EXISTING AND FUTURE BASELINE ASSUMPTIONS AND CONDITIONS
TBG062714093019HNL 15
visitor attractions, airports, and harbors have been processed to prepare input for the travel demand modeling and traffic forecasting for the Island of Kauai.
Population Table 4 summarizes the population within Kauai County by districts. Nearly 70 percent of the island’s population resides on the east half of the island within the Lihue district (22 percent), East Kauai district (31 percent), and Koloa-Poipu-Kalaheo district (19 percent) within the communities of Lihue, Poipu, Kapaa, and Wailua. The Waimea and Hanapepe-Eleele districts on the west coast of the island include smaller communities and are the least populated on the island. They include less than 10 percent each of the island’s total population. The Planning Districts for the Island of Kauai are shown in Figure 7.
Less than 20 percent of Kauai’s total population lives below the poverty line. The poverty threshold is set nationwide through the United States Census and is based on the number of individuals in a household and the yearly annual income of the household. The percentage of the population living below the poverty line is estimated from census data and reported by the American Community Survey. The poverty low-income level is adjusted annually to reflect inflation. Within the Lihue and Waimea districts, between 5 and 10 percent of the population live below the poverty line. Between 10 and 20 percent of the population in the North Shore district, portions of the East Kauai district, and portions of Koloa-Poipu-Kalaheo district are considered low-income and are categorized as living below the poverty line.
TABLE 4 Existing Population
Planning District Population Percent of Total
Waimea 5,340 8%
Hanapepe – Eleele 5,320 8%
Koloa – Poipu - Kalaheo 11,830 19%
Lihue 14,100 22%
East Kauai 20,160 31%
North Shore 7,520 12%
Total 64,270 100%
CH2M HILL, 2012a (Population is estimated based on persons per household statistic from 2000 and 2010 Census and number of housing units from Kauai County Assessor Data, April/May 2011).

DISTRICT OF KAUAI: EXISTING AND FUTURE BASELINE ASSUMPTIONS AND CONDITIONS
TBG062714093019HNL 16
FIGURE 7 Existing State Planning District Boundaries County of Kauai Planning Department, 2012

DISTRICT OF KAUAI: EXISTING AND FUTURE BASELINE ASSUMPTIONS AND CONDITIONS
TBG062714093019HNL 17
Households Table 5 summarizes the households within Kauai County by districts. The distribution of households on the island is similar to the population distribution with the majority of households located on the eastern half of the island. Nearly one third of the island’s households are located in the East Kauai district, within Kapaa and Wailua Homesteads. The Waimea and Hanapepe-Eleele districts contain the fewest number of households compared to other planning districts on the island. Figure 8 illustrates the number of households throughout the island of Kauai.
TABLE 5 Existing Households
Planning District Households Percent of Total
Waimea 2,090 9%
Hanapepe – Eleele 2,060 9%
Koloa – Poipu - Kalaheo 4,310 19%
Lihue 4,510 20%
East Kauai 7,060 31%
North Shore 2,840 12%
Total 22,870 100%
Kauai County Assessor Data, 2011
Employment There were approximately 30,400 jobs in Kauai County in 2007, as summarized in Table 6.
TABLE 6 Existing Employment
Planning District Employment Percent of Total
Waimea 1,940 6%
Hanapepe – Eleele 1,040 4%
Koloa – Poipu - Kalaheo 5,210 17%
Lihue 13,910 46%
East Kauai 5,220 17%
North Shore 3,080 10%
Total 30,400 100%
Hawaii Department of Labor and Industrial Relations, 2007
Lihue is the primary employment center on Kauai with almost 50 percent of all jobs located within this district. Employment was most concentrated in Lihue town. The Koloa-Poipu-Kalaheo and East Kauai districts each support approximately 17 percent of the total job opportunities on the island, while the remaining districts each have less than 10 percent of the total employment positions. Approximately 11,900 jobs were in service occupations and 4,200
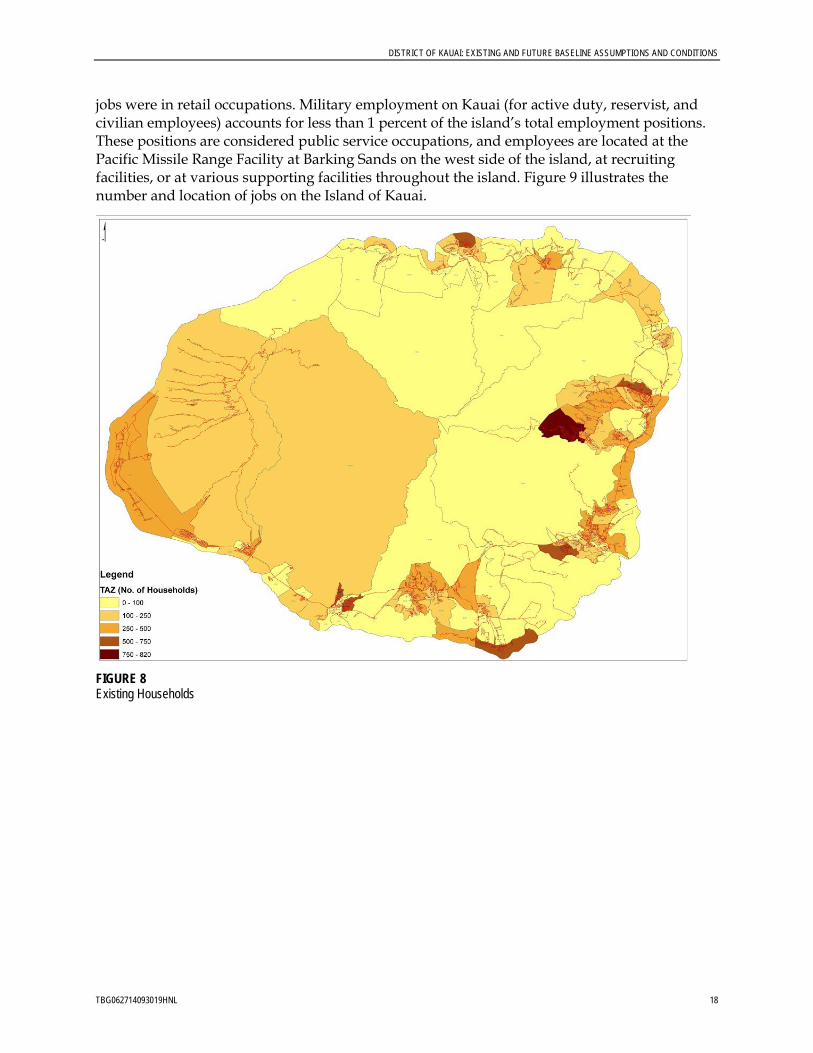
DISTRICT OF KAUAI: EXISTING AND FUTURE BASELINE ASSUMPTIONS AND CONDITIONS
TBG062714093019HNL 18
jobs were in retail occupations. Military employment on Kauai (for active duty, reservist, and civilian employees) accounts for less than 1 percent of the island’s total employment positions. These positions are considered public service occupations, and employees are located at the Pacific Missile Range Facility at Barking Sands on the west side of the island, at recruiting facilities, or at various supporting facilities throughout the island. Figure 9 illustrates the number and location of jobs on the Island of Kauai.
FIGURE 8 Existing Households

DISTRICT OF KAUAI: EXISTING AND FUTURE BASELINE ASSUMPTIONS AND CONDITIONS
TBG062714093019HNL 19
FIGURE 9 Existing Employment
Visitor Industry The visitor industry is Kauai’s leading economic sector. The single passenger airport within the county in Lihue conveyed nearly three million air passengers during 2007. The Port Allen airport did not serve air passengers in 2007 (HDOT, 2008).
Nawiliwili Harbor also services the visitor industry through cruise ship accommodations. The Hawaii Department of Transportation Harbors Division estimated that nearly 456,000 cruise ship passengers were accommodated at Nawiliwili Harbor in 2007.
In 2007, there were nearly 8,700 visitor accommodations on the Island of Kauai. The area characterized by the greatest number of hotel rooms was located in Poipu on the island’s south shore (DBEDT, 2008).
Visitor attractions including museums, cultural sites, and parks generated over 3.7 million visitor trips in 2007 (DBEDT, 2008). The attractions that generated the largest number of trips included Kilauea Point National Wildlife Refuge, Kokee Natural History Museum, and the Kauai Museum.
DISTRICT OF KAUAI: EXISTING AND FUTURE BASELINE ASSUMPTIONS AND CONDITIONS
TBG062714093019HNL 20
Airport and Harbor Cargo Air and harbor cargo also impact socioeconomic and travel demand characteristics through the county. As noted previously, there are no specified freight routes, however, airport and harbor cargo are transported along many of the arterial roadways to transport goods to market.
The annual air traffic statistics (HDOT, 2008) summarized the cargo tonnage accommodated through the airports within the county. Nearly fifteen thousand tons of cargo was handled during 2007. All of the cargo operations were accommodated at the Lihue Airport.
Hawaii Department of Transportation Harbors Division recorded over one million tons of cargo through harbors on Kauai. Approximately 90 percent of the total cargo went through Nawiliwili Harbor, while the remaining 10 percent was handled at Port Allen Harbor.
Existing System Performance The existing transportation system performance is described in terms of operations and safety. These discussions establish existing or baseline performance characteristics from which the future scenarios can be assessed.
Vehicular Volumes Average daily traffic volumes on Kaumualii Highway west of Lihue, as estimated by the travel demand model, peak at approximately 36,200 vehicles per day in both directions near Puhi Road in front of Kauai Community College. Volumes gradually decrease to approximately 30,000 vehicles per day in both directions approaching Omao. As the highway extends further west, away from the central hub of Lihue, daily traffic volumes decrease to 12,800 vehicles per day near Hanapepe Park and 7,200 vehicles per day between Waimea and Kekaha. Directional volumes are typically higher in the morning heading towards Lihue, while in the afternoon they are higher in the direction leaving the town.
Within Lihue, average daily traffic volumes on Kuhio Highway range between 13,600 near Laukona Street and 30,400 vehicles per day near Nawiliwili Road, while Kapule Highway carries up to 24,400 daily vehicles near Hanamaulu Beach Park. North of Lihue, Kapule Highway merges with Kuhio Highway and daily traffic volumes, as estimated by the travel demand model, peak at approximately 36,100 daily vehicles approaching the Wailua and Kapaa area. Wailua includes a large percentage of the island’s households and Kapaa includes tourist amenities and retail establishments. A significant number of vehicles begin or end their trips in this area, therefore daily volumes on Kuhio Highway to the north decrease. Volumes near Anahola are in the range of 14,800 vehicles per day, while volumes further decrease to 11,600 daily vehicles in both directions approaching Princeville and Hanalei.
Highway Volume to Capacity Ratio and Level of Service The performance of the existing roadway network is described in terms of volume to capacity (V/C) ratio and level of service (LOS). Level of service generally describes operating conditions on a roadway based on a variety of measures, such as delay, speed, and density. There are six LOS classifications, each given a letter designation from A to F. The classifications are defined by the Transportation Research Board’s 2010 Highway Capacity Manual. LOS A represents ideal operating conditions with little to no delay and where movements are not influenced by other

DISTRICT OF KAUAI: EXISTING AND FUTURE BASELINE ASSUMPTIONS AND CONDITIONS
TBG062714093019HNL 21
vehicles on the roadway. LOS F represents poor operating conditions, including high delays and extreme congestion.
Traffic operations can also be described by volume to capacity ratios. This measurement quantifies the relative vehicle demand versus the capacity of a facility. A V/C ratio of 1.0 indicates the vehicle demand is equal to the capacity of the facility, and correlates to LOS F conditions.
Table 7 summarizes the performance of the existing modeled roadway system. The model includes all roads on the federal-aid roadway system (arterials and collectors), as well as select local roads (necessary for circulation and distribution of local traffic). Roadways in the model are referred to as links, and each link is classified based on characteristics such as speed, capacity, and the roadways federal functional classification. Link classification may not exactly match the roads federal functional classification due to adjustments made during the model validation process. Adjustments to link classifications were made to align observed traffic with the models traffic assignment.
TABLE 7 2007 Daily Roadway Performance
Roadway Link Classification
Percentage of Lane Miles
V/C < 0.8 (LOS C or better)
0.8 < V/C < 0.9 (LOS D)
0.9 < V/C < 1.0 (LOS E)
V/C > 1.0 (LOS F)
Lane Miles
Principal Arterials 52% 5% 8% 35% 50
Minor Arterials 88% 2% 6% 4% 109
Collectors 100% 0% 0% 0% 233
Total 90% 1% 3% 6% 392
CH2M HILL, 2012b
As estimated by the 2007 travel demand forecast model, 35 percent of all lane miles on links classified as principal arterials operate at LOS F, or at a V/C ratio of 1.0 or higher. These congested segments occur on Kuhio Highway between Lihue and Kapaa, as well as on Kaumualii Highway between Lihue and Omao. At both of these locations, the daily traffic volumes are at or exceed the daily capacity of the roadway. Lihue is the employment center of the island and therefore attracts high vehicle volumes on a typical day. Due to the unique belt highway system on Kauai, all traffic into or out of town must use either Kuhio Highway or Kaumualii Highway. Congestion occurs because all traffic is forced to use these single accesses from either direction.
Level of Service (LOS) Definitions
LOS A Free flows operation, vehicles are almost completely unimpeded in their ability to maneuver within the traffic stream.
LOS B Reasonably free flow, vehicles maneuver within the traffic stream is only slightly restricted.
LOS C Freedom to maneuver within the traffic stream is noticeably restricted.
LOS D Freedom to maneuver within the traffic stream is more noticeably limited and the driver experiences reduced physical and psychological comfort level.
LOS E Vehicles are closely spaced, leaving little room to maneuver within the traffic stream at speeds that still exceed 49 miles per hour.
LOS F Breakdowns in vehicular flow. Source: Transportation Research Board 2010.

DISTRICT OF KAUAI: EXISTING AND FUTURE BASELINE ASSUMPTIONS AND CONDITIONS
TBG062714093019HNL 22
FIGURE 10 Existing Volume to Capacity Ratio
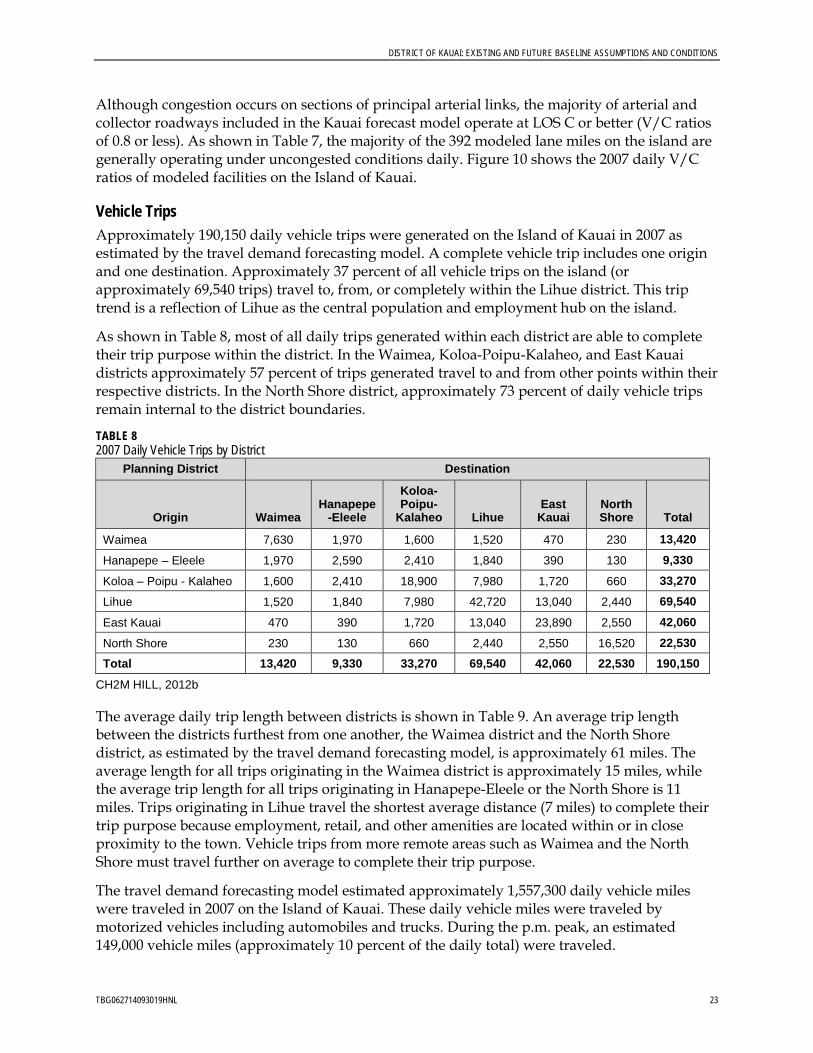
DISTRICT OF KAUAI: EXISTING AND FUTURE BASELINE ASSUMPTIONS AND CONDITIONS
TBG062714093019HNL 23
Although congestion occurs on sections of principal arterial links, the majority of arterial and collector roadways included in the Kauai forecast model operate at LOS C or better (V/C ratios of 0.8 or less). As shown in Table 7, the majority of the 392 modeled lane miles on the island are generally operating under uncongested conditions daily. Figure 10 shows the 2007 daily V/C ratios of modeled facilities on the Island of Kauai.
Vehicle Trips Approximately 190,150 daily vehicle trips were generated on the Island of Kauai in 2007 as estimated by the travel demand forecasting model. A complete vehicle trip includes one origin and one destination. Approximately 37 percent of all vehicle trips on the island (or approximately 69,540 trips) travel to, from, or completely within the Lihue district. This trip trend is a reflection of Lihue as the central population and employment hub on the island.
As shown in Table 8, most of all daily trips generated within each district are able to complete their trip purpose within the district. In the Waimea, Koloa-Poipu-Kalaheo, and East Kauai districts approximately 57 percent of trips generated travel to and from other points within their respective districts. In the North Shore district, approximately 73 percent of daily vehicle trips remain internal to the district boundaries.
TABLE 8 2007 Daily Vehicle Trips by District
Planning District Destination
Origin Waimea Hanapepe
-Eleele
Koloa-Poipu-
Kalaheo Lihue East
Kauai North Shore Total
Waimea 7,630 1,970 1,600 1,520 470 230 13,420
Hanapepe – Eleele 1,970 2,590 2,410 1,840 390 130 9,330
Koloa – Poipu - Kalaheo 1,600 2,410 18,900 7,980 1,720 660 33,270
Lihue 1,520 1,840 7,980 42,720 13,040 2,440 69,540
East Kauai 470 390 1,720 13,040 23,890 2,550 42,060
North Shore 230 130 660 2,440 2,550 16,520 22,530 Total 13,420 9,330 33,270 69,540 42,060 22,530 190,150
CH2M HILL, 2012b
The average daily trip length between districts is shown in Table 9. An average trip length between the districts furthest from one another, the Waimea district and the North Shore district, as estimated by the travel demand forecasting model, is approximately 61 miles. The average length for all trips originating in the Waimea district is approximately 15 miles, while the average trip length for all trips originating in Hanapepe-Eleele or the North Shore is 11 miles. Trips originating in Lihue travel the shortest average distance (7 miles) to complete their trip purpose because employment, retail, and other amenities are located within or in close proximity to the town. Vehicle trips from more remote areas such as Waimea and the North Shore must travel further on average to complete their trip purpose.
The travel demand forecasting model estimated approximately 1,557,300 daily vehicle miles were traveled in 2007 on the Island of Kauai. These daily vehicle miles were traveled by motorized vehicles including automobiles and trucks. During the p.m. peak, an estimated 149,000 vehicle miles (approximately 10 percent of the daily total) were traveled.

DISTRICT OF KAUAI: EXISTING AND FUTURE BASELINE ASSUMPTIONS AND CONDITIONS
TBG062714093019HNL 24
TABLE 9 2007 Daily Average Vehicle Trip Length between Districts (Miles)
Planning District Destination
Origin Waimea Hanapepe
-Eleele
Koloa-Poipu-
Kalaheo Lihue East
Kauai North Shore
Weighted Average
Waimea 7 9 22 31 40 61 15
Hanapepe – Eleele 9 3 9 18 28 46 11
Koloa – Poipu - Kalaheo 22 9 4 13 22 42 9
Lihue 31 18 13 3 9 30 7
East Kauai 40 27 22 9 4 20 8
North Shore 60 46 41 29 20 5 11 Weighted Average 15 11 9 7 8 11 9
CH2M HILL, 2012b
Average Trip Time The overall, island-wide, average trip time per vehicle trip on Kauai in 2007 was 18 minutes, as estimated by the travel demand forecasting model and shown in Table 10. Trips originating from the Waimea district would take approximately 1 hour and 40 minutes to the North Shore district, while the reverse direction trip would take approximately 10 minutes longer due to differences in the length of the directional roadways. Internal trips within each of the districts would take on average between 6 and 11 minutes to complete.
TABLE 10 2007 Daily Average Vehicle Trip Time between Districts (Minutes)
Planning District Destination
Origin Waimea Hanapepe
-Eleele
Koloa-Poipu-
Kalaheo Lihue East
Kauai North Shore
Weighted Average
Waimea 11 15 35 51 69 101 24
Hanapepe – Eleele 15 6 16 33 52 80 19
Koloa – Poipu - Kalaheo 35 17 8 25 44 74 17
Lihue 52 34 26 7 20 52 15
East Kauai 80 63 54 28 11 34 21
North Shore 111 90 83 60 34 10 22 Weighted Average 25 20 18 17 18 21 18
CH2M HILL, 2012b
A total of 51,650 daily vehicle hours of travel were estimated by the travel demand forecasting model in 2007. This vehicle hour estimate includes all time spent traveling by automobiles and trucks. During the p.m. peak, 4,760 vehicle hours (or approximately 9 percent of the daily total) were generated in 2007.
Travel Time Figure 11 depicts the estimated p.m. peak vehicle travel times from Lihue to other locations on the island in 2007. From Lihue, an average vehicle trip to Kapaa would take between 15 and 20 minutes, while trips to Poipu would range between 35 and 45 minutes. In 2007, trips to

DISTRICT OF KAUAI: EXISTING AND FUTURE BASELINE ASSUMPTIONS AND CONDITIONS
TBG062714093019HNL 25
Hanalei or Waimea would take between 45 and 60 minutes. Only trips from Lihue to Waimea Canyon would take longer than 60 minutes, but no trips from Lihue would take more than 75 minutes during the p.m. peak.
Accident Locations The Highway Safety Improvement Program compiles accident data for the state roadways and state and county intersections. The following lists depict the locations with high accident rates and/or occurrences between 2006 and 2008.
State route locations (non-intersection) with accident rates above 75 and six or more accidents between 2006 and 2008:
• Kuhio Highway (Route 560) MP 1.1-1.4 • Kuhio Highway (Route 560) MP 2.0-2.3 • Kuhio Highway (Route 560) MP 2.3-2.6 • Kuhio Highway (Route 56) MP 8.5-8.8 • Kuhio Highway (Route 56) MP 6.0-6.3 • Waapa Road (Route 51) MP 0.1-0.4 • Kaumualii Highway (Route 50) MP 0.0-0.3 • Kuhio Highway (Route 56) MP 1.9-2.2 • Kuhio Highway (Route 56) MP 7.0-7.3 • Kuhio Highway (Route 56) MP 23.9-24.2 • Kuhio Highway (Route 56) MP 24.8-25.1 • Kaumualii Highway (Route 50) MP 6.9-7.2 • Kaumualii Highway (Route 50) MP 11.4-11.7 • Kuhio Highway (Route 56) MP 1.1-1.4 • Kuhio Highway (Route 56) MP 0.1-0.4 • Kaumualii Highway (Route 50) MP 11.1-11.4 • Kuhio Highway (Route 56) MP 26.9-27.2 • Kaumualii Highway (Route 50) MP 1.0-1.3 • Kaumualii Highway (Route 50) MP 11.7-12.0 • Kaumualii Highway (Route 50) MP 5.7-6.0 • Kaumualii Highway (Route 50) MP 1.3-1.6 • Kuhio Highway (Route 56) MP 4.3-4.6 • Kaumualii Highway (Route 50) MP 4.8-5.1 • Kuhio Highway (Route 56) MP 7.3-7.6 • Kuhio Highway (Route 56) MP 8.8-9.1 • Kuhio Highway (Route 56) MP 7.8-8.1 • Kaumualii Highway (Route 50) MP 2.0-2.3 • Kaumualii Highway (Route 50) MP 2.7-3.0 • Kuhio Highway (Route 56) MP 3.5-3.8 • Kuhio Highway (Route 56) MP 3.8-4.1 • Kuhio Highway (Route 56) MP 8.1-8.4 • Kaumualii Highway (Route 50) MP 0.3-0.6

DISTRICT OF KAUAI: EXISTING AND FUTURE BASELINE ASSUMPTIONS AND CONDITIONS
TBG062714093019HNL 26
FIGURE 11 Existing Travel Time from Lihue CH2M HILL, 2012b

DISTRICT OF KAUAI: EXISTING AND FUTURE BASELINE ASSUMPTIONS AND CONDITIONS
TBG062714093019HNL 27
State intersection locations with nine or more crashes between 2006 and 2008:
• Kapule Highway (Route 51)/Rice Street • Kapule Highway (Route 51)/Ahukini Road • Kuhio Highway (Route 56)/Kapule Highway • Kuhio Highway (Route 56)/Kuamoo Road • Kaumualii Highway (Route 50)/Maluhia Road • Kaumualii Highway (Route 50)/Nuhou Road • Kaumualii Highway (Route 50)/Kuhio Highway and Rice Street • Kuhio Highway (Route 56)/ Kauai Beach Drive
County intersection locations (that are part of the federal-aid highways system) with three or more crashes between 2006 and 2008:
• Rice Street (Route 5020)/ Eiwa Street • Poipu Road (Route520)/ Ala Kinoiki Road • Umi Street (Route 5710)/Hardy Street • Moi Road (Route 543)/Hanapepe Road • Olohena Road (Route 581)/Kaapuni Road • Rice Street (Route 5020)/Hardy Street • Rice Street (Route 5020)/Hoolako Street • Rice Street (Route 5020)/Kalena Street • Kalepa Street (Route 5035)/Ulu Maika Street
State locations with two or more pedestrian related crashes between 2006 and 2008:
• Kaumualii Highway (Route 50) at Papalina Road MP 11.8 • Kuhio Highway (Route 56) at Mailihuna Road MP 9.8
County locations (that are part of the federal-aid highways system) with two or more pedestrian related crashes between 2006 and 2008:
• There are no locations with more than one accident.
HDOT has provided this traffic accident information under the protection of 23 United States Code 402(k) and 409. This information may not be used in any federal or state court proceeding in any action for damages arising from any occurrence at a location mentioned or addressed in the information provided.

DISTRICT OF KAUAI: EXISTING AND FUTURE BASELINE ASSUMPTIONS AND CONDITIONS
TBG062714093019HNL 28
Forecast Year Conditions (2020/2035) Baseline Transportation System The baseline transportation system includes projects that have been completed since 2007 and those that have committed construction funding as defined by the Statewide Transportation Improvement Program: Revision #3 FFY 2011 Through 2014 (HDOT, 2011). For the purpose of the future baseline Kauai travel demand model, projects that have effects on roadway capacity were added to the 2007 system. Table 11 lists the projects that were included in both the 2020 and 2035 baseline transportation systems.
TABLE 11 Baseline Transportation Projects
Facility Location Project Description/ Recommendation Status
Lihue
Kuhio Highway South Leho Drive to Aleka Loop
Short-term improvements.
Construction of 12 to 18 months
Kuhio Highway Ehiku Street to Eha Street
Widen to four lanes. Estimated 2012 construction completion
Koloa-Poipu-Kalaheo
Kaumualii Highway
Koloa Road to Rice Street
Widen to a four-lane divided highway between Koloa Road and Kuhio Highway/ Rice Street intersection.
Phase 1A2 – Rice Street to Lihue Mill Bridge; estimated construction completion 2015.
Phase 1A21 – Lihue Mill Bridge to Anonui Street; estimated construction completion 2012.
Phases 1B, 1C, 2, and 3 have no committed funding and are not included in the future baseline conditions.
Forecast Socioeconomic Conditions The aggregate land use and socioeconomic forecast data were developed by the Hawaii Department of Business, Economic Development and Tourism (DBEDT, 2008). These data include forecasts of population, employment, and visitor’s for each county in Hawaii. Kauai County staff provided information on where they expected future growth to occur within the island. This information was used to assist in the distribution of the DBEDT forecasts for the island to the traffic analysis zones. Kauai staff provided growth information for housing units, visitor accommodations, and square footage by retail, office, and industrial uses by traffic analysis zones. This information was used to distribute forecast variables (households, retail, service and other employment, and visitor accommodations).
The methodology used to develop and process the forecasts is contained in Attachment 2, while a summary of socioeconomic forecasts is included in Attachment 3.

DISTRICT OF KAUAI: EXISTING AND FUTURE BASELINE ASSUMPTIONS AND CONDITIONS
TBG062714093019HNL 29
Population Table 12 summarizes the population growth within Kauai County by districts. The island-wide population is expected to grow by 14 percent by 2020 and 33 percent overall by 2035. The majority of this growth would occur in the Lihue and Koloa-Poipu-Kalaheo districts. Compared to 2007, the population in both districts is expected to grow by approximately 20 percent by the year 2020, and by 47 percent by 2035. By 2035, the Lihue district is expected to grow by approximately 6,600 residents, and the Koloa-Poipu-Kalaheo district would grow by 5,580 residents. The North Shore district is expected to have the lowest percentage of population growth on the island.
TABLE 12 Forecast Population
Planning District
Population Population Change (Year 2007 to Year 2020)
Population Change (Year 2007 to Year 2035)
2007 2020 2035 Difference %
Difference Difference %
Difference
Waimea 5,340 6,280 7,220 940 18% 1,880 35%
Hanapepe – Eleele 5,320 6,200 6,540 880 17% 1,220 23%
Koloa – Poipu - Kalaheo 11,830 14,170 17,410 2,340 20% 5,580 47%
Lihue 14,100 16,660 20,700 2,560 18% 6,600 47%
East Kauai 20,160 22,070 24,460 1,910 9% 4,300 21%
North Shore 7,520 8,160 8,840 640 9% 1,320 18%
Total 64,270 73,540 85,170 9,270 14% 20,900 33%
CH2M HILL, 2012a (Population based on forecasts from the DBEDT. Allocations based on data provided by Kauai County).
Households Table 13 summarizes the household growth within Kauai County by districts. The total number of households on the island is expected to increase by 12 percent by 2020 and by 30 percent by 2035. The Lihue district would experience the highest percentage of household growth compared to all other districts. By 2020, the number of households in the Lihue district would increase by nearly 1,300 units (or 29 percent) compared to existing 2007 conditions. By 2035, households would increase by another 1,440 units resulting in over 60 percent growth overall compared to existing conditions. Households in Koloa-Poipu-Kalaheo district would grow by nearly 1,800 units (over 40 percent) by 2035, and East Kauai district would see nearly 1,500 new households (over 20 percent growth), compared to existing conditions.
Figures 12 and 13 illustrate the number of households throughout the Island of Kauai for Years 2020 and 2035, respectively.

DISTRICT OF KAUAI: EXISTING AND FUTURE BASELINE ASSUMPTIONS AND CONDITIONS
TBG062714093019HNL 30
TABLE 13 Forecast Households
Planning District
Households Households Change
(Year 2007 to Year 2020) Households Change
(Year 2007 to Year 2035)
2007 2020 2035 Difference %
Difference Difference %
Difference
Waimea 2,090 2,190 2,520 100 5% 430 21%
Hanapepe – Eleele 2,060 2,160 2,290 100 5% 230 11%
Koloa – Poipu - Kalaheo 4,310 4,930 6,090 620 14% 1,780 41%
Lihue 4,510 5,800 7,240 1,290 29% 2,730 61%
East Kauai 7,060 7,680 8,550 620 9% 1,490 21%
North Shore 2,840 2,840 3,090 0 0% 250 9%
Total 22,870 25,600 29,780 2,730 12% 6,910 30%
CH2M HILL, 2012a (Households based on population forecasts from the DBEDT and persons per household growth from 2000 and 2010 Census.)
Employment Table 14 summarizes the employment growth within Kauai County by districts. Lihue district is expected to support nearly half of the island’s job opportunities in the future and will remain the island’s primary employment center. In Lihue district, compared to 2007 conditions, approximately 2,900 additional jobs are expected by the year 2020 (an increase of 21 percent). Nearly 4,100 additional employment opportunities after 2020 are expected by 2035 (an increase of 50 percent total). Koloa-Poipu-Kalaheo and East Kauai districts are expected to see over 20 percent increase in employment by 2020 (at least 1,000 new jobs), and at least 30 percent increase by 2035 (at least 1,500 new jobs). Figures 14 and 15 illustrate the number of employment throughout the Island of Kauai for Years 2020 and 2035, respectively.
TABLE 14 Forecast Employment
Planning District
Employment Employment Change (Year 2007 to Year 2020)
Employment Change (Year 2007 to Year 2035)
2007 2020 2035 Difference %
Difference Difference %
Difference
Waimea 1,940 2,420 2,580 480 25% 640 33%
Hanapepe – Eleele 1,040 1,120 1,230 80 8% 190 18%
Koloa – Poipu - Kalaheo 5,210 6,320 6,860 1,110 21% 1,650 32%
Lihue 13,910 16,810 20,890 2,900 21% 6,980 50%
East Kauai 5,220 6,290 6,770 1,070 20% 1,550 30%
North Shore 3,080 3,540 3,840 460 15% 760 25%
Total 30,400 36,500 42,170 6,100 20% 11,770 39%
CH2M HILL, 2012a (Employment based on forecasts from the DBEDT. Allocations based on data provided by Kauai County).

DISTRICT OF KAUAI: EXISTING AND FUTURE BASELINE ASSUMPTIONS AND CONDITIONS
TBG062714093019HNL 31
FIGURE 12 Year 2020 Households
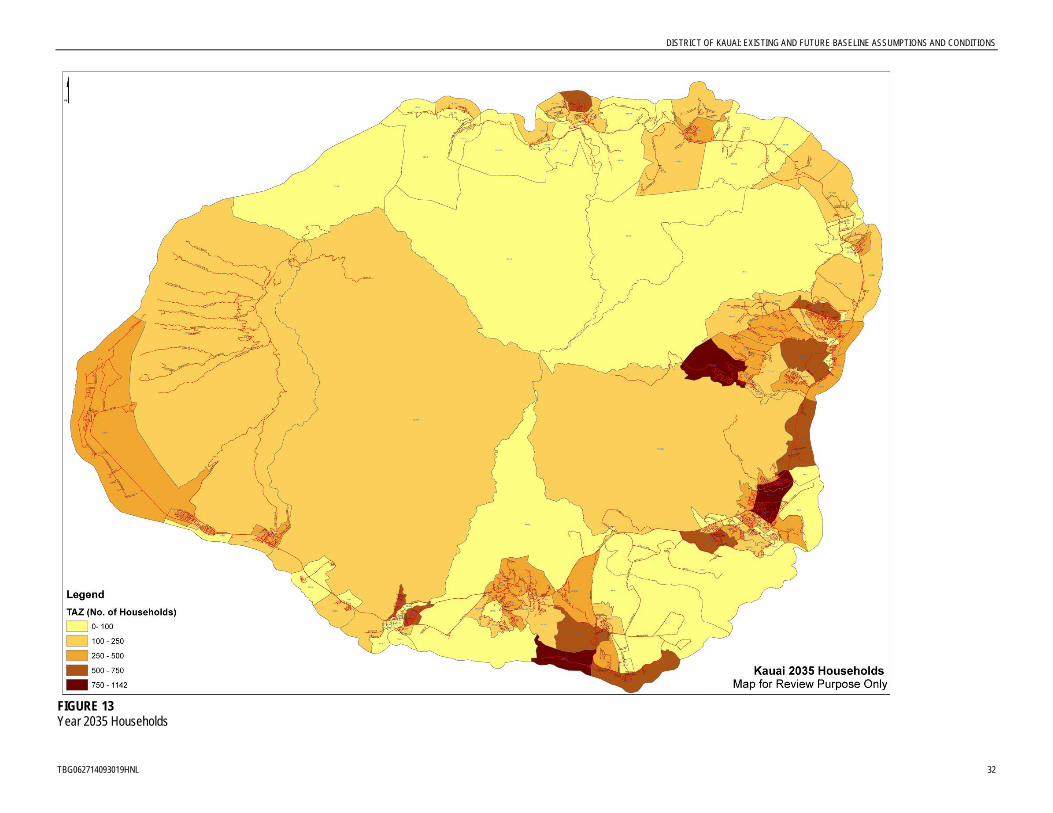
DISTRICT OF KAUAI: EXISTING AND FUTURE BASELINE ASSUMPTIONS AND CONDITIONS
TBG062714093019HNL 32
FIGURE 13 Year 2035 Households

DISTRICT OF KAUAI: EXISTING AND FUTURE BASELINE ASSUMPTIONS AND CONDITIONS
TBG062714093019HNL 33
FIGURE 14 Year 2020 Employment

DISTRICT OF KAUAI: EXISTING AND FUTURE BASELINE ASSUMPTIONS AND CONDITIONS
TBG062714093019HNL 34
FIGURE 15 Year 2035 Employment

DISTRICT OF KAUAI: EXISTING AND FUTURE BASELINE ASSUMPTIONS AND CONDITIONS
TBG062714093019HNL 35
Visitor Industry The Lihue airport is forecast to accommodate approximately 3.1 million passengers in Year 2020 and nearly 3.6 million passengers in Year 2035 (CH2M HILL, 2012b). This forecast equates to an approximate 6.2 percent increase of passengers by Year 2020, and 20.7 percent increase by Year 2035.
Nawiliwili Harbor is forecast to accommodate approximately 484,000 cruise ship passengers in Year 2020 and 550,000 passengers in Year 2035 (CH2M HILL, 2012b). This forecast equates to an approximate 6.2 percent increase of passengers by Year 2020, and 20.7 percent increase by Year 2035.
By Year 2020, the forecast estimates approximately 9,100 visitor accommodations on the Island of Kauai, a growth of approximately 4.9 percent. By year 2035, approximately 9,200 visitor accommodations are projected, resulting in a 5.7 percent growth. (CH2M HILL, 2012b)
Airport and Harbor Cargo The Island of Kauai airport is forecast to accommodate approximately 15,200 tons of cargo in Year 2020 and 17,600 tons in Year 2035 (CH2M HILL, 2012b). This forecast equates to an approximate 3.3 percent increase of air cargo by Year 2020, and 19.7 percent increase by Year 2035.
The two harbors on Kauai are forecast to accommodate approximately 1.0 million tons of cargo in Year 2020, which equates to an approximate 3.3 percent increase. By Year 2035, the harbors are forecast to accommodate roughly 1.2 million tons, which is approximately an increase of 19.7 percent (CH2M HILL, 2012b). Approximately 90 percent of the forecasted cargo tonnage would be accommodated at Nawiliwili Harbor, while the remaining 10 percent would be handled at Port Allen Harbor.
Forecast System Performance The forecast transportation system performance is based on the baseline transportation system and the socioeconomic forecasts described in the previous sections. The travel demand model estimates future forecast traffic volumes and system characteristics. The demand model estimates of the future land transportation system operations are described and compared to the existing performance characteristics.
Vehicular Volumes By 2020, average daily traffic volumes on Kaumualii Highway will increase by between 11 and 14 percent compared to 2007 conditions. Approximately 41,200 daily vehicles are forecast near Puhi Road, 33,800 vehicles are forecast near Omao, and 14,200 vehicles are expected near Hanapepe Park in 2020. North of Lihue, average daily traffic volumes on Kuhio Highway near Wailua are expected to increase by approximately 8 percent over existing conditions to 38,900 vehicles. Near Hanalei, vehicles would increase by approximately 5 percent from 11,600 in 2007 to 12,200 in 2020.
In 2035, average daily forecast traffic volumes on Kaumualii Highway between Lihue and Omao are expected to increase by approximately 33 percent compared to 2007 volumes. Daily traffic volumes would range between 40,000 vehicles and 48,000 vehicles. Forecast traffic

DISTRICT OF KAUAI: EXISTING AND FUTURE BASELINE ASSUMPTIONS AND CONDITIONS
TBG062714093019HNL 36
volumes are also expected to increase near Hanapepe Park (by approximately 24 percent to 15,600 daily vehicles) and between Waimea and Kekaha (by approximately 19 percent to 8,600 daily vehicles) by 2035. On Kuhio Highway, average daily traffic volumes increase by 25 percent (to 45,200 vehicles) in Wailua and by 12 percent (to 13,000 vehicles) in Hanalei.
Highway Volume to Capacity Ratio and Level of Service Tables 15 and 16 summarize the performance of the future modeled roadway system. The forecast increase in congested lane miles indicates an increase in vehicles on the Kauai roadway network in 2020 and in 2035. In 2007 and 2020, 6 percent of the modeled roadway network experiences V/C ratios of 1.0 or more (LOS F). This trend worsens to 10 percent of the network in 2035. Similar to 2007 conditions, most of the LOS F facilities are links classified as principal arterials with 31 percent of principal arterial lane miles at LOS F in 2020, and 48 percent at LOS F in 2035.
The majority of arterial and collector roadways on Kauai would operate at LOS C or better (V/C ratios of 0.8 or less) in both 2020 and 2035. This indicates that the majority of the 396 lane miles modeled would generally operate under uncongested conditions daily.
Figure 16 shows the 2020 forecast daily V/C ratios of modeled facilities on the Island of Kauai. Figure 17 shows the 2035 forecast V/C ratios. In both 2020 and 2035, the principal arterials of Kuhio Highway between Lihue and Kapaa, and Kaumualii Highway between Lihue and Omao, are expected to operate at LOS F. By 2035, the minor arterial segment of Kaumualii Highway through Lawai and through Hanapepe-Eleele would worsen from LOS E in 2020 to LOS F due to increases in traffic demand.
Kuhio Highway in Kealia, north of Kapaa, is expected to worsen from LOS E in 2007 to LOS F in both 2020 and 2035. Kuhio Highway within Lihue would worsen to LOS F compared to existing conditions due to increases in traffic.
TABLE 15 2020 Daily Roadway Performance
Roadway Link Classification
Percentage of Lane Miles (2020)
V/C < 0.8 (LOS C or better)
0.8 < V/C < 0.9 (LOS D)
0.9 < V/C < 1.0 (LOS E)
1.0 < V/C (LOS F)
Lane Miles
Principal Arterials 42% 11% 16% 31% 54
Minor Arterials 85% 2% 6% 7% 109
Collectors 100% 0% 0% 0% 233
Total 88% 2% 4% 6% 396
CH2M HILL, 2012b

DISTRICT OF KAUAI: EXISTING AND FUTURE BASELINE ASSUMPTIONS AND CONDITIONS
TBG062714093019HNL 37
TABLE 16 2035 Daily Roadway Performance
Roadway Link Classification
Percentage of Lane Miles (2035)
V/C < 0.8 (LOS C or better)
0.8 < V/C < 0.9 (LOS D)
0.9 < V/C < 1.0 (LOS E)
1.0 < V/C (LOS F)
Lane Miles
Principal Arterials 31% 6% 15% 48% 54
Minor Arterials 78% 7% 2% 13% 109
Collectors 100% 0% 0% 0% 233
Total 84% 3% 3% 10% 396
CH2M HILL, 2012b

DISTRICT OF KAUAI: EXISTING AND FUTURE BASELINE ASSUMPTIONS AND CONDITIONS
TBG062714093019HNL 38
FIGURE 16 Year 2020 Volume to Capacity Ratio

DISTRICT OF KAUAI: EXISTING AND FUTURE BASELINE ASSUMPTIONS AND CONDITIONS
TBG062714093019HNL 39
FIGURE 17 Year 2035 Volume to Capacity Ratio

DISTRICT OF KAUAI: EXISTING AND FUTURE BASELINE ASSUMPTIONS AND CONDITIONS
TBG062714093019HNL 40
Vehicle Trips As shown in Tables 17 and 18, the total vehicle trips generated on Kauai increase from 190,150 trips in 2007 to 217,450 trips in 2020 and 246,380 trips in 2035. Compared to 2007, overall vehicle trips are expected to increase by approximately 14 percent in 2020 and by approximately 30 percent in 2035. The East Kauai district experiences modest growth compared to 2007 in total vehicle trips; 13 percent growth in 2020 and 20 percent growth in 2035. The Lihue district would experience the most significant growth from approximately 69,540 total vehicle trips in 2007 to 82,900 trips in 2020 and 101,300 in 2035 which are growth rates of 19 percent and 46 percent, respectively. Approximately 38 percent of all trips generated in 2020, and 41 percent of trips in 2035, would travel to, from, or within the Lihue district. Similar to 2007 conditions, the majority of forecast vehicle trips would be able to complete their trip purpose within the same district they were generated.
TABLE 17 2020 Daily Vehicle Trips by District
Planning District Destination (2020)
Origin Waimea Hanapepe
-Eleele
Koloa-Poipu-
Kalaheo Lihue East
Kauai North Shore Total
Waimea 8,610 2,110 1,820 1,700 520 250 15,010
Hanapepe – Eleele 2,110 2,680 2,560 1,940 390 130 9,810
Koloa – Poipu - Kalaheo 1,820 2,560 22,430 9,270 1,900 710 38,690
Lihue 1,700 1,940 9,270 53,070 14,400 2,520 82,900
East Kauai 520 390 1,900 14,400 27,370 2,740 47,320
North Shore 250 130 710 2,520 2,740 17,370 23,720
Total 15,010 9,810 38,690 82,900 47,320 23,720 217,450
CH2M HILL, 2012b
TABLE 18 2035 Daily Vehicle Trips by District
Planning District Destination (2035)
Origin Waimea Hanapepe
-Eleele
Koloa-Poipu-
Kalaheo Lihue East
Kauai North Shore Total
Waimea 9,420 2,250 1,970 2,090 550 260 16,540
Hanapepe – Eleele 2,250 2,760 2,610 2,290 410 140 10,460
Koloa – Poipu - Kalaheo 1,970 2,610 24,050 11,460 2,020 740 42,850
Lihue 2,090 2,290 11,460 66,060 16,500 2,900 101,300
East Kauai 550 410 2,020 16,500 27,970 2,850 50,300
North Shore 260 140 740 2,900 2,850 18,040 24,930
Total 16,540 10,460 42,850 101,300 50,300 24,930 246,380
CH2M HILL, 2012b

DISTRICT OF KAUAI: EXISTING AND FUTURE BASELINE ASSUMPTIONS AND CONDITIONS
TBG062714093019HNL 41
The future average daily trip length between districts is shown in Tables 19 and 20. In 2020 and 2035, the average trip length between districts is expected to remain very similar to existing conditions. An average trip length between the Waimea district and the North Shore district in 2020 and in 2035 would be approximately 60 miles. The average length for all trips originating in the Waimea district in 2020 and in 2035 is the same as existing at approximately 15 miles, while the average trip length for all trips originating in the North Shore is also similar to existing conditions at approximately 11 miles.
TABLE 19 2020 Daily Average Vehicle Trip Length between Districts (Miles)
Planning District Destination (2020)
Origin Waimea Hanapepe
-Eleele
Koloa-Poipu-
Kalaheo Lihue East
Kauai North Shore
Weighted Average
Waimea 7 10 22 31 40 60 15
Hanapepe – Eleele 10 3 9 18 28 46 11
Koloa – Poipu - Kalaheo 22 9 3 13 22 42 9
Lihue 31 18 13 3 9 30 7
East Kauai 40 28 22 9 4 20 8
North Shore 61 46 42 30 20 5 11
Weighted Average 15 11 9 7 8 11 9
CH2M HILL, 2012b
TABLE 20 2035 Daily Average Vehicle Trip Length between Districts (Miles)
Planning District Destination (2035)
Origin Waimea Hanapepe
-Eleele
Koloa-Poipu-
Kalaheo Lihue East
Kauai North Shore
Weighted Average
Waimea 7 9 21 30 40 60 15
Hanapepe – Eleele 9 3 9 18 28 46 11
Koloa – Poipu - Kalaheo 21 9 3 13 22 42 9
Lihue 30 19 13 3 9 30 7
East Kauai 40 28 22 9 4 20 8
North Shore 61 47 42 30 20 5 12
Weighted Average 15 11 9 7 8 12 9
CH2M HILL, 2012b
The forecast daily vehicle miles traveled increases from 1,557,300 vehicle miles in 2007 to 1,729,200 vehicle miles in 2020 on the Island of Kauai. This equates to an 11 percent increase overall. In 2035, approximately 1,939,800 vehicle miles will be traveled island-wide, for an increase of approximately 24 percent between 2007 and 2035. Approximately 10 percent of the daily vehicle miles traveled would occur during the p.m. peak hour.

DISTRICT OF KAUAI: EXISTING AND FUTURE BASELINE ASSUMPTIONS AND CONDITIONS
TBG062714093019HNL 42
Average Trip Time The overall, island-wide, average trip time per vehicle trip would rise from 18 minutes in 2007 to 23 minutes in 2020 (28 percent increase), and 35 minutes in 2035 (94 percent increase) as shown in Tables 21 and 22. This increase in average trip time is attributed to higher travel times and increased trips associated with the East Kauai and North Shore districts. Average trip times from the East Kauai district would increase from 21 minutes in 2007 to 72 minutes in 2035 (an increase of over 200 percent). From the North Shore district, average trip times would more than double from 22 minutes in 2007 to 47 minutes in 2035.
Average trip times from Lihue would change only slightly from 15 minutes in 2007 to 22 minutes in 2035. This modest increase is likely due to the relatively large amount of roadway network and route choices within Lihue. Trips would be distributed across multiple facilities.
TABLE 21 2020 Daily Average Vehicle Trip Time between Districts (Minutes)
Planning District Destination (2020)
Origin Waimea Hanapepe
-Eleele
Koloa-Poipu-
Kalaheo Lihue East
Kauai North Shore
Weighted Average
Waimea 12 15 36 51 70 102 25
Hanapepe – Eleele 15 6 17 32 53 82 19
Koloa – Poipu - Kalaheo 36 17 8 24 44 75 17
Lihue 55 36 27 9 21 55 16
East Kauai 127 109 100 63 12 35 35
North Shore 158 135 125 102 34 10 29
Weighted Average 29 23 21 25 18 21 23
CH2M HILL, 2012b
TABLE 22 2035 Daily Average Vehicle Trip Time between Districts (Minutes)
Planning District Destination (2035)
Origin Waimea Hanapepe
-Eleele
Koloa-Poipu-
Kalaheo Lihue East
Kauai North Shore
Weighted Average
Waimea 11 15 36 57 79 112 26
Hanapepe – Eleele 15 6 18 40 62 91 22
Koloa – Poipu - Kalaheo 37 18 8 30 52 83 19
Lihue 69 49 39 15 23 56 22
East Kauai 242 225 215 147 12 37 72
North Shore 272 245 228 196 34 10 47
Weighted Average 37 33 33 46 20 23 35
CH2M HILL, 2012b

DISTRICT OF KAUAI: EXISTING AND FUTURE BASELINE ASSUMPTIONS AND CONDITIONS
TBG062714093019HNL 43
Daily vehicle hours traveled in 2020 and 2035 would increase at a faster rate than vehicle miles traveled in the future baseline years. A total of 72,550 daily vehicle hours of travel were estimated in 2020, which is approximately 40 percent greater than 2007 conditions. In 2035, 128,140 daily vehicle hours would be spent by automobiles and trucks on Kauai’s arterials or collectors. This represents a 148 percent increase over 2007 daily vehicle hours.
Travel Time Figures 18 and 19 depict the estimated p.m. peak vehicle travel times from Lihue to locations within the planning districts in 2020 and 2035, respectively. In 2020, travel times from Lihue to Kapaa, Hanalei, or Waimea would be similar to existing travel times. Trips to Poipu would take slightly less time (between 20 and 30 minutes) compared to 2007 conditions (between 30 and 45 minutes) due to the baseline improvement and widening of Kaumualii Highway between Rice Street in Lihue and Koloa Road in Lawai.
In 2035, p.m. peak hour travel times from Lihue would increase compared to existing conditions. Travel times to the Koloa/Poipu area would take between 45 and 60 minutes (existing trips take less than 45 minutes), while an average vehicle trip to Hanalei or Waimea would generally take between 60 and 75 minutes (existing trips take less than 60 minutes). No trips from Lihue would take more than 120 minutes during the p.m. peak in 2035.

DISTRICT OF KAUAI: EXISTING AND FUTURE BASELINE ASSUMPTIONS AND CONDITIONS
TBG062714093019HNL 44
FIGURE 18 2020 Travel Time from Lihue CH2M HILL, 2012b

DISTRICT OF KAUAI: EXISTING AND FUTURE BASELINE ASSUMPTIONS AND CONDITIONS
TBG062714093019HNL 45
FIGURE 19 2035 Travel Time from Lihue CH2M HILL, 2012b

DISTRICT OF KAUAI: EXISTING AND FUTURE BASELINE ASSUMPTIONS AND CONDITIONS
TBG062714093019HNL 46
References American Association of State Highway and Transportation Officials. 1999. Guide for the
Development of Bicycle Facilities.
CH2M HILL. 2012a. 2020 and 2035 Forecast Land Use and Socioeconomic Data Methodology. August.
CH2M HILL. 2012b. Travel Demand Model Analysis and Results for Federal-Aid Highways 2035 Transportation Plan for the District of Kauai. May.
County of Kauai. 2000. Kauai General Plan. November.
County of Kauai Planning Department. 2012. Planning District Boundaries. March.
State of Hawaii County Assessor. 2011. Hawaii County Assessor Data. March/April 2011.
State of Hawaii Department of Business, Economic Development, and Tourism (DBEDT). 2008. Visitor Plant Inventory.
State of Hawaii Department of Business, Economic Development and Tourism (DBEDT). 2011. State of Hawaii Data Book 2010. August.
State of Hawaii Department of Labor and Industrial Relations. 2007. Second Quarter 2007.
State of Hawaii Department of Transportation (HDOT). 2003. Bike Plan Hawaii, A State of Hawaii Master Plan Abridged Version. September.
State of Hawaii Department of Transportation, Airports Division (HDOT). 2008. Calendar Year 2007 Air Traffic Statistics. June.
State of Hawaii Department of Transportation (HDOT). 2009. HPMS Database 2009.
State of Hawaii Department of Transportation (HDOT). 2010. Highway Safety Improvement Program, High Accident Listings. November.
State of Hawaii Department of Transportation (HDOT). 2011. Statewide Transportation Improvement Program: Revision #3 FFY 2011 Through 2014. September 8.
State of Hawaii Department of Transportation (HDOT). 2012. Federal-Aid and State Highway Update: System Identification and Functional Classification. December.
State of Hawaii Department of Transportation (HDOT). 2013. Statewide Pedestrian Master Plan. May.
State of Hawaii Land Use Commission (LUC). 2007. Land Use District Boundaries. Available at: http://luc.state.hi.us/maps/2007kauai.pdf. Accessed on February 20, 2012.
Transportation Research Board. 2003. Access Management Manual.
Transportation Research Board. 2010. Highway Capacity Manual.

Attachment 1 Land Use and Socioeconomic Data Methodology


T E C H N I C A L M E M O R A N D U M Statewide Long-Range Land Transportation Plan and the Regional Long-Range Land Transportation Plans for Maui, Hawaii, and Kauai Counties
Land-Use and Socioeconomic Data Methodology
PREPARED FOR: Hawaii Long-Range Land Transportation Plan Project Management Team
PREPARED BY: Neha Rathi/CH2M HILL
DATE: Updated May 4, 2012
Introduction This memorandum discusses the methodology used to develop and process the 2007 land use and socioeconomic data for the three islands: Maui, Hawaii, and Kauai. The raw data for households, employment, schools, visitor accommodations, visitor attractions, airports, and harbors have been processed to prepare input for the travel demand modeling and traffic forecasting.
This socioeconomic data is available in many forms and from many sources. Typically, the data must provide at least one source for estimating trip productions and one source for estimating trip attractions. The trip productions are traditionally a function of the number of persons or households within an area. Trip attractions are related to activities outside the house such as employment, school, shopping or recreation within an area. This socioeconomic data is summarized at the traffic analysis zone (TAZ) level for the 2007 base year and shown in Appendix A through C.
Data and Source of Data The land use and socioeconomic data needed for TAZs by the travel demand model are listed in Table 1 along with the source for the data.
1

HAWAII LONG-RANGE LAND TRANSPORTATION PLAN – LAND-USE AND SOCIO-ECONOMIC DATA METHODOLOGY
The majority of trips in the travel demand models are produced by households and attracted by employment across each island. Table 2 summarizes the base year household
Table 1 Land-Use and Socioeconomic Data and Sources
Data Description Source Details
Household Assessor Data – Residential Buildings and Apartments data for each parcel
County information from DWELDAT - Residential Building Extract
COMINTEXT - Commercial Building Extract
Kauai – April/May 2011
Hawaii- March/April 2011
Maui – March/April 2011
School Enrollment
Hawaii Department of Education (Website: http://doe.k12.hi.us/reports/enrollment.htm)
Enrollment 2007-2008 (Fall 2008) – “Enroll 07-08 w/ all Charter.xls”
Employment Geo-coded point data from Hawaii Department of Labor and Industrial Relations
Second Quarter 2007 employment data “EQUIC72c”
Visitor Attraction
Hawaii State Department of Business, Economic Development and Tourism (DBEDT) (Website:
http://hawaii.gov/dbedt/) – The State of Hawaii Data book
2008 State of Hawaii Data Book – Section 7 (Recreation and Travel) Table 7.43 –
Attendance at museums and other cultural attractions : 2006 to 2008 “Sectio07.pdf”
2007 Hawaii State Parks Survey prepared for Hawaii Tourism Authority (December 2007)
“HTAPRO-Report-12-01-2007.pdf”
Visitor Accommodation
Assessor Data – Hotels, Motels and Dormitory data for each parcel
Visitor Plan Inventory DBEDT (Website: http://hawaii.gov/dbedt/info/visitor-stats/visitor-plant/)
County data from COMINTEXT - Commercial Building Extract
Kauai – April/May 2011
Hawaii- March/April 2011
Maui – March/April 2011
Totals from Visitor Plant Inventory 2008 – Table 5: Inventory by Area and Unit Type
“vpi2008.pdf”
Airport Tonnage Hawaii Department of Transportation, Airports Division (Website:
http://hawaii.gov/dot/airports/library/publications-and-statistics/) - Annual-Air-Traffic-Statistics
The State of Hawaii Airport Activity Statistics by Calendar Year – Table : Calendar Year 2007 Air Traffic Statistics “annual-air-traffic-
statistics.pdf”
Airport Passenger
Hawaii Department of Transportation, Airports Division (Website:
http://hawaii.gov/dot/airports/library/publications-and-statistics/) - Annual-Air-Traffic-Statistics
The State of Hawaii Airport Activity Statistics by Calendar Year – Table : Calendar Year 2007 Air Traffic Statistics “annual-air-traffic-
statistics.pdf”
Harbor Tonnage
Hawaii Department of Transportation, Harbors Division Data provided by Dean Watase from Harbor Division in email on 05/09/2011
Harbor Passenger
Hawaii State Department of Business, Economic Development and Tourism (Website:
http://hawaii.gov/dbedt/info/visitor-stats/visitor-research/) – Annual Visitor Research Report
2007 Annual Visitor Research Report – Table 76: 2007 Total Cruise Passengers by MMA
“2007-annual-visitor-research.pdf”
2

HAWAII LONG-RANGE LAND TRANSPORTATION PLAN – LAND-USE AND SOCIO-ECONOMIC DATA METHODOLOGY
and employment data for the three islands. Appendix A through C lists all of the socioeconomic data used in the travel demand model by TAZ for each island.
Island Households
Employment Retail Service Other Total
Hawaii 62,865 9,403 25,438 33,503 68,344 Kauai 22,870 4,174 11,863 14,352 30,389 Maui 47,203 9,474 24,467 35,748 69,689
Households The County assessor data was used to develop the estimate of housing units. The residential buildings and the commercial buildings datasets were used to estimate the 2007 housing units.
Each record in the residential buildings dataset was assigned an estimated number of units based on the square footage, number of rooms, number of bathrooms, and type of building. The numbers of units for each record for apartments from the commercial buildings dataset in the assessor data were estimated using an average of 700 square feet of area for each unit based on reviewing the information in the dataset.
The residential buildings dataset includes all the housing records for developments up to year 2011. Only the development records up to 2007 were included in estimating housing units for the year 2007.
The housing units’ data from the residential buildings dataset and apartments from the commercial buildings dataset were aggregated to census tract level for comparison review against 2000 and 2010 census data. The review showed that the 2007 summary from the assessor data was not matching the census data. To align the housing unit estimates from the assessor data and the census, an interpolation between 2000 and 2010 census data was done to estimate 2007 housing units by census tract. This approach was used on all three islands.
The occupancy rates for each census tract were calculated from the 2010 census data and applied to the estimated 2007 housing units by census tracts. This gave an estimate of 2007 households for each island by census tract. The households were then redistributed proportionally to the parcels from assessor data. The final household numbers were aggregated from the parcel level to TAZ level for each island for the land use input.
The data and methodology used to estimate households by TAZs is therefore different than a previous version of the Maui model, which used household estimates directly from the 2000 census.
School Enrollment The 2007 school enrollment data from the Department of Education website was aggregated to TAZ level for each island.
Table 2 2007 Household and Employment Data by Island
3

HAWAII LONG-RANGE LAND TRANSPORTATION PLAN – LAND-USE AND SOCIO-ECONOMIC DATA METHODOLOGY
Employment The Department of Labor and Industrial Relations (DLIR) provided employment data from the second quarter of year 2007 for the three islands. The data for the first month of the second quarter, April 2007, was processed for the land use inputs. The data from DLIR provided information on the employee count, employer ownership, state government department codes, North American Industry Classification System (NAICS) employment group codes, place address and X-Y coordinates.
A review of the data showed that a significant percentage of the data points were not geo-located correctly or were not geo-located. To address these issues, only the data points with ten or more employees were further studied to geo-locate using the NAICS code definition and internet search. The data points which were not geo-located and have less than ten employees were distributed proportionally for each employment group to the TAZs which have the same employment group.
The school and education program employees were distributed among the schools on each island, proportionally based on school enrollment levels. The library employees were equally distributed among the libraries on each island.
The geo-located data points were then aggregated to the TAZ level in different employment groups. The employment data for the project were categorized into three groups – Service, Retail and Other. The groups were identified based on the NAICS codes and are described in Table 3. The employment groups and corresponding NAICS codes are the same categorization used in a previous version of the Maui model developed by HNTB and are consistent across the three island models.
4

HAWAII LONG-RANGE LAND TRANSPORTATION PLAN – LAND-USE AND SOCIO-ECONOMIC DATA METHODOLOGY
Visitor Attractions The visitors’ data at parks and cultural attractions from the Hawaii State Data Book available on the DBEDT website was used for estimating the visitor attractions. The parks and cultural attraction sites were geo-located and assigned the visitor counts from the data book. The geo-located points were then aggregated to TAZ level for an estimate of visitor attractions on each island as per the Maui model specification.
Visitor Accommodations The commercial buildings dataset from the assessor data was processed to estimate the 2007 visitor accommodations. The records for hotels, motels and dormitories by each parcel were used in estimating the total units for visitor accommodations. The numbers of units for each record for visitor accommodation in the assessor data were estimated using an average of 400 square feet of area for each unit based on reviewing the information in the dataset. The number of units for each parcel was then aggregated to TAZ level for each island. The island totals were compared to the Visitor Plant Inventory from DBEDT and the TAZ data was adjusted up to match.
TABLE 2 Employment Groups and NAICS Codes
NAICS Code Range Description Employment Group
100000 - 219999 Agriculture, Forestry, Fishing and Hunting and Mining Other
220000 - 229999 Utilities Other
230000 - 299999 Construction Other
300000 - 399999 Manufacturing Other
400000 - 439999 Wholesale Other
440000 - 459999 Retail Retail
480000 - 499999 Transportation and Warehousing Other
500000 - 519999 Information Service
520000 - 529999 Finance and Insurance Service
530000 - 539999 Real Estate and Rental and Leasing Service
540000 - 549999 Professional, Scientific, Technical Services Service
550000 - 559999 Management of Companies and Enterprises Service
560000 - 599999 Administration, Support, Waste Management and Remediation Service
600000 - 619999 Educational Services Other
620000 - 699999 Health Care and Social Assistance Service
700000 - 719999 Arts, Entertainment and Recreation Service
720000 - 799999 Accommodations and Food Service Other
800000 - 899999 Private Services Service
900000 - 999999 Public Services Service
5
HAWAII LONG-RANGE LAND TRANSPORTATION PLAN – LAND-USE AND SOCIO-ECONOMIC DATA METHODOLOGY
The methodology used to estimate visitor accommodations by TAZs is different than the previous version of the Maui model, which used individual records from the Visitor Plant Inventory. The records were geocoded and aggregated to TAZ.
Airport and Harbor Data The airport and harbor data are consistent across the three islands and accounts for interaction between the islands. Tonnage and passengers leaving one of the three islands and arriving at another is included in the data. The travel demand models take into account the arrival and departures at each harbor/airport. The models do not link flows from one model to another, rather the models account for the total in or out for one island. Each island model operates independently of the other two island models.
Airport Tonnage: The airport tonnage data from the Hawaii Department of Transportation, Airports Division website was assigned to the corresponding TAZs on each island.
Airport Passengers: The airport passenger data from the Hawaii Department of Transportation, Airports Division website was assigned to the corresponding TAZs on each island.
Harbor Tonnage: The harbor tonnage data provided by the Hawaii Department of Transportation, Harbor Division was assigned to the corresponding TAZ on each island.
Harbor Passengers: The harbor passenger data from the Hawaii State Department of Business, Economic Development and Tourism was assigned to the corresponding TAZ on each island.
6

HAWAII LONG-RANGE LAND TRANSPORTATION PLAN – LAND-USE AND SOCIO-ECONOMIC DATA METHODOLOGY
Appendixes A through C – 2007 Socioeconomic Data Each islands 2007 base year socioeconomic data is shown in appendixes A, B, and C by traffic analysis zone (TAZ). Below is a glossary of the abbreviations used in tables.
Glossary HH Households SCHL ENR School Enrollments OTHER EMP Other Employment RETAIL EMP Retail Employment SERVICE EMP Service Employment TOT EMP Total Employment VIS ATT Visitor Attractions VISITOR ACCOM Visitor Accommodations AIR TONS Air Tonnage AIR PASNGR Air Passenger HARBOR TONS Harbor Tonnage HARBOR PSNGR Harbor Passenger
7
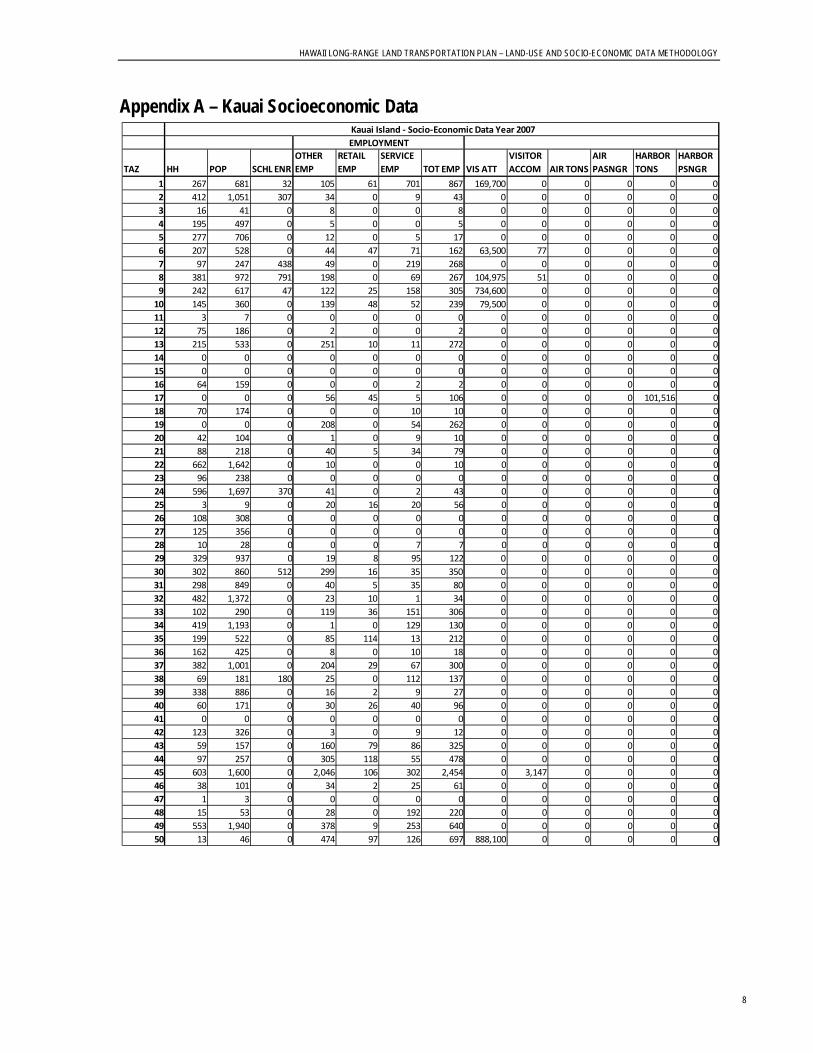
HAWAII LONG-RANGE LAND TRANSPORTATION PLAN – LAND-USE AND SOCIO-ECONOMIC DATA METHODOLOGY
Appendix A – Kauai Socioeconomic Data
TAZ HH POP SCHL ENROTHER EMP
RETAIL EMP
SERVICE EMP TOT EMP VIS ATT
VISITOR ACCOM AIR TONS
AIR PASNGR
HARBOR TONS
HARBOR PSNGR
1 267 681 32 105 61 701 867 169,700 0 0 0 0 02 412 1,051 307 34 0 9 43 0 0 0 0 0 03 16 41 0 8 0 0 8 0 0 0 0 0 04 195 497 0 5 0 0 5 0 0 0 0 0 05 277 706 0 12 0 5 17 0 0 0 0 0 06 207 528 0 44 47 71 162 63,500 77 0 0 0 07 97 247 438 49 0 219 268 0 0 0 0 0 08 381 972 791 198 0 69 267 104,975 51 0 0 0 09 242 617 47 122 25 158 305 734,600 0 0 0 0 0
10 145 360 0 139 48 52 239 79,500 0 0 0 0 011 3 7 0 0 0 0 0 0 0 0 0 0 012 75 186 0 2 0 0 2 0 0 0 0 0 013 215 533 0 251 10 11 272 0 0 0 0 0 014 0 0 0 0 0 0 0 0 0 0 0 0 015 0 0 0 0 0 0 0 0 0 0 0 0 016 64 159 0 0 0 2 2 0 0 0 0 0 017 0 0 0 56 45 5 106 0 0 0 0 101,516 018 70 174 0 0 0 10 10 0 0 0 0 0 019 0 0 0 208 0 54 262 0 0 0 0 0 020 42 104 0 1 0 9 10 0 0 0 0 0 021 88 218 0 40 5 34 79 0 0 0 0 0 022 662 1,642 0 10 0 0 10 0 0 0 0 0 023 96 238 0 0 0 0 0 0 0 0 0 0 024 596 1,697 370 41 0 2 43 0 0 0 0 0 025 3 9 0 20 16 20 56 0 0 0 0 0 026 108 308 0 0 0 0 0 0 0 0 0 0 027 125 356 0 0 0 0 0 0 0 0 0 0 028 10 28 0 0 0 7 7 0 0 0 0 0 029 329 937 0 19 8 95 122 0 0 0 0 0 030 302 860 512 299 16 35 350 0 0 0 0 0 031 298 849 0 40 5 35 80 0 0 0 0 0 032 482 1,372 0 23 10 1 34 0 0 0 0 0 033 102 290 0 119 36 151 306 0 0 0 0 0 034 419 1,193 0 1 0 129 130 0 0 0 0 0 035 199 522 0 85 114 13 212 0 0 0 0 0 036 162 425 0 8 0 10 18 0 0 0 0 0 037 382 1,001 0 204 29 67 300 0 0 0 0 0 038 69 181 180 25 0 112 137 0 0 0 0 0 039 338 886 0 16 2 9 27 0 0 0 0 0 040 60 171 0 30 26 40 96 0 0 0 0 0 041 0 0 0 0 0 0 0 0 0 0 0 0 042 123 326 0 3 0 9 12 0 0 0 0 0 043 59 157 0 160 79 86 325 0 0 0 0 0 044 97 257 0 305 118 55 478 0 0 0 0 0 045 603 1,600 0 2,046 106 302 2,454 0 3,147 0 0 0 046 38 101 0 34 2 25 61 0 0 0 0 0 047 1 3 0 0 0 0 0 0 0 0 0 0 048 15 53 0 28 0 192 220 0 0 0 0 0 049 553 1,940 0 378 9 253 640 0 0 0 0 0 050 13 46 0 474 97 126 697 888,100 0 0 0 0 0
EMPLOYMENT Kauai Island - Socio-Economic Data Year 2007
8

HAWAII LONG-RANGE LAND TRANSPORTATION PLAN – LAND-USE AND SOCIO-ECONOMIC DATA METHODOLOGY
TAZ HH POP SCHL ENROTHER EMP
RETAIL EMP
SERVICE EMP TOT EMP VIS ATT
VISITOR ACCOM AIR TONS
AIR PASNGR
HARBOR TONS
HARBOR PSNGR
51 6 21 0 273 0 0 273 0 0 0 0 0 052 219 768 949 578 285 106 969 0 0 0 0 0 053 201 705 0 4 0 0 4 0 0 0 0 0 054 102 358 0 0 0 0 0 0 0 0 0 0 055 0 0 0 93 92 138 323 0 0 0 0 905,594 455,86556 137 481 0 14 356 57 427 0 0 0 0 0 057 0 0 0 156 411 547 1,114 0 0 0 0 0 058 288 775 0 78 9 102 189 2,895 0 0 0 0 059 73 196 0 4 0 0 4 0 0 0 0 0 060 122 328 1,271 189 0 8 197 0 0 0 0 0 061 206 554 0 24 56 33 113 0 0 0 0 0 062 148 398 0 160 100 355 615 0 13 0 0 0 063 286 770 0 67 39 110 216 0 0 0 0 0 064 414 1,114 905 741 202 2,270 3,213 21,373 29 0 0 0 065 452 1,216 0 1,192 103 274 1,569 0 1,356 0 0 0 066 1 3 0 461 8 540 1,009 88,400 0 14,721 2,955,394 0 067 131 353 0 24 440 44 508 0 0 0 0 0 068 447 1,568 523 92 24 57 173 0 0 0 0 0 069 0 0 0 0 0 0 0 0 0 0 0 0 070 440 1,543 0 336 22 1,072 1,430 0 2 0 0 0 071 260 912 0 4 0 3 7 0 0 0 0 0 072 441 1,157 0 560 161 50 771 0 1,842 0 0 0 073 235 617 0 41 0 46 87 0 0 0 0 0 074 820 2,224 0 65 4 40 109 0 0 0 0 0 075 256 694 0 7 5 8 20 0 0 0 0 0 076 364 987 0 47 8 69 124 0 0 0 0 0 077 147 386 0 1 0 5 6 0 0 0 0 0 078 416 1,092 0 3 0 0 3 0 132 0 0 0 079 156 409 0 10 0 0 10 0 0 0 0 0 080 12 31 678 185 19 60 264 17,970 0 0 0 0 081 26 77 0 311 262 988 1,561 0 0 0 0 0 082 377 1,122 0 133 25 22 180 0 0 0 0 0 083 286 851 0 299 41 70 410 0 0 0 0 0 084 299 890 1,909 131 10 64 205 0 47 0 0 0 085 13 39 0 41 7 38 86 0 0 0 0 0 086 349 1,039 0 58 0 29 87 0 0 0 0 0 087 481 1,432 0 24 0 8 32 0 0 0 0 0 088 234 697 0 353 278 173 804 0 0 0 0 0 089 347 941 0 29 0 17 46 0 0 0 0 0 090 137 422 0 0 0 11 11 0 0 0 0 0 091 200 616 0 7 0 4 11 0 0 0 0 0 092 592 1,762 0 19 2 158 179 0 0 0 0 0 093 48 143 0 115 0 4 119 0 0 0 0 0 094 54 166 0 15 0 6 21 0 0 0 0 0 095 21 65 0 0 0 0 0 0 0 0 0 0 096 171 526 0 0 0 0 0 0 0 0 0 0 097 117 360 0 0 0 0 0 0 0 0 0 0 098 63 194 0 0 0 0 0 0 0 0 0 0 099 58 179 49 5 0 0 5 0 0 0 0 0 0
100 4 12 0 0 0 0 0 0 0 0 0 0 0
EMPLOYMENT Kauai Island - Socio-Economic Data Year 2007
9

HAWAII LONG-RANGE LAND TRANSPORTATION PLAN – LAND-USE AND SOCIO-ECONOMIC DATA METHODOLOGY
TAZ HH POP SCHL ENROTHER EMP
RETAIL EMP
SERVICE EMP TOT EMP VIS ATT
VISITOR ACCOM AIR TONS
AIR PASNGR
HARBOR TONS
HARBOR PSNGR
101 28 86 0 46 16 4 66 0 0 0 0 0 0102 48 148 0 0 0 0 0 0 0 0 0 0 0103 152 468 0 0 0 0 0 0 0 0 0 0 0104 106 326 0 0 0 0 0 0 0 0 0 0 0105 38 100 0 25 0 1 26 0 0 0 0 0 0106 47 124 0 1 8 33 42 0 0 0 0 0 0107 55 145 0 32 15 183 230 478,000 0 0 0 0 0108 373 986 313 224 35 86 345 0 0 0 0 0 0109 92 243 0 5 0 12 17 0 0 0 0 0 0110 0 0 0 0 0 0 0 0 0 0 0 0 0111 137 362 0 92 0 39 131 0 0 0 0 0 0112 44 116 0 0 0 12 12 0 0 0 0 0 0113 76 201 0 0 6 0 6 0 0 0 0 0 0114 35 93 0 0 6 89 95 0 0 0 0 0 0115 235 621 0 58 0 19 77 0 1,058 0 0 0 0116 638 1,687 0 210 0 29 239 0 0 0 0 0 0117 215 568 0 394 1 3 398 0 854 0 0 0 0118 140 370 0 133 0 19 152 0 0 0 0 0 0119 155 410 0 6 0 16 22 0 0 0 0 0 0120 75 198 0 67 40 351 458 0 85 0 0 0 0121 4 11 0 0 0 0 0 0 0 0 0 0 0122 23 61 222 0 0 0 0 592 0 0 0 0 0123 170 453 0 468 164 198 830 0 0 0 0 0 0124 10 27 0 0 0 0 0 0 0 0 0 0 0125 73 195 0 0 0 0 0 0 0 0 0 0 0126 132 352 0 0 0 0 0 0 0 0 0 0 0127 61 163 0 0 0 0 0 0 0 0 0 0 0128 9 24 0 0 0 0 0 0 0 0 0 0 0129 2 5 0 0 0 0 0 708,400 0 0 0 0 0130 0 0 0 0 0 0 0 0 0 0 0 0 0131 0 0 0 0 0 0 0 423,100 0 0 0 0 0
Totals 22,870 64,265 9,496 14,352 4,174 11,863 30,389 3,781,105 8,693 14,721 2,955,394 1,007,110 455,865
EMPLOYMENT Kauai Island - Socio-Economic Data Year 2007
10

HAWAII LONG-RANGE LAND TRANSPORTATION PLAN – LAND-USE AND SOCIO-ECONOMIC DATA METHODOLOGY
Appendix B – Hawaii Socioeconomic Data
TAZ HH POP SCHL ENROTHER EMP
RETAIL EMP
SERVICE EMP TOT EMP VIS ATT
VISITOR ACCOM AIR TONS
AIR PASNGR
HARBOR TONS
HARBOR PSNGR
1 0 0 131 652 20 343 1,015 16,382 0 22,349 3,216,642 0 02 0 0 0 0 0 0 0 0 0 0 0 0 03 883 2,495 0 97 1 15 113 0 0 0 0 0 04 28 79 0 10 9 92 111 0 0 0 0 0 05 1,121 3,167 0 102 0 49 151 0 0 0 0 0 06 0 0 0 0 0 0 0 0 0 0 0 0 07 101 285 0 37 0 0 37 0 0 0 0 0 08 229 647 0 37 0 10 47 0 0 0 0 0 09 0 0 0 0 0 0 0 0 0 0 0 0 0
10 0 0 0 0 0 0 0 119,237 0 0 0 0 011 4 13 0 1,050 581 210 1,841 0 0 0 0 0 012 0 0 0 224 5 3 232 0 0 0 0 0 013 23 74 0 0 0 0 0 0 0 0 0 0 014 0 0 0 8 8 22 38 0 0 0 0 0 015 0 0 0 45 17 64 126 0 0 0 0 0 016 908 2,912 3,531 1,095 314 560 1,969 0 0 0 0 0 017 120 331 0 44 0 247 291 0 0 0 0 0 018 0 0 0 0 0 14 14 0 0 0 0 0 019 0 0 0 129 457 80 666 0 0 0 0 0 020 185 511 0 281 733 140 1,154 0 0 0 0 0 021 128 410 0 542 144 214 900 232,112 1,155 0 0 0 022 2 6 0 127 196 399 722 0 0 0 0 0 023 91 292 0 362 194 426 982 0 35 0 0 0 024 695 1,919 0 221 103 497 821 0 0 0 0 0 025 821 2,267 0 1,005 91 616 1,712 0 1,031 0 0 0 026 276 762 0 294 28 799 1,121 9,197 299 0 0 0 027 48 133 0 13 0 1 14 0 0 0 0 0 028 116 309 0 2 0 4 6 0 0 0 0 0 029 1,083 2,819 0 342 2 57 401 0 25 0 0 0 030 295 768 552 82 0 7 89 0 0 0 0 0 031 242 630 0 23 8 23 54 22,300 0 0 0 0 032 495 1,289 0 56 0 33 89 0 0 0 0 0 033 397 1,033 0 63 72 112 247 0 0 0 0 0 034 102 272 0 243 8 13 264 0 29 0 0 0 035 272 702 0 94 0 20 114 0 0 0 0 0 036 105 271 0 0 0 0 0 0 0 0 0 0 037 72 186 0 22 0 33 55 0 0 0 0 0 038 787 2,032 0 728 19 421 1,168 0 2,230 0 0 0 039 91 235 0 208 163 163 534 0 0 0 0 0 040 208 537 0 17 0 113 130 0 0 0 0 0 041 38 98 0 145 43 49 237 0 0 0 0 0 042 39 102 0 0 0 27 27 0 0 0 0 0 043 6 16 0 0 0 0 0 0 0 0 0 0 044 422 1,107 577 89 20 237 346 5,780 0 0 0 0 045 320 840 1,342 266 8 204 478 0 0 0 0 0 046 11 29 0 0 0 0 0 0 0 0 0 0 047 148 389 0 0 32 0 32 0 0 0 0 0 048 117 308 137 15 1 3 19 0 0 0 0 0 049 143 375 0 146 82 607 835 0 8 0 0 0 050 114 304 0 32 1 2 35 0 0 0 0 0 0
Hawaii Island - Socio-Economic Data Year 2007EMPLOYMENT
11
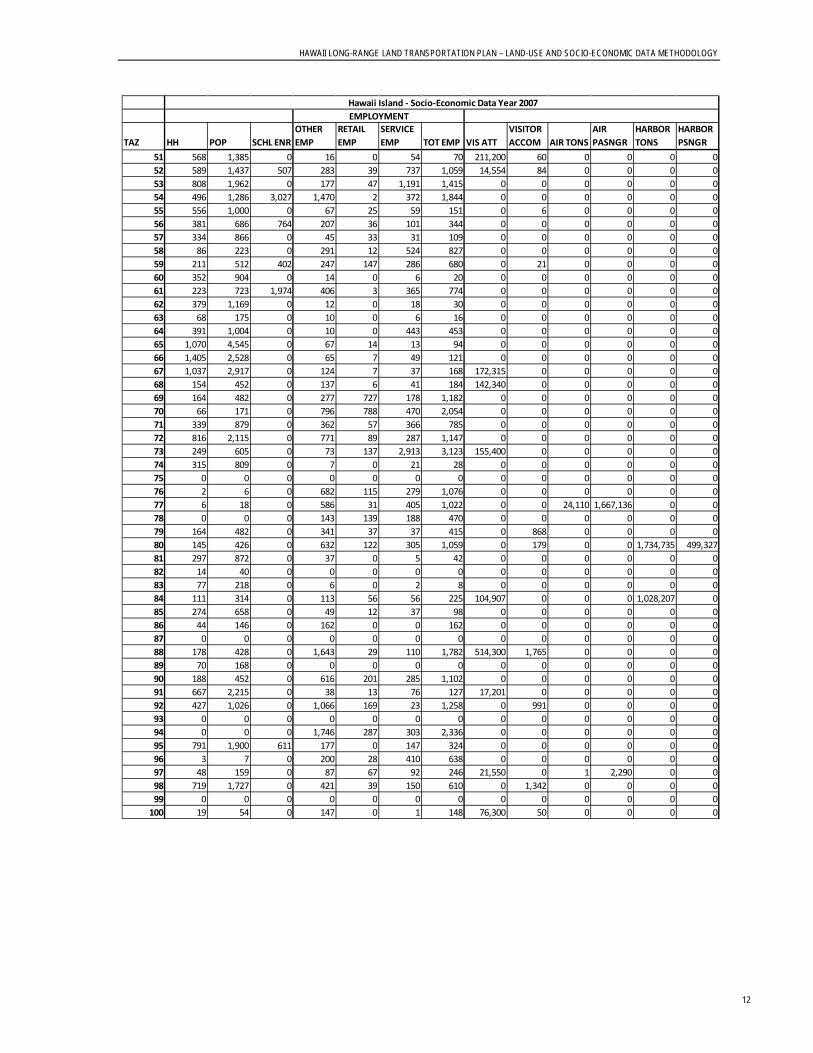
HAWAII LONG-RANGE LAND TRANSPORTATION PLAN – LAND-USE AND SOCIO-ECONOMIC DATA METHODOLOGY
TAZ HH POP SCHL ENROTHER EMP
RETAIL EMP
SERVICE EMP TOT EMP VIS ATT
VISITOR ACCOM AIR TONS
AIR PASNGR
HARBOR TONS
HARBOR PSNGR
51 568 1,385 0 16 0 54 70 211,200 60 0 0 0 052 589 1,437 507 283 39 737 1,059 14,554 84 0 0 0 053 808 1,962 0 177 47 1,191 1,415 0 0 0 0 0 054 496 1,286 3,027 1,470 2 372 1,844 0 0 0 0 0 055 556 1,000 0 67 25 59 151 0 6 0 0 0 056 381 686 764 207 36 101 344 0 0 0 0 0 057 334 866 0 45 33 31 109 0 0 0 0 0 058 86 223 0 291 12 524 827 0 0 0 0 0 059 211 512 402 247 147 286 680 0 21 0 0 0 060 352 904 0 14 0 6 20 0 0 0 0 0 061 223 723 1,974 406 3 365 774 0 0 0 0 0 062 379 1,169 0 12 0 18 30 0 0 0 0 0 063 68 175 0 10 0 6 16 0 0 0 0 0 064 391 1,004 0 10 0 443 453 0 0 0 0 0 065 1,070 4,545 0 67 14 13 94 0 0 0 0 0 066 1,405 2,528 0 65 7 49 121 0 0 0 0 0 067 1,037 2,917 0 124 7 37 168 172,315 0 0 0 0 068 154 452 0 137 6 41 184 142,340 0 0 0 0 069 164 482 0 277 727 178 1,182 0 0 0 0 0 070 66 171 0 796 788 470 2,054 0 0 0 0 0 071 339 879 0 362 57 366 785 0 0 0 0 0 072 816 2,115 0 771 89 287 1,147 0 0 0 0 0 073 249 605 0 73 137 2,913 3,123 155,400 0 0 0 0 074 315 809 0 7 0 21 28 0 0 0 0 0 075 0 0 0 0 0 0 0 0 0 0 0 0 076 2 6 0 682 115 279 1,076 0 0 0 0 0 077 6 18 0 586 31 405 1,022 0 0 24,110 1,667,136 0 078 0 0 0 143 139 188 470 0 0 0 0 0 079 164 482 0 341 37 37 415 0 868 0 0 0 080 145 426 0 632 122 305 1,059 0 179 0 0 1,734,735 499,32781 297 872 0 37 0 5 42 0 0 0 0 0 082 14 40 0 0 0 0 0 0 0 0 0 0 083 77 218 0 6 0 2 8 0 0 0 0 0 084 111 314 0 113 56 56 225 104,907 0 0 0 1,028,207 085 274 658 0 49 12 37 98 0 0 0 0 0 086 44 146 0 162 0 0 162 0 0 0 0 0 087 0 0 0 0 0 0 0 0 0 0 0 0 088 178 428 0 1,643 29 110 1,782 514,300 1,765 0 0 0 089 70 168 0 0 0 0 0 0 0 0 0 0 090 188 452 0 616 201 285 1,102 0 0 0 0 0 091 667 2,215 0 38 13 76 127 17,201 0 0 0 0 092 427 1,026 0 1,066 169 23 1,258 0 991 0 0 0 093 0 0 0 0 0 0 0 0 0 0 0 0 094 0 0 0 1,746 287 303 2,336 0 0 0 0 0 095 791 1,900 611 177 0 147 324 0 0 0 0 0 096 3 7 0 200 28 410 638 0 0 0 0 0 097 48 159 0 87 67 92 246 21,550 0 1 2,290 0 098 719 1,727 0 421 39 150 610 0 1,342 0 0 0 099 0 0 0 0 0 0 0 0 0 0 0 0 0
100 19 54 0 147 0 1 148 76,300 50 0 0 0 0
Hawaii Island - Socio-Economic Data Year 2007EMPLOYMENT
12

HAWAII LONG-RANGE LAND TRANSPORTATION PLAN – LAND-USE AND SOCIO-ECONOMIC DATA METHODOLOGY
TAZ HH POP SCHL ENROTHER EMP
RETAIL EMP
SERVICE EMP TOT EMP VIS ATT
VISITOR ACCOM AIR TONS
AIR PASNGR
HARBOR TONS
HARBOR PSNGR
101 305 862 0 667 0 494 1,161 0 310 0 0 0 0102 10 28 0 284 0 122 406 0 0 0 0 0 0103 5 14 0 0 0 0 0 471,400 0 0 0 0 0104 113 319 0 279 0 1 280 0 0 0 0 0 0105 201 536 0 258 55 180 493 0 0 0 0 0 0106 4 12 0 142 19 78 239 64,600 0 0 0 0 0107 3 8 0 0 0 51 51 0 0 0 0 0 0108 353 984 0 21 0 16 37 0 0 0 0 0 0109 86 247 241 27 0 1 28 0 0 0 0 0 0110 114 316 0 4 0 9 13 0 0 0 0 0 0111 0 0 0 0 0 0 0 0 0 0 0 0 0112 2 6 0 0 0 0 0 0 0 0 0 0 0113 2 6 0 0 0 0 0 0 0 0 0 0 0114 308 968 0 95 40 14 149 0 0 0 0 0 0115 2 5 0 0 0 1 1 0 0 0 0 0 0116 350 953 1,127 203 13 19 235 0 111 0 0 0 0117 576 1,568 314 37 23 14 74 44,400 0 0 0 0 0118 3,426 10,296 0 706 205 171 1,082 0 0 0 0 0 0119 1,925 5,975 0 345 109 7 461 0 0 0 0 0 0120 44 242 0 298 142 67 507 0 0 0 0 0 0121 10 26 146 4 0 0 4 0 19 0 0 0 0122 0 0 0 0 0 0 0 0 0 0 0 0 0123 72 190 0 0 0 0 0 0 4 0 0 0 0124 15 39 0 39 28 14 81 0 0 0 0 0 0125 0 0 0 0 0 0 0 0 0 0 0 0 0126 207 545 0 0 0 0 0 0 0 0 0 0 0127 8 21 0 27 42 5 74 0 0 0 0 0 0128 594 1,584 0 226 8 20 254 0 0 0 0 0 0129 230 764 1,094 132 8 464 604 0 0 0 0 0 0130 349 1,159 0 214 0 35 249 0 0 0 0 0 0131 497 1,194 0 26 0 63 89 0 0 0 0 0 0132 1,511 3,114 182 27 0 2 29 0 0 0 0 0 0133 39 95 334 322 283 970 1,575 18,300 19 0 0 0 0134 134 370 0 0 0 17 17 0 0 0 0 0 0135 213 554 0 0 9 0 9 0 0 0 0 0 0136 94 243 0 16 0 9 25 0 0 0 0 0 0137 48 124 0 0 0 5 5 0 0 0 0 0 0138 54 139 0 0 0 1 1 0 0 0 0 0 0139 97 250 0 0 0 0 0 0 0 0 0 0 0140 104 273 0 0 0 488 488 0 0 0 0 0 0141 101 265 0 3 0 1 4 0 117 0 0 0 0142 171 449 0 5 0 0 5 0 0 0 0 0 0143 0 0 0 0 0 0 0 0 0 0 0 0 0144 128 336 0 29 0 7 36 13,794 0 0 0 0 0145 92 242 0 1 0 9 10 0 0 0 0 0 0146 93 245 0 7 0 2 9 0 0 0 0 0 0147 7 18 0 44 5 36 85 0 0 0 0 0 0148 21 55 0 23 0 0 23 115,900 0 0 0 0 0149 206 542 0 2 0 7 9 0 0 0 0 0 0150 241 634 0 89 0 1 90 0 0 0 0 0 0
Hawaii Island - Socio-Economic Data Year 2007EMPLOYMENT
13

HAWAII LONG-RANGE LAND TRANSPORTATION PLAN – LAND-USE AND SOCIO-ECONOMIC DATA METHODOLOGY
TAZ HH POP SCHL ENROTHER EMP
RETAIL EMP
SERVICE EMP TOT EMP VIS ATT
VISITOR ACCOM AIR TONS
AIR PASNGR
HARBOR TONS
HARBOR PSNGR
151 44 116 0 0 0 0 0 0 0 0 0 0 0152 140 368 0 28 9 91 128 0 0 0 0 0 0153 12 32 0 10 0 0 10 0 0 0 0 0 0154 29 77 0 0 0 0 0 0 0 0 0 0 0155 76 203 0 40 0 8 48 0 0 0 0 0 0156 18 48 0 0 0 0 0 0 0 0 0 0 0157 153 408 471 24 6 0 30 0 0 0 0 0 0158 95 253 0 1 0 2 3 0 0 0 0 0 0159 9 24 0 0 0 0 0 0 0 0 0 0 0160 98 261 0 11 0 0 11 0 0 0 0 0 0161 443 1,138 0 1,156 618 111 1,885 0 0 0 0 0 0162 213 520 0 3 0 0 3 53,300 0 0 0 0 0163 99 241 0 17 1 1,176 1,194 0 0 0 0 0 0164 172 531 0 11 0 4 15 0 0 0 0 0 0165 535 1,505 0 19 2 2 23 0 0 0 0 0 0166 383 1,125 0 218 302 117 637 0 0 0 0 0 0167 1,327 4,093 596 83 0 302 385 0 0 0 0 0 0168 69 203 0 29 6 37 72 0 0 0 0 0 0169 332 975 543 70 0 22 92 0 0 0 0 0 0170 64 181 0 0 0 0 0 0 0 0 0 0 0171 42 119 0 247 78 43 368 0 0 0 0 0 0172 5 14 0 0 0 0 0 30,600 0 0 0 0 0173 64 181 0 0 0 0 0 9,800 0 0 0 0 0174 205 579 0 0 0 0 0 0 0 0 0 0 0175 134 379 880 62 0 2 64 0 0 0 0 0 0176 219 619 0 42 0 64 106 0 3 0 0 0 0177 55 155 0 0 0 0 0 0 0 0 0 0 0178 180 509 0 0 0 0 0 0 0 0 0 0 0179 443 1,252 0 16 0 13 29 0 18 0 0 0 0180 2 6 0 0 0 0 0 0 0 0 0 0 0181 53 150 0 0 0 0 0 0 2 0 0 0 0182 175 494 0 91 23 52 166 0 0 0 0 0 0183 5 14 0 0 0 0 0 0 0 0 0 0 0184 244 689 0 20 0 17 37 0 0 0 0 0 0185 944 3,135 0 49 0 57 106 0 0 0 0 0 0186 50 166 0 44 108 166 318 0 0 0 0 0 0187 117 337 0 0 0 0 0 0 0 0 0 0 0188 0 0 0 0 0 0 0 0 0 0 0 0 0189 13 36 0 0 0 0 0 0 0 0 0 0 0190 237 661 0 54 3 70 127 0 64 0 0 0 0191 231 644 0 0 0 0 0 0 0 0 0 0 0192 482 1,344 1,218 257 74 226 557 0 0 0 0 0 0193 15 43 0 0 0 0 0 0 0 0 0 0 0194 48 138 0 0 0 0 0 0 0 0 0 0 0195 126 363 0 4 0 3 7 0 0 0 0 0 0196 16 46 0 0 0 0 0 0 0 0 0 0 0197 255 734 0 8 0 6 14 5,500 0 0 0 0 0198 174 501 0 2 0 0 2 0 0 0 0 0 0199 376 1,043 200 72 2 11 85 0 0 0 0 0 0200 49 136 0 2 0 0 2 0 0 0 0 0 0
Hawaii Island - Socio-Economic Data Year 2007EMPLOYMENT
14

HAWAII LONG-RANGE LAND TRANSPORTATION PLAN – LAND-USE AND SOCIO-ECONOMIC DATA METHODOLOGY
TAZ HH POP SCHL ENROTHER EMP
RETAIL EMP
SERVICE EMP TOT EMP VIS ATT
VISITOR ACCOM AIR TONS
AIR PASNGR
HARBOR TONS
HARBOR PSNGR
201 146 405 0 4 0 0 4 0 0 0 0 0 0202 131 341 0 26 0 1 27 0 0 0 0 0 0203 28 73 0 0 0 0 0 0 0 0 0 0 0204 396 1,031 334 87 13 56 156 0 0 0 0 0 0205 18 47 0 0 0 0 0 0 0 0 0 0 0206 251 653 0 12 1 1 14 189,400 0 0 0 0 0207 317 825 0 0 0 0 0 0 0 0 0 0 0208 8 21 0 0 0 0 0 0 0 0 0 0 0209 264 687 0 7 0 17 24 0 0 0 0 0 0210 36 94 0 0 0 0 0 79,372 0 0 0 0 0211 100 260 0 3 0 5 8 0 0 0 0 0 0212 155 404 0 7 2 0 9 0 0 0 0 0 0213 168 437 0 0 0 6 6 0 0 0 0 0 0214 467 1,513 154 40 3 25 68 0 0 0 0 0 0215 40 130 0 0 0 0 0 157,900 0 0 0 0 0216 7 23 0 92 0 0 92 0 0 0 0 0 0217 417 1,311 0 60 0 3 63 0 0 0 0 0 0218 883 1,820 470 121 20 56 197 0 0 0 0 0 0219 467 1,468 0 8 0 5 13 0 0 0 0 0 0220 300 618 0 0 0 0 0 0 0 0 0 0 0221 883 1,820 0 0 0 0 0 100,000 0 0 0 0 0222 367 862 0 0 0 0 0 0 0 0 0 0 0223 703 1,651 0 345 99 155 599 11,900 0 0 0 0 0224 111 302 0 0 0 0 0 0 0 0 0 0 0225 28 76 0 0 0 0 0 0 42 0 0 0 0226 0 0 0 0 0 0 0 0 0 0 0 0 0227 25 68 0 0 0 0 0 0 0 0 0 0 0228 1,493 4,066 654 92 0 26 118 0 0 0 0 0 0229 336 789 60 9 0 3 12 0 0 0 0 0 0230 6 33 0 0 0 0 0 0 0 0 0 0 0231 369 2,029 2,424 577 94 136 807 0 140 0 0 0 0232 200 526 0 0 0 51 51 0 0 0 0 0 0233 11 29 0 0 0 0 0 0 0 0 0 0 0234 210 553 0 4 0 0 4 0 0 0 0 0 0235 67 176 0 0 0 0 0 0 0 0 0 0 0236 1 3 0 91 32 153 276 1,467,779 0 0 0 0 0237 0 0 0 0 0 0 0 0 0 0 0 0 0238 0 0 0 0 0 0 0 0 0 0 0 0 0239 1 3 0 0 0 0 0 0 0 0 0 0 0240 4 11 0 0 0 0 0 0 0 0 0 0 0241 469 1,234 516 235 15 81 331 0 0 0 0 0 0242 88 232 414 66 0 7 73 0 0 0 0 0 0243 30 79 0 0 0 0 0 0 0 0 0 0 0244 29 76 0 26 0 16 42 0 6 0 0 0 0245 24 63 0 0 0 0 0 0 0 0 0 0 0246 365 961 0 0 0 0 0 0 0 0 0 0 0247 120 316 0 29 0 16 45 0 0 0 0 0 0248 1,079 2,840 0 16 0 0 16 25,900 0 0 0 0 0249 23 61 0 0 0 0 0 0 0 0 0 0 0250 116 305 0 1 0 0 1 0 0 0 0 0 0
Hawaii Island - Socio-Economic Data Year 2007EMPLOYMENT
15

HAWAII LONG-RANGE LAND TRANSPORTATION PLAN – LAND-USE AND SOCIO-ECONOMIC DATA METHODOLOGY
TAZ HH POP SCHL ENROTHER EMP
RETAIL EMP
SERVICE EMP TOT EMP VIS ATT
VISITOR ACCOM AIR TONS
AIR PASNGR
HARBOR TONS
HARBOR PSNGR
251 33 87 0 0 0 0 0 0 0 0 0 0 0252 36 95 0 0 9 4 13 0 0 0 0 0 0253 26 68 0 0 0 0 0 0 0 0 0 0 0254 211 555 0 36 13 63 112 0 0 0 0 0 0255 1 3 0 93 0 0 93 0 0 0 0 0 0256 115 303 0 0 0 1 1 0 0 0 0 0 0257 262 689 0 0 0 0 0 0 0 0 0 0 0258 91 239 0 0 0 41 41 0 0 0 0 0 0259 9 24 0 0 0 0 0 0 0 0 0 0 0260 37 97 142 16 0 1 17 489,785 0 0 0 0 0261 34 89 0 0 0 0 0 0 0 0 0 0 0262 81 216 0 32 0 0 32 0 0 0 0 0 0263 42 139 0 33 0 10 43 0 0 0 0 0 0264 143 475 152 81 0 6 87 0 0 0 0 0 0265 169 561 0 126 0 69 195 0 28 0 0 0 0266 0 0 0 0 0 0 0 0 0 0 0 0 0267 426 2,343 0 3 0 0 3 0 0 0 0 0 0268 341 941 152 48 0 13 61 0 0 0 0 0 0269 29 80 0 11 0 0 11 0 0 0 0 0 0
Totals 62,865 173,038 26,373 33,503 9,403 25,438 68,344 5,184,705 11,061 46,460 4,886,068 2,762,942 499,327
Hawaii Island - Socio-Economic Data Year 2007EMPLOYMENT
16

HAWAII LONG-RANGE LAND TRANSPORTATION PLAN – LAND-USE AND SOCIO-ECONOMIC DATA METHODOLOGY
Appendix C – Maui Socioeconomic Data
TAZ HH POP SCHL ENROTHER EMP
RETAIL EMP
SERVICE EMP TOT EMP VIS ATT
VISITOR ACCOM AIR TONS
AIR PASNGR
HARBOR TONS
HARBOR PSNGR
1 349 1,006 327 335 14 109 458 261,841 164 10 5,271 0 02 0 0 0 25 4 31 60 0 0 0 0 0 03 85 245 0 0 0 0 0 0 0 0 0 0 04 45 98 0 499 8 12 519 0 8 0 0 0 05 388 1,187 0 247 0 259 506 525,400 33 0 0 0 06 273 835 0 3,960 523 99 4,582 0 44 0 0 0 07 169 517 0 70 2 37 109 0 0 0 0 0 08 126 421 0 28 0 47 75 0 0 0 0 0 09 93 285 0 0 0 6 6 0 0 0 0 0 0
10 178 545 0 47 1 16 64 0 0 0 0 0 011 492 1,066 0 231 0 46 277 0 0 0 0 0 012 423 887 0 232 14 25 271 0 0 0 0 0 013 89 187 0 219 78 111 408 0 0 0 0 0 014 0 0 1,450 147 0 49 196 0 0 0 0 0 015 187 434 0 121 43 71 235 0 42 0 0 0 016 798 1,674 0 191 7 106 304 0 0 0 0 0 017 0 0 0 0 0 98 98 0 0 0 0 0 018 999 2,321 0 537 108 156 801 0 5,934 0 0 0 019 196 455 650 128 4 98 230 0 0 0 0 0 020 133 309 0 49 1 31 81 0 0 0 0 0 021 100 334 0 170 0 14 184 0 113 0 0 0 022 827 2,765 0 54 0 57 111 0 0 0 0 0 023 2 2 0 0 0 0 0 0 0 0 0 0 024 263 743 0 6 0 28 34 0 0 0 0 0 025 1 4 0 0 0 0 0 0 0 0 0 0 026 9 11 0 8 0 157 165 0 0 0 0 0 027 427 519 0 77 46 374 497 471,570 0 0 0 0 028 6 13 0 0 0 0 0 1,322,817 0 0 0 0 029 240 520 0 6 0 0 6 0 0 0 0 0 030 6 13 0 2 24 0 26 3,800 0 0 0 0 031 368 798 0 63 2 21 86 0 0 0 0 0 032 1,166 2,527 0 223 64 68 355 0 0 0 0 0 033 5 14 0 0 0 13 13 0 0 0 0 0 034 874 1,447 1,387 465 108 596 1,169 0 0 0 0 0 035 685 1,134 0 46 19 192 257 0 0 0 0 0 036 1,180 3,087 0 335 7 85 427 0 0 0 0 0 037 321 2,288 0 2 9 0 11 0 0 0 0 0 038 893 2,540 208 457 127 70 654 0 0 0 0 0 039 306 507 0 0 0 108 108 0 2 0 0 0 040 32 39 0 9 0 0 9 0 7 0 0 0 041 99 120 0 8 0 0 8 0 0 0 0 0 042 203 247 0 13 0 7 20 0 0 0 0 0 043 79 196 0 0 0 13 13 0 0 0 0 0 044 175 433 701 531 183 223 937 0 49 0 0 0 045 502 1,243 0 287 50 221 558 72,262 0 0 0 0 046 101 250 0 1,205 545 479 2,229 264,692 49 0 0 0 047 70 173 0 4 0 4 8 0 0 0 0 0 048 218 540 0 109 342 110 561 0 0 0 0 0 049 519 2,716 0 211 170 724 1,105 0 0 0 0 0 050 3 16 0 0 0 0 0 0 0 0 0 0 0
EMPLOYMENT Maui Island - Socio-Economic Data Year 2007
17
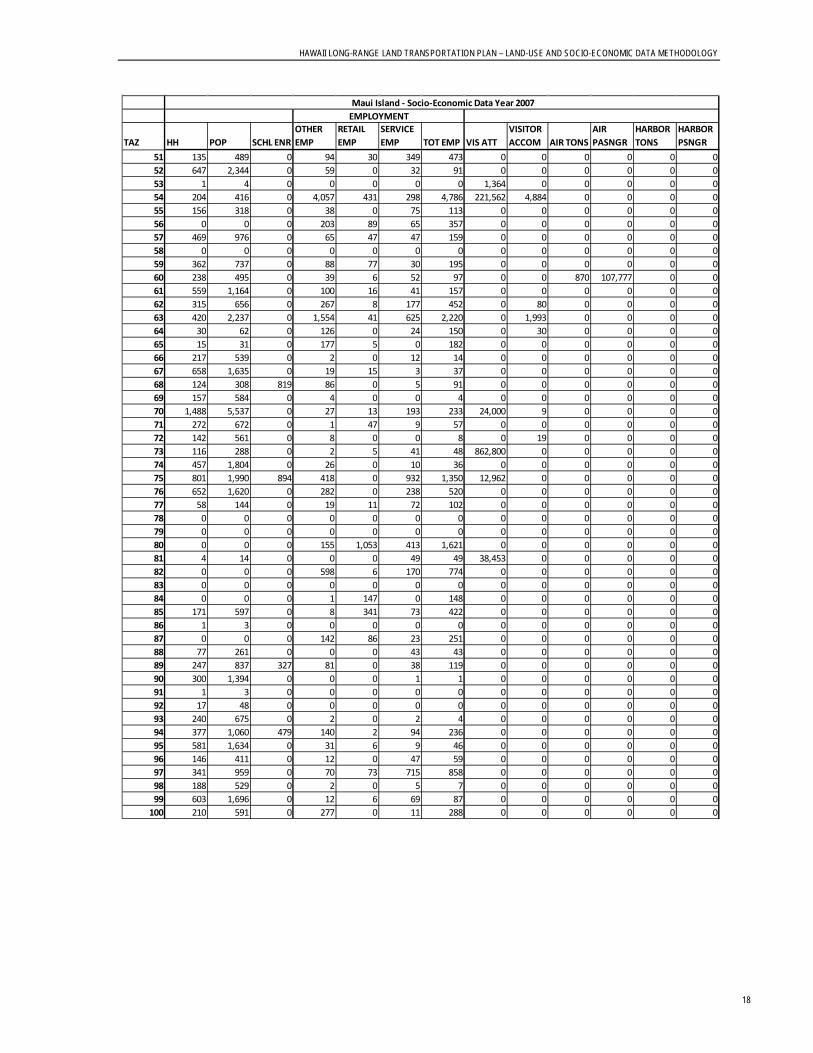
HAWAII LONG-RANGE LAND TRANSPORTATION PLAN – LAND-USE AND SOCIO-ECONOMIC DATA METHODOLOGY
TAZ HH POP SCHL ENROTHER EMP
RETAIL EMP
SERVICE EMP TOT EMP VIS ATT
VISITOR ACCOM AIR TONS
AIR PASNGR
HARBOR TONS
HARBOR PSNGR
51 135 489 0 94 30 349 473 0 0 0 0 0 052 647 2,344 0 59 0 32 91 0 0 0 0 0 053 1 4 0 0 0 0 0 1,364 0 0 0 0 054 204 416 0 4,057 431 298 4,786 221,562 4,884 0 0 0 055 156 318 0 38 0 75 113 0 0 0 0 0 056 0 0 0 203 89 65 357 0 0 0 0 0 057 469 976 0 65 47 47 159 0 0 0 0 0 058 0 0 0 0 0 0 0 0 0 0 0 0 059 362 737 0 88 77 30 195 0 0 0 0 0 060 238 495 0 39 6 52 97 0 0 870 107,777 0 061 559 1,164 0 100 16 41 157 0 0 0 0 0 062 315 656 0 267 8 177 452 0 80 0 0 0 063 420 2,237 0 1,554 41 625 2,220 0 1,993 0 0 0 064 30 62 0 126 0 24 150 0 30 0 0 0 065 15 31 0 177 5 0 182 0 0 0 0 0 066 217 539 0 2 0 12 14 0 0 0 0 0 067 658 1,635 0 19 15 3 37 0 0 0 0 0 068 124 308 819 86 0 5 91 0 0 0 0 0 069 157 584 0 4 0 0 4 0 0 0 0 0 070 1,488 5,537 0 27 13 193 233 24,000 9 0 0 0 071 272 672 0 1 47 9 57 0 0 0 0 0 072 142 561 0 8 0 0 8 0 19 0 0 0 073 116 288 0 2 5 41 48 862,800 0 0 0 0 074 457 1,804 0 26 0 10 36 0 0 0 0 0 075 801 1,990 894 418 0 932 1,350 12,962 0 0 0 0 076 652 1,620 0 282 0 238 520 0 0 0 0 0 077 58 144 0 19 11 72 102 0 0 0 0 0 078 0 0 0 0 0 0 0 0 0 0 0 0 079 0 0 0 0 0 0 0 0 0 0 0 0 080 0 0 0 155 1,053 413 1,621 0 0 0 0 0 081 4 14 0 0 0 49 49 38,453 0 0 0 0 082 0 0 0 598 6 170 774 0 0 0 0 0 083 0 0 0 0 0 0 0 0 0 0 0 0 084 0 0 0 1 147 0 148 0 0 0 0 0 085 171 597 0 8 341 73 422 0 0 0 0 0 086 1 3 0 0 0 0 0 0 0 0 0 0 087 0 0 0 142 86 23 251 0 0 0 0 0 088 77 261 0 0 0 43 43 0 0 0 0 0 089 247 837 327 81 0 38 119 0 0 0 0 0 090 300 1,394 0 0 0 1 1 0 0 0 0 0 091 1 3 0 0 0 0 0 0 0 0 0 0 092 17 48 0 0 0 0 0 0 0 0 0 0 093 240 675 0 2 0 2 4 0 0 0 0 0 094 377 1,060 479 140 2 94 236 0 0 0 0 0 095 581 1,634 0 31 6 9 46 0 0 0 0 0 096 146 411 0 12 0 47 59 0 0 0 0 0 097 341 959 0 70 73 715 858 0 0 0 0 0 098 188 529 0 2 0 5 7 0 0 0 0 0 099 603 1,696 0 12 6 69 87 0 0 0 0 0 0
100 210 591 0 277 0 11 288 0 0 0 0 0 0
EMPLOYMENT Maui Island - Socio-Economic Data Year 2007
18

HAWAII LONG-RANGE LAND TRANSPORTATION PLAN – LAND-USE AND SOCIO-ECONOMIC DATA METHODOLOGY
TAZ HH POP SCHL ENROTHER EMP
RETAIL EMP
SERVICE EMP TOT EMP VIS ATT
VISITOR ACCOM AIR TONS
AIR PASNGR
HARBOR TONS
HARBOR PSNGR
101 48 135 0 0 0 4 4 0 0 0 0 0 0102 148 416 1,354 153 0 18 171 0 0 0 0 0 0103 186 405 0 19 0 3 22 0 0 0 0 0 0104 4 29 0 13 0 0 13 0 0 0 0 0 0105 0 0 0 418 23 401 842 0 0 0 0 0 0106 34 119 0 66 0 345 411 0 0 32,368 6,517,710 0 0107 0 0 0 1,747 1,013 1,135 3,895 0 0 0 0 0 0108 320 1,117 0 3,743 681 1,294 5,718 0 0 0 0 0 0109 0 0 0 547 243 243 1,033 0 427 0 0 3,143,083 496,813110 0 0 0 261 543 217 1,021 0 31 0 0 0 0111 58 202 0 243 12 582 837 0 0 0 0 0 0112 38 133 0 465 633 717 1,815 0 0 0 0 0 0113 180 628 0 67 26 25 118 0 0 0 0 0 0114 712 2,323 1,006 126 0 14 140 0 0 0 0 0 0115 859 2,802 0 7 0 392 399 0 0 0 0 0 0116 289 1,009 0 0 0 7 7 0 0 0 0 0 0117 427 1,490 0 1 0 23 24 0 0 0 0 0 0118 163 757 2,589 266 0 32 298 0 0 0 0 0 0119 254 1,180 0 11 0 0 11 0 0 0 0 0 0120 368 1,248 0 1 0 2,425 2,426 0 0 0 0 0 0121 509 1,726 0 9 0 13 22 0 0 0 0 0 0122 687 2,329 1,015 106 0 15 121 0 0 0 0 0 0123 824 3,828 0 5 1 43 49 0 0 0 0 0 0124 387 1,312 0 10 47 122 179 0 12 0 0 0 0125 255 1,007 0 44 7 11 62 0 0 0 0 0 0126 46 182 0 0 0 783 783 0 0 0 0 0 0127 728 1,799 0 646 75 1,507 2,228 0 0 0 0 0 0128 413 1,630 818 362 55 1,017 1,434 0 0 0 0 0 0129 184 517 0 45 74 75 194 0 0 0 0 0 0130 893 2,510 0 1,139 183 850 2,172 0 0 0 0 0 0131 703 2,775 1,602 403 58 209 670 0 0 0 0 0 0132 33 93 0 11 0 2 13 0 0 0 0 0 0133 39 110 0 0 0 0 0 0 0 0 0 0 0134 483 1,365 0 5 2 7 14 0 0 0 0 0 0135 650 1,685 0 74 0 84 158 0 352 0 0 0 0136 535 1,387 0 3 0 5 8 0 352 0 0 0 0137 282 731 0 108 0 30 138 0 0 0 0 0 0138 545 1,413 0 26 0 23 49 0 0 0 0 0 0139 18 47 0 1 0 7 8 0 0 0 0 0 0140 308 798 0 2 1 27 30 0 0 0 0 0 0141 144 373 0 3 0 0 3 0 0 0 0 0 0142 202 524 0 188 111 104 403 0 0 0 0 0 0143 129 334 0 408 375 269 1,052 0 1,274 0 0 0 0144 105 272 0 0 0 0 0 0 0 0 0 0 0145 995 3,577 277 1,157 100 560 1,817 0 0 0 0 0 0146 70 202 0 13 0 0 13 259,500 0 0 0 0 0147 93 268 0 8 0 7 15 0 0 0 0 0 0148 154 444 0 0 0 0 0 0 0 0 0 0 0149 371 804 0 46 0 267 313 0 0 0 0 0 0150 36 78 0 0 0 0 0 0 0 0 0 0 0
EMPLOYMENT Maui Island - Socio-Economic Data Year 2007
19

HAWAII LONG-RANGE LAND TRANSPORTATION PLAN – LAND-USE AND SOCIO-ECONOMIC DATA METHODOLOGY
TAZ HH POP SCHL ENROTHER EMP
RETAIL EMP
SERVICE EMP TOT EMP VIS ATT
VISITOR ACCOM AIR TONS
AIR PASNGR
HARBOR TONS
HARBOR PSNGR
151 132 286 455 56 0 40 96 0 0 0 0 0 0152 630 1,365 0 286 6 49 341 29,275 0 0 0 0 0153 469 2,454 2,235 228 0 17 245 0 77 0 0 0 0154 375 764 0 1,060 13 110 1,183 0 3,153 0 0 0 0155 659 1,372 0 92 42 76 210 0 78 0 0 0 0156 118 257 0 1 0 9 10 0 0 0 0 0 0157 952 2,071 0 162 21 35 218 0 0 0 0 0 0158 2,059 4,479 441 238 65 154 457 0 0 0 0 0 0
Totals 47,203 135,195 19,034 35,748 9,474 24,467 69,689 4,372,298 19,216 33,248 6,630,758 3,143,083 496,813
EMPLOYMENT Maui Island - Socio-Economic Data Year 2007
20
Attachment 2 2020 and 2035 Forecast
Land Use and Socioeconomic Data Methodology


1
T E C H N I C A L M E M O R A N D U M Statewide Long-Range Land Transportation Plan and the Regional Long-Range Land Transportation Plans for Maui, Hawaii and Kauai Counties
2020 and 2035 Forecast Land Use and Socioeconomic Data Methodology
PREPARED FOR: Hawaii Long-Range Land Transportation Plan Technical Advisory Committee
PREPARED BY: Kevin Murphy/CH2M HILL
DATE: Revised August 30, 2012
Introduction This memorandum discusses the methodology used to develop the 2020 and 2035 land use and socioeconomic data for the three islands: Maui, Hawaii and Kauai. The forecasts for households, employment, schools, visitor accommodations, visitor attractions, airports, and harbors have been processed to prepare input for the travel demand modeling and traffic forecasting.
Forecast Data and Methods The land use and socioeconomic forecast data comes from the Hawaii State Department of Business, Economic Development, and Tourism (DBEDT). The DBEDT forecast used is the Long Range Project (November 2008). This data includes forecasts of population, employment and visitor’s for each County in the State of Hawaii. Table 1 shows the variables used to forecast each data item needed for the travel demand model.
Maui and Kauai County staff provided information on where they expected future growth to occur. This information was used to assist in the distribution of the DBEDT forecasts for the Island to the traffic analysis zones (TAZ). Maui staff provided growth information for housing units, visitor accommodations, and square footage by retail, office and industrial uses by TAZ. This information was used to distribute forecast variables (households, retail, service and other employment, and visitor accommodations).
Kauai County staff provided information on the growth of housing units, resort units and commercial square footage by TAZ. This information was used to distribute forecast variables (households, employment and visitor units).
Household forecast distribution for Hawaii used an intermediate step from the DBEDT island total to district using the population forecasts from the Hawaii County General Plan. Households were distributed to the districted based upon the population forecast distribution described in the plan. The TAZ distribution of households was done as a proportionate share of each TAZs percentage of the district’s total in the base year applied to the forecasted district total. Employment growth was distributed based upon the base year distribution.

2
Summary of Forecasts The following tables summarize the 2020 and 2035 forecasts for the three Islands. Hawaii is forecasted to experience the largest growth in households with 43,436 between 2007 and 2035. Hawaii is also expected to have the highest employment growth with 34,362 between 2007 and 2035 with Maui having a similar amount of growth with 32,347. Kauai is forecasted to grow at a slower rate than both Hawaii and Maui between 2007 and 2035.
Island 2007 Base Year Households Retail Service Other Total
Hawaii 62,865 9,403 25,438 33,503 68,344 Kauai 22,870 4,174 11,863 14,352 30,389 Maui 47,203 9,474 24,467 35,748 69,689
TABLE 1 Land Use and Socioeconomic Data Variables and Methods Forecast Data DBEDT Variable used Method
Household Population Calculated persons per household for 2020 and 2035 based upon the change in household size from 2000 to 2010 from the Census. Applied the revised person/household to the population forecast to estimate households. Households were distributed based upon information provided by the County or base year data.
School Enrollment Population ages 5 to 19 Annual growth rates were developed for population ages 5 to 19 for each forecast period (2007 to 2020 and 2020 to 2035). The growth rates were applied to the 2007 base to estimate 2020 and then to 2020 to estimate 2035 school enrollment.
Employment Employment by category Growth increment was calculated for employment from 2007 to 2020 and from 2020 to 2035. Employment was distributed based upon data provided by the County or the base year.
Visitor Attraction Visitor projection from average growth scenario
Annual growth rate was calculated for each forecast period (2007 to 2020 and 2020 to 2035) and applied to the base data.
Visitor Accommodation
Hotel rooms (Visitor accommodations) projection from average growth scenario
Growth increment was calculated for each forecast period (2007 to 2020 and 2020 to 2035) and distributed based upon data provided by the County or the base year.
Airport Tonnage Population Annual growth rate was calculated for each forecast period (2007 to 2020 and 2020 to 2035) and applied to the base data.
Airport Passenger Visitor projection from average growth scenario
Annual growth rate was calculated for each forecast period (2007 to 2020 and 2020 to 2035) and applied to the base data.
Harbor Tonnage Population Annual growth rate was calculated for each forecast period (2007 to 2020 and 2020 to 2035) and applied to the base data.
Harbor Passenger Visitor projection from average growth scenario
Annual growth rate was calculated for each forecast period (2007 to 2020 and 2020 to 2035) and applied to the base data.
TABLE 2 2007 Base Year Data by Island

3
Island 2020 2035 2020 2035 Population Households Population Households Person/HH Person/HH
Hawaii 225,264 83,164 280,020 106,301 2.71 2.63 Kauai 73,536 25,589 85,177 29,780 2.87 2.86 Maui 163,093 58,674 197,356 74,105 2.78 2.66
Island 2020 2035 Retail Service Other Total Retail Service Other Total
Hawaii 11,353 42,248 31,723 85,324 13,425 52,799 36,482 102,706 Kauai 4,730 17,258 14,488 36,476 5,302 20,519 16,341 42,162 Maui 11,442 38,137 37,698 87,277 13,075 45,997 42,964 102,036
TABLE 3 2020 and 2035 Population and Household Forecasts by Island
TABLE 4 2020 and 2035 Employment by Category by Island


Attachment 3 Summary of Socioeconomic Data


TBG062714093019HNL
A summary of the socioeconomic data for 2007, 2020, and 2035 is provided by traffic analysis zone. Below is a glossary of the abbreviations used in the tables.
Glossary TAZ Traffic Analysis Zone HH Households POP Population SCHL ENR School Enrollments OTHER EMP Other Employment RETAIL EMP Retail Employment SERVICE EMP Service Employment TOT EMP Total Employment VIS ATT Visitor Attractions VISITOR ACCOM Visitor Accommodations AIR TONS Air Tonnage AIR PASNGR Air Passenger HARBOR TONS Harbor Tonnage HARBOR PSNGR Harbor Passenger

DISTRICT OF KAUAI: EXISTING AND FUTURE BASELINE ASSUMPTIONS AND CONDITIONS
TBG062714093019HNL
TAZ HH POP SCHL ENROTHER EMP
RETAIL EMP
SERVICE EMP TOT EMP VIS ATT
VISITOR ACCOM AIR TONS
AIR PASNGR
HARBOR TONS
HARBOR PSNGR HH POP SCHL ENR
OTHER EMP
RETAIL EMP
SERVICE EMP TOT EMP VIS ATT
VISITOR ACCOM AIR TONS
AIR PASNGR
HARBOR TONS
HARBOR PSNGR HH POP SCHL ENR
OTHER EMP
RETAIL EMP
SERVICE EMP TOT EMP VIS ATT
VISITOR ACCOM AIR TONS
AIR PASNGR
HARBOR TONS
HARBOR PSNGR
1 267 681 32 105 61 701 867 169,700 0 0 0 0 0 267 767 35 106 68 958 1,132 180,261 0 0 0 0 0 267 764 41 120 70 1,007 1,196 204,848 0 0 0 0 02 412 1,051 307 34 0 9 43 0 0 0 0 0 0 450 1,293 333 34 0 12 47 0 6 0 0 0 0 450 1,287 395 39 0 13 52 0 6 0 0 0 03 16 41 0 8 0 0 8 0 0 0 0 0 0 16 46 0 8 0 0 8 0 0 0 0 0 0 16 46 0 9 0 0 9 0 0 0 0 0 04 195 497 0 5 0 0 5 0 0 0 0 0 0 195 560 0 5 0 0 5 0 0 0 0 0 0 195 558 0 6 0 0 6 0 0 0 0 0 05 277 706 0 12 0 5 17 0 0 0 0 0 0 277 796 0 12 0 7 19 0 0 0 0 0 0 277 792 0 14 0 7 21 0 0 0 0 0 06 207 528 0 44 47 71 162 63,500 77 0 0 0 0 207 595 0 44 52 97 194 67,452 77 0 0 0 0 207 592 0 50 54 102 206 76,652 77 0 0 0 07 97 247 438 49 0 219 268 0 0 0 0 0 0 150 431 475 49 0 299 349 0 8 0 0 0 0 489 1,399 564 56 0 314 370 0 8 0 0 0 08 381 972 791 198 0 69 267 104,975 51 0 0 0 0 381 1,095 857 200 0 94 294 111,508 51 0 0 0 0 381 1,090 1,019 225 0 99 325 126,717 51 0 0 0 09 242 617 47 122 25 158 305 734,600 0 0 0 0 0 242 695 51 123 28 216 367 780,316 0 0 0 0 0 242 692 61 139 29 227 394 886,748 0 0 0 0 0
10 145 360 0 139 48 52 239 79,500 0 0 0 0 0 145 417 0 140 53 71 265 84,448 0 0 0 0 0 145 415 0 158 55 75 288 95,966 29 0 0 0 011 3 7 0 0 0 0 0 0 0 0 0 0 0 3 9 0 0 0 0 0 0 0 0 0 0 0 3 9 0 0 0 0 0 0 0 0 0 0 012 75 186 0 2 0 0 2 0 0 0 0 0 0 75 216 0 2 0 0 2 0 0 0 0 0 0 75 215 0 2 0 0 2 0 0 0 0 0 013 215 533 0 251 10 11 272 0 0 0 0 0 0 215 618 0 253 11 15 280 0 0 0 0 0 0 215 615 0 286 11 16 313 0 0 0 0 0 014 0 0 0 0 0 0 0 0 0 0 0 0 0 0 0 0 0 0 0 0 0 0 0 0 0 0 0 0 0 0 0 0 0 0 0 0 0 0 015 0 0 0 0 0 0 0 0 0 0 0 0 0 0 0 0 0 0 0 0 0 0 0 0 0 0 0 0 0 0 0 0 0 0 0 0 0 0 016 64 159 0 0 0 2 2 0 0 0 0 0 0 64 184 0 0 0 3 3 0 0 0 0 0 0 64 183 0 0 0 3 3 0 0 0 0 0 017 0 0 0 56 45 5 106 0 0 0 0 101,516 0 0 0 0 57 50 7 113 0 0 0 0 104,889 0 0 0 0 64 51 7 122 0 0 0 0 121,482 018 70 174 0 0 0 10 10 0 0 0 0 0 0 70 201 0 0 0 14 14 0 0 0 0 0 0 70 200 0 0 0 14 14 0 0 0 0 0 019 0 0 0 208 0 54 262 0 0 0 0 0 0 99 285 0 210 0 74 284 0 16 0 0 0 0 231 661 0 237 0 78 314 0 16 0 0 0 020 42 104 0 1 0 9 10 0 0 0 0 0 0 42 121 0 1 0 12 13 0 0 0 0 0 0 42 120 0 1 0 13 14 0 0 0 0 0 021 88 218 0 40 5 34 79 0 0 0 0 0 0 88 253 0 40 6 46 92 0 0 0 0 0 0 88 252 0 46 6 49 100 0 0 0 0 0 022 662 1,642 0 10 0 0 10 0 0 0 0 0 0 662 1,903 0 10 0 0 10 0 0 0 0 0 0 662 1,893 0 11 0 0 11 0 0 0 0 0 023 96 238 0 0 0 0 0 0 0 0 0 0 0 96 276 0 0 0 0 0 0 0 0 0 0 0 96 275 0 0 0 0 0 0 0 0 0 0 024 596 1,697 370 41 0 2 43 0 0 0 0 0 0 596 1,713 401 41 0 3 44 0 0 0 0 0 0 596 1,705 477 47 0 3 50 0 0 0 0 0 025 3 9 0 20 16 20 56 0 0 0 0 0 0 3 9 0 20 18 27 65 0 0 0 0 0 0 3 9 0 23 18 29 70 0 0 0 0 0 026 108 308 0 0 0 0 0 0 0 0 0 0 0 108 310 0 0 0 0 0 0 0 0 0 0 0 108 309 0 0 0 0 0 0 0 0 0 0 027 125 356 0 0 0 0 0 0 0 0 0 0 0 125 359 0 0 0 0 0 0 0 0 0 0 0 125 358 0 0 0 0 0 0 0 0 0 0 028 10 28 0 0 0 7 7 0 0 0 0 0 0 10 29 0 0 0 10 10 0 0 0 0 0 0 10 29 0 0 0 10 10 0 0 0 0 0 029 329 937 0 19 8 95 122 0 0 0 0 0 0 329 946 0 19 9 130 158 0 0 0 0 0 0 329 941 0 22 9 136 167 0 0 0 0 0 030 302 860 512 299 16 35 350 0 0 0 0 0 0 302 868 555 302 18 48 367 0 0 0 0 0 0 302 864 659 340 18 50 409 0 0 0 0 0 031 298 849 0 40 5 35 80 0 0 0 0 0 0 298 856 0 40 6 48 94 0 0 0 0 0 0 298 852 0 46 6 50 102 0 0 0 0 0 032 482 1,372 0 23 10 1 34 0 0 0 0 0 0 482 1,385 0 23 11 1 36 0 0 0 0 0 0 482 1,379 0 26 11 1 39 0 0 0 0 0 033 102 290 0 119 36 151 306 0 0 0 0 0 0 102 293 0 120 40 206 366 0 0 0 0 0 0 102 292 0 135 41 217 393 0 0 0 0 0 034 419 1,193 0 1 0 129 130 0 0 0 0 0 0 419 1,204 0 1 0 176 177 0 0 0 0 0 0 419 1,198 0 1 0 185 186 0 0 0 0 0 035 199 522 0 85 114 13 212 0 0 0 0 0 0 199 572 0 86 126 18 230 0 0 0 0 0 0 199 569 0 97 130 19 246 0 0 0 0 0 036 162 425 0 8 0 10 18 0 0 0 0 0 0 162 466 0 8 0 14 22 0 0 0 0 0 0 162 463 0 9 0 14 23 0 0 0 0 0 037 382 1,001 0 204 29 67 300 0 0 0 0 0 0 558 1,604 0 206 32 152 390 0 28 0 0 0 0 794 2,271 0 232 33 156 422 0 49 0 0 0 038 69 181 180 25 0 112 137 0 0 0 0 0 0 293 842 195 25 0 214 239 0 35 0 0 0 0 528 1,510 232 28 0 221 250 0 57 0 0 0 039 338 886 0 16 2 9 27 0 0 0 0 0 0 338 971 0 16 2 12 31 0 0 0 0 0 0 338 967 0 18 2 13 33 0 0 0 0 0 040 60 171 0 30 26 40 96 0 0 0 0 0 0 60 172 0 30 29 55 114 0 0 0 0 0 0 60 172 0 34 30 57 121 0 0 0 0 0 041 0 0 0 0 0 0 0 0 0 0 0 0 0 0 0 0 0 0 0 0 0 0 0 0 0 0 0 0 0 0 0 0 0 0 0 0 0 0 042 123 326 0 3 0 9 12 0 0 0 0 0 0 155 445 0 3 37 12 53 0 5 0 0 0 0 155 443 0 3 37 13 54 0 5 0 0 0 043 59 157 0 160 79 86 325 0 0 0 0 0 0 249 716 0 162 87 118 367 0 30 0 0 0 0 557 1,593 0 182 90 123 396 0 30 0 0 0 044 97 257 0 305 118 55 478 0 0 0 0 0 0 97 279 0 308 131 338 777 0 0 0 0 0 0 474 1,356 0 347 135 342 824 0 0 0 0 0 045 603 1,600 0 2,046 106 302 2,454 0 3,147 0 0 0 0 603 1,733 0 2,066 117 567 2,750 0 3,147 0 0 0 0 603 1,725 0 2,329 121 587 3,038 0 3,147 0 0 0 046 38 101 0 34 2 25 61 0 0 0 0 0 0 38 109 0 34 2 34 71 0 0 0 0 0 0 38 109 0 39 2 36 77 0 0 0 0 0 047 1 3 0 0 0 0 0 0 0 0 0 0 0 1 3 0 0 0 0 0 0 0 0 0 0 0 1 3 0 0 0 0 0 0 0 0 0 0 048 15 53 0 28 0 192 220 0 0 0 0 0 0 15 43 0 28 0 262 291 0 0 0 0 0 0 15 43 0 32 0 276 308 0 0 0 0 0 049 553 1,940 0 378 9 253 640 0 0 0 0 0 0 553 1,589 0 382 10 346 738 0 0 0 0 0 0 553 1,582 0 430 10 363 804 0 0 0 0 0 050 13 46 0 474 97 126 697 888,100 0 0 0 0 0 220 632 0 479 107 172 758 943,369 32 0 0 0 0 220 629 0 540 111 181 831 1,072,040 32 0 0 0 051 6 21 0 273 0 0 273 0 0 0 0 0 0 6 17 0 276 0 0 276 0 0 0 0 0 0 6 17 0 311 0 0 311 0 0 0 0 0 052 219 768 949 578 285 106 969 0 0 0 0 0 0 219 629 1,028 584 315 145 1,044 0 0 0 0 0 0 219 626 1,222 658 325 152 1,136 0 0 0 0 0 053 201 705 0 4 0 0 4 0 0 0 0 0 0 362 1,040 0 4 0 0 4 0 25 0 0 0 0 362 1,035 0 5 0 0 5 0 25 0 0 0 054 102 358 0 0 0 0 0 0 0 0 0 0 0 102 293 0 0 0 0 0 0 0 0 0 0 0 102 292 0 0 0 0 0 0 0 0 0 0 055 0 0 0 93 92 138 323 0 0 0 0 905,594 455,865 0 0 0 94 102 189 384 0 0 0 0 935,680 484,235 0 0 0 106 105 198 409 0 0 0 0 1,083,701 550,28356 137 481 0 14 356 57 427 0 0 0 0 0 0 137 394 0 14 394 78 486 0 0 0 0 0 0 137 392 0 16 406 82 504 0 0 0 0 0 057 0 0 0 156 411 547 1,114 0 0 0 0 0 0 0 0 0 158 524 748 1,430 0 0 0 0 0 0 0 0 0 178 539 785 1,502 0 0 0 0 0 058 288 775 0 78 9 102 189 2,895 0 0 0 0 0 288 828 0 79 10 139 228 3,075 0 0 0 0 0 288 824 0 89 10 146 246 3,495 0 0 0 0 059 73 196 0 4 0 0 4 0 0 0 0 0 0 73 210 0 4 0 0 4 0 0 0 0 0 0 73 209 0 5 0 0 5 0 0 0 0 0 060 122 328 1,271 189 0 8 197 0 0 0 0 0 0 122 351 1,377 191 0 11 202 0 0 0 0 0 0 122 349 1,637 215 0 11 227 0 0 0 0 0 061 206 554 0 24 56 33 113 0 0 0 0 0 0 206 592 0 24 62 45 131 0 0 0 0 0 0 206 589 0 27 64 47 139 0 0 0 0 0 062 148 398 0 160 100 355 615 0 13 0 0 0 0 148 425 0 162 111 485 758 0 13 0 0 0 0 148 423 0 182 114 510 806 0 13 0 0 0 063 286 770 0 67 39 110 216 0 0 0 0 0 0 286 822 0 68 43 150 261 0 0 0 0 0 0 286 818 0 76 45 158 279 0 0 0 0 0 064 414 1,114 905 741 202 2,270 3,213 21,373 29 0 0 0 0 664 1,908 980 748 224 3,103 4,075 22,703 68 0 0 0 0 997 2,852 1,166 844 486 4,708 6,037 25,800 68 0 0 0 065 452 1,216 0 1,192 103 274 1,569 0 1,356 0 0 0 0 475 1,365 0 1,204 114 599 1,917 0 1,360 0 0 0 0 475 1,359 0 1,357 118 618 2,093 0 1,360 0 0 0 066 1 3 0 461 8 540 1,009 88,400 0 14,721 2,955,394 0 0 1 3 0 466 9 738 1,213 93,901 0 15,210 3,139,317 0 0 1 3 0 525 9 775 1,309 106,709 0 17,616 3,567,506 0 067 131 353 0 24 440 44 508 0 0 0 0 0 0 565 1,624 0 24 487 60 571 0 68 0 0 0 0 1,142 3,266 0 27 678 1,062 1,767 0 68 0 0 0 068 447 1,568 523 92 24 57 173 0 0 0 0 0 0 656 1,885 567 93 27 78 197 0 33 0 0 0 0 935 2,674 674 105 27 82 214 0 33 0 0 0 069 0 0 0 0 0 0 0 0 0 0 0 0 0 0 0 0 0 0 0 0 0 0 0 0 0 0 0 0 0 0 0 0 0 0 0 0 0 0 070 440 1,543 0 336 22 1,072 1,430 0 2 0 0 0 0 440 1,265 0 339 24 1,466 1,829 0 2 0 0 0 0 691 1,976 0 383 25 1,539 1,947 0 2 0 0 0 0
EMPLOYMENT Kauai Island - Socio-Economic Data Year 2007 Kauai Island - Socio-Economic Data Year 2020 Forecast
EMPLOYMENTKauai Island - Socio-Economic Data Year 2035 Forecast
EMPLOYMENT

DISTRICT OF KAUAI: EXISTING AND FUTURE BASELINE ASSUMPTIONS AND CONDITIONS
TBG062714093019HNL
TAZ HH POP SCHL ENROTHER EMP
RETAIL EMP
SERVICE EMP TOT EMP VIS ATT
VISITOR ACCOM AIR TONS
AIR PASNGR
HARBOR TONS
HARBOR PSNGR HH POP SCHL ENR
OTHER EMP
RETAIL EMP
SERVICE EMP TOT EMP VIS ATT
VISITOR ACCOM AIR TONS
AIR PASNGR
HARBOR TONS
HARBOR PSNGR HH POP SCHL ENR
OTHER EMP
RETAIL EMP
SERVICE EMP TOT EMP VIS ATT
VISITOR ACCOM AIR TONS
AIR PASNGR
HARBOR TONS
HARBOR PSNGR
71 260 912 0 4 0 3 7 0 0 0 0 0 0 260 747 0 4 0 4 8 0 0 0 0 0 0 260 744 0 5 0 4 9 0 0 0 0 0 072 441 1,157 0 560 161 50 771 0 1,842 0 0 0 0 441 1,267 0 566 178 240 984 0 1,842 0 0 0 0 441 1,261 0 638 184 244 1,065 0 1,842 0 0 0 073 235 617 0 41 0 46 87 0 0 0 0 0 0 235 675 0 41 0 63 104 0 0 0 0 0 0 235 672 0 47 0 66 113 0 0 0 0 0 074 820 2,224 0 65 4 40 109 0 0 0 0 0 0 820 2,357 0 66 4 55 125 0 0 0 0 0 0 820 2,345 0 74 5 57 136 0 0 0 0 0 075 256 694 0 7 5 8 20 0 0 0 0 0 0 256 736 0 7 6 11 24 0 0 0 0 0 0 256 732 0 8 6 11 25 0 0 0 0 0 076 364 987 0 47 8 69 124 0 0 0 0 0 0 364 1,046 0 47 9 94 151 0 0 0 0 0 0 364 1,041 0 54 9 99 162 0 0 0 0 0 077 147 386 0 1 0 5 6 0 0 0 0 0 0 147 422 0 1 0 7 8 0 0 0 0 0 0 147 420 0 1 0 7 8 0 0 0 0 0 078 416 1,092 0 3 0 0 3 0 132 0 0 0 0 416 1,196 0 3 0 97 100 0 132 0 0 0 0 416 1,190 0 3 0 97 101 0 132 0 0 0 079 156 409 0 10 0 0 10 0 0 0 0 0 0 156 448 0 10 0 0 10 0 0 0 0 0 0 156 446 0 11 0 0 11 0 0 0 0 0 080 12 31 678 185 19 60 264 17,970 0 0 0 0 0 12 34 735 187 21 82 290 19,088 0 0 0 0 0 748 2,139 873 211 22 86 318 21,692 0 0 0 0 081 26 77 0 311 262 988 1,561 0 0 0 0 0 0 26 75 0 314 290 1,351 1,955 0 0 0 0 0 0 26 74 0 354 299 1,419 2,072 0 0 0 0 0 082 377 1,122 0 133 25 22 180 0 0 0 0 0 0 377 1,083 0 134 28 30 192 0 0 0 0 0 0 377 1,078 0 151 29 32 212 0 0 0 0 0 083 286 851 0 299 41 70 410 0 0 0 0 0 0 324 931 0 302 45 96 443 0 6 0 0 0 0 324 927 0 340 47 101 488 0 6 0 0 0 084 299 890 1,909 131 10 64 205 0 47 0 0 0 0 299 859 2,068 132 11 87 231 0 47 0 0 0 0 435 1,244 2,459 149 11 92 252 0 47 0 0 0 085 13 39 0 41 7 38 86 0 0 0 0 0 0 13 37 0 41 8 52 101 0 0 0 0 0 0 13 37 0 47 8 55 109 0 0 0 0 0 086 349 1,039 0 58 0 29 87 0 0 0 0 0 0 349 1,003 0 59 0 40 98 0 0 0 0 0 0 349 998 0 66 0 42 108 0 0 0 0 0 087 481 1,432 0 24 0 8 32 0 0 0 0 0 0 481 1,382 0 24 0 11 35 0 0 0 0 0 0 481 1,376 0 27 0 11 39 0 0 0 0 0 088 234 697 0 353 278 173 804 0 0 0 0 0 0 234 672 0 356 308 237 901 0 0 0 0 0 0 234 669 0 402 317 248 968 0 0 0 0 0 089 347 941 0 29 0 17 46 0 0 0 0 0 0 497 1,428 0 29 0 23 53 0 23 0 0 0 0 497 1,421 0 33 0 24 57 0 23 0 0 0 090 137 422 0 0 0 11 11 0 0 0 0 0 0 137 394 0 0 0 15 15 0 0 0 0 0 0 137 392 0 0 0 16 16 0 0 0 0 0 091 200 616 0 7 0 4 11 0 0 0 0 0 0 200 575 0 7 0 5 13 0 0 0 0 0 0 200 572 0 8 0 6 14 0 0 0 0 0 092 592 1,762 0 19 2 158 179 0 0 0 0 0 0 592 1,701 0 19 2 216 237 0 0 0 0 0 0 592 1,693 0 22 2 227 251 0 0 0 0 0 093 48 143 0 115 0 4 119 0 0 0 0 0 0 48 138 0 116 0 5 122 0 0 0 0 0 0 48 137 0 131 0 6 137 0 0 0 0 0 094 54 166 0 15 0 6 21 0 0 0 0 0 0 139 399 0 15 0 8 23 0 13 0 0 0 0 139 398 0 17 0 9 26 0 13 0 0 0 095 21 65 0 0 0 0 0 0 0 0 0 0 0 200 575 0 0 0 0 0 0 28 0 0 0 0 200 572 0 0 0 0 0 0 28 0 0 0 096 171 526 0 0 0 0 0 0 0 0 0 0 0 342 983 0 0 0 0 0 0 27 0 0 0 0 342 978 0 0 0 0 0 0 27 0 0 0 097 117 360 0 0 0 0 0 0 0 0 0 0 0 117 336 0 0 0 0 0 0 0 0 0 0 0 117 335 0 0 0 0 0 0 0 0 0 0 098 63 194 0 0 0 0 0 0 0 0 0 0 0 63 181 0 0 0 0 0 0 0 0 0 0 0 63 180 0 0 0 0 0 0 0 0 0 0 099 58 179 49 5 0 0 5 0 0 0 0 0 0 58 167 53 5 0 0 5 0 0 0 0 0 0 58 166 63 6 0 0 6 0 0 0 0 0 0
100 4 12 0 0 0 0 0 0 0 0 0 0 0 4 11 0 0 0 0 0 0 0 0 0 0 0 4 11 0 0 0 0 0 0 0 0 0 0 0101 28 86 0 46 16 4 66 0 0 0 0 0 0 28 80 0 46 18 5 70 0 0 0 0 0 0 28 80 0 52 18 6 76 0 0 0 0 0 0102 48 148 0 0 0 0 0 0 0 0 0 0 0 48 138 0 0 0 0 0 0 0 0 0 0 0 48 137 0 0 0 0 0 0 0 0 0 0 0103 152 468 0 0 0 0 0 0 0 0 0 0 0 152 437 0 0 0 0 0 0 0 0 0 0 0 152 435 0 0 0 0 0 0 0 0 0 0 0104 106 326 0 0 0 0 0 0 0 0 0 0 0 106 305 0 0 0 0 0 0 0 0 0 0 0 106 303 0 0 0 0 0 0 0 0 0 0 0105 38 100 0 25 0 1 26 0 0 0 0 0 0 38 109 0 25 0 1 27 0 0 0 0 0 0 38 109 0 28 0 1 30 0 0 0 0 0 0106 47 124 0 1 8 33 42 0 0 0 0 0 0 47 135 0 1 9 45 55 0 0 0 0 0 0 47 134 0 1 9 47 58 0 0 0 0 0 0107 55 145 0 32 15 183 230 478,000 0 0 0 0 0 55 158 0 32 17 250 299 507,747 0 0 0 0 0 181 518 0 36 17 263 316 577,002 0 0 0 0 0108 373 986 313 224 35 86 345 0 0 0 0 0 0 373 1,072 339 226 39 118 383 0 0 0 0 0 0 499 1,427 403 255 40 123 418 0 0 0 0 0 0109 92 243 0 5 0 12 17 0 0 0 0 0 0 92 264 0 5 0 16 21 0 0 0 0 0 0 92 263 0 6 0 17 23 0 0 0 0 0 0110 0 0 0 0 0 0 0 0 0 0 0 0 0 0 0 0 0 0 0 0 0 0 0 0 0 0 0 0 0 0 0 0 0 0 0 0 0 0 0111 137 362 0 92 0 39 131 0 0 0 0 0 0 137 394 0 93 0 53 146 0 0 0 0 0 0 137 392 0 105 0 56 161 0 0 0 0 0 0112 44 116 0 0 0 12 12 0 0 0 0 0 0 44 126 0 0 0 16 16 0 0 0 0 0 0 44 126 0 0 0 17 17 0 0 0 0 0 0113 76 201 0 0 6 0 6 0 0 0 0 0 0 76 218 0 0 7 0 7 0 0 0 0 0 0 76 217 0 0 7 0 7 0 0 0 0 0 0114 35 93 0 0 6 89 95 0 0 0 0 0 0 35 101 0 0 7 122 128 0 0 0 0 0 0 35 100 0 0 7 128 135 0 0 0 0 0 0115 235 621 0 58 0 19 77 0 1,058 0 0 0 0 235 675 0 59 0 38 96 0 1,058 0 0 0 0 235 672 0 66 0 39 105 0 1,058 0 0 0 0116 638 1,687 0 210 0 29 239 0 0 0 0 0 0 638 1,834 0 212 0 40 252 0 0 0 0 0 0 638 1,825 0 239 0 42 281 0 0 0 0 0 0117 215 568 0 394 1 3 398 0 854 0 0 0 0 215 618 0 398 1 4 403 0 854 0 0 0 0 215 615 0 449 1 4 454 0 854 0 0 0 0118 140 370 0 133 0 19 152 0 0 0 0 0 0 140 402 0 134 0 26 160 0 0 0 0 0 0 140 400 0 151 0 27 179 0 0 0 0 0 0119 155 410 0 6 0 16 22 0 0 0 0 0 0 155 445 0 6 0 22 28 0 0 0 0 0 0 155 443 0 7 0 23 30 0 0 0 0 0 0120 75 198 0 67 40 351 458 0 85 0 0 0 0 75 216 0 68 44 480 592 0 85 0 0 0 0 75 215 0 76 46 504 626 0 85 0 0 0 0121 4 11 0 0 0 0 0 0 0 0 0 0 0 4 11 0 0 0 0 0 0 0 0 0 0 0 4 11 0 0 0 0 0 0 0 0 0 0 0122 23 61 222 0 0 0 0 592 0 0 0 0 0 23 66 241 0 0 0 0 629 0 0 0 0 0 23 66 286 0 0 0 0 715 0 0 0 0 0123 170 453 0 468 164 198 830 0 0 0 0 0 0 170 489 0 473 182 271 925 0 0 0 0 0 0 170 486 0 533 187 284 1,004 0 0 0 0 0 0124 10 27 0 0 0 0 0 0 0 0 0 0 0 10 29 0 0 0 0 0 0 0 0 0 0 0 10 29 0 0 0 0 0 0 0 0 0 0 0125 73 195 0 0 0 0 0 0 0 0 0 0 0 73 210 0 0 0 0 0 0 0 0 0 0 0 73 209 0 0 0 0 0 0 0 0 0 0 0126 132 352 0 0 0 0 0 0 0 0 0 0 0 132 379 0 0 0 0 0 0 0 0 0 0 0 132 378 0 0 0 0 0 0 0 0 0 0 0127 61 163 0 0 0 0 0 0 0 0 0 0 0 61 175 0 0 0 0 0 0 0 0 0 0 0 61 174 0 0 0 0 0 0 0 0 0 0 0128 9 24 0 0 0 0 0 0 0 0 0 0 0 9 26 0 0 0 0 0 0 0 0 0 0 0 9 26 0 0 0 0 0 0 0 0 0 0 0129 2 5 0 0 0 0 0 708,400 0 0 0 0 0 2 6 0 0 0 0 0 752,486 0 0 0 0 0 2 6 0 0 0 0 0 855,122 0 0 0 0 0130 0 0 0 0 0 0 0 0 0 0 0 0 0 0 0 0 0 0 0 0 0 0 0 0 0 0 0 0 0 0 0 0 0 0 0 0 0 0 0131 0 0 0 0 0 0 0 423,100 0 0 0 0 0 0 0 0 0 0 0 0 449,431 0 0 0 0 0 0 0 0 0 0 0 0 510,731 0 0 0 0 0
Totals 22,870 64,265 9,496 14,352 4,174 11,863 30,389 3,781,105 8,693 14,721 2,955,394 1,007,110 455,865 25,589 73,536 10,290 14,488 4,730 17,258 36,485 4,016,414 9,119 15,210 3,139,317 1,040,569 484,235 29,780 85,177 12,231 16,341 5,302 20,519 42,172 4,564,237 9,191 17,616 3,567,506 1,205,183 550,283
EMPLOYMENT Kauai Island - Socio-Economic Data Year 2007 Kauai Island - Socio-Economic Data Year 2020 Forecast
EMPLOYMENTKauai Island - Socio-Economic Data Year 2035 Forecast
EMPLOYMENT


Appendix EPublic Involvement Summary

TBG062714093019HNL 1
APPENDIX E
Public Involvement Summary for the Regional Federal-Aid Highways 2035 Transportation Plan for the District of Kauai
Introduction Public involvement was a key component in the development of the Regional Federal-Aid Highways 2035 Transportation Plan for the District of Kauai (Plan). A public involvement plan was formulated at the beginning of the Plan development process to ensure that public and stakeholder participation would be integrated into Plan development and help shape the Plan. This appendix provides a summary of the public and stakeholder involvement and describes the decision-making structure and process.
HDOT’s Public Involvement Policy The State of Hawaii Department of Transportation (HDOT) is committed to a comprehensive and fair public involvement process. As stated in the HDOT’s Public Involvement Policy, dated May 2009, the HDOT “…recognizes the value of public involvement as a programmatic measure that strengthens and solidifies its transportation programs… The HDOT Public Involvement Policy supports and encourages broad-based public involvement in the conception, development, and enhancement of transportation plans, programs, and projects.”
Goals of the Public Involvement Plan The HDOT was committed to an approach that:
• Increased public awareness and understanding of the transportation planning process inHawaii.
• Provided an open and transparent decision-making process that was conducted throughequitable and constructive two-way communication between the project team and the public.
• Provided early and ongoing opportunities for stakeholders to raise issues and concerns forconsideration by the project team.
• Met applicable state and federal laws, regulations, policies, and procedures.
• Proactively informed and encouraged the participation of all stakeholders regardless of race,ethnicity, age, disability, income, or primary language — in accordance with the FederalHighway Administration (FHWA) Title VI and Environmental Justice (EJ) guidance.Encouraged broad citizen participation, including citizens who have traditionally beenunderserved and underrepresented, such as minority and low-income populations.
• Stimulated a broad-based interest in the HDOT’s planning activities, and builds widespreadcommunity understanding of findings and decisions.

APPENDIX E PUBLIC INVOLVEMENT SUMMARY FOR THE REGIONAL FEDERAL-AID HIGHWAYS 2035 TRANSPORTATION PLAN KAUAI DISTRICT
TBG062714093019HNL 2
Plan Development Process and Stakeholder Involvement A key element of the approach to developing the Plan was a structured and transparent planning process that clearly identified major tasks and decision points. Thorough and thoughtful consideration of issues during major tasks by all of the project stakeholder groups helped to ensure quality decisions that would not have to be revisited later in the project because something of significance had been omitted or improperly addressed. Public and stakeholder involvement activities, such as meetings and workshops, were integrated into the work plan so that the stakeholder input could shape the decisions made during major tasks in the planning process.
The primary avenues for stakeholder input and discussion were through a Policy Committee (PC), a Technical Advisory Committee (TAC), a Citizen Advisory Committee (CAC), and general public meetings. Because the development of this Plan and the Statewide Federal-Aid Highways 2035 Transportation Plan (Statewide Plan) proceeded concurrently, the Stakeholder Advisory Committee (SAC) also provided specific input to the Kauai District. Two SAC members were from the Kauai District. Stakeholder groups, roles, and responsibilities are described in subsequent sections under Stakeholder Involvement.
Additional outreach avenues included flyers, public notices, HDOT press releases, a Facebook page, and a project website. Public comments were also received through mail, email, and phone. More information on the major tasks and the role of public and stakeholder input in shaping the outcome of the task, as well as concerns expressed by the stakeholders is provided in subsequent sections below.
Plan Development Process The Statewide Federal-Aid Highways 2035 Transportation Plan and Kauai District’s Regional Federal-Aid Highways 2035 Transportation Plan were developed concurrently in an open and comprehensive process through a series of milestones. The process is described below and shown on Figure 1.
Establish Goals and Objectives – This milestone focused on reviewing existing regulatory and policy requirements related to land transportation, and developing project goals and objectives for the long-range land transportation system.
Gather Data and Develop Model – This milestone included gathering data and information related to the land transportation system and current HDOT programs. A major portion of the task included developing/updating the regional travel demand models, which were the basis for forecasting and assessing future traffic conditions.

APPENDIX E PUBLIC INVOLVEMENT SUMMARY FOR THE REGIONAL FEDERAL-AID HIGHWAYS 2035 TRANSPORTATION PLAN KAUAI DISTRICT
TBG062714093019HNL 3
FIGURE 1 Project Development Process
Define Future Conditions – Based on the forecasting results and endorsed program definitions, this milestone focused on identifying future system deficiencies and developing the plan priorities and evaluation criteria.
Identify Solutions – This milestone focused on developing potential solutions to address overall plan policies, goals and objectives, and identified transportation needs and deficiencies. Funding sources, allocations, and financing strategies were also identified.
Develop and Evaluate Solutions and Create Implementation Plan – This milestone focused on evaluating the potential solutions against requirements and plan goals and objectives and creating implementation recommendations.
Draft and Refine Plans – This milestone documented the project development process, analyses, and recommendations for the Plan. The document was refined and finalized based on stakeholder comments and input.
Stakeholder Involvement Throughout the development of the Plan, participation by a diverse group of stakeholders at various levels was sought and their various viewpoints were incorporated. All stakeholder groups acted in an advisory capacity for the project. The overall goal of stakeholder group facilitation was to provide the HDOT Director of Transportation clear, comprehensive, and defendable recommendations for approval.
The following sections summarize the specific involvement of the PC, TAC, CAC, and the general public through public meetings, project website, social media, emails, and phone calls.
Technical Advisory Committee The TAC consisted of senior managers from the HDOT and County departments. The TAC provided significant technical input throughout the development of the Plan. TAC member agencies are shown in Table 1.

APPENDIX E PUBLIC INVOLVEMENT SUMMARY FOR THE REGIONAL FEDERAL-AID HIGHWAYS 2035 TRANSPORTATION PLAN KAUAI DISTRICT
TBG062714093019HNL 4
TABLE 1 TAC Member Agencies County of Kauai - Department of Public Works
County of Kauai - Planning Department
County of Kauai - Transportation Agency
County of Kauai - Civil Defense Agency
County of Kauai - Police Department
County of Kauai - Fire Department
HDOT Kauai District Office
Responsibilities of TAC were to:
• Represent the interests of their agencies or jurisdictions.
• Provide technical support, information, insight, and reviews.
• Communicate project progress to their directors, elected or appointed officials, and to agency or jurisdictional colleagues as needed.
• Review recommendations from the public and project team, review background materials and make informed, comprehensive recommendations at the milestones of the project. The decisions made by the TAC were recommendations to the PC.
Throughout the development of the Plan, five TAC meetings were held in addition to the two PC/TAC joint meetings. Below are summaries of the TAC meetings.
TAC Meeting #1, May 25, 2010, 9:00 am to noon • Project Overview. The TAC was given an overview of the project: project background, project
purpose, development process, framework, and stakeholder involvement.
• Goals and Objectives. The TAC started a discussion on goals and objectives. Goals and objectives were framed around the federal planning factors to ensure a comprehensive land transportation plan. The TAC also provided input on a list of existing plans and policies. The existing plans and policies were reviewed to ensure that the Plan is compliant and aligned with adopted plans and requirements.
• Stakeholder Involvement. The TAC provided comments in regards to the draft list of categories for the CAC and the SAC. The TAC also provided input on public outreach techniques that have worked/not worked for their specific region.
• Data Collection. The TAC briefly talked about data collection. The TAC was asked to assist in gathering land use, population, economic, and transportation facility data for the development of the travel demand model.
TAC Meeting #2, July 27, 2010, 9:30 am to 12:30 pm • Project Objectives and Outcomes. The project objectives and outcomes were further clarified
based on comments received to ensure everyone had a common understanding of the project.
• Goals and Objectives. The TAC discussed major topics related to long-term goals and objectives for Kauai’s transportation system, which included secondary access/alternative emergency routes, connectivity between towns, capacity improvements, enhancing safety, mauka/makai connectors, alternative transportation, diversity of funding sources, agency coordination, and developer/land owner coordination with agencies, etc.

APPENDIX E PUBLIC INVOLVEMENT SUMMARY FOR THE REGIONAL FEDERAL-AID HIGHWAYS 2035 TRANSPORTATION PLAN KAUAI DISTRICT
TBG062714093019HNL 5
• Travel Demand Model. The TAC discussed the travel demand model data needs and desired analysis capabilities. Output/capabilities of the model would depend on goals defined for the Plan.
TAC Meeting #3, February 15, 2011, 9:30 am to 1:00 pm • Finalized Goals and Objectives. A final draft of goals and objectives was presented. The TAC
was asked to provide their final comments. The final draft was revised based on input from the TAC, CAC, and SAC.
• Solution Evaluation Process. The draft solution evaluation and prioritization process was presented and discussed. The TAC felt that the process is fair and that it is good to have a transparent process.
• Travel Demand Model. The travel demand model efforts were discussed. The model was used to identify capacity needs. The TAC reviewed the traffic analysis zones. The TAC was also asked to assist with defining future conditions and land use forecast.
TAC Meeting #4 (via videoconference), May 25, 2011, 1:00 pm to 4:00 pm • Prioritized Goals and Objectives. The CAC’s and SAC’s prioritization results were shared with
the TAC. The TAC developed a group consensus of the top five priorities and identified goals that they felt were inherent to their daily business. The TAC agreed to come up with numerical priorities via email in a few weeks.
• Finalized Solution Evaluation Process. The TAC reviewed changes made to the last draft Solution Evaluation Process memo and agreed with the changes. The TAC provided input on county programs that administer projects on the federal-aid highways and how those projects are prioritized. The TAC also shared any gaps in current programs and any foreseeable needs in the future.
• Future Needs. The TAC reviewed a list of committed and potential capacity projects taken from previous plans and the Statewide Transportation Improvement Program (STIP), and provided status updates and project details. The TAC also provided input on non-capacity needs.
TAC Meeting #5, November 16, 2011, 9:00 am to noon • Goal Priorities. The TAC reviewed the resulting goal priorities for Kauai District. The TAC felt
that the top priorities are consistent with the District’s priorities.
• Draft Evaluation Criteria. The TAC reviewed the draft evaluation criteria that would be used to evaluate the potential solutions. The TAC also reviewed the evaluation criteria’s data sources and grading.
• Socioeconomic Data. The TAC reviewed and provided comments on the land use and socioeconomic data and how the data were used to develop the future forecasts. Growth in employment and households was identified.
• Travel Demand Model. The TAC reviewed the 2007 based traffic condition and the 2035 no build traffic condition generated by the model. The TAC discussed where the existing capacity deficiencies are and where the future capacity deficiencies are projected. The TAC also noted that a few facilities were missing in the model.
• Future Needs and Potential Solutions. The TAC reviewed an initial list of potential solutions that had been developed based on the travel demand model output, existing plans/policies, and stakeholder input. The TAC validated the potential solutions and provided additional input on a set of maps.
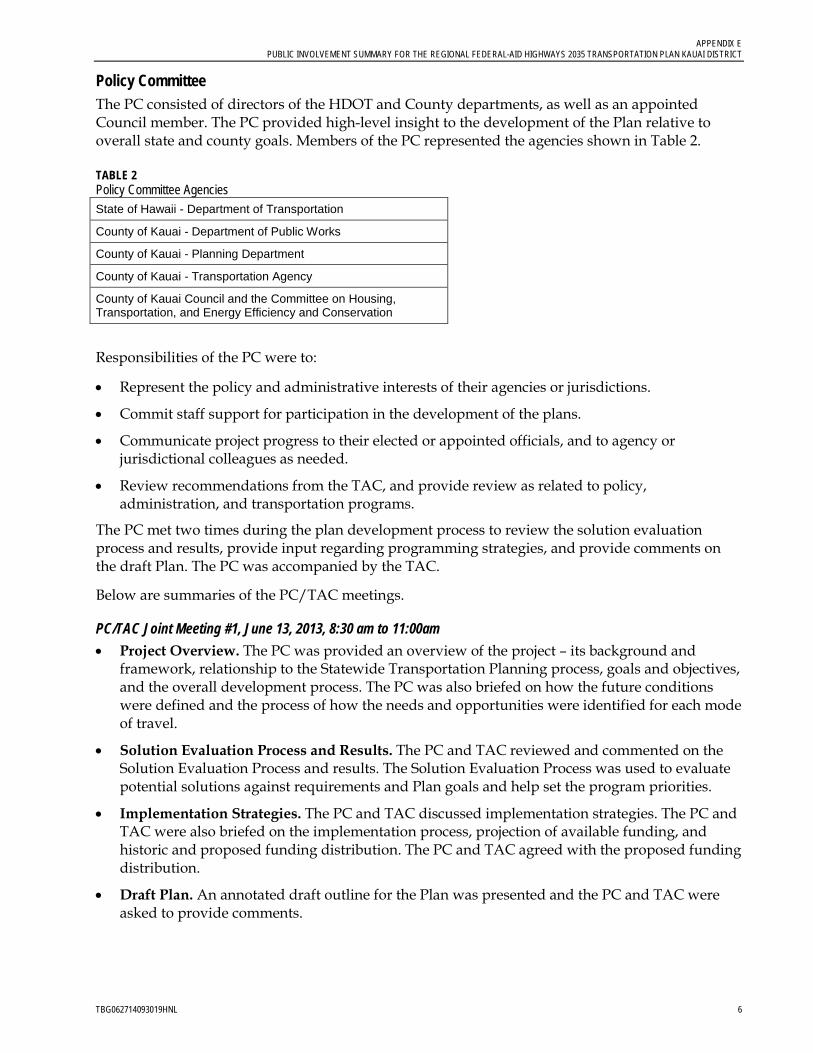
APPENDIX E PUBLIC INVOLVEMENT SUMMARY FOR THE REGIONAL FEDERAL-AID HIGHWAYS 2035 TRANSPORTATION PLAN KAUAI DISTRICT
TBG062714093019HNL 6
Policy Committee The PC consisted of directors of the HDOT and County departments, as well as an appointed Council member. The PC provided high-level insight to the development of the Plan relative to overall state and county goals. Members of the PC represented the agencies shown in Table 2.
TABLE 2 Policy Committee Agencies State of Hawaii - Department of Transportation
County of Kauai - Department of Public Works
County of Kauai - Planning Department
County of Kauai - Transportation Agency
County of Kauai Council and the Committee on Housing, Transportation, and Energy Efficiency and Conservation
Responsibilities of the PC were to:
• Represent the policy and administrative interests of their agencies or jurisdictions.
• Commit staff support for participation in the development of the plans.
• Communicate project progress to their elected or appointed officials, and to agency or jurisdictional colleagues as needed.
• Review recommendations from the TAC, and provide review as related to policy, administration, and transportation programs.
The PC met two times during the plan development process to review the solution evaluation process and results, provide input regarding programming strategies, and provide comments on the draft Plan. The PC was accompanied by the TAC.
Below are summaries of the PC/TAC meetings.
PC/TAC Joint Meeting #1, June 13, 2013, 8:30 am to 11:00am • Project Overview. The PC was provided an overview of the project – its background and
framework, relationship to the Statewide Transportation Planning process, goals and objectives, and the overall development process. The PC was also briefed on how the future conditions were defined and the process of how the needs and opportunities were identified for each mode of travel.
• Solution Evaluation Process and Results. The PC and TAC reviewed and commented on the Solution Evaluation Process and results. The Solution Evaluation Process was used to evaluate potential solutions against requirements and Plan goals and help set the program priorities.
• Implementation Strategies. The PC and TAC discussed implementation strategies. The PC and TAC were also briefed on the implementation process, projection of available funding, and historic and proposed funding distribution. The PC and TAC agreed with the proposed funding distribution.
• Draft Plan. An annotated draft outline for the Plan was presented and the PC and TAC were asked to provide comments.

APPENDIX E PUBLIC INVOLVEMENT SUMMARY FOR THE REGIONAL FEDERAL-AID HIGHWAYS 2035 TRANSPORTATION PLAN KAUAI DISTRICT
TBG062714093019HNL 7
PC/TAC Joint Meeting #2, December 10, 2013, 2:00 pm to 3:30pm • Draft Plan. The PC and TAC were given an overview of the draft Plan by chapter and were
asked to provide comments.
Citizen Advisory Committee The CAC were volunteers selected by the HDOT through an application process. The CAC is a comprehensive community, business, and special interest focus group that represented a wide range of transportation system users, communities, geographic areas, ages, and diverse populations. The CAC served as a communication link with those interests and communities and provided insight into community values and public sentiment regarding the Plan. CAC member’s categories are shown in Table 3.
TABLE 3 CAC Member Categories Transit Health
Freight Utilities
Car Environment
Visitor Industry Sustainability
Business Community Energy
Residential Community Cultural
Development Community ADA
Pedestrian Military
Bicycle Elderly
School
Responsibilities of CAC members were to:
• Represent their constituents’ perspectives during group deliberations.
• Communicate project progress with their constituents.
• Provide feedback at key milestones throughout the project. Provide input prior to distribution of key materials at public workshops.
• Act as ambassadors for the project.
• Share information and solicit feedback from their representative stakeholders.
• Provide recommendations to HDOT.
Throughout the development of the Plan, four CAC meetings were held. Below are summaries of the CAC meetings.
CAC Meeting #1, November 16, 2010, 9:00 am to noon • Project Overview. The CAC was given an overview of the project: project background, project
purpose, development process, and project framework.
• Goals and Objectives. The CAC discussed goals and objectives for the Plan. Goals and objectives were framed around the federal planning factors to ensure a comprehensive land transportation plan. A draft goals and objectives memo was provided to the CAC

APPENDIX E PUBLIC INVOLVEMENT SUMMARY FOR THE REGIONAL FEDERAL-AID HIGHWAYS 2035 TRANSPORTATION PLAN KAUAI DISTRICT
TBG062714093019HNL 8
• Future Conditions. The Plan and Policy Review memos were also provided to the CAC. The CAC was asked to provided comments and information on other plans and developments.
CAC Meeting #2, March 1, 2011, 12:30 pm to 3:30 pm • Solution Evaluation Process. A brief overview of the draft solution evaluation and
prioritization process was introduced. The intent was to provide a general overview and obtain comments from the CAC.
• Prioritized Goals and Objectives. The CAC was given a final set of goals and asked to prioritize the goals. The CAC discussed the prioritization results.
• Travel Demand Model. The CAC examined the existing transportation network: functional classification, speed, lanes, and traffic analysis zones. The CAC also discussed the future network and land use assumptions.
CAC Meeting #3, April 12, 2012, 9:00 am to noon • Goal Priorities. The CAC reviewed and commented on the goal prioritization process and
results.
• Socioeconomic Data. The CAC reviewed the land use and socioeconomic data and how the data were used to develop the future forecasts. Growth in employment and households were identified and illustrated.
• Travel Demand Model. The CAC reviewed the 2007-based traffic condition and the 2035 no build traffic condition generated by the model. The CAC discussed where the existing capacity deficiencies are and where the future capacity deficiencies are projected.
• Future Needs and Potential Solutions. The CAC reviewed an initial list of potential solutions that had been developed based on the travel demand model output, existing plans/policies, and stakeholder input. The CAC validated the potential solutions and provided additional input on a set of maps.
• Solution Evaluation Process. The solution evaluation and prioritization process was discussed in details. The discussion was focused on the Tier 1 and Tier 2 evaluation. An example was provided.
CAC Meeting #4, December 16, 2013, 9:00 am to 11:00 am • Draft Plan. The CAC was given an overview of the draft Plan by chapter and asked to provide
comments.
Public Involvement Various methods and tools were used to engage the general public to follow the project’s progress and provide input at specific project milestones.
Public Meetings Two public meetings were held in Kauai. The public meetings were structured in an interactive format so that attendees were able to share their community values, concerns, opportunities, and priorities, as well as validate the information already gathered and provide additional input. The agenda and presentation materials were posted on the project website.
Below are summaries of the public meetings.

APPENDIX E PUBLIC INVOLVEMENT SUMMARY FOR THE REGIONAL FEDERAL-AID HIGHWAYS 2035 TRANSPORTATION PLAN KAUAI DISTRICT
TBG062714093019HNL 9
Public Meeting #1, March 14, 2012, 5:30 pm to 7:30 pm The goals of the first public meeting were to introduce the project and gather input on land transportation deficiencies and needs. A presentation was given and followed by a small group exercise to identify the deficiencies and needs. The groups provided their comments on a set of maps and presented their needs to the large group. Attendees also talked to project staff and provided written and verbal feedback. The specific topics covered during the meeting are described below.
• Project Background and Framework. Attendees were given information on the project background and framework – what the Plan is about, why the Plan is necessary, and how it will be developed. The project management team also explained the Solution Evaluation Process and how it would help identify the priorities.
• Project Status and Information. The project management team reviewed what had been done to date and provided an update on current status. The project management team also went through the existing and forecast socioeconomic data, as well as the present and future travel demands.
• Identify Deficiencies and Needs. Attendees split into groups to identify deficiencies, needs, and opportunities on a set of large maps. Input was facilitated and framed around the eight federal planning factors. Each group presented results to the larger group so everyone was aware of the information shared. A summary of their input was shared with the CAC and TAC and is described below.
− Environment and Sustainability
- Preserve rural/scenic environment and character - Kekaha/Mauka of Kekaha – erosion issues
− Economic Vitality
- New and bypass roadways: Lihue Mauka bypass, Kapaa Relief route
− System Preservation/System Efficiency
- Maintenance of existing system – focus on maintaining/improving the existing system before doing any roadway widening, fund upkeep of the existing infrastructure to minimize the need for reconstruction
- Minimize need for rebuilding
− Modal Integration
- Promote multimodal options – focus on integration of modes and complete streets near population centers
- Expand transit system – coverage and frequency
− Security/Safety
- Disaster preparedness – prepare for extreme weather, heavy rain/runoff - Widen shoulders for emergency use and safety
Public Meeting #2, April 3, 2014, 5:30 pm to 7:30 pm The goals of the second public meeting were to share the draft Plan and get feedback from the public. The first part of the meeting provided an overview of the draft Plan by chapter in a presentation format. The second part of the meeting was intended to be a small group exercise, where attendees would simulate a process to prioritize projects and allocate limited funds. On

APPENDIX E PUBLIC INVOLVEMENT SUMMARY FOR THE REGIONAL FEDERAL-AID HIGHWAYS 2035 TRANSPORTATION PLAN KAUAI DISTRICT
TBG062714093019HNL 10
Kauai, the public was very engaged. They preferred an interactive presentation of the draft Plan and questions and comments were entertained throughout the evening. The public appreciated the engagement and the small group exercise was cancelled in order to provide more time for comments and discussion by the group as a whole. Questions and comments were taken throughout the meeting. Attendees also talked to project staff and provided written and verbal feedback.
Below is a summary of questions and comments raised at the meeting.
1. Invest more funds on transit, which could possibly address both capacity and resiliency issues.
Response: The funding source for transit is different from the highways funding source. Transit projects are funded by the Federal Transit Administration. Funding from the FHWA cannot directly fund transit projects. FHWA funds infrastructure projects. The infrastructure (that is, roads) supports transit operation.
2. Can FHWA funds be used to implement/support Travel Demand Management strategies?
Response: Yes.
3. Preserving existing infrastructure in place won’t work for the long-term. Instead, reconstruct and relocate our coastal roadways and bridges inland in order to avoid impacts from shoreline erosion and sea level rise.
4. Kauai needs more alternative routes (for example, mauka bypass in Kapaa).
5. What is the meaning of having a $600 million project listed as one of the potential solutions while the projected funds available for Kauai through 2035 is only $630 million?
Response: This Plan is a long-range plan, and recommendations are not based on fiscal constraints. It is an appropriate approach to identify all the deficiencies and needs then develop potential solutions that would address the deficiencies and needs, regardless of its cost. In the next steps, which are developing the mid-range plan and updating the STIP, the state and county will prioritize projects based on fiscal constraints. The HDOT will start working on the mid-range plan after this long-range plan project is done. The HDOT will work with the counties and start off with the priorities from the long-range plan. The next step is the STIP, which is regularly updated. A series of public meetings for the STIP update will be held in April and May this year.
6. Special interest groups throughout the island are very different based on their geographical location. Make sure all voices are heard. It also seems that the hotel rooms/visitor impacts are underestimated on the other side of the island.
Response: When we formed the CAC, we ensured there was geographical representation.
Project Website A project website (www.hawaiilongrangeplan.com) was developed and maintained throughout the plan development process. The project website provided a venue to facilitate two-way communication between the public and the project management team. Through the website, the project management team was able to share project information, announce involvement opportunities, and receive comments and feedback. A comment received via the website was in regards to three documents relating to active transportation on Kauai: the Koloa-Poipu Area Circulation Plan, the North Shore Path Alternatives Report, and the West Side Path Alternatives Report. The project management team reviewed the three documents and incorporated relevant findings into the Plan.

APPENDIX E PUBLIC INVOLVEMENT SUMMARY FOR THE REGIONAL FEDERAL-AID HIGHWAYS 2035 TRANSPORTATION PLAN KAUAI DISTRICT
TBG062714093019HNL 11
Social Media A Facebook page was created and managed throughout the plan development process. The Facebook page was primarily used to broadcast project updates to Facebook users and direct them to the project website for more information. The Facebook page allowed users to share information with their friends and helped promote the project.
Friends E-Mail List A “Friends” e-mail list was also developed and maintained throughout the plan development process. The Friends e-mail list included:
• Public agencies • Elected officials • State and County Environmental Justice/Title VI coordinators • Business, community, interest groups, and private organizations • Individuals (property owners, residents, and other citizens)
Friends on the e-mail list received project status updates and notices of CAC and public meetings. Friends were also notified via email when materials were posted on the project website for input.
Flyers Flyers were created and distributed to inform the public in regards to the CAC opportunity and the public meetings. Flyers were mailed to contacts on the project mailing list, which included stakeholder groups that were listed on the Title VI/EJ Dynamic Outreach list provided by the HDOT Title VI/EJ specialist ( June 2010). The project mailing list was also supplemented with the

APPENDIX E PUBLIC INVOLVEMENT SUMMARY FOR THE REGIONAL FEDERAL-AID HIGHWAYS 2035 TRANSPORTATION PLAN KAUAI DISTRICT
TBG062714093019HNL 12
Statewide Pedestrian Master Plan outreach list, which included libraries, senior centers, colleges, health centers, charities, community associations/neighborhood boards, related community interest groups, child and family service centers, chambers of commerce, cultural clubs, Office of Hawaiian Affairs, developers, veteran centers, business and professional associations, clinics, and tourism associations. Over 70 stakeholder groups on Kauai received the flyers.
The flyers were also emailed to the PC, TAC, CAC, and related government agencies for distribution.
News Media Outreach and Coordination Public notices were placed on the Garden Island and the Star-Advertiser to announce the CAC opportunity and public meetings. In addition, the HDOT also prepared press releases and reached out to members of the news media to encourage media coverage regarding public involvement opportunities. The project received news coverage on the Kauai Planning & Action Alliance Newsletter (June 2010), Damon Tucker: Hawaii News & Information (http://damontucker.com, February 2012), the KHON2 (February 2012), and the Garden Island (April 2014).
Emails, Phone Calls, and Letters Over the course of the Plan’s development, the public was able to provide comments and raise questions through emails, phone calls, and letters. Comments were received via emails in regards to active transportation on Kauai and emergency responses in North Shore.
Additional Approaches for CAC Solicitation In addition to making announcements through public notices, HDOT press releases, the project website, Facebook page, flyers, and emails, several other approaches were taken concurrently to solicit membership for the CAC. These approaches and efforts are described as follow:
Other Project - Public Meetings The project management team staff attended public meetings for other related projects to promote the CAC opportunities. The project management team staff attended and distributed flyers and applications at the CAC meetings and public meetings for the Statewide Pedestrian Master Plan, and public meetings for the Hawaii Statewide Transportation Plan. The opportunities were also promoted at public meetings for the Oahu Regional Transportation Plan with a project display board and staff to answer questions.
News Media An article featuring the project and the CAC opportunities was published on the Kauai Planning & Action Alliance’s August 2010 newsletter. The newsletter was sent to over 1000 people with a majority of them living on Kauai.
Internet The CAC opportunity was announced on the HDOT Website (http://hawaii.gov/dot).
Focused Outreach Additional outreach was also done to focus on potential candidates, by the project management team and associates. The project management team staff reached out to applicants and colleagues

APPENDIX E PUBLIC INVOLVEMENT SUMMARY FOR THE REGIONAL FEDERAL-AID HIGHWAYS 2035 TRANSPORTATION PLAN KAUAI DISTRICT
TBG062714093019HNL 13
for suggestions on other potential candidate. Several contacts were obtained from the Hawaii Statewide Transportation Plan 2002 CAC List.
The project management team’s Public Involvement Specialist located on Kauai made announcements on several occasions, which included:
1. Kauai Planning & Action Alliance’s annual membership meeting on June 24, 2010. About 70 island members attended the meeting.
2. Get Fit Kauai Built Environment meeting on July 15, 2010. Flyers and applications were distributed to Get Fit Kauai’s mailing list of about 50.
3. Kauai Workforce Investment Board, a diverse group of about 28 individuals.


Appendix FProcess for Solution Evaluation and Results


TBG062714093019HNL 1
T E C H N I C A L M E M O R A N D U M Statewide Federal-Aid Highways 2035 Transportation Plan and Regional Federal-Aid Highways 2035 Transportation Plans for the Districts of Maui, Hawaii, and Kauai
Process for Solution Evaluation (District of Kauai) PREPARED FOR: State of Hawaii Department of Transportation PREPARED BY: CH2M HILL DATE: November 29, 2012
Introduction This memorandum outlines the process for evaluating and prioritizing solutions for the Regional Federal-Aid Highways 2035 Transportation Plan for the District of Kauai (Plan).
As part of the development of the Plan, the federal-aid highways within the District of Kauai were analyzed for problems related to existing and anticipated congestion, safety, security, mobility, preservation, and connectivity. Solutions were then developed to address the identified problems. The solutions are prioritized using a logical process for two reasons: (1) to ensure that a combination of community, local agency, state agency and other stakeholder input helps shape the priorities for solution implementation on the district highway system; and (2) to assist the State of Hawaii Department of Transportation (HDOT) in project programming by identifying priority solutions.
Solution evaluation consists of a seven-step process, as shown on Figure 1. These steps are described in greater detail in the body of this memorandum.
FIGURE 1 Seven-step Process for Solution Evaluation

PROCESS FOR SOLUTION EVALUATION (DISTRICT OF KAUAI)
TBG062714093019HNL 2
Step 1. Finalize Goals and Objectives for the Plans
Goals and objectives set the basic vision for any planning process and provide a framework for evaluating success once the plan has been implemented. The goals and objectives for the Plans are aligned with existing federal legislation (Moving Ahead for Progress in the 21st Century [MAP-21]), and state and local regulatory and policy requirements. The goals and objectives also incorporate input from stakeholders (community, local agencies, and state agencies). The set of goals and objectives used for this Plan is also used for the Regional Federal-Aid Highways 2035 Transportation Plans for the Districts of Maui and Hawaii, and the Statewide Federal-Aid Highways 2035 Transportation Plan.
As described in the remainder of the memo, it is the prioritizing of these goals that may differ between the regional plans and the statewide plan.
Work with stakeholders resulted in 22 goals, which are organized into eight categories of planning factors. The eight planning factors are consistent with Federal Highways Administration (FHWA) guidance and are listed in no particular order:
• Environment and Sustainability • Modal Integration • System Preservation • Security • Economic Vitality • System Efficiency Management and Operations • Transportation Access Mobility • Safety
A ninth additional category is also included to encompass goals that are not directly associated with the federal planning factors.
Table 1 includes the finalized goals, objectives, and strategies, categorized by planning factor.

PROCESS FOR SOLUTION EVALUATION (DISTRICT OF KAUAI)
TBG062714093019HNL 3
TABLE 1 Goals, Objectives, and Strategies
Goals Objectives Strategies
Federal Planning Factor: Environment and Sustainability
1.1. Preserve and enhance the natural environment, including biological and aesthetic resources.
» Avoid, minimize, and provide reasonable measures to mitigate degradation of the natural environment caused by transportation facilities and operations.
» Construct and maintain a transportation system that complements scenic corridors and protected views.
» Provide transportation facilities that complement the natural environment and enhance quality of life.
» Review environmental assessments to identify potential degradation of the natural environment caused by transportation facilities and operations.
» Create categories of environmental mitigation to protect habitat and ecologically sensitive areas from potential impacts of transportation facilities and operations.
» Develop and maintain landscape plans that preserve the scenic environment.
» Improve the aesthetic quality of gateway roads.
» Provide educational interpretive sites regarding preserving and enhancing the natural environment for public viewing at scenic pull-offs, and Park & Rides.
1.2. Preserve and enhance Hawaii’s cultural resources environment, including archaeological and historical sites.
» Avoid, minimize, and provide reasonable measures to mitigate degradation of Hawaii’s cultural resources environment caused by transportation facilities and operations
» Review environmental assessments to identify potential degradation of cultural resources caused by transportation facilities and operations.
» Create categories of environmental mitigation to protect culturally sensitive areas from potential impacts of transportation facilities and operations.
» Develop a formal consultation process with Native Hawaiian Organizations.
» Develop consistent and comprehensive processes for addressing cultural, natural, and historic resources.
» Coordinate transportation corridor and public safety needs with the preservation of historical and cultural features.
1.3. Meet the relevant environmental regulations and standards set by federal, state, and county/city agencies. Maintain collaborative working relationships with agencies and comply with goals of their relevant plans and policies.
» Develop transportation solutions that support federal, state, and regional natural resource agency programs.
» Create transportation system solutions that meet all aesthetic, noise, air, and water quality standards.
» Periodically evaluate environmental regulation compliance, evaluate compliance goals, and prioritize improvements needed.
» Consult and collaborate with regulatory agencies to implement solutions.

PROCESS FOR SOLUTION EVALUATION (DISTRICT OF KAUAI)
TBG062714093019HNL 4
TABLE 1 Goals, Objectives, and Strategies
Goals Objectives Strategies
1.4. Promote the use of sustainable practices in designing, constructing, operating, and maintaining transportation facilities and programs.
» Develop land use and transportation infrastructure that are coordinated and compatible to promote sustainable growth and mobility.
» Implement sustainability and livability practices in existing and new transportation facilities.
» Create transportation solutions that promote the balance of a strong diversified economy, a clean and aesthetic environment, and a healthy quality of life.
» Encourage road users to reduce impact to the environment.
» Promote the use of sustainable and renewable energy sources. Support solutions that will contribute towards achieving the State Clean Energy Goal.
» Create transportation facilities that support an increase in energy efficiency. Create projects and programs and ‘green’ initiatives to promote more efficient use of energy.
» Reserve and/or develop right-of-way width for build-out conditions of multimodal transportation facilities, and utilities.
» Develop cost effective, clean, and green alternative materials used in infrastructure.
» Use tax incentives and public acknowledgement as means to reward road users for using less fuel, producing less pollution, providing facilities for bicyclists and pedestrians.
» Develop an evaluation tool for measuring sustainability over the life cycle of a transportation project or program.
» Use integrated action plans from DBEDT’s Lead by Example Energy Initiatives to support the Hawaii Clean Energy Initiative (HCEI) goal of 40 percent renewable energy by 2030.
» Provide conveniently located and an adequate number of alternative energy fueling/recharging stations.
» Pursue opportunities for developing underground utility corridors, and integrating them as separate pedestrian/bicycle paths.
1.5. Promote long-term resiliency relative to all hazards mitigation, namely global climate change, with considerations to reducing contributions to climate change from transportation facilities, and reducing the future impacts of climate change on the transportation system.
» Acknowledge that climate change will impact portions of our existing transportation infrastructure and address the potential effect of sea level rise and extreme weather changes on Hawaii’s transportation facilities.
» Orient transportation planning to incorporate strategies for adapting to climate change, including; sea level rise, extreme weather events, energy costs, and energy supply disruption.
» Clearly identify shoreline areas affected by climate change and develop plan to preserve or relocate at-risk transportation facilities and avoid new construction in affected zones. Utilize climate change and sea level rise data consistent with State of Hawaii current policy (which forecasts a 1-meter rise by the end of the 21st century).

PROCESS FOR SOLUTION EVALUATION (DISTRICT OF KAUAI)
TBG062714093019HNL 5
TABLE 1 Goals, Objectives, and Strategies
Goals Objectives Strategies
Federal Planning Factor: Modal Integration
2.1. Provide a Complete Streets transportation system of motorized and nonmotorized options.
» Create transportation facilities that support all modes of travel that result in a well-connected systemwide network for travel between transport modes and between communities.
» Promote education and understanding of the benefits of bicycling and walking and laws applicable to each group.
» Coordinate modal plans for motorized, pedestrian, bicycle, and transit modes so that uses of these interconnected systems complement each other.
» Include specific training in drivers’ education courses.
» Include more questions about bicycle and pedestrian laws in the written driver’s license exam.
» Provide transit, bike ride, and walking opportunities for transportation professionals and decision-makers so they can better understand the concerns of transit riders, bicyclists, and pedestrians.
» Support programs and agencies that provide bike/pedestrian safety educational materials and courses (emphasize outreach efforts on high-risk populations such as children and the elderly).
2.2. Promote efficient travel between modes by creating connections and removing barriers.
» Promote design and development of complete, integrated multimodal street systems for all users (including freight, motorists, pedestrians, bicycles, transit, etc.) of all ages and abilities.
» Encourage transportation infrastructure and transportation service concurrency with land development.
» Provide funding mechanisms and explore alternatives to implement multimodal facility development.
» Improve agency coordination to provide practical, seamless, and safe facilities for connections between modes.
» Design transportation solutions that address issues of distance, safety, and ease of access between bus stops, nonmotorized amenities, and land uses. Highlight transit and nonmotorized modes as affordable, attractive, simple, and desirable options for travel.
» Promote development of park-and-ride stations at population centers, urban area perimeters, and bypass road intersections.
2.3. Promote safe connections between modal alternatives.
» Provide transportation modal options and connections that address safety considerations of all users, especially at-risk population segments (children, elderly, disabled).
» Update street design standards to support best practices for pedestrian and bicycle facilities and safety.
» Coordinate with agencies that support vulnerable populations to better understand concerns of transit riders, bicyclists, and pedestrians.

PROCESS FOR SOLUTION EVALUATION (DISTRICT OF KAUAI)
TBG062714093019HNL 6
TABLE 1 Goals, Objectives, and Strategies
Goals Objectives Strategies
Federal Planning Factor: System Preservation
3.1. Manage transportation assets and optimize investments.
» Plan and implement maintenance, resurfacing, rehabilitation, and reconstruction to optimize existing transportation system improvements and spending.
» Maintain inventory of all transportation assets. Include information on current condition of assets. Maintain systems to monitor and evaluate infrastructure changes so they match regular planning investment cycles.
» Identify variations in cost for periodic maintenance versus total replacement of facilities to help prioritize projects. Consider total life cycle costs.
» Improve use of technology to protect and preserve existing infrastructure.
» Support a strong policy of size and weight enforcement, including innovative technologies to protect and preserve the existing infrastructure.
3.2. Maintain safe, efficient, complete transportation system for the long-term.
» Plan and implement existing system improvements to effectively sustain the overall transportation system’s safe, efficient, and complete operations.
» Maintain a schedule for maintenance, replacement, and reconstruction using asset inventory information.
» Maintain and/or upgrade critical routes (i.e. routes serving as single access to communities with inadequate size/load capacity) and as key emergency evacuation and/or services corridors.
» Maintain an aggressive Preventative Maintenance Program to extend the useful life of current infrastructure.
» Improve coordination of system preservation needs with other infrastructure projects and programs.
» Include impacts related to all hazards mitigation, including global climate change, in assessment of system preservation plans.
Federal Planning Factor: Security
4.1. Plan, maintain, and operate a transportation system that supports evacuation, response and recovery for incidents.
» Reduce travel time during incident responses.
» Improve incident detection and response capabilities, including access and air and sea modal connections.
» Improve coordination with emergency managers and major traffic generators and attractors during the planning and execution phases of an incident response.
» Provide adequate facilities and capacity to support the needs of emergency and evacuation routes.
» Promote and develop alternate route options for existing highways and freeways to allow efficient rerouting of traffic away from the primary incident location.
» Identify and develop strategic evacuation routes that support the multihazard plans.
» Maintain and upgrade key emergency and access routes (i.e. routes serving as single access to communities with inadequate size or load capacity).
» Improve public transportation use for emergency evacuation of nonmobile residents during incidents.
» Improve surveillance systems and upgrade detection equipment (such as cameras or loop sensors on roadways) to reduce incident detection time and response time.

PROCESS FOR SOLUTION EVALUATION (DISTRICT OF KAUAI)
TBG062714093019HNL 7
TABLE 1 Goals, Objectives, and Strategies
Goals Objectives Strategies
» Improve flow of information to the traveling public
» Implement multiagency training programs so staff are well educated on protocols and procedures during incident response. Ensure appropriate agencies are involved and alerted to incidents in a timely manner. Ensure that program developers and trainers are qualified to develop appropriate procedures.
» Develop a comprehensive outreach mechanism to inform agencies and traffic generators and attractors (e.g. service industries) about incidents.
» Enhance multimedia tools to provide information to the traveling public (such as radio and internet information) and information regarding where they can access information (such as “in case of emergency tune to xxx” variable message signs)
4.2. Improve resiliency of the state through the transportation system.
» Plan and design for transportation system resilience to maintain efficient and effective connectivity for communities during recovery periods, including resiliency of the utility systems along transportation corridors.
» Establish a forum with the emergency management community, utility providers, and transportation service and infrastructure users to evaluate the transportation system resiliency.
» Prioritize roads that provide connectivity in rural areas of the state.
Federal Planning Factor: Economic Vitality
5.1. Promote the expansion and diversification of Hawaii’s economy through the efficient and effective use of transportation facilities including movement of people, goods, and services in a safe, energy efficient, and environmentally sound manner.
» Maintain and develop an integrated, efficient, and reliable freight system by ensuring connectivity between air, land, and water (harbor) facilities.
» Develop an integrated, efficient, and reliable multimodal transportation system that is resilient to impacts of rising oil/energy costs and that will meet future transport demands.
» Develop an integrated multimodal system of transportation facilities, services, and information systems that provide for efficient commuter and local resident trips.
» Develop an integrated multimodal system of transportation facilities, services, and information so that intrastate, interstate, and international travelers can travel easily for business and recreation.
» Identify and address capacity constrained areas within the transportation system. Prioritize the capacity projects when other strategies are not appropriate.
» Consider transportation alternatives that support arrivals and departures of travelers at all hours of the day; and the communication needs of foreign travelers (multilanguage and universal signs).
» Encourage and promote concurrent improvements in transportation infrastructure to mitigate impacts of all new developments and maintain an efficient transportation system that supports economic vitality.
» Identify specific funding strategies to enhance economic vitality.
» Explore financial strategies that examine fees (revenue sources) that cover all transportation modes.
» Support efficient and effective movement along the transportation system with traveler information, such as signage and real-time multimedia announcements.
» Coordinate schedules and routes of freight transport needs with other transportation system projects to minimize delay and support economic vitality.

PROCESS FOR SOLUTION EVALUATION (DISTRICT OF KAUAI)
TBG062714093019HNL 8
TABLE 1 Goals, Objectives, and Strategies
Goals Objectives Strategies
» Improve end-user benefits by reducing operating costs and reducing freight delays.
» Maintain and operate an integrated transportation system that supports the economic vitality of all islands, especially locations that can be significantly impacted by small changes in the transportation system (such as Molokai and Lanai).
Federal Planning Factor: System Efficiency Management and Operations
6.1. Improve capacity and efficiency, and reduce congestion within the existing transportation system for long-term benefit.
» Improve consistency and predictability of travel time along existing corridors.
» Preserve the functional classification system hierarchical operating characteristics.
» Promote transportation demand management and operations techniques, such as carpooling/vanpooling and staggered work hours.
» Promote high-occupancy facilities to improve mobility within the existing infrastructure.
» Promote Intelligent Transportation Systems (ITS) strategies and implement advanced traveler information devices to monitor traffic operations. Inform users of conditions, and identify locations where avoiding bottlenecks or geometric constraints can improve traffic flow, reduce delay, and improve reliability of the system.
» Preserve the function of transportation facilities by implementing appropriate access management requirements based on the roadway’s functional characteristics.
» Develop connectivity between subdivisions and interior roadways to maintain mobility and function of arterials and major collectors.
» Identify changes in demographics, transportation modes, and needs of users on a regular basis.
Federal Planning Factor: Transportation Access Mobility
7.1. Provide appropriate and reliable transportation access options statewide to all users.
» Provide services and infrastructure to support modal alternatives for all demographics.
» Coordinate between public and private transit and bus service providers to integrate programs, align investments, and provide affordable, streamlined services.
» Coordinate multimodal infrastructure and transit service improvements with human service agencies to determine needs of underserved populations, such as disabled, elderly, and Environmental Justice (EJ) populations.
7.2. Ensure transportation investments » Prioritize projects equitably to serve all » Provide constant and continuous information broadly to the public about

PROCESS FOR SOLUTION EVALUATION (DISTRICT OF KAUAI)
TBG062714093019HNL 9
TABLE 1 Goals, Objectives, and Strategies
Goals Objectives Strategies in programs and prioritization processes are balanced (across modes and demographics, i.e., serves environmental justice (EJ) populations).
modes and demographics, with attention to underserved communities.
expenditures on transportation infrastructure and services, and operations performance.
» Create a monitoring system to evaluate transportation projects and programs against the goals and standards that they were originally developed to achieve. Develop strategies and tools to support corrective actions.
» Promote transparent decision processes with broader citizen engagement and oversight. This can be accomplished by establishing sub-area groups, advisory boards, or committees comprised of a broad spectrum of representatives for all residents including underserved populations (such as disabled, elderly, and EJ).
» Support paratransit programs that meet the needs of the disabled and elderly population.
Federal Planning Factor: Safety
8.1. Maintain a safe transportation system for all land transportation modes.
» Address transportation safety through a mixture of education, enforcement, and engineering solutions.
» Reduce the number traffic related fatalities.
» Reduce the number of collisions and crashes involving serious injuries and fatalities for all land transportation modes.
» Coordinate with the Strategic Highway Safety Plan to implement plan recommendations and monitor performance, including:
- Photo enforcement - Prioritization of nonmotorized needs - Improved signage - Increased design considerations for safety of all modes (including
temporary traffic control plans) - Intelligent Transportation Systems (ITS) - Improved data reporting, assessment, and availability of information - Impaired driving, motorcycle/moped, pedestrian and bicycle educational
programs prioritizing young, high-risk new operators - Increased bicycle and pedestrian educational programs - Improved civil and criminal fines or penalties for fatalities or serious injuries - Increased enforcement - Safe enforcement areas - Increased severity of sentencing for convicted repeat offenders thereby
keeping them from operating a motor vehicle while in an impaired condition.
» Develop solutions that reduce or prevent head-on collisions on existing

PROCESS FOR SOLUTION EVALUATION (DISTRICT OF KAUAI)
TBG062714093019HNL 10
TABLE 1 Goals, Objectives, and Strategies
Goals Objectives Strategies infrastructure as well as new facilities.
» Develop improved access for emergency service to reduce response time and evacuation time.
» Develop roadside features that enhance safety of the transportation system.
» Promote legislation, enforcement and education to reduce the risk of distracted transportation system users (all modes).
» Promote education and enforcement programs to reduce injury risk to pedestrians and passengers with disabilities.
» Develop transportation solutions that recognize and uphold the goals and strategies of safety programs supported by FHWA and AASHTO.
8.2. Improve safety of the community through connectivity of the transportation infrastructure.
» Provide emergency access to all parts of the state, especially in locations with only one road in and out.
» Consider using other roads including military access roads and plantation or cane haul roads as alternatives during an emergency especially in a weather related emergency. Identify which agency or agencies would be responsible for implementation. (Agreements with individual land owners and agencies are needed.)
Federal Planning Factor: Additional Goals, Objectives, and Strategies
9.1. Obtain sufficient and specific transportation funding
» Create and implement a funding mechanism that would cover the costs of providing a safe, efficient, sustainable transportation system into the future.
» Obtain diverse funding and ensure that funding set aside for transportation is used only for transportation.
» Coordinate and communicate with the Counties on future transit corridors
» Supplement current transportation funding by identifying and securing diverse funding sources to support the multimodal transportation system, e.g., public and private partnerships.
» Identify and implement user fees that equitably spreads the cost burden over all modes of transportation without impacting EJ populations.
» Reduce the deficit in state transportation facilities with increased taxes specifically earmarked for Capital Improvements or Maintenance.
» Support policy that requires new development/growth to fund their impacts on transportation facilities (impact fees).
9.2. Optimize project delivery. » Improve coordination of plans and resources.
» Improve efficiency of planning and delivery of projects.
» Plan, develop, and maintain transportation infrastructure within programmed budget amounts.
» From planning through operations, improve coordination and communication between multiple departments, public citizen groups, and agencies to address needs and resources efficiently.
» Provide communications between multiple departments, public citizen groups, and agencies related to status of projects.

PROCESS FOR SOLUTION EVALUATION (DISTRICT OF KAUAI)
TBG062714093019HNL 11
TABLE 1 Goals, Objectives, and Strategies
Goals Objectives Strategies
» In areas where multiple state and/or federal agencies have authority, create a lead agency to manage overall project reducing delays, redundancies and inefficiencies. Develop procedures and protocol to monitor compliance, cooperation, communication and efficiency.
» Utilize transportation funds efficiently, and maximize revenues.
9.3. Provide on-going planning to assess and address statewide needs.
» Monitor, evaluate and develop solutions, and adjust program goals on a continuing periodic coordinated basis.
» Continue to implement the 3-C planning process (comprehensive, cooperative and continuing).
9.4. Coordinate use of public right-of-way with other public service providers.
» Continue the safe accommodation and installation of utility facilities within the right-of-way or easement along state highways and federal-aid county highways.
» Coordinate with utility service providers to work together in establishing location, design, and methods for the possible accommodation and installation of utility facilities along state highways and federal aid county highways. Considerations should include, but not be limited to safety, future widening and site specific issues.
» Coordinate and communicate transportation and utility planning efforts to enable development of a coordinated transportation and utility system.

PROCESS FOR SOLUTION EVALUATION (DISTRICT OF KAUAI)
TBG062714093019HNL 12
Step 2. Weight the Goals and Planning Factors
The Plan uses the eight planning factors and 22 goals to help make decisions about how solutions could be prioritized. The objectives were not used in developing solutions, but could potentially serve as a basis for developing Plan performance measures. Performance measures will be discussed later in the plan development process.
The various planning factors and goals essentially serve as criteria to help prioritize potential solutions according to a wide spectrum of stakeholder values related to Kauai’s land transportation system and Kauai’s future. Weights were assigned to the planning factors and goals to reflect how important stakeholders think individual planning factors and goals are for achieving long-range planning success.
It is important to agree on a set of weights prior to developing solutions to create an objective process. The weights provide insight into the most important priorities for the district and reflect stakeholder values about the land transportation system.
Weighting the Goals The 22 goals are weighted based on discussions from facilitated work sessions with the Kauai Technical Advisory Committee (TAC). Using Stakeholder Advisory Committee (SAC) goal weightings and Citizen’s Advisory Committee (CAC) goal weightings as input, the Kauai TAC assigned weights to the goals to reflect regional priorities. See Table 2.
The Kauai TAC weights were used as input to prioritize potential solutions within each region; therefore, though the goals themselves remain the same for the statewide and regional plans, the weightings differ, reflecting the unique values of each regional community.
FIGURE 2 Goal Weighting Process
Work session participants assigned weights to the 22 goals on a scale of 100 (the total weightings must add up to 100). The individual input from all participants in the Kauai TAC work session was averaged. The Kauai TAC weights, along with the CAC and SAC goal weights, are shown in Table 2.

PROCESS FOR SOLUTION EVALUATION (DISTRICT OF KAUAI)
TBG062714093019HNL 13
TABLE 2 Goal Priority Weighting
Goals
Goal Priority Weight
SAC Kauai CAC
Kauai TAC
Environment and Sustainability Goals 1.1 Preserve and enhance the natural environment, including biological and aesthetic resources.
2.8% 5.5% 4.0%
1.2 Preserve and enhance Hawaii’s cultural resources environment, including archaeological and historical sites.
3.9% 5.7% 3.0%
1.3 Meet the relevant environmental regulations and standards set by federal, state and county/city agencies. Maintain collaborative working relationships with agencies and comply with goals of their relevant plans and policies.
4.2% 6.9% 4.0%
1.4 Promote the use of sustainable practices in designing, constructing, operating, and maintaining transportation facilities and programs.
5.9% 4.8% 3.0%
1.5 Promote long-term resiliency relative to all hazards mitigation, namely global climate change, with considerations to reducing contributions to climate change from transportation facilities, and reducing the future impacts of climate change on the transportation system.
7.6% 11.7% 6.0%
Modal Integration Goals 2.1 Provide a Complete Streets transportation system of motorized and nonmotorized options.
8.1% 5.8% 7.0%
2.2 Promote efficient travel between modes by creating connections and removing barriers.
7.1% 3.9% 3.0%
2.3 Promote safe connections between modal alternatives. 5.0% 3.9% 3.0%
System Preservation Goals 3.1 Manage transportation assets and optimize investments. 2.8% 3.9% 3.0% 3.2 Maintain a safe, efficient, complete transportation system for the long-term. 3.8% 3.4% 8.0%
Security Goals 4.1 Plan, maintain, and operate a transportation system that supports evacuation, response, and recovery for incidents.
5.4% 7.5% 6.0%
4.2 Improve resiliency of the state through the transportation system. 2.9% 2.3% 4.0%
Economic Vitality Goals 5.1 Promote the expansion and diversification of Hawaii’s economy through the efficient and effective use of transportation facilities including movement of people, goods, and services in a safe, energy efficient, and environmentally sound manner.
3.6% 3.9% 4.0%
System Efficiency Management and Operations Goals 6.1 Improve capacity and efficiency, and reduce congestion within the existing transportation system for long-term benefit.
4.8% 4.7% 7.0%
Transportation Access Mobility Goals 7.1 Provide appropriate and reliable transportation access options statewide to all users. 6.0% 3.0% 4.0% 7.2 Ensure transportation investments in programs and prioritization processes are balanced (across modes and demographics, i.e. serves environmental justice (EJ) populations).
5.0% 1.9% 3.0%
Safety Goals 8.1 Maintain a safe transportation system for all land transportation modes. 7.1% 6.5% 8.0% 8.2 Improve safety of the community through connectivity of the transportation infrastructure.
3.4% 1.6% 4.0%
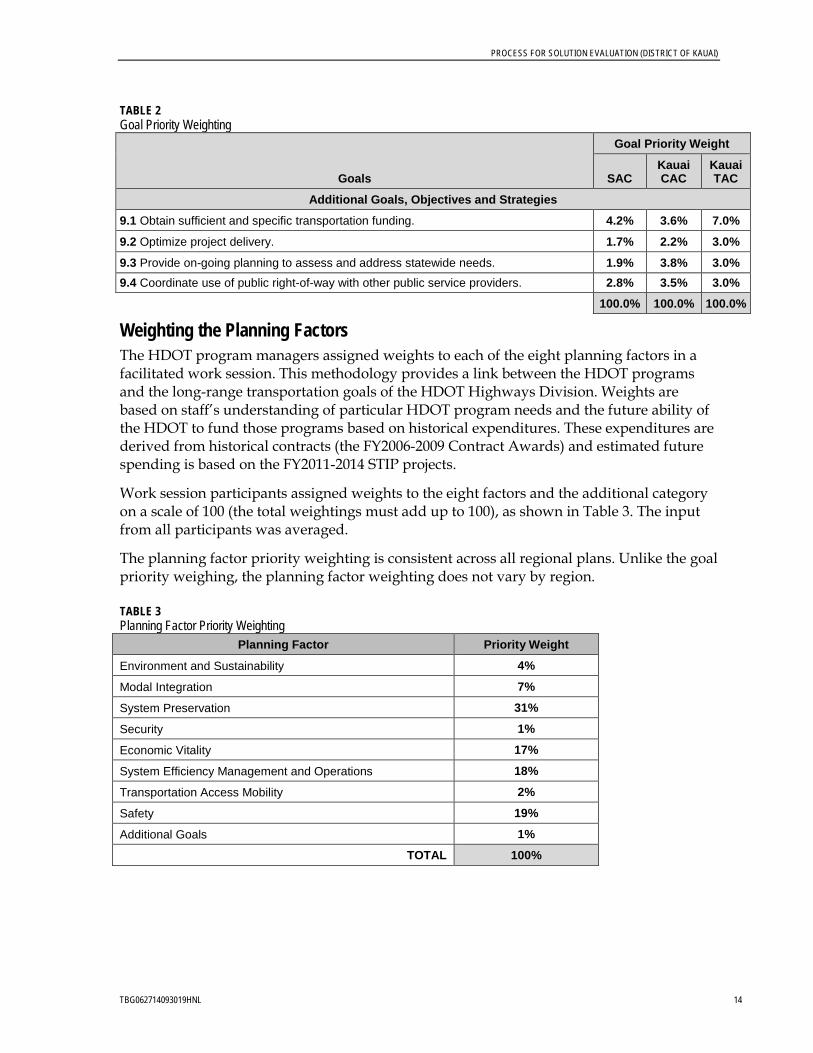
PROCESS FOR SOLUTION EVALUATION (DISTRICT OF KAUAI)
TBG062714093019HNL 14
TABLE 2 Goal Priority Weighting
Goals
Goal Priority Weight
SAC Kauai CAC
Kauai TAC
Additional Goals, Objectives and Strategies
9.1 Obtain sufficient and specific transportation funding. 4.2% 3.6% 7.0%
9.2 Optimize project delivery. 1.7% 2.2% 3.0%
9.3 Provide on-going planning to assess and address statewide needs. 1.9% 3.8% 3.0% 9.4 Coordinate use of public right-of-way with other public service providers. 2.8% 3.5% 3.0%
100.0% 100.0% 100.0%
Weighting the Planning Factors The HDOT program managers assigned weights to each of the eight planning factors in a facilitated work session. This methodology provides a link between the HDOT programs and the long-range transportation goals of the HDOT Highways Division. Weights are based on staff’s understanding of particular HDOT program needs and the future ability of the HDOT to fund those programs based on historical expenditures. These expenditures are derived from historical contracts (the FY2006-2009 Contract Awards) and estimated future spending is based on the FY2011-2014 STIP projects.
Work session participants assigned weights to the eight factors and the additional category on a scale of 100 (the total weightings must add up to 100), as shown in Table 3. The input from all participants was averaged.
The planning factor priority weighting is consistent across all regional plans. Unlike the goal priority weighing, the planning factor weighting does not vary by region.
TABLE 3 Planning Factor Priority Weighting
Planning Factor Priority Weight
Environment and Sustainability 4%
Modal Integration 7%
System Preservation 31%
Security 1%
Economic Vitality 17%
System Efficiency Management and Operations 18%
Transportation Access Mobility 2%
Safety 19%
Additional Goals 1%
TOTAL 100%

PROCESS FOR SOLUTION EVALUATION (DISTRICT OF KAUAI)
TBG062714093019HNL 15
Step 3. Develop Solutions After understanding the issues and transportation needs on the federal-aid highway system on Kauai, potential solutions were developed for each of the identified problem areas. Potential solutions were based on:
• Plan, policy, and program reviews to allow the team to build upon previously identified solutions
• Future forecasted travel demands to help guide appropriate capacity solutions
• Stakeholder input to reflect the knowledge of all groups represented, and to guide the development of non-capacity solutions.
To generate a diverse range of potential solutions, the stakeholders worked in facilitated groups to mark up maps of Kauai and identify locations of potential solutions. This interactive format encouraged stakeholders to weigh the benefits of particular solutions on their island environment, and resulted in a comprehensive preliminary list of potential solutions for the District of Kauai.
Step 4. Apply Tier 1 Pass/Fail Evaluation to the Solutions
The list of potential solutions resulting from Step 3 was anticipated to be large. Step 4 is intended to cull the list of solutions to prevent wasted effort for solutions unlikely to be pursued because they are inconsistent with Plan goals and/or the HDOT mission. Therefore, all potential solutions were evaluated against a set of six high-level Tier 1 pass/fail criteria. These Tier 1 pass/fail criteria are consistent with the goals and objectives of the Plan, and are intended to narrow the list of potential solutions to a set of manageable options.
The project management team (PMT) performed the Tier 1 evaluation after solutions were developed. If a solution failed any of the criteria, it was not advanced forward to the Tier 2 evaluation process. The results were shared with all stakeholder groups for validation. The Tier 1 evaluation worksheet is shown in Table 4.

PROCESS FOR SOLUTION EVALUATION (DISTRICT OF KAUAI)
TBG062714093019HNL 16
TABLE 4 Tier 1 Pass/Fail Criteria
Tier 1 Evaluation Matrix – Pass/Fail
Criteria Pass/Fail
HDOT Highways Mission: Is the solution in alignment with the Hawaii Department of Transportation Highways Division mission?
The mission of the Highways Division is to provide a safe, and efficient and accessible highway system through the utilization of available resources in the maintenance, enhancement, and support of land transportation facilities.
Plan Goals: Does the solution support one or more of the plan goals as described in the Final Goals, Objectives, and Strategies Memorandum dated November 29, 2012 for the Statewide Federal-Aid Highways 2035 Transportation Plan or the Regional Federal-Aid Highways 2035 Transportation Plans for the Districts of Maui, Hawaii, and Kauai?
Jurisdiction/Significance: Is the solution within the physical and/or operational jurisdiction of the federal-aid highways network or a regionally significant transportation project that is integral to the transportation system as defined by adopted statewide and regional plans?
Completeness: Is the solution complete? Does it account for all necessary investments or actions to ensure the realization of the solution’s objective?
Acceptable: Is the solution implementable and acceptable in terms of applicable laws, regulations, and public policies?
Redundant: Is the need/deficiency already being addressed independent of this planning process? Potential solutions that passed the Tier 1 evaluation and were advanced to Tier 2 evaluation are shown in Attachment 1.
Step 5. Apply Tier 2 Evaluation to Remaining Solutions and Assign Grades
The Tier 2 evaluation is intended to assess remaining solutions in relation to the plan goals (the same goals weighted in Step 2). Evaluation criteria were developed for each plan goal in order to provide a measurable comparative assessment of solutions. For each goal, each solution was given a grade between -2 and +2.
This grade shows how well a potential solution meets or addresses a specific Plan goal. The grades are also intended to show the advantages and disadvantages of the solutions in relation to each other. The grades will provide a means of seeing tradeoffs among the solutions, thereby making the comparative function of the grades more important than the grades themselves.
The Tier 2 evaluation criteria grades are as follows:
-2, -1 The solution is contrary to the Plan goal
0 The solution is not directly related or does not impact the Plan goal
1, 2 The solution supports realization of the Plan goal
The project management team (PMT) applied the Tier 2 evaluation to all solutions. The results were shared with stakeholders for validation. Table 5 shows each of the Plan goals, the evaluation criteria, and the grading scale to show how scores were assigned.

PROCESS FOR SOLUTION EVALUATION (DISTRICT OF KAUAI)
TBG062714093019HNL 17
TABLE 5 Tier 2 Evaluation Criteria
Goal Grading Evaluation Criteria and Data Source Grade
Environment and Sustainability
Goal 1.1: Preserve and enhance the natural environment, including biological and aesthetic resources.
-2: Solution does not meet any of the five evaluation criteria related the natural environment
-1: Solution meets one of the five evaluation criteria related the natural environment
0: Solution meets two of the five evaluation criteria related the natural environment
1: Solution meets three of the five evaluation criteria related the natural environment
2: Solution meets at least four of five evaluation criteria related the natural environment
Source: DBEDT GIS – Natural Resource/Environmental Layers and Physical Features Layers http://www.state.hi.us/dbedt/gis/download.htm
Source: Hawaii Scenic Byways Program – Program Objectives
1. Does the solution not directly impact, or does the solution provide net benefits to, prime agricultural lands (based on Hawaii Land Use Commission – Land Use District Boundary maps)?
2. Does the solution not directly impact, or does the solution provide net benefits to wetland habitats (based on the State of Hawaii GIS layers for Wetlands)?
3. Does the solution not directly impact, or does the solution provide net benefits to streams (based on the State of Hawaii GIS layers for Streams)?
4. Does the solution not directly impact, or does the solution provide net benefits to, critical habitats or known areas of threatened and endangered species (based on US Fish and Wildlife Service GIS data for critical habitats)?
5. Does the solution meet at least one of the following objectives of the Hawaii Scenic Byways Program?
a) Preserve, enhance, and protect the beauty of our natural, cultivated, and built landscapes and their relationship to our history, our culture, and our future.
b) Promote understanding of Hawaii’s heritage and an appreciation of our diversity.
c) Encourage land uses that create and complement scenic vistas and panoramas.
d) Create and improve relationships among the architectural, technological, and engineering elements of transportation facilities and associated structures visible in the travel corridor.
e) Improve traffic flow along main routes and promote pedestrian, bicycle, and paratransit travel in ways that contribute to conserving energy resources and improving air quality.

PROCESS FOR SOLUTION EVALUATION (DISTRICT OF KAUAI)
TBG062714093019HNL 18
TABLE 5 Tier 2 Evaluation Criteria
Goal Grading Evaluation Criteria and Data Source Grade
Goal 1.2: Preserve and enhance Hawaii’s cultural resources and environment, including archaeological and historical sites.
-2: Direct impact to archaeological or cultural resources (that cannot be mitigated)
-1: Potential impacts to archaeological or cultural resources (that cannot be mitigated)
0: No impacts/enhancements to archaeological or cultural resources
1: Potential enhancements to existing archaeological or cultural resources
2: Enhances existing archaeological or cultural resources
Source: State Historic Preservation Division (SHPD) - Hawaii Register of Historic Places
http://hawaii.gov/dlnr/hpd/
Does the potential solution affect any place listed on the National and State Register of Historic Places for Hawaii?
Goal 1.3: Meet the relevant environmental regulations and standards set by federal, state and county/city agencies. Maintain collaborative working relationships with agencies and comply with goals of their relevant plans and policies.
-2: Does not meet any of the three evaluation criteria related to environmental regulations and standards
-1: -
0: Meets at least one of the three evaluation criteria related to environmental regulations and standards
1: -
2: Meets all three of the relevant evaluation criteria related to environmental regulations and standards
Source: United States Environmental Protection Agency http://www.epa.gov/aboutepa/whatwedo.html
Source: Hawaii Department of Health (Office of Environmental Quality Control)
http://hawaii.gov/health/environmental/oeqc/index.html
Source: Hawaii Statewide Transportation Plan
1. Is the solution aligned with the mission and the purpose of the United States Environmental Protection Agency? Specifically, does the solution protect human health and the environment through reduction of environmental risk and support of diverse, sustainable, and economically productive communities and ecosystems?
2. Does the potential solution support the purpose of the Office of Environmental Quality Control to maintain the optimum quality of the State’s environment through coordinated efforts by state agencies?
3. Does the solution meet Goal IV of the Hawaii Statewide Transportation Plan (to protect Hawaii’s unique environment quality of life and mitigate any negative impacts)?
Goal 1.4: Promote the use of sustainable practices in designing, constructing, operating, and maintaining transportation facilities and programs.
-2: Solution does not meet any of the five evaluation criteria related to sustainable practices
-1: Solution meets one of the five evaluation criteria related to sustainable practices
0: Solution meets two of the five evaluation criteria related to sustainable practices
1: Solution meets three of the five evaluation criteria related to sustainable practices
Source: Hawaii 2050 Sustainability Plan
http://www.hawaii2050.org/index.php/site/sp_goals
Is the solution aligned with goals and strategic actions of the Hawaii 2050 Sustainability Plan? Specifically, is the solution expected to:
1. Improve energy efficiencies and options in transportation?
2. Increase access to public transportation?
3. Reduce traffic congestion?

PROCESS FOR SOLUTION EVALUATION (DISTRICT OF KAUAI)
TBG062714093019HNL 19
TABLE 5 Tier 2 Evaluation Criteria
Goal Grading Evaluation Criteria and Data Source Grade
2: Solution meets at least four of five evaluation criteria related to sustainable practices
4. Encourage and provide incentives for telecommuting?
5. Increase and improve bicycle and pedestrian facilities, including multiuse pathways?
Goal 1.5: Promote long-term resiliency relative to all hazards mitigation, including global climate change, with considerations to reducing contributions to climate change from transportation facilities, and reducing the future impacts of climate change on the transportation system.
-2: Does not meet either evaluation criteria related to potential climate change or energy efficiency.
-1:
0: Meets one of the evaluation criteria related to potential climate change or energy efficiency.
1:
2: Meets both evaluation criteria related to potential climate change and energy efficiency.
Source: Hawaii Clean Energy Initiative (HCEI) http://www.hawaiicleanenergyinitiative.org/
Source: Regional travel demand model travel times
Source: Hawaii Statewide Transportation Plan
1. Does the solution support the Transportation sector goal of the HCEI to reduce consumption of petroleum in ground transportation by 70% by 2030? Specifically, does the solution improve energy/fuel efficiency of vehicles by reducing vehicle travel times?
2. Does the solution meet Objective 7 of Goal IV of the Hawaii Statewide Transportation Plan (to encourage adaptation to the effects of global climate change and build resilience in the transportation system, and to address the potential effect of a one meter sea-level rise and extreme weather changes by the end of the 21st century on Hawaii’s air, land and water transportation facilities)? Specifically, does the solution meet the appropriate shoreline development setback distance for each region to minimize damage from coastal hazards due to sea-level rise? 1
Modal Integration
Goal 2.1: Provide a Complete Streets transportation system of motorized and nonmotorized options.
-2: Does not support the two Complete Streets principles listed under the Evaluation Criteria
-1: -
0: No impacts to the multimodal transportation system
1: -
2: Aligns with the two Complete Streets principles listed under the Evaluation Criteria
Source: Hawaii Complete Streets – Final Complete Streets Legislative Report (November 2010)
Does the solution support the following principles listed in the final Complete Streets legislative report?
1. Accessibility and mobility for all – Plan and design transportation facilities for ease of use and access to destinations by providing an appropriate path of travel for all users, and enhance the ability to move people and goods throughout the state and its counties.
2. Use and Comfort of all users – Ensure all users of all abilities including bicyclists, pedestrians, transit riders, and drivers feel comfortable and safe using the transportation system.
1 Maps depicting a one-meter rise in sea level are not currently available for all regions. Alternate measurable criteria will be used to develop the Statewide and Regional Long-Range Land Transportation Plans for the Islands of Maui/Molokai/Lanai, Hawaii and Kauai (2035). One-meter sea level rise contour maps may be used for subsequent long-range plan evaluations.

PROCESS FOR SOLUTION EVALUATION (DISTRICT OF KAUAI)
TBG062714093019HNL 20
TABLE 5 Tier 2 Evaluation Criteria
Goal Grading Evaluation Criteria and Data Source Grade
Goal 2.2: Promote efficient travel between modes by creating connections and removing barriers.
-2: Creates barriers to multimodal connection opportunities
-1: No multimodal connection opportunities
0: No impacts to multimodal system
1: Provides multimodal connection opportunities
2: Provides multimodal connection opportunities between multiple modes of travel
Source: Hawaii Statewide Pedestrian Master Plan – Existing Bus Route maps
(Maps K-2, M-2, H-3)
Source: Hawaii DOT Highway Performance Monitoring System (HPMS)
Does the solution improve existing connections to and between vehicles, transit and nonmotorized modes?
Goal 2.3: Promote safe connections between modal alternatives.
-2: Does not support the Complete Streets principle listed under the Evaluation Criteria
-1: -
0: No impacts to the multimodal transportation system
1: -
2: Aligns with the Complete Streets principle listed under the Evaluation Criteria
Source: Hawaii Complete Streets – Final Complete Streets Legislative Report (November 2010)
Does the solution support the following principle listed in the final Complete Streets legislative report?
Safety – Plan, design, and construct transportation facilities and land developments to create an environment that reduces risk and supports the safe movement of people and goods by all modes.
System Preservation
Goal 3.1: Manage transportation assets and optimize investments.
-2: Solution causes adverse impacts to transportation assets (pavement, bridge, or structure) by minimizing life-cycle costs
-1:
0: Solution is not applicable to either of the two Evaluation Criteria, or existing asset (pavement, bridge, or structure) data is insufficient
1:
2: Solution meets either of the two Evaluation Criteria
Source: HDOT State Route System – Road Inventory Line Diagrams
Source: HDOT Bridge Program – 10 Year Plan Rehabilitation and Replacement Schedule
Source: Hawaii DOT Highway Performance Monitoring System (HPMS)
1. For roadway pavement improvements, does the solution optimize life-cycle costs of the existing transportation asset? Specifically, assuming a 20-year typical life span for asphalt concrete-paved roadways and other pavement permutations in Hawaii, is the potential solution expected to be implemented at least 15 years after its most recent pavement improvement (construction completion, rehabilitation, or resurfacing), or does the solution address a documented need for short-term maintenance (within 15 years of its most recent pavement improvement)?
2. For bridge or structure improvements, does the solution align with or support identified/scheduled existing asset improvement needs? Specifically, does the potential solution coincide with documented rehabilitation or replacement activities in the current “Bridge Program - 10 Year Plan” database?

PROCESS FOR SOLUTION EVALUATION (DISTRICT OF KAUAI)
TBG062714093019HNL 21
TABLE 5 Tier 2 Evaluation Criteria
Goal Grading Evaluation Criteria and Data Source Grade
Goal 3.2: Maintain a safe, efficient, complete transportation system for the long-term.
-2: Solution causes adverse impacts to transportation assets by reducing useful life of facility
-1:
0: No impacts to maintaining the existing transportation system or solution is not applicable to either of the two Evaluation Criteria
1: Solution meets one of the two Evaluation Criteria
2: Solution meets both Evaluation Criteria
Source: FHWA Pavement Preservation Definitions (2005)
http://www.fhwa.dot.gov/pavement/preservation/091205.cfm
Source: FHWA Bridge Preservation Guide (2011)
http://www.fhwa.dot.gov/bridge/preservation/guide/index.cfm
Source: HDOT Bridge Program – 10 Year Plan Rehabilitation and Replacement Schedule
1. Does the solution support long-term operation of the existing transportation system through preventive maintenance (defined by FHWA as a planned strategy of cost-effective treatments to an existing roadway system and its appurtenances that preserves the system, retards future deterioration, and maintains or improves the functional condition of the system without substantially increasing structural capacity)? Specifically, does the solution involve any of the following preventive maintenance strategies:
a) Washing or cleaning of bridge/pavement? b) Sealing asphalt cracks or concrete joints? c) Overlaying thin layers of asphalt? d) Facilitating or improving drainage? e) Removing debris? f) Maintaining adjacent vegetation and landscaping?
2. Does the solution support continuity of the existing transportation system through preservation of critical routes? Specifically, will the solution extend the life of a transportation facility that:
a) Serves as the single access to a community or area?
b) Is a key emergency evacuation route or emergency service corridor?

PROCESS FOR SOLUTION EVALUATION (DISTRICT OF KAUAI)
TBG062714093019HNL 22
TABLE 5 Tier 2 Evaluation Criteria
Goal Grading Evaluation Criteria and Data Source Grade
Security
Goal 4.1: Plan, maintain, and operate a transportation system that supports evacuation, response, and recovery for incidents.
-2: Removes critical facilities and lifelines necessary for incident evacuation, response and recovery
-1: Reduces capabilities of critical facilities and lifelines necessary for incident evacuation, response and recovery
0: No impact to critical facilities and lifelines necessary for incident evacuation, response and recovery
1: Improves capability of critical facilities and lifelines for incident evacuation, response and recovery
2: Provides additional usable or alternate critical facilities and lifelines for incident evacuation, response and recovery
Hawaii State Civil Defense – 2010 Hazard Mitigation Plan http://www.scd.hawaii.gov/2010_hmp.html (refers to individual island multihazard plans)
Source: Kauai Multi-Hazard Mitigation Strategy
Is the solution aligned with the relevant goals of the plan, specifically, does the solution secure and maintain lifelines and access for medical assistance and transport of materials/fuel during hazard events?
Source: Hawaii County Multi-Hazard Mitigation Plan
Is the solution aligned with the relevant goals of the plan, specifically, does the solution control future development and support retrofitting existing structures within hazard areas? Does the solution allow or encourage all emergency response critical facilities and communication systems to remain operational during hazard events?
Source: Maui County Multi-Hazard Mitigation Plan
Is the solution aligned with the relevant goals of the plan, specifically, does the solution support reduction of property damage caused by hazard events? Does it encourage the ongoing operations of critical facilities during and after an event?
Goal 4.2: Improve resiliency of the state through the transportation system.
-2: Not in alignment with preparedness plans, and does not support transportation infrastructure and facilities vital to recovery
-1:
0: No impact to supporting resiliency of the state during recovery periods
1:
2: Supports preparedness plans, and protects transportation infrastructure and facilities vital to recovery
Hawaii State Civil Defense – 2010 Hazard Mitigation Plan http://www.scd.hawaii.gov/2010_hmp.html
(refers to individual island multihazard plans)
Source: Kauai Multi-Hazard Mitigation Strategy
Is the solution aligned with the relevant goals of the plan, specifically, does the solution secure and maintain lifelines and access for medical assistance and transport of materials/fuel during hazard events?
Source: Hawaii County Multi-Hazard Mitigation Plan
Is the solution aligned with the relevant goals of the plan, specifically, does the solution ensure that all lifeline infrastructures are able to withstand hazard events?
Source: Maui County Multi-Hazard Mitigation Plan
Is the solution aligned with the relevant goals of the plan, specifically, does the solution protect the ongoing operations of critical facilities during an event?
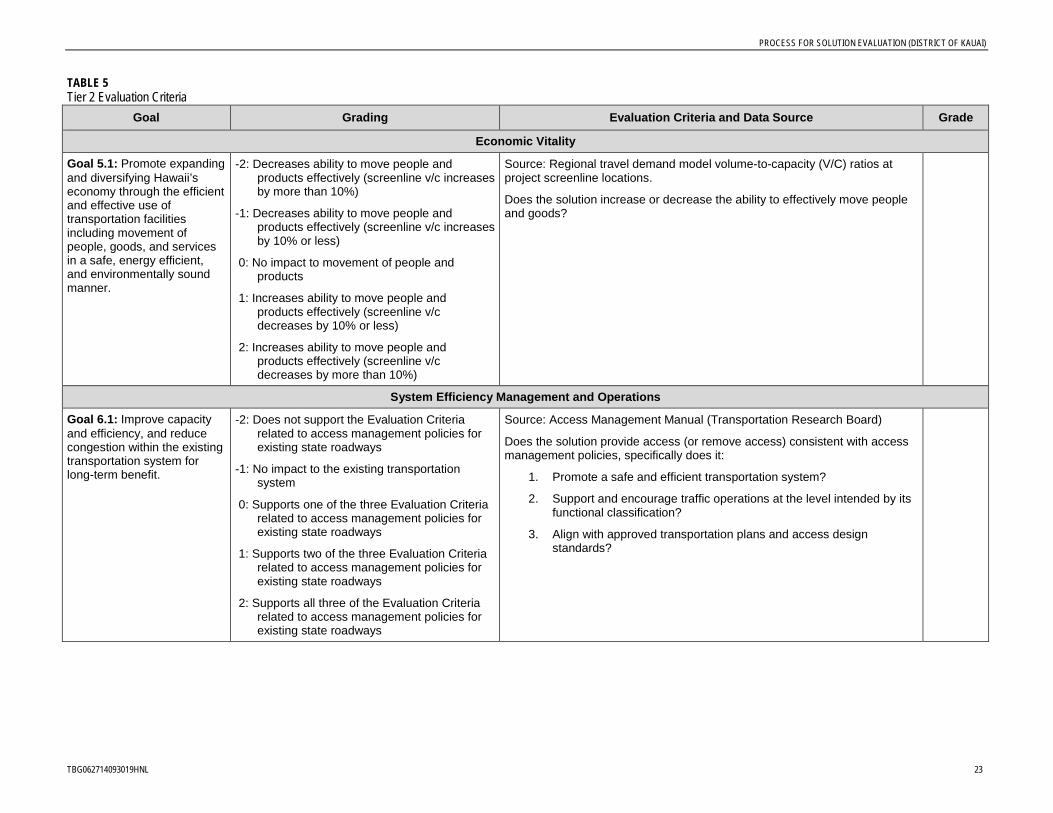
PROCESS FOR SOLUTION EVALUATION (DISTRICT OF KAUAI)
TBG062714093019HNL 23
TABLE 5 Tier 2 Evaluation Criteria
Goal Grading Evaluation Criteria and Data Source Grade
Economic Vitality
Goal 5.1: Promote expanding and diversifying Hawaii’s economy through the efficient and effective use of transportation facilities including movement of people, goods, and services in a safe, energy efficient, and environmentally sound manner.
-2: Decreases ability to move people and products effectively (screenline v/c increases by more than 10%)
-1: Decreases ability to move people and products effectively (screenline v/c increases by 10% or less)
0: No impact to movement of people and products
1: Increases ability to move people and products effectively (screenline v/c decreases by 10% or less)
2: Increases ability to move people and products effectively (screenline v/c decreases by more than 10%)
Source: Regional travel demand model volume-to-capacity (V/C) ratios at project screenline locations.
Does the solution increase or decrease the ability to effectively move people and goods?
System Efficiency Management and Operations
Goal 6.1: Improve capacity and efficiency, and reduce congestion within the existing transportation system for long-term benefit.
-2: Does not support the Evaluation Criteria related to access management policies for existing state roadways
-1: No impact to the existing transportation system
0: Supports one of the three Evaluation Criteria related to access management policies for existing state roadways
1: Supports two of the three Evaluation Criteria related to access management policies for existing state roadways
2: Supports all three of the Evaluation Criteria related to access management policies for existing state roadways
Source: Access Management Manual (Transportation Research Board)
Does the solution provide access (or remove access) consistent with access management policies, specifically does it:
1. Promote a safe and efficient transportation system?
2. Support and encourage traffic operations at the level intended by its functional classification?
3. Align with approved transportation plans and access design standards?

PROCESS FOR SOLUTION EVALUATION (DISTRICT OF KAUAI)
TBG062714093019HNL 24
TABLE 5 Tier 2 Evaluation Criteria
Goal Grading Evaluation Criteria and Data Source Grade
Transportation Access Mobility
Goal 7.1: Provide appropriate and reliable transportation access options statewide to all users.
-2: Removes service and/or infrastructure to support access to all modal alternatives (transit, pedestrian, bicycle)
-1: Restricts services and/or infrastructure that support access to all modal alternatives (transit, pedestrian, bicycle) for all users
0: No impacts to the existing land transportation system multimodal access options
1: Improves existing service and/or infrastructure to support access to all modal alternatives (transit, pedestrian, bicycle)
2: Provides service and/or infrastructure to support access to all modal alternatives (transit, pedestrian, bicycle) in areas that currently do not have modal options
Source: Hawaii Statewide Pedestrian Master Plan – Existing Bus Route maps
(Maps K-2, M-2, H-3)
Source: Bike Plan Hawaii – Regional maps
Does the solution improve existing transportation access options or provide transportation access options to new geographic areas?
Goal 7.2: Ensure transportation investments in programs and prioritization processes are balanced (across modes and demographics, i.e. serves environmental justice (EJ) populations).
-2: Investments do not support infrastructure and access to modal alternatives (transit, pedestrian, bicycle) and do not consider underserved populations
-1: -
0: Not applicable
1: -
2: Investments support infrastructure and access to modal alternatives (transit, pedestrian, bicycle) with consideration to underserved populations
Source: American Community Survey (5-year estimates) maps showing percentage of population (by census tract) below poverty level.
Source: Hawaii Statewide Pedestrian Master Plan – Existing Bus Route maps
(Maps K-2, M-2, H-3)
Source: HDOT Guide for Public Involvement (yes/no)
Does the solution improve multimodal service to EJ (environmental justice) populations?
Does the public involvement plan support the formation of subarea groups, task forces, or advisory committees comprised of all populations, with special attention on committees/input from underserved populations?

PROCESS FOR SOLUTION EVALUATION (DISTRICT OF KAUAI)
TBG062714093019HNL 25
TABLE 5 Tier 2 Evaluation Criteria
Goal Grading Evaluation Criteria and Data Source Grade
Safety
Goal 8.1: Maintain a safe transportation system for all land transportation modes.
-2: Does not support the Complete Streets principle nor the HSHSP strategic actions listed under the Evaluation Criteria
-1: -
0: Supports either the Complete Streets principle or any of the HSHSP strategic actions listed under the Evaluation Criteria
1: -
2: Supports both the Complete Streets principle and any of the HSHSP strategic actions listed under the Evaluation Criteria
Source: Hawaii Complete Streets – Final Complete Streets Legislative Report (November 2010)
Does the solution support the following principle listed in the final Complete Streets legislative report?
Safety – Plan, design, and construct transportation facilities and land developments to create an environment that reduces risk and supports the safe movement of people and goods by all modes.
Source: Hawaii Strategic Highway Safety Plan
Is the solution aligned with and does it support the strategic actions of the HSHSP? Emphasis areas include curbing aggressive driving, combating impaired driving, protecting vehicle occupants, safeguarding pedestrians and bicyclists, ensuring motorcycle and moped safety, building safer roads by design, and improving data and safety management systems. Strategic actions of these emphasis areas include:
1. Does the solution support implementation of Intelligent Transportation System technologies, such as synchronization of traffic signals?
2. Does the solution support the installation of milled rumble strips at roadway centerlines and shoulders?
3. Does the solution support nonmotorized modes of travel and increase their visibility through lighting, signage and advanced technology at intersections?
4. Does the solution include medians or other physical barriers to separate directional traffic to reduce or minimize the number of potential conflicts between vehicles?
5. Does the solution remove or relocate fixed objects, steep grades, or ditches from critical locations?

PROCESS FOR SOLUTION EVALUATION (DISTRICT OF KAUAI)
TBG062714093019HNL 26
TABLE 5 Tier 2 Evaluation Criteria
Goal Grading Evaluation Criteria and Data Source Grade
Goal 8.2: Improve safety of the community through connectivity of the transportation infrastructure.
-2: Restricts existing access for emergency response vehicles and nonmotorized modes
-1: -
0: No impacts to emergency access
1: -
2: Improves existing connectivity and/or provides a second access for emergency response vehicles and nonmotorized modes
Source: Hawaii DOT Highway Performance Monitoring System (HPMS)
Does the solution improve existing access or increase access to areas that currently have very few access options?
Additional Goals
Goal 9.1: Obtain sufficient and specific transportation funding.
-2: -Not eligible for available federal or state funding.
-1: -
0: Eligible for available federal or state funding.
1: -
2: Able to be supplemented with diverse (or alternative) funding sources.
Goal 9.2: Optimize project delivery.
-2: -
-1: -
0: Not applicable
1: -
2:
Not applicable for solution evaluation.
Goal 9.3: Provide on-going planning to assess and address statewide needs.
-2: -
-1: -
0: Not applicable
1: -
2: Supports the statewide planning process

PROCESS FOR SOLUTION EVALUATION (DISTRICT OF KAUAI)
TBG062714093019HNL 27
TABLE 5 Tier 2 Evaluation Criteria
Goal Grading Evaluation Criteria and Data Source Grade
Goal 9.4: Coordinate use of public right-of-way with other public service providers.
-2: Does not allow for right-of-way use coordination for programmed utility agency infrastructure.
-1: -
0: Not applicable
1: -
2: Allows for right-of-way use coordination for programmed utility agency infrastructure.
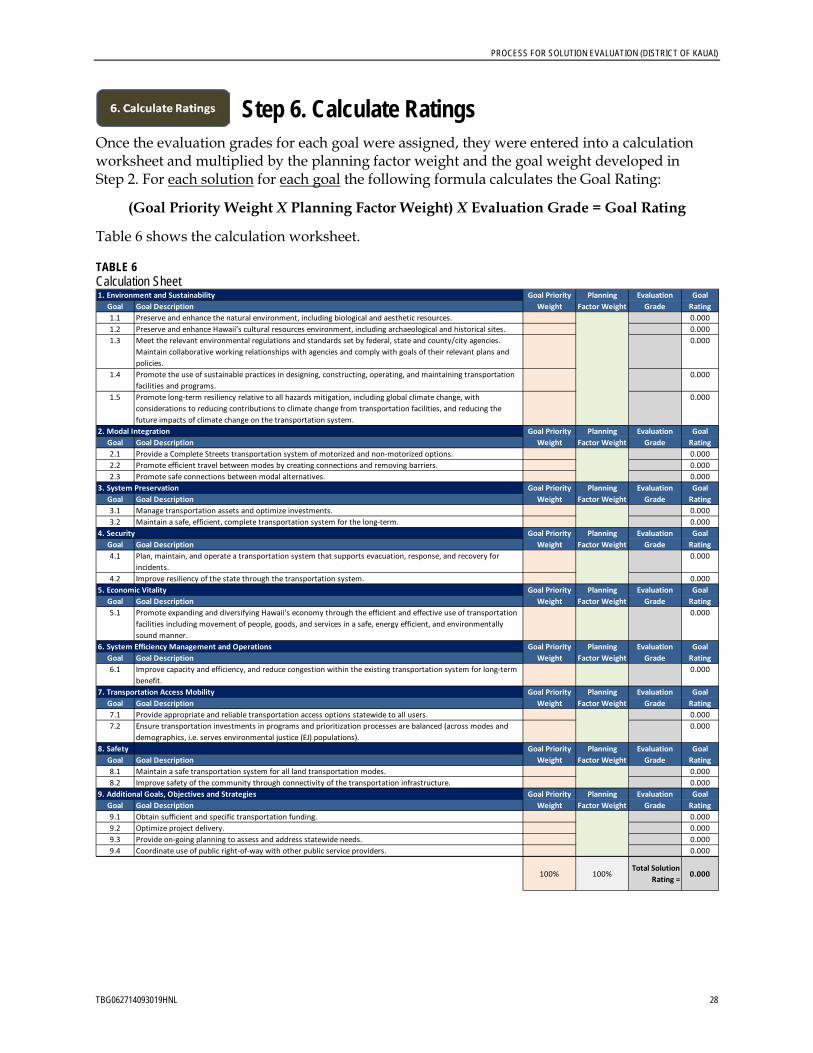
PROCESS FOR SOLUTION EVALUATION (DISTRICT OF KAUAI)
TBG062714093019HNL 28
Step 6. Calculate Ratings Once the evaluation grades for each goal were assigned, they were entered into a calculation worksheet and multiplied by the planning factor weight and the goal weight developed in Step 2. For each solution for each goal the following formula calculates the Goal Rating:
(Goal Priority Weight X Planning Factor Weight) X Evaluation Grade = Goal Rating
Table 6 shows the calculation worksheet.
TABLE 6 Calculation Sheet 1. Environment and Sustainability
Goal Goal Description1.1 Preserve and enhance the natural environment, including biological and aesthetic resources. 0.0001.2 Preserve and enhance Hawaii’s cultural resources environment, including archaeological and historical sites. 0.0001.3 Meet the relevant environmental regulations and standards set by federal, state and county/city agencies.
Maintain collaborative working relationships with agencies and comply with goals of their relevant plans and policies.
0.000
1.4 Promote the use of sustainable practices in designing, constructing, operating, and maintaining transportation facilities and programs.
0.000
1.5 Promote long-term resiliency relative to all hazards mitigation, including global climate change, with considerations to reducing contributions to climate change from transportation facilities, and reducing the future impacts of climate change on the transportation system.
0.000
2. Modal IntegrationGoal Goal Description2.1 Provide a Complete Streets transportation system of motorized and non-motorized options. 0.0002.2 Promote efficient travel between modes by creating connections and removing barriers. 0.0002.3 Promote safe connections between modal alternatives. 0.000
3. System PreservationGoal Goal Description3.1 Manage transportation assets and optimize investments. 0.0003.2 Maintain a safe, efficient, complete transportation system for the long-term. 0.000
4. SecurityGoal Goal Description4.1 Plan, maintain, and operate a transportation system that supports evacuation, response, and recovery for
incidents.0.000
4.2 Improve resiliency of the state through the transportation system. 0.0005. Economic Vitality
Goal Goal Description5.1 Promote expanding and diversifying Hawaii's economy through the efficient and effective use of transportation
facilities including movement of people, goods, and services in a safe, energy efficient, and environmentally sound manner.
0.000
6. System Efficiency Management and OperationsGoal Goal Description6.1 Improve capacity and efficiency, and reduce congestion within the existing transportation system for long-term
benefit.0.000
7. Transportation Access MobilityGoal Goal Description7.1 Provide appropriate and reliable transportation access options statewide to all users. 0.0007.2 Ensure transportation investments in programs and prioritization processes are balanced (across modes and
demographics, i.e. serves environmental justice (EJ) populations).0.000
8. SafetyGoal Goal Description8.1 Maintain a safe transportation system for all land transportation modes. 0.0008.2 Improve safety of the community through connectivity of the transportation infrastructure. 0.000
9. Additional Goals, Objectives and StrategiesGoal Goal Description9.1 Obtain sufficient and specific transportation funding. 0.0009.2 Optimize project delivery. 0.0009.3 Provide on-going planning to assess and address statewide needs. 0.0009.4 Coordinate use of public right-of-way with other public service providers. 0.000
100% 100%Total Solution
Rating =0.000
Evaluation Grade
Goal Rating
Goal Priority Weight
Planning Factor Weight
Evaluation Grade
Goal Rating
Goal Priority Weight
Planning Factor Weight
Evaluation Grade
Goal Rating
Goal Priority Weight
Planning Factor Weight
Evaluation Grade
Goal Priority Weight
Planning Factor Weight
Evaluation Grade
Goal Rating
Goal Rating
Goal Rating
Goal Priority Weight
Planning Factor Weight
Evaluation Grade
Goal Rating
Goal Priority Weight
Planning Factor Weight
Goal Priority Weight
Planning Factor Weight
Evaluation Grade
Goal Rating
Goal Priority Weight
Planning Factor Weight
Evaluation Grade
Goal Rating
Goal Priority Weight
Planning Factor Weight
Evaluation Grade

PROCESS FOR SOLUTION EVALUATION (DISTRICT OF KAUAI)
TBG062714093019HNL 29
When all ratings were calculated, they were summed for each solution. This resulted in a total solution rating, which can be compared to other total solution ratings for other potential solutions in the District of Kauai.
Sum of Goal Ratings = Total Solution Rating The total solution ratings show how each solution scores compared to the other solutions within the same region; but the process also shows the strengths and weaknesses of each solution in terms of the goals (for example, which solutions perform best in terms of safety, which perform best in terms of economic vitality, etc.).
It is important to remember that the evaluation process is a TOOL for decision-making and planning; the solutions should not be ranked or prioritized based on the total solution rating score alone.
Step 7. Prioritize the Solutions Following the assignment of ratings, the PMT developed planning level cost estimates for each of the potential solutions. Estimated planning level costs are important variables for each solution because they allow the solution to be evaluated against fiscal constraints.
The total solution ratings, in conjunction with cost information, was used to identify potential solutions that consistently met the Plans priority goals and best addressed the regions deficiencies. Solutions with relatively high scores, compared to other solutions within the District of Kauai, could indicate the solution meets the regions priority goals for land transportation. Lower ranking solutions could indicate that the solution does not meet the priority goals for the Plan, or does not meet an identified regional need or deficiency.
Potential solutions that scored relatively high were not definitively ranked or determined to be specific recommendations for the Plan. Rather, the potential solutions will be prioritized and implemented through a series of overarching HDOT Highways Division programs. These existing programs provide, manage, and maintain infrastructure and services on Kauai’s federal-aid roadways. The overarching programs and their subprograms are described in Table 7.
Potential solutions for the District of Kauai that address priority goals of the Plan, and their correlation to the implementing HDOT Highways Division programs, are described below:
• System preservation and maintenance projects – Potential solutions for highway maintenance and continuous highway operations fall under the existing System Preservation Program. Solutions include regular maintenance such as pavement resurfacing, rehabilitation, or reconstruction; bridge replacement or rehabilitation, guardrail repairs; and sidewalk repairs. System preservation solutions also include removing and clearing roadside vegetation and debris; protecting slopes and hillsides from erosion; constructing roadways to allow runoff and prevent ponding or flooding; and upkeep of drainage facilities to maintain roadway operations during heavy rains. Preserving Kauai’s transportation system is crucial because the islands belt roads are community lifelines. Maintaining the region’s highways aligns with the System Preservation, Security, Safety, and System Efficiency Management and Operations goals of the Plan.

PROCESS FOR SOLUTION EVALUATION (DISTRICT OF KAUAI)
TBG062714093019HNL 30
• Safety projects – Solutions identified include infrastructure projects, such as installing warning signage, lighting, or guardrail; maintaining embankments, slopes, and retaining walls; and reconfiguring intersections or roadways where high numbers of documented accidents have occurred. Potential solutions also include non-infrastructure projects, such as safety awareness campaigns and programs to communicate safety-related education and outreach. The existing Safety Program includes subprograms that implement safety improvements focused on rockfall and slope stabilization, shoreline protection, and guardrail and shoulder improvements. Improving the safety of Kauai’s roadway infrastructure aligns with the Environment and Sustainability, Safety, and System Preservation goals of the Plan.
• Modal integration projects – Potential modal integration projects on Kauai include improved roads with new bicycle lanes, new shared paths exclusively meant for nonmotorized modes, safer connections and increased visibility between modes, and preservation and maintenance of existing nonmotorized facilities. The existing Safety Program, System Preservation Program, and Capacity Program include subprograms that implement these types of priority multimodal projects. Providing options for all users and safely integrating modes aligns with the Environment and Sustainability, Modal Integration, Safety, Transportation Access Mobility, and System Preservation goals of the Plan.
• Capacity projects – Improving efficiency and reducing congestion on Kauai’s roadways was identified as a priority need. Infrastructure capacity solutions to address these needs include widening existing highways to provide more capacity, constructing new roadways to provide circulation options, and realigning or improving existing facilities to include nonmotorized modes on shared roadways. The existing Capacity Program is capable of implementing solutions. Addressing congestion aligns with the Environment and Sustainability, System Preservation, Economic Vitality, and System Efficiency Management and Operations goals of the Plan.
• Security and resiliency projects – Potential solutions to improve Kauai’s resiliency to threats, emergencies, and natural disasters include maintaining the condition of critical roadway facilities and providing alternate access/egress routes for potentially vulnerable communities. The Capacity Program and System Preservation Program have subprograms to prioritize and implement security and resiliency solutions. Providing reliable travel options aligns with the System Preservation, Safety, and Security goals of the Plan.
• Transit projects –Transit solutions include expanded service with additional routes, new service areas, larger coaches, upgraded bus stops, and new park-and-ride locations. While transit is implemented by the county, some existing HDOT programs, such as the Capacity Program and System Preservation Program, provide complementary benefits. System preservation and capacity projects can reduce transit travel time and help maintain transit schedules. Improving transit service and reliability for all users aligns with the Modal Integration and Transportation Access Mobility goals of the Plan.
PROCESS FOR SOLUTION EVALUATION (DISTRICT OF KAUAI)
TBG062714093019HNL 31
Future Planning and Budgeting This evaluation process is intended to be replicable. Since information, political priorities, funding sources, and state, regional, and local leadership change, it is important that this process is flexible. Goals, weights, and grading schemes could change over time – but the seven-step process is a defensible solution-prioritization process that can be applied to future planning cycles.

PROCESS FOR SOLUTION EVALUATION (DISTRICT OF KAUAI)
TBG062714093019HNL 32
TABLE 7 HDOT Highways Division Program Summary and Correlation to Planning Factors
Program/Subprogram Purpose
Correlation to Planning Factors Primary (Secondary) Factors Addressed
by program
Safety Programs
Highway Safety Improvement Program (HSIP)
The Highway Safety Improvement Program (HSIP is a component program of the FHWA Federal Aid Program. It provides improvements in areas characterized with high-accident occurrences. This program also funds grants for safety related education and public outreach programs. The goal of the Program is to reduce the number of fatal and serious injury accidents. There are four main components:
• HSIP Core Program includes the planning/data collection, analysis, implementation and evaluation of projects to address high-accident locations
• High-Risk Rural Roads Program has a similar process to the Core Program, with a focus on fatal and serious injury accidents on rural roads with classifications of collector or lower.
• Highway-Rail Safety Program requests that funds are transferred to the Core Program due to the rarity of serious train related accidents in Hawaii.
• Non-Infrastructure Flex Account allows up to 10% of the annual HSIP Core Program to fund non-infrastructure projects identified in the Strategic Highway Safety Plan. This Program is managed as a NHTSA grant program.
The Program calculates benefit/cost ratio to rank projects. At least one project from each County is selected and additional projects are selected based on overall ranking. The evaluation of the projects includes a 2- to 3-year before-and-after accident analysis. Evaluation is submitted annually to FHWA.
Safety
Bridge Lead Paint Abatement The Bridge Program’s purpose is to effectively manage the state’s bridge inventory in accordance with the applicable federal regulations. The program maintains records for state and county bridges including recurring bridge inspection and inventories. These records are the basis for developing priorities for lead paint abatement.
Safety (Environment and Sustainability)
Rockfall and Slope Stabilization The Rockfall and Slope Stabilization Program prioritizes and implements projects to maintain integrity of roadway embankments and roadside slopes. The Program also handles emergency response related to rockslide and slope failures.
Safety (Environment and Sustainability, System Preservation and Security)
Retaining Walls The Retaining Wall Program implements retaining wall projects that are identified in the Rockfall and Slope Stabilization Program.
Safety (Environment and Sustainability, System Preservation and Security)
Highway Shoreline Protection The Shoreline Protection Program prioritizes and implements projects to maintain integrity of roadways and embankments adjacent to the shoreline. The Program also handles emergency response related to roadway failures from ocean impacts.
Safety (Environment and Sustainability, System Preservation and Security)
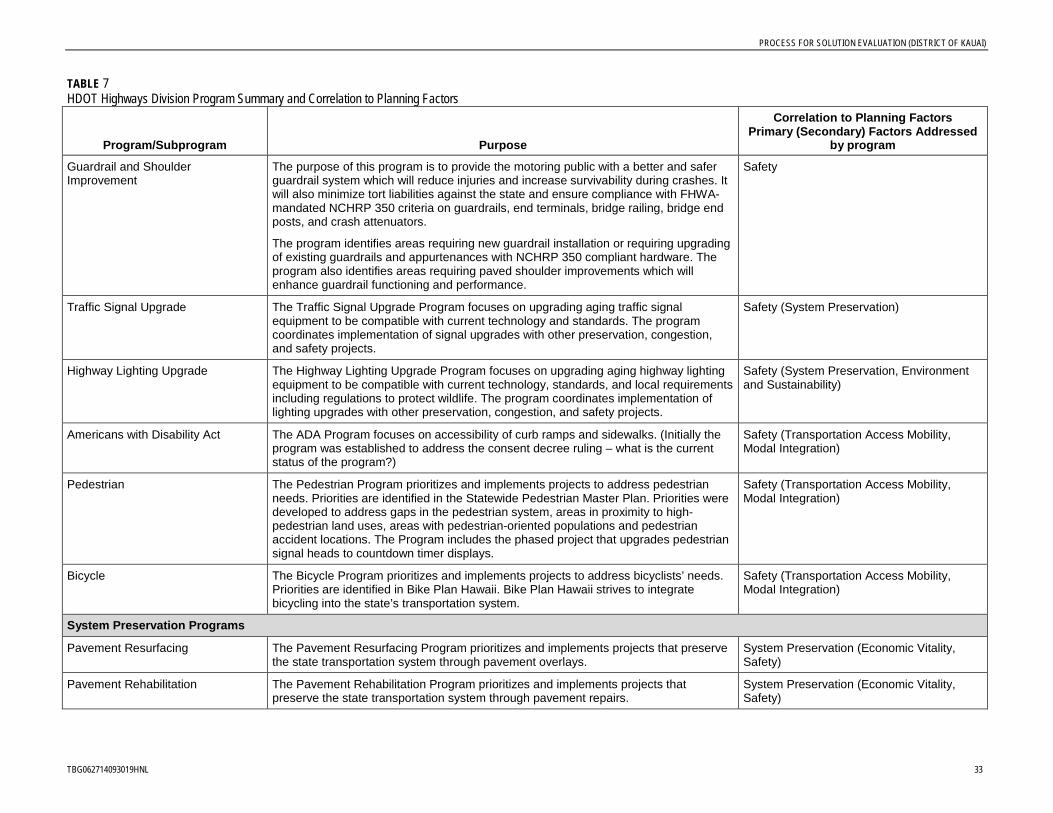
PROCESS FOR SOLUTION EVALUATION (DISTRICT OF KAUAI)
TBG062714093019HNL 33
TABLE 7 HDOT Highways Division Program Summary and Correlation to Planning Factors
Program/Subprogram Purpose
Correlation to Planning Factors Primary (Secondary) Factors Addressed
by program
Guardrail and Shoulder Improvement
The purpose of this program is to provide the motoring public with a better and safer guardrail system which will reduce injuries and increase survivability during crashes. It will also minimize tort liabilities against the state and ensure compliance with FHWA-mandated NCHRP 350 criteria on guardrails, end terminals, bridge railing, bridge end posts, and crash attenuators.
The program identifies areas requiring new guardrail installation or requiring upgrading of existing guardrails and appurtenances with NCHRP 350 compliant hardware. The program also identifies areas requiring paved shoulder improvements which will enhance guardrail functioning and performance.
Safety
Traffic Signal Upgrade The Traffic Signal Upgrade Program focuses on upgrading aging traffic signal equipment to be compatible with current technology and standards. The program coordinates implementation of signal upgrades with other preservation, congestion, and safety projects.
Safety (System Preservation)
Highway Lighting Upgrade The Highway Lighting Upgrade Program focuses on upgrading aging highway lighting equipment to be compatible with current technology, standards, and local requirements including regulations to protect wildlife. The program coordinates implementation of lighting upgrades with other preservation, congestion, and safety projects.
Safety (System Preservation, Environment and Sustainability)
Americans with Disability Act The ADA Program focuses on accessibility of curb ramps and sidewalks. (Initially the program was established to address the consent decree ruling – what is the current status of the program?)
Safety (Transportation Access Mobility, Modal Integration)
Pedestrian The Pedestrian Program prioritizes and implements projects to address pedestrian needs. Priorities are identified in the Statewide Pedestrian Master Plan. Priorities were developed to address gaps in the pedestrian system, areas in proximity to high-pedestrian land uses, areas with pedestrian-oriented populations and pedestrian accident locations. The Program includes the phased project that upgrades pedestrian signal heads to countdown timer displays.
Safety (Transportation Access Mobility, Modal Integration)
Bicycle The Bicycle Program prioritizes and implements projects to address bicyclists’ needs. Priorities are identified in Bike Plan Hawaii. Bike Plan Hawaii strives to integrate bicycling into the state’s transportation system.
Safety (Transportation Access Mobility, Modal Integration)
System Preservation Programs
Pavement Resurfacing The Pavement Resurfacing Program prioritizes and implements projects that preserve the state transportation system through pavement overlays.
System Preservation (Economic Vitality, Safety)
Pavement Rehabilitation The Pavement Rehabilitation Program prioritizes and implements projects that preserve the state transportation system through pavement repairs.
System Preservation (Economic Vitality, Safety)

PROCESS FOR SOLUTION EVALUATION (DISTRICT OF KAUAI)
TBG062714093019HNL 34
TABLE 7 HDOT Highways Division Program Summary and Correlation to Planning Factors
Program/Subprogram Purpose
Correlation to Planning Factors Primary (Secondary) Factors Addressed
by program
Pavement Reconstruction The Pavement Reconstruction Program prioritizes and implements projects that preserve the state transportation system through pavement reconstruction/replacement.
System Preservation (Economic Vitality, Safety)
Pavement Preventive Maintenance The Pavement Preservation Program prioritizes and implements projects that preserve the state transportation system through preventive pavement maintenance.
System Preservation (Economic Vitality, Safety)
Bridge Replacement The Bridge Program’s purpose is to effectively manage the state’s bridge inventory in accordance with the applicable federal regulations. The program maintains records for state and county bridges including recurring bridge inspection and inventories. These records allow for prioritizing bridges for replacement.
System Preservation (Economic Vitality, Safety)
Bridge Rehabilitation The Bridge Program’s purpose is to effectively manage the state’s bridge inventory in accordance with the applicable federal regulations. The program maintains records for state and county bridges including recurring bridge inspection and inventories. These records allow for prioritizing bridges for rehabilitation including the widening of existing structures.
System Preservation (Economic Vitality, Safety)
Bridge Preventive Maintenance The Bridge Program’s purpose is to effectively manage the state’s bridge inventory in accordance with the applicable federal regulations. The program maintains records for state and county bridges including recurring bridge inspection and inventories. These records allow for prioritizing bridges for preventive maintenance.
System Preservation (Economic Vitality, Safety)
Seismic Retrofit The Bridge Program’s purpose is to effectively manage the state’s bridge inventory in accordance with the applicable federal regulations. The program maintains records for state and county bridges including recurring bridge inspection and inventories. These records allow for prioritizing bridges for seismic retrofit.
System Preservation (Economic Vitality, Safety)
Drainage Improvements The Drainage Program provides upgrades to the existing highway drainage system to maintain roadway integrity and operations. The Program assists the Districts’ maintenance staff with immediate mitigation for existing and/or recurring drainage issues. The Program is intended to be a means to fast track design and construction of small drainage projects statewide.
The Drainage Program solicits potential projects from the Districts biennially. Field investigations are conducted to determine if the project can be funded under the Program. Based on estimated construction cost, design schedule, and urgency of the project, the projects are then programmed into the budget. Programming is done for the next 2-3 fiscal years. Potential drainage projects that are not included in the Program are budgeted using other funding sources.
System Preservation (Environment and Sustainability, Safety)

PROCESS FOR SOLUTION EVALUATION (DISTRICT OF KAUAI)
TBG062714093019HNL 35
TABLE 7 HDOT Highways Division Program Summary and Correlation to Planning Factors
Program/Subprogram Purpose
Correlation to Planning Factors Primary (Secondary) Factors Addressed
by program
Traffic Signal Upgrade The Traffic Signal Upgrade Program focuses on upgrading aging traffic signal equipment to be compatible with current technology and standards. The program coordinates implementation of signal upgrades with other preservation, congestion, and safety projects.
System Preservation (Safety)
Highway Lighting Replacement The Highway Lighting Replacement Program focuses on replacement of highway lighting equipment. The program replaces damaged and stolen lighting components.
System Preservation (Safety)
Destination Sign Structure Replacement
The Destination Sign Structure Replacement Program upgrades aging destination sign structures to be compatible with current technology, standards, and local requirements.
System Preservation (Safety)
Pedestrian The Pedestrian Program prioritizes and implements projects to address pedestrian needs. Priorities are identified in the Statewide Pedestrian Master Plan. Priorities were developed to address gaps in the pedestrian system, areas in proximity to high-pedestrian land uses, areas with pedestrian-oriented populations and pedestrian accident locations. The System Preservation aspect of the Program includes addressing sidewalk repair.
System Preservation (Transportation Access Mobility, Modal Integration)
Bicycle The Bicycle Program prioritizes and implements projects to address bicyclists’ needs. Priorities are identified in the Bike Plan Hawaii. Bike Plan Hawaii strives to integrate bicycling into the state’s transportation system. The System Preservation aspect of the Program includes addressing bicycle facility repair.
System Preservation (Transportation Access Mobility, Modal Integration)
Contextual Landscape Program The Contextual Landscaping Program is responsible for developing standards, guidelines, and policies for the sustainable protection and enhancement of the unique context of Hawaii’s road corridors. The Program supports sustainable protection and landscaping components in other preservation projects. The standards, guidelines, and policies are currently being developed in the HDOT Sustainable Landscape Master Plan.
System Preservation, Environment and Sustainability, Economic Vitality (Safety, Modal Integration)
Erosion Control The Erosion Control Program provides protection for bridge supports and roadway embankments from the effects of runoff and flowing of water.
System Preservation (Environment and Sustainability)
Signing and Striping The Signing and Striping Program addresses meeting the federal requirements for reflectorization.
System Preservation (Safety)

PROCESS FOR SOLUTION EVALUATION (DISTRICT OF KAUAI)
TBG062714093019HNL 36
TABLE 7 HDOT Highways Division Program Summary and Correlation to Planning Factors
Program/Subprogram Purpose
Correlation to Planning Factors Primary (Secondary) Factors Addressed
by program
Congestion Programs
Intelligent Transportation System The ITS Program develops and provides regional ITS architecture statewide. The program also provides infrastructure and operations that address events along the highway system. One of the components of the program is the Freeway Management System on Oahu.
The Freeway Management System provides infrastructure and operations that address both recurring and nonrecurring events that cause congestion on Oahu freeways. The program includes coordination with the City and County of Honolulu to establish the joint Traffic Control Center. The program also provides provision and operation of ITS infrastructure and the Freeway Service Patrol
System Efficiency Management and Operations (Economic Vitality, Safety)
Intersection Operations Improvements
The Intersection Operations Improvements Program focuses on modification of intersections to address congestion and safety issues. The program coordinates implementation of signing, channelization and other intersection improvements with other preservation, congestion, and safety projects.
System Efficiency Management and Operations (Economic Vitality, Safety)
Traffic Signal Optimization The Traffic Signal Optimization Program focuses on providing optimized traffic flow along corridors. The program provides infrastructure and operations for urban corridors that are connected to the Traffic Management Center (within urban Oahu area), and interconnects signals along key traffic flow corridors.
System Efficiency Management and Operations (Economic Vitality, Safety)
Traffic Signal Upgrade The Traffic Signal Upgrade Program focuses on upgrading aging traffic signal equipment to be compatible with current technology and standards. The program coordinates implementation of signal upgrades with other preservation, congestion and safety projects.
System Efficiency Management and Operations (Economic Vitality, Safety)
Capacity Programs
New Roads and Bridges The Capacity Program provides identified capacity needs for all modes of travel. Capacity needs are identified and prioritized in the Long-Range Land Transportation Plans. The New Roads and Bridges program addresses the priorities that identify the need for new roadways.
System Efficiency Management and Operations (Economic Vitality, Safety, Modal Integration)
Bypass The Capacity Program provides identified capacity needs for all modes of travel. Capacity needs are identified and prioritized in the Long-Range Land Transportation Plans. The Bypass program addresses the priorities that identify the need for highway bypasses.
System Efficiency Management and Operations (Economic Vitality, Safety, Modal Integration)
Widening The Capacity Program provides identified capacity needs for all modes of travel. Capacity needs are identified and prioritized in the Long-Range Land Transportation Plans. The Widening program addresses the priorities that identify the need for roadway widening.
System Efficiency Management and Operations (Economic Vitality, Safety, Modal Integration)

PROCESS FOR SOLUTION EVALUATION (DISTRICT OF KAUAI)
TBG062714093019HNL 37
TABLE 7 HDOT Highways Division Program Summary and Correlation to Planning Factors
Program/Subprogram Purpose
Correlation to Planning Factors Primary (Secondary) Factors Addressed
by program
Pedestrian The Pedestrian Program prioritizes and implements projects to address pedestrian needs. Priorities are identified in the Statewide Pedestrian Master Plan. Priorities were developed to address gaps in the pedestrian system, areas in proximity to high-pedestrian land uses, areas with pedestrian-oriented populations and pedestrian accident locations. Pedestrian improvements related to Capacity address pedestrian demands and may include new facilities.
Modal Integration (Transportation Access Mobility)
Bicycle The Bicycle Program prioritizes and implements projects to address bicyclists’ needs. Priorities are identified in the Bike Plan Hawaii. Bike Plan Hawaii strives to integrate bicycling into the state’s transportation system. Bicycle improvements related to Capacity address bicycle demands and may include new facilities.
Modal Integration (Transportation Access Mobility)
Environmental Programs
Contextual Landscape Program The Contextual Landscape Program is responsible for developing standards, guidelines and polices for the sustainable protection and enhancement of the unique context of Hawaii’s road corridors. Priorities are currently being developed in the HDOT Statewide Sustainable Landscape Master Plan.
Environment and Sustainability, Economic Vitality, System Preservation (Safety, Modal Integration)
Municipal Separate Storm Sewer System (MS4)
An MS4 permit is acquired on a 5 year timeframe that allows HDOT Highways to discharge storm water runoff. Currently the MS4 is required only on Oahu. The MS4 Program elements address the conditions set forth in the permit. The Program priorities are defined in the permit conditions. The current Program elements include; Environmental Management System, Storm Water Monitoring, Debris Control, Erosion Control, Master Consultant and Highways Divisions Charges.
Environment and Sustainability
Other Programs
Maui Transportation Maui Transportation oversees three grant programs: Maui Bus, Maui Economic Opportunity, which provides paratransit service and Air Ambulance.
Transportation Access Mobility
Hawaii Mass Transit The Hawaii County Mass Transit Agency provides public transportation around the island on the Hele-On bus. In addition, the Transit Agency offers a Shared Ride Taxi program which provides door to door transportation for as little as $2.00 within the urbanized area of Hilo.
Transportation Access Mobility
Kauai Transportation The Kaua’i Bus operates a public (fixed-route) bus service and a paratransit (door-to-door) bus service from Hanalei to Kekaha daily.
Transportation Access Mobility


Attachment 1 District of Kauai Tier 2 Potential Solutions


Kauai District Tier 2 Roadway Infratructure Potential Solutions
Route
NumberJurisdiction Project Title Project Description
Primary
Program
50 County Eleele Bridge Preserve and rehabilitate bridgeSystem
Preservation
50 StateKaumualii Highway ‐ Maluhia Road to
KekahaWiden shoulders for signed shared roadway Safety
50 StateKaumualii Highway ‐ Anonui Street to
Kipu Road (Phase 1B)Additional 2 travel lanes Capacity
50 State Kaumualii Highway ‐ Bridge 7E Rehabilitate Bridge 7ESystem
Preservation
50 StateKaumualii Highway ‐ Hanapepe Road to
Eleele RoadAdditional 2 travel lanes Capacity
50 StateKaumualii Highway ‐ Kahili Mountain Park
Road to Koloa RoadHighway Improvements Capacity
50 StateKaumualii Highway ‐ Kalaheo Town to
Koloa RoadAdditional 2 travel lanes Capacity
50 State
Kaumualii Highway ‐ Kipu Road to Vicinity
of Haiku Airstrip (West of Humane
Society, M.P. 3.47. Phase 1C)
Additional 2 travel lanes Capacity
50 StateKaumualii Highway ‐ vicinity of Mahea
Road
Construct a pedestrian/bicycle underpass between Lima Ola
Workforce housing project and Eleele Elementary SchoolCapacity
50 StateKaumualii Highway (Waimea Town to
Kekaha Town)Resurface highway
System
Preservation
50 State Kaumualii Highway and Akemama Road Improve intersection sight distance and geometrics Safety
50 StateKaumualii Highway at Papalina Road
intersection
Pedestrian crossing improvements at the Kaumualii Highway
and Papalina Road intersection and install pedestrian
countdown timers and advanced pedestrian warning signs
Safety
50 State Kaumualii Highway in Kekaha Realign highway away from the ocean Safety
50 StateKaumualii Highway, Hanapepe River
BridgeRehab or replace bridge
System
Preservation
50 State
Kaumualii Highway, Huleia Bridge to
West of Kahili Mountain Park Road
(Approx. 1000 ft, Phase 3)
Highway Improvements Capacity
50 State Kaumualii Highway, Omao Bridge Rehabilitate bridgeSystem
Preservation
50 State
Kaumualii Highway, Vicinity of Haiku
Airstrip (West of Humane Society, M.P.
3.47) to Huleia Bridge (Phase 2)
Highway Improvements Capacity
50 County Koloa to Nawiliwili Construct a multi‐use path, south of Kaumualii Highway Capacity
51 State Kapule Highway Additional 2 travel lanes with bike lanes and sidewalks Capacity
51 State Kapule Highway Install center rumble strips Safety
51 State Kapule Highway, Nawiliwili Stream Bridge Rehab and widen bridgeSystem
Preservation
56 State Kuhio Highway ‐ Hanamaulu to Wailua Widen shoulders for signed shared roadway Safety
56 State Kuhio Highway ‐ Kapaia Bridge Rehabilitate bridgeSystem
Preservation
56 StateKuhio Highway ‐ Kapule Highway to
Mailihuna RoadAdditional 2 travel lanes Capacity
56 State Kuhio Highway ‐ Kealia to Princeville Provide passing lanes, where feasible Congestion
56 State Kuhio Highway ‐ near Hanamaulu Install rumble strips/center barriers and lower speed limit Safety
56 StateKuhio Highway ‐ vicinity of Kuamoo Road
to Mailihuna RoadStabilize hillside areas Safety
1 of 5

Kauai District Tier 2 Roadway Infratructure Potential Solutions
Route
NumberJurisdiction Project Title Project Description
Primary
Program
56 StateKuhio Highway ‐ Wilcox Memorial
Hospital to Hanamaulu Road
Improve pedestrian connections by replacing eroded sidewalks
and closing sidewalk gapsCapacity
56 StateKuhio Highway and Kapule Highway
intersection
Review traffic controls, striping and operations through the
intersectionCongestion
56 State Kuhio Highway at Kapaia Valley Widen highway for bike and pedestrian accommodation Safety
56 State Kuhio Highway at Kapaka Street Improve highway and intersection operations Congestion
56 StateKuhio Highway at Kawaihau Road
intersection
Construct an access between the communities along Cane Haul
Road, Hauaala Road, and Kawaihau Road to the multi‐use path
on the makai side of Kuhio Highway
Capacity
56 StateKuhio Highway at Koolau Road, Vicinity of
MoloaaImprove intersection operations Congestion
56 State Kuhio Highway in Anahola Construct new pedestrian crossings Safety
56 State Kuhio Highway in Anahola Preserve Anahola BridgeSystem
Preservation
56 State Kuhio Highway in Wailua Address highway drainage and pondingSystem
Preservation
56 StateKuhio Highway Kapaia Road to Laukona
StreetMaintain vegetation Safety
56 StateKuhio Highway on the bend between
Kalihiwai Road and Kahiliholo RoadStabilize hillside and maintain vegetation Safety
56 State Kuhio Highway vicinity of Ehiku StreetComplete the sidewalk gap on Kuhio Highway at Ehiku Street
near Wal‐MartCapacity
56 State Kuhio Highway, Kapaa Stream Bridge Rehab bridgeSystem
Preservation
58 StateNawiliwili Road vicinity of Nawiliwili
HarborAddress highway drainage and flooding
System
Preservation
520 CountyMaluhia Road ‐ Ala Kinoiki Road to
Kaumualii HighwayAdditional 2 travel lanes Capacity
520 CountyMaluhia Road ‐ Kaumualii Highway to
Koloa TownConstruct a shared use path Capacity
520 County Maluhia Road ‐ Tree Tunnel Resurface highwaySystem
Preservation
520 CountyPoipu Road ‐ Lawai Road to Ala Kinoiki
Road
Improve existing roadway to include bike lanes and sidewalks,
consider roundaboutCapacity
522 County Ala Kinoiki Way Additional 2 travel lanes Capacity
530 CountyKoloa Road ‐ Kaumualii Highway to Poipu
RoadSign as shared road Capacity
530 County Koloa Road ‐ Lawai to Koloa Town Guardrail, signing, striping and rumble strip improvements Safety
550 County Kokee Road (after the hairpin turn) Widening after the hairpin turn, where it is a single lane Capacity
552 County Alae Road Resurface highwaySystem
Preservation
560 StateKuhio Highway ‐ Aku Road to Hanalei
Dolphin CenterProvide a separated pedestrian facility Capacity
560 State Kuhio Highway from Princeville to HaenaRaise road and reinforce shoreline along the west side of
Hanalei BaySafety
560 State Kuhio Highway in Hanalei Bicycle and pedestrian facilities Capacity
560 StateKuhio Highway, Wainiha River No. 1
BridgeRehab/replace bridge
System
Preservation
560 StateKuhio Highway, Wainiha River No. 2
BridgeRehab/replace bridge
System
Preservation
560 StateKuhio Highway, Wainiha River No. 3
BridgeRehab/replace bridge
System
Preservation
2 of 5

Kauai District Tier 2 Roadway Infratructure Potential Solutions
Route
NumberJurisdiction Project Title Project Description
Primary
Program
560 StateKuhio Highway, Waioli, Waipa and
Waikoko Stream BridgesReplace existing bridges
System
Preservation
562 County Kilauea Road Construct bicycle and pedestrian facilities Capacity
570 StateAhukini Road ‐ Kuhio Highway to Kapule
Highway
Improve airport access including realignment and illumination.
Additional 2 travel lanes with sidewalks and bike lanes or a
bicycle path
Capacity
570 State
Ahukini Road at Kuhio Highway and
Kapule Highway Intersections and
Kapule Highway at Kuhio Highway
intersection
Evaluate intersection operations, including roundabouts as an
alternativeCongestion
580 State Kuamoo Road Maintain shoulders/vegetation. Erosion control Safety
580 StateKuamoo Road ‐ Kuhio Highway to Kamalu
RoadImprove roadway to accommodate non‐motorized modes Capacity
580 StateKuamoo Road ‐ Kuhio Highway to Kamalu
RoadImprove existing roadway to include bike lanes and sidewalks Capacity
581 CountyKamalu Road ‐ Kuamoo Road to Olohena
RoadImprove existing roadway to include bike lanes and sidewalks Capacity
581 CountyKamalu Road at Olohena Road
intersectionImprove intersection sight distance Safety
581 County Kamalu Road Bridge Address drainage issues at the Kamalu Road BridgeSystem
Preservation
581 County Kamalu Road vicinity of Opaekaa Road
Realign Kamalu Road from Opaekaa Road to a point
approximately 3,300 feet east, including construction of a new
bridge (Kamalu Road Bridge No. 1) crossing Kalama Stream
System
Preservation
581 CountyOlohena Road ‐ Kaapuni Road to Kamalu
RoadImprove existing roadway to include bike lanes and sidewalks Capacity
581 CountyOlohena Road ‐ Kapaa Bypass Road to
Kaapuni RoadImprove existing roadway to include bike lanes and sidewalks Capacity
581 CountyOlohena Road ‐ Kuhio Highway to Kapaa
Bypass RoadImprove existing roadway to include bike lanes and sidewalks Capacity
5010 County Puhi RoadThicken pavement section to accommodate freight/industrial
park traffic
System
Preservation
5010 CountyPuhi Road ‐ Kaumualii Highway to
Hulemalu Road
Bike lane from Kaumualii Highway to Hulemalu Road and
pedestrian facilities (connecting to generators, Kaumualii
Highway to Hanalima Street)
Capacity
5020 CountyRice Street ‐ Kuhio Highway to Kapule
Highway
Construct bicycle and pedestrian facilities. Analyze vehicle
operations along Rice Street with a road dietCapacity
5020 CountyRice Street and Eiwa Street, Rice Street
and Umi Street intersections
Review traffic operations and analyze traffic control options ‐
conduct necessary warrantsCongestion
5020 State Rice Street vicinity of Nawiliwili Harbor
Provide a sidewalk or walkway connection from the Nawiliwili
Bridge to shopping and services, the Marriott hotel and other
destinations to the north
Capacity
5040 CountyHaleko Road ‐ Rice Street to Nawiliwili
RoadConstruct bicycle lanes and sidewalks or contrasting paving Capacity
5720 CountyHardy Street ‐ Kuhio Highway to Umi
StreetConstruct bike lanes Capacity
5860 CountyKawaihau Road ‐ Kuhio Highway to
Mailihuna RoadConstruct bicycle and pedestrian facilities Capacity
5860 CountyKawaihau Road ‐ Kuhio Highway to
Mailihuna RoadImprove roadway to include bike lanes and sidewalks Capacity
530/522/
520County
Koloa Town (Koloa Road/Ala Kinoiki
Road/Poipu Road)Construct bike and pedestrian facilities Capacity
531/532 County Papalina Road, Waha Road, Lauoho RoadCreate bicycle and pedestrian facilities between Kalaheo and
LawaiCapacity
3 of 5

Kauai District Tier 2 Roadway Infratructure Potential Solutions
Route
NumberJurisdiction Project Title Project Description
Primary
Program
N/A CountyAlternative routes or bypass roads
around major highway bridges islandwide
Acquire land to create alternative routes or bypass roads
around major highway bridges to assist in evacuation or aid
emergency vehicles
Capacity
N/A State/CountyCoordinate Kauai Multimodal
Transportation Plan recommendationsCoordinate with Kauai County, Transportation Agency Other
N/A State/County Safety Education ProgramsSupport and/or provide educational programs to improve
pedestrian, bicycle, and transit safetySafety
N/A State/County EnforcementSupport enforcement efforts (stings) related to cell phone
usage while driving and distracted drivingSafety
N/A State Intersection safety improvements Improve safety Safety
N/A State Non‐intersection safety improvements Improve safety Safety
N/A County Intersection safety improvements Improve safety Safety
N/A County Non‐intersection safety improvements Improve safety Safety
N/A
Federal Grant
Program/County
Applicant ‐ SRTS
Safe Routes To School (SRTS) projects Implement or support SRTS projects Safety
N/A StateGuardrail and Shoulder Improvement
ProgramMaintain and/or improve guardrail and shoulder Safety
N/A State Erosion controlAddress erosion problems alongside the roadways near the
shorelineSafety
N/A State Slope and rockfall protectionStabilize hillside areas. Implement retaining walls at locations
identified by the Rockfall/Slope Stabilization programSafety
N/A State/County Drainage maintenance Keep drainage culverts clean, remove mud and vegetationSystem
Preservation
N/A StateResurface and rehab roadways and
bridgesResurface and rehab roadways and bridges islandwide
System
Preservation
N/A State Repair highway lighting Replace damage and stolen County‐owned highway lighting
equipment and components
System
Preservation
N/A StateMaintain and modernize traffic signal
equipmentMaintain and modernize traffic signal equipment islandwide
System
Preservation
N/A State Signage upgrade and replacement Replace and upgrade signage with standard reflective coatingSystem
Preservation
N/A State Address highway drainage and flooding Address highway drainage and flooding islandwideSystem
Preservation
N/A State Coastal Path ‐ Kuna Bay to AnaholaConstruct a coastal multi‐use path (Phase V of the Lihue‐
Anahola Coastal Bike Path)Capacity
N/A StateKapaa Relief Route ‐ Kapule Highway to
Kapaa StreamConstruct the Kapaa Relief Route Capacity
N/A County Kapahi Road BridgeReplace the existing bridge and include approach ramps,
guardrails, pedestrian walkway and utility accommodations
System
Preservation
N/A CountyKaumualii Highway bypass ‐ Pakala to
ManaConstruct a bypass roadway, mauka of Kaumualii Highway Safety
N/A CountyKawaihau Road ‐ Mailihuna Road to
Kapahi RoadConstruct bicycle and pedestrian facilities Capacity
N/A State/County Kekaha to WaimeaSupport the development of the County's West Side Bicycle
Route that are within federal‐aid highways Capacity
N/A State Lihue Airport and Nawiliwili Harbor Conduct Lihue Airport and Nawiliwili Harbor Access studies Other
N/A County Lihue‐Hanamaulu Bypass RoadConstruct a new 2‐lane Lihue‐Hanamaulu Bypass Road, along
existing agriculture road alignmentCapacity
4 of 5
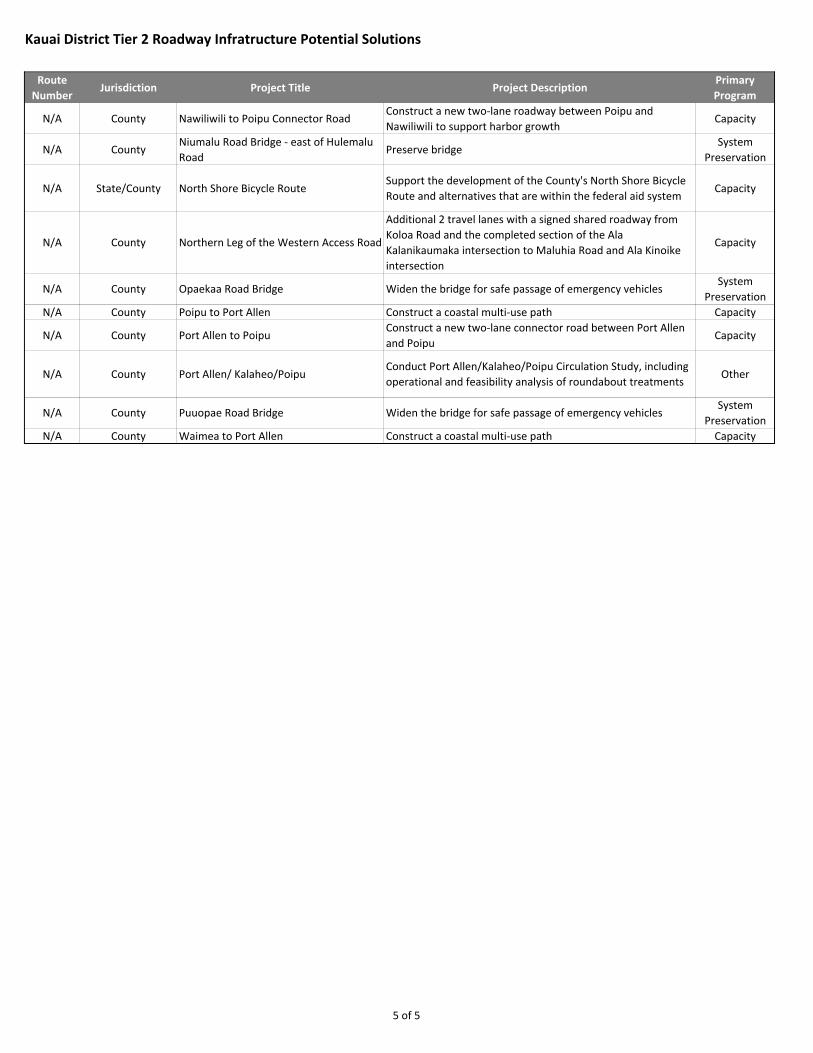
Kauai District Tier 2 Roadway Infratructure Potential Solutions
Route
NumberJurisdiction Project Title Project Description
Primary
Program
N/A County Nawiliwili to Poipu Connector RoadConstruct a new two‐lane roadway between Poipu and
Nawiliwili to support harbor growthCapacity
N/A CountyNiumalu Road Bridge ‐ east of Hulemalu
RoadPreserve bridge
System
Preservation
N/A State/County North Shore Bicycle RouteSupport the development of the County's North Shore Bicycle
Route and alternatives that are within the federal aid systemCapacity
N/A County Northern Leg of the Western Access Road
Additional 2 travel lanes with a signed shared roadway from
Koloa Road and the completed section of the Ala
Kalanikaumaka intersection to Maluhia Road and Ala Kinoike
intersection
Capacity
N/A County Opaekaa Road Bridge Widen the bridge for safe passage of emergency vehiclesSystem
Preservation
N/A County Poipu to Port Allen Construct a coastal multi‐use path Capacity
N/A County Port Allen to PoipuConstruct a new two‐lane connector road between Port Allen
and PoipuCapacity
N/A County Port Allen/ Kalaheo/Poipu Conduct Port Allen/Kalaheo/Poipu Circulation Study, including
operational and feasibility analysis of roundabout treatmentsOther
N/A County Puuopae Road Bridge Widen the bridge for safe passage of emergency vehiclesSystem
Preservation
N/A County Waimea to Port Allen Construct a coastal multi‐use path Capacity
5 of 5

Kauai District Tier 2 Transit Services and Operations Potential Solutions
Jurisdiction Project DescriptionPrimary
Program
County
Town pairs of mass transit (bus) with mass transit hubs, park and rides,
sheltered bike parking, weather proof shelters, then have main line service
through hubs
Congestion
County Run buses every 15 minutes Congestion
CountyRestructure existing shuttle service, and determine the need for new shuttle
service in additional areasCongestion
County Increase frequency of mainline service Congestion
CountyReduce trips taken by supporting increased bus use, including stops at the
schools and convenient stopsCongestion
County Coordinate North Shore service with Haena State Park Master Plan Congestion
CountyCoordinate South Shore service with proposed private Koloa/Poipu shuttle
serviceCongestion
County Purchase buses and operate bus transit facilities Congestion
County Operate public transit Congestion
County Expand incentives to use transit Congestion
CountyRetrofit the existing (Lihue) bus facility to accommodate larger buses and
support alternative fuelsCongestion
County Bus shuttle service between Hanalei and the end of Route 560 Congestion
CountyDevelop a map‐based software that the public can use through the Internet
to track real‐time bus arrival timesCongestion
CountyEstablish satellite bus facilities in the North Shore and West Side for
overnight and mid‐day bus storageCongestion
CountyBegin purchasing larger vehicles for the core mainline routes, including 40'
urban busesCongestion
County Install wi‐fi service on buses and at selected stops Congestion
CountyInvestigate the feasibility of providing racks for surfboards on the sides of its
busesCongestion
CountyEvaluate feasibility of using a different bike rack that can accommodate
three or four bikes at one timeCongestion
CountyBus stops: Accessibility and connectivity to residential areas and all
destinations, bus pull‐out areas and crosswalksCongestion
County Develop bus/HOV lanes where traffic congestion occurs Congestion
CountyLinear rail from Poipu to Princeville via Lihue/Kapaa. Initially use the right of
way for exclusive bus and bikesCongestion
State/County Provide bus passenger shelters and sidewalks ‐ all highway bus stops Congestion
County Provide bus shelters at bus stops Congestion
County Create park and ride facilities Congestion
County
Gradually relocate bus stops out of shopping centers, parking lots and side
streets to the main highway (with the exception of certain park‐and‐ride
lots)
Congestion
1 of 1

Appendix GExpenditure and Funding Summary


TBG062714093019HNL 1
T E C H N I C A L M E M O R A N D U M Statewide Federal-Aid Highways 2035 Transportation Plan and Regional Federal-Aid Highways 2035 Transportation Plans for the Districts of Maui, Hawaii, and Kauai
Expenditure and Funding Summary PREPARED FOR: States of Hawaii Department of Transportation
PREPARED BY: CH2M HILL
DATE: October 9, 2012
Introduction An assessment of recent and planned State of Hawaii Department of Transportation, Highways Division (HDOT) expenditures and funding was conducted to aid in the development of the financial element of the Statewide Federal-Aid Highways 2035 Transportation Plan and the Regional Federal-Aid Highways 2035 Transportation Plans for the Districts of Maui, Hawaii, and Kauai. The assessment was performed to illustrate current Highways Division priorities through summaries of implemented and planned Program fund allocations. The summaries will be used as a tool to understand mid- and long-term funding needs, but are not intended to be used to forecast funding trends.
This memorandum summarizes the short-term historical and projected expenditures by Program as of September 2010 at the statewide and district levels. Historical data are presented for federal fiscal years (FFY) 2006-2009 and projected expenditures are presented for FFY 2011-2014.
Historical revenue sources are summarized to identify the level of contribution for various state and federal revenues that fund the HDOT Highways Programs.
Historical and Projected Funding by Program Within the time periods reviewed, HDOT subprograms and projects were programmed under the following overarching Highways Division Programs:
• System Preservation Program – provides regular maintenance, rehabilitation, reconstruction, and replacement of transportation facilities to maintain the overall operations of the transportation system.
• Capacity Program – provides support to address capacity needs for all modes of land transportation through widening of existing facilities or provision of new facilities.
• Congestion Program – manages and optimizes performance of current infrastructure to improve mobility, reliability, and predictability of travel within the existing transportation system.
• Safety Program – provides education, and roadway and roadside infrastructure improvements that reduce the severity and number of crashes. The Safety Program also
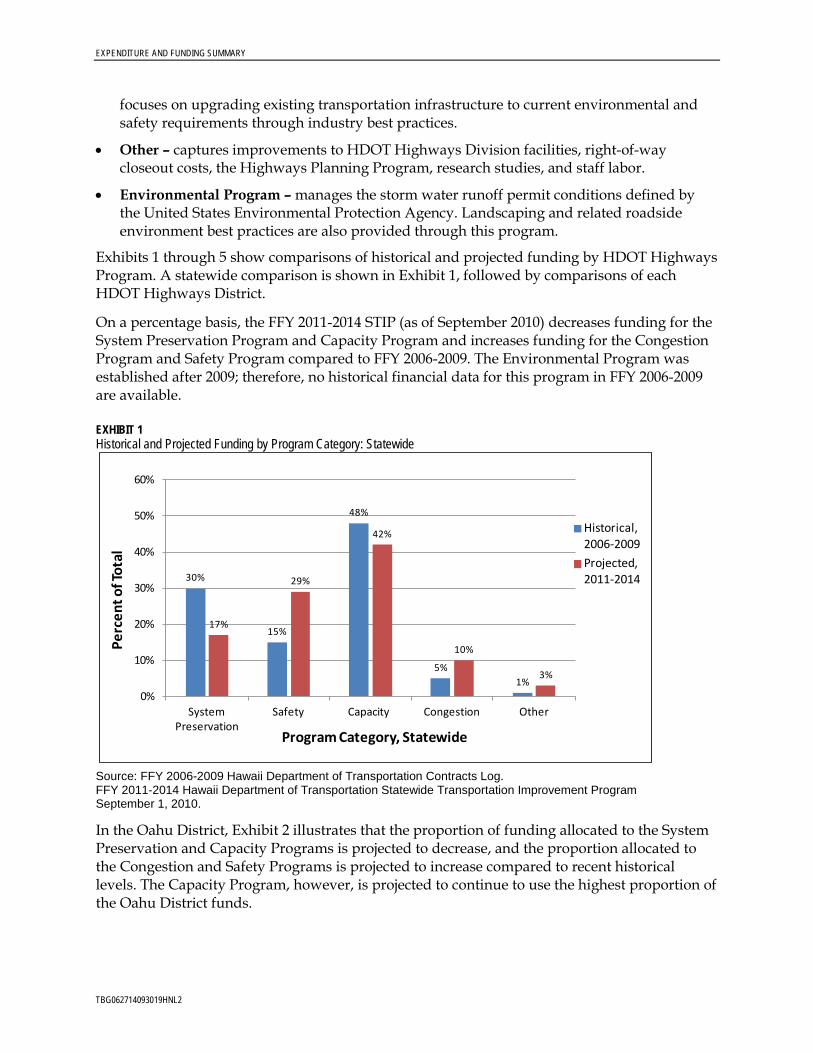
EXPENDITURE AND FUNDING SUMMARY
TBG062714093019HNL2
focuses on upgrading existing transportation infrastructure to current environmental and safety requirements through industry best practices.
• Other – captures improvements to HDOT Highways Division facilities, right-of-way closeout costs, the Highways Planning Program, research studies, and staff labor.
• Environmental Program – manages the storm water runoff permit conditions defined by the United States Environmental Protection Agency. Landscaping and related roadside environment best practices are also provided through this program.
Exhibits 1 through 5 show comparisons of historical and projected funding by HDOT Highways Program. A statewide comparison is shown in Exhibit 1, followed by comparisons of each HDOT Highways District.
On a percentage basis, the FFY 2011-2014 STIP (as of September 2010) decreases funding for the System Preservation Program and Capacity Program and increases funding for the Congestion Program and Safety Program compared to FFY 2006-2009. The Environmental Program was established after 2009; therefore, no historical financial data for this program in FFY 2006-2009 are available.
EXHIBIT 1 Historical and Projected Funding by Program Category: Statewide
Source: FFY 2006-2009 Hawaii Department of Transportation Contracts Log. FFY 2011-2014 Hawaii Department of Transportation Statewide Transportation Improvement Program September 1, 2010.
In the Oahu District, Exhibit 2 illustrates that the proportion of funding allocated to the System Preservation and Capacity Programs is projected to decrease, and the proportion allocated to the Congestion and Safety Programs is projected to increase compared to recent historical levels. The Capacity Program, however, is projected to continue to use the highest proportion of the Oahu District funds.
30%
15%
48%
5%1%
17%
29%
42%
10%
3%
0%
10%
20%
30%
40%
50%
60%
System Preservation
Safety Capacity Congestion Other
Perc
ent o
f Tot
al
Program Category, Statewide
Historical,2006-2009Projected,2011-2014

EXPENDITURE AND FUNDING SUMMARY
TBG062714093019HNL 3
Some of the major projects that contribute to the relative increase in Congestion and Safety Program funds include improvements to the congestion freeway management system, the Alapai Transportation Management Center, replacement/rehabilitation of bridges along Kamehameha and Kalanianaole Highways, H-1 guardrail/shoulder improvements, and Highway Safety Improvement Program improvements.
EXHIBIT 2 Historical and Projected Funding by Program Category: Oahu District
Source: FFY 2006-2009 Hawaii Department of Transportation Contracts Log. FFY 2011-2014 Hawaii Department of Transportation Statewide Transportation Improvement Program September 1, 2010.
Exhibit 3 depicts that funding allocations for the Hawaii District are projected to change significantly with the proportion of funds allocated to the Capacity Program increasing, and the proportion of funds allocated to the System Preservation Program decreasing. As of September 2010, the planned Capacity funds are largely programmed for construction of the Saddle Road improvements.
24%
14%
51%
9%
2%
17%
28%
41%
11%
3%
0%
10%
20%
30%
40%
50%
60%
System Preservation
Safety Capacity Congestion Other
Perc
ent o
f Tot
al
Program Category, Oahu
Historical,2006-2009Projected,2011-2014

EXPENDITURE AND FUNDING SUMMARY
TBG062714093019HNL4
EXHIBIT 3 Historical and Projected Funding by Program Category: Hawaii District
Source: FFY 2006-2009 Hawaii Department of Transportation Contracts Log. FFY 2011-2014 Hawaii Department of Transportation Statewide Transportation Improvement Program September 1, 2010.
By contrast, Exhibit 4 shows in the Maui District that the proportion of funds allocated to the Safety Program is projected to increase, and the proportion of funds allocated to the Capacity and System Preservation Programs is projected to decrease. This reflects the recent completion of projects on Honoapiilani Highway, Haleakala Highway, and Mokulele Highway.
Planned Safety Program projects include the Waiehu Beach Road (Iao Stream Bridge) bridge rehabilitation, Kamehameha V Road (Makakupaia Bridge) bridge replacement, Honoapiilani Highway (Honolua Bridge) bridge replacement, guardrail/shoulder improvements, Highway Safety Improvement Program improvements, and shoreline protection projects.
65%
32%
0% 0%3%
10%
28%
59%
1% 2%
0%
10%
20%
30%
40%
50%
60%
70%
System Preservation
Safety Capacity Congestion Other
Perc
ent o
f Tot
al
Program Category, Hawaii
Historical,2006-2009Projected,2011-2014

EXPENDITURE AND FUNDING SUMMARY
TBG062714093019HNL 5
EXHIBIT 4 Historical and Projected Funding by Program Category: Maui District
Source: FFY 2006-2009 Hawaii Department of Transportation Contracts Log. FFY 2011-2014 Hawaii Department of Transportation Statewide Transportation Improvement Program September 1, 2010.
Exhibit 5 shows the proportion of funds allocated in the Kauai District. Funds allocated to the Capacity and Congestion Programs are projected to increase whereas the funds allocated to the System Preservation Program are projected to decrease. The Safety Program is projected to continue to use nearly half of the Kauai District funds. This is largely attributed to the Kuhio Highway improvements to the Wailua Cane Haul Bridge Widening (contracted in 2009) and the planned bridge replacements/rehabilitation projects (Kapaia Bridge, Kapahi Bridge, Omao Bridge, Puuopae Bridge, Waioli, Waipa, and Waikoko Stream Bridges).
The high level of System Preservation Program funds in the FFY 2006-2009 period included numerous resurfacing projects along Kauai’s major highways: Kaumualii Highway, Kuhio Highway, and Kapule Highway.
The planned increase in the Capacity and Congestion Programs include the Kaumualii Highway, Anonui Street to Kipu Road improvements, Lydgate Park to Kapaa Bike/Pedestrian Path, and various intersection operation improvement projects.
28%
4%
67%
1% 0%
8%
43% 41%
6%2%
0%
10%
20%
30%
40%
50%
60%
70%
80%
System Preservation
Safety Capacity Congestion Other
Perc
ent o
f Tot
al
Program Category, Maui
Historical,2006-2009Projected,2011-2014

EXPENDITURE AND FUNDING SUMMARY
TBG062714093019HNL6
EXHIBIT 5 Historical and Projected Funding by Program Category: Kauai District
Source: FFY 2006-2009 Hawaii Department of Transportation Contracts Log. FFY 2011-2014 Hawaii Department of Transportation Statewide Transportation Improvement Program September 1, 2010.
Exhibit 6 compares historical and projected funding by District. As shown, the proportion of funds allocated to the Hawaii District is projected to increase, and the proportion allocated to the Maui District is projected to decrease. The relative proportion of funding to the Oahu and Kauai Districts is projected to remain very close to that experienced from FFY 2006-2009.
EXHIBIT 6 Historical and Projected Funding Statewide by District
Source: FFY 2006-2009 Hawaii Department of Transportation Contracts Log. FFY 2011-2014 Hawaii Department of Transportation Statewide Transportation Improvement Program September 1, 2010.
47%49%
0%4%
0%
14%
47%
22%
15%
2%
0%
10%
20%
30%
40%
50%
60%
System Preservation
Safety Capacity Congestion Other
Perc
ent o
f Tot
al
Program Category, Kauai
Historical,2006-2009Projected,2011-2014
52%
32%
8% 8%
51%
13%
26%
10%
0%
10%
20%
30%
40%
50%
60%
Oahu Maui Hawaii Kauai
Perc
ent o
f Tot
al St
ate
Fund
ing
District
Historical,2006-2009Projected,2011-2014

EXPENDITURE AND FUNDING SUMMARY
TBG062714093019HNL 7
Exhibit 7 compares historical and projected future funding by Program in dollars. As shown, the Capacity Program has received more funding than any other Program with nearly $350 million in funding. Projected future funding for the Capacity Program is expected to remain similar to that of the recent past. When compared to actual expenditures in FFY 2006-2009, the September 2010 STIP focuses on the Safety Program and the Congestion Program, with a decline projected for the System Preservation Program.
EXHIBIT 7 Funding by Program
Source: FFY 2006-2009 Hawaii Department of Transportation Contracts Log. FFY 2011-2014 Hawaii Department of Transportation Statewide Transportation Improvement Program September 1, 2010.
Exhibit 8 shows a summary of the number of projects funded in each Program from FFY 2006 to 2009 and the number of projects funded from FFY 2011 to 2014. One hundred sixty-five projects were contracted from FFY 2006 to 2009. Nearly 100 projects were contracted under the System Preservation Program. The September 2010 STIP anticipates commencement of 148 projects. The Safety Program is expected to see the largest increase in the number of projects completed from FFY 2011 to 2014. Compared to FFY 2006 to 2009, the current STIP increases the number of projects in all categories except System Preservation.
$0
$50,000,000
$100,000,000
$150,000,000
$200,000,000
$250,000,000
$300,000,000
$350,000,000
$400,000,000
System Preservation
Safety Capacity Congestion Other
Program Category
Total Cost by Program, 2006-2009
Total Cost by Program, 2011-2014

EXPENDITURE AND FUNDING SUMMARY
TBG062714093019HNL8
EXHIBIT 8 Numbers of Projects by Program
Source: FFY 2006-2009 Hawaii Department of Transportation Contracts Log. FFY 2011-2014 Hawaii Department of Transportation Statewide Transportation Improvement Program September 1, 2010.
Historical State and Federal Revenue Sources HDOT Highways Division relies on funding from state and federal sources to maintain and enhance transportation facilities. Sources of state funding include vehicle surcharges, registration fees, vehicle weight taxes, fuel tax, investment earning, and miscellaneous income. In 2008, the HDOT Highways Division reported operating revenue of approximately $213 million. Exhibit 9 presents a breakdown of state sources of funding in 2008. Fuel tax revenue accounted for 41 percent of HDOT Highways revenues. Vehicle surcharges, weight tax, and registration fees comprised 23 percent, 16 percent, and 10 percent of revenues, respectively.
EXHIBIT 9 Hawaii Department of Transportation Highways Operating Revenue, 2008
Source: HDOT, 2010
0
20
40
60
80
100
120
System Preservation
Safety Capacity Congestion Other
Program Category
Total No. of Projectsby Program, 2006-2009
Total No. of Projectsby Program, 2011-2014
3% $6 mil
23% $49 mil
7% $15 mil
10% $21 mil
16% $34 mil
41% $87 mil
2008 Hawaii DOT Highways Operating Revenues ($213 mil)
Miscellaneous
Vehicle Surcharges
Investment Earnings
Vehicle Registration Fee
Vehicle Weight Tax
Fuel Tax

EXPENDITURE AND FUNDING SUMMARY
TBG062714093019HNL 9
Estimates of HDOT Highways revenues for 2009 were reporting a slight reduction in revenues when compared to 2008. Revenues for 2009 were expected to be approximately $196 million (HDOT, 2010). Revenue growth is expected to remain flat because of the economic recession’s impact on tax and fee revenue.
Exhibit 10 presents historical funding received from the Federal Highway Administration in the State of Hawaii. Funding has remained relatively constant over the past four years, increasing from approximately $168 million in 2006 to $172 million in 2009. Over 84 percent of the federal money comes from five programs: National Highway System, Surface Transportation, Bridge Replacement and Rehabilitation, High Priority Projects, and Equity Bonus.
EXHIBIT 10 Federal Highway Administration Funding, 2006-2009
USDOT Federal Highway Administration Program 2006 2007 2008 2009
Interstate Maintenance $8,623,472 $8,762,366 $8,903,496 $9,046,898
National Highway System $44,671,377 $45,390,197 $46,121,226 $46,864,027
Surface Transportation Program $30,857,302 $31,354,195 $31,859,088 $32,372,111
Bridge Replacement and Rehabilitation $21,205,138 $21,546,692 $21,893,747 $22,246,380
Congestion Mitigation and Air Quality $8,364,628 $8,499,317 $8,636,175 $8,775,237
Recreational Trails $764,160 $819,406 $874,652 $929,898
Metropolitan Planning $1,448,969 $1,472,634 $1,496,045 $1,519,833
Safety $5,079,050 $5,178,547 $5,279,645 $5,382,372
Rail Highway Crossings $1,100,000 $1,100,000 $1,100,000 $1,100,000
Safe Routes to School $1,000,000 $1,000,000 $1,000,000 $1,000,000
High-priority Projects $25,120,000 $25,120,000 $25,120,000 $25,120,000
Equity Bonus $19,276,425 $18,686,749 $18,065,609 $17,412,499
Total $167,510,521 $168,930,103 $170,349,683 $171,769,255 Source: HDOT, 2010
Exhibit 11 presents combined federal and state revenues for 2008 and 2009. Total revenues for 2008 were approximately $383 million. State revenues accounted for nearly 56 percent of total revenues. 2009 revenues decreased to approximately $368 million with state revenues representing 53 percent of the total.

EXPENDITURE AND FUNDING SUMMARY
TBG062714093019HNL10
EXHIBIT 11 Total State and Federal Revenues, 2008-2009
Source: HDOT, 2010
Summary This memorandum presents information about Highways Division priorities at the state and district levels as of September 2010 through summaries of implemented and planned Program fund allocations. It includes historical and projected funding by program and by district, thus providing information that can be used as a tool to assess mid- and long-term funding needs, as shown in the FFY 2011-2014 STIP. Comparisons are provided that illustrate the differences between past and proposed future funding priorities.
Statewide, the STIP as of September 2010 is projecting a relative increase in funding for the Congestion and Safety Programs and a relative decrease in funding for the System Preservation and Capacity Programs. By District, the proportion of funding allocated to the Hawaii District is projected to increase, the proportion allocated to the Maui District is projected to decrease, and the proportions allocated to the Oahu and Kauai Districts are projected to remain relatively similar to the recent past.
The HDOT Highways Program is funded by both state and federal sources. In 2008 and 2009, State revenues accounted for nearly 56 percent and 53 percent of total revenues, respectively, with the remainder coming from federal sources.
Fuel taxes are the largest source of state funding accounting for 41 percent of revenues in 2008. Over 84 percent of federal funds come from five programs: National Highway System, Surface Transportation, Bridge Replacement and Rehabilitation, High Priority Projects, and Equity Bonus.
In the future, highway program funding is expected to remain flat because of the economic recession’s impact on state and federal taxes and fees.
$0
$50,000,000
$100,000,000
$150,000,000
$200,000,000
$250,000,000
$300,000,000
$350,000,000
$400,000,000
$450,000,000
2008 2009
Federal
State

EXPENDITURE AND FUNDING SUMMARY
TBG062714093019HNL 11
Reference State of Hawaii Department of Transportation (HDOT). 2010. 2035 Hawaii Statewide
Transportation Plan: Issue Paper on Financial Issues. June.


Appendix HFuture Funding Strategies


TBG062714093019HNL 1
T E C H N I C A L M E M O R A N D U M Statewide and Regional Federal-Aid Highways 2035 Transportation Plans for the Districts of Maui, Hawaii, and Kauai
Future Funding Strategies PREPARED FOR: State of Hawaii Department of Transportation
PREPARED BY: CH2M HILL
DATE: March 2014
Introduction As part of the State of Hawaii Department of Transportation (HDOT) Statewide Transportation Planning Process, policy and planning activities must be coordinated with funding and implementation activities. The purpose of this memorandum is to present a summary of the funding needs for the State of Hawaii’s Highway Fund by outlining long-term program costs through 2035. This memorandum will also identify current and future sources of revenue for the Highway Fund at the statewide and federal level and discuss potential funding shortfalls. Finally, the memorandum will identify funding strategies to meet anticipated needs and provide a discussion of possible contingency measures to mitigate funding gaps.
Current Funding Summary In August 2011, the Expenditure and Funding Summary Technical Memorandum was prepared to illustrate the HDOT Highways Division priorities through summaries of historic implemented/planned program fund allocation. A review of the Statewide Transportation Improvement Program (STIP) project list as of June 2010 was used during the analysis. It should be noted that the STIP has been revised since the completion of the August 2011 memo to reflect the current status of listed projects.
The historic fund allocation summaries were used as a tool for understanding potential mid- and long-term funding needs, but were not intended to be used to forecast funding trends. The memorandum summarized the short-term historical and projected expenditures by program at the statewide and district levels. Historical data were presented for federal fiscal years (FFY) 2006-2009, and short-term projected expenditures were presented for FFY 2011-2014.
Historical revenue was also summarized to identify the level of contribution for various state and federal revenues that fund the HDOT Highways Division’s programs. Land transportation projects are implemented through one of the following overarching HDOT Highways programs:
• System Preservation Program – provides regular maintenance, rehabilitation, reconstruction and replacement of transportation facilities to maintain the overall operations of the transportation system.
• Capacity Program – provides support to address identified capacity needs for all modes of land transportation, from widening existing facilities to constructing new facilities.

FUTURE FUNDING STRATEGIES
TBG062714093019HNL 2
• Congestion Program – manages and optimizes performance of current infrastructure to improve mobility, reliability, and predictability of travel within the existing transportation system.
• Safety Program – provides education, and roadway and roadside infrastructure improvements that reduce the severity and number of crashes. The Safety Program also focuses on upgrading existing transportation infrastructure to current environmental and safety requirements through industry best practices.
• Other – captures improvements to HDOT Highways Division’s facilities, right-of-way closeout costs, the Highways Planning Program, and staff labor.
• Environmental Program – manages the stormwater runoff permit conditions defined by the United States Environmental Protection Agency. Landscaping and related roadside environment best practices are also provided through this program.
Figure 1 compares historical and projected funding for each of the HDOT Highways Division’s programs at the statewide level, as of 2011. On a percentage basis, the FFY 2011-2014 STIP indicates decreased funding for the System Preservation and Capacity programs and increased funding for the Congestion and Safety programs compared to FFY 2006-2009. The Environmental Program was established after 2009; therefore, no historical financial data for this program in FFY 2006-2009 are available.
FIGURE 1 Historical and Projected Funding by Program Category: Statewide
Source: FFY 2006-2009 Hawaii Department of Transportation Contracts Log. FFY 2011-2014 Hawaii Department of Transportation Statewide Transportation Improvement Program September 1, 2010.
Figure 2 compares historical and projected short-term future funding, in dollars, by program. As shown, the Capacity Program received more funding than any other program with nearly $350 million in funding. Short-term projected funding for the Capacity Program is expected to remain similar to FFY 2006-2009. Compared to FFY 2006-2009, the FFY 2011-2014 STIP shows increased focus on the Safety Program and the Congestion Program, with a drop in funding for the System Preservation Program.
30%
15%
48%
5%1%
17%
29%
42%
10%
3%
0%
10%
20%
30%
40%
50%
60%
System Preservation
Safety Capacity Congestion Other
Perc
ent o
f Tot
al
Program Category, Statewide
Historical,2006-2009Projected,2011-2014

FUTURE FUNDING STRATEGIES
TBG062714093019HNL 3
FIGURE 2 Funding by Program
Source: FFY 2006-2009 Hawaii Department of Transportation Contracts Log. FFY 2011-2014 Hawaii Department of Transportation Statewide Transportation Improvement Program September 1, 2010.
Figure 3 shows a summary of the number of funded projects under each program for FFY 2006-2009 and FFY 2011-2014. A total of 165 projects were programmed in FFY 2006-2009. Nearly 100 projects were programmed into the System Preservation Program. A total of 148 projects were programmed in FFY 2011-2014. The Safety Program has the largest increase in the number of projects programmed in FFY 2011-2014 compared to FFY 2006-2009. The STIP shows an increased number of projects in all program categories except System Preservation. However, the number and amount of funding for capacity projects will likely decrease due to the adoption of Moving Ahead for Progress in the 21st Century (MAP-21) in July 2012, which contains no earmarked funds.
FIGURE 3 Numbers of Projects by Program
Source: FFY 2006-2009 Hawaii Department of Transportation Contracts Log. FFY 2011-2014 Hawaii Department of Transportation Statewide Transportation Improvement Program September 1, 2010.
$0
$50,000,000
$100,000,000
$150,000,000
$200,000,000
$250,000,000
$300,000,000
$350,000,000
$400,000,000
System Preservation
Safety Capacity Congestion Other
Total Cost by Program, 2006-2009
Total Cost by Program, 2011-2014
0
20
40
60
80
100
120
System Preservation
Safety Capacity Congestion Other
Total No. of Projects by Program, 2006-2009
Total No. of Projects by Program, 2011-2014

FUTURE FUNDING STRATEGIES
TBG062714093019HNL 4
Funding Needs In the future, the resources required to address projected statewide land transportation needs are expected to exceed the available funds. By the year 2035, the estimated cost to address identified transportation needs would be over $30 billion (2011 dollars). With anticipated available funds of approximately $7.01 billion through 2035, the state is likely to experience a funding shortfall.
Land Transportation Needs Future needs and deficiencies of the statewide land transportation system were identified during the development of the Statewide Federal-Aid Highways 2035 Transportation Plan (HDOT, 2014). Relevant plans, policies, and programs were reviewed, and future projected land use and socioeconomic conditions were evaluated to identify where poor operations could occur. Stakeholders also provided information on programmatic transportation system needs.
At the commencement of the planning process, documented statewide transportation needs and deficiencies were identified and compiled during a review of relevant plans and policies. Relevant sources included the Hawaii Statewide Transportation Plan (2011), Bike Plan Hawaii (2003), Statewide Pedestrian Master Plan (2013), and the Hawaii Strategic Highway Safety Plan (2007-2012).
Vehicular volumes in all regions are anticipated to grow as land uses are developed and population and employment opportunities increase. Increases in traffic would result in greater demand on the state’s roadway infrastructure and higher levels of congestion compared with existing conditions. Forecasted travel times between communities would increase, and vehicles could experience long delays in the future. Because roadways are used by cars, freight, transit, bicyclists, and pedestrians, the increased congestion would affect all modes. Roadways that are not expected to be able to accommodate future traffic volumes were identified as transportation deficiencies.
These needs and deficiencies were supplemented through facilitated discussions with stakeholder groups representing various cross-sections of the community. These facilitated discussions captured agency and user perspectives of statewide land transportation system operations. Recurring regional needs and comprehensive statewide land transportation needs were summarized as an initial step in development of potential programmatic statewide solutions.
Identified statewide transportation system needs and deficiencies included:
• Preserving and maintaining continuous highway operations – Address issues related to slope erosion and stabilization, rockfall hazards, shoreline erosion, drainage and flooding, and roadside vegetation.
• Improving capacity and safety of nonmotorized modes – Evaluate need for more bicycle lanes, shared-use paths, sidewalks, and trails, and improve integration between nonmotorized and motorized modes.
• Providing emergency access/egress to communities – Maintain traffic operations for communities that are separated by geographic features and rely on a single roadway for access.
FUTURE FUNDING STRATEGIES
TBG062714093019HNL 5
• Improving and expanding transit service – Evaluate need for more transit routes, new service areas, improved infrastructure, and more amenities.
• Addressing congestion – Develop strategies to reduce congestion for all modes on state roadways.
Potential Solutions Based on the identified needs, regional project solutions and statewide programmatic solutions were developed. Programmatic solutions involved changes or improvements to address overarching system needs. These solutions would affect more than just a specific roadway facility or location; programmatic solutions have an impact statewide.
These potential solutions would be implemented through the overarching HDOT Highways Division’s programs (System Preservation, Capacity, Congestion, and Safety) or through existing county programs. Both the state and the counties have processes to first prioritize and then implement solutions. Figure 4 shows the correlation between potential solutions that address the identified statewide needs, and the HDOT Highways Division’s program(s) that would implement the solution.
FIGURE 4 Statewide Needs and Potential Solutions by Program
Statewide Need Potential Programmatic Solutions Program(s)
Implemented Through
Preserve and maintain continuous highway operations
• Perform regular maintenance on roads and bridge • Remove roadside vegetation
• Install erosion control and slope stabilization • Improve drainage facilities • Replace highway lighting
• Repair bicycle lanes and sidewalks
System Preservation
Improve capacity and safety of nonmotorized modes
• Encourage Complete Streets • Construct new bicycle lanes and sidewalks
• Provide lights, pavements markers, signage
Capacity, Safety
Provide emergency access and improve resiliency
• Construct alternate routes or bypass roads • Reinforce critical lifeline facilities
• Relocate roads away from shoreline
Capacity
Improve and expand transit service
• Increase frequency of routes
• Introduce service to new areas • Create transit connections to key transportation hubs • Enhance transit amenities
Regional Transit Authorities
Address and reduce congestion
• Consider transit-only lanes or high occupancy vehicle lanes • Explore peak-hour, directional traffic control • Implement Intelligent Transportation System technologies
Congestion
Cost estimates were developed for potential solutions based on conceptual drawings, preliminary project descriptions, bid tabulations, typical contingencies, and average construction costs per vehicular lane mile. Based on preliminary estimates, the cost to implement potential solutions and address statewide programmatic needs was approximately
FUTURE FUNDING STRATEGIES
TBG062714093019HNL 6
$30 billion. Figure 5 shows that each of the districts had different transportation deficiencies and therefore different program funding needs.
FIGURE 5 Estimated Costs of Program Needs, by District HDOT Highways Program Oahua Maui Hawaii Kauai
System Preservation $406 M $1.1 B $315 M
Safety $680 M $960 M $595 M
Capacity $1.9 B $4.1 B $2.2 B
Congestion $60 M $405 M $57 M
Other $60 M $795 M $10 M
Total = $30.4 B $16.7 B $3.1 B $7.4 B $3.2 B
a Source: Oahu Metropolitan Planning Organization, 2011.
Inflation Per the HDOT memo (HWY-PS 2.6454) dated December 8, 2007, inflation must be used when developing financial plans that include projects funded by federal dollars in the STIP. The HDOT developed a methodology that used the average inflation rate as reported by Consumer Price Index (CPI) data to estimate a constant inflation rate for all financial planning. Based on the average inflation rate from 2003-2006 as shown in the memo, a constant inflation rate of 4.0 percent (rounded) per year was calculated. The HDOT Highways Staff Services Office is responsible for validating and updating the inflation rate each budget cycle.
Figure 6 presents the inflation rate derived from the HDOT methodology presented in HDOT memo HWY-PS 2.6454.
FIGURE 6 HDOT Project Inflation Factor (2003-2006)
Year Honolulu Index % Change
2003 184.0
2004 188.9 2.7%
2005 195.6 3.5%
2006 201.6 3.2%
Average Difference 3.1%
Rounded Up 4.0%
Source: HDOT, 2007
Based on a review of more recent CPI data for Honolulu, Figure 7 shows an inflation rate of 3.0 percent (rounded) for data between 2008 and 2011.

FUTURE FUNDING STRATEGIES
TBG062714093019HNL 7
FIGURE 7 Projected Inflation Factor (2008-2011)
Year Honolulu Index % Change
2008 228.9
2009 230.0 0.5%
2010 234.9 3.1%
2011 243.6 2.7%
Average Difference 2.1%
Rounded Up 3.0%
Source: United States Department of Labor, Bureau of Labor Statistics, 2012a.
Projecting inflation is an imperfect science, and as an alternative approach to the current HDOT methodology, a longer history of CPI data were reviewed to calculate inflation factors. Looking further back than the most recent four years ensured that the inflation factor was not calculated based on recent booms or busts in the economy, which would cause factors that were too high or too low depending on where the economy was in the cycle.
Reviewing the past 30 years of CPI data for Honolulu (1982 through 2011) provided a similar rate of inflation when compared to the previous four years of data (2008 through 2011). Figure 8 presents the average annual inflation rate for Honolulu and the United States from 1982 to 2011. The national rate averaged approximately 3.0 percent per year over the 30 year time period while the local rate of inflation was slightly higher at 3.3 percent per year.
FIGURE 8 Average 30-year Consumer Price Index
Year Honolulu Index United States Index
1982 97.2 97.7
2011 243.6 227.0
Average Annual Change 3.3% 3.0%
Source: United States Department of Labor, Bureau of Labor Statistics, 2012a-b.
An additional method to estimating inflation was to look at inflation factors developed by a third party that specializes in economic forecasting and analysis, such as IHS Global Insight. IHS Global Insight provides construction labor and pricing forecasts for the United States. As the CPI for Honolulu and the nation tracked fairly closely over the past 30 years, the inflation factors from IHS Global Insight served as a guide for estimating inflationary trends statewide.
Figure 9 presents historical and projected inflation for the United States based on data analyzed by IHS Global Insight in the second quarter of 2012. Inflation for the period between 2009 and 2011 averaged about 1.7 percent while projected inflation for 2011-2014 was estimated at 3.9 percent.

FUTURE FUNDING STRATEGIES
TBG062714093019HNL 8
FIGURE 9 Inflation Rates
Time Period Average Annual Inflation Rate
2009-2011 1.7%
2011-2014 3.9%
Source: IHS Global Insight
The historical average of 1.7 percent from 2009 to 2011 was relatively consistent with the inflation rate experienced in Honolulu from 2008 to 2011 (2.1 percent) over a similar time period (see Figure 7). The inflation forecasts from IHS Global Insight indicated that inflation was closer to 4 percent over the near future as labor and construction prices were expected to rise. Based on the various inflation factor calculations, a constant inflation rate of 4 percent per year was assumed to be conservative and was applied to the estimated costs of projected statewide needs.
Sources of Future Funding The HDOT Highways Programs rely on funding from state and federal sources to maintain and enhance transportation facilities. Through 2035, the HDOT Highways Division could expect to receive funds totaling approximately $7.01 billion.
Federal Funding Federal funding is received for the maintenance and construction of the federal highway system and for major arterials and collectors that feed into the highway system. Figure 10 presents the annual federal funding received from 2002 through 2011. Over that period, federal funding ranged from $82 million in 2004 to $217 million in 2009. The average amount of federal dollars received each year for the past 10 years was approximately $152 million annually.
FIGURE 10 Historical Highway Federal Funds, FFY 2002-2011
Fiscal Year Interstate Other
Total Amount Reimbursed
2002 $12,300,000 $126,423,000 $138,723,000
2003 $12,653,000 $119,428,000 $132,082,000
2004 $4,089,000 $78,449,000 $82,538,000
2005 $4,528,000 $153,676,000 $158,204,000
2006 $8,052,000 $112,461,000 $120,513,000
2007 $14,222,000 $103,783,000 $118,006,000
2008 $8,410,000 $183,929,000 $192,340,000
2009 $16,886,000 $200,118,000 $217,003,000
2010 $10,771,000 $175,714,000 $186,485,000
2011 $14,116,000 $166,164,000 $180,279,000
Average $10,603,000 $142,015,000 $152,617,000
Source: HDOT, 2012a

FUTURE FUNDING STRATEGIES
TBG062714093019HNL 9
Current federal transportation legislation, MAP-21, was adopted in July 2012. It is a long-term highway authorization act and guides transportation policy at the federal level. It includes funding for fiscal years 2013 and 2014, and outlines national goals and transportation performance targets. Beyond 2014, the amount of future federal dollars to be received for the highway system in Hawaii is unknown; therefore, to present a more conservative estimate of future funds, the projected average annual amount of federal funding was assumed to be approximately equal to the average amount received over the past 10 years. This estimated amount was held constant through 2035.
State Funding Historical and projected sources of state funds were obtained from the HDOT annual reports and the 2011 Highway Fund Revenue Bond Official Statement (HDOT, 2012b). Sources of pledged state funding include vehicle surcharges, registration fees, vehicle weight taxes, fuel tax, investment earning, and miscellaneous income. Each major source of revenue is discussed below:
• Highway Fuel License Tax – Currently, the highway fuel tax is $0.17 per gallon of gasoline and diesel oil for highway use and $0.02 per gallon of gasoline, diesel oil, and liquid petroleum gas for non-highway use. The fuel taxes are collected by the Department of Taxation and transferred to the State Highway Fund. In FFY 2011, the highway fuel tax contributed approximately $89.0 million to the State Highway Fund.
• Vehicle Registration Fees – The State vehicle registration fee increased from $25 per vehicle to $45 per vehicle in 2011. In FFY 2011, the registration fees contributed approximately $20.8 million to the State Highway Fund.
• Weight Taxes – All vehicles, including motor vehicles, are assessed an annual State vehicle weight tax. The tax increased in 2011 to $0.0175 per pound. The maximum charge for a vehicle increased to $300 per vehicle. The additional weight tax is expected to result in an increase in net revenues of nearly $33.0 million in FFY 2013. In FFY 2011, weight taxes contributed approximately $33.4 million in revenues to the State Highway Fund.
• Rental/Tour Vehicle Surcharge – The rental/tour vehicle surcharge imposes a daily tax on the rental of all motor vehicles and tour vehicles. In FFY 2011, the rental and tour vehicle surcharge contributed approximately $43.9 million to the State Highway Fund.
• Interest – This is income derived from the investment of Highway Special fund money held by the State. In FFY 2011, interest income was approximately $4.0 million.
• Miscellaneous – Miscellaneous revenues include permit fees, driver license fees, inspection fees, rental fees, and other miscellaneous revenues.
Figure 11 presents historical revenues for the State Highway Fund from FFY 2002 through FFY 2011. Total revenues ranged from approximately $185 million in FFY 2003 to approximately $212 million in FFY 2008. In 2011, the HDOT highways reported operating revenue of approximately $197 million. Fuel taxes, weight taxes, and rental vehicle surcharges were the three largest contributors of revenue each year.

FUTURE FUNDING STRATEGIES
TBG062714093019HNL 10
FIGURE 11 Historical Revenues for Highway Fund, FFY 2002-2011
Source: HDOT, 2012a
Figure 12 presents the breakdown of revenues by source for FFY 2011. Fuel taxes accounted for 45 percent of total revenues while the rental vehicle surcharge accounted for 22 percent of the total.
FIGURE 12 Sources of Revenue for Highway Fund, FFY 2011
Source: HDOT, 2012a
Figure 13 presents projected revenues from state sources from 2012 through 2035. Compared to the operating revenue of just under $200 million in 2011, revenues increased in 2012 to approximately $232 million. This was due to an increase in the weight tax, which generated
$0
$50,000
$100,000
$150,000
$200,000
$250,000
$300,000
2002 2003 2004 2005 2006 2007 2008 2009 2010 2011
Reve
nue
Sour
ce ($
000s
)
Misc.
Interest
Rental/Tour Vehicle SurchargeWeight Taxes
Registration Fees
Fuel Taxes
$89.3 mil , 45%
$20.8 mil , 11%
$33.4 mil , 17%
$43.9 mil , 22%
$4.0 mil , 2% $5.6 mil , 3%
Fuel Taxes
Registration Fees
Weight Taxes
Rental/Tour VehicleSurcharge
Interest
Misc.

FUTURE FUNDING STRATEGIES
TBG062714093019HNL 11
approximately $20 million in additional revenue, and an increase in registration fees, which generated approximately $12 million in additional revenue.
Forecasted revenues are expected to increase from $232 million in 2012 to nearly $350 million in 2035. This includes revenue of approximately $23 million between 2012 and 2013 from the increase in weight tax and registrations fees. The delay in the realization of the additional revenues is because of the implementation schedule and the lag between the collection of the fees by the counties and the transfer of money to the State Highway Fund.
For projection purposes, all revenues were expected to grow on an annual basis of approximately 1.3 percent per year. This growth rate is consistent with growth rates presented in the 2011 Highway Revenue Bonds Official Statement (HDOT, 2012b).
FIGURE 13 Revenue Projections for Highway Fund, FFY 2012-2035
Source: Official Statement, State of Hawaii Highway Revenue Bonds, Series 2011B; CH2M HILL estimate
Figure 14 presets the estimated combined funding from state and federal sources from 2012 through 2035. Funding is expected to grow from approximately $385 million in 2012 to nearly $495 million in 2035. Growth in funding dollars is assumed to be from state generated revenue sources, as the federal fund contribution was assumed to be held constant. Assuming inflation, total available funding through 2035 is expected to be approximately $7 billion (in 2011 dollars).

FUTURE FUNDING STRATEGIES
TBG062714093019HNL 12
FIGURE 14 Projection of Combined State and Federal Funds, FFY 2012-2035
Sources: HDOT, 2012a; CH2M HILL estimate
Future Funding Plan The current funding outlook indicates a significant gap between estimated transportation needs (over $30 billion) and future available funds (approximately $7.01 billion). Based on historical trends this gap is not expected to close over time, and shortfalls in available dollars will continue to be a key factor in future planning.
Historically, approximately 51 percent of the annual HDOT Highway Division funds were distributed to the Oahu District. The Maui District received on average approximately 23 percent of the HDOT Highway Division funds, while the Hawaii District and the Kauai District received 17 percent and 9 percent, respectively. Assuming future distributions are consistent with past allocations, the expected revenue for each district is shown in Figure 15.
FIGURE 15 Estimated Statewide Revenue and Need, by District HDOT Highways
District Expected Revenue
($B) Estimated Need
($B) Funding Gap
($B)
Oahu $3.6 $16.7 ($13.1)
Maui $1.6 $3.1 ($1.5)
Hawaii $1.2 $7.4 ($6.2)
Kauai $0.6 $3.2 ($2.6)
Total $7.0 $30.4 ($23.4)
The projected revenue is not likely to meet the estimated needs, and a significant funding gap is expected for each district. This situation is not unique to the state of Hawaii, and will require decision-makers to prioritize solutions to ensure effective use of limited funds.
$0
$50,000
$100,000
$150,000
$200,000
$250,000
$300,000
$350,000
$400,000
$450,000
$500,000
2012
2013
2014
2015
2016
2017
2018
2019
2020
2021
2022
2023
2024
2025
2026
2027
2028
2029
2030
2031
2032
2033
2034
2035
000s
Federal
State

FUTURE FUNDING STRATEGIES
TBG062714093019HNL 13
The evaluation and prioritization processes used in the Statewide and Regional Federal-Aid Highways 2035 Transportation Plans look at the transportation system comprehensively and incorporate goals and values that were agreed upon at inception. It provides a strategy for moving forward with implementation, which will effectively use the funds available for addressing the needs of the transportation system. Key decision-makers continuing to use these processes should feel comfortable knowing that the community’s values are being represented in the program priorities. According to past program distributions and the plans’ goal-weighting priorities, the limited statewide funding will likely be distributed to the HDOT Highways Programs as shown in Figure 16. This distribution is based on needs and is consistent with MAP-21 federal legislation. MAP-21 guidance is largely focused on improving or enhancing current assets, and preserving and maintaining the condition of existing infrastructure. The majority of MAP-21 federal highway funds are dedicated to strengthening federal-aid highways through preservation and improvement.
FIGURE 16 Future Funding Distribution, by Program HDOT Highways Program Expected Distribution
System Preservation 45%
Safety 18%
Capacity 25%
Congestion 10%
Other 2%
TOTAL 100%
Funding Strategies State and federal funding sources have not kept up with the demands of the highway transportation system. Unpredictability in funding sources for transportation projects makes it difficult for the state Highway Division to plan for future facilities. Delays to improvements in the transportation system leads to frustration among the taxpaying citizens who expect the highway infrastructure to keep up with the growing demand.
The fuel tax, which is the largest contributor to the state funding sources, is levied based on fuel consumption rather than value and is subject to volatility in consumption patterns. Consumption patterns can be impacted by improved vehicle efficiency and overall economic conditions. Other tax based revenue streams are subject to legislative approval and are not modified on a regular basis to keep pace with increasing needs and costs.
As shown in Figure 15, the state is not expected to have the funding available to implement all of the solutions needed to address deficiencies. A shortage of funding will likely mean the deferral of needed projects and may delay improvements to safety, congestion relief, and infrastructure preservation. The state will need to consider alternative revenue sources to meet the needs of the transportation system. In addition to current funding sources, other revenue sources that could be considered by the Legislature and other governing bodies include:
FUTURE FUNDING STRATEGIES
TBG062714093019HNL 14
• Mileage-based user fees – Drivers pay a fee based on the number of miles traveled on public roadways. Private roadways would be excluded. Mileage could be tracked through various methods.
• Tolls – Drivers pay a fee each time a specific public roadway is used or a certain bridge is crossed. Toll fees may change based on the time of day. Tolling in Hawaii would require the Legislature to change the current laws that prohibit toll charges.
• Special general excise tax on automotive parts and services – Taxes would be collected through the performance of specific services (such as vehicle inspections or repairs) and the sale of equipment related to motorized vehicles.
• General excise tax increase – A portion of revenue from an increase in the general sales tax could be allocated to transportation improvements and projects.
• Public/private partnerships – An agreement between a private entity and a public agency to deliver transportation projects, typically with greater involvement and risk taken by the private entity.
• Impact fees on new development – Private developers pay a predetermined, per-vehicle fee based on the number of vehicle trips expected to be generated by the potential development.
• Bicycle registration – A bicycle licensing system could be developed, and user fees could be collected based on the type of bicycle registered. Fees could support maintenance and upkeep of bicycle lanes and shared roadways.
• Carbon tax/cap – A fee or tax could be imposed on producers of large amounts of carbon. These producers would pay a fee to “offset” their carbon production.
• Increase current funding sources – Because new sources of funding are difficult to identify, increasing the existing mechanisms – such as raising the rental/tour vehicle surcharge or vehicle weight tax – could generate additional revenue.
• Grant anticipation borrowing – This strategy allows public agencies to borrow against anticipated future federal and/or state revenues to fund capital projects that require large upfront expenditures. Existing programs include Grant Anticipation Revenue Vehicle bonds for highways and Grant Anticipation Note bonds for transit.
• State infrastructure banks and other revolving loan funds – These are lending organizations initially funded with federal grants and/or state funds and operated at the state level. These funds leverage federal and state resources by lending rather than granting federal-aid funds.
• Bonds – Bonds are issued by the state or other agency to finance assets with long useful lives (such as transportation projects). The administering entity issues bonds with a set return on investment, and investors purchase the bonds to help fund transportation projects. Bonds help smooth the impact of a large expensive projects by providing upfront capital, and allowing the state or county to repay over a set amount of time.
• Land swaps and donated lands – Right-of-way costs can be a large portion of total transportation project costs. Working with land owners to swap land for right-of-way or to donate land for a project could reduce project costs. Donated land value could also be used to leverage federal funds.

FUTURE FUNDING STRATEGIES
TBG062714093019HNL 15
Reducing Funding Needs Strategies to reduce funding needs could also be considered by the state to help minimize the future funding gap. By working with public and private entities to reduce the demand on the transportation system, potential needs could be reduced without investing directly into the transportation network. Strategies include:
• Land Use Planning – The demand for auto-based travel can be influenced through land use decisions and urban design. The development of denser, mixed-use areas could lead to greater travel options, and private auto use could decline when the environment is attractive to pedestrians, bicyclists, and transit users. Achieving land use changes requires zoning codes and regulations that allow for mixed uses and flexible design.
• Transportation Demand Management – Multiple strategies to help manage travel demand involve changing the mode of travel (usually from single-occupant, auto-based), the time of travel, or to remove the trip from the network altogether. Demand strategies include:
− Make bicycling attractive – Require bicycle-friendly facilities, such as easily accessed and secure bike parking and storage, showers at destination locations (including employers), and other amenities.
− Make walking attractive – Require sidewalks and pedestrian infrastructure such as mid-block crossings, pedestrian activated signals, and shaded routes. Change land use patterns or zoning codes to create more walkable districts and improve connectivity among pedestrian destinations.
− Make transit attractive – Increase the number of transit routes, expand service hours, and shorten headways to improve the overall transit network. Create transit priority corridors to ensure transit is an attractive option to the single-occupancy vehicle.
− Make ridesharing attractive – Implement education and ride-matching programs to increase the number of people per vehicle. Work with employers and high volume destinations to implement ridesharing programs through incentives such as preferential parking. Explore social media and mobile apps to facilitate connections between program participants.
− Change travel times – Work with employers to implement flexible work schedules to reduce congestion during typical peak travel times.
− Reduce potential trips – Work with employers to implement teleworking to reduce the amount of trips employees take to work.
References IHS Global Insight. Aggregate Price and Wage Forecasts, 2nd Quarter 2012. Paid subscription.
Oahu Metropolitan Planning Organization. 2011. Oahu Regional Transportation Plan 2035. Available at: http://www.oahumpo.org/wp-content/uploads/2013/01/11.1.2AdoptedPlan20110411.pdf. April.
State of Hawaii Department of Transportation (HDOT). 2007. HWY-PS 2.6454. December 8.
State of Hawaii Department of Transportation (HDOT). 2012a. Official Statement, State of Hawaii Highway Revenue Bonds, Series 2011B. Available at:

FUTURE FUNDING STRATEGIES
TBG062714093019HNL 16
http://hawaii.gov/dot/highways/officialstatements/Official%20Statement%202011.pdf. Accessed on August 6, 2012.
State of Hawaii Department of Transportation (HDOT). 2012b. Highways Division Annual Audited Financial Statements, Fiscal Year 2011. Available at: http://hawaii.gov/dot/highways/financials/highways-division-financial-audit-reports. Accessed on September 21, 2012.
State of Hawaii Department of Transportation (HDOT). 2014. Available at: http://www.hawaiilongrangeplan.com/wp-content/uploads/2014/03/Statewide_Cover.pdf. March.
United States Department of Labor, Bureau of Labor Statistics. 2012a. Consumer Price Index, Honolulu. Available at: http://www.bls.gov/cpi/. Accessed on September 21, 2012.
United States Department of Labor, Bureau of Labor Statistics. 2012b. Consumer Price Index, United States. Available at: http://www.bls.gov/cpi/. Accessed on September 21, 2012.