Fecal Contamination of Drinking-Water in Low- and Middle-Income Countries: A Systematic Review and...
23
Fecal Contamination of Drinking-Water in Low- and Middle-Income Countries: A Systematic Review and Meta-Analysis Robert Bain 1 *, Ryan Cronk 1 , Jim Wright 2 , Hong Yang 2 , Tom Slaymaker 3 , Jamie Bartram 1 * 1 The Water Institute, University of North Carolina at Chapel Hill, Chapel Hill, North Carolina, United States of America, 2 University of Southampton, Southampton, United Kingdom, 3 WaterAid UK, London, United Kingdom Abstract Background: Access to safe drinking-water is a fundamental requirement for good health and is also a human right. Global access to safe drinking-water is monitored by WHO and UNICEF using as an indicator ‘‘use of an improved source,’’ which does not account for water quality measurements. Our objectives were to determine whether water from ‘‘improved’’ sources is less likely to contain fecal contamination than ‘‘unimproved’’ sources and to assess the extent to which contamination varies by source type and setting. Methods and Findings: Studies in Chinese, English, French, Portuguese, and Spanish were identified from online databases, including PubMed and Web of Science, and grey literature. Studies in low- and middle-income countries published between 1990 and August 2013 that assessed drinking-water for the presence of Escherichia coli or thermotolerant coliforms (TTC) were included provided they associated results with a particular source type. In total 319 studies were included, reporting on 96,737 water samples. The odds of contamination within a given study were considerably lower for ‘‘improved’’ sources than ‘‘unimproved’’ sources (odds ratio [OR] = 0.15 [0.10–0.21], I 2 = 80.3% [72.9–85.6]). However over a quarter of samples from improved sources contained fecal contamination in 38% of 191 studies. Water sources in low-income countries (OR = 2.37 [1.52–3.71]; p,0.001) and rural areas (OR = 2.37 [1.47–3.81] p,0.001) were more likely to be contaminated. Studies rarely reported stored water quality or sanitary risks and few achieved robust random selection. Safety may be overestimated due to infrequent water sampling and deterioration in quality prior to consumption. Conclusion: Access to an ‘‘improved source’’ provides a measure of sanitary protection but does not ensure water is free of fecal contamination nor is it consistent between source types or settings. International estimates therefore greatly overstate use of safe drinking-water and do not fully reflect disparities in access. An enhanced monitoring strategy would combine indicators of sanitary protection with measures of water quality. Please see later in the article for the Editors’ Summary. Citation: Bain R, Cronk R, Wright J, Yang H, Slaymaker T, et al. (2014) Fecal Contamination of Drinking-Water in Low- and Middle-Income Countries: A Systematic Review and Meta-Analysis. PLoS Med 11(5): e1001644. doi:10.1371/journal.pmed.1001644 Academic Editor: Paul R. Hunter, University of East Anglia, United Kingdom Received September 28, 2013; Accepted April 3, 2014; Published May 6, 2014 Copyright: ß 2014 Bain et al. This is an open-access article distributed under the terms of the Creative Commons Attribution License, which permits unrestricted use, distribution, and reproduction in any medium, provided the original author and source are credited. Data Availability: The authors confirm that all data underlying the findings are fully available without restriction. Funding: This work was supported by WaterAid UK on behalf of the Water Working Group of WHO and UNICEF’s Joint Monitoring Programme for Water Supply and Sanitation (www.wssinfo.org). The JMP Water Working Group and the JMP Water Quality Taskforce reviewed the manuscript. The funders had no role in study design, data collection and analysis, or decision to publish. The authors alone are responsible for the views expressed in this publication and they do not necessarily represent the decisions or policies of WaterAid UK. Competing Interests: TS chairs the WHO/UNICEF JMP expert working group tasked with developing targets and indicators for enhanced global monitoring of drinking-water post-2015 which commissioned the systematic review to inform its deliberations. JB is a member of the expert working group and is an unpaid advisor to both WHO and UNICEF. Abbreviations: CDF, cumulative density function; FIB, fecal indicator bacteria; JMP, Joint Monitoring Programme; LMICs, low- and middle-income countries; MDG, Millennium Development Goal; OR, odds ratio; RADWQ, Rapid Assessment of Drinking-Water Quality; TTC, thermotolerant coliform. * E-mail: [email protected] (RB); [email protected] (RB, alternate email); [email protected] (JB) PLOS Medicine | www.plosmedicine.org 1 May 2014 | Volume 11 | Issue 5 | e1001644
Transcript of Fecal Contamination of Drinking-Water in Low- and Middle-Income Countries: A Systematic Review and...
Fecal Contamination of Drinking-Water in Low- andMiddle-Income Countries: A Systematic Review andMeta-AnalysisRobert Bain1*, Ryan Cronk1, Jim Wright2, Hong Yang2, Tom Slaymaker3, Jamie Bartram1*
1 The Water Institute, University of North Carolina at Chapel Hill, Chapel Hill, North Carolina, United States of America, 2 University of Southampton, Southampton, United
Kingdom, 3 WaterAid UK, London, United Kingdom
Abstract
Background: Access to safe drinking-water is a fundamental requirement for good health and is also a human right. Globalaccess to safe drinking-water is monitored by WHO and UNICEF using as an indicator ‘‘use of an improved source,’’ whichdoes not account for water quality measurements. Our objectives were to determine whether water from ‘‘improved’’sources is less likely to contain fecal contamination than ‘‘unimproved’’ sources and to assess the extent to whichcontamination varies by source type and setting.
Methods and Findings: Studies in Chinese, English, French, Portuguese, and Spanish were identified from online databases,including PubMed and Web of Science, and grey literature. Studies in low- and middle-income countries published between1990 and August 2013 that assessed drinking-water for the presence of Escherichia coli or thermotolerant coliforms (TTC)were included provided they associated results with a particular source type. In total 319 studies were included, reportingon 96,737 water samples. The odds of contamination within a given study were considerably lower for ‘‘improved’’ sourcesthan ‘‘unimproved’’ sources (odds ratio [OR] = 0.15 [0.10–0.21], I2 = 80.3% [72.9–85.6]). However over a quarter of samplesfrom improved sources contained fecal contamination in 38% of 191 studies. Water sources in low-income countries(OR = 2.37 [1.52–3.71]; p,0.001) and rural areas (OR = 2.37 [1.47–3.81] p,0.001) were more likely to be contaminated.Studies rarely reported stored water quality or sanitary risks and few achieved robust random selection. Safety may beoverestimated due to infrequent water sampling and deterioration in quality prior to consumption.
Conclusion: Access to an ‘‘improved source’’ provides a measure of sanitary protection but does not ensure water is free offecal contamination nor is it consistent between source types or settings. International estimates therefore greatly overstateuse of safe drinking-water and do not fully reflect disparities in access. An enhanced monitoring strategy would combineindicators of sanitary protection with measures of water quality.
Please see later in the article for the Editors’ Summary.
Citation: Bain R, Cronk R, Wright J, Yang H, Slaymaker T, et al. (2014) Fecal Contamination of Drinking-Water in Low- and Middle-Income Countries: A SystematicReview and Meta-Analysis. PLoS Med 11(5): e1001644. doi:10.1371/journal.pmed.1001644
Academic Editor: Paul R. Hunter, University of East Anglia, United Kingdom
Received September 28, 2013; Accepted April 3, 2014; Published May 6, 2014
Copyright: � 2014 Bain et al. This is an open-access article distributed under the terms of the Creative Commons Attribution License, which permits unrestricteduse, distribution, and reproduction in any medium, provided the original author and source are credited.
Data Availability: The authors confirm that all data underlying the findings are fully available without restriction.
Funding: This work was supported by WaterAid UK on behalf of the Water Working Group of WHO and UNICEF’s Joint Monitoring Programme for Water Supplyand Sanitation (www.wssinfo.org). The JMP Water Working Group and the JMP Water Quality Taskforce reviewed the manuscript. The funders had no role in studydesign, data collection and analysis, or decision to publish. The authors alone are responsible for the views expressed in this publication and they do notnecessarily represent the decisions or policies of WaterAid UK.
Competing Interests: TS chairs the WHO/UNICEF JMP expert working group tasked with developing targets and indicators for enhanced global monitoring ofdrinking-water post-2015 which commissioned the systematic review to inform its deliberations. JB is a member of the expert working group and is an unpaidadvisor to both WHO and UNICEF.
Abbreviations: CDF, cumulative density function; FIB, fecal indicator bacteria; JMP, Joint Monitoring Programme; LMICs, low- and middle-income countries;MDG, Millennium Development Goal; OR, odds ratio; RADWQ, Rapid Assessment of Drinking-Water Quality; TTC, thermotolerant coliform.
* E-mail: [email protected] (RB); [email protected] (RB, alternate email); [email protected] (JB)
PLOS Medicine | www.plosmedicine.org 1 May 2014 | Volume 11 | Issue 5 | e1001644

Introduction
The importance of water to human health and wellbeing is
encapsulated in the Human Right to Water and Sanitation, which
entitles everyone to ‘‘sufficient, safe, acceptable physically acces-
sible and affordable water for personal and domestic uses’’ [1], as
reaffirmed by the United Nations General Assembly and Human
Rights Council in 2010 [2]. Millennium Development Goals
(MDGs) Target 7c aims ‘‘to halve the proportion of the population
without sustainable access to safe drinking-water …’’ [3], a step
towards universal access. ‘‘Use of an improved source’’ was
adopted as an indicator for monitoring access to safe drinking-
water globally (Table 1) and relies on national censuses and
nationally representative household surveys as the primary sources
of data.
The Joint Monitoring Programme for Water Supply and
Sanitation (JMP) of WHO/UNICEF categorizes a drinking-water
source type as improved if ‘‘by nature of its construction or
through active intervention, [it] is protected from outside
contamination, in particular from contamination with faecal
matter’’ [4]. Improved source types include piped water into
dwelling, yard, or plot, standpipe, borehole, protected dug well or
spring, and rainwater. Unimproved source types are those that do
not protect water from outside contamination (unprotected wells,
unprotected springs, surface waters, and tanker trucks). While the
categorization reflects well-established principles of sanitary
protection, on announcing that the target had been met in 2010,
the JMP cautioned that the MDG indicator does not take water
quality measurements into account [5]. The indicator has been
criticized for not adequately reflecting safety [6–8], with some
estimates suggesting that reported access to safe water might be
overestimated by billions of people [9,10], by not accounting for
microbial water safety [8] or more fully accounting for sanitary
status [9].
Diseases related to contamination of drinking-water constitute a
major burden on public health. The principal risk to health is from
ingestion of water contaminated with feces containing pathogens
that cause infectious diseases such as cholera and other diarrheal
diseases, dysenteries, and enteric fevers [11,12]. The burden of
water-related disease varies according to context and is highest in
low-income settings where diarrhea remains a leading cause of
child deaths [13]. Systematic reviews of epidemiological evidence
from intervention studies [14–18], and especially outbreak
investigations [19,20], suggest drinking-water quality plays an
important role in fecal-oral transmission, though the magnitude of
the effect has been contested owing to a limited number of blinded
trials [21]. It is difficult to isolate the effects of one component of
the multiple and interrelated fecal-oral pathways, which are highly
context-specific.
WHO publishes widely recognized Guidelines for Drinking-
water Quality (GDWQ) (4th edition) that include criteria for
assessing health risks and setting targets for improving water
safety [12]. Direct measurement of pathogens is complex but
techniques for assessing fecal contamination using fecal
Table 1. Types of improved source and the estimated proportion of the global population using these as their primary source ofdrinking-water.
Source Categorya Description
Global Population UsingWater Source in 2010b (%)
Urban Rural Total
Household or yardconnection
Piped water into dwelling, also called a household connection, isdefined as a water service pipe connected with in-house plumbing toone or more taps. Piped water to yard/plot, also called a yard connection,is defined as a piped water connection to a tap placed in the yard or plotoutside the dwelling.
80 29 54
Standpipe Public tap or standpipe is a public water point from which people can collectwater. A standpipe is also known as a public fountain or public tap. Publicstandpipes can have one or more taps and are typically made of brickwork,masonry, or concrete.
6 8 7
Borehole Tubewell or borehole is a deep hole that has been driven, bored, or drilled,with the purpose of reaching groundwater supplies. Boreholes/tubewells areconstructed with casing, or pipes, which prevent the small diameter hole fromcaving in and protects the water source from infiltration by runoff water.
8 30 18
Protected dug well Protected dug well is a dug well that is protected from runoff water by awell lining or casing that is raised above ground level and a platform thatdiverts spilled water away from the well. A protected dug well is also covered, sothat bird droppings and animals cannot fall into the well.
2c 10c 6c
Protected spring The spring is typically protected from runoff, bird droppings, and animals bya ‘‘spring box,’’ which is constructed of brick, masonry, or concrete and is builtaround the spring so that water flows directly out of the box into a pipe or cistern,without being exposed to outside pollution.
,1c 3c 2c
Rainwater Rainwater refers to rain that is collected or harvested from surfaces (by roof orground catchment) and stored in a container, tank, or cistern until used.
,1 2 1
Source: UNICEF/WHO [5].aHouseholds using bottled water as their primary source of water for drinking are generally considered to use an improved source if one of the above sources is used forwashing and cooking. The JMP estimates that 6% of the urban population and 1% of the rural population primarily use bottled water as their source of drinking-water.bAn estimated 3% of the global population use surface waters and a further 8% use ‘‘other unimproved sources’’ such as tanker trucks, unprotected dug wells, andunprotected springs.cPublished estimates include do not distinguish protected and unprotected. In the absence of data we assumed half are protected.doi:10.1371/journal.pmed.1001644.t001
Fecal Contamination of Drinking-Water
PLOS Medicine | www.plosmedicine.org 2 May 2014 | Volume 11 | Issue 5 | e1001644

indicator bacteria (FIB) are well established and widely
applied. The WHO GDWQ recommend using E. coli, or
alternatively thermotolerant coliform (TTC), and new enzy-
matic methods have made quantification simpler, cheaper, and
more robust [22,23]. The WHO GDWQ recommend that E.
coli, or alternatively TTC, be used in assessing fecal contam-
ination of drinking-water [12]. The WHO guideline value for
E. coli (‘‘none detected in any 100-ml sample’’) [12] is reflected
in the standards of most OECD member states and low- and
middle-income countries (LMICs). The WHO GDWQ further
suggest the use of a risk classification to prioritize interventions
as higher levels of indicator organisms are generally indicative
of greater levels of fecal contamination. A commonly used risk
classification is based on the number of indicator organisms in
a 100 ml sample, which includes: ,1, ‘‘very low risk’’; 1–10,
‘‘low risk’’; 10–100, ‘‘medium risk’’; .100, ‘‘high risk’’ or
‘‘very high risk’’ [24,25]. However FIB are imperfect and their
level does not necessarily equate to risk [26]; since quality
varies both temporally and spatially, occasional sampling may
not accurately reflect actual exposure.
A complementary approach in safety assessment is the
identification of hazards and preventative risk management
measures through ‘‘sanitary inspection’’ of a water source and
its surroundings [24,27]. The improved source indicator is in
effect a very simplified form of sanitary inspection. Like FIB,
sanitary inspections have long been a tool in assessing
drinking-water safety. In 1904, Prescott and Winslow stated,
‘‘[t]he first attempt of the expert called in to pronounce upon
the character of a potable water should be to make a thorough
sanitary inspection…’’ [28]. Standardized forms can be used to
assess sanitary risk and derive a summary measure, the sanitary
risk score. These forms typically include questions about the
integrity of protective elements, such as fencing or well covers,
and the proximity of hazards such as latrines; forms are
available for different types of water source. Like water quality,
some sanitary risk factors may vary spatially and temporally.
The approach can be combined with microbiological analysis,
either to yield a risk cross-tabulation [24,25] or as a part of a
more detailed Water Safety Plan [29].
In January 2012, WHO and UNICEF established working
groups to develop targets and indicators for enhanced global
monitoring of drinking-water, sanitation, and hygiene post-
2015. The water working group proposed to continue using the
improved water source classification as part of a revised set of
indicators for assessing progressive improvements in service
[30]. This review was commissioned to assist the group in
evaluating the evidence linking improved source types and
health-related indicators of water quality. The following
specific questions were considered in order to determine the
potential and limits of classification by source type in assessing
safety in future global reporting: (i) Is water from improved
sources less likely to exceed health-based guidelines for
microbial water quality than water from unimproved sources?
(ii) To what extent does microbial contamination vary between
source types, between countries, and between rural and urban
areas? (iii) Are some types of water source associated with
higher risk scores as assessed by sanitary inspection?
Methods
We conducted a systematic review of studies of fecal contam-
ination of drinking-water in LMICs in adherence with PRISMA
guidelines (Text S1) [31]. The protocol for the review is described
in Protocol S1.
Search StrategyStudies were identified from both peer-reviewed and grey
literature. To identify peer-reviewed literature, the topic ‘‘water
quality’’ was combined with terms to restrict the search to
drinking-water and either a measure of microbial water quality
(e.g., ‘‘coli’’) or sanitary risk (e.g., ‘‘sanitary inspection’’). We
further restricted the search to LMICs using a list of country
names based on the MDG regions [32]. Online databases were
searched including PubMed, Web of Science, and the Global
Health Library. Grey literature was sourced from a variety of sites
including those used in previous drinking-water–related reviews
[33–35]. Translated search terms (Chinese, French, Portuguese,
and Spanish) were used to identify additional studies. An email
requesting submissions of relevant studies was distributed to water
sector professional networks. We searched bibliographies of
included studies and contacted authors where full texts could not
be obtained through other means. Searches were conducted
between 7th January and 1st August 2013.
Eligibility and SelectionStudies were included in the review provided they: reported on
water quality, at either the point of collection or consumption,
from sources used for drinking that would not be classified as
surface waters by the JMP; contained extractable data on TTC or
E. coli with sample volumes not less than 10 ml; were published
between January 1990 (the baseline year for MDG targets) and
August 2013; included results from at least ten separate water
samples from different water sources of a given type or, in the case
of piped systems, individual taps, and in the case of packaged
waters, brands; reported data from LMICs as defined by the
MDG regions [32] (thereby excluding 55 high-income countries,
comprising 18.1% of the global population in 2010 [36]); were
published in languages spoken by at least one author (Chinese,
English, French, Portuguese, or Spanish); and included sufficient
detail about the water sources and associated results with a water
source with sufficient detail to be categorized (refer to Figure 1 for
details). Other indicators such as coliphage and direct pathogen
detection are not as widely used and are not included in this review
[37]. We did not include studies that only assessed surface waters
as these are generally considered unfit for drinking. We included
bottled water and sachet water that do not form part of the JMP
improved source classification (which is concerned with the
household’s primary source of water for drinking, cooking, and
personal hygiene [38]) but are nonetheless important sources of
drinking-water in many countries.
Independent primary screening of English language titles and
abstracts for studies was conducted by two authors (RB and RC). If
any reviewer selected a study, we referred to the full text. Data
from eligible studies were extracted into a standardized spread-
sheet and 10% of the English language texts were subjected to
independent quality control by a second author (RB and RC).
Screening and extraction of data in other languages was
conducted by one author (RB or HY).
Data Extraction and MatchingWhere possible we extracted or calculated the following
information for each type of water source in the studies: (i) total
number of samples and proportion containing E. coli or TTC; (ii)
proportion of samples within microbial risk categories (,1 or not
detected, 1–10, 10–100, and .100 E. coli or TTC per 100 ml); (iii)
geometric mean, mean, or median levels of E. coli or TTC; and (iv)
risk categories according to the sanitary inspection (‘‘low,’’
‘‘medium,’’ ‘‘high,’’ and ‘‘very high’’ risk) as reported in the
studies. For intervention studies (other than the provision of an
Fecal Contamination of Drinking-Water
PLOS Medicine | www.plosmedicine.org 3 May 2014 | Volume 11 | Issue 5 | e1001644

improved source, for example the protection of unprotected
springs), estimates could be based on either the baseline or control
group; when both were available we used whichever had the
largest sample size. For studies reporting both E. coli and TTC, we
used only the E. coli results. Where repeated measures were taken
at the same source and data permitted we extracted the lowest
compliance level (e.g., wet season data) with WHO Guideline
values as well as the overall proportion of samples containing FIB.
We identified countries as ‘‘low,’’ ‘‘lower middle,’’ ‘‘upper
middle,’’ and ‘‘high’’ income using the 2013 World Bank
classification [39]. We recorded whether studies took place during
or shortly after emergencies or natural disasters and if they were in
non-household settings such as schools and health facilities. We
identified additional study characteristics expected to influence
water quality, including the setting (urban/rural), season (wet/dry
or period of sampling), and study design [34].
Each type of water source in a given study was classified as
improved or unimproved and matched to a specific water source
type following the classification used in household surveys
including the Demographic and Health Surveys [38]. We
recorded whether samples had been taken directly from the water
source or after storage, for example in the home. Where the
appropriate match could not be determined, our approach
differed depending on the type of source. We grouped ground-
water sources from studies that did not distinguish between
protected and unprotected (unclassified dug well, unclassified
spring) and we created groups for studies of other sources such as
bottled and sachet water. Further information about the matching
is available in Figure 1.
Study Quality and BiasStudies were rated for quality on the basis of the criteria
summarized in Table 2. A quality score between 0 and 13 for each
study was determined on the basis of the number of affirmative
responses. We also categorized studies on the basis of anticipated
susceptibility to bias in estimating the compliance to health-based
Figure 1. Matching drinking-water source types to the classification used by the Joint Monitoring Programme.doi:10.1371/journal.pmed.1001644.g001
Fecal Contamination of Drinking-Water
PLOS Medicine | www.plosmedicine.org 4 May 2014 | Volume 11 | Issue 5 | e1001644

guidelines and the extent of microbial contamination; our
categories were: case-control or cohort, intervention, diagnostic
study, cross-sectional survey, and longitudinal survey. Any study of
at least 6 months duration and more than two samples at each
water point was categorized as longitudinal. We identified studies
where authors indicated whether selection was intended to be
representative or selection had been randomized.
AnalysisBecause of the extent of heterogeneity between studies, we chose
to plot cumulative density functions (CDFs) of the proportion of
samples with detected (.1 per 100 ml) and high (.100 per
100 ml) FIB in each study to compare water source types between
studies. This approach has been used in a systematic review of
prevalence of schizophrenia [40]. CDFs are used to qualitatively
assess the proportion of studies reporting frequent and high levels
of microbial contamination. Measures of central tendency from
studies were not included in the meta-analysis because of limited
reporting of measures of dispersion, inadequate explanation of the
handling of censored data, and the difficulty in reconciling diverse
reported measures of central tendency (e.g., geometric versus
arithmetic mean) [41].
Random effects meta-regression was used to investigate
risk factors and settings where fecal contamination is
most common and other possible explanations for the
observed heterogeneity between studies [42]. A logit transfor-
mation is recommended for the analysis of proportions [43]
and was applied to both the proportion of samples with
detectable (.1 per 100 ml) and high (.100 per 100 ml) levels
of FIB. The metareg function in Stata was used after a continuity
correction of 60.5 where the proportion of samples positive
was zero or one [44], and we estimated the within study
variance for each proportion as the reciprocal of the binomial
variance [45]. Subgroup analysis included variables defined a
priori (including water source type, rural versus urban, and
income-level) and defined a posteriori (for example if piped
water had been treated prior to distribution). We separately
evaluated piped and other improved sources for those variables
reaching significance at the 5% level in bivariate analysis for
all source types.
Studies that included both improved and unimproved sources
were then combined using meta-analysis with the odds ratio (OR)
as the effect measure. We calculated a pooled estimate of the
protective effect of an improved source and corresponding
confidence intervals using the metan function in Stata. We then
assessed the influence of small study bias by the funnel plot method
and performed an Egger’s test using a normal likelihood
approximation. The extent of heterogeneity in protective effect
was determined using Higgins I2 and corresponding confidence
intervals were calculated [42]. Calculations were performed in
Stata 13SE.
Results
Search ResultsAs shown in Figure 2, in total, 6,586 reports were identified
through database searches. A further 1,274 reports were
identified from grey literature and correspondence with
experts. Most studies were excluded because they did not test
water that was clearly used for drinking, did not associate
results with a water source type, or did not include enough
different water sources or in the case of packaged water,
brands. Studies often did not provide an adequate description
of the water sources to allow them to be matched to the JMP
source categories; this limitation was particularly the case for
ground water sources. For example, several studies reported
results for ‘‘hand pumps’’ (a description of the technology
above ground) but did not provide details about well
construction. Although these may often be boreholes, hand
pump conversions are also applied to dug wells. Other studies
simply described water sources as ‘‘wells’’ or ‘‘springs.’’ Some
studies provided details that are not captured in the JMP
classification, such as whether water from a piped supply had
been treated. Full texts could not be obtained for 99 potentially
relevant reports, many of which were conference presentations
and most of which were identified from bibliographies. The
Table 2. Quality criteria used to assess studies of microbial water quality.
Criterion Question
Selection described Do the authors describe how the water samples were chosen, including how either the types of water source or their users wereselected?
Selection representative Did the authors detail an approach designed to provide representative picture water quality in a given area?
Selection randomized Was sampling randomized over a given study area or population?
Region described Does the study report the geographic region within the country where it was conducted?
Season reported Were the seasons or months of sampling reported?
Quality control Were quality control procedures specified or referred to?
Method described Are well-defined and appropriate methods of microbial analysis described or referenced?
Point of sampling Was the point at which water was sampled well defined? (For example whether the water was collected from within a householdstorage container or directly from a water source)
Handling described Are sample handling procedures described, including sample collection, transport method, and duration?
Handling minimum criteria Does sample handling and processing meet the following criteria: transport on ice or between 2–8uC, analysis within 6 hours ofcollection, and specified incubation temperature?
Accredited laboratory Was the microbial analysis conducted in an accredited laboratory setting?
Trained technician Do the authors state whether trained technicians conducted the water quality assessments or the analyses were undertaken bylaboratory technicians?
External review Was the study subject to peer review or external review prior to publication?
doi:10.1371/journal.pmed.1001644.t002
Fecal Contamination of Drinking-Water
PLOS Medicine | www.plosmedicine.org 5 May 2014 | Volume 11 | Issue 5 | e1001644

remaining 310 reports [6,24,46–353] were incorporated in our
review and provide information on 96,737 water samples. The
total number of studies is higher (319) due to a small number of
multi-country reports. On average each study provides
information on 1.7 water source types, resulting in a database
with 555 datasets (Dataset S1).
Figure 2. Flowchart for a review of safety of sources of drinking-water.doi:10.1371/journal.pmed.1001644.g002
Fecal Contamination of Drinking-Water
PLOS Medicine | www.plosmedicine.org 6 May 2014 | Volume 11 | Issue 5 | e1001644

Study CharacteristicsCharacteristics of included studies are summarized in
Table 3. The review is dominated by cross-sectional studies
(n = 241, 75%) with fewer longitudinal surveys (n = 39, 12%).
Authors report selecting sources or households at random in a
minority of studies (n = 68, 21%); most of these studies selected
sources randomly within a region or community rather than at
national level. The main exceptions were the Rapid Assess-
ment of Drinking-Water Quality (RADWQ) studies commis-
sioned by WHO and UNICEF, of which five have been
published [64,65,164,281,322] and a repeated cross-sectional
study in Peru for which only the total coliform results have
previously been reported but for which we were able to secure
E. coli data [227].
Study quality varied greatly spanning from a quality score of
1 to 12 and with an interquartile range of 5 to 8 (Figure S1).
Whereas most studies described the analytical method used to
detect E. coli or TTC (80%), how water sources were selected
(67%), and the setting in which the study took place (86%),
fewer specified quality control procedures (15%), met the basic
sample handling criteria (25%), used trained technicians to
conduct the water quality tests (15%), or arranged testing in an
accredited laboratory (12%) (Figure S2). Most studies were
from sub-Saharan Africa, southern Asia, or Latin America and
the Caribbean (Figure 3). The majority of included studies
investigated water quality at the source. Studies reporting on
the quality of water stored in households by provenance were
less common (n = 49), and few of these compare quality of
stored water with that of the associated source (n = 26). Several
studies took place during or after emergencies [97,201] and
natural hazards, including cyclones [235], floods [78,208],
droughts [341], and tsunamis [130,147,331]. Non-household
settings such as schools and health facilities were addressed in a
small number of studies (n = 17). Few studies separately report
water quality information from slum or peri-urban settings
(n = 7).
Qualitative SynthesisIn Figures S3 and S4 levels of microbial contamination are
shown using the FIB level classification (,1, 1–10, 10–100, and .
100 FIB per 100 ml), grouped by type of improved water source.
These results are broadly in agreement with a comparison using
measures of central tendency (Figure S5) and show great
variability in the likelihood and extent of contamination between
studies and source types.
Large studies with random sampling demonstrate marked
differences in water quality between countries; for example less
than 0.01% of samples from utility piped supplies in Jordan [281]
were found to contain TTC compared with 9% to 23% of utility
piped supplies in the other four RADWQ countries
[64,65,164,322]. Only one national randomized study differenti-
ated between rural and urban areas; the proportion of samples
from piped supplies containing E. coli was found to be substantially
higher in rural (61%, n = 101) than urban (37%, n = 1470) areas in
Peru [227].
In comparison to microbial testing, sanitary inspections are
less widely practiced or data are rarely published. Sanitary
inspection procedures vary considerably and are usually
adapted to the local context; of the 44 studies reporting
sanitary inspections only 12 used standardized WHO forms. In
Figure S6 the sanitary risk levels as reported in nine studies are
compared with the proportion of samples containing FIB and
suggest that there is no strong association between these two
measures.
Between Studies Analysis: CDF and Meta-regressionThe number of studies reporting high proportions of samples
contaminated or high levels of FIB is lower for improved sources
as can be seen in Figure S7. Yet, in 38% of 191 studies reporting
the quality of improved sources, at least a quarter of samples
exceeded recommended levels of FIB. Figure S8 shows CDFs by
source type with similar patterns to those from the FIB level
classification.
Results of the meta-regression are shown in Table 4. We find
that country income-level is a significant determinant of water
quality and the odds of contamination are 2.37 times (95% CI
1.52–3.72 [p = 0.001]; Table 4) higher in low-income countries
compared with wealthier countries. However this result is not
significant when separately considering piped and other improved
sources (Tables S1 and S2).
Meta-regression showed a substantial difference in the propor-
tion of samples containing FIB between urban and rural areas
(OR = 2.37 [95% CI 1.47–3.81], p,0.001). There is weak
evidence to suggest that piped supplies are more likely to be
contaminated in rural areas (OR = 2.4 [95% CI 0.98–5.92],
p = 0.054; Table S1), but no evidence of differences for all other
improved source types (OR = 1.19 [95% CI 0.52–2.72], p = 0.67;
Table S2).
Protection of groundwater (OR = 0.26 [95% CI 0.11–0.60];
p = 0.002; Table 3) and treatment of piped water (OR = 0.07 [95%
CI 0.02–0.27], p,0.001; Table 3) were both strongly related to
better water quality. Contamination of stored water was more
likely than water at the source (OR = 2.09 [95% CI 1.16–3.78],
p = 0.015; Table 3), including for piped supplies (OR = 2.35 [95%
CI 1.08–5.12], p = 0.032; Table S1).
Within Studies Analysis: Meta-analysisFigure 4 is a forest plot showing the ORs of contamination
for improved sources compared to unimproved sources from
eligible studies. Meta-analysis of randomized and non-ran-
domized studies showed that improved sources are less likely to
be contaminated (pooled OR = 0.15 [0.10–0.21]; Figure 4); the
protective effect was found to be greater in randomized studies
and none of the randomized studies found contamination to be
more frequent in improved sources. Heterogeneity was
relatively high (I2 = 80.3% [95% CI 72.9–85.6) indicating that
the protective effect varies considerably between settings. The
OR for a small number of studies was greater than one,
suggesting that in some settings improved sources may not
always be less likely to contain FIB than the unimproved
alternative.
Assessment of BiasEgger’s test found no evidence of small study effects for the
meta-analysis of improved versus unimproved sources
(p = 0.64; Figure S9). Meta-regression did not detect evidence
of bias due to study design, lack of randomization, study
quality, or season (‘‘wet’’ or ‘‘dry’’). As expected, we find that
levels of FIB (risk classification or measures of central
tendency) were more likely to be reported in studies where
water was more contaminated with FIB (Tables 4, S1, and S2)
and therefore may constrain comparisons between studies.
Publication year was also related to the proportion of samples
containing FIB (OR = 0.96 [95% CI 0.93–1.00]; p = 0.029;
Table 4), but this was not significant when separately
considering piped and other improved sources (Tables S1
and S2). Studies testing the same sources in different seasons
report considerable variation in microbial water quality (Table
S3).
Fecal Contamination of Drinking-Water
PLOS Medicine | www.plosmedicine.org 7 May 2014 | Volume 11 | Issue 5 | e1001644

Table 3. Characteristics of included studies.
Characteristic Studies Datasets Samples
Number (%) Number (%) Number (%)
Setting
Urban 146 (46) 227 (41) 30,038 (31)
Rural 130 (41) 243 (44) 34,850 (36)
Both urban and rural 41 (13) 83 (15) 31,767 (33)
Unclassified setting 2 (1) 2 (0) 82 (0)
Emergencies 13 (4) 26 (5) 2,897 (3)
Non-household 17 (5) 21 (4) 2,121 (2)
Point of sampling
Stored water 50 (15) 74 (13) 19,965 (21)
Directly from source 293 (92) 481 (87) 76,772 (79)
Water supply
Improved 209 (65) 273 (49) 56, 268 (58)
Piped 118 (37) 119 (21) 32,348 (33)
Borehole 83 (26) 83 (15) 11,452 (12)
Protected dug well 36 (11) 36 (6) 8,697 (9)
Protected spring 11 (3) 11 (2) 978 (1)
Rainwater 25 (8) 25 (5) 2,793 (3)
Unimproved 62 (19) 71 (13) 5,594 (6)
Unprotected dug well 49 (15) 49 (9) 4,577 (5)
Unprotected spring 16 (5) 16 (3) 810 (1)
Tanker truck 6 (2) 6 (1) 207 (0)
Unclassified 167 (53) 213 (38) 35,087 (36)
Sachet 15 (5) 15 (3) 1,305 (1)
Bottled 35 (11) 35 (6) 2,339 (2)
Dug well 49 (15) 49 (9) 4,577 (5)
Spring 16 (5) 16 (3) 810 (1)
Design
Randomized 68 (21) 131 (24) 31,210 (32)
Representative 74 (23) 148 (27) 37,614 (39)
Cohort or case control 5 (2) 15 (3) 4,114 (4)
Intervention 22 (7) 47 (8) 9,799 (10)
Cross-sectional survey 241 (75) 404 (73) 48,559 (50)
Longitudinal survey 39 (12) 66 (12) 32,302 (33)
Diagnostic 12 (4) 23 (4) 1,963 (2)
Parameter
E. coli 152 (48) 270 (49) 32,298 (33)
TTC only 167 (52) 285 (51) 64,439 (67)
Language
English 276 (86) 502 (90) 81,349 (84)
Spanish 6 (2) 8 (1) 3,024 (3)
Portuguese 24 (8) 29 (5) 9,146 (9)
French 4 (1) 5 (1) 187 (0)
Chinese 9 (3) 11 (2) 3,031 (3)
Reporting
Presence/absence of FIB 287 (90) 499 (90) 90,056 (93)
Microbial risk classification 90 (28) 165 (30) 23,953 (25)
Mean FIB 80 (25) 136 (25) 15,530 (16)
Geometric mean FIB 34 (11) 68 (12) 11,797 (12)
Fecal Contamination of Drinking-Water
PLOS Medicine | www.plosmedicine.org 8 May 2014 | Volume 11 | Issue 5 | e1001644

Discussion
Safety of Improved SourcesWe demonstrate that water from improved sources is less likely
to contain FIB than unimproved sources. Using meta-analysis we
compare water from unimproved sources and improved sources
within the same study and found improved sources were less likely
to contain FIB (OR = 0.15 [95% CI 0.10–0.21]) (Figure 4), with
the greatest protective effects in studies where selection of water
sources was randomized. Comparison between studies of im-
proved versus unimproved sources yielded an OR of 0.14 (95% CI
0.08–0.25) for the presence of FIB and 0.13 (95% CI 0.05–0.34)
Table 3. Cont.
Characteristic Studies Datasets Samples
Number (%) Number (%) Number (%)
Range of FIB 74 (23) 108 (19) 9,407 (10)
Standard deviation of FIB 21 (7) 38 (7) 4,417 (5)
Sanitary risk 44 (14) 82 (15) 15,808 (16)
WHO sanitary risk 12 (4) 31 (6) 9,160 (9)
Sanitary risk classification 17 (5) 44 (8) 10,667 (11)
Sample Sizea
Small (n = 10–30) NA 192 (35) 3,711 (4)
Medium (n = 31–100) NA 187 (34) 11,615 (12)
Large (n = 101–6,021) NA 176 (32) 81,411 (84)
Qualityb
Low (1–5) 113 (36) 199 (36) 27,892 (29)
Medium (6–7) 94 (29) 142 (26) 16,980 (17)
High (8–13) 112 (35) 214 (39) 51,865 (54)
Total 319 (100) 555 (100) 96,737 (100)
aTerciles by datasets.bTerciles by study.NA, not applicable.doi:10.1371/journal.pmed.1001644.t003
108
60
92LAC
11EA
SA 17SEA
SSA
4NA
3O
23
WA
1 CCA1
5-9 studies3-4 studies2 studies1 study
Studies per country
MDG RegionsNumber of studies n
20+ studies10-20 studies
High income countries
0 studies
Figure 3. Map of study locations.doi:10.1371/journal.pmed.1001644.g003
Fecal Contamination of Drinking-Water
PLOS Medicine | www.plosmedicine.org 9 May 2014 | Volume 11 | Issue 5 | e1001644

for samples exceeding 100 FIB per 100 ml (Table 4). Cumulative
density plots show markedly lower contamination for improved
sources relative to unimproved sources.
While improved sources clearly offer a greater degree of
protection compared to unimproved sources, they are not all nor
consistently safe [354]. In particular, protected dug wells were
rarely free of fecal contamination and it is not uncommon for these
sources to contain high levels of FIB. High levels of contamination
were occasionally reported for boreholes and piped water, which
are typically perceived as high quality and lower risk. Risk factors
for microbial contamination of piped supplies include intermit-
tency [198] and inadequate chlorination [20,355]. For boreholes
and dug wells, the reasons for fecal contamination can be more
difficult to ascertain owing to the possibility of aquifer contami-
nation and/or inadequate sanitary completion. In many cases
contamination is associated with poor hygiene and inadequate
sanitation, but specific risks can be readily identified through
sanitary inspection of the water source and its surroundings and
may in part explain the heterogeneity in FIB concentrations
observed for a given source type.
Studies included in this review show great variability in water
quality for water sources of a given type, suggesting considerable
scope for reducing exposure to fecal contamination through
systematic management of water safety. Microbial water quality
displays substantial heterogeneity between studies and we found a
high I2 when comparing improved and unimproved sources from
the same study (I2 = 80.3% [72.9–85.6]; Figure 4).
Across all studies, we find a higher risk of contamination in rural
areas compared to urban areas (OR = 2.37 [1.47–3.81], p,0.001;
Table 4) and a higher risk of contamination in low-income
countries (OR = 2.37 [1.52–3.71], p,0.001; Table 4). Higher risk
in rural areas is consistent with a recent multi-country study of
over 25,000 hand pumps, which found greater risk of non-
functioning water sources in areas distant from district centers
[356].
There is some evidence to suggest that overall water quality has
gradually improved over time. Publication year was associated
with the proportion of samples containing FIB (OR 0.96 [0.93–
1.00], p = 0.023; Table 4); this may reflect a progressive trend
towards greater use of source types associated with less
contamination and potentially a lessening of population-level
exposure.
We found only limited published data on sanitary risk,
suggesting that sanitary risk inspection techniques are not
widely used and/or reported, despite being well-established in
national and international drinking-water guidelines [12].
Studies report sanitary risks in some sources that are not
found to contain detectable FIB, indicating that infrequent
monitoring does not provide assurance of water safety.
Conversely, low sanitary risk scores are reported for water
sources that contain FIB, indicating that sanitary inspections
alone do not capture water safety fully. Although individual
studies report different levels of sanitary risk, the data are too
few to draw general conclusions. Moreover, the use of different
questions for each source type and their equal weighting limits
the comparability of sanitary risk scores. While a simple
prevalence of factor scoring is unlikely to be appropriate in
more complex systems, there has been progress in developing
Table 4. Between studies meta-regression.
Variables Proportion of Samples .1 FIB per 100 ml Proportion of Samples .100 FIB per 100 ml
Obs. OR [95% CI] p-Value Obs. OR [95% CI] p-Value
Source type
Improved vs. unimproved 291 0.14 [0.08–0.25] ,0.001 87 0.13 [0.05–0.33] ,0.001
Piped vs. other improved 239 0.53 [0.32–0.89] 0.017 68 0.47 [0.18–1.20] 0.11
Protected vs. unprotected groundwater 90 0.26 [0.11–0.60] 0.002 31 0.37 [0.09–1.52] 0.16
Treated piped vs. untreated pipeda 69 0.07 [0.02–0.27] ,0.001 18 0.10 [0.01–0.72] 0.025
Stored vs. source 474 2.09 [1.16–3.78] 0.015 140 1.85 [0.68–5.04] 0.23
Setting
Low-income vs. other 414 2.37 [1.52–3.71] ,0.001 122 1.30 [0.59–2.86] 0.52
Rural vs. urban 344 2.37 [1.47–3.81] ,0.001 96 1.18 [0.49–2.83] 0.71
Study characteristics
Thermotolerant vs. E. coli 417 1.08 [0.70–1.67] 0.72 122 0.99 [0.45–2.19] 0.98
Publication year 415 0.96 [0.93–1.00] 0.029 122 0.96 [0.91–1.02] 0.16
Random vs. non-random selection 417 0.92 [0.53–1.57] 0.75 122 0.60 [0.25–1.44] 0.25
High quality vs. lower qualityb 417 0.90 [0.54–1.49] 0.68 122 0.51 [0.21–1.23] 0.13
Longitudinal vs. cross-sectional 372 1.00 [0.58–1.73] 0.99 116 1.05 [0.40–2.73] 0.93
Wet vs. dry 51 0.99 [0.32–3.10] 0.99 22 0.93 [0.09–9.34] 0.95
Reporting format
Measure of central tendency 417 2.31 [1.45–3.69] ,0.001 122 1.22 [0.55–2.68] 0.62
Microbial risk classification 417 2.30 [1.45–3.67] ,0.001 — — —
With the exception of stored versus source, we restricted the analysis to source water samples. We excluded emergencies from the meta-regression.aPost hoc analysis.bTop tercile of studies versus bottom two terciles.Obs.,number of observations.doi:10.1371/journal.pmed.1001644.t004
Fecal Contamination of Drinking-Water
PLOS Medicine | www.plosmedicine.org 10 May 2014 | Volume 11 | Issue 5 | e1001644

scoring for quality of water safety plans and higher scoring
utilities have been linked to both improved water quality and
health outcomes [357].
Limitations of the ReviewAt the outcome level, our principal analyses are based on the
proportion of samples detecting FIB rather than compliance to
health guidelines over the course of a year. These prevalence
measures overestimate compliance to health guidelines and
national standards that require minimum sampling frequen-
cies. Furthermore, where the sample volume is less than the
recommended 100 ml [12], contamination is less likely to be
detected and will be detected less frequently.
At the study level, our review was limited by infrequent
reporting of a consistent measure of central tendency (or of
individual sample data), sanitary risk inspections, and stored water
quality. In analysis, we combine studies that used diverse sample
handling and microbiological analytical methods and these factors
may account for some of the variability in reported water quality.
The majority of the included studies were cross-sectional and do
not provide information on temporal variability in water quality.
Few studies achieved robust random selection of water sources,
and few received high scores for study quality (14% with .9 out of
13; Figure S1) with description of quality control procedures,
meeting handling criteria, and statement of season(s) of sampling
most frequently omitted quality factors. Many studies, particularly
NOTE: Weights are from random effects analysis
.
.
Overall (I−squared = 80.3%, p < 0.001)
Sutton 2012 [320]Parker 2010 [266]
Pathak 2005 [268]Magrath 2006 [214]
Tambekar 2012 [324]
Randomised selection
Subtotal (I−squared = 78.3%, p < 0.001)
Vanderslice 1993 [334]
Williams 1997 [341]
Mamo 2011 [219]
Tillet 2007 [327]
Nyanchaga 1994 [247]
Uhl 2012 [330]
Tambekar 2007 [323]
Subtotal (I−squared = 88.3%, p < 0.001)
Maiga 2006 [218]
Moe 1991 [230]
Sampson 2008 [297]
Admassu 2004 [52]
Schaffner 2002 [300]
Gundry 2009 [143]
Simiyu 2009 [312]
Kravitz 1999 [194]
Patrick 2010 [270]
Lloyd 1991 [24]
study
Jagals 2013 [168]
Sutton 2002 [319]
Rheinheimer 2010 [294]
Opisa 2012 [259]
Guillemin 1991 [143]
Cronin 2006 [103]
Desmarchelier 1992 [112]
Jiban Singh 2009 [172]
Pathak 1994 [267]
Ince 2010 [164]
Non−randomised selection
0.15 (0.10, 0.21)
0.05 (0.02, 0.11)0.04 (0.00, 0.63)
0.03 (0.00, 0.22)0.03 (0.00, 0.46)
0.30 (0.15, 0.60)
0.17 (0.12, 0.25)
0.01 (0.00, 0.06)
0.07 (0.01, 0.75)
0.37 (0.17, 0.80)
0.08 (0.03, 0.20)
0.74 (0.03, 19.27)
0.03 (0.00, 0.47)
0.48 (0.31, 0.74)
0.07 (0.02, 0.31)
0.38 (0.12, 1.19)
0.21 (0.07, 0.68)
0.23 (0.16, 0.33)
0.29 (0.11, 0.80)
0.11 (0.00, 2.50)
0.03 (0.01, 0.08)
1.11 (0.21, 6.01)
0.03 (0.00, 0.15)
0.13 (0.05, 0.38)
0.09 (0.03, 0.28)
OR (95% CI)
0.05 (0.02, 0.15)
0.09 (0.06, 0.12)
0.44 (0.02, 11.58)
0.19 (0.01, 4.21)
0.05 (0.03, 0.11)
0.27 (0.14, 0.50)
0.10 (0.03, 0.34)
9.11 (1.44, 57.62)
0.25 (0.19, 0.35)
0.49 (0.23, 1.04)
100.00
4.221.27
1.921.22
4.40
83.07
2.91
%
1.58
4.23
3.86
1.01
1.26
4.89
16.93
3.47
3.40
5.00
3.74
1.07
3.92
2.46
2.43
3.68
3.36
Weight
3.69
5.03
1.00
1.10
4.47
4.54
3.31
2.23
5.05
4.27
Improved sources safer Improved sources less safe
1.1 10
Figure 4. Forest plot of the odds of fecal contamination for improved and unimproved sources.doi:10.1371/journal.pmed.1001644.g004
Fecal Contamination of Drinking-Water
PLOS Medicine | www.plosmedicine.org 11 May 2014 | Volume 11 | Issue 5 | e1001644
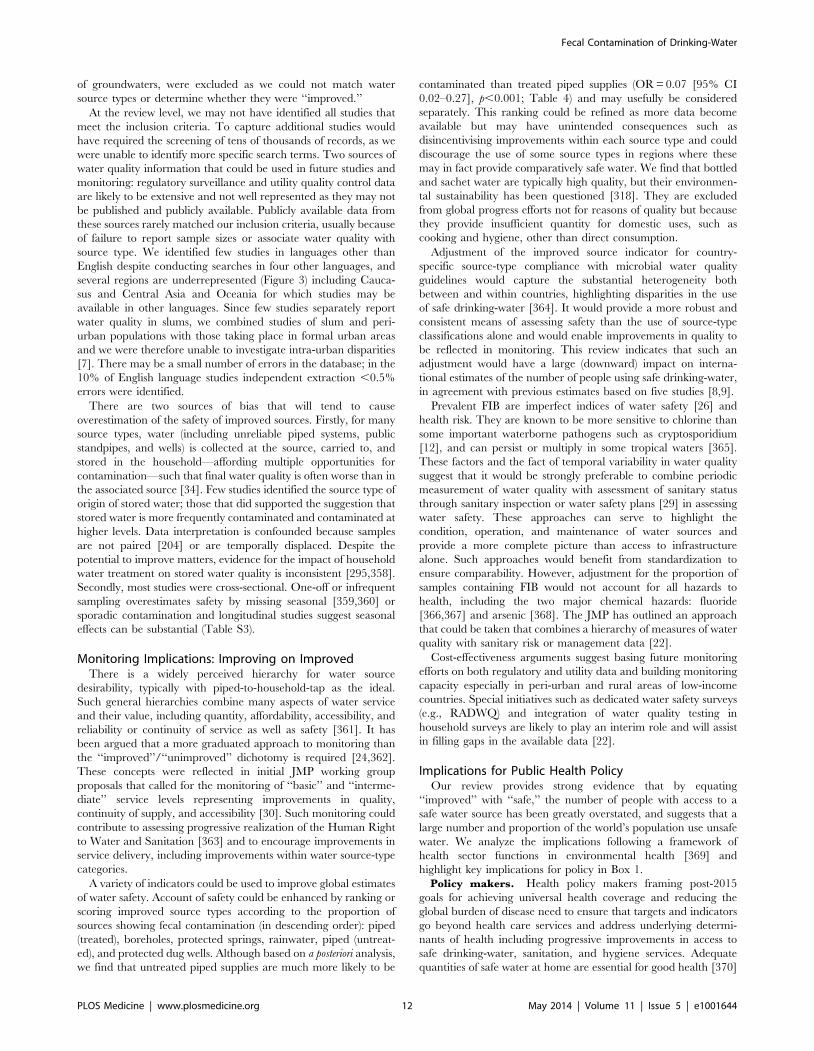
of groundwaters, were excluded as we could not match water
source types or determine whether they were ‘‘improved.’’
At the review level, we may not have identified all studies that
meet the inclusion criteria. To capture additional studies would
have required the screening of tens of thousands of records, as we
were unable to identify more specific search terms. Two sources of
water quality information that could be used in future studies and
monitoring: regulatory surveillance and utility quality control data
are likely to be extensive and not well represented as they may not
be published and publicly available. Publicly available data from
these sources rarely matched our inclusion criteria, usually because
of failure to report sample sizes or associate water quality with
source type. We identified few studies in languages other than
English despite conducting searches in four other languages, and
several regions are underrepresented (Figure 3) including Cauca-
sus and Central Asia and Oceania for which studies may be
available in other languages. Since few studies separately report
water quality in slums, we combined studies of slum and peri-
urban populations with those taking place in formal urban areas
and we were therefore unable to investigate intra-urban disparities
[7]. There may be a small number of errors in the database; in the
10% of English language studies independent extraction ,0.5%
errors were identified.
There are two sources of bias that will tend to cause
overestimation of the safety of improved sources. Firstly, for many
source types, water (including unreliable piped systems, public
standpipes, and wells) is collected at the source, carried to, and
stored in the household—affording multiple opportunities for
contamination—such that final water quality is often worse than in
the associated source [34]. Few studies identified the source type of
origin of stored water; those that did supported the suggestion that
stored water is more frequently contaminated and contaminated at
higher levels. Data interpretation is confounded because samples
are not paired [204] or are temporally displaced. Despite the
potential to improve matters, evidence for the impact of household
water treatment on stored water quality is inconsistent [295,358].
Secondly, most studies were cross-sectional. One-off or infrequent
sampling overestimates safety by missing seasonal [359,360] or
sporadic contamination and longitudinal studies suggest seasonal
effects can be substantial (Table S3).
Monitoring Implications: Improving on ImprovedThere is a widely perceived hierarchy for water source
desirability, typically with piped-to-household-tap as the ideal.
Such general hierarchies combine many aspects of water service
and their value, including quantity, affordability, accessibility, and
reliability or continuity of service as well as safety [361]. It has
been argued that a more graduated approach to monitoring than
the ‘‘improved’’/‘‘unimproved’’ dichotomy is required [24,362].
These concepts were reflected in initial JMP working group
proposals that called for the monitoring of ‘‘basic’’ and ‘‘interme-
diate’’ service levels representing improvements in quality,
continuity of supply, and accessibility [30]. Such monitoring could
contribute to assessing progressive realization of the Human Right
to Water and Sanitation [363] and to encourage improvements in
service delivery, including improvements within water source-type
categories.
A variety of indicators could be used to improve global estimates
of water safety. Account of safety could be enhanced by ranking or
scoring improved source types according to the proportion of
sources showing fecal contamination (in descending order): piped
(treated), boreholes, protected springs, rainwater, piped (untreat-
ed), and protected dug wells. Although based on a posteriori analysis,
we find that untreated piped supplies are much more likely to be
contaminated than treated piped supplies (OR = 0.07 [95% CI
0.02–0.27], p,0.001; Table 4) and may usefully be considered
separately. This ranking could be refined as more data become
available but may have unintended consequences such as
disincentivising improvements within each source type and could
discourage the use of some source types in regions where these
may in fact provide comparatively safe water. We find that bottled
and sachet water are typically high quality, but their environmen-
tal sustainability has been questioned [318]. They are excluded
from global progress efforts not for reasons of quality but because
they provide insufficient quantity for domestic uses, such as
cooking and hygiene, other than direct consumption.
Adjustment of the improved source indicator for country-
specific source-type compliance with microbial water quality
guidelines would capture the substantial heterogeneity both
between and within countries, highlighting disparities in the use
of safe drinking-water [364]. It would provide a more robust and
consistent means of assessing safety than the use of source-type
classifications alone and would enable improvements in quality to
be reflected in monitoring. This review indicates that such an
adjustment would have a large (downward) impact on interna-
tional estimates of the number of people using safe drinking-water,
in agreement with previous estimates based on five studies [8,9].
Prevalent FIB are imperfect indices of water safety [26] and
health risk. They are known to be more sensitive to chlorine than
some important waterborne pathogens such as cryptosporidium
[12], and can persist or multiply in some tropical waters [365].
These factors and the fact of temporal variability in water quality
suggest that it would be strongly preferable to combine periodic
measurement of water quality with assessment of sanitary status
through sanitary inspection or water safety plans [29] in assessing
water safety. These approaches can serve to highlight the
condition, operation, and maintenance of water sources and
provide a more complete picture than access to infrastructure
alone. Such approaches would benefit from standardization to
ensure comparability. However, adjustment for the proportion of
samples containing FIB would not account for all hazards to
health, including the two major chemical hazards: fluoride
[366,367] and arsenic [368]. The JMP has outlined an approach
that could be taken that combines a hierarchy of measures of water
quality with sanitary risk or management data [22].
Cost-effectiveness arguments suggest basing future monitoring
efforts on both regulatory and utility data and building monitoring
capacity especially in peri-urban and rural areas of low-income
countries. Special initiatives such as dedicated water safety surveys
(e.g., RADWQ) and integration of water quality testing in
household surveys are likely to play an interim role and will assist
in filling gaps in the available data [22].
Implications for Public Health PolicyOur review provides strong evidence that by equating
‘‘improved’’ with ‘‘safe,’’ the number of people with access to a
safe water source has been greatly overstated, and suggests that a
large number and proportion of the world’s population use unsafe
water. We analyze the implications following a framework of
health sector functions in environmental health [369] and
highlight key implications for policy in Box 1.
Policy makers. Health policy makers framing post-2015
goals for achieving universal health coverage and reducing the
global burden of disease need to ensure that targets and indicators
go beyond health care services and address underlying determi-
nants of health including progressive improvements in access to
safe drinking-water, sanitation, and hygiene services. Adequate
quantities of safe water at home are essential for good health [370]
Fecal Contamination of Drinking-Water
PLOS Medicine | www.plosmedicine.org 12 May 2014 | Volume 11 | Issue 5 | e1001644
and, together with improvements in sanitation and hygiene,
considered one of the more cost-effective interventions to protect
and improve public health [371].
Through the process of implementing the MDGs, great strides
have been made in increasing coverage of improved water sources
although an estimated 783 million people still lack an improved
source, most living in sub-Saharan Africa and Southeast Asia [5].
This review confirms that there are also pronounced disparities in
access to ‘‘safe’’ water between and within countries. The Human
Right to Water and Sanitation calls for progressive reduction in
inequalities, and public health considerations suggest that reducing
exposure among the most vulnerable, including the poor,
undernourished, and immunocompromised, is a key public health
concern. Health policy makers therefore have an important role to
play in advocating for health protecting policies in other sectors,
including those by actors concerned with water supply services.
Standard setting for water quality. The health sector plays
a substantive role in drinking-water quality standard setting in
many countries; this is logical since the underlying rationale is
based on health concerns. The evidence presented here suggests
that failures in water safety are frequent in LMICs, and that
effective standard setting would combine outcomes measures (such
as the measurement of FIB) with the verification of preventive or
protective measures through sanitary inspection, water safety
plans, or similar approaches. Future standard setting should take
account of inequalities in access so as to direct efforts to those most
affected and be informed by the availability of effective interven-
tions.
Surveillance. The health sector also plays an important role
in environmental health including drinking-water quality surveil-
lance in many countries. However in many LMICs surveillance of
water quality is limited outside large consolidated urban centers
and enforcement of guidelines can be weak [372]. Surveillance is
typically weakest in rural areas where levels of access to ‘‘improved
sources’’ are lowest and the likelihood of contamination is greatest.
The lack of disaggregated data for peri-urban and urban slum
areas is also a problem in many countries. To-date the focus of
public health policy, targets, and monitoring has been a
household’s primary source of drinking-water [373], but there is
growing concern over inadequate water, sanitation, and hygiene
services in non-household settings, such as schools and health care
facilities [30,373]. A public health perspective suggests that health
sector surveillance should focus particularly on these settings
where the risk of exposure is high.
Health care settings. Ensuring adequate environmental
health in health care settings is a key responsibility of the health
profession [374], but in many countries access to water, sanitation,
and hygiene in health care facilities remains inadequate. While
data were few, those studies that addressed water safety in health
care settings documented water safety deficiencies [142,235].
Furthermore, nationally representative surveys of health care
facilities in Uganda and Rwanda found two-thirds of health care
facilities to lack an improved water source [375,376]. There are
also opportunities to better protect and improve health through
incorporation of water safety components in health programs such
as those focused on specific diseases [377] or sensitive life stages
such as maternal and child health [378]. Given the vulnerability of
the populations using them and the potential for health facilities to
serve as models for the wider community, the health sector has
both a duty of care and an opportunity to advance health through
better management of water safety in its own facilities.
Outbreak investigation. Despite clear evidence of its
prevalence, the global burden of disease attributable to fecal
contamination of drinking-water remains poorly understood. Data
on outbreaks of waterborne disease [19] and of the impact of
interventions to improve water quality on endemic disease [15,16]
provide evidence of the importance of fecal contamination. The
associated studies frequently provide only weak insight into causal
factors that might otherwise contribute to improved preventive
action. There is an opportunity to enhance current outbreak
investigation, advancing its role from one of curtailment to general
prevention, thereby improving the ability to retrieve information
that can be generalized for future prevention.
Waterborne disease burden. Study of the national and
global burden of disease provides an opportunity to enhance
public health protection and increase cost-effective action by
focusing efforts on disease burdens and risk factors of greatest
significance. The recent Global Burden of Disease study [379]
based its estimates on the assumption of zero risk for those
supplied by improved drinking-water sources and no additional
benefit of a piped supply on premises [354]. The findings of this
review indicate that fecal contamination of drinking-water is
widespread, particularly in rural areas and low-income countries.
Some improved source types, especially protected dug wells and
protected springs, are frequently and sometimes highly contam-
inated. Contamination reported in piped supplies in especially
rural but also urban areas is concerning given that these serve the
majority (63%; Table 1) of the world’s population and the use of
this source type is expanding rapidly in many countries, especially
in China [380]. In assuming improved sources are safe [379],
current estimates may greatly underestimate waterborne disease
burden and this gap would be expected to grow as improved
source coverage increases.
Implications for ResearchWe have applied analytical tools usually associated with the
medical sciences (meta-analysis of prevalence) to the study of
environmental contaminants. There are differences in the
Box 1. Key Implications for Policy
N Fecal contamination of drinking-water is widespreadglobally, especially in low-income countries and ruralareas, and affects many improved sources.
N The Global Burden of Disease 2010 study may greatlyunderestimate diarrheal disease burden by assumingzero risk from improved sources.
N Adjustment of safe drinking-water coverage estimatesfor water quality and ideally sanitary risk would highlightdisparities and enable improvements in quality to bereflected in monitoring.
N Piped water is not a panacea: high levels of contamina-tion have been reported in a range of settings and waterstored in the household, often motivated by anintermittent or distant source, is more likely to becontaminated, especially in rural areas.
N Quality and sanitary risks are heterogeneous indicatingthat it is possible to substantially enhance safety andreduce exposure through incremental improvements inservice.
N Greater use should be made of sanitary inspections asthese provide a complementary means of assessingsafety and are able to identify corrective actions toprevent contamination.
N Studies of microbial contamination and sanitary riskcould be improved by adhering to higher standards,including those outlined in our quality criteria.
Fecal Contamination of Drinking-Water
PLOS Medicine | www.plosmedicine.org 13 May 2014 | Volume 11 | Issue 5 | e1001644

underlying data that merit highlighting and limit the transfer-
ability of these techniques. Firstly, robust sampling frames are
usually available for the selection of households (e.g., from
national statistical offices), but random selection of water sources
is more challenging. Studies such as RADWQ that adapted
stratified cluster sampling techniques used in household surveys
to address this problem have been subject to methodological
criticism [381]. Future directions to achieve representative
samples could include the use of water point mapping [382] or
satellite imagery to create lists of water points but both are
relatively complex and approaches based on population may be
more feasible. Secondly, whereas epidemiological studies seek to
measure outcome variables such as the number of events at a
given point in time (‘‘point prevalence’’) or the rate at which they
occur (‘‘incidence’’), environmental studies often seek to deter-
mine whether a threshold condition of safety has been exceeded
(‘‘compliance’’). Even brief failures in safety may negate much of
the potential health benefits of otherwise safe water [383,384]. As
a consequence, assessments of safety can be particularly
susceptible to the frequency of monitoring and temporal
representativity can be as important as spatial or population-
based randomization.
In order to assess levels of compliance with regulatory
standards or international guidelines based on infrequent
surveys or limited data, research is required to understand
the effect of repeated sampling of both source and stored water
that results from variability over time (e.g., seasonality) and
replicate sampling (sequential testing). Given their potential to
inform assessments of safety, there is also a need to improve
understanding of the relative importance of sanitary risks and
their temporal variation for which very limited data are
currently available. There is unlikely to be a simple correlation
between sanitary risks and microbial contamination [103,209]
but the predictive value of sanitary risks may be much higher
when accounting for compliance over time because some
infrastructure failures will only lead to contamination in the
presence of a co-factor such as rainfall. There is also a need to
better understand the role of water collection and storage on
microbial contamination and the associated risk to health.
We find strong evidence of differences in water quality
between rural and urban areas, including for piped supplies.
Further work is needed to characterize intra-urban differences;
we encourage randomized water quality surveys to include
slum or peri-urban populations as part of the sampling frame.
Finally, the approaches taken in this review could be extended
to other drinking-water contaminants, such as arsenic and
fluoride.
Conclusions
Fecal contamination of drinking-water in LMICs is wide-
spread. We demonstrate that improved sources are in general
safer than unimproved sources of drinking-water, but they are
not universally nor consistently free of fecal contamination. In
38% of 191 studies at least a quarter of samples from improved
sources exceeded WHO recommended levels of FIB. By
equating ‘‘use of an improved source’’ with ‘‘safe,’’ interna-
tional estimates greatly overstate access to safe drinking-water.
Substantial differences are observed in the presence and levels
of contamination between countries, between urban and rural
regions, and between water source types. Infrequent measure-
ments of water quality alone tend to overestimate safety and so
an improved future strategy would combine sanitary status
with water quality measurements.
Supporting Information
Figure S1 Study quality rating for 319 studies.(EPS)
Figure S2 Frequency of 13 quality criteria being met by319 included studies.(EPS)
Figure S3 Fecal indicator bacteria level classificationfor improved sources by source type and study. Included
studies are those for which a FIB level classification was reported
or could be calculated. Sample size in curved parentheses.
Reference number in square brackets. Source types are: BH,
borehole; PWS, piped water supply; PS, protected spring; PDW,
protected dug well; RWH, rainwater harvesting.
(EPS)
Figure S4 Fecal indicator bacteria level classificationfor unimproved and unclassified sources by source typeand study. Included studies are those for which a FIB level
classification was reported or could be calculated. Sample size in
curved parentheses. Reference number in square brackets. Source
types are: UDW, unprotected dug well; US, unprotected spring;
TT, tanker truck; B, bottled; S, sachet. NDW, dug well
(unclassified); NS, springs (unclassified).
(EPS)
Figure S5 Measures of central tendency reported byincluded studies, by source type. Size of circles proportional
to number of water samples evaluated.
(EPS)
Figure S6 Comparison of sanitary risk levels andproportion of samples containing fecal indicator bacte-ria in studies using WHO standardized inspectionforms.(EPS)
Figure S7 Cumulative density functions for the propor-tion of samples in each study with detectable (.1 per100 ml) and high (.100 per 100 ml) E. coli or TTC, byimproved and unimproved source.(EPS)
Figure S8 Cumulative density function of the propor-tion of samples containing fecal indicator bacteria ineach study for improved (left) and unimproved (right)sources by type.(EPS)
Figure S9 Funnel plot for the odds ratio comparing thesafety of improved and unimproved sources in a givenstudy.(EPS)
Table S1 Between studies meta-regression for pipedsupplies.(DOCX)
Table S2 Between studies meta-regression for otherimproved sources.(DOCX)
Table S3 Variation in microbial safety during the year,findings of included studies for selected source types.(DOCX)
Alternative Language Abstract S1 Mandarin Chinesetranslation of the abstract by Hong Yang.(DOCX)
Fecal Contamination of Drinking-Water
PLOS Medicine | www.plosmedicine.org 14 May 2014 | Volume 11 | Issue 5 | e1001644

Dataset S1 Database of included water quality studies.(XLSX)
Protocol S1 Systematic review protocol.(DOCX)
Text S1 PRISMA checklist of items to include whenreporting a systematic review or meta-analysis.(DOC)
Acknowledgments
We thank Mellanye Lackey for assistance in selecting the search terms and
electronic databases and the librarians at UNC for locating many of the full
texts. We are grateful for the support provided by Benjamin Mann in
generating the map of studies by country and to Manpreet Singh and
Wilson Cheng for discussions regarding implications for health policy. The
authors wish to thank Joe Brown for insightful comments on earlier
versions of the manuscript. This paper was shared with the JMP Water
Working Group and valuable comments were received from the group. In
particular, we would like to thank David Bradley, Rick Johnston and Philip
Peters. We would also like to thank Annette Pruss-Ustun and Sophie
Bonjour at WHO for sharing a list of water quality studies.
Author Contributions
Conceived and designed the experiments: RB RC JW HY TS JB.
Performed the experiments: RB RC HY. Analyzed the data: RB RC.
Wrote the first draft of the manuscript: RB. Contributed to the writing of
the manuscript: RB RC JW HY TS JB. ICMJE criteria for authorship read
and met: RB RC JW HY TS JB. Agree with manuscript results and
conclusions: RB RC JW HY TS JB.
References
1. Committee on Economic Socal and Community Rights (2002) General
comment no. 15, The right to water. UN Doc. E/C.12/2010. New York:
United Nations.
2. United Nations (2010) Resolution on Human Right to Water and Sanitation.United Nations General Assembly. A/64/292. New York: United Nations.
3. United Nations (2013) UN Goal 7: Ensure Environmental Sustainability.Available: http://www.un.org/millenniumgoals/environ.shtml. Accessed 1
December 2013.
4. UNICEF/WHO Joint Monitoring Programme: definitions and methods.Available: http://www.wssinfo.org/definitions-methods/. Accessed 1 Decem-
ber 2013.
5. WHO/UNICEF (2013) Progress on Sanitation and Drinking-Water: 2012
Update WHO/UNICEF. Available: http://www.wssinfo.org/definitions-methods. Accessed 1 December 2013.
6. Godfrey S, Labhasetwar P, Wate S, Pimpalkar S (2011) How safe are the globalwater coverage figures? Case study from Madhya Pradesh, India. Environ
Monit Asses 176: 561–574.
7. Schafer D, Werchota R, Dolle K (2007) MDG monitoring for urban watersupply and sanitation: catching up with reality in Sub-Saharan Africa.
Eschborn: Deutsche Gesellschaft fur Technische Zusammenarbeit (GTZ).
8. Bain RES, Gundry SW, Wright JA, Yang H, Pedley S, et al. (2012) Accounting
for water quality in monitoring access to safe drinking-water as part of theMillennium Development Goals: lessons from five countries. Bull World Health
Organ 90: 228–235A.
9. Onda K, LoBuglio J, Bartram J (2012) Global access to safe water: accounting
for water quality and the resulting impact on MDG progress. Int J Environ ResPublic Health 9: 880–894.
10. Payen G (2011) Worldwide needs for safe drinking water are underestimated:billions of people are impacted. Paris: AquaFed.
11. White GF, Bradley DJ, White AU (1972) Drawers of water: domestic water use
in East Africa. Chicago: The University of Chicago Press.
12. WHO (2011) Guidelines for drinking-water quality. Geneva: World Health
Organization.
13. Liu L, Johnson HL, Cousens S, Perin J, Scott S, et al. (2012) Global, regional,and national causes of child mortality: an updated systematic analysis for 2010
with time trends since 2000. Lancet 379: 2151–2161.
14. Esrey SA, Feachem RG, Hughes JM (1985) Interventions for the control of
diarrhoeal diseases among young children: improving water supplies andexcreta disposal facilities. Bull World Health Organ 63: 757–772.
15. Fewtrell L, Colford JM, Jr. (2005) Water, sanitation and hygiene in developingcountries: interventions and diarrhoea—a review. Water Sci Technol 52: 133–
142.
16. Clasen T, Roberts I, Rabie T, Schmidt W, Cairncross S (2006) Interventions toimprove water quality for preventing diarrhoea. Cochrane Database Syst Rev
19: CD004794.
17. Waddington H, Snilstveit B (2009) Effectiveness and sustainability of water,
sanitation, and hygiene interventions in combating diarrhoea. Journal ofDevelopment Effectiveness 1: 295–335.
18. Cairncross S, Hunt C, Boisson S, Bostoen K, Curtis V, et al. (2010) Water,sanitation and hygiene for the prevention of diarrhoea. Int J Epidemiol 39:
i193–i205.
19. Ligon GC (2012) Waterborne disease outbreaks: a systematic review of thehealth effects of drinking water system failures, Chapel Hill (North Carolina):
University of North Carolina at Chapel Hill.
20. Craun GF, Brunkard JM, Yoder JS, Roberts VA, et al. (2010) Causes of
Outbreaks Associated with Drinking Water in the United States from 1971 to2006. Clin Microbiol Rev 23(3):507–528.
21. Schmidt WP, Cairncross S (2009) Household water treatment in poorpopulations: is there enough evidence for scaling up now? Environ Sci
Technol 43: 986–992.
22. WHO/UNICEF (2010) JMP Technical Task Force Meeting on Monitoring
Drinking-water Quality. Geneva and New York: WHO/UNICEF Joint
Monitoring Programme. Available: http://www.wssinfo.org/fileadmin/user_
upload/resources/JMP-Task-Force-Meeting-on-Monitoring-Drinking-water-
Quality.pdf. Accessed 1 December 2013.
23. Bain RES, Bartram JK, Elliott M, Matthews RL, McMahan L, et al. (2012) A
summary catalogue of microbial drinking water tests for low and medium
resource settings. Int J Environ Res Public Health 9: 1609–1625.
24. Lloyd BJ, Bartram JK (1991) Surveillance solutions to microbiological problems
in water-quality control in developing-countries. Water Sci Technol 24: 61–75.
25. WHO (1997) Guidelines for Drinking-Water Quality. Geneva: World Health
Organization
26. Gleeson C, Gray NF (1997) The coliform index and waterborne disease:
problems of microbial drinking water assessment. London; New York: E & FN
SPON. xii, 194 p. p.
27. WHO (2012) Water safety planning for small community water supplies: Step-
by-step risk management guidance for drinking-water supplies in small
communities. Geneva: World Health Organization.
28. Prescott SC, Winslow CEA (1904) Elements of Water Bacteriology, with special
reference to sanitary water analysis (1904). New York: John Wiley & Sons.
29. Davison A, Howard G, Stevens M, Callan P, Fewtrell L, et al. (2005) Water
safety plans: Managing drinking-water quality from catchment to consumer.
Geneva: World Health Organization.
30. WHO/UNICEF (2013) Proposal for consolidated drinking water, sanitation
and hygiene targets, indicators and definitions. Geneva and New York: WHO/
UNICEF. Available: http://www.wssinfo.org/fileadmin/user_upload/
resources/A-proposal-for-consolidated-WASH-goal-targets-definitions-and-
indicators_version7_Nov22_final.pdf. Accessed 1 December 2013.
31. Moher D, Liberati A, Tetzlaff J, Altman DG, Group P (2009) Preferred
reporting items for systematic reviews and meta-analyses: the PRISMA
statement. PLoS Med 6: e1000097.
32. UN (2013) Millennium Development Indicators: World and regional groupings.
Available: http://mdgs.un.org/unsd/mdg/Host.aspx?Content = Data/
RegionalGroupings. Accessed 1 December 2013.
33. Opryszko MC, Huang H, Soderlund K, Schwab KJ (2009) Data gaps in
evidence-based research on small water enterprises in developing countries.
J Water Health 7: 609–622.
34. Wright J, Gundry S, Conroy R (2004) Household drinking water in developing
countries: a systematic review of microbiological contamination between source
and point-of-use. Trop Med Int Health 9: 106–117.
35. Wright JA, Yang H, Walker K, Pedley S, Elliott J, et al. (2012) The H(2)S test
versus standard indicator bacteria tests for faecal contamination of water:
systematic review and meta-analysis. Trop Med Int Health 17: 94–105.
36. United Nations Department of Economic and Social Affairs (2012) World
Population Prospects: The 2012 Revision. Available: http://esa.un.org/wpp/.
Accessed 1 December 2013.
37. Rompre A, Servais P, Baudart J, de-Roubin MR, Laurent P (2002) Detection
and enumeration of coliforms in drinking water: current methods and emerging
approaches. J Microbiol Methods 49: 31–54.
38. WHO/UNICEF (2006) Core questions on drinking-water and sanitation for
household surveys WHO/UNICEF. Geneva and New York: WHO/UNICEF.
Available: http://www.who.int/water_sanitation_health/monitoring/oms_
brochure_core_questionsfinal24608.pdf. Accessed 1 December 2013.
39. World Bank (2013) Country and lending groups. Available: http://data.
worldbank.org/about/country-classifications/country-and-lending-groups. Ac-
cessed 1 December 2013.
40. Saha S, Chant D, Welham J, McGrath J (2005) A systematic review of the
prevalence of schizophrenia. PLoS Med 2: e141.
41. McBride GB (2005) Using statistical methods for water quality management:
issues, problems, and solutions. Hoboken (New Jersey): Wiley-Interscience.
xxiv, 313 p. p.
42. Borenstein M (2009) Introduction to meta-analysis. Chichester, U.K.: John
Wiley & Sons. xxviii, 421 p. p.
Fecal Contamination of Drinking-Water
PLOS Medicine | www.plosmedicine.org 15 May 2014 | Volume 11 | Issue 5 | e1001644

43. Warton DI, Hui FK (2011) The arcsine is asinine: the analysis of proportions in
ecology. Ecology 92: 3–10.
44. Sweeting M, J. Sutton A, C. Lambert P (2004) What to add to nothing? Useand avoidance of continuity corrections in meta-analysis of sparse data.
Statistics in Medicine 23: 1351–1375.
45. Rodrıguez G. (2007) Logit Models for Binary Data. Lecture Notes onGeneralized Linear Models. Available: http://data.princeton.edu/wws509/
notes/c3.pdf. Accessed 30 December 2013.
46. Abdellah AM, Abdel-Magid HM, Yahia NA (2012) Assessment of Drinking
Water Microbial Contamination in Al-Butana Region of Sudan. Journal ofApplied Sciences (Faisalabad) 12: 856–862.
47. Abera S, Zeyinudin A, Kebede B, Deribew A, Ali S, et al. (2011)
Bacteriological analysis of drinking water sources. Afr J Microbiol Res 5:2638–2641.
48. Abu Amr SS, Yassin MM (2008) Microbial contamination of the drinking
water distribution system and its impact on human health in Khan Yunis
Governorate, Gaza Strip: seven years of monitoring (2000–2006). PublicHealth 122: 1275–1283.
49. Abu Mayla YS, Abu Amr SS (2010) Chemical and microbiological quality of
drinking water in Gaza Strip, Palestine. Science Vision 10: 80–88.
50. Abusafa A, Arafat HA, Abu-Baker M, Khalili KN (2012) Utilisation of drinkingwater from rainwater-harvesting cisterns in the Palestinian territories:
assessment of contamination risk. Int J Environment and Waste Management
9: 358–371.
51. Addo KK, Mensah GI, Bekoe M, Bonsu C, Akyeh ML (2009) Bacteriologicalquality of sachet water produced and sold in Teshie-Nungua suburbs of Accra,
Ghana. African Journal of Food Agriculture Nutrition and Development 9.
52. Admassu M, Wubshet M, Gelaw B (2004) A survey of bacteriological quality ofdrinking water in North Gondar. Ethiop J Health Dev 18: 112–115.
53. Aga T, Beka NC, Eziashi AC (2010) Spatial variation in groundwater quality of
Jos metropolis and environs, north-central Nigeria. Continental J Environmental
Sciences 4: 1–11.
54. Agard L, Alexander C, Green S, Jackson M, Patel S, et al. (2002) Microbialquality of water supply to an urban community in Trinidad. Journal of Food
Protection 65: 1297–1303.
55. Ahmad M, Bajahlan AS (2009) Quality comparison of tap water vs. bottledwater in the industrial city of Yanbu (Saudi Arabia). Environ Monit Asses 159:
1–14.
56. Ahmed K, Ahmed M, Ahmed J, Khan A (2012) Risk Assessment by
Bacteriological Evaluation of Drinking Water of Gilgit-Baltistan. PakistanJournal of Zoology 44: 427–432.
57. Ahmed MF, Shamsuddin SAJ, Mahmud SG, Rashid HU, Deere D, et al.
(2005) Risk Assessment of Arsenic Mitigation Options (RAAMO). Dhaka,Bangladesh: APSU.
58. Ahmed SA, Hoque BA, Mahmud A (1998) Water management practices in
rural and urban homes: a case study from Bangladesh on ingestion of pollutedwater. Public Health 112: 317–321.
59. Ahoussi KE, Koffi YB, Kouassi AM, Osemwegie I, Biemi J (2013) Influence ofAnthropogenic Activities of Groundwater from Hand Dug Wells within the
Precarious Settlements of Southern Abidjan, Cote d9Ivoire: Case of the Slumsof Anoumabo (Marcory) and Adjouffou (Port-Bouet). Journal of Water
Resource and Protection, 5: 427–439.
60. Akoachere JF, Omam LA, Massalla TN (2013) Assessment of the relationshipbetween bacteriological quality of dug-wells, hygiene behaviour and well
characteristics in two cholera endemic localities in Douala, Cameroon. BMC
Public Health 13: 692.
61. Al-Khatib IA, Arafat HA (2009) Chemical and microbiological quality ofdesalinated water, groundwater and rain-fed cisterns in the Gaza strip,
Palestine. Desalination 249: 1165–1170.
62. Al-Salaymeh A, Al-Khatib IA, Arafat HA (2011) Towards Sustainable WaterQuality: Management of Rainwater Harvesting Cisterns in Southern Palestine.
Water Resour Manag 25: 1721–1736.
63. Albert J, Luoto J, Levine D (2010) End-User Preferences for and Performance
of Competing POU Water Treatment Technologies among the Rural Poor ofKenya. Environ Sci Technol 44: 4426–4432.
64. Aldana JM (2010) Rapid assessment of drinking-water quality in the Republic
of Nicaragua: country report of the pilot project implementation in 2004–2005.Geneva: WHO/UNICEF. Available: http://www.wssinfo.org/fileadmin/
user_upload/resources/RADWQ_Nicaragua.pdf. Accessed 1 December 2013.
65. Aliev S, Shodmonov P, Babakhanova N, Schmoll O (2010) Rapid assessment of
drinking-water quality in the Republic of Tajikistan: country report of the pilotproject implementation in 2004–2005. Geneva: WHO/UNICEF. Available:
http://www.wssinfo.org/fileadmin/user_upload/resources/RADWQ_Tajikistan.pdf. Accessed 1 December 2013.
66. Alves NC, Odorizzi AC, Goulart FC (2002) Microbiological analysis of mineral
water and drinking water of reservoir supplies, Brazil. Rev Saude Publica 36:
749–751.
67. Amouei A, Miranzadeh MB, Shahandeh Z, Taheri T, Asgharnia HA, et al.(2012) A Study on the Microbial Quality of Drinking Water in Rural Areas of
Mazandaran Province in North of Iran (2011). Journal of EnvironmentalProtection 3: 605–605.
68. Ampofo JA, Andoh A, Tetteh W, Bello M (2007) Microbiological quality and
health risks of packaged water produced in southern Ghana. Journal of Applied
Science and Technology 12: 88–97.
69. An Y-J, Breindenbach GP (2005) Monitoring E-coli and total coliforms in
natural spring water as related to recreational mountain areas. Environ Monit
Asses 102: 131–137.
70. Andrade CdS, Leite CC, da Silva MD, de Assis PN, Guimaraes AG (2004)
Quality of water used in the beach huts of Salvador-Bahia seashore
microbiological aspects. Revista do Instituto Adolfo Lutz 63: 215–219.
71. Arnold M, Vanderslice JA, Taylor B, Benson S, Allen S, et al. (2013) Drinking
water quality and source reliability in rural Ashanti region, Ghana. J Water
Health 11: 161–172.
72. Augoustinos MT, Venter SN, Kfir R (1995) Assessment of water quality
problems due to microbial growth in drinking water distribution systems.
Environ Toxic Water 10: 295–299.
73. Austin CJ (1993) Chlorinating household water in The Gambia. 19th WEDC
conference. Accra, Ghana: WEDC.
74. Awuah E, Nyarko KB, Owusu PA, Osei-Bonsu K (2009) Small town water
quality. Desalination 248: 453–459.
75. Ayantobo OO, Oluwasanya GO, Idowu OA, Eruola AO (2012) Water Quality
Evaluation of Hand-dug Wells in Ibadan, Oyo State, Nigeria. Special
Publication of the Nigerian Association of Hydrological Sciences (2012):
231–239
76. Aydin A (2007) The microbiological and physico-chemical quality of
groundwater in West Thrace, Turkey. Pol J Environ Stud 16: 377–383.
77. Bahram A, Hamid B, Akram N (2012) Estimation of coliform contamination
rate and impact of environmental factor on bacterial quality of tube well water
supplies in Khorramdarreh County, Iran. Afr J Biotechnol 11: 7912–7915.
78. Baig SA, Xu X, Navedullah, Muhammad N, Khan ZU, et al. (2012) Pakistan’s
drinking water and environmental sanitation status in post 2010 flood scenario:
humanitarian response and community needs. Journal of Applied Sciences in
Environmental Sanitation 7: 49–54.
79. Baker KK, Sow S, Kotloff KL, Nataro JP, Farag TH, et al. (2013) Quality of
piped and stored water in households with children under five years of age
enrolled in the Mali Site of the Global Enteric Multi-Center Study (GEMS).
Am J Trop Med Hyg. 89(2):214–22
80. Barbosa DA, Lage MM, Badaro ACL (2009) Microbiological quality of water
drinking fountains of a university campus in Ipatinga, Minas Gerais. Nutrir
Gerais 3: 505–517.
81. Barthiban S, Lloyd BJ (2012) Validity of the application of open dug well
sanitary survey methodology in the development of a water safety plan in the
Maldives islands. Brebbia CA, Zubir SS, editors. Management of natural
resources, sustainable development and ecological hazards III. Ashurst, UK:
Wit Press. pp. 369–380.
82. Barthiban S, Lloyd BJ, Maier M (2012) Sanitary hazards and microbial quality
of open dug wells in the Maldives Islands. Journal of Water Resource and
Protection 4: 474–474.
83. Bartram JK (1996) Optimizing the monitoring and assessment of rural water
supplies. Guildford, UK: University of Surrey.
84. Begum J, Ahmed K, Bora KN (2004) Isolation and identification of coliform
bacteria from different sources of drinking water. Nature, Environment and
Pollution Technology 3: 51–53.
85. Besser RE (1995) Prevencion de la transmision del colera: evaluacion rapida de
la calidad del agua municipal en Trujillo, Peru. Boletin - Oficina Sanitaria
Panamericana 119: 189–194.
86. Bharath J, Mosodeen M, Motilal S, Sandy S, Sharma S, et al. (2003) Microbial
quality of domestic and imported brands of bottled water in Trinidad. Int J Food
Microbiol 81: 53–62.
87. Bordalo AA, Savva-Bordalo J (2007) The quest for safe drinking water: an
example from Guinea-Bissau (West Africa). Water Research 41: 2978–2986.
88. Bracho MG, Moron V, Luzardo M, Montiel M, Botero L (2008) Hepatitis A
virus, adenovirus 40–41 and bacteriophages in water for human consumption.
Ciencia (Maracaibo) 16: 271–278.
89. Broshears RE, Amin Akbari M, Chornack MP, Mueller DK, Ruddy BC (2005)
Inventory of ground-water resources in the Kabul Basin, Afghanistan. Reston
(Virginia): U.S. Geological Survey (USGS).
90. Camara O (2011) Pollution microbiologique des eaux souterraines dans le
quartier Tanghin de Ouagadougou: etats des lieux et perspectives. Ouaga-
dougou, Burkina Faso: Foundation 2iE.
91. Cardoso ALSP, Tessari ENC, de Castro AGM, Kanashiro AMI (2001)
Avaliacao da qualidade microbiologica de aguas minerais comercializadas em
supermercados da cidade de Alfenas. Higiene Alimentar 15.
92. Carrasco L, Mena KD, Mota LC, Ortiz M, Behravesh CB, et al. (2008)
Occurrence of faecal contamination in households along the US-Mexico
border. Lett Appl Microbiol 46: 682–687.
93. Caylak E, Tokar M (2012) Metallic and microbial contaminants in drinking
water of Cankiri, Turkey. E-Journal of Chemistry 9: 608–614.
94. Chaidez C, Soto M, Martinez C, Keswick B (2008) Drinking water
microbiological survey of the Northwestern State of Sinaloa, Mexico. J Water
Health 6: 125–130.
95. Chemuliti JK, Gathura PB, Kyule MM, Njeruh FM (2002) Bacteriological
qualities of indoor and out-door drinking water in Kibera sub-location of
Nairobi, Kenya. East Afr Med J 79: 271–273.
96. Chen D, Lan L (2011) The analysis of drinking-water sanitation in cities and
towns of Nanping in the year 2008-2010. Chinese Journal of Health
Laboratory Technology 21: 2519–2521.
Fecal Contamination of Drinking-Water
PLOS Medicine | www.plosmedicine.org 16 May 2014 | Volume 11 | Issue 5 | e1001644

97. Chung C (2011) The challenges of a water system management handover in
Eastern Ethiopia - from the United Nations Refugee Agency to a local
community. Cambridge: Massachusetts Institute of Technology.
98. Clasen T, Saeed TF, Boisson S, Edmondson P, Shipin O (2007) Household
water treatment using sodium dichloroisocyanurate (NaDCC) tablets: a
randomized, controlled trial to assess microbiological effectiveness in
Bangladesh. Am J Trop Med Hyg 76: 187–192.
99. Coelho DA, Faria e Silva PM, Veiga SMOM, Fiorini JE (2007) Avaliacao da
qualidade microbiologica de aguas minerais comercializadas em super-
mercados da cidade de Alfenas. Higiene Alimentar 21: 88–92.
100. Coloru B, Mgaya S, Taubert R (2012) Appropriate technologies for rural water
supply: a comparative study between ‘‘rope pumps’’ and conventional piston-
pumps on water quality and other sustainability parameters. Milan: ACRA/
SHIPO.
101. Copeland CC, Beers BB, Thompson MR, Fitzgerald RP, Barrett LJ, et al.
(2009) Faecal contamination of drinking water in a Brazilian shanty town:
importance of household storage and new human faecal marker testing. J Water
Health 7: 324–331.
102. Costello DH (2013) An Evaluation of a Water, Sanitation, and Hygiene
(WASH) Program for rural communities in Northern Afghanistan. Corvallis:
Oregon State University.
103. Cronin AA, Breslin N, Gibson J, Pedley S (2006) Monitoring source and
domestic water quality in parallel with sanitary risk identification in northern
Mozambique to prioritise protection interventions. J Water Health 4: 333–345.
104. Cui B, Deng H, Jing Y, Yue F, Yu Q, et al. (2012) Investigation on the quality
of groundwater in Rural Fengtai District. Journal of Environmental Hygiene 2:
280–284.
105. da Silva MEZ, Santana RG, Guilhermetti M, Filho IC, Endo EH, et al. (2008)
Comparison of the bacteriological quality of tap water and bottled mineral
water. Int J Hyg Environ Health 211: 504–509.
106. Dada AC (2009) Sachet water phenomenon in Nigeria: Assessment of the
potential health impacts. Afr J Microbiol Res 3: 15–21.
107. Daoud AK, Swaileh KM, Hussein RM, Matani M (2011) Quality assessment of
roof-harvested rainwater in the West Bank, Palestinian Authority. J Water
Health 9: 525–533.
108. de Sa LLC, de Jesus IM, Santos ECO, Vale ER, Loureiro ECB, et al. (2005)
Microbiological quality of drinking water in two areas following sanitation
interventions – Belem, Para State, Brazil. Epidemiol Serv Saude, 14: 171–180.
109. de Siqueira LP, Shinohara NK, de Lima RM, de Paiva Jdo E, de Lima Filho
JL, et al. (2010) Microbiological evaluation of drinking water used in feeding
units. Cien Saude Colet 15: 63–66.
110. Degbey C, Makoutode M, Fayomi B, Brouwer CD (2010) La qualite de l 9 eau
de boisson en milieu professionnel a Godomey en 2009 au Benin Afrique de
l9Ouest. J Int Sante Trav 1:15–22.
111. Degbey C, Makoutode M, Ouendo EM, Fayomi B, De Brouwer C (2008) The
quality of well water in the municipality of Abomey-Calavi in Benin.
Environnement Risques & Sante 7: 279–283.
112. Desmarchelier P, Lew A, Caique W, Knight S, Toodayan W, et al. (1992) An
evaluation of the hydrogen sulphide water screening test and coliform counts
for water quality assessment in rural Malaysia. Trans R Soc Trop Med Hyg 86:
448–450.
113. Devoto F, Duflo E, Dupas P, Pariente W, Pons V (2011) Happiness on tap:
piped water adoption in Urban Morocco. Cambridge (Massachusetts): National
Bureau of Economic Research.
114. Dongol B, Merz J, Schaffner M, Nakarmi G, Shah P, et al. (2005) Shallow
groundwater in a middle mountain catchment of Nepal: quantity and quality
issues. Environ Geol 49: 219–229.
115. dos Reis JAP (1998) Perfil Higienico sanitario das aguas de consumo do distrito
federal. Revista de Saude do Distrito 9:32–35.
116. Egwari L, Aboaba OO (2002) Environmental impact on the bacteriological
quality of domestic water supplies in Lagos, Nigeria. Revista de Saude Publica
36: 513–520.
117. Ehlers MM, van Zyl WB, Pavlov DN, Muller EE (2004) Random survey of the
microbial quality of bottled water in South Africa. Water SA 30: 203–210.
118. Ejechi BO, Olobaniyi SB, Ogban FE, Ugbe FC (2007) Physical and sanitary
quality of hand-dug well water from oil-producing area of Nigeria. Environ
Monit Assess 128: 495–501.
119. Ejechi EO, Ejechi BO (2008) Safe drinking water and satisfaction with
environmental quality of life in some oil and gas industry impacted cities of
Nigeria. Soc Indic Res 85: 211–222.
120. El-Salam MM, Al-Ghitany EM, Kassem MM (2008) Quality of bottled water
brands in Egypt Part II: biological water examination. J Egypt Public Health
Assoc 83: 468–486.
121. Eldin MNA, Madany IM, Al-Tayaran A, Al-Jubair AH, Gomaa A (1993)
Quality of water from some wells in Saudi Arabia. Water Air Soil Poll 66: 135–
143.
122. Empereur-Bissonnet P, Salzman V, Monjour L (1992) Evaluation of a new type
of transport and storage recipient for improving the quality of drinking-water in
rural african areas. Bulletin De La Societe De Pathologie Exotique 85: 390–
394.
123. Escamilla V, Knappett PSK, Yunus M, Streatfield PK, Emch M (2013)
Influence of latrine proximity and type on tubewell water quality and diarrheal
disease in Bangladesh. Ann Assoc Am Geogr 103: 299–308.
124. Eshcol J, Mahapatra P, Keshapagu S (2009) Is fecal contamination of drinking
water after collection associated with household water handling and hygiene
practices? A study of urban slum households in Hyderabad, India. J Water
Health 7: 145–154.
125. Esterhuizen L, Fossey A, Lues JFR (2012) Dairy farm borehole water quality in
the greater Mangaung region of the Free State Province, South Africa. Water
SA 38: 803–806.
126. Falcone-Dias MF, Emerick GL, Farache-Filho A (2012) Mineral water: a
microbiological approach. Wa Sci Technol 12: 556–562.
127. Farache Filho A, Dias MFF (2008) Qualidade microbiologica de aguas
minerais em galoes de 20 litros. Alim Nutr 19: 243–248.
128. Farache Filho A, Dias MFF, Taromaru RH, Cerqueira CS, Duque JD (2008)
Qualidade microbiologica de aguas minerais nao carbonatadas em embalagens
de 1,5 litros, comercializadas em araraquara-sp. Alim Nutr 19: 421–425.
129. Ferguson AS, Layton AC, Mailloux BJ, Culligan PJ, Williams DE, et al. (2012)
Comparison of fecal indicators with pathogenic bacteria and rotavirus in
groundwater. Sci Total Environ 431: 314–322.
130. Ferretti E, Bonadonna L, Lucentini L, Della Libera S, Semproni M, et al.
(2010) A case study of sanitary survey on community drinking water supplies
after a severe (post-Tsunami) flooding event. Annali Dell Istituto Superiore Di
Sanita 46: 236–241.
131. Fiore MM, Minnings K, Fiore LD (2010) Assessment of biosand filter
performance in rural communities in southern coastal Nicaragua: an evaluation
of 199 households. Rural Remote Health 10: 1483.
132. Flores-Abuxapqui JJ, Suarez-Hoil GJ, Puc-Franco MA, Heredia-Navarrete
MR, Vivas-Rosel MD, et al. (1995) Bacteriological quality of drinking water in
the City of Merida, Mexico. Salud Publica Mex 37: 236–239.
133. Frischknecht DS (2006) Analise de NMP de coliformes em aguas minerais
comercializadas no Distrito Federal. Bras lia: Universidade de Bras lia.
134. Garode AM, Nanoty VD, Bodhankar MG (1998) Bacteriological status of
drinking water in and around Chikhli town of Buldana district, Maharashtra.
Pollution Research 17: 293–294.
135. Gaytan M, Castro T, Bonilla P, Lugo A, Vilaclara G (1997) Preliminary study
of selected drinking water samples in Mexico City. Revista Internacional de
Contaminacion Ambiental 13: 73–78.
136. Gelinas Y, Randall H, Robidoux L, Schmit J-P (1996) Well water survey in two
districts of Conakry (Republic of Guinea), and comparison with the piped city
water. Water Research 30: 2017–2026.
137. Genthe B, Seager J, Vundule C, Strauss N, Maforah F (1996) The effect of
water supply, handling and usage on water quality in relation to health indicies
in developing communities Stellenbosch, South Africa: Water Research
Council.
138. Ghenghesh KS, Belhaj K, Algaui A, Alturki E, Eltomi A (2004) Blessed water:
bacteriological quality of drinking water obtained from mosques in Tripoli-
Libya. Int J Antimicrob Ag 24: S150.
139. Gonul SA, Karapinar M (1991) The microbiological quality of drinking water
supplies of Izmir City: the incidence of Yersinia enterocolitica. Int J Food
Microbiol 13: 69–73.
140. Gorter AC, Alberts JH, Gago JF, Sandiford P (1995) A randomized trial of the
impact of rope-pumps on water quality. J Trop Med Hyg 98: 247–255.
141. Grimason AM, Beattie TK, Morse TD, Masangwi SJ, Jabu GC, et al. (2013)
Classication and quality of groundwater supplies in the Lower Shire Valley,
Malawi – part 2: classification of borehole water supplies in Chikhwawa,
Malawi. Water SA 39.
142. Guedes ZBL, Oria HF, Britto NPB, Neto JWS, Silveira; JWd, et al. (2004)
Controle sanitario da agua consumida nas unidades de saude do municipio de
Fortaleza, CE. Higiene Alimentar 18: 28–31.
143. Guillemin F, Henry P, Uwechue N, Monjour L (1991) Faecal contamination of
rural water supply in the Sahelian area. Water Research 25: 923–927.
144. Guimaraes APRC, Serafini AB (2005) Avaliacao da qualidade microbiologica
de amostras de agua mineral natural, envasada, comercializadas em Goiania,
Goias. Goiania, Brazil: UFG.
145. Gundry SW, Wright JA, Conroy RM, Du Preez M, Genthe B, et al. (2009)
Child dysentery in the Limpopo Valley: a cohort study of water, sanitation and
hygiene risk factors. J Water Health 7: 259–266.
146. Gupta SK, Sheikh MA, Islam MS, Rahman KS, Jahan N, et al. (2008)
Usefulness of the hydrogen sulfide test for assessment of water quality in
Bangladesh. J Appl Microbiol 104: 388–395.
147. Gupta SK, Suantio A, Gray A, Widyastuti E, Jain N, et al. (2007) Factors
associated with E. coli contamination of household drinking water among
tsunami and earthquake survivors, Indonesia. Am J Trop Med Hyg 76: 1158–
1162.
148. Gwimbi P (2011) The microbial quality of drinking water in Manonyane
community: Maseru District (Lesotho). African Health Sciences 11: 474–480.
149. Handzel T (1998) The effect of improved drinking water quality on the risk of
diarrheal disease in an urban slum of Dhaka, Bangladesh: A home chlorination
intervention trial. Chapel Hill: University of North Carolina at Chapel Hill.
150. Haruna R, Ejobi F, Kabagambe EK (2005) The quality of water from
protected springs in Katwe and Kisenyi parishes, Kampala city, Uganda. Afr
Health Sci 5: 14–20.
151. Hashmi I, Farooq S, Qaiser S (2009) Chlorination and water quality
monitoring within a public drinking water supply in Rawalpindi Cantt
(Westridge and Tench) area, Pakistan. Environ Monit Asses 158: 393–403.
Fecal Contamination of Drinking-Water
PLOS Medicine | www.plosmedicine.org 17 May 2014 | Volume 11 | Issue 5 | e1001644
152. Hashmi I, Farooq S, Qaiser S (2009) Incidence of fecal contamination within a
public drinking water supply in Ratta Amral, Rawalpindi. Desalination and
Water Treatment 11: 124–131.
153. Henry FJ, Rahim Z (1990) Transmission of diarrhoea in two crowded areas
with different sanitary facilities in Dhaka, Bangladesh. J Trop Med Hyg 93:
121–126.
154. Herath AT, Abayasekara CL, Chandrajith R, Adikaram NKB (2012)
Temporal variation of microbiological and chemical quality of noncarbonated
bottled drinking water sold in Sri Lanka. J Food Sci 77: M160–M164.
155. Hira-Smith MM, Yuan Y, Savarimuthu X, Liaw J, Hira A, et al. (2007) Arsenic
concentrations and bacterial contamination in a pilot shallow dugwell program
in West Bengal, India. J Environ Sci Health A Tox Hazard Subst Environ Eng
42: 89–95.
156. Holm RH (2012) Survey of water quality in northern Malawi, Africa, and
communication of human health risk. Pullman: Washington State University.
157. Holt S (2009) A survey of water storage practices and beliefs in households in
Bonao, Dominican Republic in 2005. Atlanta: Georgia State University.
158. Hoque BA, Sack RB, Siddiqi M, Jahangir AM, Hazera N, et al. (1993)
Environmental health and the 1991 Bangladesh cyclone. Disasters 17: 143–
152.
159. Hoque BA, Yamaura S, Sakai A, Khanam S, Karim M, et al. (2006) Arsenic
mitigation for water supply in bangladesh: appropriate technological and policy
perspectives. Water Qual Res J Can 41: 226–234.
160. Horak HM, Chynoweth JS, Myers WP, Davis J, Fendorf S, et al. (2010)
Microbial and metal water quality in rain catchments compared with
traditional drinking water sources in the East Sepik Province, Papua New
Guinea. J Water Health 8: 126–138.
161. Howard G, Luyima P (1999) Urban and peri-urban water supply surveillance
programme report on water supply surveillance in ten selected urban areas of
Uganda. Loughborough, UK: Loughborough University.
162. Hubbard B, Gelting R, Baffigo V, Sarisky J (2005) Community environmental
health assessment strengthens environmental public health services in the
Peruvian Amazon. Int J Hyg Envir Heal 208: 101–107.
163. Hussain J, Hussain I, Ojha KG, Sharma KC (2001) Bacteriological pollution of
ground water in textile city, Bhilwara, Rajasthan (India). Asian J Chem 13:
1123–1126.
164. Ince M, Bashire D, Oni OOO, Awe EO, Ogbechie V, et al. (2010) Rapid
assessment of drinking-water quality in the Federal Republic of Nigeria:
country report of the pilot project implementation in 2004–2005. Geneva:
WHO/UNICEF. Available: http://www.wssinfo.org/fileadmin/user_upload/
resources/RADWQ_Nigeria.pdf. Accessed 1 December 2013.
165. Isaac-Marquez AP, Lezama-Davila CM, Ku-Pech PP, Tamay-Segovia P (1994)
Sanitary quality of water supply for human consumption in Campeche. Salud
Publica Mex 36: 655–661.
166. Islam MA, Sakakibara H, Karim MR, Sekine M, Mahmud ZH (2011)
Bacteriological assessment of drinking water supply options in coastal areas of
Bangladesh. J Water Health 9: 415–428.
167. Itama E, Olaseha IO, Sridhar MKC (2006) Springs as supplementary potable
water supplies for inner city populations: a study from Ibadan, Nigeria. Urban
Water J 3: 215–223.
168. Jagals P, Barnard TG, Mokoena MM, Ashbolt N, Roser DJ (2013) Pathogenic
Escherichia coli in rural household container waters. Water Sci Technol 67:
1230–1237.
169. Jagals P, Bokako TC, Grabow WOK (1999) Changing consumer water-use
patterns and their effect on microbiological water quality as a result of an
engineering intervention. Water SA 25: 297–297.
170. Jagals P, Grabow WOK, Williams E (1997) The effects of supplied water
quality on human health in an urban development with limited basic
subsistence facilities. Water SA 23: 373–378.
171. Jayatilleke SK, Gunawardana SS (2009) Microbiological quality of well water
in Kalutara District. Ceylon Med J 54: 44–45.
172. Jiban Singh M, Somashekar RK, Prakash KL, Shivanna K (2009)
Bacteriological assessment of groundwater in Arkavathi and Vrishabhavathi
basins, Bangalore, Karnataka. Journal of Ecology and The Natural
Environment 1: 156–159.
173. Jimmy DH, Sundufu AJ, Malanoski AP, Jacobsen KH, Ansumana R, et al.
(2013) Water quality associated public health risk in Bo, Sierra Leone. Environ
Monit Assess 185: 241–251.
174. Joya SA, Mostofa G, Yousuf J, Islam A, Elahi A, et al. (2006) One solution to
the arsenic problem: a return to surface (improved dug) wells. J Health Popul
Nutr 24: 363–375.
175. Junaidu AU, Adamu RYA, Ibrahim MTO (2001) Bacteriological assessment of
pipe borne water in Sokoto metropolis, Nigeria. Tropical Veterinarian 19:
160–162.
176. Jung JH, Yoo CH, Koo ES, Kim HM, Na Y, et al. (2011) Occurrence of
norovirus and other enteric viruses in untreated groundwaters of Korea.
J Water Health 9: 544–555.
177. Kanyerere T, Levy J, Xu Y, Saka J (2012) Assessment of microbial
contamination of groundwater in upper Limphasa River catchment, located
in a rural area of northern Malawi. Water SA (Pretoria) 38: 581–595.
178. Karim MR (2010) Microbial contamination and associated health burden of
rainwater harvesting in Bangladesh. Water Sci Technol 61: 2129–2135.
179. Karnchanawong S, Koottatep S, Ikeguchi T (1993) Monitoring and evaluation
of shallow well water quality near a waste disposal site. Environ Int 19: 579–
587.
180. Kassenga GR (2007) The health-related microbiological quality of bottled
drinking water solid in Dar es Salaam, Tanzania. J Water Health 5: 179–185.
181. Kerala State Pollution Control Board (1991) The bacterial quality of water in
selected wells in Kerala: an investigation. Trivandrum SEU-Kerala.
182. Khadse GK, Kalita M, Pimpalkar SN, Labhsetwar PK (2011) Drinking water
quality monitoring and surveillance for safe water supply in Gangtok, India.
Environ Monit Asses 178: 401–414.
183. Khadse GK, Kalita MD, Labhsetwar PK (2012) Change in drinking water
quality from source to point-of-use and storage: a case study from Guwahati,
India. Environ Monit Asses 184: 5343–5361.
184. Khadse GK, Kalita MD, Pimpalkar SN, Labhasetwar PK (2011) Surveillance
of drinking water quality for safe water supply-a case study from Shillong,
India. Water Resour Manag 25: 3321–3342.
185. Khan SU, Bangash FK (2001) Drinking water quality forecast of Peshawar
valley on the basis of sample data. J Chem Soc Pakistan 23: 243–252.
186. Khush R, London A, Arnold J, Ramaswamy K (2009) Evaluating the
sustainability and impacts of water, sanitation & hygiene interventions. San
Francisco: Aquaya.
187. Kilanko-Oluwasanya GO (2009) Better safe than sorry: towards appropriate
water safety plans for urban self supply systems. Cranfield, UK: Cranfield
University.
188. Kimani-Murage EW, Ngindu AM (2007) Quality of water the slum dwellers
use: the case of a Kenyan slum. J Urban Health 84: 829–838.
189. Kiptum CK, Ndambuki JM (2012) Well water contamination by pit latrines: a
case study of Langas. International Journal of Water Resources and
Environmental Engineering 4: 35–43.
190. Klasen S, Lechtenfeld T, Meier K, Rieckmann J (2012) Benefits trickling away:
the health impact of extending access to piped water and sanitation in urban
Yemen. Journal of Development Effectiveness 4: 537–565.
191. Knappett PSK, McKay LD, Layton A, Williams DE, Alam MJ, et al. (2012)
Unsealed tubewells lead to increased fecal contamination of drinking water.
J Water Health 10: 565–578.
192. Knight SM, Toodayan W, Caique WC, Kyi W, Barnes A, et al. (1992) Risk
factors for the transmission of diarrhoea in children: a case-control study in
rural Malaysia. Int J Epidemiol 21: 812–818.
193. Korfali SI, Jurdi M (2009) Provision of safe domestic water for the promotion
and protection of public health: a case study of the city of Beirut, Lebanon.
Environ Geochem Hlth 31: 283–295.
194. Kravitz JD, Nyaphisi M, Mandel R, Petersen E (1999) Quantitative bacterial
examination of domestic water supplies in the Lesotho Highlands: Water
quality, sanitation, and village health. Bull World Health Organ 77: 829–836.
195. Kremer M, Leino J, Miguel E, Zwane AP (2011) Spring cleaning: rural water
impacts, valuation, and property rights institutions. Q J Econ 126: 145–205.
196. Kremer M, Null C, Zwane AP (2008) Trickle down: diffusion of chlorine for
drinking water treatment in Kenya. Available: http://www.stanford.edu/
group/SITE/archive/SITE_2008/segment_1/papers/de_giorgi_SITE_
Trickle_Down.pdf. Accessed 1 December 2013.
197. Kromoredjo P, Fujioka RS (1991) Evaluating three simple methods to assess
the microbial quality of drinking water in indonesia. Environ Toxic Water 6:
259–270.
198. Kumpel E, Nelson KL (2013) Comparing microbial water quality in an
intermittent and continuous piped water supply. Water Res 47:5176–5188.
199. Lacey S, Lopez R, Frangos C, Khodadoust A (2011) Water quality degradation
after water storage at household level in a piped water system in rural
Guatemala. International Journal for Service Learning in Engineering 6: 118–
129.
200. Lal M, Kaur H (2006) A microbiological study of bottled mineral water
marketed in Ludhiana. Indian J Public Health 50: 31–32.
201. Lantagne D, Clasen T (2011) Assessing the Implementation of Selected
Household Water Treatment and Safe Storage (HWTS) Methods in
Emergency Settings. London: London School of Hygiene and Tropical
Medicine.
202. Leber J, Rahman MM, Ahmed KM, Mailloux B, van Geen A (2011)
Contrasting influence of geology on E. coli and arsenic in aquifers of
Bangladesh. Ground Water 49: 111–123.
203. Leiter M, Levy J, Mutiti S, Boardman M, Wojnar A, et al. (2013) Drinking
water quality in the Mount Kasigau region of Kenya: a source to point-of-use
assessment. Environmental Earth Sciences 68: 1–12.
204. Levy K, Nelson KL, Hubbard A, Eisenberg JNS (2008) Following the water: a
controlled study of drinking water storage in northern coastal Ecuador. Environ
Health Persp 116: 1533–1540.
205. Lin M-Y, Chen X-L, You T-Z (2009) Hygienic quality of bottled drinking
water in Longyan from 2006 to 2008. Chinese Journal of Public Health
Engineering/Zhongguo Weisheng Gongcheng Xue 8: 168–169.
206. Lira I, Matamoros A, Jacob F, Baltodano F, Harvey R (2008) Measurement of
the quality of potable water by detection of H2S-producing bacteria;
comparison with detection of fecal coliforms by the Millipore method in rural
Nicaragua. Matagalpa/Jinotega, Nicaragua: ENACAL/DAR. Available:
http://tascanica.org/images/Pathoscreenreport.pdf. Accessed 1 December
2013.
Fecal Contamination of Drinking-Water
PLOS Medicine | www.plosmedicine.org 18 May 2014 | Volume 11 | Issue 5 | e1001644

207. Long WF, Yang JJ, Xu QJ (2012) Microbial contamination of householddrinking water in five Haikou residential groups. Huanjing yu Zhiye Yixue 29:
566–568.
208. Luby S, Islam MS, Johnston R (2006) Chlorine spot treatment of flooded tubewells, an efficacy trial. J Appl Microbiol 100: 1154–1158.
209. Luby SP, Gupta SK, Sheikh MA, Johnston RB, Ram PK, et al. (2008)
Tubewell water quality and predictors of contamination in three flood-proneareas in Bangladesh. J Appl Microbiol 105: 1002–1008.
210. Lukacs H (2002) From design to implementation: innovative slow sand
filtration for use in developing countries. Cambridge: Massachusetts Institute ofTechnology.
211. Machdar E, van der Steen NP, Raschid-Sally L, Lens PN (2013) Application of
Quantitative Microbial Risk Assessment to analyze the public health risk frompoor drinking water quality in a low income area in Accra, Ghana. Sci Total
Environ 449: 134–142.
212. Macy JT, Dunne EF, Angoran-Benie YH, Kamelan-Tano Y, Kouadio L, et al.(2005) Comparison of two methods for evaluating the quality of stored drinking
water in Abidjan, Cote d9lvoire, and review of other comparisons in theliterature. J Water Health 3: 221–228.
213. Magan M, Bile KM, Kazi BM, Gardezi Z (2010) Safe water supply in
emergencies and the need for an exit strategy to sustain health gains: lessonslearned from the 2005 earthquake in Pakistan. East Mediterr Health J 16
Suppl: S91–97.
214. Magrath J (2006) Towards sustainable water-supply solutions in Rural SierraLeone: a pragmatic approach, using comparisons with Mozambique. Oxford:
Oxfam/WaterAid.
215. Mah U, Haq T, Perveen F, Sultana L (2007) Bacteriological analysis ofgroundwater of Karachi. Pakistan J Sci Ind R 50: 273–277.
216. Mahasneh IA (1992) Isolation and characterization of faecal indicator bacteria
from urban and rural natural drinking water sources. Biomedical Letters 47:347–354.
217. Mahfouz AA, Abdel-Moneim M, al-Erian RA, al-Amari OM (1995) Impact ofchlorination of water in domestic storage tanks on childhood diarrhoea: a
community trial in the rural areas of Saudi Arabia. J Trop Med Hyg 98: 126–
130.
218. Maiga H, Maiga B, Sutton S (2006) Self-supply in Mali. Waterlines 25: 13–14.
219. Mamo E, Mekonta L, Butterworth J, Sutton S (2011) New insights on the oldest
approach: family wells in Ethiopia. 6th Rural Water Supply Network Forum2011. Uganda. Kampala, Uganda: RWSN.
220. Mane VR, Chandorkar AA, Kumar R (2005) Prevalence of pollution in surface
and ground water sources in the rural areas of Satara Region, Maharashtra,India. Asian Journal of Water, Environment and Pollution 2: 81–87.
221. Massoud MA, Al-Abady A, Jurdi M, Nuwayhid I (2010) The challenges of
sustainable access to safe drinking water in rural areas of developing countries:case of Zawtar El-Charkieh, Southern Lebanon. J Environ Health 72: 24–30.
222. Matsinhe NP, Juizo D, Rietveld LC, Persson KM (2008) Water services with
independent providers in peri-urban Maputo: challenges and opportunities forlong-term development. Water SA 34: 411–420.
223. Mazengia E, Chidavaenzi MT, Bradley M, Jere M, Nhandara C, et al. (2002)
Effective and culturally acceptable water storage in Zimbabwe: maintaining thequality of water abstracted from upgraded family wells. J Environ Health 64:
15–18.
224. Mertens TE, Fernando MA, Marshall TFDC, Kirkwood BR, Cairncross S, et
al. (1990) Determinants of water quality availability and use in Kurunegala Sri
Lanka. Trop Med Parasitol 41: 89–97.
225. Metwali RM (2003) Water quality of some wells in Taiz City (Yemen Republic)
and its surroundings. Folia Microbiol (Praha) 48: 90–94.
226. Michelina AF, Bronharoa TM, Dareb F, Ponsanoc EHG (2006) Qualidademicrobiologica de aguas de sistemas de abastecimento publico da regiao de
Aracatuba, SP. Higiene Alimentar 20: 90–95.
227. Miranda M, Aramburu A, Junco J, Campos M (2010) State of the quality ofdrinking water in households in children under five years in Peru, 2007–2010.
Rev Peru Med Exp Salud Publica 27: 506–511.
228. Miranzadeh MB, Heidari M, Mesdaghinia AR, Younesian M (2011) Survey ofmicrobial quality of drinking water in rural areas of Kashan-Iran in second half
of 2008. Pak J Biol Sci 14: 59–63.
229. Moazeni M, Atefi M, Ebrahimi A, Razmjoo P, Vahid Dastjerdi M (2013)Evaluation of chemical and microbiological quality in 21 brands of Iranian
bottled drinking waters in 2012: a comparison study on label and real contents.Journal of Environmental and Public Health 2013: 4.
230. Moe CL, Sobsey MD, Samsa GP, Mesolo V (1991) Bacterial indicators of risk
of diarrhoeal disease from drinking-water in the Philippines. Bull World HealthOrgan 69: 305–317.
231. Momba MNB, Obi CL, Thompson P (2009) Survey of disinfection efficiency of
small drinking water treatment plants: challenges facing small water treatmentplants in South Africa. Water Sa 35: 485–493.
232. Mora-Bueno D, Sanchez-Pena LC, del Razo LM, Gonzalez-Arias CA,
Medina-Diaz IM, et al. (2012) Presencia de arsenico y coliformes en aguapotable del municipio de Tecuala, Nayarit, Mexico. Rev Int Contam Ambie
28: 127–135.
233. Morgan P (1990) Rural water supplies and sanitation. London: Macmillan. 358p.
234. Moshtaghi H, Boniadian M (2007) Microbial quality of drinking water in
Shahrekord (Iran). Research Journal of Microbiology 2: 299–302.
235. Mosley LM, Sharp DS, Singh S (2004) Effects of a tropical cyclone on thedrinking-water quality of a remote Pacific Island. Disasters 28: 405–417.
236. Moyo S, Wright J, Ndamba J, Gundry S (2004) Realising the maximum healthbenefits from water quality improvements in the home: a case from Zaka
district, Zimbabwe. Phys Chem Earth 29: 1295–1299.
237. Mpenyana-Monyatsi L, Onyango MS, Momba MNB (2012) Groundwater
quality in a South African rural community: a possible threat to public health.
Pol J Environ Stud 21: 1349–1358.
238. Muzuga JM, Tole MP, Ucakuwun EK (1998) The impact of geology and pit
latrines on ground water quality in Kwale District. Dunes, groundwater,mangroves and birdlife in costal Kenya. Nairobi, Kenya: Acts Press.
239. Mzuga JM, Tole MP, Ucakuwun EK (2001) Contamination of groundwaterresources by pit latrines in Kwale District, Kenya. Discov Innovat 13: 203–212.
240. Nascimento AR, Azevedo TKL, Filho NEM, Rojas MOAI (2000) Qualidademicrobiologica das aguas minerais consumidas na cidade de Sao Luıs - MA.
Higiene Alimentar 14: 69–72.
241. NEERI (2005) Study on surveillance of drinking water quality in selected cities/
towns in India. Volume I: surveillance volume II: city appraisal. Nehru Marg,Nagpur: NEERI.
242. Nikaeen M, Pejhan A, Jalali M (2009) Rapid monitoring of indicator coliformsin drinking water by an enzymatic assay. Iranian Journal of Environmental
Health Science and Engineering 6: 7–10.
243. Nogueira G, Nakamura CV, Tognim MCB, Abreu Filho BA, Dias Filho BP(2003) Microbiological quality of drinking water of urban and rural
communities, Brazil. Revista de Saude Publica 37: 232–236.
244. Norton DM, Rahman M, Shane AL, Hossain Z, Kulick RM, et al. (2009)
Flocculant-disinfectant point-of-use water treatment for reducing arsenicexposure in rural Bangladesh. Int J Environ Heal R 19: 17–29.
245. Nunes SM, Fuzihara TO (2011) Availacao microbiologica das aguas envadas ecommercializadas na regiao do ABC, SP. Higiene Alimentar 25: 195–199.
246. Nwosu JN, Ogueke CC (2004) Evaluation of sachet water samples in Owerrimetropolis. Nigerian Food Journal 22: 164–170.
247. Nyanchaga EN (1994) Rehabilitation of hand-dug wells and springs. Aqua(Oxford) 43: 233–237.
248. Obiri-Danso K, Okore-Hanson A, Jones K (2003) The microbiological qualityof drinking water sold on the streets in Kumasi, Ghana. Lett Appl Microbiol
37: 334–339.
249. Ogan MT (1992) Microbiological quality of bottled water sold in retail outletsin Nigeria. J Appl Bacteriol 73: 175–181.
250. Okagbue RN, Dlamini NR, Siwela M, Mpofu F (2002) Microbiological qualityof water processed and bottled in Zimbabwe. Afr J Health Sci 9: 99–103.
251. Okioga T (2007) Water quality and business aspects of sachet-vended water inTamale, Ghana [Master of Engineering dissertation]. Cambridge: Massachu-
setts Institute of Technology.
252. Okura MH, Siqueira KB (2005) Enumeracao de coliformes totais e coliformes
termotolerantes em agua de abastecimento e de minas. Higiene Alimentar 19:86–91.
253. Olaoye OA, Onilude AA (2009) Assessment of microbiological quality ofsachet-packaged drinking water in Western Nigeria and its public health
significance. Public Health 123: 729–734.
254. Oloruntoba EO, Sridhar MK (2007) Bacteriological quality of drinking water
from source to household in Ibadan, Nigeria. Afr J Med Med Sci 36: 169–175.
255. Omar KB, Potgieter N, Barnard TG (2010) Development of a rapid screeningmethod for the detection of pathogenic Escherichia coli using a combination of
Colilert Quanti-Trays/2000 and PCR. Wa Sci Technol 10: 7–13.
256. Omer EOM, Sallam T (2012) Bacteriogical investigation of drinking water in
Shendi Locality, River Nile State, Sudan. Open Access Scientific Reports 1:329.
257. Onifade AK, M LR (2008) Microbiological analysis of sachet water vended inOndo State, Nigeria. Environmental Research Journal 2: 107–110.
258. Oo KN, Han AM, Hlaing T, Aye T (1991) Bacteriologic studies of food andwater consumed by children in Myanmar: 1. The nature of contamination.
J Diarrhoeal Dis Res 9: 87–90.
259. Opisa S, Odiere MR, Jura WG, Karanja DM, Mwinzi PN (2012) Faecal
contamination of public water sources in informal settlements of Kisumu City,
western Kenya. Water Sci Technol 66: 2674–2681.
260. Opryszko MC, Guo Y, Macdonald L, Macdonald L, Kiihl S, et al. (2013)
Impact of water-vending kiosks and hygiene education on household drinkingwater quality in rural Ghana. Am J Trop Med Hyg. 88: 651–660.
261. Ordinioha B (2011) A survey of the community water supply of some ruralriverine communities in the Niger Delta region, Nigeria: Health implications
and literature search for suitable interventions. Niger Med J 52: 13–18.
262. Oswald WE, Lescano AG, Bern C, Calderon MM, Cabrera L, et al. (2007)
Fecal contamination of drinking water within peri-urban households, Lima,Peru. Am J Trop Med Hyg 77: 699–704.
263. Oyedeji O, Olutiola PO, Moninuola MA (2010) Microbiological quality of
packaged drinking water brands marketed in Ibadan metropolis and Ile-Ife cityin South Western Nigeria. Afr J Microbiol Res 4: 96–102.
264. Pan F, Meng K, Zhao H (2011) Hygienic investigation on rural drinking waterin Daxing District of Beijing. Occupation and Health 27: 2140–2141.
265. Pant H, Sarfaraz S, Iyengar L (2002) Evaluation of L-Cystine-amended H2Stest for the detection of faecal pollution in potable water: comparison with
standard multiple tube fermentation method. World Journal of Microbiologyand Biotechnology 18: 317–320.
Fecal Contamination of Drinking-Water
PLOS Medicine | www.plosmedicine.org 19 May 2014 | Volume 11 | Issue 5 | e1001644

266. Parker AH, Youlten R, Dillon M, Nussbaumer T, Carter RC, et al. (2010) Anassessment of microbiological water quality of six water source categories in
north-east Uganda. J Water Health 8: 550–560.
267. Pathak SP, Gopal K (1994) Antibiotic resistance and metal tolerance amongColiform sp. from drinking water in a hilly area. J Environ Biol 15: 139–139.
268. Pathak SP, Gopal K (2005) Efficiency of modified H2S test for detection offaecal contamination in water. Environ Monit Assess 108: 59–65.
269. Pathak SP, Gopal K (2008) Prevalence of bacterial contamination with
antibiotic resistant and enterotoxigenic fecal coliforms in treated drinkingwater. J Toxicol Env Heal A 71: 427–433.
270. Patrick JM (2010) Recommendations for at-risk water supplies in CapizProvince, Philippines: using water source and community assessments.
Cambridge: Massachusetts Institute of Technology.
271. Phatthararangrong N, Chantratong N, Jitsurong S (1998) Bacteriologicalquality of holywater from Thai temples in Songkhla Province, southern
Thailand. J Med Assoc Thailand 81: 547–550.
272. Pickering AJ, Davis J, Walters SP, Horak HM, Keymer DP, et al. (2010)Hands, water, and health: fecal contamination in Tanzanian communities with
improved, non-networked water supplies. Environ Sci Technol 44: 3267–3272.
273. Pinfold JV, Horan NJ, Wirojanagud W, Mara D (1993) The bacteriological
quality of rainjar water in rural northeast Thailand. Water Research 27: 297–
302.
274. Piranha JM, Pacheco A, Gamba RC, Mehnert DU, Garrafa P, et al. (2006)
Faecal contamination (viral and bacteria) detection in groundwater used fordrinking purposes in Sao Paulo, Brazil. Geomicrobiol J 23: 279–283.
275. Platenburg RJPM, Zaki M (1993) Patterns of water quality in rural areas of
Assyut Governorate, Egypt. Water Sci Technol 27: 55–55.
276. Potgieter N, Becker PJ, Ehlers MM (2009) Evaluation of the CDC safe water-
storage intervention to improve the microbiological quality of point-of-usedrinking water in rural communities in South Africa. Water SA 35: 505–516.
277. Potgieter N, Mudau LS, Maluleke FRS (2006) Microbiological quality of
groundwater sources used by rural communities in Limpopo Province, SouthAfrica. Kroiss H, Potgieter N, editors. London: IWA Publishing. 371–377 p.
278. Pradhan B (2004) Rural communities’ perception on water quality and water
borne disease: the case of Bungamati Village Development Committee inKathmandu Valley, Nepal. Journal of Nepal Health Research Council 2.
279. Pritchard M, Mkandawire T, O9Neill JG (2007) Biological, chemical andphysical drinking water quality from shallow wells in Malawi: case study of
Blantyre, Chiradzulu and Mulanje. Phys Chem Earth 32: 1167–1177.
280. Pritchard M, Mkandawire T, O9Neill JG (2008) Assessment of groundwaterquality in shallow wells within the southern districts of Malawi. Phys Chem
Earth 33: 812–823.
281. Properzi F (2010) Rapid assessment of drinking-water quality in the Hashemite
Kingdom of Jordan: country report of the pilot project implementation in
2004–2005. Geneva: WHO/UNICEF. Available: http://www.wssinfo.org/fileadmin/user_upload/resources/RADWQ_Jordan.pdf. Accessed 1 Decem-
ber 2013.
282. Putri LSE, Kustanti N, Yunita E (2013) Effect of land use on ground water
quality (a casestudy from Ciracas Sub District, East Jakarta, Indonesia).
International Journal of Bioscience, Biochemistry and Bioinformatics 3: 33–36.
283. Qi W (2007) Analysis of water quality of 186 samples from homemade wells of
Yuci District of Jinzhong City in 2005. Preventive Medicine Tribune 13: 536–537.
284. Quick RE, Kimura A, Thevos A, Tembo M, Shamputa I, et al. (2002)
Diarrhea prevention through household-level water disinfection and safestorage in Zambia. Am J Trop Med Hyg 66: 584–589.
285. Radaideh J, Al-Zboon K, Al-Harahsheh A, Al-Adamat R (2009) Qualityassessment of harvested rainwater for domestic uses. Jordan Journal of Earth
and Environmental Sciences 2: 26–31.
286. Rainey RC, Harding AK (2005) Drinking water quality and solar disinfection:effectiveness in peri-urbanhouseholds in Nepal. J Water Health 3: 239–248.
287. Ramteke PW (1995) Comparison of standard most probable number method
with three alternate tests for detection of bacteriological water qualityindicators. Environ Toxic Water 10: 173–178.
288. Ramteke PW, Bhattacharjee JW, Pathak SP, Kalra N (1992) Evaluation ofcoliforms as indicators of water-quality in India. J Appl Bacteriol 72: 352–356.
289. Rao PNS, Suresh K, Basavarjappa KG (2006) Bacteriological quallity of
potable water in Davangere city. Journal of Communicable Diseases 38: 381–384.
290. Rawat V, Jha SK, Bag A, Singhai M, Rawat CMS (2012) The bacteriologicalquality of drinking water in Haldwani Block of Nainital District, Uttarakhand,
India. J Water Health 10: 465–470.
291. Razzolini MTP, Santos TFD, Bastos VK (2010) Detection of Giardia andCryptosporidium cysts/oocysts in watersheds and drinking water sources in
Brazil urban areas. J Water Health 8: 399–404.
292. Reddy PS, Ata-Ur-Rasheed MD, Sharma S (2000) Microbiological analysis of
bottled water. Indian J Med Microbiol 18: 72–76.
293. Rejith PG, Jeeva SP, Vijith H, Sowmya M, Hatha AAM (2009) Determinationof groundwater quality index of a Highland Village of Kerala (India) using
geographical information system. J Environ Health 71: 51–58.
294. Rheinheimer DS, GonCalves CS, Bortoluzzi EC, Pellegrin JBR, da Silva JLS,et al. (2010) Qualidade de aguas subterraneas captadas em fontes em funcao da
presenca de protecao fısica e de sua posicao na paisagem. Eng Agr c,Jaboticabal, 30: 948–957.
295. Rosa G, Miller L, Clasen T (2010) Microbiological effectiveness of disinfecting
water by boiling in rural Guatemala. Am J Trop Med Hyg 82: 473–477.
296. Rufener S, Maeusezahl D, Mosler H-J, Weingartner R (2010) Quality of
drinking-water at source and point-of-consumption-drinking cup as a high
potential recontamination risk: a field study in Bolivia. J Health Popul Nutr 28:
34–41.
297. Sampson M (2008) Water quality assessment of hand dug wells. Phnom Penh,
Cambodia: Resource Development International.
298. Santana A, Silva SCFL, Farani IO, Amaral CHR, Macedo VF (2003)
Qualidade microbiologica de aguas minerais. Cienc Tecnol Aliment 23: 190–
194.
299. Sasikaran S, Sritharan K, Balakumar S, Arasaratnam V (2012) Physical,
chemical and microbial analysis of bottled drinking water. Ceylon Med J 57:
111–116.
300. Schaffner M (2002) Drinking water quality assessment and improvement in the
Jhikhu Khola watershed. Bern: Universitat Bern.
301. Semerjian LA (2011) Quality assessment of various bottled waters marketed in
Lebanon. Environ Monit Asses 172: 275–285.
302. Shaheed A, Orgill J, Ratana C, Montgomery MA, Jeuland A, et al. (2013)
Water quality risks of ‘‘improved ’’ water sources: evidence from Cambodia.
Trop Med Int Health 19: 186–194.
303. Shaikh SA, Gul N, Sultana L (2008) Surveillance of drinking water of Karachi
City: microbiological quality. Pakistan J Sci Ind R 51: 272–275.
304. Shakya (2004) An integrated drinking water quality assessment of rainwater
harvesting jars and the related socio-economic conditions and gender issues of
Chappani VDC-1, Palpa District. Available: http://www.aehms.org/pdf/
Shakya%20&%20Sharma%20Proceedings%20FE.pdf. Accessed 30 December
2014.
305. Shar AH, Kazi YF, Kanhar NA, Soomro IH, Zia SM, et al. (2010) Drinking
water quality in Rohri City, Sindh, Pakistan. Afr J Biotechnol 9: 7102–7107.
306. Shar AH, Kazi YF, Soomro IH (2009) Antibiotic susceptibility of thermo-
tolerant escherichia coli 2 isolated from drinking water of Khairpur City,
Sindh, Pakistan. Pakistan Journal of Biological Sciences 12: 648–652.
307. Shar AH, Kazi YF, Zardari M, Soomro IH (2007) Enumeration of total and
faecal coliform bacteria in drinking water of Khairpur City, Sindh, Pakistan.
Bangladesh J Microbiol 24: 163–165.
308. Sharma BK, Sharma LL, Durve VS (2008) Assessment of hand pump waters in
three tribal dominated districts of southern Rajasthan, India. Journal of
Environmental Science & Engineering 50: 133–136.
309. Shrestha S, Malla SS, Aihara Y, Kondo N, Nishida K (2013) Water Quality at
Supply Source and Point of Use in the Kathmandu Valley. Journal of Water
and Environment Technology 11: 331–340.
310. Silva EF, Salgueiro AA (2001) Avaliacao da qualidade bacteriologica de agua
de pocos na regio metropolitana de Recife - P. Higiene Alimentar 15: 73–78.
311. Simango C, Dindiwe J, Rukure G (1992) Bacterial-contamination of food and
household stored drinking-water in a farmworker community in Zimbabwe.
Cent Afr J Med 38: 143–149.
312. Simiyu S (2009) Assessment of spring water quality and quantity, and health
implications in Tongaren division, Nzoia River catchment, Kenya. Afr J Ecol
47: 99–104.
313. Singh KP, Gaur A, Chandra H, Ray PK (1993) Drinking water quality status of
Bankura District (West Bengal) as indicator of environmental pollution.
Agrawal VP, Abidi SAH, Verma GP, Singh KP, editors. Muzaffarnagar
(India): Society of Bioscience. 71–78 p.
314. Smith PG, Sabone TG (1994) Drinking water quality in the Gantsi District of
Botswana. Int J Environ Heal R 4: 141–147.
315. Soto FRM, Fonseca YSK, Antunes DV, Risseto MR, Amaku M, et al. (2005)
Microbiological evaluation of public water supply in schools of Ibiuna-SP:
comparative study of water quality in conduit and post conduit. Revista do
Instituto Adolfo Lutz 64: 128–131.
316. Soto FRM, Fonseca YSK, Risseto MR, de Azevedo SS, Arini MdLB, et al.
(2006) Monitoring the quality of water from groundwater located in the rural
public schools of the Ibiuna municipality/SP: microbiological and physico-
chemical parameters, and factors for environmental risk. Revista do Instituto
Adolfo Lutz 65: 106–111.
317. Souza Coelho MI, Mendes ES, Soares Cruz MC, Bezerra SS, Pinheiro e Silva
RP (2010) Evaluation of the microbiological quality of mineral water consumed
in the metropolitan region of Recife, Pernambuco State. Acta Scientiarum
Health Science 32: 1–8.
318. Stoler J, Fink G, Weeks JR, Otoo RA, Ampofo JA, et al. (2012) When urban
taps run dry: sachet water consumption and health effects in low income
neighborhoods of Accra, Ghana. Health Place 18: 250–262.
319. Sutton S (2002) Community led improvements of rural drinking water supplies.
Shewsbury, UK: SWL Consultants. Available: http://www.rural-water-supply.
net/en/resources/details/249. Accessed 1 December 2013.
320. Sutton S, Butterworth J, Mekonta L (2012) A hidden resource: household-led
rural water supply in Ethiopia. The Netherlands: IRC International Water and
Sanitation Centre. Available: http://www.irc.nl/content/download/185695/
850981/file/A%20hidden%20resource%20web_2012.pdf. Accessed 1 Decem-
ber 2013.
321. Tabor M, Kibret M, Abera B (2011) Bacteriological and physicochemical
quality of drinking water and hygiene-sanitation practices of the consumers in
bahir dar city, ethiopia. Ethiop J Health Sci 21: 19–26.
Fecal Contamination of Drinking-Water
PLOS Medicine | www.plosmedicine.org 20 May 2014 | Volume 11 | Issue 5 | e1001644

322. Tadesse D, Desta A, Geyid A, Girma W, Fisseha S, et al. (2010) Rapid
assessment of drinking-water quality in the Federal Democratic Republic of
Ethiopia: country report of the pilot project implementation in 2004–2005.
Geneva: WHO/UNICEF.
323. Tambekar DH, Hirulkar NB, Werulkar SA (2007) Multidrug resistance in
Salmonella typhi isolated from drinking water in Amravati. Nature,
Environment and Pollution Technology 6: 285–288.
324. Tambekar DH, Neware BB (2012) Water quality index and multivariate
analysis for groundwater quality assessment of villages of rural india. Science
Research Reporter 2: 229–235.
325. Taylor H, Ebdon J, Phillips R, Chavula G, Kapudzama O (2012) Assessment
of drinking water quality for low-cost water options in rural Malawi. Brighton,
UK: University of Brighton.
326. Tewari S, Ramteke PW, Garg SK (2003) Evaluation of simple microbiol tests
for detection of fecal coliforms directly at 44.5 C. Environ Monit Asses 85: 191–
198.
327. Tillet W (2007) An investigation into the impacts and challenges of
implementing self supply in Eastern Uganda. Cranfield, UK: Cranfield
University.
328. Tole MP (1997) Pollution of groundwater in the coastal Kwale District, Kenya.
IAHS Publications Series of the Proceedings and Reports - Intern Assoc
Hydrological Sciences 240: 287–310.
329. Trevett AF, Carter RC, Tyrrel SF (2004) Water quality deterioration: a study
of household drinking water quality in rural Honduras. Int J Environ Heal R
14: 273–283.
330. Uhl VW, Daw A, Baron JA (2012) How a city gets its drinking water a case
study - capital city of Monrovia, Liberia. Lambertville (New Jersey): UHL &
Associates, Inc.
331. Vaccari M, Collivignarelli C, Tharnpoophasiam P, Vitali F (2010) Wells
sanitary inspection and water quality monitoring in Ban Nam Khem (Thailand)
30 months after 2004 Indian Ocean tsunami. Environ Monit Assess 161: 123–
133.
332. Valente JPS, Lopes CAM, Caminhas AMT, Horacio A (1999) Bacteriological
evaluation of the water supplies of the Eldorado municipality — Vale do
Ribeira (SP). Revista do Instituto Adolfo Lutz 58: 9–13.
333. van Geen A, Ahmed KM, Akita Y, Alam MJ, Culligan PJ, et al. (2011) Fecal
contamination of shallow tubewells in Bangladesh inversely related to arsenic.
Environ Sci Technol 45: 1199–1205.
334. Vanderslice J, Briscoe J (1993) All coliforms are not created equal - a
comparison of the effects of water source and in-house water contamination on
infantile diarrheal disease. Water Resour Res 29: 1983–1995.
335. Varghese J, Jaya DS (2008) Drinking water quality assessment of rain water
harvested in ferrocement tanks in Alappuzha District, Kerala (India). Journal of
Environmental Science & Engineering 50: 115–120.
336. Vidal J, Consuegra A, Gomescaseres L, Marrugo J (2009) Assessment of the
microbiological quality of water packed in bags manufactured in Sincelejo-
Colombia. Revista Mvz Cordoba 14: 1736–1744.
337. Vollaard AM, Ali S, Smet J, van Asten H, Widjaja S, et al. (2005) A survey of
the supply and bacteriologic quality of drinking water and sanitation in Jakarta,
Indonesia. SE Asian J Trop Med 36: 1552–1561.
338. Warner NR, Levy J, Harpp K, Farruggia F (2008) Drinking water quality in
Nepal’s Kathmandu Valley: a survey and assessment of selected controlling site
characteristics. Hydrogeology Journal 16: 321–334.
339. Watts R (1992) Low-cost water supplies and their contribution to health. Afr
Health 15: 10–11.
340. Welch P, David J, Clarke W, Trinidade A, Penner D, et al. (2000) Microbial
quality of water in rural communities of Trinidad. Rev Panam Salud Publica 8:
172–180.
341. Williams MA, Moran P, Nhandara C, Hove I, Charimari L, et al. (1997)
Contamination of traditional drinking water sources during a period of extreme
drought in the Zvimba communal lands, Zimbabwe. Cent Afr J Med 43: 316–
321.
342. Wright J, Cronin A, Okotto-Okotto J, Yang H, Pedley S, et al. (2013) A spatial
analysis of pit latrine density and groundwater source contamination. Environ
Monit Asses 185: 4261–4272.
343. Wu Z (2008) Drinking water test of rural centralized water supply in Dianjiang.
Prev Med 46: 123–125.
344. Xavier RP, Siqueira LP, Chaves Vital FA, Soares Rocha FJ, Irmao JI, et al.
(2011) Microbiological quality of drinking rainwater in the inland region of
Pajeu, Pernambuco, northeast Brazil. Revista do Instituto de Medicina
Tropical de Sao Paulo 53: 121–124.
345. Yao Y-B, Li Q-J, Liu X-Z (2012) Health survey of rural drinking water in
Jiangxi Province from 2008 to 2010. Journal of Environment and Health 29:
340–342.
346. Yasin N, Shah N, Khan J, Saba NU, ul Islam Z (2012) Bacteriological status of
drinking water in the peri-urban areas of Rawalpindi and Islamabad-Pakistan.
Afr J Microbiol Res 6: 169–175.
347. Yassin MM, Abu Amr SS, Al-Najar HM (2006) Assessment of microbiological
water quality and its relation to human health in Gaza Governorate, Gaza
Strip. Public Health 120: 1177–1187.
348. Yongsi HBN (2010) Suffering for water, suffering from water: access to
drinking-water and associated health risks in Cameroon. J Health Popul Nutr
28: 424–435.
349. Zeenat A, Hatha AAM, Viola L, Vipra K (2009) Bacteriological quality and
risk assessment of the imported and domestic bottled mineral water sold in Fiji.J Water Health 7: 642–649.
350. Zeilhofer P, Zeilhofer LV, Hardoim EL, Lima ZM, Oliveira CS (2007) GIS
applications for mapping and spatial modeling of urban-use water quality: a
case study in District of Cuiaba, Mato Grosso, Brazil. Cad Saude Publica 23:
875–884.
351. Zhang XD, Ge ZX, Xiang JH, Zhu MF, Zhang JF, et al. (2012) Water quality
in automatic water vending machines in Pudong New Area: an evaluation
using drinking water quality index. Huanjing yu Zhiye Yixue 29: 231–233.
352. Zuin V, Ortolano L, Alvarinho M, Russel K, Thebo A, et al. (2011) Watersupply services for Africa’s urban poor: the role of resale. J Water Health 9:
773–784.
353. Elala D, Labhasetwar P, Tyrrel SF (2011) Deterioration in water quality from
supply chain to household and appropriate storage in the context of
intermittent water supplies. Wa Sci Technol 11.
354. Shaheed A, Orgill J, Montgomery MA, Jeuland MA, Brown J (2014) Why
‘‘improved’’ water sources are not always safe. Bull World Health Organ 92:
283–289.
355. Hrudey SE, Hrudey EJ, Pollard SJT (2006) Risk management for assuring safedrinking water. Environ Int, 32(8): 948–957.
356. Foster T (2013) Predictors of Sustainability for Community-Managed
Handpumps in Sub-Saharan Africa: Evidence from Liberia, Sierra Leone,
and Uganda. Environ Sci Technol 47: 12037–12046.
357. Gunnarsdottir MJ, Gardarsson SM, Elliott M, Sigmundsdottir G, Bartram J
(2012) Benefits of water safety plans: microbiology, compliance, and public
health. Environ Sci Technol 46: 7782–7789.
358. Psutka R, Peletz R, Michelo S, Kelly P, Clasen T (2011) Assessing themicrobiological performance and potential cost of boiling drinking water in
urban Zambia. Environ Sci Technol 45: 6095–6101.
359. Blum D, Huttly SRA, Okoro JI, Akujobi C, Kirkwood BR (1987)
Bacteriological quality of traditional water sources in North-Eastern Imo
State, Nigeria. Epidemiol Infect 99:429–437.
360. Wright RC (1986) Seasonality of bacterial quality of water in a tropical
developing country (Sierra Leone). J Hygiene-Camb 96:75–82.
361. Kayser GL, Moriarty P, Fonseca C, Bartram J (2013) Drinking water service
delivery frameworks for monitoring evaluation, policy and planning: a review.Int J Environ Res Public Health Vol 10, No 10, p 4812–4835.
362. Bartram J (2008) Improving on haves and have-nots. Nature 452: 283–284.
363. de Albuquerque C, Roaf V (2012) On the right track: good practices inrealising the rights to water and sanitation. Geneva: OHCRH.
364. Yang H, Bain R, Bartram J, Gundry S, Pedley S, et al. (2013) Water safety and
inequality in access to drinking-water between rich and poor households.
Environ Sci Technol 47: 1222–1230.
365. Rivera SC, Hazen TC, Toranzos GA (1988) Isolation of fecal coliforms from
pristine sites in a tropical rain forest. Appl Environ Microbiol 54: 513–517.
366. Ayoob S, Gupta AK (2006) Fluoride in drinking water: a review on the status
and stress effects. Crit Rev Env Sci Tec 36: 433–487.
367. Amini M, Mueller K, Abbaspour KC, Rosenberg T, Afyuni M, et al. (2008)
Statistical modeling of global geogenic fluoride contamination in groundwaters.
Environ Sci Technol 42: 3662–3668.
368. Amini M, Abbaspour KC, Berg M, Winkel L, Hug SJ, et al. (2008) Statisticalmodeling of global geogenic arsenic contamination in groundwater. Environ
Sci Technol 42: 3669–3675.
369. Rehfuess EA, Bruce N, Bartram JK (2009) More health for your buck: health
sector functions to secure environmental health. Bull World Health Organ 87:
880–882.
370. Hunter PR, MacDonald AM, Carter RC (2010) Water Supply and Health.
PLoS Med 7: e1000361.
371. Hutton G (2012) Global costs and benefits of drinking-water supply and
sanitation interventions to reach the MDG target and universal coverage.Geneva: WHO. WHO/HSE/WSH/12.01.
372. Howard G, Bartram J (2005) Effective water supply surveillance in urban areas
of developing countries. J Water Health 3: 31–43.
373. Bradley DJ, Bartram JK (2013) Domestic water and sanitation as watersecurity: monitoring, concepts and strategy. Philos T Roy Soc A 371:
20120420.
374. WHO (2008) Essential environmental health standards in health care. Geneva:
WHO.
375. Ministry of Health Uganda, Macro International Inc. (2008) Uganda Service
Provision Assessment Survey 2007. Uganda; Calverton (Maryland): Ministry of
Health; Macro International Inc.
376. Ministry of Health Rwanda, Macro International Inc. (2008) Rwanda ServiceProvision Assessment Survey 2007. Rwanda; Calverton (Maryland): NIS,
MOH; Macro International Inc.
377. Peletz R, Mahin T, Elliott M, Harris MS, Chan KS, et al. (2013) Water,
sanitation, and hygiene interventions to improve health among people living
with HIV/AIDS: a systematic review. AIDS 27: 2593–2601.
378. Benova L, Cumming O, Campbell OM (2014) Systematic review and meta-
analysis: association between water and sanitation environment and maternal
mortality. Trop Med Int Health 19: 368–387.
379. Lim SS, Vos T, Flaxman AD, Danaei G, Shibuya K, et al. (2012) Acomparative risk assessment of burden of disease and injury attributable to 67
Fecal Contamination of Drinking-Water
PLOS Medicine | www.plosmedicine.org 21 May 2014 | Volume 11 | Issue 5 | e1001644

risk factors and risk factor clusters in 21 regions, 1990–2010: a systematic
analysis for the Global Burden of Disease Study 2010. Lancet 380: 2224–2260.380. Yang H, Wright JA, Gundry SW (2012) Water accessibility: boost water safety
in rural China. Nature 484: 318.
381. WHO/UNICEF (2012) Review: sampling issues in tools for water qualitymonitoring. Geneva and New York: WHO/UNICEF Joint Monitoring
Programme. Available: http://www.wssinfo.org/fileadmin/user_upload/resources/Report-of-Review-WQ-sampling-Geneva-18-19June2012_final.pdf.
Accessed 1 December 2013.
382. Jimenez A, Perez-Foguet A (2008) Improving water access indicators in
developing countries: a proposal using water point mapping methodology. Wa
Sci Technol 8: 279–287.
383. Brown J, Clasen T (2012) High adherence is necessary to realize health gains
from water quality interventions. PLoS One 7: e36735.
384. Hunter PR, Zmirou-Navier D, Hartemann P (2009) Estimating the impact on
health of poor reliability of drinking water interventions in developing
countries. Sci Total Environ 407: 2621-2624.
Fecal Contamination of Drinking-Water
PLOS Medicine | www.plosmedicine.org 22 May 2014 | Volume 11 | Issue 5 | e1001644

Editors’ Summary
Background. Access to clean water is fundamental tohuman health. The importance of water to human healthand wellbeing is encapsulated in the Human Right toWater, reaffirmed by the United Nations in 2010, whichentitles everyone to ‘‘sufficient, safe, acceptable andphysically accessible and affordable water for personaland domestic uses.’’ A step towards such universal accessto water is Millennium Development Goal (MDG) target 7cthat aims to halve the proportion of the populationwithout sustainable access to safe drinking-water. One ofthe indicators to help monitor progress towards this targetused by the Joint Monitoring Project (JMP—an initiative ofthe World Health Organization and UNICEF) is ‘‘use of animproved source.’’ Improved sources include piped waterinto a dwelling, yard, or plot, or a standpipe, borehole, andprotected dug well. Unimproved sources are those that donot protect water from outside contamination, such asunprotected wells, unprotected springs, and surfacewaters.
Why Was This Study Done? While this simple categori-zation may reflect established principles of sanitary protec-tion, this indicator has been criticized for not adequatelyreflecting safety, suggesting that reported access to safewater might be overestimated by billions of people by notaccounting for microbial water safety or more fully account-ing for sanitary status. So the researchers conducted asystematic review and meta-analysis to investigate whetherwater from improved sources is less likely to exceed health-based guidelines for microbial water quality than water fromunimproved sources and to what extent microbial contam-ination varies between source types, between countries, andbetween rural and urban areas.
What Did the Researchers Do and Find? The researcherscomprehensively searched the literature to find appropriatestudies that investigated fecal contamination of all types ofdrinking-water in low and middle-income countries. Theresearchers included studies that contained extractable dataon Escherichia coli or thermotolerant coliform (the WHOrecommended indicators of fecal contamination) collectedby appropriate techniques. The authors also assessed studiesfor bias and quality and used a statistical method (randomeffects meta-regression) to investigate risk factors andsettings where fecal contamination of water sources wasmost common.
Using these methods, the authors included 319 studiesreporting on 96,737 water samples. Most studies were fromsub-Saharan Africa, southern Asia, or Latin America and theCaribbean. They found that overall, the odds (chance) ofcontamination within a given study were considerably lowerfor ‘‘improved’’ sources than ‘‘unimproved’’ sources (oddsratio = 0.15). However, in 38% of 191 studies, over a quarterof samples from improved sources contained fecal contam-ination. In particular, protected dug wells were rarely free offecal contamination. The researchers also found that watersources in low-income countries, and rural areas were morelikely to be contaminated (both had odds ratios of 2.37).
What Do These Findings Mean? These findings showthat while water from improved sources is less likely tocontain fecal contamination than unimproved sources, theyare not consistently safe. This study also provides evidencethat by equating ‘‘improved’’ with ‘‘safe,’’ the number ofpeople with access to a safe water source has been greatlyoverstated, and suggests that a large number and propor-tion of the world’s population use unsafe water. As studiesrarely reported stored water quality or sanitary risks, theaccuracy of these findings may be limited. Nevertheless, thefindings from this study suggest that the Global Burden ofDisease 2010 may greatly underestimate diarrheal diseaseburden by assuming zero risk from improved water sourcesand that new indicators are needed to assess access to safedrinking water. Therefore, greater use should be made ofother measures, such as sanitary inspections, to provide acomplementary means of assessing safety and to helpidentify corrective actions to prevent water contamination.
Additional Information. Please access these Web sites viathe online version of this summary at http://dx.doi.org/10.1371/journal.pmed.1001644.
N PLOS Medicine has a published series on water andsanitation
N The WHO/UNICEF Joint Monitoring Programme for WaterSupply and Sanitation has extensive information includingdata and country files
N UN Water is the inter-agency coordination mechanism forall freshwater and sanitation related matters
N The UN also provides information on the human right towater and sanitation
Fecal Contamination of Drinking-Water
PLOS Medicine | www.plosmedicine.org 23 May 2014 | Volume 11 | Issue 5 | e1001644