Defesa da desobediência civil como direito fundamental Rev MP Maranhão
Upload
khangminh22Category
view
1download
0
FEASIBILITY STUDY ON THE AURIZONA GOLD MINE PROJECT, MARANHÃO, BRAZIL
NI 43-101 TECHNICAL REPORT
Prepared by Lycopodium Minerals Canada Ltd in accordance with the requirements of National Instrument 43-101, “Standards of Disclosure
for Mineral Project”, of the Canadian Securities Administrators Qualified Persons: Neil Lincoln, P.Eng., VP Business Development and Studies, Lycopodium Minerals Canada Ltd. Miguel Tortosa, P.Eng., Senior Project Manager, Lycopodium Minerals Canada Ltd. Sindy Cheng, P.Eng., Lead Process Engineer, Lycopodium Minerals Canada Ltd. Stephen Day, Geoscientist, SRK Consulting Inc. Esteban Hormazabal Z, Principal Consultant, Rock Mechanics David Pieter Hoekstra, Principal Consultant, SRK Consulting Inc. Marek Nowak, P.Eng., Principal Geostatistician, SRK Consulting Inc. Jeffrey V. Parshley, Chairman, SRK Consulting Inc. Michael Royle, Principal Hydrogeologist, SRK Consulting (Canada) James Siddorn, Geologist, SRK Consulting Inc. Jose Carlos Virgili, Director, Walm Engenharia e Tecnologia Amviental Gordon Zurowski, P.Eng., Principal Mine Engineer, AGP Mining Consultants Submitted to: Trek Mining 730 – 800 West Pender Street Vancouver, British Columbia V6C 2V6 Canada
File Location: 16.04
Rev: 0
01 10.07.2017 ISSUED NL MT NL
REV NO. DATE REVIEW BY DESIGN
APPROVED PROJECT
APPROVED
Lycopodium Minerals Canada, 5060 Spectrum Way, Suite 400, Mississauga, Ontario L4W 5N5

FEASIBILITY STUDY ON THE AURIZONA GOLD MINE PROJECT NI 43-101 TECHNICAL REPORT
DATE & SIGNATURE PAGE
Title of Report: “Feasibility Study on the Aurizona Gold Mine Project” NI 43-101 Technical Report
Location: Maranhão, Brazil
Effective Date of Report: 10 July 2017
[SIGNED] DATE
Neil Lincoln, P.Eng. (Lycopodium) 9 August, 2017
Miguel Tortosa, P.Eng. (Lycopodium) 9 August, 2017
Sindy Cheng, P.Eng. (Lycopodium) 9 August, 2017
Stephen Day (SRK Consulting Inc.) 9 August, 2017
Esteban Hormazabal Z (SRK Consulting) 9 August, 2017
David Pieter Hoekstra (SRK Consulting) 9 August, 2017
Marek Nowak (SRK Consulting Inc.) 9 August, 2017
Jeffrey V. Parshley, ( SRK Consulting) 9 August, 2017
Michael Royle (SRK Consulting) 9 August, 2017
James Siddorn, (SRK Consulting) 9 August, 2017
Jose Carlos Virgili (Walm) 9 August, 2017
Gordon Zurowski, P.Eng. (AGP) 9 August, 2017
5070-16.04\5070-STY-001_01
July 2017 Lycopodium Minerals Canada Ltd

FEASIBILITY STUDY ON THE AURIZONA GOLD MINE PROJECT NI 43-101 TECHNICAL REPORT
Table of Contents
1.0 SUMMARY 1.1 1.1 Principal Outcomes 1.1 1.2 Background 1.2
1.2.1 Pre-feasibility Study 1.2 1.2.2 Feasibility Study 1.2
1.3 Reliance on Other Experts 1.3 1.4 Property Description and Ownership 1.3 1.5 Geology and Mineralization 1.3 1.6 Exploration 1.4 1.7 Drilling 1.4 1.8 Mineral Resource Estimate 1.5 1.9 Mineral Processing and Metallurgical Testing 1.6 1.10 Mineral Reserve Estimates 1.7 1.11 Mining Methods 1.7 1.12 Recovery Methods 1.12 1.13 Project Infrastructure 1.12 1.14 Environmental Conditions 1.14 1.15 Capital and Operating Cost Estimates 1.14 1.16 Economic Analysis 1.16 1.17 Adjacent Properties 1.17 1.18 Interpretations and Conclusions 1.18 1.19 Recommendations 1.18
2.0 INTRODUCTION 2.1 2.1 Background 2.1 2.2 Terms of Reference 2.3 2.3 Qualified Persons 2.3 2.4 Scope of Personal Inspection 2.5 2.5 Effective Dates 2.5 2.6 Previous Technical Reports 2.6
3.0 RELIANCE ON OTHER EXPERTS 3.1 3.1 Mineral Titles 3.1 3.2 Royalties, Agreements, Encumbrances and Income Taxes 3.1 3.3 Environmental Liabilities and Permitting 3.1
4.0 PROPERTY DESCRIPTION AND LOCATION 4.1 4.1 Property Description and Location 4.1 4.2 Mineral Titles 4.3 4.3 Legal Surveys 4.9 4.4 Location of Mineralization 4.9 4.5 Nature and Extent of Issuer’s Interest 4.9 4.6 Royalties, Agreements, Encumbrances and Income Taxes 4.9
4.6.1 Royalties 4.9 4.6.2 Sandstorm Agreement 4.9 4.6.3 SUDENE Tax Incentive 4.10
4.7 Environmental Liabilities and Permitting 4.11
5070-16.04\5070-STY-001_01
July 2017 Lycopodium Minerals Canada Ltd
FEASIBILITY STUDY ON THE AURIZONA GOLD MINE PROJECT NI 43-101 TECHNICAL REPORT
4.7.1 Required Permits and Status 4.11 4.7.2 Environmental Liabilities 4.12 4.7.3 Other Significant Factors and Risks 4.12
5.0 ACCESSIBILITY, CLIMATE, LOCAL RESOURCES, INFRASTRUCTURE AND PHYSIOGRAPHY 5.1 5.1 Topography, Elevation and Vegetation 5.1 5.2 Climate 5.1 5.3 Sufficiency of Surface Rights 5.1 5.4 Accessibility and Transportation to the Property 5.1 5.5 Infrastructure Availability and Sources 5.2
5.5.1 Access Road and Transportation 5.2 5.5.2 Power 5.2 5.5.3 Mine and Plant Access Roads 5.3 5.5.4 Mine Site Facilities 5.3 5.5.5 Plant Site Facilities 5.3 5.5.6 Tailings Storage Facility 5.3 5.5.7 Water 5.3 5.5.8 Mining Personnel 5.4 5.5.9 Waste Disposal Areas 5.4 5.5.10 Processing Plant Sites 5.4 5.5.11 Communications 5.5
6.0 HISTORY 6.1 6.1 Prior Ownership and Ownership Changes 6.2 6.2 Previous Exploration and Development Results 6.2
6.2.1 Gencor (1991 to 1995) 6.2 6.2.2 Eldorado Gold Corp (1996 to 1997) 6.4 6.2.3 Brascan (1999 to 2000) 6.5
6.3 Historic Mineral Resource and Reserve Estimates 6.5 6.4 Historic Production 6.6
7.0 GEOLOGICAL SETTING AND MINERALIZATION 7.1 7.1 Regional Geology 7.1
7.1.2 Lithology 7.3 7.1.3 Structural Geology 7.4 7.1.4 Weathering Profile 7.5
7.2 Local and Property Geology 7.5 7.2.2 Local Lithology 7.7 7.2.3 Weathering Profile 7.11 7.2.4 Structural Geology 7.12 7.2.5 Mineralization 7.13
8.0 DEPOSIT TYPES 8.1
9.0 EXPLORATION 9.1 9.1 Geological Mapping 9.1 9.2 Geophysical Surveys 9.1 9.3 Airborne Geophysical Surveys 9.2 9.4 Ground Geophysical Surveys 9.3
5070-16.04\5070-STY-001_01
July 2017 Lycopodium Minerals Canada Ltd
FEASIBILITY STUDY ON THE AURIZONA GOLD MINE PROJECT NI 43-101 TECHNICAL REPORT
9.5 Auger Drilling 9.3 9.6 Trenching 9.3 9.7 Regional Drilling 9.3
10.0 DRILLING 10.1 10.1 Trek Drilling Procedures 10.1
10.1.1 Drill Responsibilities 10.2 10.1.2 Diamond Drilling 10.2 10.1.3 Procedures at the Drill 10.2 10.1.4 Core Transportation Procedure 10.3 10.1.5 Drill Core Checking 10.3 10.1.6 Photography 10.3 10.1.7 Core Logging 10.3 10.1.8 Reverse Circulation Drilling 10.4
10.2 Historical Drilling 10.4 10.3 Trek Drilling 10.4
11.0 SAMPLE PREPARATION, ANALYSES AND SECURITY 11.1 11.1 Methods 11.1
11.1.1 Historic Core Sampling Methods 11.1 11.1.2 Trek Core Sampling Methods 11.1
11.2 Factors Impacting Accuracy of Results 11.2 11.3 Security Measures 11.2 11.4 Historical Sample Preparation and Analysis 11.2
11.4.1 Diamond Drill Samples 11.2 11.4.2 Reverse Circulation Drill Samples 11.3 11.4.3 Assaying 11.3 11.4.4 Quality Assurance/Quality Control 11.3
11.5 Trek Sample Preparation and Analysis 11.4 11.5.1 Laboratory and Sample Submission Procedures 11.4 11.5.2 Sample Preparation 11.4 11.5.3 Assay 11.6
11.6 Quality Assurance/Quality Control 11.7 11.6.1 Blanks 11.8 11.6.2 Standards 11.8 11.6.3 Duplicates 11.12
11.7 Specific Gravity 11.14 11.8 SRK Comments 11.14
12.0 DATA VERIFICATION 12.1 12.1 Verifications by Trek 12.1 12.2 Verifications in Previous Technical Reports 12.1 12.3 Verifications by SRK Consulting 12.1
12.3.1 Site Visit 12.1 12.3.2 Database Validation 12.2 12.3.3 Data Type Validation 12.2
12.4 Data Adequacy 12.3
13.0 MINERAL PROCESSING AND METALLURGICAL TESTING 13.1 13.1 Metallurgical Testwork 13.1
5070-16.04\5070-STY-001_01
July 2017 Lycopodium Minerals Canada Ltd
FEASIBILITY STUDY ON THE AURIZONA GOLD MINE PROJECT NI 43-101 TECHNICAL REPORT
13.1.1 Metallurgical Testing Before 2012 13.2 13.1.2 Metallurgical Testing Between 2012 and 2015 13.6 13.1.3 Metallurgical Testing in 2016 13.44 13.1.4 Metallurgical Testing in 2017 13.54
13.2 Metallurgical Performance Projections 13.66
14.0 MINERAL RESOURCE ESTIMATES 14.1 14.1 Introduction 14.1 14.2 Resource Estimation Procedures 14.1 14.3 Resource Database 14.2 14.4 Geology Modelling 14.2
14.4.1 Piaba 14.3 14.4.2 Boa Esperança 14.10
14.5 Compositing 14.14 14.5.1 Piaba 14.14 14.5.2 Boa Esperança 14.15
14.6 Capping 14.15 14.6.1 Piaba 14.15 14.6.2 Boa Esperança 14.16
14.7 Contact Analysis 14.17 14.7.1 Piaba 14.17 14.7.2 Boa Esperança 14.17
14.8 Statistical Analysis 14.18 14.8.1 Piaba 14.18 14.8.2 Boa Esperança 14.18
14.9 Variography 14.19 14.9.1 Piaba 14.19 14.9.2 Boa Esperança 14.20
14.10 Specific Gravity 14.20 14.10.1 Piaba 14.20 14.10.2 Boa Esperança 14.21
14.11 Block Model and Grade Estimation Methodology 14.21 14.11.1 Boa Esperança 14.24
14.12 Model Validation and Sensitivity 14.26 14.12.1 Piaba 14.27
14.13 Mineral Resource Classification 14.31 14.13.1 Piaba 14.31 14.13.2 Boa Esperança 14.32
14.14 Mineral Resource Statement 14.33 14.15 Grade Sensitivity Analysis 14.37 14.16 Comparison with 2016 Resource Estimates in the Piaba Deposit 14.42
15.0 MINERAL RESERVE ESTIMATES 15.1 15.1 Summary 15.1 15.2 Mining Method and Mining Costs 15.1
15.2.1 Geotechnical Considerations 15.2 15.2.2 Economic Pit Shell Development 15.2 15.2.3 Cut-off Grade 15.3 15.2.4 Dilution 15.4 15.2.5 Pit Design 15.4
5070-16.04\5070-STY-001_01
July 2017 Lycopodium Minerals Canada Ltd

FEASIBILITY STUDY ON THE AURIZONA GOLD MINE PROJECT NI 43-101 TECHNICAL REPORT
15.2.6 Mine Reserves Statement 15.5
16.0 MINING METHODS 16.1 16.1 Introduction 16.1 16.2 Geologic Model Importation 16.1 16.3 Economic Pit Shell Development 16.4 16.4 Dilution Calculation 16.8 16.5 Geotechnical 16.10
16.5.1 Site Geology 16.10 16.5.2 Structural and Engineering Geology 16.10 16.5.3 Pit Slope Design 16.12
16.6 Pit Design and Phase Development 16.16 16.7 Mine Schedule 16.29 16.8 Grade Control 16.35 16.9 Waste Management Facility Design 16.36 16.10 Mine Plan Sequence 16.38 16.11 Comments on Section 16 16.48
17.0 RECOVERY METHODS 17.1 17.1 Mineral Processing 17.1
17.1.1 Introduction 17.1 17.1.2 Summary 17.2
17.2 Plant Design 17.6 17.2.1 Major Process Design Criteria 17.6
17.3 Process Plant Description 17.7 17.3.1 Primary Crushing 17.7 17.3.2 Mill Feed Surge Bin 17.8 17.3.3 Cyanide Leaching and Carbon Adsorption 17.9 17.3.4 Carbon Stripping 17.11 17.3.5 Carbon Reactivation 17.12 17.3.6 Intensive Cyanide Leaching – Gravity Concentrate 17.12 17.3.7 Gold Electrowinning and Refining 17.13 17.3.8 Treatment of Leach Residue 17.13 17.3.9 Tailing Management 17.13 17.3.10 Reagents Handling 17.13 17.3.11 Water Supply 17.14 17.3.12 Air Supply 17.15 17.3.13 Assay and Metallurgical Laboratory 17.15 17.3.14 Process Control and Instrumentation 17.16
18.0 PROJECT INFRASTRUCTURE 18.1 18.1 Mine Infrastructure 18.1
18.1.1 Mine Truck Shop/Warehouse Facility 18.1 18.1.2 Mine Roads 18.1 18.1.3 Explosives Storage 18.1
18.2 Process Plant and Site Infrastructure 18.3 18.3 Camp 18.15 18.4 Water Supply and Water Balance 18.15
18.4.1 Site Wide Water Balance 18.15 18.5 Plant Geotechnical Conditions 18.20
5070-16.04\5070-STY-001_01
July 2017 Lycopodium Minerals Canada Ltd

FEASIBILITY STUDY ON THE AURIZONA GOLD MINE PROJECT NI 43-101 TECHNICAL REPORT
18.6 Surface Water Management 18.20 18.6.1 Conceptual Surface Water Flow Model 18.20 18.6.2 Surface Water Management 18.21 18.6.3 Pit Dewatering 18.23 18.6.4 Pump Sizing and Water Exchange 18.23 18.6.5 Sediment Management 18.27
18.7 Tailings Storage Facility 18.27 18.7.1 Vené TSF 18.28 18.7.2 Ze Bolacha TSF 18.32
18.8 Waste Storage Facilities 18.35 18.8.1 General 18.35 18.8.2 Waste Storage Facilities 18.36 18.8.3 Stability Analysis 18.37
19.0 MARKET STUDIES AND CONTRACTS 19.1 19.1 Market Studies 19.1 19.2 Contracts 19.1
20.0 ENVIRONMENTAL STUDIES, PERMITTING AND SOCIAL OR COMMUNITY IMPACT 20.1 20.1 Mine License 20.1 20.2 Regulatory Framework and Update 20.3
20.2.1 Brazilian Laws 20.3 20.2.2 Environmental Permitting 20.5 20.2.3 Mining Permitting 20.7
20.3 Potential Environmental Impacts and Mitigation Measures 20.8 20.3.1 Ongoing Monitoring Program 20.9 20.3.2 Geochemical Characterization 20.10 20.3.3 Waste Rock Geochemical Characterization 20.10 20.3.4 Tailings Geochemical Characterization 20.11 20.3.5 Water and Load Balance Modelling 20.11 20.3.6 Acid Rock Drainage Management Plan 20.11
20.4 Required Permits and Status 20.12 20.4.1 Post-Performance or Reclamations Bonds 20.13
20.5 Social and Community 20.13 20.5.1 Program “Grow-up” 20.13 20.5.2 Program “Human Resources Hires” 20.14 20.5.3 Campaigns to Raise Social Awareness 20.14 20.5.4 Program “Gold Women” 20.14 20.5.5 Program “Open Doors”: Public Consultation 20.14 20.5.6 Local Infrastructure Development 20.15 20.5.7 Public Security 20.15 20.5.8 Potable Water Treatment Plant 20.15 20.5.9 Hospital 20.15
20.6 Closure 20.15 20.6.1 Closure Objectives and Assumptions 20.16 20.6.2 Post-Closure Land Use 20.17 20.6.3 Water Management 20.17 20.6.4 Piaba and Boa Esperança Pits 20.17 20.6.5 Waste Rock Storage Facilities 20.18 20.6.6 Tailings Storage Facility (TSF) 20.19
5070-16.04\5070-STY-001_01
July 2017 Lycopodium Minerals Canada Ltd

FEASIBILITY STUDY ON THE AURIZONA GOLD MINE PROJECT NI 43-101 TECHNICAL REPORT
20.6.7 Process Plant 20.19 20.6.8 Buildings and Infrastructure 20.19 20.6.9 Monitoring 20.20 20.6.10 Closure Management and Security 20.21 20.6.11 Mine Closure Schedule 20.21 20.6.12 Relinquishment 20.21
21.0 CAPITAL AND OPERATING COSTS 21.1 21.1 Capital Cost Estimate 21.1 21.2 Capital Cost Estimate Responsibility 21.1 21.3 Work Breakdown Structure WBS 21.2 21.4 Process Plant Capital Costs 21.5 21.5 Basis of Estimate 21.8
21.5.1 Temporary Construction Facilities 21.10 21.5.2 Preliminaries 21.11 21.5.3 Earthworks 21.11 21.5.4 Concrete 21.12 21.5.5 Steelwork 21.12 21.5.6 Platework/Tankage 21.12 21.5.7 In-plant Conveyors 21.13 21.5.8 Mechanical Equipment 21.13 21.5.9 Plant Pipework 21.13 21.5.10 Overland Pipework 21.13 21.5.11 Electrical/Instrumentation 21.13 21.5.12 Erection and Installation 21.14 21.5.13 Architectural/Buildings 21.14 21.5.14 Transport 21.14 21.5.15 Catering and Accommodation 21.14 21.5.16 Engineering Procurement and Construction Management 21.14 21.5.17 Pre-production Costs 21.14 21.5.18 Working Capital 21.14 21.5.19 Vendor Commissioning 21.15 21.5.20 Spares 21.15 21.5.21 Project Insurance 21.15 21.5.22 Duties/Taxes/Fees 21.15 21.5.23 First Fill and Opening Stocks 21.15 21.5.24 Qualifications/Exclusions 21.15
21.6 Labour Rates and Crew Rates 21.16 21.7 General and Administration Labour 21.17 21.8 Exchange Rates 21.18 21.9 Contingency 21.19 21.10 Detailed Capital Cost Estimate Breakdown 21.19 21.11 Mining Capital Cost 21.22
21.11.1 Mining Capital 21.23 21.11.2 Miscellaneous Mine Capital 21.26 21.11.3 Pre-Production Stripping 21.27 21.11.4 Contingency 21.27
21.12 Operating Costs 21.28 21.12.1 Introduction 21.28
21.13 Mining Operating Cost 21.29
5070-16.04\5070-STY-001_01
July 2017 Lycopodium Minerals Canada Ltd

FEASIBILITY STUDY ON THE AURIZONA GOLD MINE PROJECT NI 43-101 TECHNICAL REPORT
21.13.1 Labour – Trek and Contractor 21.29 21.13.2 General Mine and Engineering 21.32 21.13.3 Drilling and Blasting 21.33 21.13.4 Grade Control 21.35 21.13.5 Dewatering 21.36 21.13.6 Contract Services 21.37 21.13.7 Total Mine Operating Costs 21.38
21.14 Process Plant Operating Costs 21.38 21.14.1 Introduction 21.39 21.14.2 Qualifications and Exclusions 21.41 21.14.3 Exchange Rates, Estimate Date and Escalation 21.41 21.14.4 Operating Cost Accuracy 21.41 21.14.5 Plant Design Parameters 21.42 21.14.6 Cost Categories 21.42 21.14.7 Production Schedule Operating Cost Analysis 21.54
22.0 ECONOMIC ANALYSIS 22.3 22.1 Introduction 22.3 22.2 Main Assumptions and Parameters 22.3
22.2.1 Production 22.3 22.2.2 Capital Investment 22.4 22.2.3 Operating Costs 22.7 22.2.4 Revenue 22.8 22.2.5 Royalties 22.8 22.2.6 Taxation 22.9 22.2.7 All-In Sustaining Costs 22.12 22.2.8 Evaluation Date, Escalation and Others 22.12
22.3 Financial Analysis 22.12 22.4 Sensitivity Analysis 22.13
22.4.1 Sensitivity Analysis – NPV (after tax) 22.14 22.4.2 Sensitivity Analysis – IRR 22.15
23.0 ADJACENT PROPERTIES 23.1
24.0 OTHER RELEVANT DATA AND INFORMATION 24.1
25.0 INTERPRETATION AND CONCLUSIONS 25.1 25.1 General 25.1 25.2 Mineral Resource Estimate 25.1 25.3 Mineral Processing and Metallurgical Testing 25.2 25.4 Mining Methods 25.2 25.5 Recovery Methods 25.3 25.6 Project Infrastructure 25.4
25.6.1 General 25.4 25.6.2 Fresh Water 25.4 25.6.3 Tailings Storage Facilities 25.4 25.6.4 Water Management 25.5 25.6.5 Waste Storage Facilities (WSF) 25.5 25.6.6 Closure Planning 25.6
25.7 Environmental Studies, Permitting and Social or Community Impact 25.6
5070-16.04\5070-STY-001_01
July 2017 Lycopodium Minerals Canada Ltd

FEASIBILITY STUDY ON THE AURIZONA GOLD MINE PROJECT NI 43-101 TECHNICAL REPORT
25.8 Economic Analysis 25.6
26.0 RECOMMENDATIONS 26.1 26.1 General 26.1 26.2 Geology and Resource Estimate 26.1 26.3 Mineral Processing and Metallurgical Testing 26.1 26.4 Mining Methods 26.1 26.5 Recovery Methods 26.1 26.6 Tailings Storage Facility 26.1 26.7 Waste Storage Facilities 26.1 26.8 Mine Waste Geochemistry 26.2 26.9 Pit Geotechnical Engineering 26.2 26.10 Plant Geotechnical Engineering 26.3 26.11 Water Supply 26.3 26.12 Surface Water Management Plan 26.4 26.13 Environmental Studies, Permitting and Social or Community Impact 26.4
26.13.1 Closure 26.4
27.0 REFERENCES 27.1
5070-16.04\5070-STY-001_01
July 2017 Lycopodium Minerals Canada Ltd

FEASIBILITY STUDY ON THE AURIZONA GOLD MINE PROJECT NI 43-101 TECHNICAL REPORT
TABLES Table 1.1 Aurizona Mine - Performance Summary 1.1 Table 1.2 Mineral Resource Statement*, Aurizona Property, Brazil, SRK Consulting 1.6 Table 1.3 Proven and Probable Reserves – Aurizona Mine 1.7 Table 1.4 LOM Schedule 1.10 Table 1.5 Capital Cost Summary - Major Area 1.15 Table 1.6 LOM Average Operating Costs 1.16 Table 1.7 Financial Results Summary 1.17 Table 2.1 NI 43-101 Technical Report Matrix 2.2 Table 2.2 Aurizona Mine Technical Report Qualified Persons 2.4 Table 2.3 Site Visits by Qualified Persons 2.5 Table 4.1 Obligations of Brazilian Exploration Permit Holders 4.3 Table 4.2 Trek Mineral Permits 4.5 Table 6.1 Historical Measured, Indicated and Inferred Mineral Resources 6.6 Table 6.2 Aurizona Production 2010 to 2015 6.6 Table 9.1 Summary of Exploration Work 9.1 Table 9.2 Summary of Regional Exploration Drilling 9.4 Table 10.1 Piaba and Boa Esperança Drilling by Drill Type 10.4 Table 11.1 QA/QC Sample Summary 11.7 Table 11.2 Standard Reference Material Samples 11.10 Table 13.1 Composite Head Analysis 13.3 Table 13.2 Bond Crushing, Ball Mill and Abrasion Index Determination 13.3 Table 13.3 Gold Recovery/Extraction versus Grind Size 13.4 Table 13.4 Test Results – Gravity Concentration Followed by Standard Cyanidation 13.4 Table 13.5 Test Results – Gravity Concentration Followed by CIL Cyanidation 13.5 Table 13.6 Activated Carbon Comparison 13.5 Table 13.7 Test Results – Gravity Concentration Followed by 24 Hour Direct Cyanidation 13.6 Table 13.8 Sample Received at Inspectorate, November 2012 – First Shipment 13.7 Table 13.9 Sample Received at Inspectorate, December 2013 – Second Shipment 13.8 Table 13.10 Head Grades - Variability Composites for Gravity/Cyanidation Tests 13.9 Table 13.11 Grindability Variability Composites 13.10 Table 13.12 Oxide Master Composite 13.11 Table 13.13 Rock Master Composite 13.11 Table 13.14 Piaba Saprolite and Transition Composite Head Assay 13.13 Table 13.15 Piaba Saprolite and Rock Diorite Head Assay on Selected Composites 13.13 Table 13.16 Mineral Weight Percentage Distribution, XRD – Quantitative Phase Analysis – Piaba 13.15 Table 13.17 Test Result Summary – Piaba Saprolite Composites 13.17 Table 13.18 Test Result Summary - Piaba Transition Composites 13.19 Table 13.19 Test Result Summary – Piaba Rock Diorite Composites 13.22 Table 13.20 Test Result Summary – Piaba Rock QDT Composites 13.25 Table 13.21 Test Result Summary - Piaba Rock QFP Composites 13.29 Table 13.22 Effect of Grind Size on Gold Recovery - Rock Master Composite 13.30 Table 13.23 Effect of Leaching Retention Time on Gold Recovery - Rock Master Composite 13.31 Table 13.24 Test Results – 2015 Rock QDT Composite 13.31 Table 13.25 Effect of Grind Size on Gold Recovery – Oxide Master Composite 13.32 Table 13.26 Effect of Leaching Retention Time on Gold Recovery - Oxide Master Composite 13.32 Table 13.27 Test Result Summary – Boa Esperança Deposit Composites 13.33 Table 13.28 Test Result Summary - Laterite Composites 13.34 Table 13.29 Gravity and Flotation Concentration Test Results 13.35 Table 13.30 Cyanide Leach Test Results - Flotation Concentrates 13.35
5070-16.04\5070-STY-001_01
July 2017 Lycopodium Minerals Canada Ltd
FEASIBILITY STUDY ON THE AURIZONA GOLD MINE PROJECT NI 43-101 TECHNICAL REPORT
Table 13.31 Grindability Test Results 13.38 Table 13.32 Summary of ALS Comminution Testwork 13.40 Table 13.33 Cyanide Detoxification Test Results 13.41 Table 13.34 Settling Test Results 13.42 Table 13.35 ABA Test Results 13.43 Table 13.36 Composite Sample and Head Assays 13.45 Table 13.37 Gravity Concentration and CIL Cyanidation Test Results 13.48 Table 13.38 60 kg Gravity Test Results 13.51 Table 13.39 Gravity Concentrate Leach Results 13.51 Table 13.40 Gravity-Cyanidation-Flotation-Concentration Regrind & Leaching Process Results 13.53 Table 13.41 Gravity-Flotation-Cyanidation Process Results 13.53 Table 13.42 Head Assay Data 13.56 Table 13.43 Summary of Gold Recoveries 13.57 Table 13.44 Summary of Gravity and Intensive Leach Recoveries 13.58 Table 13.45 Summary of Gravity Tails Leaching Test Results 13.59 Table 13.46 Cyanide Consumptions for Leach Tests 13.59 Table 13.47 Gold Recoveries Summary 13.60 Table 13.48 Head Assays Comparison - SGS vs. ALS Labs 13.60 Table 13.49 Percentage of High Arsenic Ores in Deposit 13.61 Table 13.50 Results of Au-AA31a and Au-AA31 Tests 13.63 Table 13.51 Preg-Robbing Index 13.64 Table 13.52 Metallurgical Performance Summary 13.66 Table 14.1 Exploration Data used for Resource Estimation 14.2 Table 14.2 Piaba: Final Estimation Domains 14.8 Table 14.3 Boa Esperança: Final Estimation Domains 14.12 Table 14.4 Piaba Gold Composite Capping 14.16 Table 14.5 Boa Esperança Gold Composite Capping 14.16 Table 14.6 Correlograms of Gold Grades 14.20 Table 14.7 Piaba: Average SG values 14.21 Table 14.8 Boa Esperança: Average SG values 14.21 Table 14.9 Piaba: Block Model Extents 14.22 Table 14.10 Piaba: Resource Estimation Parameters 14.24 Table 14.11 Boa Esperança: Block model extents 14.24 Table 14.12 Boa Esperança Estimation Parameters 14.26 Table 14.13 Boa Esperança Estimation Parameters 14.29 Table 14.14 WhittleTM Optimization Parameters for Resource Estimation Constraint 14.34 Table 14.15 Mineral Resource Statement*, Aurizona Property, Brazil, SRK Consulting 14.35 Table 14.16 Piaba Open Pit Mineral Resources Split by Weathering Horizons 14.35 Table 14.17 Boa Esperança Open Pit Mineral Resources Split by Weathering Horizons 14.36 Table 14.18 Piaba Cit-off Grade Sensitivity Analysis 14.38 Table 14.19 Boa Esperança Cut-off Grade Sensitivity Analysis 14.39 Table 15.1 Proven and Probable Reserves – Aurizona Mine 15.1 Table 15.2 Pit Optimization Parameters 15.3 Table 15.3 Proven and Probable Reserves – Summary for Aurizona 15.5 Table 15.4 Proven and Probable Reserves – By Pit Area 15.6 Table 16.1 Mineral Resource Statement*, Aurizona Property, Brazil, SRK 16.2 Table 16.2 Mineral Resources by Material Type – Piaba Pit, SRK 16.3 Table 16.3 Pit Optimization Parameters 16.5 Table 16.4 Main Geotechnical Units at the Aurizona Mine 16.10 Table 16.5 Integrated Structural Domains (spot surface mapping, SM & Core Logging, CL) 16.11
5070-16.04\5070-STY-001_01
July 2017 Lycopodium Minerals Canada Ltd
FEASIBILITY STUDY ON THE AURIZONA GOLD MINE PROJECT NI 43-101 TECHNICAL REPORT
Table 16.6 Summary of the rock mass Parameters for the main Geotechnical Units 16.12 Table 16.7 Slope design recommendations for Piaba Central & Piaba East Pits 16.15 Table 16.8 Summary of Geotechnical Parameters Used in Detail Design 16.18 Table 16.9 Final Design – Phase Tonnages and Grades 16.19 Table 16.10 Feasibility Mine Schedule 16.32 Table 16.11 Waste Storage Facility (WSF) Parameters 16.38 Table 17.1 Major Design Criteria 17.6 Table 18.1 Explosives Quantities Stored and Minimum Separation Distances 18.2 Table 18.2 Sediment Basin and Sump Pump Parameters 18.25 Table 18.3 Dewatering Parameters 18.26 Table 18.4 Pump Requirements for Average Operating Conditions 18.27 Table 18.5 Vené TSF Dam Raises 18.29 Table 18.6 Vené Stability Summary at Crest El. 40.5m 18.31 Table 18.7 Ze Bolacha Stability Analysis Summary at Crest El. 36m 18.34 Table 18.8 Ze Bolacha Dam Raises 18.35 Table 18.9 Parameters Adopted for the Waste Material 18.37 Table 18.10 Modelled Foundation Material Strengths 18.38 Table 18.11 North & West WFS Stability Analysis 18.40 Table 18.12 South WSF Stability Analysis 18.41 Table 18.13 East WSF 18.42 Table 20.1 Mining Permit Status 20.2 Table 20.2 Aurizona Mine Monitored Parameters 20.10 Table 20.3 Post Closure Land Use 20.17 Table 20.4 Preliminary Mine Closure Schedule 20.21 Table 21.1 Capital Cost Estimate Responsibility 21.2 Table 21.2 Capital Cost Work Breakdown Structure – Level 1 to 3 21.3 Table 21.3 Capital Cost Work Breakdown Structure – Discipline Codes 21.5 Table 21.4 Capital Cost Estimate Summary by Area (US$, Q2 2017, -10% +15%) 21.6 Table 21.5 Capital Cost Estimate Summary by Commodity (US$, Q2 2017, -10% +15%) 21.7 Table 21.6 Capital Cost Estimate Basis 21.8 Table 21.7 Crew Rates 21.16 Table 21.8 General and Administration Labour 21.17 Table 21.9 Exchange Rates 21.19 Table 21.10 Capital Cost Estimate by Plant Area (US$, Q1 2017, -10% +15%) 21.20 Table 21.11 Capital Cost Summary – Mining (excluding contingency and taxes) 21.22 Table 21.12 Mining Capital by Period 21.23 Table 21.13 Mining Major Equipment – Capital Cost (excluding contingency, taxes and associated Trek
Costs) 21.24 Table 21.14 Contractor Mining Equipment by Period 21.25 Table 21.15 Contingency Percentages – Mining Capital Cost Estimate 21.27 Table 21.16 Life of Mine Operating Cost Summary 21.28 Table 21.17 Mine Staffing and Hourly Requirements and Annual Employee Wages (Year 2) 21.30 Table 21.18 Proposed Contractor Personnel 21.32 Table 21.19 Drill Pattern Specifications 21.33 Table 21.20 Drill Productivity Criteria 21.34 Table 21.21 Design Powder Factors 21.34 Table 21.22 Dewatering Parameters 21.37 Table 21.23 Contract Mining Tonnages and Contract Cost 21.38 Table 21.24 Open Pit Mine Operating Costs ($/t Total Material) 21.38 Table 21.25 Open Pit Mine Operating Costs ($/t Ore Processed) 21.38
5070-16.04\5070-STY-001_01
July 2017 Lycopodium Minerals Canada Ltd
FEASIBILITY STUDY ON THE AURIZONA GOLD MINE PROJECT NI 43-101 TECHNICAL REPORT
Table 21.26 LOM Process Operating Summary 21.40 Table 21.27 Process Design Criteria 21.42 Table 21.28 Process Plant Labour Compensation 21.44 Table 21.29 Summary of Consumables and Reagent Consumptions and Costs for Saprolite Ores 21.45 Table 21.30 Summary of Consumables and Reagent Consumptions and Costs for Transition Ores 21.47 Table 21.31 Summary of Consumables and Reagent Consumptions and Costs for Fresh Rock 21.49 Table 21.32 Summary of Power Costs for Saprolite Ores 21.51 Table 21.33 Summary of Power Costs for Transition Ores 21.51 Table 21.34 Summary of Power Costs for Fresh Rock 21.52 Table 21.35 Summary of Maintenance Costs 21.53 Table 21.36 Summary of G&A Expenses 21.54 Table 21.37 Process Plant Capacity and Metal Production 21.55 Table 21.38 Summary of Operating Cost by Year 21.55 Table 22.1 Initial Capital Cost Summary 22.5 Table 22.2 Capital Cost Disbursement Schedule 22.6 Table 22.3 Sustaining Capital Summary 22.6 Table 22.4 Sustaining Capital Disbursement Schedule 22.7 Table 22.5 Operating Costs Summary 22.8 Table 22.6 All-In Sustaining Costs 22.12 Table 22.7 Financial Results Summary 22.13 Table 22.8 Sensitivities for NPV (after tax) @ 5% Discount Rate 22.14 Table 22.9 Sensitivities for IRR 22.15 Table 22.10 Projections - Production Flow 22.16 Table 22.11 Projections - Total Operating Costs 22.18 Table 22.12 Projections - Unit Operating Costs 22.19 Table 22.13 Projections: Profit and Loss Statement 22.20 Table 22.14 Projections: Post-tax Cash Flow Statement 22.21 Table 22.15 Projections: Pre-tax Cash Flow Statement 22.23 Table 22.16 Projections: All In Sustaining Costs (AISC) 22.24 Table 22.17 Projections: Income Taxes and Compensations 22.25 Table 22.18 ICMS Credits Conversion 22.27 Table 25.1 Process Plant Recoveries 25.4 Table 25.2 LOM Project Operating Costs 25.7 Table 25.3 Project Summary Economic Parameters 25.8 FIGURES Figure 1.1 Site Layout with Pits and WSF 1.11 Figure 4.1 General Location Map 4.2 Figure 4.2 Trek Mineral Permits 4.8 Figure 7.1 Aurizona Regional Geology Map 7.2 Figure 7.2 Aurizona Regional Geophysical Map - Total Magnetic Intensity 7.5 Figure 7.3 Aurizona Property Geology Map 7.6 Figure 7.6 Piaba and Boa Esperança Mineralization Location 7.14 Figure 9.1 Historical Regional Airborne Magnetic Survey 9.2 Figure 9.2 Near-Mine Exploration Targets and Gold Occurrences 9.4 Figure 9.3 Regional Exploration Targets and Gold Occurrences 9.5 Figure 10.1 Piaba and Boa Esperança Drill Hole Location Map 10.5 Figure 10.2 Cross Section through Piaba, 50m Thick, Looking Northeast 10.6 Figure 11.1 Aurizona ALS Chemex Drill Core and RC Sample Preparation Flowsheet 11.6
5070-16.04\5070-STY-001_01
July 2017 Lycopodium Minerals Canada Ltd
FEASIBILITY STUDY ON THE AURIZONA GOLD MINE PROJECT NI 43-101 TECHNICAL REPORT
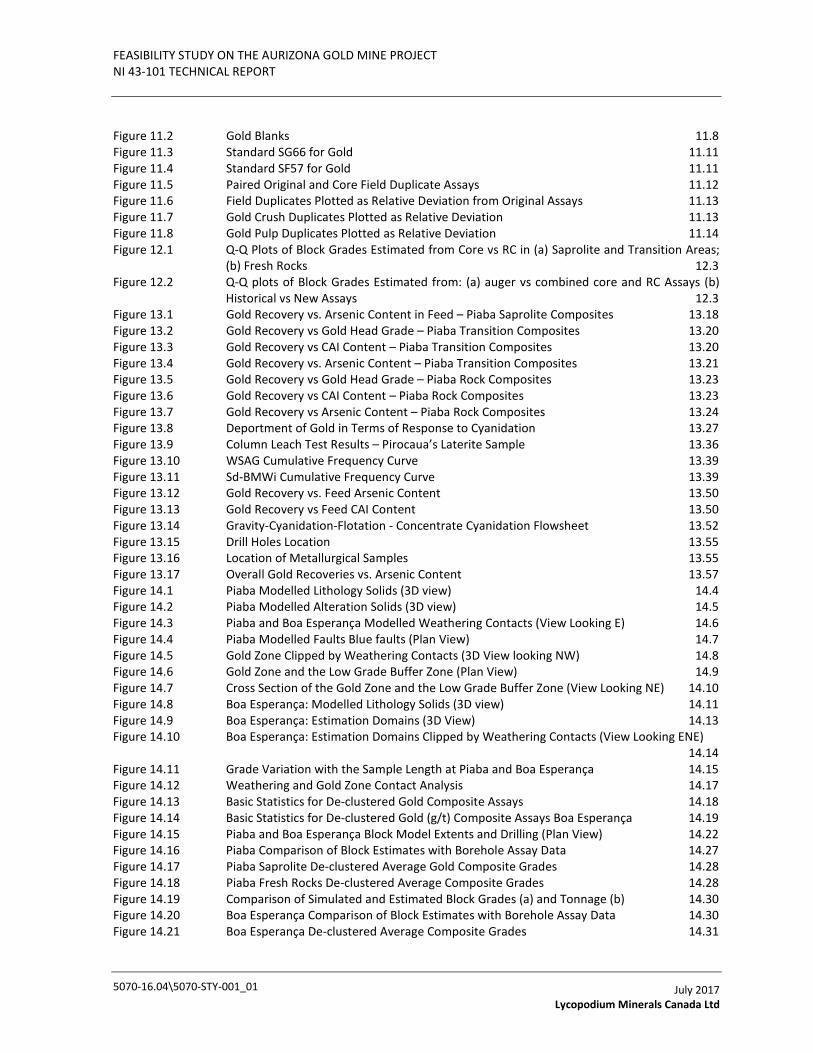
Figure 11.2 Gold Blanks 11.8 Figure 11.3 Standard SG66 for Gold 11.11 Figure 11.4 Standard SF57 for Gold 11.11 Figure 11.5 Paired Original and Core Field Duplicate Assays 11.12 Figure 11.6 Field Duplicates Plotted as Relative Deviation from Original Assays 11.13 Figure 11.7 Gold Crush Duplicates Plotted as Relative Deviation 11.13 Figure 11.8 Gold Pulp Duplicates Plotted as Relative Deviation 11.14 Figure 12.1 Q-Q Plots of Block Grades Estimated from Core vs RC in (a) Saprolite and Transition Areas;
(b) Fresh Rocks 12.3 Figure 12.2 Q-Q plots of Block Grades Estimated from: (a) auger vs combined core and RC Assays (b)
Historical vs New Assays 12.3 Figure 13.1 Gold Recovery vs. Arsenic Content in Feed – Piaba Saprolite Composites 13.18 Figure 13.2 Gold Recovery vs Gold Head Grade – Piaba Transition Composites 13.20 Figure 13.3 Gold Recovery vs CAI Content – Piaba Transition Composites 13.20 Figure 13.4 Gold Recovery vs. Arsenic Content – Piaba Transition Composites 13.21 Figure 13.5 Gold Recovery vs Gold Head Grade – Piaba Rock Composites 13.23 Figure 13.6 Gold Recovery vs CAI Content – Piaba Rock Composites 13.23 Figure 13.7 Gold Recovery vs Arsenic Content – Piaba Rock Composites 13.24 Figure 13.8 Deportment of Gold in Terms of Response to Cyanidation 13.27 Figure 13.9 Column Leach Test Results – Pirocaua’s Laterite Sample 13.36 Figure 13.10 WSAG Cumulative Frequency Curve 13.39 Figure 13.11 Sd-BMWi Cumulative Frequency Curve 13.39 Figure 13.12 Gold Recovery vs. Feed Arsenic Content 13.50 Figure 13.13 Gold Recovery vs Feed CAI Content 13.50 Figure 13.14 Gravity-Cyanidation-Flotation - Concentrate Cyanidation Flowsheet 13.52 Figure 13.15 Drill Holes Location 13.55 Figure 13.16 Location of Metallurgical Samples 13.55 Figure 13.17 Overall Gold Recoveries vs. Arsenic Content 13.57 Figure 14.1 Piaba Modelled Lithology Solids (3D view) 14.4 Figure 14.2 Piaba Modelled Alteration Solids (3D view) 14.5 Figure 14.3 Piaba and Boa Esperança Modelled Weathering Contacts (View Looking E) 14.6 Figure 14.4 Piaba Modelled Faults Blue faults (Plan View) 14.7 Figure 14.5 Gold Zone Clipped by Weathering Contacts (3D View looking NW) 14.8 Figure 14.6 Gold Zone and the Low Grade Buffer Zone (Plan View) 14.9 Figure 14.7 Cross Section of the Gold Zone and the Low Grade Buffer Zone (View Looking NE) 14.10 Figure 14.8 Boa Esperança: Modelled Lithology Solids (3D view) 14.11 Figure 14.9 Boa Esperança: Estimation Domains (3D View) 14.13 Figure 14.10 Boa Esperança: Estimation Domains Clipped by Weathering Contacts (View Looking ENE) 14.14 Figure 14.11 Grade Variation with the Sample Length at Piaba and Boa Esperança 14.15 Figure 14.12 Weathering and Gold Zone Contact Analysis 14.17 Figure 14.13 Basic Statistics for De-clustered Gold Composite Assays 14.18 Figure 14.14 Basic Statistics for De-clustered Gold (g/t) Composite Assays Boa Esperança 14.19 Figure 14.15 Piaba and Boa Esperança Block Model Extents and Drilling (Plan View) 14.22 Figure 14.16 Piaba Comparison of Block Estimates with Borehole Assay Data 14.27 Figure 14.17 Piaba Saprolite De-clustered Average Gold Composite Grades 14.28 Figure 14.18 Piaba Fresh Rocks De-clustered Average Composite Grades 14.28 Figure 14.19 Comparison of Simulated and Estimated Block Grades (a) and Tonnage (b) 14.30 Figure 14.20 Boa Esperança Comparison of Block Estimates with Borehole Assay Data 14.30 Figure 14.21 Boa Esperança De-clustered Average Composite Grades 14.31
5070-16.04\5070-STY-001_01
July 2017 Lycopodium Minerals Canada Ltd
FEASIBILITY STUDY ON THE AURIZONA GOLD MINE PROJECT NI 43-101 TECHNICAL REPORT
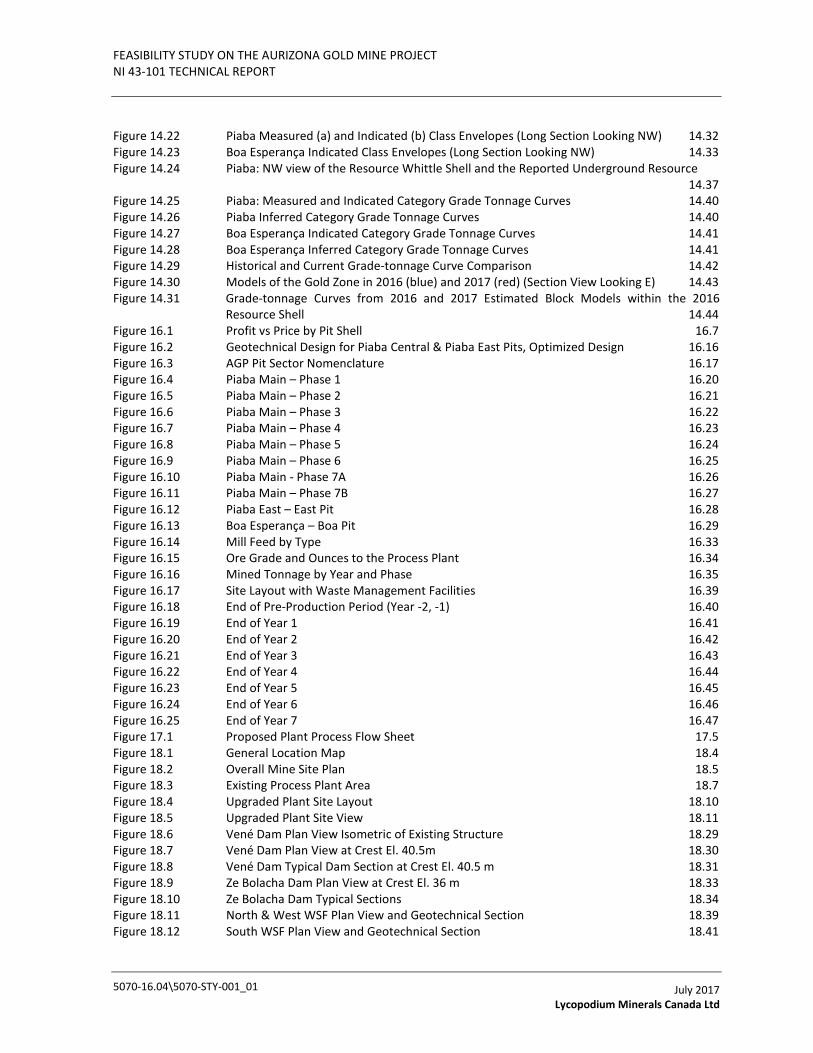
Figure 14.22 Piaba Measured (a) and Indicated (b) Class Envelopes (Long Section Looking NW) 14.32 Figure 14.23 Boa Esperança Indicated Class Envelopes (Long Section Looking NW) 14.33 Figure 14.24 Piaba: NW view of the Resource Whittle Shell and the Reported Underground Resource 14.37 Figure 14.25 Piaba: Measured and Indicated Category Grade Tonnage Curves 14.40 Figure 14.26 Piaba Inferred Category Grade Tonnage Curves 14.40 Figure 14.27 Boa Esperança Indicated Category Grade Tonnage Curves 14.41 Figure 14.28 Boa Esperança Inferred Category Grade Tonnage Curves 14.41 Figure 14.29 Historical and Current Grade-tonnage Curve Comparison 14.42 Figure 14.30 Models of the Gold Zone in 2016 (blue) and 2017 (red) (Section View Looking E) 14.43 Figure 14.31 Grade-tonnage Curves from 2016 and 2017 Estimated Block Models within the 2016
Resource Shell 14.44 Figure 16.1 Profit vs Price by Pit Shell 16.7 Figure 16.2 Geotechnical Design for Piaba Central & Piaba East Pits, Optimized Design 16.16 Figure 16.3 AGP Pit Sector Nomenclature 16.17 Figure 16.4 Piaba Main – Phase 1 16.20 Figure 16.5 Piaba Main – Phase 2 16.21 Figure 16.6 Piaba Main – Phase 3 16.22 Figure 16.7 Piaba Main – Phase 4 16.23 Figure 16.8 Piaba Main – Phase 5 16.24 Figure 16.9 Piaba Main – Phase 6 16.25 Figure 16.10 Piaba Main - Phase 7A 16.26 Figure 16.11 Piaba Main – Phase 7B 16.27 Figure 16.12 Piaba East – East Pit 16.28 Figure 16.13 Boa Esperança – Boa Pit 16.29 Figure 16.14 Mill Feed by Type 16.33 Figure 16.15 Ore Grade and Ounces to the Process Plant 16.34 Figure 16.16 Mined Tonnage by Year and Phase 16.35 Figure 16.17 Site Layout with Waste Management Facilities 16.39 Figure 16.18 End of Pre-Production Period (Year -2, -1) 16.40 Figure 16.19 End of Year 1 16.41 Figure 16.20 End of Year 2 16.42 Figure 16.21 End of Year 3 16.43 Figure 16.22 End of Year 4 16.44 Figure 16.23 End of Year 5 16.45 Figure 16.24 End of Year 6 16.46 Figure 16.25 End of Year 7 16.47 Figure 17.1 Proposed Plant Process Flow Sheet 17.5 Figure 18.1 General Location Map 18.4 Figure 18.2 Overall Mine Site Plan 18.5 Figure 18.3 Existing Process Plant Area 18.7 Figure 18.4 Upgraded Plant Site Layout 18.10 Figure 18.5 Upgraded Plant Site View 18.11 Figure 18.6 Vené Dam Plan View Isometric of Existing Structure 18.29 Figure 18.7 Vené Dam Plan View at Crest El. 40.5m 18.30 Figure 18.8 Vené Dam Typical Dam Section at Crest El. 40.5 m 18.31 Figure 18.9 Ze Bolacha Dam Plan View at Crest El. 36 m 18.33 Figure 18.10 Ze Bolacha Dam Typical Sections 18.34 Figure 18.11 North & West WSF Plan View and Geotechnical Section 18.39 Figure 18.12 South WSF Plan View and Geotechnical Section 18.41
5070-16.04\5070-STY-001_01
July 2017 Lycopodium Minerals Canada Ltd

FEASIBILITY STUDY ON THE AURIZONA GOLD MINE PROJECT NI 43-101 TECHNICAL REPORT
Figure 18.13 East WSF - Evaluated Stability Sections 18.42 Figure 22.1 Sensitivities for NPV @ 5% Discount Rate 22.14 Figure 22.2 Sensitivities for IRR 22.15
5070-16.04\5070-STY-001_01
July 2017 Lycopodium Minerals Canada Ltd

FEASIBILITY STUDY ON THE AURIZONA GOLD MINE PROJECT
NI 43-101 TECHNICAL REPORT - SUMMARY
5070-STY-001
Table of Contents Page
1.0 SUMMARY 1.1 1.1 Principal Outcomes 1.1 1.2 Background 1.2
1.2.1 Pre-feasibility Study 1.2 1.2.2 Feasibility Study 1.2
1.3 Reliance on Other Experts 1.3 1.4 Property Description and Ownership 1.3 1.5 Geology and Mineralization 1.3 1.6 Exploration 1.4 1.7 Drilling 1.4 1.8 Mineral Resource Estimate 1.5 1.9 Mineral Processing and Metallurgical Testing 1.6 1.10 Mineral Reserve Estimates 1.7 1.11 Mining Methods 1.7 1.12 Recovery Methods 1.12 1.13 Project Infrastructure 1.12 1.14 Environmental Conditions 1.14 1.15 Capital and Operating Cost Estimates 1.14 1.16 Economic Analysis 1.16 1.17 Adjacent Properties 1.17 1.18 Interpretations and Conclusions 1.18 1.19 Recommendations 1.18
TABLES Table 1.1 Aurizona Mine - Performance Summary 1.1 Table 1.2 Mineral Resource Statement*, Aurizona Property, Brazil, SRK Consulting 1.6 Table 1.3 Proven and Probable Reserves – Aurizona Mine 1.7 Table 1.4 LOM Schedule 1.10 Table 1.5 Capital Cost Summary - Major Area 1.15 Table 1.6 LOM Average Operating Costs 1.16 Table 1.7 Financial Results Summary 1.17 FIGURES Figure 1.1 Site Layout with Pits and WSF 1.11
5070\16.4\5070-STY-001 July 2017 Lycopodium Minerals Canada Ltd.
FEASIBILITY STUDY ON THE AURIZONA GOLD MINE PROJECT NI 43-101 TECHNICAL REPORT
Page 1.1
1.0 SUMMARY
1.1 Principal Outcomes
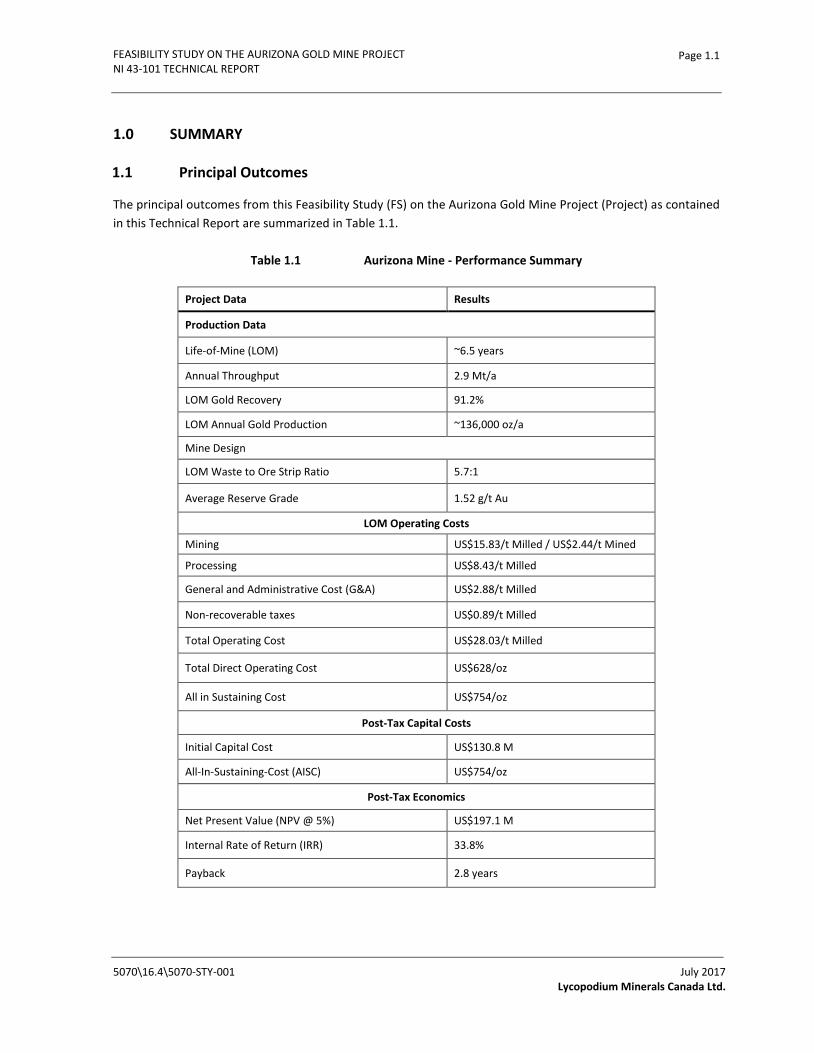
The principal outcomes from this Feasibility Study (FS) on the Aurizona Gold Mine Project (Project) as contained in this Technical Report are summarized in Table 1.1.
Table 1.1 Aurizona Mine - Performance Summary
Project Data Results
Production Data
Life-of-Mine (LOM) ~6.5 years
Annual Throughput 2.9 Mt/a
LOM Gold Recovery 91.2%
LOM Annual Gold Production ~136,000 oz/a
Mine Design
LOM Waste to Ore Strip Ratio 5.7:1
Average Reserve Grade 1.52 g/t Au
LOM Operating Costs
Mining US$15.83/t Milled / US$2.44/t Mined
Processing US$8.43/t Milled
General and Administrative Cost (G&A) US$2.88/t Milled
Non-recoverable taxes US$0.89/t Milled
Total Operating Cost US$28.03/t Milled
Total Direct Operating Cost US$628/oz
All in Sustaining Cost US$754/oz
Post-Tax Capital Costs
Initial Capital Cost US$130.8 M
All-In-Sustaining-Cost (AISC) US$754/oz
Post-Tax Economics
Net Present Value (NPV @ 5%) US$197.1 M
Internal Rate of Return (IRR) 33.8%
Payback 2.8 years
5070\16.4\5070-STY-001 July 2017 Lycopodium Minerals Canada Ltd.
FEASIBILITY STUDY ON THE AURIZONA GOLD MINE PROJECT NI 43-101 TECHNICAL REPORT
Page 1.2
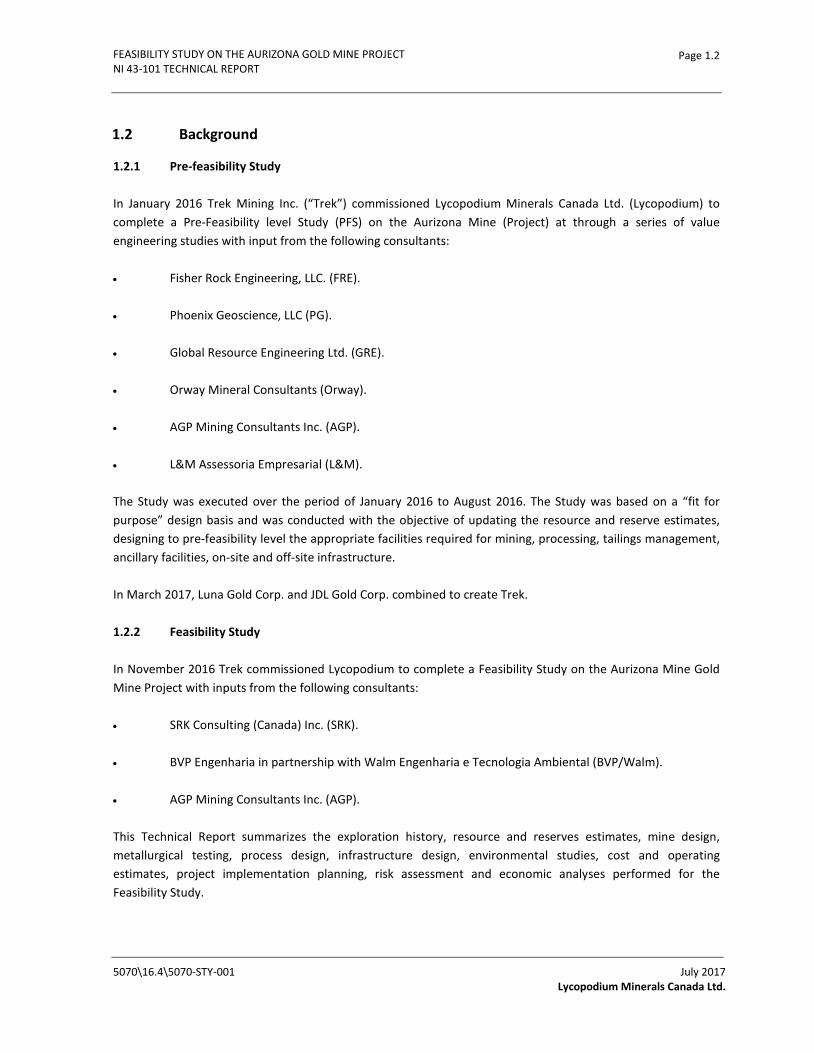
1.2 Background
1.2.1 Pre-feasibility Study
In January 2016 Trek Mining Inc. (“Trek”) commissioned Lycopodium Minerals Canada Ltd. (Lycopodium) to complete a Pre-Feasibility level Study (PFS) on the Aurizona Mine (Project) at through a series of value engineering studies with input from the following consultants:
• Fisher Rock Engineering, LLC. (FRE).
• Phoenix Geoscience, LLC (PG).
• Global Resource Engineering Ltd. (GRE).
• Orway Mineral Consultants (Orway).
• AGP Mining Consultants Inc. (AGP).
• L&M Assessoria Empresarial (L&M).
The Study was executed over the period of January 2016 to August 2016. The Study was based on a “fit for purpose” design basis and was conducted with the objective of updating the resource and reserve estimates, designing to pre-feasibility level the appropriate facilities required for mining, processing, tailings management, ancillary facilities, on-site and off-site infrastructure.
In March 2017, Luna Gold Corp. and JDL Gold Corp. combined to create Trek.
1.2.2 Feasibility Study
In November 2016 Trek commissioned Lycopodium to complete a Feasibility Study on the Aurizona Mine Gold Mine Project with inputs from the following consultants:
• SRK Consulting (Canada) Inc. (SRK).
• BVP Engenharia in partnership with Walm Engenharia e Tecnologia Ambiental (BVP/Walm).
• AGP Mining Consultants Inc. (AGP).
This Technical Report summarizes the exploration history, resource and reserves estimates, mine design, metallurgical testing, process design, infrastructure design, environmental studies, cost and operating estimates, project implementation planning, risk assessment and economic analyses performed for the Feasibility Study.
5070\16.4\5070-STY-001 July 2017 Lycopodium Minerals Canada Ltd.
FEASIBILITY STUDY ON THE AURIZONA GOLD MINE PROJECT NI 43-101 TECHNICAL REPORT
Page 1.3
Lycopodium considers the work performed appropriate for a Feasibility Study; -10% +15% intended overall accuracy; as defined by the Association for the Advancement of Cost Engineering (AACE).
All currency in this Technical Report is stated in US dollars unless otherwise indicated.
1.3 Reliance on Other Experts
In compiling this Technical Report, Lycopodium has relied upon others for certain aspects including mineral title, surface rights, property agreements, political setting, environmental liabilities and permitting and taxes as outlined in Section 3.
1.4 Property Description and Ownership
The Project is located in the state of Maranhão, northeastern Brazil between the cities of São Luis and Belém. The area is centred at latitude 01°18' south and longitude 45°45' west on the northern coast of Brazil, 320 km northwest of the capital city of São Luis. The Property is located on the Atlantic coast within 3 km of an ocean inlet. The elevation of the Project area varies from 0 to 90 masl. The climate is tropical, often humid, with annual rainfalls of up to 3,000 mm.
The Project currently consists of a developed mine camp, open pit operation, process plant and associated infrastructure. The Property includes one (1) Mining License (Portaria de Lavra) no. 1201/88, with DNPM no. 800.256/78, totalling 9,981 ha and27 exploration licenses totalling approximately 213,179 ha.
All mining and processing operations have been suspended as of September 2015. The Project and all facilities were placed on care and maintenance in the third quarter of 2015 pending additional geological exploration work and value engineering studies incorporating a hard rock crushing and grinding circuit. A Pre-feasibility Study was issued in October 2016 following resource definition and exploration drilling.
The Property is owned by Mineracão Aurizona S.A. (MASA), which is wholly owned by Aurizona Goldfields Corporation (AGC), a wholly owned subsidiary of Trek.
1.5 Geology and Mineralization
Aurizona is located within the São Luis Craton (SLC), an eastern extension of the Guyana Shield which contains several major Proterozoic gold deposits (e.g., Las Cristinas, Omai and Rosebel) extending from Venezuela to Brazil. The SLC consists of the Paleoproterozoic Aurizona Group metavolcano-sedimentary succession, volcanics and granitoids of the Tromaí Intrusive Suite covered by Phanerozoic sedimentary basin deposits and recent coastal sediments. The Aurizona Group hosts the Piaba and Boa Esperança gold deposits and numerous near-mine and regional exploration targets. It consists of a well-developed metavolcanosedimentary sequence of schists, intermediate to mafic metavolcanic and metapyroclastic rocks, in addition to subordinate quartzites, banded iron formation (BIF) and metachert intruded by dioritic and quartz porphyries, which collectively define a classic Greenstone Belt sequence.
5070\16.4\5070-STY-001 July 2017 Lycopodium Minerals Canada Ltd.
FEASIBILITY STUDY ON THE AURIZONA GOLD MINE PROJECT NI 43-101 TECHNICAL REPORT
Page 1.4
Piaba is a 3.3 km long shear-hosted orogenic gold deposit. The gold deposit trends east-northeast and is hosted in a northern hanging wall sequence composed mainly of quartz-diorite and quartz porphyry intrusives with subordinate intermediate volcanics. A distinctive volcano-sedimentary sequence forms a structural footwall limiting the deposit to the south. The host quartz-diorite intrusive is medium to coarsely crystalline and highly brecciated and altered. The orebody dips steeply to the north-northwest and gold occurs as native gold and within pyrite in several generations of quartz veins and disseminations within the host rocks. Hydrothermal alteration is dominated by quartz-carbonate-tourmaline-chlorite sericite-pyrite. The Boa Esperança deposit and near-mine exploration targets have similar geology to Piaba.
The Project area consists of a peneplain dissected into rounded flat knolls and bordered and interdigitated with Holocene marine and fluvio-marine sediments. The mineralized sequence is weathered to a vertical depth of more than 60m, below which primary gold mineralization occurs in less weathered, sulphide-bearing rocks. Trek utilizes a classification to standardize the weathering profile within the deposit, which includes laterite, saprolite, hard saprolite, an intervening transitional zone, and fresh rock.
1.6 Exploration
A number of different companies carried out initial exploration work between 1991 and January 2007, when Trek acquired the Project. Exploration activities included airborne and ground geophysical surveys; regional soil surveys; geological mapping and sampling; and auger, core, and reverse circulation (RC) drilling.
Trek has conducted detailed geological studies throughout the Aurizona region and has identified numerous regional and near-mine gold targets on the property. These targets have similar geological characteristics as Piaba and have the potential to enhance the project value. The near mine targets will be evaluated as the Project advances toward production.
1.7 Drilling
Trek has conducted diamond core, reverse circulation, and auger drilling at Aurizona Mine since its acquisition of the Property in January 2007. In general, RC and core holes are drilled sub-perpendicular to the main mineralization trends and are drilled at various dips to intersect the steeply-dipping mineralization and shear zones at high angles.
The sample interval is a nominal 2m in barren hanging wall rocks and is 1m or less within the mineralization. Intervals should neither be greater than 2.5m nor less than 0.2m. Sample intervals are selected on the basis of lithology, mineralization, alteration, weathering, structures and veins.
Trek has conducted an independent Quality Assurance/Quality Control (QA/QC) sampling program, such as blanks, standard reference materials, and duplicates, were included in the sample stream for the Piaba and Boa Esperança deposits. SRK has compiled and reviewed the results of the QA/QC sample program. Trek’s sampling methods, sample preparation and QA/QC procedures meet industry standards.
5070\16.4\5070-STY-001 July 2017 Lycopodium Minerals Canada Ltd.
FEASIBILITY STUDY ON THE AURIZONA GOLD MINE PROJECT NI 43-101 TECHNICAL REPORT
Page 1.5
The Piaba and Boa Esperança resource database includes all drilling and assays through December 2016. Auger drilling was not included in the Piaba Resource Estimation.
1.8 Mineral Resource Estimate
The mineral resource model prepared by SRK considers a total of 1,334 drill holes for both the Piaba and Boa Esperança deposits. The drill holes prior to 2007 were drilled by Gencor and Eldorado. Trek conducted all drilling during the period of 2007 to 2016. The resource estimation was completed by Marek Nowak, P.Eng (APEGBC #16985), an appropriate “independent qualified person” as this term is defined in National Instrument 43-101. The effective date of the resource statement is January 5, 2017.
At Piaba, ordinary kriging was used to estimate block grades and at Boa Esperança inversed distance squared estimation was applied. To determine the quantities of material offering “reasonable prospects for eventual economic extraction” by an open pit, SRK used a Whittle pit optimizer and reasonable mining assumptions to evaluate the proportions of the block models that could be “reasonably expected” to be mined from an open pit. The results are used as a guide to assist in the preparation of a mineral resource statement.
Table 1.2 presents the Measured, Indicated, and Inferred resources in the Piaba and Boa Esperança deposits at 0.6 g/t gold cut-off within the designed Whittle shells. In addition, a potential underground portion of the resource, classified as Inferred, below the Whittle shell is reported at 2.0 g/t gold cut-off. The underground portion is reported in higher grade areas, outlined within explicitly modelled envelopes, closer to the bottom of the Piaba Whittle shell. The cut-off is based on an assumption that the underground mine costs will be higher by a factor of three. The resources are based on the partial percentage block model and have been reported from the gold zone only, i.e., the resources are not diluted by the buffer zone.
5070\16.4\5070-STY-001 July 2017 Lycopodium Minerals Canada Ltd.

FEASIBILITY STUDY ON THE AURIZONA GOLD MINE PROJECT NI 43-101 TECHNICAL REPORT
Page 1.6
Table 1.2 Mineral Resource Statement*, Aurizona Property, Brazil, SRK Consulting
Deposit Category Quantity Grade Contained Metal
(x1000 Tonnes) Au (g/t) Au (000's oz)
Open Pit Piaba Measured 8,860 1.46 415
Indicated 19,030 1.64 1,002
Total M & I 27,890 1.58 1,417
Inferred 740 1.56 37
Boa Esperanҫa Indicated 370 1.14 14
Inferred 140 1.88 8
Total Open Pit M & I 28,260 1.57 1,431
Inferred 880 1.61 45
Underground Piaba Inferred 5,090 2.99 490
* Notes: The Mineral Resource estimate has an effective date of January 5, 2017 and was prepared by Mr. Marek Nowak, M.A.Sc., P.Eng. (APEGBC #16985) of SRK, who is a qualified person under NI 43-101. The Mineral Resources are inclusive of Mineral Reserves. Mineral Resources are reported relative to a conceptual pit shell. Open pit Mineral Resources are reported within the conceptual pit shell at a cut-off grade of 0.60 g/t gold, whereas underground Mineral Resources are reported below the conceptual pit shell at a cut-off grade of 2.0 g/t gold. The conceptual pit shell is based on a gold price of USD $1,400 and USD $1,350 per ounce at Piaba and Boa Esperança respectively. Gold recoveries of 90% for laterite / saprolite material and 89% transitional material and fresh rock were assumed. Mineral Resources are not Mineral reserves and do not have demonstrated economic viability. All figures are rounded to reflect the relative accuracy of the estimate. Mineral Resource estimates may be materially affected by environmental, permitting, legal, title, taxation, sociopolitical, marketing, and other relevant issues.
1.9 Mineral Processing and Metallurgical Testing
The process design criteria are based on test work conducted from 2011 through to 2017. The test work has been consistent across the various campaigns and laboratories and showed that gold is readily recovered using conventional cyanide leaching with a retention time of 30 hours. Utilizing a P80 100 µm grind size, gold recoveries between 90% and 97% are expected over the LOM.
Mineralization at the Piaba and Boa Esperança ore bodies is hosted across saprolite, hard saprolite, transition and fresh rock weathering horizons. The average Axb values were moderate for the transition ore and very competent for the fresh rock. The transition ore average Axb value of 67 was the 27th percentile of the Orway database. The fresh rock average Axb value of 28.1 was the 94th percentile of the Orway database. The Bond ball mill work indices (BWi) values ranged from very soft (saprolite) to moderate (fresh rock). The saprolite, transition and fresh rock average BWi values of 5.7, 8.1, and 13.6 places the respective ore in the 2nd, 7th and 32nd percentile for grinding amenability.
Leaching reagent consumptions ranges from 0.45 to 0.54 kg/t NaCN and 0.80 to 3.71 kg/t CaO.
.
5070\16.4\5070-STY-001 July 2017 Lycopodium Minerals Canada Ltd.

FEASIBILITY STUDY ON THE AURIZONA GOLD MINE PROJECT NI 43-101 TECHNICAL REPORT
Page 1.7
1.10 Mineral Reserve Estimates
The Project Mineral Reserves are based on the conversion of the Measured and Indicated Resources within the current Feasibility Study mine plan. Measured Resources were converted directly to Proven Reserves and Indicated Resources to Probable Reserves. The total Mineral Reserves for the Project are shown in Table 1.3.
Table 1.3 Proven and Probable Reserves – Aurizona Mine
Proven Probable Total
Ore Type Tonnes
kt Grade g/t Au
Gold oz
Tonnes kt
Grade g/t Au
Gold oz
Tonnes kt
Grade g/t Au
Gold oz
Laterite 122 1.94 8,000 539 0.98 17,000 661 1.16 25,000
Saprolite 1,684 1.52 82,000 1,310 1.38 58,000 2,994 1.46 140,000
Transition 2,553 1.34 110,000 1,363 1.18 52,000 3,916 1.29 162,000
Fresh Rock 4,079 1.46 192,000 8,186 1.72 452,000 12,265 1.63 644,000
Total 8,438 1.44 392,000 11,398 1.58 579,000 19,836 1.52 971,000
Note: This Mineral Reserve estimate is current as of May 29, 2017 and is based on the Mineral Resource estimate dated January 5, 2017 by SRK. The Mineral Reserve calculation was completed under the supervision of Gordon Zurowski, P.Eng of AGP Mining Consultants Inc., who is a Qualified Person as defined under NI 43-101. Mineral Reserves are stated within the final design pit based on a $1,056 /ounce gold price pit shell with a $1,200 /ounce gold price for revenue. The cut-off grade was 0.60 g/t Au for the Piaba pit areas and 0.41 g/t Au for the Boa Esperança area. The mining cost averaged $2.32/tonne mined, processing averages $11.30/tonne milled and G&A was $2.84/tonne milled. The process recovery averaged 90.3%. The exchange rate assumption applied was R$3.30 equal to US$1.00. The Mineral Reserves only consider the Piaba and Boa Esperança deposits.
1.11 Mining Methods
The open pit mine develops the resources that are contained within the Piaba and Boa Esperança resource areas. The resources that form the basis of the Feasibility Study mine designs and schedule are from the January 5, 2017 resource model. Only the Piaba and Boa Esperança deposits are included in the Study and only Measured and Indicated resources were used. All Inferred material was considered as waste with zero grade assigned.
A series of pit optimizations were examined at various metal prices with the base gold price at US$1,200/oz. Metal prices lower than were examined to determine the best blend of resource utilization, strip ratio and project economics. Based on this analysis the pit design work was advanced using pit shell based a gold price of US$1,056/oz.
The Piaba and Boa Esperança geologic models provided by SRK were ore percent models. The Piaba model had a mineralized corridor with a modelled “buffer” zone of mineralization. The more continuous nature of the zone lent itself to lower dilution. Diluted grades and ore percentages were calculated and used to determine
5070\16.4\5070-STY-001 July 2017 Lycopodium Minerals Canada Ltd.
FEASIBILITY STUDY ON THE AURIZONA GOLD MINE PROJECT NI 43-101 TECHNICAL REPORT
Page 1.8
the reserves. Using a 0.5m contact surface for Piaba this equated to 10% tonnage dilution and 3.6% grade dilution.
Boa Esperança was also an ore percent model but with a different block size and is less continuous than Piaba. For Boa Esperança the dilution was calculated for the contact blocks as well but more sides were present for diluting. The overall tonnage dilution for Boa was 11.6% due to the thin nature of the veins present and the grade dilution was 11.0%.
Eight pit phases are designed for Piaba Main and a single phase in Piaba East. A single pit design was created for Boa Esperança for the Study and this does not extend to the ultimate economic limits. The Boa Esperança pit’s primary purpose is a water storage facility which takes advantage of the mineralization present to offset the cost of excavating the facility. As such, the design was focused on maximizing the water storage capability and minimizing material movement.
The Life of Mine Plan mines 19.8 Mt of ore grading 1.52 g/t Au diluted and moves 113.2 Mt of waste. This equates to a 5.7:1 strip ratio. The resources for the Piaba pit phases are based on a cutoff of 0.6 g/t Au for all material to elevate the grade and ounces through the process plant. The Boa Esperança pit used a blended milling cutoff of 0.41 g/t Au for the material within that pit. The schedule uses a high-grade cut-off of 1 g/t Au for all material types to separate high grade from low grade in the mine schedule.
The deposits comprise laterite and saprolite material overlying a zone of transition material which in turn is underlain by fresh rock. The laterite and saprolite require no drilling and blasting. The transition will need light blasting and the rock, normal blasting. Blasting is expected to be accomplished with 127 mm top hammer or down the hole hammer drills on a 6m bench. Benches will be prepared with track dozers.
Ore grade control will utilize the blast holes in the fresh rock and reverse circulation drilling in the saprolite and transition zone and to a lesser degree in the fresh rock. Samples in the ore will be collected each metre and included in the ore control model for mine planning purposes. Drilling will be in advance of the mined benches to allow proper planning.
Equipment sizing for ramps and working benches is based on the use of 63 t rigid frame trucks but the full contract mining may only use 41 t articulated trucks and 30 t rigid body trucks. Single lane access is 17.8m (2 x operating width plus berm and ditch) and double lane widths are 23.5m (3 x operating width plus berm and ditch). Ramp gradients are 10% in the pit for uphill gradients and 8% uphill on the dump access roads. Working benches are designed for 35 to 40m minimum on push backs, although one push back did work in a retreat manner to facilitate access.
The mine designs apply the latest geotechnical criteria from SRK. Every 54m in the saprolite and transition material there will be an extra width berm. Every 108m in the rock there will be an extra width “geotechnical” berm. Mining in the saprolite and transition zone is single 6m benches. In the rock, the spacing between safety berms is 18m.
5070\16.4\5070-STY-001 July 2017 Lycopodium Minerals Canada Ltd.
FEASIBILITY STUDY ON THE AURIZONA GOLD MINE PROJECT NI 43-101 TECHNICAL REPORT
Page 1.9
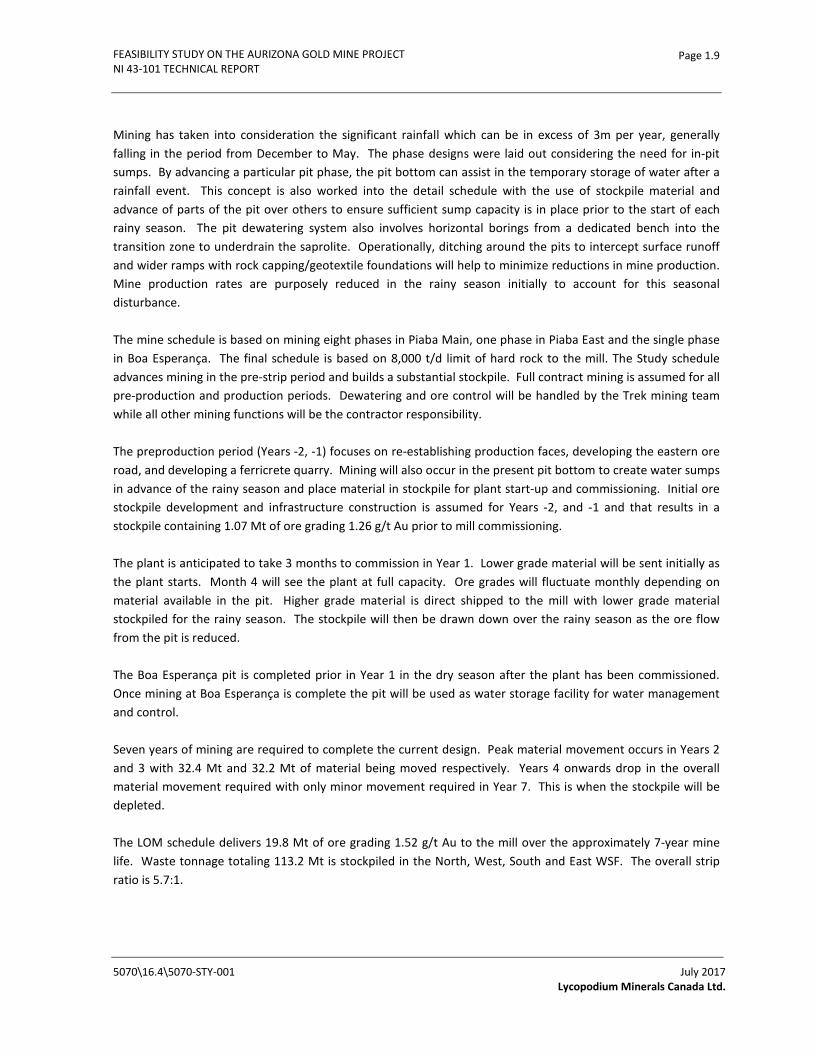
Mining has taken into consideration the significant rainfall which can be in excess of 3m per year, generally falling in the period from December to May. The phase designs were laid out considering the need for in-pit sumps. By advancing a particular pit phase, the pit bottom can assist in the temporary storage of water after a rainfall event. This concept is also worked into the detail schedule with the use of stockpile material and advance of parts of the pit over others to ensure sufficient sump capacity is in place prior to the start of each rainy season. The pit dewatering system also involves horizontal borings from a dedicated bench into the transition zone to underdrain the saprolite. Operationally, ditching around the pits to intercept surface runoff and wider ramps with rock capping/geotextile foundations will help to minimize reductions in mine production. Mine production rates are purposely reduced in the rainy season initially to account for this seasonal disturbance.
The mine schedule is based on mining eight phases in Piaba Main, one phase in Piaba East and the single phase in Boa Esperança. The final schedule is based on 8,000 t/d limit of hard rock to the mill. The Study schedule advances mining in the pre-strip period and builds a substantial stockpile. Full contract mining is assumed for all pre-production and production periods. Dewatering and ore control will be handled by the Trek mining team while all other mining functions will be the contractor responsibility.
The preproduction period (Years -2, -1) focuses on re-establishing production faces, developing the eastern ore road, and developing a ferricrete quarry. Mining will also occur in the present pit bottom to create water sumps in advance of the rainy season and place material in stockpile for plant start-up and commissioning. Initial ore stockpile development and infrastructure construction is assumed for Years -2, and -1 and that results in a stockpile containing 1.07 Mt of ore grading 1.26 g/t Au prior to mill commissioning.
The plant is anticipated to take 3 months to commission in Year 1. Lower grade material will be sent initially as the plant starts. Month 4 will see the plant at full capacity. Ore grades will fluctuate monthly depending on material available in the pit. Higher grade material is direct shipped to the mill with lower grade material stockpiled for the rainy season. The stockpile will then be drawn down over the rainy season as the ore flow from the pit is reduced.
The Boa Esperança pit is completed prior in Year 1 in the dry season after the plant has been commissioned. Once mining at Boa Esperança is complete the pit will be used as water storage facility for water management and control.
Seven years of mining are required to complete the current design. Peak material movement occurs in Years 2 and 3 with 32.4 Mt and 32.2 Mt of material being moved respectively. Years 4 onwards drop in the overall material movement required with only minor movement required in Year 7. This is when the stockpile will be depleted.
The LOM schedule delivers 19.8 Mt of ore grading 1.52 g/t Au to the mill over the approximately 7-year mine life. Waste tonnage totaling 113.2 Mt is stockpiled in the North, West, South and East WSF. The overall strip ratio is 5.7:1.
5070\16.4\5070-STY-001 July 2017 Lycopodium Minerals Canada Ltd.
FEASIBILITY STUDY ON THE AURIZONA GOLD MINE PROJECT NI 43-101 TECHNICAL REPORT
Page 1.10
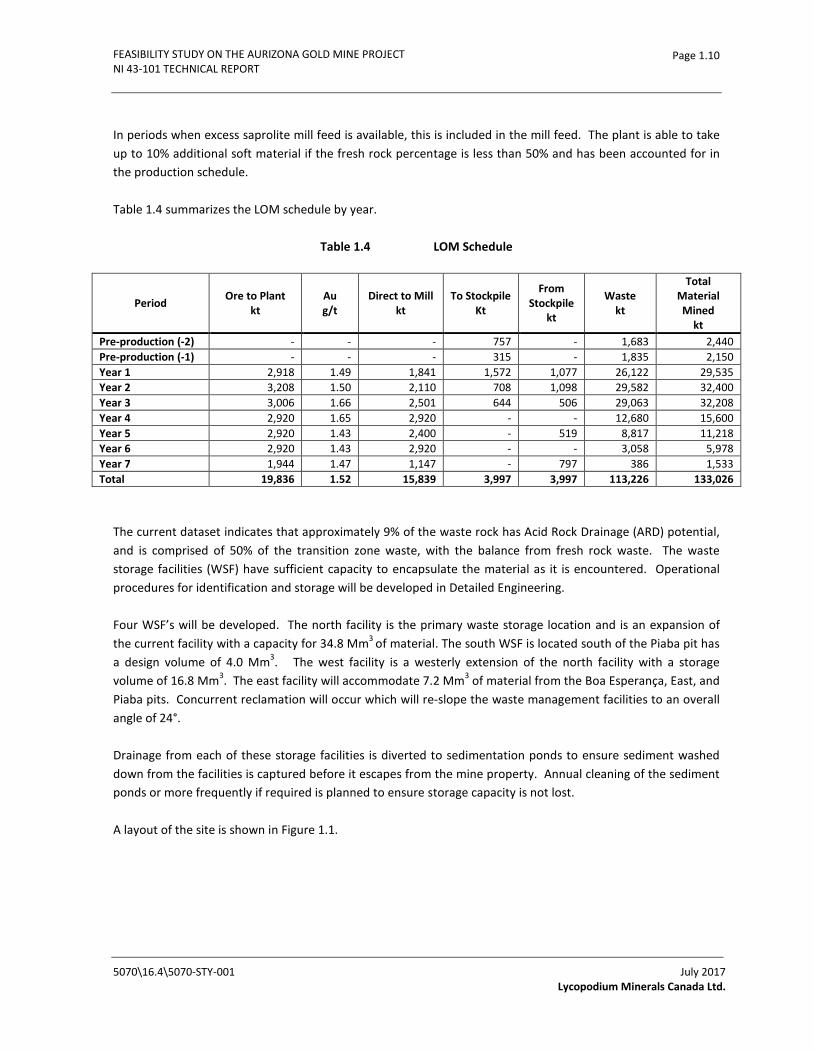
In periods when excess saprolite mill feed is available, this is included in the mill feed. The plant is able to take up to 10% additional soft material if the fresh rock percentage is less than 50% and has been accounted for in the production schedule.
Table 1.4 summarizes the LOM schedule by year.
Table 1.4 LOM Schedule
Period Ore to Plant kt
Au g/t
Direct to Mill kt
To Stockpile Kt
From Stockpile
kt
Waste kt
Total Material Mined
kt Pre-production (-2) - - - 757 - 1,683 2,440 Pre-production (-1) - - - 315 - 1,835 2,150 Year 1 2,918 1.49 1,841 1,572 1,077 26,122 29,535 Year 2 3,208 1.50 2,110 708 1,098 29,582 32,400 Year 3 3,006 1.66 2,501 644 506 29,063 32,208 Year 4 2,920 1.65 2,920 - - 12,680 15,600 Year 5 2,920 1.43 2,400 - 519 8,817 11,218 Year 6 2,920 1.43 2,920 - - 3,058 5,978 Year 7 1,944 1.47 1,147 - 797 386 1,533 Total 19,836 1.52 15,839 3,997 3,997 113,226 133,026
The current dataset indicates that approximately 9% of the waste rock has Acid Rock Drainage (ARD) potential, and is comprised of 50% of the transition zone waste, with the balance from fresh rock waste. The waste storage facilities (WSF) have sufficient capacity to encapsulate the material as it is encountered. Operational procedures for identification and storage will be developed in Detailed Engineering.
Four WSF’s will be developed. The north facility is the primary waste storage location and is an expansion of the current facility with a capacity for 34.8 Mm3 of material. The south WSF is located south of the Piaba pit has a design volume of 4.0 Mm3. The west facility is a westerly extension of the north facility with a storage volume of 16.8 Mm3. The east facility will accommodate 7.2 Mm3 of material from the Boa Esperança, East, and Piaba pits. Concurrent reclamation will occur which will re-slope the waste management facilities to an overall angle of 24°.
Drainage from each of these storage facilities is diverted to sedimentation ponds to ensure sediment washed down from the facilities is captured before it escapes from the mine property. Annual cleaning of the sediment ponds or more frequently if required is planned to ensure storage capacity is not lost.
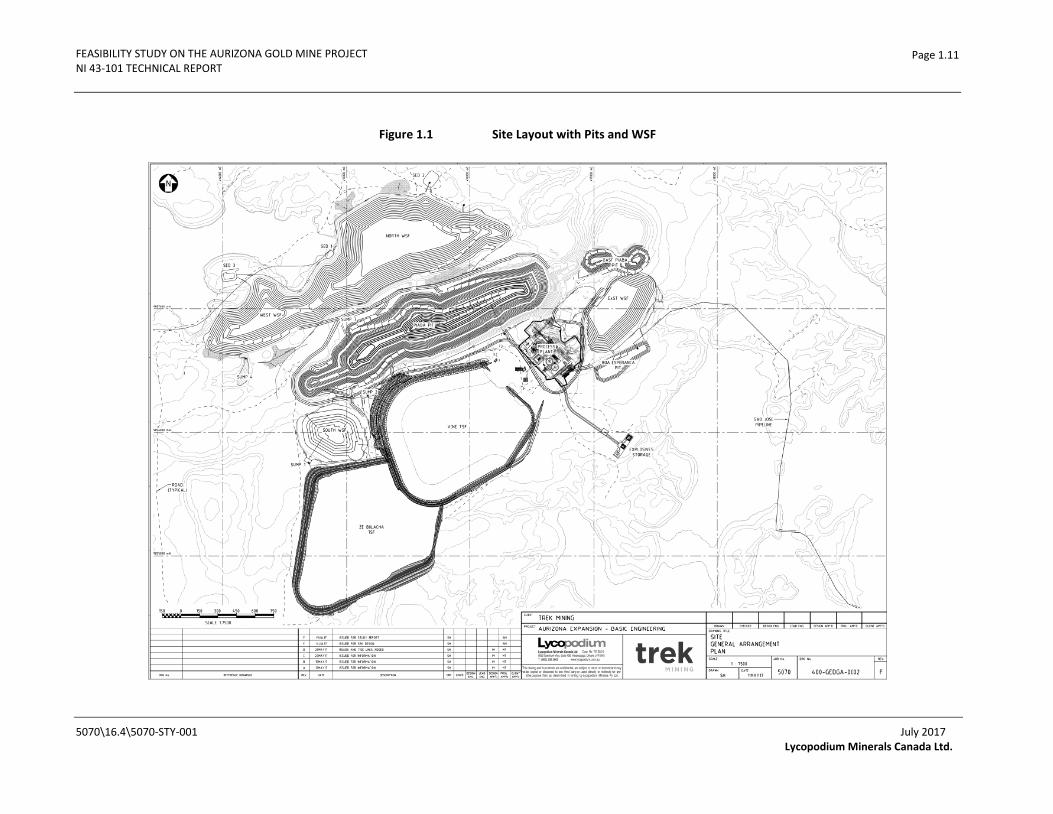
A layout of the site is shown in Figure 1.1.
5070\16.4\5070-STY-001 July 2017 Lycopodium Minerals Canada Ltd.
FEASIBILITY STUDY ON THE AURIZONA GOLD MINE PROJECT NI 43-101 TECHNICAL REPORT
Page 1.11
Figure 1.1 Site Layout with Pits and WSF
5070\16.4\5070-STY-001 July 2017 Lycopodium Minerals Canada Ltd.

FEASIBILITY STUDY ON THE AURIZONA GOLD MINE PROJECT NI 43-101 TECHNICAL REPORT
Page 1.12
1.12 Recovery Methods
Similar to the existing operation, a combination of conventional gravity concentration and leach/CIP cyanidation process is proposed for the plant expansion to a throughput of 8,000 t/d. The main upgrade for the throughput expansion will be to the comminution circuit making it capable of processing various mill feeds from the saprolite, transition and fresh rock mineralization zones at a nominal processing rate of 8,000 t/d. The comminution circuit was developed based on the grindability test results, engineering experience, the topography of the plant site, and operability of the system. The equipment proposed for the Phase 1 expansion, which has been partially installed, will be completely installed and commissioned to meet the proposed throughput.
The process plant will comprise crushing, grinding, gravity concentration, leach/CIP cyanidation process and gold recovery from the loaded carbon to produce gold doré, including:
• A crushing facility, including a vibrating screen, a primary jaw crusher, and related material handling equipment.
• A crushed ore surge bin and related feeding and reclaim systems.
• A SABC grinding circuit, including a SAG mill, a ball mill, a pebble crusher, and related pumping and pebble handling systems.
• A gravity concentration circuit and an independent gravity concentrate intensive leaching system, including an ACACIA intensive leaching reactor, an electrowinning cell and related pumping and storage facilities.
• Main gold leach/CIP cyanidation and related gold recovery and carbon handling circuits, including leaching feed thickening, CIP cyanide leach, loaded carbon acid wash and elution, carbon reactivation, gold electrowinning, and melting.
• Cyanide destruction of the leach residue.
The average gold production to doré is estimated to be approximately 136,000 oz/a.
1.13 Project Infrastructure
The Project will use a number of infrastructure items which already exist which include the access roads, water supply, power transmission line, sewage treatment plant, communications systems, offices and accommodation
The locations of facilities and other infrastructure items were selected to take advantage of local topography, accommodate environmental considerations and ensure efficient and convenient operation of the mine haul fleet.
5070\16.4 \5070-STY-001 July 2017 Lycopodium Minerals Canada Ltd.

FEASIBILITY STUDY ON THE AURIZONA GOLD MINE PROJECT NI 43-101 TECHNICAL REPORT
Page 1.13
The Project infrastructure will include:
• Off-site, on-site, and service road access.
• Mine haul roads.
• Heavy and light vehicle workshops.
• Fuel storage and distribution.
• Explosives storage and handling.
• Waste storage facilities (WSF) and overburden dump.
• Run-of-mine (ROM) stockpile.
• Process and ancillary facilities, including:
- ROM ore stockpile pad.
- Crushing facility including vibratory feeder, jaw crusher and associated material handling equipment.
- Surge bin with temporary stockpile.
- SABC circuit.
- Gravity concentration/ACACIA/electrowinning and associate facilities.
- Leach / CIP cyanidation and related gold recovery.
- Reagent storage and handling.
- Facilities for administration and an assay laboratory.
• Power supply and distribution system.
• Water supply and distribution system.
• Pit dewatering system.
• Sewage collection and management.
• Surface water management system.
5070\16.4 \5070-STY-001 July 2017 Lycopodium Minerals Canada Ltd.
FEASIBILITY STUDY ON THE AURIZONA GOLD MINE PROJECT NI 43-101 TECHNICAL REPORT
Page 1.14
• Tailings storage facility (TSF).
• Communications.
• Emergency helipad.
• Medical centre.
1.14 Environmental Conditions
The Project has the following environmental conditions:
• Small scale artisanal mining (garimpeiro) operations exist in the region and has impacted the vegetation, the soil and the hydrologic system in areas near the Project. To date, it does not appear that these projects utilize mercury to extract gold.
• The mine has excess water during the wet season therefore sedimentation control is required for all mine runoff and process water prior to discharge in the surrounding estuaries.
• In January 2016, water within the Piaba pit became mildly acidic, and Acid Rock Drainage (ARD) impacted ephemeral seeps were observed on the existing north WSF. Samples confirmed that the site experienced the first ARD that had been seen in six years of operation. Prior studies assumed that the neutralization potential in mine waste would keep acid-generating rock from impacting water quality. As a result of this change in the site geochemical conditions, and expanded static and kinetic geochemical testing program has commenced and an ARD management plan has been incorporated into the mine development and operation plan.
1.15 Capital and Operating Cost Estimates
The total initial capital cost is estimated at US$130.8 million including duties and recoverable taxes and is summarized in Table 1.5 along with the estimated sustaining capital requirements.
The capital cost estimate (estimate) includes all the direct and in-direct costs along with the appropriate project estimating contingencies for all the facilities required to bring the Project into production, as defined by this Study.
Equipment and material to be purchased for the Project are a combination of new units and refurbishment of existing equipment and structures. The labour rate build up is based on the statutory laws governing benefits to workers in effect in Brazil at the time of the estimate. Brazilian import tariffs have been applied.
Cost items obtained from local sources are converted at an exchange rate of US$: $R = 1:3.3 per the second quarter of 2017.
5070\16.4 \5070-STY-001 July 2017 Lycopodium Minerals Canada Ltd.

FEASIBILITY STUDY ON THE AURIZONA GOLD MINE PROJECT NI 43-101 TECHNICAL REPORT
Page 1.15
The estimate does not include any allowances for escalation, exchange rate fluctuations or project risks. The execution strategy is based on an engineering, procurement and construction management (EPCM) implementation approach and horizontal (discipline based) construction contract packaging. The capital cost estimate has a predicted intended overall accuracy of -10% + 15%.
Table 1.5 Capital Cost Summary - Major Area
Area Costs k US$ Contingency k
US$ Taxes/Duties k
US$ Grand Total k
US$
Mining $19,300 $1,242 $1,980 $22,523
Feed Preparation $6,137 $580 $708 $7,425
Grinding Total $24,022 $1,783 $3,731 $29,536
Balance of Plant $10,557 $1,107 $1,206 $12,870
Regents $1,497 $158 $215 $1,870
Tailings Dam $2,561 $282 $267 $3,109
Site Services $7,766 $836 $1,496 $10,098
Total Direct Costs $71,840 $5,988 $9,603 $87,431
Construction In-directs $5,903 $821 $927 $7,652
EPCM $5,505 $248 $956 $6,709
Owner's Costs $18,817 $478 $717 $20,013
Working Capital $9,000 $0 $0 $9,000
Total Initial Capital Costs $111,065 $7,535 $12,203 $130,805 Management & Owner's Costs $1,080 $12 $104 $1,195
Mining $8,734 $1,380 $468 $10,582
Tailings Dam $29,419 $3,226 $3,111 $35,756
Closure Costs $2,932 $174 $639 $3,744 Total Sustaining Capital Costs $42,165 $4,792 $4,322 $51,277 Total Initial & Sustaining Costs $153,230 $12,327 $16,525 $182,082
This capital cost estimate reflects the joint efforts of Lycopodium, Trek and specialist consultants retained by Trek. Lycopodium was responsible for compiling the submitted data into the overall estimate and reviewed and accepted and or modified the inputs from Trek or its other consultants.
The sustaining capital cost for the Project reflects additional capital expenditures after the Project is in operation to replace light vehicles/office equipment, increasing the storage capacity of the TSF and mine closure/environmental rehabilitation costs. The total expansion and sustaining capital cost for the Project during the production years 1 to 7 is US$51 million including closure costs, salvage value and duties/taxes.
5070\16.4 \5070-STY-001 July 2017 Lycopodium Minerals Canada Ltd.

FEASIBILITY STUDY ON THE AURIZONA GOLD MINE PROJECT NI 43-101 TECHNICAL REPORT
Page 1.16
The major expenditures in the sustaining capital include the raising of the TSF dams and closure/environmental rehabilitation costs.
Direct cash operating costs for the Project have been estimated under three functional headings -mining, processing and general and administrative (G&A). The operating costs have been estimated by the following parties:
• Mining – AGP.
• Processing – Lycopodium.
• G&A – Prepared by Trek and approved by Lycopodium.
Total LOM direct operating cost for the Project are US$628/oz and US$28.03/t of ore milled based on a contractor operated mine fleet as shown in Table 1.6. The average total direct operating costs are a sum of the mine, process and general and administrative costs, non-recoverable taxes. Total cash operating costs include gold refining and transportation and royalties for a total of US$691/oz, and all-in sustain cots amount to US$754/oz.
Table 1.6 LOM Average Operating Costs
Onsite Operating Costs $/oz $/t Milled $/t Mined
Mining 355 15.83 2.44
Processing 189 8.43
G&A 64 2.88
Non-Recoverable Taxes 20 0.89
Total Direct Operating Costs 628 28.03
Refining & Transport 14
Royalties 49
Total Cash Operating Cost 691
Sustaining Capital 63
All-in Sustaining Cost 754
The operating cost estimates are expressed in US dollars in Q2 2017 terms and are estimated to be accurate within -10% +15%.
1.16 Economic Analysis
A detailed explanation of the Project economics is provided in Section 22 of the Technical Report.
5070\16.4 \5070-STY-001 July 2017 Lycopodium Minerals Canada Ltd.

FEASIBILITY STUDY ON THE AURIZONA GOLD MINE PROJECT NI 43-101 TECHNICAL REPORT
Page 1.17
As per Table 1.7, at a gold price of US$1,250/oz, the Project is estimated to have the following results:
Table 1.7 Financial Results Summary
Summary Criteria
Throughput 2.9 Mt/a
Average Annual Gold Production 136,000 oz/a
Mine Life 6.5 years
Discount Rate 5%
Gold Price $1,250/oz
Results After Tax
Initial Capital Costs $131 M
Sustaining Costs $51 M
All-In-Sustaining Cost (AISC) $754/oz
Net Present Value (NPV @ 5%) $197 M
Internal rate of Return (IRR) 33.8%
Payback 2.8 years
The results of the economic analysis represent forward looking information and there can be no assurance that gold production forecasts, projected capital and operating costs, cash flows, or mine operating schedules will prove to be accurate, as actual results and future events could differ materially from those anticipated. Risks related to forecast mine operations include unexpected events and delays during design and construction; expansion and start-up; variations in metal grade and recovery rates; changes to government regulations; results of current exploration activities; changes in Project parameters as plans continue to be refined; future metal prices; failure of equipment or processes to operate as anticipated; labour or community disputes and other risks of the mining industry.
More details on the assumptions used and factors applied when developing the forward-looking information, as well as the risk factors that could cause actual results to differ materially from the forward-looking information are provided in the relevant sections of the Technical Report.
1.17 Adjacent Properties
The focus of the Technical Report is the Piaba and Boa Esperança deposits found on the Aurizona mining license. In addition to this mining license, Trek controls several additional exploration licenses in various states of mineral development that are adjacent to the Aurizona mining license.
.
5070\16.4 \5070-STY-001 July 2017 Lycopodium Minerals Canada Ltd.
FEASIBILITY STUDY ON THE AURIZONA GOLD MINE PROJECT NI 43-101 TECHNICAL REPORT
Page 1.18
1.18 Interpretations and Conclusions
The Project has been investigated at a Feasibility Study This Technical Report provides a summary of the results and findings of the study including but not limited to resource exploration, metallurgical sampling and testing, mineral resource estimation, mineral reserve estimation, mine design, process design, infrastructure design; environmental assessment, capital and operating cost estimates and economic analysis. The extent and level of investigation and study for each of these areas is considered to be consistent with that normally associated with Feasibility level studies for resource development projects.
Each section of this Technical Report describes in detail the results of the various investigations and studies along with principal findings and appropriate discussions of significant risks that may have been identified during the Study as well as recommendations for the next steps.
1.19 Recommendations
The principal recommendation emanating from the Study is that the Project is financially viable and should move forward to the execution phase.
Trek should approve the capital cost budget of US$131 million to start detail engineering, procurement and construction.
5070\16.4 \5070-STY-001 July 2017 Lycopodium Minerals Canada Ltd.

FEASIBILITY STUDY ON THE AURIZONA GOLD MINE PROJECT NI 43-101 TECHNICAL REPORT
Page 2.1
2.0 INTRODUCTION
2.1 Background
This Technical Report has been compiled by Lycopodium Minerals Canada Ltd (Lycopodium) for Trek Mining Inc. (Trek), in compliance with the disclosure requirements of the Canadian National Instrument 43-101 Technical Report (NI 43-101) and in accordance with the requirements of Form 43-101 F1.
The individuals presented in Table 2.1, by virtue of their education, experience and professional association are considered Qualified Persons (QPs) as defined in NI 43-101 for this report. The QPs meet the requirement of independence as defined in NI 43-101. Section responsibilities are also listed in Table 2.1.
5070-\16.4\5070-STY-001
July 2017 Lycopodium Minerals Canada Ltd.
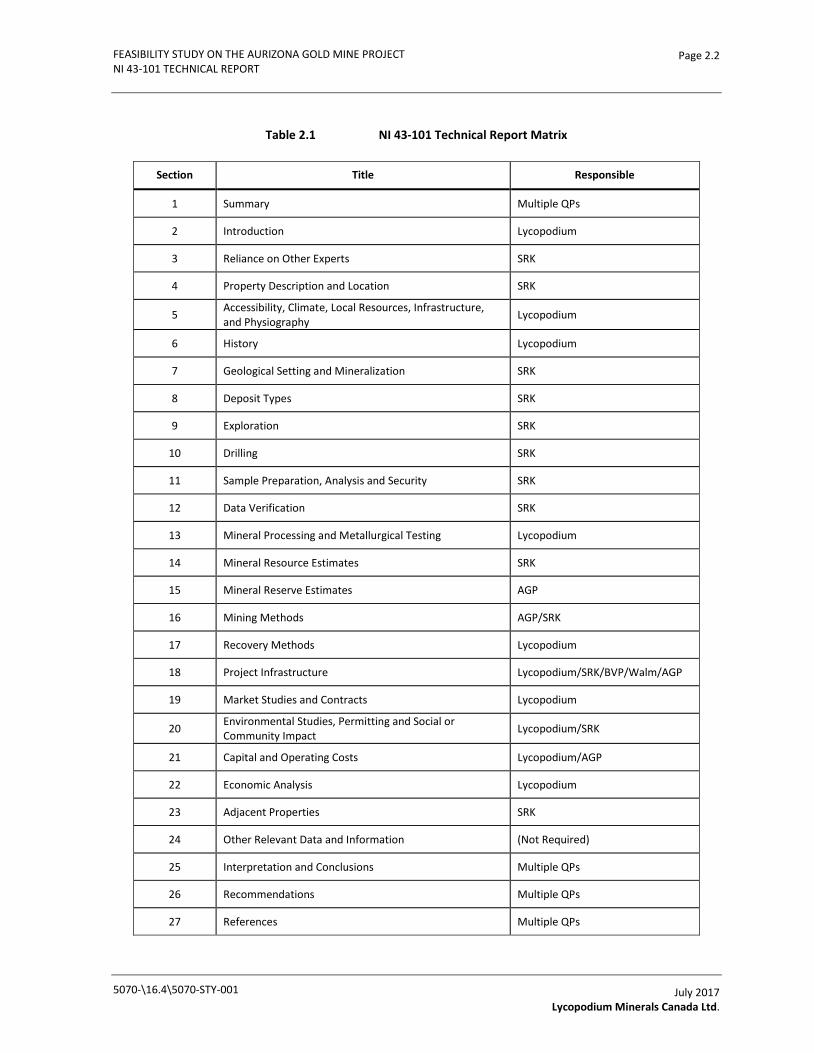
FEASIBILITY STUDY ON THE AURIZONA GOLD MINE PROJECT NI 43-101 TECHNICAL REPORT
Page 2.2
Table 2.1 NI 43-101 Technical Report Matrix
Section Title Responsible
1 Summary Multiple QPs
2 Introduction Lycopodium
3 Reliance on Other Experts SRK
4 Property Description and Location SRK
5 Accessibility, Climate, Local Resources, Infrastructure, and Physiography Lycopodium
6 History Lycopodium
7 Geological Setting and Mineralization SRK
8 Deposit Types SRK
9 Exploration SRK
10 Drilling SRK
11 Sample Preparation, Analysis and Security SRK
12 Data Verification SRK
13 Mineral Processing and Metallurgical Testing Lycopodium
14 Mineral Resource Estimates SRK
15 Mineral Reserve Estimates AGP
16 Mining Methods AGP/SRK
17 Recovery Methods Lycopodium
18 Project Infrastructure Lycopodium/SRK/BVP/Walm/AGP
19 Market Studies and Contracts Lycopodium
20 Environmental Studies, Permitting and Social or Community Impact Lycopodium/SRK
21 Capital and Operating Costs Lycopodium/AGP
22 Economic Analysis Lycopodium
23 Adjacent Properties SRK
24 Other Relevant Data and Information (Not Required)
25 Interpretation and Conclusions Multiple QPs
26 Recommendations Multiple QPs
27 References Multiple QPs
5070-\16.4\5070-STY-001
July 2017 Lycopodium Minerals Canada Ltd.
FEASIBILITY STUDY ON THE AURIZONA GOLD MINE PROJECT NI 43-101 TECHNICAL REPORT
Page 2.3
2.2 Terms of Reference
In November 2016 Trek Mining Inc. (Trek) commissioned Lycopodium Minerals Canada Ltd. (Lycopodium) to complete a Feasibility Study with inputs from the following consultants:
• SRK Consulting (SRK).
• BVP Engenharia in partnership with Walm Engenharia e Tecnologia Ambiental (BVP/WALM)
• AGP Mining Consultants Inc. (AGP).
The Project is based on the Piaba and Boa Esperança gold deposits. A mineral resource model was prepared by Phoenix Geoscience, LLC (PG) during late 2015 and early 2016 to account for new drilling information and a revision to the geological interpretation.
The Piaba and Boa Esperança deposits were used as a basis of this Study processing 2.9 Mtpa to produce an average 136,311 oz/a of gold. This Study was conducted with the objective of designing the appropriate new crushing and grinding facilities along with the refurbishment of the existing process plant required for the aforementioned operation. This Technical Report summarizes all value engineering studies performed by the various consultants at a feasibility level (-10% + 15% intended overall accuracy) and used in the economic evaluation of the Project and supports disclosure of mineral reserves on the Aurizona Mine property.
2.3 Qualified Persons
Table 2.2 provides a summary listing of the Qualified Persons (QP or QPs) who have contributed to the preparation and content of this Technical Report.
5070-\16.4\5070-STY-001
July 2017 Lycopodium Minerals Canada Ltd.
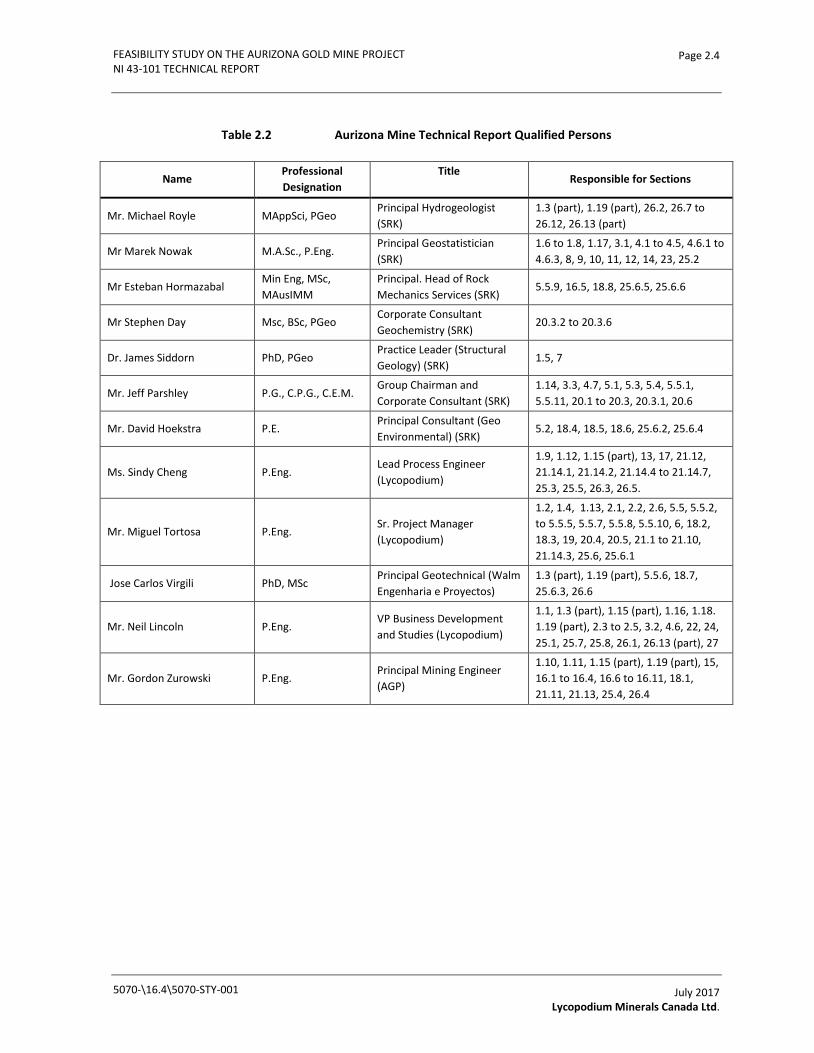
FEASIBILITY STUDY ON THE AURIZONA GOLD MINE PROJECT NI 43-101 TECHNICAL REPORT
Page 2.4
Table 2.2 Aurizona Mine Technical Report Qualified Persons
Name Professional Designation
Title Responsible for Sections
Mr. Michael Royle MAppSci, PGeo Principal Hydrogeologist (SRK)
1.3 (part), 1.19 (part), 26.2, 26.7 to 26.12, 26.13 (part)
Mr Marek Nowak M.A.Sc., P.Eng. Principal Geostatistician (SRK)
1.6 to 1.8, 1.17, 3.1, 4.1 to 4.5, 4.6.1 to 4.6.3, 8, 9, 10, 11, 12, 14, 23, 25.2
Mr Esteban Hormazabal Min Eng, MSc, MAusIMM
Principal. Head of Rock Mechanics Services (SRK)
5.5.9, 16.5, 18.8, 25.6.5, 25.6.6
Mr Stephen Day Msc, BSc, PGeo Corporate Consultant Geochemistry (SRK)
20.3.2 to 20.3.6
Dr. James Siddorn PhD, PGeo Practice Leader (Structural Geology) (SRK)
1.5, 7
Mr. Jeff Parshley P.G., C.P.G., C.E.M. Group Chairman and Corporate Consultant (SRK)
1.14, 3.3, 4.7, 5.1, 5.3, 5.4, 5.5.1, 5.5.11, 20.1 to 20.3, 20.3.1, 20.6
Mr. David Hoekstra P.E. Principal Consultant (Geo Environmental) (SRK)
5.2, 18.4, 18.5, 18.6, 25.6.2, 25.6.4
Ms. Sindy Cheng P.Eng. Lead Process Engineer (Lycopodium)
1.9, 1.12, 1.15 (part), 13, 17, 21.12, 21.14.1, 21.14.2, 21.14.4 to 21.14.7, 25.3, 25.5, 26.3, 26.5.
Mr. Miguel Tortosa P.Eng. Sr. Project Manager (Lycopodium)
1.2, 1.4, 1.13, 2.1, 2.2, 2.6, 5.5, 5.5.2, to 5.5.5, 5.5.7, 5.5.8, 5.5.10, 6, 18.2, 18.3, 19, 20.4, 20.5, 21.1 to 21.10, 21.14.3, 25.6, 25.6.1
Jose Carlos Virgili PhD, MSc Principal Geotechnical (Walm Engenharia e Proyectos)
1.3 (part), 1.19 (part), 5.5.6, 18.7, 25.6.3, 26.6
Mr. Neil Lincoln P.Eng. VP Business Development and Studies (Lycopodium)
1.1, 1.3 (part), 1.15 (part), 1.16, 1.18. 1.19 (part), 2.3 to 2.5, 3.2, 4.6, 22, 24, 25.1, 25.7, 25.8, 26.1, 26.13 (part), 27
Mr. Gordon Zurowski P.Eng. Principal Mining Engineer (AGP)
1.10, 1.11, 1.15 (part), 1.19 (part), 15, 16.1 to 16.4, 16.6 to 16.11, 18.1, 21.11, 21.13, 25.4, 26.4
5070-\16.4\5070-STY-001
July 2017 Lycopodium Minerals Canada Ltd.
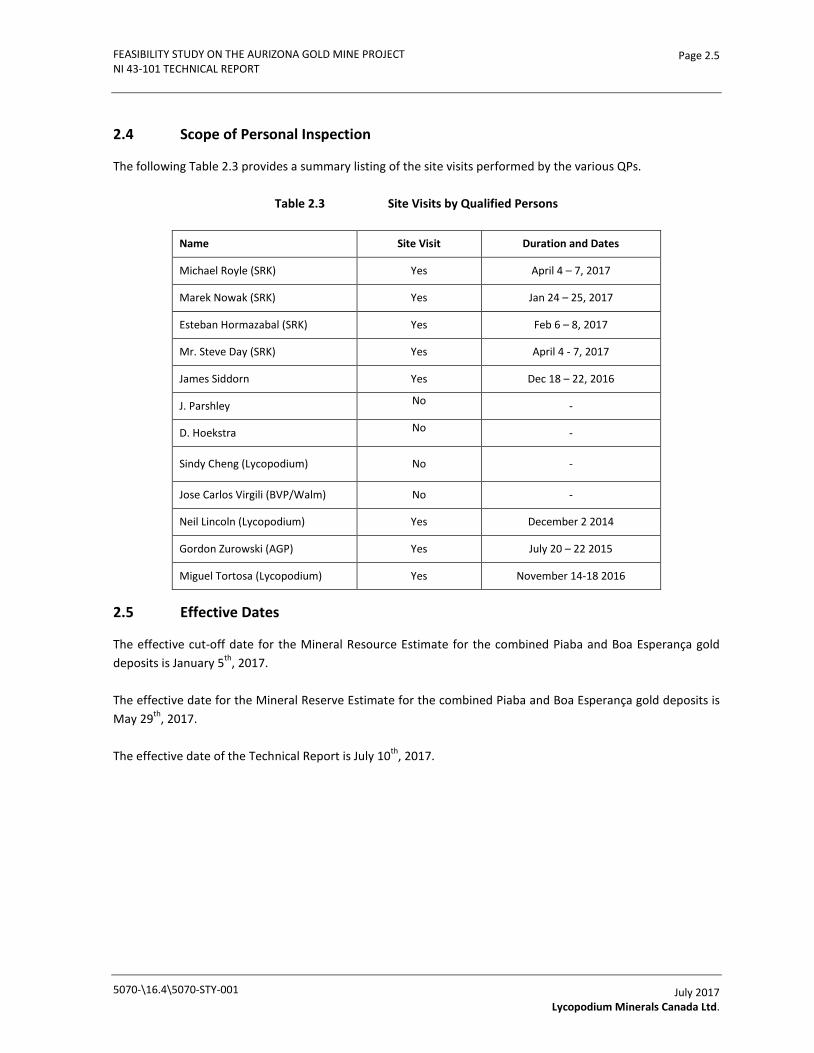
FEASIBILITY STUDY ON THE AURIZONA GOLD MINE PROJECT NI 43-101 TECHNICAL REPORT
Page 2.5
2.4 Scope of Personal Inspection
The following Table 2.3 provides a summary listing of the site visits performed by the various QPs.
Table 2.3 Site Visits by Qualified Persons
Name Site Visit Duration and Dates
Michael Royle (SRK) Yes April 4 – 7, 2017
Marek Nowak (SRK) Yes Jan 24 – 25, 2017
Esteban Hormazabal (SRK) Yes Feb 6 – 8, 2017
Mr. Steve Day (SRK) Yes April 4 - 7, 2017
James Siddorn Yes Dec 18 – 22, 2016
J. Parshley No -
D. Hoekstra No -
Sindy Cheng (Lycopodium) No -
Jose Carlos Virgili (BVP/Walm) No -
Neil Lincoln (Lycopodium) Yes December 2 2014
Gordon Zurowski (AGP) Yes July 20 – 22 2015
Miguel Tortosa (Lycopodium) Yes November 14-18 2016
2.5 Effective Dates
The effective cut-off date for the Mineral Resource Estimate for the combined Piaba and Boa Esperança gold deposits is January 5th, 2017.
The effective date for the Mineral Reserve Estimate for the combined Piaba and Boa Esperança gold deposits is May 29th, 2017.
The effective date of the Technical Report is July 10th, 2017.
5070-\16.4\5070-STY-001
July 2017 Lycopodium Minerals Canada Ltd.

FEASIBILITY STUDY ON THE AURIZONA GOLD MINE PROJECT NI 43-101 TECHNICAL REPORT
Page 2.6
2.6 Previous Technical Reports
Trek has previously filed the following Technical Reports for the Project:
• NI 43-101 Technical Report, Mineração Aurizona, S.A., Piaba Project, Maranhão, Brazil, SRK Consulting, May 9 2008.
• NI 43-101 Technical Report, Mineração Aurizona, S.A., Piaba Project, Maranhão, Brazil, SRK Consulting, September 1 2010.
• NI 43-101 Technical Report Mineração Aurizona S.A. Aurizona Project, SRK Consulting, January 23 2012.
• Resource Report Aurizona Project, Brazil, SRK Consulting, January 29 2013.
• NI 43-101 Technical Report Aurizona Mine Update, Brazil, March 27 2015.
• NI-43-101 Technical Report, Pre-Feasibility Study on Aurizona Mine Project, September 12, 2016.
5070-\16.4\5070-STY-001
July 2017 Lycopodium Minerals Canada Ltd.
FEASIBILITY STUDY ON THE AURIZONA GOLD MINE PROJECT NI 43-101 TECHNICAL REPORT
Page 3.1
3.0 RELIANCE ON OTHER EXPERTS
3.1 Mineral Titles
Lycopodium and SRK relied on information provided by Trek, Messrs. Carlos Paranhos and Scott Heffernan (May 11, 2017) for explanation of the Mineral Titles and AngloGold Ashanti Agreement (Section 4.2).
3.2 Royalties, Agreements, Encumbrances and Income Taxes
Lycopodium and SRK relied on information provided by Trek, Messrs. Carlos Paranhos and Scott Heffernan (May 11, 2017) for explanation of the Royalties, Agreements, Encumbrances and Income Taxes (Section 4.6).
3.3 Environmental Liabilities and Permitting
Lycopodium and SRK relied on information provided by Trek, Messrs, Carlos Paranhos and Scot Heffernan (June 2017) for explanation of the Environmental Liabilities and Permitting (Section 4.7).
5070-\16.04\5070-STY-001 July 2017 Lycopodium Minerals Canada Ltd.

FEASIBILITY STUDY ON THE AURIZONA GOLD MINE PROJECT NI 43-101 TECHNICAL REPORT
Page 4.1
4.0 PROPERTY DESCRIPTION AND LOCATION
4.1 Property Description and Location
The Project is located in the municipality of Godofredo Viana (population 10,500) in the state of Maranhão (Figure 4.1). The area is centred at latitude 01°18' S and longitude 45°45' W on the northern coast of Brazil, 320 km due northwest of the capital city of São Luis.
The Project currently consists of a developed mine camp, open pit operation, process plant and associated infrastructure. As of June 2017, Trek Mining Inc. (Trek) employs approximately 300 employees and contractors from the local communities and around Brazil. All mining and processing operations have been suspended as of September 2015. The Project and all facilities were placed on care and maintenance in the third quarter of 2015 pending additional geological exploration work and value engineering studies incorporating a hard rock crushing and grinding circuit. A Pre-feasibility Study was issued in October 2016 following resource definition and exploration drilling.
5070-\16.04\5070-STY-001
July 2017 Lycopodium Minerals Canada Ltd.

FEASIBILITY STUDY ON THE AURIZONA GOLD MINE PROJECT NI 43-101 TECHNICAL REPORT
Page 4.2
Figure 4.1 General Location Map
5070-\16.04\5070-STY-001
July 2017 Lycopodium Minerals Canada Ltd.
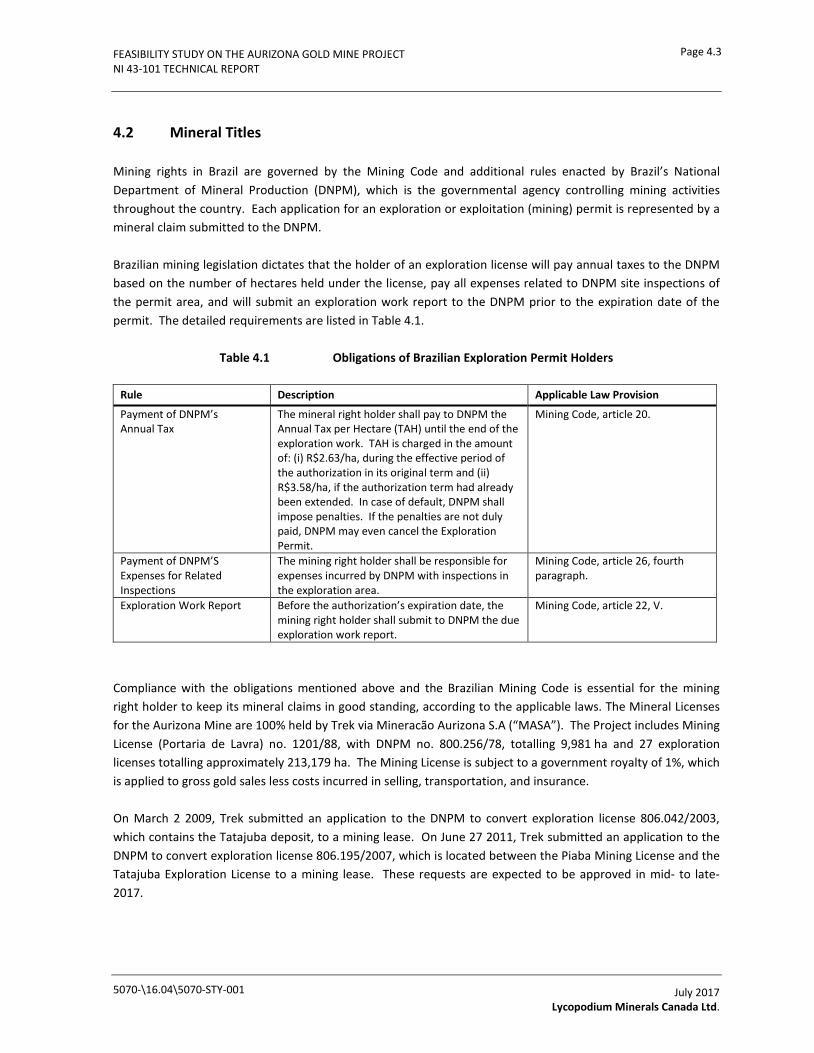
FEASIBILITY STUDY ON THE AURIZONA GOLD MINE PROJECT NI 43-101 TECHNICAL REPORT
Page 4.3
4.2 Mineral Titles
Mining rights in Brazil are governed by the Mining Code and additional rules enacted by Brazil’s National Department of Mineral Production (DNPM), which is the governmental agency controlling mining activities throughout the country. Each application for an exploration or exploitation (mining) permit is represented by a mineral claim submitted to the DNPM.
Brazilian mining legislation dictates that the holder of an exploration license will pay annual taxes to the DNPM based on the number of hectares held under the license, pay all expenses related to DNPM site inspections of the permit area, and will submit an exploration work report to the DNPM prior to the expiration date of the permit. The detailed requirements are listed in Table 4.1.
Table 4.1 Obligations of Brazilian Exploration Permit Holders
Rule Description Applicable Law Provision
Payment of DNPM’s Annual Tax
The mineral right holder shall pay to DNPM the Annual Tax per Hectare (TAH) until the end of the exploration work. TAH is charged in the amount of: (i) R$2.63/ha, during the effective period of the authorization in its original term and (ii) R$3.58/ha, if the authorization term had already been extended. In case of default, DNPM shall impose penalties. If the penalties are not duly paid, DNPM may even cancel the Exploration Permit.
Mining Code, article 20.
Payment of DNPM’S Expenses for Related Inspections
The mining right holder shall be responsible for expenses incurred by DNPM with inspections in the exploration area.
Mining Code, article 26, fourth paragraph.
Exploration Work Report Before the authorization’s expiration date, the mining right holder shall submit to DNPM the due exploration work report.
Mining Code, article 22, V.
Compliance with the obligations mentioned above and the Brazilian Mining Code is essential for the mining right holder to keep its mineral claims in good standing, according to the applicable laws. The Mineral Licenses for the Aurizona Mine are 100% held by Trek via Mineracão Aurizona S.A (“MASA”). The Project includes Mining License (Portaria de Lavra) no. 1201/88, with DNPM no. 800.256/78, totalling 9,981 ha and 27 exploration licenses totalling approximately 213,179 ha. The Mining License is subject to a government royalty of 1%, which is applied to gross gold sales less costs incurred in selling, transportation, and insurance.
On March 2 2009, Trek submitted an application to the DNPM to convert exploration license 806.042/2003, which contains the Tatajuba deposit, to a mining lease. On June 27 2011, Trek submitted an application to the DNPM to convert exploration license 806.195/2007, which is located between the Piaba Mining License and the Tatajuba Exploration License to a mining lease. These requests are expected to be approved in mid- to late-2017.
5070-\16.04\5070-STY-001
July 2017 Lycopodium Minerals Canada Ltd.
FEASIBILITY STUDY ON THE AURIZONA GOLD MINE PROJECT NI 43-101 TECHNICAL REPORT
Page 4.4
Exploration licenses 800.329/1991 and 800.331/1991 are part of the Touro target area. On September 11, 2014 and September 30, 2014, respectively, Trek submitted the required Partial Exploration Reports and requested an additional exploration extension of 3 years. On November 26, 2014, Trek submitted the Positive Final Exploration Report for exploration license 800.330/1991 to convert this Touro exploration license to a mining lease. The submissions for these three leases are currently under DNPM evaluation. All exploration licenses are subject to an annual exploration tax according to the claim size and time held. Trek confirms that all land tax payments are up to date.
Table 4.2 provides a list of all current exploration licenses and Figure 4.2 shows the Trek/MASA mineral permits.
5070-\16.04\5070-STY-001
July 2017 Lycopodium Minerals Canada Ltd.
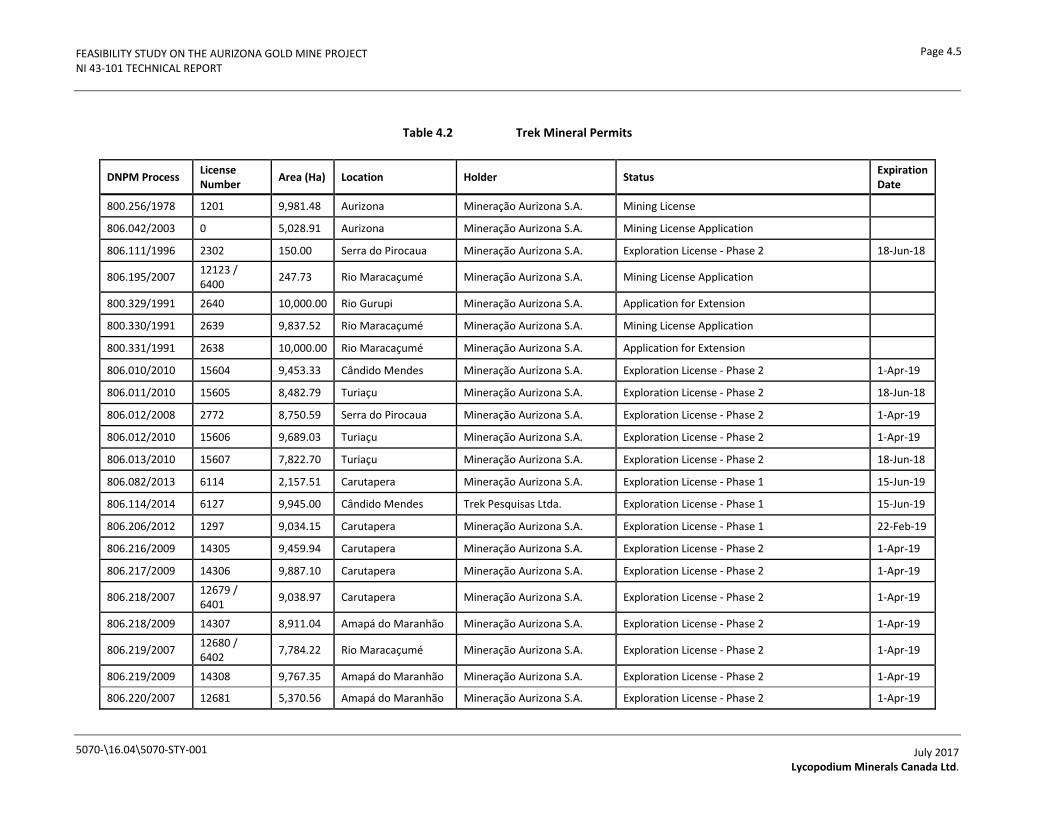
FEASIBILITY STUDY ON THE AURIZONA GOLD MINE PROJECT NI 43-101 TECHNICAL REPORT
Page 4.5
Table 4.2 Trek Mineral Permits
DNPM Process License Number Area (Ha) Location Holder Status Expiration
Date
800.256/1978 1201 9,981.48 Aurizona Mineração Aurizona S.A. Mining License
806.042/2003 0 5,028.91 Aurizona Mineração Aurizona S.A. Mining License Application
806.111/1996 2302 150.00 Serra do Pirocaua Mineração Aurizona S.A. Exploration License - Phase 2 18-Jun-18
806.195/2007 12123 / 6400 247.73 Rio Maracaçumé Mineração Aurizona S.A. Mining License Application
800.329/1991 2640 10,000.00 Rio Gurupi Mineração Aurizona S.A. Application for Extension
800.330/1991 2639 9,837.52 Rio Maracaçumé Mineração Aurizona S.A. Mining License Application
800.331/1991 2638 10,000.00 Rio Maracaçumé Mineração Aurizona S.A. Application for Extension
806.010/2010 15604 9,453.33 Cândido Mendes Mineração Aurizona S.A. Exploration License - Phase 2 1-Apr-19
806.011/2010 15605 8,482.79 Turiaçu Mineração Aurizona S.A. Exploration License - Phase 2 18-Jun-18
806.012/2008 2772 8,750.59 Serra do Pirocaua Mineração Aurizona S.A. Exploration License - Phase 2 1-Apr-19
806.012/2010 15606 9,689.03 Turiaçu Mineração Aurizona S.A. Exploration License - Phase 2 1-Apr-19
806.013/2010 15607 7,822.70 Turiaçu Mineração Aurizona S.A. Exploration License - Phase 2 18-Jun-18
806.082/2013 6114 2,157.51 Carutapera Mineração Aurizona S.A. Exploration License - Phase 1 15-Jun-19
806.114/2014 6127 9,945.00 Cândido Mendes Trek Pesquisas Ltda. Exploration License - Phase 1 15-Jun-19
806.206/2012 1297 9,034.15 Carutapera Mineração Aurizona S.A. Exploration License - Phase 1 22-Feb-19
806.216/2009 14305 9,459.94 Carutapera Mineração Aurizona S.A. Exploration License - Phase 2 1-Apr-19
806.217/2009 14306 9,887.10 Carutapera Mineração Aurizona S.A. Exploration License - Phase 2 1-Apr-19
806.218/2007 12679 / 6401 9,038.97 Carutapera Mineração Aurizona S.A. Exploration License - Phase 2 1-Apr-19
806.218/2009 14307 8,911.04 Amapá do Maranhão Mineração Aurizona S.A. Exploration License - Phase 2 1-Apr-19
806.219/2007 12680 / 6402 7,784.22 Rio Maracaçumé Mineração Aurizona S.A. Exploration License - Phase 2 1-Apr-19
806.219/2009 14308 9,767.35 Amapá do Maranhão Mineração Aurizona S.A. Exploration License - Phase 2 1-Apr-19
806.220/2007 12681 5,370.56 Amapá do Maranhão Mineração Aurizona S.A. Exploration License - Phase 2 1-Apr-19
5070-\16.04\5070-STY-001
July 2017 Lycopodium Minerals Canada Ltd.

FEASIBILITY STUDY ON THE AURIZONA GOLD MINE PROJECT NI 43-101 TECHNICAL REPORT
Page 4.6
DNPM Process License Number Area (Ha) Location Holder Status Expiration
Date
806.220/2009 14309 9,581.66 Carutapera Mineração Aurizona S.A. Exploration License - Phase 2 1-Apr-19
806.222/2009 14311 9,043.05 Amapá do Maranhão Mineração Aurizona S.A. Exploration License - Phase 2 1-Apr-19
806.282/2007 800 9,946.15 Carutapera Mineração Aurizona S.A. Exploration License - Phase 2 18-Jun-18
806.283/2007 801 8,759.26 Amapá do Maranhão Mineração Aurizona S.A. Exploration License - Phase 2 1-Apr-19
806.284/2007 802 9,754.09 Rio Maracaçumé Mineração Aurizona S.A. Exploration License - Phase 2 1-Apr-19
806.683/2010 1293 5,275.94 Turiaçu Mineração Aurizona S.A. Exploration License - Phase 1 22-Feb-19
806.046/2007 3,562.50 Luís Domingues Mineração Aurizona S.A. Bid Process - Process Under Analysis
806.149/2009 8,968.60 Turiaçu Mineração Aurizona S.A. Bid Process - Process Under Analysis
806.228/2007 5,793.48 Cândido Mendes Mineração Aurizona S.A. Bid Process - Process Under Analysis
806.308/2011 9,894.11 Cândido Mendes Mineração Aurizona S.A. Bid Process - Process Under Analysis
850.764/2008 10,000.00 Carutapera Mineração Aurizona S.A. Bid Process - Process Under Analysis
5070-\16.04\5070-STY-001
July 2017 Lycopodium Minerals Canada Ltd.
FEASIBILITY STUDY ON THE AURIZONA GOLD MINE PROJECT NI 43-101 TECHNICAL REPORT
Page 4.7
AngloGold Ashanti Agreement
On May 27 2016 Trek entered into an exploration agreement with AngloGold Ashanti Limited (“AGA”) for the Company’s greenfields mineral claims that surround the Aurizona Gold Mine (Table 4.2). The terms of the agreement require AGA to invest US$14 million in exploration expenditure over a four year period to earn a 70% interest in the mineral claims. The joint venture will not include mineral claims that correspond to the Aurizona Gold Mine, the nearby Tatajuba orebody extension and other brownfields properties, or the Touro greenfields property. Should AGA not fund the US$14 million in exploration over the 4-year earn in period, then they will not receive any interest in the mineral claims.
The agreement currently covers an area of approximately 2,000 km2, which may change as areas are dropped or added as allowed under the agreement. AGA is required to spend a minimum of US$2 million during the first year of the earn-in period, and can withdraw from the agreement at any time after spending US$2 million.
After expenditure of US$2 million in the first year of the agreement, AGA must spend an additional US$12 million over the next three years to vest at 70% interest in the mineral claims. Following AGA’s vesting, Trek will thereafter be obligated to fund future joint venture expenditures on a pro-rata basis. In the event Trek elects not to contribute its pro-rata share of future joint venture expenditures and its interest in the joint venture were to fall below 5%, Trek would be required to transfer its joint venture interest to AGA in exchange for a 1% net smelter returns royalty (“NSR”) on the greenfields properties. The joint venture agreement will provide AGA with a one-time option to purchase the 1% NSR for US$8 million. If, after completion of the earn-in, AGA elects to sell its interest in the joint venture, Trek has the option to purchase AGA’s pro rata interest in any gold resources identified in a NI 43-101 compliant mineral resource estimate for US$10/oz.
5070-\16.04\5070-STY-001
July 2017 Lycopodium Minerals Canada Ltd.

FEASIBILITY STUDY ON THE AURIZONA GOLD MINE PROJECT NI 43-101 TECHNICAL REPORT
Page 4.8
Figure 4.2 Trek Mineral Permits
5070-\16.04\5070-STY-001
July 2017 Lycopodium Minerals Canada Ltd.
FEASIBILITY STUDY ON THE AURIZONA GOLD MINE PROJECT NI 43-101 TECHNICAL REPORT
Page 4.9
4.3 Legal Surveys
Exploration licenses in Brazil are paper filings and do not require the actual location of monuments on the ground. The filing includes descriptions of the corners of the licenses in Geographical Coordinate System using the South American Provisional 1956 datum. Mining Licenses are required to be marked and Trek reports that all accessible vertices in the Piaba Mine License have been monuments.
4.4 Location of Mineralization
The Piaba and Boa Esperança resources and associated mine facilities described in this Technical Report are completely contained within Mining License 800.256/78. The Tatajuba target is completely contained within Exploration License 806.042/0003. The near mine exploration targets are located within Mining Permit 800.256/1978 and Exploration Permits 860.042/03,806.195/2007 and 806.111/1996.
4.5 Nature and Extent of Issuer’s Interest
Trek, through its wholly-owned subsidiary MASA, owns 100% of the mineral licenses associated with the Project.
4.6 Royalties, Agreements, Encumbrances and Income Taxes
4.6.1 Royalties
The Mining License is subject to a government royalty of 1% which is applied to gross gold sales less costs incurred in selling, transportation, and insurance.
4.6.2 Sandstorm Agreement
Previously the Project was subject to a 17% gold stream that was replaced with a NSR payable to Sandstorm. This Gold Stream has been terminated and replaced by two NSR royalties (the “Aurizona Project NSR” and the “Greenfields NSR”) and a convertible debenture. The Aurizona Project NSR covers the entire Aurizona Project (the mining license and the three brownfield exploration licences) including the current NI 43-101 compliant Mineral Resources, and all adjacent exploration upside that would be processed through the Aurizona mill net of third-party refining costs. The Aurizona Project NSR is a sliding scale royalty based on the price of gold as follows:
• 3% if the price of gold is less than or equal to US$1,500/oz.
• 4% if the price of gold is between US$1,500 and US$2,000/oz.
• 5% if the price of gold is greater than US$2,000/oz.
5070-\16.04\5070-STY-001
July 2017 Lycopodium Minerals Canada Ltd.

FEASIBILITY STUDY ON THE AURIZONA GOLD MINE PROJECT NI 43-101 TECHNICAL REPORT
Page 4.10
The Greenfields NSR covers the exploration ground held by Trek and would be a 2% NSR. Trek has the right to purchase one-half of the Greenfields NSR for US$10 million at any time prior to commercial production at Aurizona.
Sandstorm holds a right of first refusal on any future streams or royalties on the Project and Greenfields.
Under restructuring, Sandstorm also received a US$30 million debenture bearing interest at a rate of 5% per annum (the Debenture). The Debenture is payable in three equal annual tranches of US$10 million plus accrued interest beginning June 30, 2018. Trek has the right to convert principal and interest owing under the Debenture into common shares of Trek, so long as Sandstorm does not own more than 20% of the outstanding common shares of Trek.
4.6.3 SUDENE Tax Incentive
The SUDENE tax incentive (the SUDENE Tax Incentive) is a tax incentive program developed by the Brazilian Government under the responsibility of the Superintendence for the Development of the Northeast Region (SUDENE). The goal of this program is to attract new investments and to generate wealth and employment, enabling a more efficient social policy to develop the most underdeveloped regions of Brazil. The SUDENE Tax Incentive represents a 75% reduction of the Brazilian corporate income tax rate of 25% for a period of 10 years commencing in the calendar year following the receipt of an appraisal certificate (an Appraisal Certificate) from SUDENE attesting that a company has fulfilled all the legal requirements to qualify for this tax incentive.
Trek applied for the SUDENE Tax Incentive for the Aurizona Mine and received the Appraisal Certificate from SUDENE in October 2011. Therefore, Trek is subject to the reduced corporate income tax rate commencing in 2011 for a period of 10 years (the Eligible Period). Trek is required to make an additional application to extend the SUDENE Tax Incentive beyond the Eligible Period and expand the SUDENE Tax Incentive for production in excess of the amounts specified in the Appraisal Certificate and for future mine expansions or the implementation of new mining operations. Such applications are subject to approval by SUDENE
The effective income tax rate of approximately 15.25% during this Eligible Period is based on a 6.25% corporate income tax rate plus a 9.0% social tax rate.
Trek plans to request an expansion and extension to the SUDENE Tax Incentive prior to its expiry. The Company has received tax advice from Brazilian tax experts that given the Company’s large continued investment in the Project the Company is likely to receive another 10 year extension. The assumption of receiving the extension has been used in the development of the financial model for this Study.
5070-\16.04\5070-STY-001
July 2017 Lycopodium Minerals Canada Ltd.

FEASIBILITY STUDY ON THE AURIZONA GOLD MINE PROJECT NI 43-101 TECHNICAL REPORT
Page 4.11
4.7 Environmental Liabilities and Permitting
4.7.1 Required Permits and Status
The Secretaria de Estado do Meio Ambiente e Recursos Naturais (SEMA-MA) issued the Aurizona Mine with an Operating License (LO) on July 11, 2007 to recommence the mining and processing of gold within the limits of Mining License DNPM No. 800.256/1978, an area comprising 9,981.47 ha. The LO, No. 259/2007, was renewed and a new LO, No. 108/2010 was issued in March 2010 and was valid until March 2012. The renewal documentation for this license was submitted in December 2011 and evaluated by SEMA-MA and Trek received an updated LO in July 2016 which is valid for four years. Specific licenses and permits required for the operation are discussed in Section 20.
In 2015, following the decision to suspend production, a care and maintenance plan was prepared for the DNPM that detailed the plans for temporary suspension of mining operations while the Company proceeded with additional exploration and engineering work. A care and maintenance permit was received in August 2015 from the DNPM with an effective period of 2 years. As such, the Company will need either inform the DNPM that the mine is coming out of care and maintenance or request another care and maintenance permit prior to August 2017.
The first Environmental Impact Assessment of the area is from 1995, when Aurizona was not yet the mining rights holder. At the beginning of 2007, Mineração Aurizona began regional mineral research, and between 2007 and 2012 it accumulated more than 72,000 chemical analyses for gold related to the deposits of Piaba and Boa Esperança.
In 2007, as a condition of the LO for the 2008-2010 period a Conceptual Mine Closure Plan was required, which provides very preliminary information, issued exclusively to meet the Environmental Agency (SEMA Maranhão) requirement.
In 2012 the EIA was updated for renewal of the LO for the 2010-2012 period. In August 2015, the DNPM authorized the temporary suspension of mining operations, for a period of two years to carry out new exploration and technical work and re-engineer the project.
On June 20, 2016, the current LO was issued, with conditions valid for four years, which authorizes the resumption of the mining activities. The Company’s forecast for the start of the mining activities is for mid-2017, with production targeted for the end of 2018.
The current LO includes the requirement for a sanitary treatment program, additional monitoring of surface water, groundwater, effluents, water for human consumption and air quality and still construction of hazardous waste storage area - class 1 (ABNT NBR 10.004:2004), and safety studies for the Vené tailings dam.
5070-\16.04\5070-STY-001
July 2017 Lycopodium Minerals Canada Ltd.

FEASIBILITY STUDY ON THE AURIZONA GOLD MINE PROJECT NI 43-101 TECHNICAL REPORT
Page 4.12
In addition to updating the LO (LO 19/2013), other permits are necessary for full operation of the mine including permits for infrastructure planning, clearing vegetation, the use of surface and groundwater in wells located on the mine site and accommodation areas, and for the discharge of treated effluent to local receiving bodies. These permits are applied for and granted in the normal course of business.
Environmental Authorizations are granted by SEMA for effluent discharge in Aurizona River at the discharge point called Curva do Edmilson. Currently the Project has two specifics authorizations: AA-SEMA n° 04-2017 which authorizes pumping rainwater from the pit and AA-SEMA n° 05-2017 which authorizes pumping water from tailings dam, both directly to Curva do Edmilson. These authorizations have several conditions to be met such as effluent quality compliance with CONAMA n° 430/2011. These authorizations are valid for only 90 days and are regularly renewed.
Some requirements were made by SEMA with regard to the Company’s new effluent discharge authorization to discharge into the São José River which is affected by tidal variation. These requirements are listed in document n° 208797/2016/SEMA issued by SEMA on September 26, 2016.
At the federal level, Mineração Aurizona has the Federal Technical Registry - CTF at IBAMA and has Certifications of the Federal Police and Brazilian Army for import, storage, transport and handling of controlled chemical products. The company also has an Installation License for a fuel station.
4.7.2 Environmental Liabilities
The Aurizona Mine region has a long history of artisanal gold production. An inspection conducted in 1989 by the Ministry of Mines and Energy and the State Secretariat for the Environment for Maranhão verified the uncontrolled exploitation of the area by prospectors and concluded the area was contaminated. During the environmental impact assessment (EIA/RIMA) process, levels of mercury were measured. In August 2009, several soil, sediments, and water mercury assays were performed on areas potentially impacted by mining activities by artisanal miners (known as garimpeiros) in the Project region. Mercury values were lower than reference values required for impacted areas. As such, potential environmental impact from garimpeiros is not considered a significant liability.
4.7.3 Other Significant Factors and Risks
Trek Mining is not aware of any other significant factors or risks associated with the Project that are not stated in this Technical Report.
5070-\16.04\5070-STY-001
July 2017 Lycopodium Minerals Canada Ltd.
FEASIBILITY STUDY ON THE AURIZONA GOLD MINE PROJECT NI 43-101 TECHNICAL REPORT
Page 5.1
5.0 ACCESSIBILITY, CLIMATE, LOCAL RESOURCES, INFRASTRUCTURE AND PHYSIOGRAPHY
5.1 Topography, Elevation and Vegetation
The Project is located on the Atlantic coast within 3 km of an ocean inlet. The area around the property is a peneplain characterized by rounded flat knolls and indented and flooded coastlines with wide estuaries. The coastline is characterized by the occurrence of mangrove swamps and has an elevation of 2 to 3 masl in and on the edges of saline waterways. The vegetation consists of grasses in the low-lying areas with denser tropical vegetation consisting of larger shrubs, vines, and hardwood tropical trees on the low rounded hills. The elevation in the Project area varies from 0 to 90 masl.
5.2 Climate
The climate is tropical and often humid, with annual rainfalls of up to 3,000 mm. The rainy season occurs from mid December to mid-July with the heaviest rains from February through May. The area is close to the equator and has relatively steady temperatures ranging from an average low of 24°C to an average high of 31°C. Although rains are generally intense, year round exploration, mining and processing operations can be carried out at the Property.
5.3 Sufficiency of Surface Rights
Trek controls sufficient surface rights for the required infrastructure and operation of the Aurizona Mine.
The Project is owned by (MASA), which is wholly owned by Aurizona Goldfields Corporation (AGC), a wholly owned subsidiary of Trek.
5.4 Accessibility and Transportation to the Property
All year road access is available from the state capital cities of Belém, Pará (400 km), and São Luis, Maranhão (320 km), the latter requiring a ferry transfer from São Luis island to the mainland or longer bypass road on land. The main federal highway connecting both capitals (BR316) has been resurfaced in both states and is in good condition. State highway MA206 connects BR316 with the town of Godofredo Viana, from which the Property is accessed by 16 km of a regularly maintained 8 m wide laterite road.
The Aurizona Mine, in partnership with the local authorities, upgraded the landing strip at Godofredo Viana. Travel time between Aurizona and São Luis or Belém is approximately one hour by light aircraft.
5070-\17T16.417T\5070-STY-001
July 2017 Lycopodium Minerals Canada Ltd.

FEASIBILITY STUDY ON THE AURIZONA GOLD MINE PROJECT NI 43-101 TECHNICAL REPORT
Page 5.2
5.5 Infrastructure Availability and Sources
Aurizona is located in Maranhão state, a remote region of Brazil, but benefits from a local population of skilled labour. Water is abundant and major population centres of Belem and São Luis are approximately a six hour drive away.
5.5.1 Access Road and Transportation
Transportation of gold, unlike many minerals, is a very minor part of the total mine transportation requirement, as measured by volume. Apart from the more intense transportation requirement during the construction phase, the principal transportation requirement thereafter is low to moderate for supplies such as diesel fuel, process chemicals, spares and personnel transport.
To mitigate the impact on local communities, the access road to the mine plant and warehouse areas avoids the main centres of population. Although the local roads are state or municipality controlled, the Aurizona Mine has worked with the authorities to ensure that all roads are maintained fit for purpose. The laterite roads are watered and graded regularly, sign posted adequately and speed limits are respected.
All hazardous deliveries are met by mine security on exiting the state highway and escorted to the Property. Very wide or very long cargos are escorted from the loading point to the Property.
5.5.2 Power
Grid power is currently supplied by the Companhia Energética do Maranhão (CEMAR) and as of July 2012 CEMAR was able to guarantee the supply of 4.6 MW of power which was sufficient for the previous operations. In addition to grid power, the mine relies on three connected 2.5 MVA generators that act as a backup. A fourth 2.5 MVA generator is on site but has not been installed.
A detailed list of equipment and power requirements was supplied to CEMAR in March 2015 and a power study was performed by CEMAR at the request of MASA. CEMAR’s study confirmed that subject to upgrading transformers and switchgear at two substations, the existing power line is able to supply to 15 MW of power for the Project. The substations to be upgraded are located at the Aurizona plant site and Manaus do Maranhão (46 km from the Project). An updated equipment list with demands totalling approximately 16.3 kW was submitted to CEMAR in Q2 2017, and an updated power study will be submitted to MASA by CEMAR.
Subsequent discussions with CEMAR have established that the upgrades are best performed by MASA using CEMAR approved contractors and CEMAR certified equipment purchased directly by MASA. The lead time for the upgrades is 11 months or less.
MASA will purchase power on the free market and CEMAR will provide the transmission service.
5070-\17T16.417T\5070-STY-001
July 2017 Lycopodium Minerals Canada Ltd.

FEASIBILITY STUDY ON THE AURIZONA GOLD MINE PROJECT NI 43-101 TECHNICAL REPORT
Page 5.3
5.5.3 Mine and Plant Access Roads
Dedicated access roads to the mine and process plant have been constructed, fenced off, and adequately signed to protect local people and livestock from entering the mine areas. A single access point to the operation is secured by double gates and spikes allowing only authorized personnel into the working area. After entering through the main gate, the road splits in two, with one road for the plant and the other for the open pit for which radio communication with the supervisor is required prior to gaining access.
5.5.4 Mine Site Facilities
All essential mine facilities have been constructed. External lay down areas and a horticultural nursery are located adjacent to the mine camp.
5.5.5 Plant Site Facilities
The principal facilities in support of the process plant are a gold room, assay laboratory, three standby 2.5 MVA diesel generators, fuelling station, compressors, electrical building and substation, warehouse, lay-down, helicopter pad and office space. A plant maintenance workshop exists as well as a two-bay heavy equipment workshop. A camp is currently located at Aurizona village with an infirmary, offices, lodging facilities and kitchen/dining area for serving meals to the administration staff, short-term contractors and visitors.
5.5.6 Tailings Storage Facility
Section 18.5 provides a full description of the Vené and Ze Bolacha TSF.
5.5.7 Water
The use of all water sources, including surface and underground water, requires approval from SEMA.
Process Water
Process water comes from the Vené TSF, Piaba pit dewatering, recirculation of solution recovered from the pre-leach and CIP tailings thickeners, and eventually from Boa Esperança Pit, once excavated and working as water storage reservoir. Approximately 322 m3/h of process make-up water along with 19 m3/h of freshwater makeup is pumped to the process plant.
The CIP tailings reports to the CIP tailings thickener which concentrates the solids and recovers a large part of the water as thickener overflow. An estimated 190 m3/h of the CIP tailings thickener overflow is recycled to process while the CIP tailings is pumped to the cyanide destruct circuit prior to final discharge to the Vené TSF where approximately 322 m3/h is recirculated back to the process plant.
5070-\17T16.417T\5070-STY-001
July 2017 Lycopodium Minerals Canada Ltd.

FEASIBILITY STUDY ON THE AURIZONA GOLD MINE PROJECT NI 43-101 TECHNICAL REPORT
Page 5.4
Potable Water Supply
Water in the camp area is drawn from an existing cased well, which has a flow rate of approximately 4 m3/h. Potable water also comes from the municipal water treatment plant. A monitoring plan for quality control has been implemented in accordance with standards established by the Ministry of Health Directive No 518/04.
Industrial Water and Fire Fighting Water
The industrial requirement includes showers, toilets, carbon washing, general cleaning purposes, and fire-fighting. Industrial water comes from a small dam on the back of Pirocaua Hill and potentially from clean water pumped from the pit.
5.5.8 Mining Personnel
Mining operations have been temporarily suspended as of September 2015. In general, however, mining personnel is made up of a combination of local workforce for the operations and support services along with select technical expertise from throughout Brazil. The majority of the heavy equipment operators and mine workers are from the region.
5.5.9 Waste Disposal Areas
During operations, waste rock was deposited on the North WSF which is located on the hanging wall side of the Piaba pit. On returning to operations, the North WSF will be expanded and two new WSF will be included in the Project - the South and the East WSF. The total volume of waste rock is estimated to be 64.3 mm3 and the total design capacity in these three WSF is 66.8 mm3.
Additional areas and optimizations are currently being evaluated.
5.5.10 Processing Plant Sites
The plant is located approximately 500m south of the ultimate Piaba pit. The current plant is made up of security access buildings, laboratory, gold room, shops, electrical rooms, compressor rooms, flocculent addition plant, cyanide and lime addition warehouses, substation, maintenance offices, warehouse, helipad, fuel bay, power generator room containing three 2.5 MVA generators.
With mining activities temporarily suspended, the process plant was treating mineralized stockpile material until the stockpile was exhausted in August 2015. The process plant is currently on care and maintenance.
5070-\17T16.417T\5070-STY-001
July 2017 Lycopodium Minerals Canada Ltd.

FEASIBILITY STUDY ON THE AURIZONA GOLD MINE PROJECT NI 43-101 TECHNICAL REPORT
Page 5.5
5.5.11 Communications
At present, there are landline telephones, cell phone coverage, and satellite communications for the mine camp and process plant. Additional systems for handheld and vehicle radios are installed including two repeater towers that enable full radio coverage as far as the Godofredo Viana airport for security purposes. An upgraded information technology (IT) system was installed in 2012 including, a wireless mesh, a new very-small aperture terminal and a fibre optic connection between the camp and process plant.
5070-\17T16.417T\5070-STY-001
July 2017 Lycopodium Minerals Canada Ltd.

FEASIBILITY STUDY ON THE AURIZONA GOLD MINE PROJECT NI 43-101 TECHNICAL REPORT
Page 6.1
6.0 HISTORY
The Aurizona region has a long history of artisanal gold production dating back to the Jesuits in the 17th Century. There are anecdotal reports that companies were active in the area in the 1880s, but that they left due to problems with the indigenous Urubus people. In 1912, there was considerable activity around the village of Aurizona and again in 1931 when the government declared a “free mining area except for the tax on gold production payable to the State”. Garimpeiros have been active in the region, on a discontinuous basis, since that time. Very large nuggets up to 30+ kg have been reported from the alluvial flats.
In 1978, Brascan, through subsidiary companies, started exploration programs in the alluvium that lasted through 1985. In 1988, a subsidiary of Brascan, MASA, received a license to mine within DNPM area 800.256/1978. In 1991, an application for a five year suspension of mining operations was applied for with the purpose of carrying out an evaluation of the primary gold resources.
In 1991, a joint venture agreement was signed between Cesbra S/A, a Brascan Brazil subsidiary, and Unamgen, an exploration subsidiary of Gencor, the South African mining company. Unamgen assumed the position of operator of the joint venture company, MASA. Exploration from 1991 to 1993 consisted of an airborne magnetic and radiometric heliborne survey, photogrammetry survey, soil geochemical surveys, mapping and sampling of garimpeiro pits and follow-up ground geophysical surveys consisting of induced polarization, electromagnetic, magnetic and gamma spectrometry. The Piaba deposit was drill tested with auger, reverse circulation and diamond drilling.
In 1994, following preliminary process tests at Mintek in South Africa, more comprehensive test work was carried out in Brazil at the Metais de Goías S/A (Metago) metallurgical process facility in Goiania and at the laboratory of Paulo Abib Engenharia S.A., a mining engineering company subsequently acquired by Kilborn Engineering, now SNC-Lavalin Inc., located in São Paulo. The emphasis at that time was on gravity concentration techniques since the Property was only accessible by light aircraft or small boats and other infrastructure was negligible.
This work resulted in a positive economic evaluation of working the Piaba deposit using mining equipment from Cesbra’s tin operations in Rondonia, a gravity only process plant with diesel powered electricity generation. At the same time, a technical study report and an EIA to mine the weathered part of the Piaba deposit were submitted to government agencies and public meetings were held.
While this work was being finalized, Gencor was in the process of acquiring BHP Billiton’s Brazilian minerals assets from Royal Dutch/Shell. Following that acquisition in 1994, Gencor conducted a strategic review of the enlarged business and determined that it would divest or spin off all its gold assets and would spend no more money on gold exploration. As a result, Unamgen terminated its joint venture with Cesbra in 1995.
5070-\17T16.417T\5070-STY-001
July 2017 Lycopodium Minerals Canada Ltd.

FEASIBILITY STUDY ON THE AURIZONA GOLD MINE PROJECT NI 43-101 TECHNICAL REPORT
Page 6.2
In 1996, Gencor agreed to sell its gold assets in Brazil to Eldorado Gold and in the process introduced Eldorado to Cesbra. This resulted in a new project joint venture with Unamgen, as a subsidiary of Eldorado, as the operator. In 1997, an exploration program commenced that included diamond and reverse circulation drilling of the extensions of the Piaba deposit along strike to the east and west. This lasted less than a year due to the deterioration of market conditions for junior mining stocks at that time.
In total, in the period from 1991 to 1997, approximately 22,000 m were drilled (core and reverse circulation) at Aurizona by Unamgen.
Apart from the minor work necessary to maintain title, no further systematic exploration or development activity was carried out until Trek acquired 100% of MASA from both venture partners in January 2007. In the meantime, the regional infrastructure had improved considerably in terms of road access, telecommunications and grid power availability.
6.1 Prior Ownership and Ownership Changes
In January 2007, Luna Gold completed a purchase agreement (the Purchase Agreement) to acquire all of the outstanding shares of Aurizona Goldfields Corporation (AGC), which ultimately holds the Aurizona assets through the Brazilian entity, from Brascan and Eldorado. In July 2011, all obligations were satisfied in regards to the Purchase Agreement by Luna Gold.
In March 2017, Luna Gold Corp. and JDL Gold Corp. combined to create Trek Mining Inc. (“Trek”).
6.2 Previous Exploration and Development Results
Unamgen conducted exploration on the Property, first as a subsidiary of Gencor and later as a subsidiary of Eldorado. This work was strongly focused in the Aurizona area.
6.2.1 Gencor (1991 to 1995)
Initial work at Aurizona was carried out by Unamgen as the joint-venture operator from 1991 to 1993 and was focused on identifying bulk tonnage, gold deposits amenable to open pit mining methods. Saprolite and fresh rock mineralization was discovered during this program. Work programs carried out during this period include:
Airborne (Heli) Magnetic and Radiometric Survey (1991)
• Contractor: AERODAT.
• Flight Line Spacing: 200 m.
• Tie Line Spacing: 2 km.
• Flight Line Direction: 162°.
5070-\17T16.417T\5070-STY-001
July 2017 Lycopodium Minerals Canada Ltd.
FEASIBILITY STUDY ON THE AURIZONA GOLD MINE PROJECT NI 43-101 TECHNICAL REPORT
Page 6.3
• Control Line Direction: 072°.
• Area Flown: 182 km2.
• Flight Lines: 1,045 km.
Interpretations of these data were made by Gencor in 1991. Particular emphasis was given to the identification of the regional structural trend, the extent of the greenstone of the Aurizona Group and magnetic stratigraphy.
Ground Geophysical Surveys
• Magnetometry.
• Time domain induced polarization (IP).
• Frequency domain electromagnetics (EM).
• Electro-resistivity.
• Very-low frequency.
• Gamma-spectrometry.
Induced polarization was one of the more successful historical survey methods in determining structural controls on gold mineralization at Piaba, by locating the footwall graphitic metavolcanic unit that broadly delimits the southern margin of the deposit. Magnetics and gamma spectrometry were also useful in defining the geological trend in the wider Aurizona area.
Aerophotogrametric Survey (1:25,000)
A photogeological survey covering an area of 270 km2 was conducted based on interpretation of 1:25,000 scale black and white aerial photographs with photo-restituted maps at 1:10,000 scale. This work was carried out by Prospecções e Aerolevantamentos S.A. (Prospec). The main features observed are east / northeast striking lineaments truncated by northwest trending structures. Discrete circular features are also apparent.
Soil Geochemical Data (Aurizona)
A total of 12 detailed soil grids were established with lines spaced at 100 m and with sample stations at 25 m. Samples were analyzed for gold, arsenic, copper, molybdenum, lead, nickel and zinc. This program defined a major east/northeast trending soil gold anomaly encompassing the Piaba and Tatajuba deposits, and also defined anomalies at several near-mine exploration targets. Piaba was defined by a wide gold anomaly associated with moderate copper and zinc values, with outward enrichment associated with garimpeiro pits.
5070-\17T16.417T\5070-STY-001
July 2017 Lycopodium Minerals Canada Ltd.
FEASIBILITY STUDY ON THE AURIZONA GOLD MINE PROJECT NI 43-101 TECHNICAL REPORT
Page 6.4
Geologic Mapping and Sampling (Garimpeiro Pits)
Due to the lack of outcrop in the Project area, geologic mapping was limited to the garimpeiro pits. The pits were channel sampled and mapped with the objective of determining geological controls on the gold mineralization and grade distribution. The program indicated that the laterite and saprolite are mineralized and that gold bears a strong correlation with both sub-horizontal and sub-vertical and stockwork quartz veins.
Auger Drilling
Shallow drilling via both manual and mechanized augers was used to verify the gold anomalies generated by the soil sampling and to evaluate certain garimpeiro tailings dumps in the Project area. Holes were drilled to an average depth of 8 m.
Drilling (Reverse Circulation and Diamond)
Unamgen drilled 142 diamond drillholes (BRAZD001 to BRAZD142) using mostly HQ (63.5 mm) diameter core at Aurizona, the majority of which were cited in the oxide zone of the Piaba deposit. Unamgen also drilled 67 reverse circulation holes (BRAZP001 to BRAZP067) which were also concentrated in the oxide zone of the Piaba deposit. Drilling at Piaba was initially conducted on 50 m spaced sections and later infilled to irregular 25m sections in the Central Zone. Unamgen also drilled several nearby targets including Tatajuba and Micote. All the Unamgen drilling was carried out by a private Brazilian drilling firm, Serviços Técnicos Minerais Ltda (Seta).
Economic Viability Study (1994)
In 1994, Unamgen commissioned Paulo Abib Engenharia to produce an economic viability study and EIA to mine the oxide gold mineralization at Piaba.
6.2.2 Eldorado Gold Corp (1996 to 1997)
The joint venture was terminated by Unamgen in 1995 due to Gencor’s decision to exit the gold business. In 1996, Eldorado acquired Gencor’s gold assets in Brazil, including Unamgen. Eldorado exercised Unamgen’s buy back option in 1997 and commenced additional exploration with Unamgen as the operator. Work carried out during this period included the following:
Drilling (Reverse Circulation and Diamond)
Eldorado drilled 61 diamond drillholes (BRAZD143 to BRAZD203) at Aurizona using HQ (63.5mm) diameter core, the majority of which were located in the oxide portions of the Piaba and Tatajuba deposits. At Piaba, Unamgen drilled east and west extensions and extended the deposit strike. In addition, some holes were drilled into the deeper portions of the Piaba deposit to test the fresh rock potential. Unamgen drilled 26 reverse circulation holes (BRAZP068 to BRAZP092A), which were also concentrated in the oxide portion of the Piaba deposit. Unamgen also conducted scout drilling at several near mine exploration targets including Boa Esperança, Pé Grande, Ferradura and Conceição. All Unamgen drilling during this period was carried out by a private Brazilian drilling firm Pesquisas Geológicas Ltda (Geoserv).
5070-\17T16.417T\5070-STY-001
July 2017 Lycopodium Minerals Canada Ltd.
FEASIBILITY STUDY ON THE AURIZONA GOLD MINE PROJECT NI 43-101 TECHNICAL REPORT
Page 6.5
Airborne (Fixed Wing) Magnetic and Radiometric Survey (1996)
• Contractor: Geomag.
• Flight Line Spacing: 250 m.
• Tie Line Spacing: 2.5 km.
• Flight Line Direction: 160°.
• Area Flown: 11,270 km2.
• Flight Lines: 22,863 km.
Due to the down turn in the gold price in 1997, Unamgen shut down exploration in Brazil and conducted no further exploration work on the Property.
6.2.3 Brascan (1999 to 2000)
In 1999, Brascan commissioned a gravity pilot plant to test the saprolite and garimpeiro tailings at Piaba. The pilot plant test work was completed in February 2000. The Property was placed on care and maintenance from 2000 until March 2007, when Trek commenced a new exploration program at Aurizona, Trek’s exploration work initially focused on the Piaba and Tatajuba deposits and more recently included systematic exploration of the Aurizona area via soil sampling, geologic mapping, geophysical surveying, shallow auger drilling, trenching, diamond and reverse circulation drilling.
6.3 Historic Mineral Resource and Reserve Estimates
Table 6.1 list the historical Measured, Indicated and Inferred Mineral Resources at Aurizona. The Unamgen and Aurizona Mineral Resources were estimated prior to the institution of NI 43-101 Technical Report guidelines and are presented for interest only and should not be relied upon. The Unamgen Mineral Resources were also estimated prior to NI 43-101 guidelines and were publicly reported by Eldorado between 2000 and 2005 (Eldorado 2005). A QP has not done sufficient work to classify the historical estimates as current Mineral Resources or Mineral Reserves. Trek is not treating these historical estimates as current Mineral Resources or Mineral Reserves.
5070-\17T16.417T\5070-STY-001
July 2017 Lycopodium Minerals Canada Ltd.
FEASIBILITY STUDY ON THE AURIZONA GOLD MINE PROJECT NI 43-101 TECHNICAL REPORT
Page 6.6
Table 6.1 Historical Measured, Indicated and Inferred Mineral Resources
(For information only and not to be relied on)
Source/Year Cut-off
Au
Measured and Indicated Inferred
Tonnes Mt
Au g/t
Contained Ounces
Koz Tonnes
Mt Au g/t
Contained Ounces
Koz
Eldorado (2000- 2005)(1) 0.30 6.3 1.27 256.0 4.3 1.27 178.0
Mineração Aurizona (2000) 0.30 12.5 1.27 500.0 8.6 1.27 350.0
Unamgen (1995) 0.75 5.0 1.78 286.0 (1)Eldorado’s Mineral Resources represent 50% of the total Mineral Resource at Piaba.
6.4 Historic Production
Historic garimpeiro production from the Property has been from small pits and cannot be quantified. The Aurizona Mine production for the period 2010 to 2015 is shown in Table 6.2.
Table 6.2 Aurizona Production 2010 to 2015
Description 2010 2011 2012 2013 2014 2015 Total
Dry Ore (t) 747,349 1,275,652 2,155,203 1,934,176 2,014,237 1,010,295 9,136,912
Au (g/t) 1.15 1.3 1.21 1.43 1.22 1.34 1.28
Contained Ounces (oz) 27,642 53,313 83,709 88,854 79,008 43,392 375,918
Recovery (%) 59 78 87 90 87 81 88
Recovered Ounces (oz) 15,759 43,055 74,269 79,229 74,622 42,108 329,042
5070-\17T16.417T\5070-STY-001
July 2017 Lycopodium Minerals Canada Ltd.
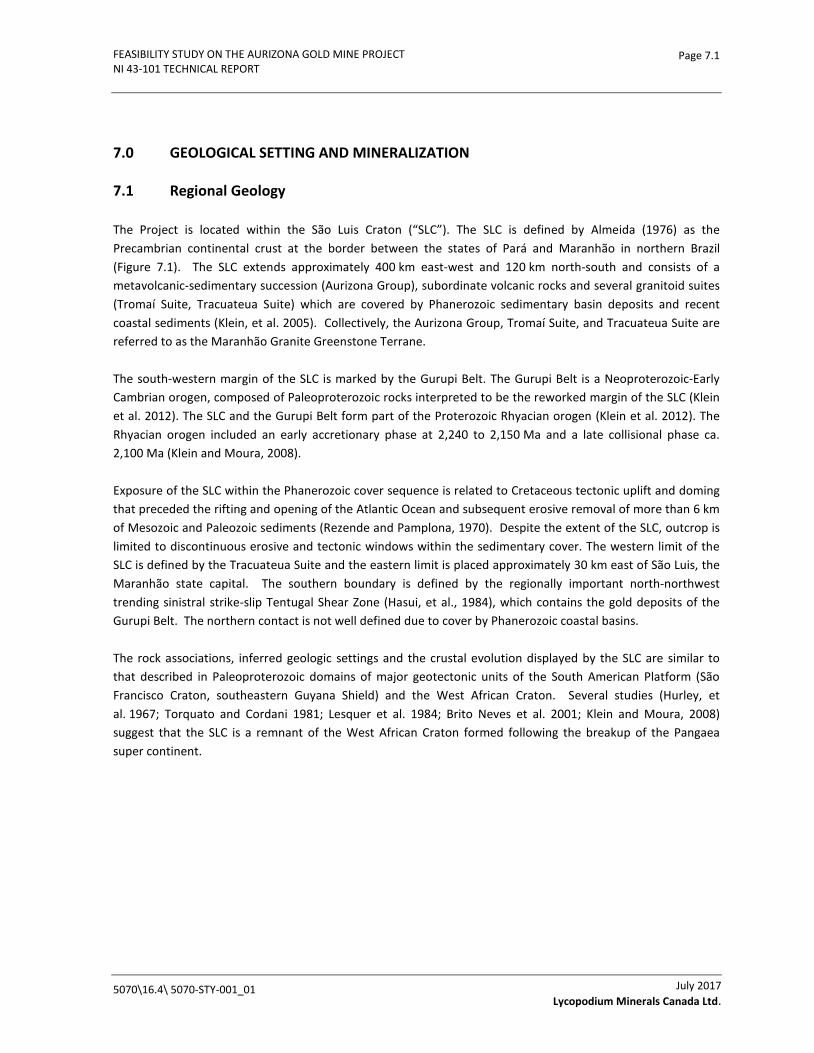
FEASIBILITY STUDY ON THE AURIZONA GOLD MINE PROJECT NI 43-101 TECHNICAL REPORT
Page 7.1
7.0 GEOLOGICAL SETTING AND MINERALIZATION
7.1 Regional Geology
The Project is located within the São Luis Craton (“SLC”). The SLC is defined by Almeida (1976) as the Precambrian continental crust at the border between the states of Pará and Maranhão in northern Brazil (Figure 7.1). The SLC extends approximately 400 km east-west and 120 km north-south and consists of a metavolcanic-sedimentary succession (Aurizona Group), subordinate volcanic rocks and several granitoid suites (Tromaí Suite, Tracuateua Suite) which are covered by Phanerozoic sedimentary basin deposits and recent coastal sediments (Klein, et al. 2005). Collectively, the Aurizona Group, Tromaí Suite, and Tracuateua Suite are referred to as the Maranhão Granite Greenstone Terrane.
The south-western margin of the SLC is marked by the Gurupi Belt. The Gurupi Belt is a Neoproterozoic-Early Cambrian orogen, composed of Paleoproterozoic rocks interpreted to be the reworked margin of the SLC (Klein et al. 2012). The SLC and the Gurupi Belt form part of the Proterozoic Rhyacian orogen (Klein et al. 2012). The Rhyacian orogen included an early accretionary phase at 2,240 to 2,150 Ma and a late collisional phase ca. 2,100 Ma (Klein and Moura, 2008).
Exposure of the SLC within the Phanerozoic cover sequence is related to Cretaceous tectonic uplift and doming that preceded the rifting and opening of the Atlantic Ocean and subsequent erosive removal of more than 6 km of Mesozoic and Paleozoic sediments (Rezende and Pamplona, 1970). Despite the extent of the SLC, outcrop is limited to discontinuous erosive and tectonic windows within the sedimentary cover. The western limit of the SLC is defined by the Tracuateua Suite and the eastern limit is placed approximately 30 km east of São Luis, the Maranhão state capital. The southern boundary is defined by the regionally important north-northwest trending sinistral strike-slip Tentugal Shear Zone (Hasui, et al., 1984), which contains the gold deposits of the Gurupi Belt. The northern contact is not well defined due to cover by Phanerozoic coastal basins.
The rock associations, inferred geologic settings and the crustal evolution displayed by the SLC are similar to that described in Paleoproterozoic domains of major geotectonic units of the South American Platform (São Francisco Craton, southeastern Guyana Shield) and the West African Craton. Several studies (Hurley, et al. 1967; Torquato and Cordani 1981; Lesquer et al. 1984; Brito Neves et al. 2001; Klein and Moura, 2008) suggest that the SLC is a remnant of the West African Craton formed following the breakup of the Pangaea super continent.
5070\16.4\ 5070-STY-001_01
July 2017 Lycopodium Minerals Canada Ltd.
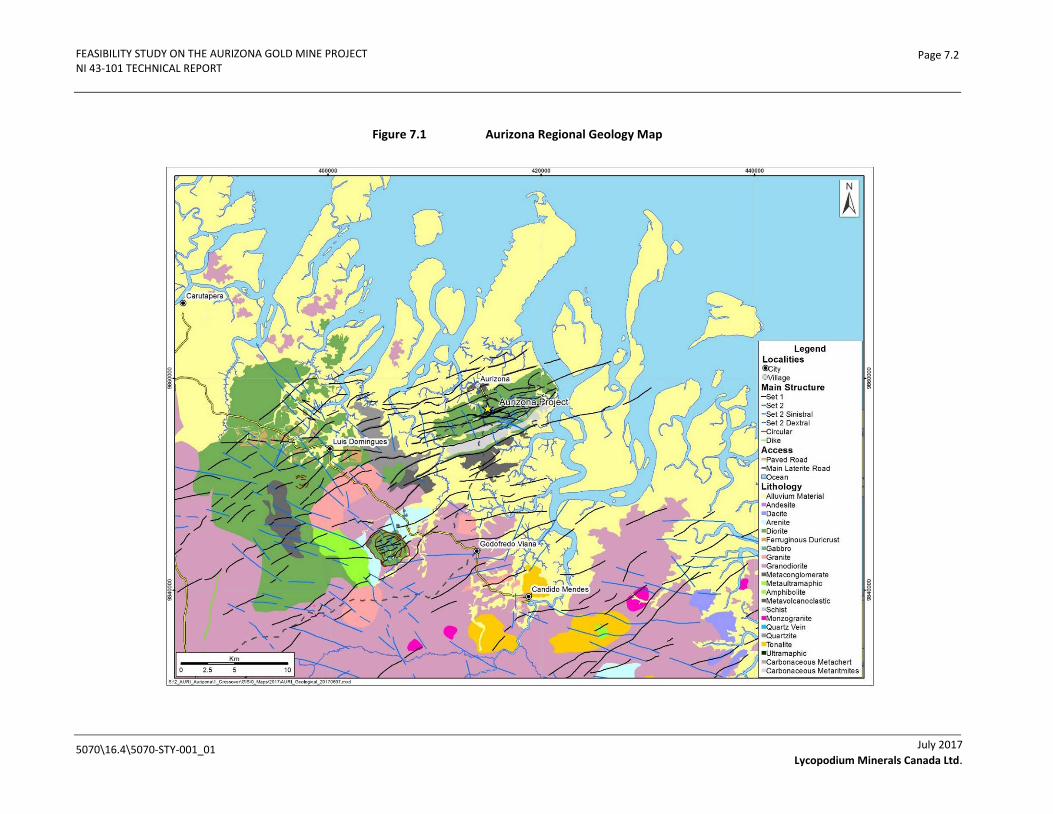
FEASIBILITY STUDY ON THE AURIZONA GOLD MINE PROJECT NI 43-101 TECHNICAL REPORT
Page 7.2
Figure 7.1 Aurizona Regional Geology Map
5070\16.4\5070-STY-001_01
July 2017 Lycopodium Minerals Canada Ltd.

FEASIBILITY STUDY ON THE AURIZONA GOLD MINE PROJECT NI 43-101 TECHNICAL REPORT
Page 7.3
7.1.2 Lithology
The major regional lithologies surrounding the Project consist of the Paleoproterozoic Maranhão Granite-Greenstone terrane, Proterozoic to Eopaleozoic Viseu and Igarapé de Areia Formations. The Maranhão Granite-Greenstone terrane includes the Aurizona Group metavolcanic-sedimentary formations, the Tromaí Suite, and the Tracuateua Suite. Each major unit is described below.
Aurizona Group
The Aurizona Group hosts the gold mineralization in the Project and trends east-northeast to west-southwest. In the project area, it consists of a well-developed metavolcanic-sedimentary sequence of schists, intermediate to mafic rocks and metapyroclastic rocks, as well as subordinate quartzites, banded iron formation (BIF), and metachert. This sequence is intruded by two suites of granites, the Tromaí and Tracuateua Suites. The two primary formations within the Aurizona Group are the Pirocaua Formation and the Ramos Formation. The Pirocaua Formation consists of metavolcanic and metapyroclastic rocks. The Ramos Formations consists of metasedimentary rocks in the Project area.
Overall, the metamorphic grade of the Aurizona Group is chlorite zone greenschist facies. The Aurizona Group rocks display a well-developed regional foliation that strikes between N15°W and N70°W and dips steeply (~70°) to the northeast.
Limited age dating of a metapyroclastic unit in the Aurizona Group yielded an age of 2,240 ±5 Ma (Klein and Moura, 2001). More recent lead evaporation and neodymium isotope data (Klein et al. 2005) indicate that the Aurizona Group developed from 2,240 Ma to approximately 2,200 to 2,180 Ma from juvenile protoliths. The Aurizona Group is considered to have formed in an island-arc setting (Klein et al. 2005) and hosts most of the gold mineralization discovered to date in the northern portion of the SLC.
Tromaí Intrusive Suite
The Tromaí Intrusive Suite is the most widespread intrusive unit in the SLC and consists of a suite of composite anorogenic batholiths of tonalite-trondhjemite-granodiorite and minor monzogranite with variable textural and structural characteristics. The Tromaí Intrusive Suite has been subdivided into three subunits, Cavala Quartzo Diorite, Igarapé Bom Jesus Granodiorite, and Areal Granite. The Cavala Quartz Diorite and the Igarapé Bom Jesus Granodiorite form batholiths and the Areal Granite consists of a single stock composed of syeno-granites and monzo-granites (Luna, 2016).
Recent studies suggest that the Tromaí Intrusive Suite locally intruded the Aurizona Group and formed in an oceanic island arc setting between 2,168 and 2,147 Ma (Klein et al. 2005). Dacite and rhyodacite lithologies associated with the Tromaí Intrusive Suite are considered as extrusive equivalents of the granitoids and differ from the metavolcanic-sedimentary succession of the Aurizona Group in that they are not strongly metamorphosed and generally undeformed (Costa, et al. 1977).
5070\16.4\5070-STY-001_01
July 2017 Lycopodium Minerals Canada Ltd.
FEASIBILITY STUDY ON THE AURIZONA GOLD MINE PROJECT NI 43-101 TECHNICAL REPORT
Page 7.4
Tracuateua Intrusive Suite
The Tracuateua Intrusive Suite consists of strongly peraluminous, S-type, two-mica granites, derived from the partial melting of crustal rocks. These granites have zircon Pb-Pb crystallization ages of 2086-91 Ma and Sm-Nd model ages varying between 2.31 and 2.50 Ga (Klein & Moura, 2008).
Viseu and Igarapé de Areia Formations
The Viseu and Igarapé de Areia formations formed in fault-bound extensional sedimentary basins formed over the sequences of the SLC and Gurupi Belt (Abreu et al. 1980; Pastana 1995). The Viseu and Igarapé de Areia formations consist of continental clastic sediments dominated by sandstones, arkoses and conglomerates. The rocks are weakly metamorphosed (sub-greenschist) and display well-preserved sedimentary structures and large scale open folds. The dominant foliation strikes northwest-southeast and northeast-southwest. The Igarapé de Areia Formation is considered to be equivalent to the Tarkwaian sedimentary sequence of Ghana (Klein and Lopes 2009). A large proportion of detrital zircons found in arkose from one of these basins shows Pb-Pb ages between 700 and 500 Ma (Pinheiro et al. 2003).
7.1.3 Structural Geology
Structural trends throughout the SLC are dominated by north/northeast-south/southwest and west/northwest-east/southeast trending structures (Figure 7.2). The metavolcano-sedimentary succession displays the best regional foliation which strikes northeast-southwest and northwest-southeast dipping at moderate to high angles.
Mapping, airborne geophysics and photo interpretation carried out by on the Property show a clear northeast-southwest structural and lithological orientation. The volcano-sedimentary rocks normally show a sub-vertical dip and a distinct orientation of their schistosity and banding in the same direction. Discrete shear zones, up to a few tens of metres wide and several kilometres long are common and cross-cut both the intrusive and supracrustal lithologies (Klein et al. 2005). Zones of mylonitization occur although their extent is limited. There is a strong association between gold occurrences and structural lineaments which form distinct gold corridors. The rocks of the area represent a Paleoproterozoic accretionary terrane associated with the Trans-Amazonian orogeny (2.2 to 1.9 Ga).
5070\16.4\5070-STY-001_01
July 2017 Lycopodium Minerals Canada Ltd.

FEASIBILITY STUDY ON THE AURIZONA GOLD MINE PROJECT NI 43-101 TECHNICAL REPORT
Page 7.5
Figure 7.2 Aurizona Regional Geophysical Map - Total Magnetic Intensity
7.1.4 Weathering Profile
The Project is situated in an area of low relief with occasional higher elevations centred on lateritic plateaus and more resistant intrusive complexes. Laterite and alluvium cover the area with very rare outcrops of bedrock. The saprolite profile is very mature and locally attains depths of up to 100m.
7.2 Local and Property Geology
The Project is hosted by the Aurizona Group and the Tromaí Intrusive Suite along east-northeast trending shear zones. The Piaba and Boa Esperança deposits are two shear-hosted gold deposits shown in Figure 7.3 and Figure 7.4.
5070\16.4\5070-STY-001_01
July 2017 Lycopodium Minerals Canada Ltd.
FEASIBILITY STUDY ON THE AURIZONA GOLD MINE PROJECT NI 43-101 TECHNICAL REPORT
Page 7.6
Figure 7.3 Aurizona Property Geology Map
5070\16.4\5070-STY-001_01
July 2017 Lycopodium Minerals Canada Ltd.
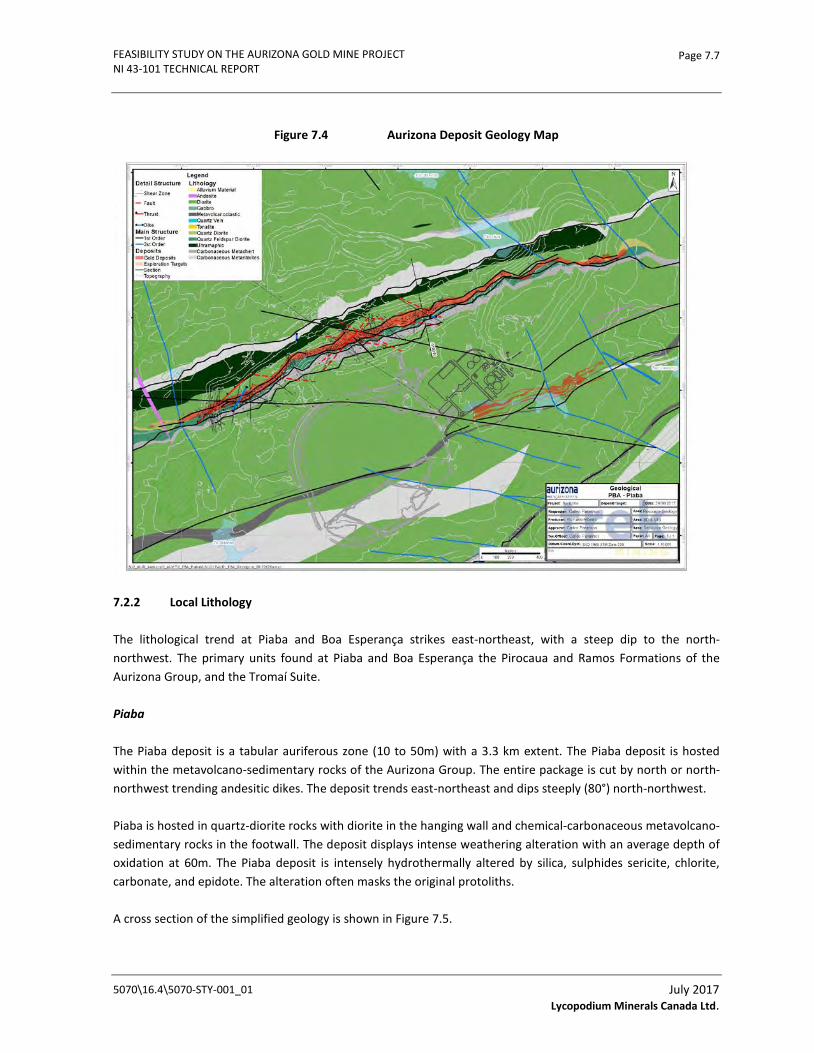
FEASIBILITY STUDY ON THE AURIZONA GOLD MINE PROJECT NI 43-101 TECHNICAL REPORT
Page 7.7
Figure 7.4 Aurizona Deposit Geology Map
7.2.2 Local Lithology
The lithological trend at Piaba and Boa Esperança strikes east-northeast, with a steep dip to the north-northwest. The primary units found at Piaba and Boa Esperança the Pirocaua and Ramos Formations of the Aurizona Group, and the Tromaí Suite.
Piaba
The Piaba deposit is a tabular auriferous zone (10 to 50m) with a 3.3 km extent. The Piaba deposit is hosted within the metavolcano-sedimentary rocks of the Aurizona Group. The entire package is cut by north or north-northwest trending andesitic dikes. The deposit trends east-northeast and dips steeply (80°) north-northwest.
Piaba is hosted in quartz-diorite rocks with diorite in the hanging wall and chemical-carbonaceous metavolcano-sedimentary rocks in the footwall. The deposit displays intense weathering alteration with an average depth of oxidation at 60m. The Piaba deposit is intensely hydrothermally altered by silica, sulphides sericite, chlorite, carbonate, and epidote. The alteration often masks the original protoliths.
A cross section of the simplified geology is shown in Figure 7.5.
5070\16.4\5070-STY-001_01
July 2017 Lycopodium Minerals Canada Ltd.
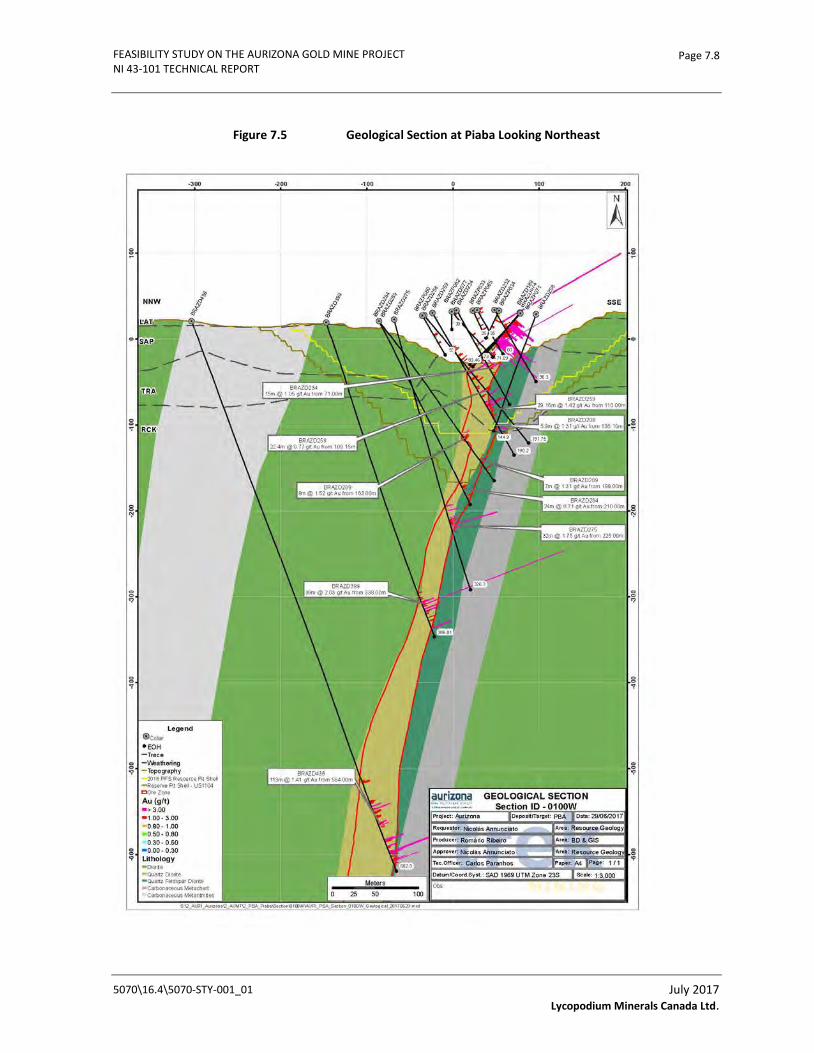
FEASIBILITY STUDY ON THE AURIZONA GOLD MINE PROJECT NI 43-101 TECHNICAL REPORT
Page 7.8
Figure 7.5 Geological Section at Piaba Looking Northeast
5070\16.4\5070-STY-001_01
July 2017 Lycopodium Minerals Canada Ltd.
FEASIBILITY STUDY ON THE AURIZONA GOLD MINE PROJECT NI 43-101 TECHNICAL REPORT
Page 7.9
The metavolcano-sedimentary unit in the footwall of the deposit is characterized by carbonaceous phyllites and banded metachert in gradational contact with subordinated layers of phyllites and carbonaceous metagreywackes. The gradational contacts indicate a depositional environment with chemical and subordinately clasto-volcanic contributions. In metagreywacke beds the fining/younging direction is normal and oriented north, suggesting that the stratigraphy is not inverted. The preservation of depositional primary structures in the metavolcano-sedimentary rocks such as banding and fining direction refutes the possibility of extensive shearing in the entire unit. The footwall metavolcano-sedimentary rocks have been metamorphosed to greenschist facies which is supported by the presence of very thin granulations of garnet, quartz, oxides, and iron hydroxides, which may be metacherts.
The contact of the footwall metavolcano-sedimentary rocks with the overlying quartz diorite is often marked by fractured zone filled by quartz, sulphide, and carbonate. The quartz diorite hosts the bulk of the auriferous zone at Piaba. This quartz diorite was previously logged as tonalite. After further study the tonalite has been subdivided into two separate units, a quartz diorite and feldspar quartz diorite. This break down was determined from petrography and multi-element geochemistry analysis.
The quartz diorite is limited in the lower portion by thin, ductile shear zones (shearing bands with graphite and quartz veins with thicknesses from 1 to 10m) or by faults with fracturing and intense brecciation. The feldspar quartz diorite contains spherulites, plumes, and micrographic intergrowth texture of plagioclase and quartz which confirms an intrusive origin for the igneous rocks of the Piaba deposit.
The hanging wall contact of the quartz diorite unit with the overlying diorite unit is gradational, but locally exhibits thin, ductile shear zones (1 to 10m), or even fault zones with intense fracturing and infill by carbonaceous-graphitic material. The diorite overlying the quartz diorite unit is heterogenous and envelops distinct lithological types, as much by magmatic differentiation as by the distinct intensity and the hydrothermal alteration on the protoliths. An example is the occurrence of ultramafic and gabbroic rocks which were not represented in the model due to their small scale. The diorite unit has mixed characteristics between volcanic and plutonic features and additional petrographic and geochemical studies are necessary to clarify its exact origin.
The contact between the diorite unit and the overlying metavolcano-sedimentary unit is quite complex and involves total or partial assimilation of carbonaceous metavolcano-sedimentary rocks by the intrusive/volcanic, partially assimilated xenoliths, indentations, infill of fractures, and even dikes, This indicates a nonconformity contact with characteristics that may indicate intrusion notwithstanding the non-occurrence of thermal metamorphism haloes into the overlying metavolcano-sedimentary sequence.
5070\16.4\5070-STY-001_01
July 2017 Lycopodium Minerals Canada Ltd.
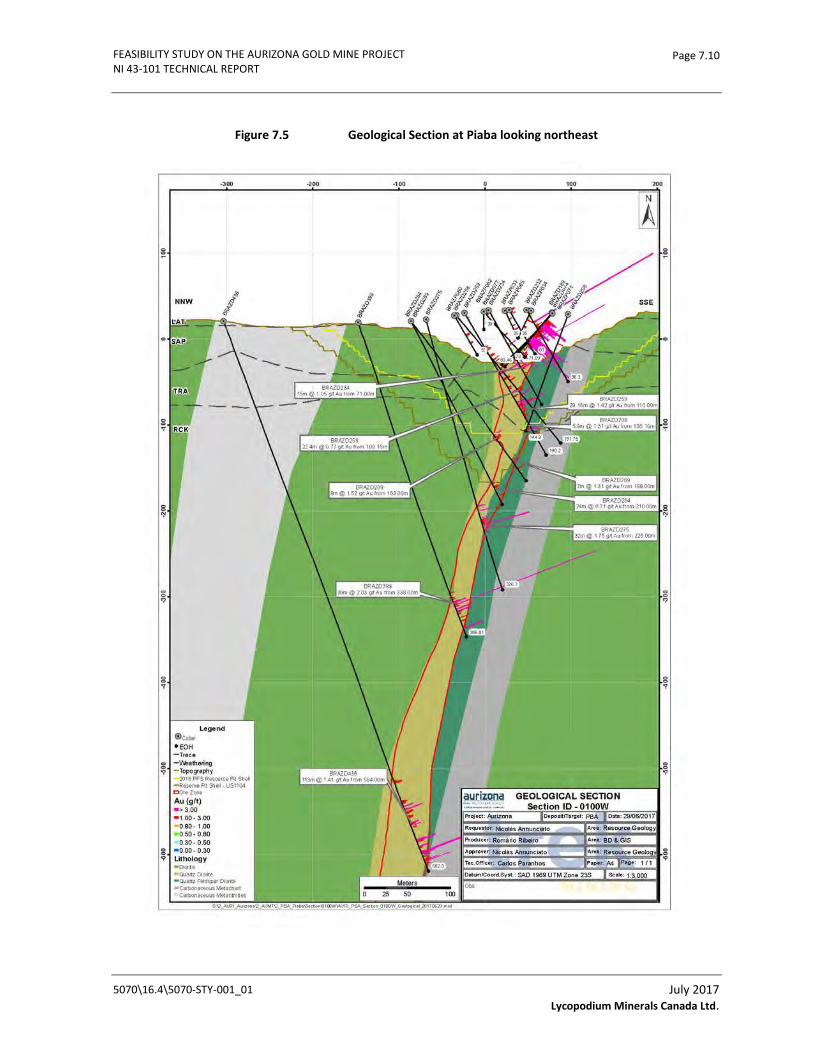
FEASIBILITY STUDY ON THE AURIZONA GOLD MINE PROJECT NI 43-101 TECHNICAL REPORT
Page 7.10
Figure 7.5 Geological Section at Piaba looking northeast
5070\16.4\5070-STY-001_01
July 2017 Lycopodium Minerals Canada Ltd.
FEASIBILITY STUDY ON THE AURIZONA GOLD MINE PROJECT NI 43-101 TECHNICAL REPORT
Page 7.11
Boa Esperança
The Boa Esperança deposit is hosted by diorite within a metavolcano-sedimentary sequence. The diorite is associated with lenses of gabbro and andesite which are in nonconformable contact with the metavolcano-sedimentary sequence. The metavolcano-sedimentary sequence includes carbonaceous metagraywacke, carbonaceous metachert and carbonaceous phyllites.
It is postulated that the metavolcano-sedimentary sequence was intruded by the mafic units. This is supported by the occurrence of assimilation of fragments of the metavolcano-sedimentary rocks within the igneous rocks.
7.2.3 Weathering Profile
The relief of the Aurizona region is of a coastal plain type, flat and gently undulated, with terrain elevations ranging between 3 and 20m, with the exception of the Pirocaua Hills that reach elevations of around 100m.
Mature complete and incomplete weathering profiles have been mapped at depth, with thicknesses of 10 to 100 m. These consist of thick soils, consolidated and unconsolidated lateritic horizons thick zones of mottled saprolite, saprock, and fresh rock under various stages of weathering.
The ferruginous laterite crust may be solid (duricrust); an example is the Pirocaua Hills. More commonly it is disaggregated, made up of gravel consisting of ferruginous nodules and pisoliths within an unconsolidated sandy-clay matrix, and may appear as residual evolution, at the top of the profile, or transported eroded deposits.
Below the lateritic front, there is a mottled saprolitic horizon that is characterized by the loss in texture and structure of the bedrock and the development of red macroscopic ferruginous segregations at abrupt or gradual contacts. The mottled horizons may vary between 1 to 10m in thickness.
Below the mottled area, saprolites that result from the partial to complete decomposition of the bedrock occur, with partial loss of original texture and structure, the dissolution of the older mineral stages and generation of by-products, such as clay, iron oxide and hydroxide, manganese, aluminium, phosphate and other minor elements present in the decomposed rock. Locally, the saprolite displays a harder, more competent, iron-rich character, which is termed Hard Saprolite. The Hard Saprolite may represent a secondary lateritic profile that developed within the saprolite in response to large-scale paleo water table fluctuations.
Between the saprolite and the Hard Saprolite there is a transition horizon, or saprock, which is characterized by the incipient transformations of the original rock, with perceivable mineralogical weathering, resulting from the dissolution of carbonates, partial oxidation of sulphides, discoloration or loss of shine of silicate minerals, and the decrease of the resistance of the rock. In structural terms it can be noted that the joints and fractures become wider and more oxidized and their walls more weathered and, in addition, foliation is highlighted, due to the incipient weathering.
5070\16.4\5070-STY-001_01
July 2017 Lycopodium Minerals Canada Ltd.
FEASIBILITY STUDY ON THE AURIZONA GOLD MINE PROJECT NI 43-101 TECHNICAL REPORT
Page 7.12
The bedrock preserves its textural and structural features. When influenced by deep faulting, however, the bedrock may present narrow, tubular zones where weathering has more effect, which results in a decrease of rock resistance due to the percolation of surface fluids at low pressure and temperature.
7.2.4 Structural Geology
Piaba
Shear zones are present in the hanging wall and footwall of the Piaba deposit. The shear zones are represented by decimetric to metric zones of increased foliation development and displayed in the alignment of amphibole, chlorite, sericite, graphite, and quartz. In the hanging wall of the Piaba deposit, this increase in foliation development often occurs in proximity with the hanging wall of both the quartz-diorite and the gold mineralization. A similar increase in foliation development can be observed through the gold zone and into the feldspar quartz diorite in the footwall of the Piaba deposit. In the gold zone, brittle-ductile deformation evidenced by excessive fragmentation of the rocks, brecciation, intrusion of quartz-carbonate-sulphide veins, shear bands, infilling of the matrix with carbon material, chlorite, carbonate and sericite and mineral stretching, can be recognized in the core samples. Two ages of shear zones are present at Piaba, earlier auriferous chloritic shear zones that are reactivated, and shear zones crosscut by graphitic shear zones. Where reactivated by subsequent graphitic shear zones, these shear zones can be associated with additional auriferous quartz veining.
The gold zone at Piaba is associated with silicified and carbonatized quartz-diorite, which displays cataclastic textures (Dunne 2009; 2011). Silicification is one of the most important components for the ore-forming process that together with sulphidation controlled the deposition of gold at Piaba. In general, the auriferous quartz-diorite consists of 10 to 40% blue quartz and plagioclase phenocrystals, is medium- to coarse-grained with a cataclastic texture and intense hydrothermal alteration, and is characterised by sulphidation, silicification, and tourmalinization associated with minor carbonate, sericite, and chlorite hydrothermal alteration.
The contact of the feldspar quartz diorite with the metavolcano-sedimentary rocks of the footwall generally appears as fractured and at times sheared, with coarse graphite and quartz-carbonate veining.
In the metavolcano-sedimentary rocks in the footwall of the Piaba deposit, another shear zone occurs, marked by a zone of increased foliation (1 to 12m wide). In this shear zone, the kinematic elements, such as stretched quartz and mafic minerals, shear bands with anastomosed mylonitic S-C foliation, and millimetric and centimetric quartz-carbonate-sulphide veins parallel to the main shear zone, are displayed along the strike and dip of the Piaba deposit.
During the 2015 drilling program, approximately 7,675 structural measurements related to bedding, laminations, geological contact, foliation/shear zones, vein and fractures were obtained from oriented core. Preliminary interpretation of the structural information shows that all lithologies in Piaba trend east-northeast and dip steep to the north-northwest. The main chloritic-graphitic shear zone associated with the Piaba deposit has the same orientation.
5070\16.4\5070-STY-001_01
July 2017 Lycopodium Minerals Canada Ltd.
FEASIBILITY STUDY ON THE AURIZONA GOLD MINE PROJECT NI 43-101 TECHNICAL REPORT
Page 7.13
Also, discrete northwest-trending graphitic shear zones and brittle faults appear to modify the geometry of the gold zone. Nine shear zones and/or brittle faults have been defined in the Piaba deposit. These shear zones and/or brittle faults partially segment the Piaba deposit, although offsets of the gold zone along them are limited. The maximum offset observed is 100 m, whereas most offsets are on the order of 10m.
The Piaba deposit is crosscut by the Pirocaua fault zone at the east-northeast end of the deposit. This brittle fault zone is up to 350m wide and locally disrupts the Piaba gold zone (maximum offset 75m).
Boa Esperanca
Structures present at Boa Esperança are preferentially oriented to the east-northeast and dip steeply to the north-northwest. The structures are a combination of brittle and ductile features and include mylonitic foliation, shear bands, and asymmetric trailing porphyroclasts. Mineralized quartz carbonate veins occur parallel to the main structures and foliation.
7.2.5 Mineralization
Piaba
The Piaba deposit has a strike length of 3.3 km and trends east-northeast. The primary gold mineralization is hosted by sheared and veined quartz-diorite. The auriferous zone is associated with intense hydrothermal alteration and quartz veining.
The alteration assemblage associated with gold mineralization is composed of quartz, chlorite, carbonate (ankerite and calcite), tourmaline, alkali-feldspar, sericite, and pyrite. Gold mineralization and alteration are strong to intense, particularly within the centre of the deposit. Quartz occurs in veins and in silicified fronts. Pyrite occurs in quartz veins although it predominantly forms a matrix replacement, particularly at deeper levels. Minor pyrrhotite occurs at deeper levels and arsenopyrite has been rarely observed. Graphite alteration is related to reactivation of the main Piaba chloritic shear zone and is restricted to discrete crosscutting shear zones. No significant base metals occur at Piaba.
Gold mineralization at Piaba resulted from the reaction obtained from the mixing of the auriferous hydrothermal fluids with reducing carbonate fluids along the high permeability zones produced by brecciation of the quartz diorite during movement along the main Piaba shear zone.
5070\16.4\5070-STY-001_01
July 2017 Lycopodium Minerals Canada Ltd.
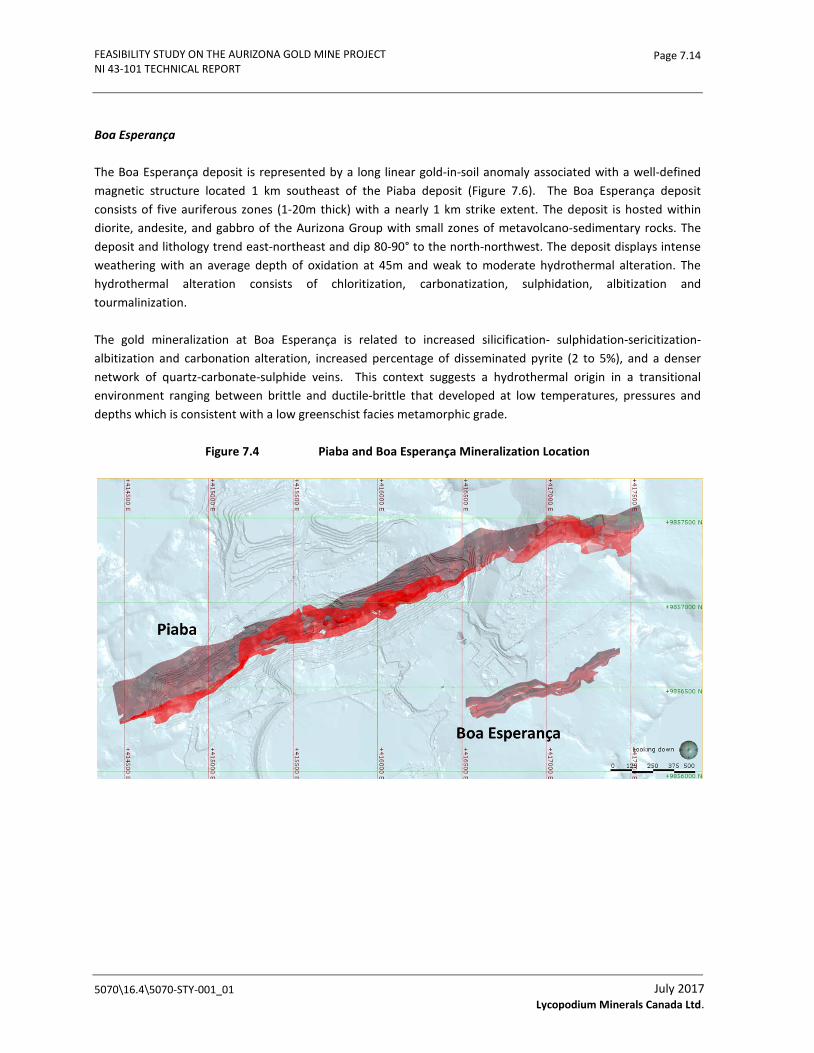
FEASIBILITY STUDY ON THE AURIZONA GOLD MINE PROJECT NI 43-101 TECHNICAL REPORT
Page 7.14
Boa Esperança
The Boa Esperança deposit is represented by a long linear gold-in-soil anomaly associated with a well-defined magnetic structure located 1 km southeast of the Piaba deposit (Figure 7.6). The Boa Esperança deposit consists of five auriferous zones (1-20m thick) with a nearly 1 km strike extent. The deposit is hosted within diorite, andesite, and gabbro of the Aurizona Group with small zones of metavolcano-sedimentary rocks. The deposit and lithology trend east-northeast and dip 80-90° to the north-northwest. The deposit displays intense weathering with an average depth of oxidation at 45m and weak to moderate hydrothermal alteration. The hydrothermal alteration consists of chloritization, carbonatization, sulphidation, albitization and tourmalinization.
The gold mineralization at Boa Esperança is related to increased silicification- sulphidation-sericitization-albitization and carbonation alteration, increased percentage of disseminated pyrite (2 to 5%), and a denser network of quartz-carbonate-sulphide veins. This context suggests a hydrothermal origin in a transitional environment ranging between brittle and ductile-brittle that developed at low temperatures, pressures and depths which is consistent with a low greenschist facies metamorphic grade.
Figure 7.4 Piaba and Boa Esperança Mineralization Location
5070\16.4\5070-STY-001_01
July 2017 Lycopodium Minerals Canada Ltd.

FEASIBILITY STUDY ON THE AURIZONA GOLD MINE PROJECT NI 43-101 TECHNICAL REPORT
Page 8.1
8.0 DEPOSIT TYPES
Piaba is a bulk tonnage, low grade gold deposit amenable to open pit mining methods situated in a tropical environment similar to other gold deposits in this part of South America including the Las Cristinas and El Callao gold deposits in Venezuela, the now depleted Omai Gold Mine in Guyana and the Rosebel gold deposit in Suriname. Gold mineralization at Aurizona is typical of orogenic gold deposits formed in regional scale brittle-ductile structures in supracrustal terranes. The general model for these types of deposits involves the migration of large amounts of hydrothermal fluids (generated during collisional orogenesis) within shear zones. The hydrothermal fluids carry gold in solution until changes in temperature, pressure, reduction potential or pH (traps) facilitate its precipitation. The gold source is likely the country rocks through which metamorphic fluids travel before concentrating in the shear zones.
Mineralization is often continuous to considerable depths in these systems as evidenced with the 2012 drill program, which intersected gold mineralization to a depth of -600 mRL at Piaba. Geological modelling indicates that mineralization defined to date at Piaba is located within the brittle-ductile deformation zone consistent with the model of Groves et al. (1998).
5070\16.4\5070-STY-001
July 2017 Lycopodium Minerals Canada Ltd.
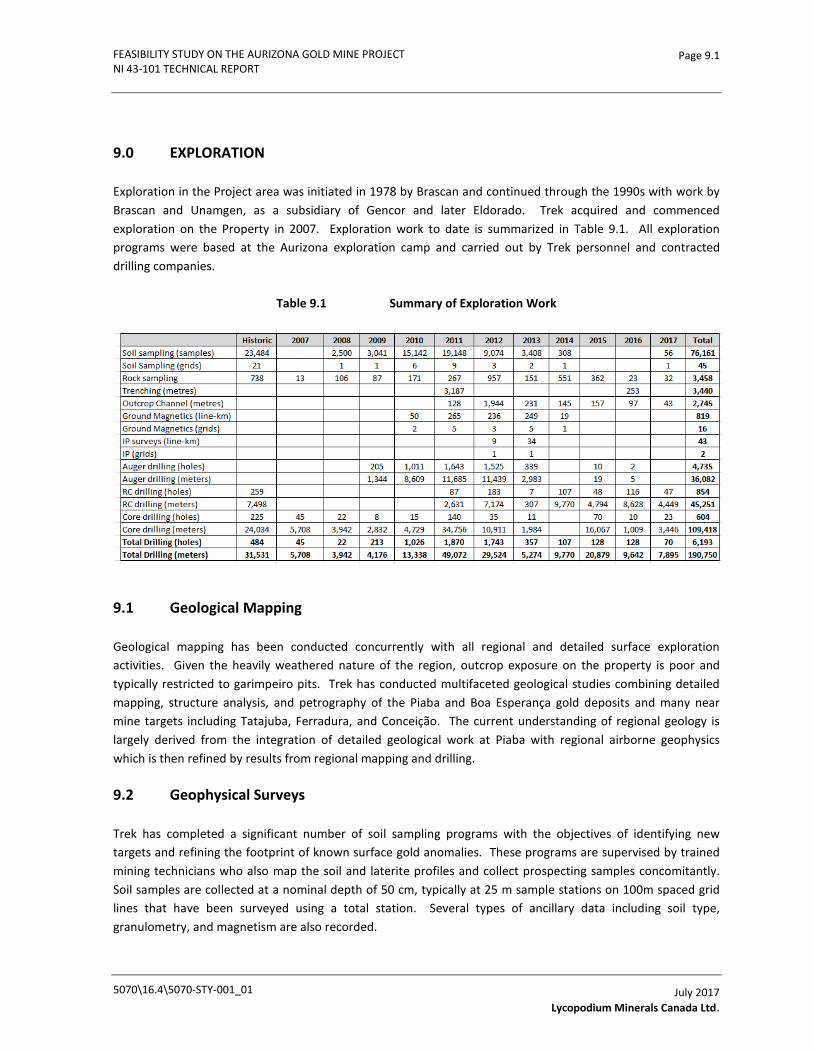
FEASIBILITY STUDY ON THE AURIZONA GOLD MINE PROJECT NI 43-101 TECHNICAL REPORT
Page 9.1
9.0 EXPLORATION
Exploration in the Project area was initiated in 1978 by Brascan and continued through the 1990s with work by Brascan and Unamgen, as a subsidiary of Gencor and later Eldorado. Trek acquired and commenced exploration on the Property in 2007. Exploration work to date is summarized in Table 9.1. All exploration programs were based at the Aurizona exploration camp and carried out by Trek personnel and contracted drilling companies.
Table 9.1 Summary of Exploration Work
9.1 Geological Mapping
Geological mapping has been conducted concurrently with all regional and detailed surface exploration activities. Given the heavily weathered nature of the region, outcrop exposure on the property is poor and typically restricted to garimpeiro pits. Trek has conducted multifaceted geological studies combining detailed mapping, structure analysis, and petrography of the Piaba and Boa Esperança gold deposits and many near mine targets including Tatajuba, Ferradura, and Conceição. The current understanding of regional geology is largely derived from the integration of detailed geological work at Piaba with regional airborne geophysics which is then refined by results from regional mapping and drilling.
9.2 Geophysical Surveys
Trek has completed a significant number of soil sampling programs with the objectives of identifying new targets and refining the footprint of known surface gold anomalies. These programs are supervised by trained mining technicians who also map the soil and laterite profiles and collect prospecting samples concomitantly. Soil samples are collected at a nominal depth of 50 cm, typically at 25 m sample stations on 100m spaced grid lines that have been surveyed using a total station. Several types of ancillary data including soil type, granulometry, and magnetism are also recorded.
5070\16.4\5070-STY-001_01
July 2017 Lycopodium Minerals Canada Ltd.
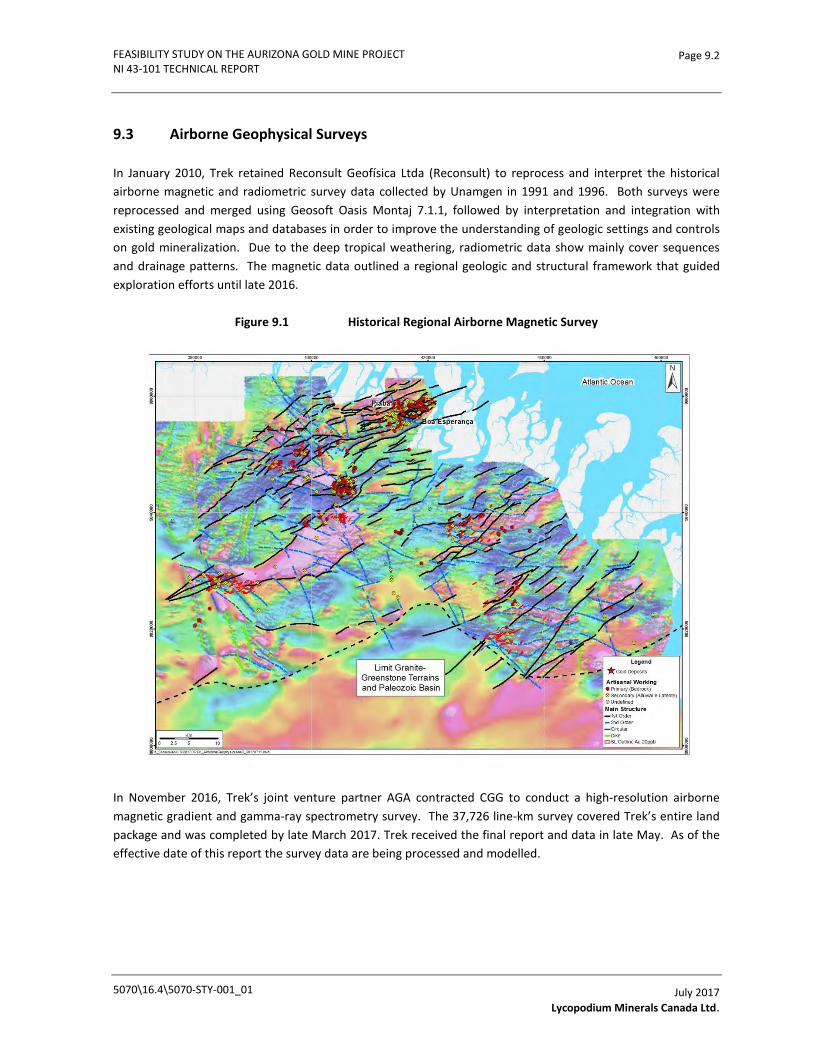
FEASIBILITY STUDY ON THE AURIZONA GOLD MINE PROJECT NI 43-101 TECHNICAL REPORT
Page 9.2
9.3 Airborne Geophysical Surveys
In January 2010, Trek retained Reconsult Geofísica Ltda (Reconsult) to reprocess and interpret the historical airborne magnetic and radiometric survey data collected by Unamgen in 1991 and 1996. Both surveys were reprocessed and merged using Geosoft Oasis Montaj 7.1.1, followed by interpretation and integration with existing geological maps and databases in order to improve the understanding of geologic settings and controls on gold mineralization. Due to the deep tropical weathering, radiometric data show mainly cover sequences and drainage patterns. The magnetic data outlined a regional geologic and structural framework that guided exploration efforts until late 2016.
Figure 9.1 Historical Regional Airborne Magnetic Survey
In November 2016, Trek’s joint venture partner AGA contracted CGG to conduct a high-resolution airborne magnetic gradient and gamma-ray spectrometry survey. The 37,726 line-km survey covered Trek’s entire land package and was completed by late March 2017. Trek received the final report and data in late May. As of the effective date of this report the survey data are being processed and modelled.
5070\16.4\5070-STY-001_01
July 2017 Lycopodium Minerals Canada Ltd.

FEASIBILITY STUDY ON THE AURIZONA GOLD MINE PROJECT NI 43-101 TECHNICAL REPORT
Page 9.3
9.4 Ground Geophysical Surveys
In advance of drilling, using trained Company employees and Company-owned equipment, Trek has conducted numerous ground magnetic surveys to enhance exploration targets identified from historic airborne surveys. Trek owns three GSM-19 v7.0 Overhauser Magnetometer Units running Novatel SuperStar II global positioning system (GPS) board adaptation kits. One unit serves as a permanent base station and two units are used to collect magnetic data over target areas. Collected data are processed by Reconsult. To date, ground surveys have been completed over a number of targets including Tatajuba, Ferradura, Conceição, São Lourenço, Micote, Genipapo, and Barriguda.
Additionally, the Company carried out a limited amount of IP surveying as an orientation study in 2012 and 2013. Several IP anomalies were subsequently tested with no significant results.
9.5 Auger Drilling
Auger drilling has a very low environmental impact and has been successful in defining sub-cropping mineralization. Several auger drill campaigns have been carried out using Company owned motorized Honda auger drills fabricated by Trado Equipamentos e Servicos Ltda. Initial auger drill programs were focused on condemnation drilling of areas intended for mine infrastructure (plant site, waste and tailings storage). Subsequent auger drill programs are focused on the systematic testing of the near-mine targets on structural lineaments hosting and parallel to the Piaba and Boa Esperança gold deposits. Auger drill teams are supervised by trained mining technicians. Holes are drilled to a typical depth of 10 m in the lateritic and saprolitic profile. Samples are collected at 1m intervals using a 10.16 cm diameter collector with average sample weights of 16 kg.
9.6 Trenching
Trenching is a rapid and cost-effective manner to verify and reveal the nature of gold anomalies identified through soil sampling, and auger drilling as well as areas disturbed from garimpeiro activity. Trenches are opened perpendicular to the anomalies and are useful in determining the nature and extent of potential gold-bearing structures and quartz veins. Trenches vary in depth from 3 to 5 m and are opened using an excavator. Trenches are mapped in detail prior to sampling, which is conducted on contiguous panels along the trench walls.
9.7 Regional Drilling
In addition to the extensive drilling carried out on the Piaba and Boa Esperança deposits (detailed in Section 10.0), Trek has a completed a significant amount of drilling on both near-mine and regional targets as summarized below in Table 9.2 and shown in Figure 9.3.
5070\16.4\5070-STY-001_01
July 2017 Lycopodium Minerals Canada Ltd.

FEASIBILITY STUDY ON THE AURIZONA GOLD MINE PROJECT NI 43-101 TECHNICAL REPORT
Page 9.4
Table 9.2 Summary of Regional Exploration Drilling
Figure 9.2 Near-Mine Exploration Targets and Gold Occurrences
5070\16.4\5070-STY-001_01
July 2017 Lycopodium Minerals Canada Ltd.
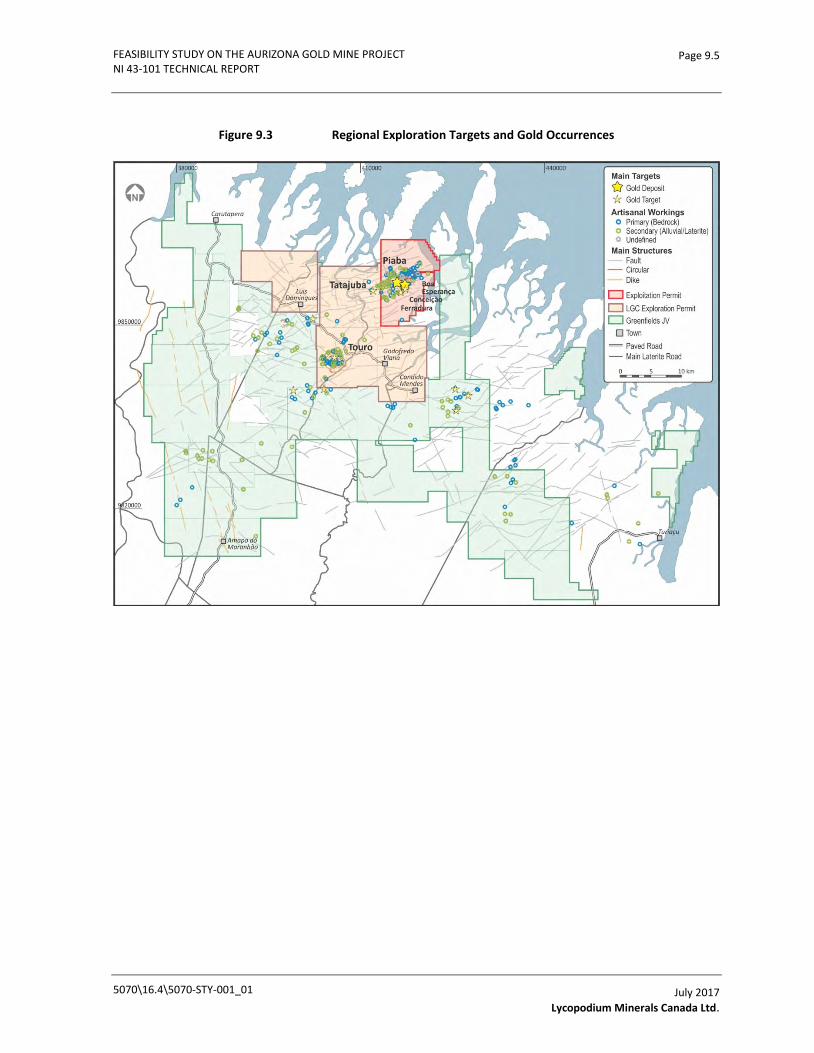
FEASIBILITY STUDY ON THE AURIZONA GOLD MINE PROJECT NI 43-101 TECHNICAL REPORT
Page 9.5
Figure 9.3 Regional Exploration Targets and Gold Occurrences
5070\16.4\5070-STY-001_01
July 2017 Lycopodium Minerals Canada Ltd.
FEASIBILITY STUDY ON THE AURIZONA GOLD MINE PROJECT NI 43-101 TECHNICAL REPORT
Page 10.1
10.0 DRILLING
10.1 Trek Drilling Procedures
Trek has conducted drilling programs at Aurizona since its acquisition of the Property in January 2007. Prior to drill mobilization, the exploration manager obtains all required permits. A field visit to the planned drill sites is conducted to document and photograph the area, vegetation type, proximity to any preservation areas and access.
The exploration manager provides the project geologist and senior project mining technician with the information required to commence drilling including:
• Objective of the drill program.
• Location of the drill pads.
• Planned azimuth, dip, and length of drill holes.
• Sampling and internal QA/QC procedure.
• Drill core checking and core sampling criteria (intervals).
• Sample security and chain of custody procedure.
• Sample shipment procedure.
• Data transfer procedure.
• Logging procedure.
• Company responsibilities.
• Drill contractor responsibilities including copy of drill contract.
Prior to drill mobilization, the senior project mining technician liaises with landowners to discuss the program and obtain their authorization for the drill to mobilize to their property. Drilling only commences following agreement with the landowner.
Daily checks are conducted to ensure that all Trek personnel are equipped with personal protective equipment (PPE) and that all tools and ancillary equipment are in good working order.
5070-\16.04\5070-STY-001
July 2017 Lycopodium Minerals Canada Ltd.

FEASIBILITY STUDY ON THE AURIZONA GOLD MINE PROJECT NI 43-101 TECHNICAL REPORT
Page 10.2
10.1.1 Drill Responsibilities
The exploration manager, in association with the project geologist, is responsible for drill planning and hole siting. Drill programs must have clear objectives to maximize exploration investment and are required to be approved by the Vice President Exploration and/or Chief Executive Officer. Only one Trek professional (exploration manager, project geologist or senior project mining technician) is responsible for the drill program and liaising with the drill contractor at any one time.
The senior project mining technician is responsible for negotiating with local service providers for tractor rental, water truck rental, etc. All contracts must be approved by the exploration manager prior to execution.
Drill pads and access routes are constructed in a manner that minimizes any potential negative impact on the environment and landowners.
The project database coordinator is responsible for checking the daily drill bulletins against the core delivered. Particular attention is given to core recoveries, intervals core quality and downhole survey data.
The drill contractor is carefully monitored and regulated during mobilization, drilling and demobilization.
10.1.2 Diamond Drilling
All diamond drilling is carried out with HQ (63.5 mm) core. Prior to drilling, the drill hole locations, orientation, and planned final depth are checked by the senior project mining technician.
The drill company is informed of the strict requirement to collect quality core samples. On-site supervision is maintained and site inspection visits are carried out at regular intervals to ensure the contractor is working within the contractual parameters.
A Trek surveyor uses differential GPS to survey drill hole collar locations. All holes outside the mine area are sealed and marked with a concrete plinth and a metal marker showing hole azimuth and dip. Approximately 1 m of casing is left to permanently mark the collar and to allow for downhole surveys. The downhole surveys are carried out at 50m intervals on all inclined holes.
10.1.3 Procedures at the Drill
Core boxes are labelled and arrows drawn so that the core is systematically laid out in the box. After each drill run a wooden marker or aluminium tag with downhole location is placed in a core box. Transfer of the core from the core barrel to the box is done as carefully as possible so that no core is allowed to fall on the ground. A plastic or rubber mallet is used to loosen core from the core tube. As soon as a core box is full a lid is properly secured. Regular inspections are carried out to ensure that core boxes are clean, sturdy and suitable for core storage.
Intervals of ground core and any other irregularities are documented to address potential inaccuracies in depth labelling of the core boxes.
5070-\16.04\5070-STY-001
July 2017 Lycopodium Minerals Canada Ltd.
FEASIBILITY STUDY ON THE AURIZONA GOLD MINE PROJECT NI 43-101 TECHNICAL REPORT
Page 10.3
10.1.4 Core Transportation Procedure
Transportation of core from a drill site to the logging facility is conducted in a manner which minimizes or eliminates shifting of material in the core boxes. Transportation and storage of cut or split core is conducted in a manner which ensures that the remaining core does not shift and that marked sample intervals remain intact.
Appropriate measures are taken to eliminate the possibility of sample tampering through proper chain of custody management and documentation.
10.1.5 Drill Core Checking
The core boxes are checked on arrival at the core logging facility to ensure that they are intact. The core boxes are opened sequentially and the core is aligned by matching broken pieces. The depth intervals are measured in each box and any lost core or depth inaccuracies are noted. The boxes are labelled with metal or plastic labels listing the hole name and interval. Geotechnical measurements, including recovery and rock quality designation, are taken before sample intervals are selected. This work is carried out by trained technicians.
10.1.6 Photography
All drill core is systematically photographed using the following procedure:
• Digital core photography is supervised by the database coordinator.
• Core is photographed in its entirety from top to bottom of a hole immediately following interval checking and box labelling and prior to logging or sampling.
• Any excess dirt, grease or drilling fluids are removed and the core is dampened prior to photography and sampling.
• Core photographs are always taken under the same conditions. Core boxes are photographed two at a time in a darkened area with a digital camera and flash.
• Core photographs are printed and stored in albums for future reference.
10.1.7 Core Logging
An initial summary log containing the main lithological contacts, structures and mineralization is completed and the core is sent for cutting. Detailed core logging restarts when the cut core is returned to the geologist responsible for logging the hole.
Core logging is conducted using dedicated core logging sheets which contain all required data fields including collar, survey, lithology, alteration, structure, mineralization, veins, assay, QA/QC and downhole survey.
Beginning in 2015, all diamond drilling programs have included oriented core (fresh rock only) using a Reflex ACTII core orientation tool. The oriented core program follows industry best practices and includes:
5070-\16.04\5070-STY-001
July 2017 Lycopodium Minerals Canada Ltd.
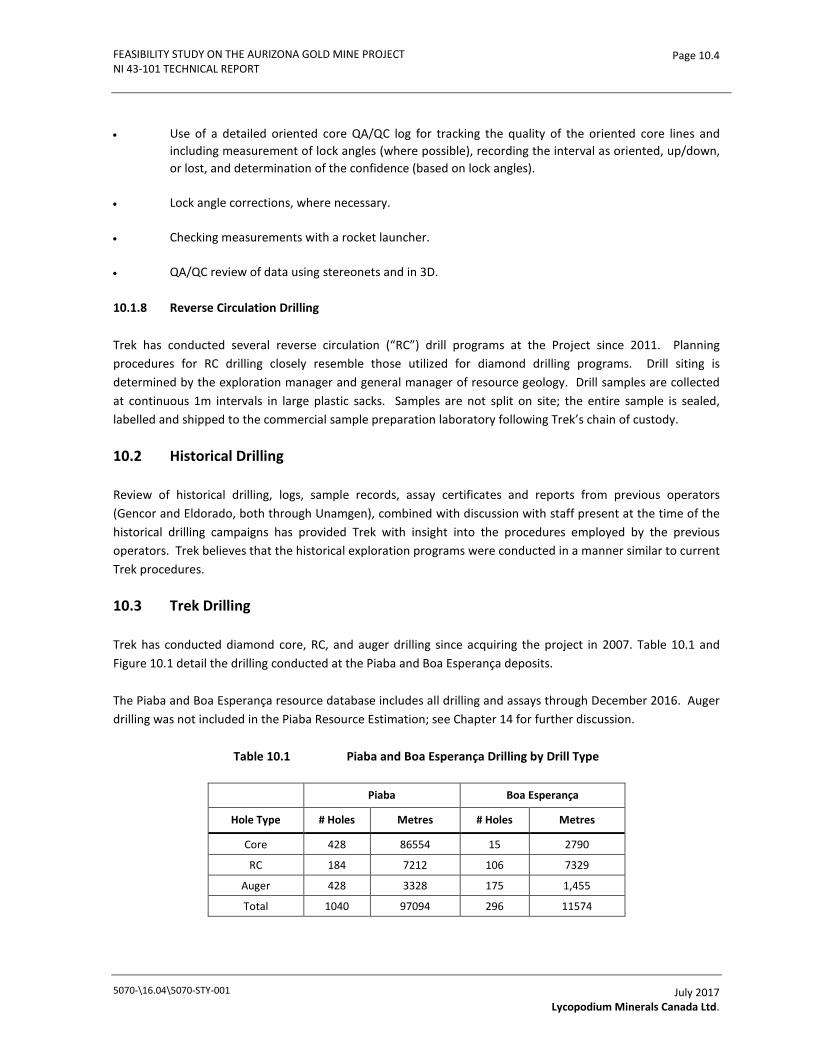
FEASIBILITY STUDY ON THE AURIZONA GOLD MINE PROJECT NI 43-101 TECHNICAL REPORT
Page 10.4
• Use of a detailed oriented core QA/QC log for tracking the quality of the oriented core lines and including measurement of lock angles (where possible), recording the interval as oriented, up/down, or lost, and determination of the confidence (based on lock angles).
• Lock angle corrections, where necessary.
• Checking measurements with a rocket launcher.
• QA/QC review of data using stereonets and in 3D.
10.1.8 Reverse Circulation Drilling
Trek has conducted several reverse circulation (“RC”) drill programs at the Project since 2011. Planning procedures for RC drilling closely resemble those utilized for diamond drilling programs. Drill siting is determined by the exploration manager and general manager of resource geology. Drill samples are collected at continuous 1m intervals in large plastic sacks. Samples are not split on site; the entire sample is sealed, labelled and shipped to the commercial sample preparation laboratory following Trek’s chain of custody.
10.2 Historical Drilling
Review of historical drilling, logs, sample records, assay certificates and reports from previous operators (Gencor and Eldorado, both through Unamgen), combined with discussion with staff present at the time of the historical drilling campaigns has provided Trek with insight into the procedures employed by the previous operators. Trek believes that the historical exploration programs were conducted in a manner similar to current Trek procedures.
10.3 Trek Drilling
Trek has conducted diamond core, RC, and auger drilling since acquiring the project in 2007. Table 10.1 and Figure 10.1 detail the drilling conducted at the Piaba and Boa Esperança deposits.
The Piaba and Boa Esperança resource database includes all drilling and assays through December 2016. Auger drilling was not included in the Piaba Resource Estimation; see Chapter 14 for further discussion.
Table 10.1 Piaba and Boa Esperança Drilling by Drill Type
Piaba Boa Esperança
Hole Type # Holes Metres # Holes Metres
Core 428 86554 15 2790
RC 184 7212 106 7329
Auger 428 3328 175 1,455
Total 1040 97094 296 11574
5070-\16.04\5070-STY-001
July 2017 Lycopodium Minerals Canada Ltd.

FEASIBILITY STUDY ON THE AURIZONA GOLD MINE PROJECT NI 43-101 TECHNICAL REPORT
Page 10.5
Figure 10.1 Piaba and Boa Esperança Drill Hole Location Map
5070-\16.04\5070-STY-001
July 2017 Lycopodium Minerals Canada Ltd.

FEASIBILITY STUDY ON THE AURIZONA GOLD MINE PROJECT NI 43-101 TECHNICAL REPORT
Page 10.6
Figure 10.2 shows the drilling at Piaba in cross section. In general, RC and core holes are drilled sub-perpendicular to the main mineralization trends and are drilled at various dips to intersect the steeply-dipping mineralization and shear zones at high angles.
Figure 10.2 Cross Section through Piaba, 50m Thick, Looking Northeast
5070-\16.04\5070-STY-001
July 2017 Lycopodium Minerals Canada Ltd.

FEASIBILITY STUDY ON THE AURIZONA GOLD MINE PROJECT NI 43-101 TECHNICAL REPORT
Page 11.1
11.0 SAMPLE PREPARATION, ANALYSES AND SECURITY
11.1 Methods
11.1.1 Historic Core Sampling Methods
The sampling methods employed by Unamgen for both Gencor and Eldorado have not been documented. Trek employs senior mining technicians who worked for Unamgen in the 1990s who state that the Unamgen methodology for sampling core is similar to that used by Trek. Core recovery was calculated as recovered length divided by drilled length and RC recovery was calculated as the sample weight divided by the representative weight of 1m of sample.
RC sampling was conducted at 1m intervals. For the initial Unamgen RC drillholes, the samples were homogenized at the drill site via cone and quartering with one quarter of the sample sent to the lab. For all RC drillholes prior to Trek ownership the whole sample was processed at the Aurizona prep lab. Current Trek sampling methods are discussed in Section 11.1.2.
11.1.2 Trek Core Sampling Methods
The project geologist is directly responsible for ensuring that the sampling procedure is carried out to the specifications required by the exploration manager.
Sample interval selection is the task of the geologist responsible for core logging. The sample interval is a nominal 2m in barren hanging wall rocks and is 1m or less within the mineralization. Intervals should neither be greater than 2.5m nor less than 0.2m. Sample intervals are selected on the basis of lithology, mineralization, alteration, weathering, structures and veins.
Sample intervals are marked on the core box. The geologist marks the core using red and yellow crayons in two parallel lines separated by 0.3 cm. The red line is marked on the right side of the core, the yellow line on the left. An arrow is marked pointing downhole on the left side of the core. Core is marked respecting any foliation (perpendicular) and in a manner that best produces as similar core halves as possible.
An electric core saw is used to cut hard drill core. Saprolite and similar softer material, which would suffer washing during cutting is cut manually with a large knife or machete. The saw and knife/machete is washed between each sample interval.
The core is sent for sampling once approved by the geologist. Core is consistently sampled on the same side (right – red line). The remaining core half is stored in the box for future reference. The core logging geologist checks the sample intervals with the core sampler (mining technician), and is responsible for all sampling procedures including the physical insertion of QA/QC controls in the sample stream.
5070-\16.04\5070-STY-001
July 2017 Lycopodium Minerals Canada Ltd.
FEASIBILITY STUDY ON THE AURIZONA GOLD MINE PROJECT NI 43-101 TECHNICAL REPORT
Page 11.2
Each core sample has a specific pre-numbered sample ticket with the prefix “DH-“. The core sampler notes hole ID, depth, sample type, and interval on the sample ticket. A sample ticket number is placed inside the bag. Internal QA/QC samples (blanks, Certified Reference Materials (“CRM”) and quarter core duplicates) are assigned routine “DH“ numbers and tickets. The sample bags are then placed in rice sacks, sewn shut, addressed and compiled into batches. The sample sequence, including the internal control samples (blanks, CRM and duplicates) is recorded in GDMS from CAE Mining.
When the drill core has been sampled it is stored in the core storage facility for future reference.
RC samples are collected at the drill rig by the contracted drilling personnel. The entire sample representing 1m is collected and no sample processing or splitting is conducted at the drill site. The samples are shipped to the commercial assay laboratory where they are dried and processed in the same manner as drill core samples. Blanks and certified reference materials are inserted in a similar manner as with drill core. Since the entire drilled sample is collected and submitted to the laboratory, field duplicates are not collected for RC.
11.2 Factors Impacting Accuracy of Results
The drill core recovery is good to excellent averaging over 96%. The sample intervals are well marked and carefully sampled.
11.3 Security Measures
The core and RC samples are taken to the Project core storage facility on a daily basis. The facility is located within a walled compound that has 24-hour armed security. The core storage building is locked when Trek exploration geological staff is not present.
Core and RC samples are placed in pre-labelled polythene bags and closed with sealed security ties and labels. All samples are double bagged for added security. The sample bags are then placed in rice sacks, sewn shut, addressed and compiled into batches. Batches are placed into 55-gallon plastic barrels and sealed for transportation to the laboratory.
All samples are transported by truck and a Trek representative accompanies all sample shipments. Public transport is not used. Chain of custody is maintained during transportation, sample collection, shipping, reception at the laboratory and preparation to avoid tampering or inappropriate release of privileged information. Assay results are maintained confidential and only released to authorized personnel.
11.4 Historical Sample Preparation and Analysis
11.4.1 Diamond Drill Samples
Sample preparation for all historical drilling was conducted at a sample preparation laboratory at the Aurizona camp. This laboratory was designed and set up by the independent company Nomos Laboratories (“Nomos”).
5070-\16.04\5070-STY-001
July 2017 Lycopodium Minerals Canada Ltd.

FEASIBILITY STUDY ON THE AURIZONA GOLD MINE PROJECT NI 43-101 TECHNICAL REPORT
Page 11.3
All Gencor and Eldorado drill samples were prepared at the Aurizona prep lab. The sample (average weight 3 kg) was dried, crushed to 6.4 mm and subsequently milled to 150 mesh in a Seta Mill. The sample was then homogenized eight times in a Jones Splitter. A 250 g split was further milled to 200 mesh in a Nilton da Rocha Vertical Mill and a 120 g aliquot was split and packed for shipping to the laboratory.
11.4.2 Reverse Circulation Drill Samples
For the initial Unamgen RC drillholes, the samples were homogenized at the drill site via cone and quartering. For other RC drillholes prior to Trek ownership, the whole sample was processed at the Aurizona prep lab. The sample (average weight 25 kg) was dried and sieved to 1 mm. The oversize (greater than 1 mm) was milled and the entire sample subsequently homogenized six times in a large Jones Splitter. A 3 kg sample was then milled to 150 mesh in a Seta Mill and then homogenized eight times in a Riffle Splitter. A 2.7 kg pulp was archived and the 250 g split further milled to 200 mesh in a Nilton da Rocha Vertical Mill and a 120 g aliquot was split and packed for shipping to the laboratory. Currently, Trek collects the entire 1 m sample interval per Section 11.1.2. Current laboratory preparation and analysis procedures are discussed in Section 11.5.1.
11.4.3 Assaying
Following sample preparation, approximately 120 g aliquots of each sample are shipped to an independent commercial laboratory. Gencor samples were assayed by Nomos and Eldorado samples were assayed by Bondar Clegg Laboratories (“Bondar Clegg”) in Luziânia, Goias. All historical drill samples were analyzed by fire assay (FA) with atomic absorption (AA) finish on a 50 g sample. Original assay certificates are available for all historical drill samples. In addition, approximately 70% of all historical reject and pulp samples are intact and stored at the Aurizona exploration camp.
11.4.4 Quality Assurance/Quality Control
Gencor and Eldorado operated QA/QC programs on their drilling programs which involved the insertion of blanks and Standard Reference Material (“SRM”) samples for gold in all sample batches. In addition, some samples were sent to a second laboratory for check assays.
Standard Reference Samples
Gencor and Eldorado developed several SRM samples for gold during their drill programs. The samples were prepared by Gencor and Eldorado from project material and drill core in their sample preparation laboratory and sent to several commercial laboratories for round robin analysis. Average gold values were calculated by Nomos staff. Standard deviations are not available.
Blanks
Gencor and Eldorado used alluvial quartz sand for the blank material in all drill programs. The lower detection limit appears to be 0.01 g/t Au and there are five samples out of 310 with assays over five times the detection limit or 0.05 g/t Au. However, four of these samples are less than 0.10 g/t Au and these are not considered to be significant.
5070-\16.04\5070-STY-001
July 2017 Lycopodium Minerals Canada Ltd.
FEASIBILITY STUDY ON THE AURIZONA GOLD MINE PROJECT NI 43-101 TECHNICAL REPORT
Page 11.4
Insertion of Internal Controls
Internal control samples were inserted randomly within the drill core sequence by the core logging geologist. The location of the control samples was noted on the sample log. The laboratory was instructed to prep and analyze all samples in numerical order. Audit checks were carried out on the assay laboratories by Gencor and Eldorado staff. The historical drill database contains approximately 5.5% of internal controls for Piaba.
Secondary Check Lab Analysis
Gencor and Eldorado also sent samples to Bondar Clegg and Nomos for check analyses. The results of the check assay program are not available.
11.5 Trek Sample Preparation and Analysis
11.5.1 Laboratory and Sample Submission Procedures
Trek initially used ACME Analytical Laboratories Ltd (ACME) as its primary independent lab for sample preparation (Maraba, Pará) and analysis (Vancouver, Canada). Trek used ALS Chemex in Belo Horizonte as its secondary independent laboratory. Since January 2008, Trek has been using ALS Chemex in Belo Horizonte and Goiania as its primary preparation laboratory and ALS Chemex in Lima, Peru and Perth, Australia as its primary assay laboratory. From September 2011 to December 2011 Trek also used ACME Labs in Goiania and Santiago, Chile as a primary lab due to backlogs at ALS Chemex.
ACME is accredited under the general ISO 9001:2000 regulations but does not have ISO 17025 laboratory accreditation. ALS Chemex in Lima has ISO 17025 accreditation and ALS Chemex Vancouver has IOS 9001:2008 accreditation.
All samples are transported to the commercial transport company by truck and one Trek representative accompanies all sample shipments. Instructions to both laboratories are provided via detailed requisition forms outlining the complete procedures for sample preparation and assay which include that the entire sample must be milled prior to the removal of aliquots for analysis. A complete paper trail of requisition forms to the laboratory, delivery reports and work order receipts is maintained at the Project site.
11.5.2 Sample Preparation
The samples are received from Trek in the laboratory’s reception area in batches enclosed in sealed rice sacks containing the individual samples in separate plastic bags. Minimal drying is required because the samples are all diamond core that have been pre-dried in sunlight during the logging and sampling process.
5070-\16.04\5070-STY-001
July 2017 Lycopodium Minerals Canada Ltd.
FEASIBILITY STUDY ON THE AURIZONA GOLD MINE PROJECT NI 43-101 TECHNICAL REPORT
Page 11.5
All samples generated by Trek through January 2, 2008 were prepared in sequential order at ACME. All drill samples generated by Trek after that were prepared in sequential order at ALS Chemex in Belo Horizonte and also by ACME Laboratories in Goiania. The sample preparation method for drill core and RC at ALS Chemex is outlined in Figure 11.1. For both laboratories Trek has a policy of a minimum of 80% passing 10 mesh for all drill core samples and 85% passing 200 mesh for all drill core pulps. After January 3, 2008, a 1 kg split is pulverized to 85% passing 200 mesh (ACME 2007 – 0.50 kg split) to better address any coarse gold associated with high grade quartz veins.
5070-\16.04\5070-STY-001
July 2017 Lycopodium Minerals Canada Ltd.
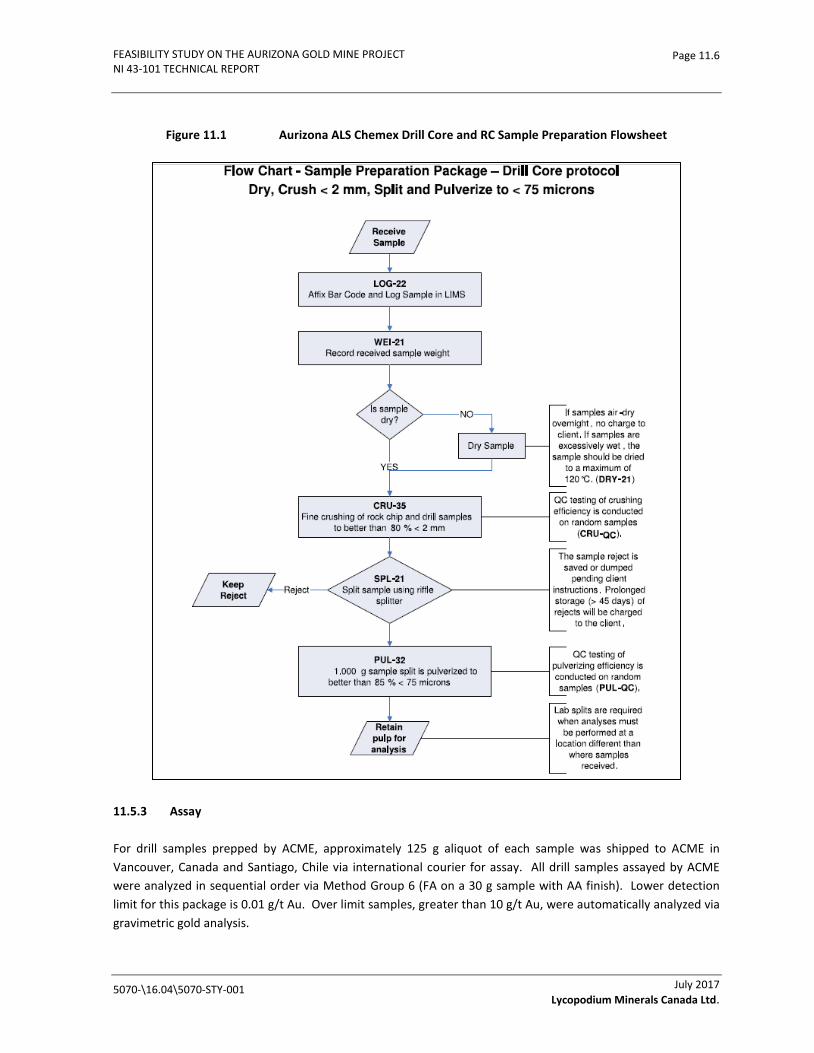
FEASIBILITY STUDY ON THE AURIZONA GOLD MINE PROJECT NI 43-101 TECHNICAL REPORT
Page 11.6
Figure 11.1 Aurizona ALS Chemex Drill Core and RC Sample Preparation Flowsheet
11.5.3 Assay
For drill samples prepped by ACME, approximately 125 g aliquot of each sample was shipped to ACME in Vancouver, Canada and Santiago, Chile via international courier for assay. All drill samples assayed by ACME were analyzed in sequential order via Method Group 6 (FA on a 30 g sample with AA finish). Lower detection limit for this package is 0.01 g/t Au. Over limit samples, greater than 10 g/t Au, were automatically analyzed via gravimetric gold analysis.
5070-\16.04\5070-STY-001
July 2017 Lycopodium Minerals Canada Ltd.
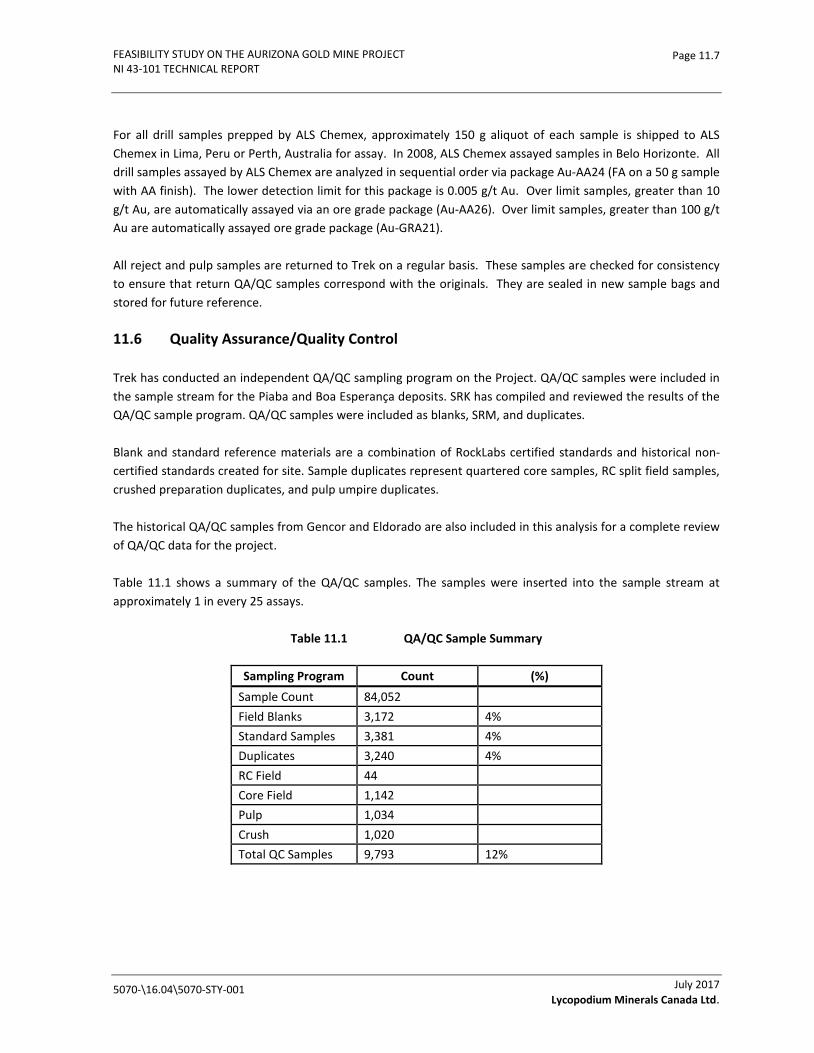
FEASIBILITY STUDY ON THE AURIZONA GOLD MINE PROJECT NI 43-101 TECHNICAL REPORT
Page 11.7
For all drill samples prepped by ALS Chemex, approximately 150 g aliquot of each sample is shipped to ALS Chemex in Lima, Peru or Perth, Australia for assay. In 2008, ALS Chemex assayed samples in Belo Horizonte. All drill samples assayed by ALS Chemex are analyzed in sequential order via package Au-AA24 (FA on a 50 g sample with AA finish). The lower detection limit for this package is 0.005 g/t Au. Over limit samples, greater than 10 g/t Au, are automatically assayed via an ore grade package (Au-AA26). Over limit samples, greater than 100 g/t Au are automatically assayed ore grade package (Au-GRA21).
All reject and pulp samples are returned to Trek on a regular basis. These samples are checked for consistency to ensure that return QA/QC samples correspond with the originals. They are sealed in new sample bags and stored for future reference.
11.6 Quality Assurance/Quality Control
Trek has conducted an independent QA/QC sampling program on the Project. QA/QC samples were included in the sample stream for the Piaba and Boa Esperança deposits. SRK has compiled and reviewed the results of the QA/QC sample program. QA/QC samples were included as blanks, SRM, and duplicates.
Blank and standard reference materials are a combination of RockLabs certified standards and historical non-certified standards created for site. Sample duplicates represent quartered core samples, RC split field samples, crushed preparation duplicates, and pulp umpire duplicates.
The historical QA/QC samples from Gencor and Eldorado are also included in this analysis for a complete review of QA/QC data for the project.
Table 11.1 shows a summary of the QA/QC samples. The samples were inserted into the sample stream at approximately 1 in every 25 assays.
Table 11.1 QA/QC Sample Summary
Sampling Program Count (%) Sample Count 84,052 Field Blanks 3,172 4% Standard Samples 3,381 4% Duplicates 3,240 4% RC Field 44 Core Field 1,142 Pulp 1,034 Crush 1,020 Total QC Samples 9,793 12%
5070-\16.04\5070-STY-001
July 2017 Lycopodium Minerals Canada Ltd.

FEASIBILITY STUDY ON THE AURIZONA GOLD MINE PROJECT NI 43-101 TECHNICAL REPORT
Page 11.8
11.6.1 Blanks
A total of 3,172 field blanks were included in the QA/QC samples from 1991 to 2017. In those years Gencor and Eldorado utilized alluvial quartz sand for the blank material in all drill programs. During the 2007 to 2016 drill programs, Trek utilized two types of blank material – barren granite for use with core samples and commercial quartz sand for use with RC and auger samples. Trek analyzed 10 samples of the granite and 10 samples of the quartz sand prior to use and all samples were below detection limit. The blank material was collected in bulk and transported to a sterile area within the site. The samples were broken into small pieces. Any vein or pegmatitic material was discarded. The selected blank material was stored in sealed plastic containers with locks.
Blanks perform well, with only 2% of them returning values higher than five times the detection limit (Figure 11.2).
Figure 11.2 Gold Blanks
(Source: SRK 2017)
11.6.2 Standards
In all drill programs between 1992 and 2016 a total of 3,381 SRM samples were used. The certified standards are pre-packaged envelopes of pulverized material from RockLabs. Noncertified standards were used prior to Trek’s ownership. Of the 29 standards utilized, only 18 are discussed in this Report. All other standards have been used only sporadically. Figure 11.3 and Figure 11.4 show the plotted results for some of the most commonly used standards, SGS66 and SF57.
5070-\16.04\5070-STY-001
July 2017 Lycopodium Minerals Canada Ltd.
FEASIBILITY STUDY ON THE AURIZONA GOLD MINE PROJECT NI 43-101 TECHNICAL REPORT
Page 11.9
From 1991 to 1997, Gencor and Eldorado developed several uncertified SRM samples for gold during their drill programs. The samples were prepared from project material and drill core in their sample preparation laboratory and sent to several commercial laboratories for round robin analyses. Average gold values were calculated by Nomos staff. Standard deviations are not available. Table 11.2 describes the standards used in all drill campaigns and it shows the percent of the failed standards. A standard has failed when the reported assay falls outside of the ±3 standard deviations. Of the 18 standards reviewed in detail, most performed well to excellent with less than 10% of samples falling outside of three standard deviations. Standards SL51 OXJ80 performed the worst with 11% and 12% of the samples falling outside of three standard deviations.
Standards SF45, OXC72, and OXC58 show a slight positive bias relative to the expected values. Overall, the standards perform well and do not show a systematic bias that would impact the resource.
The standard sample performance is acceptable.
5070-\16.04\5070-STY-001
July 2017 Lycopodium Minerals Canada Ltd.

FEASIBILITY STUDY ON THE AURIZONA GOLD MINE PROJECT NI 43-101 TECHNICAL REPORT
Page 11.10
Table 11.2 Standard Reference Material Samples
Standard ID Year Count Fail % Lab SRM Au ppm +3 std -3 std Average
Au ppm Relative
Bias SG66 2015-2017 447 <1% RockLabs 1.086 1.182 0.99 1.088 0.002
U01* Pre-2007 331 3% 0.592
SF57 2011-2017 330 1% RockLabs 0.848 0.938 0.758 0.835 -0.015
SL51 2010-2012 258 12% RockLabs 5.909 6.317 5.501 5.808 -0.017
OXJ68 2010-2012 228 5% RockLabs 2.342 2.534 2.15 2.323 -0.008
SF45 2010-2012 226 3% RockLabs 0.848 0.932 0.764 0.938 0.106
SI64 2015-2017 221 0% RockLabs 1.78 1.906 1.654 1.798 0.010
OXC88 2011-2012 206 2% RockLabs 0.203 0.233 0.173 0.202 -0.004
U02* Pre-2007 182 1% 0.680
OXC72 2010-2011 127 6% RockLabs 0.205 0.229 0.181 0.250 0.219
OXJ80 2011-2012 127 11% RockLabs 2.331 2.457 2.205 2.358 0.012
OXE56 2007-2010 120 8% RockLabs 0.611 0.656 0.566 0.602 -0.015
OXC58 2007-2010; 2014 110 3% RockLabs 0.201 0.222 0.18 0.290 0.445
SN50 2010-2011 94 4% RockLabs 8.685 9.225 8.145 8.593 -0.011
OXI54 2007-2010 79 5% RockLabs 1.868 2.066 1.67 1.798 -0.037
SL34 2007-2008 61 8% RockLabs 5.893 6.313 5.473 5.738 -0.026
OXJ64 2008-2010 47 2% RockLabs 2.366 2.603 2.129 2.383 0.007
SN38 2008-2010 44 5% RockLabs 8.573 9.047 8.099 8.394 -0.021
UA* Pre-2007 37
U05* Pre-2007 35
SK33 2009-2010 17 RockLabs 4.041 4.35 3.732
UC* Pre-2007 15
A0.5* Pre-2007 12
SP37 2009-2010 8 RockLabs 18.14 19.28 17
SN60 2012 7 RockLabs 8.595 9.264 7.926
U04* Pre-2007 5
A2* Pre-2007 4
U03* Pre-2007 2
UB* Pre-2007 1
Grand Total 3381
5070-\16.04\5070-STY-001
July 2017 Lycopodium Minerals Canada Ltd.

FEASIBILITY STUDY ON THE AURIZONA GOLD MINE PROJECT NI 43-101 TECHNICAL REPORT
Page 11.11
Figure 11.3 Standard SG66 for Gold
(Source: SRK 2017)
Figure 11.4 Standard SF57 for Gold
(Source: SRK 2017)
5070-\16.04\5070-STY-001
July 2017 Lycopodium Minerals Canada Ltd.
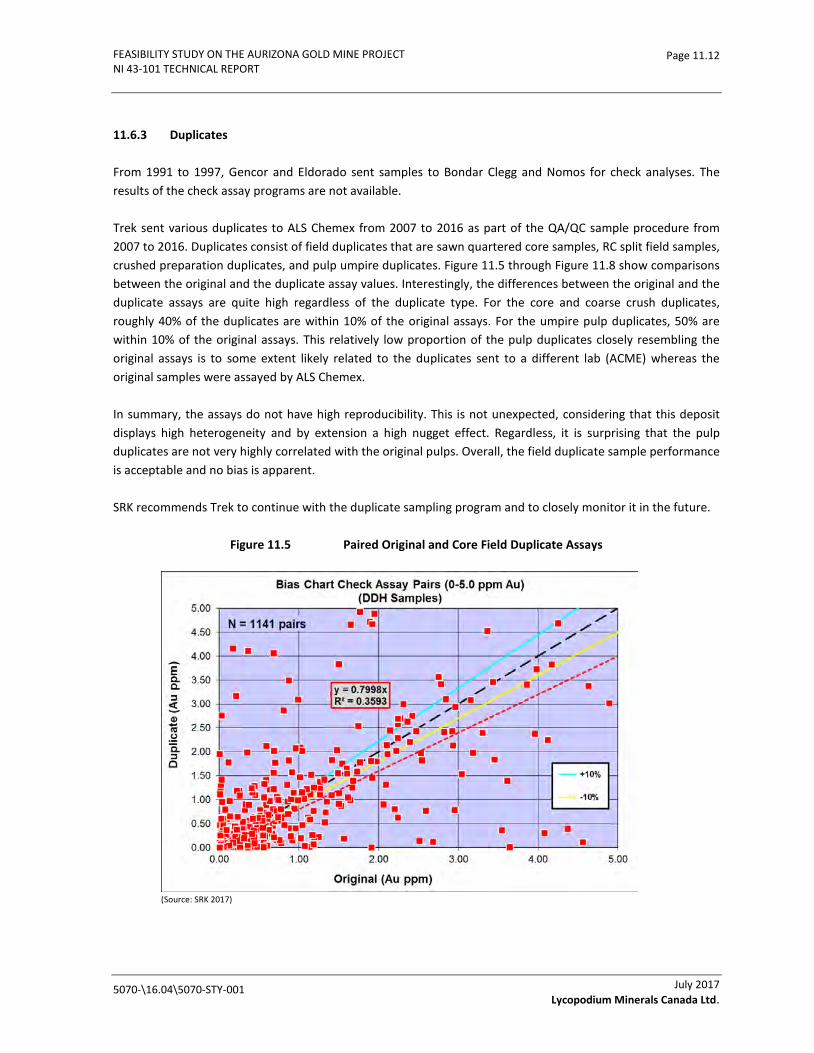
FEASIBILITY STUDY ON THE AURIZONA GOLD MINE PROJECT NI 43-101 TECHNICAL REPORT
Page 11.12
11.6.3 Duplicates
From 1991 to 1997, Gencor and Eldorado sent samples to Bondar Clegg and Nomos for check analyses. The results of the check assay programs are not available.
Trek sent various duplicates to ALS Chemex from 2007 to 2016 as part of the QA/QC sample procedure from 2007 to 2016. Duplicates consist of field duplicates that are sawn quartered core samples, RC split field samples, crushed preparation duplicates, and pulp umpire duplicates. Figure 11.5 through Figure 11.8 show comparisons between the original and the duplicate assay values. Interestingly, the differences between the original and the duplicate assays are quite high regardless of the duplicate type. For the core and coarse crush duplicates, roughly 40% of the duplicates are within 10% of the original assays. For the umpire pulp duplicates, 50% are within 10% of the original assays. This relatively low proportion of the pulp duplicates closely resembling the original assays is to some extent likely related to the duplicates sent to a different lab (ACME) whereas the original samples were assayed by ALS Chemex.
In summary, the assays do not have high reproducibility. This is not unexpected, considering that this deposit displays high heterogeneity and by extension a high nugget effect. Regardless, it is surprising that the pulp duplicates are not very highly correlated with the original pulps. Overall, the field duplicate sample performance is acceptable and no bias is apparent.
SRK recommends Trek to continue with the duplicate sampling program and to closely monitor it in the future.
Figure 11.5 Paired Original and Core Field Duplicate Assays
(Source: SRK 2017)
5070-\16.04\5070-STY-001
July 2017 Lycopodium Minerals Canada Ltd.
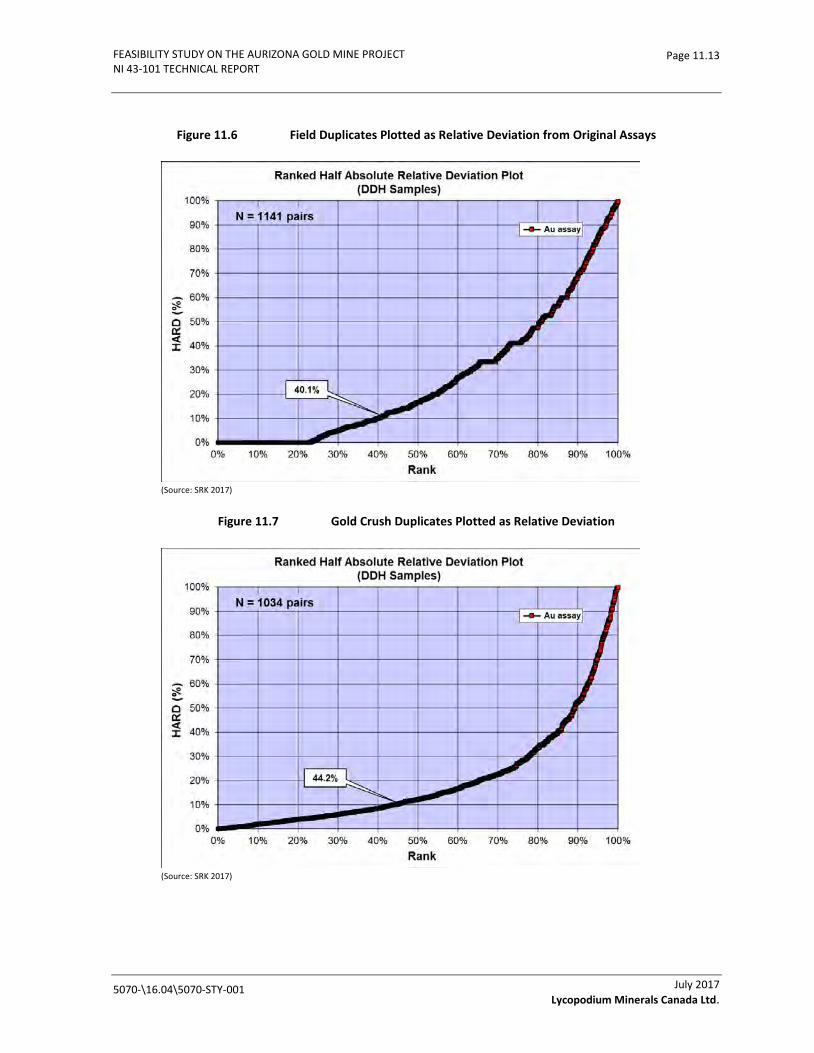
FEASIBILITY STUDY ON THE AURIZONA GOLD MINE PROJECT NI 43-101 TECHNICAL REPORT
Page 11.13
Figure 11.6 Field Duplicates Plotted as Relative Deviation from Original Assays
(Source: SRK 2017)
Figure 11.7 Gold Crush Duplicates Plotted as Relative Deviation
(Source: SRK 2017)
5070-\16.04\5070-STY-001
July 2017 Lycopodium Minerals Canada Ltd.
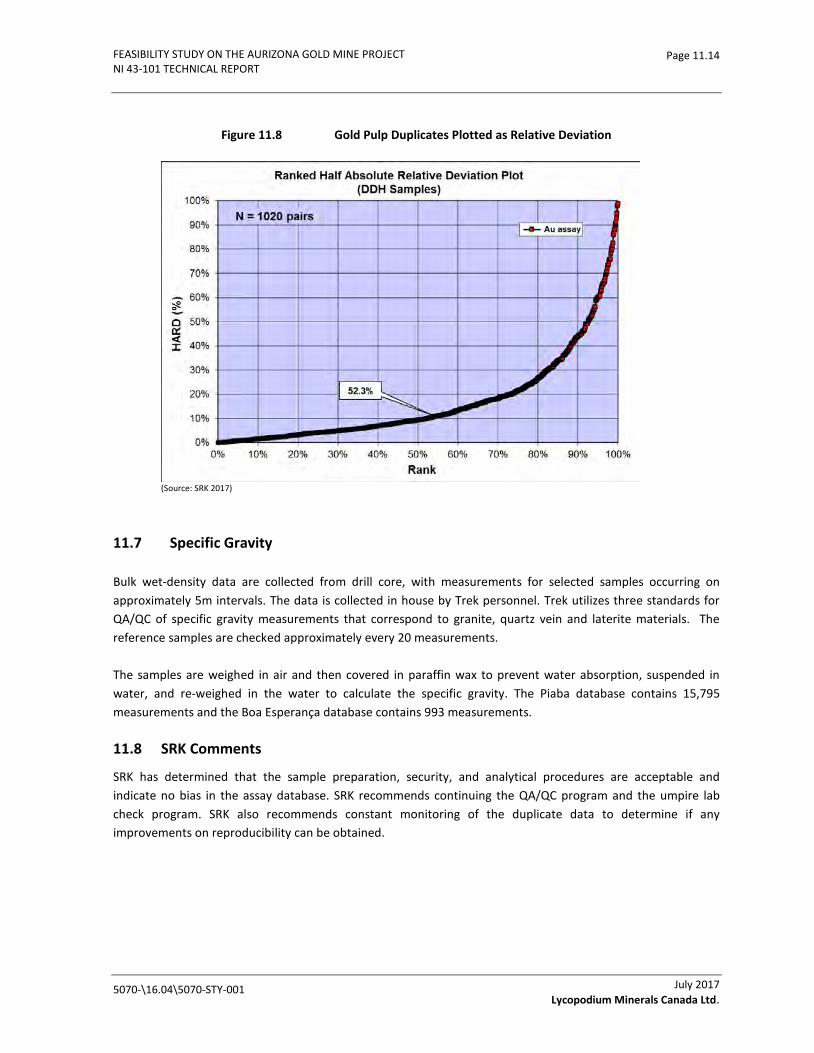
FEASIBILITY STUDY ON THE AURIZONA GOLD MINE PROJECT NI 43-101 TECHNICAL REPORT
Page 11.14
Figure 11.8 Gold Pulp Duplicates Plotted as Relative Deviation
(Source: SRK 2017)
11.7 Specific Gravity
Bulk wet-density data are collected from drill core, with measurements for selected samples occurring on approximately 5m intervals. The data is collected in house by Trek personnel. Trek utilizes three standards for QA/QC of specific gravity measurements that correspond to granite, quartz vein and laterite materials. The reference samples are checked approximately every 20 measurements.
The samples are weighed in air and then covered in paraffin wax to prevent water absorption, suspended in water, and re-weighed in the water to calculate the specific gravity. The Piaba database contains 15,795 measurements and the Boa Esperança database contains 993 measurements.
11.8 SRK Comments
SRK has determined that the sample preparation, security, and analytical procedures are acceptable and indicate no bias in the assay database. SRK recommends continuing the QA/QC program and the umpire lab check program. SRK also recommends constant monitoring of the duplicate data to determine if any improvements on reproducibility can be obtained.
5070-\16.04\5070-STY-001
July 2017 Lycopodium Minerals Canada Ltd.
FEASIBILITY STUDY ON THE AURIZONA GOLD MINE PROJECT NI 43-101 TECHNICAL REPORT
Page 12.1
12.0 DATA VERIFICATION
12.1 Verifications by Trek
The historic data was not available in digital format, but all the paper lab certificates had been preserved in excellent quality. Trek prepared the database from the historical data as a double entry, i.e. two people independently entered the data and then checked the resulting databases. This method was used to ensure that the database was built correctly. The historical data represent approximately 19% of the sampled meters.
12.2 Verifications in Previous Technical Reports
In performing the previous Mineral Resource estimates, SRK checked the database in 2008, 2009, 2010 and 2012 against the original assay certificates. Errors in the 2008 database were reported to Trek and the necessary corrections were made. Trek has completely audited its database and no errors were found by SRK in its 2009, 2010 and 2012 checks (SRK 2013).
12.3 Verifications by SRK Consulting
12.3.1 Site Visit
In accordance with NI 43-101 guidelines, James Siddorn and Marek Nowak visited the Project.
Dr. James Siddorn, PGeo, visited the site from December 18th to 22nd, 2016. The purpose of the site visit was to review the 3D geological modelling strategy for both the Piaba and Boa Esperança deposits, including a review of weathering, alteration, lithology, and structural geology wireframes constructed by Trek. This review built on previous site visits by SRK in 2016 which focused on the structural geological controls on gold mineralization in the Piaba deposit (in January and April 2016).
Marek Nowak visited the site on January 24th and 25th, 2017.
The purpose of the site visit was to review the drilling, logging and sampling procedures, examine drill core, and interview project personnel.
The site visit was also aimed at investigating the geological controls on the distribution of the gold mineralization. The geological setting was reviewed both in drill core and in an open pit. A design of a high grade mineralized zone was reviewed with the Project chief geologist. In addition, quality of the current database and validation procedures was also reviewed and discussed with a database manager.
SRK was given full access to relevant data, and conducted interviews of Aurizona personnel to obtain information on the past exploration work and to understand procedures used to collect, record, store and analyze historical and current exploration data.
5060-\16.04\5060-STY-001
July 2017 Lycopodium Minerals Canada Ltd.
FEASIBILITY STUDY ON THE AURIZONA GOLD MINE PROJECT NI 43-101 TECHNICAL REPORT
Page 12.2
12.3.2 Database Validation
SRK validated the collar, survey, and assay data for both the Piaba and Boa Esperança deposits. All holes are routinely surveyed for downhole deviation. SRK compared drill hole collars with the topographic surface and determined that no large differences were present. The drill hole traces were visually checked by SRK to validate the downhole surveys.
The assay database was compared against the assay certificates. The assay certificates from 2008 to 2017 were provided by ALS Chemex. Assays from ACME labs, representing 18% of the current database, were not available and were not verified by SRK, as they are not in digital format.. QA/QC samples were included during all years of drilling, from 1992 to 2016. A total of 50% of the assay values were validated, and only minor transcription errors were found. All errors were corrected in the assay database before use for the resource.
12.3.3 Data Type Validation
There are three different drill data types in the current database: auger, core, and RC. In addition, the current data can be split into pre-1999 (historical) and post-2006 periods (new). The different data types can be compared to each other and they can also be compared to production data.
To make the comparisons, SRK estimated in the Piaba deposit, separately from each data type, small blocks (5 x 5 x 2m) with the nearest neighbour methodology. In addition, the blocks were estimated from production data by the inverse distance squared procedure. The estimates were done separately in different weathering horizons within a high grade gold zone domain. Only blocks estimated from different data types were used in the comparisons.
Figure 12.1 and Figure 12.2 present results from some of the comparison that have been made. The conclusions from this analysis are as follows:
• Assays from auger holes return generally much higher grades than the exploration data and the production data.
• Assays from historical holes in fresh rock appear generally lower than the assays from new drill holes.
• Assays from production data are similar to exploration data (RC and core).
• Assays from core holes are generally similar to assays from RC holes.
Based on the results, assays from auger holes in the Piaba deposit have been excluded from resource estimation.
In the Boa Esperança deposit there are too few data to make the comparisons. Moreover, assays from auger holes represent almost all data in laterite. Therefore, the assays from the auger holes were used for estimating grades in laterite, but were excluded in other weathering horizons.
5060-\16.04\5060-STY-001
July 2017 Lycopodium Minerals Canada Ltd.

FEASIBILITY STUDY ON THE AURIZONA GOLD MINE PROJECT NI 43-101 TECHNICAL REPORT
Page 12.3
Figure 12.1 Q-Q Plots of Block Grades Estimated from Core vs RC in (a) Saprolite and Transition Areas; (b) Fresh Rocks
(Source: SRK 2017)
Figure 12.2 Q-Q plots of Block Grades Estimated from: (a) auger vs combined core and RC Assays (b) Historical vs New Assays
(Source: SRK 2017)
12.4 Data Adequacy
It is the QP’s opinion that the database has been verified and is suitable for use in the Mineral Resource estimation. No limitations were imposed on the QP in the data verification process.
(a) (b)
(a) (b)
5060-\16.04\5060-STY-001
July 2017 Lycopodium Minerals Canada Ltd.

FEASIBILITY STUDY ON THE AURIZONA GOLD MINE PROJECT NI 43-101 TECHNICAL REPORT
5070\16.4\5070-STY-001
Page 13.1
July 2017 Lycopodium Minerals Canada Ltd.
13.0 MINERAL PROCESSING AND METALLURGICAL TESTING
13.1 Metallurgical Testwork
A number of metallurgical test programs were carried out on the laterite, saprolite, transition and fresh rock
mineralization samples from the Piaba deposit and the surrounding targets between 1994 and 2017. The main
metallurgical laboratories involved in the testwork included:
Paulo Abib Engenharia S.A. (1995).
Lakefield Research Limited (1997).
Metago (1994 and 2007-2008).
Núcleo de Inovações Tecnológicas/NUTEC - Fundação Gorceix (2007).
Departamento de Engenharia de Minas da UFMG (2007).
HAD Services S/S Ltda (2008).
Metcon Research (Metcon) (2009).
Advanced Mineral Technology Laboratory, Ltd. (AMTEL) (2013).
Hazen Research, Inc. (2013).
Koeppern Machinery Australia (Koeppern) (2013).
Inspectorate (now Bureau Veritas Commodities Canada Ltd (BV)) (2013 - 2016).
SGS Geosol Laboratorios Ltda (2017).
ALS Minerals (2017).
The testwork results show that the mineralization responds well to gravity concentration followed by a CIL
process. There is a significant amount of nugget gold varying widely from sample to sample. On average, the
gravity concentration could recover approximately 30 to 40% of the gold from the feeds. Some of the samples
contain carbonaceous materials but do not appear to be significantly preg-robbing if the CIL procedure is used
for the cyanidation tests. However, it appears that gold extraction may be reduced if the samples contain an
elevated arsenic concentration.

FEASIBILITY STUDY ON THE AURIZONA GOLD MINE PROJECT NI 43-101 TECHNICAL REPORT
5070\16.4\5070-STY-001
Page 13.2
July 2017 Lycopodium Minerals Canada Ltd.
The proposed flow sheet is a hybrid leach/CIP circuit. Refer to Section 17 for more details on the flow sheet
development and process description.
In general, the transition ore samples are moderately resistant to SAG mill grinding compared to the very
competent fresh rock samples based on the SAGDesign WSAG and the SMC Axb ore parameters. Based on the
BWi parameter, the transition ore is also softer to ball mill grinding than the fresh rock.
The following sections details the testwork performed on various different ore types including Piaba, Boa
Esperança, Ferradura and Conceição but this Report only considers the Piaba and Boa Esperança resources for
design purposes.
During the re-logging program in 2014/2015, the lithotypes of the Piaba deposit were renamed by the MASA
geologists and other external consultants. Therefore, all metallurgical samples collected prior to the re-logging
program will fall under a new name and the following chapter has been updated to reflect this change. Dalcite
(“DAC”) samples will be renamed as diorite (“DRT”) and tonalite (“TON”) samples will be renamed as quartz-
diorite (“QDT”).
13.1.1 Metallurgical Testing Before 2012
The results that were obtained in the test programs conducted before 2012 have been presented and discussed
in the metallurgical testing sections in the previous NI 43-101 technical reports published in 2008, 2010, 2011
and 2013.
More recent metallurgical studies, including cyanidation testwork, comminution studies and solid/liquid
separation studies were conducted by Metcon Research (Metcon) and summarized in Section 11 of the NI 43-
101 Technical Report published in 2011 by SRK.
Metcon Test Program
Metallurgical studies were conducted on the following ore types:
Piaba transition.
Piaba fresh.
Table 13.1 provides head grade analyses for each of the ore composites tested as part of Metcon’s metallurgical
program. Ore composite head grades ranged from 1.30 to 1.76 g/t Au, which is similar to the mill feed grades
being mined according to the new mine plan.
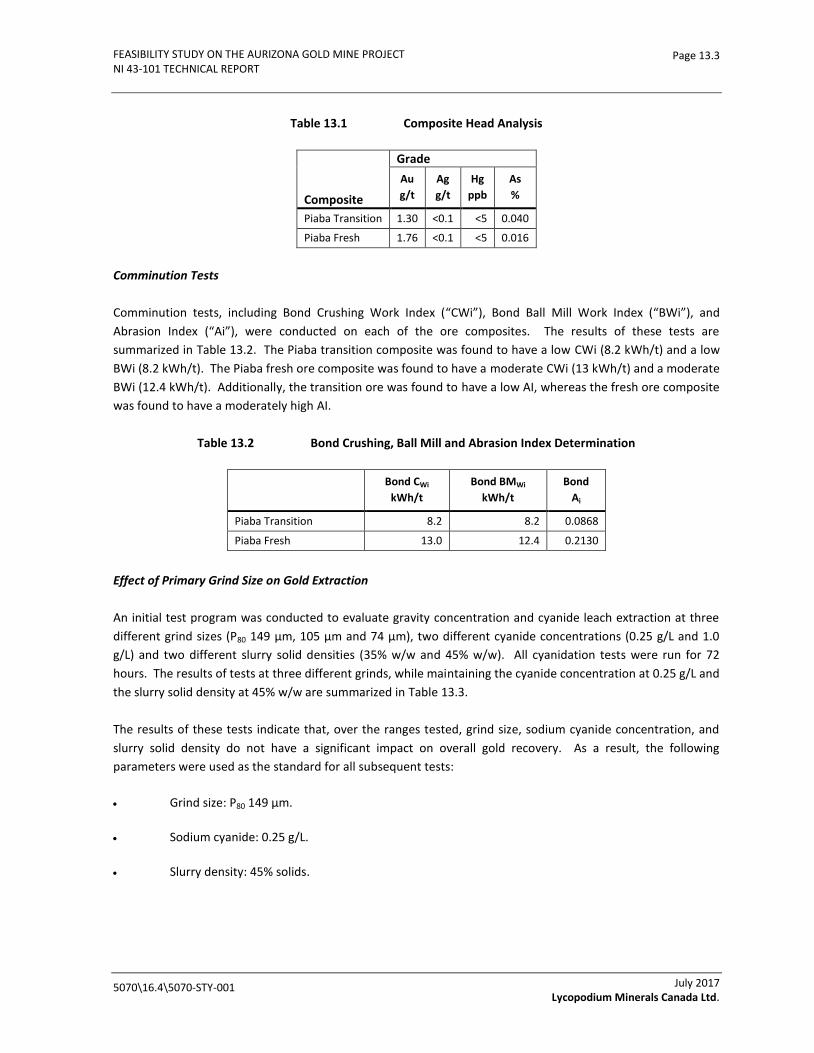
FEASIBILITY STUDY ON THE AURIZONA GOLD MINE PROJECT NI 43-101 TECHNICAL REPORT
5070\16.4\5070-STY-001
Page 13.3
July 2017 Lycopodium Minerals Canada Ltd.
Table 13.1 Composite Head Analysis
Composite
Grade
Au
g/t
Ag
g/t
Hg
ppb
As
%
Piaba Transition 1.30 <0.1 <5 0.040
Piaba Fresh 1.76 <0.1 <5 0.016
Comminution Tests
Comminution tests, including Bond Crushing Work Index (“CWi”), Bond Ball Mill Work Index (“BWi”), and
Abrasion Index (“Ai”), were conducted on each of the ore composites. The results of these tests are
summarized in Table 13.2. The Piaba transition composite was found to have a low CWi (8.2 kWh/t) and a low
BWi (8.2 kWh/t). The Piaba fresh ore composite was found to have a moderate CWi (13 kWh/t) and a moderate
BWi (12.4 kWh/t). Additionally, the transition ore was found to have a low AI, whereas the fresh ore composite
was found to have a moderately high AI.
Table 13.2 Bond Crushing, Ball Mill and Abrasion Index Determination
Bond CWi
kWh/t
Bond BMWi
kWh/t
Bond
Ai
Piaba Transition 8.2 8.2 0.0868
Piaba Fresh 13.0 12.4 0.2130
Effect of Primary Grind Size on Gold Extraction
An initial test program was conducted to evaluate gravity concentration and cyanide leach extraction at three
different grind sizes (P80 149 µm, 105 µm and 74 µm), two different cyanide concentrations (0.25 g/L and 1.0
g/L) and two different slurry solid densities (35% w/w and 45% w/w). All cyanidation tests were run for 72
hours. The results of tests at three different grinds, while maintaining the cyanide concentration at 0.25 g/L and
the slurry solid density at 45% w/w are summarized in Table 13.3.
The results of these tests indicate that, over the ranges tested, grind size, sodium cyanide concentration, and
slurry solid density do not have a significant impact on overall gold recovery. As a result, the following
parameters were used as the standard for all subsequent tests:
Grind size: P80 149 µm.
Sodium cyanide: 0.25 g/L.
Slurry density: 45% solids.

FEASIBILITY STUDY ON THE AURIZONA GOLD MINE PROJECT NI 43-101 TECHNICAL REPORT
5070\16.4\5070-STY-001
Page 13.4
July 2017 Lycopodium Minerals Canada Ltd.
Table 13.3 Gold Recovery/Extraction versus Grind Size
Sample
Gold Recovery %
Gravity Leach
Gravity +
Leach
Piaba Transition
P80 149 µm 74.2 19.4 93.6
P80 105 µm 62.2 28.5 90.7
P80 74 µm 62.4 29.0 91.4
Piaba Fresh
P80 149 µm 60.8 31.3 92.1
P80 105 µm 57.8 32.1 89.9
P80 74 µm 57.0 34.2 91.2
Gravity Concentration Followed by Standard Cyanidation of Gravity Tailings
Two tests were conducted on Piaba composites to evaluate gold recovery achievable by gravity concentration
followed by agitated cyanidation. Gold extraction during cyanidation was monitored at 24, 48 and 72 hours.
The results of these tests are summarized in Table 13.4 and indicate that 29 to 52% of the gold could be
recovered into a gravity concentrate and that gravity concentration followed by cyanidation for 24 hours would
recover approximately 90 to 93% of the gold from the transition and fresh ore composites respectively.
Table 13.4 Test Results – Gravity Concentration Followed by Standard Cyanidation
Sample
Gold Recovery %
Gravity
Gravity +
24 h Leach
Gravity +
48 h Leach
Gravity +
72 h Leach
Piaba Transition 52.4 89.5 90.5 91.0
Piaba Fresh 28.8 89.4 93.3 91.5
Sodium cyanide concentration: 250 ppm; slurry solid density: 45% w/w; grind size: P80 149 µm.
Gravity Concentration Followed by CIL Cyanidation of Gravity Tailings
Two tests were conducted on Piaba composites to evaluate gravity concentration followed by CIL leaching of
the gravity tailings over 72 hours. The test results are summarized in Table 13.5 and indicate gold recoveries
ranging from 90 to 92% for transition and fresh ore composites respectively. It should be pointed out that by
the nature of CIL testing, gold extraction as a function of leaching retention time cannot be reported and that
these tests identify recoveries achievable after 72 hours of cyanidation.

FEASIBILITY STUDY ON THE AURIZONA GOLD MINE PROJECT NI 43-101 TECHNICAL REPORT
5070\16.4\5070-STY-001
Page 13.5
July 2017 Lycopodium Minerals Canada Ltd.
Table 13.5 Test Results – Gravity Concentration Followed by CIL Cyanidation
Sample
Gold Recovery %
Gravity Gravity +
72 h Leach
Piaba Transition 65.0 90.4
Piaba Fresh 64.1 91.8
Sodium cyanide concentration: 250 ppm; slurry solid density: 45% w/w; grind size: P80 149 µm
In April 2009, Metcon conducted additional metallurgical testwork on the composite samples identified above
comprising gravity concentration followed by 24 hour cyanidation agitated leach.
Carbon Evaluation
Earlier CIL tests on the saprolite sample showed incomplete adsorption of the extracted gold onto carbon
indicating that some constituents in the saprolite sample may be fouling the carbon and preventing complete
gold adsorption. Table 13.6 provides a summary of the CIL test results using carbon from Calgon Carbon
Corporation (Calgon) and from PICA USA, Inc. (PICA). The PICA carbon showed better loading than the Calgon
carbon but the dissolved gold from the saprolite sample was still not completely loaded onto the carbons.
Table 13.6 Activated Carbon Comparison
Sample
Recovery % Au
Calgon Carbon PICA Carbon
Gravity Concentrate 23.3 17.7
Loaded Carbon 22.8 51.3
Barren Solution 44.8 17.7
Gravity+ CIL Recovery 90.8 86.7
Sodium cyanide concentration: 250 ppm; slurry solid density: 45% w/w; grind size: P80 149 µm
24 Hour Cyanidation Tests
Further tests were conducted to evaluate gold recovery by gravity concentration followed by 24 hour agitated
cyanidation on each of the composites. The results are summarized in Table 13.7 and indicate overall gold
recoveries in the range of 83 to 85% which is 5 to 7% lower than earlier test results. This seems to be a result of
lowered recovery by gravity concentration.

FEASIBILITY STUDY ON THE AURIZONA GOLD MINE PROJECT NI 43-101 TECHNICAL REPORT
5070\16.4\5070-STY-001
Page 13.6
July 2017 Lycopodium Minerals Canada Ltd.
Table 13.7 Test Results – Gravity Concentration Followed by 24 Hour Direct Cyanidation
Sample
Recovery % Au
Gravity Gravity + 24 h Leach
Piaba Transition 20.2 84.8
Piaba Fresh 30.7 82.9
Note: Sodium cyanide concentration: 250 ppm; slurry solid density: 45% w/w; grind size: P80 149 µm
13.1.2 Metallurgical Testing Between 2012 and 2015
During 2012 and 2014, several testing programs, including comprehensive testwork conducted in 2013, were
conducted by Inspectorate under the supervision of SNC-Lavalin Inc. (SNC). In 2015, further testwork was
conducted by Inspectorate, under the supervision of Tetra Tech, on a master composite generated from the
rock zone quartz-diorite type drill core interval samples used for the 2013 test program. The testwork was
completed to generate the tailings samples for geotechnical and geochemical characteristic testing and cyanide
detoxification testing.
Samples
A total of 7,880 kg of drill core and fine rock samples were received by Inspectorate on November 27, 2012 for
sample preparation, composition and metallurgical testing. The fine rock samples were exclusively made up for
the laterite material. These are summarized in Table 13.8. Out of these samples, 92 and five different
variability composites from the Piaba and Boa Esperança deposits, respectively, were also constructed for the
testing.

FEASIBILITY STUDY ON THE AURIZONA GOLD MINE PROJECT NI 43-101 TECHNICAL REPORT
5070\16.4\5070-STY-001
Page 13.7
July 2017 Lycopodium Minerals Canada Ltd.
Table 13.8 Sample Received at Inspectorate, November 2012 – First Shipment
Deposit Weathering Rock Type Lithology
Weight
kg %
Piaba Saprolite (8 drill holes) Diorite 47 -
QDT 124 -
QFP 24 -
Subtotal 195 3.5
Transition (12 drill holes) Diorite 16 -
QDT 219 -
QFP 72 -
Subtotal 307 5.4
Fresh Rock (85 drill holes) Diorite 533 -
QDT 2,170 -
QFP 2,228 -
Subtotal 4,931 87.0
Deep Holes (5 drill holes) Diorite - -
QDT 83 -
QFP 150 -
Subtotal 233 4.1
Total - 5,666 100.0
Boa Esperança Saprolite (3 drillholes) QDT 36 -
Transition QDT 11 -
Fresh Rock QDT 16 -
Total - 63 -
Piaba Laterite - 415 -
Pirocaua - 1,329 -
Total - - 7,240 -
Note:QFP – Quartz Feldspar Porphyry
On December 10 2013, an additional 850 kg of samples from the Piaba deposit were received to construct the
variability composites for confirmation tests. The samples are listed in Table 13.9. Out of the 850 kg sample,
approximately 430 kg was below the “cut-off grade” saprolite diorite material that was used for a heap leach
column test program.
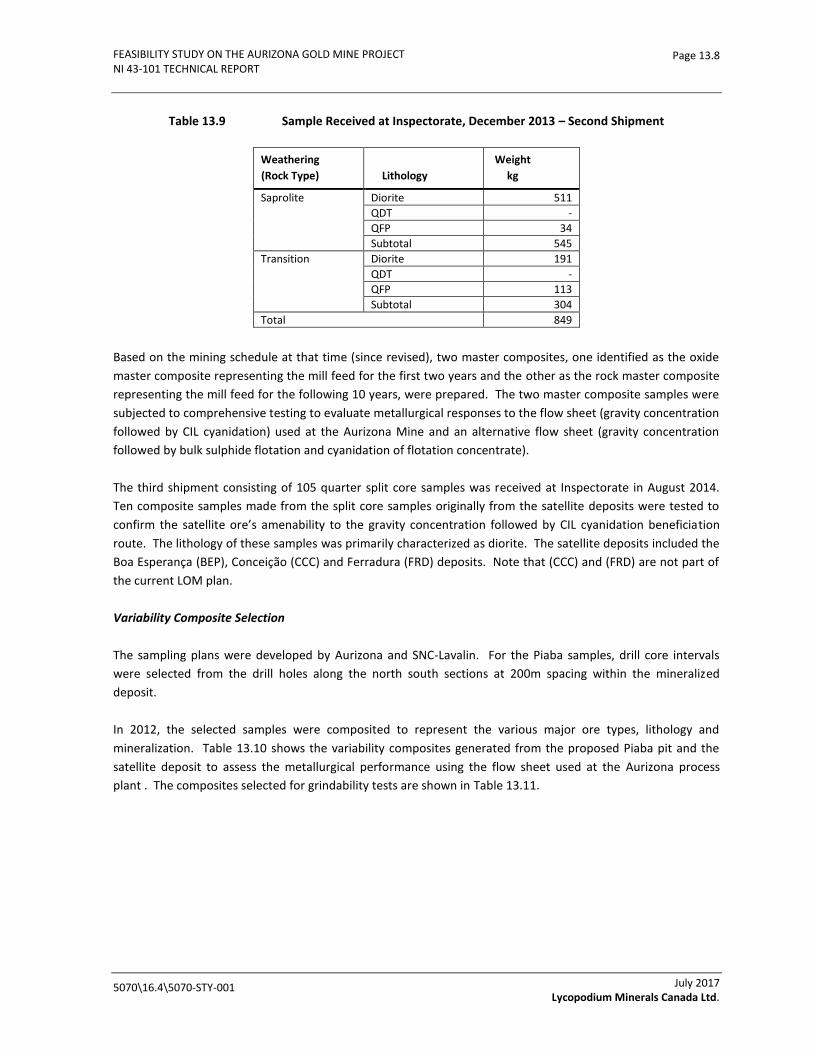
FEASIBILITY STUDY ON THE AURIZONA GOLD MINE PROJECT NI 43-101 TECHNICAL REPORT
5070\16.4\5070-STY-001
Page 13.8
July 2017 Lycopodium Minerals Canada Ltd.
Table 13.9 Sample Received at Inspectorate, December 2013 – Second Shipment
Weathering
(Rock Type) Lithology
Weight
kg
Saprolite Diorite 511
QDT -
QFP 34
Subtotal 545
Transition Diorite 191
QDT -
QFP 113
Subtotal 304
Total 849
Based on the mining schedule at that time (since revised), two master composites, one identified as the oxide
master composite representing the mill feed for the first two years and the other as the rock master composite
representing the mill feed for the following 10 years, were prepared. The two master composite samples were
subjected to comprehensive testing to evaluate metallurgical responses to the flow sheet (gravity concentration
followed by CIL cyanidation) used at the Aurizona Mine and an alternative flow sheet (gravity concentration
followed by bulk sulphide flotation and cyanidation of flotation concentrate).
The third shipment consisting of 105 quarter split core samples was received at Inspectorate in August 2014.
Ten composite samples made from the split core samples originally from the satellite deposits were tested to
confirm the satellite ore’s amenability to the gravity concentration followed by CIL cyanidation beneficiation
route. The lithology of these samples was primarily characterized as diorite. The satellite deposits included the
Boa Esperança (BEP), Conceição (CCC) and Ferradura (FRD) deposits. Note that (CCC) and (FRD) are not part of
the current LOM plan.
Variability Composite Selection
The sampling plans were developed by Aurizona and SNC-Lavalin. For the Piaba samples, drill core intervals
were selected from the drill holes along the north south sections at 200m spacing within the mineralized
deposit.
In 2012, the selected samples were composited to represent the various major ore types, lithology and
mineralization. Table 13.10 shows the variability composites generated from the proposed Piaba pit and the
satellite deposit to assess the metallurgical performance using the flow sheet used at the Aurizona process
plant . The composites selected for grindability tests are shown in Table 13.11.

FEASIBILITY STUDY ON THE AURIZONA GOLD MINE PROJECT NI 43-101 TECHNICAL REPORT
5070\16.4\5070-STY-001
Page 13.9
July 2017 Lycopodium Minerals Canada Ltd.
Table 13.10 Head Grades - Variability Composites for Gravity/Cyanidation Tests
Deposit Weathering/
Rock Type Lithology Sample
No.
Head g/t Au CAI % As %
Low Avg. High Low Avg. High Low Avg. High
Piaba Saprolite Diorite 5 0.86 1.34 1.66 0.13 0.14 0.64 0.004 0.011 0.018
QDT 3 0.78 1.63 2.08 0.17 0.27 0.31 0.008 0.008 0.009
QFP 1 0.78 0.78 0.78 0.72 0.72 0.72 0.001 0.001 0.001
Transition Diorite 4 1.17 1.58 1.84 0.29 0.48 0.60 0.001 0.016 0.049
QDT 7 0.72 4.39 24.70 0.13 0.74 1.65 0.000 0.020 0.100
QFP 5 0.94 1.51 2.82 0.02 0.51 0.97 0.000 0.043 0.117
Fresh Rock Diorite 10 0.43 1.24 2.72 0.33 0.54 0.85 0.000 0.010 0.030
QDT 26 0.45 1.44 6.74 0.18 0.55 3.14 0.000 0.070 0.950
QFP 23 0.30 1.55 5.47 0.28 0.59 1.19 0.000 0.019 0.170
SW Laterite 3 0.36 1.69 2.29 - - - - - -
Pirocaua Laterite 4 0.33 1.00 2.61 - - - - - -
BEP Saprolite QDT 1 0.56 0.56 0.56 0.14 0.14 0.14 0.027 0.027 0.027
Transition QDT 1 0.43 0.43 0.43 0.58 0.58 0.58 0.006 0.006 0.006
Fresh Rock QDT 1 0.96 0.96 0.96 0.42 0.42 0.42 0.002 0.002 0.002
n/a Laterite 2 0.34 1.09 1.84 n/a n/a n/a n/a n/a n/a
CCC Transition Gabbro 1 0.56 0.56 0.56 0.16 0.16 0.16 0.027 0.027 0.027
Fresh Rock QDT 1 1.05 1.05 1.05 0.20 0.20 0.20 - - -
FRD Fresh Rock QDT 2 0.83 1.58 2.34 0.28 0.33 0.37 0.001 0.002 0.003
CAI – carbon acid insoluble

FEASIBILITY STUDY ON THE AURIZONA GOLD MINE PROJECT NI 43-101 TECHNICAL REPORT
5070\16.4\5070-STY-001
Page 13.10
July 2017 Lycopodium Minerals Canada Ltd.
Table 13.11 Grindability Variability Composites
Deposit Weathering/
Rock Type Lithology Composite
No. Depth
m SAG
Design Bond BMWi
Bond Ai
Piaba Transition Diorite 1 50 - 140 Yes Yes No
QFP 2 55 -120 Yes Yes No
QDT 1 50 - 200 Yes Yes No
Fresh Rock Diorite 3 50 - 95 Yes Yes Yes
110 - 190 Yes Yes No
200 - 240 Yes Yes Yes
QFP 6 100 - 140 Yes Yes No
185 - 200 Yes Yes Yes
200 - 250 Yes Yes Yes
250 - 320 Yes Yes Yes
310 - 370 Yes Yes Yes
435 - 670 Yes Yes No
QDT 6 75 - 165 Yes Yes Yes
156 - 214 Yes Yes Yes
200 - 257 Yes Yes No
254 - 300 Yes Yes Yes
290 - 357 Yes Yes Yes
522 - 606 Yes Yes No
FRD Fresh Rock QDT 1 122 – 158 Yes Yes No
CCC Fresh Rock QDT 1 96 -110 Yes Yes No
BEP Saprolite - 1 25 – 415 No Yes No
Fresh Rock QDT 1 191 - 200 No Yes No
Piaba Pirocaua Laterite 1 n/a No Yes No
Master Composite Selection
Two master composites were prepared in accordance with the mining schedule provided by Trek. One of the
two composites represents the mill feed for the first two years of production, identified as oxide master
composite and the other, labelled as rock master composite, represents the mill feed in the following 10 years.
The two composites were constituted based on the weight percent of each lithology within each rock type to
come up with an overall gold grade matching the grade proposed by the mine plan. As shown in Table 13.12
and Table 13.13, the gold head grade of oxide and master composite was 1.24 and 1.36 g/t Au, respectively.

FEASIBILITY STUDY ON THE AURIZONA GOLD MINE PROJECT NI 43-101 TECHNICAL REPORT
5070\16.4\5070-STY-001
Page 13.11
July 2017 Lycopodium Minerals Canada Ltd.
Table 13.12 Oxide Master Composite
Rock Type Weight
%
Calculated Head Grade
g/t Au
Assay Head Grade Au
g/t
As
ppm
S2-
%
CAI
%
Laterite 8.7 1.07 - - - -
SW 3.6 1.14 - - - -
Pirocaua 5.1 1.03 - - - -
Saprolite 70.6 1.30 - - - -
Diorite 12.0 1.32 - - - -
QDT 38.2 1.37 - - - -
QFP 20.4 1.14 - - - -
Transition 18.9 1.19 - - - -
Diorite 2.3 1.35 - - - -
QDT 3.8 1.32 - - - -
QFP 12.7 1.12 - - - -
Rock 1.9 1.14 - - - -
Diorite 0.1 1.22 - - - -
QDT 1.7 1.12 - - - -
QFP 0.1 1.43 - - - -
Total/Average 100.0 1.25 0.89 91 0.31 0.31
S(2-
) – sulphide sulphur
Table 13.13 Rock Master Composite
Rock Type Weight
%
Calculated Head Grade
g/t Au
Assay Head Grade Au g/t
As ppm
S2- %
CAI %
Diorite 20.0 1.22 - - - -
QDT 10.0 1.12 - - - -
QFP 70.0 1.43 - - - -
Total/Average 100.0 1.36 0.67 138 1.36 0.51
FEASIBILITY STUDY ON THE AURIZONA GOLD MINE PROJECT NI 43-101 TECHNICAL REPORT
5070\16.4\5070-STY-001
Page 13.12
July 2017 Lycopodium Minerals Canada Ltd.
Metallurgical Test Results and Discussions
Variability Composites
In the 2013 test program, metallurgical tests were performed on each of the 112 variability composites to
evaluate gold recovery achievable using a flow sheet that was being used by the Aurizona Mine. The flow sheet
consisted of gravity concentration and cyanidation on the gravity concentration tailings. To simulate the flow
sheet being used at the mine, the flow sheet used at the laboratory included gravity concentration by a
laboratory size Knelson concentrator, followed by 48 hour bottle rolled CIL cyanidation of the gravity tails at a
target grind size of P80 105 µm. These CIL tests were run at a solid density of 35% w/w and an initial cyanide
and carbon concentration of 0.5 g/L and 10 g/L, respectively.
No attempt was made to further optimize the circuit. The results of these tests are summarized and presented
in the following sections.
Head Assay and X-ray Diffraction Analysis
Table 13.10 shows the head assays, including gold, CAI (graphite carbon + organic carbon) and arsenic of the
105 variability composites. Table 13.14 shows that the differences between assay and calculated head grade are
significant in most of the saprolite and transition composites tested. The results may indicate nugget effect
occurring in these samples. Similar gold nugget effects were found in the rock composites. In order to confirm
the presence of free gold, selected composites were assayed in triplicate, the results of which are summarized
in Table 13.15. The assay results confirm the finding that free gold occurs in these composites.
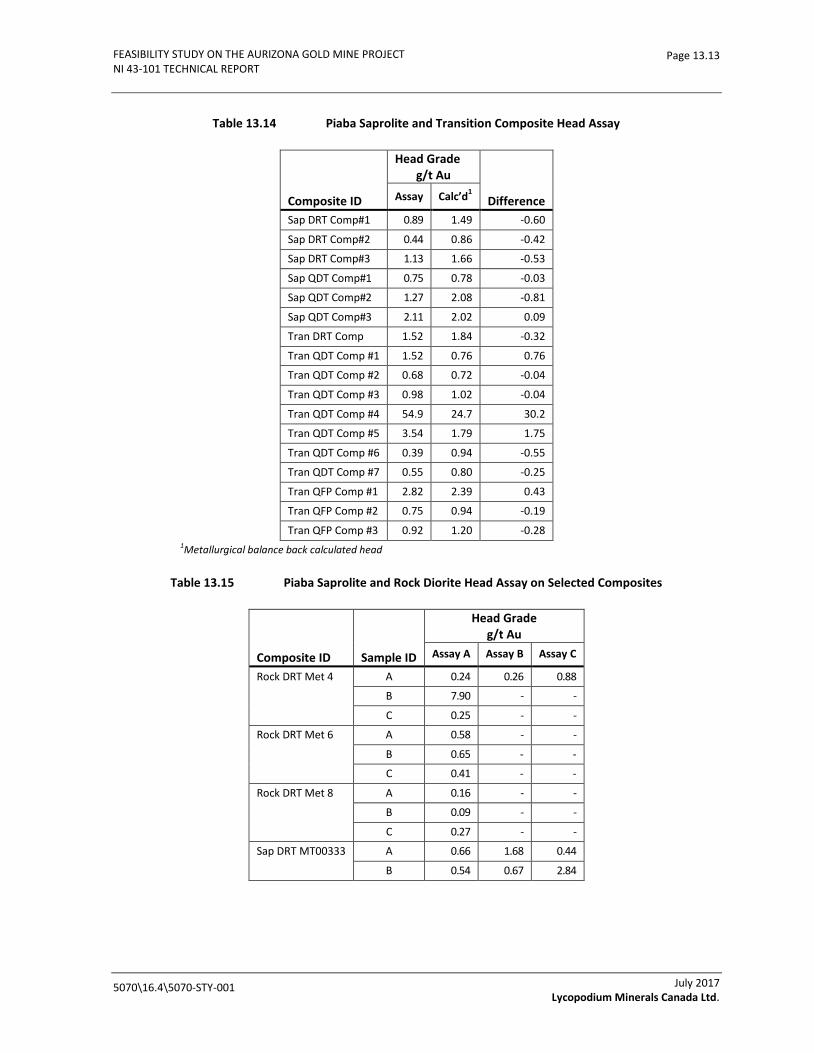
FEASIBILITY STUDY ON THE AURIZONA GOLD MINE PROJECT NI 43-101 TECHNICAL REPORT
5070\16.4\5070-STY-001
Page 13.13
July 2017 Lycopodium Minerals Canada Ltd.
Table 13.14 Piaba Saprolite and Transition Composite Head Assay
Composite ID
Head Grade g/t Au
Difference Assay Calc’d1
Sap DRT Comp#1 0.89 1.49 -0.60
Sap DRT Comp#2 0.44 0.86 -0.42
Sap DRT Comp#3 1.13 1.66 -0.53
Sap QDT Comp#1 0.75 0.78 -0.03
Sap QDT Comp#2 1.27 2.08 -0.81
Sap QDT Comp#3 2.11 2.02 0.09
Tran DRT Comp 1.52 1.84 -0.32
Tran QDT Comp #1 1.52 0.76 0.76
Tran QDT Comp #2 0.68 0.72 -0.04
Tran QDT Comp #3 0.98 1.02 -0.04
Tran QDT Comp #4 54.9 24.7 30.2
Tran QDT Comp #5 3.54 1.79 1.75
Tran QDT Comp #6 0.39 0.94 -0.55
Tran QDT Comp #7 0.55 0.80 -0.25
Tran QFP Comp #1 2.82 2.39 0.43
Tran QFP Comp #2 0.75 0.94 -0.19
Tran QFP Comp #3 0.92 1.20 -0.28 1Metallurgical balance back calculated head
Table 13.15 Piaba Saprolite and Rock Diorite Head Assay on Selected Composites
Composite ID Sample ID
Head Grade g/t Au
Assay A Assay B Assay C
Rock DRT Met 4 A 0.24 0.26 0.88
B 7.90 - -
C 0.25 - -
Rock DRT Met 6 A 0.58 - -
B 0.65 - -
C 0.41 - -
Rock DRT Met 8 A 0.16 - -
B 0.09 - -
C 0.27 - -
Sap DRT MT00333 A 0.66 1.68 0.44
B 0.54 0.67 2.84

FEASIBILITY STUDY ON THE AURIZONA GOLD MINE PROJECT NI 43-101 TECHNICAL REPORT
5070\16.4\5070-STY-001
Page 13.14
July 2017 Lycopodium Minerals Canada Ltd.
Some of the composites were analyzed by x-ray diffraction (XRD) analysis.
Table 13.16 shows the main minerals identified by XRD and the mineral weight percent distribution of the
selected composites. The most common mineral is quartz, which accounts for between 33 and 57% of the total
minerals. The analysis also shows that kaolinite/feldspar content in the saprolite quartz-diorite composite is
approximately 40% while the transition QFP and quartz-diorite composites contain about 35% and 30% of
montmorillonite/feldspar and kaolinite, respectively. A high slurry viscosity may be expected when these types
of the ores are processed.
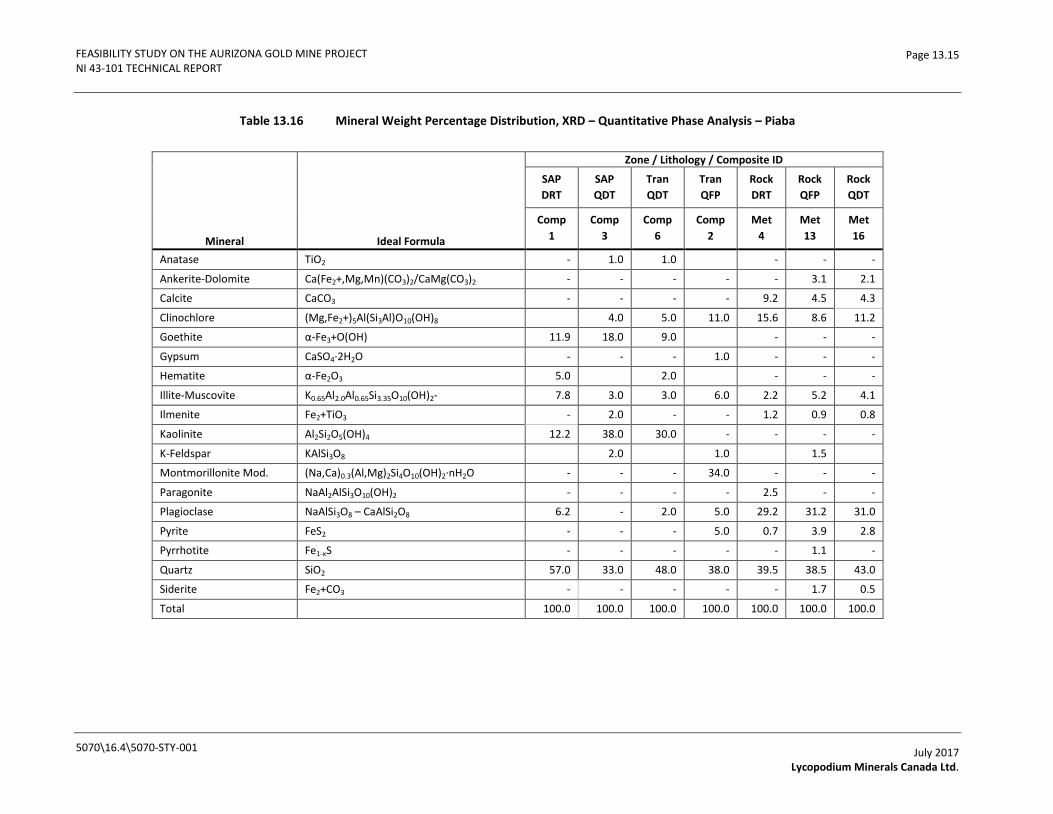
FEASIBILITY STUDY ON THE AURIZONA GOLD MINE PROJECT NI 43-101 TECHNICAL REPORT
5070\16.4\5070-STY-001
Page 13.15
July 2017 Lycopodium Minerals Canada Ltd.
Table 13.16 Mineral Weight Percentage Distribution, XRD – Quantitative Phase Analysis – Piaba
Mineral Ideal Formula
Zone / Lithology / Composite ID
SAP
DRT
SAP
QDT
Tran
QDT
Tran
QFP
Rock
DRT
Rock
QFP
Rock
QDT
Comp
1
Comp
3
Comp
6
Comp
2
Met
4
Met
13
Met
16
Anatase TiO2 - 1.0 1.0 - - -
Ankerite-Dolomite Ca(Fe2+,Mg,Mn)(CO3)2/CaMg(CO3)2 - - - - - 3.1 2.1
Calcite CaCO3 - - - - 9.2 4.5 4.3
Clinochlore (Mg,Fe2+)5Al(Si3Al)O10(OH)8 4.0 5.0 11.0 15.6 8.6 11.2
Goethite α-Fe3+O(OH) 11.9 18.0 9.0 - - -
Gypsum CaSO4·2H2O - - - 1.0 - - -
Hematite α-Fe2O3 5.0 2.0 - - -
Illite-Muscovite K0.65Al2.0Al0.65Si3.35O10(OH)2- 7.8 3.0 3.0 6.0 2.2 5.2 4.1
Ilmenite Fe2+TiO3 - 2.0 - - 1.2 0.9 0.8
Kaolinite Al2Si2O5(OH)4 12.2 38.0 30.0 - - - -
K-Feldspar KAlSi3O8 2.0 1.0 1.5
Montmorillonite Mod. (Na,Ca)0.3(Al,Mg)2Si4O10(OH)2·nH2O - - - 34.0 - - -
Paragonite NaAl2AlSi3O10(OH)2 - - - - 2.5 - -
Plagioclase NaAlSi3O8 – CaAlSi2O8 6.2 - 2.0 5.0 29.2 31.2 31.0
Pyrite FeS2 - - - 5.0 0.7 3.9 2.8
Pyrrhotite Fe1-xS - - - - - 1.1 -
Quartz SiO2 57.0 33.0 48.0 38.0 39.5 38.5 43.0
Siderite Fe2+CO3 - - - - - 1.7 0.5
Total 100.0 100.0 100.0 100.0 100.0 100.0 100.0

FEASIBILITY STUDY ON THE AURIZONA GOLD MINE PROJECT NI 43-101 TECHNICAL REPORT
5070\16.4\5070-STY-001
Page 13.16
July 2017 Lycopodium Minerals Canada Ltd.
Metallurgical Performance – Gravity Concentration + Cyanidation Flowsheet
Piaba Saprolite Composites
A total of nine gravity concentration followed by CIL leaching tests were performed on each of the nine
variability composites to evaluate the effects of gold grade and CAI concentration on gold recovery and leach
residual grade. The result summary in Table 13.17 shows that the saprolite samples responded well to the
gravity concentration followed by CIL leaching procedure. Gold recovery averages 93.7% from the saprolite
samples with an average gold grade of 1.3 g/t Au. On average, the gravity concentration recovers
approximately 23% of the gold from the head samples. There is a significant variation in gold recovery to the
gravity concentrate, varying from 3 to 60%. This implies that some of the samples may contain a significant
amount of nugget gold.
The CAI was not preg-robbing however, the plot of recovery versus arsenic content in the feeds in Figure 13.1
shows that gold recovery may decrease when the feed arsenic content increases beyond 0.015% (150 ppm) as
indicated by the one sample at 0.018% Au.
A consistently low leach residual gold assay (0.04 g/t Au) was obtained from the QDT composites in spite of
increasing head grade from 0.78 to 2.08 g/t Au. Of the three QDT composites tested, an average gold recovery
of 97% was achieved on an average calculated head grade of 1.63 g/t Au and at a grind size of P80 74 µm.
Due to the limited core samples, only one QPF composite was tested. The metallurgical performance was
comparable to the other two types of lithology tested. It is recommended that more variability composites
should be tested in the next round of testing.
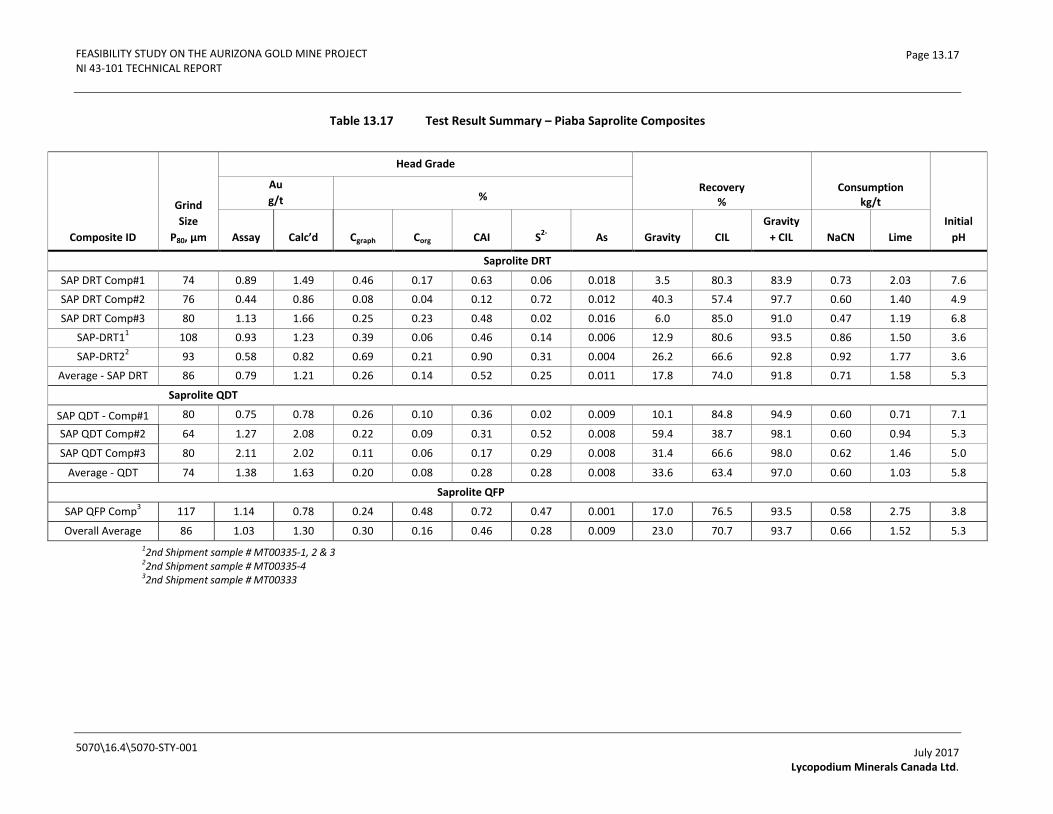
FEASIBILITY STUDY ON THE AURIZONA GOLD MINE PROJECT NI 43-101 TECHNICAL REPORT
5070\16.4\5070-STY-001
Page 13.17
July 2017 Lycopodium Minerals Canada Ltd.
Table 13.17 Test Result Summary – Piaba Saprolite Composites
Composite ID
Grind
Size
P80, µm
Head Grade
Recovery %
Consumption kg/t
Initial
pH
Au
g/t %
Assay Calc’d Cgraph Corg CAI S2-
As Gravity CIL
Gravity
+ CIL NaCN Lime
Saprolite DRT
SAP DRT Comp#1 74 0.89 1.49 0.46 0.17 0.63 0.06 0.018 3.5 80.3 83.9 0.73 2.03 7.6
SAP DRT Comp#2 76 0.44 0.86 0.08 0.04 0.12 0.72 0.012 40.3 57.4 97.7 0.60 1.40 4.9
SAP DRT Comp#3 80 1.13 1.66 0.25 0.23 0.48 0.02 0.016 6.0 85.0 91.0 0.47 1.19 6.8
SAP-DRT11 108 0.93 1.23 0.39 0.06 0.46 0.14 0.006 12.9 80.6 93.5 0.86 1.50 3.6
SAP-DRT22 93 0.58 0.82 0.69 0.21 0.90 0.31 0.004 26.2 66.6 92.8 0.92 1.77 3.6
Average - SAP DRT 86 0.79 1.21 0.26 0.14 0.52 0.25 0.011 17.8 74.0 91.8 0.71 1.58 5.3
Saprolite QDT
SAP QDT - Comp#1 80 0.75 0.78 0.26 0.10 0.36 0.02 0.009 10.1 84.8 94.9 0.60 0.71 7.1
SAP QDT Comp#2 64 1.27 2.08 0.22 0.09 0.31 0.52 0.008 59.4 38.7 98.1 0.60 0.94 5.3
SAP QDT Comp#3 80 2.11 2.02 0.11 0.06 0.17 0.29 0.008 31.4 66.6 98.0 0.62 1.46 5.0
Average - QDT 74 1.38 1.63 0.20 0.08 0.28 0.28 0.008 33.6 63.4 97.0 0.60 1.03 5.8
Saprolite QFP
SAP QFP Comp3 117 1.14 0.78 0.24 0.48 0.72 0.47 0.001 17.0 76.5 93.5 0.58 2.75 3.8
Overall Average 86 1.03 1.30 0.30 0.16 0.46 0.28 0.009 23.0 70.7 93.7 0.66 1.52 5.3
12nd Shipment sample # MT00335-1, 2 & 3 22nd Shipment sample # MT00335-4 32nd Shipment sample # MT00333
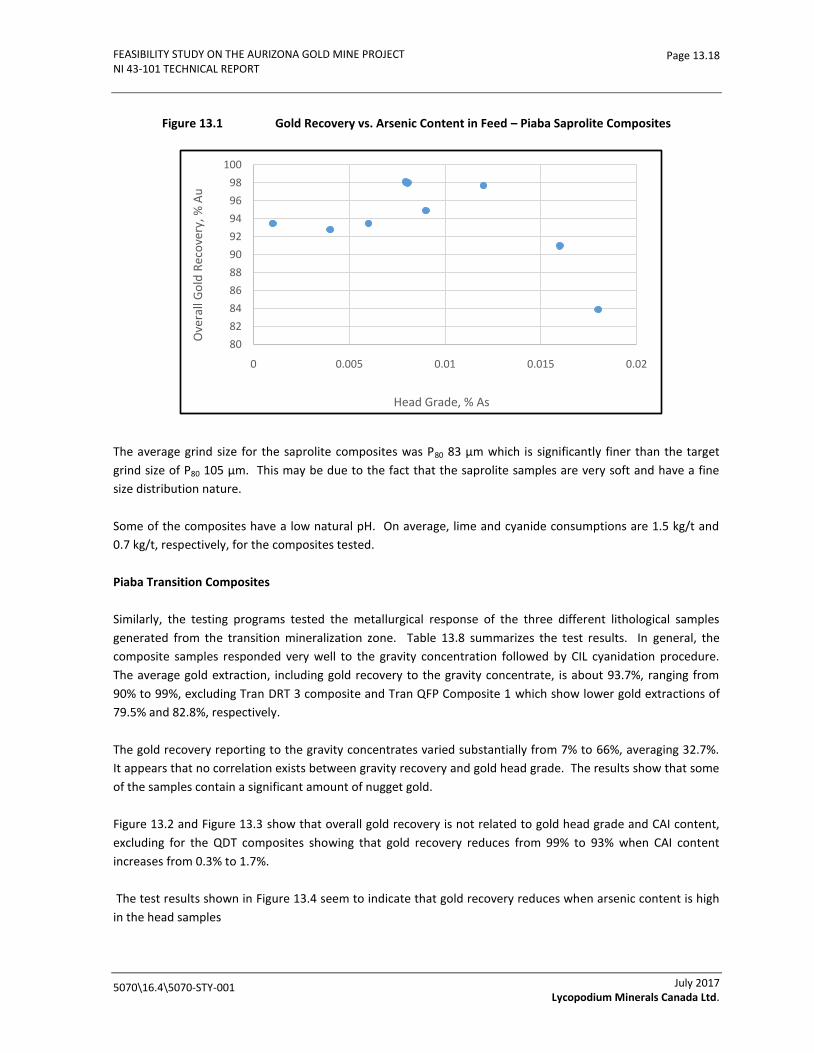
FEASIBILITY STUDY ON THE AURIZONA GOLD MINE PROJECT NI 43-101 TECHNICAL REPORT
5070\16.4\5070-STY-001
Page 13.18
July 2017 Lycopodium Minerals Canada Ltd.
Figure 13.1 Gold Recovery vs. Arsenic Content in Feed – Piaba Saprolite Composites
The average grind size for the saprolite composites was P80 83 µm which is significantly finer than the target
grind size of P80 105 µm. This may be due to the fact that the saprolite samples are very soft and have a fine
size distribution nature.
Some of the composites have a low natural pH. On average, lime and cyanide consumptions are 1.5 kg/t and
0.7 kg/t, respectively, for the composites tested.
Piaba Transition Composites
Similarly, the testing programs tested the metallurgical response of the three different lithological samples
generated from the transition mineralization zone. Table 13.8 summarizes the test results. In general, the
composite samples responded very well to the gravity concentration followed by CIL cyanidation procedure.
The average gold extraction, including gold recovery to the gravity concentrate, is about 93.7%, ranging from
90% to 99%, excluding Tran DRT 3 composite and Tran QFP Composite 1 which show lower gold extractions of
79.5% and 82.8%, respectively.
The gold recovery reporting to the gravity concentrates varied substantially from 7% to 66%, averaging 32.7%.
It appears that no correlation exists between gravity recovery and gold head grade. The results show that some
of the samples contain a significant amount of nugget gold.
Figure 13.2 and Figure 13.3 show that overall gold recovery is not related to gold head grade and CAI content,
excluding for the QDT composites showing that gold recovery reduces from 99% to 93% when CAI content
increases from 0.3% to 1.7%.
The test results shown in Figure 13.4 seem to indicate that gold recovery reduces when arsenic content is high
in the head samples
80
82
84
86
88
90
92
94
96
98
100
0 0.005 0.01 0.015 0.02
Ove
rall
Go
ld R
eco
very
, % A
u
Head Grade, % As

FEASIBILITY STUDY ON THE AURIZONA GOLD MINE PROJECT NI 43-101 TECHNICAL REPORT
5070\16.4\5070-STY-001
Page 13.19
July 2017 Lycopodium Minerals Canada Ltd.
Table 13.18 Test Result Summary - Piaba Transition Composites
Composite ID
Grind Size P80, µm
Head Grade
Recovery % Consumption kg/t
Initial pH
(Au g/t) (%)
Assay Calc’d Corg CAI1 S
2- As Gravity CIL
Gravity
+ CIL NaCN Lime
Tran DRT
Tran DRT
Comp 61 1.52 1.84 0.09 0.29 0.02 0.001 22.5 77.2 99.7 0.71 1.83 5.2
Tran-DRT11 101 3.66 1.17 0.24 0.56 0.82 0.010 25.7 69.6 95.3 0.62 3.68 3.3
Tran-DRT22 83 0.56 1.81 0.11 0.60 0.19 0.006 65.9 31.4 97.3 0.58 2.58 3.9
Tran-DRT33 112 1.65 1.49 0.13 0.49 0.61 0.049 8.6 70.9 79.5 0.62 3.09 4.4
Average - Tran
DRT 89 1.85 1.58 0.14 0.48 0.41 0.016 30.7 62.3 93.0 0.63 2.80 4.2
Tran QDT
Tran QDT
Comp #1 53 1.52 0.76 1.11 1.30 0.36 0.009 39.4 55.3 94.7 0.96 3.91 3.3
Tran QDT
Comp #2 77 0.68 0.72 0.09 0.41 2.17 0.002 41.6 57.7 99.3 0.90 3.48 6.4
Tran QDT
Comp #3 80 0.98 1.02 0.04 0.32 1.13 0.001 30.9 68.1 99.0 0.92 3.16 4.4
Tran QDT
Comp #4 71 54.92 24.71 1.10 1.65 3.57 0.002 7.8 84.7 92.6 0.87 6.65 7.0
Tran QDT
Comp #5 128 3.54 1.79 0.07 0.39 2.22 0.004 41.0 58.7 99.7 0.92 5.95 4.7
Tran QDT
Comp #6 72 0.39 0.94 0.04 0.13 0.47 0.013 33.8 65.6 99.5 0.73 2.92 5.3
Tran QDT
Comp #7 88 0.55 0.80 0.38 0.95 0.78 0.100 39.7 55.3 95.0 0.79 3.86 5.4
Average - Tran
QDT 85 5.98 3.22 0.30 0.63 1.06 0.018 32.3 63.1 95.4 0.77 3.66 4.8
Tran QFP
Tran QFP
Comp #1 72 2.82 2.39 0.12 0.35 2.02 0.117 36.2 46.6 82.8 0.82 2.26 6.1
Tran QFP
Comp #2 75 0.75 0.94 0.37 0.97 1.92 0.001 36.1 63.4 99.5 0.80 6.30 4.3
Tran QFP
Comp #3 74 0.92 1.20 0.03 0.20 0.99 0.011 39.8 56.4 96.3 0.65 1.35 4.3
Tran-QFP14 114 0.57 0.61 0.24 0.56 0.63 0.004 32.5 61.0 93.5 0.66 3.68 3.9
12nd Shipment sample # MT00336-1 22nd Shipment sample MT00336-2, 3 & 4 32nd Shipment sample MT00336-5
42nd Shipment sample # MT00334- 1 & 2 52nd Shipment sample MT00334-3

FEASIBILITY STUDY ON THE AURIZONA GOLD MINE PROJECT NI 43-101 TECHNICAL REPORT
5070\16.4\5070-STY-001
Page 13.20
July 2017 Lycopodium Minerals Canada Ltd.
Figure 13.2 Gold Recovery vs Gold Head Grade – Piaba Transition Composites
Figure 13.3 Gold Recovery vs CAI Content – Piaba Transition Composites
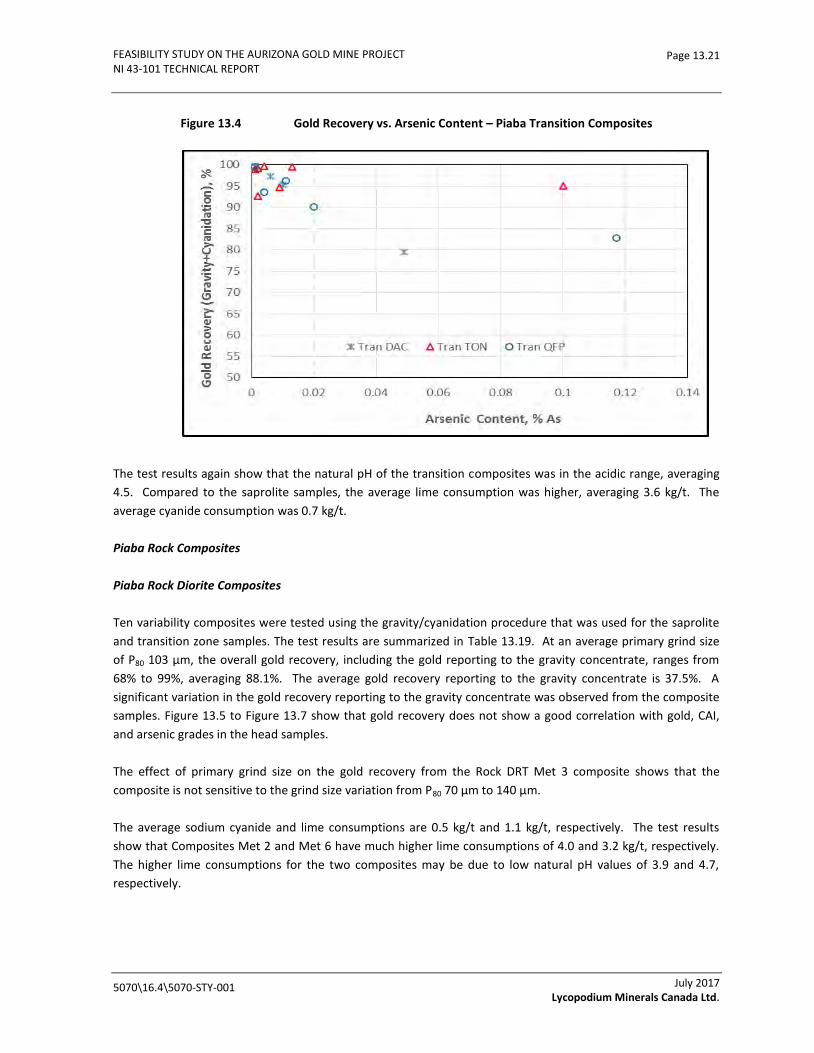
FEASIBILITY STUDY ON THE AURIZONA GOLD MINE PROJECT NI 43-101 TECHNICAL REPORT
5070\16.4\5070-STY-001
Page 13.21
July 2017 Lycopodium Minerals Canada Ltd.
Figure 13.4 Gold Recovery vs. Arsenic Content – Piaba Transition Composites
The test results again show that the natural pH of the transition composites was in the acidic range, averaging
4.5. Compared to the saprolite samples, the average lime consumption was higher, averaging 3.6 kg/t. The
average cyanide consumption was 0.7 kg/t.
Piaba Rock Composites
Piaba Rock Diorite Composites
Ten variability composites were tested using the gravity/cyanidation procedure that was used for the saprolite
and transition zone samples. The test results are summarized in Table 13.19. At an average primary grind size
of P80 103 µm, the overall gold recovery, including the gold reporting to the gravity concentrate, ranges from
68% to 99%, averaging 88.1%. The average gold recovery reporting to the gravity concentrate is 37.5%. A
significant variation in the gold recovery reporting to the gravity concentrate was observed from the composite
samples. Figure 13.5 to Figure 13.7 show that gold recovery does not show a good correlation with gold, CAI,
and arsenic grades in the head samples.
The effect of primary grind size on the gold recovery from the Rock DRT Met 3 composite shows that the
composite is not sensitive to the grind size variation from P80 70 µm to 140 µm.
The average sodium cyanide and lime consumptions are 0.5 kg/t and 1.1 kg/t, respectively. The test results
show that Composites Met 2 and Met 6 have much higher lime consumptions of 4.0 and 3.2 kg/t, respectively.
The higher lime consumptions for the two composites may be due to low natural pH values of 3.9 and 4.7,
respectively.
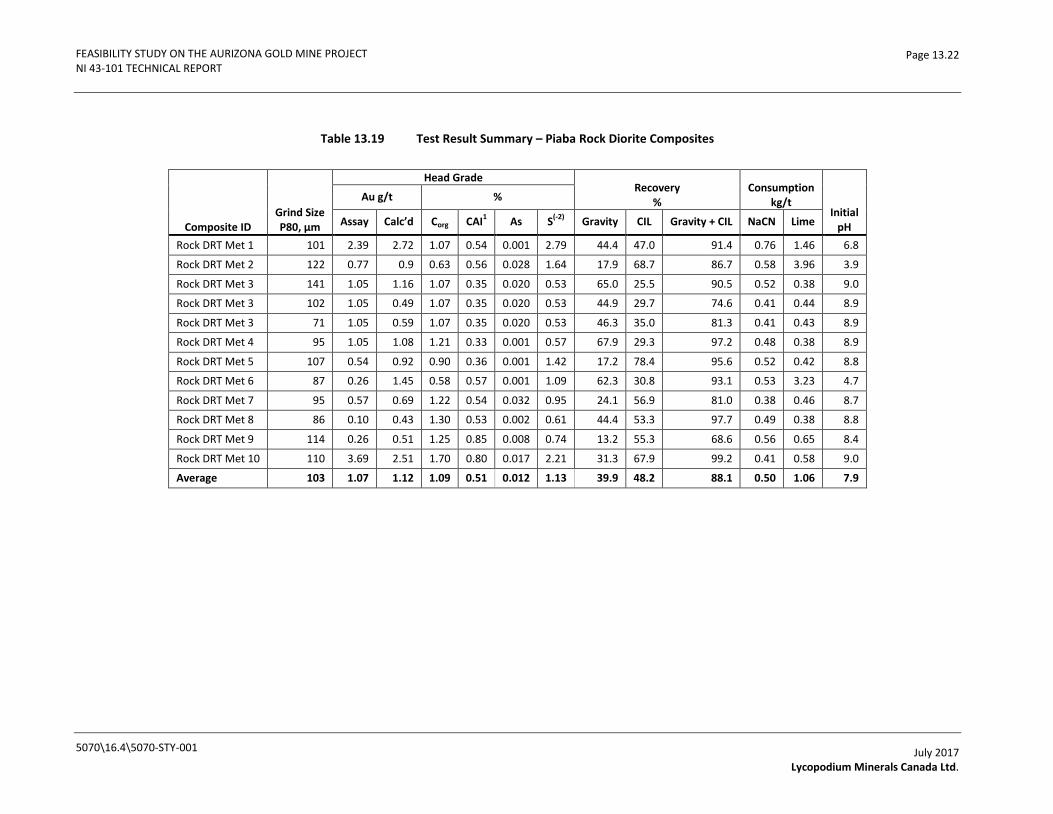
FEASIBILITY STUDY ON THE AURIZONA GOLD MINE PROJECT NI 43-101 TECHNICAL REPORT
5070\16.4\5070-STY-001
Page 13.22
July 2017 Lycopodium Minerals Canada Ltd.
Table 13.19 Test Result Summary – Piaba Rock Diorite Composites
Composite ID Grind Size P80, µm
Head Grade Recovery
% Consumption
kg/t Initial
pH
Au g/t %
Assay Calc’d Corg CAI1 As S
(-2) Gravity CIL Gravity + CIL NaCN Lime
Rock DRT Met 1 101 2.39 2.72 1.07 0.54 0.001 2.79 44.4 47.0 91.4 0.76 1.46 6.8
Rock DRT Met 2 122 0.77 0.9 0.63 0.56 0.028 1.64 17.9 68.7 86.7 0.58 3.96 3.9
Rock DRT Met 3 141 1.05 1.16 1.07 0.35 0.020 0.53 65.0 25.5 90.5 0.52 0.38 9.0
Rock DRT Met 3 102 1.05 0.49 1.07 0.35 0.020 0.53 44.9 29.7 74.6 0.41 0.44 8.9
Rock DRT Met 3 71 1.05 0.59 1.07 0.35 0.020 0.53 46.3 35.0 81.3 0.41 0.43 8.9
Rock DRT Met 4 95 1.05 1.08 1.21 0.33 0.001 0.57 67.9 29.3 97.2 0.48 0.38 8.9
Rock DRT Met 5 107 0.54 0.92 0.90 0.36 0.001 1.42 17.2 78.4 95.6 0.52 0.42 8.8
Rock DRT Met 6 87 0.26 1.45 0.58 0.57 0.001 1.09 62.3 30.8 93.1 0.53 3.23 4.7
Rock DRT Met 7 95 0.57 0.69 1.22 0.54 0.032 0.95 24.1 56.9 81.0 0.38 0.46 8.7
Rock DRT Met 8 86 0.10 0.43 1.30 0.53 0.002 0.61 44.4 53.3 97.7 0.49 0.38 8.8
Rock DRT Met 9 114 0.26 0.51 1.25 0.85 0.008 0.74 13.2 55.3 68.6 0.56 0.65 8.4
Rock DRT Met 10 110 3.69 2.51 1.70 0.80 0.017 2.21 31.3 67.9 99.2 0.41 0.58 9.0
Average 103 1.07 1.12 1.09 0.51 0.012 1.13 39.9 48.2 88.1 0.50 1.06 7.9

FEASIBILITY STUDY ON THE AURIZONA GOLD MINE PROJECT NI 43-101 TECHNICAL REPORT
5070\16.4\5070-STY-001
Page 13.23
July 2017 Lycopodium Minerals Canada Ltd.
Figure 13.5 Gold Recovery vs Gold Head Grade – Piaba Rock Composites
Figure 13.6 Gold Recovery vs CAI Content – Piaba Rock Composites
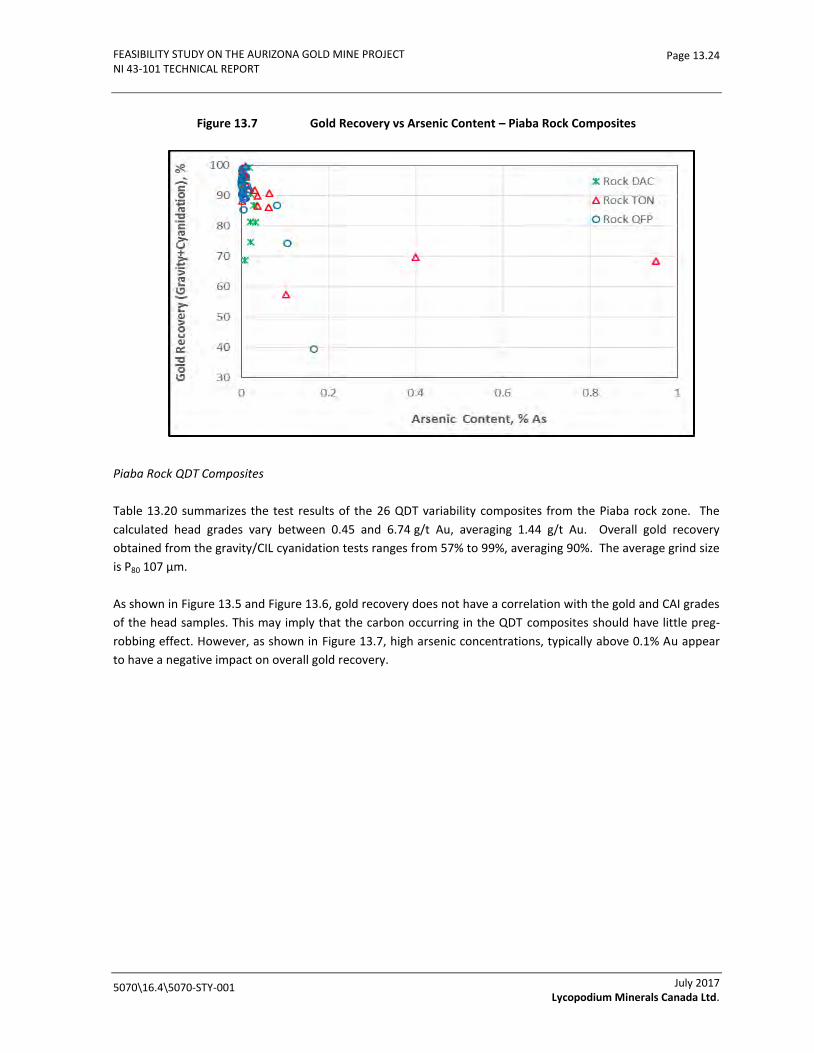
FEASIBILITY STUDY ON THE AURIZONA GOLD MINE PROJECT NI 43-101 TECHNICAL REPORT
5070\16.4\5070-STY-001
Page 13.24
July 2017 Lycopodium Minerals Canada Ltd.
Figure 13.7 Gold Recovery vs Arsenic Content – Piaba Rock Composites
Piaba Rock QDT Composites
Table 13.20 summarizes the test results of the 26 QDT variability composites from the Piaba rock zone. The
calculated head grades vary between 0.45 and 6.74 g/t Au, averaging 1.44 g/t Au. Overall gold recovery
obtained from the gravity/CIL cyanidation tests ranges from 57% to 99%, averaging 90%. The average grind size
is P80 107 µm.
As shown in Figure 13.5 and Figure 13.6, gold recovery does not have a correlation with the gold and CAI grades
of the head samples. This may imply that the carbon occurring in the QDT composites should have little preg-
robbing effect. However, as shown in Figure 13.7, high arsenic concentrations, typically above 0.1% Au appear
to have a negative impact on overall gold recovery.

FEASIBILITY STUDY ON THE AURIZONA GOLD MINE PROJECT NI 43-101 TECHNICAL REPORT
5070\16.4\5070-STY-001
Page 13.25
July 2017 Lycopodium Minerals Canada Ltd.
Table 13.20 Test Result Summary – Piaba Rock QDT Composites
Composite ID
Grind Size
P80, µm
Head Grade Recovery %
Consumption kg/t
Initial pH
Au g/t %
Assay Calc’d Corg CAI As S2- Gravity CIL Gravity +
CIL NaCN Lime
Rock QDT Met 1
104 0.43 0.78 3.15 3.14 0.004 0.94 28.6 67.5 96.2 0.88 1.80 7.0
Rock QDT Met 2
104 0.87 0.85 1.33 1.00 0.001 1.41 24.9 63.3 88.2 0.54 1.19 7.8
Rock QDT Met 3
103 1.28 1.48 1.67 0.73 0.400 2.62 10.8 58.7 69.5 0.56 0.91 8.4
Rock QDT Met 4
117 1.02 1.19 1.32 0.68 00.031 1.38 29.3 62.3 91.6 0.49 0.65 8.7
Rock QDT Met 5
116 3.02 6.74 1.18 0.66 0.009 1.82 48.2 48.4 96.6 0.52 0.60 8.7
Rock QDT Met 6
121 0.57 0.93 1.43 0.72 0.001 1.11 26.0 65.4 91.4 0.52 0.65 9.0
Rock QDT Met 7
107 2.84 3.85 2.58 0.56 0.951 2.43 17.4 51.0 68.4 0.62 0.82 9.0
Rock QDT Met 81
117 0.85 1.10 4.16 0.52 0.102 1.46 10.6 46.6 57.2 0.56 0.90 8.7
Rock QDT Met 9
123 1.01 0.77 1.14 0.53 0.009 1.52 34.2 55.3 89.6 0.54 0.73 8.7
Rock QDT Met 10
103 1.24 1.62 1.17 0.52 0.001 1.28 48.0 47.7 95.7 0.52 0.99 8.2
Rock QDT Met 11
104 0.73 0.93 1.75 0.45 0.063 1.32 23.2 62.8 86.0 0.53 1.35 7.5
Rock QDT Met 12
102 1.46 1.47 1.02 0.49 0.016 1.39 24.7 67.2 91.8 0.53 1.32 7.8
Rock QDT Met 13
107 1.55 1.44 1.23 0.47 0.004 1.20 29.6 63.5 93.0 0.49 0.63 8.6
Rock QDT Met 14
102 1.81 1.01 1.01 0.44 0.001 1.23 30.2 64.8 95.0 0.60 0.70 8.3
Rock QDT Met 15
102 0.79 0.86 1.55 0.33 0.064 0.68 25.1 65.6 90.7 0.47 0.58 8.7
Rock QDT Met 16
108 1.06 1.40 1.01 0.37 0.036 1.47 34.5 52.0 86.5 0.52 0.85 8.3
Rock QDT 106 0.63 1.00 1.55 0.35 0.009 0.63 46.2 49.8 96.0 0.48 0.63 8.5

FEASIBILITY STUDY ON THE AURIZONA GOLD MINE PROJECT NI 43-101 TECHNICAL REPORT
5070\16.4\5070-STY-001
Page 13.26
July 2017 Lycopodium Minerals Canada Ltd.
Composite ID
Grind Size
P80, µm
Head Grade Recovery %
Consumption kg/t
Initial pH
Au g/t %
Assay Calc’d Corg CAI As S2- Gravity CIL Gravity +
CIL NaCN Lime
Met 17
Rock QDT Met 18
104 2.23 0.45 0.85 0.33 0.001 0.80 43.4 55.5 98.9 0.46 0.57 8.4
Rock QDT Met 19
110 1.39 1.52 1.46 0.38 0.003 3.03 30.5 65.6 96.1 0.48 0.87 8.5
Rock QDT Met 20
103 0.81 0.98 1.55 0.26 0.037 0.57 20.5 69.3 89.8 0.46 0.80 9.0
Rock QDT Met 21
103 1.70 1.32 1.72 0.25 0.012 1.45 24.7 68.4 93.2 0.54 0.89 8.7
Rock QDT Met 22
105 1.34 1.45 1.46 0.24 0.002 1.15 60.1 37.8 97.9 0.49 1.07 8.8
Rock QDT Met 23
101 0.58 0.79 2.24 0.24 0.001 0.77 52.9 43.3 96.2 0.58 1.03 8.7
Rock QDT Met 24
102 1.78 1.94 1.26 0.28 0.001 1.62 35.8 59.6 95.4 0.52 0.78 8.8
Rock QDT Met 25
107 0.52 0.47 1.00 0.25 0.000 0.62 38.9 56.9 95.8 0.41 0.64 9.0
Rock QDT Met 26
102 0.57 1.08 0.89 0.18 0.010 0.65 63.2 36.4 99.5 0.43 0.67 8.8
Average 107 1.23 1.44 1.56 0.55 0.068 1.33 33.1 57.1 90.2 0.53 0.87 8.5 1Residue was submitted to AMTEL for gold deportation analysis
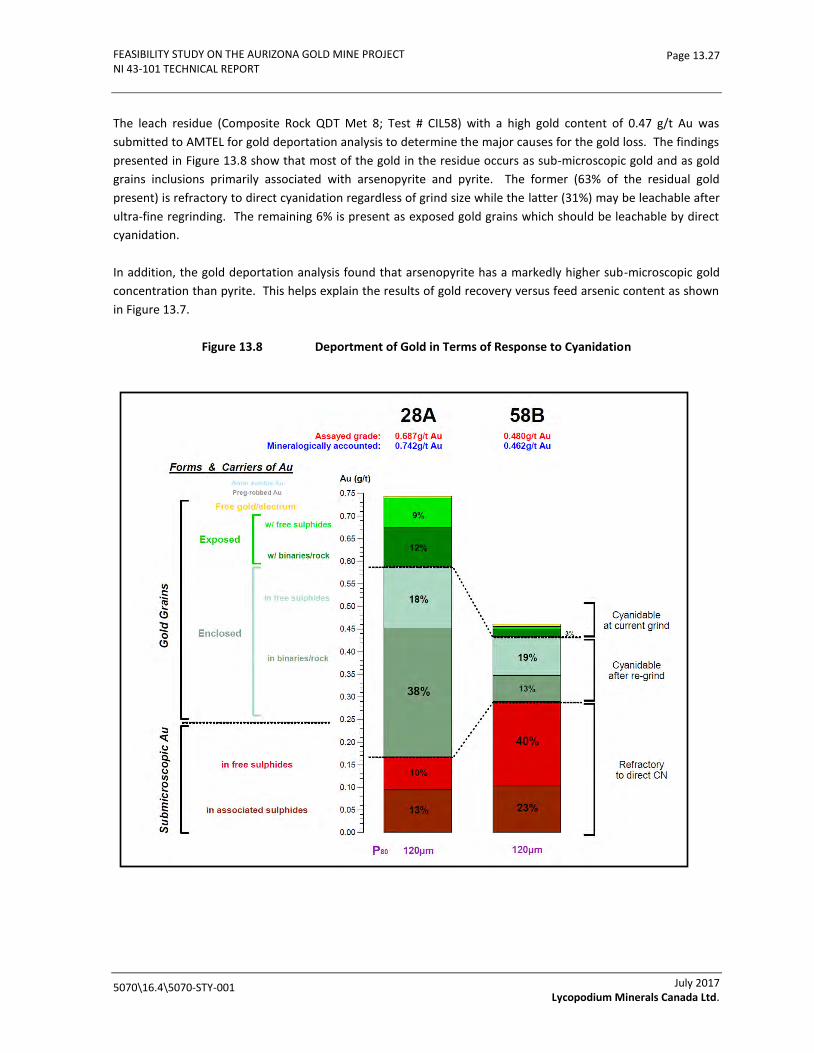
FEASIBILITY STUDY ON THE AURIZONA GOLD MINE PROJECT NI 43-101 TECHNICAL REPORT
5070\16.4\5070-STY-001
Page 13.27
July 2017 Lycopodium Minerals Canada Ltd.
The leach residue (Composite Rock QDT Met 8; Test # CIL58) with a high gold content of 0.47 g/t Au was
submitted to AMTEL for gold deportation analysis to determine the major causes for the gold loss. The findings
presented in Figure 13.8 show that most of the gold in the residue occurs as sub-microscopic gold and as gold
grains inclusions primarily associated with arsenopyrite and pyrite. The former (63% of the residual gold
present) is refractory to direct cyanidation regardless of grind size while the latter (31%) may be leachable after
ultra-fine regrinding. The remaining 6% is present as exposed gold grains which should be leachable by direct
cyanidation.
In addition, the gold deportation analysis found that arsenopyrite has a markedly higher sub-microscopic gold
concentration than pyrite. This helps explain the results of gold recovery versus feed arsenic content as shown
in Figure 13.7.
Figure 13.8 Deportment of Gold in Terms of Response to Cyanidation
FEASIBILITY STUDY ON THE AURIZONA GOLD MINE PROJECT NI 43-101 TECHNICAL REPORT
5070\16.4\5070-STY-001
Page 13.28
July 2017 Lycopodium Minerals Canada Ltd.
Piaba Rock Quartz Feldspar Porphyry Composites (QFP)
The gravity/CIL cyanidation test procedure was used to evaluate the metallurgical responses of 23 QFP
composites. The test results are summarized and presented in Table 13.21. On average, approximately 90% of
the gold was extracted, including 34.5% of the gold reporting to the gravity concentrate. Although most of the
composites responded well to the gravity concentration followed by CIL cyanidation procedure, Composites
ROCK QFP Met 8 and Met 22 with approximately 0.17% As produced a much lower overall gold recovery.
The gold recoveries vs. gold head grade and CAI and arsenic contents are plotted in Figure 13.5 to Figure 13.7.
As shown in Figure 13.5 and Figure 13.6, gold recovery does not have a good correlation with the gold and CAI
grades of the head samples. The data appears to show that the arsenic concentration has a negative impact on
gold recovery, especially when the head arsenic content is above 0.1% As. The same observations are seen for
the Piaba Rock QDP composites.
The average sodium cyanide and lime consumption of the QFP composites are 0.5 kg/t and 0.7 kg/t,
respectively.
As shown in Figure 13.8, the gold deportation analysis performed on the CIL 28 leach residue (Composite Rock
QFP Met 1) reveals that over 50% of the gold lost into the residue occurs as gold grain inclusions in sulphides
and other minerals and over 20% of the gold as sub-microscopic gold in sulphides. The former may be
leachable after a fine regrinding but the sub-microscopic gold is expected to be refractory to direct cyanidation
regardless of grind size. It should be noted that over 20% of the gold in this residue is exposed and may be
directly leachable. AMTEL indicates that although the sample contains a significant amount of organic carbon,
the carbonaceous materials do not appear to be preg-robbing.
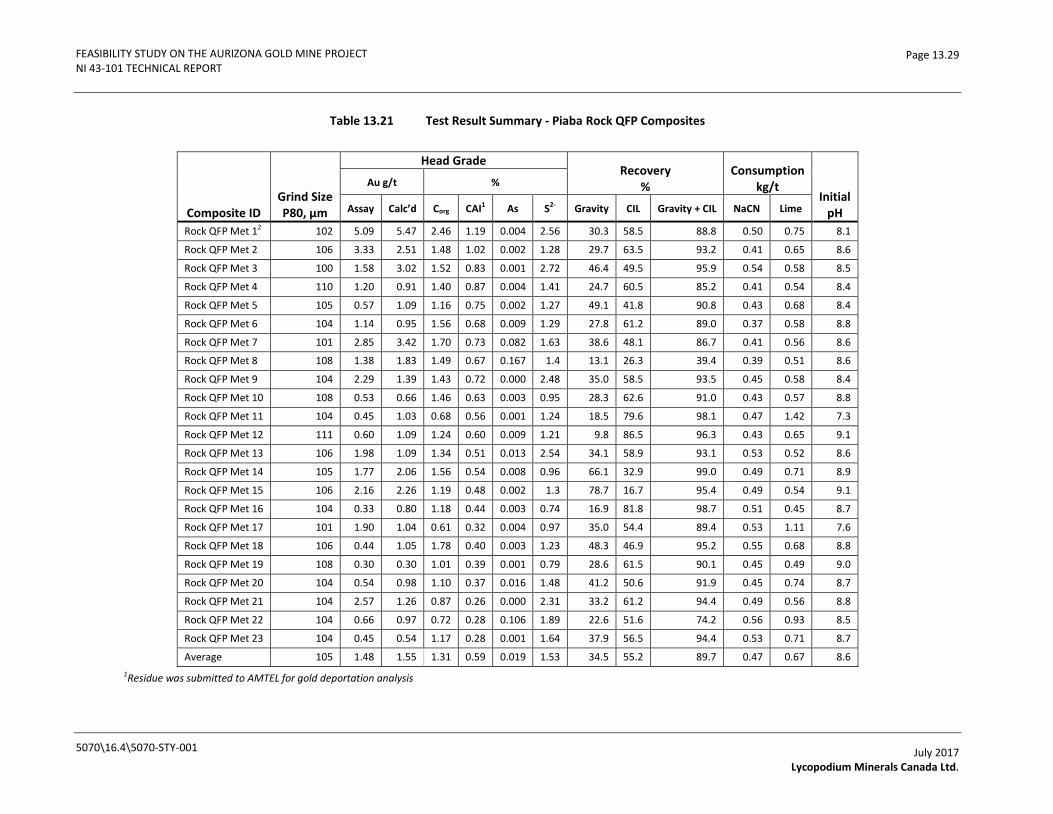
FEASIBILITY STUDY ON THE AURIZONA GOLD MINE PROJECT NI 43-101 TECHNICAL REPORT
5070\16.4\5070-STY-001
Page 13.29
July 2017 Lycopodium Minerals Canada Ltd.
Table 13.21 Test Result Summary - Piaba Rock QFP Composites
Composite ID Grind Size P80, µm
Head Grade Recovery
% Consumption
kg/t Initial
pH
Au g/t %
Assay Calc’d Corg CAI1 As S2- Gravity CIL Gravity + CIL NaCN Lime
Rock QFP Met 12 102 5.09 5.47 2.46 1.19 0.004 2.56 30.3 58.5 88.8 0.50 0.75 8.1
Rock QFP Met 2 106 3.33 2.51 1.48 1.02 0.002 1.28 29.7 63.5 93.2 0.41 0.65 8.6
Rock QFP Met 3 100 1.58 3.02 1.52 0.83 0.001 2.72 46.4 49.5 95.9 0.54 0.58 8.5
Rock QFP Met 4 110 1.20 0.91 1.40 0.87 0.004 1.41 24.7 60.5 85.2 0.41 0.54 8.4
Rock QFP Met 5 105 0.57 1.09 1.16 0.75 0.002 1.27 49.1 41.8 90.8 0.43 0.68 8.4
Rock QFP Met 6 104 1.14 0.95 1.56 0.68 0.009 1.29 27.8 61.2 89.0 0.37 0.58 8.8
Rock QFP Met 7 101 2.85 3.42 1.70 0.73 0.082 1.63 38.6 48.1 86.7 0.41 0.56 8.6
Rock QFP Met 8 108 1.38 1.83 1.49 0.67 0.167 1.4 13.1 26.3 39.4 0.39 0.51 8.6
Rock QFP Met 9 104 2.29 1.39 1.43 0.72 0.000 2.48 35.0 58.5 93.5 0.45 0.58 8.4
Rock QFP Met 10 108 0.53 0.66 1.46 0.63 0.003 0.95 28.3 62.6 91.0 0.43 0.57 8.8
Rock QFP Met 11 104 0.45 1.03 0.68 0.56 0.001 1.24 18.5 79.6 98.1 0.47 1.42 7.3
Rock QFP Met 12 111 0.60 1.09 1.24 0.60 0.009 1.21 9.8 86.5 96.3 0.43 0.65 9.1
Rock QFP Met 13 106 1.98 1.09 1.34 0.51 0.013 2.54 34.1 58.9 93.1 0.53 0.52 8.6
Rock QFP Met 14 105 1.77 2.06 1.56 0.54 0.008 0.96 66.1 32.9 99.0 0.49 0.71 8.9
Rock QFP Met 15 106 2.16 2.26 1.19 0.48 0.002 1.3 78.7 16.7 95.4 0.49 0.54 9.1
Rock QFP Met 16 104 0.33 0.80 1.18 0.44 0.003 0.74 16.9 81.8 98.7 0.51 0.45 8.7
Rock QFP Met 17 101 1.90 1.04 0.61 0.32 0.004 0.97 35.0 54.4 89.4 0.53 1.11 7.6
Rock QFP Met 18 106 0.44 1.05 1.78 0.40 0.003 1.23 48.3 46.9 95.2 0.55 0.68 8.8
Rock QFP Met 19 108 0.30 0.30 1.01 0.39 0.001 0.79 28.6 61.5 90.1 0.45 0.49 9.0
Rock QFP Met 20 104 0.54 0.98 1.10 0.37 0.016 1.48 41.2 50.6 91.9 0.45 0.74 8.7
Rock QFP Met 21 104 2.57 1.26 0.87 0.26 0.000 2.31 33.2 61.2 94.4 0.49 0.56 8.8
Rock QFP Met 22 104 0.66 0.97 0.72 0.28 0.106 1.89 22.6 51.6 74.2 0.56 0.93 8.5
Rock QFP Met 23 104 0.45 0.54 1.17 0.28 0.001 1.64 37.9 56.5 94.4 0.53 0.71 8.7
Average 105 1.48 1.55 1.31 0.59 0.019 1.53 34.5 55.2 89.7 0.47 0.67 8.6
1Residue was submitted to AMTEL for gold deportation analysis
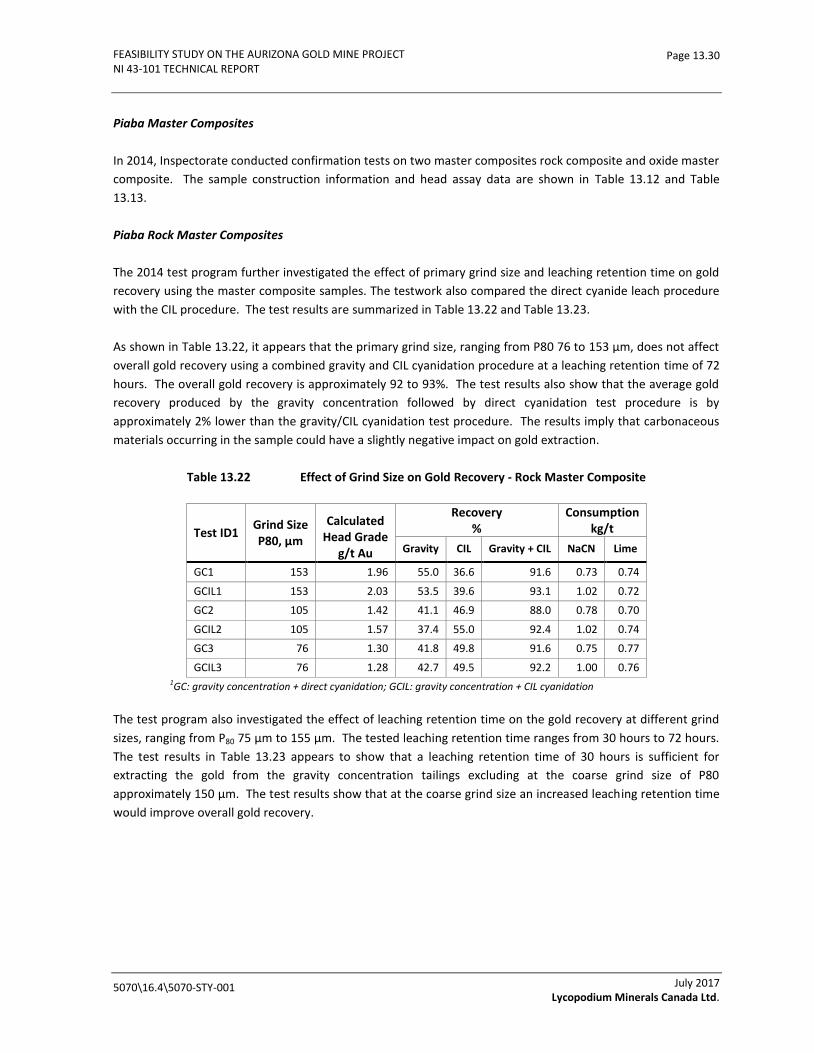
FEASIBILITY STUDY ON THE AURIZONA GOLD MINE PROJECT NI 43-101 TECHNICAL REPORT
5070\16.4\5070-STY-001
Page 13.30
July 2017 Lycopodium Minerals Canada Ltd.
Piaba Master Composites
In 2014, Inspectorate conducted confirmation tests on two master composites rock composite and oxide master
composite. The sample construction information and head assay data are shown in Table 13.12 and Table
13.13.
Piaba Rock Master Composites
The 2014 test program further investigated the effect of primary grind size and leaching retention time on gold
recovery using the master composite samples. The testwork also compared the direct cyanide leach procedure
with the CIL procedure. The test results are summarized in Table 13.22 and Table 13.23.
As shown in Table 13.22, it appears that the primary grind size, ranging from P80 76 to 153 µm, does not affect
overall gold recovery using a combined gravity and CIL cyanidation procedure at a leaching retention time of 72
hours. The overall gold recovery is approximately 92 to 93%. The test results also show that the average gold
recovery produced by the gravity concentration followed by direct cyanidation test procedure is by
approximately 2% lower than the gravity/CIL cyanidation test procedure. The results imply that carbonaceous
materials occurring in the sample could have a slightly negative impact on gold extraction.
Table 13.22 Effect of Grind Size on Gold Recovery - Rock Master Composite
Test ID1 Grind Size P80, µm
Calculated Head Grade
g/t Au
Recovery %
Consumption kg/t
Gravity CIL Gravity + CIL NaCN Lime
GC1 153 1.96 55.0 36.6 91.6 0.73 0.74
GCIL1 153 2.03 53.5 39.6 93.1 1.02 0.72
GC2 105 1.42 41.1 46.9 88.0 0.78 0.70
GCIL2 105 1.57 37.4 55.0 92.4 1.02 0.74
GC3 76 1.30 41.8 49.8 91.6 0.75 0.77
GCIL3 76 1.28 42.7 49.5 92.2 1.00 0.76 1GC: gravity concentration + direct cyanidation; GCIL: gravity concentration + CIL cyanidation
The test program also investigated the effect of leaching retention time on the gold recovery at different grind
sizes, ranging from P80 75 µm to 155 µm. The tested leaching retention time ranges from 30 hours to 72 hours.
The test results in Table 13.23 appears to show that a leaching retention time of 30 hours is sufficient for
extracting the gold from the gravity concentration tailings excluding at the coarse grind size of P80
approximately 150 µm. The test results show that at the coarse grind size an increased leaching retention time
would improve overall gold recovery.

FEASIBILITY STUDY ON THE AURIZONA GOLD MINE PROJECT NI 43-101 TECHNICAL REPORT
5070\16.4\5070-STY-001
Page 13.31
July 2017 Lycopodium Minerals Canada Ltd.
Table 13.23 Effect of Leaching Retention Time on Gold Recovery - Rock Master Composite
Test ID
Grind Size P80, µm
Leaching Retention
Time h
Calculated Head Grade
g/t Au
Recovery % Consumption kg/t
Gravity CIL Gravity + CIL NaCN Lime
GCIL4 150 30 1.23 31.7 55.2 86.9 0.50 0.56 GCIL5 150 36 1.19 32.7 55.6 88.3 0.61 0.60
GCIL6 150 48 1.19 32.8 58.0 90.8 0.69 0.68
GCIL1 153 72 2.03 53.5 39.6 93.1 1.02 0.72
GCIL7 120 30 2.11 58.0 36.3 94.3 0.51 0.53
GCIL8 120 36 2.12 57.8 36.1 93.9 0.60 0.59
GCIL9 120 48 2.22 55.4 39.2 94.6 0.71 0.65
BGCIL11
105 30 1.77 54.4 39.1
93.5 0.45 0.80
GCIL2 105 48 1.57 37.4 55.0 92.4 1.02 0.74
GCIL18
75 30 1.49 53.9 39.4
93.3 0.41 0.70
GCIL19
75 36 1.46 55.0 37.8
92.8 0.40 0.80
GCIL20
75 48 1.52 53.1 40.7
93.8 0.58 0.88
GCIL3 76 72 1.28 42.7 49.5 92.2 1.00 0.76 1BGCIL1: Large scale test with a feed weight of 6 kg
In 2015, Inspectorate conducted further tests using the gravity concentration followed by CIL cyanidation test
procedure to generate leach residue samples for residue characteristic tests. The tests were conducted on a
rock zone QDT composite generated from the drill core interval samples used for the 2013 test program. The
grind size is P80 105 µm. The leaching retention time used for the tests was 48 hours. Test results are shown in
Table 13.24. Approximately 92.4% of the gold was recovered from the composite sample.
Table 13.24 Test Results – 2015 Rock QDT Composite
Test ID Measured
Head g/t Au
Calculated Head
g/t Au
Recovery %
Consumption kg/t
Gravity CIL Gravity + CIL NaCN Lime
GCIL-1 0.97 1.01 19.4 71.7 91.1 0.57 0.90
GCIL-2 0.97 1.47 39.3 54.6 93.9 0.55 0.90
GCIL-3 0.97 1.27 31.1 61.0 92.1 0.57 0.90
Average 0.97 1.25 30.0 62.4 92.4 0.56 0.90

FEASIBILITY STUDY ON THE AURIZONA GOLD MINE PROJECT NI 43-101 TECHNICAL REPORT
5070\16.4\5070-STY-001
Page 13.32
July 2017 Lycopodium Minerals Canada Ltd.
Piaba Oxide Master Composites
Similar to the rock composites, the 2014 test program investigated the effect of primary grind size and leaching
retention time on gold recovery from the oxide master composite samples. The head assay and sample
construction are detailed in Table 13.12. The test results are summarized in Table 13.25 and Table 13.26.
It appears that the tested primary grind size, ranging from P80 81 to 134 µm, does not significantly affect overall
gold recovery using a combined gravity and CIL cyanidation test-procedure at a leaching retention time of 48
hours. The overall gold recovery is approximately 92 to 95%, which is higher than the recovery produced from
the rock master composite.
Table 13.25 Effect of Grind Size on Gold Recovery – Oxide Master Composite
Test ID Grind Size
P80, µm
Calculated Head Grade
g/t Au
Recovery % Au
Consumption kg/t
Gravity CIL Gravity + CIL NaCN Lime
GCIL21 134 1.18 21.5 70.9 92.4 0.65 2.3
GCIL22 107 1.35 38.4 56.4 94.8 0.67 2.2
GCIL23 81 1.09 19.7 74.8 94.5 0.71 2.1
The leaching retention time tests were conducted at a grind size of P80 105 µm. The results show that the oxide
master composite responds well to the gravity/CIL cyanidation test procedure. Over 91% of the gold was
recovered using the test procedure with a leaching retention time of 12 hours. An increase in leaching
retention time improved overall gold recovery but not significantly when the leaching retention time was
beyond 18 hours.
Table 13.26 Effect of Leaching Retention Time on Gold Recovery - Oxide Master Composite
Test ID
Leaching Retention
Time h
Calculated Head Grade
g/t Au
Recovery % Au
Consumption kg/t
Gravity CIL Gravity +
CIL NaCN Lime
GCIL24 12 1.12 24.0 67.5 91.5 0.31 2.2
GCIL25 18 1.09 24.4 69.2 93.6 0.37 2.3
GCIL26 24 1.12 23.9 69.8 93.7 0.48 2.3
GCIL27 30 1.16 23.1 71.7 94.8 0.54 2.4
GCIL22 48 1.35 38.4 56.4 94.8 0.67 2.2
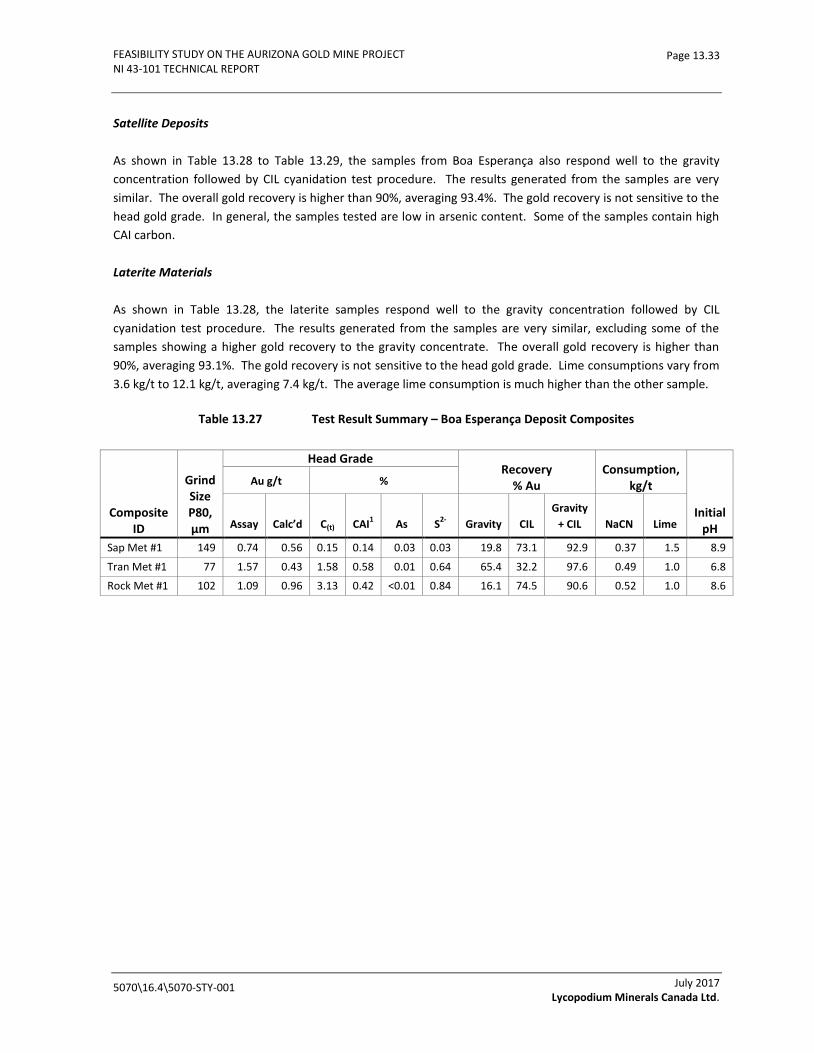
FEASIBILITY STUDY ON THE AURIZONA GOLD MINE PROJECT NI 43-101 TECHNICAL REPORT
5070\16.4\5070-STY-001
Page 13.33
July 2017 Lycopodium Minerals Canada Ltd.
Satellite Deposits
As shown in Table 13.28 to Table 13.29, the samples from Boa Esperança also respond well to the gravity
concentration followed by CIL cyanidation test procedure. The results generated from the samples are very
similar. The overall gold recovery is higher than 90%, averaging 93.4%. The gold recovery is not sensitive to the
head gold grade. In general, the samples tested are low in arsenic content. Some of the samples contain high
CAI carbon.
Laterite Materials
As shown in Table 13.28, the laterite samples respond well to the gravity concentration followed by CIL
cyanidation test procedure. The results generated from the samples are very similar, excluding some of the
samples showing a higher gold recovery to the gravity concentrate. The overall gold recovery is higher than
90%, averaging 93.1%. The gold recovery is not sensitive to the head gold grade. Lime consumptions vary from
3.6 kg/t to 12.1 kg/t, averaging 7.4 kg/t. The average lime consumption is much higher than the other sample.
Table 13.27 Test Result Summary – Boa Esperança Deposit Composites
Composite ID
Grind Size P80, µm
Head Grade Recovery
% Au Consumption,
kg/t
Initial pH
Au g/t %
Assay Calc’d C(t) CAI1 As S
2- Gravity CIL
Gravity
+ CIL NaCN Lime
Sap Met #1 149 0.74 0.56 0.15 0.14 0.03 0.03 19.8 73.1 92.9 0.37 1.5 8.9
Tran Met #1 77 1.57 0.43 1.58 0.58 0.01 0.64 65.4 32.2 97.6 0.49 1.0 6.8
Rock Met #1 102 1.09 0.96 3.13 0.42 <0.01 0.84 16.1 74.5 90.6 0.52 1.0 8.6
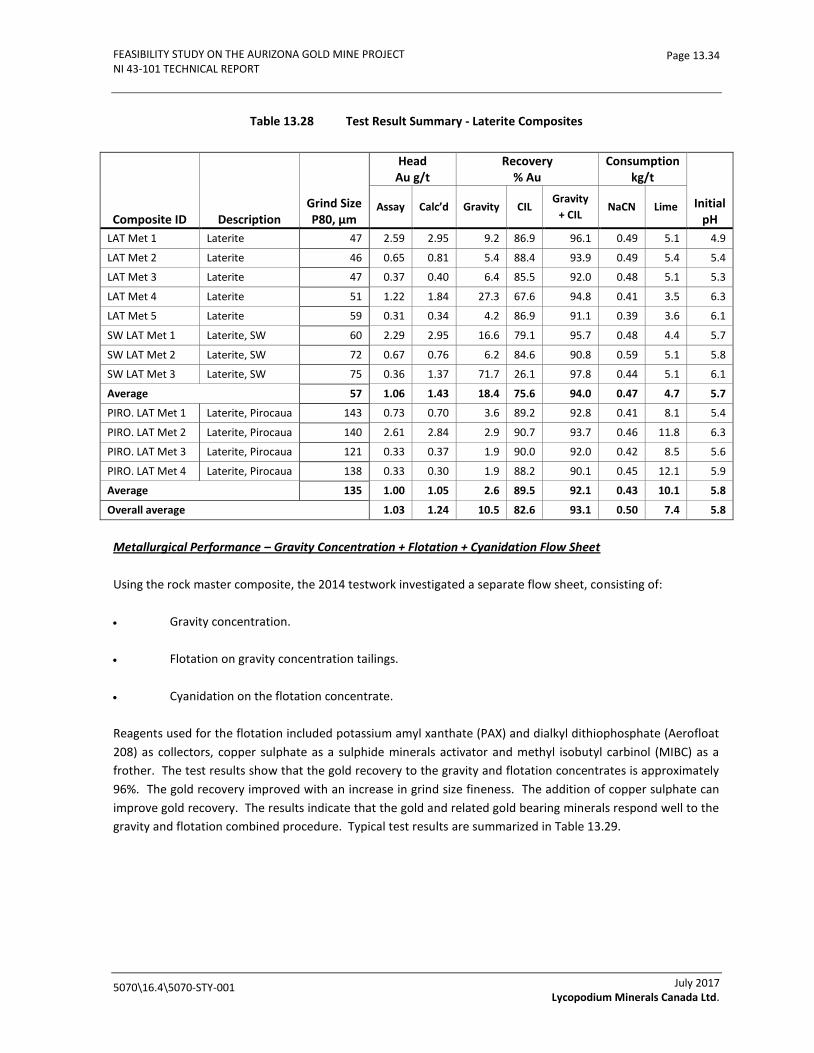
FEASIBILITY STUDY ON THE AURIZONA GOLD MINE PROJECT NI 43-101 TECHNICAL REPORT
5070\16.4\5070-STY-001
Page 13.34
July 2017 Lycopodium Minerals Canada Ltd.
Table 13.28 Test Result Summary - Laterite Composites
Composite ID Description Grind Size P80, µm
Head Au g/t
Recovery % Au
Consumption kg/t
Initial pH
Assay Calc’d Gravity CIL Gravity
+ CIL NaCN Lime
LAT Met 1 Laterite 47 2.59 2.95 9.2 86.9 96.1 0.49 5.1 4.9
LAT Met 2 Laterite 46 0.65 0.81 5.4 88.4 93.9 0.49 5.4 5.4
LAT Met 3 Laterite 47 0.37 0.40 6.4 85.5 92.0 0.48 5.1 5.3
LAT Met 4 Laterite 51 1.22 1.84 27.3 67.6 94.8 0.41 3.5 6.3
LAT Met 5 Laterite 59 0.31 0.34 4.2 86.9 91.1 0.39 3.6 6.1
SW LAT Met 1 Laterite, SW 60 2.29 2.95 16.6 79.1 95.7 0.48 4.4 5.7
SW LAT Met 2 Laterite, SW 72 0.67 0.76 6.2 84.6 90.8 0.59 5.1 5.8
SW LAT Met 3 Laterite, SW 75 0.36 1.37 71.7 26.1 97.8 0.44 5.1 6.1
Average 57 1.06 1.43 18.4 75.6 94.0 0.47 4.7 5.7
PIRO. LAT Met 1 Laterite, Pirocaua 143 0.73 0.70 3.6 89.2 92.8 0.41 8.1 5.4
PIRO. LAT Met 2 Laterite, Pirocaua 140 2.61 2.84 2.9 90.7 93.7 0.46 11.8 6.3
PIRO. LAT Met 3 Laterite, Pirocaua 121 0.33 0.37 1.9 90.0 92.0 0.42 8.5 5.6
PIRO. LAT Met 4 Laterite, Pirocaua 138 0.33 0.30 1.9 88.2 90.1 0.45 12.1 5.9
Average 135 1.00 1.05 2.6 89.5 92.1 0.43 10.1 5.8
Overall average 1.03 1.24 10.5 82.6 93.1 0.50 7.4 5.8
Metallurgical Performance – Gravity Concentration + Flotation + Cyanidation Flow Sheet
Using the rock master composite, the 2014 testwork investigated a separate flow sheet, consisting of:
Gravity concentration.
Flotation on gravity concentration tailings.
Cyanidation on the flotation concentrate.
Reagents used for the flotation included potassium amyl xanthate (PAX) and dialkyl dithiophosphate (Aerofloat
208) as collectors, copper sulphate as a sulphide minerals activator and methyl isobutyl carbinol (MIBC) as a
frother. The test results show that the gold recovery to the gravity and flotation concentrates is approximately
96%. The gold recovery improved with an increase in grind size fineness. The addition of copper sulphate can
improve gold recovery. The results indicate that the gold and related gold bearing minerals respond well to the
gravity and flotation combined procedure. Typical test results are summarized in Table 13.29.

FEASIBILITY STUDY ON THE AURIZONA GOLD MINE PROJECT NI 43-101 TECHNICAL REPORT
5070\16.4\5070-STY-001
Page 13.35
July 2017 Lycopodium Minerals Canada Ltd.
Table 13.29 Gravity and Flotation Concentration Test Results
Test ID Calculated
Head g/t Au
Recovery1
Mass %
Gravity % Au
Flotation % Au
Overall % Au
14.0 GF5 (2 kg Charge) 15.0 2.17 16.0 9.1 17.0 58.9 18.0 36.9 19.0 95.8
BGF1 (20 kg Charge) 1.44 11.3 50.4 45.9 96.3
BGF2 (20 kg Charge) 1.10 13.9 25.3 66.9 92.1 1At a grind size of P80 105 µm.
The concentrates generated from the flotation tests were subjected to CIL cyanidation. The leaching tests were
carried out at a solid density of 25 to 30% w/w with a cyanide concentration of 2 g/L sodium cyanide for 72
hours. Four regrind sizes, including the “as produced”, were tested. The test results are summarized in Table
13.30.
Table 13.30 Cyanide Leach Test Results - Flotation Concentrates
Test ID
Regrind Size
P80, µm
Head Grade g/t Au
Extraction % Au
NaCN Consumption
Lime Consumption
Measured Calculated
kg/t
conc
kg/t
ore)
kg/t
conc
kg/t
ore
CIL11 36 5.88 5.99 88.2 8.5 1.0 0.9 0.10
CIL2 20 5.88 6.50 90.6 9.7 1.1 1.1 0.12
CIL3 12 5.88 4.82 90.9 16.5 1.9 0.6 0.07
CIL4 6 5.88 5.58 94.4 20.3 2.3 1.2 0.13 1As produced, without regrinding.
The results show that 88% of the gold was extracted from the “as produced” concentrate without regrinding.
The gold extraction improves with regrinding prior to cyanidation. The gold extraction improves to 94.4% after
the flotation concentrate is reground to P80 6 µm.
The overall gold recovery by using the flow sheet, consisting of gravity and flotation concentration followed by
cyanidation on reground concentrate (at a regrind size of P80 12 to 2020 µm), is estimated to be approximately
91%, which is similar to the recovery using the gravity followed by CIL flowsheet. To see potential improvement
in gold recovery, the regrind size will need to be closer to P80 6 µm.
Heap Leach Amenability
Two low grade materials, representing Pirocaua’s laterite mineralization and Piaba’s SAP-DRT mineralization,
were tested by column leach procedure to evaluate the metallurgical response of the samples to heap leach.
The testing was conducted on “as received” for the laterite sample and on three-quarter inch crushed materials
for the SAP-DRT sample.
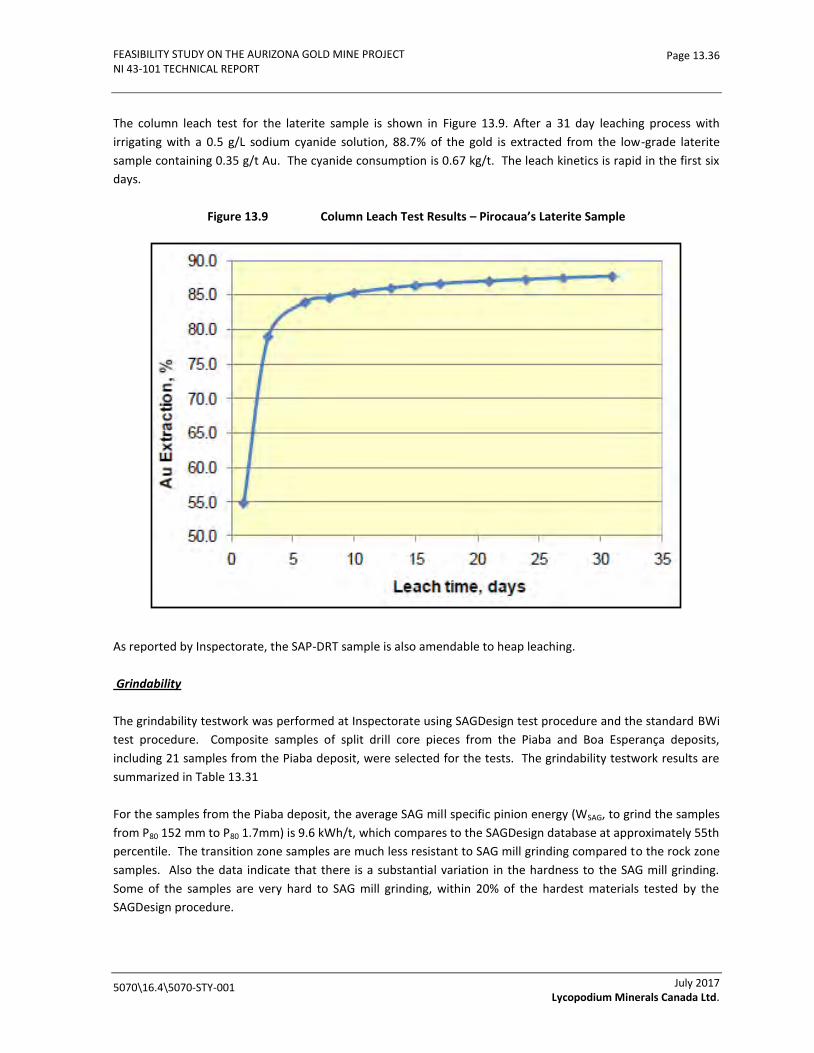
FEASIBILITY STUDY ON THE AURIZONA GOLD MINE PROJECT NI 43-101 TECHNICAL REPORT
5070\16.4\5070-STY-001
Page 13.36
July 2017 Lycopodium Minerals Canada Ltd.
The column leach test for the laterite sample is shown in Figure 13.9. After a 31 day leaching process with
irrigating with a 0.5 g/L sodium cyanide solution, 88.7% of the gold is extracted from the low-grade laterite
sample containing 0.35 g/t Au. The cyanide consumption is 0.67 kg/t. The leach kinetics is rapid in the first six
days.
Figure 13.9 Column Leach Test Results – Pirocaua’s Laterite Sample
As reported by Inspectorate, the SAP-DRT sample is also amendable to heap leaching.
Grindability
The grindability testwork was performed at Inspectorate using SAGDesign test procedure and the standard BWi
test procedure. Composite samples of split drill core pieces from the Piaba and Boa Esperança deposits,
including 21 samples from the Piaba deposit, were selected for the tests. The grindability testwork results are
summarized in Table 13.31
For the samples from the Piaba deposit, the average SAG mill specific pinion energy (WSAG, to grind the samples
from P80 152 mm to P80 1.7mm) is 9.6 kWh/t, which compares to the SAGDesign database at approximately 55th
percentile. The transition zone samples are much less resistant to SAG mill grinding compared to the rock zone
samples. Also the data indicate that there is a substantial variation in the hardness to the SAG mill grinding.
Some of the samples are very hard to SAG mill grinding, within 20% of the hardest materials tested by the
SAGDesign procedure.

FEASIBILITY STUDY ON THE AURIZONA GOLD MINE PROJECT NI 43-101 TECHNICAL REPORT
5070\16.4\5070-STY-001
Page 13.37
July 2017 Lycopodium Minerals Canada Ltd.
The average SAG discharge BWi(Sd-BMWi) for the Piaba samples, which was conducted at a 106 µm closing
screen size, is 12.5 kWh/t. Compared to the SAGDesign database, the average Sd-BMWi is approximately at the
25th percentile. Similarly, the transition zone samples are much softer to ball mill grinding, compared to the
rock zone samples. In general, the SAGDesign BWi is consistent, ranging from 12.8 to 16.2 kWh/t, excluding two
samples with an average Sd-BMWi of approximately 10 kWh/t. The standard BWi test results show that the
BWi are 13.6 and 10.7 kWh/t for the rock master composite and the oxide master composite, respectively,
constructed from the Piaba samples.
The testwork results also show that the samples from the other deposits identified above are softer than the
Piaba samples.
The AI tests show that the mineralization from the rock zone of the Piaba deposit may be abrasive.

FEASIBILITY STUDY ON THE AURIZONA GOLD MINE PROJECT NI 43-101 TECHNICAL REPORT
5070\16.4\5070-STY-001
Page 13.38
July 2017 Lycopodium Minerals Canada Ltd.
Table 13.31 Grindability Test Results
Sample ID Specific Gravity
Calc’d WSAG1 to 1.7 mm
kWh/t Sd-BMWi1
kWh/t
Bond BMWi kWh/t
Bond Ai
Piaba Deposit
Tran QDT Comp 2.36 3.5 7.2 - -
Tran QFP Comp 2.32 2.0 7.8 - -
Tran QSP (MT00334) 2.66 2.7 9.1 - -
Tran QSP (MT00336) 2.69 2.9 6.6 - -
Rock DRT SAG #1 2.41 4.0 9.5 - 0.1552
Rock DRT SAG #2 2.49 14.6 16.2 - -
Rock DRT SAG #3 2.66 14.4 15.3 - 0.4853
Rock QFP SAG #1 2.52 8.0 12.8 - -
Rock QFP SAG #2 2.59 11.8 10.6 - 0.5148
Rock QFP SAG #3 2.49 11.6 13.8 - 0.3748
Rock QFP SAG #4 2.63 9.3 14.4 - 0.4668
Rock QFP SAG #5 2.63 13.0 13.9 - 0.4883
Rock QFP SAG #6 2.59 13.3 14.0 - -
Rock QDT SAG #1 2.63 10.9 15.2 - 0.5511
Rock QDT SAG #2 2.58 11.9 14.3 - 0.4662
Rock QDT SAG #3 2.59 10.5 13.1 - -
Rock QDT SAG #4 2.60 12.5 14.5 - 0.6121
Rock QDT SAG #5 2.53 10.1 15.1 - 0.6239
Rock QDT SAG #6 2.66 15.9 13.8 - -
Rock Master Composite - - - 13.6 -
Oxide Master Composite - - - 10.7 -
Other Deposits
Ferraduro Rock QDT Comp 2.56 3.3 6.4 - -
Conceição Rock QDT Comp 2.68 13.5 10.9 - -
Ferraduro Rock QDT Comp 2.56 3.3 6.4 - -
MT-00356 Comp 2 - - - 5.65 0.0694
MT-00357/00360 Comp 1 - - - 6.36 0.0316
MT-00355 Comp 2 - - - 9.92 0.0263
MT-00355/358/361 Comp 1 2.69 8.0 9.9 - 0.1494 1WSAG and Sd-BMWi are the SAG mill and Ball Mill Work Index developed from the SAG Design test procedure.
2MT-00356, 00357 & 00358 – Ferradura; MT-00360 & 00361 – Conceição; MT-00355 – Boa Esperança.

FEASIBILITY STUDY ON THE AURIZONA GOLD MINE PROJECT NI 43-101 TECHNICAL REPORT
5070\16.4\5070-STY-001
Page 13.39
July 2017 Lycopodium Minerals Canada Ltd.
Figure 13.10 WSAG Cumulative Frequency Curve
Figure 13.11 Sd-BMWi Cumulative Frequency Curve
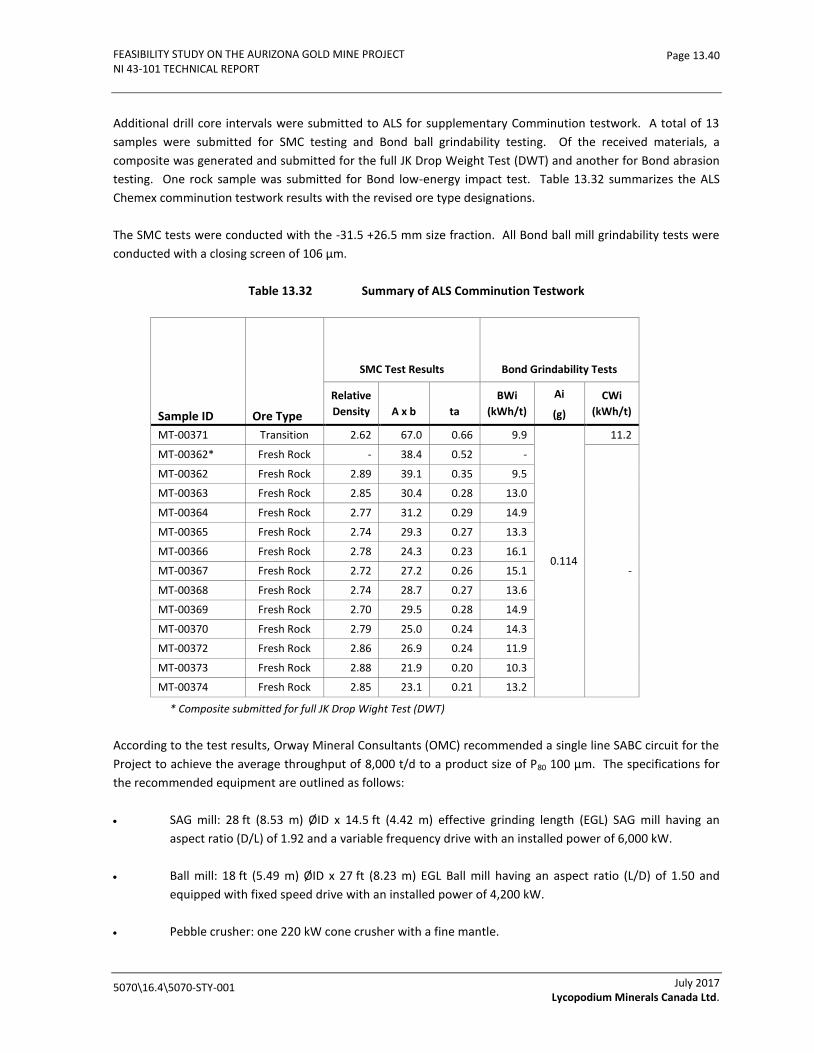
FEASIBILITY STUDY ON THE AURIZONA GOLD MINE PROJECT NI 43-101 TECHNICAL REPORT
5070\16.4\5070-STY-001
Page 13.40
July 2017 Lycopodium Minerals Canada Ltd.
Additional drill core intervals were submitted to ALS for supplementary Comminution testwork. A total of 13
samples were submitted for SMC testing and Bond ball grindability testing. Of the received materials, a
composite was generated and submitted for the full JK Drop Weight Test (DWT) and another for Bond abrasion
testing. One rock sample was submitted for Bond low-energy impact test. Table 13.32 summarizes the ALS
Chemex comminution testwork results with the revised ore type designations.
The SMC tests were conducted with the -31.5 +26.5 mm size fraction. All Bond ball mill grindability tests were
conducted with a closing screen of 106 µm.
Table 13.32 Summary of ALS Comminution Testwork
Sample ID Ore Type
SMC Test Results
Bond Grindability Tests
Relative
Density A x b ta
BWi
(kWh/t)
Ai
(g)
CWi
(kWh/t)
MT-00371 Transition 2.62 67.0 0.66 9.9
0.114
11.2
MT-00362* Fresh Rock - 38.4 0.52 -
-
MT-00362 Fresh Rock 2.89 39.1 0.35 9.5
MT-00363 Fresh Rock 2.85 30.4 0.28 13.0
MT-00364 Fresh Rock 2.77 31.2 0.29 14.9
MT-00365 Fresh Rock 2.74 29.3 0.27 13.3
MT-00366 Fresh Rock 2.78 24.3 0.23 16.1
MT-00367 Fresh Rock 2.72 27.2 0.26 15.1
MT-00368 Fresh Rock 2.74 28.7 0.27 13.6
MT-00369 Fresh Rock 2.70 29.5 0.28 14.9
MT-00370 Fresh Rock 2.79 25.0 0.24 14.3
MT-00372 Fresh Rock 2.86 26.9 0.24 11.9
MT-00373 Fresh Rock 2.88 21.9 0.20 10.3
MT-00374 Fresh Rock 2.85 23.1 0.21 13.2
* Composite submitted for full JK Drop Wight Test (DWT)
According to the test results, Orway Mineral Consultants (OMC) recommended a single line SABC circuit for the
Project to achieve the average throughput of 8,000 t/d to a product size of P80 100 µm. The specifications for
the recommended equipment are outlined as follows:
SAG mill: 28 ft (8.53 m) ØID x 14.5 ft (4.42 m) effective grinding length (EGL) SAG mill having an
aspect ratio (D/L) of 1.92 and a variable frequency drive with an installed power of 6,000 kW.
Ball mill: 18 ft (5.49 m) ØID x 27 ft (8.23 m) EGL Ball mill having an aspect ratio (L/D) of 1.50 and
equipped with fixed speed drive with an installed power of 4,200 kW.
Pebble crusher: one 220 kW cone crusher with a fine mantle.

FEASIBILITY STUDY ON THE AURIZONA GOLD MINE PROJECT NI 43-101 TECHNICAL REPORT
5070\16.4\5070-STY-001
Page 13.41
July 2017 Lycopodium Minerals Canada Ltd.
In 2013 Koeppern Machinery Australia Pty Ltd (Koeppern) conducted a preliminary high pressure grinding roll
(HPGR) test on a composite sample generated from the 2013 test program. The particle size of the sample is P80
26 mm while the moisture of the sample is low, at 2.2%.
The test was conducted at a specific pressing force (Fsp) of 3 (N/mm2) using a single pass procedure. The
average net specific energy consumption was determined to be 1.88 kWh/t. For the applied specific pressing
force the energy expenditure is slightly higher than Koeppern’s expectation. The specific throughput constant
was estimated to be 236 ts/hm3. Average flake density and thickness was 2.36 t/m
3 and 25.1 mm, respectively.
Based on this test data flake de-agglomeration prior to screening of HPGR product may be necessary in
industrial application. Koeppern recommends further testwork to investigate the performance of the HPGR
comminution.
Cyanide Detoxification
Two cyanide detoxification tests were conducted on the leach residues that were generated from the rock
master composite in the 2014 program and from the rock zone QDT composite in the 2015 program.
The SO2 / air cyanide detoxification was simulated in a continuous mode on the leach residues. The test results
are summarized in Table 13.33.
Table 13.33 Cyanide Detoxification Test Results
Sample ID
Reagent Consumption (g/g CNT) Analysis (mg/L)
SO2 CuSO4 Lime CN T CN Free CN WAD CNO
- SCN
- SO4
2-
2014 Testwork
Solution (Before Detox) - - - 190 185 185 46 15 118
Solution (After Detox) 6.5 0.94 8.4 0.12 <0.05 <0.05 26 14 5,139
2015 Testwork
Solution (Before Detox) - - - 157 147 152 143 15 148
Solution (After Detox) 6.0 0.71 3.8 0.26 <0.05 <0.05 392 16 2,150
CNT – total cyanide; CNWAD – weak acid dissociable cyanide
The results show that after the SO2 / air treatment, the total free cyanide in the treated residues can be reduced
to approximately 1 mg/L or lower and the weak acid dissociable cyanide to lower than 0.05 mg/L.
Settling Tests
Three types of flocculants, Magnafloc (MF) 10, 155 and 361, were tested in 2013 and the test results are shown
in Table 13.34. It was found that at a dosage of 40 g/t, flocculant MF-10 together with a coagulant (namely PAC)
produced a relatively better settlement. A 24 hour raked underflow solid density was 71.3% w/w. The unit
thickening rate was estimated to be 0.06 m2/t/d of dry solids at a thickener underflow solid density of 60% w/w.
A poor supernatant clarity was observed.

FEASIBILITY STUDY ON THE AURIZONA GOLD MINE PROJECT NI 43-101 TECHNICAL REPORT
5070\16.4\5070-STY-001
Page 13.42
July 2017 Lycopodium Minerals Canada Ltd.
Table 13.34 Settling Test Results
Sample ID
Flocculant Dosage
Initial Solid
Density, % w/w
24-h Max. U/F
Solid Density % w/w
Unit Settling Rate @ 60%
w/w, m2/t/d
Initial Settling
Rate m/h
Residue – BGCIL1 MF-10, 40 g/t 20 71.3 0.06 13.6
In 2012, Outotec conducted settling tests on the samples from the Aurizona Mine. Dynamic tests produced a
unit settling rate of 0.5 t/(m2/h).
Other Tests
The 2013 test program also conducted acid-base-accounting (ABA) tests on seven Piaba head samples using the
standard Sobek Method to evaluate the Piaba sample’s potential for acid drainage.
The ABA test results presented in Table 13.35 show that the Piaba saprolite and transition samples may be
potentially acid producers due to low positive or negative net neutralization potentials (NNP).
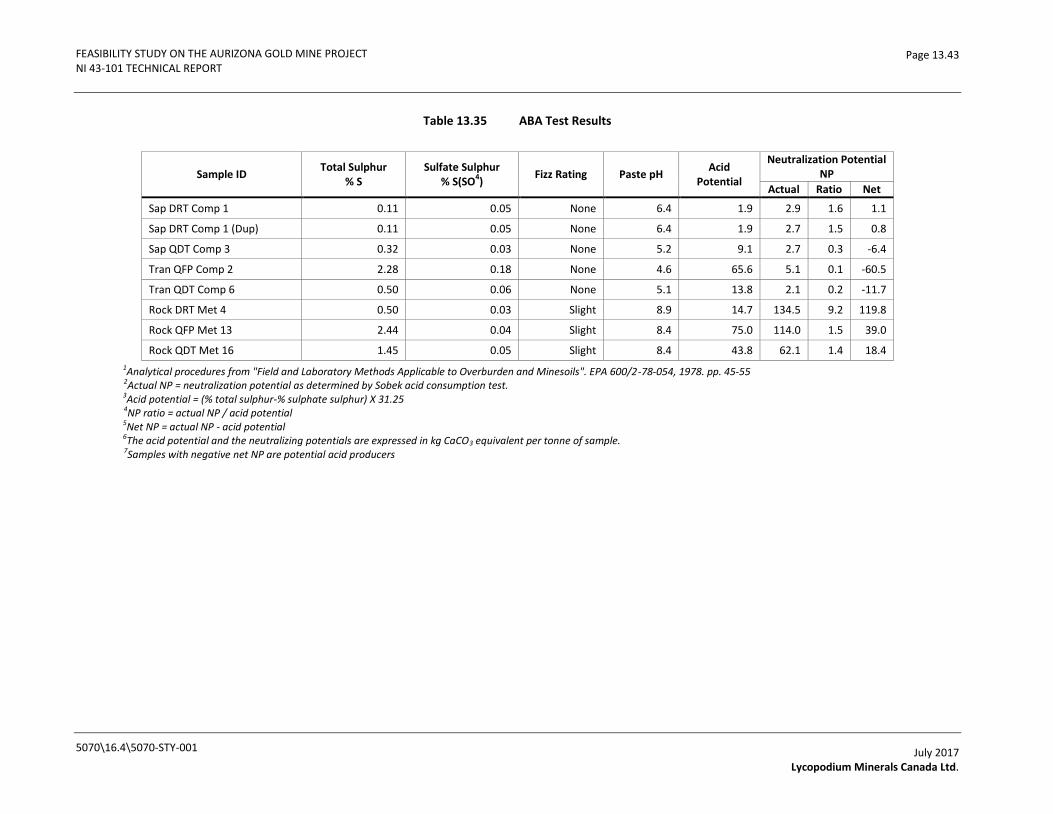
FEASIBILITY STUDY ON THE AURIZONA GOLD MINE PROJECT NI 43-101 TECHNICAL REPORT
5070\16.4\5070-STY-001
Page 13.43
July 2017 Lycopodium Minerals Canada Ltd.
Table 13.35 ABA Test Results
Sample ID Total Sulphur
% S Sulfate Sulphur
% S(SO4)
Fizz Rating Paste pH Acid
Potential
Neutralization Potential NP
Actual Ratio Net
Sap DRT Comp 1 0.11 0.05 None 6.4 1.9 2.9 1.6 1.1
Sap DRT Comp 1 (Dup) 0.11 0.05 None 6.4 1.9 2.7 1.5 0.8
Sap QDT Comp 3 0.32 0.03 None 5.2 9.1 2.7 0.3 -6.4
Tran QFP Comp 2 2.28 0.18 None 4.6 65.6 5.1 0.1 -60.5
Tran QDT Comp 6 0.50 0.06 None 5.1 13.8 2.1 0.2 -11.7
Rock DRT Met 4 0.50 0.03 Slight 8.9 14.7 134.5 9.2 119.8
Rock QFP Met 13 2.44 0.04 Slight 8.4 75.0 114.0 1.5 39.0
Rock QDT Met 16 1.45 0.05 Slight 8.4 43.8 62.1 1.4 18.4
1Analytical procedures from "Field and Laboratory Methods Applicable to Overburden and Minesoils". EPA 600/2-78-054, 1978. pp. 45-55 2Actual NP = neutralization potential as determined by Sobek acid consumption test. 3Acid potential = (% total sulphur-% sulphate sulphur) X 31.25 4NP ratio = actual NP / acid potential 5Net NP = actual NP - acid potential 6The acid potential and the neutralizing potentials are expressed in kg CaCO3 equivalent per tonne of sample. 7Samples with negative net NP are potential acid producers
FEASIBILITY STUDY ON THE AURIZONA GOLD MINE PROJECT NI 43-101 TECHNICAL REPORT
5070\16.4\5070-STY-001
Page 13.44
July 2017 Lycopodium Minerals Canada Ltd.
13.1.3 Metallurgical Testing in 2016
Following the 2012 metallurgical test program, which included testing of 105 variability composite samples and
fresh rock and oxide master composites, BV Minerals Metallurgical Division was retained by Trek to conduct
additional confirmatory testing of one master composite and 26 variability samples including four composite
samples representing the initial four years of mill feeds according to the 2015 mine plan and 22 samples
representing different lithological rock types and spatial locations within the Piaba gold deposit.
The primary objective of this additional test program was to verify the amenability of the samples to the
proposed gravity / CIL process route.
The scope of the test program consisted of sample preparation, head assays and gravity pre-concentration
followed by cyanidation of gravity tailings. In addition, flotation of gravity tailings and leach tailings resulting
from a high arsenic content sample was also investigated in a scoping level.
Samples
A shipment of 177 split core samples with a total weight of 1,015kg was received directly from the Project at BV
Minerals Metallurgical Division on December 15 2015. A second shipment of 26 ¾ inch comminution test reject
samples with a total weight of 718 kg was received on February 9th
2016 from ALS Metallurgy in Kamloops.
According to sample identification, the 177 split core samples from the first shipment were grouped into 20
composite samples, including one Master composite and 19 variability composite samples, while the
comminution test rejects received from ALS were constructed into 13 composite samples. The composite
sample list is presented in Table 13.36.
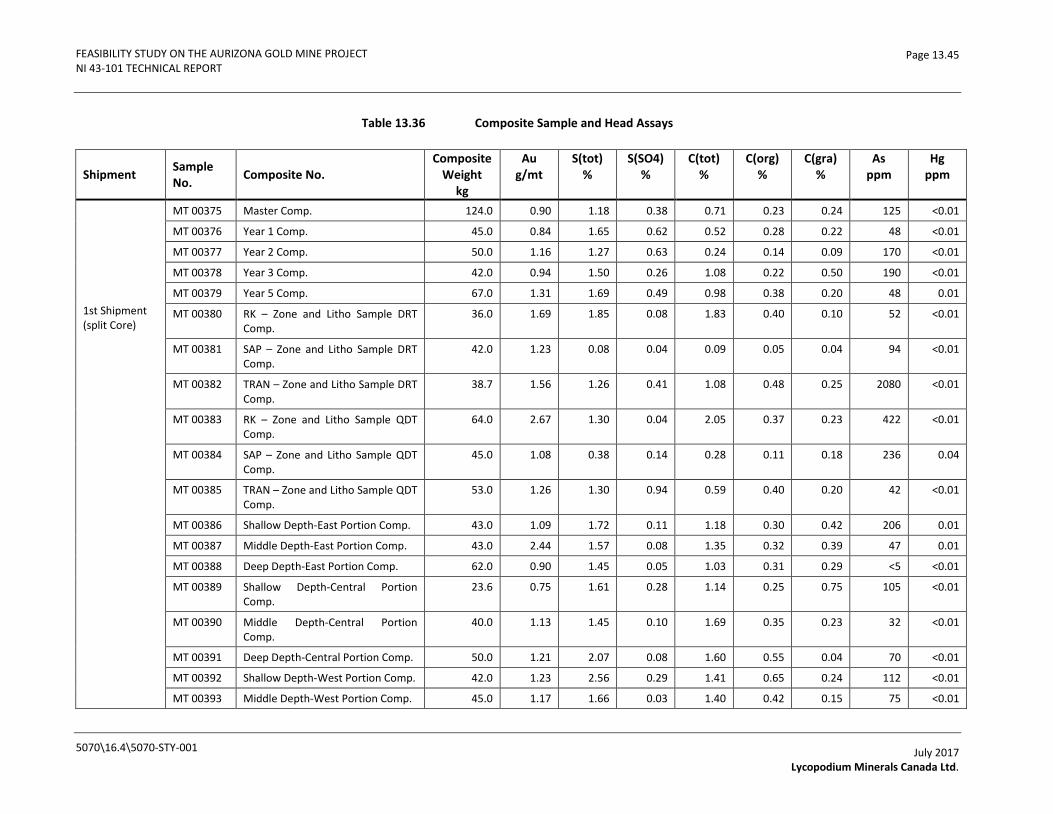
FEASIBILITY STUDY ON THE AURIZONA GOLD MINE PROJECT NI 43-101 TECHNICAL REPORT
5070\16.4\5070-STY-001
Page 13.45
July 2017 Lycopodium Minerals Canada Ltd.
Table 13.36 Composite Sample and Head Assays
Shipment Sample No.
Composite No. Composite
Weight kg
Au g/mt
S(tot) %
S(SO4) %
C(tot) %
C(org) %
C(gra) %
As ppm
Hg ppm
1st Shipment (split Core)
MT 00375 Master Comp. 124.0 0.90 1.18 0.38 0.71 0.23 0.24 125 <0.01
MT 00376 Year 1 Comp. 45.0 0.84 1.65 0.62 0.52 0.28 0.22 48 <0.01
MT 00377 Year 2 Comp. 50.0 1.16 1.27 0.63 0.24 0.14 0.09 170 <0.01
MT 00378 Year 3 Comp. 42.0 0.94 1.50 0.26 1.08 0.22 0.50 190 <0.01
MT 00379 Year 5 Comp. 67.0 1.31 1.69 0.49 0.98 0.38 0.20 48 0.01
MT 00380 RK – Zone and Litho Sample DRT Comp.
36.0 1.69 1.85 0.08 1.83 0.40 0.10 52 <0.01
MT 00381 SAP – Zone and Litho Sample DRT Comp.
42.0 1.23 0.08 0.04 0.09 0.05 0.04 94 <0.01
MT 00382 TRAN – Zone and Litho Sample DRT Comp.
38.7 1.56 1.26 0.41 1.08 0.48 0.25 2080 <0.01
MT 00383 RK – Zone and Litho Sample QDT Comp.
64.0 2.67 1.30 0.04 2.05 0.37 0.23 422 <0.01
MT 00384 SAP – Zone and Litho Sample QDT Comp.
45.0 1.08 0.38 0.14 0.28 0.11 0.18 236 0.04
MT 00385 TRAN – Zone and Litho Sample QDT Comp.
53.0 1.26 1.30 0.94 0.59 0.40 0.20 42 <0.01
MT 00386 Shallow Depth-East Portion Comp. 43.0 1.09 1.72 0.11 1.18 0.30 0.42 206 0.01
MT 00387 Middle Depth-East Portion Comp. 43.0 2.44 1.57 0.08 1.35 0.32 0.39 47 0.01
MT 00388 Deep Depth-East Portion Comp. 62.0 0.90 1.45 0.05 1.03 0.31 0.29 <5 <0.01
MT 00389 Shallow Depth-Central Portion Comp.
23.6 0.75 1.61 0.28 1.14 0.25 0.75 105 <0.01
MT 00390 Middle Depth-Central Portion Comp.
40.0 1.13 1.45 0.10 1.69 0.35 0.23 32 <0.01
MT 00391 Deep Depth-Central Portion Comp. 50.0 1.21 2.07 0.08 1.60 0.55 0.04 70 <0.01
MT 00392 Shallow Depth-West Portion Comp. 42.0 1.23 2.56 0.29 1.41 0.65 0.24 112 <0.01
MT 00393 Middle Depth-West Portion Comp. 45.0 1.17 1.66 0.03 1.40 0.42 0.15 75 <0.01

FEASIBILITY STUDY ON THE AURIZONA GOLD MINE PROJECT NI 43-101 TECHNICAL REPORT
5070\16.4\5070-STY-001
Page 13.46
July 2017 Lycopodium Minerals Canada Ltd.
Shipment Sample No.
Composite No. Composite
Weight kg
Au g/mt
S(tot) %
S(SO4) %
C(tot) %
C(org) %
C(gra) %
As ppm
Hg ppm
MT 00394 Deep Depth-West Portion Comp. 22.0 1.44 2.94 0.08 1.41 0.61 0.16 166 n/a
2nd Shipment (Comminution Rejects)
MT 00362* 125.0 0.17 0.58 <0.01 1.42 0.22 0.02 32 0.01
MT 00363 123.5 3.45 0.85 <0.01 2.23 0.40 0.11 48 0.03
MT 00364 115.2 0.47 0.32 <0.01 1.51 0.14 0.07 63 0.02
MT 00365 37.5 0.87 1.40 0.02 1.24 0.34 0.35 201 <0.01
MT 00366 37.2 0.35 0.62 <0.01 2.10 0.25 0.12 15 <0.01
MT 00367 36.7 0.14 0.87 0.01 0.95 0.24 0.08 <5 <0.01
MT 00368 31.1 0.32 0.91 0.02 1.25 0.22 0.40 7 <0.01
MT 00369 33.5 1.04 0.95 0.02 1.11 0.27 0.32 <5 <0.01
MT 00370 33.2 0.51 1.47 0.01 1.40 0.36 0.24 <5 <0.01
MT 00371* 48.8 0.09 0.37 0.02 0.36 0.20 0.15 <5 <0.01
MT 00372* 30.0 0.06 0.55 <0.01 2.85 0.22 <0.01 45 <0.01
MT 00373* 30.9 0.01 0.27 <0.01 2.38 0.17 <0.01 56 <0.01
MT 00374* 35.6 0.01 0.13 <0.01 1.71 0.08 0.01 39 <0.01
*Not tested due to the low assayed grade
FEASIBILITY STUDY ON THE AURIZONA GOLD MINE PROJECT NI 43-101 TECHNICAL REPORT
5070\16.4\5070-STY-001
Page 13.47
July 2017 Lycopodium Minerals Canada Ltd.
Head Sample Analysis
The main head assays for the 33 composite samples are listed in Table 13.36.
As the main value of interest, gold in the test samples varied between 0.01 and 3.45 g/t Au. The S was mainly
present as sulphide sulphur. The carbon levels were relatively low, suggesting that preg-robbing is not
anticipated to occur during cyanidation.
Arsenic varied from <5 ppm to 2080 ppm for sample MT00382. The low gold recovery from sample MT00382
confirmed that the increased As level has a negative impact on gold recovery.
The Hg content was low in all the samples tested.
Gravity Concentration/Cyanidation Flowsheet
Following test conditions established in the 2012 test program, a combination of gravity pre-concentration
followed by CIL cyanidation of gravity scalped tailings was performed on 27 new composite samples including
one master composite, four mining phase composites and 22 lithological rock type and spatial location samples
within the Piaba gold deposit.
The tests were conducted at a target P80 grind of 105 µm. One test grind was conducted on each composite to
establish the laboratory grind time required to achieve the target P80 size of 105 µm prior to metallurgical
testing. Gravity concentration was performed in two stages and CIL cyanidation of gravity scalped tailings was
carried out for 48 hours at 40% solids and 0.5 g/L NaCN with 20 g/L activated carbon. The test results are
summarized in Table 13.37.
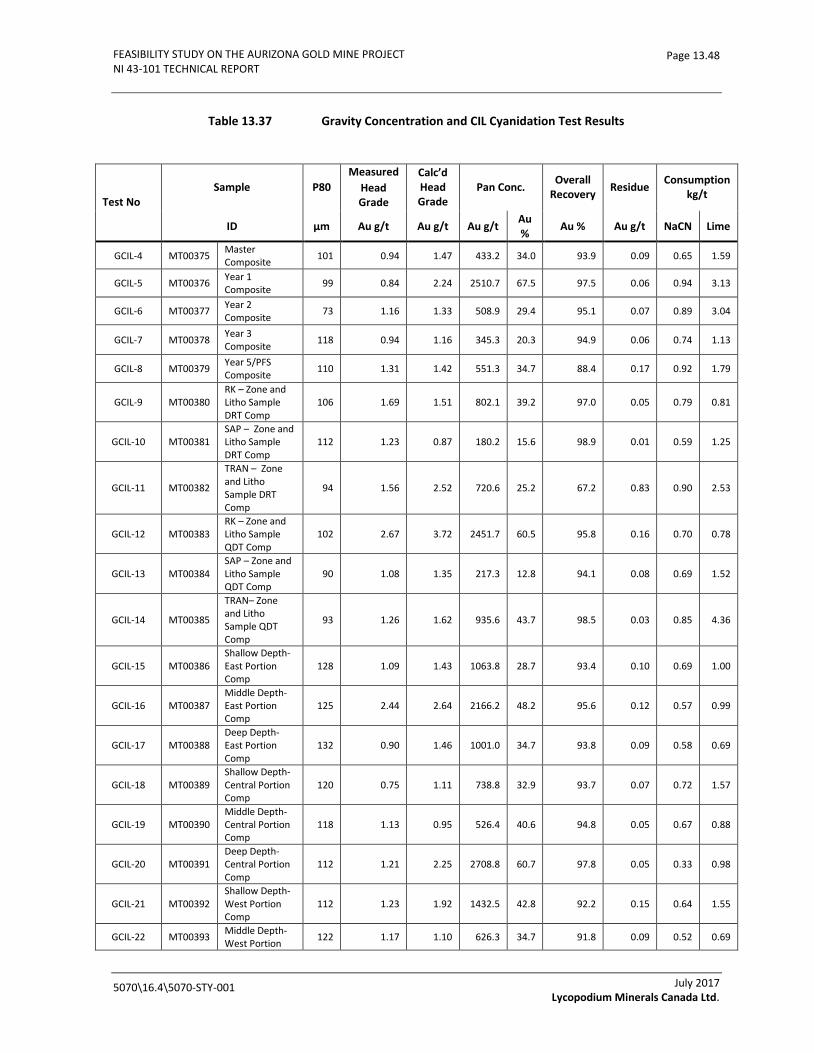
FEASIBILITY STUDY ON THE AURIZONA GOLD MINE PROJECT NI 43-101 TECHNICAL REPORT
5070\16.4\5070-STY-001
Page 13.48
July 2017 Lycopodium Minerals Canada Ltd.
Table 13.37 Gravity Concentration and CIL Cyanidation Test Results
Test No Sample P80
Measured
Head Grade
Calc’d Head Grade
Pan Conc. Overall
Recovery Residue
Consumption kg/t
ID µm Au g/t Au g/t Au g/t Au %
Au % Au g/t NaCN Lime
GCIL-4 MT00375 Master Composite
101 0.94 1.47 433.2 34.0 93.9 0.09 0.65 1.59
GCIL-5 MT00376 Year 1 Composite
99 0.84 2.24 2510.7 67.5 97.5 0.06 0.94 3.13
GCIL-6 MT00377 Year 2 Composite
73 1.16 1.33 508.9 29.4 95.1 0.07 0.89 3.04
GCIL-7 MT00378 Year 3 Composite
118 0.94 1.16 345.3 20.3 94.9 0.06 0.74 1.13
GCIL-8 MT00379 Year 5/PFS Composite
110 1.31 1.42 551.3 34.7 88.4 0.17 0.92 1.79
GCIL-9 MT00380 RK – Zone and Litho Sample DRT Comp
106 1.69 1.51 802.1 39.2 97.0 0.05 0.79 0.81
GCIL-10 MT00381 SAP – Zone and Litho Sample DRT Comp
112 1.23 0.87 180.2 15.6 98.9 0.01 0.59 1.25
GCIL-11 MT00382
TRAN – Zone and Litho Sample DRT Comp
94 1.56 2.52 720.6 25.2 67.2 0.83 0.90 2.53
GCIL-12 MT00383 RK – Zone and Litho Sample QDT Comp
102 2.67 3.72 2451.7 60.5 95.8 0.16 0.70 0.78
GCIL-13 MT00384 SAP – Zone and Litho Sample QDT Comp
90 1.08 1.35 217.3 12.8 94.1 0.08 0.69 1.52
GCIL-14 MT00385
TRAN– Zone and Litho Sample QDT Comp
93 1.26 1.62 935.6 43.7 98.5 0.03 0.85 4.36
GCIL-15 MT00386 Shallow Depth-East Portion Comp
128 1.09 1.43 1063.8 28.7 93.4 0.10 0.69 1.00
GCIL-16 MT00387 Middle Depth-East Portion Comp
125 2.44 2.64 2166.2 48.2 95.6 0.12 0.57 0.99
GCIL-17 MT00388 Deep Depth-East Portion Comp
132 0.90 1.46 1001.0 34.7 93.8 0.09 0.58 0.69
GCIL-18 MT00389 Shallow Depth-Central Portion Comp
120 0.75 1.11 738.8 32.9 93.7 0.07 0.72 1.57
GCIL-19 MT00390 Middle Depth-Central Portion Comp
118 1.13 0.95 526.4 40.6 94.8 0.05 0.67 0.88
GCIL-20 MT00391 Deep Depth-Central Portion Comp
112 1.21 2.25 2708.8 60.7 97.8 0.05 0.33 0.98
GCIL-21 MT00392 Shallow Depth-West Portion Comp
112 1.23 1.92 1432.5 42.8 92.2 0.15 0.64 1.55
GCIL-22 MT00393 Middle Depth-West Portion
122 1.17 1.10 626.3 34.7 91.8 0.09 0.52 0.69
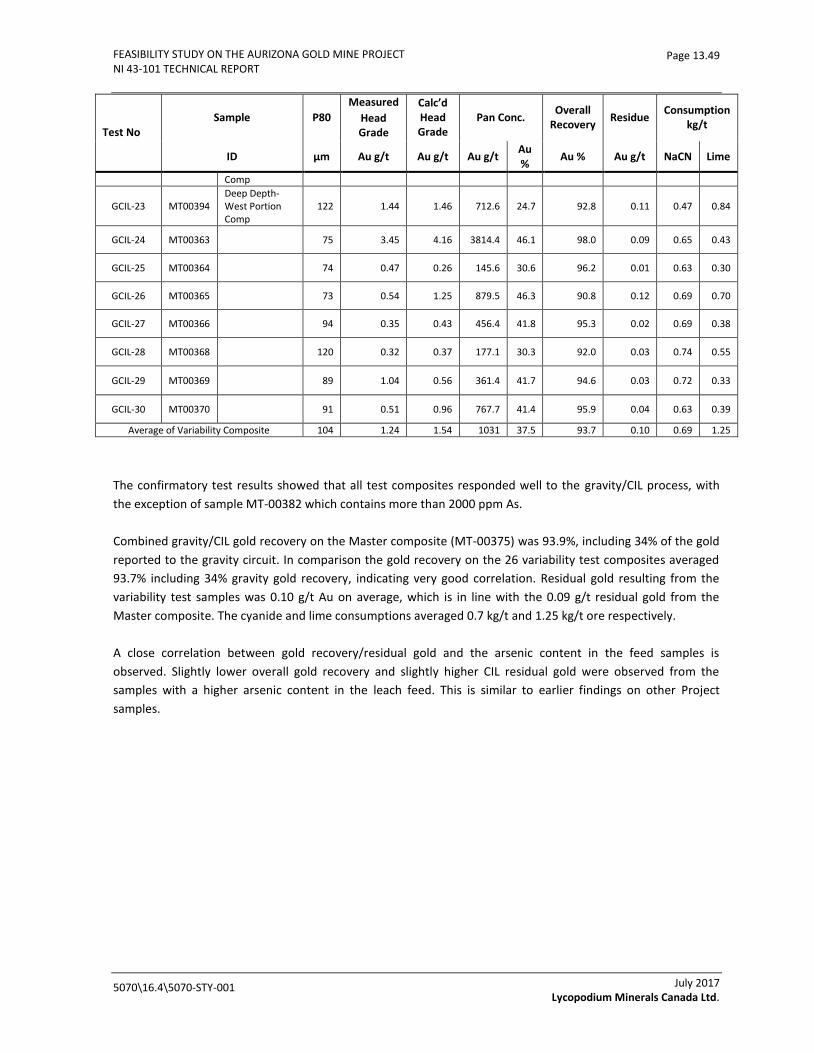
FEASIBILITY STUDY ON THE AURIZONA GOLD MINE PROJECT NI 43-101 TECHNICAL REPORT
5070\16.4\5070-STY-001
Page 13.49
July 2017 Lycopodium Minerals Canada Ltd.
Test No Sample P80
Measured
Head Grade
Calc’d Head Grade
Pan Conc. Overall
Recovery Residue
Consumption kg/t
ID µm Au g/t Au g/t Au g/t Au %
Au % Au g/t NaCN Lime
Comp
GCIL-23 MT00394 Deep Depth-West Portion Comp
122 1.44 1.46 712.6 24.7 92.8 0.11 0.47 0.84
GCIL-24 MT00363 75 3.45 4.16 3814.4 46.1 98.0 0.09 0.65 0.43
GCIL-25 MT00364 74 0.47 0.26 145.6 30.6 96.2 0.01 0.63 0.30
GCIL-26 MT00365 73 0.54 1.25 879.5 46.3 90.8 0.12 0.69 0.70
GCIL-27 MT00366 94 0.35 0.43 456.4 41.8 95.3 0.02 0.69 0.38
GCIL-28 MT00368 120 0.32 0.37 177.1 30.3 92.0 0.03 0.74 0.55
GCIL-29 MT00369 89 1.04 0.56 361.4 41.7 94.6 0.03 0.72 0.33
GCIL-30 MT00370 91 0.51 0.96 767.7 41.4 95.9 0.04 0.63 0.39
Average of Variability Composite 104 1.24 1.54 1031 37.5 93.7 0.10 0.69 1.25
The confirmatory test results showed that all test composites responded well to the gravity/CIL process, with
the exception of sample MT-00382 which contains more than 2000 ppm As.
Combined gravity/CIL gold recovery on the Master composite (MT-00375) was 93.9%, including 34% of the gold
reported to the gravity circuit. In comparison the gold recovery on the 26 variability test composites averaged
93.7% including 34% gravity gold recovery, indicating very good correlation. Residual gold resulting from the
variability test samples was 0.10 g/t Au on average, which is in line with the 0.09 g/t residual gold from the
Master composite. The cyanide and lime consumptions averaged 0.7 kg/t and 1.25 kg/t ore respectively.
A close correlation between gold recovery/residual gold and the arsenic content in the feed samples is
observed. Slightly lower overall gold recovery and slightly higher CIL residual gold were observed from the
samples with a higher arsenic content in the leach feed. This is similar to earlier findings on other Project
samples.
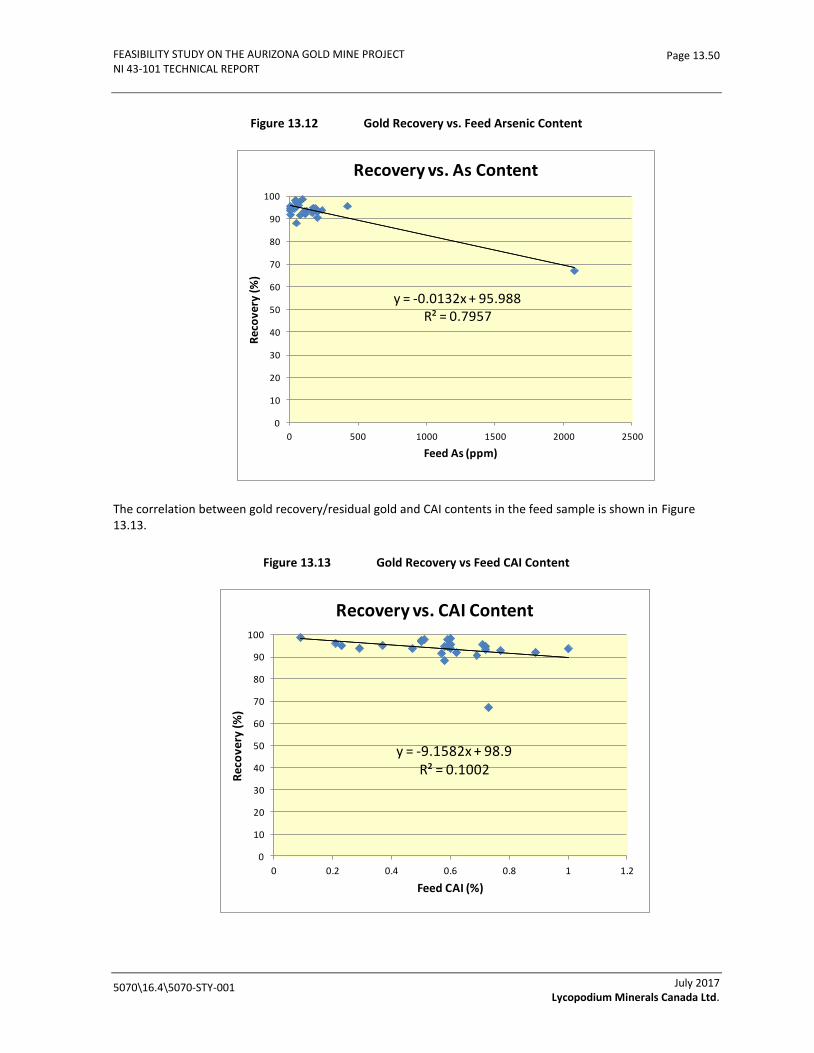
FEASIBILITY STUDY ON THE AURIZONA GOLD MINE PROJECT NI 43-101 TECHNICAL REPORT
5070\16.4\5070-STY-001
Page 13.50
July 2017 Lycopodium Minerals Canada Ltd.
Figure 13.12 Gold Recovery vs. Feed Arsenic Content
The correlation between gold recovery/residual gold and CAI contents in the feed sample is shown in Figure 13.13.
Figure 13.13 Gold Recovery vs Feed CAI Content
y = -0.0132x + 95.988R² = 0.7957
0
10
20
30
40
50
60
70
80
90
100
0 500 1000 1500 2000 2500
Rec
ove
ry (%
)
Feed As (ppm)
Recovery vs. As Content
y = -9.1582x + 98.9R² = 0.1002
0
10
20
30
40
50
60
70
80
90
100
0 0.2 0.4 0.6 0.8 1 1.2
Rec
ove
ry (
%)
Feed CAI (%)
Recovery vs. CAI Content
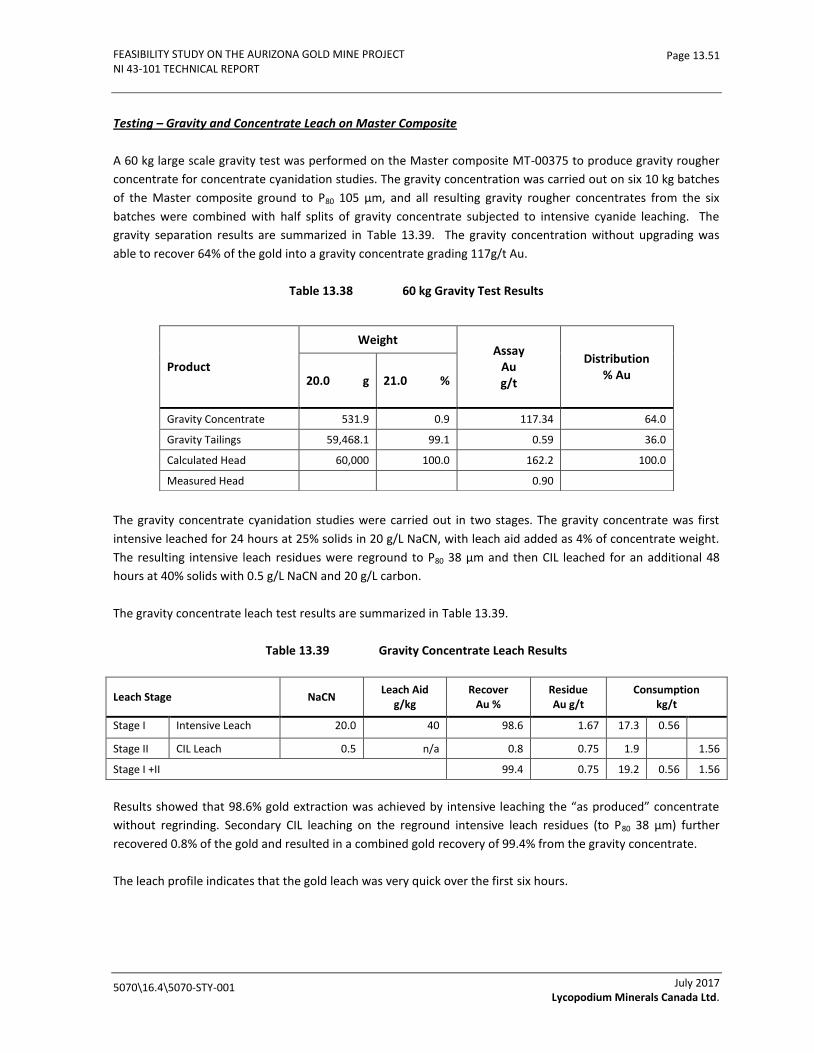
FEASIBILITY STUDY ON THE AURIZONA GOLD MINE PROJECT NI 43-101 TECHNICAL REPORT
5070\16.4\5070-STY-001
Page 13.51
July 2017 Lycopodium Minerals Canada Ltd.
Testing – Gravity and Concentrate Leach on Master Composite
A 60 kg large scale gravity test was performed on the Master composite MT-00375 to produce gravity rougher
concentrate for concentrate cyanidation studies. The gravity concentration was carried out on six 10 kg batches
of the Master composite ground to P80 105 µm, and all resulting gravity rougher concentrates from the six
batches were combined with half splits of gravity concentrate subjected to intensive cyanide leaching. The
gravity separation results are summarized in Table 13.39. The gravity concentration without upgrading was
able to recover 64% of the gold into a gravity concentrate grading 117g/t Au.
Table 13.38 60 kg Gravity Test Results
The gravity concentrate cyanidation studies were carried out in two stages. The gravity concentrate was first
intensive leached for 24 hours at 25% solids in 20 g/L NaCN, with leach aid added as 4% of concentrate weight.
The resulting intensive leach residues were reground to P80 38 µm and then CIL leached for an additional 48
hours at 40% solids with 0.5 g/L NaCN and 20 g/L carbon.
The gravity concentrate leach test results are summarized in Table 13.39.
Table 13.39 Gravity Concentrate Leach Results
Leach Stage NaCN Leach Aid
g/kg Recover
Au % Residue Au g/t
Consumption kg/t
Stage I Intensive Leach 20.0 40 98.6 1.67 17.3 0.56
Stage II CIL Leach 0.5 n/a 0.8 0.75 1.9 1.56
Stage I +II 99.4 0.75 19.2 0.56 1.56
Results showed that 98.6% gold extraction was achieved by intensive leaching the “as produced” concentrate
without regrinding. Secondary CIL leaching on the reground intensive leach residues (to P80 38 µm) further
recovered 0.8% of the gold and resulted in a combined gold recovery of 99.4% from the gravity concentrate.
The leach profile indicates that the gold leach was very quick over the first six hours.
Product
Weight Assay
Au g/t
Distribution % Au 20.0 g 21.0 %
Gravity Concentrate 531.9 0.9 117.34 64.0
Gravity Tailings 59,468.1 99.1 0.59 36.0
Calculated Head 60,000 100.0 162.2 100.0
Measured Head 0.90
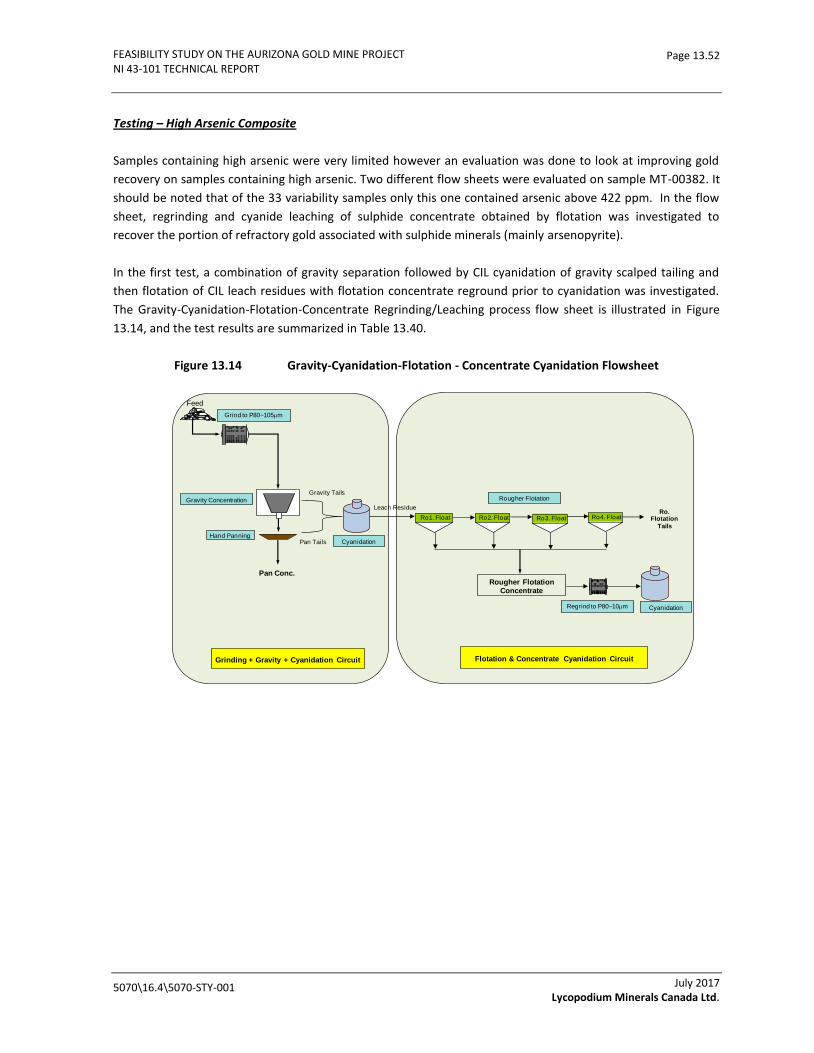
FEASIBILITY STUDY ON THE AURIZONA GOLD MINE PROJECT NI 43-101 TECHNICAL REPORT
5070\16.4\5070-STY-001
Page 13.52
July 2017 Lycopodium Minerals Canada Ltd.
Testing – High Arsenic Composite
Samples containing high arsenic were very limited however an evaluation was done to look at improving gold
recovery on samples containing high arsenic. Two different flow sheets were evaluated on sample MT-00382. It
should be noted that of the 33 variability samples only this one contained arsenic above 422 ppm. In the flow
sheet, regrinding and cyanide leaching of sulphide concentrate obtained by flotation was investigated to
recover the portion of refractory gold associated with sulphide minerals (mainly arsenopyrite).
In the first test, a combination of gravity separation followed by CIL cyanidation of gravity scalped tailing and
then flotation of CIL leach residues with flotation concentrate reground prior to cyanidation was investigated.
The Gravity-Cyanidation-Flotation-Concentrate Regrinding/Leaching process flow sheet is illustrated in Figure
13.14, and the test results are summarized in Table 13.40.
Figure 13.14 Gravity-Cyanidation-Flotation - Concentrate Cyanidation Flowsheet
Pan Conc.
Hand Panning
Gravity Concentration
Gravity Tails
Pan Tails
Grind to P80~105mm
Feed
Ro1. Float Ro2. Float Ro3. FloatRo.
Flotation
Tails
Rougher Flotation Concentrate
Grinding + Gravity + Cyanidation Circuit Flotation & Concentrate Cyanidation Circuit
Ro4. Float
Regrind to P80~10mm
Rougher Flotation
Cyanidation
Leach Residue
Cyanidation
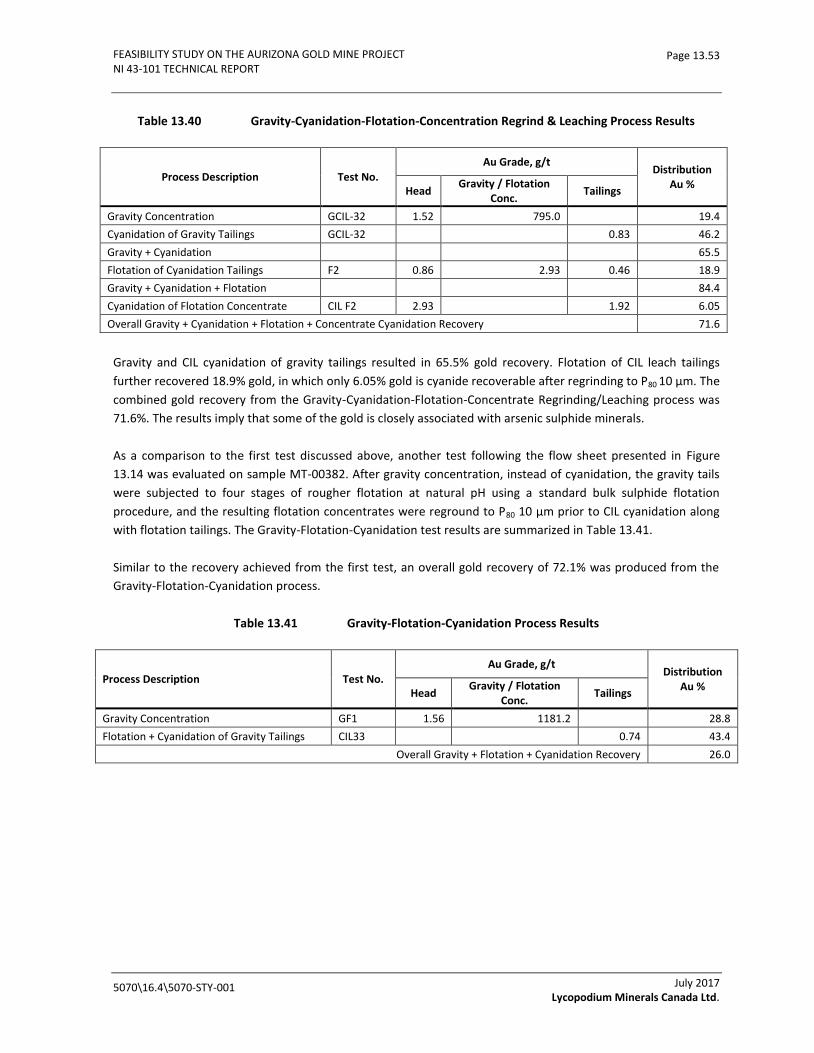
FEASIBILITY STUDY ON THE AURIZONA GOLD MINE PROJECT NI 43-101 TECHNICAL REPORT
5070\16.4\5070-STY-001
Page 13.53
July 2017 Lycopodium Minerals Canada Ltd.
Table 13.40 Gravity-Cyanidation-Flotation-Concentration Regrind & Leaching Process Results
Process Description Test No.
Au Grade, g/t Distribution
Au % Head
Gravity / Flotation Conc.
Tailings
Gravity Concentration GCIL-32 1.52 795.0 19.4
Cyanidation of Gravity Tailings GCIL-32 0.83 46.2
Gravity + Cyanidation 65.5
Flotation of Cyanidation Tailings F2 0.86 2.93 0.46 18.9
Gravity + Cyanidation + Flotation 84.4
Cyanidation of Flotation Concentrate CIL F2 2.93 1.92 6.05
Overall Gravity + Cyanidation + Flotation + Concentrate Cyanidation Recovery 71.6
Gravity and CIL cyanidation of gravity tailings resulted in 65.5% gold recovery. Flotation of CIL leach tailings
further recovered 18.9% gold, in which only 6.05% gold is cyanide recoverable after regrinding to P80 10 µm. The
combined gold recovery from the Gravity-Cyanidation-Flotation-Concentrate Regrinding/Leaching process was
71.6%. The results imply that some of the gold is closely associated with arsenic sulphide minerals.
As a comparison to the first test discussed above, another test following the flow sheet presented in Figure
13.14 was evaluated on sample MT-00382. After gravity concentration, instead of cyanidation, the gravity tails
were subjected to four stages of rougher flotation at natural pH using a standard bulk sulphide flotation
procedure, and the resulting flotation concentrates were reground to P80 10 µm prior to CIL cyanidation along
with flotation tailings. The Gravity-Flotation-Cyanidation test results are summarized in Table 13.41.
Similar to the recovery achieved from the first test, an overall gold recovery of 72.1% was produced from the
Gravity-Flotation-Cyanidation process.
Table 13.41 Gravity-Flotation-Cyanidation Process Results
Process Description Test No.
Au Grade, g/t Distribution
Au % Head
Gravity / Flotation Conc.
Tailings
Gravity Concentration GF1 1.56 1181.2 28.8
Flotation + Cyanidation of Gravity Tailings CIL33 0.74 43.4
Overall Gravity + Flotation + Cyanidation Recovery 26.0
FEASIBILITY STUDY ON THE AURIZONA GOLD MINE PROJECT NI 43-101 TECHNICAL REPORT
5070\16.4\5070-STY-001
Page 13.54
July 2017 Lycopodium Minerals Canada Ltd.
13.1.4 Metallurgical Testing in 2017
Metallurgical Testwork on Aurizona Gold Ore containing High Arsenic
Thirteen composites of gold bearing ores with high arsenic were provided to SGS Geosol Laboratorios Ltda to evaluate the impact of arsenic on overall gold recovery. Tests were conducted to evaluate the metallurgical response on the samples of gravity concentration, intensive cyanidation of gravity concentrate and cyanidation leaching of gravity tails. Test Procedure The test procedure was prepared to simulate the current process design. The composites were ground to a P80 of 106 microns and fed to a centrifuge concentrator. The concentrator concentrate was then subjected to intensive leaching with a strong oxidant and high cyanide concentration. The concentrator tails was leached by cyanide in a bottle roll to simulate 18 hours leaching followed by 18 hours of leaching/adsorption with carbon. Two additional set of test parameters were used for cyanidation of gravity tailings for evaluation. The three different sets of test parameters are summarized below:
1. Bottle roll with 18 hours leaching and 18 hours leaching/adsorption with carbon. 2. Bottle roll with 6 hours of pre-lime treatment, 12 hours leaching followed by 18 hours
leaching/adsorption with carbon. 3. Bottle roll with 48 hours of leaching/adsorption with carbon.
The head gold grades, carbon gold content and leached tails gold content were assayed in triplicate. Samples For the purpose of this evaluation, the selection criteria for the samples were as follow:
1. Located inside the pit shell. 2. Gold grade above cut-off grade. 3. Target highest arsenic content in available samples. 4. Ensure a mix of saprolite, transition and fresh rock samples.
The samples were provided by the Exploration Geologist of MASA. Half cores from different drill holes were combined to make the test composites. Figure 13.15 shows the sample locations in section view.
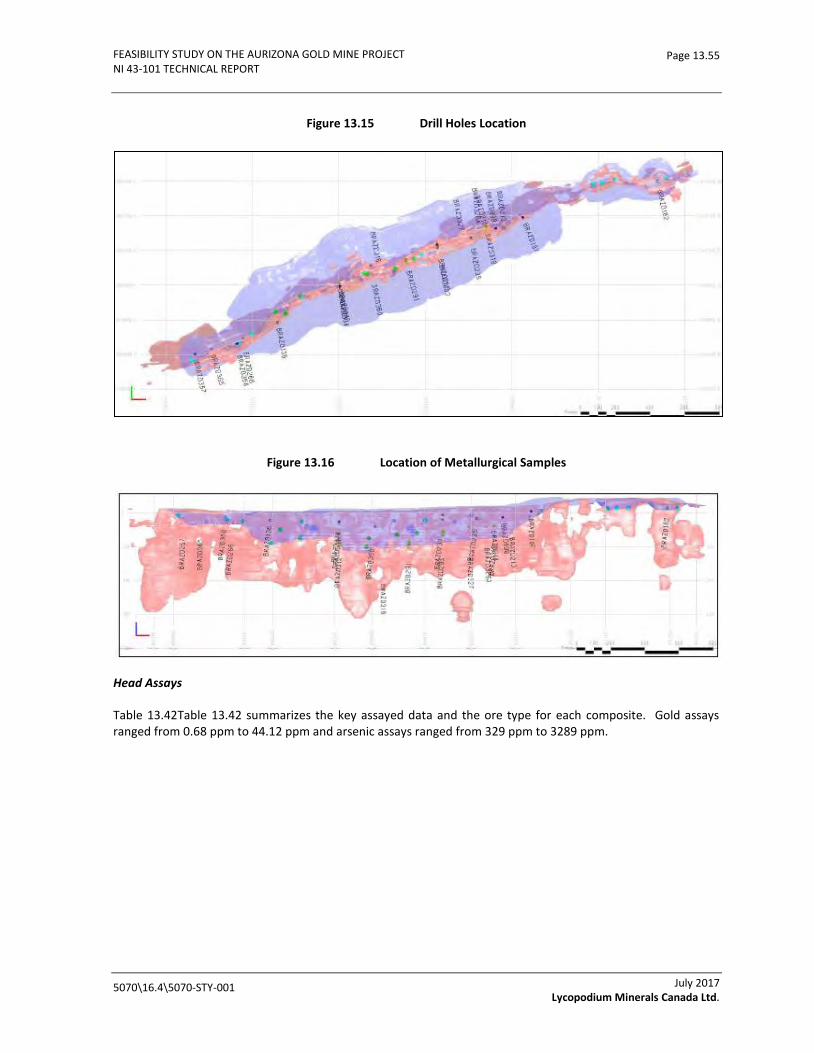
FEASIBILITY STUDY ON THE AURIZONA GOLD MINE PROJECT NI 43-101 TECHNICAL REPORT
5070\16.4\5070-STY-001
Page 13.55
July 2017 Lycopodium Minerals Canada Ltd.
Figure 13.15 Drill Holes Location
Figure 13.16 Location of Metallurgical Samples
Head Assays
Table 13.42Table 13.42 summarizes the key assayed data and the ore type for each composite. Gold assays ranged from 0.68 ppm to 44.12 ppm and arsenic assays ranged from 329 ppm to 3289 ppm.

FEASIBILITY STUDY ON THE AURIZONA GOLD MINE PROJECT NI 43-101 TECHNICAL REPORT
5070\16.4\5070-STY-001
Page 13.56
July 2017 Lycopodium Minerals Canada Ltd.
Table 13.42 Head Assay Data
Composite ID
Ore Type Au ppm
As ppm
Cu ppm
Ag ppm
Fe %
C %
S %
TOC %
SO4 %
MT 00414 Fresh Rock Diorite Quartz
6.80 892 27 0.5 6.4 1.2 2.2 0.4 0.07
MT 00415 Fresh Rock Diorite Quartz
2.34 2,238 14 < 0.2 5.8 1.0 1.4 0.4 0.06
MT 00416 Fresh Rock Diorite Quartz
1.13 546 12 < 0.2 5.9 1.0 1.1 0.3 0.10
MT 00417 Fresh Rock Diorite Quartz
1.25 3,108 13 < 0.2 6.7 1.4 1.1 0.4 0.06
MT 00418 Fresh Rock Diorite Quartz
1.37 875 13 < 0.2 6.0 1.0 0.9 0.2 0.05
MT 00419 Fresh Rock Diorite Quartz
0.68 2,262 14 < 0.2 5.9 1.5 0.9 0.3 0.02
MT 00420 Transition Rock 4.33 3,097 13 < 0.2 9.5 1.1 1.7 0.7 0.15
MT 00421 Transition Rock 1.31 3,289 29 < 0.2 9.2 1.3 1.1 0.2 0.04
MT 00422 Transition Rock 0.90 329 28 < 0.2 7.5 0.5 0.9 0.5 0.05
MT 00423 Saprolite 3.53 2,589 48 11.5 7.4 0.3 0.8 0.3 0.14
MT 00424 Saprolite 1.40 844 < 10 < 0.2 2.3 0.5 1.3 0.5 0.28
MT 00425 Saprolite 2.44 1,707 73 0.9 6.8 0.2 0.2 0.2 0.05
MT 00426 Diorite quartz + Transition
44.12 1,483 < 10 2.0 7.6 0.3 1.2 0.3 0.66
Summary of Results Table 13.43 below summarizes the recoveries data for each composite. Each composite underwent gravity concentration and intensive leaching of gravity concentrate, cyanide leaching of gravity tails with 18 hours leaching and 18 hours leaching/adsorption with carbon. Overall gold recoveries are plotted against arsenic content in Figure 13.17.
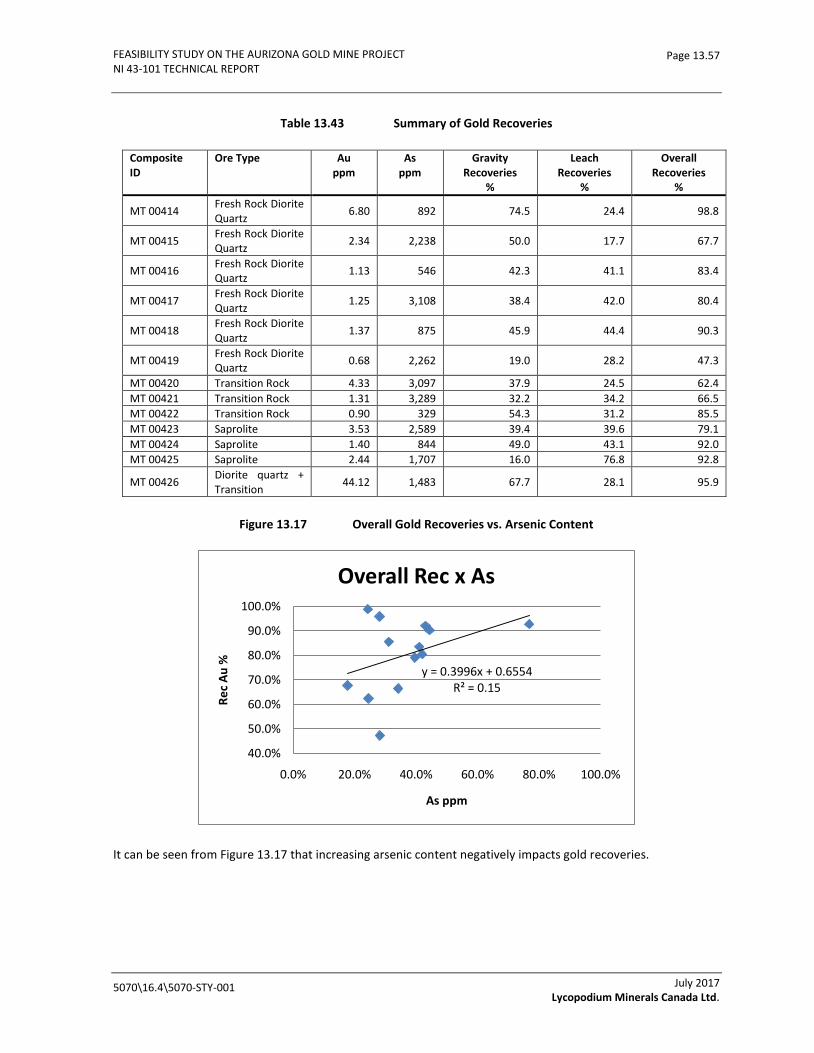
FEASIBILITY STUDY ON THE AURIZONA GOLD MINE PROJECT NI 43-101 TECHNICAL REPORT
5070\16.4\5070-STY-001
Page 13.57
July 2017 Lycopodium Minerals Canada Ltd.
Table 13.43 Summary of Gold Recoveries
Composite ID
Ore Type Au ppm
As ppm
Gravity Recoveries
%
Leach Recoveries
%
Overall Recoveries
%
MT 00414 Fresh Rock Diorite Quartz
6.80 892 74.5 24.4 98.8
MT 00415 Fresh Rock Diorite Quartz
2.34 2,238 50.0 17.7 67.7
MT 00416 Fresh Rock Diorite Quartz
1.13 546 42.3 41.1 83.4
MT 00417 Fresh Rock Diorite Quartz
1.25 3,108 38.4 42.0 80.4
MT 00418 Fresh Rock Diorite Quartz
1.37 875 45.9 44.4 90.3
MT 00419 Fresh Rock Diorite Quartz
0.68 2,262 19.0 28.2 47.3
MT 00420 Transition Rock 4.33 3,097 37.9 24.5 62.4
MT 00421 Transition Rock 1.31 3,289 32.2 34.2 66.5
MT 00422 Transition Rock 0.90 329 54.3 31.2 85.5
MT 00423 Saprolite 3.53 2,589 39.4 39.6 79.1
MT 00424 Saprolite 1.40 844 49.0 43.1 92.0
MT 00425 Saprolite 2.44 1,707 16.0 76.8 92.8
MT 00426 Diorite quartz + Transition
44.12 1,483 67.7 28.1 95.9
Figure 13.17 Overall Gold Recoveries vs. Arsenic Content
It can be seen from Figure 13.17 that increasing arsenic content negatively impacts gold recoveries.
y = 0.3996x + 0.6554R² = 0.15
40.0%
50.0%
60.0%
70.0%
80.0%
90.0%
100.0%
0.0% 20.0% 40.0% 60.0% 80.0% 100.0%
Re
c A
u %
As ppm
Overall Rec x As
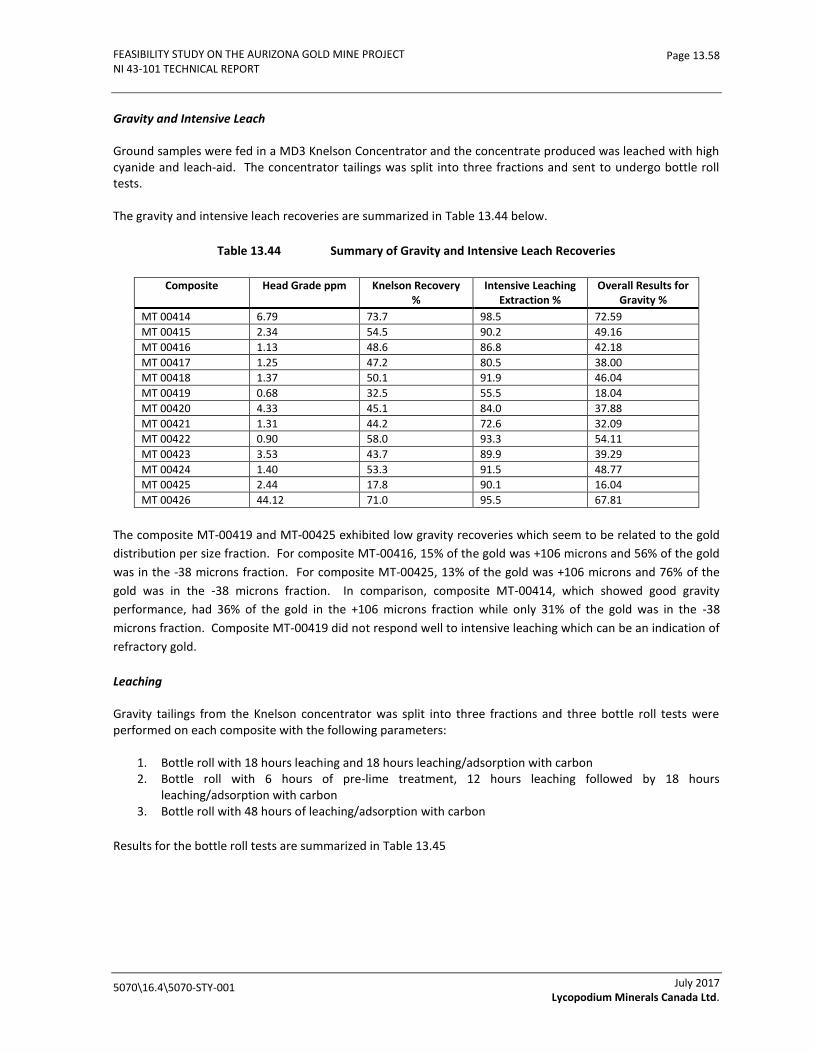
FEASIBILITY STUDY ON THE AURIZONA GOLD MINE PROJECT NI 43-101 TECHNICAL REPORT
5070\16.4\5070-STY-001
Page 13.58
July 2017 Lycopodium Minerals Canada Ltd.
Gravity and Intensive Leach Ground samples were fed in a MD3 Knelson Concentrator and the concentrate produced was leached with high cyanide and leach-aid. The concentrator tailings was split into three fractions and sent to undergo bottle roll tests. The gravity and intensive leach recoveries are summarized in Table 13.44 below.
Table 13.44 Summary of Gravity and Intensive Leach Recoveries
Composite Head Grade ppm Knelson Recovery %
Intensive Leaching Extraction %
Overall Results for Gravity %
MT 00414 6.79 73.7 98.5 72.59
MT 00415 2.34 54.5 90.2 49.16
MT 00416 1.13 48.6 86.8 42.18
MT 00417 1.25 47.2 80.5 38.00
MT 00418 1.37 50.1 91.9 46.04
MT 00419 0.68 32.5 55.5 18.04
MT 00420 4.33 45.1 84.0 37.88
MT 00421 1.31 44.2 72.6 32.09
MT 00422 0.90 58.0 93.3 54.11
MT 00423 3.53 43.7 89.9 39.29
MT 00424 1.40 53.3 91.5 48.77
MT 00425 2.44 17.8 90.1 16.04
MT 00426 44.12 71.0 95.5 67.81
The composite MT-00419 and MT-00425 exhibited low gravity recoveries which seem to be related to the gold
distribution per size fraction. For composite MT-00416, 15% of the gold was +106 microns and 56% of the gold
was in the -38 microns fraction. For composite MT-00425, 13% of the gold was +106 microns and 76% of the
gold was in the -38 microns fraction. In comparison, composite MT-00414, which showed good gravity
performance, had 36% of the gold in the +106 microns fraction while only 31% of the gold was in the -38
microns fraction. Composite MT-00419 did not respond well to intensive leaching which can be an indication of
refractory gold.
Leaching Gravity tailings from the Knelson concentrator was split into three fractions and three bottle roll tests were performed on each composite with the following parameters:
1. Bottle roll with 18 hours leaching and 18 hours leaching/adsorption with carbon 2. Bottle roll with 6 hours of pre-lime treatment, 12 hours leaching followed by 18 hours
leaching/adsorption with carbon 3. Bottle roll with 48 hours of leaching/adsorption with carbon
Results for the bottle roll tests are summarized in Table 13.45
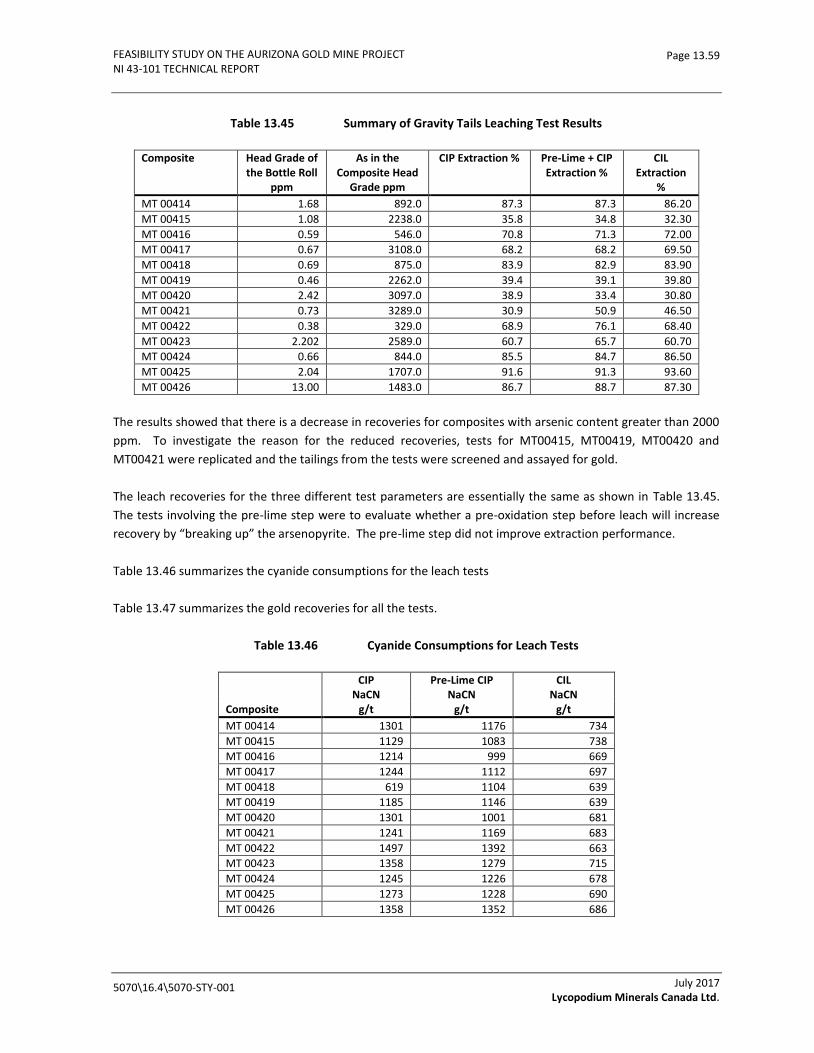
FEASIBILITY STUDY ON THE AURIZONA GOLD MINE PROJECT NI 43-101 TECHNICAL REPORT
5070\16.4\5070-STY-001
Page 13.59
July 2017 Lycopodium Minerals Canada Ltd.
Table 13.45 Summary of Gravity Tails Leaching Test Results
Composite Head Grade of the Bottle Roll
ppm
As in the Composite Head
Grade ppm
CIP Extraction % Pre-Lime + CIP Extraction %
CIL Extraction
%
MT 00414 1.68 892.0 87.3 87.3 86.20
MT 00415 1.08 2238.0 35.8 34.8 32.30
MT 00416 0.59 546.0 70.8 71.3 72.00
MT 00417 0.67 3108.0 68.2 68.2 69.50
MT 00418 0.69 875.0 83.9 82.9 83.90
MT 00419 0.46 2262.0 39.4 39.1 39.80
MT 00420 2.42 3097.0 38.9 33.4 30.80
MT 00421 0.73 3289.0 30.9 50.9 46.50
MT 00422 0.38 329.0 68.9 76.1 68.40
MT 00423 2.202 2589.0 60.7 65.7 60.70
MT 00424 0.66 844.0 85.5 84.7 86.50
MT 00425 2.04 1707.0 91.6 91.3 93.60
MT 00426 13.00 1483.0 86.7 88.7 87.30
The results showed that there is a decrease in recoveries for composites with arsenic content greater than 2000
ppm. To investigate the reason for the reduced recoveries, tests for MT00415, MT00419, MT00420 and
MT00421 were replicated and the tailings from the tests were screened and assayed for gold.
The leach recoveries for the three different test parameters are essentially the same as shown in Table 13.45.
The tests involving the pre-lime step were to evaluate whether a pre-oxidation step before leach will increase
recovery by “breaking up” the arsenopyrite. The pre-lime step did not improve extraction performance.
Table 13.46 summarizes the cyanide consumptions for the leach tests
Table 13.47 summarizes the gold recoveries for all the tests.
Table 13.46 Cyanide Consumptions for Leach Tests
CIP Pre-Lime CIP CIL NaCN NaCN NaCN Composite g/t g/t g/t
MT 00414 1301 1176 734
MT 00415 1129 1083 738
MT 00416 1214 999 669
MT 00417 1244 1112 697
MT 00418 619 1104 639
MT 00419 1185 1146 639
MT 00420 1301 1001 681
MT 00421 1241 1169 683
MT 00422 1497 1392 663
MT 00423 1358 1279 715
MT 00424 1245 1226 678
MT 00425 1273 1228 690
MT 00426 1358 1352 686
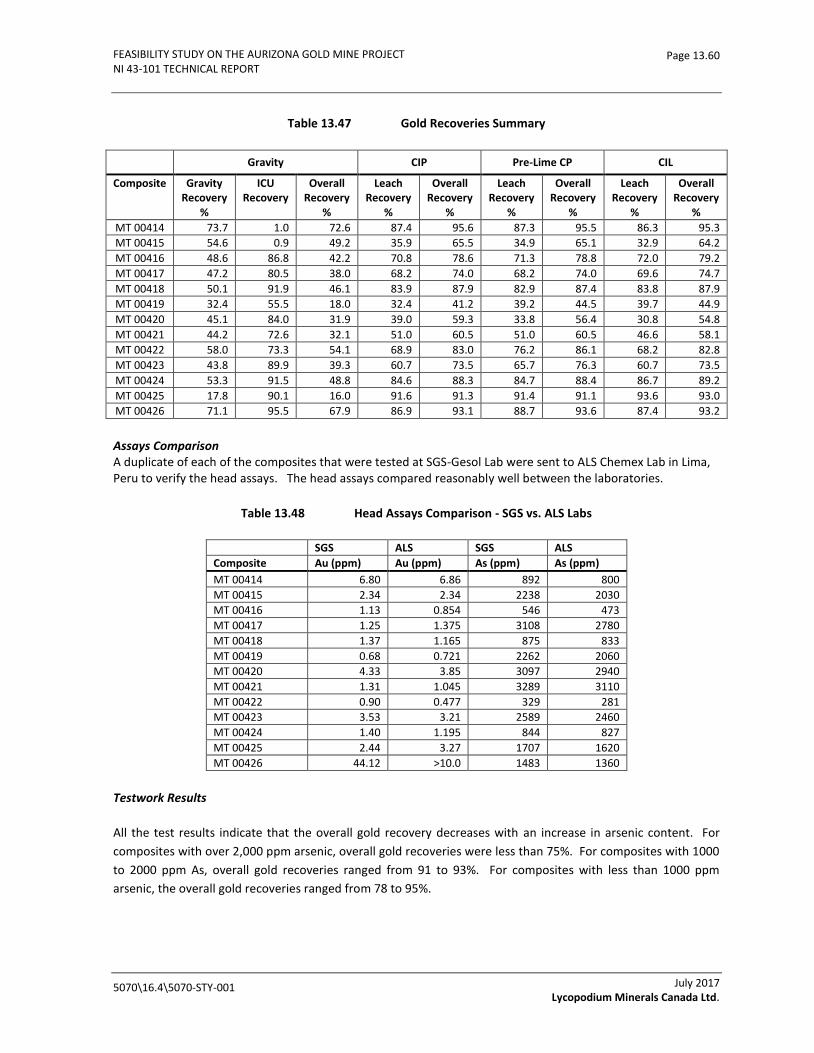
FEASIBILITY STUDY ON THE AURIZONA GOLD MINE PROJECT NI 43-101 TECHNICAL REPORT
5070\16.4\5070-STY-001
Page 13.60
July 2017 Lycopodium Minerals Canada Ltd.
Table 13.47 Gold Recoveries Summary
Gravity CIP Pre-Lime CP CIL
Composite Gravity Recovery
%
ICU Recovery
Overall Recovery
%
Leach Recovery
%
Overall Recovery
%
Leach Recovery
%
Overall Recovery
%
Leach Recovery
%
Overall Recovery
%
MT 00414 73.7 1.0 72.6 87.4 95.6 87.3 95.5 86.3 95.3
MT 00415 54.6 0.9 49.2 35.9 65.5 34.9 65.1 32.9 64.2
MT 00416 48.6 86.8 42.2 70.8 78.6 71.3 78.8 72.0 79.2
MT 00417 47.2 80.5 38.0 68.2 74.0 68.2 74.0 69.6 74.7
MT 00418 50.1 91.9 46.1 83.9 87.9 82.9 87.4 83.8 87.9
MT 00419 32.4 55.5 18.0 32.4 41.2 39.2 44.5 39.7 44.9
MT 00420 45.1 84.0 31.9 39.0 59.3 33.8 56.4 30.8 54.8
MT 00421 44.2 72.6 32.1 51.0 60.5 51.0 60.5 46.6 58.1
MT 00422 58.0 73.3 54.1 68.9 83.0 76.2 86.1 68.2 82.8
MT 00423 43.8 89.9 39.3 60.7 73.5 65.7 76.3 60.7 73.5
MT 00424 53.3 91.5 48.8 84.6 88.3 84.7 88.4 86.7 89.2
MT 00425 17.8 90.1 16.0 91.6 91.3 91.4 91.1 93.6 93.0
MT 00426 71.1 95.5 67.9 86.9 93.1 88.7 93.6 87.4 93.2
Assays Comparison A duplicate of each of the composites that were tested at SGS-Gesol Lab were sent to ALS Chemex Lab in Lima, Peru to verify the head assays. The head assays compared reasonably well between the laboratories.
Table 13.48 Head Assays Comparison - SGS vs. ALS Labs
SGS ALS SGS ALS
Composite Au (ppm) Au (ppm) As (ppm) As (ppm)
MT 00414 6.80 6.86 892 800
MT 00415 2.34 2.34 2238 2030
MT 00416 1.13 0.854 546 473
MT 00417 1.25 1.375 3108 2780
MT 00418 1.37 1.165 875 833
MT 00419 0.68 0.721 2262 2060
MT 00420 4.33 3.85 3097 2940
MT 00421 1.31 1.045 3289 3110
MT 00422 0.90 0.477 329 281
MT 00423 3.53 3.21 2589 2460
MT 00424 1.40 1.195 844 827
MT 00425 2.44 3.27 1707 1620
MT 00426 44.12 >10.0 1483 1360
Testwork Results
All the test results indicate that the overall gold recovery decreases with an increase in arsenic content. For
composites with over 2,000 ppm arsenic, overall gold recoveries were less than 75%. For composites with 1000
to 2000 ppm As, overall gold recoveries ranged from 91 to 93%. For composites with less than 1000 ppm
arsenic, the overall gold recoveries ranged from 78 to 95%.

FEASIBILITY STUDY ON THE AURIZONA GOLD MINE PROJECT NI 43-101 TECHNICAL REPORT
5070\16.4\5070-STY-001
Page 13.61
July 2017 Lycopodium Minerals Canada Ltd.
Comparison of the gold and arsenic distribution per size fraction of the leached tailings showed a strong
correlation between gold and arsenic in the minus 38 microns fraction. It is a strong indication that the un-
leached gold is associated with fine arsenopyrite.
The three different test parameters for leaching the gravity tails did not show any differences in recoveries.
In comparison with the previous testwork, reducing the leach time from 48 hours to 36 hours did not impact
gold recoveries.
High Arsenic vs. Gold Recoveries
Based on the testwork discussion in the previous sections, high arsenic levels in the samples have a negative
impact on gold recovery. To evaluate the impact of the reduced recovery in high arsenic ores, the percentage
of high arsenic ores in the deposit was calculated from a total of 2,169 assay samples in the main zone. Samples
with an arsenic level greater than 1,000 ppm are considered high arsenic ores and the results are summarized in
Table 13.49.
Table 13.49 Percentage of High Arsenic Ores in Deposit
Ore Type No. of Samples > 1000 ppm As % High As in Deposit
Saprolite 12 0.55
Transition 19 0.88
Fresh Rock 81 3.73
From Table 13.42, ores with high levels of arsenic in the saprolite and transition zones account for less than
1.5% of the ore body. Given the small amount of high arsenic ores in the saprolite and transition zones, the
effects on leach recoveries will be negligible, so no discount on gold recoveries was applied.
As for the fresh rock ores, 3.73% of the ores in this zone are considered as high arsenic ores. To account for
this, five high arsenic test recoveries were included in the calculation of the average gold recoveries out of a
total of 79 tests. The average gold recovery including the high arsenic tests is 90.0%, a discount of 2.0% in gold
recovery if no arsenic tests are included in the calculations.
This percent of estimated high arsenic ores will likely be even lower. For example, in fresh rocks only 2% of
estimated blocks above 0.6% gold cut-off have the estimated arsenic values higher than 1000 ppm. Microscopic
investigations of the samples should be performed to analyze the deportment of the gold in the samples to
establish the possible causes of the reduced recovery in these high arsenic samples.
Metallurgical Testwork on Aurizona Gold Ore containing High Carbonaceous Material
Nineteen composites of gold bearing ores with high carbonaceous material were provided to ALS Metallurgy in
Santiago to evaluate the potential impact of preg-robbing activity on overall gold recovery. Tests were
conducted to evaluate the relative preg-robbing nature of the samples.
FEASIBILITY STUDY ON THE AURIZONA GOLD MINE PROJECT NI 43-101 TECHNICAL REPORT
5070\16.4\5070-STY-001
Page 13.62
July 2017 Lycopodium Minerals Canada Ltd.
A common laboratory technique to determine preg-robbing affinity is to compare the amount of gold absorbed
onto the ore from a known gold-spiked leach solution to the same ore leached with an un-spiked solution. This
test will yield the relative preg-robbing nature of the ore but does not yield any specific information as to the
chemical and physical nature of the sample.
This analysis requires two leaches per sample. One regular leach, and one spike leach. Gold retention is
measured by comparing the two results.
For the regular leach, a prepared sample is weighed into a closed 100 mL plastic vessel, to which a sodium
cyanide solution (0.25% NaCN) is added. The sample is immediately shaken until homogenized, and rolled for an
additional hour. An aliquot of the final leach solution is centrifuged then analyzed by atomic absorption
spectrometry (AAS) with background correction.
For the spike leach, a prepared sample is weighed into a plastic vessel, to which, a leach solution, 0.25% NaCN,
and gold spike solution (3.4 mg/L) are added. The solution is then homogenized and rolled for a specified time.
After rolling, a portion of the leachate is withdrawn, centrifuged until clear, and analyzed by AASagainst matrix
matched standards.
Samples The initial step in the process of selecting samples for the preg-robbing testwork reported herein was a thorough review of historical data to ensure that samples were correctly characterized, e.g. rock and weathering types, and consistent with current geological model. The data were then scrutinized and samples selectively chosen to ensure there was adequate representation of lithology, alteration and weathering types; the range of gold grades (low, medium, high); ore versus waste when pertinent; the range and type of carbon present and general spatial distribution throughout the ore deposit. For the purpose of this study, moderate to strong carbon content samples were used based on geological logging. The samples were provided by the Exploration Geologist of MASA. Half cores from different drill holes are combined to make the test composites. Summary of Results
Table 13.50 summarizes the test results for Au-AA31a and Au-AA31.

FEASIBILITY STUDY ON THE AURIZONA GOLD MINE PROJECT NI 43-101 TECHNICAL REPORT
5070\16.4\5070-STY-001
Page 13.63
July 2017 Lycopodium Minerals Canada Ltd.
Table 13.50 Results of Au-AA31a and Au-AA31 Tests
Au-AA31a Au-AA31
Organic Leach Au w/o Initial Au in Final Au in
Composite Carbon Spike Solution Spike Solution Spike Solution
% mg/l mg/l mg/l
MT-00 395 0.18 0.68 3.43 4.79
MT-00 396 0.26 0.66 3.43 4.30
MT-00 397 0.34 1.70 3.43 4.98
MT-00 398 0.15 0.08 3.43 3.40
MT-00 399 0.02 0.36 3.43 3.64
MT-00 400 0.48 1.56 3.43 5.05
MT-00 401 0.68 0.30 3.43 3.42
MT-00 402 0.77 0.31 3.43 2.21
MT-00 403 0.29 0.09 3.43 3.45
MT-00 404 0.11 0.79 3.43 3.95
MT-00 405 0.45 0.60 3.43 2.23
MT-00 406 0.39 0.23 3.43 3.22
MT-00 407 0.20 2.52 3.43 5.89
MT-00 408 0.42 1.58 3.43 2.96
MT-00 409 0.33 2.07 3.43 4.00
MT-00 410 0.11 2.25 3.43 5.28
MT-00 411 2.10 1.80 3.43 3.64
MT-00 412 0.58 35.10 3.43 42.10
MT-00 413 0.63 0.11 3.43 3.34
Discussion
The Preg-robbing Index (PRI) is calculated to evaluate the relative preg-robbing characteristics of the samples.
The PRI of the samples can be characterized as:
PRI = AuCN (ppm) + 3.4 ppm – AuPR
where AuCN is the cyanide- leachable gold of an ore sample, AuPR is the final gold concentration after being
preg-robbed and 3.4 ppm is the amount of gold spiked in the leach test.
For a highly preg-robbing material, the AuPR approaches zero (gold is fully adsorbed or preg-robbed), therefore
the PRI value would be > 3.4ppm. For a non-preg-robbing ore, AuPR is equal to the concentration of AuCN plus
the spiked 3.4 ppm gold, which yields zero preg-robbing value.
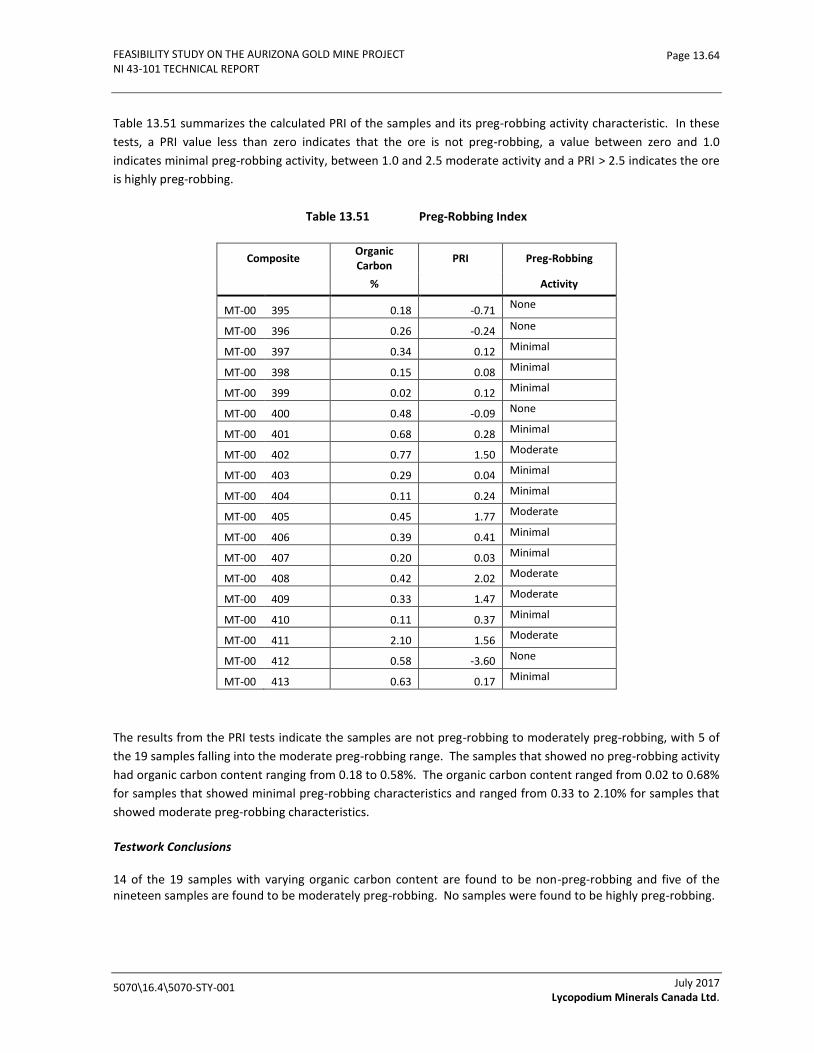
FEASIBILITY STUDY ON THE AURIZONA GOLD MINE PROJECT NI 43-101 TECHNICAL REPORT
5070\16.4\5070-STY-001
Page 13.64
July 2017 Lycopodium Minerals Canada Ltd.
Table 13.51 summarizes the calculated PRI of the samples and its preg-robbing activity characteristic. In these
tests, a PRI value less than zero indicates that the ore is not preg-robbing, a value between zero and 1.0
indicates minimal preg-robbing activity, between 1.0 and 2.5 moderate activity and a PRI > 2.5 indicates the ore
is highly preg-robbing.
Table 13.51 Preg-Robbing Index
Composite Organic Carbon
PRI Preg-Robbing
%
Activity
MT-00 395 0.18 -0.71 None
MT-00 396 0.26 -0.24 None
MT-00 397 0.34 0.12 Minimal
MT-00 398 0.15 0.08 Minimal
MT-00 399 0.02 0.12 Minimal
MT-00 400 0.48 -0.09 None
MT-00 401 0.68 0.28 Minimal
MT-00 402 0.77 1.50 Moderate
MT-00 403 0.29 0.04 Minimal
MT-00 404 0.11 0.24 Minimal
MT-00 405 0.45 1.77 Moderate
MT-00 406 0.39 0.41 Minimal
MT-00 407 0.20 0.03 Minimal
MT-00 408 0.42 2.02 Moderate
MT-00 409 0.33 1.47 Moderate
MT-00 410 0.11 0.37 Minimal
MT-00 411 2.10 1.56 Moderate
MT-00 412 0.58 -3.60 None
MT-00 413 0.63 0.17 Minimal
The results from the PRI tests indicate the samples are not preg-robbing to moderately preg-robbing, with 5 of
the 19 samples falling into the moderate preg-robbing range. The samples that showed no preg-robbing activity
had organic carbon content ranging from 0.18 to 0.58%. The organic carbon content ranged from 0.02 to 0.68%
for samples that showed minimal preg-robbing characteristics and ranged from 0.33 to 2.10% for samples that
showed moderate preg-robbing characteristics.
Testwork Conclusions 14 of the 19 samples with varying organic carbon content are found to be non-preg-robbing and five of the nineteen samples are found to be moderately preg-robbing. No samples were found to be highly preg-robbing.

FEASIBILITY STUDY ON THE AURIZONA GOLD MINE PROJECT NI 43-101 TECHNICAL REPORT
5070\16.4\5070-STY-001
Page 13.65
July 2017 Lycopodium Minerals Canada Ltd.
High Carbon Content versus Gold Recoveries
Carbonaceous material was identified during the geological logging process. Test work targeting high carbon
content was performed to investigate the potential preg-robbing activity.
Based on the testwork results on these samples, the majority of the samples showed no to minimal preg-
robbing characteristics. A few of the samples showed moderate preg-robbing activity and no samples indicated
high preg-robbing activity.
During the arsenic testwork program, bottle-roll tests were performed on 13 samples with varying arsenic
content and spatial distribution. Three bottle-roll tests were performed for each of the samples with the
following parameters:
1. Bottle roll with 18 hours leaching and 18 hours leaching/adsorption with carbon 2. Bottle roll with 6 hours of pre-lime treatment, 12 hours leaching followed by 18 hours
leaching/adsorption with carbon 3. Bottle roll with 48 hours of leaching/adsorption with carbon
The leach recoveries for the three different test parameters are effectively the same, which indicates that preg-
robbing was not observed for these samples. The results are summarized in Table 13.45.
Given the results from the preg-robbing and arsenic study and that this high carbonaceous material contributes
to a minute percentage of the orebody, it was determined that the impact on overall gold recoveries is
negligible and no discount on gold recoveries is applied. Table 13.51 provides more geological information
regarding the carbonaceous material.
If required, there are several things during operating that can be done to minimize the preg-robbing effects
when processing these high organic carbon ores:
Keep the moderately preg-robbing ores (high organic carbon content) from the non-graphitic ores.
Maximize gravity circuit gold recovery.
Ensure the activity of the activated carbon is maintained through routine regeneration and testing.
Increase carbon concentration in adsorption tanks.
Adding blinding agent, such as kerosene or diesel, to foul the carbonaceous material. Testwork will
need to be performed to investigate dosage rate to ensure that the activity of the activated carbon is
maintained and not affected by the blinding agent.
Modify the leach circuit to a CIL circuit.

FEASIBILITY STUDY ON THE AURIZONA GOLD MINE PROJECT NI 43-101 TECHNICAL REPORT
5070\16.4\5070-STY-001
Page 13.66
July 2017 Lycopodium Minerals Canada Ltd.
13.2 Metallurgical Performance Projections
According to the test results, the gold metallurgical performances for the different ore types in the mine plan
are shown in Table 13.52.
Table 13.52 Metallurgical Performance Summary
Recoveries Unit Value
Gravity/Intensive Leach - Piaba Saprolite % 21.4
Gravity/Intensive Leach - Piaba Transition % 35.6
Gravity/Intensive Leach - Piaba Fresh Rock % 36.2
Gravity/Intensive Leach - Boa Esperança Saprolite % 19.8
Gravity/Intensive Leach - Boa Esperança Transition % 65.4
Cyanidation - Piaba Saprolite % 72.8
Cyanidation - Piaba Transition % 59.4
Cyanidation - Piaba Fresh Rock % 54.7
Cyanidation - Boa Esperança Saprolite % 73.1
Cyanidation - Boa Esperança Transition % 32.2
Elution / Carbon Handling / EW - All Ore Types % 98.5
Overall - Piaba Saprolite % 93.1
Overall - Piaba Transition % 94.1
Overall - Piaba Fresh Rock % 90.0
Overall - Boa Esperança Saprolite % 91.8
Overall - Boa Esperança Transition % 97.1

FEASIBILITY STUDY ON THE AURIZONA GOLD MINE PROJECT NI 43-101 TECHNICAL REPORT
Page 14.1
14.0 MINERAL RESOURCE ESTIMATES
14.1 Introduction
The Mineral Resource Statement presented herein represents the gold mineral resource evaluation prepared for the Project in accordance with the NI 43-101.
The mineral resource model prepared by SRK considers 1,334 drill holes for both the Piaba and Boa Esperança deposits. The drill holes prior to 2007 were drilled by Gencor and Eldorado. Trek conducted all drilling during the period of 2007 to 2016. The resource estimation work was completed by Marek Nowak, P.Eng (APEGBC #16985), appropriate “independent qualified person” as this term is defined in NI 43-101. The effective date of the resource statement is January 5, 2017.
This section describes the resource estimation methodology and summarizes the key assumptions considered by SRK. It is the opinion of SRK that the resource evaluation reported herein is a reasonable representation of the gold mineral resources found on the Project at the current level of sampling. The mineral resources have been estimated in conformity with generally accepted CIM “Estimation of Mineral Resource and Mineral Reserves Best Practices” guidelines and are reported in accordance with NI 43-101. Mineral resources are not mineral reserves and do not have demonstrated economic viability. There is no certainty that all or any part of the mineral resource will be converted into mineral reserve.
The database used to estimate the Aurizona Project mineral resources was audited by SRK. SRK is of the opinion that the current drilling information is sufficiently reliable to interpret with confidence the boundaries for gold mineralization, and that the assay data are sufficiently reliable to support mineral resource estimation.
Leapfrog GeoTM 4.0 was used to construct the geological solids and GEOVIA GEMSTM was used to prepare assay data for geostatistical analysis, construct the block model, estimate metal grades, and tabulate mineral resources. Statistical analysis was completed in non-commercial software and in SAGE for variography analysis.
14.2 Resource Estimation Procedures
The resource evaluation methodology involved the following procedures:
• Database compilation and verification.
• Construction of wireframe models for the boundaries of the mineralization.
• Definition of resource domains.
• Data conditioning (compositing and capping) for geostatistical analysis and variography.
• Block modelling and grade interpolation.
5070\16.4\5070-STY-001
July 2017 Lycopodium Minerals Canada Ltd.
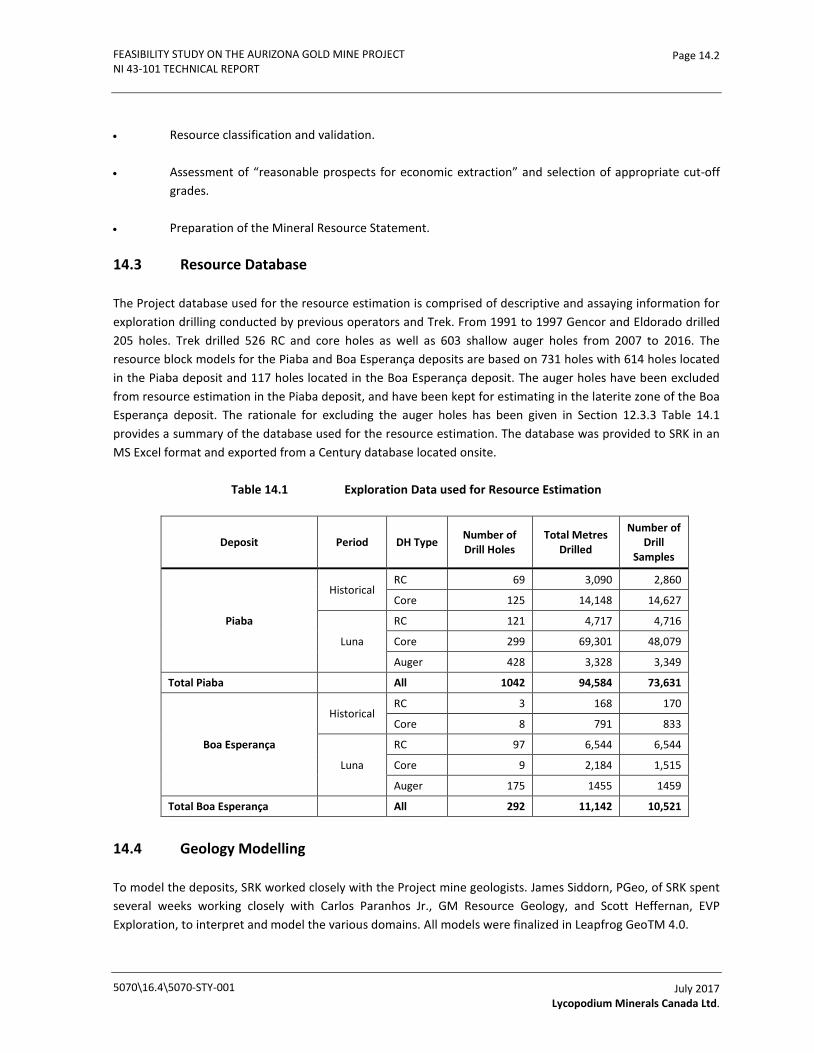
FEASIBILITY STUDY ON THE AURIZONA GOLD MINE PROJECT NI 43-101 TECHNICAL REPORT
Page 14.2
• Resource classification and validation.
• Assessment of “reasonable prospects for economic extraction” and selection of appropriate cut-off grades.
• Preparation of the Mineral Resource Statement.
14.3 Resource Database
The Project database used for the resource estimation is comprised of descriptive and assaying information for exploration drilling conducted by previous operators and Trek. From 1991 to 1997 Gencor and Eldorado drilled 205 holes. Trek drilled 526 RC and core holes as well as 603 shallow auger holes from 2007 to 2016. The resource block models for the Piaba and Boa Esperança deposits are based on 731 holes with 614 holes located in the Piaba deposit and 117 holes located in the Boa Esperança deposit. The auger holes have been excluded from resource estimation in the Piaba deposit, and have been kept for estimating in the laterite zone of the Boa Esperança deposit. The rationale for excluding the auger holes has been given in Section 12.3.3 Table 14.1 provides a summary of the database used for the resource estimation. The database was provided to SRK in an MS Excel format and exported from a Century database located onsite.
Table 14.1 Exploration Data used for Resource Estimation
Deposit Period DH Type Number of Drill Holes
Total Metres Drilled
Number of Drill
Samples
Piaba
Historical RC 69 3,090 2,860
Core 125 14,148 14,627
Luna
RC 121 4,717 4,716
Core 299 69,301 48,079
Auger 428 3,328 3,349
Total Piaba All 1042 94,584 73,631
Boa Esperança
Historical RC 3 168 170
Core 8 791 833
Luna
RC 97 6,544 6,544
Core 9 2,184 1,515
Auger 175 1455 1459
Total Boa Esperança All 292 11,142 10,521
14.4 Geology Modelling
To model the deposits, SRK worked closely with the Project mine geologists. James Siddorn, PGeo, of SRK spent several weeks working closely with Carlos Paranhos Jr., GM Resource Geology, and Scott Heffernan, EVP Exploration, to interpret and model the various domains. All models were finalized in Leapfrog GeoTM 4.0.
5070\16.4\5070-STY-001
July 2017 Lycopodium Minerals Canada Ltd.

FEASIBILITY STUDY ON THE AURIZONA GOLD MINE PROJECT NI 43-101 TECHNICAL REPORT
Page 14.3
14.4.1 Piaba
Gold mineralization in the Piaba deposit is structurally controlled and is situated near and within the highly fractured quartz diorite. A mineralized envelope is associated with intense hydrothermal alteration and quartz veining. The mineralization exhibits a tabular form and is confined to a deformational corridor predominantly trending 70º and steeply dipping to the northwest. The mineralization within the deposit is strongly associated with structural controls including small splay faults from the main shear corridor. In addition, weathering profiles also influence gold distribution.
The following domains, surfaces and faults were modelled from drill hole intercepts and sectional interpretations:
Lithology (Figure 14.1)
• Quartz diorite
• Metasedimentary rocks
• Diorite
• Feldspar quartz diorite
Alteration (Figure 14.2)
• Sulphide
• Silicification
Note that the silicification and sulphide solids follow very closely a high grade gold zone domain.
Weathering (Figure 14.3)
• Laterite
• Saprolite
• Transition
Note that the weathering surfaces are modelled across both the Piaba and Boa Esperança deposits.
5070\16.4\5070-STY-001
July 2017 Lycopodium Minerals Canada Ltd.
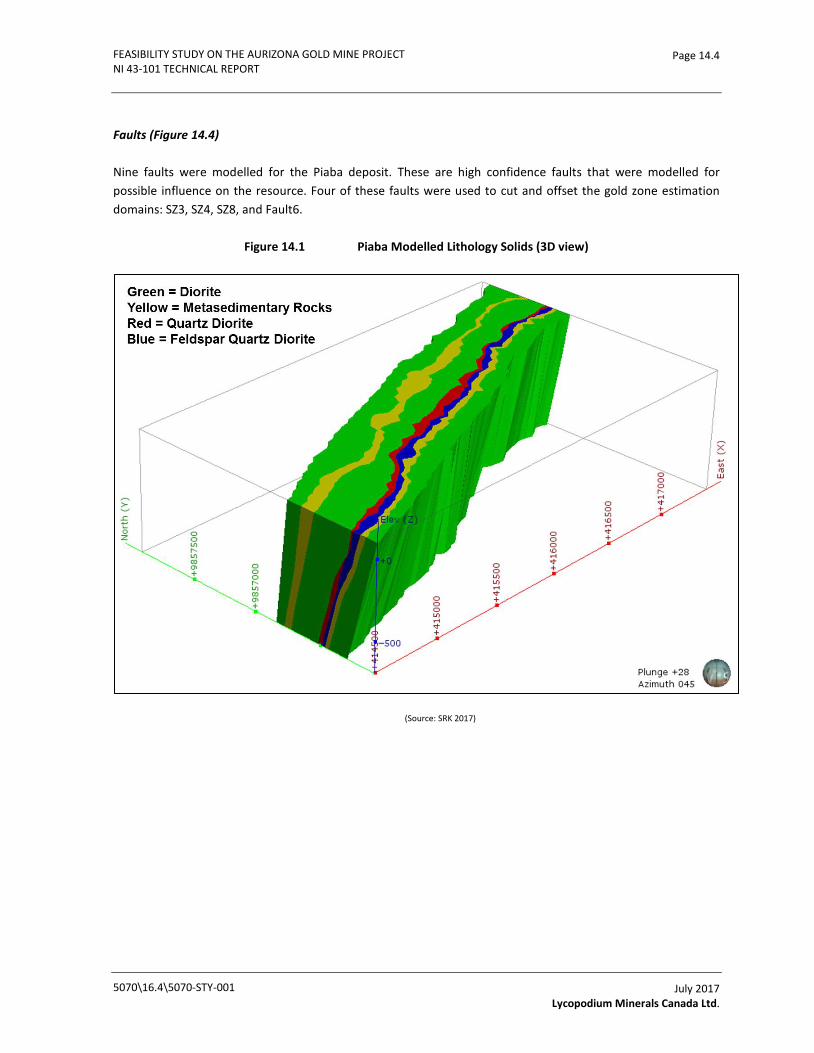
FEASIBILITY STUDY ON THE AURIZONA GOLD MINE PROJECT NI 43-101 TECHNICAL REPORT
Page 14.4
Faults (Figure 14.4)
Nine faults were modelled for the Piaba deposit. These are high confidence faults that were modelled for possible influence on the resource. Four of these faults were used to cut and offset the gold zone estimation domains: SZ3, SZ4, SZ8, and Fault6.
Figure 14.1 Piaba Modelled Lithology Solids (3D view)
(Source: SRK 2017)
5070\16.4\5070-STY-001
July 2017 Lycopodium Minerals Canada Ltd.
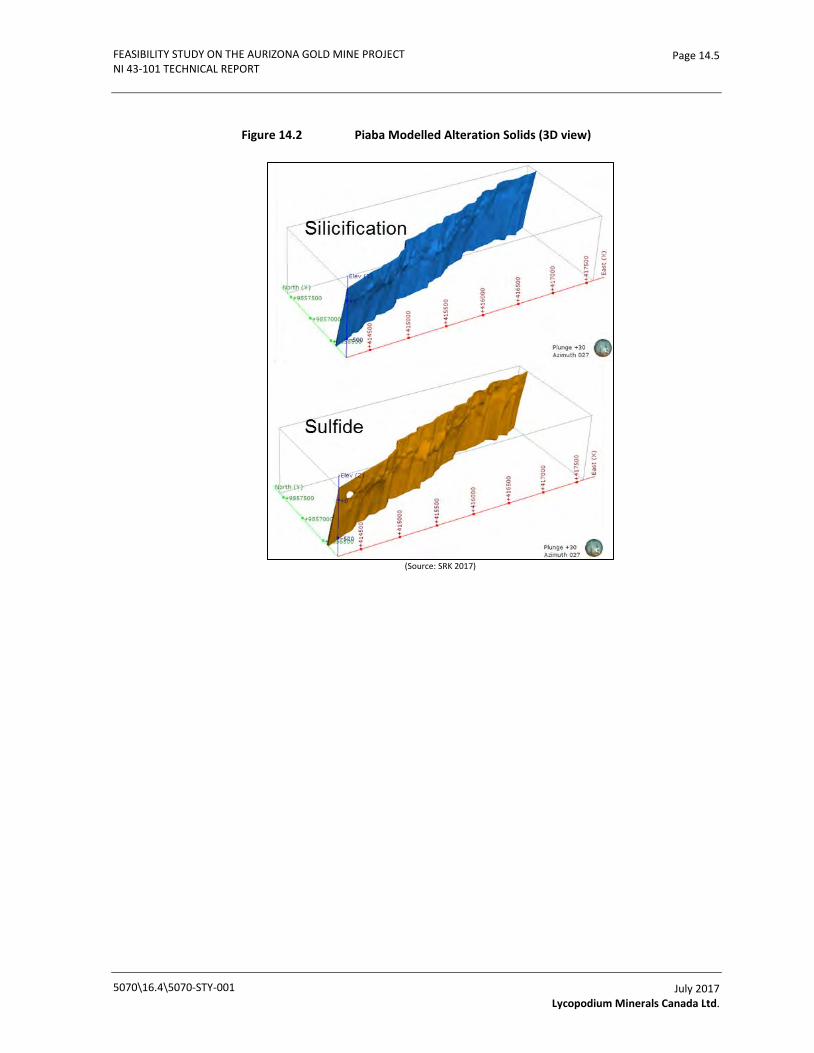
FEASIBILITY STUDY ON THE AURIZONA GOLD MINE PROJECT NI 43-101 TECHNICAL REPORT
Page 14.5
Figure 14.2 Piaba Modelled Alteration Solids (3D view)
(Source: SRK 2017)
5070\16.4\5070-STY-001
July 2017 Lycopodium Minerals Canada Ltd.

FEASIBILITY STUDY ON THE AURIZONA GOLD MINE PROJECT NI 43-101 TECHNICAL REPORT
Page 14.6
Figure 14.3 Piaba and Boa Esperança Modelled Weathering Contacts (View Looking E)
(Source: SRK 2017)
5070\16.4\5070-STY-001
July 2017 Lycopodium Minerals Canada Ltd.
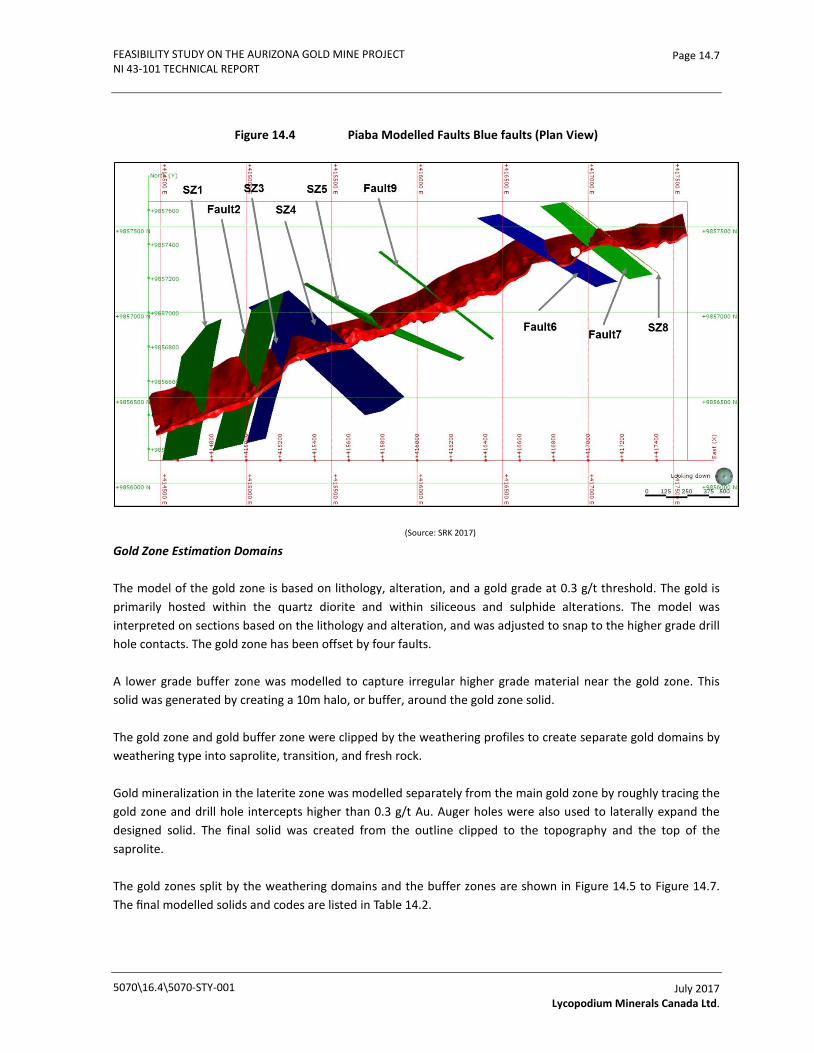
FEASIBILITY STUDY ON THE AURIZONA GOLD MINE PROJECT NI 43-101 TECHNICAL REPORT
Page 14.7
Figure 14.4 Piaba Modelled Faults Blue faults (Plan View)
(Source: SRK 2017)
Gold Zone Estimation Domains
The model of the gold zone is based on lithology, alteration, and a gold grade at 0.3 g/t threshold. The gold is primarily hosted within the quartz diorite and within siliceous and sulphide alterations. The model was interpreted on sections based on the lithology and alteration, and was adjusted to snap to the higher grade drill hole contacts. The gold zone has been offset by four faults.
A lower grade buffer zone was modelled to capture irregular higher grade material near the gold zone. This solid was generated by creating a 10m halo, or buffer, around the gold zone solid.
The gold zone and gold buffer zone were clipped by the weathering profiles to create separate gold domains by weathering type into saprolite, transition, and fresh rock.
Gold mineralization in the laterite zone was modelled separately from the main gold zone by roughly tracing the gold zone and drill hole intercepts higher than 0.3 g/t Au. Auger holes were also used to laterally expand the designed solid. The final solid was created from the outline clipped to the topography and the top of the saprolite.
The gold zones split by the weathering domains and the buffer zones are shown in Figure 14.5 to Figure 14.7. The final modelled solids and codes are listed in Table 14.2.
5070\16.4\5070-STY-001
July 2017 Lycopodium Minerals Canada Ltd.

FEASIBILITY STUDY ON THE AURIZONA GOLD MINE PROJECT NI 43-101 TECHNICAL REPORT
Page 14.8
Table 14.2 Piaba: Final Estimation Domains
Zone Weathering Estimation Domain
Block Model Code
Gold Zone
Laterite GZLat 21
Saprolite GZSapr 22
Transition GZTran 23
Fresh GZFrsh 24
Buffer Zone
Saprolite BFSapr 32
Transition BFTran 33
Fresh BFFrsh 34
Waste Waste >40
Figure 14.5 Gold Zone Clipped by Weathering Contacts (3D View looking NW)
(Source: SRK 2017)
5070\16.4\5070-STY-001
July 2017 Lycopodium Minerals Canada Ltd.
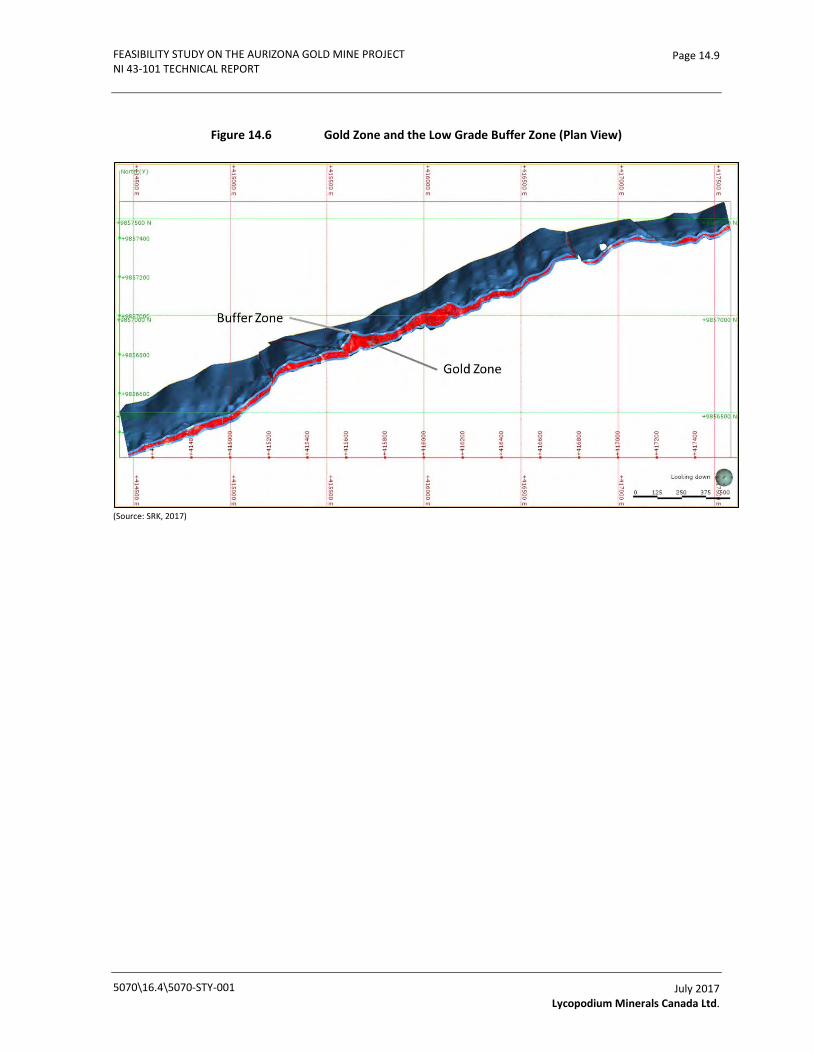
FEASIBILITY STUDY ON THE AURIZONA GOLD MINE PROJECT NI 43-101 TECHNICAL REPORT
Page 14.9
Figure 14.6 Gold Zone and the Low Grade Buffer Zone (Plan View)
(Source: SRK, 2017)
5070\16.4\5070-STY-001
July 2017 Lycopodium Minerals Canada Ltd.

FEASIBILITY STUDY ON THE AURIZONA GOLD MINE PROJECT NI 43-101 TECHNICAL REPORT
Page 14.10
Figure 14.7 Cross Section of the Gold Zone and the Low Grade Buffer Zone (View Looking NE)
(Source: SRK 2017)
14.4.2 Boa Esperança
The following domains and surfaces were modelled from drill hole intercepts and sectional interpretations:
Lithology (Figure 14.8)
• Metasedimentary rocks
5070\16.4\5070-STY-001
July 2017 Lycopodium Minerals Canada Ltd.
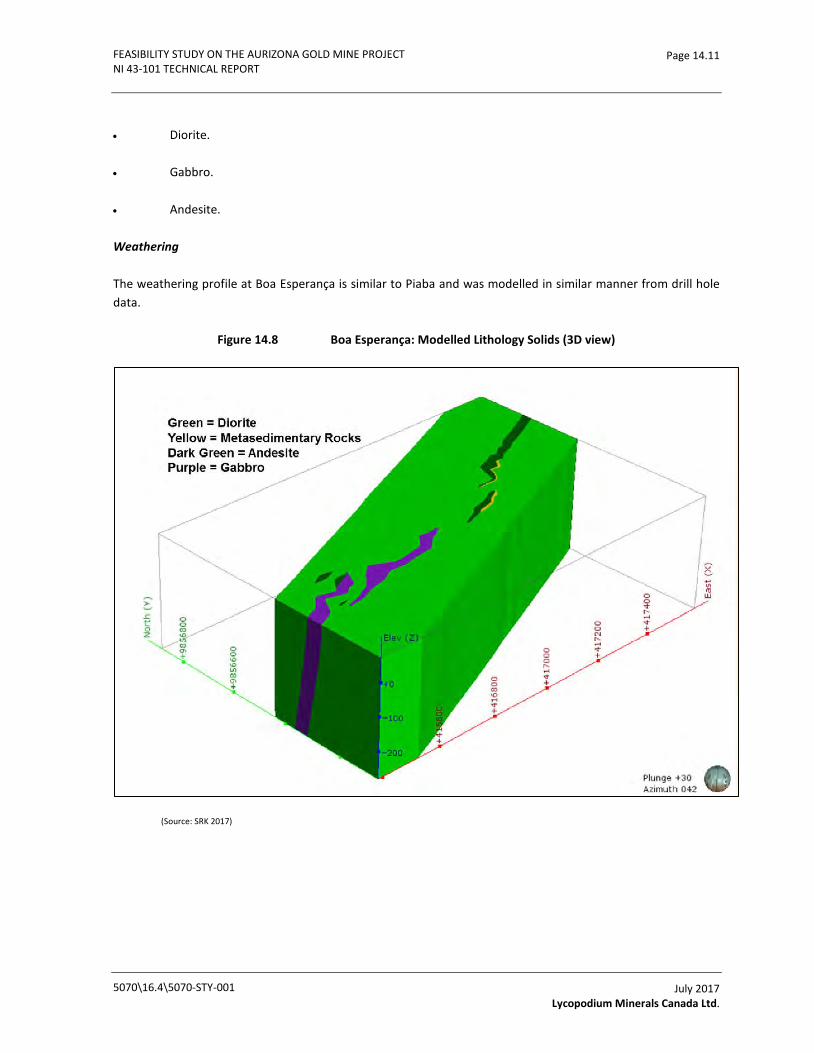
FEASIBILITY STUDY ON THE AURIZONA GOLD MINE PROJECT NI 43-101 TECHNICAL REPORT
Page 14.11
• Diorite.
• Gabbro.
• Andesite.
Weathering
The weathering profile at Boa Esperança is similar to Piaba and was modelled in similar manner from drill hole data.
Figure 14.8 Boa Esperança: Modelled Lithology Solids (3D view)
(Source: SRK 2017)
5070\16.4\5070-STY-001
July 2017 Lycopodium Minerals Canada Ltd.
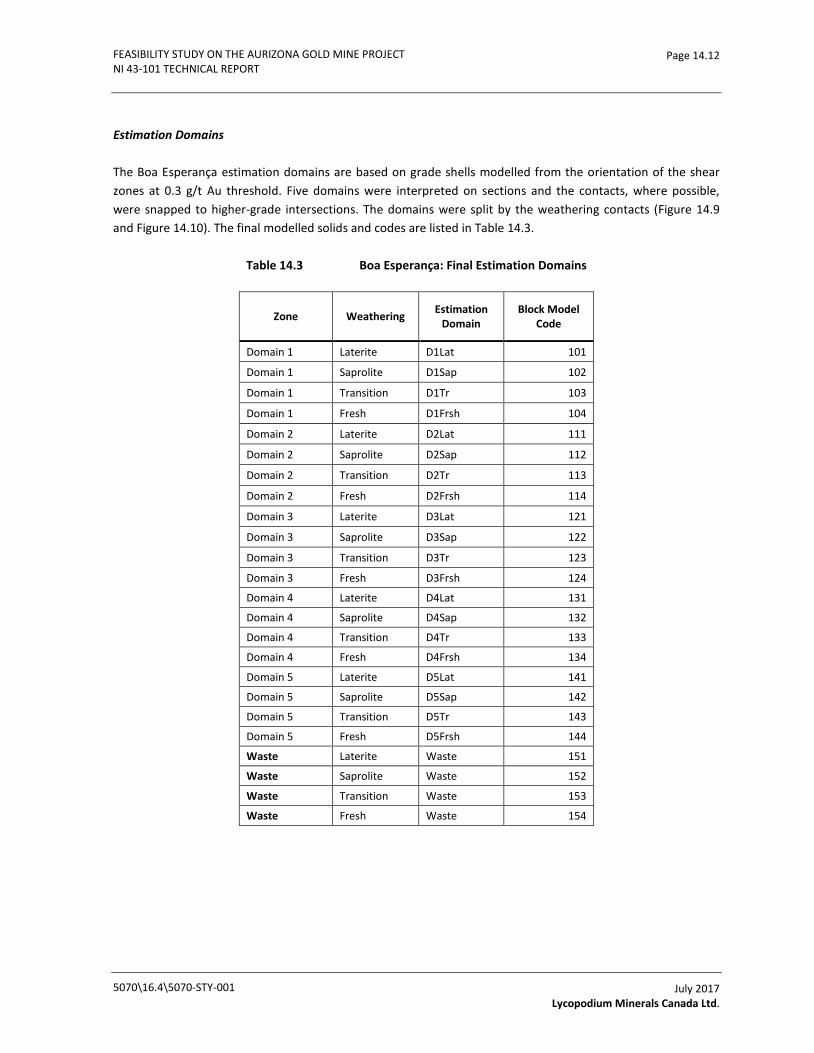
FEASIBILITY STUDY ON THE AURIZONA GOLD MINE PROJECT NI 43-101 TECHNICAL REPORT
Page 14.12
Estimation Domains
The Boa Esperança estimation domains are based on grade shells modelled from the orientation of the shear zones at 0.3 g/t Au threshold. Five domains were interpreted on sections and the contacts, where possible, were snapped to higher-grade intersections. The domains were split by the weathering contacts (Figure 14.9 and Figure 14.10). The final modelled solids and codes are listed in Table 14.3.
Table 14.3 Boa Esperança: Final Estimation Domains
Zone Weathering Estimation Domain
Block Model Code
Domain 1 Laterite D1Lat 101
Domain 1 Saprolite D1Sap 102
Domain 1 Transition D1Tr 103
Domain 1 Fresh D1Frsh 104
Domain 2 Laterite D2Lat 111
Domain 2 Saprolite D2Sap 112
Domain 2 Transition D2Tr 113
Domain 2 Fresh D2Frsh 114
Domain 3 Laterite D3Lat 121
Domain 3 Saprolite D3Sap 122
Domain 3 Transition D3Tr 123
Domain 3 Fresh D3Frsh 124
Domain 4 Laterite D4Lat 131
Domain 4 Saprolite D4Sap 132
Domain 4 Transition D4Tr 133
Domain 4 Fresh D4Frsh 134
Domain 5 Laterite D5Lat 141
Domain 5 Saprolite D5Sap 142
Domain 5 Transition D5Tr 143
Domain 5 Fresh D5Frsh 144
Waste Laterite Waste 151
Waste Saprolite Waste 152
Waste Transition Waste 153
Waste Fresh Waste 154
5070\16.4\5070-STY-001
July 2017 Lycopodium Minerals Canada Ltd.

FEASIBILITY STUDY ON THE AURIZONA GOLD MINE PROJECT NI 43-101 TECHNICAL REPORT
Page 14.13
Figure 14.9 Boa Esperança: Estimation Domains (3D View)
(Source: SRK 2017)
5070\16.4\5070-STY-001
July 2017 Lycopodium Minerals Canada Ltd.

FEASIBILITY STUDY ON THE AURIZONA GOLD MINE PROJECT NI 43-101 TECHNICAL REPORT
Page 14.14
Figure 14.10 Boa Esperança: Estimation Domains Clipped by Weathering Contacts (View Looking ENE)
(Source: SRK 2017)
14.5 Compositing
14.5.1 Piaba
Before compositing, SRK capped one extreme assay value of 1,103 g/t to 310 g/t. In addition, the influence of high grade assays has been further limited by capping the composites as described in Section 14.6. All assays were composited to 2m intervals within the gold and the buffer zone prior to resource estimation. All composites less than 0.5m in length were excluded from the estimation process.
5070\16.4\5070-STY-001
July 2017 Lycopodium Minerals Canada Ltd.
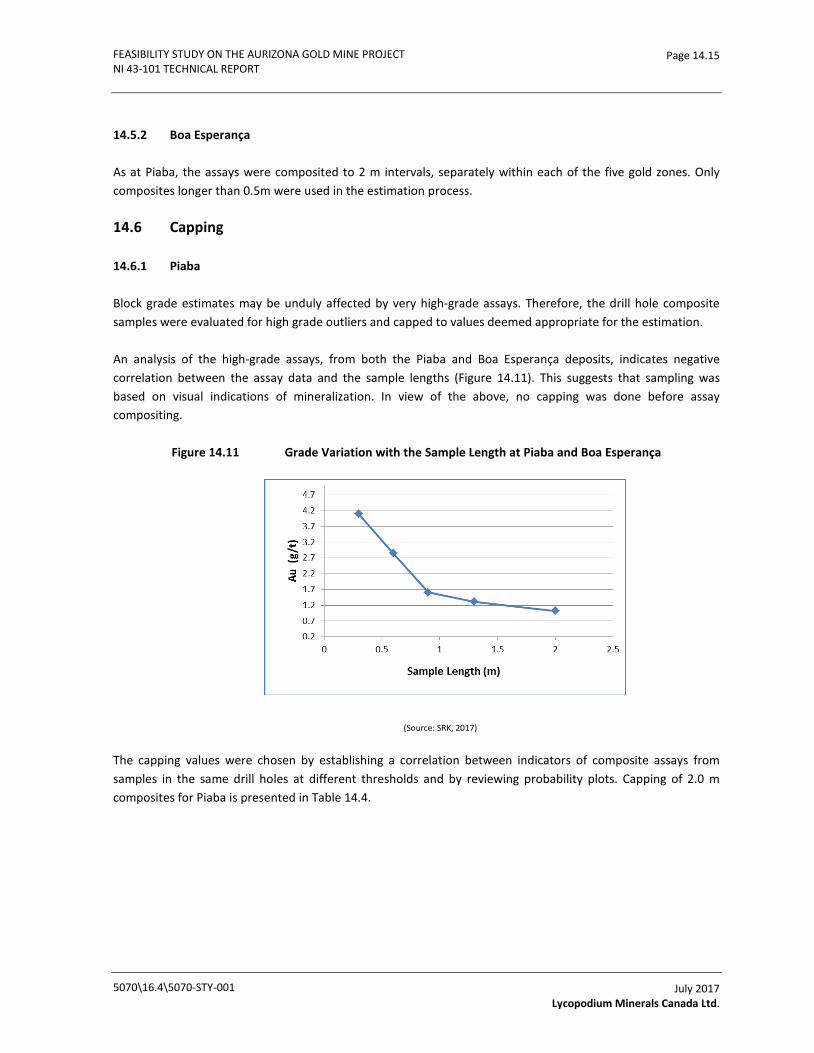
FEASIBILITY STUDY ON THE AURIZONA GOLD MINE PROJECT NI 43-101 TECHNICAL REPORT
Page 14.15
14.5.2 Boa Esperança
As at Piaba, the assays were composited to 2 m intervals, separately within each of the five gold zones. Only composites longer than 0.5m were used in the estimation process.
14.6 Capping
14.6.1 Piaba
Block grade estimates may be unduly affected by very high-grade assays. Therefore, the drill hole composite samples were evaluated for high grade outliers and capped to values deemed appropriate for the estimation.
An analysis of the high-grade assays, from both the Piaba and Boa Esperança deposits, indicates negative correlation between the assay data and the sample lengths (Figure 14.11). This suggests that sampling was based on visual indications of mineralization. In view of the above, no capping was done before assay compositing.
Figure 14.11 Grade Variation with the Sample Length at Piaba and Boa Esperança
(Source: SRK, 2017)
The capping values were chosen by establishing a correlation between indicators of composite assays from samples in the same drill holes at different thresholds and by reviewing probability plots. Capping of 2.0 m composites for Piaba is presented in Table 14.4.
5070\16.4\5070-STY-001
July 2017 Lycopodium Minerals Canada Ltd.

FEASIBILITY STUDY ON THE AURIZONA GOLD MINE PROJECT NI 43-101 TECHNICAL REPORT
Page 14.16
Table 14.4 Piaba Gold Composite Capping
Estimation Domain
Max Composite Assay (%)
Number of Data
Capped Value
Number Capped
Average Uncapped
Average Capped %Diff
GZLat 100.7 1,148 30 3 0.89 0.85 4
GZSapr 168.0 3,013 40 7 1.32 1.28 3
GZTran 68.0 1,622 10 13 1.2 1.11 7
GZFrsh 123.0 5,063 40 9 1.31 1.29 2
BFSapr 8.4 2,076 4 6 0.15 0.14 7
BFTran 6.9 986 3 9 0.16 0.15 6
BFFrsh 37.2 3,655 5 14 0.11 0.09 18
Waste 44.3 24,245 2 120 0.045 0.041 9
14.6.2 Boa Esperança
The procedure for capping the extreme values for Boa Esperança was identical to the one applied at Piaba. Table 14.5 summarizes the composite capping levels for Boa Esperança.
Table 14.5 Boa Esperança Gold Composite Capping
Estimation Domain
Max Composite Assay (%)
Number of Data
Capped Value
Number Capped
Average Uncapped
Average Capped %Diff Est Dom
D1Lat 3.9 52 3.00 2 1.09 0.97 11 101
D1SapTrFrsh 43.3 158 5.00 4 0.73 0.64 12 102-104
D2Lat 2.7 89 2.00 7 0.58 0.56 3 111
D2SapTrFrsh 5.5 148 4.00 3 0.93 0.9 3 112-114
D3Lat 8.0 69 2.50 3 0.58 0.54 7 121
D3SapTrFrsh 7.7 161 4.00 5 1.03 1.03 0 122-124
D4Lat 0.9 47 0.70 3 0.38 0.36 5 131
D4SapTrFrsh 4.9 75 2.50 3 0.77 0.69 10 132-134
D5Lat 0.93 2 0.70 1 0.4 0.33 18 141
D5SapTrFrsh 2.28 12 0.70 1 0.39 0.37 5 142-144
Waste 4.998 4145 1.00 27 0.05 0.05 0 150
5070\16.4\5070-STY-001
July 2017 Lycopodium Minerals Canada Ltd.
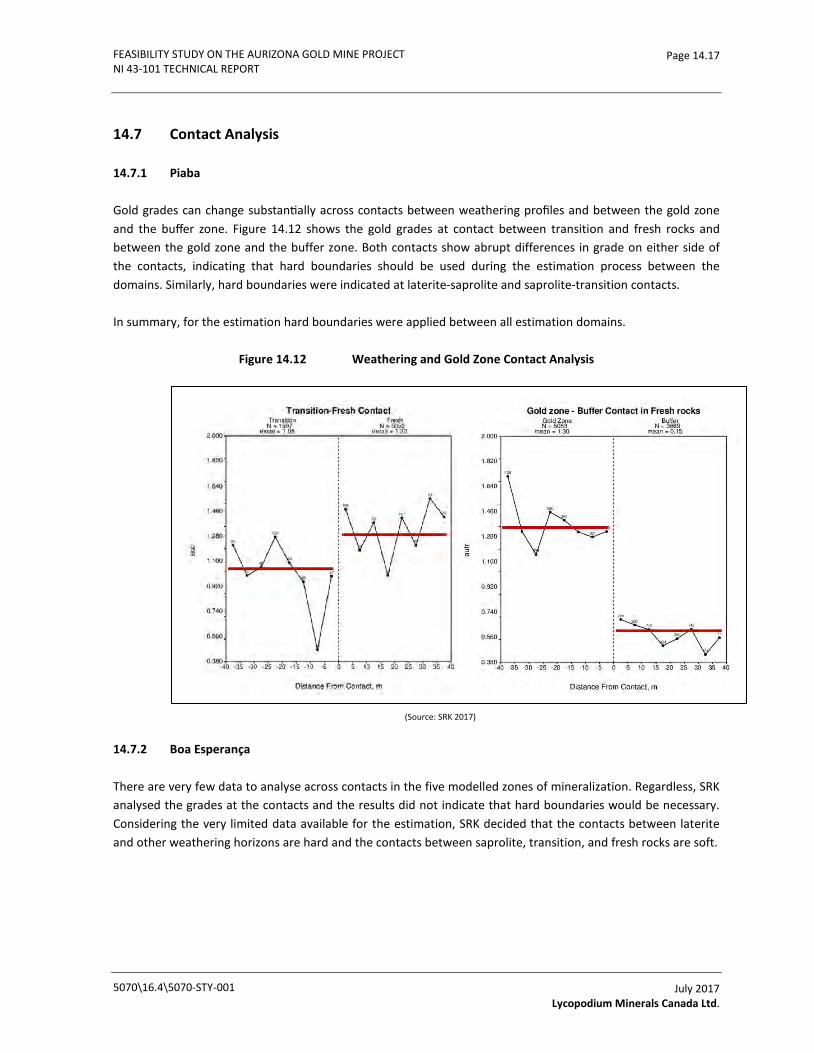
FEASIBILITY STUDY ON THE AURIZONA GOLD MINE PROJECT NI 43-101 TECHNICAL REPORT
Page 14.17
14.7 Contact Analysis
14.7.1 Piaba
Gold grades can change substantially across contacts between weathering profiles and between the gold zone and the buffer zone. Figure 14.12 shows the gold grades at contact between transition and fresh rocks and between the gold zone and the buffer zone. Both contacts show abrupt differences in grade on either side of the contacts, indicating that hard boundaries should be used during the estimation process between the domains. Similarly, hard boundaries were indicated at laterite-saprolite and saprolite-transition contacts.
In summary, for the estimation hard boundaries were applied between all estimation domains.
Figure 14.12 Weathering and Gold Zone Contact Analysis
(Source: SRK 2017)
14.7.2 Boa Esperança
There are very few data to analyse across contacts in the five modelled zones of mineralization. Regardless, SRK analysed the grades at the contacts and the results did not indicate that hard boundaries would be necessary. Considering the very limited data available for the estimation, SRK decided that the contacts between laterite and other weathering horizons are hard and the contacts between saprolite, transition, and fresh rocks are soft.
5070\16.4\5070-STY-001
July 2017 Lycopodium Minerals Canada Ltd.
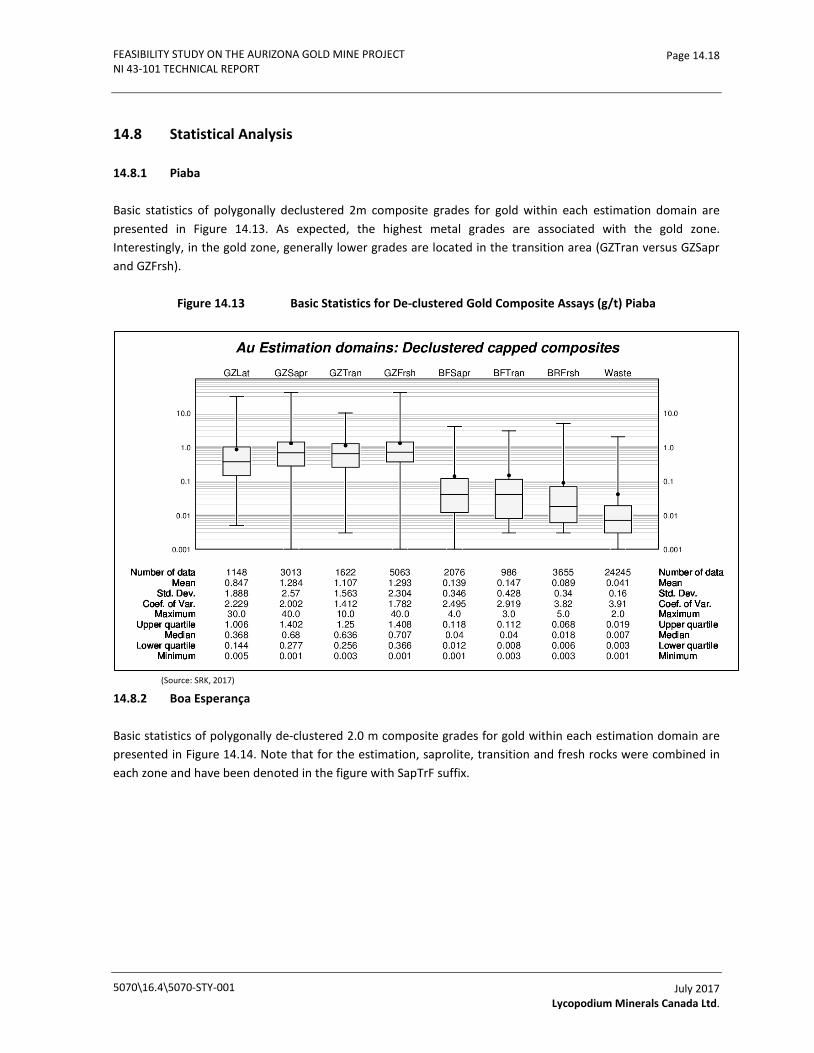
FEASIBILITY STUDY ON THE AURIZONA GOLD MINE PROJECT NI 43-101 TECHNICAL REPORT
Page 14.18
14.8 Statistical Analysis
14.8.1 Piaba
Basic statistics of polygonally declustered 2m composite grades for gold within each estimation domain are presented in Figure 14.13. As expected, the highest metal grades are associated with the gold zone. Interestingly, in the gold zone, generally lower grades are located in the transition area (GZTran versus GZSapr and GZFrsh).
Figure 14.13 Basic Statistics for De-clustered Gold Composite Assays (g/t) Piaba
(Source: SRK, 2017)
14.8.2 Boa Esperança
Basic statistics of polygonally de-clustered 2.0 m composite grades for gold within each estimation domain are presented in Figure 14.14. Note that for the estimation, saprolite, transition and fresh rocks were combined in each zone and have been denoted in the figure with SapTrF suffix.
5070\16.4\5070-STY-001
July 2017 Lycopodium Minerals Canada Ltd.

FEASIBILITY STUDY ON THE AURIZONA GOLD MINE PROJECT NI 43-101 TECHNICAL REPORT
Page 14.19
Figure 14.14 Basic Statistics for De-clustered Gold (g/t) Composite Assays Boa Esperança
(Source: SRK, 2017)
14.9 Variography
14.9.1 Piaba
Correlogram models were designed for gold from composited assay data and, where possible, from production data. Correlogram models were designed from the production data in saprolite and transition zones. In laterite and fresh zones, the correlograms were designed from the exploration data. Downhole correlograms were used to model nugget effects (i.e. assay variability at very close distances). The models used in the resource estimation are presented in Table 14.6. Note the relatively short ranges of continuity in the fresh rock domain.
5070\16.4\5070-STY-001
July 2017 Lycopodium Minerals Canada Ltd.
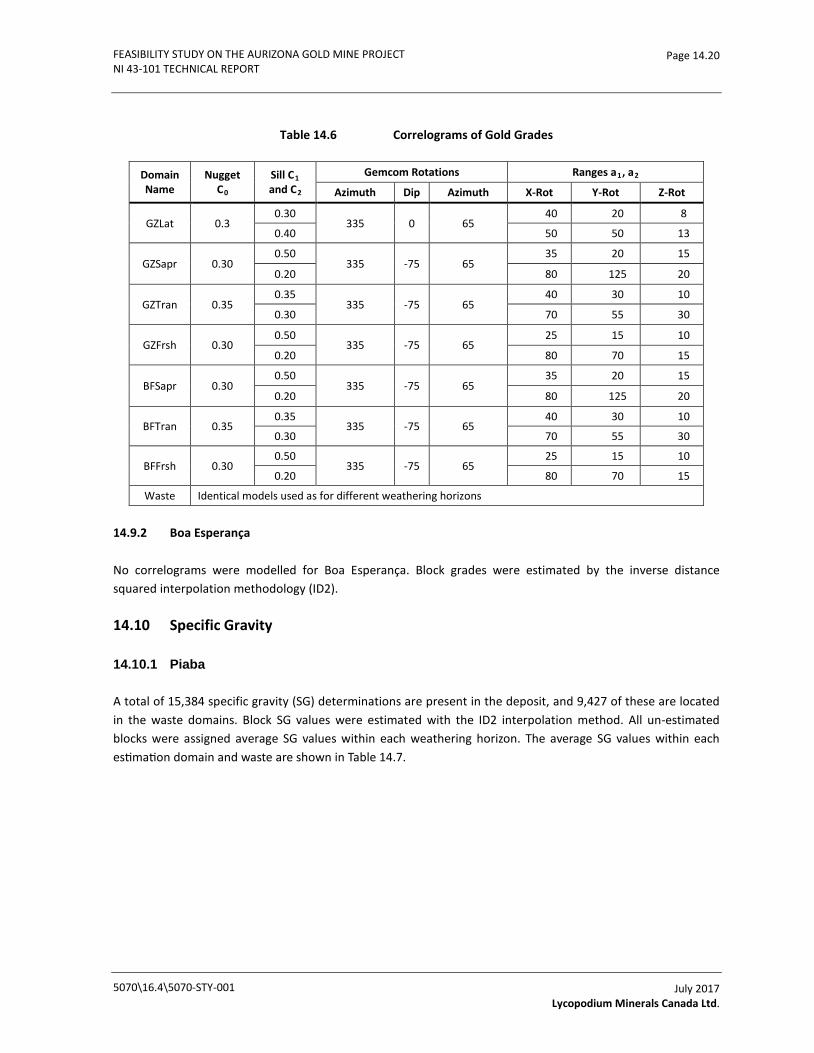
FEASIBILITY STUDY ON THE AURIZONA GOLD MINE PROJECT NI 43-101 TECHNICAL REPORT
Page 14.20
Table 14.6 Correlograms of Gold Grades
Domain Name
Nugget C0
Sill C1 and C2
Gemcom Rotations Ranges a1, a2
Azimuth Dip Azimuth X-Rot Y-Rot Z-Rot
GZLat 0.3 0.30
335 0 65 40 20 8
0.40 50 50 13
GZSapr 0.30 0.50
335 -75 65 35 20 15
0.20 80 125 20
GZTran 0.35 0.35
335 -75 65 40 30 10
0.30 70 55 30
GZFrsh 0.30 0.50
335 -75 65 25 15 10
0.20 80 70 15
BFSapr 0.30 0.50
335 -75 65 35 20 15
0.20 80 125 20
BFTran 0.35 0.35
335 -75 65 40 30 10
0.30 70 55 30
BFFrsh 0.30 0.50
335 -75 65 25 15 10
0.20 80 70 15
Waste Identical models used as for different weathering horizons 14.9.2 Boa Esperança
No correlograms were modelled for Boa Esperança. Block grades were estimated by the inverse distance squared interpolation methodology (ID2).
14.10 Specific Gravity
14.10.1 Piaba
A total of 15,384 specific gravity (SG) determinations are present in the deposit, and 9,427 of these are located in the waste domains. Block SG values were estimated with the ID2 interpolation method. All un-estimated blocks were assigned average SG values within each weathering horizon. The average SG values within each estimation domain and waste are shown in Table 14.7.
5070\16.4\5070-STY-001
July 2017 Lycopodium Minerals Canada Ltd.
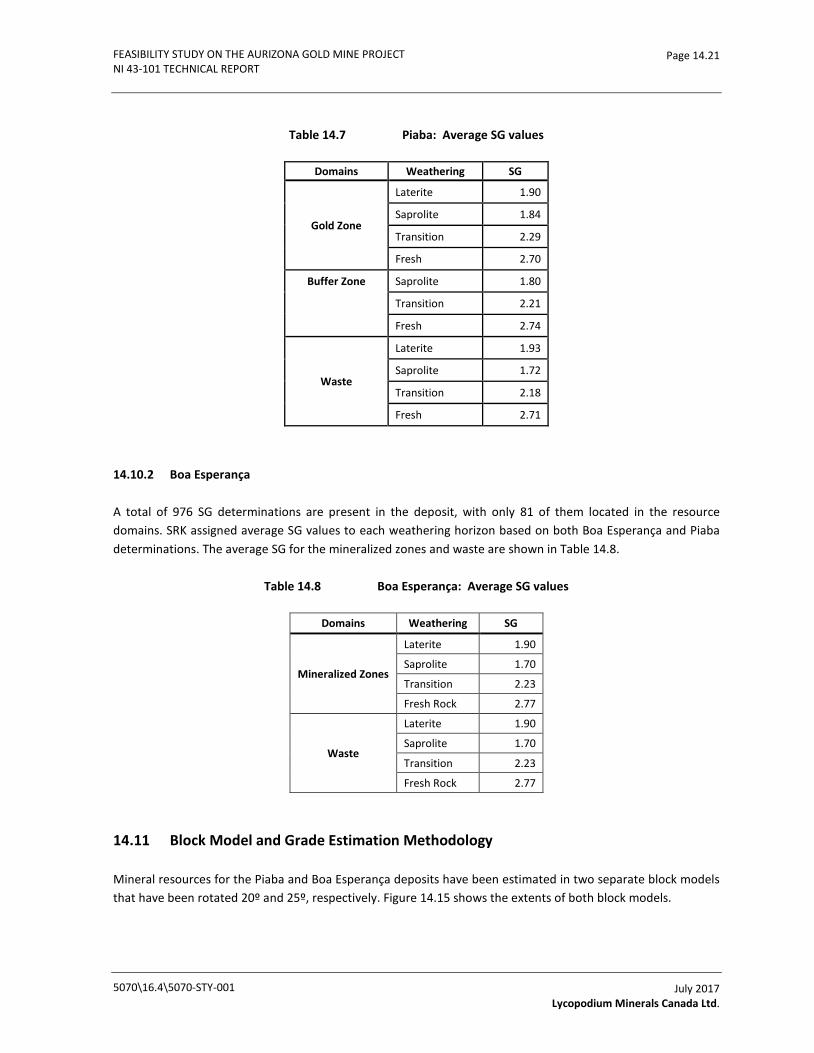
FEASIBILITY STUDY ON THE AURIZONA GOLD MINE PROJECT NI 43-101 TECHNICAL REPORT
Page 14.21
Table 14.7 Piaba: Average SG values
Domains Weathering SG
Gold Zone
Laterite 1.90
Saprolite 1.84
Transition 2.29
Fresh 2.70
Buffer Zone Saprolite 1.80
Transition 2.21
Fresh 2.74
Waste
Laterite 1.93
Saprolite 1.72
Transition 2.18
Fresh 2.71
14.10.2 Boa Esperança
A total of 976 SG determinations are present in the deposit, with only 81 of them located in the resource domains. SRK assigned average SG values to each weathering horizon based on both Boa Esperança and Piaba determinations. The average SG for the mineralized zones and waste are shown in Table 14.8.
Table 14.8 Boa Esperança: Average SG values
Domains Weathering SG
Mineralized Zones
Laterite 1.90
Saprolite 1.70
Transition 2.23
Fresh Rock 2.77
Waste
Laterite 1.90
Saprolite 1.70
Transition 2.23
Fresh Rock 2.77
14.11 Block Model and Grade Estimation Methodology
Mineral resources for the Piaba and Boa Esperança deposits have been estimated in two separate block models that have been rotated 20º and 25º, respectively. Figure 14.15 shows the extents of both block models.
5070\16.4\5070-STY-001
July 2017 Lycopodium Minerals Canada Ltd.
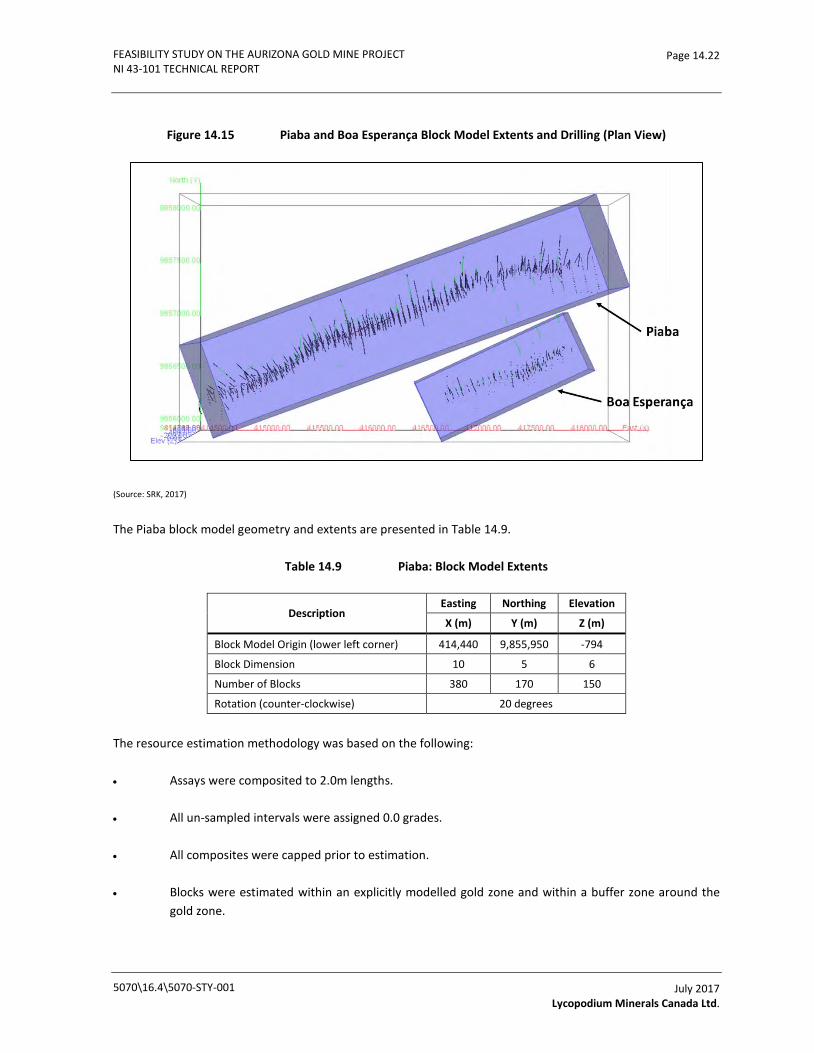
FEASIBILITY STUDY ON THE AURIZONA GOLD MINE PROJECT NI 43-101 TECHNICAL REPORT
Page 14.22
Figure 14.15 Piaba and Boa Esperança Block Model Extents and Drilling (Plan View)
(Source: SRK, 2017)
The Piaba block model geometry and extents are presented in Table 14.9.
Table 14.9 Piaba: Block Model Extents
Description Easting Northing Elevation
X (m) Y (m) Z (m)
Block Model Origin (lower left corner) 414,440 9,855,950 -794
Block Dimension 10 5 6
Number of Blocks 380 170 150
Rotation (counter-clockwise) 20 degrees
The resource estimation methodology was based on the following:
• Assays were composited to 2.0m lengths.
• All un-sampled intervals were assigned 0.0 grades.
• All composites were capped prior to estimation.
• Blocks were estimated within an explicitly modelled gold zone and within a buffer zone around the gold zone.
5070\16.4\5070-STY-001
July 2017 Lycopodium Minerals Canada Ltd.

FEASIBILITY STUDY ON THE AURIZONA GOLD MINE PROJECT NI 43-101 TECHNICAL REPORT
Page 14.23
• Blocks were also estimated within the waste domain.
• Only blocks estimated in the gold zone have been considered as resource. Estimated block grades in the buffer zone were used for assessment of dilution in the engineering studies.
• Ordinary kriging was applied to estimate block grades.
• Hard boundaries were applied between weathering profiles (laterite/saprolite/transition/fresh).
• A hard boundary was applied between the gold zone and the buffer zone.
• Specific gravity was estimated by the ID2.
The selection of the search radii and rotations of search ellipsoids were guided by gold correlogram models. In addition, the search radii were established to estimate a large portion of the blocks within the modelled area with limited extrapolation. The parameters were established by conducting repeated test resource estimates and reviewing the results as a series of plan views and sections. Table 14.10 shows applied gold estimation parameters.
5070\16.4\5070-STY-001
July 2017 Lycopodium Minerals Canada Ltd.

FEASIBILITY STUDY ON THE AURIZONA GOLD MINE PROJECT NI 43-101 TECHNICAL REPORT
Page 14.24
Table 14.10 Piaba: Resource Estimation Parameters
Domain Pass Min Sample
Max Sample
Limit by Hole
Gemcom Rotations Search Radii
Azimuth Dip Azimuth X-Rot Y-Rot Z-Rot
GZLat 1 6 16 4 335 0 0 70 70 20
2 4 16 4 335 0 0 105 105 30
GZSapr 1 6 16 4 335 -75 65 90 60 40
2 4 16 4 335 -75 65 135 90 60
GZTran 1 6 16 4 335 -75 65 70 55 40
2 4 16 4 335 -75 65 110 90 60
GZFrsh 1 6 16 4 335 -75 65 80 80 40
2 4 16 4 335 -75 65 120 120 60
BFSapr 1 6 16 4 335 -75 65 90 60 40
2 4 16 4 335 -75 65 135 90 60
BFTran 1 6 16 4 335 -75 65 70 55 40
2 4 16 4 335 -75 65 110 90 60
BFFrsh 1 6 16 4 335 -75 65 80 80 40
2 4 16 4 335 -75 65 120 120 60
Waste 1 4 16 4 As in weathering horizons above in Pass 2
14.11.2 Boa Esperança
The Boa Esperança block model geometry and extents are presented in Table 14.11.
Table 14.11 Boa Esperança: Block model extents
Description Easting Northing Elevation
X (m) Y (m) Z (m)
Block Model Origin (Lower left corner) 416,400 9,855,917 -200
Block Dimension 10 5 3
Number of Blocks 145 110 100
Rotation 25 degrees The resource estimation methodology was based on the following:
• Assays were composited to 2.0 m lengths.
• All un-sampled intervals were assigned 0.0 grades.
• Composites were capped prior to estimation.
• Blocks were estimated within five explicitly modelled mineralized domains.
5070\16.4\5070-STY-001
July 2017 Lycopodium Minerals Canada Ltd.
FEASIBILITY STUDY ON THE AURIZONA GOLD MINE PROJECT NI 43-101 TECHNICAL REPORT
Page 14.25
• Blocks were estimated within a waste domain.
• ID2 estimation was applied to estimate block grades.
• Hard boundaries were applied between laterite and other weathering profiles.
• Soft boundaries were applied between saprolite, transition, and fresh rocks.
• Blocks were assigned average SG values based on assessment of density in each weathering profile.
Resource estimation parameters in the Boa Esperança deposit are presented in Table 14.12.
5070\16.4\5070-STY-001
July 2017 Lycopodium Minerals Canada Ltd.

FEASIBILITY STUDY ON THE AURIZONA GOLD MINE PROJECT NI 43-101 TECHNICAL REPORT
Page 14.26
Table 14.12 Boa Esperança Estimation Parameters
Domain Pass Min Sample
Max Sample
Limit by Hole
Gemcom Rotations Search Radii
Azimuth Dip Azimuth X-Rot Y-Rot Z-Rot
D1Lat 1 6 16 4 0 0 0 40 40 10
2 1 16 4 0 0 0 90 90 15
D1SapTrFrsh 1 6 16 4 335 -75 65 50 50 25
2 1 16 4 335 -75 65 90 90 35
D2Lat 1 6 16 4 0 0 0 40 40 10
2 1 16 4 0 0 0 90 90 15
D2SapTrFrsh 1 6 16 4 335 -75 65 50 50 25
2 1 16 4 335 -75 65 90 90 35
D3Lat 1 6 16 4 0 0 0 40 40 10
2 1 16 4 0 0 0 90 90 15
D3SapTrFrsh 1 6 16 4 335 -75 65 50 50 25
2 1 16 4 335 -75 65 90 90 35
D4Lat 1 6 16 4 0 0 0 40 40 10
2 1 16 4 0 0 0 90 90 15
D4SapTrFrsh 1 6 16 4 335 -75 65 50 50 25
2 1 16 4 335 -75 65 90 90 35
D5Lat 1 6 16 4 0 0 0 40 40 10
2 1 16 4 0 0 0 90 90 15
D5SapTrFrsh 1 6 16 4 335 -75 65 50 50 25
2 1 16 4 335 -75 65 90 90 35
WstLat 1 2 16 4 0 0 0 90 90 15
WstSapTrFrsh 1 2 16 4 335 -75 65 90 90 35
14.12 Model Validation and Sensitivity
All mineralized domains in both Piaba and Boa Esperança were validated by completing a series of visual inspections and by:
• Comparison of local “well-informed” block grades with composites contained within those blocks.
• Comparison of average assay grades with average block estimates along different directions – swath plots.
At Piaba additional validation has been completed:
• Comparison with production and ID3 estimates.
5070\16.4\5070-STY-001
July 2017 Lycopodium Minerals Canada Ltd.

FEASIBILITY STUDY ON THE AURIZONA GOLD MINE PROJECT NI 43-101 TECHNICAL REPORT
Page 14.27
• Assessment of desired variability of block estimates from simulated block grades.
14.12.1 Piaba
Well-informed Blocks
Figure 14.16 shows a comparison of estimated block grades with drill hole assay composite data contained within those blocks in the gold zone saprolite and fresh domains. On average, the estimated blocks are similar to the actual data, although there is a large scatter of points around the x=y line. This scatter is typical of smoothed block estimates, based on relatively short ranges of continuity of gold grades, compared to the more variable assay data used to estimate those blocks. This is indicated by a thick white line that runs through the middle of the cloud and is the result of a piece-wise linear regression smoother.
Figure 14.16 Piaba Comparison of Block Estimates with Borehole Assay Data
(Source: SRK, 2017)
Swath Plots
Another check involved a comparison of average composite grades and average block estimates along different directions. This involved calculating de-clustered average composite grades and comparison with average block estimates along east-west, north-south, and horizontal swaths. Figure 14.17 and Figure 14.18 show the swath plots in the gold zone within saprolite and fresh rocks. Overall, the validation shows that current resource estimates are a good reflection of drill hole assay data.
5070\16.4\5070-STY-001
July 2017 Lycopodium Minerals Canada Ltd.

FEASIBILITY STUDY ON THE AURIZONA GOLD MINE PROJECT NI 43-101 TECHNICAL REPORT
Page 14.28
Figure 14.17 Piaba Saprolite De-clustered Average Gold Composite Grades Compared to Gold Block Estimates
(Source: SRK, 2017)
Figure 14.18 Piaba Fresh Rocks De-clustered Average Composite Grades Compared to Block Estimates
(Source: SRK, 2017)
Comparison with Production and ID3 Estimates
In another check, ordinary kriged (OK) block estimates were compared against ID3 estimates and production data. SRK constructed the production block model by ID2 block estimates from RC production drill holes. Only blocks estimated from all three methods were compared. Table 14.13 shows that the OK estimates are smoother than the ID3 estimates. The ID3 estimates return higher average grades at higher cut-offs. On the other hand, the production grades are quite similar to the OK estimates at 0.4 g/t and 1.0 g/t cut-off and slightly lower at the higher cut-offs. Overall, the recoverable metal content is slightly lower from the production model than from the OK model.
5070\16.4\5070-STY-001
July 2017 Lycopodium Minerals Canada Ltd.
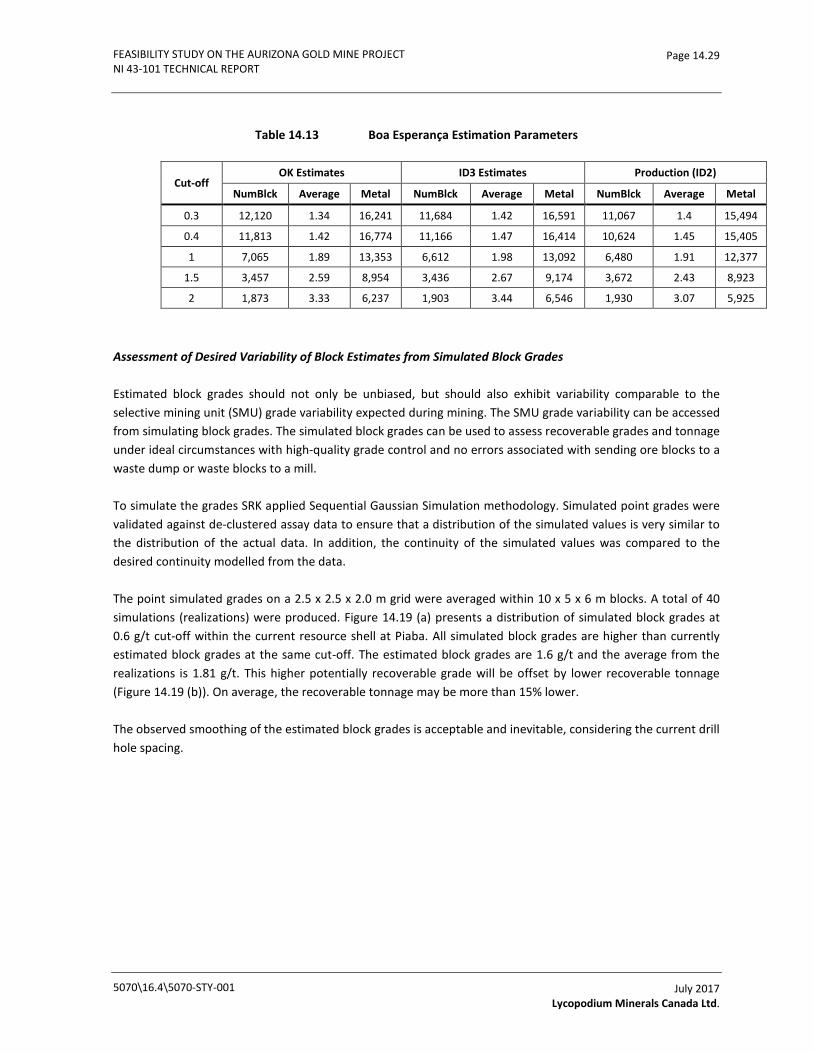
FEASIBILITY STUDY ON THE AURIZONA GOLD MINE PROJECT NI 43-101 TECHNICAL REPORT
Page 14.29
Table 14.13 Boa Esperança Estimation Parameters
Cut-off OK Estimates ID3 Estimates Production (ID2)
NumBlck Average Metal NumBlck Average Metal NumBlck Average Metal
0.3 12,120 1.34 16,241 11,684 1.42 16,591 11,067 1.4 15,494
0.4 11,813 1.42 16,774 11,166 1.47 16,414 10,624 1.45 15,405
1 7,065 1.89 13,353 6,612 1.98 13,092 6,480 1.91 12,377
1.5 3,457 2.59 8,954 3,436 2.67 9,174 3,672 2.43 8,923
2 1,873 3.33 6,237 1,903 3.44 6,546 1,930 3.07 5,925
Assessment of Desired Variability of Block Estimates from Simulated Block Grades
Estimated block grades should not only be unbiased, but should also exhibit variability comparable to the selective mining unit (SMU) grade variability expected during mining. The SMU grade variability can be accessed from simulating block grades. The simulated block grades can be used to assess recoverable grades and tonnage under ideal circumstances with high-quality grade control and no errors associated with sending ore blocks to a waste dump or waste blocks to a mill.
To simulate the grades SRK applied Sequential Gaussian Simulation methodology. Simulated point grades were validated against de-clustered assay data to ensure that a distribution of the simulated values is very similar to the distribution of the actual data. In addition, the continuity of the simulated values was compared to the desired continuity modelled from the data.
The point simulated grades on a 2.5 x 2.5 x 2.0 m grid were averaged within 10 x 5 x 6 m blocks. A total of 40 simulations (realizations) were produced. Figure 14.19 (a) presents a distribution of simulated block grades at 0.6 g/t cut-off within the current resource shell at Piaba. All simulated block grades are higher than currently estimated block grades at the same cut-off. The estimated block grades are 1.6 g/t and the average from the realizations is 1.81 g/t. This higher potentially recoverable grade will be offset by lower recoverable tonnage (Figure 14.19 (b)). On average, the recoverable tonnage may be more than 15% lower.
The observed smoothing of the estimated block grades is acceptable and inevitable, considering the current drill hole spacing.
5070\16.4\5070-STY-001
July 2017 Lycopodium Minerals Canada Ltd.
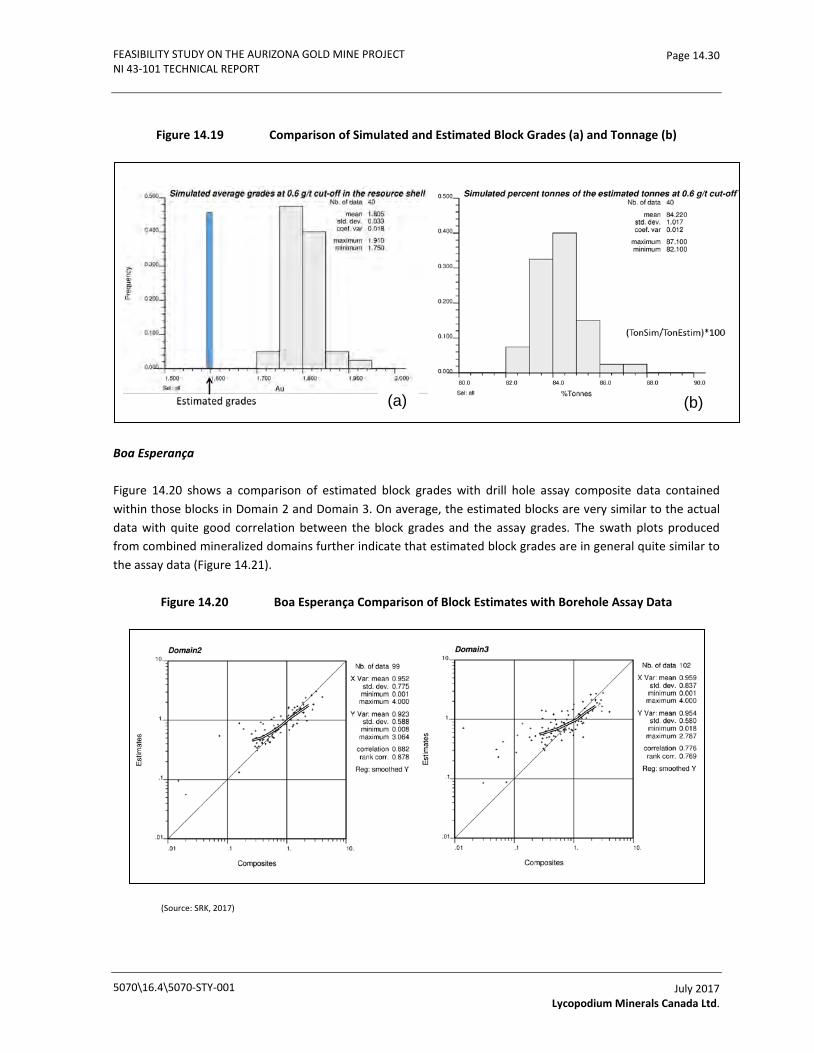
FEASIBILITY STUDY ON THE AURIZONA GOLD MINE PROJECT NI 43-101 TECHNICAL REPORT
Page 14.30
Figure 14.19 Comparison of Simulated and Estimated Block Grades (a) and Tonnage (b)
Boa Esperança
Figure 14.20 shows a comparison of estimated block grades with drill hole assay composite data contained within those blocks in Domain 2 and Domain 3. On average, the estimated blocks are very similar to the actual data with quite good correlation between the block grades and the assay grades. The swath plots produced from combined mineralized domains further indicate that estimated block grades are in general quite similar to the assay data (Figure 14.21).
Figure 14.20 Boa Esperança Comparison of Block Estimates with Borehole Assay Data
(Source: SRK, 2017)
(a) (b)
5070\16.4\5070-STY-001
July 2017 Lycopodium Minerals Canada Ltd.

FEASIBILITY STUDY ON THE AURIZONA GOLD MINE PROJECT NI 43-101 TECHNICAL REPORT
Page 14.31
Figure 14.21 Boa Esperança De-clustered Average Composite Grades Compared to Block Estimates
(Source: SRK, 2017)
14.13 Mineral Resource Classification
Block model quantities and grade estimates for the Project were classified according to the CIM Definition Standards for Mineral Resources and Mineral Reserves (May, 2014) by Marek Nowak, PEng. (APEGBC #16985), an appropriate independent qualified person for the purpose of NI 43-101.
Mineral resource classification is typically a subjective concept. Industry best practices suggest that resource classification should consider both the confidence in the geological continuity of the mineralized structures, the quality and quantity of exploration data supporting the estimates, and the geostatistical confidence in the tonnage and grade estimates. Appropriate classification criteria should aim at integrating both concepts to delineate regular areas at similar resource classification.
SRK is satisfied that the geological modelling honours the current geological information and knowledge. The location of the samples and the assay data are sufficiently reliable to support resource evaluation. The sampling information was acquired by core drilling on sections spaced at approximately 30m for Piaba and 50m for Boa Esperança.
14.13.1 Piaba
A block in the gold zone was assigned to a Measured category if the following criteria were met when the block was estimated:
• At least three drill holes were used.
• Average distance to samples used to estimate a block was less than 50m.
• There was more than 70% chance that a block was higher than 0.3 g/t Au.
• Zone width was at least 15 m.
5070\16.4\5070-STY-001
July 2017 Lycopodium Minerals Canada Ltd.

FEASIBILITY STUDY ON THE AURIZONA GOLD MINE PROJECT NI 43-101 TECHNICAL REPORT
Page 14.32
• Limited down dip distance from current topography.
A block was assigned to an Indicated category if the following criteria were met when the block was estimated:
• At least three drill holes were used.
• Average distance to samples used to estimate a block was less than 50 m.
• All other blocks were assigned to an Inferred category.
• Measured and Indicated envelopes were designed around the blocks assigned to the categories.
The Measured and Indicated class envelopes are shown in Figure 14.22.
Figure 14.22 Piaba Measured (a) and Indicated (b) Class Envelopes (Long Section Looking NW)
(Source: SRK, 2017)
14.13.2 Boa Esperança
A block was assigned to an Indicated category if the following criteria were met when the block was estimated:
• At least three drill holes were used.
• Average distance to samples used to estimate a block was less than 30 m.
A block was assigned to an Inferred category if the following criteria were met when the block was estimated:
• At least two drill holes were used and average distance to samples was less than 60 m; or
• One drill hole was used and average distance to samples was less than 30 m.
(a)
(b)
5070\16.4\5070-STY-001
July 2017 Lycopodium Minerals Canada Ltd.
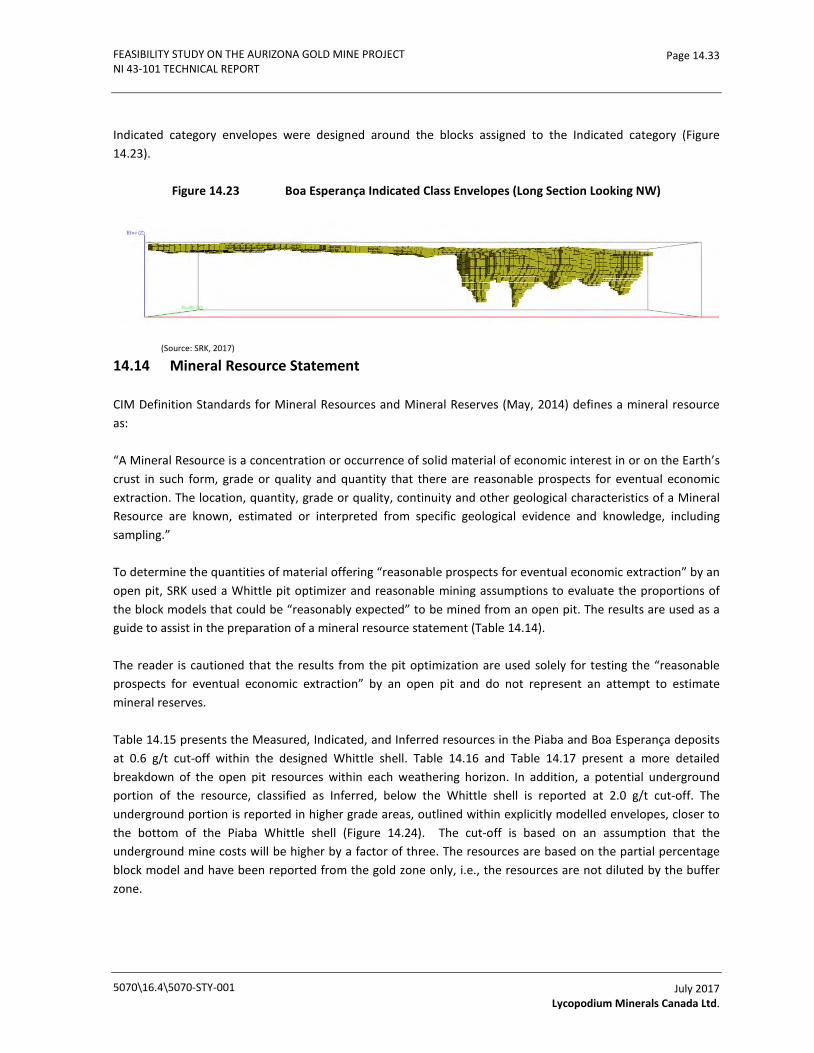
FEASIBILITY STUDY ON THE AURIZONA GOLD MINE PROJECT NI 43-101 TECHNICAL REPORT
Page 14.33
Indicated category envelopes were designed around the blocks assigned to the Indicated category (Figure 14.23).
Figure 14.23 Boa Esperança Indicated Class Envelopes (Long Section Looking NW)
(Source: SRK, 2017)
14.14 Mineral Resource Statement
CIM Definition Standards for Mineral Resources and Mineral Reserves (May, 2014) defines a mineral resource as:
“A Mineral Resource is a concentration or occurrence of solid material of economic interest in or on the Earth’s crust in such form, grade or quality and quantity that there are reasonable prospects for eventual economic extraction. The location, quantity, grade or quality, continuity and other geological characteristics of a Mineral Resource are known, estimated or interpreted from specific geological evidence and knowledge, including sampling.”
To determine the quantities of material offering “reasonable prospects for eventual economic extraction” by an open pit, SRK used a Whittle pit optimizer and reasonable mining assumptions to evaluate the proportions of the block models that could be “reasonably expected” to be mined from an open pit. The results are used as a guide to assist in the preparation of a mineral resource statement (Table 14.14).
The reader is cautioned that the results from the pit optimization are used solely for testing the “reasonable prospects for eventual economic extraction” by an open pit and do not represent an attempt to estimate mineral reserves.
Table 14.15 presents the Measured, Indicated, and Inferred resources in the Piaba and Boa Esperança deposits at 0.6 g/t cut-off within the designed Whittle shell. Table 14.16 and Table 14.17 present a more detailed breakdown of the open pit resources within each weathering horizon. In addition, a potential underground portion of the resource, classified as Inferred, below the Whittle shell is reported at 2.0 g/t cut-off. The underground portion is reported in higher grade areas, outlined within explicitly modelled envelopes, closer to the bottom of the Piaba Whittle shell (Figure 14.24). The cut-off is based on an assumption that the underground mine costs will be higher by a factor of three. The resources are based on the partial percentage block model and have been reported from the gold zone only, i.e., the resources are not diluted by the buffer zone.
5070\16.4\5070-STY-001
July 2017 Lycopodium Minerals Canada Ltd.
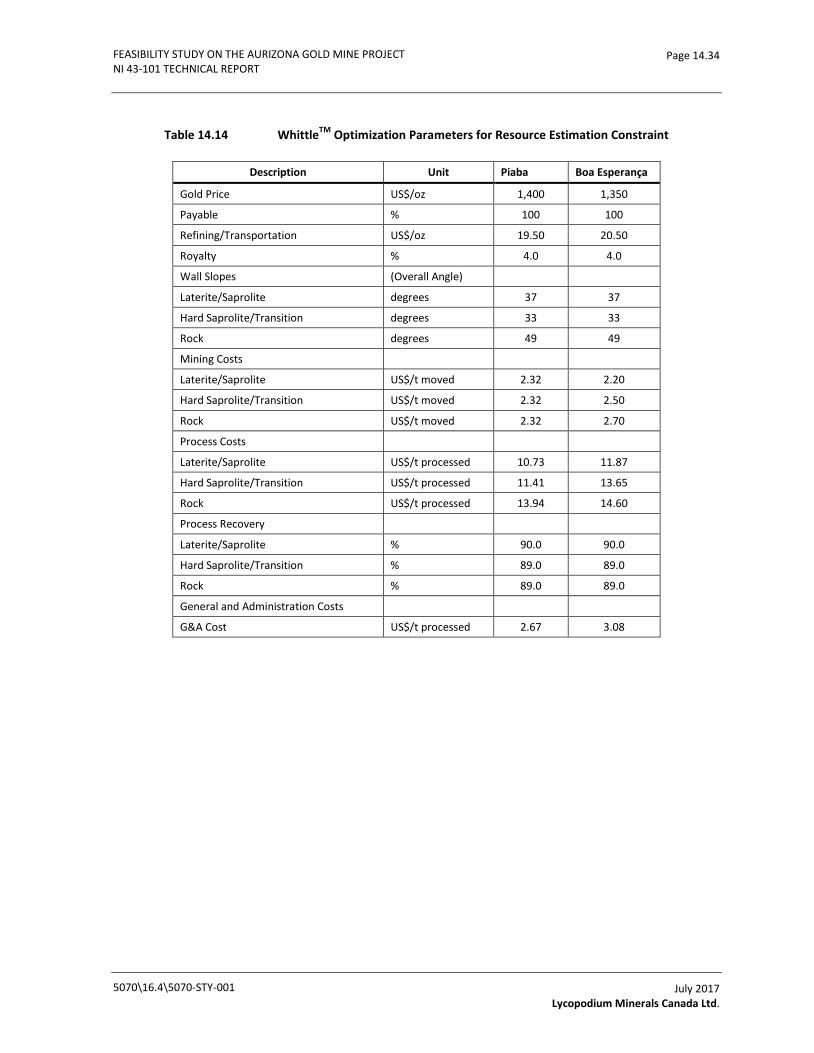
FEASIBILITY STUDY ON THE AURIZONA GOLD MINE PROJECT NI 43-101 TECHNICAL REPORT
Page 14.34
Table 14.14 WhittleTM Optimization Parameters for Resource Estimation Constraint
Description Unit Piaba Boa Esperança
Gold Price US$/oz 1,400 1,350
Payable % 100 100
Refining/Transportation US$/oz 19.50 20.50
Royalty % 4.0 4.0
Wall Slopes (Overall Angle) Laterite/Saprolite degrees 37 37
Hard Saprolite/Transition degrees 33 33
Rock degrees 49 49
Mining Costs Laterite/Saprolite US$/t moved 2.32 2.20
Hard Saprolite/Transition US$/t moved 2.32 2.50
Rock US$/t moved 2.32 2.70
Process Costs Laterite/Saprolite US$/t processed 10.73 11.87
Hard Saprolite/Transition US$/t processed 11.41 13.65
Rock US$/t processed 13.94 14.60
Process Recovery Laterite/Saprolite % 90.0 90.0
Hard Saprolite/Transition % 89.0 89.0
Rock % 89.0 89.0
General and Administration Costs G&A Cost US$/t processed 2.67 3.08
5070\16.4\5070-STY-001
July 2017 Lycopodium Minerals Canada Ltd.
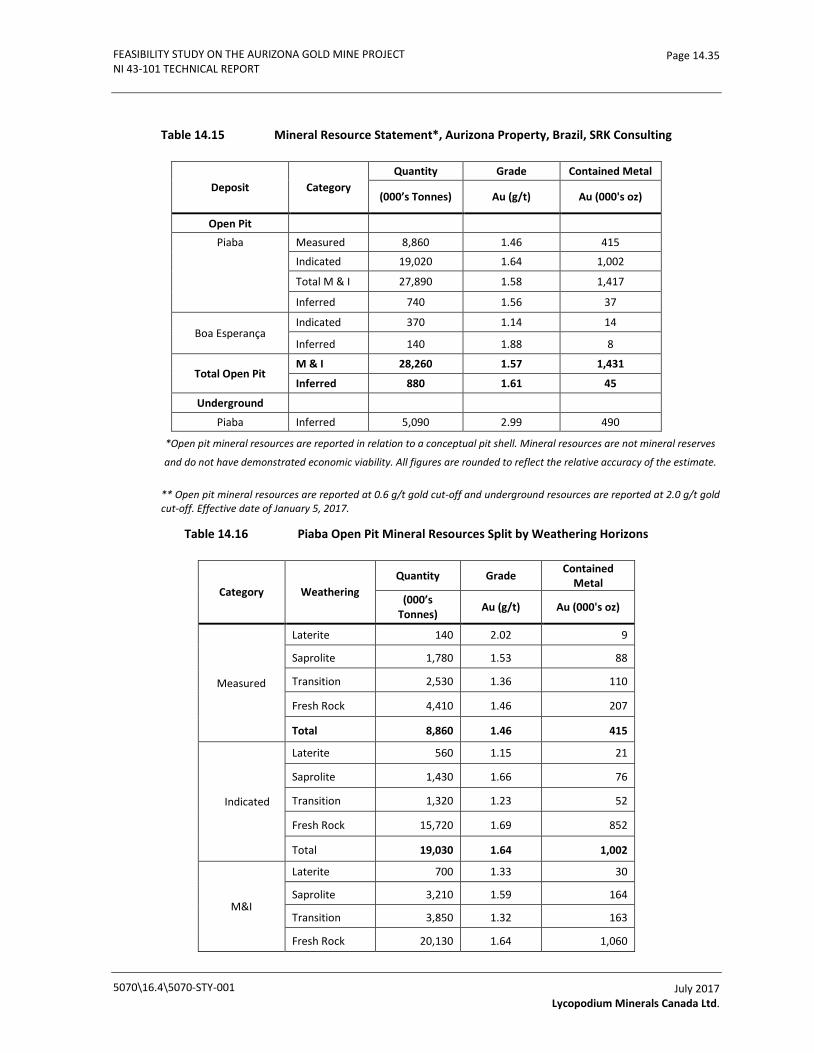
FEASIBILITY STUDY ON THE AURIZONA GOLD MINE PROJECT NI 43-101 TECHNICAL REPORT
Page 14.35
Table 14.15 Mineral Resource Statement*, Aurizona Property, Brazil, SRK Consulting
Deposit Category Quantity Grade Contained Metal
(000’s Tonnes) Au (g/t) Au (000's oz)
Open Pit Piaba Measured 8,860 1.46 415
Indicated 19,020 1.64 1,002
Total M & I 27,890 1.58 1,417
Inferred 740 1.56 37
Boa Esperanҫa Indicated 370 1.14 14
Inferred 140 1.88 8
Total Open Pit M & I 28,260 1.57 1,431
Inferred 880 1.61 45
Underground Piaba Inferred 5,090 2.99 490
*Open pit mineral resources are reported in relation to a conceptual pit shell. Mineral resources are not mineral reserves
and do not have demonstrated economic viability. All figures are rounded to reflect the relative accuracy of the estimate.
** Open pit mineral resources are reported at 0.6 g/t gold cut-off and underground resources are reported at 2.0 g/t gold cut-off. Effective date of January 5, 2017.
Table 14.16 Piaba Open Pit Mineral Resources Split by Weathering Horizons
Category Weathering Quantity Grade Contained
Metal (000’s
Tonnes) Au (g/t) Au (000's oz)
Measured
Laterite 140 2.02 9
Saprolite 1,780 1.53 88
Transition 2,530 1.36 110
Fresh Rock 4,410 1.46 207
Total 8,860 1.46 415
Indicated
Laterite 560 1.15 21
Saprolite 1,430 1.66 76
Transition 1,320 1.23 52
Fresh Rock 15,720 1.69 852
Total 19,030 1.64 1,002
M&I
Laterite 700 1.33 30
Saprolite 3,210 1.59 164
Transition 3,850 1.32 163
Fresh Rock 20,130 1.64 1,060
5070\16.4\5070-STY-001
July 2017 Lycopodium Minerals Canada Ltd.
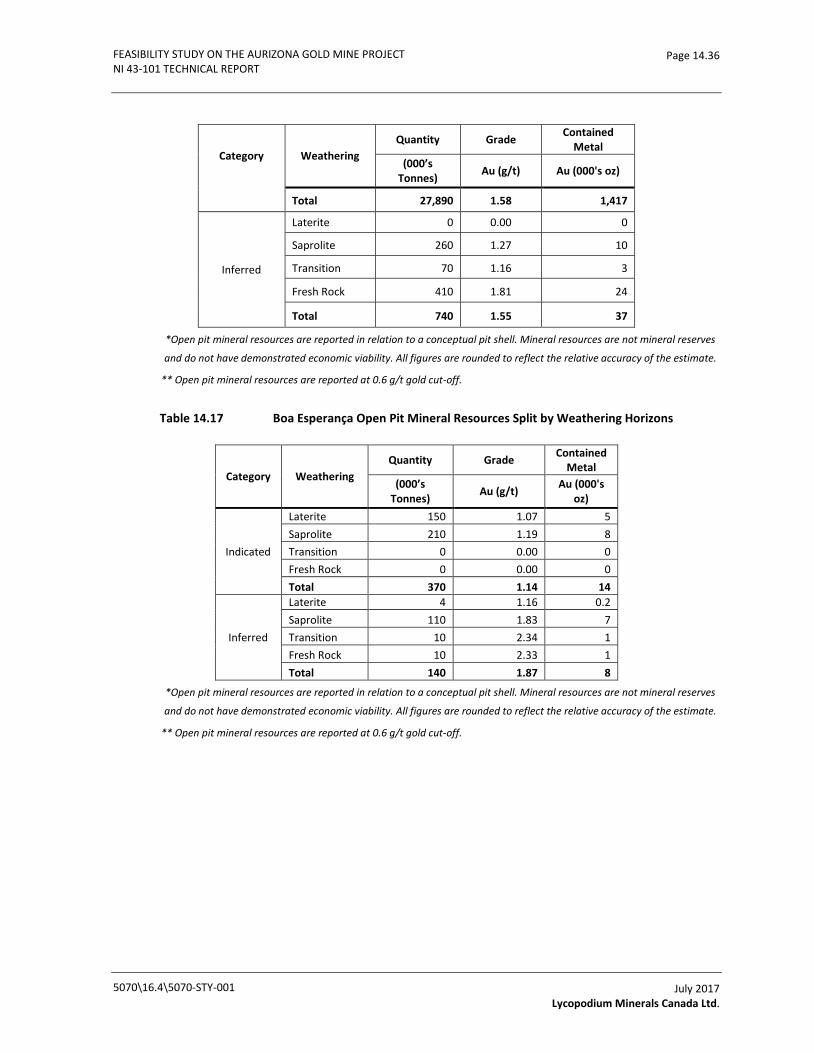
FEASIBILITY STUDY ON THE AURIZONA GOLD MINE PROJECT NI 43-101 TECHNICAL REPORT
Page 14.36
Category Weathering Quantity Grade Contained
Metal (000’s
Tonnes) Au (g/t) Au (000's oz)
Total 27,890 1.58 1,417
Inferred
Laterite 0 0.00 0
Saprolite 260 1.27 10
Transition 70 1.16 3
Fresh Rock 410 1.81 24
Total 740 1.55 37
*Open pit mineral resources are reported in relation to a conceptual pit shell. Mineral resources are not mineral reserves
and do not have demonstrated economic viability. All figures are rounded to reflect the relative accuracy of the estimate.
** Open pit mineral resources are reported at 0.6 g/t gold cut-off.
Table 14.17 Boa Esperança Open Pit Mineral Resources Split by Weathering Horizons
Category Weathering Quantity Grade Contained
Metal (000’s
Tonnes) Au (g/t) Au (000's oz)
Indicated
Laterite 150 1.07 5 Saprolite 210 1.19 8 Transition 0 0.00 0 Fresh Rock 0 0.00 0 Total 370 1.14 14
Inferred
Laterite 4 1.16 0.2 Saprolite 110 1.83 7 Transition 10 2.34 1 Fresh Rock 10 2.33 1 Total 140 1.87 8
*Open pit mineral resources are reported in relation to a conceptual pit shell. Mineral resources are not mineral reserves
and do not have demonstrated economic viability. All figures are rounded to reflect the relative accuracy of the estimate.
** Open pit mineral resources are reported at 0.6 g/t gold cut-off.
5070\16.4\5070-STY-001
July 2017 Lycopodium Minerals Canada Ltd.

FEASIBILITY STUDY ON THE AURIZONA GOLD MINE PROJECT NI 43-101 TECHNICAL REPORT
Page 14.37
Figure 14.24 Piaba: NW view of the Resource Whittle Shell and the Reported Underground Resource
14.15 Grade Sensitivity Analysis
The mineral resources at the Project are sensitive to the selection of the reporting cut-off grade. To illustrate this sensitivity, the block model quantities and grade estimates are presented at various cut-offs in Table 14.16 and Table 14.17 for the Piaba and Boa Esperança deposits.
The presented tonnes and grade represent totals for the open pit development. The reader is cautioned that the figures presented in the tables should not be misconstrued with a Mineral Resource Statement. The figures are only presented to show the sensitivity of the block model estimates to the selection of cut-off grade.
Figure 14.25 and Figure 14.26 present this sensitivity as grade tonnage curves in Piaba within the Whittle shell. Figure 14.27 and Figure 14.28 present grade tonnage curves in Boa Esperança within the Whittle shell.
5070\16.4\5070-STY-001
July 2017 Lycopodium Minerals Canada Ltd.

FEASIBILITY STUDY ON THE AURIZONA GOLD MINE PROJECT NI 43-101 TECHNICAL REPORT
Page 14.38
Table 14.18 Piaba Cit-off Grade Sensitivity Analysis
Category Cut-off Quantity Grade Contained Metal
Au (g/t) (000’s Tonnes) Au (g/t) Au (000's oz)
Measured and Indicated
1.00 18,640 1.97 1,180
0.90 20,960 1.85 1,250
0.80 23,280 1.75 1,310
0.70 25,680 1.66 1,370
0.60 27,890 1.58 1,417
0.50 29,660 1.52 1,450
0.40 30,990 1.47 1,470
0.30 31,860 1.44 1,480
0.20 32,360 1.42 1,480
0.10 32,540 1.42 1,480
Inferred
1.00 440 2.10 30
0.90 500 1.97 31 0.80 560 1.84 33 0.70 630 1.71 35 0.60 740 1.56 37 0.50 840 1.43 39 0.40 930 1.34 40 0.30 970 1.31 41 0.20 980 1.29 41 0.10 990 1.28 41
*The reader is cautioned that the figures in this table should not be misconstrued with a Mineral Resource Statement. The figures are only presented to show the sensitivity of the block model estimates to the selection of cut-off grade.
5070\16.4\5070-STY-001
July 2017 Lycopodium Minerals Canada Ltd.
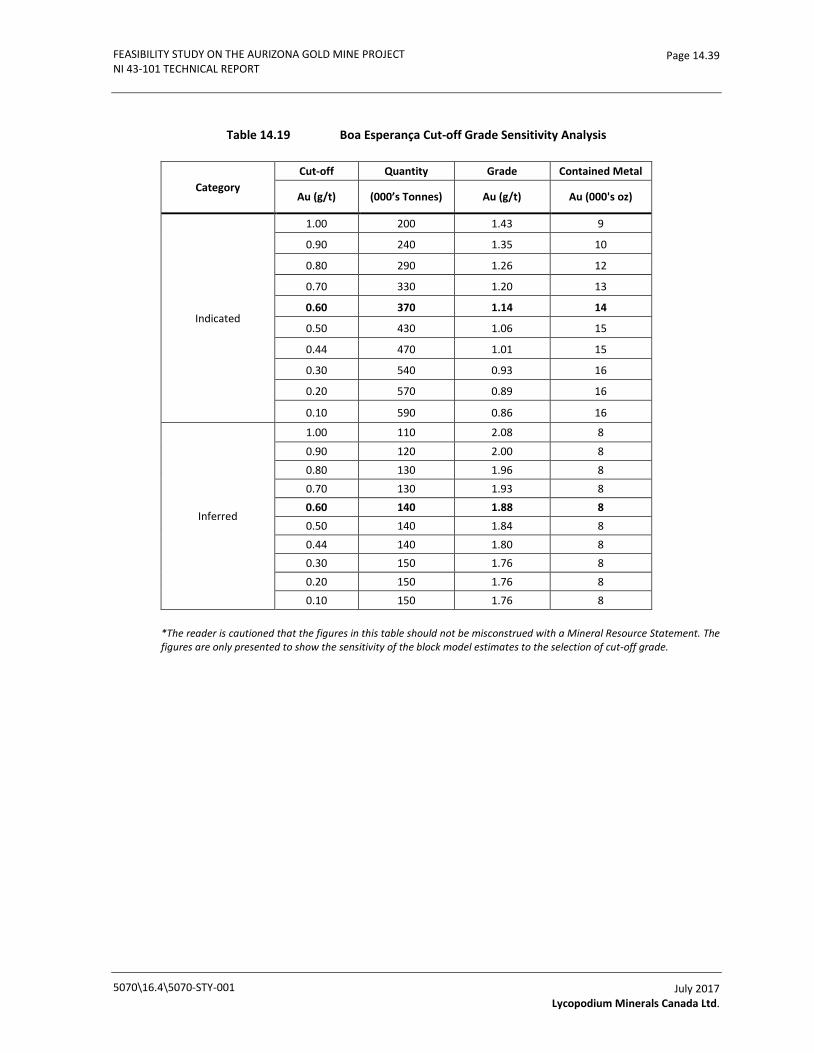
FEASIBILITY STUDY ON THE AURIZONA GOLD MINE PROJECT NI 43-101 TECHNICAL REPORT
Page 14.39
Table 14.19 Boa Esperança Cut-off Grade Sensitivity Analysis
Category Cut-off Quantity Grade Contained Metal
Au (g/t) (000’s Tonnes) Au (g/t) Au (000's oz)
Indicated
1.00 200 1.43 9
0.90 240 1.35 10
0.80 290 1.26 12
0.70 330 1.20 13
0.60 370 1.14 14
0.50 430 1.06 15
0.44 470 1.01 15
0.30 540 0.93 16
0.20 570 0.89 16
0.10 590 0.86 16
Inferred
1.00 110 2.08 8
0.90 120 2.00 8 0.80 130 1.96 8 0.70 130 1.93 8 0.60 140 1.88 8 0.50 140 1.84 8 0.44 140 1.80 8 0.30 150 1.76 8 0.20 150 1.76 8 0.10 150 1.76 8
*The reader is cautioned that the figures in this table should not be misconstrued with a Mineral Resource Statement. The figures are only presented to show the sensitivity of the block model estimates to the selection of cut-off grade.
5070\16.4\5070-STY-001
July 2017 Lycopodium Minerals Canada Ltd.

FEASIBILITY STUDY ON THE AURIZONA GOLD MINE PROJECT NI 43-101 TECHNICAL REPORT
Page 14.40
Figure 14.25 Piaba: Measured and Indicated Category Grade Tonnage Curves
(Source: SRK, 2017)
Figure 14.26 Piaba Inferred Category Grade Tonnage Curves
(Source: SRK, 2017)
5070\16.4\5070-STY-001
July 2017 Lycopodium Minerals Canada Ltd.
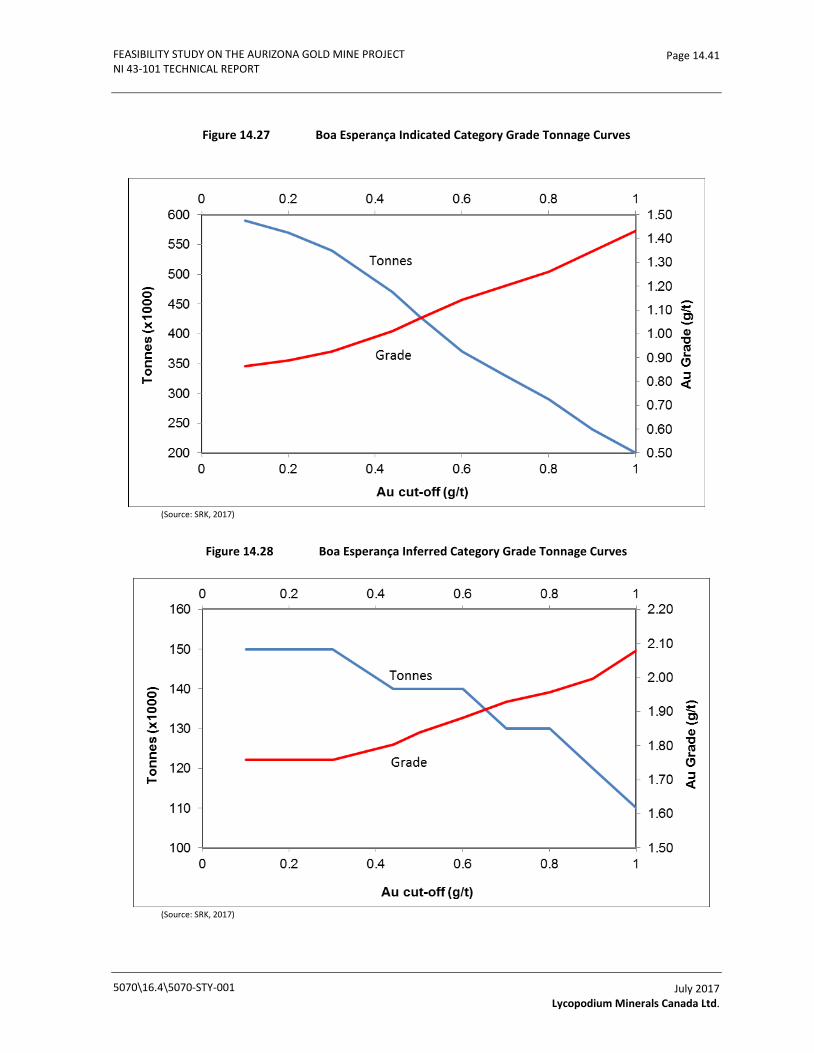
FEASIBILITY STUDY ON THE AURIZONA GOLD MINE PROJECT NI 43-101 TECHNICAL REPORT
Page 14.41
Figure 14.27 Boa Esperança Indicated Category Grade Tonnage Curves
(Source: SRK, 2017)
Figure 14.28 Boa Esperança Inferred Category Grade Tonnage Curves
(Source: SRK, 2017)
5070\16.4\5070-STY-001
July 2017 Lycopodium Minerals Canada Ltd.
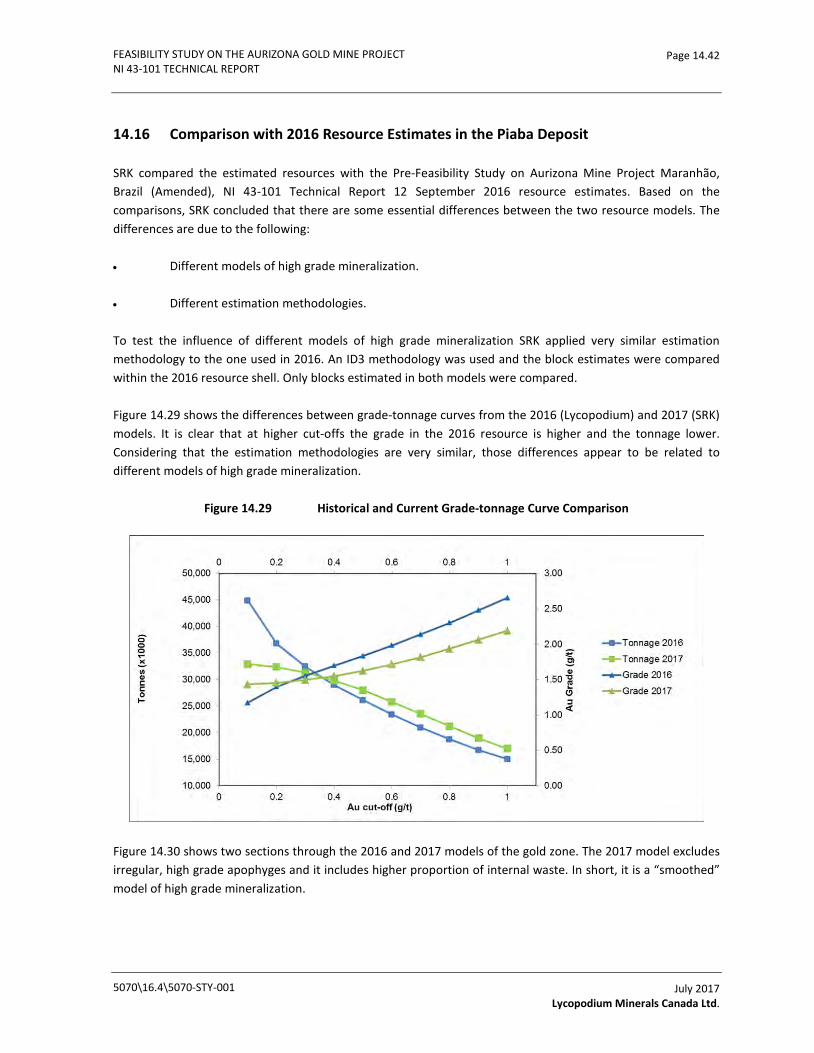
FEASIBILITY STUDY ON THE AURIZONA GOLD MINE PROJECT NI 43-101 TECHNICAL REPORT
Page 14.42
14.16 Comparison with 2016 Resource Estimates in the Piaba Deposit
SRK compared the estimated resources with the Pre-Feasibility Study on Aurizona Mine Project Maranhão, Brazil (Amended), NI 43-101 Technical Report 12 September 2016 resource estimates. Based on the comparisons, SRK concluded that there are some essential differences between the two resource models. The differences are due to the following:
• Different models of high grade mineralization.
• Different estimation methodologies.
To test the influence of different models of high grade mineralization SRK applied very similar estimation methodology to the one used in 2016. An ID3 methodology was used and the block estimates were compared within the 2016 resource shell. Only blocks estimated in both models were compared.
Figure 14.29 shows the differences between grade-tonnage curves from the 2016 (Lycopodium) and 2017 (SRK) models. It is clear that at higher cut-offs the grade in the 2016 resource is higher and the tonnage lower. Considering that the estimation methodologies are very similar, those differences appear to be related to different models of high grade mineralization.
Figure 14.29 Historical and Current Grade-tonnage Curve Comparison
Figure 14.30 shows two sections through the 2016 and 2017 models of the gold zone. The 2017 model excludes irregular, high grade apophyges and it includes higher proportion of internal waste. In short, it is a “smoothed” model of high grade mineralization.
5070\16.4\5070-STY-001
July 2017 Lycopodium Minerals Canada Ltd.

FEASIBILITY STUDY ON THE AURIZONA GOLD MINE PROJECT NI 43-101 TECHNICAL REPORT
Page 14.43
Figure 14.30 Models of the Gold Zone in 2016 (blue) and 2017 (red) (Section View Looking E)
An additional difference between the two resource models is related to the estimation methodology. The 2016 resource has been estimated with the ID3 methodology whereas in 2017 the resource block grades were estimated by OK methodology. In the vast majority of cases the OK model returns much smoother results than the ID3 model. Considering short ranges of continuity of the mineralization, the OK model is much better suited for estimation of block grades at Piaba. Figure 14.31 shows grade-tonnage curves within the 2016 resource shell for the OK estimated block grades (2017) and the ID3 block grades (2016). The differences between the grades and tonnes at higher cut-offs are even higher than those presented in Figure 14.29. Those differences represent a combination of different geology models and estimation methodologies.
5070\16.4\5070-STY-001
July 2017 Lycopodium Minerals Canada Ltd.
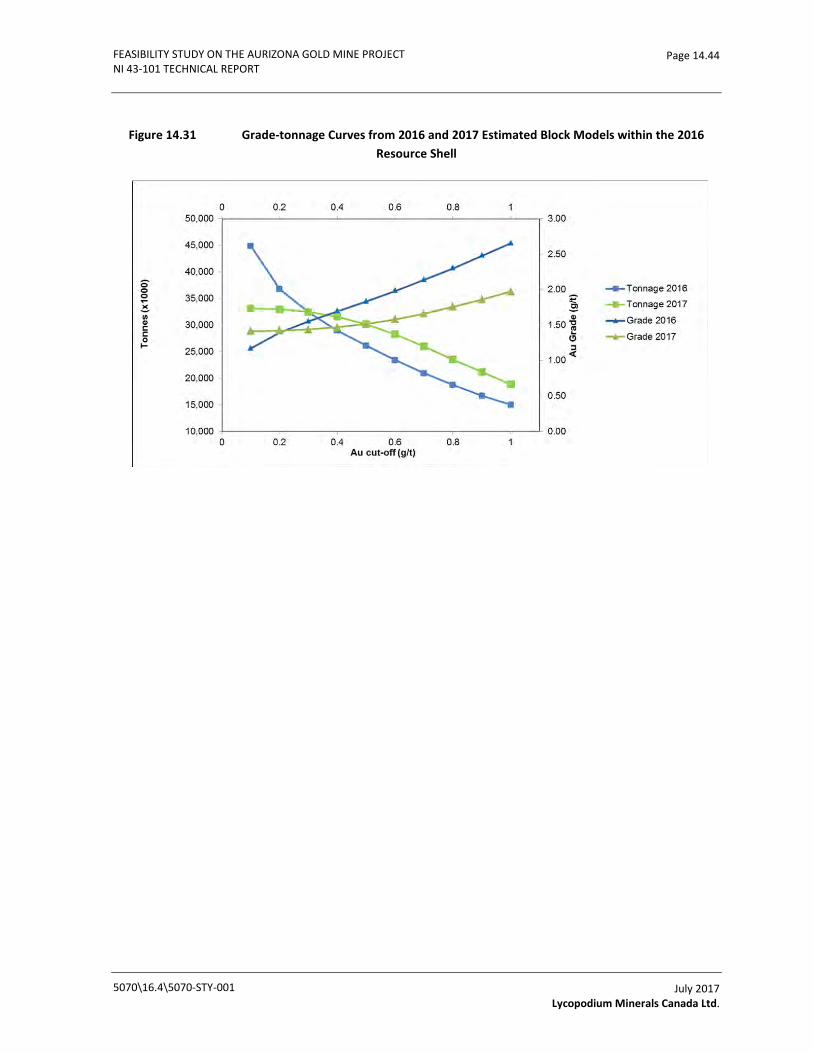
FEASIBILITY STUDY ON THE AURIZONA GOLD MINE PROJECT NI 43-101 TECHNICAL REPORT
Page 14.44
Figure 14.31 Grade-tonnage Curves from 2016 and 2017 Estimated Block Models within the 2016 Resource Shell
5070\16.4\5070-STY-001
July 2017 Lycopodium Minerals Canada Ltd.
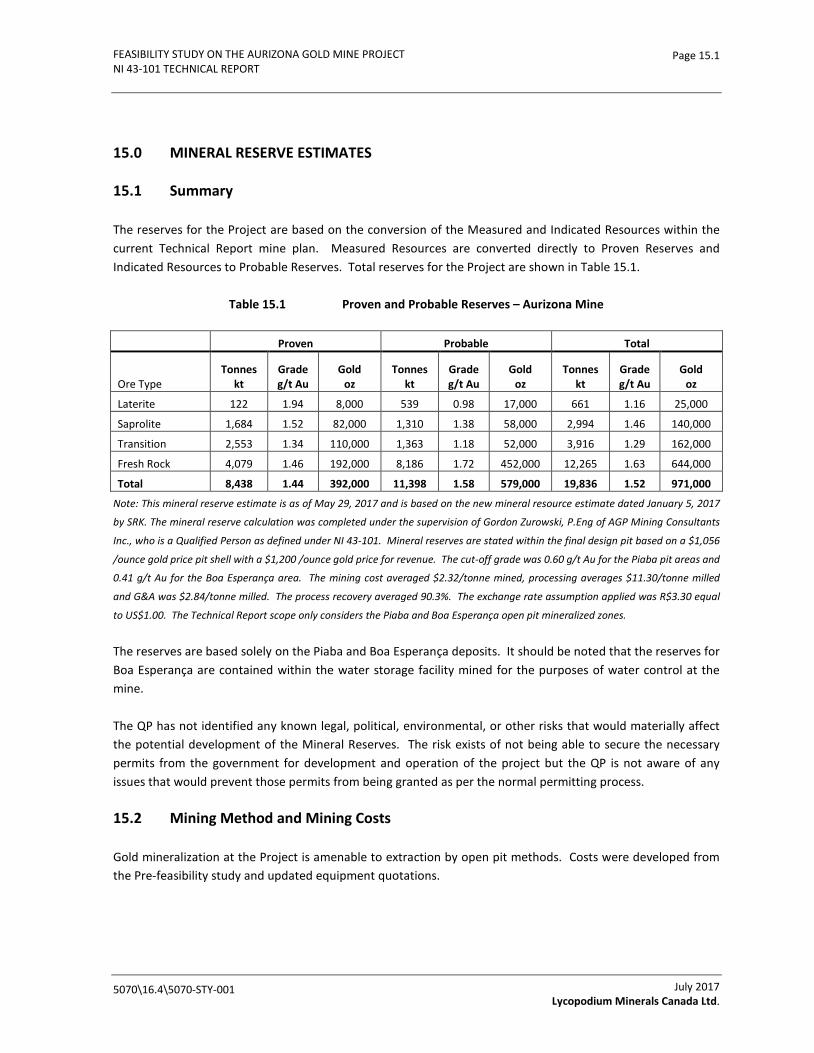
FEASIBILITY STUDY ON THE AURIZONA GOLD MINE PROJECT NI 43-101 TECHNICAL REPORT
Page 15.1
15.0 MINERAL RESERVE ESTIMATES
15.1 Summary
The reserves for the Project are based on the conversion of the Measured and Indicated Resources within the current Technical Report mine plan. Measured Resources are converted directly to Proven Reserves and Indicated Resources to Probable Reserves. Total reserves for the Project are shown in Table 15.1.
Table 15.1 Proven and Probable Reserves – Aurizona Mine
Proven Probable Total
Ore Type Tonnes
kt Grade g/t Au
Gold oz
Tonnes kt
Grade g/t Au
Gold oz
Tonnes kt
Grade g/t Au
Gold oz
Laterite 122 1.94 8,000 539 0.98 17,000 661 1.16 25,000
Saprolite 1,684 1.52 82,000 1,310 1.38 58,000 2,994 1.46 140,000
Transition 2,553 1.34 110,000 1,363 1.18 52,000 3,916 1.29 162,000
Fresh Rock 4,079 1.46 192,000 8,186 1.72 452,000 12,265 1.63 644,000
Total 8,438 1.44 392,000 11,398 1.58 579,000 19,836 1.52 971,000
Note: This mineral reserve estimate is as of May 29, 2017 and is based on the new mineral resource estimate dated January 5, 2017
by SRK. The mineral reserve calculation was completed under the supervision of Gordon Zurowski, P.Eng of AGP Mining Consultants
Inc., who is a Qualified Person as defined under NI 43-101. Mineral reserves are stated within the final design pit based on a $1,056
/ounce gold price pit shell with a $1,200 /ounce gold price for revenue. The cut-off grade was 0.60 g/t Au for the Piaba pit areas and
0.41 g/t Au for the Boa Esperança area. The mining cost averaged $2.32/tonne mined, processing averages $11.30/tonne milled
and G&A was $2.84/tonne milled. The process recovery averaged 90.3%. The exchange rate assumption applied was R$3.30 equal
to US$1.00. The Technical Report scope only considers the Piaba and Boa Esperança open pit mineralized zones.
The reserves are based solely on the Piaba and Boa Esperança deposits. It should be noted that the reserves for Boa Esperança are contained within the water storage facility mined for the purposes of water control at the mine.
The QP has not identified any known legal, political, environmental, or other risks that would materially affect the potential development of the Mineral Reserves. The risk exists of not being able to secure the necessary permits from the government for development and operation of the project but the QP is not aware of any issues that would prevent those permits from being granted as per the normal permitting process.
15.2 Mining Method and Mining Costs
Gold mineralization at the Project is amenable to extraction by open pit methods. Costs were developed from the Pre-feasibility study and updated equipment quotations.
5070\16.4\5070-STY-001
July 2017 Lycopodium Minerals Canada Ltd.

FEASIBILITY STUDY ON THE AURIZONA GOLD MINE PROJECT NI 43-101 TECHNICAL REPORT
Page 15.2
All design work is based on the Piaba and Boa Esperança models generated by SRK with an effective date of January 5, 2017. Only Measured and Indicated Resources were used for this Study and all Inferred Resources were considered to be waste.
This section discusses the development and parameters employed to declare reserves for the current feasibility study pit design.
15.2.1 Geotechnical Considerations
Piaba
Wall slopes for pit optimization were based on work completed by SRK for Trek. The slopes were then modified to consider the inclusion of ramps to arrive at the overall angle. In the case of the laterite and saprolite slopes, the inclusion of one, 17.3m ramp for each side was included, bringing the 41° inter-ramp angle to 37° overall. The transition zone averages approximately 30m thick. The inter-ramp angle for this material was estimated at 46° initially, but with the inclusion of a “dewatering” level of 15-17m, this lowered the overall angle to 33°. The dewatering level is included to allow for control of the expected drainage from the transition zone. The fresh rock is of higher rock quality; therefore, the inter-ramp angle was estimated at 56°. With the inclusion of two, 17.3m wide ramps, the overall angle drops to 49°.
For the final design, the pit slopes discussed in Section 16.5 were used. These included the use of geotechnical berms placed at 54m intervals vertically in accordance with the guidelines provided. The various sectors had similar bench widths and bench face angles irrespective of the rock type. One area though, sector HW V, has a particular joint set that required much flatter bench face angles to avoid this joint set from day lighting. As well, the azimuth of the walls in this corner needed to be within a certain range (almost perpendicular) and this was incorporated in the design process.
The pit is assumed to be drained conditions, because horizontal drain holes are planned every 24 m vertically as mining progresses. The initial design is to have drill stations every 200m horizontally on the 24m levels and three drillholes drilled 50m from each station radiating out as a fan.
Boa Esperança
The pit design created for Boa Esperança is not designed out to ultimate economic limits. This pit was primarily designed as a water storage facility and took advantage of the mineralization present in the area to subsidize the cost of mining the facility. The design was focused on maximizing the water storage capability without the use of a dam, and minimizing material movement.
15.2.2 Economic Pit Shell Development
The final pit designs were based on pit shells using the Lerch-Grossman procedure in MineSight. The parameters for the shells are shown in Table 15.2.
5070\16.4\5070-STY-001
July 2017 Lycopodium Minerals Canada Ltd.
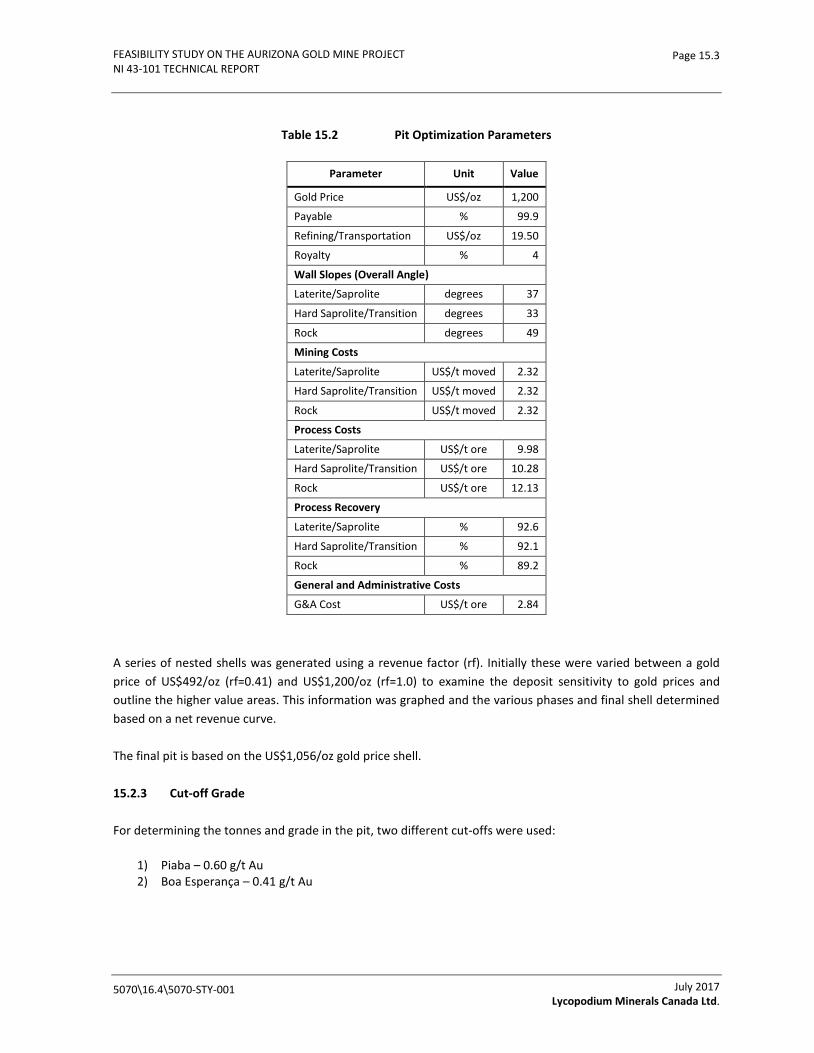
FEASIBILITY STUDY ON THE AURIZONA GOLD MINE PROJECT NI 43-101 TECHNICAL REPORT
Page 15.3
Table 15.2 Pit Optimization Parameters
Parameter Unit Value
Gold Price US$/oz 1,200
Payable % 99.9
Refining/Transportation US$/oz 19.50
Royalty % 4
Wall Slopes (Overall Angle)
Laterite/Saprolite degrees 37
Hard Saprolite/Transition degrees 33
Rock degrees 49
Mining Costs
Laterite/Saprolite US$/t moved 2.32
Hard Saprolite/Transition US$/t moved 2.32
Rock US$/t moved 2.32
Process Costs
Laterite/Saprolite US$/t ore 9.98
Hard Saprolite/Transition US$/t ore 10.28
Rock US$/t ore 12.13
Process Recovery
Laterite/Saprolite % 92.6
Hard Saprolite/Transition % 92.1
Rock % 89.2
General and Administrative Costs
G&A Cost US$/t ore 2.84
A series of nested shells was generated using a revenue factor (rf). Initially these were varied between a gold price of US$492/oz (rf=0.41) and US$1,200/oz (rf=1.0) to examine the deposit sensitivity to gold prices and outline the higher value areas. This information was graphed and the various phases and final shell determined based on a net revenue curve.
The final pit is based on the US$1,056/oz gold price shell.
15.2.3 Cut-off Grade
For determining the tonnes and grade in the pit, two different cut-offs were used:
1) Piaba – 0.60 g/t Au 2) Boa Esperança – 0.41 g/t Au
5070\16.4\5070-STY-001
July 2017 Lycopodium Minerals Canada Ltd.
FEASIBILITY STUDY ON THE AURIZONA GOLD MINE PROJECT NI 43-101 TECHNICAL REPORT
Page 15.4
The marginal cut-off for the Project would normally be determined by material type:
1) Laterite/Saprolite = 0.38 g/t Au 2) Transition = 0.39 g/t Au 3) Rock = 0.46 g/t Au
Piaba provides the bulk of the mill feed and ounces and to facilitate project economics, the cut-off was raised to 0.60 g/t Au regardless of material type.
Boa Esperança contains softer laterite and saprolite material. The cut-off grade was elevated slightly to cover potential stockpiling costs and was set at 0.41 g/t Au.
15.2.4 Dilution
The geologic model provided by SRK for Piaba was an ore percent model. Surrounding the ore zone was a modelled “buffer” zone of mineralization. When reviewed by AGP, it was determined that due to the geometry of the mineralized corridor no more than one contact side existed for potential dilution. Assuming 0.5 m of contact dilution and the block size provided, this equates to 10% dilution. This 10% value was added to the ore percent of all the contact blocks, but at the grade of the diluting block. This provided a diluted ore percent and grade. The reserves were then run with the diluted ore percent and diluted grade. This resulted in on average 3.6% grade dilution for the Piaba pit.
Boa Esperança was also presented as an ore percent model, but with a different block size and less continuous mineralization than Piaba. For Boa Esperança the dilution was calculated for the contact blocks as well, but more sides were present for diluting. The same concept of 0.5 m of dilution per side was applied. This, due to the block size equated to 9.1% for one side, 13% for two sides, 20% for three sides and 23.1% for all four sides. The surrounding block grade was queried for use in the dilution calculation. A diluted ore percent was generated as well as the diluted grade. Reserves for Boa Esperança were also reported on diluted grade. The overall dilution for Boa Esperança was 11% due to the thin nature of the veins present.
15.2.5 Pit Design
The detailed pit design used the pit shells developed to provide guidance on the phasing and final pit. Wall slopes for the inter-ramp were per the SRK recommendations, with one exception. In the north-east corner of the pit, the walls were flattened slightly to provide an extra measure of stability in the location of the prime ore haulage route.
Equipment sizing for ramps and working benches is based on the use of 63 t rigid frame trucks. The sizing of the ramp is actually sized for the smaller capacity 56 t rigid frame units, as they are slightly wider than the 63 t rigid frame versions. The operating width used for the truck is 5.7m. This means that single lane access is 17.8m (2x operating width plus berm and ditch) and double lane widths are 23.5m (3x operating width plus berm and ditch). Ramp gradients are 10% in the pit for uphill gradients and 8% uphill on the dump access roads. Working benches were designed for 35m – 40m minimum on pushbacks, although some pushbacks did work in a retreat manner to facilitate access.
5070\16.4\5070-STY-001
July 2017 Lycopodium Minerals Canada Ltd.

FEASIBILITY STUDY ON THE AURIZONA GOLD MINE PROJECT NI 43-101 TECHNICAL REPORT
Page 15.5
Piaba is designed with nine phases, although one is an internal ramp development phase. The first three phases are all in the bottom of the existing open pit. The purpose of these phases is to provide a stockpile of higher grade feed material early in the schedule. They also act as initial sumps for rainfall in the initial years of mining as the sides of the pit are laid back in other phases. The other phases work along the length of the pit to provide the width and ramp development to drive deeper for higher grade rock ore material. The western end of the pit provides earlier high-grade material and goes deeper with the final phase in the main Piaba pit on the eastern side. Included in the final phase is an accelerated phase that allows ramp access within the mining area and reduces the need for additional ramp access along the final wall.
Piaba East is the eastern most phase on the plateau where the primary crusher is located. It is mined later in the schedule and provides laterite and saprolite feed material at lower grades than the main Piaba pit. This is a single phase of the nine Piaba phases.
Boa Esperança is mined in the first year of production. It is only mined currently to provide a water storage facility. The lower grade material is stockpiled and feed into the mill as required. This is a single phase on its own.
15.2.6 Mine Reserves Statement
The reserves for the Project are based on the conversion of the Measured and Indicated Resources within the current Technical Report mine plan. Measured Resources are converted directly to Proven Reserves and Indicated Resources to Probable Reserves. These were prepared under the supervision of Gordon Zurowski, P. Eng. of AGP Mining Consultants Inc. who is a QP as defined under NI 43-101. The reserves are based solely on the Piaba and Boa Esperança open pits.
Cut-offs for the Piaba and Piaba East areas was 0.6 g/t Au. For Boa Esperança the cut-off was 0.41 g/t Au.
This estimate has an effective date of May 29, 2017. Total reserves for the Project are shown in Table 15.3 and Table 15.4.
Table 15.3 Proven and Probable Reserves – Summary for Aurizona
Proven Probable Total
Ore Type Tonnes (kt)
Grade (g/t) Gold (oz) Tonnes
(kt) Grade (g/t) Gold (oz) Tonnes
(kt) Grade (g/t) Gold (oz)
Laterite 122 1.94 8,000 539 0.98 17,000 661 1.16 25,000
Saprolite 1,684 1.52 82,000 1,310 1.38 58,000 2,994 1.46 140,000
Transition 2,553 1.34 110,000 1,363 1.18 52,000 3,916 1.29 162,000
Fresh Rock 4,079 1.46 192,000 8,186 1.72 452,000 12,265 1.63 644,000
Total 8,438 1.44 392,000 11,398 1.58 579,000 19,836 1.52 971,000
Note: Mineral Reserves are included within Mineral Resources
5070\16.4\5070-STY-001
July 2017 Lycopodium Minerals Canada Ltd.
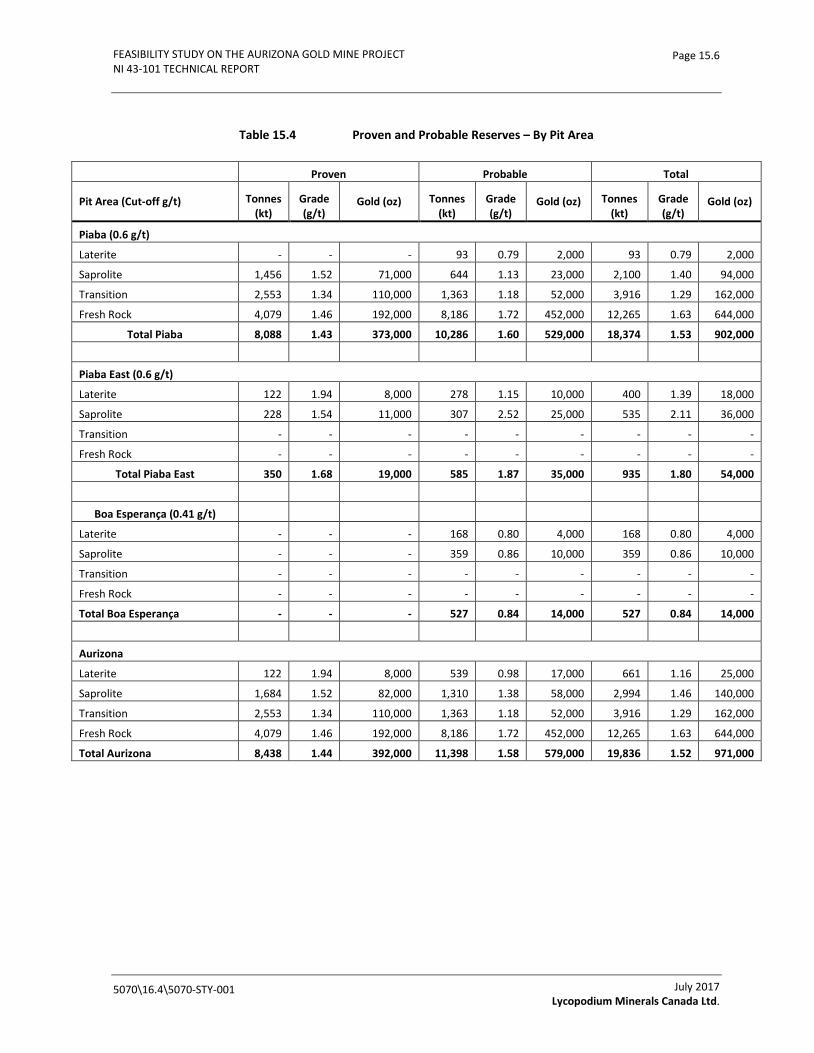
FEASIBILITY STUDY ON THE AURIZONA GOLD MINE PROJECT NI 43-101 TECHNICAL REPORT
Page 15.6
Table 15.4 Proven and Probable Reserves – By Pit Area
Proven Probable Total
Pit Area (Cut-off g/t) Tonnes (kt)
Grade (g/t)
Gold (oz) Tonnes (kt)
Grade (g/t)
Gold (oz) Tonnes (kt)
Grade (g/t)
Gold (oz)
Piaba (0.6 g/t)
Laterite - - - 93 0.79 2,000 93 0.79 2,000
Saprolite 1,456 1.52 71,000 644 1.13 23,000 2,100 1.40 94,000
Transition 2,553 1.34 110,000 1,363 1.18 52,000 3,916 1.29 162,000
Fresh Rock 4,079 1.46 192,000 8,186 1.72 452,000 12,265 1.63 644,000
Total Piaba 8,088 1.43 373,000 10,286 1.60 529,000 18,374 1.53 902,000
Piaba East (0.6 g/t)
Laterite 122 1.94 8,000 278 1.15 10,000 400 1.39 18,000
Saprolite 228 1.54 11,000 307 2.52 25,000 535 2.11 36,000
Transition - - - - - - - - -
Fresh Rock - - - - - - - - -
Total Piaba East 350 1.68 19,000 585 1.87 35,000 935 1.80 54,000
Boa Esperança (0.41 g/t)
Laterite - - - 168 0.80 4,000 168 0.80 4,000
Saprolite - - - 359 0.86 10,000 359 0.86 10,000
Transition - - - - - - - - -
Fresh Rock - - - - - - - - -
Total Boa Esperança - - - 527 0.84 14,000 527 0.84 14,000
Aurizona
Laterite 122 1.94 8,000 539 0.98 17,000 661 1.16 25,000
Saprolite 1,684 1.52 82,000 1,310 1.38 58,000 2,994 1.46 140,000
Transition 2,553 1.34 110,000 1,363 1.18 52,000 3,916 1.29 162,000
Fresh Rock 4,079 1.46 192,000 8,186 1.72 452,000 12,265 1.63 644,000
Total Aurizona 8,438 1.44 392,000 11,398 1.58 579,000 19,836 1.52 971,000
5070\16.4\5070-STY-001
July 2017 Lycopodium Minerals Canada Ltd.
FEASIBILITY STUDY ON THE AURIZONA GOLD MINE PROJECT NI 43-101 TECHNICAL REPORT
Page 16.1
16.0 MINING METHODS
16.1 Introduction
Open pit mining was selected as the method to examine the development of the Piaba and Boa Esperança deposits. This is based on the size of the resource, tenor of the grade, grade distribution and proximity to topographic features. The mine had previously operated as an open pit until early 2015. AGP is of the opinion that with current metal pricing levels and knowledge of the mineralization, open pit mining offers the most reasonable approach for development.
The potential for underground development beneath the open pit has not been examined as part of this Technical Report. Areas of higher grade gold resources are present beneath the existing open pit and should be considered in future evaluations.
16.2 Geologic Model Importation
SRK developed the resource models using Gemcom software. Two models are used for the Study - Piaba and Boa Esperança. The latest Piaba model provided to AGP is dated January 5, 2017. The Boa Esperança model also has an effective date of January 5, 2017. Both models form the basis for the work completed in the Technical Report.
5070\16.4\5070-STY-001
July 2017 Lycopodium Minerals Canada Ltd.

FEASIBILITY STUDY ON THE AURIZONA GOLD MINE PROJECT NI 43-101 TECHNICAL REPORT
Page 16.2
The resources contained within the models are shown in Table 16.1 as of January 5, 2017.
Table 16.1 Mineral Resource Statement*, Aurizona Property, Brazil, SRK
Deposit Category Quantity Grade Contained Metal
(000’s Tonnes) Au (g/t) Au (000's oz)
Open Pit Piaba Measured 8,860 1.46 415
Indicated 19,030 1.64 1,002 Total M & I 27,890 1.58 1,417 Inferred 740 1.56 37
Boa Esperança Indicated 370 1.14 14
Inferred 140 1.88 8
Total Open Pit M & I 28,260 1.57 1,431
Inferred 880 1.61 45
Underground Piaba Inferred 5,090 2.99 490
*Open pit mineral resources are reported in relation to a conceptual pit shell. Mineral resources are not mineral reserves and do not have
demonstrated economic viability. All figures are rounded to reflect the relative accuracy of the estimate. Open pit mineral resources are
reported at 0.6 g/t gold cut-off and underground resources are reported at 2.0 g/t gold cut-off.
5070\16.4\5070-STY-001
July 2017 Lycopodium Minerals Canada Ltd.
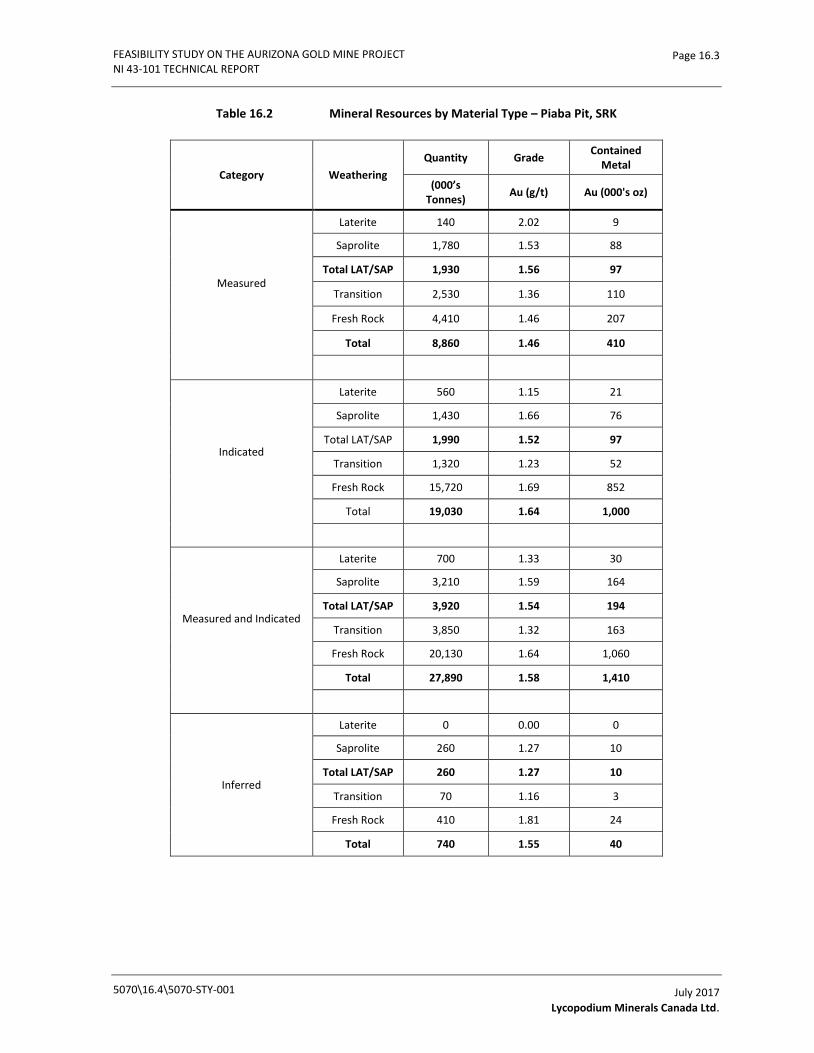
FEASIBILITY STUDY ON THE AURIZONA GOLD MINE PROJECT NI 43-101 TECHNICAL REPORT
Page 16.3
Table 16.2 Mineral Resources by Material Type – Piaba Pit, SRK
Category Weathering Quantity Grade Contained
Metal
(000’s Tonnes) Au (g/t) Au (000's oz)
Measured
Laterite 140 2.02 9
Saprolite 1,780 1.53 88
Total LAT/SAP 1,930 1.56 97
Transition 2,530 1.36 110
Fresh Rock 4,410 1.46 207
Total 8,860 1.46 410
Indicated
Laterite 560 1.15 21
Saprolite 1,430 1.66 76
Total LAT/SAP 1,990 1.52 97
Transition 1,320 1.23 52
Fresh Rock 15,720 1.69 852
Total 19,030 1.64 1,000
Measured and Indicated
Laterite 700 1.33 30
Saprolite 3,210 1.59 164
Total LAT/SAP 3,920 1.54 194
Transition 3,850 1.32 163
Fresh Rock 20,130 1.64 1,060
Total 27,890 1.58 1,410
Inferred
Laterite 0 0.00 0
Saprolite 260 1.27 10
Total LAT/SAP 260 1.27 10
Transition 70 1.16 3
Fresh Rock 410 1.81 24
Total 740 1.55 40
5070\16.4\5070-STY-001
July 2017 Lycopodium Minerals Canada Ltd.
FEASIBILITY STUDY ON THE AURIZONA GOLD MINE PROJECT NI 43-101 TECHNICAL REPORT
Page 16.4
The 2017 Mineral Resource models are ore percent models. The block models contain the topography, rock type, density, ore percent, gold grade, and classification. The mining model created by AGP in MineSight uses the same model dimensions as the original resource model with added items used for mine planning purposes. MineSight was used for the mining portion of the Project to take advantage of the included Lerchs-Grossman routine for economic pit shell development. The boundaries for the models are the same as the geology resource models. The Piaba model was rotated 20° counter-clockwise around the origin and Boa Esperança was rotated 25° counter-clockwise.
The specific gravity for the various lithology types was also imported. The average specific gravities in the model are laterite/saprolite (1.82 t/m3), hard saprolite/transition (2.19 t/m3) and fresh rock (2.77 t/m3). Each block carries its own specific gravity.
The Piaba model has two grade items; gold zone and buffer zone. The buffer zone is the area around the modelled wireframe with lower grade gold and grades that were estimated. Both the gold zone and the buffer zone had a grade item and an ore percentage and were imported.
The Boa Esperança model only had a single ore percent and gold grade. This was imported in addition to the rock type, classification, and specific gravity.
Only Measured and Indicated Resources were used for the Study. All Inferred Resources were considered as waste.
16.3 Economic Pit Shell Development
To determine the potential size of the open pit, various input parameters were required including estimates of the expected mining, processing and G&A costs, as well as metallurgical recoveries, pit slopes and reasonable long-term metal price assumptions. AGP worked together with Trek personnel and reviewed the past operating cost parameters and forecast new parameters. From this, a set of parameters was developed and refined. The parameters chosen are shown in Table 16.3.
5070\16.4\5070-STY-001
July 2017 Lycopodium Minerals Canada Ltd.

FEASIBILITY STUDY ON THE AURIZONA GOLD MINE PROJECT NI 43-101 TECHNICAL REPORT
Page 16.5
Table 16.3 Pit Optimization Parameters
Parameter Unit Value
Gold Price US$/oz 1,200
Payable % 99.9
Refining/Transportation US$/oz 19.50
Royalty % 4
Wall Slopes (Overall Angle)
Laterite/Saprolite degrees 37
Transition degrees 33
Rock degrees 49
Mining Costs
Laterite/Saprolite US$/t moved 2.32
Transition US$/t moved 2.32
Rock US$/t moved 2.32
Process Costs
Laterite/Saprolite US$/t ore 9.98
Transition US$/t ore 10.28
Rock US$/t ore 12.13
Process Recovery
Laterite/Saprolite % 92.6
Hard Saprolite/Transition % 92.1
Rock % 89.2
General and Administrative Costs
G&A Cost US$/t ore 2.84
All dollar values are in US dollars unless noted otherwise.
The gold price was varied between $492/oz to $1,200/oz to examine the deposit sensitivity to gold prices and outline the higher value areas. Payables, refining and transportation costs were used from operational information.
The royalty is in two parts. There is a 1% royalty called the CFEM (Compensação Financeira pela Exploração de Recursos Minerais), which is levied by the Brazilian Government on gold production. The remaining portion is a sliding scale where the royalty payable to Sandstorm is 3% for gold prices less than or equal to $1,500/oz, 4% for gold prices between $1,500 and $2,000/oz and 5% when gold is greater than $2,000/oz.
Wall slopes for pit optimization were based on work completed by SRK for Trek. The slopes were then modified to consider the inclusion of ramps to arrive at the overall angle. In the case of the laterite and saprolite slopes, the inclusion of one 17.3 m ramp (double width for a Cat 740B) was included, bringing the 41° inter-ramp angle to 37° overall. For the final design, the pit slopes discussed in Section 16.5 were used.
5070\16.4\5070-STY-001
July 2017 Lycopodium Minerals Canada Ltd.
FEASIBILITY STUDY ON THE AURIZONA GOLD MINE PROJECT NI 43-101 TECHNICAL REPORT
Page 16.6
The transition zone averages approximately 30 m thick. The inter-ramp angle for this material was estimated at 46° initially, but with the inclusion of a “dewatering” level of 17.3m, this lowered the overall angle to 33°. The dewatering level is included to allow for control of the expected drainage from the transition zone. Due to of the nature of the material it is expected that the greatest inflow of water to the pit will come from this area and rapid removal of the water will be required to ensure slope stability.
The fresh rock is of higher rock quality; therefore, the inter-ramp angle was estimated at 56°. With the inclusion of two 17.3m wide ramps, the overall angle drops to 49°.
The mining costs are estimates based on internal study work completed by AGP and are slightly higher than the Pre-feasibility Study costs. This reflects the change in the exchange rate considered for the Study as well as increases in equipment operating costs (fuel, repair parts, etc.). The costs represent what is expected as a blended cost over the LOM for all material types to the various dump locations.
Pit optimizations running variable mining costs were also examined. These indicated potential for expansion of the current ultimate pit deeper in the western portion and also deeper in the centre section of Piaba. The net value of the comparable pits was similar and AGP opted to use the fixed mining cost pits to further the design. The potential that more drilling will allow for the inclusion of additional material to the west of the final design should be examined in further detail.
Process costs were provided by Lycopodium based on their own test work and analysis. This also applied to the process recovery as more detailed test work was used to further refine the process circuit.
Trek provided the G&A cost estimate based on assumed manpower levels from the Pre-feasibility Study. The G&A cost estimate was based on historic costs from prior operational years at the Aurizona Mine and forward projections.
A boundary of 80m was applied from the toe of the TSF. SRK examined the slope and determined that 80 m provides sufficient long term slope stability.
Initial pit shells were generated to examine sensitivity to the gold price with an upper gold price of $1,200/oz. This was to gain an understanding of the deposit and highlight potential opportunities in the design process to follow. Only Measured and Indicated material was used in the analysis. The gold price was varied from $492/oz up to $1,200/oz to determine the size of the shell. All other parameters were fixed. This was intended to visualize any natural breakpoints in the deposit. The net profit before capital for each pit was calculated on an undiscounted basis for each pit shell using $1,200/oz as the revenue price. Ore/waste tonnes and net profit were plotted against gold price.
A graph of the results is shown in Figure 16.1.
5070\16.4\5070-STY-001
July 2017 Lycopodium Minerals Canada Ltd.

FEASIBILITY STUDY ON THE AURIZONA GOLD MINE PROJECT NI 43-101 TECHNICAL REPORT
Page 16.7
Figure 16.1 Profit vs Price by Pit Shell
The graph illustrates various break points in the pit shells. With the increase in the waste tonnage, and to a lesser degree the mill tonnage, the net profit also increased. In the case of the first break point shown at $564/oz, the waste tonnage increases by 7.8 Mt, with a corresponding increase in mill feed tonnage of 1.8 Mt or an incremental strip ratio of 4.25. The net profit also increased at this point showing that there was still value to be obtained by going with a higher metal price.
The second break point was at $648/oz. The waste tonnage increased by 8.4 Mt and the mill feed by 2.5 Mt, for an incremental strip ratio of 3.36:1. There was an additional breakpoint noted at $804/oz. The net profit was still increasing, although at a flatter rate than in earlier breakpoints.
The final major break point was at $1,056/oz (pit 147). This resulted in a jump in the waste tonnage by 8.9 Mt with a gain of 0.7 Mt of ore for an incremental strip ratio of 13.0:1; however, the change in the net profit was only $4.5 million, well within the accuracy of the analysis. The shell strip ratio is 5.01:1 at $1,056/oz.
In discussion with Trek, AGP decided to advance the pit design work based on a $1,056/oz price. This metal price provides a reasonable strip ratio and just under 19 Mt of undiluted mill feed. It also saves significant potential waste movement that would be required for the higher metal prices. This is shown in the flattening of the net value curve for gold prices, in excess of $1,056/oz.
5070\16.4\5070-STY-001
July 2017 Lycopodium Minerals Canada Ltd.

FEASIBILITY STUDY ON THE AURIZONA GOLD MINE PROJECT NI 43-101 TECHNICAL REPORT
Page 16.8
16.4 Dilution Calculation
The geologic model provided was an ore percent grade model. In the case of the Piaba model this meant there were two grade items: gold zone and buffer zone. For Boa Esperança, only one grade item had an ore percent; the gold grade.
The Piaba model was created with grade wireframes prior to assigning the grades into the block. These wireframes were the gold zone (GZ) and buffer zone (Buff). GZ is the zone being used for mill feed and Buf is the material surrounding the vein that has variable grades and would represent the dilution.
AGP believes that contact dilution will be present even with the selective mining equipment proposed. To determine the amount of dilution and the grade of the dilution the size of the block in the model was examined. The block model is 10m along strike (X axis), 5m thick (Y axis) and 6m high (Z axis). The expected blast pattern is a 3.7m burden and 4.3m spacing. One ore block in the model will be defined by 5 blast holes. It was assumed that contact dilution would be 0.5m in thickness. With 0.5m of dilution on the long side, that equates to 10% dilution.
For Piaba, an elevated cutoff of 0.6 g/t for all materials was used. Blocks below 0.6 g/t were wasted.
The model and wireframes were reviewed and it was noticed that due to the geometry, there was only one contact block for dilution at any given time. It was then decided to add the 10% dilution to the model for use in tonnage and grade calculations. A new model item was created called DORE% = diluted ore percent. This item was populated with the 10% dilution with the following logic:
• If GZ%>90%, then DORE% = 100% - the diluted ore percentage was capped at 100%.
• If GZ%<=90%, then DORE% = GZ%+ 10% - this added the required dilution percentage.
The gold grade was estimated by using the dilution percentage and the gold grade within the buffer zone of the block. The diluted gold grade was an item called DAU. It was calculated with the following formula:
DAU = (GZ% x AuGZ) + 10% x (BufAu)
Where:
GZ% = gold zone ore percent
AuGZ = gold zone gold grade
BufAu = buffer zone gold grade
5070\16.4\5070-STY-001
July 2017 Lycopodium Minerals Canada Ltd.

FEASIBILITY STUDY ON THE AURIZONA GOLD MINE PROJECT NI 43-101 TECHNICAL REPORT
Page 16.9
Comparing the in situ value to the diluted value for the design pit optimization shell showed that for the main Piaba pit, the ore tonnage dilution was 3.9% overall with a grade dilution of 3.3%. The grade dilution is lower as a result of the waste blocks containing some mineralization. Piaba East is a little thinner and so the dilution represented a great increase. The ore tonnage dilution was 9.5% with a grade dilution of 8.8%. The blend of Piaba and Piaba East results in an overall increase in tonnage for dilution of 4.2% and a grade dilution of 3.6%.
Boa Esperança is a multi-vein system with thinner veins. The effect of contact dilution was expected to be greater. When the wireframes were reviewed, however, it was apparent that more than one side of dilution would be present so the methodology for calculating dilution changed slightly. No grade was estimated in the model outside of the ore wireframe so the diluting material is considered to have a zero grade. The cutoff for Boa Esperança is based on the average milling cutoff of the four material types of 0.41 g/t.
The percentage of dilution is calculated for each contact side using the same assumed 0.5m contact dilution distance. If one side of the block is touching waste, then it is estimated that dilution of 9.1% would result. If two sides are contacting, it would rise to 13%. Three sides would be 20%, and four sides 23.1%. Four sides represent an isolated block of ore.
MineSight has a routine that enables the user to query surrounding blocks against a set of conditions. For the dilution percentage calculation, the procedure was run to determine how many waste blocks contacted an ore block, which determined the dilution percentage to apply. This dilution percentage was stored in the block.
Like the Piaba model, the dilution percentage was added to the existing ore percent item and stored in a new item called DORE%. The gold grade was stored in the diluted gold item DAU. The calculations were as follows:
DORE% = Ore% + Dil% - capped at 100%
DAu = (Ore% x Au) + (Dil% x 0)/Dore%
Where:
DORE% = diluted ore percentage.
Ore% = ore percentage.
Dil% = calculated dilution percentage based on the number of contact sides.
Au = model gold grade.
DAu = diluted gold grade
The Boa Esperança ore tonnage was then run with the block model DORE% item to report out the proper tonnes and grade with the reported grade of DAu. Comparing the in situ to the diluted value for the design pit showed ore tonnage dilution of 11.6% and grade dilution of 11.0%.
Tonnes and grade for the pit designs and reserves are reported with the diluted tonnes and grade.
5070\16.4\5070-STY-001
July 2017 Lycopodium Minerals Canada Ltd.

FEASIBILITY STUDY ON THE AURIZONA GOLD MINE PROJECT NI 43-101 TECHNICAL REPORT
Page 16.10
16.5 Geotechnical
SRK performed a feasibility level geotechnical study and design for the Piaba and Boa Esperança Pit walls, and these reports are on file with Trek. This section of the report provides a brief summary of the geotechnical study and recommendations.
16.5.1 Site Geology
The general site geology is covered in detail in Sections 7 and 14.1.
16.5.2 Structural and Engineering Geology
Geotechnical Units
The definition of the basic geotechnical units has been developed based on previous studies, and they were determined based on available geological and geotechnical information and results from laboratory tests. According to the available information, the main geotechnical units are shown in Table 16.4.
Table 16.4 Main Geotechnical Units at the Aurizona Mine
5070\16.4\5070-STY-001
July 2017 Lycopodium Minerals Canada Ltd.

FEASIBILITY STUDY ON THE AURIZONA GOLD MINE PROJECT NI 43-101 TECHNICAL REPORT
Page 16.11
Structural Geology
The main structure in the Piaba pit, which is responsible for the structural direction of the Proterozoic lithologies, is oriented NE-SW. This tendency is characterized in the lithotypes of the greenstone belt sequence by rhythmic banding and foliation. Diorite intrusions occurred preferentially along this structure. Discrete shear zones, parallel to the intrusions of diorites, take place along the contacts of the mineralized zone and present themselves as important hosts for the deposit of gold.
Table 16.5 summarizes the integrated structural domains.
Table 16.5 Integrated Structural Domains (spot surface mapping, SM & Core Logging, CL)
Rock Mass Properties
The failure criterion of Hoek-Brown (Hoek et al., 2002) has been used to estimate resistance and deformation parameters for the defined basic geotechnical units.
An important variability is observed in transitional rock units (UGB8 & UGB10) on its characterization and classification parameters associated by unconsolidated materials like weathered material and weak zones. In consequence, it is highly recommended to improve the geotechnical characterization data.
Several materials testing campaigns were completed in the previous study phases. Table 16.6 shows the rock mass parameters for the main Geotechnical Units at the Project.
5070\16.4\5070-STY-001
July 2017 Lycopodium Minerals Canada Ltd.
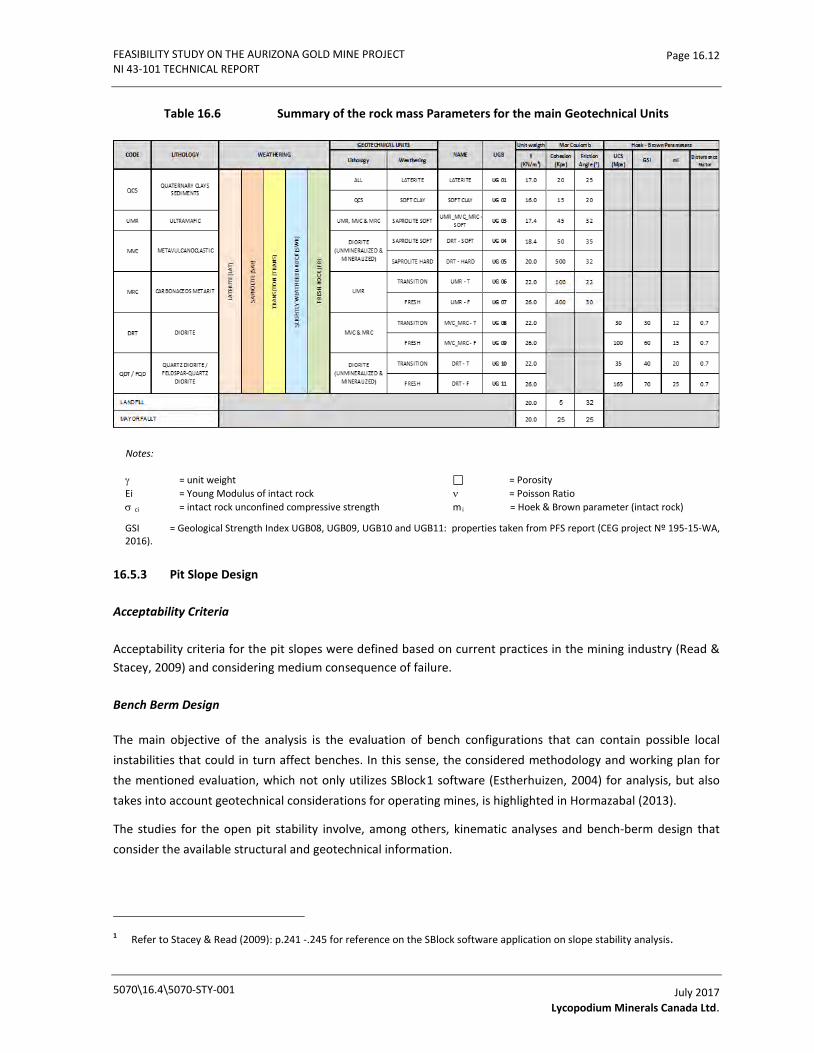
FEASIBILITY STUDY ON THE AURIZONA GOLD MINE PROJECT NI 43-101 TECHNICAL REPORT
Page 16.12
Table 16.6 Summary of the rock mass Parameters for the main Geotechnical Units
Notes: γ = unit weight = Porosity Ei = Young Modulus of intact rock ν = Poisson Ratio σ ci = intact rock unconfined compressive strength mi = Hoek & Brown parameter (intact rock)
GSI = Geological Strength Index UGB08, UGB09, UGB10 and UGB11: properties taken from PFS report (CEG project Nº 195-15-WA, 2016).
16.5.3 Pit Slope Design
Acceptability Criteria
Acceptability criteria for the pit slopes were defined based on current practices in the mining industry (Read & Stacey, 2009) and considering medium consequence of failure.
Bench Berm Design
The main objective of the analysis is the evaluation of bench configurations that can contain possible local instabilities that could in turn affect benches. In this sense, the considered methodology and working plan for the mentioned evaluation, which not only utilizes SBlock1 software (Estherhuizen, 2004) for analysis, but also takes into account geotechnical considerations for operating mines, is highlighted in Hormazabal (2013).
The studies for the open pit stability involve, among others, kinematic analyses and bench-berm design that consider the available structural and geotechnical information.
1 Refer to Stacey & Read (2009): p.241 -.245 for reference on the SBlock software application on slope stability analysis.
5070\16.4\5070-STY-001
July 2017 Lycopodium Minerals Canada Ltd.

FEASIBILITY STUDY ON THE AURIZONA GOLD MINE PROJECT NI 43-101 TECHNICAL REPORT
Page 16.13
The SBlock program (Esterhuizen, 2004) is a tool that can be used to conduct probabilistic analysis of the effects of discontinuities on bench scale stability. Knowledge of the distribution of the orientation, spacing and length characteristics of discontinuities makes it possible to simulate blocks in the slope face of a bench.
In summary, the main technical considerations for the bench-berm stability analysis are as follows:
a) Bench-berm design considers a bench height of 6 m for single benches for the transition zone and 18 m for triple benches for the bottom pit (rock units). This requires the use of pre-splitting techniques for the fresh rock (pre-splitting of 18m in one pass).
b) Bench faces considers 55º for laterite unit, 49° (soft) to 67° (hard) for saprolite weathering; 49° to 75° for transition zone and 80° to 85° for fresh rock.
c) Acceptability criteria for this analysis consider a Probability of Failure (PF) < 30%, according to current practices in the mining industry (Read & Stacey, 2009).
Slopes Stability Analyses
Stability analyses were performed using the generalized limit equilibrium method (GLE) and the software SLIDE (Rocscience, 2010).
a) In this analysis, structures were included explicitly in fresh rock in order to verify other potential failure mechanics. All possible failures were analyzed: overall slopes, single inter-ramp, multiple inter-ramp, local sectors associated with geological contacts and/or geological faults, etc.
b) A path search technique was used to find the most critical failure surface in each case. c) Structural domains were defined using the data available for this Study, consisting of major faults,
provided in the updated structural model by Trek, structural data obtained from oriented cores made in the Piaba pit and surface mapping developed by the geostructural company.
d) In the Piaba Central and East pits, water tables were drawn for each section based on the last available hydrogeological information (based on model to surface water level updated). 12 m of water level was considered for Boa Esperanza.
e) Water-filled tension cracks were used in the stability analysis. f) PF determined by Monte Carlo analysis using the Response Surface Method (Morgan & Herion, 1990). g) For the Piaba pit, 15 geotechnical cross sections were defined to assess the stability of inter-ramp and
overall slopes. h) For the Boa Esperança pit, two sections were defined to assess slope stability. i) Acceptability criteria for pit slopes were defined based on current practices in the mining industry
(Read & Stacey, 2009). A medium consequence of failure was considered. Results from the slope stability analyses, considering a medium consequence of failure, indicate that most of the slopes are stable for the static case, using both a “dry condition” (fully drained/depressurized slope) and the predicted “groundwater condition” (calculated groundwater table at the time of excavation, as taken from the mine site scale transient 3D groundwater model).
However, under these conditions, section P02 (on the HW) and section P06 (on the FW), are below the limit for the acceptability criteria when assessed using the groundwater conditions predicted by the 3D groundwater modelling.
5070\16.4\5070-STY-001
July 2017 Lycopodium Minerals Canada Ltd.
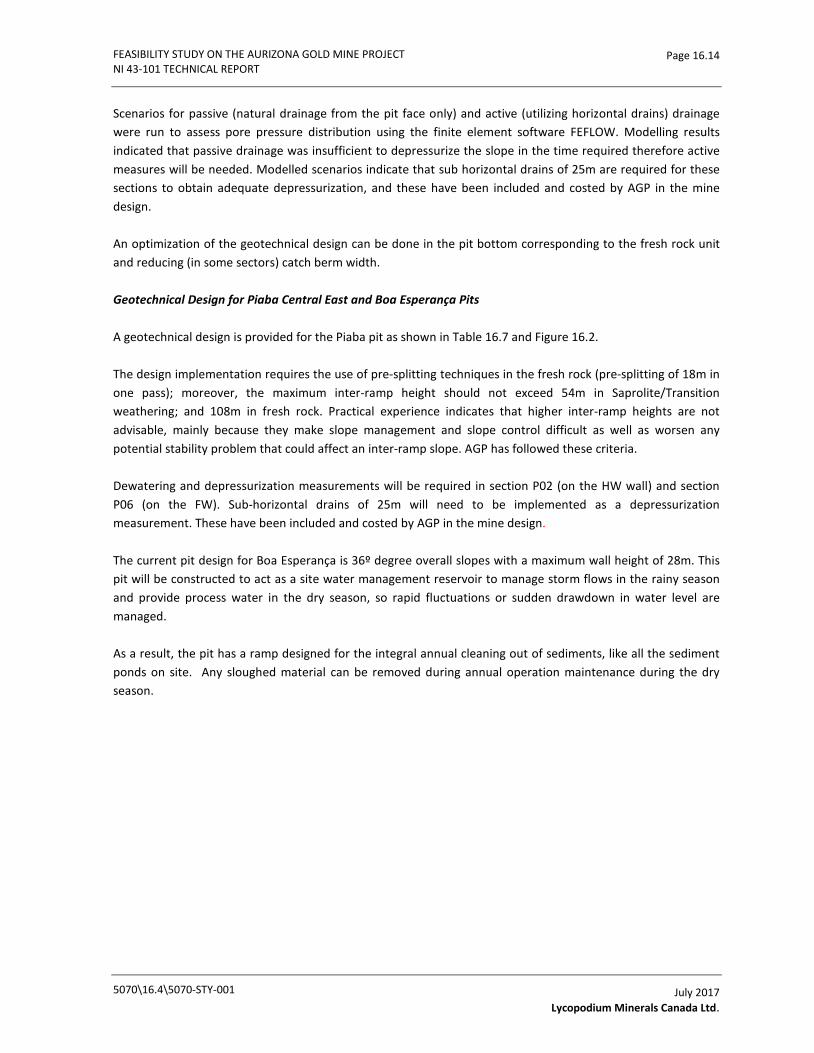
FEASIBILITY STUDY ON THE AURIZONA GOLD MINE PROJECT NI 43-101 TECHNICAL REPORT
Page 16.14
Scenarios for passive (natural drainage from the pit face only) and active (utilizing horizontal drains) drainage were run to assess pore pressure distribution using the finite element software FEFLOW. Modelling results indicated that passive drainage was insufficient to depressurize the slope in the time required therefore active measures will be needed. Modelled scenarios indicate that sub horizontal drains of 25m are required for these sections to obtain adequate depressurization, and these have been included and costed by AGP in the mine design.
An optimization of the geotechnical design can be done in the pit bottom corresponding to the fresh rock unit and reducing (in some sectors) catch berm width.
Geotechnical Design for Piaba Central East and Boa Esperança Pits
A geotechnical design is provided for the Piaba pit as shown in Table 16.7 and Figure 16.2.
The design implementation requires the use of pre-splitting techniques in the fresh rock (pre-splitting of 18m in one pass); moreover, the maximum inter-ramp height should not exceed 54m in Saprolite/Transition weathering; and 108m in fresh rock. Practical experience indicates that higher inter-ramp heights are not advisable, mainly because they make slope management and slope control difficult as well as worsen any potential stability problem that could affect an inter-ramp slope. AGP has followed these criteria.
Dewatering and depressurization measurements will be required in section P02 (on the HW wall) and section P06 (on the FW). Sub-horizontal drains of 25m will need to be implemented as a depressurization measurement. These have been included and costed by AGP in the mine design.
The current pit design for Boa Esperança is 36º degree overall slopes with a maximum wall height of 28m. This pit will be constructed to act as a site water management reservoir to manage storm flows in the rainy season and provide process water in the dry season, so rapid fluctuations or sudden drawdown in water level are managed.
As a result, the pit has a ramp designed for the integral annual cleaning out of sediments, like all the sediment ponds on site. Any sloughed material can be removed during annual operation maintenance during the dry season.
5070\16.4\5070-STY-001
July 2017 Lycopodium Minerals Canada Ltd.
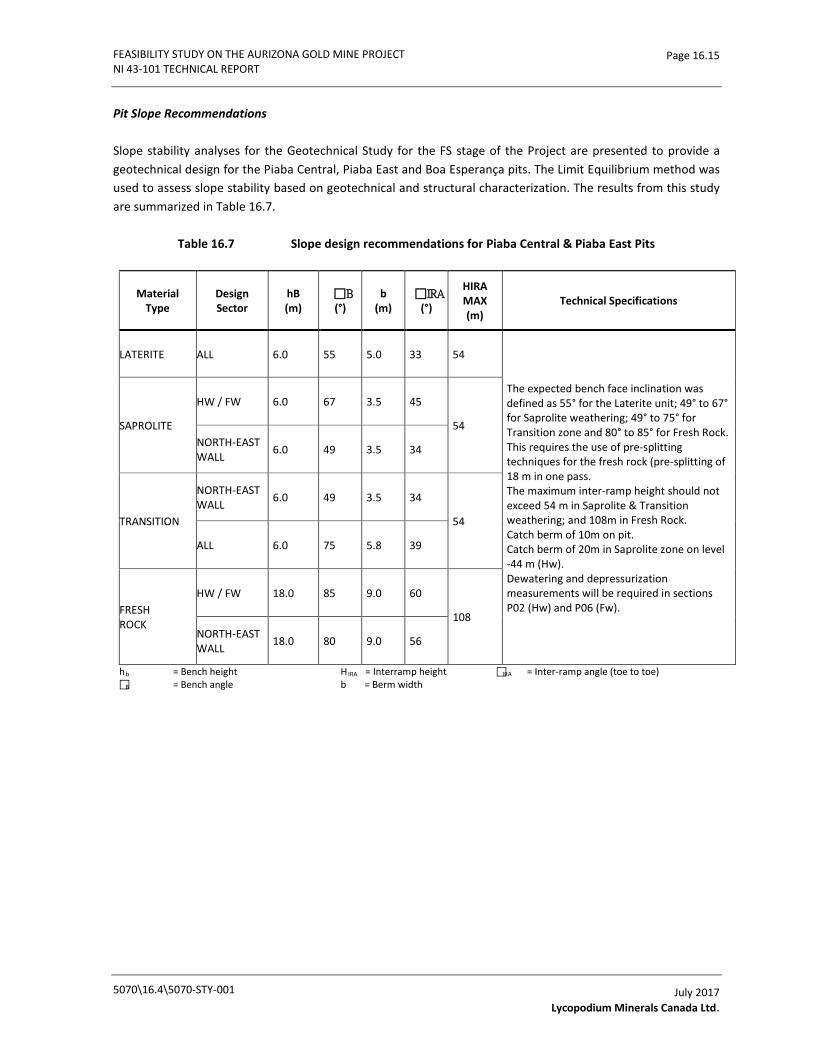
FEASIBILITY STUDY ON THE AURIZONA GOLD MINE PROJECT NI 43-101 TECHNICAL REPORT
Page 16.15
Pit Slope Recommendations
Slope stability analyses for the Geotechnical Study for the FS stage of the Project are presented to provide a geotechnical design for the Piaba Central, Piaba East and Boa Esperança pits. The Limit Equilibrium method was used to assess slope stability based on geotechnical and structural characterization. The results from this study are summarized in Table 16.7.
Table 16.7 Slope design recommendations for Piaba Central & Piaba East Pits
Material Type
Design Sector
hB (m)
B (°)
b (m)
IRA (°)
HIRA MAX (m)
Technical Specifications
LATERITE ALL 6.0 55 5.0 33 54
The expected bench face inclination was defined as 55° for the Laterite unit; 49° to 67° for Saprolite weathering; 49° to 75° for Transition zone and 80° to 85° for Fresh Rock. This requires the use of pre-splitting techniques for the fresh rock (pre-splitting of 18 m in one pass. The maximum inter-ramp height should not exceed 54 m in Saprolite & Transition weathering; and 108m in Fresh Rock. Catch berm of 10m on pit. Catch berm of 20m in Saprolite zone on level -44 m (Hw). Dewatering and depressurization measurements will be required in sections P02 (Hw) and P06 (Fw).
SAPROLITE
HW / FW 6.0 67 3.5 45
54 NORTH-EAST WALL 6.0 49 3.5 34
TRANSITION
NORTH-EAST WALL 6.0 49 3.5 34
54
ALL 6.0 75 5.8 39
FRESH ROCK
HW / FW 18.0 85 9.0 60
108 NORTH-EAST WALL 18.0 80 9.0 56
hb = Bench height HIRA = Interramp height IRA = Inter-ramp angle (toe to toe) B = Bench angle b = Berm width
5070\16.4\5070-STY-001
July 2017 Lycopodium Minerals Canada Ltd.

FEASIBILITY STUDY ON THE AURIZONA GOLD MINE PROJECT NI 43-101 TECHNICAL REPORT
Page 16.16
Figure 16.2 Geotechnical Design for Piaba Central & Piaba East Pits, Optimized Design
As a result of this Study, the following recommendations are presented for the slope design for the Piaba Central and Piaba East Pits:
a) Ongoing geotechnical and structural characterization during operations is recommended.
b) Geotechnical monitoring and control of pit operations including the limit blast program and general house-keeping.
16.6 Pit Design and Phase Development
Pit designs were developed for the Piaba pit area - both the main area and north-east of the previous ore stockpile which is called East Pit. The pit optimization shells used to determine the ultimate pit were also used to outline areas of higher value for targeted early mining. These higher value shells were used for Phase development.
Geotechnical parameters outlined in Section 16.5 were used for each of the weathering zones and rock types. Geotechnical berms were placed at 54m intervals in accordance with the guidelines provided. The various sectors had similar bench widths and bench face angles irrespective of the rock type. One area though, sector HWV, has a particular joint set that required much flatter bench face angles to avoid this joint set day-lighting. As well the azimuth of the walls in this corner need to be within a certain range (almost perpendicular) and this was incorporated in the design process.
5070\16.4\5070-STY-001
July 2017 Lycopodium Minerals Canada Ltd.
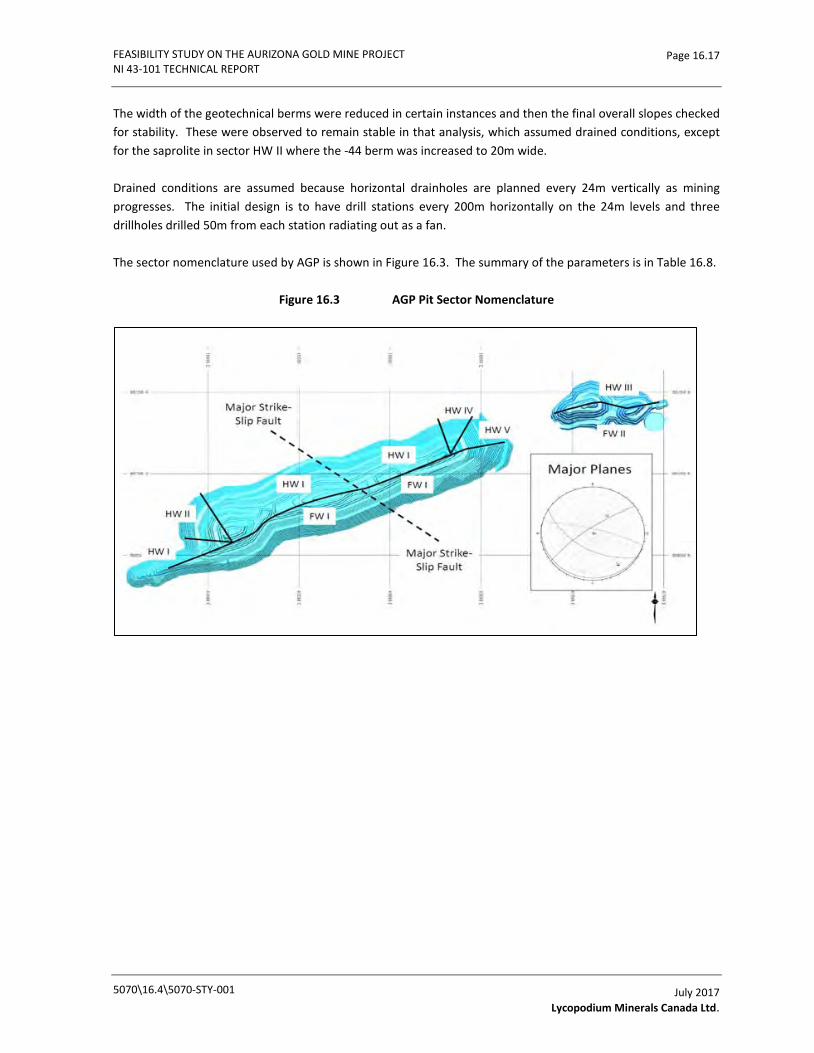
FEASIBILITY STUDY ON THE AURIZONA GOLD MINE PROJECT NI 43-101 TECHNICAL REPORT
Page 16.17
The width of the geotechnical berms were reduced in certain instances and then the final overall slopes checked for stability. These were observed to remain stable in that analysis, which assumed drained conditions, except for the saprolite in sector HW II where the -44 berm was increased to 20m wide.
Drained conditions are assumed because horizontal drainholes are planned every 24m vertically as mining progresses. The initial design is to have drill stations every 200m horizontally on the 24m levels and three drillholes drilled 50m from each station radiating out as a fan.
The sector nomenclature used by AGP is shown in Figure 16.3. The summary of the parameters is in Table 16.8.
Figure 16.3 AGP Pit Sector Nomenclature
5070\16.4\5070-STY-001
July 2017 Lycopodium Minerals Canada Ltd.
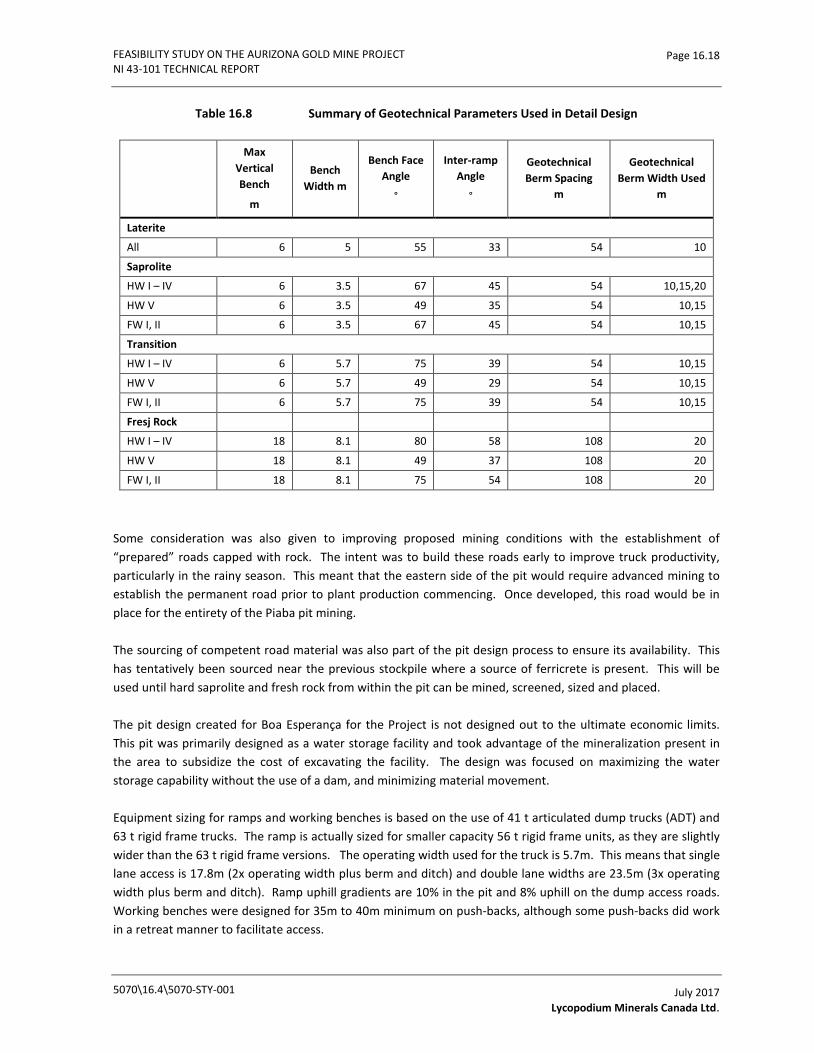
FEASIBILITY STUDY ON THE AURIZONA GOLD MINE PROJECT NI 43-101 TECHNICAL REPORT
Page 16.18
Table 16.8 Summary of Geotechnical Parameters Used in Detail Design
Max Vertical Bench
m
Bench Width m
Bench Face Angle
°
Inter-ramp Angle
°
Geotechnical Berm Spacing
m
Geotechnical Berm Width Used
m
Laterite
All 6 5 55 33 54 10
Saprolite
HW I – IV 6 3.5 67 45 54 10,15,20
HW V 6 3.5 49 35 54 10,15
FW I, II 6 3.5 67 45 54 10,15
Transition
HW I – IV 6 5.7 75 39 54 10,15
HW V 6 5.7 49 29 54 10,15
FW I, II 6 5.7 75 39 54 10,15
Fresj Rock
HW I – IV 18 8.1 80 58 108 20
HW V 18 8.1 49 37 108 20
FW I, II 18 8.1 75 54 108 20
Some consideration was also given to improving proposed mining conditions with the establishment of “prepared” roads capped with rock. The intent was to build these roads early to improve truck productivity, particularly in the rainy season. This meant that the eastern side of the pit would require advanced mining to establish the permanent road prior to plant production commencing. Once developed, this road would be in place for the entirety of the Piaba pit mining.
The sourcing of competent road material was also part of the pit design process to ensure its availability. This has tentatively been sourced near the previous stockpile where a source of ferricrete is present. This will be used until hard saprolite and fresh rock from within the pit can be mined, screened, sized and placed.
The pit design created for Boa Esperança for the Project is not designed out to the ultimate economic limits. This pit was primarily designed as a water storage facility and took advantage of the mineralization present in the area to subsidize the cost of excavating the facility. The design was focused on maximizing the water storage capability without the use of a dam, and minimizing material movement.
Equipment sizing for ramps and working benches is based on the use of 41 t articulated dump trucks (ADT) and 63 t rigid frame trucks. The ramp is actually sized for smaller capacity 56 t rigid frame units, as they are slightly wider than the 63 t rigid frame versions. The operating width used for the truck is 5.7m. This means that single lane access is 17.8m (2x operating width plus berm and ditch) and double lane widths are 23.5m (3x operating width plus berm and ditch). Ramp uphill gradients are 10% in the pit and 8% uphill on the dump access roads. Working benches were designed for 35m to 40m minimum on push-backs, although some push-backs did work in a retreat manner to facilitate access.
5070\16.4\5070-STY-001
July 2017 Lycopodium Minerals Canada Ltd.

FEASIBILITY STUDY ON THE AURIZONA GOLD MINE PROJECT NI 43-101 TECHNICAL REPORT
Page 16.19
Piaba was designed in 8 phases, with one acting as the internal access phases. They initially start at the eastern end of the pit, advancing west before deepening in the middle and western ends and increasing in depth to obtain higher-grade rock. The final design phase tonnages and grades are shown in Table 16.9.
Table 16.9 Final Design – Phase Tonnages and Grades
Phase Ore Mt
Au g/t
Waste Mt
Total Mt
Strip Ratio
Piaba Main
Ph1 0.38 1.34 1.44 1.82 3.81
Ph2 0.47 1.14 0.43 0.90 0.92
Ph3 0.38 1.32 0.60 0.98 1.59
Ph4 1.96 1.42 8.25 10.22 4.20
Ph5 2.54 1.58 22.22 24.75 8.76
Ph6 5.40 1.60 33.44 38.84 6.19
Ph7A 0.82 1.27 3.28 4.10 4.01
Ph7B 6.43 1.56 37.44 43.87 5.83
Total Piaba Main 18.37 1.53 107.12 125.49 5.83
Piaba East
East 0.94 1.80 3.49 4.42 3.73
Quarry - - 0.32 0.32 -
Total Piaba East 0.94 1.80 3.81 4.74 4.05
Total Piaba 19.31 1.54 110.92 130.23 5.73
Boa Esperança 0.53 0.84 2.31 2.83 4.38
Total Aurizona 19.84 1.52 113.23 133.06 5.71
The resources for the pit phases are based on cutoff of 0.60 g/t Au for all material types to provide an elevated feed grade to the process plant. Breakeven milling cut-off values would normally be 0.38 g/t for laterite/saprolite, 0.39 g/t Au for transition material, and 0.46 g/t Au for rock. The schedule has a high-grade cut-off of 1 g/t Au for all material types to separate high grade from the lower 0.6 g/t cut-off for scheduling purposes.
The phase designs are described in further detail below:
Piaba Main – Phase 1
Phase 1 development in Piaba is focused on the eastern end of the Main pit. Its purpose is two-fold: prepare permanent ore access from the pit on the eastern side, and provide early ore material for a stockpile prior to plant start-up. The permanent road will be to full operating width and create a new ramp to the primary crusher (Figure 16.4).
5070\16.4\5070-STY-001
July 2017 Lycopodium Minerals Canada Ltd.

FEASIBILITY STUDY ON THE AURIZONA GOLD MINE PROJECT NI 43-101 TECHNICAL REPORT
Page 16.20
Figure 16.4 Piaba Main – Phase 1
5070\16.4\5070-STY-001
July 2017 Lycopodium Minerals Canada Ltd.

FEASIBILITY STUDY ON THE AURIZONA GOLD MINE PROJECT NI 43-101 TECHNICAL REPORT
Page 16.21
Piaba Main – Phase 2
Phase 2 development occurs to the west of Phase 1, deepening the centre portion of the pit. Double lane ramp access along the south footwall will be maintained for shorter ore haulage. Waste material will go both to the north and south along existing ramp accesses. This phase is to provide ore for the stockpile and a sump for the rainy season (Figure 16.5).
Figure 16.5 Piaba Main – Phase 2
5070\16.4\5070-STY-001
July 2017 Lycopodium Minerals Canada Ltd.

FEASIBILITY STUDY ON THE AURIZONA GOLD MINE PROJECT NI 43-101 TECHNICAL REPORT
Page 16.22
Piaba Main – Phase 3
Phase 3 mines material to the west of Phase 2 in the bottom of the current pit. This is also to provide ore to the stockpile prior to plant start-up and a second sump for water storage in the rainy season. The current access road along the south high wall will be maintained for the mining of ore and waste in Figure 16.6.
Figure 16.6 Piaba Main – Phase 3
5070\16.4\5070-STY-001
July 2017 Lycopodium Minerals Canada Ltd.

FEASIBILITY STUDY ON THE AURIZONA GOLD MINE PROJECT NI 43-101 TECHNICAL REPORT
Page 16.23
Piaba Main – Phase 4
Phase 4 mines the centre portion of the pit to advance ore development, particularly in the dry season. Access will be along the south wall for ore and some waste and to the north for waste. Maintaining the ramp on the footwall side assists in the short-term with ore and waste haulage but will be removed in later phases to minimize waste stripping. The eastern portion of Phase 4 will act as the new sump in the subsequent rainy seasons allowing mining to occur with minimal difficulty (Figure 16.7).
Figure 16.7 Piaba Main – Phase 4
5070\16.4\5070-STY-001
July 2017 Lycopodium Minerals Canada Ltd.
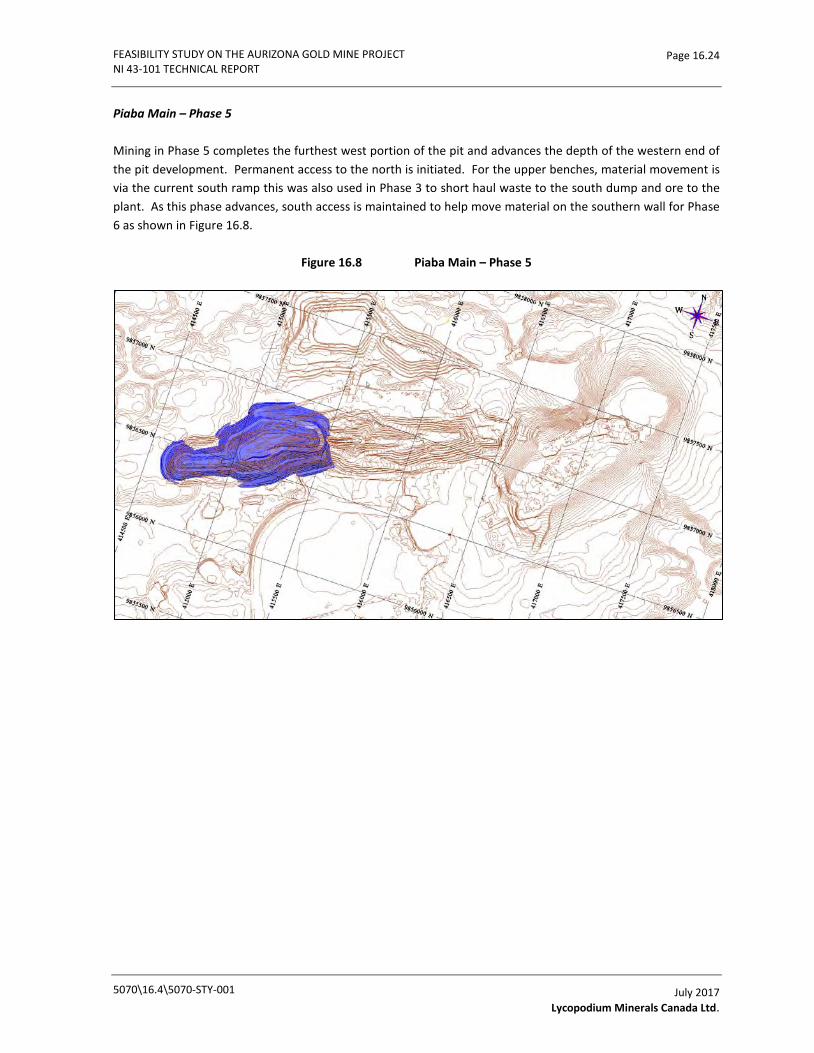
FEASIBILITY STUDY ON THE AURIZONA GOLD MINE PROJECT NI 43-101 TECHNICAL REPORT
Page 16.24
Piaba Main – Phase 5
Mining in Phase 5 completes the furthest west portion of the pit and advances the depth of the western end of the pit development. Permanent access to the north is initiated. For the upper benches, material movement is via the current south ramp this was also used in Phase 3 to short haul waste to the south dump and ore to the plant. As this phase advances, south access is maintained to help move material on the southern wall for Phase 6 as shown in Figure 16.8.
Figure 16.8 Piaba Main – Phase 5
5070\16.4\5070-STY-001
July 2017 Lycopodium Minerals Canada Ltd.
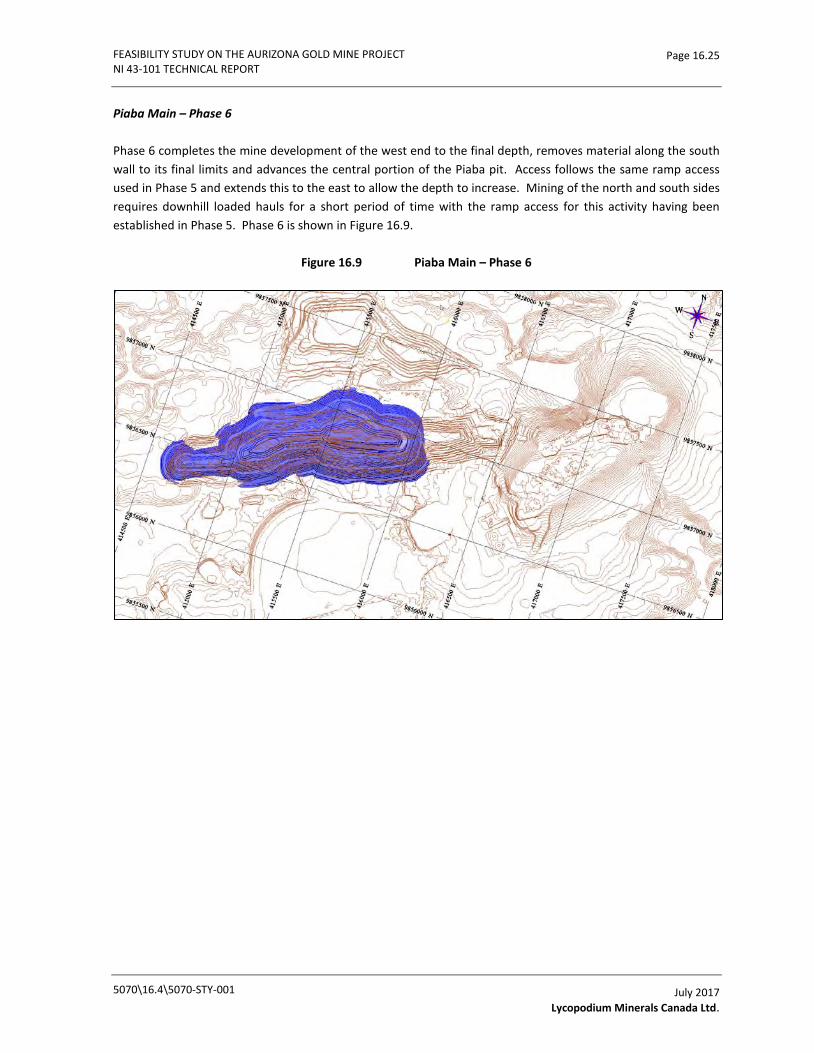
FEASIBILITY STUDY ON THE AURIZONA GOLD MINE PROJECT NI 43-101 TECHNICAL REPORT
Page 16.25
Piaba Main – Phase 6
Phase 6 completes the mine development of the west end to the final depth, removes material along the south wall to its final limits and advances the central portion of the Piaba pit. Access follows the same ramp access used in Phase 5 and extends this to the east to allow the depth to increase. Mining of the north and south sides requires downhill loaded hauls for a short period of time with the ramp access for this activity having been established in Phase 5. Phase 6 is shown in Figure 16.9.
Figure 16.9 Piaba Main – Phase 6
5070\16.4\5070-STY-001
July 2017 Lycopodium Minerals Canada Ltd.
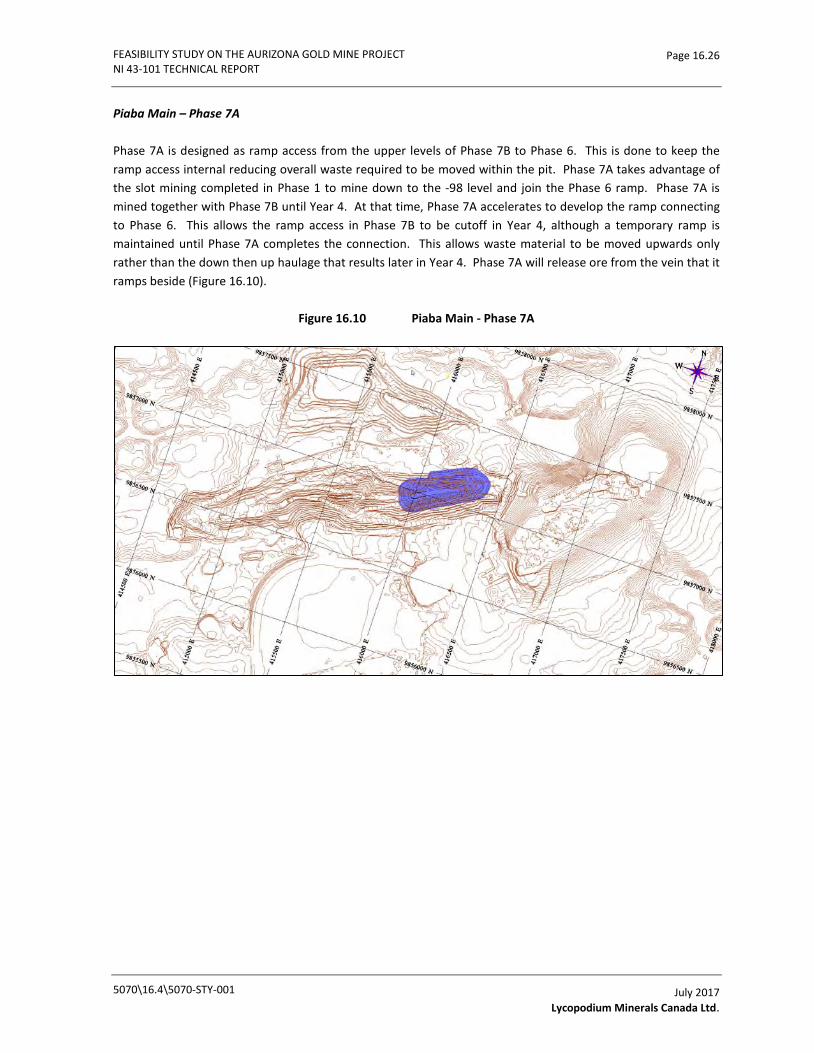
FEASIBILITY STUDY ON THE AURIZONA GOLD MINE PROJECT NI 43-101 TECHNICAL REPORT
Page 16.26
Piaba Main – Phase 7A
Phase 7A is designed as ramp access from the upper levels of Phase 7B to Phase 6. This is done to keep the ramp access internal reducing overall waste required to be moved within the pit. Phase 7A takes advantage of the slot mining completed in Phase 1 to mine down to the -98 level and join the Phase 6 ramp. Phase 7A is mined together with Phase 7B until Year 4. At that time, Phase 7A accelerates to develop the ramp connecting to Phase 6. This allows the ramp access in Phase 7B to be cutoff in Year 4, although a temporary ramp is maintained until Phase 7A completes the connection. This allows waste material to be moved upwards only rather than the down then up haulage that results later in Year 4. Phase 7A will release ore from the vein that it ramps beside (Figure 16.10).
Figure 16.10 Piaba Main - Phase 7A
5070\16.4\5070-STY-001
July 2017 Lycopodium Minerals Canada Ltd.

FEASIBILITY STUDY ON THE AURIZONA GOLD MINE PROJECT NI 43-101 TECHNICAL REPORT
Page 16.27
Piaba Main – Phase 7B
Phase 7B is the final mine phase. It mines the eastern portion of the pit with a small section of ramp along the north wall. The intent is to use this access with the addition of a temporary ramp for as long as possible in order to move waste and ore from the most direct route possible. The ramp was established in this manner to reduce overall stripping requirements. Mid-way through Year 4, the internal ramp (Phase 7A) will be used to haul material down then back up the ramp from Phase 6.
Phase 7B deepens the central portion of the pit below Phase 6 and uses a slot along the vein itself. Additional ore material may be recovered in the ramp on a retreat basis but this is an opportunity that has not been included in the current schedule. Phase 7B is shown in Figure 16.11.
Figure 16.11 Piaba Main – Phase 7B
5070\16.4\5070-STY-001
July 2017 Lycopodium Minerals Canada Ltd.
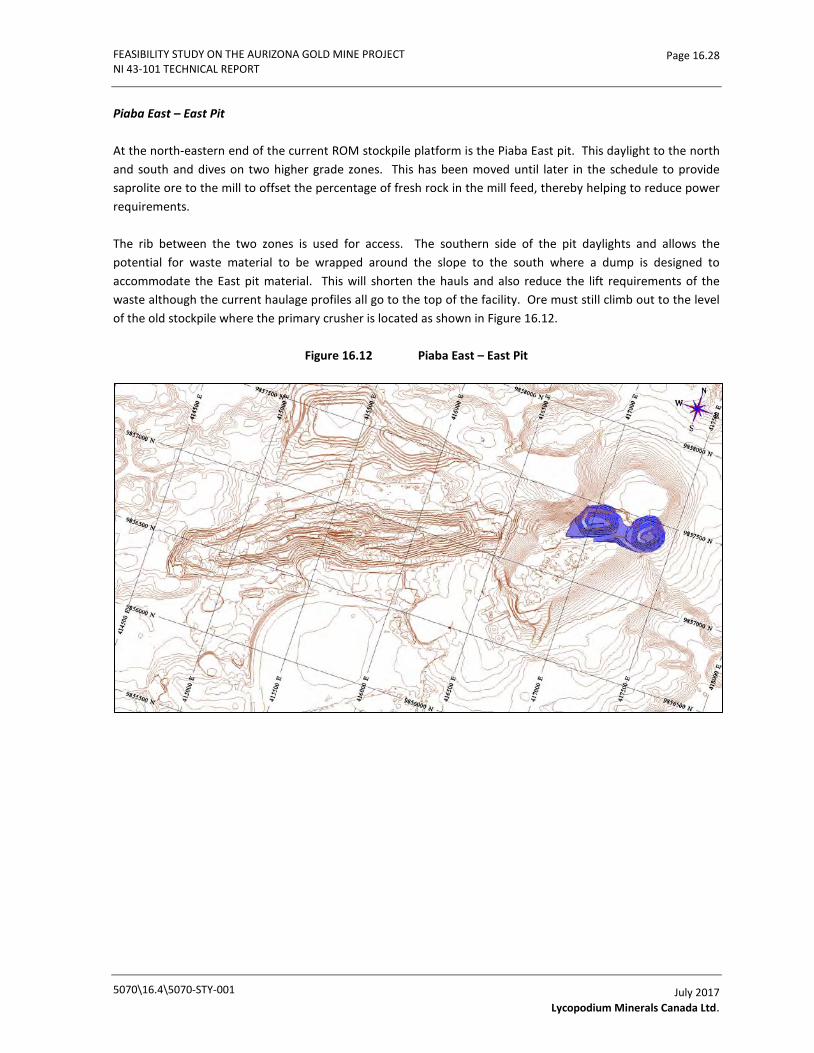
FEASIBILITY STUDY ON THE AURIZONA GOLD MINE PROJECT NI 43-101 TECHNICAL REPORT
Page 16.28
Piaba East – East Pit
At the north-eastern end of the current ROM stockpile platform is the Piaba East pit. This daylight to the north and south and dives on two higher grade zones. This has been moved until later in the schedule to provide saprolite ore to the mill to offset the percentage of fresh rock in the mill feed, thereby helping to reduce power requirements.
The rib between the two zones is used for access. The southern side of the pit daylights and allows the potential for waste material to be wrapped around the slope to the south where a dump is designed to accommodate the East pit material. This will shorten the hauls and also reduce the lift requirements of the waste although the current haulage profiles all go to the top of the facility. Ore must still climb out to the level of the old stockpile where the primary crusher is located as shown in Figure 16.12.
Figure 16.12 Piaba East – East Pit
5070\16.4\5070-STY-001
July 2017 Lycopodium Minerals Canada Ltd.
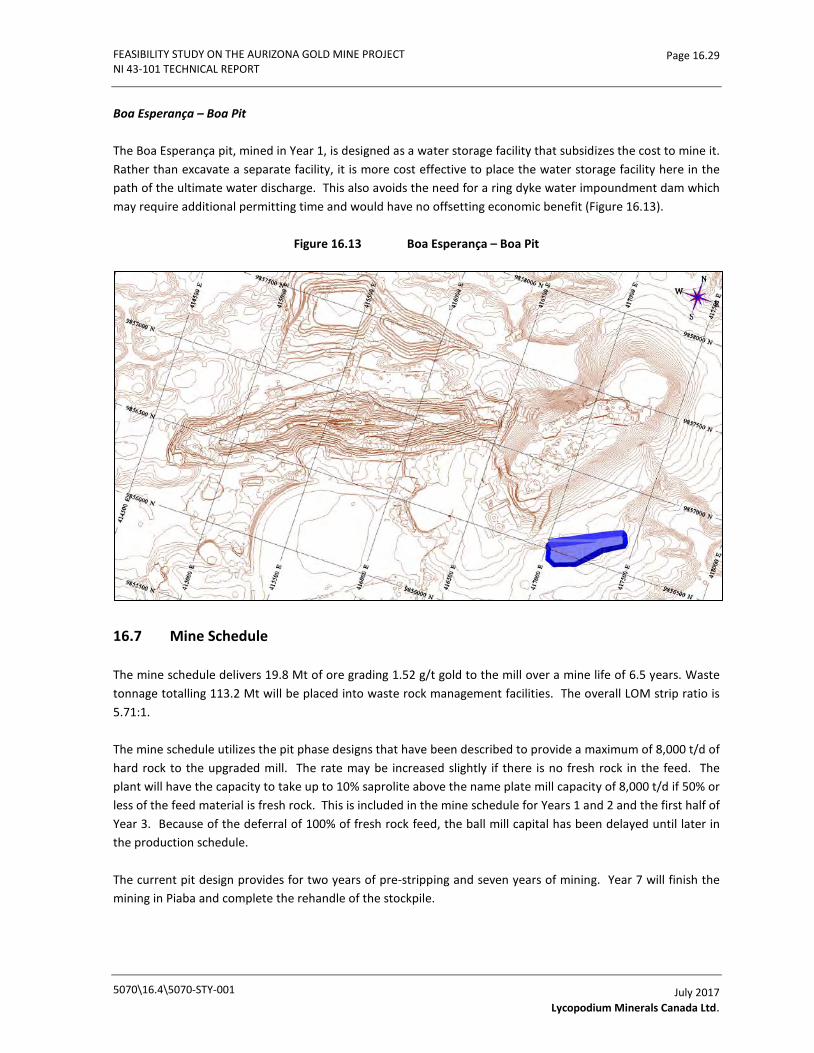
FEASIBILITY STUDY ON THE AURIZONA GOLD MINE PROJECT NI 43-101 TECHNICAL REPORT
Page 16.29
Boa Esperança – Boa Pit
The Boa Esperança pit, mined in Year 1, is designed as a water storage facility that subsidizes the cost to mine it. Rather than excavate a separate facility, it is more cost effective to place the water storage facility here in the path of the ultimate water discharge. This also avoids the need for a ring dyke water impoundment dam which may require additional permitting time and would have no offsetting economic benefit (Figure 16.13).
Figure 16.13 Boa Esperança – Boa Pit
16.7 Mine Schedule
The mine schedule delivers 19.8 Mt of ore grading 1.52 g/t gold to the mill over a mine life of 6.5 years. Waste tonnage totalling 113.2 Mt will be placed into waste rock management facilities. The overall LOM strip ratio is 5.71:1.
The mine schedule utilizes the pit phase designs that have been described to provide a maximum of 8,000 t/d of hard rock to the upgraded mill. The rate may be increased slightly if there is no fresh rock in the feed. The plant will have the capacity to take up to 10% saprolite above the name plate mill capacity of 8,000 t/d if 50% or less of the feed material is fresh rock. This is included in the mine schedule for Years 1 and 2 and the first half of Year 3. Because of the deferral of 100% of fresh rock feed, the ball mill capital has been delayed until later in the production schedule.
The current pit design provides for two years of pre-stripping and seven years of mining. Year 7 will finish the mining in Piaba and complete the rehandle of the stockpile.
5070\16.4\5070-STY-001
July 2017 Lycopodium Minerals Canada Ltd.

FEASIBILITY STUDY ON THE AURIZONA GOLD MINE PROJECT NI 43-101 TECHNICAL REPORT
Page 16.30
Mining must take into consideration the significant rainfall that occurs at the mine. This can be in excess of 3 m/a, generally falling in the period from December to May. Mining must be prepared to handle this rain with several strategies. The phase designs were laid out considering the need for in-pit sumps. By advancing a particular pit phase, the pit bottom can assist in the temporary storage of water after a rainfall event. This concept is also worked into the detail schedule with the use of stockpile material and the advance of parts of the pit over others to ensure sufficient sump capacity is in place prior to the start of the rainy season.
Operationally, ditching around the pits to intercept surface run-off and wider ramps with rock capping/geotextile foundations will help to minimize reductions in mine production. Mine production rates are purposely reduced in the initial mining rainy seasons to account for this seasonal disturbance.
The quantity of pre-strip required depended on the expected timing of the plant start-up due to the ability to mine in the bottom of the pit, as it exists presently, during the rainy season. Reducing the pre-strip portion aids in reducing initial capital but is balanced against having sufficient ore in the stockpile for the rainy season with higher grade for earlier payback. The feasibility schedule works on the assumption that the plant will start at the beginning of a wet season. This requires that the pre-strip period starts in the preceding two dry seasons to develop a stockpile sufficient to cover during the rainy season and prepare the necessary infrastructure (ditches, roads, etc.) in dry conditions.
When mining restarts, the key initial development objective is to establish proper roads. This will require excavation, compaction, use of geotextile fabrics and mesh and properly sized/screened rock. No significant rock outcrops have been located in the general vicinity but ferricrete is known to exist on the platform near the proposed primary crusher. This becomes the primary mining area to start. Approximately 2 to 3m of material must be stripped off the ferricrete, than the ferricrete must be ripped or broken with blasting to allow it to be loaded. It will need to be crushed and screened to remove fine clays that could cause issues later, and to make the material suitable for road top coat.
The feasibility schedule advances mining in the pre-strip period and builds a substantial stockpile. Contract material movement and infrastructure is assumed for Years -2 and -1. Dewatering and ore control will be handled by the Trek mining team while all other mining functions will be the responsibility of a mining contractor.
Mining in Year -2 will total 2.44 Mt with a ramp up to full monthly production by the contractor in the second month. Year -1 mining will include a month before the rainy season starts then will be idle until the end of that period. The contractor will start up again in the dry season and continue to prepare the pit and stockpile for mining during the rainy season. Year -1 mining will total 2.15 Mt of material movement. The pre-production periods (Year -2, -1) focus on:
• Mining of the quarry to obtain material for proper road construction.
• Construction of long term haul roads and dewatering ditches.
• Establishment of the eastern ore road to the pit (Phase 1 upper part).
5070\16.4\5070-STY-001
July 2017 Lycopodium Minerals Canada Ltd.

FEASIBILITY STUDY ON THE AURIZONA GOLD MINE PROJECT NI 43-101 TECHNICAL REPORT
Page 16.31
• Mining of two higher grade extraction areas (Phase 2 and Phase 3) for high grade ore stockpiling and water sump preparation.
• Initiate mining of Phase 4.
• Provide laterite for the first lift of the tailings management facility.
At the end of the pre-production periods, the stockpile will contain 1.07 Mt of ore grading 1.26 g/t Au in advance of the mill start-up. Pit positions at the end of Year -1 will have Phase 1 at the -12 level, Phase 2 and Phase 3 will be complete and being used as sumps for pit dewatering. Mining in Phase 4 will have commenced and be at level 0. Phase 4 is well above the water at the start of plant production and will be mined during the rainy season. Phase 5 mining will also be initiated down to the 18 level.
In Year 1, the plant is anticipated to take three months to commission. Lower grade material will be sent initially as the plant starts. The first month is expected to take 60% of full production, the second month 80% of full capacity and the third month 90%. Month four will see the plant at full capacity. Ore grades will fluctuate monthly depending on material available in the pit with the grade to the plant increasing as the plant is commissioned to avoid loss of high grade during this time. Higher grade material is direct shipped to the mill with lower grade material stockpiled for the rainy season. The stockpile will then be drawn down over the rainy season as the ore flow from the pit is reduced.
Year 1 sees the completion of Phase 1 and the completion of Phase 4 to its final level (-120). Phase 4 will act as a sump during the rainy season going forward. Phases 5 will continue to advance this year to the -54 level, above Phase 4. Phase 6 will also start but only for the first six benches during the dry season to help prepare the area for mining during the next rainy season with shorter haulage distances and providing an alternate location for mining above the water level.
The Boa pit will be completed in the dry season of Year 1 or periods 7, 8, and 9. This will provide feed material for the mill but will also allow water to be collected for use by the mill in subsequent dry seasons.
Year 2 has the completion of Phase 5 to the -108 level in the dry season, its final level. The Phase 4 low point will continue to act as a sump in Year 2. Phase 6 will continue its development, driving deeper to the larger benches of ore. At the end of Year 2, it will be at the -102 level, above the pit sump left in Phase 4 which is at the -120 level.
In Year 3, Phase 6 provides the bulk of the mill feed material. This phase mines to the -120 level by the end of the year. It is advancing the western end of the pit towards completion through a slot connecting the two higher grade areas of the mine. Phases 7A and 7B will start this year and develop rapidly. Phase 7A is starting the advance of the ramp system to join into the Phase 6 ramp access and will be at the -60 level while Phase 7B will be at the -30 level.
The East pit is initiated in Year 3. It advances to 30 level and is three benches short of completing the pit by the end of Year 3.
5070\16.4\5070-STY-001
July 2017 Lycopodium Minerals Canada Ltd.
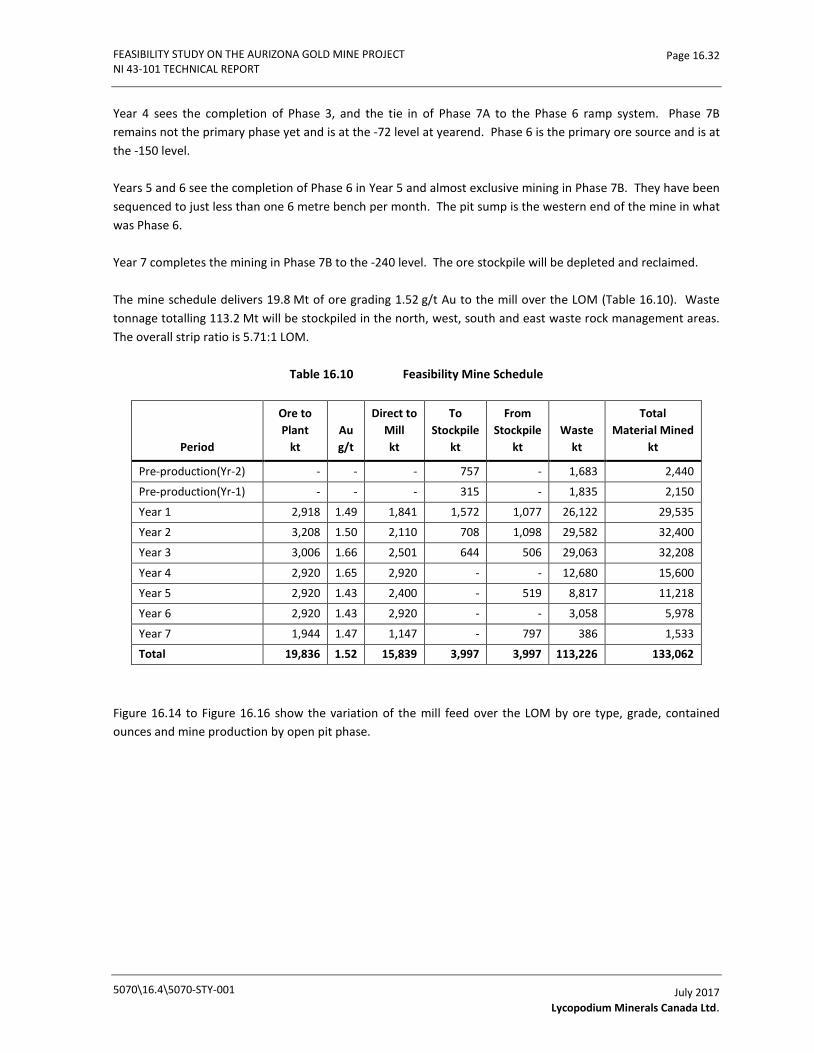
FEASIBILITY STUDY ON THE AURIZONA GOLD MINE PROJECT NI 43-101 TECHNICAL REPORT
Page 16.32
Year 4 sees the completion of Phase 3, and the tie in of Phase 7A to the Phase 6 ramp system. Phase 7B remains not the primary phase yet and is at the -72 level at yearend. Phase 6 is the primary ore source and is at the -150 level.
Years 5 and 6 see the completion of Phase 6 in Year 5 and almost exclusive mining in Phase 7B. They have been sequenced to just less than one 6 metre bench per month. The pit sump is the western end of the mine in what was Phase 6.
Year 7 completes the mining in Phase 7B to the -240 level. The ore stockpile will be depleted and reclaimed.
The mine schedule delivers 19.8 Mt of ore grading 1.52 g/t Au to the mill over the LOM (Table 16.10). Waste tonnage totalling 113.2 Mt will be stockpiled in the north, west, south and east waste rock management areas. The overall strip ratio is 5.71:1 LOM.
Table 16.10 Feasibility Mine Schedule
Period
Ore to Plant
kt Au g/t
Direct to Mill kt
To Stockpile
kt
From Stockpile
kt Waste
kt
Total Material Mined
kt
Pre-production(Yr-2) - - - 757 - 1,683 2,440
Pre-production(Yr-1) - - - 315 - 1,835 2,150
Year 1 2,918 1.49 1,841 1,572 1,077 26,122 29,535
Year 2 3,208 1.50 2,110 708 1,098 29,582 32,400
Year 3 3,006 1.66 2,501 644 506 29,063 32,208
Year 4 2,920 1.65 2,920 - - 12,680 15,600
Year 5 2,920 1.43 2,400 - 519 8,817 11,218
Year 6 2,920 1.43 2,920 - - 3,058 5,978
Year 7 1,944 1.47 1,147 - 797 386 1,533
Total 19,836 1.52 15,839 3,997 3,997 113,226 133,062
Figure 16.14 to Figure 16.16 show the variation of the mill feed over the LOM by ore type, grade, contained ounces and mine production by open pit phase.
5070\16.4\5070-STY-001
July 2017 Lycopodium Minerals Canada Ltd.

FEASIBILITY STUDY ON THE AURIZONA GOLD MINE PROJECT NI 43-101 TECHNICAL REPORT
Page 16.33
Figure 16.14 Mill Feed by Type
5070\16.4\5070-STY-001
July 2017 Lycopodium Minerals Canada Ltd.

FEASIBILITY STUDY ON THE AURIZONA GOLD MINE PROJECT NI 43-101 TECHNICAL REPORT
Page 16.34
Figure 16.15 Ore Grade and Ounces to the Process Plant
5070\16.4\5070-STY-001
July 2017 Lycopodium Minerals Canada Ltd.
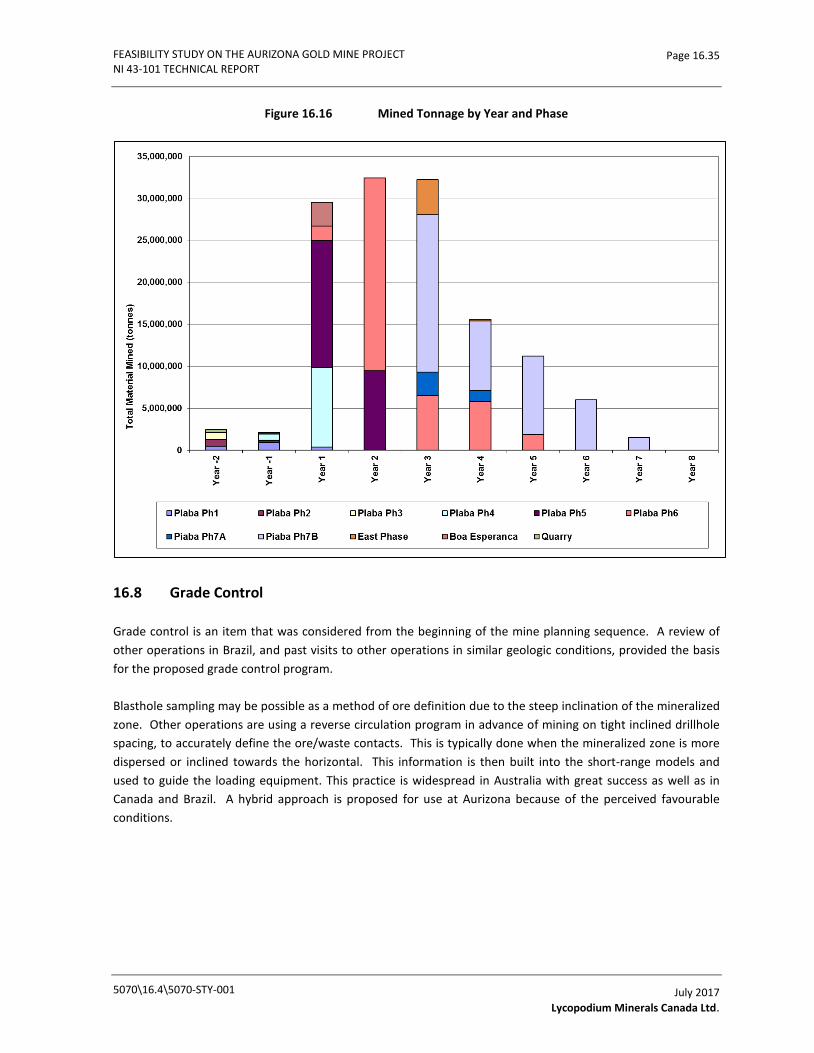
FEASIBILITY STUDY ON THE AURIZONA GOLD MINE PROJECT NI 43-101 TECHNICAL REPORT
Page 16.35
Figure 16.16 Mined Tonnage by Year and Phase
16.8 Grade Control
Grade control is an item that was considered from the beginning of the mine planning sequence. A review of other operations in Brazil, and past visits to other operations in similar geologic conditions, provided the basis for the proposed grade control program.
Blasthole sampling may be possible as a method of ore definition due to the steep inclination of the mineralized zone. Other operations are using a reverse circulation program in advance of mining on tight inclined drillhole spacing, to accurately define the ore/waste contacts. This is typically done when the mineralized zone is more dispersed or inclined towards the horizontal. This information is then built into the short-range models and used to guide the loading equipment. This practice is widespread in Australia with great success as well as in Canada and Brazil. A hybrid approach is proposed for use at Aurizona because of the perceived favourable conditions.
5070\16.4\5070-STY-001
July 2017 Lycopodium Minerals Canada Ltd.
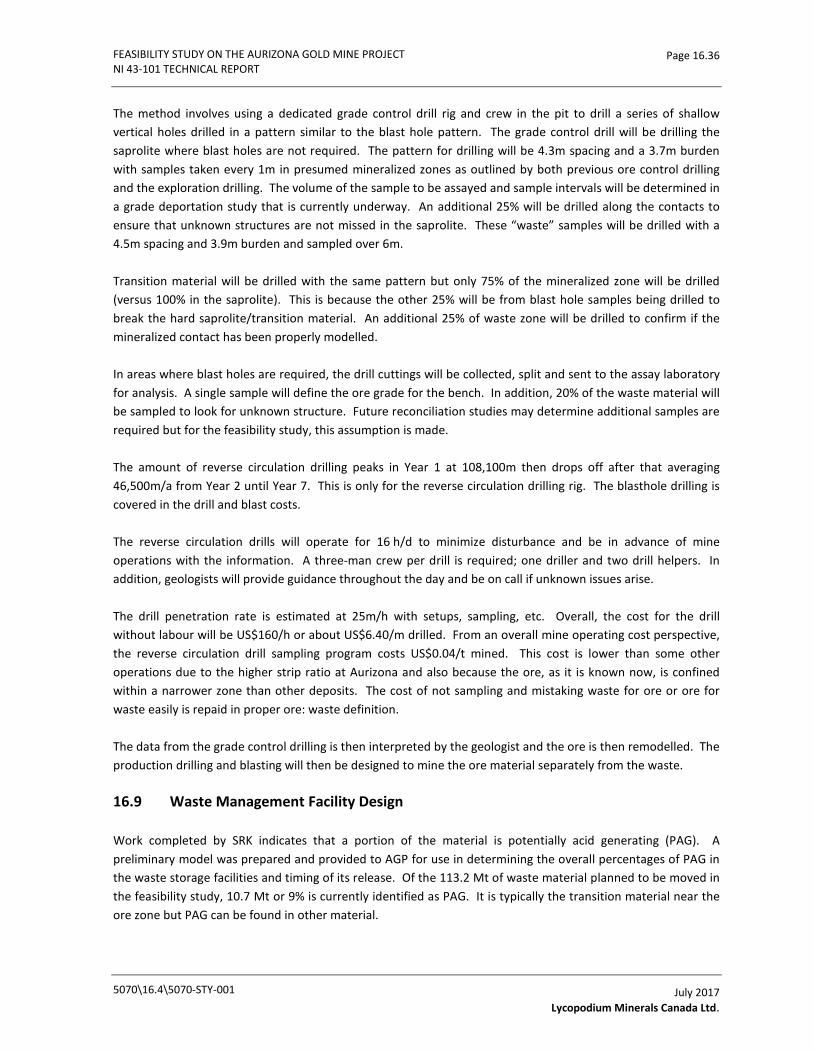
FEASIBILITY STUDY ON THE AURIZONA GOLD MINE PROJECT NI 43-101 TECHNICAL REPORT
Page 16.36
The method involves using a dedicated grade control drill rig and crew in the pit to drill a series of shallow vertical holes drilled in a pattern similar to the blast hole pattern. The grade control drill will be drilling the saprolite where blast holes are not required. The pattern for drilling will be 4.3m spacing and a 3.7m burden with samples taken every 1m in presumed mineralized zones as outlined by both previous ore control drilling and the exploration drilling. The volume of the sample to be assayed and sample intervals will be determined in a grade deportation study that is currently underway. An additional 25% will be drilled along the contacts to ensure that unknown structures are not missed in the saprolite. These “waste” samples will be drilled with a 4.5m spacing and 3.9m burden and sampled over 6m.
Transition material will be drilled with the same pattern but only 75% of the mineralized zone will be drilled (versus 100% in the saprolite). This is because the other 25% will be from blast hole samples being drilled to break the hard saprolite/transition material. An additional 25% of waste zone will be drilled to confirm if the mineralized contact has been properly modelled.
In areas where blast holes are required, the drill cuttings will be collected, split and sent to the assay laboratory for analysis. A single sample will define the ore grade for the bench. In addition, 20% of the waste material will be sampled to look for unknown structure. Future reconciliation studies may determine additional samples are required but for the feasibility study, this assumption is made.
The amount of reverse circulation drilling peaks in Year 1 at 108,100m then drops off after that averaging 46,500m/a from Year 2 until Year 7. This is only for the reverse circulation drilling rig. The blasthole drilling is covered in the drill and blast costs.
The reverse circulation drills will operate for 16 h/d to minimize disturbance and be in advance of mine operations with the information. A three-man crew per drill is required; one driller and two drill helpers. In addition, geologists will provide guidance throughout the day and be on call if unknown issues arise.
The drill penetration rate is estimated at 25m/h with setups, sampling, etc. Overall, the cost for the drill without labour will be US$160/h or about US$6.40/m drilled. From an overall mine operating cost perspective, the reverse circulation drill sampling program costs US$0.04/t mined. This cost is lower than some other operations due to the higher strip ratio at Aurizona and also because the ore, as it is known now, is confined within a narrower zone than other deposits. The cost of not sampling and mistaking waste for ore or ore for waste easily is repaid in proper ore: waste definition.
The data from the grade control drilling is then interpreted by the geologist and the ore is then remodelled. The production drilling and blasting will then be designed to mine the ore material separately from the waste.
16.9 Waste Management Facility Design
Work completed by SRK indicates that a portion of the material is potentially acid generating (PAG). A preliminary model was prepared and provided to AGP for use in determining the overall percentages of PAG in the waste storage facilities and timing of its release. Of the 113.2 Mt of waste material planned to be moved in the feasibility study, 10.7 Mt or 9% is currently identified as PAG. It is typically the transition material near the ore zone but PAG can be found in other material.
5070\16.4\5070-STY-001
July 2017 Lycopodium Minerals Canada Ltd.

FEASIBILITY STUDY ON THE AURIZONA GOLD MINE PROJECT NI 43-101 TECHNICAL REPORT
Page 16.37
In order to ensure that PAG material is identified and disposed of appropriately, operations will implement PAG measurements as part of grade control procedures, and continue to refine PAG modelling during Basic and Detailed Engineering phases. With the current level of understanding it is expected that less than 20% of the total material will be PAG. Operational mitigation strategies for PAG materials have been developed to address this material. These measures include the addition of lime to PAG materials during stacking, selective placement within the waste facility to ensure encapsulation with saprolite, co-disposal with buffering waste rock, and proper drainage control over the long term.
Various rock types are present in the material mined within the final design pit in addition to two to three weathering levels. The weathering includes laterite, saprolite and a transition zone above the rock. Saprolite is thicker over the diorite than the metasediments and has the texture of silty clay. The saprolite often retains some of the structures of the parent rock and may contain hard stones which make the saprolite highly variable. Ferricrete lenses are occasionally present and these are targeted early in the mine life for road material with this material being located near the new crusher location. Ferricrete and also what is referred to as hard saprolite were key challenges in the previous Trek mining operations.
The rock types include unmineralized diorite, clastic metasediments (greywacke), mineralized diorite, quartz-diorite (ore host) and chemical metasediments (carbonaceous metachert). A sulphide halo extends outside the ore zone quartz-diorite and may be responsible for creating acid-generating waste rock that is being tested.
Mining will initiate in the saprolite horizon but over time will include higher percentages of transition material and finally fresh rock. This material will be co-mingled in the WSF.
The north WSF will be developed first on the south side of the existing WSF. This will enable proper preparation of the foundation near the town to the north in advance of deposition starting in Year 1. The north WSF is the primary waste storage location and is an expansion of the previous WSF. The north WSF will have capacity for 34.8 Mm3 of material from the Piaba Main pit. Rock type percentages for the final north WSF are shown in Table 16.11.
The west WSF is a westerly extension of the north WSF. This will be developed in Year 3 and completed in Year 7. The present access road will need to be diverted to the west along the boundary of the mangrove swamps but this is not expected to be required until Year 4. Sufficient distance from the toe to the mangrove areas has been maintained to ensure that the WSF will not encroach on the protected area. The west WSF will have a storage volume of 16.8 Mm3 of material of which 15.1 Mm3 will be utilized. Material for this facility will come from the Piaba Main pit.
The south WSF is located in the SW corner of the pit area. This will take material that is short hauled to it from the western end of the pit during the pre-production periods. It will also be used for short haul of material in Year 1 and 2. Its 4 Mm3 of capacity will be filled entirely by the middle of Year 2.
The east WSF will accommodate material from the Boa pit, the East pit and eastern portions of the Piaba pit when efficient to do so. Initial development will occur in Year -2 with the quarry development and the new Piaba east ore access. The opening of the Boa Pit in Year 1 will see the East WSF grow with the material from Boa. It will be completed at the end of Year 4 with material from the East pit. It will have a fully capacity of 7.2 Mm3.
5070\16.4\5070-STY-001
July 2017 Lycopodium Minerals Canada Ltd.

FEASIBILITY STUDY ON THE AURIZONA GOLD MINE PROJECT NI 43-101 TECHNICAL REPORT
Page 16.38
Table 16.11 Waste Storage Facility (WSF) Parameters
Parameter Units North WSF West WSF South WSF East WSF Total WSF
Design Capacity Mm3 34.8 16.8 4.0 7.2 61.8
Capacity Utilized Mm3 34.0 15.1 4.0 7.2 60.3
Maximum Height Masl 112 100 58 106
m 106 92 50 68
Rock Type Stored
Laterite % 0 0 0 17 7
Saprolite % 56 8 92 83 43
Transition % 21 26 4 0 18
Rock % 13 53 0 0 23
PAG % 10 13 4 0 9
The design of the WSF considers variable swell factors dependent on the material types. For laterite and saprolite a swell factor of 15% was applied. Transition material is expected to be in the 20% range and fresh rock at 30% swell. The dump lifts will be 10m high and have a 37° slope. A berm of 8.1m will be left. Concurrent reclamation will occur which will reslope the WSF to an overall angle of 24°. This is easily managed, as the height between lifts of the facility is only 10m, sufficiently short enough for dozers to re-slope the face efficiently.
The north WSF will have a top elevation of 112 masl. The western WSF will have a level of 100 masl and the east WSF will have a level of 106 masl and the south WSF will be 58 masl.
Drainage from each of these WSF will be diverted to sedimentation ponds. This is to ensure sediment washed down from the facilities is captured before it escapes from the mine property. The sediment ponds will be cleaned annually or more frequently if required to ensure storage capacity in the ponds is not compromised.
The Boa Esperança pit will be filled with water for its role as a water storage facility.
The mine layout is shown in Figure 16.17.
16.10 Mine Plan Sequence
End of Year positions of the open pit are shown in Figure 16.17 to Figure 16.24.
5070\16.4\5070-STY-001
July 2017 Lycopodium Minerals Canada Ltd.

FEASIBILITY STUDY ON THE AURIZONA GOLD MINE PROJECT NI 43-101 TECHNICAL REPORT
Page 16.39 DRAFT
Figure 16.17 Site Layout with Waste Management Facilities
5070\16.4\5070-STY-001
July 2017 Lycopodium Minerals Canada Ltd.

FEASIBILITY STUDY ON THE AURIZONA GOLD MINE PROJECT NI 43-101 TECHNICAL REPORT
Page 16.40 DRAFT
Figure 16.18 End of Pre-Production Period (Year -2, -1)
5070\16.4\5070-STY-001
July 2017 Lycopodium Minerals Canada Ltd.

FEASIBILITY STUDY ON THE AURIZONA GOLD MINE PROJECT NI 43-101 TECHNICAL REPORT
Page 16.41 DRAFT
Figure 16.19 End of Year 1
5070\16.4\5070-STY-001
July 2017 Lycopodium Minerals Canada Ltd.
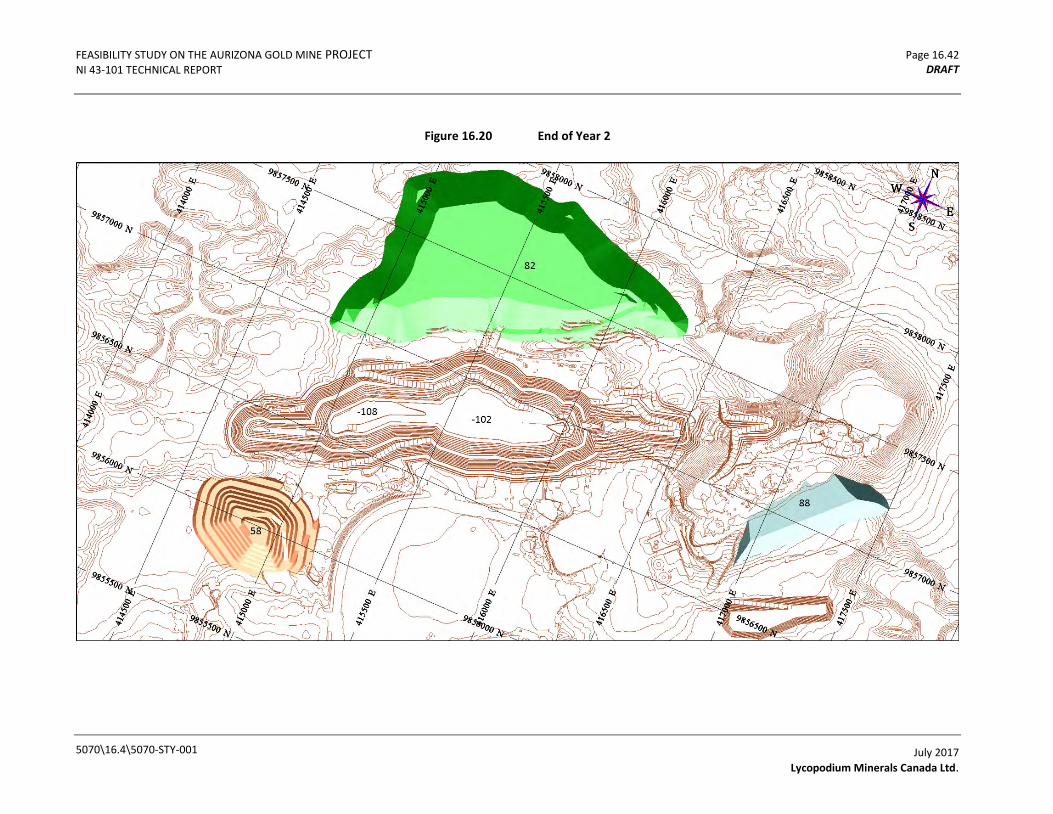
FEASIBILITY STUDY ON THE AURIZONA GOLD MINE PROJECT NI 43-101 TECHNICAL REPORT
Page 16.42 DRAFT
Figure 16.20 End of Year 2
5070\16.4\5070-STY-001
July 2017 Lycopodium Minerals Canada Ltd.
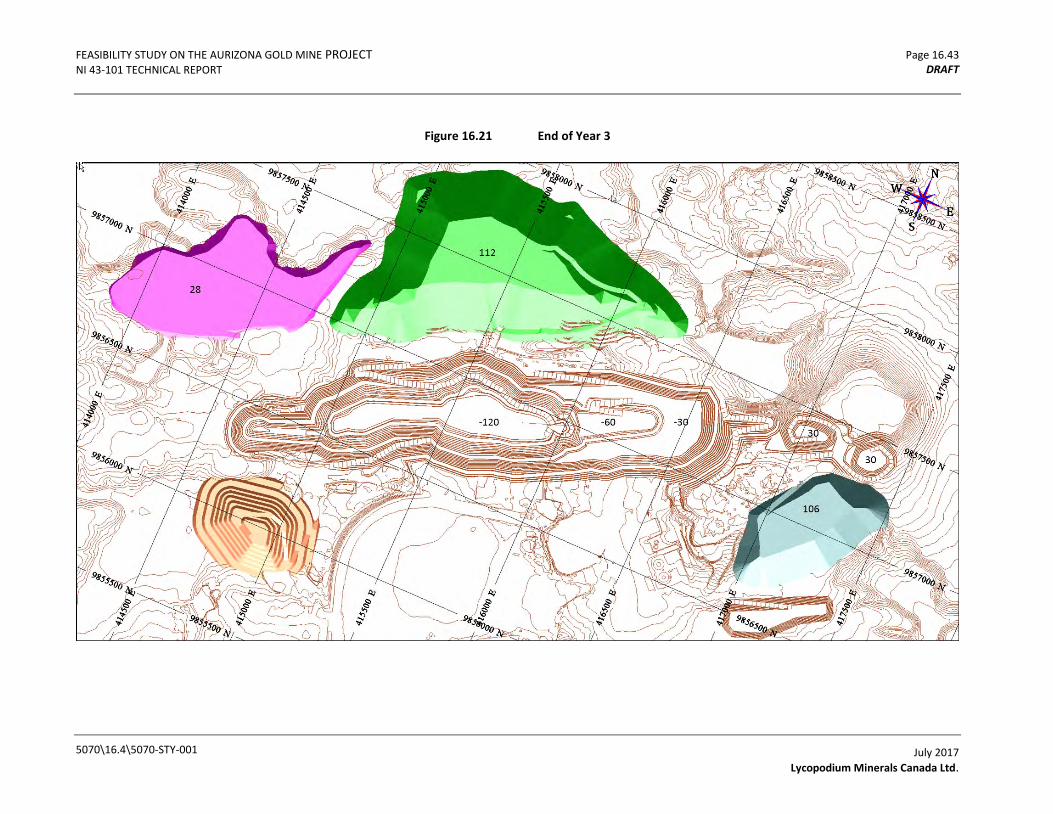
FEASIBILITY STUDY ON THE AURIZONA GOLD MINE PROJECT NI 43-101 TECHNICAL REPORT
Page 16.43 DRAFT
Figure 16.21 End of Year 3
5070\16.4\5070-STY-001
July 2017 Lycopodium Minerals Canada Ltd.

FEASIBILITY STUDY ON THE AURIZONA GOLD MINE PROJECT NI 43-101 TECHNICAL REPORT
Page 16.44 DRAFT
Figure 16.22 End of Year 4
5070\16.4\5070-STY-001
July 2017 Lycopodium Minerals Canada Ltd.
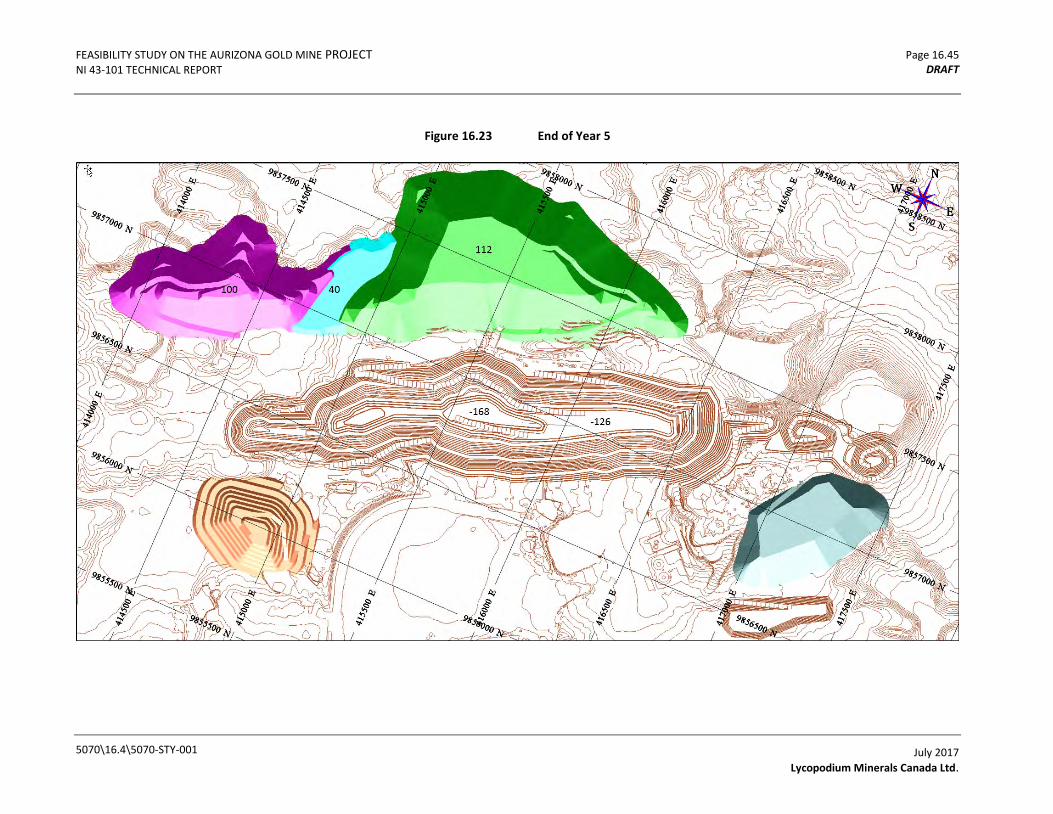
FEASIBILITY STUDY ON THE AURIZONA GOLD MINE PROJECT NI 43-101 TECHNICAL REPORT
Page 16.45 DRAFT
Figure 16.23 End of Year 5
5070\16.4\5070-STY-001
July 2017 Lycopodium Minerals Canada Ltd.
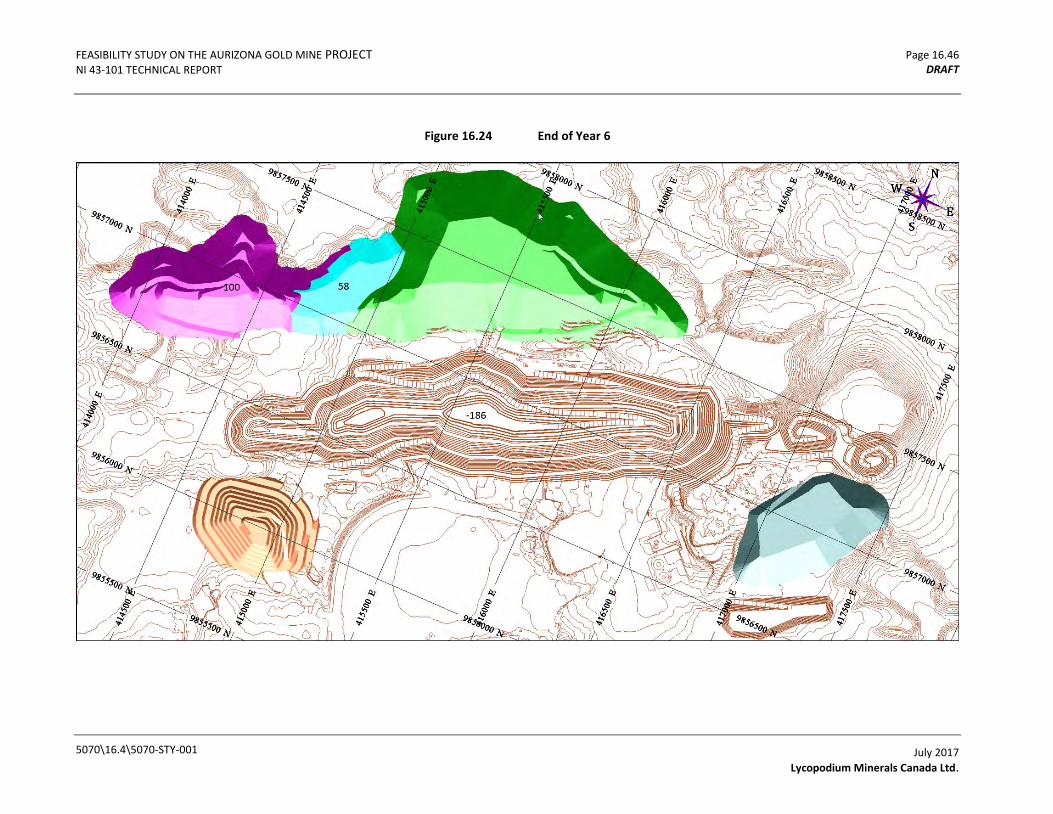
FEASIBILITY STUDY ON THE AURIZONA GOLD MINE PROJECT NI 43-101 TECHNICAL REPORT
Page 16.46 DRAFT
Figure 16.24 End of Year 6
5070\16.4\5070-STY-001
July 2017 Lycopodium Minerals Canada Ltd.

FEASIBILITY STUDY ON THE AURIZONA GOLD MINE PROJECT NI 43-101 TECHNICAL REPORT
Page 16.47 DRAFT
Figure 16.25 End of Year 7
5070\16.4\5070-STY-001
July 2017 Lycopodium Minerals Canada Ltd.
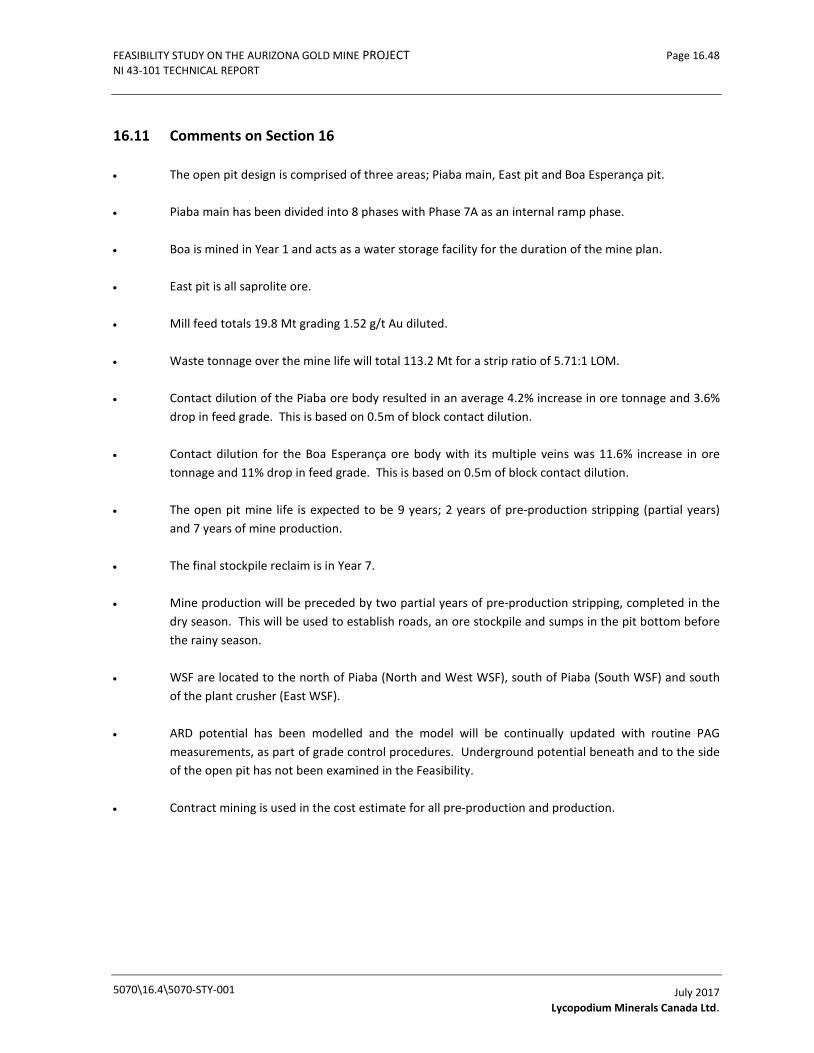
FEASIBILITY STUDY ON THE AURIZONA GOLD MINE PROJECT NI 43-101 TECHNICAL REPORT
Page 16.48
16.11 Comments on Section 16
• The open pit design is comprised of three areas; Piaba main, East pit and Boa Esperança pit.
• Piaba main has been divided into 8 phases with Phase 7A as an internal ramp phase.
• Boa is mined in Year 1 and acts as a water storage facility for the duration of the mine plan.
• East pit is all saprolite ore.
• Mill feed totals 19.8 Mt grading 1.52 g/t Au diluted.
• Waste tonnage over the mine life will total 113.2 Mt for a strip ratio of 5.71:1 LOM.
• Contact dilution of the Piaba ore body resulted in an average 4.2% increase in ore tonnage and 3.6% drop in feed grade. This is based on 0.5m of block contact dilution.
• Contact dilution for the Boa Esperança ore body with its multiple veins was 11.6% increase in ore tonnage and 11% drop in feed grade. This is based on 0.5m of block contact dilution.
• The open pit mine life is expected to be 9 years; 2 years of pre-production stripping (partial years) and 7 years of mine production.
• The final stockpile reclaim is in Year 7.
• Mine production will be preceded by two partial years of pre-production stripping, completed in the dry season. This will be used to establish roads, an ore stockpile and sumps in the pit bottom before the rainy season.
• WSF are located to the north of Piaba (North and West WSF), south of Piaba (South WSF) and south of the plant crusher (East WSF).
• ARD potential has been modelled and the model will be continually updated with routine PAG measurements, as part of grade control procedures. Underground potential beneath and to the side of the open pit has not been examined in the Feasibility.
• Contract mining is used in the cost estimate for all pre-production and production.
5070\16.4\5070-STY-001
July 2017 Lycopodium Minerals Canada Ltd.

FEASIBLITY STUDY ON THE AURIZONA GOLD MINE PROJECT NI 43-101 TECHNICAL REPORT
Page 17.1
17.0 RECOVERY METHODS
17.1 Mineral Processing
17.1.1 Introduction
The process plant at the Aurizona Mine was originally designed to treat soft saprolitic ores at a rate of 5,500 t/d. The historical process plant included direct ROM feed to a small 800 HP SAG mill followed by three 450 HP ball mills in parallel. Gold recovery was by gravity concentration and a hybrid CIL leach circuit followed by elution, electrowinning and melting. Tailings were thickened and detoxified prior to disposal.
In the proposed future operation, more mill feed will come from the hard saprolite zone and transitional zone. According to the mine plan, significant proportions of the mill feed are anticipated to be contributed from the transitional and fresh rock zones over rest of the LOM. The mine cannot be operated economically using the existing processing facilities, especially the existing comminution circuit. A significant mill upgrade is required to achieve planned gold production. As reported by Trek, the process operation was suspended at the end of 2015 because the mill feed rate was anticipated to reduce significantly without the mill upgrade.
During 2013 and 2014, Trek started a plant upgrading program: the Phase 1 plant expansion. The upgrade work was focused on increasing the throughput of mineralized saprolite to a nominal rate of 10,000 t/d and was partially completed with installations of some new equipment. Some equipment was purchased but had not yet been installed. The main upgrade work for the Phase 1 plant expansion included:
• Installation of an intensive leach circuit completed with an ACACIA reactor, an electrowinning circuit, partially completed.
• Installation of a carbon regeneration kiln with an installed power of 1,000 kW, the estimated carbon handling capacity is 12 t/d, partially completed.
• Installation of a 6 t capacity carbon acid washing column partially completed.
• Installation of a 6 t capacity carbon elution column partially completed.
• Installation of three electrowinning cells partially complete.
• Partial installation of three leaching tanks.
• Two 50m thickeners were purchased, but not installed only the pads and foundations were partially completed.
The comminution circuit upgrade was not in the scope of the Phase 1 work, although later work by different consulting firms proposed different comminution circuits for handling the harder mill feeds anticipated for the coming years.
5070\16.04\5070-STY-001_01
July 2017 Lycopodium Minerals Canada Ltd.

FEASIBLITY STUDY ON THE AURIZONA GOLD MINE PROJECT NI 43-101 TECHNICAL REPORT
Page 17.2
17.1.2 Summary
A combination of conventional gravity concentration and leach/CIP cyanidation process is proposed for the expansion of the Project. The upgrades to the process plant will comprise crushing, grinding, gravity concentration, leach/CIP cyanidation process and gold recovery from the loaded carbon to produce gold doré. The majority of installed and uninstalled equipment that was proposed for the Phase 1 expansion will be completely installed and commissioned. With the upgrade, the process plant will be capable of processing the fresh ore at a nominal process rate of 8,000 t/d.
A hybrid leach/CIP circuit is proposed with the new larger leach tanks providing leaching capacity and the existing tanks used in CIP duty. This will enhance the elution circuit performance by increasing the gold loading on the carbon. Modelling of the leach/CIP circuit will be required to confirm this assumption however previous test work suggests the leach kinetics should make the different ore types amenable to leach/CIP.
The main design work for the Project is to upgrade the comminution circuit to be capable of processing various mill feeds from the saprolite, transitional and fresh rock mineralization zones at a nominal processing rate of 8,000 t/d. The comminution circuit was developed based on the grindability test results, engineering experience, the topography of the plant site and operability of the system. The size selection of the grinding mills was based on the amenability of the ore to grinding, as determined through previous test programs. The proposed comminution circuit includes primary crushing by a jaw crusher and a SABC circuit.
The process plant will consist of the following main processing facilities:
• A crushing and ore storage facility, including a feeder, a primary jaw crusher, a crushed ore surge bin and related conveying systems.
• An SABC grinding circuit, including a SAG mill, a ball mill, a pebble crusher and related pumping and pebble handling systems.
• A gravity concentration circuit with intensive leaching, including an ACACIA leaching reactor, an electrowinning cell and related equipment.
• Cyanide Leach/CIP circuit and related gold recovery and carbon handling circuits, including pre-leach thickening, leach and CIP tanks, acid wash and elution, carbon reactivation, gold electrowinning and melting.
• Cyanide destruction.
The following description should be read in conjunction with the simplified flowsheet shown in Figure 17.1.
The ROM ore will be trucked to the plant site and will either be directly dumped into a hopper located at the east edge of the receiving pad or to the ROM stockpiles on the storage pad. The crushing circuit consists of a vibrating feeder, a jaw crusher and apron feeder. The crusher product particle size will be approximately P80 150 mm.
5070\16.04\5070-STY-001_01
July 2017 Lycopodium Minerals Canada Ltd.
FEASIBLITY STUDY ON THE AURIZONA GOLD MINE PROJECT NI 43-101 TECHNICAL REPORT
Page 17.3
The crushed ore will be transported by conveyor to a 70 t surge bin and then reclaimed and fed to the SABC grinding circuit to reduce the crushed ore to a particle size of P80 100 µm. During normal crusher operation, the surge bin is maintained in an overflow state. The overflowing ore is conveyed to a crushed ore stockpile for eventual reclaim by front end loader (FEL) during crusher outages.
The SAG mill in the SABC circuit will be in a closed circuit with a pebble crusher while the ball mill will be in a closed circuit with cyclones. A percentage of the cyclone underflow will report to two centrifugal gravity concentrators. On average, approximately 30 to 40% of the gold in the ROM ore is estimated to be recovered from the centrifugal gravity concentration circuit. The intensive leach unit will solubilize the gold from the gravity concentrate, while the gold in the pregnant solution will be recovered by electrowinning.
The cyclone overflow from the SABC circuit will flow by gravity to the pre-leach thickener where the slurry will be thickened for downstream cyanidation. The underflow of the thickener will be cyanide leached in the upgraded leach/CIP circuit to recover the remaining gold that has not been recovered by the gravity circuit.
The loaded carbon from the CIP circuit will be washed by diluted acid solution and eluted by the Anglo American Research Laboratory (AARL) elution process. The gold in the pregnant solution will be recovered by electrowinning. The barren solution will be recirculated back to the elution circuit. The gold sludge produced in the electrowinning cells, together with the gold sludge from the intensive leach circuit, will be smelted to produce gold doré bullion.
The residue from the leach circuit will be sent to a cyanide destruction circuit employing a sulphur dioxide / air process to destroy the residual weak acid dissociable (WAD) cyanide.
The treated residue slurry will then be pumped to the TSF.
5070\16.04\5070-STY-001_01
July 2017 Lycopodium Minerals Canada Ltd.

FEASIBLITY STUDY ON THE AURIZONA GOLD MINE PROJECT NI 43-101 TECHNICAL REPORT
Page 17.5
Figure 17.1 Proposed Plant Process Flow Sheet
5070\16.04\5070-STY-001_01
July 2017 Lycopodium Minerals Canada Ltd.
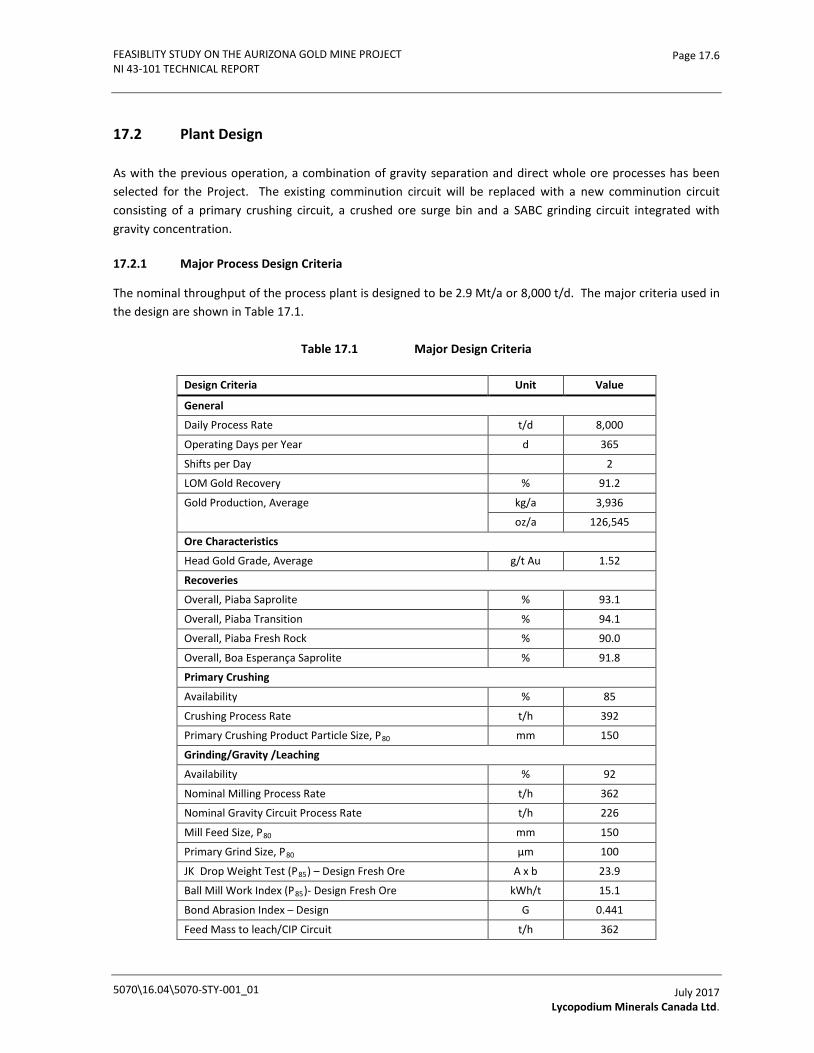
FEASIBLITY STUDY ON THE AURIZONA GOLD MINE PROJECT NI 43-101 TECHNICAL REPORT
Page 17.6
17.2 Plant Design
As with the previous operation, a combination of gravity separation and direct whole ore processes has been selected for the Project. The existing comminution circuit will be replaced with a new comminution circuit consisting of a primary crushing circuit, a crushed ore surge bin and a SABC grinding circuit integrated with gravity concentration.
17.2.1 Major Process Design Criteria
The nominal throughput of the process plant is designed to be 2.9 Mt/a or 8,000 t/d. The major criteria used in the design are shown in Table 17.1.
Table 17.1 Major Design Criteria
Design Criteria Unit Value
General
Daily Process Rate t/d 8,000
Operating Days per Year d 365
Shifts per Day 2
LOM Gold Recovery % 91.2
Gold Production, Average kg/a 3,936
oz/a 126,545
Ore Characteristics
Head Gold Grade, Average g/t Au 1.52
Recoveries
Overall, Piaba Saprolite % 93.1
Overall, Piaba Transition % 94.1
Overall, Piaba Fresh Rock % 90.0
Overall, Boa Esperança Saprolite % 91.8
Primary Crushing
Availability % 85
Crushing Process Rate t/h 392
Primary Crushing Product Particle Size, P80 mm 150
Grinding/Gravity /Leaching
Availability % 92
Nominal Milling Process Rate t/h 362
Nominal Gravity Circuit Process Rate t/h 226
Mill Feed Size, P80 mm 150
Primary Grind Size, P80 µm 100
JK Drop Weight Test (P85) – Design Fresh Ore A x b 23.9
Ball Mill Work Index (P85)- Design Fresh Ore kWh/t 15.1
Bond Abrasion Index – Design G 0.441
Feed Mass to leach/CIP Circuit t/h 362
5070\16.04\5070-STY-001_01
July 2017 Lycopodium Minerals Canada Ltd.
FEASIBLITY STUDY ON THE AURIZONA GOLD MINE PROJECT NI 43-101 TECHNICAL REPORT
Page 17.7
17.3 Process Plant Description
17.3.1 Primary Crushing
The crushing facility will process the ROM ore at an average processing rate of 392 t/h. A jaw crusher is proposed for the primary crushing.
The major equipment and facilities at the ROM receiving and crushing areas include:
• One mobile rock breaker.
• One stationary grizzly with 700 mm spacing bars.
• One, 190 t ROM surge bin.
• One, apron feeder.
• One vibrating grizzly feeder.
• One jaw crusher equipped with a 160 kW motor.
• One SAG mill feed surge bin feed conveyor with belt scale.
• One dust suppressing system.
The ROM ore will be trucked from the open pits and dumped directly into the ROM surge bin with 700 mm spacing bars, or stockpiled on the ROM storage pad and then reclaimed by a FEL to the surge bin. Any ore coarser than 700 mm will be broken down by a mobile breaker. The ore in the surge bin will be reclaimed by the 1,500 mm wide by 9m long apron feeder.
The ROM ore will then be fed onto the vibrating grizzly feeder, where the screen oversize coarser than 115 mm will be directed to the jaw crusher, which will crush the screen oversize to a P80 of approximately 150 mm. The crushed ore will report to the surge bin feed conveyor which will also receive the vibrating screen undersize. The combined crushed ore and the screen undersize will be conveyed to the SAG mill feed surge bin.
An FEL will be provided at the ROM storage pad to reclaim the stockpiled ore into the ROM ore surge bin when required.
The ore receiving and primary crushing areas will be equipped with a dust suppressing spraying system to control fugitive dust generated during ROM ore feeding, screening, crushing and conveyor loading.
5070\16.04\5070-STY-001_01
July 2017 Lycopodium Minerals Canada Ltd.
FEASIBLITY STUDY ON THE AURIZONA GOLD MINE PROJECT NI 43-101 TECHNICAL REPORT
Page 17.8
17.3.2 Mill Feed Surge Bin
The SAG mill feed surge bin will have a live capacity of 70 t. The crushed material will be reclaimed from the bin by a apron feeder at a nominal rate of 362 t/h onto a belt conveyor to feed the reclaimed ore to the SAG mill. During crusher operation, the surge bin feed rate exceeds the discharge rate and the bin is maintained in an overflow state. The overflowing ore is conveyed to the stockpile for eventual reclaim by FEL during crusher outages. The crushed ore stockpile is designed to have 30 hours of storage.
Pebble lime that is trucked and stored in a lime surge bin will be fed from the lime surge bin and added onto the SAG mill feed conveyor at a controlled rate for pH control.
A water spraying system will be installed in the area to control fugitive dust.
Primary Grinding, Classification and Primary Gravity Concentration
The primary grinding circuit will consist of a SAG mill and a ball mill in a closed circuit with classifying cyclones operating at a nominal rate of 362 t/h of ore. A pebble crusher in a closed circuit with the SAG mill will be provided to crush the pebbles generated from the SAG mill. .
The grinding and gravity concentration circuit will include:
• One SAG mill feed conveyor equipped with a weigh scale.
• One SAG mill, 8.5m diameter by 4.0m long (28ft by 13ft) (EGL), driven by a 5,300 kW variable frequency drive (VFD).
• One ball mill, 5.5m diameter x 7.4m long (18ft by 24ft) (EGL), driven by a 3,800kW fixed speed drive.
• One pebble crusher with an installed power of 250 kW and associated pebble surge bin and conveyors.
• One mill discharge pump box and related two mill discharge transfer pumps.
• One 50 m3 cyclone feed pump box and two cyclone feed slurry pumps.
• A cyclone cluster of six 50 mm cyclones (5 operating, 1 spare).
• Two KC-XD-30 centrifugal gravity concentrators and associated screens.
The crushed ore from the surge bin will be reclaimed onto the SAG mill feed belt conveyor that feeds the ore to the SAG mill. The SAG mill will be equipped with 70 mm pebble ports to discharge the fine fraction from the SAG mill. The SAG mill discharge will be screened by a short trommel screen that is integrated with the SAG mill and then by a vibrating screen. The trommel screen will have an opening of 10mm (slot wide). Steel balls will be manually added into the SAG mill on a batch basis as grinding media.
5070\16.04\5070-STY-001_01
July 2017 Lycopodium Minerals Canada Ltd.

FEASIBLITY STUDY ON THE AURIZONA GOLD MINE PROJECT NI 43-101 TECHNICAL REPORT
Page 17.9
The oversize from the trommel screen will be transported by two, 600 mm wide belt conveyors in series to a to a shorthead cone crusher equipped with a 250 kW motor. The pebbles will be crushed to P80 of approximately 10mm and the crushed pebbles will be fed onto the SAG mill feed conveyor. One magnet and one metal detector will be provided to remove and detect any steel metal pieces. A by-pass chute ahead of the pebble surge bin will be installed to divert the materials that may contain the detected steel pieces. The SAG mill trommel undersize will discharge by gravity into the mill discharge transfer pump box in the grinding circuit.
The product from the ball mill will be discharged into the mill discharge transfer pump box where the slurry from the SAG mill also reports. The combined slurry will be pumped to the cyclone feed pump box for classification. The cyclone underflow will return to the ball mill, creating a circulating load to the ball mill of approximately 250%. The cyclone overflow with a P80 of 100 µm will flow by gravity to the pre-leach thickener prior to subsequent cyanidation treatment. The pulp density of the hydrocyclone overflow slurry will be approximately 30% w/w solids. Steel balls will be manually added into the ball mill on a batch basis as grinding media.
The VFD on the SAG mill is shared and used by both the SAG and ball mills during start-ups. An inching drive is included for the ball mill.
The grinding mills will have 9.1 MW of total installed grinding providing sufficient power for the duty feed rate at the predicted feed blends in the LOM plan. The design power of the grinding mills provides for up to 85% harder fresh rock feed. During times when the feed contains less than 50% of the harder fresh rock material, the comminution circuit can handle a higher throughput without sacrificing grind size. If 100% fresh rock is fed to the grinding circuit, the model predicts the SAG mill will constrain production, requiring maximum ball charge to achieve an instantaneous feed rate 1% lower than duty throughput.
The gravity concentration process will recover coarse gold particles from a portion of the cyclone underflow. Approximately 25% of the cyclone underflow will report to two trash screens. The trash screen undersize slurries will flow by gravity to two centrifugal concentrators separately while the trash screen oversize materials will report to the gravity tails pump box. The tailings from the gravity concentration will report to the gravity tails pump box and will be pumped to the ball mill feed chute. The gravity concentrates will flow by gravity to a gravity concentrate storage hopper in a secure area prior to gold leaching in an intensive leach reactor. The gravity concentration circuit and intensive leaching area will have secure enclosures and closed circuit television (CCTV) cameras. Access to the two areas will be restricted to authorized personnel only.
Dilution water will be added to the grinding circuit as required. Lime will be added to maintain slurry pH at 10.5 or higher.
17.3.3 Cyanide Leaching and Carbon Adsorption
The cyclone overflow will be screened to remove any oversize material. The trash screen undersize will flow by gravity to the 50m pre-leach feed thickener to increase slurry density for the downstream cyanidation. The thickener overflow will report to a lined process water pond prior to recycle to the process plant.
5070\16.04\5070-STY-001_01
July 2017 Lycopodium Minerals Canada Ltd.
FEASIBLITY STUDY ON THE AURIZONA GOLD MINE PROJECT NI 43-101 TECHNICAL REPORT
Page 17.10
The thickener underflow at 43% w/w solids will be pumped to the head of a cyanide leach bank. The cyanidation will be performed in a leach circuit consisting of three leach tanks in series followed by eight CIP tanks arranged in two parallel lines of four tanks in series. The three, 17.5m diameter by 17.0m high leach tanks partially installed during the Phase 1 upgrade will be completely installed with a dual impeller agitator per tank.
The existing eight leach tanks, each 11.4m in diameter by 15.0m high will be used for CIP where additional leaching will occur. The 11 total leach/CIP tanks will provide a total retention time of more than 36 hours. The tanks will be aerated with compressed air from four oil-free compressors (three in operation and one in standby). The CIP tanks will be equipped with in-tank carbon transfer pumps and inter-stage screens to advance the loaded carbon to the next CIP tank. Activated carbon will be added into the last leach tank and the loaded carbon will leave the CIP circuit from the first CIP tank. Activated carbon concentrations may vary between 10 and 15 g/L slurry within the CIP tanks.
Sodium cyanide will be added to the leach tanks to extract gold. If required, hydrated lime slurry will be added to maintain the slurry pH to approximately 10.5.
The loaded carbon leaving the first CIP tank will be transferred to the carbon stripping circuit, while the leach residue from the last tank will be sent to a carbon safety screen to recover any coarse carbon grains. The screen undersize will report to the existing residue thickener prior to being pumped to the cyanide destruction circuit.
The key equipment in the leach circuit includes:
• One pre-leach thickener feed trash screen.
• One, 50m diameter pre-leach thickener.
• Three, 17.5m diameter x 17.0m high leach tanks.
• Eight, 11.4m diameter x 15.0m high CIP leach tanks equipped with in-tank carbon transferring pumps and screens.
• One, 1.2m wide x 3.7m long loaded carbon screen.
• One, 2.0m wide x 6.0m long carbon safety screen with 0.6 mm apertures.
• Four dedicated oil free type air compressors.
Cyanide detection and alarm systems, safety showers and emergency medical stations will be provided in the area to protect operators.
5070\16.04\5070-STY-001_01
July 2017 Lycopodium Minerals Canada Ltd.

FEASIBLITY STUDY ON THE AURIZONA GOLD MINE PROJECT NI 43-101 TECHNICAL REPORT
Page 17.11
17.3.4 Carbon Stripping
The loaded carbon will be harvested from the CIP circuit. The carbon will then be pumped to a 6 t fiberglass reinforced plastic (FRP) acid wash vessel and washed with a dilute 5% hydrochloric acid solution to remove any passivating, inorganic mineral deposits on the surface of the carbon. Afterwards, the acid washed carbon will be rinsed with fresh water and transferred into a new 6 t elution vessel. The Phase 1 acid wash vessel will be fully commissioned. A new 6 t elution column will be purchased and installed.
The gold will be stripped from the loaded activated carbon by the pressurized AARL elution process. This process includes the following:
• Pre-soak in 3% w/v NaCN and 2% w/v NaOH solution for 20 minutes.
• Elution with 8 BV (at 2 BV/h) of filtered fresh water at 120°C and 170 to 200 kPa.
• Carbon cool with 1BV (at 2 BV/h) filtered fresh water.
The pregnant solution generated from the elution process will report to the pregnant solution holding tanks for subsequent gold recovery by electrowinning.
At the end of the elution process, the stripped carbon will be discharged from the bottom of the vessel through a regulating valve to the stripped carbon tank and then pumped to carbon regeneration circuit for reactivation.
The stripping process will include the following main equipment:
• One 6 t acid wash vessel.
• One 6 t elution vessel.
• One 60 m3 pre-soak solution tank.
• One 123 m3 pregnant solution tank.
• One 102 m3 barren solution tanks, one with 600 kW electric tank heater.
• One 2000 kW strip solution heater.
5070\16.04\5070-STY-001_01
July 2017 Lycopodium Minerals Canada Ltd.

FEASIBLITY STUDY ON THE AURIZONA GOLD MINE PROJECT NI 43-101 TECHNICAL REPORT
Page 17.12
17.3.5 Carbon Reactivation
The stripped carbon will be transferred by a recessed impeller pump to a stationary dewatering screen for dewatering and then to 12 t capacity carbon regeneration kiln feed hopper, prior to reactivation. The carbon regeneration kiln is capable of regenerating the barren carbon at a rate of 500 kg carbon per hour. The kiln will be heated by electricity and operated at approximately 650°C - 700°C in an inert atmosphere. The regeneration is required to remove or burn away any passivating organic foulants such as oils or greases loaded up during the CIP circuit. The hot, reactivated carbon will then leave the kiln and be quenched in a 4 m3 capacity conical bottomed quench tank flooded with water. The regenerated carbon will be then sized and circulated back into the CIP circuit. As required, make-up fresh carbon will be added. The fresh carbon will be treated by attrition and sizing prior to being added into the CIP circuit.
The main equipment used for the carbon reactivation process and make-up carbon addition will include:
• One, 12 t carbon reactivation kiln feed hopper.
• One fired carbon reactivation kiln with an installed electrical power of 1,000 kW.
• One, 4 m3 carbon quench tank.
• One, 1.2m wide x 2.44m long carbon sizing screen.
• Fine carbon handling associated equipment.
17.3.6 Intensive Cyanide Leaching – Gravity Concentrate
The gravity concentrates from the centrifugal concentrators will be sent to an intensive cyanide leach circuit. The system installation will be completed and replace the existing gravity tabling circuit by. The intensive leach circuit, consisting of a 3 t concentrate storage hopper, a 2 t reactor, a 5 m3 pregnant solution tank, a dedicated 1.4 m3 electro-winning cell with 13 cathodes and associated pumps and control systems, will be operated on a batch basis. The high-grade gravity concentrates will be leached at approximately 50°C by a solution consisting of fresh water, 10 to 20 g/L of sodium cyanide, 4 to 10 g/L of sodium hydroxide, and 3 kg per batch proprietary “leach aid”. The solution will be circulated through the reactor until such time that the concentrate is devoid of gold values. The pregnant solution produced from the intensive leach unit will be stored in a 5 m3 pregnant solution tank and then pumped to the electro-winning cell to recover the extracted gold. Gold deposited onto woven wool, stainless steel cathodes will be washed and the resulting sludge will periodically be pumped to the gold room for dewatering and melting to produce gold doré. The barren solutions from the electrowinning will be returned to the 5 m3 pregnant eluate tank for reusing in the intense leach circuit.
The intensive leach residue after washing will be pumped back to the grinding circuit for further grinding.
The area will be secured and monitored by CCTV system. Any access to the area will be restricted to authorized personnel only.
5070\16.04\5070-STY-001_01
July 2017 Lycopodium Minerals Canada Ltd.
FEASIBLITY STUDY ON THE AURIZONA GOLD MINE PROJECT NI 43-101 TECHNICAL REPORT
Page 17.13
17.3.7 Gold Electrowinning and Refining
Pregnant solution from the loaded carbon elution circuit will be pumped from the 123 m3 pregnant solution holding tank to the electrowinning circuit where the gold will be electrochemically deposited onto woven wool, stainless steel cathodes. The electrowinning circuit consists of three new 0.9 m3 electrowinning cells and related rectifiers that were constructed as a part of the Phase 1 expansion to replace the existing electrowinning cells. These new cells will be completely installed and commissioned. The cells, each with eight cathodes, will operate in parallel mode with two cells in service and one on standby. Periodically, the stainless steel cathodes will need to be cleaned by pressure washing to remove precious metals in the form of sludge. The gold sludge will be pumped to a plate and frame filter press for dewatering on a batch basis.
The depleted solution from the electrowinning circuit will be sent to the leach circuit.
The filtered and dried gold sludge cake will be mixed with flux and melted at approximately 1200°C in a new 170 kW induction furnace to produce gold bullion containing mostly gold and some silver and impurities.
The areas are provided with sufficient ventilation. The gold room is in a security facility with security entrances and monitored by 24 hour CCTV surveillance. The access to the gold room will be restricted to authorized personnel only.
17.3.8 Treatment of Leach Residue
Cyanide Detoxification
The residues from the carbon safety screen in the CIP circuit will be pumped to an existing cyanide detoxification circuit comprised of two, 11.4m diameter x 15.0m high reactors, each outfitted with an agitator driven by a 90 kW motor. The weak acid dissociable (WAD) residual cyanide in the underflow of the thickener will be decomposed by a sulphur dioxide/air oxidation process. The reagents used will include sodium metabisulphide (SMBS), copper sulphate and lime. The reagent storage, preparation and dosing systems for these reagents will be upgraded. An emergency discharge pond adjacent to the cyanide detoxification tanks is provided for any emergency discharges of the leach slurry.
After detoxification, the tailings slurry will be pumped to the TSF.
17.3.9 Tailing Management
The treated CIP residue will be pumped to the TSF located west of the main process plant. The supernatant from the TSF will be reclaimed by pumping to the process water pond for reuse. The excess water will be discharged to the environment. The tailings management is detailed in Section 18.6.
17.3.10 Reagents Handling
The reagents used in the process will include:
• CIP and Gold Recovery: pebble lime (CaO), hydrated lime (Ca(OH)2), sodium cyanide (NaCN), activated carbon, sodium hydroxide (NaOH) and hydrochloric acid (HCl).
5070\16.04\5070-STY-001_01
July 2017 Lycopodium Minerals Canada Ltd.
FEASIBLITY STUDY ON THE AURIZONA GOLD MINE PROJECT NI 43-101 TECHNICAL REPORT
Page 17.14
• Cyanide Destruction: sodium metabisulphite (Na2S2O5), copper sulphate (CuSO4) and hydrated lime (Ca(OH)2).
• Others: flocculant and antiscalant.
All the reagents will be prepared in a separate reagent preparation and storage facility in a containment area. The reagent storage tanks will be equipped with level indicators and instrumentation to ensure that spills do not occur during operation.
Hydrochloric acid will be diluted by approximately 10% in a dilution tank prior to being added to the required process circuits via a metering pump where it will be further diluted to 5%, while sodium hydroxide and antiscalant will be added in the undiluted form.
All the solid type reagents (calcium hydroxide, sodium cyanide, copper sulphate, and sodium metabisulphite) will be mixed with fresh water to 10 to 25% solution strength in respective mixing tanks, and stored in separate holding tanks before being added to various addition points by metering pumps. The pebble lime will be directly added onto the ROM hopper discharge conveyor at a controlled rate.
Cyanide monitoring and alarm systems will be installed at the cyanide preparation and leaching areas. Emergency medical stations and emergency cyanide detoxification chemicals will be provided at the areas as well.
Flocculant will be received in solid form and prepared in a packaged preparation system including a screw feeder, a flocculant eductor and mixing devices. Mixed solution will be transferred and stored in an agitated flocculant holding tank. Flocculant will be added via metering pumps to the pre-leach feed thickener and the tailings thickener.
17.3.11 Water Supply
Two separate water supply systems will be provided to support the process operations: one fresh water system and one process water system for various process circuits.
Fresh Water Supply System
Fresh water will be used primarily for the following:
• Fire water for emergency use.
• Cooling water for mill motors and mill lubrication systems.
• Carbon elution/intensive leach/dust suppression.
• Reagent preparation.
• Gland water.
5070\16.04\5070-STY-001_01
July 2017 Lycopodium Minerals Canada Ltd.

FEASIBLITY STUDY ON THE AURIZONA GOLD MINE PROJECT NI 43-101 TECHNICAL REPORT
Page 17.15
By design, the fire water tank will be full at all times for any emergency. Potable water will be supplied by bottled water.
Process Water Supply System
The process water system will supply the process water for the grinding/gravity, cyanide leach and gold recovery circuits.
The overflows from the pre-leach thickener and the tailings thickener will report to the process water pond. Any additional make-up water will be reclaimed from the TSF and pumped to the process water pond. The process water will be distributed to the various service points.
17.3.12 Air Supply
Plant air service systems will supply air to the following areas:
• Leach/CIP– high pressure air by dedicated oil-free type air compressors.
• Cyanide destruction – low pressure air by blowers.
• Plant services – high pressure air for various services by dedicated air compressors.
• Instrumentation services – instrument air will come from the plant air compressors and will be dried and stored in a dedicated air receiver.
17.3.13 Assay and Metallurgical Laboratory
There is an existing assay laboratory at the mine that will be refurbished and upgraded. The laboratory is equipped with necessary sample preparation equipment and analytical instruments to provide routine assays for the mine, process, and environmental departments. The assay laboratory will provide various assays, including gold fire assay. The obtained data from the assay will be used for routine process optimization and metallurgical balance accounting.
There is also a metallurgical laboratory located in the process plant. The laboratory is equipped with metallurgical test equipment. The laboratory will perform the metallurgical tests to optimize the process flow sheet and improve metallurgical performance.
5070\16.04\5070-STY-001_01
July 2017 Lycopodium Minerals Canada Ltd.

FEASIBLITY STUDY ON THE AURIZONA GOLD MINE PROJECT NI 43-101 TECHNICAL REPORT
Page 17.16
17.3.14 Process Control and Instrumentation
The existing process plant will be controlled by existing plant control system (PCS). Programmable logic controllers (PLC) and remote distributed I/O systems will be integrated to the existing PCS for the new process areas and future equipment. The existing main control room will continue to serve as a central monitoring station of the process plant to provide overall operator process monitoring and control. The existing PC based operator workstations (OWS) with duel screen, engineering workstation (EWS) and servers will remain for all plant monitoring and control. PLCs and distributed I/O systems will be located throughout the plant and are networked to the main plant control room. All key process and maintenance parameters will be available for trending and alarming on the PCS.
Operator work stations will be capable of monitoring the entire process plant site process operations and will be capable of viewing alarms and controlling equipment within the plant.
In addition to the process plant control system, a CCTV system will be installed at various locations throughout the process plant including the crushing facility, grinding facility, the gravity concentration area, and the gold recovery facilities. The cameras will be monitored from the central control room.
The samples from various process streams will be manually collected and assayed for daily metallurgical balance and process optimization.
5070\16.04\5070-STY-001_01
July 2017 Lycopodium Minerals Canada Ltd.

FEASIBILITY STUDY ON THE AURIZONA GOLD MINE PROJECT NI 43-101 TECHNICAL REPORT
Page 18.1
18.0 PROJECT INFRASTRUCTURE
18.1 Mine Infrastructure
The Aurizona Mine was placed on care and maintenance status in late 2015 and had operated successfully for over 4 years prior to that. The Study presents a restart case where the project benefits from the existing site and surrounding infrastructure.
18.1.1 Mine Truck Shop/Warehouse Facility
With a full contract mining operation, the contractor is responsible for providing their own workshops. This will be located near the north end of the plant site. The building will be a tent structure likely with 40m x 20m with a concrete pad base. This will contain bays for heavy vehicle maintenance, light vehicle maintenance, welding and tire repair. Warehousing will be contained in attached sea containers to this facility. In addition, an existing hard sided 4 bay truck shop that was erected at the site in 2014 by a mining contractor will be utilized for the repair and maintenance of the mobile mining fleet until this must be relocated due to pit advance.
18.1.2 Mine Roads
The various mine roads have been designed to connect the pit with the WSF or the plant crusher/stockpile. A total of 5 km of road will be constructed initially and then expanded as needed during the LOM.
Haul roads used by the haulage trucks on the pit perimeter will be double lane roads. Double lane roads are designed at three times the operating width of the truck. For the Study this means there is a running surface of 17.1m with a minimum of a 2% cross-fall for drainage. If the drop-off on the road edge is more than 2.5m, a berm 1.6m high is required. Normal ditching is 0.5m deep with slopes of 1.5:1. The roads will be built of a minimum of 1m of compacted rock fill base.
It is anticipated that only mine traffic will utilize these roads except in the area of the process plant facility. For a time, the ore haulage will occur through the plant/shop area to access the south ramp up to the stockpile. All non-mine traffic will have to stop prior to entering the road way as the haulage trucks will have the right of way. All site roads crossing the haulage road will have signage indicating a full stop is required prior to proceeding.
18.1.3 Explosives Storage
The storage of explosives is governed by the Brazilian Army under Regulation R-105: Regulamento Para a Fiscalização de Produtos Controlados (Regulation for Controlled Products Inspection).
5070-\16.4\5070-STY-001
July 2017 Lycopodium Minerals Canada Ltd.

FEASIBILITY STUDY ON THE AURIZONA GOLD MINE PROJECT NI 43-101 TECHNICAL REPORT
Page 18.2
The allowable quantities of explosive products to be stored and the corresponding separation distances required from exposed sites are detailed in Annex XV of Regulation R-105. The products to be stored for the mine operations can be classified into three categories:
• Bulk products.
• Packaged explosives.
• Detonators and safety fuse.
Bulk products include bulk emulsion and bulk ammonium nitrate. These do not become an explosive until they are mixed by a truck and loaded into the blast hole. Bulk emulsion will be the primary blasting agent used as this product has much better water-resistance compared to ANFO. Packaged explosives require a detonator or booster in order for them to explode. Examples are packaged ANFO, boosters, detonating cord and cartridge emulsion explosives. These products will be stored in approved magazines.
Detonators and safety fuses are used to initiate packaged explosives and therefore must be stored separately in approved magazines.
The maximum quantities to be stored with the corresponding required separation distances are shown in the following Table 18.1.
Table 18.1 Explosives Quantities Stored and Minimum Separation Distances
Product Quantity
Stored kg
Minimum Distance m
Inhabited Buildings Railways Highways
Bulk Products (Bulk Emulsion + Bulk Ammonium Nitrate) 226,800 180 180 180 Packaged Explosives 60,000 610 345 685 Detonators and Safety Fuse 9,000 530 320 160
The explosives products may be stored in the same compound but they must be separated by the appropriate distances. The distances may be reduced by adding barricading such as earth mounding, with the approval of the Brazilian Army.
The storage compound must be fenced and be monitored by security cameras. In addition, security personnel must be in attendance at all times.
The proposed explosives storage compound will be approximately 200m x 250m in area and its location with respect to the site can be seen in Figure 18.2.
5070-\16.4\5070-STY-001
July 2017 Lycopodium Minerals Canada Ltd.
FEASIBILITY STUDY ON THE AURIZONA GOLD MINE PROJECT NI 43-101 TECHNICAL REPORT
Page 18.3
18.2 Process Plant and Site Infrastructure
Accessibility
All year access roads are available from the state capital cities of Belém, Pará (400 km), and São Luis, Maranhão (320 km), the latter requiring a ferry transfer from São Luis Island to the mainland or longer bypass road on land. There is a main federal highway connecting both capitals (BR316). State highway MA206 connects BR316 with the town of Godofredo Viana, a distance of 110 km, from which the Property is accessed by 16 km of a regularly maintained 8 km wide laterite road.
The Aurizona Mine, in partnership with the local authorities, has upgraded the landing strip at Godofredo Viana. Travel time between the Aurizona Mine and São Luis or Belém is approximately one hour by light aircraft.
Figure 18.1 depicts the regional roads that lead to the Aurizona Mine site while Figure 18.2 shows the overall mine site plan.
5070-\16.4\5070-STY-001
July 2017 Lycopodium Minerals Canada Ltd.
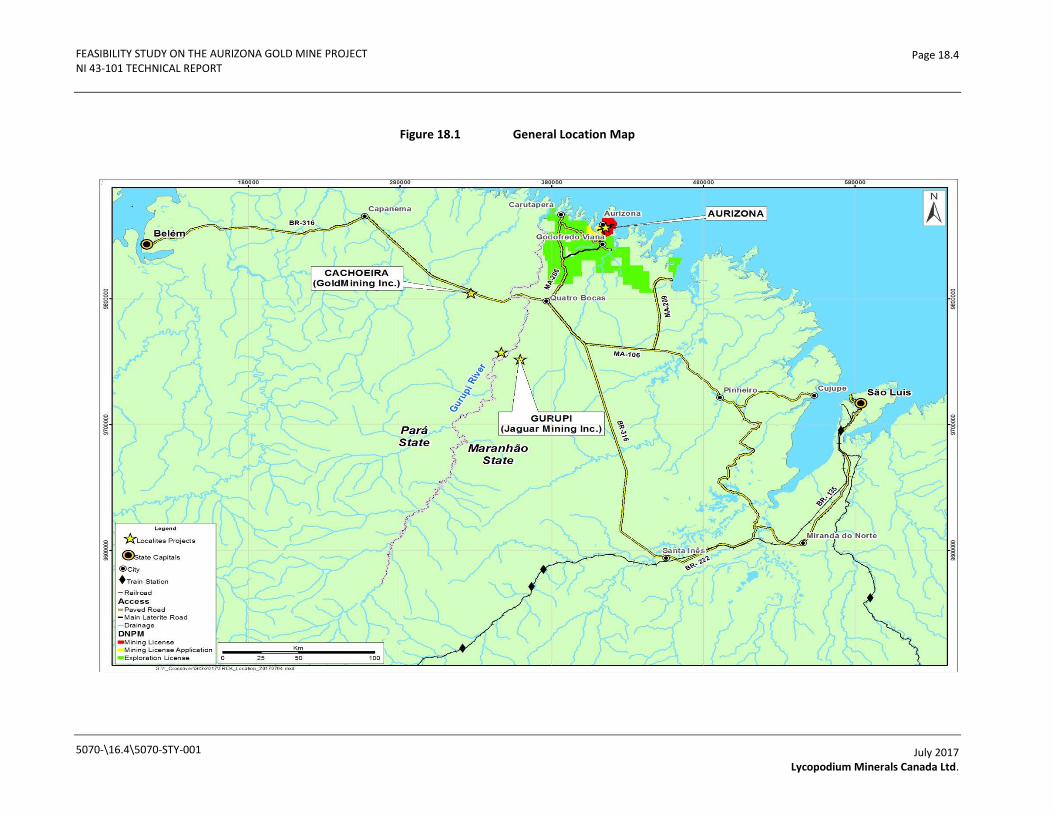
FEASIBILITY STUDY ON THE AURIZONA GOLD MINE PROJECT NI 43-101 TECHNICAL REPORT
Page 18.4
Figure 18.1 General Location Map
5070-\16.4\5070-STY-001
July 2017 Lycopodium Minerals Canada Ltd.

FEASIBILITY STUDY ON THE AURIZONA GOLD MINE PROJECT NI 43-101 TECHNICAL REPORT
Page 18.5
Figure 18.2 Overall Mine Site Plan
5070-\16.4\5070-STY-001
July 2017 Lycopodium Minerals Canada Ltd.
FEASIBILITY STUDY ON THE AURIZONA GOLD MINE PROJECT NI 43-101 TECHNICAL REPORT
Page 18.6
Mine and Plant Access Roads
Dedicated access roads to the mine and process plant have been constructed, fenced off and adequately signed to protect local people and livestock from entering the mine areas. A single access point to the operations area is secured by double gates allowing only authorized personnel to the working area. After entering through the main gate, the road splits in two - one road for the process plant and the other for the open pit. Radio communication with the supervisor is required prior to gaining access.
The new front end of the process plant will consist of the following unit processes:
• Primary crusher and related facilities.
• Surge bin with temporary ore storage stockpile.
• SAG mill, ball mill, pebble crusher and related facilities.
The proposed area for the new grinding circuit is already relatively flat so minimal earthworks will be required. Minor new access roads will be required to service and maintain the new infrastructure installations.
Road surface structures will be designed with consideration to frequency of the standard axle load and the sub-grade modulus.
Mine Site Facilities
The mine contractor will be fully supported by a maintenance shop for heavy equipment, lunchroom, toilets, resting areas, etc. Mining operations have been temporarily suspended however mining personnel will be made up of a combination of local workforce for the operations and support services along with select technical expertise from throughout Brazil.
Plant Site Facilities
All essential process facilities have been constructed. The process plant was originally constructed in 2010 to treat saprolitic ores at the rate of 5,000 t/d and through improvements during the previous operating period the plant routinely processed in excess of 7,000 t/d of soft saprolite ore. External lay down areas and a horticultural nursery are located adjacent to the construction camp. The existing process plant area is shown in Figure 18.3.
5070-\16.4\5070-STY-001
July 2017 Lycopodium Minerals Canada Ltd.
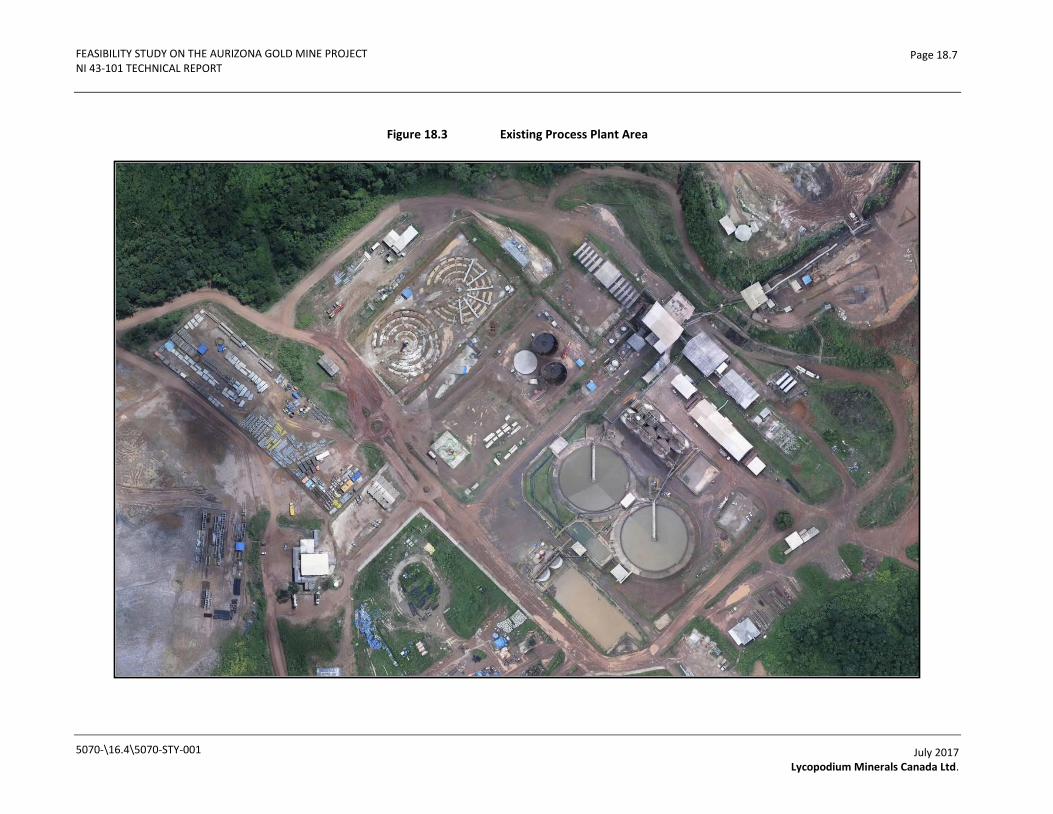
FEASIBILITY STUDY ON THE AURIZONA GOLD MINE PROJECT NI 43-101 TECHNICAL REPORT
Page 18.7
Figure 18.3 Existing Process Plant Area
5070-\16.4\5070-STY-001
July 2017 Lycopodium Minerals Canada Ltd.
FEASIBILITY STUDY ON THE AURIZONA GOLD MINE PROJECT NI 43-101 TECHNICAL REPORT
Page 18.8
The existing process plant will be upgraded to be capable of processing various types of mill feeds at the nominal process rate of 8,000 t/d. The process plant will consist of following main processing facilities:
• ROM ore stockpile pad.
• Crushing facility including vibratory feeder, jaw crusher and associated material handling equipment.
• Surge bin with temporary stockpile.
• SABC circuit.
• Gravity concentration/ACACIA/electrowinning and associate facilities.
• Leach/CIP cyanidation and related gold recovery.
• Reagent storage and handling.
• Facilities for administration and an assay laboratory.
• Power supply and distribution system.
• Water supply and distribution system.
• Sewage collection and management.
• Surface water management.
• Tailings surface facility (TSF).
• Communications.
• Helipad.
• Medical centre.
The main upgrade work for the Project is to replace the existing comminution system with a new crushing and grinding circuit. The upgraded plant site layout and the new comminution system are shown in Figure 18.4 and Figure 18.5.
Just as the existing operation, the gold extraction process will be supported by assay and metallurgical laboratories, a secured gold room, compressor stations, reagent preparation facilities and related storage facilities, electrical rooms, substations, maintenance shops and offices, warehouse, helipad, a power generator room containing four 2.5kVA generators and a related fuelling station (currently three are installed).
Process operations have been temporarily suspended. The process personnel were made up of a combination of local workforce for the operations and support services along with select technical expertise from throughout Brazil. The majority of the process operators and workers were from the region.
5070-\16.4\5070-STY-001
July 2017 Lycopodium Minerals Canada Ltd.

FEASIBILITY STUDY ON THE AURIZONA GOLD MINE PROJECT NI 43-101 TECHNICAL REPORT
Page 18.10
Figure 18.4 Upgraded Plant Site Layout
5070-\16.4\5070-STY-001
July 2017 Lycopodium Minerals Canada Ltd.
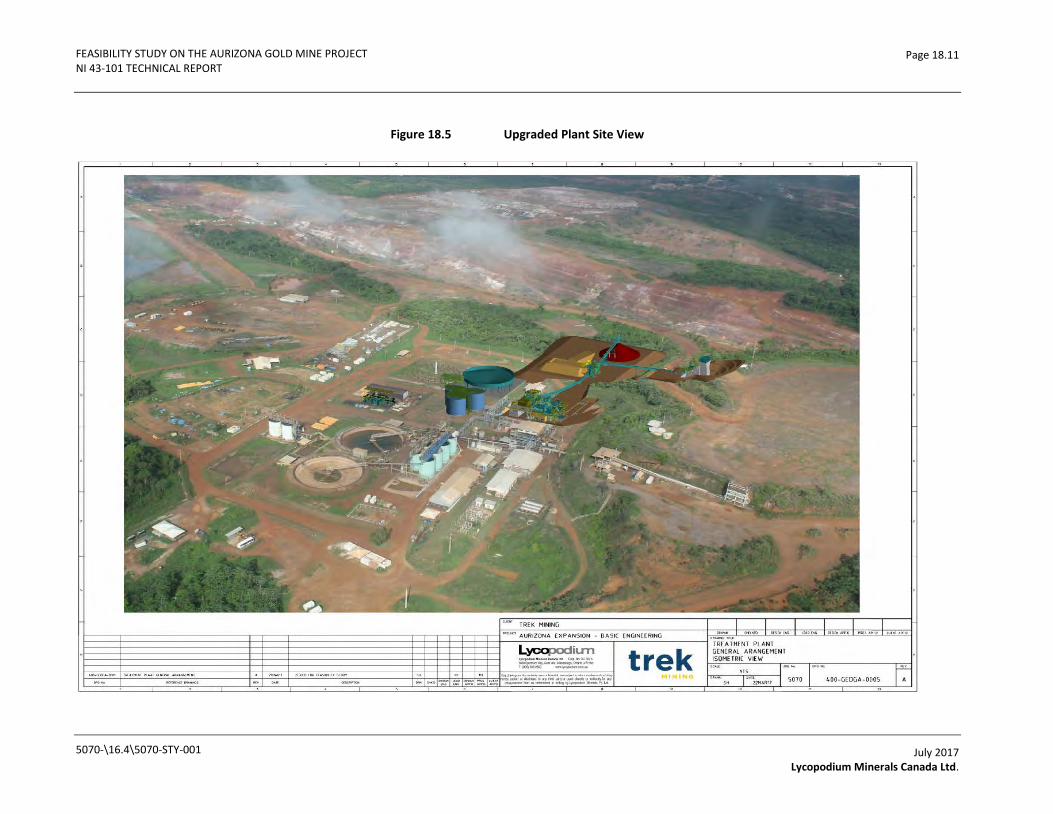
FEASIBILITY STUDY ON THE AURIZONA GOLD MINE PROJECT NI 43-101 TECHNICAL REPORT
Page 18.11
Figure 18.5 Upgraded Plant Site View
5070-\16.4\5070-STY-001
July 2017 Lycopodium Minerals Canada Ltd.
FEASIBILITY STUDY ON THE AURIZONA GOLD MINE PROJECT NI 43-101 TECHNICAL REPORT
Page 18.12
Power Supply and Distribution
The Companhia Energética do Maranhão (CEMAR) Manaus substation currently provides power supply to the plant through the existing overhead 69 kV line with 4.6 MW capacity. The utility will revamp the existing overhead line and off site substations to increase the line capacity to 14 MW. The existing and in-service 5 MVA power transformer will be modified for increased power of 7.5 MVA. Existing but not in-service 10 MVA power transformer will be modified for increased power of 12.5 MVA.
The outdoor switchyard will expand to accommodate the 10 MVA/12.5 MVA transformer.
The plant maximum demand varies based on the annual mine plan with year one of operation having the lowest maximum demand and year six of operation having the highest maximum demand with 16.3 MW. When the demand power requirement of the plant becomes more than 14 MW supplied by utility, then the existing generators will be synchronized with the relevant 4.16 kV buses for a continuous service application to increase power supply.
Plant Total Maximum Demand
The plant total installed load includes in-service and standby new equipment and existing loads which will remain in service and does not include any future loads.
The plant maximum demand load assumes a load factor of 85% for the majority of the loads and exclude standby loads.
Plant annual average operating load assume a utilization factor of 0.92 for the majority of the plant process equipment.
Electrical Distribution
Plant incoming 69 kV electricity is stepped down to 4.16 kV at the existing outdoor substation via the existing 7.5/5 MVA transformer. The existing 7.5/5 MVA transformer and 4.16 kV switchgear will feed all existing, modified and new loads except milling and crushing loads.
The existing 69 kV outdoor substation will be expanded to accommodate 69/4.16 kV, 12.5/10 MVA transformer. The existing but not in service indoor 4.16 kV switchgear 490-QD-11 will be connected to the secondary of this transformer and will feed all new and future loads of the crushing and milling areas.
To increase the available apparent power supply, one new power factor correction unit will be installed in the existing electrical building.
Existing switchgear and MCCs are located inside the existing electrical buildings. A new electrical building will be built inside the milling plant and will house a new MV switchgear, MV VFD and milling area 4.16 kV/460 V transformer and MCC. The crushing and neutralization areas each will have their own 4.16 kV/460V transformer, pre-fabricated electrical room and MCC.
5070-\16.4\5070-STY-001
July 2017 Lycopodium Minerals Canada Ltd.
FEASIBILITY STUDY ON THE AURIZONA GOLD MINE PROJECT NI 43-101 TECHNICAL REPORT
Page 18.13
The neutralization plant transformer will be fed from one of the existing 4.16 kV switchgear 490-QD-02 spare feeders. Power supply to mine dewatering pumps will be from existing 4.16 kV switchgear via overhead line and pole mounted transformer.
Indoor and outdoor distribution boards will be installed for lighting and small power distribution of the milling and crushing plant as well as UPS power distribution
Emergency power will be provided on the site by means of existing diesel generators. Two of these generators will be connected to the 4.16 kV switchgear fed by the 7.5/5 MVA transformer and one generator will be connected to the 4.16 kV switchgear fed by 12.5/10 MVA transformer. Critical process loads plus 1/3 of the new lighting loads will be on emergency back-up power. Emergency power will be generated at 460 VAC and will be stepped up to 4.16 kV and will be connected to the relevant 4.16 kV switchgear. Transfer from normal power to emergency back-up power will be automatic with the loss of normal power at 4.16 kV switchgear. The generators will be synchronized at 4.16 kV buses when the plant maximum demand is higher than maximum power supplied power by utility.
Transformers and Compounds
The existing plant 69/4.16kV transformers are ONAN with on-line tap changer. The existing 5 MVA and 10 MVA transformers will be modified to ONAF for increased power of 7.5 MVA and 12.5 MVA respectively.
4.16 kV/460 V, 2 MVA and 1.5 MVA distribution transformers will be dry type with de-energized tap changers.
4.16 kV Switchgear
The existing but not in service 4.16kV switchgear 490-QD-11 needs to be modified and a new feeder section will be added to accommodate the electrical power distribution re-arrangement.
The new 4.16 kV switchgear 490-QD-20 will be fully withdraw-able and arc-resistant design complete with protection, metering and grounding facilities.
The design fault level and circuit breaker ratings adopted are:
• 4.16 kV Switchgear: 2,000 A, 25kA/3 s.
• 4.16 kV Switchgear incoming circuit breaker: 2,000 A.
• 4.16 kV Feeder circuit breakers: 1,250 A.
Protection will be provided by microprocessor based protection relays.
5070-\16.4\5070-STY-001
July 2017 Lycopodium Minerals Canada Ltd.

FEASIBILITY STUDY ON THE AURIZONA GOLD MINE PROJECT NI 43-101 TECHNICAL REPORT
Page 18.14
Electronic Variable Speed Drives
One 4.16 kV variable frequency drive (VFD) will be utilized for the SAG mill and ball mill. The VFD will be floor mounted and connected to a low resistance grounded 4.16 kV distribution system. The ball mill will start through MV VFD and will switch to normal power when at speed. The SAG mill will start and run though the MV VFD.
Low voltage (LV) VFD units with line reactors will be utilized. These are floor or wall mounted (dependent upon size) along the internal wall of the electrical rooms.
460 V Motor Control Centre (MCC)
Existing loads, with no change, will stay connected to existing MCCs. Existing loads that are not in service anymore will be disconnected and their starters and feeders will become available as spare. The milling area, crushing area and neutralization area will have their own 460 V MCC.
The new MCCs will be front access and housed in the electrical building in the milling area and the pre-fabricated electrical rooms in crushing and neutralization areas. MCCs will have type 2 protection coordination. All motor starters will be equipped with intelligent protection relays with Profibus DP communication. The LV MCC will supply power to the low voltage motors, low voltage variable speed drives and low voltage distribution boards.
Grounding System and Lightning Protection
The following method of system grounding will be implemented at various voltage levels:
• 4.16 kV Low resistance grounding.
• 460 V Solidly grounded.
Existing lightning protection will be extended to provide required protection and coverage for all exposed points of the new equipment and structures. The extended lightning protection system will have its own independent grounding electrodes and will be interconnected with the plant grounding system.
Communications
At present, there are landline telephones, internet, cell phone coverage and satellite communications for the mine camp and process plant. Additional systems for handheld and vehicle radios are installed including two repeater towers that enable full radio coverage as far as Godofredo Viana airport for security purposes. An upgraded IT system was installed in 2012 including, a wireless mesh, new very-small aperture terminal (VSAT) and fibre optic connection between the camp and process plant. Further enhancements are expected as the local community grows. Local Brazilian internet providers are enhancing their infrastructure with broad band connections making them available for the operation expansion.
5070-\16.4\5070-STY-001
July 2017 Lycopodium Minerals Canada Ltd.

FEASIBILITY STUDY ON THE AURIZONA GOLD MINE PROJECT NI 43-101 TECHNICAL REPORT
Page 18.15
18.3 Camp
There is currently a camp located in the Aurizona village with an infirmary, offices, lodging facilities, and kitchen/dining area for serving meals mainly to the administration staff including a small number of short term contractors. There will be no construction camp purposefully built for the Aurizona Gold Mine Expansion as construction labour will be housed in the surrounding villages.
18.4 Water Supply and Water Balance
SRK developed a site wide mine water management plan for the life of the Project, including surface water controls and a site-wide water balance.
18.4.1 Site Wide Water Balance
A detailed water balance model of the Project was developed using GoldSim software version 12 to simulate water management from pre-production through closure.
Facility arrangement drawings, sequenced on a yearly basis through the life of mine, were used to establish the change in the facility footprints and sequence diversion channel alignments to collect contact surface water flows and route them to designated discharge points. The sequenced arrangement drawings were also used in the water balance to track the expansion of the facilities through time as the mine progresses, capturing the dynamic nature of the Project and allowing the model to respond appropriately through the life of the Project.
Climatological data used in the design was based on a daily climate record developed for the site, extrapolating approximately 30 years’ regional climate records from the nearby Candido Mendes meteorological station n° 145006, from Agência Nacional de Águas, located approximately 20km from the site.
The model was simulated stochastically using a Monte-Carlo approach. During the simulation, stochastically selected years from the extrapolated data are used to simulate precipitation for corresponding individual years in the simulation. This allows representative daily rainfall, previously experienced in the region, to be used as climatic input to the model, without repeating the same sequence of wet and dry years as was experienced in the historical record. The model was simulated using different sequences of annual climate years and the results of hundreds of different combinations was reduced statistically to provide mean or extreme values. Using this approach, the model simulates a spectrum of wet and dry years for every part of the life of mine.
Additionally, the model adjusts the existing climate record to include a 100-yr storm event at a 1 in 100 year recurrence period.
The goals of developing the life of mine site-wide water balance were twofold: the first was to ensure availability of sufficient water for plant operations; and the second was to simulate operations throughout the life of the facility, determine timing of TSF raises, develop an integrated management plan for contact and process water and ensure that discharges back to the environment meet regulatory effluent requirements.
5070-\16.4\5070-STY-001
July 2017 Lycopodium Minerals Canada Ltd.

FEASIBILITY STUDY ON THE AURIZONA GOLD MINE PROJECT NI 43-101 TECHNICAL REPORT
Page 18.16
The Project is located in an area of high rainfall with approximately 3m of average annual rainfall and a distinct wet and dry season. The model shows that the system will generate excess water on an average annual basis, and no additional exterior water sources are required. The first goal was achieved by there being ample rainfall in part of the year and storage of sufficient water to sustain operations through a reasonably foreseeable drought period. The Project includes potential water storage within the two TSFs and Boa Esperança Pit during operations as well as significant inflow of groundwater and storage in the Piaba pit. Simulations did not indicate that additional sources of water would be required to sustain operations.
The results of the water balance clearly reflect that the Project area is heavily impacted by seasonal rains with significant rainfall between January and June, followed by a dry season with little rainfall and high evaporation rates from July through December. The surface water management plan largely focuses on an integrated system of sediment control facilities, sumps, channels and pumps and pipelines to control flows and manage discharge principally during the wet season. In general, water is accumulated during the rainy season and used to augment plant fresh water requirements in the dry season, as needed.
The second goal of surface water controls and ensuring that discharges back to the environment meet regulatory effluent requirements from the site was achieved by careful segregation of contact water from non-contact water. The surface water management infrastructure will collect non-contact run-off and seepage for monitoring and sediment control prior to discharge to the Aurizona and São Jose Rivers. Contact water will be collected and routed to the Boa Esperança Reservoir (BER). The BER will store contact water like a reservoir for reuse or release to the environment under controlled conditions, attenuating the flow releases such that regulatory discharge requirements are met.
Key components of the water balance are discussed below.
Vené and Ze Bolacha Tailings Storage Facilities
Tailings will be deposited in the Vené and the Ze Bolacha TSFs. The Vené TSF is currently in care and maintenance and generates an average annual net surplus of approximately 4000 m3/day of rainwater. This excess water is monitored for water quality and pumped to Edmilson Curve and ultimately discharged to the Aurizona River under the existing discharge authorization. The monitoring data during the care and maintenance period was used to develop and calibrate the water balance model, and successfully duplicated the behaviour of the Vené TSF flows and water levels. The discharge to Edmilson Curve will continue during pre-production.
The current mine plane has the BER completed early in operational year 1. Once operations restart, the slurry water from the TSF will be pumped back for reuse in the Plant operations, and a minimum amount of water will be stored in the reservoir to ensure development of a good beach in an effort to maximize tailings density and storage capacity. Once the BER is available, excess water during the rainy season in the Vené TSF will be monitored for water quality requirements and pumped as allowed to the BER. Ze Bolacha TSF will be operated in a similar way.
5070-\16.4\5070-STY-001
July 2017 Lycopodium Minerals Canada Ltd.

FEASIBILITY STUDY ON THE AURIZONA GOLD MINE PROJECT NI 43-101 TECHNICAL REPORT
Page 18.17
A TSF to BER pumping capacity of 43,200 m3/day was designed based on the water balance model. Although extreme storm events or extended wet periods will result in pool volumes above 1 million m3, the water management system in the TSFs are designed to maintain a nominal volume in the TSF between 300,000 m3 and 500,000 m3.
The modelling of the TSF included simulation of the reclamation of the Vené TSF during the operational period and Ze Bolacha after the end of mining. The model assumed all available tailings water would be pumped from the TSF and a reclamation cover placed over the tailings during the dry season following end of deposition. At the start of the next wet season, water ponding on the TSF was assumed to be clean and discharges to the environment from the TSF were allowed to occur.
The water and mass balance modelling, using the water quality predictions developed in Section 20 predict that the excess TSF water can be mixed and discharged to the São Jose River when operated with the BER for attenuation and the diffuser for mixing.
Waste Rock Dumps
The WSFs will produce run-off and seepage flows from rainfall on the dump footprints. Water quality modelling indicates that the majority of the waste rock in the dumps will be considered Non-PAG waste and that run-off and seepage from this material will meet discharge water quality (Section 20.3). The waste management plan (Section 16.9) recommends that only Non-PAG saprolite waste will be placed at the perimeters of the WRD, further ensuring that run-off from the site will meet discharge quality. The water balance routes discharge quality run-off and seepage to sediment basins for discharge to the Aurizona River at Edmilson Curve or into the active TSF if the flows cannot be conveyed to the discharge points.
In some low points, the run-off and seepage cannot be conveyed to the discharge point by gravity, and sumps and pumping are necessary to lift the water to the sediment basins. The water balance model simulates the surge volume in the sediment basins and sumps and the nominal pumping capacity of the pumping system. The model was used to verify the sediment basin sizes and select appropriate pump capacities to prevent uncontrolled discharge from the sediment basins for the design storm event, which is a 565 mm 5-day rain event. This event was chosen as the largest 5-day rainfall total from the 30-year historical climate record. A regression of the 30 years of annual maximum 5-day rainfall totals suggest that this value is analogous to a 100-yr reoccurrence period.
During operations, where PAG waste is anticipated to potentially produce lower water quality, several mitigation measures will be applied to ensure regulatory discharge requirements (Section 20.3). PAG will also only be placed in the northeast, southeast and southwest quadrants of the North Dump, where run-off and seepage can be easily collected, monitored and treated, as required.
5070-\16.4\5070-STY-001
July 2017 Lycopodium Minerals Canada Ltd.
FEASIBILITY STUDY ON THE AURIZONA GOLD MINE PROJECT NI 43-101 TECHNICAL REPORT
Page 18.18
Piaba Pit
The Piaba Pit will collect run-off from the pit walls and groundwater seepage inflow, predicted by 3D Groundwater modelling. In addition, seepage from the North Dump will be routed to the Piaba Pit, as required. Under the current care and maintenance conditions, accumulated water in the Piaba pit is pumped to Edmilson Curve.
Water quality predictions performed for the exposed pit walls (Section 20.3) has indicated that once operations resume and mining exposes PAG waste in the transition zone, water in the pit sumps may not meet regulatory discharge quality, principally as it relates to pH. Once the BER is online, all water collecting in the Piaba pit will be pumped to the pit rim and ultimately to the BER. Operational water quality mitigation plans are presented in Section 20.3. The water balance was used to select the nominal pumping capacity for the Piaba pit sumps, with the goal of minimizing the accumulation in the sumps during the wet season, while maintaining reasonable pump size.
The mine dewatering system has been designed to remove an average of approximately 11,500 m3/day from the pit to the pit rim as estimated from the water balance simulations (Section 18.4.1). The model predicts that dry season flows will average approximately 5,600 m3/hr, while wet season flows will average approximately 13,000 m3/day. The water balance model determined that a peak pumping capacity of 24,000 m3/day was needed to limit the accumulation of water in the pit bottom during the wet season. Typical wet season ponding will be less than 100,000 m3, while spikes in the sump volume from extreme storms will be approximately 500,000 m3.
The pit water balance considers flows from groundwater inflows, as predicted by the 3D groundwater model, and additional inflows from precipitation, pit wall run-off, and seepage flows from the NW WRD.
As discussed in the mine scheduling in Section 16.6, mining in the Piaba pit has been designed to avoid the pit bottoms during the wet season and adequate room has been left in the lower lifts of the pit to accommodate the accumulation of water during periods of high rainfall.
Boa Esperança Reservoir
Once the Boa Esperança Pit is exhausted, the pit will be used as a water storage reservoir. The BER will have a capacity of approximately 600,000 m3 of water and will be used for water supply during dry seasons or drought periods, surge volume to attenuate inflows before discharging to the São Jose River.
The water balance model estimated that approximately 33,000 m3 of water in the pit lake was sufficient to mitigate the water shortfalls expected during an extreme dry period, and maintaining a surge volume of approximately 500,000 m3 in the BER is sufficient to address the surge in volume resulting from extreme events on the mine site.
5070-\16.4\5070-STY-001
July 2017 Lycopodium Minerals Canada Ltd.

FEASIBILITY STUDY ON THE AURIZONA GOLD MINE PROJECT NI 43-101 TECHNICAL REPORT
Page 18.19
The combined excess water from the waste dumps, tailings facility, open pit, as well as groundwater inflows results in an annual average net surplus volume of water to the system on the order of 10,000 to 30,000 m3/day. However, this volume is predominately generated during the wet season between January and June. The water balance model indicates that average flows during the wet season will be approximately 25,000 m3/day while flows during the dry season will be typically 0. A peak operational discharge rate of 50,000 m3/day will be required to discharge water from the BER. This discharge rate is based on TSF reclamation assumptions described for the TSFs above. Modelling indicated that additional discharge would be required if both the inactive Vené TSF and active Ze Bolacha TSFs are pumping excess water to the BER.
During the operational period, the water management system takes advantage of the approximately 500,000 m3 of surge volume available in the BER to attenuate the peak flows reporting to the BER. The model attempts to maintain adequate freeboard in the BER, increasing discharge from the BER to the São Jose River as needed to maintain the water in the BER 2 m below the level of the pit rim. The model predicted no uncontrolled discharges from BER during the simulated life of mine.
Water Quality Load Balance
The water balance model was extended to include a load balance of the dissolved mass within the water management system. Source term chemistry for 42 chemical constituents was developed for water inflows to the system, including run-off and seepage from Non-PAG and PAG waste rock, groundwater inflows, and tailings water.
The model includes source terms for both the median water chemistry (P50) and the 95th percentile of the modelled water chemistry (P95). Simulations were made with both chemistries to establish expected values (P50) as well as extremes (P95). The P95 values are relevant in demonstrating the sensitivity of select parameters to the source chemistry and should be used to guide refinement of the source term inputs, indicate elements that should be included in water monitoring, as well as select mitigation measures that may be required.
The GoldSim Contaminant Transport (CT) module was used to add the mass loading from all the source terms to the model, tracking the accumulation of mass along with water in the model. The load balance then predicts water quality concentrations for all 42 chemical constituents in waters conveyed, stored, or discharged in the model. The GoldSim CT model conserves mass throughout the model and does not address chemical reactions, decay of any constituents or other possible reactions in the chemical mass as a result of environmental conditions. In addition, the concentrations of some environmentally important elements were calculated from empirical values that were below detection limits and might, therefore, be higher than expected. From these standpoints, concentrations reported by the Load Balance will be conservative.
The Load Balance was used to predict water quality in the Piaba Pit and BER for determination of discharge water quality from these facilities. The predicted water quality in the BER was used to select the required dilution ratios needed for the diffuser to be located in the São Jose River for BER discharges.
5070-\16.4\5070-STY-001
July 2017 Lycopodium Minerals Canada Ltd.

FEASIBILITY STUDY ON THE AURIZONA GOLD MINE PROJECT NI 43-101 TECHNICAL REPORT
Page 18.20
The load balance modelling predicted most constituents in the BER during discharge to the São Jose River will meet regulatory discharge requirements. However, as discussed in Section 20.3, mitigation measures will be required from some constituents predicted above regulatory discharge requirements in the BER.
18.5 Plant Geotechnical Conditions
Geotechnical characterization of the plant facility was accomplished by advancing a series of eleven geotechnical borings which ranged in depth up to about 25m. The standard penetration testing (SPT) were performed in each boring and water levels were measured.
The foundation area of the industrial plant is, according to the results obtained in the drill logs, natural ground and some backfills with a thicknesses varying from 0.20m to 7.85m and SPT values ranging from 11 to 12 blows, which are classified as hard.
Below this landfill layer is a thick layer of saprolite characterized in two units based on density/consistency: an upper unit and the lower unit. The upper saprolite unit exists below the ground surface to a depth generally between 15m and 20m and exhibits a medium dense or stiff to very stiff consistency (SPT values ranging from 8 to 22 blows). The lower unit underlies the upper saprolite and exhibits a dense or hard consistency. Groundwater was reported in the boring logs to be greater than 10m below the ground surface.
The subsurface conditions are favourable for shallow foundation support of planned equipment and building structures. Design bearing pressures ranging from 150 kPa to 250 kPa with an associated maximum settlement of 25 mm are anticipated.
Slopes were designed with the configuration listed below. The recommended slope configurations are typical for the project area.
Fill Slopes: 2.0H:1.0V configuration.
Cut Slopes: 1.5H:1.0V configuration.
18.6 Surface Water Management
18.6.1 Conceptual Surface Water Flow Model
The surface water management plan (SWMP) is designed as an integrated approach to ensure sufficient water for Plant operations, while safely conveying flows to discharge points. Where the channels are internal to the facilities, they have been designed for the 100-yr recurrence period. WSF Perimeter channels which will remain after the end of active mining have been designed for the 500-yr re-occurrence period.
Internal channels on the surface of the facility will lead to perimeter channels which will convey the flows by gravity to a sediment basin. If the flow cannot reach the discharge point by gravity, sediment basins will be emptied by on-demand pumping that will lift the water to a perimeter channel that flows by gravity to the discharge point.
5070-\16.4\5070-STY-001
July 2017 Lycopodium Minerals Canada Ltd.
FEASIBILITY STUDY ON THE AURIZONA GOLD MINE PROJECT NI 43-101 TECHNICAL REPORT
Page 18.21
Seeps may form below the perimeter channels in low areas or pre-development drainages. Where seeps are expected to form, or develop during operations, sumps with on-demand pumps will lift the collected seepage water to the nearest perimeter channel for conveyance to another sump or sediment basin.
Sediment basins will be monitored for water quality and release non-contact water to the Aurizona River at Edmilson Curve. Other surface water flows will be routed through other facilities to the BER, where it will be monitored and discharged to the São Jose River.
18.6.2 Surface Water Management
Surface water management for the project has been developed on a facility by facility basis, with the flow from each facility routed to a discharge point, either by gravity flow or through on-demand pumping. Surface water controls are shown Figure 18.2.
North & West Waste Storage Facility
Surface water run-off from the North and West WRD will be collected at the perimeter channels and routed to Sump 3B or Sediment Basins SED1, SED2, SED3, and SED4. Only minor run-on to the facility is anticipated from the area southwest of the North WRD and naturally flows to SED4. Surface water from the North WRD surface directly above Sump 3B will be diverted West, around Sump 3B to SED4, to the extent practicable so that Sump 3B will primarily collect seepage from PAG and non-PAG waste placed on the southern portion of the North WRD. Water collecting in Sump 3B will be discharged in a controlled manner to the Piaba pit. Water from the SED3 will be lifted by pump into a perimeter channel that flows by gravity to SED2. Water from SED4 will be lifted by pump to a perimeter channel that flows by gravity to SED1. Water from SED1 will overflow from a spillway into a perimeter channel that flows by gravity to SED2. All water reports to SED2 before it is released in a controlled manner at Edmilson Curve to the Aurizona River.
South Waste Storage Facility
Surface water run-off from the South WRD will be collected in perimeter channels and routed to Sumps 1 and 2. A limited amount of run-on is expected from the undisturbed watersheds between the Vené TSF and Piaba bit and adjacent to the South WRD. Both sumps will pump collected water to the active TSF.
East Waste Storage Facility
Surface water run-off from the East WSF will be collected in perimeter channels and routed to the BER once it is established. Before the BER is established, run-off from the East WSF will be directed to the Vené TSF for discharge to Edmilson Curve. No significant run-off is anticipated at the East WSF.
5070-\16.4\5070-STY-001
July 2017 Lycopodium Minerals Canada Ltd.
FEASIBILITY STUDY ON THE AURIZONA GOLD MINE PROJECT NI 43-101 TECHNICAL REPORT
Page 18.22
Process Area and Ore Stockpiles
Surface water run-off from the process plant and Ore Stockpiles will be collected in the plant facility channels as discussed in Section 18.4 and routed to the BER once it is established. Before the BER is established, run-off from the Process Area and Ore Stockpiles will be allowed to flow by Gravity into the Vené TSF. Non-contact run-off from areas of the process plant that are not potentially impacted by process solutions will be allowed to discharge to the São Jose River. No significant run-on is anticipated to the plant area or Ore Stockpiles.
Piaba Pit
Run-off from the Piaba pit walls will be collected in the in-pit sumps, as will discharge from Sump 3B collecting PAG seepage from the Northwest WSF. Potential run-on into the pit will be diverted to Sump 2 adjacent to the South WRD by a diversion channel running between the Piaba Pit and the Vené TSF. Water accumulating in the Piaba Pit sumps and lower lifts will be pumped to the BER once it is available. Water will be pumped to Edmilson curve using the existing pipeline infrastructure before the BER is able to receive flows.
Vené and Ze Bolacha Tailings Storage Facilities
Surface water controls for the Vené and Ze Bolacha TSFs are described in Section 18.7. Outboard surfaces of the TSFs will be reclaimed immediately following construction and run-off from the facilities will be flow to existing drainages. A small amount of run-on to the Vené TSF is anticipated from the watershed between the Vené TSF and the Process Plant.
Boa Esperança Reservoir
BER is located in the inactive Boa Esperança Pit, which is expected to be completed in Year 1. The BER will be allowed to accumulate water and will function as an attenuation and surge storage component for discharge of water from the site as well as a back-up water supply for process plant make-up water.
Water balance modelling of the BER as described in Section 18.4 was performed to select discharge rates necessary to prevent uncontrolled releases from the BER. Discharge from the BER to the diffuser in the São Jose River will be necessary on a regular basis to maintain target water levels in the BER.
São Jose Pipeline
The 4.1 km long São José Pipeline will be required to convey water discharged from the BER to the São José River at the diffuser. This route will be a multi-purpose right-of-way capable of sustaining a maintenance road, a pipeline, and a diffuser discharge point on the river.
The pipeline alignment was selected to minimize impacts on the mangrove while also providing the shortest route to the main channel, which is a very large, tidally impacted river. At the São José River discharge point, the river is approximately 860m wide and was assumed to be approximately 6m deep. The design flow rate is 50,000 m3/day, and the system is designed to operate 24 hours/day with three pumps, where two are operational and 1 is in reserve. The pipeline is 24-in diameter HDPE pipe.
5070-\16.4\5070-STY-001
July 2017 Lycopodium Minerals Canada Ltd.

FEASIBILITY STUDY ON THE AURIZONA GOLD MINE PROJECT NI 43-101 TECHNICAL REPORT
Page 18.23
The mixing zone was simulated using the CORMIX mixing zone model (GTH Software, 2007), while streamflow in the São Jose River was simulated using the HEC-RAS-2D 2-dimensional hydraulic model. Mixing models were developed for both a single pipe surface discharge and a submerged multi-port diffuser under low flow conditions (7Q10) and tidal influences with the maximum predicted discharges from the BER of 50,000 m3/day. The scenarios were also evaluated at two locations in the São Jose River, one in the branch near the mine site and a second in the main river channel.
The dilution obtained for the discharges suggest higher dilution rates for the Main location with a dilution of 56 times compared to a dilution of 19 times for the branch location at an effluent discharge of 50,000 m³/d. For the maximum mixing zone, a distance of 1600 m is expected for the Main location and 500 m for the Branch.
As discussed in Sections 18.4 and 20.3, the water quality in the BER discharge to the São Jose River will require a diffuser structure in the main channel to achieve adequate dilution of the water in the BER to meet regulatory discharge requirements in the São Jose River.
18.6.3 Pit Dewatering
Under the current care and maintenance conditions, Piaba Pit water is discharged to Edmilson curve. Once the BER is available, Piaba Pit water is pumped to the active TSF, where excess water will be pumped to the BER.
Required discharges from the Piaba Pit was determined using the water balance, and predicted an average monthly flow during the wet season of approximately 13,000 m3/day, and an average monthly flow during the dry season of approximately 5,600 m3/day. A peak pumping capacity of 24,000 m3/day was adequate to limit the accumulation of water in the pit during prolonged storm events.
The Piaba Pit dewatering system has been designed to minimize the accumulation of water in the pit bottom but it is recognized that storm events are command and water may accumulate in the in-pit sumps and lower levels of the pit. The schedule of mining activities in the pit described in Section 16.10 is intended to limit activities in the pit bottom during the wet season.
The Boa Esperança Pit is not anticipated to intercept the groundwater table and pit dewatering is only expected for stormwater water run-off from the pit walls. During the brief period of mining activity, stormwater collecting from pit walls will be monitored and discharged to Edmilson curve. A pumping capacity of 4400 m3/hr was adequate to limit the accumulation of water in the pit bottom.
Pit pump sizing is presented in Section 18.6.4 below.
18.6.4 Pump Sizing and Water Exchange
Several pumping systems are necessary to control discharges from the site. Pumping systems can be divided into two categories; surface water management and mine water management.
5070-\16.4\5070-STY-001
July 2017 Lycopodium Minerals Canada Ltd.
FEASIBILITY STUDY ON THE AURIZONA GOLD MINE PROJECT NI 43-101 TECHNICAL REPORT
Page 18.24
Surface Water Management Pumping
Surface water management pumps are designed to route water collected in low areas to discharge points in the mine. The pumps service relatively small storage sumps or sediment basin and need to be sized to address extreme storm events to prevent uncontrolled releases. Water quality is characterized as described in Section 20.3, and the discharge to the Aurizona and São Jose Rivers will be monitored and shall be in compliance with regulatory water quality discharge guidelines.
An evaluation of storm systems for the site determined that multi-day storm events were the most critical periods for water management, not single high intensity storms. An examination of precipitation records identified the highest multi-day storm event as a 5-day rainfall of 564.5 mm. A Gumbel regression suggests that this event has a return period of at least 100 yrs.
Pumps and sump systems for the sumps and sediment basins were sized to collect and convey runoff and seepage from this event. Pumps from the sumps and sediment basins will be dedicated pumping systems leading to fusion welded HDPE pipelines.
In addition to surface water flows, a number of seeps are expected in low areas around the NW WSF that will not be collected by the perimeter channels. Although the exact location and magnitude of these seeps is unknown, small, portable pumps can be installed during operations, as required, in these areas to collect seepage and convey it to a nearby perimeter channel through small diameter HDPE pipelines.
The estimated pumps required for surface water management are shown in Table 18.2.
5070-\16.4\5070-STY-001
July 2017 Lycopodium Minerals Canada Ltd.

FEASIBILITY STUDY ON THE AURIZONA GOLD MINE PROJECT NI 43-101 TECHNICAL REPORT
Page 18.25
Table 18.2 Sediment Basin and Sump Pump Parameters
Sediment Basin/Sump Pumping Rate Pump Capacity Pumps Required Pipeline Size
SED1 Gravity flow
SED2 Gravity flow
SED3 180 m3/hr 180 m3/hr 1 152.4 mm
SED4 720 m3/hr 180 m3/hr 4 304.8 mm
Sump 1 990 m3/hr 180 m3/hr 6 355.6 mm
Sump 2 1080 m3/hr 180 m3/hr 6 355.6 mm
Sump 3B Gravity flow
Additionally, SRK estimated that up to 7 seepage collection pumps would be required at various locations around the NW WSF to lift seepage flows from low points at the perimeter to the perimeter channel. SRK estimated that pumps with a capacity of 380 to 760 L/min (23 to 45 m3/hr) would be required at each seep with 50 to 75 mm HDEP pipelines to the nearest perimeter channel.
Due to the remote location of the sediment basins and sumps, diesel pumps were selected for the Sediment basins, sumps and seepage collection pumps.
The design flow rate for the floating pumping system in the BER is 50,000 m3/day and is designed to operate 24 hours/day with three pumps, where two are operational and one is in reserve.
The pumping system within Boa Esperança reservoir has been designed to operate with 2 or 3 active pumps in a barge with cover to protect equipment from weathering. Barges will be anchored in the pit rim by steel cables allowing the barge to move vertically as the water level changes. The conveyance and discharge pipeline will be constructed using 24” HDPE from the reservoir to the discharge point approximately 4,175m from the BER. Diffuser will be single port and submerged during high tides. Diffuser will be anchored to the ground to avoid movement of pipeline due to tidal variation.
Mine Water Management Pumping
Mine water will collect within the TSFs and Pits of the project and be treated as contact water. Due to the wet climate of the site, excess water will accumulate and pumping will be required to maintain control of the water volumes in these facilities.
Water accumulating in the TSFs will be pumped to the BER once it becomes available. Prior to the completion of the BER, water in the TSFs will be managed internally and through the existing discharge to Edmilson Curve. The site-wide water balance was used to size the pumping system such that excess water would not accumulate in the TSFs and maintain adequate free board within the TSF. Excess water in the TSFs will be drawn from the reclaim water pipelines and diverted to the BER.
5070-\16.4\5070-STY-001
July 2017 Lycopodium Minerals Canada Ltd.
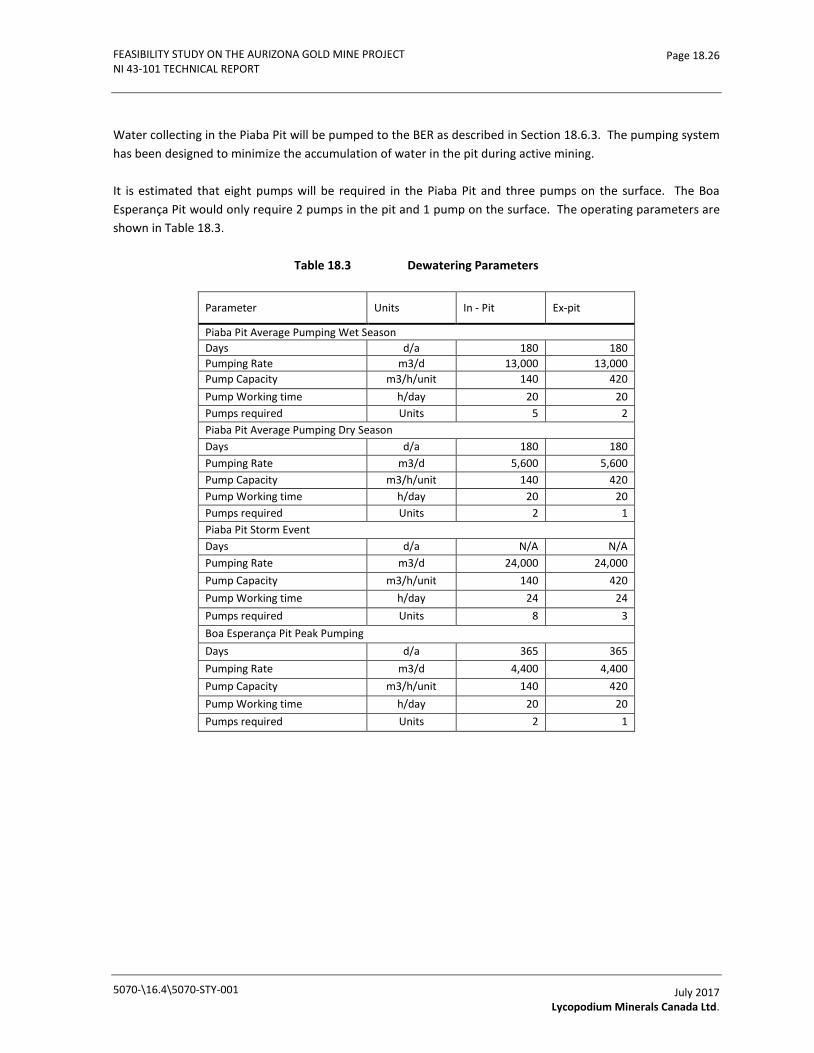
FEASIBILITY STUDY ON THE AURIZONA GOLD MINE PROJECT NI 43-101 TECHNICAL REPORT
Page 18.26
Water collecting in the Piaba Pit will be pumped to the BER as described in Section 18.6.3. The pumping system has been designed to minimize the accumulation of water in the pit during active mining.
It is estimated that eight pumps will be required in the Piaba Pit and three pumps on the surface. The Boa Esperança Pit would only require 2 pumps in the pit and 1 pump on the surface. The operating parameters are shown in Table 18.3.
Table 18.3 Dewatering Parameters
Parameter Units In - Pit Ex-pit
Piaba Pit Average Pumping Wet Season Days d/a 180 180 Pumping Rate m3/d 13,000 13,000 Pump Capacity m3/h/unit 140 420 Pump Working time h/day 20 20 Pumps required Units 5 2 Piaba Pit Average Pumping Dry Season Days d/a 180 180 Pumping Rate m3/d 5,600 5,600 Pump Capacity m3/h/unit 140 420 Pump Working time h/day 20 20 Pumps required Units 2 1 Piaba Pit Storm Event Days d/a N/A N/A Pumping Rate m3/d 24,000 24,000 Pump Capacity m3/h/unit 140 420 Pump Working time h/day 24 24 Pumps required Units 8 3 Boa Esperança Pit Peak Pumping Days d/a 365 365 Pumping Rate m3/d 4,400 4,400 Pump Capacity m3/h/unit 140 420 Pump Working time h/day 20 20 Pumps required Units 2 1
5070-\16.4\5070-STY-001
July 2017 Lycopodium Minerals Canada Ltd.

FEASIBILITY STUDY ON THE AURIZONA GOLD MINE PROJECT NI 43-101 TECHNICAL REPORT
Page 18.27
Pump Requirements
The following table shows the number of pumps (Imbil BP150-580 A) required per year to meet the dewatering requirements over the mine life:
Table 18.4 Pump Requirements for Average Operating Conditions
Area Year -1 Year 1 Year 2 Year 3 Year 4 Year 5 Year 6 Year 7 In-pit 3 4 5 5 5 5 5 5 Ex-pit 1 2 2 2 2 2 2 2
18.6.5 Sediment Management
The objective of the sediment basins is to collect run-off and seepage downstream of the WRDs and disturbed project areas and to provide primary suspended sediment collection, before final discharge into the surrounding tidal mangroves.
There are a series of sediment basins, sumps and the BER, which serve as the collection and monitoring points prior to discharge back to the environment. Sediment Basin SED2 is designed as a leaky dam structure and will function as the final discharge point to the Aurizona River at Edmilson Curve, while the BER will function as the final discharge point to the São Jose River through the São Jose diffuser.
18.7 Tailings Storage Facility
The TSF is being designed for the LOM based on a total of 19.8 Mt of processed ore, and there is potential for future expansions. After neutralization for cyanide, traditional tailings slurry (approximately 40% solids) will be pumped via pipeline to the TSF and spigoted from the dam crest to maintain the water pool towards the rear of the reservoir area and away from the main dam embankments.
The existing Vené facility was initially constructed in 2009 and is designed to a maximum elevation of 40.5 masl. The future Ze Bolacha facility is designed to a maximum elevation of 35 masl, although the simulations indicate a maximum elevation of 33.25 masl is sufficient. Combined, the two facilities will provide a total of approximately 18.0 Mm3 of tailings storage (struck elevation). Decanted slurry water will be pumped back to the plant for reuse in the process water requirements or to the Boa Esperança Reservoir for settlement and discharge.
In general, the region is extremely low relief, although there are a few small residual hills. The TSF is surrounded by mangroves on two sides. The main dam embankments are situated in alluvial lowlands and are U-shaped impoundments due to the low relief. Surface run-off is limited to the impoundment itself due to the lack of up gradient catchment and water diversions.
5070-\16.4\5070-STY-001
July 2017 Lycopodium Minerals Canada Ltd.
FEASIBILITY STUDY ON THE AURIZONA GOLD MINE PROJECT NI 43-101 TECHNICAL REPORT
Page 18.28
BVP performed a feasibility level geotechnical review of the GeoHydroTech Engenharia design of the Vené TSF raise and the Ze Bolacha TSF from the pre-feasibility study (PFS). Additional field work including CPTU and SPT drilling was performed along with additional soils and foundation testing based on the PFS recommendations. These results were incorporated into the feasibility design of the facilities. In addition, BVP’s scope of work included the detailed design package for construction for the next raise of the Vené TSF to elevation 31.6m.
BVP’s designs for the Vené and Ze Bolacha facilities have been reviewed and approved by Walm Engenharia e Technologia Ambiental, the QP for this area.
Subsequent to completing the Vené facility design, work has been undertaken that demonstrates that additional lifts to the Vené to accommodate the entire LOM tailings are feasible at a substantially lower cost than building the Ze Bolacha facility. Work is ongoing to complete this design and cost estimate.
18.7.1 Vené TSF
The Vené TSF was initially designed by Golder and constructed in 2009. It is an unlined, compacted earth fill structure with a sand chimney and blanket drain. The dam has gone through a series of raises and is currently at elevation 29.5m. As mentioned above, this dam will be raised via centreline construction to a height of 40.5 masl.
There is a temporary, trapezoidal open channel emergency spillway in the north abutment near station -31 +50 that spills to the Piaba pit and is designed for the 10,000 year return period event. Current instrumentation includes Casagrande type and vibrating wire piezometers, survey monuments and flowmonitoring stations. A series of monitoring wells are also situated around the dam and throughout the site to monitor water quality.
5070-\16.4\5070-STY-001
July 2017 Lycopodium Minerals Canada Ltd.
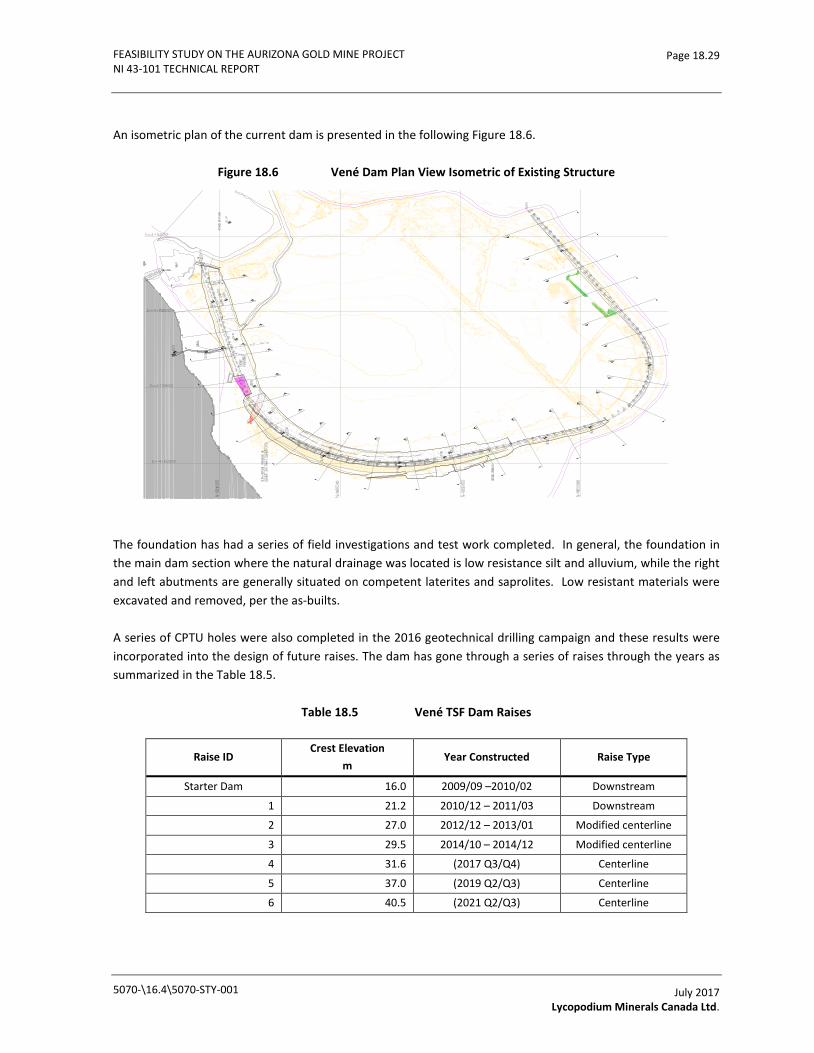
FEASIBILITY STUDY ON THE AURIZONA GOLD MINE PROJECT NI 43-101 TECHNICAL REPORT
Page 18.29
An isometric plan of the current dam is presented in the following Figure 18.6.
Figure 18.6 Vené Dam Plan View Isometric of Existing Structure
The foundation has had a series of field investigations and test work completed. In general, the foundation in the main dam section where the natural drainage was located is low resistance silt and alluvium, while the right and left abutments are generally situated on competent laterites and saprolites. Low resistant materials were excavated and removed, per the as-builts.
A series of CPTU holes were also completed in the 2016 geotechnical drilling campaign and these results were incorporated into the design of future raises. The dam has gone through a series of raises through the years as summarized in the Table 18.5.
Table 18.5 Vené TSF Dam Raises
Raise ID Crest Elevation
m Year Constructed Raise Type
Starter Dam 16.0 2009/09 –2010/02 Downstream
1 21.2 2010/12 – 2011/03 Downstream
2 27.0 2012/12 – 2013/01 Modified centerline
3 29.5 2014/10 – 2014/12 Modified centerline
4 31.6 (2017 Q3/Q4) Centerline
5 37.0 (2019 Q2/Q3) Centerline
6 40.5 (2021 Q2/Q3) Centerline
5070-\16.4\5070-STY-001
July 2017 Lycopodium Minerals Canada Ltd.

FEASIBILITY STUDY ON THE AURIZONA GOLD MINE PROJECT NI 43-101 TECHNICAL REPORT
Page 18.30
A plan view and typical section for the proposed dam raises to elevation 40.5m is presented in Figures 18.7 and 18.8.
Figure 18.7 Vené Dam Plan View at Crest El. 40.5m
An open channel emergency spillway for the proposed structure is situated in the south abutment and discharges into a drainage in the nearby mangrove. The emergency spillway is sized for the 10,000 year event. The spillway is composed of a rectangular, reinforced concrete section in the dam abutment and transitions to a trapezoidal open channel and finally a stilling basin prior to discharging to the natural drainage channel.
5070-\16.4\5070-STY-001
July 2017 Lycopodium Minerals Canada Ltd.
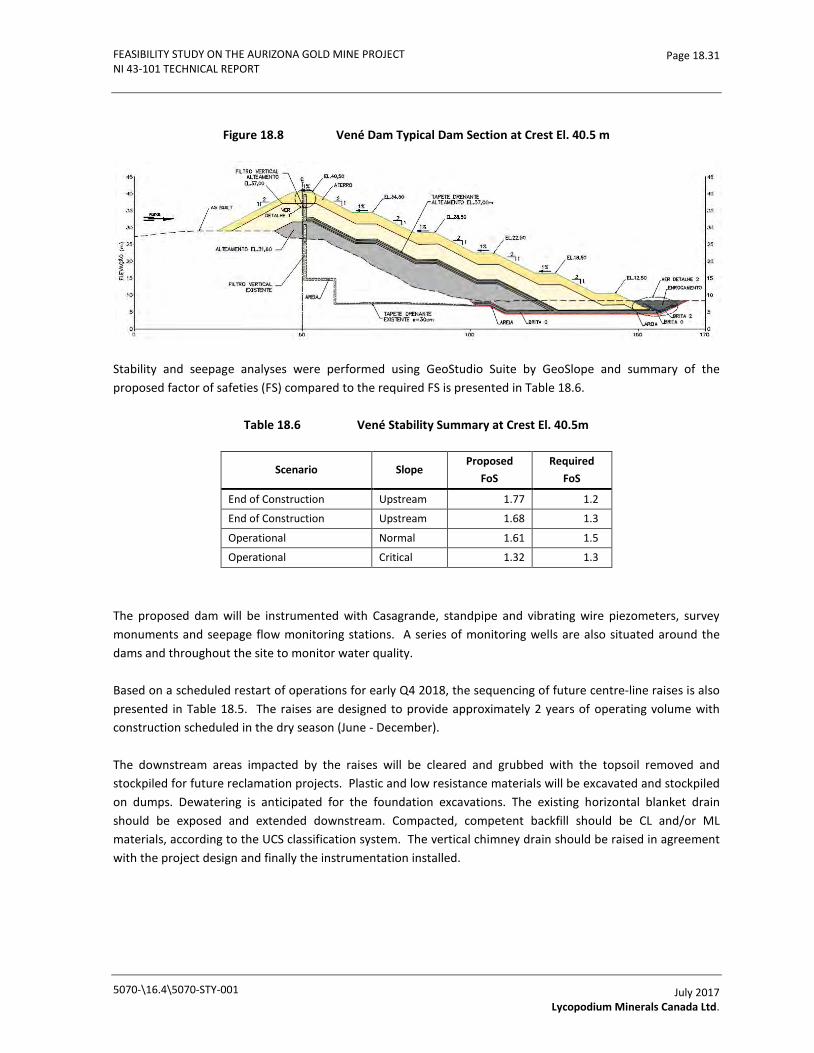
FEASIBILITY STUDY ON THE AURIZONA GOLD MINE PROJECT NI 43-101 TECHNICAL REPORT
Page 18.31
Figure 18.8 Vené Dam Typical Dam Section at Crest El. 40.5 m
Stability and seepage analyses were performed using GeoStudio Suite by GeoSlope and summary of the proposed factor of safeties (FS) compared to the required FS is presented in Table 18.6.
Table 18.6 Vené Stability Summary at Crest El. 40.5m
Scenario Slope Proposed
FoS Required
FoS
End of Construction Upstream 1.77 1.2
End of Construction Upstream 1.68 1.3
Operational Normal 1.61 1.5
Operational Critical 1.32 1.3
The proposed dam will be instrumented with Casagrande, standpipe and vibrating wire piezometers, survey monuments and seepage flow monitoring stations. A series of monitoring wells are also situated around the dams and throughout the site to monitor water quality.
Based on a scheduled restart of operations for early Q4 2018, the sequencing of future centre-line raises is also presented in Table 18.5. The raises are designed to provide approximately 2 years of operating volume with construction scheduled in the dry season (June - December).
The downstream areas impacted by the raises will be cleared and grubbed with the topsoil removed and stockpiled for future reclamation projects. Plastic and low resistance materials will be excavated and stockpiled on dumps. Dewatering is anticipated for the foundation excavations. The existing horizontal blanket drain should be exposed and extended downstream. Compacted, competent backfill should be CL and/or ML materials, according to the UCS classification system. The vertical chimney drain should be raised in agreement with the project design and finally the instrumentation installed.
5070-\16.4\5070-STY-001
July 2017 Lycopodium Minerals Canada Ltd.

FEASIBILITY STUDY ON THE AURIZONA GOLD MINE PROJECT NI 43-101 TECHNICAL REPORT
Page 18.32
The tailings are potentially acid generating (PAG), and as a result the facility is designed to maintain the tailings saturated along with the placement of an engineered evapotranspiration cover upon closure to prevent oxygen diffusion and pyrite oxidation. Therefore, near the end of life of the facility, the tailings deposition should be configured so that the final beach attains the desired general grading for closure and then the surface will be drained and covered with a layer of inert waste rock and topsoil. The surface should be revegetated and drainage channels should direct flows to the closure spillway.
18.7.2 Ze Bolacha TSF
In Q2 2022, Vené TSF will be nearing the end of its operational life and the Ze Bolacha TSF needs to be operational. In order to be constructed in the dry season, the dam has to be started in Q3/Q4 2021. The Ze Bolacha TSF will be constructed to the southwest of the Vené TSF. It is also designed as a compacted earth fill structure with a sand chimney and blanket drain. A starter dam with a crest elevation of 33.25m will be constructed initially with future centre line raises possible. A plan view and typical sections are presented in Figures 18.9 and 18.10.
5070-\16.4\5070-STY-001
July 2017 Lycopodium Minerals Canada Ltd.
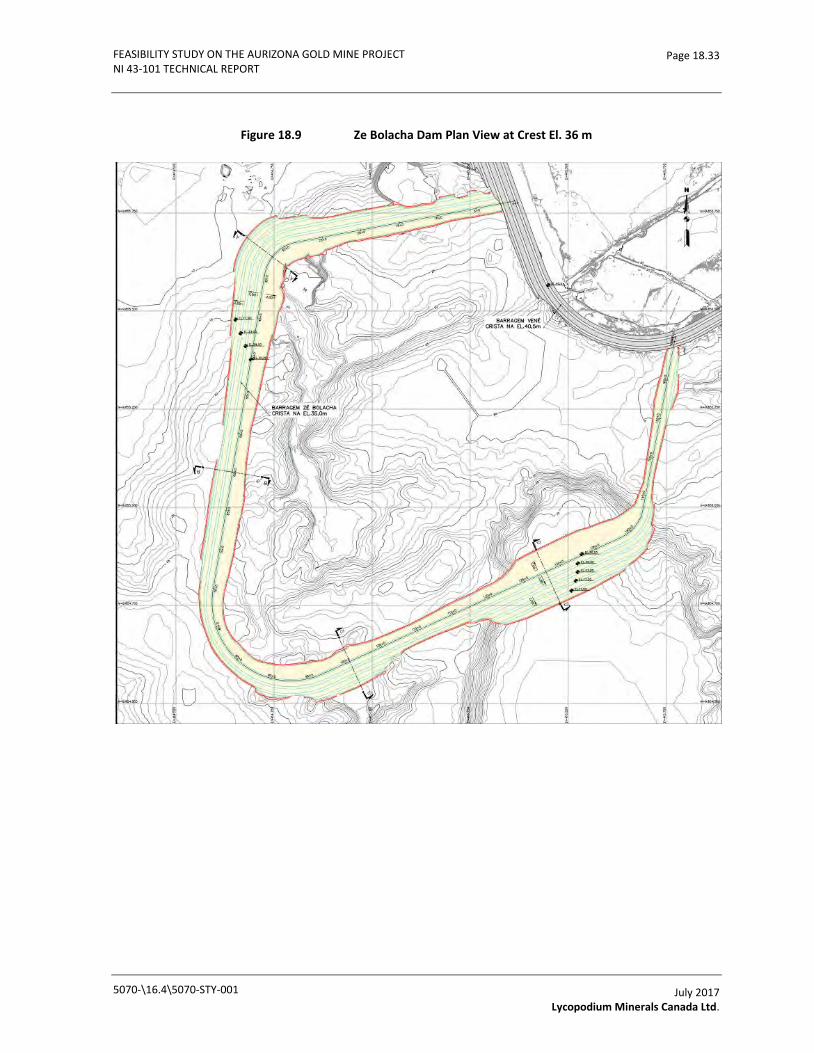
FEASIBILITY STUDY ON THE AURIZONA GOLD MINE PROJECT NI 43-101 TECHNICAL REPORT
Page 18.33
Figure 18.9 Ze Bolacha Dam Plan View at Crest El. 36 m
5070-\16.4\5070-STY-001
July 2017 Lycopodium Minerals Canada Ltd.
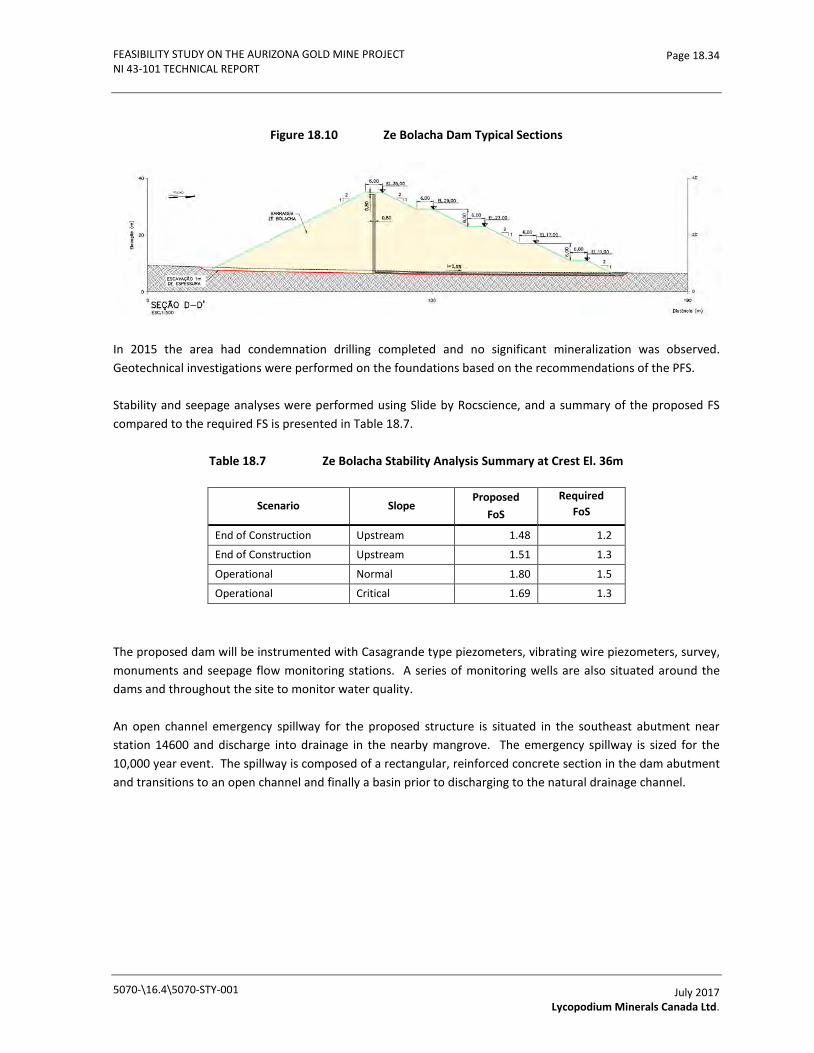
FEASIBILITY STUDY ON THE AURIZONA GOLD MINE PROJECT NI 43-101 TECHNICAL REPORT
Page 18.34
Figure 18.10 Ze Bolacha Dam Typical Sections
In 2015 the area had condemnation drilling completed and no significant mineralization was observed. Geotechnical investigations were performed on the foundations based on the recommendations of the PFS.
Stability and seepage analyses were performed using Slide by Rocscience, and a summary of the proposed FS compared to the required FS is presented in Table 18.7.
Table 18.7 Ze Bolacha Stability Analysis Summary at Crest El. 36m
Scenario Slope Proposed
FoS Required
FoS
End of Construction Upstream 1.48 1.2
End of Construction Upstream 1.51 1.3
Operational Normal 1.80 1.5
Operational Critical 1.69 1.3
The proposed dam will be instrumented with Casagrande type piezometers, vibrating wire piezometers, survey, monuments and seepage flow monitoring stations. A series of monitoring wells are also situated around the dams and throughout the site to monitor water quality.
An open channel emergency spillway for the proposed structure is situated in the southeast abutment near station 14600 and discharge into drainage in the nearby mangrove. The emergency spillway is sized for the 10,000 year event. The spillway is composed of a rectangular, reinforced concrete section in the dam abutment and transitions to an open channel and finally a basin prior to discharging to the natural drainage channel.
5070-\16.4\5070-STY-001
July 2017 Lycopodium Minerals Canada Ltd.
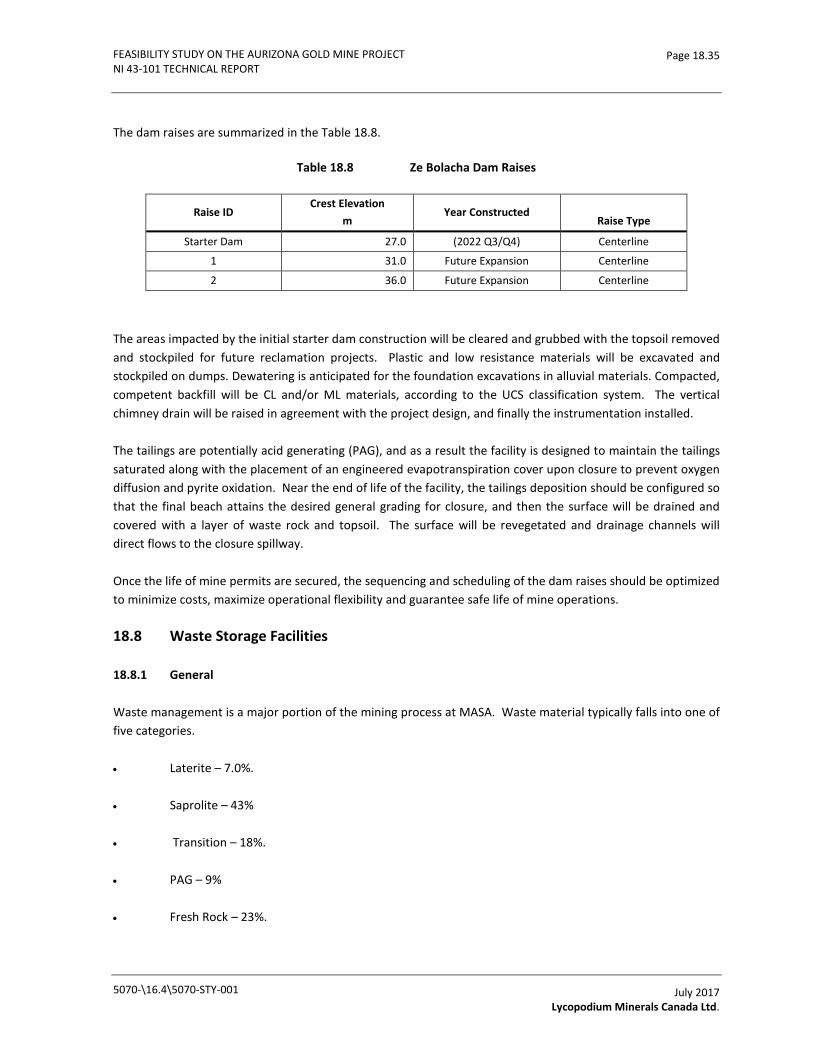
FEASIBILITY STUDY ON THE AURIZONA GOLD MINE PROJECT NI 43-101 TECHNICAL REPORT
Page 18.35
The dam raises are summarized in the Table 18.8.
Table 18.8 Ze Bolacha Dam Raises
Raise ID Crest Elevation
m Year Constructed
Raise Type
Starter Dam 27.0 (2022 Q3/Q4) Centerline
1 31.0 Future Expansion Centerline
2 36.0 Future Expansion Centerline
The areas impacted by the initial starter dam construction will be cleared and grubbed with the topsoil removed and stockpiled for future reclamation projects. Plastic and low resistance materials will be excavated and stockpiled on dumps. Dewatering is anticipated for the foundation excavations in alluvial materials. Compacted, competent backfill will be CL and/or ML materials, according to the UCS classification system. The vertical chimney drain will be raised in agreement with the project design, and finally the instrumentation installed.
The tailings are potentially acid generating (PAG), and as a result the facility is designed to maintain the tailings saturated along with the placement of an engineered evapotranspiration cover upon closure to prevent oxygen diffusion and pyrite oxidation. Near the end of life of the facility, the tailings deposition should be configured so that the final beach attains the desired general grading for closure, and then the surface will be drained and covered with a layer of waste rock and topsoil. The surface will be revegetated and drainage channels will direct flows to the closure spillway.
Once the life of mine permits are secured, the sequencing and scheduling of the dam raises should be optimized to minimize costs, maximize operational flexibility and guarantee safe life of mine operations.
18.8 Waste Storage Facilities
18.8.1 General
Waste management is a major portion of the mining process at MASA. Waste material typically falls into one of five categories.
• Laterite – 7.0%.
• Saprolite – 43%
• Transition – 18%.
• PAG – 9%
• Fresh Rock – 23%.
5070-\16.4\5070-STY-001
July 2017 Lycopodium Minerals Canada Ltd.
FEASIBILITY STUDY ON THE AURIZONA GOLD MINE PROJECT NI 43-101 TECHNICAL REPORT
Page 18.36
A total of 113.2 Mt of waste material will be stored in the WSF.
18.8.2 Waste Storage Facilities
There are four different WSF required over the life of the mine to accommodate the 113.2 Mt (60.3 Mm3) of waste material. These are called:
• North WSF - capacity of 34.8 Mm3.
• West WSF - capacity of 16.8 Mm3.
• South WSF - capacity of 4.0 Mm3.
• East WSF - capacity of 7.2 Mm3.
Currently the total estimated waste volume is 60.3 Mm3 and the design capacity is 61.8 Mm3.
The North and West WSF are located to the north and west of the Piaba pit. They are designed to store the bulk of the material from the mine plan, it will occupy an area of approximately 151 ha and accumulating a total of 51.6 Mm³ of material.
The North WSF will have a top level of 112 masl or is 102m in height. The West WSF top level is 100 masl for an overall height of 90m.
The base foundation will have ditching with some rock placement to facilitate drainage. The WSF will also be surrounded by a ditch system directing run-off to sedimentation ponds prior to discharge to the environment.
The South WSF is adjacent to the TSF and is located near the south-west end of the Piaba pit. It was designed to store the laterite and saprolite material from the mine plan and will cover an area of 21.5 ha. With a maximum elevation 58 masl and maximum height of 48m, it will a accumulate 4.0 Mm³
To strengthen the south WSF, which is mostly on an inundated streambed, a layer of wasterock fill will be pushed out and compacted in order to enable the traffic of the operation equipment. The WSF will also be surrounded by a ditch system directing run-off to sedimentation ponds prior to discharge to the environment.
The East WSF is located near the Boa Esperança pit. With the crest in elevation 106 masl, maximum height of 66m, will cover an area of approximately 22 ha. and accumulate 7.2 Mm³. The WSF will also be surrounded by a ditch system directing run-off to sedimentation ponds prior to discharge to the environment.
The WSFs will be operated to mitigate the impacts of PAG waste rock (see Section 20). The WSF will be progressively reclaimed, and a final cover cap placed at closure.
5070-\16.4\5070-STY-001
July 2017 Lycopodium Minerals Canada Ltd.

FEASIBILITY STUDY ON THE AURIZONA GOLD MINE PROJECT NI 43-101 TECHNICAL REPORT
Page 18.37
18.8.3 Stability Analysis
Stability analyses were performed to ensure the design of geotechnically stable WSF.
Seismic Hazard
Brazil occupies one of the lowest-seismicity regions in South America. Until 2006, it was virtually the only South American country without a national seismic standard for building construction (Santos & Lima, 2008).
For the present level of study, pseudostatic analyses were performed using input ground motions of 0.05 g, which corresponds to the 475 year return period for horizontal peak ground acceleration (PGA) in Northeast Brazil based on the region’s recently developed seismic hazard map.
Geotechnical Properties
Geotechnical properties of the major geologic strata (laterite/saprolite, transition, fresh rock) were assigned based on the updated strength profiles for the Piaba pit. Geotechnical strength parameters were developed based on combinations of:
• Reasonable published values for various geologic materials.
• Limited triaxial testing performed on saprolitic and lateritic soil samples collected from the exposed Piaba pit walls in a 2013 and 2015 field investigation.
• Transition zone and fresh rock: point load tests and/or unconfined compressive strength (UCS) tests performed by Luna personnel on rock cores during metallurgical coring.
Waste Strength Parameters
The waste materials were conservatively divided into two groups: “weathering grade V saprolite soil” to represent laterite/saprolite and “poorly graded rock fill” to represent transition/fresh rock.
The waste strength parameters were estimated based on the experience of the teams that carried out studies in this waste dump, since no laboratory tests were carried out at this stage of the project.
The parameters adopted for the waste material are shown in Table 18.9.
Table 18.9 Parameters Adopted for the Waste Material
Material
γnat
(kN/m³)
c’
(kN/m²)
φ’
(°)
Laterite/saprolite 18 5 28
Transition/Fresh rock 20 0 40
5070-\16.4\5070-STY-001
July 2017 Lycopodium Minerals Canada Ltd.

FEASIBILITY STUDY ON THE AURIZONA GOLD MINE PROJECT NI 43-101 TECHNICAL REPORT
Page 18.38
Foundation Strength Parameters
Generally, the WSF foundations are broken into the three weathering horizons: laterite/saprolite, hard saprolite and transition/fresh rock. The South WSF foundation is weaker material because of alluvial materials with thickness up to 10m deep.
It was assumed that foundation slip-surface would not develop below the transition zone. This allowed for simplification of the analysis models by defining materials 50m below ground surface as bedrock; and thus, impenetrable, which does not require strength definition for modelling.
The modelled foundation material strengths are shown in Table 18.10.
Table 18.10 Modelled Foundation Material Strengths
Material
γnat (kN/m³) c’
(kN/m²)
φ’
(°)
Laterite 17 20 30
Saprolite 19 30 34
Alluvium 16 10 26
Analysis Methodology
Stability studies were carried out using the Slide 6.0 software developed by Rocscience Inc., Canada, which allows the search of the rupture surface with the lowest safety factor through several methods, either whether circular or non-circular.
The following assumptions and criteria were adopted:
• Isotropic and homogeneous materials.
• Spencer's equilibrium-limit method and adoption of the Mohr-Coulomb criterion.
• Circular global rupture.
• FS minimum of 1.5 for normal water table, 1.3 for critical water table (ABNT, 2006) and 1.1 for earthquakes.
• Variable groundwater.
• Horizontal seismic acceleration equal to 0.05g.
In general, four cases were studied for each WSF:
5070-\16.4\5070-STY-001
July 2017 Lycopodium Minerals Canada Ltd.
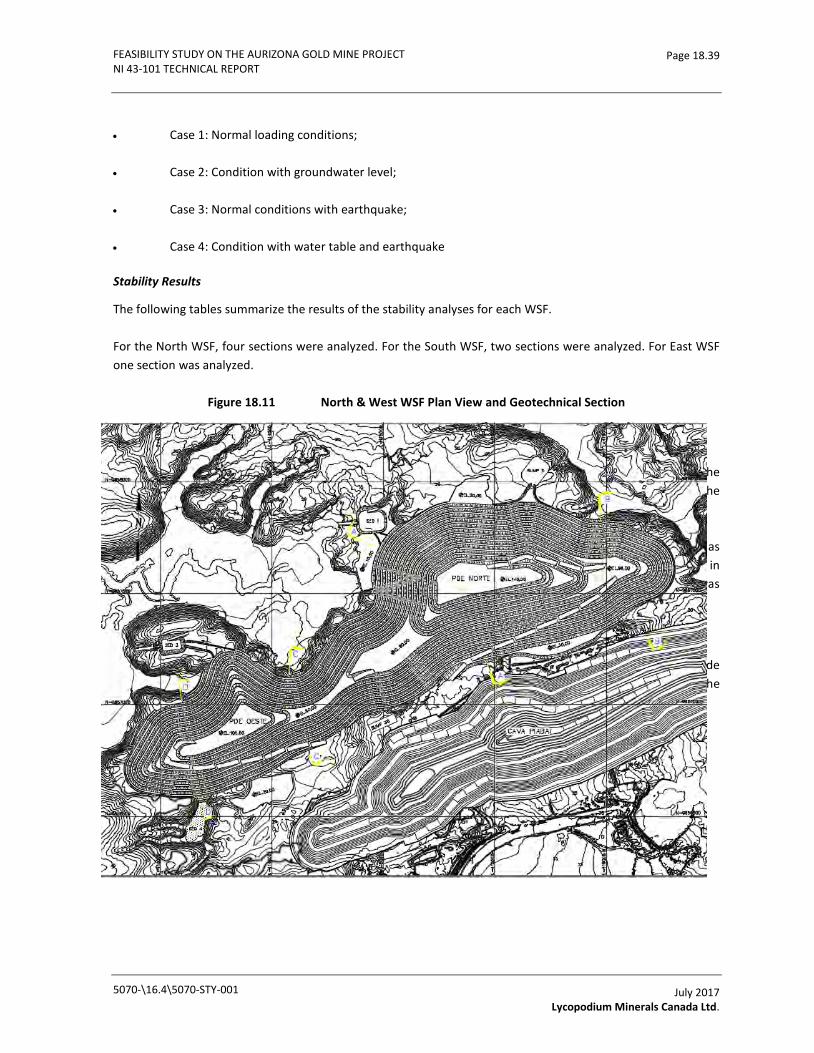
FEASIBILITY STUDY ON THE AURIZONA GOLD MINE PROJECT NI 43-101 TECHNICAL REPORT
Page 18.39
• Case 1: Normal loading conditions;
• Case 2: Condition with groundwater level;
• Case 3: Normal conditions with earthquake;
• Case 4: Condition with water table and earthquake
Stability Results
The following tables summarize the results of the stability analyses for each WSF.
For the North WSF, four sections were analyzed. For the South WSF, two sections were analyzed. For East WSF one section was analyzed.
Figure 18.11 North & West WSF Plan View and Geotechnical Section
Section D was chosen to address the proximity influence the North WSF to the Piaba pit wall because it has the minimum distance between the North WSF and the pit wall. This section is also the closest limit of WSF to the pit slopes.
Two groundwater conditions were analysed: (a) presence of groundwater (5 m below ground surface or as approximated from pit drawn-down) and (b) a dried foundation (with a deep phreatic surface). Additionally, in WSF with mixed fine-grained and hard rock waste (the North and West WSF) the saprolite/laterite waste was assigned a large footprint area as a conservative assumption.
Stability Results
The stability analyses were initially run as both circular and block failure modes; however, the circular mode proved more critical and is used for discussion and reported here. Table 18.11 summarizes the results of the stability analyses.
5070-\16.4\5070-STY-001
July 2017 Lycopodium Minerals Canada Ltd.
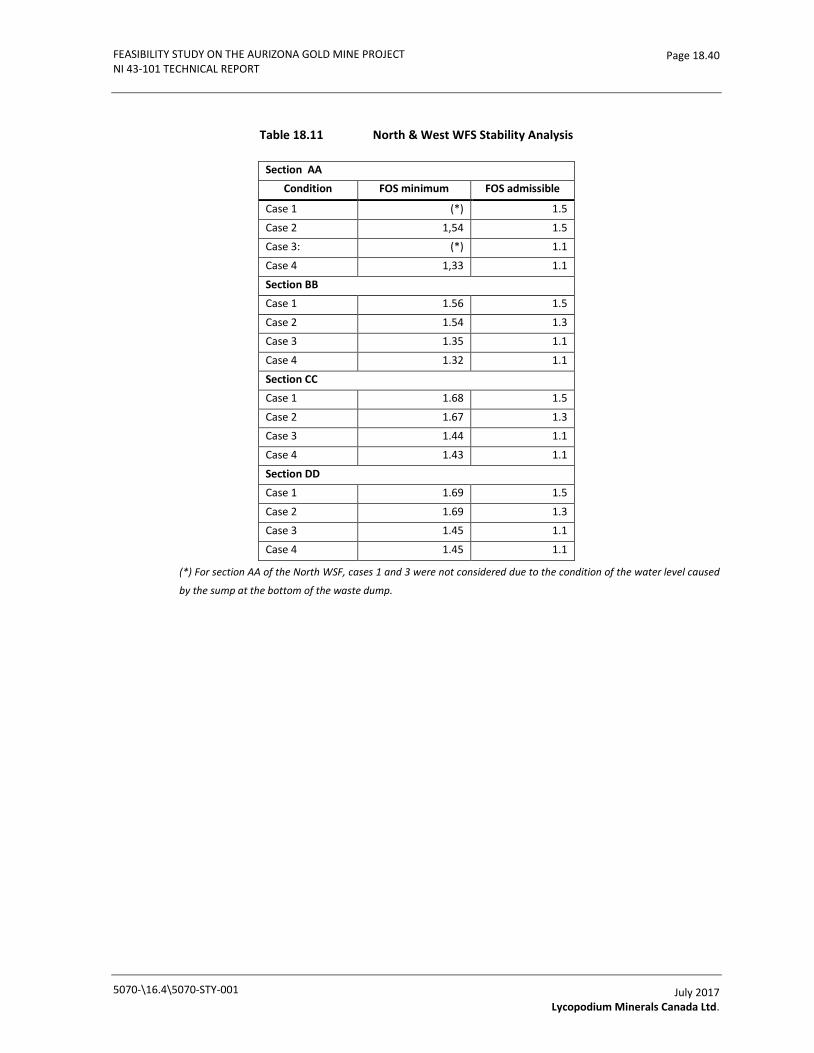
FEASIBILITY STUDY ON THE AURIZONA GOLD MINE PROJECT NI 43-101 TECHNICAL REPORT
Page 18.40
Table 18.11 North & West WFS Stability Analysis
Section AA Condition FOS minimum FOS admissible
Case 1 (*) 1.5
Case 2 1,54 1.5 Case 3: (*) 1.1
Case 4 1,33 1.1
Section BB Case 1 1.56 1.5
Case 2 1.54 1.3 Case 3 1.35 1.1
Case 4 1.32 1.1
Section CC Case 1 1.68 1.5
Case 2 1.67 1.3 Case 3 1.44 1.1
Case 4 1.43 1.1
Section DD Case 1 1.69 1.5
Case 2 1.69 1.3 Case 3 1.45 1.1
Case 4 1.45 1.1
(*) For section AA of the North WSF, cases 1 and 3 were not considered due to the condition of the water level caused
by the sump at the bottom of the waste dump.
5070-\16.4\5070-STY-001
July 2017 Lycopodium Minerals Canada Ltd.

FEASIBILITY STUDY ON THE AURIZONA GOLD MINE PROJECT NI 43-101 TECHNICAL REPORT
Page 18.41
Figure 18.12 South WSF Plan View and Geotechnical Section
Table 18.12 South WSF Stability Analysis
Section AA Condition FOS minimum FOS admissible
Case 1 1.76 1.5
Case 2 1.65 1.3 Case 3: 1.42 1.1
Case 4 1.33 1.1
Section BB Case 1 1.64 1.5
Case 2 1.55 1.3 Case 3 1.35 1.1
Case 4 1.28 1.1
5070-\16.4\5070-STY-001
July 2017 Lycopodium Minerals Canada Ltd.

FEASIBILITY STUDY ON THE AURIZONA GOLD MINE PROJECT NI 43-101 TECHNICAL REPORT
Page 18.42
Figure 18.13 East WSF - Evaluated Stability Sections
Table 18.13 East WSF
Section AA
Condition FOS minimum FOS admissible
Case 1 1.65 1.5
Case 2 1.51 1.3
Case 3: 1.42 1.1 Case 4 1.30 1.1
5070-\16.4\5070-STY-001
July 2017 Lycopodium Minerals Canada Ltd.

FEASIBILITY STUDY ON THE AURIZONA GOLD MINE PROJECT NI 43-101 TECHNICAL REPORT
Page 19.1
19.0 MARKET STUDIES AND CONTRACTS
19.1 Market Studies
No formal market studies have been undertaken.
A gold price of US$ 1,250/oz from Trek Mining has been used in the mineral reserve estimate and the economic analysis.
The Aurizona Mine will produce gold doré which is readily marketable on an ‘ex-works’ or ‘delivered’ basis to a number of refineries in North America, Europe or Africa. There are no indications of the presence of penalty elements that may impact the price or render the product unsalable.
19.2 Contracts
There are no material contracts or agreements in place as of the effective date of this Technical Report. Refining contracts are typically put in place with well organized international refineries and sales are made based on spot gold prices. These contracts typically include fees for transportation from the site, insurance, assaying, refining and an allowance for metal losses during refining. The ability to get a contract in place for the sale of the doré prior to the start of production is not considered a risk to the Project.
5070-\16T16.416T\5070-STY-001
July 2017 Lycopodium Minerals Canada Ltd.
FEASIBILITY STUDY ON THE AURIZONA GOLD MINE PROJECT NI 43-101 TECHNICAL REPORT
Page 20.1
20.0 ENVIRONMENTAL STUDIES, PERMITTING AND SOCIAL OR COMMUNITY IMPACT
20.1 Mine License
The Property includes Mining License (Portaria de Lavra) no. 1201/88, with DNPM no. 800.256/78, totalling 9,981 ha and three exploration licenses totalling approximately 5,427 ha. The Mining License is subject to a government royalty of 1%, which is applied to gross gold sales less costs incurred in selling, transportation, and insurance.
On March 2 2009, Trek submitted an application to the DNPM to convert exploration license806.042/2003, which contains the Tatajuba deposit, to a mining lease. On June 27 2011, Trek submitted an application to the DNPM to convert exploration license 806.195/2007, which is located between the Piaba Mining License and the Tatajuba Exploration License to a mining lease.
These requests are expected to be approved in mid-2017. Exploration licenses 800.329/1991 and 800.331/1991 are part of the Touro target area. On September11 2014 and September 30 2014, respectively, Trek submitted the required Partial Exploration Reports and requested an additional exploration extension of 3 years. On November 26 2014, Trek submitted the Positive Final Exploration Report for exploration license 800.330/1991 to convert this Touro exploration license to a mining license. The submissions for these three licenses are currently under DNPM evaluation. All exploration licenses are subject to an annual exploration tax according to the claim size and time held. Trek confirms that all land tax payments are up to date. Please see Table 20.1 for the status of the Mining Permit.
5070-\16.4\5070-STY-001
July 2017 Lycopodium Minerals Canada Ltd.

FEASIBILITY STUDY ON THE AURIZONA GOLD MINE PROJECT NI 43-101 TECHNICAL REPORT
Page 20.2
Table 20.1 Mining Permit Status
DNPM Type of Permit Status Validity Until
806.195/2007 Exploration License - Phase 1 - Final Exploration Report (FER) Denied - MASA Appealed report presented
806.111/1996 Exploration License - Phase 2 granted 18/06/2018
800.256/1978 Mining License On-going
806.042/2003 Mining License Application application filed
806.082/2013 Exploration License - Phase 1 granted 15/06/2019
806.114/2014 Exploration License - Phase 1 granted 15/06/2019
806.206/2012 Exploration License - Phase 1 granted 22/02/2019
806.683/2010 Exploration License - Phase 1 granted 22/02/2019
806.010/2010 Exploration License - Phase 2 granted 01/04/2019
806.011/2010 Exploration License - Phase 2 granted 18/06/2018
806.012/2008 Exploration License - Phase 2 granted 01/04/2019
806.012/2010 Exploration License - Phase 2 granted 01/04/2019
806.013/2010 Exploration License - Phase 2 granted 18/06/2018
806.216/2009 Exploration License - Phase 2 granted 01/04/2019
806.217/2009 Exploration License - Phase 2 granted 01/04/2019
806.218/2007 Exploration License - Phase 2 granted 01/04/2019
806.218/2009 Exploration License - Phase 2 granted 01/04/2019
806.219/2007 Exploration License - Phase 2 granted 01/04/2019
806.219/2009 Exploration License - Phase 2 granted 01/04/2019
806.220/2007 Exploration License - Phase 2 granted 01/04/2019
806.220/2009 Exploration License - Phase 2 granted 01/04/2019
806.222/2009 Exploration License - Phase 2 granted 01/04/2019
806.282/2007 Exploration License - Phase 2 granted 18/06/2018
806.283/2007 Exploration License - Phase 2 granted 01/04/2019
806.284/2007 Exploration License - Phase 2 granted 01/04/2019
806.228/2007 Bid Process - MASA Appealed or Process Under Analysis application filed
5070-\16.4\5070-STY-001
July 2017 Lycopodium Minerals Canada Ltd.
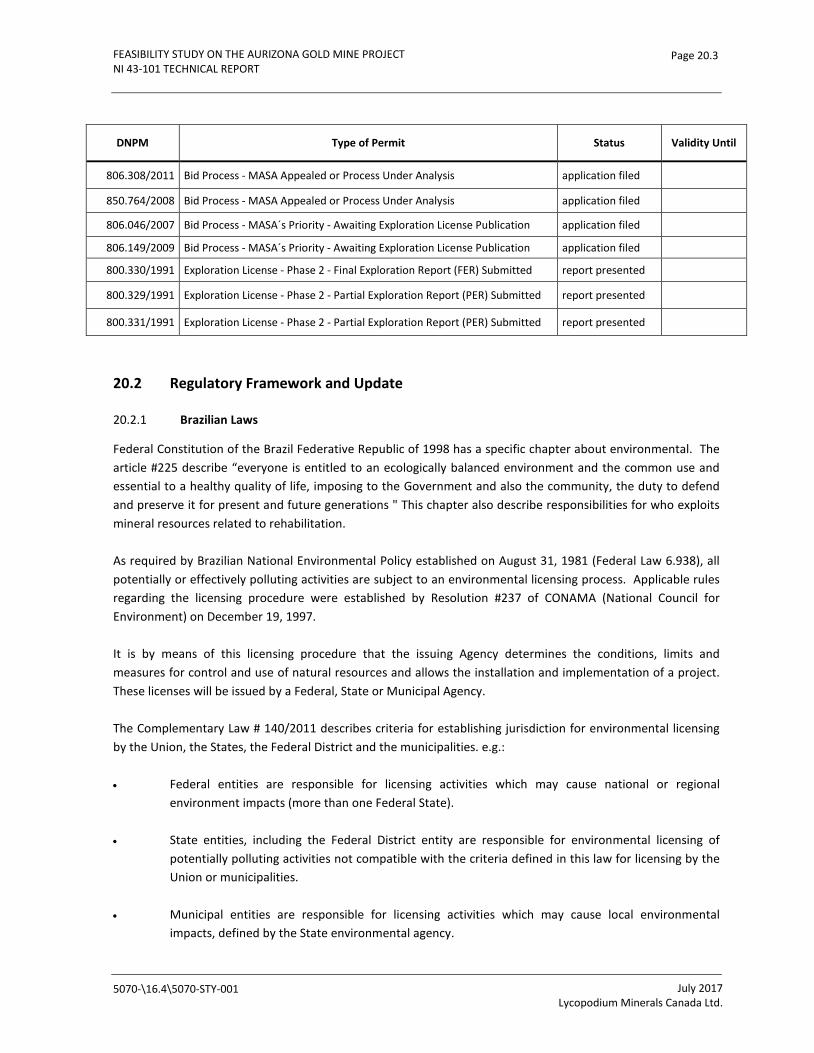
FEASIBILITY STUDY ON THE AURIZONA GOLD MINE PROJECT NI 43-101 TECHNICAL REPORT
Page 20.3
DNPM Type of Permit Status Validity Until
806.308/2011 Bid Process - MASA Appealed or Process Under Analysis application filed
850.764/2008 Bid Process - MASA Appealed or Process Under Analysis application filed
806.046/2007 Bid Process - MASA´s Priority - Awaiting Exploration License Publication application filed
806.149/2009 Bid Process - MASA´s Priority - Awaiting Exploration License Publication application filed
800.330/1991 Exploration License - Phase 2 - Final Exploration Report (FER) Submitted report presented
800.329/1991 Exploration License - Phase 2 - Partial Exploration Report (PER) Submitted report presented
800.331/1991 Exploration License - Phase 2 - Partial Exploration Report (PER) Submitted report presented
20.2 Regulatory Framework and Update
20.2.1 Brazilian Laws
Federal Constitution of the Brazil Federative Republic of 1998 has a specific chapter about environmental. The article #225 describe “everyone is entitled to an ecologically balanced environment and the common use and essential to a healthy quality of life, imposing to the Government and also the community, the duty to defend and preserve it for present and future generations " This chapter also describe responsibilities for who exploits mineral resources related to rehabilitation.
As required by Brazilian National Environmental Policy established on August 31, 1981 (Federal Law 6.938), all potentially or effectively polluting activities are subject to an environmental licensing process. Applicable rules regarding the licensing procedure were established by Resolution #237 of CONAMA (National Council for Environment) on December 19, 1997.
It is by means of this licensing procedure that the issuing Agency determines the conditions, limits and measures for control and use of natural resources and allows the installation and implementation of a project. These licenses will be issued by a Federal, State or Municipal Agency.
The Complementary Law # 140/2011 describes criteria for establishing jurisdiction for environmental licensing by the Union, the States, the Federal District and the municipalities. e.g.:
• Federal entities are responsible for licensing activities which may cause national or regional environment impacts (more than one Federal State).
• State entities, including the Federal District entity are responsible for environmental licensing of potentially polluting activities not compatible with the criteria defined in this law for licensing by the Union or municipalities.
• Municipal entities are responsible for licensing activities which may cause local environmental impacts, defined by the State environmental agency.
5070-\16.4\5070-STY-001
July 2017 Lycopodium Minerals Canada Ltd.
FEASIBILITY STUDY ON THE AURIZONA GOLD MINE PROJECT NI 43-101 TECHNICAL REPORT
Page 20.4
Other criteria are considered such as administrative responsibility for the management of Protected Areas Units. The federative entities (Union, State and municipalities) could establish specific criteria for environmental compliance activities, but, for example, a local rule cannot be less restrictive with respect to an environmental aspect of a Federal State standard.
For potentially polluting activities a prior environmental impact study is required, as already specified in this report and in Federal Constitution/1988, Article #225, §1, incumbent to public authority: “require, according to the law, for installation of potentially polluting, a prior environmental impact study, which shall be accessible to the public”.
Specifics laws in Brazil consider aspects e.g. about forest, water resources, Conservation Units, and special areas.
Law #12.651/2012 is the standard to protection and sustainable use of forests and other forms of native vegetation. This law consider definition to aspects related to Permanent Preservation Area (APP), Legal Reserve (RL), need for intervention forms of vegetation, economic instruments.
The Legal Reserve and Permanent Preservation Area can be characterized as restrictions on property rights, grounded in social function provided for in the Federal Constitution.
Every rural propriety must maintain a certain percentage of vegetation and areas of permanent preservation, necessary for the biodiversity. Permanent Preservation Area could be covered or not by native vegetation with environmental function of preserving water resources, landscape, geological stability and biodiversity, facilitate gene flow of fauna and flora, soil protection and ensure the welfare of human populations.
The National Policy on Water Resources, Law #9.433 is an instrument the grant water use. The enterprise needs this permission for any use that changes the regime, quantity or quality of water in site.
According Law # 9.985/2000 National Conservation of Nature System the enterprise of significant environmental impact must commit financial resources for the implementation and maintenance of Conservation Unit, - specially protected areas in accordance with Article 225, §1o,III Federal Costituição 1998. The quantum of environmental compensation, to be held by the environmental agency, should be based on the degree of environmental impact. This calculation shall be scaled at the stage of Preliminary Licence (LP), from the preparation of the EIA/RIMA.
The Environmental Crimes Law (9.605/98) typifies as Penal Crime: construct, renovate, expand, install, or operate potentially polluting activity without license or environmental permit.
Applicable rules regarding effluents discharge limits were established by Resolution #430 of CONAMA (National Council for Environment) on May 13, 2011.
Applicable rules regarding water portability for human consumption were established by Ministerial Order #2914 Ministry of Health on December 12, 2011.
5070-\16.4\5070-STY-001
July 2017 Lycopodium Minerals Canada Ltd.

FEASIBILITY STUDY ON THE AURIZONA GOLD MINE PROJECT NI 43-101 TECHNICAL REPORT
Page 20.5
20.2.2 Environmental Permitting
In Brazil mineral resources are federal property, regulated by the National Department of Mineral Production (DNPM). Environmental considerations, however, may also be administered by state and local agencies in accordance with the prevailing interest, for example relating to specific environmental characteristic.
At the geological exploration stage the exploration license holders may require the following environmental permits:
• Deforestation Authorization.
• Environmental Authorization or license.
In Maranhão State the environmental aspects are regulated by law #5.409/1992.
As a general procedure for all Mining Projects throughout Brazil, the permitting process occurs as follows:
1. Preliminary License (LP):
• Must be demonstrated that the enterprise is environmentally feasible. According to its size or potential environmental impacts, correspondent environmental measures must be anticipated. Besides a detailed Baseline Study, an Environmental Impact Assessment (also known as EIA/RIMA) must be conducted. This phase, for mining projects, also means public hearings. When compared to the two other licenses, this is the most important license.
• It is a basic condition to obtain the LP that assurances are presented so that preventive measures, recovery, mitigation and compensations are implemented.
• Still, important aspects must be evaluated in the environmental impact studies, such as interference on Protected Areas (UCs) and other protected areas such as relevant archaeological and socio-cultural heritage.
• Negative impacts on the environment, established from EIA/RIMA, should be compensated, according to Brazilian Law 9.985/2000 which introduces the System of Conservation Units and determine environmental compensation standards.
2. Installation License (LI):
• At this stage the Basic Engineering shall be presented to the authorities. It is subject to the presentation of an environmental control plan referred to as a PCA (Plano de Controle Ambiental = Environmental Control Plan) together with a PRAD (Plano de Recuperação de Áreas Degradadas = Impacted Areas Recovery Plan).
• DNPM only issues the Mining Concession if the Installation License is granted.
5070-\16.4\5070-STY-001
July 2017 Lycopodium Minerals Canada Ltd.
FEASIBILITY STUDY ON THE AURIZONA GOLD MINE PROJECT NI 43-101 TECHNICAL REPORT
Page 20.6
• At this licensing stage definitions and regularization concerning the “Legal Reserve” must be established. It is an area which size depends on State rules that must preserve the natural biota and shall be legalized by the Rural Environmental Register (Cadastro Ambiental Rural – CAR) or at the Real Estate Notary Office as property of the entrepreneur, according Federal Law 12.651/2012. In Maranhão the law has established 80% of the enterprise area.
3. Operational License (LO):
• This license allows the Project to start-up, and is basically issued after all environmental measures are in place and have been duly checked by the authorities.
• During the Life of Mine the company must renew the LO. Throughout the mining operation the PRAD must be in action. At the time of the renewal a report summarizing environmental performance must be presented.
• If during the operation there are substantial changes to the initial project plan (e.g. an additional treatment plant) this will require another/specific LI which subsequently will become a LO.
The responsibility to protect the environment is shared between the federal, state and municipal authorities (Brazilian Federal Constitution - CF/1988, Article #24; Complementary Law #140/2011). Competence for environmental licensing could be delegated to municipalities through an agreement to impact local environmental activities.
The recovery of the impacted areas from mineral resource exploitation can be found in Brazilian Constitution, 1988, Article #225, § 2, where recovery should be compatible with the technical solution required by the environmental agency.
The National Agency for Mining (DNPM) regulated the Mine Closure requirements by the NRM (Normas Reguladoras de Mineração = Mining Regulation Standards) which include the environmental ones. Specifically the NRM #20 deals with this subject.
• In NRM #20, the Mine Closure Plan should be part of the Economic Utilization Plan of the mine, or it may be required to submit to those projects that have previously been approved, without this plan.
• The Mine Closure Plan required by DNPM provides for the deactivation and closure steps to be considered from the beginning of the project, still in the implementation phase.
There is no federal legislation governing or defining the minimum scope and content of a Mine Closure Plan. What is established by law is a general requirement to prepare a plan to decommission and rehabilitate disturbed areas.
5070-\16.4\5070-STY-001
July 2017 Lycopodium Minerals Canada Ltd.

FEASIBILITY STUDY ON THE AURIZONA GOLD MINE PROJECT NI 43-101 TECHNICAL REPORT
Page 20.7
20.2.3 Mining Permitting
Mining rights in Brazil are regulated by the Mining Code Decree 227 from February 27, 1967 and further rules enacted by Brazil’s National Department of Mineral Production (DNPM), which is the governmental agency controlling mining activities in Brazil.
Each application for exploration or mining is represented by a claim submitted to the DNPM. Brazilian Mining legislation allows that mining rights (Exploration Permits or Mining Concessions) may be, with the DNPM’s approval, totally or partially, assigned or transferred to others by their holder. The administrative process for both is similar, even though there are specific conditions for each assignment or transfer of Exploration Permit and/or Mining Concession. In both cases, the interested party needs to file a specific administrative process at the DNPM, according to the provisions set forth in the Ordinance #199, July 14, 2006 enacted by the DNPM.
Once granted, an Exploration Permit for metallic substances is valid until for three years, with the possibility to be extended until for three years more. After this time, the holder must present a report (termed Final Exploration Report) detailing all technical activities performed in order to define a mineral reserve and prove that this particular project is feasible. In addition, at the holder’s discretion, this report may be presented before the validity of the permit expires. One of the main points to be addressed in this report is the presentation of the reserves (classified by Brazilian Mining Code as Measured, Indicated, and Inferred), which will translate (at the Mining Concession step) to the tonnages/volumes that the mining company will be allowed to exploit. If during the life of the mine, more exploration is conducted and the reserves are expanded, then these new constraints can be added to the allowed quantities to be mined, provided the DNPM approves this work. Even if the project does not demonstrate feasibility, submittal of a Final Exploration Report is mandatory.
The reader is cautioned that the DNPM still considers the Measured, Indicated, and Inferred tonnages/volumes as reserves, and not (as in other countries) as resources. This wording/conceptual difference may lead to misunderstandings.
During the validity of an Exploration Permit, the holder will have to pay a tax referred to as the annual tax per hectare. The value is R$2.36/ha for the first three years, and R$3.58/ha when the Exploration Permit has been renewed.
Exploration Permits are granted to Brazilian citizens and/or mining companies established in Brazil. Mining Concessions are only granted to mining companies. At the moment the application is filed at any DNPM office, the application receives a number which will not change during of its life, either as Exploration Permit or Mining Concession. For example, the DNPM number 800.256/1978 means that the first filing for an Exploration Permit was made in 1978.
5070-\16.4\5070-STY-001
July 2017 Lycopodium Minerals Canada Ltd.
FEASIBILITY STUDY ON THE AURIZONA GOLD MINE PROJECT NI 43-101 TECHNICAL REPORT
Page 20.8
If the Final Exploration Report is approved by the DNPM, the holder has one year to present a Plano de Aproveitamento Econômico (PAE, otherwise known as an Economic Exploitation Plan) in addition to other documents of minor importance. The PAE is comparable to a Feasibility Study. Only after its approval by the DNPM, may a company initiate mine construction and resource extraction. In addition to several corporate taxes paid by companies in Brazil, mining companies also pay a tax for mineral exploitation called CFEM (Financial Compensation for the Exploitation of Mineral Resources). This tax is levied on the sale of raw or processed minerals. If the land owner is not the company extracting the resource, the company must pay a royalty equal to 50 percent of the CFEM to the land owner.
20.3 Potential Environmental Impacts and Mitigation Measures
The Aurizona Mine has the following potential environmental impacts:
• Air quality degradation (from fugitive dust).
• Noise.
• Water consumption and water use (quantity reduction).
• Water contamination from mine-influenced water discharge.
• Land use changes.
The Project will mitigate fugitive dust through the application of water on roadways during the dry season. Noise will be mitigated by engineering controls on major equipment (e.g. sound shields around noise-generating machines) and also through the fact that the plant is located a significant distance from settled areas. Noise near the Aurizona Village is minimal because only the camp, core shed, offices warehouse and assay laboratory are near this population centre.
Water consumption and water use is discussed in detail in Section 18.3. Water balance and freshwater make-up water is discussed in Section 18.4. Water contamination from sediment loading (TSS) is discussed in detail in Section 18.6. The potential for other water quality impacts is discussed in this section. Land use changes are discussed in mine closure (see Section 20.5).
Current effluent discharge for the site is directed towards the permitted discharge point at Curva do Edmilson on the Aurizona River. This discharge is monitored, tested and the results are reported periodically to SEMA. It’s important to note that regional studies have shown that certain metals are naturally high because of the local geology and environment, and background water quality, as determined by the ongoing monitoring program in nearby rivers with no Project impacts, periodically exceeds water quality standards.
5070-\16.4\5070-STY-001
July 2017 Lycopodium Minerals Canada Ltd.
FEASIBILITY STUDY ON THE AURIZONA GOLD MINE PROJECT NI 43-101 TECHNICAL REPORT
Page 20.9
The proposed Mine site will have two effluent discharge points. One is the current discharge point on the Aurizona river from sediment pond SED 1 at Curva do Edmilson. The future proposed discharge point is from Boa Esperança Reservoir to the São José River through a pipeline and diffuser. Future water quality in the effluent was predicted using the site-wide water and load balance and geochemistry source terms defined by geochemical characterization. The model indicates that there are no major issues during operations and post-closure the discharge to Aurizona River but manganese which may eventually be above legal limits stated in CONAMA n° 430/2011 for both operations and post-closure periods. The water and load balance was anticipated to be overly conservative with regards to cyanide concentration predictions as natural cyanide degradation is not included, and cyanide detoxification will be included during operations. Predicted cyanide concentrations in the discharge were based on detoxification performance and estimates or natural degradation and are not anticipated to be above the legal limits in the Boa Esperança discharge.
As a legal requirement effluent from Boa Esperança Reservoir discharged in São José River cannot alter the river water classification, which is defined by its chemistry. A dispersion model was carried out for São José River considering two hypothetical discharge points during periods of low flow in the river, one in the São José River branch and the other in the main channel of the River. Results show that the mixing zone for the branch is able to dilute effluent by a factor of 19 while the main channel will dilute the effluent by a factor of 56 Based on the load balance model for the operational period, the effluent discharge to São José River will require an average dilution factor of 15, primarily driven by the arsenic concentration in the effluent. Discharge in the main São José River is therefore recommended to provide adequate factor of safety against exceeding the legal limits.
20.3.1 Ongoing Monitoring Program
The following main structures included in the environmental licensing and ongoing monitoring programs include:
• Camp site.
• Plant site.
• Open pit.
• TSF.
• WSF.
• Solids waste and hazardous waste disposal.
• Water treatment plant.
• Sewage treatment plant.
• Fuel station.
• Access roads.
5070-\16.4\5070-STY-001
July 2017 Lycopodium Minerals Canada Ltd.
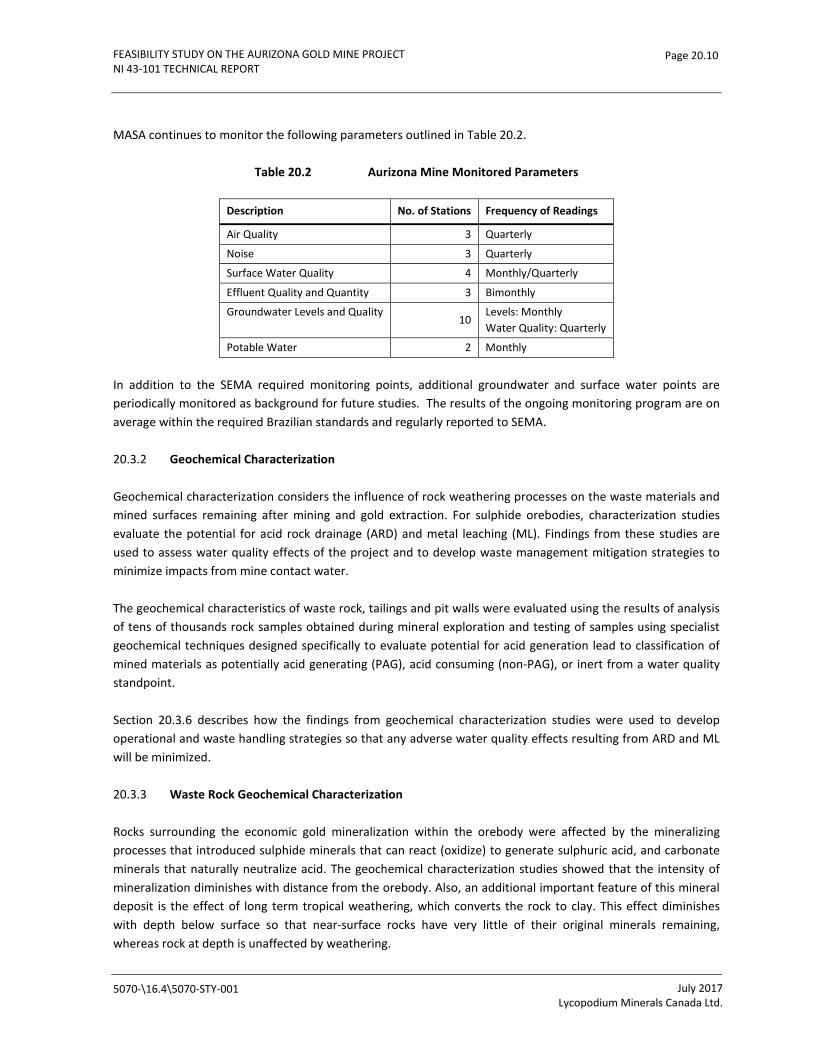
FEASIBILITY STUDY ON THE AURIZONA GOLD MINE PROJECT NI 43-101 TECHNICAL REPORT
Page 20.10
MASA continues to monitor the following parameters outlined in Table 20.2.
Table 20.2 Aurizona Mine Monitored Parameters
Description No. of Stations Frequency of Readings
Air Quality 3 Quarterly
Noise 3 Quarterly
Surface Water Quality 4 Monthly/Quarterly
Effluent Quality and Quantity 3 Bimonthly
Groundwater Levels and Quality 10
Levels: Monthly Water Quality: Quarterly
Potable Water 2 Monthly
In addition to the SEMA required monitoring points, additional groundwater and surface water points are periodically monitored as background for future studies. The results of the ongoing monitoring program are on average within the required Brazilian standards and regularly reported to SEMA.
20.3.2 Geochemical Characterization
Geochemical characterization considers the influence of rock weathering processes on the waste materials and mined surfaces remaining after mining and gold extraction. For sulphide orebodies, characterization studies evaluate the potential for acid rock drainage (ARD) and metal leaching (ML). Findings from these studies are used to assess water quality effects of the project and to develop waste management mitigation strategies to minimize impacts from mine contact water.
The geochemical characteristics of waste rock, tailings and pit walls were evaluated using the results of analysis of tens of thousands rock samples obtained during mineral exploration and testing of samples using specialist geochemical techniques designed specifically to evaluate potential for acid generation lead to classification of mined materials as potentially acid generating (PAG), acid consuming (non-PAG), or inert from a water quality standpoint.
Section 20.3.6 describes how the findings from geochemical characterization studies were used to develop operational and waste handling strategies so that any adverse water quality effects resulting from ARD and ML will be minimized.
20.3.3 Waste Rock Geochemical Characterization
Rocks surrounding the economic gold mineralization within the orebody were affected by the mineralizing processes that introduced sulphide minerals that can react (oxidize) to generate sulphuric acid, and carbonate minerals that naturally neutralize acid. The geochemical characterization studies showed that the intensity of mineralization diminishes with distance from the orebody. Also, an additional important feature of this mineral deposit is the effect of long term tropical weathering, which converts the rock to clay. This effect diminishes with depth below surface so that near-surface rocks have very little of their original minerals remaining, whereas rock at depth is unaffected by weathering.
5070-\16.4\5070-STY-001
July 2017 Lycopodium Minerals Canada Ltd.
FEASIBILITY STUDY ON THE AURIZONA GOLD MINE PROJECT NI 43-101 TECHNICAL REPORT
Page 20.11
Geochemical analysis showed that near surface rock has been weathered extensively and has negligible potential for ARD. At greater depth where the rock is partially weathered (the transition zone), approximately 50% of the waste rock has potential to generate ARD. Below this, where the rock is unweathered, the proportion of waste rock with ARD potential is near 10%. Leaching potential for the elements manganese and arsenic was identified and mitigation procedures developed.
20.3.4 Tailings Geochemical Characterization
Tailings are the residues following the processing of ore to recover gold. It is assumed that the mineral components of the ore are not largely affected by the gold processing, so that the geochemical characteristics of tailings were inferred from the ore. It was concluded that tailings are likely PAG on average with greater ARD potential when ore is derived from partially weathered rock (transition) and lower for unweathered rock.
20.3.5 Water and Load Balance Modelling
The geochemical characterization was used to predict contact water chemistry for all water sources simulated in the site-wide water and load balance described in Section 18.4. Forty-two water quality constituents were included in each source term and water quality was assigned to each source in the load balance. Predictions were developed for both “typical” and “extreme” water qualities although “extreme” water qualities were only use to explore the sensitivity of the model to the possible range of water quality inputs. Loading predictions utilized “typical” water qualities.
The model carries the mass loading with key flows with the model and performs conservative mixing at points of interest within the model. These points of interest include TSF Ponds, pit lakes, sediment ponds, sumps, and discharge points. The water quality predicted at these points is based on conservation of mass (i.e. no chemical reactions or attenuation are incorporated). For this reason, the model tends to over-predict water chemistry because chemical constituents are removed from the water column by a variety of natural processes.
The model predicts acceptable water quality in the discharge, through the São Jose River pipeline. Downstream the pipeline, a hydraulic diffuser was modelled with a hydraulic dispersion model; which includes the effect of the tide at the São Jose River discharge and the São Jose River flows. This hydraulic dispersion model predicts the dilution through a mixing process between the discharge and the hydraulic conditions of the São Jose River.
20.3.6 Acid Rock Drainage Management Plan
The ARD Management Plan will implement conventional technologies to limit water quality effects due to ARD and ML. The specific methods are:
• Use of clay-rich weathered rock to encapsulate waste rock with ARD potential and limit contact with oxygen and water.
• Use of lime to prevent initiation of ARD before encapsulation can be completed.
5070-\16.4\5070-STY-001
July 2017 Lycopodium Minerals Canada Ltd.

FEASIBILITY STUDY ON THE AURIZONA GOLD MINE PROJECT NI 43-101 TECHNICAL REPORT
Page 20.12
• Co-disposal with the mixing of rock with lower and higher ARD potential to create an overall blend with lower ARD potential.
• Maintaining tailings in saturated conditions to prevent ARD from starting.
• Design of waste facilities so that water can be captured in settling ponds or the open pit and monitored before discharge to the environment.
• Use of lime to treat acidic water at collection points, if needed.
20.4 Required Permits and Status
MASA is currently in the process of updating all of the licenses and permits in compliance with regulatory requirements to permit the construction and operation of the proposed Aurizona re-development.
An Economic Exploitation Plan [Plano de Aproveitamento Econômico (PAE)] was completed in May 2017 and submitted to the Departamento Nacional de Produção Mineral (DNPM) to resume the Aurizona mine operation. The DNPM is currently evaluating the PAE.
In March 2017 MASA submitted the Environmental Control Report [Relatório de Controle Ambiental (RCA)] and the Environmental Control Plan [Plano de Controle Ambiental (PCA)] to the Secretary of State for Environment and Natural Resources of Maranhão [Secretaria de Estado de Meio Ambiente e Recursos Naturais do Maranhão (SEMA)]. Both are currently being evaluated by SEMA. The two reports are the basis for SEMA licensing approval. They reflect the environmental care MASA will undertake during operation.
In addition, a formal request was submitted to SEMA in May 2017 to clarify the Installation License (LI) and Operation License (LO) approval process. SEMA is currently considering issuing an (LI) with an estimated completion date of July 2017. This will allow construction on the mine site to begin. When the construction is completed the new facilities will fall within the (LO) that MASA currently has with SEMA.
Other permits continue to be in place including:
• Permit to discharge water from the Tailings dam.
• Permit to discharge water from the pit.
These discharge permits are temporary for the current operation with no mining or processing activity. An application will be submitted to SEMA prior to the restart of operations to update these permits for operation once all hydrogeological and hydrological studies are completed.
Other permits are currently under environmental study or review by SEMA including an LI for the Fuel Station, an LO for diesel storage tanks, and an application for installation of an Incinerator.
5070-\16.4\5070-STY-001
July 2017 Lycopodium Minerals Canada Ltd.
FEASIBILITY STUDY ON THE AURIZONA GOLD MINE PROJECT NI 43-101 TECHNICAL REPORT
Page 20.13
20.4.1 Post-Performance or Reclamations Bonds
This is not required under current Brazilian legislation.
20.5 Social and Community
MASA continues to invest in programs and projects in the communities within the area of influence of the mine that are focused around infrastructure improvement, skills training, education, behavioural change and strengthening of local institutional and leadership skills. These programs and projects have been developed in partnership with the local communities, the state (Maranhão) institutions and the Industry State Federation (FIEMA).
One of the key tools in ensuring effective communication between the company and the communities was the establishment of the Community Development Committee (CDC). The CDC, which meets monthly, is a volunteer committee and is comprised of local leaders and authorities. The CDC is evolving into an important forum to discuss local issues, to seek common solutions and implement cooperative strategies for local business development.
The CDC is recognized as a legitimate space where local leaders, community interest groups and the company can discuss issues, impacts, and grievances in an open and transparent manner. The Company introduced a grievance mechanism procedure to the communities and continues to provide training on how to effectively use this procedure, along with a daily engagement process based on small meetings, personal contacts and workshops planned on different projects
The following is a list of projects and programs that MASA supports in the communities within the area of influence.
20.5.1 Program “Grow-up”
This program, which is based on a multi stakeholder partnership model, involves strengthening local labour skills and develops local suppliers through the establishment of partnerships with the Industry State Federation (FIEMA). The main objectives are to:
• Enable graduates from this program to access employment opportunities not only with MASA but in the wider markets.
• Develop local suppliers with the appropriate skills to enable them to access and to provide services and products demanded in the region.
In 2014, 150 local people received training in Administrative Assistance and Diesel Engine Mechanics. In 2015 the program increased and 12 classes were provided involving an average of 25 students in each one, who received training in different areas such as seam, mechanics and building. The individuals from this training program have volunteered 6 hours of their time to projects defined by the CDC.
5070-\16.4\5070-STY-001
July 2017 Lycopodium Minerals Canada Ltd.
FEASIBILITY STUDY ON THE AURIZONA GOLD MINE PROJECT NI 43-101 TECHNICAL REPORT
Page 20.14
MASA’s community relations and supply chain teams continue to foster the development of local suppliers through engagement with the community and identification of local potential needs. Small businesses receive training and instruction aimed at improving management skills to sell products or provide services.
In 2016, MASA started the development of local suppliers for agriculture. Families are encouraged to develop small multifaceted agriculture units that will be provide different food for the local market, with a view to an expanding market place as the number of employees increases at MASA.
20.5.2 Program “Human Resources Hires”
MASA has developed a database of skilled and unskilled local labour from the communities within the direct area of influence (Aurizona, São Luis and Barão do Pirucáua) and the town of Godofreda Viana. Approximately 75% of the staff employed at the mine from the State of Maranhão and the local communities.
MASA is currently updating the database to ensure that a large percentage of employees continue to be hired from the State of Maranhão and more specifically from the municipality of Godofredo Viana.
20.5.3 Campaigns to Raise Social Awareness
MASA promotes social initiatives to raise awareness about important issues such as children’s education, community safety and the prevention of domestic violence and substance abuse. Specific programs include:
Campaigns for the Prevention of STD/AIDS, Domestic Violence and Substance Abuse: Working with state institutions such as SESI, the Police and local NGOs, organize and support campaigns aimed at the prevention of STD/AIDS and reinforce respect for gender equality and the prevention of domestic violence and substance abuse.
Safe Traffic: Providing instruction aimed at preventing driving accidents and development of good driving habits for teenagers as they reach the legal age to obtain a driver’s license.
20.5.4 Program “Gold Women”
Gold Women is a focus group for women to discuss issues and concerns such as equal employment opportunities, gender equality, family values, among others and empower women living in these communities to create an environment for change and improvements in their quality of life and those of their families.
20.5.5 Program “Open Doors”: Public Consultation
The objective of this program is to provide information to the public on an ongoing basis regarding mining activities in a framework of openness and transparency. When necessary and/or requested by the communities, MASA will engage third party professionals to assist in the public consultation processes. This program includes:
• Environmental outreach and education in various communities near the Project.
5070-\16.4\5070-STY-001
July 2017 Lycopodium Minerals Canada Ltd.
FEASIBILITY STUDY ON THE AURIZONA GOLD MINE PROJECT NI 43-101 TECHNICAL REPORT
Page 20.15
• Partnerships to provide classes in sports and support for local cultural events.
• Guided mine visits where local groups are taken on a tour of the Project.
• Sport Classes for Children and Teenagers.
20.5.6 Local Infrastructure Development
MASA in partnership with the communities and the City Hall (Godofreda Viana) support strategic investments to improve local infrastructure such as the installation of the potable water treatment plant in the Aurizona Village. Potential new investments are brought forward during public meetings and priorities for implementation are defined and agreed upon by the CDC, MASA and City Hall.
MASA, through co-operative partnerships with the state and local governments, also provides support in the areas of public health and security.
20.5.7 Public Security
MASA has a cooperative agreement with the State Security Secretary with the principal objective to improve the local public security and reinforce local security police forces. MASA financed the construction of the police station while the State Security Secretary provided the local police to staff the new station.
20.5.8 Potable Water Treatment Plant
MASA continues to support the operation of the Aurizona Village potable water treatment plant. MASA provides financial support for the salaries of 4 operators working on a 24 hour basis. Technical support, water quality analyses and equipment maintenance are supported by MASA.
20.5.9 Hospital
MASA operates an urgent care and emergency clinic for its employees however, because of the lack of community health public services MASA provides approximately 70 community consultations per month.
20.6 Closure
An update to the Aurizona 2012 Mine Closure Plan (Ênfase of São Luis) is presented here, and incorporates recent geochemical characterization data collected for the feasibility study. The full Mine Closure Plan document is submitted in a separate report titled Aurizona Mine Conceptual Closure Plan, SRK 2017; it will require periodic reviews during operations. This section presents a summary of this updated closure plan.
5070-\16.4\5070-STY-001
July 2017 Lycopodium Minerals Canada Ltd.

FEASIBILITY STUDY ON THE AURIZONA GOLD MINE PROJECT NI 43-101 TECHNICAL REPORT
Page 20.16
The Mine Closure Plan must comply with DNPM regulations NRM 20 and NRM-21, as described in the Normas Reguladoras da Mineração. The Aurizona Mine Closure Plan describes the permanent closure of groundwater wells, WSF, landfill, the process plant, TSF and supporting facilities. Closure is expected to occur throughout various stages of operations. Physical, chemical, biological and anthropogenic stability of the site will be achieved by ensuring ground and slope stability, prevention of release of pollutants, sustainable restoration of biota, and meaningful community engagement.
This plan is based on the best available information at the time of preparation; it will be reviewed every three years and updated with new data obtained from ongoing operations.
20.6.1 Closure Objectives and Assumptions
Closure strategies were designed to meet the following closure objectives:
• Ensure health and safety of workers and of public.
• Identify and mitigate social risks/impacts on the community, Trek and the overall success of the closure process.
• Safeguard the sustainability of community interests.
• Minimize residual environmental impacts by avoiding conditions that might cause environmental degradation.
• Ensure geotechnical and geochemical stability of mine site features.
• Establish effective vegetation cover and return the land to suitable post-mining land use.
Closure strategies were based on the following assumptions:
• Identified post-closure land uses will be acceptable to the local community and regulators.
• Government and local communities will assume site responsibility after closure.
• Local communities will be interested in utilizing the remaining facilities to support small-scale commercial agriculture.
• Facility footprints will allow regrading without infringing on the operational stormwater control channels.
• Vegetation will mature and prevent erosion of cover within two years of placement.
5070-\16.4\5070-STY-001
July 2017 Lycopodium Minerals Canada Ltd.
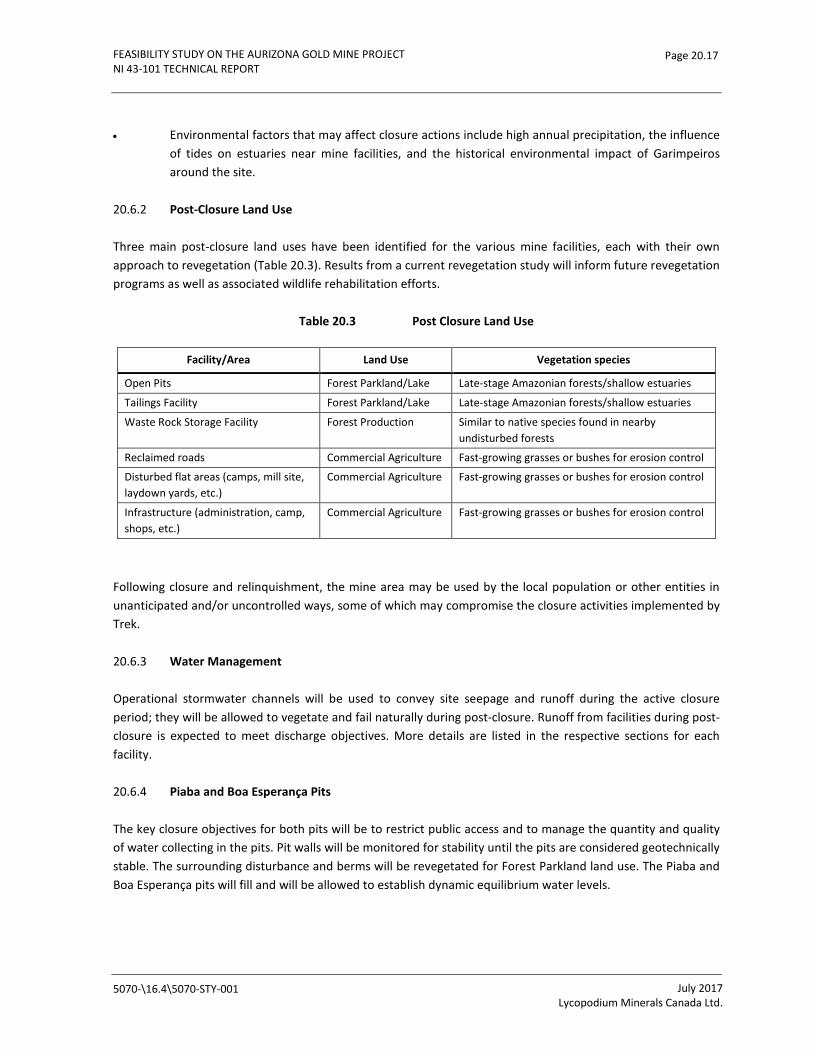
FEASIBILITY STUDY ON THE AURIZONA GOLD MINE PROJECT NI 43-101 TECHNICAL REPORT
Page 20.17
• Environmental factors that may affect closure actions include high annual precipitation, the influence of tides on estuaries near mine facilities, and the historical environmental impact of Garimpeiros around the site.
20.6.2 Post-Closure Land Use
Three main post-closure land uses have been identified for the various mine facilities, each with their own approach to revegetation (Table 20.3). Results from a current revegetation study will inform future revegetation programs as well as associated wildlife rehabilitation efforts.
Table 20.3 Post Closure Land Use
Facility/Area Land Use Vegetation species
Open Pits Forest Parkland/Lake Late-stage Amazonian forests/shallow estuaries
Tailings Facility Forest Parkland/Lake Late-stage Amazonian forests/shallow estuaries
Waste Rock Storage Facility Forest Production Similar to native species found in nearby undisturbed forests
Reclaimed roads Commercial Agriculture Fast-growing grasses or bushes for erosion control
Disturbed flat areas (camps, mill site, laydown yards, etc.)
Commercial Agriculture Fast-growing grasses or bushes for erosion control
Infrastructure (administration, camp, shops, etc.)
Commercial Agriculture Fast-growing grasses or bushes for erosion control
Following closure and relinquishment, the mine area may be used by the local population or other entities in unanticipated and/or uncontrolled ways, some of which may compromise the closure activities implemented by Trek.
20.6.3 Water Management
Operational stormwater channels will be used to convey site seepage and runoff during the active closure period; they will be allowed to vegetate and fail naturally during post-closure. Runoff from facilities during post-closure is expected to meet discharge objectives. More details are listed in the respective sections for each facility.
20.6.4 Piaba and Boa Esperança Pits
The key closure objectives for both pits will be to restrict public access and to manage the quantity and quality of water collecting in the pits. Pit walls will be monitored for stability until the pits are considered geotechnically stable. The surrounding disturbance and berms will be revegetated for Forest Parkland land use. The Piaba and Boa Esperança pits will fill and will be allowed to establish dynamic equilibrium water levels.
5070-\16.4\5070-STY-001
July 2017 Lycopodium Minerals Canada Ltd.
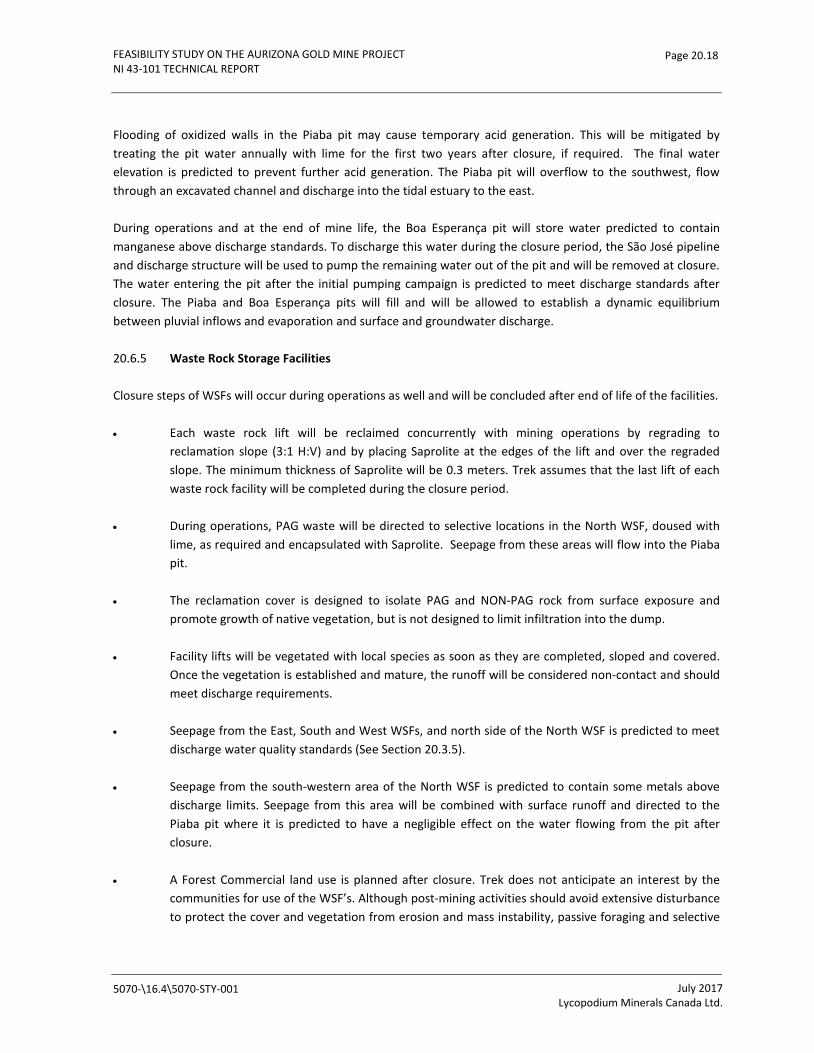
FEASIBILITY STUDY ON THE AURIZONA GOLD MINE PROJECT NI 43-101 TECHNICAL REPORT
Page 20.18
Flooding of oxidized walls in the Piaba pit may cause temporary acid generation. This will be mitigated by treating the pit water annually with lime for the first two years after closure, if required. The final water elevation is predicted to prevent further acid generation. The Piaba pit will overflow to the southwest, flow through an excavated channel and discharge into the tidal estuary to the east.
During operations and at the end of mine life, the Boa Esperança pit will store water predicted to contain manganese above discharge standards. To discharge this water during the closure period, the São José pipeline and discharge structure will be used to pump the remaining water out of the pit and will be removed at closure. The water entering the pit after the initial pumping campaign is predicted to meet discharge standards after closure. The Piaba and Boa Esperança pits will fill and will be allowed to establish a dynamic equilibrium between pluvial inflows and evaporation and surface and groundwater discharge.
20.6.5 Waste Rock Storage Facilities
Closure steps of WSFs will occur during operations as well and will be concluded after end of life of the facilities.
• Each waste rock lift will be reclaimed concurrently with mining operations by regrading to reclamation slope (3:1 H:V) and by placing Saprolite at the edges of the lift and over the regraded slope. The minimum thickness of Saprolite will be 0.3 meters. Trek assumes that the last lift of each waste rock facility will be completed during the closure period.
• During operations, PAG waste will be directed to selective locations in the North WSF, doused with lime, as required and encapsulated with Saprolite. Seepage from these areas will flow into the Piaba pit.
• The reclamation cover is designed to isolate PAG and NON-PAG rock from surface exposure and promote growth of native vegetation, but is not designed to limit infiltration into the dump.
• Facility lifts will be vegetated with local species as soon as they are completed, sloped and covered. Once the vegetation is established and mature, the runoff will be considered non-contact and should meet discharge requirements.
• Seepage from the East, South and West WSFs, and north side of the North WSF is predicted to meet discharge water quality standards (See Section 20.3.5).
• Seepage from the south-western area of the North WSF is predicted to contain some metals above discharge limits. Seepage from this area will be combined with surface runoff and directed to the Piaba pit where it is predicted to have a negligible effect on the water flowing from the pit after closure.
• A Forest Commercial land use is planned after closure. Trek does not anticipate an interest by the communities for use of the WSF’s. Although post-mining activities should avoid extensive disturbance to protect the cover and vegetation from erosion and mass instability, passive foraging and selective
5070-\16.4\5070-STY-001
July 2017 Lycopodium Minerals Canada Ltd.

FEASIBILITY STUDY ON THE AURIZONA GOLD MINE PROJECT NI 43-101 TECHNICAL REPORT
Page 20.19
planting of commercial trees could occur without adversely impacting the slopes. Further study is needed prior to including this option in a final closure plan.
20.6.6 Tailings Storage Facility (TSF)
Two TSFs will be present at time of closure. The Vené TSF was first constructed in 2009 and is planned to operate until 2022. The Ze Bolacha TSF will be constructed in 2021 and will operate until the end of mining in 2024. Both are designed as a compacted earth fill structure with a sand chimney and blanket drain. The conceptual closures for the TSFs are based on the following assumptions;
• The tailings dams will be stable after closure, in the proposed closure configuration (designed by others). Tailings waste will not generate acid under operating conditions (saturated).
• Tailings spillway channels will be designed to safely convey the 10,000-year storm event and will be constructed during operations.
Near the end of tailings deposition, the spigoting plan will be modified to partially fill in the supernatant pond area and create a shallow slope to drain the tailings surface towards the spillway. At the end of tailings deposition, remaining tailings supernatant water will be pumped from the tailings surface to the Boa Esperança Reservoir in preparation for cover placement. Cover will be placed over the tailings surface to create a shallow slope towards the spillway. Cover placement will be designed to limit water pooling to less than 1 meter during the wet season. To reduce the risk of potential acid generation, the surfaces of both facilities will be covered within the first dry season following the end of deposition for each facility. Details of this conceptual design are found in the Aurizona Mine Conceptual Closure Plan (SRK, 2017).
Once the tailings cover is complete, surface water will be allowed to inundate the tailings up to the spillway elevation and flow over the spillway without further treatment. The closure surface will be revegetated with a perennial grass and shrub mix that will tolerate periodic inundation for periods up to three months. SRK expects that runoff, even prior to mature vegetation, will meet discharge limits and will be allowed to discharge to the environment without further control.
20.6.7 Process Plant
The mill and crusher facility will be sold, dismantled and removed from the site by the buyer.
Prior to dismantling, the mill will be decontaminated and any remaining reagents will be returned to vendors or be safely disposed. Remaining scrap metal will be removed from the site and recycled. Concrete foundations will be buried in-place beneath a minimum of two meters of soil. The area will be regraded to moderate any significant variations in topography and to ensure surface drainage without excessive erosion. Surface drainage from this area will be directed onto the Vené tailings surface.
20.6.8 Buildings and Infrastructure
Buildings, roads and other infrastructure will be preserved if needed, or otherwise safely disposed or recycled.
5070-\16.4\5070-STY-001
July 2017 Lycopodium Minerals Canada Ltd.
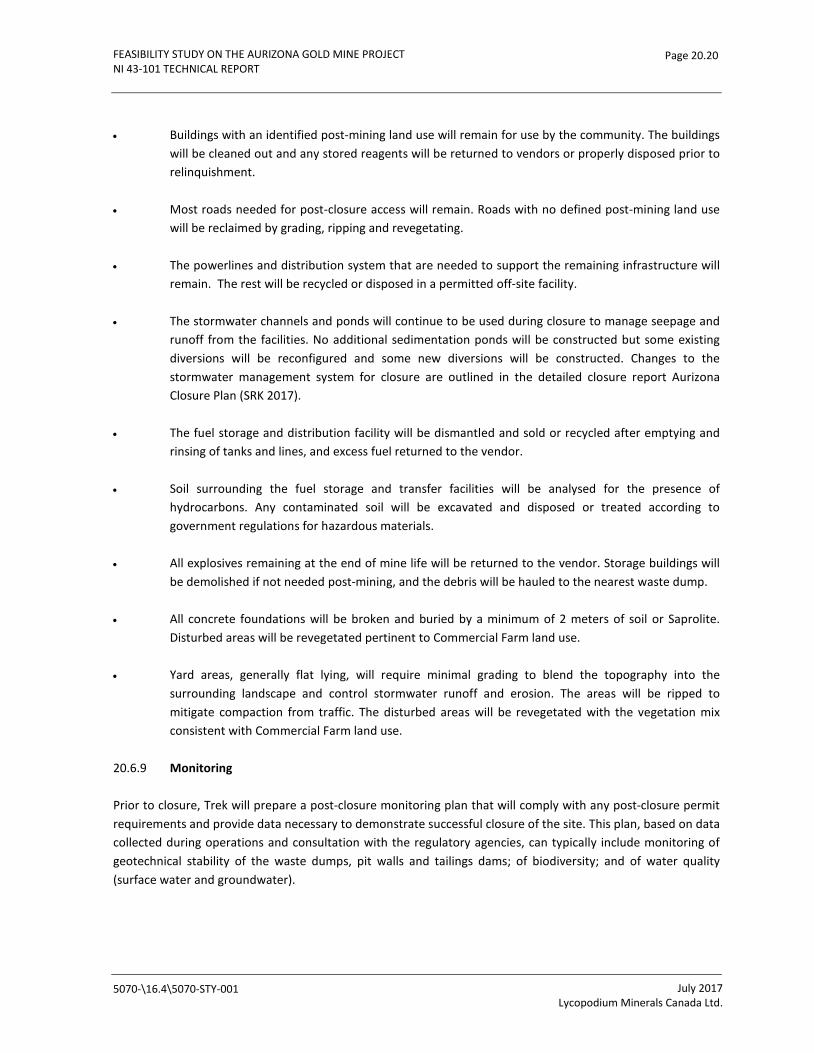
FEASIBILITY STUDY ON THE AURIZONA GOLD MINE PROJECT NI 43-101 TECHNICAL REPORT
Page 20.20
• Buildings with an identified post-mining land use will remain for use by the community. The buildings will be cleaned out and any stored reagents will be returned to vendors or properly disposed prior to relinquishment.
• Most roads needed for post-closure access will remain. Roads with no defined post-mining land use will be reclaimed by grading, ripping and revegetating.
• The powerlines and distribution system that are needed to support the remaining infrastructure will remain. The rest will be recycled or disposed in a permitted off-site facility.
• The stormwater channels and ponds will continue to be used during closure to manage seepage and runoff from the facilities. No additional sedimentation ponds will be constructed but some existing diversions will be reconfigured and some new diversions will be constructed. Changes to the stormwater management system for closure are outlined in the detailed closure report Aurizona Closure Plan (SRK 2017).
• The fuel storage and distribution facility will be dismantled and sold or recycled after emptying and rinsing of tanks and lines, and excess fuel returned to the vendor.
• Soil surrounding the fuel storage and transfer facilities will be analysed for the presence of hydrocarbons. Any contaminated soil will be excavated and disposed or treated according to government regulations for hazardous materials.
• All explosives remaining at the end of mine life will be returned to the vendor. Storage buildings will be demolished if not needed post-mining, and the debris will be hauled to the nearest waste dump.
• All concrete foundations will be broken and buried by a minimum of 2 meters of soil or Saprolite. Disturbed areas will be revegetated pertinent to Commercial Farm land use.
• Yard areas, generally flat lying, will require minimal grading to blend the topography into the surrounding landscape and control stormwater runoff and erosion. The areas will be ripped to mitigate compaction from traffic. The disturbed areas will be revegetated with the vegetation mix consistent with Commercial Farm land use.
20.6.9 Monitoring
Prior to closure, Trek will prepare a post-closure monitoring plan that will comply with any post-closure permit requirements and provide data necessary to demonstrate successful closure of the site. This plan, based on data collected during operations and consultation with the regulatory agencies, can typically include monitoring of geotechnical stability of the waste dumps, pit walls and tailings dams; of biodiversity; and of water quality (surface water and groundwater).
5070-\16.4\5070-STY-001
July 2017 Lycopodium Minerals Canada Ltd.

FEASIBILITY STUDY ON THE AURIZONA GOLD MINE PROJECT NI 43-101 TECHNICAL REPORT
Page 20.21
20.6.10 Closure Management and Security
Personnel needed at closure will include a closure manager, an environmental monitoring technician, equipment operators, and safety and administration staff as required. A security team will be maintained during closure until a post-mining land use plan is implemented.
20.6.11 Mine Closure Schedule
Most of the planned closure actions will occur during mining operations with some being completed during the closure period. The WSFs will be reclaimed on a lift-by-lift basis as they are completed, with only the last lift being reclaimed during the closure period. The Vené TSF will be closed in 2022 and the Ze Bolacha TSF will be closed during the closure period. A preliminary closure schedule, based on the actions defined herein, is presented in table 20.4.
Preparation of the final closure plan will be completed two years prior to closure to determine any additional information, actions and approvals that will be needed prior to closure.
Table 20.4 Preliminary Mine Closure Schedule
20.6.12 Relinquishment
Return of the mining concessions to the Government of Brazil will occur once the mine reclamation and closure actions are complete and monitoring has demonstrated successful rehabilitation consistent with the selected Land Use and negotiated terms with regulators.
After mine closure and site handover, ongoing management and monitoring measures may be required for the rehabilitated site, and responsibility for this will need to be determined. This may include control of vegetation, grazing animals, and public access as well as fire management and maintenance of safety fences and signs.
5070-\16.4\5070-STY-001
July 2017 Lycopodium Minerals Canada Ltd.
FEASIBILITY STUDY ON THE AURIZONA GOLD MINE PROJECT NI 43-101 TECHNICAL REPORT
Page 21.1
21.0 CAPITAL AND OPERATING COSTS
21.1 Capital Cost Estimate
The purpose of the capital cost estimate is to provide substantiated costs which can be utilized to assess the economics of the Project and to provide a control budget for the Project during execution.
The cost estimate includes the initial capital and sustaining capital for the Project. The contributors to the capital cost estimate are provided in Section 21.2 while Section 21.5.9 provides a detailed list of exclusions and qualifications.
The Work Breakdown Structure (WBS) is based on a project specific WBS as shown in Section 21.3.
The capital cost estimate is based on an engineering, procurement and construction management (EPCM) implementation approach and horizontal (discipline based) construction contract packaging.
Major equipment pricing was based on competitive bids received from established vendors. For minor equipment, quotations and actual equipment costs from other recent similar Lycopodium projects were utilized and are considered representative for the Project.
Unit rates for earthworks, concrete, steelwork, plate work field erected tankage buildings and labour were based on quotations from local Brazilian contractors.
Preliminary engineering work was completed for the process plant, plant layout, conceptual mechanical engineering design and conceptual electrical engineering design. The quantities used for compiling the estimate were based on the preliminary engineering, similar projects or from first principle estimates.
The capital costs are presented in US$ as at the second quarter 2017 (Q2 2017) to an accuracy of -10% +15%.
All currency in this Section is stated in US$ unless otherwise indicated.
21.2 Capital Cost Estimate Responsibility
This capital cost estimate reflects the joint efforts of Lycopodium, Trek and consultants retained by Trek – AGP for mining, Walm for the TSF, SRK for the ARD, surface water management and closure costs and Trek for the owner’s costs. Lycopodium was responsible for compiling the submitted data into the overall cost estimate but did not review or validate the inputs from Trek or its other consultants. Table 21.1 outlines the responsibilities of each Consultant for input of information into the capital cost estimate.
Each consultant provided input to the capital cost estimate appropriate to a -10% +15% accuracy estimate, including all related indirect costs and allowances.
5070\16.4\5070-STY-001
July 2017 Lycopodium Minerals Canada Ltd

FEASIBILITY STUDY ON THE AURIZONA GOLD MINE PROJECT NI 43-101 TECHNICAL REPORT
Page 21.2
Table 21.1 Capital Cost Estimate Responsibility
Company Responsibilities
AGP Design and estimates for the open pit mines, initial stripping, mining equipment, contractor pre-stripping, mining services and mining salvage value. Mining sustaining capital costs.
Walm Design and estimates for the Vene and Ze Bolacha TSFs (both initial capital and sustaining capital costs).
Lycopodium
Design and estimates for the treatment plant; earthworks; refurbishment of existing equipment; demolition and relocation of reagents; primary crushing and handling facilities; grinding circuit; leach/CIP/tailings circuit; elution; carbon regeneration; intensive leaching; electrowinning; gold room; tailings line; reagents; water services; piperacks; electrical services; fire services; security system; warehouse; laboratory; LPG system; EPCM services; spares; first fills; commissioning.
SRK
Surface water management including acid rock drainage and waste rock foundation costs. Quantities for closure costs.
Trek Mining Owners costs estimates for Trek’s team; pre-production labour and expenses; insurance; new access road; power line upgrade, which were duly reviewed and accepted by Lycopodium.
Lycopodium Duties and taxes (included in the financial model).
21.3 Work Breakdown Structure WBS
The Work Breakdown Structure (WBS) for the Project was developed jointly by Trek and Lycopodium and included four WBS organization levels and a series of discipline codes.
The WBS for levels 1, 2 and 3 is shown in Table 21.2.
A listing of discipline codes adopted in the estimate can be found in Table 21.3.
5070\16.4\5070-STY-001
July 2017 Lycopodium Minerals Canada Ltd
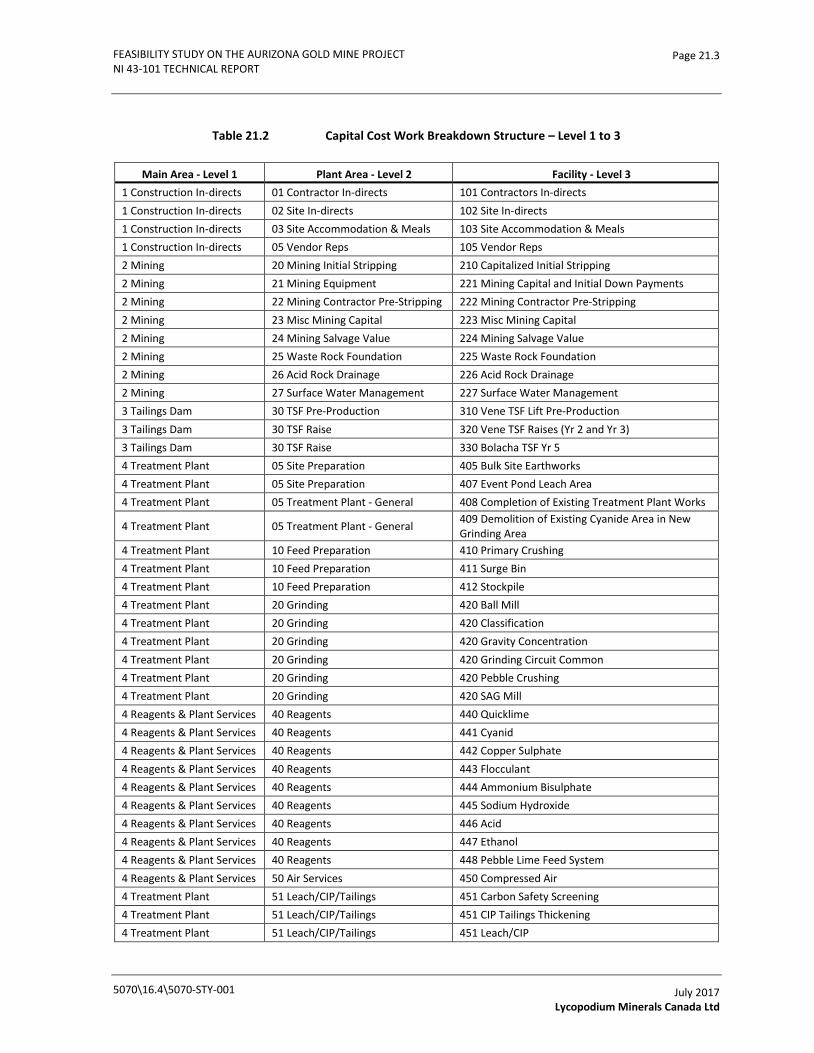
FEASIBILITY STUDY ON THE AURIZONA GOLD MINE PROJECT NI 43-101 TECHNICAL REPORT
Page 21.3
Table 21.2 Capital Cost Work Breakdown Structure – Level 1 to 3
Main Area - Level 1 Plant Area - Level 2 Facility - Level 3 1 Construction In-directs 01 Contractor In-directs 101 Contractors In-directs 1 Construction In-directs 02 Site In-directs 102 Site In-directs 1 Construction In-directs 03 Site Accommodation & Meals 103 Site Accommodation & Meals 1 Construction In-directs 05 Vendor Reps 105 Vendor Reps 2 Mining 20 Mining Initial Stripping 210 Capitalized Initial Stripping 2 Mining 21 Mining Equipment 221 Mining Capital and Initial Down Payments 2 Mining 22 Mining Contractor Pre-Stripping 222 Mining Contractor Pre-Stripping 2 Mining 23 Misc Mining Capital 223 Misc Mining Capital 2 Mining 24 Mining Salvage Value 224 Mining Salvage Value 2 Mining 25 Waste Rock Foundation 225 Waste Rock Foundation 2 Mining 26 Acid Rock Drainage 226 Acid Rock Drainage 2 Mining 27 Surface Water Management 227 Surface Water Management 3 Tailings Dam 30 TSF Pre-Production 310 Vene TSF Lift Pre-Production 3 Tailings Dam 30 TSF Raise 320 Vene TSF Raises (Yr 2 and Yr 3) 3 Tailings Dam 30 TSF Raise 330 Bolacha TSF Yr 5 4 Treatment Plant 05 Site Preparation 405 Bulk Site Earthworks 4 Treatment Plant 05 Site Preparation 407 Event Pond Leach Area 4 Treatment Plant 05 Treatment Plant - General 408 Completion of Existing Treatment Plant Works
4 Treatment Plant 05 Treatment Plant - General 409 Demolition of Existing Cyanide Area in New Grinding Area
4 Treatment Plant 10 Feed Preparation 410 Primary Crushing 4 Treatment Plant 10 Feed Preparation 411 Surge Bin 4 Treatment Plant 10 Feed Preparation 412 Stockpile 4 Treatment Plant 20 Grinding 420 Ball Mill 4 Treatment Plant 20 Grinding 420 Classification 4 Treatment Plant 20 Grinding 420 Gravity Concentration 4 Treatment Plant 20 Grinding 420 Grinding Circuit Common 4 Treatment Plant 20 Grinding 420 Pebble Crushing 4 Treatment Plant 20 Grinding 420 SAG Mill 4 Reagents & Plant Services 40 Reagents 440 Quicklime 4 Reagents & Plant Services 40 Reagents 441 Cyanid 4 Reagents & Plant Services 40 Reagents 442 Copper Sulphate 4 Reagents & Plant Services 40 Reagents 443 Flocculant 4 Reagents & Plant Services 40 Reagents 444 Ammonium Bisulphate 4 Reagents & Plant Services 40 Reagents 445 Sodium Hydroxide 4 Reagents & Plant Services 40 Reagents 446 Acid 4 Reagents & Plant Services 40 Reagents 447 Ethanol 4 Reagents & Plant Services 40 Reagents 448 Pebble Lime Feed System 4 Reagents & Plant Services 50 Air Services 450 Compressed Air 4 Treatment Plant 51 Leach/CIP/Tailings 451 Carbon Safety Screening 4 Treatment Plant 51 Leach/CIP/Tailings 451 CIP Tailings Thickening 4 Treatment Plant 51 Leach/CIP/Tailings 451 Leach/CIP
5070\16.4\5070-STY-001
July 2017 Lycopodium Minerals Canada Ltd
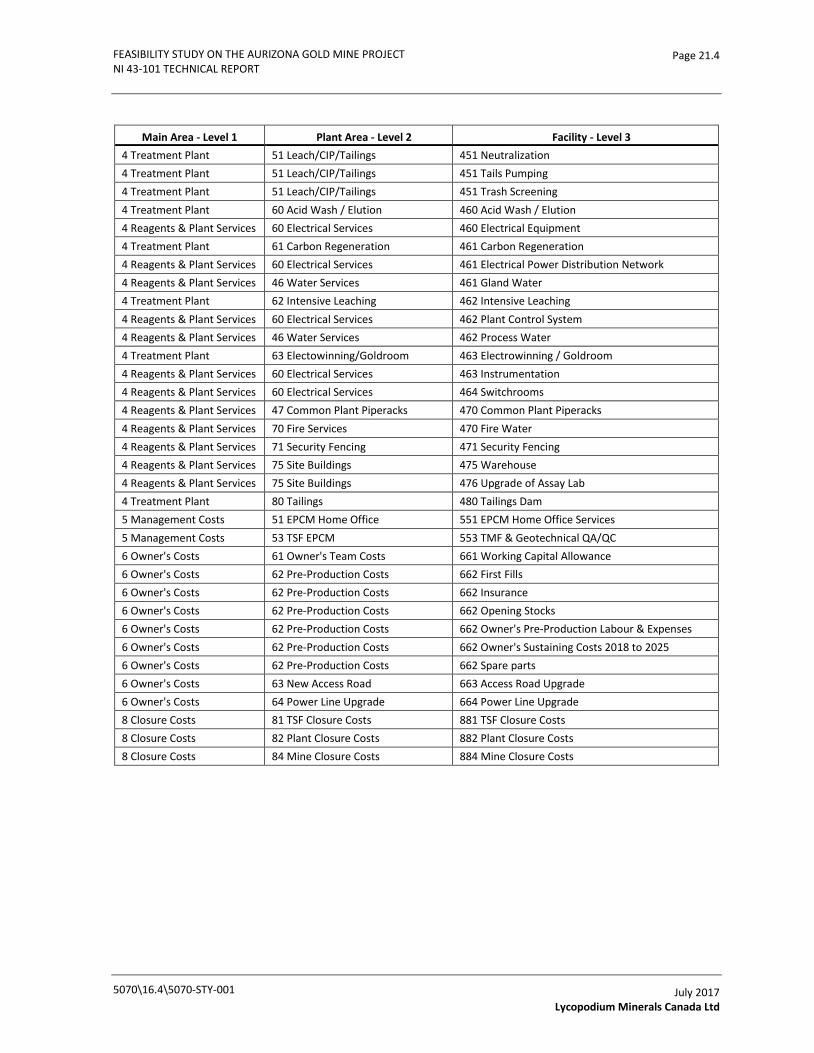
FEASIBILITY STUDY ON THE AURIZONA GOLD MINE PROJECT NI 43-101 TECHNICAL REPORT
Page 21.4
Main Area - Level 1 Plant Area - Level 2 Facility - Level 3 4 Treatment Plant 51 Leach/CIP/Tailings 451 Neutralization 4 Treatment Plant 51 Leach/CIP/Tailings 451 Tails Pumping 4 Treatment Plant 51 Leach/CIP/Tailings 451 Trash Screening 4 Treatment Plant 60 Acid Wash / Elution 460 Acid Wash / Elution 4 Reagents & Plant Services 60 Electrical Services 460 Electrical Equipment 4 Treatment Plant 61 Carbon Regeneration 461 Carbon Regeneration 4 Reagents & Plant Services 60 Electrical Services 461 Electrical Power Distribution Network 4 Reagents & Plant Services 46 Water Services 461 Gland Water 4 Treatment Plant 62 Intensive Leaching 462 Intensive Leaching 4 Reagents & Plant Services 60 Electrical Services 462 Plant Control System 4 Reagents & Plant Services 46 Water Services 462 Process Water 4 Treatment Plant 63 Electowinning/Goldroom 463 Electrowinning / Goldroom 4 Reagents & Plant Services 60 Electrical Services 463 Instrumentation 4 Reagents & Plant Services 60 Electrical Services 464 Switchrooms 4 Reagents & Plant Services 47 Common Plant Piperacks 470 Common Plant Piperacks 4 Reagents & Plant Services 70 Fire Services 470 Fire Water 4 Reagents & Plant Services 71 Security Fencing 471 Security Fencing 4 Reagents & Plant Services 75 Site Buildings 475 Warehouse 4 Reagents & Plant Services 75 Site Buildings 476 Upgrade of Assay Lab 4 Treatment Plant 80 Tailings 480 Tailings Dam 5 Management Costs 51 EPCM Home Office 551 EPCM Home Office Services 5 Management Costs 53 TSF EPCM 553 TMF & Geotechnical QA/QC 6 Owner's Costs 61 Owner's Team Costs 661 Working Capital Allowance 6 Owner's Costs 62 Pre-Production Costs 662 First Fills 6 Owner's Costs 62 Pre-Production Costs 662 Insurance 6 Owner's Costs 62 Pre-Production Costs 662 Opening Stocks 6 Owner's Costs 62 Pre-Production Costs 662 Owner's Pre-Production Labour & Expenses 6 Owner's Costs 62 Pre-Production Costs 662 Owner's Sustaining Costs 2018 to 2025 6 Owner's Costs 62 Pre-Production Costs 662 Spare parts 6 Owner's Costs 63 New Access Road 663 Access Road Upgrade 6 Owner's Costs 64 Power Line Upgrade 664 Power Line Upgrade 8 Closure Costs 81 TSF Closure Costs 881 TSF Closure Costs 8 Closure Costs 82 Plant Closure Costs 882 Plant Closure Costs 8 Closure Costs 84 Mine Closure Costs 884 Mine Closure Costs
5070\16.4\5070-STY-001
July 2017 Lycopodium Minerals Canada Ltd

FEASIBILITY STUDY ON THE AURIZONA GOLD MINE PROJECT NI 43-101 TECHNICAL REPORT
Page 21.5
Table 21.3 Capital Cost Work Breakdown Structure – Discipline Codes
Phase Cost Cat Disc Code Initial Capital Indirect Costs A General B Earthworks C Concrete F Mechanical H Electrical & Inst O Owners Costs P EPCM Costs Direct Costs A General B Earthworks C Concrete D Steelwork E Platework F Mechanical E Tankage G Piping H Electrical & Inst M Buildings Q Mining B TMF Earthworks R Closure Costs Sustaining Capital Indirect Costs B Earthworks O Owners Costs P TMF EPCM Direct Costs G Piping Q Mining B TMF Earthworks R Closure Costs
21.4 Process Plant Capital Costs
The capital estimates are based on a single stage crushing, SAG/ball mill circuit with a nominal 8,000 t/d throughput. Table 21.4 summarizes the capital cost estimate by Area.
5070\16.4\5070-STY-001
July 2017 Lycopodium Minerals Canada Ltd
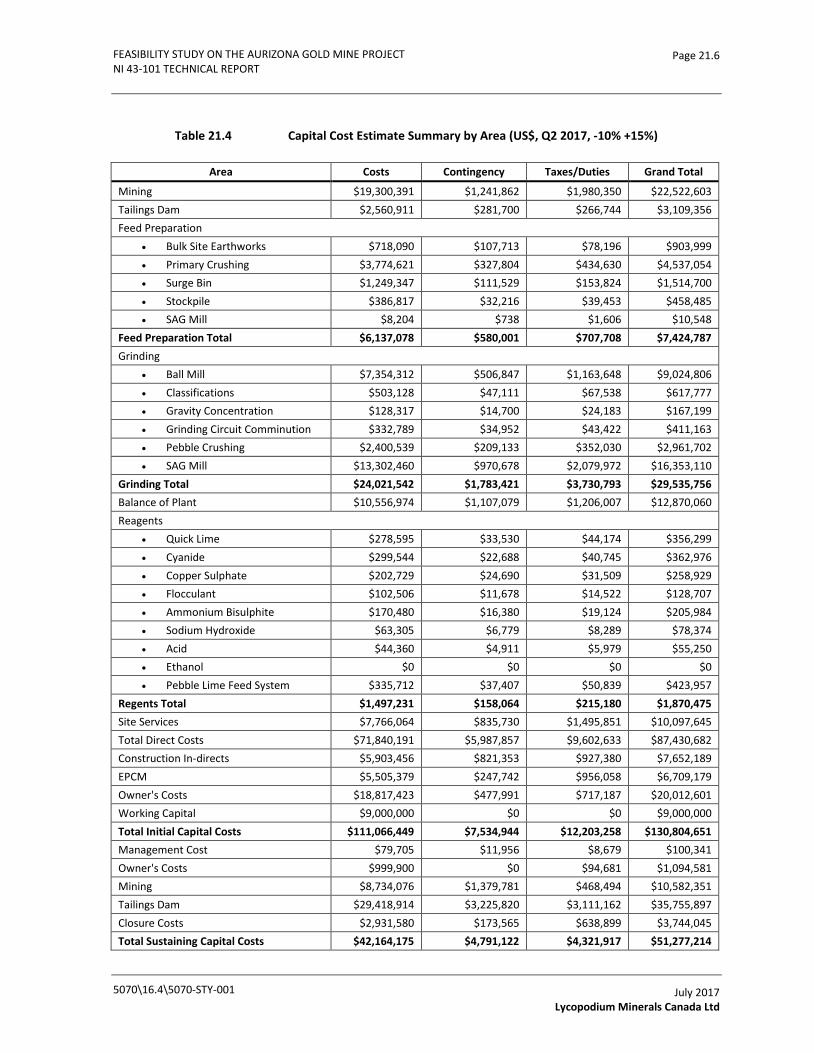
FEASIBILITY STUDY ON THE AURIZONA GOLD MINE PROJECT NI 43-101 TECHNICAL REPORT
Page 21.6
Table 21.4 Capital Cost Estimate Summary by Area (US$, Q2 2017, -10% +15%)
Area Costs Contingency Taxes/Duties Grand Total
Mining $19,300,391 $1,241,862 $1,980,350 $22,522,603 Tailings Dam $2,560,911 $281,700 $266,744 $3,109,356 Feed Preparation
• Bulk Site Earthworks $718,090 $107,713 $78,196 $903,999 • Primary Crushing $3,774,621 $327,804 $434,630 $4,537,054 • Surge Bin $1,249,347 $111,529 $153,824 $1,514,700 • Stockpile $386,817 $32,216 $39,453 $458,485 • SAG Mill $8,204 $738 $1,606 $10,548
Feed Preparation Total $6,137,078 $580,001 $707,708 $7,424,787 Grinding
• Ball Mill $7,354,312 $506,847 $1,163,648 $9,024,806 • Classifications $503,128 $47,111 $67,538 $617,777 • Gravity Concentration $128,317 $14,700 $24,183 $167,199 • Grinding Circuit Comminution $332,789 $34,952 $43,422 $411,163 • Pebble Crushing $2,400,539 $209,133 $352,030 $2,961,702 • SAG Mill $13,302,460 $970,678 $2,079,972 $16,353,110
Grinding Total $24,021,542 $1,783,421 $3,730,793 $29,535,756 Balance of Plant $10,556,974 $1,107,079 $1,206,007 $12,870,060 Reagents
• Quick Lime $278,595 $33,530 $44,174 $356,299 • Cyanide $299,544 $22,688 $40,745 $362,976 • Copper Sulphate $202,729 $24,690 $31,509 $258,929 • Flocculant $102,506 $11,678 $14,522 $128,707 • Ammonium Bisulphite $170,480 $16,380 $19,124 $205,984 • Sodium Hydroxide $63,305 $6,779 $8,289 $78,374 • Acid $44,360 $4,911 $5,979 $55,250 • Ethanol $0 $0 $0 $0 • Pebble Lime Feed System $335,712 $37,407 $50,839 $423,957
Regents Total $1,497,231 $158,064 $215,180 $1,870,475 Site Services $7,766,064 $835,730 $1,495,851 $10,097,645 Total Direct Costs $71,840,191 $5,987,857 $9,602,633 $87,430,682 Construction In-directs $5,903,456 $821,353 $927,380 $7,652,189 EPCM $5,505,379 $247,742 $956,058 $6,709,179 Owner's Costs $18,817,423 $477,991 $717,187 $20,012,601 Working Capital $9,000,000 $0 $0 $9,000,000 Total Initial Capital Costs $111,066,449 $7,534,944 $12,203,258 $130,804,651 Management Cost $79,705 $11,956 $8,679 $100,341 Owner's Costs $999,900 $0 $94,681 $1,094,581 Mining $8,734,076 $1,379,781 $468,494 $10,582,351 Tailings Dam $29,418,914 $3,225,820 $3,111,162 $35,755,897 Closure Costs $2,931,580 $173,565 $638,899 $3,744,045 Total Sustaining Capital Costs $42,164,175 $4,791,122 $4,321,917 $51,277,214
5070\16.4\5070-STY-001
July 2017 Lycopodium Minerals Canada Ltd
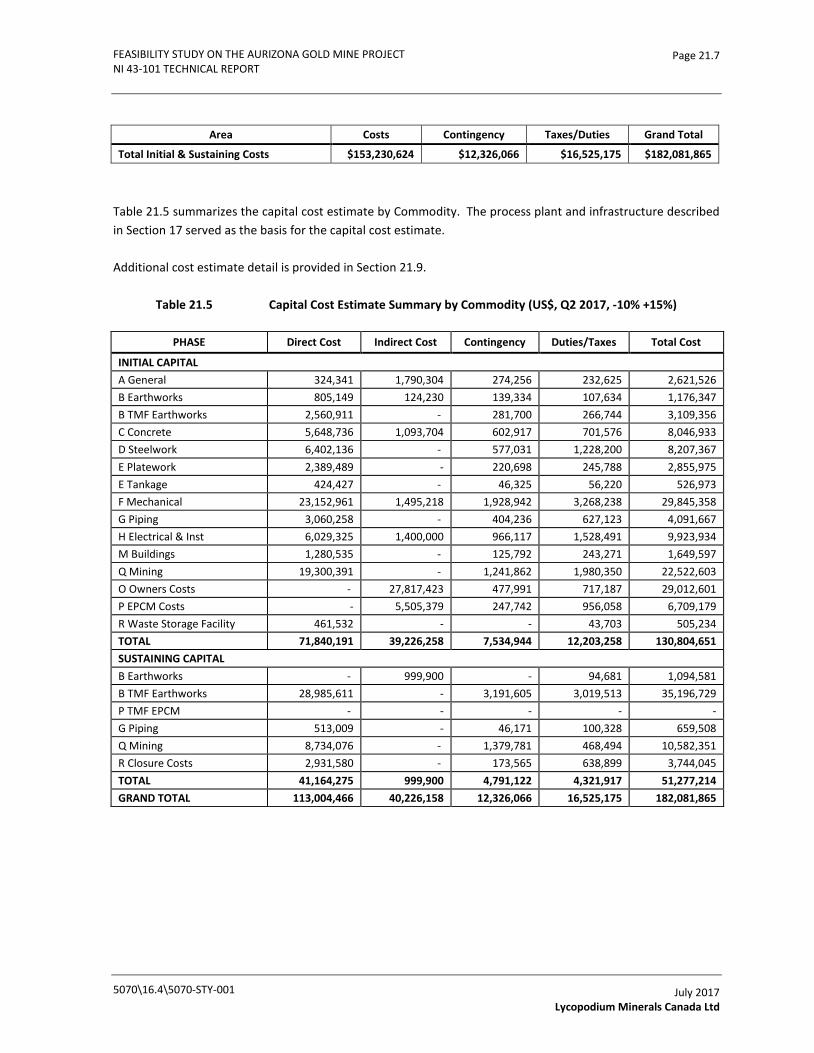
FEASIBILITY STUDY ON THE AURIZONA GOLD MINE PROJECT NI 43-101 TECHNICAL REPORT
Page 21.7
Area Costs Contingency Taxes/Duties Grand Total
Total Initial & Sustaining Costs $153,230,624 $12,326,066 $16,525,175 $182,081,865
Table 21.5 summarizes the capital cost estimate by Commodity. The process plant and infrastructure described in Section 17 served as the basis for the capital cost estimate.
Additional cost estimate detail is provided in Section 21.9.
Table 21.5 Capital Cost Estimate Summary by Commodity (US$, Q2 2017, -10% +15%)
PHASE Direct Cost Indirect Cost Contingency Duties/Taxes Total Cost
INITIAL CAPITAL A General 324,341 1,790,304 274,256 232,625 2,621,526 B Earthworks 805,149 124,230 139,334 107,634 1,176,347 B TMF Earthworks 2,560,911 - 281,700 266,744 3,109,356 C Concrete 5,648,736 1,093,704 602,917 701,576 8,046,933 D Steelwork 6,402,136 - 577,031 1,228,200 8,207,367 E Platework 2,389,489 - 220,698 245,788 2,855,975 E Tankage 424,427 - 46,325 56,220 526,973 F Mechanical 23,152,961 1,495,218 1,928,942 3,268,238 29,845,358 G Piping 3,060,258 - 404,236 627,123 4,091,667 H Electrical & Inst 6,029,325 1,400,000 966,117 1,528,491 9,923,934 M Buildings 1,280,535 - 125,792 243,271 1,649,597 Q Mining 19,300,391 - 1,241,862 1,980,350 22,522,603 O Owners Costs - 27,817,423 477,991 717,187 29,012,601 P EPCM Costs - 5,505,379 247,742 956,058 6,709,179 R Waste Storage Facility 461,532 - - 43,703 505,234 TOTAL 71,840,191 39,226,258 7,534,944 12,203,258 130,804,651 SUSTAINING CAPITAL B Earthworks - 999,900 - 94,681 1,094,581 B TMF Earthworks 28,985,611 - 3,191,605 3,019,513 35,196,729 P TMF EPCM - - - - - G Piping 513,009 - 46,171 100,328 659,508 Q Mining 8,734,076 - 1,379,781 468,494 10,582,351 R Closure Costs 2,931,580 - 173,565 638,899 3,744,045 TOTAL 41,164,275 999,900 4,791,122 4,321,917 51,277,214 GRAND TOTAL 113,004,466 40,226,158 12,326,066 16,525,175 182,081,865
5070\16.4\5070-STY-001
July 2017 Lycopodium Minerals Canada Ltd
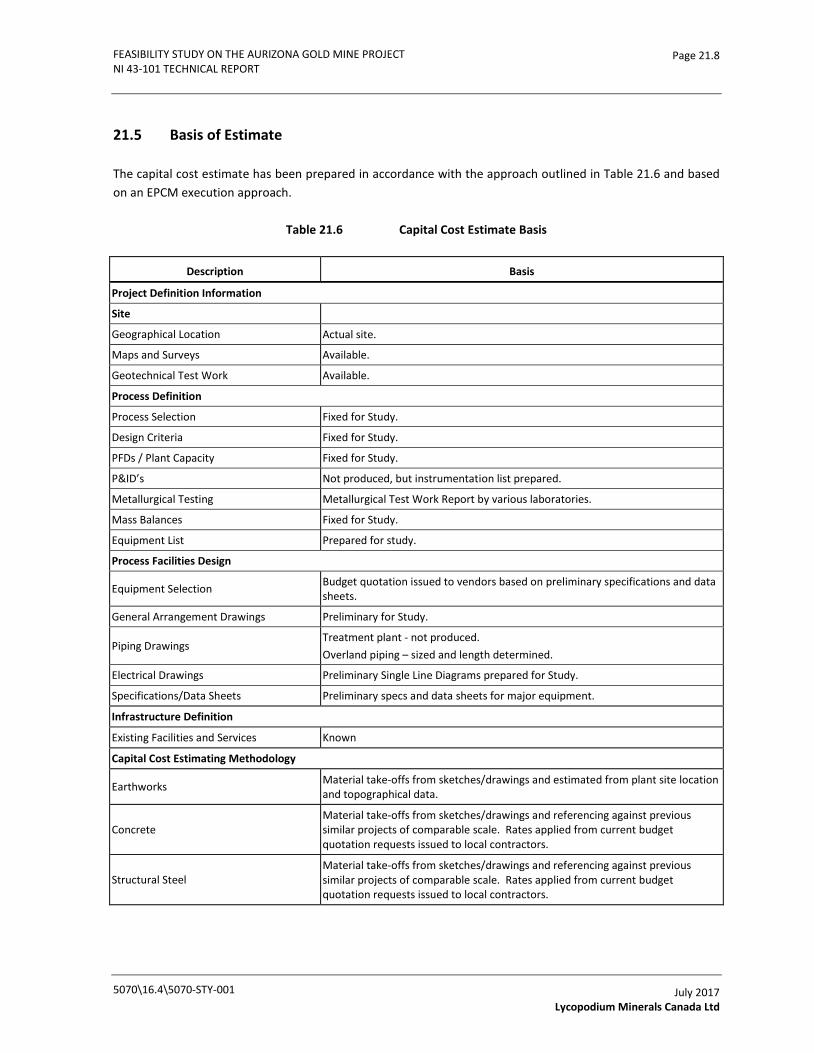
FEASIBILITY STUDY ON THE AURIZONA GOLD MINE PROJECT NI 43-101 TECHNICAL REPORT
Page 21.8
21.5 Basis of Estimate
The capital cost estimate has been prepared in accordance with the approach outlined in Table 21.6 and based on an EPCM execution approach.
Table 21.6 Capital Cost Estimate Basis
Description Basis
Project Definition Information
Site
Geographical Location Actual site.
Maps and Surveys Available.
Geotechnical Test Work Available.
Process Definition
Process Selection Fixed for Study.
Design Criteria Fixed for Study.
PFDs / Plant Capacity Fixed for Study.
P&ID’s Not produced, but instrumentation list prepared.
Metallurgical Testing Metallurgical Test Work Report by various laboratories.
Mass Balances Fixed for Study.
Equipment List Prepared for study.
Process Facilities Design
Equipment Selection Budget quotation issued to vendors based on preliminary specifications and data sheets.
General Arrangement Drawings Preliminary for Study.
Piping Drawings Treatment plant - not produced. Overland piping – sized and length determined.
Electrical Drawings Preliminary Single Line Diagrams prepared for Study.
Specifications/Data Sheets Preliminary specs and data sheets for major equipment.
Infrastructure Definition
Existing Facilities and Services Known
Capital Cost Estimating Methodology
Earthworks Material take-offs from sketches/drawings and estimated from plant site location and topographical data.
Concrete Material take-offs from sketches/drawings and referencing against previous similar projects of comparable scale. Rates applied from current budget quotation requests issued to local contractors.
Structural Steel Material take-offs from sketches/drawings and referencing against previous similar projects of comparable scale. Rates applied from current budget quotation requests issued to local contractors.
5070\16.4\5070-STY-001
July 2017 Lycopodium Minerals Canada Ltd
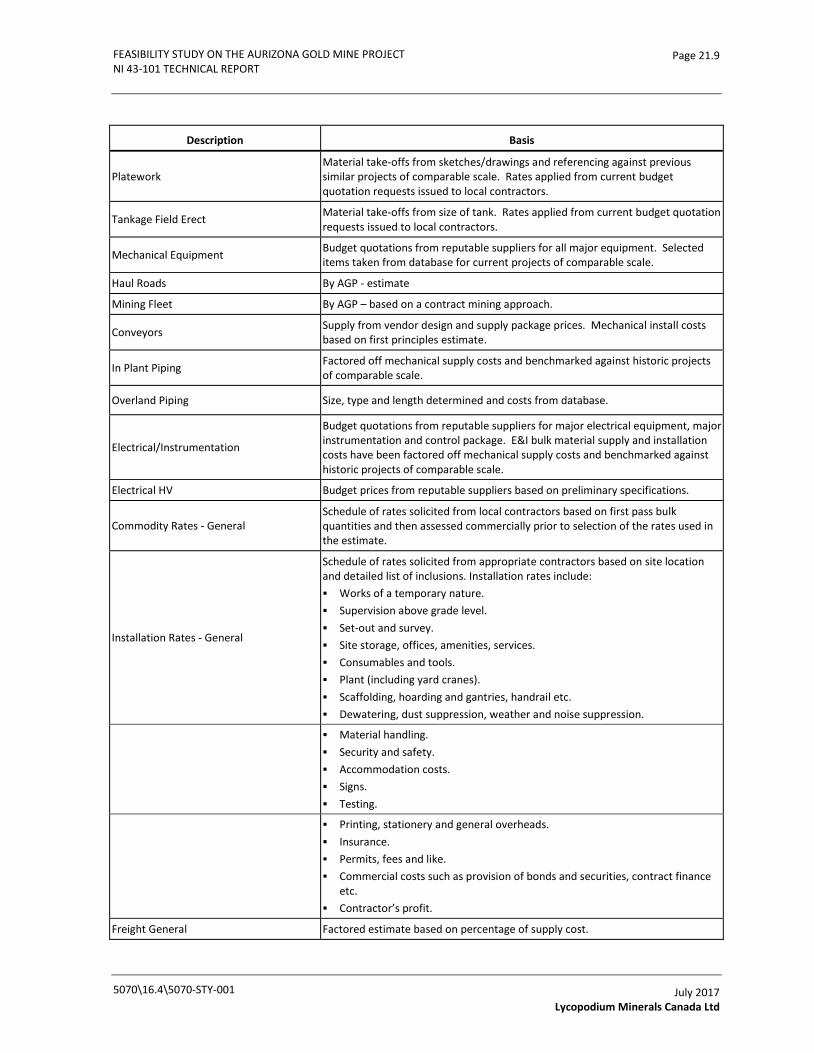
FEASIBILITY STUDY ON THE AURIZONA GOLD MINE PROJECT NI 43-101 TECHNICAL REPORT
Page 21.9
Description Basis
Platework Material take-offs from sketches/drawings and referencing against previous similar projects of comparable scale. Rates applied from current budget quotation requests issued to local contractors.
Tankage Field Erect Material take-offs from size of tank. Rates applied from current budget quotation requests issued to local contractors.
Mechanical Equipment Budget quotations from reputable suppliers for all major equipment. Selected items taken from database for current projects of comparable scale.
Haul Roads By AGP - estimate
Mining Fleet By AGP – based on a contract mining approach.
Conveyors Supply from vendor design and supply package prices. Mechanical install costs based on first principles estimate.
In Plant Piping Factored off mechanical supply costs and benchmarked against historic projects of comparable scale.
Overland Piping Size, type and length determined and costs from database.
Electrical/Instrumentation
Budget quotations from reputable suppliers for major electrical equipment, major instrumentation and control package. E&I bulk material supply and installation costs have been factored off mechanical supply costs and benchmarked against historic projects of comparable scale.
Electrical HV Budget prices from reputable suppliers based on preliminary specifications.
Commodity Rates - General Schedule of rates solicited from local contractors based on first pass bulk quantities and then assessed commercially prior to selection of the rates used in the estimate.
Installation Rates - General
Schedule of rates solicited from appropriate contractors based on site location and detailed list of inclusions. Installation rates include: Works of a temporary nature. Supervision above grade level. Set-out and survey. Site storage, offices, amenities, services. Consumables and tools. Plant (including yard cranes). Scaffolding, hoarding and gantries, handrail etc. Dewatering, dust suppression, weather and noise suppression.
Material handling. Security and safety. Accommodation costs. Signs. Testing.
Printing, stationery and general overheads. Insurance. Permits, fees and like. Commercial costs such as provision of bonds and securities, contract finance
etc. Contractor’s profit.
Freight General Factored estimate based on percentage of supply cost.
5070\16.4\5070-STY-001
July 2017 Lycopodium Minerals Canada Ltd
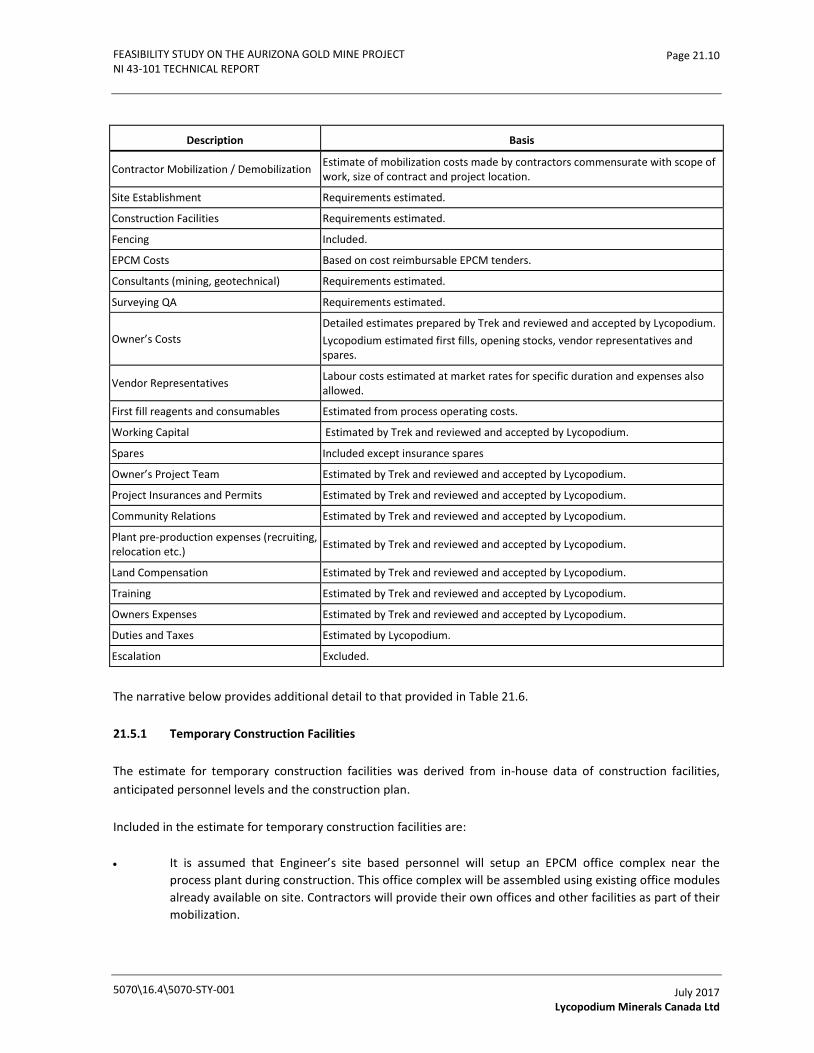
FEASIBILITY STUDY ON THE AURIZONA GOLD MINE PROJECT NI 43-101 TECHNICAL REPORT
Page 21.10
Description Basis
Contractor Mobilization / Demobilization Estimate of mobilization costs made by contractors commensurate with scope of work, size of contract and project location.
Site Establishment Requirements estimated.
Construction Facilities Requirements estimated.
Fencing Included.
EPCM Costs Based on cost reimbursable EPCM tenders.
Consultants (mining, geotechnical) Requirements estimated.
Surveying QA Requirements estimated.
Owner’s Costs Detailed estimates prepared by Trek and reviewed and accepted by Lycopodium. Lycopodium estimated first fills, opening stocks, vendor representatives and spares.
Vendor Representatives Labour costs estimated at market rates for specific duration and expenses also allowed.
First fill reagents and consumables Estimated from process operating costs.
Working Capital Estimated by Trek and reviewed and accepted by Lycopodium.
Spares Included except insurance spares
Owner’s Project Team Estimated by Trek and reviewed and accepted by Lycopodium.
Project Insurances and Permits Estimated by Trek and reviewed and accepted by Lycopodium.
Community Relations Estimated by Trek and reviewed and accepted by Lycopodium.
Plant pre-production expenses (recruiting, relocation etc.) Estimated by Trek and reviewed and accepted by Lycopodium.
Land Compensation Estimated by Trek and reviewed and accepted by Lycopodium.
Training Estimated by Trek and reviewed and accepted by Lycopodium.
Owners Expenses Estimated by Trek and reviewed and accepted by Lycopodium.
Duties and Taxes Estimated by Lycopodium.
Escalation Excluded.
The narrative below provides additional detail to that provided in Table 21.6.
21.5.1 Temporary Construction Facilities
The estimate for temporary construction facilities was derived from in-house data of construction facilities, anticipated personnel levels and the construction plan.
Included in the estimate for temporary construction facilities are:
• It is assumed that Engineer’s site based personnel will setup an EPCM office complex near the process plant during construction. This office complex will be assembled using existing office modules already available on site. Contractors will provide their own offices and other facilities as part of their mobilization.
5070\16.4\5070-STY-001
July 2017 Lycopodium Minerals Canada Ltd

FEASIBILITY STUDY ON THE AURIZONA GOLD MINE PROJECT NI 43-101 TECHNICAL REPORT
Page 21.11
• Container stores for instrumentation and other items required to be stored undercover.
• Communications and on-site radio communications will be utilized.
• Existing water supply from the existing water treatment plant trucked and pumped into a header tank, septic tanks for sewage.
• Existing power distribution to the various temporary facilities.
21.5.2 Preliminaries
Mobilization/Demobilization
Costs for mobilization/demobilization of labour and equipment to/from the Project site were adopted from budget quotation enquiries to contractors or adjusted from current tenders/contracts to reflect the project location.
21.5.3 Earthworks
Plant Site
Quantities for plant site earthworks, in-plant roads, culverts, etc. were derived from the plant layout drawings and the topographical map.
Bulk earthwork quantities were established from a preliminary design.
Rates were derived from bids from local contractors. Rates were reviewed and benchmarked against other projects.
TSF
The TSF design, scope, quantities and costs have been prepared by BVP/Walm for the Vené TSF dam raises and the new Ze Bolacha TSF.
Haul Roads
Haul roads for mining were estimated by AGP.
ROM Pads
Quantities for the ROM pad are limited to the detailed engineered fill and drainage works required around the primary crushing chamber. The bulk quantities for the ROM pad constructed from mine waste were estimated by AGP.
5070\16.4\5070-STY-001
July 2017 Lycopodium Minerals Canada Ltd

FEASIBILITY STUDY ON THE AURIZONA GOLD MINE PROJECT NI 43-101 TECHNICAL REPORT
Page 21.12
21.5.4 Concrete
Quantities for concrete works were established using:
• General arrangement drawings.
• Detailed drawings and benchmarking from similar sized projects previously completed by Lycopodium.
A material take-off was carried out. Rates for the estimate were solicited from Brazilian contractors with experience of this kind of work and capacity to perform the works. These rates were evaluated and a selection made based on cost and capability.
Rates and quantities were prepared on a composite per cubic metre basis which include detailed excavation and backfill. Mobilization and preliminaries and general costs were separated to reflect the contracting methodology.
21.5.5 Steelwork
Quantities for structural steel were established using:
• General arrangement drawings.
• Details from similar sized projects previously completed by Lycopodium.
A material take-off was carried out with member sizing based on similar structures from Lycopodium’s database.
Rates for this estimate were solicited from Brazilian contractors with experience of this kind of work and capacity to perform the works.
Site installation hours were estimated using Lycopodium’s database of experience and installation hours solicited from contractors for this estimate. These rates were evaluated and a selection made based on cost and capability.
21.5.6 Platework/Tankage
Platework and tankage quantities were estimated using sizing provided in the mechanical equipment list. A preliminary design was undertaken for each tank to select appropriate plate thicknesses to develop tank tonnages. Lining materials, where applicable, were quantified separately.
Rates for this estimate were solicited from Brazilian contractors with experience of this kind of work and capacity to perform the works. These rates were evaluated and a selection made based on cost and capability.
5070\16.4\5070-STY-001
July 2017 Lycopodium Minerals Canada Ltd
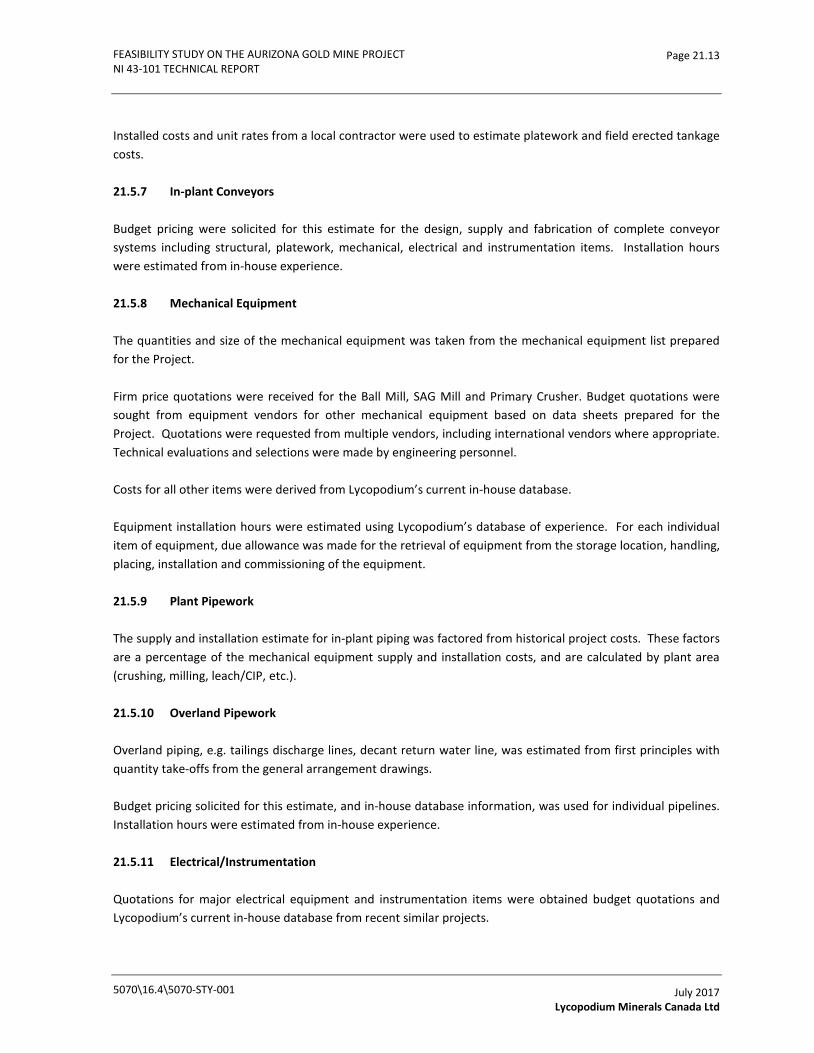
FEASIBILITY STUDY ON THE AURIZONA GOLD MINE PROJECT NI 43-101 TECHNICAL REPORT
Page 21.13
Installed costs and unit rates from a local contractor were used to estimate platework and field erected tankage costs.
21.5.7 In-plant Conveyors
Budget pricing were solicited for this estimate for the design, supply and fabrication of complete conveyor systems including structural, platework, mechanical, electrical and instrumentation items. Installation hours were estimated from in-house experience.
21.5.8 Mechanical Equipment
The quantities and size of the mechanical equipment was taken from the mechanical equipment list prepared for the Project.
Firm price quotations were received for the Ball Mill, SAG Mill and Primary Crusher. Budget quotations were sought from equipment vendors for other mechanical equipment based on data sheets prepared for the Project. Quotations were requested from multiple vendors, including international vendors where appropriate. Technical evaluations and selections were made by engineering personnel.
Costs for all other items were derived from Lycopodium’s current in-house database.
Equipment installation hours were estimated using Lycopodium’s database of experience. For each individual item of equipment, due allowance was made for the retrieval of equipment from the storage location, handling, placing, installation and commissioning of the equipment.
21.5.9 Plant Pipework
The supply and installation estimate for in-plant piping was factored from historical project costs. These factors are a percentage of the mechanical equipment supply and installation costs, and are calculated by plant area (crushing, milling, leach/CIP, etc.).
21.5.10 Overland Pipework
Overland piping, e.g. tailings discharge lines, decant return water line, was estimated from first principles with quantity take-offs from the general arrangement drawings.
Budget pricing solicited for this estimate, and in-house database information, was used for individual pipelines. Installation hours were estimated from in-house experience.
21.5.11 Electrical/Instrumentation
Quotations for major electrical equipment and instrumentation items were obtained budget quotations and Lycopodium’s current in-house database from recent similar projects.
5070\16.4\5070-STY-001
July 2017 Lycopodium Minerals Canada Ltd

FEASIBILITY STUDY ON THE AURIZONA GOLD MINE PROJECT NI 43-101 TECHNICAL REPORT
Page 21.14
Bulk E&I supply and installations costs were factored and benchmarked against similar sized Lycopodium built projects.
21.5.12 Erection and Installation
In addition to the discipline by discipline assessment of erection/installation costs detailed above, allowance was made for construction cranage and miscellaneous equipment and construction costs such as site establishment, construction personnel meals, etc. Unit rates for equipment were solicited from local Brazilian contractors.
21.5.13 Architectural/Buildings
Preliminary designs for the site buildings were produced and budget quotations from local contractors were received. The capital costs of the respective buildings were reviewed and benchmarked against Lycopodium’s database for similar projects.
21.5.14 Transport
All pricing solicited from the marketplace were obtained on the basis of delivery to site or in the case of imported items the cost of freight was estimated based on in-land transport from ex-works to the export port road freight, sea freight to Brazil and for road freight to site was made. All up freight costs were also benchmarked against other constructed projects with similar logistical conditions.
21.5.15 Catering and Accommodation
The contractors’ installation rates include the cost to cover meals and accommodation during construction.
21.5.16 Engineering Procurement and Construction Management
The EPCM costs were derived from tenders. The EPCM costs are based on a reputable EPCM Contractor undertaking all the EPCM scope of services for the process plant whilst maximizing the use of local Brazilian detailed engineering, procurement and construction management content.
21.5.17 Pre-production Costs
Pre-production labour costs for the process plant were estimated by Trek and reviewed by Lycopodium.
21.5.18 Working Capital
The working capital was estimated by Trek and reviewed by Lycopodium. Nine million dollars USD has been included to cover for the operating cash deficit in months 1 and 2 of operations.
5070\16.4\5070-STY-001
July 2017 Lycopodium Minerals Canada Ltd
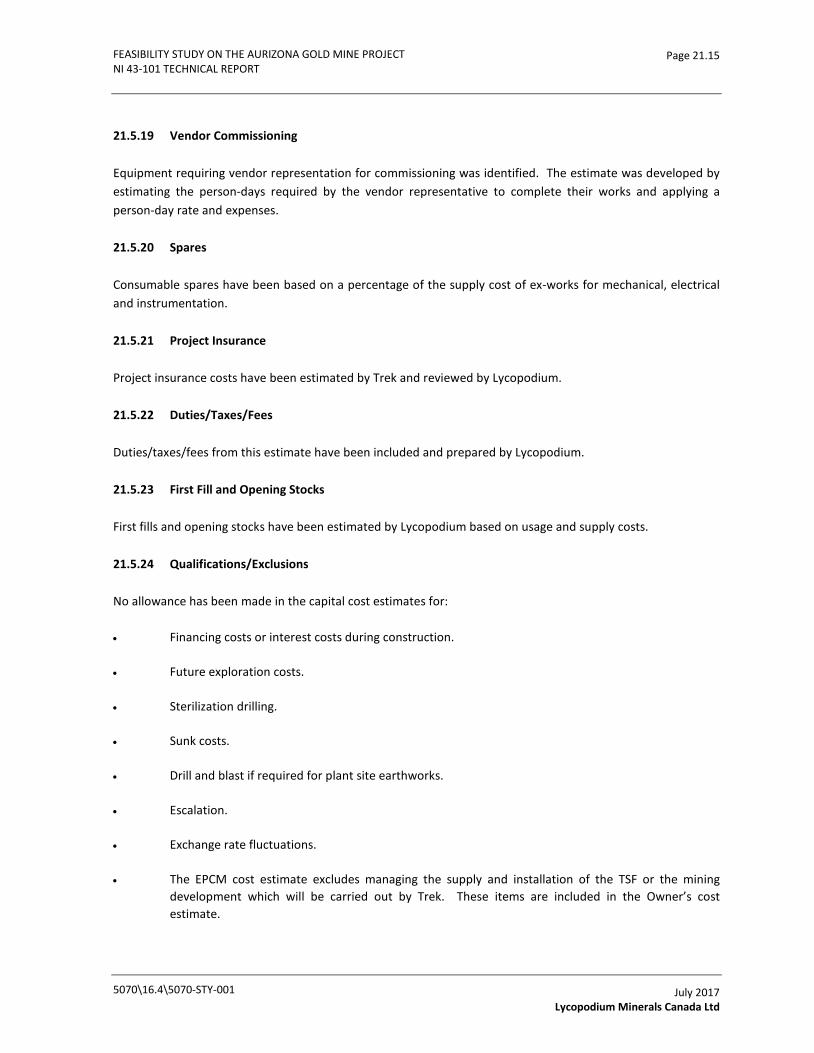
FEASIBILITY STUDY ON THE AURIZONA GOLD MINE PROJECT NI 43-101 TECHNICAL REPORT
Page 21.15
21.5.19 Vendor Commissioning
Equipment requiring vendor representation for commissioning was identified. The estimate was developed by estimating the person-days required by the vendor representative to complete their works and applying a person-day rate and expenses.
21.5.20 Spares
Consumable spares have been based on a percentage of the supply cost of ex-works for mechanical, electrical and instrumentation.
21.5.21 Project Insurance
Project insurance costs have been estimated by Trek and reviewed by Lycopodium.
21.5.22 Duties/Taxes/Fees
Duties/taxes/fees from this estimate have been included and prepared by Lycopodium.
21.5.23 First Fill and Opening Stocks
First fills and opening stocks have been estimated by Lycopodium based on usage and supply costs.
21.5.24 Qualifications/Exclusions
No allowance has been made in the capital cost estimates for:
• Financing costs or interest costs during construction.
• Future exploration costs.
• Sterilization drilling.
• Sunk costs.
• Drill and blast if required for plant site earthworks.
• Escalation.
• Exchange rate fluctuations.
• The EPCM cost estimate excludes managing the supply and installation of the TSF or the mining development which will be carried out by Trek. These items are included in the Owner’s cost estimate.
5070\16.4\5070-STY-001
July 2017 Lycopodium Minerals Canada Ltd

FEASIBILITY STUDY ON THE AURIZONA GOLD MINE PROJECT NI 43-101 TECHNICAL REPORT
Page 21.16
• The programming of the plant control system is included in the direct costs.
21.6 Labour Rates and Crew Rates
Base labour rates for different trades and classifications have been obtained from Brazilian contractors. Payroll mark-ups and burdens for social charges and uplifts have been included taking into consideration site conditions, work exposure and existing legislation.
Equipment rental rates were added to the direct labour rates to derive the “all-in” crew rates per discipline used in the estimate. Table 21.7 provides a summary of the average crew rates per discipline of work.
Table 21.7 Crew Rates
Crew Base + Fringes
Rate $R/h
Equipment Rental Rate
$R/h
"All-In" Rate $R/h
General Work 60.0 15.0 75.0
Concrete 70.0 25.0 95.0
Steelwork 79.0 36.3 115.3
Plate Work and Shop Tankage 79.0 36.3 115.3
Field Erected Tankage 79.0 36.3 115.3
Mechanical Equipment 79.0 36.3 115.3
Mills 86.9 39.9 126.8
Pipework 86.9 39.9 126.8
Electrical and Instrumentation 95.0 25.0 120.0
Buildings 70.0 20.0 90.0
5070\16.4\5070-STY-001
July 2017 Lycopodium Minerals Canada Ltd
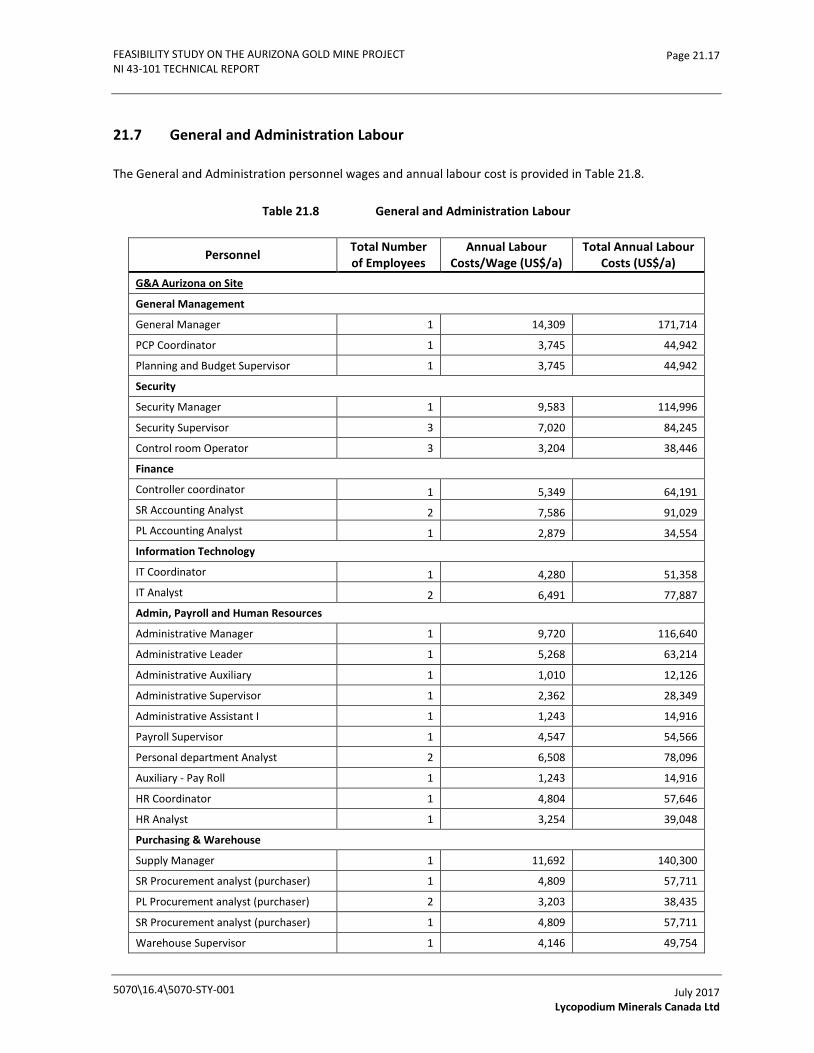
FEASIBILITY STUDY ON THE AURIZONA GOLD MINE PROJECT NI 43-101 TECHNICAL REPORT
Page 21.17
21.7 General and Administration Labour
The General and Administration personnel wages and annual labour cost is provided in Table 21.8.
Table 21.8 General and Administration Labour
Personnel Total Number of Employees
Annual Labour Costs/Wage (US$/a)
Total Annual Labour Costs (US$/a)
G&A Aurizona on Site
General Management
General Manager 1 14,309 171,714
PCP Coordinator 1 3,745 44,942
Planning and Budget Supervisor 1 3,745 44,942
Security
Security Manager 1 9,583 114,996
Security Supervisor 3 7,020 84,245
Control room Operator 3 3,204 38,446
Finance
Controller coordinator 1 5,349 64,191 SR Accounting Analyst 2 7,586 91,029 PL Accounting Analyst 1 2,879 34,554 Information Technology
IT Coordinator 1 4,280 51,358 IT Analyst 2 6,491 77,887 Admin, Payroll and Human Resources
Administrative Manager 1 9,720 116,640
Administrative Leader 1 5,268 63,214
Administrative Auxiliary 1 1,010 12,126
Administrative Supervisor 1 2,362 28,349
Administrative Assistant I 1 1,243 14,916
Payroll Supervisor 1 4,547 54,566
Personal department Analyst 2 6,508 78,096
Auxiliary - Pay Roll 1 1,243 14,916
HR Coordinator 1 4,804 57,646
HR Analyst 1 3,254 39,048
Purchasing & Warehouse
Supply Manager 1 11,692 140,300
SR Procurement analyst (purchaser) 1 4,809 57,711
PL Procurement analyst (purchaser) 2 3,203 38,435
SR Procurement analyst (purchaser) 1 4,809 57,711
Warehouse Supervisor 1 4,146 49,754
5070\16.4\5070-STY-001
July 2017 Lycopodium Minerals Canada Ltd
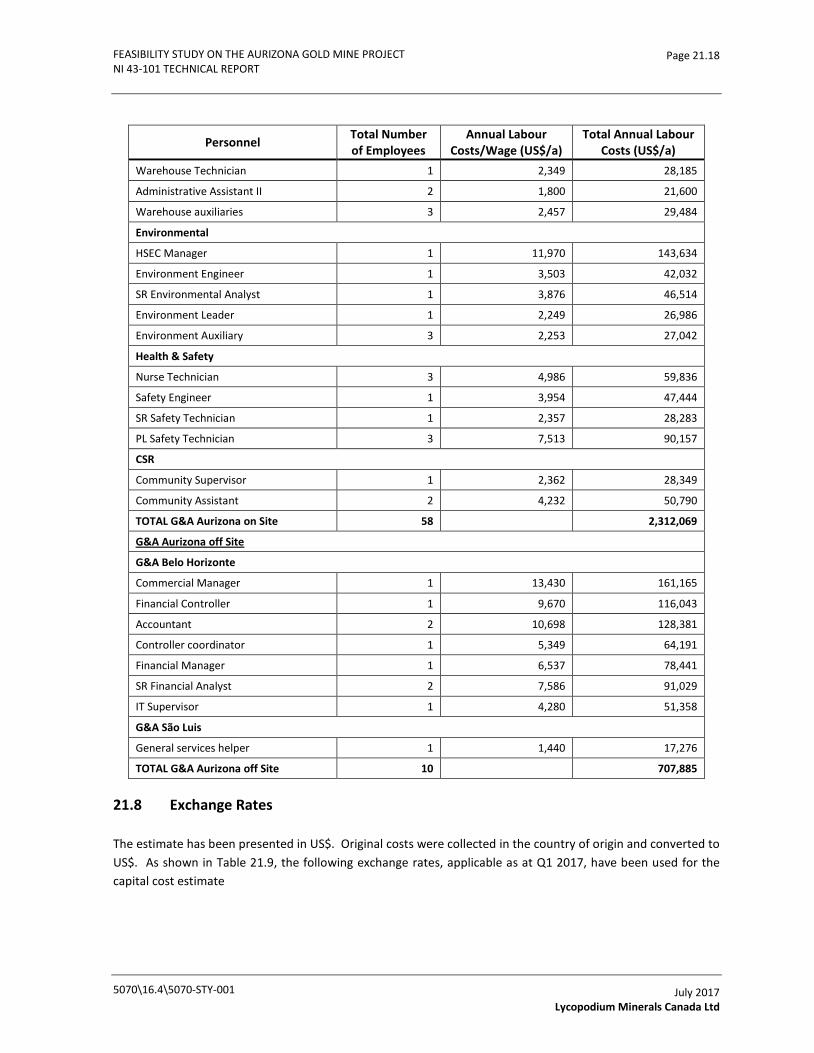
FEASIBILITY STUDY ON THE AURIZONA GOLD MINE PROJECT NI 43-101 TECHNICAL REPORT
Page 21.18
Personnel Total Number of Employees
Annual Labour Costs/Wage (US$/a)
Total Annual Labour Costs (US$/a)
Warehouse Technician 1 2,349 28,185
Administrative Assistant II 2 1,800 21,600
Warehouse auxiliaries 3 2,457 29,484
Environmental
HSEC Manager 1 11,970 143,634
Environment Engineer 1 3,503 42,032
SR Environmental Analyst 1 3,876 46,514
Environment Leader 1 2,249 26,986
Environment Auxiliary 3 2,253 27,042
Health & Safety
Nurse Technician 3 4,986 59,836
Safety Engineer 1 3,954 47,444
SR Safety Technician 1 2,357 28,283
PL Safety Technician 3 7,513 90,157
CSR
Community Supervisor 1 2,362 28,349
Community Assistant 2 4,232 50,790
TOTAL G&A Aurizona on Site 58 2,312,069
G&A Aurizona off Site
G&A Belo Horizonte
Commercial Manager 1 13,430 161,165
Financial Controller 1 9,670 116,043
Accountant 2 10,698 128,381
Controller coordinator 1 5,349 64,191
Financial Manager 1 6,537 78,441
SR Financial Analyst 2 7,586 91,029
IT Supervisor 1 4,280 51,358
G&A São Luis
General services helper 1 1,440 17,276
TOTAL G&A Aurizona off Site 10 707,885
21.8 Exchange Rates
The estimate has been presented in US$. Original costs were collected in the country of origin and converted to US$. As shown in Table 21.9, the following exchange rates, applicable as at Q1 2017, have been used for the capital cost estimate
5070\16.4\5070-STY-001
July 2017 Lycopodium Minerals Canada Ltd
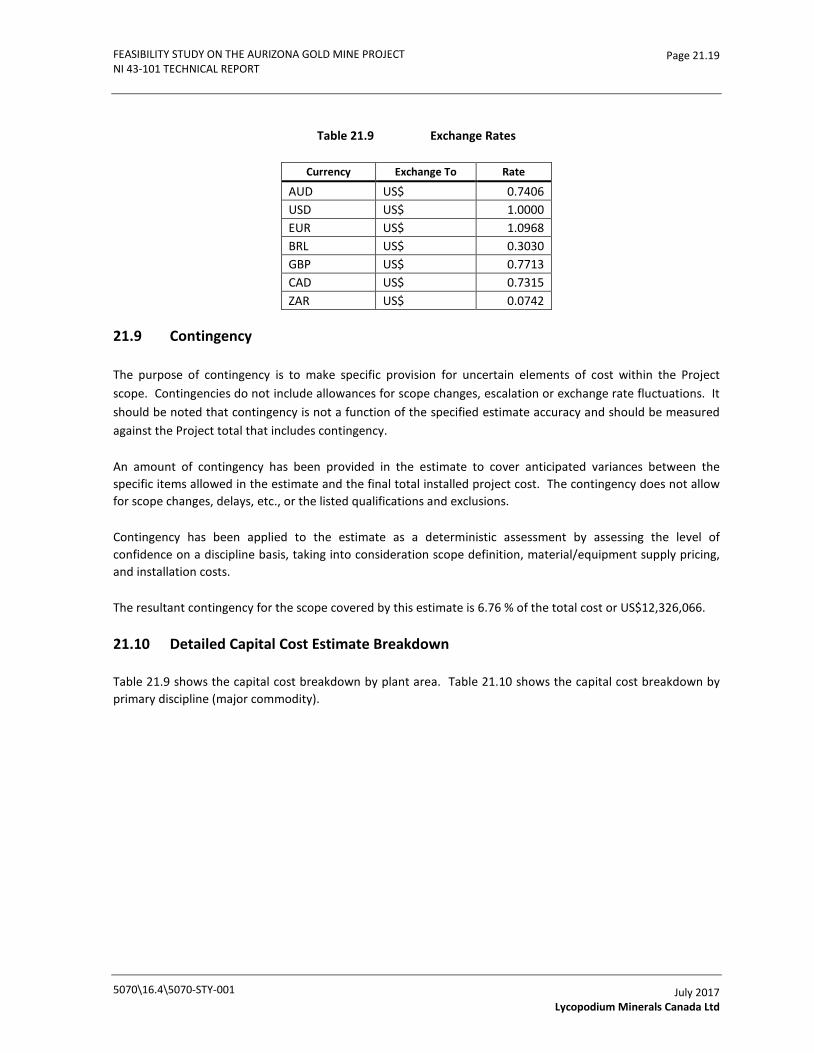
FEASIBILITY STUDY ON THE AURIZONA GOLD MINE PROJECT NI 43-101 TECHNICAL REPORT
Page 21.19
Table 21.9 Exchange Rates
Currency Exchange To Rate
AUD US$ 0.7406 USD US$ 1.0000 EUR US$ 1.0968 BRL US$ 0.3030 GBP US$ 0.7713 CAD US$ 0.7315 ZAR US$ 0.0742
21.9 Contingency
The purpose of contingency is to make specific provision for uncertain elements of cost within the Project scope. Contingencies do not include allowances for scope changes, escalation or exchange rate fluctuations. It should be noted that contingency is not a function of the specified estimate accuracy and should be measured against the Project total that includes contingency.
An amount of contingency has been provided in the estimate to cover anticipated variances between the specific items allowed in the estimate and the final total installed project cost. The contingency does not allow for scope changes, delays, etc., or the listed qualifications and exclusions.
Contingency has been applied to the estimate as a deterministic assessment by assessing the level of confidence on a discipline basis, taking into consideration scope definition, material/equipment supply pricing, and installation costs.
The resultant contingency for the scope covered by this estimate is 6.76 % of the total cost or US$12,326,066.
21.10 Detailed Capital Cost Estimate Breakdown
Table 21.9 shows the capital cost breakdown by plant area. Table 21.10 shows the capital cost breakdown by primary discipline (major commodity).
5070\16.4\5070-STY-001
July 2017 Lycopodium Minerals Canada Ltd

FEASIBILITY STUDY ON THE AURIZONA GOLD MINE PROJECT NI 43-101 TECHNICAL REPORT
Page 21.20
Table 21.10 Capital Cost Estimate by Plant Area (US$, Q1 2017, -10% +15%)
Phase Plant Area Direct Cost Indirect Cost Contingency Duties/Taxes Total Cost
INITIAL CAPITAL 1 Construction In-directs 01 Contractor In-directs - 4,113,152 576,288 715,517 5,404,956
02 Site In-directs - 695,142 104,271 92,313 891,726
03 Site Accommodation & Meals - 625,562 93,834 119,550 838,946
05 Vendor Reps - 469,600 46,960 - 516,560
5 Management Costs 51 EPCM Home Office - 5,505,379 247,742 956,058 6,709,179
6 Owner's Costs 60 Electrical Services - 1,276,539 255,308 145,052 1,676,899
62 Pre-Production Costs - 17,540,884 222,683 572,135 18,335,703
61 Working Capital Allowance 9,000,000 - - - 9,000,000
2 Mining 21 Mining Equipment 1,409,000 - 70,450 88,826 1,568,276
23 Misc Mining Capital 2,867,343 - 200,714 180,762 3,248,819
20 Mining Initial Stripping 1,743,477 - 87,174 173,346 2,003,997
22 Mining Contractor Pre-Stripping 10,408,000 - 520,400 1,034,818 11,963,218
27 Surface Water Management 2,366,790 - 236,679 460,430 3,063,898
26 Acid Rock Drainage 250,000 62,500 42,168 354,668
25 Waste Rock Foundation 255,781 - 63,945 - 319,726
3 Tailings Dam 30 TMF Pre-Production 2,560,911 - 281,700 266,744 3,109,356
4 Treatment Plant 05 Site Preparation 410,179 - 42,066 30,109 482,355
05 Treatment Plant - General 3,285,980 - 468,811 268,476 4,023,266
10 Feed Preparation 6,137,078 - 580,001 707,708 7,424,787
20 Grinding 24,021,542 - 1,783,421 3,730,793 29,535,756
46 Water Services 57,078 - 5,137 8,800 71,015
51 Leach/CIP/Tailings 5,042,189 - 467,557 686,132 6,195,878 60 Acid Wash / Elution 756,456 - 70,419 91,252 918,127 61 Carbon Regeneration 31,956 - 2,910 3,819 38,686 62 Intensive Leaching 48,545 - 5,076 6,334 59,955 63 Electowinning/Goldroom 460,263 - 44,878 66,849 571,990
5070\16.4\5070-STY-001
July 2017 Lycopodium Minerals Canada Ltd
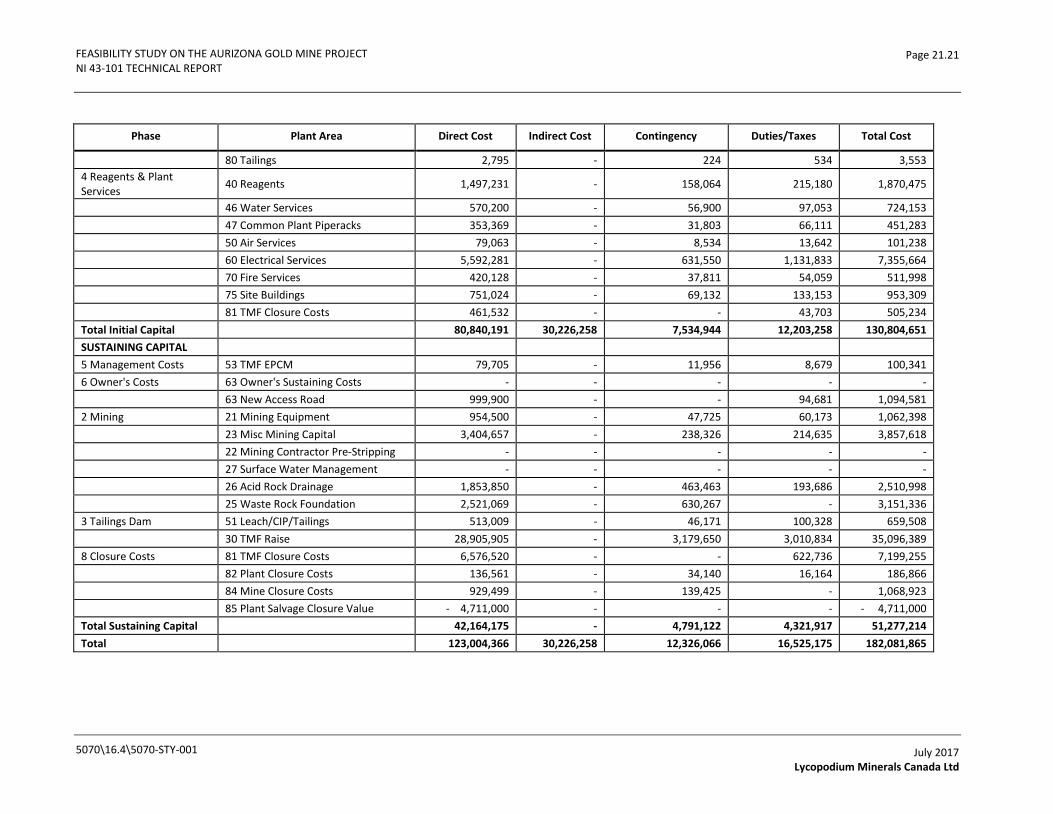
FEASIBILITY STUDY ON THE AURIZONA GOLD MINE PROJECT NI 43-101 TECHNICAL REPORT
Page 21.21
Phase Plant Area Direct Cost Indirect Cost Contingency Duties/Taxes Total Cost
80 Tailings 2,795 - 224 534 3,553 4 Reagents & Plant Services 40 Reagents 1,497,231 - 158,064 215,180 1,870,475
46 Water Services 570,200 - 56,900 97,053 724,153 47 Common Plant Piperacks 353,369 - 31,803 66,111 451,283 50 Air Services 79,063 - 8,534 13,642 101,238 60 Electrical Services 5,592,281 - 631,550 1,131,833 7,355,664 70 Fire Services 420,128 - 37,811 54,059 511,998 75 Site Buildings 751,024 - 69,132 133,153 953,309 81 TMF Closure Costs 461,532 - - 43,703 505,234 Total Initial Capital 80,840,191 30,226,258 7,534,944 12,203,258 130,804,651 SUSTAINING CAPITAL 5 Management Costs 53 TMF EPCM 79,705 - 11,956 8,679 100,341 6 Owner's Costs 63 Owner's Sustaining Costs - - - - - 63 New Access Road 999,900 - - 94,681 1,094,581 2 Mining 21 Mining Equipment 954,500 - 47,725 60,173 1,062,398 23 Misc Mining Capital 3,404,657 - 238,326 214,635 3,857,618 22 Mining Contractor Pre-Stripping - - - - - 27 Surface Water Management - - - - - 26 Acid Rock Drainage 1,853,850 - 463,463 193,686 2,510,998 25 Waste Rock Foundation 2,521,069 - 630,267 - 3,151,336 3 Tailings Dam 51 Leach/CIP/Tailings 513,009 - 46,171 100,328 659,508 30 TMF Raise 28,905,905 - 3,179,650 3,010,834 35,096,389 8 Closure Costs 81 TMF Closure Costs 6,576,520 - - 622,736 7,199,255 82 Plant Closure Costs 136,561 - 34,140 16,164 186,866 84 Mine Closure Costs 929,499 - 139,425 - 1,068,923 85 Plant Salvage Closure Value - 4,711,000 - - - - 4,711,000 Total Sustaining Capital 42,164,175 - 4,791,122 4,321,917 51,277,214 Total 123,004,366 30,226,258 12,326,066 16,525,175 182,081,865
5070\16.4\5070-STY-001
July 2017 Lycopodium Minerals Canada Ltd
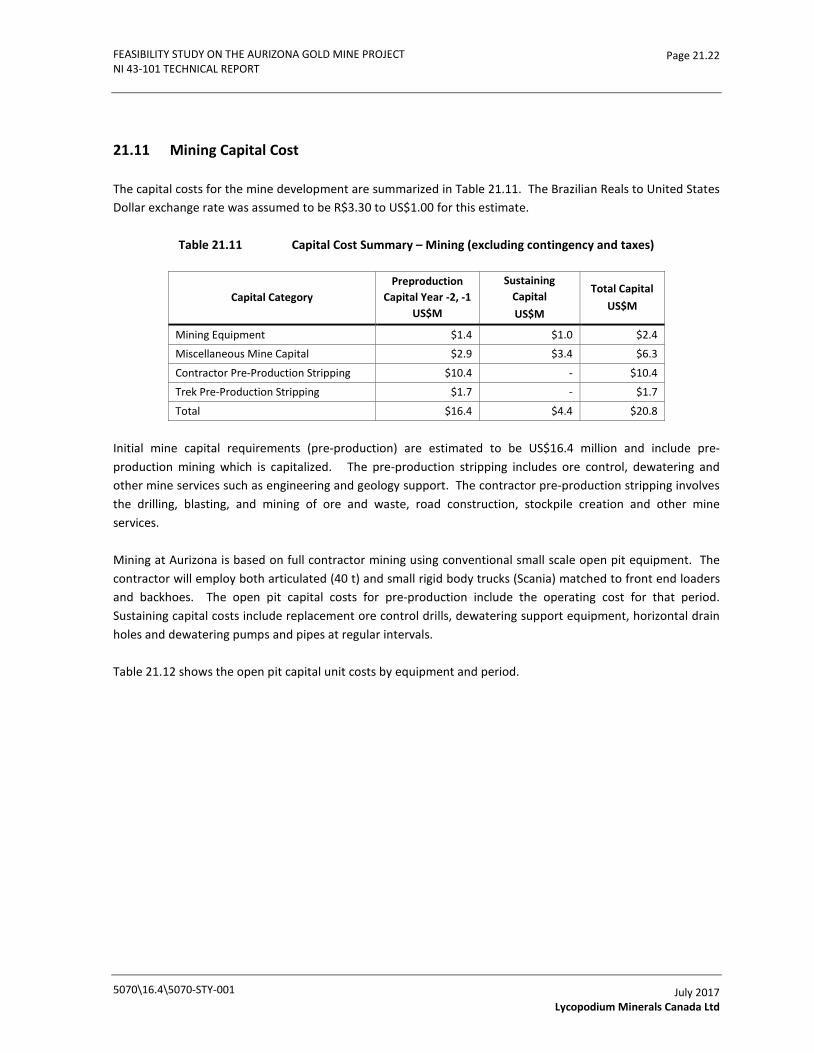
FEASIBILITY STUDY ON THE AURIZONA GOLD MINE PROJECT NI 43-101 TECHNICAL REPORT
Page 21.22
21.11 Mining Capital Cost
The capital costs for the mine development are summarized in Table 21.11. The Brazilian Reals to United States Dollar exchange rate was assumed to be R$3.30 to US$1.00 for this estimate.
Table 21.11 Capital Cost Summary – Mining (excluding contingency and taxes)
Capital Category Preproduction
Capital Year -2, -1 US$M
Sustaining Capital US$M
Total Capital US$M
Mining Equipment $1.4 $1.0 $2.4
Miscellaneous Mine Capital $2.9 $3.4 $6.3
Contractor Pre-Production Stripping $10.4 - $10.4
Trek Pre-Production Stripping $1.7 - $1.7
Total $16.4 $4.4 $20.8 Initial mine capital requirements (pre-production) are estimated to be US$16.4 million and include pre-production mining which is capitalized. The pre-production stripping includes ore control, dewatering and other mine services such as engineering and geology support. The contractor pre-production stripping involves the drilling, blasting, and mining of ore and waste, road construction, stockpile creation and other mine services.
Mining at Aurizona is based on full contractor mining using conventional small scale open pit equipment. The contractor will employ both articulated (40 t) and small rigid body trucks (Scania) matched to front end loaders and backhoes. The open pit capital costs for pre-production include the operating cost for that period. Sustaining capital costs include replacement ore control drills, dewatering support equipment, horizontal drain holes and dewatering pumps and pipes at regular intervals.
Table 21.12 shows the open pit capital unit costs by equipment and period.
5070\16.4\5070-STY-001
July 2017 Lycopodium Minerals Canada Ltd
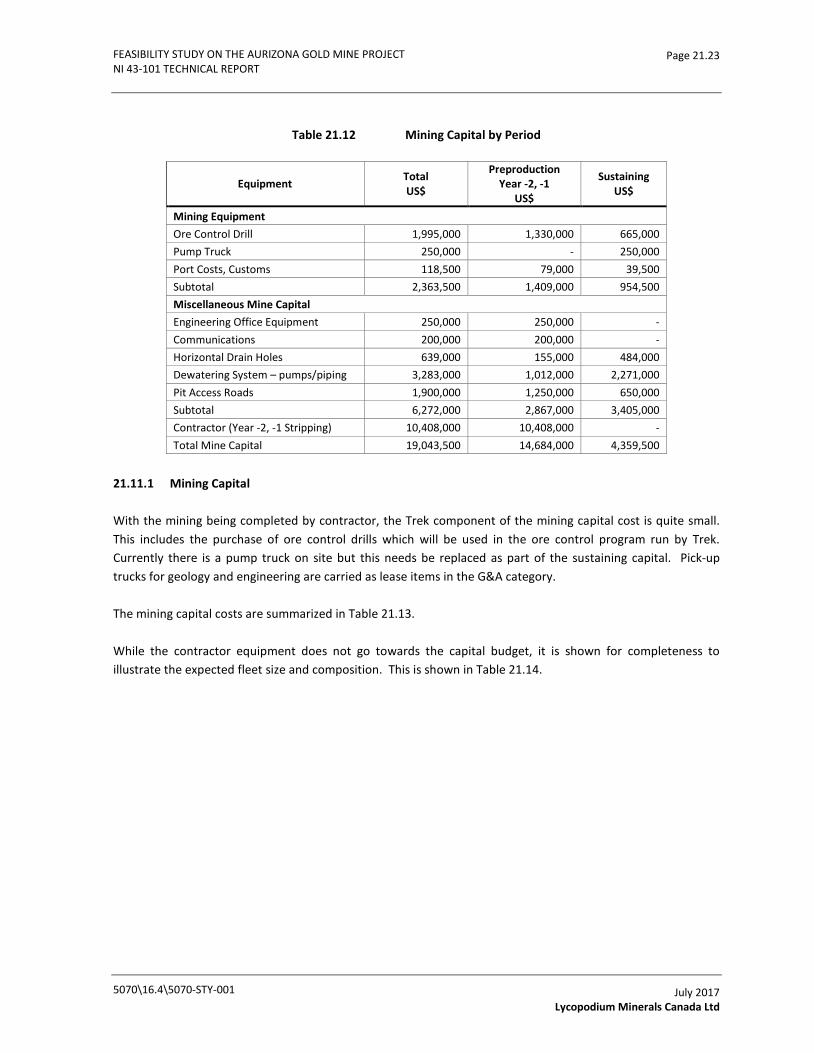
FEASIBILITY STUDY ON THE AURIZONA GOLD MINE PROJECT NI 43-101 TECHNICAL REPORT
Page 21.23
Table 21.12 Mining Capital by Period
Equipment Total US$
Preproduction Year -2, -1
US$
Sustaining US$
Mining Equipment Ore Control Drill 1,995,000 1,330,000 665,000 Pump Truck 250,000 - 250,000 Port Costs, Customs 118,500 79,000 39,500 Subtotal 2,363,500 1,409,000 954,500 Miscellaneous Mine Capital Engineering Office Equipment 250,000 250,000 - Communications 200,000 200,000 - Horizontal Drain Holes 639,000 155,000 484,000 Dewatering System – pumps/piping 3,283,000 1,012,000 2,271,000 Pit Access Roads 1,900,000 1,250,000 650,000 Subtotal 6,272,000 2,867,000 3,405,000 Contractor (Year -2, -1 Stripping) 10,408,000 10,408,000 - Total Mine Capital 19,043,500 14,684,000 4,359,500
21.11.1 Mining Capital
With the mining being completed by contractor, the Trek component of the mining capital cost is quite small. This includes the purchase of ore control drills which will be used in the ore control program run by Trek. Currently there is a pump truck on site but this needs be replaced as part of the sustaining capital. Pick-up trucks for geology and engineering are carried as lease items in the G&A category.
The mining capital costs are summarized in Table 21.13.
While the contractor equipment does not go towards the capital budget, it is shown for completeness to illustrate the expected fleet size and composition. This is shown in Table 21.14.
5070\16.4\5070-STY-001
July 2017 Lycopodium Minerals Canada Ltd
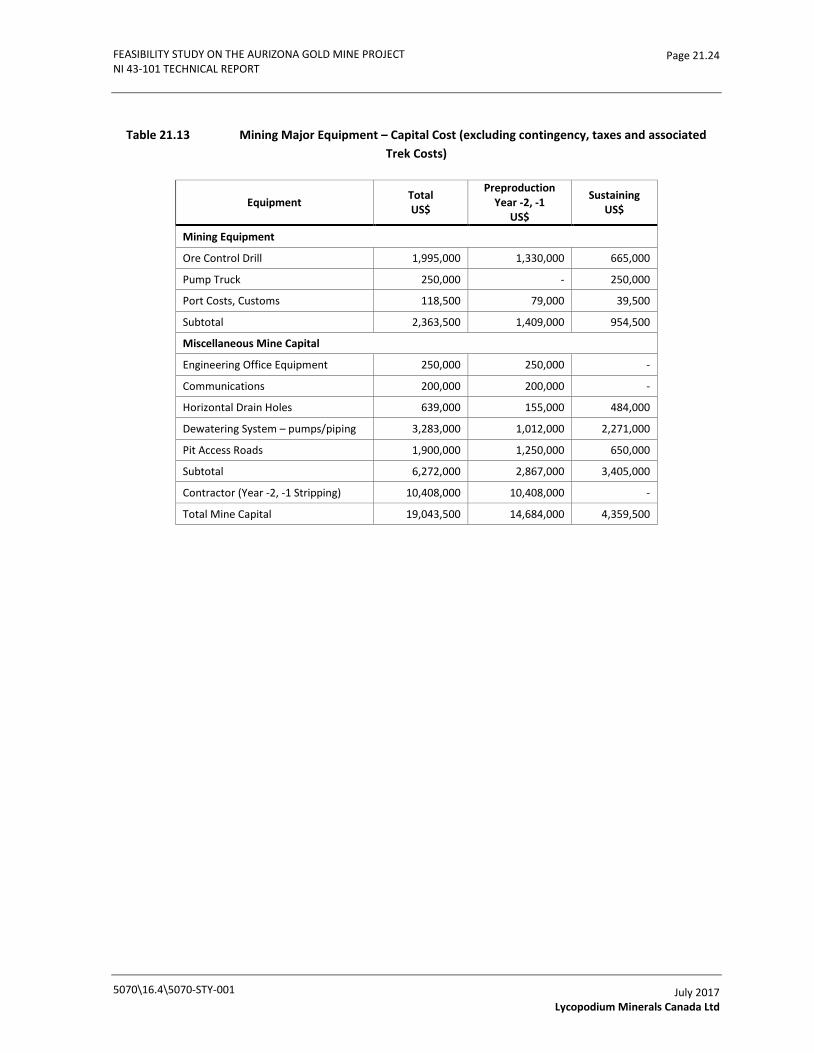
FEASIBILITY STUDY ON THE AURIZONA GOLD MINE PROJECT NI 43-101 TECHNICAL REPORT
Page 21.24
Table 21.13 Mining Major Equipment – Capital Cost (excluding contingency, taxes and associated Trek Costs)
Equipment Total US$
Preproduction Year -2, -1
US$
Sustaining US$
Mining Equipment
Ore Control Drill 1,995,000 1,330,000 665,000
Pump Truck 250,000 - 250,000
Port Costs, Customs 118,500 79,000 39,500
Subtotal 2,363,500 1,409,000 954,500
Miscellaneous Mine Capital
Engineering Office Equipment 250,000 250,000 -
Communications 200,000 200,000 -
Horizontal Drain Holes 639,000 155,000 484,000
Dewatering System – pumps/piping 3,283,000 1,012,000 2,271,000
Pit Access Roads 1,900,000 1,250,000 650,000
Subtotal 6,272,000 2,867,000 3,405,000
Contractor (Year -2, -1 Stripping) 10,408,000 10,408,000 -
Total Mine Capital 19,043,500 14,684,000 4,359,500
5070\16.4\5070-STY-001
July 2017 Lycopodium Minerals Canada Ltd

FEASIBILITY STUDY ON THE AURIZONA GOLD MINE PROJECT NI 43-101 TECHNICAL REPORT
Page 21.25
Table 21.14 Contractor Mining Equipment by Period
Equipment Model Preproduction
Units Year -2, -1
Units Year 1 to 9
Production Drill Atlas Copco ROC L8 1 3
Excavator Cat 390D 1 5
Articulated Truck Cat 745C 8 45
8x4 Tipper Truck 8x4 0 34
Tracked Dozer Cat D8T 1 4
Grader Cat 140K 1 2
Soil Roller Cat CS54B 1 1
Wheel Loader Cat 966H 1 1
Backhoe Mining Cat 420F 1 2
Backhoe Construction Cat 420F 1 1
8x4 Tipper Truck - Construction 8x4 13 2
Excavator - Construction Cat 320 1 1
Excavator - Construction Cat 336 1 1
Tracked Dozer - Construction Cat D6T 1 1
Grader - Construction Cat 140K 1 1
Water Truck - Construction 8x4, 15,000 L 1 1
Soil Roller - Construction Cat CS54B 1 1
Wheel Loader - Construction Cat 966H 1 1
Secondary Crusher - Construction Not specified 1 1
8x4 Truck (Auxiliary) 8x4 3 3
5070\16.4\5070-STY-001
July 2017 Lycopodium Minerals Canada Ltd

FEASIBILITY STUDY ON THE AURIZONA GOLD MINE PROJECT NI 43-101 TECHNICAL REPORT
Page 21.26
21.11.2 Miscellaneous Mine Capital
The miscellaneous mine capital includes various separate line items in the costing:
• Engineering Office Equipment.
• Communications.
• Pit Access Road Construction and Upgrading.
• Contractor Pre-stripping (shown separately in the various tables)
• Dewatering Pumps and piping.
The engineering office equipment includes such items as desktop computers, plotter, digitizer, licenses for mining and geology software and survey equipment with associated peripherals. This cost is estimated at US$250,000 with most of the cost being the mining software.
The communication category is an allowance for additional radios and repeaters for use by the geology and engineering teams in addition to ore control and dewatering operations.
Road construction and upgrading is considered imperative to maintaining efficient mining during the rainy season. This will involve proper road construction with compaction, geotextile and geomembranes and crushed rock. An estimate of US$250,000/km is used for the pre-production road construction of 7.6 km.
Dewatering is a key component of stable wall slopes. This will be accomplished with horizontal drain holes and significant pumps and piping to remove the water from the pit. Horizontal drilling will occur over the entire mine life and is proportioned based on wall exposure. Dewatering stations are created each 200m horizontally and 23m vertically. Each station will have 3 sub-horizontal drain holes fanning out from the station for a depth of 50m each. The initial horizontal drain hole program is estimated at US$155,000 in Year -1.
The dewatering system is a set of pumps for in the pit with piping to bring this to the surface storage ponds. The surface system then pumps the water from those ponds on the edge of the pit to the final discharge points. Four pumps will be purchased initially with 2 km of piping to start the system. The cost estimate came from vendor quotes and includes all the accessories required for a functional system. The pumping requirements for the pits are based on the information provided by SRK. Average pumping requirements are expected to be 11,500 m3/d with a maximum pumping rate of 24,000 m3/day during storm events or in the rainy season.
A contractor will be employed by Trek to both initiate mining and complete all mining activities during production. A contract mining cost of US$2.27/t moved is estimated based on contract quotations received for mining. The contract tonnage is estimated at 2.44 Mt in Year -2 and 2.15 Mt in Year -1.
5070\16.4\5070-STY-001
July 2017 Lycopodium Minerals Canada Ltd
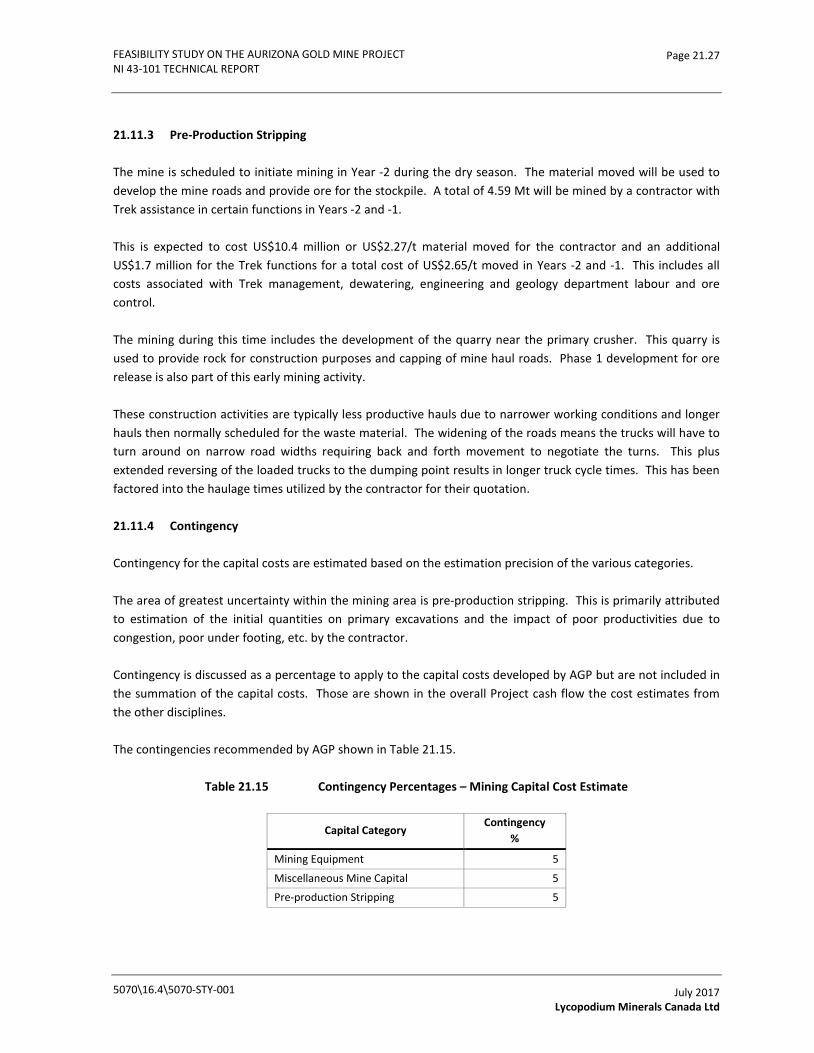
FEASIBILITY STUDY ON THE AURIZONA GOLD MINE PROJECT NI 43-101 TECHNICAL REPORT
Page 21.27
21.11.3 Pre-Production Stripping
The mine is scheduled to initiate mining in Year -2 during the dry season. The material moved will be used to develop the mine roads and provide ore for the stockpile. A total of 4.59 Mt will be mined by a contractor with Trek assistance in certain functions in Years -2 and -1.
This is expected to cost US$10.4 million or US$2.27/t material moved for the contractor and an additional US$1.7 million for the Trek functions for a total cost of US$2.65/t moved in Years -2 and -1. This includes all costs associated with Trek management, dewatering, engineering and geology department labour and ore control.
The mining during this time includes the development of the quarry near the primary crusher. This quarry is used to provide rock for construction purposes and capping of mine haul roads. Phase 1 development for ore release is also part of this early mining activity.
These construction activities are typically less productive hauls due to narrower working conditions and longer hauls then normally scheduled for the waste material. The widening of the roads means the trucks will have to turn around on narrow road widths requiring back and forth movement to negotiate the turns. This plus extended reversing of the loaded trucks to the dumping point results in longer truck cycle times. This has been factored into the haulage times utilized by the contractor for their quotation.
21.11.4 Contingency
Contingency for the capital costs are estimated based on the estimation precision of the various categories.
The area of greatest uncertainty within the mining area is pre-production stripping. This is primarily attributed to estimation of the initial quantities on primary excavations and the impact of poor productivities due to congestion, poor under footing, etc. by the contractor.
Contingency is discussed as a percentage to apply to the capital costs developed by AGP but are not included in the summation of the capital costs. Those are shown in the overall Project cash flow the cost estimates from the other disciplines.
The contingencies recommended by AGP shown in Table 21.15.
Table 21.15 Contingency Percentages – Mining Capital Cost Estimate
Capital Category Contingency
%
Mining Equipment 5
Miscellaneous Mine Capital 5
Pre-production Stripping 5
5070\16.4\5070-STY-001
July 2017 Lycopodium Minerals Canada Ltd

FEASIBILITY STUDY ON THE AURIZONA GOLD MINE PROJECT NI 43-101 TECHNICAL REPORT
Page 21.28
21.12 Operating Costs
21.12.1 Introduction
Direct cash operating costs for the Project have been estimated under three functional headings – mining, process plant and G&A. The operating costs have been estimated by the following parties:
• Mining – AGP.
• Process Plant – Lycopodium.
• G&A – Prepared by Trek and reviewed by Lycopodium.
The LOM overall operating cost for the Project is US$27.14/t of ore processed based on an owner operated and is summarized in Table 21.16.
Table 21.16 Life of Mine Operating Cost Summary
LOM $/t ore $/oz
Mining 15.83 355 Process Plant 8.43 189 G&A 2.88 64 Total 27.14 608
The operating cost estimates are expressed in Q2 2017 terms and are expected to be accurate within ±15%. Unit rates for cost items that have been received from Brazilian sources are converted via the US$:$R exchange rate of 1:3.3 as per Q2 2017.
Sources of general data and assumptions used as the basis for estimating the process operating costs are listed below:
• The process design criteria of this Study.
• The production rate of 2.92 Mt/a of ore.
• Manpower requirements were developed by AGP, Trek and Lycopodium. Labour rates were provided by Trek.
• The unit cost of electrical energy is US$0.083/kWh.
• The unit cost of diesel fuel is US$0.906/L.
5070\16.4\5070-STY-001
July 2017 Lycopodium Minerals Canada Ltd

FEASIBILITY STUDY ON THE AURIZONA GOLD MINE PROJECT NI 43-101 TECHNICAL REPORT
Page 21.29
• Brazilian taxes on materials have not been included in the operating cost estimate but have been captured in the financial model in Section 22.
21.13 Mining Operating Cost
The mine operating costs are based on a full contract mining operation with Trek providing technical support for geology, engineering, and ore control. The dewatering in the pit is also in the control of Trek personnel due to its critical nature to the overall mine production sequence.
Contract mining costs were based on detailed mine plan information including ore and waste haulage profiles. These were provided to four contractors to provide quotations on the work both as a supplement to a potential Trek mining fleet and as a 100% contract mining option. The contractors were to provide expected fuel consumption and Trek would purchase the fuel for their use. The Feasibility Study included a trade-off of Owner operated, hybrid (owner and contractor) and full contract mining. After review with Trek management it was decided to proceed with the full contract mining option which is discussed further.
Mine operating costs are estimated from base principles for Trek and quotations from the contractors in local currency.
Fuel is estimated from quotations provided by Trek and applied to the proposed Trek team as well as to the contract mining price. Pricing is for Biodiesel S10 (B5 S10). Biodiesel contains 5% ethanol in the fuel. The pricing refers to S10, which is 10 mg per 1,000,000 mg or ultra-low sulphur diesel. A value of US$0.906/L of diesel is used in the operating cost calculations net of taxes.
21.13.1 Labour – Trek and Contractor
Labour costs for the various job classifications were obtained from Trek’s current roster and compared to other labour costs in the AGP database and reviewing other operations. These rates were used and included the appropriate burden for each category to cover items such as health care, vacation and federal holidays. The mine labour is based on a 12-hour shift schedule.
The mine staff labour remains consistent for the mine life after the initial recruitment in the pre-production period (Year -1). The construction staff would supervise the contractor in Year -2. This level plateaus at 50 staff in Year 2, including Mine Dewatering, Engineering and Geology and Ore Control. The staff workforce for Year 2, the peak of mining activity, is shown in Table 21.17. This includes the loaded annual salary for each position.
5070\16.4\5070-STY-001
July 2017 Lycopodium Minerals Canada Ltd
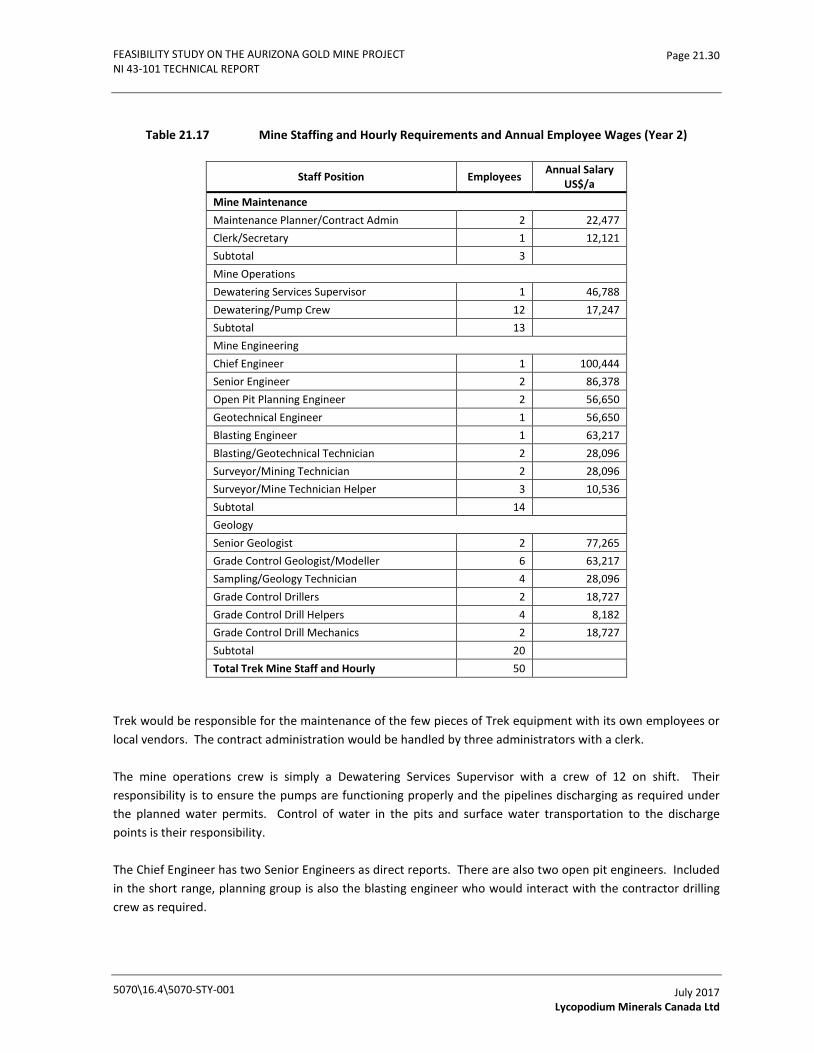
FEASIBILITY STUDY ON THE AURIZONA GOLD MINE PROJECT NI 43-101 TECHNICAL REPORT
Page 21.30
Table 21.17 Mine Staffing and Hourly Requirements and Annual Employee Wages (Year 2)
Staff Position Employees Annual Salary US$/a
Mine Maintenance Maintenance Planner/Contract Admin 2 22,477 Clerk/Secretary 1 12,121 Subtotal 3 Mine Operations Dewatering Services Supervisor 1 46,788 Dewatering/Pump Crew 12 17,247 Subtotal 13 Mine Engineering Chief Engineer 1 100,444 Senior Engineer 2 86,378 Open Pit Planning Engineer 2 56,650 Geotechnical Engineer 1 56,650 Blasting Engineer 1 63,217 Blasting/Geotechnical Technician 2 28,096 Surveyor/Mining Technician 2 28,096 Surveyor/Mine Technician Helper 3 10,536 Subtotal 14 Geology Senior Geologist 2 77,265 Grade Control Geologist/Modeller 6 63,217 Sampling/Geology Technician 4 28,096 Grade Control Drillers 2 18,727 Grade Control Drill Helpers 4 8,182 Grade Control Drill Mechanics 2 18,727 Subtotal 20 Total Trek Mine Staff and Hourly 50
Trek would be responsible for the maintenance of the few pieces of Trek equipment with its own employees or local vendors. The contract administration would be handled by three administrators with a clerk.
The mine operations crew is simply a Dewatering Services Supervisor with a crew of 12 on shift. Their responsibility is to ensure the pumps are functioning properly and the pipelines discharging as required under the planned water permits. Control of water in the pits and surface water transportation to the discharge points is their responsibility.
The Chief Engineer has two Senior Engineers as direct reports. There are also two open pit engineers. Included in the short range, planning group is also the blasting engineer who would interact with the contractor drilling crew as required.
5070\16.4\5070-STY-001
July 2017 Lycopodium Minerals Canada Ltd

FEASIBILITY STUDY ON THE AURIZONA GOLD MINE PROJECT NI 43-101 TECHNICAL REPORT
Page 21.31
The short-range planning group in engineering also has two surveyor/mine technicians and three surveyor/mine helpers. They will assist in the field with staking, surveying and sample collection with the geology group.
The Mine Geology department will also report to the Chief Engineer. In the geology department, two Senior Geologists report to the Chief Engineer. One will be in short range and grade control drilling and one in long range/reserves. There are also 6 grade control geologists (one per contractor operations crew and dayshift double coverage) and 4 sampling technicians (also, one per contractor operations crew and double coverage dayshift).
The contractor would also have a crew of people to operate the equipment and appropriate supervision. The proposed contractor workforce is shown in Table 21.18 for pre-production and mining (Years 1 – 7). The table shows the requirements for all shifts, however the average number of personnel required per day is 100 during pre-production and 353 during the mining production years.
5070\16.4\5070-STY-001
July 2017 Lycopodium Minerals Canada Ltd

FEASIBILITY STUDY ON THE AURIZONA GOLD MINE PROJECT NI 43-101 TECHNICAL REPORT
Page 21.32
Table 21.18 Proposed Contractor Personnel
Contractor Position Employees Year -1
Employees Year 1-7
Project Manager 1 1 Operations Boss 1 1 Shift Boss 3 3 Drill and Blast Supervisor 3 3 Equipment Instructor 3 3 Technical Office Boss 1 1 Technical Office Assistant 1 1 Cost and Planning Engineer 1 1 Surveyor 2 2 Survey Helper 1 1 Safety Boss 1 1 Safety Engineer 2 2 Administrator 1 1 Human Resources Coordinator 1 1 Administrative Assistant 1 1 Social Assistant 1 1 General Services Personnel 2 2 Maintenance Boss 1 1 Equipment Supervisor 3 3 Equipment Planner 1 1 Logistic and Warehouse Boss 1 1 Warehouse Assistant 1 1 Warehouse Helper 4 4 Excavator Operator 4 20 Haul Truck Driver 32 180 Dozer Operator 4 16 Grader Operator 4 8 Compactor Operator 4 4 Water Truck Driver 4 12 Front Loader Operator 4 4 Backhoe Operator 4 8 Lube Truck Driver 4 4 Fuel Truck Driver 4 8 General Mine Labourer 6 12 Electrician 4 11 Heavy Duty Mechanic 4 21 Tire Technician 2 8 TOTAL 121 353
21.13.2 General Mine and Engineering
This cost category covers the cost of salaries of the technical team and dewatering crew. This is based on the staffing requirements discussed earlier. The cost also includes the cost of consumables which covers items such as consultants for geotechnical review and purchase of ore control and survey supplies.
Costs for this category average $1.9 million per year or approximately $0.09 /t material moved.
5070\16.4\5070-STY-001
July 2017 Lycopodium Minerals Canada Ltd
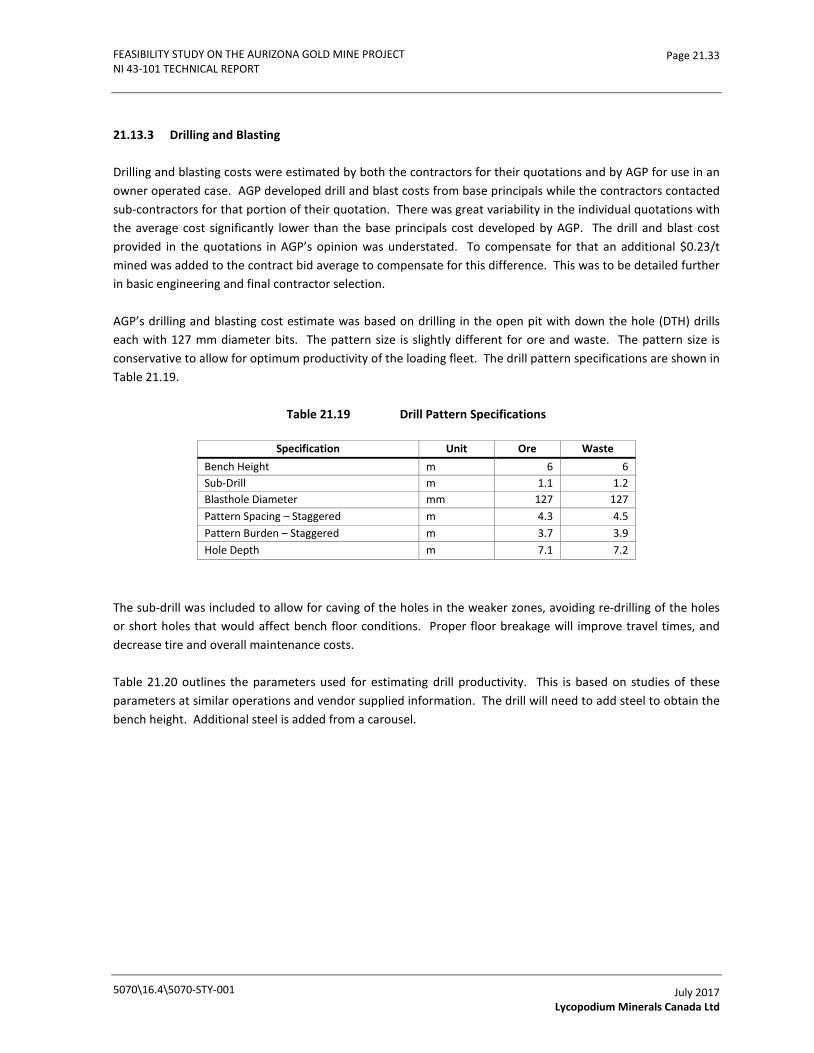
FEASIBILITY STUDY ON THE AURIZONA GOLD MINE PROJECT NI 43-101 TECHNICAL REPORT
Page 21.33
21.13.3 Drilling and Blasting
Drilling and blasting costs were estimated by both the contractors for their quotations and by AGP for use in an owner operated case. AGP developed drill and blast costs from base principals while the contractors contacted sub-contractors for that portion of their quotation. There was great variability in the individual quotations with the average cost significantly lower than the base principals cost developed by AGP. The drill and blast cost provided in the quotations in AGP’s opinion was understated. To compensate for that an additional $0.23/t mined was added to the contract bid average to compensate for this difference. This was to be detailed further in basic engineering and final contractor selection.
AGP’s drilling and blasting cost estimate was based on drilling in the open pit with down the hole (DTH) drills each with 127 mm diameter bits. The pattern size is slightly different for ore and waste. The pattern size is conservative to allow for optimum productivity of the loading fleet. The drill pattern specifications are shown in Table 21.19.
Table 21.19 Drill Pattern Specifications
Specification Unit Ore Waste Bench Height m 6 6 Sub-Drill m 1.1 1.2 Blasthole Diameter mm 127 127 Pattern Spacing – Staggered m 4.3 4.5 Pattern Burden – Staggered m 3.7 3.9 Hole Depth m 7.1 7.2
The sub-drill was included to allow for caving of the holes in the weaker zones, avoiding re-drilling of the holes or short holes that would affect bench floor conditions. Proper floor breakage will improve travel times, and decrease tire and overall maintenance costs.
Table 21.20 outlines the parameters used for estimating drill productivity. This is based on studies of these parameters at similar operations and vendor supplied information. The drill will need to add steel to obtain the bench height. Additional steel is added from a carousel.
5070\16.4\5070-STY-001
July 2017 Lycopodium Minerals Canada Ltd

FEASIBILITY STUDY ON THE AURIZONA GOLD MINE PROJECT NI 43-101 TECHNICAL REPORT
Page 21.34
Table 21.20 Drill Productivity Criteria
Drill Activity Unit Ore Waste Pure Penetration Rate m/min 0.60 0.60 Hole Depth m 7.1 7.2 Drill Time min 11.8 12.0 Move, Spot, and Collar Blast Hole min 3.00 3.00 Level Drill min 0.50 0.50 Add Steel min 0.50 0.50 Pull Drill Rods min 1.50 1.50 Total Setup/Breakdown Time min 5.50 5.50 Total Drill Time per Hole min 17.30 17.5 Drill Productivity m/h 24.6 24.7
An emulsion product will be used for blasting to provide water protection. With the high rainfall, it is expected that a water-resistant explosive will be required. The powder factors used in the explosives calculation are shown in Table 21.21.
Table 21.21 Design Powder Factors
Unit Ore Waste Powder Factor kg/m3 0.688 0.682 Powder Factor kg/t 0.248 0.246
Buffer blasting and pre-shear will be employed for wall control. The buffer will have half the normal pattern burden and normal pattern spacing. The spacing will be 2.3m by 1.95m burden and 0.2m of sub-drill. The pre-shear will have a 1.5m spacing and 1.9m burden. Only 1.5m of explosive will be placed in the hole to reduce energy that may be directed into the wall.
The blasting cost is estimated using quotations from Brazilian vendors. The emulsion price is $139/100 kg and includes rental of the magazines and secure delivery to the site and based on the explosives vendor delivering the product to the bore hole in the pit. Trek was responsible for guiding the loading process, including placement of primers/boosters, detonators, detonation cords, stemming and firing the shot. A primer/booster in the stemming column of the holes is included to ensure oversize in the collar is managed properly.
The explosive vendor price includes leasing of the explosives and accessories magazines to Trek and the vendor’s pick-up trucks, pumps and labour. It also includes the cost of security required in some states for the transportation of explosives.
This was the basis for the AGP drill and blast cost estimate which provided the additional $0.23/t mined difference.
5070\16.4\5070-STY-001
July 2017 Lycopodium Minerals Canada Ltd
FEASIBILITY STUDY ON THE AURIZONA GOLD MINE PROJECT NI 43-101 TECHNICAL REPORT
Page 21.35
21.13.4 Grade Control
Grade control is an item that was considered from the beginning of the mine planning sequence. A review of other operations in Brazil and visits prior to this study to other operations in similar geologic conditions provided the basis for the proposed ore control program.
Blast hole sampling will be employed as a method of ore definition due to the steep inclination of the mineralized zone. In addition, a reverse circulation program in advance of mining using tight inclined drillhole spacing to accurately define the ore/waste contacts. This ore-waste boundary information is then built into the short-range models and then marked in the field to guide the loading equipment. This practice is widespread in Australia with great success and in Canada and Brazil. A hybrid approach is proposed for use at the Aurizona Mine because of the perceived favourable conditions.
The method involves using a dedicated grade control drill rig and crew in the pit to drill a series of shallow vertical holes in a pattern similar to the blast hole pattern. The grade control drill will be drilling the saprolite where blast holes are not required. The pattern for drilling will be 4.3m spacing and 3.7m burden with samples taken every 1m in presumed mineralized zones as outlined by both previous ore control drilling and the exploration drilling. The samples spacing is to be verified with a gold deportation study currently underway. An additional 25% will be drilled along the waste contacts to ensure that unknown structures are not missed in the saprolite. These waste samples will be drilled with a 4.5m spacing and 3.9m burden and sampled over 6 m.
Transition material will be drilled with the same pattern but only 75% of the mineralized zone will be drilled (versus 100% in the saprolite). This is because the other 25% will be from blast hole samples being drilled to break the transition material. An additional 25% of waste zone will be drilled to confirm if the mineralized contact has been properly modelled.
In areas where blast holes are required, the drill cuttings will be collected, split and sent to the assay laboratory for analysis. A single sample will define the ore grade for the bench. In addition, 20% of the waste contact material will be sampled to look for unknown structure. Future reconciliation studies may determine if additional samples are required.
The amount of reverse circulation drilling peaks in Year 1 at 108,000m then drops off after that averaging 46,500 m/a from Year 2 until Year 7. This is only for the reverse circulation drilling rig. The blast hole drilling is already accounted for in the drill and blast cost.
The reverse circulation drills will operate for 16 h/d to minimize disturbance and be in advance of mine operations with the information. A three-person crew per drill is required; one driller and two drill helpers. In addition, geologists will provide guidance throughout the day and be on call if unknown issues arise.
The drill penetration rate is estimated at 25 m/h with set-ups, sampling, etc. Overall, the cost for the drill without labour will be US$160/h or about US$6.40/m drilled. From an overall mine operating cost perspective, the reverse circulation drill sampling program costs $0.04/t mined with the assay cost included. This cost is lower than some other operations due to the higher strip ratio (5.7:1) and a narrower ore zone resulting in a focused drilled area relative to other deposits.
5070\16.4\5070-STY-001
July 2017 Lycopodium Minerals Canada Ltd
FEASIBILITY STUDY ON THE AURIZONA GOLD MINE PROJECT NI 43-101 TECHNICAL REPORT
Page 21.36
The data from the grade control drilling is then interpreted by the geologist and the ore is contacts/zone are remodelled. Where possible, the production drilling and blasting is then sequenced to excavate the ore material separate from the waste.
Assay quantities were estimated base on whether it was an ore sample or waste sample. To this a cost of R$16.50 per sample was applied for the assaying work. This is also part of the ore control cost.
21.13.5 Dewatering
Pit dewatering is a significant work function at the Aurizona Mine. With average annual rainfall annually in excess of 3m and groundwater present, efficient and cost effective dewatering will be crucial to the success of the Aurizona Mine development. Dewatered slopes will allow a reduction in the strip ratio by permitting steeper inter-ramp angles that would also be inherently safer.
Working together with the SRK technical team, estimates of the daily pumping requirements were made. It is estimated that an average 11,500m3/day will need to be pumped from within the pit to the pit rim. From there, this will then need to be pumped to the required discharge point. These discharge points may be to the north of the pit or to the south into the TSF depending on water quality.
Storm events are common and have the potential to impact mining operations. Pumping rates as high as 24,000m3/day of pumping may be required for several weeks to recover from one of these events. The capital cost estimate has considered this in the estimation for the number of pumps required on site to handle such an event.
The dewatering cost estimate is broken into two components:
• In-pit.
• Ex-pit.
In-pit includes the pumps, sumps, pipelines responsible for moving water from the pit to the pit rim and any additional items. Labour for this is already included in the General and Mine Engineering category of the mine operating cost. The mine has a dedicated pump crew and pump crew supervisor.
Ex-pit pumps will pick-up the water from the storage ponds and push it to the various discharge points around the mine property.
The in-pit pumps, like the ex-pit pumps are the same size to allow them to be interchanged as required. All the pumps are electrically powered.
It is estimated that 5 pumps will be required in the pit and 2 pumps on the surface. The operating parameters are shown in Table 21.22.
5070\16.4\5070-STY-001
July 2017 Lycopodium Minerals Canada Ltd

FEASIBILITY STUDY ON THE AURIZONA GOLD MINE PROJECT NI 43-101 TECHNICAL REPORT
Page 21.37
Table 21.22 Dewatering Parameters
Parameter Units In-Pit Ex-pit Average Pumping Days days per year 365 365 Pumping Rate m3/day 11,500 11,500 Pump Capacity m3/hr/unit 140 420 Pump Working time hrs/day 20 20 Pumps required units 5 2 Storm Event Days days per year 365 365 Pumping Rate m3/day 24,000 24,000 Pump Capacity m3/hr/unit 140 420 Pump Working time hrs/day 24 24 Pumps required units 8 3
The capital cost estimate for pumping is based on 12 pumps required which meets the need for the storm event and also for pumps in maintenance.
The operating cost for the pumps are based on electrical consumption of 200 kwh/h in-pit and 151 kwh/h ex-pit and US$10,000/pump in repairs annually. Together with an expected US$20,000/a in pipeline repairs the annual cost in pit is US$675,900. Ex-pit the annual cost is estimated at US$222,600.
This cost works out to US$0.04/t moved over the period of Year 1 to 7.
21.13.6 Contract Services
The contract services category in the mine operating cost is the cost associated with the full contract mining. This includes all production mining and the additional cost associated with the Boa Esperança water storage areas.
An average contract mining cost of US$2.04/t moved was obtained with the contractor quotes. Two of the quotations were excluded. One due to the larger size of the equipment would not function without significant additional waste added to the plan negating any benefits of the cost proposed. They were not the lowest cost. The other cost excluded was almost double the cost of the other two bids and did not seem representative.
To the contractor costs which included drill and blasting, an additional $0.23/t moved was applied to compensate for what AGP believed was an underestimation of that cost category. This increased the contractor cost to $2.27/t moved for all tonnes attributed to the contractor. That value was used for the Feasibility study.
The contract tonnage is estimated at 2.44 Mt in Year -2 and 2.15 Mt in Year -1. This was capitalized. Costs associated with the ore control, and dewatering are to Trek’s account and also capitalized in Years -2 and -1.
As shown in Table 21.23, the contract mining that is included under contract services includes the following tonnages.
5070\16.4\5070-STY-001
July 2017 Lycopodium Minerals Canada Ltd

FEASIBILITY STUDY ON THE AURIZONA GOLD MINE PROJECT NI 43-101 TECHNICAL REPORT
Page 21.38
Table 21.23 Contract Mining Tonnages and Contract Cost
Material Units Year 1 Year 2 Year 3 Year 4 Year 5 Year 6 Year 7 Total Ore Mt 3.4 2.8 3.1 2.9 2.4 2.9 1.1 18.8 Waste Mt 26.1 29.6 29.1 12.7 8.8 3.1 0.4 109.7 Total Tonnes Mined Mt 29.5 32.4 32.2 15.6 11.2 6.0 1.5 128.5 Stockpile Rehandle Mt 1.1 1.1 0.5 0.0 0.5 0.0 0.8 4.0 Total Tonnes Moved Mt 30.6 33.5 32.7 15.6 11.7 6.0 2.3 132.5 Cost US$M 66.97 73.46 73.03 35.37 25.44 13.56 3.48 291.30
The peak year for the contract services is Year 2. The contract services value is $291.3 million for the life of production, not including the pre-production quantity.
21.13.7 Total Mine Operating Costs
The total life of mine operating costs per tonne material mined are shown below in Table 21.24. Table 21.25 shows the same costs as per tonne ore.
Table 21.24 Open Pit Mine Operating Costs ($/t Total Material)
Open Pit Operating Category Unit Year 1 Year 3 Year 5 Year 1 - 7 Average Cost
General Mine and Engineering US$/t 0.06 0.06 0.17 0.09 Support (Dewatering Crew) US$/t 0.00 0.00 0.01 0.00 Grade Control US$/t 0.04 0.03 0.04 0.04 Dewatering US$/t 0.03 0.03 0.08 0.04 Contract Mining Services US$/t 2.27 2.27 2.27 2.27 Total US$/t 2.40 2.39 2.57 2.44
Table 21.25 Open Pit Mine Operating Costs ($/t Ore Processed)
Open Pit Operating Category Unit Year 1 Year 3 Year 5 Year 1 - 7 Average Cost
General Mine and Engineering US$/t ore 0.65 0.63 0.65 0.58 Support (Dewatering Crew) US$/t ore 0.03 0.02 0.03 0.02 Grade Control US$/t ore 0.44 0.33 0.16 0.25 Dewatering US$/t ore 0.26 0.30 0.31 0.29 Contract Mining Services US$/t ore 22.95 24.29 8.71 14.69 Total US$/t ore 24.33 25.58 9.86 15.83
21.14 Process Plant Operating Costs
The process operating costs for the Aurizona Mine have been estimated under two functional areas: process plant and general and administration (G&A). The operating costs have been estimated by the following parties:
• Process Plant – Lycopodium and Trek.
5070\16.4\5070-STY-001
July 2017 Lycopodium Minerals Canada Ltd

FEASIBILITY STUDY ON THE AURIZONA GOLD MINE PROJECT NI 43-101 TECHNICAL REPORT
Page 21.39
• G&A – Lycopodium and Trek.
The operating cost estimates are expressed in US$ in Q1 2017 terms and are expected to be accurate within ±15%
21.14.1 Introduction
The process operating costs for the Aurizona Mine have been developed according to typical industry standards applicable to gold processing plants.
Quantities and cost data were compiled from a variety of sources including:
• Metallurgical test work.
• Supplier quotations.
• Advice from Trek.
• Lycopodium data.
• First principles.
The LOM overall process plant operating cost plus G&A cost for the Aurizona Mine is US$11.31 /t of ore processed. As shown in Table 21.26, this average operating cost is a sum of the process and administrative costs.
5070\16.4\5070-STY-001
July 2017 Lycopodium Minerals Canada Ltd
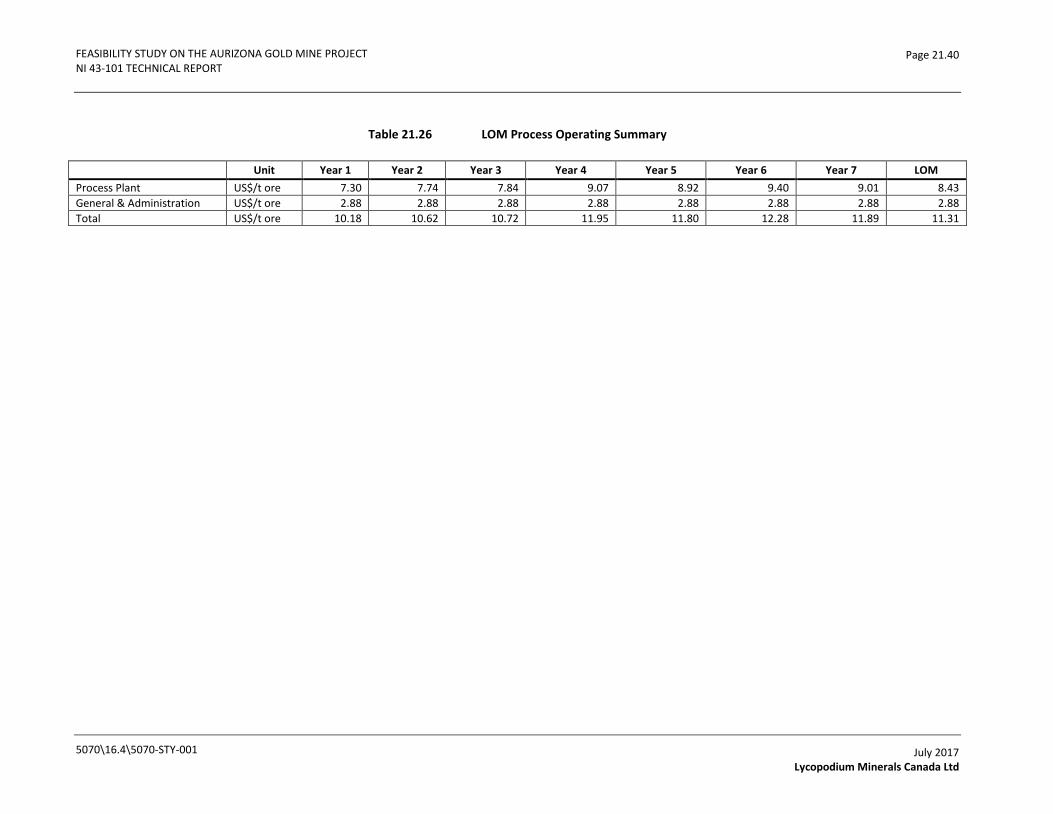
FEASIBILITY STUDY ON THE AURIZONA GOLD MINE PROJECT NI 43-101 TECHNICAL REPORT
Page 21.40
Table 21.26 LOM Process Operating Summary
Unit Year 1 Year 2 Year 3 Year 4 Year 5 Year 6 Year 7 LOM
Process Plant US$/t ore 7.30 7.74 7.84 9.07 8.92 9.40 9.01 8.43 General & Administration US$/t ore 2.88 2.88 2.88 2.88 2.88 2.88 2.88 2.88 Total US$/t ore 10.18 10.62 10.72 11.95 11.80 12.28 11.89 11.31
5070\16.4\5070-STY-001
July 2017 Lycopodium Minerals Canada Ltd
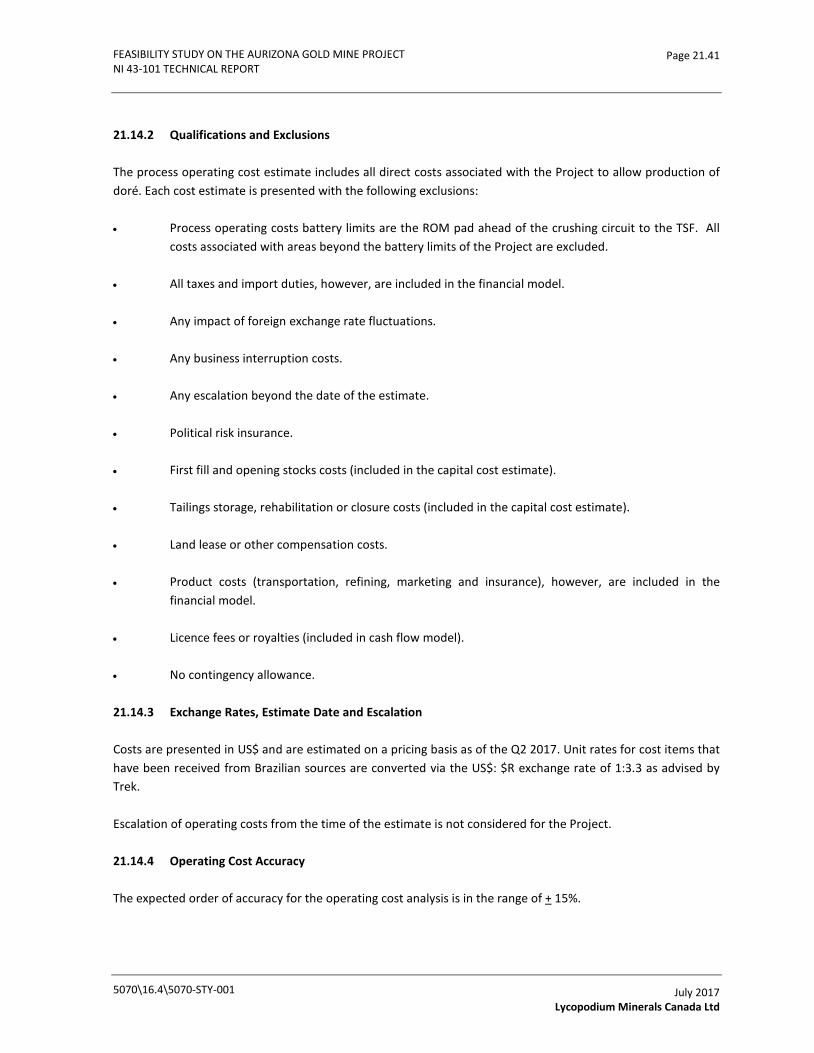
FEASIBILITY STUDY ON THE AURIZONA GOLD MINE PROJECT NI 43-101 TECHNICAL REPORT
Page 21.41
21.14.2 Qualifications and Exclusions
The process operating cost estimate includes all direct costs associated with the Project to allow production of doré. Each cost estimate is presented with the following exclusions:
• Process operating costs battery limits are the ROM pad ahead of the crushing circuit to the TSF. All costs associated with areas beyond the battery limits of the Project are excluded.
• All taxes and import duties, however, are included in the financial model.
• Any impact of foreign exchange rate fluctuations.
• Any business interruption costs.
• Any escalation beyond the date of the estimate.
• Political risk insurance.
• First fill and opening stocks costs (included in the capital cost estimate).
• Tailings storage, rehabilitation or closure costs (included in the capital cost estimate).
• Land lease or other compensation costs.
• Product costs (transportation, refining, marketing and insurance), however, are included in the financial model.
• Licence fees or royalties (included in cash flow model).
• No contingency allowance.
21.14.3 Exchange Rates, Estimate Date and Escalation
Costs are presented in US$ and are estimated on a pricing basis as of the Q2 2017. Unit rates for cost items that have been received from Brazilian sources are converted via the US$: $R exchange rate of 1:3.3 as advised by Trek.
Escalation of operating costs from the time of the estimate is not considered for the Project.
21.14.4 Operating Cost Accuracy
The expected order of accuracy for the operating cost analysis is in the range of + 15%.
5070\16.4\5070-STY-001
July 2017 Lycopodium Minerals Canada Ltd

FEASIBILITY STUDY ON THE AURIZONA GOLD MINE PROJECT NI 43-101 TECHNICAL REPORT
Page 21.42
21.14.5 Plant Design Parameters
Operating costs have been developed according to the process design criteria. Table 21.27 summarizes the process plant design criteria.
Table 21.27 Process Design Criteria
Criteria Item Unit Value
Design Production
Total Annual ROM t 2,920,000
Saprolite – Piaba % 11.1
Transition – Piaba % 19.7
Fresh Rock – Piaba % 61.8
Saprolite - Boa Esperança % 2.7
Saprolite - East Piaba % 4.7
Total % 100
Design Grades
Saprolite - Piaba g/t Au 1.37
Transition - Piaba g/t Au 1.29
Fresh Rock - Piaba g/t Au 1.63
Saprolite - Boa Esperança g/t Au 0.84
Saprolite - East Piaba g/t Au 1.80
Overall g/t Au 1.52
Design Recoveries
Saprolite - Piaba % 93.1
Transition - Piaba % 94.1
Fresh Rock - Piaba % 90.0
Saprolite - Boa Esperança % 91.8
Saprolite – East Piaba % 93.1
Overall % 91.2 The process plant operating costs have been developed based on an annual ROM throughput of 2.92 Mt/a, which consists of three major different ore types - Saprolite, Transition and Fresh Rock. Fixed and variable cost items of the operating cost by ore type are subdivided into the major cost categories as described in the sections below.
21.14.6 Cost Categories
The operating cost estimate includes six major categories as defined below:
1. Process Plant Labour.
2. Consumables.
3. Power.
4. Maintenance.
5070\16.4\5070-STY-001
July 2017 Lycopodium Minerals Canada Ltd

FEASIBILITY STUDY ON THE AURIZONA GOLD MINE PROJECT NI 43-101 TECHNICAL REPORT
Page 21.43
5. Mobile Equipment.
6. G&A.
A description of each cost category is provided in the following sections.
Process Plant Labour
The process labour is divided into the following areas - process plant operations, metallurgy and maintenance. The process labour includes a combination of day and shift work. The estimated annual process plant labour cost is US$2.314 million/a.
Wages and Salaries
Table 21.28 summarizes the annual labour costs for each position. These costs include provisions for health plan and medical examinations, life insurance, holidays, overtime and termination fees, etc. Wages and salaries have been provided by Trek.
Consumables
The consumables category covers all wear parts and consumable materials in the process plant. Consumables include liners for equipment such as crushers and mills, reagents, as well as diesel fuel.
Consumption rates for each individual ore types and pricing for consumables and reagents are summarized in Tables 21.29, Table 21.30 and Table 21.31. The tables have been based on the following:
• Comminution consumables (crusher liners, mill liners and grinding media) were evaluated for each ore type due to the difference in equipment operating conditions. Crusher liner, SAG mill liner, ball mill liner as well as steel ball consumption rates are based OMC calculations.
• Laboratory test work results are used, wherever possible to determine the reagent consumption rates. In the absence of test work data, reagent consumption rates are assumed based on first principle calculations, Lycopodium experience and generally accepted practice within the industry.
• Diesel fuel consumption rates for the mobile equipment are based on first principles calculations and Lycopodium experience. A diesel price of US$0.906/L was used in the estimate, provided by Trek.
• Consumables and reagents prices are obtained through supplier quotes, provided by Trek.
• Water treatment plant consumables are based on Lycopodium experience.
• Laboratory costs are allocated on a per sample basis, provided by Trek.
5070\16.4\5070-STY-001
July 2017 Lycopodium Minerals Canada Ltd

FEASIBILITY STUDY ON THE AURIZONA GOLD MINE PROJECT NI 43-101 TECHNICAL REPORT
Page 21.44
Table 21.28 Process Plant Labour Compensation
Personnel Total Number of Employees
Annual Labour Costs/Wage
US$/a
Total Annual Labour Costs
US$/a
Operations Plant Superintendent 1 138,646 138,646 General Foreman 1 64,658 64,658 Shift Foreman 4 36,117 144,468 Crushing Operators 4 15,780 63,121 Operators II 4 12,840 51,362 EW/Gold Room Operators 4 21,632 86,527 Reagents Operator 4 15,780 63,121 Control Room Operators 4 17,710 70,841 General Labourers 4 11,740 46,960 Metallurgy Chief Metallurgist 1 64,658 64,658 Senior Metallurgist 1 61,013 61,013 Plant Metallurgist 1 18,079 18,079 Lab Technicians 1 14,522 14,522 Process Technician 1 18,079 36,159 Maintenance Maintenance Superintendent 1 100,930 100,930 Maintenance General Foreman 1 83,364 83,364 Maintenance Planner 1 26,377 26,377 Maintenance Foreman 1 62,384 62,384 Electrical General Supervisor 1 80,044 80,044 Instrumentation Supervisor 1 54,490 54,490 Mechanical Engineer 1 54,620 54,620 Electrical Engineer 1 69,961 69,961 Mechanics - Shop 4 17,800 71,202 Mechanics - Specialist 4 20,752 83,006 Mechanics - General 4 17,800 71,202 Electrician 6 24,611 147,665 Instrument Technicians 2 26,325 52,651 Welder 4 17,067 68,267 Crane/Equipment Operator 2 17,247 34,495 Assay Lab Assay Lab Coordinator 1 47,916 47,916 Assay Lab Technician 8 14,522 116,176 Chemists 1 47,978 47,978 Sample Prep Labourers 10 11,740 117,401 Total Process Plant 90 - 2,314,264
5070\16.4\5070-STY-001
July 2017 Lycopodium Minerals Canada Ltd

FEASIBILITY STUDY ON THE AURIZONA GOLD MINE PROJECT NI 43-101 TECHNICAL REPORT
Page 21.45
Table 21.29 Summary of Consumables and Reagent Consumptions and Costs for Saprolite Ores
Operating Consumable Unit Cost
Unit Consumption Rate
Total Cost US$/unit US$/a US$/t ore
Crusher Liners Jaw Crusher, Fixed Jaw 9,758 set 2.2 set(s)/y 21,800 0.007
Jaw Crusher, Swing Jaw 8,686 set 1.5 set(s)/y 12,935 0.004 Jaw Crusher, Upper Cheek Plate 2,708 set 0.7 set(s)/y 2,016 0.001 Jaw Crusher, Lower Cheek Plate 2,012 set 1.5 set(s)/y 2,996 0.001 Pebble Crusher, Mantle & Bowl Liner 8,238 set - - - Mill Liners SAG Mill Liner 3.05 kg 10 g/t ore 89,177 0.031 Ball Mill Liner 1.62 kg 21 g/t ore 99,032 0.034 Grinding Media SAG Mill Balls 0.88 kg 23 g/t ore 59,101 0.020 Ball Mill Balls 0.88 kg 254 g/t ore 652,678 0.224 Screens Grizzly 10,550 set 0.7 set(s)/year 7,856 0.003 SAG Mill Trommel 23,000 set 0.4 set(s)/year 9,200 0.003 Ball Mill Trommel 23,000 set - - - Gravity Concentrator Feed Screen 10,111 set 2.0 set(s)/year 20,222 0.007 Trash Linear Screen 10,111 set 2.0 set(s)/year 20,222 0.007 Loaded Carbon Screen 2,528 set 1.0 set(s)/year 2,528 0.001 Carbon Safety Screen 10,111 set 2.0 set(s)/year 20,222 0.007 CIP Intertank Screen 5,562 set 8.0 set(s)/year 44,496 0.015 Carbon Sizing Screen 10,111 set 1.0 set(s)/year 10,111 0.003 Carbon Dewatering Screen 10,111 set 1.0 set(s)/year 10,111 0.003 Leaching Lime, Pebble 0.05 kg 1,920 g/t ore 283,740 0.097 Lime, Hydrated 0.07 kg 480 g/t ore 96,730 0.033 Sodium Cyanide 1.95 kg 540 g/t ore 3,074,760 1.053 Carbon 1.95 kg 20 g/t ore 113,880 0.039 Flocculant 2.40 kg 35 g/t ore 245,280 0.084 Elution/Gold Room Sodium Cyanide, Elution 1.95 kg 30.9 g/t ore 175,918 0.060 Sodium Cyanide, ILR 1.95 kg 10 g/t ore 57,296 0.020 Leach-Aid 27.60 kg 0.3 g/t ore 27,804 0.010 50% Sodium Hydroxide, Elution 0.26 kg 60 g/t ore 46,141 0.016 50% Sodium Hydroxide, ILR 0.26 kg 2.0 g/t ore 1,543 0.001 33% Hydrochloric Acid 0.14 kg 256 g/t ore 100,888 0.035 Borax 1.49 kg 0.2 g/t ore 729 0.000 Sodium Nitrate 1.68 kg 0.1 g/t ore 548 0.000
5070\16.4\5070-STY-001
July 2017 Lycopodium Minerals Canada Ltd
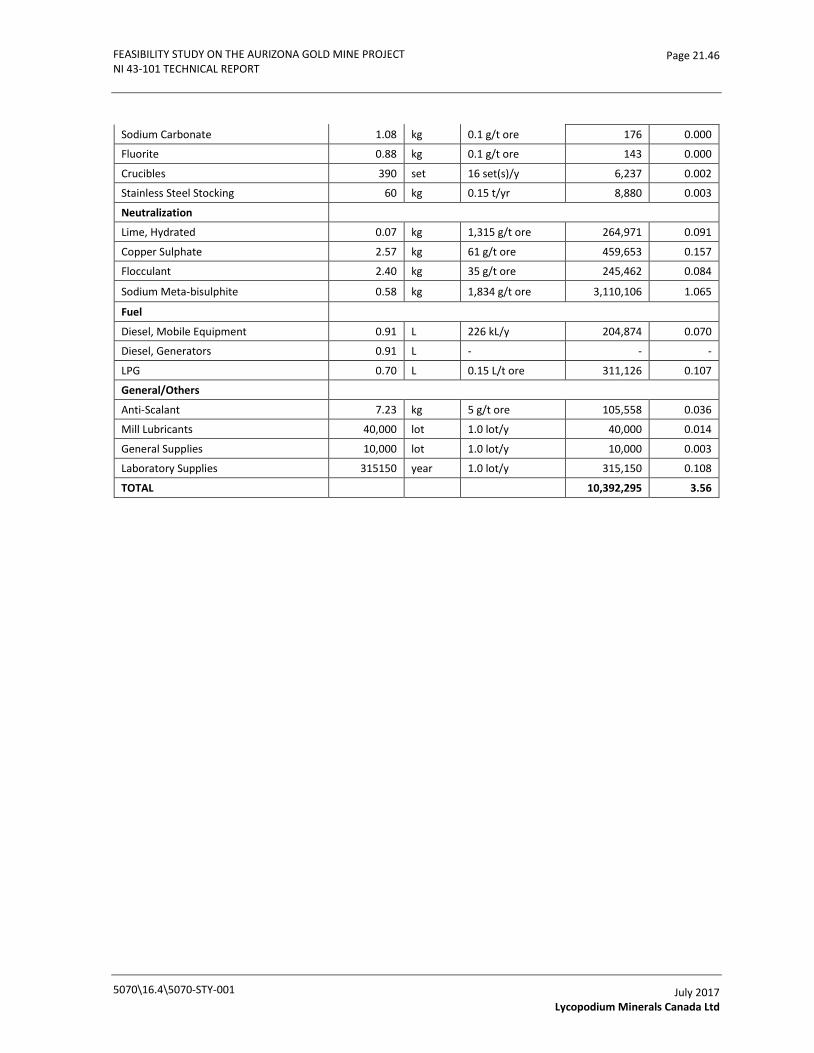
FEASIBILITY STUDY ON THE AURIZONA GOLD MINE PROJECT NI 43-101 TECHNICAL REPORT
Page 21.46
Sodium Carbonate 1.08 kg 0.1 g/t ore 176 0.000
Fluorite 0.88 kg 0.1 g/t ore 143 0.000
Crucibles 390 set 16 set(s)/y 6,237 0.002
Stainless Steel Stocking 60 kg 0.15 t/yr 8,880 0.003
Neutralization Lime, Hydrated 0.07 kg 1,315 g/t ore 264,971 0.091
Copper Sulphate 2.57 kg 61 g/t ore 459,653 0.157
Flocculant 2.40 kg 35 g/t ore 245,462 0.084
Sodium Meta-bisulphite 0.58 kg 1,834 g/t ore 3,110,106 1.065
Fuel Diesel, Mobile Equipment 0.91 L 226 kL/y 204,874 0.070
Diesel, Generators 0.91 L - - -
LPG 0.70 L 0.15 L/t ore 311,126 0.107
General/Others Anti-Scalant 7.23 kg 5 g/t ore 105,558 0.036
Mill Lubricants 40,000 lot 1.0 lot/y 40,000 0.014
General Supplies 10,000 lot 1.0 lot/y 10,000 0.003
Laboratory Supplies 315150 year 1.0 lot/y 315,150 0.108
TOTAL
10,392,295 3.56
5070\16.4\5070-STY-001
July 2017 Lycopodium Minerals Canada Ltd

FEASIBILITY STUDY ON THE AURIZONA GOLD MINE PROJECT NI 43-101 TECHNICAL REPORT
Page 21.47
Table 21.30 Summary of Consumables and Reagent Consumptions and Costs for Transition Ores
Operating Consumable Unit Cost
Unit Consumption Rate Total Cost
US$/unit US$/a US$/t ore Crusher Liners
Jaw Crusher, Fixed Jaw 9,758 set 1.5 set(s)/y 14,532 0.005
Jaw Crusher, Swing Jaw 8,686 set 1.5 set(s)/y 12,935 0.004
Jaw Crusher, Upper Cheek Plate 2,708 set 0.7 set(s)/y 2,016 0.001
Jaw Crusher, Lower Cheek Plate 2,012 set 0.7 set(s)/y 1,498 0.000
Pebble Crusher, Mantle & Bowl Liner 8,238 set - - -
Mill Liners SAG Mill Liner 3.05 kg 17 g/t ore 151,601 0.052
Ball Mill Liner 1.62 kg 22 g/t ore 103,748 0.036
Grinding Media
SAG Mill Balls 0.88 kg 40 g/t ore 102,784 0.035
Ball Mill Balls 0.88 kg 358 g/t ore 919,917 0.315
Screens Grizzly 10,550 set 0.7 set(s)/year 7,856 0.003
SAG Mill Trommel 23,000 set 2.5 set(s)/year 57,500 0.020
Ball Mill Trommel 23,000 set - - -
Gravity Concentrator Feed Screen 10,111 set 2.0 set(s)/year 20,222 0.007
Trash Linear Screen 10,111 set 2.0 set(s)/year 20,222 0.007
Loaded Carbon Screen 2,528 set 1.0 set(s)/year 2,528 0.001
Carbon Safety Screen 10,111 set 2.0 set(s)/year 20,222 0.007
CIP Intertank Screen 5,562 set 8.0 set(s)/year 44,496 0.015
Carbon Sizing Screen 10,111 set 1.0 set(s)/year 10,111 0.003
Carbon Dewatering Screen 10,111 set 1.0 set(s)/year 10,111 0.003
Leaching Lime, Pebble 0.05 kg 2,968 g/t ore 438,615 0.150
Lime, Hydrated 0.07 kg 742 g/t ore 149,528 0.051
Sodium Cyanide 1.95 kg 490 g/t ore 2,790,060 0.956
Carbon 1.95 kg 20 g/t ore 113,880 0.039
Flocculant 2.40 kg 35 g/t ore 245,280 0.084
Elution/Gold Room Sodium Cyanide, Elution 1.95 kg 30.9 g/t ore 175,918 0.060
Sodium Cyanide, ILR 1.95 kg 10 g/t ore 57,296 0.020
Leach-Aid 27.60 kg 0.3 g/t ore 27,804 0.010
50% Sodium Hydroxide, Elution 0.26 kg 60 g/t ore 46,141 0.016
50% Sodium Hydroxide, ILR 0.26 kg 2.0 g/t ore 1,543 0.001
33% Hydrochloric Acid 0.14 kg 256 g/t ore 100,888 0.035
Borax 1.49 kg 0.2 g/t ore 729 0.000
Sodium Nitrate 1.68 kg 0.1 g/t ore 548 0.000
5070\16.4\5070-STY-001
July 2017 Lycopodium Minerals Canada Ltd

FEASIBILITY STUDY ON THE AURIZONA GOLD MINE PROJECT NI 43-101 TECHNICAL REPORT
Page 21.48
Sodium Carbonate 1.08 kg 0.1 g/t ore 176 0.000
Fluorite 0.88 kg 0.1 g/t ore 143 0.000
Crucibles 390 set 16 set(s)/y 6,237 0.002
Stainless Steel Stocking 60 kg 0.15 t/yr 8,880 0.003
Neutralization Lime, Hydrated 0.07 kg 1,315 g/t ore 264,971 0.091
Copper Sulphate 2.57 kg 61 g/t ore 459,653 0.157
Flocculant 2.40 kg 35 g/t ore 245,462 0.084
Sodium Meta-bisulphite 0.58 kg 1,834 g/t ore 3,110,106 1.065
Fuel Diesel, Mobile Equipment 0.91 L 226 kL/y 204,874 0.070
Diesel, Generators 0.91 L - - -
LPG 0.70 L 0.15 L/t ore 311,126 0.107
General/Others Anti-Scalant 7.23 kg 5 g/t ore 105,558 0.036
Mill Lubricants 40,000 lot 1.0 lot/y 40,000 0.014
General Supplies 10,000 lot 1.0 lot/y 10,000 0.003
Laboratory Supplies 315150 year 1.0 lot/y 315,191 0.108
TOTAL
10,732,863 3.68
5070\16.4\5070-STY-001
July 2017 Lycopodium Minerals Canada Ltd
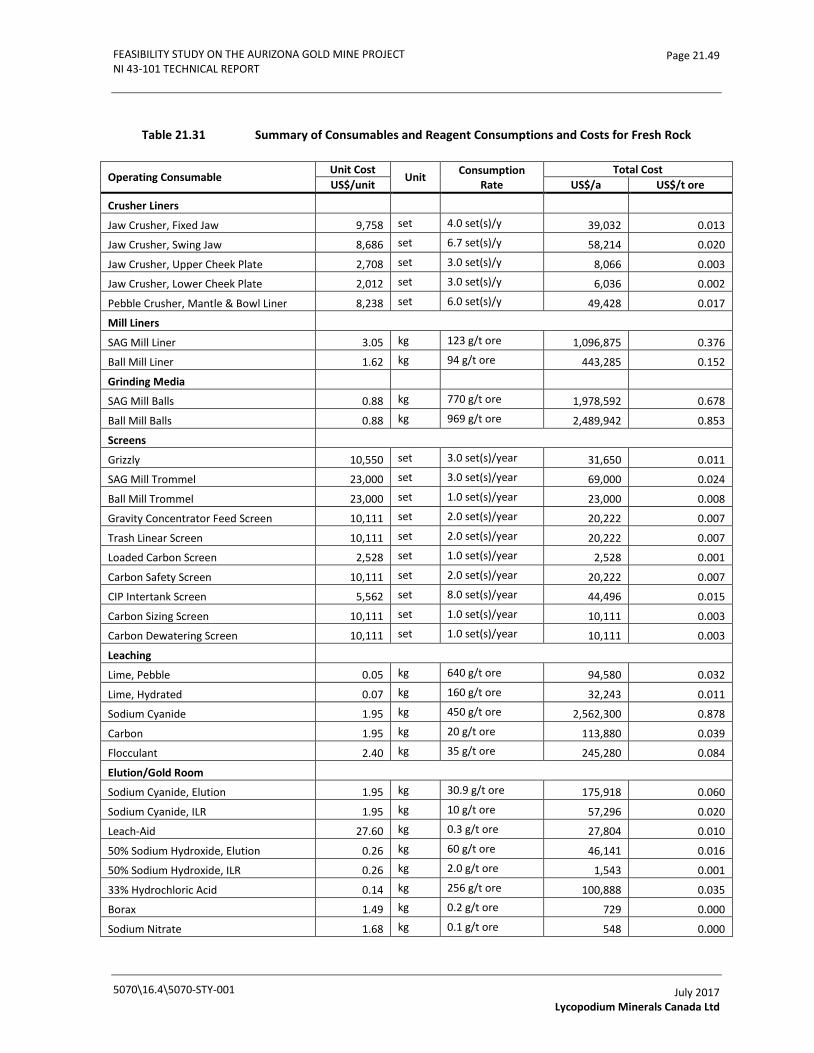
FEASIBILITY STUDY ON THE AURIZONA GOLD MINE PROJECT NI 43-101 TECHNICAL REPORT
Page 21.49
Table 21.31 Summary of Consumables and Reagent Consumptions and Costs for Fresh Rock
Operating Consumable Unit Cost
Unit Consumption Rate
Total Cost US$/unit US$/a US$/t ore
Crusher Liners
Jaw Crusher, Fixed Jaw 9,758 set 4.0 set(s)/y 39,032 0.013
Jaw Crusher, Swing Jaw 8,686 set 6.7 set(s)/y 58,214 0.020
Jaw Crusher, Upper Cheek Plate 2,708 set 3.0 set(s)/y 8,066 0.003
Jaw Crusher, Lower Cheek Plate 2,012 set 3.0 set(s)/y 6,036 0.002
Pebble Crusher, Mantle & Bowl Liner 8,238 set 6.0 set(s)/y 49,428 0.017
Mill Liners SAG Mill Liner 3.05 kg 123 g/t ore 1,096,875 0.376
Ball Mill Liner 1.62 kg 94 g/t ore 443,285 0.152
Grinding Media
SAG Mill Balls 0.88 kg 770 g/t ore 1,978,592 0.678
Ball Mill Balls 0.88 kg 969 g/t ore 2,489,942 0.853
Screens Grizzly 10,550 set 3.0 set(s)/year 31,650 0.011
SAG Mill Trommel 23,000 set 3.0 set(s)/year 69,000 0.024
Ball Mill Trommel 23,000 set 1.0 set(s)/year 23,000 0.008
Gravity Concentrator Feed Screen 10,111 set 2.0 set(s)/year 20,222 0.007
Trash Linear Screen 10,111 set 2.0 set(s)/year 20,222 0.007
Loaded Carbon Screen 2,528 set 1.0 set(s)/year 2,528 0.001
Carbon Safety Screen 10,111 set 2.0 set(s)/year 20,222 0.007
CIP Intertank Screen 5,562 set 8.0 set(s)/year 44,496 0.015
Carbon Sizing Screen 10,111 set 1.0 set(s)/year 10,111 0.003
Carbon Dewatering Screen 10,111 set 1.0 set(s)/year 10,111 0.003
Leaching Lime, Pebble 0.05 kg 640 g/t ore 94,580 0.032
Lime, Hydrated 0.07 kg 160 g/t ore 32,243 0.011
Sodium Cyanide 1.95 kg 450 g/t ore 2,562,300 0.878
Carbon 1.95 kg 20 g/t ore 113,880 0.039
Flocculant 2.40 kg 35 g/t ore 245,280 0.084
Elution/Gold Room Sodium Cyanide, Elution 1.95 kg 30.9 g/t ore 175,918 0.060
Sodium Cyanide, ILR 1.95 kg 10 g/t ore 57,296 0.020
Leach-Aid 27.60 kg 0.3 g/t ore 27,804 0.010
50% Sodium Hydroxide, Elution 0.26 kg 60 g/t ore 46,141 0.016
50% Sodium Hydroxide, ILR 0.26 kg 2.0 g/t ore 1,543 0.001
33% Hydrochloric Acid 0.14 kg 256 g/t ore 100,888 0.035
Borax 1.49 kg 0.2 g/t ore 729 0.000
Sodium Nitrate 1.68 kg 0.1 g/t ore 548 0.000
5070\16.4\5070-STY-001
July 2017 Lycopodium Minerals Canada Ltd

FEASIBILITY STUDY ON THE AURIZONA GOLD MINE PROJECT NI 43-101 TECHNICAL REPORT
Page 21.50
Power
The process plant electricity consumption is determined based on the installed power excluding standby equipment. Electrical load factors and utilization factors are applied to the installed power to arrive at the annual average power draw which is then multiplied by total hours operated per annum and the electricity price to obtain the plant power cost.
Power consumptions and costs per plant area for each individual ore types are summarized in Table 21.32, Table 21.33 and Table 21.34.
The majority of the electricity is provided by grid power. The grid can provide up to a maximum of 15 MW. The power unit cost of $0.083 US$/kWh is used in the calculations and is based on Q2 2017 local market rates. Any additional power requirements will be supplemented with diesel generators.
Sodium Carbonate 1.08 kg 0.1 g/t ore 176 0.000
Fluorite 0.88 kg 0.1 g/t ore 143 0.000
Crucibles 390 set 16 set(s)/y 6,237 0.002
Stainless Steel Stocking 60 kg 0.15 t/yr 8,880 0.003
Neutralization Lime, Hydrated 0.07 kg 1,315 g/t ore 264,971 0.091
Copper Sulphate 2.57 kg 61g/t ore 459,653 0.157
Flocculant 2.40 kg 35 g/t ore 245,462 0.084
Sodium Meta-bisulphite 0.58 kg 1,834 g/t ore 3,110,106 1.065
Fuel Diesel, Mobile Equipment 0.91 L 226 kL/y 204,874 0.070
Diesel, Generators 0.91 L 436 kL/y 395,264 0.135
LPG 0.70 L 0.15 L/t ore 311,126 0.107
General/Others Anti-Scalant 7.23 kg 5 g/t ore 105558 0.036
Mill Lubricants 40,000 lot 2.0 lot/y 80,000 0.027
General Supplies 10,000 lot 1.0 lot/y 10,000 0.003
Laboratory Supplies 315150 year 1.0 lot/y 315150 0.108
TOTAL
16,231,845 5.27
5070\16.4\5070-STY-001
July 2017 Lycopodium Minerals Canada Ltd

FEASIBILITY STUDY ON THE AURIZONA GOLD MINE PROJECT NI 43-101 TECHNICAL REPORT
Page 21.51
Table 21.32 Summary of Power Costs for Saprolite Ores
Area Installed Power
Max. Continuous
Draw
Average Continuous
Draw
Total Annual Consumption Total Annual Power Cost
kW kW kW kWh/a US$/a US$/t ore
Process Plant Crushing 312 261 221 1,932,544 161,045 0.06 Milling 11,468 6,339 4,093 35,851,439 2,987,620 1.02 Gravity 322 237 176 1,543,162 128,597 0.04 Leach 1,447 1,100 910 7,968,622 664,052 0.23 Acid Wash/Elution/EW 1,544 1,350 1,072 9,388,793 782,399 0.27 Tailings & CN Destruct 557 350 294 2,577,455 214,788 0.07 Reagents 159 98 45 389,908 32,492 0.01 Utilities, & Tailings 2,365 1,162 1,014 8,883,341 740,278 0.25 Others Mine Services 837 428 196 1,719,528 143,294 0.05 Buildings & Services 942 541 334 2,922,511 243,543 0.08
TOTAL COST 6,098,108 2.09
Table 21.33 Summary of Power Costs for Transition Ores
Area Installed Power
Max. Continuous
Draw
Average Continuous
Draw
Total Annual Consumption Total Annual Power Cost
kW kW kW kWh/a US$/a US$/t ore
Process Plant Crushing 312 261 221 1,932,544 161,045 0.06 Milling 11,468 6,744 4,465 39,115,415 3,259,618 1.12 Gravity 322 237 176 1,543,162 128,597 0.04 Leach 1,447 1,100 910 7,968,622 664,052 0.23 Acid Wash/Elution/EW 1,544 1,350 1,072 9,388,793 782,399 0.27 Tailings & CN Destruct 557 350 294 2,577,455 214,788 0.07 Reagents 159 98 45 389,908 32,492 0.01 Utilities, & Tailings 2,365 1,162 1,014 8,883,341 740,278 0.25 Others Mine Services 837 428 196 1,719,528 143,294 0.05 Buildings & Services 942 541 334 2,922,511 243,543 0.08
TOTAL COST 6,370,106 2.18
5070\16.4\5070-STY-001
July 2017 Lycopodium Minerals Canada Ltd

FEASIBILITY STUDY ON THE AURIZONA GOLD MINE PROJECT NI 43-101 TECHNICAL REPORT
Page 21.52
Table 21.34 Summary of Power Costs for Fresh Rock
Area Installed Power
Max. Continuous
Draw
Average Continuous
Draw
Total Annual Consumption Total Annual Power Cost
kW kW kW kWh/year US$/a US$/t ore
Process Plant Crushing 312 261 221 1,932,544 161,045 0.06 Milling 11,468 9,382 6,892 60,375,584 5,031,299 1.72 Gravity 322 237 176 1,543,162 128,597 0.04 Leach 1,447 1,100 910 7,968,622 664,052 0.23 Acid Wash/Elution/EW 1,544 1,350 1,072 9,388,793 782,399 0.27 Tailings & CN Destruct 557 350 294 2,577,455 214,788 0.07 Reagents 159 98 45 389,908 32,492 0.01 Utilities, & Tailings 2,365 1,162 1,014 8,883,341 740,278 0.25 Others Mine Services 1,170 915 753 6,600,485 550,040 0.19 Buildings & Services 942 541 334 2,922,511 243,543 0.08 Total Power Required 20,284 15,398 102,582,403 - -
Grid Power 15,000 102,582,403 8,548,534 2.93 Diesel Generator Power 398 - -
TOTAL COST 8,548,534 2.93
5070\16.4\5070-STY-001
July 2017 Lycopodium Minerals Canada Ltd
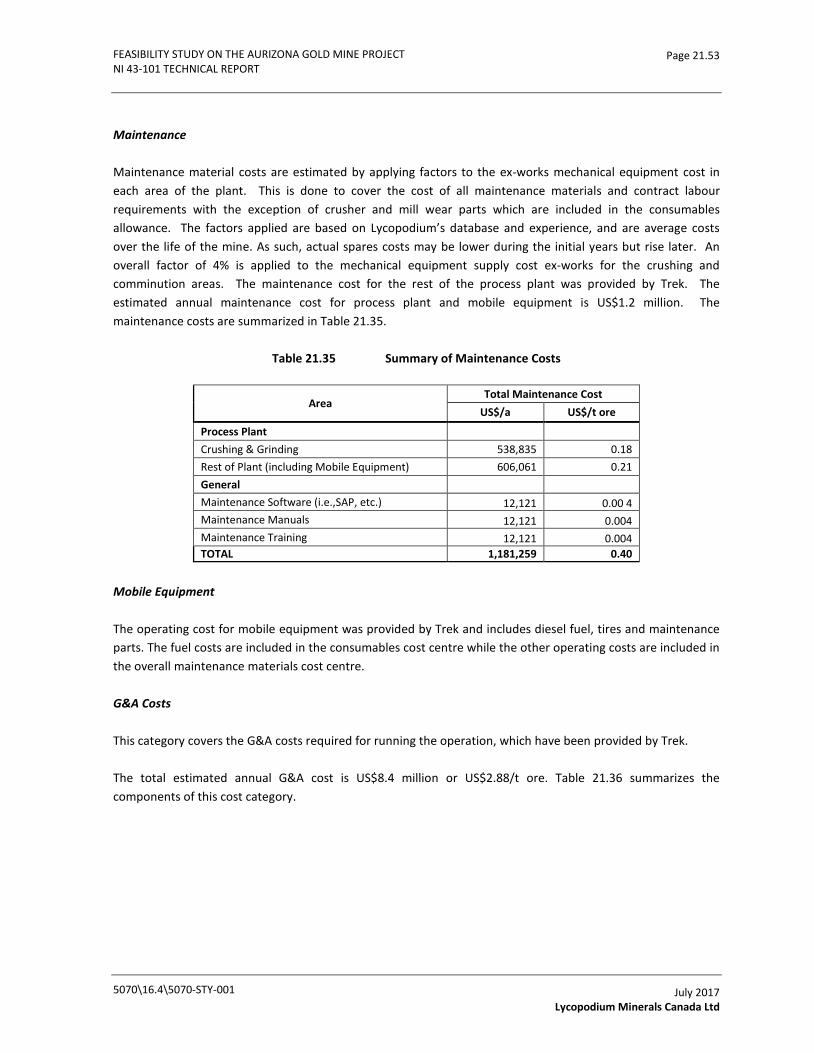
FEASIBILITY STUDY ON THE AURIZONA GOLD MINE PROJECT NI 43-101 TECHNICAL REPORT
Page 21.53
Maintenance
Maintenance material costs are estimated by applying factors to the ex-works mechanical equipment cost in each area of the plant. This is done to cover the cost of all maintenance materials and contract labour requirements with the exception of crusher and mill wear parts which are included in the consumables allowance. The factors applied are based on Lycopodium’s database and experience, and are average costs over the life of the mine. As such, actual spares costs may be lower during the initial years but rise later. An overall factor of 4% is applied to the mechanical equipment supply cost ex-works for the crushing and comminution areas. The maintenance cost for the rest of the process plant was provided by Trek. The estimated annual maintenance cost for process plant and mobile equipment is US$1.2 million. The maintenance costs are summarized in Table 21.35.
Table 21.35 Summary of Maintenance Costs
Area Total Maintenance Cost
US$/a US$/t ore
Process Plant Crushing & Grinding 538,835 0.18 Rest of Plant (including Mobile Equipment) 606,061 0.21 General Maintenance Software (i.e.,SAP, etc.) 12,121 0.00 4 Maintenance Manuals 12,121 0.004 Maintenance Training 12,121 0.004 TOTAL 1,181,259 0.40
Mobile Equipment
The operating cost for mobile equipment was provided by Trek and includes diesel fuel, tires and maintenance parts. The fuel costs are included in the consumables cost centre while the other operating costs are included in the overall maintenance materials cost centre.
G&A Costs
This category covers the G&A costs required for running the operation, which have been provided by Trek.
The total estimated annual G&A cost is US$8.4 million or US$2.88/t ore. Table 21.36 summarizes the components of this cost category.
5070\16.4\5070-STY-001
July 2017 Lycopodium Minerals Canada Ltd

FEASIBILITY STUDY ON THE AURIZONA GOLD MINE PROJECT NI 43-101 TECHNICAL REPORT
Page 21.54
Table 21.36 Summary of G&A Expenses
21.14.7 Production Schedule Operating Cost Analysis
Operating costs are developed according to the process design criteria as follows: • Nominal ROM throughput of 2.9 Mt/a.
• Average gold grade of 1.52 g/t Au.
• 6.5 year mine life.
• Overall gold recovery of 91.2%.
The annual operating costs are calculated for the 7-year LOM according to the mine plan provided. Table 21.37
summarizes the plant capacity and metal production.
Item Annual Costs
US$/a US$/t ore
G&A Labour 2,312,000 0.79 Contracted Services 1,379,000 0.47 Vehicle Rentals and Fuel 787,000 0.27 Travel Costs 1,312,000 0.45 IT/Computer 182,000 0.06 Insurance 400,000 0.14 Power 376,000 0.13 Environ & Licensing 491,000 0.17 CSR 90,000 0.03 G&A Labour in Belo/SLZ 708,000 0.24 Others 358,000 0.12 TOTAL 8,395,000 2.88
5070\16.4\5070-STY-001
July 2017 Lycopodium Minerals Canada Ltd

FEASIBILITY STUDY ON THE AURIZONA GOLD MINE PROJECT NI 43-101 TECHNICAL REPORT
Page 21.55
Table 21.37 Process Plant Capacity and Metal Production
Year Mill Feed Tonnage
t
Head Grade g/t Au
Recovery % Au
Gold Production to Dore
kg oz
1 2,917,663 1.49 92.8% 4,046.0 130,082 2 3,207,999 1.50 91.9% 4,421.7 142,161 3 3,006,390 1.66 92.0% 4,601.8 147,952 4 2,920,000 1.65 90.4% 4346.2 139,733 5 2,920,000 1.43 90.5% 3790.8 121,876 6 2,920,000 1.43 90.0% 3758.0 120,823 7 1,944,014 1.47 90.2% 2,583.7 83,069
Total LOM 19,836,066 1.52 91.2% 27,548.2 885,696
The operating costs by the major categories are presented in Table 21.38.
Table 21.38 Summary of Operating Cost by Year
Unit Year 1 Year 2 Year 3 Year 4 Year 5 Year 6 Year 7 LOM
Process Plant Process Plant Labour US$/t ore 0.79 0.72 0.77 0.79 0.79 0.79 0.60 0.76
Operating Consumables US$/t ore 3.86 4.20 4.24 5.05 4.95 5.27 5.14 4.64
Power US$/t ore 2.25 2.42 2.43 2.82 2.78 2.93 2.87 2.63
Maintenance US$/t ore 0.40 0.40 0.40 0.40 0.40 0.40 0.40 0.40 General & Administration US$/t ore 2.88 2.88 2.88 2.88 2.88 2.88 2.88 2.88
Total US$/t ore 10.18 10.62 10.72 11.95 11.80 12.28 11.89 11.31
5070\16.4\5070-STY-001
July 2017 Lycopodium Minerals Canada Ltd

FEASIBILITY STUDY ON THE AURIZONA GOLD MINE PROJECT NI 43-101 TECHNICAL REPORT
Page 22.2
22.0 ECONOMIC ANALYSIS
22.1 Introduction
This summary details the results of the economic analysis based on the Study.
The financial analysis for the Project was completed by L&M and required and accepted the following provided input to the financial model:
• AGP - Responsible for the open pit design, mine plan and production schedule, and capital and operating costs for the mine.
• Lycopodium - Responsible for the process plant design, process selection and capital and operating costs for the process plant and infrastructure.
• L&M - Responsible for the economic modelling and for the estimate of the basic tax incurrence and of the tax benefits at a federal level, according to Brazilian tax legislation.
• Trek - Responsible for providing market assumptions, including the gold price projections, foreign exchange rate projections, potential tax benefits to be granted by the State Government of Maranhão and all the remaining information needed to complete the financial analysis.
This economic analysis refers only to the Aurizona Mine, as defined by this Study, and should not be interpreted as an economic evaluation of Trek’s assets and liabilities, which are not part of this Study.
The main tool used for this analysis is an Excel-based discounted cash flow model. The purpose of this model is to assess the key economic metrics and to identify and assess the key value drivers of the Project, integrating the investment and operating costs at this phase of the Project.
All currency in this Section is provided in US dollars, unless otherwise indicated.
22.2 Main Assumptions and Parameters
The following section summarizes the main assumptions used in the Project’s financial analysis, including the mine production plan, product logistics, capital and operating expenditures, revenues, taxation, royalties and other general parameters.
22.2.1 Production
The period of the construction and production plans is based on Project years. The construction period begins in year -2, month -18. The first output of saleable gold (doré) is planned to begin in month 1. Mining activity is planned to finish early in year 7.
The metallurgical recovery for the contained gold is expected to be 91.2%, which results in 885,700 oz after processing.
The contract return practiced by the refinery is 99.99% which results in 885,700 oz of payable gold. 5070\16.4\5070-STY-001_01 July 2017 Lycopodium Minerals Canada Ltd.
FEASIBILITY STUDY ON THE AURIZONA GOLD MINE PROJECT NI 43-101 TECHNICAL REPORT
Page 22.3
Table 22.10 summarizes the annual feed to the process plant with the respective mineral grades, tonnes of ore and waste mined and the total material moved, plant production, gold content recovered, product in process inventories, gold payable after the refining process and the metal delivered.
22.2.2 Capital Investment
The initial capital cost amounts to $130.8 million, which includes an allowance for contingencies, and $9.0 million for initial working capital. Values in Brazilian Reais were converted to US dollars at the rate of BRL$:US$ = 3.3:1.
Table 22.1 and Table 22.2 summarize the initial capital cost expenditure by commodity and disbursement schedule.
5070\16.4\5070-STY-001_01 July 2017 Lycopodium Minerals Canada Ltd.
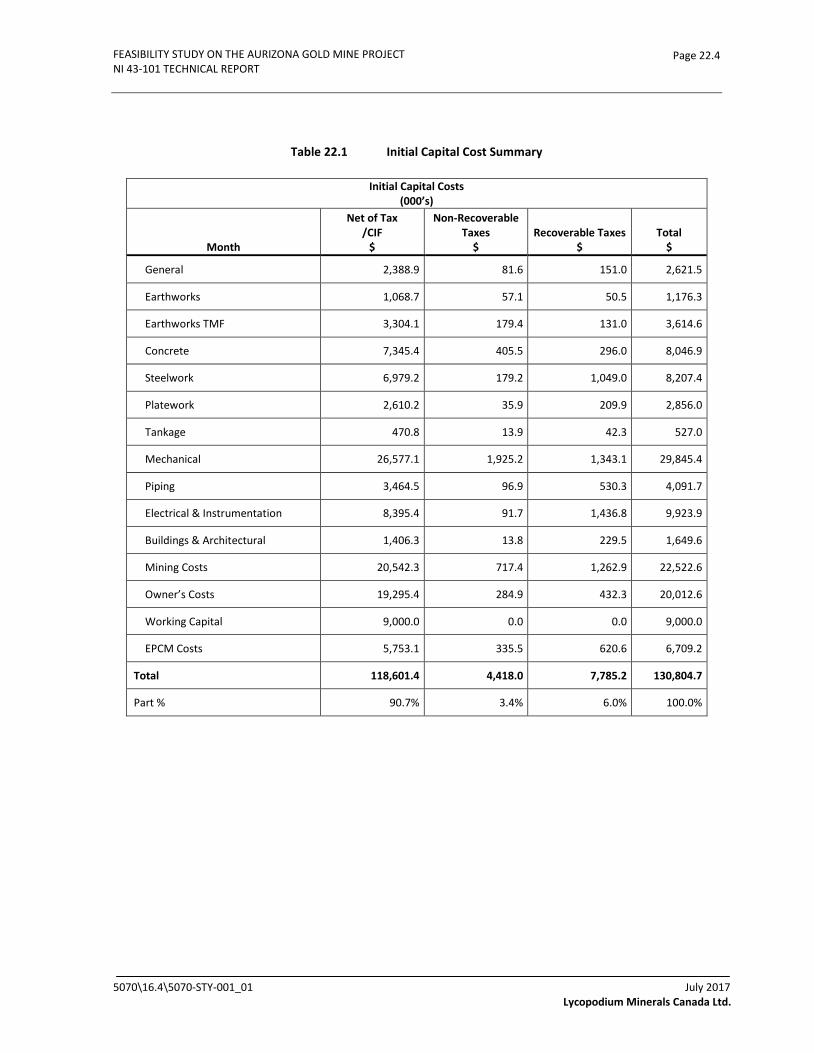
FEASIBILITY STUDY ON THE AURIZONA GOLD MINE PROJECT NI 43-101 TECHNICAL REPORT
Page 22.4
Table 22.1 Initial Capital Cost Summary
Initial Capital Costs (000’s)
Month
Net of Tax /CIF
$
Non-Recoverable Taxes
$ Recoverable Taxes
$ Total
$
General 2,388.9 81.6 151.0 2,621.5
Earthworks 1,068.7 57.1 50.5 1,176.3
Earthworks TMF 3,304.1 179.4 131.0 3,614.6
Concrete 7,345.4 405.5 296.0 8,046.9
Steelwork 6,979.2 179.2 1,049.0 8,207.4
Platework 2,610.2 35.9 209.9 2,856.0
Tankage 470.8 13.9 42.3 527.0
Mechanical 26,577.1 1,925.2 1,343.1 29,845.4
Piping 3,464.5 96.9 530.3 4,091.7
Electrical & Instrumentation 8,395.4 91.7 1,436.8 9,923.9
Buildings & Architectural 1,406.3 13.8 229.5 1,649.6
Mining Costs 20,542.3 717.4 1,262.9 22,522.6
Owner’s Costs 19,295.4 284.9 432.3 20,012.6
Working Capital 9,000.0 0.0 0.0 9,000.0
EPCM Costs 5,753.1 335.5 620.6 6,709.2
Total 118,601.4 4,418.0 7,785.2 130,804.7
Part % 90.7% 3.4% 6.0% 100.0%
5070\16.4\5070-STY-001_01 July 2017 Lycopodium Minerals Canada Ltd.
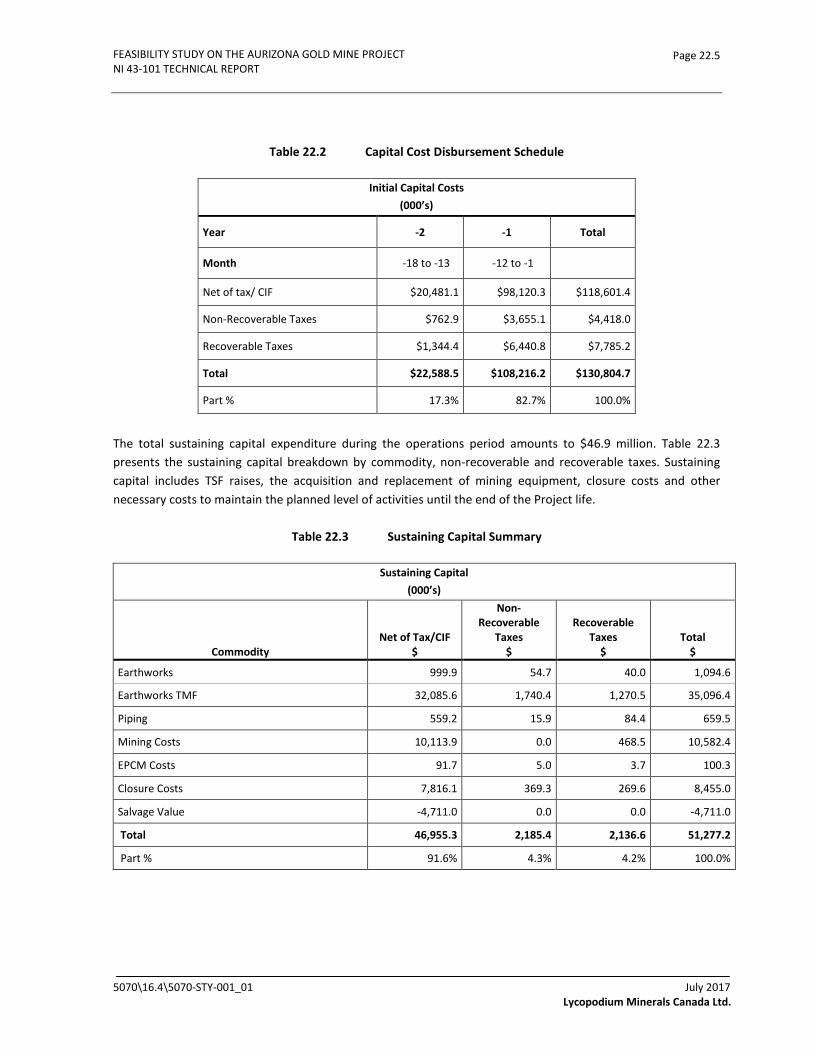
FEASIBILITY STUDY ON THE AURIZONA GOLD MINE PROJECT NI 43-101 TECHNICAL REPORT
Page 22.5
Table 22.2 Capital Cost Disbursement Schedule
Initial Capital Costs (000’s)
Year -2 -1 Total
Month -18 to -13 -12 to -1
Net of tax/ CIF $20,481.1 $98,120.3 $118,601.4
Non-Recoverable Taxes $762.9 $3,655.1 $4,418.0
Recoverable Taxes $1,344.4 $6,440.8 $7,785.2
Total $22,588.5 $108,216.2 $130,804.7
Part % 17.3% 82.7% 100.0%
The total sustaining capital expenditure during the operations period amounts to $46.9 million. Table 22.3 presents the sustaining capital breakdown by commodity, non-recoverable and recoverable taxes. Sustaining capital includes TSF raises, the acquisition and replacement of mining equipment, closure costs and other necessary costs to maintain the planned level of activities until the end of the Project life.
Table 22.3 Sustaining Capital Summary
Sustaining Capital (000’s)
Commodity Net of Tax/CIF
$
Non-Recoverable
Taxes $
Recoverable Taxes
$ Total
$
Earthworks 999.9 54.7 40.0 1,094.6
Earthworks TMF 32,085.6 1,740.4 1,270.5 35,096.4
Piping 559.2 15.9 84.4 659.5
Mining Costs 10,113.9 0.0 468.5 10,582.4
EPCM Costs 91.7 5.0 3.7 100.3
Closure Costs 7,816.1 369.3 269.6 8,455.0
Salvage Value -4,711.0 0.0 0.0 -4,711.0
Total 46,955.3 2,185.4 2,136.6 51,277.2
Part % 91.6% 4.3% 4.2% 100.0%
5070\16.4\5070-STY-001_01 July 2017 Lycopodium Minerals Canada Ltd.
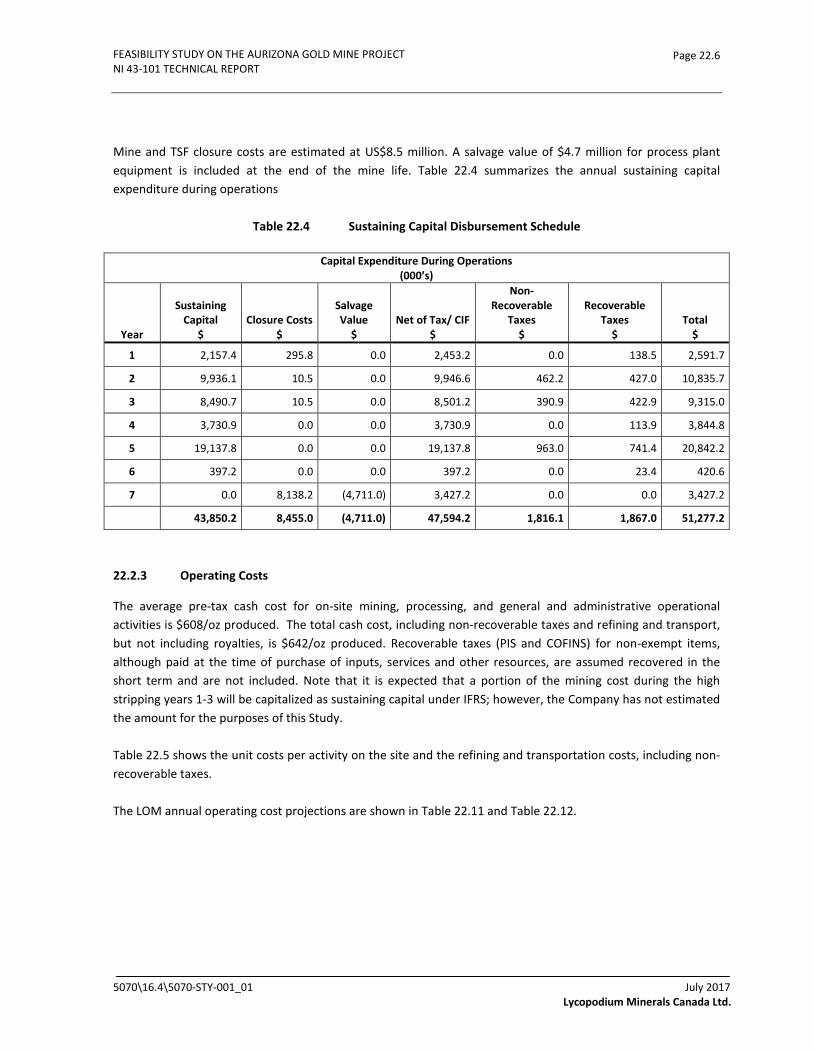
FEASIBILITY STUDY ON THE AURIZONA GOLD MINE PROJECT NI 43-101 TECHNICAL REPORT
Page 22.6
Mine and TSF closure costs are estimated at US$8.5 million. A salvage value of $4.7 million for process plant equipment is included at the end of the mine life. Table 22.4 summarizes the annual sustaining capital expenditure during operations
Table 22.4 Sustaining Capital Disbursement Schedule
Capital Expenditure During Operations (000’s)
Year
Sustaining Capital
$ Closure Costs
$
Salvage Value
$ Net of Tax/ CIF
$
Non-Recoverable
Taxes $
Recoverable Taxes
$ Total
$
1 2,157.4 295.8 0.0 2,453.2 0.0 138.5 2,591.7
2 9,936.1 10.5 0.0 9,946.6 462.2 427.0 10,835.7
3 8,490.7 10.5 0.0 8,501.2 390.9 422.9 9,315.0
4 3,730.9 0.0 0.0 3,730.9 0.0 113.9 3,844.8
5 19,137.8 0.0 0.0 19,137.8 963.0 741.4 20,842.2
6 397.2 0.0 0.0 397.2 0.0 23.4 420.6
7 0.0 8,138.2 (4,711.0) 3,427.2 0.0 0.0 3,427.2
43,850.2 8,455.0 (4,711.0) 47,594.2 1,816.1 1,867.0 51,277.2
22.2.3 Operating Costs
The average pre-tax cash cost for on-site mining, processing, and general and administrative operational activities is $608/oz produced. The total cash cost, including non-recoverable taxes and refining and transport, but not including royalties, is $642/oz produced. Recoverable taxes (PIS and COFINS) for non-exempt items, although paid at the time of purchase of inputs, services and other resources, are assumed recovered in the short term and are not included. Note that it is expected that a portion of the mining cost during the high stripping years 1-3 will be capitalized as sustaining capital under IFRS; however, the Company has not estimated the amount for the purposes of this Study.
Table 22.5 shows the unit costs per activity on the site and the refining and transportation costs, including non-recoverable taxes.
The LOM annual operating cost projections are shown in Table 22.11 and Table 22.12.
5070\16.4\5070-STY-001_01 July 2017 Lycopodium Minerals Canada Ltd.
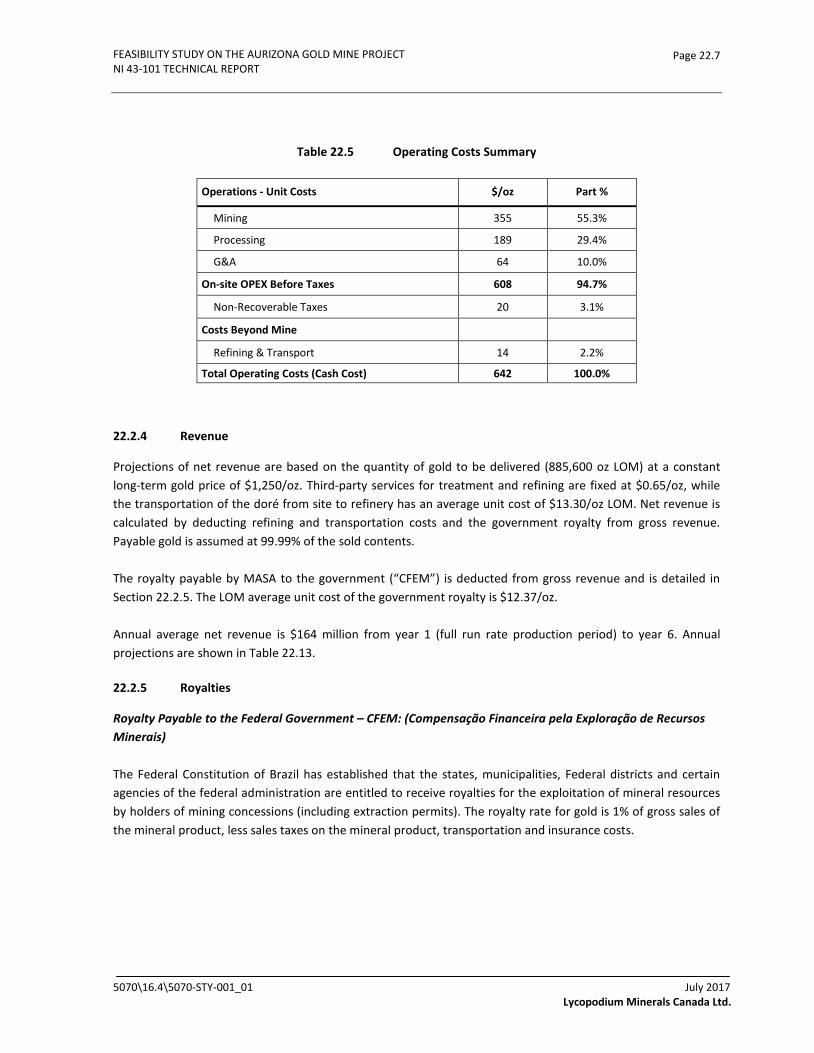
FEASIBILITY STUDY ON THE AURIZONA GOLD MINE PROJECT NI 43-101 TECHNICAL REPORT
Page 22.7
Table 22.5 Operating Costs Summary
Operations - Unit Costs $/oz Part %
Mining 355 55.3%
Processing 189 29.4%
G&A 64 10.0%
On-site OPEX Before Taxes 608 94.7%
Non-Recoverable Taxes 20 3.1%
Costs Beyond Mine
Refining & Transport 14 2.2%
Total Operating Costs (Cash Cost) 642 100.0%
22.2.4 Revenue
Projections of net revenue are based on the quantity of gold to be delivered (885,600 oz LOM) at a constant long-term gold price of $1,250/oz. Third-party services for treatment and refining are fixed at $0.65/oz, while the transportation of the doré from site to refinery has an average unit cost of $13.30/oz LOM. Net revenue is calculated by deducting refining and transportation costs and the government royalty from gross revenue. Payable gold is assumed at 99.99% of the sold contents.
The royalty payable by MASA to the government (“CFEM”) is deducted from gross revenue and is detailed in Section 22.2.5. The LOM average unit cost of the government royalty is $12.37/oz.
Annual average net revenue is $164 million from year 1 (full run rate production period) to year 6. Annual projections are shown in Table 22.13.
22.2.5 Royalties
Royalty Payable to the Federal Government – CFEM: (Compensação Financeira pela Exploração de Recursos Minerais)
The Federal Constitution of Brazil has established that the states, municipalities, Federal districts and certain agencies of the federal administration are entitled to receive royalties for the exploitation of mineral resources by holders of mining concessions (including extraction permits). The royalty rate for gold is 1% of gross sales of the mineral product, less sales taxes on the mineral product, transportation and insurance costs.
5070\16.4\5070-STY-001_01 July 2017 Lycopodium Minerals Canada Ltd.
FEASIBILITY STUDY ON THE AURIZONA GOLD MINE PROJECT NI 43-101 TECHNICAL REPORT
Page 22.8
Aurizona Mine NSR Due to Sandstorm
The Aurizona Mine NSR covers all future mineral production from the Aurizona Mine and requires the Company to pay Sandstorm a sliding scale royalty based on the price of gold as follows:
• 3% if the price of gold is less than or equal to $1,500/oz.
• 4% if the price of gold is between $1,500/oz and $2,000/oz.
• 5% if the price of gold is greater than $2,000/oz.
22.2.6 Taxation
Applicable Federal Taxes
• II: Imposto de Importação.
• IPI: Imposto sobre Produtos Industrializados.
• IRPJ: Imposto de Renda da Pessoa Jurídica.
• CSLL: Contribuição Social sobre o Lucro Líquido.
• COFINS: Contribuição para o Financiamento da Seguridade Social.
• PIS: Programa de Integração Social.
• CFEM: Compensação Financeira pela Exploração de Recursos Minerais.
• AFRMM: Adicional ao Frete para Renovação da Marinha Mercante.
Applicable State Taxes
• ICMS: Imposto sobre Operações Relativas à Circulação de Mercadorias e sobre Prestação de Serviços de Transporte Interestadual e Intermunicipal e de Comunicação.
• DIFAL: Complemento relativo ao Diferencial de Alíquotas do ICMS.
Applicable Municipal Taxes
• ISSQN: Imposto sobre Serviços de Qualquer Natureza.
Fiscal Benefits at Federal Level
The results presented in this economic analysis utilize the tax benefits provided for mainly export companies and also those benefits targeted to new investments:
5070\16.4\5070-STY-001_01 July 2017 Lycopodium Minerals Canada Ltd.

FEASIBILITY STUDY ON THE AURIZONA GOLD MINE PROJECT NI 43-101 TECHNICAL REPORT
Page 22.9
• RECAP - Suspension of PIS and COFINS on the acquisitions of machinery, instrumentation and
equipment in the construction phase. The rules and the granting of the benefit are determined by the Secretaria da Receita Federal do Brasil (“SRF”). The legal basis of RECAP is in effect and provided for in Articles 12 to 16 of Law Nº 11,196, of November 21, 2005 and the list of items considered as “BK” is contained in the Federal Decree Nº 6581 of September 26, 2008.
• DRAWBACK - Suspension of Import Duty, IPI, PIS and COFINS on imported inputs and raw materials. The tax regime of Drawback consists of the suspension of payment of taxes due, in customs clearance of inputs (raw materials, intermediate products and packaging materials), for a maximum period of up to one year, provided that the products resulting from the manufacturing process are effectively exported. Legal basis: Decree-Law 37/66 and Portaria Secex Nº 23, of July 14, 2011.
• PREPON-EX - Suspension of PIS and COFINS on purchases of inputs and raw materials to be consumed in the production process for companies that exports the minimum of 60% of its production. Excluded from this benefit are energy and diesel. Legal basis: articles 14, 16 and 44 of Law Nº. 11,196, of November 21, 2005 and on normative instruction SRF Nº 595 of December 27, 2005.
• SUDENE - INCOME TAX - The Company is subject to corporate income tax in Brazil at a rate of 25% and to social contribution tax at a rate of 9%. The Company is entitled to a special Brazilian tax incentive granted by the Superintendence for the Development of the Northeast (“SUDENE”) that provides a 75% reduction to the corporate income taxes payable on eligible profits earned for the year in relation to the Aurizona operations. The Company is entitled to the SUDENE tax incentive for a 10-year period commencing in the year of receipt of the Appraisal Certificate from SUDENE. To receive the full benefits of the exemption, the Company is required to make an application the SUDENE tax incentive for the implementation of the new operations. Such applications are subject to approval by SUDENE. Legal basis: Federal supplementary Law Nº 125, of January 3, 2007. Finally, the application for the benefit and the approval of SUDENE should occur by December 31, 2018. However, the Senate of Brazil approved the Draft Law Nº 656/2015, which extends this deadline to December 31, 2023. This draft law will be submitted to the Comissão de Assuntos Econômicos (“CAE”) and is expected to be approved.
• INCENTIVIZED ACCELERATED DEPRECIATION - SUDENE: This benefit allows for acceleration of the depreciation and amortization expenses for the purposes of income tax calculation. Legal basis: art. 31 of Law Nº 11196 of November 21, 2005; Decree Nº 5988, of October 19, 2006; Decree Nº 4212, of April 26, 2002; and Decree Nº 4213, of April 26, 2002.
• PIS and COFINS CREDITS ANTICIPATION - SUDENE: Granting period of 12 months from the purchase of credits of the contribution for the PIS and COFINS. Legal basis: art. 31 of Law Nº 11196 of November 21, 2005; item III of §1 of art. 3 of Law Nº 10637, of December 30, 2002; item III of §1 of art. 3 of Law Nº 10833, of December 29, 2003; paragraph 4 of art.15 of Law Nº 10865, of April 30, 2004; Decree Nº 5988, of December 19, 2006; Decree Nº 5789, of May 25, 2006; Decree Nº 4212, of April 26, 2002; and Decree Nº 4213, of April 26, 2002. This benefit ensures that the PIS and COFINS paid on purchases are credited.
The annual income tax calculations (IRPJ and CSLL) and PIS and COFINS offsets are shown in Table 22.17.
5070\16.4\5070-STY-001_01 July 2017 Lycopodium Minerals Canada Ltd.
FEASIBILITY STUDY ON THE AURIZONA GOLD MINE PROJECT NI 43-101 TECHNICAL REPORT
Page 22.10
Fiscal Benefits at State Level
• ICMS DEFERRAL ON IMPORTS: For new investments, Maranhão State grants the benefit of ICMS deferral on imports of machinery, equipment, and instruments, as well as their parts, components and accessories that are cleared inside the State’s territory. This benefit should be applied to items intended for the fixed assets of the project, according to the conditions laid down in Article 11 of annex 1.3 of the ICMS Regulation, approved by State Decree Nº 19714, of July 10, 2003.
• ICMS CONVERSION TO VAR (VALUE ADDED RECEIVABLES): The ICMS is a value-added tax. Given that sales of gold to markets outside of Brazil are not taxed, the result is a cumulative balance of credits arising from the tax paid on capital and operating expenditures. However, the laws of Maranhão State provide that, if the Company obtains authorization from the State Government, this balance can be converted into a receivable (value-added tax receivable) and may subsequently be used for payment of suppliers who are interested in supplying products in exchange of these credits.
• The ICMS credits are accumulated monthly in a current asset account. After five years, which is the expiration period, if the conversion of the credits in receivables is not approved by the State Government, the amount should be written off. The Study assumes that any credits receivable are fully utilized.
• The Government of Maranhão State may approve the conversion of credits within regular terms, which this Study assumes as up to one year. These conversions are represented in the financial projections as cash inflows, which can be used for the payment of suppliers for capital or operating goods for the Project, located within the Maranhão territory. Legal basis: articles 34, 35, 36, 38, 40 and 45 of the State Law Nº 7,799, of December 19, 2002 (tax system of Maranhão State) and State Law Nº 8,616, of June 05, 2007 (ICMS credits transfer).
The ICMS annual credits conversion flow is shown in Table 22.18.
• ICMS AGREEMENT WITH MARANHÃO STATE: MASA is in negotiations with the Government of Maranhão State to obtain an exemption from ICMS on the Project. While a final agreement has not been signed, the exemption is assumed as a base case in this Study and includes the following:
• Exemption from ICMS differential rate (“DIFAL”) on purchases of fixed assets from suppliers outside of Maranhão State.
• Exemption from ICMS on purchases of energy and diesel to be used in operations from suppliers inside Maranhão State.
• Exemption from ICMS on purchases of spares and repair parts from suppliers inside Maranhão State.
• Exemption from ICMS on imports of inputs and consumables for operations.
5070\16.4\5070-STY-001_01 July 2017 Lycopodium Minerals Canada Ltd.
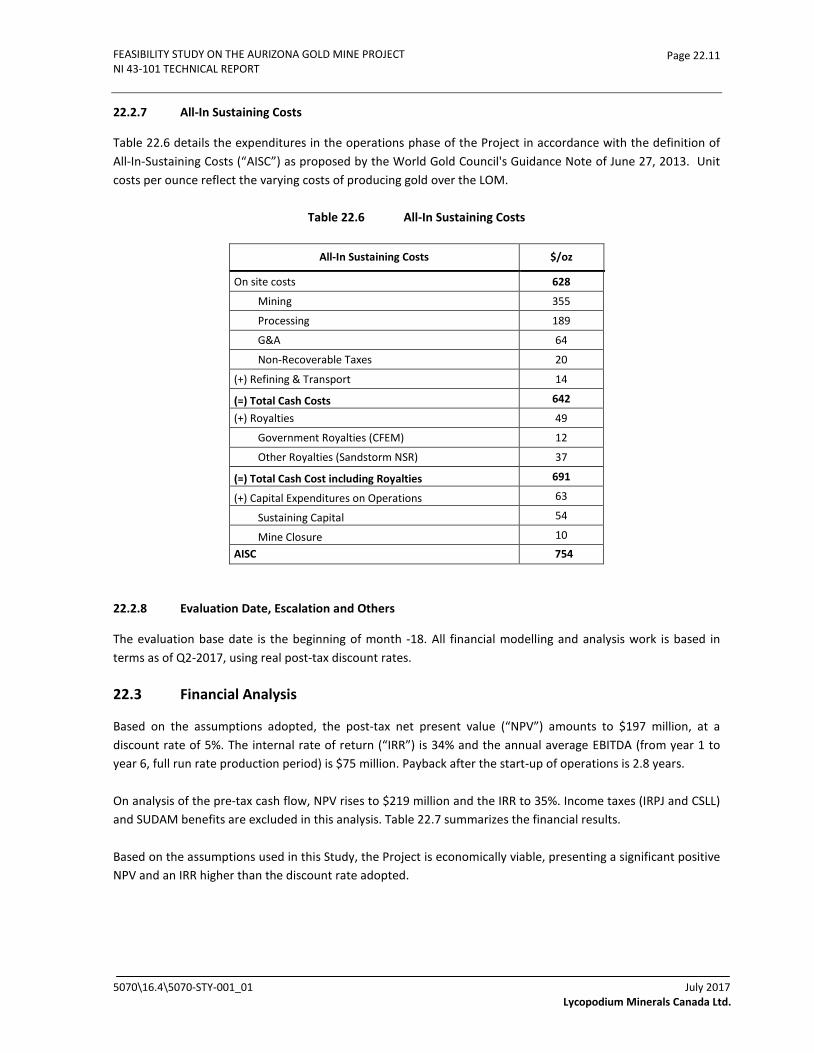
FEASIBILITY STUDY ON THE AURIZONA GOLD MINE PROJECT NI 43-101 TECHNICAL REPORT
Page 22.11
22.2.7 All-In Sustaining Costs
Table 22.6 details the expenditures in the operations phase of the Project in accordance with the definition of All-In-Sustaining Costs (“AISC”) as proposed by the World Gold Council's Guidance Note of June 27, 2013. Unit costs per ounce reflect the varying costs of producing gold over the LOM.
Table 22.6 All-In Sustaining Costs
All-In Sustaining Costs $/oz
On site costs 628
Mining 355
Processing 189
G&A 64
Non-Recoverable Taxes 20
(+) Refining & Transport 14
(=) Total Cash Costs 642
(+) Royalties 49
Government Royalties (CFEM) 12
Other Royalties (Sandstorm NSR) 37
(=) Total Cash Cost including Royalties 691
(+) Capital Expenditures on Operations 63
Sustaining Capital 54
Mine Closure 10 AISC 754
22.2.8 Evaluation Date, Escalation and Others
The evaluation base date is the beginning of month -18. All financial modelling and analysis work is based in terms as of Q2-2017, using real post-tax discount rates.
22.3 Financial Analysis
Based on the assumptions adopted, the post-tax net present value (“NPV”) amounts to $197 million, at a discount rate of 5%. The internal rate of return (“IRR”) is 34% and the annual average EBITDA (from year 1 to year 6, full run rate production period) is $75 million. Payback after the start-up of operations is 2.8 years.
On analysis of the pre-tax cash flow, NPV rises to $219 million and the IRR to 35%. Income taxes (IRPJ and CSLL) and SUDAM benefits are excluded in this analysis. Table 22.7 summarizes the financial results.
Based on the assumptions used in this Study, the Project is economically viable, presenting a significant positive NPV and an IRR higher than the discount rate adopted.
5070\16.4\5070-STY-001_01 July 2017 Lycopodium Minerals Canada Ltd.
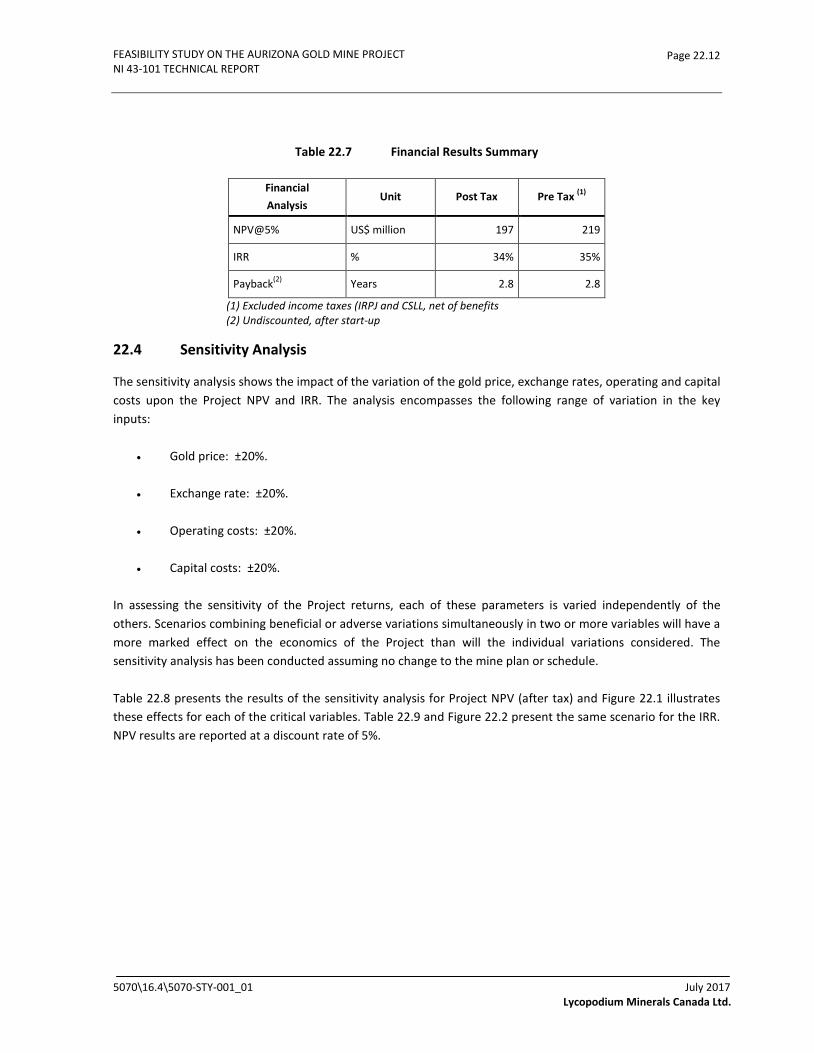
FEASIBILITY STUDY ON THE AURIZONA GOLD MINE PROJECT NI 43-101 TECHNICAL REPORT
Page 22.12
Table 22.7 Financial Results Summary
Financial Analysis
Unit Post Tax Pre Tax (1)
NPV@5% US$ million 197 219
IRR % 34% 35%
Payback(2) Years 2.8 2.8
(1) Excluded income taxes (IRPJ and CSLL, net of benefits (2) Undiscounted, after start-up
22.4 Sensitivity Analysis
The sensitivity analysis shows the impact of the variation of the gold price, exchange rates, operating and capital costs upon the Project NPV and IRR. The analysis encompasses the following range of variation in the key inputs:
• Gold price: ±20%.
• Exchange rate: ±20%.
• Operating costs: ±20%.
• Capital costs: ±20%.
In assessing the sensitivity of the Project returns, each of these parameters is varied independently of the others. Scenarios combining beneficial or adverse variations simultaneously in two or more variables will have a more marked effect on the economics of the Project than will the individual variations considered. The sensitivity analysis has been conducted assuming no change to the mine plan or schedule.
Table 22.8 presents the results of the sensitivity analysis for Project NPV (after tax) and Figure 22.1 illustrates these effects for each of the critical variables. Table 22.9 and Figure 22.2 present the same scenario for the IRR. NPV results are reported at a discount rate of 5%.
5070\16.4\5070-STY-001_01 July 2017 Lycopodium Minerals Canada Ltd.
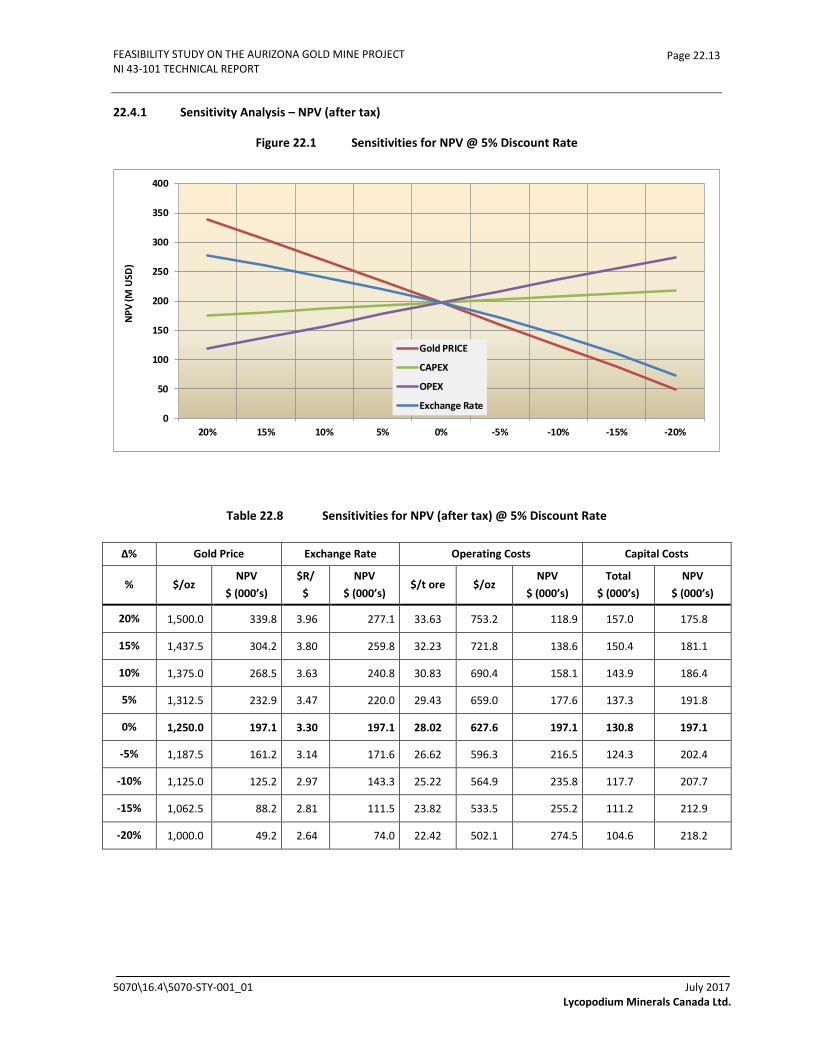
FEASIBILITY STUDY ON THE AURIZONA GOLD MINE PROJECT NI 43-101 TECHNICAL REPORT
Page 22.13
22.4.1 Sensitivity Analysis – NPV (after tax)
Figure 22.1 Sensitivities for NPV @ 5% Discount Rate
Table 22.8 Sensitivities for NPV (after tax) @ 5% Discount Rate
Δ% Gold Price Exchange Rate Operating Costs Capital Costs
% $/oz NPV
$ (000’s) $R/
$ NPV
$ (000’s) $/t ore $/oz
NPV $ (000’s)
Total $ (000’s)
NPV $ (000’s)
20% 1,500.0 339.8 3.96 277.1 33.63 753.2 118.9 157.0 175.8
15% 1,437.5 304.2 3.80 259.8 32.23 721.8 138.6 150.4 181.1
10% 1,375.0 268.5 3.63 240.8 30.83 690.4 158.1 143.9 186.4
5% 1,312.5 232.9 3.47 220.0 29.43 659.0 177.6 137.3 191.8
0% 1,250.0 197.1 3.30 197.1 28.02 627.6 197.1 130.8 197.1
-5% 1,187.5 161.2 3.14 171.6 26.62 596.3 216.5 124.3 202.4
-10% 1,125.0 125.2 2.97 143.3 25.22 564.9 235.8 117.7 207.7
-15% 1,062.5 88.2 2.81 111.5 23.82 533.5 255.2 111.2 212.9
-20% 1,000.0 49.2 2.64 74.0 22.42 502.1 274.5 104.6 218.2
0
50
100
150
200
250
300
350
400
20% 15% 10% 5% 0% -5% -10% -15% -20%
NPV
(M U
SD)
Gold PRICE
CAPEX
OPEX
Exchange Rate
5070\16.4\5070-STY-001_01 July 2017 Lycopodium Minerals Canada Ltd.

FEASIBILITY STUDY ON THE AURIZONA GOLD MINE PROJECT NI 43-101 TECHNICAL REPORT
Page 22.14
22.4.2 Sensitivity Analysis – IRR
Figure 22.2 Sensitivities for IRR
Table 22.9 Sensitivities for IRR
Δ% Gold Price Exchange Rate Operating Costs Capital Costs
% $/oz IRR% $R/
$ IRR% $/t ore $/oz IRR%
Total $ (000’s)
IRR%
20% 1,500.0 52.9% 3.96 50.9% 33.63 753.2 21.6% 157.0 27.5%
15% 1,437.5 48.3% 3.80 46.8% 32.23 721.8 24.7% 150.4 28.9%
10% 1,375.0 43.6% 3.63 42.6% 30.83 690.4 27.7% 143.9 30.4%
5% 1,312.5 38.7% 3.47 38.3% 29.43 659.0 30.7% 137.3 32.0%
0% 1,250.0 33.8% 3.30 33.8% 28.02 627.6 33.8% 130.8 33.8%
-5% 1,187.5 28.7% 3.14 29.1% 26.62 596.3 36.8% 124.3 35.7%
-10% 1,125.0 23.5% 2.97 24.3% 25.22 564.9 39.9% 117.7 37.7%
-15% 1,062.5 18.1% 2.81 19.3% 23.82 533.5 42.9% 111.2 40.0%
-20% 1,000.0 12.3% 2.64 14.0% 22.42 502.1 45.9% 104.6 42.4%
0.0%
10.0%
20.0%
30.0%
40.0%
50.0%
60.0%
20% 15% 10% 5% 0% -5% -10% -15% -20%
IRR
(%)
Gold PRICE
CAPEX
OPEX
Exchange Rate
5070\16.4\5070-STY-001_01 July 2017 Lycopodium Minerals Canada Ltd.

FEASIBILITY STUDY ON THE AURIZONA GOLD MINE PROJECT NI 43-101 TECHNICAL REPORT
Page 22.15
Table 22.10 Projections - Production Flow
LOM CF Annual Projections Project Year
Operating Assumptions Unit Total -2 -1 1 2 3 4 5 6 7 8 9 10
Direct to Mill Ore (000t) 15,839.1 - - 1,841.0 2,110.3 2,500.8 2,920.0 2,400.5 2,920.0 1,146.6 - - -
Mine to Stockpile " 3,997.0 757.5 315.4 1,571.8 708.1 644.3 - - - - - - -
From Stockpile to Mill " 3,997.0 - - 1,076.7 1,097.7 505.6 - 519.5 - 797.5 - - -
Waste Tonnes Mined " 113,135.9 1,592.5 1,834.6 26,121.6 29,581.6 29,063.3 12,680.5 8,817.1 3,058.5 386.1 - - -
Ore Mined (000t) 19,836.1 757.5 315.4 3,412.7 2,818.4 3,145.1 2,920.0 2,400.5 2,920.0 1,146.6 - - -
Stripping Ratio 5.70 2.10 5.82 7.65 10.50 9.24 4.34 3.67 1.05 0.34 - - -
Total Material Mined (000t) 132,972.0 2,350.0 2,150.0 29,534.3 32,400.0 32,208.4 15,600.5 11,217.6 5,978.5 1,532.7 - - -
Material Mined during Operations Period " 128,472.0 - - 29,534.3 32,400.0 32,208.4 15,600.5 11,217.6 5,978.5 1,532.7 - - -
Total Material Moved (000t) 136,968.9 2,350.0 2,150.0 30,611.0 33,497.7 32,714.0 15,600.5 11,737.1 5,978.5 2,330.1 - - -
Material Moved during Operations Period " 132,468.9 - - 30,611.0 33,497.7 32,714.0 15,600.5 11,737.1 5,978.5 2,330.1 - - -
Ore fed to milling (000t) 19,836.1 - - 2,917.7 3,208.0 3,006.4 2,920.0 2,920.0 2,920.0 1,944.0 - - -
Gold head grade (g/t) 1.52 - - 1.49 1.50 1.66 1.65 1.43 1.43 1.47 - - -
Gold content (oz) 971,251.9 - - 140,171.1 154,638.4 160,779.8 154,592.7 134,700.6 134,248.3 92,120.9 - - -
Ore Reserve (000t) 19,836.1 19,836.1 16,918.4 13,710.4 10,704.0 7,784.0 4,864.0 1,944.0 0.0 0.0 0.0 0.0
Reserve Tail (%) 100.0% 100.0% 85.3% 69.1% 54.0% 39.2% 24.5% 9.8% 0.0% 0.0% 0.0% 0.0%
PROCESSING
Metallurgical recovery (%) 91.2% 0.0% 0.0% 92.8% 91.9% 92.0% 90.4% 90.5% 90.0% 90.2% 0.0% 0.0% 0.0%
Au content after processing (oz) 885,696.3 0.0 0.0 130,082.2 142,160.8 147,951.6 139,732.6 121,876.2 120,823.5 83,069.4 0.0 0.0 0.0
WIP (End of Period) " 0.0 0.0 0.0 0.0 0.0 0.0 0.0 0.0 0.0 0.0 0.0 0.0
Gold to refining (produced) " 885,696.3 - - 130,082.2 142,160.8 147,951.6 139,732.6 121,876.2 120,823.5 83,069.4 - - -
REFINING
5070-\16.4\5070-STY-001 July 2017 Lycopodium Minerals Canada Ltd.
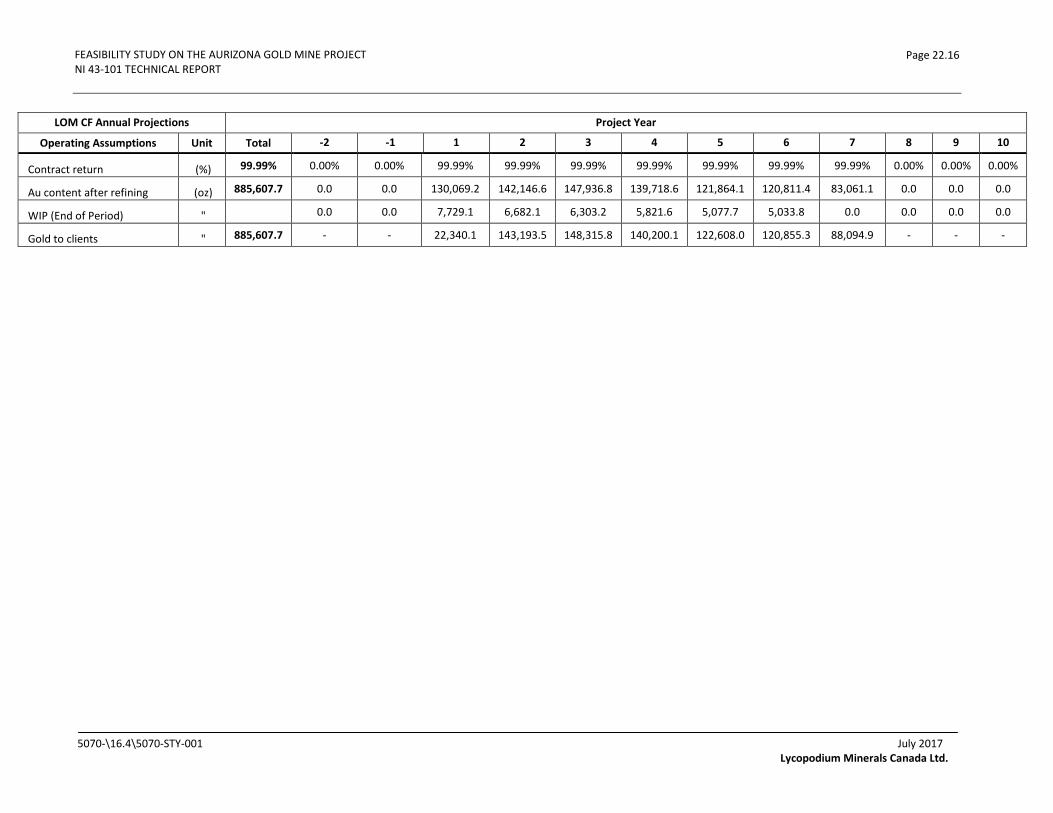
FEASIBILITY STUDY ON THE AURIZONA GOLD MINE PROJECT NI 43-101 TECHNICAL REPORT
Page 22.16
LOM CF Annual Projections Project Year
Operating Assumptions Unit Total -2 -1 1 2 3 4 5 6 7 8 9 10
Contract return (%) 99.99% 0.00% 0.00% 99.99% 99.99% 99.99% 99.99% 99.99% 99.99% 99.99% 0.00% 0.00% 0.00%
Au content after refining (oz) 885,607.7 0.0 0.0 130,069.2 142,146.6 147,936.8 139,718.6 121,864.1 120,811.4 83,061.1 0.0 0.0 0.0
WIP (End of Period) " 0.0 0.0 7,729.1 6,682.1 6,303.2 5,821.6 5,077.7 5,033.8 0.0 0.0 0.0 0.0
Gold to clients " 885,607.7 - - 22,340.1 143,193.5 148,315.8 140,200.1 122,608.0 120,855.3 88,094.9 - - -
5070-\16.4\5070-STY-001 July 2017 Lycopodium Minerals Canada Ltd.
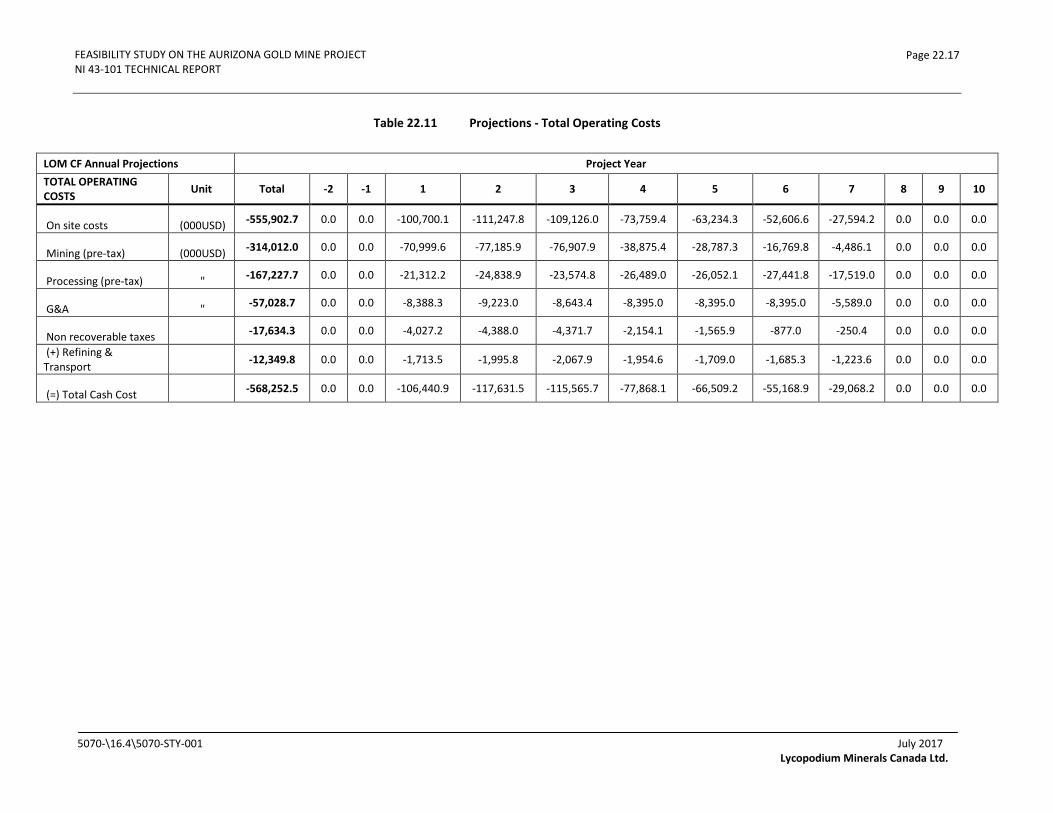
FEASIBILITY STUDY ON THE AURIZONA GOLD MINE PROJECT NI 43-101 TECHNICAL REPORT
Page 22.17
Table 22.11 Projections - Total Operating Costs
LOM CF Annual Projections Project Year TOTAL OPERATING COSTS Unit Total -2 -1 1 2 3 4 5 6 7 8 9 10
On site costs (000USD) -555,902.7 0.0 0.0 -100,700.1 -111,247.8 -109,126.0 -73,759.4 -63,234.3 -52,606.6 -27,594.2 0.0 0.0 0.0
Mining (pre-tax) (000USD) -314,012.0 0.0 0.0 -70,999.6 -77,185.9 -76,907.9 -38,875.4 -28,787.3 -16,769.8 -4,486.1 0.0 0.0 0.0
Processing (pre-tax) " -167,227.7 0.0 0.0 -21,312.2 -24,838.9 -23,574.8 -26,489.0 -26,052.1 -27,441.8 -17,519.0 0.0 0.0 0.0
G&A " -57,028.7 0.0 0.0 -8,388.3 -9,223.0 -8,643.4 -8,395.0 -8,395.0 -8,395.0 -5,589.0 0.0 0.0 0.0
Non recoverable taxes -17,634.3 0.0 0.0 -4,027.2 -4,388.0 -4,371.7 -2,154.1 -1,565.9 -877.0 -250.4 0.0 0.0 0.0
(+) Refining & Transport -12,349.8 0.0 0.0 -1,713.5 -1,995.8 -2,067.9 -1,954.6 -1,709.0 -1,685.3 -1,223.6 0.0 0.0 0.0
(=) Total Cash Cost -568,252.5 0.0 0.0 -106,440.9 -117,631.5 -115,565.7 -77,868.1 -66,509.2 -55,168.9 -29,068.2 0.0 0.0 0.0
5070-\16.4\5070-STY-001 July 2017 Lycopodium Minerals Canada Ltd.
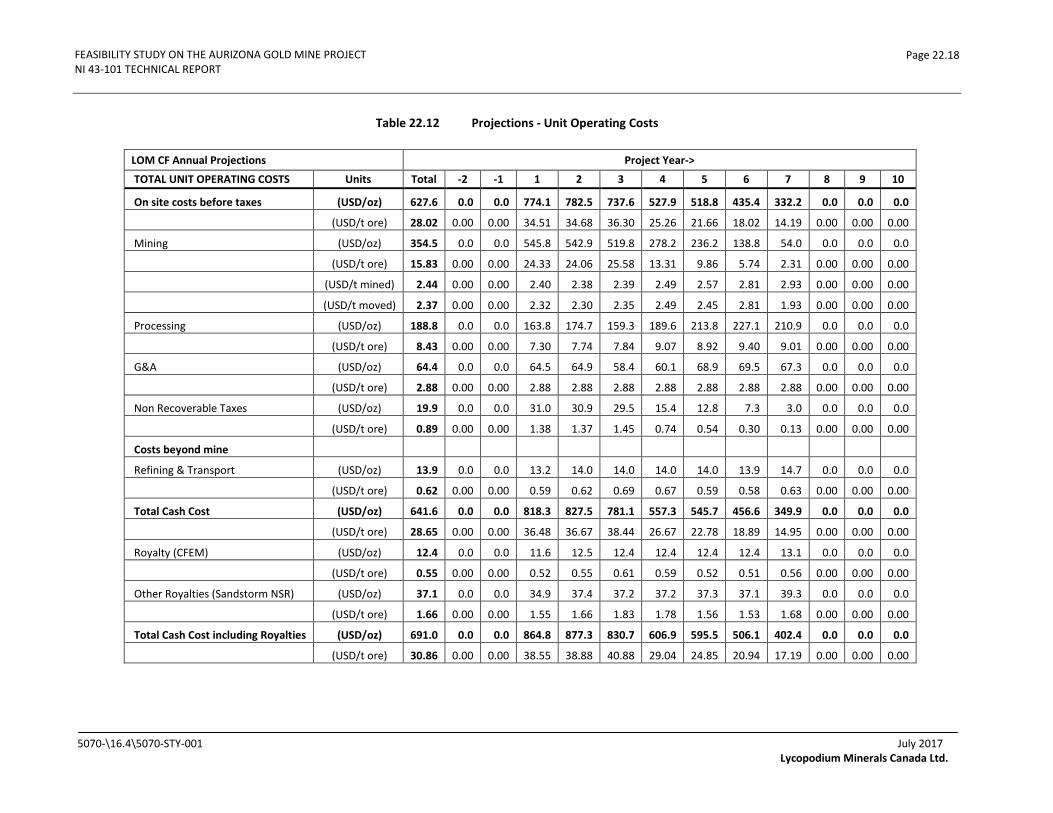
FEASIBILITY STUDY ON THE AURIZONA GOLD MINE PROJECT NI 43-101 TECHNICAL REPORT
Page 22.18
Table 22.12 Projections - Unit Operating Costs
LOM CF Annual Projections Project Year->
TOTAL UNIT OPERATING COSTS Units Total -2 -1 1 2 3 4 5 6 7 8 9 10
On site costs before taxes (USD/oz) 627.6 0.0 0.0 774.1 782.5 737.6 527.9 518.8 435.4 332.2 0.0 0.0 0.0
(USD/t ore) 28.02 0.00 0.00 34.51 34.68 36.30 25.26 21.66 18.02 14.19 0.00 0.00 0.00
Mining (USD/oz) 354.5 0.0 0.0 545.8 542.9 519.8 278.2 236.2 138.8 54.0 0.0 0.0 0.0
(USD/t ore) 15.83 0.00 0.00 24.33 24.06 25.58 13.31 9.86 5.74 2.31 0.00 0.00 0.00
(USD/t mined) 2.44 0.00 0.00 2.40 2.38 2.39 2.49 2.57 2.81 2.93 0.00 0.00 0.00
(USD/t moved) 2.37 0.00 0.00 2.32 2.30 2.35 2.49 2.45 2.81 1.93 0.00 0.00 0.00
Processing (USD/oz) 188.8 0.0 0.0 163.8 174.7 159.3 189.6 213.8 227.1 210.9 0.0 0.0 0.0
(USD/t ore) 8.43 0.00 0.00 7.30 7.74 7.84 9.07 8.92 9.40 9.01 0.00 0.00 0.00
G&A (USD/oz) 64.4 0.0 0.0 64.5 64.9 58.4 60.1 68.9 69.5 67.3 0.0 0.0 0.0
(USD/t ore) 2.88 0.00 0.00 2.88 2.88 2.88 2.88 2.88 2.88 2.88 0.00 0.00 0.00
Non Recoverable Taxes (USD/oz) 19.9 0.0 0.0 31.0 30.9 29.5 15.4 12.8 7.3 3.0 0.0 0.0 0.0
(USD/t ore) 0.89 0.00 0.00 1.38 1.37 1.45 0.74 0.54 0.30 0.13 0.00 0.00 0.00
Costs beyond mine
Refining & Transport (USD/oz) 13.9 0.0 0.0 13.2 14.0 14.0 14.0 14.0 13.9 14.7 0.0 0.0 0.0
(USD/t ore) 0.62 0.00 0.00 0.59 0.62 0.69 0.67 0.59 0.58 0.63 0.00 0.00 0.00
Total Cash Cost (USD/oz) 641.6 0.0 0.0 818.3 827.5 781.1 557.3 545.7 456.6 349.9 0.0 0.0 0.0
(USD/t ore) 28.65 0.00 0.00 36.48 36.67 38.44 26.67 22.78 18.89 14.95 0.00 0.00 0.00
Royalty (CFEM) (USD/oz) 12.4 0.0 0.0 11.6 12.5 12.4 12.4 12.4 12.4 13.1 0.0 0.0 0.0
(USD/t ore) 0.55 0.00 0.00 0.52 0.55 0.61 0.59 0.52 0.51 0.56 0.00 0.00 0.00
Other Royalties (Sandstorm NSR) (USD/oz) 37.1 0.0 0.0 34.9 37.4 37.2 37.2 37.3 37.1 39.3 0.0 0.0 0.0
(USD/t ore) 1.66 0.00 0.00 1.55 1.66 1.83 1.78 1.56 1.53 1.68 0.00 0.00 0.00
Total Cash Cost including Royalties (USD/oz) 691.0 0.0 0.0 864.8 877.3 830.7 606.9 595.5 506.1 402.4 0.0 0.0 0.0
(USD/t ore) 30.86 0.00 0.00 38.55 38.88 40.88 29.04 24.85 20.94 17.19 0.00 0.00 0.00
5070-\16.4\5070-STY-001 July 2017 Lycopodium Minerals Canada Ltd.
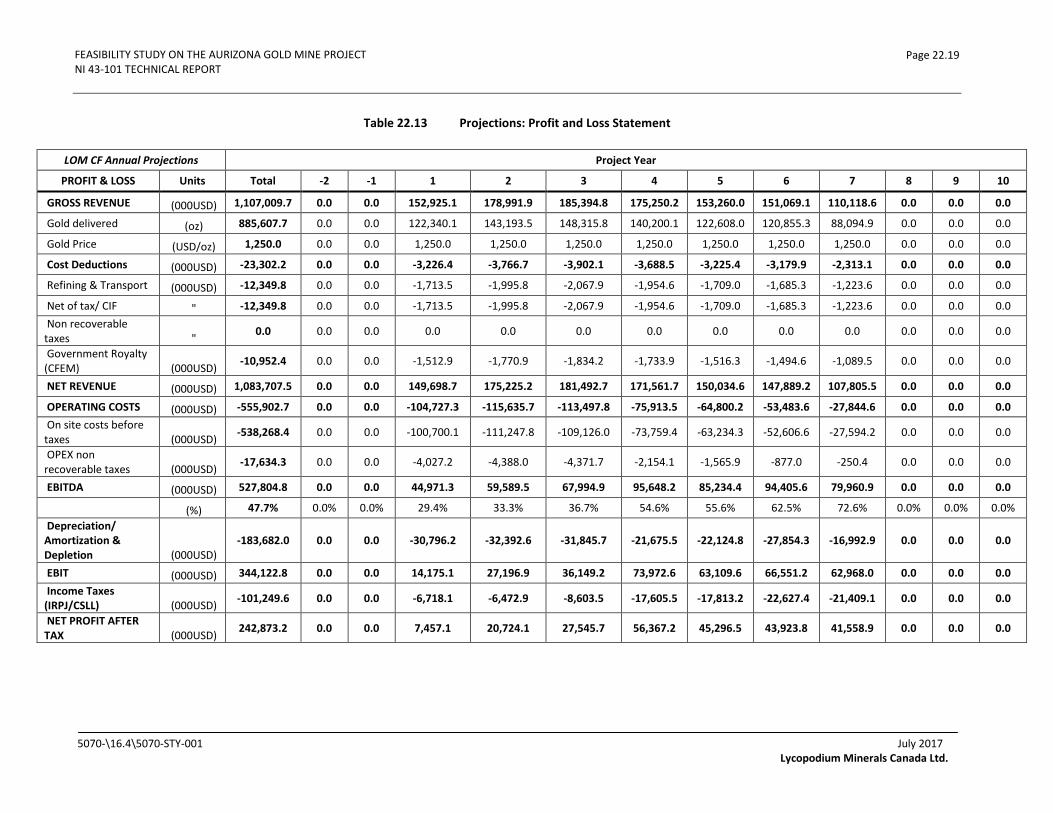
FEASIBILITY STUDY ON THE AURIZONA GOLD MINE PROJECT NI 43-101 TECHNICAL REPORT
Page 22.19
Table 22.13 Projections: Profit and Loss Statement
LOM CF Annual Projections Project Year
PROFIT & LOSS Units Total -2 -1 1 2 3 4 5 6 7 8 9 10
GROSS REVENUE (000USD) 1,107,009.7 0.0 0.0 152,925.1 178,991.9 185,394.8 175,250.2 153,260.0 151,069.1 110,118.6 0.0 0.0 0.0
Gold delivered (oz) 885,607.7 0.0 0.0 122,340.1 143,193.5 148,315.8 140,200.1 122,608.0 120,855.3 88,094.9 0.0 0.0 0.0
Gold Price (USD/oz) 1,250.0 0.0 0.0 1,250.0 1,250.0 1,250.0 1,250.0 1,250.0 1,250.0 1,250.0 0.0 0.0 0.0
Cost Deductions (000USD) -23,302.2 0.0 0.0 -3,226.4 -3,766.7 -3,902.1 -3,688.5 -3,225.4 -3,179.9 -2,313.1 0.0 0.0 0.0
Refining & Transport (000USD) -12,349.8 0.0 0.0 -1,713.5 -1,995.8 -2,067.9 -1,954.6 -1,709.0 -1,685.3 -1,223.6 0.0 0.0 0.0
Net of tax/ CIF " -12,349.8 0.0 0.0 -1,713.5 -1,995.8 -2,067.9 -1,954.6 -1,709.0 -1,685.3 -1,223.6 0.0 0.0 0.0 Non recoverable taxes " 0.0 0.0 0.0 0.0 0.0 0.0 0.0 0.0 0.0 0.0 0.0 0.0 0.0
Government Royalty (CFEM) (000USD) -10,952.4 0.0 0.0 -1,512.9 -1,770.9 -1,834.2 -1,733.9 -1,516.3 -1,494.6 -1,089.5 0.0 0.0 0.0
NET REVENUE (000USD) 1,083,707.5 0.0 0.0 149,698.7 175,225.2 181,492.7 171,561.7 150,034.6 147,889.2 107,805.5 0.0 0.0 0.0
OPERATING COSTS (000USD) -555,902.7 0.0 0.0 -104,727.3 -115,635.7 -113,497.8 -75,913.5 -64,800.2 -53,483.6 -27,844.6 0.0 0.0 0.0 On site costs before taxes (000USD) -538,268.4 0.0 0.0 -100,700.1 -111,247.8 -109,126.0 -73,759.4 -63,234.3 -52,606.6 -27,594.2 0.0 0.0 0.0
OPEX non recoverable taxes (000USD) -17,634.3 0.0 0.0 -4,027.2 -4,388.0 -4,371.7 -2,154.1 -1,565.9 -877.0 -250.4 0.0 0.0 0.0
EBITDA (000USD) 527,804.8 0.0 0.0 44,971.3 59,589.5 67,994.9 95,648.2 85,234.4 94,405.6 79,960.9 0.0 0.0 0.0
(%) 47.7% 0.0% 0.0% 29.4% 33.3% 36.7% 54.6% 55.6% 62.5% 72.6% 0.0% 0.0% 0.0% Depreciation/ Amortization & Depletion (000USD)
-183,682.0 0.0 0.0 -30,796.2 -32,392.6 -31,845.7 -21,675.5 -22,124.8 -27,854.3 -16,992.9 0.0 0.0 0.0
EBIT (000USD) 344,122.8 0.0 0.0 14,175.1 27,196.9 36,149.2 73,972.6 63,109.6 66,551.2 62,968.0 0.0 0.0 0.0 Income Taxes (IRPJ/CSLL) (000USD) -101,249.6 0.0 0.0 -6,718.1 -6,472.9 -8,603.5 -17,605.5 -17,813.2 -22,627.4 -21,409.1 0.0 0.0 0.0
NET PROFIT AFTER TAX (000USD) 242,873.2 0.0 0.0 7,457.1 20,724.1 27,545.7 56,367.2 45,296.5 43,923.8 41,558.9 0.0 0.0 0.0
5070-\16.4\5070-STY-001 July 2017 Lycopodium Minerals Canada Ltd.
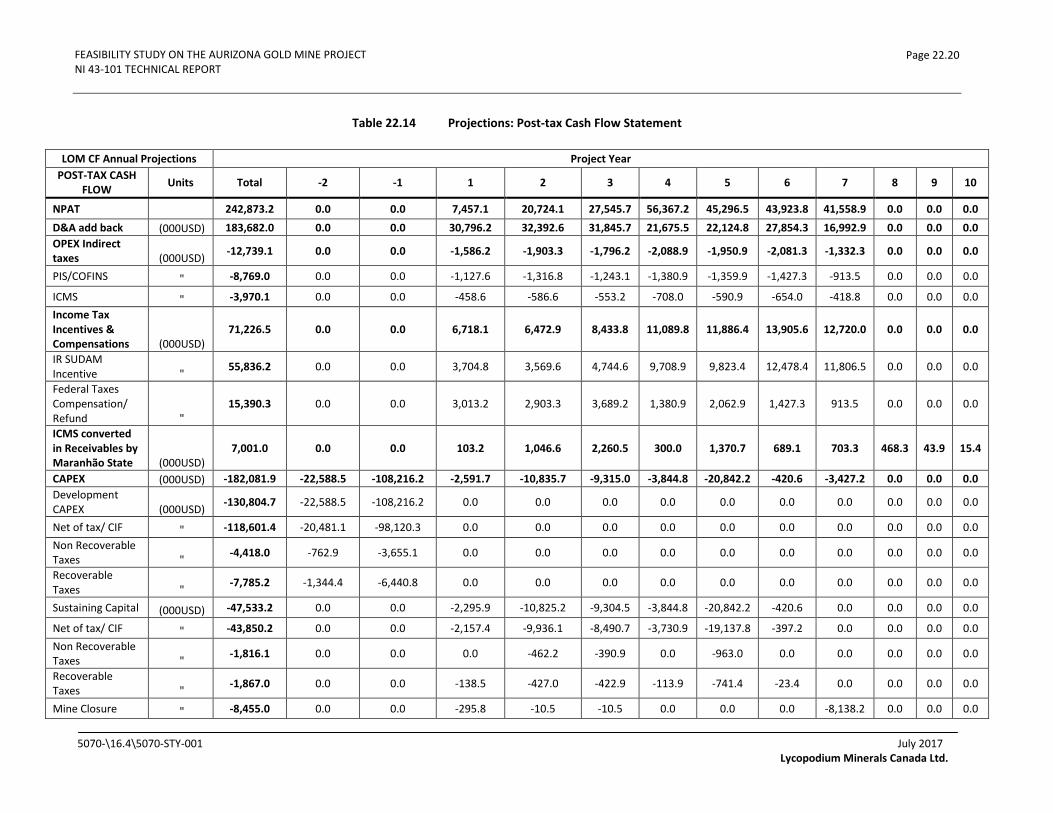
FEASIBILITY STUDY ON THE AURIZONA GOLD MINE PROJECT NI 43-101 TECHNICAL REPORT
Page 22.20
Table 22.14 Projections: Post-tax Cash Flow Statement
LOM CF Annual Projections Project Year POST-TAX CASH
FLOW Units Total -2 -1 1 2 3 4 5 6 7 8 9 10
NPAT 242,873.2 0.0 0.0 7,457.1 20,724.1 27,545.7 56,367.2 45,296.5 43,923.8 41,558.9 0.0 0.0 0.0 D&A add back (000USD) 183,682.0 0.0 0.0 30,796.2 32,392.6 31,845.7 21,675.5 22,124.8 27,854.3 16,992.9 0.0 0.0 0.0 OPEX Indirect taxes (000USD) -12,739.1 0.0 0.0 -1,586.2 -1,903.3 -1,796.2 -2,088.9 -1,950.9 -2,081.3 -1,332.3 0.0 0.0 0.0
PIS/COFINS " -8,769.0 0.0 0.0 -1,127.6 -1,316.8 -1,243.1 -1,380.9 -1,359.9 -1,427.3 -913.5 0.0 0.0 0.0
ICMS " -3,970.1 0.0 0.0 -458.6 -586.6 -553.2 -708.0 -590.9 -654.0 -418.8 0.0 0.0 0.0 Income Tax Incentives & Compensations (000USD)
71,226.5 0.0 0.0 6,718.1 6,472.9 8,433.8 11,089.8 11,886.4 13,905.6 12,720.0 0.0 0.0 0.0
IR SUDAM Incentive " 55,836.2 0.0 0.0 3,704.8 3,569.6 4,744.6 9,708.9 9,823.4 12,478.4 11,806.5 0.0 0.0 0.0
Federal Taxes Compensation/ Refund "
15,390.3 0.0 0.0 3,013.2 2,903.3 3,689.2 1,380.9 2,062.9 1,427.3 913.5 0.0 0.0 0.0
ICMS converted in Receivables by Maranhão State (000USD)
7,001.0 0.0 0.0 103.2 1,046.6 2,260.5 300.0 1,370.7 689.1 703.3 468.3 43.9 15.4
CAPEX (000USD) -182,081.9 -22,588.5 -108,216.2 -2,591.7 -10,835.7 -9,315.0 -3,844.8 -20,842.2 -420.6 -3,427.2 0.0 0.0 0.0 Development CAPEX (000USD) -130,804.7 -22,588.5 -108,216.2 0.0 0.0 0.0 0.0 0.0 0.0 0.0 0.0 0.0 0.0
Net of tax/ CIF " -118,601.4 -20,481.1 -98,120.3 0.0 0.0 0.0 0.0 0.0 0.0 0.0 0.0 0.0 0.0 Non Recoverable Taxes " -4,418.0 -762.9 -3,655.1 0.0 0.0 0.0 0.0 0.0 0.0 0.0 0.0 0.0 0.0
Recoverable Taxes " -7,785.2 -1,344.4 -6,440.8 0.0 0.0 0.0 0.0 0.0 0.0 0.0 0.0 0.0 0.0
Sustaining Capital (000USD) -47,533.2 0.0 0.0 -2,295.9 -10,825.2 -9,304.5 -3,844.8 -20,842.2 -420.6 0.0 0.0 0.0 0.0
Net of tax/ CIF " -43,850.2 0.0 0.0 -2,157.4 -9,936.1 -8,490.7 -3,730.9 -19,137.8 -397.2 0.0 0.0 0.0 0.0 Non Recoverable Taxes " -1,816.1 0.0 0.0 0.0 -462.2 -390.9 0.0 -963.0 0.0 0.0 0.0 0.0 0.0
Recoverable Taxes " -1,867.0 0.0 0.0 -138.5 -427.0 -422.9 -113.9 -741.4 -23.4 0.0 0.0 0.0 0.0
Mine Closure " -8,455.0 0.0 0.0 -295.8 -10.5 -10.5 0.0 0.0 0.0 -8,138.2 0.0 0.0 0.0
5070-\16.4\5070-STY-001 July 2017 Lycopodium Minerals Canada Ltd.

FEASIBILITY STUDY ON THE AURIZONA GOLD MINE PROJECT NI 43-101 TECHNICAL REPORT
Page 22.21
LOM CF Annual Projections Project Year POST-TAX CASH
FLOW Units Total -2 -1 1 2 3 4 5 6 7 8 9 10
Salvage Value " 4,711.0 0.0 0.0 0.0 0.0 0.0 0.0 0.0 0.0 4,711.0 0.0 0.0 0.0 Working Capital Cash Adjustments (000USD)
9,000.0 0.0 0.0 8,093.6 81.1 385.7 -1,340.8 -188.3 -412.8 2,006.7 374.9 0.0 0.0
Other Royalties (Sandstorm NSR) (000USD) -32,839.8 0.0 0.0 -4,536.3 -5,309.9 -5,499.8 -5,198.9 -4,546.5 -4,481.5 -3,266.8 0.0 0.0 0.0
Post Tax Cash Flow (000USD) 286,121.8 -22,588.5 -108,216.2 44,453.9 42,668.2 53,860.3 76,959.1 53,150.4 78,976.6 65,955.4 843.2 43.9 15.4
Project NPV@5% (*)
(000 USD) 197,066.1 -22,253.1 -103,065.8 39,994.3 36,801.2 44,280.4 60,299.5 39,661.7 56,127.2 44,641.2 543.5 27.0 9.0
IRR (%) 33.8% Payback (years) 2.8
Exchange Rate (BRL/USD) 3.50 3.50 3.50 3.50 3.50 3.50 3.50 3.50 3.50 3.50 3.50 3.50 (*) Individual periods calculation
5070-\16.4\5070-STY-001 July 2017 Lycopodium Minerals Canada Ltd.

FEASIBILITY STUDY ON THE AURIZONA GOLD MINE PROJECT NI 43-101 TECHNICAL REPORT
Page 22.22
Table 22.15 Projections: Pre-tax Cash Flow Statement
LOM CF Annual Projections Project Year
PRE-TAX CASH FLOW Units Total -2 -1 1 2 3 4 5 6 7 8 9 10
Net Income Tax payable IR/CSLL to pay after SUDENE Incentive (000USD) -45,413.4 0.0 0.0 -3,013.2 -2,903.3 -3,689.2 -7,896.6 -7,989.7 -10,149.1 -9,602.6 0.0 0.0 0.0
PIS/COFINS Offset/ Refund " 15,390.3 0.0 0.0 3,013.2 2,903.3 3,689.2 1,380.9 2,062.9 1,427.3 913.5 0.0 0.0 0.0
Net IR/CSLL payable after PIS/COFINS offset
" -30,023.1 0.0 0.0 0.0 0.0 -169.7 -6,515.7 -5,926.8 -8,721.8 -8,689.1 0.0 0.0 0.0
Net Income Tax payable add-back (000USD) 30,023.1 0.0 0.0 0.0 0.0 169.7 6,515.7 5,926.8 8,721.8 8,689.1 0.0 0.0 0.0
Pre-Tax Cash Flow (000USD) 316,145.0 -22,588.5 -108,216.2 44,453.9 42,668.2 54,030.0 83,474.8 59,077.2 87,698.3 74,644.5 843.2 43.9 15.4
Project NPV@5% (*) (000USD) 218,810.6 -22,253.1 -103,065.8 39,994.3 36,801.2 44,417.5 65,404.7 44,084.3 62,325.6 50,522.3 543.5 27.0 9.0
IRR (%) 35.4% Payback (years) 2.8 0.00 0.00 0.00 0.00 2.84 0.00 0.00 0.00 0.00 0.00 0.00 0.00
Exchange Rate (BRL/USD) 3.50 3.50 3.50 3.50 3.50 3.50 3.50 3.50 3.50 3.50 3.50 3.50 (*) Individual periods calculation
5070-\16.4\5070-STY-001 July 2017 Lycopodium Minerals Canada Ltd.

FEASIBILITY STUDY ON THE AURIZONA GOLD MINE PROJECT NI 43-101 TECHNICAL REPORT
Page 22.23
Table 22.16 Projections: All In Sustaining Costs (AISC)
LOM CF Annual Projections Units Project Year
Total -2 -1 1 2 3 4 5 6 7 8 9 10
On site Operating Costs (USD/oz) 627.6 0.0 0.0 805.1 813.4 767.1 543.3 531.7 442.7 335.2 0.0 0.0 0.0
Mining (pre-tax) " 354.5 0.0 0.0 545.8 542.9 519.8 278.2 236.2 138.8 54.0 0.0 0.0 0.0
Processing (pre-tax) " 188.8 0.0 0.0 163.8 174.7 159.3 189.6 213.8 227.1 210.9 0.0 0.0 0.0
G&A " 64.4 0.0 0.0 64.5 64.9 58.4 60.1 68.9 69.5 67.3 0.0 0.0 0.0
Non recoverable taxes " 19.9 0.0 0.0 31.0 30.9 29.5 15.4 12.8 7.3 3.0 0.0 0.0 0.0
(+) Refining & Transport " 13.9 0.0 0.0 13.2 14.0 14.0 14.0 14.0 13.9 14.7 0.0 0.0 0.0
(=) Total Cash Cost " 641.6 0.0 0.0 818.3 827.5 781.1 557.3 545.7 456.6 349.9 0.0 0.0 0.0
(+) Royalties (USD/oz) 49.4 0.0 0.0 46.5 49.8 49.6 49.6 49.7 49.5 52.4 0.0 0.0 0.0
Government Royalties (CFEM) (USD/oz) 12.4 0.0 0.0 11.6 12.5 12.4 12.4 12.4 12.4 13.1 0.0 0.0 0.0
Other Royalties (Sandstorm NSR) (USD/oz) 37.1 0.0 0.0 34.9 37.4 37.2 37.2 37.3 37.1 39.3 0.0 0.0 0.0
(=) Total Cash Cost including Royalties (USD/oz) 691.0 0.0 0.0 864.8 877.3 830.7 606.9 595.5 506.1 402.4 0.0 0.0 0.0
(+) Capital Expenditures on Operations " 63.2 0.0 0.0 19.9 76.2 63.0 27.5 171.0 3.5 98.0 0.0 0.0 0.0
Sustaining Capital " 53.7 0.0 0.0 17.6 76.1 62.9 27.5 171.0 3.5 0.0 0.0 0.0 0.0
Mine Closure (USD/oz) 9.5 0.0 0.0 2.3 0.1 0.1 0.0 0.0 0.0 98.0 0.0 0.0 0.0
(=) ALL-IN SUSTAINING COSTS " 754.2 0.0 0.0 884.7 953.5 893.6 634.4 766.5 509.6 500.3 0.0 0.0 0.0
(*) Individual periods calculation
5070-\16.4\5070-STY-001 July 2017 Lycopodium Minerals Canada Ltd.
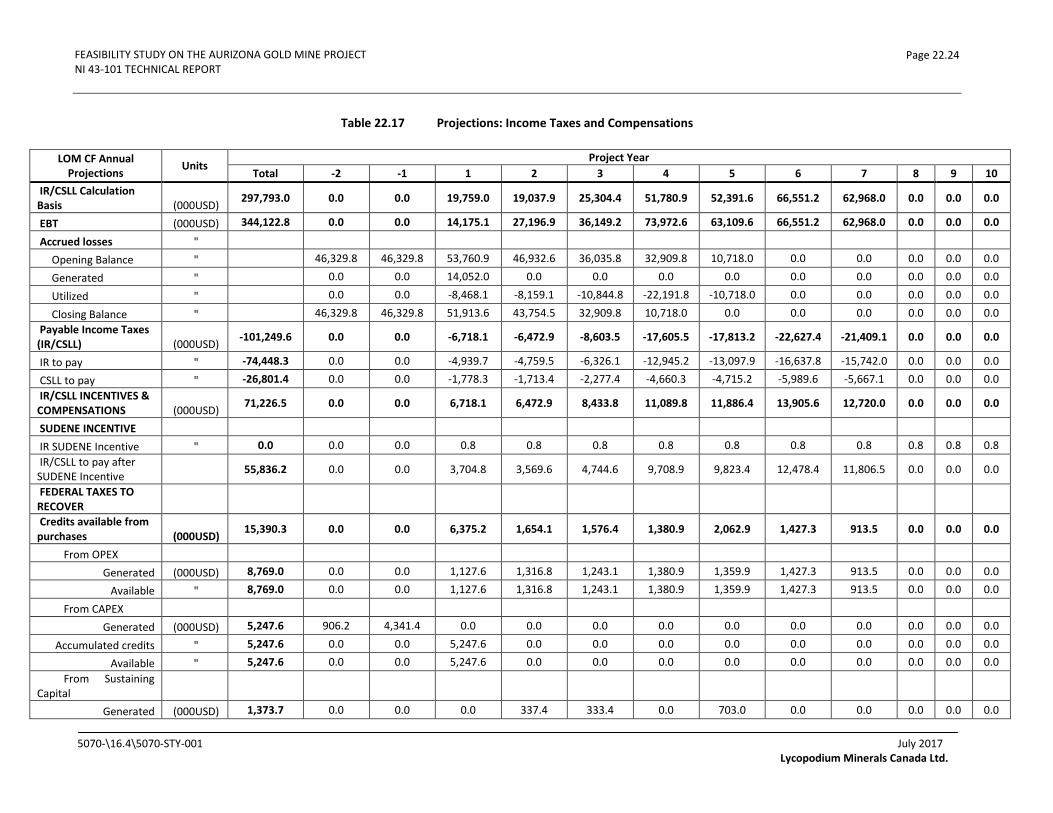
FEASIBILITY STUDY ON THE AURIZONA GOLD MINE PROJECT NI 43-101 TECHNICAL REPORT
Page 22.24
Table 22.17 Projections: Income Taxes and Compensations
LOM CF Annual Projections Units
Project Year Total -2 -1 1 2 3 4 5 6 7 8 9 10
IR/CSLL Calculation Basis (000USD) 297,793.0 0.0 0.0 19,759.0 19,037.9 25,304.4 51,780.9 52,391.6 66,551.2 62,968.0 0.0 0.0 0.0
EBT (000USD) 344,122.8 0.0 0.0 14,175.1 27,196.9 36,149.2 73,972.6 63,109.6 66,551.2 62,968.0 0.0 0.0 0.0
Accrued losses " Opening Balance " 46,329.8 46,329.8 53,760.9 46,932.6 36,035.8 32,909.8 10,718.0 0.0 0.0 0.0 0.0 0.0
Generated " 0.0 0.0 14,052.0 0.0 0.0 0.0 0.0 0.0 0.0 0.0 0.0 0.0
Utilized " 0.0 0.0 -8,468.1 -8,159.1 -10,844.8 -22,191.8 -10,718.0 0.0 0.0 0.0 0.0 0.0
Closing Balance " 46,329.8 46,329.8 51,913.6 43,754.5 32,909.8 10,718.0 0.0 0.0 0.0 0.0 0.0 0.0 Payable Income Taxes (IR/CSLL) (000USD) -101,249.6 0.0 0.0 -6,718.1 -6,472.9 -8,603.5 -17,605.5 -17,813.2 -22,627.4 -21,409.1 0.0 0.0 0.0
IR to pay " -74,448.3 0.0 0.0 -4,939.7 -4,759.5 -6,326.1 -12,945.2 -13,097.9 -16,637.8 -15,742.0 0.0 0.0 0.0
CSLL to pay " -26,801.4 0.0 0.0 -1,778.3 -1,713.4 -2,277.4 -4,660.3 -4,715.2 -5,989.6 -5,667.1 0.0 0.0 0.0 IR/CSLL INCENTIVES & COMPENSATIONS (000USD) 71,226.5 0.0 0.0 6,718.1 6,472.9 8,433.8 11,089.8 11,886.4 13,905.6 12,720.0 0.0 0.0 0.0
SUDENE INCENTIVE IR SUDENE Incentive " 0.0 0.0 0.0 0.8 0.8 0.8 0.8 0.8 0.8 0.8 0.8 0.8 0.8 IR/CSLL to pay after SUDENE Incentive 55,836.2 0.0 0.0 3,704.8 3,569.6 4,744.6 9,708.9 9,823.4 12,478.4 11,806.5 0.0 0.0 0.0
FEDERAL TAXES TO RECOVER Credits available from purchases (000USD) 15,390.3 0.0 0.0 6,375.2 1,654.1 1,576.4 1,380.9 2,062.9 1,427.3 913.5 0.0 0.0 0.0
From OPEX Generated (000USD) 8,769.0 0.0 0.0 1,127.6 1,316.8 1,243.1 1,380.9 1,359.9 1,427.3 913.5 0.0 0.0 0.0
Available " 8,769.0 0.0 0.0 1,127.6 1,316.8 1,243.1 1,380.9 1,359.9 1,427.3 913.5 0.0 0.0 0.0
From CAPEX Generated (000USD) 5,247.6 906.2 4,341.4 0.0 0.0 0.0 0.0 0.0 0.0 0.0 0.0 0.0 0.0
Accumulated credits " 5,247.6 0.0 0.0 5,247.6 0.0 0.0 0.0 0.0 0.0 0.0 0.0 0.0 0.0
Available " 5,247.6 0.0 0.0 5,247.6 0.0 0.0 0.0 0.0 0.0 0.0 0.0 0.0 0.0 From Sustaining
Capital Generated (000USD) 1,373.7 0.0 0.0 0.0 337.4 333.4 0.0 703.0 0.0 0.0 0.0 0.0 0.0
5070-\16.4\5070-STY-001 July 2017 Lycopodium Minerals Canada Ltd.
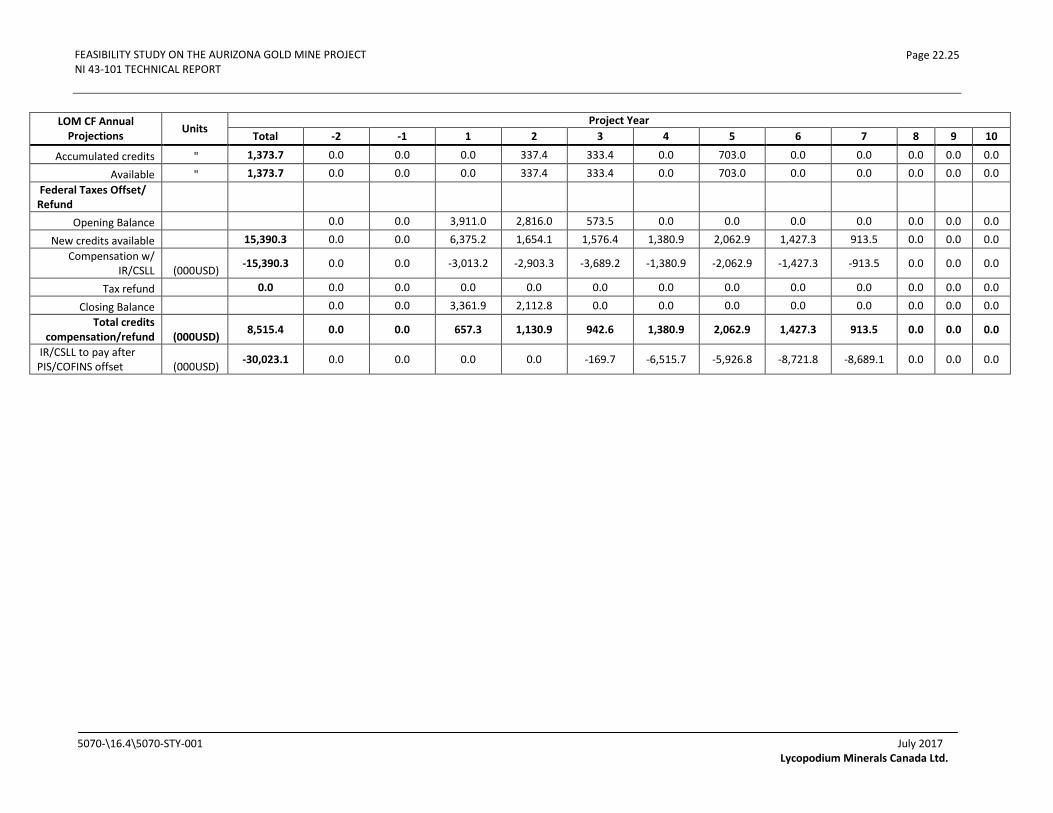
FEASIBILITY STUDY ON THE AURIZONA GOLD MINE PROJECT NI 43-101 TECHNICAL REPORT
Page 22.25
LOM CF Annual Projections Units
Project Year Total -2 -1 1 2 3 4 5 6 7 8 9 10
Accumulated credits " 1,373.7 0.0 0.0 0.0 337.4 333.4 0.0 703.0 0.0 0.0 0.0 0.0 0.0
Available " 1,373.7 0.0 0.0 0.0 337.4 333.4 0.0 703.0 0.0 0.0 0.0 0.0 0.0 Federal Taxes Offset/ Refund
Opening Balance 0.0 0.0 3,911.0 2,816.0 573.5 0.0 0.0 0.0 0.0 0.0 0.0 0.0
New credits available 15,390.3 0.0 0.0 6,375.2 1,654.1 1,576.4 1,380.9 2,062.9 1,427.3 913.5 0.0 0.0 0.0 Compensation w/
IR/CSLL (000USD) -15,390.3 0.0 0.0 -3,013.2 -2,903.3 -3,689.2 -1,380.9 -2,062.9 -1,427.3 -913.5 0.0 0.0 0.0
Tax refund 0.0 0.0 0.0 0.0 0.0 0.0 0.0 0.0 0.0 0.0 0.0 0.0 0.0
Closing Balance 0.0 0.0 3,361.9 2,112.8 0.0 0.0 0.0 0.0 0.0 0.0 0.0 0.0 Total credits
compensation/refund (000USD) 8,515.4 0.0 0.0 657.3 1,130.9 942.6 1,380.9 2,062.9 1,427.3 913.5 0.0 0.0 0.0
IR/CSLL to pay after PIS/COFINS offset (000USD) -30,023.1 0.0 0.0 0.0 0.0 -169.7 -6,515.7 -5,926.8 -8,721.8 -8,689.1 0.0 0.0 0.0
5070-\16.4\5070-STY-001 July 2017 Lycopodium Minerals Canada Ltd.
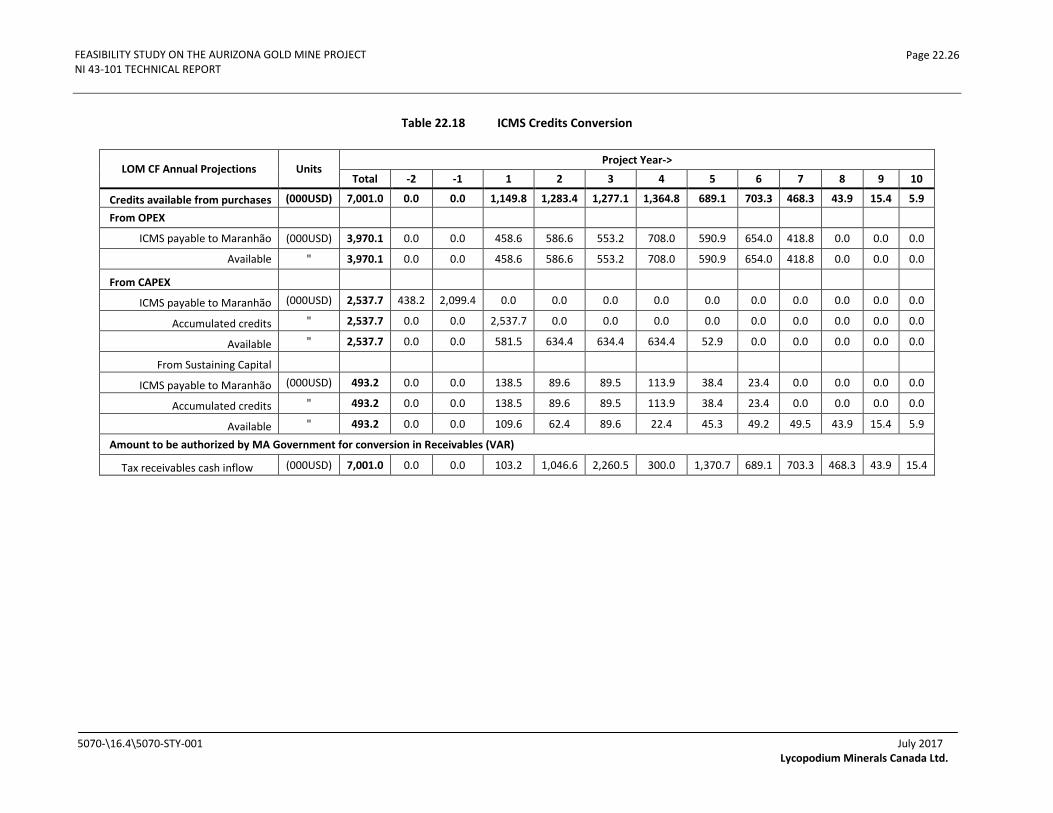
FEASIBILITY STUDY ON THE AURIZONA GOLD MINE PROJECT NI 43-101 TECHNICAL REPORT
Page 22.26
Table 22.18 ICMS Credits Conversion
LOM CF Annual Projections Units Project Year->
Total -2 -1 1 2 3 4 5 6 7 8 9 10
Credits available from purchases (000USD) 7,001.0 0.0 0.0 1,149.8 1,283.4 1,277.1 1,364.8 689.1 703.3 468.3 43.9 15.4 5.9
From OPEX ICMS payable to Maranhão (000USD) 3,970.1 0.0 0.0 458.6 586.6 553.2 708.0 590.9 654.0 418.8 0.0 0.0 0.0
Available " 3,970.1 0.0 0.0 458.6 586.6 553.2 708.0 590.9 654.0 418.8 0.0 0.0 0.0
From CAPEX ICMS payable to Maranhão (000USD) 2,537.7 438.2 2,099.4 0.0 0.0 0.0 0.0 0.0 0.0 0.0 0.0 0.0 0.0
Accumulated credits " 2,537.7 0.0 0.0 2,537.7 0.0 0.0 0.0 0.0 0.0 0.0 0.0 0.0 0.0
Available " 2,537.7 0.0 0.0 581.5 634.4 634.4 634.4 52.9 0.0 0.0 0.0 0.0 0.0
From Sustaining Capital ICMS payable to Maranhão (000USD) 493.2 0.0 0.0 138.5 89.6 89.5 113.9 38.4 23.4 0.0 0.0 0.0 0.0
Accumulated credits " 493.2 0.0 0.0 138.5 89.6 89.5 113.9 38.4 23.4 0.0 0.0 0.0 0.0
Available " 493.2 0.0 0.0 109.6 62.4 89.6 22.4 45.3 49.2 49.5 43.9 15.4 5.9
Amount to be authorized by MA Government for conversion in Receivables (VAR)
Tax receivables cash inflow (000USD) 7,001.0 0.0 0.0 103.2 1,046.6 2,260.5 300.0 1,370.7 689.1 703.3 468.3 43.9 15.4
5070-\16.4\5070-STY-001 July 2017 Lycopodium Minerals Canada Ltd.
FEASIBILITY STUDY FOR THE AURIZONA GOLD MINE PROJECT NI 43-101 TECHNICAL REPORT
Page 23.1
23.0 ADJACENT PROPERTIES
There are no adjacent properties.
5070\16.4\5070-STY-001_01
July 2017 Lycopodium Minerals Canada Ltd.
FEASIBILITY STUDY ON THE AURIZONA GOLD MINE PROJECTS NI 43-101 TECHNICAL REPORT
Page 24.1
24.0 OTHER RELEVANT DATA AND INFORMATION
Not applicable.
5070\16.4\5070-STY-001
July 2017 Lycopodium Minerals Canada Ltd.

FEASIBILITY STUDY ON THE AURIZONA GOLD MINE PROJECT NI 43-101 TECHNICAL REPORT
Page 25.1
25.0 INTERPRETATION AND CONCLUSIONS
25.1 General
This Technical Report provides a summary of the results and findings from each major area of investigation and study including but not limited to resource exploration; metallurgical testing and interpretation; resource estimation; mine design; process plant design; infrastructure design; environmental assessment; capital and operating cost estimates; and economic analysis. The extent and level of investigation and study for each of these areas is consistent with a typical mine Feasibility level study.
Based on the findings from the various technical areas of the Study the economic analysis performed shows the Project is financially viable and should move forward to the execution phase.
25.2 Mineral Resource Estimate
The Mineral Resource estimate presented in Section 14 represents an update to the Mineral Resource estimate from the 2016 pre-feasibility study. The updated resource estimate includes new 3D models of geological structures, lithology, alteration, and weathering horizons. In addition, a new interpretation of the gold zone at Piaba and estimation domains at Boa Esperança, and a change in grade estimation parameters were incorporated in the models.
The Mineral Resource model was prepared by SRK considering 1,042 holes drilled at Piaba and 292 holes drilled at Boa Esperança. To model the deposits SRK worked closely with the Aurizona mine geologists. SRK is of the opinion that the current drill hole information is sufficiently reliable and accurate to interpret the boundaries of the gold mineralization and the assay data are sufficiently reliable to support the Mineral Resource estimation.
It was concluded that the resource model reasonably matches the data, while reviewing the results on sections. Locally, the estimations were reviewed by comparisons of local “well-informed” block grades with composites contained within those blocks and by comparisons of average assay grades with average block estimates along different directions (swath plots). In addition, at Piaba, comparisons were made with production and inverse distance cubed estimates and an assessment of desired variability of block estimates from simulated block grades has been completed.
Mineral Resources were classified as Measured, Indicated, or Inferred according to CIM guidelines. Pit optimization shells were used to constrain open pit resources. Underground resources were constrained by a 2.0 g/t Au shell that was edited to account for mineable geometries.
5070-\18T16.418T\5070-STY-001
July 2017 Lycopodium Minerals Canada Ltd.
FEASIBILITY STUDY ON THE AURIZONA GOLD MINE PROJECT NI 43-101 TECHNICAL REPORT
Page 25.2
25.3 Mineral Processing and Metallurgical Testing
A number of metallurgical test programs were carried out on the saprolite, transition and fresh rock mineralization samples from the Piaba deposit and the satellite deposits between 1994 and 2017. The test work results show that the mineralization responds well to gravity concentration followed by a CIL process. There is a significant amount of nugget gold varying widely from sample to sample. In general, the samples from the saprolite and transition zones are considered soft from the perspective of both SAG mill and ball mill grinding but the samples from the fresh rock zone are considered moderately hard to ball mill grinding while from the perceptive of SAG milling there is considerable variability .Some of the fresh rock is considered very hard to SAG mill grinding. The flowsheet and comminution circuit specified in this study takes account of these factors.
The test work has shown that some samples with high levels of arsenic can have reduced gold recovery especially in the gravity circuit. This high arsenic material above 1,000 g/t in fresh rock is estimated to represent approximately 2 % of blocks above 0.6 g/t gold cut-off in the Piaba ore body
25.4 Mining Methods
Mining studies have been completed using the resource estimate as of January 5, 2017 for Piaba and Boa Esperança pits and includes the following aspects:
• Pit optimization utilized the Lerch-Grossman algorithm to determine the ultimate pit limits. A metal price of $1,056/oz gold was used to define the ultimate pit for the Study.
• Final pits were designed for Piaba Main, Piaba East and Boa Esperança. Bench and overall pit slope designs were based on recommendations by SRK.
• Mineral reserves have been determined from mineral resources by taking into account geologic, mining, processing, legal and environmental considerations and are therefore classified in accordance with the 2014 CIM Definition Standards for Mineral Resources and Mineral Reserves.
• Proven Mineral Reserves amount to 8.44 Mt at an average grade of 1.44 g/t Au. Probable Mineral Reserves amount to 11.40 Mt at an average grade of 1.58 g/t Au. Total estimated Mineral Reserves amounts to 19.84 Mt at an average grade of 1.52 g/t Au. Inferred Mineral Resources have not been converted to reserves and instead are treated as waste for mine planning purposes.
• The mine schedule moves 113.23 Mt of waste and 19.84 Mt of ore for a strip ratio of 5.71:1 over a 7 year mine life. There are two partial pre-production periods in addition which are used to prepare proper haul roads, and develop an ore stockpile prior to plant commissioning.
• The WSF’s, located close to the pits and waterways, were designed in accordance with geotechnical and geochemical recommendations.
5070-\18T16.418T\5070-STY-001
July 2017 Lycopodium Minerals Canada Ltd.

FEASIBILITY STUDY ON THE AURIZONA GOLD MINE PROJECT NI 43-101 TECHNICAL REPORT
Page 25.3
• Mining will be completed with full contractor mining. The anticipated equipment the contractor will use is 41 t articulated dump trucks and 30 t rigid body trucks matched with size appropriate front end loaders and hydraulic excavators. Support for dilution control will be the responsibility of the excavators in delineating the ore/waste contacts. Support equipment such as dozers, graders and water trucks will assist in the mining operation.
• Grade control will be completed by Trek Mining personnel. It is provided by a separate fleet of reverse circulation drills working in advance of the active mine faces in the laterite, and saprolite horizons. The transition and fresh rock zones will utilize blast hole cuttings for grade control with some reverse circulation support.
• Dewatering activities run by Trek will be of a large scale to accommodate the average annual 3m of rainfall and groundwater inflows to the pit. Water will be pumped from the pits to the pit rim then pumped horizontally to the TSF or other reservoirs. Excess will either be consumed by the process or managed to meet regulatory limits prior to discharge.
• Estimates of both mine capital and operating costs are summarized in Section 21. Capital costs consider full contract mining for the pre-production periods and full production.
• The mine operating cost estimate is dominated by the contractor costs. The contractor is responsible for all drilling, blasting, loading, hauling and support functions in the mine. Trek is directly responsible for ore control, dewatering and overall supervision by engineering and geology.
25.5 Recovery Methods
The existing process plant at the Aurizona Mine was designed to treat soft saprolitic ores grading at approximately 1.5 g/t Au at a rate of 5,000 t/d. The Feasibility Study has identified a mine plan which will provide the process plant with feed at higher throughput rate and a higher content of fresh rock. Accordingly, the study has identified the need to install a new fit for purpose comminution circuit and complete the installation of the Phase 1 expansion of the gold recovery portions of the circuit.
A combination of conventional gravity concentration and leach/CIP is proposed for the expansion of the Project. The upgrades to the process plant will comprise crushing, grinding, gravity concentration, leach/CIP process and gold recovery from the loaded carbon to produce gold doré. The majority of the equipment that was proposed for the Phase 1 expansion will be completely installed and commissioned. With the upgrade, the process plant will be capable of processing the fresh ore at a nominal process rate of 8,000 t/d.
Overall average recoveries are shown in Table 25.1
5070-\18T16.418T\5070-STY-001
July 2017 Lycopodium Minerals Canada Ltd.
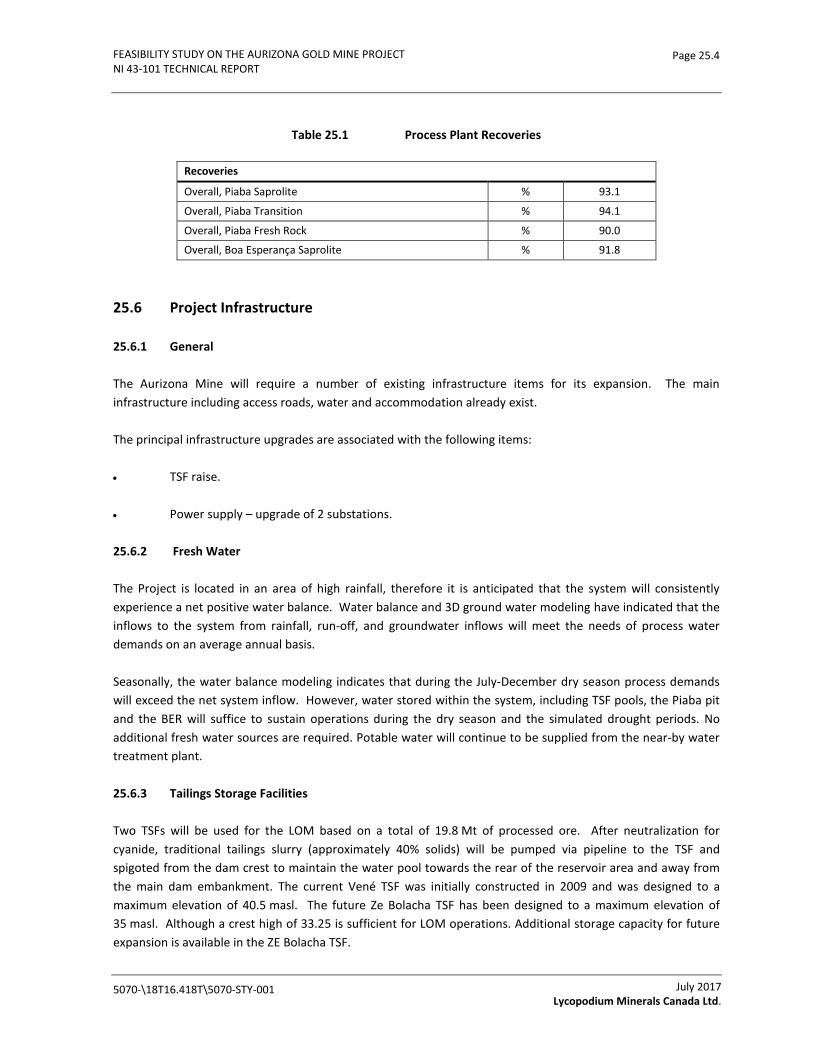
FEASIBILITY STUDY ON THE AURIZONA GOLD MINE PROJECT NI 43-101 TECHNICAL REPORT
Page 25.4
Table 25.1 Process Plant Recoveries
Recoveries
Overall, Piaba Saprolite % 93.1
Overall, Piaba Transition % 94.1
Overall, Piaba Fresh Rock % 90.0
Overall, Boa Esperança Saprolite % 91.8
25.6 Project Infrastructure
25.6.1 General
The Aurizona Mine will require a number of existing infrastructure items for its expansion. The main infrastructure including access roads, water and accommodation already exist.
The principal infrastructure upgrades are associated with the following items:
• TSF raise.
• Power supply – upgrade of 2 substations.
25.6.2 Fresh Water
The Project is located in an area of high rainfall, therefore it is anticipated that the system will consistently experience a net positive water balance. Water balance and 3D ground water modeling have indicated that the inflows to the system from rainfall, run-off, and groundwater inflows will meet the needs of process water demands on an average annual basis.
Seasonally, the water balance modeling indicates that during the July-December dry season process demands will exceed the net system inflow. However, water stored within the system, including TSF pools, the Piaba pit and the BER will suffice to sustain operations during the dry season and the simulated drought periods. No additional fresh water sources are required. Potable water will continue to be supplied from the near-by water treatment plant.
25.6.3 Tailings Storage Facilities
Two TSFs will be used for the LOM based on a total of 19.8 Mt of processed ore. After neutralization for cyanide, traditional tailings slurry (approximately 40% solids) will be pumped via pipeline to the TSF and spigoted from the dam crest to maintain the water pool towards the rear of the reservoir area and away from the main dam embankment. The current Vené TSF was initially constructed in 2009 and was designed to a maximum elevation of 40.5 masl. The future Ze Bolacha TSF has been designed to a maximum elevation of 35 masl. Although a crest high of 33.25 is sufficient for LOM operations. Additional storage capacity for future expansion is available in the ZE Bolacha TSF.
5070-\18T16.418T\5070-STY-001
July 2017 Lycopodium Minerals Canada Ltd.
FEASIBILITY STUDY ON THE AURIZONA GOLD MINE PROJECT NI 43-101 TECHNICAL REPORT
Page 25.5
Combined, the two TSF will provide a total of 17.98 Mm3 of tailings storage. Decanted slurry water will be pumped back to the plant for re-use in the process water requirements or to the Boa Esperança reservoir for settlement and discharge. A conceptual study has determined that it is viable to raise the Vené TSF to contain the LOM of tails volume by placing a closure dyke on the backside of the reservoir to protect the plant facilities. This alternative design is also being investigated and detailed further for possible future implementation in order to benefit from a reduction is sustaining capital expenses.
25.6.4 Water Management
The Project is located in an area of high rainfall with approximately 3m of average annual rainfall and a distinct wet and dry season. The facilities will consistently experience high intensity short duration stormwater events and rain on the facilities will result in a steady water inflow to the mine facilities during the rainy season.
The surface water management plan (SWMP) is designed as an integrated approach to ensure sufficient water for Plant operations, while safely conveying flows to discharge points. The SWMP largely focuses on a system of sediment control facilities, sumps, channels and pumps and pipelines to control flows and manage discharge principally during the wet season.
The surface water management infrastructure will collect non-contact run-off and seepage for monitoring and sediment control prior to discharge to the Aurizona and São Jose Rivers. Contact water will be collected and routed to the Boa Esperança Reservoir (BER). The BER will store contact water like a reservoir for reuse or release to the environment under controlled conditions, attenuating the flow releases such that regulatory discharge requirements are met.
An operational waste management plan was developed using conventional technologies to limit and control water quality impacts due to potential ARD and/or metals leaching. The specific methods include ongoing monitoring and PAG testing programs, encapsulation, co-disposal, and lime treatment, as required.
Conservative water quality source terms were developed for potential contact water, and load balance modeling within the water balance model was used to predict the water quality throughout the site during operations and closure. Predictions were developed for both “typical” and “extreme” water qualities although “extreme” water qualities were only use to explore the sensitivity of the model to the possible range of water quality inputs.
The output from the water balance and load balance modeling was used to develop a mixing zone model in the São Jose River in order to predict water quality and aid in the selection of the size, location, and shape of the diffuser. The mixing model predicts acceptable water quality from the São José River pipeline discharge point.
25.6.5 Waste Storage Facilities (WSF)
Four waste storage facilities are planned to accommodate the 113.2 Mt of waste generated in the LOM plan. Two are located to the north and west of the Piaba pit (North and West WSF). A third is located to the East of the process facility (East WSF) and the last is located to the south of the Piaba pit (South WSF). The facilities will hold 113.2 Mt of mine waste with a volume of 60.3 Mm3.
5070-\18T16.418T\5070-STY-001
July 2017 Lycopodium Minerals Canada Ltd.
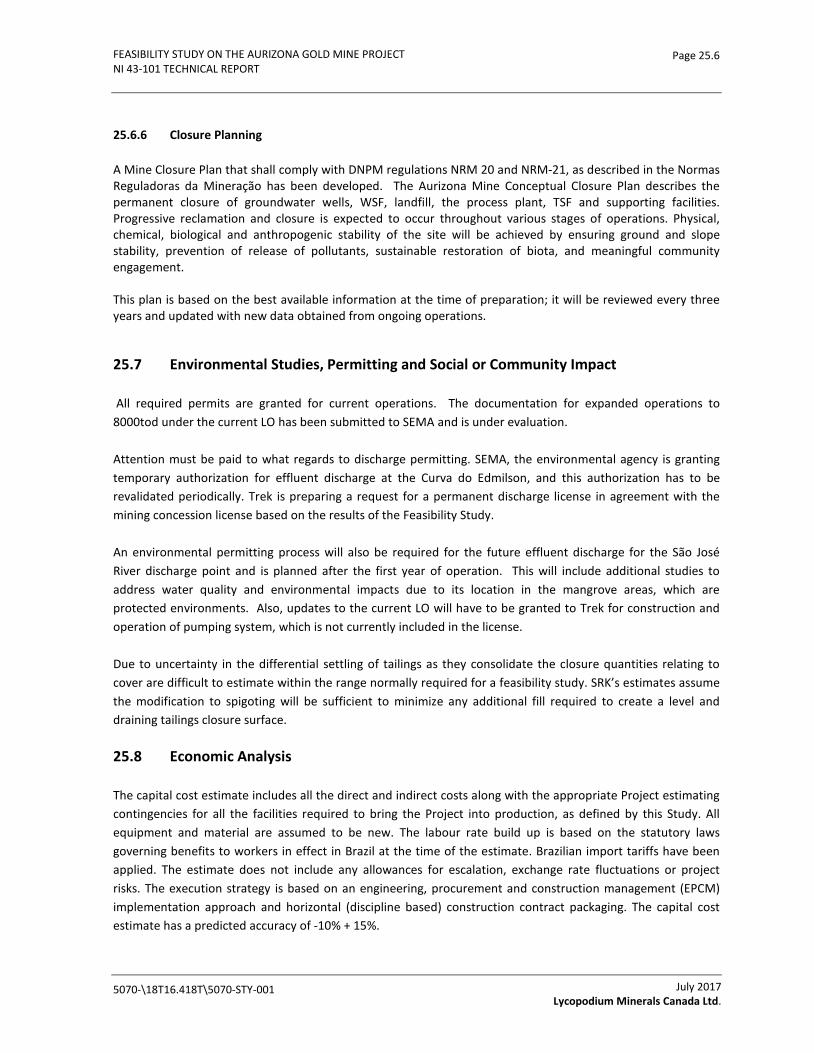
FEASIBILITY STUDY ON THE AURIZONA GOLD MINE PROJECT NI 43-101 TECHNICAL REPORT
Page 25.6
25.6.6 Closure Planning
A Mine Closure Plan that shall comply with DNPM regulations NRM 20 and NRM-21, as described in the Normas Reguladoras da Mineração has been developed. The Aurizona Mine Conceptual Closure Plan describes the permanent closure of groundwater wells, WSF, landfill, the process plant, TSF and supporting facilities. Progressive reclamation and closure is expected to occur throughout various stages of operations. Physical, chemical, biological and anthropogenic stability of the site will be achieved by ensuring ground and slope stability, prevention of release of pollutants, sustainable restoration of biota, and meaningful community engagement. This plan is based on the best available information at the time of preparation; it will be reviewed every three years and updated with new data obtained from ongoing operations. 25.7 Environmental Studies, Permitting and Social or Community Impact
All required permits are granted for current operations. The documentation for expanded operations to 8000tod under the current LO has been submitted to SEMA and is under evaluation.
Attention must be paid to what regards to discharge permitting. SEMA, the environmental agency is granting temporary authorization for effluent discharge at the Curva do Edmilson, and this authorization has to be revalidated periodically. Trek is preparing a request for a permanent discharge license in agreement with the mining concession license based on the results of the Feasibility Study.
An environmental permitting process will also be required for the future effluent discharge for the São José River discharge point and is planned after the first year of operation. This will include additional studies to address water quality and environmental impacts due to its location in the mangrove areas, which are protected environments. Also, updates to the current LO will have to be granted to Trek for construction and operation of pumping system, which is not currently included in the license.
Due to uncertainty in the differential settling of tailings as they consolidate the closure quantities relating to cover are difficult to estimate within the range normally required for a feasibility study. SRK’s estimates assume the modification to spigoting will be sufficient to minimize any additional fill required to create a level and draining tailings closure surface.
25.8 Economic Analysis
The capital cost estimate includes all the direct and indirect costs along with the appropriate Project estimating contingencies for all the facilities required to bring the Project into production, as defined by this Study. All equipment and material are assumed to be new. The labour rate build up is based on the statutory laws governing benefits to workers in effect in Brazil at the time of the estimate. Brazilian import tariffs have been applied. The estimate does not include any allowances for escalation, exchange rate fluctuations or project risks. The execution strategy is based on an engineering, procurement and construction management (EPCM) implementation approach and horizontal (discipline based) construction contract packaging. The capital cost estimate has a predicted accuracy of -10% + 15%.
5070-\18T16.418T\5070-STY-001
July 2017 Lycopodium Minerals Canada Ltd.
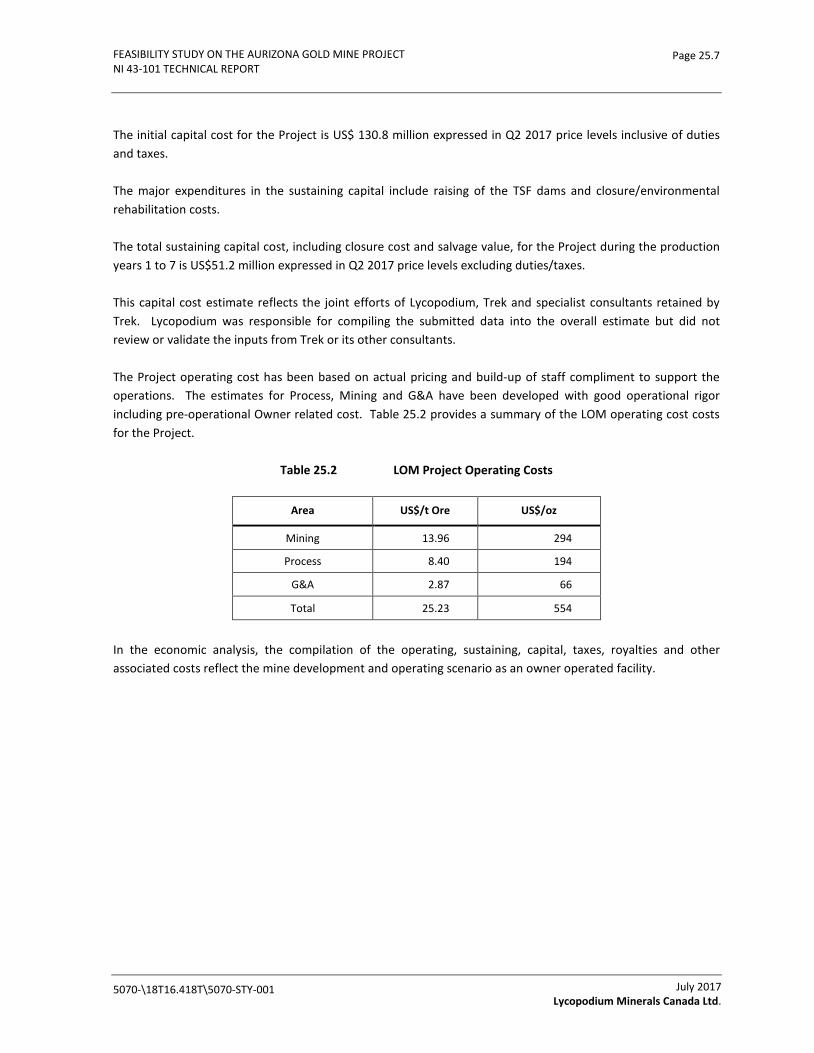
FEASIBILITY STUDY ON THE AURIZONA GOLD MINE PROJECT NI 43-101 TECHNICAL REPORT
Page 25.7
The initial capital cost for the Project is US$ 130.8 million expressed in Q2 2017 price levels inclusive of duties and taxes.
The major expenditures in the sustaining capital include raising of the TSF dams and closure/environmental rehabilitation costs.
The total sustaining capital cost, including closure cost and salvage value, for the Project during the production years 1 to 7 is US$51.2 million expressed in Q2 2017 price levels excluding duties/taxes.
This capital cost estimate reflects the joint efforts of Lycopodium, Trek and specialist consultants retained by Trek. Lycopodium was responsible for compiling the submitted data into the overall estimate but did not review or validate the inputs from Trek or its other consultants.
The Project operating cost has been based on actual pricing and build-up of staff compliment to support the operations. The estimates for Process, Mining and G&A have been developed with good operational rigor including pre-operational Owner related cost. Table 25.2 provides a summary of the LOM operating cost costs for the Project.
Table 25.2 LOM Project Operating Costs
Area US$/t Ore US$/oz
Mining 13.96 294
Process 8.40 194
G&A 2.87 66
Total 25.23 554
In the economic analysis, the compilation of the operating, sustaining, capital, taxes, royalties and other associated costs reflect the mine development and operating scenario as an owner operated facility.
5070-\18T16.418T\5070-STY-001
July 2017 Lycopodium Minerals Canada Ltd.

FEASIBILITY STUDY ON THE AURIZONA GOLD MINE PROJECT NI 43-101 TECHNICAL REPORT
Page 25.8
Summary economic parameters for the Project are included in Table 25.3.
Table 25.3 Project Summary Economic Parameters
26.0 Summary Criteria
Throughput 2.9 Mt/a
Average Annual Gold Production 126,545 oz/a
Mine Life ~7 years
Discount Rate 5%
Gold Price $1,250/oz
Results After Tax
Initial Capital Costs US130.8 M
Sustaining Costs 51.2 M
All-In-Sustaining Cost (AISC) $754.2/oz
Net Present Value (NPV) US197.1 M
Internal rate of Return (IRR) 33.8%
Payback 2.8 years
Based on the results of the Study, the Project is financially viable and should move forward to the execution phase.
5070-\18T16.418T\5070-STY-001
July 2017 Lycopodium Minerals Canada Ltd.

FEASIBILITY STUDY ON THE AURIZONA GOLD MINE PROJECT NI 43-101 TECHINCAL REPORT
Page 26.1
26.0 RECOMMENDATIONS
26.1 General
Based on the results of the Study, it is recommended that Trek proceed with the construction of the project described in this Feasibility Study.
26.2 Geology and Resource Estimate
Significant work has been conducted to advance the geological understanding of the Project. The work demonstrates the potential for the area to host economically viable gold deposits. To advance the understanding of the Piaba and Boa Esperança deposits, SRK recommends that Trek continues to examine the controls on gold mineralization during mining/operation, through the routine integration of pit mapping and grade control sampling.
26.3 Mineral Processing and Metallurgical Testing
None
26.4 Mining Methods
None
26.5 Recovery Methods
None
26.6 Tailings Storage Facility
None
26.7 Waste Storage Facilities
To advance the WSF designs, the following are recommended as part of the Detailed Engineering and start-up process:
• Expand the field testing database to cover a wider area corresponding to the new dump footprints.
• Assess variability in the natural ground from a qualitative standpoint over the new areas of investigation.
• Validate data from previous field investigations.
• Field map and qualitatively assess the depth of weathered material within the existing dump.
5070\16.4\5070-STY-001
July 2017 Lycopodium Minerals Canada Ltd.
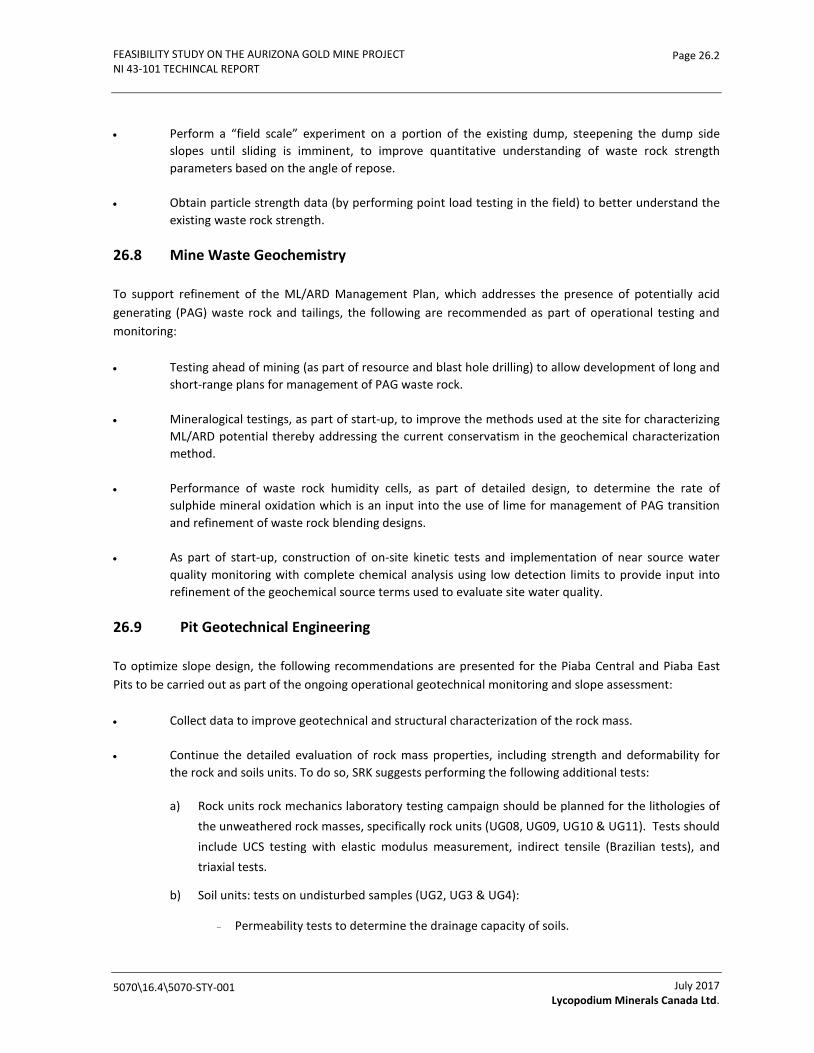
FEASIBILITY STUDY ON THE AURIZONA GOLD MINE PROJECT NI 43-101 TECHINCAL REPORT
Page 26.2
• Perform a “field scale” experiment on a portion of the existing dump, steepening the dump side slopes until sliding is imminent, to improve quantitative understanding of waste rock strength parameters based on the angle of repose.
• Obtain particle strength data (by performing point load testing in the field) to better understand the existing waste rock strength.
26.8 Mine Waste Geochemistry
To support refinement of the ML/ARD Management Plan, which addresses the presence of potentially acid generating (PAG) waste rock and tailings, the following are recommended as part of operational testing and monitoring:
• Testing ahead of mining (as part of resource and blast hole drilling) to allow development of long and short-range plans for management of PAG waste rock.
• Mineralogical testings, as part of start-up, to improve the methods used at the site for characterizing ML/ARD potential thereby addressing the current conservatism in the geochemical characterization method.
• Performance of waste rock humidity cells, as part of detailed design, to determine the rate of sulphide mineral oxidation which is an input into the use of lime for management of PAG transition and refinement of waste rock blending designs.
• As part of start-up, construction of on-site kinetic tests and implementation of near source water quality monitoring with complete chemical analysis using low detection limits to provide input into refinement of the geochemical source terms used to evaluate site water quality.
26.9 Pit Geotechnical Engineering
To optimize slope design, the following recommendations are presented for the Piaba Central and Piaba East Pits to be carried out as part of the ongoing operational geotechnical monitoring and slope assessment:
• Collect data to improve geotechnical and structural characterization of the rock mass.
• Continue the detailed evaluation of rock mass properties, including strength and deformability for the rock and soils units. To do so, SRK suggests performing the following additional tests:
a) Rock units rock mechanics laboratory testing campaign should be planned for the lithologies of the unweathered rock masses, specifically rock units (UG08, UG09, UG10 & UG11). Tests should include UCS testing with elastic modulus measurement, indirect tensile (Brazilian tests), and triaxial tests.
b) Soil units: tests on undisturbed samples (UG2, UG3 & UG4):
- Permeability tests to determine the drainage capacity of soils.
5070\16.4\5070-STY-001
July 2017 Lycopodium Minerals Canada Ltd.

FEASIBILITY STUDY ON THE AURIZONA GOLD MINE PROJECT NI 43-101 TECHINCAL REPORT
Page 26.3
- Triaxial tests CID (Consolidated Drained) for the determination of deformation modules. It is important to control the load application speed and to verify the consolidation of each specimen.
- Consolidation tests in order to evaluate the deformation of the soil and also to determine deformation modulus.
- Other test option for the determination of deformation modulus is the Bender elements test for several confining pressures.
• Geotechnical monitoring and control of pit operations including the limit blast program and general house-keeping must be considered at the highest level.
• To avoid the sudden occurrence of unexpected slope failures that could jeopardize the safety of miners and equipment, it is necessary to maintain a permanent geotechnical control of the pit slopes during operational stage. To achieve this objective, the Aurizona Mine needs to install geotechnical instrumentation at key locations in the pit (mainly prisms with total stations in each walls), and provide a field geotechnical support on a daily basis. Trek should assess the use of Radar equipment to monitor areas of interest when people are working below. The development of protocols for threshold values for several alarm levels, TARP’s, assignment of responsibilities, duties, tasks and action plans should be implemented. Also, inclinometers in conjunction with piezometers could be installed on the same boreholes (Fw & Hw) in order to monitoring subsurface displacements/deformations and pore pressure distributions.
26.10 Plant Geotechnical Engineering
None
26.11 Water Supply
The following activities are recommended as part of ongoing monitoring and drilling/mining at the site to refine the understanding of the site water balance:
• Install accurate flow monitoring systems to measure pit dewatering rates, especially in dry season, to exclude the influence of direct precipitation on the measured pit inflows from groundwater.
• Install accurate flow monitoring systems to measure seepage from the WSFs during dry season to assess infiltration and long term seepage rates.
• Ongoing hydrogeological characterization of faults and major fracture sets intersecting the Piaba pits to better assess depressurisation potential at depth, and possibility to intercept water for use on site as “pre-contact” water (i.e.: not having had contact with mine wastes).
5070\16.4\5070-STY-001
July 2017 Lycopodium Minerals Canada Ltd.

FEASIBILITY STUDY ON THE AURIZONA GOLD MINE PROJECT NI 43-101 TECHINCAL REPORT
Page 26.4
26.12 Surface Water Management Plan
The surface water management plan performance is a key aspect of the site operations, and should be reassessed on a regular basis during operations to optimize the system and reduce any risks associated with high rainfall events. The following elements should be included in the on-going assessment:
• Completion of the Vene TSF reclamation during the dry season following the end of deposition is necessary to maintain control of excess water in the BER. The viability of this schedule should be confirmed during the development of final closure plans.
• Management of water storage during operations (i.e. Piaba Pit Sump, Vene and Ze Bolacha TSFs, and BER) is limited to a narrow range during operations, with the intent of optimizing TSF and pit operations and providing a surge capacity to contain the inflow from extreme storm events. Maintaining such tight control will require diligent monitoring of the water storage facilities and establishing of reliable method of predicting inflows. The system should be prepared to address the possibility of high rainfall at any time during operations that will result in unexpected inflows to the water management components.
• SRK is aware of continued hydrologic monitoring at the site. These data should be used to regularly update the understanding of the climatic conditions and hydrological behaviour at the site.
26.13 Environmental Studies, Permitting and Social or Community Impact
26.13.1 Closure
During operations, Trek will continue to conduct technical studies that are intended to provide information needed to predict future conditions at the site for final closure planning, including evaluation of social closure impacts and opportunities should be conducted to identify opportunities for sustainable economic development and revegetation options.
As part of the operational monitoring and reclamation process, Trek will evaluate alternative methods and reduce the associated risks. These include:
• Assess stormwater management from the Piaba Pit and the system isolating water from ponding on the TSF dams. The current plan is the fill the area west of the South WSF to create a gravity drainage route to for discharge to the west. However, it might be possible to create berms against the dams to protect them and allow water to pond in the area south of the WSF until it naturally drains. This should be assessed as part of the operations design/management.
• Implement the geochemical recommendations from Section 26.8 Mine Waste Geochemistry and re-evaluate the waste rock and water management closure plan as more information is known about waste rock source terms.
• Tailings are not predicted to be potentially acid generating, but ongoing testing and modelling should be conducted and the TSF closure plan should be periodically re-evaluated.
5070\16.4\5070-STY-001
July 2017 Lycopodium Minerals Canada Ltd.
FEASIBILITY STUDY ON THE AURIZONA GOLD MINE PROJECT NI 43-101 TECHNICAL REPORT
Page 27.1
27.0 REFERENCES
Pre-Feasibility Study on Aurizona Mine Project Maranhão, Brazil (Amended), NI 43-101 Technical Report; Effective Date, 12 September 2016
Additional Metallurgical Testing on samples from Aurizona Mine, Maranhão, Brazil; Bureau Veritas Commodities Canada Ltd.; May 25, 2016
Almeida, F.F.M., Hasui, Y., Brito Neves, B.B., 1976. The Upper Precambrian of South América. Boletim Instituto de Geociências USP 7, 45–80.
Aurizona Gold Mine Project, SAGDesign Test Work Results for 2 Samples; Starkey & Associates Inc.; February 5, 2013
Aurizona Gold Project, SAGDesign Test Work Results for 22 Samples; Starkey & Associates Inc.; April 26, 2013
Aurizona Expansion Project – Phase 2, SAGDesign Comminution and Mill Sizing Analysis; Starkey & Associates Inc.; June 11th, 2013
Blight, G. E., & Leong, E. C. (2012). Mechanics of Residual Soils. Boca Raton: CRC Press.
Brito Neves, B. B., Van Schmus, W. R. & Egal, A.H. 2002. North-western Africa–North-eastern Brazil. Major tectonic links and correlation problems. Journal of African Earth Sciences, 34, 275–278
Comminution Testing; Hazen Project #11723; April 3, 2013.
Costa, J.L., Araujo, A.A.F., Villas Boas, J.M., Faria, C.A.S., Silva Neto, C.S., Wanderley, V.J.R., 1977. Projeto Gurupi. Departamento Nacional da Produção Mineral/Companhia de Pesquisa de Recursos Minerai, 258.
Crux Engineering Group (August 2015). Geotechnical Coreshack Procedures Manual Soil and Rock Core Logging Rock Strength Testing.
Crux Engineering Group (November 2015). Pre-feasibility Level Geotechnical Pit Slope Design Report.
Crux Engineering Group (November 2015). Interim Geotechnical Pre-feasibility Study Piaba Pit Plant Facility Geotechnical Recommendations.
Crux Engineering Group (April 2016). Interim Geotechnical Pit Slope Report.
Departamento de Engenharia de Minas da UFMG, (2007), Determination of Bond Work Index, prepared for Mineração Aurizona S.A. pp9.
(DHN, 2017) Diretoria de hidrografia e navegação 2017. Previsões de marés. website: http://www.mar.mil.br/dhn/chm/box-previsao-mare/tabuas/
Doneker, R., & Jirka, G. 2007. CORMIX USER MANUAL A Hydrodynamic mixing zone model and decision support system for pollutant discharges into surface water. Washington .C.: U.S. Environmental Protection Agency
5070\16.04\5070-STY-001_01
July 2017 Lycopodium Minerals Canada Ltd.
FEASIBILITY STUDY ON THE AURIZONA GOLD MINE PROJECT NI 43-101 TECHNICAL REPORT
Page 27.2
Dunne, K. 2009. Petrographic Report, Piaba Project (internal report)
Dunne, K. 2011. Petrographic Report, Piaba Project (internal report)
Geocret. (June 2014). Aurizona Mining Geotechnical SPT Survey. Geocret Engenharia E Tecnologia LTDA.
Geostudio 2012. Slope/W: Geotechnical Modeling Software. Calgary Canada, 2012.
Golder 2014, Estudos da Espansao Fase -2 Drenagem Acid de Rocha y Lixivacao de Metais. Golder Associates, Belo Horizonte, Brazil, May 2014
GoldSim (2017). GoldSim Version 12.0 Dynamic Simulation Softare Copyright ©2017 GoldSim Technology Group LLC.
(GRDC, 2017) Global Runoff Data Center 2017. Daily Gauge Information. website: http://www.bafg.de/GRDC/EN/Home/homepage_node.html
GRE 2015. Waste Storage Facility Design Criteria Memo. Global Resource Engineering, Denver, Colorado. July 2015.
GRE 2016a. Aurizona Mine Site Wide Water Balance. Global Resource Engineering, Denver Colorado, July 2016.
GRE 2016b. Aurizona Mine Surface Water Management Plan. Global Resource Engineering, Denver Colorado, July 2016.
GRE 2016c. Aurizona Mine Waste Rock Storage Facility Stability Report. Global Resource Engineering, Denver Colorado, July 2016.
GRE 2016d. Aurizona Mine Geochemical Characterization and ARD Management Plan Report. Global Resource Engineering, Denver Colorado, July 2016.
HAD Services S/S Ltda. (February 2008). Dimensionamento de Circuito de Cominuição Minero Aurífero de Aurizona, prepared for Luna Gold Corp. pp33.
Hasui, Y., Abreu, F.A.M., Villas, R.N.N., 1984. Província Parnaíba. In: Almeida, F.F.M., Hasui, Y. (Eds.), O Pré-Cambriano no Brasil. Edgard Blücher, São Paulo, pp. 36–45.
Hidroweb (2017) Candido Mendes Daily climate record, 1986-2016, Agéncia Nacional de Águas (http:/hydroweb.ana.gov.br),
Hoek and Brown (1997). Practical Rock Engineering. Retrieved from https:// www.rocscience.com/learning/hoek-s-corner.
Hurley, P. M., Almeida, F. F. M. etal. 1967. Test of continental drift by comparison of radiometric ages. Science, 157, 495–500.
INAP 2016. Global Acid Rock Drainage Guide (GARD Guide). International Network on Acid Prevention, wiki document, 2016.
5070\16.04\5070-STY-001_01
July 2017 Lycopodium Minerals Canada Ltd.
FEASIBILITY STUDY ON THE AURIZONA GOLD MINE PROJECT NI 43-101 TECHNICAL REPORT
Page 27.3
Info Design (2008), Projeto Mineração Aurizona S.A. – Beneficiation Volume 1, prepared for Mineração Aurizona S.A.
Info Design (2008), Projeto Mineração Aurizona S.A. – Elétrica, prepared for Mineração Aurizona S.A.
Info Design (2008), Projeto Mineração o Aurizona S.A. – Importações, prepared for Mineração Aurizona S.A.
Info Design (2008), Projeto Mineração Aurizona S.A. – Suprimentos:Sumário Executivo Mapa de Suprimentos Tablulações, prepared for Mineração Aurizona S.A.
Interim Progress of Cumminution Circuit and Mine Site Prefeasibility Study for the Aurizona Mine, December 18, 2015, Tetra Tech.
Kelley, Dan. 2016. Analysis of Oceanographic Data “oce” R package.
KLEIN, E. L., MOURA, C. A. V. & PINHEIRO, B. L. S. 2005a. Paleoproterozoic crustal evolution of the Sao Luıs craton, Brazil: evidence from zircon geochronology and Sm–Nd isotopes. Gondwana Research, 8, 177–186.
Klein E.L., Rodrigues J.B., Lopes E.C.S., Soledade G.L. 2012. Diversity of Rhyacian granitoids in the basement of the Neoproterozoic-Early Cambrian Gurupi Belt, northern Brazil: geochemistry, U-Pb zircon geochronology, and Nd isotope constraints on the Paleoproterozoic magmatic and crustal evolution. Precambrian Research, 220-221:192-216.
KLEIN, E. L. & MOURA, C. A. V. 2001. Age constraints on granitoids and metavolcanic rocks of the Sao Luıs craton and Gurupi Belt, northern Brazil: implications for lithostratigraphy and geological evolution. International Geology Review, 43, 237–253.
Klein, E.L and Moura, C.A.V. (2008) Sao Luıs Craton and Gurupi Belt (Brazil): possible links with the West African Craton and surrounding Pan-African belts. From: PANKHURST, R. J., TROUW, R. A. J., BRITO NEVES, B. B. & DE WIT, M. J. (eds) West Gondwana: Pre-Cenozoic Correlations Across the South Atlantic Region. Geological Society, London, Special Publications, 294, 137–151.
Kleinmann, R.L.P. and Erickson, P.M. 1983. Control of acid drainage from coal refuse using anionic surfactants. Bureau of Mines RI 8847, 16 pp.
Lakefield Research Limited (November 6, 1997), An Investigation of the Recovery of Gold from Samples Submitted by Eldorado Gold Corporation: Progress Report No 1, prepared for Eldorado Gold Corporation, November 6, 1997, pp10.
Leps, T. (1970). Review of the shearing strength of rockfill. J. of Soil Mech. and Found. Div., ASCE, Vol. 96, No. SM4, Proc. Paper 7394, 1159-1170.
Lesquer, A., Beltrao, J. F. & Abreu, F. A. M. 1984.Proterozoic links between northeastern Brazil and West Africa: a plate tectonic model based on gravity data. Tectonophysics, 110, 9–26.
Luna Gold Corp. (2015). Press Release: Luna Gold Announces Restructuring of Sandstorm Stream Agreement. March 15, 2009.
5070\16.04\5070-STY-001_01
July 2017 Lycopodium Minerals Canada Ltd.
FEASIBILITY STUDY ON THE AURIZONA GOLD MINE PROJECT NI 43-101 TECHNICAL REPORT
Page 27.4
Luna Gold Corp. (2015). Internal report: PBA_Report_Structural_Piaba_20150521_GTS, May 2015, pp39.
McDougall, T.J. and P.M. Barker, 2011: Getting started with TEOS-10 and the Gibbs Seawater (GSW) Oceanographic Toolbox, 28pp., SCOR/IAPSO WG127, ISBN 978-0-646-55621-5.
Metago (May 4, 1994). Report on the Metallurgical Gold Extraction: Part 1, prepared for Mineração Aurizona S.A. pp82.
Metago (May 4, 1994). Report on the Metallurgical Gold Extraction: Part 2, prepared for Mineração Aurizona S.A. pp85.
Metago (2007). Pilot Plant, prepared for Mineração Aurizona S.A.
Metallurgical Testing On Samples From Aurizona Mine, Maranhão, Brazil; Inspectorate Exploration & Mining Services Ltd; June 21, 2013.
Metallurgical Testing on Samples, From Satellite Deposits, Maranhão, Brazil; Bureau Veritas Commodities Canada Ltd.; October 15, 2014.
(MGDS, 2017) Marine Geoscience Data System. 2017. Global Multi-Resolution Topography (GMRT) Data Synthesis. Downloaded from http://opentopo.sdsc.edu/raster?opentopoID=OTGMRT.112016.4326.1
NI 43-101 Technical Report, Effective Date: May 9, 2008, SRK Consulting (US), Inc. (SRK).
NI 43-101 Technical Report, Effective Date: July 13, 2010, SRK Consulting (US), Inc. (SRK).
NI 43-101 Technical Report, Effective Date: December 31, 2011, SRK Consulting (US), Inc. (SRK).
NI 43-101 Technical Report, Effective Date: January 29, 2013, Luna Gold Corp.
Paulo Abib Engenhario S.A. (1995). Ensaios de Beneficiamento em Laboratória Para o Minério de Ouro do Piaba Aurizona, prepared for Mineração Aurizona S.A. pp86.
Phase II - Metallurgical Testing On Samples From Aurizona Mine, Maranhão, Brazil; Inspectorate Exploration & Mining Services Ltd; March 18, 2014.
PINHEIRO, B. L. S., MOURA, C. A. V. & KLEIN, E. L. 2003. Estudo de proveniencia em arenitos das formacoes Igarape de Areia e Viseu, nordeste do Para, com base em datacao de monocristais de zircao por evaporacao de chumbo. In: 8 Simposio de Geologia da Amazonia, Manaus, Brazil, Extended abstracts (CD-ROM).
Read, J and Stacey, P (2009). Guidelines for Open Pit Slope Design.
Deportment of Gold in CIL Leach Tails of Piaba Ore Composites; AMTEL; July 2, 2013.
Rezende, O. M.&Pamplona, H. R. P. 1970. Estudo do desenvolvimento do Arco Ferrer-Urbano Santos. Boletim Tecnico da Petrobras, 13, 5–14.
RESOLUÇÃO No 357, DE 17 DE MARÇO DE 2005. Regulations of the Republic of Brazil, 2005.
5070\16.04\5070-STY-001_01
July 2017 Lycopodium Minerals Canada Ltd.

FEASIBILITY STUDY ON THE AURIZONA GOLD MINE PROJECT NI 43-101 TECHNICAL REPORT
Page 27.5
Settling Tests – Aurizona Expansion Project; Outotec, February 07, 2013.
Sobek, A. A., Benedetti, D.A., and Rastogi, V. (1990) Successful Reclamation Using Controlled Release Bactericides: Two Case Studies. Paper presented at the 1990 Mining and Reclamation Conference and Exhibition, Charleston, West Virginia, April 23-26, 1990.
SRK Consulting (2008). NI 43-101 Technical Report, Mineração Aurizona, S.A., Piaba Project, Maranhão, Brazil, SRK Consulting, May 9, 2008.
SRK Consulting (2008). NI 43-101 Technical Report, Mineração Aurizona, S.A., Piaba Project, Maranhão, Brazil, SRK Consulting, May 9, 2008.
SRK Consulting (2010). NI 43-101 Technical Report, Mineração Aurizona, S.A., Piaba Project, Maranhão, Brazil, SRK Consulting, September 1, 2010.
SRK Consulting (2010). NI 43-101 Technical Report, Mineração Aurizona, S.A., Piaba Project, Maranhão, Brazil, SRK Consulting, September 1, 2010.
SRK Consulting, (2011). NI 43-101 Technical Report Mineração Aurizona S.A. Aurizona Project, SRK Consulting, January 23, 2012.
SRK Consulting, (2012). NI 43-101 Technical Report Mineração Aurizona S.A. Aurizona Project, SRK Consulting, January 23, 2012.
SRK Consulting (2013). Resource Report Aurizona Project, Brazil, SRK Consulting, January 29, 2013.
TORQUATO, J. R. & CORDANI, U. G. 1981. Brazil-Africa geological links. Earth-Science Reviews, 17, 155–176.
(UNESCO, 1983) Fofonoff N.P. and Millard Jr R.C. (1983) Algorithms for Computation of Fundamental Properties of Seawater. UNESCO Technical Papers in Marine Science 44. UNESCO, Paris, 53 p.
(USACE, 2016) U.S. Army Corps of Engineers. Hydrologic Engineering Center River Analysis System, September 2016. HEC-RAS 2D 5.0.3 website: http://www.hec.usace.army.mil/software/hec-ras/downloads.aspx
(USACE, 2017) U.S. Army Corps of Engineers, Hydrologic Engineering Center Hydrologic Modeling System, March 2017, U.S. Army Corps of Engineers Hydrologic Engineering Center.
(USGS, 2017) U.S. Geological Survey 2017. Shuttle Radar Topography Mission (SRTM) Earth Explorer. Downloaded from: https://earthexplorer.usgs.gov/
Verburg, R., B. Johnson, M. Fordham, and M. Logsdon. 2003. A Rapid and Cost-Effective Method for Bench Screening of Geochemical Performance and Disposal Options for High-Sulfide Tailings. Presented at the 6th International Conference of Acid Rock Drainage (ICARD), Cairns, QLD, Australia, July 12-18, 2003. Pp739-749.
5070\16.04\5070-STY-001_01
July 2017 Lycopodium Minerals Canada Ltd.
Copyright © 2022 FDOKUMEN