Feasibility of implementing molecular-guided therapy for the treatment of patients with relapsed or...
16
ORIGINAL RESEARCH Feasibility of implementing molecular-guided therapy for the treatment of patients with relapsed or refractory neuroblastoma Giselle L. Saulnier Sholler 1,2 , Jeffrey P. Bond 3 , Genevieve Bergendahl 1 , Akshita Dutta 1 , Julie Dragon 3 , Kathleen Neville 4 , William Ferguson 5 , William Roberts 6 , Don Eslin 7 , Jacqueline Kraveka 8 , Joel Kaplan 9 , Deanna Mitchell 1 , Nehal Parikh 10 , Melinda Merchant 11 , Takamaru Ashikaga 12 , Gina Hanna 7 , Pamela Jean Lescault 13 , Ashley Siniard 14 , Jason Corneveaux 14 , Matthew Huentelman 14 & Jeffrey Trent 14 1 Helen DeVos Children’s Hospital, Grand Rapids, Michigan 2 Michigan State University College of Medicine, Grand Rapids, Michigan 3 Department of Microbiology and Molecular Genetics, University of Vermont College of Medicine, Burlington, Vermont 4 Children’s Mercy Hospital, Kansas City, Missouri 5 Cardinal Glennon Children’s Hospital, St. Louis University, St. Louis, Missouri 6 UC San Diego School of Medicine and Rady Children’s Hospital, San Diego, California 7 Arnold Palmer Hospital for Children, Orlando, Florida 8 Medical University of South Carolina, Charleston, South Carolina 9 Levine Children’s Hospital, Charlotte, North Carolina 10 Connecticut Children’s Medical Center, Hartford, Connecticut 11 NCI Center for Cancer Research, Bethesda, Maryland 12 Medical Biostatistics, University of Vermont College of Medicine, Burlington, Vermont 13 Josephine Bay Paul Center for Comparative Molecular Biology and Evolution, The Marine Biological Laboratory, Woods Hole, Massachusetts 14 Translational Genomics Research Institute, Phoenix, Arizona Keywords Genomic profiling, molecular-guided therapy, molecular tumor board, neuroblastoma, pediatric oncology Correspondence Giselle L. Saulnier Sholler, 100 Michigan Avenue NE MC 272, Grand Rapids, MI 49503. Tel: 616-267-0334; Fax: 616-391-2785; E-mail: Giselle.SaulnierSholler@ helendevoschildrens.org Funding Information We thank the Dell Corporation for their grant support for this clinical trial and their computational expertise. We would also like to thank the pediatric advocate foundations supporting our work to advance science including Beat NB, Arms Wide Open Foundation, Charles and Meryl Witmer Foundation, Owen Moscone Foundation, Because of Ezra Foundation, Max’s Ring of Fire, Lillie’s Friends Foundation, Brooke’s Blossoming Hope Foundation, Melina’s White Light, Ishan Gala Foundation, Ethan’s Rodeo, Daxton’s Fish. Received: 23 October 2014; Revised: 20 January 2015; Accepted: 22 January 2015 Abstract The primary objective of the study was to evaluate the feasibility and safety of a process which would utilize genome-wide expression data from tumor biopsies to support individualized treatment decisions. Current treatment options for recurrent neuroblastoma are limited and ineffective, with a survival rate of <10%. Molecular profiling may provide data which will enable the practitioner to select the most appropriate therapeutic option for individual patients, thus improving outcomes. Sixteen patients with neuroblastoma were enrolled of which fourteen were eligible for this study. Feasibility was defined as comple- tion of tumor biopsy, pathological evaluation, RNA quality control, gene expression profiling, bioinformatics analysis, generation of a drug prediction report, molecular tumor board yielding a treatment plan, independent medical monitor review, and treatment initiation within a 21 day period. All eligible biopsies passed histopathology and RNA quality control. Expression profiling by microarray and RNA sequencing were mutually validated. The average time from biopsy to report generation was 5.9 days and from biopsy to initiation of treatment was 12.4 days. No serious adverse events were observed and all adverse events were expected. Clinical benefit was seen in 64% of patients as stabilization of disease for at least one cycle of therapy or partial response. The overall response rate was 7% and the progression free survival was 59 days. This study demonstrates the feasibility and safety of performing real-time geno- mic profiling to guide treatment decision making for pediatric neuroblastoma patients. ª 2015 The Authors. Cancer Medicine published by John Wiley & Sons Ltd. This is an open access article under the terms of the Creative Commons Attribution License, which permits use, distribution and reproduction in any medium, provided the original work is properly cited. 1 Cancer Medicine Open Access
-
Upload
independent -
Category
Documents
-
view
4 -
download
0
Transcript of Feasibility of implementing molecular-guided therapy for the treatment of patients with relapsed or...
ORIGINAL RESEARCH
Feasibility of implementing molecular-guided therapy forthe treatment of patients with relapsed or refractoryneuroblastomaGiselle L. Saulnier Sholler1,2, Jeffrey P. Bond3, Genevieve Bergendahl1, Akshita Dutta1, Julie Dragon3,Kathleen Neville4, William Ferguson5, William Roberts6, Don Eslin7, Jacqueline Kraveka8, JoelKaplan9, Deanna Mitchell1, Nehal Parikh10, Melinda Merchant11, Takamaru Ashikaga12, GinaHanna7, Pamela Jean Lescault13, Ashley Siniard14, Jason Corneveaux14, Matthew Huentelman14 &Jeffrey Trent14
1Helen DeVos Children’s Hospital, Grand Rapids, Michigan2Michigan State University College of Medicine, Grand Rapids, Michigan3Department of Microbiology and Molecular Genetics, University of Vermont College of Medicine, Burlington, Vermont4Children’s Mercy Hospital, Kansas City, Missouri5Cardinal Glennon Children’s Hospital, St. Louis University, St. Louis, Missouri6UC San Diego School of Medicine and Rady Children’s Hospital, San Diego, California7Arnold Palmer Hospital for Children, Orlando, Florida8Medical University of South Carolina, Charleston, South Carolina9Levine Children’s Hospital, Charlotte, North Carolina10Connecticut Children’s Medical Center, Hartford, Connecticut11NCI Center for Cancer Research, Bethesda, Maryland12Medical Biostatistics, University of Vermont College of Medicine, Burlington, Vermont13Josephine Bay Paul Center for Comparative Molecular Biology and Evolution, The Marine Biological Laboratory, Woods Hole, Massachusetts14Translational Genomics Research Institute, Phoenix, Arizona
Keywords
Genomic profiling, molecular-guided therapy,
molecular tumor board, neuroblastoma, pediatric
oncology
Correspondence
Giselle L. Saulnier Sholler, 100 Michigan Avenue
NE MC 272, Grand Rapids, MI 49503.
Tel: 616-267-0334; Fax: 616-391-2785;
E-mail: Giselle.SaulnierSholler@
helendevoschildrens.org
Funding Information
We thank the Dell Corporation for their grant
support for this clinical trial and their computational
expertise. We would also like to thank the pediatric
advocate foundations supporting our work to
advance science including Beat NB, Arms Wide
Open Foundation, Charles and Meryl Witmer
Foundation, Owen Moscone Foundation, Because
of Ezra Foundation, Max’s Ring of Fire, Lillie’s
Friends Foundation, Brooke’s Blossoming Hope
Foundation, Melina’s White Light, Ishan Gala
Foundation, Ethan’s Rodeo, Daxton’s Fish.
Received: 23 October 2014; Revised:
20 January 2015; Accepted: 22 January 2015
Abstract
The primary objective of the study was to evaluate the feasibility and safety of a
process which would utilize genome-wide expression data from tumor biopsies
to support individualized treatment decisions. Current treatment options for
recurrent neuroblastoma are limited and ineffective, with a survival rate of
<10%. Molecular profiling may provide data which will enable the practitioner
to select the most appropriate therapeutic option for individual patients, thus
improving outcomes. Sixteen patients with neuroblastoma were enrolled of
which fourteen were eligible for this study. Feasibility was defined as comple-
tion of tumor biopsy, pathological evaluation, RNA quality control, gene
expression profiling, bioinformatics analysis, generation of a drug prediction
report, molecular tumor board yielding a treatment plan, independent medical
monitor review, and treatment initiation within a 21 day period. All eligible
biopsies passed histopathology and RNA quality control. Expression profiling
by microarray and RNA sequencing were mutually validated. The average time
from biopsy to report generation was 5.9 days and from biopsy to initiation of
treatment was 12.4 days. No serious adverse events were observed and all
adverse events were expected. Clinical benefit was seen in 64% of patients as
stabilization of disease for at least one cycle of therapy or partial response. The
overall response rate was 7% and the progression free survival was 59 days.
This study demonstrates the feasibility and safety of performing real-time geno-
mic profiling to guide treatment decision making for pediatric neuroblastoma
patients.
ª 2015 The Authors. Cancer Medicine published by John Wiley & Sons Ltd. This is an open access article under the terms of
the Creative Commons Attribution License, which permits use, distribution and reproduction in any medium,
provided the original work is properly cited.
1
Cancer MedicineOpen Access
doi: 10.1002/cam4.436
Introduction
Pioneering a new chapter in medicine, this study is the
first completed pediatric trial utilizing personalized med-
icine in the United States. We evaluated the feasibility
and safety of using predictive modeling based on gen-
ome-wide mRNA expression profiles of neuroblastoma
tumor biopsies to create therapeutic regimens individual-
ized to each patient. Neuroblastoma is the most com-
mon extra cranial solid tumor in children. With 700
new diagnoses per year, it accounts for 7–10% of child-
hood cancers [1, 2]. Currently, children diagnosed after
12–15 months of age have a poor long-term survival rate
despite aggressive multimodal therapies [3, 4]. Even for
children who are able to complete high-dose chemother-
apy (HDC) followed by hematopoietic stem cell trans-
plantation (HSCT) and maintenance therapy consisting
of immune therapy with antiGD2 antibody and retinoic
acid, the 5-year event-free survival remains at only 50%
[5, 6]. Long-term survival of patients following relapse is
<5%, and neuroblastoma accounts for 15% of all pediat-
ric cancer deaths in the United States [7]. Given the
small number of patients available, the diversity of geno-
mic profiles [8, 9], and the limited number of drugs
available for testing, a deeper understanding of the
genomics of neuroblastoma and its treatment is critical
[10].
The management of relapsed neuroblastoma patients is
particularly challenging: there are currently few treatment
options from which tumor boards can select with any
degree of confidence. There are no established standard-
of-care treatments for relapsed neuroblastoma: options
include a variety of Phase I or Phase II therapies with rel-
atively modest response rates (10–35%) [4, 11]. Even in
patients who initially respond to current therapies,
tumors often progress on to further rapid relapses. Novel
strategies are urgently needed. Recent evidence establish-
ing the genetic heterogeneity of the disease reveals the
existence of several major molecular subsets that collec-
tively may provide prognostic value for future disease
management [8, 9]. The identification of agents that tar-
get-specific molecular pathways associated with the devel-
opment and/or progression of neoplastic diseases holds
promise. Molecularly-guided approaches that identify
existing agents which target-specific alterations in tumors
may improve patient survival while avoiding the toxicity
associated with agents that are unlikely to be beneficial
[12].
It is now firmly established that cancer results from
perturbations in the molecular pathways that disturb the
normal cellular homeostatic state [13–16]. Fluctuations in
these networks may result from genetic or epigenetic
events that cause gene expression changes in tumor cells.
This study utilizes an approach by which the expanding
knowledge of molecular pathways and the mechanisms of
action of targeted drug therapies [17, 18] can be utilized
to create individualized therapeutic regimens using a
Tumor Profiling Analysis Platform (TPAP) in real-time
for patients with neuroblastoma. In our study, patients
undergoing tumor biopsy have a sample sent for patho-
logical evaluation and gene expression profiling from
which bioinformatics analysis and generation of a drug
prediction report is created. This is reviewed by a molec-
ular tumor board which yields an individualized treat-
ment plan for each patient, who is then followed for
safety and response.
Materials and Methods
Study population
This was an open label, multicenter prospective feasibility
study in patients with refractory or recurrent neuroblas-
toma. Patients were scheduled to undergo a standard-of-
care surgical resection and/or diagnostic biopsy procedure
and gave consent for additional samples to be collected
during this procedure. A voluntary consent for optional
biology studies was obtained. The Institutional Review
Board (IRB) at WIRB, Helen DeVos Children’s Hospital
(MI), Arnold Palmer Children’s Hospital (FL), National
Cancer Institute (NCI), Children’s Mercy Hospitals and
Clinics (MO), Connecticut Children’s Hospital (CT), Dell
Children’s Hospital (TX), Cardinal Glennon Children’s
Hospital (MO), and Levine Children’s Hospital (NC)
approved this trial. An IRB approved consent was
obtained from each subject or subject guardian. (Clinical
Trials identifier: NCT01355679; Study ID: NMTRC001).
This study was conducted under FDA approval for IDE
G100111.
Eligibility
Patients with refractory or recurrent neuroblastoma dis-
ease initially diagnosed during or under the age of
21 years were eligible for this study. Current disease state
was required to be one without any known curative
therapy. Inclusion criteria also defined a Lansky Play
score >50. Adequate bone marrow and liver function was
required; no other significant organ toxicity as above
Grade 2 by National Cancer Institute Common Toxicity
Criteria for Adverse Events, version 4 NCI-CTCAE.
Exclusion criteria included patients who were adminis-
tered chemotherapy within 7 days prior to enrollment
and 14 days prior to study treatment start; patients
2 ª 2015 The Authors. Cancer Medicine published by John Wiley & Sons Ltd.
Molecular-Guided Therapy for Neuroblastoma G. Saulnier Sholler et al.
receiving antitumor therapy for their disease or any other
investigational drug; patients who had received any
radiotherapy within the last 30 days without another site
of disease to follow; serious infections or a life-threaten-
ing illness that is >Grade 2 (NCI-CTCAE V4.0). There
was no limit put on the number of previous treatments.
Study design
Primary objective
The primary objective of this study was to determine the
feasibility of using predictive modeling based on genome-
wide mRNA expression profiles of bone-marrow-derived
neuroblastoma cells or tumor biopsies to make real-time
treatment decisions. The measure was defined as “Enroll-
ment onto study, quality mRNA obtained, gene chip
completed, tumor board held, medical monitor review
and approval, start of treatment by 21 days post biopsy/
surgical resection date, and completion of 1 cycle of ther-
apy.” For statistical reporting a binomial distribution was
used for the testing process with a combination of Type I
error levels (10%) and Power (70%) with an overall basic
design as a MiniMax approach. The study accepted the
null hypothesis if the observed feasibility rate was less
than or equal to 9/14. Otherwise, stop and reject the null
hypothesis.
Secondary objectives
The secondary objectives of this study were to determine
the safety of allowing a molecular tumor board to deter-
mine individualized treatment plans and to determine the
activity of treatments chosen based on overall response
rate (ORR) and progression free survival (PFS).
Definition of overall response for eachpatient
This definition is utilized to describe response in all
lesions defined as measurable in this study, including CT/
MRI lesions which meet RECIST criteria, MIBG-positive
lesions, and bone marrow disease. These criteria are used
in the statistical analysis to define the overall response of
the patient. Complete response (CR) was defined as the
disappearance of all target lesions. No evidence of tumor
at any site (chest, abdomen, liver, bone, bone marrow,
nodes, etc.), and homovanillic acid/vanillyl mandelic acid
(HVA/VMA) normal. Partial response (PR) was defined
as at least a 30% decrease in the disease measurement for
CT/MRI target lesions, taking as reference the disease
measurement done to confirm measurable disease in tar-
get lesions at study entry. Bone marrow with CR. MIBG
with either PR/CR in bone lesions; MIBG may be SD or
CR in soft tissue lesions corresponding to lesions on CT/
MRI. HVA/VMA may still be elevated. Progressive disease
(PD) was defined as any one of the following: at least a
20% increase in the disease measurement for CT/MRI tar-
get lesions, taking as reference the smallest disease mea-
surement recorded since the start of treatment,
appearance of one or more new lesions or new sites of
tumor, or new disease in either the bone marrow or new
MIBG lesions. Stable disease (SD) was defined as no new
lesions; no new sites of disease, and they do not fit the
criteria for PD/PR/CR as above.
Time to progression was defined as the period from the
first day of study drug administration until the criteria for
progression was met. Duration of response was defined as
the period of time from when measurement criteria are
met for CR or PR, whichever is first recorded, until the
first date that recurrent or PD is objectively documented.
The assessment of response included the initial measur-
able targets, was performed again after the first and
second cycle, then performed again after every other cycle.
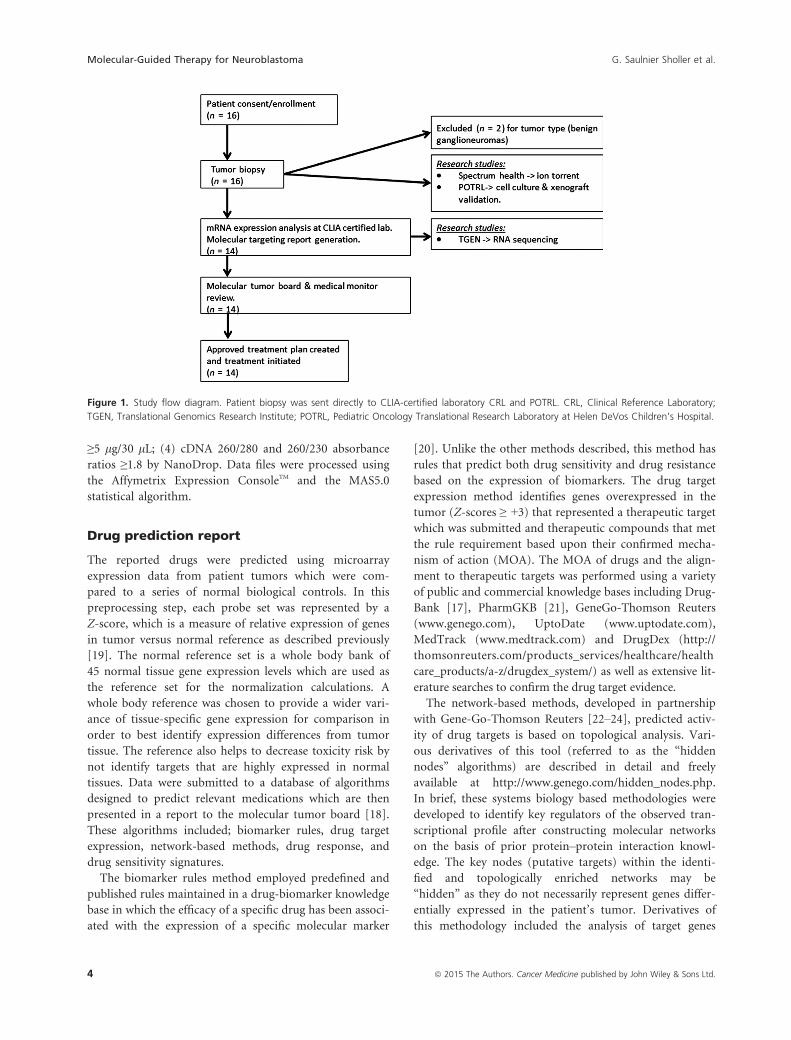
Sample procurement and gene expressionprofiling
Patients enrolled on this study were scheduled to
undergo a biopsy or resection per treating oncologist as
part of their treatment plan. At the time of biopsy, a
fresh tumor sample was committed for this research
study and prepared immediately. This subject sample was
de-identified and sent to various sites for assessments: A
single tumor biopsy in RNAlater was shipped to the
CLIA-certified laboratory Clinical Reference Laboratory
(CRL) for mRNA expression analysis using U133 Plus
2.0 GeneChip and from which the remaining mRNA was
sent to Translational Genomics Research Institute (TGen)
for high-performance RNA-seq analysis. A biopsy sample
was sent to the Pediatric Oncology Translational Research
Laboratory (POTRL) for in vitro/in vivo biology studies
(Fig. 1).
Sample quality control
To pass quality control, tumor samples were read by clin-
ical pathology for a ≥75% viable tumor by nuclei, and
<20% necrosis. Sample was then processed by CRL. The
RNA extraction, amplification, Affymetrix U133 Plus 2.0
GeneChip� hybridization (Santa Clara, CA), and scanning
procedures utilized CLIA-certified CRL standard proto-
cols. Passing criteria include: (1) RNA integrity number
(RIN) >6.5 using the Agilent (Waldbronn, Germany)
2100 BioAnalyzer; (2) RNA 260/280 and 260/230 absor-
bance ratios >1.8 by NanoDrop; (3) total cDNA yield
ª 2015 The Authors. Cancer Medicine published by John Wiley & Sons Ltd. 3
G. Saulnier Sholler et al. Molecular-Guided Therapy for Neuroblastoma
≥5 lg/30 lL; (4) cDNA 260/280 and 260/230 absorbance
ratios ≥1.8 by NanoDrop. Data files were processed using
the Affymetrix Expression ConsoleTM and the MAS5.0
statistical algorithm.
Drug prediction report
The reported drugs were predicted using microarray
expression data from patient tumors which were com-
pared to a series of normal biological controls. In this
preprocessing step, each probe set was represented by a
Z-score, which is a measure of relative expression of genes
in tumor versus normal reference as described previously
[19]. The normal reference set is a whole body bank of
45 normal tissue gene expression levels which are used as
the reference set for the normalization calculations. A
whole body reference was chosen to provide a wider vari-
ance of tissue-specific gene expression for comparison in
order to best identify expression differences from tumor
tissue. The reference also helps to decrease toxicity risk by
not identify targets that are highly expressed in normal
tissues. Data were submitted to a database of algorithms
designed to predict relevant medications which are then
presented in a report to the molecular tumor board [18].
These algorithms included; biomarker rules, drug target
expression, network-based methods, drug response, and
drug sensitivity signatures.
The biomarker rules method employed predefined and
published rules maintained in a drug-biomarker knowledge
base in which the efficacy of a specific drug has been associ-
ated with the expression of a specific molecular marker
[20]. Unlike the other methods described, this method has
rules that predict both drug sensitivity and drug resistance
based on the expression of biomarkers. The drug target
expression method identifies genes overexpressed in the
tumor (Z-scores ≥ +3) that represented a therapeutic target
which was submitted and therapeutic compounds that met
the rule requirement based upon their confirmed mecha-
nism of action (MOA). The MOA of drugs and the align-
ment to therapeutic targets was performed using a variety
of public and commercial knowledge bases including Drug-
Bank [17], PharmGKB [21], GeneGo-Thomson Reuters
(www.genego.com), UptoDate (www.uptodate.com),
MedTrack (www.medtrack.com) and DrugDex (http://
thomsonreuters.com/products_services/healthcare/health
care_products/a-z/drugdex_system/) as well as extensive lit-
erature searches to confirm the drug target evidence.
The network-based methods, developed in partnership
with Gene-Go-Thomson Reuters [22–24], predicted activ-
ity of drug targets is based on topological analysis. Vari-
ous derivatives of this tool (referred to as the “hidden
nodes” algorithms) are described in detail and freely
available at http://www.genego.com/hidden_nodes.php.
In brief, these systems biology based methodologies were
developed to identify key regulators of the observed tran-
scriptional profile after constructing molecular networks
on the basis of prior protein–protein interaction knowl-
edge. The key nodes (putative targets) within the identi-
fied and topologically enriched networks may be
“hidden” as they do not necessarily represent genes differ-
entially expressed in the patient’s tumor. Derivatives of
this methodology included the analysis of target genes
Figure 1. Study flow diagram. Patient biopsy was sent directly to CLIA-certified laboratory CRL and POTRL. CRL, Clinical Reference Laboratory;
TGEN, Translational Genomics Research Institute; POTRL, Pediatric Oncology Translational Research Laboratory at Helen DeVos Children’s Hospital.
4 ª 2015 The Authors. Cancer Medicine published by John Wiley & Sons Ltd.
Molecular-Guided Therapy for Neuroblastoma G. Saulnier Sholler et al.

that represent key points of information convergence and
divergence, which can be considered putative effectors
and drivers respectively. After these respective analyses,
the overlay of the drug target knowledge base with topo-
logically significant nodes provided a method to predict
drug efficacy.
The drug response signatures reproduced the Connectiv-
ity Map concept initially developed by the Broad Institute
[25] in which the genomic consequence of drug exposure is
used to connect drug effect to disease signatures. The
hypothesis underlying this method is that drugs that reverse
the disease genotype (gene expression profile) toward nor-
malcy have the potential to reverse the disease phenotype.
Up to 500 of the most over and underexpressed genes in
the patient’s tumor (Z-scores ≥ +1.5 or ≤ �1.5, respec-
tively) were submitted to this method. Rank-based statistics
were used to identify drugs with a significant inverse
connectivity to the disease genotype.
The drug sensitivity signatures implemented the Para-
metric Gene Set Enrichment Analysis method to align
NCI-60 cell line sensitivity signatures that are predictive
across at least two independent cell contexts with the
patient’s differentially expressed genes. All genes that
passed the preprocessing thresholds were evaluated. The
NCI-60 drug signature mapped over and under expressed
genes (determined by predrug treatment) to the observed
in vitro drug sensitivity as measured by the half maximal
inhibitory concentration (IC50) of the various cell lines
studied [26, 27].
Upon execution of these analyses, a compiled report
was generated. The report allowed the molecular tumor
board to quickly navigate to the underlying knowledge
and evidence at multiple levels, including the molecular
predictions and inferring methodologies, and any evidence
from published literature and clinical trials that may sup-
port the use of the predicted agent in the patient’s disease
context. The total FDA approved drugs with pediatric dos-
ing available at the time of this study was 108 drugs.
Treatment protocol decision
Treatment protocols were devised by a tumor board which
consisted of pediatric oncologists, pharmacists,
bioinformaticians, and pathologists utilizing the drug pre-
diction report which was generated through analysis of the
gene expression profile of the patient’s tumor. The drug
prediction report provided a list of potentially effective
agents based on the analyses described above. Decision
rules for the tumor board included: (1) All drugs with
predicted efficacy were reported to the tumor board with
an associated predicted efficacy score and rank. (2) Drugs
chosen must be FDA approved with established standard
and safe dosing schedules (see Table S3 for the clinical
trial drug list). Those without known pediatric dosing
were excluded. (3) Potential drug choices were analyzed
with regards to safety, mechanism, availability, and cost.
Focus was on low-toxicity, targeted therapies. (4) Drug
combinations were allowed, up to a maximum of four
agents. Literature searches were conducted to assemble
data on previously established and tested regimens which
were given priority. (5) The pharmacist performed analysis
of possible drug interactions between the potentially effec-
tive agents and the subject’s routine medications and sup-
plements. For drug interactions and known toxicities the
following databases were used: MicroMedex (Greenwood
Village, CO), LexiComp (Hudson, OH), E-facts and Natu-
ral Medicines Database. (6) Patients’ history and previ-
ously received treatments were reviewed. Drugs which a
patient had failed were given low priority and used only if
there was a rationale for synergy in combination therapy.
Prioritization rules
The following prioritization rules were used to choose
drugs for each patient’s individualized treatment plan. For
a given proposed combination of drugs, the first priority to
establish doses was to identify the same combination of
drugs in a peer-reviewed journal article or presented as a
reviewed abstract, or part of an ongoing peer-reviewed clin-
ical trial registered with clinical trials.gov. When a pro-
posed combination of drugs had not previously been
reported, dosing was established by studying how each
component of the proposed combination had been com-
bined with other cytotoxic agents similar to those being
considered for combination therapy. Again, the source of
information was a peer-reviewed journal article or pre-
sented as a reviewed abstract, or part of an ongoing peer-
reviewed clinical trial registered with clinical trials.gov.
When a proposed combination of drugs had no available
combination data, dosing guidelines started with the maxi-
mum tolerated dose (MTD) determined by a phase I/II
pediatric study. Per pharmacy review, doses were reduced
to compensate for potential additive toxicities of combina-
tion agents.
The treatment regimens were discussed with families
and included review of known side effects, serious adverse
effects of possible new drug combinations and any addi-
tional clinical monitoring that might be recommended by
the FDA and/or the tumor board. The families were given
the option to proceed with therapy and were asked to
sign a treatment-specific memo.
Safety measures
All adverse events, whether serious or not, were described
in the source documents and Grade 2 or higher (per
ª 2015 The Authors. Cancer Medicine published by John Wiley & Sons Ltd. 5
G. Saulnier Sholler et al. Molecular-Guided Therapy for Neuroblastoma
CTCAE 4.0) adverse events were captured on the adverse
event case report forms. All Grade 2 or higher new events
were captured, including those that worsened in intensity
or frequency relative to baseline, and those which
occurred after administration of study drug through the
period of protocol-specified follow up. Regardless of sus-
pected cause, adverse events were collected for 30 days
following the last treatment and any suspected study
drug-related toxicities at the 30 day follow-up visit were
followed until resolution to baseline or ≤Grade 2 or sta-
bilization of the event.
Research methods
RNA-sequencing research studies
RNA sequencing was performed using 1.0 µg of total
RNA quantified via Nanodrop (Thermo Scientific, Pitts-
burgh, PA). A sequencing library was prepared with Illu-
mina’s Truseq RNA Sample Preparation Kit v2 (Illumina
Inc, San Diego, CA) following the manufacturer’s proto-
col. In brief, poly-A containing mRNA molecules were
purified using poly-T oligo attached magnetic beads. The
mRNA was then thermally fragmented and converted to
double-stranded cDNA. The cDNA fragments were end-
repaired, a single “A” nucleotide was incorporated,
sequencing adapters were ligated, and fragments were
enriched with 15 cycles of PCR. Final PCR-enriched frag-
ments were validated on a 2100 Bioanalyzer (Agilent
Technologies, Waldbronn, Germany) and quantified by
qPCR using Kapa’s Library Quantification Kit (Kapa Bio-
systems, Woburn, MA) on the 7900HT (Applied Biosys-
tems, Foster City, CA). The final library was sequenced
by 50 bp paired-end sequencing on a HiSeq2000 (Illu-
mina, San Diego, CA).
Raw reads passing Illumina quality filters were con-
verted to FASTQ format in Phred33 scale with CASAVA
1.8.3. RNA-Seq reads were aligned with TopHat (v2.0.8)
[28] which first utilizes Bowtie (v2.1.0.0) [29] to map
reads with “splice-aware” alignments to the Homo Sapi-
ens build GRCh37 from Ensembl [30]. To estimate the
library fragment size for TopHat, we initially mapped a
subset of 1 million reads with bwa (v0.6.1) to the human
genome, followed by picard version 1.80 [31] module
CollectInsertSizeMetrics and provided these values to To-
pHat options “–mate-inner-dist 87 –mate-std-dev 86.”
Additional TopHat flags utilized were –transcriptome-
index (to Ensembl GRCh37.70), –no-coverage-search, –b2-sensitive and –keep-fasta-order. Next, we calculated
gene expression values expressed as fragments per kilobase
pair of exon per million fragments mapped using cuff-
links version 2.1.1 [28]. We used the –GTF option in
cufflinks to annotate to human gene models GRCh37.70.
Additionally we used the –multi-read-correct and –frag-bias-correct options in cufflinks and masked tRNAs,
rRNAs, and mtRNAs as suggested in the cufflinks docu-
mentation.
Ion torrent
Ion torrent deep amplicon sequencing of tumor samples:
deoxyribonucleic acid was extracted from tumor tissues
and quantitated using the Qubit2 fluorometer (Invitro-
gen, Grand Island, NY). Ten nanograms of DNA was
used for multiplex PCR of a panel covering 739 muta-
tions in 46 cancer-related genes (Ion AmpliSeq Cancer
Panel, Life Technologies, Grand Island, NY). Subsequent
processing of samples was performed according to the
manufacturer’s protocol. Library constructions of the
amplicons and subsequent enrichment of the sequencing
beads was performed using the OneTouch (Grand Island,
NY) system. Sequencing was done on the 314 chip with
10 megabases capacity using the Ion Torrent Personal
Genome Machine (Life Technologies) as per the manufac-
turer’s protocol. Data analysis, including alignment to the
hg19 human reference genome and base calling, was done
using built-in software.
Results
Feasibility and safety
The primary objective of this study was to evaluate the
feasibility and safety of a process using predictive model-
ing based on genome-wide mRNA expression profiles of
neuroblastoma tumor biopsies to make real-time treat-
ment decisions. Feasibility was defined as “completion of
enrollment onto study, quality mRNA obtained, gene chip
completed, tumor board held, medical monitor review
and approval, start of treatment by 21 days post biopsy/
surgical resection date, and completion of 1 cycle of
therapy.”
There were 16 subjects enrolled with multiply relapsed
or refractory neuroblastoma of which 14 were eligible:
eight males and six females with a median age of
10.1 years (see Table 1A). Subjects were between 1–11 years post diagnosis. The patients presented with
actively progressing neuroblastoma and had exhausted
relapse therapies (see Table S1). All subjects had soft tis-
sue disease in which biopsy was possible. All biopsies
were adequate by pathology evaluation (>75% viable
tumor) and RNA quality (>6.5 RIN). Two subjects were
deemed ineligible due to benign tumor type after biopsy,
therefore 14 subjects were eligible to remain on study.
Gene chips were completed in 3–8 days (95% CI: 3.8–6.8), report generation took 0–3 days (95% CI: 0.0–1.5),
6 ª 2015 The Authors. Cancer Medicine published by John Wiley & Sons Ltd.
Molecular-Guided Therapy for Neuroblastoma G. Saulnier Sholler et al.
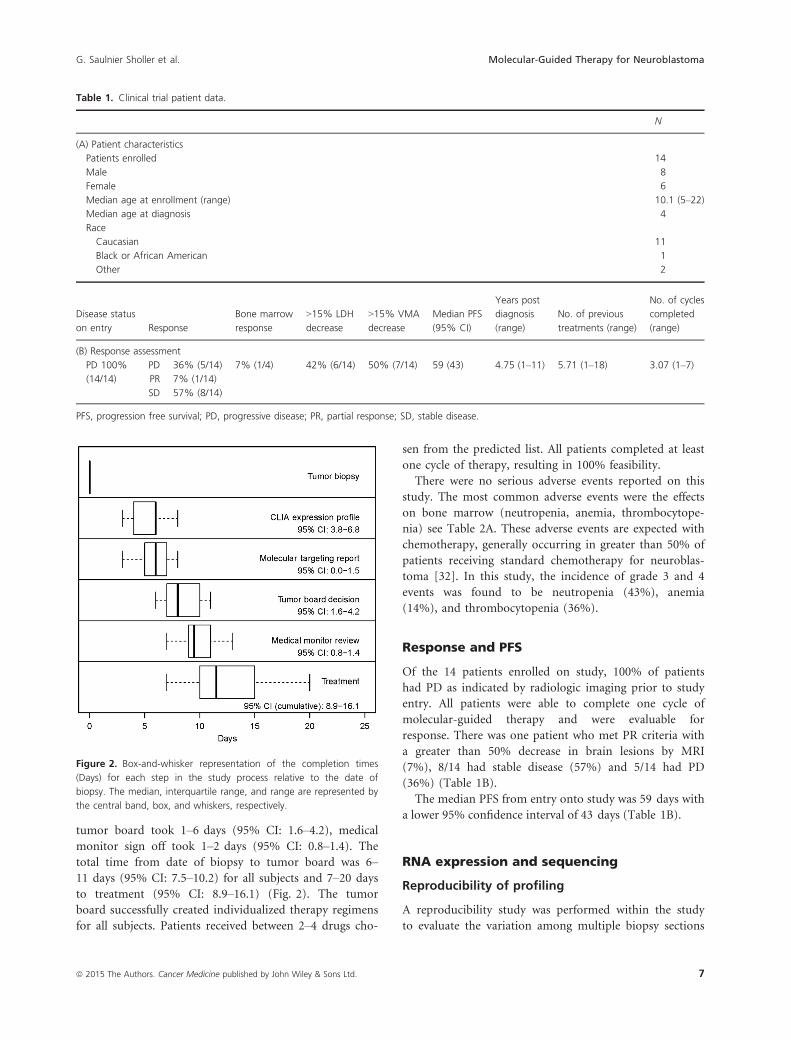
tumor board took 1–6 days (95% CI: 1.6–4.2), medical
monitor sign off took 1–2 days (95% CI: 0.8–1.4). Thetotal time from date of biopsy to tumor board was 6–11 days (95% CI: 7.5–10.2) for all subjects and 7–20 days
to treatment (95% CI: 8.9–16.1) (Fig. 2). The tumor
board successfully created individualized therapy regimens
for all subjects. Patients received between 2–4 drugs cho-
sen from the predicted list. All patients completed at least
one cycle of therapy, resulting in 100% feasibility.
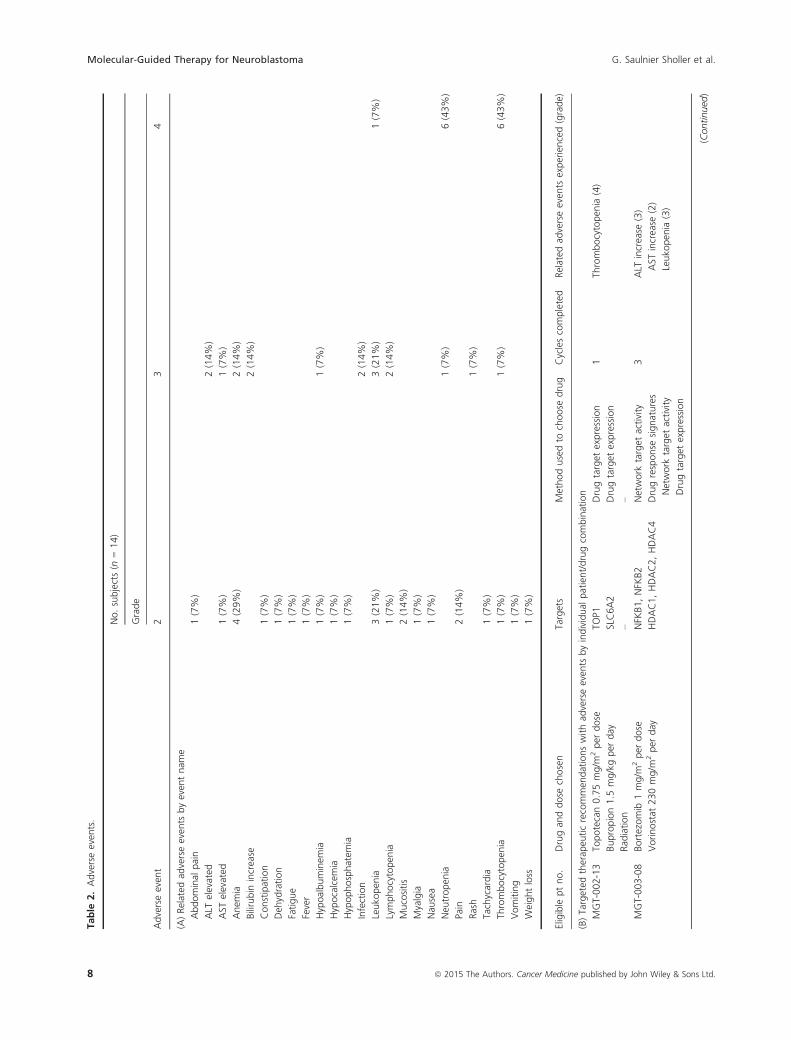
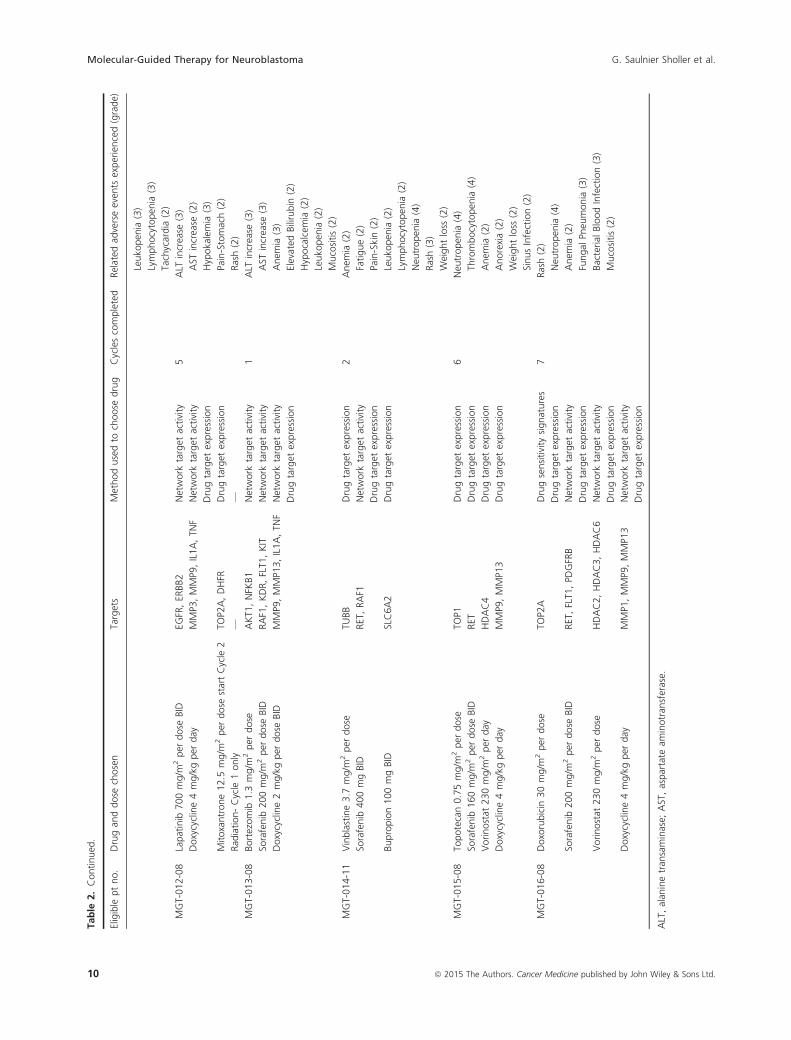
There were no serious adverse events reported on this
study. The most common adverse events were the effects
on bone marrow (neutropenia, anemia, thrombocytope-
nia) see Table 2A. These adverse events are expected with
chemotherapy, generally occurring in greater than 50% of
patients receiving standard chemotherapy for neuroblas-
toma [32]. In this study, the incidence of grade 3 and 4
events was found to be neutropenia (43%), anemia
(14%), and thrombocytopenia (36%).
Response and PFS
Of the 14 patients enrolled on study, 100% of patients
had PD as indicated by radiologic imaging prior to study
entry. All patients were able to complete one cycle of
molecular-guided therapy and were evaluable for
response. There was one patient who met PR criteria with
a greater than 50% decrease in brain lesions by MRI
(7%), 8/14 had stable disease (57%) and 5/14 had PD
(36%) (Table 1B).
The median PFS from entry onto study was 59 days with
a lower 95% confidence interval of 43 days (Table 1B).
RNA expression and sequencing
Reproducibility of profiling
A reproducibility study was performed within the study
to evaluate the variation among multiple biopsy sections
Table 1. Clinical trial patient data.
N
(A) Patient characteristics
Patients enrolled 14
Male 8
Female 6
Median age at enrollment (range) 10.1 (5–22)
Median age at diagnosis 4
Race
Caucasian 11
Black or African American 1
Other 2
Disease status
on entry Response
Bone marrow
response
>15% LDH
decrease
>15% VMA
decrease
Median PFS
(95% CI)
Years post
diagnosis
(range)
No. of previous
treatments (range)
No. of cycles
completed
(range)
(B) Response assessment
PD 100%
(14/14)
PD 36% (5/14) 7% (1/4) 42% (6/14) 50% (7/14) 59 (43) 4.75 (1–11) 5.71 (1–18) 3.07 (1–7)
PR 7% (1/14)
SD 57% (8/14)
PFS, progression free survival; PD, progressive disease; PR, partial response; SD, stable disease.
Figure 2. Box-and-whisker representation of the completion times
(Days) for each step in the study process relative to the date of
biopsy. The median, interquartile range, and range are represented by
the central band, box, and whiskers, respectively.
ª 2015 The Authors. Cancer Medicine published by John Wiley & Sons Ltd. 7
G. Saulnier Sholler et al. Molecular-Guided Therapy for Neuroblastoma
Table
2.Adverseeven
ts.
Adverseeven
t
No.subjects(n
=14)
Grade
23
4
(A)Related
adverseeven
tsbyeven
tnam
e
Abdominal
pain
1(7%)
ALT
elevated
2(14%)
AST
elevated
1(7%)
1(7%)
Anem
ia4(29%)
2(14%)
Bilirubin
increase
2(14%)
Constipation
1(7%)
Deh
ydration
1(7%)
Fatigue
1(7%)
Fever
1(7%)
Hypoalbuminem
ia1(7%)
1(7%)
Hypocalcem
ia1(7%)
Hypophosphatem
ia1(7%)
Infection
2(14%)
Leuko
pen
ia3(21%)
3(21%)
1(7%)
Lymphocytopen
ia1(7%)
2(14%)
Mucositis
2(14%)
Myalgia
1(7%)
Nau
sea
1(7%)
Neu
tropen
ia1(7%)
6(43%)
Pain
2(14%)
Rash
1(7%)
Tachycardia
1(7%)
Thrombocytopen
ia1(7%)
1(7%)
6(43%)
Vomiting
1(7%)
Weightloss
1(7%)
Eligible
ptno.
Drugan
ddose
chosen
Targets
Methodusedto
choose
drug
Cyclescompleted
Related
adverseeven
tsexperienced(grade)
(B)Targeted
therap
euticrecommen
dationswithad
verseeven
tsbyindividual
patient/drugcombination
MGT-002-13
Topotecan0.75mg/m
2per
dose
TOP1
Drugtarget
expression
1Th
rombocytopen
ia(4)
Bupropion1.5
mg/kgper
day
SLC6A2
Drugtarget
expression
Rad
iation
––
MGT-003-08
Bortezomib
1mg/m
2per
dose
NFK
B1,NFK
B2
Network
target
activity
3ALT
increase
(3)
AST
increase
(2)
Leuko
pen
ia(3)
Vorinostat
230mg/m
2per
day
HDAC1,HDAC2,HDAC4
Drugresponse
signatures
Network
target
activity
Drugtarget
expression
(Continued
)
8 ª 2015 The Authors. Cancer Medicine published by John Wiley & Sons Ltd.
Molecular-Guided Therapy for Neuroblastoma G. Saulnier Sholler et al.

Table
2.Continued
.
Eligible
ptno.
Drugan
ddose
chosen
Targets
Methodusedto
choose
drug
Cyclescompleted
Related
adverseeven
tsexperienced(grade)
Neu
tropen
ia(4)
Thrombocytopen
ia(4)
Doxorubicin
30mg/m
2per
dose
TOP2
ADrugtarget
expression
MGT-004-13
Bevacizumab
625mg/day
VEG
FANetwork
target
activity
1Fever(2)
Vorinostat
300mg/day
HDAC1
Drugresponse
signatures
Network
target
activity
MGT-006-13
Topotecan1mg/m
2per
dose
TOP1
Drugtarget
expression
1Leuko
pen
ia(4)
Lymphopen
ia(3)
Neu
tropen
ia(4)
Elevated
Bilirubin
(3)
Pain
(Esophag
us)
(2)
Thrombocytopen
ia(4)
Bupropion1.5
mg/kgper
day
SLC6A2
Drugtarget
expression
Vinblastine3mg/m
2per
dose
TUBB
Drugtarget
expression
Zometa4mg/m
2per
dose
Max:4mg
FDPS
Drugtarget
expression
MGT-007-04
Bortezomib
1.3
mg/m
2per
dose
AKT1
,NFK
B1
Network
target
activity
Drugtarget
expression
2Pain
(abdominal)(2)
Neu
tropen
ia(3)
Anem
ia(2)
Myalgia
(2)
Leuko
pen
ia(2)
Thrombocytopen
ia(2)
Vorinostat
230mg/m
2per
day
HDAC1,HDAC3,HDAC7
Network
target
activity
Drugtarget
expression
Doxorubicin25mg/m
2per
dose
TPO2B
Drugsensitivity
signatures
Network
target
activity
Simvastin
20mg/day
IGF1,RHOA
Network
target
activity
Drugtarget
expression
MGT-008-08
Donep
ezil5mgQOD
ACHE
Drugtarget
expression
6Anem
ia(2)
Leuko
pen
ia(3)
Neu
tropen
ia(4)
Thrombocytopen
ia(4)
Vorinostat
230mg/m
2per
day
HDAC2,HDAC6
Drugtarget
expression
Vinblastine4mg/m
2per
dose
TUBB
Drugtarget
expression
Zometa4mg/m
2per
dose
Max:4mg
FDPS
Drugtarget
expression
MGT-009-08
Bortezomib
1.3
mg/m
2per
dose
AKT1
,NFK
B1,NFK
B2
Network
target
activity
Drugtarget
expression
1Constipation(2)
Deh
ydration(2)
Hypoalbunem
ia(3)
Hypophosphatem
ia(2)
Nau
sea(2)
Thrombocytopen
ia(4)
Sorafenib
150mg/m
2per
dose
BID
RET
Drugtarget
expression
Doxorubicin
30mg/m
2per
dose
TOP2
A,TO
P2B
Drugsensitivity
signatures
Network
target
activity
Drugtarget
expression
MGT-010-08
Cytarab
ine50mg/m
2per
dose
SLC29A1
Biomarker-based
rules
2Neu
tropen
ia(4)
Anem
ia(4)
Thrombocytopen
ia(4)
Leuko
pen
ia(4)
Pain
(2)
Sorafenib
200mg/m
2per
BID
PDGFRB,FLT3
,FLT4
,RET
Network
target
activity
Drugtarget
expression
MGT-011-13
Vorinostat
230mg/m
2per
day
HDAC3,HADC6
Network
target
activity
Drugtarget
expression
5Neu
tropen
ia(2)
Anem
ia(3)
Hypoalbunem
ia(2)
Thrombocytopen
ia(3)
Vomiting(2)
Sorafenib
200mg/m
2per
day
PDGFRB,RET
Network
target
activity
Drugtarget
expression
Vinblastine4mg/m
2per
dose
TUBB
Drugtarget
expression
(Continued
)
ª 2015 The Authors. Cancer Medicine published by John Wiley & Sons Ltd. 9
G. Saulnier Sholler et al. Molecular-Guided Therapy for Neuroblastoma
Table
2.Continued
.
Eligible
ptno.
Drugan
ddose
chosen
Targets
Methodusedto
choose
drug
Cyclescompleted
Related
adverseeven
tsexperienced(grade)
Leuko
pen
ia(3)
Lymphocytopen
ia(3)
Tachycardia
(2)
MGT-012-08
Lapatinib
700mg/m
2per
dose
BID
EGFR,ER
BB2
Network
target
activity
5ALT
increase
(3)
AST
increase
(2)
Hypokalemia
(3)
Pain-Stomach(2)
Rash(2)
Doxycycline4mg/kgper
day
MMP3
,MMP9
,IL1A,TN
FNetwork
target
activity
Drugtarget
expression
Mitoxantrone12.5
mg/m
2per
dose
startCycle
2TO
P2A,DHFR
Drugtarget
expression
Rad
iation-Cycle
1only
——
MGT-013-08
Bortezomib
1.3
mg/m
2per
dose
AKT1
,NFK
B1
Network
target
activity
1ALT
increase
(3)
AST
increase
(3)
Anem
ia(3)
Elevated
Bilirubin
(2)
Hypocalcem
ia(2)
Leuko
pen
ia(2)
Mucositis(2)
Sorafenib
200mg/m
2per
dose
BID
RAF1,KDR,FLT1
,KIT
Network
target
activity
Doxycycline2mg/kgper
dose
BID
MMP9
,MMP1
3,IL1A,TN
FNetwork
target
activity
Drugtarget
expression
MGT-014-11
Vinblastine3.7
mg/m
2per
dose
TUBB
Drugtarget
expression
2Anem
ia(2)
Fatigue(2)
Pain-Skin(2)
Leuko
pen
ia(2)
Lymphocytopen
ia(2)
Neu
tropen
ia(4)
Rash(3)
Weightloss
(2)
Sorafenib
400mgBID
RET,RAF1
Network
target
activity
Drugtarget
expression
Bupropion100mgBID
SLC6A2
Drugtarget
expression
MGT-015-08
Topotecan0.75mg/m
2per
dose
TOP1
Drugtarget
expression
6Neu
tropen
ia(4)
Thrombocytopen
ia(4)
Anem
ia(2)
Anorexia(2)
Weightloss
(2)
SinusInfection(2)
Sorafenib
160mg/m
2per
dose
BID
RET
Drugtarget
expression
Vorinostat
230mg/m
2per
day
HDAC4
Drugtarget
expression
Doxycycline4mg/kgper
day
MMP9
,MMP1
3Drugtarget
expression
MGT-016-08
Doxorubicin
30mg/m
2per
dose
TOP2
ADrugsensitivity
signatures
Drugtarget
expression
7Rash(2)
Neu
tropen
ia(4)
Anem
ia(2)
Fungal
Pneu
monia
(3)
Bacterial
BloodInfection(3)
Mucositis(2)
Sorafenib
200mg/m
2per
dose
BID
RET,FLT1
,PD
GFRB
Network
target
activity
Drugtarget
expression
Vorinostat
230mg/m
2per
dose
HDAC2,HDAC3,HDAC6
Network
target
activity
Drugtarget
expression
Doxycycline4mg/kgper
day
MMP1
,MMP9
,MMP1
3Network
target
activity
Drugtarget
expression
ALT,alan
inetran
saminase;
AST,aspartate
aminotran
sferase.
10 ª 2015 The Authors. Cancer Medicine published by John Wiley & Sons Ltd.
Molecular-Guided Therapy for Neuroblastoma G. Saulnier Sholler et al.
from the same tumor. Expression profiling and drug pre-
dictions based on triplicate sections were analyzed.
Distance-based nonparametric multivariate analysis of
variance [33, 34] allowed us to reject the null hypothesis
that variation between biopsies can be accounted for by
the variation within biopsies (P = 0.001). That the varia-
tion among expression profiles associated with the same
biopsy is small compared with the variation between
expression profiles associated with different biopsies is
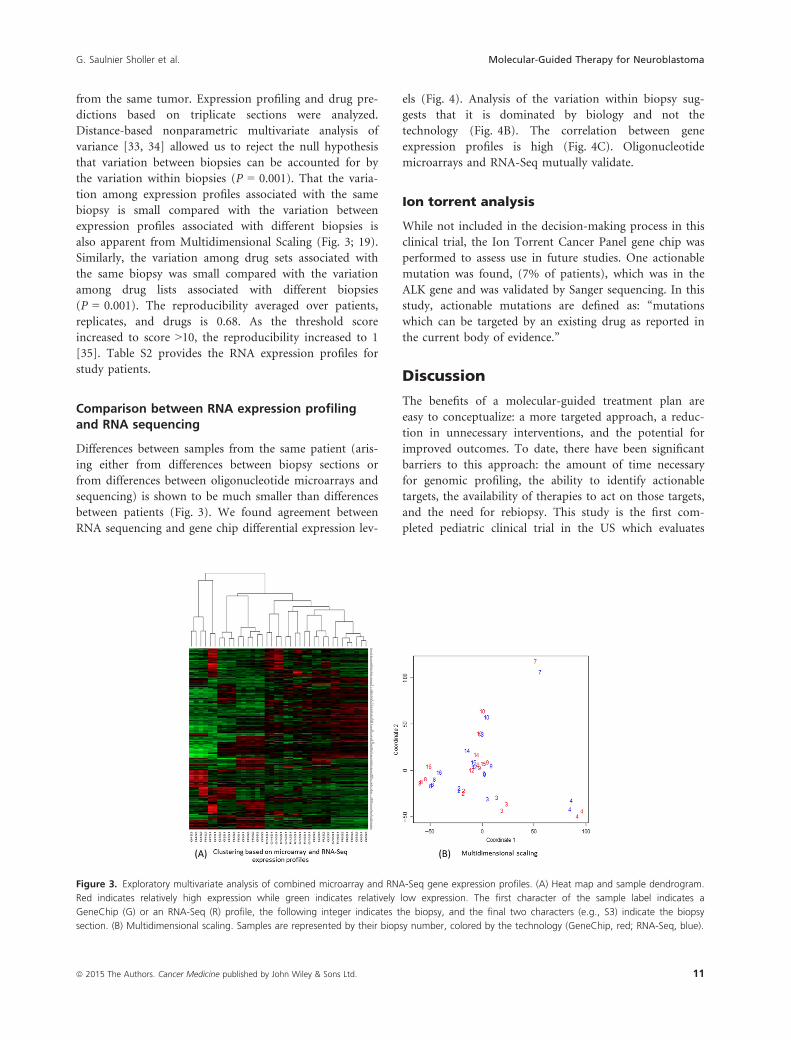
also apparent from Multidimensional Scaling (Fig. 3; 19).
Similarly, the variation among drug sets associated with
the same biopsy was small compared with the variation
among drug lists associated with different biopsies
(P = 0.001). The reproducibility averaged over patients,
replicates, and drugs is 0.68. As the threshold score
increased to score >10, the reproducibility increased to 1
[35]. Table S2 provides the RNA expression profiles for
study patients.
Comparison between RNA expression profilingand RNA sequencing
Differences between samples from the same patient (aris-
ing either from differences between biopsy sections or
from differences between oligonucleotide microarrays and
sequencing) is shown to be much smaller than differences
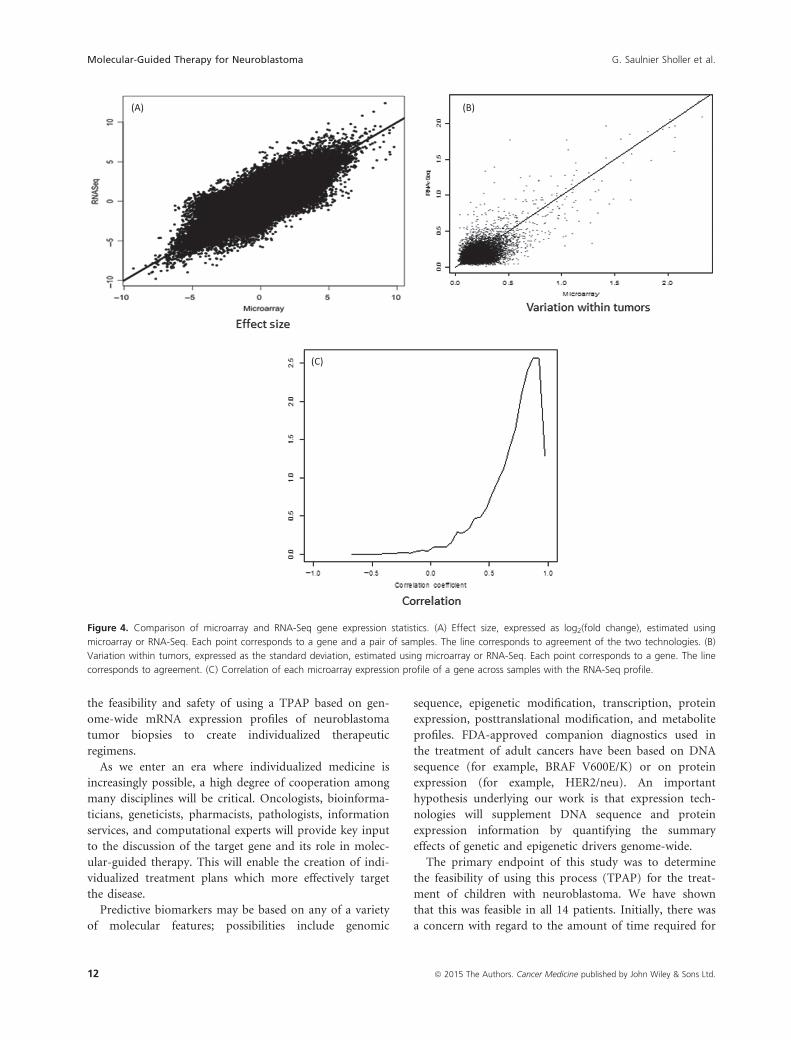
between patients (Fig. 3). We found agreement between
RNA sequencing and gene chip differential expression lev-
els (Fig. 4). Analysis of the variation within biopsy sug-
gests that it is dominated by biology and not the
technology (Fig. 4B). The correlation between gene
expression profiles is high (Fig. 4C). Oligonucleotide
microarrays and RNA-Seq mutually validate.
Ion torrent analysis
While not included in the decision-making process in this
clinical trial, the Ion Torrent Cancer Panel gene chip was
performed to assess use in future studies. One actionable
mutation was found, (7% of patients), which was in the
ALK gene and was validated by Sanger sequencing. In this
study, actionable mutations are defined as: “mutations
which can be targeted by an existing drug as reported in
the current body of evidence.”
Discussion
The benefits of a molecular-guided treatment plan are
easy to conceptualize: a more targeted approach, a reduc-
tion in unnecessary interventions, and the potential for
improved outcomes. To date, there have been significant
barriers to this approach: the amount of time necessary
for genomic profiling, the ability to identify actionable
targets, the availability of therapies to act on those targets,
and the need for rebiopsy. This study is the first com-
pleted pediatric clinical trial in the US which evaluates
(A) (B)
Figure 3. Exploratory multivariate analysis of combined microarray and RNA-Seq gene expression profiles. (A) Heat map and sample dendrogram.
Red indicates relatively high expression while green indicates relatively low expression. The first character of the sample label indicates a
GeneChip (G) or an RNA-Seq (R) profile, the following integer indicates the biopsy, and the final two characters (e.g., S3) indicate the biopsy
section. (B) Multidimensional scaling. Samples are represented by their biopsy number, colored by the technology (GeneChip, red; RNA-Seq, blue).
ª 2015 The Authors. Cancer Medicine published by John Wiley & Sons Ltd. 11
G. Saulnier Sholler et al. Molecular-Guided Therapy for Neuroblastoma
the feasibility and safety of using a TPAP based on gen-
ome-wide mRNA expression profiles of neuroblastoma
tumor biopsies to create individualized therapeutic
regimens.
As we enter an era where individualized medicine is
increasingly possible, a high degree of cooperation among
many disciplines will be critical. Oncologists, bioinforma-
ticians, geneticists, pharmacists, pathologists, information
services, and computational experts will provide key input
to the discussion of the target gene and its role in molec-
ular-guided therapy. This will enable the creation of indi-
vidualized treatment plans which more effectively target
the disease.
Predictive biomarkers may be based on any of a variety
of molecular features; possibilities include genomic
sequence, epigenetic modification, transcription, protein
expression, posttranslational modification, and metabolite
profiles. FDA-approved companion diagnostics used in
the treatment of adult cancers have been based on DNA
sequence (for example, BRAF V600E/K) or on protein
expression (for example, HER2/neu). An important
hypothesis underlying our work is that expression tech-
nologies will supplement DNA sequence and protein
expression information by quantifying the summary
effects of genetic and epigenetic drivers genome-wide.
The primary endpoint of this study was to determine
the feasibility of using this process (TPAP) for the treat-
ment of children with neuroblastoma. We have shown
that this was feasible in all 14 patients. Initially, there was
a concern with regard to the amount of time required for
(A) (B)
(C)
Figure 4. Comparison of microarray and RNA-Seq gene expression statistics. (A) Effect size, expressed as log2(fold change), estimated using
microarray or RNA-Seq. Each point corresponds to a gene and a pair of samples. The line corresponds to agreement of the two technologies. (B)
Variation within tumors, expressed as the standard deviation, estimated using microarray or RNA-Seq. Each point corresponds to a gene. The line
corresponds to agreement. (C) Correlation of each microarray expression profile of a gene across samples with the RNA-Seq profile.
12 ª 2015 The Authors. Cancer Medicine published by John Wiley & Sons Ltd.
Molecular-Guided Therapy for Neuroblastoma G. Saulnier Sholler et al.
profiling and the generation of a tumor board treatment
plan. However, the mean of 12 days was sufficient: no
patients experienced significant disease progression prior
to initiation of therapy.
The second primary endpoint of safety for this study
showed that there were no serious or unexpected adverse
events. The events seen were those typically seen in chil-
dren with neuroblastoma receiving the medications pre-
scribed. Our observation is that the approach used in this
study appeared to result in less severe side effects than we
have observed in children who receive nontargeted ther-
apy for relapsed disease and warrants further evaluation
in a larger study.
As all patients had shown radiological progression of
disease prior to study enrollment, the expectation would
be continued progression if the molecular-guided therapy
were not effective. In this heavily pretreated patient popu-
lation, stabilization of disease in 57% and response in 7%
may suggest benefit and should be further studied. The
combined clinical benefit in 64% of patients suggests an
improvement over the 17–48% combined benefit of
recent Phase I neuroblastoma studies [36–41].The clustering analysis demonstrates that genetic differ-
ences occur even within the same class of tumor, empha-
sizing the need for personalized and highly targeted
therapies. In addition, patients may group into “treatment
clusters,” which may lead to novel clinical trial designs
that classify patients to a particular treatment plan based
on genomic expression differences. The regimens chosen
in this study suggest that treatment clusters may occur.
Certain medications emerged repeatedly from the drug
prediction report: vorinostat (HDAC overexpression), and
sorafenib (RET overexpression) were each used in eight
of 16 patients (see Table 2B). A larger patient sample
would be required to test this.
Another important aspect of this study was the impor-
tance of biopsy. Biopsy of one patient revealed a neuroen-
docrine carcinoma which had been incorrectly diagnosed
as neuroblastoma. This subject was allowed to remain on
study. Biopsy of two other patients revealed ganglioneu-
roma (benign tumor) making them ineligible for this
study. One patient was enrolled a second time with
biopsy revealing that genomic differences had occurred
between relapses, suggesting that prior therapy may have
had an impact which would have been undetected with-
out biopsy: this subject counted as two separate encoun-
ters in the enrollment numbers. These examples clearly
emphasize the need for rebiopsy at relapse for all patients
since 3/16 (19%) would have been inappropriately treated
without biopsy. Rebiopsy has not been favored due to
ethical considerations of an unnecessary procedure. Yet,
in this study, rebiopsy revealed critical information about
3/16 patients who would have been misdiagnosed or
inappropriately treated. In addition, this study demon-
strates that rebiopsy can safely be performed with mini-
mal risk as there were no adverse events associated with
any patient biopsies.
A reproducibility analysis of triplicate biopsy sampling
was undertaken during this study. This showed signifi-
cant correlation in overall expression profiling as well as
drug predictions confirmed in RNA Sequencing. High-
throughput Sequencing (HTS) to determine changes in
gene expression is rapidly becoming a viable choice and
is referred to as RNA-seq. The methods studied appear
to mutually validate each other and therefore either
could be used in the same context (such as drug predic-
tion). RNA sequencing may add further understanding
through identification of gene fusions or possibly greater
sensitivity. As such, RNA sequencing may provide
greater transcriptome coverage, and further allow com-
plete annotation and quantification of all genes and their
isoforms in a given sample. An important development
during this study was that previously RNA sequencing
required up to 2 months but has now been optimized
to completion in 2 weeks in a CLIA-certified laboratory.
As we move toward deeper RNA-Seq, we chose to evalu-
ate this in comparison to RNA expression profiling and
found that these methods do correlate in patient
samples.
We also evaluated the ability of the Ion Torrent DNA
mutation panel to find actionable mutations in our
patients for incorporation into future studies. We found
that 7% of patients in this small sample size had identi-
fied actionable mutations. This was in the low range of
the literature reports of ~10–22% actionable mutation
rate in adults [42]. The actionable mutation identified
was ALK, which has been identified in 7% of neuroblas-
toma patients [43] and ALK inhibitors, such as Crizotinib
are currently being tested in pediatrics. This method was
validated with Sanger sequencing, although this should
continue to be evaluated in a larger sample set to show
statistical power prior to recommending this test alone.
This method was integrated into the decision-making
process for the tumor board in the follow-up clinical
trial.
Understanding of known genetic mutations and their
effects on therapeutic choices such as undertaken in this
trial will help us gain the knowledge to improve predic-
tions. With the establishment of patient cell lines and
mice models in over 50% of cases it is possible to study
drug effectiveness in vitro and in vivo. Future directions
include an ongoing validation study using patient-derived
cell lines and mice models to improve drug prediction
algorithms.
The future of oncology lies in a process using data-dri-
ven genetic and mechanistic understanding of patients’
ª 2015 The Authors. Cancer Medicine published by John Wiley & Sons Ltd. 13
G. Saulnier Sholler et al. Molecular-Guided Therapy for Neuroblastoma
tumors for choosing therapies. A better understanding of
tumor-specific information will pave the way for individ-
ualized, targeted treatment plans. The continued develop-
ment of a TPAP will allow improved and more accurate
predictions in the future. We believe that this study is an
initial step pointing the way toward future advances in
molecular-guided therapy which will improve the selec-
tion of treatment options and open new avenues of inves-
tigation.
Acknowledgments
We thank the Dell Corporation for their grant support
for this clinical trial and their computational expertise.
We thank Maja Sholler for her support in editing of this
manuscript. We would also like to thank the pediatric
advocate foundations supporting our work to advance
science including Beat NB, Arms Wide Open Foundation,
Charles and Meryl Witmer Foundation, Owen Moscone
Foundation, Because of Ezra Foundation, Max’s Ring of
Fire, Lillie’s Friends Foundation, Brooke’s Blossoming
Hope Foundation, Melina’s White Light, Ishan Gala
Foundation, Ethan’s Rodeo, Daxton’s Fish.
Conflict of Interest
None declared.
References
1. Society AC. 2008. Cancer facts and figures. American
Cancer Society, Atlanta, GA.
2. Bernstein, M. L., J. M. Leclerc, G. Bunin, L. Brisson, L.
Robison, J. Shuster, et al. 1992. A population-based study
of neuroblastoma incidence, survival, and mortality in
North America. J. Clin. Oncol. 10:323–329.3. Brodeur, G. M., J. Pritchard, F. Berthold, N. L. Carlsen, V.
Castel, R. P. Castelberry, et al. 1993. Revisions of the
international criteria for neuroblastoma diagnosis, staging,
and response to treatment. J. Clin. Oncol. 11:1466–1477.4. Park, J. R., A. Eggert, and H. Caron. 2008. Neuroblastoma:
biology, prognosis, and treatment. Pediatr. Clin. North
Am. 55:97–120, x.
5. Matthay, K. K., J. G. Villablanca, R. C. Seeger, D. O.
Stram, R. E. Harris, N. K. Ramsay, et al. 1999. Treatment
of high-risk neuroblastoma with intensive chemotherapy,
radiotherapy, autologous bone marrow transplantation,
and 13-cis-retinoic acid. Children’s Cancer Group. N. Engl.
J. Med. 341:1165–1173.
6. Hartmann, O., D. Valteau-Couanet, G. Vassal, V. Lapierre,
L. Brugieres, R. Delgado, et al. 1999. Prognostic factors in
metastatic neuroblastoma in patients over 1 year of age
treated with high-dose chemotherapy and stem cell
transplantation: a multivariate analysis in 218 patients
treated in a single institution. Bone Marrow Transplant.
23:789–795.
7. Wagner, L. M., and M. K. Danks. 2009. New therapeutic
targets for the treatment of high-risk neuroblastoma. J.
Cell. Biochem. 107:46–57.8. Wei, J. S., B. T. Greer, F. Westermann, S. M. Steinberg, C.
G. Son, Q. R. Chen, et al. 2004. Prediction of clinical
outcome using gene expression profiling and artificial
neural networks for patients with neuroblastoma. Cancer
Res. 64:6883–6891.9. Pugh, T. J., O. Morozova, E. F. Attiyeh, S. Asgharzadeh, J.
S. Wei, D. Auclair, et al. 2013. The genetic landscape of
high-risk neuroblastoma. Nat. Genet. 45:279–284.
10. Park, J. R., R. Bagatell, W. B. London, J. M. Maris, S. L.
Cohn, K. K. Mattay, et al. 2013. Children’s Oncology
Group’s 2013 blueprint for research: neuroblastoma.
Pediatr. Blood Cancer 60:985–993.
11. Shah, S., S. Weitman, A. M. Langevin, M. Bernstein, W.
Furman, and C. Pratt. 1998. Phase I therapy trials in
children with cancer. J. Pediatr. Hematol. Oncol. 20:431–438.
12. Nieder, C., M. Adam, M. Molls, and A. L. Grosu. 2006.
Therapeutic options for recurrent high-grade glioma in
adult patients: recent advances. Crit. Rev. Oncol. Hematol.
60:181–193.
13. Vogelstein, B., N. Papadopoulos, V. E. Velculescu, S.
Zhou, L. A. Diaz Jr., and K. W. Kinzler. 2013. Cancer
genome landscapes. Science 339:1546–1558.14. Cancer Genome Atlas N. 2012. Comprehensive molecular
portraits of human breast tumours. Nature 490:61–70.15. Cancer Genome Atlas Research N. 2013. Comprehensive
molecular characterization of clear cell renal cell
carcinoma. Nature 499:43–49.
16. Cancer Genome Atlas Research N. 2014. Comprehensive
molecular characterization of urothelial bladder carcinoma.
Nature 507:315–322.17. Overington, J. P., B. Al-Lazikani, and A. L. Hopkins. 2006.
How many drug targets are there? Nat. Rev. Drug Discov.
5:993–996.18. Wishart, D. S., C. Knox, A. C. Guo, D. Cheng, S.
Shrivastava, D. Tzur, et al. 2008. DrugBank: a
knowledgebase for drugs, drug actions and drug targets.
Nucleic Acids Res. 36:D901–D906.
19. Saulnier Sholler, G. L., G. Bergendahl, E. Currier, S. R.
Lenox, J. Bond, M. Slavik, et al. 2012. A pilot trial testing
the feasibility of using molecular-guided therapy in
patients with recurrent neuroblastoma. J. Cancer Ther.
3:602–612.
20. Webb, C. P., and D. M. Cherba. 2009. Systems biology of
personalized medicine. Pp. 615–630 in S. Krawetz, ed.
Bioinformatics for systems biology. Humana Press, New
York, NY.
21. Von Hoff, D. D., J. J. Stephenson Jr., P. Rosen, D. M.
Loesch, M. J. Borad, S. Anthony, et al. 2010. Pilot study
14 ª 2015 The Authors. Cancer Medicine published by John Wiley & Sons Ltd.
Molecular-Guided Therapy for Neuroblastoma G. Saulnier Sholler et al.
using molecular profiling of patients’ tumors to find
potential targets and select treatments for their refractory
cancers. J. Clin. Oncol. 28:4877–4883.22. Dezso, Z., Y. Nikolsky, T. Nikolskaya, J. Miller, D. Cherba,
C. Webb, et al. 2009. Identifying disease-specific genes
based on their topological significance in protein networks.
BMC Syst. Biol. 3:36.
23. Shi, W., M. Bessarabova, D. Dosymbekov, Z. Dezso, T.
Nikolskaya, M. Dudoladova, et al. 2010. Functional
analysis of multiple genomic signatures demonstrates that
classification algorithms choose phenotype-related genes.
Pharmacogenomics J. 10:310–323.24. Vellaichamy, A., Z. Dezso, L. JeBailey, A. M. Chinnaiyan,
A. Sreekumar, A. I. Nesvizhskii, et al. 2010. “Topological
significance” analysis of gene expression and proteomic
profiles from prostate cancer cells reveals key mechanisms
of androgen response. PLoS One 5:e10936.
25. Lamb, J., E. D. Crawford, D. Peck, J. W. Modell, I. C.
Blat, M. J. Wrobel, et al. 2006. The Connectivity Map:
using gene-expression signatures to connect small
molecules, genes, and disease. Science 313:1929–1935.
26. Lee, J. K., D. M. Havaleshko, H. Cho, J. N. Weinstein, E.
P. Kaldjian, J. Karpovich, et al. 2007. A strategy for
predicting the chemosensitivity of human cancers and its
application to drug discovery. Proc. Natl. Acad. Sci. USA
104:13086–13091.27. Gheeya, J. S., Q. R. Chen, C. D. Benjamin, A. T. Cheuk, P.
Tsang, J. Y. Chung, et al. 2009. Screening a panel of drugs
with diverse mechanisms of action yields potential
therapeutic agents against neuroblastoma. Cancer Biol.
Ther. 8:2386–2395.
28. Trapnell, C., L. Pachter, and S. L. Salzberg. 2009. TopHat:
discovering splice junctions with RNA-Seq. Bioinformatics
25:1105–1111.29. Langmead, B., and S. L. Salzberg. 2012. Fast gapped-read
alignment with Bowtie 2. Nat. Methods 9:357–359.30. Flicek, P., M. R. Amode, D. Barrell, K. Beal, S. Brent, D.
Carvalho-Silva, et al. 2012. Ensembl 2012. Nucleic Acids
Res. 40:D84–D90.31. Jones, S., X. Zhang, D. W. Parsons, J. C. Lin, R. J. Leary,
P. Angenendt, et al. 2008. Core signaling pathways in
human pancreatic cancers revealed by global genomic
analyses. Science 321:1801–1806.32. Saylors, R. L., III, K. C. Stine, J. Sullivan, J. L. Kepner, D.
A. Wall, M. L. Bernstein, et al. 2001. Cyclophosphamide
plus topotecan in children with recurrent or refractory
solid tumors: a Pediatric Oncology Group phase II study.
J. Clin. Oncol. 19:3463–3469.
33. Anderson, M. J. 2001. A new method for non-
parametric multivariate analysis of variance. Austral Ecol.
26:32–46.34. McArdle, B. H., and M. J. Anderson. 2001. Fitting
multivariate models to community data: a comment on
distance-based redundancy analysis. Ecology 82:290–297.
35. Davidoff, A. M. 2009. Wilms’ tumor. Curr. Opin. Pediatr.
21:357–364.
36. Maurer, B. J., M. H. Kang, J. G. Villablanca, J. Janeba, S.
Groshen, K. K. Matthay, et al. 2013. Phase I trial of
fenretinide delivered orally in a novel organized lipid
complex in patients with relapsed/refractory
neuroblastoma: a report from the New Approaches to
Neuroblastoma Therapy (NANT) consortium. Pediatr.
Blood Cancer 60:1801–1808.
37. Morgenstern, D. A., M. Marzouki, U. Bartels, M. S. Irwin,
G. L. Sholler, J. Gammon, et al. 2014. Phase I study of
vinblastine and sirolimus in pediatric patients with
recurrent or refractory solid tumors. Pediatr. Blood Cancer
61:128–133.38. Modak, S., B. H. Kushner, K. Kramer, A. Vickers, I. Y.
Cheung, and N. K. Cheung. 2013. Anti-GD2 antibody 3F8
and barley-derived (1 –> 3), (1 –> 4)-beta–glucan: a Phase
I study in patients with chemoresistant neuroblastoma.
Oncoimmunology 2:e23402.
39. Spunt, S. L., S. A. Grupp, T. A. Vik, V. M. Santana, D. J.
Greenblatt, J. Clancy, et al. 2011. Phase I study of
temsirolimus in pediatric patients with recurrent/refractory
solid tumors. J. Clin. Oncol. 29:2933–2940.
40. Russell, H. V., S. G. Groshen, T. Ara, Y. A. DeClerck, R.
Hawkins, H. A. Jackson, et al. 2011. A phase I study of
zoledronic acid and low-dose cyclophosphamide in
recurrent/refractory neuroblastoma: a New Approaches to
Neuroblastoma Therapy (NANT) study. Pediatr. Blood
Cancer 57:275–282.
41. McGregor, L. M., C. F. Stewart, K. R. Crews, M. Tagen, A.
Wozniak, J. Wu, et al. 2012. Dose escalation of
intravenous irinotecan using oral cefpodoxime: a phase I
study in pediatric patients with refractory solid tumors.
Pediatr. Blood Cancer 58:372–379.42. Sequist, L. V., R. S. Heist, A. T. Shaw, P. Fidias,
R. Rosovsky, J. S. Temel, et al. 2011. Implementing
multiplexed genotyping of non-small-cell lung
cancers into routine clinical practice. Ann. Oncol.
22:2616–2624.43. Mosse, Y. P., M. Laudenslager, L. Longo, K. A. Cole, A.
Wood, E. F. Attiyeh, et al. 2008. Identification of ALK as a
major familial neuroblastoma predisposition gene. Nature
455:930–935.
Supporting Information
Additional Supporting Information may be found in the
online version of this article:
Table S1. Enrollment characteristics and previous relapse
therapies prior to enrollment.
Table S2. Oligonucleotide microarray gene expression
data. Each row is a probe set on the Affymetrix Gen-
eChip� Human Genome U133 Plus 2.0 Array. Columns
ª 2015 The Authors. Cancer Medicine published by John Wiley & Sons Ltd. 15
G. Saulnier Sholler et al. Molecular-Guided Therapy for Neuroblastoma
are labelled <Enrollment ID>. <Feature> where <Enroll-
ment ID> is one of 15 enrollment identifiers (‘MGT-001-
13’ . . . ‘MGT-016-08’) and <Feature> reflects whether it
was included in the analysis (‘MAS5’), whether it was
called present or absent (‘PMed’), the MAS5 expression
statistic (‘Raw’) and the Z-score (‘ZScore’).
Table S3. Clinical trial drug list.
16 ª 2015 The Authors. Cancer Medicine published by John Wiley & Sons Ltd.
Molecular-Guided Therapy for Neuroblastoma G. Saulnier Sholler et al.