FDOT Seaport Office Ocean Highway & Port Authority ...
57
FDOT Seaport Office Ocean Highway & Port Authority Strategic Master Plan Planning Advisory Board Briefing Stephen Berry – Cardno TEC Brian Wheeler – Genesis Group Joseph Strain – Marshal Strain Enterprises James Hunt – Cardno TEC Sharon Niemczyk – Cardno Entrix Allen Skinner – Genesis Group Beth Carson - Genesis Group
-
Upload
khangminh22 -
Category
Documents
-
view
3 -
download
0
Transcript of FDOT Seaport Office Ocean Highway & Port Authority ...

FDOT Seaport OfficeOcean Highway & Port AuthorityStrategic Master Plan Planning Advisory Board Briefing Stephen Berry – Cardno TECBrian Wheeler – Genesis GroupJoseph Strain – Marshal Strain Enterprises
James Hunt – Cardno TECSharon Niemczyk – Cardno EntrixAllen Skinner – Genesis GroupBeth Carson - Genesis Group
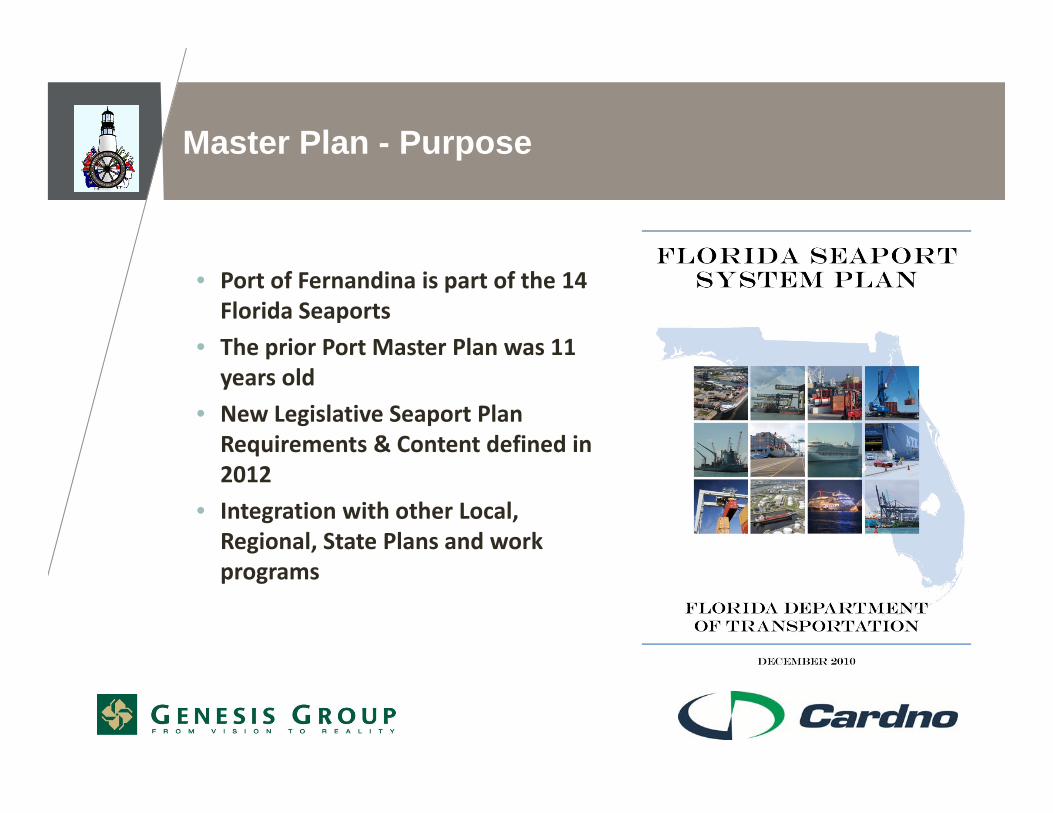
• Port of Fernandina is part of the 14 Florida Seaports
• The prior Port Master Plan was 11 years old
• New Legislative Seaport Plan Requirements & Content defined in 2012
• Integration with other Local, Regional, State Plans and work programs
Master Plan - Purpose

Intergovernmental and Stakeholder Coordination Is A Critical Element To A Successful Master Planning Effort! Project Initiation August 14, 2013
Key Intergovernmental Coordination Will be Required With:• City of Fernandina Beach• Nassau County including Incorporated Towns• Nassau County Economic Development Board• Northeast Florida TPO/FDOT
Other Key Stakeholders and Interested Parties:State Senator Aaron Bean, State Representative Janet Adkins, Kinder-Morgan, RockTenn, Rayonier, CSX, Norfolk Southern, Genesee-Wyoming, USACE, USCG, Joel Embry, Shrimpers Co-op, Camden County GA, City of Kingsland Economic Development, Others…
Intergovernmental and Stakeholder Coordination
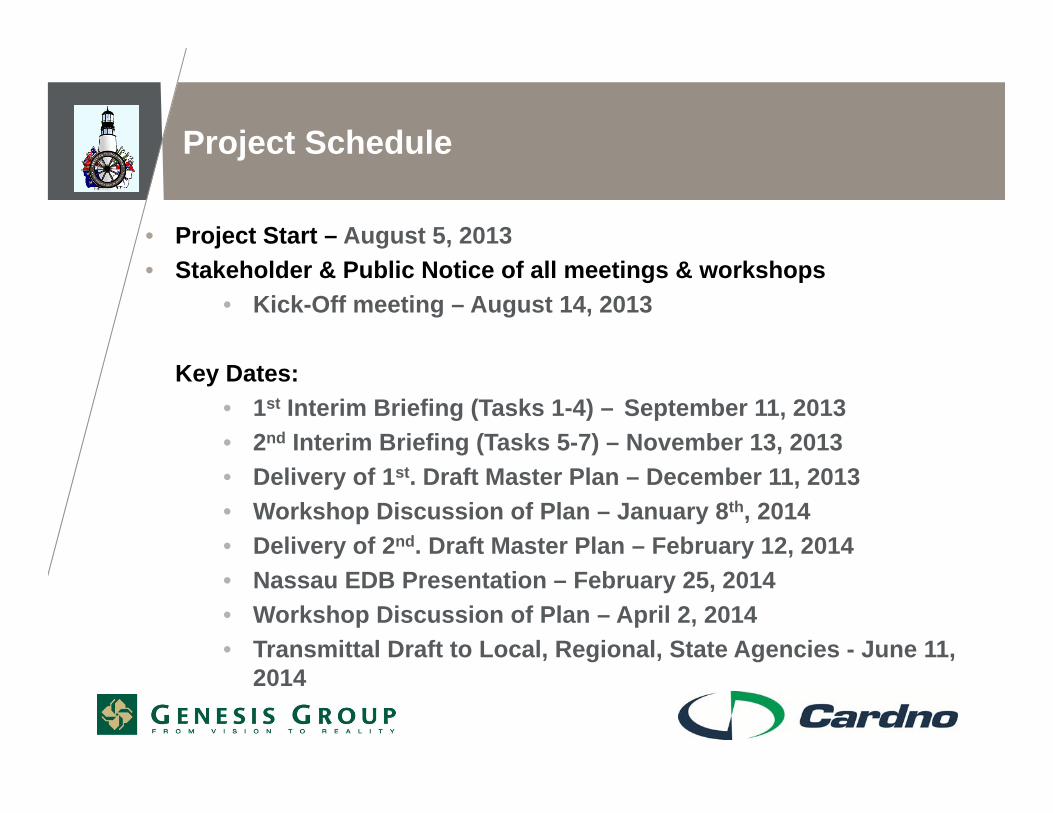
• Project Start – August 5, 2013• Stakeholder & Public Notice of all meetings & workshops
• Kick-Off meeting – August 14, 2013
Key Dates:• 1st Interim Briefing (Tasks 1-4) – September 11, 2013• 2nd Interim Briefing (Tasks 5-7) – November 13, 2013• Delivery of 1st. Draft Master Plan – December 11, 2013• Workshop Discussion of Plan – January 8th, 2014• Delivery of 2nd. Draft Master Plan – February 12, 2014• Nassau EDB Presentation – February 25, 2014• Workshop Discussion of Plan – April 2, 2014• Transmittal Draft to Local, Regional, State Agencies - June 11,
2014
Project Schedule

Legislative Transition DCA – DEO - Seaports

• Legislative Requirements - 10 year Seaport Master Plan Update • Project Goals And Objectives – Data & Analysis for OHPA Board• Focus Areas Of The Master Plan Update – Basis for Coordination• Existing Facilities & Operations- Berth, Landside Storage, Equipment• Opportunities & Constraints Assessment - Economic, Transportation• Future Markets & Business Development – 3, 5,10 year horizon• Port Facility Development & Capacities – Freight Options & Modes• Area Transportation Impact Analysis – Existing, Background,
Expansion• OHPA funding & finance – Grants, Programs, Entities• Schedule for completion w/ local, regional, State review
Master Plan Components

Project Goals and Objectives are:• Develop a 10-year horizon port strategic plan that includes an economic
development component that identifies targeted business opportunities for increasing business and attracting new business for the OHPA.
• Include in the master plan an infrastructure development and improvement component that identifies those improvements within the plan area for the port to attain a strategic advantage in competing with other similar ports.
• Update the master plan to identify intermodal transportation facilities needed over the ten year planning horizon which are reasonably foreseeable and achievable to maximize the potential of OHPA investments.
• Incorporate in the updated master plan a component that identifies physical, environmental, and regulatory barriers to achieving the master plan goals.
• Have an updated master plan that has an intergovernmental component that specifies modes and methods to coordinate the plan with the missions of the FDOT, other state agencies, and affected local government agencies.
Project Goals and Objectives

Review the marine and landside transportation facilities, capacities, land use, opportunities & constraints
Leverage the regional features & focus market analysis efforts to play to those strengths:– Deep water access, close to ocean with inland navigable water ways– Non-union, low cost offloading and loading – Potential niche port benefits– Rail access & interstate access– Strong nearby manufacturing community
Gain input from key stakeholders & potential partners Evaluate offsite Near Port locations in surrounding areas, including southern
Georgia, to expand port business capacity through the use of intermodal sites & ancillary barge ports
Identification of economic opportunities & funding sources Discuss OHPA role in regional industrial development & define business
models associated with industrial development opportunities
Focus Areas for the Master Plan Update

Cargo Summary 2010 2011 2012 2013ContainersContainers (boxes) 20,540 16,330 11,312 9,905Containers (tons) 146,652 102,969 60,384 39,802TEUs 32,113 22,005 14,018 11,239Break‐bulk Cargo(tons)Kraft Liner Board(KLB)
221,186 207,543 149,770 126,438
Lumber 2,966 8,530 16 18Rebar 106,136 112,430 51,284 32,100Steel 142,576 207,416 94,501 58,989Woodpulp 7,714 4,970 8,054 12,869Misc. General Cargo 1,611 3,216 20,388 4,982Bulk Cargo 0 0 345 0Total General Tons 482,189 544,105 324,358 235,396
Total Tons 628,841 647,074 384,742 275,198
The Port Has Been Losing Cargo Over The Past Few Years

Existing Port Facilities
• 23 acre Marine Terminal Complex• 2-Berth, 1,200 foot Marginal Wharf• 200,000 sq. ft. of covered warehouse;• 20,000 sq. ft. of additional “open” sheds• 11 Acres of Open Storage
• 6-7 Acre Container Operations;• 4-5 Acre General Open Storage
• On -Terminal Rail• 11 Car Loading Area in Storage
Yard• Rail Sidings Along Warehouses
• -36 ft MLLW Navigational Channel and Berth Depth
• -51 ft MLLW Approach Channel (shared with Sub-Base)

Kraft Board and Container Tons Make-Up Over 50% of The Cargo Mix
18%
35%
1%
16%
26%
1% 2% 0%
2010‐2012 Average
Container Tons
Kraft Liner Board (KLB)
Lumber
Rebar
Steel
Woodpulp
Mise General Cargo
Bulk Cargo

• 2-Berth Wharf, 1,200 feet long• Current 175 to 225 Vessel Calls Per Year• Typical Vessels:
• Break-Bulk/General Cargo Vessels; typically 10,000 to 45,000 dwt.,• 345 to 640Feet LOA (Length Overall) and maximum draft 22 to
36 feet• Container Vessels – typically in 900 – 2,500 TEU range.
• 410-656 Feet LOA and maximum draft of 23 to 36 feet• Max Berth Utilization For 2 Berth Terminal – 50% to 60%• Cargo Handled By Rail Mounted Gantry Cranes, MHC, or Ship’s Gear
• Averages 15 -25 moves per hour per crane;• Capacity to handle 400 Calls per Year for Smaller vessels (under 550 ft. LOA);
• Based on 24 hour berth availability• Less If Larger Vessels Call
Berth Operations and Capacity

• 200,000 sq. ft. of warehouse storage• Typically 75% of area available for actual stacking/storage of
cargo• Other area for circulation. Equipment storage, etc.
• Capacity Assumptions:• Floor Load limits of 720 Lbs/.SF (.36 tons/SF)• Average dwell time of 30 days*
• Static Capacity – 54,000 Tons• Annual Capacity – 500,000 Tons
Warehouse Capacity

• 11 Acre Open Storage Area• 6-7 Acres for Container Storage with GTGs and Reach Stackers• 4-5 Acres for Miscellaneous Break-bulk and General Cargo (includes
containers) for Non-Weather Sensitive cargoes• Assumptions For Open Storage
• Dwell Times: Containers - 5-15 days; Break-Bulk Dwell Time – 30 days• 85% of Containers Stored using RTG• 15% of Containers Stored with Reach Stackers or Wheeled• Pavement Strength for Break-Bulk 1,000 lbs per sq. ft.
• Static Capacity:• Break-Bulk and General cargo (steel products, lumber, etc.) – 44,000 Tons• Containers 2,900 – 3,200 TEUs
• Annual Capacity:• Break-Bulk – 400,000 – 450,000 Tons;• Containers: 50,000 – 60,000 TEUs
Open Storage Yard Capacity

# of Berths Practical Utilization
Berth Hours Available
Avg. time per Vessel
Call
Potential Annual Vessel
calls
Berth Capacity 2 50% – 60% 9,600 24 hrs. 400
Cargo Storage Capacity
Type Area Static Capacity
Avg. Dwell Time
Annual Storage Capacity
Cover Storage 200,000 sf 54,000 Tons 30 days 555,000 Tons
Open Storage 4 Ac. 44,000 Tons 30 days 450,000 TonsContainer Yard 7 Ac. 3,200 TEUs 5‐15 days 55,000 TEUs
Port of Fernandina Annual Capacity Summary

• Existing Port has approximately 1 million Tons of Break-Bulk cargo capacity for current cargo Mix; and Capacity for 50,000 TEUs (+/-) annually;
• Current equipment is adequate for current cargo mix• 2-Berth Wharf has capacity for growth; however larger vessels (over 550-ft
LOA) will impact capacity;
• Major Constraints:• Physical port expansion areas are limited because of adjacent City
and Industrial land uses;• Rail Operations are limited because of need to serve adjacent user
and limited rail storage and loading facilities on Port;• Potential new cargo opportunities might require:
• Deeper Draft;• New Storage Facilities• Dedicated Intermodal Container Loading Facility • Additional Berth/Wharf Length
Current Operational Summary

Existing Facilities & Operations – Near Port
CSX - vacant
RockTenn - vacant
Marine & Landside Environmental & Regulatory Constraints exist

Opportunities and Constraints – Port Expansion-Environmental and Regulatory
• Naturally Deep Water in Fernandina Harbor-Regular Maintenance Dredging Not Required
- MAJOR BENEFIT• St. Mary’s Entrance Channel Regularly Maintained to -51 ft. MLLW to Support
Kings Bay Navy Base – MAJOR BENEFIT• Harbor Deepening?
- No Existing Environmental Permits for New Dredging- Environmental Impact Statement Would Be Required- Potentially Significant Impacts to Threatened and Endangered Species,
Essential Fish Habitat - No Available Upland Disposal Site-All Material Would Have to Go Offshore- New Federal Authorization Required - Federal Benefit/Cost Analysis Approval – Questionable

Existing Facilities & Operations – Near Port
I-95 is not presently restricted and has excess capacity

Existing Facilities & Operations – Near Port
Class -1 Double Stack Certified Rail is underutilized from the Port to US17, with no serious delays at road/rail intersections.
The slow train crossing at Centre and North Front Street is an unfortunate but necessary train movement for the Port and RockTenn operations.
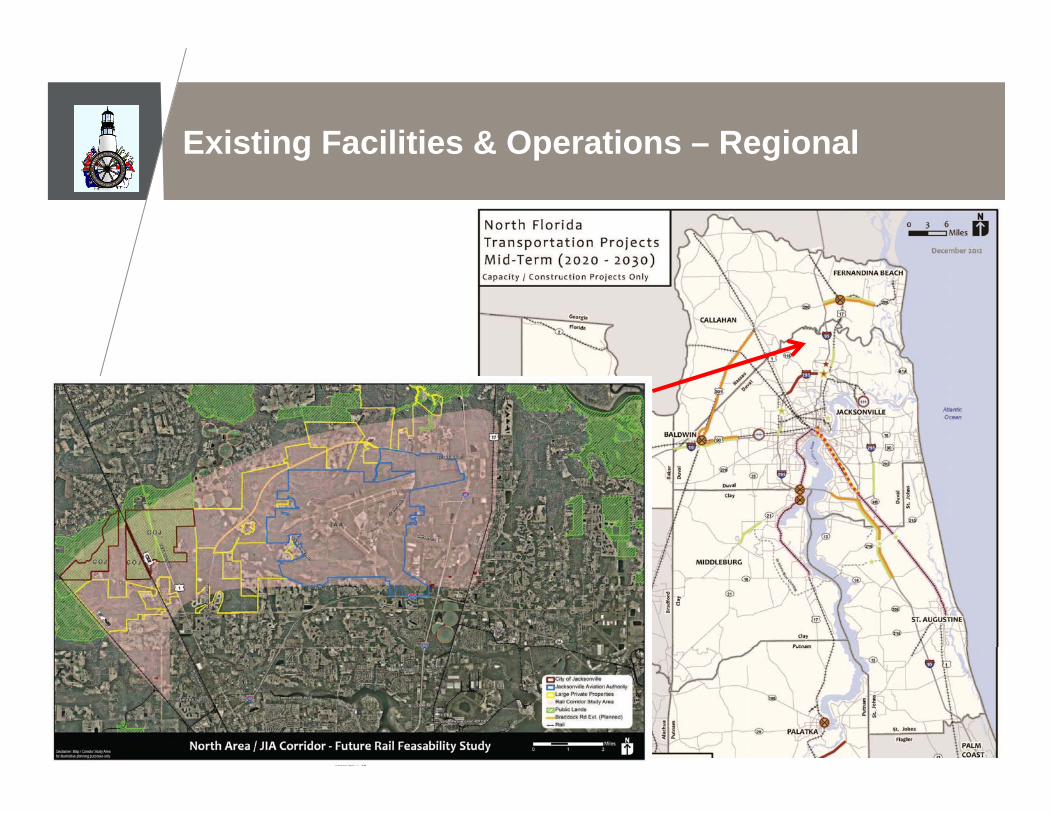
Existing Facilities & Operations – Regional

Opportunities & Constraints - Regional

Opportunities & Constraints – Port Expansion
Proximity to ocean – short channel – military dredging – no air-draft limits Two-way ship movements - navigable waterway - rail to port
Strong Charter to support Economic Development – but limited operations Land Constrained – City, CRA, Wetlands, Adjacent Industrial Development Competes with 14 Florida Ports for State/Federal Funding Underutilized Port/Business Volume for existing size & configuration Regional Industrial Development & Distribution Capability is growing Freight Market Adjustment of Post Panamax Ships

Existing Facilities & Operations – Near Port
Despite barge navigational inland water, there is no active Barge based in-bound freight or out-bound freight movements.

During the next 50 years, over 80% of all Global Economic Growth will occur outside of the United States. Significant local investment in large scale regional infrastructure may not find broader market support.
Opportunities related to Freight Trade & Logistics will need to target market segments & support modes of travel that are projected to increase or become more locally relevant.
As Post-Panamax ship calls increase along East Coast Ports, new servicing opportunities are created for smaller ships displaced by berthing schedules.
Opportunities & Constraints - Global

Opportunities & Constraints – National - Rail

Opportunities & Constraints – National - Rail

Opportunities & Constraints – National - Rail
Opportunities & Constraints – Florida Context
Imbalance of trade flows - The combination of a large consumer market and a small manufacturing base create an imbalance of trade flows. The Florida trade flow analysis indicates inbound freight tonnage (from other states or nations) is nearly 80 percent larger than outbound freight tonnage. This suggests nearly one half of all trucks, rail cars, ships, and cargo planes which bring goods to Florida return empty – adding to the cost of delivering goods in the state.
Location for Domestic Distribution – 450 mile drive time coverage mapping indicates a superior location to be in North Florida to avoid limitations created by our geographic peninsula.

Opportunities & Constraints – Near Port

Opportunities & Constraints - Regional
Barge & Rail connectivity
Significant potential scale of Manufacturing / Distribution
Old Mill - Market Active
Air Park Relocation Study
Environmental & Regulatory Constraints

Opportunities & Constraints – Near Port
North Ancillary Property could be utilized for security & admin functions
Barge staging & ship provisioning
Cruise Ship Port of call -Cruise Home Port Terminal
Environmental Constraints surround all working water front sites.

Future Markets & Business Development
National & Regional Short Sea Shipping
2005 Total Florida - S.S. Target Freight Market 12,283,699 TEU 2005 Total Georgia – S.S. Target Freight Market – 12,088,517 TEU 2014 – 2019 Projected Target Market Capture – 0 TEU Business Development Targets : I-95 Corridor Coalition, Florida Ports Council, Local
& Regional Small Ship/Barge Operators

Future Markets & Business Development
Trans-shipment Hubs – North Caribbean
2017 Total Caribbean Container Market – 23,760,000 TEU 2017 Projected Northern Hub Market Capture – 89,100 TEU X-PRESS FEEDERS, Florida Caribbean Express (CASFCX),
Sea Star Lines, National Shipping & Other existing carriers active in the region with small ship inventory.

Future Markets & Business Development
Relocated Small Ships - Eastern U.S.
2019 Total Relocated Freight Market – 360,000 TEU 2019 Projected Target Market Capture – 72,000 TEU
Target Shippers include:HANJIN, COSCO, K LINE, YANG MINGGRAND ALLIANCE - HAPAG LLOYD,NYK, & OOCL, ACL CMA CGM, ANL,MARFRET, NYK, HYUNDAI,EVERGREEN LINE, MAERSK LINE

Future Markets & Business Development
National & Regional Partners
2012 Total CSX Rail-Port Freight Market – 6,400,000 TEU 2014 Projected Target Market Capture – 0 TEU Business Development Targets : CSX, Genesee & Wyoming, Boatright Co.
Target Shippers include:
CMA/CGM, MSC, CROWLEY, APL, ZIM, HAMBURG/SUD, MOLMAERSK, HAPAG/LLOYD, HYUNDAI,

Future Markets & Business Development
Local Area - Barge
Barge Connected Waterways to Port Total 71 miles
2014 – 2019 Projected Target Market Capture – 4,555 TEU
Business Development Targets : Independent Container Line, Crowley Barge Services, Trailer Bridge Barge Services, Coil-Tainer, Banacol

Future Markets & Business Development
Local Area Industrial - Intermodal
Rail & Highway Connected Industrial Land Parcels Strategic to Port – 3,495 ac.
2019 Projected Total Target Market = 2,391,085 TEU via Truck
2019 Projected Total Target Market = 422,760 TEU via Rail
2019 – 2023 Projected Market Capture = 239,108 TEU via Truck
2019 – 2023 Projected Market Capture = 42,276 TEU via Rail

Future Markets & Business Development
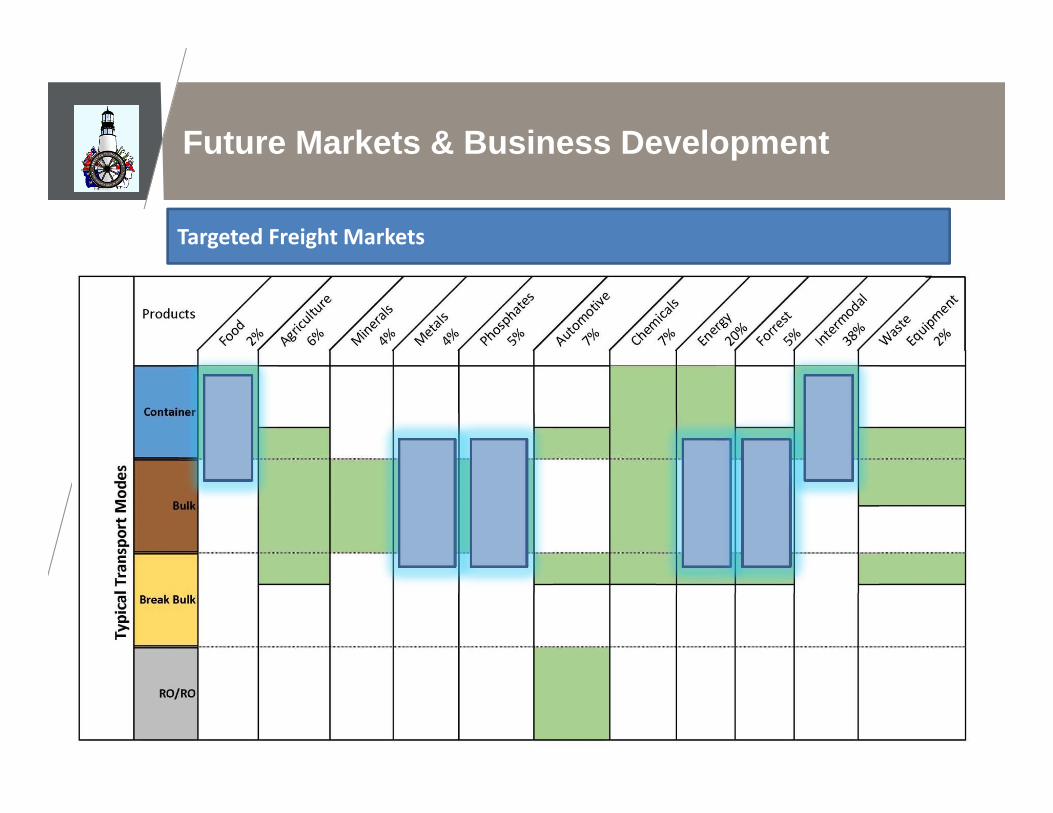
Future Markets & Business Development
Targeted Freight Markets

Future Markets & Business Development
Market Capture Projections – Mode Split
All values stated in TEU Values do not include existing Port freight business volume beyond 2013 Values are not cumulative across time periods

Cargo Summary 2015 2018 2023
ContainersThroughput Number 18,002 74,180 139,324Container Tons 113,032 547,855 1,348,657Total Equivalent Units (TEUS) 23,327 100,515 203,376
Breakbulk CargoKraft Liner Board (KLB) 125,000 87,500 75,000Lumber 3,500 3,500 3,500Rebar 74,000 85,750 96,500Steel 100,000 135,750 158,000Woodpulp 9,000 6,912 11,500Misc. General Cargo 22,500 27,313 30,000Bulk Cargo 845 1,095 1,250Total General Tons 334,845 347,820 375,750Total Tons 447,877 895,675 1,724,407
Future Cargo Opportunity Forecast

Breakbulk Opportunities Will Be Steady While Container Opportunities will be Growing
0
50,000
100,000
150,000
200,000
250,000
2010 2015 2020 2025
Tons
Year
Containerized Cargo Opportunities
Container TEUs
‐50,000
0
50,000
100,000
150,000
200,000
250,000
2005 2010 2015 2020 2025
Tons
Year
Breakbulk Cargo Opportunities
Kraft Liner Board (KLB)LumberRebarSteel
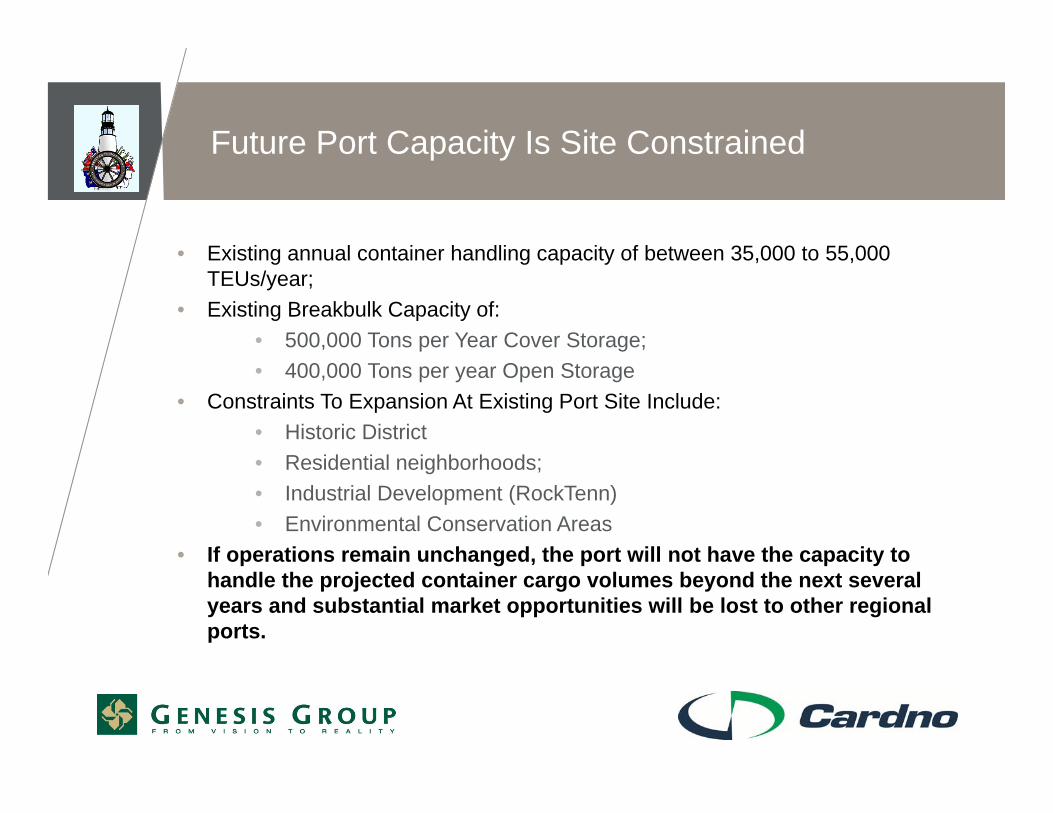
• Existing annual container handling capacity of between 35,000 to 55,000 TEUs/year;
• Existing Breakbulk Capacity of:• 500,000 Tons per Year Cover Storage;• 400,000 Tons per year Open Storage
• Constraints To Expansion At Existing Port Site Include:• Historic District• Residential neighborhoods;• Industrial Development (RockTenn)• Environmental Conservation Areas
• If operations remain unchanged, the port will not have the capacity to handle the projected container cargo volumes beyond the next several years and substantial market opportunities will be lost to other regional ports.
Future Port Capacity Is Site Constrained

• Use “Off-Port” properties for empty staging, chassis storage or other non-critical operations to increase cargo storage capacity at the Port Site;
• Evaluate new purchase of off-port sites for new opportunities such as:
• Barge Transfer or Cruise type activities at Pogy Site;
• Rail intermodal activities near Crawford Diamond;
• Other potential properties
OHPA Will Need To Look At Off-Site Properties to Increase Modal Capacity & Efficiency

Phase 1: Facility Reallocation • Relocate some of the open
breakbulk storage to other areas with Port and expand container storage area:• Use open storage areas behind
wharf as breakbulk cargo storage;
• Develop additional RTG Container Storage at existing breakbulk areas;
• Container capacity reaches 60 – 65,000 TEUs per year
• Capital Costs - $620k, plus equipment costs
10-Year Facility Improvements

Phase 2 – Develop Available Expansion Projects:• Fill in .7 ac. area behind existing wharf (Cap
Cost $500k)• Extend existing wharf 400-ft, including STS
crane rails (Cap Costs up to $15million)• Possibly extend additional 200-ft
•Fill 1.25 ac. area behind new wharf extension (Cap Costs $1 million)•Relocate breakbulk to new fill areas behind wharf;•Expand Container Storage on existing terminal (Cap Cost $650k plus equipment costs)•Container storage capacity increases to 75-85,000 TEUs/yr.
10-Year Facility Improvements

• Any future Phase 3 expansion would likely require expanding the Port into the Environmental Conservation Areas east of the container yard;
• This would provide only marginal increase in Container throughput capacity;
100,000 TEUs/yr.• The ability to permit such an
expansion is considered unlikely
10-Year Facility Improvements
Phase 3 – Footprint Expansion

• Class C Feeder Vessel Will Required substantial dredging
• Navigational Channel will need to be deepened to -45 feet;
• Turning Basin will need to be widened and deepened;
• Design standard is 1.5 LOA or 1,200-ft for 800-ft vessel
• Berths will need to be deepened to -40 to -42 feet• Total Dredging costs range from $22.7 million to $30.3 million• Depending on USACE funding, OHPA may have to pay 100% of dredging costs• Economic Returns are marginal given
other landside constraints
Dredging –Detailed Analysis

• Traffic Projections Based on FDOT Historical Trends• Locations where the historical trend indicates < 1.0% annual growth, then
1.0% annual growth was assumed.• Locations where the historical trend indicates > 1.0% annual growth, then
then the calculated historical annual growth was used.• Port of Fernandina Truck Traffic
• Future Port truck traffic will continue to use 8th Street / SR 200 (SR A1A) as the primary route from US 17 and I-95.
• Truck traffic anticipated to increase from 134 daily trips to 603 daily trips.• Roadway Level of Service
• With the capacity improvements (4L to 6L) to portions of SR 200, no additional roadway segments become deficient due to the addition of port-related traffic at build out.
• Railroad Traffic• Existing Port rail traffic: 6-11 rail cars per day.• Future (2023) POF rail traffic: 15-21 rail cars per day.
Future Traffic Projections (2023)

Roadway Segment Existing Conditions (2012)
FutureBackground Conditions (2023)
Future Conditions with Improvements
(2023)
Future Conditions
POF Build out (2023)
Future Conditions
with Near Port(2023)
SR 200 (Amelia Is. Pkwy to Sadler)
Critical Deficient Deficient Deficient Deficient
SR 200 (US 17 to Rubin Lane)
OK Deficient OK OK OK
SR 200 (Rubin Lane to Chester Road)
Critical Deficient OK OK OK
SR 200 (Chester Road to Blackrock Road)
Deficient Deficient OK Critical Critical
SR 200 (Blackrock Road to Old Nassauville Road)
Deficient Deficient OK Critical Critical
SR 200 (Old NassauvilleRoad to Amelia Is. Pkwy)
OK OK OK OK OK
Centre Street (Front Street to 8th Street)
OK Critical Critical Critical Critical
14th Street (Hickory Street to Jasmine Street)
OK OK OK OK Critical
14th Street (Jasmine Street to Lime Street)
OK OK OK OK Critical
Existing & Future PM Peak Roadway Level of Service (LOS)

2023 Roadway LOS (with Improvements)
• Deficient Segments:
• SR 200: Amelia Island Pkwy to Sadler Rd.
• Critical Segments:• Centre Street: Front Street to
8th Street

Port of Fernandina Truck Traffic Distribution
100% to 8th Street / SR 200 50% to I-95/SR 17 North 50% to I-95 South

2023 Roadway LOS (with Improvements + POF Traffic)
• Deficient Segments:
• SR 200: Amelia Island Pkwy to Sadler Rd.
• Critical Segments:• SR 200: Chester Road to
Blackrock Road• SR 200: Blackrock Road to
Old Nassauville Rd.• Centre Street: Front Street to
8th Street

• Local Manufacturing & Distribution Opportunities Require Logistics & Infrastructure
• Established Ports produce Direct, Local, City/County Jobs at the rate of 1 Job per 2,103 tons of freight volume.
• Established Ports create regional (3-5 Counties) support Jobs at the rate of 1 job per 199 Tons of freight volume.
• Established Ports induce up/down stream Jobs at the rate of 1 job per 45 Tons of freight volume.
Economic Return to Region – Jobs

Local Agency Adoption
OHPA Board Adopted Master Plan (Transmittal Draft June 2014)
163.3177(1)(b) Local gov’t may include, documents adopted by reference but not incorporated verbatim into the plan; identify title, author, editiono City of Fernandina submittal for September Planning
Advisory Boardo Will be working with Nassau County to incorporate
appropriate policies, components.o Expedited State Review (approx. 4 -5 months from
submittal)

FDOT Seaport OfficeOcean Highway & Port AuthorityStrategic Master Plan Planning Advisory Board Briefing Stephen Berry – Cardno TECBrian Wheeler – Genesis GroupJoseph Strain – Marshal Strain Enterprises
James Hunt – Cardno TECSharon Niemczyk – Cardno EntrixAllen Skinner – Genesis GroupBeth Carson - Genesis Group