
Measurement of Efficiency Level in Nigerian Seaport after ...
10
IOSR Journal of Business and Management (IOSR-JBM) e-ISSN: 2278-487X, p-ISSN: 2319-7668. Volume 12, Issue 5 (Jul. - Aug. 2013), PP 46-55 www.iosrjournals.org www.iosrjournals.org 46 | Page Measurement of Efficiency Level in Nigerian Seaport after Reform Policy Implementation. Case Study of Onne and Rivers Seaport, Nigeria. Okeudo, G. N. Department of Transport Management Technology,Federal University of Technology, Owerri. Abstract:This paper focuses on the impact of reforms on port performance using Onne and Rivers ports as a reference point. It analyses the pre and post reform eras of the ports in terms of their performance. The reforms took effect from 1996 after the Federal Government of Nigeria concessioned the ports to private investors. Parameters such as Ship traffic, Cargo throughput, Ship turn round time, Berth Occupancy and personnel were used as variables for the assessment. Secondary Data were collected from the Nigerian Ports Authority and Integrated Logistic Services Nigeria (Intels) for the period 2001 to 2010 and analyzed using Data Envelopment Analysis to assess the efficiency of the port. Analysis revealed a continuous improvement in the overall efficiency of both Ports Since 2006 when the new measure was introduced. Average Ship turn-around time improved in the ports due to modern and fast cargo handling equipment and more cargo handling space which were provided. There is an increase in Ship traffic calling at the ports, resulting in increased cargo throughput and berth occupancy rate at ports of Onne and Rivers. The reform also led to more private investment in the ports’ existing and new facilities and the introduction of a World Class service in port operation. This study concludes that the Ports of Onne and Rivers are performing better under the reform programme of the Federal Government of Nigeria. It finally recommends the urgent need for a regulator to appraise the performance of the reform programme from time to time as provided by the agreement and for the full adoption and utilization of management information system (MIS) to aid performance efficiency. Keywords:Performance, Ports, Reforms, ship Traffic, Cargo throughput, Ship Turnaround time, Efficiency. I. Introduction 1.1 Background Of Study Ports always play a strategic role in the development of domestic and international trade of a country whether it is a developing or developed country. However, in a globalized world where distances are becoming squeezed, ports play an active role in sustaining the economic growth of a country. In the modern world of a fast growing technological era, ports are playing the role of an industry, not just passive actor in transportation but also in complete supply chain management. This is why it is said that “ports are more than piers” that is, more than just infrastructure or a complex infrastructure (Prakash, 2005). Today in any context and in any country, it is essential that ports provide efficient, adequate and competitive services. If they fail, ship-owners who find them too costly or too slow will go elsewhere. Hence if ports do not provide cost-effective services, imports will cost more for consumers and exports will not be competitive on world markets, national revenue will decline as well the standard of living of all people. Nigeria has a total of eleven ports and eight oil terminals organised in three zones of Western, Central and Eastern zones. The central zone with its headquarters in Warri and the Eastern zone with its headquarters in Port Harcourt are predominantly oil terminals, although Warri, Sample, Koko, Port Harcourt, Calabar and the Federal ocean terminal are important general cargoes. (Chioma, 2011). Ports not only a chain in transportation for inter-change, but they function as self-sustaining industry that is linked with domestic and international trade. At some places, ports also act as a foreign exchange earner not only in the form of transshipment or hub port but as part of supply chain management by providing logistics services to the industry. That is why a port needs to be treated as an industry. The management of a port should not only be concerned with the demand and supply of throughput but with institutional framework, application of technology, marketing strategy and ultimately economic impact of the development and implementation of projects or programmes (Prakash , 2005). 1.2 Statement of Research Problem Port technology have to change at a faster rate to commensurate with the pace of technological changes in shipping, for instance from handling of bulk palletized cargo to containerization. Ships and ports have never so technically advanced, never been so sophisticated, never been more immense, never carried/contained so much cargo, never been safer and never been as environmentally friendly as they are today. In order to support
-
Upload
khangminh22 -
Category
Documents
-
view
0 -
download
0
Transcript of Measurement of Efficiency Level in Nigerian Seaport after ...
IOSR Journal of Business and Management (IOSR-JBM)
e-ISSN: 2278-487X, p-ISSN: 2319-7668. Volume 12, Issue 5 (Jul. - Aug. 2013), PP 46-55 www.iosrjournals.org
www.iosrjournals.org 46 | Page
Measurement of Efficiency Level in Nigerian Seaport after
Reform Policy Implementation.
Case Study of Onne and Rivers Seaport, Nigeria.
Okeudo, G. N. Department of Transport Management Technology,Federal University of Technology, Owerri.
Abstract:This paper focuses on the impact of reforms on port performance using Onne and Rivers ports as a
reference point. It analyses the pre and post reform eras of the ports in terms of their performance. The reforms
took effect from 1996 after the Federal Government of Nigeria concessioned the ports to private investors.
Parameters such as Ship traffic, Cargo throughput, Ship turn round time, Berth Occupancy and personnel were
used as variables for the assessment. Secondary Data were collected from the Nigerian Ports Authority and
Integrated Logistic Services Nigeria (Intels) for the period 2001 to 2010 and analyzed using Data Envelopment
Analysis to assess the efficiency of the port. Analysis revealed a continuous improvement in the overall
efficiency of both Ports Since 2006 when the new measure was introduced. Average Ship turn-around time improved in the ports due to modern and fast cargo handling equipment and more cargo handling space which
were provided. There is an increase in Ship traffic calling at the ports, resulting in increased cargo throughput
and berth occupancy rate at ports of Onne and Rivers. The reform also led to more private investment in the
ports’ existing and new facilities and the introduction of a World Class service in port operation. This study
concludes that the Ports of Onne and Rivers are performing better under the reform programme of the Federal
Government of Nigeria. It finally recommends the urgent need for a regulator to appraise the performance of
the reform programme from time to time as provided by the agreement and for the full adoption and utilization
of management information system (MIS) to aid performance efficiency.
Keywords:Performance, Ports, Reforms, ship Traffic, Cargo throughput, Ship Turnaround time, Efficiency.
I. Introduction 1.1 Background Of Study
Ports always play a strategic role in the development of domestic and international trade of a country
whether it is a developing or developed country. However, in a globalized world where distances are becoming
squeezed, ports play an active role in sustaining the economic growth of a country.
In the modern world of a fast growing technological era, ports are playing the role of an industry, not
just passive actor in transportation but also in complete supply chain management. This is why it is said that
“ports are more than piers” that is, more than just infrastructure or a complex infrastructure (Prakash, 2005).
Today in any context and in any country, it is essential that ports provide efficient, adequate and
competitive services. If they fail, ship-owners who find them too costly or too slow will go elsewhere. Hence if
ports do not provide cost-effective services, imports will cost more for consumers and exports will not be competitive on world markets, national revenue will decline as well the standard of living of all people. Nigeria
has a total of eleven ports and eight oil terminals organised in three zones of Western, Central and Eastern
zones. The central zone with its headquarters in Warri and the Eastern zone with its headquarters in Port
Harcourt are predominantly oil terminals, although Warri, Sample, Koko, Port Harcourt, Calabar and the
Federal ocean terminal are important general cargoes. (Chioma, 2011).
Ports not only a chain in transportation for inter-change, but they function as self-sustaining industry
that is linked with domestic and international trade. At some places, ports also act as a foreign exchange earner
not only in the form of transshipment or hub port but as part of supply chain management by providing logistics
services to the industry. That is why a port needs to be treated as an industry. The management of a port should
not only be concerned with the demand and supply of throughput but with institutional framework, application
of technology, marketing strategy and ultimately economic impact of the development and implementation of
projects or programmes (Prakash , 2005).
1.2 Statement of Research Problem Port technology have to change at a faster rate to commensurate with the pace of technological changes
in shipping, for instance from handling of bulk palletized cargo to containerization. Ships and ports have never
so technically advanced, never been so sophisticated, never been more immense, never carried/contained so
much cargo, never been safer and never been as environmentally friendly as they are today. In order to support
Measurement Of Efficiency Level In Nigerian Seaport After Reform Implementation
www.iosrjournals.org 47 | Page
the global and regional trade development, Nigerian ports have increasingly been under pressure to improve on
efficiency and productivity by ensuring that port services are provided on an internationally competitive basis.
The performance of a port can be evaluated by observing both its utilization and the speed and
reliability of movement of cargo; and services through the port (UNTAD, 2002). While there are a number of
activities involved from entry to departure of a cargo into/out of the port, it is important to measure the performance of the ports or the total movement of cargo. This includes the throughput of the port, ship traffic,
berth occupancy, ship turnaround time etc.
1.3 Objectives of Study (a) To determine the impact of Port Reforms on the performance/efficiency of the port.
(b) To identify the pitfalls/constraints if any existing in the reform programme.
©To recommend solutions that will help to increase the productivity, operational efficiency.
1.4 Research Question. (a) How has the Port Reform in Nigeria fared so far?
(b) Has the Port Reforms in Nigeria actually improved port productivity in the Seaports under study to a large
extent?
(C) Has the Port Reform in Nigeria actually experienced any pitfall so far?
(D) What are the likely solutions and recommendations in order to achieve an effective and efficient Port
system in Nigeria?
1.5 Research Hypothesis
H0: The general efficiency of Ports has not improved as a result of the reform
1.6 Brief Description of Rivers Ports.
A Rivers port as used in the research work comprises the Following;
(a) Port Harcourt Port
(b) Okirirka petroleum jetty
(c) Crude oil terminals of Bonny, Ima, Okwori, Obe,E.A Offshore, Erha, Brass, Okono, Bongaetc
(d) Other Jetties including Bitumen Delmar, Ibeto, Saipem, Kidney Island, Haastrup, Aker Base, Marine Base,
Magcobar etc.
1.6.1 Port Harcourt Port (Hard Quay)
This is located at the capital of Rivers State and lies along the Bonny River, about 42miles (66Km)
upstream from Gulf of Guinea in the South Western of the Niger Delta. It was founded in 1912 in an area
traditionally inhabited by the Ijo people. It majorly served the export of coal from Enugu coalfield after the
establishment of the rail link in 1916. Palm products, columbite and Tin from Jos, peanuts from the Northern
states, and since 1958, petroleum products from fields in the eastern Niger Delta. It also served the industries in the region. The Port Harcourt port has a depth of about 7.8meters and quay length of about 1877meters. Port
Harcourt was named after Lewis Viscount Harcourt, who was the Secretary of the State for the British Colonies.
1.6.2 ONNE PORT COMPLEX
Onne Port Complex is situated in the heart of Niger Delta, Nigeria’s main Oil and Gas production area.
It was created to supplement Port Harcourt’s port capacity and traffic.TheOnne Oil and Gas free zone, located
south of port Harcourt on Bonny River in Rivers State, was established by the Federal Government of Nigeria to
provide an Oil Service Centre and Support Base to serve Nigerian onshore and offshore fields, whilst also
providing easy access and duty-free distribution to the entire West African and Sub-Saharan oil and gas
industry.TheOnne Oil and Gas free zone was established by Government Decree No.8, issued in the Official
Gazette No. 12 on the 29th march, 1996 declaring an area of some 26square kilometers in Onne/Ikpokiri of
Rivers state as dedicated “Oil and Gas Free Zone”. The port is made up of Federal Ocean Terminal (FOT) and Federal Lighter Terminal (FLT).
Federal Ocean Terminal (Fot)
Quay Length ---------------------- 1,320 meters
Draft ---------------------- 10 meters (low tide)
Industrial area ---------------------- 500,000 square meters
Warehouse ---------------------- 46,000 square meters
Measurement Of Efficiency Level In Nigerian Seaport After Reform Implementation
www.iosrjournals.org 48 | Page
1.6.2 Federal Lighter Terminal (Flt)
Quay Length ------------------- 1,675 meters
Draft 1 & 2 ------------------- 8 meters (low tide)
Draft 3 & 4 ------------------- 10 meters (low tide)
Industrial area ------------------- 400,000 square meters Warehouse area ------------------- 33,000 square meters
Industrial area under development --- 900,000 square meters
It is important to note here that the West African Container Terminal (WACT) located at FOT Onne
has a Container stacking area measuring about 165,000 square meters and berth length of 570 meters; managed
and operated by Maersk Sea land.
II. Review of Related Literature. 2.1 Early Port Performance In Nigeria The activities of the Nigerian Ports were commercialized in 1992 under the name, “Nigerian Ports Plc”. However, considering the fact that the government still wholly owns the company, it reverted to its former
name, Nigerian Ports Authority in October 1996. This reversion is however, not in conflict with
commercialization efforts and commitment to improved services.
Okorigba (2008) observed that the efficiency improved at the ports after the reforms of 2006, as cargo dwell
time and turn round time of vessels reduced to an average of 2.45days as compared to an average of 6.85days
and 10.43days before the reforms.
He equally found out that infrastructural modernization and equipment enhancement reduced delays of
cargo discharge at the ports thus increasing efficiency of the ports.
Ehbenine (2009) opined that port concession is very viable in a national economy because of it’s
significance as a global tool for port development and unquantifiable gains to the economy, eliminating poor
quality services and delays at the ports. He concluded that private operators would be more reasonable in their
dealings to avoid government revocation of their license and unnecessary public reaction; freeing up of government funds for other priority developmental projects; attracts and uses foreign investment and technology
and also port concessioning will expose the private sector concern for a more efficient service than government
(NPA) in port service delivery.
Josiah (2008) in his study of Lagos port complex (port performance) noted the following as the
contributing factors to low port performance at Nigerian ports: (a) poor services and poor cargo handling (b)
documentation procedures characterized by long procedures (c) poor labour performance (d) queuing for berths
problems and allocation (e) poor customs and port authority relationship (f) corruption and port pilfering and so
on. Josiah (2008) concluded by suggesting the following.
(a) The use of satisfactory port traffic flow arrangement and reviewing them very often for the arrival and
departure of vessels.
(b) Improvement of documentation process in terms of information reliability and spread of efficiency using ship arrival message (SAM), which is a linkage of port networks that allows port computers to interact with
each other so that as a soon as a ship departs a port, the next ports of call are notified automatically through
this network. The ships travel, arrival times, at these ports of call, the type, volume of cargo to be delivered
at each port of call, as well as the names of the consignees, the shipping agents, ships and nationality of the
ship. This makes preparation for ships arrival fast and easier. This works on the principle of Electronic
Data Interchange (EDI).
(c) Efficient berth allocation policy that considers ships length, size, draught, volume and type of cargo etc
hence reduction in waiting time, idle time and improved turn round time of the vessel.
Emeghara (1992) noted that from 1975-76, ship congestions at the Nigerian seaports was not due to
lack of berthing facilities, but due to the fact that the cargoes stacking areas were not relieved of traffic as early
as they should be. He further argued that lack of adequate, efficient and cost effective transport linkages with the
hinterlands of the ports poses operational problems which mitigate against capacity utilization. He concluded that the Nigerian ports are under-utilized considering berthing and cargo handling capacities available hence the
poor performance of the ports.
Adebayo (2005) equally identified cumber some clearing, system as one of the problems of poor port
performance in Nigeria as the cargo clearing system depends on manual paper and physical movement of
document to and from various processing centers located within and outside the ports. He also identified the non
availability of multimodal transport system or rather the utilization of trucks rather than rail transport for the
movement of goods to and from the hinterlands to the ports. This is also bad in some ports whereby no provision
is made for the parking of the trucks prior to loading and so on.
Emeghara (2008) in his study on the various delay causative factors influencing the high turnaround
time of ships in Nigerian port, he identified the following:
Measurement Of Efficiency Level In Nigerian Seaport After Reform Implementation
www.iosrjournals.org 49 | Page
(a) Corruption at all levels in the port.
(b) Lack of cargo handling equipments.
(c) Lack of skilled manpower among dockworkers.
(d) The channel depth or drafts of the entry channels.
However, the Onne and Rivers ports has drastically improved on the quantity and quality of cargo handling equipments since after the reforms and also on the other issues raised by the researcher in his study
hence the performance currently. He also alleged low productivity of an average Nigeria dockworker as well as
the private terminal operator slow training and retraining of the abundant unskilled dockworkers.
These trends have reduced since after the reforms of the ports as they were evident in the ports prior to
the port concessioning.
2.2 Port Performance Measurement
Performance measurement plays an important role in the development of an organization. As a result,
all ports, without exception, use a variety of methods to examine their performance. Performance can be defined
as the “Capacity to produce positive results” that is, depending on the expectations(Ducruet, C. 2009).
Ports are essentially providers of service activities, in particular for vessel, cargo, and inland transport.
As such, it is possible that a port may provide sound service to vessel operators on one hand and an unsatisfactory service to cargo or inland transport operators on the other. Hence, port performance cannot
normally be accessed on the basis of a single value or measure, rather evaluations are made by comparing
indicator values for a given port over time as well as across ports for a given time period (De Monie, 1987).
Despite the importance of port performance measurement, however, it is surprising to note that there
are almost no standard methods that are accepted as applicable to every port for measurement of its performance
(Cullinane, 2002). More surprisingly, it is even harder to find standard terminology to describe port production,
with different container ports using different terms to describe port production. “Measurement will always have
a natural tendency to be terminal-specific” (Robinson, 1999).
As reported by De Monie (1987), the measurement of port productivity has been greatly impeded by
the following factors:
(a) The sheer number of parameters involved. (b) The lack of up-to-date, factual and reliable data, collected in an accepted manner and available for
dissemination.
(c) The absence of generally agreed and acceptable definition.
(d) The profound influence of local factors on the data obtained.
(e) The divergent interpretation given by various interests to identical results.
Port operations are increasingly specialized and processed in dedicated terminals but many flows of goods
are still handled at general purpose berth; as in the case of Port Harcourt port and Onne ports.
For instance, both ports in reference handles General cargoes, bulk, containers, refined petroleum
products, oil exploration equipments and so on; hence there is no homogeneity of products/terminals for
comparison.
Depending on the case, port performance should be assessed for an homogenous set of berths or
terminals. It is usually expressed as the average number of calls and the average flow-volume or weight of goods over a standard period of time, number of calls per berth and per year, volume or weight of cargo handled
per hour, per call or per day, per gang or per crane or based on the new port performance indicators (PPI).
In addition, other criteria can be used to see how existing capacity and performance meet the
requirements of
(a) the shipper or the ship owner: mainly average waiting time of ship, dwelling time of cargo and data related
to quality (value).
(b) Port Authority/concessionaire: basically berth occupancy rate and global traffic and so on.
2.2.1 Performance Measurement Studies Using Dea
Data Envelopment Analysis (DEA) which is a non-parametric efficiency evaluation model based on
mathematical programming theory which was developed byCharnes et al (1978). It is used in operations research and econometrics for multi-variant frontierestimation and ranking which can be used in calculating
efficiency levels within a group oforganizations.
The concept of DEA is developed around the basic idea that efficiency of a DMU is determined by its
ability to transform inputs into desired outputs. This concept of efficiency was adopted from engineering which
defines efficiency of a machine/process as output /input = 1. In this approach, efficiency is always less than or
equal to unity as some energy loss will always occur during transformation process.
In the last 10 years, measurement of port efficiency using Data Envelopment Analysis (DEA) and
Stochastic Frontier Analysis (SFA) has been symbolic. For instance, Tongzon (2001) investigated port
Measurement Of Efficiency Level In Nigerian Seaport After Reform Implementation
www.iosrjournals.org 50 | Page
efficiency of selected Australian ports and benchmarked them with other international ports based on DEA
estimates. Lee et al. (2005) examined efficiency of ports in the Asia Pacific region applying Recursive DEA,
while Cullinane and Wang (2006) studied the efficiency of European container ports by using DEA and
Ablanedo-Rosas et al. (2010) evaluated the relative efficiency of 11 major Chinese ports using adopted version
of DEA. Song and Yeo (2004) investigated the competitiveness and efficiency of container ports in China using the Analytic Hierarchy Process (AHP) framework. Pang (2006) analysed and evaluated 50 major ports in China
by using DEA and dynamically evaluated their efficiency based on 3 years of consecutive data. A related study
is developed by Zhou et al. (2008), who evaluated the comparative efficiency of Chinese third-party logistics
providers by means of DEA. Roll and Hayuth (1993) were probably the first attempt to apply DEA to
investigate the port efficiency.
However, their study was not truly involved with the real data analysis. Martinez-Budria et al. (1999)
divided 26 ports into three groups: high-complexity ports, medium- complexity ports, and low complexity ports.
The results of Martinez-Budria et al. (1999) showed that the high-complexity ports were more efficient
than the medium- and low complexity ports by using DEA–BCC (Banker et al., 1984). Others like Tongzon
(2001) used DEA–CCR (Charnes et al., 1978) and DEA–additive variation models to measure the efficiency of
selected Australian and other international ports. Valentine and Gray (2001) analyzed 31 out of 100 world’s top
container ports by using DEA–CCR. Park and De (2004) used a four-stage DEA to investigate the efficiency of the North American seaport Infrastructure productivity from 1984 to 1997. Di’az-Herna’ndez et al. (2008b)
studied the cargo handling productivity in Spanish ports. Min and Park (2008) proposed a hybrid DEA-
simulation model to evaluate the relative efficiency of major container terminals in South Korea. Wu and Lin
(2008) performed an international comparison of logistic port operations with a focus on India. Ablanedo Rosas
and Ruiz-Torres (2009) used DEA to evaluate the efficiency of cargo and cruise operations in major Mexican
ports.
Some researchers have measured the impact of these reforms; a specific case is the relationship
between privatization and the relative efficiency within the container port industry that has been studied by
Estache et al. (2004), Tongzon and Heng (2005), Cullinane et al. (2005a), Pallis and Syriopoulos (2007).
Furthermore, after the reforms, ports’ performance has been investigated based on financial factors
such as Park and De (2004). While Ablanedo-Rosas et al (2010) used a financial ratio-based data envelopment analysis to examine the relative efficiency of 11 major Chinese ports. Pang (2006) analyzed 50 ports in
Mainland China by using DEA and dynamically evaluated their efficiency based on 3 years of consecutive data.
Danijela et al. (2011), evaluated efficiencies of River ports in Serbia using Window-based DEA the result
showed variability and very low efficiency scores among the ports.
2.3 Operational Performance Indicators (Productivity).
Primary measures of vessel performance are the ship turn-round time and the tonnage handled per ship
day in port.
2.3.1 Ship Turn Round Time
The ship turn-round time is the duration of the vessel’s stay in port and is calculated from the time of arrival of
the vessel to its departure as earlier explained in the tables. As a productivity indicator, ship turn-round time is a function of the following:
(a) The volume of cargo
(b) The facilities available at the port for cargo handling
(c) The composition or nature of cargo.
Hence from the above, it’s necessary that the port differentiate the basic ship-turn round time for the
different vessels like tankers, bulk carriers, container vessels and general cargoes vessels in relation to the ports
or berth allocated to them, as such is not fully considered in the ports of Onne and Rivers Ports, excepting those
of crude oil terminals.
There is also the need to sub-divide these vessels into domestic trade, regional trade and ocean going
vessels.
(A) Volume of Cargo The tonnage handled per day or hour for a vessel in port is a more useful measure of a vessel
performance based on the fact that a vessel’s stay in port is influenced by the volume of cargo that it works.
(B) Cargo Handling Facilities Also the cargo handling facilities or gang output/tonne/hour or the crane moves per hour is also
relevant in determining the performance. These are the factor productivity indicators of the ports. The major
ones are:
Measurement Of Efficiency Level In Nigerian Seaport After Reform Implementation
www.iosrjournals.org 51 | Page
(a) Labour output: Labour/tonne/hour or gang/hr or tonne/berth/day or hour or ton/ship day etc. and
(b) Crane productivity relating to the number of cranes available and the moves they make per hour between
the ship and shore and also if (TEU) loaded or empty.
The tonnage handled per ship day (hour) is a measure of the volume of cargo handled per unit of the time of the vessel in port hence productivity in port is generally measured in terms of tonnage of cargo handled
per unit work station per hour. General cargo work station is the gang while container is the crane or hook.
Productivity is measured in terms of:
(a) Tonnes per gang hour for general cargo
(b) Tonnes per pump hour for liquid cargo while pump is the work station and
(c) TEUs per crane or hook hour.
The size of the gang is a material factor hence the larger the gang size, the greater its output.
In establishing the size of the gang, like in Onne and Rivers ports, it should be of note that they have
separate stevedoring and wharf gangs while some ports operate an integrated gang that works on board vessels
(stevedoring) as well as at the apron (wharfingering).
(C) The Composition Or Nature Of Cargo
The composition or nature of cargo and the size or quantity has an influence on the performance of the
workstation or gang.
The large and more homogeneous the cargo the greater is the productivity.
As in the case of liquid cargoes, the temperature, viscously, distance etc influences the productivity or
the output.
2.3.2 Cargo Dwell Time In Port
This is another port performance indicator based on importer/exporter point of view and it is basic as
the only indicator of interests to them. A high cargo dwell time is generally an indication that all is not well with
the port; cargo dwell time in Onne and Rivers ports is mostly attributed to the customs procedure, non-utilization of EDI (Electronic Data Interchange) and e-payments, etc. It should be equally noted here that the
importance of dwell time obviously varies with the nature of cargo. These cargo dwell time problems must
be addressed if Nigerian ports generally must attain the 48 hours cargo clearing time.
III. Methodology The reforms took effect from 1996 after the Federal Government of Nigeria concessioned the ports to
private investors. Parameters such as Ship traffic, Cargo throughput, Ship turn round time, Berth Occupancy and
personnel were used as variables for the assessment. Secondary Data were collected from the Nigerian Ports
Authority and Integrated Logistic Services Nigeria (Intels) for the period 2001 to 2010 and analyzed using Data Envelopment Analysis to assess the efficiency of the port.
The study made use of various statistical tools and techniques in analyzing the data collected for the
period 2001 to 2010 (10 years) which overlaps the pre and post concession era of the ports in the study. These
statistical tool include descriptive tools such as the percentage, frequency, tables and charts, The two-sample t
Test was also used to test the difference between the sample means for the pre reform era and the post reform
era to validate if there exists any statistically significant contribution of the reform policy and the Data
Envelopment Analysis (DEA) which is a non-parametric efficiency evaluation model based on mathematical
programming theory was utilized to check the relative efficiency levels of the seaport under study
3.1 DEA Applications to Seaport Efficiency Measurement Data Envelopment Analysis (DEA) which is a non-parametric efficiency evaluation model based on
mathematical programming theory which was developed byCharnes et al (1978). It is used in operations research and econometrics for multi-variant frontierestimation and ranking which can be used in calculating
efficiency levels within a group oforganizations.
The concept of DEA is developed around the basic idea that efficiency of a DMU is determined by its
ability to transform inputs into desired outputs. This concept of efficiency was adopted from engineering which
defines efficiency of a machine/process as output /input = 1. In this approach, efficiency is always less than or
equal to unity as some energy loss will always occur during transformation process.
From the study, one output and four inputs were utilized in the derivation of the efficiency level.
Output- Cargo Throughput
Input 1- Total Ships Traffic
Input2- Berth Occupancy
Measurement Of Efficiency Level In Nigerian Seaport After Reform Implementation
www.iosrjournals.org 52 | Page
Input 3-Turn around Time
Personnel Strength.
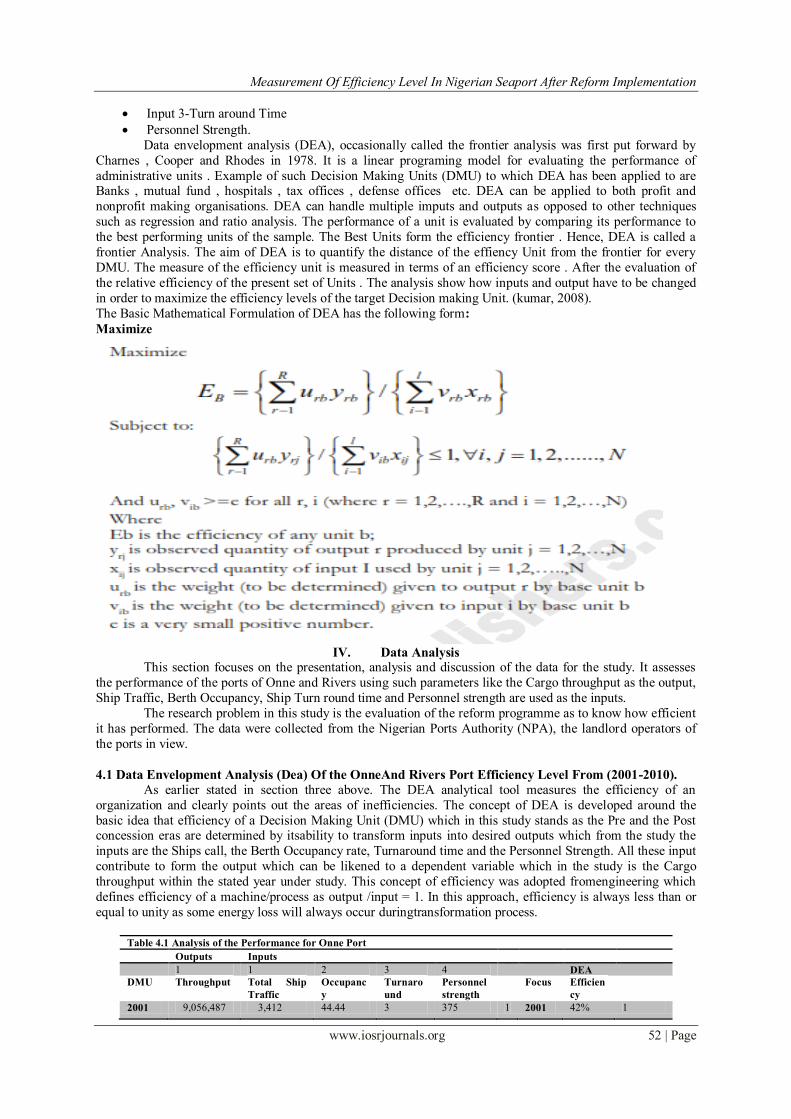
Data envelopment analysis (DEA), occasionally called the frontier analysis was first put forward by
Charnes , Cooper and Rhodes in 1978. It is a linear programing model for evaluating the performance of
administrative units . Example of such Decision Making Units (DMU) to which DEA has been applied to are Banks , mutual fund , hospitals , tax offices , defense offices etc. DEA can be applied to both profit and
nonprofit making organisations. DEA can handle multiple imputs and outputs as opposed to other techniques
such as regression and ratio analysis. The performance of a unit is evaluated by comparing its performance to
the best performing units of the sample. The Best Units form the efficiency frontier . Hence, DEA is called a
frontier Analysis. The aim of DEA is to quantify the distance of the effiency Unit from the frontier for every
DMU. The measure of the efficiency unit is measured in terms of an efficiency score . After the evaluation of
the relative efficiency of the present set of Units . The analysis show how inputs and output have to be changed
in order to maximize the efficiency levels of the target Decision making Unit. (kumar, 2008).
The Basic Mathematical Formulation of DEA has the following form:
Maximize
IV. Data Analysis
This section focuses on the presentation, analysis and discussion of the data for the study. It assesses
the performance of the ports of Onne and Rivers using such parameters like the Cargo throughput as the output,
Ship Traffic, Berth Occupancy, Ship Turn round time and Personnel strength are used as the inputs.
The research problem in this study is the evaluation of the reform programme as to know how efficient
it has performed. The data were collected from the Nigerian Ports Authority (NPA), the landlord operators of
the ports in view.
4.1 Data Envelopment Analysis (Dea) Of the OnneAnd Rivers Port Efficiency Level From (2001-2010).
As earlier stated in section three above. The DEA analytical tool measures the efficiency of an
organization and clearly points out the areas of inefficiencies. The concept of DEA is developed around the
basic idea that efficiency of a Decision Making Unit (DMU) which in this study stands as the Pre and the Post concession eras are determined by itsability to transform inputs into desired outputs which from the study the
inputs are the Ships call, the Berth Occupancy rate, Turnaround time and the Personnel Strength. All these input
contribute to form the output which can be likened to a dependent variable which in the study is the Cargo
throughput within the stated year under study. This concept of efficiency was adopted fromengineering which
defines efficiency of a machine/process as output /input = 1. In this approach, efficiency is always less than or
equal to unity as some energy loss will always occur duringtransformation process.
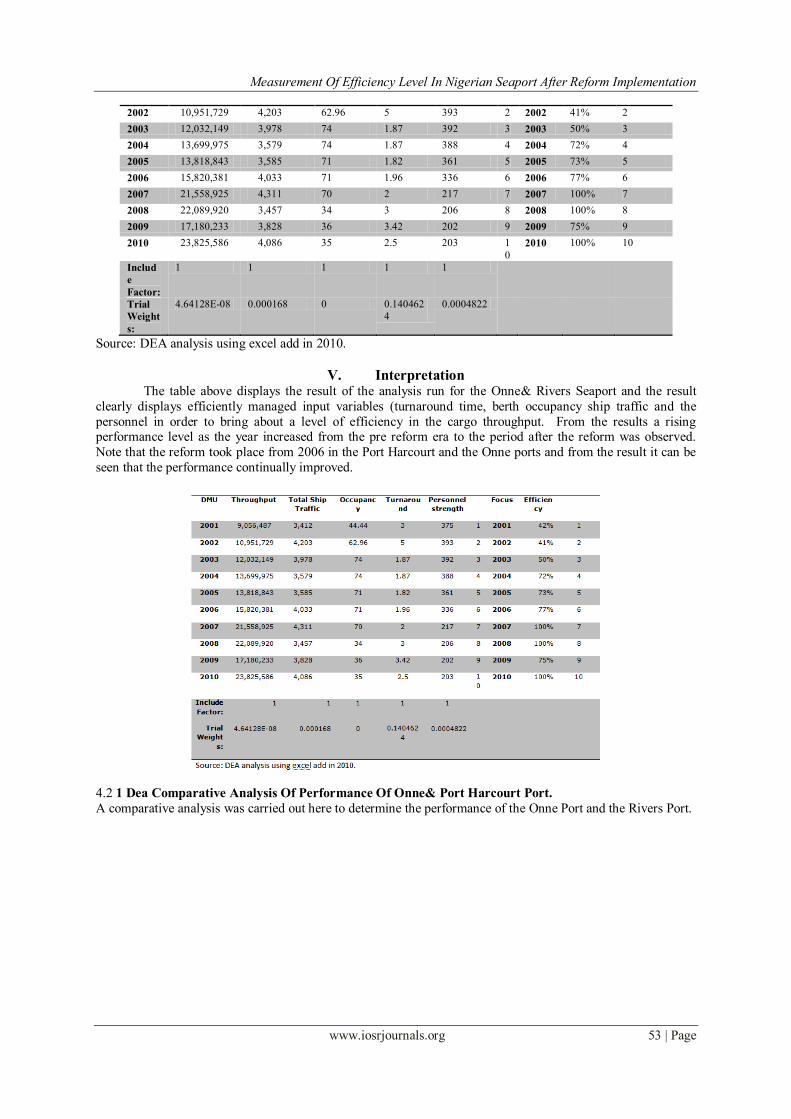
Table 4.1 Analysis of the Performance for Onne Port
Outputs Inputs
1 1 2 3 4 DEA
DMU Throughput Total Ship
Traffic
Occupanc
y
Turnaro
und
Personnel
strength
Focus Efficien
cy
2001 9,056,487 3,412 44.44 3 375 1 2001 42% 1
Measurement Of Efficiency Level In Nigerian Seaport After Reform Implementation
www.iosrjournals.org 53 | Page
2002 10,951,729 4,203 62.96 5 393 2 2002 41% 2
2003 12,032,149 3,978 74 1.87 392 3 2003 50% 3
2004 13,699,975 3,579 74 1.87 388 4 2004 72% 4
2005 13,818,843 3,585 71 1.82 361 5 2005 73% 5
2006 15,820,381 4,033 71 1.96 336 6 2006 77% 6
2007 21,558,925 4,311 70 2 217 7 2007 100% 7
2008 22,089,920 3,457 34 3 206 8 2008 100% 8
2009 17,180,233 3,828 36 3.42 202 9 2009 75% 9
2010 23,825,586 4,086 35 2.5 203 1
0
2010 100% 10
Includ
e
Factor:
1 1 1 1 1
Trial
Weight
s:
4.64128E-08 0.000168 0 0.140462
4
0.0004822
Source: DEA analysis using excel add in 2010.
V. Interpretation The table above displays the result of the analysis run for the Onne& Rivers Seaport and the result
clearly displays efficiently managed input variables (turnaround time, berth occupancy ship traffic and the
personnel in order to bring about a level of efficiency in the cargo throughput. From the results a rising performance level as the year increased from the pre reform era to the period after the reform was observed.
Note that the reform took place from 2006 in the Port Harcourt and the Onne ports and from the result it can be
seen that the performance continually improved.
4.2 1 Dea Comparative Analysis Of Performance Of Onne& Port Harcourt Port.
A comparative analysis was carried out here to determine the performance of the Onne Port and the Rivers Port.
Measurement Of Efficiency Level In Nigerian Seaport After Reform Implementation
www.iosrjournals.org 54 | Page
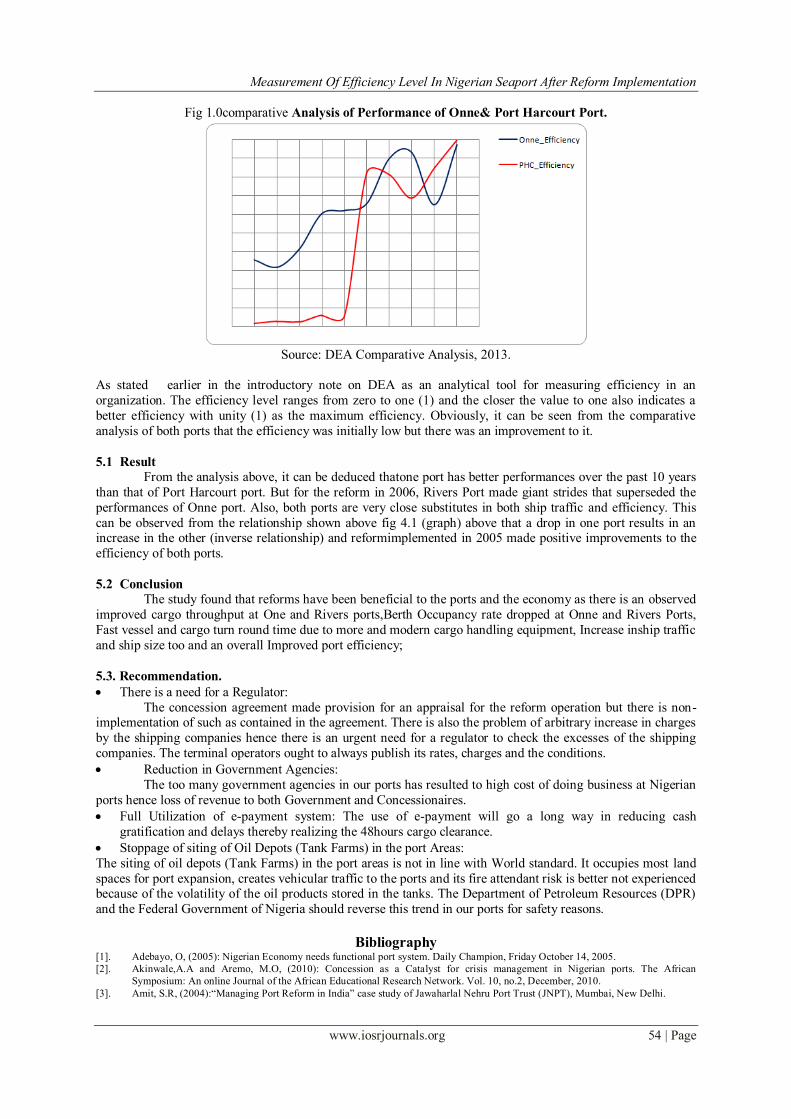
Fig 1.0comparative Analysis of Performance of Onne& Port Harcourt Port.
Source: DEA Comparative Analysis, 2013.
As stated earlier in the introductory note on DEA as an analytical tool for measuring efficiency in an
organization. The efficiency level ranges from zero to one (1) and the closer the value to one also indicates a
better efficiency with unity (1) as the maximum efficiency. Obviously, it can be seen from the comparative
analysis of both ports that the efficiency was initially low but there was an improvement to it.
5.1 Result
From the analysis above, it can be deduced thatone port has better performances over the past 10 years
than that of Port Harcourt port. But for the reform in 2006, Rivers Port made giant strides that superseded the
performances of Onne port. Also, both ports are very close substitutes in both ship traffic and efficiency. This
can be observed from the relationship shown above fig 4.1 (graph) above that a drop in one port results in an increase in the other (inverse relationship) and reformimplemented in 2005 made positive improvements to the
efficiency of both ports.
5.2 Conclusion
The study found that reforms have been beneficial to the ports and the economy as there is an observed
improved cargo throughput at One and Rivers ports,Berth Occupancy rate dropped at Onne and Rivers Ports,
Fast vessel and cargo turn round time due to more and modern cargo handling equipment, Increase inship traffic
and ship size too and an overall Improved port efficiency;
5.3. Recommendation.
There is a need for a Regulator:
The concession agreement made provision for an appraisal for the reform operation but there is non-implementation of such as contained in the agreement. There is also the problem of arbitrary increase in charges
by the shipping companies hence there is an urgent need for a regulator to check the excesses of the shipping
companies. The terminal operators ought to always publish its rates, charges and the conditions.
Reduction in Government Agencies:
The too many government agencies in our ports has resulted to high cost of doing business at Nigerian
ports hence loss of revenue to both Government and Concessionaires.
Full Utilization of e-payment system: The use of e-payment will go a long way in reducing cash
gratification and delays thereby realizing the 48hours cargo clearance.
Stoppage of siting of Oil Depots (Tank Farms) in the port Areas:
The siting of oil depots (Tank Farms) in the port areas is not in line with World standard. It occupies most land
spaces for port expansion, creates vehicular traffic to the ports and its fire attendant risk is better not experienced because of the volatility of the oil products stored in the tanks. The Department of Petroleum Resources (DPR)
and the Federal Government of Nigeria should reverse this trend in our ports for safety reasons.
Bibliography [1]. Adebayo, O, (2005): Nigerian Economy needs functional port system. Daily Champion, Friday October 14, 2005.
[2]. Akinwale,A.A and Aremo, M.O, (2010): Concession as a Catalyst for crisis management in Nigerian ports. The African
Symposium: An online Journal of the African Educational Research Network. Vol. 10, no.2, December, 2010.
[3]. Amit, S.R, (2004):“Managing Port Reform in India” case study of Jawaharlal Nehru Port Trust (JNPT), Mumbai, New Delhi.
Measurement Of Efficiency Level In Nigerian Seaport After Reform Implementation
www.iosrjournals.org 55 | Page
[4]. Baird, A.J, (1995): Privatization of trust ports in the United Kingdom: Review and Analysis of the first sales. Journal of Transport
Policy, Vol.2, No.2. 135-143
[5]. Baird, A.J, (1999): “Privatization defined; Is it the universal panacea?” Mimeo.Napier University.
[6]. Banister, D. (1995): “Transport and Urban Development” Alexandria Press, Oxford.
[7]. Chioma, O.A,(2011): “Freight traffic at Nigerian seaports; problem and Prospect”. Medwell Journals. Vol. 6 (1), 250-258, 2012.
[8]. De Langen, P.W, Nijdam, M.H. and Van der Horst, M. (2006): New Indicators to Measure Port Performance, proceedings of the
IAME conference, July 12-14, Melorne, Australia.
[9]. De Monie, G, (1994): Mission and Role of Port authorities; Processing of the world port privatization conference, London.
[10]. De Monie, G. (1987): Measuring and Evaluating Port Performance and Productivity,-UNTAD Monograph on port management no.
6 and The International Association of Ports and Harbour (IAPH).
[11]. Ducruet, C, Dumay, B, and De Langen, P. (2009): Average Wage Level as a new Port Performance Indicator; A method and
Illustration of U.S Port Counties. Erasmus University, Rotterdam.
[12]. Ehbenine, O.A, (2009): Impact of Port Privatization and Concessioning and the future of Nigerian ports.
[13]. Emeghara, G.C, (1992): Capacity Utilization of Nigerian Ports. An Unpublished M.Sc Thesis presented to the Department of
Transport Management Technology, F.U.T Owerri.
[14]. Emeghara, G.C, (2008): A Perceptual Assessment of the Delay factors in the Nigerian Port Operation: A Ph.D Thesis of Federal
Univesity of Technology, Owerri (Transport Management).
[15]. Estache, A. Gonzalez, M. and Trujillo, L. (2001): Technical Efficiency gains from port Reforms: The potential yardstick
competition in Mexico. The World Bank.
[16]. Filani, O.(2008): Maritime Productivity Today. Journal of Transport Studies .Vol 3(1).
[17]. Fourgeaud,P. (2000): Measuring Port Performance. The World Bank.
[18]. Gonzalez, M.M, and Trujillo, L. (2008): Reforms and Infrastructure Efficiency in Spain’s Container Ports: Transportation research
part A 42 Pgs 243-257.
[19]. Goss, R.O, (1990): Economic policies and Seaports- Part 3: Are Port Authorities Necessary? Journal of Maritime Policy and
Management Vol.17.
[20]. Harding, A, Palsson, G, and Raballand, G. (2007): Port and Maritime Transport Challeges in West and Central Africa. Sub-Sahara
Africa Tranaport Policy Programme SSATP working paper no. 84.
[21]. Igbuzor, O, (2003): Privatization in Nigeria: Critical Issues of concern to civil society –Seminar Paper.
[22]. Ircha,M.C. (2001): North American port Reforms: The Canadian and American Experience,International Journal of Maritime
Economics, Vol.3.
[23]. Jibendu ,K.M. (2008): Reasearch Methodology on Data Envelopment Analysis, Boca Raton , Universal Publishers
[24]. Kareem, W.A, (2010): An Assessment of Nigeria’s Seaport Reforms. An Economic Policy and Financial Market Publication of the
Fronteira Post
[25]. KekChoo Chung, (1993): Port Performance indicators, a transport note no. RS-6.Transportation, Water and Urban
Development.The World Bank.
[26]. Leighland, J and Palsson, G. (2007): . Washington, DC: Public Private Infrastructure Advisory Facility
[27]. Marlow, P.B, and Paixao, A.C. (2003): Measuring Lean Port Performance. International Journal of Transport Management.
[28]. Mary, R.B, and Cullianane,K. (2007): Devolution,Port Governance and Port performance, Research in transportation Economics,
Vol.17.
[29]. Ndikom, O.B, (2006): The Essentials of Port Reforms: The Nigerian Experience. Lagos: Bunmico Publishers
[30]. O.T African Line- Trade and Transport Report, January 2009.
[31]. O.T African Line- Trade Watch (West African Trade and Transport Report), November 2009.
[32]. Okorigba, U.M, (2008): The Challenges and Prospects of recent port performance in Nigeria; A case study of Tincan Island port s.
MSc thesis of Federal University of Technology, Owerri (Transport Management Technology).
[33]. Onwuegbuchulam, D.(2012): Productivity and efficiency of Nigerian Seaports; A production frontier Analysis.McdowelsJounal
International Business Management 6(1), pp 41-46,2012.
[34]. Osaretin, P.A, (2006): Efficient Port Operation and the benefit of Actors- A case study of Tincan Island port,Nigeria. MSc thesis of
School of Business, Economics and Law, Gotenborg University (Logistics and Transport Management).
[35]. Prakash, G. (2005): Port Planning as a Strategic Tool: A Typology; Institute of Transport and Maritime Management Antwerp.
[36]. Thomas, B.J, (1985): Operational Planning in Ports. UNCTAD Monogram on Port Management.
[37]. Transformation of Maritime Sector by Local Content Programme. The Punch, Friday May 28, 2010.
[38]. UNCTAD (United Nation Conference on Trade and Development) (1996): Comparative Analysis of Deregulation,
Commercialization and Privatization of Ports. UNCTAD/SSD/Port/3.
[39]. UNTAD, New York, (2002).
[40]. UNTAD, Review of Maritime Transport, (2001).
[41]. Valentine, V.F, (2003): A Comparison of African Port Performance.
[42]. Nigerian Energy and Transport News Update.(2007) DDH Magazine.
[43]. http://www.otal.com: The Official webpage of OT African Line-Nigeria.
[44]. http://www.apmterminal.com: The Official webpage of apmoller terminals- West African Container Terminal (WACT), Port
Harcourt, Nigeria.
[45]. World Bank, (2000): World Bank Port Reform Tool kit, Transport Division.