Fault Diagnosis of Railway Point Machines Using the Locally ...
17
applied sciences Article Fault Diagnosis of Railway Point Machines Using the Locally Connected Autoencoder Zhen Li 1,2,3, *, Zhuo Yin 2,3 , Tao Tang 1 and Chunhai Gao 2,3 1 School of Electronic and Information Engineering, Beijing Jiaotong University, Beijing 10044, China; [email protected] 2 National Engineering Laboratory for Urban Rail Transit Communication and Operation Control, Beijing 100044, China; [email protected] (Z.Y.); [email protected] (C.G.) 3 Traffic Control Technology Co., Ltd., Beijing 100070, China * Correspondence: [email protected]; Tel.: +86-10-5282-4695 Received: 04 November 2019; Accepted: 25 November 2019 ; Published: 27 November 2019 Abstract: Data-driven fault diagnosis is considered a modern technique in Industry 4.0. In the area of urban rail transit, researchers focus on the fault diagnosis of railway point machines as failures of the point machine may cause serious accidents, such as the derailment of a train, leading to significant personnel and property loss. This paper presents a novel data-driven fault diagnosis scheme for railway point machines using current signals. Different from any handcrafted feature extraction approach, the proposed scheme employs a locally connected autoencoder to automatically capture high-order features. To enhance the temporal characteristic, the current signals are segmented and blended into some subsequences. These subsequences are then fed to the proposed autoencoder. With the help of a weighting strategy, the seized features are weight averaged into a final representation. At last, different from the existing classification methods, we employ the local outlier factor algorithm to solve the fault diagnosis problem without any training steps, as the accurate data labels that indicate a healthy or unhealthy state are difficult to acquire. To verify the effectiveness of the proposed fault diagnosis scheme, a fault dataset termed “Cu-3300” is created by collecting 3300 in-field current signals. Using Cu-3300, we perform comprehensive analysis to demonstrate that the proposed scheme outperforms the existing methods. We have made the dataset Cu-3300 and the code file freely accessible as open source files. To the best of our knowledge, the dataset Cu-3300 is the first open source dataset in the area of railway point machines and our conducted research is the first to investigate the use of autoencoders for fault diagnosis of point machines. Keywords: railway point machines; urban rail transit systems; fault diagnosis; autoencoder 1. Introduction With the tremendous deployment of different kinds of sensors and actuators, the Internet of Things (IoT) emerges as an advanced method to connect devices and collect the status data [1]. Aided by the use of a large amount of operation data, the data-driven fault diagnosis is considered as a modern technique in Industry 4.0 and has become a research hotspot in recent years [2–5]. In the area of urban rail transit, the significant increase of the line mileage and the passenger throughput leads to a high capacity utilization of the existing infrastructure [6]. This kind of situation may cause more equipment failures and service disruptions, resulting in a great impact on traffic safety, property, and customer satisfaction. Among these infrastructure failures in urban rail transit systems, the vast majority of them are triggered by railway point machines [7]. The point machine is a critical component that is used to safely switch the train direction. To meet the demand of fault-tolerant operation of Appl. Sci. 2019, 9, 5139; doi:10.3390/app9235139 www.mdpi.com/journal/applsci
-
Upload
khangminh22 -
Category
Documents
-
view
10 -
download
0
Transcript of Fault Diagnosis of Railway Point Machines Using the Locally ...
applied sciences
Article
Fault Diagnosis of Railway Point Machines Using theLocally Connected Autoencoder
Zhen Li 1,2,3,*, Zhuo Yin 2,3 , Tao Tang 1 and Chunhai Gao 2,3
1 School of Electronic and Information Engineering, Beijing Jiaotong University, Beijing 10044, China;[email protected]
2 National Engineering Laboratory for Urban Rail Transit Communication and Operation Control,Beijing 100044, China; [email protected] (Z.Y.); [email protected] (C.G.)
3 Traffic Control Technology Co., Ltd., Beijing 100070, China* Correspondence: [email protected]; Tel.: +86-10-5282-4695
Received: 04 November 2019; Accepted: 25 November 2019 ; Published: 27 November 2019 �����������������
Abstract: Data-driven fault diagnosis is considered a modern technique in Industry 4.0. In thearea of urban rail transit, researchers focus on the fault diagnosis of railway point machinesas failures of the point machine may cause serious accidents, such as the derailment of a train,leading to significant personnel and property loss. This paper presents a novel data-driven faultdiagnosis scheme for railway point machines using current signals. Different from any handcraftedfeature extraction approach, the proposed scheme employs a locally connected autoencoder toautomatically capture high-order features. To enhance the temporal characteristic, the current signalsare segmented and blended into some subsequences. These subsequences are then fed to the proposedautoencoder. With the help of a weighting strategy, the seized features are weight averaged into a finalrepresentation. At last, different from the existing classification methods, we employ the local outlierfactor algorithm to solve the fault diagnosis problem without any training steps, as the accurate datalabels that indicate a healthy or unhealthy state are difficult to acquire. To verify the effectiveness ofthe proposed fault diagnosis scheme, a fault dataset termed “Cu-3300” is created by collecting 3300in-field current signals. Using Cu-3300, we perform comprehensive analysis to demonstrate that theproposed scheme outperforms the existing methods. We have made the dataset Cu-3300 and the codefile freely accessible as open source files. To the best of our knowledge, the dataset Cu-3300 is the firstopen source dataset in the area of railway point machines and our conducted research is the first toinvestigate the use of autoencoders for fault diagnosis of point machines.
Keywords: railway point machines; urban rail transit systems; fault diagnosis; autoencoder
1. Introduction
With the tremendous deployment of different kinds of sensors and actuators, the Internet ofThings (IoT) emerges as an advanced method to connect devices and collect the status data [1]. Aidedby the use of a large amount of operation data, the data-driven fault diagnosis is considered as amodern technique in Industry 4.0 and has become a research hotspot in recent years [2–5]. In thearea of urban rail transit, the significant increase of the line mileage and the passenger throughputleads to a high capacity utilization of the existing infrastructure [6]. This kind of situation may causemore equipment failures and service disruptions, resulting in a great impact on traffic safety, property,and customer satisfaction. Among these infrastructure failures in urban rail transit systems, the vastmajority of them are triggered by railway point machines [7]. The point machine is a critical componentthat is used to safely switch the train direction. To meet the demand of fault-tolerant operation of
Appl. Sci. 2019, 9, 5139; doi:10.3390/app9235139 www.mdpi.com/journal/applsci
Appl. Sci. 2019, 9, 5139 2 of 17
railway transportation and reduce the maintenance costs of metro operators, advanced fault diagnosesschemes of the point machines are of utmost need.
The literature includes a wide range of methods for condition monitoring-based failure diagnosisof point machines, including sound analysis [8], gap measurement [9,10], and electric currentanalysis [11–13]. Among these methods, electric current analysis is considered a straightforwardand effective approach for failure diagnosis of the point machine, as the point machine is directlyactuated by an electric motor [14]. The support vector machine is a representative method to solvethe task [15]. The support vector classification method usually has two key steps: feature extractionand fault recognition. The feature extraction process, however, is typically manually designed—asthe classifier is incapable of capturing information from raw signals—and typically much of the maineffort involves incorporating expert knowledge into the system, which can be influenced by personalattitudes and not fully objective, like artificial intelligence. The problem of how to automaticallyextract features needs to be well addressed. In addition, one core characteristic of our data is that eachcurrent signal is a time series of correlated count data. The temporal characteristic should be takeninto consideration to improve the accuracy of fault diagnosis of point machines [16].
Bearing these challenges in mind, in this paper, we propose a novel fault diagnosis scheme forrailway point machines. First, a locally connected autoencoder is employed to obtain high-orderfeature representations. Thereby, instead of the labor-intensive hand-engineering feature extractionapproach, effective features can automatically be captured from the raw electrical data. Different fromother autoencoder-based methods, in the proposed autoencoder, “locally” means that the currentsignal is equally segmented into some subsequences. Then, these subsequences are fed sequentially tothe input layer of the autoencoder. To enhance the temporal characteristic, inspired by the word2vecmethod [17], adjacent subsequences are blended to obtain the features of the current subsequence.Second, after the local features are extracted using the locally connected autoencoder, a weightingstrategy is proposed to weight average the features into their final representations. The reason forusing this strategy is that the electric signals collected from the point machines may contain somenoninformative information, which causes the unexpected redundancy and the high disturbance ofthe local features. By employing a weighting function, useful and robust features will be enhanced,whereas the less informative features will be reduced. Finally, different from the existing methods,which input the features into the softmax classifier for classification, we use the Local Outlier Factor(LOF) algorithm for outlier detection. The function of the softmax classifier is to give the probabilitiesfor each class label [18]. The LOF algorithm does not require prelabeled samples for its learningprocess, and therefore is very suitable for fault diagnosis of point machines, because the samplesgathered in practice related to such machines typically are in lack of labels. Further, the fault datasetsintegrated by the researchers in general also lack completeness, as not all types of possible unhealthystates occur within the datasets.
To verify the effectiveness of the proposed fault diagnosis scheme, we collected 3300 in-fieldcurrent signals to be used for fault analysis by various algorithms. The signals are generated frompoint machines that are installed and currently being used in operation lines. By aid of this dataset,we evaluate the prediction performance of the proposed algorithm by comparing its prediction skillswith respect to existing methods, such as the feature-based LOF algorithm, the stacked denoisingautoencoder, the sparse denoising autoencoder, and the gated recurrent unit-based sequence tosequence autoencoder. The results show that the proposed scheme not only has the ability toautomatically capture most effective features from the raw current signals, but also achieves superiordiagnosis accuracy compared to the existing methods.
The fault dataset, which we have termed Cu-3300, as well as the code file of theproposed scheme have been made available online at https://github.com/MichaelYin1994/SignalRepresentationAnalysis. To the best of our knowledge, Cu-3300 is the first open source datasetin the area of railway point machines and our fault analysis is the first to investigate the use ofautoencoders for fault diagnosis of point machines.
Appl. Sci. 2019, 9, 5139 3 of 17
The rest of the paper is organized as follows. Section 2 discusses the related work. The proposedfault diagnosis scheme is detailed in Section 3. Section 4 verifies the superior performance of theproposed scheme. Section 5 concludes the paper.
2. Related Works
Fault diagnosis of point machines has been widely addressed in urban rail transit. Traditionally,condition monitoring systems are applied to rail transit applications to ensure driving safety. In thesesystems, a simple threshold is designed to detect abnormal behavior, resulting in poor performance ofthe detection accuracy. To improve the condition monitoring system, much effort has been targetedtowards capturing the fault patterns. Shaw [19] investigated various point machines and explored coremeasurements for fault diagnosis. In this work, the electrical signals are considered to be the foremostfeature to study to infer the health condition of the point machine. Vileiniskis et al. [13] presented an earlydetection method in the measurement of the current signals. Using the similarity measure of edit distance,the one-class support vector machine is employed to seize the changes. Using the electric current as aparameter, Asada et al. [7] proposed a wavelet transform-based feature extraction scheme by which anaccurate health prediction was obtained. Aided by in-field current data, the authors of [14] proposed aclassification method to detect the replacement conditions. Sa et al. [11] focused on the aging effect ofthe point machine. This task is regarded as a binary-class classification problem. Similarly, the supportvector data description was applied. Different from the current data-based approach, the authors of [8]put forward a data mining scheme that employs audio data of the point machine. The scheme is capableof extracting mel-frequency cepstrum coefficients to reduced feature dimensions. The fault detectionaccuracy is reported to exceed 94.1%. The point machines’ gap was investigated in [10]. The proposededge detection algorithm has the advantage of overcoming the local intensity variation in gap images,which can effectively show the health condition of the point machines.
All the research discussed above are classification approaches, where the training process requiresprelabeled samples. These researches mentioned above can be categorized as the classificationapproach, where the training process is necessary with prelabeled samples. However, the lack ofavailable labeled data necessary for the training of the models used for anomaly detection techniquesis usually a major obstacle to apply such models. Kim et al. [12] pioneered a diagnosis method usingdynamic time warping to manage the variation of the current signals without training steps. Inspiredby the authors of [12], we attempt to solve the fault detection problem in a non-training way. In thispaper, the LOF algorithm is employed for fault detection.
Autoencoders have attracted attention in the field of fault diagnosis as replacements for anyhandcrafted features and expert knowledge incorporated in the traditional fault analysis approaches.Thirukovalluru et al. [20] presented a review on handcrafted based feature extraction algorithms andautoencoders. In this paper, a fault analysis was performed based on five different fault datasetsand it was demonstrated that the autoencoder methods performed best. A two-layer encoder wasproposed in [21], which was regularized by the contractive regularization and validated on artificiallyconstructed datasets. Using bearing and gearbox fault datasets, the authors of [4] showed that theautoencoder yields better classification performances than the support vector machine based methods.The authors of [22] used a parse autoencoder to obtain useful representations of different sensorsignals. The obtained representations were fed to train a deep belief network for fault classification.To address for unobserved working conditions, the authors of [23] developed a cross-domain stackeddenoising autoencoder. The maximum mean discrepancy was calculated to achieve effective marginaldistribution adaptation. Wu et al. [24] proposed a multilevel denoising autoencoder approach.By accounting for the effects of hyperparameters, their approach outperformed traditional approaches,such as Principal Component Analysis (PCA) and Fisher Discriminant Analysis. However, this effectiveautomatic feature learning technique has not been introduced in fault diagnosis of the railway pointmachine. Therefore in this paper, adapting the inherent characteristics of the point machine, we employ
Appl. Sci. 2019, 9, 5139 4 of 17
the locally connected autoencoder to locally capture any informative feature. Then, a weighting strategyis designed to integrate the extracted features into useful representations.
3. Methodology
3.1. Current Signals of Railway Point Machines
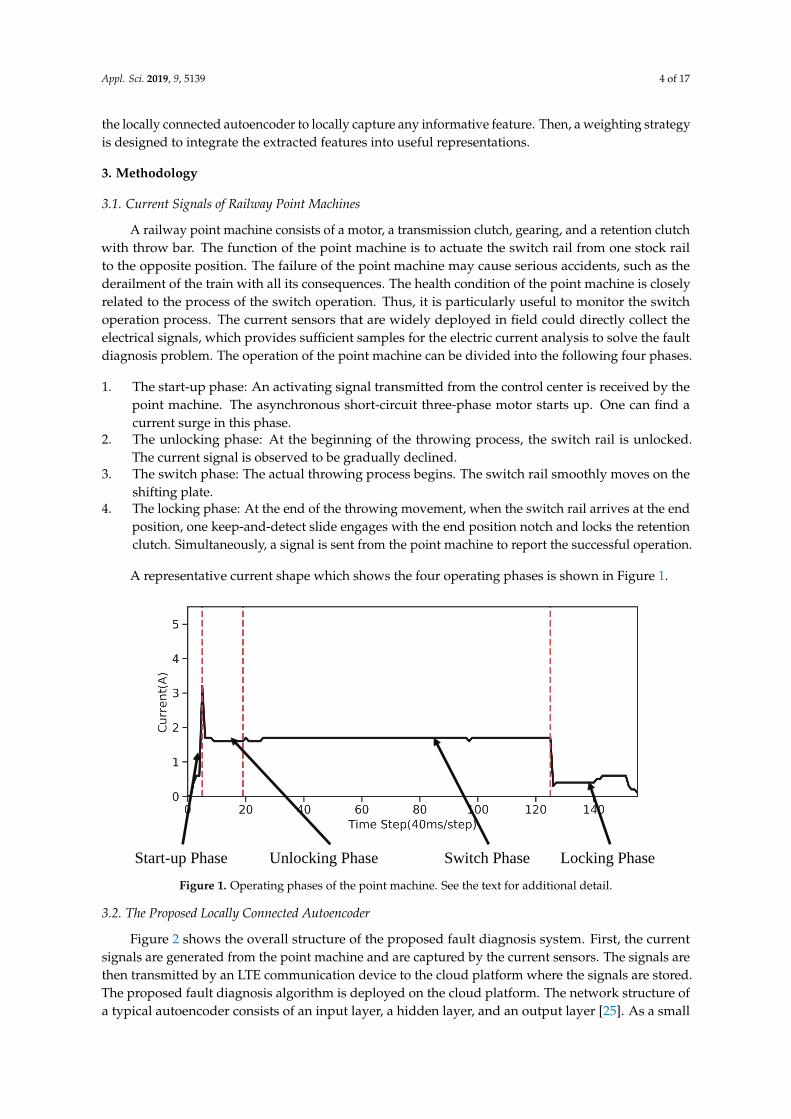
A railway point machine consists of a motor, a transmission clutch, gearing, and a retention clutchwith throw bar. The function of the point machine is to actuate the switch rail from one stock railto the opposite position. The failure of the point machine may cause serious accidents, such as thederailment of the train with all its consequences. The health condition of the point machine is closelyrelated to the process of the switch operation. Thus, it is particularly useful to monitor the switchoperation process. The current sensors that are widely deployed in field could directly collect theelectrical signals, which provides sufficient samples for the electric current analysis to solve the faultdiagnosis problem. The operation of the point machine can be divided into the following four phases.
1. The start-up phase: An activating signal transmitted from the control center is received by thepoint machine. The asynchronous short-circuit three-phase motor starts up. One can find acurrent surge in this phase.
2. The unlocking phase: At the beginning of the throwing process, the switch rail is unlocked.The current signal is observed to be gradually declined.
3. The switch phase: The actual throwing process begins. The switch rail smoothly moves on theshifting plate.
4. The locking phase: At the end of the throwing movement, when the switch rail arrives at the endposition, one keep-and-detect slide engages with the end position notch and locks the retentionclutch. Simultaneously, a signal is sent from the point machine to report the successful operation.
A representative current shape which shows the four operating phases is shown in Figure 1.
Start-up Phase Unlocking Phase Switch Phase Locking Phase
Figure 1. Operating phases of the point machine. See the text for additional detail.
3.2. The Proposed Locally Connected Autoencoder
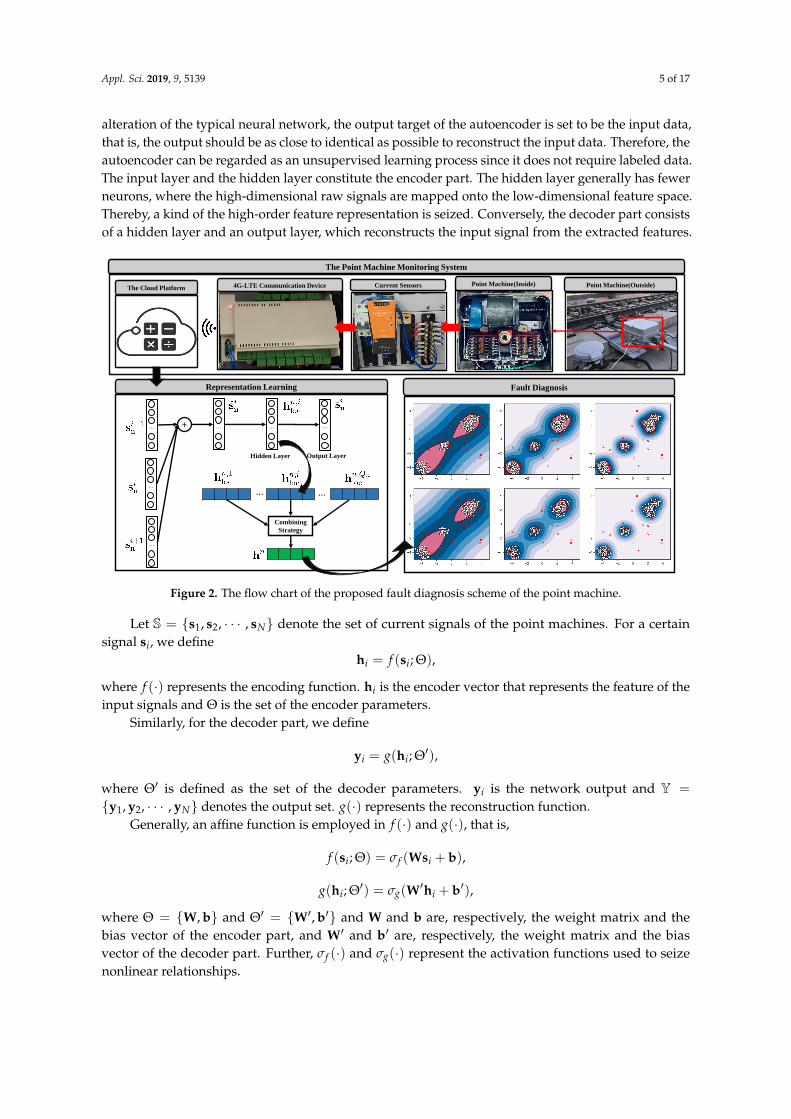
Figure 2 shows the overall structure of the proposed fault diagnosis system. First, the currentsignals are generated from the point machine and are captured by the current sensors. The signals arethen transmitted by an LTE communication device to the cloud platform where the signals are stored.The proposed fault diagnosis algorithm is deployed on the cloud platform. The network structure ofa typical autoencoder consists of an input layer, a hidden layer, and an output layer [25]. As a small
Appl. Sci. 2019, 9, 5139 5 of 17
alteration of the typical neural network, the output target of the autoencoder is set to be the input data,that is, the output should be as close to identical as possible to reconstruct the input data. Therefore, theautoencoder can be regarded as an unsupervised learning process since it does not require labeled data.The input layer and the hidden layer constitute the encoder part. The hidden layer generally has fewerneurons, where the high-dimensional raw signals are mapped onto the low-dimensional feature space.Thereby, a kind of the high-order feature representation is seized. Conversely, the decoder part consistsof a hidden layer and an output layer, which reconstructs the input signal from the extracted features.
The Point Machine Monitoring System
Point Machine(Inside)Current Sensors4G-LTE Communication Device Point Machine(Outside)The Cloud Platform
…
Representation Learning
…
… … …+ …
Output LayerHidden Layer
… …
Combining
Strategy
Fault Diagnosis
Figure 2. The flow chart of the proposed fault diagnosis scheme of the point machine.
Let S = {s1, s2, · · · , sN} denote the set of current signals of the point machines. For a certainsignal si, we define
hi = f (si; Θ),
where f (·) represents the encoding function. hi is the encoder vector that represents the feature of theinput signals and Θ is the set of the encoder parameters.
Similarly, for the decoder part, we define
yi = g(hi; Θ′),
where Θ′ is defined as the set of the decoder parameters. yi is the network output and Y =
{y1, y2, · · · , yN} denotes the output set. g(·) represents the reconstruction function.Generally, an affine function is employed in f (·) and g(·), that is,
f (si; Θ) = σf (Wsi + b),
g(hi; Θ′) = σg(W′hi + b′),
where Θ = {W, b} and Θ′ = {W′, b′} and W and b are, respectively, the weight matrix and thebias vector of the encoder part, and W′ and b′ are, respectively, the weight matrix and the biasvector of the decoder part. Further, σf (·) and σg(·) represent the activation functions used to seizenonlinear relationships.
Appl. Sci. 2019, 9, 5139 6 of 17
To describe the average differences (also termed as the reconstruction errors) between the outputsof the decoder part and the actual values, a loss function is defined and calculated as
minW,W′ ,b,b′
1N
N
∑i=1
L(si, σg(σf (si))), (1)
whereL(x, x′) = ‖x− x′‖2
2.
Note that in the above-mentioned autoencoder, each training sample is directly fed to the inputlayer. Thus, the extracted features are global descriptions that may lack the representation of localproperties. To enhance the local properties of the fault signals, we divide the raw signals into segmentsfor feature extraction. For each current signal sn in dataset S, sn ∈ R|sn |×1 denotes the nth signal with|sn| data points. The signal sn is equally segmented into Qn subsequences
sn = {s1n, s2
n, · · · , sQnn }, Qn = b|sn|/Mlocc,
where Mloc denotes the window size, sin ∈ RMloc×1, and i ∈ {1, 2, · · · , Qn}. Note that the number of
segments generated by sn may not be the same, as different signals typically consist of a differentnumber of points.
Different from the existing methods [21–24], to obtain richer feature representations, in this paper,we propose a new network structure—the locally connected autoencoder—to enhance the temporalcharacteristics by preserving the linear regularities among subsequences. Inspired by the word2vecmethod [17], we define
s̃in = si−1
n ⊕ sin ⊕ si+1
n , (2)
where ⊕ represents vector addition.Using Equation (2), we create a new dataset S̃ = {s̃1, s̃2, · · · , s̃N}, where
s̃n = {s̃1n, s̃2
n, · · · , s̃Qnn }.
s̃in is fed into the encoder and the locally connected encoder is used to extract the local feature
from sin.
We randomly select the segments s̃in ∈ RMloc×1 from the dataset S̃ to compose the local training
set. Then, W ∈ RKloc×Mloc , b ∈ RKloc×1, W′ ∈ RMloc×Kloc , and W′ ∈ RMloc×1 are trained in the network,where Kloc denotes the hidden size. In the encoder part, W and b are used to map s̃i
n into the featurespace, whereas W′ and b′ are employed to reconstruct s̃i
n. The minibatch gradient descent method isemployed with Ns samples. Equation (1) can be rewritten as
minW,W′ ,b,b′
1Ns
Ns
∑n=1‖σg[W′σf (Ws̃i
n + b) + b′]− sin‖2
2,
where σf (·) is defined as the hyperbolic tangent function, i.e., tanh(·), to capture the nonlinearrelationship, whereas σg(·) is set as the linear function. The hyperbolic tangent function can be written as
tanh(x) =ex − e−x
ex + e−x .
The backpropagation algorithm and minibatch gradient descent method are used to train andupdate all the parameters to reduce the reconstruction error, where the Adam optimizer is adopted.In addition, the early stopping mechanism is used to limit overfitting. The derivations of the trainingprocess are not covered in this paper due to space restrictions. One can refer to the work in [25] for adetailed description.
Appl. Sci. 2019, 9, 5139 7 of 17
After the training process, the local feature hn,iloc ∈ RKloc×1 of the segment s̃i
n can be calculated as
hn,iloc = tanh[W(si−1
n ⊕ sin ⊕ si+1
n ) + b].
The encoding result hn,iloc preserves useful information of the segment si
n and can be used to formthe representation of the original signal sn.
3.3. The Proposed Weighting Strategy
In the autoencoder-based method hn,iloc is designed as the high-order feature with Kloc < Mloc,
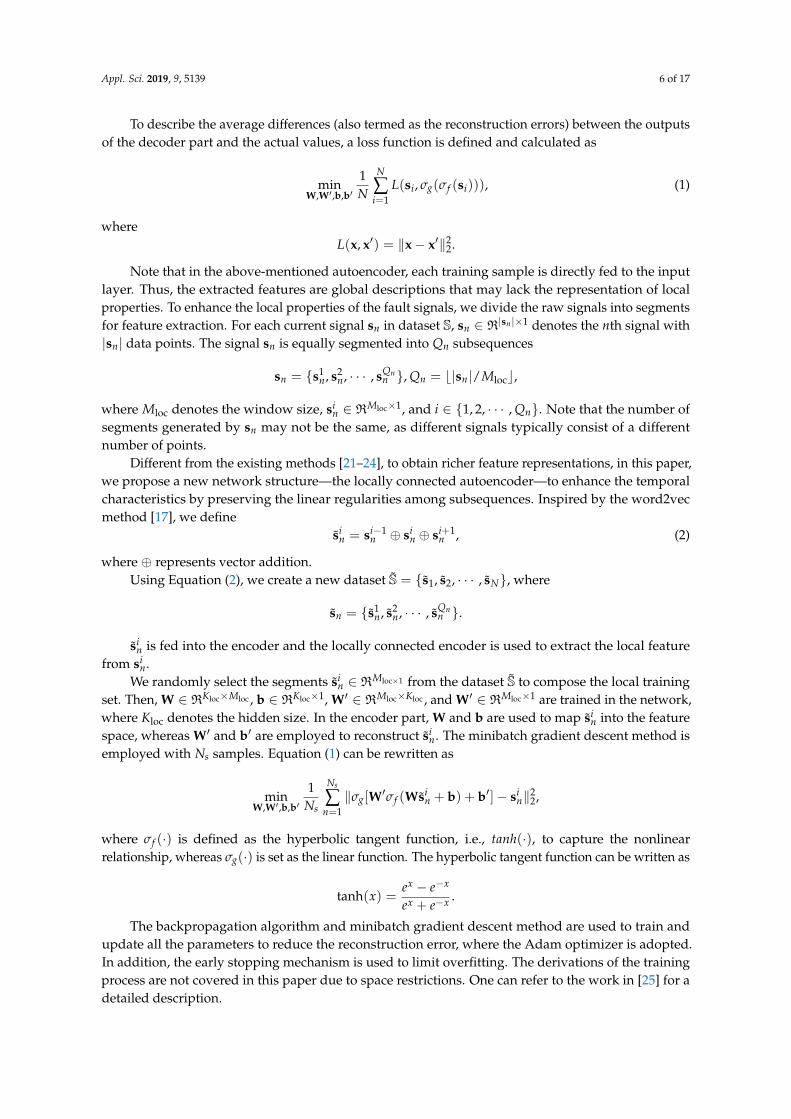
which is automatically extracted. In [15], the simple average strategy is used to combine the localfeatures into a final representation. Although sometimes the average strategy is appropriate to use,often it will have a bad influence on the final signal representations of the point machine, as differentsubsequences contain typically very different amounts of information. For example, the subsequencesrelated to the switch phase may contain less useful information then the other stages, as the currentsignal remains at an almost constant level. To obtain more effective final feature representations,we proposed a weighting strategy as depicted in Figure 3 and explained below.
Segment ID 0 1 2 … 16517
Variance 0.22 0.01 0.87 … 1.20
Bin Frequency 0.89 0.89 0.05 … 0.041
Segments Variance Distribution
Local Features
Signal Hidden
Representation
0.20 … 0.12 0.46 0.43 … 0.42 0.46 0.90 … 0.02 0.25
0.51 … 0.55 0.39
… …
0.01 … 0.29 … 0.19
+
Weighting
Function
Figure 3. The proposed weighting strategy.
For a certain subsequence sin = [si,1
n , si,2n , · · · , si,Mloc
n ], the segment variance is calculated as
vin =
∑Mlocj=1 (si,j
n − µin)
2
Mloc,
where µin =
∑Mlocj=1 si,j
n
Mloc. Then, we create a variance dataset SVar defined by SVar = {v1, v2, · · · , vN},
where vn = {v1n, v2
n, · · · , vQnn }.
Then, the variance dataset SVar is equally divided into L bins, where SVar = {S1Var,S2
Var, · · · ,SLVar}.
We define a parameter ρ to describe the bin frequency, where ρl denotes the number of varianceslocated in Sl
Var.A weighting function is designed as
ω(sin) =
21 + eα·ρl
, if vin ∈ Sl
Var.
Appl. Sci. 2019, 9, 5139 8 of 17
Here, α is defined as the tuning parameter. Then, the final hidden representation of a certaincurrent signal sn is calculated as
hn =∑Qn
i=1 ω(sin)h
n,iloc
Qn.
By aid of this analysis, it is clear that the high-order representation hn is captured from sn by thelocally connected autoencoder and the weighting strategy.
For the sake of high robustness and easy implementation, we employ the local outlier factor (LOF)algorithm for fault diagnosis using hn. By conducting a representation dataset H = {h1, h2, · · · , hN},the radius of the smallest hypersphere is calculated that contains the k nearest neighbors. The localdensity is then computed, where a fault signal will have lower local density. One can refer to thework [26] for detailed steps.
4. Fault Data Analysis
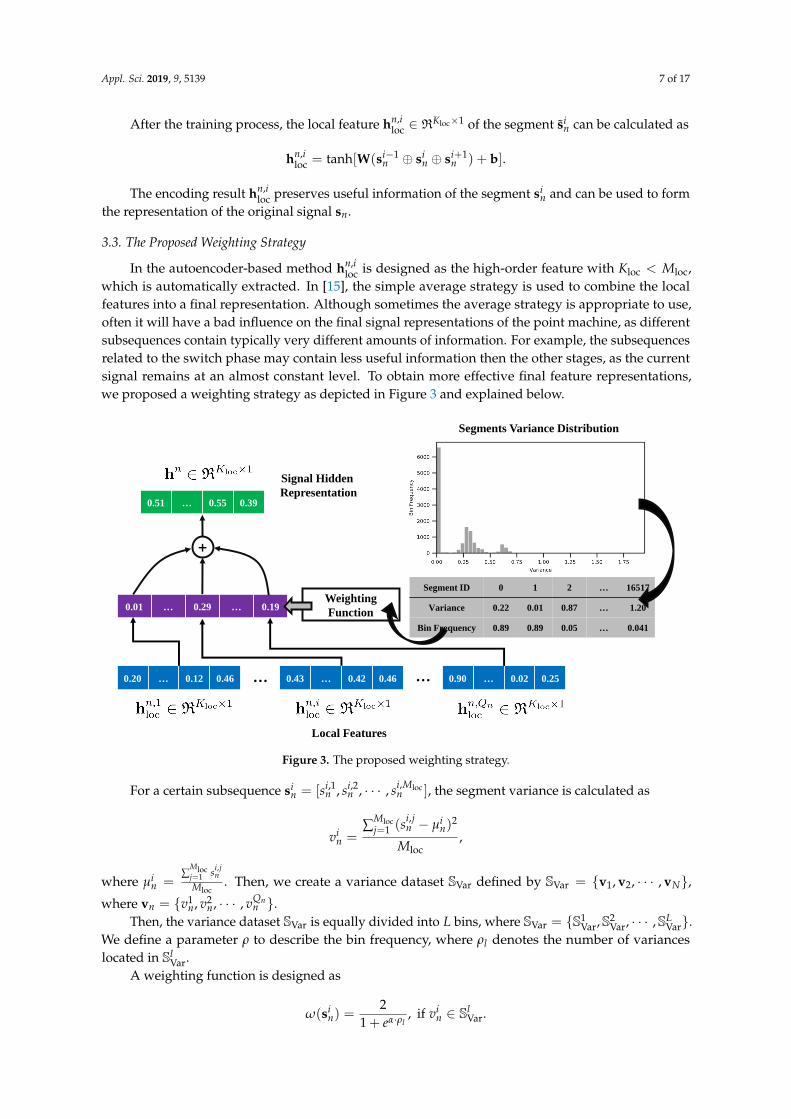
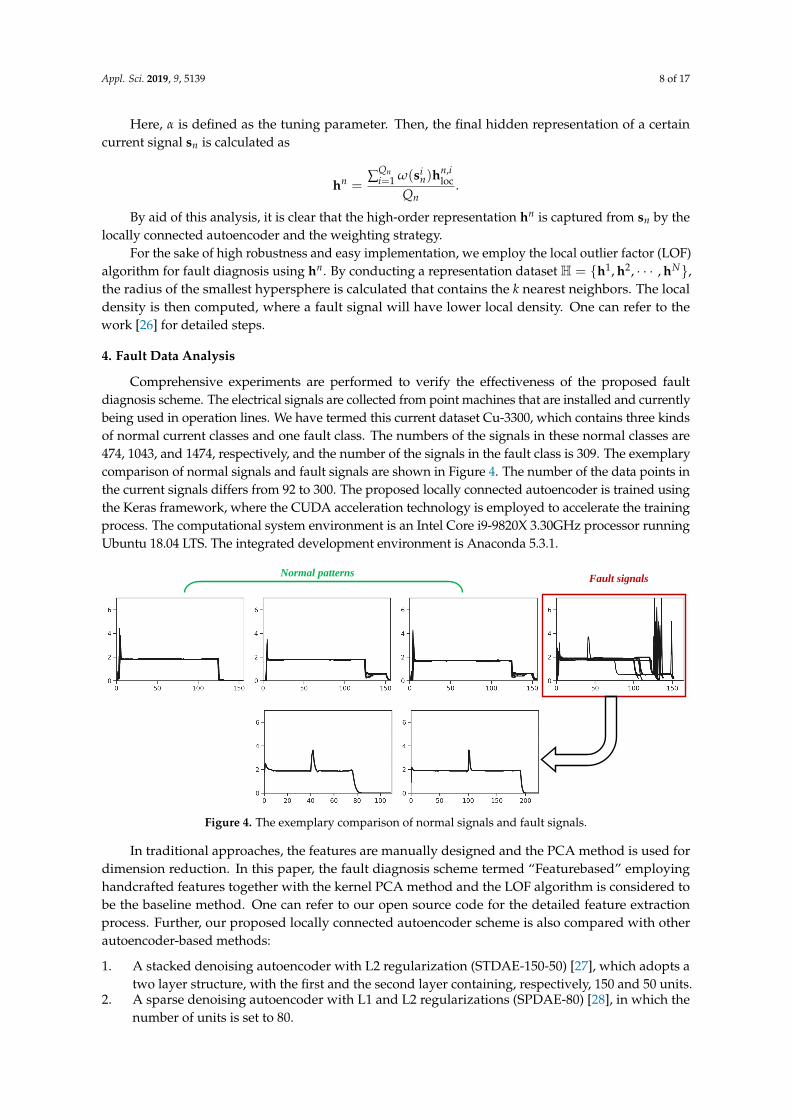
Comprehensive experiments are performed to verify the effectiveness of the proposed faultdiagnosis scheme. The electrical signals are collected from point machines that are installed and currentlybeing used in operation lines. We have termed this current dataset Cu-3300, which contains three kindsof normal current classes and one fault class. The numbers of the signals in these normal classes are474, 1043, and 1474, respectively, and the number of the signals in the fault class is 309. The exemplarycomparison of normal signals and fault signals are shown in Figure 4. The number of the data points inthe current signals differs from 92 to 300. The proposed locally connected autoencoder is trained usingthe Keras framework, where the CUDA acceleration technology is employed to accelerate the trainingprocess. The computational system environment is an Intel Core i9-9820X 3.30GHz processor runningUbuntu 18.04 LTS. The integrated development environment is Anaconda 5.3.1.
Normal patternsFault signals
Figure 4. The exemplary comparison of normal signals and fault signals.
In traditional approaches, the features are manually designed and the PCA method is used fordimension reduction. In this paper, the fault diagnosis scheme termed “Featurebased” employinghandcrafted features together with the kernel PCA method and the LOF algorithm is considered tobe the baseline method. One can refer to our open source code for the detailed feature extractionprocess. Further, our proposed locally connected autoencoder scheme is also compared with otherautoencoder-based methods:
1. A stacked denoising autoencoder with L2 regularization (STDAE-150-50) [27], which adopts atwo layer structure, with the first and the second layer containing, respectively, 150 and 50 units.
2. A sparse denoising autoencoder with L1 and L2 regularizations (SPDAE-80) [28], in which thenumber of units is set to 80.
Appl. Sci. 2019, 9, 5139 9 of 17
3. Two gated recurrent unit-based sequence to sequence autoencoders [29]. In the network structure,100 units are employed in the encoder as well as the decoder. The autoencoders with 40 hiddenunits and 70 hidden units are named as GRU-40 and GRU-70, respectively.
4. The proposed fault diagnosis scheme without the weighting strategy.
4.1. Feature Representations of Different Approaches
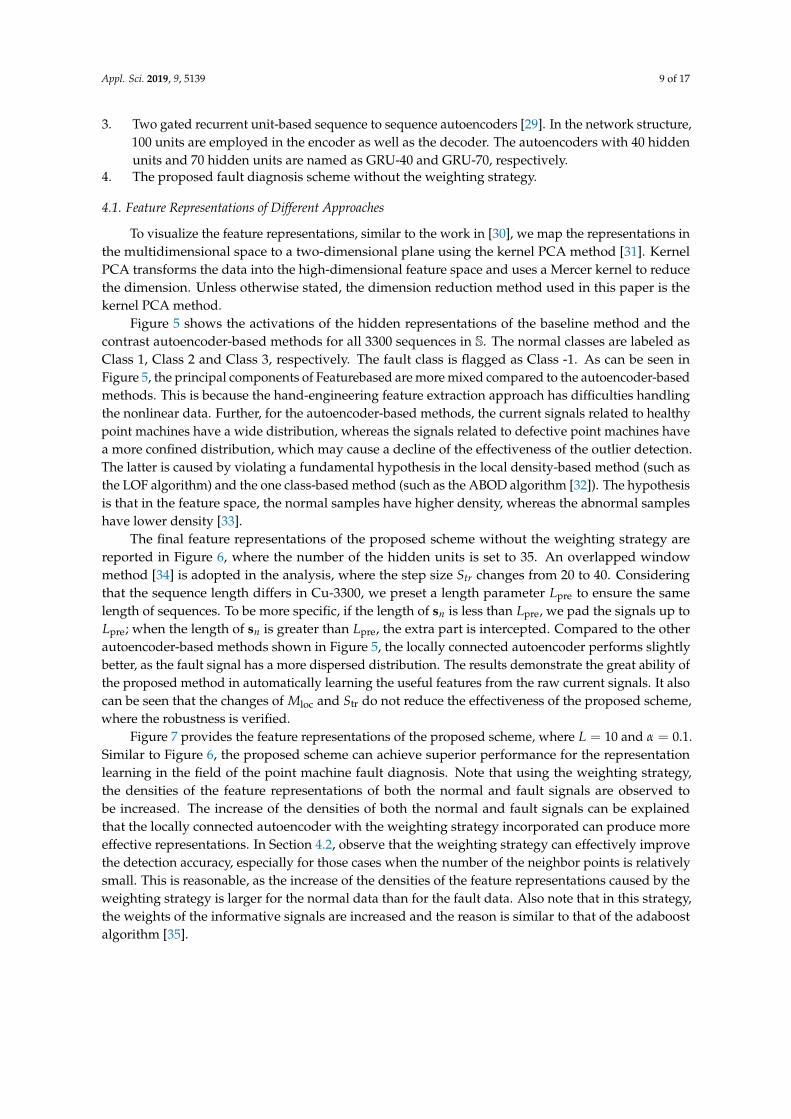
To visualize the feature representations, similar to the work in [30], we map the representations inthe multidimensional space to a two-dimensional plane using the kernel PCA method [31]. KernelPCA transforms the data into the high-dimensional feature space and uses a Mercer kernel to reducethe dimension. Unless otherwise stated, the dimension reduction method used in this paper is thekernel PCA method.
Figure 5 shows the activations of the hidden representations of the baseline method and thecontrast autoencoder-based methods for all 3300 sequences in S. The normal classes are labeled asClass 1, Class 2 and Class 3, respectively. The fault class is flagged as Class -1. As can be seen inFigure 5, the principal components of Featurebased are more mixed compared to the autoencoder-basedmethods. This is because the hand-engineering feature extraction approach has difficulties handlingthe nonlinear data. Further, for the autoencoder-based methods, the current signals related to healthypoint machines have a wide distribution, whereas the signals related to defective point machines havea more confined distribution, which may cause a decline of the effectiveness of the outlier detection.The latter is caused by violating a fundamental hypothesis in the local density-based method (such asthe LOF algorithm) and the one class-based method (such as the ABOD algorithm [32]). The hypothesisis that in the feature space, the normal samples have higher density, whereas the abnormal sampleshave lower density [33].
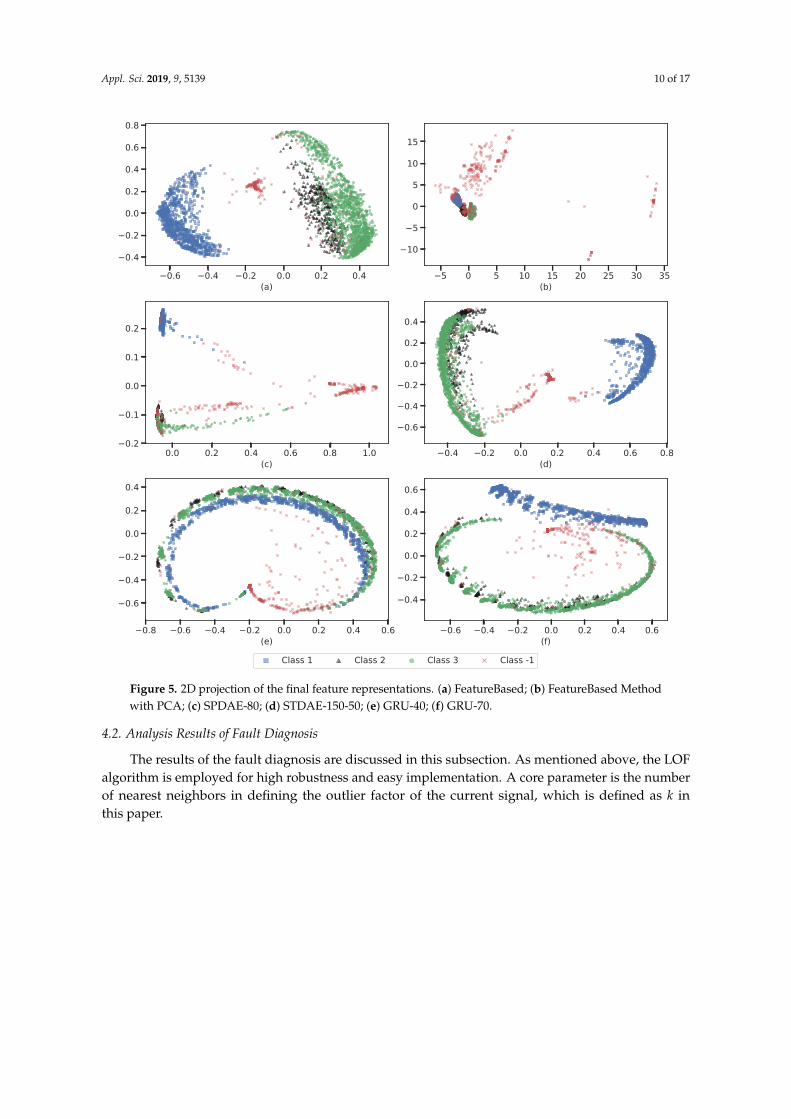
The final feature representations of the proposed scheme without the weighting strategy arereported in Figure 6, where the number of the hidden units is set to 35. An overlapped windowmethod [34] is adopted in the analysis, where the step size Str changes from 20 to 40. Consideringthat the sequence length differs in Cu-3300, we preset a length parameter Lpre to ensure the samelength of sequences. To be more specific, if the length of sn is less than Lpre, we pad the signals up toLpre; when the length of sn is greater than Lpre, the extra part is intercepted. Compared to the otherautoencoder-based methods shown in Figure 5, the locally connected autoencoder performs slightlybetter, as the fault signal has a more dispersed distribution. The results demonstrate the great ability ofthe proposed method in automatically learning the useful features from the raw current signals. It alsocan be seen that the changes of Mloc and Str do not reduce the effectiveness of the proposed scheme,where the robustness is verified.
Figure 7 provides the feature representations of the proposed scheme, where L = 10 and α = 0.1.Similar to Figure 6, the proposed scheme can achieve superior performance for the representationlearning in the field of the point machine fault diagnosis. Note that using the weighting strategy,the densities of the feature representations of both the normal and fault signals are observed tobe increased. The increase of the densities of both the normal and fault signals can be explainedthat the locally connected autoencoder with the weighting strategy incorporated can produce moreeffective representations. In Section 4.2, observe that the weighting strategy can effectively improvethe detection accuracy, especially for those cases when the number of the neighbor points is relativelysmall. This is reasonable, as the increase of the densities of the feature representations caused by theweighting strategy is larger for the normal data than for the fault data. Also note that in this strategy,the weights of the informative signals are increased and the reason is similar to that of the adaboostalgorithm [35].
Appl. Sci. 2019, 9, 5139 10 of 17
0.6 0.4 0.2 0.0 0.2 0.4(a)
0.4
0.2
0.0
0.2
0.4
0.6
0.8
5 0 5 10 15 20 25 30 35(b)
10
5
0
5
10
15
0.0 0.2 0.4 0.6 0.8 1.0(c)
0.2
0.1
0.0
0.1
0.2
0.4 0.2 0.0 0.2 0.4 0.6 0.8(d)
0.6
0.4
0.2
0.0
0.2
0.4
0.8 0.6 0.4 0.2 0.0 0.2 0.4 0.6(e)
0.6
0.4
0.2
0.0
0.2
0.4
0.6 0.4 0.2 0.0 0.2 0.4 0.6(f)
0.4
0.2
0.0
0.2
0.4
0.6
Class 1 Class 2 Class 3 Class -1
Figure 5. 2D projection of the final feature representations. (a) FeatureBased; (b) FeatureBased Methodwith PCA; (c) SPDAE-80; (d) STDAE-150-50; (e) GRU-40; (f) GRU-70.
4.2. Analysis Results of Fault Diagnosis
The results of the fault diagnosis are discussed in this subsection. As mentioned above, the LOFalgorithm is employed for high robustness and easy implementation. A core parameter is the numberof nearest neighbors in defining the outlier factor of the current signal, which is defined as k inthis paper.
Appl. Sci. 2019, 9, 5139 11 of 17
0.6 0.4 0.2 0.0 0.2 0.4(a)
0.6
0.4
0.2
0.0
0.2
0.4
0.4 0.2 0.0 0.2 0.4 0.6(b)
0.2
0.0
0.2
0.4
0.6
0.8
1.0
0.4 0.2 0.0 0.2 0.4 0.6(c)
0.0
0.2
0.4
0.6
0.8
1.0
1.2
0.3 0.2 0.1 0.0 0.1 0.2 0.3 0.4 0.5(d)
0.2
0.0
0.2
0.4
0.6
0.8
1.0
1.2
0.6 0.4 0.2 0.0 0.2 0.4(e)
0.2
0.0
0.2
0.4
0.6
0.6 0.4 0.2 0.0 0.2 0.4(f)
0.0
0.2
0.4
0.6
0.8
1.0
1.2
Class 1 Class 2 Class 3 Class -1
Figure 6. 2D projection of the final feature representations of the proposed scheme without theweighting strategy. (a) Mloc = 20 = Str = 20; (b) Mloc = Str = 30; (c) Mloc = Str = 40 ; (d) Mloc = 40,Str = 10; (e) Mloc = 40, Str = 20; (f) Mloc = 40, Str = 30.
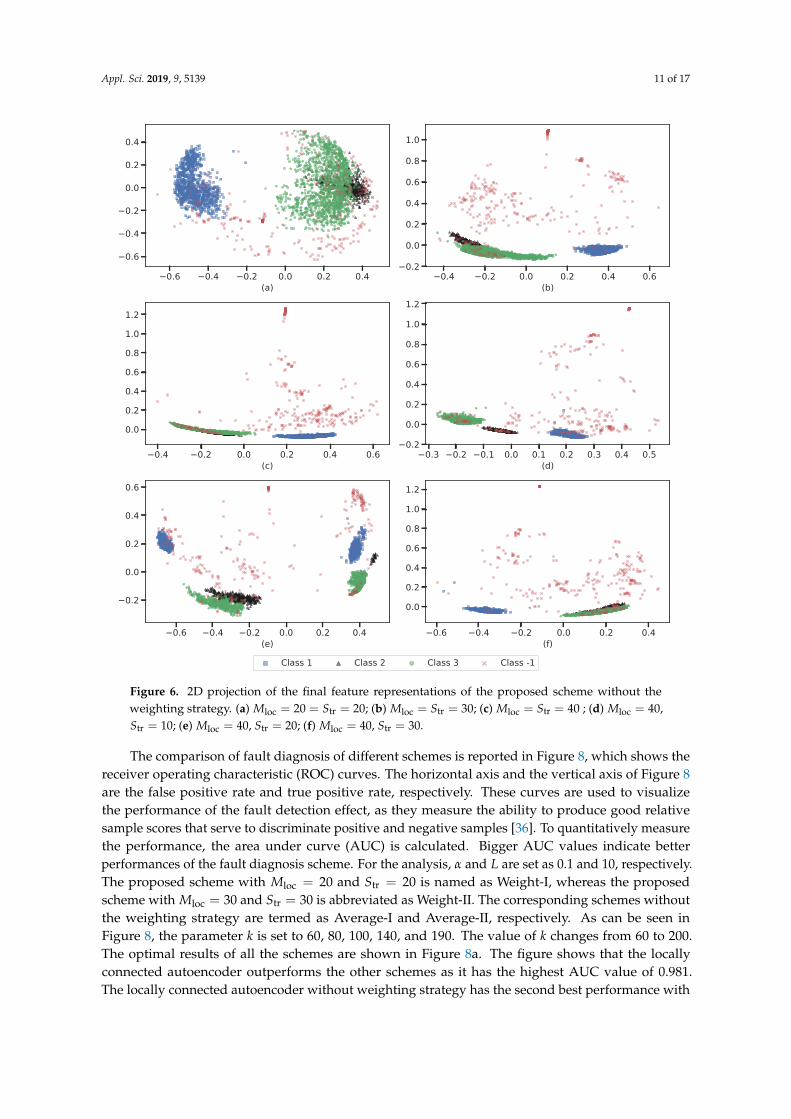
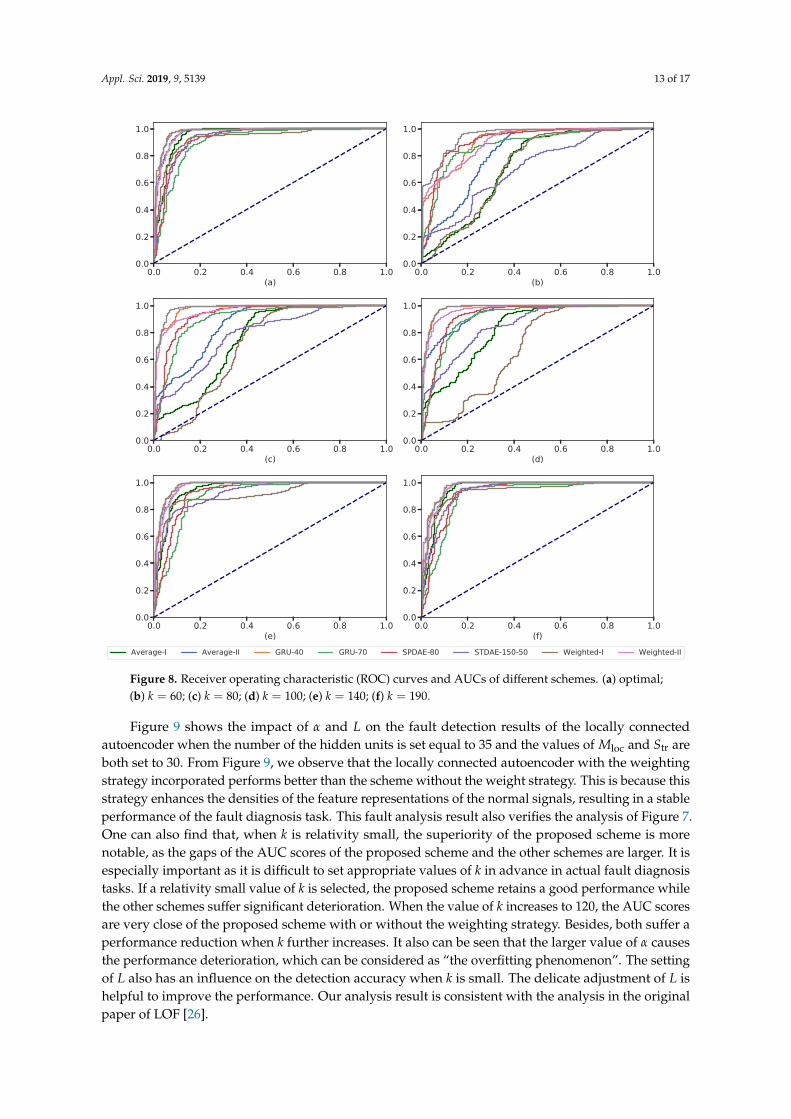
The comparison of fault diagnosis of different schemes is reported in Figure 8, which shows thereceiver operating characteristic (ROC) curves. The horizontal axis and the vertical axis of Figure 8are the false positive rate and true positive rate, respectively. These curves are used to visualizethe performance of the fault detection effect, as they measure the ability to produce good relativesample scores that serve to discriminate positive and negative samples [36]. To quantitatively measurethe performance, the area under curve (AUC) is calculated. Bigger AUC values indicate betterperformances of the fault diagnosis scheme. For the analysis, α and L are set as 0.1 and 10, respectively.The proposed scheme with Mloc = 20 and Str = 20 is named as Weight-I, whereas the proposedscheme with Mloc = 30 and Str = 30 is abbreviated as Weight-II. The corresponding schemes withoutthe weighting strategy are termed as Average-I and Average-II, respectively. As can be seen inFigure 8, the parameter k is set to 60, 80, 100, 140, and 190. The value of k changes from 60 to 200.The optimal results of all the schemes are shown in Figure 8a. The figure shows that the locallyconnected autoencoder outperforms the other schemes as it has the highest AUC value of 0.981.The locally connected autoencoder without weighting strategy has the second best performance with

Appl. Sci. 2019, 9, 5139 12 of 17
an AUC value of 0.979. The AUC scores of these schemes are listed in Table 1. Note that the schemewith the best performance is marked in bold in this table.
0.6 0.4 0.2 0.0 0.2 0.4(a)
0.2
0.0
0.2
0.4
0.6
0.8
1.0
0.4 0.2 0.0 0.2 0.4(b)
0.0
0.2
0.4
0.6
0.8
1.0
0.2 0.0 0.2 0.4 0.6(c)
1.2
1.0
0.8
0.6
0.4
0.2
0.0
1.0 0.8 0.6 0.4 0.2 0.0(d)
0.4
0.2
0.0
0.2
0.4
0.6 0.4 0.2 0.0 0.2 0.4 0.6(e)
0.2
0.0
0.2
0.4
0.6
0.6 0.4 0.2 0.0 0.2(f)
1.0
0.8
0.6
0.4
0.2
0.0
0.2
Class 1 Class 2 Class 3 Class -1
Figure 7. 2D projection of the final feature representations of the proposed scheme. (a) Mloc = 20 =
Str = 20; (b) Mloc = Str = 30; (c) Mloc = Str = 40; (d) Mloc = 40, Str = 10; (e) Mloc = 40, Str = 20;(f) Mloc = 40, Str = 30.
Appl. Sci. 2019, 9, 5139 13 of 17
0.0 0.2 0.4 0.6 0.8 1.0(a)
0.0
0.2
0.4
0.6
0.8
1.0
0.0 0.2 0.4 0.6 0.8 1.0(b)
0.0
0.2
0.4
0.6
0.8
1.0
0.0 0.2 0.4 0.6 0.8 1.0(c)
0.0
0.2
0.4
0.6
0.8
1.0
0.0 0.2 0.4 0.6 0.8 1.0(d)
0.0
0.2
0.4
0.6
0.8
1.0
0.0 0.2 0.4 0.6 0.8 1.0(e)
0.0
0.2
0.4
0.6
0.8
1.0
0.0 0.2 0.4 0.6 0.8 1.0(f)
0.0
0.2
0.4
0.6
0.8
1.0
Average-I Average-II GRU-40 GRU-70 SPDAE-80 STDAE-150-50 Weighted-I Weighted-II
Figure 8. Receiver operating characteristic (ROC) curves and AUCs of different schemes. (a) optimal;(b) k = 60; (c) k = 80; (d) k = 100; (e) k = 140; (f) k = 190.
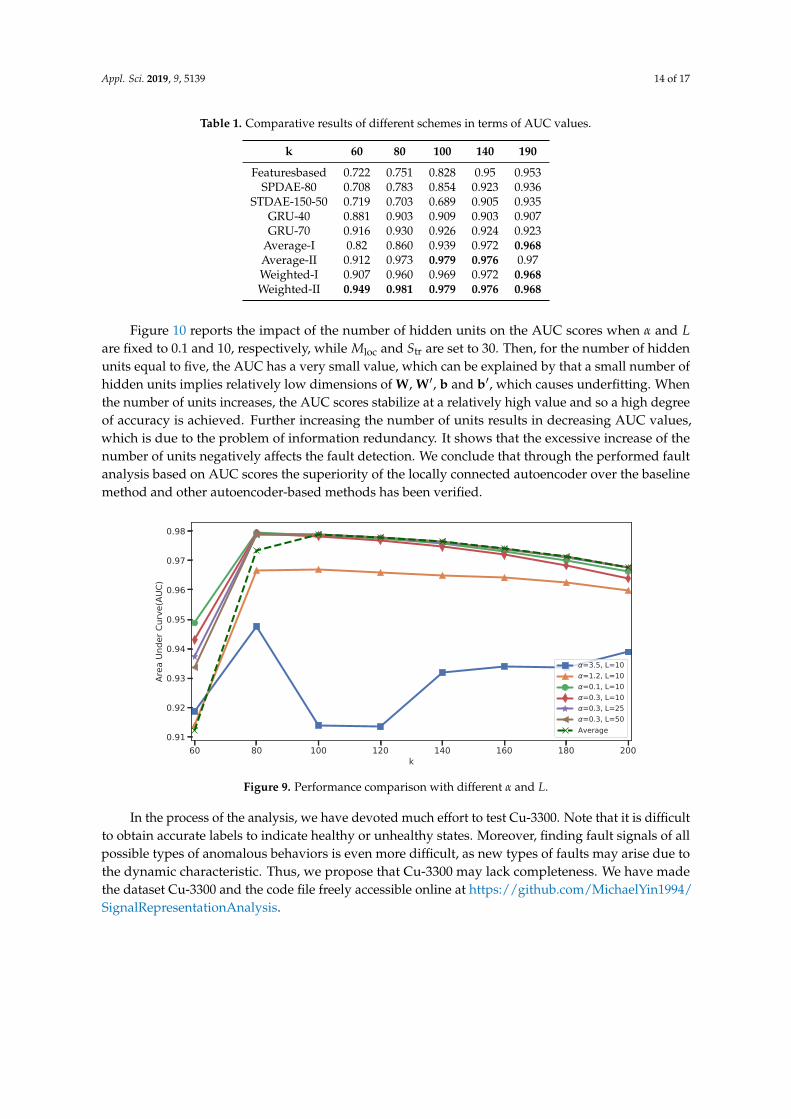
Figure 9 shows the impact of α and L on the fault detection results of the locally connectedautoencoder when the number of the hidden units is set equal to 35 and the values of Mloc and Str areboth set to 30. From Figure 9, we observe that the locally connected autoencoder with the weightingstrategy incorporated performs better than the scheme without the weight strategy. This is because thisstrategy enhances the densities of the feature representations of the normal signals, resulting in a stableperformance of the fault diagnosis task. This fault analysis result also verifies the analysis of Figure 7.One can also find that, when k is relativity small, the superiority of the proposed scheme is morenotable, as the gaps of the AUC scores of the proposed scheme and the other schemes are larger. It isespecially important as it is difficult to set appropriate values of k in advance in actual fault diagnosistasks. If a relativity small value of k is selected, the proposed scheme retains a good performance whilethe other schemes suffer significant deterioration. When the value of k increases to 120, the AUC scoresare very close of the proposed scheme with or without the weighting strategy. Besides, both suffer aperformance reduction when k further increases. It also can be seen that the larger value of α causesthe performance deterioration, which can be considered as “the overfitting phenomenon”. The settingof L also has an influence on the detection accuracy when k is small. The delicate adjustment of L ishelpful to improve the performance. Our analysis result is consistent with the analysis in the originalpaper of LOF [26].
Appl. Sci. 2019, 9, 5139 14 of 17
Table 1. Comparative results of different schemes in terms of AUC values.
k 60 80 100 140 190
Featuresbased 0.722 0.751 0.828 0.95 0.953SPDAE-80 0.708 0.783 0.854 0.923 0.936
STDAE-150-50 0.719 0.703 0.689 0.905 0.935GRU-40 0.881 0.903 0.909 0.903 0.907GRU-70 0.916 0.930 0.926 0.924 0.923
Average-I 0.82 0.860 0.939 0.972 0.968Average-II 0.912 0.973 0.979 0.976 0.97Weighted-I 0.907 0.960 0.969 0.972 0.968Weighted-II 0.949 0.981 0.979 0.976 0.968
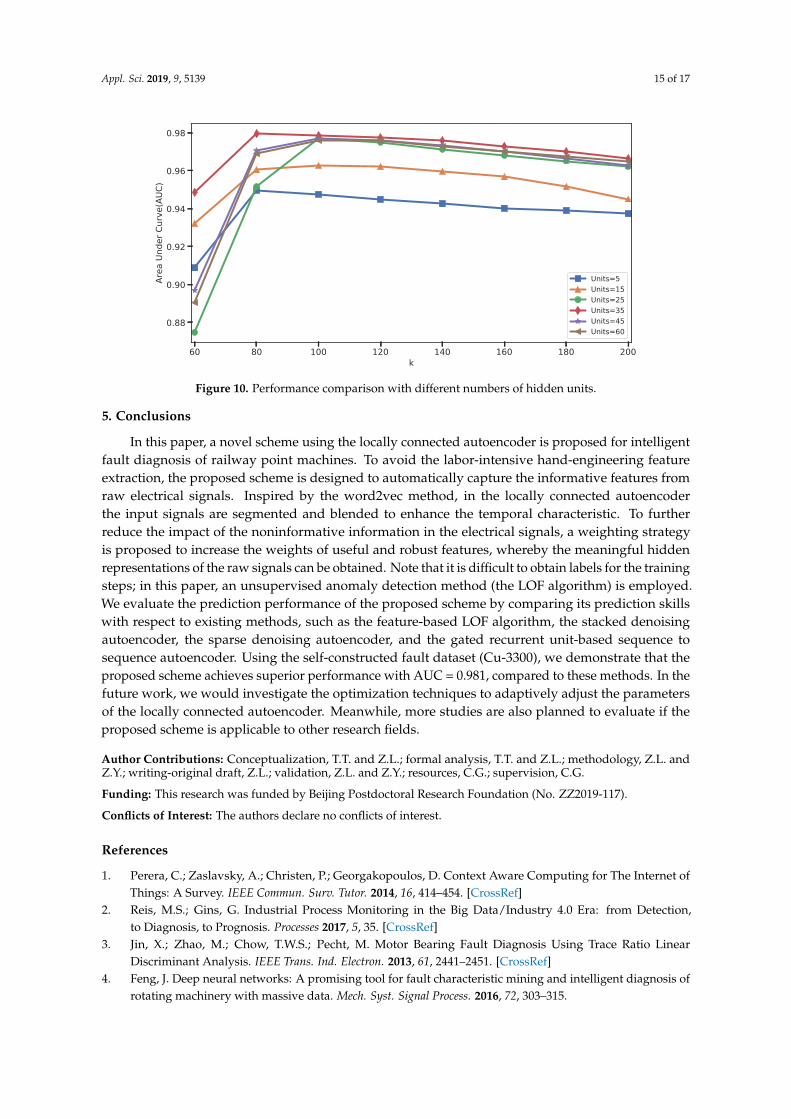
Figure 10 reports the impact of the number of hidden units on the AUC scores when α and Lare fixed to 0.1 and 10, respectively, while Mloc and Str are set to 30. Then, for the number of hiddenunits equal to five, the AUC has a very small value, which can be explained by that a small number ofhidden units implies relatively low dimensions of W, W′, b and b′, which causes underfitting. Whenthe number of units increases, the AUC scores stabilize at a relatively high value and so a high degreeof accuracy is achieved. Further increasing the number of units results in decreasing AUC values,which is due to the problem of information redundancy. It shows that the excessive increase of thenumber of units negatively affects the fault detection. We conclude that through the performed faultanalysis based on AUC scores the superiority of the locally connected autoencoder over the baselinemethod and other autoencoder-based methods has been verified.
60 80 100 120 140 160 180 200k
0.91
0.92
0.93
0.94
0.95
0.96
0.97
0.98
Area
Und
er C
urve
(AUC
)
=3.5, L=10=1.2, L=10=0.1, L=10=0.3, L=10=0.3, L=25=0.3, L=50
Average
Figure 9. Performance comparison with different α and L.
In the process of the analysis, we have devoted much effort to test Cu-3300. Note that it is difficultto obtain accurate labels to indicate healthy or unhealthy states. Moreover, finding fault signals of allpossible types of anomalous behaviors is even more difficult, as new types of faults may arise due tothe dynamic characteristic. Thus, we propose that Cu-3300 may lack completeness. We have madethe dataset Cu-3300 and the code file freely accessible online at https://github.com/MichaelYin1994/SignalRepresentationAnalysis.
Appl. Sci. 2019, 9, 5139 15 of 17
60 80 100 120 140 160 180 200k
0.88
0.90
0.92
0.94
0.96
0.98
Area
Und
er C
urve
(AUC
)
Units=5Units=15Units=25Units=35Units=45Units=60
Figure 10. Performance comparison with different numbers of hidden units.
5. Conclusions
In this paper, a novel scheme using the locally connected autoencoder is proposed for intelligentfault diagnosis of railway point machines. To avoid the labor-intensive hand-engineering featureextraction, the proposed scheme is designed to automatically capture the informative features fromraw electrical signals. Inspired by the word2vec method, in the locally connected autoencoderthe input signals are segmented and blended to enhance the temporal characteristic. To furtherreduce the impact of the noninformative information in the electrical signals, a weighting strategyis proposed to increase the weights of useful and robust features, whereby the meaningful hiddenrepresentations of the raw signals can be obtained. Note that it is difficult to obtain labels for the trainingsteps; in this paper, an unsupervised anomaly detection method (the LOF algorithm) is employed.We evaluate the prediction performance of the proposed scheme by comparing its prediction skillswith respect to existing methods, such as the feature-based LOF algorithm, the stacked denoisingautoencoder, the sparse denoising autoencoder, and the gated recurrent unit-based sequence tosequence autoencoder. Using the self-constructed fault dataset (Cu-3300), we demonstrate that theproposed scheme achieves superior performance with AUC = 0.981, compared to these methods. In thefuture work, we would investigate the optimization techniques to adaptively adjust the parametersof the locally connected autoencoder. Meanwhile, more studies are also planned to evaluate if theproposed scheme is applicable to other research fields.
Author Contributions: Conceptualization, T.T. and Z.L.; formal analysis, T.T. and Z.L.; methodology, Z.L. andZ.Y.; writing-original draft, Z.L.; validation, Z.L. and Z.Y.; resources, C.G.; supervision, C.G.
Funding: This research was funded by Beijing Postdoctoral Research Foundation (No. ZZ2019-117).
Conflicts of Interest: The authors declare no conflicts of interest.
References
1. Perera, C.; Zaslavsky, A.; Christen, P.; Georgakopoulos, D. Context Aware Computing for The Internet ofThings: A Survey. IEEE Commun. Surv. Tutor. 2014, 16, 414–454. [CrossRef]
2. Reis, M.S.; Gins, G. Industrial Process Monitoring in the Big Data/Industry 4.0 Era: from Detection,to Diagnosis, to Prognosis. Processes 2017, 5, 35. [CrossRef]
3. Jin, X.; Zhao, M.; Chow, T.W.S.; Pecht, M. Motor Bearing Fault Diagnosis Using Trace Ratio LinearDiscriminant Analysis. IEEE Trans. Ind. Electron. 2013, 61, 2441–2451. [CrossRef]
4. Feng, J. Deep neural networks: A promising tool for fault characteristic mining and intelligent diagnosis ofrotating machinery with massive data. Mech. Syst. Signal Process. 2016, 72, 303–315.
Appl. Sci. 2019, 9, 5139 16 of 17
5. Pacheco, F.; Oliveira, J.V.D.; Sanchez, R.V.; Cerrada, M.; Cabrera, D.; Li, C.; Zurita, G.; Artes, M. A statisticalcomparison of neuroclassifiers and feature selection methods for gearbox fault diagnosis under realisticconditions. Neurocomputing 2016, 194, 192–206. [CrossRef]
6. Famurewa, S.M.; Zhang, L.; Asplund, M. Maintenance analytics for railway infrastructure decision support.J. Qual. Maint. Eng. 2017, 23, 310–325. [CrossRef]
7. Asada, T.; Roberts, C.; Koseki, T. An algorithm for improved performance of railway condition monitoringequipment: Alternating-current point machine case study. Transp. Res. Part Emerg. Technol. 2013, 30, 81–92.[CrossRef]
8. Lee, J.; Choi, H.; Park, D.; Chung, Y.; Kim, H.Y.; Yoon, S. Fault Detection and Diagnosis of Railway PointMachines by Sound Analysis. Sensors 2016, 16, 549. [CrossRef]
9. Xu, T.; Wang, H.; Yuan, T.; Zhou, M. BDD-Based Synthesis of Fail-Safe Supervisory Controllers forSafety-Critical Discrete Event Systems. IEEE Trans. Intell. Transp. Syst. 2016, 17, 2385–2394. [CrossRef]
10. Xu, T.; Wang, G.; Wang, H.; Yuan, T.; Zhong, Z. Gap Measurement of Point Machine Using Adaptive WaveletThreshold and Mathematical Morphology. Sensors 2016, 16, 2006. [CrossRef]
11. Sa, J.; Choi, Y.; Chung, Y.; Lee, J.; Park, D. Aging Detection of Electrical Point Machines Based on SupportVector Data Description. Symmetry 2017, 9, 290. [CrossRef]
12. Kim, H.; Sa, J.; Chung, Y.; Park, D.; Yoon, S. Fault diagnosis of railway point machines using dynamic timewarping. Electron. Lett. 2016, 52, 818–819. [CrossRef]
13. Vileiniskis, M.; Remenyte Prescott, R.; Rama, D. A fault detection method for railway point systems. Proc. Inst.Mech. Eng. Part F: J. Rail Rapid Transit 2018, 230, 852–865. [CrossRef]
14. Sa, J.; Choi, Y.; Chung, Y.; Kim, H.Y.; Park, D.; Yoon, S. Replacement Condition Detection of Railway PointMachines Using an Electric Current Sensor. Sensors 2017, 17, 263. [CrossRef]
15. Feng, J.; Lei, Y.; Guo, L.; Lin, J.; Xing, S. A neural network constructed by deep learning technique and itsapplication to intelligent fault diagnosis of machines. Neurocomputing 2017, 272, 619–628.
16. Kim, J.; Kim, H.; Park, D.; Chung, Y. Modelling of fault in RPM using the GLARMA and INGARCH model.Electron. Lett. 2018, 54, 297–299. [CrossRef]
17. Mikolov, T.; Corrado, G.; Chen, K.; Dean, J. Efficient Estimation of Word Representations in Vector Space.In Proceedings of Workshop at ICLR, Scottsdale, AZ, USA, 2–4 May 2013; pp. 1–12.
18. Wang, X.; Zhang, S.; Lei, Z.; Liu, S.; Guo, X.; Li, S. Ensemble Soft-margin Softmax Loss for Image Classification.In Proceedings of the the 27th International Joint Conference on Artificial Intelligence, Stockholm, Sweden,13–19 July 2018; pp. 992–998.
19. Shaw, D.C. A universal approach to Points Condition Monitoring. In Proceedings of the 4th IET InternationalConference on Railway Condition Monitoring, Derby, UK, 18–20 June 2008; pp. 1–6.
20. Thirukovalluru, R.; Dixit, S.; Sevakula, R.K.; Verma, N.K.; Salour, A. Generating feature sets for faultdiagnosis using denoising stacked auto-encoder. In Proceedings of the IEEE International Conference onPrognostics and Health Management, Ottawa, ON, Canada, 20–22 June 2016; pp. 1–7.
21. Schulz, H.; Cho, K.; Raiko, T.; Behnke, S. Two-layer contractive encodings for learning stable nonlinearfeatures. Neural Netw. 2015, 64, 4–11. [CrossRef]
22. Chen, Z.; Li, W. Multisensor Feature Fusion for Bearing Fault Diagnosis Using Sparse Autoencoder andDeep Belief Network. IEEE Trans. Instrum. Meas. 2017, 66, 1693–1702. [CrossRef]
23. Pang, S.; Yang, X. A Cross-Domain Stacked Denoising Autoencoders for Rotating Machinery Fault Diagnosisunder Different Working Conditions. IEEE Access 2019, 7, 77277–77292. [CrossRef]
24. Wu, X.; Jiang, G.; Wang, X.; Xie, P.; Li, X. A Multi-Level-Denoising Autoencoder Approach for Wind TurbineFault Detection. IEEE Access 2019, 7, 59376–59387. [CrossRef]
25. Vincent, P.; Larochelle, H.; Lajoie, I.; Bengio, Y.; Manzagol, P.A. Stacked Denoising Autoencoders: LearningUseful Representations in a Deep Network with a Local Denoising Criterion. J. Mach. Learn. Res. 2010, 11,3371–3408.
26. Breunig, M.; Kriegel, H.-P.; Ng, R.; Sander, J. LOF: Identifying Density-Based Local Outliers. ACM Sigmod Rec.2000, 29, 93–104. [CrossRef]
27. Lu, C.; Wang, Z.Y.; Qin, W.L.; Ma, J. Fault diagnosis of rotary machinery components using a stackeddenoising autoencoder-based health state identification. Signal Process. 2017, 130, 377–388. [CrossRef]
28. Sun, W.; Shao, S.; Rui, Z.; Yan, R.; Zhang, X.; Chen, X. A sparse auto-encoder-based deep neural networkapproach for induction motor faults classification. Measurement 2016, 89, 171–178. [CrossRef]
Appl. Sci. 2019, 9, 5139 17 of 17
29. Bianchi, F.M.; Livi, L.; Mikalsen, K.; Kampffmeyer, M.; Jenssen, R. Learning representations of multivariatetime series with missing data. Pattern Recognit. 2019, 96, 106973. [CrossRef]
30. de Bruin, T.; Verbert, K.; Babuška, R. Railway Track Circuit Fault Diagnosis Using Recurrent Neural Networks.IEEE Trans. Neural Networks Learn. Syst. 2016, 28, 523–533. [CrossRef]
31. Mika, S.; Schölkopf, B.; Smola, A.; Müller, K.-R.; Scholz, M.; Rätsch, G. Kernel PCA and De-noising in FeatureSpaces. In Proceedings of the 1998 Conference on Advances in Neural Information Processing Systems II,Denver, CO, USA, 29 November–4 December 1999; pp. 536–542.
32. Kriegel, H.-P.; Schubert, M.; Zimek, A. In Proceedings of the ACM SIGKDD International Conference onKnowledge Discovery and Data Mining, Las Vegas, NV, USA, 24–27 August 2008; pp. 444–452.
33. Wu, M.; Ye, J. A Small Sphere and Large Margin Approach for Novelty Detection Using Training Data withOutliers. IEEE Trans. Pattern Anal. Mach. Intell. 2009, 31, 2088–2092.
34. Gupta, M.; Gao, J.; Aggarwal, C.C.; Han, J. Outlier Detection for Temporal Data: A Survey. IEEE Trans.Knowl. Data Eng. 2014, 26, 2250–2267. [CrossRef]
35. Rätsch, G.; Onoda, T.; Müller, K.-R. Soft Margins for AdaBoost. Mach. Learn. 2001, 42, 287–320. [CrossRef]36. Fawcett, T. An introduction to ROC analysis. Pattern Recognit. Lett. 2005, 27, 861–874. [CrossRef]
c© 2019 by the authors. Licensee MDPI, Basel, Switzerland. This article is an open accessarticle distributed under the terms and conditions of the Creative Commons Attribution(CC BY) license (http://creativecommons.org/licenses/by/4.0/).