Fatty acid profile and oxidative stability of pork as influenced by duration and time of dietary...
31
L. Haak, S. De Smet, D. Fremaut, K. Van Walleghem and K. Raes dietary linseed or fish oil supplementation Fatty acid profile and oxidative stability of pork as influenced by duration and time of published online February 29, 2008 J ANIM SCI http://jas.fass.org/content/early/2008/02/29/jas.2007-0032.citation the World Wide Web at: The online version of this article, along with updated information and services, is located on www.asas.org by guest on May 18, 2011 jas.fass.org Downloaded from
Transcript of Fatty acid profile and oxidative stability of pork as influenced by duration and time of dietary...

L. Haak, S. De Smet, D. Fremaut, K. Van Walleghem and K. Raesdietary linseed or fish oil supplementation
Fatty acid profile and oxidative stability of pork as influenced by duration and time of
published online February 29, 2008J ANIM SCI
http://jas.fass.org/content/early/2008/02/29/jas.2007-0032.citationthe World Wide Web at:
The online version of this article, along with updated information and services, is located on
www.asas.org
by guest on May 18, 2011jas.fass.orgDownloaded from

n-3 fatty acids and pork quality1
2
Fatty acid profile and oxidative stability of pork as influenced by duration and time 3
of dietary linseed or fish oil supplementation14
5
L. Haak*, S. De Smet*,2, D. Fremaut†, K. Van Walleghem†, K. Raes*,36
7
* Laboratory for Animal Nutrition and Animal Product Quality, Department of Animal 8
Production, Ghent University, 9090 Melle, Belgium and †Faculty of Biosciences and 9
Landscape Architecture, University College of Ghent, 9000 Gent, Belgium 10
11
1Ghent University is gratefully acknowledged for the grant. This research was supported 12
by the Institute for the Promotion of Innovation by Science and Technology in Flanders 13
(IWT, Brussels, Belgium). The authors thank Lambers-Seghers (Baasrode, Belgium), 14
voeders Biervliet (Diksmuide, Belgium), DSM Nutritional Products (Deinze, Belgium), 15
KTA (Diksmuide, Belgium), and Westvlees (Westrozebeke, Belgium) for their 16
assistance. S. Lescouhier, S. Coolsaet, and D. Baeyens are thanked for their technical 17
assistance.18
19
2Corresponding author: [email protected]; phone: +32 9 264 90 03; fax: +32 9 20
264 90 9921
22
3Present address: EnBiChem, Department of Industrial Engineering and Technology, 23
University College West-Flanders, 8500 Kortrijk, Belgium24
Page 1 of 29 Journal of Animal Science
Published Online First on February 29, 2008 as doi:10.2527/jas.2007-0032 by guest on May 18, 2011jas.fass.orgDownloaded from

ABSTRACT: In this experiment, the effect of duration and time of feeding n-3 PUFA 25
sources on the fatty acid composition and oxidative stability of the Longissimus thoracis26
(LT) was investigated. Linseed (L) and fish oil (F), rich in α-linolenic acid (α-LNA) and 27
eicosapentaenoic and docosahexaenoic acid (EPA and DHA) respectively, were supplied 28
equivalent to a level of 1.2 % of oil, either during the whole fattening period or only 29
during the first (P1; 8 wk) or second (P2; 6 to 9 wk till slaughter) fattening phase. All 30
diets were based on barley, wheat, and soybean meal and were fed ad libitum. Crossbred 31
pigs (n = 154; Topigs 40 x Piétrain) were randomly allotted to the 7 feeding groups. In 32
the basal diet (B), only animal fat was used as supplementary fat source. Three dietary 33
groups were supplied the same fatty acid source during both fattening phases, i.e. group 34
BB, LL, and FF. For the other 4 dietary groups, the fatty acid source was switched after 35
the first phase (groups BL, BF, LF, and FL; the first and second letter indicating the diet 36
in P1 and P2 respectively). Twelve animals per feeding group were selected based on 37
average live weight. The LT was analysed for fatty acid composition; lipid stability 38
(thiobarbituric acid-reactive substances, TBARS) and color stability (a* value, % of 39
myoglobin pigments) were determined on the LT after illuminated chill storage up to 8 d. 40
The α-LNA, EPA, and docosapentaenoic acid (DPA) incorporation was independent of 41
the duration of linseed feeding (respectively 1.24, 0.54, and 0.75 % of total fatty acids for 42
group LL). Supplying fish oil during both phases resulted in the greatest EPA and DHA 43
proportions (1.37 and 1.02 % of total fatty acids) (P < 0.05), but the content of DPA was 44
not affected. The proportion of DHA was greater when fish oil was administered during 45
P2 as compared to P1 (P < 0.05). There was no effect of diet on meat ultimate pH and 46
drip loss, nor on lipid or color oxidation. 47
Page 2 of 29Journal of Animal Science
by guest on May 18, 2011jas.fass.orgDownloaded from

48
Key Words: Fish oil, Linseed, Omega-3 fatty acids, Oxidative stability, Pork49
50
INTRODUCTION51
Long chain n-3 polyunsaturated fatty acids (LC n-3 PUFA), eicosapentaenoic 52
acid (EPA, C20:5n-3) and docosahexaenoic acid (DHA, C22:6n-3), exert positive effects 53
on human health (see review Narayan et al., 2006). Increasing their intake may be most 54
easily achieved by supplementing the human diet with encapsulated fish oil or microalgae 55
or by increasing the consumption of fish. However, as the intake of fatty fish is low in 56
Western societies, the consumption of LC n-3 PUFA from terrestrial animal products 57
(meat, eggs) may be important (Howe et al., 2006). Givens et al. (2006) and De Henauw 58
et al. (2007) argued that enrichment of meat products with n-3 PUFA by dietary means 59
could help bridging the gap between their recommended and actual intake. Hereby, the 60
feed oil source is important and delivering either the LC n-3 PUFA as such as in fish oil, 61
or under the form of its precursor fatty acid (FA) (α-linolenic acid; α-LNA) as in linseed 62
(oil). Apart from the nature of the oil source, the duration and level of its supplementation 63
are of crucial importance and can be varied to determine the optimal supplementation 64
strategy (see review Wood et al. (2003) and Raes et al. (2004)).65
A more unsaturated FA profile may limit the shelf-life of meat as PUFA are more 66
prone to oxidation. This has been identified as a major problem in previous work using α-67
LNA-rich oilseeds or fish oils to enrich pork with n-3 PUFA above certain concentrations 68
(Romans et al., 1995b; Overland et al., 1996; Leskanich et al., 1997; Wood et al., 2003). 69
Page 3 of 29 Journal of Animal Science
by guest on May 18, 2011jas.fass.orgDownloaded from

Oxidation may be manifest as off-odors and flavors resulting from lipid oxidation or as 70
an impaired meat color.71
In this experiment, we assessed the importance of the time and duration of linseed 72
and fish oil supplementation to enhance the incorporation of n-3 PUFA in pork. While 73
altering the fatty acid profile, also the oxidative stability (color and lipid oxidation) was 74
measured.75
MATERIALS AND METHODS76
Experimental Setup and Sampling77
Crossbred pigs (n = 154; Topigs 40 sow (Helvoirt, The Netherlands) x Piétrain 78
sire) at a mean (SD) live weight of 36.4 (4.5) kg were randomly allotted to 7 feeding 79
groups. Each group was housed in 2 pens of 11 animals, and was fully balanced 80
according to sex (barrow-gilt). The trial lasted for 14–17 wk and consisted of 2 phases 81
(P1: 8 wk (till approximately 70 kg); P2: 6 to 9 wk (till approximate slaughter weight of 82
100 kg)), in which the feed fat source differed depending on the dietary group. Pigs were 83
fed ad libitum. All diets were based on barley, wheat, and soybean meal. The dietary fat 84
was adjusted to 4 % (on as-fed basis) by the addition of rendered animal fat. Diets were 85
formulated for an equal energy supply (2225 kcal/kg as-fed) and a minimum linoleic acid 86
(LA) content of 0.9 %. In the basal diet (B), only animal fat was used as supplementary 87
fat source. In diets L and F, linseed (group L; α-LNA supply) or fish oil (group F; EPA 88
and DHA supply) were added respectively to provide 1.2 % of oil at the expense of 89
animal fat. Three dietary groups were supplied the same fatty acid source during both 90
fattening phases, i.e., group BB, LL, and FF. For the other 4 dietary groups the fatty acid 91
source was switched after the first phase (groups BL, BF, LF, and FL; the first and 92
Page 4 of 29Journal of Animal Science
by guest on May 18, 2011jas.fass.orgDownloaded from

second letter indicating the diet in P1 and P2 respectively). A graphical presentation of 93
the experimental setup is given in Figure 1. The composition and the fatty acid profile of 94
the experimental diets are given in Tables 1 and 2 respectively. 95
The experiment was carried out according to the guidelines of the ethical 96
committee of Ghent University (Belgium). Animals were harvested in 2 groups with a 3-97
wk interval in a commercial abattoir following electrical stunning (Westvlees, Belgium). 98
Per slaughter day, 6 animals from each feeding group (3 barrows and 3 gilts) closest to 99
the average group live weight were selected. Mean (SD) live weight at slaughter and cold 100
carcass weight was 97.1 (6.1) kg and 78.6 (5.1) kg respectively. The Longissimus 101
thoracis (LT; starting from the seventh rib, left carcass side) was sampled 24 h post 102
mortem (d 0) and sliced into 2.5 cm thick chops. One chop was immediately vacuum 103
packed and stored at –18°C until fatty acid analysis. The other chop was used for fresh 104
meat quality assessment (lipid and color oxidation). 105
Carcass and Meat Quality Measurements106
At the start of each phase and before slaughter, pigs were weighed individually. 107
Carcass lean content was assessed by means of a Giralda Choirometer PG 200 apparatus. 108
At 24 h post mortem, pH in the LT (6th- to 7th-rib region; Knick Portamess 654 with 109
Schott N5800A electrode) and PQM ( PQM-I Kombi (INTEK, GmbH)) in the LT and the 110
ham (Semimembranosus) were measured.111
Percentage drip loss of meat was determined by measuring the amount of fluid 112
lost from a 2.5 cm-thick loin chop that was suspended for 48 h in a chill cabinet at 4°C. 113
For color measurements, meat samples were overwrapped in an oxygen permeable 114
polyethylene film (oxygen transmission rate > 1000 cm³/m²/24h). On d0 the measurement 115
was done after 30 min of blooming (in the film at 4°C) and then daily until 8 d of 116
Page 5 of 29 Journal of Animal Science
by guest on May 18, 2011jas.fass.orgDownloaded from

illuminated chill storage (fluorescent light, 900 lx, 4°C). Reflectance spectra (every 10 117
nm between 400 and 700 nm) and color coordinates (CIE L*a*b* color system 1976) 118
were assessed using a HunterLab Miniscan Minolta XE plus spectrocolorimeter (light 119
source of D65, standard observer of 10°, 45°/0° geometry, 1 in. light surface, white 120
standard). The results were expressed as lightness (L*), redness (a*), yellowness (b*), 121
hue value (tan-1 b*/a*), and saturation index (SI) ((a*2 + b*2)1/2). By means of reflectance 122
values at specific wavelengths, the percentage of the different forms of myoglobin 123
(oxymyoglobin (OxyMb), deoxymyoglobin (Mb), and metmyoglobin (MetMb)) were 124
calculated according to the method of Krzywicki (1979), modified by Lindahl et al. 125
(2001). 126
For lipid oxidation analysis, the same samples as for color measurements were 127
used. Lipid oxidation was assessed by thiobarbituric acid-reactive substances 128
measurement (TBARS) using the distillation method as described by Tarladgis et al. 129
(1960) after adding the strong antioxidant butylated hydroxytoluene (BHT) and was 130
expressed as µg malondialdehyde (MDA)/g meat. Lipid oxidation of LT samples was 131
measured in duplicate after 8 d of storage. 132
Fatty Acid Analysis133
Feed and meat samples were extracted using chloroform/methanol (2/1; vol/vol) 134
(modified after Folch et al., 1957). Fatty acids were methylated as described by Raes et 135
al. (2001) and analysed by gas chromatography (HP6890, Brussels, Belgium) on a CP-136
Sil88 column for fatty acid methyl esters (FAME) (100 m x 0.25 mm x 0.2 µm; 137
Chrompack, The Netherlands). Peaks were identified based on their retention times, 138
corresponding with standards (NuChek Prep., IL, USA; Sigma, Bornem, Belgium). 139
Page 6 of 29Journal of Animal Science
by guest on May 18, 2011jas.fass.orgDownloaded from

Nonadecanoic acid (C19:0) was used as an internal standard to quantify the individual 140
and total i.m. fatty acids. 141
Statistics142
For all analyses performed on the fresh meat, a GLM with fixed factors feeding 143
group and gender was used. The interaction term was not significant (P>0.05). In a 144
preliminary statistical analysis, slaughter group was added as a factor but since it was not 145
significant, it was omitted from the final model. Contrast analysis was performed to 146
detect differences between feeding groups. The effect of the fatty acid profile of the diets 147
given during both feeding phases was tested by the contrasts LL vs. BB, LL vs. FF, and 148
BB vs. FF. The effect of duration of supplementation of linseed and fish oil was assessed 149
by the following contrasts respectively: LL vs. (BL and FL) and FF vs. (BF, LF, and FL). 150
The significance of the time of fish oil supplementation was tested by contrasting LF vs. 151
FL. The analyses were performed using the statistical software package S-Plus for 152
Windows (version 6.0).153
RESULTS154
Performance and Carcass Characteristics 155
Diet did not influence ADG (637.3 and 675.8 g/d in P1 and P2 respectively). The 156
mean (SD) carcass lean content was 59.6 (2.42) %, and was generally not different 157
between feeding groups, except for a lower carcass lean content in group FF as compared 158
to the groups FL and LL (58.3 % for FF and 60.4 % and 60.7 % for FL and LL) (P < 159
0.05). 160
Page 7 of 29 Journal of Animal Science
by guest on May 18, 2011jas.fass.orgDownloaded from

Fatty Acids161
There was no difference for the total i.m. fatty acid content between the feeding 162
groups (mean (SD) 1.41 (0.22) g/100g meat) with the lowest and greatest value for 163
groups BL and FF respectively (Tables 3 to 5). 164
Table 3 shows the effect of supplying a single fatty acid source during the whole 165
fattening period on the fatty acid profile of the LT muscle (groups BB, LL, and FF). The 166
total n-6 PUFA and LA proportion was similar in groups BB and LL. The basal diet gave 167
rise to a greater arachidonic acid (C20:4n-6; AA) proportion as compared to linseed 168
feeding (P < 0.05). The proportion of total as well as individual n-6 PUFA was lower in 169
the FF group as compared to the LL and BB groups (P < 0.05) (except for LA being 170
lower, however non-significantly (P > 0.05), in FF as compared to LL). 171
The α-LNA proportion was greatest in the meat of group LL (P < 0.05). The 172
supply of α-LNA in this group also increased the proportion of EPA and DPA as 173
compared to the basal feeding group (P < 0.05). However, the DHA proportion did not 174
differ between BB and LL. The total and LC n-3 PUFA proportion was greatest for group 175
FF (P < 0.05). The fish oil diet resulted in a 6-fold increased deposition of EPA and DHA 176
in the LT as compared to the basal diet and a 3- and 5-fold increase of EPA and DHA 177
respectively as compared to the linseed feeding. In the FF group, the DPA level was 178
greater compared to group BB (P < 0.05). 179
The effect of duration and time of linseed or fish oil supplementation on the fatty 180
acid profile of the LT muscle is shown in Tables 4 and 5. The α-LNA incorporation was 181
similar when feeding linseed during both phases or only during P2. For EPA and DPA, 182
there was no difference between feeding the basal or linseed diet in P1 in combination 183
with linseed in P2. Feeding fish oil continuously as compared to fish oil feeding only in 1 184
Page 8 of 29Journal of Animal Science
by guest on May 18, 2011jas.fass.orgDownloaded from

phase, resulted in greater EPA and DHA proportions (P < 0.05), but the proportion of 185
DPA was not affected. When fish oil was fed either during P1 or P2, only the proportion 186
of DHA was influenced, being greater when fish oil was administered during P2 (P < 187
0.05).188
Barrows had the greatest i.m. fatty acid content, together with the greatest total 189
and individual SFA proportions (C12:0, C14:0, C16:0, and C18:0) (P < 0.05). Only the 190
proportion of C17:0 was greater for gilts (data not shown) (P < 0.05). The proportions of 191
the major MUFA, C18:1cis-9 and C16:1cis-9, were greater for barrows (data not shown) 192
(P < 0.05). Total and individual n-6 (except for C22:4n-6) and n-3 PUFA were greater for 193
gilts (P < 0.001) (Table 6).194
Meat Quality Traits195
Mean (SD) drip loss was 4.6 (0.7) % and was not influenced by a particular diet. 196
pH after 24 h post mortem was 5.7 (0.04) and was not different between groups. PQM 197
measured in the loin and ham was 5.1 (0.3) and 6.7 (1.0) respectively and was also not 198
influenced by the dietary treatments. 199
For the color of fresh LT expressed as L*, a*, and b* values (and SI and hue 200
values calculated from those data), groups were not different throughout the storage 201
period (data not shown). Up to d 3 of chill storage, color stability expressed as MetMb % 202
and OxyMb % was not different between groups. From d 3 until the end of the chill 203
storage, group LL behaved differently, although not significantly, as compared to the 204
other groups having lower MetMb % and greater OxyMb % (Figure 2). 205
Page 9 of 29 Journal of Animal Science
by guest on May 18, 2011jas.fass.orgDownloaded from

Lipid oxidation values as assessed by the TBARS test were not influenced by206
dietary treatment or gender. On d 8 of storage, TBARS values were lower than 0.2 µg207
MDA/g meat (data not shown).208
DISCUSSION209
Performance and Carcass Characteristics 210
Average daily gain was within normal range for fattening pigs and was not 211
influenced by diet. This is consistent with literature recommending a maximum of 5 % of 212
fish oil in the diet to prevent depression of feed intake and growth of the pigs (Van 213
Oeckel and Boucque, 1992).214
Fatty Acids215
The lack of effect of dietary fatty acid source on the i.m. fatty acid content accords 216
with other work on pigs receiving diets differing in total fat and (or) fatty acid 217
composition (Allee et al., 1972; St. John et al., 1987; Rhee et al., 1988; Leskanich et al., 218
1997; Scheeder et al., 2000).219
The slightly lower dietary LA supply in the FF group resulted in a significantly 220
lower n-6 PUFA proportion in the meat. In case of similar dietary supply of n-6 fatty 221
acids (groups LL and BB), an increased n-3 PUFA supply in the LL group was not 222
accompanied by a decreased deposition of n-6 fatty acids, except for AA. These results 223
were partly in agreement with Riley et al. (2000) where an equal amount of LA together 224
with increasing levels of dietary α-LNA did not induce differences in total n-6 fatty acids 225
deposited in the LT. However, in contrast to our study, no differences in any of the 226
individual n-6 PUFA were found by Riley et al. (2000). The greater AA proportion in 227
meat of the animals on the basal diet compared to the linseed or fish oil diet confirms the 228
Page 10 of 29Journal of Animal Science
by guest on May 18, 2011jas.fass.orgDownloaded from

inhibiting effect of higher α-LNA proportions on elongation and desaturation of LA to its 229
longer chain metabolites and the competition between AA and LC n-3 PUFA for 230
incorporation into phospholipids. The increased supply of α-LNA in group LL yielded a 231
significant increase in the proportion of EPA and DPA as compared to group BB.232
However, increasing DHA proportion in meat was only achieved when fish oil was 233
included in the animals diet. Hence, this study supports other literature findings that 234
specific dietary supply of DHA is needed to increase the DHA content of pork (Romans 235
et al., 1995a,b; Ahn et al., 1996; Riley et al., 2000; Raes et al., 2004). The DHA 236
formation seems to be strictly metabolically regulated and cannot be substantially 237
influenced by dietary supply of the precursors. The desaturation and elongation chain of 238
n-3 fatty acids seems to block at the level of DPA. On the other hand, Enser et al. (2000) 239
observed an increased i.m. DHA level in pork by feeding linseed at a level of 4 g α-240
LNA/kg feed. However, the increase was small (0.38 and 0.45 g/100 g of total fatty acids 241
for the control and linseed fed group, respectively). Also, incorporation of α-LNA and 242
elongation to EPA and DPA was more efficient in their research compared to our study. 243
Recently, also Kralik et al. (2006) found that adding rapeseed oil to pigs' diets (at a level 244
of 3 % and 6 %) increased the DHA content in muscle tissue, which in turn supports the 245
fact that pigs can synthesize DHA in vivo.246
The total and LC n-3 PUFA proportion was significantly greater for group FF > 247
group LL > group BB. It seems that the incorporation efficiency of EPA and DHA from 248
fish oil into muscle was much higher than the one of α-LNA from linseed. A level of 2.31 249
% EPA and 3.53 % DHA in the lipid fraction of the fish oil diet resulted in 1.37 % and 250
1.02 % of EPA and DHA respectively in the muscle lipid fraction, whereas 16 % α-LNA 251
in the lipid fraction of the linseed diet only resulted in 1.24 % α-LNA in the muscle lipid 252
Page 11 of 29 Journal of Animal Science
by guest on May 18, 2011jas.fass.orgDownloaded from

fraction. This can be explained by 3 factors. First, there might be an effect of the matrix 253
in which the fatty acids were embedded, leading to a potentially higher digestibility of the 254
fatty acids in the fish oil compared to those in crushed linseed. Secondly, β-oxidation is 255
faster for α-LNA compared to its long chain products which are more selectively 256
incorporated into phospholipids within permanent cell structures (Leyton et al., 1987). 257
When a fatty acid is preferentially oxidised for energy, this could account for low 258
incorporation rates observed with this particular fatty acid. Thirdly, after absorption α-259
LNA has to compete with LA for incorporation and desaturation and elongation to its 260
longer chain metabolites in the tissues (Mohrhauer and Holman, 1963).261
The increased level of DPA after fish oil supplementation as compared to the 262
basal diet, is in accordance with Lauridsen et al. (1999). However, other studies 263
consistently showed an increased EPA and DHA deposition, but no effect on the DPA 264
concentration in pigs fed fish oil diets (Irie and Sakimoto, 1992; Morgan et al., 1992; 265
Leskanich et al., 1997). DPA can be formed during elongation of EPA or by 266
retroconversion of DHA (Sprecher et al., 1995).267
The α-LNA incorporation was similar when feeding linseed during both phases or 268
only during P2. This indicates that, in case of linseed supplementation during P2, the α-269
LNA proportion remained unchanged irrespective of the oil source during the previous 270
phase (P1). Also, for EPA and DPA there was no difference between feeding the basal or 271
linseed diet in P1 in combination with linseed in P2. It seems that by supplying linseed 272
for 6 to 9 wk before slaughter at the level in this experiment, the saturation plateau for the 273
synthesis of the long chain metabolites was reached. 274
The greatest EPA and DHA proportions were obtained when fish oil was fed 275
during both phases. When supplied during either P1 or P2, the proportion of DHA was276
Page 12 of 29Journal of Animal Science
by guest on May 18, 2011jas.fass.orgDownloaded from

greatest with fish oil feeding in P2. To our knowledge, the alternating supply of fish oil 277
and linseed (oil) has only been studied in fish (Bell et al., 2004). Feeding fish oil in at 278
least 1 phase caused the n-6/n-3 ratio to be conform the recommendation of < 5 by De 279
Hoge Gezondheidsraad (2003). The n-6/n-3 ratio is known to be highly influenced by the 280
fatty acid composition of the diet. The range of the P/S ratio was narrow (0.27 to 0.4) and 281
for all groups lower than the recommended minimal value of 0.7 by De Hoge 282
Gezondheidsraad (2003). 283
Meat Quality Traits284
Despite the significant effects of dietary fat source on the i.m. fatty acid 285
composition, none of the measured meat quality traits (pH, drip loss, color, lipid 286
oxidation) was significantly different between dietary treatments. The reason for the 287
distinct color stability for group LL from d 3 on is unclear. For monitoring the negative 288
quality effects of high PUFA diets in pork, several thresholds have been suggested for the 289
maximum level of PUFA in feed. Warnants et al. (1996) proposed the threshold for feed 290
to be 18 g PUFA/kg feed. For all the feeds in this experiment, PUFA were below this 291
level. Feeding linseed at a similar level to our trial did not induce negative effects on pork 292
quality as seen by Sheard et al. (2000). However, it should be kept in mind that these 293
threshold levels are dependent on other factors besides the PUFA levels in the feed, e.g. 294
duration of supplementation, dietary antioxidant levels, storage and processing conditions 295
of the meat, muscle and animal differences.296
IMPLICATIONS297
The effects of duration and time of feeding a specific fat source on the muscle 298
fatty acid composition is dependent on the fatty acids considered. For the deposition of α-299
Page 13 of 29 Journal of Animal Science
by guest on May 18, 2011jas.fass.orgDownloaded from

linolenic acid and its conversion to long chain metabolites in muscle following the supply 300
of linseed, only the last phase before slaughter was determinant. When supplying fish oil, 301
the greatest eicosapentaenoic (EPA) and docosahexaenoic acid (DHA) proportions were 302
found in case of a continuous supply throughout the fattening period, and levels of DHA 303
but not EPA were lower when fish oil was fed during the first fattening phase followed 304
by linseed feeding before slaughter. Neither meat quality traits (drip loss, pH,…), nor 305
lipid or color oxidation were influenced by dietary oil source or duration of 306
supplementation. 307
LITERATURE CITED308
Ahn, D. H., S. Lutz, and J. S. Sim. 1996. Effects of dietary α-linolenic acid on the fatty 309
acid composition, storage stability and sensory characteristics of pork loin. Meat Sci. 310
43:291–299.311
Allee, G. L., D. R. Romsos, G. A. Leveille, and D. H. Baker. 1972. Lipogenesis and 312
enzymatic activity in pig adipose tissue as influenced by source of dietary fat. J. Anim. 313
Sci. 35:41–47.314
Bell, J. G., R. J. Henderson, D. R. Tocher, and J. R. Sargent. 2004. Replacement of 315
dietary fish oil with increasing levels of linseed oil: Modification of flesh fatty acid 316
compositions in Atlantic salmon (Salmo salar) using a fish oil finishing diet. Lipids. 317
39:223–232. 318
De Henauw, S., J. Van Camp, G. Sturtewagen, C. Matthys, M. Bilau, N. Warnants, K. 319
Raes, M. J. Van Oeckel, and S. De Smet. 2007. Simulated changes in human fatty acid 320
intake through n-3 fatty acid enrichment of foods from animal origin. J. Sci. Food Agric. 321
87: 200–211.322
Page 14 of 29Journal of Animal Science
by guest on May 18, 2011jas.fass.orgDownloaded from

De Hoge Gezondheidsraad. Ministerie van Sociale Zaken, Volksgezondheid en 323
Leefmilieu. 2003. Voedingsaanbevelingen voor België, herziene versie 2003. België, 324
Brussel. 85p.325
Enser, M., R. I. Richardson, J. D. Wood, B. P. Gill, and P. R. Sheard. 2000. Feeding 326
linseed to increase the n-3 PUFA of pork: fatty acid composition of muscle, adipose 327
tissue, liver and sausages. Meat Sci. 55:201–212.328
Folch, J., M. Lees, and S. G. H. Stanley. 1957. A simple method for the isolation and 329
purification of total lipids from animal tissues. J. Biol. Chem. 226:497–509.330
Givens, D. I., K. E. Khem, and R. A. Gibbs. 2006. The role of meat as a source of n-3 331
polyunsaturated fatty acids in the human diet. Meat Sci. 74:209–218.332
Howe, P., B. Meyer, S. Record, and K. Baghurst. 2006. Dietary intake of long-chain 333
omega-3 polyunsaturated fatty acids: contribution of meat sources. Nutrition. 22:47–53. 334
Irie, M., and M. Sakimoto. 1992. Fat characteristics of pigs fed fish oil containing 335
eicosapentaenoic and docosahexaenoic acids. J. Anim. Sci. 70:470–477.336
Kralik, G., J. Csapo, and T. Crnjac. 2006. Feeding rapeseed oil to increase the n-3 PUFA 337
of pork: Fatty acid composition of muscle and adipose tissue. Acta Aliment. 35:251–258.338
Krzywicki, K. 1979. Assessment of relative content of myoglobin, oxymyoglobin and 339
metmyoglobin at the surface of beef. Meat Sci. 3:1–10.340
Lauridsen, C., G. Andersen, M. Andersson, V. Danielsen, R. Engberg, and K. Jakobsen. 341
1999. Effect of dietary fish oil supplied to pigs from weaning to 60 kg liveweight on 342
performance, tissue fatty acid composition and palatability of pork when slaughtered at 343
100 kg liveweight. J. Anim. Feed Sci. 8:441–456. 344
Page 15 of 29 Journal of Animal Science
by guest on May 18, 2011jas.fass.orgDownloaded from

Leskanich, C. O., K. R. Matthews, C. C. Warkup, R. C. Noble, and M. Hazzledine. 1997. 345
The effects of dietary oil containing (n-3) fatty acids on the fatty acid, physicochemical, 346
and organoleptic characteristics of pig meat and fat. J. Anim. Sci. 75:673–683.347
Leyton, J., P. J. Drury, and M. A. Crawford. 1987. Differential oxidation of saturated and 348
unsaturated fatty acids in vivo in the rat. Br. J. Nutr. 57:383–393.349
Lindahl, G., K. Lundström, and E. Tornberg. 2001. Contribution of pigment content, 350
myoglobin forms and internal reflectance to the colour of pork loin and ham from pure 351
breed pigs. Meat Sci. 59:141–151.352
Mohrhauer, H., and R. T. Holman. 1963. Effect of linolenic acid upon the metabolism of 353
linoleic acid. J. Nutr. 81:67–74.354
Morgan, C. A., R. C. Noble, M. Cocchi, and R. McCartney. 1992. Manipulation of the 355
fatty acid composition of pig meat lipids by dietary means. J. Sci. Food Agric. 58:357–356
368.357
Narayan, B., K. Miyashita, and M. Hosakawa. 2006. Physiological effects of 358
eicosapentaenoic acid (EPA) and docosahexaenoic acid (DHA) - A review. Food Rev. 359
Int. 22:291–307 360
Overland, M., O. Tangbol, A. Haug, and E. Sundstol. 1996. Effect of fish oil on growth 361
performance, carcass characteristics, sensory parameters and fatty acid composition in 362
pigs. Acta Agric. Scand. 46:11–17.363
Raes, K., S. De Smet, and D. Demeyer. 2001. Effect of double-muscling in Belgian Blue 364
young bulls on the intramuscular fatty acid composition with emphasis on conjugated 365
linoleic acid and polyunsaturated fatty acids. Anim. Sci. 73:253–260.366
Page 16 of 29Journal of Animal Science
by guest on May 18, 2011jas.fass.orgDownloaded from

Raes, K., S. De Smet, and D. Demeyer. 2004. Effect of dietary fatty acids on 367
incorporation of long chain polyunsaturated fatty acids and conjugated linoleic acid in 368
lamb, beef and pork meat: a review. Anim. Feed Sci. Technol. 113:199–221.369
Rhee, K. S., T. L. Davidson, D. A. Knabe, H. R. Cross, Y. A. Ziprin, and K. C. Rhee. 370
1988. Effect of dietary high-oleic sunflower oil on pork carcass traits and fatty acid 371
profiles of raw tissues. Meat Sci. 24:249–260.372
Riley, P. A., M. Enser, G. R. Nute, and J. D. Wood. 2000. Effects of dietary linseed on 373
nutritional value and other quality aspects of pig muscle and adipose tissue. Anim. Sci. 374
71:483–500.375
Romans, J. R., R. C. Johnson, D. M. Wulf, G. W. Libal, and W. J. Costello. 1995a. 376
Effects of ground flaxseed in swine diets on pig performance and on physical and sensory 377
characteristics and n-3 fatty acid content of pork. Part I. Dietary level of flaxseed. J. 378
Anim. Sci. 73:1982–1986.379
Romans, J. R., D. M. Wulf, R. C. Johnson, G. W. Libal, and W. J. Costello. 1995b. 380
Effects of ground flaxseed in swine diets on pig performance and on physical and sensory 381
characteristics and n-3 fatty acid content of pork. Part II. Duration of 15% dietary 382
flaxseed. J. Anim. Sci. 73:1987–1999.383
Scheeder, M. R. L., K. R. Glaser, B. Eichenberger, and C. Wenk. 2000. Influence of 384
different fats in pig feed on fatty acid composition of phospholipids and physical meat 385
quality characteristics. Eur. J. Lipid Sci. Tech. 102:391–401 386
Sheard, P. R., M. Enser, J. D. Wood, G. R. Nute, B. P. Gill, and R. I. Richardson. 2000. 387
Shelf life and quality of pork and pork products with raised n-3 PUFA. Meat Sci. 55:213–388
221.389
Page 17 of 29 Journal of Animal Science
by guest on May 18, 2011jas.fass.orgDownloaded from

Sprecher, H., D. L. Luthria, B. S. Mohammed, and S. P. Baykousheva. 1995. 390
Reevaluation of the pathways for the biosynthesis of polyunsaturated fatty acids. J. Lipid 391
Res. 36:2471–2477.392
St. John, L. C., C. R. Young, D. A. Knabe, L. D. Thompson, G. T. Schelling, S. M. 393
Grundy, and S. B. Smith. 1987. Fatty acid profiles and sensory and carcass traits of 394
tissues from steers and swine fed an elevated monounsaturated fat diet. J. Anim. Sci. 395
64:1441–1447.396
Tarladgis, B. G., B. M. Watts, and M. T. Younathan. 1960. A distillation method for the 397
quantitative determination of malonaldehyde in rancid foods. J. Am. Oil Chem. Soc. 398
37:44–48.399
Van Oeckel, M. J., and C. V. Boucque. 1992. Omega-3-fatty acids in pig nutrition – a 400
review. Landbouwtijdschrift. 45:1177–1192.401
Warnants, N., M. J. Van Oeckel, and C. V. Boucque. 1996. Incorporation of dietary 402
polyunsaturated fatty acids in pork tissues and its implications for the quality of the end 403
products. Meat Sci. 44:125–144. 404
Wood, J. D., R. I. Richardson, G. R. Nute, A. V. Fisher, M. M. Campo, E. Kasapidou, P. 405
R. Sheard, and M. Enser. 2003. Effects of fatty acids on meat quality: a review. Meat Sci. 406
66: 21–32.407
Page 18 of 29Journal of Animal Science
by guest on May 18, 2011jas.fass.orgDownloaded from
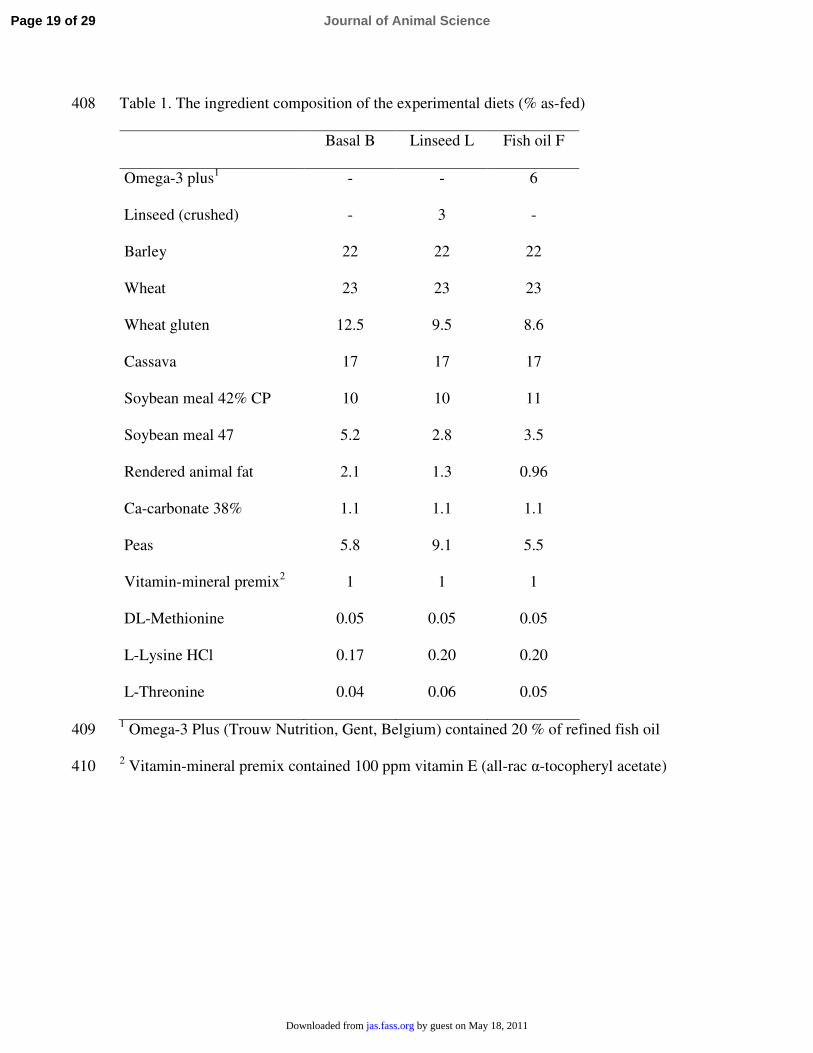
Table 1. The ingredient composition of the experimental diets (% as-fed)408
Basal B Linseed L Fish oil F
Omega-3 plus1 - - 6
Linseed (crushed) - 3 -
Barley 22 22 22
Wheat 23 23 23
Wheat gluten 12.5 9.5 8.6
Cassava 17 17 17
Soybean meal 42% CP 10 10 11
Soybean meal 47 5.2 2.8 3.5
Rendered animal fat 2.1 1.3 0.96
Ca-carbonate 38% 1.1 1.1 1.1
Peas 5.8 9.1 5.5
Vitamin-mineral premix2 1 1 1
DL-Methionine 0.05 0.05 0.05
L-Lysine HCl 0.17 0.20 0.20
L-Threonine 0.04 0.06 0.05
1 Omega-3 Plus (Trouw Nutrition, Gent, Belgium) contained 20 % of refined fish oil409
2 Vitamin-mineral premix contained 100 ppm vitamin E (all-rac α-tocopheryl acetate)410
Page 19 of 29 Journal of Animal Science
by guest on May 18, 2011jas.fass.orgDownloaded from

Table 2. The fatty acid profile of the experimental diets (g/100g FAME)411
Basal B Linseed L Fish oil F
C12:0 0.28 0.16 0.32
C14:0 1.19 0.76 2.15
C16:0 20.2 16.9 17.5
C18:0 8.90 6.94 5.77
C16:1cis-9 1.54 1.15 2.51
C18:1cis-9 26.0 22.4 21.2
C18:1cis-11 1.76 1.39 1.78
C20:1cis-11 0.55 0.41 1.29
C18:2n-6 28.5 27.5 25.5
C18:3n-3 3.41 15.9 3.79
C20:5n-3 - - 2.31
C22:6n-3 - - 3.53
412
Page 20 of 29Journal of Animal Science
by guest on May 18, 2011jas.fass.orgDownloaded from

Table 3. Fatty acid profile (g/100g FAME) of the LT muscle as influenced by a single 413
fatty acid source during the whole fattening period (n = 12)414
BB1 LL1 FF1 SEM LL-BB LL-FF BB-FF
C18:2n-6 11.2 10.4 8.84 2.35 NS8 NS *
C20:4n-6 2.90 2.38 1.65 0.77 *7 * *
C22:4n-6 0.39 0.29 0.15 0.16 NS * *
n-6 15.1 13.7 11.1 3.24 NS * *
C18:3n-3 0.55 1.24 0.47 0.40 * * NS
C20:5n-3 0.22 0.54 1.37 0.45 * * *
C22:5n-3 0.47 0.75 0.82 0.23 * NS *
C22:6n-3 0.14 0.18 1.02 0.37 NS * *
n-3 1.38 2.72 3.68 0.99 * * *
SFA2 34.5 34.0 35.5 2.06 NS * NS
MUFA3 44.5 44.6 45.6 3.00 NS NS NS
PUFA4 16.8 16.7 15.1 3.67 NS NS NS
n-6/n-35 11.0 5.23 3.03 2.64 * * *
P/S6 0.35 0.35 0.27 0.09 NS * *
Total, g/100g 1.38 1.49 1.79 0.54 NS NS *
1 B, L, F: basal, linseed and fish oil diet respectively, first and second letter indicating diet 415
in phase 1 and 2 respectively416
Page 21 of 29 Journal of Animal Science
by guest on May 18, 2011jas.fass.orgDownloaded from
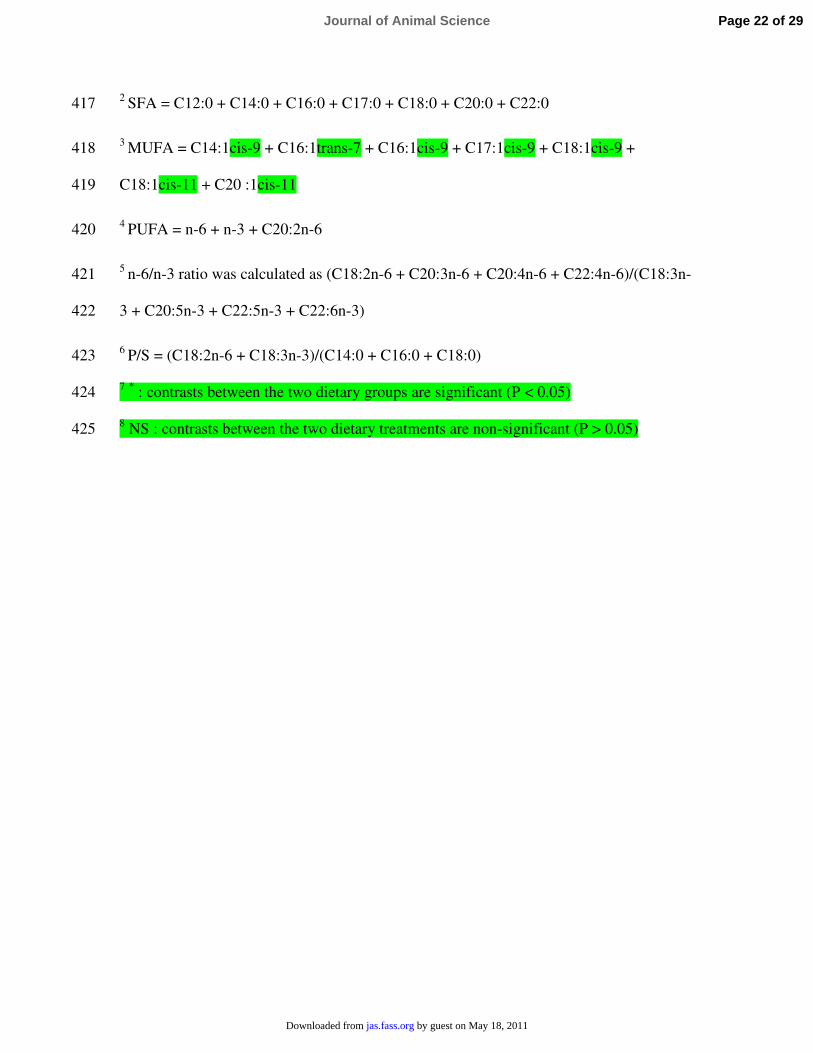
2 SFA = C12:0 + C14:0 + C16:0 + C17:0 + C18:0 + C20:0 + C22:0417
3 MUFA = C14:1cis-9 + C16:1trans-7 + C16:1cis-9 + C17:1cis-9 + C18:1cis-9 + 418
C18:1cis-11 + C20 :1cis-11419
4 PUFA = n-6 + n-3 + C20:2n-6 420
5 n-6/n-3 ratio was calculated as (C18:2n-6 + C20:3n-6 + C20:4n-6 + C22:4n-6)/(C18:3n-421
3 + C20:5n-3 + C22:5n-3 + C22:6n-3)422
6 P/S = (C18:2n-6 + C18:3n-3)/(C14:0 + C16:0 + C18:0)423
7 * : contrasts between the two dietary groups are significant (P < 0.05)424
8 NS : contrasts between the two dietary treatments are non-significant (P > 0.05)425
Page 22 of 29Journal of Animal Science
by guest on May 18, 2011jas.fass.orgDownloaded from

Table 4. Fatty acid profile (g/100g FAME) of the LT muscle as influenced by duration of 426
linseed supplementation and oil source during P1 (n = 12)427
LL1 BL1 FL1 SEM LL-BL LL-FL
C18:2n-6 10.4 11.6 10.6 2.35 NS8 NS
C20:4n-6 2.38 3.04 2.26 0.77 *7 NS
C22:4n-6 0.29 0.46 0.23 0.16 * NS
n-6 13.7 15.7 13.7 3.24 NS NS
C18:3n-3 1.24 1.23 1.12 0.40 NS NS
C20:5n-3 0.54 0.57 0.97 0.45 NS *
C22:5n-3 0.75 0.74 0.91 0.23 NS *
C22:6n-3 0.18 0.22 0.65 0.37 NS *
n-3 2.72 2.76 3.66 0.99 NS *
SFA2 34.0 33.0 34.0 2.06 NS NS
MUFA3 44.6 43.4 43.7 3.00 NS NS
PUFA4 16.7 18.8 17.6 3.67 NS NS
n-6/n-35 5.23 5.79 3.74 2.64 NS *
P/S6 0.35 0.40 0.35 0.09 NS NS
Total, g/100g 1.49 1.08 1.32 0.54 * NS
Page 23 of 29 Journal of Animal Science
by guest on May 18, 2011jas.fass.orgDownloaded from

1 B, L, F: basal, linseed and fish oil diet respectively, first and second letter indicating diet 428
in phase 1 and 2 respectively429
2 SFA = C12:0 + C14:0 + C16:0 + C17:0 + C18:0 + C20:0 + C22:0430
3 MUFA = C14:1cis-9 + C16:1trans-7 + C16:1cis-9 + C17:1cis-9 + C18:1cis-9 + 431
C18:1cis-11 + C20 :1cis-11432
4 PUFA = n-6 + n-3 + C20:2n-6 433
5 n-6/n-3 ratio was calculated as (C18:2n-6 + C20:3n-6 + C20:4n-6 + C22:4n-6)/(C18:3n-434
3 + C20:5n-3 + C22:5n-3 + C22:6n-3)435
6 P/S = (C18:2n-6 + C18:3n-3)/(C14:0 + C16:0 + C18:0)436
7 * : contrasts between the two dietary groups are significant (P < 0.05)437
8 NS : contrasts between the two dietary treatments are non-significant (P > 0.05)438
Page 24 of 29Journal of Animal Science
by guest on May 18, 2011jas.fass.orgDownloaded from

Table 5. Fatty acid profile (g/100g FAME) of the LT muscle as influenced by duration 439
and time of fish oil supplementation (n = 12)440
FF1 LF1 BF1 FL1 SEM BF-FF LF-FF FL-FF LF-FL
C18:2n-6 8.84 9.82 9.94 10.6 2.35 NS8 NS * NS
C20:4n-6 1.65 2.04 2.45 2.26 0.77 *7 NS * NS
C22:4n-6 0.15 0.19 0.20 0.23 0.16 NS NS NS NS
n-6 11.1 12.5 13.0 13.7 3.24 NS NS * NS
C18:3n-3 0.47 0.77 0.50 1.12 0.40 NS * * *
C20:5n-3 1.37 1.09 1.04 0.97 0.45 * * * NS
C22:5n-3 0.82 0.83 0.71 0.91 0.23 NS NS NS NS
C22:6n-3 1.02 0.78 0.82 0.65 0.37 * * * *
n-3 3.68 3.47 3.07 3.66 0.99 * NS NS NS
SFA2 35.5 35.5 34.9 34.0 2.06 NS NS * *
MUFA3 45.6 44.0 44.6 43.7 3.00 NS NS NS NS
PUFA4 15.1 16.3 16.4 17.6 3.67 NS NS * NS
n-6/n-35 3.03 3.63 4.25 3.74 2.64 * NS * NS
P/S6 0.27 0.30 0.30 0.35 0.09 NS NS * NS
Total, g/100g 1.79 1.53 1.29 1.32 0.54 * NS * NS
Page 25 of 29 Journal of Animal Science
by guest on May 18, 2011jas.fass.orgDownloaded from

1 B, L, F: basal, linseed and fish oil diet respectively, first and second letter indicating diet 441
in phase 1 and 2 respectively442
2 SFA = C12:0 + C14:0 + C16:0 + C17:0 + C18:0 + C20:0 + C22:0443
3 MUFA = C14:1cis-9 + C16:1trans-7 + C16:1cis-9 + C17:1cis-9 + C18:1cis-9 + 444
C18:1cis-11 + C20 :1cis-11445
4 PUFA = n-6 + n-3 + C20:2n-6 446
5 n-6/n-3 ratio was calculated as (C18:2n-6 + C20:3n-6 + C20:4n-6 + C22:4n-6)/(C18:3n-447
3 + C20:5n-3 + C22:5n-3 + C22:6n-3)448
6 P/S = (C18:2n-6 + C18:3n-3)/(C14:0 + C16:0 + C18:0)449
7 * : contrasts between the two dietary groups are significant (P < 0.05)450
8 NS : contrasts between the two dietary treatments are non-significant (P > 0.05)451
Page 26 of 29Journal of Animal Science
by guest on May 18, 2011jas.fass.orgDownloaded from

Table 6. Fatty acid profile (g/100g FAME) of the LT muscle as influenced by gender (n = 452
42)453
Barrow Gilt P SEM
C18:2n-6 9.27 11.4 < 0.001 2.35
C20:4n-6 2.08 2.69 < 0.001 0.77
C22:4n-6 0.26 0.28 0.546 0.16
n-61 12.1 15.0 < 0.001 3.24
C18:3n-3 0.79 0.89 0.036 0.40
C20:5n-3 0.74 0.91 0.008 0.45
C22:5n-3 0.68 0.82 0.001 0.23
C22:6n-3 0.48 0.60 < 0.001 0.37
n-32 2.68 3.22 < 0.001 0.99
Total, g/100g 1.58 1.23 0.001 0.54
1n-6 = C18:2n-6 + C20:3n-6 + C20:4n-6 + C22:4n-6 454
2n-3 = C18:3n-3 + C20:5n-3 + C22:5n-3 + C22:6n-3 455
456
Page 27 of 29 Journal of Animal Science
by guest on May 18, 2011jas.fass.orgDownloaded from

Figure 1: Graphical presentation of the experimental setup457
458
Figure 2: % of metmyoglobin (MetMb) (upper panel) and oxymyoglobin (OxyMb) 459
(lower panel) in the Longissimus thoracis during chill storage as influenced by feeding 460
group ( for the LL group: linseed diet in both phases; - for the mean of the other groups)461
Page 28 of 29Journal of Animal Science
by guest on May 18, 2011jas.fass.orgDownloaded from

0
5
10
15
20
25
30
0 1 2 3 4 5 6 7 8
storage, d
Met
Mb
% LL
other
01020304050607080
0 1 2 3 4 5 6 7 8
storage, d
Oxy
Mb
%
LL
other
BL
BF
LF
FL
LL
FF
BB
P1
P2a
P2b
P1(8wk) P2 (6wk) P2 (3wk)
switch harvest 2harvest 1
462
E2007- Figure 1463
E2007- Figure 2464
465
Page 29 of 29 Journal of Animal Science
by guest on May 18, 2011jas.fass.orgDownloaded from

Citations
ticleshttp://jas.fass.org/content/early/2008/02/29/jas.2007-0032.citation#otherarThis article has been cited by 2 HighWire-hosted articles:
by guest on May 18, 2011jas.fass.orgDownloaded from