Fatigue damage detection in graphite/epoxy composites using sonic infrared imaging technique
10
Fatigue damage detection in graphite/epoxy composites using sonic infrared imaging technique Ahsan Mian a , Xiaoyan Han b , Sarwar Islam b , Golam Newaz c, * a Department of Mechanical Engineering, 5050 Anthony Wayne Drive, Detroit, MI 48202, USA b Department of Electrical Engineering, 5050 Anthony Wayne Drive, Detroit, MI 48202, USA c Institute for Manufacturing Research, 5050 Anthony Wayne Drive, Detroit, MI 48202, USA Received 4 September 2002; received in revised form 10 June 2003; accepted 2 July 2003 Abstract This paper describes the application of a short ultrasonic pulse thereby infrared surface imaging to assess fatigue damage in graphite/epoxy composites. The technique uses a short pulse of sound wave that infuses to the material and results in frictional heating at the crack surfaces. The heating at the crack defuses into the surface of the sample, and the temperature rise at the crack location is sufficient to be captured by an infrared (IR) camera. In this paper, the ability of sonic infrared imaging technique in detecting fatigue damage in composite materials has been demonstrated. Finite element modeling was performed to better under- stand the effect of applied sound pulse at the damage locations and to interpret the vibrometer data. The same samples were also tested using thermal wave imaging nondestructive evaluation (NDE) technique. # 2003 Published by Elsevier Ltd. Keywords: B. Fatigue; C. Finite element analysis (FEA); C. Non-destructive testing; Sonic-infrared imaging 1. Introduction Over the years, IR-thermography is intensively being used by nondestructive evaluation engineers for damage detection in materials. Some investigations were direc- ted towards the evaluation of subsurface flaws, such as delamination, by applying external heat thereby obser- ving the resulting thermal images on the surface [1]. Such a technique is popularly known as thermal wave imaging (TWI). Another means of thermal NDE method is referred as vibrothermography, where high power long ultrasonic pulse is applied to a sample for a period of tens of seconds to introduce localized heating at the sites of material discontinuities/disbonds. Utiliz- ing this technique, Mignogna et al. [2,3] studied the mechanisms that cause the apparent softening of metals during simultaneous application of tensile load and high-power ultrasonic insonation. In a related work, Mignogna et al. [4] observed localized temperature rise at the point of attached thermocouple to a sample during the application of a long ultrasonic pulse. In addition, the authors reported rapid localized heating at the sites of fatigue cracks, artificially induced defects, and grain boundaries during long insonation. Applic- ation of the vibrothermography technique in character- izing impact damage in composite materials has been reported elsewhere [5,6]. Works sited in Refs. [2–6] used long ultrasonic pulse of tens of seconds and observed heating at the locations of material discontinuities. In contrast, a group of researchers at Wayne State Uni- versity was successful in imaging fatigue cracks in materials by infusing a very short ultrasonic pulse [7,8] of a small fraction of a second. The study presented in this paper is a continuation of the work cited in Refs. [7,8], by employing the so-called sonic-IR technique to composite materials. The technique is based on the heating at cracks or disbonds in a material due to the applied sound wave into it. The heat is presumably generated from friction of the mating surfaces [4,7–9] when they rub, or from plastic deformation when they ‘clap’. The effect appears to begin on a time scale of milliseconds or less after initiation of a sound pulse in the sample. An IR camera views the location of a surface breaking fatigue crack or 0266-3538/$ - see front matter # 2003 Published by Elsevier Ltd. doi:10.1016/j.compscitech.2003.07.005 Composites Science and Technology 64 (2004) 657–666 www.elsevier.com/locate/compscitech * Corresponding author. Tel.: +1-313-577-3843; fax: +1-313-577- 8789. E-mail address: [email protected] (G. Newaz).
Transcript of Fatigue damage detection in graphite/epoxy composites using sonic infrared imaging technique

Fatigue damage detection in graphite/epoxy composites using sonicinfrared imaging technique
Ahsan Miana, Xiaoyan Hanb, Sarwar Islamb, Golam Newazc,*aDepartment of Mechanical Engineering, 5050 Anthony Wayne Drive, Detroit, MI 48202, USAbDepartment of Electrical Engineering, 5050 Anthony Wayne Drive, Detroit, MI 48202, USAcInstitute for Manufacturing Research, 5050 Anthony Wayne Drive, Detroit, MI 48202, USA
Received 4 September 2002; received in revised form 10 June 2003; accepted 2 July 2003
Abstract
This paper describes the application of a short ultrasonic pulse thereby infrared surface imaging to assess fatigue damage ingraphite/epoxy composites. The technique uses a short pulse of sound wave that infuses to the material and results in frictionalheating at the crack surfaces. The heating at the crack defuses into the surface of the sample, and the temperature rise at the crack
location is sufficient to be captured by an infrared (IR) camera. In this paper, the ability of sonic infrared imaging technique indetecting fatigue damage in composite materials has been demonstrated. Finite element modeling was performed to better under-stand the effect of applied sound pulse at the damage locations and to interpret the vibrometer data. The same samples were also
tested using thermal wave imaging nondestructive evaluation (NDE) technique.# 2003 Published by Elsevier Ltd.
Keywords: B. Fatigue; C. Finite element analysis (FEA); C. Non-destructive testing; Sonic-infrared imaging
1. Introduction
Over the years, IR-thermography is intensively beingused by nondestructive evaluation engineers for damagedetection in materials. Some investigations were direc-ted towards the evaluation of subsurface flaws, such asdelamination, by applying external heat thereby obser-ving the resulting thermal images on the surface [1].Such a technique is popularly known as thermal waveimaging (TWI). Another means of thermal NDEmethod is referred as vibrothermography, where highpower long ultrasonic pulse is applied to a sample for aperiod of tens of seconds to introduce localized heatingat the sites of material discontinuities/disbonds. Utiliz-ing this technique, Mignogna et al. [2,3] studied themechanisms that cause the apparent softening of metalsduring simultaneous application of tensile load andhigh-power ultrasonic insonation. In a related work,Mignogna et al. [4] observed localized temperature riseat the point of attached thermocouple to a sample
during the application of a long ultrasonic pulse. Inaddition, the authors reported rapid localized heating atthe sites of fatigue cracks, artificially induced defects,and grain boundaries during long insonation. Applic-ation of the vibrothermography technique in character-izing impact damage in composite materials has beenreported elsewhere [5,6]. Works sited in Refs. [2–6] usedlong ultrasonic pulse of tens of seconds and observedheating at the locations of material discontinuities. Incontrast, a group of researchers at Wayne State Uni-versity was successful in imaging fatigue cracks inmaterials by infusing a very short ultrasonic pulse [7,8]of a small fraction of a second. The study presented inthis paper is a continuation of the work cited in Refs.[7,8], by employing the so-called sonic-IR technique tocomposite materials.The technique is based on the heating at cracks or
disbonds in a material due to the applied sound waveinto it. The heat is presumably generated from frictionof the mating surfaces [4,7–9] when they rub, or fromplastic deformation when they ‘clap’. The effect appearsto begin on a time scale of milliseconds or less afterinitiation of a sound pulse in the sample. An IR cameraviews the location of a surface breaking fatigue crack or
0266-3538/$ - see front matter # 2003 Published by Elsevier Ltd.
doi:10.1016/j.compscitech.2003.07.005
Composites Science and Technology 64 (2004) 657–666
www.elsevier.com/locate/compscitech
* Corresponding author. Tel.: +1-313-577-3843; fax: +1-313-577-
8789.
E-mail address: [email protected] (G. Newaz).

subsurface fatigue damage at a frame rate of 500 Hz. Asurface-breaking crack appears immediately as a sharpline after the sound source is turned on, and the IRimage then becomes more and more smeared when timegoes on due to heat diffusion. For a subsurface crack, itappears some time later after the sound is turned on anddoes not show as a sharp line due to heat diffusion fromthe crack location to the surface, and it becomes moresmeared as time goes on. The technique has been usedin detecting damage entities in various isotropic materi-als. However, the ability of the technique in detectingfatigue damage in composite materials is yet to be tes-ted. This paper will be devoted to presenting some ofthe IR images obtained from several fatigued compositesamples.It is well established that the application of cyclic
loads to woven laminated composites results in damagein the form of matrix cracking followed by delamination[10–13]. In the present article, the damage progressionwith fatigue loads was first detected using sonic-IRtechnique. A finite element model was developed for thenotched composite samples with two delaminationzones to understand the mechanics of frictional heatgeneration while the samples are subjected to sonic-IRtest. The same damaged samples were also tested usingthe thermal wave imaging (TWI) NDE technique. Theimages of the damage zones obtained from both techni-ques are compared and presented.
2. Materials and sample preparation
The material used in this study consisted of 5208 epoxyreinforced with woven ([0/90]4s) IM7 carbon fiber. Thecomposite panels were manufactured using a resin-transfer molding process. The thickness and fiber volumefraction of each panel are nominally 3.0 and 0.55 mm,respectively. A total of seven specimens were cut fromthe composite panel. The specimens are 25 mm wide and216 mm long. Of the seven samples, four were unnotchedand the remaining three are notched. The notched sam-ples have a hole of 6.2 mm diameter at the geometriccenter.
3. Experimental methods
3.1. Fatigue test
Before conducting the fatigue tests, the failurestrengths of the notched and unnotched samples weredetermined using quasi-static tensile tests. For the ten-sile tests, one notched and one un-notched samples wereused. The failure strengths for the un-notched and not-ched samples were 590 and 490 MPa, respectively. Thereduction in failure stress for the notched sample is due
to the stress concentration in the initial delaminationattributed to the machining procedure near the notchregion.The remaining two notched and three un-notched
samples were subjected to fatigue loads. The appliedload was sinusoidal with a frequency of 5 Hz. Tension–tension fatigue tests were run at a stress ratio (R) of 0.1with the maximum stress of 75% of the ultimatestrength obtained from the static tests. The maximumstress level was chosen to be high to obtain damageaccumulation at a lower number of load cycles.All tests were conducted in a 100 kN servo-hydraulic
closed-loop testing machine under load control. Testmachine actuator position and load for the static test wererecorded with an automated data acquisition system.The tests were interrupted periodically and the sampleswere tested for damage using sonic-IR and TWI techni-ques. The sonic-IR and TWI images of the fatiguedsamples were collected at 0, 1000, 3000, and 13000cycles.
3.2. Sonic-IR imaging test
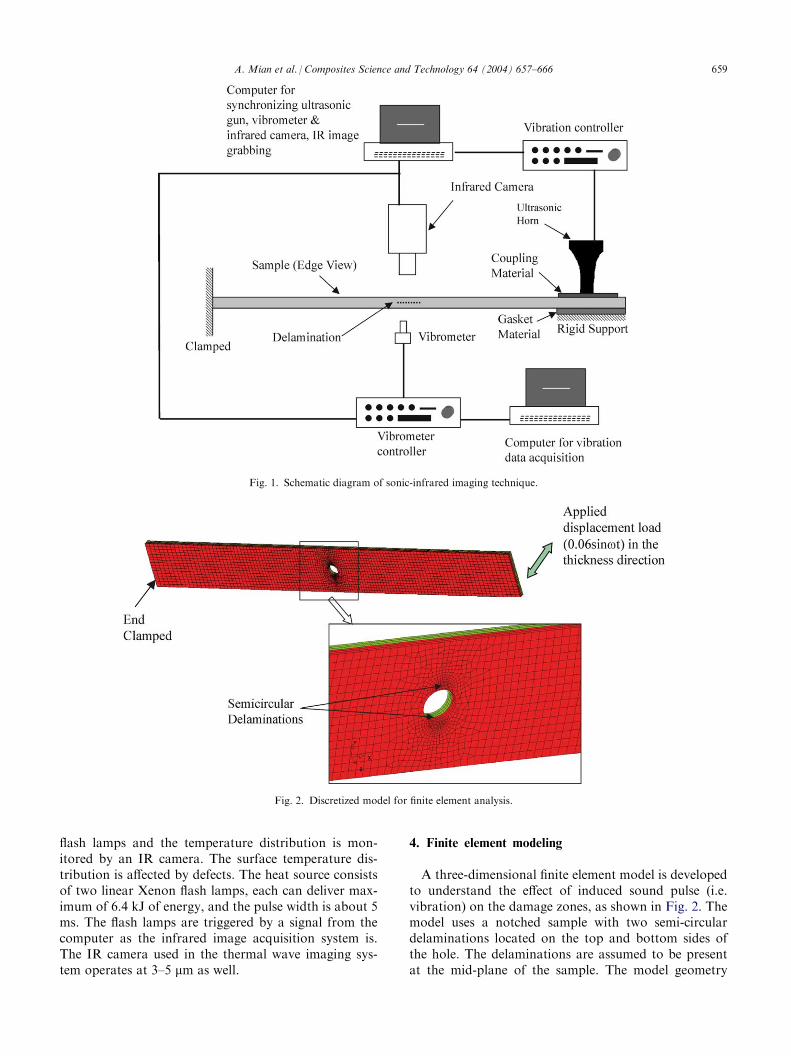
The experimental set up for the sonic infrared imagingtest is shown in Fig. 1. A low frequency (20 kHz) ultra-sonic welding gun is used to infuse the sample with a200 ms pulse of sound. The ultrasonic source has max-imum 1 kW of power. The tip of the welding horn ispressed against the sample through an intermediatecoupling material. Coupling materials such as water orultrasonic gel are not required at this frequency range.However, to prevent marring of the surface at the con-tact location, a softer material such as paper can be usedbetween the sample and the gun tip. Leather was used asa coupling material in our experiments. The low fre-quency sound effectively infuses the entire sample, andbecause of the long wavelength of the sound and multi-ple reflections from various surfaces, the sound is pre-sent with all acoustic modes. The surface temperature ofthe sample to be tested is imaged by an IR video camerathat is operated in 3–5 mm region. The camera is cou-pled to a fast frame grabber in a computer. The cameradigitizes the video images with a 14-bit depth, and trans-mits them to the computer as a stream of 16-bit data. Tobetter understand the effect of the infused sound pulseinto the damage zone, a non-contact laser vibrometerwas used to monitor the vibration pattern of a point onthe sample during the test. It is mentioned here that theultrasonic gun, IR camera, and the vibrometer weretriggered simultaneously by a computer. A separatecomputer was used for the vibration data acquisition.
3.3. Thermal wave imaging
In the thermal wave imaging (TWI) technique, heat isapplied to the surface of the sample uniformly using
658 A. Mian et al. / Composites Science and Technology 64 (2004) 657–666
flash lamps and the temperature distribution is mon-itored by an IR camera. The surface temperature dis-tribution is affected by defects. The heat source consistsof two linear Xenon flash lamps, each can deliver max-imum of 6.4 kJ of energy, and the pulse width is about 5ms. The flash lamps are triggered by a signal from thecomputer as the infrared image acquisition system is.The IR camera used in the thermal wave imaging sys-tem operates at 3–5 mm as well.
4. Finite element modeling
A three-dimensional finite element model is developedto understand the effect of induced sound pulse (i.e.vibration) on the damage zones, as shown in Fig. 2. Themodel uses a notched sample with two semi-circulardelaminations located on the top and bottom sides ofthe hole. The delaminations are assumed to be presentat the mid-plane of the sample. The model geometry
Fig. 1. Schematic diagram of sonic-infrared imaging technique.
Fig. 2. Discretized model for finite element analysis.
A. Mian et al. / Composites Science and Technology 64 (2004) 657–666 659
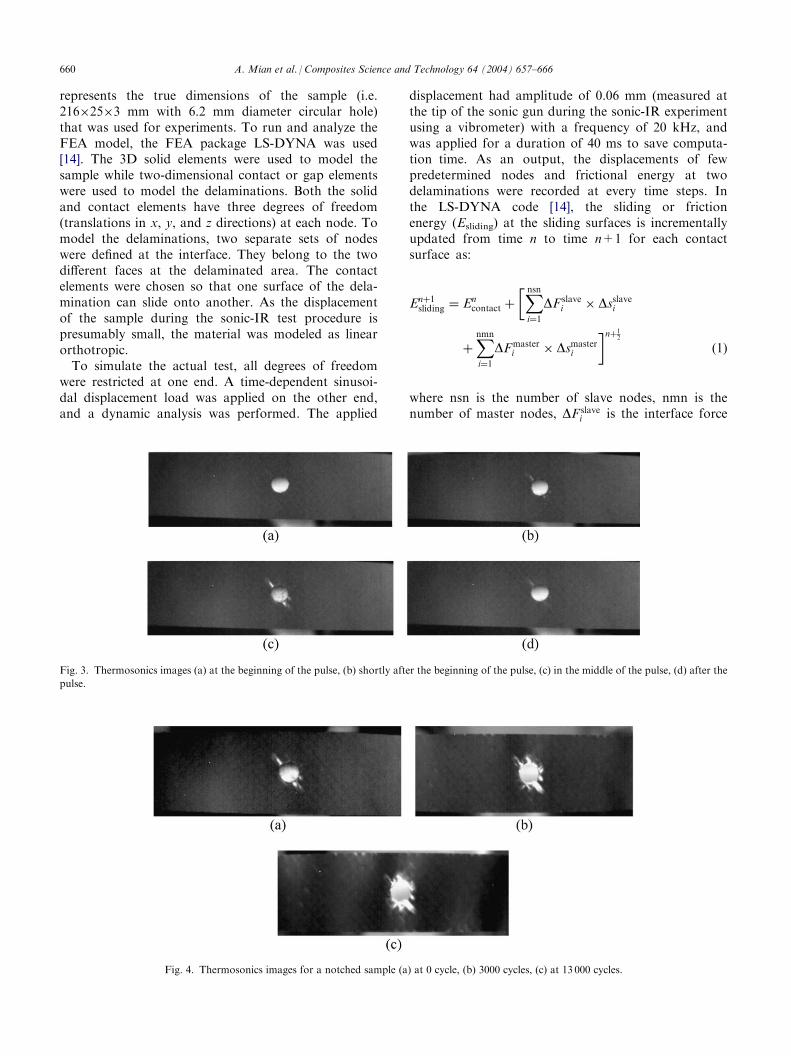
represents the true dimensions of the sample (i.e.216�25�3 mm with 6.2 mm diameter circular hole)that was used for experiments. To run and analyze theFEA model, the FEA package LS-DYNA was used[14]. The 3D solid elements were used to model thesample while two-dimensional contact or gap elementswere used to model the delaminations. Both the solidand contact elements have three degrees of freedom(translations in x, y, and z directions) at each node. Tomodel the delaminations, two separate sets of nodeswere defined at the interface. They belong to the twodifferent faces at the delaminated area. The contactelements were chosen so that one surface of the dela-mination can slide onto another. As the displacementof the sample during the sonic-IR test procedure ispresumably small, the material was modeled as linearorthotropic.To simulate the actual test, all degrees of freedom
were restricted at one end. A time-dependent sinusoi-dal displacement load was applied on the other end,and a dynamic analysis was performed. The applied
displacement had amplitude of 0.06 mm (measured atthe tip of the sonic gun during the sonic-IR experimentusing a vibrometer) with a frequency of 20 kHz, andwas applied for a duration of 40 ms to save computa-tion time. As an output, the displacements of fewpredetermined nodes and frictional energy at twodelaminations were recorded at every time steps. Inthe LS-DYNA code [14], the sliding or frictionenergy (Esliding) at the sliding surfaces is incrementallyupdated from time n to time n+1 for each contactsurface as:
Enþ1sliding ¼ En
contact þ
�Xnsni¼1
DF slavei � Dsslavei
þXnmn
i¼1
DFmasteri � Dsmaster
i
�nþ12ð1Þ
where nsn is the number of slave nodes, nmn is thenumber of master nodes, DF slave
i is the interface force
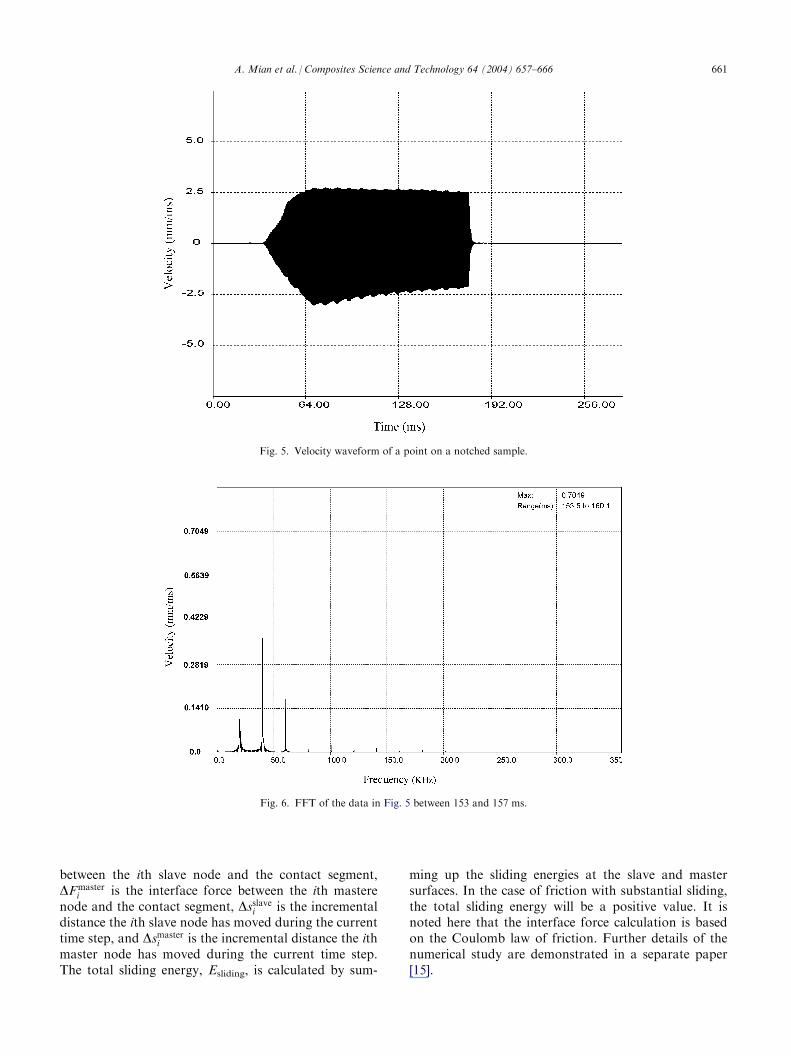
Fig. 3. Thermosonics images (a) at the beginning of the pulse, (b) shortly after the beginning of the pulse, (c) in the middle of the pulse, (d) after the
pulse.
Fig. 4. Thermosonics images for a notched sample (a) at 0 cycle, (b) 3000 cycles, (c) at 13 000 cycles.
660 A. Mian et al. / Composites Science and Technology 64 (2004) 657–666
between the ith slave node and the contact segment,DFmaster
i is the interface force between the ith masterenode and the contact segment, Dsslavei is the incrementaldistance the ith slave node has moved during the currenttime step, and Dsmaster
i is the incremental distance the ithmaster node has moved during the current time step.The total sliding energy, Esliding, is calculated by sum-
ming up the sliding energies at the slave and mastersurfaces. In the case of friction with substantial sliding,the total sliding energy will be a positive value. It isnoted here that the interface force calculation is basedon the Coulomb law of friction. Further details of thenumerical study are demonstrated in a separate paper[15].
Fig. 5. Velocity waveform of a point on a notched sample.
Fig. 6. FFT of the data in Fig. 5 between 153 and 157 ms.
A. Mian et al. / Composites Science and Technology 64 (2004) 657–666 661
5. Results
5.1. Experimental
Fig. 3 shows a sequence of sonic-IR images for anotched sample before the sample was subjected tofatigue. The images are taken during the 200-ms periodof an acoustic pulse. Fig. 3(a)–(d) represent the imagesat the beginning of the pulse, shortly after the beginningof the pulse, in the middle of the pulse, and after thepulse. The images show the heating progression and itsdiffusion away from the damage zones.To obtain the sonic-IR images at various cycles, the
fatigue tests were interrupted and the samples removedfrom the MTS machine. After the samples were tested,
they were reinserted into the machine and the cyclicloading continued. The samples were then repeatedlyremoved from the tester and additional IR images werecaptured. Before the samples were reloaded to the fati-gue tester, the samples were tested for damage using thethermal wave imaging technique. Fig. 4 shows the sonic-IR images for a notched sample at various load cycles.It is seen from the figures that damage was presentbefore the samples were subjected to fatigue loadings.However, additional damage occurs near the circularnotch as the samples were subjected to cyclic loading.The damage mechanisms are predominantly delamin-ation and distributed matrix cracks [10–13].As mentioned earlier, a non-contact laser vibrometer
was used to monitor the vibration pattern of various
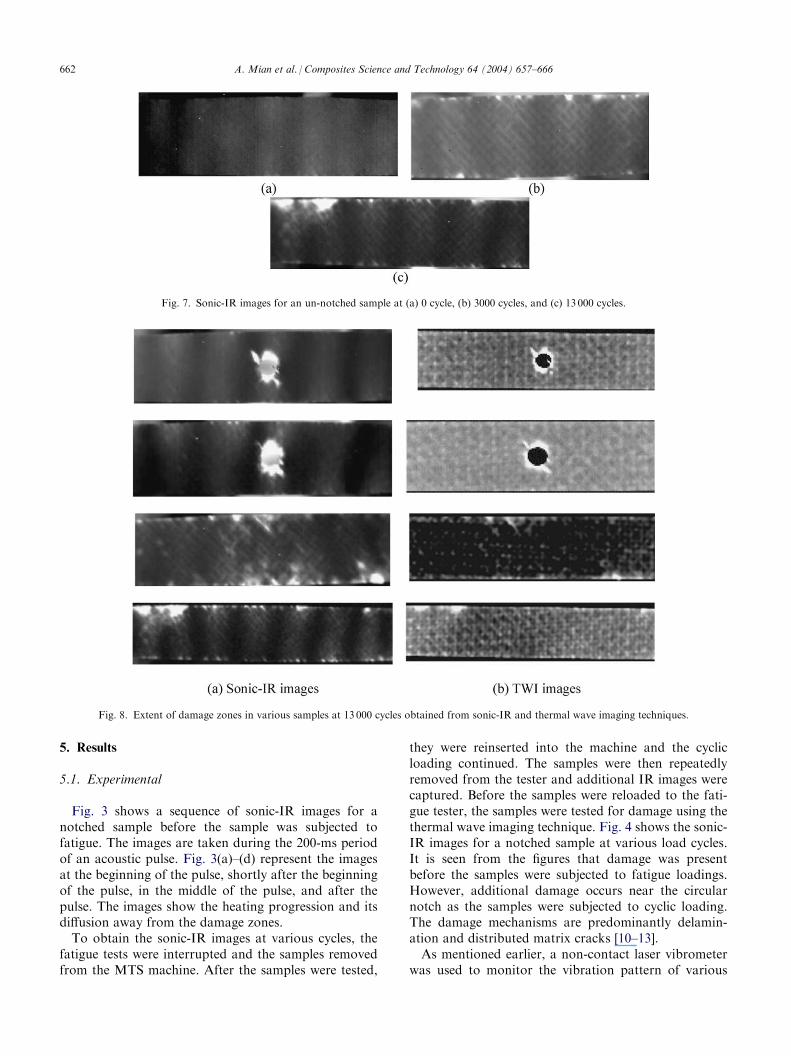
Fig. 7. Sonic-IR images for an un-notched sample at (a) 0 cycle, (b) 3000 cycles, and (c) 13 000 cycles.
Fig. 8. Extent of damage zones in various samples at 13 000 cycles obtained from sonic-IR and thermal wave imaging techniques.
662 A. Mian et al. / Composites Science and Technology 64 (2004) 657–666
locations on the samples. Such a plot is shown in Fig. 5.The plot in Fig. 5 shows the velocity of a point rightabove the circular hole on the same notched sample at13000 cycles. Fig. 6 shows the FFT of the data rangedbetween 153 and 160 ms. It is observed that the vibra-tion spectrum contains various harmonics of the input20 kHz frequency. The presence of this harmonics isordinarily attributed to ‘‘nonlinearities’’ in the couplingbetween acoustic source (in our case, ultrasonic welding
horn) and the sample. The multitude of higher fre-quencies commensurate with the input frequency ismore likely to be responsible for the enhanced heatingeffect, even though the sample is being insonated with avery short pulse. In other words, a short sound pulse isenough to generate sufficient heat to be captured by anIR camera. It is worth mentioning that the IR image forthis sample, given in Fig. 3(c), was captured at 155 ms.Similar IR images for an unnotched sample at different
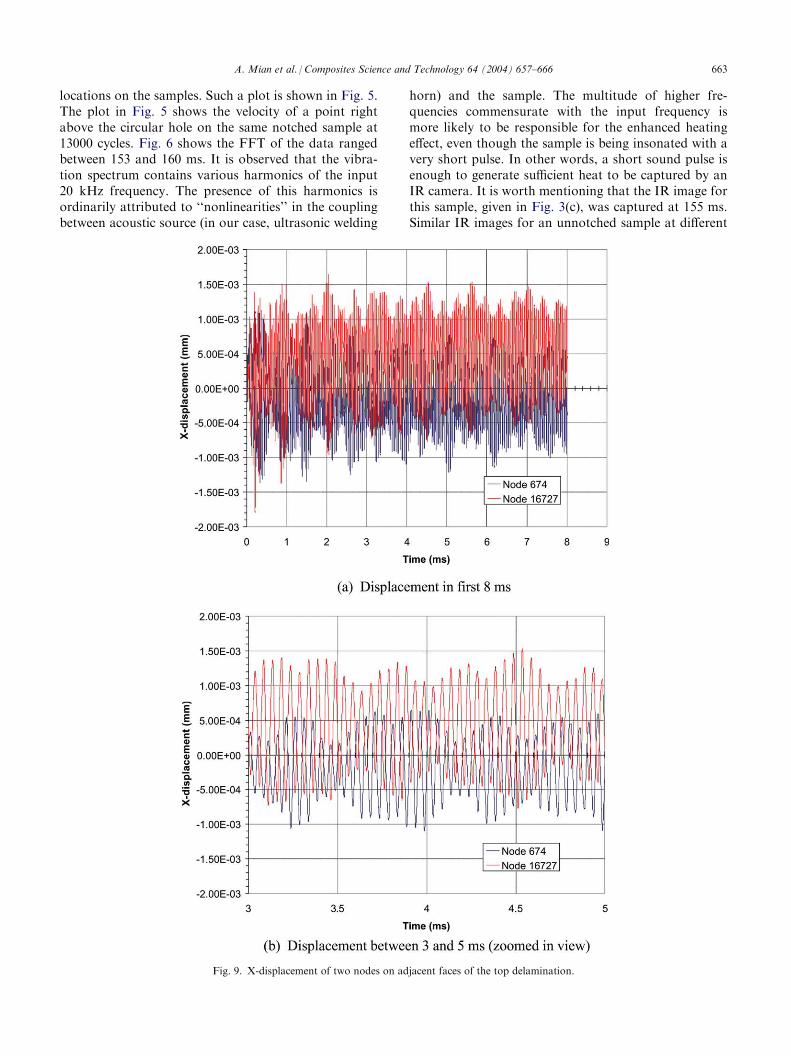
Fig. 9. X-displacement of two nodes on adjacent faces of the top delamination.
A. Mian et al. / Composites Science and Technology 64 (2004) 657–666 663

load cycles are shown in Fig. 7. It is observed that thedamage areas increased with the fatigue load cycles asexpected. In this case, damage seems to have startedfrom the edge of the sample. This is due to the obviousreason that the samples had some initial damages at theedge while machining them from a large compositeplate.Once the sonic-IR testing of the samples were com-
pleted, the same samples were tested for damage entitiesusing TWI technique. For comparison, we have
presented several TWI images of different samples at13 000 cycles along with their sonic-IR images (Fig. 8).In this particular case, the extent of damage zonesobtained from both NDE techniques look similar.However, the TWI technique has some limitations inassessing fatigue cracks. Especially, if the fatigue cracksare very fine and present at the material surface, or ifthe tightness of the subsurface crack is too high, thevariation of the thermal conductivities near the crackarea will be minimal. In such cases, TWI techniques will
Fig. 10. Y-displacement of two nodes on adjacent faces of the top delamination.
664 A. Mian et al. / Composites Science and Technology 64 (2004) 657–666
not provide accurate information. In contrast, thesonic-IR technique performs better for surface cracks,as the illumination at the crack zones appears on thesample surface almost immediately after the insonation.In the second case, the tightness of a subsurface crackwill contribute to the enhanced friction energy that iseven better for the sonic-IR imaging technique
5.2. FEA results
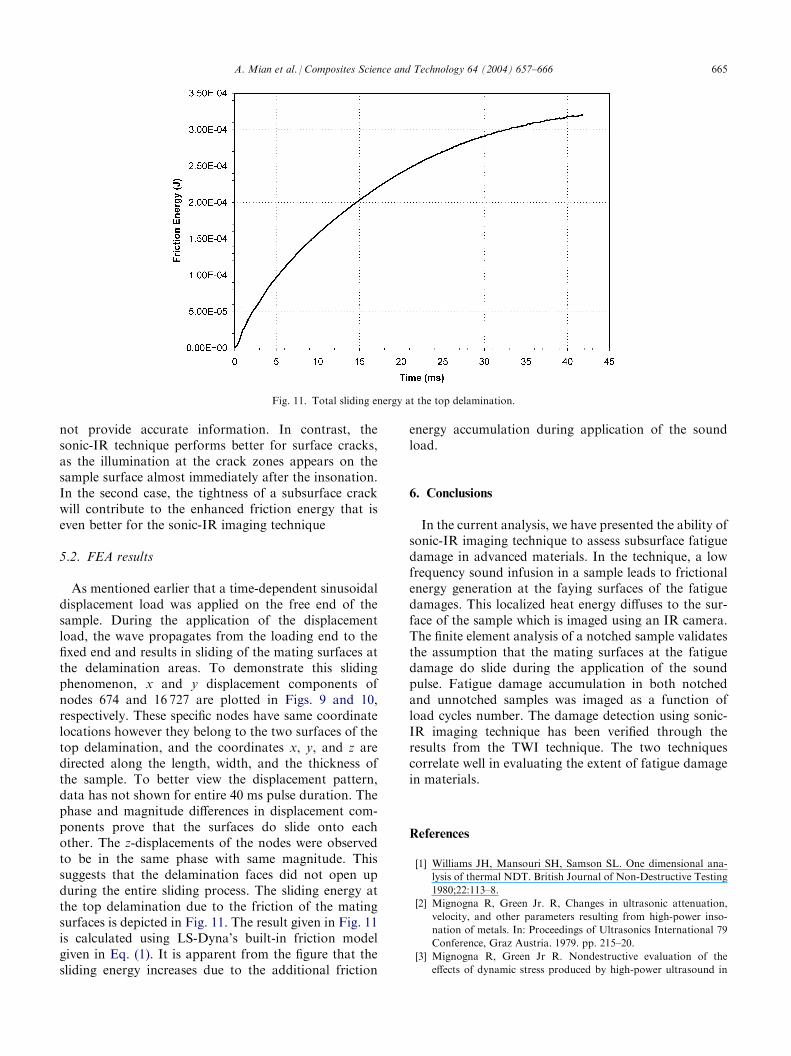
As mentioned earlier that a time-dependent sinusoidaldisplacement load was applied on the free end of thesample. During the application of the displacementload, the wave propagates from the loading end to thefixed end and results in sliding of the mating surfaces atthe delamination areas. To demonstrate this slidingphenomenon, x and y displacement components ofnodes 674 and 16 727 are plotted in Figs. 9 and 10,respectively. These specific nodes have same coordinatelocations however they belong to the two surfaces of thetop delamination, and the coordinates x, y, and z aredirected along the length, width, and the thickness ofthe sample. To better view the displacement pattern,data has not shown for entire 40 ms pulse duration. Thephase and magnitude differences in displacement com-ponents prove that the surfaces do slide onto eachother. The z-displacements of the nodes were observedto be in the same phase with same magnitude. Thissuggests that the delamination faces did not open upduring the entire sliding process. The sliding energy atthe top delamination due to the friction of the matingsurfaces is depicted in Fig. 11. The result given in Fig. 11is calculated using LS-Dyna’s built-in friction modelgiven in Eq. (1). It is apparent from the figure that thesliding energy increases due to the additional friction
energy accumulation during application of the soundload.
6. Conclusions
In the current analysis, we have presented the ability ofsonic-IR imaging technique to assess subsurface fatiguedamage in advanced materials. In the technique, a lowfrequency sound infusion in a sample leads to frictionalenergy generation at the faying surfaces of the fatiguedamages. This localized heat energy diffuses to the sur-face of the sample which is imaged using an IR camera.The finite element analysis of a notched sample validatesthe assumption that the mating surfaces at the fatiguedamage do slide during the application of the soundpulse. Fatigue damage accumulation in both notchedand unnotched samples was imaged as a function ofload cycles number. The damage detection using sonic-IR imaging technique has been verified through theresults from the TWI technique. The two techniquescorrelate well in evaluating the extent of fatigue damagein materials.
References
[1] Williams JH, Mansouri SH, Samson SL. One dimensional ana-
lysis of thermal NDT. British Journal of Non-Destructive Testing
1980;22:113–8.
[2] Mignogna R, Green Jr. R, Changes in ultrasonic attenuation,
velocity, and other parameters resulting from high-power inso-
nation of metals. In: Proceedings of Ultrasonics International 79
Conference, Graz Austria. 1979. pp. 215–20.
[3] Mignogna R, Green Jr R. Nondestructive evaluation of the
effects of dynamic stress produced by high-power ultrasound in
Fig. 11. Total sliding energy at the top delamination.
A. Mian et al. / Composites Science and Technology 64 (2004) 657–666 665

materials. In: Stinchcomb WW, editor. Mechanics of non-
destructive testing. New York: Plenum Publishing Co.; 1980.
p. 231–48.
[4] Mignogna R, Green Jr R, Duke Jr J, Henneke II E, Reifsnider K.
Thermographic investigation of high-power ultrasonic heating in
materials. Ultrasonics 1981:159–63.
[5] Henneke EG, Reifsnider KL, Stinchcomb WW. Thermography—
an NDT method for damage detection. Journal of Metals 1979;
31(9):11–15.
[6] Potet P, Bathias C, Degrigny B. Quantitative characterization of
impact damage in composite materials: a comparison of compu-
terized vibrothermography and X-ray topography. Materials
Evaluation 1988;46:1050–4.
[7] Favro LD, Thomas RL, Han X, Ouyang Z, Newaz G, Gentile D.
Sonic infrared imaging of fatigue cracks. International Journal of
Fatigue 2001;23:5471–6.
[8] Favro LD, Han X, Ouyang Z, Sun G, Sui H, Thomas RL.
Infrared imaging of defects heated by a sonic pulse. Review of
Scientific Instruments 2000;71(6):2418–21.
[9] Rantala J, Wu D, Busse G. Amplitude-modulated lock-in vibro-
thermography for NDE of polymers and composites. Research in
Nondestructive Evaluation 1995;7(4):215–28.
[10] Naik R, Patel S, Case S. Fatigue damage mechanism character-
ization and modeling of a woven graphite/epoxy composite.
Journal of Thermoplastic Composite Materials 2001;14(5):404–
20.
[11] Shokrieh M, Lessard L. Progressive fatigue damage modeling of
composite materials. Journal of Composite Materials 2000;
34(13):1081–116.
[12] Spearing M, Beaumont P, Ashby M. Fatigue damage mechanics
of notched graphite–epoxy composites. In: Composite materials:
fatigue and fracture, 3rd vol., ASTM; 1991. pp. 617–37.
[13] Piggott M, Lam Putrick. Fatigue failure processes in aligned
carbon-epoxy laminates. In: Composite materials: fatigue and
fracture, 3rd vol, ASTM; 1991. pp. 686–95.
[14] LS-DYNA3d v.960, Liverpool Software Technology Corpora-
tion, California.
[15] Mian A, Newaz G, Han X, Saha C. Response of subsurface
fatigue damage under sonic load—a computational study.
Composite Science and Technology accepted.
666 A. Mian et al. / Composites Science and Technology 64 (2004) 657–666