Fast Sampling of Adherent Cell Cultures for Optimal ...
12
Metabolomics ISSN: 2153-0769 JOM an open access journal Short Communication Open Access Bordag et al., Metabolomics 2016, 6:1 DOI: 10.4172/2153-0769.1000164 Volume 6 • Issue 1 • 1000164 *Corresponding author: Reszka RC, Metanomics Health GmbH, Berlin, Germany, Tel: +49 30 34807 407; Fax: +49 30 34807 401; E-mail: regina.reszka@ metanomics-health.de Received January 06, 2016; Accepted January 23, 2016; Published January 25, 2016 Citation: Bordag N, Rennefahrt U, Nachtigall J, Maldonado SG, Reszka RC, et al. (2016) Fast Sampling of Adherent Cell Cultures for Optimal Metabolomics Results. Metabolomics 6: 164. doi:10.4172/2153-0769.1000164 Copyright: © 2016 Bordag N, et al. This is an open-access article distributed under the terms of the Creative Commons Attribution License, which permits unrestricted use, distribution, and reproduction in any medium, provided the original author and source are credited. Fast Sampling of Adherent Cell Cultures for Optimal Metabolomics Results Bordag N 1 , Rennefahrt U 1 , Nachtigall J 1 , Maldonado SG 1 , Reszka RC 2 *, Ramirez-Hernandez T 3 , Kamp H 3 , Fux E 1 , and van Ravenzwaay B 3 1 metanomics GmbH, Berlin, Germany 2 Metanomics Health GmbH, Berlin, Germany 3 BASF SE, Ludwigshafen, Germany Materials and Method Cell culture and harvesting Six technical replicates per cell line and harvest condition were cultivated. MDA-MB-231 cells were freshly obtained from ATCC (HTB-26, Lot. 59922846) using passage 8 and MCF7 house-kept cells equivalent to ATCC (HTB-22) using passage 11 for experiments. Cells harvested by trypsinization or scraping were grown in standard uncoated 8.70 cm 2 6-well polystyrene culture dishes (83.3920.300, Sarstedt AG&Co.). Cells harvested by MxP ® CellCollect were grown in uncoated 6.4 cm 2 lumox ® dishes 35 (94.6077.331, Sarstedt AG&Co.). Per dish 0.25∙10 6 MDA-MB-231 and 0.3∙10 6 MCF7 cells were seeded and grown in RPMI-1640 medium (+10% FBS+2 mM glutamine+100 µg/ml Penicillin/Streptomycin) under standard growth conditions (37°C, 5% CO 2 ) reaching 80% confluence aſter 48 h. For trypsinization, as described in [13], cells were quickly washed once with PBS (HPLC grade) and 0.2 mL 0.05% trypsin in 0.02% EDTA (R-001-100, Gibco ® ) were added for 5 min at 37°C. Detached cells were gently suspended in 0.4 mL fresh medium (37°C), transferred and spun down with 900 rpm for 3 min at 4°C. To mimic cell counting an Keywords: Metabolomics; In vitro sampling procedures; Adherent eukaryotic cells; Scraping; Trypsinization; MxP ® CellCollect Abbreviations ANOVA: Analysis of Variance; CHCl 3 : Chloroform; DCM: Dichloromethane; EtOH: Ethanol; FBS: Fetal Bovine Serum; GC: Gas Chromatography; HPLC: High Performance LC; ISTD: Internal Standard; LC: Liquid Chromatography; MeOH: Methanol; MRM: Multiple Reaction Monitoring; MS: Mass Spectrometry; PBS: Phosphate Buffered Saline; PCA: Principal Component Analysis; RPMI: Roswell Park Memorial Institute; TCA: Tricarboxylic Acid Cycle; TNBC: Triple Negative Breast Cancer; s: Second(s) Introduction Metabolomics is a valuable tool generating biological insight from the most diverse sample types ranging from plants, to plasma, tissue or cell culture. e use of metabolomics to obtain insight into the toxicological properties and mode of action of compounds when tested in rats, has been demonstrated in the MetaMap ® Tox Project [1,2] and a successful step towards using this technology for in vitro systems was shown by [3].With adherent cells metabolomics is now becoming an invaluable tool to study disease mechanisms and mode of action of compounds, to discover drug targets and off-target effects, to observe resistance strategies, and to investigate toxicities [4-12]. A suitable sampling method is a key feature for routine use of high quality metabolomics with adherent cells. e method must be sufficiently robust, reproducible, easily performable, and most importantly, able to capture the physiological, non-perturbed intracellular metabolism [7]. e purpose of this investigation was to compare the most commonly used sampling procedures such as trypsinization and scraping, with a newly developed method called MxP ® CellCollect and to suggest better standards in metabolomics sampling practices. Abstract Metabolomics is a valuable tool to gain mechanistic insight into biological processes. It is frequently used to obtain complementary details to other ‘omics technologies such as transcriptomics or proteomics. For knowledge generation, reproducible measurements of physiological, intact, and artifact-free metabolite levels are imperative necessitating further standardization of best practices to improve reliability of research outcomes. Here we report a novel cell sample preparation method (MxP ® CellCollect) for metabolomics applications using adherent mammalian cells, which reduces the time consumption and physiological stress of conventional methods such as trypsinization or cell scraping. The most common sampling procedures to detach cells from their growth surface, trypsinization and scraping were compared to the MxP ® CellCollect method investigating metabolite profiles of two breast cancer cell lines (MDA-MB-231 and MCF7). Metabolite levels as well as direction of metabolite changes differed tremendously revealing issues with trypsinization and scraping risking non-physiological or misleading results in contrast to MxP ® CellCollect. Differences in metabolic profiles of cells harvested by trypsinization as compared to MxP ® CellCollect or scraping can be directly attributed to prolonged, medium-free incubation time during cell detachment leading to a severely energy-depleted intracellular state. Labile metabolites or metabolites with fast intracellular turnover rates such as glycolysis and TCA cycle intermediates were strongly and significantly decreased by trypsinization. The same was true for amino acids and nucleoside triphosphates. Results obtained with scraping using methanol as solvent were multifaceted. Even mild evaporation of methanol prior metabolite extraction led to temperature- and/or light-dependent degradation of labile metabolites such as nucleoside triphosphates into di- and monophosphates liberating pyrophosphate. Furthermore, lipid metabolites, in particular cell membrane lipids, were found to have significantly lower levels than measured by trypsinization or MxP ® CellCollect, indicating that lipid metabolites are insufficiently detached and/or unspecifically adsorb to the hydrophobic dish and scraping tool. M e t a b o l o m i c s : O p e n A c c e s s ISSN: 2153-0769 Metabolomics: Open Access
-
Upload
khangminh22 -
Category
Documents
-
view
0 -
download
0
Transcript of Fast Sampling of Adherent Cell Cultures for Optimal ...
MetabolomicsISSN: 2153-0769 JOM an open access journal
Short Communication Open Access
Bordag et al., Metabolomics 2016, 6:1 DOI: 10.4172/2153-0769.1000164
Volume 6 • Issue 1 • 1000164
*Corresponding author: Reszka RC, Metanomics Health GmbH, Berlin,Germany, Tel: +49 30 34807 407; Fax: +49 30 34807 401; E-mail: [email protected]
Received January 06, 2016; Accepted January 23, 2016; Published January 25, 2016
Citation: Bordag N, Rennefahrt U, Nachtigall J, Maldonado SG, Reszka RC, et al. (2016) Fast Sampling of Adherent Cell Cultures for Optimal Metabolomics Results. Metabolomics 6: 164. doi:10.4172/2153-0769.1000164
Copyright: © 2016 Bordag N, et al. This is an open-access article distributed under the terms of the Creative Commons Attribution License, which permits unrestricted use, distribution, and reproduction in any medium, provided the original author and source are credited.
Fast Sampling of Adherent Cell Cultures for Optimal Metabolomics ResultsBordag N1, Rennefahrt U1, Nachtigall J1, Maldonado SG1, Reszka RC2*, Ramirez-Hernandez T3, Kamp H3, Fux E1, and van Ravenzwaay B3
1metanomics GmbH, Berlin, Germany2Metanomics Health GmbH, Berlin, Germany3BASF SE, Ludwigshafen, Germany
Materials and MethodCell culture and harvesting
Six technical replicates per cell line and harvest condition were cultivated. MDA-MB-231 cells were freshly obtained from ATCC (HTB-26, Lot. 59922846) using passage 8 and MCF7 house-kept cells equivalent to ATCC (HTB-22) using passage 11 for experiments. Cells harvested by trypsinization or scraping were grown in standard uncoated 8.70 cm2 6-well polystyrene culture dishes (83.3920.300, Sarstedt AG&Co.). Cells harvested by MxP® CellCollect were grown in uncoated 6.4 cm2 lumox® dishes 35 (94.6077.331, Sarstedt AG&Co.). Per dish 0.25∙106 MDA-MB-231 and 0.3∙106 MCF7 cells were seeded and grown in RPMI-1640 medium (+10% FBS+2 mM glutamine+100 µg/ml Penicillin/Streptomycin) under standard growth conditions (37°C, 5% CO2) reaching 80% confluence after 48 h.
For trypsinization, as described in [13], cells were quickly washed once with PBS (HPLC grade) and 0.2 mL 0.05% trypsin in 0.02% EDTA (R-001-100, Gibco®) were added for 5 min at 37°C. Detached cells were gently suspended in 0.4 mL fresh medium (37°C), transferred and spun down with 900 rpm for 3 min at 4°C. To mimic cell counting an
Keywords: Metabolomics; In vitro sampling procedures; Adherenteukaryotic cells; Scraping; Trypsinization; MxP® CellCollect
AbbreviationsANOVA: Analysis of Variance; CHCl3: Chloroform; DCM:
Dichloromethane; EtOH: Ethanol; FBS: Fetal Bovine Serum; GC: Gas Chromatography; HPLC: High Performance LC; ISTD: Internal Standard; LC: Liquid Chromatography; MeOH: Methanol; MRM: Multiple Reaction Monitoring; MS: Mass Spectrometry; PBS: Phosphate Buffered Saline; PCA: Principal Component Analysis; RPMI: Roswell Park Memorial Institute; TCA: Tricarboxylic Acid Cycle; TNBC: Triple Negative Breast Cancer; s: Second(s)
IntroductionMetabolomics is a valuable tool generating biological insight
from the most diverse sample types ranging from plants, to plasma, tissue or cell culture. The use of metabolomics to obtain insight into the toxicological properties and mode of action of compounds when tested in rats, has been demonstrated in the MetaMap®Tox Project [1,2] and a successful step towards using this technology for in vitro systems was shown by [3].With adherent cells metabolomics is now becoming an invaluable tool to study disease mechanisms and mode of action of compounds, to discover drug targets and off-target effects, to observe resistance strategies, and to investigate toxicities [4-12]. A suitable sampling method is a key feature for routine use of high quality metabolomics with adherent cells. The method must be sufficiently robust, reproducible, easily performable, and most importantly, able to capture the physiological, non-perturbed intracellular metabolism [7]. The purpose of this investigation was to compare the most commonly used sampling procedures such as trypsinization and scraping, with a newly developed method called MxP® CellCollect and to suggest better standards in metabolomics sampling practices.
AbstractMetabolomics is a valuable tool to gain mechanistic insight into biological processes. It is frequently used to obtain
complementary details to other ‘omics technologies such as transcriptomics or proteomics. For knowledge generation, reproducible measurements of physiological, intact, and artifact-free metabolite levels are imperative necessitating further standardization of best practices to improve reliability of research outcomes. Here we report a novel cell sample preparation method (MxP® CellCollect) for metabolomics applications using adherent mammalian cells, which reduces the time consumption and physiological stress of conventional methods such as trypsinization or cell scraping. The most common sampling procedures to detach cells from their growth surface, trypsinization and scraping were compared to the MxP® CellCollect method investigating metabolite profiles of two breast cancer cell lines (MDA-MB-231 and MCF7). Metabolite levels as well as direction of metabolite changes differed tremendously revealing issues with trypsinization and scraping risking non-physiological or misleading results in contrast to MxP® CellCollect. Differences in metabolic profiles of cells harvested by trypsinization as compared to MxP® CellCollect or scraping can be directly attributed to prolonged, medium-free incubation time during cell detachment leading to a severely energy-depleted intracellular state. Labile metabolites or metabolites with fast intracellular turnover rates such as glycolysis and TCA cycle intermediates were strongly and significantly decreased by trypsinization. The same was true for amino acids and nucleoside triphosphates. Results obtained with scraping using methanol as solvent were multifaceted. Even mild evaporation of methanol prior metabolite extraction led to temperature- and/or light-dependent degradation of labile metabolites such as nucleoside triphosphates into di- and monophosphates liberating pyrophosphate. Furthermore, lipid metabolites, in particular cell membrane lipids, were found to have significantly lower levels than measured by trypsinization or MxP® CellCollect, indicating that lipid metabolites are insufficiently detached and/or unspecifically adsorb to the hydrophobic dish and scraping tool.
Met
ab
olomics: OpenAccess
ISSN: 2153-0769Metabolomics: Open Access

Citation: Bordag N, Rennefahrt U, Nachtigall J, Maldonado SG, Reszka RC, et al. (2016) Fast Sampling of Adherent Cell Cultures for Optimal Metabolomics Results. Metabolomics 6: 164. doi:10.4172/2153-0769.1000164
Page 2 of 4
Volume 6 • Issue 1 • 1000164MetabolomicsISSN: 2153-0769 JOM an open access journal
artificial break of 5 min was introduced. Cells were thereafter washed twice with PBS (4°C).
For scraping, as described in [12], cell monolayers were quickly washed twice with ice-cold 5% maltose solution and residual fluid was removed with vacuum. Immediately 1 mL MeOH (HPLC grade) (-20°C) was added and cells were scraped (2-Posit. Blade 25, thermoplastic elastomers, Sarstedt AG&Co).
For MxP® CellCollect (Figure 1) the lumox® membrane (with the adherent cells on) was cut out with a scalpel, falling into a dish with 37°C warm washing buffer (isotonic NaCl for MxP® Broad Profiling or 4.5 g/L glucose in isotonic NaCl for MxP® Energy) [14]. The membrane was quickly picked up with tweezers and dip-washed twice in two further dishes with fresh washing buffer. The membrane was placed on top of a 2 mL Eppendorf tube and pushed inside with a pipette tip adding 600 µL DCM/EtOH (9:11) for MxP® Broad Profiling or 900 µL (2:1) DCM/EtOH for MxP® Energy (-80°C). The procedure from cutting the membrane until freezing should not exceed 30 s for each sample to prevent metabolic changes during sampling. All harvested cells were immediately snap frozen in liquid nitrogen and stored until extraction at -80°C. Directly before extraction, the MeOH of scraped cells was removed by mild evaporation over a few minutes at 40°C and DCM/EtOH (mixtures as above) were added. Likewise, DCM/EtOH mixtures were added to trypsinized cell pellets after thawing before routine extraction and measurement (described in supplementary information).
Statistical analysis
Metabolite values were log10-transformed for all statistical analysis in order to better approximate a normal distribution. For univariate analysis a linear ANOVA model was set up in the statistical software R [15] with the categorical fixed factors METHOD and CELL_LINE (readouts: ratios, p-values, t-values, Benjamini-Hochberg corrected q-values in supplementary Table 1). For multivariate analysis, data was further centered and scaled to unit variance and multivariate statisticswere performed by using Simca P+ software (version 13, Umetrics AB, Umea, Sweden).
Results and DiscussionA quick sampling is a key prerequisite in order to capture
physiological intracellular metabolite levels and to avoid loss of metabolites with high turnover rates (e.g. glycolysis intermediates). Since metabolite concentrations are very sensitive to any variation in the cell environment an ideal harvest and quenching method for metabolomics analysis would immediately stop all intracellular enzymatic activities and subsequently all intracellular changes in metabolite concentrations, without first affecting the cell environment. Furthermore, such a method should be rapid, highly efficient, and reproducible to allow an unbiased measurement of cellular metabolite
concentrations, and to enable direct comparison of a large number of analytical samples. At the same time all cells with all of their metabolites must be collected and contaminations from spent media have to be avoided [16]. The necessary washing must leave metabolism unperturbed and should not induce any leakage or metabolite loss. Although great advances have been achieved by introduction of direct quenching and scraping instead of trypsinization [11,16-19] still a major drawback remains, namely the need for manual scraping and collection of cells. These steps might increase the variability of biological replicates due to differences in efficiency of cell transfer from the cell culture dish or cover slight into the extraction vial. Furthermore, these steps are time-consuming and therefore, might reduce overall attractiveness of this method to be used in high throughput cell culture experiments including several hundred samples in parallel.
New sampling method – MxP® CellCollect
The cells are grown on lumox® dishes, which foremost offer excellent gas diffusion through the thin, gas-permeable, membrane-like bottom on which the cells grow. More importantly, these dishes allow cutting out the membrane and thereby to collect all cells quickly at once (Figure 1). The cells on the membrane are gently and thoroughly washed by immediate dipping into two consecutive dishes. The metabolism is then rapidly quenched by pushing the membrane into a tube with a pipette tip, immediately adding -80°C precooled solvent and further snap freezing in liquid nitrogen. The time from cells being without medium until quenching is typically around a few seconds and the whole procedure takes less than 30 s. Standard coatings such as fibronectin were well compatible and cell-free blanks incubated with medium as additional controls showed no impact on results.
Comparison of trypsinization and scraping
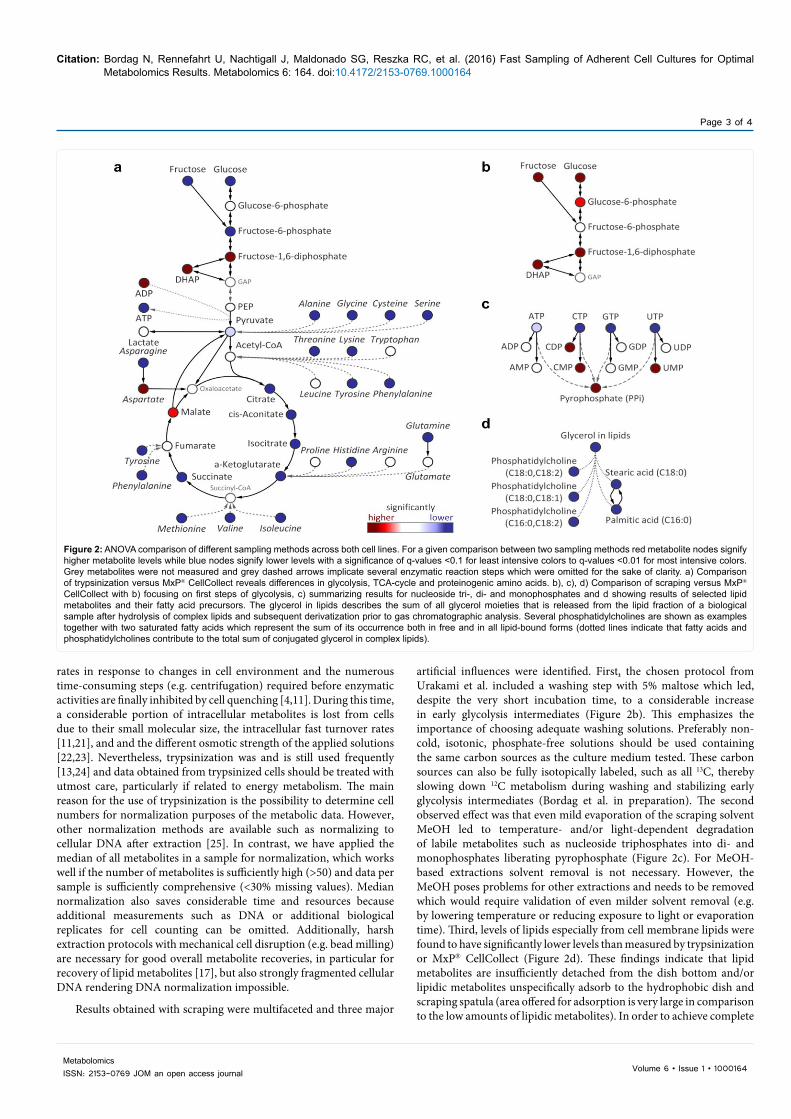
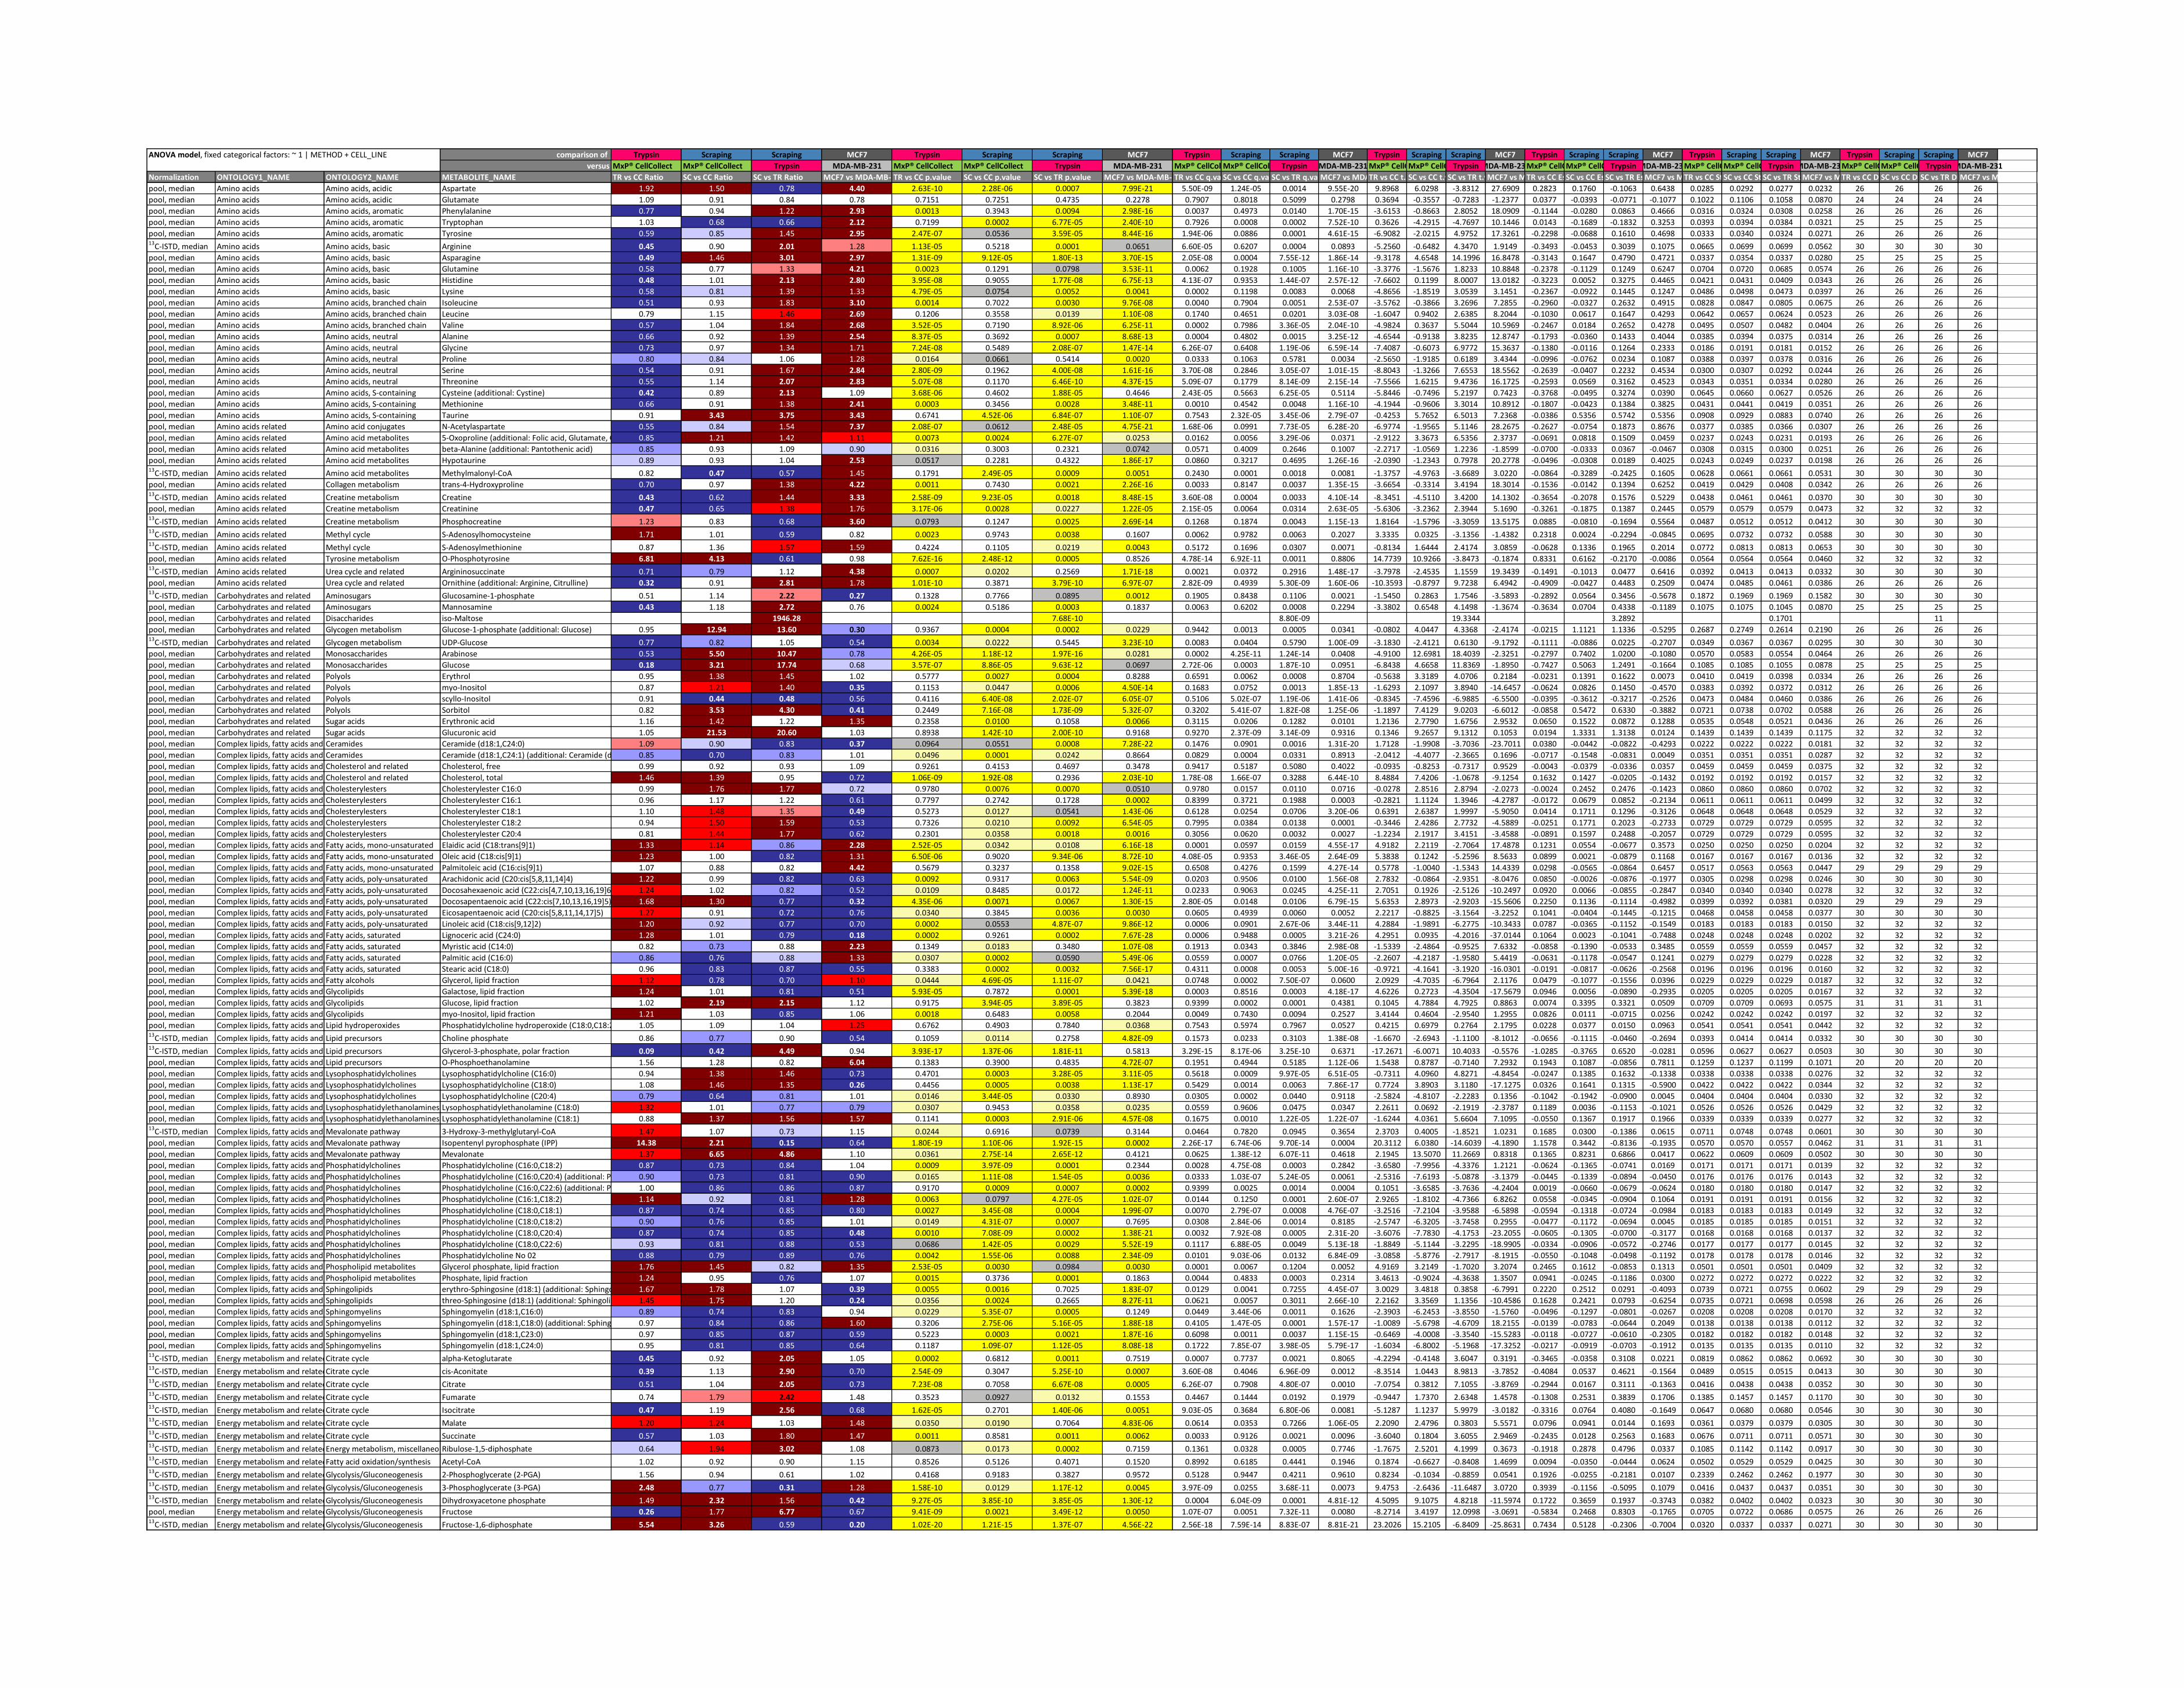
The two most conventional cell harvesting protocols, trypsinization [13]. and scraping in cold MeOH [12], were directly compared to the developed method for two different cell lines while all other parameters (extraction, measurement, normalization) were kept constant. Both multivariate (PCA, supplementary information Figure S1) and univariate analysis (ANOVA, Figure 2 and supplementary information Table 1) revealed obvious differences between all three methods. Differences in the metabolic profiles of cells harvested by trypsinization as compared to MxP® CellCollect or scraping can be directly attributed to the prolonged, medium-free incubation time during cell detachment leading to a severely energy-depleted intracellular state (Figure 2a). Glycolysis and TCA cycle intermediates as well as almost all amino acids and nucleoside triphosphates were strongly and statistically significantly decreased. Adenylate energy charge (AEC=ATP+0.5∙ADP/ (ATP+ADP+AMP)) was with a value of 0.70 (± 0.05) far below AEC levels found with scraping or MxP® CellCollect (with values of 0.82 (± 0.07) and 0.84 (± 0.03), respectively). Although trypsinization is a valuable method for cell detachment from their growth surface (e.g. for cell passaging), our results and literature data [4,20] emphasize that trypsinization is not a suitable choice for physiological metabolomics since trypsin severely alters the physiological state of cells due to its interaction with membrane proteins resulting in sustained membrane damage in combination with metabolite leakage, and decreased cell viability, all of which significantly alter metabolite levels and cellular metabolite profiles [11]. As a consequence a considerable and highly variable portion of metabolites will be released into the trypsin solution and/or washing buffer depending on the length of trypsinization and washing/centrifugation steps. Furthermore, metabolic data varies for extremely labile metabolites or for metabolites with fast turnover
Figure 1: Sampling procedure. MxP® CellCollect sampling consists of cutting the membrane, dip washing the cells on the membrane, and quenching the metabolism with -80°C cold solvent. The transparent membrane was colored red for better visibility.
Citation: Bordag N, Rennefahrt U, Nachtigall J, Maldonado SG, Reszka RC, et al. (2016) Fast Sampling of Adherent Cell Cultures for Optimal Metabolomics Results. Metabolomics 6: 164. doi:10.4172/2153-0769.1000164
Page 3 of 4
Volume 6 • Issue 1 • 1000164MetabolomicsISSN: 2153-0769 JOM an open access journal
rates in response to changes in cell environment and the numerous time-consuming steps (e.g. centrifugation) required before enzymatic activities are finally inhibited by cell quenching [4,11]. During this time, a considerable portion of intracellular metabolites is lost from cells due to their small molecular size, the intracellular fast turnover rates [11,21], and and the different osmotic strength of the applied solutions [22,23]. Nevertheless, trypsinization was and is still used frequently [13,24] and data obtained from trypsinized cells should be treated with utmost care, particularly if related to energy metabolism. The main reason for the use of trypsinization is the possibility to determine cell numbers for normalization purposes of the metabolic data. However, other normalization methods are available such as normalizing to cellular DNA after extraction [25]. In contrast, we have applied the median of all metabolites in a sample for normalization, which works well if the number of metabolites is sufficiently high (>50) and data per sample is sufficiently comprehensive (<30% missing values). Median normalization also saves considerable time and resources because additional measurements such as DNA or additional biological replicates for cell counting can be omitted. Additionally, harsh extraction protocols with mechanical cell disruption (e.g. bead milling) are necessary for good overall metabolite recoveries, in particular for recovery of lipid metabolites [17], but also strongly fragmented cellular DNA rendering DNA normalization impossible.
Results obtained with scraping were multifaceted and three major
artificial influences were identified. First, the chosen protocol from Urakami et al. included a washing step with 5% maltose which led, despite the very short incubation time, to a considerable increase in early glycolysis intermediates (Figure 2b). This emphasizes the importance of choosing adequate washing solutions. Preferably non-cold, isotonic, phosphate-free solutions should be used containing the same carbon sources as the culture medium tested. These carbon sources can also be fully isotopically labeled, such as all 13C, thereby slowing down 12C metabolism during washing and stabilizing early glycolysis intermediates (Bordag et al. in preparation). The second observed effect was that even mild evaporation of the scraping solvent MeOH led to temperature- and/or light-dependent degradation of labile metabolites such as nucleoside triphosphates into di- and monophosphates liberating pyrophosphate (Figure 2c). For MeOH-based extractions solvent removal is not necessary. However, the MeOH poses problems for other extractions and needs to be removed which would require validation of even milder solvent removal (e.g. by lowering temperature or reducing exposure to light or evaporation time). Third, levels of lipids especially from cell membrane lipids were found to have significantly lower levels than measured by trypsinization or MxP® CellCollect (Figure 2d). These findings indicate that lipid metabolites are insufficiently detached from the dish bottom and/or lipidic metabolites unspecifically adsorb to the hydrophobic dish and scraping spatula (area offered for adsorption is very large in comparison to the low amounts of lipidic metabolites). In order to achieve complete
Figure 2: ANOVA comparison of different sampling methods across both cell lines. For a given comparison between two sampling methods red metabolite nodes signify higher metabolite levels while blue nodes signify lower levels with a significance of q-values <0.1 for least intensive colors to q-values <0.01 for most intensive colors. Grey metabolites were not measured and grey dashed arrows implicate several enzymatic reaction steps which were omitted for the sake of clarity. a) Comparison of trypsinization versus MxP® CellCollect reveals differences in glycolysis, TCA-cycle and proteinogenic amino acids. b), c), d) Comparison of scraping versus MxP® CellCollect with b) focusing on first steps of glycolysis, c) summarizing results for nucleoside tri-, di- and monophosphates and d showing results of selected lipid metabolites and their fatty acid precursors. The glycerol in lipids describes the sum of all glycerol moieties that is released from the lipid fraction of a biological sample after hydrolysis of complex lipids and subsequent derivatization prior to gas chromatographic analysis. Several phosphatidylcholines are shown as examples together with two saturated fatty acids which represent the sum of its occurrence both in free and in all lipid-bound forms (dotted lines indicate that fatty acids and phosphatidylcholines contribute to the total sum of conjugated glycerol in complex lipids).
Citation: Bordag N, Rennefahrt U, Nachtigall J, Maldonado SG, Reszka RC, et al. (2016) Fast Sampling of Adherent Cell Cultures for Optimal Metabolomics Results. Metabolomics 6: 164. doi:10.4172/2153-0769.1000164
Page 4 of 4
Volume 6 • Issue 1 • 1000164MetabolomicsISSN: 2153-0769 JOM an open access journal
Toxicol Lett 230: 467-478.
9. Mattes WB, Kamp HG, Fabian E, Herold M, Krennrich G, et al. (2013) Prediction of clinically relevant safety signals of nephrotoxicity through plasma metabolite profiling. Biomed Res Int.
10. Ser Z, Liu X, Tang NN, Locasale JW (2015) Extraction parameters formetabolomics from cultured cells. Anal Biochem 475: 22-28.
11. Teng Q, Huang WL, Collette TW, Ekman DR, Tan C (2009) A direct cell quenching method for cell-culture based metabolomics. Metabolomics 5: 199-208.
12. Urakami K, Zangiacomi V, Yamaguchi K, Kusuhara M (2013) Impact of2-deoxy-D-glucose on the target metabolome profile of a human endometrial cancer cell line. Biomed Res 34: 221-229.
13. Reitman ZJ, Jin G, Karoly ED, Spasojevic I, Yang J et al. (2011) Profiling the effects of isocitrate dehydrogenase 1 and 2 mutations on the cellularmetabolome. Proc Natl Acad Sci USA 108: 3270-3275.
14. Daemen A, Peterson D, Sahu N, McCord R, Du X et al. (2015) Metabolite profiling stratifies pancreatic ductal adenocarcinomas into subtypes with distinct sensitivities to metabolic inhibitors. Proc Natl Acad Sci USA 112: E4410-E4417.
15. R Development Core Team R2R (2014) A language and environment for statistical computing.
16. Martano G, Delmotte N, Kiefer P, Christen P, Kentner D, et al. (2015) Fast sampling method for mammalian cell metabolic analyses using liquidchromatography-mass spectrometry. Nat Protoc 10: 1-11.
17. Danielsson AP, Moritz T, Mulder H, Spegel P (2010) Development and optimization of a metabolomic method for analysis of adherent cell cultures.Anal Biochem 404: 30-39.
18. Lorenz MA, Burant CF, Kennedy RT (2011) Reducing time and increasingsensitivity in sample preparation for adherent mammalian cell metabolomics.Anal Chem 83: 3406-3414.
19. Ritter JB, Genzel Y, Reichl U (2008) Simultaneous extraction of severalmetabolites of energy metabolism and related substances in mammalian cells: optimization using experimental design. Anal Biochem 373: 349-369.
20. Dettmer K, Nurnberger N, Kaspar H, Gruber MA, Almstetter MF, et al. (2011) Metabolite extraction from adherently growing mammalian cells formetabolomics studies: optimization of harvesting and extraction protocols. Anal Bioanal Chem 399: 1127-1139.
21. Villas-Boas SG, Hojer-Pedersen J, Akesson M, Smedsgaard J, Nielsen J(2005) Global metabolite analysis of yeast: evaluation of sample preparationmethods. Yeast 22: 1155-1169.
22. Britten RJ, Mcclure FT (1962) Amino Acid Pool in Escherichia-Coli. BacteriolRev. 26: 292-335.
23. Smeaton JR, Elliott WH (1967) Selective release of ribonuclease-inhibitor from Bacillus subtilis cells by cold shock treatment. Biochem Biophys Res Commun 26: 75-81.
24. Ghosh JC, Siegelin MD, Vaira V, Faversani A, Tavecchio M, et al. (2015) Adaptive mitochondrial reprogramming and resistance to PI3K therapy. J NatlCancer Inst 107.
25. Silva LP, Lorenzi PL, Purwaha P, Yong V, Hawke DH, et al. (2013) Measurement of DNA concentration as a normalization strategy for metabolomic data from adherent cell lines. Anal Chem 85: 9536-9542.
recovery of lipidic metabolites the use of harsher solvents for scraping is necessary which in turn might risk the dissolving of the cell culture dish polystyrene plastic. In contrast, MxP® CellCollect is compatible with many solvents and harsh mechanical cell disruption which is a prerequisite for high recovery of polar and apolar metabolites [17] from the complete sample.
ConclusionWe developed a user-friendly, fast, efficient, reproducible, and
robust sampling method for adherent cells. In summary, MxP® CellCollect proves to deliver more reliable results for metabolic profiling of adherent cells than the widely used scraping and trypsinization procedures. The presented manual sampling is extremely flexible and easily adoptable. The method was developed so that it is also suitable for possible automatization and translation into 96-well format in the future. More than 150 different cell lines havebeen analyzed by applying MxP® CellCollect so far, indicating overallthat this new method is compatible with any adherent cell type and any common extraction or measurement protocol (MS- or NMR-based),easily adoptable without the need for sophisticated equipment. Herea high-throughput, routine MS-based protocol was applied which isalso commonly used for sample types such as suspension cells, plasma, blood, or urine, thereby leading to increasing comparability.
Acknowledgement
The authors sincerely thank all of their team members and colleagues for their constant support and fruitful discussions.
References
1. van Ravenzwaay B, Cunha GCP, Leibold E, Looser R, Mellert W, et al. (2007)The use of metabolomics for the discovery of new biomarkers of effect. Toxicol Lett 172: 21-28.
2. van Ravenzwaay B, Coelho-Palermo Cunha G, Fabian E, Herold M, Kamp H, et al. (2010) The use of metabolomics in cancer research. An Omics Perspective of Cancer. Springer.
3. Balcke G, Kolle S, Kamp H, Bethan B, Looser R, et al. (2011) Linking energymetabolism to dysfunctions in mitochondrial respiration - A metabolomics invitro approach. Toxicology Letters 203: 200-209.
4. Halama A (2014) Metabolomics in cell culture--a strategy to study crucialmetabolic pathways in cancer development and the response to treatment.Arch Biochem Biophys 564: 100-109.
5. Kamp H, Fabian E, Groeters S, Herold M, Krennrich G, et al. (2012) Application of in vivo metabolomics to preclinical/toxicological studies: case study onphenytoin-induced systemic toxicity. Bioanalysis 4: 2291-2301.
6. Kentner D, Martano G, Callon M, Chiquet P, Brodmann M, et al. (2014) Shigella reroutes host cell central metabolism to obtain high-flux nutrient supply for vigorous intracellular growth. Proc Natl Acad Sci USA 111: 9929-9934.
7. Leon Z, Garcia-Canaveras JC, Donato MT, Lahoz A (2013) Mammalian cell metabolomics: experimental design and sample preparation. Electrophoresis34: 2762-2775.
8. Mattes W, Davis K, Fabian E, Greenhaw J, Herold M, et al. (2014) Detection of hepatotoxicity potential with metabolite profiling (metabolomics) of rat plasma.
Supplementary Information
MxP® Broad Profiling
For MxP® Broad Profiling the samples were prepared and subjected to LC-MS/MS, GC-MS analysis as described
below. After addition of water the samples were extracted using a ball mill (Retsch, Germany), filtered through a
centrifuge filter (Millipore, mesh size 0.2 mm) and fractionated into an aqueous, polar phase and an organic,
lipophilic phase. For the transmethanolysis of the lipid extracts (lipophilic phase) a mixture of 140 µL of
chloroform, 37 µL of hydrochloric acid (37% by weight HCl in water), 320 µL of methanol and 20 µL of toluene
was added to the evaporated extract. The vessel was sealed tightly and heated for 2 hours at 100°C, with shaking.
The solution was subsequently evaporated to dryness. The residue was dried completely. The methoximation of the
carbonyl groups was carried out by reaction with methoxyamine hydrochloride (20 mg/mL in pyridine, 100 µL for
1.5 hours at 60°C) in a tightly sealed vessel. 20 µL of a solution of odd-numbered, straight-chain fatty acids
(solution of each 0.3 mg/mL of fatty acids from 7 to 25 carbon atoms and each 0.6 mg/mL of fatty acids with 27, 29,
and 31 carbon atoms in 3/7 (v/v) pyridine/toluene) were added as time standards. Finally, the derivatization with 100
µL of N-methyl-N-(trimethylsilyl)-2,2,2-trifluoroacetamide (MSTFA) was carried out for 30 minutes at 60°C, again
in the tightly sealed vessel. The final volume before injection into the GC was 200 µL. For the dried polar
phase the derivatization was performed in the following way: the methoximation of the carbonyl groups
was carried out by reaction with methoxyamine hydrochloride (20 mg/mL in pyridine, 50 µL for 1.5 hours
at 60°C) in a tightly sealed vessel. 10 µL of a solution of odd-numbered, straight-chain fatty acids (solution
of each 0.3 mg/mL of fatty acids from 7 to 25 carbon atoms and each 0.6 mg/mL of fatty acids with 27,
29, and 31 carbon atoms in 3/7 (v/v) pyridine/toluene) were added as time standards. Finally, the
derivatization with 50 µL of N-methyl-N-(trimethylsilyl)-2,2,2-trifluoroacetamide (MSTFA) was carried
out for 30 minutes at 60°C, again in the tightly sealed vessel. The final volume before injection into the
GC was 100 µL.
The GC-MS system consists of an Agilent 6890 GC coupled to an Agilent 5973 MSD (Agilent,
Waldbronn, Germany), autosamplers were CompiPal or GCPal from CTC (CTC, Zwingen, Switzerland).
In LC-MS analysis, both fractions were reconstituted in appropriate solvent mixtures. HPLC was performed by
gradient elution on reversed phase separation columns. Mass spectrometric detection, which allows target
and high sensitivity MRM (Multiple Reaction Monitoring) profiling in parallel to a full screen analysis, was
applied as described in WO2003073464. The HPLC instruments were Agilent 1100 (Agilent, Waldbronn, Germany), the
MS instruments were API4000 from SCIEX (AB SCIEX, Darmstadt, Germany). Data of 113 known and 74
unknown metabolites were normalized to the median of reference samples which were derived from a pool formed
from additional biological aliquots of all sampling groups (→ polar reference material and lipid reference
material) to account for inter- and intra-instrumental variation. In a second step metabolite profiling data was
normalized to the sample-specific metabolite median to correct for variations in cell numbers.
RennefU
Notiz
Marked festgelegt von RennefU
RennefU
Notiz
Marked festgelegt von RennefU
MxP® Energy
For MxP® Energy UPLC-MS/MS, an Aquity (Waters) coupled to the API5500 a negative mode ESI-MS/MS-
System (Applied Biosystems), were used as described in [3]. In short, samples were kept at all times at 5°C or
below. For extraction 1.5 M ammonium acetate and ISTD (13C-labeled yeast extract) were added to the cells in the
DCM/EtOH quenching solution and the mixture was homogenized for 30 s in a bead mill FastPrep24 (MP
Biomedicals) at -20°C. Phase separation was achieved by 2 min centrifugation with 14000 rpm at 4°C. Polar
phases were spin-filtrated (Ultrafree®-MC 5.0 µm, Millipore) in 5 min. Samples were extracted and spin-filtrated
a second time with additional 1.5 M ammonium acetate. Spin filters were finally washed with water and
all three filtrates were combined and lyophilized to remove the ammonium acetate. Samples were
resuspended in deionized water and the separation was performed by gradient elution at 45°C using 10
mM tributylammonium acetate (pH 6.2) in A) water and B) 50% ACN with a gradient from 5-90% on a 1.5
µm RP UPLC column (VisionHT-HL, 2.1 mm ×10 cm, Alltech-Grom). All 65 known metabolites were
measured in MRM mode and each metabolite was normalized against the corresponding 13C-analyte. In a
second step metabolite profiling data was normalized to the median of all metabolites from one replicate dish.
For production of 13C-labeled, yeast extract as ISTD, a yeast culture of Candida utilis (DSMZ sp. 2361) was
grown in shake flasks on 10 g/L [U13C6] D-glucose in yeast nitrogen base amino acid-free medium (Y1250
Sigma–Aldrich). Cells were cultured under aerobic conditions at 28°C at 180 rpm on an orbital shaker and
harvested at an optical density of 4 (600 nm, 1 cm cuvette) by short centrifugation at 4°C. Cells were washed
twice with 10 g/L [U13C6] D-glucose in 0.15 M ammonium acetate by centrifugation. The cell pellet was
quenched with DCM/EtOH (2/1) and extracted as described for MxP® Broad Profiling. The polar phase
containing the labelled metabolites was stored at -80°C until further use as ISTD.
Multivariate s tatis tical analys is
For multivariate analysis, data was further centered and scaled to unit variance and multivariate statistics were
performed by using Simca P+ software (version 13, Umetrics AB, Umea, Sweden).
Figure S1: Principal component analysis (PCA) of cell line-specific metabolite profiles harvested either by
trypsinization, scraping or MxP® CellCollect. The scores plots of all four models for the first two
principal components reveal very large differences resulting from sampling within each of the two cell
lines from two different measurement platforms.
ANOVA model, fixed categorical factors: ~ 1 | METHOD + CELL_LINE comparison of Trypsin Scraping Scraping MCF7 Trypsin Scraping Scraping MCF7 Trypsin Scraping Scraping MCF7 Trypsin Scraping Scraping MCF7 Trypsin Scraping Scraping MCF7 Trypsin Scraping Scraping MCF7 Trypsin Scraping Scraping MCF7
versus MxP® CellCollect MxP® CellCollect Trypsin MDA-MB-231 MxP® CellCollect MxP® CellCollect Trypsin MDA-MB-231 MxP® CellCollectMxP® CellCollectTrypsin MDA-MB-231 MxP® CellCollectMxP® CellCollectTrypsin MDA-MB-231MxP® CellCollectMxP® CellCollectTrypsin MDA-MB-231MxP® CellCollectMxP® CellCollectTrypsin MDA-MB-231MxP® CellCollectMxP® CellCollectTrypsin MDA-MB-231
Normalization ONTOLOGY1_NAME ONTOLOGY2_NAME METABOLITE_NAME TR vs CC Ratio SC vs CC Ratio SC vs TR Ratio MCF7 vs MDA-MB-231 RatioTR vs CC p.value SC vs CC p.value SC vs TR p.value MCF7 vs MDA-MB-231 p.valueTR vs CC q.valueSC vs CC q.valueSC vs TR q.valueMCF7 vs MDA-MB-231 q.valueTR vs CC t.valueSC vs CC t.valueSC vs TR t.valueMCF7 vs MDA-MB-231 t.valueTR vs CC Est.logSC vs CC Est.logSC vs TR Est.logMCF7 vs MDA-MB-231 Est.logTR vs CC Std.ErrSC vs CC Std.ErrSC vs TR Std.ErrMCF7 vs MDA-MB-231 Std.ErrTR vs CC DFSC vs CC DFSC vs TR DFMCF7 vs MDA-MB-231 DF
pool, median Amino acids Amino acids, acidic Aspartate 1.92 1.50 0.78 4.40 2.63E-10 2.28E-06 0.0007 7.99E-21 5.50E-09 1.24E-05 0.0014 9.55E-20 9.8968 6.0298 -3.8312 27.6909 0.2823 0.1760 -0.1063 0.6438 0.0285 0.0292 0.0277 0.0232 26 26 26 26
pool, median Amino acids Amino acids, acidic Glutamate 1.09 0.91 0.84 0.78 0.7151 0.7251 0.4735 0.2278 0.7907 0.8018 0.5099 0.2798 0.3694 -0.3557 -0.7283 -1.2377 0.0377 -0.0393 -0.0771 -0.1077 0.1022 0.1106 0.1058 0.0870 24 24 24 24
pool, median Amino acids Amino acids, aromatic Phenylalanine 0.77 0.94 1.22 2.93 0.0013 0.3943 0.0094 2.98E-16 0.0037 0.4973 0.0140 1.70E-15 -3.6153 -0.8663 2.8052 18.0909 -0.1144 -0.0280 0.0863 0.4666 0.0316 0.0324 0.0308 0.0258 26 26 26 26
pool, median Amino acids Amino acids, aromatic Tryptophan 1.03 0.68 0.66 2.12 0.7199 0.0002 6.77E-05 2.40E-10 0.7926 0.0008 0.0002 7.52E-10 0.3626 -4.2915 -4.7697 10.1446 0.0143 -0.1689 -0.1832 0.3253 0.0393 0.0394 0.0384 0.0321 25 25 25 25
pool, median Amino acids Amino acids, aromatic Tyrosine 0.59 0.85 1.45 2.95 2.47E-07 0.0536 3.59E-05 8.44E-16 1.94E-06 0.0886 0.0001 4.61E-15 -6.9082 -2.0215 4.9752 17.3261 -0.2298 -0.0688 0.1610 0.4698 0.0333 0.0340 0.0324 0.0271 26 26 26 2613C-ISTD, median Amino acids Amino acids, basic Arginine 0.45 0.90 2.01 1.28 1.13E-05 0.5218 0.0001 0.0651 6.60E-05 0.6207 0.0004 0.0893 -5.2560 -0.6482 4.3470 1.9149 -0.3493 -0.0453 0.3039 0.1075 0.0665 0.0699 0.0699 0.0562 30 30 30 30
pool, median Amino acids Amino acids, basic Asparagine 0.49 1.46 3.01 2.97 1.31E-09 9.12E-05 1.80E-13 3.70E-15 2.05E-08 0.0004 7.55E-12 1.86E-14 -9.3178 4.6548 14.1996 16.8478 -0.3143 0.1647 0.4790 0.4721 0.0337 0.0354 0.0337 0.0280 25 25 25 25
pool, median Amino acids Amino acids, basic Glutamine 0.58 0.77 1.33 4.21 0.0023 0.1291 0.0798 3.53E-11 0.0062 0.1928 0.1005 1.16E-10 -3.3776 -1.5676 1.8233 10.8848 -0.2378 -0.1129 0.1249 0.6247 0.0704 0.0720 0.0685 0.0574 26 26 26 26
pool, median Amino acids Amino acids, basic Histidine 0.48 1.01 2.13 2.80 3.95E-08 0.9055 1.77E-08 6.75E-13 4.13E-07 0.9353 1.44E-07 2.57E-12 -7.6602 0.1199 8.0007 13.0182 -0.3223 0.0052 0.3275 0.4465 0.0421 0.0431 0.0409 0.0343 26 26 26 26
pool, median Amino acids Amino acids, basic Lysine 0.58 0.81 1.39 1.33 4.79E-05 0.0754 0.0052 0.0041 0.0002 0.1198 0.0083 0.0068 -4.8656 -1.8519 3.0539 3.1451 -0.2367 -0.0922 0.1445 0.1247 0.0486 0.0498 0.0473 0.0397 26 26 26 26
pool, median Amino acids Amino acids, branched chain Isoleucine 0.51 0.93 1.83 3.10 0.0014 0.7022 0.0030 9.76E-08 0.0040 0.7904 0.0051 2.53E-07 -3.5762 -0.3866 3.2696 7.2855 -0.2960 -0.0327 0.2632 0.4915 0.0828 0.0847 0.0805 0.0675 26 26 26 26
pool, median Amino acids Amino acids, branched chain Leucine 0.79 1.15 1.46 2.69 0.1206 0.3558 0.0139 1.10E-08 0.1740 0.4651 0.0201 3.03E-08 -1.6047 0.9402 2.6385 8.2044 -0.1030 0.0617 0.1647 0.4293 0.0642 0.0657 0.0624 0.0523 26 26 26 26
pool, median Amino acids Amino acids, branched chain Valine 0.57 1.04 1.84 2.68 3.52E-05 0.7190 8.92E-06 6.25E-11 0.0002 0.7986 3.36E-05 2.04E-10 -4.9824 0.3637 5.5044 10.5969 -0.2467 0.0184 0.2652 0.4278 0.0495 0.0507 0.0482 0.0404 26 26 26 26
pool, median Amino acids Amino acids, neutral Alanine 0.66 0.92 1.39 2.54 8.37E-05 0.3692 0.0007 8.68E-13 0.0004 0.4802 0.0015 3.25E-12 -4.6544 -0.9138 3.8235 12.8747 -0.1793 -0.0360 0.1433 0.4044 0.0385 0.0394 0.0375 0.0314 26 26 26 26
pool, median Amino acids Amino acids, neutral Glycine 0.73 0.97 1.34 1.71 7.24E-08 0.5489 2.08E-07 1.47E-14 6.26E-07 0.6408 1.19E-06 6.59E-14 -7.4087 -0.6073 6.9772 15.3637 -0.1380 -0.0116 0.1264 0.2333 0.0186 0.0191 0.0181 0.0152 26 26 26 26
pool, median Amino acids Amino acids, neutral Proline 0.80 0.84 1.06 1.28 0.0164 0.0661 0.5414 0.0020 0.0333 0.1063 0.5781 0.0034 -2.5650 -1.9185 0.6189 3.4344 -0.0996 -0.0762 0.0234 0.1087 0.0388 0.0397 0.0378 0.0316 26 26 26 26
pool, median Amino acids Amino acids, neutral Serine 0.54 0.91 1.67 2.84 2.80E-09 0.1962 4.00E-08 1.61E-16 3.70E-08 0.2846 3.05E-07 1.01E-15 -8.8043 -1.3266 7.6553 18.5562 -0.2639 -0.0407 0.2232 0.4534 0.0300 0.0307 0.0292 0.0244 26 26 26 26
pool, median Amino acids Amino acids, neutral Threonine 0.55 1.14 2.07 2.83 5.07E-08 0.1170 6.46E-10 4.37E-15 5.09E-07 0.1779 8.14E-09 2.15E-14 -7.5566 1.6215 9.4736 16.1725 -0.2593 0.0569 0.3162 0.4523 0.0343 0.0351 0.0334 0.0280 26 26 26 26
pool, median Amino acids Amino acids, S-containing Cysteine (additional: Cystine) 0.42 0.89 2.13 1.09 3.68E-06 0.4602 1.88E-05 0.4646 2.43E-05 0.5663 6.25E-05 0.5114 -5.8446 -0.7496 5.2197 0.7423 -0.3768 -0.0495 0.3274 0.0390 0.0645 0.0660 0.0627 0.0526 26 26 26 26
pool, median Amino acids Amino acids, S-containing Methionine 0.66 0.91 1.38 2.41 0.0003 0.3456 0.0028 3.48E-11 0.0010 0.4542 0.0048 1.16E-10 -4.1944 -0.9606 3.3014 10.8912 -0.1807 -0.0423 0.1384 0.3825 0.0431 0.0441 0.0419 0.0351 26 26 26 26
pool, median Amino acids Amino acids, S-containing Taurine 0.91 3.43 3.75 3.43 0.6741 4.52E-06 6.84E-07 1.10E-07 0.7543 2.32E-05 3.45E-06 2.79E-07 -0.4253 5.7652 6.5013 7.2368 -0.0386 0.5356 0.5742 0.5356 0.0908 0.0929 0.0883 0.0740 26 26 26 26
pool, median Amino acids related Amino acid conjugates N-Acetylaspartate 0.55 0.84 1.54 7.37 2.08E-07 0.0612 2.48E-05 4.75E-21 1.68E-06 0.0991 7.73E-05 6.28E-20 -6.9774 -1.9565 5.1146 28.2675 -0.2627 -0.0754 0.1873 0.8676 0.0377 0.0385 0.0366 0.0307 26 26 26 26
pool, median Amino acids related Amino acid metabolites 5-Oxoproline (additional: Folic acid, Glutamate, Glutamine)0.85 1.21 1.42 1.11 0.0073 0.0024 6.27E-07 0.0253 0.0162 0.0056 3.29E-06 0.0371 -2.9122 3.3673 6.5356 2.3737 -0.0691 0.0818 0.1509 0.0459 0.0237 0.0243 0.0231 0.0193 26 26 26 26
pool, median Amino acids related Amino acid metabolites beta-Alanine (additional: Pantothenic acid) 0.85 0.93 1.09 0.90 0.0316 0.3003 0.2321 0.0742 0.0571 0.4009 0.2646 0.1007 -2.2717 -1.0569 1.2236 -1.8599 -0.0700 -0.0333 0.0367 -0.0467 0.0308 0.0315 0.0300 0.0251 26 26 26 26
pool, median Amino acids related Amino acid metabolites Hypotaurine 0.89 0.93 1.04 2.53 0.0517 0.2281 0.4322 1.86E-17 0.0860 0.3217 0.4695 1.26E-16 -2.0390 -1.2343 0.7978 20.2778 -0.0496 -0.0308 0.0189 0.4025 0.0243 0.0249 0.0237 0.0198 26 26 26 2613C-ISTD, median Amino acids related Amino acid metabolites Methylmalonyl-CoA 0.82 0.47 0.57 1.45 0.1791 2.49E-05 0.0009 0.0051 0.2430 0.0001 0.0018 0.0081 -1.3757 -4.9763 -3.6689 3.0220 -0.0864 -0.3289 -0.2425 0.1605 0.0628 0.0661 0.0661 0.0531 30 30 30 30
pool, median Amino acids related Collagen metabolism trans-4-Hydroxyproline 0.70 0.97 1.38 4.22 0.0011 0.7430 0.0021 2.26E-16 0.0033 0.8147 0.0037 1.35E-15 -3.6654 -0.3314 3.4194 18.3014 -0.1536 -0.0142 0.1394 0.6252 0.0419 0.0429 0.0408 0.0342 26 26 26 2613C-ISTD, median Amino acids related Creatine metabolism Creatine 0.43 0.62 1.44 3.33 2.58E-09 9.23E-05 0.0018 8.48E-15 3.60E-08 0.0004 0.0033 4.10E-14 -8.3451 -4.5110 3.4200 14.1302 -0.3654 -0.2078 0.1576 0.5229 0.0438 0.0461 0.0461 0.0370 30 30 30 30
pool, median Amino acids related Creatine metabolism Creatinine 0.47 0.65 1.38 1.76 3.17E-06 0.0028 0.0227 1.22E-05 2.15E-05 0.0064 0.0314 2.63E-05 -5.6306 -3.2362 2.3944 5.1690 -0.3261 -0.1875 0.1387 0.2445 0.0579 0.0579 0.0579 0.0473 32 32 32 3213C-ISTD, median Amino acids related Creatine metabolism Phosphocreatine 1.23 0.83 0.68 3.60 0.0793 0.1247 0.0025 2.69E-14 0.1268 0.1874 0.0043 1.15E-13 1.8164 -1.5796 -3.3059 13.5175 0.0885 -0.0810 -0.1694 0.5564 0.0487 0.0512 0.0512 0.0412 30 30 30 3013C-ISTD, median Amino acids related Methyl cycle S-Adenosylhomocysteine 1.71 1.01 0.59 0.82 0.0023 0.9743 0.0038 0.1607 0.0062 0.9782 0.0063 0.2027 3.3335 0.0325 -3.1356 -1.4382 0.2318 0.0024 -0.2294 -0.0845 0.0695 0.0732 0.0732 0.0588 30 30 30 3013C-ISTD, median Amino acids related Methyl cycle S-Adenosylmethionine 0.87 1.36 1.57 1.59 0.4224 0.1105 0.0219 0.0043 0.5172 0.1696 0.0307 0.0071 -0.8134 1.6444 2.4174 3.0859 -0.0628 0.1336 0.1965 0.2014 0.0772 0.0813 0.0813 0.0653 30 30 30 30
pool, median Amino acids related Tyrosine metabolism O-Phosphotyrosine 6.81 4.13 0.61 0.98 7.62E-16 2.48E-12 0.0005 0.8526 4.78E-14 6.92E-11 0.0011 0.8806 14.7739 10.9266 -3.8473 -0.1874 0.8331 0.6162 -0.2170 -0.0086 0.0564 0.0564 0.0564 0.0460 32 32 32 3213C-ISTD, median Amino acids related Urea cycle and related Argininosuccinate 0.71 0.79 1.12 4.38 0.0007 0.0202 0.2569 1.71E-18 0.0021 0.0372 0.2916 1.48E-17 -3.7978 -2.4535 1.1559 19.3439 -0.1491 -0.1013 0.0477 0.6416 0.0392 0.0413 0.0413 0.0332 30 30 30 30
pool, median Amino acids related Urea cycle and related Ornithine (additional: Arginine, Citrulline) 0.32 0.91 2.81 1.78 1.01E-10 0.3871 3.79E-10 6.97E-07 2.82E-09 0.4939 5.30E-09 1.60E-06 -10.3593 -0.8797 9.7238 6.4942 -0.4909 -0.0427 0.4483 0.2509 0.0474 0.0485 0.0461 0.0386 26 26 26 2613C-ISTD, median Carbohydrates and related Aminosugars Glucosamine-1-phosphate 0.51 1.14 2.22 0.27 0.1328 0.7766 0.0895 0.0012 0.1905 0.8438 0.1106 0.0021 -1.5450 0.2863 1.7546 -3.5893 -0.2892 0.0564 0.3456 -0.5678 0.1872 0.1969 0.1969 0.1582 30 30 30 30
pool, median Carbohydrates and related Aminosugars Mannosamine 0.43 1.18 2.72 0.76 0.0024 0.5186 0.0003 0.1837 0.0063 0.6202 0.0008 0.2294 -3.3802 0.6548 4.1498 -1.3674 -0.3634 0.0704 0.4338 -0.1189 0.1075 0.1075 0.1045 0.0870 25 25 25 25
pool, median Carbohydrates and related Disaccharides iso-Maltose 1946.28 7.68E-10 8.80E-09 19.3344 3.2892 0.1701 11
pool, median Carbohydrates and related Glycogen metabolism Glucose-1-phosphate (additional: Glucose) 0.95 12.94 13.60 0.30 0.9367 0.0004 0.0002 0.0229 0.9442 0.0013 0.0005 0.0341 -0.0802 4.0447 4.3368 -2.4174 -0.0215 1.1121 1.1336 -0.5295 0.2687 0.2749 0.2614 0.2190 26 26 26 2613C-ISTD, median Carbohydrates and related Glycogen metabolism UDP-Glucose 0.77 0.82 1.05 0.54 0.0034 0.0222 0.5445 3.23E-10 0.0083 0.0404 0.5790 1.00E-09 -3.1830 -2.4121 0.6130 -9.1792 -0.1111 -0.0886 0.0225 -0.2707 0.0349 0.0367 0.0367 0.0295 30 30 30 30
pool, median Carbohydrates and related Monosaccharides Arabinose 0.53 5.50 10.47 0.78 4.26E-05 1.18E-12 1.97E-16 0.0281 0.0002 4.25E-11 1.24E-14 0.0408 -4.9100 12.6981 18.4039 -2.3251 -0.2797 0.7402 1.0200 -0.1080 0.0570 0.0583 0.0554 0.0464 26 26 26 26
pool, median Carbohydrates and related Monosaccharides Glucose 0.18 3.21 17.74 0.68 3.57E-07 8.86E-05 9.63E-12 0.0697 2.72E-06 0.0003 1.87E-10 0.0951 -6.8438 4.6658 11.8369 -1.8950 -0.7427 0.5063 1.2491 -0.1664 0.1085 0.1085 0.1055 0.0878 25 25 25 25
pool, median Carbohydrates and related Polyols Erythrol 0.95 1.38 1.45 1.02 0.5777 0.0027 0.0004 0.8288 0.6591 0.0062 0.0008 0.8704 -0.5638 3.3189 4.0706 0.2184 -0.0231 0.1391 0.1622 0.0073 0.0410 0.0419 0.0398 0.0334 26 26 26 26
pool, median Carbohydrates and related Polyols myo-Inositol 0.87 1.21 1.40 0.35 0.1153 0.0447 0.0006 4.50E-14 0.1683 0.0752 0.0013 1.85E-13 -1.6293 2.1097 3.8940 -14.6457 -0.0624 0.0826 0.1450 -0.4570 0.0383 0.0392 0.0372 0.0312 26 26 26 26
pool, median Carbohydrates and related Polyols scyllo-Inositol 0.91 0.44 0.48 0.56 0.4116 6.40E-08 2.02E-07 6.05E-07 0.5106 5.02E-07 1.19E-06 1.41E-06 -0.8345 -7.4596 -6.9885 -6.5500 -0.0395 -0.3612 -0.3217 -0.2526 0.0473 0.0484 0.0460 0.0386 26 26 26 26
pool, median Carbohydrates and related Polyols Sorbitol 0.82 3.53 4.30 0.41 0.2449 7.16E-08 1.73E-09 5.32E-07 0.3202 5.41E-07 1.82E-08 1.25E-06 -1.1897 7.4129 9.0203 -6.6012 -0.0858 0.5472 0.6330 -0.3882 0.0721 0.0738 0.0702 0.0588 26 26 26 26
pool, median Carbohydrates and related Sugar acids Erythronic acid 1.16 1.42 1.22 1.35 0.2358 0.0100 0.1058 0.0066 0.3115 0.0206 0.1282 0.0101 1.2136 2.7790 1.6756 2.9532 0.0650 0.1522 0.0872 0.1288 0.0535 0.0548 0.0521 0.0436 26 26 26 26
pool, median Carbohydrates and related Sugar acids Glucuronic acid 1.05 21.53 20.60 1.03 0.8938 1.42E-10 2.00E-10 0.9168 0.9270 2.37E-09 3.14E-09 0.9316 0.1346 9.2657 9.1312 0.1053 0.0194 1.3331 1.3138 0.0124 0.1439 0.1439 0.1439 0.1175 32 32 32 32
pool, median Complex lipids, fatty acids and relatedCeramides Ceramide (d18:1,C24:0) 1.09 0.90 0.83 0.37 0.0964 0.0551 0.0008 7.28E-22 0.1476 0.0901 0.0016 1.31E-20 1.7128 -1.9908 -3.7036 -23.7011 0.0380 -0.0442 -0.0822 -0.4293 0.0222 0.0222 0.0222 0.0181 32 32 32 32
pool, median Complex lipids, fatty acids and relatedCeramides Ceramide (d18:1,C24:1) (additional: Ceramide (d18:2,C24:0))0.85 0.70 0.83 1.01 0.0496 0.0001 0.0242 0.8664 0.0829 0.0004 0.0331 0.8913 -2.0412 -4.4077 -2.3665 0.1696 -0.0717 -0.1548 -0.0831 0.0049 0.0351 0.0351 0.0351 0.0287 32 32 32 32
pool, median Complex lipids, fatty acids and relatedCholesterol and related Cholesterol, free 0.99 0.92 0.93 1.09 0.9261 0.4153 0.4697 0.3478 0.9417 0.5187 0.5080 0.4022 -0.0935 -0.8253 -0.7317 0.9529 -0.0043 -0.0379 -0.0336 0.0357 0.0459 0.0459 0.0459 0.0375 32 32 32 32
pool, median Complex lipids, fatty acids and relatedCholesterol and related Cholesterol, total 1.46 1.39 0.95 0.72 1.06E-09 1.92E-08 0.2936 2.03E-10 1.78E-08 1.66E-07 0.3288 6.44E-10 8.4884 7.4206 -1.0678 -9.1254 0.1632 0.1427 -0.0205 -0.1432 0.0192 0.0192 0.0192 0.0157 32 32 32 32
pool, median Complex lipids, fatty acids and relatedCholesterylesters Cholesterylester C16:0 0.99 1.76 1.77 0.72 0.9780 0.0076 0.0070 0.0510 0.9780 0.0157 0.0110 0.0716 -0.0278 2.8516 2.8794 -2.0273 -0.0024 0.2452 0.2476 -0.1423 0.0860 0.0860 0.0860 0.0702 32 32 32 32
pool, median Complex lipids, fatty acids and relatedCholesterylesters Cholesterylester C16:1 0.96 1.17 1.22 0.61 0.7797 0.2742 0.1728 0.0002 0.8399 0.3721 0.1988 0.0003 -0.2821 1.1124 1.3946 -4.2787 -0.0172 0.0679 0.0852 -0.2134 0.0611 0.0611 0.0611 0.0499 32 32 32 32
pool, median Complex lipids, fatty acids and relatedCholesterylesters Cholesterylester C18:1 1.10 1.48 1.35 0.49 0.5273 0.0127 0.0541 1.43E-06 0.6128 0.0254 0.0706 3.20E-06 0.6391 2.6387 1.9997 -5.9050 0.0414 0.1711 0.1296 -0.3126 0.0648 0.0648 0.0648 0.0529 32 32 32 32
pool, median Complex lipids, fatty acids and relatedCholesterylesters Cholesterylester C18:2 0.94 1.50 1.59 0.53 0.7326 0.0210 0.0092 6.54E-05 0.7995 0.0384 0.0138 0.0001 -0.3446 2.4286 2.7732 -4.5889 -0.0251 0.1771 0.2023 -0.2733 0.0729 0.0729 0.0729 0.0595 32 32 32 32
pool, median Complex lipids, fatty acids and relatedCholesterylesters Cholesterylester C20:4 0.81 1.44 1.77 0.62 0.2301 0.0358 0.0018 0.0016 0.3056 0.0620 0.0032 0.0027 -1.2234 2.1917 3.4151 -3.4588 -0.0891 0.1597 0.2488 -0.2057 0.0729 0.0729 0.0729 0.0595 32 32 32 32
pool, median Complex lipids, fatty acids and relatedFatty acids, mono-unsaturated Elaidic acid (C18:trans[9]1) 1.33 1.14 0.86 2.28 2.52E-05 0.0342 0.0108 6.16E-18 0.0001 0.0597 0.0159 4.55E-17 4.9182 2.2119 -2.7064 17.4878 0.1231 0.0554 -0.0677 0.3573 0.0250 0.0250 0.0250 0.0204 32 32 32 32
pool, median Complex lipids, fatty acids and relatedFatty acids, mono-unsaturated Oleic acid (C18:cis[9]1) 1.23 1.00 0.82 1.31 6.50E-06 0.9020 9.34E-06 8.72E-10 4.08E-05 0.9353 3.46E-05 2.64E-09 5.3838 0.1242 -5.2596 8.5633 0.0899 0.0021 -0.0879 0.1168 0.0167 0.0167 0.0167 0.0136 32 32 32 32
pool, median Complex lipids, fatty acids and relatedFatty acids, mono-unsaturated Palmitoleic acid (C16:cis[9]1) 1.07 0.88 0.82 4.42 0.5679 0.3237 0.1358 9.02E-15 0.6508 0.4276 0.1599 4.27E-14 0.5778 -1.0040 -1.5343 14.4339 0.0298 -0.0565 -0.0864 0.6457 0.0517 0.0563 0.0563 0.0447 29 29 29 29
pool, median Complex lipids, fatty acids and relatedFatty acids, poly-unsaturated Arachidonic acid (C20:cis[5,8,11,14]4) 1.22 0.99 0.82 0.63 0.0092 0.9317 0.0063 5.54E-09 0.0203 0.9506 0.0100 1.56E-08 2.7832 -0.0864 -2.9351 -8.0476 0.0850 -0.0026 -0.0876 -0.1977 0.0305 0.0298 0.0298 0.0246 30 30 30 30
pool, median Complex lipids, fatty acids and relatedFatty acids, poly-unsaturated Docosahexaenoic acid (C22:cis[4,7,10,13,16,19]6) 1.24 1.02 0.82 0.52 0.0109 0.8485 0.0172 1.24E-11 0.0233 0.9063 0.0245 4.25E-11 2.7051 0.1926 -2.5126 -10.2497 0.0920 0.0066 -0.0855 -0.2847 0.0340 0.0340 0.0340 0.0278 32 32 32 32
pool, median Complex lipids, fatty acids and relatedFatty acids, poly-unsaturated Docosapentaenoic acid (C22:cis[7,10,13,16,19]5) 1.68 1.30 0.77 0.32 4.35E-06 0.0071 0.0067 1.30E-15 2.80E-05 0.0148 0.0106 6.79E-15 5.6353 2.8973 -2.9203 -15.5606 0.2250 0.1136 -0.1114 -0.4982 0.0399 0.0392 0.0381 0.0320 29 29 29 29
pool, median Complex lipids, fatty acids and relatedFatty acids, poly-unsaturated Eicosapentaenoic acid (C20:cis[5,8,11,14,17]5) 1.27 0.91 0.72 0.76 0.0340 0.3845 0.0036 0.0030 0.0605 0.4939 0.0060 0.0052 2.2217 -0.8825 -3.1564 -3.2252 0.1041 -0.0404 -0.1445 -0.1215 0.0468 0.0458 0.0458 0.0377 30 30 30 30
pool, median Complex lipids, fatty acids and relatedFatty acids, poly-unsaturated Linoleic acid (C18:cis[9,12]2) 1.20 0.92 0.77 0.70 0.0002 0.0553 4.87E-07 9.86E-12 0.0006 0.0901 2.67E-06 3.44E-11 4.2884 -1.9891 -6.2775 -10.3433 0.0787 -0.0365 -0.1152 -0.1549 0.0183 0.0183 0.0183 0.0150 32 32 32 32
pool, median Complex lipids, fatty acids and relatedFatty acids, saturated Lignoceric acid (C24:0) 1.28 1.01 0.79 0.18 0.0002 0.9261 0.0002 7.67E-28 0.0006 0.9488 0.0005 3.21E-26 4.2951 0.0935 -4.2016 -37.0144 0.1064 0.0023 -0.1041 -0.7488 0.0248 0.0248 0.0248 0.0202 32 32 32 32
pool, median Complex lipids, fatty acids and relatedFatty acids, saturated Myristic acid (C14:0) 0.82 0.73 0.88 2.23 0.1349 0.0183 0.3480 1.07E-08 0.1913 0.0343 0.3846 2.98E-08 -1.5339 -2.4864 -0.9525 7.6332 -0.0858 -0.1390 -0.0533 0.3485 0.0559 0.0559 0.0559 0.0457 32 32 32 32
pool, median Complex lipids, fatty acids and relatedFatty acids, saturated Palmitic acid (C16:0) 0.86 0.76 0.88 1.33 0.0307 0.0002 0.0590 5.49E-06 0.0559 0.0007 0.0766 1.20E-05 -2.2607 -4.2187 -1.9580 5.4419 -0.0631 -0.1178 -0.0547 0.1241 0.0279 0.0279 0.0279 0.0228 32 32 32 32
pool, median Complex lipids, fatty acids and relatedFatty acids, saturated Stearic acid (C18:0) 0.96 0.83 0.87 0.55 0.3383 0.0002 0.0032 7.56E-17 0.4311 0.0008 0.0053 5.00E-16 -0.9721 -4.1641 -3.1920 -16.0301 -0.0191 -0.0817 -0.0626 -0.2568 0.0196 0.0196 0.0196 0.0160 32 32 32 32
pool, median Complex lipids, fatty acids and relatedFatty alcohols Glycerol, lipid fraction 1.12 0.78 0.70 1.10 0.0444 4.69E-05 1.11E-07 0.0421 0.0748 0.0002 7.50E-07 0.0600 2.0929 -4.7035 -6.7964 2.1176 0.0479 -0.1077 -0.1556 0.0396 0.0229 0.0229 0.0229 0.0187 32 32 32 32
pool, median Complex lipids, fatty acids and relatedGlycolipids Galactose, lipid fraction 1.24 1.01 0.81 0.51 5.93E-05 0.7872 0.0001 5.39E-18 0.0003 0.8516 0.0003 4.18E-17 4.6226 0.2723 -4.3504 -17.5679 0.0946 0.0056 -0.0890 -0.2935 0.0205 0.0205 0.0205 0.0167 32 32 32 32
pool, median Complex lipids, fatty acids and relatedGlycolipids Glucose, lipid fraction 1.02 2.19 2.15 1.12 0.9175 3.94E-05 3.89E-05 0.3823 0.9399 0.0002 0.0001 0.4381 0.1045 4.7884 4.7925 0.8863 0.0074 0.3395 0.3321 0.0509 0.0709 0.0709 0.0693 0.0575 31 31 31 31
pool, median Complex lipids, fatty acids and relatedGlycolipids myo-Inositol, lipid fraction 1.21 1.03 0.85 1.06 0.0018 0.6483 0.0058 0.2044 0.0049 0.7430 0.0094 0.2527 3.4144 0.4604 -2.9540 1.2955 0.0826 0.0111 -0.0715 0.0256 0.0242 0.0242 0.0242 0.0197 32 32 32 32
pool, median Complex lipids, fatty acids and relatedLipid hydroperoxides Phosphatidylcholine hydroperoxide (C18:0,C18:2-OOH) 1.05 1.09 1.04 1.25 0.6762 0.4903 0.7840 0.0368 0.7543 0.5974 0.7967 0.0527 0.4215 0.6979 0.2764 2.1795 0.0228 0.0377 0.0150 0.0963 0.0541 0.0541 0.0541 0.0442 32 32 32 3213C-ISTD, median Complex lipids, fatty acids and relatedLipid precursors Choline phosphate 0.86 0.77 0.90 0.54 0.1059 0.0114 0.2758 4.82E-09 0.1573 0.0233 0.3103 1.38E-08 -1.6670 -2.6943 -1.1100 -8.1012 -0.0656 -0.1115 -0.0460 -0.2694 0.0393 0.0414 0.0414 0.0332 30 30 30 3013C-ISTD, median Complex lipids, fatty acids and relatedLipid precursors Glycerol-3-phosphate, polar fraction 0.09 0.42 4.49 0.94 3.93E-17 1.37E-06 1.81E-11 0.5813 3.29E-15 8.17E-06 3.25E-10 0.6371 -17.2671 -6.0071 10.4033 -0.5576 -1.0285 -0.3765 0.6520 -0.0281 0.0596 0.0627 0.0627 0.0503 30 30 30 30
pool, median Complex lipids, fatty acids and relatedLipid precursors O-Phosphoethanolamine 1.56 1.28 0.82 6.04 0.1383 0.3900 0.4835 4.72E-07 0.1951 0.4944 0.5185 1.12E-06 1.5438 0.8787 -0.7140 7.2932 0.1943 0.1087 -0.0856 0.7811 0.1259 0.1237 0.1199 0.1071 20 20 20 20
pool, median Complex lipids, fatty acids and relatedLysophosphatidylcholines Lysophosphatidylcholine (C16:0) 0.94 1.38 1.46 0.73 0.4701 0.0003 3.28E-05 3.11E-05 0.5618 0.0009 9.97E-05 6.51E-05 -0.7311 4.0960 4.8271 -4.8454 -0.0247 0.1385 0.1632 -0.1338 0.0338 0.0338 0.0338 0.0276 32 32 32 32
pool, median Complex lipids, fatty acids and relatedLysophosphatidylcholines Lysophosphatidylcholine (C18:0) 1.08 1.46 1.35 0.26 0.4456 0.0005 0.0038 1.13E-17 0.5429 0.0014 0.0063 7.86E-17 0.7724 3.8903 3.1180 -17.1275 0.0326 0.1641 0.1315 -0.5900 0.0422 0.0422 0.0422 0.0344 32 32 32 32
pool, median Complex lipids, fatty acids and relatedLysophosphatidylcholines Lysophosphatidylcholine (C20:4) 0.79 0.64 0.81 1.01 0.0146 3.44E-05 0.0330 0.8930 0.0305 0.0002 0.0440 0.9118 -2.5824 -4.8107 -2.2283 0.1356 -0.1042 -0.1942 -0.0900 0.0045 0.0404 0.0404 0.0404 0.0330 32 32 32 32
pool, median Complex lipids, fatty acids and relatedLysophosphatidylethanolamines Lysophosphatidylethanolamine (C18:0) 1.32 1.01 0.77 0.79 0.0307 0.9453 0.0358 0.0235 0.0559 0.9606 0.0475 0.0347 2.2611 0.0692 -2.1919 -2.3787 0.1189 0.0036 -0.1153 -0.1021 0.0526 0.0526 0.0526 0.0429 32 32 32 32
pool, median Complex lipids, fatty acids and relatedLysophosphatidylethanolamines Lysophosphatidylethanolamine (C18:1) 0.88 1.37 1.56 1.57 0.1141 0.0003 2.91E-06 4.57E-08 0.1675 0.0010 1.22E-05 1.22E-07 -1.6244 4.0361 5.6604 7.1095 -0.0550 0.1367 0.1917 0.1966 0.0339 0.0339 0.0339 0.0277 32 32 32 3213
C-ISTD, median Complex lipids, fatty acids and relatedMevalonate pathway 3-Hydroxy-3-methylglutaryl-CoA 1.47 1.07 0.73 1.15 0.0244 0.6916 0.0739 0.3144 0.0464 0.7820 0.0945 0.3654 2.3703 0.4005 -1.8521 1.0231 0.1685 0.0300 -0.1386 0.0615 0.0711 0.0748 0.0748 0.0601 30 30 30 30
pool, median Complex lipids, fatty acids and relatedMevalonate pathway Isopentenyl pyrophosphate (IPP) 14.38 2.21 0.15 0.64 1.80E-19 1.10E-06 1.92E-15 0.0002 2.26E-17 6.74E-06 9.70E-14 0.0004 20.3112 6.0380 -14.6039 -4.1890 1.1578 0.3442 -0.8136 -0.1935 0.0570 0.0570 0.0557 0.0462 31 31 31 31
pool, median Complex lipids, fatty acids and relatedMevalonate pathway Mevalonate 1.37 6.65 4.86 1.10 0.0361 2.75E-14 2.65E-12 0.4121 0.0625 1.38E-12 6.07E-11 0.4618 2.1945 13.5070 11.2669 0.8318 0.1365 0.8231 0.6866 0.0417 0.0622 0.0609 0.0609 0.0502 30 30 30 30
pool, median Complex lipids, fatty acids and relatedPhosphatidylcholines Phosphatidylcholine (C16:0,C18:2) 0.87 0.73 0.84 1.04 0.0009 3.97E-09 0.0001 0.2344 0.0028 4.75E-08 0.0003 0.2842 -3.6580 -7.9956 -4.3376 1.2121 -0.0624 -0.1365 -0.0741 0.0169 0.0171 0.0171 0.0171 0.0139 32 32 32 32
pool, median Complex lipids, fatty acids and relatedPhosphatidylcholines Phosphatidylcholine (C16:0,C20:4) (additional: Phosphatidylcholine (C18:2,C18:2))0.90 0.73 0.81 0.90 0.0165 1.11E-08 1.54E-05 0.0036 0.0333 1.03E-07 5.24E-05 0.0061 -2.5316 -7.6193 -5.0878 -3.1379 -0.0445 -0.1339 -0.0894 -0.0450 0.0176 0.0176 0.0176 0.0143 32 32 32 32
pool, median Complex lipids, fatty acids and relatedPhosphatidylcholines Phosphatidylcholine (C16:0,C22:6) (additional: Phosphatidylcholine (C18:2,C20:4))1.00 0.86 0.86 0.87 0.9170 0.0009 0.0007 0.0002 0.9399 0.0025 0.0014 0.0004 0.1051 -3.6585 -3.7636 -4.2404 0.0019 -0.0660 -0.0679 -0.0624 0.0180 0.0180 0.0180 0.0147 32 32 32 32
pool, median Complex lipids, fatty acids and relatedPhosphatidylcholines Phosphatidylcholine (C16:1,C18:2) 1.14 0.92 0.81 1.28 0.0063 0.0797 4.27E-05 1.02E-07 0.0144 0.1250 0.0001 2.60E-07 2.9265 -1.8102 -4.7366 6.8262 0.0558 -0.0345 -0.0904 0.1064 0.0191 0.0191 0.0191 0.0156 32 32 32 32
pool, median Complex lipids, fatty acids and relatedPhosphatidylcholines Phosphatidylcholine (C18:0,C18:1) 0.87 0.74 0.85 0.80 0.0027 3.45E-08 0.0004 1.99E-07 0.0070 2.79E-07 0.0008 4.76E-07 -3.2516 -7.2104 -3.9588 -6.5898 -0.0594 -0.1318 -0.0724 -0.0984 0.0183 0.0183 0.0183 0.0149 32 32 32 32
pool, median Complex lipids, fatty acids and relatedPhosphatidylcholines Phosphatidylcholine (C18:0,C18:2) 0.90 0.76 0.85 1.01 0.0149 4.31E-07 0.0007 0.7695 0.0308 2.84E-06 0.0014 0.8185 -2.5747 -6.3205 -3.7458 0.2955 -0.0477 -0.1172 -0.0694 0.0045 0.0185 0.0185 0.0185 0.0151 32 32 32 32
pool, median Complex lipids, fatty acids and relatedPhosphatidylcholines Phosphatidylcholine (C18:0,C20:4) 0.87 0.74 0.85 0.48 0.0010 7.08E-09 0.0002 1.38E-21 0.0032 7.92E-08 0.0005 2.31E-20 -3.6076 -7.7830 -4.1753 -23.2055 -0.0605 -0.1305 -0.0700 -0.3177 0.0168 0.0168 0.0168 0.0137 32 32 32 32
pool, median Complex lipids, fatty acids and relatedPhosphatidylcholines Phosphatidylcholine (C18:0,C22:6) 0.93 0.81 0.88 0.53 0.0686 1.42E-05 0.0029 5.52E-19 0.1117 6.88E-05 0.0049 5.13E-18 -1.8849 -5.1144 -3.2295 -18.9905 -0.0334 -0.0906 -0.0572 -0.2746 0.0177 0.0177 0.0177 0.0145 32 32 32 32
pool, median Complex lipids, fatty acids and relatedPhosphatidylcholines Phosphatidylcholine No 02 0.88 0.79 0.89 0.76 0.0042 1.55E-06 0.0088 2.34E-09 0.0101 9.03E-06 0.0132 6.84E-09 -3.0858 -5.8776 -2.7917 -8.1915 -0.0550 -0.1048 -0.0498 -0.1192 0.0178 0.0178 0.0178 0.0146 32 32 32 32
pool, median Complex lipids, fatty acids and relatedPhospholipid metabolites Glycerol phosphate, lipid fraction 1.76 1.45 0.82 1.35 2.53E-05 0.0030 0.0984 0.0030 0.0001 0.0067 0.1204 0.0052 4.9169 3.2149 -1.7020 3.2074 0.2465 0.1612 -0.0853 0.1313 0.0501 0.0501 0.0501 0.0409 32 32 32 32
pool, median Complex lipids, fatty acids and relatedPhospholipid metabolites Phosphate, lipid fraction 1.24 0.95 0.76 1.07 0.0015 0.3736 0.0001 0.1863 0.0044 0.4833 0.0003 0.2314 3.4613 -0.9024 -4.3638 1.3507 0.0941 -0.0245 -0.1186 0.0300 0.0272 0.0272 0.0272 0.0222 32 32 32 32
pool, median Complex lipids, fatty acids and relatedSphingolipids erythro-Sphingosine (d18:1) (additional: Sphingolipids) 1.67 1.78 1.07 0.39 0.0055 0.0016 0.7025 1.83E-07 0.0129 0.0041 0.7255 4.45E-07 3.0029 3.4818 0.3858 -6.7991 0.2220 0.2512 0.0291 -0.4093 0.0739 0.0721 0.0755 0.0602 29 29 29 29
pool, median Complex lipids, fatty acids and relatedSphingolipids threo-Sphingosine (d18:1) (additional: Sphingolipids) 1.45 1.75 1.20 0.24 0.0356 0.0024 0.2665 8.27E-11 0.0621 0.0057 0.3011 2.66E-10 2.2162 3.3569 1.1356 -10.4586 0.1628 0.2421 0.0793 -0.6254 0.0735 0.0721 0.0698 0.0598 26 26 26 26
pool, median Complex lipids, fatty acids and relatedSphingomyelins Sphingomyelin (d18:1,C16:0) 0.89 0.74 0.83 0.94 0.0229 5.35E-07 0.0005 0.1249 0.0449 3.44E-06 0.0011 0.1626 -2.3903 -6.2453 -3.8550 -1.5760 -0.0496 -0.1297 -0.0801 -0.0267 0.0208 0.0208 0.0208 0.0170 32 32 32 32
pool, median Complex lipids, fatty acids and relatedSphingomyelins Sphingomyelin (d18:1,C18:0) (additional: Sphingomyelin (d16:1,C20:0))0.97 0.84 0.86 1.60 0.3206 2.75E-06 5.16E-05 1.88E-18 0.4105 1.47E-05 0.0001 1.57E-17 -1.0089 -5.6798 -4.6709 18.2155 -0.0139 -0.0783 -0.0644 0.2049 0.0138 0.0138 0.0138 0.0112 32 32 32 32
pool, median Complex lipids, fatty acids and relatedSphingomyelins Sphingomyelin (d18:1,C23:0) 0.97 0.85 0.87 0.59 0.5223 0.0003 0.0021 1.87E-16 0.6098 0.0011 0.0037 1.15E-15 -0.6469 -4.0008 -3.3540 -15.5283 -0.0118 -0.0727 -0.0610 -0.2305 0.0182 0.0182 0.0182 0.0148 32 32 32 32
pool, median Complex lipids, fatty acids and relatedSphingomyelins Sphingomyelin (d18:1,C24:0) 0.95 0.81 0.85 0.64 0.1187 1.09E-07 1.12E-05 8.08E-18 0.1722 7.85E-07 3.98E-05 5.79E-17 -1.6034 -6.8002 -5.1968 -17.3252 -0.0217 -0.0919 -0.0703 -0.1912 0.0135 0.0135 0.0135 0.0110 32 32 32 3213C-ISTD, median Energy metabolism and relatedCitrate cycle alpha-Ketoglutarate 0.45 0.92 2.05 1.05 0.0002 0.6812 0.0011 0.7519 0.0007 0.7737 0.0021 0.8065 -4.2294 -0.4148 3.6047 0.3191 -0.3465 -0.0358 0.3108 0.0221 0.0819 0.0862 0.0862 0.0692 30 30 30 3013C-ISTD, median Energy metabolism and relatedCitrate cycle cis-Aconitate 0.39 1.13 2.90 0.70 2.54E-09 0.3047 5.25E-10 0.0007 3.60E-08 0.4046 6.96E-09 0.0012 -8.3514 1.0443 8.9813 -3.7852 -0.4084 0.0537 0.4621 -0.1564 0.0489 0.0515 0.0515 0.0413 30 30 30 3013C-ISTD, median Energy metabolism and relatedCitrate cycle Citrate 0.51 1.04 2.05 0.73 7.23E-08 0.7058 6.67E-08 0.0005 6.26E-07 0.7908 4.80E-07 0.0010 -7.0754 0.3812 7.1055 -3.8769 -0.2944 0.0167 0.3111 -0.1363 0.0416 0.0438 0.0438 0.0352 30 30 30 3013C-ISTD, median Energy metabolism and relatedCitrate cycle Fumarate 0.74 1.79 2.42 1.48 0.3523 0.0927 0.0132 0.1553 0.4467 0.1444 0.0192 0.1979 -0.9447 1.7370 2.6348 1.4578 -0.1308 0.2531 0.3839 0.1706 0.1385 0.1457 0.1457 0.1170 30 30 30 3013
C-ISTD, median Energy metabolism and relatedCitrate cycle Isocitrate 0.47 1.19 2.56 0.68 1.62E-05 0.2701 1.40E-06 0.0051 9.03E-05 0.3684 6.80E-06 0.0081 -5.1287 1.1237 5.9979 -3.0182 -0.3316 0.0764 0.4080 -0.1649 0.0647 0.0680 0.0680 0.0546 30 30 30 3013C-ISTD, median Energy metabolism and relatedCitrate cycle Malate 1.20 1.24 1.03 1.48 0.0350 0.0190 0.7064 4.83E-06 0.0614 0.0353 0.7266 1.06E-05 2.2090 2.4796 0.3803 5.5571 0.0796 0.0941 0.0144 0.1693 0.0361 0.0379 0.0379 0.0305 30 30 30 3013C-ISTD, median Energy metabolism and relatedCitrate cycle Succinate 0.57 1.03 1.80 1.47 0.0011 0.8581 0.0011 0.0062 0.0033 0.9126 0.0021 0.0096 -3.6040 0.1804 3.6055 2.9469 -0.2435 0.0128 0.2563 0.1683 0.0676 0.0711 0.0711 0.0571 30 30 30 3013C-ISTD, median Energy metabolism and relatedEnergy metabolism, miscellaneousRibulose-1,5-diphosphate 0.64 1.94 3.02 1.08 0.0873 0.0173 0.0002 0.7159 0.1361 0.0328 0.0005 0.7746 -1.7675 2.5201 4.1999 0.3673 -0.1918 0.2878 0.4796 0.0337 0.1085 0.1142 0.1142 0.0917 30 30 30 3013
C-ISTD, median Energy metabolism and relatedFatty acid oxidation/synthesis Acetyl-CoA 1.02 0.92 0.90 1.15 0.8526 0.5126 0.4071 0.1520 0.8992 0.6185 0.4441 0.1946 0.1874 -0.6627 -0.8408 1.4699 0.0094 -0.0350 -0.0444 0.0624 0.0502 0.0529 0.0529 0.0425 30 30 30 3013C-ISTD, median Energy metabolism and relatedGlycolysis/Gluconeogenesis 2-Phosphoglycerate (2-PGA) 1.56 0.94 0.61 1.02 0.4168 0.9183 0.3827 0.9572 0.5128 0.9447 0.4211 0.9610 0.8234 -0.1034 -0.8859 0.0541 0.1926 -0.0255 -0.2181 0.0107 0.2339 0.2462 0.2462 0.1977 30 30 30 3013
C-ISTD, median Energy metabolism and relatedGlycolysis/Gluconeogenesis 3-Phosphoglycerate (3-PGA) 2.48 0.77 0.31 1.28 1.58E-10 0.0129 1.17E-12 0.0045 3.97E-09 0.0255 3.68E-11 0.0073 9.4753 -2.6436 -11.6487 3.0720 0.3939 -0.1156 -0.5095 0.1079 0.0416 0.0437 0.0437 0.0351 30 30 30 3013C-ISTD, median Energy metabolism and relatedGlycolysis/Gluconeogenesis Dihydroxyacetone phosphate 1.49 2.32 1.56 0.42 9.27E-05 3.85E-10 3.85E-05 1.30E-12 0.0004 6.04E-09 0.0001 4.81E-12 4.5095 9.1075 4.8218 -11.5974 0.1722 0.3659 0.1937 -0.3743 0.0382 0.0402 0.0402 0.0323 30 30 30 30
pool, median Energy metabolism and relatedGlycolysis/Gluconeogenesis Fructose 0.26 1.77 6.77 0.67 9.41E-09 0.0021 3.49E-12 0.0050 1.07E-07 0.0051 7.32E-11 0.0080 -8.2714 3.4197 12.0998 -3.0691 -0.5834 0.2468 0.8303 -0.1765 0.0705 0.0722 0.0686 0.0575 26 26 26 2613
C-ISTD, median Energy metabolism and relatedGlycolysis/Gluconeogenesis Fructose-1,6-diphosphate 5.54 3.26 0.59 0.20 1.02E-20 1.21E-15 1.37E-07 4.56E-22 2.56E-18 7.59E-14 8.83E-07 8.81E-21 23.2026 15.2105 -6.8409 -25.8631 0.7434 0.5128 -0.2306 -0.7004 0.0320 0.0337 0.0337 0.0271 30 30 30 30

13C-ISTD, median Energy metabolism and relatedGlycolysis/Gluconeogenesis Fructose-2,6-diphosphate 0.71 3.19 4.50 1.14 0.4812 0.0305 0.0061 0.7438 0.5697 0.0538 0.0098 0.8013 -0.7132 2.2714 2.9493 0.3299 -0.1502 0.5033 0.6535 0.0587 0.2106 0.2216 0.2216 0.1780 30 30 30 3013C-ISTD, median Energy metabolism and relatedGlycolysis/Gluconeogenesis Fructose-6-phosphate 0.18 1.34 7.48 1.71 7.17E-06 0.3877 1.30E-06 0.0547 4.39E-05 0.4939 6.42E-06 0.0758 -5.4175 0.8766 6.0253 1.9997 -0.7468 0.1272 0.8740 0.2330 0.1379 0.1451 0.1451 0.1165 30 30 30 30
pool, median Energy metabolism and relatedGlycolysis/Gluconeogenesis Glucose-6-phosphate 1.14 1.69 1.48 0.67 0.5150 0.0151 0.0433 0.0190 0.6066 0.0293 0.0571 0.0284 0.6605 2.6100 2.1290 -2.5085 0.0566 0.2280 0.1714 -0.1718 0.0856 0.0874 0.0805 0.0685 25 25 25 2513C-ISTD, median Energy metabolism and relatedGlycolysis/Gluconeogenesis Glycerate 0.75 1.86 2.48 0.97 0.1090 0.0019 2.43E-05 0.8353 0.1610 0.0046 7.67E-05 0.8735 -1.6517 3.4147 4.9844 -0.2098 -0.1242 0.2702 0.3944 -0.0133 0.0752 0.0791 0.0791 0.0636 30 30 30 3013C-ISTD, median Energy metabolism and relatedGlycolysis/Gluconeogenesis Lactate 0.52 1.20 2.29 0.69 9.03E-05 0.2341 5.78E-06 0.0041 0.0004 0.3264 2.31E-05 0.0067 -4.5425 1.2152 5.5323 -3.1208 -0.2828 0.0778 0.3606 -0.1631 0.0623 0.0640 0.0652 0.0523 29 29 29 2913C-ISTD, median Energy metabolism and relatedGlycolysis/Gluconeogenesis Phosphoenolpyruvate (PEP) 5.08 1.68 0.33 2.45 0.0001 0.1903 0.0081 0.0074 0.0005 0.2778 0.0124 0.0113 4.3945 1.3399 -2.8365 2.8728 0.7055 0.2263 -0.4791 0.3898 0.1605 0.1689 0.1689 0.1357 30 30 30 30
pool, median Energy metabolism and relatedGlycolysis/Gluconeogenesis Pyruvate (additional: Phosphoenolpyruvate (PEP)) 0.43 0.77 1.79 2.30 0.0193 0.4509 0.0903 0.0058 0.0384 0.5575 0.1110 0.0091 -2.4945 -0.7655 1.7591 3.0069 -0.3682 -0.1156 0.2526 0.3618 0.1476 0.1510 0.1436 0.1203 26 26 26 26
pool, median Energy metabolism and relatedKetone bodies 3-Hydroxybutyrate (additional: 2-Hydroxy-3-oxopropanoic acid, 2-Hydroxybutyrate, 2-Hydroxyisobutyrate, 3-Hydroxyisobutyrate, 3-Hydroxypyruvate, 4-Hydroxybutyrate, Malonate)1.38 1.65 1.20 0.96 2.39E-05 7.71E-09 0.0083 0.4098 0.0001 8.07E-08 0.0126 0.4612 4.9366 7.7516 2.8150 -0.8352 0.1389 0.2181 0.0792 -0.0192 0.0281 0.0281 0.0281 0.0230 32 32 32 3213C-ISTD, median Energy metabolism and relatedPentose phosphate pathway 6-Phosphogluconic acid 0.40 0.65 1.62 0.92 1.89E-10 0.0002 4.59E-05 0.3027 4.32E-09 0.0008 0.0001 0.3567 -9.4002 -4.1738 4.7599 -1.0488 -0.3943 -0.1842 0.2101 -0.0372 0.0419 0.0441 0.0441 0.0355 30 30 30 30
pool, median Energy metabolism and relatedPentose phosphate pathway Ribose-5-phosphate 1.32 2.50 1.90 1.33 0.0031 7.29E-11 3.46E-08 0.0004 0.0080 1.41E-09 2.72E-07 0.0007 3.2588 10.5207 7.7162 4.1027 0.1206 0.3985 0.2779 0.1238 0.0370 0.0379 0.0360 0.0302 26 26 26 2613C-ISTD, median Energy metabolism and relatedPentose phosphate pathway Ribulose-5-phosphate (additional: Xylulose-5-phospate)1.07 1.03 0.96 1.16 0.5413 0.7934 0.7489 0.1250 0.6261 0.8545 0.7641 0.1626 0.6180 0.2643 -0.3230 1.5782 0.0291 0.0131 -0.0160 0.0629 0.0472 0.0496 0.0496 0.0399 30 30 30 3013C-ISTD, median Energy metabolism and relatedPentose phosphate pathway Sedoheptulose-7-phosphate 0.72 0.32 0.44 0.76 0.4559 0.0174 0.0818 0.4510 0.5529 0.0328 0.1021 0.4987 -0.7553 -2.5184 -1.8006 -0.7637 -0.1411 -0.4951 -0.3540 -0.1206 0.1869 0.1966 0.1966 0.1579 30 30 30 3013C-ISTD, median Hormones, signal substances and relatedOther hormones, signal substances and relatedAdenosine monophosphate, cyclic (cAMP) 0.86 2.55 2.97 0.58 0.6571 0.0120 0.0042 0.0634 0.7396 0.0242 0.0069 0.0874 -0.4483 2.6733 3.0994 -1.9277 -0.0649 0.4072 0.4721 -0.2358 0.1448 0.1523 0.1523 0.1223 30 30 30 30
pool, median Hormones, signal substances and relatedOther hormones, signal substances and relatedgamma-Aminobutyrate (GABA) 0.65 0.75 1.17 0.88 1.47E-05 0.0023 0.0666 0.0781 8.39E-05 0.0056 0.0860 0.1055 -5.3139 -3.3729 1.9148 -1.8339 -0.1893 -0.1229 0.0663 -0.0532 0.0356 0.0364 0.0346 0.0290 26 26 26 26
pool, median Miscellaneous Miscellaneous Pyrophosphate (PPi) (additional: Phosphate (inorganic and from organic phosphates))1.51 2.47 1.63 1.43 0.0007 1.02E-08 7.72E-05 0.0004 0.0021 9.84E-08 0.0002 0.0007 3.8705 8.2367 4.6850 4.0907 0.1800 0.3918 0.2119 0.1550 0.0465 0.0476 0.0452 0.0379 26 26 26 26
pool, median Miscellaneous Miscellaneous Serine, lipid fraction 1.25 1.05 0.84 0.84 0.0052 0.5281 0.0243 0.0063 0.0124 0.6251 0.0331 0.0097 3.0021 0.6379 -2.3642 -2.9267 0.0976 0.0207 -0.0769 -0.0777 0.0325 0.0325 0.0325 0.0265 32 32 32 32
pool, median Miscellaneous Polyamines Putrescine (additional: Agmatine) 1.19 0.88 0.74 1.36 0.0070 0.0488 2.07E-05 9.53E-07 0.0159 0.0816 6.79E-05 2.16E-06 2.9265 -2.0674 -5.1830 6.3704 0.0746 -0.0539 -0.1286 0.1324 0.0255 0.0261 0.0248 0.0208 26 26 26 26
pool, median Miscellaneous Polyamines Spermidine 1.13 0.80 0.71 2.12 0.0292 0.0003 3.70E-07 5.39E-16 0.0543 0.0010 2.07E-06 3.01E-15 2.3085 -4.1571 -6.7457 17.6520 0.0525 -0.0968 -0.1493 0.3273 0.0227 0.0233 0.0221 0.0185 26 26 26 2613C-ISTD, median Nucleobases and related Nucleotides Adenosine diphosphate (ADP) 2.91 0.79 0.27 0.72 5.52E-08 0.1454 2.79E-09 0.0130 5.33E-07 0.2134 2.60E-08 0.0199 7.1760 -1.4950 -8.3149 -2.6393 0.4644 -0.1018 -0.5662 -0.1443 0.0647 0.0681 0.0681 0.0547 30 30 30 3013C-ISTD, median Nucleobases and related Nucleotides Adenosine monophosphate (AMP) 0.82 1.00 1.21 0.98 0.1403 0.9723 0.1704 0.8438 0.1957 0.9782 0.1970 0.8788 -1.5147 -0.0350 1.4046 -0.1987 -0.0840 -0.0020 0.0819 -0.0093 0.0554 0.0583 0.0583 0.0469 30 30 30 3013C-ISTD, median Nucleobases and related Nucleotides Adenosine triphosphate (ATP) 0.63 0.81 1.28 0.75 3.38E-05 0.0426 0.0177 0.0011 0.0002 0.0727 0.0250 0.0020 -4.8684 -2.1179 2.5089 -3.6097 -0.2001 -0.0916 0.1085 -0.1254 0.0411 0.0432 0.0432 0.0347 30 30 30 3013C-ISTD, median Nucleobases and related Nucleotides Cytidine diphosphate (CDP) 3.35 1.67 0.50 0.66 2.83E-08 0.0056 0.0003 0.0049 3.09E-07 0.0121 0.0007 0.0079 7.4250 2.9824 -4.0742 -3.0365 0.5251 0.2219 -0.3032 -0.1815 0.0707 0.0744 0.0744 0.0598 30 30 30 3013C-ISTD, median Nucleobases and related Nucleotides Cytidine monophosphate (CMP) 0.69 2.13 3.09 0.58 0.0771 0.0013 1.01E-05 0.0034 0.1240 0.0034 3.70E-05 0.0058 -1.8309 3.5549 5.2950 -3.1780 -0.1609 0.3288 0.4897 -0.2361 0.0879 0.0925 0.0925 0.0743 30 30 30 3013C-ISTD, median Nucleobases and related Nucleotides Cytidine triphosphate (CTP) 0.86 0.73 0.85 0.71 0.1028 0.0026 0.1022 0.0001 0.1535 0.0060 0.1244 0.0002 -1.6829 -3.2854 -1.6860 -4.4235 -0.0671 -0.1378 -0.0707 -0.1490 0.0398 0.0419 0.0419 0.0337 30 30 30 3013C-ISTD, median Nucleobases and related Nucleotides Deoxyadenosine diphosphate (dADP) 0.95 1.85 1.94 0.78 0.7836 0.0020 0.0010 0.1062 0.8406 0.0050 0.0019 0.1407 -0.2771 3.3812 3.6445 -1.6655 -0.0209 0.2679 0.2887 -0.1060 0.0753 0.0792 0.0792 0.0636 30 30 30 3013C-ISTD, median Nucleobases and related Nucleotides Deoxyadenosine monophosphate (dAMP) 0.84 1.71 2.04 0.82 0.3918 0.0174 0.0022 0.2537 0.4892 0.0328 0.0039 0.3033 -0.8690 2.5179 3.3437 -1.1637 -0.0765 0.2332 0.3097 -0.0866 0.0880 0.0926 0.0926 0.0744 30 30 30 3013C-ISTD, median Nucleobases and related Nucleotides Deoxycytidine triphosphate (dCTP) 0.62 1.36 2.18 1.05 0.0894 0.2930 0.0103 0.8268 0.1385 0.3933 0.0152 0.8704 -1.7554 1.0703 2.7385 0.2207 -0.2062 0.1323 0.3384 0.0219 0.1174 0.1236 0.1236 0.0993 30 30 30 3013
C-ISTD, median Nucleobases and related Nucleotides Deoxythymidine diphosphate (dTDP) 2.70 1.54 0.57 0.66 0.0057 0.2294 0.1195 0.1493 0.0134 0.3217 0.1440 0.1922 2.9771 1.2268 -1.6025 -1.4801 0.4312 0.1870 -0.2442 -0.1812 0.1449 0.1524 0.1524 0.1224 30 30 30 3013C-ISTD, median Nucleobases and related Nucleotides Deoxythymidine triphosphate (dTTP) 0.80 0.77 0.97 1.01 0.1479 0.1192 0.8487 0.9549 0.2050 0.1802 0.8590 0.9610 -1.4855 -1.6042 -0.1924 0.0570 -0.0995 -0.1131 -0.0136 0.0032 0.0670 0.0705 0.0705 0.0566 30 30 30 3013
C-ISTD, median Nucleobases and related Nucleotides Deoxyuridine triphosphate (dUTP) 0.66 1.38 2.09 1.05 0.3019 0.4436 0.0861 0.8937 0.3886 0.5512 0.1069 0.9118 -1.0504 0.7764 1.7748 0.1348 -0.1806 0.1405 0.3211 0.0196 0.1720 0.1809 0.1809 0.1453 30 30 30 3013C-ISTD, median Nucleobases and related Nucleotides Guanosine diphosphate (GDP) 4.63 1.25 0.27 0.74 9.24E-05 0.5404 0.0009 0.2951 0.0004 0.6338 0.0018 0.3494 4.5106 0.6193 -3.6675 -1.0655 0.6654 0.0961 -0.5693 -0.1328 0.1475 0.1552 0.1552 0.1247 30 30 30 3013C-ISTD, median Nucleobases and related Nucleotides Guanosine monophosphate (GMP) 0.80 1.20 1.50 1.07 0.4130 0.5305 0.1649 0.7801 0.5106 0.6251 0.1915 0.8262 -0.8302 0.6346 1.4236 0.2817 -0.0984 0.0791 0.1775 0.0282 0.1185 0.1247 0.1247 0.1002 30 30 30 3013C-ISTD, median Nucleobases and related Nucleotides Guanosine triphosphate (GTP) 0.71 0.72 1.01 0.86 0.0024 0.0051 0.9007 0.1065 0.0063 0.0110 0.9079 0.1407 -3.3154 -3.0250 0.1259 -1.6640 -0.1493 -0.1434 0.0060 -0.0633 0.0450 0.0474 0.0474 0.0381 30 30 30 3013
C-ISTD, median Nucleobases and related Nucleotides Inosine monophosphate (IMP) 0.68 0.51 0.75 1.40 0.0345 0.0009 0.1215 0.0322 0.0609 0.0025 0.1452 0.0464 -2.2156 -3.6991 -1.5935 2.2467 -0.1689 -0.2967 -0.1278 0.1447 0.0762 0.0802 0.0802 0.0644 30 30 30 3013C-ISTD, median Nucleobases and related Nucleotides Uridine diphosphate (UDP) 3.82 1.28 0.33 0.67 6.06E-10 0.1338 1.05E-07 0.0035 1.17E-08 0.1987 7.32E-07 0.0058 8.9233 1.5410 -6.9395 -3.1713 0.5820 0.1058 -0.4762 -0.1748 0.0652 0.0686 0.0686 0.0551 30 30 30 3013C-ISTD, median Nucleobases and related Nucleotides Uridine monophosphate (UMP) 0.68 3.06 4.49 1.25 0.0325 7.50E-07 2.53E-09 0.1339 0.0582 4.70E-06 2.45E-08 0.1732 -2.2425 6.2226 8.3539 1.5407 -0.1664 0.4859 0.6524 0.0966 0.0742 0.0781 0.0781 0.0627 30 30 30 3013C-ISTD, median Nucleobases and related Nucleotides Uridine triphosphate (UTP) 0.71 0.69 0.96 0.71 0.0006 0.0003 0.6896 6.39E-05 0.0020 0.0011 0.7173 0.0001 -3.8180 -4.0318 -0.4032 -4.6421 -0.1469 -0.1633 -0.0163 -0.1510 0.0385 0.0405 0.0405 0.0325 30 30 30 3013C-ISTD, median Nucleobases and related Purine metabolism 5-Aminoimidazole-4-carboxamide-1-beta-ribofuranosyl-5'-monophosphate (AICAR)0.50 0.89 1.78 0.16 0.0023 0.6062 0.0131 1.76E-11 0.0063 0.6979 0.0192 5.96E-11 -3.3238 -0.5210 2.6379 -10.4156 -0.2985 -0.0492 0.2493 -0.7906 0.0898 0.0945 0.0945 0.0759 30 30 30 30
pool, median Nucleobases and related Purine metabolism Adenine 1.04 0.69 0.66 1.30 0.4682 7.33E-08 5.04E-09 8.14E-07 0.5618 5.41E-07 4.38E-08 1.86E-06 0.7362 -7.4033 -8.5439 6.4326 0.0160 -0.1643 -0.1803 0.1137 0.0217 0.0222 0.0211 0.0177 26 26 26 2613C-ISTD, median Nucleobases and related Purine metabolism Adenosine 1.05 1.42 1.35 0.85 0.8247 0.1436 0.2071 0.3848 0.8771 0.2120 0.2372 0.4391 0.2235 1.5019 1.2895 -0.8819 0.0215 0.1521 0.1306 -0.0717 0.0963 0.1013 0.1013 0.0813 30 30 30 3013C-ISTD, median Nucleobases and related Purine metabolism Adenylosuccinic acid 0.97 0.77 0.79 0.99 0.9353 0.5189 0.5614 0.9812 0.9442 0.6202 0.5944 0.9812 -0.0819 -0.6533 -0.5877 -0.0238 -0.0133 -0.1140 -0.1007 -0.0033 0.1621 0.1744 0.1713 0.1376 28 28 28 28
pool, median Nucleobases and related Purine metabolism Guanine 1.33 0.86 0.65 0.96 0.0305 0.2436 0.0013 0.7011 0.0559 0.3359 0.0024 0.7618 2.2881 -1.1932 -3.6072 -0.3881 0.1232 -0.0657 -0.1889 -0.0170 0.0538 0.0551 0.0524 0.0439 26 26 26 2613C-ISTD, median Nucleobases and related Purine metabolism Guanosine 0.93 2.69 2.89 0.51 0.7242 3.92E-05 1.51E-05 0.0003 0.7937 0.0002 5.21E-05 0.0006 -0.3562 4.8151 5.1537 -4.0645 -0.0303 0.4303 0.4606 -0.2918 0.0849 0.0894 0.0894 0.0718 30 30 30 3013C-ISTD, median Nucleobases and related Purine metabolism Phosphoribosyl pyrophosphate (PRPP) 0.69 0.77 1.12 0.71 0.0013 0.0241 0.3302 0.0005 0.0038 0.0436 0.3665 0.0010 -3.5405 -2.3749 0.9899 -3.8761 -0.1639 -0.1157 0.0482 -0.1517 0.0463 0.0487 0.0487 0.0391 30 30 30 3013
C-ISTD, median Nucleobases and related Pyrimidine metabolism Carbamoylaspartate 0.23 1.02 4.47 0.41 8.87E-13 0.8905 2.30E-12 2.34E-09 4.45E-11 0.9291 5.79E-11 6.84E-09 -11.7786 0.1389 11.3331 -8.3846 -0.6427 0.0080 0.6507 -0.3867 0.0546 0.0574 0.0574 0.0461 30 30 30 30
pool, median Nucleobases and related Pyrimidine metabolism Uridine 7.97 11.25 1.41 0.10 9.86E-11 2.23E-12 0.1277 2.39E-14 2.82E-09 6.92E-11 0.1518 1.03E-13 9.4085 10.9722 1.5636 -13.0386 0.9012 1.0510 0.1498 -1.0198 0.0958 0.0958 0.0958 0.0782 32 32 32 32
pool, median Unknown Unknown lipid Unknown lipid (29971286) 1.54 1.19 0.77 0.06 9.53E-05 0.0782 0.0079 3.39E-22 0.0004 0.1234 0.0122 7.24E-21 4.6734 1.8400 -2.8952 -35.2897 0.1888 0.0767 -0.1120 -1.2106 0.0404 0.0417 0.0387 0.0343 24 24 24 24
pool, median Unknown Unknown lipid Unknown lipid (29971443) 0.91 0.79 0.86 0.95 0.1529 0.0006 0.0271 0.3090 0.2097 0.0019 0.0366 0.3624 -1.4642 -3.7799 -2.3157 -1.0338 -0.0404 -0.1043 -0.0639 -0.0233 0.0276 0.0276 0.0276 0.0225 32 32 32 32
pool, median Unknown Unknown lipid Unknown lipid (29971883) 0.97 0.83 0.85 0.54 0.6522 0.0058 0.0178 3.97E-13 0.7374 0.0124 0.0250 1.56E-12 -0.4550 -2.9543 -2.4993 -11.7321 -0.0126 -0.0817 -0.0691 -0.2650 0.0277 0.0277 0.0277 0.0226 32 32 32 32
pool, median Unknown Unknown lipid Unknown lipid (69970017) 1.01 0.82 0.82 0.90 0.8927 9.74E-06 6.55E-06 0.0018 0.9270 4.89E-05 2.54E-05 0.0032 0.1359 -5.2452 -5.3811 -3.3949 0.0022 -0.0863 -0.0886 -0.0456 0.0165 0.0165 0.0165 0.0134 32 32 32 32
pool, median Unknown Unknown lipid Unknown lipid (69970020) 1.11 0.88 0.79 0.19 0.0105 0.0016 6.50E-07 9.63E-33 0.0228 0.0040 3.34E-06 1.21E-30 2.7174 -3.4602 -6.1776 -52.9674 0.0451 -0.0574 -0.1024 -0.7171 0.0166 0.0166 0.0166 0.0135 32 32 32 32
pool, median Unknown Unknown lipid Unknown lipid (69970121) 0.79 0.82 1.04 0.58 0.0038 0.0140 0.6036 5.70E-10 0.0092 0.0274 0.6312 1.75E-09 -3.1248 -2.6004 0.5244 -8.7253 -0.1050 -0.0874 0.0176 -0.2394 0.0336 0.0336 0.0336 0.0274 32 32 32 32
pool, median Unknown Unknown lipid Unknown lipid (69970127) 0.65 0.48 0.74 2.91 0.0002 3.05E-08 0.0049 3.10E-14 0.0007 2.55E-07 0.0080 1.30E-13 -4.2347 -7.2539 -3.0192 12.9124 -0.1863 -0.3192 -0.1328 0.4639 0.0440 0.0440 0.0440 0.0359 32 32 32 32
pool, median Unknown Unknown lipid Unknown lipid (69970150) 1.09 0.92 0.85 0.48 0.0592 0.0495 0.0004 1.47E-20 0.0977 0.0823 0.0008 1.67E-19 1.9567 -2.0416 -3.9983 -21.4555 0.0357 -0.0372 -0.0729 -0.3193 0.0182 0.0182 0.0182 0.0149 32 32 32 32
pool, median Unknown Unknown lipid Unknown lipid (69970151) 1.13 0.90 0.80 1.20 0.0012 0.0029 1.13E-07 1.53E-07 0.0034 0.0066 7.50E-07 3.76E-07 3.5659 -3.2228 -6.7887 6.6828 0.0517 -0.0468 -0.0985 0.0792 0.0145 0.0145 0.0145 0.0118 32 32 32 32
pool, median Unknown Unknown lipid Unknown lipid (69970153) 1.20 1.01 0.85 0.95 0.0001 0.7433 0.0003 0.1685 0.0005 0.8147 0.0007 0.2115 4.3928 0.3304 -4.0624 -1.4090 0.0784 0.0059 -0.0725 -0.0205 0.0178 0.0178 0.0178 0.0146 32 32 32 32
pool, median Unknown Unknown lipid Unknown lipid (69970154) 1.09 0.91 0.84 0.77 0.0259 0.0265 5.30E-05 1.33E-09 0.0489 0.0476 0.0001 3.98E-09 2.3364 -2.3255 -4.6618 -8.4034 0.0391 -0.0389 -0.0779 -0.1147 0.0167 0.0167 0.0167 0.0136 32 32 32 32
pool, median Unknown Unknown lipid Unknown lipid (69970507) 0.73 1.39 1.90 0.59 0.0228 0.0160 2.40E-05 2.68E-05 0.0449 0.0309 7.67E-05 5.70E-05 -2.3914 2.5431 4.9345 -4.8973 -0.1352 0.1438 0.2790 -0.2261 0.0565 0.0565 0.0565 0.0462 32 32 32 32
pool, median Unknown Unknown lipid Unknown lipid (69970512) 0.87 0.92 1.06 0.77 0.3546 0.5935 0.6917 0.0435 0.4473 0.6897 0.7173 0.0613 -0.9393 -0.5391 0.4002 -2.1026 -0.0614 -0.0353 0.0262 -0.1123 0.0654 0.0654 0.0654 0.0534 32 32 32 32
pool, median Unknown Unknown lipid Unknown lipid (69970534) 1.81 0.67 0.37 0.29 9.28E-06 0.0010 3.74E-10 1.10E-14 5.54E-05 0.0027 5.30E-09 5.09E-14 5.2618 -3.6256 -8.8875 -13.4171 0.2569 -0.1770 -0.4339 -0.5348 0.0488 0.0488 0.0488 0.0399 32 32 32 32
pool, median Unknown Unknown lipid Unknown lipid (69970538) 0.90 0.74 0.82 1.01 0.4668 0.0372 0.1602 0.9473 0.5618 0.0639 0.1877 0.9588 -0.7365 -2.1745 -1.4379 0.0666 -0.0448 -0.1323 -0.0875 0.0033 0.0609 0.0609 0.0609 0.0497 32 32 32 32
pool, median Unknown Unknown lipid Unknown lipid (69970546) 1.38 1.03 0.75 1.95 0.0002 0.6672 0.0007 4.86E-12 0.0007 0.7612 0.0014 1.77E-11 4.2045 0.4340 -3.7705 10.6405 0.1408 0.0145 -0.1262 0.2909 0.0335 0.0335 0.0335 0.0273 32 32 32 32
pool, median Unknown Unknown lipid Unknown lipid (69970547) 1.21 0.96 0.79 1.42 0.0033 0.4656 0.0004 3.43E-08 0.0082 0.5700 0.0009 9.36E-08 3.1777 -0.7386 -3.9163 7.2121 0.0823 -0.0191 -0.1014 0.1525 0.0259 0.0259 0.0259 0.0211 32 32 32 32
pool, median Unknown Unknown lipid Unknown lipid (69970550) 0.26 0.23 0.90 1.11 4.16E-05 1.48E-05 0.7246 0.6602 0.0002 7.03E-05 0.7422 0.7205 -4.7451 -5.1005 -0.3555 0.4438 -0.5886 -0.6326 -0.0441 0.0449 0.1240 0.1240 0.1240 0.1013 32 32 32 32
pool, median Unknown Unknown lipid Unknown lipid (69970553) 1.09 0.81 0.74 3.37 0.0989 0.0004 2.73E-06 2.01E-24 0.1496 0.0011 1.19E-05 6.31E-23 1.6994 -3.9821 -5.6815 28.7330 0.0382 -0.0896 -0.1279 0.5280 0.0225 0.0225 0.0225 0.0184 32 32 32 32
pool, median Unknown Unknown lipid Unknown lipid (69970558) 1.21 0.88 0.73 2.58 0.0004 0.0116 1.76E-07 3.46E-22 0.0013 0.0234 1.11E-06 7.24E-21 3.9538 -2.6787 -6.6325 24.2891 0.0821 -0.0556 -0.1377 0.4118 0.0208 0.0208 0.0208 0.0170 32 32 32 32
pool, median Unknown Unknown lipid Unknown lipid (69970574) 1.12 0.93 0.83 1.44 0.0070 0.0687 3.94E-05 5.23E-13 0.0159 0.1098 0.0001 2.02E-12 2.8801 -1.8841 -4.7642 11.6087 0.0478 -0.0313 -0.0790 0.1573 0.0166 0.0166 0.0166 0.0135 32 32 32 32
pool, median Unknown Unknown lipid Unknown lipid (69970597) 0.84 1.10 1.32 0.76 0.0432 0.2605 0.0027 0.0004 0.0742 0.3573 0.0047 0.0008 -2.1056 1.1455 3.2511 -3.9111 -0.0782 0.0425 0.1207 -0.1186 0.0371 0.0371 0.0371 0.0303 32 32 32 32
pool, median Unknown Unknown lipid Unknown lipid (69970610) 0.90 0.77 0.85 1.05 0.2275 0.0039 0.0689 0.4412 0.3037 0.0085 0.0885 0.4901 -1.2305 -3.1132 -1.8827 0.7798 -0.0446 -0.1128 -0.0682 0.0231 0.0362 0.0362 0.0362 0.0296 32 32 32 32
pool, median Unknown Unknown lipid Unknown lipid (69970611) 1.01 0.87 0.86 0.39 0.9080 0.0342 0.0264 5.50E-18 0.9379 0.0597 0.0357 4.18E-17 0.1164 -2.2121 -2.3286 -17.5565 0.0033 -0.0626 -0.0659 -0.4055 0.0283 0.0283 0.0283 0.0231 32 32 32 32
pool, median Unknown Unknown lipid Unknown lipid (69970615) 1.09 0.96 0.88 1.90 0.0999 0.4086 0.0165 1.21E-16 0.1502 0.5127 0.0236 7.80E-16 1.6942 -0.8374 -2.5316 15.7673 0.0367 -0.0181 -0.0548 0.2788 0.0217 0.0217 0.0217 0.0177 32 32 32 32
pool, median Unknown Unknown lipid Unknown lipid (69970619) 0.74 0.63 0.86 2.81 9.71E-05 1.38E-07 0.0302 9.46E-19 0.0004 9.60E-07 0.0405 8.48E-18 -4.4514 -6.7191 -2.2677 18.6457 -0.1312 -0.1980 -0.0668 0.4486 0.0295 0.0295 0.0295 0.0241 32 32 32 32
pool, median Unknown Unknown lipid Unknown lipid (69970620) 0.91 0.74 0.81 1.85 0.0244 7.26E-09 6.00E-06 2.06E-19 0.0464 7.92E-08 2.36E-05 2.07E-18 -2.3624 -7.7739 -5.4114 19.6339 -0.0392 -0.1291 -0.0899 0.2663 0.0166 0.0166 0.0166 0.0136 32 32 32 32
pool, median Unknown Unknown lipid Unknown lipid (69970621) 1.22 0.93 0.76 1.42 0.0033 0.2354 0.0001 7.20E-08 0.0083 0.3264 0.0003 1.88E-07 3.1703 -1.2094 -4.3797 6.9480 0.0850 -0.0324 -0.1175 0.1521 0.0268 0.0268 0.0268 0.0219 32 32 32 32
pool, median Unknown Unknown lipid Unknown lipid (69970623) 0.92 0.77 0.84 1.22 0.0172 1.58E-08 2.11E-05 3.80E-08 0.0346 1.41E-07 6.82E-05 1.03E-07 -2.5125 -7.4918 -4.9794 7.1755 -0.0372 -0.1111 -0.0738 0.0869 0.0148 0.0148 0.0148 0.0121 32 32 32 32
pool, median Unknown Unknown lipid Unknown lipid (69970625) 0.88 0.69 0.79 1.52 0.0032 5.30E-10 3.85E-06 9.18E-14 0.0081 7.83E-09 1.57E-05 3.72E-13 -3.1898 -8.7534 -5.5636 12.4006 -0.0577 -0.1584 -0.1007 0.1832 0.0181 0.0181 0.0181 0.0148 32 32 32 32
pool, median Unknown Unknown lipid Unknown lipid (69970626) 0.90 0.72 0.80 1.52 0.0060 7.15E-11 1.98E-07 8.63E-16 0.0139 1.41E-09 1.19E-06 4.61E-15 -2.9439 -9.5363 -6.5923 14.7080 -0.0443 -0.1434 -0.0991 0.1806 0.0150 0.0150 0.0150 0.0123 32 32 32 32
pool, median Unknown Unknown lipid Unknown lipid (69970627) 0.93 0.74 0.80 0.87 0.1349 1.94E-07 1.64E-05 0.0005 0.1913 1.31E-06 5.52E-05 0.0009 -1.5339 -6.5995 -5.0656 -3.8821 -0.0299 -0.1286 -0.0987 -0.0618 0.0195 0.0195 0.0195 0.0159 32 32 32 32
pool, median Unknown Unknown lipid Unknown lipid (69970629) 1.01 0.83 0.82 0.55 0.7114 4.29E-06 1.45E-06 1.61E-20 0.7901 2.24E-05 6.90E-06 1.75E-19 0.3733 -5.5265 -5.8999 -21.3895 0.0055 -0.0816 -0.0871 -0.2579 0.0148 0.0148 0.0148 0.0121 32 32 32 32
pool, median Unknown Unknown lipid Unknown lipid (69970631) 1.01 0.87 0.87 0.85 0.8383 0.0020 0.0012 1.85E-05 0.8878 0.0050 0.0022 3.98E-05 0.2057 -3.3594 -3.5652 -5.0237 0.0036 -0.0582 -0.0617 -0.0710 0.0173 0.0173 0.0173 0.0141 32 32 32 32
pool, median Unknown Unknown lipid Unknown lipid (69970632) 0.89 0.74 0.83 1.27 0.0004 6.25E-12 2.03E-07 9.45E-12 0.0013 1.57E-10 1.19E-06 3.34E-11 -3.9513 -10.5339 -6.5826 10.3611 -0.0489 -0.1304 -0.0815 0.1047 0.0124 0.0124 0.0124 0.0101 32 32 32 32
pool, median Unknown Unknown lipid Unknown lipid (69970633) 0.99 0.87 0.88 0.55 0.7506 0.0001 0.0004 7.52E-21 0.8121 0.0005 0.0008 9.44E-20 -0.3206 -4.3035 -3.9829 -21.9372 -0.0046 -0.0616 -0.0570 -0.2565 0.0143 0.0143 0.0143 0.0117 32 32 32 32
pool, median Unknown Unknown lipid Unknown lipid (69970636) 1.41 1.40 0.99 0.61 0.0006 0.0009 0.9044 1.88E-07 0.0020 0.0025 0.9080 4.54E-07 3.7938 3.6728 -0.1210 -6.6096 0.1502 0.1454 -0.0048 -0.2137 0.0396 0.0396 0.0396 0.0323 32 32 32 32
pool, median Unknown Unknown lipid Unknown lipid (69970638) 1.30 1.30 1.00 0.50 0.0002 0.0002 0.9725 1.12E-14 0.0007 0.0008 0.9725 5.12E-14 4.1843 4.1496 -0.0348 -13.4052 0.1152 0.1143 -0.0010 -0.3014 0.0275 0.0275 0.0275 0.0225 32 32 32 32
pool, median Unknown Unknown lipid Unknown lipid (69970639) 1.20 0.99 0.83 0.77 8.78E-05 0.7468 3.43E-05 2.68E-09 0.0004 0.8149 0.0001 7.72E-09 4.4865 -0.3257 -4.8122 -8.1422 0.0777 -0.0056 -0.0834 -0.1152 0.0173 0.0173 0.0173 0.0141 32 32 32 32
pool, median Unknown Unknown lipid Unknown lipid (69970641) 0.92 0.82 0.89 0.50 0.0616 7.84E-05 0.0144 4.53E-19 0.1010 0.0003 0.0207 4.37E-18 -1.9375 -4.5260 -2.5885 -19.1185 -0.0378 -0.0883 -0.0505 -0.3045 0.0195 0.0195 0.0195 0.0159 32 32 32 32
pool, median Unknown Unknown lipid Unknown lipid (69970642) 1.01 0.85 0.85 0.80 0.8812 0.0006 0.0004 1.44E-07 0.9225 0.0017 0.0008 3.59E-07 0.1507 -3.8274 -3.9781 -6.7028 0.0027 -0.0689 -0.0716 -0.0985 0.0180 0.0180 0.0180 0.0147 32 32 32 32
pool, median Unknown Unknown lipid Unknown lipid (69970658) 0.74 0.56 0.76 0.40 9.39E-07 3.96E-13 2.73E-06 1.56E-21 6.74E-06 1.66E-11 1.19E-05 2.40E-20 -6.0499 -11.7326 -5.6827 -23.1124 -0.1281 -0.2485 -0.1203 -0.3996 0.0212 0.0212 0.0212 0.0173 32 32 32 32
pool, median Unknown Unknown lipid Unknown lipid (69970801) 1.13 0.86 0.76 2.82 0.0858 0.0442 0.0005 3.61E-18 0.1355 0.0750 0.0011 2.92E-17 1.7725 -2.0944 -3.8669 17.8117 0.0549 -0.0649 -0.1198 0.4507 0.0310 0.0310 0.0310 0.0253 32 32 32 32
pool, median Unknown Unknown lipid Unknown lipid (69970802) 0.98 0.75 0.77 1.05 0.5621 9.65E-09 4.91E-08 0.1202 0.6472 9.69E-08 3.64E-07 0.1580 -0.5858 -7.6700 -7.0842 1.5965 -0.0095 -0.1237 -0.1143 0.0210 0.0161 0.0161 0.0161 0.0132 32 32 32 32
pool, median Unknown Unknown lipid Unknown lipid (69970803) 1.03 0.85 0.82 0.36 0.5997 0.0014 0.0003 3.10E-23 0.6812 0.0037 0.0007 7.78E-22 0.5300 -3.5054 -4.0355 -26.2876 0.0110 -0.0729 -0.0839 -0.4463 0.0208 0.0208 0.0208 0.0170 32 32 32 32
pool, median Unknown Unknown lipid Unknown lipid (69970806) 1.04 0.90 0.86 2.68 0.2151 0.0015 4.38E-05 2.22E-28 0.2903 0.0040 0.0001 1.39E-26 1.2647 -3.4632 -4.7278 38.5088 0.0172 -0.0471 -0.0643 0.4278 0.0136 0.0136 0.0136 0.0111 32 32 32 32
pool, median Unknown Unknown lipid Unknown lipid (69970813) 0.83 0.67 0.80 0.34 0.0002 9.90E-11 1.28E-05 3.80E-25 0.0006 1.77E-09 4.48E-05 1.36E-23 -4.2560 -9.4071 -5.1511 -30.3264 -0.0795 -0.1758 -0.0963 -0.4628 0.0187 0.0187 0.0187 0.0153 32 32 32 32
pool, median Unknown Unknown lipid Unknown lipid (69970814) 0.87 0.77 0.88 0.76 0.0984 0.0024 0.1200 0.0003 0.1496 0.0056 0.1440 0.0005 -1.7025 -3.3000 -1.5975 -4.0736 -0.0598 -0.1159 -0.0561 -0.1168 0.0351 0.0351 0.0351 0.0287 32 32 32 32
pool, median Unknown Unknown lipid Unknown lipid (69970815) 0.99 0.81 0.82 0.91 0.8118 0.0005 0.0009 0.0429 0.8671 0.0014 0.0018 0.0608 -0.2401 -3.8861 -3.6460 -2.1090 -0.0057 -0.0928 -0.0871 -0.0411 0.0239 0.0239 0.0239 0.0195 32 32 32 32
pool, median Unknown Unknown lipid Unknown lipid (69970816) 0.93 0.78 0.84 0.99 0.2244 0.0003 0.0074 0.8476 0.3012 0.0009 0.0115 0.8791 -1.2389 -4.1009 -2.8620 -0.1937 -0.0328 -0.1085 -0.0758 -0.0042 0.0265 0.0265 0.0265 0.0216 32 32 32 32
pool, median Unknown Unknown lipid Unknown lipid (69970817) 0.82 0.71 0.86 2.60 5.97E-05 3.40E-09 0.0017 9.57E-24 0.0003 4.27E-08 0.0030 2.67E-22 -4.6204 -8.0532 -3.4329 27.3135 -0.0859 -0.1497 -0.0638 0.4145 0.0186 0.0186 0.0186 0.0152 32 32 32 32
pool, median Unknown Unknown lipid Unknown lipid (69970818) 0.85 0.68 0.79 0.04 0.0005 6.48E-11 2.73E-06 3.12E-41 0.0016 1.41E-09 1.19E-05 7.82E-39 -3.8938 -9.5753 -5.6815 -97.9519 -0.0693 -0.1704 -0.1011 -1.4235 0.0178 0.0178 0.0178 0.0145 32 32 32 32
pool, median Unknown Unknown lipid Unknown lipid (69970819) 0.96 0.82 0.85 0.36 0.2817 2.03E-06 4.89E-05 4.62E-28 0.3664 1.13E-05 0.0001 2.32E-26 -1.0949 -5.7845 -4.6896 -37.6177 -0.0160 -0.0844 -0.0684 -0.4479 0.0146 0.0146 0.0146 0.0119 32 32 32 32
pool, median Unknown Unknown lipid Unknown lipid (69970820) 1.17 0.99 0.85 0.03 0.1493 0.9547 0.1347 7.23E-29 0.2059 0.9663 0.1593 6.05E-27 1.4776 -0.0572 -1.5348 -39.9105 0.0682 -0.0026 -0.0708 -1.5031 0.0461 0.0461 0.0461 0.0377 32 32 32 32
pool, median Unknown Unknown lipid Unknown lipid (69970823) 1.00 0.81 0.81 1.04 0.9531 2.00E-06 1.68E-06 0.1575 0.9570 1.13E-05 7.71E-06 0.1997 0.0592 -5.7894 -5.8486 1.4474 0.0009 -0.0925 -0.0934 0.0189 0.0160 0.0160 0.0160 0.0130 32 32 32 32
pool, median Unknown Unknown lipid Unknown lipid (69970824) 0.92 0.79 0.85 1.34 0.0071 5.68E-10 1.68E-06 2.34E-14 0.0159 7.93E-09 7.71E-06 1.03E-13 -2.8770 -8.7266 -5.8496 13.0474 -0.0344 -0.1042 -0.0699 0.1273 0.0119 0.0119 0.0119 0.0098 32 32 32 32
pool, median Unknown Unknown lipid Unknown lipid (69970825) 1.16 1.01 0.87 1.79 0.0164 0.8832 0.0232 1.20E-13 0.0333 0.9275 0.0319 4.78E-13 2.5328 0.1482 -2.3847 12.2765 0.0639 0.0037 -0.0601 0.2527 0.0252 0.0252 0.0252 0.0206 32 32 32 32
pool, median Unknown Unknown lipid Unknown lipid (69970831) 1.08 0.93 0.87 0.46 0.0866 0.1083 0.0017 1.72E-21 0.1359 0.1677 0.0031 2.40E-20 1.7679 -1.6523 -3.4202 -23.0363 0.0321 -0.0300 -0.0620 -0.3412 0.0181 0.0181 0.0181 0.0148 32 32 32 32
pool, median Unknown Unknown lipid Unknown lipid (69970832) 1.00 0.85 0.85 0.89 0.9267 5.25E-05 6.86E-05 0.0002 0.9417 0.0002 0.0002 0.0005 -0.0928 -4.6649 -4.5721 -4.1410 -0.0014 -0.0716 -0.0702 -0.0519 0.0154 0.0154 0.0154 0.0125 32 32 32 32
pool, median Unknown Unknown lipid Unknown lipid (69970841) 0.99 0.83 0.83 0.60 0.8821 5.86E-05 9.02E-05 2.52E-16 0.9225 0.0002 0.0002 1.47E-15 -0.1495 -4.6266 -4.4771 -15.3663 -0.0027 -0.0829 -0.0802 -0.2248 0.0179 0.0179 0.0179 0.0146 32 32 32 32
pool, median Unknown Unknown lipid Unknown lipid (69970843) 1.14 0.85 0.75 2.77 0.0240 0.0060 7.94E-06 1.68E-21 0.0464 0.0126 3.03E-05 2.40E-20 2.3700 -2.9452 -5.3152 23.0541 0.0556 -0.0691 -0.1247 0.4417 0.0235 0.0235 0.0235 0.0192 32 32 32 32
pool, median Unknown Unknown polar Unknown polar (39970147) 0.69 31.73 46.19 0.85 0.0440 8.50E-17 1.96E-18 0.2573 0.0748 7.11E-15 1.64E-16 0.3061 -2.1172 19.0530 22.2172 -1.1583 -0.1631 1.5015 1.6646 -0.0727 0.0770 0.0788 0.0749 0.0628 26 26 26 26
pool, median Unknown Unknown polar Unknown polar (39970148) 0.82 48.87 59.70 0.90 0.1556 1.47E-20 2.39E-21 0.3536 0.2122 2.27E-18 3.01E-19 0.4071 -1.4644 28.4334 30.6407 -0.9452 -0.0870 1.6890 1.7760 -0.0457 0.0594 0.0594 0.0580 0.0484 25 25 25 25
pool, median Unknown Unknown polar Unknown polar (39970175) 0.64 314.39 493.30 0.67 0.0283 1.81E-20 7.72E-22 0.0155 0.0530 2.27E-18 1.95E-19 0.0233 -2.3340 29.7953 34.0782 -2.6070 -0.1956 2.4975 2.6931 -0.1741 0.0838 0.0838 0.0790 0.0668 24 24 24 24
pool, median Unknown Unknown polar Unknown polar (39970411) 1.08 0.92 0.85 0.95 0.2841 0.2241 0.0221 0.3944 0.3676 0.3209 0.0308 0.4479 1.0937 -1.2454 -2.4343 -0.8660 0.0325 -0.0379 -0.0704 -0.0210 0.0297 0.0304 0.0289 0.0242 26 26 26 26
pool, median Unknown Unknown polar Unknown polar (39970992) 0.76 1.02 1.35 2.50 0.0743 0.8921 0.0500 6.97E-08 0.1203 0.9291 0.0656 1.84E-07 -1.8595 0.1370 2.0556 7.4244 -0.1220 0.0092 0.1312 0.3972 0.0656 0.0672 0.0638 0.0535 26 26 26 26
pool, median Unknown Unknown polar Unknown polar (39971140) 1.18 2.06 1.75 1.21 0.2438 2.52E-05 0.0003 0.1025 0.3202 0.0001 0.0007 0.1368 1.1927 5.1091 4.1480 1.6927 0.0715 0.3133 0.2418 0.0827 0.0599 0.0613 0.0583 0.0489 26 26 26 26
pool, median Unknown Unknown polar Unknown polar (39971995) 0.88 1.02 1.17 1.09 0.1399 0.7966 0.0773 0.2426 0.1957 0.8545 0.0979 0.2928 -1.5229 0.2604 1.8394 1.1956 -0.0566 0.0099 0.0665 0.0362 0.0372 0.0380 0.0361 0.0303 26 26 26 26
pool, median Unknown Unknown polar Unknown polar (39972117) 0.59 6.97 11.76 1.23 0.0242 3.02E-09 3.96E-11 0.2339 0.0464 3.99E-08 6.65E-10 0.2842 -2.4201 9.5044 12.0027 1.2239 -0.2274 0.8430 1.0703 0.0906 0.0939 0.0887 0.0892 0.0741 22 22 22 22
pool, median Unknown Unknown polar Unknown polar (39972124) 1.79 3.19 1.78 1.08 0.0823 0.0014 0.0808 0.7653 0.1308 0.0038 0.1012 0.8174 1.8101 3.5853 1.8200 0.3018 0.2539 0.5032 0.2492 0.0345 0.1403 0.1403 0.1369 0.1143 25 25 25 25
pool, median Unknown Unknown polar Unknown polar (39972135) 2.06 1.83 0.89 1.72 1.66E-05 0.0003 0.3861 6.40E-05 9.07E-05 0.0009 0.4231 0.0001 5.3128 4.2246 -0.8821 4.7913 0.3142 0.2620 -0.0522 0.2354 0.0591 0.0620 0.0591 0.0491 25 25 25 25
pool, median Unknown Unknown polar Unknown polar (59970914) 0.74 0.87 1.17 0.91 0.0102 0.2041 0.1612 0.3135 0.0223 0.2945 0.1881 0.3654 -2.7305 -1.2963 1.4342 -1.0240 -0.1307 -0.0620 0.0686 -0.0400 0.0479 0.0479 0.0479 0.0391 32 32 32 32
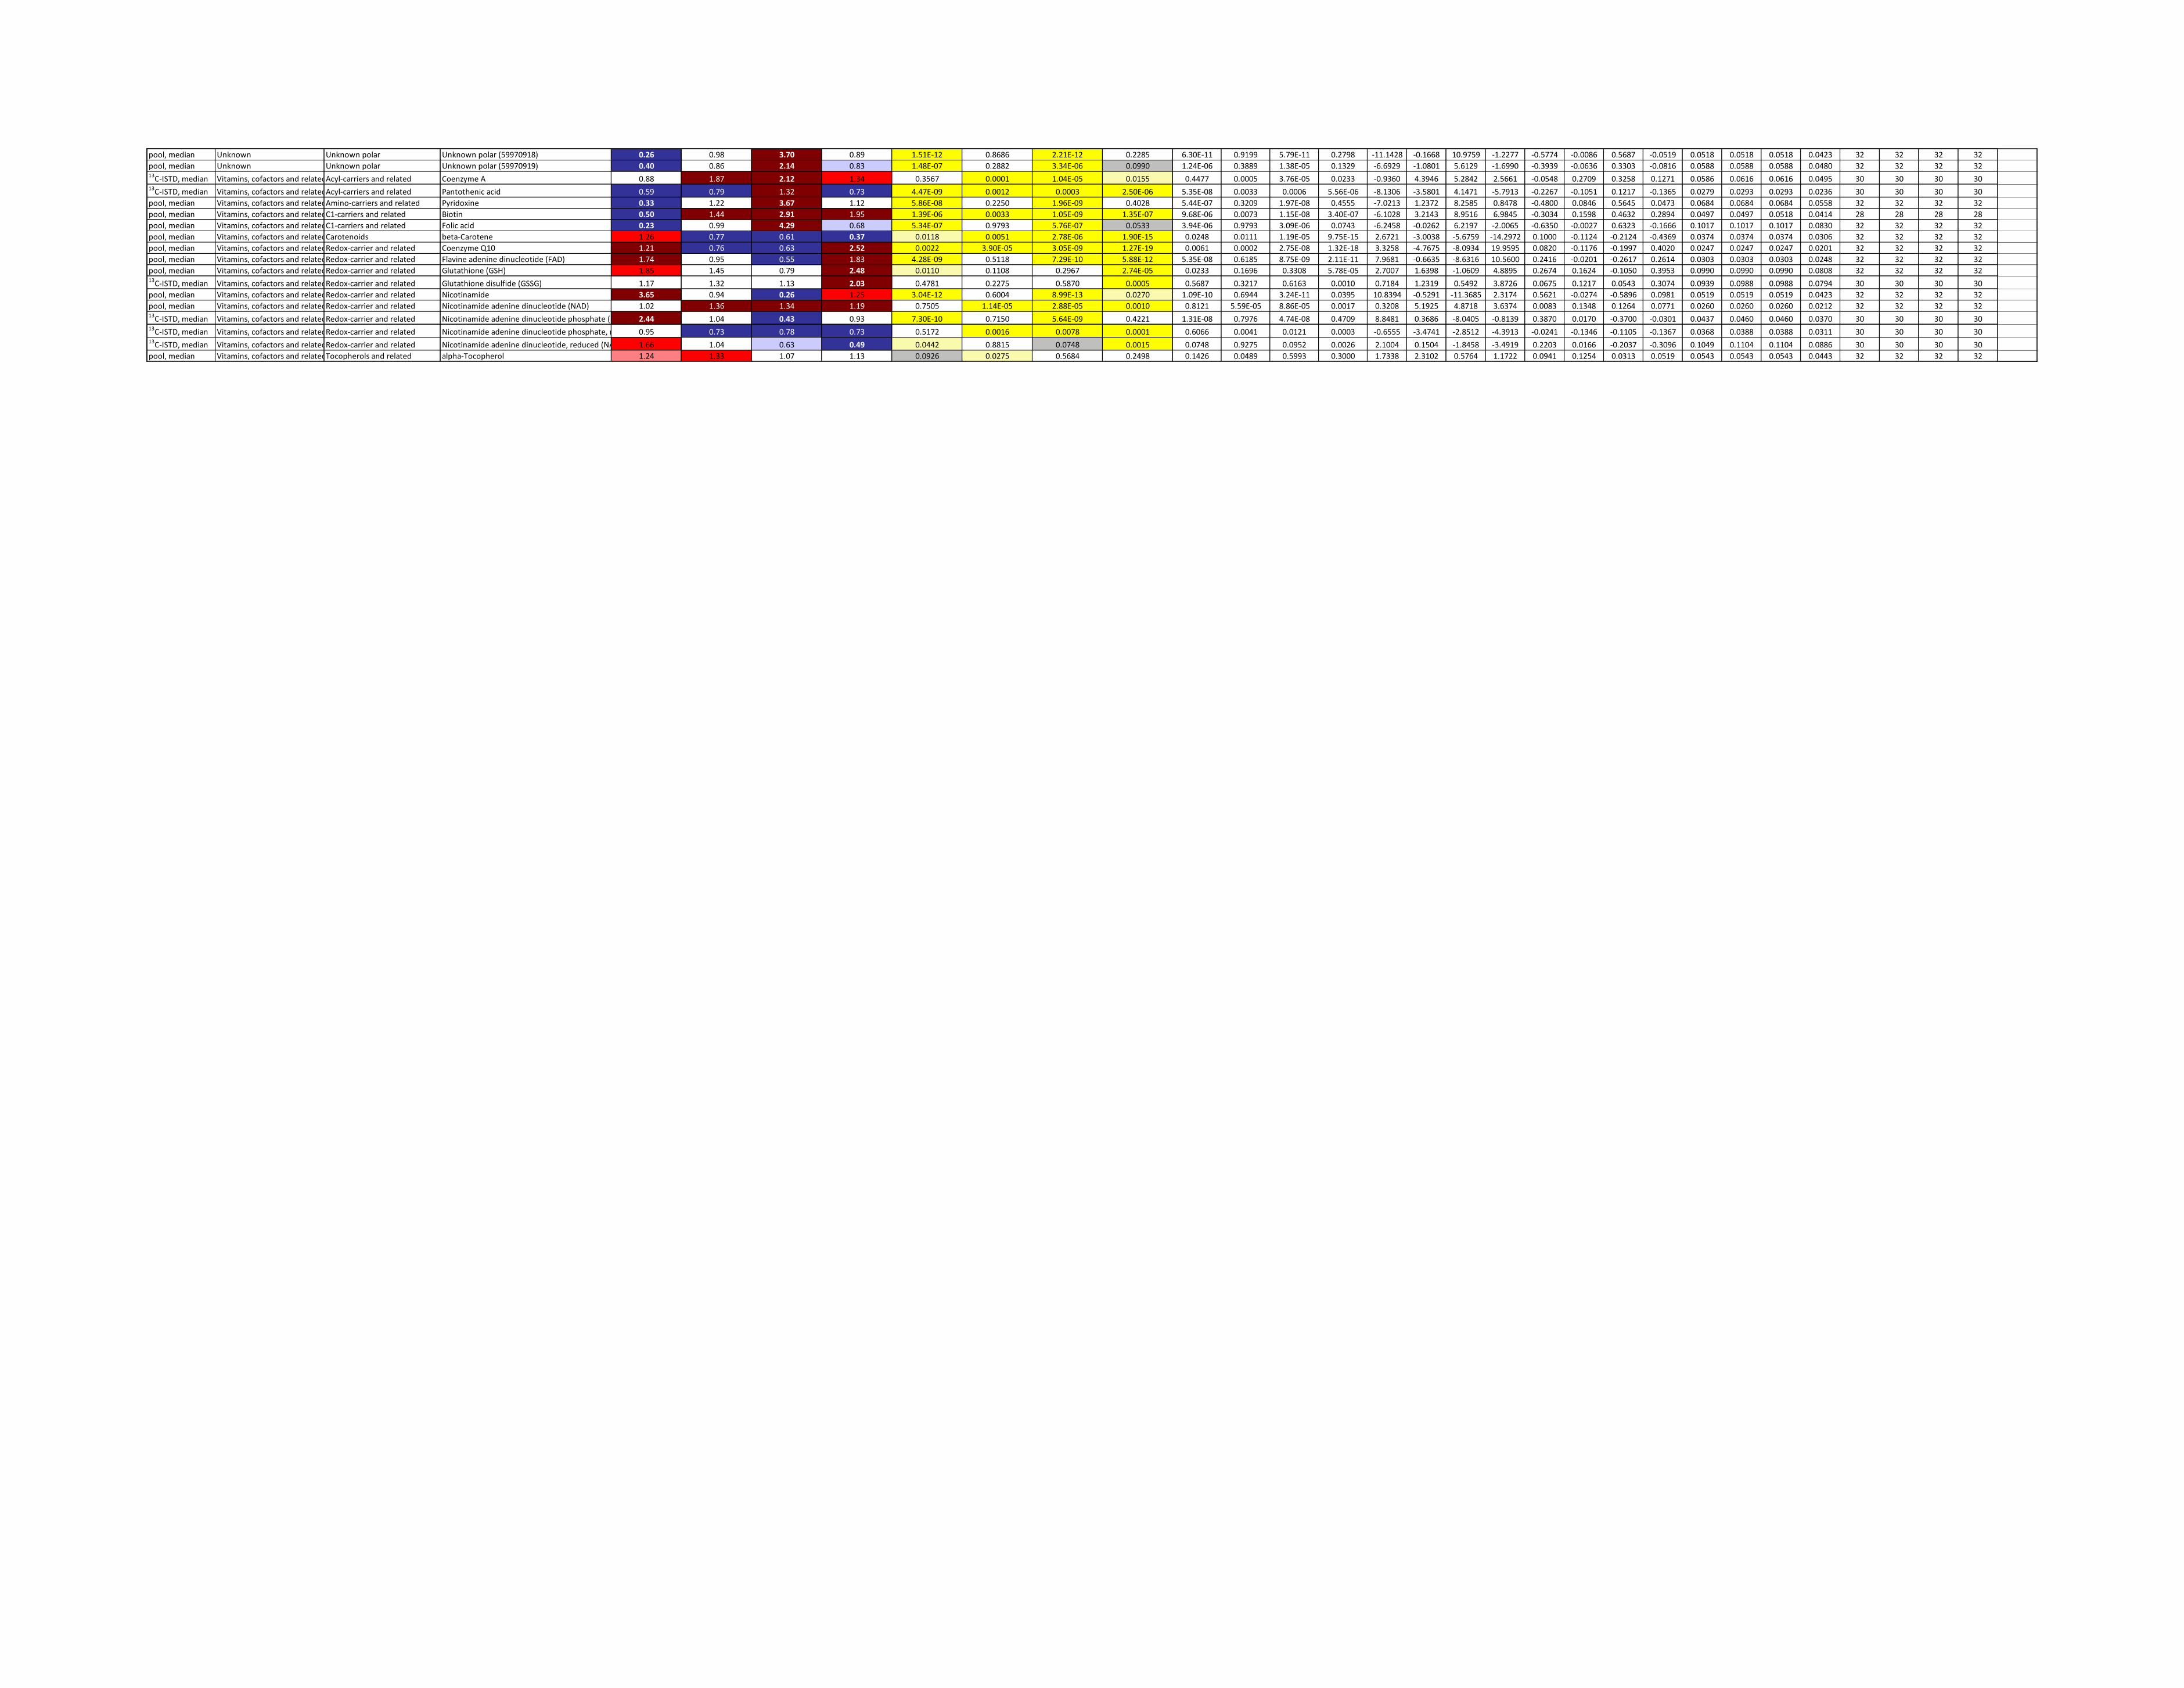
pool, median Unknown Unknown polar Unknown polar (59970918) 0.26 0.98 3.70 0.89 1.51E-12 0.8686 2.21E-12 0.2285 6.30E-11 0.9199 5.79E-11 0.2798 -11.1428 -0.1668 10.9759 -1.2277 -0.5774 -0.0086 0.5687 -0.0519 0.0518 0.0518 0.0518 0.0423 32 32 32 32
pool, median Unknown Unknown polar Unknown polar (59970919) 0.40 0.86 2.14 0.83 1.48E-07 0.2882 3.34E-06 0.0990 1.24E-06 0.3889 1.38E-05 0.1329 -6.6929 -1.0801 5.6129 -1.6990 -0.3939 -0.0636 0.3303 -0.0816 0.0588 0.0588 0.0588 0.0480 32 32 32 3213C-ISTD, median Vitamins, cofactors and relatedAcyl-carriers and related Coenzyme A 0.88 1.87 2.12 1.34 0.3567 0.0001 1.04E-05 0.0155 0.4477 0.0005 3.76E-05 0.0233 -0.9360 4.3946 5.2842 2.5661 -0.0548 0.2709 0.3258 0.1271 0.0586 0.0616 0.0616 0.0495 30 30 30 3013C-ISTD, median Vitamins, cofactors and relatedAcyl-carriers and related Pantothenic acid 0.59 0.79 1.32 0.73 4.47E-09 0.0012 0.0003 2.50E-06 5.35E-08 0.0033 0.0006 5.56E-06 -8.1306 -3.5801 4.1471 -5.7913 -0.2267 -0.1051 0.1217 -0.1365 0.0279 0.0293 0.0293 0.0236 30 30 30 30
pool, median Vitamins, cofactors and relatedAmino-carriers and related Pyridoxine 0.33 1.22 3.67 1.12 5.86E-08 0.2250 1.96E-09 0.4028 5.44E-07 0.3209 1.97E-08 0.4555 -7.0213 1.2372 8.2585 0.8478 -0.4800 0.0846 0.5645 0.0473 0.0684 0.0684 0.0684 0.0558 32 32 32 32
pool, median Vitamins, cofactors and relatedC1-carriers and related Biotin 0.50 1.44 2.91 1.95 1.39E-06 0.0033 1.05E-09 1.35E-07 9.68E-06 0.0073 1.15E-08 3.40E-07 -6.1028 3.2143 8.9516 6.9845 -0.3034 0.1598 0.4632 0.2894 0.0497 0.0497 0.0518 0.0414 28 28 28 28
pool, median Vitamins, cofactors and relatedC1-carriers and related Folic acid 0.23 0.99 4.29 0.68 5.34E-07 0.9793 5.76E-07 0.0533 3.94E-06 0.9793 3.09E-06 0.0743 -6.2458 -0.0262 6.2197 -2.0065 -0.6350 -0.0027 0.6323 -0.1666 0.1017 0.1017 0.1017 0.0830 32 32 32 32
pool, median Vitamins, cofactors and relatedCarotenoids beta-Carotene 1.26 0.77 0.61 0.37 0.0118 0.0051 2.78E-06 1.90E-15 0.0248 0.0111 1.19E-05 9.75E-15 2.6721 -3.0038 -5.6759 -14.2972 0.1000 -0.1124 -0.2124 -0.4369 0.0374 0.0374 0.0374 0.0306 32 32 32 32
pool, median Vitamins, cofactors and relatedRedox-carrier and related Coenzyme Q10 1.21 0.76 0.63 2.52 0.0022 3.90E-05 3.05E-09 1.27E-19 0.0061 0.0002 2.75E-08 1.32E-18 3.3258 -4.7675 -8.0934 19.9595 0.0820 -0.1176 -0.1997 0.4020 0.0247 0.0247 0.0247 0.0201 32 32 32 32
pool, median Vitamins, cofactors and relatedRedox-carrier and related Flavine adenine dinucleotide (FAD) 1.74 0.95 0.55 1.83 4.28E-09 0.5118 7.29E-10 5.88E-12 5.35E-08 0.6185 8.75E-09 2.11E-11 7.9681 -0.6635 -8.6316 10.5600 0.2416 -0.0201 -0.2617 0.2614 0.0303 0.0303 0.0303 0.0248 32 32 32 32
pool, median Vitamins, cofactors and relatedRedox-carrier and related Glutathione (GSH) 1.85 1.45 0.79 2.48 0.0110 0.1108 0.2967 2.74E-05 0.0233 0.1696 0.3308 5.78E-05 2.7007 1.6398 -1.0609 4.8895 0.2674 0.1624 -0.1050 0.3953 0.0990 0.0990 0.0990 0.0808 32 32 32 3213C-ISTD, median Vitamins, cofactors and relatedRedox-carrier and related Glutathione disulfide (GSSG) 1.17 1.32 1.13 2.03 0.4781 0.2275 0.5870 0.0005 0.5687 0.3217 0.6163 0.0010 0.7184 1.2319 0.5492 3.8726 0.0675 0.1217 0.0543 0.3074 0.0939 0.0988 0.0988 0.0794 30 30 30 30
pool, median Vitamins, cofactors and relatedRedox-carrier and related Nicotinamide 3.65 0.94 0.26 1.25 3.04E-12 0.6004 8.99E-13 0.0270 1.09E-10 0.6944 3.24E-11 0.0395 10.8394 -0.5291 -11.3685 2.3174 0.5621 -0.0274 -0.5896 0.0981 0.0519 0.0519 0.0519 0.0423 32 32 32 32
pool, median Vitamins, cofactors and relatedRedox-carrier and related Nicotinamide adenine dinucleotide (NAD) 1.02 1.36 1.34 1.19 0.7505 1.14E-05 2.88E-05 0.0010 0.8121 5.59E-05 8.86E-05 0.0017 0.3208 5.1925 4.8718 3.6374 0.0083 0.1348 0.1264 0.0771 0.0260 0.0260 0.0260 0.0212 32 32 32 3213C-ISTD, median Vitamins, cofactors and relatedRedox-carrier and related Nicotinamide adenine dinucleotide phosphate (NADP) 2.44 1.04 0.43 0.93 7.30E-10 0.7150 5.64E-09 0.4221 1.31E-08 0.7976 4.74E-08 0.4709 8.8481 0.3686 -8.0405 -0.8139 0.3870 0.0170 -0.3700 -0.0301 0.0437 0.0460 0.0460 0.0370 30 30 30 3013
C-ISTD, median Vitamins, cofactors and relatedRedox-carrier and related Nicotinamide adenine dinucleotide phosphate, reduced (NADPH)0.95 0.73 0.78 0.73 0.5172 0.0016 0.0078 0.0001 0.6066 0.0041 0.0121 0.0003 -0.6555 -3.4741 -2.8512 -4.3913 -0.0241 -0.1346 -0.1105 -0.1367 0.0368 0.0388 0.0388 0.0311 30 30 30 3013C-ISTD, median Vitamins, cofactors and relatedRedox-carrier and related Nicotinamide adenine dinucleotide, reduced (NADH) 1.66 1.04 0.63 0.49 0.0442 0.8815 0.0748 0.0015 0.0748 0.9275 0.0952 0.0026 2.1004 0.1504 -1.8458 -3.4919 0.2203 0.0166 -0.2037 -0.3096 0.1049 0.1104 0.1104 0.0886 30 30 30 30
pool, median Vitamins, cofactors and relatedTocopherols and related alpha-Tocopherol 1.24 1.33 1.07 1.13 0.0926 0.0275 0.5684 0.2498 0.1426 0.0489 0.5993 0.3000 1.7338 2.3102 0.5764 1.1722 0.0941 0.1254 0.0313 0.0519 0.0543 0.0543 0.0543 0.0443 32 32 32 32
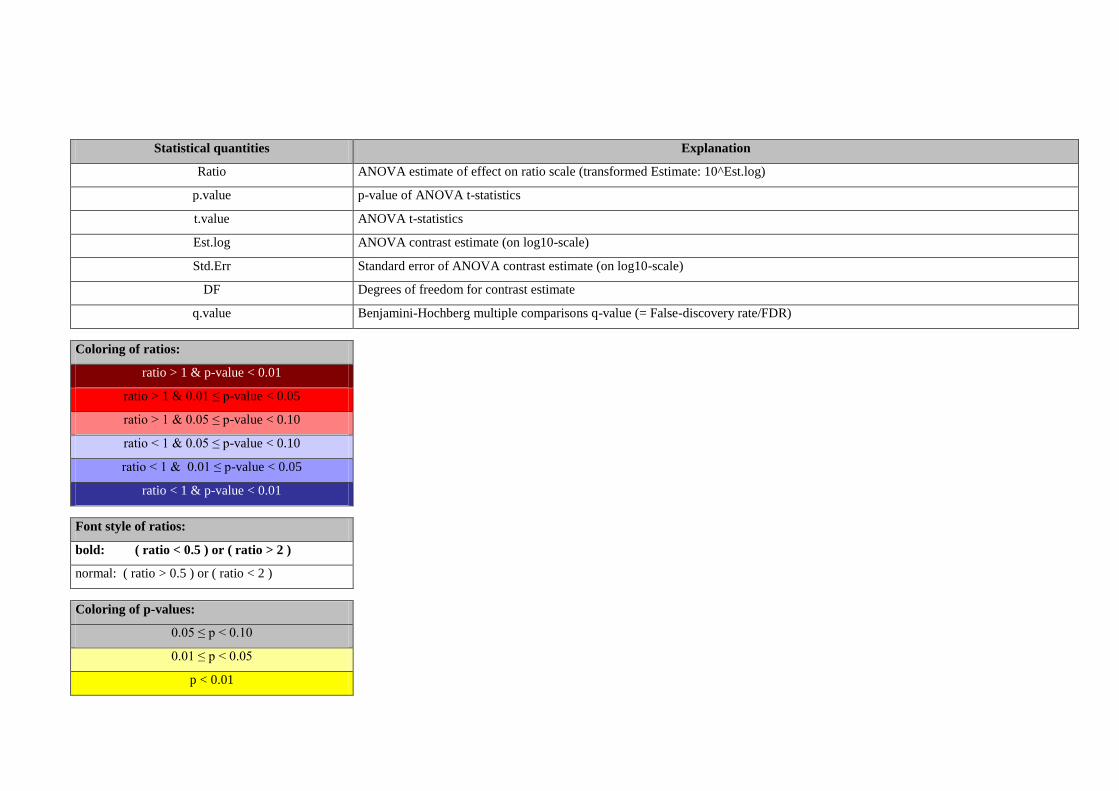
Statistical quantities Explanation
Ratio ANOVA estimate of effect on ratio scale (transformed Estimate: 10^Est.log)
p.value p-value of ANOVA t-statistics
t.value ANOVA t-statistics
Est.log ANOVA contrast estimate (on log10-scale)
Std.Err Standard error of ANOVA contrast estimate (on log10-scale)
DF Degrees of freedom for contrast estimate
q.value Benjamini-Hochberg multiple comparisons q-value (= False-discovery rate/FDR)
Coloring of ratios:
ratio > 1 & p-value < 0.01
ratio > 1 & 0.01 ≤ p-value < 0.05
ratio > 1 & 0.05 ≤ p-value < 0.10
ratio < 1 & 0.05 ≤ p-value < 0.10
ratio < 1 & 0.01 ≤ p-value < 0.05
ratio < 1 & p-value < 0.01
Font style of ratios:
bold: ( ratio < 0.5 ) or ( ratio > 2 )
normal: ( ratio > 0.5 ) or ( ratio < 2 )
Coloring of p-values:
0.05 ≤ p < 0.10
0.01 ≤ p < 0.05
p < 0.01
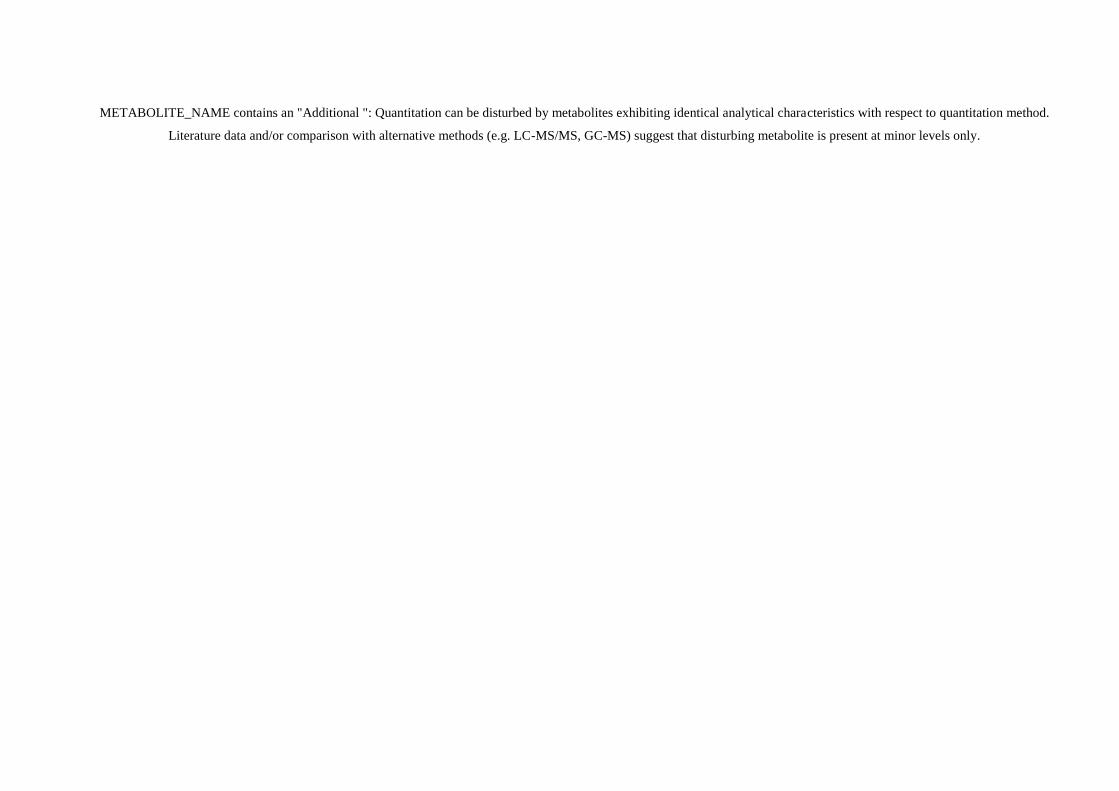
METABOLITE_NAME contains an "Additional ": Quantitation can be disturbed by metabolites exhibiting identical analytical characteristics with respect to quantitation method.
Literature data and/or comparison with alternative methods (e.g. LC-MS/MS, GC-MS) suggest that disturbing metabolite is present at minor levels only.