Fast diffusion along mobile grain boundaries in calcite
40
1 Fast diffusion along mobile grain boundaries in calcite ANDREW MCCAIG 1 , STEPHEN J. COVEY-CRUMP 2 , WALID BEN ISMAÏL 2 AND GEOFFREY E. LLOYD 1 1. Earth Sciences, School of Earth and Environment, University of Leeds, Leeds, LS2 9JT, UK 2. School of Earth, Atmospheric, and Environmental Sciences, Williamson Building, University of Manchester, Manchester, M13 9PL, UK ABSTRACT Experimental measurements of grain boundary diffusion are usually conducted on static boundaries, despite the fact that grain boundaries deep in the Earth are frequently mobile. In order to explore the possible effect of boundary mobility on grain boundary diffusion rates we have measured the uptake of 44 Ca from a layer of 44 Ca-enriched calcite powder during the static recrystallization of a single crystal of calcite at 900°C. A region about 500 m wide adjacent to the powder layer is heterogeneously enriched in 44 Ca, and complex zoning patterns, including sharp steps in composition and continuous increases and decreases in 44 Ca content, are developed. In metamorphic rocks, these would normally be interpreted in terms of changes in pressure or temperature, Rayleigh fractionation, or episodic fluid infiltration. These explanations cannot apply in our experiments, and instead the zoning patterns are interpreted as being due to variations in grain boundary migration rate. We have applied an analytical model which allows the product of grain boundary diffusion coefficient and grain boundary width (D GB ) to be calculated from the grain boundary migration rate and the compositional gradient away from the powder layer. D GB in the mobile grain boundaries is at least 5 orders of magnitude greater than the published value for static boundaries under the same conditions. In order to allow the scale of chemical equilibrium (and hence textural evolution) to be be predicted under both experimental and geological conditions, we present quantitative diffusion-regime maps for static and mobile boundaries in calcite, using both published values and our new values for grain boundary diffusion in mobile boundaries. Enhanced diffusion in mobile boundaries has wide
Transcript of Fast diffusion along mobile grain boundaries in calcite

1
Fast diffusion along mobile grain
boundaries in calcite ANDREW MCCAIG
1, STEPHEN J. COVEY-CRUMP
2, WALID BEN ISMAÏL
2 AND
GEOFFREY E. LLOYD1
1. Earth Sciences, School of Earth and Environment, University of Leeds, Leeds,
LS2 9JT, UK
2. School of Earth, Atmospheric, and Environmental Sciences, Williamson
Building, University of Manchester, Manchester, M13 9PL, UK
ABSTRACT
Experimental measurements of grain boundary diffusion are usually conducted on
static boundaries, despite the fact that grain boundaries deep in the Earth are
frequently mobile. In order to explore the possible effect of boundary mobility on
grain boundary diffusion rates we have measured the uptake of 44
Ca from a layer
of 44
Ca-enriched calcite powder during the static recrystallization of a single
crystal of calcite at 900°C. A region about 500 m wide adjacent to the powder
layer is heterogeneously enriched in 44
Ca, and complex zoning patterns, including
sharp steps in composition and continuous increases and decreases in 44
Ca
content, are developed. In metamorphic rocks, these would normally be
interpreted in terms of changes in pressure or temperature, Rayleigh fractionation,
or episodic fluid infiltration. These explanations cannot apply in our experiments,
and instead the zoning patterns are interpreted as being due to variations in grain
boundary migration rate. We have applied an analytical model which allows the
product of grain boundary diffusion coefficient and grain boundary width (DGB)
to be calculated from the grain boundary migration rate and the compositional
gradient away from the powder layer. DGB in the mobile grain boundaries is at
least 5 orders of magnitude greater than the published value for static boundaries
under the same conditions.
In order to allow the scale of chemical equilibrium (and hence textural evolution)
to be be predicted under both experimental and geological conditions, we present
quantitative diffusion-regime maps for static and mobile boundaries in calcite,
using both published values and our new values for grain boundary diffusion in
mobile boundaries. Enhanced diffusion in mobile boundaries has wide

2
implications for the high temperature rheology of Earth materials, for
geochronology, and for interpretations of the length- and time-scales of chemical
mass-transport. Moreover, zones of anomalously high electrical conductivity in
the crust and mantle could be regions undergoing recrystallization such as active
shear zones, rather than regions of anomalous mineralogy, water- or melt-content
as is generally suggested.
Introduction
Grain boundaries exert a considerable influence on the physical properties of
polycrystalline materials (Sutton and Balluffi 1995). Grain boundary diffusion is
generally several orders of magnitude faster than diffusion through mineral
lattices (Poirier 1985; Farver and Yund 1996; Mishin et al. 1997; Carlson 2002),
and this fact is particularly important when considering:
1) the rate-competitiveness of those high temperature deformation processes
which are accommodated by grain boundary diffusion (Poirier 1985; McCaig and
Knipe 1990; Knipe and McCaig 1994; Langdon 1994; Mukherjee 2002),
2) processes leading to chemical homogenization in the crust and mantle (Eiler et
al. 1992; Lewis et al. 1998; Steefel and Lichtner 1998),
3) metamorphic and diagenetic reactions (Carlson 2002; Putnis 2002), and
4) the interpretation of geochronological data (Freeman et al. 1997).
Diffusion along migrating boundaries can lead to complex compositional zoning
patterns (McCaig and Knipe 1990; Yund and Tullis 1991; Knipe and McCaig
1994), and can itself be a driving force for grain boundary migration (Hay and
Evans 1987). Moreover, recent experiments suggest that cation diffusion through
grain boundaries is the dominant mechanism of electrical conductivity in fine
grained dry olivine (ten Grotenhuis et al. 2004), with important implications for
conductivity anomalies in the mantle.
Modelling diffusive mass transfer within the Earth depends on the quality and
relevance of experimental data. In grain boundaries it is generally only possible to
measure the product DGB, where DGB is the grain boundary diffusion coefficient,
and is the effective grain boundary width (e.g. Mishin et al. 1997).
Measurements of this product in minerals have invariably been made on static

3
grain boundaries, and the question of whether such experimental data can be
applied to situations where boundaries are moving has not been considered.
Experimental data on grain boundary diffusion are presently interpreted using
some variant of the Fisher model (Fisher 1951). This solves the diffusion
penetration relationship for diffusion from a constant-composition free surface
into a semi-infinite medium containing a thin slab of high diffusivity material
(representing the grain boundary) oriented normal to the surface (a problem
analogous to the diffusion of heat along a thin copper foil embedded in cork). The
Fisher model for a stationary boundary was adapted by Mishin and Razumovskii
(1992) for a boundary moving parallel to the free surface. In doing so, they
provided a method for calculating DGB in mobile boundaries. However, despite
the simplicity of the final equations, this model has not so far been used to
estimate grain boundary diffusion coefficients. Here we apply this model to the
results of an experiment designed to investigate the uptake of isotopically labelled
Ca into a recrystallizing single crystal of calcite. We find that the product DGB
for 44
Ca in moving boundaries is at least five orders of magnitude faster than the
published value in static boundaries. Possible consequences of this result for the
patterns and scale of diffusive processes in natural sytems are explored.
Experimental details
The experiment reported here was conducted on calcite, which is one of the best-
studied mineral systems for diffusion, with tracer grain boundary diffusion
parameters reported for both Ca and O (Farver and Yund 1996). Moreover, it is a
material which readily recrystallizes at pressure and temperature conditions that
are experimentally convenient.
The experimental sample was a right circular cylinder composed of a layer of
calcite powder containing approximately 25% 44
Ca-enriched grains mixed with
75% “normal” calcite, sandwiched between thick discs of Carrara marble and
single crystal calcite (Fig. 1). The 44
Ca-enriched calcite (98.53% 44
Ca compared
with a natural abundance of 1.96%) was purchased from Oak Ridge National
Laboratories. It had < 10 ppm trace elements and a particle size of ~ 5 µm. The
calcite powder with which it was mixed was analytic grade (99%+ CaCO3,
Covey-Crump 1997a) with a particle size of ~ 2 µm. The single crystal was a core

4
taken from an Iceland Spar rhomb, with the coring direction normal to a cleavage
plane. The Iceland Spar contains a wide variety of trace components with a total
concentration of < 300 ppm (Covey-Crump 1997a). Immediately prior to
specimen assembly, the core was cleaved to provide a fresh surface for contact
with the powder. The Carrara marble was a core taken from the same block of
marble as used in the experiments reported by Rutter (1995) and Covey-Crump
(1997b) which investigated the dynamic and static recrystallization kinetics of
Carrara marble respectively. This is a white, granoblastic calcite marble with <
1% impurity phases, and calcite which is 99.76% pure with respect to solute
impurities. The mean grain size (lineal intercept size) is 147 µm and the grain
boundaries are well defined but non-planar. Most grains show some undulatory
extinction, and there is a weak shape fabric, but there is no lattice preferred
orientation.
The sample assembly was placed in a thin-walled iron sleeve (to keep the
confining medium out of the sample) and the charge was hot isostatically pressed
for 10 hr at 900 oC and 200 MPa confining pressure in an internally heated, argon
confining medium, triaxial rock deformation apparatus (Paterson 1990). Under
these conditions, fine-grained calcite powders sinter to near fully dense aggregates
extremely rapidly (Covey-Crump 1997a). Given this, and the fact that the system
is closed, the extent of calcite decomposition in pore spaces during the experiment
can be assumed to be negligible.
After the experiment, the specimen was cut longitudinally, mounted in a block
of epoxy, and syton polished before characterization using SEM electron
backscatter diffraction (EBSD, e.g. Prior et al. 1999) and orientation contrast
imaging (Lloyd 1987). Fig. 2 shows the resulting microstructure. During the
experiment, the calcite powder recrystallized to a “foam” texture which then
underwent normal grain growth to a grain size of about 80 µm (see the bottom
right part of Fig. 3A and Fig. 4). Most of the single crystal retained its original
orientation with the exception of the development of thin twin lamellae (Fig. 2).
However, in a layer about 2 mm wide immediately adjacent to the powder layer,
the single crystal statically recrystallized to a grain size of 100-1000 µm (Figs. 2
and 3A). The driving force for this recrystallization was the strain energy
introduced into the single crystal during the initial pressurization of the charge as
the powder layer compacted. There were no noticeable microstructural changes in

5
the Carrara marble layer, which retained its initial grain size of about 150 µm. The
behaviour of all three layers is in good agreement with that observed in other
investigations of the static recrystallization and normal grain growth kinetics of
calcite (Covey-Crump 1997a,b).
The specimen was gold coated and analyzed for calcium isotopes using the
Cameca ims4f ion probe at the University of Edinburgh. Images (Figs. 3 and 4)
were produced by collecting a map of raw counts of both 44
Ca and 40
Ca, and then
using image manipulation software on the ion probe to create a new image of 44
Ca
/(44
Ca + 40
Ca). This procedure removes bands of higher intensity caused by image
overlaps and previous ion probe traces, and gives a brightness level approximating
to the % 44
Ca within a particular image (minor isotopes 42
Ca, 43
Ca, and 48
Ca were
not recorded in the mapping). Note that each image was finally converted to Tiff
format before assembling montages, and in this stage equalization performed by
the software means that the intensities cannot be compared directly from image to
image; intensities have also been altered when stitching the images together. In
the case of the profiles (Fig. 3), % 44
Ca is derived from the raw counts by % 44
Ca
= 100 44
Ca/(44
Ca+40
Ca+42
Ca+43
Ca+48
Ca). The profiles were measured by first
burning a profile with a 4 µm step. This burned a swath about 20 µm wide in the
gold coat. Subsequently a new profile was measured along the same track with a 2
µm step, minimum apertures and zero offset, giving a significantly improved
spatial resolution, estimated at 5 µm. Given the very large range in isotopic ratios
in the sample (from 1.96% to 98.5% 44
Ca), the loss in analytical precision due to
reducing the apertures was not important. In one case a profile was reconstructed
from a Tiff image using Scion® software (Fig. 3D, traverse 25). The absolute
intensity in individual pixels was calibrated using known concentrations from
tracer-free areas and a cross-cutting ion probe traverse.
Results
Ion probe images (Figs. 3B and 4B) show that significant quantities of 44
Ca have
been incorporated into the recrystallized margin of the single crystal during grain
boundary migration. Both the concentration of 44
Ca, and the proportion of 44
Ca-
enriched calcite, decrease away from the powder layer, but 44
Ca contents of up to
8% were detected at over 300 µm from the original interface. Zoning patterns are
6
complex, with both sharp steps and continuous gradients in both directions, as
shown by profiles (Figs. 3C and D). Sharp steps frequently correspond to grain
boundaries; others occur mid-grain, and are interpreted as former grain boundary
locations. Comparison of Figs. 3A and 3B suggests that the original isotopic
interface is located 30-40 µm away from the current edge of the coarse
recrystallized layer, implying that new grains nucleating near the interface have
grown into both the single crystal and the powder layer. The original interface is
marked by a sharp step in isotopic composition not linked to current grain
boundaries.
Fig. 4B shows the distribution of 44
Ca in part of the recrystallized powder
layer, while Fig. 5 shows a typical traverse across this material. It is clear that the
bright, sometimes euhedral areas in Fig. 4B are relict 44
Ca -enriched grains which
grew during the experiment, were not swept by any grain boundary, and hence
preserved their initial composition. Fig. 5 traverses across one such core, with
peak compositions of 96% 44
Ca. Since the size of these enriched areas is
comparable to the size of the ion beam, it is not possible to obtain an analysis
which is not contaminated by adjacent less enriched material, and we believe that
these cores have not been altered at all from the initial doped powder composition.
Around the cores, the 44
Ca content of the calcite drops very rapidly and most
analysis points within the powder layer are between 20 and 30% 44
Ca (Fig. 5).
Other peaks in 44
Ca content within Fig. 4B are interpreted to be 44
Ca-enriched
grains which have been swept by grain boundaries and incorporated into growing
grains. Peak compositions in such cases are between 30 and 80 % 44
Ca. It is clear
that grain growth can partially homogenize 44
Ca ratios within the layer, but that
more than one pass of the grain boundaries is required to remove all traces of the
original composition (cf. Jessell 2004).
Model for tracer distribution in and around a
moving grain boundary
Theoretical models of the diffusion of tracer along moving grain boundaries
predict very different patterns of tracer distribution from those produced by
diffusion along static grain boundaries (Mishin et al. 1997). Mishin and
Razumovskii (1992) developed an analytical solution for the situation shown in

7
Fig. 6, in which a migrating boundary within an initially tracer-free medium is
oriented perpendicular to an interface carrying a tracer source of constant
composition. They showed (Mishin and Razumovskii, 1992, Eq. 18) that provided
the parameter = Vt / (Dvt)0.5
> 6, the distribution of tracer around and behind the
moving boundary reaches a steady state given by:
)(expexp
21
5.0
1
xHD
xV
D
VyCC
vGB
(1)
where C1 is the concentration at y = 0, V is the grain boundary migration velocity,
Dv and DGB are the volume and grain boundary diffusion coefficients respectively,
is the grain boundary width, and H(x) is the Heaviside unit step function. This
model is a good approximation to the situation shown in Fig. 3 where boundaries,
which were oriented at a high angle to the interface with the powder layer, have
migrated across the single crystal. At 900 oC, Dv for Ca in calcite is 1.3 x 10
-18
m2s
-1 (Farver and Yund 1996). The characteristic volume diffusion distance
(Dvt)0.5
under the conditions of our experiment at t = 10 hr is therefore expected to
be 0.2 µm. Hence any variations in the 44
Ca concentration resulting from volume
diffusion are unresolvable by the ion probe in spot or traverse mode and are much
less than the characteristic distance for grain boundary migration Vt. Volume
diffusion can therefore be neglected in the analysis of zoning patterns. The
predicted value of DGBat 900 oC is 2 x 10
-21 m
3s
-1 (Farver and Yund 1996).
Using the same authors’ estimate of = 3 x 10⁻⁹
m, the expected characteristic
distance for grain boundary diffusion, under the conditions of our experiment and
with t = 10 hr, is 155 µm, although this will be considerably retarded if tracer
leaks into the grains (Mishin et al. 1997). With (Dvt)0.5
= 0.2 µm at the end of the
experiment, then the parameter = Vt/(Dvt)0.5
is greater than 6 for any zone (Vt)
greater than 1.2 µm wide. Hence, steady state will have been achieved very
quickly for any constant velocity of boundary migration which resulted in an
observable zone.

8
Interpretation of zoning patterns
The concentration gradient away from the tracer source in the area swept by the
moving boundary can be easily derived from Eq. 1:
(lnC) / y = - (V / DGB)0.5
(2)
Eq. 2 can be used to interpret the complex zoning patterns seen in Fig. 3B. Bright
zones reflect high C (and therefore low dC/dy) and hence slow grain boundary
migration, whereas dark zones reflect low C and therefore high dC/dy and hence
fast grain boundary migration. It follows that the complexities of the zoning
patterns can be interpreted primarily in terms of variations in grain boundary
migration velocity.
For a boundary oriented at a high angle to the diffusion interface (such as that
between grains (c) and (d) in Fig. 3), transverse profiles such as that numbered 19
in Fig. 3B are expected to record a constant composition if the boundary
migration velocity was constant. Sharp steps in composition occur if the boundary
migration velocity changed suddenly, or if the traverse crosses the final position
of the migrating boundary. In the latter case the direction of boundary migration
must have been towards the unenriched area, since once a grain has been enriched,
tracer cannot be completely removed from it by diffusion. Continuous zoning
profiles (such as the increasing 44
Ca content around the central dark zone in grain
(c)) occur if the migration velocities changed gradually. Where boundaries
migrate in a direction perpendicular to the interface, continuous changes in
composition in the direction of migration may also occur even at steady state
because the distance from the diffusion interface would then be changing – this
may be the case for parts of profile 10. SEM EBSD analysis (Fig. 2) shows that
none of the grains in the area of Fig. 3 have the orientation of the original single
crystal. Tracer enriched parts of Fig. 3 have therefore been swept at least twice by
grain boundaries. In some cases reversals of grain boundary migration direction
appear to have occurred, for example at the boundary between grains (b) and (c).

9
Calculation of diffusion parameters
Eq. 2 can be rearranged to allow values of DGB to be estimated, provided that the
grain boundary migration velocity is known,
DGB = V / ((lnC)/y)2
(3)
To use this equation we must assume that a steady state was reached, that DGB is
not dependent on boundary migration velocity, and that the tracer layer is
effectively a constant source of tracer. Although Eq. 2 applies to a fixed
composition boundary condition, Güthoff et al. (1993) report that this equation
can also be used in the case of a thin film boundary condition. Boundary
conditions in our experiment in fact approximate more closely to a constant
composition source than a thin film. In the tracer-enriched powder layer, although
a wide range in composition from around 10% to 97% 44
Ca has been recorded in
profiles (Fig. 5), a strong compositional mode at 20-25% 44
Ca is present. This
compositional range was not present in the powder layer before recrystallization,
and is a little lower than the mean composition of the layer as a whole (26% 44
Ca).
Allowing for 44
Ca-enriched grain cores which are isolated from grain boundaries,
the effective average composition of the layer as a source of tracer is about 23%
44Ca. In order to calculate (lnC)/y, we therefore assume that the recrystallizing
powder layer represents a constant composition source (C1) containing 23% 44
Ca,
while the value in the single crystal C0 = 1.96% 44
Ca. Fig. 7 shows profiles 2 and
25 in Fig. 3B recast in terms of lnC´ vs. distance, where C´ = (C-C0)/(C1-C0).
Profile 25, which was recovered from an ion probe image and calibrated using
other measured profiles, gives a gradient (lnC´)/y of 2.9 x 10³ m
-1. The main
linear segment of the directly measured profile 2 gives a gradient of 1.5 x 10⁴ m
-1.
A shorter linear segment gives a gradient of 6.9 x10⁴ m
-1, but is unlikely to
represent a steady state. Since profile 2 is oblique to the zones of changing 44
Ca
content, these are maximum values of the gradient parallel to the grain boundary.
Equation 3 shows that the lowest values of V that occurred during the
experiment should have resulted in zones with the lowest values of (lnC)/y.
Matching the lowest observed value of (lnC)/y with the lowest possible value
for V for a particular zone will clearly yield a minimum estimate of DGBIn our

10
experiments, boundary velocities are unknown, but minimum velocities for
particular growth zones can be estimated by dividing the width of the zone by the
total time (10 hr) of the experiment. For example, the width of zone X (Fig. 3B) is
50 µm, giving a minimum migration velocity of 1.4 x 10⁻⁹
ms-1
. In practice this
probably underestimates velocities by at least an order of magnitude, since
boundaries in the single crystal have migrated by at least 2 mm in total during the
10 hr experiment. Note that Hay and Evans (1992) report maximum migration
velocities of 6 x 10⁻⁹
ms-1
in in situ experiments on chemically-induced grain
boundary migration (CIGM) in calcite.
DGB calculated from Eq. 3 is 1.7 x 10⁻¹⁶
m3s
-1 for profile 25 and 6 x 10
-18
m3s
-1 for the main linear segment in profile 2, and it is apparent from the
preceding discussion that these are minimum values which are likely to be
underestimated by at least an order of magnitude. The higher of the two values is
five orders of magnitude faster than the value 2 x 10-21
m3s
-1 reported by Farver
and Yund (1996). We interpret this difference to reflect the difference in grain
boundary diffusion rates in mobile versus static grain boundaries. However, there
are other factors which may contribute to the difference which ought to be
considered first:
1) Any movement of the grain boundaries in Farver and Yund’s experiments
would have led to an underestimate of DGB (Mishin et al. 1997). Equation 2 can
be used to calculate a gradient (lnC)/y for any value of V and DGB. This can
then be used to calculate a new value of DGB using the static boundary equation
(Farver and Yund 1996). If boundaries moved 1 µm in a typical 18 hr experiment,
DGBwould be underestimated by a factor of about two. Movement by 100 µm in
18 hr would lead to an underestimate by two orders of magnitude. Farver and
Yund (1996) sought to avoid this problem by checking for microstructural
changes using TEM, and by using pre-annealed Solnhofen limestone. This fine-
grained (7 µm) limestone contains a few percent of second phase impurities which
effectively render the grain boundaries immobile during isostatic heat treatments
at 900 oC. It is most unlikely that boundaries moved by more than 1 µm during
their experiments without leaving a microstructural signature, and hence this
cannot explain the discrepancy between our results. Moreover, since grain
boundary mobility is strongly temperature dependent, inaccuracies in estimates of

11
DGB from this source would be apparent in Arrhenius plots, and hence it is
unlikely that Farver and Yund’s estimates of this parameter were orders of
magnitude in error.
2) Anything which affects grain boundary structure potentially affects grain
boundary diffusion rates (Sutton and Balluffi 1995). This could include solute
impurities contained within the grain boundary, and lattice preferred orientation.
In many materials, solutes segregate to grain boundaries such that the equilibrium
concentration in the boundary is greater than in the lattice. The presence of solutes
can reduce both the rate of grain boundary migration and grain boundary
diffusion. If a boundary migrates fast enough to escape its solute cloud, a step
change in migration rate and diffusion rate could occur (Sutton and Baluffi 1995),
and this might explain differences in measured diffusion rates between stationary
and mobile boundaries. However, where solute impurity effects have been
quantified, the difference in grain boundary diffusion rate was only a factor of two
to four (Surholt and Herzig, 1997). Furthermore, the effect is greatest in extremely
pure materials, rather than the natural materials used both by ourselves and Farver
and Yund (1996). Although solute effects on grain boundaries in geological
materials deserve further study, it seems unlikely that they could account for more
than five orders of magnitude difference in diffusion rate between experiments on
comparable materials. Effects of lattice preferred orientation could be
considerable for specific boundary types, for example coherent tilt boundaries
where the boundary consists of a set of parallel edge dislocations (Sutton and
Baluffi 1995). However, in the recrystallized single crystals in our experiments a
wide variety of both lattice and boundary orientations occur (Fig. 2), and most
boundaries must be incoherent. A similar range in boundary mismatches must
have occurred in the materials used by Farver and Yund (1996), so it seems
unlikely than crystallographic effects could explain the discrepancy between the
experimental results.
3) The presence of water in the experimental charges is potentially significant in
influencing grain boundary diffusion rates. Large differences in oxygen volume
diffusion rates have been reported between dry and wet conditions (Farver 1994).
These differences were attributed to molecular water being the dominant diffusion
12
species. Calcium diffusion in both the lattice and grain boundaries has only been
studied in nominally dry conditions (Farver and Yund 1996), and oxygen grain
boundary diffusion in calcite has only been studied under hydrothermal conditions
(Farver and Yund 1998). However, Kronenburg et al. (1984) found no difference
in carbon diffusion rates between dry and wet conditions, and it is unlikely that
molecular water would significantly enhance rates of calcium diffusion. Our
experiments were nominally dry, but the calcite powders would have contained
adsorbed water from the atmosphere. Farver and Yund’s samples would also have
contained water given off by the dehydration of hydrous impurity phases in the
Solnhofen limestone. Consequently, it is difficult to see how water in the grain
boundaries could account for the difference in diffusion rates, although a more
systematic study of grain boundary diffusion rates under dry and hydrothermal
conditions is clearly desirable.
Discussion
Quantification of diffusion regimes
The concept of diffusion regimes has been widely applied in the Materials
literature (Hart 1957; Cahn and Balluffi 1979; Mishin and Razumovskii 1992;
Balluffi et al. 2005), and more rarely in Earth Sciences (Evans et al. 1986), but
such regimes have rarely been quantified. Here we take the opportunity to make a
quantitative analysis of diffusion regimes and distances, including a treatment of
mobile grain boundaries, for polycrystalline calcite. This is possible because for
calcite, data not only on grain boundary and volume diffusion, but also on grain
boundary migration rates as a function of temperature and driving force, are now
available.
Qualitative treatment
Fig. 8 shows the classic treatment of diffusion regimes in stationary and mobile
boundaries (Cahn and Balluffi 1979). On the left side of the diagram are the
regimes for stationary boundaries as defined by Harrison (1961). When the
characteristic distance for lattice diffusion, (Dvt)0.5
> d, where d is the grain size,
the A-regime prevails. Diffusion occurs in both the lattice and the grain

13
boundaries, and an effective diffusion coefficient can be defined (Balluffi et al.
2005) as:
Deff = Dv + (3/d)DGB (4)
The factor (3/d) is the approximate ratio of atomic sites in grain boundaries to
those in the lattice. If (Dvt)0.5
is smaller than the atomic spacing , the C-regime
prevails, with no lattice diffusion, although diffusion may still occur along grain
boundaries. Most experiments on grain boundary diffusion are carried out in the
B-regime, where diffusion occurs in both grain boundaries and the adjoining
lattice, with grain centres being unaffected.
Boundaries can be considered to be migrating when Vt > . The A-regime for
migrating boundaries occurs when Vt > d. Under these conditions, every atom is
visited by several boundaries, and an effective diffusion coefficient can be
estimated using Eq. 4 even if Dv is essentially zero (Cahn and Balluffi 1979;
Balluffi et al. 2005). The migrating boundary field is further divided into a region
where volume diffusion occurs in front of the migrating boundary and another
where it can be neglected. This diffusion ahead of the boundary is expressed by
the second exponential in Eq. 1. It is noteworthy that any system will begin at the
origin in Fig. 8, and end up in the A-regime if the time elapsed is long enough.
Quantitative treatment – static boundaries
Farver and Yund (1996) used a relationship similar to eq. 4 to discuss the scale of
diffusive mass transfer under various conditions, comparing this with natural
datasets. However, they did not consider moving boundaries, and did not attempt
to quantify the boundary between the A- and B-regimes. Strictly speaking, whole-
rock data can only be interpreted using equation 4 in the A-regime.
In their work on diffusion induced grain boundary migration, Evans et al.
(1986) represented Fig. 8 in ln (time) vs 1/T space, which is much more useful for
considering geological processes. Only a qualitative treatment was possible at that
time. Quantitative treatment requires not only knowledge of volume and grain
boundary diffusion coefficients, but also an estimate of grain boundary migration
velocity as a function of temperature and driving force.
14
In this space, the boundary between the A- and B-regimes for static
boundaries is given by the condition (Dvt)0.5
= d in which Dv = Dvoexp(-Hv/RT).
On Fig. 9A this boundary is shown for calcium diffusion in calcite at a range of
grain sizes using Farver and Yund’s (1996) values of Dvo = 0.13 m2s
-1, and Hv =
382 kJmol-1
. For static grain boundaries at a temperature of 700 oC, the A-regime
is reached after about 5000 years for a grain size of 10 µm, and after about 10
million years for a grain size of 1 mm. It is unlikely to be reached at < 500 oC on
geological timescales, a fact reflected in the common preservation of chemical
zoning in calcite at medium grades of metamorphism.
Quantitative treatment – mobile boundaries
Calculation of the A-regime boundary for mobile boundaries, where Vt = d,
requires grain boundary migration rates to be estimated. Driving forces for grain
boundary migration include grain surface energy, intracrystalline strain energy,
and chemical energy due to the overstepping of metamorphic reactions or due to
diffusion induced grain boundary migration (Balluffi et al. 2005). These driving
forces are discussed in turn below.
Normal grain growth under dry conditions
Normal grain growth driven by surface energy minimization can be described by
the equation:
d1/n
– d01/n
= k0texp(-H/RT) (5)
where d is the grain size, d0 is the grain size at the start of the growth period (i.e.
t0), t is the duration of the growth period, n is a dimensionless constant which
depends only on the process controlling the growth rate, k0 is a rate constant, H is
the apparent activation enthalpy for the process controlling growth, R is the gas
constant, and T is temperature (e.g. Covey-Crump 1997a). For a pure
monomineralic system, n = 0.5.
In a detailed study of the normal grain growth kinetics of polycrystalline
calcite, Covey-Crump (1997a) found that under pore-fluid absent conditions the
growth kinetics were strongly influenced by residual porosity at low temperatures

15
and at long times (relatively large grain sizes), when the driving force for further
growth was relatively small. In these circumstances n can vary between 0.25 and
0.5. However, in experiments on Iceland Spar (the same material as used for the
single crystal in our experiment), at short times (up to 1 day) at 706 oC, the grain
growth data were well described with n = 0.5. Using the rate constant at that
temperature (see Covey-Crump 1997a Fig. 6), together with the activation
enthalpy for the recrystallization of the calcite powders during the initial sintering
phase of the experiments,, then the normal grain growth kinetics are given by n =
0.5, H = 240.5 kJmol-1
and k0 = 3.78 x 10¹⁰
µm1/n
s-1
.
We used these parameters to calculate the boundary migration velocity, V, as a
function of temperature for a grain size of 30 µm by inserting d = 31 µm and d0 =
30 µm into Eq. 5. The curve labelled “30 µm” on Fig. 9A shows the time required
for the condition Vt = d to be reached for d = 30 µm as determined from these
velocities. Since the growth rate at d < 30 µm is invariably greater than that at 30
µm, this is a maximum estimate of the time required for the A-regime to be
reached. The curve labelled “100 µm” on Fig. 9A was determined in the same
way but with V determined as a function of temperature using d = 101 µm and d0
= 100 in Eq. 5. Use of the most sluggish calcite growth kinetics, affected by
residual porosity and/or impurities, would shift the 100 m curve upwards by 1.25
log units on Fig. 9A.
Also shown on Fig. 9A are the conditions at the end of our 10 hr experiment.
The powder layer grew by a process of strain energy driven recrystallization
during sintering, followed by normal grain growth, with a final grain size of about
80 µm. Figure 9A shows that conditions would have been close to the A-
regime/B-regime boundary for moving boundaries, but well within the B-regime
for static boundaries, as confirmed by the preservation of unaltered grain cores
where no grain boundary has swept through the material. An experimental
duration of several years would have been required to reach the static boundary A-
regime, even at a grain size of 10 m. In areas which were swept by grain
boundaries, initial isotopic heterogeneities have been largely smoothed out (Fig.
5), as expected for conditions close to the A-regime.
Fig. 9A also shows curves for the condition Vt = (Dvt)0.5
, above which no
volume diffusion occurs ahead of the moving boundary. These show that under
conditions of normal grain growth, lattice diffusion ahead of the moving boundary

16
is unimportant under virtually any natural or experimental conditions. This is
why it is so critically important that boundaries are stationary during experiments
to measure the product DGB by standard profiling techniques, as discussed earlier
(Farver and Yund 1996; Mishin et al. 1997).
Fluid-assisted grain growth
The normal grain growth kinetics of polycrystalline calcite under pore fluid
present conditions were also investigated by Covey-Crump (1997a). This yielded
a rather simpler dataset to interpret than the pore fluid absent experiments, and
revealed a small pressure dependence of the grain growth kinetics. Incorporating
the activation volume term into the activation energy at a pressure of 200 MPa
yields the values n = 0.33, k0 = 5.9391 x 107 µm
1/ns
-1 and H = 169.47 kJmol
-1. This
value of n suggests that growth was controlled by diffusion in the fluid phase.
These values have been used to calculate the dashed curves labelled “fluid-
assisted” in Fig. 9B. Because of the lower activation energy, at low temperatures
the A-regime for fluid assisted grain growth is reached before that for dry grain
growth.
Grain boundary migration driven by intracrystalline strain energy
In the single crystal in our experiments, and in many natural situations, grain
boundary migration is more likely to be driven by intracrystalline strain energy
than by surface energy. Indeed, surface energy is generally regarded as the
smallest significant driving force for grain boundary migration (Balluffi et al.
2005). Covey-Crump (1997b) investigated the static recrystallization kinetics of
previously deformed Carrara marble and found that the time taken for 50%
recrystallization is given by:
t0.5 = 4.358 x 10⁻¹⁴
exp(-0.0308*)exp(392400/RT) (6)
where * is the mechanical state variable of Hart (1976) in MPa, which for the
present purposes may be approximated by the flow stress. t0.5 is the time taken for
boundaries to migrate 75 µm, since the starting grain size in Carrara marble is
~150 µm. Eq. 5 can therefore be rearranged to give the migration velocity (V) in
ms-1
:

17
V = 7.5 x 10⁻⁵
/[4.358 x 10-14
exp(-0.0308*)exp(392400/RT)] (7)
Rutter (1995) found the following empirical, temperature-independent
relationship between flow stress and recrystallized grain size for migration
recrystallization from his experiments on Carrara marble:
log = 2.22 + 0.37logd – 0.30(logd)2 (8)
This relationship gives a flow stress of 58 MPa at 100 µm and 129 MPa at 30 µm.
These stress values were substituted for * in calculating migration velocities
using Eq. 7, and hence the condition Vt = d for grain sizes of 100 and 30 µm (Fig.
9B, curves labelled “recrystallization”). The activation energy of 392.4kJmol-1
in
Eq. 7 is very similar to the value for Ca lattice diffusion in calcite of 382 kJmol-1
(Farver and Yund 1996), and so the slopes of these curves are similar to those of
the curves for static boundaries in Fig. 9A. The high activation energy means that
strain energy-driven recrystallization is most important at high temperatures such
as those in our experiment. Fig. 9B suggests that the single crystal in our
experiment probably recrystallized in or near the A-regime even given the large
grain size of the new grains (Fig. 2).
Stress/dynamically recrystallized grain size relationships have been reviewed
by De Bresser et al. (2001), who suggest that the recrystallized grain size should
track the boundary between the grain size sensitive and grain size insensitive
deformation regimes, implying that this relationship should depend on
temperature. We have calculated stresses using their Eq. 13 (with flow law
parameter sets 6 and 8 in their Table 2). They are somewhat lower than those
given by Eq. 8 at 900 oC, but unrealistically high (>1000 MPa) at temperatures <
600oC, undoubtedly reflecting uncertainty in the material parameters in the
relevant flow laws (De Bresser et al. 2002). Consequently, in advance of
improvements in these flow laws, we have retained the more robust relationship
given by Eq. 8.

18
Grain boundary migration driven by chemical variations
Metamorphic recrystallization is driven by energy associated with the
overstepping of reactions.This is an intrinsically more complex problem than
single phase kinetics since interphase boundaries are involved, and the diffusion
of components towards and away from the migrating boundary is often a rate-
limiting step for the migration itself (Carlson 2002). We have not attempted to
incorporate this into our quantitative treatment of diffusion regimes, although
some possible consequences of our results for the interpretation of metamorphic
textures are discussed below.
Another important driving force for grain boundary migration is chemically-
induced grain boundary migration (CIGM), which has been observed
experimentally in many metal alloys and also in calcite (Hillert and Purdy 1978;
Chongmo and Hillert 1981; Evans et al. 1986; Hay and Evans 1987; 1992). CIGM
occurs when a component which forms a solid solution with the host mineral
diffuses along the grain boundary and is incorporated into the growing grains. It
has never been observed during self-diffusion of an isotopic tracer (Hay and
Evans 1992; Mishin et al. 1997), and was not therefore a driving force for
boundary migration in our experiments. Hay and Evans (1992) record maximum
velocities for CIGM driven by Sr solid solution in calcite of 6 x 10⁻⁹
ms-1
at 700
oC. If we compare this with velocities calculated using Eqs. 5 and 7 at the same
temperature, it is about two orders of magnitude faster than either the normal
grain growth rate at 30 µm, or strain energy driven migration at 128 MPa flow
stress. It is clear that if CIGM occurs in nature, the A-regime for moving
boundaries will be reached quite easily. One interesting observation is that a
commonly advanced mechanism for driving CIGM is coherency strain (Hay and
Evans 1992), in which the tracer is absorbed into the lattice ahead of the migrating
boundary, creating a volumetrically strained region into which the boundary
migrates. Using Dv = 3.7 x 10⁻²²
at 700 oC (Farver and Yund 1996) and V = 6 x 10
-
9 ms
-1, Vt = (Dvt)
0.5 after only 10
-5 s. In this time, only 6 x 10
-14 m of lattice
diffusion could occur, far less than an atomic spacing. Under the experimental
conditions of Hay and Evans (1992), it seems very unlikely that diffusion ahead of
the migrating boundary could possibly drive CIGM, unless it occurred by some
much faster mechanism.

19
Characteristic distances for diffusion in the migrating
boundary A-regime
Fig. 9C shows characteristic distance contours in the A-regime (solid lines)
calculated using the effective diffusion coefficient from Eq. 4 and the data of
Farver and Yund (1996). When compared with characteristic distances for pure
lattice diffusion (the static grain boundary A-regime boundaries in Fig. 9A), it is
clear how much grain boundary migration aids chemical redistribution,
particularly at lower temperatures. However, only 1-5 µm of diffusion is predicted
under the experimental conditions, which is clearly far less than has occurred.
When our new enhanced value of DGB in mobile boundaries is used (dashed
lines), the predicted diffusion distance is between 100 and 1000 µm, in
accordance with the observations. This supports our findings using a different
method of estimating DGB. The enhanced diffusion contours show that under
lower crustal conditions, effective diffusion distances > 1 m could be achieved in
relatively short geological timescales in shear zones undergoing dynamic
recrystallization.
Also shown on Fig. 9 are the approximate conditions for recrystallization (~
300 oC, 1 million years) in carbonate mylonites beneath the Gavarnie Thrust in the
Pyrenees (McCaig et al. 1995). These mylonites contain microzoning patterns
within dynamically recrystallized calcite with an average grain size of 30 µm
(Knipe and McCaig 1994). These have been interpreted to reflect introduction of a
chemical anomaly in an advecting fluid followed by redistribution by grain
boundary diffusion and incorporation of the anomaly into growing grains.
Redistribution by diffusion must have occurred on a length scale of centimetres to
metres, but without homogenization by volume diffusion. This suggests that the
sample was in the upper B-regime or the boundary migration A-regime.
Inspection of Fig. 9 suggests that these conditions could have been met if grain
boundary migration was fluid assisted, but that even the enhanced diffusion rates
in mobile boundaries would not redistribute chemical signatures on the scale
required under dry conditions, particularly since the timescale for the chemical
redistribution event may have been much less than 1 million years. It is likely that
diffusion occurred via a grain boundary fluid phase, the presence of which is
suggested by relict porosity (Knipe and McCaig 1994).

20
Reasons for faster diffusion in mobile boundaries
We conclude from our experiment that the value of DGB for Ca in calcite was at
least five orders of magnitude faster in mobile grain boundaries than was observed
by Farver and Yund (1996) in static grain boundaries. As yet we have no
information on the temperature dependence of this enhanced diffusion, or on
whether the diffusion coefficient varies smoothly as a function of grain boundary
migration rate, or is enhanced in a step-like way when a certain boundary velocity
is exceeded.
The possibility that diffusion in moving grain boundaries might be much
faster than in static ones has been the subject of an extended debate in the material
sciences literature. Early experiments on metals investigating grain boundary
diffusion by inducing discontinuous precipitation reactions and CIGM, suggested
that diffusion in moving grain boundaries was indeed several orders of magnitude
faster than in stationary ones (Hillert and Purdy 1978; Chongmo and Hillert
1981). However, more recent work on a wider range of metallic systems has not
confirmed this conclusion (e.g. Mishin et al. 1997; Zieba 2003. Most experiments
in the material sciences literature are based on migration of interphase boundaries
during discontinuous precipitation (exsolution) reactions. This necessarily
involves interdiffusion of two or more species, and so the rate of migration may
be controlled by the rate of diffusion in the boundary, a situation common in
metamorphism (Carlson 1992). However, in our experiments boundary migration
is independent of any chemical effects and so it is the effect of migration velocity
on diffusion rates in the boundary, rather than vice versa, which is of interest. It is
unclear whether these differences in experimental procedure could affect the
results, or if the phenomenon is material specific, perhaps related to the nature of
bonding.
The fact that diffusion along static grain boundaries is orders of magnitude
faster than through the crystal lattice, reflects the fact that high angle grain
boundaries are highly disordered in comparison with the lattice and as such
provide a more open pathway for atomic movements (Sutton and Balluffi 1995).
In materials containing ionic bonds such as calcite, charge balance effects mean
that a zone of the lattice adjacent to the boundary may also contain high defect
concentrations. Consequently, the fact that grain boundary diffusion may be faster
in migrating boundaries than in static ones may reflect differences in the grain

21
boundary structure between the two cases. Minerals can have extremely complex
grain boundary structures. For example, HRTEM studies of olivine have revealed
grain boundary microstructures including nanocrystals intermediate in orientation
between the two adjacent grains and surrounded by multiple dislocations
(Heinemann et al. 2003). Moving boundaries may have even more complex
internal structures (and hence effective width), and glide and climb of boundary
dislocations could lead to enhanced rates of diffusion. In advance of a more
detailed understanding of grain boundary structure in geological materials, and of
the atomistic mechanisms of grain boundary diffusion in general, considerations
of this matter remain poorly constrained.
Implications for the rheology of Earth materials
Grain boundary diffusion controls the rate of deformation mechanisms such as
Coble creep and diffusion-accommodated grain boundary sliding. Ordinarily,
grain boundary migration in the sense discussed so far in this paper, is not a major
part of such mechanisms. However, there are two ways in which our results may
be significant in terms of deformation rate. Firstly, it is possible that during grain
boundary sliding, the internal structure of boundaries is affected and faster
diffusion may occur. Secondly, it has been suggested that due to feedback
between grain growth and grain size reduction due to dynamic recrystallization,
many rocks may actually deform under conditions transitional between grain size-
sensitive diffusional creep and grain size insensitive dislocation creep (De Bresser
et al. 2001; Ter Heege et al. 2002). In these circumstances, diffusional creep
would be accompanied by grain boundary migration driven by intracrystalline
strain energy, and diffusion rates in the mobile boundaries would be enhanced.
Normally, a transition from diffusional creep to dislocation creep, for example
due to grain growth, would result in a decrease in strain rate at constant stress. A
positive feedback between grain boundary migration and diffusion rates would
lead to a relative increase in strain rate and perhaps a wide transition zone
between the two deformation mechanisms, as observed by Walker et al. (1990) in
their experiments on calcite aggregates.

22
Implications for the interpretation of mineral zoning
patterns and reaction rims
Our experiments reveal complex zoning patterns which are interpreted to result
entirely from variations in mineral growth rates within a chemical gradient.. In
this section we examine some comparable zoning patterns in metamorphic rocks
which have been attributed to variations in temperature and pressure, to Rayleigh
fractionation, or to inheritance from other phases. In some cases alternative
explanations for the zoning patterns are suggested based on our experiments. We
are not suggesting that the previous interpretations are incorrect, merely that the
effects of variable growth rate should be considered.
Recent studies of zoning patterns in metamorphic minerals have revealed a
wide range of complex zoning patterns, often different for different chemical
components. For example, Yang and Rivers (2001) showed that Mn and Cr
zoning patterns in a single garnet can cross each other, with the Cr zoning patterns
apparently being inherited from a pre-existing layering overgrown by the garnet.
In contrast, concentric Mn zoning patterns are assumed to be the result of
Rayleigh fractionation due to the strong partitioning of Mn into garnet, with local
equilibrium maintained with the surrounding matrix at the edge of the garnet.
Examples of “overprint zoning” are clear in our experiments, although it is pre-
existing chemical inhomogeneities in a monophase system rather than a pre-
existing mineralogy which is overprinted. For example, in both Figs. 3 and 4, the
original interface between the 44
Ca-enriched powder and the single crystal is
preserved locally as a sharp chemical step crossing a new recrystallized grain.
These new grains replace both the original single crystal and the powder. Eq. 2
implies that steps of this type will be preserved if the characteristic distance of
grain boundary migration is much greater than the characteristic grain boundary
diffusion distance, i.e. Vt >> (DGBt)0.5
. We assume that these steps were preserved
during the initial strain-driven recrystallization, probably in a few minutes.
Subsequently, the boundaries migrated much more slowly, and where boundaries
cut the compositional step, it was blurred giving gradients in 44
Ca content which
can be described by Eq. 2. The dependence of overprint zoning on both grain
boundary diffusion rate and growth rate was recognized by Yang and Rivers
(2001), who used a parameter GL/D, where G is growth rate, L a characteristic
distance, and D grain boundary diffusion rate, to describe the phenomenon. They

23
suggested that an inner, inclusion-rich portion of a garnet with overprint zoning of
Cr grew rapidly under conditions where GL/D > 1, while an outer part with more
uniform Cr zoning grew slowly under conditions where GL/D < 1. This parameter
is essentially the same as the parameter Vt/(DGBt)0.5
used above.
Other examples of “monophase overprint zoning” occur in the powder layer,
as seen in Figs. 4 and 5. The highest 44
Ca contents occur in euhedral cores to
calcite grains which are assumed to be nuclei inherited from the original powder.
However, spikes in 44
Ca content of 35 and 50% also occur in traverse 17, and
these appear to be “islands” of enrichment within larger calcite grains. These
“islands” are reminiscent of the isolated regions of high Mn content in garnet
from Harpswell Neck, Maine, observed by Spear and Daniel (1998; 2001) and
Hirsch et al. (2003). These have been interpreted to be inherited from precursor
Mn-rich phases such as ilmenite which were incorporated into the garnet. Our
experiments suggest that complex zones of this type could alternatively be
combined grain growth and recrystallization textures. In this interpretation,
original small, Mn-enriched garnet grains would be incorporated into larger ones,
with the original crystallographic orientation of the small grains being removed as
the grain boundary swept across them. Our suggestion differs from the
interpretation of the above authors in that we see no conflict between the original
Mn concentrations being produced by growth of small garnets, and their
occurrence in a single crystal. Irrespective of the origin of the chemical
heterogeneity being overprinted, if recrystallization is occurring in the B-regime
for a given component, then the dispersion of that component will depend on the
ratio of grain boundary diffusion rate to boundary migration rate. This gives not
only a first order interpretative tool when studying such microchemical features,
but also a potential quantitative method of assessing grain boundary diffusion
rates of various components. In the case of the Harpswell Neck garnets,
components which covary with Mn must have diffused at a similar rate or slower,
while components that are found at similar concentrations within and outside the
anomalous areas either diffused rapidly or were present at uniform concentration
before overprinting. At Harpswell Neck, unpublished trace element data
apparently supports a precursor phase other than garnet for the Mn-rich areas (W.
Carlson pers. comm. 2006). If ilmenite was the precursor phase, as suggested by
Hirsch et al. (2003), then the fact that Mn concentration does not correlate with

24
Fe/Mg ratio means that Fe-Mg grain boundary diffusion must have been orders of
magnitude faster than Mn grain boundary diffusion at the time of garnet growth.
The ratio of diffusion rates could be readily quantified using eq. 3 if chemical
gradients across the Mn-enriched regions were quantified.
We believe that variations in crystal growth rate may contribute to a variety of
other zoning patterns seen in metamorphic rocks. Continuous concentric zoning
was also produced in our experiments (e.g. in the core of grain (c) in Fig. 3A, seen
in traverse 19). In metamorphic rocks such zoning would generally be interpreted
to be due to Rayleigh fractionation, a change in metamorphic conditions, or to
discontinuous changes in the minor matrix phases contributing to the reaction
(Chernoff and Carlson 1999; Carlson 2002). None of these factors can be
responsible for the 44
Ca zoning seen in our experiments. We also observe
oscillatory zoning, for example, in the outer parts of grain (c) (Fig. 3). Oscillatory
zoning in metamorphic minerals has been attributed to variations in fluid supply
or composition (McCaig and Knipe 1990; Yardley et al. 1991; Jamtveit et al.
1993), to changes in decompression rate (Schumacher et al. 1999), or to variations
in fO2 in the grain boundary network (Sherlock and Okay 1999). Again, none of
these factors can explain the oscillatory zoning seen in our experiments. We
believe that growth rate variations may be a more important control on
metamorphic zoning patterns than is generally recognized, within a general
framework of local component-specific disequilibrium as described by Carlson
(2002). In some cases, such growth rate variations may be due to feedback
between nutrient supply to the growing grain and depletion of the grain boundary
network of nutrients by mineral growth. In other cases accumulation of strain
energy during deformation, or periodic pinning of grain boundaries by minor
phases may be the main control on growth rate. If we add the possibility that grain
boundary diffusion rates are higher in mobile boundaries, then extraction of
quantitative data on rates of metamorphic reactions from zoning patterns (Carlson
2002) may be problematic. It is important to emphasize that we are not rejecting
any of the known causes of element zoning in minerals, but that we have
demonstrated an additional mechanism which is rarely considered.

25
Implications for chemical redistribution in the crust, mantle
and ice sheets
If diffusion in mobile boundaries is also faster than in static boundaries in other
rock-forming minerals such as quartz and olivine, this has profound implications
for many branches of Earth Sciences. Characteristic distances for diffusion
(proportional to (Dt)0.5
) could be greater by more than two orders of magnitude in
actively deforming zones than in rocks where no recrystallization was taking
place. Grain boundary diffusion is important in the resetting of isotopic signatures
during cooling, and hence for the interpretation of cooling rates from
geochronological data (Eiler et al. 1992). Recrystallization is known to be an
effective mechanism for isotopic resetting in shear zones (McCaig 1997; Stünitz
1998). It is normally assumed that this is because the sweeping of grain
boundaries through the material reduces the need for volume diffusion, so that
chemical redistribution is effectively controlled by grain boundary diffusion. This
effect is obvious in our experiments. If the rate of grain boundary diffusion is also
transiently increased during recrystallization, this effect would be much greater.
This could affect the interpretation of diffusively spread climate signatures in ice
(e.g. Johnson et al. 1997), and the extent of isotopic homogenization in the
mantle. Figure 9 provides a framework for quantifying these effects in any
mineral system where the appropriate data on diffusion and grain boundary
migration rates is available.
Implications for conductivity anomalies in the crust and
mantle
Faster diffusion of cations in mobile boundaries could have far-reaching
consequences for the interpretation of conductivity anomalies in the crust and
mantle (Wannamaker et al. 2002; Booker et al. 2004). These anomalies are
normally, if controversially (Yardley and Valley 1997), interpreted to be zones of
anomalous composition (hydrous fluid- or graphite-rich) or physical state (melt-
bearing). However, recent experimental results show that electrical conductivity in
fine grained olivine is controlled by grain boundary diffusion of cations, and that,

26
provided GB >> GI and << d, the bulk conductivity of a material (b) is given
by:
b = GI + GB[1 - (1 – 3/d)2/3
] (9)
where b is the bulk conductivity, GI the grain interior conductivity (set to 1 in
Fig. 10), GB the grain boundary conductivity, the grain boundary width, and d
the grain size (ten Grotenhuis et al. 2004). Note that Eq. 4 is an approximate
version of Eq. 9. Fig. 10 shows the extent of this effect for both stationary and
mobile grain boundaries. The curve for stationary boundaries, constructed using
= 1 nm and GB /GI = 105 in Eq. 9 (ten Grotenhuis, 2004, Fig. 6), shows that the
bulk conductivity is only significantly enhanced for grain sizes < 200 µm, and at a
grain size of 1 µm bulk conductivity is enhanced by just over two orders of
magnitude. The curve for mobile boundaries, constructed using = 1 nm and GB
/GI = 1010
in Eq. 9 (i.e. assuming five orders of magnitude faster diffusion in
moving boundaries than in static ones), shows that the bulk conductivity is
significantly enhanced at all grain sizes, and is more than seven orders of
magnitude higher than the within-grain conductivity at a grain size of 1 µm.
Conductivity typically varies in the upper mantle by two to three orders of
magnitude (Booker et al. 2004). Our data suggest that conductivities could easily
be enhanced by this amount in actively recrystallizing zones, leading to the
intriguing possibility that zones of active deformation, metamorphic
recrystallization, or replacive phase transitions in the crust and mantle might be
detectable by electrical methods.
Conclusions
Two important conclusions can be drawn from our study. Firstly, complex zoning
patterns in metamorphic rocks could arise simply because of variations in mineral
growth rate. This possibility needs to be borne in mind when interpreting zoning
patterns in terms of P-T change, fluid infiltration, or Rayleigh fractionation. For
growth rate to be an important control on mineral zoning, the characteristic
distance for grain boundary movement needs to be comparable to or greater than
the characteristic distance for grain boundary diffusion. The key test would be

27
within-zone gradients in composition which can be related to local sources of
mobile components, similar to the 44
Ca gradients seen in Fig. 2.
Secondly, grain boundary diffusion in our experiments was five orders of
magnitude faster than the published value in static boundaries, and the most likely
explanation is that the diffusivity in the boundaries was enhanced during
migration. This result is not observed in many alloys and is almost certainly
mineral specific, but it could have far-ranging consequences in petrology and
geophysics. There is a clear case for further experiments both on calcite and on
other mineral systems to test this possibility further and to develop the theoretical
basis for the phenomenon.
Acknowledgments
John Craven and Simone Käsemann are thanked for their assistance with ion
probe analysis and interpretation, and Eric Condliffe for assisting with SEM
analysis. Reviews by William Carlson and Timothy Grove helped to improve the
manuscript, and we are grateful to the latter for suggesting the analysis of
diffusion regimes. Saskia ten Grotenhuis is thanked for her comments on an
earlier version of the paper. This work was supported by Royal Society Research
Grant 21456 and by NERC ion probe grant IMP/162/0500. Part of it was carried
out while SCC held a Royal Society University Research Fellowship
Figure captions
Fig. 1 Sketch longitudinal section through the experimental charge after hot pressing.
Fig. 2 EBSD map of the central part of the sample. Greyscales correspond to different grain
orientations. Patterns were collected automatically at 10 µm intervals and processed using
Channel® software. Note the twinned single crystal at the top of the image, the recrystallized zone
adjacent to the fine powder layer, and Carrara marble with a weak grain shape fabric at the bottom.
The box indicates the area of Fig. 3. The area of Fig. 4 extends beyond the left hand edge of the
EBSD map.
Fig. 3 A Orientation contrast image of the recrystallized edge of the single crystal and part of the
44Ca-doped powder layer. Contrast in this image relates only to the orientation of calcite grains.
The dashed line is the original position of the single crystal/powder layer interface inferred from
the sharp isotopic composition contrast boundary in Fig. 3B. B 44
Ca map of the same area. Note

28
that sharp steps in composition occur both at grain boundaries and within grains. C Ion probe
traverse 19 as located on Fig. 3B. D Traverses 2, 10, and 25. Ion probe traverses 2 and 10 start
below the image in Fig. 3B. Traverse 25 (black line) was reconstructed from an ion probe Tiff
image using Scion® software, calibrated using spot analyses from traverses.
Fig. 4 A Orientation contrast image showing part of the fine powder layer and the interface with
the recrystallized single crystal. B Ion probe collage of approximately the same area. Precise
correlation of the images proved difficult, and traverse 17 is also located only approximately.
Fig. 5 Traverse 17 in the fine powder layer. Note the 44
Ca rich grain cores corresponding to the
bright euhedral original powder grains in Fig. 4B. Much of the traverse has reached an
approximate average composition of about 23% 44
Ca.
Fig. 6 The grain boundary geometry for which Mishin and Razumovskii (1992) have produced the
analytical solution for tracer concentrations given in Eq. 1. represents the grain boundary width,
and V is the grain boundary migration velocity (which is parallel to the constant composition
surface). Note that with V = 0, the geometry is the same as used by Fisher in solving the diffusion
problem for a stationary grain boundary (Fisher 1951).
Fig. 7 Profiles 4 and 25 in Fig. 3 recast in terms of ln C´. See text for details.
Fig. 8 Diffusion regimes for stationary and moving boundaries (Cahn and Balluffi 1979; Balluffi
et al. 2005). A, B and C represent the regimes for stationary boundaries of Harrison (1961). The A-
regime occurs when the characteristic distance for volume diffusion, (Dvt)0.5
, exceeds the grain size
d. The C-regime involves no diffusion within crystals so (Dvt)0.5
< , where is the interatomic
spacing. Boundaries can be considered mobile when the characteristic distance for migration, Vt >
. For mobile boundaries the A-regime exists where Vt > d. Within the regime of moving
boundaries, a further subdivision can be made where Vt > (Dvt)0.5
, such that no lattice diffusion
occurs ahead of the moving boundaries.
Fig. 9 Quantitative diffusion regimes for Ca in calcite. A Boundary between A and B regimes for
various grain sizes, d (labels in µm). Curves in upper left are for static boundaries and represent
the condition (Dvt)0.5
= d. These are also characteristic distance contours for pure lattice diffusion.
Curves in the centre of the diagram labelled “grain growth” are for mobile boundaries and
represent the condition Vt = d. Arrhenius parameters are taken from Covey-Crump (1997a) for
normal grain growth of dry Iceland Spar powders (see text for details). The curves in the bottom
right of the diagram represent the condition Vt = (Dvt)0.5
, above which there is no lattice diffusion
ahead of a moving boundary, and use the same equation for Vt as the “grain growth” curves.
Experimental conditions from this paper are labelled E, while approximate conditions in the
Gavarnie Thrust mylonite (Knipe and McCaig 1994) are labelled GT. See text for details. B
Boundary between moving boundary A- and B-regimes for alternative recrystallization

29
mechanisms, with grain growth curves from Fig. 9A reproduced for comparison. Curves labelled
“recrystallization” use the equation of Covey-Crump (1997b) for static recovery of Carrara marble
to calculate grain boundary velocity, but with Hart’s state variable replaced by the flow stress
(Rutter 1995) for the given grain size in dynamic recrystallization. Curves labelled “fluid assisted”
are based on the pore-fluid present grain growth experiments of Covey-Crump (1997a). C
Characteristic diffusion distance contours (in m unless otherwise stated) for moving boundaries
in the A-regime. Heavy line is the A-regime boundary for a 100 µm grain size from diagrams A
and B. Solid contours are for an effective diffusion coefficient (Balluffi et al. 2005) using the
volume and grain boundary diffusion data of Farver and Yund (1996), and a grain boundary width
of 3 nm. Dashed lines use the enhanced value of DGB calculated in this paper. See text for
discussion.
Fig. 10 Relationship between bulk conductivity (b) and grain size assuming a grain boundary
width of 1 nm and a grain boundary conductivity (GB) 105 times greater than the grain interior
permeability (GI set to 1). Curve for moving boundaries based on the same equation, with GB
105 times greater than the value assumed for static boundaries.
References
Balluffi RW, Allen SM, Carter CW (2005) Kinetics of Materials. Wiley-Interscience 645p.
Booker JR, Favetto A, Pomposiello MC (2004) Low electrical resistivity associated with plunging
of the Nazca flat slab beneath Argentina. Nature 429: 399-403
Cahn JW, Balluffi RW (1979) On diffusional mass transport in polycrystals containing stationary
or migrating grain boundaries. Scripta Metall 13: 499-502
Carlson WD (2002) Scales of disequilibrium and rates of equilibration during metamorphism. Am
Mineral 87: 185-204
Chernoff CB, Carlson WD (1999) Disequilibrium for Ca during growth of pelitic garnet. J Met
Geol 15:421-438
Chongmo L, Hillert M (1981) A metallographic study of diffusion induced grain boundary
migration in the Fe-Zn system. Acta Metall 29: 1949-1960
Covey-Crump SJ (1997a) The normal grain growth behaviour of nominally pure calcitic
aggregates. Contrib Mineral Petrol 129: 239-254
Covey-Crump SJ (1997b) The high temperature static recovery and recrystallization behaviour of
cold-worked Carrara marble. J Struct Geol 19: 225-241. Erratum (1997): J Struct Geol 19: p. III
De Bresser JHP, Ter Heege JH, Spiers CJ (2001) Grain size reduction by dynamic
recrystallization: can it result in major rheological weakening? Int J Earth Sci 90: 28-45
De Bresser JHP, Evans B, Renner J (2002) On estimating the strength of calcite rocks under
natural conditions. In: De Meer S, Drury MR, De Bresser JHP, Pennock GM (eds) Deformation
Mechanisms, Rheology and Tectonics: Current Status and Future Perspectives. Geol Soc
London Spec Publ 200, 309-329

30
Eiler JM, Baumgartner LP, Valley JW (1992) Intercrystalline stable isotope diffusion: a fast grain
boundary model. Contrib Mineral Petrol 12: 543-557
Evans B, Hay RS, Shimuzu N (1986) Diffusion-induced grain boundary migration in calcite.
Geology 14: 60-63
Farver JR (1994) Oxygen self-diffusion in calcite: dependence on temperature and water fugacity.
Earth Planet Sci Lett 121: 575-587
Farver JR, Yund RA (1996) Volume and grain-boundary diffusion of calcium in natural and hot-
pressed calcite aggregates. Contrib Mineral Petrol 123: 77-91
Farver JR, Yund RA (1998) Oxygen grain boundary diffusion in natural and hot-pressed calcite
aggregates. Earth Planet Sci Lett 161: 189-200
Fisher JC (1951) Calculation of diffusion penetration curves for surface and grain boundary
diffusion. J Appl Phys 22:74-77
Freeman SR, Inger S, Butler RWH, Cliff RA (1997) Dating deformation using Rb-Sr in white
mica: greenschist facies deformation ages from the Entrelor shear zone, Italian Alps. Tectonics
16: 57-76
Güthoff F, Mishin Y, Herzig C (1993) Self-diffusion along stationary and moving grain
boundaries in -Hf. Zeit Metall 84: 584-591
Harrison LG (1961) Influence of dislocations on diffusion kinetics in solids with particular
reference to the alkali halides. Trans Farad Soc 57: 1191-1199
Hart EW (1976) Constitutive equations for the nonelastic deformation of metals. J Eng Mat
Technol 98: 193-202
Hay RS, Evans B (1987) Chemically-induced grain boundary migration in calcite: temperature
dependence, phenomenology, and possible applications to geologic systems. Contrib Mineral
Petrol 97: 127-141
Hay RS, Evans B (1992) The coherency strain driving force for CIGM in non-cubic crystals:
comparison with in situ observations in calcite. Acta Metall Mater 40: 2581-2593
Heinemann S, Wirth R, Dresen G (2003) Synthetic grain boundaries in rock-forming minerals.
Eos Trans Am Geophys Union, Fall Meeting Suppl 84 (46): Abs. T41B-01
Hillert M, Purdy GR (1978) Chemically induced grain boundary migration. Acta Metall 26: 333-
340
Hirsch DM, Prior DJ, Carlson WD (2003) An overgrowth model to explain multiple, dispersed
high-Mn regions in the cores of garnet porphyroblasts. Am Mineral 88: 131-141
Jamtveit B, Wogelius RA, Fraser DG (1993) Zonation patterns of skarn garnets – records of
hydrothermal system evolution. Geology 21: 113-116
Jessell MW (2004) Grain growth microstructures as indicators of sample evolution,
recrystallization and grain growth, pts 1 and 2. Mat Sci Forum 467-470: 1051-1056
Johnson SJ, Clausen HB, Dansgaard W, Gundestrup NS, Hammer CU, Andersen U, Andersen K,
Hvideberg CS, Dahl-Jensen D, Steffensen JP, Shoji H, Sveinsbjörnsdóttir AE, White J, Jouzel
J, Fisher D (1997) The delta O-18 record along the Greenland Ice Core Project deep ice core
and the problem of possible Eemian climatic instability. J Geophys Res 102: 26397-26410

31
Knipe RJ, McCaig AM (1994) Microstructural and microchemical consequences of fluid flow in
deforming rocks. In: Parnell J (ed) Geofluids: origin, migration and evolution of fluids in
sedimentary basins. Geol Soc London Spec Publ 78: 99-111
Kronenburg AK, Yund RA, Giletti, BJ (1984) Carbon and oxygen diffusion in calcite: effects of
Mn content and PH2O. Phys Chem Mineral 11: 101-112
Langdon TG (1994) A unified approach to grain boundary sliding in creep and plasticity. Acta
Metall Mater 42: 2437-2443
Lewis S, Holness MB, Graham CM (1998) Ion microprobe study of marble from Naxos, Greece:
grain-scale fluid pathways and stable isotope equilibration during metamorphism. Geology 26:
935-938
Lloyd GE (1987) Atomic number and crystallographic contrast images with the SEM: a review of
backscattered electron techniques. Min Mag 51: 3-19
McCaig AM, (1997) The geochemistry of volatile fluid flow in shear zones In: Holness M. (ed.)
Deformation enhanced melt segregation and metamorphic fluid transport. Chapman and Hall,
227-260
McCaig AM, Knipe RJ (1990) Mass-transport mechanisms in deforming rocks: recognition using
microstructural and microchemical criteria. Geology 18: 824-827
McCaig AM, Wayne DM, Marshall JD, Banks DA, Henderson I, (1995). Isotopic and fluid
inclusion studies of fluid movement along the Gavarnie Thrust, central Pyrenees: Reaction
fronts in carbonate mylonites. Am J Sci 295: 309-343
Mishin YM, Razumovskii IM (1992) A model for diffusion along a moving grain boundary. Acta
metall mater 40: 839-845
Mishin YM, Herzig C, Bernadini J, Gust W (1997) Grain boundary diffusion: fundamentals to
recent developments. Int Mat Rev 42: 155-178
Mukherjee AK (2002) An examination of the constitutive equation for elevated temperature
plasticity. Mat Sci Eng A322: 1-22
Paterson MS (1990) Rock deformation experimentation. In: Duba AG, Durham WB, Handin JW,
Wang HF (eds) The brittle-ductile transition in rocks (The Heard Volume). Geophys
Monograph, Am Geophys Union 36: 187-194
Poirier JP (1985) Creep of crystals: high temperature deformation processes in metals, ceramics
and minerals. Cambridge University Press, 260p.
Prior DJ, Boyle AP, Brenker F, Cheadle MC, Day A, Lopez G, Peruzzo L, Potts GJ, Reddy S,
Spiess R, Timms NE, Trimby P, Wheeler J, Zetterstrom L (1999) The application of electron
backscatter diffraction and orientation contrast imaging in the SEM to textural problems in
rocks. Am Mineral 84: 1741-1759
Putnis A (2002) Mineral replacement reactions: from macroscopic observations to microscopic
mechanisms. Mineral Mag 66: 689-708
Rutter EH (1995) Experimental study of the influence of stress, temperature, and strain on the
dynamic recrystallization of Carrara marble. J Geophys Res 100: 24651-24663
Rutter EH, Brodie KH (1988) The role of tectonic grain size reduction in the rheological
stratification of the lithosphere. Geol Rund 77: 295-308
32
Schumacher R, Rotzler K, Maresch WV (1999) Subtle oscillatory zoning in garnet from regional
metamorphic phyllites and mica schists, western Erzgebirge, Germany. Can Mineral 37: 381-
402
Sherlock SC, Okay AI (1999) Oscillatory zoned chrome lawsonite in the Tavsanli Zone, northwest
Turkey. Mineral Mag 63: 687-692
Spear FS, Daniel CG (1998) 3-dimensional imaging of garnet porhyroblast sizes and chemical
zoning. Nucleation and growth history in the garnet zone. Geol Mat Res 1: 1-43
Spear FS, Daniel CG (2001) Diffusion control of garnet growth, Harpswell Neck, Maine, USA. J
Met Geol 19: 179-195
Steefel CI, Lichtner PC (1998) Multicomponent reactive transport in discrete fractures: I. Controls
on reaction front geometry. J Hydrol 209: 186-199
Stünitz H (1998) Syndeformational recrystallization - dynamic or compositionally induced.
Contrib Mineral Petrol 131: 219-236
Surholt T, Herzig CHR (1997) Grain boundary self-diffusion in Cu polycrystals of different purity.
Acta mater 45: 3817-3823
Sutton AP, Balluffi RW (1995) Interfaces in crystalline materials. Oxford Science Publications,
819p.
ten Grotenhuis SM, Drury MR, Peach CJ, Spiers CJ (2004) Electrical properties of fine-grained
olivine: evidence for grain boundary transport. J Geophys Res 109: B06203
Ter Heege JH, De Bresser JHP, Spiers CJ (2002) The influence of dynamic recrystallization on the
grain size distribution and rheological behaviour of Carrara marble deformed in axial
compression. In: De Meer S, Drury MR, De Bresser JHP, Pennock, GM (eds) Deformation
mechanisms, rheology and tectonics: current status and future perspectives. Geol Soc London
Spec Publ 200: 331-353
Walker AN, Rutter, EH, Brodie KH (1990) Experimental study of grain-size sensitive flow of
synthetic, hot-pressed calcite rocks. In: Knipe RJ, Rutter EH (eds) Deformation Mechanisms,
Rheology and Tectonics. Geol Soc London Spec Publ 54: 259-284
Wannamaker PE, Jiracek GR, Stodt JA, Caldwell TG, Gonzalez VM, McKnight JD, Porter AD
(2002) Fluid generation and pathways beneath an active compressional orogen, the New
Zealand Southern Alps, inferred from magnetotelluric data. J Geophys Res 107: art. No. 2117
White SH, Burrows SE, Carrera J, Shaw ND, Humphreys FJ (1980) On mylonites in ductile shear
zones. J Struct Geol 2: 175-187
Yang P, Rivers T (2001) Chromium and manganese zoning in pelitic garnet and kyanite: spiral,
overprint, and oscillatory zoning patterns and the role of growth rate. J Met Geol 19: 455-476
Yardley BWD, Rochelle, CA, Barnicoat AC, Lloyd GE (1991) Oscillatory zoning in metamorphic
minerals – an indicator of infiltration metasomatism. Mineral Mag 55: 357-365
Yardley BWD, Valley JW (1997) The petrologic case for a dry lower crust. J Geophys Res 102:
12173-12185
Yund RA, Tullis J (1991) Compositional changes of minerals associated with dynamic
recrystallization. Contrib Mineral Petrol 108: 346-355
Zieba P (2003) Diffusion along migrating grain boundaries. Interface Science 11: 51-58

33

34

35

36
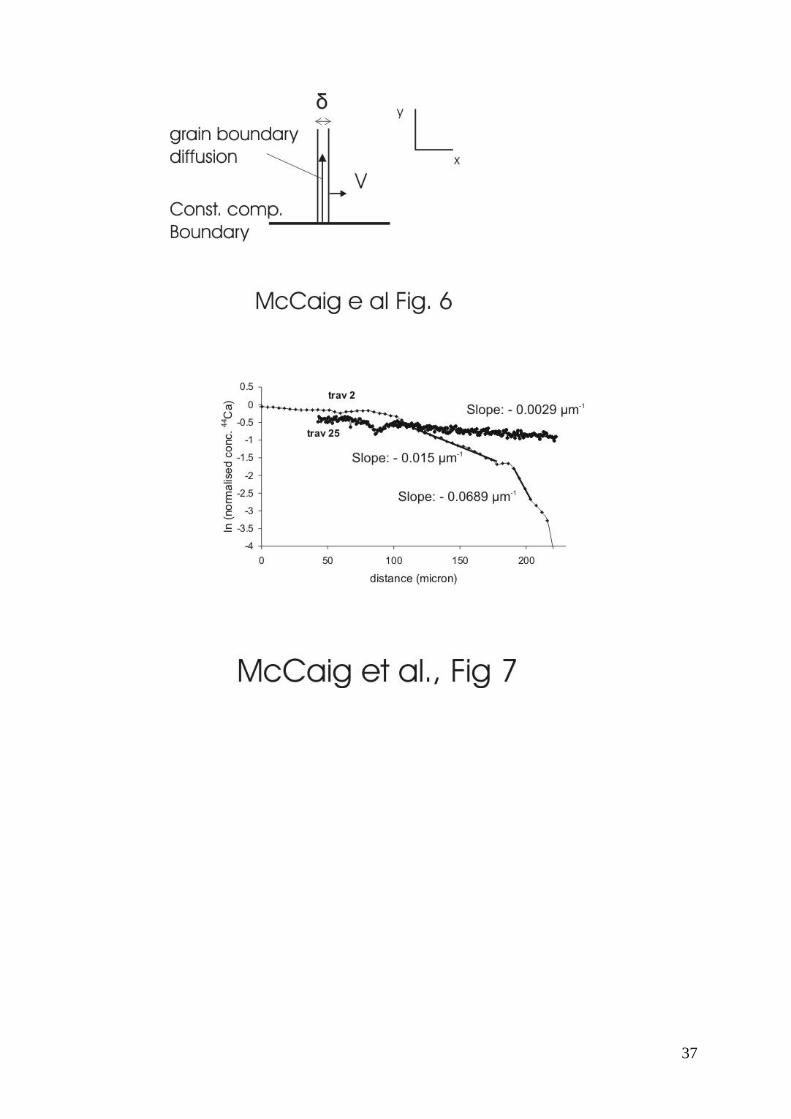
37

38
McCaig et al Fig 8
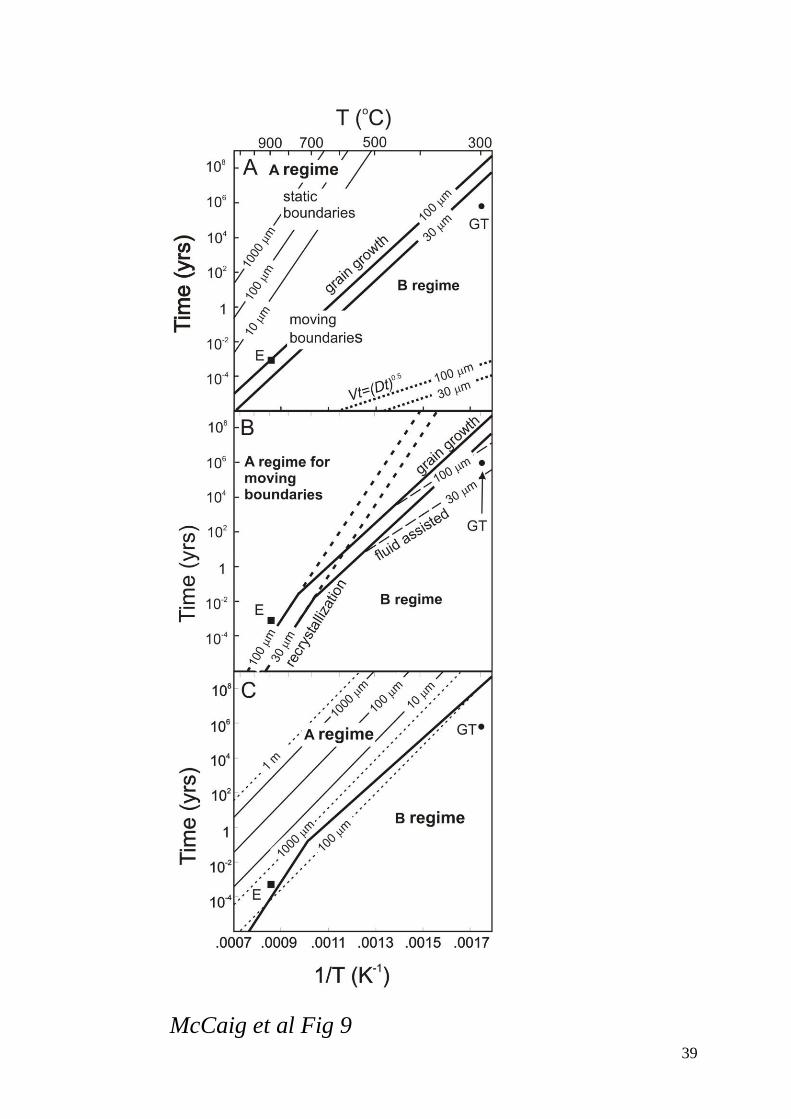
39
McCaig et al Fig 9
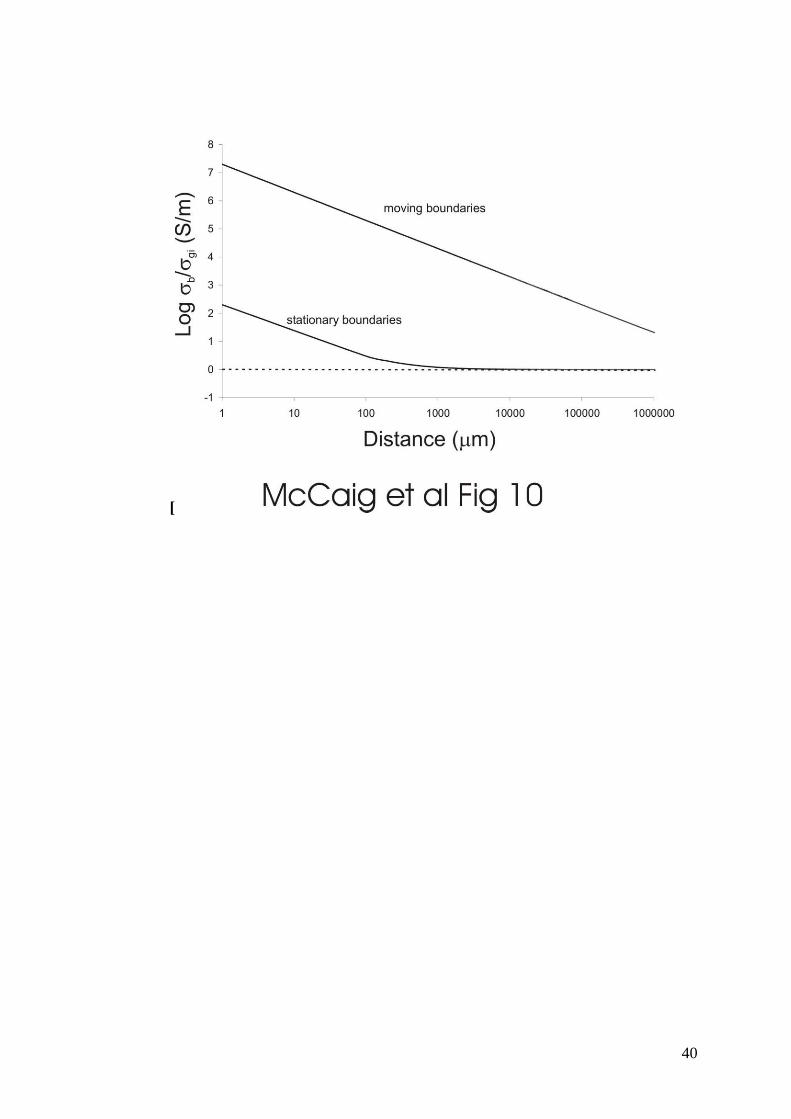
40
[

![Kinetics of diffusion induced grain boundary migration of [100] twist boundaries in the Cu(Zn) system](https://static.fdokumen.com/doc/165x107/631c6051a906b217b906ec8b/kinetics-of-diffusion-induced-grain-boundary-migration-of-100-twist-boundaries.jpg)