Family services in suburbs; do they make a difference in children’s development? What 2009 and...
22
1 Family services in suburbs; do they make a difference in children’s development? What 2009 and 2012 Australian Early Development Index results reveal about the efficacy of Salisbury Communities for Children. Alexandra Diamond, Elspeth McInnes & Victoria Whitington University of South Australia October 2013
Transcript of Family services in suburbs; do they make a difference in children’s development? What 2009 and...
1
Family services in suburbs; do they make a difference in children’s
development? What 2009 and 2012 Australian Early Development Index
results reveal about the efficacy of Salisbury Communities for Children.
Alexandra Diamond, Elspeth McInnes & Victoria Whitington
University of South Australia
October 2013

2
Abstract
This paper reports on analyses of 2009 and 2012 Australian Early Development Index results for particular suburbs within the City of Salisbury. It aims to
provide information to allow Salisbury Communities for Children to evaluate its services and to plan future activities.
Data for the seven suburbs within Salisbury Communities for Children’s remit, and for five other suburbs with similar socioeconomic status scores were
accessed from the 2009 and 2012 Australian Early Development Index’s maps and Community Profiles for the City of Salisbury. Gregory and Brinkman’s
Comparative Results Tool was used to find whether percentages of vulnerable children in the Salisbury Communities for Children suburbs had significantly
changed from 2009 to 2012, and to compare proportions of vulnerability in amalgamated Salisbury Communities for Children suburbs and matched
suburbs.
Although validity is threatened by incomplete data sets, results for the individual Salisbury Communities for Children suburbs indicate that whilst some
suburbs (particularly Brahma Lodge/Salisbury Plain, Salisbury East/Salisbury South and Ingle Farm) have seen significant reductions in percentages of
vulnerable children, others (particularly Pooraka) have seen significant increases in percentages of vulnerable children. The results for the individual
suburbs are discussed, and recommendations are made for steps that Salisbury Communities for Children might take to improve young children’s
developmental outcomes.
Comparisons between the proportions of vulnerable children in an amalgamation of suburbs within Salisbury Communities for Children’s remit and in an
amalgamated group of matched suburbs indicated that from 2009 to 2012, the amalgamated Salisbury Communities for Children suburbs saw significant
improvement in more domains than that seen in the matched group of suburbs. Also, by 2012 the group of Salisbury Communities for Children’s suburbs no
longer had significantly higher rates of vulnerability than the matched group. Instead the SC4C suburbs had significantly lower rates of vulnerability than the
matched group in One or more domains and in the Communication skills and general knowledge domain. These differences indicate that from 2009 to 2012
very young children in Salisbury Communities for Children suburbs received more developmental support than those living in the matched group of
suburbs.
Please note that for full meaning, Tables 1 and 4, and Appendix 1 of this report should be printed in colour.
3
Background
Salisbury Communities for Children
Salisbury Communities for Children (SC4C) has been funded by the Commonwealth Department of Families, Housing, Community Services and Indigenous
Affairs since 2006. As SC4C’s Facilitating Partner, the Salvation Army Ingle Farm has worked alongside Lutheran Community Care, Centacare, the City of
Salisbury, Relationships Australia South Australia, Schools Ministry Group, Save the Children and the South Australian Department of Education and Child
Development to provide a suite of services for families with young children living in Brahma Lodge, Ingle Farm, Para Hills, Para Hills West, Para Vista,
Pooraka and Salisbury East. From 2006 the main services aimed at supporting children’s development before school have been universal and targeted
playgroups (structured and unstructured), music groups, support groups for culturally and linguistically diverse families, postnatal mental health support,
parenting education, universal support groups for mothers and babies, and home visiting of vulnerable and isolated families.
The importance of very early environments for human development
Over recent decades neuroscience has revealed much about the importance of the early years for later physical and mental health, capacity to learn and
behaviour (Mustard 2008). Experiences in the early years affect gene functions, influencing ‘whether …genes build the capacity for future skills to develop’
(National Scientific Council on the Developing Child [NSCDC] 2006, p.3). Thus early environments affect the quality of brain architecture and establish either
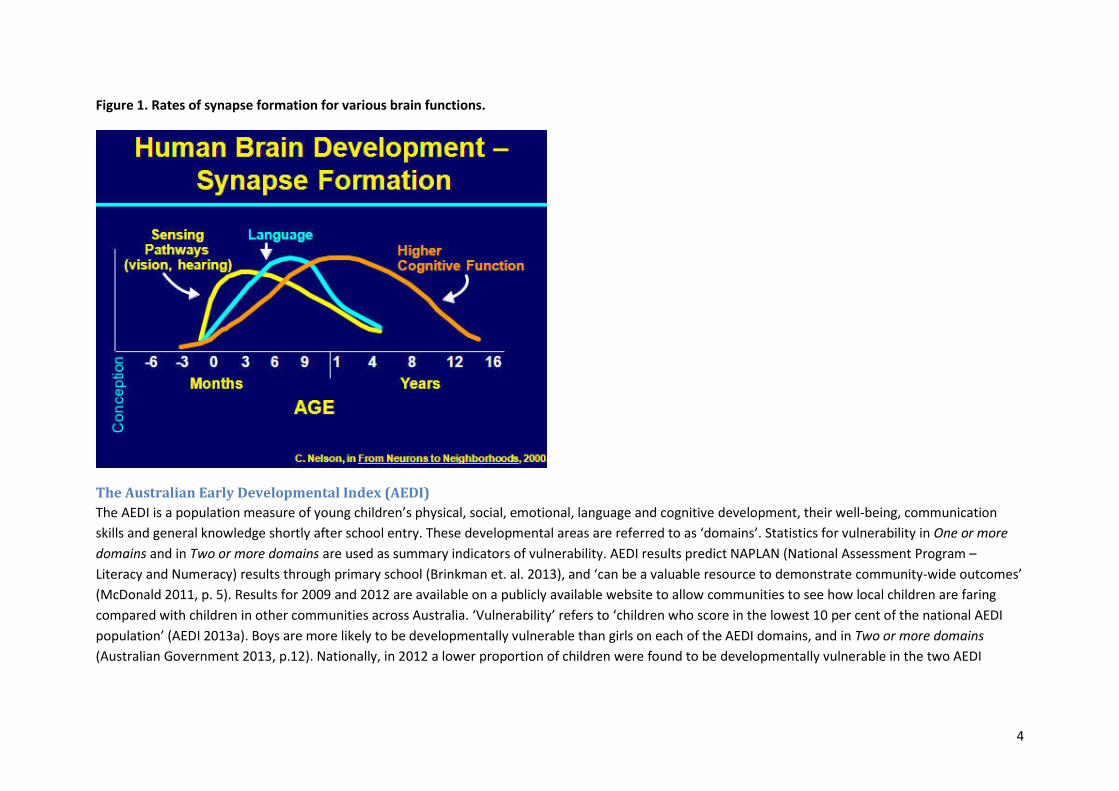
a strong or a vulnerable foundation for all subsequent development (NSCDC 2007a). Figure 1 overleaf illustrates work by the eminent developmental
neuroscientist, Charles Nelson, who found formation of neural connections within the brain is most rapid during the first years. Stimulating environments
help to build these connections (NSCDC 2007b). Adverse environments, including prenatal exposure to toxins (such as lead, alcohol and other drugs), and
lack of stimulation and toxic stress in early childhood can damage developing brains and lead to lifelong problems in learning, behaviour, and physical and
mental health (NSCDC 2006; NSCDC, 2007b). Services that help build parents’ capacities to provide infants and toddlers with nurturing relationships and
stimulating environments, and address specific developmental challenges effectively strengthen brain development (NSCDC 2007c).
4
Figure 1. Rates of synapse formation for various brain functions.
The Australian Early Developmental Index (AEDI)
The AEDI is a population measure of young children’s physical, social, emotional, language and cognitive development, their well-being, communication
skills and general knowledge shortly after school entry. These developmental areas are referred to as ‘domains’. Statistics for vulnerability in One or more
domains and in Two or more domains are used as summary indicators of vulnerability. AEDI results predict NAPLAN (National Assessment Program –
Literacy and Numeracy) results through primary school (Brinkman et. al. 2013), and ‘can be a valuable resource to demonstrate community-wide outcomes’
(McDonald 2011, p. 5). Results for 2009 and 2012 are available on a publicly available website to allow communities to see how local children are faring
compared with children in other communities across Australia. ‘Vulnerability’ refers to ‘children who score in the lowest 10 per cent of the national AEDI
population’ (AEDI 2013a). Boys are more likely to be developmentally vulnerable than girls on each of the AEDI domains, and in Two or more domains
(Australian Government 2013, p.12). Nationally, in 2012 a lower proportion of children were found to be developmentally vulnerable in the two AEDI
5
summary indicators and in each of the developmental domains (except in the Physical health and wellbeing domain, which remained unchanged) than in
2009 (Australian Government 2013, p. 27).
Using the AEDI to evaluate community supports for young children’s development
The Comparative Results Tool (CRT) devised by Gregory and Brinkman (2013) can be used to investigate whether differences in AEDI results between 2009
and 2012 represent significant shifts in the quality of children’s development. ‘Comparing [AEDI] results over time …. allows for analysis and evaluation of
the success of programs implemented between the years of the data collections. Comparing results can also assist in identifying where future resources
could be channelled’ (AEDI 2013b). The CRT calculates ‘critical difference’, that is ‘the minimal level of change required between the 2009 and 2012 AEDI for
the results to be significant’ (AEDI 2013c, p. 2). ‘Critical difference’ varies depending on the number of children in the community and the specific AEDI
outcome of interest (Gregory & Brinkman 2013). Although ‘it is important that communities celebrate any positive changes in the level of childhood
vulnerability, rather than focusing exclusively on whether a change reaches critical difference’ (AEDI 2013b, p.2), ‘critical difference’ reassures communities
that improved results are probably not by chance.
Measuring the impact of the provision of a range of services on the development of children across a community is extremely challenging, particularly
because families’ (voluntary) engagement with these services may vary with the nature of the services, with their children’s ages, and with the families
themselves. ‘It can be difficult to attribute changes in [a] community directly to a particular initiative’ (McDonald 2011, p. 1). Edwards et al (2009 cited in
McDonald, 2011, p. 2) recommend, ‘an experimental or quasi-experimental design [as] the best method …to estimate what the outcomes for
children…would have been in absence of the intervention’. The CRT can be used to discover ‘critical differences’ between AEDI percentages of vulnerable
children in particular groups of suburbs. That is, it allows the researcher to explore whether a group of suburbs has significantly higher or lower percentages
of vulnerability than another group of suburbs.
Child development social gradients
Based on census data, the Socio Economic Indexes for Areas (SEIFA) summarises information about the economic, educational and social levels of people
within an area (Australian Bureau of Statistics [ABS] 2013). The SEIFA Index of Relative Socio-Economic Disadvantage (IRSD), used in the 2006 AEDI maps,
includes only measures of relative disadvantage such as low income, low educational attainment, overcrowding, unemployment, single parent families with
children, and no car ownership (ABS 2013). Australia’s average SEIFA score is 1000. A score lower than 1000 indicates the households in the area on average
experience more disadvantage than Australia’s average (ABS 2013). Socioeconomic factors (families’ access to resources, power and information) are
typically found to be statistically related to child development outcomes (most famously in Hart & Risley, 1995). When socioeconomic status (SES) scores
are plotted against developmental outcomes’ scores (e.g. from the EDI in Canada and the AEDI in Australia), the relationship between the scores typically
forms a ‘gradient’, with the poorest individuals at the lowest end of the gradient (i.e. with the worst developmental outcomes), those better off further up
6
the gradient (i.e. with better developmental outcomes), and those with the highest SES at the top of the slope (i.e. with the strongest developmental
outcomes) (Government of South Australia 2013; McCain, Mustard & Shanker 2007; Mustard 2008). Some communities are off the gradient however; that
is, their AEDI results are either better or worse than predicted by their SEIFA scores.
National child development social gradients show that although a much higher proportion of children in low SES families are developmentally vulnerable,
because there are more middle SES families, the greatest number of developmentally vulnerable children is found in middle SES communities (Human Early
Learning Partnership 2011). This establishes the need for universal services, with specific provisions made for those who face particular barriers to access
(Human Early Learning Partnership 2012).
Method
SEIFA IRSD scores based on 2006 census results for each of the AEDI local communities within the Salisbury AEDI community were accessed from the 2009
AEDI maps1. Five other suburbs in the Salisbury AEDI community with similar 2006 SEIFA IRSD scores were chosen to serve as a quasi-control group. This
allowed comparison between outcomes for children living within the SC4C’s remit and outcomes for children living outside of SC4C’s zone. The five control
group suburbs are located on the western side of Main North Road and are referred to as ‘non-SC4C suburbs’. It is assumed that families residing in the
non-SC4C suburbs are less likely than families living in SC4C suburbs, to have accessed the SC4C services which are predominantly sited at Family Zone at
Ingle Farm Primary School on the eastern side of Main North Road and about nine kilometres away from the nearest non-SC4C suburb.
The 2009 and 2012 AEDI results and the number of children included in the data for each of the two AEDI summary indicators and the five AEDI
developmental domains for the SC4C and non SC4C suburbs were accessed from the AEDI maps website (via http://maps.aedi.org.au/lga/sa/47140). The
CRT devised by Gregory and Brinkman (2013) was then used to investigate whether the differences in AEDI results between 2009 and 2012 in the individual
suburbs represented significant shifts in the percentages of developmentally vulnerable children.
To allow consideration of the possible effects of overrepresentation of boys, the proportions of children surveyed who were boys in each of the suburbs of
interest were accessed from the 2009 (AEDI 2011, p. 18) and 2012 (AEDI 2012, p. 12) Salisbury Community Profiles. Percentages of boys in the
amalgamated SC4C and non-SC4C groups of suburbs were also calculated from these sources.
1 SEIFA IRSD scores for the AEDI local communities do not yet appear in the 2012 AEDI maps. Boundaries for AEDI local communities do not always match census suburb boundaries. Therefore SEIFA IRSD scores
based on the 2011 census are not reported from the ABS website. However SEIFA IRSD scores based on the 2011 census are expected to be similar to 2009 scores for all suburbs referred to in this paper.
7
The number of vulnerable children and the number of surveyed children in each AEDI domain for the individual SC4C and non-SC4C suburbs were obtained
from the AEDI maps and used to calculate amalgamated percentages of vulnerable children in each domain for the SC4C and non-SC4C groups of suburbs.
Gregory and Brinkman’s CRT (2013) was then used to compare the 2009 and 2012 results of each of the two amalgamated groups, and to compare the
results of the amalgamated SC4C suburbs with those of the amalgamated non-SC4C suburbs.
Results
The 2006 SEIFA IRSD scores for each SC4C and non-SC4C suburb in the City of Salisbury are presented first. Then the AEDI results for the individual SC4C
suburbs are presented and analysed. Next, the percentages of children surveyed in the individual SC4C suburbs who were boys, are presented. Finally, the
paper presents and analyses the amalgamated SC4C and non-SC4C suburbs’ AEDI results and percentages of surveyed children who were boys.
SEIFA IRSD scores for the SC4C and non-SC4C suburbs
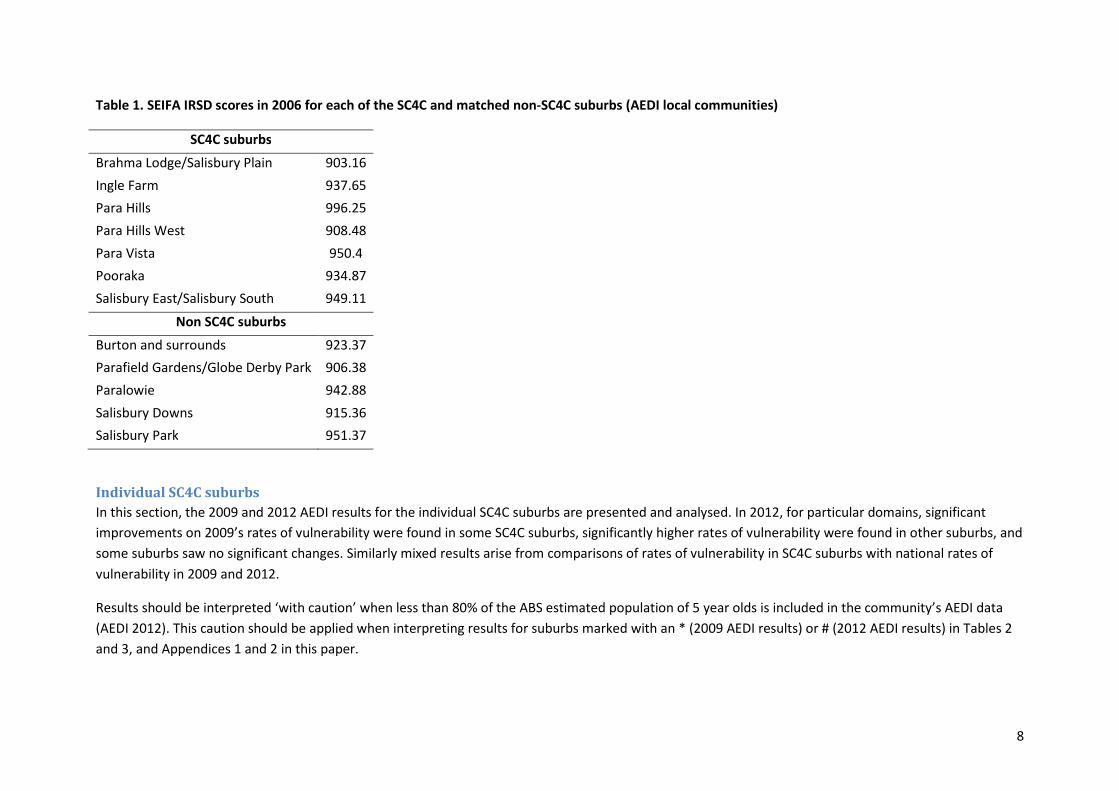
SEIFA IRSD scores for all the suburbs of interest were below the national average score (1000). Scores for the SC4C suburbs ranged from 903.16 to 996.25,
M = 939.99, whilst scores for the five ‘control’ non-SC4C suburbs ranged from 906.38 to 951.37, M = 927.87. SEIFA IRSD figures for individual suburbs
appear as Table 1.
8
Table 1. SEIFA IRSD scores in 2006 for each of the SC4C and matched non-SC4C suburbs (AEDI local communities)
SC4C suburbs
Brahma Lodge/Salisbury Plain 903.16
Ingle Farm 937.65
Para Hills 996.25
Para Hills West 908.48
Para Vista 950.4
Pooraka 934.87
Salisbury East/Salisbury South 949.11
Non SC4C suburbs
Burton and surrounds 923.37
Parafield Gardens/Globe Derby Park 906.38
Paralowie 942.88
Salisbury Downs 915.36
Salisbury Park 951.37
Individual SC4C suburbs
In this section, the 2009 and 2012 AEDI results for the individual SC4C suburbs are presented and analysed. In 2012, for particular domains, significant
improvements on 2009’s rates of vulnerability were found in some SC4C suburbs, significantly higher rates of vulnerability were found in other suburbs, and
some suburbs saw no significant changes. Similarly mixed results arise from comparisons of rates of vulnerability in SC4C suburbs with national rates of
vulnerability in 2009 and 2012.
Results should be interpreted ‘with caution’ when less than 80% of the ABS estimated population of 5 year olds is included in the community’s AEDI data
(AEDI 2012). This caution should be applied when interpreting results for suburbs marked with an * (2009 AEDI results) or # (2012 AEDI results) in Tables 2
and 3, and Appendices 1 and 2 in this paper.
9
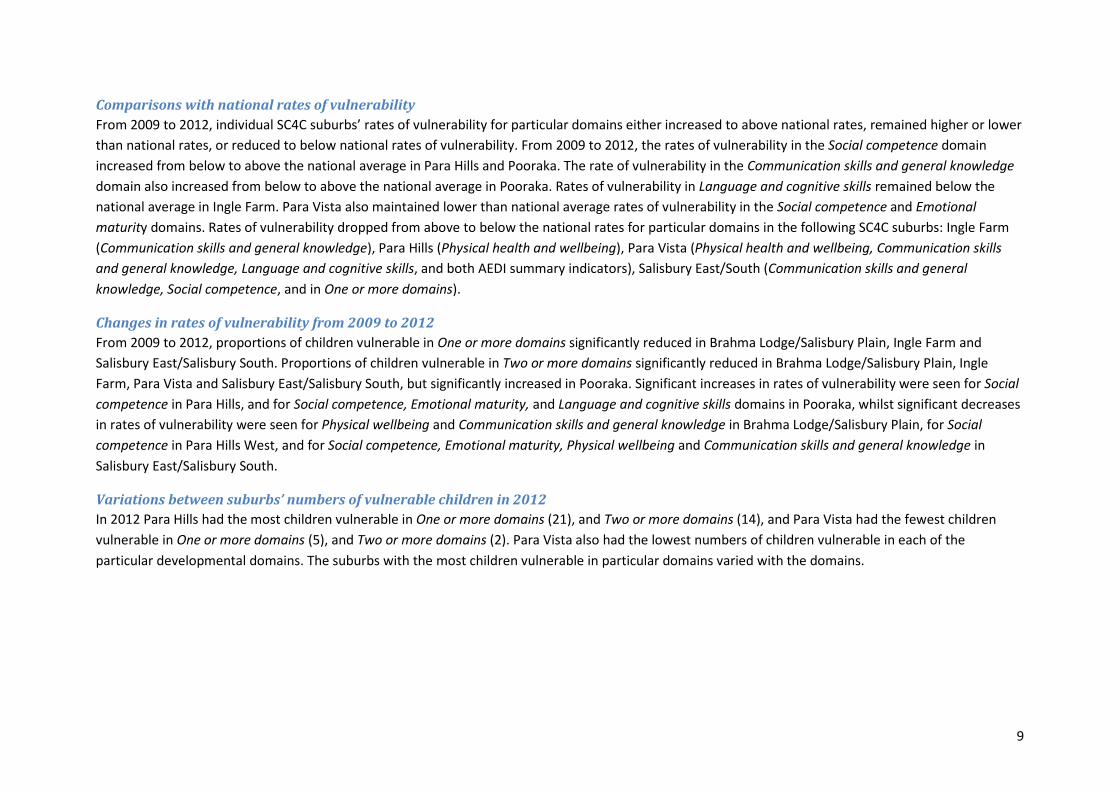
Comparisons with national rates of vulnerability
From 2009 to 2012, individual SC4C suburbs’ rates of vulnerability for particular domains either increased to above national rates, remained higher or lower
than national rates, or reduced to below national rates of vulnerability. From 2009 to 2012, the rates of vulnerability in the Social competence domain
increased from below to above the national average in Para Hills and Pooraka. The rate of vulnerability in the Communication skills and general knowledge
domain also increased from below to above the national average in Pooraka. Rates of vulnerability in Language and cognitive skills remained below the
national average in Ingle Farm. Para Vista also maintained lower than national average rates of vulnerability in the Social competence and Emotional
maturity domains. Rates of vulnerability dropped from above to below the national rates for particular domains in the following SC4C suburbs: Ingle Farm
(Communication skills and general knowledge), Para Hills (Physical health and wellbeing), Para Vista (Physical health and wellbeing, Communication skills
and general knowledge, Language and cognitive skills, and both AEDI summary indicators), Salisbury East/South (Communication skills and general
knowledge, Social competence, and in One or more domains).
Changes in rates of vulnerability from 2009 to 2012
From 2009 to 2012, proportions of children vulnerable in One or more domains significantly reduced in Brahma Lodge/Salisbury Plain, Ingle Farm and
Salisbury East/Salisbury South. Proportions of children vulnerable in Two or more domains significantly reduced in Brahma Lodge/Salisbury Plain, Ingle
Farm, Para Vista and Salisbury East/Salisbury South, but significantly increased in Pooraka. Significant increases in rates of vulnerability were seen for Social
competence in Para Hills, and for Social competence, Emotional maturity, and Language and cognitive skills domains in Pooraka, whilst significant decreases
in rates of vulnerability were seen for Physical wellbeing and Communication skills and general knowledge in Brahma Lodge/Salisbury Plain, for Social
competence in Para Hills West, and for Social competence, Emotional maturity, Physical wellbeing and Communication skills and general knowledge in
Salisbury East/Salisbury South.
Variations between suburbs’ numbers of vulnerable children in 2012
In 2012 Para Hills had the most children vulnerable in One or more domains (21), and Two or more domains (14), and Para Vista had the fewest children
vulnerable in One or more domains (5), and Two or more domains (2). Para Vista also had the lowest numbers of children vulnerable in each of the
particular developmental domains. The suburbs with the most children vulnerable in particular domains varied with the domains.
10
Table 2. Percentages of children vulnerable in each domain for Australia and individual SC4C suburbs in 2009 and 2012
One or more
domains
Two or more
domains
Physical
wellbeing
Social
competence
Emotional
maturity
Communication
and general
knowledge
Language and
cognitive skills
2009 2012 2009 2012 2009 2012 2009 2012 2009 2012 2009 2012 2009 2012
Australia 23.6 22.0 11.8 10.8 9.3 9.3 9.5 9.3 8.9 7.6 9.2 9 8.9 6.8
Brahma Lodge/
Salisbury
Plain#
50.0 37.5
(18)
33.3 20.8
(10)
35.7 10.4
(5)
26.2 20.8
(10)
16.7 10.6
(5)
23.8 14.6
(7)
26.2 14.6
(7)
Ingle Farm#
32.9 22.5
(18)
17.1 11.3
(9)
15.9 10.0
(8)
13.4 11.3
(9)
13.4 10.0
(8)
9.8 7.6
(6)
7.3 5.1
(4)
Para Hills#
26.4 26.9
(21)
12.6 17.9
(14)
11.5 9.0
(7)
5.7 20.5
(16)
10.3 12.8
(10)
10.3 11.5
(9)
12.8 9.0
(7)
Para Hills
West*
45.5 35.5
(11)
18.2 22.6
(7)
13.6 22.6
(7)
22.7 12.9
(4)
18.2 12.9
(4)
22.7 12.9
(4)
9.1 16.1
(5)
Para Vista*
29.2 17.2
(5)
25.0 6.9
(2)
16.7 6.9
(2)
8.3 6.9
(2)
8.3 6.9
(2)
16.7 6.9
(2)
20.8 3.4
(1)
Pooraka*#
31.2 27.9
(19)
13.0 19.1
(13)
15.6 10.4
(8)
6.5 13.2
(9)
10.4 16.2
(11)
13.2 14.7
(10)
6.5 11.8
(8)
Salisbury East/
Salisbury South
36.5 19.4
(19)
21.2 11.2
(11)
17.6 10.0
(8)
20.0 9.2
(9)
17.6 10.2
(10)
13.1 6.1
(6)
11.8 8.2
(8)
Yellow: Significant reduction in the percentage of children vulnerable from 2009 to 2012; Turquoise: Significant increase in the percentage of children vulnerable from 2009 to 2012.
11
Table 2 presents the percentages of children vulnerable in each of the developmental domains and in the two AEDI summary indicators in 2009 and 2012
for each of the SC4C suburbs and Australia-wide. To facilitate interpretation, results found by the CRT to be critically different in 2012 from 2009 are
highlighted, and figures in bold denote lower than Australian average rates.2 Because suburbs might have a low percentage of vulnerable children, yet a
high number of vulnerable children (or vice versa), Table 2 also includes 2012’s numbers of vulnerable children in each domain in brackets.
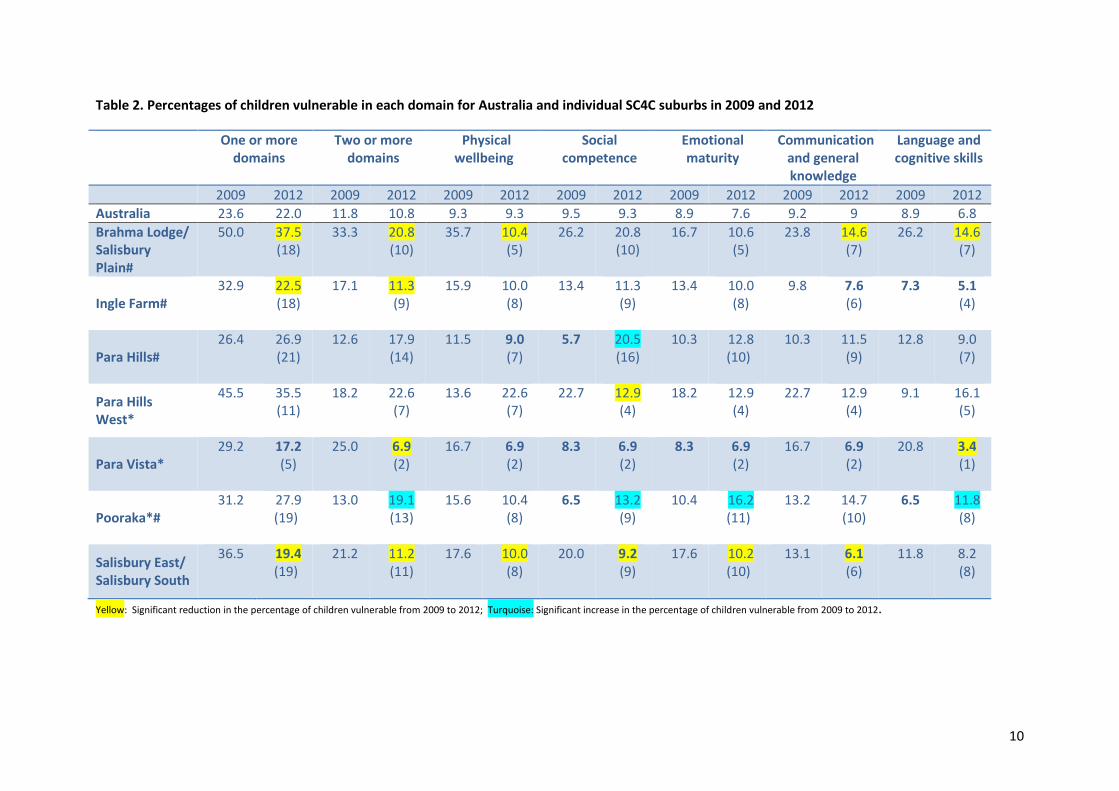
Proportions of children surveyed who were boys
The proportions of boys varied between individual suburbs. In the 2009 AEDI survey, Para Vista’s sample comprised the highest proportion of boys (66.7%),
whilst Pooraka, Para Hills West and Salisbury East/ Salisbury South had the highest proportion of boys in 2012 (60% to 60.3%). Para Hills West and Para
Vista saw the greatest changes in the proportions of boys included in the AEDI survey; in 2012 Para Hills West had 17.7% more boys and Para Vista had
21.9% fewer boys, than in 2009. Table 3 presents the percentages of children surveyed in the SC4C suburbs who were boys. 3
Table 3. Percentages of boys in 2009 and 2012 for the individual SC4C suburbs
2009 2012
Brahma Lodge/Salisbury Plain# 53.2 56
Ingle Farm# 48.9 48.8
Para Hills# 52 52.3
Para Hills West* 42.3 60
Para Vista* 66.7 44.8
Pooraka* # 52.4 60.3
Salisbury East/Salisbury South 57.7 60.2
In the next section the 2009 and 2012 AEDI results for the amalgamated SC4C and non-SC4C groups of suburbs are presented and analysed.
Amalgamations of SC4C and non-SC4C suburbs
The rates of vulnerability in each of the two amalgamated groups of SC4C and non-SC4C suburbs are first compared with national rates of vulnerability.
Changes in rates of vulnerability between 2009 and 2012 for each of the two amalgamated groups are analysed next. Then the 2009 and 2012 percentages
2 A similar table for the five ‘control group’ non-SC4C suburbs in the City of Salisbury appears as Appendix 1.
3 A similar table for the five ‘control group’ non-SC4C suburbs in the City of Salisbury appears as Appendix 2.
12
of surveyed children who were boys in the amalgamated groups are presented. Finally, comparisons are made between the two groups’ rates of
vulnerability.
Comparisons with national rates of vulnerability
In 2012 rates of vulnerability in both AEDI summary indicators and all five domains were above the national average for both amalgamated groups of
suburbs. In the amalgamated non-SC4C suburbs the rate of vulnerability in Language and cognitive skills had increased from below the national average in
2009 to above the national average in 2012.
Changes in rates of vulnerability between 2009 and 2012
For the amalgamated group of SC4C suburbs there were significant reductions from 2009 to 2012 in percentages of children vulnerable in both AEDI
summary indicators, and in the domains of Physical wellbeing, Communication skills and general knowledge, and Language and cognitive skills. There were
also no significant increases in vulnerability in any domains in the amalgamated SC4C group. The amalgamated group of non-SC4C suburbs saw significant
reductions in the proportions of children vulnerable in Two or more domains and in the Emotional Maturity domain, whilst the proportion of children
vulnerable in the Communication skills and general knowledge domain significantly increased.
Proportions of children surveyed who were boys
The percentage of boys in the amalgamated SC4C group remained stable between 2009 and 2012. The non SC4C suburbs had 6.5% fewer boys in 2009 in
than in 2012. In 2012 the non-SC4C group had approximately the same percentage of boys as the SC4C group.
Comparison of the rates of vulnerability between the amalgamated groups of SC4C and non-SC4C suburbs
In 2009 the amalgamated SC4C suburbs had significantly higher rates of vulnerability in the Physical wellbeing and Language and cognitive skills domains,
and a significantly lower rate of vulnerability in the Emotional maturity domain than the amalgamated non-SC4C suburbs.
By 2012, in comparison with the amalgamated non-SC4C suburbs, although the amalgamated SC4C suburbs no longer had a significantly lower rate of
vulnerability in the Emotional maturity domain, the SC4C group had significantly lower rates of vulnerability in One or more domains and in Communication
skills and general knowledge, and no longer had significantly higher rates of vulnerability in the Physical wellbeing and Language and cognitive skills
domains.
Table 4 shows the percentages of developmentally vulnerable children in the two groups of amalgamated suburbs in 2009 and 2012, based on total
numbers of children found to be vulnerable and total numbers of children surveyed for each domain in each of the two groups of suburbs. To facilitate
interpretation, results found by the CRT to be critically different in 2012 from 2009 are highlighted. An * denotes where the 2009 or 2012 figure for an

13
amalgamated group is significantly higher than the other group’s figure in the same year. The figure shown in bold is the only rate better than the
Australian average for that domain. The far right column provides the 2009 and 2012 percentages of surveyed children who were boys in the amalgamated
SC4C and non-SC4C suburbs.
Table 4. Percentages of children found to be vulnerable, and of boys in the two amalgamated groups of suburbs in 2009 and 2012
One or more
domains
Two or more
domains
Physical
wellbeing
Social
competence
Emotional
maturity
Communication
and general
knowledge
Language
and
cognitive
Boys
SC4C 2009 34.1 18.4 17.2* 13.4 13.4 13.7 12* 53
2012 25.7 15.3 10.4 13.7 11.6 10.2 9.3 53.4
Non-SC4C 2009 32.2 17.4 14 13.2 16.6* 12.6 8.5 46.5
2012 31.6* 14.2 11.1 13.9 12.3 15* 9.1 53 Yellow: Significant reduction in the percentage of children vulnerable from 2009 to 2012; Pink: Significant increase in the percentage of children vulnerable from 2009 to 2012; * Significantly higher rate of
vulnerability than the other amalgamated group of suburbs in the same year.
Discussion
This section will first discuss the suburbs’ SEIFA IRSD scores and then consider the problem of children missing from the AEDI survey. Next, results for
individual SC4C suburbs are discussed. Finally, results for the amalgamated SC4C and non-SC4C suburbs are discussed.
SEIFA IRSD scores
SEIFA IRSD scores for 2006 indicate that households in all the SC4C and non-SC4C suburbs were on average more disadvantaged than the Australian
average. The range of scores and mean scores for the SC4C and non-SC4C groups of suburbs indicate that on average, households in the two amalgamated
groups of suburbs have matched levels of socioeconomic disadvantage. Because developmental vulnerability, as measured by the AEDI is related to
socioeconomic disadvantage (Government of South Australia 2013), the SEIFA IRSD scores would normally imply higher-than-Australian average rates of
developmental disadvantage in all the SC4C and non-SC4C suburbs.
The problem of missing data
Estimates of the population of five year olds based on census data indicated that 20% to 40% of children were missing from the AEDI survey for all but one
of the SC4C suburbs in either 2009 or 2012, or in both years. Children were missing from the data for the sex of the children, and for individual AEDI
14
domains and thus the two summary AEDI domains. The validity of all results drawn from sets with missing data may be compromised, and should therefore
be interpreted with caution.
Recommendation 1: To strengthen confidence in future AEDI results and their meanings, SC4C consider working in stronger partnerships with the
AEDI team at South Australia’s Department of Education and Child Development (DECD) and with schools in SC4C suburbs. This would aim to ensure
stronger commitment to AEDI data collection for the Salisbury AEDI community. This work would include communicating with local reception
teachers (whose role includes completion of AEDI checklists) about the value of AEDI results for making decisions to benefit the development of
local children.
Analysis of results for the individual SC4C suburbs
In this section, AEDI results for the individual SC4C suburbs are discussed in relation to national AEDI results, the possible effects of overrepresentation of
boys in the AEDI results for individual suburbs are considered, and AEDI results are used to make recommendations for SC4C strategic planning, with
reference to SC4C programs’ foci and locations.
Individual suburbs’ AEDI results in relation to national rates of vulnerability
The seven SC4C communities all had SEIFA IRSD scores below the national average (1000). Accordingly, it could be expected that their rates of vulnerability
would be higher than the national AEDI averages in 2009 and 2012. Although some SC4C suburbs (especially Brahma Lodge and Para Hills West) had much
higher-than-national rates of vulnerability, some SC4C suburbs had lower than national rates of vulnerability in some domains and can therefore be
considered to be off the child development social gradient. The lower than national rates of vulnerability in some domains in some SC4C suburbs may be
explained by the efficacy of various services provided by SC4C. For example, Para Vista’s lower than national rates of vulnerability in both summary
indicators and all but one of the particular AEDI domains in 2012, might be attributed to a large proportion of Para Vista families accessing the Ingle Farm
Family Zone Hub in the adjacent suburb. However without consistent data about where the users of SC4C services reside, this conclusion cannot be
confirmed.
Recommendation 2: To support future planning, SC4C begin regularly collecting data, from the various groups responsible for service delivery,
regarding service-users’ suburbs of residence.
Possible effects of over-representation of boys in individual suburbs’ AEDI results
National AEDI results indicate that boys are more likely to be developmentally vulnerable than girls in Two or more domains, and in each of the AEDI
domains (Australian Government 2013, p.12). However results for SC4C’s suburbs did not show any consistent effects of over- or under-representation of
boys. Although the 21.9% reduction in the percentage of boys may help to explain the significantly lower rate of vulnerability in Two or more domains in
15
Para Vista, Para Hills West’s 17.7% increase in numbers of boys from 2009 to 2012, did not lead to any significantly higher rates of vulnerability in that
suburb; indeed Social competence significantly improved.
Implications of individual suburbs’ AEDI results for SC4C service evaluations and planning
Changes in rates of developmental vulnerability in individual suburbs from 2009 to 2012 can provide SC4C with insights about efficacy of particular services.
Rates of developmental vulnerability in particular suburbs can be used to consider the needs of very young children within those suburbs, and may help to
guide decisions about service locations and planning of new initiatives.
Recommendation 3: When planning the location of services, SC4C consider the most recent numbers of children found to be developmentally
vulnerable in particular suburbs. For example, although there are no significant changes in rates of vulnerability in One or more domains in Pooraka
and Para Hills, these suburbs have the most children (19 and 21 respectively) vulnerable in One or more domains. Although Ingle Farm and Brahma
Lodge/Salisbury Plain had significant improvements in rates of vulnerability in One or more domains, 18 children in each of these local communities
started school in 2012 with delay in at least one developmental domain. Conversely of all the SC4C suburbs, Para Vista had the fewest
developmentally vulnerable children. These numbers suggest an argument for delivering some of the Family Zone services (at Ingle Farm) in
Maxwell Rd. 4
Ingle Farm’s significant decrease in vulnerability in both AEDI summary indicators, indicated that the range and number of services programs and provided
at Family Zone Hub (Ingle Farm) had generalised positive effects on children’s development in Ingle Farm. Para Vista’s significant decrease in vulnerability in
Two or more domains, and decrease in vulnerability in One or more domains to below the national average may, at least partly, be attributed to the services
provided at Family Zone Hub in the adjacent suburb.
Recommendation 4: To widen Family Zone’s sphere of influence, and to improve AEDI outcomes in Pooraka and Para Hills, SC4C consider optimising
the new Maxwell Rd site by having the services and programs operating in Family Zone Hub (Ingle Farm) replicated at Maxwell Rd. The Maxwell Rd
site is ideally positioned to provide easy walking access to families in Pooraka, Para Hills & Para Hills West, because it sits at the nexus of these
suburbs, does not require a steep walk up Montague Road, and is on bus routes.
4 When planning breakfast club provision, SC4C could also use the most recent AEDI results for numbers of children found to be below the 10
th percentile in the Physical wellbeing subdomain called ‘Physical
readiness for the school day’.
16
Pooraka’s significant increase in vulnerability in Two or more domains, and the high number of children vulnerable in One or more domains and Two or
more domains in Para Hills, indicated some highly vulnerable families in Pooraka and Para Hills were not accessing the supports their children need. It may
be that SC4C’s universal services are not accessible to these families.
Recommendation 5: SC4C attempt to discover what challenges to children’s development (including problems in family functioning) are faced by
the most developmentally vulnerable children and their families in Pooraka and Para Hills. It should be noted that, in 2006, Para Hills had the
highest SEIFA IRSD scores of all AEDI local communities included in this report (i.e. is the least economically and educationally disadvantaged).
Recommendation 6: SC4C explore what is needed to make SC4C support services more accessible to Para Hills and Pooraka families (e.g. weekend
access; explicitly safe; non-judgemental culture; access via child care centres). With resultant information, SC4C may consider programs targeted at
meeting these families’ access needs, (e.g. playgroups with meals/ transport/ bilingual support/ strongly strength-based approach/ Saturday
access). Programs that work towards changing deleterious family functioning (e.g. in partnership with domestic violence, drug and alcohol specialist
services) could also be considered.
Recommendation 7: The Family Referral and Consultancy aimed at primary school-aged children (referred to as Activity 6, Salisbury Communities
for Children 2013, p. 11) particularly target and support vulnerable families with younger siblings (aged 0-5) in Pooraka and Para Hills.
Recommendation 8: As there are significantly increased rates of vulnerability in Emotional maturity and high numbers of children vulnerable in this
domain in Pooraka, SC4C’s programs focused on emotional wellbeing (e.g. ‘Being with Baby’ – support program for women with postnatal
depression) currently delivered at Family Zone in Ingle Farm, be replicated at Maxwell Road or a venue in Pooraka.
According to the Community Profile (AEDI 2012, p. 13), just over 97% of children surveyed from Para Hills and Pooraka have been in early education or care.
Recommendation 9: SC4C build partnerships with the kindergartens and child care centres used by Para Hills and Pooraka families to strengthen
children’s development.
AEDI results for particular domains indicated a significant increase in vulnerability in Social Competence in Para Hills, and in Social competence, Emotional
maturity, and Language and cognitive skills in Pooraka. Of the SC4C suburbs, Pooraka and Para Hills also had some of the highest numbers of children
vulnerable in these domains in 2012. Although Pooraka’s and Para Hills’ rates of vulnerability in the Communication and general knowledge domain did not
significantly change, of all the SC4C suburbs, these two suburbs have the most children vulnerable in this domain. The ‘significant cultural change in our
[SC4C’s] working relationship with South Australia’s Department of Education and Child Development’ (SC4C 2013, p. 21) indicates there may be new
17
opportunities for collaborative work with DECD kindergartens, with shared goals for improving early childhood development. Kindergartens generally
provide stimulating learning environments for preschool children and are staffed by educators with expertise in supporting young children’s language,
cognition and social development.
Recommendation 10: To better support children’s social skills development in Para Hills, SC4C work in partnership with Lieberman Kindergarten to
support families’ access to kindergarten.
Recommendation 11: To better support social, language and cognitive development in Pooraka, SC4C focus on supporting families’ access to
kindergarten by working in partnership with Pooraka Kindergarten (e.g. by supporting playgroup on Friday afternoons).
Recommendation 12: If four year-olds in Pooraka and Para Hills attend long day child care rather than kindergarten, SC4C consider appointing a
Family Referral and Consultancy worker to assist staff at relevant centres to better support children’s social, language and cognitive development,
and families’ functioning (e.g. through the KidsMatter program).
The AEDI Community Profiles provide statistics on the Physical wellbeing subdomains (Physical readiness for the school day; Physical independence; Fine
and gross motor skills). These statistics can allow the specific issues underlying vulnerability in the Physical wellbeing domain to be understood.
Recommendation 13: To help plan strategies to address the very high rates of vulnerability in the Physical wellbeing domain in Para Hills West and
to reduce the numbers of children vulnerable in this domain across the SC4C suburbs, SC4C access 2012 statistics for each subdomain in each
suburb, and then talk with local families and other stakeholders about the local conditions that lead to vulnerability in the particular subdomains
and how these conditions might be effectively addressed.
Although Brahma Lodge still had very high rates of vulnerability in One or more domains and Two or more domains in 2012, the significant improvement in
rates for these summary indicators and for three of the particular AEDI domains since 2009 is very heartening, as are Salisbury East/Salisbury South’s
significant improvements in One or more domains, in Two or more domains and in all but one of the particular AEDI domains. All improvements in children’s
developmental outcomes should be celebrated, and services provided by SC4C could be credited with at least some of the improvements. The next section
evaluates the impact of SC4C by comparing 2009 results with 2012 results for the amalgamated suburbs within its remit, and compares the amalgamated
SC4C suburbs’ results with those for the amalgamated non-SC4C suburbs.
18
Analysis of results for the amalgamated SS4C and non-SC4C groups of suburbs
Implications of comparisons between national rates of vulnerability and the AEDI results for both amalgamated group are stated first. Then changes in AEDI
results for the amalgamated SC4C suburbs are examined to evaluate impact of SC4C services on children’s development in the suburbs within SC4C’s remit.
Finally differences between the AEDI results for the amalgamated SC4C and non-SC4C suburbs are used to evaluate SC4C’s impact.
AEDI results for the amalgamated groups in relation to national rates of vulnerability
In 2012 both of the amalgamated groups had higher-than-national AEDI averages rates of vulnerability in all domains. As the mean SEIFA IRSD scores for
both groups are below the national average (1000), this for would normally be expected. The continued higher-than-Australian average rates of
vulnerability in both amalgamated groups, indicates there is more work to be done to improve children’s developmental outcomes.
Analysis of changes in AEDI results from 2009 to 2012 AEDI for the amalgamated SC4C group of suburbs
Significant improvements between 2009 and 2012 in the SC4C groups’ results for both AEDI summary indicators, and for Physical wellbeing, Communication
and general knowledge and Language and cognitive skills, suggest that in SC4C suburbs there have been positive influences on children’s development.
Although children in the 2009 AEDI cohort residing in SC4C had opportunities to participate in SC4C services, it should be noted that these services were not
in place until 2006, when the 2009 cohort were 2 to 3 years-of-age. As explained on pages 3 to 4 of this paper, supports for infant and toddler development
are most critical for later development. The 2012 cohort of children in SC4C suburbs had opportunities to benefit from playgroups and other services
designed to provide stimulating environments and support nurturing parenting in their very earliest years. The availability of support programs targeting
the first three years of development in the amalgamated SC4C suburbs, may help to explain why the 2012 cohort experienced significantly lower rates of
developmental vulnerability than the 2009 cohort.
Analyses of comparisons between the amalgamated SC4C and non-SC4C groups of suburbs
As recommended by Edwards et al (2009 cited in McDonald 2011, p. 2), a quasi-experimental design was used to estimate what the outcomes for children
in SC4C suburbs would have been in absence of the SC4C intervention. With similar average levels of socio-economic disadvantage, both amalgamated
groups of suburbs would normally be expected to experience similar AEDI outcomes. Differences between the two groups’ AEDI outcomes may be
attributed to differences in levels of developmental supports experienced by the children living in the specific groups of amalgamated suburbs.
19
From 2009 to 2012 the amalgamated SC4C group had statistically significant improvement in more domains than the amalgamated group of non-SC4C
suburbs. In 2012, the non-SC4C group had a significantly higher rate of vulnerability Communication and general knowledge than in 2009, whilst the SC4C
group did not experience significantly higher rates of vulnerability in any domains than in 2009. Although the 2009 to 2012 changes in the non-SC4C group
might have been influenced by a 6.5% increase in the proportion of boys included in the AEDI survey, these results suggest that children living in SC4C
suburbs had received more developmental supports than children living in the non-SC4C suburbs.
The argument for a positive impact by SC4C on children’s development was also indicated by significant differences between the AEDI results for the SC4C
group and the non-SC4C group. In 2012, both groups had similar proportions of boys included in the AEDI survey. The proportions of boys therefore had no
bearing on comparisons between the 2012 results for the two groups of suburbs. The SC4C group’s significantly lower rates of vulnerability in One or more
domains and the Communication and general knowledge domain than the non-SC4C group in 2012, indicate that the 2012 cohort of 5-year-old children
living in the SC4C suburbs had experienced more developmental support than the same aged children living in the non-SC4C group.
20
References
Australian Bureau of Statistics, 2013, 2033.0.55.001 - Census of Population and Housing: Socio-Economic Indexes for Areas (SEIFA), Australia, accessed
27/8/2013, http://www.abs.gov.au/ausstats/[email protected]/Lookup/by%20Subject/2033.0.55.001~2011~Main%20Features~What%20is%20SEIFA%3f~4
Australian Early Development Index, 2011, Community profile 2011 Salisbury, South Australia, Australian Early Development Index, accessed 27/8/2013,
http://reports.aedi.org.au/community-profile/sa/2009r2/47140.pdf
Australian Early Development Index, 2012, Community profile 2012 Salisbury, South Australia, Australian Early Development Index, accessed 27/8/2013,
http://reports.aedi.org.au/community-profile/sa/2012/47140.pdf
Australian Early Development Index, 2013a, Understanding the AEDI results, accessed 20/9/13
http://www.rch.org.au/aedi/Resources/Understanding_the_AEDI_results/
Australian Early Development Index, 2013b, Comparing results: 2009 – 2012, Australian Early Development Index, accessed 9/8/13
http://www.rch.org.au/aedi/Resources/Comparing_results__2009_-_2012/
Australian Early Development Index, 2013c, Fact sheet; Comparing results: 2009 to 2012, accessed 9/8/13
http://userguide.aedi.org.au/AEDIResultsGuide/media/AEDI_Media/Resources/AEDI-Comparing-results_web_Final_150313.pdf.
Australian Government, 2013, A Snapshot of Early Childhood Development in Australia 2012 — AEDI National Report, Australian Government, Canberra,
accessed 9/8/13 http://maps.aedi.org.au/
Brinkman, SA, Gregory, T, Harris, J, Hart, B, Blackmore, S & Janus, M, 2013, 'Associations between the early development instrument at age 5 and reading
and numeracy skills at ages 8, 10 and 12: a prospective linked data study', Child Indicators Research, e-journal, unpaged.
Government of South Australia, 2013, ‘Developmental Vulnerabilty [sic] and Socioeconomic Status Report, (2009 AEDI Geographic Data),’ Education and
Learning Visual Intelligence System, Department for Education and Child Development / Prometheus Information, accessed 9/8/13 via
http://www.decd.sa.gov.au/aboutdept/files/links/ELVIS_July_2013.pdf .
Gregory, T & Brinkman, S, 2013, Methodological approach to exploring change in the Australia Early Development Instrument (AEDI): The estimation of a
critical difference, Telethon Institute for Child Health Research, Western Australia, accessed 9/8/13
www.rch.org.au/aedi/TechnicalPaper4_CalcuCriticalDifference_1301/.
21
Hart, B & Risley, TR, 1995, Meaningful differences in the everyday experience of young American children, Paul H Brookes, Baltimore.
Human Early Learning Partnership, 2011, Proportionate Universality Brief, University of British Columbia, accessed 2/10/13
http://earlylearning.ubc.ca/media/publications/proportionate_universality_brief__-_final.pdf
Human Early Learning Partnership, 2012, Addressing Barriers to Access, University of British Columbia, accessed 2/10/13
http://earlylearning.ubc.ca/media/publications/barriers_to_access_brief_final_october_16.pdf
McCain, NM, Mustard, JF & Shanker, S, 2007, Early years study 2: putting science into action, Council for Early Child Development, Toronto, Ontario,
accessed 8/7/13 http://earlyyearsstudy.ca/media/uploads/more-files/early_years_study2-en.pdf
McDonald, M, 2011, Demonstrating community-wide outcomes; Exploring the issues for child and family services, Australian Institute of Family Studies,
accessed 19/9/13 http://www.aifs.gov.au/cafca/pubs/sheets/ps/ps10.pdf
Mustard, JF, 2008, Investing in the early years: closing the gap between what we know and what we do, Department of Premier and Cabinet, Adelaide,
accessed 9/8/13 http://www.thinkers.sa.gov.au/lib/pdf/Mustard_Final_Report.pdf.
National Scientific Council on the Developing Child, 2006, Early exposure to toxic substances damages brain architecture, Working Paper 4, The Heller
School, Brandeis University, Waltham, MA, accessed 9/8/13
http://developingchild.harvard.edu/index.php/resources/reports_and_working_papers/working_papers/wp4/
National Scientific Council on the Developing Child, 2007a, A Science-Based Framework for Early Childhood Policy, accessed 9/8/13
http://developingchild.harvard.edu/index.php/resources/reports_and_working_papers/policy_framework/
National Scientific Council on the Developing Child, 2007b, The Timing and Quality of Early Experiences Combine to Shape Brain Architecture: Working Paper
No. 5, accessed 9/8/13 http://developingchild.harvard.edu/index.php/resources/reports_and_working_papers/working_papers/wp5/
National Scientific Council on the Developing Child, 2007c, The science of early childhood development: closing the gap between what we know and what
we do, accessed 9/8/13 http://developingchild.harvard.edu/resources/reports_and_working_papers/science_of_early_childhood_development/
Salisbury Communities for Children, 2013, Communities for children and community playgroups performance report for the Family Support Program,
Department of Families, Housing, Community Services and Indigenous Affairs, July- Dec 2012, Salisbury Communities for Children.
22
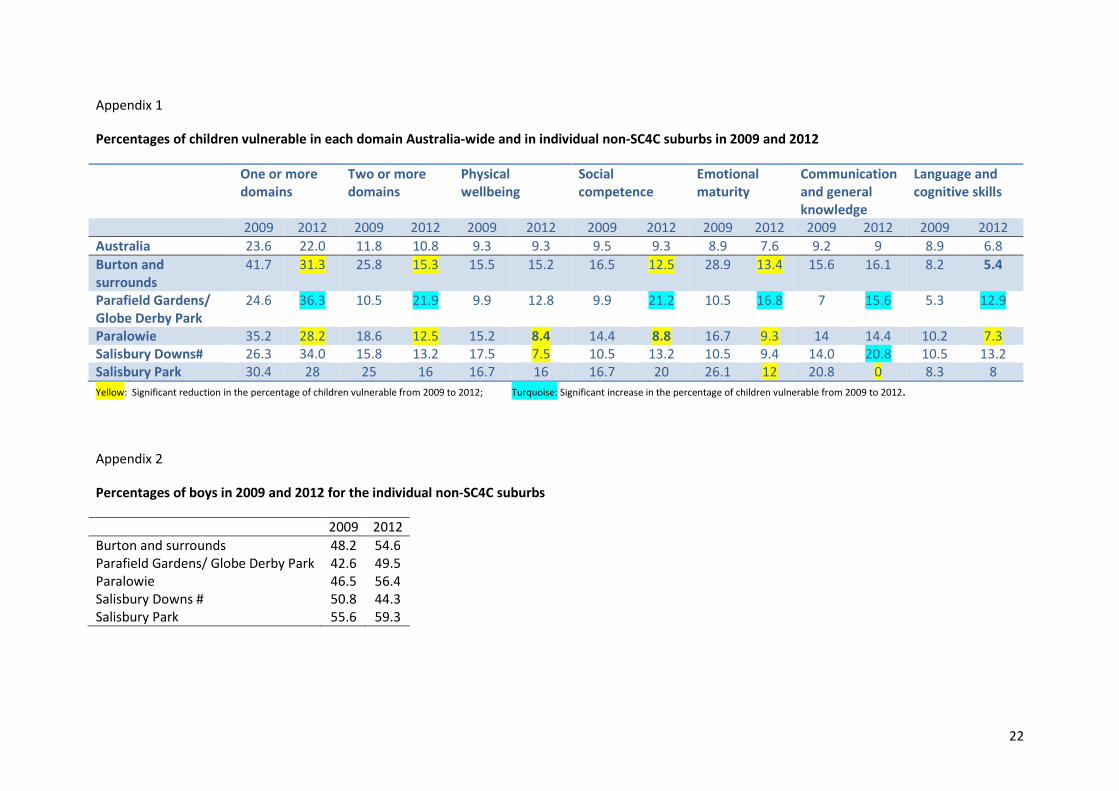
Appendix 1
Percentages of children vulnerable in each domain Australia-wide and in individual non-SC4C suburbs in 2009 and 2012
One or more
domains
Two or more
domains
Physical
wellbeing
Social
competence
Emotional
maturity
Communication
and general
knowledge
Language and
cognitive skills
2009 2012 2009 2012 2009 2012 2009 2012 2009 2012 2009 2012 2009 2012
Australia 23.6 22.0 11.8 10.8 9.3 9.3 9.5 9.3 8.9 7.6 9.2 9 8.9 6.8
Burton and
surrounds
41.7 31.3 25.8 15.3 15.5 15.2 16.5 12.5 28.9 13.4 15.6 16.1 8.2 5.4
Parafield Gardens/
Globe Derby Park
24.6 36.3 10.5 21.9 9.9 12.8 9.9 21.2 10.5 16.8 7 15.6 5.3 12.9
Paralowie 35.2 28.2 18.6 12.5 15.2 8.4 14.4 8.8 16.7 9.3 14 14.4 10.2 7.3
Salisbury Downs# 26.3 34.0 15.8 13.2 17.5 7.5 10.5 13.2 10.5 9.4 14.0 20.8 10.5 13.2
Salisbury Park 30.4 28 25 16 16.7 16 16.7 20 26.1 12 20.8 0 8.3 8
Yellow: Significant reduction in the percentage of children vulnerable from 2009 to 2012; Turquoise: Significant increase in the percentage of children vulnerable from 2009 to 2012.
Appendix 2
Percentages of boys in 2009 and 2012 for the individual non-SC4C suburbs
2009 2012
Burton and surrounds 48.2 54.6
Parafield Gardens/ Globe Derby Park 42.6 49.5
Paralowie 46.5 56.4
Salisbury Downs # 50.8 44.3
Salisbury Park 55.6 59.3