Faecal bacterial loads during flood events in Northwestern Mediterranean coastal rivers
11
Faecal bacterial loads during flood events in Northwestern Mediterranean coastal rivers Yin Chu a,c , Christian Salles a,⇑ , Marie-George Tournoud a , Patrice Got b , Marc Troussellier b , Claire Rodier a , Audrey Caro b a Université Montpellier 2, HydroSciences Montpellier (UMR 5569 CNRS, IRD, Université Montpellier 1, Université Montpellier 2), F-34095 Montpellier Cedex 5, France b CNRS, Ecosystèmes Lagunaires (UMR 5119 CNRS, Université Montpellier 2), F-34095 Montpellier Cedex 5, France c College of Resources and Environment, Anhui Agricultural University, Hefei 230036, China article info Article history: Received 24 November 2010 Received in revised form 20 May 2011 Accepted 30 May 2011 Available online 12 June 2011 This manuscript was handled by L. Charlet, Editor-in-Chief, with the assistance of Eddy Y. Zeng, Associate Editor Keywords: Faecal bacteria Flood dynamics Flood loads Statistical models Bacterial sources Land use summary In Mediterranean coastal rivers, floods last often less than a few hours but supply large amounts of con- taminants to transitional and coastal waters. Estimating flood loads requires appropriate sampling strat- egies. We applied flood-scale sampling for the survey of two rivers flowing into the Thau lagoon (France). Two bacterial indicators were considered, thermotolerant coliforms (TTC) and faecal streptococci (FC). During floods, concentrations of indicator bacteria associated with non-mineral suspended solids increased quickly with the rising flow, their decrease during the recession period was slow and erratic. Statistical analysis was performed on total bacterial flood loads measured during 20 floods, versus hydro- logical variables and land-use characteristics. The analysis highlighted the significant impacts of human pollution sources together with the magnitude of the flood. Regarding the results, the best linear regres- sion models linked total bacterial flood loads to peak discharge for both TTC and FS, reinforcing the assumption that in-stream bacterial stores play an important role in the level of bacterial flood loads in Mediterranean coastal rivers. At an annual scale, between 13.9 and 16.6 log 10 cfu of TTC could be sup- plied depending on the hydrological conditions during the year. Over the 12 year period, from 1994 to 2006 it was shown that the flood loads were responsible for at least 98% of the TTC total annual load and in 8 of 12 years the floods contributed to at least 99.9% of the annual loads. Over the same period on average the single major flood represents 74% of the total annual load. The contribution of in-stream bacterial stores was demonstrated but spatial variations in total flood loads showed that this contribution is difficult to evaluate. Bacteria from land stores appeared to be negligible in both catchments. Ó 2011 Elsevier B.V. All rights reserved. 1. Introduction During rainfall events high enteric bacterial loads are observed in rivers. They may come from various sources. The hillslopes of a river basin are a significant bacterial reservoir, particularly in rural and pasture catchments (Doran and Linn, 1979; Hunter et al., 1999). Bacterial land stores are gradually filled by the deposit of animal faeces from wild animals or from extensive breeding activities, or by the agricultural use of manure (Crowther et al., 2002). These land stores are washed away by runoff during rainfall events. Large amounts of bacteria attached to soil particles are brought to the riv- er through the drainage systems and by tributaries, as suggested by several authors (Sinton et al., 1997; Tyrrel and Quinton, 2003; Schoonover and Lockaby, 2006). Overflow from sewage systems in the case of excessive volumes due to runoff on urban areas, as well as failure of septic tanks in rural zones, are the other sources of bacterial loads during rainfall events (Al Bakri et al., 2008; Astrom et al., 2009). The continuous discharge of effluents from sewage treatment works (STW) also contributes significant bacterial loads (Wainright et al., 1992; Álvarez-Salgado et al., 1993). Of course, improvements have been made in this domain, thanks to the strict application of European Directives as often reported in the literature (Crowther et al., 2002; Tyrrel and Quinton, 2003). But these sources should nevertheless be taken into account. The final source of enteric bacterial loads that has been identified is the river-bed sediments. Bacteria bound to particulate organic mat- ter are settled in the river-bed sediments during low flow periods (Irvine and Pettibone, 1996; Haller et al., 2009b; Mckergow and Davies-Colley, 2010). Trapped in the sediment in the presence of organic matter, bacteria are able to survive or even to multiply (Sherer et al., 1992; Smith et al., 2008). In-stream stores of bacteria have been highlighted by a number of authors as serious sources of contamination during floods (Buckley et al., 1998; Crabill et al., 1999; Jamieson et al., 2004; Muirhead et al., 2004). For some authors, high levels of bacterial contamination during floods are mainly due to the entrainment of contaminated sediments from in-stream stores of bacteria (Wyer et al., 1996; Nagels et al., 2002). 0022-1694/$ - see front matter Ó 2011 Elsevier B.V. All rights reserved. doi:10.1016/j.jhydrol.2011.05.047 ⇑ Corresponding author. Tel.: +33 (0)467 14 42 69; fax: +33 (0)467 14 47 74. E-mail address: [email protected] (C. Salles). Journal of Hydrology 405 (2011) 501–511 Contents lists available at ScienceDirect Journal of Hydrology journal homepage: www.elsevier.com/locate/jhydrol
-
Upload
independent -
Category
Documents
-
view
4 -
download
0
Transcript of Faecal bacterial loads during flood events in Northwestern Mediterranean coastal rivers
Journal of Hydrology 405 (2011) 501–511
Contents lists available at ScienceDirect
Journal of Hydrology
journal homepage: www.elsevier .com/ locate / jhydrol
Faecal bacterial loads during flood events in Northwestern Mediterraneancoastal rivers
Yin Chu a,c, Christian Salles a,⇑, Marie-George Tournoud a, Patrice Got b, Marc Troussellier b, Claire Rodier a,Audrey Caro b
a Université Montpellier 2, HydroSciences Montpellier (UMR 5569 CNRS, IRD, Université Montpellier 1, Université Montpellier 2), F-34095 Montpellier Cedex 5, Franceb CNRS, Ecosystèmes Lagunaires (UMR 5119 CNRS, Université Montpellier 2), F-34095 Montpellier Cedex 5, Francec College of Resources and Environment, Anhui Agricultural University, Hefei 230036, China
a r t i c l e i n f o
Article history:Received 24 November 2010Received in revised form 20 May 2011Accepted 30 May 2011Available online 12 June 2011This manuscript was handled by L. Charlet,Editor-in-Chief, with the assistance of EddyY. Zeng, Associate Editor
Keywords:Faecal bacteriaFlood dynamicsFlood loadsStatistical modelsBacterial sourcesLand use
0022-1694/$ - see front matter � 2011 Elsevier B.V. Adoi:10.1016/j.jhydrol.2011.05.047
⇑ Corresponding author. Tel.: +33 (0)467 14 42 69;E-mail address: [email protected] (C. S
s u m m a r y
In Mediterranean coastal rivers, floods last often less than a few hours but supply large amounts of con-taminants to transitional and coastal waters. Estimating flood loads requires appropriate sampling strat-egies. We applied flood-scale sampling for the survey of two rivers flowing into the Thau lagoon (France).Two bacterial indicators were considered, thermotolerant coliforms (TTC) and faecal streptococci (FC).During floods, concentrations of indicator bacteria associated with non-mineral suspended solidsincreased quickly with the rising flow, their decrease during the recession period was slow and erratic.Statistical analysis was performed on total bacterial flood loads measured during 20 floods, versus hydro-logical variables and land-use characteristics. The analysis highlighted the significant impacts of humanpollution sources together with the magnitude of the flood. Regarding the results, the best linear regres-sion models linked total bacterial flood loads to peak discharge for both TTC and FS, reinforcing theassumption that in-stream bacterial stores play an important role in the level of bacterial flood loadsin Mediterranean coastal rivers. At an annual scale, between 13.9 and 16.6 log10cfu of TTC could be sup-plied depending on the hydrological conditions during the year. Over the 12 year period, from 1994 to2006 it was shown that the flood loads were responsible for at least 98% of the TTC total annual loadand in 8 of 12 years the floods contributed to at least 99.9% of the annual loads. Over the same periodon average the single major flood represents 74% of the total annual load. The contribution of in-streambacterial stores was demonstrated but spatial variations in total flood loads showed that this contributionis difficult to evaluate. Bacteria from land stores appeared to be negligible in both catchments.
� 2011 Elsevier B.V. All rights reserved.
1. Introduction Astrom et al., 2009). The continuous discharge of effluents from
During rainfall events high enteric bacterial loads are observedin rivers. They may come from various sources. The hillslopes of ariver basin are a significant bacterial reservoir, particularly in ruraland pasture catchments (Doran and Linn, 1979; Hunter et al., 1999).Bacterial land stores are gradually filled by the deposit of animalfaeces from wild animals or from extensive breeding activities, orby the agricultural use of manure (Crowther et al., 2002). These landstores are washed away by runoff during rainfall events. Largeamounts of bacteria attached to soil particles are brought to the riv-er through the drainage systems and by tributaries, as suggested byseveral authors (Sinton et al., 1997; Tyrrel and Quinton, 2003;Schoonover and Lockaby, 2006). Overflow from sewage systemsin the case of excessive volumes due to runoff on urban areas, aswell as failure of septic tanks in rural zones, are the other sourcesof bacterial loads during rainfall events (Al Bakri et al., 2008;
ll rights reserved.
fax: +33 (0)467 14 47 74.alles).
sewage treatment works (STW) also contributes significantbacterial loads (Wainright et al., 1992; Álvarez-Salgado et al.,1993). Of course, improvements have been made in this domain,thanks to the strict application of European Directives as oftenreported in the literature (Crowther et al., 2002; Tyrrel and Quinton,2003). But these sources should nevertheless be taken into account.The final source of enteric bacterial loads that has been identified isthe river-bed sediments. Bacteria bound to particulate organic mat-ter are settled in the river-bed sediments during low flow periods(Irvine and Pettibone, 1996; Haller et al., 2009b; Mckergow andDavies-Colley, 2010). Trapped in the sediment in the presence oforganic matter, bacteria are able to survive or even to multiply(Sherer et al., 1992; Smith et al., 2008). In-stream stores of bacteriahave been highlighted by a number of authors as serious sources ofcontamination during floods (Buckley et al., 1998; Crabill et al.,1999; Jamieson et al., 2004; Muirhead et al., 2004). For someauthors, high levels of bacterial contamination during floods aremainly due to the entrainment of contaminated sediments fromin-stream stores of bacteria (Wyer et al., 1996; Nagels et al., 2002).

502 Y. Chu et al. / Journal of Hydrology 405 (2011) 501–511
Under a Mediterranean climate, all these processes arefacilitated: the long dry periods that enhance accumulationprocesses are interrupted by short-duration rainfall events associ-ated with intense runoff processes. As a result, Mediterraneancoastal rivers are subject to flash floods that transport the major-ity of the annual loads of suspended solids, bacteria and othercontaminants, as reported by many authors (e.g. Meybeck et al.,1992; Cherifi and Loudiki, 1999; Letcher et al., 1999). Baudartet al. (2000) estimated that storm events contributed to 95–99%of the annual faecal bacteria loads transported by the Tech river(France) to the Mediterranean Sea. The significant amount ofpollutants released by coastal rivers in short periods of time arepotentially harmful for transitional and coastal waters: thesustainability of activities such as fishing, shellfish farming andtourism may be impacted (Wyer et al., 1996; Chigbu et al.,2005; Petersen et al., 2005; Kashefipour et al., 2006; Riou et al.,2007; Shah et al., 2007; Kay et al., 2007).
Consequently, flood events must be carefully assessed toimprove the estimate of inputs of bacteria from rivers to coastalaquatic environments in the Mediterranean context. Moreover,since high flow and flood periods are unlikely to be sampled undera regular sampling programme, specific sampling protocols areneeded (Salles et al., 2008).
The present study focused on bacteria loads during flood eventsin two Mediterranean coastal rivers that have an impact on recrea-tional activities and shellfish farming in the Thau lagoon (France),through the use of two indicator bacteria, thermotolerant coliforms(TTC) and faecal streptococci (FS). The objectives of the study wereto: (i) analyze the levels and dynamics of bacterial concentrationsduring flood events, (ii) characterize total flood loads in relation toflood characteristics and land use descriptors, (iii) estimate the total
0 5 km
Thau
lagoo
n
Medite
rrane
Pa
Pallas
V(T
Fig. 1. Location of the Vène
bacterial flood loads supplied to the lagoon by the two rivers duringfloods at an annual scale.
2. Study sites and available data
2.1. Study sites
The Thau lagoon (France) is a large brackish lagoon devoted torecreational activities and shellfish farming for which good sani-tary conditions are required throughout the year. Different studieshave proved that pollutants (including bacteria) mainly come fromits catchment area (Fiandrino et al., 2003; Tournoud et al., 2006).Our study focused on the two main rivers draining the Thau catch-ment: Pallas and Vène (Fig. 1).
The Pallas river is a typical Mediterranean intermittent river. Its53 km2 basin is mainly composed of marl-clay, partly filling karsticareas in the upper part (25% of the catchment area). Natural areas(46%) consist of garrigue and pine trees. Agricultural areas (52% ofthe catchment area) consist of vineyards (30%), market gardening,orchard, and cereals. The basin is sparsely populated and has nosignificant industrial activity. Point-source pollutant inputs comemainly from one winery and one sewage treatment works (STW)sized for 2000 equivalent-inhabitants. The STW uses extensivetreatment ponds.
The Vène river drains a superficial basin of 67 km2 that rangesfrom 2 to 323 m in elevation. The catchment is divided into twomain zones: (i) the central part of the basin, which covers about40% of the total catchment area, is a flat marly plain dedicated toagriculture (mainly vineyards: 21% of the total basin area);(ii) limestone massifs on both sides are highly karstified andcovered by natural garrigue used for sheep and poultry. Two
anSea
Urban
Agricultural
Natural
Karstic spring
Rain gauge
Stream gauge
STW
Spring 1
V(R1)
V(R3)
V(R2)
)
Spring 2
and Pallas catchments.

Y. Chu et al. / Journal of Hydrology 405 (2011) 501–511 503
intermittent karstic springs feed the river: the upper one (Spring1) isthe river spring; the lower one (Spring2) is located a few hundredmeters upstream from the outlet. Small urban zones (3% of the catch-ment area) are spread in the central zone. Point-source pollutantinputs come mainly from two wineries and three STWs, altogethersized for 9800 equivalent-inhabitants. Two STWs are extensivetreatment ponds that discharge their effluents directly into the river;the third one, located in the upper basin, uses activated sludgeprocesses. There is no disinfection process at any of the three plants.
3. Available data
3.1. Hydrological data
The locations of rain and stream gauges are shown in Fig. 1. Thestream gauge in the Pallas river is located at the outlet (Pa station).Gauges in the Vène river are located at the outlet (V(R3) station), atthe upper spring (V(R1) station 150 m downstream from Spring1),at an intermediate location (V(R2) station), and in its main tribu-tary (V(T) station). The main characteristics of the sub-catchmentsare summarized in Table 1. Rainfall and flow data are available at a5 min time step.
Fig. 2 presents rainfall – and discharge versus time at Pa andV(R3) stations for a typical hydrological year. Both rivers showedtypical Mediterranean intermittent behavior, with long low flowperiods interrupted by short floods.
3.2. Sampling and analytical protocols
Regular and flood surveys were conducted at the gaugingstations: from August 1993 to September 1995 at Pa and V(R3)stations, and from October 2002 to September 2006 at V(R3),V(R2), V(R1) and V(T) stations. The routine survey consisted inbi-monthly grab samples. During floods, samples were collectedby an automatic sampling device.
Water samples were stored in clean, sterile 1 L bottles at 4 �C.The samples were filtered at the laboratory within less than 6 hafter collection. Thermotolerant coliforms (TTC) and faecal strepto-cocci (FS) were counted, using the standard membrane filtrationmethod with three replicates (APHA, 1992). The results are ex-pressed in colony forming units per 100 mL (cfu/100 mL). Totalsuspended solids (TSS) and ash free dry mass (AFDM) were mea-sured for each sample.
3.3. Calculation of loads
The ‘‘instant load at time t’’ L(t), is the bacterial concentration attime t C(t), by Q(t) the river flow discharge at time t :
LðtÞ ¼ kLCðtÞQðtÞ ð1Þ
where kL, the time unit conversion factor, equals 3.6 107 if L, Q and Care respectively expressed in cfu/h, m3/s and cfu/100 mL.
Total load during a flood event (TFL) was calculated followingSalles et al. (2008):
Table 1Sampling site characteristics.
Watershed Study site Area (km2) Land use Po
Agriculture (%) Urban (%) Nature (%) To
Pallas Pa 52.0 55.6 1.2 38.4 39
Vène V(T) 17.6 24.4 1.8 73.8 13V(R1) 1.6 16.6 0.0 83.4 0V(R2) 35.0 48.9 5.6 45.5 77V(R3) 67.2 39.3 4.2 56.5 11
a (nb) = number of units ; p.e.: person equivalent.
TFL ¼Xm
j¼1
kT CintðtjÞ QðtjÞ dt ð2Þ
where m is the number of discharge data during the flood event; dtis the discharge data time step (here dt = 5 min) ; Cint(tj) is the lin-ear interpolated concentration value at time tj, between the ob-served values C(ti) and C(ti+1), with ti 6 tj < ti+1; kT, the unitconversion factor, equals 6105 if TFL, Q, Cint and dt are respectivelyexpressed in cfu, m3/s, cfu/100 mL and min.
3.4. Statistical analysis
All the bacterial concentration data were log10 transformedprior to analysis to reduce the skewness of their distribution; thesame transformation was applied to bacterial load data. All meanbacterial concentrations (or loads) reported here are geometricmeans, calculated as the antilog of the mean of the log10 trans-formed concentrations (or loads).
Relationships between mean bacterial concentrations (or loads)and explanatory variables (characteristics of catchments or/andhydrological conditions) were examined using the Pearson correla-tion coefficient (Pearson-CC). Prior to analysis, the independence ofexplanatory variables was verified on the basis of significant Pear-son at p < 0.05. Variables with more than 25% of missing or zerovalues were excluded from the analysis. Statistical significancewas assessed with a confidence level of 95%.
4. Results
Over the whole survey, 147 samples were collected in routineand 242 samples during floods. 21 floods were correctly sampled,as recommended by Salles et al. (2008). The events are namedX#n, where X is the name of the river (i.e. Pa, V) and the numberingn refers to the rainfall event and is ordered chronologically. In thecase of the Vène river the name of the river is followed by the nameof the gauging station into brackets (as example V(R3) for the R3 sta-tion). The 21 floods were generated by 11 rainfall events: 3 in spring(#3, #4, #5), 6 in September (#1, #7, #8, #9, #10, #11) and 2 in au-tumn. Except for the events #3, #5, #7 and #11, the sampling wasdone at least at two gauging stations, enabling the comparison ofthe river response in terms of bacterial flood loads. Table 2 presentsthe main characteristics of the events. The floods are characterizedin terms of duration (D), number of samples (NS), TTC and FS totalflood loads (TTC-TFL, FS-TFL), total rainfall amount (H), peak rainfallintensity over 15 mn (PI), peak discharge (PQ), total flood volume(V), initial discharge (AQ), total rainfall amount during the 10 and30 previous days (H-10, H-30). For a given station, the rainfalldescriptors are calculated using the nearest rain gauge.
Floods lasted from 3 h to 6 days. Some events presented a verylow peak discharge but are representative because they occur aftera long dry period with a river bed dry or nearly dry. TFL ranges from10.98 to 14.90 log10cfu for TTC and from 10.83 to 14.74 log10cfu forFS.
pulation Pollution sources
tal (hab.) Septic tanks (hab.) STW p.e. (nb)a Livestock (nb)a Winery (nb)a
57 399 2500 p.e. (1)
70 233 1
30 793 3800p.e. (2) 3 2400 1299 9800 p.e. (3) 5 3

Jul-
10
PallasVène
1995 1995
10
0
6
12
18
24
30
Sep-1994
Oct-1994
Nov-1994
Dec-1994
Jan-1995
Feb-1995
Mar-1995
Apr-1995
May-1995
Jun-1995
Jul-1995
Aug-1995
Flow
(m3/
s)0
20
40
60
80
100
Hou
rly ra
infa
ll (m
m)
0
3
6
9
12
15
Sep-1994
Oct-1994
Nov-1994
Dec-1994
Jan-1995
Feb-1995
Mar- Apr-1995
May-1995
Jun-1995
Aug-1995
Flow
(m3/
s)
0
20
30
40
50
Hou
rly ra
infa
ll (m
m)
PallasVène
(a) (b)
Fig. 2. Vène and Pallas rivers: rainfall-flow versus time – year 1994–95: Hydrogram (lines) combined with hyetograph (vertical bars); (a) Vène (V(R3)) and (b) Pallas (Pa).
504 Y. Chu et al. / Journal of Hydrology 405 (2011) 501–511
4.1. Dynamics of concentrations during floods
Descriptive statistics of TTC and FS concentrations observedduring the routine survey and the flood events are presented inFig. 3, using box-and-whisker plots. Considering all flood samplestogether, TTC (respectively FS) concentrations varied between 1.4(respectively 1.1) and 5.9 log10 cfu/100 mL. But the arithmeticmean of faecal bacteria concentrations observed during the routinesurvey is about one order of magnitude lower than in flood survey,whatever the gauging station. As already pointed out by a numberof authors (e.g. Kirchner et al., 2004), routine monitoring misses al-most all flood events and thus fails to reveal the fine structure andthe amplitude of concentrations during flood. During a given flood,concentrations of both indicator bacteria could vary over three or-ders of magnitude. Moreover, looking at each flood separately, it isworth noting that the ranges of mean concentrations of TTC and FSwere similar. The earliest autumn floods were more contaminatedthan subsequent floods, for both TTC and FS (e.g. P#1 vs P#2 orV#9(R2) vs V#10(R2)): bacterial land and in-stream stores, filledduring the dry periods, are partly flushed by the very firstfloods (Wilkinson et al., 2006), but subsequent floods are still
Table 2Flood characteristics.
Rainevent
Floodname
Flood startingdate
Duration NS Total flood loads
D (h) TTC(log10cfu)
FS(log10cfu)
#1 P#1 22/09/1994 56 29 12.80 12.85V#1(R3) 22/09/1994 45 37 13.07 13.25
#2 P#2 19/10/1994 135 7 14.43 14.27V#2(R3) 19/10/1994 105 6 14.90 14.74
#3 aP#3 24/04/1995 67 5 11.21 10.31#4 P#4 14/03/1996 144 4 13.95 13.39
V#4(R3) 14/03/1996 137 4 14.42 13.91#5 P#5 23/04/1996 18 8 12.50 12.13#6 V#6(R3) 24/11/2002 90 18 12.92 12.98
V#6(R1) 24/11/2002 91 3 10.98 10.83#7 V#7(R3) 07/09/2003 19 9 11.45 11.36#8 V#8(R3) 22/09/2003 135 9 14.76 14.43
V#8(R2) 22/09/2003 117 17 14.57 14.36V#8(T) 22/09/2003 67 3 13.32 13.36
#9 V#9(R2) 01/09/2004 10 9 13.32 13.32V#9(T) 02/09/2004 4 8 11.45 12.09
#10 aV#10(R3) 13/09/2004 9 14 14.01 14.53aV#10(R2) 13/09/2004 11 13 13.91 14.05aV#10(R1) 13/09/2004 3 2 12.31 12.06aV#10(T) 13/09/2004 10 13 12.58 13.58
#11 aV#11(R3) 13/09/2006 39 21 14.47 14.39
NS: number of water samples collected during the flood.H: total rainfall amount (at the nearest rain gauge); PI: peak intensity over 15 min (allPQ: peak discharge; V: flood volume.AQ: preceding discharge; H-10 (H-30): total rainfall amount over 10 (30) days precedin
a Validation flood.
contaminated. However, #7 and #8 events, observed in September2003 at V(R3) station did not follow the same pattern: The firstflood was so small (with a peak discharge of less than 70 L/s) thatbacterial stores were not flushed out at all. Late autumn floodswere the least contaminated for both TTC and FS (e.g. V#6(R3)).
Detailed dynamics of bacterial concentrations are presented inFig. 4a–d for four well-sampled floods. For all the floods, concentra-tions of FS and TTC showed similar dynamics: concentrations startsone order of magnitude higher that level observed in routine surveyand then decreased after the peak discharge. It may be assumedthat after the peak, both dilution effects and exhaustion of bacterialstores resulted in a decrease in bacterial concentrations. Looking atthe FS/TTC ratios, it is obvious that, for most of the floods, concen-trations of FS were higher than those of TTC during the rising flood.It may be assumed that the first part of the flood corresponds to theflushing of old bacterial stores with high organic matter contents inwhich streptococcus had a longer capacity to survive than coliforms(Sherer et al., 1992; del Mar Lleo et al., 2005; Haller et al., 2009a). Infact, during this period, ash-free dry mass (AFDM) representedmore than 70% of the total suspended solids (TSS): Suspended solidsconsisted mainly of organic matter associated with indicator
Rain eventcharacteristics
Floodcharacteristics
Antecedent hydrologicalconditions
H(mm)
PI (mm/h)
PQ (m3/s)
V(103 m3)
AQ (m3/s)
H-10(mm)
H-30(mm)
65.0 44.8 1.215 25.4 0.000 27.6 68.863.8 22.4 1.356 40.7 0.005 25.1 77.9
119.0 46.4 8.076 1463.3 0.012 24.4 116119.0 14.8 18.150 5213.5 0.352 34.6 165
17.4 4.0 0.019 1.9 0.002 2.8 2.867.2 1.2 6.810 1369.0 0.336 11.8 72.655.4 1.2 16.010 3922.9 2.000 21.4 21.4
8.2 10.4 0.922 24.6 0.125 9.8 14.617.3 22.0 2.230 529.1 0.303 18.6 87.616.8 12.0 0.902 179.8 0.000 17.9 91.1
9.8 24.0 0.067 1.7 0.010 2.1 39.6116.1 86.8 13.390 1734.6 0.009 0.0 6.4125.2 86.8 8.595 1582.5 0.002 0.0 3.5125.2 86.8 6.128 274.3 0.000 0.0 4.8
22.5 75.2 1.715 9.2 0.001 3.0 25.516.8 26.8 0.146 0.4 0.000 3.3 21.955.4 115.6 19.840 318.0 0.000 16.0 41.124.6 52.4 10.700 140.4 0.001 15.4 47.2
1.8 6.8 1.637 3.4 0.000 15.4 47.21.6 6.8 2.803 19.8 0.000 16.4 37.2
14.0 42.4 12.980 366.0 0.010 0.4 21.6
available rain gauges).
g the event.

V#11
(R3)
(21)
V#10
(T) (
13)
V#10
(R2)
(13)
V#10
(R3)
(12)
V#9(
T) (8
)
V#9(
R2)
(9)
V#8(
R2)
(17)
V#8(
R3)
(9)
V#7(
R3)
(9)
V#6(
R3)
(18)
P#5
(8)
V#2(
R3
(6)
P#2
(7)
V#1(
R3)
(37)
P#1
(29)
All f
lood
s (2
42)
Reg
ular
(147
)
0
1
2
3
4
5
6
Ther
mot
oler
ant c
olifo
rm (l
og10
cfu
/100
mL)
Reg
ular
(147
)
All f
lood
s (2
42)
P#1
(29)
V#1(
R3)
(37)
P#2
(7)
V#2(
R3
(6)
P#5
(8)
V#6(
R3)
(18)
V#7(
R3)
(9)
V#8(
R3)
(9)
V#8(
R2)
(17)
V#9(
R2)
(9)
V#9(
T) (8
)
V#10
(R3)
(12)
V#10
(R2)
(13)
V#10
(T) (
13)
V#11
(R3)
(21)
0
1
2
3
4
5
6
Faec
al S
trept
ococ
cus
(log1
0 cf
u/10
0mL)
(a)
(b)
Fig. 3. Box plots of faecal bacteria concentrations categorized by floods: The arithmetic mean is represented by circles, black diamonds represent minimum and maximumvalue. The box defines the 25th and 75th percentiles and median, the whiskers length is 1.5 the difference between the 1st and 3rd quartile. Between brackets after the floodname is the number of samples collected during the flood. Flood events for which less than six samples were collected are not reported on this figure.
Y. Chu et al. / Journal of Hydrology 405 (2011) 501–511 505
bacteria, as already reported by Baudart et al., (2000). During therecession, most of the floods showed TTC/FS ratios higher than 1,reflecting the impact of a recent source of contamination: probablythe overflow of combined sewer systems.
Correlation analysis confirmed the above assumptions. As the re-sult of their related dynamics, the correlations between TTC and FSconcentrations (log10 transformed variables) were strong exceptfor floods occurring during the #9 and #10 rain event. Bacterial con-centrations and suspended solids were also closely correlated (min-imum Pearson-CC 0.7, p < 0.05): indicator bacteria were mainlybound to particulate matter removed from the riverbed sedimentsand from soil particles. The correlations between bacterial concen-trations and flow discharges were weaker; moreover, Pearson-CCshowed positive or negative values depending on the flood dynam-ics. For example, the complex V#8 (R2) flood event consisted in a fastrainfall–runoff event that was followed by a karstic flood (Fig. 4c):
Pearson-CC between bacterial concentrations and flow dischargeswere negative for both TTC (r = �0.46) and FS (r = �0.42) atp < 0.05, underlying the major dilution effect of the karstic floodon bacterial concentrations. Another example is the P#2 event,(Fig. 4b): Pearson-CC between bacterial concentrations and flow dis-charges were positive for both TTC (r = 0.82) and FS (r = 0.85),confirming the hypothesis of a strong flush effect and the exhaustionof bacterial stores.
4.2. Bacterial flood loads
TFL were evaluated for the complete set of floods. The results (inlog10 transformed values) are shown in Table 2, together with thehydrological characteristics of the observed flood events.
Considering all flood events together, TTC-TFLs varied from10.98 to 14.90 log10cfu; FS-TFLs varied from 10.83 to 14.74

2
3
4
5
6
94/09/2212:00
94/09/2300:00
94/09/2312:00
94/09/2400:00
94/09/2412:00
94/09/2500:00
94/09/2512:00
94/09/2600:00
Indi
cato
r bac
teria
(l
og10
cfu
/100
mL)
0
2
4
Dis
char
ge (m
3/s)
2
3
4
5
6
94/10/1900:00
94/10/2000:00
94/10/2100:00
94/10/2200:00
94/10/2300:00
94/10/2400:00
94/10/2500:00
Indi
cato
r bac
teria
(l
og10
cfu
/100
mL)
0
10
20
30
40
Dis
char
ge (m
3/s)
TTC (cfu/100mL)
FS (cfu/100mL)
Discharge (m3/s)
time of sampling
2
3
4
5
6
03/09/2206:00
03/09/2209:00
03/09/2212:00
03/09/2215:00
03/09/2218:00
03/09/2221:00
03/09/2300:00
Indi
cato
r bac
teria
(l
og10
cfu
/100
mL)
0
10
20
30
40
Dis
char
ge (m
3/s)
2
3
4
5
6
06/09/1318:00
06/09/1406:00
06/09/1418:00
06/09/1506:00
06/09/1518:00
Indi
cato
r bac
teria
(l
og10
cfu
/100
mL)
0
10
20
30
40
Dis
char
ge (m
3/s)
(a) (b)
(c) (d)
Fig. 4. Dynamics of indicator bacteria during floods: Discharge and indicator bacteria versus time during four sampled floods: Pallas river flood P#1 (a) and P#2 (b) and alongthe Vène river V#8(R2) (c) and V#11(R3) (d). Black circles correspond to TTC, stars to FS, the line corresponds to discharge, and empty dots on the hydrograph correspond tothe time of sampling.
Table 3Pearson correlation coefficients (n = 20) between bacterial TFL and descriptors of therainfall event, the flood and preceding hydrological conditions. Definition of theindependent variables are given in the column headings in Table 2.
Independent variables Dependent variables [log]
TTC-TFL FS-TFL
Agriculture% ns nsUrban% 0.516 0.557*
Natural% ns nsPop%_septica ns nsPop_densityb 0.565* 0.576*
H 0.666* 0.588*
PI 0.437 0.508PQ 0.819* 0.787*
V [log10] 0.818* 0.719*
AQ ns nsH10 ns nsH30 ns ns
ns: not significant (p P 0.05).[log] indicates that the data are log10 transformed.
a % of the population using a septic tank.b Population density.
* p < 0.01.
506 Y. Chu et al. / Journal of Hydrology 405 (2011) 501–511
log10cfu. In most cases, for a given flood, TTC- and FS-TFLs had sim-ilar orders of magnitude. But during early spring floods (e.g. P#4 orV#4(R3)) TTC-TFL reached higher values than FS-TFL: Old bacterialstores are not involved in such flood probably because accumula-tion processes on the hillslopes or in the riverbed are limited dur-ing the antecedent wet period (i.e. winter). The lowest TFL valueswere observed in the smallest catchment (i.e. V(R1)) or duringsmall rainfall–runoff events (e.g. P#3 or V#7); the highest valueswere observed in early autumn floods. TFL increased along theVène river (e.g. #6, #8 and #10 rain events).
Correlation analysis is used here (i) to point out which of thehydrological characteristic(s) (see Table 2) is (are) statistically bestlinked to TFLs and (ii) to check which land use descriptor best ex-plain TFL. The land-use descriptors concern agricultural, naturaland urban areas (expressed as a percentage of the catchment area),population density and the population that uses septic tanks and isnot connected to the sewage system. Correlations between TFLs(log10 transformed values) and explanatory variables are presentedin Table 3.
We found highly significant relationships between TFLs and thehydrological descriptors of the event, in particular PQ, V and H,which were linked to the magnitude of the flood. PI showed weak-er correlations with TFLs. PI is more related to land phase pro-cesses. The magnitude of the dry period before the flood,described by H-30, shows no significant correlation with TFL. Thatwould suggest low contribution from the hillslope to the bacteriaTFL. Since Salles et al. (2003) underlined the importance of H-30for total suspended solid total flood load in the same catchments.There were no significant correlations between TTC-TFL (orFS-TFL) and antecedent hydrological condition.
Correlations between TFL and land-use descriptors were notvery strong. Urban area and population density were both linked
to TFL both for TTC and for FS. The lack of significant correlationswith agricultural or natural areas reflects the dominance of urbansources of the faecal indicator during floods. The effects of agricul-tural activities, dominated by vineyards, were weak. Even whennatural areas were used for sheep and poultry, they did not pro-duce significant amounts of bacterial pollution. The strong impactof human sources on bacterial loads during floods was quitesurprising for several reasons: these catchments are sparsely pop-ulated; a dense sewage network deserves the scattered inhabit-ants, so only a small percentage of the population use septic tanks.

10
11
12
13
14
15
16
Observed TTC_TFL (log10cfu/100mL)
Pred
icte
d TT
C_T
FL (l
og10
cfu) Pa#3
V#10(R3)
V#10(R2)
V#10(R1)
V#10(T)
V#11(R3)
1 factor model:TFL = 0.176 PQ +12.249r2 adjusted=0.679
10
11
12
13
14
15
16
10 11 12 13 14 15 16
10 11 12 13 14 15 16
Observed FS_TFL (log10cfu/100mL)
Pred
icte
d FS
_TFL
(log
10cf
u)
Pa#3
V#10(R3)
V#10(R2)
V#10(R1)
V#10(T)
V#11(R3)
1 factor model:TFL = 0.150 PQ +12.293r2 adjusted=0.594
(a)
(b)
Fig. 5. a and b: Plot of model results: one-factor model: observed versus predicted bacteria TFL (a) and SF(b). For both figures, empty (respectively black) symbols are thefloods used for calibration (respectively validation); vertical bars represent the 95% prediction interval.
Y. Chu et al. / Journal of Hydrology 405 (2011) 501–511 507
Tests showed that when we randomly removed one flood fromthe data set, the correlation matrix remained unchanged. The non-significant correlations concerned the same pair of variables. H, Vand PQ variables always showed the strongest correlations, withr values greater than 0.7 (significance at p < 0.01). The ranking ofthe three correlation coefficients depended upon which flood wasremoved, but most of the best correlations involved PQ.
Thus, in the coastal Mediterranean catchments studied here,bacterial flood loads were mainly explained first by the magnitudeof the flood that flushed out riverbed sediments, then by the im-pact of human sources and lastly by the intensity of the rainfallthat contributed to flushed out bacterial land store.
5. Bacterial flood modeling
5.1. Statistical modeling of total flood loads
The dataset was split into two sub-sets to investigate linearrelationships between hydrological variables, land use-descriptors
and TFL. Five floods were kept for validation purposes: one wasrandomly chosen in each catchment; the 15 others were used tofit the models (Table 2).
From the above correlation analysis, only three hydrologicalvariables were kept as explanatory factors: PQ (flood magnitude),PI (land process magnitude), H30 (antecedent conditions); fourout of five land-use descriptors were kept: percentage of agricul-tural area (agricultural impacts), percentage of natural area (breed-ing impacts), the population using septic tanks and populationdensity (human impact magnitude). The other variables were re-moved, because correlations existed among them at p < 0.05. Hwas correlated to all the hydrological variables except H-10;H-10 and H-30 were correlated; the same was true for V and PQ,MI and PI, percentage of urban area and population density.
Multiple linear regression models were fitted between TFL (TTCand FS), and the set of explanatory factors using an ascendant step-wise method.
As expected, peak discharge appeared to be the best explana-tory factor for 1-factor linear regression models for both TTC-TFLand FS-TFL. The plots of observed versus predicted TFLs are shown

11
12
13
14
15
16
17
18
19
1994-95 1995-96 1996-97 1997-98 1998-99 1999-00 2000-01 2001-02 2002-03 2003-04 2004-05 2005-2006 2006-07
Ann
ual T
TC l
oad
(log1
0 cf
u) load during no-flood
the major flood
all floods minus the major flood
total
Not
Ava
ilabl
e
0
200
400
600
800
1000
1200
1994-95 1995-96 1996-97 1997-98 1998-99 1999-00 2000-01 2001-02 2002-03 2003-04 2004-05 2005-06 2006-07
rain
dep
th a
t ann
ual s
cale
(mm
)
Not
Ava
ilabl
e
(a)
(b)
Fig. 6. a: Estimated annual loads at the outlet of the Vène river. Black bars represent the load during the period without flood, vertical hatched bars is the load of the majorflood, right hatched bars are the load of all floods except the major flood and empty bars represent the total annual load. b: Annual rainfall depth over the Vène basin. Averageinter annual rain depth (dotted line).
508 Y. Chu et al. / Journal of Hydrology 405 (2011) 501–511
in Fig. 5a and b. The adjusted coefficient of determination wasalready high for TTC-TFL (r2 = 0.679). The five validation pointswere within the 95% prediction interval. However two of themare located far from the model line for TTC: Predicted TTC-TFL loadfor V#10(R3) flood were 1.5 orders of magnitude higher than theobserved value. For FS, the worst prediction also concerned theV#10(R3) flood, with an excess error in the order of magnitudeof 2. The 2-factor models were similar for TTC-TFL and FS-TFL.The second best explanatory factor was population density. ForFS, there was a significant increase in the coefficient of determina-tion compared to the 1-factor model: from 0.594 to 0.712. Invalidation, all the predicted values were within the 95% predictioninterval, as already observed for the 1-factor model. Nevertheless,the 2-factor model does not improve the accuracy of the predictedload. Opposite, for some of the validation points, the predictionaccuracy from the 2-factor model is less than prediction from the1-factor model. The coefficient of determination improvement forFS was too slight to justify the use of the 2-factor models.
5.2. Annual estimates of bacterial loads due to flood events
The 1-factor model was applied on the discharge measured on a5 min time step at the outlet of the Vène river (R3 station) fromSeptember 1994 to August 2007. For the 12 year period we derivedthe annual TTC loads considering loads from floods and loads dur-ing periods without flood. Flood loads were calculated using thestatistical model derived from this study. Loads during no-floodperiod are estimated from the product of the volume and the med-ian value of the TTC concentration observed during the regularsampling.
Fig. 6a reports the total annual loads with the loads during: no-flood; the major flood and during all floods except the major floodfor the 12 years data. Annual rain depth observed over the basinand the average inter-annual rain depth estimated by Grillot(2006) are given Fig. 6b.
Total annual load ranges over three orders of magnitude from13.92 to 16.61 log10cfu. The total load uncertainty derived fromour statistical model, is close to one order of magnitude. The an-nual basin export is in between 1.2 1012 and 6.1 � 1014 cfuTTC/km2/year, on average it equals 1.3 � 1014 cfu TTC/km2/year.This is close to the export coefficient for Scotland and Northern Ire-land of between 1013 and 1014 cfu/km2/year suggested by Kay et al.(2007) but is two orders of magnitude larger than the export coef-ficient reported by Mckergow and Davies-Colley (2010) for the rur-al Motueka basin. Nevertheless, a large inter-annual variability isobserved and the floods contribution is of high importance. Lowannual loads (i.e. in the range 1014 cfu) coincide with annual raindepth lower than the average inter-annual rain. But a dry year doesnot necessarily imply low loads (e.g. year 2004–2005). It dependsmore on the temporal distribution of the rain during the year thanthe annual rain depth. For the all years, the contribution of no-flood periods to the annual TTC load represent never more than2% of the total annual load. For 8 years out of 12, the floods eventsare bringing at least 99.9% of the annual load. Furthermore, it ap-pears that the single major flood has a great impact on the annualflood load. On average, at the year scale, the load of the single ma-jor flood is 10 times more than the all other floods. It contributes atleast to half of the annual flood load. Over the 12 year period inaverage the single major flood contributes to 74% of the total an-nual load. Such results emphasized the need to carefully assessthe inputs during flood.

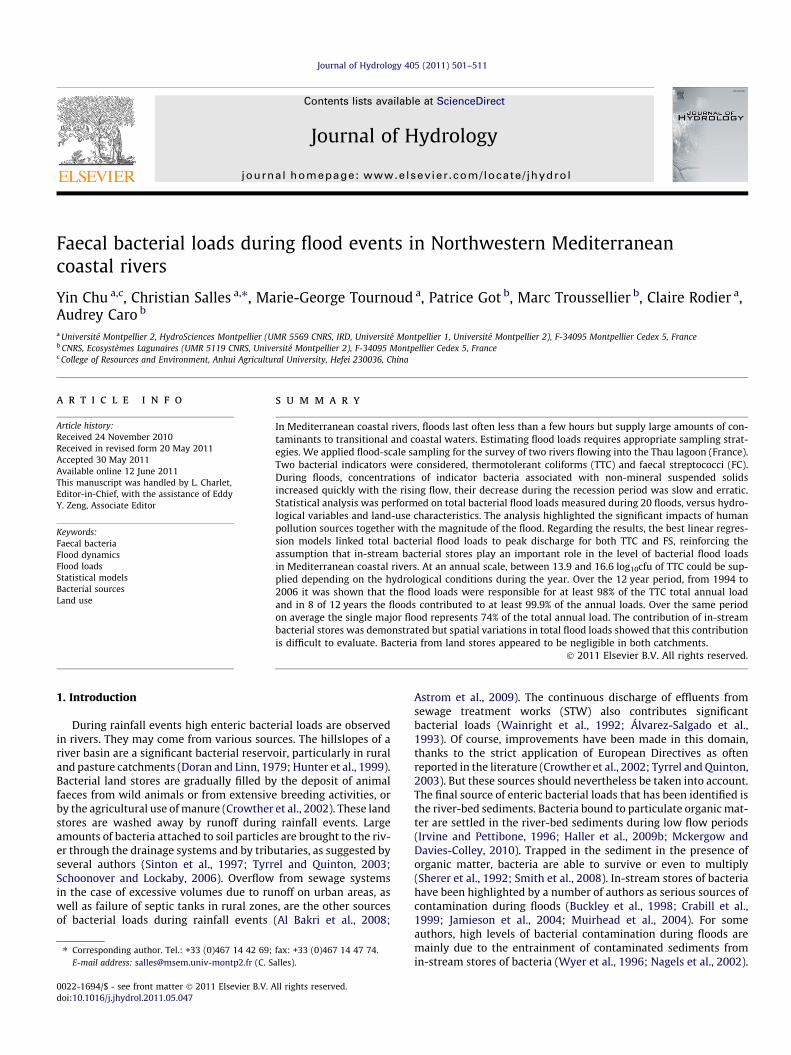
Fig. 7. Spatial evolution of bacterial total flood loads along river reaches during the #10 rain event. Black bars correspond to measured loads at the gauging stations, righthatched bars to estimated loads by runoff from land stores, dotted bars to estimated loads by sewage overflow and left hatched bars to estimated loads from in-stream stores;empty bars represent the sum of the three estimations plus the load observed at the upstream gauging station.
Y. Chu et al. / Journal of Hydrology 405 (2011) 501–511 509
5.3. Sources of bacterial loads during a flood event
Attention was paid to increases in bacterial load along the Vèneriver to estimate the apportionment of the bacterial load withinthe various sources of bacteria. The gauging stations are locatedalong the Vène river, from the spring (R1) to the outlet (R3). Here-after, the results are illustrated with specific reference to TTCwhich was closely related to FS (r = 0.95, p < 0.01).
Fig. 7 presents the balance sheet of bacterial total flood loadsalong the Vène river reaches for the #10 rain event. Total floodloads of TTC measured at the gauging stations V(R1) , V(R2)and V(R3) are compared with estimated loads supplied to the riv-er along V(R1)-to-V(R2) and V(R2)-to-V(R3) river reaches. Alongthe river reach, bacterial loads were assumed to originate from:(i) runoff over hillslope bacterial land stores; (ii) overflow of sew-age systems and (iii) in-stream bacterial stores accumulated dur-ing the dry season and flushed during floods. Loads from landstores were roughly calculated by multiplying an estimated run-off volume supplied to the river between the two gauging sta-tions by an estimated land runoff bacterial concentration. Theland runoff bacterial concentration was estimated from the high-est event mean concentration observed at the V(R1) station. Actu-ally, at the V(R1) station the almost source of bacterial is thewashing of land stores by runoff. Loads from overflowing sewagesystems were calculated by multiplying an estimated duration ofoverflow (taken as equal to the duration of rainfall events lastingmore than 5 min with intensities exceeding 10 mm/h) by an esti-mated bacterial fluxes of waste waters (Ellis and Yu, 1995). Loadsfrom in-stream stores were calculated by multiplying the numberof dry days before the flood by the daily amount of contamina-tion continuously supplied to the river by the STW during thedry season. The #9 rain event occurs ten days before the #10 rainevent. It is indeed possible to place the period before the #10 rainevent in the same category as a long dry period. Actually low lev-els of TFL where observed during the #9 rain event and we as-sume that in-stream-stores are poorly affected by the #9 rainevent.
It is worth noting that the total load observed at the V(R1)gauge station represented only 2% of the total load observed atthe V(R2). TFL was 2 orders of magnitude lower at V(R1) stationthan at V(R3) station. The proportions were even lower in termsof volume. Looking at the estimates of V(R1)-to-V(R2) loads, bacte-rial loads from land stores were 20% of loads from the othersources. Overflows of sewage systems and in-stream stores arelikely to have made similar TTC contributions. Adding V(R1) TFLto V(R1)-to-V(R2) estimated loads represents no more than 20%of observed V(R2) TFL.
The V(R2)/V(R3) ratios were much higher than V(R1)/V(R2) ra-tios in terms of volumes and loads: V(R2) represents one half of thebacterial loads at the outlet during the flood. Between V(R2) andV(R3), land and in-stream stores are likely to have contributed sim-ilar volumes of TTC and FS. But their loads were more than two or-ders of magnitude lower than V(R3) TFL. Maximum loads fromsewage overflows plus V(R2) TFL were of the same order of magni-tude as V(R3) TFL. But no more than 60% of V(R3) TFLs were ex-plained by adding V(R2), V(T) TFLs and mean V(R2)-to-V(R3) loads.
So, estimated loads originating from the potential sources didnot entirely explain the spatial increase in TFL along the riverduring the flood event. Some of the sources were probably under-estimated, or other processes should have been taken into consid-eration. In-stream stores of bacteria in particular require furtherinvestigation. Some studies have reported high concentrations ofbacteria in riverbed sediments (Baudart et al., 2000; Jamiesonet al., 2004), but the rates of accumulation of bacteria in riverbedsediments are not yet well known. Moreover, due to the presenceof organic matter, bacteria trapped in sediments are probably ableto survive and even to multiply (Sherer et al., 1992). At the end ofthe dry period, the total stock of indicator bacteria in in-streamstores could be much higher that the bacterial loads released intothe river by the continuous direct point-sources. Got et al. (2006)observed increasing bacterial concentrations in the riverbed sedi-ments of the Vène river during one dry month: from 3.3 to4.8 log10cfu per 100 cm3 of dry sediment for TTC and 4.3 to5.3 log10cfu per 100 cm3 of dry sediment for FS; but these figures

510 Y. Chu et al. / Journal of Hydrology 405 (2011) 501–511
are difficult to extrapolate all along the river. Other possiblesources of contamination also need further investigation.
6. Conclusion
The aim of this study was to characterize bacterial loads duringMediterranean flood events in terms of temporal dynamics andspatial evolution and to relate total bacterial flood loads to floodcharacteristics and land-use descriptors. A final discussion gives afirst estimation of the apportionment of the bacterial load withinthe various sources along the river.
During the rising flood period, concentrations of indicator bac-teria increased rapidly. Bacterial concentrations peaked beforepeak discharge. This fast response is attributed to bacteria trappedin the sediments, in-stream stores bacteria that were flushed bythe high flow velocities. During the recession period, the decreasein concentrations was slow and sometimes erratic. During this per-iod, TTC/FS ratios were generally higher than 1, pointing to thecontribution of more recent sources than in stream stores bacteria,probably the overflow of the combined sewage systems.
Correlation analysis showed that, (i) Among the land-usedescriptors, the percentage of urban areas and population densitywas most strongly correlated with total flood loads. So, in theVène and Pallas rivers, agricultural and rearing activities have alower impact on bacterial contamination of the rivers than humansources of indicator bacteria. (ii) Among the hydrological variables,total flood loads were explained by the magnitude of the flood, thatis to say by peak discharge, flood volume and rainfall amount, butweakly correlated with peak rainfall intensities. This confirmedthat land processes (controlled by rainfall intensities) had a limitedimpact on the bacterial loads in the rivers, but that rivers processes(controlled by peak discharge and flood volume) are of primaryimportance.
Simple linear regression models were used to estimate totalflood loads of TTC and FS. The 1-factor model, relating loads to peakdischarge, showed better agreement than the 2-factor model,which added the influence of population density. Our attempt toextrapolate to total annual loads highlighted the importance offloods and the single major flood to the bacterial loads.
The advantage of the statistical model for estimating the floodloads brought to the lagoon by the two rivers on an annual scaleis its simplicity and its robustness.
Bacterial loads are increasing along the river. A raw approachshows that land sources made rather small contributions and only40–70% of bacterial loads at the gauging stations could be ex-plained by the estimated contribution of bacterial in-stream storesand overflows of sewage systems.
For a better understanding of bacterial accumulation in the riv-erbed between floods, a more deterministic approach is necessaryin order to integrate the bacterial processes that occur during thelow flow periods.
Acknowledgments
This study was performed in the scope of the PNEC LagunesMéditerranéennes program of the Institut Français de la Mer (IFR-EMER, France) and the Institut des Sciences de la Terre (INSU,CNRS, France). Some data presented in the paper were gained inthe scope of the Contrat pour l’Etang de Thau, funded by the RégionLanguedoc-Roussillon (France) and the Agence de l’Eau Rhône-Méditerranée-Corse (France). During her participation to thisstudy, Yin Chu benefited from a doctoral grant in the scope ofthe European Project DITTY (‘‘Development of an information tech-nology tool for the management of Southern European lagoons un-der the influence of river-basin runoff’’ - EVK3-CT-2002-00084).
References
Al Bakri, D., Rahman, S., Bowling, L., 2008. Sources and management of urbanstormwater pollution in rural catchments, Australia. Journal of Hydrology 356(3–4), 299–311.
Álvarez-Salgado, X.A., Rosón, G., Pérez, F.F., Pazos, Y., 1993. Hydrographicalvariability off the Rías Baixas (NW Spain) during the upwelling season.Journal of Geophysical Research 98, 14447–14455.
APHA, 1992. Standard Methods for the Examination of Water and Wastewater (18thed.), American Public Health Association, Inc., New York.
Astrom, J., Pettersson, T.J.R., Stenstrom, T.A., Bergstedt, O., 2009. Variability analysisof pathogen and indicator loads from urban sewer systems along a river. WaterScience and Technology 59 (2), 203–212.
Baudart, J., Grablos, J., Barusseau, J.P., Lebaron, P., 2000. Salmonella spp. and faecalcoliform loads in coastal waters from a point vs. nonpoint source of pollution.Journal of Environmental Quality 29 (1), 241–250.
Buckley, R., Clough, E., Warnken, W., Wild, C., 1998. Coliform bacteria in streambedsediments in a subtropical rainforest conservation reserve. Water Research 32(6), 1852–1856.
Cherifi, O., Loudiki, M., 1999. Flood transport of dissolved and suspended matter inthe El Abid river basin (Morocco). Hydrobiologia 410, 287–294.
Chigbu, P., Gordon, S., Strange, T.R., 2005. Faecal coliform bacteria disappearancerates in a north-central Gulf of Mexico estuary. Estuarine, Coastal and ShelfScience 65, 309–318.
Crabill, C., Donald, R., Snelling, J., Foust, R., Southam, G., 1999. The impact ofsediment faecal coliform reservoirs on seasonal water quality in Oak Creek,Arizona. Water Research 33 (9), 2163–2371.
Crowther, J., Kay, D., Wyer, M.D., 2002. Faecal-indicator concentrations in watersdraining lowland pastoral catchments in the UK: relationships with land useand farming practices. Water Research 36 (7), 1725–1734.
Del Mar Lleo, M., Bonato, B., Benedetti, D., Canepari, P., 2005. Survival ofenterococcal species in aquatic environments. FEMS Microbiology Ecology 54,189–196.
Doran, J.W., Linn, D.M., 1979. Bacteriological quality of runoff water frompastureland. Applied Environmental Microbiology 37, 985–991.
Ellis, J.B., Yu, W., 1995. Bacteriology of urban runoff: The combined sewer as abacterial reactor and generator. Water Science and Technology 31 (7), 303–310.
Fiandrino, A., Martin, Y., Got, P., Bonnefont, J.L., Troussellier, M., 2003. Bacterialcontamination of Mediterranean coastal seawater as affected by riverineinputs: simulation approach applied to a shellfish breeding area (Thau lagoon,France). Water Research 37 (8), 1711–1722.
Got, P., Caro, A., Perrin, J.L., Tournoud, M.G., Troussellier, M., 2006. Sewage Inputsand Accumulation of Faecal Bacteria in the Bed Sediments of a Temporary RiverFlowing into the Thau lagoon (France). EGU General Assembly, Vienna, April2006.
Grillot, C., 2006., Fonctionnement hydrologique et dynamique des nutriments d’unerivière intermittente méditerranéenne en étiage et en crue. Analyse spatiale ettemporelle. Thèse de Doctorat, Université de Montpellier 2, Montpellier, France.
Haller, L., Pote, J., Loizeau, J.L., Wildi, W., 2009a. Distribution and survival of faecalindicator bacteria in the sediments of the Bay of Vidy, Lake Geneva, Switzerland.Ecological Indicators 9, 540–547.
Haller, L., Amedegnato, E., Pote, J., Wildi, W., 2009b. Influence of freshwatersediment characteristics on persistence of fecal indicator bacteria. Water AirSoil Pollution 203, 217–227.
Hunter, C., Perkins, J., Tranter, J., Gunn, J., 1999. Agriculture land-use effects on theindicator bacterial quality of an upland stream in the Derbyshire Peak district inthe UK. Water Research 33 (17), 3577–3586.
Irvine, K.N., Pettibone, G.W., 1996. Planning level evaluation of densities andsources of indicator bacteria in a mixed land use watershed. EnvironmentalTechnology 17 (1), 1–12.
Jamieson, R.C., Lee, J.H., Kostaschuk, R., Gordon, R.J., 2004. Persistence of entericbacteria in alluvial streams. Journal of Environmental Engineering and Science 3(3), 203–212.
Kashefipour, S.M., Lin, B., Falconer, R.A., 2006. Modelling the fate of faecal indicatorsin a coastal basin. Water Research 40 (7), 1413–1425.
Kay, D., Edwards, A.C., Ferrier, R.C., Francis, C., Kay, C., Rushby, L., Watkins, J.,McDonald, A.T., Wyer, M., Crowther, J., Wilkinson, J., 2007. Catchment microbialdynamics: the emergence of a research agenda. Progress in Physical Geography31, 59–76.
Kirchner, J.W., Feng, X., Neal, C., Robson, A.J., 2004. The fine structure of waterquality dynamics: the (high frequency) wave of the future. HydrologicalProcesses 18, 1353–1359.
Letcher, R.A., Jakeman, A.J., Merritt, W.S., McKee, L.J., Eyre, B.D., Baginska, B., 1999.Review of Technique to Estimate Catchment Exports. Report EPA 99/73,Environment Protection Authority, Sydney.
Mckergow, L.A., Davies-colley, R.J., 2010. Stormflow dynamics and loads ofEscherichia coli in a large mixed land use catchment. Hydrological Processes289, 276–289.
Meybeck, M., Bouloubassi, I., Huang, W.W., Hubert, P., Pasco, A., Ragu A., Toma, A.,1992. Etablissement des flux polluants. Rapport Inter-Agences, Laboratoire deGéologie appliquée, Naturalia Biologia 9, France, 500p.
Muirhead, R.W., Davies-Colley, R.J., Donnison, A.M., Nagels, J.W., 2004. Faecalbacteria yields in artificial flood events: quantifying in-stream stores. WaterResearch 38 (5), 1215–1224.

Y. Chu et al. / Journal of Hydrology 405 (2011) 501–511 511
Nagels, J.W., Davies-Colley, R.J., Donnison, A.M., Muirhead, R.W., 2002. Faecalcontamination over flood events in a pastoral agricultural stream in NewZealand. Water Science and Technology 45 (12), 45–52.
Petersen, T.M., Rifai, H.S., Suarez, M.P., Stein, A.R., 2005. Bacteria loads from pointand nonpoint sources in an urban watershed. Journal of EnvironmentalEngineering 131 (10), 1414–1425.
Riou, P., Le Saux, J.C., Dumas, F., Caprais, M.P., Le Guyader, S.F., Pommepuy, M., 2007.Microbial impact of small tributaries on water and shellfish quality in shallowcoastal areas. Water Research 41 (12), 2774–2786.
Salles, C., Tournoud, MG., Picot, B., Chu, y., 2003. Diffuse and point source pollutionsat catchment scale: a statistical quantifying tool.In: IWA Conference on DiffusePollution, Dublin, pp. 99–104.
Salles, C., Tournoud, M.G., Chu, Y., 2008. Estimating nutrient and sediment floodloads in a small Mediterranean river. Hydrological Processes 22 (2), 242–253.
Schoonover, J.E., Lockaby, B.G., 2006. Land cover impacts on stream nutrients andfecal coliform in the lower Piedmont of West Georgia. Journal of Hydrology 331(3–4), 371–382.
Shah, V.G., Dunstan, R.H., Geary, P.M., Coombes, P., Roberts, T.K., Rothkirch, T.,2007. Comparisons of water quality parameters from diverse catchmentsduring dry periods and following rain events. Water Research 41 (16),3655–3666.
Sherer, B.M., Miner, J.R., Moore, J.A., Buckhouse, J.C., 1992. Indicator bacterialsurvival in stream sediments. Journal of Environmental Quality 21 (4), 591–595.
Sinton, L.W., Finlay, R.K., Pang, L., Scott, D.M., 1997. Transport of bacteria andbacteriophages in irrigated effluent into and through an alluvial gravel aquifer.Water, Air and Soil Pollution 98 (1–2), 17–42.
Smith, J., Edwards, J., Hilger, H., Steck, T.R., 2008. Sediment can be a reservoir forcoliform bacteria released into streams. Journal of General and AppliedMicrobiology 54, 173–179.
Tournoud, M.G., Payraudeau, S., Cernesson, F., Salles, C., 2006. Origins andquantification of nitrogen inputs into a coastal lagoon: application to theThau lagoon (France). Ecological Modelling 193 (1–2), 19–33.
Tyrrel, S.F., Quinton, J.N., 2003. Overland flow transport of pathogens from agriculturalland receiving faecal wastes. Journal of Applied Microbiology 94, 87S–93S.
Wainright, S.C., Couch, C.A., Meyer, J.L., 1992. Fluxes of bacteria and organic matterinto a blackwater river from river sediments and floodplain soils. FreshwaterBiology 28, 37–48.
Wilkinson, J., Kay, D., Wyer, M., Jenkins, A., 2006. Processes driving the episodicflux of faecal indicator organisms in streams impacting on recreational andshellfish harvesting waters. Water Research 40 (1), 153–161.
Wyer, MD., Kay, D., Dawson, HM., Jackson, GF., Jones, F., Yeo, J., Whittle, J., 1996.Delivery of microbial indicator organisms to coastal waters from catchmentsources. Water Science and Technology 33 (2), 37–50.