Factsheet August 2012.cdr - BOI AXA Mutual Fund
12
Facts Monthly fund, analysis and market reviews Figures in August 2012 We are now We are turning a new leaf. We are turning a new leaf.
-
Upload
khangminh22 -
Category
Documents
-
view
1 -
download
0
Transcript of Factsheet August 2012.cdr - BOI AXA Mutual Fund

Facts Monthly fund, analysis and market reviews
Figures in
August 2012
We are now
We are turning a new leaf.We are turning a new leaf.
The Indian benchmark indices ended August up ~1%. The Foreign Institutional Investors (FIIs) continued to be net
buyers with an inflow of ~$1.75 Bn during the month. Domestic institutions, on the other hand, continued to be net
sellers during the month with outflows worth US$ 780 Mn during August.
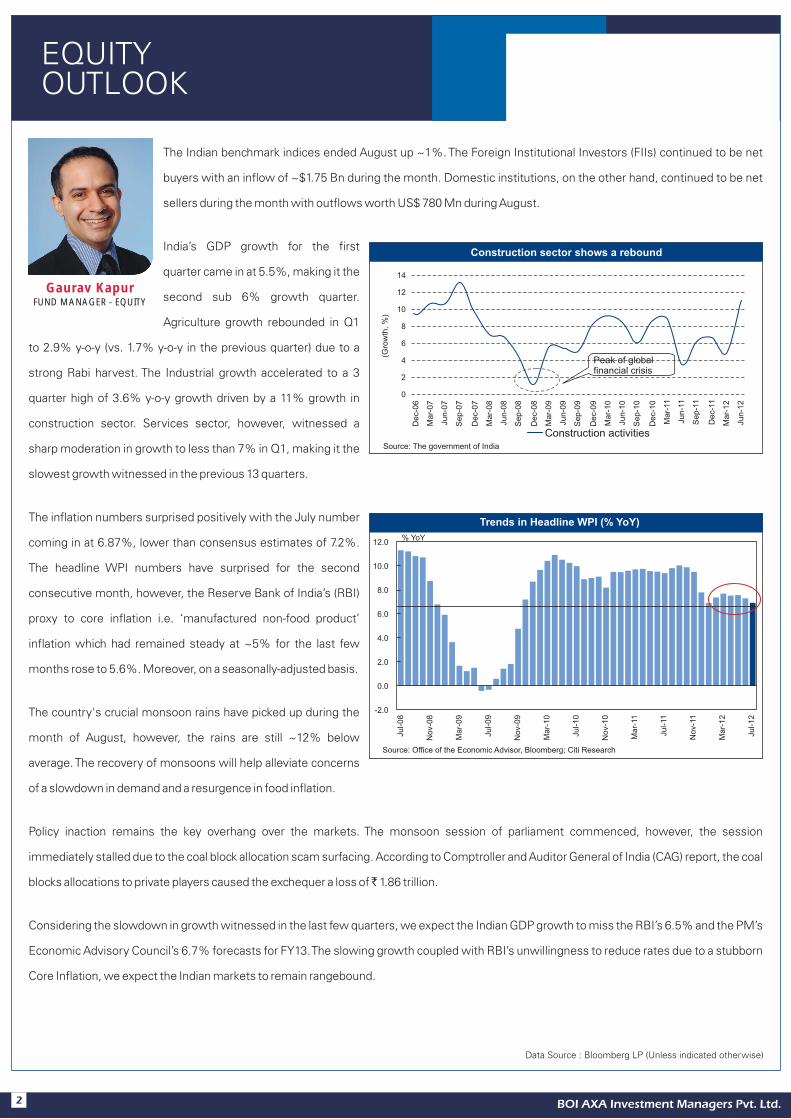
India’s GDP growth for the first
quarter came in at 5.5%, making it the
second sub 6% growth quarter.
Agriculture growth rebounded in Q1
to 2.9% y-o-y (vs. 1.7% y-o-y in the previous quarter) due to a
strong Rabi harvest. The Industrial growth accelerated to a 3
quarter high of 3.6% y-o-y growth driven by a 11% growth in
construction sector. Services sector, however, witnessed a
sharp moderation in growth to less than 7% in Q1, making it the
slowest growth witnessed in the previous 13 quarters.
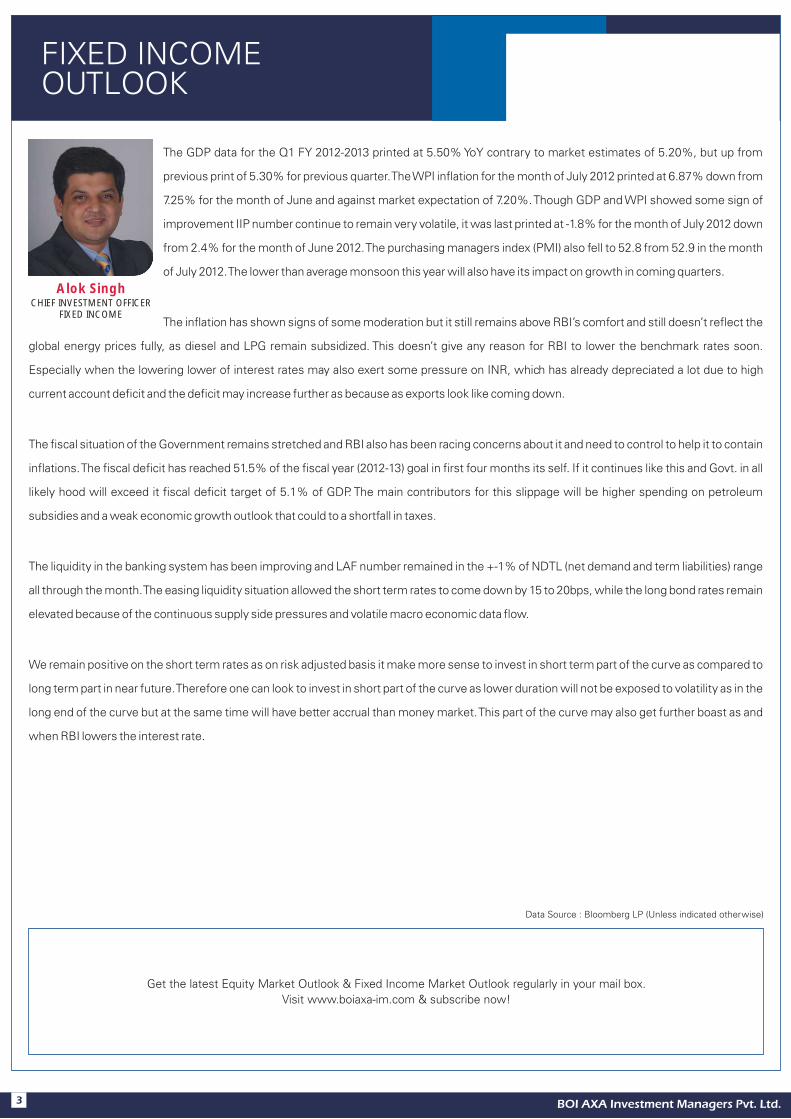
The inflation numbers surprised positively with the July number
coming in at 6.87%, lower than consensus estimates of 7.2%.
The headline WPI numbers have surprised for the second
consecutive month, however, the Reserve Bank of India’s (RBI)
proxy to core inflation i.e. ‘manufactured non-food product’
inflation which had remained steady at ~5% for the last few
months rose to 5.6%. Moreover, on a seasonally-adjusted basis.
The country's crucial monsoon rains have picked up during the
month of August, however, the rains are still ~12% below
average. The recovery of monsoons will help alleviate concerns
of a slowdown in demand and a resurgence in food inflation.
Policy inaction remains the key overhang over the markets. The monsoon session of parliament commenced, however, the session
immediately stalled due to the coal block allocation scam surfacing. According to Comptroller and Auditor General of India (CAG) report, the coal
blocks allocations to private players caused the exchequer a loss of ̀ 1.86 trillion.
Considering the slowdown in growth witnessed in the last few quarters, we expect the Indian GDP growth to miss the RBI’s 6.5% and the PM’s
Economic Advisory Council’s 6.7% forecasts for FY13. The slowing growth coupled with RBI’s unwillingness to reduce rates due to a stubborn
Core Inflation, we expect the Indian markets to remain rangebound.
Data Source : Bloomberg LP (Unless indicated otherwise)
BOI AXA Investment Managers Pvt. Ltd.
EQUITYOUTLOOK
Gaurav KapurFUND MANAGER - EQUITY
2
Source: The government of India
Construction sector shows a rebound
14
12
10
8
6
4
2
0
Construction activities
(Gro
wth
, %
)
De
c-0
6
Ma
r-0
7
Ju
n-0
7
Se
p-0
7
De
c-0
7
Ma
r-0
8
Ju
n-0
8
Se
p-0
8
De
c-0
8
Ma
r-0
9
Ju
n-0
9
Se
p-0
9
De
c-0
9
Ma
r-1
0
Ju
n-1
0
Se
p-1
0
De
c-1
0
Ma
r-11
Ju
n-1
1
Se
p-1
1
De
c-1
1
Ma
r-1
2
Ju
n-1
2
Peak of globalfinancial crisis
Source: Office of the Economic Advisor, Bloomberg; Citi Research
Trends in Headline WPI (% YoY)
12.0
10.0
8.0
6.0
4.0
2.0
0.0
-2.0
% YoY
Jul-08
Nov-
08
Mar-
09
Jul-09
Nov-
09
Mar-
10
Jul-10
Nov-
10
Mar-
11
Jul-11
Nov-
11
Mar-
12
Jul-12
FIXED INCOME OUTLOOK
Data Source : Bloomberg LP (Unless indicated otherwise)
The GDP data for the Q1 FY 2012-2013 printed at 5.50% YoY contrary to market estimates of 5.20%, but up from
previous print of 5.30% for previous quarter. The WPI inflation for the month of July 2012 printed at 6.87% down from
7.25% for the month of June and against market expectation of 7.20%. Though GDP and WPI showed some sign of
improvement IIP number continue to remain very volatile, it was last printed at -1.8% for the month of July 2012 down
from 2.4% for the month of June 2012. The purchasing managers index (PMI) also fell to 52.8 from 52.9 in the month
of July 2012. The lower than average monsoon this year will also have its impact on growth in coming quarters.
The inflation has shown signs of some moderation but it still remains above RBI’s comfort and still doesn’t reflect the
global energy prices fully, as diesel and LPG remain subsidized. This doesn’t give any reason for RBI to lower the benchmark rates soon.
Especially when the lowering lower of interest rates may also exert some pressure on INR, which has already depreciated a lot due to high
current account deficit and the deficit may increase further as because as exports look like coming down.
The fiscal situation of the Government remains stretched and RBI also has been racing concerns about it and need to control to help it to contain
inflations. The fiscal deficit has reached 51.5% of the fiscal year (2012-13) goal in first four months its self. If it continues like this and Govt. in all
likely hood will exceed it fiscal deficit target of 5.1% of GDP. The main contributors for this slippage will be higher spending on petroleum
subsidies and a weak economic growth outlook that could to a shortfall in taxes.
The liquidity in the banking system has been improving and LAF number remained in the +-1% of NDTL (net demand and term liabilities) range
all through the month. The easing liquidity situation allowed the short term rates to come down by 15 to 20bps, while the long bond rates remain
elevated because of the continuous supply side pressures and volatile macro economic data flow.
We remain positive on the short term rates as on risk adjusted basis it make more sense to invest in short term part of the curve as compared to
long term part in near future. Therefore one can look to invest in short part of the curve as lower duration will not be exposed to volatility as in the
long end of the curve but at the same time will have better accrual than money market. This part of the curve may also get further boast as and
when RBI lowers the interest rate.
Get the latest Equity Market Outlook & Fixed Income Market Outlook regularly in your mail box.
Visit www.boiaxa-im.com & subscribe now!
Alok SinghCHIEF INVESTMENT OFFICER
FIXED INCOME
BOI AXA Investment Managers Pvt. Ltd.3

Growth 16.65Bonus 16.65Regular Dividend 11.73Quarterly Dividend 10.57
Growth 16.81Bonus 16.81 Regular Dividend 11.83Quarterly Dividend 10.69
NAV ( ` )
Regular Plan
Eco Plan
• For Dividend History please refer page no. 7
Regular Plan
NIL
1% if redeemed within 1 year from the date of allotment
Eco Plan
Entry Load
Exit Load
Investmentsthrough
SIP / STP
Investments through Liq-uity
InstitutionalPlan
BOI An Open Ended Equity Growth Fund(Previously known as Bharti AXA Equity Fund)All data as on August 31, 2012 (Unless indicated otherwise)
AXA Equity Fund
SECTOR ALLOCATION
LOAD STRUCTURE
NAV (AS ON AUGUST 31, 2012)
* Total Exposure to illiquid securities is 0.00% of the portfolio, i.e. ̀ 0.00 lakhAll corporate ratings are assigned by rating agencies like CRISIL, CARE, ICRA, FITCH.**Thinly traded/Non traded securities and illiquid securities as defined in SEBI Regulations and Guidelines.
Portfolio Holdings AMFI Sector % to Net Classification Assets
EQUITY & EQUITY RELATEDListed / awaiting listing on the stock exchangesITC Ltd Consumer Goods 9.66HDFC Bank Ltd Financial Services 9.02Reliance Industries Ltd Energy 8.31Housing Development Finance Corporation Ltd Financial Services 7.76ICICI Bank Ltd Financial Services 6.47Larsen & Toubro Ltd Construction 4.42Infosys Ltd IT 3.38Cairn India Ltd Energy 3.08Sun Pharmaceuticals Industries Ltd Pharma 3.03Hindustan Unilever Ltd Consumer Goods 3.01Tata Consultancy Services Ltd IT 2.74Mahindra & Mahindra Ltd Automobile 2.52Bharat Heavy Electricals Ltd Industrial Manufacturing 2.23Bata India Ltd Consumer Goods 2.21Cipla Ltd Pharma 2.21Power Grid Corporation of India Ltd Energy 2.10Coal India Ltd Metals 2.03NTPC Ltd Energy 1.92Oil & Natural Gas Corporation Ltd Energy 1.84Dr. Reddy's Laboratories Ltd Pharma 1.33Axis Bank Ltd Financial Services 1.20Tata Motors Ltd Automobile 1.02Hero MotoCorp Ltd Automobile 0.96Tech Mahindra Ltd IT 0.96Bajaj Auto Ltd Automobile 0.92Tata Steel Ltd Metals 0.92Wipro Ltd IT 0.92Grasim Industries Ltd Cement & Cement Products 0.87Hindalco Industries Ltd Metals 0.86Bharti Airtel Ltd Telecom 0.85Kalpataru Power Transmission Ltd Energy 0.81MindTree Ltd IT 0.79Tata Power Co. Ltd Energy 0.76GAIL (I) Ltd Energy 0.68Ranbaxy Laboratories Ltd Pharma 0.58Development Credit Bank Ltd Financial Services 0.52Nestle India Ltd Consumer Goods 0.41Gujarat Mineral Development Corporation Ltd Metals 0.38Jindal Steel & Power Ltd Metals 0.38ING Vysya Bank Ltd Financial Services 0.37Satyam Computer Services Ltd IT 0.03Total 94.46
Cash & Cash EquivalentNet Receivables/Payables (0.29)CBLO / Reverse Repo Investments 5.83Total 5.54
GRAND TOTAL 100.00
PORTFOLIO DETAILS
Growth 21.05Dividend 11.48
Growth 21.23Dividend 11.56
NAV ( ` )
Regular Plan
Eco Plan
• For Dividend History please refer page no. 7
NIL
NIL
Entry Load
Exit Load
BOI An Open-Ended Equity Linked Savings Scheme(Previously known as Bharti AXA Tax Advantage Fund) All data as on August 31, 2012 (Unless indicated otherwise)
AXA Tax Advantage Fund
SECTOR ALLOCATION
LOAD STRUCTURE
NAV (AS ON AUGUST 31, 2012)
* Total Exposure to illiquid securities is 0.00% of the portfolio, i.e. ̀ 0.00 lakhAll corporate ratings are assigned by rating agencies like CRISIL, CARE, ICRA, FITCH.**Thinly traded/Non traded securities and illiquid securities as defined in SEBI Regulations and Guidelines.
Portfolio Holdings AMFI Sector % to Net Classification Assets
EQUITY & EQUITY RELATEDListed / awaiting listing on the stock exchangesITC Ltd Consumer Goods 8.72HDFC Bank Ltd Financial Services 7.63ICICI Bank Ltd Financial Services 6.65Housing Development Finance Corporation Ltd Financial Services 5.88Reliance Industries Ltd Energy 5.13Larsen & Toubro Ltd Construction 3.77Cairn India Ltd Energy 3.30Sun Pharmaceuticals Industries Ltd Pharma 3.17Hindustan Unilever Ltd Consumer Goods 3.17Mahindra & Mahindra Ltd Automobile 2.76Bata India Ltd Consumer Goods 2.54Bharat Heavy Electricals Ltd Industrial Manufacturing 2.39IPCA Laboratories Ltd Pharma 2.37Nestle India Ltd Consumer Goods 2.08Tata Consultancy Services Ltd IT 2.06Coal India Ltd Metals 1.94Colgate Palmolive (India) Ltd Consumer Goods 1.86NTPC Ltd Energy 1.83Cipla Ltd Pharma 1.75Dr. Reddy's Laboratories Ltd Pharma 1.71Power Grid Corporation of India Ltd Energy 1.69Satyam Computer Services Ltd IT 1.55Tech Mahindra Ltd IT 1.52Bharti Airtel Ltd Telecom 1.45Oil & Natural Gas Corporation Ltd Energy 1.44Infosys Ltd IT 1.42Hindustan Petroleum Corporation Ltd Energy 1.29Grasim Industries Ltd Cement & Cement Products 1.24Bosch Ltd Automobile 1.15Kalpataru Power Transmission Ltd Energy 1.14Axis Bank Ltd Financial Services 1.00TVS Motor Company Ltd Automobile 0.92Dish TV (I) Ltd Media & Entertainment 0.91Wipro Ltd IT 0.84Gujarat Mineral Development Corporation Ltd Metals 0.81Hindalco Industries Ltd Metals 0.79Tata Power Co. Ltd Energy 0.78MindTree Ltd IT 0.76KPIT Cummins Infosystems Ltd IT 0.75Lupin Ltd Pharma 0.75Tata Steel Ltd Metals 0.56Indusind Bank Ltd Financial Services 0.55Page Industries Ltd Textiles 0.53Hero MotoCorp Ltd Automobile 0.53Ranbaxy Laboratories Ltd Pharma 0.52Development Credit Bank Ltd Financial Services 0.44GAIL (I) Ltd Energy 0.38CRISIL Ltd Financial Services 0.28Total 96.70
Cash & Cash EquivalentNet Receivables/Payables (0.44)CBLO / Reverse Repo Investments 3.74Total 3.30
GRAND TOTAL 100.00
PORTFOLIO DETAILS
INVESTMENT OBJECTIVE
BENCHMARK
S&P CNX Nifty Index
DATE OF ALLOTMENT
October 21, 2008
FUND MANAGER
MINIMUM APPLICATION AMOUNT
- ` 5,000 and in multiples of ` 1 - ` 5,000 and in multiples of ` 1
- ` 5 crore and in multiples of ` 1
ADDITIONAL PURCHASE AMOUNT
- ` 1,000 and in multiples of ` 1 - ` 1,000 and in multiples of ` 1
- ` 1,00,000 and in multiples of ` 1
TOTAL EXPENSE RATIO
• Regular Plan 2.50%• Institutional Plan 1.75%• Eco Plan 2.25%
To generate income and long-term capital appreciation through a diversified portfolio of predominantly equity and equity-related securities including equity derivatives, across all market capitalizations. The Scheme is in the nature of diversified multi-cap fund. The Scheme is not providing any assured or guaranteed returns.
Experience : Managing this fund since March 2011. Total of 7 years of experience including 6 years in research and fund management.
Gaurav Kapur
Regular PlanEco PlanInstitutional Plan
Regular PlanEco PlanInstitutional Plan
PORTFOLIO TURNOVER RATIO
0.59 Times^(^Basis last rolling 12 months)
INVESTMENT OBJECTIVE
BENCHMARK
S&P CNX Nifty Index
DATE OF ALLOTMENT
February 25, 2009
FUND MANAGER
MINIMUM APPLICATION AMOUNT
- ` 500 and in multiples of ` 500 - ` 500 and in multiples of ` 500
ADDITIONAL PURCHASE AMOUNT
- ` 500 and in multiples of ` 500 - ` 500 and in multiples of ` 500
TOTAL EXPENSE RATIO
• Regular Plan 2.50%• Eco Plan 2.25%
The Scheme seeks to generate long-term capital growth from a diversified portfolio of predominantly equity and equity-related securities across all market capitalisations. The Scheme is in the nature of diversified multi-cap fund. The Scheme is not providing any assured or guaranteed returns. There can be no assurance that the investment objectives of the Scheme will be realized.
Experience : Managing this fund since March 2011. Total of 7 years of experience including 6 years in research and fund management.
Gaurav Kapur
Regular PlanEco Plan
Regular PlanEco Plan
PORTFOLIO TURNOVER RATIO
0.83 Times^(^Basis last rolling 12 months)
BOI AXA Investment Managers Pvt. Ltd.4
Investments through SIP / STPEco PlanRegular Plan
25.34%
19.50%
15.29%
8.82%
7.15%
5.54%
5.42%
4.57%
4.42%
2.23%
0.87%
0.85%
Financial Services
Energy
Consumer Goods
IT
Pharma
Cash & Cash Equivalent
Automobile
Metals
Construction
Industrial Manufacturing
Cement & Cement Products
Telecom
22.43%18.37%
16.98%10.27%
8.90%5.36%
4.10%3.77%
3.30%2.39%
1.45%1.24%
0.91%0.53%
Financial ServicesConsumer Goods
EnergyPharma
ITAutomobile
MetalsConstruction
Cash & Cash EquivalentIndustrial Manufacturing
TelecomCement & Cement Products
Media & EntertainmentTextiles
BOI An Open Ended Equity Scheme(Previously known as Bharti AXA Focused Infrastructure Fund) All data as on August 31, 2012 (Unless indicated otherwise)
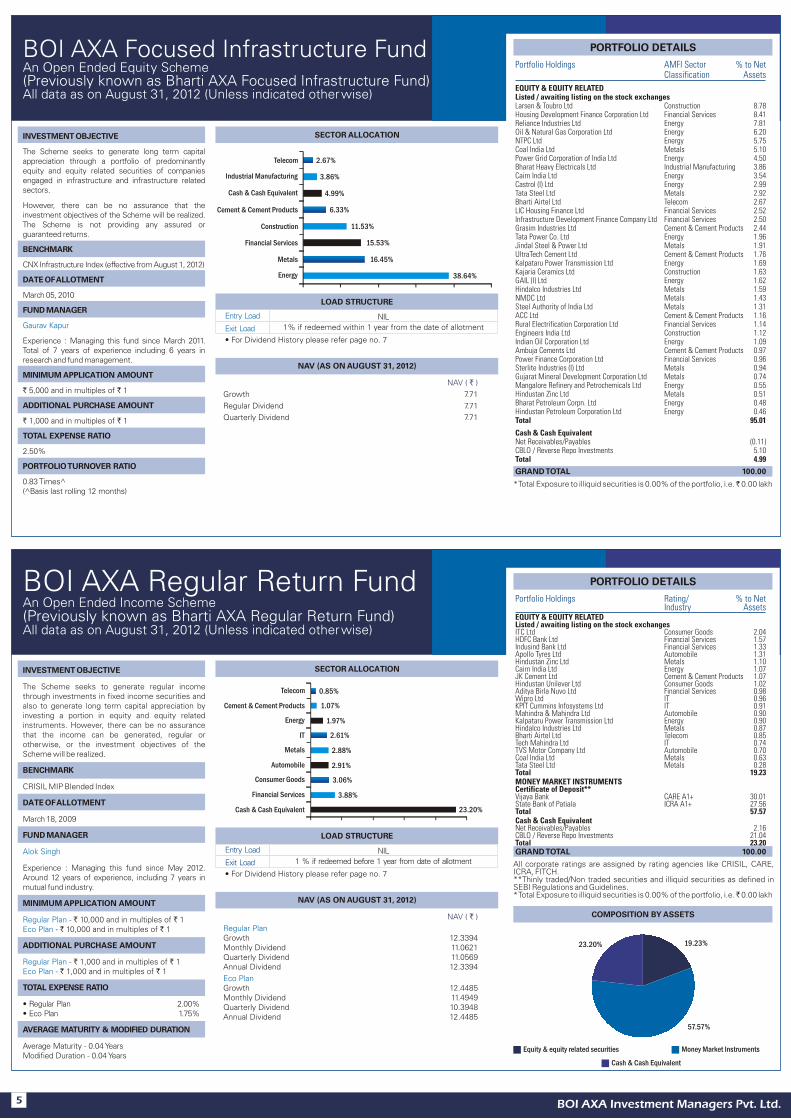
AXA Focused Infrastructure Fund
SECTOR ALLOCATION
LOAD STRUCTURE
* Total Exposure to illiquid securities is 0.00% of the portfolio, i.e. ̀ 0.00 lakh
Portfolio Holdings AMFI Sector % to Net Classification Assets
EQUITY & EQUITY RELATEDListed / awaiting listing on the stock exchangesLarsen & Toubro Ltd Construction 8.78Housing Development Finance Corporation Ltd Financial Services 8.41Reliance Industries Ltd Energy 7.81Oil & Natural Gas Corporation Ltd Energy 6.20NTPC Ltd Energy 5.75Coal India Ltd Metals 5.10Power Grid Corporation of India Ltd Energy 4.50Bharat Heavy Electricals Ltd Industrial Manufacturing 3.86Cairn India Ltd Energy 3.54Castrol (I) Ltd Energy 2.99Tata Steel Ltd Metals 2.92Bharti Airtel Ltd Telecom 2.67LIC Housing Finance Ltd Financial Services 2.52Infrastructure Development Finance Company Ltd Financial Services 2.50Grasim Industries Ltd Cement & Cement Products 2.44Tata Power Co. Ltd Energy 1.96Jindal Steel & Power Ltd Metals 1.91UltraTech Cement Ltd Cement & Cement Products 1.76Kalpataru Power Transmission Ltd Energy 1.69Kajaria Ceramics Ltd Construction 1.63GAIL (I) Ltd Energy 1.62Hindalco Industries Ltd Metals 1.59NMDC Ltd Metals 1.43Steel Authority of India Ltd Metals 1.31ACC Ltd Cement & Cement Products 1.16Rural Electrification Corporation Ltd Financial Services 1.14Engineers India Ltd Construction 1.12Indian Oil Corporation Ltd Energy 1.09Ambuja Cements Ltd Cement & Cement Products 0.97Power Finance Corporation Ltd Financial Services 0.96Sterlite Industries (I) Ltd Metals 0.94Gujarat Mineral Development Corporation Ltd Metals 0.74Mangalore Refinery and Petrochemicals Ltd Energy 0.55Hindustan Zinc Ltd Metals 0.51Bharat Petroleum Corpn. Ltd Energy 0.48Hindustan Petroleum Corporation Ltd Energy 0.46Total 95.01
Cash & Cash EquivalentNet Receivables/Payables (0.11)CBLO / Reverse Repo Investments 5.10Total 4.99
GRAND TOTAL 100.00
PORTFOLIO DETAILS
BOI An Open Ended Income Scheme(Previously known as Bharti AXA Regular Return Fund) All data as on August 31, 2012 (Unless indicated otherwise)
AXA Regular Return Fund
SECTOR ALLOCATION
LOAD STRUCTURE
Portfolio Holdings Rating/ % to Net Industry Assets
EQUITY & EQUITY RELATEDListed / awaiting listing on the stock exchangesITC Ltd Consumer Goods 2.04HDFC Bank Ltd Financial Services 1.57Indusind Bank Ltd Financial Services 1.33Apollo Tyres Ltd Automobile 1.31Hindustan Zinc Ltd Metals 1.10Cairn India Ltd Energy 1.07JK Cement Ltd Cement & Cement Products 1.07Hindustan Unilever Ltd Consumer Goods 1.02Aditya Birla Nuvo Ltd Financial Services 0.98Wipro Ltd IT 0.96KPIT Cummins Infosystems Ltd IT 0.91Mahindra & Mahindra Ltd Automobile 0.90Kalpataru Power Transmission Ltd Energy 0.90Hindalco Industries Ltd Metals 0.87Bharti Airtel Ltd Telecom 0.85Tech Mahindra Ltd IT 0.74TVS Motor Company Ltd Automobile 0.70Coal India Ltd Metals 0.63Tata Steel Ltd Metals 0.28Total 19.23MONEY MARKET INSTRUMENTSCertificate of Deposit**Vijaya Bank CARE A1+ 30.01State Bank of Patiala ICRA A1+ 27.56Total 57.57Cash & Cash EquivalentNet Receivables/Payables 2.16CBLO / Reverse Repo Investments 21.04Total 23.20GRAND TOTAL 100.00
PORTFOLIO DETAILS
INVESTMENT OBJECTIVE
BENCHMARK
DATE OF ALLOTMENT
March 05, 2010
FUND MANAGER
MINIMUM APPLICATION AMOUNT
` 5,000 and in multiples of ` 1
ADDITIONAL PURCHASE AMOUNT
` 1,000 and in multiples of ` 1
TOTAL EXPENSE RATIO
2.50%
The Scheme seeks to generate long term capital appreciation through a portfolio of predominantly equity and equity related securities of companies engaged in infrastructure and infrastructure related sectors.
However, there can be no assurance that the investment objectives of the Scheme will be realized. The Scheme is not providing any assured or guaranteed returns.
Experience : Managing this fund since March 2011. Total of 7 years of experience including 6 years in research and fund management.
CNX Infrastructure Index (effective from August 1, 2012)
Gaurav Kapur
PORTFOLIO TURNOVER RATIO
0.83 Times^(^Basis last rolling 12 months)
INVESTMENT OBJECTIVE
BENCHMARK
CRISIL MIP Blended Index
DATE OF ALLOTMENT
March 18, 2009
FUND MANAGER
MINIMUM APPLICATION AMOUNT
- ` 10,000 and in multiples of ` 1 - ` 10,000 and in multiples of ` 1
ADDITIONAL PURCHASE AMOUNT
- ` 1,000 and in multiples of ` 1 - ` 1,000 and in multiples of ` 1
TOTAL EXPENSE RATIO
• Regular Plan 2.00%• Eco Plan 1.75%
The Scheme seeks to generate regular income through investments in fixed income securities and also to generate long term capital appreciation by investing a portion in equity and equity related instruments. However, there can be no assurance that the income can be generated, regular or otherwise, or the investment objectives of the Scheme will be realized.
Experience : Managing this fund since May 2012. Around 12 years of experience, including 7 years in mutual fund industry.
Alok Singh
Regular PlanEco Plan
Regular PlanEco Plan
AVERAGE MATURITY & MODIFIED DURATION
Average Maturity - 0.04 YearsModified Duration - 0.04 Years
BOI AXA Investment Managers Pvt. Ltd.5
NAV ( ` )
Regular Plan
Eco Plan
Growth 12.3394Monthly Dividend 11.0621Quarterly Dividend 11.0569Annual Dividend 12.3394
Growth 12.4485Monthly Dividend 11.4949Quarterly Dividend 10.3948Annual Dividend 12.4485
• For Dividend History please refer page no. 7
NIL
1 % if redeemed before 1 year from date of allotment
Entry Load
Exit Load
NAV (AS ON AUGUST 31, 2012)
Growth 7.71
Regular Dividend 7.71
Quarterly Dividend 7.71
NAV ( ` )
• For Dividend History please refer page no. 7
NIL
1% if redeemed within 1 year from the date of allotment
Entry Load
Exit Load
NAV (AS ON AUGUST 31, 2012)
Equity & equity related securities Money Market Instruments
Cash & Cash Equivalent
19.23%
57.57%
23.20%
All corporate ratings are assigned by rating agencies like CRISIL, CARE, ICRA, FITCH.**Thinly traded/Non traded securities and illiquid securities as defined in SEBI Regulations and Guidelines.* Total Exposure to illiquid securities is 0.00% of the portfolio, i.e. ̀ 0.00 lakh
COMPOSITION BY ASSETS
38.64%
16.45%
15.53%
11.53%
6.33%
4.99%
3.86%
2.67%
Energy
Metals
Financial Services
Construction
Cement & Cement Products
Cash & Cash Equivalent
Industrial Manufacturing
Telecom
23.20%
3.88%
3.06%
2.91%
2.88%
2.61%
1.97%
1.07%
0.85%
Cash & Cash Equivalent
Financial Services
Consumer Goods
Automobile
Metals
IT
Energy
Cement & Cement Products
Telecom

BOI AXA Investment Managers Pvt. Ltd.6
BOI An Open Ended Liquid Scheme(Previously known as Bharti AXA Liquid Fund) All data as on August 31, 2012 (Unless indicated otherwise)
AXA Liquid Fund
CREDIT PROFILE
LOAD STRUCTURE
• For Dividend History please refer page no. 7
NIL
NIL
Entry Load
Exit Load
Growth 1,285.6997Daily Dividend 1,000.0105Weekly Dividend 1,000.9103
Growth 1,304.7645Daily Dividend 1,000.0001Weekly Dividend -
Growth 1,310.9418Daily Dividend 1,000.0257Weekly Dividend -
NAV ( ` )
Regular Plan
Institutional Plan
Super Institutional Plan
NAV (AS ON AUGUST 31, 2012)
90.52%
CashA1+
9.48%
Portfolio Holdings Rating/ % to Net Industry Assets
MONEY MARKET INSTRUMENTSCertificate of Deposit**Oriental Bank of Commerce CRISIL A1+ 19.98UCO Bank CRISIL A1+ 19.96Central Bank of India CARE A1+ 10.03Punjab & Sind Bank ICRA A1+ 10.03State Bank of Patiala ICRA A1+ 2.65The Jammu & Kashmir Bank CRISIL A1+ 1.91Kotak Mahindra Bank CRISIL A1+ 1.87Allahabad Bank ICRA A1+ 1.48State Bank of Bikaner & Jaipur CRISIL A1+ 1.31Canara Bank CRISIL A1+ 0.71State Bank of Hyderabad ICRA A1+ 0.61
Total 70.54
MONEY MARKET INSTRUMENTSCommercial Paper**Indian Oil Corporation Ltd CRISIL A1+ 19.98Total 19.98
Cash & Cash EquivalentNet Receivables/Payables (6.71)CBLO / Reverse Repo Investments 16.19Total 9.48
GRAND TOTAL 100.00
PORTFOLIO DETAILS
All corporate ratings are assigned by rating agencies like CRISIL, CARE, ICRA, FITCH.**Thinly traded/Non traded securities and illiquid securities as defined in SEBI Regulations and Guidelines.
Money Market Instruments Cash & Cash Equivalent
90.52%
9.48%
COMPOSITION BY ASSETS
BOI An Open Ended Income Scheme(Previously known as Bharti AXA Treasury Advantage Fund) All data as on August 31, 2012 (Unless indicated otherwise)
AXA Treasury Advantage Fund
CREDIT PROFILEINVESTMENT OBJECTIVE
BENCHMARK
CRISIL Liquid Fund Index
DATE OF ALLOTMENT
July 16, 2008
FUND MANAGER
MINIMUM APPLICATION AMOUNT
ADDITIONAL PURCHASE AMOUNT
TOTAL EXPENSE RATIO
• Regular Plan 0.15%• Institutional Plan 0.10%
AVERAGE MATURITY & MODIFIED DURATION
The Scheme seeks to deliver reasonable market related returns with lower risk and higher liquidity through portfolio of debt and money market instruments. The Scheme is not providing any assured or guaranteed returns.
Experience : Managing this fund since June 2010. Total of around 12 years experience in fund and portfolio management including forex portfolio management.
Ramesh Rachuri
Regular Plan Institutional Plan
Regular Plan Institutional Plan
- ` 5,000 and in multiples of ` 1 - ` 1 crore and in multiples of ` 1
- ` 1,000 and in multiples of ` 1 - ` 1,00,000 and in multiples of ` 1
Average Maturity - 21 DaysModified Duration - 19 Days
LOAD STRUCTURE
Growth 1,311.2372Daily Dividend 1,000.0317Weekly Dividend 1,001.6346
Growth 1,332.3030Daily Dividend 1,000.0317Weekly Dividend -
NAV ( ` )
Regular Plan
Institutional Plan
• For Dividend History please refer page no. 7
NIL
0.25% if redeemed within 7 days from the date of allotment
Entry Load
Exit Load
NAV (AS ON AUGUST 31, 2012)
87.17%
CashA1+, Sovereign
12.83%
Portfolio Holdings Rating/ % to Net Industry Assets
MONEY MARKET INSTRUMENTSCertificate of Deposit**State Bank of Hyderabad ICRA A1+ 22.79Canara Bank CRISIL A1+ 21.23Vijaya Bank CARE A1+ 13.62State Bank of Patiala ICRA A1+ 9.78Allahabad Bank ICRA A1+ 7.80State Bank of Bikaner & Jaipur CRISIL A1+ 3.88The Jammu & Kashmir Bank CRISIL A1+ 1.61Total 80.71
Treasury BillTBILL 182 DAY 2012 SOV 6.46Total 6.46
Cash & Cash EquivalentNet Receivables/Payables 3.61CBLO / Reverse Repo Investments 9.22Total 12.83
GRAND TOTAL 100.00
PORTFOLIO DETAILS
All corporate ratings are assigned by rating agencies like CRISIL, CARE, ICRA, FITCH.**Thinly traded/Non traded securities and illiquid securities as defined in SEBI Regulations and Guidelines.
Money Market Instruments Cash & Cash Equivalent
87.17%
12.83%
COMPOSITION BY ASSETS
# The assigned rating AAAmfs is valid only for “BOI AXA Treasury Advantage Fund ”. The rating of CRISIL is not an opinion of the Asset Management Company’s willingness or ability to make timely payments to the investor. The rating is also not an opinion on the stability of the NAV of the Fund, which could vary with market developments.The rating indicates that the funds' portfolios will provide 'very strong' protection against losses from credit default. CRISIL's assessment of a rated fund's credit quality is based on the creditworthiness of the fund's portfolio. CRISIL reserves the right to suspend, withdraw or revise the ratings assigned to the scheme at any time on the basis of new information, or unavailability of information or other circumstances, which CRISIL believes, may have an impact on the rating. For detail methodology, please visit CRISIL's website www.crisil.com. Past performance is no guarantee of the future results.
# The assigned rating AAAmfs is valid only for “BOI AXA Liquid Fund ”. The rating of CRISIL is not an opinion of the Asset Management Company’s willingness or ability to make timely payments to the investor. The rating is also not an opinion on the stability of the NAV of the Fund, which could vary with market developments.The rating indicates that the funds' portfolios will provide 'very strong' protection against losses from credit default. CRISIL's assessment of a rated fund's credit quality is based on the creditworthiness of the fund's portfolio. CRISIL reserves the right to suspend, withdraw or revise the ratings assigned to the scheme at any time on the basis of new information, or unavailability of information or other circumstances, which CRISIL believes, may have an impact on the rating. For detail methodology, please visit CRISIL's website www.crisil.com. Past performance is no guarantee of the future results.
INVESTMENT OBJECTIVE
BENCHMARK
CRISIL Liquid Fund Index
DATE OF ALLOTMENT
July 16, 2008
FUND MANAGER
MINIMUM APPLICATION AMOUNT
ADDITIONAL PURCHASE AMOUNT
TOTAL EXPENSE RATIO
• Regular Plan 0.15%• Institutional Plan 0.10%• Super 0.05%
AVERAGE MATURITY & MODIFIED DURATION
The Scheme seeks to deliver reasonable market related returns with lower risk and higher liquidity through portfolio of debt and money market instruments. The Scheme is not providing any assured or guaranteed returns.
Experience : Managing this fund since June 2010. Total of around 12 years experience in fund and portfolio management including forex portfolio management.
Ramesh Rachuri
Regular Plan Institutional PlanSuper Institutional Plan -
Regular Plan Institutional PlanSuper Institutional Plan -
- ` 5,000 and in multiples of ` 1 - ` 1 crore and in multiples of ` 1
` 5 crore and in multiples of ` 1
- ` 1,000 and in multiples of ` 1 - ` 1,00,000 and in multiples of ` 1
` 1,00,000 and in multiples of ` 1
Institutional Plan
Average Maturity - 68 DaysModified Duration - 62 Days

Up to 3 months 100
4 months to 6 months Nil
7 months to 1 year Nil
> 1 year Nil
% of Assets Duration
BOI An Open Ended Income Scheme(Previously known as Bharti AXA Short Term Income Fund) All data as on August 31, 2012 (Unless indicated otherwise)
AXA Short Term Income Fund
CREDIT PROFILEINVESTMENT OBJECTIVE
BENCHMARK
CRISIL Short Term Bond Fund Index
DATE OF ALLOTMENT
December 18, 2008
FUND MANAGER
MINIMUM APPLICATION AMOUNT
ADDITIONAL PURCHASE AMOUNT
TOTAL EXPENSE RATIO
• Regular Plan 1.25%• Institutional Plan 0.60%
AVERAGE MATURITY & MODIFIED DURATION
The Scheme seeks to deliver reasonable market The Scheme seeks to generate income and capital appreciation by investing in a diversified portfolio of debt and money market securities. However, there can be no assurance that the income can be generated, regular or otherwise, or the investment objectives of the Scheme will be realized. The Scheme is not providing any assured or guaranteed returns.
Experience : Managing this fund since June 2010. Total of around 12 years experience in fund and portfolio management including forex portfolio management.
Ramesh Rachuri
Regular Plan Institutional Plan
Regular Plan Institutional Plan
- ` 5,000 and in multiples of ` 1 - ` 1 crore and in multiples of ` 1
- ` 1,000 and in multiples of ` 1 - ` 1,00,000 and in multiples of ` 1
Average Maturity - 0.09 YearsModified Duration - 0.09 Years
LOAD STRUCTURE
Growth 12.2305Monthly Dividend 10.2816
Growth 12.4037Weekly Dividend -
NAV ( ` )
Regular Plan
Institutional Plan
Quarterly Dividend 10.1949
Monthly Dividend -
• For Dividend History please refer page no. 7
NIL
0.50% if redeemed within 6 months from date of allotment
Entry Load
Exit Load
NAV (AS ON AUGUST 31, 2012)
72.95%
CashA1+, Sovereign
27.05%
Portfolio Holdings Rating/ % to Net
Industry Assets
MONEY MARKET INSTRUMENTS
Certificate of Deposit**
Vijaya Bank CARE A1+ 27.74
State Bank of Bikaner & Jaipur CRISIL A1+ 18.16
State Bank of Patiala ICRA A1+ 14.34
Kotak Mahindra Bank CRISIL A1+ 6.38
Allahabad Bank ICRA A1+ 2.38
Total 69.00
Treasury Bill
TBILL 182 DAY 2012 SOV 3.95
Total 3.95
Cash & Cash Equivalent
Net Receivables/Payables 1.97
CBLO / Reverse Repo Investments 25.08
Total 27.05
GRAND TOTAL 100.00
PORTFOLIO DETAILS
All corporate ratings are assigned by rating agencies like CRISIL, CARE, ICRA, FITCH.**Thinly traded/Non traded securities and illiquid securities as defined in SEBI Regulations and Guidelines.
COMPOSITION BY ASSETS
^Pursuant to payment of dividend, NAV of the Dividend Option of the Plan/Scheme falls to the extent of such dividend payment and applicable statutory levy (taxes, levies, cess etc.), if any. a b $Individual/HUFs Others Past performance may or may no be sustained in the future. Face Value - ` 10/- #Since there are no investors in BOI AXA Equity Fund - Institutional Plan - Regular Dividend and Institutional Plan - Quarterly Dividend the data of NAV as on record date is not provided
$EQUITY FUNDS$HYBRID FUND
Record Date Dividend/ Unit NAV^as onDeclared (in ` ) Record Date
BOI AXA Equity Fund
Regular Plan - Regular Dividend
Regular Plan - Quarterly Dividend
Eco Plan - Regular Dividend
Eco Plan - Quarterly Dividend
Institutional Plan - #
Regular Dividend
Institutional Plan - #Quarterly Dividend
29-May-2009 1.00 15.2123-September-2009 1.00 15.2115-October-2009 1.00 14.9625-November-2009 1.00 14.3129-April-2010 1.00 13.96
29-May-2009 0.50 - 23-September-2009 0.50 - 25-November-2009 1.00 - 29-March-2010 1.00 - 29-April-2010 1.00 -
23-September-2009 0.50 15.7325-November-2009 1.00 16.4329-March-2010 1.00 15.5129-April-2010 1.00 15.1427-September-2010 2.00 14.7027-June-2011 0.50 11.41
29-May-2009 1.00 15.2423-September-2009 1.00 15.2415-October-2009 1.00 15.0025-November-2009 1.00 14.3529-April-2010 1.00 13.99
23-September-2009 0.50 15.7625-November-2009 1.00 16.4629-March-2010 1.00 15.5529-April-2010 1.00 15.1927-September-2010 2.00 14.7727-June-2011 0.50 11.50
29-May-2009 1.00 - 23-September-2009 1.00 - 15-October-2009 1.00 - 25-November-2009 1.00 - 29-April-2010 1.00 -
$EQUITY FUNDS
Record Date Dividend/ Unit NAV^as onDeclared (in ` ) Record Date
BOI AXA Tax Advantage Fund
Regular Plan
Eco Plan
04-June-2009 1.00 18.8423-December-2009 3.00 21.5125-January-2010 3.00 18.2316-March-2010 3.00 15.43
04-June-2009 1.00 18.8523-December-2009 3.00 21.5425-January-2010 3.00 18.2716-March-2010 3.00 15.45
DEBT / INCOME FUNDS
Record Date Dividend/ Unit NAV^as onDeclared (in ` ) Record Date
$BOI AXA Short Term Income FundInstitutional Monthly Dividend
Institutional - Quarterly Dividend
Regular Monthly Dividend
Regular Quarterly Dividend
a25-November-2010 0.044799 10.1584
b25-November-2010 0.041754 10.1584
a27-December-2010 0.043921 10.1575
b27-December-2010 0.040935 10.1575
a25-January-2011 0.043921 10.1704
b25-January-2011 0.040935 10.1704
a25-February-2011 0.052705 10.1881
b25-February-2011 0.049122 10.1881
a29-December-2009 0.1751890 10.2708
b29-December-2009 0.1630520 10.2708
a26-March-2012 0.070473 10.2868
b26-March-2012 0.060402 10.2868
a25-April-2012 0.070473 10.2698
b25-April-2012 0.060402 10.2698
a25-July-2012 0.070473 10.3780
b25-July-2012 0.060402 10.3780
a27-August-2012 0.079282 10.3636
b27-August-2012 0.067953 10.3636
a26-March-2012 0.211419 10.3535
b26-March-2012 0.181207 10.3535
a25-June-2012 0.211419 10.2994
b25-June-2012 0.181207 10.2994
Record Date Dividend/ Unit NAV^as on
Declared (in ` ) Record Date
BOI AXA Regular Return Fund
Regular Monthly Dividend
Regular Quarterly Dividend
Eco Monthly Dividend
Eco Quarterly Dividend
a26-April-2010 0.0746660 10.2992
b26-April-2010 0.0695890 10.2992
a25-October-2010 0.074666 10.3666
b25-October-2010 0.069589 10.3666
a25-November-2010 0.074666 10.2258
b25-November-2010 0.069589 10.2258
a27-December-2010 0.040406 10.1991
a27-December-2010 0.037659 10.1991
a25-March-2010 0.2233660 10.4878
b25-March-2010 0.2078920 10.4878
a29-December-2010 0.114195 10.4804
a29-December-2010 0.106431 10.4804
a26-March-2012 0.176182 10.9116
a26-March-2012 0.151006 10.9116
a25-February-2010 0.0744550 10.2741
b25-February-2010 0.0692970 10.2741
a25-March-2010 0.0744550 10.3359
b25-March-2010 0.0692970 10.3359
a26-September-2011 0.132137 10.1673
b26-September-2011 0.113255 10.1673
a26-March-2012 0.176182 10.4563
b26-March-2012 0.151006 10.4563
a25-June-2012 0.176182 10.4142
b25-June-2012 0.151006 10.4142
BOI AXA Investment Managers Pvt. Ltd.7
Dividend History
# The assigned rating AAAmfs is valid only for “BOI AXA Short Term Income Fund ”. The rating of CRISIL is not an opinion of the Asset Management Company’s willingness or ability to make timely payments to the investor. The rating is also not an opinion on the stability of the NAV of the Fund, which could vary with market developments.The rating indicates that the funds' portfolios will provide 'very strong' protection against losses from credit default. CRISIL's assessment of a rated fund's credit quality is based on the creditworthiness of the fund's portfolio. CRISIL reserves the right to suspend, withdraw or revise the ratings assigned to the scheme at any time on the basis of new information, or unavailability of information or other circumstances, which CRISIL believes, may have an impact on the rating. For detail methodology, please visit CRISIL's website www.crisil.com. Past performance is no guarantee of the future results.

Scheme Performance (Fund Manager wise)All data as on August 31, 2012 (Unless indicated otherwise)
BOI AXA Investment Managers Pvt. Ltd.8
PERFORMANCE (as on June 29, 2012)
Period
#NAV Per Unit ( )
(Face Value ` 10)
` Scheme Returns (%) ^
Benchmark Returns
(S&P CNX Nifty) (%)
Additional Benchmark Returns (%) Scheme (`)
Current Value of Standard Investment of ` 10,000 in the
Benchmark (S&P CNX Nifty) (`)
Additional Benchmark (`)
Since inception* till June 29, 2012 (CAGR)
June 30, 2011 to June 29, 2012 (Absolute)
June 30, 2010 to June 30, 2011 (Absolute)
20.80 25.9175% 21.4020% N.A.
Not applicable
20.80 -6.4748% -6.5251% N.A.
22.24 0.2253% 6.3040% N.A.
^ Past performance may or may not be sustained in the future. *Date of first NAV - February 27, 2009. #NAV as on the last date of the respective periods above.
BOI AXA Tax Advantage Fund - Regular Plan - Growth Option (Previously known as Bharti AXA Tax Advantage Fund)
June 30, 2009 to June 30, 2010 (Absolute) 22.19 33.5942% 23.8028% N.A.
N.A.19,10121,577
PERFORMANCE (as on June 29, 2012)
Period
#NAV Per Unit ( )
(Face Value ` 10)
` Scheme Returns (%) ^
Benchmark Returns
(BSE 100 Index) (%)
Additional Benchmark
Returns (%) (S&P CNX Nifty) Scheme (`)
Current Value of Standard Investment of ` 10,000 in the
Benchmark (BSE 100 Index) (`)
Additional Benchmark (`)(S&P CNX Nifty)
Since inception* till June 29, 2012 (CAGR)
June 30, 2011 to June 29, 2012 (Absolute)
June 30, 2010 to June 30, 2011 (Absolute)
7.87 -10.8974% 0.0118% 1.3659%
Not applicable
7.87 -16.3656% -7.1583% -6.5251%
9.41 -8.8178% 3.8264% 6.3040%
^ Past performance may or may not be sustained in the future. *Date of first NAV - March 10, 2010. #NAV as on the last date of the respective periods above.
BOI AXA Focused Infrastructure Fund - Growth Option (Previously known as Bharti AXA Focused Infrastructure Fund)
10,31810,0037,663
PERFORMANCE (as on June 29, 2012)
Period
#NAV Per Unit ( )
(Face Value ` 10)
` Scheme Returns (%) ^
Benchmark Returns
(S&P CNX Nifty) (%)
Additional Benchmark Returns (%) Scheme (`)
Current Value of Standard Investment of ` 10,000 in the
Benchmark (S&P CNX Nifty) (`)
Additional Benchmark (`)
Since inception* till June 29, 2012 (CAGR)
June 30, 2011 to June 29, 2012 (Absolute)
June 30, 2010 to June 30, 2011 (Absolute)
16.50 15.9749% 20.0888% N.A. 17,223 19,573 N.A.
Not applicable
16.50 -5.8219% -6.5251% N.A.
17.52 1.4476% 6.3040% N.A.
^ Past performance may or may not be sustained in the future. *Date of first NAV - October 29, 2008. #NAV as on the last date of the respective periods above.
BOI AXA Equity Fund - Regular Plan - Growth Option (Previously known as Bharti AXA Equity Fund)
June 30, 2009 to June 30, 2010 (Absolute) 17.27 20.5164% 23.8028% N.A.
Mr. Gaurav Kapur
PERFORMANCE (as on June 29, 2012)
^ Past performance may or may not be sustained in the future. *Date of first NAV - March 20, 2009. #NAV as on the last date of the respective periods above. **The returns for Additional Benchmark in respect of debt/ liquid schemes will be published as and when made available by market data providers.
Period
#NAV Per Unit ( )
(Face Value ` 10)
` Scheme Returns (%) ^
Benchmark Returns
(CRISIL MIPBlended Index) (%)
Additional Benchmark
Returns ** (%) Scheme (`)
Current Value of Standard Investment of ` 10,000 in the
Benchmark (CRISIL MIP
Blended Index) (`)
Additional Benchmark (`)
Since inception* till June 29, 2012 (CAGR)
June 30, 2011 to June 29, 2012 (Absolute)
June 30, 2010 to June 30, 2011 (Absolute)
12.1860 6.1813% 8.6941% N.A. 12,174 13,144 N.A.
Not applicable
12.1860 6.3703% 6.5425% N.A.
11.4562 3.6835% 5.0258% N.A.
BOI AXA Regular Return Fund - Regular Plan - Growth Option (Previously known as Bharti AXA Regular Return Fund)
June 30, 2009 to June 30, 2010 (Absolute) 11.0492 2.8397% 7.6615% N.A.
Mr. Alok Singh
June 30, 2009 to June 30, 2010 (Absolute) N.A. N.A. N.A. N.A.

BOI AXA Investment Managers Pvt. Ltd.9
Scheme Performance (Fund Manager wise)All data as on August 31, 2012 (Unless indicated otherwise)
PERFORMANCE (as on June 29, 2012)
Period
#NAV Per Unit (`)
(Face Value ` 1,000)
Scheme Returns (%) ^
Benchmark Returns (CRISIL Liquid Fund
Index) (%)
Additional Benchmark Returns(CRISIL 91 Day T-Bill
Index) (%) Scheme (`)
Current Value of Standard Investment of ` 10,000 in the
Benchmark (CRISIL Liquid Fund
Index) (`)
Additional Benchmark (CRISIL 91 DayT-Bill Index) (`)
Since inception* till June 29, 2012 (CAGR)
June 30, 2011 to June 29, 2012 (Absolute)
June 30, 2010 to June 30, 2011 (Absolute)
Not applicable
^ Past performance may or may not be sustained in the future. *Date of first NAV - July 18, 2008. #NAV as on the last date of the respective periods above.
BOI AXA Liquid Fund - Institutional Plan - Growth Option (Previously known as Bharti AXA Liquid Fund)
June 30, 2009 to June 30, 2010 (Absolute)
7 Days (Simple Annualized)
15 Days (Simple Annualized)
30 Days (Simple Annualized)
1285.8657
1285.8657
1188.2924
1114.3672
6.5484%
8.2112%
6.6338%
3.9787%
6.8488%
8.6822%
7.1837%
3.2874%
5.0369%
8.0068%
4.7198%
2.3301%
8.0418%
7.8340%
7.9886%
8.3084%
8.1005%
8.2418%
7.8908%
6.8302%
8.0660%
12,848 12,992 12,143
PERFORMANCE (as on June 29, 2012)
^ Past performance may or may not be sustained in the future. *Date of first NAV - July 18, 2008. #NAV as on the last date of the respective periods above.
Period
#NAV Per Unit (`)
(Face Value ` 1,000)
Scheme Returns (%) ^
Benchmark Returns
(CRISIL Liquid FundIndex) (%)
Additional Benchmark Returns(CRISIL 91 Day T-Bill
Index) (%) Scheme (`)
Current Value of Standard Investment of ` 10,000 in the
Benchmark (CRISIL Liquid Fund
Index) (`)
Since inception* till June 29, 2012 (CAGR)
June 30, 2011 to June 29, 2012 (Absolute)
June 30, 2010 to June 30, 2011 (Absolute) Not applicable
BOI AXA Treasury Advantage Fund - Regular Plan - Growth Option (Previously known as Bharti AXA Treasury Advantage Fund)
June 30, 2009 to June 30, 2010 (Absolute)
Additional Benchmark (CRISIL 91 DayT-Bill Index) (`)
1292.0727
1292.0727
1193.1896
1116.7821
6.6801%
8.2873%
6.8418%
4.2008%
6.8488%
8.6822%
7.1837%
3.2874%
5.0369%
8.0068%
4.7198%
2.3301%
12,911 12,992 12,143
PERFORMANCE (as on June 29, 2012)
^ Past performance may or may not be sustained in the future. *Date of first NAV - December 22, 2008. #NAV as on the last date of the respective periods above.
Period
#NAV Per Unit (`)
(Face Value ` 1,000)
Scheme Returns (%) ^
Benchmark Returns
(CRISIL Short TermBond FundIndex) (%)
Additional Benchmark Returns
(CRISIL 1 Year T-Bill Index) (%) Scheme (`)
Current Value of Standard Investment of ` 10,000 in the
Benchmark (CRISIL Short Term
Bond Fund Index) (`)
Since inception* till June 29, 2012 (CAGR)
June 30, 2011 to June 29, 2012 (Absolute)
June 30, 2010 to June 30, 2011 (Absolute)
BOI AXA Short Term Income Fund - Regular Plan - Growth Option (Previously known as Bharti AXA Short Term Income Fund)
June 30, 2009 to June 30, 2010 (Absolute)
Additional Benchmark (CRISIL 1 Year T-Bill
Index) (`)
Not applicable
11,77812,62311,8254.7574%
7.7284%
4.4264%
1.9677%
6.8410%
8.8132%
5.5855%
4.8519%
4.8760%
7.5091%
6.6166%
3.9100%
12.0780
12.0780
11.2344
10.5372
Mr. Ramesh Rachuri

This report is as of August 31, 2012 unless indicated otherwise. Statements relating to outlook and forecast are the opinions of the Author. The views expressed by
the author are personal and are not necessarily that of BOI AXA Investment Managers Private Limited (AMC). This report is for information purpose only and is not
intended to be any investment advice. Please make independent research/ obtain professional help before taking any decision of investment / sale. AMC makes no
representation as to the quality, liquidity or market perception of any securities/ issuer / borrower, if described in the report above, nor does it provide any guarantee
whatsoever. Information and material used in this report are believed to be from reliable sources. However, AMC does not warrant the accuracy, reasonableness
and/or completeness of any information. AMC does not undertake to update any information or material in this report. Decisions taken by you based on the
information provided in this report are to your own account and risk. AMC and any of its officers, directors and employees shall not be liable for any loss or damage of
any nature, as also any loss of profit in any way arising from the use of this material in any manner. AMC or its directors, officers and employees, including author of
this report / persons involved in the preparation or issuance of this report may, from time to time, have long or short positions in, and buy or sell the securities, if any,
mentioned herein or have other potential conflict of interest with respect to any recommendation and related information and opinions given in the report /report. This
report, or any part of it, should not be duplicated, or contents altered / modified, in whole or in part in any form and or re-distributed without AMC’s prior written
consent.
Mutual Fund investments are subject to market risks, read all scheme related documents carefully.
© BOI AXA Investment Managers Private Limited 2012.
Disclaimer/Statutory Details
BOI AXA Investment Managers Pvt. Ltd.10

WE ARE IN NEWS
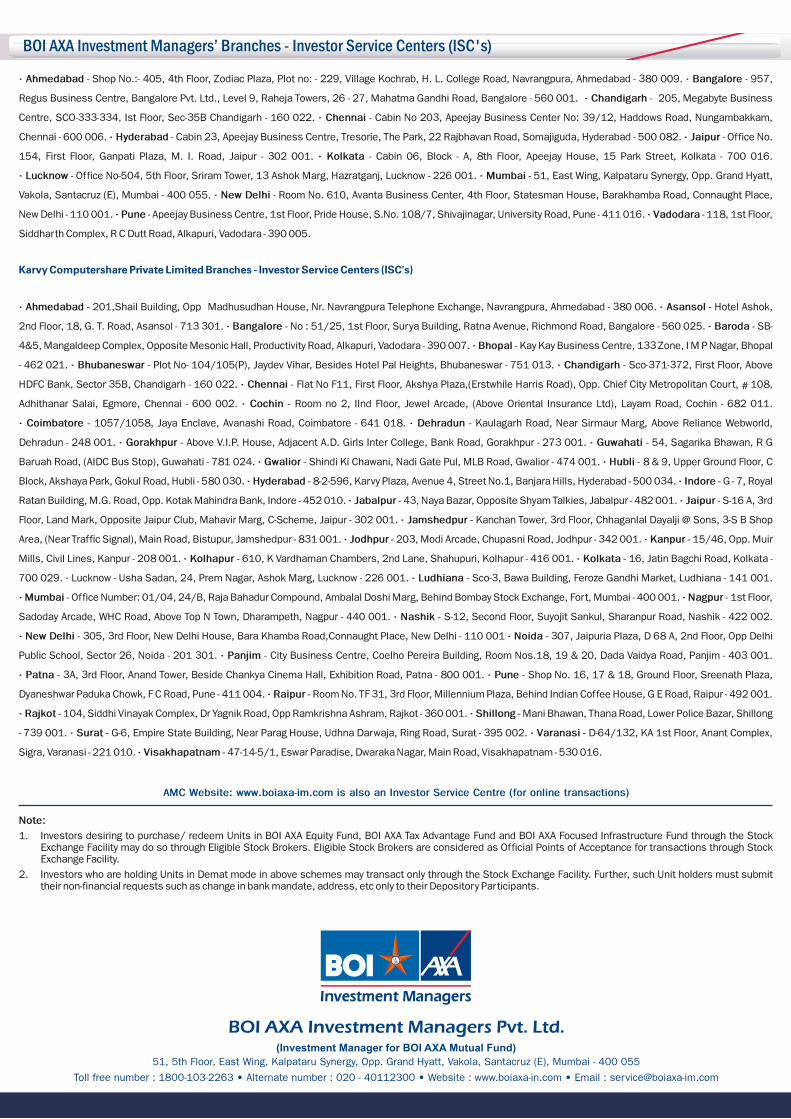
• Ahmedabad - Shop No.:- 405, 4th Floor, Zodiac Plaza, Plot no: - 229, Village Kochrab, H. L. College Road, Navrangpura, Ahmedabad - 380 009. • Bangalore - 957,
Regus Business Centre, Bangalore Pvt. Ltd., Level 9, Raheja Towers, 26 - 27, Mahatma Gandhi Road, Bangalore - 560 001. • Chandigarh - 205,
SCO-333-334, Ist Floor, Sec-35B Chandigarh - 160 022. • Chennai - Cabin No 203, Apeejay Business Center No: 39/12, Haddows Road, Nungambakkam,
Chennai - 600 006. • Hyderabad - Cabin 23, Apeejay Business Centre, Tresorie, The Park, 22 Rajbhavan Road, Somajiguda, Hyderabad - 500 082. • Jaipur - Office No.
154, First Floor, Ganpati Plaza, M. I. Road, Jaipur - 302 001. • Kolkata - Cabin 06, Block - A, 8th Floor, Apeejay House, 15 Park Street, Kolkata - 700 016.
• Lucknow - Office No-504, 5th Floor, Sriram Tower, 13 Ashok Marg, Hazratganj, Lucknow - 226 001. • Mumbai - 51, East Wing, Kalpataru Synergy, Opp. Grand Hyatt,
Vakola, Santacruz (E), Mumbai - 400 055. • New Delhi - Room No. 610, Avanta Business Center, 4th Floor, Statesman House, Barakhamba Road, Connaught Place,
New Delhi - 110 001. • Pune - Apeejay Business Centre, 1st Floor, Pride House, S.No. 108/7, Shivajinagar, University Road, Pune - 411 016. • Vadodara - 118, 1st Floor,
Siddharth Complex, R C Dutt Road, Alkapuri, Vadodara - 390 005.
• Ahmedabad - 201,Shail Building, Opp Madhusudhan House, Nr. Navrangpura Telephone Exchange, Navrangpura, Ahmedabad - 380 006. • Asansol - Hotel Ashok,
2nd Floor, 18, G. T. Road, Asansol - 713 301. • Bangalore - No : 51/25, 1st Floor, Surya Building, Ratna Avenue, Richmond Road, Bangalore - 560 025. • Baroda - SB-
4&5, Mangaldeep Complex, Opposite Mesonic Hall, Productivity Road, Alkapuri, Vadodara - 390 007. • Bhopal - Kay Kay Business Centre, 133 Zone, I M P Nagar, Bhopal
- 462 021. • Bhubaneswar - Plot No- 104/105(P), Jaydev Vihar, Besides Hotel Pal Heights, Bhubaneswar - 751 013. • Chandigarh - Sco-371-372, First Floor, Above
HDFC Bank, Sector 35B, Chandigarh - 160 022. • Chennai - Flat No F11, First Floor, Akshya Plaza,(Erstwhile Harris Road), Opp. Chief City Metropolitan Court, # 108,
Adhithanar Salai, Egmore, Chennai - 600 002. • Cochin - Room no 2, IInd Floor, Jewel Arcade, (Above Oriental Insurance Ltd), Layam Road, Cochin - 682 011.
• Coimbatore - 1057/1058, Jaya Enclave, Avanashi Road, Coimbatore - 641 018. • Dehradun - Kaulagarh Road, Near Sirmaur Marg, Above Reliance Webworld,
Dehradun - 248 001. • Gorakhpur - Above V.I.P. House, Adjacent A.D. Girls Inter College, Bank Road, Gorakhpur - 273 001. • Guwahati - 54, Sagarika Bhawan, R G
Baruah Road, (AIDC Bus Stop), Guwahati - 781 024. • Gwalior - Shindi Ki Chawani, Nadi Gate Pul, MLB Road, Gwalior - 474 001. • Hubli - 8 & 9, Upper Ground Floor, C
Block, Akshaya Park, Gokul Road, Hubli - 580 030. • Hyderabad - 8-2-596, Karvy Plaza, Avenue 4, Street No.1, Banjara Hills, Hyderabad - 500 034. • Indore - G - 7, Royal
Ratan Building, M.G. Road, Opp. Kotak Mahindra Bank, Indore - 452 010. • Jabalpur - 43, Naya Bazar, Opposite Shyam Talkies, Jabalpur - 482 001. • Jaipur - S-16 A, 3rd
Floor, Land Mark, Opposite Jaipur Club, Mahavir Marg, C-Scheme, Jaipur - 302 001. • Jamshedpur - Kanchan Tower, 3rd Floor, Chhaganlal Dayalji @ Sons, 3-S B Shop
Area, (Near Traffic Signal), Main Road, Bistupur, Jamshedpur - 831 001. • Jodhpur - 203, Modi Arcade, Chupasni Road, Jodhpur - 342 001. • Kanpur - 15/46, Opp. Muir
Mills, Civil Lines, Kanpur - 208 001. • Kolhapur - 610, K Vardhaman Chambers, 2nd Lane, Shahupuri, Kolhapur - 416 001. • Kolkata - 16, Jatin Bagchi Road, Kolkata -
700 029. • Lucknow - Usha Sadan, 24, Prem Nagar, Ashok Marg, Lucknow - 226 001. • Ludhiana - Sco-3, Bawa Building, Feroze Gandhi Market, Ludhiana - 141 001.
• Mumbai - Office Number: 01/04, 24/B, Raja Bahadur Compound, Ambalal Doshi Marg, Behind Bombay Stock Exchange, Fort, Mumbai - 400 001. • Nagpur - 1st Floor,
Sadoday Arcade, WHC Road, Above Top N Town, Dharampeth, Nagpur - 440 001. • Nashik - S-12, Second Floor, Suyojit Sankul, Sharanpur Road, Nashik - 422 002.
• New Delhi - 305, 3rd Floor, New Delhi House, Bara Khamba Road,Connaught Place, New Delhi - 110 001 • Noida - 307, Jaipuria Plaza, D 68 A, 2nd Floor, Opp Delhi
Public School, Sector 26, Noida - 201 301. • Panjim - City Business Centre, Coelho Pereira Building, Room Nos.18, 19 & 20, Dada Vaidya Road, Panjim - 403 001.
• Patna - 3A, 3rd Floor, Anand Tower, Beside Chankya Cinema Hall, Exhibition Road, Patna - 800 001. • Pune - Shop No. 16, 17 & 18, Ground Floor, Sreenath Plaza,
Dyaneshwar Paduka Chowk, F C Road, Pune - 411 004. • Raipur - Room No. TF 31, 3rd Floor, Millennium Plaza, Behind Indian Coffee House, G E Road, Raipur - 492 001.
• Rajkot - 104, Siddhi Vinayak Complex, Dr Yagnik Road, Opp Ramkrishna Ashram, Rajkot - 360 001. • Shillong - Mani Bhawan, Thana Road, Lower Police Bazar, Shillong
- 739 001. • Surat - G-6, Empire State Building, Near Parag House, Udhna Darwaja, Ring Road, Surat - 395 002. • Varanasi - D-64/132, KA 1st Floor, Anant Complex,
Sigra, Varanasi - 221 010. • Visakhapatnam - 47-14-5/1, Eswar Paradise, Dwaraka Nagar, Main Road, Visakhapatnam - 530 016.
Megabyte Business
Centre,
Karvy Computershare Private Limited Branches - Investor Service Centers (ISC's)
BOI AXA Investment Managers’ Branches - Investor Service Centers (ISC's)
AMC Website: www.boiaxa-im.com is also an Investor Service Centre (for online transactions)
Note:
1. Investors desiring to purchase/ redeem Units in BOI AXA Equity Fund, BOI AXA Tax Advantage Fund and BOI AXA Focused Infrastructure Fund through the Stock Exchange Facility may do so through Eligible Stock Brokers. Eligible Stock Brokers are considered as Official Points of Acceptance for transactions through Stock Exchange Facility.
2. Investors who are holding Units in Demat mode in above schemes may transact only through the Stock Exchange Facility. Further, such Unit holders must submit their non-financial requests such as change in bank mandate, address, etc only to their Depository Participants.
51, 5th Floor, East Wing, Kalpataru Synergy, Opp. Grand Hyatt, Vakola, Santacruz (E), Mumbai - 400 055
Toll free number : 1800-103-2263 • Alternate number : 020 - 40112300 • Website : www.boiaxa-in.com • Email : [email protected]
BOI AXA Investment Managers Pvt. Ltd.(Investment Manager for BOI AXA Mutual Fund)