download - AXA Mansard Health, Life, Motor, Travel Insurance ...
224
-
Upload
khangminh22 -
Category
Documents
-
view
1 -
download
0
Transcript of download - AXA Mansard Health, Life, Motor, Travel Insurance ...


OUR PURPOSE AND VISIONOur purpose, vision and values outline who we are, what we want to achieve and how we want to achieve it. They provide direction for our Company and help ensure that we are all working towards the same goal.
PurposeWe act for Human Progress by protecting what matters.
VisionTo transform our value proposition “from payer to partner”, we will deliver new services complementing the traditional insurance coverage and build new business models to increase the protection of our customers.
OUR CORPORATE VALUESOur values are the foundation of our organization. They serve as our guide, inspiring our actions and our decisions. These values reflect our way of doing and thinking, for the benefit of our customers, shareholders, employees, business partners and in any community we operate in. The following core values drive everything we do at AXA Mansard Insurance Plc.
Customer FirstAll our thinking starts with the customer. We consider the way they live today and tomorrow so that we continue to be relevant and impactful.
IntegrityWe are guided by strong moral principles, trusting our internal judgment to do the right thing for our customers, employees, stakeholders and partners.
CourageWe speak our mind and act to make things happen. We push the boundaries of what is possible and take bold actions to find new ways to be valuable.
One AXABeing together and being different makes us better. We are stronger when collaborating and acting as one team.

REPORT1.1 Corporate Information 6
1.2 Results at a Glance 7
1.3 Notice of Annual General Meeting 8
1.4 Chairman’s Statement 12
1.5 CEO’s Statement: From the Executive Suite 15
1.6 Board of Directors 18
1.7 Management Team 20
1.8 2020 Corporate Social Responsibility Report 23
1.9 Corporate Governance Report 27
1.10 Directors’ Report 35
1.11 Internal Control & Risk Management 39
1.12 Certification Pursuant to Section 60(2) of Investment and Securities Act No.29 of 2007 45
1.13 Management’s Discussion and Analysis 46
1.14 Statement of Directors’ Responsibilities 48
1.15 Statement of Corporate Responsibility 49
1.16 Report of the Statutory Audit Committee 50
FINANCIALS2.1 Report of the External Consultants 52
2.2 Independent Auditor’s Report to the Shareholders of AXA Mansard Insurance Plc 53
2.3 Consolidated Statement of Financial Position as at December 31, 2020 57
2.4 Consolidated Statement of Comprehensive Income for the Year Ended December 31, 2020 58
2.5 Consolidated Statements of Changes in Equity 59
2.6 Statements of Changes in Equity 61
2.7 Cashflow Statement for the Year Ended December 31, 2020 63
2.8 Notes to the Financial Statements for the Year Ended December 31, 2020 64
OTHER NATIONAL DISCLOSURES3.1 Appendix 1 (Claims Paid Triangulations as at December 31, 2020) Half-Yearly Triangulation 176
3.2 Appendix 2 (Summarised Revenue Accounts (Non-Life Business)) 191
3.3 Appendix 3 (Summarised Revenue Accounts (Life)) 192
3.4 Appendix 4 (Annuity Disclosures) Statement of Assets And Liabilities 193
3.5 Appendix 5A (Five Year Financial Summary - Group) 195
3.6 Appendix 5B (Five Year Financial Summary - Parent) 197
3.7 APPENDIX 6 (Statement of Value Added) 199
3.8 Unclaimed Dividend Listing as at December 31, 2020 200
3.9 E-Mandate Activation Form 215
3.10 Proxy Form 217
3.11 Corporate Directory 219
3.12 Corporate Addresses 221
CON
TEN
TS 1
2
3

IntroductionAXA Mansard Insurance plc is a Nigerian financial service group with interests in insurance, asset and investment management and health insurance. AXA Mansard Group comprises AXA Mansard Insurance Plc. and two subsidiaries all operating in Nigeria.
AXA Mansard Insurance Plc’s Financial Statements comply with the applicable legal requirements of the Companies and Allied Matters Act (CAMA), 2020 regarding financial statements and comprises Consolidated and Separate Financial Statements of the group for the year ended 31 December 2020. The consolidated and separate financial statements have been prepared in accordance with the International Financial Reporting Standards issued by the International Accounting Standards Board.

ANNUAL REPORT 2020- AXA MANSARD | 5
1REPORTREPORT1.1 Corporate Information 6
1.2 Results at a Glance 7
1.3 Notice of Annual General Meeting 8
1.4 Chairman’s Statement 12
1.5 CEO’s Statement: From the Executive Suite 15
1.6 Board of Directors 18
1.7 Management Team 20
1.8 2020 Corporate Social Responsibility Report 23
1.9 Corporate Governance Report 27
1.10 Directors’ Report 35
1.11 Internal Control & Risk Management 39
1.12 Certification Pursuant to Section 60(2) of Investment and Securities Act No.29 of 2007 45
1.13 Management’s Discussion and Analysis 46
1.14 Statement of Directors’ Responsibilities 48
1.15 Statement of Corporate Responsibility 49
1.16 Report of the Statutory Audit Committee 50

6 | ANNUAL REPORT 2020 - AXA MANSARD
1 1.1 CORPORATE INFORMATION
1.1 CORPORATE INFORMATION
Registered OfficeSanta Clara CourtPlot 1412, Ahmadu Bello Way Victoria Island Lagoswww.axamansard.com
Company SecretaryMrs. Omowunmi Mabel Adewusi
RC No.133276
FRC Registration No.FRC/2012/0000000000228
AuditorsKPMG Professional ServicesKPMG TowerBishop Aboyade Cole Street,Victoria Island, LagosTel: (01) 2718955www.kpmg.com/ng
BankersGuaranty Trust Bank PlcStandard Chartered Bank Nigeria LimitedFirst City Monument Bank LimitedStanbic IBTC Bank PlcAccess Bank PlcCitibank Nigeria LimitedEcobank Nigeria PlcFidelity Bank PlcHeritage Bank LimitedUnion Bank of Nigeria PlcUnited Bank of Africa Plc
REPORT
ChairmanMr. Olusola Adeeyo Chairman Nigerian
DirectorsMr. Kunle Ahmed Chief Executive Officer Nigerian
Mr. Ohis Ohiwerei Independent Director Nigerian
Mr. Hassan El-Shabrawishi Non Executive Director Egyptian
Mr. Tope Adeniyi Non Executive Director Nigerian Appointed effective February 14,2020
Mrs. Rashidat Adebisi Executive Director Nigerian Appointed effective February 14,2020
Mr. John Dickson Non Executive Director British Appointed effective March 17, 2020
Mr. Kuldeep Kaushik Non Executive Director Indian Appointed effective July 8, 2020
Mr. Tosin Runsewe Executive Director Nigerian *Resigned from the Board effective from January 31, 2020
Mr. Yomi Onifade Executive Director Nigerian *Resigned from the Board effective from March 31, 2020
Mr. Lesley Ndlovu Non Executive Director Zimbabwean *Resigned from the Board effective from February 14, 2020
Mr. Tom Wilkinson Non Executive Director British *Resigned from the Board effective from December 23, 2020
Mr. Sohail Ali Executive Director British *Resigned from the Board effective from March 31, 2020
Re-insurersAfrican Reinsurance CorporationContinental Reinsurance Plc.Swiss ReMunich Reinsurance Company Limited
ActuariesEY Nigeria Olurotimi O. Okapaise - FRC No: FRC/2012/NAS/00000000738
QED Actuaries & Cons. (Pty) Ltd C Van Heerden - FRC No: FRC/2018/NAS/00000018470
AXA Mansard Jolaolu Fakoya - FRC No: FRC/2019/002/00000020016
ValuersOsas & Oseji Est. Surv. & Valuers Osas & Oseji - FRC No: FRC/2012/000000000052
Aigbekaen Osas Davis - FRC No: FRC/2013/NIESV/00000001140
RegistrarDataMax Registrars Limited
ANNUAL REPORT 2020- AXA MANSARD | 7
1
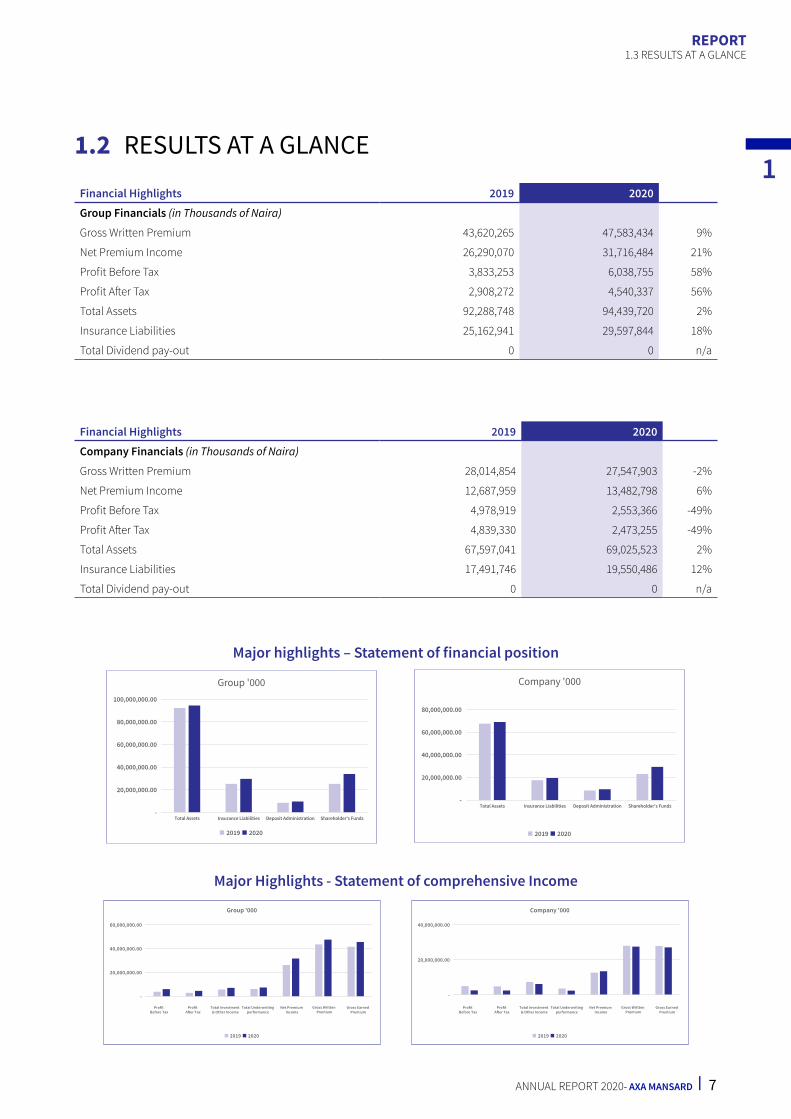
1.3 RESULTS AT A GLANCE
1.2 RESULTS AT A GLANCE
REPORT
Financial Highlights 2019 2020
Group Financials (in Thousands of Naira)
Gross Written Premium 43,620,265 47,583,434 9%
Net Premium Income 26,290,070 31,716,484 21%
Profit Before Tax 3,833,253 6,038,755 58%
Profit After Tax 2,908,272 4,540,337 56%
Total Assets 92,288,748 94,439,720 2%
Insurance Liabilities 25,162,941 29,597,844 18%
Total Dividend pay-out 0 0 n/a
Financial Highlights 2019 2020
Company Financials (in Thousands of Naira)
Gross Written Premium 28,014,854 27,547,903 -2%
Net Premium Income 12,687,959 13,482,798 6%
Profit Before Tax 4,978,919 2,553,366 -49%
Profit After Tax 4,839,330 2,473,255 -49%
Total Assets 67,597,041 69,025,523 2%
Insurance Liabilities 17,491,746 19,550,486 12%
Total Dividend pay-out 0 0 n/a
-
20,000,000.00
40,000,000.00
60,000,000.00
80,000,000.00
100,000,000.00
Total Assets Insurance Liabilities Deposit Administration Shareholder's Funds
Group '000
2019 2020
-
20,000,000.00
40,000,000.00
60,000,000.00
80,000,000.00
Total Assets Insurance Liabilities Deposit Administration Shareholder's Funds
Company '000
2019 2020
Major highlights – Statement of financial position
Major Highlights - Statement of comprehensive Income
-
20,000,000.00
40,000,000.00
60,000,000.00
Profit Before Tax
Profit After Tax
Total Investment & Other Income
Total Underwriting performance
Net Premium Income
Gross Written Premium
Gross Earned Premium
Group '000
2019 2020
Profit Before Tax
Profit After Tax
Total Investment & Other Income
Total Underwriting performance
Net Premium Income
Gross Written Premium
Gross Earned Premium
-
20,000,000.00
40,000,000.00
Company '000
2019 2020

8 | ANNUAL REPORT 2020 - AXA MANSARD
1.3 NOTICE OF ANNUAL GENERAL MEETING
NOTICE IS HEREBY GIVEN that the Twenty-Nineth Annual General Meeting of AXA MANSARD INSURANCE PLC will hold at the Oriental Hotel, No. 3, Lekki Road, Victoria Island, Lagos on Friday, May 7, 2021, at 10:00 a.m. to transact the following business:
ORDINARY BUSINESS1. To receive the Audited Financial Statements for the year ended December 31, 2020, and the Reports of the Directors, Auditors and
Statutory Audit Committee thereon;
2. To elect a Director;
3. To declare a dividend;
4. To authorise Directors to fix the remuneration of the Auditors;
5. To disclose the remuneration of Managers;
6. To elect the Shareholder representatives of the Statutory Audit Committee.
PROXYA member entitled to attend and vote at the Annual General Meeting is entitled to appoint a proxy from the proxies stated in the Notice to attend and vote in his/her stead in accordance with the Corporate Affairs Commission guidelines on holding General Meetings using proxies. For the appointment to be valid, a completed and duly stamped proxy form must be deposited at the office of the Registrar, DataMax Registrars Limited, No. 2c Gbagada Express Road, Gbagada Phase 1, Lagos State, not less than 48 hours before the time fixed for the meeting. A blank proxy form is attached to this Annual Report.
BY ORDER OF THE BOARD
OMOWUNMI MABEL ADEWUSI Company SecretaryFRC/2013/NBA/00000000967
Santa Clara Court, Plot 1412, Ahmadu Bello Way, Victoria Island, Lagos. April 14, 2021
1 1.2 NOTICE OF ANNUAL GENERAL MEETINGREPORT

ANNUAL REPORT 2020- AXA MANSARD | 9
1NOTES
1. ATTENDANCE AND VOTING BY PROXYIn the interest of public safety and having due regard to COVID-19 Guidelines and restrictions for Safe Mass Gatherings in Nigeria by the Nigeria Centre for Disease and Control (NCDC), Lagos State Government and pursuant to the Corporate Affairs Commission’s (CAC) Guidelines on holding Annual General Meetings by Public Companies using Proxies, only persons indicated to be selected proxies on the Proxy Form would attend the Meeting physically. All other Shareholders would be required to attend the Meeting online and to vote at the Meeting through a proxy.
In view of the foregoing, the approval of the CAC was obtained for the Annual General Meeting to be held by proxy.
A proxy may be selected from any of the following individuals (the Selected Proxies):
� Mr. Olusola Adeeyo – Chairman
� Mr. Kunle Ahmed – Chief Executive Officer
� Chief Timothy Adesiyan – Shareholder
� Mrs. Ganiat Adetutu Siyonbola – Shareholder
� Sir Sunny Nwosu – Shareholder
� Mr. Olufemi Abolude – Shareholder
� Mr. Opeyemi Ojedele-Akinwonmi – Shareholder
� Mrs. Bisi Bakare – Shareholder
� Mr. Gbola Akinola – Shareholder
� Mr. Oladimeji Adeleke – Shareholder
The Selected Proxies are to attend the Meeting and vote on their own behalf as well as on behalf of the Shareholders who selected them as proxies. The Selected Proxies are encouraged to comply with relevant public health advice in order to protect the health of others. Other Shareholders can attend the meeting and participate in the proceedings online via real-time streaming options which have been provided in this notice.
A Proxy Form would be sent to the registered email address of Shareholders and would also be available online at www.datamaxregistrars.com, www.axamansard.com and attached to the Annual Report. It is requested that duly executed Proxy Forms (together with any Power of Attorney or other authority under which it is signed, or a notarised copy of such Power of Attorney or other authority) be lodged at the office of Datamax Registrars Limited, as shown on the Proxy Form, not less than 48 hours before the time appointed for the Meeting. The stamping of the Proxy Form will be borne by the Company
2. ACCREDITATION OF SHAREHOLDERS TO ATTEND THE MEETING VIA ELECTRONIC PLATFORMShareholders who intend to attend the meeting electronically are required to register for the meeting by visiting maxmeeting.datamaxgroup.ng. Kindly be informed that Shareholders will be required to provide their registered email address(es) and phone number(s) in completing the accreditation. A message containing a unique link to be utilized for attending the meeting will be sent to the registered email of Shareholders upon completion of the accreditation process.
3. DIVIDEND If approved, dividend will be payable on Friday, May 7, 2021, at the rate of 5.5Kobo per every 50 kobo ordinary share, to shareholders whose names are registered in the Register of Members as at the close of business on Thursday, April 22, 2021. Shareholders who have completed and submitted the e-dividend Mandate Form will receive a direct credit of the dividend into the bank accounts indicated in the e-dividend Mandate Form immediately after the Annual General Meeting.
4. E-DIVIDEND MANDATEShareholders are kindly requested to update their records and advise Datamax Registrars Limited of their updated records and relevant bank accounts for the payment of their dividends. The shareholder data update form and the e-dividend Mandate Form are contained in this Annual Report. The completed forms should be submitted to Datamax Registrars Limited at their office located at No. 2c Gbagada Express Road, Gbagada Phase 1, Lagos State.
1.2 NOTICE OF ANNUAL GENERAL MEETINGREPORT
10 | ANNUAL REPORT 2020 - AXA MANSARD
5. UNCLAIMED DIVIDENDThe list of all Unclaimed Dividends will be circulated with the Annual Report. All Shareholders with Unclaimed Dividends are advised to submit their completed e-dividend mandate form by e-mail or writing to the Registrar, Datamax Registrars Limited, No. 2c Gbagada Express Road, Gbagada Phase 1, Lagos State.
6. E-ANNUAL REPORTThe electronic version of the Annual report is available at www.axamansard.com. Shareholders who have provided their email addresses to the Registrars will receive the electronic version of the Annual Report via email. Furthermore, Shareholders who are interested in receiving the electronic version of the Annual Report are kindly required to request via email to [email protected].
7. CLOSURE OF REGISTERThe Register of Members will be closed on April 23, 2021 in accordance with the provisions of Section 114 of the Companies and Allied Matters Act, Cap. C20, Laws of the Federation of Nigeria, 2020.
8. STATUTORY AUDIT COMMITTEEIn accordance with Section 406(6) of the Companies and Allied Matters Act, 2020, a shareholder may nominate another shareholder for appointment to the Statutory Audit Committee. Such nomination should be in writing and should reach the Company Secretary at least twenty-one (21) days before the Annual General Meeting.
Kindly note that the provisions of the Code of Corporate Governance issued by the Securities and Exchange Commission (SEC) indicate that some of the members of the Statutory Audit Committee should have basic financial literacy and be knowledgeable in internal control processes.
In view of the foregoing, nominations to the Statutory Audit Committee should be supported by the Curricula Vitae of the nominees.
9. ELECTION OF DIRECTORSMr. Kuldeep Kaushik is being proposed for election as a Non-Executive Director. His appointment has been approved by the National Insurance Commission and will be presented for shareholders’ approval at the 29th Annual General Meeting.
The profile of the aforementioned Director is available in the Annual report and also on the company’s website at www.axamansard.com.
10. SHAREHOLDERS RIGHTS TO ASK QUESTIONSIn line with Rule 19.12(c) of the Listing Rules of The Nigerian Stock Exchange, Shareholders of the Company reserve the right to ask questions not only at the Annual General meeting but also in writing prior to the meeting, and such questions must be submitted to the Company than 7 days to the date of the meeting. Such questions should be addressed to the Company Secretary and reach the Company at its Head Office or by electronic mail at [email protected]
11. WEBSITEA copy of this notice and other information relating to the meeting can be found at www.axamansard.com.
1 1.2 NOTICE OF ANNUAL GENERAL MEETINGREPORT

AXA Mansard is CGRS compliant. The Corporate Governance Rating System(CGRS) is a joint initiative between The Nigerian Stock Exchange and the Convention on Business Integrity (CBi) to establish a Corporate Governance Rating System for listed companies to strengthen the corporate regulatory and supervisory capacity in Nigeria

12 | ANNUAL REPORT 2020 - AXA MANSARD
1.4 CHAIRMAN’S STATEMENT
Dear Shareholders; the Board of Directors; Ladies and Gentlemen, I welcome you all to the 29th Annual General Meeting of AXA Mansard Insurance plc.
Our company achieved revenue growth and substantial improvement in its profitability despite the challenging business and competitive environment. Our business adapted every aspect of its operations as the impact of CoVID19 changed clients’ and partners’ interactions. We are proud of our employees for their resilience.
I will present an overview of the global and local markets, outline some of our significant achievements in 2020 and provide an outlook for the 2021 financial year.
ECONOMIC BACKGROUNDThe CoVID19 pandemic effectively triggered a global economic recession; the global economy is estimated to have contracted by 4.3%.
I should be clear here that the pandemic’s most significant impact has been on people’s lives. There were 1.8 million deaths related to CoVID19 by the end of 2020. Millions of jobs have also been lost as institutions have struggled; consequently, millions worldwide are dealing with extreme poverty.
The year 2020 was characterized by successive waves of the pandemic and the introduction, easing, and subsequent re-introduction of lockdown measures as global leaders struggled to balance limiting the loss of lives against the impact of imposed lockdowns on their economic metrics. This introduced significant uncertainty to global demand, trade, and production.
MAJOR ECONOMIESThe United States’ economic output is estimated to have declined in 2020 by 3.6%. To provide context, the U.S. output contraction in 2009 during the financial crisis was 2.5%. The federal government responded by keeping rates low and massive stimulus spending. These interventions helped stem the initial economic decline, although the pandemic’s consecutive waves continued to challenge the U.S. economy.
The emergence of approved vaccines, further stimulus spending, and improved management is expected to propel a resurgence of the U.S. economy.
The Euro area contracted by a historic 7.4% as multiple CoVID19 waves hit critical sectors of the economy - specifically Services and Tourism. In response, the European Union extended financial support packages to the hardest-hit countries. The manufacturing segment is also recovering quickly.
Finally, China’s massive growth over the past decade decelerated to 2%. The Chinese government has managed the crisis admirably and invested heavily in public infrastructure during the crisis. Consequently, according to the world bank, there has been a sharp increase in government deficit and total debt. Industrial production has been on the rebound, as well as exports.
NIGERIAAlong with the rest of the globe, Nigeria’s economy was challenged in 2020, especially with a reduction in energy demand. This led to the decline in oil prices, Nigeria’s primary source of foreign exchange income. The leading economic indicators were largely negative; GDP
We acknowledge what a challenging year 2020 was for many of our customers, but we assure you that our resolve to put customers first remains sacrosanct.
“”
1 1.4 Chairman’s StatementREPORT

ANNUAL REPORT 2020- AXA MANSARD | 13
1
1.4 CHAIRMAN’S STATEMENTREPORT
declined 1.9%, inflation rose to 15.75% by the end of the year, and the external reserves had declined to $34.85 billion - a 10% decline from the 2019 position.
2020’s economic performance is a result of local events compounded by the pandemic-induced disruption. Issues with insecurity in the food-producing regions, the land border closure, and the increased fuel prices were mainly responsible for the rise in food prices that fed inflation. On the other hand, the pandemic limited many corporate companies’ revenue-generating capacity, forcing challenging decisions, mainly cost reduction, to ensure survival.
FINANCIAL PERFORMANCEIn 2020, AXA Mansard grew Gross Written Premiums by 9.1% from ₦43.6bn in 2019 to ₦47.6bn in 2020. The main driver of growth was the health business that grew by 28% from N15.6bn in 2019 to ₦20.0bn in 2020. The Insurance business ended the year with Gross Written Premiums of ₦27.5bn, down 2% from ₦28.0Bn in a challenging year, especially for the corporate segment of the life business.
Our Profit Before Taxes grew by 58% in 2020, from ₦3.8bn in 2019 to ₦6.0bn in 2020. The performance is a testament to the business’s commitment to prioritize the quality of its core business – underwriting profits which grew by 22% from ₦6.1bn in 2019 to ₦7.7bn in 2020.
We invested in our people to ensure that all employees were empowered and productive despite the disruption to everyday life and habits. We also made substantial investments to ensure that our clients had access to our services throughout the year. Despite these investments, we only grew overall expenses by 3% in 2020.
Concerning returning value directly to our customers, our net claims paid grew by 16% from ₦17.5bn in 2019 to ₦20.3bn in 2020 as we continued to protect our clients, helping them to bounce back from the impact of unexpected events and being their partner beyond just the payment for losses incurred.
We closed 2020 with total assets of ₦94.4bn, and our total equity grew by 25% to ₦37.6bn in 2020. Significantly, Insurance Shareholders’ funds at the end of 2020 was ₦29.3bn; strictly speaking, share capital was raised from ₦5.25bn to ₦18bn as approved by you, dear shareholders.
Gross Written Premium Profit After Tax Net Claims Paid
43.6bn in 2019 3.8bn in 2019 17.5bn in 2019
₦47.6Bn ₦6.0bn ₦20.3bn9.1% 58% 16%
CUSTOMERSIn 2020, we continued to prioritize our customers. Early in the year, during the lockdown, we provided a free teleconsultation service for all AXA Mansard clients to have access to medical experts even when they could not visit the hospital.
Our Insurance businesses created flexible payment options across our corporate plans to support customers with optimizing their cashflows. We also incurred about One billion Naira on claims (or potential claims) for our clients affected by the EndSars unrest towards the end of the year.
We launched low-cost health products, under One thousand Naira monthly, to ensure that many more Nigerians had access to health benefits.
We acknowledge what a challenging year 2020 was for many of our customers, but we assure you that our resolve to put customers first remains sacrosanct.
EMPLOYEESWe are grateful to our employees, our greatest assets. They are the backbone of all our financial and non-financial achievements, and we are confident we have the right team to achieve our future objectives.
We acknowledge the level of resolve, flexibility, and professionalism every employee had to show in 2020 to keep our customers happy and ensure our operations continued to run without interruption during a pandemic. We are grateful.
Our employees are important stakeholders, and we are committed to investing in their professional and technical development. We will also continue to work hard to ensure that every employee feels valued, empowered, and productive.
AWARDS & RECOGNITIONSI am proud to announce that the world’s leading insurance risk ratings agency, AM Best, affirmed our financial strength rating of B+. The ratings reflect the company’s balance sheet strength, operational performance, and enterprise risk management.
At the annual Marketing Stakeholders Summit awards, we were named the Most Outstanding Insurance Company of the decade. Well done to the team.

14 | ANNUAL REPORT 2020 - AXA MANSARD
We take these recognitions as a testament to our efforts to build a sustainable company, and we are committed to continued optimization of stakeholder value in the coming years.
DIVIDENDSOur shareholders are important to us. To you, we are committed to delivering value in the short, long, and medium-term.
Regarding the financial year 2020, I am happy to inform you that we will be declaring dividends of 5.5 kobo per share. This would mean that we would be paying total dividends of ₦1.98b subject to the deduction of withholding taxes.
I appreciate you all for your patience with us as we made efforts to ensure sufficient capitalization of the business for the past two years. We hope you see the quantum of dividends as a signal of our continued commitment to delivering value.
OUTLOOK FOR 2021We expect moderate growth in the global economic output in 2021; the world bank projects an average increase of 3.8%, although risks from adverse events related to the pandemic remain material. There will be a heightened focus on leaders’ responsibility in managing the pandemic and introducing economic reforms to revitalize economies.
In the U.S., 3.5% growth in 2021 is expected, driven by improved management of the pandemic. Widespread vaccination should also increase economic activity and drive demand.
We expect China’s economic output to grow to 7.9% in 2021 from 2% in 2020 as demand and manufacturing activities continue to surge.
Economic growth in the Euro area in 2021 should rebound to 3.6% from a contraction of 7.6% in 2020. Improved CoVID19 management should lead to a strengthened manufacturing sector which will benefit from increased external demand, mainly China’s.
Along with other emerging economies that have experienced the worst impact of the pandemic on average individuals, Nigeria’s economy is expected to grow slowly in 2021: between 1.7% - 2.0%. The economy already grew in the last quarter of 2020, exiting a recession. Critical revenue-generating metrics, including oil production and prices, have optimistic projections for 2021.
Overall, we expect a slow but steady economic recovery in 2021. The impact of the recovery should filter through large corporates, small businesses, and then individuals. AXA Mansard will continue to support all our clients as we navigate this period of uncertainty.
On a final note, I thank you, shareholders, for the continuing faith in this business. We are determined now more than ever to build a resilient company even in a period of crisis to reward the confidence you have in us in the short and long term. We also thank our clients who have continued to trust us as we protect the things that matter most to them.
Mr. Olusola AdeeyoChairman
1 1.4 Chairman’s StatementREPORT

ANNUAL REPORT 2020- AXA MANSARD | 15
11.5 CEO’S STATEMENT: FROM THE EXECUTIVE SUITE
Dear Valued Shareholders,
It is my pleasure to present you with a summary of AXA Mansard’s performance in 2020, offer some context to the results, and share our view and expectations for 2021.
NIGERIA OVERVIEWIn line with the global trend, Nigeria’s leading economic indicators painted a dim picture for the nation, businesses, and individuals. Gross Domestic Product declined by 1.92% in 2020; inflation rose slightly higher than 15% by the end of the year, while unemployment rates worsened to 33%. Of course, everything in 2020 happened against the backdrop of the CoVID19 pandemic. The pandemic brought global economic activity and trade close to a halt and significantly disrupted global supply chains. The direct implication of this was a sharp decline in energy prices - impacting Nigeria’s revenue generation capacity causing a massive shock to some of Nigeria’s most prominent institutions.
Other factors coincided with CoVID19 to create the dire metrics; we saw continued insecurity in segments of the country, while increased electricity tariffs, and closure of land borders to trade worsened inflation figures in the short term.
As the year came to an end, the nation experienced a different type of disruption, a sad diversion from young Nigerians exercising their civil rights to speak. Miscreants hijacked these protests and caused damage to businesses estimated at around ₦13 Billion Naira.
I should mention these events impacted institutions and individuals, some of whom are our clients. At AXA Mansard, we continued to reaffirm to society that we remain partners during such challenging periods by helping them traverse the challenges and managing the fallout.
THE NIGERIAN INSURANCE INDUSTRYThree (3) main activities defined the insurance industry in 2020: the industry’s collective response to CoVID19, an affirmation of the industry’s position as a source of support during the hijacked EndSARS crisis, and a series of consolidations in response to NAICOM’s proposed minimum capital - although currently suspended.
REPORT1.5 CEO’s Statement: From the Executive Suite
Despite headwinds impacting our preferred segments, mainly commercial lines, gross revenues grew by 9% from ₦43.6bn in 2019 to ₦47.6bn in 2020. Profits Before Taxes (PBT) also increased by 58%...
“
As the pandemic initially hit, the insurance industry contributed around ₦17 Billion Naira in insurance coverage, cash and protection equipment’s combined to support the federal government in combating the effects of the pandemic...
“
”
”
As the pandemic initially hit, the insurance industry contributed around ₦17 Billion Naira in insurance coverage, cash and protection equipment’s combined to support the federal government in combating the effects of the pandemic on the economy. This collaborative effort is both noteworthy and praiseworthy, as this was also a challenging period for the industry itself which was struggling to grow. The declining interest rate environment limited the capacity to grow the fastest growing product line for the sector - annuities. The direct impact of the CoVID19 on the commercial lines clients also placed a strain on industry growth.

16 | ANNUAL REPORT 2020 - AXA MANSARD
As I mentioned earlier, the civil unrest towards the end of 2020 led to considerable damage to lives and properties. Total reserves across the industry are estimated to be approximately ₦13 billion naira. There is no doubt that this will harm Loss Ratios across the sector in the short term. However, I believe it showcases the industry’s strength and highlights the role of the Insurance industry in the economy.
Finally, companies across the sector took action to recapitalize in line with NAICOM’s requirements. Further to your approval at the last Extra Ordinary General Meeting, your company finalized documentary processes with the Securities and Exchange Commission and other Regulators to meet the precise capital definition by NAICOM.
Overall, despite strong headwinds that was expected to slow down industry growth in 2020, the industry demonstrated resilience, and companies with solid fundamentals, including AXA Mansard, came out stronger.
AXA MANSARD’S PERFORMANCE SUMMARY
GLOBAL PERFORMANCEDespite headwinds impacting our preferred segments, mainly commercial lines, gross revenues grew by 9% from ₦43.6bn in 2019 to ₦47.6bn in 2020. Profits Before Taxes (PBT) also increased by 58%, from ₦3.8 billion in 2019 to ₦6.0 billion in 2020. We achieved these headline results through a combination of resilience across the organization and unwavering focus on technical excellence to improve our core businesses’ quality.
In 2020, we incurred significant expenses in technology platforms and tools to maintain workforce productivity and maintain client access to our services - adapting our business model to deal with a level of remote work previously unexpected. Pre-pandemic, the company had made steps to become a more flexible workplace; CoVID19 only accelerated the conviction. Yet, we only grew overall operating expenses by 3% from 2019. The investments made supported 9% revenue growth and strong customer satisfaction scores by the end of the year - 75 points, up from 73 points the previous year.
In recent years, our prioritization of portfolio quality also paid dividends in 2020, with underwriting performance improving by 22%, as underwriting profits increased from ₦6.1 billion in 2019 to ₦7.4 billion in 2020. Specifically, the technical teams worked to reduce reinsurance costs by 10% from 2019. All our preferred business segments were profitable in 2020.
These, combined with our pension business’s sale in 2020, drove strong profitability and revenue growth.
ASSET MANAGEMENT (AUMS)We completed the sale of the pension business in 2020. Once again, we thank the team for their professionalism and commitment to delivering some of the highest industry leading returns to their clients. We wish them all the best as they embark on a new phase of their journey.
AXA Mansard Investments Limited (AMIL) grew Assets under Management (AuM) by 20%, from ₦82 billion in 2019 to ₦99 billion in 2020. Given the economic clime, that was no mean feat. We invested in initiatives that put clients right at the center of our business. Specifically, we launched an instant liquidation service and offered customers more investment options - all online. We
also maintained a top 3 position for investment returns to our customers all through the year.
LOOKING AHEAD - 2021Dear Shareholders, our goal for 2021 could not be more inspiring; we want to “Act for Progress” for our stakeholders: customers, employees, shareholders, the environment, and society.
We acknowledge the challenges and uncertainties that 2021 brings. The economy is in recovery, and our clients, corporate and individual alike, are only starting to figure out how to navigate this unique environment. No one is precisely sure how many more waves of the pandemic we will experience or how they will impact the economy. Whatever happens, we believe that putting our stakeholders at the center of every action will help us navigate the terrain successfully.
Acting for Customer progress: We will find new ways to connect to our clients by expanding our footprints online and offline. We know that insurance is a crucial pillar for the economy, businesses, and individuals in disruption times; 2020 proves that. Therefore, we want to be right next to our customers when they need us.
1 1.5 CEO’S STATEMENT: FROM THE EXECUTIVE SUITEREPORT
our prioritization of portfolio quality also paid dividends in 2020, with underwriting performance improving by 22%, as underwriting profits increased from ₦6.1 billion in 2019 to ₦7.4 billion in 2020.
“
”Acting for Employee progress: We will upskill our employees and find new ways to transform their hard work into tangible results. We believe in improving employee efficiency and creating a conducive work environment to help them live high-quality lives. We will continue to invest in mental health initiatives and support every employee by making the workplace more flexible.
Acting for Shareholder progress: We will remain focused on growth and profitability. In 2021, more than ever, we have a renewed sense of delivering shareholder value.
We also want to be more responsible for the society: Building customized capacity to partner with small businesses for progress. For the first time, we will measure our impact on the environment - our carbon emissions, waste, water, etc.
Finally, we thank our esteemed customers and business partners, including brokers, for your patronage and continued trust in our capacity to serve you across all our business lines. We also thank the Shareholders without whom we will not exist as a company, and we value your belief in our ability to do what is right. We will continue to act for your progress.
Kunle Ahmed
Chief Executive Officer


18 | ANNUAL REPORT 2020 - AXA MANSARD
1.6 BOARD OF DIRECTORS
1 1.6 BOARD OF DIRECTORSREPORT
4
1
5
2
3
6

ANNUAL REPORT 2020- AXA MANSARD | 19
1
1.6 BOARD OF DIRECTORSREPORT
1. Mr. Olusola Adeeyo
2. Mr. Kunle Ahmed
3. Mrs. Rashidat Adebisi
4. Mr. Tope Adeniyi
5. Mr. Hassan El-Shabrawishi
6. Mr. John Dickson
7. Mr. Kuldeep Kaushik
8. Mr. Ohis Ohiwerei
7 8

20 | ANNUAL REPORT 2020 - AXA MANSARD
1.7 MANAGEMENT TEAM
1 1.7 MANAGEMENT TEAMREPORT
1
5
9
3
7
11
2
6
10
4
8
12

ANNUAL REPORT 2020- AXA MANSARD | 21
1
1.7 MANAGEMENT TEAMREPORT
1. Mr. Kunle Ahmed
2. Mr. Tope Adeniyi
3. Mr. Deji Tunde-Anjous
4. Mrs. Ngozi Ola-Israel
5. Mrs. Olajumoke Odunlami
6. Mr. Olusola Odumuyiwa
7. Mr. Babajide Babalola
8. Mr. Bayo Adesanya
9. Mr. Jolaolu Fakoya
10. Mr. Akinlolu Akinyele
11. Mr. Kunle Akinbowale
12. Mrs. Abisola Nwaboshi
13. Mr. Adeola Adebanjo
14. Mr. Taiwo Aluko
15. Mrs. Samira Nwaturocha
16. Mrs. Omowunmi Adewusi
17. Mrs. Rashidat Adebisi
13
17
1514 16

22 | ANNUAL REPORT 2020 - AXA MANSARD

ANNUAL REPORT 2020- AXA MANSARD | 23
1
2020 CORPORATE SOCIAL RESPONSIBILITY REPORT
1.8 2020 CORPORATE SOCIAL RESPONSIBILITY REPORT
REPORT
BACKGROUNDAXA Mansard’s overall CSR objective is to achieve positive impact on the society as a whole while maximizing the creation of shared value for members of staff, shareholders and stakeholders. In the face of an unprecedented pandemic, AXA Mansard’s CSR efforts were directed towards the fight against COVID-19. We demonstrated our commitment to this by complementing the government’s efforts in this regard. We also undertook education related activities.
SUPPORT FOR NON-GOVERNMENTAL ORGANIZATIONS
DONATION TO GOVERNMENT HOSPITALSIn April 2020, AXA Mansard donated Personal Protective Equipment (PPE) worth millions to the Lagos State Government, University College Hospital, Ibadan (UCH) and Nigeria Centre for Disease Control at the Federal Capital Territory (FCT) Abuja to aid in their fight against the COVID-19 Outbreak. PPE donated include Splash resistant suits/coveralls, N95 Masks, Goggles etc.
In addition to this, we also donated ₦100 million’s worth of life insurance cover for 100 medical professionals across Lagos, Abuja and Ibadan.
INDUSTRY DONATION TO GOVERNMENTAXA Mansard complimented the Nigerian Insurers Association (NIA)’s effort in the fight against COVID-19 by contributing towards the N500m industry donation to the Federal Government. This was a move to further support in containing the spread of the pandemic.
DONATION TO RED-CROSSIn September 2020, AXA Mansard employees participated in AXA’s CR Week Worldwide sport challenge. The Nigerian Red Cross has been identified as the organisation to benefit from funds raised from participation of AXA Mansard employees. The proceeds of the events were channelled towards the efforts of the Nigerian Red Cross towards educating people on COVID-19 and alleviating the effects of the COVID-19 pandemic around Nigeria. We supported the NGO with the sum of Five Hundred Thousand Naira (₦500,000).
DONATE A BOOK’ INITIATIVEIn March 2020, AXA Mansard employees championed the ‘Donate a book’ Initiative where employees committed to donating a book towards children who need them. The books were donated to students at Akodu Primary School, Mushin along with a generator for the school’s use and white board markers.
COMPLAINTS AND FEEDBACKINTRODUCTIONAt AXA Mansard Insurance Plc., customers are a vital part of our business. Our focus has been to deliver excellent customer service across our touch points and remain a thought leader in the industry. Bearing this in mind, we consider customers’ feedback as valuable insights to enable us make better decisions, improve our business and the overall customer experience.
COMPLAINTS CHANNELS Our goal is to be accessible whenever and wherever our customers need us and also drive engagement to foster mutual relationship. In view of this, we were available via the following multi-channel platforms to engage customers and address their requests:
1. AXA Mansard CCare and Complaint email channels,
2. AXA Mansard hotline,
3. AXA Mansard Website,
4. Correspondence from customers,
5. AXA Mansard Twitter handle, Google+, Instagram, Facebook channel and Live Chat Platform on the website
Customers can also pay a visit to any of our Welcome Centers nationwide to interact with our staff and provide feedback. The addresses for these centres can be found on our website –https://www.axamansardplc.com/office-directory.
RESOLUTION STRUCTUREOur resolution structure shows a standard process flow on how complaints are resolved within stipulated timelines and steps taken to mitigate future occurrence while also presenting opportunity for continuous innovation. For this purpose, we have a dedicated Customer Interface team which comprises the Contact Centre and Branch Operations teams. The Contact Centre is responsible for prompt investigation and resolution of customers’ complaints within the approved period. The Contact Centre liaises with other units within the organization and ensures that customers’ complaints are satisfactorily resolved.
Customers’ complaints are stream-lined based on the type of complaints to provide an enabling environment for proper monitoring, proper documentation and effective feedback process for received complaints.
The process flow of customer complaint and resolution is as follows:
� The officer at the receiving point of a customer’s complaint acknowledges and records the complaint.
� The complaint is reviewed and it is determined if the complaint could be resolved at first-level.
� Where the complaint can be resolved at the first level, a resolution is immediately provided to the customer.
� Where such complaint cannot be resolved at the first level, the receiving point forwards such complaint to the appropriate unit in the organization to resolve, while also keeping the customer informed.
� Upon resolution, the customer is contacted and the resolution is explained to the customer.
� The complaint case is closed and marked as resolved.
In addition to our current process is the utilization of the Customer Relationship Management (CRM) application for documentation and review of the customer experience journey. The combination of these processes have adequately helped us measure customer resolution, and have provided statistical summaries on customer relationship management.
24 | ANNUAL REPORT 2020 - AXA MANSARD
CUSTOMERS’ OPINION ON PRODUCTS To enrich our customer experience, we paid attention to customer’s opinion and included periodic keep in touch activities to evaluate their perspectives and opinions about our products and services.The evaluation was conducted through:
� One-on-one focus meetings with key customers.
� Interviews with select customers.
� Opinions received via our AXA Mansard CCare mailbox ([email protected])
� Surveys / Questionnaires administered to customers.
� Keep in Touch activities with customers
These various evaluations were carried out to afford our organization the opportunity to evaluate customers’ perception about us, in order to ensure that processes are continuously reviewed to improve service delivery and enhance product quality.
FEEDBACK ON CUSTOMERS’ COMPLAINTS TO AXA MANSARD INSURANCE PLCFeedback on customers’ complaints is provided to Management, relevant Units and Groups within the organization to ensure that complaints and issues raised by customers are brought to their knowledge, so as to bring about further review and inclusion of best practice.
The feedback gathered ensures that:
� AXA Mansard retains her customers as customers feel appreciated and respected,
� The quality service delivery at AXA Mansard is maintained and standardized across board,
� A reliable source of identifying improvement opportunities is presented to management,
� A reliable source of data on customers’ complaints and expectations is collated.
The feedbacks are circulated to management staff through the company’s internal information channel for the general information of all staff.
Incidence of complaint not resolved within stipulated turnaround time, was largely due to dependency on third party assistance in resolutions, however all complaints are usually resolved within 24hrs. If the issue exceeds our stated turnaround time, it is mandatory that complaints are closed with our customers consent at an agreed upon time.
We continually strive to ensure improvements in our service delivery with a view to reducing customer complaints. Major tools for achieving this is through:
� Our Keep in Touch (KIT) Process, which helps us continuously engage and interact with our customers. This has in turn helped the organization address customer concerns before they became complaints.
� An increase in number of our customer Touch points (Welcome Centers, Contact Centre, Live chat, Website Call Back, Social media handles etc.). Our availability has made it easy for customers to walk in or engage us and have a delightful experience while their concerns are being addressed.
1 1.8 2020 CORPORATE SOCIAL RESPONSIBILITY REPORTREPORT
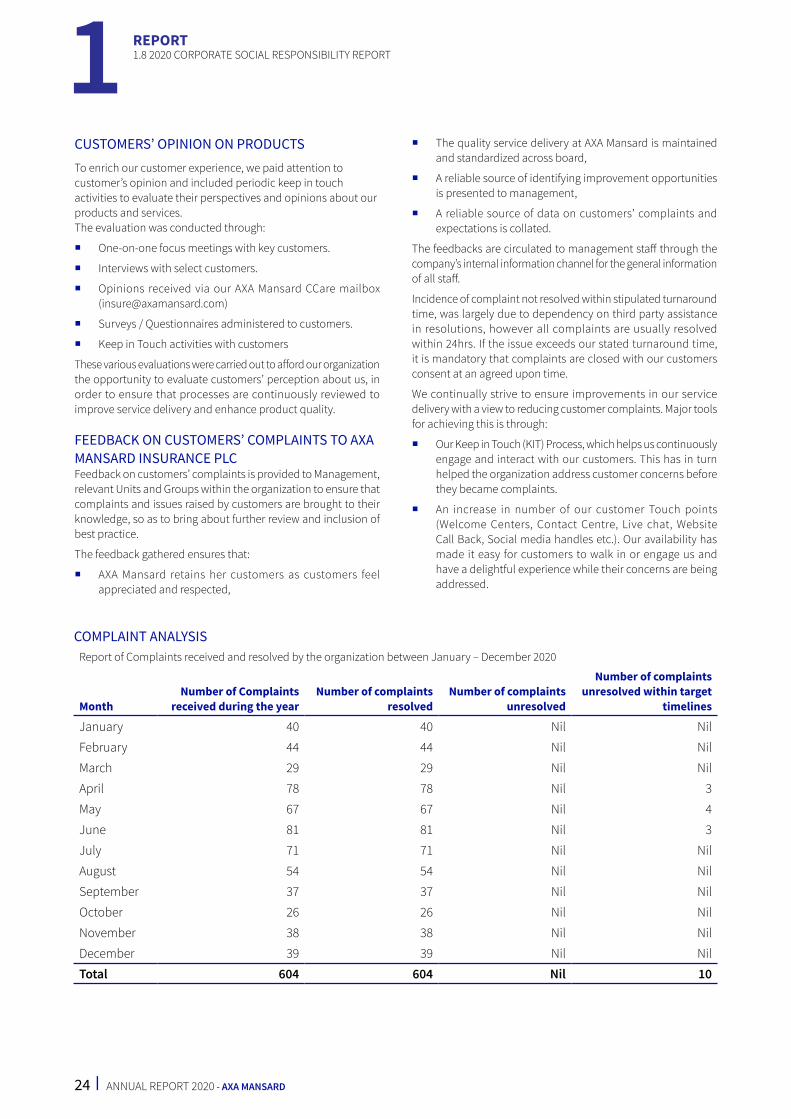
COMPLAINT ANALYSISReport of Complaints received and resolved by the organization between January – December 2020
MonthNumber of Complaints
received during the yearNumber of complaints
resolvedNumber of complaints
unresolved
Number of complaints unresolved within target
timelines
January 40 40 Nil Nil
February 44 44 Nil Nil
March 29 29 Nil Nil
April 78 78 Nil 3
May 67 67 Nil 4
June 81 81 Nil 3
July 71 71 Nil Nil
August 54 54 Nil Nil
September 37 37 Nil Nil
October 26 26 Nil Nil
November 38 38 Nil Nil
December 39 39 Nil Nil
Total 604 604 Nil 10

ANNUAL REPORT 2020- AXA MANSARD | 25
1
December
November
October
September
AugustJuly
JuneMay
April
March
February
January
9080706050403020100
Number of Complaints received during the period
1.8 2020 CORPORATE SOCIAL RESPONSIBILITY REPORTREPORT
The year started out with the normal pace of activities and complaints received in January and February largely involving service issues experienced by customers making liquidations on our Life contributory products. These complaints were mainly as a result of process changes inherent in the transition from use of the existing liquidations platform to a new application, as well as unfamiliarity of the new process for first time users. However, these were soon addressed with learnings incorporated to improve the process. During the period, customers were closely managed and kept abreast of status until their concerns where sorted.
From April to July, new service protocols necessitated by the lockdown imposed on many parts of the country as a result of the pandemic, as well as the need to adhere to physical distancing guidelines led to an abrupt change in customers’ usual service experience. Specifically, these protocols necessitated the temporary shutdown of our physical offices and an immediate migration to a remote working framework and this consequently impacted our operational service. These customer complaints were distributed as follows: delayed liquidation lodgement (50%), delayed claim lodgement (30%), inability to reach our contact numbers due to migration to a remote-enable mobile network (10%), delayed delivery of hardcopy certificates (5%) and delayed physical vehicle inspection (5%). Nonetheless, the service framework was soon adjusted to deal with this new reality, with increased focus on promoting remote working methodologies and tools for staff to comply with health directives and implementation of more self-service options for customers, of course with the attendant customer education to increase adoption of these channels.
The challenges faced during the period were not limited to AXA Mansard alone but were equally affecting the business operations of vendors and other third parties in the service value chain. Specifically for claims management, our loss adjusters could not visit accident scenes for vehicle inspection as a consequence of physical distancing policies, while in some states, our approved auto mechanic garages for assessing and repairing vehicle damage worked at limited capacity or not at all, given their need to comply with state imposed curfews. These developments had significant impact on turnaround time (TAT) for such services. In view of these limitations, AXA Mansard temporarily adopted
online vehicle inspection in lieu of physical inspection to ensure a smoother experience for our customers. By August, while a lot of these concerns had been sorted, we still witnessed some customer complaints related to delays in completing the booking transactions, leading us to optimize our booking platform, which improved TAT for issuance of policy certificates.
With these initiatives, we were able to address common complaint areas and ultimately reduce the number of new complaints. The complaints reported in September and October mainly involved delayed confirmation of payments made by customers. This was caused by downtime of a third-party payment channel, resulting in amounts paid by customers either not being to our accounts or being returned to customers account, in many cases without them realising this had happened. This glitch consequently impacted on timeline for posting and updating of customers’ policy statements. The issue with the third-party platform has since been addressed and we have introduced and communicated other payment channels for customers can select in order to reduce dependency of the customer on any particular channel. In November and December, most of the service complaints resulted from internal network challenges during the period, which slowed our ability to deliver promptly on settlement, issuance of tax rebate documents and other general services dependent on the affected applications. To address this, a system maintenance and upgrade was carried out and this successfully addressed the root cause. During the period, affected customers were kept abreast of the situation until the issue was resolved.
All complaints received during the year (2020) were acknowledged and addressed accordingly.
SUSTAINABILITY REPORT
THE ENVIRONMENTAL AND SOCIAL MANAGEMENT SYSTEM- OUR APPROACHAs the foremost insurance company in Nigeria to pioneer and incorporate the environment and social facets of risk management, as an ancillary function to mainstream insurance risk underwriting, AXA Mansard remains passionate and dedicated to managing the potential Environmental & Social risks of our business and

26 | ANNUAL REPORT 2020 - AXA MANSARD
applying the appropriate standards in the review of our business operations and those of our clients, as well as in our relationship with the communities in which we operate
Our Environmental and Social risk management framework constitutes an integral part of our robust corporate governance, social responsibility and enterprise risk management strategies. Our obligation to uphold environmental and social sustainability considers the occupational and community health, safety and security concerns of the businesses we underwrite and advocates social responsiveness amongst our clients in relation to these risks.
We are taking a more serious look at the environmental and social impacts and risks potentially associated with our business activities as we strive to retain our standards and the delicate balance between ensuring viable competitiveness and delivering on our corporate social responsibilities. This is evident in our constant improvement of the ESMS tools and processes we use to ensure that it continues to function efficiently and effectively, we put other identified E&S risk that emerge in the course of the year into consideration as well as ensure that changes in relevant environmental standards are reflected.
The management of E&S risks is governed by its Environmental & Social Management System (ESMS) framework- which consists of a policy, a set of procedures to identify, assess and manage environmental and social risks in our clients’ operations and the assignment of administering such responsibility by the Enterprise Risk Management (ERM) unit.
In addition, through our Environmental & Social Management System processes, we evaluate our clients’ current capabilities in managing identified environmental & social risks that could arise in the cause of their business operations and we offer advisory
services and also assist in developing E&S framework as value- added service.
We are committed to assisting our clients develop environmental and social risk management frameworks as value-added service as this we believe is mutually beneficial to our clients and ourselves in relation to managing E&S risks as the success of our customers, clients and stakeholders guarantees future business, which strengthens our commercial sustainability.
CONTINUOUS AWARENESSA significant contribution we are making to socioeconomic development is in creating awareness by training and building the capacity of our employees in the subject of sustainability and enlightening our customers, clients and all other stakeholders. We seek to increase our clients’ understanding of how E&S issues can impact their business, thereby reducing resistance to environmental and social risk management requirements and developing strong partnership for sustainability.
OUR COMMITMENTWe will remain focused and committed on Sustainable performance. This translates into taking measures to minimize harm in the communities we operate in, we would continually communicate our progress and create more awareness and promote such drives from other players in the industry.
It is our belief that for sustainability initiative to thrive within the Nigerian Insurance industry, a firm commitment by and robust collaboration with all industry stakeholders is necessary and we are committed to this.
1 REPORT1.8 2020 CORPORATE SOCIAL RESPONSIBILITY REPORT

ANNUAL REPORT 2020- AXA MANSARD | 27
1
1.9 CORPORATE GOVERNANCE REPORTREPORT
1.9 CORPORATE GOVERNANCE REPORT
AXA Mansard Insurance Plc (“the Group”) has consistently developed corporate policies and standards to encourage good and transparent corporate governance framework to avoid potential conflicts of interest between all stakeholders whilst promoting ethical business practices. This is the foundation of our history, values and culture as a Company for building and sustaining an endurable institution that guarantees profitability and professionalism whilst enhancing shareholders’ value.
As a public quoted company, the Company strives to carry out its business operations on the principles of integrity and professionalism whilst enhancing shareholders’ value through transparent conduct at all times with the adoption and application of local regulatory standards as well as international best practices in corporate governance, service delivery.
In order to ensure consistency in its practice of good corporate governance, the Company continuously reviews its practice to align with the various applicable Codes of Corporate Governance such as the SEC Code, Nigerian Code of Corporate Governance and the NAICOM Code with particular reference to compliance, disclosures and structure. Furthermore, an annual board appraisal is conducted by an Independent Consultant appointed by the Company whose report is submitted to NAICOM and presented to shareholders at the Annual General Meeting of the Company in compliance with the recommendation of the NAICOM Code of Corporate Governance.
GOVERNANCE STRUCTURE
THE BOARDThe governance of the Company resides with the Board of Directors who is accountable to shareholders for creating and delivering sustainable value through the effective management of the Company. The Board of Directors is committed to the highest standards of corporate governance and integrity and is responsible for the efficient operation of the Company and to ensure the Company fully discharges its legal, financial and regulatory responsibilities.
The Board also reviews corporate performance, monitors the implementation of corporate strategy and sets the Company’s performance objectives. The Board monitors the effectiveness of its governance practices, manages potential conflict and provides general direction to Management. The collaboration between Board and Management contributed to optimal performance of the company and the sound corporate governance practices. The Board has four (4) Committees through which it exercises its oversight functions to ensure the proper management and direction of the Company. The Committees are the Board Investment & Finance Committee, Board Risk Management & Technical Committee, the Board Governance, Remuneration, Establishment & General Purpose Committee and the Statutory Audit Committee.
The Board membership comprises of eight (8) members, including the Independent Chairman, four (4) Non-Executive Directors, two (2) Executive Directors and one (1) Independent Director appointed based on the criteria laid down by NAICOM for the appointment of Independent Director(s) .The Independent Director does not have any significant shareholding interest or any special business relationship with the Company. The effectiveness of the Board
derives from the appropriate balance and mix of skills and experience of Directors, both Executive and Non-Executive. The Company’s Board is made up of seasoned professionals, who have excelled in their various professions and possess the requisite integrity, skills and experience to bring to bear independent judgment on the deliberations of the Board.
RESPONSIBILITIES OF THE BOARDThe Board determines the strategic objectives of the Company in delivering long-term growth and short-term goals. In fulfilling its primary responsibility, the Board is aware of the importance of achieving a balance between conformance to governance principles and economic performance. The Board has delegated the responsibility for day to day operations to Management in order to create a nexus between short term goals and long term objectives.
Nonetheless, the powers reserved for the Board include the following:a) determination of Board structure, size and composition,
including appointment and removal of Directors, succession planning for the Board and senior management and Board Committee membership;
b) approval of mergers and acquisitions, branch expansion and establishment of subsidiaries; approval of remuneration policy and packages of the Board members
c) approval of policy documents on significant issues including Enterprise-wide Risk Management, Human Resources, Corporate governance and Anti – money laundering
d) approval of resolutions and corresponding documentation for shareholders in general meeting(s), shareholders circulars, prospectus and principal regulatory filings with the regulators.
e) approval of major changes to the Company’s corporate structure (excluding internal reorganizations) and changes relating to the Company capital structure or its status as a public limited company
f) approval of quarterly, half-yearly and full year financial statements (whether audited or unaudited) and any significant change in accounting policies and/or practices
g) the determination and approval of the strategic objectives and policies of the Company to deliver long-term value;
h) approval of the Company’s strategy, medium and short term plan and its annual operating and capital expenditure budget
ROLES OF KEY MEMBERS OF THE BOARDThe positions of the Chairman of the Board and the Chief Executive Officer are separate and held by different persons. The Chairman and the Chief Executive Officer are not members of the same extended family.
The ChairmanThe Chairman has the responsibility to lead and manage the Board to ensure that it operates effectively and fully discharges all its statutory responsibilities, whilst promoting effective relations

28 | ANNUAL REPORT 2020 - AXA MANSARD
and open communication within the boardroom. The Chairman discharges his duties with prudence, integrity and professional skills at all times.
The Chief Executive OfficerThe Chief Executive Officer is charged with supervisory role over the technical operations of the Company, which involves investment management, risk management, formulation of policies, and the implementation of operational decisions. The CEO is the first line of reference for issues to be discussed at the Board, and is charged with ensuring compliance with regulations and policies of both the Board and regulatory authorities.
The Independent DirectorIn line with the NAICOM code of corporate governance, the Board has an Independent Director who is responsible for the protection of shareholders’ rights and interests in the Company. The Independent Director does not represent any particular shareholding interest, nor hold any business interest in the Company, to ensure his objective contributions to the Company’s development.
Company SecretaryThe Company Secretary is a point of reference and support for all directors. It is the Company Secretary’s responsibility to provide the directors with all requisite information promptly and regularly. The Board may, through the Company Secretary, obtain information from external sources, such as, consultants and other advisers, if there is a need for outside expertise, via the Company Secretary or directly.
The Company Secretary is responsible for assisting the Chairman and Chief Executive Officer in the formulation of an annual board plan, organization of board meetings, and ensuring that the minutes of board meetings clearly and properly capture the board’s discussions and decisions.
DIRECTOR NOMINATION PROCESSThe Board agrees upon the criteria for the desired experience and competencies of new directors. The Board has power under the Articles of Association to appoint a director to fill a casual vacancy or to appoint an additional director. The Board Governance, Remuneration, Establishment & General Purpose Committee is responsible for identifying and nominating suitable candidates for the Boards approval.
The balance and mix of appropriate skills and experience of Non-Executive Directors is taken into account when considering a proposed appointment. In reviewing the Board composition, the Board ensures a mix with representatives from different industry sectors.
The shareholding of an individual in the company is not considered a criterion for the nomination or appointment of a director. The appointment of directors is subject to the approval of NAICOM.
The following are considered critical in nominating a new director;
(i) Sterling reputation, and demonstrable adherence to the highest personal moral and ethical standards
(ii) Professionalism
(iii) Independence, objectivity and dedication
(iv) Impeccable corporate governance record
(iv) Ability to add value to the Organization
INDUCTION AND CONTINUOUS TRAINING OF BOARD MEMBERSOn appointment to the Board, all directors receive a formal induction tailored to meet their individual requirements. The new directors are oriented about the Company and its operations through the Company Secretary via the provision of the Company’s Articles of Association, relevant statutory books and regulations and adequate information on the operations.
The directors are also given a mandate and terms of reference to aid in performance of their functions. Management further strives to acquaint the new directors with the operations of the Company via trainings/seminars to the extent desired by new directors to enable them function in their position.
The training and education of directors on issues pertaining to their oversight functions is a continuous process, in order to update their knowledge and skills and keep them informed of new developments in the insurance industry and operating environment.
CHANGES ON THE BOARDDuring the course of the year ended December 31, 2020, Mr. Tosin Runsewe, Mr. Lesley Ndlovu, Mr. Yomi Onifade, Mr. Tom Wilkinson and Mr. Sohail Ali resigned from the Board. Mrs. Rashidat Adebisi, Mr. Tope Adeniyi, Mr. John Dickson and Mr. Kuldeep Kaushik were appointed to the Board of the Company during the year under review. Mrs. Rashidat Adebisi, Mr. Tope Adeniyi and Mr. John Dickson were presented and approved at the Annual General Meeting held in 2020. Mr. Kuldeep Kaushik will be presented to the board at this meeting.
PROFILE OF APPOINTED DIRECTORProfile of Mr. Kuldeep KaushikMr. Kushik has over 18 years’ experience in corporate & business strategy, business transformation and operational excellence, business development, program management, change management and technology consulting. He also has extensive experience in Life, Savings and Health Insurance businesses.
He is currently the Chief Operating Officer of AXA International and New Markets. Prior to this, he worked at AXA Hong Kong where he headed the Operations & Transformation team. Mr. Kaushik was appointed to the Board of AXA Mansard Insurance Plc. as a Non-Executive Director on 8 July 2020.
NON-EXECUTIVE DIRECTORS (NEDS) REMUNERATIONThe company’s policy on remuneration of Non-Executive directors is guided by the provisions of the NAICOM and SEC Codes which stipulate that the remuneration for Executive Directors’ should be limited to Directors’ fees and reimbursable travel and hotel expenses. Director’s fees and sitting allowance was paid to only Non-Executive Directors as recommended by the Board Governance, Remuneration, and Establishment & General Purpose Committee.
BOARD MEETINGSThe Board of Directors’ meetings are held every quarter, or as the need arises, to consider the Company’s financial statements for the period or to review management accounts for the quarter. At the meetings, the directors also consider the reports and minutes of Board committees, and any other reports pertaining to issues within the scope of the Board’s responsibilities.
1 1.9 CORPORATE GOVERNANCE REPORTREPORT

ANNUAL REPORT 2020- AXA MANSARD | 29
1The Board met three (4) times during the period ended December 31, 2020.
Name of Director Composition Meetings attended 12-Feb-20 14-May-20 29-Jul-20 4-Nov-20
Mr. Olusola Adeeyo Director 4 X X X X
Mr. Kunle Ahmed Director 4 X X X X
Mr. Tosin Runsewe* Director - N/A N/A N/A N/A
Mr. Yomi Onifade** Director 1 X N/A N/A N/A
Mr. Sohail Ali*** Director - - N/A N/A N/A
Mr. Lesley Ndlovu**** Director 1 X N/A N/A N/A
Mr. Ohis Ohiwerei Director 4 X X X X
Mr. Tom Wilkinson***** Director 4 X X X X
Mr. Hassan El-Shabrawishi Director 4 X X X X
Mrs. Rashidat Adebisi****** Director 3 N/A X X X
Mr. Tope Adeniyi******* Director 3 N/A X X X
Mr. John Dickson******** Director 3 N/A X X X
Mr. Kuldeep Kaushik********* Director 2 N/A N/A X X
* Resigned from the Board effective from January 31, 2020.
** Resigned from the Board effective from March 31, 2020.
*** Resigned from the Board effective from March 31, 2020.
**** Resigned from the Board effective from February 14, 2020.
***** Resigned from the Board effective from December 23, 2020.
****** Appointed Effective February 14, 2020.
******* Appointed Effective February 14, 2020.
******* Appointed Effective March 17, 2020
******** Appointed Effective July 8, 2020
REPORT1.9 CORPORATE GOVERNANCE REPORT
BOARD COMMITTEESThe Board carries out its responsibilities through its Committees, which have clearly defined terms of reference, setting out their roles, responsibilities, functions and scope of authority. The Board has four (4) Committees, namely:
a) Statutory Audit Committee,
b) Board Investment & Finance Committee,
c) Board Risk Management and Technical Committee and
d) Board Governance, Remuneration, Establishment & General Purpose Committee.
Through these Committees, the Board is able to more effectively deal with complex and specialized issues and to fully utilize its expertise to formulate strategies for the Company. The Committees make recommendations to the Board, which retains responsibility for final decision making.
All Committees in the exercise of their powers as delegated conform to the regulations laid down by the Board, with well-defined terms of reference contained in the charter of each Committee. The Committees render reports to the Board at the Board’s quarterly meetings.
A summary of the roles, responsibilities, composition and frequency of meetings of each of the Committees are as stated hereunder:
(i) Statutory Audit CommitteeAuditing is vital to ensuring that accounting norms for insurance businesses are effectively applied and maintained and to monitor the quality of internal control procedures; ensure compliance with all regulatory directives. The Committee shall be responsible for the review of the integrity of the data and information provided in the Audit and/or Financial Reports.
The Committee shall provide oversight functions with regard to both the company’s financial statements and its internal control and risk management functions. The Committee shall ensure compliance with legal and other regulatory requirements, assessment of qualifications and independence of external auditor; and performance of the company’s internal audit function as well as that of external auditors.
The Committee Chairman shall report formally to the Board on its proceedings after each meeting on all matters within its functions and responsibilities. The Committee shall make whatever recommendations to the Board it deems appropriate on any area within its remit where action or improvement is needed.

30 | ANNUAL REPORT 2020 - AXA MANSARD
1 1.9 CORPORATE GOVERNANCE REPORTREPORT
The Committee is made up of the following members:
1 Mr. Ohis Ohiwerei Non-Executive (Independent) Director Chairman
2 Mr. Lesley Ndlovu Non-Executive Director Member
3 Mr. Akingbola Akinola Shareholder’s Representative Member
4 Mrs. Ayodeji Oloye Shareholder’s Representative Member
The Committee met four (4) times during the year under review:
Name Composition Meetings attended 5-Feb-20 23-Apr-20 23-Jul-20 22-Oct-20
Mr. Ohis Ohiwerei Chairman 4 X X X X
Mr. Lesley Ndlovu* Member 1 X N/A N/A N/A
Mr. Akingbola Akinola Independent shareholder 4 X X X X
Mrs. Ayodeji Oloye Independent shareholder 3 X X X -
*Resigned from the Board effective from February 14, 2020.
(ii) Board Investment and Finance CommitteeThe Committee has supervisory functions over investment and other finance-related issues such as capital & funding requirements.
The responsibilities of the Committee include the consideration and approval of all investments above management limit, the review and approval of the investment manual on a periodic basis and, in particular the financial implications of new and major investment strategies/initiatives.
The Committee is made up of the following members:
1 Mr. Lesley Ndlovu Non Executive Director Chairman
2 Mr. Tosin Runsewe Executive Director (Client Services) Member
3 Mr. Yomi Onifade Executive Director (Technical) Member
4 Mr. Sohail Ali Executive Director (Actuarial Services) Member
5 Mrs. Rashidat Adebisi Executive Director (Client Services) Chairman
6 Mr. Tope Adeniyi Non Executive Director Member
7 Mr. Kunle Ahmed Chief Executive Officer Member
The Committee met four (4) times during the year under review:
Name of Director Composition Meetings attended 11-Feb-20 13-May-20 27-Jul-20 2-Nov-20
Mr. Lesley Ndlovu* Chairman 1 X N/A N/A N/A
Mr. Tosin Runsewe** Member - N/A N/A N/A N/A
Mr. Yomi Onifade*** Member 1 X N/A N/A N/A
Mr. Sohail Ali**** Member 0 - N/A N/A N/A
Mrs. Rashidat Adebisi***** Chairman 3 N/A X X X
Mr. Tope Adeniyi****** Member 3 N/A X X X
Mr. Kunle Ahmed******* Member 2 N/A N/A X X
* Resigned from the Board effective from February 14, 2020.
** Resigned from the Board effective from January 31, 2020.
*** Resigned from the Board effective from March 31, 2020.
**** Resigned from the Board effective from March 31, 2020.
***** Appointed Effective February 14, 2020
****** Appointed Effective February 14, 2020
******* Appointed Effective July 27, 2020

ANNUAL REPORT 2020- AXA MANSARD | 31
1
REPORT1.9 CORPORATE GOVERNANCE REPORT
(iii) Board Risk Management and Technical Committee
The Board Risk Management and Technical Committee has supervisory functions over risk management, the risk profile, the enterprise-wide risk management framework, underwriting functions of the Company and the risk-reward strategy as determined by the Board.
The Committee is responsible for overseeing management’s process for the identification of significant risks across the Company, and
the adequacy of prevention, detection and reporting mechanisms. The Committee is also charged with the review of large underwritten risks in order to verify the adequacy of the reinsurance cover.
The Committee is responsible for overseeing management’s process for the identification of significant risks across the Company, and the adequacy of prevention, detection and reporting mechanisms. The Committee is also charged with the review of large underwritten risks in order to verify the adequacy of the reinsurance cover.
The Committee is made up of the following members:
1 Mr. John Dickson Non Executive Director Chairman
2 Mr. Kunle Ahmed Chief Executive Officer Member
3 Mr. Tosin Runsewe Executive Director (Client Services) Member
4 Mr. Yomi Onifade Executive Director (Technical) Member
5 Mrs. Rashidat Adebisi Executive Director (Client Services) Member
6 Mr. Sohail Ali Executive Director (Actuarial Services) Member
The Committee met four (4) times during the period under review:
Name of Director Composition Meetings attended 11-Feb-20 13-May-20 27-Jul-20 3-Nov-20
Mr. John Dickson* Chairman 3 N/A X X X
Mr. Kunle Ahmed Member 4 X X X X
Mr. Tosin Runsewe** Member 0 N/A N/A N/A N/A
Mr. Yomi Onifade*** Member 1 X N/A N/A N/A
Mr. Sohail Ali**** Member 0 - N/A N/A N/A
Mrs. Rashidat Adebisi***** Member 3 N/A X X X
Mr. Kuldeep Kaushik****** Member 2 N/A N/A X X
* Appointed to the Committee effective March 17, 2020.
** Resigned from the Board effective from January 31, 2020.
*** Resigned from the Board effective from March 31, 2020.
**** Resigned from the Board effective from March 31, 2020.
***** Appointed to the Committee effective February 14, 2020
****** Appointed to the Committee effective July 8, 2020.
(iv) Board Governance, Remuneration, Establishment and General Purpose Committee
The Committee is responsible for establishing the criteria for board and board committee memberships, appointments to executive management and review of candidates’ qualifications, and any potential conflicts of interest. In addition, the Committee
is responsible for assessing the contribution of current directors in connection with their re-nomination and making recommendations to the Board.
The Committee ensures that a succession policy and plan exists for the positions of chairman, CEO/MD, the executive directors, and senior management.
The Committee is made up of the following members:
1 Mr. Ohis Ohiwerei Non Executive Director Chairman
2 Mr. Tom Wilkinson Non Executive Director Member
3 Mr. Lesley Ndlovu Non Executive Director Member

32 | ANNUAL REPORT 2020 - AXA MANSARD
1 1.9 CORPORATE GOVERNANCE REPORTREPORT
The Committee met four (4) times during the period under review:
Name of Director Composition Meetings attended 11-Feb-20 13-May-20 27-Jul-20 3-Nov-20
Mr. Ohis Ohiwerei Chairman 4 X X X X
Mr. Tom Wilkinson* Member 4 X X X X
Mr. Lesley Ndlovu** Member 1 X N/A N/A N/A
* Resigned from the Board effective from December 23,2020.
** Resigned from the Board effective from February 14, 2020.
ANNUAL BOARD APPRAISALThe Code of Corporate Governance for insurance institutions recognizes that a good corporate governance framework must be anchored on an effective and accountable Board of Directors whose performance is assessed periodically. The annual appraisal was conducted by DCSL Corporate Services Limited for the 2020 financial year. The appraisal is aimed at ascertaining the level of the Board’s compliance with corporate governance practices with reference to the provisions of the Nigerian Code of Corporate Governance, the NAICOM Code of Corporate Governance and the SEC Code of Corporate Governance. The Annual Board Evaluation Report for the year ended December 31, 2020, will be presented to shareholders at the 29th Annual General Meeting of the Company.
SHAREHOLDERSThe Company recognizes the rights of its shareholders and other stakeholders, and is driven to deliver desired value to these shareholders and stakeholders. The shareholders are provided with detailed information on the Company’s activities and financial results via the annual accounts. They are also provided with the opportunity to make enquiries, obtain information, share ideas, and express their concerns and opinions on all issues. These are communicated to Management and the Board and, on a broader scale, at the Annual General Meeting of the Company.
PROTECTION OF SHAREHOLDERS’ RIGHTSThe Board ensures the protection of the statutory and general rights of shareholders at all times, particularly their right to attend and vote at general meetings. All shareholders are treated equally, regardless of volume of shareholding or social status.
COMMUNICATION POLICYIt is the responsibility of the executive management under the direction of the Board, to ensure that the Board receives adequate information on a timely basis, about the Company’s businesses and operations at appropriate intervals and in an appropriate manner, to enable the Board to carry out its responsibilities.
Furthermore, the Board and management of the Company ensures that communication and dissemination of information regarding the operations and management of the company to shareholders, stakeholders and the general public is timely, accurate and continuous, to give a balanced and fair view of the Company’s financial and non-financial matters. Such information, which is in plain language, readable and understandable, is available on the Company’s website, www.axamansard.com.
The website also has an Investors Relations portal where the company’s annual reports and other relevant information about
the company is published and made accessible to its shareholders, stakeholders and the general public.
In order to reach its overall goal on information dissemination, the Company is guided by the following principles, legislation and codes of corporate governance of the jurisdictions within which it operates. These include the Insurance Act, the NAICOM Operational Guidelines, the Companies and Allied Matters Act (CAMA) and the codes of Corporate Governance issued by NAICOM and SEC.
The principles that guide the Company’s information dissemination include the following;
� Efficiency: The Company uses modern communication technologies in a timely manner to convey its messages to its target groups. The Company responds without unnecessary delay to information requests by the media and the public
� Transparency: The Company strives in its communication to be as transparent and open as possible while taking into account the concept of confidentiality between the Company and its customers, and company secretary. This contributes to maintaining a high level of accountability
� Clarity: The Company aims at clarity, i.e. to send uniform and clear messages on key issues
� Cultural awareness: The Company operates in a multicultural environment and accordingly recognizes the need to be sensitive to the cultural peculiarities of its operating environmentultural awareness: The Company operates in a multicultural environment and accordingly recognizes the need to be sensitive to the cultural peculiarities of its operating environment
� Feedback: The Company actively and regularly seeks feedback on its image and communication activities both from the media as well as from its key target groups. This feedback is used in future activities.
INDEPENDENT ADVICEThe Board of Directors are at their own discretion and at the Company’s expense required to seek independent professional advice when required to enable a Member of the Board effectively perform certain responsibilities.
INSIDER TRADING AND PRICE SENSITIVE INFORMATIONThe Company is clear in its prohibition of insider trading by its Board, management, Officers and related persons who are privy to confidential price sensitive information. Such persons are further prohibited from trading in the Company’s securities where such transactions would amount to insider trading.

ANNUAL REPORT 2020- AXA MANSARD | 33
1
REPORT1.9 CORPORATE GOVERNANCE REPORT
Directors, insiders and related parties are prohibited from disposing, selling, buying or transferring their shares in the Company for a period commencing from the date of receipt of such insider information until such a period when the information is released to the public or any other period as defined by the Company from time to time.
SECURITIES TRADING POLICYThe Company adopted and implemented a Securities Trading Policy which is applicable to all Directors and Employees. The policy has been circulated to all Directors and employees and can be found on the Company’s Website, www.axamansard.com
MANAGEMENT COMMITTEESThe Company has 3 Committees which comprises of management staff.
The Management Committee (MC) is the Committee set up to identify and make recommendations on strategies that will aid the long term objectives of the Company. The IT Steering Committee (IT Steerco) provides advice and guidance on proposed technology initiatives for the Company that embodies the overall objectives of the company. Whilst the Management Underwriting and Investment Committee (MUIC) was initiated to analyze the risks the Company is underwriting at any given period.
The MUIC also ensures that risk investment limits as contained in the Board Investment and Finance manual are complied with at all times. They provide inputs from the Board Committee and also ensure that recommendations of the Board Committees are effectively and efficiently implemented. Both Committees meet frequently as necessary to immediately take action and decisions within the confines of their powers.
The Secretary to the Committees is the Company Secretary.
MONITORING COMPLIANCE WITH CORPORATE GOVERNANCEi) Chief Compliance Officer The Chief Compliance Officer monitors compliance with
money laundering requirements and the implementation of the Corporate Governance Code of the Company. The Chief Compliance Officer together with the Chief Executive Officer certifies each year to NAICOM/SEC that they are not aware of any other violation of the Corporate Governance Code, other than as disclosed during the course of the year.
ii) Whistle blowing procedures In line with the Group’s commitment to instill the best
corporate governance practices, a whistle blowing procedure was established that ensures anonymity on any reported incidence(s). The Group has a dedicated e-mail address for whistle-blowing procedures.
CODE OF PROFESSIONAL CONDUCT FOR EMPLOYEESThe Group has an internal Code of Professional Conduct, which all members of staff are expected to subscribe to upon assumption of duties. Staff is also required to reaffirm their commitment to the Code annually. All members of staff are expected to strive to maintain the highest standards of ethical conduct and integrity in all aspects of their professional life as contained in the Code of Professional Conduct which prescribes the common ethical standards, culture and policies of the Group relating to employee values.
COMPLAINTS MANAGEMENT POLICYIn accordance with the rules and regulations of The Securities & Exchange Commission, the Company adopted and implemented a Complaints Management Policy which is a platform that addresses complaints arising out of issues that are covered under the Investments and Securities Act, 2007 (ISA) by the Company’s shareholders.
The Complaints Management policy was designed to handle and resolve complaints from all shareholders of the Company. The policy was endorsed by the Company’s senior management, who would also be responsible for its implementation and monitoring of compliance.
A copy of the Complaints Management Policy shall be made available for inspection to shareholders of the Company at the Annual General Meeting of the Company. The policy can found on the Company’s Website, www.axamansard.com.
INTERNAL MANAGEMENT STRUCTUREThe Group operates an internal management structure where all officers are accountable for duties and responsibilities attached to their respective offices and there are clearly defined and acceptable lines of authority and responsibility.
An annual appraisal of the duties assigned and dedicated to each person is done by the first quarter of the preceding year.

34 | ANNUAL REPORT 2020 - AXA MANSARD
SHARE CAPITAL HISTORYAs at 31 December 2020, the Company’s Authorized capital and Issued capital was N18,000,000,000 divided into 36,000,000,000 Ordinary shares of 50k each. The initial share capital upon incorporation and subsequent changes therein are as follows:
Date Authorized increase Cumulative Issued (₦) Increase Cumulative (₦)
1989 - 34,300,000 - 17,150,000
1998 6,346,000 40,646,000 3,173,000 20,323,000
1999 5,978,000 46,624,000 2,989,000 23,312,000
2000 706,000 47,330,000 353,000 23,665,000
2002 152,798,000 200,128,000 76,399,000 100,064,000
2004 799,872,000 1,000,000,000 399,936,000 500,000,000
2006 4,746,440,954 5,746,440,954 2,373,220,477 2,873,220,477
2006 3,938,744,509 9,685,185,463 1,969,372,254 4,842,592,731
2007 314,814,537 10,000,000,000 157,407,269 5,000,000,000
*2007 (5,000,000,000) 5,000,000,000 (2,500,000,000) 2,500,000,000
2008 3,750,000,000 8,750,000,000 1,875,000,000 4,375,000,000
2009 1,250,000,000 10,000,000,000 625,000,000 5,000,000,000
2010 - 10,000,000,000 - 5,000,000,000
2011 - 10,000,000,000 - 5,000,000,000
2012 - 10,000,000,000 - 5,000,000,000
2013 500,000,000 10,500,000,000 - 5,000,000,000
2014 - 10,500,000,000 250,000,000 5,250,000,000
2015 - 10,500,000,000 - 5,250,000,000
2016 - 10,500,000,000 - 5,250,000,000
2017 - 10,500,000,000 - 5,250,000,000
2018 - 10,000,000,000 - 5,250,000,000
2019 - 10,500,000,000 - 5,250,000,000
2020 25,500,000,000 36,000,000,000 12,750,000,000 18,000,000,000
The Company’s issued and fully paid share capital was reconstructed by a special resolution of the Board at its meeting on the 18th of October, 2007, to achieve a reduction of 50% with the result that the issued and fully paid share capital will stand at ₦2,500,000,000 divided into 5,000,000,000 Ordinary shares at 50k each with the surplus nominal value arising from the reconstruction being transferred to the Company’s capital reserve account. The reconstruction was sanctioned by the Federal High Court of Nigeria, Lagos on 31st October 2007 and registered by the Corporate Affairs Commission on the 18th of December 2007. Pursuant to an Extra Ordinary General Meeting held on the 7th of December 2020, a resolution was passed to increase the Share Capital of the Company from ₦5,250,000,000 to ₦18,000,000,000. This was done by capitalising ₦12,750,000,000 from other reserves.
The newly created shares were allotted as fully paid bonus shares to the Company’s shareholders in the proportion of seventeen new ordinary shares for every seven held at the book closure date.
DISCLOSURE: SECURITIES TRADING POLICYIn compliance with Rule 17.15 Disclosure of Dealings in Issuers’ Shares, Rulebook of the Exchange 2015 (Issuers Rule) AXA Mansard Insurance Plc maintains effective Security Trading Policy which guides Directors, Audit Committee members, employees and all individuals categorized as insiders as to their dealing in the Company’s shares. The Policy is regularly reviewed and updated by the Board. The Company has made specific inquiries of all the directors and other insiders and is not aware of any infringement.
1 1.9 CORPORATE GOVERNANCE REPORTREPORT

ANNUAL REPORT 2020- AXA MANSARD | 35
1The Directors of AXA Mansard Insurance plc are pleased to present their report on the affairs of the Company and its subsidiaries (“the Group”), together with the Group audited financial statements and the auditor’s report for the year ended December 31, 2020.
LEGAL FORM AND PRINCIPAL ACTIVITYThe Company was incorporated on 23 June 1989 as a private limited liability company called “Heritage Assurance Limited” and issued with a composite insurance license by the National Insurance Commission in March 2004. The Company’s name was changed to Guaranty Trust Assurance Limited in September 2004 following the acquisition of a majority share holding by Guaranty Trust Bank Plc, and changed again to Guaranty Trust Assurance Plc in March 2006 following the increase in number of members beyond the maximum required for a private company. In November 2009, the Company became listed on the Nigerian Stock Exchange.
The beneficial ownership of the Company changed to Societe Beaujon S.A.S (AXA S.A) in December 2014 by the acquisition of
100% of Assur Africa Holding (AAH). The Company modified its name and corporate identity to AXA Mansard Insurance Plc in July 2015.
The Company’s principal activity continues to be the provision of life and general business risk management solutions and financial services to corporate and retail customers in Nigeria.
The Company has the following subsidiaries: AXA Mansard Investments Limited and AXA Mansard Health Limited.
AXA Mansard Investments Limited was incorporated as a private limited liability company on 9 January 2008 and its principal activity involves provision of portfolio management services to both individual and corporate clients. AXA Mansard Health Limited was incorporated as a private limited liability company on the 7th of August 2003 and its principal activities is to manage the provision of health care services through health care providers and for that purpose accredited with the National Health Insurance Scheme.
1.10 DIRECTORS’ REPORT
1.13 DIRECTORS’ REPORTREPORT
OPERATING RESULTSThe following is a summary of the Group and Company’s operating results:
Group Group Parent Parent
(in thousands of Nigerian Naira) Note 31-Dec-2020 31-Dec-2019 31-Dec-2020 31-Dec-2019
Profit before tax 6,038,755 3,833,253 2,553,366 4,978,919
Taxation 42 (1,537,671) 1,009,416 (80,111) (139,589)
Profit after tax 4,501,084 2,908,272 2,473,255 4,839,330
Non Controlling Interest 28 269,016 (199,598) - -
Transfer to contingency reserve 27.3 (74,667) (131,368) (74,667) (131,368)
Dividend paid - - - -
Earnings per share – Basic (in kobo) 43 14 11 7 17
Earnings per share – Basic (in kobo); continued operation
43 14 11 7 17
Dividend per share - (in kobo) 43 - - - -
DIVIDENDSDuring the year under review, the directors are proposing to pay final dividend in the sum of 5.5 kobo per ordinary share on the issued capital of 36,000,000,000 Ordinary Share of 50 kobo each subject to the appropriate withholding tax deduction
DIRECTORS AND THEIR INTERESTSThe Directors who held office during the year, together with their direct and indirect interests in the issued share capital of the Company as recorded in the register of Directors shareholding and/or as notified by the Directors for the purposes of sections 301 and 302 of the Companies and Allied Matters Act and the listing requirements of the Nigerian Stock Exchange is noted below:

36 | ANNUAL REPORT 2020 - AXA MANSARD
1 1.13 DIRECTORS’ REPORTREPORT
Direct Holding December
2020
Indirect Holding
December 2020
Direct Holding 2019
Indirect Holding 2019
Mr. Olusola Adeeyo Chairman Nil Nil Nil Nil Mr. Kunle Ahmed Chief Executive Officer 68,846,986 Nil 20,080,371 Nil
Mr. Tosin Runsewe* Executive Director 337,019,417 Nil 92,694,600 Nil Mr. Hassan El-Shabrawishi Non Executive Director Nil Nil Nil Nil Mr. Ohis Ohiwerei Independent Director Nil Nil Nil Nil Mr. Lesley Ndlovu** Non Executive Director Nil Nil Nil Nil Mr. Yomi Onifade*** Executive Director Nil Nil Nil Nil Mr. Tom Wilkinson **** Non Executive Director Nil Nil Nil Nil Mr. Sohail Ali***** Non Executive Director Nil Nil Nil Nil Mrs. Rashidat Adebisi****** Executive Director 53,534,499 Nil N/A Nil Mr. Tope Adeniyi******* Non Executive Director 4,427,129 Nil N/A Nil Mr. John Dickson******** Non Executive Director Nil Nil Nil Nil Mr. Kuldeep Kaushik********* Non Executive Director Nil Nil Nil Nil
* Resigned from the Board effective from January 31, 2020.** Resigned from the Board effective from February 14, 2020.*** Resigned from the Board effective from March 31, 2020.**** Resigned from the Board effective from December 23, 2020. ***** Resigned from the Board effective from March 31, 2020.****** Appointed Effective February 14, 2020******* Appointed Effective February 14, 2020******** Appointed Effective March 17, 2020********* Appointed Effective July 8, 2020
DIRECTORS’ REMUNERATIONThe remuneration of the Company’s Directors is disclosed pursuant to section 34(5) of the code of corporate governance for public companies as issued by Securities and Exchange Commission as follows:
Remuneration Description Timing
Basic salary Part of gross salary package for Executive Directors only.
Reflects the insurance industry competitive salary package and the extent to which the Company’s objectives have been met for the financial year
Paid monthly during the financial year
13th month salary Part of gross salary package for Executive Directors only Paid last month of the financial year
Share based payments The amount of this remuneration to Executive directors is subject to achieving specific quantifiable targets, aligned directly with shareholders' interests.
Based on vesting conditions as stipulated in the scheme documents
Director fees Allowances paid to Non-Executive Directors Paid during the yearTravelling allowances Allowances paid to Non-Executive Directors that reside
outside NigeriaPaid during the year
Sitting allowances Allowances paid to Non-Executive Directors only for sitting at board meetings and other business meetings
Paid during the year
CHANGES ON THE BOARDMr. Tosin Runsewe, Mr. Lesley Ndlovu, Mr. Yomi Onifade, Mr. Sohail Ali and Mr. Tom Wilkinson resigned from the Board of the Company during the year under review. Mrs. Rashidat Adebisi, Mr. Tope Adeniyi, Mr. John Dickson and Mr. Kuldeep Kaushik were subsequently appointed to the Board of the Company in the course of the year. Mrs. Rashidat Adebisi, Mr. Tope Adeniyi and Mr. John Dickson were presented and approved at the Annual General Meeting held in 2020. Mr. Kuldeep Kaushik will be presented to the board at this meeting.
PROFILE OF APPOINTED DIRECTORProfile of Mr. Kuldeep KaushikMr. Kushik has over 18 years’ experience in corporate & business strategy, business transformation and operational excellence, business development, program management, change management and technology consulting. He also has extensive experience in Life, Savings and Health Insurance businesses. He is currently the Chief Operating Officer of AXA International and

ANNUAL REPORT 2020- AXA MANSARD | 37
1
1.13 DIRECTORS’ REPORTREPORT
New Markets. Prior to this, he worked at AXA Hong Kong where he headed the Operations & Transformation team. Mr. Kaushik was appointed to the Board of AXA Mansard Insurance Plc. as a Non-Executive Director on 8 July 2020.
DIRECTORS’ INTERESTS IN CONTRACTSIn compliance with Section 303 of the Companies and Allied Matters Act, none of the directors has notified the Company of any declarable interest in contracts deliberated by the Company during the year under review.
ANALYSIS OF SHAREHOLDING‘The analysis of the distribution of the shares of the Company as at 31 December, 2020 is as follows:
Share Range No. of Shareholders % Shareholders No. of Holdings % of Holdings
1 - 1,000 680 14.44% 248,925 0.01%
1001 - 5,000 976 20.73% 2,735,941 0.01%
5,001 - 10,000 372 7.90% 2,622,108 0.01%
10,001 - 50,000 1,004 21.32% 24,966,576 0.07%
50,001 - 100,000 347 7.37% 24,882,319 0.07%
100,001 - 500,000 661 14.04% 159,846,573 0.44%
500,001 - 1,000,000 194 4.12% 139,190,236 0.39%
1,000,001 - 8,000,000,000 474 10.07% 8,112,191,734 22.53%
8,000,000,001 - 10,000,000,000 1 0.02% 27,533,315,588 76.48%
Total 4,709 100% 36,000,000,000 100%
MAJOR SHAREHOLDINGSAccording to the Register of Members, no shareholder other than the undermentioned held more than 5% of the issued share capital of the Company as at 31 December 2020:
No. of shareholding % shareholding
Assur Africa Holdings Limited 27,533,315,588 76.48%
**Stanbic Nominees Nigeria Limited 2,998,165,931 8.33%
** Stanbic Nominees held the cumulative total of 8.33% of the Company’s shares largely in trading accounts on behalf of various investors.
PROPERTY AND EQUIPMENT Information relating to changes in property and equipment during the year is given in Note 18 to the financial statements.
DONATIONS AND CHARITABLE GIFTSIn order to contribute our quota in fighting against the COVID-19 and identifying with the aspirations of the community and the environment within which the Group operates, a total sum of ₦26,745,650 (2019: ₦4,952,890) was given out as donations and charitable contributions during the year. Details of the donations and charitable contributions are as follows:
Organizations: 31-Dec-2020
Government Hospitals 6,082,350
Industry Donation to the Fight Against COVID (NIA) 20,000,000
Donation to Red Cross 500,000
Donate A Book Initiative 163,300
26,745,650
HUMAN RESOURCES
EMPLOYMENT OF PHYSICALLY CHALLENGED PERSONSThe Group operates a non-discriminatory policy in the consideration of applications for employment, including those received from physically challenged persons. The Group policy is that the most
qualified and experienced persons are recruited for appropriate job levels, irrespective of an applicant’s state of origin, ethnicity, religion or physical condition. In the event of any employee becoming physically challenged in the course of employment, the Group is in a position to arrange appropriate training to ensure the continuous employment of such a person without subjecting him/her to any disadvantage in his/her career development.
Health, Safety and Welfare of EmployeesThe Group maintains business premises designed with a view to guaranteeing the safety and healthy living conditions of its employees and customers alike. Employees are adequately insured against occupational and other hazards. In addition, the Group provides medical facilities to its employees and their immediate families at its expense. Fire prevention and fire-fighting equipment are installed in strategic locations within the Company’s premises. It also operates a Group Life, Group Personal Accident and contributory pension plan in line with the Pension Reform Act 2004 (amended in 2014). In addition, the Company also has a state of the art gymnasium as well as a crèche facility at the Head Office and plans to extend the facilities to other branches in due course.
EMPLOYEE INVOLVEMENT AND TRAININGThe Group encourages participation of employees in arriving at decisions in respect of matters affecting their well being. Towards this end, the Company provides opportunities for employees to

38 | ANNUAL REPORT 2020 - AXA MANSARD
1 1.13 DIRECTORS’ REPORTREPORT
deliberate on issues affecting the Company and employees’ interests, with a view to making inputs to decisions thereon. The company places a high premium on the development of its manpower. Consequently, the Company sponsored its employees for various training courses both in Nigeria and abroad in the year under review. The Company also provides its employees with on-the-job training in the Company and at various AXA Mansard locations.
DIVERSITY AND INCLUSIONThe Company treats all its employees and customers fairly and equally, regardless of their gender and sexual orientation, race, colour, nationality, ethnic or national origin, religious belief, age,
physical or mental challenges, family status or any such factor. The Board aims to improve its female representation at Board and Top Management Levels respectively subject to the identification of appropriate skills.
RECRUITMENTThe Company conforms with all regulatory requirements in the employment of staff, ensuring that only fit and proper persons are approved for appointment to board and top management positions. All pre-employment requirements and regulatory confirmation of top management positions are duly implemented.
GENDER ANALYSISThe number and percentage of women employed during the financial period vis-a-vis total workforce is as follows:
Male Female Male FemaleNumber Number % %
Employees 162 124 57% 43%
Gender analysis of Board and top management is as follows:Board 7 1 88% 12%Top Management 12 5 71% 29%
Detailed analysis of the Board and top management is as follows:Male Female Male Female
Number Number % %Non-Executive Director 6 0 100% 0%Chief Executive Officer 1 0 100% 0%Executive Director 0 1 0% 100%EXCOM 3 3 50% 50%Senior Executive 9 2 82% 18%
ACQUISITION OF OWN SHARESThe Company did not acquire any of its own shares during the year under review.
AUDITORMessrs. KPMG Professional Services, having satisfied the relevant corporate governance rules on their tenure in office have indicated their willingness to continue in office as auditor to the Company. In accordance with Section 401 (2) of the Companies and Allied Matters Act therefore, the auditor will be re-appointed at the next annual general meeting of the Company.
BY ORDER OF THE BOARD
Mrs. Omowunmi Mabel AdewusiCompany Secretary FRC/2013/NBA/00000000967
Plot 1412, Ahmadu Bello Way, Victoria Island, Lagos.12 February 2021

ANNUAL REPORT 2020- AXA MANSARD | 39
11.11 INTERNAL CONTROL & RISK MANAGEMENT
OUR GUIDING PRINCIPLESWe have incorporated an approach aimed at creating and maximizing sustainable /superior value to our stakeholders that strategically balances the risk and reward in our business.
AXA Mansard’s Risk philosophy is guided by the following principles:
� The Company will not take any action that will compromise its integrity. It shall identify, measure, manage, control and report as practical as possible all risks.
� The Company will at all times comply with all government regulations and uphold corporate standards in accordance with international best practice.
� The Company will institute a sustainable risk culture enterprise-wide.
� The Company will only accept risks within its risk acceptance criteria and have commensurate returns and continually review its activities to determine inherent risks level and adopt appropriate risk response to residual risk levels at all times.
� The Company continually reviews its activities to determine inherent risks level and adopt appropriate risk response at all times.
� The Company will make decisions based on resilient analysis of the implications of such risk to its strategic goals and operating environment.
Risk Management Framework
Our risk management framework was fashioned to uphold a resilient risk management culture and integrate risk considerations into management and decision-making processes,
through a risk governance structure across the entire enterprise.
We operate and maintain the ‘three lines of defense model’ for the oversight and management of risk to create and promote a culture that emphasizes effective management and adherence to operating controls as illustrated below:
1ST LINE – RISK OWNERSThe Board, management and line managers: It involves broad setting of strategy, risk appetite, performance measurement, establishment and maintenance of internal control and risk management in the business. In addition, business units have the primary responsibility for managing risks and required to take responsibility for the identification, assessment, management, monitoring and reporting of risks arising within their respective businesses, thereby ensuring an informed risk and reward balance.
2ND LINE – RISK CONTROLThe Company’s risk management function provides oversight and independent reporting to executive management, implements the Group’s risks management policy in the business units, approve risk specific mandates and provide an independent overview of the effectiveness of risk management by the first line of defense. Other internal stakeholders in the role include our legal services, Compliance and Quality Assurance and Internal Control.
3RD LINE – RISK ASSURANCEThe last line of defense comprise of the internal audit function that provides independent and objective assurance of the effectiveness of the Group’s systems of internal control established by the first and second lines of defense in management of enterprise risks across the organization.
1.10 INTERNAL CONTROL & RISK MANAGEMENTREPORT
RISK MANAGEMENT GOVERNANCE STRUCTURE
Risk ManagementCommittee
Enterprise RiskManagement Function
Board Risk Management &Technical Committee
Board Audit & ComplianceCommittee
Management Underwriting& Investment Committee
Board Governance,Remuneration, Establishment
and GeneralPurpose Committee
Board Investment &Finance Committee
Other BusinessFunctions
SYSCON
BOARD
Management Committee
Criticized AssetCommittee

40 | ANNUAL REPORT 2020 - AXA MANSARD
1 1.10 INTERNAL CONTROL & RISK MANAGEMENTREPORT
The remit of setting the organization’s risk appetite and approving the strategy for managing risk and organization’s system of internal control in the overall directly lies with the Board of Directors. The implementation of this principal function is carried out via its Board Committees as enumerated below:
COMMITTEES FUNCTIONSStatutory Audit Committee � Oversight of financial reporting and accounting
� Oversight of the external auditor � Oversight of regulatory compliance � Monitoring the internal control process � Oversight of risk management activities
Board Risk Management and Technical Committee � Assist in the oversight of the review and approval of the companies risk management policies including risk appetite and risk strategy.
� Oversee management’s process for the identification of significant risks across the company and the adequacy of prevention, detection and reporting mechanisms
� Oversee management’s process for the identification of significant risks across the company and the adequacy of prevention, detection and reporting mechanisms
� Review of the company’s compliance level with applicable laws and regulatory requirements that may impact the company’s risk profile
� Review changes in the economic and business environment, including emerging trends and other factors relevant to the company’s risk profile
� Review large underwritten risks for adequacy of reinsurance and other risk management techniques
� Review and recommend for approval of the Board risk management procedures and controls for new products and services
Board Investment and Finance Committee � Reviews and approves the company’s investment policy � Approves investments over and above managements’ approval limit � Ensures that optimum risk return is achieved through asset and liability
matchingBoard Governance, Remuneration, Establishment and General Purpose Committee
� Establish the criteria for board and board committee memberships
� Appoint executive management and review of candidates’ qualifications, and any potential conflicts of interest
� Assess the contribution of current directors in connection with their re-nomination and make recommendations to the Board
INTEGRATION OF RISK MANAGEMENT FUNCTIONS: OUR APPROACHThe Risk Management function of the company is primarily responsible for coordinating the company’s cross functional response to risks. Other functions include:
a) Drive an enterprise wide process to aggregate risk exposures, produce risk reports and institute mitigation strategies;
b) Utilize risk control to ensure risk guidelines and policies approved by the board are adhered to;
c) Champion the growth of risk culture and awareness ; andd) Lead an enterprise wide risk dialogue by instigating risk
discussions in a variety of fora.
The Risk Managment Committee (RMC) of the Company provides recommendation to the Board Risk Management and Technical Committee on risk issues for the latter to assess and possibly approve in accordance with the company’s objectives of aligning risk appetite and strategy.
The Board Risk Management and Technical Committee approves the Company’s risk appetite annually on the basis of robust assessment of risks that incorporates the prudent decision making
of risk and reward trade-offs. The Board is also responsible for evaluating strategic alternatives, setting related objectives, and developing mechanisms to manage related risks establishing, documenting, and enforcing all policies that involve risk. The Chief Risk Officer (a member of this Committee) is responsible for implementing these strategies.
The role of the Chief Risk Officer (CRO) includes informing the Board as well as the Management Committee about the risk profile of the Company and also communicate the views of the Board and Senior Management to the entire Company.
RISK APPETITEThe Group recognizes that its continual sustainability initiative is largely contingent upon brand protection and enhancement of stakeholder value. Our ethos therefore mandates that the Group is averse to risks that essentially erode corporate value.
The Group’s risk appetite is primarily characterized by a clear risk strategy, monitoring and reporting procedure that provides the foundation to identify potential deviations from our risk tolerances in a timely manner across the enterprise, which is underpinned by our top-down risk management approach.

ANNUAL REPORT 2020- AXA MANSARD | 41
1
1.10 INTERNAL CONTROL & RISK MANAGEMENTREPORT
The Risk Management policies and procedures instituted are strategically aimed at managing potential, inherent and residual risk categories inherent in our operations.
The Board recognizes that the practice of risk management is critical to the achievement of corporate objectives and has actively encouraged a risk culture that embraces innovation and opportunity, primed risk-taking and acceptance of risk as inherent in all our activities, whilst reducing barriers to successful implementation.
Our structured approach to managing risks is evident in the integration of the risk management function; which is charged with the responsibility of undertaking risk-based audit on all business units using outputs of the annual company-wide risk assessment to guide its annual audit program. A quarterly assessment exercise is conducted by this unit and a rated score expressed in percentage is applied to measure the level of compliance.
RISK CATEGORIZATIONThe Group is exposed to a myriad of risks in the conduct of its business some of which are Insurance Risks, Financial (Market, Credit, Liquidity) Risk, Operational Risk, Reputational Risk, Emerging Risks, Environmental & Social Risk amongst others including Business continuity and Crisis management.
INSURANCE RISK This is the main risk occuring from our underwriting. The risk in any insurance contract is the possibility that the event insured against occurs, resulting in a claim. This risk is very random and unforeseeable. The fundamental risks the Group faces under its insurance contracts are:
� Reserving risk: underestimation/overestimation of the provision (reserves) for insurance liabilities which would lead to:
� Deviations in Budget (expected income)
� Undervaluation of overall premium (too competitive and then making losses on policies)/Loss of competitiveness for good risks
� Risk Appetite limits based on misleading KPI’s
� Pricing risk: This occurs if the frequency or severity of claims and benefits are greater than estimated. Insurance events are random hence; the actual number and amount of claims and benefits will vary from year to year from the level established using statistical techniques. and amount of claims and benefits will vary from year to year from the level established using statistical.
� Underwriting risks: this could happen if:
� the launch of new products or the product re-pricing/restyling don’t respect an appropriate governance and decision -making process weighing Risk,
� Profitability, Legal, Marketing, Compliance and Regulatory aspects.
� businesses are underwritten without the validation of the necessary levels of authorizations and without sufficient technical appreciation of the risks
� (size, geolocation, etc.)
Insurance risks covers 2 main businesses namely: Non life business and Life business.
Underwriting riskUnderwriting risks relates to risks that premiums charged are inadequate to cover the claims the company is legally obliged to pay. Furthermore, it is essential that those premiums match to the return on the company’s capital. Underwriting risk may either arise from an inaccurate assessment of the risks entailed in writing an insurance policy, or from factors wholly out of the underwriter’s control.
Underwriting risks form an integral part of our business. While we recognize that it is not practicable to eliminate all risks underwritten completely, we continually strive to leverage on managing this type of risks as a mitigation strategy because we believe that the continual profitability of our underwriting competencies, is a reflection of strategies employed in risk decision making which is in conformity with our risk appetite.
Underwriting risks may arise through the following ways: � Inadequate premium pricing vis a vis the risk insured against; � Inappropriate reinsurance arrangements; � Inadequate claims reserves- the number of claims that occur
may be higher than expected claims. � Moral hazard of policyholders which may result in adverse
claims experience.
NON LIFE BUSINESS These include the non-life contracts namely; Aviation, Oil & Gas (Energy), Engineering, Fire, General Accident, Motor, Marine Cargo & Hull.
a) Frequency and severity of claims The frequency and severity of claims can be affected by
several factors. The most significant are the increasing level of reimbursement for the damages suffered as a result of road accidents. The Group manages these risks through its underwriting strategy, adequate reinsurance arrangements and proactive claims handling and investigations. Underwriting limits are in place to enforce appropriate risk selection criteria. The reinsurance arrangements include treaty and excess of loss coverage, it helps to mitigate the Group’s risk of total net insurance losses, increases our underwriting capacity,reduces our exposures to catastrophic risk and gives us an opportunity of benefit from the reinsurers’ expertise.
b) Sources of uncertainty in the estimation of future claim payments
Claims on non-life insurance contracts are payable on a claims-occurrence basis. The Group is liable for all insured events that occurred during the term of the contract. There are several variables that affect the amount and timing of cash flows from these contracts. These mainly relate to the inherent risks of the business activities carried out by individual contract holders and the risk management procedures adopted. The reserves held for these contracts comprises a provision for Incured but not Reported (IBNR), a provision for reported claims not yet paid and a provision for unearned premiums at the end of the reporting period. Other applicable additional reserves have also been held for prudence.

42 | ANNUAL REPORT 2020 - AXA MANSARD
1 1.10 INTERNAL CONTROL & RISK MANAGEMENTREPORT
c) Process used to decide on assumptions Depending on the volume of data in the reserving classes, the
appropriate methodologies were used. Two methods were used for the projection of claims. The Basic Chain Ladder Method (BCL) and a Loss ratio method, adjusted for assumed experience to date. In more recent years and where the claim development seems slower than in the past, the Bornheutter – Ferguson Method was used based on expected loss ratios. Claims data was grouped into triangles by accident year, half-year or quarter and payment year, half-year or quarter. The choice between quarters, half-years or years was based on the volume of data in each segment. Payment development patterns were used instead of the reporting year patterns to allow for the longer tail development that would be seen in payment/settlement delays as well as to allow for the movement of partial payments in the data.
Basic Chain Ladder method (BCL)Development factors were calculated using the last 3 to 9 years’ of data by accident period. Ultimate development factors are calculated for each of the permutations and judgment is applied in the selection of these factors. Ultimate development factors are applied to the paid data per accident period and an ultimate claim amount is calculated. The future claims (the ultimate claim amount less paid claims to date) are allocated to future payment periods in line with the development patterns calculated above. The outstanding claims reported to date are then subtracted from the total future claims to give the resulting IBNR figure per period.
For cases where there were extreme large losses that had been reported but not paid, and therefore would not have influenced the development patterns, the total case reserves were excluded from the calculation for IBNR.
I.e. IBNR = Ultimate claim amount (excl. extreme large losses)minus paid claims to date (excl. extreme large losses)minus claims outstanding (excl. extreme large losses)
Loss Ratio methodFor two of the classes, namely, Aviation and Oil & Energy, there was limited data. A BCL method was therefore inappropriate. We allowed for expected experience to date and the average assumed ultimate loss ratio in carrying out the calculation.
The IBNR is then calculated as:
Expected average ultimate annual loss ratio
Multiplied by earned premium for the past 12 months
Minus experience to date over the past 12 accident months
An estimate of the average ultimate loss ratio needed to be assumed. We based the loss ratios off of experience that has been seen to date in previous accident years.
LIFE & SAVINGS This includes the Group Life, Annuities ,Credit Life and Individual Life policies
(a) Frequency and severity of claims For contracts where death is the insured risk, the most
significant factors that could increase the overall frequency
of claims are terminal diseases or widespread changes in lifestyle, such as eating, smoking and exercise habits as well as adverse changes in the socio-political climate resulting in earlier or more claims than ideally expected. For contracts where survival is the insured risk, the most significant risk management factors are continued improvement in medical science, human behaviour and social conditions that would increase longevity.
(b) Sources of uncertainty in the estimation of future benefits payments and premium receipts
Uncertainty in the estimation of future benefit payments and premium receipts for life insurance contracts arises from the unpredictability of long-term changes in overall levels of mortality and the variability in contract-holder behavior. The Group uses appropriate and acceptable base tables of standard mortality according to the type of contract being written.
(c) Valuation methods Our management team establishes structures, reporting
lines and appropriate authorities and responsibilities in the pursuit of the company’s strategic objectives. The internal audit function reports on development and performance of internal control to the Board Audit Committee on a quarterly basis which demonstrates Board oversight and independence of management.
Annuities will be reserved for using a discounted cash flow approach. Here reserves are set equal to the present value of future annuity payments plus expenses, with allowance being made for any guaranteed periods as required.
REINSURANCE AGREEMENTSReinsurance is allowed for in the valuation by having gross and reinsurance ceded records in the policy files. For IFRS compliance purposes all reserves were reported gross of reinsurance, with the value of the reinsurance asset calculated and reported separately.
MARKET RISKThis is the risk that the value of financial instrument in general will change due to movements in market factors. Such movements may be occasioned by market factors (volatilities) that are directly related to an individual investment and/or systemic risks.
The four (4) risk exposures to Market risks arise through the following:
� Interest rate risk: the potential risk that the value of fixed income assets will plummet owing to movements in market interest rates.
� Equity price risk: represents the potential risk of loss in our investment in stocks, occasioned by volatility in prices
� Foreign exchange risk: potential risk of loss of an asset value held in foreign currency due to adverse changes in currency exchange rates.
� Property price risk: The Company’s portfolio is subject to property price risk arising from adverse changes in the valuation of properties.
CREDIT RISKThis risk arises from the default of a counterparty to fulfill its contractual obligation.

ANNUAL REPORT 2020- AXA MANSARD | 43
1
1.10 INTERNAL CONTROL & RISK MANAGEMENTREPORT
Three (3) notable areas of exposure to credit risks include:
1) Direct Default Risk: is the risk of exposure a company may experience due to non-payment of investment receipts or cash flow on assets at an agreed time by an obligor following a contractual agreement to do so. This type of risk could also arise from failure of registered Insurance Broker’s to remit premiums to the company after the permissible thirty days (30) grace period, as mandated by NAICOM.
2) Downgrade Risk: risk that changes in the possibility of a future default by an obligor will adversely affect the present value of the contract with the obligor today.
3) Settlement Risk: risk arising from the lag between the value and settlement dates of securities’ transactions.
LIQUIDITY RISKThe characteristic nature of our business requires adequate cash flow to meet our contractual obligations in the event of claim settlement. This is the risk of loss arising due to insufficient liquid assets to meet cash flow requirements or to fulfill its financial obligation once claims crystallize. Our exposure to liquidity risk comprises of:
1) Funding (Cash-flow) Liquidity Risk: These risks arise from investment-linked products especially in circumstances where there are liquidity constraints to meet financial obligations to customers.
2) Market (Asset) Liquidity Risk: risk of loss which is occasioned by the incapacity to sell assets at or near their carrying value at the time needed.
OPERATIONAL RISKThis is risk of loss resulting from inadequate or failed processes, people (human factors) and systems or from external events.
HEALTH AND SAFETY MANAGEMENTA Health and Safety Management system has been institutionalized to provide and maintain safe and healthy working environment and conditions for all staff. This responsibility also extends to visitors, contractors and others who may potentially be affected by our activities or present within our business premises .The Health and Safety Policy framework underpins the policy statements, roles and responsibilities of HSE officer, First Aid services, Safety Marshalls/Deputies and emergency procedures, etc.
REPUTATIONAL RISKThe risk that an event will negatively influence stakeholders’ perception or threaten to violate public trust in our brand. We firmly appreciate that Stakeholders are crucial to the success of our business and we are committed to continually conduct our business in an affirmative manner that facilitates building sustainable relationships with our stakeholders.
REPUTATIONAL RISK MANAGEMENTThe Group recognizes that in extreme cases, black swan events could result in significant reputational damage. It is to this end, that the
Group maintains a top-down approach to managing its potential and actual corporate culture and values against untoward events that may erode its brand value. Our reputation management objectives are two-fold; to proactively manage and reactively protect and leverages on a strong internal stakeholders collaboration between Legal, Compliance and Quality Assurance, Risk Management and Brand Management & Corporate Communications.
OPERATIONAL RESILIENCE: The Operational Resilience Framework covers Business Continuity Management (BCM), Crisis Management (CM) and IT Service Continuity Management (ITSCM) frameworks. The Business Continuity Framework has been designed to ensure continuous availability of processes and delivery of products and services at acceptable predefined levels in the event of a disaster or disruption to critical operations. The Crisis Management Plan (CMP) ensures that AXA Mansard has the capacity to prepare for, anticipate, respond to and recover from crisis as a result of a serious incident that immediately prevents, or threatens the continuity of business operations and the delivery of our key products and services. The IT Service Continuity Management ensures the availability of IT resources needed to sustain critical services to customers at acceptable predefined levels during disruptive incidents. The Operational Resilience policy’s objective is to protect our people, customers and brand by sustaining critical customer services at acceptable levels while responding to expected and unexpected disruptions and adapting to changes in our operation environment
Legal risks include but not limited to exposure to fines, penalties or punitive damages resulting from supervisory actions, as well as private settlements.
Emerging Risks are newly developing or changing risks that are generally characterized by major uncertainty. This includes but is not limited to Pandemic and infectious diseases, Climate change, Cybersecurity risks and Geopolitical Instability. We appreciate the considerable uncertainty posed by these risks and we are fully committed to identifying, monitoring and continually implementing mitigating actions to address the risks.
Information Risk is the likelihood that an unauthorized user will negatively impact the confidentiality, integrity, and availability of data that has been collected, transmitted, or stored. It also includes hardware and software failure, human error, spam, viruses, and malicious attacks, as well as natural disasters such as fires, cyclones, or floods. The purpose of information risk management is to identify, access, report and manage information risk, to support the achievement of AXA Mansard’s planned objectives and to align with the overall risk management framework and approach. The Information Risk (IR) Framework and its methodology are fully embedded within the Operational Risk (OR) Framework.

44 | ANNUAL REPORT 2020 - AXA MANSARD

ANNUAL REPORT 2020- AXA MANSARD | 45
11.12 CERTIFICATION PURSUANT TO SECTION 60(2) OF
INVESTMENT AND SECURITIES ACT NO.29 OF 2007
1.11 CERTIFICATION PURSUANT TO SECTION 60(2) OF INVESTMENT AND SECURITIES ACT NO.29 OF 2007
We the undersigned hereby certify the following with regards to our audited financial statements for the year ended 31 December 2020 that:
(a) We have reviewed the financial statement;
(b) To the best of our knowledge, the financial statement does not contain:
(i) Any untrue statement of a material fact, or
(ii) Omit to state a material fact, which would make the statements, misleading in the light of circumstances under which such statements were made;
(c ) To the best of our knowledge, the financial statements and other financial information included in the report fairly present in all material respects the financial condition and results of operation of the Company and its consolidated subsidiaries as of, and for the period presented in the report.
(d) We:
(i) Are responsible for establishing and maintaining internal controls.
(ii) Have designed such internal controls to ensure that material information relating to the Company and its consolidated subsidiaries is made known to such officers by others within those entries particularly during the year in which the periodic reports are being prepared;
(iii) Have evaluated the effectiveness of the Company’s internal controls as of date within 90 days prior to the report;
(iv) Have presented in the report our conclusions about the effectiveness of our internal controls based on our evaluation as of that date;
(e) We have disclosed to the auditors of the Company and Audit Committee:
(i) All significant deficiencies in the design or operation of internal controls which would adversely affect the Company’s ability to record, process, summarize and report financial data and have identified for the Company’s auditors any material weakness in internal controls, and
(ii) Any fraud, whether or not material, that involves management or other employees who have significant roles in the Company’s internal controls;
(f) We have identified in the report whether or not there were significant changes in internal controls or other factors that could significantly affect internal controls subsequent to the date of our evaluation, including any corrective actions with regard to significant deficiencies and material weaknesses.
Mr. Kunle AhmedFRC/2017/CIIN/00000017019Chief Executive Officer
Mrs. Ngozi Ola-IsraelFRC/2017/ANAN/00000017349Chief Financial Officer
REPORT

46 | ANNUAL REPORT 2020 - AXA MANSARD
1.13 MANAGEMENT’S DISCUSSION AND ANALYSIS
This “Management discussion and analysis” (MD&A) has been prepared as at 31 December 2020 and should be read in conjunction with the consolidated financial statements of AXA Mansard Insurance Plc and subsidiary companies.
FORWARD LOOKING STATEMENTSThe MD&A contains forward looking statements related to AXA Mansard Insurance Plc financial and other projections, expected future plans, event, financial and operating results, objectives and performance as well as underlying assumptions all of which involve risk and uncertainties. When used in this MD&A the words “believe”, “anticipate”, “intended” “estimate” and similar expression are used to identify forward looking statements, although not all forward-looking statements contain such words. These statements reflect management’s current belief and are based on information available to AXA Mansard Insurance Plc and are subject to certain risk, uncertainties and assumptions. As a member of the AXA Group,
consequent upon the acquisition of 100% stake in Assur Africa Holdings Limited in 2015, AXA Mansard Insurance Plc is poised to extending its corporate and retail coverage within the Nigerian insurance space and the wider Africa region.
BUSINESS STRATEGY OF THE COMPANY AND OVERALL PERFORMANCEThe Company is registered and incorporated in Nigeria and is engaged in providing insurance and investment solutions to both the corporate and retail sectors of Nigeria. It also aims to establish itself as the apex insurance company in Nigeria and the West African region.
The Company’s strategy is to use technology and international best practice to provide it’s customers with tailored solutions, superior services and specially designed programs to assist its patrons through a network of regional and agency offices spread over Nigeria.
OPERATING RESULTS
Group Group % Chg
Parent Parent % Chg(in thousands of Nigerian Naira) 31-Dec-2020 31-Dec-2019 31-Dec-2020 31-Dec-2019
Gross written premium 47,583,434 43,620,265 9% 27,547,903 28,014,854 -2%
Net premium income 31,716,484 26,290,070 21% 13,482,798 12,687,959 6%
Total underwriting profit 7,437,132 6,118,066 22% 2,364,623 3,587,832 -34%
Total investment income 7,089,381 5,673,080 25% 6,205,116 7,303,233 -15%
Profit before tax 6,038,755 3,833,253 58% 2,553,366 4,978,919 -49%
Profit after tax 4,540,337 2,908,272 56% 2,473,255 4,839,330 -49%
Earnings per share - basic (kobo); entire operations 14 11 25% 7 17 -58%
Earnings per share - basic (kobo); continuing operations
14 11 26% 7 17 -58%
1 1.12 MANAGEMENT’S DISCUSSION AND ANALYSISREPORT

ANNUAL REPORT 2020- AXA MANSARD | 47
1

48 | ANNUAL REPORT 2020 - AXA MANSARD
1.14 STATEMENT OF DIRECTORS’ RESPONSIBILITIES IN RELATION TO THE CONSOLIDATED AND SEPARATE FINANCIAL STATEMENTS FOR THE YEAR ENDED 31 DECEMBER 2020
The directors accept responsibility for the preparation of the consolidated and separate financial statements that give a true and fair view of the statement of financial position of the Group and Company at the reporting date and of its comprehensive income in the manner required by the Companies and Allied Matters Act (CAMA) 2020 of Nigeria and the Nigerian Insurance Act. The responsibilities include ensuring that the Company and the Group:
i. keep proper accounting records that disclose, with reasonable accuracy, the financial position of the Company and the Group and with the requirements of the Companies and Allied Matters Act (CAMA), 2020 and the Insurance Act;
ii. establish adequate internal controls to safeguard assets and to prevent and detect fraud and other irregularities; and
iii. prepare financial statements using suitable accounting policies supported by reasonable and prudent judgments and estimates, that are consistently applied.
The directors accept responsibility for the financial statements, which have been prepared using appropriate accounting policies supported by reasonable and prudent judgments and estimates, in compliance with,
� International Financial Reporting Standards (IFRS) as issued by the International Accounting Standards
BOARD (IASB); � the requirements of the Nigerian Insurance Act;
� relevant guidelines and circulars issued by the National Insurance Commission (NAICOM);
� the requirements of the Companies and Allied Matters Act (CAMA), 2020; and
� Financial Reporting Council of Nigeria Act
The directors further accept responsibility for the maintenance of accounting records that may be relied upon in the preparation of financial statements, as well as adequate systems of internal financial control.
The directors have made an assessment of the Company’s and Group’s ability to continue as a going concern and have no reason to believe that the Company and Group will not remain a going concern in the year ahead.
SIGNED ON BEHALF OF THE BOARD OF DIRECTORS BY:
Mr. Olusola AdeeyoFRC/2013/NIM/00000001919Chairman12 February 2021
Mr. Kunle AhmedFRC/2017/CIIN/00000017019Chief Executive Officer12 February 2021
1 1.14 STATEMENT OF DIRECTORS’ RESPONSIBILITIESREPORT

ANNUAL REPORT 2020- AXA MANSARD | 49
11.15 STATEMENT OF CORPORATE RESPONSIBILITY FOR
THE FINANCIAL STATEMENTS FOR THE YEAR ENDED 31 DECEMBER 2020
Further to the provisions of section 405 of the Companies and Allied Matters Act (CAMA), 2020, we, the Chief Executive Officer and Chief Financial Officer, hereby certify the financial statements of the AXA Mansard Insurance Plc for the year ended 31 December 2020 as follows:
a) That we have reviewed the audited consolidated and separate financial statements of the Company for the year ended 31 December 2020.
b) That the audited consolidated and separate financial statements do not contain any untrue statement of material fact or omit to state a material fact which would make the statements misleading, in the light of the circumstances under which such statement was made.
c) That the audited consolidated and separate financial statements and all other financial information included in the statements fairly present, in all material respects, the financial condition and results of operation of the Company as of and for, the year ended 31 December 2020.
d) That we are responsible for establishing and maintaining internal controls and have designed such internal controls to ensure that material information relating to the Company and its subsidiary is made known to the officer by other officers of the companies, during the period end 31 December 2020.
e) That we have evaluated the effectiveness of the Company’s internal controls within 90 days prior to the date of audited consolidated and separate financial statements, and certify that the Company’s internal controls are effective as of that date
f) That there were no significant changes in internal controls or in other factors that could significantly affect internal controls subsequent to the date of our evaluation, including any corrective action with regard to significant deficiencies and material weaknesses
g) That we have disclosed the following information to the Company’s Auditors and Audit Committee:
(i) there are no significant deficiencies in the design or operation of internal controls which could adversely affect the Company’s ability to record, process, summarize and report financial data, and have identified for the Company’s auditors any material weaknesses in internal controls, and
(ii) there is no fraud that involves management or other employees who have a significant role in the Company’s internal control
Mr. Kunle AhmedFRC/2017/CIIN/00000017019Chief Executive Officer12 February 2021
Mrs. Ngozi Ola-IsraelFRC/2017/ANAN/00000017349Chief Financial Officer12 February 2021
1.15 STATEMENT OF CORPORATE RESPONSIBILITYREPORT

1.16 REPORT OF THE STATUTORY AUDIT COMMITTEE
TO THE MEMBERS OF AXA MANSARD INSURANCE PLC:In compliance with the provisions of Section 404(7) of the Companies and Allied Matters Act of Nigeria (CAMA) 2020, the members of the Audit Committee of AXA Mansard Insurance Plc hereby report as follows:
We have exercised our statutory functions under Section 404(7) of the Companies and Allied Matters Act of Nigeria (CAMA) 2020 and acknowledge the co-operation of management and staff in the conduct of these responsibilities.
We are of the opinion that the accounting and reporting policies of the Group are in compliance with legal requirements and agreed ethical practices and that the scope and planning of both the external and internal audits for the year ended 31 December 2020 were satisfactory and reinforce the Group’s internal control systems.
We have deliberated with the external auditors, who have confirmed that necessary cooperation was received from Management in the course of their statutory audit and we are satisfied with Management’s responses to their recommendations for improvement and with the effectiveness of the Group’s system of accounting and internal control.
Mr. Ohis OhiwereiFRC/2017/CIBN/00000016412Chairman, Statutory Audit Committee12 February 2021
Members of the Statutory Audit Committee are:
1 Mr. Ohis Ohiwerei Chairman Chairman
3 Mr. Akingbola Akinola Shareholder’s representative Member
4 Mrs. Ayodeji Oloye Shareholder’s representative Member
In attendance:
Mrs Tolulope Oke
Secretary
1 1.14 REPORT OF THE STATUTORY AUDIT COMMITTEEREPORT

ANNUAL REPORT 2020 AXA MANSARD | 51
2FINANCIALSFINANCIALS2.1 Report of the External Consultants 52
2.2 Independent Auditor’s Report to the Shareholders of AXA Mansard Insurance Plc 53
2.3 Consolidated Statement of Financial Position as at December 31, 2020 57
2.4 Consolidated Statement of Comprehensive Income for the Year Ended December 31, 2020 58
2.5 Consolidated Statements of Changes in Equity 59
2.6 Statements of Changes in Equity 61
2.7 Cashflow Statement for the Year Ended December 31, 2020 63
2.8 Notes to the Financial Statements for the Year Ended December 31, 2020 64

52 | ANNUAL REPORT 2020 - AXA MANSARD
March 17, 2021
The ChairmanBoard of DirectorsAXA Mansard Insurance Plc.Santa Clara CourtPlot 1412, Ahmadu Bello WayVictoria IslandLagos
2.1 REPORT OF THE EXTERNAL CONSULTANTS ON THE PERFORMANCE OF THE BOARD OF DIRECTORS OF AXA MANSARD INSURANCE PLC (“AXA MANSARD”) FOR THE YEAR ENDED 31ST DECEMBER 2020
In line with the provisions of Principle 14.1 of the Nigerian Code of Corporate Governance, 2018 (“NCCG”), Section 4.01 (i) and (ii) of National Insurance Commission (NAICOM) Corporate Governance Guidelines, 2021(NAICOM Guidelines) and Guideline 9 of the Securities and Exchange Commission (SEC) Corporate Governance Guidelines for Public Companies in Nigeria issued in 2020 (“SCGG”), DCSL Corporate Services Limited was appointed to undertake an appraisal of the Board of Directors of AXA Mansard Insurance Plc (“AXA Mansard”) for the year-ended 31st December 2020. The appraisal entailed a review of the Company’s corporate and statutory documents, the minutes of Board and Board Committee meetings, policies and other ancillary documents made available to us. We also administered Board and Peer Review Surveys to the Directors.
The essence of the review was to ascertain the level of the Board’s compliance with corporate governance practices with particular reference to the provisions of the NAICOM Guidelines, SCGG and the NCCG and covered the following seven key corporate governance themes:
1. Board Structure and Composition
2. Strategy and Planning
3. Board Operations and Effectiveness
4. Measuring and Monitoring of Performance
5. Risk Management and Compliance
6. Corporate Citizenship; and
7. Transparency and Disclosure
We confirm that the Board of Directors continues to ensure that the Company’s governance practices align with the provisions of the SCGG, the NCCG, the NAICOM Guidelines as well as globally accepted best practices. The Board demonstrates commitment to ensuring observance of highest ethical standards and transparency in the conduct of the Company’s business. We found from the Directors’ Peer Assessment and Chairman’s Leadership Assessment surveys administered on the individual Directors that they performed well against the governance indicators and remained committed to sustaining the growth of the Company’s business.
We have brought to the attention of the Board those areas that require improvement and are satisfied that the Board has taken due notice of these.
Yours faithfully,
For: DCSL Corporate Services Ltd
Bisi AdeyemiManaging DirectorFRC/2013/NBA/00000002716
2 2.1 REPORT OF THE EXTERNAL CONSULTANTSFINANCIALS
DCSL Corporate Services Limited235 Ikorodu RoadIlupeju, Lagos
Abuja Office:1st Floor, The Statement Hotels,Plot 1002, 1st AvenueOff Shehu Shagari WayCentral Business DistrictAbuja, Nigeria
P. O. Box 965, MarinaLagos, Nigeria
Tel: +234 1 2717800Fax: +234 1 2717801www.dcsl.com.ng
Tel: +234 9 4614902-5RC NO. 352393

ANNUAL REPORT 2020 AXA MANSARD | 53
2
2.2 INDEPENDENT AUDITOR’S REPORT TO THE SHAREHOLDERS OF AXA MANSARD INSURANCE PLC
KPMG Professional ServicesKPMG TowerBishop Aboyade Cole StreetVictoria Island LagosPMB 40014, FalomoLagos
Telephone 234 (1) 271 8955
234 (1) 271 8599
Internet www.kpmg.com/ng
2.2 INDEPENDENT AUDITOR’S REPORTFINANCIALS
REPORT ON THE AUDIT OF THE CONSOLIDATED AND SEPARATE FINANCIAL STATEMENTS
OPINIONWe have audited the consolidated and separate financial statements of AXA Mansard Insurance Plc (“the Company”) and its subsidiaries (together, “the Group”), which comprise:
� the consolidated and separate statements of financial position as at 31 December, 2020;
� the consolidated and separate statements of comprehensive income;
� the consolidated and separate statements of changes in equity;
� the consolidated and separate statements of cash flows for the year then ended; and
� the notes, comprising significant accounting policies and other explanatory information.
In our opinion, the accompanying consolidated and separate financial statements give a true and fair view of the consolidated and separate financial position of the Company and its subsidiaries as at 31 December, 2020, and of its consolidated and separate financial performance and its consolidated and separate cash flows for the year then ended in accordance with International Financial Reporting Standards (IFRSs) and in the manner required by the Companies and Allied Matters Act (CAMA), 2020 and the Financial Reporting Council of Nigeria Act, 2011 the Insurance Act 2003 and relevant National Insurance Commission of Nigeria (“NAICOM”) Circulars.
BASIS FOR OPINIONWe conducted our audit in accordance with International Standards on Auditing (ISAs). Our responsibilities under those standards are further described in the Auditor’s Responsibilities for the Audit of the consolidated and separate Financial Statements section of our report. We are independent of the Group and Company in accordance with International Ethics Standards Board for Accountants International Code of Ethics for Professional Accountants (including International Independence Standards) (IESBA Code) together with the ethical requirements that are relevant to our audit of the consolidated and separate financial statements in Nigeria and we have fulfilled our other ethical responsibilities in accordance with these requirements and the IESBA Code. We believe that the audit evidence we have obtained is sufficient and appropriate to provide a basis for our opinion.
KPMG Professional Services, a Partnership established under Nigeria law, is a member of KPMG International Coorperative (“KPMG International”), a swiss entity. All rights reserved.
Registered in Nigeria No BN 986925
Adegoke A. Oyelami
Ajibola O. Olomola
Ayodele H. Othihiwa
Goodluck C. Obi
Kabir O. Okunlola
Nneka C. Eluma
Olanike I. James
Olutoyin I. Ogunlowo
Tolulope A. Odukale
Adekunle A. Elebute
Akinyemi Ashade
Chibuzor N. Anyanechi
Ibitomi M. Adepoju
Lawrence C. Amadi
Oguntayo I. Ogungbenro
Olufemi A. Babem
Oluwafemi O. Awotoye
Victor U. Onyenkpa
Adetola P. Adeyemi
Ayobami L. Salami
Chineme B. Nwigbo
Ijeoma T. Emezie-Ezigbo
Martins I. Arogie
Olabimpe S. Afolabi
Olumide O. Olayinka
Oluwatoyin A. Gbagi
Adewale K. Ajayi
Ayodele A. Soyinka
Elijah O. Oladunmoye
Joseph O. Tegbe
Mohammed M. Adama
Oladimeji I. Salaudeen
Olusegun A. Sowande
Temitope A. Onitiri

54 | ANNUAL REPORT 2020 - AXA MANSARD
2 2.2 INDEPENDENT AUDITOR’S REPORTFINANCIALS
KEY AUDIT MATTERSKey audit matters are those matters that, in our professional judgment, were of most significance in our audit of the consolidated and separate financial statements of the current period. These matters were addressed in the context of our audit of the financial statements as a whole, and in forming our opinion thereon, and we do not provide a separate opinion on these matters.
VALUATION OF INSURANCE CONTRACT LIABILITIESThe Company has significant life and non-life insurance contract liabilities. The valuation of insurance contract liabilities involves high estimation uncertainties and significant judgment over uncertain future outcomes.
Provisions for reported claims are based on historical experience. However, the eventual liabilities may differ from the estimated amounts. Furthermore, the estimated liability for claims that have occurred but are yet to be reported in respect of non-life insurance contracts involve economic assumptions about inputs such as inflation rate, ultimate loss ratio and discount rates; hence the eventual outcome is uncertain.
The actuarial assumptions used in the valuation of life insurance contract liabilities are judgmental, particularly with respect to mortality rates and discount rates. The level of complexity, the assumptions and judgment involved in estimating these amounts make insurance contract liabilities a matter of significance to our audit.
The Group’s accounting policy on valuation of insurance contract liabilities and related disclosures are shown in notes 2.2(j) (accounting policy), note 2.3(b) (critical accounting estimates and judgments) and note 20 (insurance contract liabilities).
How the matter was addressed in our audit
Our audit procedures included the following:
� We evaluated the design and implementation of key controls instituted by the Company which includes management review of data used for the valuation of insurance contract liabilities.
� We agreed the underlying data on a sample basis used in actuarial valuations of insurance contract liabilities to source documentation.
� We engaged our actuarial specialists to assess the appropriateness of the methodology used by the Company’s external actuary for determining the insurance contract liabilities.
� With the assistance of our actuarial specialist, we evaluated the reasonableness of the actuarial assumptions used by the Company’s external actuary including assumptions on the projected cash flows, basic chain ladder runoff period, inflation rate, mortality and discount rate.
OTHER INFORMATIONThe Directors are responsible for the other information. The other information comprises the Corporate Information, Corporate addresses, Vision, Mission and values, 2020 Corporate Social Responsibility initiatives, Complaints and feedback, Sustainability report, Corporate Governance report, Risk management, Certification Pursuant to Section 60(2) of Investment and Securities Act No 29 of 2007, Management’s discussion and analysis, Directors’ report, Statement of directors’ responsibilities, Report of the statutory audit committee and Other national disclosures, which we obtained prior to the date of this auditor’s report. Other information also includes the Chairman’s statement and report from the Executives, together the “outstanding reports”, which are expected to be made available to us after that date. Our opinion on the consolidated and separate financial statements does not cover the other information and we do not express any form of assurance conclusion thereon.
In connection with our audit of the consolidated and separate financial statements, our responsibility is to read the other information and in doing so, consider whether the other information is materially inconsistent with the consolidated and separate financial statements or our knowledge obtained in the audit or otherwise appears to be materially misstated. If, based on the work we have performed, we conclude that there is a material misstatement of this other information, we are required to report that fact. We have nothing to report in this regard.
When we read the Outstanding reports, if we conclude that there is a material misstatement therein, we are required to communicate the matter to the audit committee.
RESPONSIBILITIES OF THE DIRECTORS FOR THE CONSOLIDATED AND SEPARATE FINANCIAL STATEMENTSThe Directors are responsible for the preparation of consolidated and separate financial statements that give a true and fair view in accordance with IFRSs and in the manner required by the Companies and Allied Matters Act (CAMA), 2020, the Financial Reporting Council of Nigeria Act, 2011, the Insurance Act 2003 and relevant National Insurance Commission of Nigeria (“NAICOM”) Circulars, and for such

ANNUAL REPORT 2020 AXA MANSARD | 55
2
2.2 INDEPENDENT AUDITOR’S REPORTFINANCIALS
internal control as the directors determine is necessary to enable the preparation of financial statements that are free from material misstatement, whether due to fraud or error.
In preparing the consolidated and separate financial statements, the directors are responsible for assessing the Group and Company’s ability to continue as a going concern, disclosing, as applicable, matters related to going concern and using the going concern basis of accounting unless the directors either intend to liquidate the Group and Company or to cease operations, or have no realistic alternative but to do so.
AUDITOR’S RESPONSIBILITIES FOR THE AUDIT OF THE CONSOLIDATED AND SEPARATE FINANCIAL STATEMENTSOur objectives are to obtain reasonable assurance about whether the consolidated and separate financial statements as a whole are free from material misstatement, whether due to fraud or error, and to issue an auditor’s report that includes our opinion. Reasonable assurance is a high level of assurance, but is not a guarantee that an audit conducted in accordance with ISAs will always detect a material misstatement when it exists. Misstatements can arise from fraud or error and are considered material if, individually or in the aggregate, they could reasonably be expected to influence the economic decisions of users taken on the basis of these financial statements.
As part of an audit in accordance with ISAs, we exercise professional judgment and maintain professional
skepticism throughout the audit. We also:
� Identify and assess the risks of material misstatement of the consolidated and separate financial statements, whether due to fraud or error, design and perform audit procedures responsive to those risks, and obtain audit evidence that is sufficient and appropriate to provide a basis for our opinion. The risk of not detecting a material misstatement resulting from fraud is higher than for one resulting from error, as fraud may involve collusion, forgery, intentional omissions, misrepresentations, or the override of internal control.
� Obtain an understanding of internal control relevant to the audit in order to design audit procedures that are appropriate in the circumstances, but not for the purpose of expressing an opinion on the effectiveness of the Group and Company’s internal control.
� Evaluate the appropriateness of accounting policies used and the reasonableness of accounting estimates and related disclosures made by the directors.
� Conclude on the appropriateness of directors’ use of the going concern basis of accounting and, based on the audit evidence obtained, whether a material uncertainty exists related to events or conditions that may cast significant doubt on the Group and Company’s ability to continue as a going concern. If we conclude that a material uncertainty exists, we are required to draw attention in our auditor’s report to the related disclosures in the consolidated and separate financial statements or, if such disclosures are inadequate, to modify our opinion. Our conclusions are based on the audit evidence obtained up to the date of our auditor’s report. However, future events or conditions may cause the Group and Company to cease to continue as a going concern.
� Evaluate the overall presentation, structure and content of the consolidated and separate financial statements, including the disclosures, and whether the consolidated and separate financial statements represent the underlying transactions and events in a manner that achieves fair presentation.
� Obtain sufficient appropriate audit evidence regarding the financial information of the entities or business activities within the Group to express an opinion on the consolidated financial statements. We are responsible for the direction, supervision and performance of the group audit. We remain solely responsible for our audit opinion.
We communicate with Audit Committee regarding, among other matters, the planned scope and timing of the audit and significant audit findings, including any significant deficiencies in internal control that we identify during our audit.
We also provide Audit Committee with a statement that we have complied with relevant ethical requirements regarding independence, and to communicate with them all relationships and other matters that may reasonably be thought to bear on our independence, and where applicable, actions taken to eliminate threats or safeguards applied.
From the matters communicated with Audit Committee, we determine those matters that were of most significance in the audit of the consolidated and separate financial statements of the current period and are therefore the key audit matters. We describe these matters in our auditor’s report unless law or regulation precludes public disclosure about the matter or when, in extremely rare circumstances, we determine that a matter should not be communicated in our report because the adverse consequences of doing so would reasonably be expected to outweigh the public interest benefits of such communication.

56 | ANNUAL REPORT 2020 - AXA MANSARD
2 2.2 INDEPENDENT AUDITOR’S REPORTFINANCIALS
REPORT ON OTHER LEGAL AND REGULATORY REQUIREMENTSCompliance with the requirements of Schedule 5 of the Companies and Allied Matters Act (CAMA), 2020 and Section 28(2) of the Insurance Act 2003.
i. We have obtained all the information and explanations which to the best of our knowledge and belief were necessary for the purpose of our audit.
ii. In our opinion, proper books of account have been kept by the Company, so far as appears from our examination of those books and proper returns adequate for the purpose of our audit have been received.
iii. The Company’s statement of financial position and statement of comprehensive income are in agreement with the books of account and returns.
PENALTIESThe Company did not pay penalties in respect of contraventions of the requirements of the National Insurance Commission of Nigeria Guidelines and Circulars during the year ended 31 December 2020.
Oluwafemi O. Awotoye, FCA
FRC/2013/ICAN/00000001182For: KPMG Professional Services
Chartered Accountants 29 March 2021Lagos, Nigeria

ANNUAL REPORT 2020 AXA MANSARD | 57
2
2.3 CONSOLIDATED STATEMENT OF FINANCIAL POSITION AS AT DECEMBER 31, 2020(All amounts in thousands of Naira unless otherwise stated)
Group Group Parent Parent
Notes 31-Dec-20 31-Dec-19 31-Dec-20 31-Dec-19
ASSETS
Cash and cash equivalents 8 20,251,719 17,911,416 16,575,948 16,133,274 Investment securities:– Fair value through profit or loss 9.1 5,407,073 5,302,005 5,407,073 5,302,005 – Available-for-sale assets 9.2 31,102,632 27,836,825 27,764,440 22,032,646 Financial assets designated at fair value 9.3 4,485,246 4,154,695 4,485,246 4,154,695 Trade receivables 10 6,668,899 5,418,424 1,043,004 1,224,373 Reinsurance assets 11 6,499,653 8,974,246 6,327,265 8,895,612 Deferred acquisition cost 12 415,717 331,047 346,212 321,055 Other receivables 13 1,286,603 1,548,652 726,911 801,891 Loans and receivables 14 470,272 403,548 1,014,377 882,168 Investment property 15 13,694,760 15,801,949 - 1,350,000 Investment in subsidiaries 16 - - 1,652,000 3,537,247 Intangible assets 17 330,017 1,580,297 305,443 215,450 Property and equipment 18 2,428,288 1,989,781 2,154,801 1,784,543 Right of use 18c 898,841 535,863 722,803 462,082 Statutory deposit 19 500,000 500,000 500,000 500,000
TOTAL ASSETS 94,439,720 92,288,748 69,025,523 67,597,041
LIABILITIESInsurance liabilities 20 29,597,844 25,162,941 19,550,486 17,491,746
Investment contract liabilities:– At amortised cost 21.1 5,153,521 4,275,765 5,153,521 4,275,765 – Liabilities designated at fair value 21.2 4,485,246 4,154,695 4,485,246 4,154,695 Trade payables 22 9,111,737 16,567,712 8,947,445 16,478,545 Other liabilities 23 2,936,095 3,305,822 1,393,590 1,894,835 Current income tax liabilities 24 1,648,795 935,546 125,911 203,650 Borrowings 25 2,994,361 6,965,804 - - Deferred tax liability 26 818,666 841,496 - -
TOTAL LIABILITIES 56,746,265 62,209,781 39,656,199 44,499,236
EQUITY
Share capital 27.1 18,000,000 5,250,000 18,000,000 5,250,000 Share premium 27.2 - 4,443,453 - 4,443,453 Contingency reserve 27.3 4,345,125 4,270,458 4,345,125 4,270,458 Other reserves 27.4 167,381 2,687,483 167,381 2,652,077 Treasury shares 27.5 (304,924) (304,924) (304,924) (304,924)Fair value reserves 27.6 5,264,806 1,080,718 5,032,542 923,562 Retained earnings 27.7 6,470,482 7,832,957 2,129,200 5,863,179
SHAREHOLDERS’ FUNDS 33,942,870 25,260,145 29,369,324 23,097,805
Total equity attributable to the owners of the parent 33,942,870 25,260,145 29,369,324 23,097,805 Non-controlling interest in equity 28 3,750,585 4,818,822 - -
TOTAL EQUITY 37,693,455 30,078,967 29,369,324 23,097,805
TOTAL LIABILITIES AND EQUITY 94,439,720 92,288,748 69,025,523 67,597,041
Mrs. Ngozi Ola-IsraelFRC/2017/ANAN/00000017349Chief Financial Officer
Mr. Kunle AhmedFRC/2017/CIIN/00000017019Chief Executive Officer
Mr. Olusola AdeeyoFRC/2013/NIM/00000001919Chairman
Signed on behalf of the Board of Directors on 12 February 2021
2.3 CONSOLIDATED STATEMENT OF FINANCIAL POSITIONFINANCIALS

58 | ANNUAL REPORT 2020 - AXA MANSARD
Group Group Parent Parent Notes 31-Dec-20 31-Dec-19 31-Dec-20 31-Dec-19
Continuing operationsGross written premium 30 47,583,434 43,620,265 27,547,903 28,014,854 Gross premium income 30 45,519,867 41,609,412 27,069,133 27,867,055 Re-insurance expenses 30 (13,803,383) (15,319,342) (13,586,335) (15,179,096)Net premium income 30 31,716,484 26,290,070 13,482,798 12,687,959 Fee and commission on insurance contracts 31 1,657,816 1,875,748 1,657,816 1,875,748
Net underwriting income 33,374,300 28,165,818 15,140,614 14,563,707 Claims:Claims expenses (gross) 32 (21,182,710) (18,614,268) (8,569,687) (7,887,283)Claims expenses recovered from reinsurers 32 910,496 1,124,047 821,006 1,012,179 Underwriting expenses 33 (3,797,462) (3,491,524) (3,159,818) (3,034,764)Changes in individual life reserves 20.3 (991,113) (742,809) (991,113) (742,809)Changes in annuity reserves 20.4 (876,379) (323,198) (876,379) (323,198)
Net underwriting expenses (25,937,168) (22,047,752) (12,775,991) (10,975,875)
Total underwriting profit 7,437,132 6,118,066 2,364,623 3,587,832
Investment income 34 4,850,958 5,028,284 2,653,181 4,006,523 Net gains/(losses) on financial instruments 35 3,280,770 292,206 2,095,493 311,441 Net gains/ Loss on investment in property 15 (2,279,051) (404,575) - (390,000)Net gains on sale of investment in subsidiary 35 845,219 - 1,093,922 2,939,873 Profit on investment contracts 36 217,410 380,846 235,271 380,846 Other income 37 174,075 376,319 127,249 54,550
Total investment income 7,089,381 5,673,080 6,205,116 7,303,233
Expenses for marketing and administration 38 (1,216,273) (1,768,047) (1,308,034) (1,692,076)Employee benefit expense 39 (2,910,149) (2,486,486) (1,509,815) (1,188,516)Other operating expenses 40 (3,434,555) (3,254,736) (3,084,827) (2,953,481)(Impairment)/writeback of other assets 13 (22,673) (45,700) (22,673) (45,700)(Impairment)/writeback of premium receivables 10.1 (121,953) 40,911 (10,000) 4,902
Results of operating activities 6,820,910 4,277,088 2,634,390 5,016,194 Finance cost 41 (782,155) (443,835) (81,024) (37,275)Profit before tax 6,038,755 3,833,253 2,553,366 4,978,919 Income tax expense 42 (1,537,671) (1,009,416) (80,111) (139,589)Profit from continuing operations 4,501,084 2,823,837 2,473,255 4,839,330 Profit from discontinued operations (net of tax) 48 39,253 84,435 - -
Profit for the year 4,540,337 2,908,272 2,473,255 4,839,330
Profit attributable to:Owners of the parent 4,809,353 2,708,674 2,473,255 4,839,330 Non-controlling interest 28 (269,016) 199,598 - -
4,540,337 2,908,272 2,473,255 4,839,330 Other comprehensive income:Changes in available-for-sale financial assets (net of taxes) 27.6 4,184,088 1,630,944 4,108,980 1,473,468 Items that will not be subsequently reclassified to profit or loss account
Other comprehensive income for the year 4,184,088 1,630,944 4,108,980 1,473,468
Total comprehensive income for the year 8,724,425 4,539,216 6,582,235 6,312,798 Attributable to:Owners of the parent 8,993,441 4,339,618 6,582,235 6,312,798 Non-controlling interests 28 (269,016) 199,598 - -
Total comprehensive income for the year 8,724,425 4,539,216 6,582,235 6,312,798
Earnings per share:
Basic (kobo)- Restated* 43 14 11 7 17
Diluted (kobo) - Restated* 43 14 11 7 17
Earnings per share- Continuing Operations:
Basic (kobo)- Restated* 43 14 11 7 17
Diluted (kobo) - Restated* 43 14 11 7 17
2.4 CONSOLIDATED STATEMENT OF COMPREHENSIVE INCOME FOR THE YEAR ENDED DECEMBER 31, 2020(All amounts in thousands of Naira unless otherwise stated)
2 2.4 CONSOLIDATED STATEMENT OF COMPREHENSIVE INCOMEFINANCIALS

ANNUAL REPORT 2020 AXA MANSARD | 59
2
2.5
CON
SOLI
DATE
D ST
ATEM
ENTS
OF
CHAN
GES
IN E
QU
ITY
Year
end
ed D
ecem
ber 3
1, 2
020
GRO
UP
Sha
re
Capi
tal
Sha
re
prem
ium
Co
ntin
genc
y re
serv
e
Cap
ital
and
othe
r st
atut
ory
rese
rves
Sha
re
sche
me
rese
rves
Tre
asur
y sh
ares
Fai
r va
lue
rese
rves
Ret
aine
d ea
rnin
gsTo
tal
Non
Co
ntro
lling
in
tere
st T
otal
eq
uity
Bala
nce
at 1
Jan
uary
202
05,
250,
000
4,44
3,45
3 4,
270,
458
2,5
35,4
06
152,
077
(304
,924
)1,
080,
718
7,83
2,95
7 25
,260
,145
4,
818,
822
30,0
78,9
67
Tota
l com
preh
ensiv
e in
com
e fo
r the
year
Profi
t for
the
year
- -
- -
- -
- 4
,809
,353
4
,809
,353
(2
69,0
16)
4,5
40,3
37
Tran
sfer
to c
ontin
genc
y re
serv
es -
- 7
4,66
7 -
- -
- (7
4,66
7) -
- -
Tran
sfer
from
stat
utor
y re
serv
es d
ue to
di
spos
al -
- -
- -
- -
- -
- -
Oth
er co
mpr
ehen
sive
inco
me
- -
-
Chan
ges i
n fa
ir va
lue
of a
vaila
ble-
for-s
ale
finan
cial
ass
ets
- -
- -
- -
4,1
84,0
88
- 4
,184
,088
-
4,1
84,0
88
Tota
l com
preh
ensi
ve in
com
e fo
r the
yea
r -
- 7
4,66
7 -
- -
4,1
84,0
88
4,7
34,6
86
8,9
93,4
41
(269
,016
) 8
,724
,425
Tran
sact
ions
with
ow
ners
, rec
orde
d di
rect
ly in
equ
ity
Bonu
s iss
ue e
xpen
se -
(326
,020
) -
- -
- -
- (3
26,0
20)
- (3
26,0
20)
Bonu
s iss
ue to
shar
ehol
ders
12,7
50,0
00
(4,1
17,4
33)
- (2
,500
,000
) -
- -
(6,1
32,5
67)
- -
-
Equi
ty-s
ettle
d sh
are-
base
d pa
ymen
ts
expe
nse
- -
- -
15,
304
- -
- 1
5,30
4 -
15,
304
Tota
l tra
nsac
tions
with
ow
ners
of e
quity
12,7
50,0
00
(4,4
43,4
53)
- (2
,500
,000
) 1
5,30
4 -
- (6
,132
,567
) (3
10,7
16)
- (3
10,7
16)
Chan
ges i
n ow
ners
hip
inte
rest
Disp
osal
of s
ubsi
diar
y -
- -
(35,
406)
- -
- 3
5,40
6 -
(799
,221
) (7
99,2
21)
Tota
l cha
nges
in o
wne
rshi
p in
tere
sts
- -
- (3
5,40
6) -
- -
35,
406
- (7
99,2
21)
(799
,221
)
Bala
nce
at 3
1 De
cem
ber 2
020
18,0
00,0
00
- 4,
345,
125
- 16
7,38
1 (3
04,9
24)
5,26
4,80
6 6,
470,
482
33,9
42,8
70
3,75
0,58
5 37
,693
,455
(All
amou
nts i
n th
ousa
nds o
f Nai
ra u
nles
s oth
erw
ise
stat
ed)
2.5 CONSOLIDATED STATEMENTS OF CHANGES IN EQUITYFINANCIALS

60 | ANNUAL REPORT 2020 - AXA MANSARD
Year
end
ed D
ecem
ber 3
1, 2
019
GRO
UP
Sha
re
Capi
tal
Sha
re
prem
ium
Con
tinge
ncy
rese
rve
Cap
ital
and
othe
r st
atut
ory
rese
rves
Sha
re
sche
me
rese
rves
Tr
easu
ry
shar
es
Fai
r va
lue
rese
rves
Ret
aine
d ea
rnin
gsTo
tal
Non
Co
ntro
lling
in
tere
st T
otal
eq
uity
Bala
nce
at 1
Jan
uary
201
9 5
,250
,000
4
,443
,453
4
,139
,090
2
,528
,678
1
34,9
04
(304
,924
) (5
50,2
26)
5,2
62,3
79
20,
903,
354
4,6
19,2
24
25,5
22,5
78
Tota
l com
preh
ensiv
e in
com
e fo
r the
year
Profi
t for
the
year
- -
- -
- -
- 2
,708
,674
2
,708
,674
1
99,5
98
2,9
08,2
72
Tran
sfer
to c
ontin
genc
y re
serv
es -
- 1
31,3
68
- -
- -
(131
,368
) -
- -
Tran
sfer
to st
atut
ory
rese
rves
- -
- 6
,728
-
(6,7
28)
- -
Oth
er co
mpr
ehen
sive
inco
me
Chan
ges i
n fa
ir va
lue
of a
vaila
ble-
for-s
ale
finan
cial
ass
ets
- -
- -
- -
1,
630,
944
- 1
,630
,944
1
,630
,944
Tota
l com
preh
ensi
ve in
com
e fo
r the
yea
r -
- 1
31,3
68
6,7
28
- -
1,63
0,94
4 2
,570
,578
4
,339
,618
1
99,5
98
4,5
39,2
16
Tran
sact
ions
with
ow
ners
, rec
orde
d di
rect
ly in
equ
ity
Divi
dend
s to
equi
ty h
olde
rs -
- -
- -
- -
- -
- -
Equi
ty- s
ettle
d sh
are-
base
d pa
ymen
ts
expe
nse
- -
- -
17,
173
- -
- 1
7,17
3 -
17,
173
Addi
tiona
l sub
sidi
ary
inve
stm
ent w
ith N
CI -
- -
- -
- -
- -
- -
Tota
l tra
nsac
tions
with
ow
ners
of e
quity
- -
- -
17,
173
- -
- 1
7,17
3 -
17,
173
Bala
nce
at 3
1 De
cem
ber 2
019
5,2
50,0
00
4,4
43,4
53
4,2
70,4
58
2,5
35,4
06
152
,077
(3
04,9
24)
1,08
0,71
8 7,
832,
957
25,2
60,1
45
4,81
8,82
2 30
,078
,967
2 2.5 CONSOLIDATED STATEMENTS OF CHANGES IN EQUITYFINANCIALS

ANNUAL REPORT 2020 AXA MANSARD | 61
2
2.6 STATEMENTS OF CHANGES IN EQUITYFINANCIALS
2.6
STAT
EMEN
TS O
F CH
ANGE
S IN
EQ
UIT
Y
Year
end
ed D
ecem
ber 3
1, 2
020
PARE
NT
Sha
re
Capi
tal
Sha
re
prem
ium
Co
ntin
genc
y re
serv
e C
apita
l re
serv
es
Sha
re
sche
me
rese
rve
Tr
easu
ry
shar
es F
air v
alue
re
serv
es R
etai
ned
earn
ings
Tot
al
Bala
nce
at 1
Jan
uary
202
05,
250,
000
4,44
3,45
3 4,
270,
458
2,50
0,00
0 15
2,07
7 (3
04,9
24)
923
,562
5,
863,
179
23,0
97,8
05
Tota
l com
preh
ensiv
e in
com
e fo
r the
year
Profi
t for
the
year
- -
- -
- -
- 2,
473,
255
2,4
73,2
55
Tran
sfer
to c
ontin
genc
y re
serv
es -
- 7
4,66
7 -
- -
- (7
4,66
7) -
Oth
er co
mpr
ehen
sive
inco
me
-
Chan
ges i
n fa
ir va
lue
of a
vaila
ble-
for-s
ale
finan
cial
ass
ets
- -
- -
- -
4,1
08,9
80
- 4
,108
,980
Tota
l com
preh
ensi
ve in
com
e fo
r the
yea
r -
- 7
4,66
7 -
- -
4,10
8,98
0 2,
398,
588
6,5
82,2
35
Tran
sact
ions
with
ow
ners
, rec
orde
d di
rect
ly in
equ
ity
Cont
ribut
ions
by
and
dist
ribut
ions
to o
wne
rs
Bonu
s iss
ue e
xpen
se -
(326
,020
) -
- -
- -
- (3
26,0
20)
Issu
e of
add
ition
al sh
ares
due
to re
capi
talis
atio
n12
,750
,000
(4
,117
,433
) -
(2,5
00,0
00)
- -
- (6
,132
,567
) -
Divi
dend
s to
equi
ty h
olde
rs
- -
- -
- -
- -
-
Equi
ty- s
ettle
d sh
are-
base
d ex
pens
e fo
r the
yea
r -
- -
- 1
5,30
4 -
- -
15,
304
Tota
l tra
nsac
tions
with
ow
ners
12,7
50,0
00
(4,4
43,4
53)
- (2
,500
,000
) 1
5,30
4 -
- (6
,132
,567
) (3
10,7
16)
Bala
nce
at 3
1 De
cem
ber 2
020
18,0
00,0
00
- 4
,345
,125
-
167
,381
(3
04,9
24)
5,0
32,5
42
2,12
9,20
0 29
,369
,324
(All
amou
nts i
n th
ousa
nds o
f Nai
ra u
nles
s oth
erw
ise
stat
ed)

62 | ANNUAL REPORT 2020 - AXA MANSARD
Year
end
ed D
ecem
ber 3
1, 2
019
PARE
NT
Sha
re
Capi
tal
Sha
re
prem
ium
Con
tinge
ncy
rese
rve
Cap
ital
rese
rves
Sha
re
sche
me
rese
rve
Tre
asur
y sh
ares
Fai
r va
lue
rese
rves
Ret
aine
d ea
rnin
gs T
otal
Bala
nce
at 1
Jan
uary
201
9 5
,250
,000
4
,443
,453
4
,139
,090
2
,500
,000
1
34,9
04
(304
,924
) (5
49,9
06)
1,1
55,2
16
16,
767,
833
Tota
l com
preh
ensiv
e in
com
e fo
r the
year
Profi
t for
the
year
- -
- -
- -
- 4
,839
,330
4
,839
,330
Tran
sfer
to c
ontin
genc
y re
serv
es -
- 1
31,3
68
- -
- -
(131
,368
) -
Oth
er co
mpr
ehen
sive
inco
me
Chan
ge in
fair
valu
e of
ava
ilabl
e-fo
r-sal
e fin
anci
al a
sset
s -
- -
- -
- 1
,473
,468
-
1,4
73,4
68
Tota
l com
preh
ensi
ve in
com
e fo
r the
yea
r -
- 1
31,3
68
- -
- 1
,473
,468
4
,707
,962
6
,312
,798
Tran
sact
ions
with
ow
ners
, rec
orde
d di
rect
ly in
equ
ity
Divi
dend
s to
equi
ty h
olde
rs
- -
- -
- -
- -
-
Equi
ty- s
ettle
d sh
are-
base
d ex
pens
e fo
r the
yea
r -
- -
- 1
7,17
3 -
- -
17,
173
Tota
l tra
nsac
tions
with
ow
ners
- -
- -
17,
173
- -
- 1
7,17
3
Bala
nce
at 3
1 De
cem
ber 2
019
5,2
50,0
00
4,4
43,4
53
4,2
70,4
58
2,5
00,0
00
152
,077
(3
04,9
24)
923
,562
5
,863
,179
2
3,09
7,80
5
2.6 STATEMENTS OF CHANGES IN EQUITY2 FINANCIALS

ANNUAL REPORT 2020 AXA MANSARD | 63
2
2.7 CASHFLOW STATEMENTFINANCIALS
Group Group Parent Parent Notes 31-Dec-2020 31-Dec-2019 31-Dec-2020 31-Dec-2019
Cash flows from operating activitiesCash premium received 39,959,626 36,806,834 21,243,986 22,388,423 Cash paid as reinsurance premium (15,613,694) (14,534,957) (15,396,646) (14,394,711)Fee income received 1,766,002 1,802,389 1,634,382 1,802,389 Cash received on investment contract liabilities 21.1 & 21.2 2,531,835 2,488,928 2,531,835 2,488,928 Cash paid to investment contract holders 21.1 & 21.2 (2,117,495) (1,475,651) (2,117,495) (1,475,651)Claims paid 32 (20,678,867) (19,067,180) (8,857,209) (8,574,020)Cash received from reinsurers on recoveries for claims paid 1,745,441 2,459,919 1,676,478 2,459,919 Cash paid to/ received from coinsurers on recoveries and claims paid 10.2a 460,273 491,052 460,273 491,052 Underwriting expenses paid (3,712,792) (3,597,249) (3,159,818) (3,128,922)Employee benefits paid (3,042,218) (2,803,332) (1,389,618) (1,271,140)Rent received 1,402,966 984,181 - - Other operating expenses paid (5,809,548) (4,955,804) (5,639,078) (4,392,932)Premium received in advance 22 1,909,064 6,384,351 1,909,064 6,384,351
Changes in working capital (1,199,407) 4,983,482 (7,103,845) 2,777,686
Income tax paid 24 (845,714) (477,448) (157,850) (193,906)
Net cash (used in)/ from operating activities (2,045,121) 4,506,034 (7,261,695) 2,583,780
Cash flows from investing activitiesPurchases of property, plant and equipment 18 (1,061,121) (555,723) (822,664) (436,108)Dividend received 18 601,901 1,007,621 395,911 1,778,020 Investment income received 2,574,906 3,923,513 2,596,158 3,298,565 Purchase of intangible assets 17 (159,629) (73,480) (150,868) (72,955)Proceeds from the disposal of property and equipment 51,958 8,192 65,167 8,172 Proceeds from the disposal of investment property 15 1,350,000 1,300,000 1,350,000 1,300,000 Proceeds from the disposal of investment in subsidiary 48 2,767,255 - 2,979,170 4,400,000 Purchase of fair value through profit or loss financial assets 9.1(a) (990,036) (9,391,714) (990,036) (9,391,714)Sale of fair value through profit or loss financial assets 9.1(a) 2,437,936 8,147,793 2,437,936 8,147,793 Sale of available-for-sale financial assets 9.2(c) 20,719,314 38,068,193 16,298,290 30,819,132 Purchase of available-for-sale financial assets 9.2(c) (19,132,363) (37,538,476) (16,207,784) (30,075,369)Increase in loans and receivables 14a &14d (123,224) (141,092) (658,912) (586,015)Repayment of loans and receivables 14a &14d 74,812 46,068 603,184 45,115
Net cash used in investing activities 9,111,709 4,800,895 7,895,552 9,234,635
Cash flows from financing activitiesExpenses on Bonus issue (326,020) - (326,020) - Dividend paid - - - - Interest & principal repayment on borrowings 25(b) (4,709,500) (783,915) - - Borrowed funds received 25(b) - 4,047,000 - - Net cash (used in)/ from financing activities (5,035,520) 3,263,085 (326,020) - Net increase/decrease in cash and cash equivalents 2,031,068 12,570,013 307,838 11,818,416 Cash and cash equivalent at beginning of year 8 17,911,416 5,238,705 16,133,274 4,218,348 Effect of exchange rate changes on cash and cash equivalent 309,235 102,698 134,836 96,510 Cash and cash equivalent at end of year 8 20,251,719 17,911,416 16,575,948 16,133,274
2.7 CASHFLOW STATEMENT FOR THE YEAR ENDED DECEMBER 31, 2020(All amounts in thousands of Naira unless otherwise stated)

64 | ANNUAL REPORT 2020 - AXA MANSARD
2.8 NOTES TO THE FINANCIAL STATEMENTS FOR THE YEAR ENDED DECEMBER 31, 2020
1 GENERAL INFORMATION
REPORTING ENTITYAXA Mansard Insurance Plc (‘the Company’ or ‘the parent’) and its subsidiaries (together ‘the Group’) underwrite life and non-life insurance contracts. The Group also issues a diversified portfolio of investment contracts to provide its customers with asset management solutions for their savings and retirement needs. All these products are offered to both domestic and foreign markets. The Group does business in Nigeria and employs about 282 people.
The Company is a public limited company incorporated and domiciled in Nigeria. The address of its registered office is at ‘Santa Clara Court, Plot 1412, Ahmadu Bello Way Victoria Island, Lagos, Nigeria. The Company is listed on the Nigerian Stock Exchange.
2 SUMMARY OF SIGNIFICANT ACCOUNTING POLICIES
2.1 BASIS OF PRESENTATION AND COMPLIANCE WITH IFRS
These financial statements have been prepared in accordance with International Financial Reporting Standards (IFRS) and IFRS Interpretations Committee (IFRIC) Interpretations applicable to companies reporting under IFRS. These financial statements are also in compliance with the Financial Reporting Council of Nigeria Act 2011, the Companies and Allied Matters Act (CAMA) 2020, the Insurance Act of Nigeria 2003 and relevant National Insurance Commission (NAICOM) guidelines and circulars.
(a) Basis of MeasurementThese consolidated and separate financial statements have been prepared on the historical cost basis except for the following
� non-derivative financial instruments designated at fair value through profit or loss.
� available-for-sale financial assets are measured at fair value.
� investment property is measured at fair value.
� insurance liabilities measured at present value of future cashflows.
� lease liabilities measured at present value of future cashflows.
� share based payment at fair value or an approximation of fair value allowed by the relevant standards
� investment contract liabilities at fair value.
(b) Use of estimates and judgementsThe preparation of the consolidated and separate financial statements in conformity with IFRSs requires management to make judgements, estimates and assumptions that affect the application of policies and reported amounts of assets and liabilities, income and expenses. Actual results may differ from these estimates.
Information about significant areas of estimation uncertainties
and critical judgements in applying accounting policies that have the most significant effect on the amounts recognised in the consolidated and separate financial statements are described in note 2.3.
2.1.1 CHANGES IN ACCOUNTING POLICY AND DISCLOSURES
(a) Standards and Interpretations Effective During the Reporting Year
Amendments to the following standard became effective in the annual period starting from 1st January, 2020. The new reporting requirements as a result of the amendments and/or clarifications have been evaluated and their impact or otherwise are noted below:
Definition of Material - Amendments to IAS 1 and IAS 8 The IASB has made amendments to IAS 1 Presentation of Financial Statements and IAS 8 Accounting Policies, Changes in Accounting Estimates and Errors which use a consistent definition of materiality throughout International Financial Reporting Standards and the Conceptual Framework for Financial Reporting, clarify when information is material and incorporate some of the guidance in IAS 1 about immaterial information. In particular, the amendments clarify:
� that the reference to obscuring information addresses situations in which the effect is similar to omitting or misstating that information, and that an entity assesses materiality in the context of the financial statements as a whole, and;
� the meaning of primary users of general purpose financial statements to whom those financial statements are directed, by defining them as ‘existing and potential investors, lenders and other creditors’ that must rely on general purpose financial statements for much of the financial information they need.”
Revised Conceptual Framework for Financial Reporting (effective 1 January 2020)
The IASB has issued a revised Conceptual Framework which will be used in standard-setting decisions with immediate effect. Key changes include:
� increasing the prominence of stewardship in the objective of financial reporting
� reinstating prudence as a component of neutrality
� defining a reporting entity, which may be a legal entity, or a portion of an entity
� revising the definitions of an asset and a liability
� removing the probability threshold for recognition and adding guidance on derecognition
� adding guidance on different measurement basis, and
� stating that profit or loss is the primary performance indicator and that, in principle, income and expenses in
2 2.8 NOTES TO THE FINANCIAL STATEMENTSFINANCIALS

ANNUAL REPORT 2020 AXA MANSARD | 65
2
2.8 NOTES TO THE FINANCIAL STATEMENTSFINANCIALS
other comprehensive income should be recycled where this enhances the relevance or faithful representation of the financial statements.
No changes will be made to any of the current accounting standards. However, entities that rely on the Framework in determining their accounting policies for transactions, events or conditions that are not otherwise dealt with under the accounting standards will need to apply the revised Framework from 1 January 2020. These entities will need to consider whether their accounting policies are still appropriate under the revised Framework.
A number of other new standards are also effective from 1 January 2020 but these have not been disclosed as they do not have significant effects on the Group’s financial statements. They are:
� Definition of a Business (Amendments to IFRS 3)
� Interest Rate Benchmark Reform (Amendments to IFRS 9, IAS 39 and IFRS 7)
� Covid-19-Related Rent Concessions – Amendment to IFRS 16
(b) Standards Not Yet Effective The following amended standards and interpretations are not expected to have a significant impact on the Group’s financial statements:
� Sale or Contribution of Assets between an Investor and its Associate or Joint Venture (Amendments to IFRS 10 and IAS 28)
� Classification of Liabilities as Current or Noncurrent - Amendments to IAS 1
� Interest Rate Benchmark Reform – Phase 2 – Amendments to IFRS 9, IAS 39, IFRS 7, IFRS 4 and IFRS 16
� Reference to the Conceptual Framework – Amendments to IFRS 3
� Property, Plant and Equipment: Proceeds before Intended Use
� Amendments to IAS 16
(b) New and Amended Standards and Interpretations Not Yet Adopted by the Group
A number of standards, interpretations and amendments are effective for annual period beginning on or after 1 January 2020 and earlier application is permitted; however, the group has not early adopted the following new or amended standards in preparing these consolidated and separate financial statements as it plans to adopt these standards at their respective effective dates:
New or amended standards Summary of the requirements Possible impact on Consolidated financial statements
IFRS 9: Financial instruments IFRS 9, released in July 2014, replaces the existing guidance in IAS 39 Financial instruments: Recognition and measurement. IFRS 9 includes revised guidance on the reclassification and measurement of financial instruments, a new expected credit loss model for calculating impairment on financial assets and new general hedge accounting requirements. It also carries forward the guidance on recognition and derecognition of financial instruments from IAS 39. IFRS 9 is effective for annual reporting periods beginning on or after 1 January 2018 with early adoption permitted.
The Group will adopt IFRS 9 ‐ Financial Instruments from 1 January 2023. The estimated impact of the adoption of the standard on the Group’s equity as at 1 January 2023 is based on the assessments summarised below. The actual impact of adopting the standard at 1 January 2023 are subject to change until the Group presents its first financial statement that includes the date of initial application.
Classification and measurementThe Group currently categorizes the majority of its financial assets as available for sale with the fair value changes recognised in other comprehensive income. Under IFRS 9, the Group has designated these investments as measured at fair value through OCI. Consequently, all fair value gains and losses will be reported in OCI, no impairment losses will be recognised in profit or loss and no gains or losses will be reclassified to profit or loss on disposal..
Based on its assessment, the Group does not believe that the new classification requirements will have a material impact on its accounting for Trade receivables, loans, investment in debt securities and investments in equity securities that are managed on a fair value basis.
The above intended classification may change due to the continuous assessment of the requirement of the standard and review of business practices until the first set of financial statement under IFRS 9 is issued.
Impairment:The Group believes that impairment losses are likely to increase for assets in the scope of IFRS 9 impairment model, although they are not expected to be highly volatile.
The approach to impairment assessment under IFRS 9 will be determined by the final classification adopted in 2023.

66 | ANNUAL REPORT 2020 - AXA MANSARD
2 2.8 NOTES TO THE FINANCIAL STATEMENTSFINANCIALS
New or amended standards Summary of the requirements Possible impact on Consolidated financial statements
Prepayment Features with Negative Compensation (Amendments to IFRS 9)
This amendment was published to address the concerns about how IFRS 9 ‘Financial Instruments’ classifies particular prepayable financial assets. In addition, the IASB clarifies an aspect of the accounting for financial liabilities following a modification.The amendments are to be applied retrospectively for fiscal years beginning on or after 1 January 2019, i. e. one year after the first application of IFRS 9 in its current version. Early application is permitted so entities can apply the amendments together with IFRS 9 if they wish so.
The Group will adopt the amendment alomg with the effective date of IFRS 9 (2023) at the earliest.
The impact of the adoption of this amendment on the Group is being assessed.
IFRS 17: Insurance Contracts IFRS 17 was issued in May 2017 as replacement for IFRS 4 Insurance Contracts. It requires a current measurement model where estimates are re-measured each reporting period.The standard allows a choice between recognising changes in discount rates either in the statement of profit or loss or directly in other comprehensive income. The choice is likely to reflect how insurers account for their financial assets under IFRS 9.An optional, simplified premium allocation approach is permitted for the liability for the remaining coverage for short duration contracts, which are often written by non-life insurers.There is a modification of the general measurement model called the ‘variable fee approach’ for certain contracts written by life insurers where policyholders share in the returns from underlying items. The results of insurers using this model are therefore likely to be less volatile than under the general model.
The Group is assessing the potential impact of the new standard which will be effective for annual reporting periods beginning on or after 1 January 2023.
Amendments to IFRS 4: Applying IFRS 9 financial instruments with IFRS 4 insurance contractsIn September 2016, the IASB published an amendment to IFRS 4 which addresses the concerns of insurance companies about the different effective dates of IFRS 9 Financial instruments and the forthcoming new insurance contracts standard; IFRS 17. The amendment provides two different solutions for insurance companies: a temporary exemption from IFRS 9 (i.e. the ‘deferral approach’) for entities that meet specific requirements (applied at the reporting entity level), and the ‘overlay approach’. Both approaches are optional. Effective date is 1 January 2018 or when the entity first applies IFRS 9.
IFRS 4 (including the amendments) will be superseded by the forthcoming new insurance contracts standard. Accordingly, both the temporary exemption and the ‘overlay approach’ are expected to cease to be applicable when the new insurance standards becomes effective.
The Group is eligible to apply IFRS 9 deferral approach since IFRS 9 has not been previously applied by the Group and the activities of the Group are predominantly connected with insurance. To determine if the Group’s activities are predominantly connected with insurance, the Group assessed the ratio of the it’s liabilities connected with insurance - including investment contracts measured at fair value through profit or loss (FVTPL) - compared with it’s total liability. See assessment below:

ANNUAL REPORT 2020 AXA MANSARD | 67
2
2.8 NOTES TO THE FINANCIAL STATEMENTSFINANCIALS
AS REPORTED (A)ADMISSIBLE FOR
PREDOMINANCE TEST (B) AS REPORTED (A)ADMISSIBLE FOR
PREDOMINANCE TEST (B)
Group Group Parent Parent
LIABILITIES 31-Dec-15 31-Dec-15 31-Dec-15 31-Dec-15
Trade payables 1,641,069 1,641,069 1,639,272 1,639,272
Current income tax liab. 202,654 202,654 144,206 144,206
Insurance liabilities 12,916,775 12,916,775 12,293,840 12,293,840
Investment contract liabilities:
- At amortised cost 2,656,066 2,656,066 2,656,066 2,656,066
- Financial liabilities designated at fair value 7,657,492 7,657,492 4,130,895 4,130,895
Other liabilities:
- Deferred income 970,349 453,696 453,696 453,696
- Premium received in advance 559,165 559,165 559,165 559,165
- Due to investment brokers 11,479 - 11,409 -
- Creditors and accruals 570,138 - 421,229 -
- Unclaimed dividend 65,049 - 65,049 -
- Cash settled share based payment liability 22,725 - 22,725 -
Borrowings 4,028,230 - - -
Deferred tax liability 286,941 - - -
31,588,132 26,086,917 22,397,552 21,877,140
Score = (B/A)% 82.6% 97.7%
Given a score of 82.6% for the Group (Parent: 97.7%), an assessment was carried out to determine whether the Group engages in a significant activity unconnected with insurance. Based on the assessment, it was concluded that the Group does not engage in a significant activity unconnected with insurance since majority of the activities from which the Group earns income and incur expenses are insurance-related.
The Group has elected to apply the temporary exemption of IFRS 9 (deferral approach) and qualifies for the temporary exemption based on the following;
a) Its activities are predominantly connected with insurance contracts;
b) As at 31 December 2015, which is the reporting date that immediately precedes 1 April 2016, the carrying amount of
its liabilities arising from insurance contracts was N26.09b (Parent: N21.88b) which was 82.6% (Parent: 97.7%) of the total carrying amount of all its liabilities as at that date.
c) The company’s activities have remained the same and are predominantly connected with insurance contracts. The majority of the activities from which the Group earns income and incur expenses are insurance-related
Fair value disclosuresa) Financial assets with contractual terms that give rise to cash
flows that are solely payments of principal and interest (SPPI)
The Group financial assets with contractual terms that give rise to cash flows that are solely payments of principal and interest on the principal amount outstanding are as follows:
GROUPLoan and
receivables
Other financial instruments at amortised cost
Carrying amount Fair value
31 Dec 2020
Cash and cash equivalent 20,251,719 - 20,251,719 20,251,719
Loans and receivables 470,272 - 470,272 470,272
Trade receivables 6,668,899 - 6,668,899 6,668,899
Reinsurance assets (less prepaid reinsurance, IBNR & Reserves) 2,404,819 - 2,404,819 2,404,819
Other receivables (less prepayment) 819,323 - 819,323 819,323
Statutory deposit - 500,000 500,000 500,000
30,615,032 500,000 58,735,275 58,735,275

68 | ANNUAL REPORT 2020 - AXA MANSARD
2 2.8 NOTES TO THE FINANCIAL STATEMENTSFINANCIALS
PARENTLoan and
receivables
Other financial instruments at amortised cost
Carrying amount Fair value
31 Dec 2020
Cash and cash equivalent 16,575,948 - 16,575,948 16,575,948
Loans and receivables 5,153,521 - 5,153,521 5,153,521
Trade receivables 1,043,004 - 1,043,004 1,043,004
Reinsurance assets (less prepaid reinsurance, IBNR & Reserves) 2,384,292 - 2,384,292 2,384,292
Other receivables (less prepayment) 478,179 - 478,179 478,179
Statutory deposit - 500,000 500,000 500,000
25,634,944 500,000 52,446,159 52,446,159
The carrying amount of the assets above are a fair reflection of the fair values as at year end.
The credit risk rating grades of these financial assets have been disclosed in note 4.3.1 of this financial statements.
2.2 SIGNIFICANT ACCOUNTING POLICIESThe group has consistently applied the following accounting policies to all periods presented in these consolidated financial statements.
(a) ConsolidationIFRS 10 defines the principle of control and establishes control as the basis for determining which entities are consolidated in the group financial statements.
The Group controls an investee entity when it is exposed, or has rights, to variable returns from its involvement with the investee entity and has the ability to affect those returns through its power over the investee entity. The Group applies the following three elements of control as set out by the principle of control in IFRS 10 when assessing control of an investee:
(a) power over the investee entity;(b) exposure, or rights, to variable returns from involvement
with the investee entity; and(c) the ability to use power over the investee to affect the
amount of the investor’s returns.
(b) Consolidated Entities (i) Subsidiaries Subsidiaries are all entities over which the group exercises
control.
The financial statements of subsidiaries are consolidated from the date the Group acquires control, up to the date that such effective control ceases.
In the separate financial statements, investments in subsidiaries are measured at cost.
(ii) Transactions eliminated on consolidation Inter-company transactions, balances and unrealised
gains on transactions between companies within the Group are eliminated on consolidation. Unrealised losses are also eliminated in the same manner as unrealised gains, but only to the extent that there is no evidence of impairment. Accounting policies of subsidiaries have been changed where necessary to ensure consistency
with the policies adopted by the Group.
Investment in subsidiaries in the separate financial statement of the parent entity is measured at cost less impairment.
(iii) Business combinations The Group applies the acquistion method to account for
Business Combinations and acquisition-related costs are expensed as incurred.
The consideration transferred in the acquisition is generally measured at fair value as are the identifiable net assets acquired.
If the business combination is achieved in stages, fair value of the acquirer’s previously held equity interest in the acquiree is re-measured to fair value at the acquisition date through profit or loss.
Any contingent consideration to be transferred by the Group is recognised at fair value at the acquisition date. Subsequent changes to the fair value of the contingent consideration that is deemed to be an asset or liability is recognised in compliance with IAS 39 either in profit or loss or as a change to other comprehensive income. Contingent consideration that is classified as equity is not re-measured, and its subsequent settlement is accounted for within equity.
Goodwill is initially measured as the excess of the aggregate of the consideration transferred and the fair value of non- controlling interest over the net identifiable assets acquired and liabilities assumed. If this consideration is lower than the fair value of the net assets of the subsidiary acquired, the difference is recognised in profit or loss.
Business combination under common control A business combination involving entities or businesses
under common control is a business combination in which all of the combining entities or businesses are ultimately controlled by the same party of parties before and after the combination, and control is not transitory.
In the separate financial statements of the acquirer and the transferring entity, a business combination under control is accounted for using the exchange amount. In the consolidated financial statements of the acquirer, a business combination under common control is accounted for using book value accounting on the basis that the investment acquired has simply been moved

ANNUAL REPORT 2020 AXA MANSARD | 69
2
from one part of the Group to another. The book value of the entity transferred is used. Any difference between the consideration paid and the capital of the acquire is recognized in equity in the consolidated financial statements of the acquirer.
(iv) Non- controlling interests Non-controlling Interest (NCI) are measured initially at
their proportionate share of the acquiree’s identifiable net assets at the acquisition date.
(v) Changes in ownership interests in subsidiaries without change in control
Transactions with non-controlling interests that do not result in loss of control are accounted for as equity transactions – that is, as transactions with the owners in their capacity as owners. The difference between fair value of any consideration paid and the relevant share acquired of the carrying value of net assets of the subsidiary is recorded in equity between retained earnings and Non controlling interests. Gains or losses on disposals to non-controlling interests are also recorded in equity.
(vi) Disposal of subsidiaries When the Group ceases to have control, any retained
interest in the entity is re-measured to its fair value at the date when control is lost, with the change in carrying amount recognised in profit or loss. The fair value is the initial carrying amount for the purposes of subsequently accounting for the retained interest as an associate, joint venture or financial asset. In addition, any amounts previously recognised in other comprehensive income in respect of that entity are accounted for as if the Group had directly disposed of the related assets or liabilities. This may mean that amounts previously recognised in other comprehensive income are reclassified to profit or loss. The Group derecognises the assets and liabilities of the subsidiary, and any related non-controlling interests and other components of equity.
Business combination under common control A business combination involving entities or businesses
under common control is a business combination in which all of the combining entities or businesses are ultimately controlled by the same party of parties before and after the combination, and control is not transitory.
In the separate financial statements of the acquirer and the transferring entity, a business combination under control is accounted for using the exchange amount. In the consolidated financial statements of the acquirer, a business combination under common control is accounted for using book value accounting on the basis that the investment acquired has simply been moved from one part of the Group to another. The book value of the entity transferred is used. Any difference between the consideration paid and the capital of the acquire is recognized in equity in the consolidated financial statements of the acquirer.
(c) Segment ReportingAn operating segment is a component of the Group that engages in business activities from which it can earn revenues and incur expenses, including revenues and expenses that relate to transactions with any of the Group’s other components, whose operating results are reviewed regularly by the Chief Operating Decision Maker to make decisions about resources allocated to each segment and assess its performance, and for which discrete financial information is available.
Operating segments are reported in a manner consistent with the internal reporting provided to the chief operating decision maker. The chief operating decision maker, which is responsible for allocating resources and assessing performance of the operating segments, has been identified as the Management Underwriting and Investment Committee (MUIC) that makes strategic decisions.
(d) Foreign Currency Translation (i) Functional and presentation currency Items included in the financial statements of each of
the Group’s entities are measured using the currency of the primary economic environment in which the entity operates (the ‘functional currency’). The consolidated financial statements are presented in thousands of Naira (NGN) which is the Group’s presentation currency.
(ii) Transactions and balances Foreign currency transactions are translated into the
functional currency using the exchange rates prevailing at the dates of the transactions. Foreign exchange gains and losses resulting from the settlement of such transactions and from the translation at period-end exchange rates of monetary assets and liabilities denominated in foreign currencies are recognised in profit or loss.
Monetary items denominated in foreign currency are translated using the closing rate as at the reporting date. Non-monetary items measured at historical cost denominated in a foreign currency are translated with the exchange rate as at the date of initial recognition; non monetary items (e.g. investment property) in a foreign currency that are measured at fair value are translated using the closing rate as at the date when the fair value was determined.
Foreign exchange gains and losses are presented in profit or loss within ‘Net losses/gains on financial instruments’.
In the case of changes in the fair value of monetary assets denominated in foreign currency and classified as available-for-sale, a distinction is made between translation differences resulting from changes in amortised cost of the security and other changes in the carrying amount of the security. Translation differences on non-monetary financial assets and liabilities such as equities measured at fair value through profit and loss are recognised in profit or loss as part of net gain/loss on financial assets. Translation differences on non-monetary financial assets such as equities classified as available for sale are included in other comprehensive income.
2.8 NOTES TO THE FINANCIAL STATEMENTSFINANCIALS

70 | ANNUAL REPORT 2020 - AXA MANSARD
(iii) Group companies The results and financial position of all the group entities
(none of which has the currency of a hyper-inflationary economy) that have a functional currency different from the presentation currency are translated into the presentation currency as follows:
� Assets and liabilities for each statement of financial position presented are translated at the closing rate on the reporting date;
� income and expenses for each income statement are translated at average exchange rates (unless this average is not a reasonable approximation of the cumulative effect of the rates prevailing on the transaction dates, in which case income and expenses are translated at the rate on the dates of the transactions); and
� all resulting exchange differences are recognised in other comprehensive income.
(e) Financial Assets Recognition and measurement of financial assets The Group initially recognises loans and receivables on the
date on which they are originated. Regular-way purchases and sales of financial assets are recognised on trade-date which is the date on which the Group becomes a party to the contractual provisions of the instrument.
Financial assets are initially recognised at fair value, plus transaction costs that are directly attributable to its acquisition or issue (for all financial assets not initially recognised at fair value through profit or loss). Financial assets carried at fair value through profit or loss are initially recognised at fair value, and transaction costs are expensed in profit or loss.
Available-for-sale financial assets and financial assets at fair value through profit or loss are subsequently carried at fair value. Loans and receivables and held-to- maturity financial assets are carried at amortised cost using the effective interest method.
Initial recognition of pledged assets is at fair value, whilst subsequent measurement is based on the classification and measurement of the financial asset in accordance with IAS 39.
Gains and losses arising from changes in the fair value of the ‘financial assets at fair value through profit or loss’ category are included in profit or loss in the period in which they arise. Dividend income from financial assets at fair value through profit or loss is recognised in profit or loss as part of other income when the Group’s right to receive payments is established.
Changes in the fair value of monetary and non-monetary securities classified as available for sale are recognised in other comprehensive income.
When securities classified as available-for-sale are sold or impaired, the accumulated fair value adjustments recognised in other comprehensive income are included in profit or loss as net realised gains on financial assets.
Interest on available-for-sale securities calculated using the effective interest method is recognised in profit or loss.
Dividends on available-for-sale equity instruments are recognised in profit or loss when the Group’s right to receive payments is established. Interest and dividend on available for sale securities are included in the investment income line.
Classification of financial assets Financial assets are classified into the following categories:
held for trading, loans and receivables, held-to-maturity and available-for-sale. The classification by the Group is determined by management at initial recognition and depends on the intention for which the investments were acquired.
(i) Financial assets at fair value through profit or loss
Held for trading A financial asset is classified into the held for trading
category if acquired principally for the purpose of selling in the short term, if it forms part of a portfolio of financial assets in which there is evidence of short-term profit-taking.
Financial assets designated at fair value through profit or loss upon initial recognition
Other financial assets designated as at fair value through profit or loss at initial recognition are those that are:
� Separate assets held to match insurance and investment contracts liabilities that are linked to the changes in fair value of these assets. The designation of these assets to be at fair value through profit or loss eliminates or significantly reduces a measurement or recognit ion inconsistency (sometimes referred to as ‘an accounting mismatch’) that would otherwise arise from measuring assets or liabilities or recognising the gains and losses on them on different bases; and
� Managed and whose performance is evaluated on a fair value basis. Information about these financial assets is provided internally on a fair value basis to the Group’s key management personnel. The Group’s investment strategy is to invest in equity and debt securities and to evaluate them with reference to their fair values. Assets that are part of these portfolios are designated upon initial recognition at fair value through profit or loss.
(ii) Loans and receivables Loans and receivables are non-derivative financial
assets with fixed or determinable payments that are not quoted in an active market other than:
� those that the Group intends to sell in the short term which are declassified as fair value through profit or loss and those that the group upon initial recognition designates as fair value through profit or loss.
� those that the Group upon initial recognition designates as Available for Sale
� those for which the holder may not recover substantially all of its initial loans and receivables other than because of credit risk. Loans and
2 2.8 NOTES TO THE FINANCIAL STATEMENTSFINANCIALS

ANNUAL REPORT 2020 AXA MANSARD | 71
2
receivables include trade receivables, reinsurance assets and other receivables (financial assets).
Trade receivables These are non-derivative financial assets with fixed
determinable payments that are not quoted in an active market. After initial recognition, they are measured at amortised cost using the effective interest method less impairment. Discounting is omitted where the effect of discounting is immaterial. Trade receivables are made up of premium receivables and coinsurance receivables.
� Premium receivables relate to receivables from agents, brokers and insurance companies in respect of premium income.
� Coinsurance recoverables relate to only claims recoverables from coinsurers for claims settled to policy holders on behalf of coinsurers based on agreed terms.
Reinsurance assets The Company cedes businesses to reinsurers in the
normal course of business for the purpose of limiting its net loss potential through the transfer of risks. Reinsurance arrangements do not relieve the Company from its direct obligations to its policyholders. Reinsurance assets are measured at amortised costs. Reinsurance assets relate to prepaid reinsurance, reinsurers’ share of IBNR claims and claims recoverables.
Other receivables Other receivables are made up of other amounts due
from parties which are not directly linked to insurance or investment contracts. These are measured at amortised costs. Discounting is omitted where the effect of discounting is immaterial.
(iii) Held-to-maturity financial assets Held-to-maturity investments are non-derivative financial
assets with fixed or determinable payments and fixed maturities that the Group’s management has the positive intention and ability to hold to maturity, other than
� those that the Group upon initial recognition designates as at fair value through profit or loss
� those that the Group designates as available-for-sale; and
� those that meet the definition of loans and receivables.
Interest income on held-to-maturity investments are included in the consolidated profit or loss and are reported as interest income. In the case of an impairment, it is reported as a deduction from the carrying value of the investment and recognised in the consolidated profit or loss as ‘Net gains/(losses) on financial assets’. Held-to-maturity investments are largely bonds.
(iv) Available-for-sale financial assets Available-for-sale investments are financial assets that
are intended to be held for an indefinite period of time, which may be sold in response to needs for liquidity or changes in interest rates, exchange rates or equity prices
or that are not classified as loans and receivables, held-to-maturity investments or fair value through profit or loss.
Determination of fair value of financial assets For financial instruments traded in active markets, the
determination of fair values of financial assets and financial liabilities is based on the market approach (transaction price paid for an identical or a similar instrument). This includes listed equity securities and quoted debt instruments on major exchanges.
A financial instrument is regarded as quoted in an active market if quoted prices are readily and regularly available from an exchange, dealer, broker, industry group, pricing service or regulatory agency, and those prices represent actual and regularly occurring market transactions on an arm’s length basis. If the above criteria are not met, the market is regarded as being inactive. For example, a market is inactive when there is a wide bid-offer spread or significant increase in the bid-offer spread or there are few recent transactions.
For all other financial instruments, fair value is determined using valuation techniques. In these techniques, fair values are estimated from observable data in respect of similar financial instruments, using models to estimate the present value of expected future cash flows or other valuation techniques, using inputs (for example, NIBOR yield curve, foreign exchange rates, volatilities and counterparty spreads) existing at the reporting date.
For more complex instruments the Group uses internally developed models which are usually based on valuation models and techniques generally recognised as standard within the industry. Valuation models are used primarily to value unlisted debt securities for which markets were or have become illiquid. Some of the inputs to these models may not be market observable and therefore estimated based on assumptions. The impact of financial instruments valuation reflecting non-market observable inputs (Level 3 valuations) is disclosed in the note to the financial statements.
Reclassification of financial assets Financial assets other than loans and receivables are
permitted to be reclassified out of the held-for-trading category only in rare circumstances arising from a single event that is unusual and highly unlikely to recur in the near-term. In addition, the Group may choose to reclassify financial assets that would meet the definition of loans and receivables out of the held-for-trading or available-for-sale categories if the Group has the intention and ability to hold these financial assets for the foreseeable future or until maturity at the date of reclassification.
Financial assets classified as held to maturity can be reclassfied as available for sale assets. In making this reclassification, the entire portfolio becomes tainted and the group cannot designate any instrument as held to maturity for the next two years after a sale or reclassification. Fair values changes upon tainting of the HTM portfolio are recognised in Other Comprehensive income prospectively.
2.8 NOTES TO THE FINANCIAL STATEMENTSFINANCIALS

72 | ANNUAL REPORT 2020 - AXA MANSARD
Reclassifications are made at fair value as of the reclassification date. Fair value becomes the new cost or amortised cost as applicable, and no reversals of fair value gains or losses recorded before reclassification date are subsequently made. Effective interest rates for financial assets reclassified to loans and receivables and held-to-maturity categories are determined at the reclassification date. Further increases in estimates of cash flows adjust effective interest rates prospectively.
Impairment of financial assets
(a) Financial assets carried at amortised cost The Group assesses at each end of the reporting period
whether there is objective evidence that a financial asset or group of financial assets is impaired. A financial asset or group of financial assets is impaired and impairment losses are incurred only if there is objective evidence of impairment as a result of one or more events that have occurred after the initial recognition of the asset (a ‘loss event’) and that loss event (or events) has an impact on the estimated future cash flows of the financial asset or group of financial assets that can be reliably estimated. Objective evidence that a financial asset or group of assets is impaired includes observable data that comes to the attention of the Group about the following events:
� Trade receivables are outstanding for more than 30 days
� Reinsurance recoverable outstanding more than 90 days
� Significant financial difficulty of the issuer or debtor;
� A breach of contract, such as a default or delinquency in payments;
� It becoming probable that the issuer or debtor will enter bankruptcy or other financial re-organisation;
� The disappearance of an active market for that financial asset because of financial difficulties; or
� Observable data indicating that there is a measurable decrease in the estimated future cash flow from a group of financial assets since the initial recognition of those assets, although the decrease cannot yet be identified with the individual financial assets in the Group.
The Group first assesses whether objective evidence of impairment exists for financial assets that are individually significant. If the Group determines that no objective evidence of impairment exists for an individually assessed financial asset, whether significant or not, it includes the asset in a group of financial assets with similar credit risk characteristics and collectively assesses them for impairment. Assets that are individually assessed for impairment and for which an impairment loss is or continues to be recognised are not included in a collective assessment of impairment.
If there is objective evidence that an impairment loss has been incurred on loans and receivables or held-
to-maturity investments carried at amortised cost, the amount of the loss is measured as the difference between the asset’s carrying amount and the present value of estimated future cash flows (excluding future credit losses that have been incurred) discounted at the financial asset’s original effective interest rate. The carrying amount of the asset is reduced through the use of an allowance account, and the amount of the loss is recognised in profit or loss. If a held-to- maturity investment or a loan has a variable interest rate, the discount rate for measuring any impairment loss is the current effective interest rate determined under contract. The Group may measure impairment on the basis of an instrument’s fair value using an observable market price.
If in a subsequent period, the amount of the impairment loss decreases and the decrease can be related objectively to an event occurring after the impairment was recognised (such as improved credit rating), the previously recognised impairment loss is reversed by adjusting the allowance account. The amount of the reversal is recognised in profit or loss.
The discount rate is the yield at the reporting date on government bonds that have maturity dates approximating the terms of the Group’s obligations and that are denominated in the same currency in which the benefits are expected to be paid.
When the financial asset at amortised cost is uncollectible, it is written off against the related allowance for impairment. Such loans are written off after all the necessary procedures have been completed and the amount of the loss has been determined. Impairment charges relating to Investment securities are classified as net gains/loss of financial assets while those on receivables are classified as operating expenses.
Assets that are subject to amortisation are reviewed for impairment whenever events or changes in circumstances indicate that the carrying amount may not be recoverable. An impairment loss is recognised for the amount by which the asset’s carrying amount exceeds its recoverable amount.
(b) Assets classified as available for sale The Group assesses at each reporting date whether
there is objective evidence that a financial asset or a group of financial assets is impaired. In the case of equity investments classified as available-for-sale, a significant or prolonged decline in the fair value of the security below its cost is an objective evidence of impairment resulting in the recognition of an impairment loss. In this respect, a period of 12 months or longer is considered to be prolonged. If any such quantitative evidence exists for available-for-sale financial assets, the asset is considered for impairment, taking qualitative evidence into account. The cumulative loss measured as: the difference between the acquisition cost and the current fair value, less any impairment loss on that financial asset previously recognised in profit or loss is removed from equity and recognised in the consolidated profit or loss. Impairment losses recognised in the
2 2.8 NOTES TO THE FINANCIAL STATEMENTSFINANCIALS

ANNUAL REPORT 2020 AXA MANSARD | 73
2
consolidated profit or loss on equity instruments are not reversed through the consolidated profit or loss.
If in a subsequent period the fair value of a debt instrument classified as available for sale increases and the increase can be objectively related to an event occurring after the impairment loss was recognised in profit or loss, the impairment loss is reversed through the consolidated profit or loss.
Derecognition of financial assets A financial asset is derecognised if either the entity has
transferred contractual rights to receive cash flows from the asset or if the entity has retained the contractual rights to receive the cash flows from the asset but has assumed a contractual obligation to pass on the cash flows under an arrangement that meets the conditions stated below:
� the entity has no obligation to pay amounts to the eventual recipient unless it collects equivalent amounts on the original asset
� the entity is prohibited from selling or pledging the original asset other than as security to the eventual recipient
� the entity has an obligation to remit those cash flows without material delay
A financial liability shall be derecognised when the obligation specified in the contract is either discharged, cancelled or expired.
Offsetting financial instruments Financial assets and liabilities are offset and the net
amount reported in the statement of financial position only when there is a legally enforceable right to offset the recognised amounts and there is an intention to settle on a net basis, or to realise the asset and settle the liability simultaneously.
(f) Investment Property Property held for rental yields and capital appreciation that
is not occupied by the companies in the Group is classified as investment property. Investment property comprises freehold land and building.
Investment properties are measured initially at cost, including transaction costs. The carrying amount includes the cost of replacing part of an existing investment property at the time that cost is incurred if the recognition criteria are met; and excludes the costs of day-to-day servicing of an investment property. Subsequently, it is carried at fair value, adjusted if necessary, for any difference in the nature, location or condition of the specific asset. If this information is not available, the Group uses alternative valuation methods such as discounted cash flow projections or recent prices in less active markets. These valuations are reviewed annually by an independent valuation expert.
Changes in fair values are recorded in profit or loss. Property located on land that is held under a lease is classified as investment property as long as it is held for long-term rental yields and is not occupied by the companies in the
consolidated Group. The initial cost of the property shall be the fair value (where available). When not available the initial cost shall be used. The property is carried at fair value after initial recognition.
Investment properties are derecognized either when they have been disposed of, or when the investment property is permanently withdrawn from use and no future economic benefit is expected from its disposal.
Properties could have dual purposes whereby part of the property is used for own activities. The portion of a dual use property is classified as an investment property only if it could be sold or leased out separately under a finance lease or if the portion occupied by the owner is immaterial to the total lettable space. Currently, the group occupies less than 10% of the lettable space (264sqm out of 6,902sqm). The portion of the investment property occupied by the owner is considered immaterial to the total lettable space and to the value of the investment property.
(g) Intangible Assets Intangible assets represents cost associated with the acquisition
of software and inherent goodwill on business combination.
(i) Computer software Software acquired by the Group is measured at cost
less accumulated amortization and any accumulated impairment losses.
Costs associated with maintaining computer software programmes are recognised as an expense when incurred.
Development costs that are directly attributable to the design and testing of identifiable and unique software products controlled by the Group are recognised as intangible assets when the following criteria are met:
� It is technically feasible to complete the software product so that it will be available for use;
� Management intends to complete the software product and use or sell it;
� There is an ability to use or sell the software product;
� It can be demonstrated how the software product will generate probable future economic benefits;
� Adequate technical, financial and other resources to complete the development and to use or sell the software product are available; and
� The expenditure attributable to the software product during its development can be reliably measured.
Directly attributable costs that are capitalised as part of the software product include the software development employee costs, capitalised borrowing costs and an appropriate portion of directly attributable overheads. Internally developed software is stated at capitalized cost less accumulated amortization and any accumulated impairment losses.
Other development expenditures that do not meet these criteria are recognised as an expense when incurred. Development costs previously recognised as an expense
2.8 NOTES TO THE FINANCIAL STATEMENTSFINANCIALS

74 | ANNUAL REPORT 2020 - AXA MANSARD
are not recognised as an asset in a subsequent period. Subsequent expenditure on software assets is capitalised only when it increases the future economic benefits embodied in the specific assets to which it relates.
Computer software development costs recognised as assets are amortised over their useful lives, which does not exceed five years. The residual values and useful lives are reviewed at the end of each reporting period and are adjusted as appropriate.
Subsequent expenditure is capitalized only when it increases the future economic benefits embodied in the specific assets to which it relates. Amortization is calculated to write off the cost of intangible assets less their estimated residual values using the straight line method over their useful lives, and is generally recognised in profit or loss. Amortisation methods, usefiul lives and residual values are reviewed at each reporting date and adjusted if appropriate.
(ii) Goodwill Goodwill arises on the acquistion of subsidiaries and
represents the excess of the consideration transferred over the Group’s interest in the fair value of the net identifiable assets, liabilities and contingent liabilities of the acquiree and the fair value of the non-controlling interest in the acquiree. Subsequent to initial recognition, goodwill is measured at cost less accumulated impairment losses.
For the purpose of impairment testing, goodwill acquired in a business combination is allocated to each of the Cash Generating Units (CGU)’s or groups of CGUs, that is expected to benefit from the synergies of the combination. Goodwill is monitored at the operating segment level.
Goodwill impairment reviews are undertaken annually or more frequently if events or changes in circumstances indicate a potential impairment. The carrying value of goodwill is compared to the recoverable amount, which is the higher of value in use and the fair value less costs to sell. Any impairment is recognised immediately as an expense and is not subsequently reversed.
(iii) License fee The Group applies the cost model in recognising intangible
assets acquired in a business combination. Licenses acquired in a business combination are recognised at fair value at the acquisition date. Subsequently, they are carried at cost less accumulated amortisation and impairment losses. Licenses acquired in a business combination are amortised on a straight line basis over a period of 25 years.
(h) Property and Equipment Land and buildings comprise mainly outlets and offices
occupied by the Group.
Land is carried at cost. All other property and equipment are stated at historical cost less accumulated depreciation and accumulated impairment charges. Historical cost includes borrowing cost and all other expenditure that is directly attributable to the acquisition of the items.
Subsequent costs are included in the asset’s carrying amount or recognised as a separate asset, as appropriate, only when it is probable that future economic benefits associated with the item will flow to the Group and the cost of the item can be measured reliably. All other repairs and maintenance are charged to profit or loss during the financial period in which they are incurred.
Land is not depreciated. Depreciation on property and equipment is calculated using the straight-line method to allocate the cost less the residual values over the estimated useful lives as follows.
Building 50 years
Vehicles 5 years
Branding, furniture and fittings and equipment 2-5 years
Computer equipment 3 years
Leasehold improvements are depreciated over the lower of the useful life of the asset and the lease term.
The assets residual values and useful lives are reviewed at the end of each reporting period and adjusted if appropriate.
An asset’s carrying amount is written down immediately to its recoverable amount, if the asset’s carrying amount is greater than its estimated recoverable amount.
Property and equipment are dercognised at the disposal date or at the date when it is permanently withdrawn from use without the ability to be disposed of. Gains and losses on disposals are determined by comparing the proceeds with the carrying amount. These are included within other income in the Statement of Comprehensive Income.
If an investment property becomes owner-occupied, it is reclassified as property, plant and equipment, and its fair value at the date of reclassification becomes its cost for subsequent accounting purposes.
If an item of property, plant and equipment becomes an investment property because its use has changed, any difference arising between the carrying amount and the fair value of this item at the date of transfer is recognised in other comprehensive income as a revaluation of property, plant and equipment. However, if a fair value gain reverses a previous impairment loss, the gain is recognised in profit or loss. Upon the disposal of such investment property any surplus previously recorded in equity is transferred to retained earnings net of associated tax; the transfer is not made through profit or loss.
(i) Statutory deposit Statutory deposit represents 10% of the paid up capital of
the Company deposited with the Central Bank of Nigeria (CBN) in pursuant to Section 10(3) of the Insurance Act, 2003. Statutory deposit is measured at cost.
( j) Insurance Contracts The Group issues contracts that transfer insurance risk
or financial risk or both. Insurance contracts are those contracts where a party (the policy holder) transfers significant insurance risk to another party (insurer) and the latter agrees to
2 2.8 NOTES TO THE FINANCIAL STATEMENTSFINANCIALS

ANNUAL REPORT 2020 AXA MANSARD | 75
2
compensate the policyholder or other beneficiary if a specified uncertain future event (the insured event) adversely affects the policyholder, or other beneficiary. Such contracts may also transfer financial risk when the insurer issues financial instruments with a discretionary participation feature.
(1) Types of Insurance Contracts The group classifies insurance contract into life and
non-life insurance contracts.
(i) Non-life insurance contracts These contracts are accident and casualty and property
insurance contracts.
Accident and casualty insurance contracts protect the Group’s customers against the risk of causing harm to third parties as a result of their legitimate activities. Damages covered include both contractual and non-contractual events. The typical protection offered is designed for employers who become legally liable to pay compensation to injured employees (employers’ liability) and for individual and business customers who become liable to pay compensation to a third party for bodily harm or property damage (public liability).
Property insurance contracts mainly compensate the Group’s customers for damage suffered to their properties or for the value of property lost. Customers who undertake commercial activities on their premises could also receive compensation for the loss of earnings caused by the inability to use the insured properties in their business activities (business interruption cover).
Non- life insurance contracts protect the Group’s customers from the consequences of events (such as death or disability) that would affect the ability of the customer or his/her dependents to maintain their current level of income. Guaranteed benefits paid on occurrence of the specified insurance event are either fixed or linked to the extent of the economic loss suffered by the policyholder. There are no maturity or surrender benefits.
(ii) Life insurance contracts These contracts insure events associated with human
life (such as death or disability). These are divided into the individual life, group life and Annuity contracts.
� Individual life contracts are usually long term insurance contracts and span over one year while the group life insurance contracts usually cover a period of 12 months. A liability for contractual benefits that are expected to be incurred in the future when the premiums are recognised. The liability is determined as the sum of the expected discounted value of the benefit payments and the future administration expenses that are directly related to the contract, less the expected discounted value of the theoretical premiums that would be required to meet the benefits and administration expenses based on the valuation assumptions used. The liability is based on assumptions as to mortality, persistency,
maintenance expenses and investment income that are established at the time the contract is issued.
� Annuity contracts
These contracts insure customers from consequences of events that would affect the ability of the customers to maintain their current level of income. There are no maturity or surrender benefits. The annuity contracts are fixed annuity plans. Policy holders make a lump sum payment recognised as part of premium in the period when the payment was made. Constant and regular payments are made to annuitants based on terms and conditions agreed at the inception of the contract and throughout the life of the annuitants. The annuity funds are invested in long term government bonds and reasonable money markets instruments to meet up with the payment of monthly/quarterly annuity payments. The annuity funds liability is actuarially determined based on assumptions as to mortality, persistency, maintenance expenses and investment income that are established at the time the contract is issued.
(2) Recognition and measurement
(i) Non-life insurance contracts premium and claims These contracts are accident, casualty and property
insurance contracts. Accident and casualty insurance contracts protect the Group’s customers against the risk of causing harm to third parties as a result of their legitimate activities. Damages covered include both contractual and non-contractual events. The typical protection offered is designed for employers who become legally liable to pay compensation to injured employees (employers’ liability) and for individual and business customers who become liable to pay compensation to a third party for bodily harm or property damage (public liability). Property insurance contracts mainly compensate the Group’s customers for damage suffered to their properties or for the value of property lost. Customers who undertake commercial activities on their premises could also receive compensation for the loss of earnings caused by the inability to use the insured properties in their business activities. Life insurance contracts protects the Group’s customers from the consequences of events (such as death or disability) that would affect the ability of the customer or his/her dependents to maintain their current level of income. Guaranteed benefits paid on occurrence of the specified insurance event are either fixed or linked to the extent of the economic loss suffered by the insured. There are no maturity or surrender benefits. For all these contracts, premiums are recognised as revenue (earned premiums) proportionally over the period of coverage.
The portion of premium received on in-force contracts that relates to unexpired risks at the reporting date is reported as the unearned premium liability. Premiums are shown before deduction of commission.
2.8 NOTES TO THE FINANCIAL STATEMENTSFINANCIALS

76 | ANNUAL REPORT 2020 - AXA MANSARD
Claims and loss adjustment expenses are charged to income as incurred based on the estimated liability for compensation owed to contract holders or third parties damaged by the contract holders. They include direct and indirect claims settlement costs and arise from events that have occurred up to the end of the reporting period even if they have not yet been reported to the Group. The Group does not discount its liabilities for unpaid claims. Liabilities for unpaid claims are estimated using the input of assessments for individual cases reported to the Group and statistical analyses for the claims incurred but not reported, and to estimate the expected ultimate cost of more complex claims that may be affected by external factors (such as court decisions).
(ii) Life insurance contracts premium and claims Premiums are recognised as revenue when they
become payable by the contract holders. Premium are shown before deduction of commission. Life insurance premium are recognised as premium in the statement of comprehensive income.
Claims and other benefits are recorded as an expense when they are incurred.
(iii) Annuity premium and claims Annuity premiums relate to single premium payments
and recognised as earned premium income in the period in which payments are received. Claims are made to annuitants in the form of monthly/quarterly payments based on the terms of the annuity contract and charged to profit or loss as incurred. Premiums are recognised as revenue when they become payable by the contract holders. Premium are shown before deduction of commission.
(iv) Salvages Some non-life insurance contracts permit the Group to
sell (usually damaged) property acquired in the process of settling a claim. The Group may also have the right to pursue third parties for payment of some or all costs of damages to its clients property (i.e. subrogation right).
Salvage recoveries are used to reduce the claim expense when the claim is settled.
(v) Subrogation Subrogation is the right for an insurer to pursue a third
party that caused an insurance loss to the insured. This is done as a means of recovering the amount of the claim paid to the insured for the loss. A receivable for subrogation is recognised in other assets when the liability is settled and the Company has the right to receive future cash flow from the third party.
(vi) Deferred policy acquisition costs (DAC) Acquisition costs comprise all direct and indirect
costs arising from the writing of both life and non-life insurance contracts. Deferred acquisition costs represent a proportion of commission which are incurred during a financial period and are deferred to the extent that they are recoverable out of future revenue margins. For
the non life business, it is calculated by applying to the acquisition expenses the ratio of unearned premium to written premium; while no assets are established in respect of deferred acquisition cost for the life business.
(vii) Deferred income Deferred income represent a proportion of commission
received on reinsurance contracts which are booked during a financial year and are deferred to the extent that they are recoverable out of future revenue margins. It is calculated by applying to the reinsurance commission income the ratio of prepaid reinsurance to reinsurance cost.
(viii) Receivables and payables related to insurance contracts
Receivables and payables are recognised when due. These include amounts due to and from agents, brokers and insurance companies (as coinsurers) and reinsurance companies.
� Receivables and payables to agents, brokers and insurance companies (as coinsurers)
The company’s receivables and payables to agents, brokers and insurance companies (as coinsurers) relate to premium and commission.
If there is objective evidence that the insurance receivable is impaired, the Group reduces the carrying amount of the insurance receivable accordingly and recognises that impairment loss in the income statement. The Group gathers the objective evidence that an insurance receivable is impaired using the same methodology adopted for financial assets held at amortised cost. The impairment loss is calculated under the same method used for these financial assets.
� Reinsurance and coinsurance contracts held
Contracts entered into by the Group with reinsurers and that meet the classification requirements for insurance contracts are classified as reinsurance contracts held. Contracts that do not meet these classification requirements are classified as financial assets.
Reinsurance assets consist of short-term balances due from reinsurers, as well as longer term receivables that are dependent on the expected claims and benefits arising under the related reinsured insurance contracts. Reinsurance liabilities are primarily premiums payable for reinsurance contracts and are recognised as an expense when due. The Group has the right to set-off re-insurance payables against amount due from re-insurance and brokers in line with the agreed arrangement between both parties.
The Group assesses its reinsurance assets for impairment on a quarterly basis. If there is objective evidence that the reinsurance asset is impaired, the Group reduces the carrying amount of the reinsurance asset to its recoverable amount and
2 2.8 NOTES TO THE FINANCIAL STATEMENTSFINANCIALS

ANNUAL REPORT 2020 AXA MANSARD | 77
2
recognises that impairment loss in the income statement. The Group gathers the objective evidence that a reinsurance asset is impaired using the same process adopted for financial assets held at amortised cost. The impairment loss is calculated using the number of days that the receivable has been outstanding.
(k) Investment Contracts Investment contracts are those contracts that transfer
financial risk with no significant insurance risk. Investment contracts can be classified into interest linked and unitised fund. Interest linked investment contracts are measured at amortised cost while unitised funds are measured at fair value.
Investment contracts with guaranteed returns (interest linked) and other business of a savings nature are recognised as liabilities. Interest accruing to the life assured from investment of the savings is recognised in profit and loss account in the year it is earned while interest paid and due to depositors is recognised as an expense. The net result of the deposit administration revenue account is transferred to the profit or loss of the group. Unitised funds contracts sell units under seven portfolios with the value of each unit determined by the value of the underlying assets for each portfolio.
(l) Technical Reserves These are computed in compliance with the provisions of
Sections 20, 21, and 22 of the Insurance Act 2003 as follows:
(i) General insurance contracts
Reserves for unearned premium In compliance with Section 20 (1) (a) of Insurance Act
2003, the reserve for unearned premium is calculated on a time apportionment basis in respect of the risks accepted during the year.
Reserves for outstanding claims The reserve for outstanding claims is maintained at
the total amount of outstanding claims incurred and reported plus claims incurred but not reported (“IBNR”) as at the reporting date. The IBNR is based on the liability adequacy test.
Reserves for unexpired risk A provision for additional unexpired risk reserve (AURR) is
recognised for an underwriting year where it is envisaged that the estimated cost of claims and expenses would exceed the unearned premium reserve (UPR).
(ii) Life business
Life fund This is made up of net liabilities on policies in force as
computed by the actuaries at the time of the actuarial valuation or as at reporting period end.
Liability adequacy test At each end of the reporting period, liability adequacy
tests are performed by an Actuary to ensure the adequacy of the contract liabilities net of related DAC assets. In performing these tests, current best estimates of future contractual cash flows and claims handling
and administration expenses, as well as investment income from the assets backing such liabilities, are used. Any deficiency is immediately charged to profit or loss initially by writing off DAC and by subsequently establishing a provision for losses arising from liability adequacy tests “the unexpired risk provision”.
(m) Financial Liabilities (i) Borrowings Borrowings are recognised initially at fair value, net of
transaction costs incurred. Borrowings are subsequently stated at amortised cost; any difference between the proceeds (net of transaction costs) and the redemption value is recognised in the income statement over the period of the borrowings using the effective interest method.
Fees paid on the establishment of loan facilities are recognised as transaction cost of the loan to the extent that it is probable that some or all of the facility will be drawn down. The fee is deferred until the drawdown occurs. To the extent there is no evidence that it is probable that some or all of the facility will be drawn down, the fee is capitalised and amortised over the period of the facility to which it relates.
Borrowings are classified as current liabilities unless the group has an unconditional right to defer settlement of the liabilities for at least 12 months after the date of the statement of financial position.
Borrowing costs are interest and other costs incurred by the Group directly attributable to the acquisition and construction of qualifying assets which are assets that necessarily take a substantial period of time to get ready for its intended use or sale.
Borrowing costs are capitalized as part of the cost of a qualifying asset only when it is probable that they will result in future economic benefits to the Group and the costs can be measured reliably. Other borrowing costs are recognised as an expense in the period in which they are incurred.
When the carrying amount or the expected ultimate cost of the qualifying asset exceeds its recoverable amount or net realizable value, the carrying amount is written down or written off. Investment income earned on the temporary investment of specific borrowings pending their expenditure on qualifying assets is deducted from the borrowing costs eligible for capitalisation.
(ii) Trade and other payables Trade and other payables are recognised initially at fair
value and subsequently measured at amortised cost using the effective interest method. The fair value of a non-interest bearing liability is its discounted repayment amount. If the due date of the liability is less than one year discounting is omitted.
(iii) Financial guarantee contracts Financial guarantees are contracts that require the
Group to make specified payments to reimburse the holder for a loss it incurs because a specified debtor
2.8 NOTES TO THE FINANCIAL STATEMENTSFINANCIALS

78 | ANNUAL REPORT 2020 - AXA MANSARD
fails to make payment when due in compliance with the original or modified terms of a debt instrument.
Financial guarantee contracts are initially recognised at their fair value, which is the premium received, and then amortised over the life of the financial guarantee. Subsequent to initial recognition, the financial guarantee contracts are measured at the higher of the present value of any expected payment and the unamortised premium when a payment under the guarantee has become probable. Financial guarantees are included within other liabilities in line with the requirements of IAS 39.
(n) Provisions Provisions are recognised when: the Group has a present
legal or constructive obligation as a result of past events; it is more likely than not that an outflow of resources will be required to settle the obligation; and the amount has been reliably estimated. Provisions are not recognised for future operating losses.
Where there are a number of similar obligations, the likelihood that an outflow will be required in settlement is determined by considering the class of obligations as a whole. A provision is recognised even if the likelihood of an outflow with respect to any one item included in the same class of obligations may be small.
Provisions are measured at the present value of the expenditures expected to be required to settle the obligation using a pre-tax rate that reflects current market assessments of the time value of money and the risks specific to the obligation. The increase in the provision due to passage of time is recognised as interest expense.
(o) Current and Deferred Income Tax The tax expense for the period comprises current tax (company
income tax, tertiary education tax, police trust fund) and deferred tax. Tax is recognised in profit or loss, except to the extent that it relates to items recognised in other comprehensive income or directly in equity. In this case, the tax is also recognised in other comprehensive income or directly in equity, respectively.
The current income tax charge is calculated on the basis of the tax laws enacted or substantively enacted at the end of the reporting period. Management periodically evaluates positions taken in tax returns with respect to situations in which applicable tax regulation is subject to interpretation and establishes provisions where appropriate.
Deferred income tax is recognised, using the liability method, on temporary differences arising between the tax bases of assets and liabilities and their carrying amounts in the consolidated financial statements. However, if the deferred income tax arises from initial recognition of an asset or liability in a transaction other than a business combination that at the time of the transaction affects neither accounting nor taxable profit or loss, it is not accounted for. Deferred income tax is determined using tax rates (and laws) that have been enacted or substantively enacted by the end of the reporting period and are expected to apply when the related deferred income tax asset is realisable or the deferred
income tax liability is payable.
Deferred income tax assets are recognised to the extent that it is probable that future taxable profit will be available against which the temporary differences can be utilised.
Deferred income tax is provided on temporary differences arising on investments in subsidiaries and associates, except where the Group controls the timing of the reversal of the temporary difference and it is probable that the temporary difference will not reverse in the foreseeable future.
Deferred income tax assets and liabilities are offset when there is a legally enforceable right to offset current tax assets against current tax liabilities and when the deferred income tax assets and liabilities relate to income taxes levied by the same taxation authority on either the taxable entity or different taxable entities where there is an intention to settle the balances on a net basis.
The tax effects of carry-forwards of unused losses or unused tax credits are recognised as an asset when it is probable that future taxable profits will be available against which these losses can be utilised.
Deferred tax related to fair value remeasurement of available-for-sale investments, which are charged or credited directly in other comprehensive income, is also credited or charged directly to other comprehensive income and subsequently recognised in the consolidated income statement together with the deferred gain or loss.
(p) Equity and Reserves (i) Share capital Shares are classified as equity when there is no obligation
to transfer cash or other assets. Incremental costs directly attributable to the issue of equity instruments are shown in equity as a deduction from the proceeds, net of tax.
Where any member of the Group purchases the Company’s equity share capital (treasury shares), the consideration paid, including any directly attributable incremental costs (net of income taxes), is reported as a separate component of equity attributable to the Company’s equity holders. Where such shares are subsequently sold, reissued or otherwise disposed of, any consideration received is included in equity attributable to the Company’s equity holders, net of any directly attributable incremental transaction costs and the related income tax effects.
(ii) Share premium Share premium represents surplus on the par value
price of shares issued. The share premium is classified as an equity instrument in the statement of financial position.
(iii) Fair value reserves Fair value reserves represents the fair value gains or
losses on valuation of financial assets classified as Available for sale.
(iv) Treasury shares When shares recognised as equity are repurchased,
the amount of the consideration paid, which includes directly attributable costs, net of tax effects, is recognised as a deduction from equity. Repurchased shares are
2 2.8 NOTES TO THE FINANCIAL STATEMENTSFINANCIALS

ANNUAL REPORT 2020 AXA MANSARD | 79
2
classified as treasury shares and are presented in the treasury shares reserve. When treasury shares are sold or reissued subsequently, the amount received is recognised as an increase in equity and the resulting surplus or deficit on the transaction is presented within share premium.
(v) Contingency reserves
(a) Non-life business In compliance with Section 21 (2) of Insurance Act
2003, the contingency reserve is credited with the greater of 3% of total premiums, or 20% of the net profits. This shall accumulate until it reaches the amount of greater of minimum paid-up capital or 50% of net premium.
(b) Life business In compliance with Section 22 (1) (b) of Insurance
Act 2003, the contingency reserve is credited with the higher of 1% of gross premiums or 10% of net profit.
(vi) Statutory reserves In accordance with the provisions of Section 69 of the
Pension Reform Act 2004, the statutory reserve is credited with an amount equivalent to 12.5% of net profit after tax or such other percentage of the net profit as the National Pension Commission may from time to time stipulate.
(vii) Capital reserves This refers to reserves arising from business restructuring.
In 2007 the Group restructured and changed the nominal share price from N1 to 50k per share. The surplus nominal value from this reconstruction was transferred to this account.
(viii) Retained earnings Retained earnings comprise the undistributed profits
from previous years, which have not been reclassified to the other reserves.
(ix) Dividends Dividend on the Company’s ordinary shares are recognised
in equity in the period in which they are approved by the Company’s shareholders. Dividend distribution to the Company’s shareholders is recognised as equity in the financial statements in the period in which the dividend is paid to the Company’s shareholders.
(q) Earnings Per Share The Group presents basic and diluted earnings per share
(EPS) data for its ordinary shares. Basic EPS is calculated by dividing the profit or loss attributable to ordinary shareholders of the Company by the weighted average number of ordinary shares outstanding during the year excluding treasury shares held by the Company.
Diluted EPS is determined by adjusting the profit or loss attributable to ordinary shareholders and the weighted average number of ordinary shares outstanding for the effects of all dilutive potential ordinary shares which comprise share options granted to staff.
(r) Revenue Recognition Revenue comprises premium, value for services rendered,
net of value-added tax, after eliminating revenue within the Group. Revenue classes are recognised as follows:
(a) Premium income: for short duration life insurance contracts, premiums are recognised as revenue (earned premiums) proportionally over the period of coverage. The portion of premium received on in-force contracts that relates to unexpired risks at the reporting date is reported as the unearned premium liability. Premiums are shown before deduction of commission and are gross of any taxes or duties levied on premiums. Where insurance contracts have a single premium or a limited number of premium payments due over a significantly shorter period than the period during which benefits are provided, the excess of the premiums payable over the valuation premiums is deferred and recognised as income in line with the decrease of unexpired insurance risk of the contracts in force or, for annuities in force, in line with the decrease of the amount of future benefits expected to be paid.
(b) Rendering of services: Revenue arising from asset management and other related services offered by the Group are recognised in the accounting period in which the services are rendered. Fees consist primarily of investment management fees arising from services rendered in conjunction with the issue and management of investment contracts where the Group actively manages the consideration received from its customers to fund a return that is based on the investment profile that the customer selected on origination of the instrument.
These services comprise the activity of trading financial assets and derivatives in order to reproduce the contractual returns that the Group’s customers expect to receive from their investments. Such activities generate revenue that is recognised by reference to the stage of completion of the contractual services.
In all cases, these services comprise an indeterminate number of acts over the life of the individual contracts. For practical purposes, the Group recognises these fees on a straight-line basis over the estimated life of the contract. Certain upfront payments received for asset management services (‘front-end fees’) are deferred and amortised in proportion to the stage of completion of the service for which they were paid.
The Group charges its customers for asset management and other related services using the following different approaches:- Front-end fees are charged to the client on inception. This approach is used particularly for single premium contracts. The consideration received is deferred as a liability and recognised over the life of the contract on a straight-line basis; and Regular fees are charged to the customer periodically (monthly, quarterly or annually) either directly or by making a deduction from invested funds. Regular charges billed in advance are recognised on a straight-line basis over the billing period; fees charged at the end of the period are accrued as a receivable that is offset against the financial liability when charged to the customer.
2.8 NOTES TO THE FINANCIAL STATEMENTSFINANCIALS

80 | ANNUAL REPORT 2020 - AXA MANSARD
(c) Dividend income: dividend income for available-for-sale equities is recognised when the right to receive payment is established, this is the ex-dividend date for equity securities. They are reported within other income.
(d ) Net gains/(losses) on financial assets
Net realised gains/(losses) on financial assets comprises gains less losses related to trading and available-for-sale investment, and includes all realised and unrealised fair value changes and foreign exchange differences and realised gain or loss on available-for-sale investment.
(e) Net fair value gain on non financial assets
Net fair value gain on non financial assets at fair value represents fair value gains on the Group’s non financial instruments such as investment property.
(s) Changes in Life Fund Estimates Actuarial valuation of the life fund is conducted annually
to determine the net liabilities on the existing policies and the adequacy of the assets representing the insurance fund as at the date of valuation. All deficits arising therefrom are charged to profit or loss.
(t) Investment Income Interest income and expenses for all interest-bearing financial
instruments including financial instruments measured at fair value through profit or loss, are recognised within investment income and finance cost respectively in the income statement using the effective interest rate method. When a receivable is impaired, the Group reduces the carrying amount to its recoverable amount, being the estimated future cash flow discounted at the original effective interest rate of the instrument, and continues unwinding the discount as interest income.
(u) Operating Expenditure (i) Reinsurance expenses Reinsurance cost represents outward premium paid to
reinsurance companies less the unexpired portion as at the end of the accounting year.
(ii) Underwriting expenses Underwriting expenses comprise acquisition costs and
other underwriting expenses. Acquisition costs comprise all direct and indirect costs arising from the writing of insurance contracts. Examples of these costs include, but are not limited to, commission expense, supervisory levy, superintending fees and other technical expenses. Other underwriting expenses are those incurred in servicing existing policies/contract. These expenses are charged in the accounting year in which they are incurred.
(iii) Other operating expenses Other expenses are expenses other than claims
expenses, employee benefit, expenses for marketing and
administration and underwriting expenses. They include wages for contract staff, professional fee, depreciation expenses and other non-operating expenses. Other operating expenses are accounted for on accrual basis and recognised in profit or loss upon utilization of the service.
(iv) Employee benefits (a) Defined contribution plans
The Group operates a defined contributory pension scheme for eligible employees. Employees and the Group contribute 7.5% and 10.5% respectively of each qualifying staff’s salary in line with the provisions of the Pension Reform Act 2014. The Group pays contributions to pension fund administrators on a mandatory basis. The Group has no further payment obligations once the contributions have been paid. The contributions are recognised as employee benefits expense when they are due. Prepaid contributions are recognised as an asset to the extent that a cash refund or a reduction in the future payments is available.
(b) Short-term benefits
Wages, salaries, paid annual leave and sick leave, bonuses and non-monetary benefits are recognised as employee benefit expense and accrued when the associated services are rendered by the employees of the Group.
(c) Share based payment
(i) Equity-settled share based payment
The group operates an equity share-based compensation plans. The fair value of equity-settled share options is determined on the grant date and accounted for as staff costs over the vesting period of the share options, with a corresponding increase in equity. At the end of each reporting period, the group revisits its estimates of the number of options that are expected to vest based on the non market and service conditions. It recognises the impact of the revision to initial estimates, if any, in profit or loss with a corresponding adjustment to equity. On vesting of share options, amounts previously credited to the share-based payment reserve are transferred to retained earnings through an equity transfer. On exercise of equity-settled share options, proceeds received are credited to share capital and premium.
The grant date fair value of equity-settled share-based payments awards granted to employees is generally recognised as an expense, with a corresponding increase in equity, over the vesting period of the awards. The amount recognised as an expense is adjusted to reflect the number of awards for which the related services and unobservable performance conditions are expected to be met, such that the amount ultimately recognised is based on the number of awards that meet the related service and unobservable performance conditions at the vesting date. For share-based payment awards with non vesting conditions, the
2 2.8 NOTES TO THE FINANCIAL STATEMENTSFINANCIALS

ANNUAL REPORT 2020 AXA MANSARD | 81
2
grant date fair value of the share based payment is measured to reflect such conditions and there is no true-up for differences between expected and actual outcomes.
(ii) Cash-settled share based payment
The fair value of the amount payable to employees in respect of share appreciation rights, which are settled in cash, is recognised as an expense, with a corresponding increase in liabilities, over the period in which the employees become unconditionally entitled to payment. The liability is remeasured at each reporting date and at settlement date based on the fair value of the share appreciation rights. Any changes in the fair value of the liability are recognised in profit or loss.
(d) Termination benefits
Termination benefits are expensed at the earlier of when the Group can no longer withdraw the offer of those benefits and when the Group recognises costs for a restructuring if benefits are not expected to be settled wholly within the 12 months of the reporting date, then they are discounted.
(v) Leases Group acting as a lessee At commencement or on modification of a contract that
contains a lease component, the Group allocates consideration in the contract to each lease component on the basis of its relative standalone price.
The Group recognises a right-of-use asset and a lease liability at the lease commencement date. The right-of-use asset is initially measured at cost, which comprises the initial amount of the lease liability adjusted for any lease payments made at or beforethe commencement date, plus any initial direct costs incurred and an estimate of costs to dismantle and remove any improvements made to branches or office premises.
The right-of-use asset is subsequently depreciated using the straight-line method from thecommencement date to the end of the lease term. In addition, the right-of-use asset is periodically reduced by impairment losses, if any, and adjusted for certain remeasurements of the lease liability.
The lease liability is initially measured at the present value of the lease payments that are not paid at the commencement date, discounted using the interest rate implicit in the lease.
Lease payments included in the measurement of the lease liability comprise the following:
� fixed payments, including in-substance fixed payments;
� variable lease payments that depend on an index or a rate, initially measured using the index or rate as at the commencement date;
� amounts expected to be payable under a residual value guarantee; and
� the exercise price under a purchase option that the Group is reasonably certain to exercise, lease payments in an optional renewal period if the Group is reasonably
certain to exercise an extension option, and penalties for early termination of a lease unless the Group is reasonably certain not to terminate early.
The lease liability is measured at amortised cost using the effective interest method. It is remeasured when there is a change in future lease payments arising from a change in an index or rate, if there is a change in the Group’s estimate of the amount expected to be payable under a residual value guarantee, if the Group changes its assessment of whether it will exercise a purchase, extension or termination option or if there is a revised in-substance fixed lease payment.
When the lease liability is remeasured remeasured in this way, a corresponding adjustment is made to the carrying amount of the right-of-use asset, or is recorded in profit or loss if the carrying amount of the right-of-use asset has been reduced to zero. The Group presents right-of-use assets in ‘property and equipment’ and lease liabilities shown separately in the statement of financial position.
Group acting as a lessor
At inception or on modification of a contract that contains a lease component, the Group allocates the consideration in the contract to each lease component on the basis of their relative stand-alone selling prices. When the Group acts as a lessor, it determines at lease inception whether the lease is a finance lease or an operating lease.
To classify each lease, the Group makes an overall assessment of whether the lease transfers substantially all of the risks and rewards incidental to ownership of the underlying asset. If this is the case, then the lease is a finance lease; if not, then it is an operating lease. As part of this assessment, the Group considers certain indicators such as whether the lease is for the major part of the economic life of the asset.
The Group applies the derecognition and impairment requirements in IAS 39 to the net investment in the lease. The Group further regularly reviews estimated unguaranteed residual values used in calculating the gross investment in the lease.
(w) Discontinued Operations A discontinued operation is a component of the Group’s
business, the operations and cash flows of which can be clearly distinguished from the rest of the Group and which:
� represents a separate major line of business or geographic area of operations
� is part of a single co-ordinated plan to dispose of a separate major line of business or geographic area of operations; or
� is a subsidiary acquired exclusively with a view to resale
Classification are a discontinued operation occurs at the earlier of disposal or when the operations meets the criteria to be classified as held-for-sale. When an operation is classified as discontinued operation, the comparative statement of profit or loss and OCI is represented as if the operation had been discontinued from the start of the comparative year.
2.8 NOTES TO THE FINANCIAL STATEMENTSFINANCIALS

82 | ANNUAL REPORT 2020 - AXA MANSARD
2.3 CRITICAL ACCOUNTING ESTIMATES AND JUDGMENTS
The Group makes estimates and assumptions that affect the reported amounts of assets and liabilities within the financial year. Estimates and judgments are continually evaluated and based on historical experience and other factors, including expectations of future events that are believed to be reasonable under the circumstances.
(a) Fair Value of Financial Assets (i) Impairment of available-for-sale equity financial assets The Group determines that available-for-sale equity financial
assets are impaired when there has been a significant or prolonged decline in the fair value below its cost. This determination of what is significant or prolonged requires judgment. In making this judgment, the Group evaluates among other factors, the normal volatility in share price, the financial health of the investee, industry and sector performance, changes in technology, and operational and financing cash flow. In this respect, a decline of 20% or more is regarded as significant, and a period longer than 12 months is considered to be prolonged. If any such quantitative evidence exists for available-for-sale financial assets, the asset is considered for impairment, taking qualitative evidence into account.
(ii) Fair value of unquoted equity financial instruments The fair value of financial instruments where no active market
exists or where quoted prices are not otherwise available are determined by using the income approach. In these cases the fair values are estimated from observable data using valuation models. The models used to determine fair values are validated and periodically reviewed by qualified personnel independent of those that sourced them. All models are certified before they are used, and models are calibrated to ensure that outputs reflect actual data and comparative market prices. Changes in assumptions about these factors could affect the reported fair value of financial instruments.
(b ) Liabilities Arising from Insurance Contracts (i) Claims arising from non-life insurance contracts Claims on non-life insurance contracts are payable on a
claims-occurrence basis. The Group is liable for all insured events that occur during the term of the contract. There are several variables that affect the amount and timing of cash flows from these contracts. These mainly relate to the inherent risks of the business activities carried out by individual contract holders and the risk management procedures adopted. The estimated cost of claims includes direct expenses to be incurred in settling claims, net of the expected subrogation value and other recoveries. The Group takes all reasonable steps to ensure that it has appropriate information regarding its claims exposures. However, given the uncertainty in establishing claims provisions, it is likely that the final outcome will prove to be different from the original liability established. A sensitivity analysis was done to determine how the IBNR reserve amount would change if we were to consider the 75th percentile as opposed to the best estimate figures included in the reserve reviews as at 31 December 2020 and an additional gross provision of N246 million (2019: N110 million) would have been reported.
(ii) Liabilities arising from life insurance contracts The liabilities for life insurance contracts are estimated
using appropriate and acceptable base tables of standard mortality according to the type of contract being written. Management make various assumptions such as expenses inflation, valuation interest rate, mortality and further mortality improved in estimating the required reserves for life contracts. However if the group should change its basis for mortality by -5%, the group would have recognised an actuarial valuation surplus of N103 million (2019: N36 million) in the Statement of Comprehensive Income.
(c ) Impairment for Receivables The Group tests periodically whether premium receivables
have suffered any impairment. With the no premium no cover policy, all premium transactions are paid for immediately except in the case of brokered transactions. For brokered transactions, the period is extended for 30 days if credit notes have been received from the broker. If all insurance receivables within 30 days and reinsurance receivables within 90 days were deemed as impaired, an impairment would have been recognised in the income statement.
(d) Intangibles (goodwill) Goodwill represents the cost of acquisition less the aggregate
of the fair value of the purchased entity’s identifiable net assets and liabilities. Goodwill has been recognised by the group at the acquisition of AXA Mansard Health Limited in 2013. Additional judgments and assumptions are as disclosed in note 17(c).
(e) Investment Property The Group’s Investment property -Mansard Place- is accounted
for in the books of APD Limited. The property was valued using the income approach. The valuation was based on market data such as discount rates, rental risk and reversionary rates. Management estimated the market value of the leasehold interest based on the highest and best use of the property.
(f) Share Based Payments The Group measures the cost of equity settled transactions
using fair value of the equity instrument at the grant date. The estimation of the fair value requires the determination of the most appropriate model which is dependent on the terms of the grant. The estimate also requires making assumption on the most appropriate inputs for the valuation model on items such as expected life of the share option, volatility and dividend yield. The assumptions used in estimating the fair value of the share based payments have been disclosed in Note 45.
(g) Current Income Tax General Business:
Income tax Income tax expense comprises current tax (company income
tax, tertiary education tax National Information Technology Development Agency levy and Nigeria Police Trust Fund levy) and deferred tax. It is recognised in profit or loss except to the extent that it relates to a business combination, or items
2 2.8 NOTES TO THE FINANCIAL STATEMENTSFINANCIALS

ANNUAL REPORT 2020 AXA MANSARD | 83
2
recognised directly in equity or in other comprehensive income.
The Company had determined that interest and penalties relating to income taxes, including uncertain tax treatments, do not meet the definition of income taxes, and therefore are accounted for under IAS 37 Provisions, Contingent Liabilities and Contingent Assets.
(a) Current tax Current tax comprises the expected tax payable or receivable
on the taxable income or loss for the year, and any adjustment to tax payable or receivable in respect of previous years. The amount of current tax payable or receivable is the best estimate of the tax amount expected to be paid or received that reflects uncertainty related to income taxes, if any. It is measured using tax rates enacted or substantively enacted at the reporting date and is assessed as follows:1
� Company income tax is computed on taxable profits
� Tertiary education tax is computed on assessable profits
� National Information Technology Development Agency levy is computed on profit before tax
� Nigeria Police Trust Fund levy is computed on net profit (i.e. profit after deducting all expenses and taxes from revenue earned by the company during the year)
Total amount of tax payable under CITA is determined based on the higher of two components namely Company Income Tax (based on taxable income (or loss) for the year); and minimum tax. Taxes based on profit for the period are treated as income tax in line with IAS 12.
Minimum tax In line with the Finance Act 2019, minimum tax is determined
based on:
For Life business: 0.5% of gross income and;
For General business: 0.5% of gross premium
The Company offsets the tax assets arising from withholding tax (WHT) credits and current tax liabilities if, and only if, the entity has a legally enforceable right to set off the recognised amounts, and intends either to settle on a net basis, or to realise the asset and settle the liability simultaneously. The tax asset is reviewed at each reporting date and written down to the extent that it is no longer probable that future economic benefit would be realised.
(b) Deferred tax
Deferred tax is recognised in respect of temporary differences between the carrying amounts of assets and liabilities for financial reporting purposes and the amounts used for taxation purposes.
Deferred tax assets are recognised for unused tax losses, unused tax credits and deductible temporary differences to the extent that it is probable that future taxable profits will be available against which they can be used. Future taxable profits are determined based on the reversal of relevant taxable temporary differences.
If the amount of taxable temporary differences is insufficient to recognise a deferred tax asset in full, then future taxable profits, adjusted for reversals of existing temporary differences,
are considered, based on the business plans of the Company. Deferred tax assets are reviewed at each reporting date and are reduced to the extent that it is no longer probable that the related tax benefit will be realised; such reductions are reversed when the probability of future taxable profits improves.
Unrecognised deferred tax assets are reassessed at each reporting date and recognised to the extent that it has become probable that future taxable profits will be available against which they can be used. Otherwise, the amount of unrecognized deferred tax assets is disclosed in the financial statements.
NON LIFE BUSINESS AND LIFE ACTUARIAL VALUATION
Non Life Business ReservingAXA Mansard Insurance Plc (“AXA Mansard”) commissioned QED Actuaries & Consultants to calculate non life business reserves as at 31 December 2020.
The eight (8) classes of business that were reviewed are Aviation, Oil and Energy, Engineering, Fire, General Accident, Marine Cargo, Marine Hull and Motor.
The reserves have been analysed gross of reinsurance. However, net IBNR reserve is calculated by multiplying the gross IBNR reserve by a factor that is calculated as the ratio of the gross incurred claims to the net incurred claims over the past three years.
Reserving MethodologyFor the Engineering, Energy, Fire, Marine Hull and Aviation classes of business, claims paid data was sub-divided into large and attritional claims. This was to allow for separate reserves to be calculated for attritional and large claims as the large claims are expected to behave differently from the attritional claims in terms of reporting and settlement. The limits used are given in the table below:
Class Large Claim Definition (₦’000)
Aviation 25,000
Energy 310,000
Engineering 53,000
Fire 120,000
General Accident 31,000
Marine Cargo 18,000
Marine Hull 40,000
Motor 19,000
Claims of such a large nature are expected to have a very short reporting delay, and as such, no new large claims are expected to be reported.
The methodologies governing the attritional claim reserve calculations are described below:
Basic Chain Ladder Method (BCL)Development factors were calculated using the last 1 to 10 years’ data by accident period. Ultimate development factors were
2.8 NOTES TO THE FINANCIAL STATEMENTSFINANCIALS

84 | ANNUAL REPORT 2020 - AXA MANSARD
calculated and judgment was applied in the selection of these factors.
Ultimate development factors were then applied to the paid data per accident period and an ultimate claim amount is calculated. The future claims (the ultimate claim amount less paid claims to date) were allocated to future payment periods in line with the development patterns calculated above. The outstanding claims reported to date are then subtracted from the total future claims to give the resulting IBNR figure per accident half-year period.
IBNR = Ultimate claim amount (excl. extreme large losses)
minus paid claims to December 31, 2020 (excl. extreme large losses)
minus claims outstanding (excl. extreme large losses)
Assumptions Underlying the BCLThe Basic Chain Ladder Method assumes that past experience is indicative of future experience i.e. that claims recorded to date will continue to develop in a similar manner in the future. An implicit assumption is that, for an immature accident year, the claims observed thus far tell something about the claims yet to be observed. A further assumption is that it assumes consistent claim processing, a stable mix of types of claims, stable inflation and stable policy limits.
Loss Ratio MethodDue to the limited data in Energy and Aviation portfolios, using the Basic Chain Ladder method was therefore inappropriate. The Loss ratio method is often used when there is little experience (claims history) in the line of business.
We allowed for expected experience to date and the average assumed ultimate loss ratio in carrying out the calculation.
IBNR= Expected average ultimate annual loss ratio multiplied by earned premium minus experience to date
Assumptions Underlying the Loss Ratio MethodAn estimate of the average ultimate loss ratio needed to be assumed. We based the loss ratios off of experience that has been seen to date in previous accident years.
Bornhuetter-Ferguson Method (BF Method)For more recent loss halfs, initial development of each origin period is typically subject to volatility as the cumulative data are sparse. This volatility may cause the estimates of ultimate claims produced by the CL method to be misleading. For this reason, an alternative estimate of the ultimate claims using a technique known as the BF method.
Assumptions Underlying the BF Method This method requires estimates of the ultimate loss ratio for each origin period and the accompanying earned premium.
Unearned Premium Reserve (UPR) and Deferred Acquisition Cost (DAC)The unearned premium reserve and deferred acquisition cost were calculated using a time-apportionment basis, in particular, the 365ths method. In the calculations, it was assumed that both the start and end date were included in the coverage period.
Sensitivity AnalysisA sensitivity analysis was done to determine how the IBNR reserve amount would change if we were to consider the 75th percentile and 90th percentile as opposed to our best estimate figures (which would represent the 50th percentile) included in reserve reviews as at 31 December 2020. The 75th percentile is a generally accepted level of prudency. Overall, there is 15% increase from the gross best estimate reserves to the gross reserves calculated at the 75th percentile and a 39% increase from the gross best estimate reserves to the gross reserves calculated on the 90th percentile. In conclusion, there is only a 25% chance that the IBNR reserves required will exceed NGN 1,870 million and only a 10% chance that the IBNR reserves required will exceed NGN 2,253 million as at 31 December 2020.
2 2.8 NOTES TO THE FINANCIAL STATEMENTSFINANCIALS
Gross IBNR - Attritional Reserves
In thousands on naira Best Estimate 75th Percentile 90th Percentile
Aviation 83,534 96,821 116,333
Energy 931,969 1,132,964 1,441,378
Engineering 18,934 19,544 20,511
Fire 178,157 183,301 191,412
General Accident 95,737 100,302 105,426
Marine Cargo 46,948 38,835 35,220
Marine Hull 23,470 29,263 46,763
Motor 245,209 269,398 296,732
1,623,958 1,870,428 2,253,774

ANNUAL REPORT 2020 AXA MANSARD | 85
2
LIFE & SAVINGS RESERVING
Valuation Methods
Individual LifeIndividual risk business comprises whole life assurances, credit life business, term assurances of various descriptions, including mortgage protection and annuity. For all individual risk business the gross premium method of valuation was adopted.
Reserves were calculated via a cashflow projection approach, taking into account future office premiums, expenses and benefit payments including an allowance for rider benefits and surrenders where applicable. Future cashflows were discounted back to the valuation date at the valuation rate of interest.
The reserve for the individual deposit based policies has been taken as the amount standing to the credit of the policyholders at the valuation date. Where policies have active life cover this has been valued using a cashflow projection approach as described above for other risk business.
AnnuityAnnuities are reserved for using a discounted cash flow approach. Here, reserves were set equal to the present value of future annuity payments plus expenses, with allowance being made for any guaranteed periods as required.
As at 31 December 2020, the Company did not underwrite any new annuity policies.
The movement in the annuity portfolio is analysed below:
Number of annuity policies
Annual Annuity (₦’000)
At 31 December 2019 404 292,445
New entrants - -
Additional Funds - -
Deaths (4) (1,798)
At 31 December 2020 400 290,647
Group LifeReserves for Group Life comprise an Unexpired Premium Reserve (UPR) and a reserve for Incurred But Not Reported Claims (IBNR) to make an allowance for the delay in reporting of claims. The UPR represents the unexpired portion of the premium for each scheme, net of an expense margin reflecting the acquisition cost loadings. The adequacy of the UPR is then tested by comparing against an Additional Unexpired Risk Reserve (AURR), which is calculated using pooled industry claims data for the underlying assumptions. An AURR was held in cases where the UPR was deemed insufficient to meet claims in respect of the unexpired period.
An allowance was made for IBNR (Incurred But Not Reported) claims in Group Life to take care of the delay in reporting claims. This was based on an Ultimate Loss Ratio approach, which uses historical claims experience to estimate the pattern of future emerging claims, from which the IBNR portion is determined.
Assumptions UsedThe assumptions used for the insurance contracts disclosed in this note are as follows:
Valuation Interest RateThe proposed valuation interest rate is based on current market risk-free yields with adjustments. This is in line with the requirements of IFRS 4 (Paragraph 24). The use of a risk-free rate also implies that future investment margins (in excess of the risk-free return) will not be capitalized upon, which satisfies paragraph 27 of IFRS 4. Further, the result is a “fair value” liability calculation which aids the comparability of accounts between insurers.
We adopted net valuation interest rates of 7.55% for all short term and credit life businesses, 6.96% pa for all long term business and 7.39% pa for Annuity business. as at 31 December 2020, the average yield on 15 year FGN bonds was 7.06%. The VIR is calculated based on the weighted average of Gross Redemption Yield (GRY) on FGN Bond (reference: FMDQ Daily Quotations List as at 31st December 2020) using the book value of Axa Mansard’s holdings of each bond as weightings. This is to ensure that the weightings are not influenced by market volatility of medium and short-term bond prices. We considered a margin of 0.12% for reinvestment risks were deducted from the gross yield for the annuity business. This made some allowance for the duration mismatch between available bonds and the liabilities.
ExpenseExpense for Individual Life (including annuity) and individual deposit-based business were reserved explicitly at N6,400 per policy per annum excluding AIP, for which an expense of N750 was used. Credit Life Expenses were reserved for at N750 per policy annum. All expenses were assumed to increase with inflation at 11% pa.
Future Maintenance ExpensesThe regulatory maintenance expenses are derived from the best estimate maintenance expenses plus a prudence margin for adverse deviations.Some expense lines were removed from the reported Individual Life operating expenses which were identified as being directly attributable to new business, e.g. advertising, sales promotion and merchandising. 35% of the remaining reported operating expenses was allocated to new business. We allowed for a notional expense per policy of N750 pa for Credit Life business. This is predominantly short term retail business from our financial institution partners which requires less policy administration compared to other Individual Life business. The remaining expenses were apportioned over the remaining Individual Life policies to estimate the 2020 maintenance expense incurred which was N6,400 per policy per annum.
CommissionCommission rates are set as known, and understood to be 10% of each premium for all individual products (excluding annuity).
Mortality and Future ImprovementsThe Mortality Table used in the valuation is the UK’s Mortality of Assured Lives A6770 (1967-70) table. The exception is the annuity business for which the UK’s Pension Annuitants table, PA90 (rated -5) was used.
WithdrawalsSurrenders are permitted for the Whole Life Plan. An allowance has been made in the valuation for exits by surrender using the rates: Single premium policies-0%, Year 1 (lapse without value) - 10%, Year 2 (lapse without value) - 7.5%, Year 3 - 5%, Years 4 and above
2.8 NOTES TO THE FINANCIAL STATEMENTSFINANCIALS
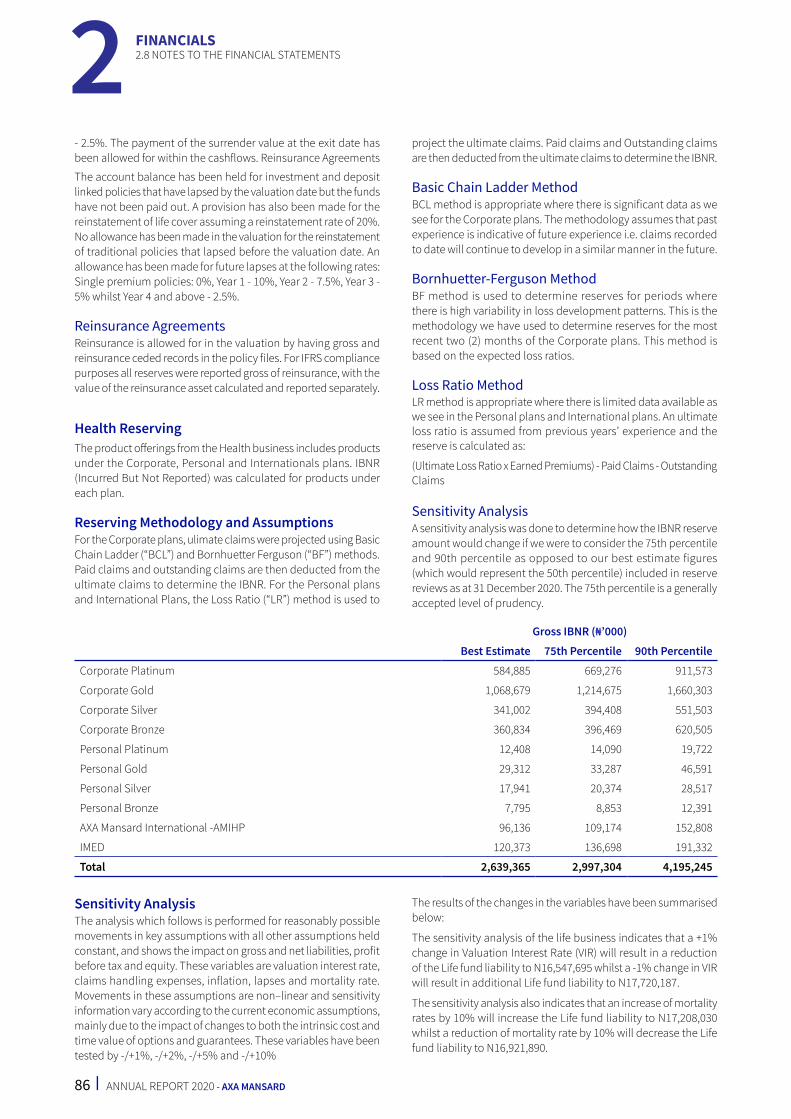
86 | ANNUAL REPORT 2020 - AXA MANSARD
- 2.5%. The payment of the surrender value at the exit date has been allowed for within the cashflows. Reinsurance Agreements
The account balance has been held for investment and deposit linked policies that have lapsed by the valuation date but the funds have not been paid out. A provision has also been made for the reinstatement of life cover assuming a reinstatement rate of 20%. No allowance has been made in the valuation for the reinstatement of traditional policies that lapsed before the valuation date. An allowance has been made for future lapses at the following rates: Single premium policies: 0%, Year 1 - 10%, Year 2 - 7.5%, Year 3 - 5% whilst Year 4 and above - 2.5%.
Reinsurance AgreementsReinsurance is allowed for in the valuation by having gross and reinsurance ceded records in the policy files. For IFRS compliance purposes all reserves were reported gross of reinsurance, with the value of the reinsurance asset calculated and reported separately.
Health ReservingThe product offerings from the Health business includes products under the Corporate, Personal and Internationals plans. IBNR (Incurred But Not Reported) was calculated for products under each plan.
Reserving Methodology and AssumptionsFor the Corporate plans, ulimate claims were projected using Basic Chain Ladder (“BCL”) and Bornhuetter Ferguson (“BF”) methods. Paid claims and outstanding claims are then deducted from the ultimate claims to determine the IBNR. For the Personal plans and International Plans, the Loss Ratio (“LR”) method is used to
project the ultimate claims. Paid claims and Outstanding claims are then deducted from the ultimate claims to determine the IBNR.
Basic Chain Ladder MethodBCL method is appropriate where there is significant data as we see for the Corporate plans. The methodology assumes that past experience is indicative of future experience i.e. claims recorded to date will continue to develop in a similar manner in the future.
Bornhuetter-Ferguson MethodBF method is used to determine reserves for periods where there is high variability in loss development patterns. This is the methodology we have used to determine reserves for the most recent two (2) months of the Corporate plans. This method is based on the expected loss ratios.
Loss Ratio MethodLR method is appropriate where there is limited data available as we see in the Personal plans and International plans. An ultimate loss ratio is assumed from previous years’ experience and the reserve is calculated as:
(Ultimate Loss Ratio x Earned Premiums) - Paid Claims - Outstanding Claims
Sensitivity AnalysisA sensitivity analysis was done to determine how the IBNR reserve amount would change if we were to consider the 75th percentile and 90th percentile as opposed to our best estimate figures (which would represent the 50th percentile) included in reserve reviews as at 31 December 2020. The 75th percentile is a generally accepted level of prudency.
2 2.8 NOTES TO THE FINANCIAL STATEMENTSFINANCIALS
Gross IBNR (₦’000)
Best Estimate 75th Percentile 90th Percentile
Corporate Platinum 584,885 669,276 911,573
Corporate Gold 1,068,679 1,214,675 1,660,303
Corporate Silver 341,002 394,408 551,503
Corporate Bronze 360,834 396,469 620,505
Personal Platinum 12,408 14,090 19,722
Personal Gold 29,312 33,287 46,591
Personal Silver 17,941 20,374 28,517
Personal Bronze 7,795 8,853 12,391
AXA Mansard International -AMIHP 96,136 109,174 152,808
IMED 120,373 136,698 191,332
Total 2,639,365 2,997,304 4,195,245
Sensitivity AnalysisThe analysis which follows is performed for reasonably possible movements in key assumptions with all other assumptions held constant, and shows the impact on gross and net liabilities, profit before tax and equity. These variables are valuation interest rate, claims handling expenses, inflation, lapses and mortality rate. Movements in these assumptions are non–linear and sensitivity information vary according to the current economic assumptions, mainly due to the impact of changes to both the intrinsic cost and time value of options and guarantees. These variables have been tested by -/+1%, -/+2%, -/+5% and -/+10%
The results of the changes in the variables have been summarised below:
The sensitivity analysis of the life business indicates that a +1% change in Valuation Interest Rate (VIR) will result in a reduction of the Life fund liability to N16,547,695 whilst a -1% change in VIR will result in additional Life fund liability to N17,720,187.
The sensitivity analysis also indicates that an increase of mortality rates by 10% will increase the Life fund liability to N17,208,030 whilst a reduction of mortality rate by 10% will decrease the Life fund liability to N16,921,890.

ANNUAL REPORT 2020 AXA MANSARD | 87
2
A m
ovem
ent o
f exp
ense
s by +
10%
will
resu
lt in
an
incr
ease
the
Life
fund
liab
ility
to N
17,1
38,8
15 w
hils
t a -1
0% c
hang
e w
ill re
duce
the
Life
fund
liab
ility
to N
16,9
85,3
50. E
xpen
se in
flatio
n m
ovin
g by
+2%
will
incr
ease
th
e lif
e fu
nd to
N17
,414
,511
whi
lst a
-2%
will
pro
duce
a re
duce
d Li
fe fu
nd li
abili
ty o
f N16
,860
,793
.
A 5%
incr
ease
in th
e La
pse
rate
will
als
o re
duce
the
Life
fund
liab
ility
to N
17,0
53,6
50 w
hils
t a 5
% d
ecre
ase
in th
e La
pse
rate
will
incr
ease
the
Liab
ility
to N
17,0
70,4
92.
SEN
SITI
VITY
OF
LIAB
ILIT
IES
TO C
HAN
GES
IN L
ON
G TE
RM V
ALUA
TIO
N A
SSU
MPT
ION
S FO
R TH
E 31
DEC
EMBE
R 20
20 V
ALUA
TIO
N
₦’00
0 B
ase
VIR
+1%
VI
R -1
%
Exp
ense
+10
%
Expe
nse
-10%
Ex
pens
e Inf
latio
n +2%
Ex
pens
e In
flatio
n -2
%
Laps
e +5
%
Lap
se -5
%
Mor
talit
y +5
%
Mor
talit
y -5
%
Indi
vidu
al D
A - F
und
Bala
nce
9,6
38,7
67
9,6
38,7
67
9,6
38,7
67
9,6
38,7
67
9,6
38,7
67
9,6
38,7
67
9,6
38,7
67
9,6
38,7
67
9,6
38,7
67
9,6
38,7
67
9,6
38,7
67
Indi
vidu
al D
A - R
isk
Rese
rve
551
,160
4
42,2
42
699
,875
5
86,7
03
515
,746
7
09,6
98
461
,649
5
60,0
26
543
,344
5
49,6
43
552
,685
Indi
vidu
al T
radi
tion
al L
ife
Insu
ranc
e 1
,908
,287
1
,733
,086
2
,150
,077
1
,940
,492
1
,876
,171
2
,068
,501
1
,819
,226
1
,983
,596
1
,833
,110
1
,901
,480
1
,915
,281
Ann
uitie
s 2
,942
,709
2
,824
,036
3
,321
,904
3
,063
,290
3
,045
,102
3
,087
,981
3
,031
,587
3
,116
,077
2
,997
,104
3
,054
,196
3
,054
,196
Ann
uitie
s - A
ddito
nal R
eser
ves
111
,487
1
11,4
87
111
,487
1
11,4
87
111
,487
1
11,4
87
111
,487
1
11,4
87
111
,487
1
11,4
87
111
,487
Gro
up L
ife -
UPR
7
23,8
61
723
,861
7
23,8
61
723
,861
7
23,8
61
723
,861
7
23,8
61
723
,861
7
23,8
61
723
,861
7
23,8
61
Gro
up L
ife -
IBN
R 9
29,1
62
929
,162
9
29,1
62
929
,162
9
29,1
62
929
,162
9
29,1
62
929
,162
9
29,1
62
929
,162
9
29,1
62
Out
stan
ding
Cla
ims
425
,263
4
25,2
63
425
,263
4
25,2
63
425
,263
4
25,2
63
425
,263
4
25,2
63
425
,263
4
25,2
63
425
,263
Addi
tiona
l res
erve
s 5
0,00
0 5
0,00
0 5
0,00
0 5
0,00
0 5
0,00
0 5
0,00
0 5
0,00
0 5
0,00
0 5
0,00
0 5
0,00
0 5
0,00
0
Gro
ss li
abili
ty
17,2
80,6
95
16,
877,
904
18,
050,
396
17,
469,
024
17,
315,
559
17,
744,
720
17,
191,
002
17,
538,
239
17,
252,
099
17,
383,
859
17,
400,
701
Rein
sura
nce
-330
,209
-3
30,2
09
-330
,209
-3
30,2
09
-330
,209
-3
30,2
09
-330
,209
-3
30,2
09
-330
,209
-3
30,2
09
-330
,209
Net
liab
ility
16
,950
,486
1
6,54
7,69
5 17
,720
,187
1
7,13
8,81
5 1
6,98
5,35
0 1
7,41
4,51
1 1
6,86
0,79
3 1
7,20
8,03
0 16
,921
,890
1
7,05
3,65
0 1
7,07
0,49
2 %
Cha
nge
in n
et li
abili
ty
--2
.38%
4.54
%1.
11%
0.21
%2.
74%
-0.5
3%1.
52%
-0.1
7%0.
61%
0.71
%
Sum
mar
y B
ase
VIR
+1%
V
IR -1
%
Expe
nse +
10%
Ex
pens
e -10
%
Expe
nse I
nflat
ion
+2%
Ex
pens
e Infl
atio
n -2
%
Laps
e +5%
La
pse -
5%
Mor
talit
y +5%
M
orta
lity -
5%
Indi
vidu
al
15,
202,
410
14,
799,
619
15,
972,
110
15,
390,
739
15,
237,
274
15,
666,
434
15,
112,
716
15,
459,
953
15,
173,
813
15,
305,
573
15,
322,
416
Grou
p 1
,748
,077
1
,748
,077
1
,748
,077
1
,748
,077
1
,748
,077
1
,748
,077
1
,748
,077
1
,748
,077
1
,748
,077
1
,748
,077
1
,748
,077
Net
liab
ility
1
6,95
0,48
6 1
6,54
7,69
5 1
7,72
0,18
7 1
7,13
8,81
5 1
6,98
5,35
0 1
7,41
4,51
1 1
6,86
0,79
3 1
7,20
8,03
0 1
6,92
1,89
0 1
7,05
3,65
0 1
7,07
0,49
2
% c
hang
e in
liab
ility
-
-2.3
8%4.
54%
1.11
%0.
21%
2.74
%-0
.53%
1.52
%-0
.17%
0.61
%0.
71%

88 | ANNUAL REPORT 2020 - AXA MANSARD
2 2.8 NOTES TO THE FINANCIAL STATEMENTSFINANCIALS
SEN
SITI
VITY
OF
LIAB
ILIT
IES
TO C
HAN
GES
IN L
ON
G TE
RM V
ALUA
TIO
N A
SSU
MPT
ION
S FO
R TH
E 31
DEC
EMBE
R 20
19 V
ALUA
TIO
N
₦’00
0 Ba
seVI
R +1
%VI
R -1
%Ex
pens
es +
10%
Expe
nses
-10%
Expe
nse i
nflat
ion
+2%
Expe
nse
infla
tion
-2%
Laps
es +
5%La
pses
-5%
Mor
talit
y +5
%M
orta
lity
-5%
Indi
vidu
al T
radi
tiona
l 1
,413
,850
1
,380
,500
1
,456
,318
1
,424
,772
1
,403
,018
1
,424
,881
1
,406
,262
1
,413
,807
1
,413
,893
1
,435
,081
1
,392
,800
PRA
Regu
late
d An
nuiti
es 2
,177
,817
2
,058
,703
2
,311
,445
2
,181
,945
2
,173
,689
2
,188
,068
2
,170
,302
2
,177
,817
2
,177
,817
2
,193
,399
2
,162
,730
Indi
vidu
al D
A 8
,066
,388
8
,066
,388
8
,066
,388
8
,066
,388
8
,066
,388
8
,066
,388
8
,066
,388
8
,066
,388
8
,066
,388
8
,066
,388
8
,066
,388
Grou
p Li
fe -
UPR
613
,431
6
13,4
31
613
,431
6
13,4
31
613
,431
6
13,4
31
613
,431
6
13,4
31
613
,431
6
13,4
31
613
,431
Gro
up L
ife -
AURR
-
-
-
-
-
-
-
-
-
-
-
Grou
p Li
fe -
IBN
R 1
,186
,716
1
,186
,716
1
,186
,716
1
,186
,716
1
,186
,716
1
,186
,716
1
,186
,716
1
,186
,716
1
,186
,716
1
,186
,716
1
,186
,716
Rei
nsur
ance
(7
04,4
62)
(704
,462
) (7
04,4
62)
(704
,462
) (7
04,4
62)
(704
,462
) (7
04,4
62)
(704
,462
) (7
04,4
62)
(704
,462
) (7
04,4
62)
Net
liab
ility
12,7
53,7
40
12,
601,
276
12,
929,
836
12,
768,
790
12,
738,
780
12,
775,
021
12,
738,
637
12,
753,
697
12,
753,
783
12,
790,
554
12,
717,
602
% C
hang
e in
net
liab
ility
-
-1
.20%
1.38
%0.
12%
-0.1
2%0.
17%
-0.1
2%0.
00%
0.00
%0.
29%
-0.2
8%
Sum
mar
yBa
seVI
R +1
%VI
R -1
%Ex
pens
es +
10%
Expe
nses
-10%
Expe
nse i
nflat
ion
+2%
Expe
nse
infla
tion
-2%
Laps
es +
5%La
pses
-5%
Mor
talit
y +5
%M
orta
lity
-5%
Indi
vidu
al
11,
658,
055
11,
505,
591
11,
834,
151
11,
673,
105
11,
643,
095
11,
679,
336
11,
642,
952
11,
658,
012
11,
658,
098
11,
694,
869
11,
621,
917
Grou
p 1
,095
,685
1
,095
,685
1
,095
,685
1
,095
,685
1
,095
,685
1
,095
,685
1
,095
,685
1
,095
,685
1
,095
,685
1
,095
,685
1
,095
,685
Net
liab
ility
12
,753
,740
1
2,60
1,27
6 1
2,92
9,83
6 1
2,76
8,79
0 1
2,73
8,78
0 1
2,77
5,02
1 1
2,73
8,63
7 1
2,75
3,69
7 1
2,75
3,78
3 1
2,79
0,55
4 1
2,71
7,60
2
% c
hang
e in
liab
ility
--1
.20%
1.38
%0.
12%
-0.1
2%0.
17%
-0.1
2%0.
00%
0.00
%0.
29%
-0.2
8%

ANNUAL REPORT 2020 AXA MANSARD | 89
2
2.8 NOTES TO THE FINANCIAL STATEMENTSFINANCIALS
3 FINANCIAL RISK MANAGEMENT
(a) Introduction and OverviewThe Group is exposed to a range of financial risks through its financial instruments, insurance assets and insurance liabilities. The key financial risk is that in the long term its investments proceeds are not sufficient to fund the obligations arising from its insurance and investment contracts. The most important components of the financial risks are:
� Market risk
� Credit risk
� Liquidity risk
3.1 MARKET RISKMarket risk is the risk of loss in On-or Off-balance sheet positions, as a result of adverse movement in foreign exchange rate, interest rate, and equity or commodity prices. The identification, management, control, measurement and reporting of market risk are aligned towards the sub-risk categories namely:
� Price risk
� Foreign exchange risk
� Interest-rate risk
3.1.1 PRICE RISKThe Group’s management of price risk is guided by the following limits:
� Investment quality and limit analysis
� Stop loss limit analysis
� Stock to total loss limit analysis
Investment Quality and Limit AnalysisManagement Underwriting & Investment Committee establishes and approves a list of eligible listed and unlisted stocks aligned with investment approval/dealer limits as approved by the Board through its Board Finance and Investment Committee.
The approved stop loss limit below shows the percentage of stock positions that can be sold given a position of events: a given percentage loss and absolute loss amounts. For example, a combination of 20% loss and N10 million loss would require the Company to sell down 25% of the position.
Stop Loss Limit AnalysisMarket capitalizations, liquidity and market volatiles are criteria used to classify certain eligible stocks. These are in categories A, B and C. Stop loss limits (which depict the volume of loss the Group is willing to accept) are ascribed to each stock category. Periodic reviews and reassessments are undertaken on the performance of the stocks. The stop loss limits on categories of stocks as approved by Management Underwriting & Investment Committee are depicted below:
CLASS STOP LOSS LIMIT CHARATERISTICS
A 25% Very liquid, high market capitalisation, low market volatility
B 23% Very liquid, moderate market capitalisation, low market volatility
C 20% Liquid, moderate market capitalisation, low market volatility
Percentage losses
Maximum losses permissible in Naira 15% 20% 25%
₦10,000,000 0.0% 25% 50%
₦15,000,000 25% 50% 75%
₦20,000,000 50% 75% 100%
>₦25,000,000 100% 100% 100%
The Group’s Enterprise Risk Management (ERM) function monitors compliance of the Investment arm to these limits and reports to Management on a weekly basis.
A summary of the Group’s Stop Loss Limit position on trading equities is as follows:

90 | ANNUAL REPORT 2020 - AXA MANSARD
December 2020Amounts in thousands of Naira
STOP LOSS LIMIT ANALYSIS ON GROUP’S QUOTED SECURITY PORTFOLIO
SECTOR OF STOCK COST PRICE MARKET PRICE STOCK CLASS % GAIN/LOSS BENCHMARK EXCEPTION
Banking and other financial institutions 94,785 119,796 A 26% 25% NO
Building materials 17,318 20,401 A 18% 25% NO
Consumer goods 24,672 22,188 C -10% 20% NO
Insurance 4,191 5,630 A 34% 25% NO
Oil and gas 18,784 13,597 C -28% 20% NO
Real estate 8,800 6,099 C -31% 20% NO
Total 168,550 187,711
STOP LOSS LIMIT ANALYSIS ON COMPANY’S QUOTED SECURITY
SECTOR OF STOCK COST PRICE MARKET PRICE STOCK CLASS % GAIN/LOSS BENCHMARK EXCEPTION
Banking and other financial institutions
31,333 39,750 A 27% 25% NO
Building materials 17,318 20,401 A 18% 25% NO
Consumer goods 24,672 22,188 C -10% 20% NO
Insurance 4,191 5,630 A 34% 25% NO
Oil and gas 18,784 13,597 C -28% 20% NO
Real estate 8,800.00 6,099 C -31% 20% NO
Total 105,098 107,665
December 2019
Amounts in thousands of Naira
STOP LOSS LIMIT ANALYSIS ON COMPANY’S QUOTED SECURITY
SECTOR OF STOCK COST PRICE MARKET PRICE STOCK CLASS % GAIN/LOSS BENCHMARK EXCEPTION
Banking and other financial institutions
67,928 68,754 A 1% 25% NO
Building materials 17,318 13,147 A -24% 25% NO
Consumer goods 24,352 22,798 C -6% 20% NO
Insurance 4,191 6,287 A 50% 25% NO
Oil and gas 18,784 11,600 C -38% 20% NO
Real estate - - C 0% 20% NO
Total 132,573 122,586
STOP LOSS LIMIT ANALYSIS ON COMPANY’S QUOTED SECURITY
SECTOR OF STOCK COST PRICE MARKET PRICE STOCK CLASS % GAIN/LOSS BENCHMARK EXCEPTION
Banking and other financial institutions
7,016 10,501 A 50% 25% NO
Building materials 17,318 13,147 A -24% 25% NO
Consumer goods 24,352 22,798 C -6% 20% NO
Insurance 4,191 6,287 A 50% 25% NO
Oil and gas 18,784 11,600 C -38% 20% NO
Real estate - - C 0% 20% NO
Total 71,661 64,333
2 2.8 NOTES TO THE FINANCIAL STATEMENTSFINANCIALS

ANNUAL REPORT 2020 AXA MANSARD | 91
2
The Group manages its exposure to price risk through adherence to stop loss limits and investment in eligible stocks as approved by the Board. Potential losses and exception as seen in the schedule above were within the Group’s stated risk appetite.
The Group further reduces its exposure to price risk with relatively low investment in quoted equities. The position held on quoted equities by the Company and Group is less than 2% of its investment portfolio mitigating the effect of price volatilities.
Stock to Total Limit AnalysisConsidering the volatility of stocks (typically quoted stocks), the Group monitors the contribution of stocks within each sector to the total stocks holding in a portfolio. The objective of the analysis is to evaluate the Company’s concentration on stocks within each sector and ultimately exposure to market volatility if the price of any of the stocks should drastically plummet.
A summary of the Group’s stock to total limit position on equities is as follows:
STOCK TO TOTAL LIMIT ON GROUP’S INVESTMENT EQUITY SECURITY
DEC 2020 DEC 2020 DEC 2019 DEC 2019
GROUP GROUP GROUP GROUP
SECTOR OF STOCK MARKET PRICE % of Total MARKET PRICE % of Total
Banking and other financial institutions 119,796 64% 68,754 56%
Building materials 20,401 11% 13,147 11%
Consumer goods 22,188 12% 22,798 19%
Insurance 5,630 3% 6,287 5%
Oil and Gas 13,597 7% 11,600 9%
Real estate 6,099 3% - 0%
Telecommunication - 0% - 0%
Total 187,711 122,586
STOCK TO TOTAL LIMIT ON COMPANY’S INVESTMENT EQUITY SECURITY
DEC 2020 DEC 2020 DEC 2019 DEC 2019
PARENT PARENT PARENT PARENT
SECTOR OF STOCK MARKET PRICE % of Total MARKET PRICE % of Total
Banking and other financial institutions 39,750 37% 10,501 16%
Building materials 20,401 19% 13,147 20%
Consumer goods 22,188 21% 22,798 35%
Insurance 5,630 5% 6,287 10%
Oil and Gas 13,597 13% 11,600 18%
Real estate 6,099 6% - 0%
Telecommunication - 0% - 0%
Total 107,665 64,333
December 31, 2020
PRICE RISK SENSITIVITY
Group
Gross amount
Increase by 13.5%
Increase by 20%
Decrease by 13.5%
Decrease by 20%
Investment securities
Financial assets fair valued through profit or loss 5,407,073 729,955 1,081,415 (729,955) (1,081,415)
Government & corporate bonds 21,585,177 2,913,999 4,317,035 (2,913,999) (4,317,035)
Treasury bills 627,993 84,779 125,599 (84,779) (125,599)
Equity securities 243,677 32,896 48,735 (32,896) (48,735)
Investment funds 8,645,785 1,167,181 1,729,157 (1,167,181) (1,729,157)
Financial assets designated at fair value 4,485,246 605,508 897,049 (605,508) (897,049)
Impact on profit after tax 3,874,023 5,739,293 (3,874,023) (5,739,293)
2.8 NOTES TO THE FINANCIAL STATEMENTSFINANCIALS

92 | ANNUAL REPORT 2020 - AXA MANSARD
Parent
Gross amount
Increase by 13.5%
Increase by 20%
Decrease by 13.5%
Decrease by 20%
Investment securities
Financial assets fair valued through profit or loss 5,407,073 729,955 1,081,415 (729,955) (1,081,415)
Government & corporate bonds 20,276,149
2,737,280 4,055,230 (2,737,280) (4,055,230)
Tenored deposits with maturity above 90 days - - - - -
Treasury bills 378,637 51,116 75,727 (51,116) (75,727)
Equity securities 163,631 22,090 32,726 (22,090) (32,726)
Investment funds 6,946,023 937,713 1,389,205 (937,713) (1,389,205)
Financial assets designated at fair value 4,485,246 605,508 897,049 (605,508) (897,049)
Impact on profit before tax 4,353,708 6,449,937 (4,353,708) (6,449,937)
December 31, 2019
PRICE RISK SENSITIVITY
Group
Gross
amountIncrease by
13.5%Increase by
20%Decrease by
13.5%Decrease by
20%
Investment securities
Financial assets fair valued through profit or loss 5,302,005 715,771 1,060,401 (715,771) (1,060,401)
Government & corporate bonds 12,820,184 1,730,725 2,564,037 (1,730,725) (2,564,037)
Tenored deposits with maturity above 90 days 1,077,894 145,516 215,579 (145,516) (215,579)
Treasury bills 4,846,197 654,237 969,239 (654,237) (969,239)
Equity securities 182,602 24,651 36,520 (24,651) (36,520)
Investment funds 8,909,948 1,202,843 1,781,990 (1,202,843) (1,781,990)
Financial assets designated at fair value 4,154,695 560,884 830,939 (560,884) (830,939)
Impact on profit after tax 3,524,238 5,221,094 (3,524,238) (5,221,094)
Parent
Gross amount
Increase by 13.5%
Increase by 20%
Decrease by 13. 5%
Decrease by 20%
Investment securities
Financial assets fair valued through profit or loss 5,302,005 715,771 1,060,401 (715,771) (1,060,401)
Government & corporate bonds 11,498,908 1,552,353 2,299,782 (1,552,353) (2,299,782)
Tenored deposits with maturity above 90 days 1,077,895 145,516 215,579 (145,516) (215,579)
Treasury bills 1,546,058 208,718 309,212 (208,718) (309,212)
Equity securities 124,349 16,787 24,870 (16,787) (24,870)
Investment funds 7,785,436 1,051,034 1,557,087 (1,051,034) (1,557,087)
Financial assets designated at fair value 4,154,695 560,884 830,939 (560,884) (830,939)
Impact on profit before tax 3,535,291 5,237,468 (3,535,291) (5,237,468)
4.1.2 FOREIGN EXCHANGE RISKAXA Mansard Insurance Group is exposed to foreign exchange currency risk primarily through undertaking certain transactions denominated in foreign currency. The Group is exposed to foreign currency risk through its investment in bank balances, fixed deposits and bonds denominated in foreign currencies.
The carrying amounts of the Group’s foreign currency denominated assets and liabilities at end of the year are as follows:
2 2.8 NOTES TO THE FINANCIAL STATEMENTSFINANCIALS

ANNUAL REPORT 2020 AXA MANSARD | 93
2
December 31, 2020 December 31, 2019
Group USD EUR GBP USD EUR GBP
Cash and cash equivalents 1,954,300 47,235 142,027 2,691,444 21,828 72,625
Investment securities -Available-for-sale 1,662,437 - - 1,662,437 - -
Borrowings 2,994,361 - - 6,965,804 - -
Parent
USD EUR GBP USD EUR GBP
Cash and cash equivalents 1,840,178 47,235 472 2,552,413 21,783 540
Investment securities -Available-for-sale 1,494,948 - - 1,494,948 - -
Foreign currency changes are monitored by the investment committee and holdings are adjusted when there is a deviation from the investment policy. The Group further manages its exposure to foreign risk exchange using sensitivity analysis to assess potential changes in the value of foreign exchange positions and impact of such changes on the Group’s investment income. At the year end, the foreign currency investments held in the portfolio were on unquoted equity, bonds, treasury bills and cash and cash equivalents. APD Limited manages the Group’s investment property and the rental payments are in USD per the tenancy agreement.
The following table details the effect of foreign exchange risk on the profit as at 31 December 2020:
December 31, 2020
FOREIGN EXCHANGE SENSITIVITY
Group
Increase by 15%
Increase by 10%
Decrease by 10%
Decrease by 15%
Investment securities exposed to foreign exchange risk Gains/(losses)
Cash and cash equivalents 321,534 214,356 (214,356) (321,534)
Investment securities
Available-for-sale 249,365 166,244 (166,244) (249,365)
Financial liabilities exposed to foreign exchange risk
Borrowings (449,154) (299,436) 299,436 449,154
Effect on profit before tax (127,620) (85,080) 85,080 127,620
Taxation @ 30% (38,286) (25,524) 25,524 38,286
Effect on profit after tax (89,334) (59,556) 59,556 89,334
Effect on other components of equity -OCI 74,810 49,873 (49,873) (74,810)
Parent
Increase by 15%
Increase by 10%
Decrease by 10%
Decrease by 15%
Investment securities exposed to foreign exchange risk Gains/(losses)
Cash and cash equivalents 283,183 188,789 (188,789) (283,183)
Investment securities
Available-for-sale 224,242 149,495 (149,495) (224,242)
Effect on profit before tax 283,183 188,789 (188,789) (283,183)
Taxation @ 30% 84,955 56,637 (56,637) (84,955)
Effect on profit after tax 198,228 132,152 (132,152) (198,228)
Effect on other components of equity -OCI 67,273 44,848 (44,848) (67,273)
2.8 NOTES TO THE FINANCIAL STATEMENTSFINANCIALS

94 | ANNUAL REPORT 2020 - AXA MANSARD
December 31, 2019
FOREIGN EXCHANGE SENSITIVITY
GroupIncrease by 15% Increase by 10% Decrease by
10% Decrease by
15%
Investments securities exposed to foreign exchange risk Gains/(losses)
Cash and cash equivalents 417,885 278,590 (278,590) (417,885)
Investment securities
Available-for-sale 249,365 166,244 (166,244) (249,365)
Financial liabilities exposed to foreign exchange risk
Borrowings (1,044,871) (696,580) 696,580 1,044,871
Effect on profit before tax (626,986) (417,991) 417,991 626,986
Taxation @ 30% (188,096) (125,397) 125,397 188,096
Effect on profit after tax (438,890) (292,593) 292,593 438,890
Effect on other components of equity -OCI 74,810 49,873 (49,873) (74,810)
ParentIncrease by 15% Increase by 10% Decrease by
10% Decrease by
15%
Investments securities exposed to foreign exchange risk Gains/(losses)
Cash and cash equivalents 386,210 257,474 (257,474) (386,210)
Investment securities
Available-for-sale 224,242 149,495 (149,495) (224,242)
Effect on profit before tax 386,210 257,474 (257,474) (386,210)
Taxation @ 30% 115,863 77,242 (77,242) (115,863)
Effect on profit after tax 270,347 180,232 (180,232) (270,347)
Effect on other components of equity -OCI 67,273 44,848 (44,848) (67,273)
The method used to arrive at the possible risk of foreign exchange rate was based on statistical analysis. The statistical analysis has been based on main currencies movement for the last five years. This information is then revised and adjusted for reasonableness under the current economic circumstances.
4.1.3 INTEREST-RATE RISKThe Company is moderately exposed to interest-rate risk through its conservative investment approach with high investment in fixed income and money market instruments which have fixed interest rates rather than floating rates. Interest rate risk also exists in policies that carry investment guarantees on early surrender or at maturity, where claim values can become higher than the value of backing assets as a result of rises or falls in interest rates.
A significant portion of the Group’s assets relate to its capital rather than liabilities, the value of its interest rate based assets exceeds its interest rate based liabilities. As a result, the Company’s investment income will move with fixed interest rates over the medium to long-
term with short-term interest rate fluctuations creating unrealized fair value gains or losses in other comprehensive income.
The Group’s major exposure to interest-rate sensitive liabilities arises from investment-linked products which accounts for a small portion of its business which are linked to the CBN Monetary Policy Rates (MPR). The fluctuations in interest rates cannot significantly impact our statement of financial position as interest-rate sensitive liabilities are quite small compared with assets.
Interest rate risk is managed principally through monitoring interest rate gaps and sensitivity analysis across all investment portfolios.
The table below, however, details the maturity profile of the interest rate sensitivity analysis of AXA Mansard Insurance Plc. as at 31 December 2020, holding all other variables constant and assuming that all interest rates are floating and move in line with prevailing interest rates. Based on historical data, 100 and 500 basis points changes are deemed to be reasonably possible and are used when reporting interest rate risk.
2 2.8 NOTES TO THE FINANCIAL STATEMENTSFINANCIALS

ANNUAL REPORT 2020 AXA MANSARD | 95
2
December 31, 2020
GROUP Non
interest bearing
1-3 months 3-6 months > 6 months Total
Interest earning assets
Cash and cash equivalents 11,134,053 9,117,666 - - 20,251,719
Financial assets fair valued through profit or loss - - - 5,407,073 5,407,073 Bonds - - - 21,585,177 21,585,177 Tenored deposits with initial maturity of 90 days and above - - - - - Treasury bills - - - 627,993 627,993 Equity securities 243,677 - - - 243,677 Investment funds - - - 8,645,785 8,645,785 Financial assets designated at fair value - - - 4,485,246 4,485,246 Loans and receivables 470,272 - - - 470,272 Statutory deposit - - - 500,000 500,000
11,848,002 9,117,666 - 41,251,274 62,216,942
Interest bearing liabilities
Investment contract liabilities– At amortised cost - 837,800 960,968 3,354,753 5,153,521 – Liabilities designated at fair value - - - 4,485,246 4,485,246 Borrowings - - - 2,994,361 2,994,361
- 837,800 960,968 10,834,360 12,633,128
Gap 8,279,866 (960,968) 30,416,914 49,583,814
Cumulative gap - Sensitivity analysis 8,279,866 7,318,898 37,735,812
Increase by 100bp 82,799 (9,610) 304,169 495,838 Increase by 500bp 413,993 (48,048) 1,520,846 2,479,191 Decrease by 100bp (82,799) 9,610 (304,169) (495,838)Decrease by 500bp (413,993) 48,048 (1,520,846) (2,479,191)
PARENT
Non interest bearing
1-3 months 3-6
months > 6 months Total
Interest earning assets
Cash and cash equivalents 8,972,560 7,603,388 - - 16,575,948
Financial assets fair valued through profit or loss - - - 5,407,073 5,407,073 Bonds - - - 20,276,149 20,276,149 Tenored deposits with initial maturity of 90 days and above - - - - - Treasury bills - - - 378,637 378,637 Equity securities 163,631 - - - 163,631 Investment funds - - - 6,946,023 6,946,023 Financial assets designated at fair value - - 4,485,246 4,485,246 Loans and receivables 1,014,377 - - - 1,014,377 Lease Receivables - - - 134,278 134,278 Statutory deposit - - - 500,000 500,000
10,150,568 7,603,388 - 38,127,406 55,881,362
Interest bearing liabilities
Investment contract liabilities
– At amortised cost - 837,800 960,968 3,354,753 5,153,521
– liabilities designated at fair value - - - 4,485,246 4,485,246
- 837,800 960,968 7,839,999 9,638,767
Gap 6,765,588 (960,968) 30,287,407 46,242,595
Cumulative gap - Sensitivity analysis 6,765,588 5,804,620 36,092,027
Increase by 100bp 67,656 (9,610) 302,874 462,426
Increase by 500bp 338,279 (48,048) 1,514,370 2,312,130
Decrease by 100bp (67,656) 9,610 (302,874) (462,426)
Decrease by 500bp (338,279) 48,048 (1,514,370) (2,312,130)
2.8 NOTES TO THE FINANCIAL STATEMENTSFINANCIALS

96 | ANNUAL REPORT 2020 - AXA MANSARD
December 31, 2019
GROUP
Non interest bearing
1-3 months 3-6 months > 6 months Total
Interest earning assets
Cash and cash equivalents 7,603,647 10,307,769 - - 17,911,416
Financial assets fair valued through profit or loss - - - 5,302,005 5,302,005 Bonds - 103,236 - 12,716,948 12,820,184 Tenored deposits with initial maturity of 90 days and above - - 944,408 133,485 1,077,894 Treasury bills - 26,140 208,405 4,611,652 4,846,197 Equity securities 182,602 - - - 182,602 Investment funds - - - 8,909,948 8,909,948 Financial assets designated at fair value - - - 4,154,695 4,154,695 Loans and receivables 403,548 - - - 403,548 Statutory deposit - - - 500,000 500,000
Total interest earning assets 8,189,797 10,437,144 1,152,814 36,328,734 56,108,488
Interest bearing liabilities
Investment contract liabilities– At amortised cost - 698,232 811,968 2,765,565 4,275,765 – Liabilities designated at fair value - - - 4,154,695 4,154,695 Borrowings - - - 6,965,804 6,965,804
Total interest bearing liabilities - 698,232 811,968 13,886,064 15,396,264
Gap 9,738,912 340,846 22,442,670 40,712,224 Cumulative gap - Sensitivity analysis 9,738,912 10,079,758 32,522,427
Increase by 100bp 97,389 3,408 224,427 407,122 Increase by 500bp 486,946 17,042 1,122,133 2,035,611 Decrease by 100bp (97,389) (3,408) (224,427) (407,122)Decrease by 500bp (486,946) (17,042) (1,122,133) (2,035,611)
PARENT Non interest bearing
1-3 months 3-6 months
> 6 months Total
Interest earning assets Interest earning assets
Cash and cash equivalents 6,024,334 10,108,940 - - 16,133,274
Financial assets fair valued through profit or loss - - - 5,302,005 5,302,005 Bonds - 102,482 - 11,396,426 11,498,908 Tenored deposits with initial maturity of 90 days and above - - 944,408 133,487 1,077,895 Treasury bills - - 121,059 1,424,999 1,546,058 Equity securities 124,349 - - - 124,349 Investment funds - - - 7,785,436 7,785,436 Financial assets designated at fair value - - 4,154,695 4,154,695 Loans and receivables 882,168 - - 882,168 Statutory deposit - - - 500,000 500,000
Total interest earning assets 7,030,851 10,211,422 1,065,467 30,697,048 49,004,787
Interest bearing liabilities
Investment contract liabilities– At amortised cost - 698,232 811,968 2,765,565 4,275,765 – Liabilities designated at fair value - - - 4,154,695 4,154,695
Total interest bearing liabilities - 698,232 811,968 6,920,260 8,430,460
Gap 9,513,190 253,499 23,776,788 40,574,327
Cumulative gap - Sensitivity analysis 9,513,190 9,766,689 33,543,477
Increase by 100bp 95,132 2,535 237,768 405,743
Increase by 500bp 475,659 12,675 1,188,839 2,028,716
Decrease by 100bp (95,132) (2,535) (237,768) (405,743)
Decrease by 500bp (475,659) (12,675) (1,188,839) (2,028,716)
2 2.8 NOTES TO THE FINANCIAL STATEMENTSFINANCIALS

ANNUAL REPORT 2020 AXA MANSARD | 97
2
4.2 NON-FINANCIAL ASSET EXPOSED TO PRICE RISKThe Group is exposed to property risk through its investment in property. AXA Mansard Insurance Group manages such risk by monitoring the contribution of property to its portfolio.
GROUP’S EXPOSURE TO PROPERTY PRICE RISKInstrument Amount % Exposure
Property 13,694,760 21.38%
Interest Generating Assets 50,368,940 78.62%
64,063,700
COMPANY’S EXPOSURE TO PROPERTY PRICE RISKInstrument Amount % Exposure
Property - 0%
Interest Generating Assets 45,730,794 100%
45,730,794
4.3 CREDIT RISKAXA Mansard Insurance Group is exposed to risk relating to its investment securities (bonds, treasury bills, fixed deposits and loan receivables. Its receivables comprise trade receivables from customers, reinsurers and coinsurers recoverable and other receivables.
Collateral Held and Other Credit Enhancements, and Their Financial EffectThe group does not hold collateral or any other enhancements against any of its receivables as at 31 December 2020.
Trade ReceivablesThe Group has placed more responsiveness on effective management of credit risk exposure that relates to trade receivables. In general, the regulator has laid great emphasis on “No Premium, No Cover” and this has positively changed the phase of credit management within the industry. The Group defines credit risk as the risk of counterparty’s failure to meet its contractual obligations. Credit risk arises from insurance cover granted to parties with payment instruments or payments plan issued by stating or implying the terms of contractual agreement.
The Company has placed stringent measures to guard against credit default. Credit risk exposure operates from the level of brokered transactions with little emphasis placed on direct business. The Company’s credit risk exposure to brokered business is very low as the Company requires brokers to provide payment within 30 days after which impairment trigger is identified and the receivable is assessed for impairment.
Sources of Credit Risk: � Direct default risk: · risk that the Group will not receive the
cash flows or assets to which it is entitled because a party with which the Group has a bilateral contract defaults on one or more obligations.
� Downgrade Risk: risk that changes in the possibility of a future default by an obligor will adversely affect the present value of the contract with the obligor today.
� Settlement Risk: risk arising from the lag between the value and settlement dates of securities transactions.
Management of Credit Risk Due to Trade ReceivablesThe Company constantly reviews brokers’ contribution to ensure that adequate attention is paid to high premium contributing brokers.
The Group credit risk is constantly reviewed and approved during the Management Underwriting & Investment Committee (MUIC) meeting. There is also a Criticized Assets Committee (CAC) which is responsible for the assessment and continued review of the Company’s premium debt and direct appropriate actions in respect of delinquent ones. It also ensured that adequate provisions are taken in line with IAS 39. Other credit risk management measures include:
� Formulating credit policies with strategic business units, underwriters, brokers, covering brokers grading, reporting, assessment, legal procedures and compliance with regulatory and statutory bodies.
� Identification of credit risk drivers within the Group in order to coordinate and monitor the probability of default that could have an unfortunate impact.
� Developing and monitoring credit limits. The Group is responsible for setting credit limits through grading in order to categorize risk exposures according to the degree of financial loss and the level of priority expected from management.
� Assessment of credit risk. All first-hand assessment and review of credit exposures in excess of credit limits, prior to granting insurance cover are subject to review process and approval given during MUIC meeting.
� Continuous reviewing of compliance and processes in order to maintain credit risk exposure within acceptable parameters.
Impairment ModelPremium debtors are measured at amortized cost, less provision for impaired receivables. Under IFRS, an asset is impaired if the
2.8 NOTES TO THE FINANCIAL STATEMENTSFINANCIALS

98 | ANNUAL REPORT 2020 - AXA MANSARD
carrying amount is greater than the recoverable amount. The standard favours the use of the incurred loss model in estimating the impairment of its receivables.
By the provisions of IAS 39, the impairment of the premium debtors is to be assessed at two different levels, individually or collectively. However, based on NAICOM’s “No Premium No Cover” guidelines which state that “all insurance covers shall be provided on a strict
‘no premium no cover’ basis”, only cover for which payment has been received shall be booked. However, brokers have a 30 day period to make payments from the date of the credit notes. The Company uses the aging of receivables as the major parameter in calculating impairment.
Below is the analysis of the group’s maximum exposure to credit risk at the year end.
Group Group Parent Parent
Maximum exposure to credit risk Notes Carrying
amount Carrying
amount Carrying
amount Carrying
amount
In thousands of Naira Dec 2020 Dec 2019 Dec 2020 Dec 2019
Cash and cash equivalents 8 20,251,719 17,911,416 16,575,948 16,133,274
Financial assets fair valued through profit or loss 9.1 5,407,073 5,302,005 5,407,073 5,302,005
Available-for-sale (less equity security) 9.2 30,858,955 27,654,223 27,600,809 21,908,297
Financial assets designated at fair value (less equity security) 9.3 4,467,868 4,140,271 4,467,868 4,140,271
Loans and receivable 14 470,272 403,548 1,014,377 882,168
Trade receivable 10 6,668,899 5,418,424 1,043,004 1,224,373
Reinsurance assets (less prepaid reinsurance, reserves and IBNR) 11 2,404,819 5,156,197 2,384,292 5,142,841
Other receivable (less prepayment) 13 819,323 974,148 478,179 347,282
Statutory deposit 19 500,000 500,000 500,000 500,000
71,848,928 67,460,232 59,471,550 55,580,511
The Group’s investment policy puts limits on the Fixed Income and Money Market instruments including portfolio composition limits, issuer type limits, aggregate issuer limits and corporate sector limits.
The Group’s investment portfolio is exposed to credit risk through its fixed income and money market instruments.
The Group’s exposure to credit risk is low as Government sector (government bonds and treasury bills) accounted for largest part 30% (2019: 30%) of the investment as at 31 December 2020.
The Group further manages its exposure to credit risk through counterparty risk via established limits as approved by the Board. These limits are determined based on credit ratings of the counterparty amongst other factors. All fixed income investments are measured for performance on a quarterly basis and monitored by management on a monthly basis.
Exposures to credit risks is managed through counterparty risks using instituted limits as approved the MUIC. These limits are based on counter party credit ratings amongst other factors.
Disclosure of Treasury Bills of Less Than 90 Days MaturityFor the purpose of IFRS 7 disclosures, treasury bills classified as cash and cash equivalents in the statement of financial position has been disclosed as part of available for sale assets.
4.3.1 CREDIT QUALITYExcept for staff loans included in loans and receivables, other receivables and trade receivables, all financial assets are neither past due nor impaired. The credit quality of the assets are as analysed below:
2 2.8 NOTES TO THE FINANCIAL STATEMENTSFINANCIALS

ANNUAL REPORT 2020 AXA MANSARD | 99
2
GroupDecember 31, 2020
Unrated A/A- AA B/B+ BB- BBB TOTAL
In thousands of Nigerian Naira
High credit
quality Very
strong
Strong financial security Substantive Doubtful
Cash and cash equivalents - 3,107,519 2,673,451 12,057,176 1,279,483 1,134,090 20,251,719
Financial assets fair valued through profit or loss - - - 5,407,073 - - 5,407,073
Available-for-sale assets 214,464 2,003,706 85,277 28,074,584 292,784 188,140 30,858,955
Financial assets designated at fair value 1,149,987 548,094 134,992 2,604,053 30,742 - 4,467,868
Loans and receivables 470,272 - - - - - 470,272
Trade receivable 6,668,899 - - - - - 6,668,899
Reinsurance assets (less prepaid reinsurance, reserves and IBNR) 2,404,819 - - - - - 2,404,819
Other receivable (less prepayment) 819,323 - - - - - 819,323
Statutory deposit - - - 500,000 - - 500,000
11,727,764 5,659,319 2,893,720 48,642,886 1,603,009 1,322,230 71,848,929
Group
December 31, 2019
Unrated A/A- AA B/B+ BB- BBB TOTAL
In thousands of Nigerian Naira
High credit
quality Very
strong
Strong financial security
Substantive Doubtful
Cash and cash equivalents 8,178,582 950,000 2,354,929 4,317,942 1,865,262 244,702 17,911,416
Financial assets fair valued through profit or loss - - - 5,302,005 - - 5,302,005
Available-for-sale assets 358,059 9,356,312 - 16,751,057 1,188,795 - 27,654,223
Financial assets designated at fair value 505,035 776,991 - 2,356,863 87,549 413,832 4,140,271
Loans and receivables 403,548 - - - - - 403,548
Trade receivable 5,418,424 - - - - - 5,418,424
Reinsurance assets (less prepaid reinsurance, reserves and IBNR) 5,156,197 - - - - - 5,156,197
Other receivable (less prepayment) 974,148 - - - - - 974,148
Statutory deposit - - - 500,000 - - 500,000
20,993,994 11,083,303 2,354,929 29,227,867 3,141,606 658,534 67,460,233
2.8 NOTES TO THE FINANCIAL STATEMENTSFINANCIALS

100 | ANNUAL REPORT 2020 - AXA MANSARD
PARENTDecember 31, 2020
Unrated A/A- AA B/B+ BB- BBB TOTAL
In thousands of Nigerian Naira High credit
quality Very
strong
Strong financial security Substantive Doubtful
Cash and cash equivalents - 3,090,467 2,673,451 9,895,683 253,421 662,926 16,575,948
Financial assets fair valued through profit or loss - - - 5,407,073 - - 5,407,073
Available-for-sale 149,315 1,981,404 85,277 25,090,605 106,068 188,140 27,600,809
Financial assets designated at fair value 1,149,987 548,094 134,992 2,604,053 30,742 - 4,467,868
Loans and receivables 1,014,377 - - - - - 1,014,377
Trade receivables 1,043,004 - - - - - 1,043,004
Reinsurance assets (less prepaid reinsurance and IBNR) 2,384,292 - - - - - 2,384,292
Other receivables (less prepayment) 478,179 - - - - - 478,179
Statutory deposit - - - 500,000 - - 500,000
6,219,154 5,619,965 2,893,720 43,497,414 390,231 851,066 59,471,550
PARENT
December 31, 2019
Unrated A/A- AA B/B+ BB- BBB TOTAL
In thousands of Nigerian NairaHigh credit
quality Very
strong
Strong financial security Substantive Doubtful
Cash and cash equivalents 6,400,440 950,000 2,354,929 4,317,942 1,865,262 244,702 16,133,274
Financial assets fair valued through profit or loss - - - 5,302,005 - - 5,302,005
Available-for-sale 292,910 9,334,010 - 11,279,298 1,002,079 - 21,908,297
Financial assets designated at fair value 505,035 776,991 - 2,356,863 87,549 413,832 4,140,271
Loans and receivables 882,168 - - - - - 882,168
Trade receivables 1,224,373 - - - - - 1,224,373
Reinsurance assets (less prepaid reinsurance and IBNR) 5,142,841 - - - - - 5,142,841
Other receivables (less prepayment) 347,282 - - - - - 347,282
Statutory deposit - - - 500,000 - - 500,000
14,795,050 11,061,001 2,354,929 23,756,108 2,954,890 658,534 55,580,511
2 2.8 NOTES TO THE FINANCIAL STATEMENTSFINANCIALS

ANNUAL REPORT 2020 AXA MANSARD | 101
2
Global Corporate Rating (GCR)’s Rating Symbols and Definitions Summary
AAA Extremely strong financial security characteristics and is the highest FSR assigned by GCR.
AA Has very strong financial security characteristics, differing only slightly from those rated higher.
A Has strong financial security characteristics, but is somewhat more likely to be affected by adverse business conditions than assurers with higher ratings.
BBB Has good financial security characteristics, but is much more likely to be affected by adverse business conditions than assurers with higher ratings.
BB Has vulnerable financial security characteristics, which might outweigh its strengths. The ability of these companies to discharge obligations is not well safeguarded in the future.
B Possessing substantial risk that obligations will not be paid when due. Judged to be speculative to a high degree.
Trade receivable and reinsurance assets (claims receivable) subject to credit risk are further assessed below:
Group Group Parent Parent
Amounts in thousands of Naira 31 Dec 2020 31 Dec 2019 31 Dec 2020 31 Dec 2019
Gross premium receivable 5,900,114 4,416,751 160,309 220,743
Co-insurance receivable 923,762 1,034,697 923,762 1,034,697
Reinsurers’ share of outstanding claims 1,502,091 3,418,524 1,502,091 3,405,168
Recoverables from reinsurers on claims paid 902,728 1,737,673 882,201 1,737,673
Total 9,228,695 10,607,645 3,468,363 6,398,281
Neither due nor impaired 9,073,718 10,574,621 3,427,296 6,367,214
Individually impaired 154,977 33,024 41,067 31,067
Gross total 9,228,695 10,607,645 3,468,363 6,398,281
Impairment allowance (154,977) (33,024) (41,067) (31,067)
Carrying amount 9,073,718 10,574,621 3,427,296 6,367,214
Loans & receivables and other receivables subject to credit risk are further assessed below:
Neither due nor impaired Group Group Parent Parent
Amounts in thousands of Naira 31 Dec 2019 31 Dec 2018 31 Dec 2019 31 Dec 2018
Other receivable (less prepayment) 819,323 974,148 478,179 347,282
Loans and receivable 470,272 403,548 1,014,377 882,168
Total 1,289,595 1,377,696 1,492,556 1,229,450
Total receivables neither due nor impaired 1,427,120 288,696 1,630,081 767,316
Individually impaired 137,524 1,221,471 137,525 1,221,471
Gross total 1,564,644 1,510,167 1,767,606 1,988,787
Impairment allowance (137,524) (1,221,471) (137,525) (1,221,471)
Carrying amount 1,427,120 288,696 1,630,081 767,316
Individually impaired 137,524 1,221,471 137,525 1,221,471
Over 365 days 137,524 1,221,471 137,525 1,221,471
CREDIT QUALITY
Credit RatingCredit rating under the new dispensation of No Premium, No Cover policy has taken a different turn. We continually review credit notes issued by brokers and adequately follow-up to ensure prompt payments as stated.
Internally, the Company categorizes brokers and reinsurers into grade A, B, C, D and E on the basis of previous premium contribution, future prospect and recommendation. The rating determines the outstanding credit limit of the broker. The credit limit of brokers is as follows:
2.8 NOTES TO THE FINANCIAL STATEMENTSFINANCIALS

102 | ANNUAL REPORT 2020 - AXA MANSARD
CATEGORIZATION CREDIT LIMIT CREDIT PERIOD
Grade A No credit limit Exposure of 20 million for a max. of 60 days Grade B Outstanding credit limit not exceeding N50 million Exposure of 5 million for a max. of 60 days Grade C Outstanding credit limit not exceeding N25 million Exposure of 2.5 million for a max. of 60 days Grade C2 Outstanding credit limit not exceeding N10 million Any exposure after 45 days Grade D Outstanding credit limit not exceeding N0.5 million Any exposure after 45 days Grade E Zero Credit Cash only
The Group’s categorization of Trade and Reinsurance receivable (less prepaid reinsurance and IBNR) as at 31 December 2020 is as follows:
Group Group Parent Parent
31 Dec 2020 31 Dec 2019 31 Dec 2020 31 Dec 2019
Trade receivable 6,668,899 5,418,424 1,043,004 1,224,373
Reinsurance receivable 2,404,819 5,156,197 2,384,292 5,142,841
Total 9,073,718 10,574,621 3,427,296 6,367,214
GroupDecember 31, 2020
Category A B C D TOTAL
Insurance brokers 78,207 - 15,424 66,678 160,309 Insurance companies 923,762 - - - 923,762 Reinsurance companies 2,404,819 - - - 2,404,819 Policy holders - 5,739,805 - - 5,739,805
3,406,788 5,739,805 15,424 66,678 9,228,695
Impairment - - (697) (154,280) (154,977)
Collective impairment - - - - -
Net carrying amount 3,406,788 5,739,805 14,727 (87,602) 9,073,718
GroupDecember 31, 2019
Category A B C D TOTAL
Insurance brokers 3,194 6,709 2,816 228,837 241,556
Insurance companies 1,034,697 - - - 1,034,697
Reinsurance companies 5,156,197 - - - 5,156,197
Policy holders - 4,175,195 - - 4,175,195
6,194,088 4,181,904 2,816 228,837 10,607,645
Impairment - - (3,243) (29,781) (33,024)
Collective impairment - - - - -
Net carrying amount 6,194,088 4,181,904 (426) 199,055 10,574,621
PARENTDecember 31, 2020
Category A B C D TOTAL
Insurance brokers 78,207 - 15,424 66,678 160,309
Insurance companies 923,762 - - - 923,762
Reinsurance companies 2,384,292 - - - 2,384,292
Policy holders - - - - -
3,386,261 - 15,424 66,678 3,468,363
Impairment - - - (41,067) (41,067)
Collective impairment - - - - -
Net carrying amount 3,386,261 - 15,424 25,611 3,427,296
2 2.8 NOTES TO THE FINANCIAL STATEMENTSFINANCIALS

ANNUAL REPORT 2020 AXA MANSARD | 103
2
PARENTDecember 31, 2019
Category A B C D TOTAL
Insurance brokers 3,194.38 6,708.57 2,816.41 208,023.16 220742.52
Insurance companies 1,034,697.00 - - - 1034697.00
Reinsurance companies 5,142,841 - - - 5,142,841
Policy holders - - - - -
6,180,732 6,709 2,816 208,023 6,398,281
Impairment - - (3,243) (27,824) (31,067)
Collective impairment - - - - -
Net carrying amount 6,180,732 6,709 (426) 180,199 6,367,214
4.3.2 CONCENTRATION OF CREDIT RISKThe Group monitors concentration of credit risk by sector.
December 31, 2020
GROUP
Concentration of credit riskFinancial
institutionsReal
estatePublic sector
Whole-sale and retail trade Individuals Total
Cash and cash equivalents 20,251,719 - - - - 20,251,719
Financial assets fair valued through profit or loss - - 5,407,073 - - 5,407,073
Available-for-sale 8,889,462 - 22,213,170 - - 31,102,632
Financial assets designated at fair value 2,258,811 - 2,226,435 - - 4,485,246
Loans and receivables 470,272 - - - - 470,272
Trade receivables - - - 6,668,899 - 6,668,899
Reinsurance assets - - - 6,499,653 - 6,499,653
Other receivables - - - 1,286,603 - 1,286,603
Statutory deposit - - 500,000 - - 500,000
Total 31,870,264 - 30,346,678 14,455,155 - 76,672,097
PARENT
Concentration of credit riskFinancial
institutionsReal
estatePublic sector
Whole-sale and retail trade Individuals Total
Cash and cash equivalents 16,575,948 - - - - 16,575,948
Financial assets fair valued through profit or loss - - 5,407,073 - - 5,407,073
Available-for-sale 7,109,654 - 20,654,786 - - 27,764,440
Financial assets designated at fair value 2,258,811 - 2,226,435 - - 4,485,246
Loans and receivables 1,014,377 - - - 1,014,377
Trade receivables 1,043,004 - - - - 1,043,004
Reinsurance assets - - 6,327,265 - 6,327,265
Other receivables - - - 726,911 - 726,911
Statutory deposit - - 500,000 - - 500,000
Total 28,001,794 - 28,788,294 7,054,176 - 63,844,264
2.8 NOTES TO THE FINANCIAL STATEMENTSFINANCIALS

104 | ANNUAL REPORT 2020 - AXA MANSARD
GROUPDecember 31, 2019
Concentration of credit riskFinancial
institutionsReal
estatePublic sector
Whole-sale and retail trade Individuals Total
Cash and cash equivalents 17,911,416 - - - - 17,911,416
Financial assets fair valued through profit or loss - - 5,302,005 - - 5,302,005
Available-for-sale 13,705,044 - 14,077,949 53,832 - 27,836,825
Financial assets designated at fair value 1,974,984 - 2,178,351 1,360 - 4,154,695
Loans and receivables 403,548 - - - - 403,548
Trade receivables - - - 5,418,424 - 5,418,424
Reinsurance assets - - - 8,974,246 - 8,974,246
Other receivables - - - 1,548,652 - 1,548,652
Statutory deposit - - 500,000 - - 500,000
Total 33,994,992 - 22,058,305 15,996,514 - 72,049,811
PARENTDecember 31, 2019
Concentration of credit riskFinancial
institutionsReal
estatePublic sector
Whole-sale and retail trade Individuals Total
Cash and cash equivalents 16,133,274 - - - - 16,133,274
Financial assets fair valued through profit or loss - - 5,302,005 - - 5,302,005
Available-for-sale 11,459,015 - 10,519,799 53,832 - 22,032,646
Financial assets designated at fair value 1,974,984 - 2,178,351 1,360 - 4,154,695
Loans and receivables 882,168 - - - 882,168
Trade receivables 1,224,373 - - - - 1,224,373
Reinsurance assets - - 8,895,612 - 8,895,612
Other receivables - - - 801,891 - 801,891
Statutory deposit - - 500,000 - - 500,000
Total 31,673,814 - 18,500,155 9,752,695 - 59,926,664
4.3.3 OFFSETTING FINANCIAL ASSETS AND FINANCIAL LIABILITIESThe disclosures set out in the tables below include financial assets and financial liabilities that are subject to an enforceable master netting arrangement or similar agreement that covers similar financial instruments, irrespective of whether they are offset in the statement of financial position.
Similar financial assets and liabilities include trade receivables and payables.
None of these agreements met the criteria for offsetting in the statement of financial position. Reinsurance payable and receivables create for the parties to the agreement a right of set-off of recognised amounts that is enforceable only following predetermined events as stipulated within the treaty agreements. Also, under the ‘IFRS 4 - Insurance contract’ requirements, reinsurance assets and liabilities are disclosed gross. Receivables and payables from insurance companies and insurance brokers or agents allow for a net settlement by the counterparties when both elect to settle on a net basis. Each party to the agreement will have the option to settle all such amounts on a net basis in the event of default of the other party. An event of default includes a failure by a party to make payment when due. At the point of payment, the offsetting agreement is used to settle on a net basis with the Counterparty.
2 2.8 NOTES TO THE FINANCIAL STATEMENTSFINANCIALS

ANNUAL REPORT 2020 AXA MANSARD | 105
2
Financial assets subject to offsetting, enforceable master netting arrangements and similar agreements (not offset in the financial statements)
GROUPDecember 31, 2020
Related amounts not offset in the statement of financial position
In thousands of Nigerian Naira
Gross amount of
recognised financial
asset
Gross amount of financial
liabilities offset in the statement
of financial position
Net amounts of financial assets
presented in the statement
financial of position
Financial instruments not offset in
the statement of financial
position
Cash collateral received
Net amount
Trade receivables 6,668,899 - 6,668,899 - - 6,668,899
Reinsurance assets 2,404,819 - 2,404,819 - - 2,404,819
Total 9,073,718 - 9,073,718 - - 9,073,718
Financial liabilities subject to offsetting, enforceable master netting arrangements and similar agreements
Related amounts not offset in the statement of financial position
In thousands of Nigerian Naira
Gross amount of recognised
financial asset
Gross amount of financial
liabilities offset in the
statement of financial
position
Net amounts of financial assets
presented in the statement
financial of position
Financial instruments
not offset in the
statement of financial
position
Cash collateral received
Net amount
Trade payables 6,549,084 - 6,549,084 - - 6,549,084
Reinsurance payables 835,626 - 835,626 - - 835,626
Total 7,384,710 - 7,384,710 - - 7,384,710
PARENTDecember 31, 2020
Related amounts not offset in the statement of financial position
In thousands of Nigerian Naira
Gross amount of recognised
financial asset
Gross amount of financial
liabilities offset in the
statement of financial
position
Net amounts of financial assets
presented in the statement
financial of position
Financial instruments
not offset in the
statement of financial
position
Cash collateral received
Net amount
Trade receivables 1,043,004 - 1,043,004 - - 1,043,004
Reinsurance assets 2,384,292 - 2,384,292 - - 2,384,292
Total 3,427,296 - 3,427,296 - - 3,427,296
Financial liabilities subject to offsetting, enforceable master netting arrangements and similar agreements
2.8 NOTES TO THE FINANCIAL STATEMENTSFINANCIALS

106 | ANNUAL REPORT 2020 - AXA MANSARD
Related amounts not offset in the statement of financial position
In thousands of Nigerian Naira
Gross amount of recognised
financial asset
Gross amount of financial
liabilities offset in the
statement of financial
position
Net amounts of financial assets
presented in the statement
financial of position
Financial instruments not offset in
the statement of financial
position
Cash collateral received
Net amount
Trade payables 6,384,792 - 6,384,792 - - 6,384,792
Reinsurance and coinsurance payables 835,626 - 835,626 - - 835,626
Total 7,220,418 - 7,220,418 - - 7,220,418
GROUPDecember 31, 2019
Related amounts not offset in the statement of financial position
In thousands of Nigerian Naira
Gross amount of recognised
financial asset
Gross amount of financial
liabilities offset in the statement
of financial position
Net amounts of financial assets
presented in the statement
financial of position
Financial instruments not offset in
the statement of financial
position
Cash collateral received
Net amount
Trade receivables 5,418,424 - 5,418,424 - - 5,418,424
Reinsurance assets 5,156,197 - 5,156,197 - - 5,156,197
Total 10,574,621 - 10,574,621 - - 10,574,621
Financial liabilities subject to offsetting, enforceable master netting arrangements and similar agreements
Related amounts not offset in the statement of financial position
In thousands of Nigerian Naira
Gross amount of recognised
financial liability
Gross amount of financial
assets offset in the statement
of financial position
Net amounts of financial liabilities
presented in the statement
financial of position
Financial instruments not offset in
the statement of financial
position
Cash collateral received
Net amount
Trade payables 11,579,928 - 11,579,928 - - 11,579,928
Reinsurance payables 2,645,937 - 2,645,937 - - 2,645,937
Total 14,225,865 - 14,225,865 - - 14,225,865
2 2.8 NOTES TO THE FINANCIAL STATEMENTSFINANCIALS

ANNUAL REPORT 2020 AXA MANSARD | 107
2
ParentDecember 31, 2019
Related amounts not offset in the statement of financial position
In thousands of Nigerian Naira
Gross amount of recognised
financial asset
Gross amount of financial
liabilities offset in the statement of
financial position
Net amounts of financial assets
presented in the statement
financial of position
Financial instruments not offset in
the statement of financial
position
Cash collateral received
Net amount
Trade receivables 1,224,373 - 1,224,373 - - 1,224,373
Reinsurance assets 5,142,841 - 5,142,841 - - 5,142,841
Total 6,367,214 - 6,367,214 - - 6,367,214
Financial liabilities subject to offsetting, enforceable master netting arrangements and similar agreements
Related amounts not offset in the statement of financial position
In thousands of Nigerian Naira
Gross amount of recognised
financial liability
Gross amount of financial
assets offset in the statement
of financial position
Net amounts of financial liabilities
presented in the statement
financial of position
Financial instruments
(including non cash collateral
Cash collateral received
Net amount
Trade payables 11,490,761 - 11,490,761 - - 11,490,761
Reinsurance payables 2,645,937 - 2,645,937 - - 2,645,937
Total 14,136,698 - 14,136,698 - - 14,136,698
The gross amount of financial assets and financial liabilities and their net amounts disclosed in the above tables have been measured in the statement of financial position on the following bases:
Trade receivables and payables Amortised cost
Reinsurance receivables and payables Amortised cost
4.4 LIQUIDITY RISKLiquidity risk is the risk that financial resources may not be available to meet maturing obligations at a reasonable cost. The Group mitigates this risk by monitoring liquidity and expected outflows. The Group’s current liabilities arise as claims are made and/or clients request for termination of their investment-linked products. It also arises from other normal business activities across the subsidiaries within the group. The Group has no material commitments for capital expenditures and there is no need for such expenditures in the normal course of business. Claims payments are funded by current operating cash flow including investment income.
The Company’s investment policy requires that a minimum of 35% of the Company’s life and non-life portfolio be held in liquid money market instruments and highlighting the availability of liquid marketable securities sufficient to meet its liabilities as at when due. The money market instruments include cash, treasury bills and term deposits with an original maturity of less than 90 days.
The limits are monitored and reported on a weekly and monthly basis to ensure that exposure of the Group’s investment portfolio to this risk is properly managed.
2.8 NOTES TO THE FINANCIAL STATEMENTSFINANCIALS

108 | ANNUAL REPORT 2020 - AXA MANSARD
Below is a summary of undiscounted contractual cashflows of financial assets matched with financial liabilities.
December 31, 2020GROUP
Carrying amount
Gross total
1-3 months
3-6 months
6-12 months 1-5 years > 5years
Cash and cash equivalents 20,251,719 20,688,312 20,688,312 - - - -
Financial assets fair valued through profit or loss
5,407,073 5,407,073 - - 5,407,073 - -
Available-for-sale (less equity investments) 30,858,955 43,758,652 167,626 1,015,496 309,063
20,317,964 21,948,503
Financial assets designated at fair value 4,467,868 4,467,868 4,467,868 - - - -
Loans and receivables 470,272 470,272 470,272 - - - -
Trade receivables 6,668,899 6,668,899 6,668,899 - - - -
Reinsurance assets (less prepaid reinsurance, IBNR & Reserves) 2,404,819 2,404,819 - - 2,404,819 - -
Other receivables (less prepayment) 819,323 819,323 819,323 - - - -
Total financial assets 71,348,928 84,685,218 33,282,300 1,015,496 8,120,955 20,317,964 21,948,503
Carrying amount
Gross total
1-3 months
3-6 months
6-12 months
1-5 years > 5years
Investment contract liabilities:
– At amortised cost 5,153,521 5,153,521 4,367,923 - 785,598 - -
– Liabilities designated at fair value 4,485,246 4,485,246 4,485,246 - - - -
Borrowings 2,994,361 3,593,916 786,020 889,476 889,476 1,028,945 -
Trade payables (less premium received in advance) 7,202,673 7,202,673 7,202,673 - - - -
Other liabilities (less deferred income) 1,694,058 1,694,058 1,694,058 - - - -
Total financial liabilities 21,529,859 22,129,414 18,535,920 889,476 1,675,073 1,028,945 -
Net financial assets/ (liabilities) 49,819,070 62,555,805 14,746,381 126,020 6,445,882 19,289,019 21,948,503
Insurance contract liabilities 29,597,844 29,597,844 7,994,710 6,261,191 2,628,632 5,282,111 7,431,200
Net policyholders' assets/(liabilities) 20,221,226 32,957,961 6,751,671 (6,135,171) 3,817,250 14,006,908 14,517,303
The Group manages its cashflows in a way to ensure that net cash outflow positions through rental inflows and advance payments on service charge
2 2.8 NOTES TO THE FINANCIAL STATEMENTSFINANCIALS

ANNUAL REPORT 2020 AXA MANSARD | 109
2
December 31, 2020PARENT
Carrying amount
Gross total 1-3 months
3-6 months
6-12 months
1-5 years > 5years
Cash and cash equivalents 16,575,948 16,778,127 16,778,127 - - - -
Financial assets fair valued through profit or loss 5,407,073 1,303,531 - - 1,303,531
Available-for-sale (less equity investments) 27,600,809 40,464,100 167,626 1,015,496 309,063 19,123,412 19,848,503
Financial assets designated at fair value 4,467,868 4,467,868 4,467,868 - - - -
Loans and receivables 1,014,377 350,238 350,238 - - - -
Trade receivables 1,043,004 1,043,004 1,043,004 - - - -
Reinsurance assets (less prepaid reinsurance, IBNR and reserves) 2,384,292 2,384,292 - - 2,384,292 - -
Other receivables (less prepayment) 478,179 392,955 392,955 - - - -
Total financial assets 58,971,550 67,184,115 23,199,818 1,015,496 2,693,355 19,123,412 21,152,034
Insurance contract liabilities
Investment contract liabilities:
– At amortised cost 5,153,521 5,153,521 4,367,923 - 785,598 - -
– Liabilities designated at fair value 4,485,246 4,485,246 4,485,246 - - - -
Trade payables (less premium received in advance) 7,038,381 7,038,381 7,038,381 - - - -
Other liabilities (less deferred income) 1,183,712 1,183,712 1,183,712 - - - -
Total financial liabilities 17,860,860 17,860,860 17,075,262 - 785,598 - -
Net financial assets/ (liabilities) 41,110,690 49,323,255 6,124,556 1,015,496 1,907,757 19,123,412 21,152,034
Insurance contract liabilities 19,550,486 19,550,486 2,994,710 1,213,833 2,628,632 5,282,111 7,431,200
Net policyholders’ assets/(liabilities) 21,560,204 29,772,769 3,129,846 (198,337) (720,875) 13,841,301 13,720,834
December 31, 2019
GROUP
Carrying amount
Gross total 1-3 months
3-6 months
6-12 months
1-5 years above 5yrs
Cash and cash equivalents 17,911,416 18,117,563 18,117,563 - - - -
Financial assets fair valued through profit or loss 5,302,005 5,302,005 279,526 5,022,479 -
Available-for-sale (less equity investments) 27,654,223 31,672,191 11,529,558 413,869 844,940 10,073,003 8,810,821
Financial assets designated at fair value 4,140,271 4,140,271 4,140,271 - - - -
Loans and receivables 403,548 403,548 403,548 - - - -
Trade receivables 5,418,424 5,418,424 5,418,424 - - - -
Reinsurance assets (less prepaid reinsurance, IBNR & Reserves) 5,156,197 5,156,197 - - 5,156,197 - -
Other receivables (less prepayment) 974,148 974,148 974,148 - - - -
Total financial assets 66,960,232 71,184,346 40,863,037 5,436,348 6,001,137 10,073,003 8,810,821
Investment contract liabilities:
– At amortised cost 4,275,765 4,275,765 3,623,972 - 651,793 - -
– Liabilities designated at fair value 4,154,695 4,154,695 4,154,695 - - - -
Borrowings 6,965,804 6,965,804 1,211,750 1,811,750 2,023,500 1,918,804 -
Trade payables 10,183,361 10,183,361 10,183,361 - - - -
Other liabilities (less deferred income and premium received in advance) 2,171,970 2,171,970 2,171,970 - - - -
Total financial liabilities 27,751,595 27,751,595 21,345,747 1,811,750 2,675,293 1,918,804 - Net financial assets/ liabilities 39,208,638 43,432,752 19,517,290 3,624,598 3,325,843 8,154,199 8,810,821 Insurance contract liabilities 25,162,941 25,162,941 5,935,970 3,885,028 2,628,632 5,282,111 7,431,200
Net policyholders’ assets/(liabilities) 14,045,697 18,269,811 13,581,320 (260,430) 697,211 2,872,089 1,379,621
The Group manages its cashflows in a way to ensure that net cash outflow positions through rental inflows and advance payments on service charge
2.8 NOTES TO THE FINANCIAL STATEMENTSFINANCIALS

110 | ANNUAL REPORT 2020 - AXA MANSARD
December 31, 2019PARENT
Carrying amount
Gross total
1-3 months
3-6 months
6-12 months
1-5 years above 5yrs
Cash and cash equivalents 16,133,274 16,335,453 16,335,453 - - - -
Financial assets fair valued through profit or loss 5,302,005 6,605,536 279,526
5,022,479
1,303,531
Available-for-sale (less equity investments)
21,908,297 23,985,851 11,439,220 395,955 839,775 3,014,998 8,295,903
Financial assets designated at fair value 4,140,271 4,140,271 4,140,271 - - - -
Loans and receivables 882,168 350,238 350,238 - - - -
Trade receivables 1,224,373 1,224,373 1,224,373 - - - -
Reinsurance assets (less prepaid reinsurance, IBNR and reserves) 5,142,841 5,142,841 - -
5,142,841 - -
Other receivables (less prepayment) 347,282 392,955 392,955 - - - -
Total financial assets 55,080,511 58,177,518 34,162,036 5,418,434 5,982,616 3,014,998 9,599,433
Investment contract liabilities:
– At amortised cost 4,275,765 4,275,765 3,623,972 - 651,793 - -
– Liabilities designated at fair value 4,154,695 4,154,695 4,154,695 - - - -
Trade payables 10,094,194 10,094,194 10,094,194 - - - -
Other liabilities (less deferred income and premium received in advance) 1,661,523 1,661,523 1,661,523 - - - -
Total financial liabilities 20,186,177 20,186,177 19,534,384 - 651,793 - -
Net financial assets and liabilities 34,894,334 37,991,341 14,627,652 5,418,434 5,330,823 3,014,998 9,599,433
Insurance contract liabilities 17,491,746 17,491,746 935,970 1,213,833 2,628,632 5,282,111 7,431,200
Net policyholders’ assets/(liabilities) 17,402,588 20,499,595 13,691,682 4,204,601 2,702,191 (2,267,112) 2,168,233
4. CAPITAL MANAGEMENTThe Group’s policy is to maintain a strong capital base to maintain investor, creditor and market confidence and to sustain the future development of the business. The impact of the level of capital on shareholders’ return is also recognised and the Group recognises the need to maintain a balance between the higher returns that might be possible with greater gearing and the advantages and security afforded by a sound capital position. The Group and its individually regulated operations have complied with all externally imposed capital requirements.
Management uses regulatory capital ratios to monitor its capital base. The allocation of capital between specific operations and activities is, to a large extent, driven by optimisation of the return achieved on the capital allocated. The amount of capital allocated to each operation or activity is based primarily on the regulatory
capital, but in some cases the regulatory requirements do not fully reflect the varying degree of risk associated with different activities. In such cases, the capital requirements may be flexed to reflect differing risk profiles, subject to the overall level of capital to support a particular operation or activity not falling below the minimum required for regulatory purposes. The process of allocating capital to specific operations and activities is undertaken independently of those responsible for the operation by Group Risk and Group Credit, and is subject to review by the Group Credit Committee or the Group Asset and Liability Management Committee (ALCO), as appropriate. The Group ensures it maintains the minimum required capital at all times throughout the year. The Regulatory capital for the non-life and businesses is determined as the solvency margin. The table below summarises the minimum required capital across the Group and the regulatory capital held against each of them.
2 2.8 NOTES TO THE FINANCIAL STATEMENTSFINANCIALS

ANNUAL REPORT 2020 AXA MANSARD | 111
2
Group Group Company Company
In thousands 31 Dec-2020 31 Dec-2019 31 Dec-2020 31 Dec-2019
Regulatory capital held 29,063,186 23,336,883 23,175,091 18,608,108
Minimum regulatory capital 5,550,000 6,550,000 5,000,000 5,000,000
2.8 NOTES TO THE FINANCIAL STATEMENTSFINANCIALS
The Group has different requirements depending on the specific operations which it engages in. The five main businesses are Insurance, Health Insurance, Pensions Fund management, Asset management (fund manager) and Property development.
The insurance business is divided into the life and non life business. The life business has a regulatory minimum capital of N2 billion
while the Non life business has a regulatory minimum capital base of N3 billion. The asset management business has a minimum capital base of N500 million, as a fund manager. These three businesses met and exceeded these minimum requirements as at 31 December 2020 as indicated below:
Health maintenance organisation
Life insurance business
Non life insurance
business
Asset management
business
In thousands of Naira 31 Dec-2020 31 Dec-2020 31 Dec-2020 31 Dec-2020
Regulatory capital held 4,792,927 10,673,293 12,553,915 1,043,051
Minimum regulatory capital 400,000 2,000,000 3,000,000 150,000
Although maximisation of the return on risk-adjusted capital is the principal basis used in determining how capital is allocated within the Group to particular operations or activities, it is not the sole basis used for decision making. Account is also taken of synergies with other operations and activities, the availability of management and other resources, and the fit of the activity with the Group’s longer-term strategic objectives. The Group’s policies in respect of capital management and allocation are reviewed regularly by the board of directors.
Insurance industry regulator measures the financial strength of insurance companies using the capital adequacy requirements for composite companies. This test compares insurers’ capital against the risk profile. The regulator indicated that insurers should produce a minimum solvency margin of 15% which is calculated as 15% of net premium or the minimum paid up share capital whichever is higher. The regulator has the authority to request more extensive reporting and can place restrictions on the Parent’s operations if the Parent falls below this requirement if deemed necessary. Over the years, the Parent Company has consistently exceeded this minimum.

112 | ANNUAL REPORT 2020 - AXA MANSARD
The Solvency Margin for the parent as at 31 December 2020 is as follows:
31-Dec-20 31-Dec-19
TOTAL ADMISSIBLE INADMISSIBLE TOTAL ADMISSIBLE INADMISSIBLE
ASSETS
Cash and cash equivalents 16,575,948 13,541,329 3,034,619 16,133,274 15,265,926 867,349
Investment securities:
– Fair value through profit or loss 5,407,073 5,407,073 - 5,302,005 5,302,005 -
– Available-for-sale assets 27,764,440 27,764,440 - 22,032,646 22,032,646 -
Financial assets designated at fair value 4,485,246 4,485,246 - 4,154,695 4,154,695 -
Trade receivables 1,043,004 119,242 923,762 1,224,373 189,675 1,034,698
Reinsurance assets 6,327,265 6,327,265 - 8,895,612 8,895,612 -
Deferred acquisition cost 346,212 346,212 - 321,055 321,055 -
Other receivables 726,911 - 726,911 801,891 - 801,891
Loans and receivables 1,014,377 228,239 786,138 882,168 205,086 677,082
Investment property - - - 1,350,000 703,405 646,595
Investment in subsidiaries 1,652,000 1,652,000 - 3,537,247 3,537,247 -
Intangible assets 305,443 305,443 - 215,450 215,450 -
Property and equipment 2,154,801 2,154,801 - 1,784,543 1,784,543 -
Right of use 722,803 - 722,803 462,082 - 462,082
Statutory deposit 500,000 500,000 - 500,000 500,000 -
TOTAL ASSETS 69,025,523 62,831,290 6,194,233 67,597,041 63,107,344 4,489,697
LIABILITIES
Insurance liabilities 19,550,486 19,550,486 - 17,491,746 17,491,746 -
Investment contract liabilities:
– At amortised cost 5,153,521 5,153,521 - 4,275,765 4,275,765 -
– Liabilities designated at fair value 4,485,246 4,485,246 - 4,154,695 4,154,695 -
Trade payables 8,947,445 8,947,445 - 16,478,545 16,478,545 -
Current income tax liabilities 125,911 125,911 - 203,650 203,650 -
Other liabilities 1,393,590 1,393,590 - 1,894,835 1,894,835 -
Borrowings - - - - - -
Deferred tax liability - - - - - -
TOTAL LIABILITIES 39,656,199 39,656,199 - 44,499,236 44,499,236 -
Excess of admissible assets over liabilities 23,175,091 18,608,108
The higher of 15% of Net premium income and shareholders funds 5,000,000 5,000,000
Solvency Ratio 464% 372%
2 2.8 NOTES TO THE FINANCIAL STATEMENTSFINANCIALS

ANNUAL REPORT 2020 AXA MANSARD | 113
2
5 MEASUREMENT OF FINANCIAL ASSETS AND LIABILITIES
5.1.ACCOUNTING CLASSIFICATION MEASUREMENT BASIS AND FAIR VALUEThe table below set out the group’s classification of each class of financial instruments and liabilities and their fair value
Group 31 Dec 2020
In thousands of Nigerian Naira Notes
Fair value
through profit
or loss
Designated at fair value
Loan and receivables
Available for sale
Other financial
instruments at
amortised cost
Carrying amount
Fair value
Cash and cash equivalents 8 - - 20,251,719 - - 20,251,719 20,251,719 Investment securities: - Fair value through profit or loss 9.1
5,407,073 - - - - 5,407,073 5,407,073
- Available-for-sale assets 9.2 - - - 31,102,632 - 31,102,632 31,102,632 Financial assets designated at fair value 9.3 - 4,485,246 - - - 4,485,246 4,485,246 Trade receivables 10 - - 6,668,899 - - 6,668,899 6,668,899 Loans and receivables 14 - - 470,272 - - 470,272 470,272 Reinsurance receivables (excluding prepaid re-insurance, IBNR & Reserves) 11 - - 2,404,819 - - 2,404,819 2,404,819 Other receivables (excl. prepayment) 13 - - 819,323 - - 819,323 819,323
Statutory deposit 19 - - - - 500,000 500,000 500,000
5,407,073 4,485,246 30,615,032 31,102,632 500,000 72,109,983 72,109,983 Investment contracts:– Designated at fair value 21.2 - 4,485,246 - - - 4,485,246 4,485,246 – At amortised cost 21.1 - - - - 5,153,521 5,153,521 5,153,521
Borrowing 25 - - - - 2,994,361 2,994,361 2,994,361
Trade payables 22 - - - - 9,111,737 9,111,737 9,111,737
Other liabilities (excluding deferred income) 23 - - - - 1,694,058 1,694,058 1,694,058
- 4,485,246 - - 18,953,677 23,438,923 23,438,923
2.8 NOTES TO THE FINANCIAL STATEMENTSFINANCIALS

114 | ANNUAL REPORT 2020 - AXA MANSARD
Parent
Notes
Fair value
through profit or
loss Designated at fair value
Loan and receivables
Available for sale
Other financial
instruments at amortised
cost Carrying
amount Fair valueCash and cash equivalents 8 - - 16,575,948 - - 16,575,948 16,575,948 Investment securities: - Fair value through profit or loss 9.1 5,407,073 - - - - 5,407,073 5,407,073
- Available for sale 9.2 - - - 27,600,809 - 27,600,809 27,600,809 Financial assets designated at fair value 9.3 - 4,467,868 - - - 4,467,868 4,467,868 Trade receivables 10 - - 1,043,004 - - 1,043,004 1,043,004 Loans and receivables 14 - - 1,014,377 - - 1,014,377 1,014,377 Reinsurance receivables (excluding prepaid re-insurance) 11 - 2,384,292 - - 2,384,292 2,384,292 Other receivables (excl. prepayment) 13 - - 478,179 - - 478,179 478,179 Statutory deposit 19 - - - - 500,000 500,000 500,000
5,407,073 4,467,868 21,495,800 27,600,809 500,000 59,471,550 59,471,550 Investment contracts:– Designated at fair value 21.2 - 4,467,868 - - - 4,467,868 4,467,868
– At amortised cost 21.1 - - - - 5,153,521 5,153,521 5,153,521 Trade payables 22 - - - 8,947,445 8,947,445 8,947,445 Other liabilities (excluding deferred income and advance premium) 23 - - - - 1,183,712 1,183,712 1,183,712
- 4,467,868 - - 15,284,678 19,752,546 19,752,546
Group 31 Dec 2019
Notes
Fair value
through profit or
loss Designated
at fair value Loan and
receivables Available
for sale
Other financial
instruments at amortised
cost Carrying
amount Fair valueCash and cash equivalents 8 - - 17,911,416 - - 17,911,416 17,911,416 Investment securities:
- Fair value through profit or loss 9.1 5,302,005 - - - - 5,302,005 5,302,005 - Available-for-sale assets 9.2 - - - 27,836,825 - 27,836,825 27,836,825 Financial assets designated at fair value 9.3 - 4,154,695 - - - 4,154,695 4,154,695 Trade receivables 10 - - 5,418,424 - - 5,418,424 5,418,424 Loans and receivables 14 - - 403,548 - - 403,548 403,548 Reinsurance receivables (excluding prepaid re-insurance, IBNR & Reserves) 11 - - 5,156,197 - - 5,156,197 5,156,197 Other receivables (excl. prepayment) 13 - - 974,148 - - 974,148 974,148 Statutory deposit 19 - - - - 500,000 500,000 500,000
5,302,005 4,154,695 29,863,733 27,836,825 500,000 67,657,258 67,657,258 Investment contracts:
– Designated at fair value 21.2 - 4,154,695 - - - 4,154,695 4,154,695 – At amortised cost 21.1 - - - - 4,275,765 4,275,765 4,275,765 Borrowing 25 - - - - 6,965,804 6,965,804 6,965,804 Trade payables 22 - - - - 16,567,712 16,567,712 16,567,712 Other liabilities (excluding deferred income) 23 - - - - 2,171,970 2,171,970 2,171,970
- 4,154,695 - - 29,981,251 34,135,946 34,135,946
2 2.8 NOTES TO THE FINANCIAL STATEMENTSFINANCIALS

ANNUAL REPORT 2020 AXA MANSARD | 115
2
Parent
Notes
Fair value
through profit or
loss
Designated at fair value
Loan and receivables
Available for sale
Other financial
instruments at
amortised cost
Carrying amount Fair value
Cash and cash equivalents 8 - - 16,133,274 - - 16,133,274 16,133,274 Investment securities: - Fair value through profit or loss 9.1 5,302,005 - - - - 5,302,005 5,302,005 - Available for sale 9.2 - - - 21,908,297 - 21,908,297 21,908,297 Financial assets designated at fair value
9.3 - 4,140,271 - - - 4,140,271 4,140,271
Trade receivables 10 - - 1,224,373 - - 1,224,373 1,224,373 Loans and receivables 14 - - 882,168 - - 882,168 882,168 Reinsurance receivables (excluding prepaid re-insurance)
11 - 5,142,841 - - 5,142,841 5,142,841
Other receivables (excl. prepayment)
13 - - 347,282 - - 347,282 347,282
Statutory deposit 19 - - - - 500,000 500,000 500,000 5,302,005 4,140,271 23,729,938 21,908,297 500,000 55,580,511 55,580,511
Investment contracts:– Designated at fair value 21.2 - 4,140,271 - - - 4,140,271 4,140,271 – At amortised cost 21.1 - - - - 4,275,765 4,275,765 4,275,765 Trade payables 22 - - - 16,478,545 16,478,545 16,478,545 Other liabilities (excluding deferred income and advance premium)
23 - - - - 1,661,523 1,661,523 1,661,523
- 4,140,271 - - 22,415,833 26,556,105 26,556,105
5.2 FAIR VALUE HIERARCHYThe Group’s accounting policy on fair value measurements is discussed under note 2.3.
The fair values of financial assets and liabilities that are traded in active markets are based on quoted market prices or dealer price quotations. For all other financial instruments, the group determines fair values using other valuation techniques.
For financial instruments that trade infrequently, and had little price transparency, fair value is less objective, and requires varying degrees of judgement depending on liquidity, concentration, uncertainty of market factors, pricing assumptions and other risk affecting the specific instrument.
VALUATION MODELS The group measures fair values using the following fair value hierarchy, which reflects the significance of the inputs used in making the measurements.
(a) Financial Instruments in Level 1 The fair value of financial instruments traded in active markets is based on quoted market prices at the reporting date date. A market is regarded as active if quoted prices are readily and regularly available from an exchange, dealer, broker, industry group, pricing service, or regulatory agency, and those prices represent actual and regularly occurring market transactions on
an arm’s length basis. The quoted market price used for financial assets held by the group is the current bid price. These instruments are included in Level 1. Instruments included in Level 1 comprise primarily Nigerian Stock Exchange equity investments classified as trading securities or available for sale.
(b) Financial Instruments in Level 2 Inputs other than quoted prices included within Level 1 that are observable either directly (i.e. as prices) or indirectly (i.e. derived from prices). This category includes instruments valued using: quoted market prices in active markets for similar instruments; quoted prices for identical or similar instruments in markets that are considered less than active; or other valuation techniques in which all significant inputs are directly or indirectly observable from market data.
(c) Financial Instruments in Level 3Inputs that are unobservable. This category includes all instruments for which the valuation technique includes inputs not based on observable data and the unobservable inputs have a significant effect on the instrument’s valuation. This category includes instruments that are valued based on quoted prices for similar instruments for which significant unobservable adjustments or assumptions are required to reflect differences between the instruments.
2.8 NOTES TO THE FINANCIAL STATEMENTSFINANCIALS

116 | ANNUAL REPORT 2020 - AXA MANSARD
The table below analyses financial instruments measured at fair value at the end of the reporting period, by the level in the fair value hierarchy into which the fair value measurement is categorized. The amounts are based on the values recognised in the statement of financial position.
Financial assets and liabilities measured at fair value
(All figures are in thousands of naira)
Group 31-Dec-20
Level 1 Level 2 Level 3 Total
Available for sale 22,400,881 8,682,251 19,500 31,102,632
Other financial assets designated at fair value 3,140,836 1,344,410 - 4,485,246
Total 25,541,717 10,026,661 19,500 35,587,878
Liability type
Other financial liabilities designated at fair value 3,140,836 1,344,410 - 4,485,246
Group 31-Dec-19
Level 1 Level 2 Level 3 Total
Available for sale 18,866,861 8,946,414 23,550 27,836,825
Other financial assets designated at fair value 4,046,441 108,254 - 4,154,695
Total 22,913,302 9,054,668 23,550 31,991,520
Liability type
Other financial liabilities designated at fair value 4,046,441 108,254 - 4,154,695
PARENT 31-Dec-20
Level 1 Level 2 Level 3 Total
Available for sale 20,762,451 6,982,489 19,500 27,764,440
Other financial assets designated at fair value 3,140,836 1,344,410 - 4,485,246
Total 23,903,287 8,326,899 19,500 32,249,686
Other financial liabilities designated at fair value 3,140,836 1,344,410 - 4,485,246
PARENT 31-Dec-19
Level 1 Level 2 Level 3 Total
Available for sale 14,187,194 7,821,902 23,550 22,032,646
Other financial assets designated at fair value 4,046,441 108,254 - 4,154,695
Total 18,233,635 7,930,156 23,550 26,187,341
Other financial liabilities designated at fair value 4,046,441 108,254 - 4,154,695
FINANCIAL INSTRUMENTS IN LEVEL 2The fair values of financial instruments measured in level 2 are observable either directly (i.e. as prices) or indirectly (i.e. derived from prices). These are as shown in the table below:
Unquoted equity Recent transaction price
Debt security Similar securities with close maturity dates
There was no transfer between levels during the year under review.
2 2.8 NOTES TO THE FINANCIAL STATEMENTSFINANCIALS

ANNUAL REPORT 2020 AXA MANSARD | 117
2
FINANCIAL INSTRUMENTS IN LEVEL 3(i) ReconciliationThe following table shows a reconciliation from the beginning balances to the ending balances for fair value measurements in level 3 of the fair value hierarchy.
Group
In thousands of Nigerian Naira Dec-20 Dec-19
Balance at 1 January 23,550 23,550
Acquisitions - -
Changes in fair value recognised in other comprehensive income (4,050) -
Balance end of year 19,500 23,550
Impact of changes in fair value of available for sale assets
OCI (4,050) -
PARENTIn thousands of Nigerian Naira Dec-20 Dec-19
Balance at 1 January 23,550 23,550
Acquisitions - -
Changes in fair value recognised in other comprehensive income (4,050) -
Balance end of year 19,500 23,550
Impact of changes in fair value of available for sale assets
OCI (4,050) -
(ii) Information about fair value measurement using significant unobservable inputs (Level 3)
For the unquoted financial instrument measured at fair value, the group uses a valuation model. Some of the significant inputs may not be observable in the market and are derived from market prices or rates or are estimated based on assumptions. Management’s judgement and estimation are usually required for selection of the appropriate valuation model to be used, determination of expected cashflows on the financial instruments being valued, determination of the probability of counterparty default and prepayments and selection of appropriate discount rates.
Fair value estimates obtained from models are adjusted for any other factors such as liquidity risk or model uncertainties, to the extent that the Group believes that a third party market participant would take them into account in pricing a transaction. Model inputs and values are calibrated against historical data and published forecasts. This calibration process is inherently subjective and it yields ranges of possible inputs and estimates of fair value, and management judgement is required to select the most appropriate point in the range.
The group’s valuation methodology for valuing certain unquoted financial instruments uses a free discounted cash flow methodology. It takes into account growth in net earnings or cash flow, fixed capital investments, working capital investments and net borrowings, beta, risk free rate, market risk premium and assumed annual growth rate. These features are used to estimate expected future cashflows and discounted at a risk-adjusted rate. However, this technique is subject to inherent limitations such as estimation of the appropriate risk -adjusted discount rate, and different assumptions and inputs would yield different results.
Unobservable Market Inputs Used in Measuring the Fair Value.Significant unobservable inputs are developed as follows:
Risk-Free RateThe risk-free rate used in the valuation models is the yield of the most actively traded 10-yr FGN bond, as we believe this is the best reference for a risk-free instrument with a similar duration to the investment horizon of equities. The risk-free rate used in the unquoted financial instruments valuation reports was the current yield, 16% on the most actively traded 10-yr FGN bond in the Nigerian bond market at the time.
BetaThe beta of a stock measures the sensitivity of the excess expected return on an individual share relative to that of a benchmark equities market or index. It is best derived by the regression analysis of a company’s stock price returns to that of the benchmark market index. However, in cases where a company is not publicly listed, it can be derived by using a proxy from a similar company which is publicly listed, or by using the industry average. There are however cases where there are no comparable companies that are publicly listed to use as proxies. In such cases, betas are estimated or assumed based on the sensitivity of the industry to the stock market and/or the overall economy as a guide. The unquoted financial instruments valuation is peculiar in the sense that it is privately held and does not have ready and direct comparables publicly listed on the Nigerian Stock Exchange. We assumed a beta of 1.28 for the unquoted financial instrument based on our perceived sensitivity of its industry to the Nigerian economy.
2.8 NOTES TO THE FINANCIAL STATEMENTSFINANCIALS

118 | ANNUAL REPORT 2020 - AXA MANSARD
Market Risk PremiumThis is the premium estimated as required over the long term risk-free rate. In most cases, the unsystematic risk pertaining to countrywide factors such as socio-political risk, a country’s sovereign rating etc. is usually priced into risk-free instruments such as government bonds. The unsystematic risk pertaining to the stock market or particular industry is addressed by the market risk premium, while the beta is responsible for company-specific risks. We have used a market risk premium of 6% for the valuation, as we believe most of the inherent risks in the Nigerian capital market have been largely priced in the bond yields.
Assumed Terminal Growth Rate “This is the rate that the company is assumed to continue to grow after the forecasted years in the valuation. It is usually
close to the GDP rate of the country where the company is situated. In certain cases, the assumed growth rate may exceed the current GDP as the industry may be in its growth phase. We have reduced the terminal growth rate for the unquoted financial instruments to 4% in line with growth projections for the country. It is important to note that huge potentials remain largely untapped in the Nigerian housing industry, predicated on a large and growing population with unmet housing needs.
Financial Instruments Not Measured At Fair ValueThe following table sets out the carrying amount of financial instruments not measured at fair value and the analysis per level in the fair value hierarchy into which each fair value measurement is categorised.
Group 31-Dec-20
Level 1 Level 2 Level 3 Total
Cash and cash equivalents - 20,251,719 - 20,251,719
Trade receivables - 6,668,899 - 6,668,899
Loan and receivables - 470,272 - 470,272
Reinsurance assets (less prepaid reinsurance & RI share of IBNR) - 2,404,819 - 2,404,819
Other receivables (less prepayment) - 819,323 - 819,323
Statutory deposit - 500,000 - 500,000
Total - 31,115,032 - 31,115,032
Investment contracts at amortised cost - 5,153,521 - 5,153,521
Borrowings - 2,994,361 - 2,994,361
Trade payables - 9,111,737 - 9,111,737
Other liabilities (excluding deferred income) - 1,694,058 - 1,694,058
Total - 18,953,677 - 18,953,677
PARENT 31-Dec-20
Level 1 Level 2 Level 3 Total
Cash and cash equivalents - 16,575,948 - 16,575,948
Trade receivables - 1,043,004 - 1,043,004
Loans and receivables - 1,014,377 - 1,014,377
Reinsurance assets (less prepaid reinsurance & RI share of IBNR) - 2,384,292 - 2,384,292
Other receivables (less prepayment) - 478,179 - 478,179
Statutory deposit - 500,000 - 500,000
Total - 21,995,800 - 21,995,800
Investment contracts at amortised cost - 5,153,521 - 5,153,521
Trade payables - 8,947,445 - 8,947,445
Other liabilities - 1,183,712 - 1,183,712
Total - 15,284,678 - 15,284,678
2 2.8 NOTES TO THE FINANCIAL STATEMENTSFINANCIALS

ANNUAL REPORT 2020 AXA MANSARD | 119
2
Group 31-Dec-19
Level 1 Level 2 Level 3 Total
Cash and cash equivalents - 17,911,416 - 17,911,416
Trade receivables - 5,418,424 - 5,418,424
Loans and receivables - 403,548 - 403,548
Reinsurance assets (less prepaid reinsurance & RI share of IBNR) - 5,156,197 - 5,156,197
Other receivables (less prepayment) - 974,148 - 974,148
Statutory deposit - 500,000 - 500,000
Total - 30,363,733 - 30,363,733
Liability type
Investment contracts at amortised cost - 4,275,765 - 4,275,765
Borrowings - 6,965,804 - 6,965,804
Trade payables - 16,567,712 - 16,567,712
Other liabilities (excluding deferred income ) - 2,171,970 - 2,171,970
Total - 29,981,251 - 29,981,251
PARENT 31-Dec-19
Level 1 Level 2 Level 3 Total
Cash and cash equivalents - 16,133,274 - 16,133,274
Trade receivables - 1,224,373 -
Loans and receivables - 882,168 - 1,224,373
Reinsurance assets (less prepaid reinsurance & RI share of IBNR) - 5,142,841 - 882,168
Other receivables (less prepayment) - 347,282 - 5,142,841
Statutory deposit - 500,000 - 347,282
Total - 24,229,938 - 23,729,938
Liability type
Investment contracts at amortised cost - 4,275,765 - 4,275,765
Trade payables - 16,478,545 - 16,478,545
Other liabilities - 1,661,523 - 1,661,523
Total - 22,415,833 - 22,415,833
Determination of Fair ValueThe determination of fair value for each class of financial instruments was based on the particular characteristic of the instruments. The method and assumptions applied are enumerated below:
Cash and Cash Equivalent and Borrowings The estimated fair value of fixed interest placement with banks, bonds and borrowings is based on the discounted cash flow techniques using prevailing money market interest rates for debts and similar credit risk and remaining maturity.
Quoted SecuritiesThe fair value for treasury bills and bonds assets is based on market prices or brokers/dealers price quotations. Where this information is not available, fair valuation is estimated using quoted market prices for securities with similar credit, maturity and yield characteristics.
Unquoted Equity Securities Available for SaleThe fair value of available-for-sale securities is based on on the
market approach which consider similar/ identical transactions.
Trade Receivables and Payables, Reinsurance Receivables and Other Liabilities The estimated fair value of receivables and payables with no stated maturity which includes no interest payables and receivables is the amount repayable or to be received on demand.
The carrying amounts of other liabilities are reasonable approximation of their fair values which are payable on demand.
Non Financial Asset Measured At Fair ValueInvestment property is valued using the income approach. The rental income/prices of comparable buildings in close proximity are adjusted for differences in key attributes such as property size, beta, growth rates, discount rate, inflation rate, holding period and capitalisation rate. The adjusted rental income/prices forms the cashflows which is discounted using the relevant discount rate. A variation of -/+5% will result in N685 million fair value losses/gain respectively.
2.8 NOTES TO THE FINANCIAL STATEMENTSFINANCIALS

120 | ANNUAL REPORT 2020 - AXA MANSARD
Office property
Valuation technique
Fair value as at December
31 2020 (in thousands) Unobservable inputsRange of unobservable inputs
(probability weighted average)
Discounted Income Capitalisation Cashflow approach 13,694,760
Forecast price per square metre
$500
Capitalisation rate 6%
Landed property
Valuation techniqueFair value as at December 31,
2020 (in thousands)Unobservable
inputsRange of unobservable inputs
(probability weighted average)
Market Valuation approach - NA NA
6. ASSET AND LIABILITY MANAGEMENT (ALM)The Group is exposed to a range of financial risks through its financial assets, financial liabilities (investment contracts and borrowings), reinsurance assets and insurance liabilities. In particular, the key financial risk is that in the long-term its investment proceeds are not sufficient to fund the obligations arising from its insurance and investment contracts. The most important components of this financial risk are interest rate risk, equity price risk, foreign currency risk and credit risk.
These risks arise from open positions in interest rate, currency and equity products, all of which are exposed to general and specific market movements. The risks that the Group primarily faces due to the nature of its investments and liabilities are interest rate risk and equity price risk.
The Group manages these positions within an ALM framework that has been developed to achieve long-term investment returns in excess of its obligations under insurance and investment contracts. Within the ALM framework, the Group periodically produces reports at portfolio, legal entity and asset and liability class level that are circulated to the Group’s key management personnel.
The principal technique of the Group’s ALM is to match assets to the liabilities arising from insurance and investment contracts by reference to the type of benefits payable to contract holders. For each distinct class of liabilities, a separate portfolio of assets is maintained. The Group has not changed the processes used to manage its risks from previous periods.
The Group’s ALM is integrated with the management of the financial risks associated with the Group’s other classes of financial assets and liabilities not directly associated with insurance and investment liabilities (in particular, borrowings and investments in foreign operations). The notes below explain how financial risks are managed using the categories utilized in the Group’s ALM framework. In particular, the ALM Framework requires the management of interest rate risk, equity price risk and liquidity risk at the portfolio level. Foreign currency and credit risk are managed on a group-wide basis.
The table below hypothecates the total assets of the parent into assets that represents insurance funds, shareholders’ funds and other funds such as investment contracts and annuity:
2 2.8 NOTES TO THE FINANCIAL STATEMENTSFINANCIALS

ANNUAL REPORT 2020 AXA MANSARD | 121
2
December 31, 2020
In thousands of Naira Non Life
Life Insurance
Funds
Investment Contracts
FundsAnnuity
funds Life Total
Total ₦’000
Insurance Contract liabilities 11,908,558 4,587,732 - 3,054,196 7,641,928 19,550,486
Investment Contract liabilities - - 9,638,767 - 9,638,767 9,638,767
Gross Insurance Funds 11,908,558 4,587,732 9,638,767 3,054,196 17,280,695 29,189,253
Less:
Reinsurance Receivables
Reinsurance premium paid in advance for next year's policies
- - - - - -
Reinsurance expenses prepaid 2,222,808 127,480 - - 127,480 2,350,288
Reinsurers share of Claims expense paid 553,529 328,672 - - 328,672 882,201
Reinsurers share of Claims expense outstanding 1,483,060 19,031 - - 19,031 1,502,091
Reinsurers share of Incurred but not reported claims & Ind life reserves 1,541,777 50,908 - - 50,908 1,592,685
Net Insurance Funds 6,107,384 4,061,641 9,638,767 3,054,196 16,754,604 22,861,988
Admissible Assets
Cash and Cash Equivalents 3,036,957 902,240 1,113,603 81,319 2,097,162 5,134,120
Treasury bills and Government Bonds 4,077,976 1,297,313 7,404,903 4,973,133 13,675,349 17,753,326
Placement with Financial Insititutions 2,451,572 1,700,965 1,128,845 120,595 2,950,405 5,401,978
Corporate Bonds & Debenture 2,144,379 - 556,872 - 556,872 2,701,251
Ordinary & Preference Shares - - 17,378 74,851 92,230 92,230
Agency Loan - - - - - -
Loan to Policy holders - - - - - -
Other Loans & Investments 7,063 721,699 - 721,699 728,762
Investment in subsidiaries, - - - - - -
Investment in Associates - - - - - -
Investment in jointly controlled entities - - - - - -
Investment Properties - - - - - -
Total Admissible Assets 11,717,948 4,622,217 10,221,601 5,249,899 20,093,717 31,811,665
SURPLUS(DEFICIT ) IN ASSETS COVER 5,610,564 560,576 582,834 2,195,703 3,339,113 8,949,677
2.8 NOTES TO THE FINANCIAL STATEMENTSFINANCIALS

122 | ANNUAL REPORT 2020 - AXA MANSARD
The following tables reconcile the consolidated statement of financial position to the classes and portfolios used in the Group’s ALM framework.
Group 31 Dec 2020
Insurance fund Investment Contracts
Shareholders funds Annuity Others Total
In thousands of Naira Non-life Life Non-life Life
ASSETS
Cash and cash equivalents 7,566,449 2,596,083 1,132,609 3,059,759 2,019,133 201,915 3,675,771 20,251,719
Fair value through profit or loss - 203,492 976,480 - -
3,250,621 - 4,430,593
Available-for-sale 6,318,956 3,035,533 3,677,010 11,306,607 1,696,166 1,730,168 3,338,192 31,102,632
Financial assets designated at fair value - - 4,485,246 - - - - 4,485,246
Trade receivables 708,552 334,452 - - - - 5,625,895 6,668,899
Reinsurance assets 5,668,385 658,880 - - - - 172,388 6,499,653
Other receivables - - - 682,851 44,060 - 559,692 1,286,603
Deferred acquisition cost 346,212 - - - - - 69,505 415,717
Loans and receivables - - - 558,962 455,415 - (544,105) 470,272
Investment properties - - - - - - 13,694,760
13,694,760
Investment in subsidiaries - - - 1,252,000 400,000 - - -
Intangible assets - - - 298,003 7,440 - 24,574 330,017
Property and equipment - - - 2,154,393 408 - 273,487 2,428,288
Right of use - 662,782 60,021 176,038 898,841
Statutory deposit - - - 300,000 200,000 - - 500,000
Deferred tax asset
TOTAL ASSETS 20,608,554 6,828,440 10,271,345 20,275,357 4,882,643 5,182,704 27,066,197 93,463,240
LIABILITIES
Insurance liabilities 11,908,557 4,587,733 - - - 3,054,196 10,047,358 29,597,844
Investment contract liabilities:
– At amortised cost - - 5,153,521 - - - - 5,153,521
– Financial liabilities designated at fair value
- - 4,485,246 - - - - 4,485,246
Trade payables - - - 7,467,491 1,479,954 - 164,292 9,111,737
Other liabilities - - - 3,547,788 (2,154,199) - 1,542,506 2,936,095
Current income tax liabilities - - - 74,557 51,354 - 1,522,884 1,648,795
Borrowings - - - - - - 2,994,361 2,994,361
Deferred tax liability - - - - - - 818,666 818,666
TOTAL LIABILITIES 11,908,557 4,587,733 9,638,767 11,089,836 (622,891) 3,054,196 17,090,067 56,746,265
SURPLUS 8,699,997 2,240,707 632,578 9,185,521 5,505,534 2,128,508 9,976,130 36,716,975
2 2.8 NOTES TO THE FINANCIAL STATEMENTSFINANCIALS

ANNUAL REPORT 2020 AXA MANSARD | 123
2
Parent 31 Dec 2020
Insurance fund Investment Contracts
Shareholders funds Annuity Total
In thousands of Naira Non-life Iife Non-life Iife
ASSETS
Cash and cash equivalents 7,566,449 2,596,083 1,132,609 3,059,759 2,019,133 201,915 16,575,948
Fair value through profit or loss - 1,179,972 976,480 - - 3,250,621 5,407,073
Available-for-sale 6,318,956 3,035,533 3,677,010 11,306,607 1,696,166 1,730,168 27,764,440
Financial assets designated at fair value - - 4,485,246 - - - 4,485,246
Trade receivables 708,552 334,452 - - - - 1,043,004
Reinsurance assets 5,668,385 658,880 - - - - 6,327,265
Other receivables - - - 682,851 44,060 - 726,911
Deferred acquisition cost 346,212 - - - - - 346,212
Loans and receivables - - - 558,962 455,415 - 1,014,377
Investment properties - - - - - - -
Investment in subsidiaries - - - 1,252,000 400,000 - 1,652,000
Intangible assets - - - 298,003 7,440 - 305,443
Property and equipment - - - 2,154,393 408 - 2,154,801
Right of use 662,782 60,021 - 722,803
Statutory deposit - - - 300,000 200,000 - 500,000
TOTAL ASSETS 20,608,554 7,804,920 10,271,345 20,275,357 4,882,643 5,182,704 69,025,523
LIABILITIES
Insurance liabilities 11,908,557 4,587,733 - - - 3,054,196 19,550,486
Investment contract liabilities:
– At amortised cost - - 5,153,521 - - - 5,153,521
– Financial liabilities designated at fair value
- - 4,485,246 - - - 4,485,246
Trade payables - - - 7,467,491 1,479,954 - 8,947,445
Other liabilities - - - 3,547,789 (2,154,199) - 1,393,590
Current income tax liabilities
- - - 74,557 51,354 - 125,911
Deferred income tax - - - - - - -
TOTAL LIABILITIES 11,908,557 4,587,733 9,638,767 11,089,837 (622,891) 3,054,196 39,656,199
SURPLUS 8,699,997 3,217,187 632,578 9,185,520 5,505,534 2,128,508 29,369,324
2.8 NOTES TO THE FINANCIAL STATEMENTSFINANCIALS

124 | ANNUAL REPORT 2020 - AXA MANSARD
The table below hypothecates the total assets of the parent into assets that represents insurance funds, shareholders’ funds and other funds such as investment contracts:
December 31, 2019
Non Life Life
In thousands of Naira
Policy-holders’
Fund
Policy-holders’
Fund
Investment Contracts
FundsAnnuity
funds Total Life Total
Total ₦’000
Insurance Contract liabilities 11,102,754 4,211,175 - 2,177,817 6,388,992 17,491,746
Investment Contract liabilities - - 8,430,460 - 8,430,460 8,430,460
Gross Insurance Funds 11,102,754 4,211,175 8,430,460 2,177,817 14,819,452 25,922,206
Less:
Reinsurance Receivables
Reinsurance premium paid in advance for next year's policies - - - - - -
Reinsurance expenses prepaid 2,029,410 253,769 - - 253,769 2,283,179
Reinsurers share of Claims expense paid 1,651,638 86,035 - - 86,035 1,737,673
Reinsurers share of Claims expense outstanding 3,301,740 103,428 - - 103,428 3,405,168
Reinsurers share of Incurred but not reported claims & Ind life reserves - 1,469,592 - - 1,469,592 1,469,592
Net Insurance Funds 4,119,966 2,298,352 8,430,460 2,177,817 12,906,629 17,026,594
Admissible Assets
Cash and Cash Equivalents 3,805,351 340,643 1,683,506 46,877 2,071,026 5,876,377
Treasury bills and Government Bonds 2,436,611 2,405,451 6,807,691 3,457,639 12,670,782 15,107,393
Placement with Financial Insititutions 6,726,800 1,522,183 963,526 11 2,485,720 9,212,521
Corporate Bonds & Debenture 1,478,737 - 425,964 108,640 534,604 2,013,341
Ordinary & Preference Shares - - 14,424 55,690 70,113 70,113
Agency Loan - - - - - -
Loan to Policy holders - - - - - -
Other Loans & Investments 6,593 776,964 3274 780238 786,831
Investment in subsidiaries, - - - - - -
Investment in Associates - - - - - -
Investment in jointly controlled entities - - - - - -
Investment Properties - - - - -
Total Admissible Assets 14,454,092 5,045,241 9,895,111 3,672,131 18,612,483 33,066,576
SURPLUS(DEFICIT ) IN ASSETS COVER 10,334,127 2,746,889 1,464,651 1,494,314 5,705,855 16,039,981
2 2.8 NOTES TO THE FINANCIAL STATEMENTSFINANCIALS

ANNUAL REPORT 2020 AXA MANSARD | 125
2
The following tables reconcile the consolidated statement of financial position to the classes and portfolios used in the Group’s ALM framework.
GroupDecember 31, 2019
Insurance fund Investment Contracts
Shareholders funds Annuity Others Total
Non-life Life Non-life Life
ASSETS
Cash and cash equivalents 10,532,152 1,862,826 1,683,506 1,344,183 663,670 46,888 1,778,192 17,911,416
Fair value through profit or loss - 3,412,576 - - - 1,889,429 - 5,302,005
Available-for-sale 4,821,525 1,404,084 3,506,952 9,205,809 1,358,514 1,735,814 5,804,128 27,836,825
Financial assets designated at fair value - - 4,154,695 - - - - 4,154,695
Trade receivables 787,979 436,394 - - - - 4,194,051 5,418,424
Reinsurance assets 8,005,396 890,216 - - - - 78,634 8,974,246
Other receivables - - - 696,906 104,985 - 746,761 1,548,652
Deferred acquisition cost 321,055 - - - - - 9,992 331,047
Loans and receivables - - - 833,896 48,272 - (478,620) 403,548
Investment properties - - - 1,350,000 - - 14,451,949 15,801,949
Investment in subsidiaries - - - 3,137,247 400,000 - - -
Intangible assets - - - 193,133 22,318 - 1,364,847 1,580,297
Property and equipment - - - 1,784,134 409 - 205,238 1,989,781
Right of use - 402,061 60,021 73,781 535,863
Statutory deposit - - - 300,000 200,000 - - 500,000
TOTAL ASSETS 24,468,107 8,006,095 9,345,153 19,247,369 2,858,189 3,672,131 28,228,953 92,288,748
LIABILITIES
Insurance liabilities 11,102,754 4,211,175 - - - 2,177,817 7,671,195 25,162,941
Investment contract liabilities:
– At amortised cost - - 4,275,765 - - - - 4,275,765
– Financial liabilities designated at fair value
- - 4,154,695 - - - - 4,154,695
Trade payables - - - 14,262,553 2,215,992 - 89,167 16,567,712
Other liabilities - - - 1,565,835 328,999 - 1,410,988 3,305,822
Current income tax liabilities - - - 129,300 74,350 - 731,896 935,546
Borrowings - - - - - - 6,965,804 6,965,804
Deferred tax liability - - - - - - 841,496 841,496
TOTAL LIABILITIES 11,102,754 4,211,175 8,430,460 15,957,688 2,619,341 2,177,817 17,710,546 62,209,781
SURPLUS 13,365,353 3,794,920 914,693 3,289,681 238,848 1,494,314 10,518,407 30,078,967
2.8 NOTES TO THE FINANCIAL STATEMENTSFINANCIALS

126 | ANNUAL REPORT 2020 - AXA MANSARD
ParentDecember 31, 2019
Insurance fund Investment Contracts Shareholders funds Annuity Total
Non-life Iife Non-life Iife
ASSETS
Cash and cash equivalents 10,532,152 1,862,826 1,683,506 1,344,233 663,670 46,888 16,133,274
Fair value through profit or loss - 3,412,576 - - - 1,889,429 5,302,005
Available-for-sale 4,821,525 1,404,084 3,506,952 9,205,757 1,358,514 1,735,814 22,032,646
Financial assets designated at fair value - - 4,154,695 - - - 4,154,695
Trade receivables 787,979 436,394 - - - - 1,224,373
Reinsurance assets 8,005,396 890,216 - - - - 8,895,612
Other receivables - - - 696,906 104,985 - 801,891
Deferred acquisition cost 321,055 - - - - - 321,055
Loans and receivables - - - 833,896 48,272 - 882,168
Investment properties - - - 1,350,000 - - 1,350,000
Investment in subsidiaries - - - 3,137,247 400,000 - 3,537,247
Intangible assets - - - 193,133 22,318 - 215,450
Property and equipment - - - 1,784,134 409 - 1,784,543
Right of use 402,061 60,021 462,082
Statutory deposit - - - 300,000 200,000 - 500,000
TOTAL ASSETS 24,468,107 8,006,095 9,345,153 19,247,367 2,858,189 3,672,131 67,597,041
LIABILITIES
Insurance liabilities 11,102,754 4,211,175 - - - 2,177,817 17,491,746
Investment contract liabilities:
– At amortised cost - - 4,275,765 - - - 4,275,765
– Financial liabilities designated at fair value
- - 4,154,695 - - - 4,154,695
Trade payables - - - 14,262,553 2,215,992 - 16,478,545
Other liabilities - - - 1,565,836 328,999 - 1,894,835
Current income tax liabilities - - - 129,300 74,350 - 203,650
Deferred income tax - - - - - - -
TOTAL LIABILITIES 11,102,754 4,211,175 8,430,460 15,957,689 2,619,341 2,177,817 44,499,236
SURPLUS 13,365,353 3,794,920 914,693 3,289,678 238,848 1,494,314 23,097,805
2 2.8 NOTES TO THE FINANCIAL STATEMENTSFINANCIALS

ANNUAL REPORT 2020 AXA MANSARD | 127
2
7 (A) THE SEGMENT INFORMATION PROVIDED BY THE MANAGEMENT UNDERWRITING & INVESTMENT COMMITTEE (MUIC) FOR THE REPORTING SEGMENTS FOR THE YEAR ENDED 31 DECEMBER 2020 IS AS FOLLOWS:
December 2020
In thousands of Nigerian Naira Investment
Management Property
Development Pension
Management Health
Maintenance Elimination adjustments Total
Cash and cash equivalents 291,555 600,765 - 2,783,451 - 20,251,719 Fair value through profit or loss - - - - - 5,407,073 Available-for-sale assets 823,374 493 - 2,514,238 87 31,102,632 Financial assets designated at fair value - - - - - 4,485,246 Trade receivables - - - 5,625,895 - 6,668,899 Reinsurance assets - - - 172,388 - 6,499,653 Deferred acquisition cost - - - 69,505 - 415,717 Other receivables 100,415 125,125 - 391,939 (57,787) 1,286,603 Loans and receivables 7,404 - - 1,545,671 (2,097,180) 470,272 Investment properties - 13,694,760 - - - 13,694,760 Investment in subsidiaries - - - 4,400,000 (6,052,000) - Intangible assets 9,672 350 - 2,552 12,000 330,017 Property, plant and equipment 66,327 50,189 - 156,971 - 2,428,288 Right of Use - - - 176,038 - 898,841 Statutory deposit - - - - - 500,000
TOTAL ASSETS 1,298,747 14,471,682 - 17,838,648 (8,194,880) 94,439,720
Insurance liabilities - - - 10,047,358 - 29,597,844
Investment contract liabilities: - – At amortised cost - - - - - 5,153,521 – Financial liabilities designated at fair value
- - - - - 4,485,246
Trade payables - - - 164,292 - 9,111,737 Other Liabilities 170,881 428,579 - 1,617,020 (673,974) 2,936,095 Current income tax liabilities 74,195 250,190 - 1,198,499 - 1,648,795 Borrowings - 4,537,089 - - (1,542,728) 2,994,361 Deferred income tax 10,620 789,494 - 18,552 - 818,666
TOTAL LIABILITIES 255,696 6,005,351 - 13,045,721 (2,216,702) 56,746,265
EQUITYShare capital 150,000 9,250 - 700,000 (859,250) 18,000,000 Share premium 790,000 2,612,162 - - (3,402,162) - Contingency reserve - - - - - 4,345,125 Other reserves - - - - - 167,381 Treasury shares - - - - - (304,924)Retained earnings 94,987 5,844,919 - 3,868,727 (5,467,351) 6,470,482 Fair value reserves 8,064 - - 224,200 - 5,264,806
1,043,051 8,466,331 - 4,792,927 (9,728,763) 33,942,870
Non-controlling interests in equity - - - - 3,750,585 3,750,585
TOTAL EQUITY 1,043,051 8,466,331 - 4,792,927 (5,978,178) 37,693,455
TOTAL LIABILITIES AND EQUITY 1,298,747 14,471,682 - 17,838,648 (8,194,880) 94,439,720
2.8 NOTES TO THE FINANCIAL STATEMENTSFINANCIALS

128 | ANNUAL REPORT 2020 - AXA MANSARD
December 2019
In thousands of Nigerian Naira Investment
Management Property
Development Pension
Management Health
Maintenance Elimination adjustments Total
Cash and cash equivalents 91,181 285,072 185,716 1,216,173 - 17,911,416 Fair value through profit or loss - - - - - 5,302,005 Available-for-sale assets 985,896 493 1,232,804 3,584,986 - 27,836,825 Financial assets designated at fair value - - - - - 4,154,695 Trade receivables - - - 4,194,051 - 5,418,424 Reinsurance assets - - - 78,634 - 8,974,246 Deferred acquisition cost - - - 9,992 - 331,047 Other receivables 197,320 131,742 193,863 223,836 - 1,548,652 Loans and receivables 7,495 - 1,983 1,284,682 (1,772,780) 403,548 Investment properties - 14,451,949 - 4,400,000 (4,400,000) 15,801,949 Investment in subsidiaries - - - - (3,537,247) - Intangible assets 19,710 455 3,220 2,931 1,338,531 1,580,297 Property, plant and equipment 16,198 48,079 86,569 54,393 - 1,989,781 Right of Use 4,199 69,582 535,863
Statutory deposit - - - - - 500,000
TOTAL ASSETS 1,321,998 14,917,790 1,773,737 15,049,677 (8,371,496) 92,288,748
Insurance liabilities - - - 7,671,195 - 25,162,941 Investment contract liabilities:– At amortised cost - - - - - 4,275,765 – Financial liabilities designated at fair value - - - - - 4,154,695 Trade payables - - - 89,167 - 16,567,712 Other Liabilities 266,656 512,476 122,630 1,009,640 (500,415) 3,305,822 Current income tax liabilities 13,494 253,607 8,897 455,898 - 935,546
Borrowings - 4,190,149 - 4,047,000 (1,271,345) 6,965,804 Deferred income tax (21,338) 852,525 - 10,309 - 841,496
TOTAL LIABILITIES 258,812 5,808,757 131,527 13,283,209 (1,771,760) 62,209,781
EQUITY Share capital 150,000 5,152 1,033,836 700,000 (1,888,989)Share premium 790,000 1,454,974 - - (2,244,974) 5,250,000 Contingency reserve - - - - - 4,443,453 Other reserves - - 35,059 - 347 4,270,458 Treasury shares - - - - - 2,687,483
Retained earnings 102,134 3,613,605 (133,910) 974,362 (2,586,413) (304,924)
Fair value reserves 21,052 - 43,998 92,106 - 7,832,957
1,063,186 5,073,731 978,983 1,766,468 (6,720,029) 1,080,718
Non-controlling interests in equity - 4,035,302 663,227 - 120,293 4,818,822
TOTAL EQUITY 1,063,186 9,109,033 1,642,210 1,766,468 (6,599,736) 30,078,967
TOTAL LIABILITIES AND EQUITY 1,321,998 14,917,790 1,773,737 15,049,677 (8,371,496) 92,288,748
2 2.8 NOTES TO THE FINANCIAL STATEMENTSFINANCIALS

ANNUAL REPORT 2020 AXA MANSARD | 129
2
2.8 NOTES TO THE FINANCIAL STATEMENTSFINANCIALS
(B)
THE
CON
SOLI
DATE
D FI
NAN
CIAL
DAT
A FO
R TH
E RE
PORT
ING
SEGM
ENTS
FO
R TH
E YE
AR E
NDE
D DE
CEM
BER
31, 2
020
IS A
S FO
LLO
WS:
Dece
mbe
r 31,
202
0 L
ife
busi
ness
In
sura
nce
Inve
stm
ent
man
agem
ent
Pro
pert
y de
velo
pmen
t H
ealth
M
aint
enan
ce
Pen
sion
m
anag
emen
t E
limin
atio
n Ad
just
men
ts
Tot
al
Reve
nue:
Deriv
ed fr
om e
xter
nal c
usto
mer
s:Gr
oss w
ritte
n pr
emiu
m 7
,466
,728
2
7,54
7,90
3 -
- 2
0,21
5,06
3 -
(179
,532
) 4
7,58
3,43
4 Gr
oss p
rem
ium
inco
me
7,3
56,2
98
27,
069,
133
- -
18,
630,
266
- (1
79,5
32)
45,
519,
867
Rein
sura
nce
expe
nses
(978
,588
)(1
3,58
6,33
5) -
- (2
17,0
48)
- -
(13,
803,
383)
Net
pre
miu
m in
com
e 6
,377
,710
1
3,48
2,79
8 -
- 1
8,41
3,21
8 -
(179
,532
) 3
1,71
6,48
4 Fe
es a
nd c
omm
issi
on in
com
e 1
67,3
27
1,6
57,8
16
- -
- -
- 1
,657
,816
Net
und
erw
ritin
g in
com
e 6
,545
,037
1
5,14
0,61
4 -
- 1
8,41
3,21
8 -
(179
,532
) 3
3,37
4,30
0
Clai
ms:
Clai
ms e
xpen
ses (
gros
s) 3
,183
,479
8
,569
,687
-
- 1
2,61
3,02
3 -
- 2
1,18
2,71
0 Cl
aim
s exp
ense
s rec
over
ed fr
om re
insu
rers
(84,
655)
(821
,006
) -
- (1
10,0
17)
- 2
0,52
7 (9
10,4
96)
Und
erw
ritin
g ex
pens
es 1
,051
,347
3
,159
,818
-
- 6
37,6
44
- -
3,7
97,4
62
Chan
ges i
n in
divi
dual
life
rese
rves
991
,113
9
91,1
13
- -
- -
- 9
91,1
13
Incr
ease
/(de
crea
se) i
n an
nuity
rese
rves
8
76,3
79
876
,379
-
- -
- -
876
,379
Net
und
erw
ritin
g ex
pens
es 6
,017
,663
1
2,77
5,99
1 -
- 1
3,14
0,65
0 -
20,
527
25,
937,
168
Tora
l und
erw
ritin
g pr
ofit
527
,374
2
,364
,623
-
- 5
,272
,568
-
(200
,059
) 7
,437
,132
Inve
stm
ent i
ncom
e 1
,056
,838
2
,653
,181
8
24,2
07
1,2
77,4
64
400
,062
-
(303
,955
) 4
,850
,958
N
et g
ains
on
finan
cial
inst
rum
ents
1,7
30,7
76
2,0
95,4
93
(83,
533)
1,0
35,6
74
233
,136
-
- 3
,280
,770
N
et g
ains
/ Los
s on
inve
stm
ent
- -
- (2
,279
,051
) -
- -
(2,2
79,0
51)
Net
gai
n on
sale
of i
nves
tmen
t in
subs
idia
ry -
1,0
93,9
22
- -
- (2
48,7
03)
845
,219
Pr
ofits
on
inve
stm
ent c
ontra
cts
235
,271
2
35,2
71
(17,
935)
74
- -
- 2
17,4
10
Oth
er in
com
e 9
2 1
27,2
49
561
-
40,
509
- 5
,756
1
74,0
75
Rent
al in
com
e -
- -
- -
- -
- To
tal i
nves
tmen
t inc
ome
3,0
22,9
77
6,2
05,1
16
723
,300
3
4,16
0 6
73,7
07
- (5
46,9
02)
7,0
89,3
81
Expe
nses
for m
arke
ting
and
adm
inist
ratio
n 6
89,8
67
1,3
08,0
34
- 1
20
87,
651
- (1
79,5
32)
1,2
16,2
73
Empl
oyee
ben
efit e
xpen
se 1
,077
,890
1
,509
,815
4
04,6
20
- 9
95,7
14
- -
2,9
10,1
49
Oth
er o
pera
ting
expe
nses
1,1
23,9
13
3,0
84,8
27
181
,209
4
8,11
9 4
04,9
70
- (2
84,5
70)
3,4
34,5
55
Impa
irmen
t of o
ther
ass
ets
2,9
01
22,
673
35,
229
- -
- (3
5,22
9) 2
2,67
4 Im
pairm
ent o
f pre
miu
m re
ceiv
able
s 6
,799
1
0,00
0 -
- 1
11,9
53
- -
121
,953
Re
sults
of o
pera
ting
activ
ities
648
,981
2
,634
,390
1
02,2
42
(14,
079)
4,3
45,9
87
- (2
47,6
30)
6,8
20,9
10
Fina
nce
cost
(81,
024)
- (4
42,9
51)
(272
,951
) -
14,
771
(782
,155
)
Profi
t bef
ore
tax
648
,981
2
,553
,366
1
02,2
42
(457
,030
) 4
,073
,036
-
(232
,859
) 6
,038
,755
In
com
e ta
x exp
ense
s (1
4,21
7) (8
0,11
1) (6
9,29
1) (1
85,6
73)
(1,1
78,3
22)
- (2
4,27
4) (1
,537
,671
)
Profi
t for
the
year
from
cont
inui
ng o
pera
tions
634
,764
2
,473
,255
3
2,95
1 (6
42,7
04)
2,8
94,7
14
- (2
57,1
33)
4,5
01,0
84
Profi
t fro
m d
isco
ntin
ued
oper
atio
ns (n
et o
f tax
) 3
9,25
3 -
39,
253
Profi
t for
the
year
39,
253
4,5
40,3
37
Asse
ts a
nd li
abili
ties
Tota
l ass
ets
28,
141,
612
69,
025,
523
1,2
98,7
47
14,
471,
682
17,
838,
648
- (8
,194
,880
) 9
4,43
9,72
0
Tota
l lia
bilit
ies
16,
657,
805
39,
656,
199
255
,696
6
,005
,351
1
3,04
5,72
1 -
(2,2
16,7
02)
56,
746,
265
Net
ass
ets/
(liab
ilitie
s) 1
1,48
3,80
7 2
9,36
9,32
4 1
,043
,051
8
,466
,331
4
,792
,927
-
(5,9
78,1
78)
37,
693,
455

130 | ANNUAL REPORT 2020 - AXA MANSARD
2 2.8 NOTES TO THE FINANCIAL STATEMENTSFINANCIALS
NO
TES
TO T
HE
FIN
ANCI
AL S
TATE
MEN
TS
Dece
mbe
r 31,
202
0
In th
ousa
nds o
f Nai
ra L
ife
busi
ness
In
sura
nce
Inve
stm
ent
man
agem
ent
Pro
pert
y de
velo
pmen
t H
ealth
M
aint
enan
ce
Pen
sion
m
anag
emen
t E
limin
atio
n Ad
just
men
ts
Tot
al
Segm
ent r
epor
ting
Exte
rnal
reve
nue
Net
pre
miu
m e
arne
d 6
,377
,710
1
3,48
2,79
8 -
- 1
8,41
3,21
8 -
(179
,532
) 3
1,71
6,48
4
Net
inte
rest
inco
me
1,2
92,1
09
2,8
88,4
52
806
,272
1
,277
,538
4
00,0
62
357
,926
(3
03,9
55)
5,4
26,2
94
Net
fees
and
com
mis
sion
167
,327
1
,657
,816
-
- -
- -
1,6
57,8
16
Net
trad
ing
inco
me/
(exp
ense
) 1
,730
,776
2
,095
,493
(8
3,53
3) 1
,035
,674
2
33,1
36
9,0
64
- 3
,289
,835
Oth
er in
com
e 9
2 1
,221
,171
5
61
(2,2
79,0
51)
40,
509
132
(2
42,9
47)
(1,2
59,6
25)
Inte
r seg
men
t rev
enue
- (4
22,4
79)
- (3
03,9
55)
- -
- (7
26,4
34)
Tota
l seg
men
t rev
enue
9,5
68,0
14
20,
923,
252
723
,300
(2
69,7
95)
19,
086,
925
367
,122
(7
26,4
34)
40,
104,
370
Repo
rtabl
e se
gmen
t pro
fit b
efor
e ta
x 6
48,9
81
2,5
53,3
66
102
,242
(4
57,0
30)
4,0
73,0
36
40,
791
(232
,859
) 6
,079
,549
Repo
rtabl
e se
gmen
t ass
ets
28,
141,
612
69,
025,
523
1,2
98,7
47
14,
471,
682
17,
838,
648
- (8
,194
,880
) 9
4,43
9,72
0
Repo
rtabl
e se
gmen
t lia
bilit
ies
16,
657,
805
39,
656,
199
255
,696
6
,005
,351
1
3,04
5,72
1 -
(2,2
16,7
02)
56,
746,
265

ANNUAL REPORT 2020 AXA MANSARD | 131
2
8 CASH AND CASH EQUIVALENTS
Group Group Parent Parent
Dec-2020 Dec-2019 Dec-2020 Dec-2019
Cash at bank and in hand 11,134,053 7,603,647 8,972,560 6,024,334
Tenored deposits (see note (a) below) 9,117,666 10,307,769 7,603,388 10,108,940
20,251,719 17,911,416 16,575,948 16,133,274
(a) Tenored deposits are made for varying periods of between one day and three months, depending on the immediate cash requirements of the Group. The carrying amounts disclosed above reasonably approximate fair value at the reporting date.
9 INVESTMENT SECURITIESThe Group’s investment securities are summarized below by measurement category:
Group Group Parent Parent
Dec-2020 Dec-2019 Dec-2020 Dec-2019
Fair value through profit or loss (see note 9.1) 5,407,073 5,302,005 5,407,073 5,302,005
Available-for-sale (see note 9.2) 31,102,632 27,836,825 27,764,440 22,032,646
Financial assets designated at fair value (see note 9.3) 4,485,246 4,154,695 4,485,246 4,154,695
40,994,951 37,293,525 37,656,759 31,489,346
Current 1,244,105 1,113,473 5,407,073 881,306
Non-current 39,750,846 36,180,052 32,249,686 30,608,040
40,994,951 37,293,525 37,656,759 31,489,346
9.1 FAIR VALUE THROUGH PROFIT OR LOSSFair value through profit or loss instruments represent interests in treasury bills and bonds as at year end.
Group Group Parent Parent
Dec-2020 Dec-2019 Dec-2020 Dec-2019
Government bonds 5,407,073 3,184,336 5,407,073 3,184,336
Treasury bills - 2,117,669 - 2,117,669
5,407,073 5,302,005 5,407,073 5,302,005
(a) Movement in fair value through profit or loss assets
2020
Group
at 1 January 2020 Additions Disposal Fair value Interest receivable as at 31
December 2020
Government bonds 3,184,336 978,538 (306,642) 1,189,003 361,838 5,407,073
Treasury bills 2,117,669 11,498 (2,131,294) 257 1,870 -
5,302,005 990,036 (2,437,936) 1,189,260 363,708 5,407,073
Parent
at 1 January 2020 Additions Disposal Fair value Interest receivable as at 31
December 2020
Government bonds 3,184,336 978,538 (306,642) 1,189,003 361,838 5,407,073
Treasury bills 2,117,669 11,498 (2,131,294) 257 1,870 -
5,302,005 990,036 (2,437,936) 1,189,260 363,708 5,407,073
2.8 NOTES TO THE FINANCIAL STATEMENTSFINANCIALS

132 | ANNUAL REPORT 2020 - AXA MANSARD
2019
Group
at 1 January 2019 Additions Disposal Fair value Interest receivable as at 31
December 2019 Government bonds 1,303,531 2,103,499 (782,590) 435,389 124,507 3,184,336
Treasury bills 1,962,517 7,288,215 (7,365,203) 39,458 192,682 2,117,669
3,266,048 9,391,714 (8,147,793) 474,847 317,189 5,302,005
Parent
at 1 January 2019 Additions Disposal Fair value Interest receivable as at 31
December 2019 Government bonds 1,303,531 2,103,499 (782,590) 435,389 124,507 3,184,336
Treasury bills 1,962,517 7,288,215 (7,365,203) 39,458 192,682 2,117,669
3,266,048 9,391,714 (8,147,793) 474,847 317,189 5,302,005
9.2 AVAILABLE-FOR-SALE ASSETSAvailable for sale instruments represent interests in quoted securities, treasury bills, listed funds and unlisted entities as at year end.
Group Group Parent Parent
Dec-2020 Dec-2019 Dec-2020 Dec-2019
Government & corporate bonds 21,585,177 12,820,184 20,276,149 11,498,908
Tenored deposits with maturity above 90 days - 1,077,894 - 1,077,895
Treasury bills 627,993 4,846,197 378,637 1,546,058
Equity securities (see table (a) below) 243,677 182,602 163,631 124,349
Investment funds (see table (b) below) 8,645,785 8,909,948 6,946,023 7,785,436
31,102,632 27,836,825 27,764,440 22,032,646
(a) Analysis of equity securities is shown below:
Group Group Parent Parent
Dec-2020 Dec-2019 Dec-2020 Dec-2019
Quoted securities 187,711 122,586 107,665 64,333
Unquoted securities
Insurance Energy pool 36,466 36,466 36,466 36,466
Imperial Homes Limited 19,500 23,500 19,500 23,500
DML Nominees limited - 50 - 50
243,677 182,602 163,631 124,349
(b) Analysis of investment funds is shown below:
Group Group Parent Parent
Dec-2020 Dec-2019 Dec-2020 Dec-2019
AXA Mansard Funds 164,379 164,379 164,379 164,379
Legacy Money Market Funds 11,228 11,228 11,228 11,228
Coral Growth Fund 3,068 3,068 3,068 3,068
AXA Mansard Money Market Fund & Income Growth Fund 5,964,753 6,228,916 4,264,991 5,104,404
IAML Money Market Investment 289,736 289,736 289,736 289,736
ARM Money Market Investment 2,212,621 2,212,621 2,212,621 2,212,621
8,645,785 8,909,948 6,946,023 7,785,436
At the reporting date, there were no available for sale assets that were overdue but not impaired. The AXA Mansard money market & income growth fund is a pool of funds invested in equity, bonds and money market.
2 2.8 NOTES TO THE FINANCIAL STATEMENTSFINANCIALS

ANNUAL REPORT 2020 AXA MANSARD | 133
2
(c) Movement in Available-for-sale assets
2020
Group
at 1 January
2020 Additions Disposal Fair value Interest
receivable
as at 31 December
2020
Government & corporate bonds 12,820,184 14,169,852 (9,652,415) 4,052,918 194,638 21,585,177
Tenored deposits with maturity above 90 days 1,077,894 - (1,077,894) - - -
Treasury bills 4,846,197 810,018 (5,308,534) 197,452 82,860 627,993
Equity 182,602 187,176 (91,766) (34,335) - 243,677
Investment Funds 8,909,948 3,965,317 (4,317,633) (31,947) 120,100 8,645,785
27,836,825 19,132,363 (20,448,242) 4,184,088 397,598 31,102,632
Parent at 1 January
2020 Additions Disposal Fair value Interest
receivable
as at 31 December
2020
Government & corporate bonds 11,498,908 12,122,368 (8,273,289) 4,046,256 881,906 20,276,149
Tenored deposits with maturity above 90 days 1,077,895 - (1,077,895) - - -
Treasury bills 1,546,058 839,616 (2,266,580) 172,415 87,128 378,637
Equity 124,349 183,757 (91,766) (52,709) - 163,631
Investment Funds 7,785,436 3,062,043 (4,317,633) (56,982) 473,159 6,946,023
22,032,646 16,207,784 (16,027,163) 4,108,980 1,442,193 27,764,440
2019
Groupat 1
January 2019 Additions Disposal Fair value
Interest receivable
as at 31 December
2019 Government & corporate bonds 10,879,158 2,593,333 (5,160,943) 1,547,022 2,961,614 12,820,184
Tenored deposits with maturity above 90 days 515,184 14,168,472 (13,782,163) - 176,401 1,077,894
Treasury bills 5,787,634 10,617,817 (12,209,247) 194,946 455,047 4,846,197
Equity 281,802 13,145 (57,837) (54,509) - 182,602
Investment Funds 4,849,892 10,145,708 (6,749,920) (56,516) 720,784 8,909,948
22,313,670 37,538,476 (37,960,111) 1,630,944 4,313,846 27,836,825
Parentat 1
January 2019 Additions Disposal Fair value
Interest receivable
as at 31 December
2019 Government & corporate bonds 9,809,282 2,963,036 (5,123,505) 1,466,617 2,383,478 11,498,908
Tenored deposits with maturity above 90 days 459,119 13,994,916 (13,508,482) - 132,342 1,077,895
Treasury bills 4,057,998 6,075,907 (9,107,288) 108,259 411,181 1,546,058
Equity 248,340 320 (77,081) (47,230) - 124,349
Investment Funds 3,313,349 7,041,190 (2,915,058) (54,178) 400,133 7,785,436
17,888,088 30,075,369 (30,731,413) 1,473,468 3,327,134 22,032,646
2.8 NOTES TO THE FINANCIAL STATEMENTSFINANCIALS

134 | ANNUAL REPORT 2020 - AXA MANSARD
9.3 FINANCIAL ASSETS DESIGNATED AT FAIR VALUE
Group Group Parent Parent
Dec-2020 Dec-2019 Dec-2020 Dec-2019
Investment contracts designated at fair value (see note (i)) 4,485,246 4,154,695 4,485,246 4,154,695
4,485,246 4,154,695 4,485,246 4,154,695
(i) Investment contracts designated at fair value
Financial assets designated at fair value represent the assets of the investment contracts managed on behalf of customers and unavailable for day to day use by the Company. The assets match the financial liabilities carried at fair value as at year end.
The category of financial assets held can be analysed as follows:
Group Group Parent Parent
Dec-2020 Dec-2019 Dec-2020 Dec-2019
Bank balances 1,344,410 108,254 1,344,410 108,254
Short term deposit 304,394 1,419,745 304,394 1,419,745
Government treasury bills 243,700 1,673,106 243,700 1,673,106
Government and corporate bonds 2,544,622 939,167 2,544,622 939,167
Quoted equity securities 17,378 14,424 17,378 14,424
4,485,246 4,154,695 4,485,246 4,154,695
10 TRADE RECEIVABLES
Group Group Parent Parent
Dec-2020 Dec-2019 Dec-2020 Dec-2019
Premium receivable (see 10.1 below) 5,745,137 4,383,727 119,242 189,676
Coinsurance receivable (see 10.2 below) 923,762 1,034,697 923,762 1,034,697
6,668,899 5,418,424 1,043,004 1,224,373
All trade receivables fall due within one year.
10.1 PREMIUM RECEIVABLES(a) Premium receivables
Group Group Parent Parent
Dec-2020 Dec-2019 Dec-2020 Dec-2019
Premium receivables 5,900,114 4,416,751 160,309 220,743
Less specific provision for impairment (154,977) (33,024) (41,067) (31,067)
5,745,137 4,383,727 119,242 189,676
Analysis of premium receivables:
Group Group Parent Parent
Dec-2020 Dec-2019 Dec-2020 Dec-2019
Life contracts insurance receivable 26,160 185,376 26,160 185,376
Non-life contracts insurance receivable 93,082 4,299 93,082 4,299
AXA Mansard Health (HMO) receivable 5,625,895 4,194,052 - -
5,745,137 4,383,727 119,242 189,675
2 2.8 NOTES TO THE FINANCIAL STATEMENTSFINANCIALS

ANNUAL REPORT 2020 AXA MANSARD | 135
2
Counter party categorization of insurance receivable:
Group Group Parent Parent
Dec-2020 Dec-2019 Dec-2020 Dec-2019
Brokers and agents 160,309 220,743 160,309 220,743
Contract holders 5,739,806 4,196,009 - -
Total insurance receivables 5,900,115 4,416,752 160,309 220,743
Less impairment of receivables:
– Brokers and agents (41,067) (31,067) (41,067) (31,067)
– Contract holders (113,910) (1,957) - -
Total impairment (154,977) (33,024) (41,067) (31,067)
5,745,137 4,383,727 119,242 189,675
There is no concentration of credit risk with respect to trade receivables, as the Group has a non-symmetrical portfolio dispersed across many industries in Nigeria.
The aging analysis of gross premium receivable as at the end of the year is as follows:
Group Group Parent Parent
Dec-2020 Dec-2019 Dec-2020 Dec-2019
0 – 30 days 4,792,846 3,031,827 93,367 7,626
31 – 90 days 835,900 1,356,983 22,732 185,948
91 – 180 days 168,581 617 13,659 269
Above 180 days 102,787 27,325 30,551 26,898
Total 5,900,114 4,416,752 160,309 220,743
The movement in impairment of insurance receivable is as follows:
(b) Impairment of premium receivable
Group Group Parent Parent
Dec-2020 Dec-2019 Dec-2020 Dec-2019
Balance, beginning of the year 33,024 73,936 31,067 35,969
Additional impairment/(write back) during the year 121,953 (40,911) 10,000 (4,902)
Balance, end of year 154,977 33,024 41,067 31,067
10.2 CO-INSURANCE RECEIVABLE
Group Group Parent Parent
Dec-2020 Dec-2019 Dec-2020 Dec-2019
Co-insurers’ share of outstanding claims 923,762 1,034,697 923,762 1,034,697
923,762 1,034,697 923,762 1,034,697
(a) The movement in co-insurance recoverable on claims paid
Group Group Parent Parent
Dec-2020 Dec-2019 Dec-2020 Dec-2019
Balance, beginning of the year 1,034,697 309,443 1,034,697 309,443
Additions in the year 349,338 825,585 349,338 825,585
Receipts during the year (460,273) (100,331) (460,273) (100,331)
923,762 1,034,697 923,762 1,034,697
2.8 NOTES TO THE FINANCIAL STATEMENTSFINANCIALS

136 | ANNUAL REPORT 2020 - AXA MANSARD
11 REINSURANCE ASSETS
Group Group Parent Parent
Dec-2020 Dec-2019 Dec-2020 Dec-2019
Total reinsurers’ share of outstanding claims (see note (a) below) 1,502,091 3,418,524 1,502,091 3,405,168
Prepaid re-insurance- Non life & health (see note (b) below) 2,289,064 2,075,397 2,222,808 2,029,410
Prepaid re-insurance- group life reserves (see note (c) below) 127,480 253,769 127,480 253,769
Reinsurance share of individual life reserves (see note (d) below) 50,908 26,634 50,908 26,634
Reinsurance share of Incurred But Not Reported (IBNR) claims (see note (e) below)
1,627,382 1,462,249 1,541,777 1,442,958
Recoverables from reinsurers on claims paid (see note (f) below) 902,728 1,737,673 882,201 1,737,673
6,499,653 8,974,246 6,327,265 8,895,612
(a) The movement in reinsurers’ share of outstanding claims is as follows:
Group Group Parent Parent
Dec-2020 Dec-2019 Dec-2020 Dec-2019
Balance, beginning of the year 3,418,524 5,111,932 3,405,168 5,104,874
Movement during the year (1,916,433) (1,693,408) (1,903,077) (1,699,706)
1,502,091 3,418,524 1,502,091 3,405,168
Reinsurance share of outstanding claims can be analysed as follows:
Group Group Parent Parent
Dec-2020 Dec-2019 Dec-2020 Dec-2019
Non-life 1,483,060 3,301,740 1,483,060 3,301,740
Life 19,031 103,428 19,031 103,428
AXA Mansard Health (HMO) - 13,356 - -
Balance, end of year 1,502,091 3,418,524 1,502,091 3,405,168
(b) The movement in prepaid reinsurance - Non life & health is as follows:
Group Group Parent Parent
Dec-2020 Dec-2019 Dec-2020 Dec-2019
Balance, beginning of the year 2,075,397 1,926,409 2,029,410 1,892,293
Movement during the year (see note 30) 213,667 148,988 193,398 137,116
2,289,064 2,075,397 2,222,808 2,029,410
(c) The movement in prepaid re-insurance- group life reserves:
Group Group Parent Parent
Dec-2020 Dec-2019 Dec-2020 Dec-2019
Balance, beginning of the year 253,769 305,258 253,769 305,258
Movement during the year (see note 30) (126,289) (51,489) (126,289) (51,489)
127,480 253,769 127,480 253,769
2 2.8 NOTES TO THE FINANCIAL STATEMENTSFINANCIALS

ANNUAL REPORT 2020 AXA MANSARD | 137
2
(d) The movement in reinsurance share of individual life reserves:
Group Group Parent Parent
Dec-2020 Dec-2019 Dec-2020 Dec-2019
Balance, beginning of the year 26,634 48,908 26,634 48,908
Movement during the year (see note 30) 24,274 (22,274) 24,274 (22,274)
50,908 26,634 50,908 26,634
Reinsurance Expense for the year:
Group Group Parent Parent
Dec-2020 Dec-2019 Dec-2020 Dec-2019
Prepaid re-insurance at the beginning of the year (see note 11(b), (c) & (d) above) 2,355,800 2,280,575 2,309,813 2,246,459
Reinsurance cost (see note 30) 13,915,035 15,394,250 13,677,718 15,242,133
Total 16,270,835 17,674,825 15,987,531 17,488,592
Prepaid re-insurance at the end of the year (see note 11(a), (b) & (c) above) (2,467,452) (2,355,800) (2,401,196) (2,309,813)
Reinsurance expense for the year (see note 30) 13,803,383 15,319,024 13,586,335 15,178,779
(e) Reinsurance share of IBNR can be analysed as follows:
Group Group Parent Parent
Dec-2020 Dec-2019 Dec-2020 Dec-2019
Non-life 1,408,988 1,022,608 1,408,988 1,022,608
Life 132,789 420,350 132,789 420,350
Health 85,605 19,291 - -
Balance, end of year 1,627,382 1,462,249 1,541,777 1,442,958
The movement in reinsurance IBNR:
Group Group Parent Parent
Dec-2020 Dec-2019 Dec-2020 Dec-2019
Balance, beginning of the year 1,462,249 1,491,441 1,442,958 1,488,122
Movement during the year 165,133 (29,192) 98,819 (45,164)
1,627,382 1,462,249 1,541,777 1,442,958
(f) The movement in recoverables from reinsurers on claims paid
Group Group Parent Parent
Dec-2020 Dec-2019 Dec-2020 Dec-2019
Balance, beginning of the year 1,737,673 1,831,274 1,737,673 1,831,274
Additions in the year 2,668,968 2,366,318 2,275,927 2,366,318
Receipts during the year (3,503,913) (2,459,919) (3,131,399) (2,459,919)
902,728 1,737,673 882,201 1,737,673
2.8 NOTES TO THE FINANCIAL STATEMENTSFINANCIALS

138 | ANNUAL REPORT 2020 - AXA MANSARD
12 DEFERRED ACQUISITION COSTThis relates to the commission paid on the unexpired premium reserve
Group Group Parent Parent
Dec-2020 Dec-2019 Dec-2020 Dec-2019
Deferred acquisition cost- Fire 118,977 68,161 118,977 68,161
Deferred acquisition cost- Gen. Accident 50,308 40,963 50,308 40,963
Deferred acquisition cost- Motor 58,599 73,221 58,599 73,221
Deferred acquisition cost- Marine 17,631 61,627 17,631 61,627
Deferred acquisition cost- Engineering 29,754 45,872 29,754 45,872
Deferred acquisition cost- Oil & Gas 60,678 24,063 60,678 24,063
Deferred acquisition cost- Aviation 10,265 7,148 10,265 7,148
Deferred acquisition cost- HMO 69,505 9,992 - -
Total 415,717 331,047 346,212 321,055
The movement in deferred acquisition cost is as follows:
Group Group Parent Parent
Dec-2020 Dec-2019 Dec-2020 Dec-2019
Balance, beginning of year 331,047 436,772 321,055 415,213
Movement in deferred acquisition cost (see note 33a) 84,670 (105,725) 25,157 (94,158)
Balance, end of year 415,717 331,047 346,212 321,055
13 OTHER RECEIVABLES
Group Group Parent Parent
Dec-2020 Dec-2019 Dec-2020 Dec-2019
Prepayment (see note (i) below) 467,280 574,504 248,732 454,609
Accrued income (see note (ii) below) 172,132 275,932 34,673 35,373
Lease receivables (see note (iv) below) 14,756 - 134,278 -
Other account receivables (see note (iii) below) 769,960 813,068 446,753 426,761
Gross 1,424,127 1,663,504 864,436 916,743
Less: Specific impairment of other receivables (see (a) below) (137,524) (114,852) (137,525) (114,852)
Net receivables 1,286,603 1,548,652 726,911 801,891
(i) Prepayment includes prepaid expenses such as maintenance agreements. The average amortization period for these expenses is 24 months.
(ii) Accrued income relates to dividend income earned but not yet received as at year end.
(iii) Other account receivables relate to amounts due from various third parties and also includes cash advanced to staff in respect of various operating expenses.
(iv) Lease receivables represents receivables for the sublease of a building.
2 2.8 NOTES TO THE FINANCIAL STATEMENTSFINANCIALS

ANNUAL REPORT 2020 AXA MANSARD | 139
2
(a) The movement in provision for impairment of other receivables:
Group Group Parent Parent
Dec-2020 Dec-2019 Dec-2020 Dec-2019
Balance, beginning of the year 114,852 69,152 114,852 69,152
Charge for the year 22,672 45,700 22,673 45,700
Balance end of year 137,524 114,852 137,525 114,852
As at year end, N199 million (2019: N115 million) were past due and have been fully impaired.
Current 885,156 1,280,501 551,709 613,670
Non-current 538,972 383,003 312,727 303,073
1,424,127 1,663,504 864,436 916,743
14 LOANS AND RECEIVABLES
Group Group Parent Parent
Dec-2020 Dec-2019 Dec-2020 Dec-2019
Loans and advances 226,254 175,647 786,138 677,082
Other loans - 1,106,619 - 1,106,619
Staff loans and advances 244,018 227,901 228,239 205,086
Gross 470,272 1,510,167 1,014,377 1,988,787
Less:
Specific impairment of Other loans - (1,106,619) - (1,106,619)
Specific impairment of staff loans and advances - - - -
- (1,106,619) - (1,106,619)
Net loans and receivables 470,272 403,548 1,014,377 882,168
(a) Movement in loans and advances to related party:
Group Group Parent Parent
Dec-2020 Dec-2019 Dec-2020 Dec-2019
Balance, beginning of the year 175,647 175,647 677,082 147,310
Additions during the year 50,607 21,237 578,927 529,772
Accrued Interest during the year - - 58,501 -
Payments during the year - (21,237) (528,372) -
Balance end of year 226,254 175,647 786,138 677,082
(b) Movement in Other loans:
Group Group Parent Parent
Dec-2020 Dec-2019 Dec-2020 Dec-2019
Balance, beginning of the year 1,106,619 1,106,619 1,106,619 1,106,619
Written off during the year (1,106,619) - (1,106,619) -
Balance end of year - 1,106,619 - 1,106,619
In 2018, the Company was to partner with the International Finance Corporation, Africa Capital Alliance and Healthshare Health Solutions in setting up a Special Purpose Vehicle (SPV) - Santa Clara Medical Limited. The SPV was to develop a world class 150-bed acute care hospital in Lagos, Nigeria to further support the development of its health insurance business. However, the project was suspended due to unforeseen circumstances while management embarks on further studies in order to determine an appropriate structure of intervention within the Nigerian Healthcare delivery system.
2.8 NOTES TO THE FINANCIAL STATEMENTSFINANCIALS

140 | ANNUAL REPORT 2020 - AXA MANSARD
The loan of N4.15b (with accrued interest) relates to the funding made available to Santa Clara Medical Limited for the purchase of the hospital land and expenses related to other pre-approval processes. The land valued at N3.04 billion initially purchased for the project was transferred to AXA Mansard Insurance Plc in settlement of the loan exposure while an impairment of N1.1b was booked. The remaining portion of this land was sold in the current year while the Company also received board approval to write off the loan impairment of N1.1b
(c) The movement in impairment of Other loans:
Group Group Parent Parent
Dec-2020 Dec-2019 Dec-2020 Dec-2019
Balance, beginning of the year 1,106,619 1,106,619 1,106,619 1,106,619
Write off during the year (1,106,619) - (1,106,619) -
Balance end of year - 1,106,619 - 1,106,619
(d) Movement in staff loans and advances:
Group Group Parent Parent
Dec-2020 Dec-2019 Dec-2020 Dec-2019
Balance, beginning of the year 227,901 209,970 205,086 175,977
Additions during the year 72,617 45,687 79,985 56,244
Accrued Interest during the year 18,312 18,312 17,980 17,980
Payments during the year (74,812) (46,068) (74,812) (45,115)
Balance end of year 244,018 227,901 228,239 205,086
Current 470,272 1,510,167 1,014,377 1,988,787
Non-current - - - -
15 INVESTMENT PROPERTY(a)
Group Group Parent Parent
Dec-2020 Dec-2019 Dec-2020 Dec-2019
Landed property (Parcel of Land, Located at Bela Vista Estate, Lekki - Lagos) - see note 14(b) - 1,350,000 - 1,350,000
Office property (Office building located at Bishop Aboyade Cole Street, VI - Lagos) 13,694,760 14,451,949 - -
Balance, end of year 13,694,760 15,801,949 - 1,350,000
Non-current 13,694,760 15,801,949 - 1,350,000
13,694,760 15,801,949 - 1,350,000
Investment properties comprise landed and office properties held for the purpose of capital appreciation and rental income. Investment property is carried at fair value which is determined by independent professional valuers; Osas & Oseji Estate Surveyors & Valuers (FRC/2012/0000000000522) revalued the office property using the discounted income capitalisation cashflow approach and direct comparison approach.
Rental income on investment property included in the statement of comprehensive income for the year was N1.24 billion (2019: N1.08 billion). See note 34.
2 2.8 NOTES TO THE FINANCIAL STATEMENTSFINANCIALS

ANNUAL REPORT 2020 AXA MANSARD | 141
2
The movement in investment property is analysed as follows:
Group Group Parent Parent
Dec-2020 Dec-2019 Dec-2020 Dec-2019
Balance, beginning of year 15,801,949 17,525,962 1,350,000 3,040,000
Additionals during the year - - - -
Investment property disposed during the year (1,350,000) (1,300,000) (1,350,000) (1,300,000)
Foreign exchange gain/(loss) 1,521,862 (19,438) - -
Change in fair value (2,279,051) (404,575) - (390,000)
Investment property at fair value 13,694,760 15,801,949 - 1,350,000
The fair value measurement for the landed property has been categorised as a level 2 fair value while the measurement of the office property has been based categorized as level 3 fair value based on the inputs to the valuation technique used (see below). The following table shows the valuation technique used in measuring the fair value of investment property, as well as the significant unobservable inputs used.
Investment Properties
Valuation technique
Fair value at 31 December
2020 (in thousands)
Unobservable inputs
Range of unobservable
inputs (probability weighted average)
Relationship of unobservable inputs
to fair value
Landed PropertyMarket Valuation
approach NA NA NA
Office Property
Discounted Income Capitalisation
Cashflow 13,694,760
Forecast price per square metre
$500 per metre square The higher the price
per square metre, the higher the fair value
Capitalisation rate 6%
The higher the capitalisation rate, the
lower the fair value
16 INVESTMENT IN SUBSIDIARIES(a) The Company’s investment in subsidiaries is as stated below:
Parent Parent
Dec-2020 Dec-2019
AXA Mansard Investments Limited 940,000 940,000
AXA Mansard Health Limited 712,000 712,000
AXA Mansard Pensions Limited - 1,885,247
1,652,000 3,537,247
(b) Principal subsidiary undertakings:
The Group is controlled by AXA Mansard Insurance Plc “the parent” (incorporated in Nigeria). The controlling interest of AXA Mansard Insurance Plc in the Group entities is disclosed in the table below:
Company name Nature of business Country of origin % of equity capital controlled
AXA Mansard Investments Limited Asset management services Nigeria 100
AXA Mansard Health Limited Health Maintenance Organisation Nigeria 100
APD Limited Property development Nigeria 55.7
2.8 NOTES TO THE FINANCIAL STATEMENTSFINANCIALS

142 | ANNUAL REPORT 2020 - AXA MANSARD
1 AXA Mansard Investments Limited was incorporated in January 2008 and its principal activity involves provision of portfolio management services to both individual and corporate clients.
2 AXA Mansard Health Limited was incorporated as a private limited liability company on 7 of August 2003 and its principal activity is to manage the provision of health care services through health care providers and for that purpose was accredited with the National Health Insurance Scheme.
3 APD Limited was incorporated on 2 September 2010 for the purpose of holding and developing a commercial office property located at Plot 928A/B, Bishop Aboyade Cole Street, Victoria Island, Lagos to an ultra modern office structure.
The movement in investment in subsidiaries during the year as follows:
Parent Parent
Dec-2020 Dec-2019
Balance, beginning of year 3,537,247 4,997,374
Additions, during the year - -
Disposal, during the year (1,885,247) (1,460,127)
Balance, end of year 1,652,000 3,537,247
The interest in APD Limited is currently held indirectly through AXA Mansard Health Limited
(c ) The table below summarises the information relating to the Group’s subsidiaries that have material Non-Controlling Interest (NCI) before any intra-group eliminations.
(i) APD Limited
Group Group
Dec-2020 Dec-2019
NCI percentage 44.3% 44.3%
Cash and cash equivalents 600,765 285,072
Other receivables 125,125 131,742
Available-for-sale assets 493 493
Investment properties 13,694,760 14,451,949
Property and equipment 50,189 48,079
Intangible assets 350 455
Borrowings (4,537,089) (4,190,149)
Other liabilities (1,468,262) (1,618,608)
Net assets 8,466,331 9,109,033
Carrying amount of NCI 3,750,585 4,035,302
Dec-2020 Dec-2019
Income 1,277,538 1,335,287
Expenses 1,734,568 1,712,670
Profit before tax (457,030) (377,383)
Profit after tax (642,702) 374,320
Profit allocated to NCI (44.3%) (284,717) 165,824
2 2.8 NOTES TO THE FINANCIAL STATEMENTSFINANCIALS

ANNUAL REPORT 2020 AXA MANSARD | 143
2
(i) AXA Mansard Pensions Limited
Group Group
Dec-2020 Dec-2019
NCI percentage 40% 40%
Cash and bank balances - 185,716
Other receivables - 195,846
Investment securities - 1,232,804
Property and equipment - 86,569
Intangible assets - 3,220
Other liabilities - (122,630)
Net assets - 1,581,525
Carrying amount of NCI - 663,227
Dec-2020 Dec-2019
Income - 607,461
Expenses - 114,981
Profit before tax - 492,480
Profit after tax - 120,554
Profit allocated to NCI (40%) 15,701 48,222
(d) Significant restrictions and impairment
Other than the equitable mortgage on the Company’s investment property (office building) which was used to secure the borrowing from RMB (see note 25), the Group does not have significant restrictions on its ability to access or use its assets and settle its liabilities asides those resulting from the regulatory frameworks within which the insurance business operates.
The regulatory frameworks require all insurance companies to maintain certain levels of regulatory capital and liquid assets and comply with other ratios such as the solvency margin.
The Company’s investment in subsidiaries was assessed for impairment as at 31 December 2020 with no trigger of impairment identified. Based on the result of this test, no impairment charge was recognised.
17 INTANGIBLE ASSETSAnalysis of intangible assets:
Group Group Parent Parent
Dec-2020 Dec-2019 Dec-2020 Dec-2019
Computer software acquired (see note (a) below) 318,017 241,765 305,443 215,450
License fee (see note (a) below) - 400,000 - -
Goodwill 12,000 938,532 - -
Total 330,017 1,580,297 305,443 215,450
2.8 NOTES TO THE FINANCIAL STATEMENTSFINANCIALS

144 | ANNUAL REPORT 2020 - AXA MANSARD
(a) Group
2020
Computer software License Goodwill Total
Cost:
Balance, beginning of year 680,172 500,000 938,532 2,118,704
Additions 159,629 - - 159,629
Intangible assets written off (39,810) (500,000) (926,532) (1,466,342)
Balance, end of year 799,991 - 12,000 811,991
Amortization:
Balance, beginning of year 438,407 100,000 - 538,407
Amortisation charge 74,860 11,667 - 86,527
Accumulated amortization on intangible asset written off (31,293) (111,667) - (142,960)
Balance, end of year 481,974 - - 481,974
Closing net book value 318,017 - 12,000 330,017
2019
Computer software License Goodwill Total
Cost:
Balance, beginning of year 606,692 500,000 938,532 2,045,224
Additions 73,480 - - 73,480
Intangible assets written off - - - -
Balance, end of year 680,172 500,000 938,532 2,118,704
Amortization:
Balance, beginning of year 438,407 80,000 - 518,407
Amortisation charge - 20,000 - 20,000
Accumulated amortization on intangible asset written off - - - -
Balance, end of year 438,407 100,000 - 538,407
Closing net book value 241,765 400,000 938,532 1,580,297
Parent
Parent Parent
Dec-2020 Dec-2019
Cost:
Balance, beginning of year 566,120 493,165
Additions 150,868 72,955
Balance, end of year 716,988 566,120
Amortization:
Balance, beginning of year 350,670 303,079
Amortisation charge 60,875 47,591
Balance, end of year 411,545 350,670
Closing net book value 305,443 215,450
(b) The licence fee represents the value of identifiable license at the acquisition of AXA Mansard Pensions Limited at the aquisition date in 2015 with a useful life of 25 years. The amount has been recognised at cost less accumulated amortisation. This was derecognised as part of the sale of the pension subsidiary in 2020 (See note 35(b)).
2 2.8 NOTES TO THE FINANCIAL STATEMENTSFINANCIALS

ANNUAL REPORT 2020 AXA MANSARD | 145
2
(c) Analysis of Goodwill allocation to CGUs
December 31, 2019
Entity/CGU Goodwill Licence Net assets
Total carrying amount
Discount rate
Terminal growth
rate
Recoverable
amount
Excess of recoverable
amount over
carrying amount
AXA Mansard Pensions Limited 200,000 400,000 1,642,210 2,242,210 16.00% 10.56% 2,823,722 581,512
AXA Mansard Insurance Plc- Life business 726,532 - 5,842,179 6,568,711 16.00% 10.00% 9,117,871 2,549,160
AXA Mansard Health Limited 12,000 - 1,766,468 1,778,468 22.57% 8.00% 7,205,639 5,427,171
938,532 400,000 9,250,857 10,589,389 19,147,232 8,557,843
(i) AXA Mansard Health Limited
On 1 May 2013, AXA Mansard Insurance Plc acquired 99.9% of the share capital of AXA Mansard Health Limited for N12 million. The principal activity of AXA Mansard Health Limited is the provision of health care services through health care providers and for that purpose is accredited with the National Health Insurance Scheme.
As a result of this acquisition, the Group has access to the local health insurance market thereby growing the Group’s insurance network. The goodwill of N12m arising represents the fair value of the consideration transferred as AXA Mansard Health Limited had a zero carrying value of its net assets at acquisition date. Cash was paid as consideration and there was no contingent consideration. None of the goodwill recognised is expected to be deductible for income tax purposes.
Annual impairment testing of goodwill
In accordance with the requirements of IAS 36 ‘Impairment of Assets’, goodwill was tested annually for impairment in previous years for each CGU, by comparing the carrying amount of each CGU to its recoverable amount, being the higher of that CGU’s value-in-use or fair value less costs to sell. An impairment charge is recognised when the recoverable amount is less than the carrying value.
No impairment test was done in 2020 as the remaining goodwill is immaterial to the Group’s financial statements
2.8 NOTES TO THE FINANCIAL STATEMENTSFINANCIALS

146 | ANNUAL REPORT 2020 - AXA MANSARD
18. PROPERTY AND EQUIPMENTGroup
Land Building Motor
vehicle Computer
equipment Office
equipment
Furniture and
fittings Work in
progress Total
Cost
Balance, 1 January 2020 389,664 657,165 1,071,977 1,037,222 536,537 1,162,736 61,551 4,916,851
Additions - - 379,258 361,348 110,781 179,639 30,094 1,061,121
Disposals - - (172,078) (14,016) (13,624) (23,376) - (223,094)
Disposal (AMPL) - - (112,814) (96,104) (41,015) (58,203) - (308,135)
Balance, 31st December 2020 389,664 657,165 1,166,343 1,288,449 592,680 1,260,797 91,646 5,446,743
Accumulated depreciation
Balance, 1 January 2020 - 83,566 657,815 790,787 443,524 951,377 - 2,927,069
Charge for the period - 13,143 177,708 181,576 37,490 86,147 - 496,063
Disposals - - (129,093) (12,746) (12,982) (21,556) - (176,378)
Disposal (AMPL) - - (79,427) (65,596) (33,267) (50,009) - (228,299)
Balance, 31st December 2020 - 96,709 627,003 894,021 434,765 965,958 - 3,018,455
Net book value
Balance, 1 January 2020 389,664 573,598 414,161 246,435 93,013 211,359 61,551 1,989,781
At 31st December 2020 389,664 560,455 539,340 394,429 157,914 294,839 91,646 2,428,288
Parent
Land Building Motor
vehicle Computer
equipment Office
equipment
Furniture and
fittings Work in
progress Total
Cost
Balance, 1 January 2020 389,664 657,165 848,539 893,653 354,435 935,314 61,551 4,140,321
Additions - - 278,585 323,283 67,417 123,284 30,094 822,664
Disposals - - (147,535) (11,475) (6,343) (10,488) - (175,841)
Balance, 31st December 2020 389,664 657,165 979,590 1,205,461 415,510 1,048,110 91,645 4,787,144
Accumulated depreciation
Balance, 1 January 2020 - 83,567 507,202 693,621 304,212 767,178 - 2,355,779
Charge for the period - 14,238 129,823 157,379 27,962 63,812 - 393,214
Disposals - - (88,406) (11,475) (6,343) (10,426) - (116,650)
Balance, 31st December 2020 - 97,805 548,619 839,524 325,831 820,564 - 2,632,343
Net book value
Balance, 1 January 2020 389,664 573,598 341,337 200,032 50,223 168,136 61,551 1,784,542
At 31st December 2020 389,664 559,360 430,971 365,937 89,679 227,546 91,645 2,154,801
(i) In the opinion of the directors, the market value of the Company’s property and equipment is not less than the value shown in the financial statements
(ii) There were no capitalised borrowing cost related to the acquisition of property and equipment during the year (December 2019: nil)
(iii) All items of property and equipment are non-current
(iv) There was no leased asset included in property and equipment (December 2019: nil)
(v) The company had no capital commitment (December 2019: nil)
(vi) The company had no items pledged for borrowings included in property and equipment (December 2019: nil)
(vii) There were no impairment losses on any class of property and equipment
2 2.8 NOTES TO THE FINANCIAL STATEMENTSFINANCIALS

ANNUAL REPORT 2020 AXA MANSARD | 147
2
18 PROPERTY AND EQUIPMENT
(b) Group
Land Building Motor
vehicle Computer
equipment Office
equipment Furniture and
fittings Work in
progress Total
Cost
Balance, 1 January 2019 389,664 657,165 856,502 896,967 502,493 1,096,570 17,906 4,417,267
Additions - - 271,613 140,255 34,044 66,166 43,645 555,723
Disposals - - (56,139) - - - - (56,139)
Balance, 31st December 2019 389,664 657,165 1,071,977 1,037,222 536,537 1,162,736 61,551 4,916,851
Accumulated depreciation
Balance, 1 January 2019 - 70,423 599,759 657,506 390,311 855,906 - 2,573,905
Charge for the period - 13,144 114,195 133,281 53,213 95,471 - 409,303
Disposals - - (56,138)
- - - - (56,138)
Balance, 31st December 2019 - 83,566 657,815 790,787 443,524 951,377 - 2,927,070
Net book value
Balance, 1 January 2019 389,664 586,742 256,743 239,461 112,182 240,664 17,906 1,843,362
At 31st December 2019 389,664 573,598 414,161 246,435 93,013 211,359 61,551 1,989,781
Parent
Land Building Motor
vehicle Computer
equipment Office
equipment Furniture and
fittings Work in
progress Total
Cost
Balance, 1 January 2019 389,664 657,165 671,689 784,920 348,488 890,520 17,906 3,760,352
Additions - - 232,989 108,733 5,947 44,794 43,645 436,108
Disposals - - (56,139) - - - - (56,139)
Balance, 31st December 2019 389,664 657,165 848,539 893,653 354,435 935,314 61,551 4,140,322
Accumulated depreciation
Balance, 1 January 2019 - 70,423 475,137 576,589 275,078 695,472 - 2,092,698
Charge for the period - 13,144 88,203 117,032 29,134 71,706 - 319,220
Disposals - - (56,138) - - - - (56,138)
Balance, 31st December 2019 - 83,567 507,202 693,621 304,212 767,178 - 2,355,779
Net book value
Balance, 1 January 2019 389,664 586,742 196,552 208,331 73,410 195,048 17,906 1,667,655
At 31st December 2019 389,664 573,598 341,337 200,032 50,223 168,136 61,551 1,784,543
18 (c) RIGHT OF USE Group Group Parent Parent
Dec-2020 Dec -2019 Dec-2020 Dec -2019
As at January 1 535,863 477,868 462,082 335,956
Additions 720,632 220,503 544,594 216,304
Accumulated Depreciation (357,654) (162,508) (283,873) (90,178)
As at December 31 898,841 535,863 722,803 462,082
2.8 NOTES TO THE FINANCIAL STATEMENTSFINANCIALS

148 | ANNUAL REPORT 2020 - AXA MANSARD
19 STATUTORY DEPOSITThis represents amounts deposited with the Central Bank of Nigeria (CBN) pursuant to Section 10(3) of the Insurance Act, 2003. This amount is not available for the day-to-day use in the working capital of the Company and so it is excluded from cash and cash equivalents. Interest earned on statutory deposits are included in interest income.
20 INSURANCE LIABILITIES
Group Group Parent Parent
Dec-2020 Dec -2019 Dec-2020 Dec -2019
– Outstanding claims (see note 20.1a) 5,188,166 6,070,304 5,127,267 5,980,088
– Claims incurred but not reported (see note 20.1b) 6,422,727 5,036,746 3,783,360 3,218,061
– Unearned premium (see note 20.2) 12,423,308 10,359,740 5,076,216 4,597,446
– Individual life reserve (see note 20.3) 2,509,447 1,518,334 2,509,447 1,518,334
– Annuity reserves (see note 20.4) 3,054,196 2,177,817 3,054,196 2,177,817
Total insurance liabilities, gross 29,597,844 25,162,941 19,550,486 17,491,746
Reinsurance receivables:
Reinsurers’ share of outstanding claims 1,502,091 3,418,524 1,502,091 3,405,168
Prepaid re-insurance- Non life & health 2,289,064 2,075,397 2,222,808 2,029,410
Reinsurance share of group life reserves 127,480 253,769 127,480 253,769
Reinsurance share of individual life reserves 50,908 26,634 50,908 26,634
Reinsurance share of Incurred But Not Reported (IBNR) claims 1,627,382 1,462,249 1,541,777 1,442,958
Recoverables from reinsurers on claims paid 902,728 1,737,673 882,201 1,737,673
Total reinsurers’ share of insurance liabilities 6,499,653 8,974,246 6,327,265 8,895,612
Net insurance liability 23,098,191 16,188,695 13,223,221 8,596,134
Current 21,064,739 19,062,238 11,512,291 11,391,043
Non-current 8,533,105 6,100,703 8,038,195 6,100,703
For our life business, the reserves calculated as at 31 December 2020 and the comparative periods were done by:
Olurotimi O. Okpaise (FRC/2012/NAS/00000000738)
Ernst & Young Nigeria Limited
For our Non-life business, the reserves calculated as at 31 December 2020 and the comparative periods were done by:
C Van Heerdan (FRC No: FRC/2018/NAS/00000018470)
QED Actuaries & Consultants (Pty) Ltd (FRC No: FRC/2016/NAS/00000013781)
For our Health business, the reserves calculated as at 31 December 2020 and the comparative periods were done by:
Jolaolu Fakoya (FRC No: FRC/2019/002/00000020016)
AXA Mansard (FRC No: FRC/2012/0000000000228)
20.1A OUTSTANDING CLAIMS
Group Group Parent Parent
Dec-2020 Dec -2019 Dec-2020 Dec -2019
Non-Life 4,702,004 5,077,011 4,702,004 5,077,011
Group life 425,263 903,077 425,263 903,077
Health 60,899 90,216 - -
5,188,166 6,070,304 5,127,267 5,980,088
2 2.8 NOTES TO THE FINANCIAL STATEMENTSFINANCIALS

ANNUAL REPORT 2020 AXA MANSARD | 149
2
Group Group Parent Parent
Dec-2020 Dec -2019 Dec-2020 Dec -2019
Balance, beginning of year 6,070,304 6,789,051 5,980,088 6,767,999
Additional claims expense during the year (See note 32) 19,475,220 18,275,346 7,682,879 7,713,021
Claims paid during year (See note 32) (20,678,867) (19,067,181) (8,857,209) (8,574,020)
Foreign exchange impact of dollar denominated claims 321,509 73,088 321,509 73,088
Balance, end of year 5,188,166 6,070,304 5,127,267 5,980,088
As at 31 December 2020
The aging analysis of the outstanding claims for the non life business is as follows:
Outstanding claims per claimant 0 - 90 days 91 - 180 days 181 - 360 days 360 days + Total
1 - 250,000 13,817 3,216 5,253 36,539 58,825
250,001- 500,000 20,523 6,369 11,955 34,378 73,226
500,001 - 1,500,000 44,757 21,811 13,138 72,483 152,189
1,500,001 - 2,500,000 11,182 3,553 14,020 66,284 95,039
2,500,001 - 5,000,000 65,886 15,333 11,300 116,383 208,902
5,000,001 - Above 963,644 124,194 356,183 2,669,802 4,113,823
Total 1,119,810 174,476 411,849 2,995,870 4,702,004
The aging analysis of the outstanding claims for the life business is as follows:
Outstanding claims per claimant 0 - 90 days 91 - 180 days 181 - 360 days 360 days + Total
1 - 250,000 382 362 1,334 14,449 16,527
250,001- 500,000 700 274 900 28,832 30,706
500,001 - 1,500,000 5,989 2,528 10,922 69,783 89,222
1,500,001 - 2,500,000 1,827 5,941 1,956 12,699 22,422
2,500,001 - 5,000,000 2,913 2,586 5,924 27,278 38,701
5,000,001 - Above 56,397 26,458 32,340 112,490 227,684
Total 68,207 38,148 53,377 265,530 425,263
The Company opened the year 2019 with 1,603 outstanding claims from prior year, this figure rose to 1,651 as at 31 December 2020 thus representing a growth rate of 3%. Of the outstanding claims, 23% are within 90 days holding days period whilst 77% are above 90 days holding period.
As at 31 December 2019
The aging analysis of the outstanding claims for the non life business is as follows:
Outstanding claims per claimant 0 - 90 days 91 - 180 days 181 - 360 days 360 days + Total
1 - 250,000 21,385 2,325 2,053 31,364 57,126
250,001- 500,000 129,362 22,485 25,347 207,338 384,532
500,001 - 1,500,000 129,988 42,483 37,246 152,423 362,141
1,500,001 - 2,500,000 35,970 - 35,415 120,471 191,856
2,500,001 - 5,000,000 - - 25,526 71,140 96,666
5,000,001 - Above 1,905,963 252,623 - 1,826,103 3,984,690
Total 2,222,669 319,916 125,587 2,408,839 5,077,011
2.8 NOTES TO THE FINANCIAL STATEMENTSFINANCIALS
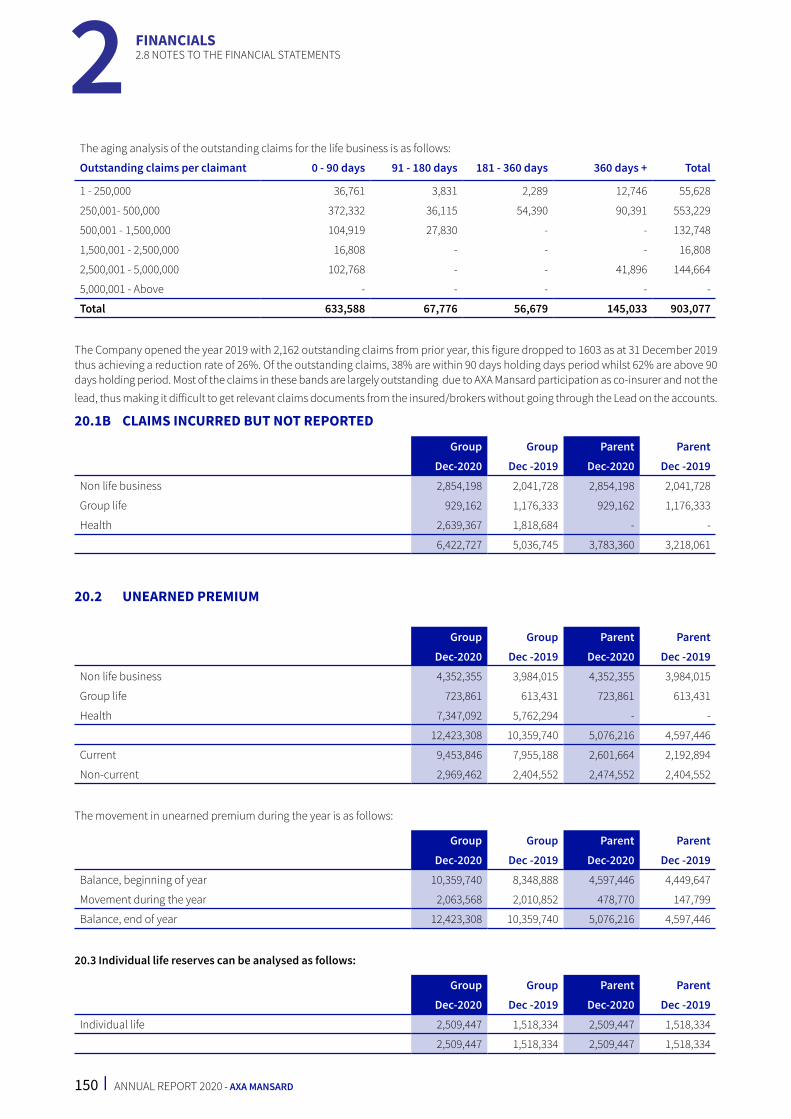
150 | ANNUAL REPORT 2020 - AXA MANSARD
The aging analysis of the outstanding claims for the life business is as follows:
Outstanding claims per claimant 0 - 90 days 91 - 180 days 181 - 360 days 360 days + Total
1 - 250,000 36,761 3,831 2,289 12,746 55,628
250,001- 500,000 372,332 36,115 54,390 90,391 553,229
500,001 - 1,500,000 104,919 27,830 - - 132,748
1,500,001 - 2,500,000 16,808 - - - 16,808
2,500,001 - 5,000,000 102,768 - - 41,896 144,664
5,000,001 - Above - - - - -
Total 633,588 67,776 56,679 145,033 903,077
The Company opened the year 2019 with 2,162 outstanding claims from prior year, this figure dropped to 1603 as at 31 December 2019 thus achieving a reduction rate of 26%. Of the outstanding claims, 38% are within 90 days holding days period whilst 62% are above 90 days holding period. Most of the claims in these bands are largely outstanding due to AXA Mansard participation as co-insurer and not the lead, thus making it difficult to get relevant claims documents from the insured/brokers without going through the Lead on the accounts.
20.1B CLAIMS INCURRED BUT NOT REPORTED
Group Group Parent Parent
Dec-2020 Dec -2019 Dec-2020 Dec -2019
Non life business 2,854,198 2,041,728 2,854,198 2,041,728
Group life 929,162 1,176,333 929,162 1,176,333
Health 2,639,367 1,818,684 - -
6,422,727 5,036,745 3,783,360 3,218,061
20.2 UNEARNED PREMIUM
Group Group Parent Parent
Dec-2020 Dec -2019 Dec-2020 Dec -2019
Non life business 4,352,355 3,984,015 4,352,355 3,984,015
Group life 723,861 613,431 723,861 613,431
Health 7,347,092 5,762,294 - -
12,423,308 10,359,740 5,076,216 4,597,446
Current 9,453,846 7,955,188 2,601,664 2,192,894
Non-current 2,969,462 2,404,552 2,474,552 2,404,552
The movement in unearned premium during the year is as follows:
Group Group Parent Parent
Dec-2020 Dec -2019 Dec-2020 Dec -2019
Balance, beginning of year 10,359,740 8,348,888 4,597,446 4,449,647
Movement during the year 2,063,568 2,010,852 478,770 147,799
Balance, end of year 12,423,308 10,359,740 5,076,216 4,597,446
20.3 Individual life reserves can be analysed as follows:
Group Group Parent Parent
Dec-2020 Dec -2019 Dec-2020 Dec -2019
Individual life 2,509,447 1,518,334 2,509,447 1,518,334
2,509,447 1,518,334 2,509,447 1,518,334
2 2.8 NOTES TO THE FINANCIAL STATEMENTSFINANCIALS

ANNUAL REPORT 2020 AXA MANSARD | 151
2
Movement in individual life reserves:
Group Group Parent Parent
Dec-2020 Dec -2019 Dec-2020 Dec -2019
Balance, beginning of year 1,518,334 775,525 1,518,334 775,525
Changes in individual life reserves 991,113 742,809 991,113 742,809
Balance, end of year 2,509,447 1,518,334 2,509,447 1,518,334
20.4 Annuity reserves can be analysed as follows:
Group Group Parent Parent
Dec-2020 Dec -2019 Dec-2020 Dec -2019 Annuity 3,054,196 2,177,817 3,054,196 2,177,817
3,054,196 2,177,817 3,054,196 2,177,817
Movement in Annuity reserves:
Group Group Parent Parent
Dec-2020 Dec -2019 Dec-2020 Dec -2019 Balance, beginning of year 2,177,817 1,854,619 2,177,817 1,854,619 Annuity premium written during the year - - - - Annuity payout during the year (4,058) (292,751) (4,058) (292,751)Accretion to/(release from) annuity fund 880,437 615,949 880,437 615,949
Balance, end of year 3,054,196 2,177,817 3,054,196 2,177,817
The accretion to/ (release from) annuity fund resulted from the changes in interest rates and reserves but no new business during the period
21 INVESTMENT CONTRACT LIABILITIESThe movement in deposit administration during the year can be divided into interest-linked and unitized fund. The analysis of investment contract liabilities during the year are as follows:
Group Group Parent Parent
Dec-2020 Dec -2019 Dec-2020 Dec -2019
Investment Contract Liabilities - At amortised cost:
- Guaranteed investment (interest-linked) 4,042,004 3,324,001 4,042,004 3,324,001
- Bonus Life investible (interest-linked) 1,111,517 951,764 1,111,517 951,764
5,153,521 4,275,765 5,153,521 4,275,765
Investment Contract Liabilities - Liabilities designated at fair value:
- Unitized funds 4,485,246 4,154,695 4,485,246 4,154,695
9,638,767 8,430,460 9,638,767 8,430,460
Movements in amounts payable under investment contracts liabilities during the year are as shown below. The liabilities are shown inclusive of interest accumulated to 31 December 2020. The movement in interest-linked funds during the year was as follows:
21.1 MOVEMENT IN INTEREST LINKED PRODUCTS
Group Group Parent Parent
Dec-2020 Dec-2019 Dec-2020 Dec-2019
Balance, beginning of year 4,275,765 3,691,424 4,275,765 3,691,424
Contributions 1,353,632 951,764 1,353,632 951,764
Withdrawal (1,269,843) (1,604,066) (1,269,843) (1,019,725)
Interest accrued during the year 793,903 652,302 793,903 652,302
Balance, end of year 5,153,521 4,275,765 5,153,521 4,275,765
2.8 NOTES TO THE FINANCIAL STATEMENTSFINANCIALS

152 | ANNUAL REPORT 2020 - AXA MANSARD
The N5.15 billion (2019: N4.28 billion) for Parent and Group refer to the Guaranteed investment (interest-linked) and Bonus life investible (interest linked) contracts shown in note 21. These are the financial liabilities presented at amortised cost in the Group financial statements (the fair value of the financial liabilities being equal to the amortised cost at the reporting date).
21.2 The movement in unitised funds during the year was as follows:
Group Group Parent Parent
Dec-2020 Dec-2019 Dec-2020 Dec-2019
Balance, beginning of year 4,154,695 3,073,457 4,154,695 3,073,457
Contributions 1,178,203 1,537,164 1,178,203 1,537,164
Withdrawals (847,652) (455,926) (847,652) (455,926)
Balance, end of year 4,485,246 4,154,695 4,485,246 4,154,695
Currrent 4,485,246 4,154,695 4,485,246 4,154,695
Total Investment Contract Liabilities 9,638,767 8,430,460 9,638,767 8,430,460
22 TRADE PAYABLESTrade payables represent liabilities to customers, agents, brokers, coinsurers and re-insurers on insurance contracts at year end.
Group Group Parent Parent
Dec-2020 Dec-2019 Dec-2020 Dec-2019
Reinsurance payable 835,626 2,645,937 835,626 2,645,937
Co-insurance payable 778,913 549,116 778,913 549,116
Unallocated premium & refunds (see (a) below) 1,727,027 2,341,847 1,727,027 2,341,847
Due to agents & brokers 3,861,107 4,646,461 3,696,815 4,557,294
Premium received in advance 1,909,064 6,384,351 1,909,064 6,384,351
9,111,737 16,567,712 8,947,445 16,478,545
‘(a) This relates to payments yet to be matched to policies and other credit balances such as unpaid refunds due to various policyholders.
The total trade payables are due within one year.
23 OTHER LIABILITIES
Group Group Parent Parent
Dec-2020 Dec-2019 Dec-2020 Dec-2019
Deferred income 1,242,038 1,133,852 209,878 233,312 Due to investment brokers - 202 - - Creditors and accruals (see (i) below) 946,053 1,778,011 435,707 1,330,575 Unclaimed dividend 63,808 65,932 63,808 65,932 Cash settled share based payment liability (see note 45 (b)) 30,333 70,912 30,333 70,912
Lease Liability (see 23.1 below) 653,864 256,913 653,864 194,104
2,936,095 3,305,822 1,393,590 1,894,835
Current 1,360,065 2,155,962 505,666 1,408,346
Non-current 1,576,030 1,149,860 887,924 486,490
(i) Amounts classified as Creditors includes transaction taxes, unremitted pensions and stale cheques while accruals represent provisions made for expenses incurred but yet to be paid for.
2 2.8 NOTES TO THE FINANCIAL STATEMENTSFINANCIALS

ANNUAL REPORT 2020 AXA MANSARD | 153
2
23.1 LEASE LIABILITY
Group Group Parent Parent
Dec-2020 Dec-2019 Dec-2020 Dec-2019
Accrued lease liability 535,565 209,839 535,565 156,829
Interest Expense 118,299 47,074 118,299 37,275
Balance 653,864 256,913 653,864 194,104
24 CURRENT INCOME TAX LIABILITIES
Group Group Parent Parent
Dec-2020 Dec-2019 Dec-2020 Dec-2019
Balance, beginning of year 935,546 773,819 203,650 257,967 Current year charge - Non-Life 65,894 99,731 65,894 99,731 - Life & Savings 14,217 39,858 14,217 39,858 - AXA Mansard Investments Limited 61,606 3,392 - - - AXA Mansard Health Limited 1,170,079 454,504 - - - AXA Mansard Pensions Limited (1,538) 8,835 - - - APD Limited 248,705 385,733 - - Tax settlement with witholding tax credit notes
Cash Payments during the year (845,714) (830,326) (157,850) (193,906)
Balance, end of year 1,648,795 935,546 125,911 203,650
25 BORROWINGS
Group Group Parent Parent
Dec-2020 Dec-2019 Dec-2020 Dec-2019
Bank borrowings 2,978,106 6,950,888 - -
Loan note 16,255 14,916 - -
Total borrowings 2,994,361 6,965,804 - -
Current 2,944,681 4,018,030 - -
Non-current 49,680 2,947,774 - -
(a) Bank borrowings
The bank borrowings represents a USD 9,748,365 facility granted to APD limited by Rand Merchant Bank payable in 3 years commencing from 31 August 2018. Interest is payable monthly at an average rate of 90 days LIBOR less a spread of 200 basis point subject to a floor annual rate of 10%. Principal is repaid once a year. The Investment property of the Company located at plot 927/928 Bishop Aboyade Cole, Victoria Island, Lagos has been used as collateral for this facility.
(b) Loan note
Loan note were granted by Karsang Ltd to APD Ltd payable in 7.5 years commencing September 2014. Interest is accrued at a rate of 10.41% and payable at maturity with the principal.
2.8 NOTES TO THE FINANCIAL STATEMENTSFINANCIALS

154 | ANNUAL REPORT 2020 - AXA MANSARD
The movement in borrowing during the year is as follows:
Group Group Parent Parent
Dec-2020 Dec-2019 Dec-2020 Dec-2019
Balance, beginning of the year 6,965,804 3,493,234 - -
Aditional loans - 4,047,000 - -
Impact of foreign exchange rate changes 155,902 (234,350) - -
Accrued interest 582,155 443,835 - -
Payments during the year (4,709,500) (783,915) - -
2,994,361 6,965,804 - -
26 DEFERRED INCOME TAX(a) Liabilities
Group Group Parent Parent
Dec-2020 Dec-2019 Dec-2020 Dec-2019
Balance, beginning of year 841,496 837,061 - -
(Credit)/ Charge in income statement for the year (22,830) 4,435 - -
Tax charge /(reversals) relating to components of other comprehensive income
- - - -
Balance, end of year 818,666 841,496 - -
Deferred income tax liability/(assets) is attributable to the following:
Property and equipment 25,187 (11,029) - -
Unrealised gain on foreign currency translation - - - -
Fair value gain on investment property 793,479 852,525 - -
Unrelieved tax losses - - - -
Balance, end of year 818,666 841,496 - -
2020
Group
Movement in deferred tax liability/ (assets):
Opening Balance
Income statement
Other Comprehensive
Income Closing balance
Property and equipment (11,029) 36,216 - 25,187
Unrealised gain/(losses) on foreign currency translation - - - -
Fair value gains on Investment property 852,525 (59,046) - 793,479
Unrelieved tax losses - - - -
841,496 (22,830) - 818,666
2 2.8 NOTES TO THE FINANCIAL STATEMENTSFINANCIALS

ANNUAL REPORT 2020 AXA MANSARD | 155
2
2019
Group
Movement in deferred tax liability/ (assets):
Opening Balance
Income statement
Other Comprehensive
Income Closing balance
Property and equipment 13,212 (24,241) - (11,029)
Unrealised gain/(losses) on foreign currency translation (54,772) 54,772 - -
Fair value gains on Investment property 878,621 (26,096) - 852,525
Unrelieved tax losses - - - -
837,061 4,435 - 841,496
(b) Unrecognised deferred tax assets
Deferred tax assets relating to the Company’s life business have not been recognised in respect of the following items:
Group Group Parent Parent
In thousands of Naira Dec-2020 Dec-2019 Dec-2020 Dec-2019
Property and equipment 28,269 28,267 28,269 28,267
Tax losses 5,497,598 2,859,840 5,497,598 2,859,840
Balance, end of year 5,525,867 2,888,107 5,525,867 2,888,107
Deferred tax assets relating to the Company’s Non-life business have not been recognised in respect of the following items:
Group Group Parent Parent
In thousands of Naira Dec-2020 Dec-2019 Dec-2020 Dec-2019
Property and equipment 454,017 451,341 454,017 306,692
Tax losses 3,607,061 4,116,970 3,607,061 4,036,042
Balance, end of year 4,061,078 4,568,311 4,061,078 4,342,734
Tax losses for which no deferred tax assets are recognised will never expire. In line with IAS 12 on recognition of deferred tax asset, a Company may recognise deferred tax asset to the extent that taxable profit will be available in future against which the assets will crystallise. AXA Mansard Insurance Plc is however of the opinion that the deferred tax assets carried by the Company may not be utilised soon, given the assessable loss position of the Company.
27 SHARE CAPITAL:
27.1 SHARE CAPITAL COMPRISES:
Group Group Parent Parent
Dec-2020 Dec-2019 Dec-2020 Dec-2019
(a) Authorized:
36,000,000,000 Ordinary shares of 50k each (Dec 2019: 10,500,000,000 ordinary shares)
18,000,000 5,250,000 18,000,000 5,250,000
During the course of the year, the Company increased its authorised share capital from N5,250,000,000 to N18,000,000,000 by the creation of 25,500,000,000 ordinary shares of N0.50 each. This was done by capitalising N12,750,000,000 from other reserves. The newly created shares were allotted as fully paid bonus shares to the Company's shareholders in the proportion of seventeen new ordinary shares for every seven held at the book closure date.
(b) Issued and fully paid
36,000,000,000 Ordinary shares of 50k each (Dec 2019: 10,500,000,000 ordinary shares)
18,000,000 5,250,000 18,000,000 5,250,000
2.8 NOTES TO THE FINANCIAL STATEMENTSFINANCIALS

156 | ANNUAL REPORT 2020 - AXA MANSARD
Movement in issued and fully paid shares
Group Group Parent Parent
Dec-2020 Dec-2019 Dec-2020 Dec-2019
Balance, beginning of year 5,250,000 5,250,000 5,250,000 5,250,000
Additional shares during the year 12,750,000 - 12,750,000 -
Balance, end of year 18,000,000 5,250,000 18,000,000 5,250,000
(i) Non-Life Business
Share capital comprises:
Group Group Parent Parent
Dec-2020 Dec-2019 Dec-2020 Dec-2019
20,000,000,000 Ordinary shares of 50k each (2019: 8,500,000,000 Ordinary shares of 50k each)
10,000,000 4,250,000 10,000,000 4,250,000
(ii) Life Business
Group Group Parent Parent
Dec-2020 Dec-2019 Dec-2020 Dec-2019
16,000,000,000 Ordinary shares of 50k each (2019: 2,000,000,000 Ordinary shares of 50k each)
8,000,000 1,000,000 8,000,000 1,000,000
27.2 SHARE PREMIUM
Group Group Parent Parent
Dec-2020 Dec-2019 Dec-2020 Dec-2019
Share Premium - 4,443,453 - 4,443,453
During the year, the Company capitalised the amount in the share premium account for the purpose of issuing bonus shares to its shareholders (see note 27(a))
27.3 CONTINGENCY RESERVESIn compliance with Section 21 (1) of Insurance Act 2003, the contingency reserve for non-life insurance business is credited with the greater of 3% of total premiums, or 20% of the profits. This shall accumulate until it reaches an amount equal to the greater of minimum paid-up capital or 50 percent of net premium. While for life business, the contingency reserves is credited with an amount equal to 1% of gross premium or 10% of net profit (whichever is greater) and accumulated until it reaches the amount of minimum paid up capital.
In 2018, the contingency reserve for non-life business reached 50% of net premiums of 2018.
The movement in this account during the year is as follows:
Group Group Parent Parent
Dec-2020 Dec-2019 Dec-2020 Dec-2019
Balance, beginning of the year 4,270,458 4,139,090 4,270,458 4,139,090
Transfer from retained earnings 74,667 131,368 74,667 131,368
Balance, end of year 4,345,125 4,270,458 4,345,125 4,270,458
Analysis per business segment
Group Group Parent Parent
Dec-2020 Dec-2019 Dec-2020 Dec-2019
Non-life business 3,591,032 3,591,032 3,591,032 3,591,032
Life business 754,093 679,426 754,093 679,426
Balance, end of year 4,345,125 4,270,458 4,345,125 4,270,458
2 2.8 NOTES TO THE FINANCIAL STATEMENTSFINANCIALS

ANNUAL REPORT 2020 AXA MANSARD | 157
2
(i) Non-Life Business
Group Group Parent Parent
Dec-2020 Dec-2019 Dec-2020 Dec-2019
Balance, beginning of year 3,591,032 3,591,032 3,591,032 3,591,032
Transfer from retained earnings - - - -
Balance, end of year 3,591,032 3,591,032 3,591,032 3,591,032
(ii) Life Business
Group Group Parent Parent
Dec-2020 Dec-2019 Dec-2020 Dec-2019
Balance, beginning of year 679,426 548,058 679,426 548,058
Transfer from retained earnings 74,667 131,368 74,667 131,368
Balance, end of year 754,092 679,426 754,093 679,426
27.4 OTHER RESERVESOther reserves comprise of the following:
Group Group Parent Parent
Dec-2020 Dec-2019 Dec-2020 Dec-2019
Capital reserves (see note (a) below) - 2,500,000 - 2,500,000
Statutory reserves (see note (b) below) - 35,406 - -
Share-based payment reserves (see note (c) below) 167,381 152,077 167,381 152,077
167,381 2,687,483 167,381 2,652,077
(a) Capital reserve
The Company’s issued and fully paid capital was reconstructed by a special resolution at its Board meeting on 18th October, 2007, to achieve a reduction of 50% with the result that the issued and fully paid capital will stand at N2,500,000,000 divided into 5,000,000,000 Ordinary shares at 50k each with the surplus nominal value arising from the reconstruction being transferred to the Company’s capital reserve account. The reconstruction was sanctioned by the Federal High Court of Nigeria, Lagos on 31st October 2007 and registered by the Corporate Affairs Commission on 18th December 2007. The balance on the capital reserve was allocated between the non-life business and life business segments in the proportion of their share capital.
During the year, the balance in the capital reserves account was capitalised for the purpose of issuing bonus shares to shareholders.
Group Group Parent Parent
Dec-2020 Dec-2019 Dec-2020 Dec-2019
Life business segment - 1,000,000 - 1,000,000
Non-life business segment - 1,500,000 - 1,500,000
- 2,500,000 - 2,500,000
(b) Statutory reserve
In compliance with the Pensions Act (2014), AXA Mansard Pensions Limited is required to reserve 12.5% of its profit after tax. This represents the accumulation of the provision for all statutory reserves from 2011. AXA Mansard Pensions Limited was disposed during the year. See statement of changes in equity for movement in statutory reserve.
2.8 NOTES TO THE FINANCIAL STATEMENTSFINANCIALS

158 | ANNUAL REPORT 2020 - AXA MANSARD
(c) Share-based payment reserves
Share-based payment reserves represent the impact of the share option granted to the employees of the Company under the Mansard Share Option Plan (MSOP). The movement in the account is as stated below:
Group Group Parent Parent
Dec-2020 Dec-2019 Dec-2020 Dec-2019
The average cost of the shares purchases as at the comparative reporting date was deducted from shareholders’ equity (2019:N17.2 million). The shares were held as treasury shares.
Balance, beginning of year 152,077 134,904 152,077 134,904
Additions, during the year-Tranche 3 15,304 17,173 15,304 17,173
Balance, end of year 167,381 152,077 167,381 152,077
27.5 TREASURY SHARESTreasury shares represent the 177,281,000 (2019: 177,281,000) 50 kobo ordinary shares held by the Company under the AXA Mansard Share Option Plan (MSOP). Details of the Share Option Plan are as disclosed in note 45.
Treasury shares’ balances as at 31 December 2020 are as analysed below:
Group Group Parent Parent
Dec-2020 Dec-2019 Dec-2020 Dec-2019
Balance, beginning of year (304,924) (304,924) (304,924) (304,924)
Value of vested portion of treasury shares - - - -
Balance, end of year (304,924) (304,924) (304,924) (304,924)
27.6 FAIR VALUE RESERVESFair value reserves includes the net accumulated change in the fair value of available for sale asset until the investment is derecognized or impaired.
Movements in the fair value reserve:
Group Group Parent Parent
Dec-2020 Dec-2019 Dec-2020 Dec-2019
At beginning of year 1,080,718 (550,226) 923,562 (549,906)
Changes in available-for-sale financial assets (net of taxes) 4,184,088 1,630,944 4,108,980 1,473,468
Balance, end of year 5,264,806 1,080,718 5,032,542 923,562
Changes in the valuation of AFS financial assets during the year are as analysed below:
Group Group Parent Parent
Dec-2020 Dec-2019 Dec-2020 Dec-2019
At beginning of year 1,080,718 (550,226) 923,562 (549,906)
Net unrealised changes in fair value of AFS assets 4,184,088 1,661,607 4,108,980 1,390,718
Realised (losses)/gains transferred to income statement - (30,663) - 82,750
Balance, end of year 5,264,806 1,080,718 5,032,542 923,562
2 2.8 NOTES TO THE FINANCIAL STATEMENTSFINANCIALS

ANNUAL REPORT 2020 AXA MANSARD | 159
2
27.7 RETAINED EARNINGSThe retained earnings represents the amount available for dividend distribution to the equity shareholders of the Company. See statement of changes in equity for movement in retained earnings.of changes in equity for movement in retained earnings.
28 NON-CONTROLLING INTERESTS IN EQUITY
Group Group
Dec-2020 Dec-2019
Opening balance 4,818,822 4,619,224
Transfer from the profit or loss account (269,016) 199,598
Disposal of subsidiary with NCI (799,221) -
Balance as at year end 3,750,585 4,818,822
Non controlling interest represents 44.3% of the equity holding of the Company’s subsidiary, APD Limited (2019: 44.3% and 40% of the equity holding of the Company’s subsidiaries, APD Limited and AXA Mansard Pensions). The Group did not pay any dividend to Non-Controlling Interest during the year (2019: nil).
APD Limited
Non controlling interest (44.3%)
Group Group
Dec-2020 Dec-2019
Opening balance 1,936,742 1,770,918
Transfer from the profit or loss account (284,717) 165,824
Balance as at year end 1,652,025 1,936,742
AXA Mansard Pensions Limited
Non controlling interest (40%)
Group Group
Dec-2020 Dec-2019
Opening balance 721,676 683,640
Transfer from profit or loss account 15,701 33,774
Disposal of subsidiary during the year (737,377) -
Balance as at year end - 721,676
29 CONTINGENCIES AND COMMITMENTS(a) Litigations and claims
The Group is presently involved in fourteen (14) legal proceedings (2019: eight (8)). These court cases arose in the normal course of business. In the directors’ opinion, after taking appropriate legal advice from the Company’s in-house legal counsel (Mrs. Omowunmi Mabel Adewusi - FRC/2013/NBA/00000000967), the outcome of these legal claims will not give rise to any significant loss.
2.8 NOTES TO THE FINANCIAL STATEMENTSFINANCIALS

160 | ANNUAL REPORT 2020 - AXA MANSARD
30 NET PREMIUM INCOME
Group Group Parent Parent
Dec-2020 Dec-2019 Dec-2020 Dec-2019
Gross written premium 47,583,434 43,620,265 27,547,903 28,014,854 Gross premium income Non-life 20,081,175 20,079,265 20,081,175 20,079,264 Life (Group life and individual life) 7,466,728 7,935,590 7,466,728 7,935,590 AXA Mansard Health (HMO) 20,035,531 15,605,411 - - Provision for unearned premium
Non life (368,340) (169,725) (368,340) (169,725)Group life (110,430) 21,926 (110,430) 21,926 AXA Mansard Health (HMO) (1,584,797) (1,863,054) - - Gross premium income 45,519,867 41,609,412 27,069,133 27,867,055 Re-insurance cost
-Non life 12,801,145 13,077,282 12,801,145 13,077,282 -Life 876,573 2,164,851 876,573 2,164,851 -AXA Mansard Health (HMO) 237,317 152,117 - - Changes in prepaid re-insurance
-Non life (193,398) (137,116) (193,398) (137,116)-Group life 126,289 51,805 126,289 51,805 -Individual life (24,274) 22,275 (24,274) 22,274
-AXA Mansard Health (HMO) (20,269) (11,872) - -
Re-insurance expenses 13,803,383 15,319,342 13,586,335 15,179,096
Net premium income 31,716,484 26,290,070 13,482,798 12,687,959
31 FEE AND COMMISSION INCOME ON INSURANCE CONTRACTSFee income represents commission received on direct business and transactions ceded to re-insurance companies during the year under review.
Group Group Parent Parent
Dec-2020 Dec-2019 Dec-2020 Dec-2019
Fees and commission income 1,657,816 1,875,748 1,657,816 1,875,748
32 CLAIMS:Claims expenses
Group Group Parent Parent Dec-2020 Dec-2019 Dec-2020 Dec-2019
Claims paid during the year (see note (a) below) 20,678,867 19,067,180 8,857,209 8,574,020
Movement in outstanding claims (882,138) (718,748) (852,821) (787,911)
Claims incurred 19,796,729 18,348,432 8,004,388 7,786,109
Outstanding claims- IBNR 1,385,981 265,836 565,299 101,174
Total claims and loss adjustment expense 21,182,710 18,614,268 8,569,687 7,887,283
Recoverable on IBNR (165,132) 29,192 (98,819) 45,164
Reinsurance share of outstanding claims 1,916,433 1,699,706 1,903,077 1,699,706
Recovered from re-insurers (2,661,797) (2,852,945) (2,625,264) (2,757,049)
Total claims expenses recovered from reinsurers (910,496) (1,124,047) (821,006) (1,012,179)
Net claims and loss adjustment expense 20,272,214 17,490,221 7,748,681 6,875,104
2 2.8 NOTES TO THE FINANCIAL STATEMENTSFINANCIALS

ANNUAL REPORT 2020 AXA MANSARD | 161
2
(a) Claims paid during the year can be analysed as follows:
Group Group Parent Parent Dec-2020 Dec-2019 Dec-2020 Dec-2019
Non life 4,948,745 5,893,139 4,948,745 5,893,139
Group life 2,725,716 1,775,268 2,725,716 1,775,268
Individual life 892,771 580,561 892,771 580,561
Annuity 289,977 292,752 289,977 325,051
HMO 11,821,658 10,493,161 - -
20,678,867 19,034,881 8,857,209 8,574,020
(b) Movement in outstanding claims during the year are as follows:
Group Group Parent Parent
Dec-2020 Dec-2019 Dec-2020 Dec-2019
Non life (375,005) (1,045,962) (375,005) (1,045,962)
Group life (477,814) 290,349 (477,814) 290,349
HMO (29,317) 69,164 - -
(882,136) (686,449) (852,819) (755,613)
33 UNDERWRITING EXPENSES:
Group Group Parent Parent
Dec-2020 Dec-2019 Dec-2020 Dec-2019
Acquisition cost 2,648,088 3,223,162 2,661,567 2,766,402
Maintenance cost 1,149,374 268,362 498,251 268,362
3,797,462 3,491,524 3,159,818 3,034,764
Analysis of acquisition cost is as shown below:
Group Group Parent Parent
Dec-2020 Dec-2019 Dec-2020 Dec-2019
Acquisition cost paid during the year 2,563,418 3,328,887 2,636,410 2,860,560
Movement in deferred acquisition cost (See note 12) 84,670 (105,725) 25,157 (94,158)
2,648,088 3,223,162 2,661,567 2,766,402
Acquisition cost is further analysed into the life and non life business as stated below
Group Group Parent Parent
Dec-2020 Dec-2019 Dec-2020 Dec-2019
Non life 2,108,471 1,957,468 2,108,471 1,957,468
Life 553,096 808,934 553,096 808,934
Health (13,479) 456,760 - -
2,648,088 3,223,162 2,661,567 2,766,402
2.8 NOTES TO THE FINANCIAL STATEMENTSFINANCIALS

162 | ANNUAL REPORT 2020 - AXA MANSARD
34 INVESTMENT INCOME
Group Group Parent Parent
Dec-2020 Dec-2019 Dec-2020 Dec-2019
Dividend income 498,101 734,802 395,211 1,707,958
Interest income on investment securities 2,193,657 2,623,847 1,822,933 2,162,032
Interest income on cash and cash equivalents 436,593 116,999 435,037 136,533
Rental income 1,235,389 1,077,813 - -
Asset management fees (see note (a) below) 487,218 474,823 - -
4,850,958 5,028,284 2,653,181 4,006,523
(a) The asset management fees represent the net of gross management fees earned by the Group after eliminating the asset management fees expenses charged by AXA Mansard Investments Limited on other members of the AXA Mansard Group.
35 NET (LOSSES)/GAINS ON FINANCIAL INSTRUMENTS
Group Group Parent Parent
(a) Dec-2020 Dec-2019 Dec-2020 Dec-2019
Gains on financial assets 271,072 88,315 271,127 87,719
Gain/Loss on Investment Property - -
Foreign exchange gain/loss 1,724,217 (270,955) 459,888 (251,124)
Fair value through Profit or Loss 1,285,481 474,846 1,364,478 474,846
3,280,770 292,206 2,095,493 311,441
Fair value loss on investment property (see note 15) (2,279,051) (404,575) - (390,000)
1,001,719 (112,369) 2,095,493 (78,559)
(b) Net gains on sale of investment in subsidiary
Group Group Parent Parent
Dec-2020 Dec-2019 Dec-2020 Dec-2019
Purchase Consideration 3,000,000 - 3,000,000 4,400,000
Investment in subisidiaries - - (1,885,248) (1,460,127)
Net asset as at date of disposal (1,618,306) - - -
Disposal cost (20,830) - (20,830) -
NCI 799,221 - - -
License (388,333) - - -
Goodwill (926,532) - - -
845,219 - 1,093,922 2,939,873
Eustacia Ltd purchased 60% of the issued and paid-up share capital of AXA Mansard Pension Ltd held by the Company (AXA Mansard Insurance Plc) for ₦3,000,000,000.00 (Three Billion Naira). The share sale agreement was executed on the 31 July 2020.
(2019: AXA Mansard Health Ltd, a fully owned subsidiary of AXA Mansard Insurance Plc purchased 55.7% of the issued and paid-up share capital of APD held by the Company (AXA Mansard Insurance Plc) for ₦4,400,000,000.00 (Four Billion, Four Hundred Million Naira). The share sale agreement was executed on the 31 December 2019, the acquisition by AXA Mansard Health was accounted for as a business combination under common control as such there is no impact on Group numbers in these financial statements.)
2 2.8 NOTES TO THE FINANCIAL STATEMENTSFINANCIALS

ANNUAL REPORT 2020 AXA MANSARD | 163
2
36 PROFIT ON INVESTMENT CONTRACTS
Group Group Parent Parent
Dec-2020 Dec-2019 Dec-2020 Dec-2019
Interest income 451,669 559,683 451,595 559,683
Gains/(losses) from sale of investments 24,542 48,752 24,542 48,752
Total interest income 476,211 608,435 476,137 608,435
Expenses
Guaranteed interest (207,690) (192,161) (207,690) (192,161)
Other expenses (51,111) (35,428) (33,176) (35,428)
Net profit 217,410 380,846 235,271 380,846
37 OTHER INCOME
Group Group Parent Parent
Dec-2020 Dec-2019 Dec-2020 Dec-2019
Profit from sale of property and equipment 5,242 8,192 5,976 8,172
Sundry income 168,833 368,127 106,502 46,378
Interest income on lease receivable - - 14,771 -
Total 174,075 376,319 127,249 54,550
38 EXPENSES FOR MARKETING AND ADMINISTRATION
Group Group Parent Parent
Dec-2020 Dec-2019 Dec-2020 Dec-2019
Marketing and administrative expenses 768,681 1,337,555 860,442 1,261,584
Direct selling cost 447,592 430,492 447,592 430,492
1,216,273 1,768,047 1,308,034 1,692,076
39 EMPLOYEE BENEFIT EXPENSE
Group Group Parent Parent
Dec-2020 Dec-2019 Dec-2020 Dec-2019
Wages and salaries 1,425,883 1,209,675 992,290 775,072
Other employee costs 925,299 875,401 72,530 141,789
Pension costs – defined contribution plans 58,301 68,575 46,584 57,173
Performance-based expenses 525,941 408,050 423,686 289,697
Other employee costs - - - -
Equity and Cash settled share-based payments (25,275) (75,215) (25,275) (75,215)
2,910,149 2,486,486 1,509,815 1,188,516
In accordance with Pension Reform Act 2014, the Group contributes 10.0% each of the qualifying staff’s salary (Basic, transport, and housing). The contributions are recognised as employee benefits expense when they are due.
2.8 NOTES TO THE FINANCIAL STATEMENTSFINANCIALS

164 | ANNUAL REPORT 2020 - AXA MANSARD
40 OTHER OPERATING EXPENSES
Group Group Parent Parent
Dec-2020 Dec-2019 Dec-2020 Dec-2019
Depreciation and amortisation charges 560,924 421,384 457,822 366,811 Depreciation on ROU 224,318 162,508 193,696 90,178 Professional fees 139,017 264,168 122,434 217,176 Directors' emolument and expenses 47,158 30,725 38,157 38,173 Contract services cost 1,081,993 948,749 908,706 797,485 Auditor's remuneration* 30,112 38,322 24,550 32,572 Bank charges 100,760 105,951 83,422 73,518 Stamp duty charge on bank transactions 2,112 5,369 2,112 5,368 Insurance related expenses 285,728 41,488 283,490 192,238 Training expenses 125,165 122,129 108,573 106,278 Asset management fees expense - - 191,596 184,690 Information technology and maintenance expenses 608,308 799,266 540,096 735,576 Rental Expense 73,510 5,328 - - Other expenses 155,449 309,349 130,173 113,419
3,434,555 3,254,736 3,084,827 2,953,481
The external auditors, KPMG Professional Services did not perform any other engagement other than statutory audit services for the Group. No non-audit fees were paid to the external auditor.
41 FINANCE COSTThe N81m finance cost in 2020 relates to capitalized lease liability while the group figures for 2020 and 2019 primarily relate to interest expense on external Loans
Group Group Parent Parent
Dec-2020 Dec-2019 Dec-2020 Dec-2019
Interest expense 782,155 443,835 81,024 37,275
782,155 443,835 81,024 37,275
42 INCOME TAX EXPENSE
Group Group Parent Parent
Dec-2020 Dec-2019 Dec-2020 Dec-2019
Minimum tax - Non life 49,158 99,731 49,158 99,731 - Life 7,762 39,858 7,762 39,858 Company income tax - AXA Mansard Investments Limited 58,993 3,392 - - - APD Limited 248,705 385,733 - - - AXA Mansard Health Limited 1,129,349 425,662 - - - AXA Mansard Pensions Limited - - - National Information Technology Development Agency (NITDA) - APD Limited - 16,693 - - - AXA Mansard Health Limited 40,730 28,842 - - - AXA Mansard Investments limited 2,613 676 - - - General 16,736 - 16,736 - - Life 6,455 - 6,455 -
1,560,501 1,000,587 80,111 139,589 Deferred tax - Non life - - - - - Life - - - - - AXA Mansard Investments limited 31,959 4,209 - -
- APD Limited (63,031) 2,540 - -
- AXA Mansard Health Limited 8,243 2,080 - -
- AXA Mansard Pensions Limited - - - -
(22,830) 8,829 - -
Total tax charge for the year 1,537,671 1,009,416 80,111 139,589
2 2.8 NOTES TO THE FINANCIAL STATEMENTSFINANCIALS

ANNUAL REPORT 2020 AXA MANSARD | 165
2
Tax on the Group’s profit before tax differ from the theoretical amount that would arise using the weighted average tax rate applicable to profit of the consolidated entities as follows:
Effective tax rate reconciliation analysis
Group Group Parent Parent
Dec-2020 Dec-2019 Dec-2020 Dec-2019
Profit before income tax 6,038,755 5,054,865 2,553,366 6,044,926
Tax calculated at domestic rate applicable in Nigeria at 30% (2019:30%) 1,811,627 1,516,460 766,010 1,813,478
Effect of:
Tax exempt income (2,392,499) (2,452,707) (1,910,421) (2,154,102)
Expenses not deducted for tax purposes 764,194 30,980 - -
Effect of unrecognized tax losses 2,208,776 3,257,470 2,208,776 1,987,122
Impact of minimum tax 55,089 148,424 55,089 139,589
Impact of industry tax law (1,063,989) (1,338,583) (1,063,989) (1,326,947)
NITDA Levy 65,861 - 24,522 -
Police Trust Fund Levy - - 124 -
Previously recognized deferred tax liability - 148,820 - -
Impact of Dividend tax - 363 - 251
Tertiary education tax 88,380 46,211 - -
1,537,671 1,009,416 80,111 139,589
43 EARNINGS PER SHARE(a) Earnings per share - Basic
Basic earnings per share is calculated by dividing the profit attributable to equity holders of the Company by the weighted average number of ordinary shares in issue during the year, excluding ordinary shares purchased by the Company and held as treasury shares.
*Restated *Restated
Group Group Parent Parent
Dec-2020 Dec-2019 Dec-2020 Dec-2019
Profit attributable to equity holders 4,809,353 3,836,039 2,473,255 5,905,337
Profit attributable to equity holders (continued operations) 4,785,801 3,785,378 2,473,255 5,905,337
Weighted average number of ordinary shares in issue (thousands) (see note (a) (i) below)
35,392,179 35,392,179 35,392,179 35,392,179
Basic earnings per share (kobo per share) 14 11 7 17
Basic earnings per share (kobo per share); Continued operations 14 11 7 17
(i) Weighted average number of ordinary shares (basic)
*Restated
Group Group
Dec-2020 Dec-2019
Issued ordinary shares at 1 January 10,500,000 10,500,000
Effect of treasury shares held (607,821) (607,821)
Effect of restatement due to bonus share issue - 25,500,000
Weighted effect of bonus issue on shares in issue 25,500,000 -
Weighted-average number of ordinary shares at 31 December 35,392,179 35,392,179
During the year, the Company issued bonus shares of seventeen shares for every seven held. In line with the requirements of IAS 33, the bonus shares issued have been treated like they were issued before the beginning of the earliest period presented.
2.8 NOTES TO THE FINANCIAL STATEMENTSFINANCIALS

166 | ANNUAL REPORT 2020 - AXA MANSARD
(b) Earnings per share- Diluted
The calculation of diluted earnings per share has been based on the profit attributable to ordinary shareholders and the weighted-average number of ordinary shares outstanding after adjustment for the effects of all dilutive potential ordinary shares.
Restated* Restated*
Group Group Parent Parent
Dec-2020 Dec-2019 Dec-2020 Dec-2019
Profit attributable to equity holders 4,809,353 3,836,039 2,473,255 5,905,337
Profit attributable to equity holders (continued operations) 4,785,801 3,785,378 2,473,255 5,905,337
Weighted average number of ordinary shares in issue (thousands) (see note (a) (i) below)
35,392,179 35,392,179 35,392,179 35,392,179
Diluted earnings per share (kobo per share) 14 11 7 17
Basic earnings per share (kobo per share); Continued operations 14 11 7 17
(i) Average number of ordinary shares (diluted)
Group Group
Dec-2020 Dec-2019
Issued ordinary shares at 1 January 10,500,000 10,500,000
Effect of treasury shares held (607,821) (607,821)
Effect of restatement due to bonus share issue - 25,500,000
Weighted effect of bonus issue on shares in issue 25,500,000 -
Weighted-average number of ordinary shares at 31 December 35,392,179 35,392,179
44 SUPPLEMENTARY INCOME STATEMENT INFORMATION:(a)’i. Employees, other than the executive directors, whose duties were wholly or mainly discharged in Nigeria, received emoluments (excluding pension contribution and other allowances) in the following ranges:
Group Group Parent Parent
Dec-2020 Dec 2019 Dec-2020 Dec 2019
Number Number Number Number
N1,400,001 – N2,050,000 - 7 - -
N2,050,001 – N2,330,000 - 4 - -
N3,000,001 – N4,500,000 117 146 93 112
N4,500,001 – N5,950,000 51 52 35 40
N5,950,001 – N6,800,000 11 22 9 17
N6,800,001 – N7,800,000 33 16 28 9
N7,800,001 – N8,600,000 3 9 3 5
N8,600,001 – N11,800,000 25 26 22 21
Above N11,800,000 42 28 35 24
282 310 225 228
2 2.8 NOTES TO THE FINANCIAL STATEMENTSFINANCIALS

ANNUAL REPORT 2020 AXA MANSARD | 167
2
ii. The average number of full time persons employed by the Company during the year was as follow:
Group Group Parent Parent
Dec-2020 Dec 2019 Dec-2020 Dec 2019
Number Number Number Number
Executive directors 4 4 2 4
Management staff 32 14 28 12
Non management staff 250 299 197 212
286 317 227 228
(b) Directors’ remuneration:
i. Remuneration expensed in respect of the directors was as follows:
Group Group Parent Parent
Dec-2020 Dec-2019 Dec-2020 Dec-2019
Executive compensation 296,464 330,897 151,255 205,340
Directors' fees 2,107 2,107 900 900
Other directors expenses 45,983 66,664 32,042 37,273
Defined contribution 11,771 11,771 6,678 6,678
Equity-settled share-based scheme 10,261 13,738 10,261 13,738
Cash-settled share-based scheme (40,353) (54,508) (40,353) (54,508)
326,233 370,668 160,783 209,421
ii. The directors’ remuneration shown above (excluding pension contributions) includes:
Group Group Parent Parent
Dec-2020 Dec-2019 Dec-2020 Dec-2019
Chairman 7,867 7,867 7,867 7,867 Highest paid director:Executive compensation and pension contribution 61,704 61,704 61,704 61,704 Equity-settled share-based scheme 25,274 13,738 25,274 13,738 Cash-settled share-based scheme - - - -
86,978 75,442 86,978 75,442
iii. The emoluments of all other directors fell within the following range:
Group Group Parent Parent
Dec-2020 Dec-2019 Dec-2020 Dec-2019
Number Number Number Number
N300,001 - N350,000 - - - - N500,001 - N1,000,000 - - - - N1,000,001- N1,500,000 6 7 6 7 N1,500,001 and above 2 4 2 4
8 11 8 11
45 SHARE-BASED PAYMENT ARRANGEMENTS(a) Equity-settled share based payment : Mansard Staff Share Option Plan (MSOP)
(i) ‘ The Group operates an equity settled share-based payment arrangement under which the entity receives services from employees as a consideration for equity instrument of the Company. The eventual value of the right is settled by receipt of value of shares equivalent to the full value of the options.
The Scheme is granted to senior management staff (employees from Managers to Executive Directors) and middle management staff (employees from Senior Executive Officers to Deputy Managers).
2.8 NOTES TO THE FINANCIAL STATEMENTSFINANCIALS

168 | ANNUAL REPORT 2020 - AXA MANSARD
The scheme has a number of grant cycles as illustrated by the table below:
Grant cycle Grant cycle Expiry date Vesting Period Shares per grant (‘000)1 2013- 2015 2017 3 yrs 237,500 2 2014- 2017 2020 4 yrs 79,167 3 2015- 2018 2021 4 yrs 79,167 4 2017- 2020 2023 4 yrs 79,167
The price at which the options are granted to eligible employees, determined on the grant date, is the six-month average market price of AXA Mansard’s shares prior to the grant Date.
All the cycles have a one year restriction period and 1.1/2 years exercise period
(ii) Measurement of fair values
The fair value of the Mansard Share Option Plan has been measured using the Black-Scholes model. The requirement that employees have to be in the Company’s employment over the vesting period under the share option scheme has been incorporated into the fair value at grant date by applying a discount to the valuation obtained. The discount has been determined by estimating the staff attrition rate over the period.
The inputs used in the measurement of the fair values at grant dates for the third cycle and the fourth cycle of the equity-settled share option plan were as follows:
4th Cycle 3rd Cycle
Fair value at grant date (Naira) 0.24 0.41
Share price at grant date (Naira) 1.83 2.82
Exercise price (Naira) 1.89 3.11
Expected volatility (weighted average) 50% 56%
Expected dividends 3.11% 3.02%
Average attrition rate 13% 13%
Risk-free interest rate (based on government treasury bills) 14.83% 13.62%
Expected volatility has been based on an evaluation of the historical volatility of the Company’s share price, particularly over the historical period commensurate with expected term.
(iii) Reconciliation of outstanding share options
The number and weighted-average prices of share options under the share options plans were as follows:
Dec 2020 Dec 2019
No of options Weighted-
average price (₦) No of options Weighted-
average price (₦)
Numbers (000) Numbers (000)
Beginning of year 177,281 - 177,281 -
Options exercised - -
Options outstanding at end of year 177,281 - 177,281 -
The weighted average share price for the AXA Mansard Insurance Plc’s share as at 31 December 2020 was N0.57 (Dec 2019: N1.86)
(b) Cash settled share based payment- Share Appreciation Rights
(i) During the year, the Group granted Share Appreciation Rights to certain senior management staff members that entitle the employees to a cash payment. The amount of the cash payment is determined based on the increase in the share price of the Company between grant date and the time of exercise.
The rights are granted to senior management staff (employees from Deputy General Managers to Executive Directors).
2 2.8 NOTES TO THE FINANCIAL STATEMENTS

ANNUAL REPORT 2020 AXA MANSARD | 169
2
The scheme has a number of grant cycles as illustrated by the table below:
Grant cycles Grant cycle Expiry date Vesting Period
1 2015-2017 2018 3 yrs
2 2016-2019 2020 4 yrs
3 2017-2020 2021 4 yrs
4 2018-2021 2022 4 yrs
The price at which the rights are granted to eligible employees, determined on the grant date, is the six-month average market price of AXA Mansard’s shares prior to the Grant Date.
All the cycles have a one year restriction period and a maximum of six years exercise period.
(ii) Measurement of fair values
The fair value of the Share Appreciation Rights has been measured using the Black-Scholes model. The requirement that employees have to be in the Company’s employment over the vesting period under the share option scheme has been incorporated into the fair value at grant date by applying a discount to the valuation obtained. The discount has been determined by estimating the attrition rate of staff over the period.
The inputs used in the measurement of the fair values at grant dates for the first grant cycle of the Share Appreciation Rights were as follows:
Dec-2020 Dec-2019
Fair value at grant date (Naira) 0.61 0.61
Share price at grant date (Naira) 1.63 1.63
Exercise price (Naira) 0.57 1.95
Expected volatility (weighted average) 53.79% 49.73%
Expected dividends 3.04% 3.12%
Average attrition rate 13% 12%
Risk-free interest rate (based on government treasury bills) 1.89% 20.98%
Expected volatility has been based on an evaluation of the historical volatility of the Company’s share price, particularly over the historical period commensurate with expected term.
The weighted average share price for the AXA Mansard Insurance Plc’s share as at 31 December 2020 was N0.57 (Dec 2019: N1.86)
(c) Equity settled share based payment- Long Term Incentives
During the year, AXA S.A. (the ultimate parent) issued incentives to obtain share options settled on the Group’s (AXA Group’s) shares. The performance conditions over which the Group’s performance was to be assessed included the AXA Group Performance, the AXA Mansard Group performance and the Corporate Social Responsibility over the three year period.
The inputs used in the measurement of the fair values at reporting date for the long term incentives are as shown below;
Dec-2020
Share price volatility (Historical three year average) 1.22%
Threshold performance 0.81
Stretch performance 1.31
Total number of shares awarded 8,143
Exchange rate (EUR/NGN) 410
(d) The total expenses recognised in respect of the share option scheme are as follows:
Dec-2020 Dec-2019
Equity-settled share-based scheme- Staff 18,321 3,435
Equity-settled share-based scheme- Directors 10,261 13,738
Cash-settled share-based scheme - Staff (13,504) (37,879)
Cash-settled share-based scheme- Directors (40,353) (54,508)
2.8 NOTES TO THE FINANCIAL STATEMENTSFINANCIALS

170 | ANNUAL REPORT 2020 - AXA MANSARD
46 RELATED PARTIES
ParentThe ultimate beneficial of the Company, which is also the ultimate parent company, is Societe Beaujon AXA which owns 76.48% (through Assur Africa Holdings) of the Company’s shares. The ultimate parent company is Societe Beaujon AXA under the Latin America and Meditteranean operations. The remaining 23.52% of the shares are widely held.
SubsidiariesTransactions between AXA Mansard Insurance Plc and the subsidiaries also meet the definition of related party transactions. Where these are eliminated on consolidation, they are not disclosed in the consolidated financial statements.
Transactions with key management personnelThe Group’s key management personnel, and persons connected with them are considered to be related parties for disclosure purposes. The definition of key management includes close members of family of key personnel and any entity over which key management exercise control. The key management personnel have been identified as the executive and non-executive directors of the Group. Close members of family are those family members who may be expected to influence, or be influenced by that individual in their dealings with AXA Mansard Insurance Plc.
The volume of related party transactions, outstanding balances at year end, and related expense and income for the year are as follows:
Statement of financial position
(a) Loans and advances
(i) Loans and advances to key management personnel
In thousands of Nigerian Naira Dec-2020 Dec 2019
Loans outstandings as at 1 January 35,586 25,858
Loans issued during the year - 19,181
Loans repayment during the year (8,932) (9,453)
Loan outstanding, end of year 26,654 35,586
These are mortgage loans granted to two Directors of AXA Mansard Investments Limited. No impairment has been recognised in respect of loans given to key management personnel (2019: Nil).
(ii) Loans and advances to subsidiaries
In thousands of Nigerian Naira Dec-2020 Dec 2019
Loans outstanding as at 1 January - 147,310
Net loans and advances issued during the year 1,220,000 529,772
Loans repayment during the year (1,220,000) -
Balance, end of year - 677,082
No impairment has been recognised in respect of loans and advances to subsidiaries (2019: Nil).
(b) Intercompany balances
In thousands of Nigerian Naira Dec-2020 Dec 2019
Intercompany (payables)/receivables 226,254 175,647
These balances arise from transactions between the parent Company and other subsidiaries within the Group and related entities in the normal course of business.
2 2.8 NOTES TO THE FINANCIAL STATEMENTSFINANCIALS

ANNUAL REPORT 2020 AXA MANSARD | 171
2
(c) Income statement
Intercompany transactions
In thousands of Nigerian Naira Dec-2020 Dec 2019
Interest income earned on intercompany loans - 83,012
Asset management fees (191,596) (184,690)
Interest income on lease receivables 14,771 -
Key management personnel
Directors' remuneration (See note (44(b) for details) (326,233) (370,668)
Interest income earned on intercompany loans represents interest charged by the parent Company on loans advanced to its subsidiary; APD Limited. The asset management fees are earned by AXA Mansard Investments Limited in respect of funds managed on behalf of the Group.
47 CONTRAVENTIONS
Group Group Parent Parent
In thousands of Nigerian Naira Dec-2020 Dec 2019 Dec-2020 Dec 2019
Penalty to National Insurance Commission (NAICOM) - - - -
48 DISCONTINUED OPERATIONSee accounting policy in note 2.2(w)
(a) During the year, Eustacia Ltd purchased 60% of the issued and paid-up share capital of AXA Mansard Pension Ltd held by the Company (AXA Mansard Insurance Plc) for ₦3,000,000,000.00 (Three Billion Naira).
The sale represents a sale of the Group’s pension management segment. This sale was done to enable the Group deepen it’s reserves for the insurance (life and general) segments. The pensions segment was not previously classified as held-for-sale or as a discontinued operation as the criteria were not met in previous years. The comparative consolidated statement of profit or loss and OCI has been re-presented to show the discontinued operations seperately from continuing operations.
(b) Results of discontinued operations
In thousands of Nigerian Naira Dec-2020 Dec 2019
Management and administration fees 278,640 429,425
Investment income 79,286 182,667
Net realised gains on financial assets 9,064 19,767
Other income 132 2,990
Total operating income 367,122 634,849
Employee benefit expense (209,741) (292,653)
Other operating expenses (51,009) (124,062)
Expenses for marketing and administration (65,581) (123,887)
Total operating expenses (326,331) (540,602)
Operating profit 40,791 94,247
Tax expenses (1,538) (9,812)
Profit for the year 39,253 84,435
Attributable to:
Owners of the parent 23,552 50,661
Non-controlling interests 15,701 33,774
Total comprehensive income for the year 39,253 84,435
Basic earnings per share (basic) - Naira 0.00 0.00
Basic earnings per share (diluted) - Naira 0.00 0.00
2.8 NOTES TO THE FINANCIAL STATEMENTSFINANCIALS

(c ) Cash flows from (used in) discontinued operations
In thousands of Nigerian Naira Dec-2020 Dec 2019
Net cash used in operating activities (326,331) (540,602)
Net cash generated from operating activities 2,767,255 150,634
2,440,924 (389,968)
(d) Effect of disposal on the financial position of the Group
In thousands of Nigerian Naira 2020
Cash and bank balance 211,915
Investment securities: Available for sale 1,013,851
Right of use asset 82,793
Other receivables 280,112
Prepayments 56,065
Intangible assets 8,518
Property and equipment 79,836
Other liabilities (41,559)
Right of use liability (62,808)
Current income tax liabilities (10,416)
Net assets and liabilities (See note 35b) 1,618,306
Consideration received, satisfied in cash 3,000,000
Cash and cash equivalents disposed of (211,915)
Cost incurred on disposal (20,830)
Net cash inflows 2,767,255
49 COVID-19 DISCLOSURES(i) Background
The COVID-19 pandemic which started in China in December 2019 and rapidly spread across the world is impacting all aspects of life in a manner that is unprecedented. The impact cuts across businesses, the economy and social interactions. These impacts seem like they will remain for the foreseeable future. In a bid to curtail the spread of the virus, the Federal Government of Nigeria imposed movement restrictions in Lagos and Ogun State as well as the Federal Capital Territory on 29 March 2020. Gradual lifting of movement has commenced with daily updates announced.
In adapting to the government’s response to COVID-19, the Company swiftly activated its Crisis Management Team (CMT); this is a committee set up within our Operational Resilience Framework. The committee’s mission is to ensure that the minimum requirements and fundamentals of Crisis Management are met, coordinate and manage crises resulting within and/or AXA Mansard’s external environment as a result of a serious incident(s) that immediately prevents, or threatens the continuity of business operations and the delivery of key products and services. This committee is responsible for taking the necessary measures to protect AXA Mansard workforce collaborators, minimize the impact upon operations, contain and/or reduce financial losses, comply with regulations, preserve the reputation and image of the company and precipitate the return to normal. The global response of the CMT to the Covid-19 pandemic encompassed ensuring Business continuity, IT Service continuity and overall Crisis Management from a holistic point of view.
2 2.8 NOTES TO THE FINANCIAL STATEMENTSFINANCIALS
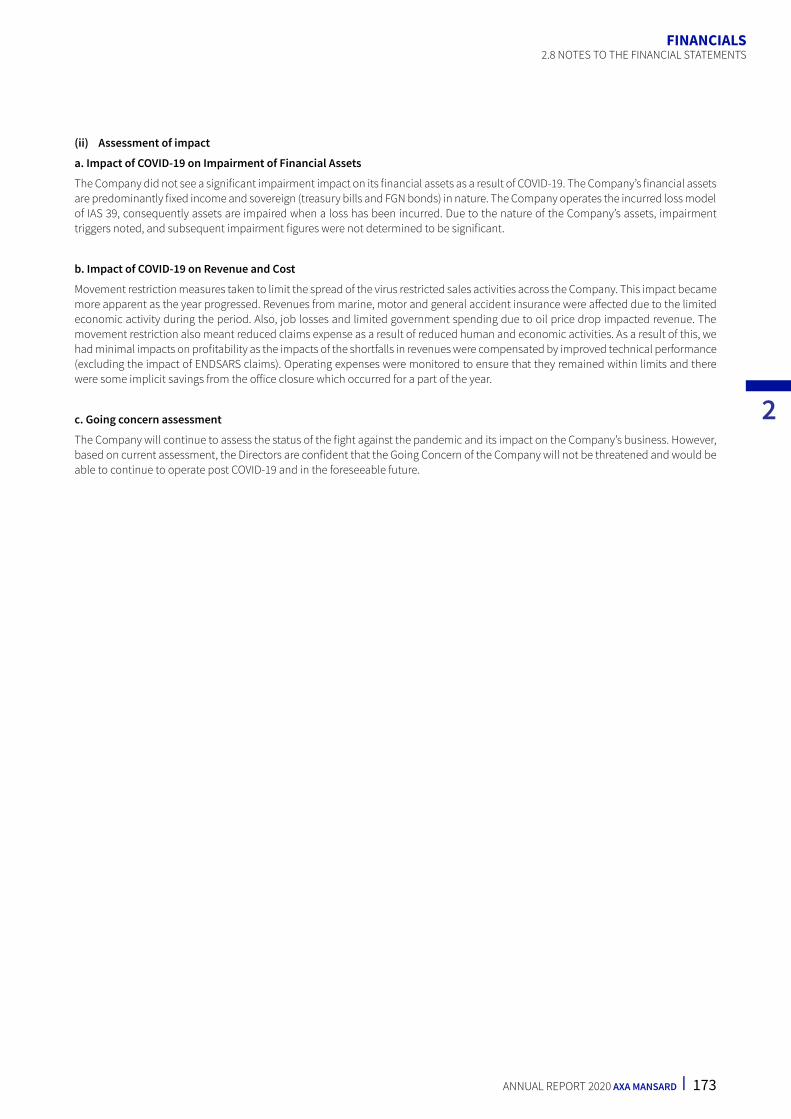
ANNUAL REPORT 2020 AXA MANSARD | 173
2
2.8 NOTES TO THE FINANCIAL STATEMENTSFINANCIALS
(ii) Assessment of impact
a. Impact of COVID-19 on Impairment of Financial Assets
The Company did not see a significant impairment impact on its financial assets as a result of COVID-19. The Company’s financial assets are predominantly fixed income and sovereign (treasury bills and FGN bonds) in nature. The Company operates the incurred loss model of IAS 39, consequently assets are impaired when a loss has been incurred. Due to the nature of the Company’s assets, impairment triggers noted, and subsequent impairment figures were not determined to be significant.
b. Impact of COVID-19 on Revenue and Cost
Movement restriction measures taken to limit the spread of the virus restricted sales activities across the Company. This impact became more apparent as the year progressed. Revenues from marine, motor and general accident insurance were affected due to the limited economic activity during the period. Also, job losses and limited government spending due to oil price drop impacted revenue. The movement restriction also meant reduced claims expense as a result of reduced human and economic activities. As a result of this, we had minimal impacts on profitability as the impacts of the shortfalls in revenues were compensated by improved technical performance (excluding the impact of ENDSARS claims). Operating expenses were monitored to ensure that they remained within limits and there were some implicit savings from the office closure which occurred for a part of the year.
c. Going concern assessment
The Company will continue to assess the status of the fight against the pandemic and its impact on the Company’s business. However, based on current assessment, the Directors are confident that the Going Concern of the Company will not be threatened and would be able to continue to operate post COVID-19 and in the foreseeable future.

174 | ANNUAL REPORT 2020 - AXA MANSARD

ANNUAL REPORT 2020 - AXA MANSARD | 175
3OTHER NATIONAL DISCLOSUREOTHER NATIONAL DISCLOSURES3.1 Appendix 1 (Claims Paid Triangulations as at December 31, 2020) Half-Yearly Triangulation 176
3.2 Appendix 2 (Summarised Revenue Accounts (Non-Life Business)) 191
3.3 Appendix 3 (Summarised Revenue Accounts (Life)) 192
3.4 Appendix 4 (Annuity Disclosures) Statement of Assets And Liabilities 193
3.5 Appendix 5A (Five Year Financial Summary - Group) 195
3.6 Appendix 5B (Five Year Financial Summary - Parent) 197
3.7 APPENDIX 6 (Statement of Value Added) 199
3.8 Unclaimed Dividend Listing as at December 31, 2020 200
3.9 E-Mandate Activation Form 215
3.10 Proxy Form 217
3.11 Corporate Directory 219
3.12 Corporate Addresses 221

176 | ANNUAL REPORT 2020 - AXA MANSARD
3.1
APPE
NDI
X 1
(CLA
IMS
PAID
TRI
ANGU
LATI
ON
S AS
AT
DECE
MBE
R 31
, 202
0)
HAL
F-YE
ARLY
TRI
ANGU
LATI
ON
MOT
OR
Deve
lopm
ent
Acci
dent
Per
iod
01
23
45
67
89
10
2010
_H1
931
,864
1
,339
,867
1
,403
,794
1
,435
,451
3
26,8
32
343
,665
3
46,1
48
346
,567
3
51,8
83
352
,441
3
60,9
05
2010
_H2
834
,169
1
,286
,440
1
,356
,574
1
,359
,529
3
00,2
08
301
,302
3
12,0
13
317
,381
3
18,4
33
318
,466
3
19,2
83
2011
_H1
894
,213
1
,280
,863
1
,319
,985
1
,343
,621
2
39,3
66
247
,621
2
60,6
39
262
,734
2
63,2
87
271
,529
2
79,5
95
2011
_H2
980
,413
1
,536
,153
1
,607
,278
1
,620
,007
3
15,5
47
355
,966
3
62,6
15
381
,136
3
95,4
65
395
,465
3
96,2
45
2012
_H1
1,1
10,4
33
1,8
11,2
48
1,9
13,9
12
2,0
11,1
08
434
,348
4
35,9
73
436
,322
4
39,2
77
443
,774
4
45,4
58
445
,458
2012
_H2
1,1
14,3
58
1,7
16,2
38
1,8
84,1
91
1,9
26,2
54
496
,308
5
08,0
83
512
,904
5
14,2
71
514
,299
5
15,1
86
517
,977
2013
_H1
1,0
96,4
48
1,6
32,8
70
1,7
29,5
31
1,7
36,2
67
332
,413
3
36,7
78
343
,611
3
43,7
73
364
,849
3
71,7
98
372
,043
2013
_H2
1,1
30,0
05
1,7
24,7
39
1,8
11,1
26
1,8
39,9
89
306
,735
3
08,0
08
316
,828
3
21,9
68
325
,526
3
26,1
90
328
,193
2014
_H1
1,2
76,8
55
1,7
19,4
26
1,8
23,1
94
1,8
52,8
32
216
,135
2
21,0
02
221
,392
2
21,7
38
222
,493
2
23,0
45
223
,045
2014
_H2
1,2
57,8
53
1,8
02,6
54
1,8
69,7
13
1,8
72,2
28
422
,628
4
24,3
12
424
,636
4
24,6
36
424
,997
4
30,7
29
430
,729
2015
_H1
1,3
06,7
03
1,7
92,3
28
1,8
21,9
99
1,9
19,7
91
310
,891
3
14,3
94
314
,445
3
15,8
89
316
,374
3
17,6
24
318
,830
2015
_H2
1,4
13,3
98
1,4
78,4
06
1,8
39,8
43
1,8
41,3
71
440
,691
4
48,2
44
452
,780
4
53,8
73
454
,267
4
54,2
67
454
,387
2016
_H1
759
,833
1
,799
,214
1
,854
,339
1
,861
,638
4
09,2
70
410
,862
4
11,9
08
412
,019
4
12,0
19
412
,050
2016
_H2
1,2
89,5
70
1,5
65,3
04
1,6
26,4
90
1,6
27,5
48
462
,685
4
63,1
75
463
,465
4
66,3
76
466
,752
2017
_H1
1,3
24,3
55
1,6
91,9
57
1,7
07,9
22
1,7
09,2
59
343
,890
3
44,1
66
346
,929
3
47,5
87
2017
_H2
1,2
11,0
46
1,6
63,8
48
1,6
80,1
74
1,6
84,4
52
366
,485
3
68,7
53
380
,307
2018
_H1
973
,957
1
,286
,285
1
,302
,920
1
,305
,144
3
00,7
14
304
,110
2018
_H2
854
,466
1
,242
,740
1
,267
,829
1
,267
,922
2
86,6
77
2019
_H1
824
,703
1
,028
,731
1
,040
,469
1
,042
,209
2019
_H2
735
,795
1
,077
,800
1
,089
,125
2020
_H1
558
,789
7
74,4
44
2020
_H2
483
,632
3 3.1 APPENDIX 1OTHER NATIONAL DISCLOSURE

3
ANNUAL REPORT 2020 - AXA MANSARD | 177
MOT
OR(
cont
d)De
velo
pmen
tAc
cide
nt P
erio
d11
1213
1415
1617
1819
2021
2010
_H1
361
,063
3
61,0
63
361
,063
3
61,0
63
361
,063
3
61,0
63
361
,063
3
69,6
02
369
,602
3
69,6
02
369
,602
2010
_H2
319
,844
3
20,8
91
320
,891
3
20,8
91
320
,891
3
21,3
34
321
,334
3
21,3
34
321
,334
3
21,3
34
2011
_H1
288
,773
2
89,4
59
289
,459
2
90,0
08
290
,008
2
90,0
08
290
,008
2
90,0
08
290
,008
2011
_H2
396
,245
3
96,4
24
396
,550
3
96,7
11
396
,711
3
96,7
11
396
,711
3
96,7
11
2012
_H1
445
,540
4
48,2
50
448
,250
4
48,2
50
448
,250
4
48,6
52
448
,652
2012
_H2
517
,977
5
18,5
87
518
,656
5
18,6
56
518
,656
5
18,6
56
2013
_H1
372
,043
3
72,0
43
372
,043
3
72,0
43
372
,043
2013
_H2
328
,193
3
28,1
93
328
,193
3
28,1
93
2014
_H1
223
,045
2
23,0
45
223
,525
2014
_H2
430
,729
4
30,7
29
2015
_H1
322
,252
2015
_H2
2016
_H1
2016
_H2
2017
_H1
2017
_H2
2018
_H1
2018
_H2
2019
_H1
2019
_H2
2020
_H1
2020
_H2
OTHER NATIONAL DISCLOSURE3.1 APPENDIX 1

178 | ANNUAL REPORT 2020 - AXA MANSARD
FIRE
Deve
lopm
ent
Acci
dent
Per
iod
01
23
45
67
89
10
2010
_H1
40,
859
171
,820
2
36,7
57
249
,958
2
56,8
01
275
,317
2
75,3
48
362
,997
3
63,4
87
363
,487
3
63,4
87
2010
_H2
15,
536
43,
082
133
,874
1
34,8
99
134
,989
1
37,5
97
138
,970
1
50,9
54
150
,954
1
50,9
54
150
,954
2011
_H1
49,
061
436
,644
5
52,0
01
566
,216
5
88,5
75
588
,677
5
90,7
46
602
,782
6
02,7
82
602
,978
6
02,9
78
2011
_H2
84,
355
446
,773
5
72,7
72
581
,073
5
88,4
56
666
,956
6
67,1
92
669
,926
6
69,9
26
669
,926
6
69,9
26
2012
_H1
147
,973
3
06,9
45
339
,021
4
72,8
27
496
,703
5
04,8
90
504
,890
5
04,8
90
504
,890
5
05,0
48
505
,048
2012
_H2
59,
287
292
,425
3
25,6
35
328
,991
3
28,9
91
330
,212
3
31,3
80
331
,380
3
31,3
80
331
,380
3
31,3
80
2013
_H1
91,
445
508
,999
5
66,9
97
567
,864
5
77,0
37
598
,029
5
98,0
29
598
,632
5
98,6
87
598
,687
5
98,6
87
2013
_H2
71,
982
413
,029
4
49,5
36
484
,991
4
85,8
29
485
,829
4
88,0
69
489
,957
4
96,8
73
496
,905
4
96,9
22
2014
_H1
148
,144
2
21,0
52
313
,404
3
22,7
11
322
,711
3
26,2
67
328
,429
3
30,9
64
331
,113
3
32,2
18
332
,618
2014
_H2
127
,695
2
62,9
70
293
,811
2
93,8
11
307
,214
3
15,6
32
322
,625
3
22,7
86
326
,515
3
27,8
09
327
,809
2015
_H1
179
,389
2
58,8
65
258
,865
3
67,3
62
373
,211
3
80,4
90
388
,331
4
00,2
34
430
,518
4
30,5
18
430
,518
2015
_H2
71,
921
71,
921
186
,444
1
93,2
41
211
,118
2
26,1
79
233
,329
2
74,6
67
274
,667
2
74,6
85
278
,358
2016
_H1
-
282
,601
3
40,2
52
594
,102
5
96,5
14
613
,460
6
63,9
81
664
,187
6
64,1
87
666
,858
2016
_H2
75,
032
162
,762
1
73,3
87
190
,753
1
96,0
09
240
,283
2
61,2
74
261
,274
2
64,9
94
2017
_H1
64,
780
151
,364
1
71,7
21
172
,823
1
75,5
03
213
,219
2
13,8
77
317
,866
2017
_H2
105
,297
2
25,8
93
290
,079
2
93,3
19
296
,132
3
00,3
36
300
,336
2018
_H1
71,
468
166
,077
2
08,9
10
286
,176
2
93,6
74
294
,047
2018
_H2
89,
461
157
,286
2
48,9
46
249
,039
2
55,6
78
2019
_H1
156
,130
2
98,7
33
380
,840
4
20,7
83
2019
_H2
29,
736
153
,630
2
09,0
97
2020
_H1
168
,836
2
21,7
26
2020
_H2
90,
742
3 3.1 APPENDIX 1OTHER NATIONAL DISCLOSURE

3
ANNUAL REPORT 2020 - AXA MANSARD | 179
FIRE
(con
td)
Deve
lopm
ent
Acci
dent
Per
iod
1112
1314
1516
1718
1920
21
2010
_H1
363
,487
3
63,4
87
363
,487
3
63,4
87
363
,487
3
63,4
87
363
,487
3
63,4
87
363
,487
3
63,4
87
363
,487
2010
_H2
150
,954
1
50,9
54
150
,954
1
50,9
54
150
,954
1
50,9
54
150
,954
1
50,9
54
150
,954
1
50,9
54
2011
_H1
603
,014
6
03,0
14
603
,014
6
03,0
14
603
,014
6
03,0
14
603
,014
6
03,0
14
603
,014
2011
_H2
669
,926
6
69,9
26
669
,926
6
69,9
26
669
,926
6
69,9
26
669
,926
6
69,9
26
2012
_H1
505
,048
5
05,1
34
505
,134
5
05,1
34
505
,134
5
05,1
34
505
,134
2012
_H2
331
,380
3
31,3
80
331
,380
3
31,3
80
331
,380
3
31,3
80
2013
_H1
598
,687
5
98,7
31
598
,731
5
98,7
31
598
,731
2013
_H2
497
,008
4
97,0
08
497
,008
4
97,0
08
2014
_H1
332
,618
3
32,6
18
332
,655
2014
_H2
327
,809
3
27,8
09
2015
_H1
431
,817
2015
_H2
2016
_H1
2016
_H2
2017
_H1
2017
_H2
2018
_H1
2018
_H2
2019
_H1
2019
_H2
2020
_H1
2020
_H2
OTHER NATIONAL DISCLOSURE3.1 APPENDIX 1

180 | ANNUAL REPORT 2020 - AXA MANSARD
MAR
INE
HU
LLDe
velo
pmen
tAc
cide
nt P
erio
d0
12
34
56
78
910
2010
52,
676
57,
043
57,
043
57,
043
57,
043
57,
043
57,
043
57,
043
57,
043
57,
043
57,
043
2011
26,
324
127
,761
1
27,7
61
127
,761
1
27,7
61
127
,761
1
27,7
61
127
,761
1
27,7
61
127
,761
2012
43,
691
95,
426
95,
822
95,
822
95,
822
95,
822
95,
822
95,
822
95,
822
2013
7,2
79
7,7
28
33,
584
33,
584
33,
584
33,
584
33,
584
33,
584
2014
37,
552
74,
735
82,
383
82,
383
82,
383
82,
383
82,
383
2015
10,
140
11,
622
11,
622
11,
622
11,
622
11,
622
2016
14,
728
48,
645
51,
946
51,
946
51,
946
2017
77,
383
86,
291
86,
291
86,
291
2018
10,
180
41,
482
41,
482
2019
963
2
3,00
0
2020
19,
862
3 3.1 APPENDIX 1OTHER NATIONAL DISCLOSURE

3
ANNUAL REPORT 2020 - AXA MANSARD | 181
OTHER NATIONAL DISCLOSURE3.1 APPENDIX 1
GEN
ERAL
ACC
IDEN
TDe
velo
pmen
tAc
cide
nt P
erio
d0
12
34
56
78
910
2010
_H1
76,
729
282
,282
3
13,9
52
323
,658
3
26,8
32
343
,665
3
46,1
48
346
,567
3
51,8
83
352
,441
3
60,9
05
2010
_H2
41,
116
164
,243
2
33,0
70
294
,080
3
00,2
08
301
,302
3
12,0
13
317
,381
3
18,4
33
318
,466
3
19,2
83
2011
_H1
46,
423
175
,359
2
10,2
91
221
,689
2
39,3
66
247
,621
2
60,6
39
262
,734
2
63,2
87
271
,529
2
79,5
95
2011
_H2
34,
103
173
,094
2
66,1
69
303
,506
3
15,5
47
355
,966
3
62,6
15
381
,136
3
95,4
65
395
,465
3
96,2
45
2012
_H1
127
,150
2
10,4
77
381
,314
4
03,0
82
434
,348
4
35,9
73
436
,322
4
39,2
77
443
,774
4
45,4
58
445
,458
2012
_H2
48,
758
279
,535
4
33,0
22
457
,159
4
96,3
08
508
,083
5
12,9
04
514
,271
5
14,2
99
515
,186
5
17,9
77
2013
_H1
169
,382
2
85,6
13
314
,166
3
31,2
74
332
,413
3
36,7
78
343
,611
3
43,7
73
364
,849
3
71,7
98
372
,043
2013
_H2
90,
643
211
,288
2
87,6
64
300
,735
3
06,7
35
308
,008
3
16,8
28
321
,968
3
25,5
26
326
,190
3
28,1
93
2014
_H1
50,
711
162
,462
1
94,3
63
197
,552
2
16,1
35
221
,002
2
21,3
92
221
,738
2
22,4
93
223
,045
2
23,0
45
2014
_H2
98,
747
295
,033
3
71,0
62
417
,314
4
22,6
28
424
,312
4
24,6
36
424
,636
4
24,9
97
430
,729
4
30,7
29
2015
_H1
133
,402
2
28,4
20
300
,947
3
04,6
79
310
,891
3
14,3
94
314
,445
3
15,8
89
316
,374
3
17,6
24
318
,830
2015
_H2
191
,862
3
74,8
56
404
,652
4
27,0
46
440
,691
4
48,2
44
452
,780
4
53,8
73
454
,267
4
54,2
67
454
,387
2016
_H1
110
,049
3
32,4
34
378
,900
4
03,9
61
409
,270
4
10,8
62
411
,908
4
12,0
19
412
,019
4
12,0
50
2016
_H2
171
,375
4
11,2
20
438
,315
4
60,0
40
462
,685
4
63,1
75
463
,465
4
66,3
76
466
,752
2017
_H1
137
,860
2
88,8
94
330
,082
3
36,0
26
343
,890
3
44,1
66
346
,929
3
47,5
87
2017
_H2
122
,885
2
73,6
59
315
,368
3
30,9
36
366
,485
3
68,7
53
380
,307
2018
_H1
110
,225
2
35,5
56
282
,928
2
92,9
68
300
,714
3
04,1
10
2018
_H2
101
,451
2
43,8
99
250
,631
2
65,5
06
286
,677
2019
_H1
60,
932
129
,359
1
36,6
58
170
,926
2019
_H2
76,
295
143
,160
1
68,2
87
2020
_H1
65,
548
142
,255
2020
_H2
34,
944

182 | ANNUAL REPORT 2020 - AXA MANSARD
3 3.1 APPENDIX 1OTHER NATIONAL DISCLOSURE
GEN
ERAL
ACC
IDEN
T (c
ontd
)De
velo
pmen
tAc
cide
nt P
erio
d11
1213
1415
1617
1819
2021
2010
_H1
361
,063
3
61,0
63
361
,063
3
61,0
63
361
,063
3
61,0
63
361
,063
3
69,6
02
369
,602
3
69,6
02
369
,602
2010
_H2
319
,844
3
20,8
91
320
,891
3
20,8
91
320
,891
3
21,3
34
321
,334
3
21,3
34
321
,334
3
21,3
34
2011
_H1
288
,773
2
89,4
59
289
,459
2
90,0
08
290
,008
2
90,0
08
290
,008
2
90,0
08
290
,008
2011
_H2
396
,245
3
96,4
24
396
,550
3
96,7
11
396
,711
3
96,7
11
396
,711
3
96,7
11
2012
_H1
445
,540
4
48,2
50
448
,250
4
48,2
50
448
,250
4
48,6
52
448
,652
2012
_H2
517
,977
5
18,5
87
518
,656
5
18,6
56
518
,656
5
18,6
56
2013
_H1
372
,043
3
72,0
43
372
,043
3
72,0
43
372
,043
2013
_H2
328
,193
3
28,1
93
328
,193
3
28,1
93
2014
_H1
223
,045
2
23,0
45
223
,525
2014
_H2
430
,729
4
30,7
29
2015
_H1
322
,252
2015
_H2
2016
_H1
2016
_H2
2017
_H1
2017
_H2
2018
_H1
2018
_H2
2019
_H1
2019
_H2
2020
_H1
2020
_H2

3
ANNUAL REPORT 2020 - AXA MANSARD | 183
OTHER NATIONAL DISCLOSURE3.1 APPENDIX 1
ENGI
NEE
RIN
GDe
velo
pmen
tAc
cide
nt P
erio
d0
12
34
56
78
910
2010
_H1
6,6
25
24,
504
124
,881
1
49,7
25
154
,225
1
55,5
51
159
,982
1
59,9
82
159
,982
1
59,9
82
159
,982
2010
_H2
2,5
19
182
,570
2
01,8
88
210
,456
2
10,4
56
212
,535
2
12,5
35
212
,535
2
12,5
35
212
,535
2
12,5
35
2011
_H1
737
6
2,72
6 8
0,72
4 8
3,99
8 8
5,25
7 8
6,34
7 8
6,34
7 8
6,34
7 8
6,56
3 8
6,56
3 8
7,10
1
2011
_H2
- 1
27,7
31
271
,465
2
96,8
55
296
,855
2
96,8
55
296
,855
2
96,8
55
296
,855
2
96,8
55
296
,855
2012
_H1
24,
065
40,
136
49,
909
59,
442
60,
307
60,
385
60,
418
60,
418
60,
418
60,
418
60,
418
2012
_H2
16,
286
95,
401
153
,026
1
53,0
53
153
,053
1
58,5
08
158
,731
1
58,7
31
158
,731
1
58,7
31
158
,731
2013
_H1
11,
807
67,
129
144
,719
1
44,7
19
155
,710
1
55,7
10
155
,710
1
55,9
62
155
,962
1
55,9
62
155
,962
2013
_H2
65,
681
114
,143
1
37,6
04
139
,203
1
39,2
03
139
,203
1
39,2
03
139
,203
1
39,2
03
139
,203
1
39,2
58
2014
_H1
24,
641
50,
725
63,
565
64,
788
65,
819
70,
184
70,
184
72,
938
72,
938
72,
938
72,
938
2014
_H2
56,
332
132
,348
1
63,4
06
163
,454
1
77,7
85
177
,785
1
77,7
85
177
,785
1
77,7
85
177
,785
1
77,7
85
2015
_H1
57,
403
88,
741
188
,863
1
89,3
30
189
,330
1
95,6
23
206
,485
2
08,3
53
208
,353
2
08,3
53
208
,353
2015
_H2
7,6
76
16,
822
22,
483
33,
435
33,
435
33,
435
33,
435
33,
435
33,
435
33,
435
33,
435
2016
_H1
49,
509
114
,494
1
30,2
91
149
,894
1
59,2
26
159
,226
1
59,2
26
159
,226
1
59,2
26
159
,226
2016
_H2
2,9
63
66,
491
71,
800
71,
800
84,
971
84,
971
112
,883
1
12,8
83
113
,302
2017
_H1
20,
554
60,
920
93,
442
93,
799
93,
799
93,
799
93,
799
93,
799
2017
_H2
31,
520
87,
144
89,
279
113
,905
1
16,0
25
116
,025
1
17,3
09
2018
_H1
49,
165
140
,256
1
41,4
01
141
,609
1
41,6
09
141
,609
2018
_H2
3,8
05
26,
904
90,
502
90,
502
90,
502
2019
_H1
4,3
67
156
,087
1
59,6
73
163
,186
2019
_H2
6,0
91
82,
076
90,
177
2020
_H1
50,
058
67,
284
2020
_H2
14,
295

184 | ANNUAL REPORT 2020 - AXA MANSARD
3 3.1 APPENDIX 1OTHER NATIONAL DISCLOSURE
ENGI
NEE
RIN
G (c
ontd
)De
velo
pmen
tAc
cide
nt P
erio
d11
1213
1415
1617
1819
2021
2010
_H1
161
,121
1
61,1
21
161
,121
1
61,1
21
161
,121
1
61,1
21
161
,121
1
61,1
21
161
,121
1
61,1
21
161
,121
2010
_H2
212
,535
2
12,5
35
212
,535
2
12,5
35
212
,535
2
12,5
35
212
,535
2
12,5
35
212
,535
2
12,5
35
2011
_H1
87,
101
87,
101
87,
101
87,
101
87,
101
87,
101
87,
101
87,
101
87,
101
2011
_H2
296
,855
2
96,8
55
296
,855
2
96,8
55
296
,855
2
96,8
55
296
,855
2
96,8
55
2012
_H1
60,
418
60,
418
60,
418
60,
418
60,
418
60,
418
60,
418
2012
_H2
158
,731
1
58,7
31
158
,731
1
58,7
31
158
,731
1
58,7
31
2013
_H1
155
,962
1
55,9
62
155
,962
1
55,9
62
155
,962
2013
_H2
139
,505
1
39,5
05
139
,505
1
39,5
05
2014
_H1
72,
938
72,
938
72,
938
2014
_H2
177
,785
1
77,7
85
2015
_H1
208
,353
2015
_H2
2016
_H1
2016
_H2
2017
_H1
2017
_H2
2018
_H1
2018
_H2
2019
_H1
2019
_H2
2020
_H1
2020
_H2

3
ANNUAL REPORT 2020 - AXA MANSARD | 185
OTHER NATIONAL DISCLOSURE3.1 APPENDIX 1
MAR
INE
CARG
ODe
velo
pmen
tAc
cide
nt P
erio
d0
12
34
56
78
910
2010
_H1
47,
831
78,
372
86,
211
87,
026
87,
026
92,
024
94,
224
97,
437
97,
437
98,
800
98,
800
2010
_H2
17,
332
74,
539
89,
596
94,
768
94,
768
94,
876
94,
963
95,
244
95,
244
95,
244
95,
244
2011
_H1
40,
601
96,
121
96,
327
96,
327
96,
370
101
,545
1
01,7
35
131
,679
1
31,6
79
133
,676
1
33,6
76
2011
_H2
101
,678
1
45,0
88
188
,610
2
26,9
09
227
,401
2
27,4
01
227
,401
2
27,4
01
227
,401
2
27,4
01
227
,401
2012
_H1
169
,550
2
04,3
83
209
,499
2
26,6
70
226
,670
2
26,6
70
226
,670
2
26,6
70
226
,670
2
26,6
70
226
,670
2012
_H2
69,
347
122
,644
1
34,3
19
142
,818
1
42,8
18
143
,829
1
43,8
29
143
,829
1
43,8
29
143
,829
1
43,8
29
2013
_H1
4,5
29
36,
578
37,
175
37,
175
37,
175
41,
530
41,
530
41,
530
41,
530
41,
530
41,
530
2013
_H2
33,
514
56,
634
59,
088
59,
088
59,
088
59,
251
64,
216
64,
216
64,
216
64,
216
64,
216
2014
_H1
22,
777
57,
512
57,
512
57,
512
57,
960
73,
390
73,
390
73,
390
73,
390
73,
390
73,
390
2014
_H2
17,
030
35,
280
35,
280
36,
793
43,
781
43,
781
43,
781
43,
781
43,
781
43,
781
43,
781
2015
_H1
15,
991
29,
148
31,
063
34,
190
39,
021
39,
021
39,
021
39,
021
39,
021
39,
021
39,
021
2015
_H2
4,8
76
13,
214
21,
917
21,
917
21,
917
21,
917
22,
253
22,
253
22,
253
22,
253
22,
253
2016
_H1
2,6
44
4,9
31
5,3
06
5,3
06
5,3
06
5,3
06
5,3
06
5,3
06
5,3
06
5,3
06
2016
_H2
689
5
,208
5
,208
5
,784
5
,795
5
,795
5
,795
5
,795
5
,795
2017
_H1
38,
869
56,
362
56,
362
56,
467
56,
467
56,
467
56,
467
56,
467
2017
_H2
8,8
93
18,
831
19,
439
19,
439
19,
502
19,
502
19,
502
2018
_H1
2,0
02
4,3
78
32,
900
32,
972
33,
119
33,
119
2018
_H2
14,
064
26,
770
27,
173
27,
173
27,
173
2019
_H1
1,3
99
9,2
57
16,
976
17,
352
2019
_H2
126
3
,668
3
,792
2020
_H1
721
4
,933
2020
_H2
-

186 | ANNUAL REPORT 2020 - AXA MANSARD
3 3.1 APPENDIX 1OTHER NATIONAL DISCLOSURE
MAR
INE
CARG
O (c
ontd
)De
velo
pmen
tAc
cide
nt P
erio
d11
1213
1415
1617
1819
2021
2010
_H1
98,
800
98,
800
98,
800
98,
800
98,
800
98,
800
98,
800
98,
800
98,
800
98,
800
98,
800
2010
_H2
95,
244
95,
244
95,
244
95,
244
95,
244
95,
244
95,
244
95,
244
95,
244
95,
244
2011
_H1
133
,676
1
33,6
76
133
,676
1
33,6
76
133
,676
1
33,6
76
133
,676
1
33,6
76
133
,676
2011
_H2
227
,401
2
27,4
01
227
,401
2
27,4
01
227
,401
2
27,4
01
227
,401
2
27,4
01
2012
_H1
226
,670
2
28,6
91
228
,691
2
28,6
91
228
,691
2
28,6
91
228
,691
2012
_H2
143
,829
1
43,8
29
143
,829
1
43,8
29
143
,829
1
43,8
29
2013
_H1
51,
657
51,
657
51,
657
51,
657
51,
657
2013
_H2
64,
216
64,
216
64,
216
64,
216
2014
_H1
73,
390
73,
390
73,
390
2014
_H2
43,
781
43,
781
2015
_H1
39,
021
2015
_H2
2016
_H1
2016
_H2
2017
_H1
2017
_H2
2018
_H1
2018
_H2
2019
_H1
2019
_H2
2020
_H1
2020
_H2

3
ANNUAL REPORT 2020 - AXA MANSARD | 187
ENER
GYDe
velo
pmen
tAc
cide
nt P
erio
d0
12
34
56
78
910
2010
_H1
- 5
,047
7
,930
7
,930
9
,444
9
,444
9
,444
9
,444
9
,444
9
,444
9
,444
2010
_H2
- 3
,060
1
6,39
5 1
6,39
5 1
46,7
54
146
,754
1
46,7
54
146
,944
1
46,9
44
146
,944
1
46,9
44
2011
_H1
- 1
81,2
94
295
,537
3
31,6
77
382
,844
3
82,8
44
437
,005
4
85,3
41
485
,341
4
90,0
08
490
,008
2011
_H2
- -
- 4
8,81
9 3
64,7
65
366
,690
3
66,6
90
366
,690
3
66,6
90
366
,690
3
66,6
90
2012
_H1
- 9
2 3
50,4
73
364
,744
4
90,9
88
601
,045
6
01,0
45
601
,045
6
69,6
34
669
,634
6
76,8
85
2012
_H2
- 5
2,82
5 5
2,82
5 6
6,92
1 8
8,30
6 1
52,0
13
184
,310
2
30,9
72
231
,803
2
31,8
03
231
,803
2013
_H1
- -
322
,955
3
47,9
85
347
,985
3
51,5
85
757
,979
7
57,9
79
757
,979
7
57,9
79
757
,979
2013
_H2
89,
676
160
,081
1
66,0
13
170
,204
1
70,2
04
170
,204
1
70,2
04
170
,204
1
72,4
09
198
,056
1
98,0
56
2014
_H1
- -
- -
- -
- 9
28
1,9
72
1,9
72
2,2
48
2014
_H2
- 3
6,73
4 7
3,11
5 7
3,11
5 7
3,11
5 7
3,11
5 7
3,65
6 7
3,65
6 7
3,65
6 7
3,65
6 7
3,65
6
2015
_H1
- -
- -
17,
019
17,
316
17,
316
17,
316
17,
316
17,
316
17,
316
2015
_H2
- -
- -
- -
146
,414
1
46,6
95
146
,695
1
46,6
95
146
,695
2016
_H1
- 9
,791
6
6,18
2 4
33,4
23
477
,230
4
79,5
12
479
,512
4
84,8
82
485
,806
4
85,8
06
2016
_H2
- 9
,936
9
,936
9
,936
9
,936
2
2,76
1 1
46,9
76
149
,705
2
13,3
47
2017
_H1
- 6
6,35
1 1
90,1
33
195
,014
4
72,3
32
509
,910
6
20,4
31
859
,876
2017
_H2
- -
- 1
1,69
4 1
2,08
4 1
2,08
4 1
2,08
4
2018
_H1
- 1
,132
1
,132
1
,132
1
,132
1
,132
2018
_H2
- 1
50
59,
598
60,
137
60,
137
2019
_H1
- -
- -
2019
_H2
- -
-
2020
_H1
- 4
28
2020
_H2
-
OTHER NATIONAL DISCLOSURE3.1 APPENDIX 1

188 | ANNUAL REPORT 2020 - AXA MANSARD
ENER
GY (c
ontd
)De
velo
pmen
tAc
cide
nt P
erio
d11
1213
1415
1617
1819
2021
2010
_H1
9,4
44
9,4
44
9,4
44
9,4
44
9,4
44
9,4
44
9,4
44
9,4
44
9,4
44
9,4
44
9,4
44
2010
_H2
146
,944
1
46,9
44
146
,944
1
46,9
44
146
,944
1
47,9
88
147
,988
1
47,9
88
147
,988
1
47,9
88
2011
_H1
490
,008
4
90,0
08
490
,008
4
90,0
08
490
,008
4
90,0
08
490
,008
4
90,0
08
490
,008
2011
_H2
366
,690
3
66,6
90
366
,690
3
66,6
90
366
,690
3
66,6
90
366
,690
3
66,6
90
2012
_H1
677
,557
6
77,5
57
677
,557
6
93,2
48
693
,248
6
93,2
48
963
,127
2012
_H2
352
,116
3
52,1
16
352
,116
3
52,1
16
352
,784
3
62,7
61
2013
_H1
757
,979
7
57,9
79
757
,979
7
57,9
79
757
,979
2013
_H2
198
,056
1
98,0
56
198
,675
1
98,7
69
2014
_H1
2,2
48
2,6
13
3,0
90
2014
_H2
74,
107
74,
107
2015
_H1
17,
316
2015
_H2
2016
_H1
2016
_H2
2017
_H1
2017
_H2
2018
_H1
2018
_H2
2019
_H1
2019
_H2
2020
_H1
2020
_H2
3 3.1 APPENDIX 1OTHER NATIONAL DISCLOSURE

3
ANNUAL REPORT 2020 - AXA MANSARD | 189
AVIA
TIO
NDe
velo
pmen
tAc
cide
nt P
erio
d0
12
34
56
78
910
2010
_H1
- -
- -
- -
- -
- -
-
2010
_H2
- -
- -
1,3
92
1,3
92
1,3
92
1,3
92
1,3
92
1,3
92
1,3
92
2011
_H1
- -
- -
- -
- -
- -
-
2011
_H2
22,
163
23,
112
23,
112
23,
112
23,
112
23,
112
23,
830
23,
830
23,
830
23,
830
23,
830
2012
_H1
- 2
1,55
4 2
4,81
5 2
8,48
4 3
9,96
7 3
9,96
7 3
9,96
7 3
9,96
7 3
9,96
7 3
9,96
7 3
9,96
7
2012
_H2
4,4
91
7,1
43
7,1
43
7,1
43
7,1
43
7,6
50
7,6
50
7,6
50
7,6
50
7,6
50
7,6
50
2013
_H1
2,2
73
6,9
82
10,
096
28,
492
28,
492
34,
375
34,
375
34,
375
34,
375
34,
375
34,
375
2013
_H2
- 7
01
701
7
01
701
7
01
701
7
01
701
7
01
701
2014
_H1
- 1
,238
6
,302
1
2,37
1 1
2,48
6 1
2,48
6 1
2,48
6 1
2,48
6 1
2,48
6 1
2,48
6 1
2,48
6
2014
_H2
- 1
22
10,
298
10,
795
10,
880
10,
880
17,
292
17,
292
28,
705
28,
705
28,
705
2015
_H1
- 1
3,01
2 1
3,67
1 1
3,67
1 2
5,10
6 2
5,10
6 2
5,10
6 3
4,32
9 4
6,86
0 4
6,86
0 4
6,86
0
2015
_H2
- -
6,7
45
6,7
45
7,1
59
7,1
59
7,1
59
7,1
59
17,
318
17,
318
17,
318
2016
_H1
- 4
4,96
9 5
7,58
0 5
7,58
0 5
7,58
0 5
7,58
0 5
7,58
0 5
7,72
7 5
7,72
7 5
7,72
7
2016
_H2
- -
- -
414
3
0,72
2 3
0,72
2 3
0,72
2 3
0,72
2
2017
_H1
42,
994
46,
649
59,
845
60,
062
60,
264
60,
264
60,
264
60,
264
2017
_H2
- 9
,076
9
,076
9
,076
9
,076
9
,076
9
,076
2018
_H1
- -
- -
- -
2018
_H2
- 1
,378
2
2,49
0 2
3,41
4 2
3,41
4
2019
_H1
- 1
,371
2
,357
2
,357
2019
_H2
- -
1,4
64
2020
_H1
- -
2020
_H2
-
OTHER NATIONAL DISCLOSURE3.1 APPENDIX 1

190 | ANNUAL REPORT 2020 - AXA MANSARD
AVIA
TIO
N (c
ontd
)De
velo
pmen
tAc
cide
nt P
erio
d11
1213
1415
1617
1819
2021
2010
_H1
- -
- -
- -
- -
- -
-
2010
_H2
1,3
92
1,3
92
1,3
92
1,3
92
1,3
92
1,3
92
1,3
92
1,3
92
1,3
92
1,3
92
2011
_H1
- -
- -
- -
- -
-
2011
_H2
23,
830
23,
830
23,
830
23,
830
23,
830
23,
830
23,
830
23,
830
2012
_H1
39,
967
39,
967
39,
967
39,
967
39,
967
39,
967
39,
967
2012
_H2
7,6
50
7,6
50
7,6
50
7,6
50
7,6
50
7,6
50
2013
_H1
34,
375
34,
375
34,
375
34,
375
34,
375
2013
_H2
701
7
01
701
7
01
2014
_H1
12,
486
12,
486
12,
486
2014
_H2
28,
705
28,
705
2015
_H1
46,
860
2015
_H2
2016
_H1
2016
_H2
2017
_H1
2017
_H2
2018
_H1
2018
_H2
2019
_H1
2019
_H2
2020
_H1
2020
_H2
3 3.1 APPENDIX 1OTHER NATIONAL DISCLOSURE

3
ANNUAL REPORT 2020 - AXA MANSARD | 191
3.2 APPENDIX 2 (SUMMARISED REVENUE ACCOUNTS (NON-LIFE BUSINESS))
FIRE GENERAL
ACCIDENT MOTOR MARINE ENGINEERING OIL &
ENERGY AVIATION Dec. 2020 Dec. 2019
₦’000 ₦’000 ₦’000 ₦’000 ₦’000 ₦’000 ₦’000 ₦’000 ₦’000
REVENUE
Gross written premium 3,193,791 1,605,909 2,459,915 644,280 689,051 10,382,894 1,084,763 20,060,603 20,035,427
Add Reinsurance Inward Premium 7,631 1,294 911 6,055 1,763 2,918 - 20,572 43,837
3,201,422 1,607,203 2,460,826 650,335 690,814 10,385,812 1,084,763 20,081,175 20,079,264
Less Unexpired Risks Provision (229,370) (27,918) 161,021 83,756 95,151 (453,301) 2,321 (368,340) (169,725)
Gross Premium Earned 2,972,052 1,579,285 2,621,847 734,091 785,965 9,932,511 1,087,084 19,712,835 19,909,539
Less Reinsurance Cost
Local Facultative Premium (1,561,762) (111,934) - (19,495) (92,230) (7,628,777) (783,718) (10,197,916) (10,992,190)
Prepaid Reinsurance 98,449 (9,235) (85,147) (68,115) (116,837) 394,785 (20,502) 193,398 137,115
Reinsurance Treaty Premium (611,962) (50,632) (48,744) (270,124) (213,087) (1,321,320) (87,360) (2,603,229) (2,085,093)
Net Premium (2,075,275) (171,801) (133,891) (357,734) (422,154) (8,555,312) (891,580) (12,607,747) (12,940,167)
Net Earned Premium 896,777 1,407,484 2,487,956 376,357 363,811 1,377,199 195,505 7,105,089 6,969,372
Add Commission Received
Direct Business Commission 5,381 1,272 - 3,635 329 409,051 49,604 469,272 434,646
Local Facultative Comm 279,842 13,696 - 4,655 3,178 92,793 41,830 435,994 507,032
Reinsurance Treaty Comm 154,760 - - 73,148 60,124 273,379 (1) 561,410 482,515
Deferred Comm. Income (14,705) (320) 10,643 15,887 21,073 (15,027) 6,260 23,811 72,981
Investment income 63,855 100,220 177,155 26,981 25,905 98,064 13,921 506,101 533,395
489,133 114,868 187,798 124,306 110,609 858,260 111,614 1,996,587 2,030,569
Total Income 1,385,910 1,522,352 2,675,754 500,663 474,420 2,235,459 307,118 9,101,676 8,999,941
Expenses
Claims Paid 1,019,268 410,852 1,487,972 79,269 204,304 1,744,076 3,004 4,948,745 5,893,139
Outstanding Claims 353,901 154,817 (72,630) 32,629 156,356 (1,036,943) 36,865 (375,005) (1,045,961)
IBNR OS 37,214 (64,584) 17,673 25,340 65,656 727,110 4,060 812,469 (279,783)
Gross Claims 1,410,383 501,085 1,433,015 137,237 426,316 1,434,243 43,929 5,386,209 4,567,395
Treaty Claims Recovered 480,750 13,966 14,692 15,977 48,479 2,061 - 575,926 756,611
Facultative Claims Recovered 65,963 72,977 73,374 - 17,582 1,362,829 - 1,592,725 1,581,086
Ri Claim Recoverable (175,311) 26,792 (9,144) 17,400 67,577 (1,747,521) 1,528 (1,818,679) (1,567,769)
IBNR Recoverable (70,633) 1,091,430 28,423 38,801 21,947 (741,068) 17,479 386,379 (127,580)
Total Claims Recovered/Recoverable 300,769 1,205,165 107,345 72,178 155,585 (1,123,699) 19,007 736,351 642,356
Net claims Incurred 1,109,614 (704,081) 1,325,670 65,059 270,732 2,557,942 24,922 4,649,858 3,925,039
Underwriting Expenses (commission expenses) 521,257 246,417 171,030 105,721 131,814 358,493 100,104 1,634,836 1,525,977
Deferred Acquisition Cost (Comm) (50,816) (9,345) 14,622 43,996 16,119 (36,617) (3,117) (25,158) 94,158
Other acquisition Cost 90,304 1,224 69,630 32,902 - 267 100 194,427 337,334
Maintenance Costs 78,285 37,067 81,267 13,862 13,622 55,730 23,667 303,500 222,073
Total underwriting expenses 639,030 275,363 336,549 196,481 161,555 377,873 120,754 2,107,605 2,179,542
Underwriting Profit (362,734) 1,951,069 1,013,534 239,123 42,134 (700,356) 161,442 2,344,213 2,895,360
OTHER NATIONAL DISCLOSURE3.2 APPENDIX 2

192 | ANNUAL REPORT 2020 - AXA MANSARD
3.3 APPENDIX 3 (SUMMARISED REVENUE ACCOUNTS (LIFE))
December 2020 December 2019
GROUP LIFE INDIVIDUAL LIFE ANNUITY TOTAL TOTAL
₦’000 ₦’000 ₦’000 ₦’000 ₦’000
REVENUE
Gross written premium 4,809,529 2,657,199 - 7,466,728 7,935,590
Less Unexpired Risks Provision (110,430) - - (110,430) 21,926
4,699,099 2,657,199 - 7,356,298 7,957,516
Less Reinsurance Premium
Local Facultative Premium (672,347) (22,285) - (694,632) (1,716,313)
Ri share of Insurance Liabilities (126,288) 24,273 - (102,015) (74,078)
Reinsurance Treaty Premium (157,522) (24,419) - (181,941) (448,538)
Net Premium 3,742,942 2,634,768 - 6,377,710 5,718,587 Add commission received
Direct business commission 11,274 (23) - 11,251 15,116
Local Facultative 111,856 2,780 - 114,636 233,949
Reinsurance treaty 35,906 5,534 - 41,440 129,509
Investment Income 460,793 199,633 396,411 1,056,838 1,316,411
619,829 207,925 396,411 1,224,165 1,694,985
Total income 4,362,771 2,842,693 396,411 7,601,875 7,413,572 Expenses
Claims paid 2,725,716 638,069 289,977 3,653,762 2,469,305
Surrenders - 254,702 - 254,702 211,576
Outstanding Claims (477,814) - - (477,814) 258,049
IBNR OS (247,171) - - (247,171) 380,958
Gross claims incurred 2,000,731 892,771 289,977 3,183,479 3,319,888 Reinsurance claims recovered - - - - (28,621)
Co insurance claims recovered (349,338) (107,276) - (456,614) (390,722)
RI Claims Recoverable 84,397 - - 84,397 131,938
RI Share of IBNR 287,560 - - 287,560 (82,416)
Net claims incurred 2,023,350 785,495 289,977 3,098,822 2,950,067
Acquisition expenses (commission expenses) 374,495 223,041 - 597,536 703,314
Other acquisition costs 69,990 82,434 - 152,424 105,619
Maintenance cost 103,149 198,079 - 301,228 46,289
Transfer to life fund - 991,112 876,379 1,867,491 1,066,007
Total expenses 2,570,984 2,280,161 1,166,356 6,017,501 4,871,296 Underwriting profit 1,791,787 562,532 (769,945) 1,584,374 2,542,276
3 3.3 APPENDIX 3OTHER NATIONAL DISCLOSURE

3
ANNUAL REPORT 2020 - AXA MANSARD | 193
3.4 APPENDIX 4
3.4 APPENDIX 4 (ANNUITY DISCLOSURES) STATEMENT OF ASSETS AND LIABILITIES
ASSETS ₦’000 ₦’000
Cash balances Counterparty Carrying amount
GTBank Plc Bank balance 81,319
Short term deposits Counterparties Interest rate Maturity date Carrying amount
Money Market Fund 120,595
120,595
Equity Issuer Purchase Cost Market Value
ZENITHBA NL Equity 7,582 7,440
UBA NL Equity 12,983 12,503
UACN NL Equity 1,851 725
TOTAL NL Equity 3,602 2,600
STANBICIBTC NL EQUITY 704 2,203
STANBIC NL Equity 1,439 4,405
GUARANTY NL Equity 3,429 4,853
FLOURMIL NL Equity 320 520
DANGSUGA NL Equity 11,149 9,100
DANGCEM NL Equity 2,847 7,829
17,318 22,675
63,224 74,853
OTHER NATIONAL DISCLOSURE

194 | ANNUAL REPORT 2020 - AXA MANSARD
Bonds Description Coupon
rateMaturity
dateAmortised
costFair
value
16.249900% NGN FEDERAL GOVERNMENT OF NIGERIA FGN 18-04-2037 16.25% 18/04/2037 305,818 566,517
12.4000% NGN FEDERAL GOVERNMENT OF NIGERIA FGN 18-03-2036 12.40% 18/03/2036 - 78,397
12.4000% NGN FEDERAL GOVERNMENT OF NIGERIA FGN 18-03-2036 12.40% 18/03/2036 26,250 43,234
12.4000% NGN FEDERAL GOVERNMENT OF NIGERIA FGN 18-03-2036 12.40% 18/03/2036 76,450 144,112
12.4000% NGN FEDERAL GOVERNMENT OF NIGERIA FGN 18-03-2036 12.40% 18/03/2036 17,500 29,687
12.4000% NGN FEDERAL GOVERNMENT OF NIGERIA FGN 18-03-2036 12.40% 18/03/2036 8,465 12,970
12.1493% NGN CENTRAL BANK OF NIGERIA FGN 18-07-2034 12.15% 18/07/2034 580,613 810,218
16.249900% NGN FEDERAL GOVERNMENT OF NIGERIA FGN 18-04-2037 16.25% 18/04/2037 120,100 188,839
14.80% NGN FEDERAL GOVERNMENT OF NIGERIA FGN 26-04-2049 14.80% 26/04/2049 204,147 380,830
14.80% NGN FEDERAL GOVERNMENT OF NIGERIA FGN 26-04-2049 14.80% 26/04/2049 - 380,830
14.80% NGN FEDERAL GOVERNMENT OF NIGERIA FGN 26-04-2049 14.80% 26/04/2049 - 952,074
14.80% NGN FEDERAL GOVERNMENT OF NIGERIA FGN 26-04-2049 14.80% 26/04/2049 103,580 190,415
14.50% NGN FEDERAL GOVERNMENT OF NIGERIA BOND 15-07-2021 14.50% 15/07/2021 28,488 32,562
12.50% NGN FEDERAL GOVERNMENT OF NIGERIA BOND 27-03-2035 12.50% 27/03/2035 351,115 454,982
12.4000% NGN FEDERAL GOVERNMENT OF NIGERIA FGN 18-03-2036 12.40% 18/03/2036 88,850 144,112
12.4000% NGN FEDERAL GOVERNMENT OF NIGERIA FGN 18-03-2036 12.40% 18/03/2036 25,113 38,910
12.4000% NGN FEDERAL GOVERNMENT OF NIGERIA FGN 18-03-2036 12.40% 18/03/2036 19,210 29,687
12.4000% NGN FEDERAL GOVERNMENT OF NIGERIA FGN 18-03-2036 12.40% 18/03/2036 48,646 74,938
12.4000% NGN FEDERAL GOVERNMENT OF NIGERIA FGN 18-03-2036 12.40% 18/03/2036 2,476 4,323
12.1493% NGN CENTRAL BANK OF NIGERIA FGN 18-07-2034 12.15% 18/07/2034 91,000 138,499
12.1493% NGN CENTRAL BANK OF NIGERIA FGN 18-07-2034 12.15% 18/07/2034 92,050 138,499
12.1493% NGN CENTRAL BANK OF NIGERIA FGN 18-07-2034 12.15% 18/07/2034 92,050 138,499
2,281,921 4,973,134
TOTAL ASSETS 5,286,516
LIABILITIES
Annuity Reserves 3,054,196
3 3.4 APPENDIX 4OTHER NATIONAL DISCLOSURE

3
ANNUAL REPORT 2020 - AXA MANSARD | 195
3.5 APPENDIX 5A (FIVE YEAR FINANCIAL SUMMARY - GROUP)
3.5 APPENDIX 5A
(All amounts in thousands of Naira unless otherwise stated)
Dec-20 Dec-19 Dec-18 Dec-17 Dec-16
STATEMENT OF FINANCIAL POSITION ₦’000 ₦’000 ₦’000 ₦’000 ₦’000
ASSETS
Cash and cash equivalents 20,251,719 17,911,416 5,238,705 5,333,318 3,523,136 Investment securities– At fair value through profit or loss 5,407,073 5,302,005 3,266,048 - - – Available-for-sale 31,102,632 27,836,825 22,313,670 22,691,784 17,539,369 – Held-to-maturity - - - - - Financial assets designated at fair value 4,485,246 4,154,695 3,073,457 3,272,242 3,325,455 Pledged assets - - - - - Trade receivables 6,668,899 5,418,424 3,615,646 1,961,018 854,923 Reinsurance assets 6,499,653 8,974,246 12,549,017 10,165,983 9,184,177 Other receivables 1,286,603 1,548,652 1,507,844 909,097 840,036 Deferred acquisition cost 415,717 331,047 436,772 494,584 593,862 Loans and receivables 470,272 403,548 311,449 3,843,254 3,177,293 Investment property 13,694,760 15,801,949 17,525,962 14,072,384 12,017,000 Intangible assets 330,017 1,580,297 1,588,175 1,648,896 1,688,903 Property and equipment 2,428,288 1,989,781 1,843,362 1,672,516 1,714,019 Right of use 898,841 535,863
Statutory deposit 500,000 500,000 500,000 500,000 500,000
TOTAL ASSETS 94,439,720 92,288,748 73,770,107 66,565,076 54,958,173
LIABILITIES
Insurance liabilities 29,597,844 25,162,941 22,538,993 21,167,952 14,433,322 Investment contract liabilities:– At amortised cost 5,153,521 4,275,765 3,691,424 3,108,070 2,734,268 Financial liabilities designated at fair value 4,485,246 4,154,695 3,073,457 3,272,242 2,916,273 Borrowing 2,994,361 6,965,804 3,493,234 3,295,031 4,225,811 Trade payables 9,111,737 16,567,712 11,180,754 8,524,336 7,423,560 Other payables 2,936,095 3,305,822 2,658,787 2,333,758 2,215,341 Current income tax liabilities 1,648,795 935,546 773,819 444,688 256,067 Deferred income tax 818,666 841,496 837,061 656,407 567,529
TOTAL LIABILITIES 56,746,265 62,209,781 48,247,529 42,802,484 34,772,171
EQUITY
Paid up share capital 18,000,000 5,250,000 5,250,000 5,250,000 5,250,000 Share premium - 4,443,453 4,443,453 4,443,453 4,443,453 Contingency reserve 4,345,125 4,270,458 4,139,090 3,615,451 3,173,900 Other reserves 167,381 2,687,483 2,663,582 2,625,479 2,612,567 Treasury shares (304,924) (304,924) (304,924) (304,924) (304,924)Retained earnings 6,470,482 7,832,957 5,262,379 4,229,226 3,221,949 Fair value reserves 5,264,806 1,080,718 (550,226) 426,131 (986,947)
SHAREHOLDERS’ FUNDS 33,942,870 25,260,145 20,903,354 20,284,816 17,409,998 Total equity attributable to the owners of the parent 33,942,870 25,260,145 20,903,354 20,284,816 17,409,998
Non-controlling interests in equity 3,750,585 4,818,822 4,619,224 3,477,776 2,776,004
TOTAL EQUITY 37,693,455 30,078,967 25,522,578 23,762,592 20,186,002
TOTAL LIABILITIES AND EQUITY 94,439,720 92,288,748 73,770,107 66,565,076 54,958,173
OTHER NATIONAL DISCLOSURE

196 | ANNUAL REPORT 2020 - AXA MANSARD
STATEMENT OF COMPREHENSIVE INCOME
Dec-20 Dec-19 Dec-18 Dec-17 Dec-16
₦’000 ₦’000 ₦’000 ₦’000 ₦’000
Gross premium written 47,583,434 43,620,265 33,923,949 26,824,830 20,713,129
Gross premium earned 45,519,867 41,609,412 32,701,781 26,198,134 20,676,584
Profit before taxation 6,038,755 5,054,865 3,380,073 3,232,099 3,125,627
Taxation (1,537,671) (1,019,228) (897,791) (556,991) (490,631)
Profit after taxation 4,540,337 4,035,637 2,482,282 2,675,108 2,634,996
Transfer to contingency reserve 74,667 131,368 523,639 441,551 451,887
Earnings per share- Basic (kobo) 13.59 37.16 21.35 19.16 20.00
Earnings per share- Diluted (kobo) 13.59 36.53 21.02 18.86 19.69
3 3.5 APPENDIX 5AOTHER NATIONAL DISCLOSURE

3
ANNUAL REPORT 2020 - AXA MANSARD | 197
Parent
Dec-20 Dec-19 Dec-18 Dec-17 Dec-16
₦’ 000 ₦’ 000 ₦’ 000 ₦’ 000 ₦’ 000
ASSETSCash and cash equivalents 16,575,948 16,133,274 4,218,348 4,779,865 2,878,081 Financial assets– At fair value through profit or loss 5,407,073 5,302,005 3,266,048 - - – Available-for-sale 27,764,440 22,032,646 17,888,088 17,677,702 14,234,470 – Financial assets designated at fair value 4,485,246 4,154,695 3,073,457 3,272,242 3,194,131 – Held-to-maturity - - - - - Loans and receivables 1,014,377 882,168 323,287 7,562,215 5,098,392 Pledged assets - - - - - Trade receivables 1,043,004 1,224,373 572,586 251,383 315,806 Reinsurance assets 6,327,265 8,895,612 12,504,524 10,115,242 9,134,825 Other receivables 726,911 801,891 779,072 649,146 555,287 Deferred acquisition cost 346,212 321,055 415,213 481,077 574,413 Investment in subsidiaries 1,652,000 3,537,247 4,997,374 3,919,573 3,919,573 Deferred tax asset - - - - - Intangible assets 305,443 215,450 190,086 218,772 229,332 Property and equipment 2,154,801 1,784,543 1,667,654 1,437,960 1,442,216 Investment Property - 1,350,000 3,040,000 Right of Use 722,803 462,082 Statutory deposit 500,000 500,000 500,000 500,000 500,000
TOTAL ASSETS 69,025,523 67,597,041 53,435,737 50,865,177 42,076,526
LIABILITIESInsurance liabilities 19,550,486 17,491,746 16,964,677 17,824,172 13,033,944 Investment contract liabilities:– At amortised cost 5,153,521 4,275,765 3,691,424 3,108,070 2,734,268 Financial liabilities designated at fair value 4,485,246 4,154,695 3,073,457 3,272,242 2,916,719 Borrowing - - - - - Trade payables 8,947,445 16,478,545 11,108,223 8,511,603 7,406,965 Other liabilities 1,393,590 1,894,835 1,572,156 1,358,567 1,017,461 Current income tax liabilities 125,911 203,650 257,967 234,959 202,157 Deferred income tax - - - - 183,220
TOTAL LIABILITIES 39,656,199 44,499,236 36,667,904 34,309,613 27,494,734
EQUITYPaid up share capital 18,000,000 5,250,000 5,250,000 5,250,000 5,250,000 Share premium - 4,443,453 4,443,453 4,443,453 4,443,453 Contingency reserve 4,345,125 4,270,458 4,139,090 3,615,451 3,173,900 Other reserves 167,381 2,652,077 2,634,904 2,595,103 2,593,900 Treasury shares (304,924) (304,924) (304,924) (304,924) (304,924)Retained earnings 2,129,200 5,863,179 1,155,216 687,639 283,393 Fair value reserves 5,032,542 923,562 (549,906) 268,842 (857,930)
SHAREHOLDERS’ FUNDS 29,369,324 23,097,805 16,767,833 16,555,564 14,581,792
Total equity attributable to the owners of the parent 29,369,324 23,097,805 16,767,833 16,555,564 14,581,792
TOTAL EQUITY 29,369,324 23,097,805 16,767,833 16,555,564 14,581,792
TOTAL LIABILITIES AND EQUITY 69,025,523 67,597,041 53,435,737 50,865,177 42,076,526
3.6 APPENDIX 5B (FIVE YEAR FINANCIAL SUMMARY - PARENT)(All amounts in thousands of Naira unless otherwise stated)
OTHER NATIONAL DISCLOSURE3.6 APPENDIX 5B

198 | ANNUAL REPORT 2020 - AXA MANSARD
STATEMENT OF COMPREHENSIVE INCOME
Dec-20 Dec-19 Dec-18 Dec-17 Dec-16
₦’ 000 ₦’ 000 ₦’ 000 ₦’ 000 ₦’ 000
Gross premium written 27,547,903 28,014,854 23,026,817 20,602,218 17,330,219 Gross premium earned 27,069,133 27,867,055 23,296,043 21,248,558 17,872,878 Profit before taxation 2,553,366 4,978,919 1,828,263 1,446,155 1,263,787 Taxation (80,111) (139,589) (207,047) (78,334) (223,408) Profit after taxation 2,473,255 4,839,330 1,621,216 1,367,821 1,040,379 Transfer to contingency reserve 74,667 131,368 523,639 1,289,487 816,971 Earnings per share (kobo) 6.99 16.69 15.71 13.25 10.08
3 3.6 APPENDIX 5BOTHER NATIONAL DISCLOSURE

3
ANNUAL REPORT 2020 - AXA MANSARD | 199
(All amounts in thousands of Naira3.7 APPENDIX 6 (STATEMENT OF VALUE ADDED)
Group Parent
Dec 2020 % Dec 2019 % Dec 2020 % Dec 2019 %
Gross premium income 47,583,434 43,620,265 27,547,903 28,014,854
Re-insurance, claims and commission & others (44,949,659) (41,292,306) (29,232,016) (27,717,834)
2,633,775 2,327,959 (1,684,113) 297,020
Investment and other income 6,915,306 5,928,620 6,205,116 7,303,233
Value added 9,549,081 8,256,579 4,521,003 7,600,253
Applied to pay:
Employee benefits 2,910,149 30% 2,779,139 34% 1,509,815 33% 1,188,516 16%
Government as tax 1,537,671 16% 1,019,228 12% 80,111 2% 139,589 2%
Shareholder as dividend - 0% - 0% - 0% - 0%
Retained in the business
Contingency reserve 74,667 1% 131,368 2% 74,667 2% 131,368 2%
Depreciation and amortisation 560,924 6% 429,303 5% 457,822 10% 366,811 5%
Retained profit for the year 4,734,686 50% 3,697,943 45% 2,398,588 53% 5,773,969 76%
Non-controlling interest (269,016) -3% 199,598 2% - 0% - 0%
Value added 9,549,081 100% 8,256,579 100% 4,521,003 100% 7,600,253 100%
OTHER NATIONAL DISCLOSURE3.7 APPENDIX 6

200 | ANNUAL REPORT 2020 - AXA MANSARD
3.8 UNCLAIMED DIVIDEND LISTING AS AT DECEMBER 31, 2020
1 ECAD PROPERTIES LTD2 ERNEST JOHN&CO LTD -3 MUSA GANIYU4 OLOLO PETER, UKUORITSEMOFE5 PETERS CHARITY6 EBENEZER EDNA, NIG LTD, -7 TOKALEX ASSOCIATES LIMITED8 BROKER ASSOCIATES LIMITED -9 AKINYOSOYE, AYOYINKA, ALEX
10 JULISAM ENTERPRISES11 OLUGUNWA OLAJIDE OGUNSANLU12 EGBOCHUKU EDITH NJIDEKA13 FLAGSHIP ASSET MANAGERS LTD -14 OSAMEDE OSAYOMORE, AIGHOBAHI15 OLUYEMI OLUWOLE, OLUFEMI16 NEXT POINT LIMITED17 AGONI SYLVESTER, O.18 OBI RAPHAEL CHINEDU19 D.O.L INVESTMENT LIMITED -20 OKPERE KIZITO, USIFO AYODELE21 ESTATE OF ALUKO-OLOKUN ISAAC,22 HERITAGE LINKS LIMITED -23 OKON TIMOTHY EFFIONG24 OGUNBANJO ADETAYO OLUSESAN25 OLUGBEMI OLUBUNMI, ADEREMI26 NWOKE KAMSIYOCHUKWU27 ONI OLATUNBOSUN OLUFEMI28 FORTUNE 2015 LIMITED -29 FAKIYESI OLUSIJI30 UMEH DUMJACHIKE CHUKWUKA31 OGUNLEYE RANTIMI, BABAPELUMI32 MOGHALU KINGSLEY, BOSAH CHIEDU33 SALAMI AKEEM, OLANREWAJU34 MARTINS CHIDY, LASBREY35 OLUYORI SEGUN,36 OWOTORUFA FREDRICK,
ENDOROKEME37 KUFORIJI OLUBI DORCAS BOLAJOKO
AYODELE38 DEMUREN OLUTAYO ADEBANJO39 BRIGUE UVIE40 BUSAINE DISTRIBUTION
ENTERPRISES -41 BOLOKOR IRENE42 ADENIYI LANRE,43 ADEDOYIN-ADEYINKA OLUMOROTI
ABIODUN44 OROGUN CAROLINE OMUBOBA
OROGUN45 AKINOLA BISI,46 OLADIPUPO ABIOLA, EMMANUEL
47 ADENIRAN GBOLAGADE, JACOB48 ONYEBUENYI KINGSLEY,
CHUKWUEMEKA49 ALABI MODUPE OLAIDE50 SPRINGBOARD & TURST INVESTMENT51 LAYONU OLADUNMOMI, OYENIKE52 ABEOKUTA TUYE, EBIKESEYE53 TIJANI ABIMBOLA, MOJISOLA54 IKOKU ALVAN, ENYINNAYA55 UDORA VICTOR, OGO56 PINEFIELDS INVESTMENT, SERVICES
LIMITED57 NWALOZIE PETER, IKECHUKWU58 OHO INVESMENTS LIMITED59 ALUKO OLUWAFEMI, JOHN60 NWOSU ABATAM, C.61 NEXTPOINT LIMITED -62 OBI PAUL, CHUKWUMA63 GLOBAL MAXWEALTH LIMITED64 FAIRCORP INVESTMENT LIMITED65 ONAMIK HOLDINGS LTD66 OZOYA INVESTMENTS LIMITED67 NWOBOSHI ABISOLA, ASANI68 AKINRIMISI MORENIKE,69 GOYIT DAVID, LUKA70 ALONGE MAY, E71 ADETOLA FRANCIS OLUWOLE72 TAYO IFEOLUWA, TOYIN MRS.73 LAWAL OLUWAKAYODE OLUWAFEMI74 ADEGBOYEGA SAMUEL,75 ALABI JOHN,76 OBUNINTA HELEN,77 GOODLUCK AKINWALE, OLUMIDE78 OYELEYE JAMES, AYODEJI79 DODO DINSHIYA, DAMIAN80 OMOJOLA VINCENT, BABALOLA81 MAMORA OLANLESI,82 RHOMAT PROPERTIES NIGLIMITED83 ADEYINKA GANIYU ADEBAYO84 OSINUBI STEPHEN, ADEDOYIN85 OGUNDIPE ABIODUN, JOHNSON86 OGBARA NURUDEEN,87 DIM PRINCE, CHINEDU88 SHEHU BALA,89 ADENUGA MIKE, AND EBUN90 HARIGOLD VENTURES LIMITED -91 LEKKAR ASSETS AND RESOURCES
LIMITED92 ATLASS PORTFOLIO LTD93 ARCHIBONG MARIA-PIA OBO94 OLUWABIYI ADEOLA, OLUFOLAKE
95 OSO OLADUPO, CHARLES96 STI/ECOBANK-TRADING A/C97 AJAYI OLUFEMI, ADEKUNLE98 EDUN OLUYEMISI TITILOPE99 INEGBEDION THADDEUS,
EGBIREGBONLEN100 SATO & SATO INTERNATIONAL LTD .101 CHUKWUEMEKA ALBERT,
CHINYEREMEZE102 ISODJE EMONEFE,103 BATUBO OWANARI,104 JINJIRI MAHMUD, Y.105 NWAOCHEI ANTHONY, IFEANYI106 ADEOGBA ADEDAYO, A.
&OLUWATOYIN O.(MR&MRS)107 OYEKUNLE OLANREWAJU,
OLUWAROTIMI108 OSIYEMI OLUWASEUN,109 CHIGBO IKENNA, T.110 AKHILOMEN PAUL, OSAREME111 WIFA SOLOMON,112 ANWAN GODWIN, WILLIE113 MUIBI ADETOKUNBO, MUSTAPHA114 BALOGUN KUDIRAT, ABIODUN115 AHMED ZUBAIR,116 FAGBEMI MODUPE, EFUNGBEMI117 BLUECORAL ASSETS LIMITED118 TIJANI JEHOSHEBA, JEHOADDAN119 NWANGWU UGOCHUKWU, SAMUEL120 OFIA IFEANYICHUKWU, JUDE121 IDACHABA ACHENYO,122 OLOWOJARE BANJO,123 ONONAIYE OLUMIDE,124 OSHIN MOBOLANLE, IGBARAGBON125 ODUNUGA MOFOLUSO, OMOLARA126 OMOZE CHRISTOPHER,127 ABOLADE AYODAPO, BODE128 ADEPETUN ADEMIDE, ANJOLAOLUWA129 ALLEY VENTURES LTD130 OJOBO ADELAJA, KAMORU131 OJELABI OLUSEGUN, DAVID132 AKINOLA ADEBAYO, ADETUNJI133 SMADAC-KOFO SALAM ALADA134 AMADI ADEPEJU, SARAH135 ADEOSUN ADEOLU, EBENEZER136 HASSAN MORENIKE, MOSEBOLATAN137 OSUNSEDO OLUSOJI,138 LAWANI BABAJIDE, AYOBAMI139 NEM INSURANCE PLC140 OGWUCHE SUNDAY, ALEX RAPHAEL141 EQUITY UNION LIMITED
3 3.8 UNCLAIMED DIVIDENDOTHER NATIONAL DISCLOSURE

3
ANNUAL REPORT 2020 - AXA MANSARD | 201
142 BABINGTON -ASHAYE, FUNMI143 MITE TO MIGHT LIMITED BY
GUARANTEE144 AGBOJO CLOTILDA, ONYEOGHANI145 CROWN WEALTH ASSET MANAGEMENT
LTD -146 ODUNLAMI IDOWU,147 OPUTA NKENAMCHI, BENEDICT148 AIBONI ELOHOR,149 AMAKU MICHAEL, ANENE150 OJOSIPE ADEDAYO, RAZAK151 ISOKARIARI TEINYE, VINCENT152 TIJANI MARY, OLOLADE153 UMOH EKONG, GEORGE154 DIVERSEDGE ENTERPRISES155 OTUDEKO MOYOSORE, O156 ABOLARIN OLUGBENGA,157 KASSIM ABDUL, KADIR158 ADEBAYO OLUWADARE, CLEMENT159 OPARA IHEANYICHUKWU,
KELECHUKWU160 FASANYA ABAYOMI, IFANIYI161 LAWAL FAROUK, OLAMIDE162 OLAWALE OLASUPO, IDOWU163 OWOLABI OLUWAMAYOWA, EDWARD164 ENTERPRISE TRUST INSURANCE
BROKERS LTD165 HELMS LIMITED166 ADEMILUYI ADEYEMI,167 ANDE BABABUSOLA, ABAYOMI168 KARUNWI O.O. (ITF KARUNWI
ADELUOLA)169 AKINBO OLANREWAJU, &
OLUWAYEMISI170 ESEYIN PHILIP, ADEWALE171 KARUNWI OYINKANSOLA,172 BABARANTI AYANDAYO, RASHEED173 TOBRISE OGHENERUONA, JOEL174 IDO BENITA IDO175 ADEREWA TINUKEMI,176 JUSTIN CHRISTIAN, AND NWANNEKA177 AKUBELEM EMMANUEL, CHIDUBEM178 AJIBI OLUFEMI, & NDIDI179 IRORO WALTER, OROBOSA180 IDISE FRIDAY,181 A.M.S HOLDINGS LTD182 JAIYEOLA OSARETIN, EARNESTINA183 OJABANJO ADELEKE, & ALERO184 MADAGUA ANTHONY, ABODUNRIN185 OBI CHUKWUEMEKA, SHADRACK186 NEW WINE INVESTMENT LIMITED187 EWEBIYI OMOWUNMI,188 EGBAI ALFRED, ONOCHIE189 MAJEKODUNMI DANIEL,
OLUFUNMILAYO190 LAYONU ADEDAMOLA, OLADAPO
191 ESEDO RAPHAEL,192 PETE JONES LTD -193 ABDULMUMINI IBRAHIM, BELLO194 CWF INVESTMENTS LIMITED195 BUGHAR LUCKY, M196 IZUNOBI LUCY,197 BIODUN &, TOLULOPE ODUSI198 AKHIGBE CHARLES,199 STERLING ASSET MGT & TRUSTEES
LTD A/C 12200 MAGAJI MOHAMMED, HAUWA201 WASIMO VENTURES LIMITED202 OBIOGBOLU ANTHONY,
OBIAGWUNCHA203 MONEKE GABRIEL, OKOYE204 SANUSI MOHAMMED, ISA205 UBA MROHWOBOR, DONATUS206 MBANUGO BEN, NWABUNIKE207 ANTHONY UBA, NWABUEZE208 OKAFOR OKECHUKWU, ISAIAH209 ABUBAKAR SULEIMAN,210 ONWADIKE CHIBUIKE, AGHAJIAKU211 IKENZE EBUNOLUWA, CHINELO212 OKEKE ULOAKU,213 OYENEYIN ALIYU, OPE214 BUKOLA OLOLADE, OLASILE215 OLAWUYI OLATAYO, J.216 AIREWELE OYANMIN, GABRIEL217 OPEKE FUNKE,218 NGEREM DANIEL,219 CREDITVILLE NIGERIA LIMITED220 HASSAN UMAR, ALHAJI221 TRUST YIELDS SECURITIES LTD (SP
ACCOUNT)222 AGINA IKECHUKWU, VICTOR223 PETER-AZEEZ ZACHARIAH, ZAKIE224 ONIGBANJO ADEBAYO,225 ADEDEJI ADETUTU, AYOADE226 RHIOGBERE GLORIA,227 TIJANI ABDULLAHI, OLAYEMI228 RICHARD-EDET VIVIAN, CHINYERE229 ADEGBOYE ADEOLU, O230 SOYEGE ADETUNDE OLAITAN
(ALLEGED DECEASED PHC 7514/2011),231 AWOJOBI JAMES OLANREWAJU232 AIDOMOJIE AGATHA, UNOMA233 CRAIG AKIN,234 YINKA MACDONALD, CEASAR235 OGIAGA OSIREGBEME,236 UGWU THEODORE, CHUKWUEMEKA237 UDOKA-EZIKE OBIANUJU, VIVIAN238 IGIEHON BRIDGET, OSARIEME239 WAHAB KUNLE, ADE (PROF)240 ONYEGWARA DAMIAN, IKENNA241 WILLIAMS ONOSHOKENEH, PAULINA
242 LIMESHARE INVESTMENT LTD243 ODUKALE ABIMBOLA, ADEBOYE244 TOBRISE EFEMENA, JANELLE245 ANIMASHAUN TOLA, & IFEOLUWA246 INEH FREDRICK,247 ODUTAYO ADEMAYOWA, OMOTOLA248 IBIROGBA KOLAWOLE,249 JIVRAJANI SHAILESH,250 MOHAMMED OLANREWAJU, YUSUF251 AYODEJI NURUDEEN,252 OUT CHRISTOPHER, OSHOMA253 UKPONG MORENIKE, OLUWATOYIN254 THOMAS GBOLADE, OLAIDE255 GOLDENITZ HELMUT, AND ANTONIA256 SOMAN INVESTMENTS NIG LTD257 ARIGBO WISDOM, CHIBUZOR258 OLATEJU OLAYEMI, MUTIAT259 DIMOWO GABRIEL,260 OTUWA ISRAEL, NDUBUISI261 AFONJA AYOOLA, TAIWO262 AWOKOYA OREOLUWA, OMOWUNMI263 OPATA DAMIAN, UGWUTIKIRI264 OMONI OLUSOLA, ROTIMI265 EMENYI ABANG, EDET266 NIG SOCIETY OF CHEMICAL
ENGINEERS267 EMIOWELE KELVIN,268 SSCM-ISIBOR STEPHEN269 JOHN ZIRA, Q270 OHAERI KENNETH, UCHE271 KALU NNANNA, ONWUCHEKWA272 AJEYOMI OLUWAFEMI, M.273 OPEODU OMOTOKE, TAWAKALIT274 KAZEEM-ABIMBOLA SHERIFAT,
OLANREWAJU275 ANIMASHAUN KAZEEM, GBENGA276 OMOMOWO BOLADE, OJUROYE277 YOMADEX INVESTMENT LTD278 BALOGUN AHMID, OKANLA279 EGBELE GLORIA, ENOGIELA280 EREKOSIMA MPAKA,281 ADINDE ROBINSON, ANAYOCHUKU282 OGUEJIOFOR IKECHUKWU,
IKEMEFUNA283 OKAFOR OKECHUKWU, ISAIAH284 OYEDEJI TUNDE, ABRAHAM285 OLUPONA ODUNAYO, IBIRONKE286 WADI BRIDGET, CHIYERE287 OLAWOYIN OLUWAGBEMIGA,
OLATUNDE288 NDUKA CHUKWUDI,289 ADENUGA ADESEGUN, MARTINS290 AJIBULU ADESEYE, AKINSANMI291 OVIE-OMAJUWA OGHENEBRUME,
OLUWATOBILOLA
OTHER NATIONAL DISCLOSURE3.8 UNCLAIMED DIVIDEND

202 | ANNUAL REPORT 2020 - AXA MANSARD
292 MRAKPOR ETUVIERE, OTONTE293 OWOLABI OYEBANJI, OYEDELE294 OMIEMA-BRIGGS DEBORAH,
OPAKIRITE295 OKONKWO ANNE, UCHE296 ODUWOLE BAYO,297 ATOYEBI ENO, IDARA298 OLUWAGBEMI OLUBUSAYO, MICHAEL299 OKPALA TOCHUKWU, CHUKWUKA300 UKACHUKWU NNODU, BONIFACE301 JONAH SILAS,302 OYINLADE OLALEKAN, ABRAHAM303 IHEANACHOR KINGSLEY, CHINEME304 OKANLAWON ABIODUN OLUFEMI305 ONYEKWELU CHINYELU, IJEOMA306 NWOSU OKEOMA, EMEKA307 ORELESI MORONKE, OLUPERO308 FALASINNU JOSEPH, EKUNDAYO309 ENE ORIFIE,310 IGADO JOHN, OCHECHE311 ANIMASHAUN,NADIA OLAOLUWA,312 ANIMASHAUN, AL-FUR�QAN,
FOLORUNSHO313 FASOTO GABRIEL, FOLUSO314 OKEREMI ADEBISI, OLUKAYODE315 BALOGUN ADEBAYO, HAMMED316 BRITS NOMINEES LTD (RC 301989)317 BEERSHEBA VENTURES318 OLORUNDAHUNSI SUNDAY,319 OSEGHALE JOSEPH,320 BIMLAG PRIESTLY TRAINING
FOUNDATION321 AGUBATA ECHEZONA, I.322 D.O.L INVESTMENT LIMITED323 OSOROH JEFFERY, OYOVWE324 DUDU JOSEPH, OMAGBEMI325 IDOWU LADIPO,326 IDRIS MUSA, ISA327 LAWAL AKANNI, MUKAILA328 ALI-DAGABANA HADIZA,329 AFOLABI YAKUBU, OLAYIWOLA
(ALLEGED DECEASED PHC260L/2018)330 FIRST TRUSTES A/C OLATINWO FISAYO331 OLONODE OLAYINKA, JOHN332 CHIEDU FRANCISCA, KANAYO333 SALIM & ASSOCIATES LIMITED334 JOSEPH OLORUNWA, SAMUEL335 JOHNSON ADEOLA,336 IGBIN YINKA, GBEMISOLA337 SOKOYA OLUDAYO OLUSEYI338 LAWUYI JONATHAN BABATUNDE,339 OPASANYA OLUBUNMI, LAWUNMI340 OYEBODE BOLA,341 AYO KASUMU, KEHINDE342 SODIPO E, A
343 EZEAGU CHIJOKE, VALENTINE (ALLEGED DECEASED. PHC NO. 248L/2009)
344 ADENIRAN OLUWATOYIN, SARAH345 OMOWALE LAMIDI, ADEDAYO346 BOSAH UCHE, CORDELIA347 UZEBU, EKUASE,,348 YAHAYA ABDULMUMINI,349 ADARAMEWA KAMORUDEEN, OLUSUYI350 OLUBODUN JOEL,351 OKEKE SAMUEL, CHUKWUEMEKA352 EKE OLA, CHIOMA353 DANIEL OLUFUNKE, ELIZABETH354 JAGUN OLANIKE, ADETOKUNBO355 DIM UCHECHUKWU, ANDERSON356 KOMOLAFE OLUSEGUN, M357 OYEDELE OLUWASEGUN, IREDELE358 LANIYAN JOS,359 ADEOSUN ADEKUNLE, SEGUN360 OKOLI IFEANYI, CHARLES361 ALLI WURAOLA, AMINAT362 ALLI DOLAPO, MARIAM363 ALLI OLAYINKA, ASIMIYU364 AKINYELUWA ADESOLA, ADERONKE365 ADELEKE MARTINA, SUNMBO366 UKPONG UKPONG, S.367 HAMMAN-OBELS GHENEYOMA,
KESIENA368 I-ONE E-PORTFOLIO A/C - 015369 OWI MARIA, INIBIYE370 OBUREBU CHRISTIANA, OYIZA371 OGBUOZOBE TOCHUKWU, STEPHEN372 DANIEL MARGARET, OLUFUNKE373 ASIOTU BENJAMIN, UJIRO374 AZONOBI OBINNA, PAULINUS375 OKPAGU NONSO, SAMSON376 ADEMILUYI ADEKUNLE, OLUWASEUN377 OJEH ISIOMA, AUGUSTINA378 OKEREMI ADEBISI, OLUKAYODE379 OTOBOEZE SAMUEL, CHIGOZIE380 UZOAGBA KENNETH, OKECHUKWU381 INVESTMENTS COMBINATIONS LTD382 ABAYOMI KOFOWOROLA ABIDEMI383 VEN (DR), / PROF (MRS) AO MALOMO384 OLA EDWARD, OLAITAN385 ADEJIMI AKINBOADE,386 OKEKE SABINA, NKEIRUKA387 OHIAERI ADANNA, IVY388 THE KINGDOM TALENTS LIMITED389 NWOBI EMMANUEL, UGOCHUKWU390 FAKIYESI AYOKANMI, OLUWASEUN391 ARM NOM: OKIGBO
C.ADAOBI&TOBECHUKWU NKEM392 OBASEKI EDOSA, BENJAMIN393 OJEWUMI KEHINDE, & MARVEL
394 TOBRISE EFEMENA, JANELLE395 AGBOOLA FELIX, OLAKUNLE396 MORAKINYO OLALEKAN, AKINGBOYE397 NASIR SAHEED, BABATUNDE398 KUPONIYI OLUMIDE, OLATOKUNBO399 SOETAN ANTHONY, MOGBONJUBOLA400 LAWAL ADEWALE, OLAJIDE401 OGBETA EBARUMEN, MARY402 UDEKEZIE MARY,403 STANDARD UNION SECURITIES-
TRADED-STK-AC404 AKINNIRANYE AKINJOMIDE,
OLASUNKANMI405 AKINNIRANYE AKINWUMI, OYEYEMI406 OKUNROUNMU OLAJIDE,407 LAWSON DAKRO, LAWSON408 OSADEBAMWEN EMOKARO,409 JUMBO TAMUNOIBI, THEOPHILUS
EBENEZER410 UBANI CHIOMA, ADA411 EZEOGUINE ANTHONY, EMEKA412 ALLI OLAYINKA, ABDUL- AZEEZ413 OSEIZA OGAZI, OLUGBENGA414 EIMUNJEZE JOSEPH, ODIANOSEN415 ADEBUTU OLALEKAN, JAMES416 ADELAGUN AYOOLUWA, DANIEL417 ADELAGUN UBANIOSHOMOSHI,
OLUWATOMISIN418 ADELAGUN OLUWAFIMIDARA,
NATHAN.O419 FATOBI HENRY, FOLORUNSO420 TOLUHI OLUWAFEMI, MICHAEL421 MBAH GABRIEL, UCHECHUKWU422 NORNAH-AWOH UYEH-IJEH,423 OWOLABI OLUWAMAYOWA, EDWARD424 OKORIE LAZARUS, UZODINMA425 AHTSEMA VENTURES, LTD426 ANDE BABABUSOLA,427 ODELANA AFOLAKE/CO-LINK INVT
MGT.CO. LTD428 OTASANYA OLUFUNSO, LAWRENCE429 OKUNOLA ISAIAH, ADEBAYO430 NWOSU CHIKA, VICTORIA431 OJELABI ISAAC, OLASUNKANMI432 IBIDAPO MATTEW, OLANIRAN433 ONAGA NNAMDI, GIOVANNI434 ADEDAYO SAMUEL, SUNDAY435 NGENE IKECHUKWU, CHRISTOPHER436 ETEKOCHAY EDITH, IFEANYICHUKWU437 IKANADE-AGBA ISOMOFA, NAOMI438 IKANADE-AGBA OSHIOKE, NATHANIEL439 TIJANI KAZEEM, OLUWATOYIN440 PROGRESSIVE UNDERTAKING GLOBAL
SERV. LTD441 AKINTE TEMITOPE, HECTOR
3 3.8 UNCLAIMED DIVIDENDOTHER NATIONAL DISCLOSURE

3
ANNUAL REPORT 2020 - AXA MANSARD | 203
442 UCHENYI KESANDU, ONYIMGBA MELVYN
443 NWIGWE PASCHAL, CHUKWUNYERE444 OKEKE EMMANUELA, CHINAZO445 IDOWU-KUOLA AYODELE, OLUBUNMI446 DOMINION HEIGHTS SCHOOLS447 SHANDY VENTURES448 BAKUT BENEDICT, YASHIM449 OMOREGIE NOSAKHARE, SHADRACK450 REGENT SCEPTER INTERNATIONAL
LIMITED451 HABILA GIZETIYA, MABEL452 OYEPEJU ADEREMI, ABRAHAM453 OLUMESE EDWARD,454 LIGALI OLUSHOLA, TAJUDEEN455 FANIMOKUN OLAITAN,456 FANIMOKUN MOGBONJUBOLA,457 SOILE OLUTOLA, OLANIYI BOB458 SASA MICHAEL, SUNDAY459 OYEDEJI RASHEED, ADEBOYE460 OSOROH VIOLET, ONORIODE461 MAKINDE TIMIOTHY, FOLORUNSO462 CAULCRICK JOSEPH, OLUSEGUN463 MSHELIA ASURA, MUAZU464 YUSSUF SODIQ, OLANREWAJU465 OLUWAJOMILOJU DANIEL,
ODUNMBAKU466 I-ONE E-PORTFOLIO AC - 134467 EMMANUEL UCHECHUKWU, G468 SOKUNBI OLAYINKA, GANIYAT469 OYEDEJI KALE,470 IHEANACHO OGECHI, JULIET471 OGUNDAIRO MOBOLAJI, ABIDEMI472 ANGA KENNETH,473 ADEJUWON ISAAC, ADEYOJU474 AKIODE AFOLABI OLUMUYIWA475 OYESANMI BOLA,476 MAKE ME BEAUTY PLACE LTD477 ABODERIN GBOYEGA,478 ADENIRAN BABATUNWA,479 AIYEOLA AFOLABI, AKINKUNMI480 SOLOMON AYOLEYI, OLUSEYI481 MUSA-ELAKAMA OLUWAFUNMIKE,
MONSURAT482 ONOJAFE PROVIDENCE,
OGHENEFEJIRO483 OYEWUMI ADEYEMI, AZEEZ484 ELAH OWOICHO, MICHAEL485 OKEOWO DANIEL, OWOYALE486 OKEKE-OJIUDU CHIEMEZIE,487 OHAERI ODINAKA, STANLEY488 AGBABIAKA HABIBULAI, AKINOLA489 DARAMOLA ABAYOMI, SUNDAY490 KOSENI MOLA, PRINCE OLUMAFIN491 KINOSHI OLUWASEYI, KAYODE
492 OLAFASOBU SAMUEL, JIMOH493 JEREMIAH SOLOMON, EFIONAYI494 ALANGRANGE SECURITIES LTD (APF A)495 OLAJIDE LASISI, OYEBANJI496 ODESANYA MONSURU, OLAJIDE497 ADEKOYA ADEBOBOLA, YAKUBU498 OLUWADARE ENOCH, KOLADE499 BELLO BABATUNDE, JAMIU500 SO-GEORGE GERALD, KARIBOYE501 HAILSHAM LOLO,502 GRANDVIEW INVESTMENTS LIMITED503 MADUBUEZE CASMIR, SUNDAY504 OKUNS GLOBAL INVEST.CORP.LTD505 SANYAOLU NOJEEM, ADEKUNLE506 OYAWOLE ANTHONY, BOLA507 EFEM ARIEL, DAMIETE508 AGBAJE BABATUNDE, AINA509 OMAGU ISA, EMMANUEL510 DAHUNSI ABIODUN, BOLARINWA
OMOTAYO511 BANKOLE JOSEPH, OLUMAYOWA512 OKOTIE YESIN, ETE513 ABORODE OLADEJI, STEPHEN514 ILONO THADDEUS, NDUDI515 OFOR GIDEON, UCHENNA OKORIE516 TAHIR MAHDI, MUHAMMAD517 OKEKE CHINWE, CHIKAODILI518 NWOSU MERCY, NWOMIKO519 AJALA OLADELE, LAWRENCE520 GBADEBO OLATOKUNBO,521 OLAJIDE EDWARD, ADENIRAN522 OMOIGIAFU NOSA, LUCKY523 ALAYANDE OLU, FOLARIN524 ONWORDI DUNZO, MOSES ANTHONY525 GOLDEN VICTORY PUBLISHERS LTD526 OVBIAGELE VINCENT, OBAGHE527 OYERINDE OYEWALE,528 ADEBANJO ADEBUNMI,529 SOETAN OLUWATOSIN, OMOTAYO530 DAIRO OPEYEMI, AYOTUNDE531 FREGENE VICTOR, ORITSEWEYINMI532 OGUNSEYE DAMILOLA, TEMITOPE533 ODOGUN OLUBUNMI, V534 BRAIMAH BABATUNDE, ADEBAYO ZAK535 DAN EAGLE VENTURES536 JOKTAN MATHEW, KONGORO537 KOSISO NONSO, OKPALLA538 AJALA SAMUEL, OLUSEGUN539 ANDE BABABUSOLA,540 EKPENYONG INIABASI, SAMUEL541 MUSTAPHA SAMSIDEEN, OLAMIDE542 OSOBU MICHAEL, ADEDAYO543 AYENI OLUREMI, BOLANLE544 ASHAMA AJITUEWUN, ENASHINERE
545 OBASA OLATUNDE, STEPHEN546 OJIELO CHIZOBA, HENRY547 AGUBE VICTORY, OBOKPARO548 OSILI KOSISOCHUKWU, E549 MEMBERE-OTAJI TONYE, LLOYD550 DEJI-FALEYE EMILOLUFE, SHAUN551 GARA MOSES, KOLO552 PDC GLOBAL SERVICES553 ANYIAM-OSIGWE PEACE, MARIE
OGECHI554 AGBATA CHARLES,555 MATTHEW COKER,556 ONWUEGBUSI OKECHUKWU, SAMUEL557 ADELOTAN HAKEEM, OLUROTIMI558 MAJEKODUNMI OLABISI, MOROLAYO559 TAIWO KASALI,560 ODUYOYE OLUMUYIWA, ADEBISI561 FATEH UDOO, MAVIS562 OKORIE CHIAMAKA, PRECIOUS563 TIJANI OLUWAYEMISI, TEMITAYO
KABIR564 ELIJAH JOSEPH, BONIFACE
IFEANYICHUKWU565 OTUBANJO OLUWASEGUN, VICTOR566 THOMAS AKINBAYO, OLAWALE567 ALEBIOSU SAHEED, ADEWALE568 ADEKOLA ADEBAYO,569 BAKUT FIDELIS, SULE570 IBRAHIM ABUBAKAR, GAYA571 ADEBOWALE KAYODE, MICHAEL572 IDISE MICHAEL, IGHOFEWO573 OKAFOR OYEHA, PAUL574 EKE ROSELINE, NGOZI575 ADEUYI SMART, GBENGA576 AKOMOLAFE KOMSON, OLAJIDE577 OGU PHILOMENA, UDODIRI578 ALABI AJOKE, ZAINAB OLAMIDE579 EFAM MONDAY, EWERF580 JUNAID OLUWAKAYODE, SEGUN581 AWOBAYO BENJAMIN, OLUPITAN582 WONSIRIM HYCIENTH,
IHEANYICHUKWU583 ATINUKE ONASHILE,584 OKPEWO EFE, FELIX585 ADEWOLE AHMED, ADEKUNLE586 UKONNE CHISOM, NNEOMA587 SYNGER JOHN, KALAKIO588 ADEWUSI YOMI, AREMU589 UTUK MONDAY, JOHN590 ANIMASHAUN TOLA, OLANREWAJU591 KAZIE OGBONNAYA, MMAJU592 MOHAMMED HAFIZ, USMAN593 GABRIEL ISREAL, UGBEDE594 AGU CYRIACUS, UCHENNA
OTHER NATIONAL DISCLOSURE3.8 UNCLAIMED DIVIDEND

204 | ANNUAL REPORT 2020 - AXA MANSARD
595 ADEFEHINTI DAVID, IBITOYE (ALLEGED DECEASED PHC299L/2017)
596 ONYEMAH FELIX, AZUKA597 ODOHO ANTHONY, OKEY598 AYODELE AYODEJI, OLUFEMI599 JEKAMI OPEOLUWA, OLUFEMI600 ANOZIE DOMINIC,601 AFEN-ASHIA BUKEYIM, KEVIN602 RAMARKRISHNAN RAMKUMAR,603 PERIDOT & GERMANE REALTORS
LIMITED604 CAPSTONE INSURANCE BROKERS LTD605 ASHIRU AYOOLA, MOSHOOD606 ODUBAYO ADEKUNLE, O.607 CHUKS MARY-ANN,608 SULAIMON TEMI-LOLUWA, IBRAHIM609 OWOYOMI AJIBIKE, ROSLYN610 OMONIWA ABIMBOLA,611 OLANREWAJU OLUWATOYIN,
OMOLADE612 ALETE VICTOR, OKACHI613 KOFI-SENAYA ALERO,614 BELLO KAYODE, ADEKUNLE615 FAFUNWA-ONIKOYI IDIAT, OLABISI616 ALEJO KAZEEM OLUSEYI617 FADEHAN OMOLARA, OMOLAYO618 OKUSADA OLUFEMI, OLUMIDE619 WILLIAMS OLUWATOFARATI,
TOLUWALASE620 ADEYI OLUBUSOLA, JUMOKE621 OLAYINKA KEHINDE, SABUR622 OKOI EMMANUEL, OBLA623 ODEKUNLE SERIFATU, IYABODE624 ADESINA-IBRAHIM ODUAYO, MARY625 JEMILOHUN PETER, OLAYINKA626 OLORUNMOLA BIDEMI, UZEZI627 OLUBANJO ADENOLA, SAMUEL628 STEPHEN LAURATI,629 ADEKANMBI ADEMOLA, CHRIS630 OKEKE ISAAC, CHUKWUEBUKA631 OKEKE DEBORAH, CHIDINMA632 ONIWINDE ABIOLA, M633 OLATUNDE JOHN, ABIODUN634 AGWUNOBI NNAMDI, & ANWULI635 BAMIDURO ADETAYO, OLANREWAJU636 SHONOWO OLUWASEUN,637 OVWIGHOWHARA OKIEMUTE, VERA638 ODIGIE STANLEY,639 AGWUNOBI NNAMDI, CHIJIOKE640 FADEYI NURUDEEN, TUNDE641 ALUSHA IORKYAR, TERSOO642 ALUSHA MYOM,643 ALUSHA ZERDOON,644 ALUSHA MBAWUESE,645 ALUSHA VERASHE,
646 ALUSHA IORKYAR, AONDOWASE647 ODEYEMI OMOTAYO, OLADOSU648 UCHE EKENE, CASMIR649 SHEHU KUTA,650 MADU GREG, OBINNA651 AKINDOLA MARY, GBEMISOLA652 OSIPITAN ADEBOLA, BABAJIDE653 OMOSEVWERHA EJIRO,654 AUTA APPEH,655 AGBE JAMES, TERNA656 UBA CHUKWUEMEKA, MAC657 ONANUGA OLADIPUPO, AKEEM658 OSUNDOLIRE IFELANWA, OLADAPO659 ADEDOYIN SAMUEL, ADELUMOLA660 ADEDOYIN ADEMOLA, EMMANUEL661 FASUBA ABOSEDE, VICTORIA662 AMINU OLASUNKANMI, SMAILA663 ILESANMI EZEKIEL, BABALOLA664 OGUH CHUKWU, EMEKA665 ONUORAH SAMUEL, IFEANYI666 ADETUNJI AYOOLA, CAROLINE667 NWANKWO BENETH,668 OGUNGBE OLUFEMI,669 OKPARA PETER, IFEANYI670 I-ONE E-PORTFOLIO A/C - 064671 OLAYEMI EBENEZER, ADEWUNMI672 ODEKUNLE TUNDE, SAIDI673 ONYEMAIZU NGOZI, NNEAMAKA674 BETTER DAYS SCHOOL675 MENSAH SIMON, PETER676 OLAYIWOLA TEMITOPE, HAFSAT677 OMOMOYESAN IDOWU,
OLUWADAMILARE678 AGOSU ADEWALE, MAUTIN679 OGUNNOWO JULIUS, OLAIWOLA680 JOHNSON YEWANDE,681 BANJOKO ADEREMI,682 ETU NKOYO, OKON683 ODUGA HAKEEM, ARIYO684 AKANNI OLUWANITEMI, AMOS685 AKANNI OLUWADUROTIMI, WILSON686 TAYO HEZEKIAH, RASIDI687 MELODI OLAMITIMBO, GABRIEL688 ALIONWU GEORGE, E.689 YASHIM JACOB, JOHN690 ORBIH OLERE, OLIVIA691 OLADIPO OLAYEMI,692 IHENACHO CHIOMA, BDIGDET NGOZI
BLESSING693 OLAGOROYE OKE-IGBALAYE,694 MODIBBO AMINA, YUSUF695 MODIBBO AISHA, YUSUF696 MODIBBO ABDULRAHMAN, YUSUF697 AROGBO MOFIYINFOLUWA, B.698 MODIBBO AHMAD, YUSUF
699 STEVE-OLEKA OGECHI, GRACE700 GOSHENITE BUSINESS, CONCEPT701 BOLARINWA ABIOLA, ABOSEDE702 JODA OLUWAKEMI, AFOLAKE703 FATOBI IFEOLUWA,704 EMEZINA CHELSY, EKWUTOSI705 LAWAL BADIRAT, OLUKEMI706 LAWAL MUBARAK, OPEYEMI MAYOWA707 BOLARINWA ATINUKE, HABIBAT708 ADESHINA KAYODE, ABIODUN709 AJEIGBE OLUSEGUN, SAMUEL710 SENA AGBIDYE, ABRAHAM711 OBASI GIBSON, OKEZIE712 SALAMI KHAIRAT, OLUWATOFUNMI
TOYIN713 AINA OLUSHOLA, REUBEN714 JINADU LAMIDI, OLANIRAN715 AYAYEIBO ERIC, EBIKAPADE716 OKEREMI DAVID, KEHINDE717 OKEREMI ENOCH, TAIWO718 OKEREMI FAITH, IDOWU719 AROBIEKE OLUWOLE, O.720 OGUNTUYI OLUSEGUN, BAMIDELE721 EZECHUKWU UGOCHUKWU, RAPHAEL722 OKPUBIGHO MERCY,723 ERINLE KEHINDE, OLUGBEMILEKE724 OLAREWAJU DAMILOLA, OLAWANDE725 ENE EDWIN, JAMES726 SALAKO ADEDEJI, SULAIMAN727 AZUBUIKE KAMSI, JESSICA728 OBIDIKE KEN-PAUL,729 OLISEDU MONICA, NONYELUM730 UGEH PATRICK, IFEANYICHUKWU731 OLAPADE OLAOPA, EMIOLA
OLUWABUNMI732 DADA MOYOSORE, MAYOMIKUN733 YUSUF MADUGU, HARUNA734 NNAMDI CHARLES, OKORO735 UKANDU CHIMAOBI, ERNEST736 UKANDU VIVIAN, CHINYERE737 UKANDU CHIEMELA, LILIAN738 UKANDU IJEOMA, BLESSING739 UKANDU KELECHI, KEVIN740 YAHUDA LINK LIMITED741 ONODEKU BENEDICTA, ONORIODE742 UKWESA MERCY,743 OKPALO CHRISTIAN, NNAEMEKA744 ORJINTA UDOCHI, HYACINTH745 OMOLE OREKA,746 OSHIOKE BENEDICT,747 ADEKOYA OLUSEGUN, MICHAEL748 OJO OLUWAJIMISOLA, ISABELLE749 AJIBADE OLUWASEGUN,750 EKE-OKORO ISAAC,751 OKONKWO MARGARET, CHINWE
3 3.8 UNCLAIMED DIVIDENDOTHER NATIONAL DISCLOSURE
3
ANNUAL REPORT 2020 - AXA MANSARD | 205
752 SOGBESAN OLUWAKEMI, ABIMBOLA753 MURRAY-BRUCE LOUISE, ANTOINETTE754 MURRAY-BRUCE MICHELLE, LINDA755 MURRAY-BRUCE ANDREW, NATHANIEL756 GOLDEN LINKS VENTURES757 NWOGBO CHIJIOKE, IFEANYI758 OYEWALE SAHEED,759 EPHRAIM ANIEFIOK, DANIEL760 AZUMA KATE,761 OKECHUKWU IFEANYI, CHRISTIAN762 OKAKA MIKE, MBANEFO CHIEDU763 EZEIBEKWE KENNETH, ELOCHUKWU764 OKAFOR RUTH, ESOHE765 TOBUN ADEPELEWURAOLA,
ADEDOYIN VICTORIA766 I-ONE E-PORTFOLIO A/C - 006767 WABARA KINGSLEY, WABARA768 AWEDA ADESHINA, HAKEEM769 NZERIBE GERALDINE, UCHECHUKWU770 OLALEYE KOLAPO,771 YELLOWE TARIBO, SOGBEYE772 ADEGBITE OLUWASEYI, ADENIKE773 AKINSANYA REBECCA, TOYIN774 UMANAH IDARAIVANA, T.775 UMANAH ARNOLD, EDIDIONG T.776 DUROJAIYE OLUKEMI, OLABISI777 UDOH INEMESIT, BRIAN E778 EKPO STEPHEN, ELIZABETH779 TOLUHI OLUWAFEMI, MICHAEL780 AMEOBI OLUWADAMILOLA,781 OLOYEDE BENSON, OLALERE782 OLAOPA OLADAPO, OLUSEUN783 CHIKELU UGOADA, IFEYINWA784 AYANDEJI ABASS, DAVID785 ONAJIDE OLASUPO, SAMUEL786 OLADEJO DUROSINMI, LUKMAN787 ABIODUN ROTIMI, TAIWO788 BAMGBOYE GBOYEGA, AJANI789 ADARE AYOKUNLE, BERNARD790 LASAKI OLUWASEYI,791 OWOLABI ADEYEMI,792 AJEIGBE JOHN, BABATUNDE793 ADEWUNMI RICHARD, GBADEBO794 GARA NABIL, DAVID795 OKEGBOLA SULAIMON, OKEDOKUN796 OKORIE LAZARUS, UZODINMA797 ODUNAIYA OMOYOSOLA,798 FAROUN JOSHUA, OLUWASEGUN799 OSEGHE ERIC,800 AZEEZ MURHITADOL, OLAKUNLE801 ONAFUWA (PASTOR), SOLOMON A.
OLUGBENGA802 MOLADE DAN, OLUWAFEMI CHOSEN803 UNUBUN ALEXANDER, OMOEGBE
804 BAYAGBONA SUSAN, OSARUGUE EKOIGIAWUE
805 JIBURU EZINNE, MMASINACHI806 OYAKHILOMEN OKOSUN,807 ONYEKWERE CHIAMAKA,
OGOCHUKWU808 PEDRO DICKBA,809 ONYIKE LIVINUS, ONYEBUCHI810 ANISON SESSI, IKECHUKWU811 FAWALE ADENIYI,812 ONWUKA LAZARUS, NNADOZIE813 UZOESI DANIEL, IFEANYI814 KAYODE SUNDAY, GBADEGESIN815 ORMANE UYOR, LILY816 UKANDU JULIANA OZICHI817 APABIRI OLUWAPEMI, BEATRICE818 ONOKWAI HELEN,819 ODUSOTE OLUWOLE, ADEDOTUN820 RAJI ADEEBOWALE, IBRAHIM821 NNAEBUE CHIBUZOR,822 KALU JAMES, UWAGWU EZERA823 ONONOGBU NGOZI, PATIENCE824 OKEREKE AUGUSTINE,825 PAM DAVOU, DAVID826 OLAGUNJU ADERONKE, LOIS827 JEGEDE OLANIYI, AYODEJI828 OKEKE BASIL, ONYEACHONAM829 TAIWO FELIX, BABATUNDE830 OMIN ELIEZER, ETA831 UMEUGOJI CHINYERE, B832 ONWE IFEANYICHUKWU,833 OLABODE OLUSOLA,834 ABUI DAUDA,835 OLUWADARE EMMANUEL, OLADIMEJI836 EKEGHE OGBONNAYA, NDUKA837 OJURAYO KHAFAYAT, OLUREMI838 AKINBOYO IFEOLUWADOTUN, PETER839 AKINBOYO FOLUKE, TUMININU840 AKINBOYO FUNMILOLA,841 DADA AYODEJI, OLUGBENGA842 JIBRO VICTOR, ABRAK843 OLUYEMI OLUFUNMILAYO,
TEJUMOLUWA844 EJIOGU AUGUSTINE, & NKECHI G (MR
& MRS)845 ADENODI ISRAEL, OLU846 JEJELOYE OLUBUKOLA,847 NWANKWO OGBONNAYA,848 OLUYEDE OLUGBENGA,849 JOHNSON OGORCHUKWU, OBI850 JULI-CHES INVESTMENT LIMITED -851 ONI OLANREWAJU, DEBORAH852 IRAOYAH BENJAMIN,853 OSAGEDE OKWUDILI, JULIUS854 EZUTAH LEKWA, NNENNAYA IGBO
855 ONI OLUWAYOMI, KOLAWOLE856 AROLE OLUWATOBILOBA, TAOFIKAT857 THOMAS AYORINDE,858 OMONI ABOSEDE, ENIOLA859 ADEYEMI JOHNSON, GBOYEGA860 JACOB TUNDE, OSHIBOWALE861 OSADARE PHILIP, EKUNDAYO862 EGBUCHE AMAKA, MAUREEN863 EJIOFOR EDMUND, GRACE [MR &
MRS]864 OKPARA ONYEKWERE,865 AGBEBIYI ADEYINKA,866 JEGEDE OLORUNFEMI, IFEANYI867 OGU PASCHAL, NWABUEZE868 AGHEDO DESMOND, ESEOSA869 OYEGUNLE OLANIYI, OLALERE870 ABODERIN GBOYEGA,871 AKINBOYO IBUKUNOLUWA,
CHRISTINE872 ETELA OWANATE, ASHFORD873 IBITOYE FLORENCE, OLUWATOYIN874 GBOLABO AKINTUNDE, OLUSOLA875 UGAH SOLOMON, ADEGBE876 ADEBUSUYI TOLULOPE, ABIOLA877 GOBTECH INVESTMENT LTD878 AKANDE MUKTAR, OPEYEMI879 OMERAH ROSELINE, OLAYEMI880 GLOBAL ASSET MGT. LTD-TRADED-
STOCK-A/C881 EMMANUEL ADELEKE, SOLOMON882 BISHI ONIBIYO, ESTHER883 EMAH PETER, BASSEY884 ODUOLA ADEMOLA, ABIDEMI885 BAKUT GABRIEL, KARAM886 ATTAH ENEYE, DANIEL887 AZEEZ AMIDU, BABATUNDE888 HASSAN OLAYEMI, & OLARONKE MR
& MRS889 OSUNSANYA OLUDOTUN, TIMOTHY
AKANNI890 ONIWINDE ADEBOYE, TAIWO
(ALLEGED DECEASED)891 NWEKE JUDE, OBIORA892 BOLARINWA JACOB, AYODEJI893 ADEHUWA JOY, BOSE894 OSETOBA OLUSOLA, AYODELE895 OBI IFEYINWA, JOSEPHINE896 AJAYI AMAKA, LOVINA897 ADIGUN SAKIRU, ADELEKE898 MATTHEW DANJUMA, TSADO899 EYENOWO NTAKIME, EZEKIEL900 OZILLY MARTINS, OLUME901 WITTE SOBARI, HENRY902 OKPALA VALENTINE, UCHE903 ADEDIRAN OLUBUNMI, OMOLARA904 ISAAC FIBERESIMARI, EDWARD
OTHER NATIONAL DISCLOSURE3.8 UNCLAIMED DIVIDEND

206 | ANNUAL REPORT 2020 - AXA MANSARD
905 MUSA MOMOH, SANI906 NNANTA JESSICA, C.907 BANJOKO ABIMBOLA, MARTINS908 OKEOWO MUFUTAU,909 AILERU HALIMOT, OLUBUNMI910 CHIEKEZI ANGELA, ONYINYE911 OPADARE OLUWASEUN, BENSON912 XSPETRA NIGERIA LTD913 OYEKUNLE OYEDELE, EMMANUEL914 EZENWEANI ANGELA, NKECHI915 SANWO CHARLES, ADEKUNLE916 GOLDUST INVESTMENT LIMITED917 OKENWA EBUKA, SAMUEL918 EKEGHE OGBONNAYA, NDUKA AND
EUNICE O919 AKINDELE SALAMI, BABATUNDE920 OWOLABI ALBERT OLURINOLA921 FABSON EYITOPE, ELIZABETH922 CHUKWUDILE OLABISI, O ADAEZE923 AJAYI ADEBOLA, OLATOKUNBO924 NGENE IJEOMA, CHARITY925 COKER MICHIAH, OLUDAYO926 YINUSA AMUDA, YUSUF927 BYRON ABIMBOLA,928 ERUVBETINE OBOR, ENAEME929 ODUNAIYA ADEBOLU, TAIWO930 LAWAL MOHAMMAD, MASANAWA931 ABASI HELPME, SORBO932 UDOH FRIDAY, ETIM933 AKUBUE BENEDICTH, NGANWUCHU934 NUMEK ENGINEERING LTD935 ADENIFUJA KAFAYAT.A.OLANREWAJU,936 ALASA BAWA,937 OGWURUMBA AUGUSTINE,938 CHINYE HELEN,939 NWOSU CHRISTIAN,940 MOHAMMED KABIR, ALIYU941 TRINITY SONGS OF JOY LIMITED942 JOHN AKINOLA, FEMI943 ODETORO ROFIKAT,
ADEBUKONLA(NEE AINA)944 OLADIPUPO KING, ADEFEMI945 OGBECHIE NNEKA, CHUKWUWETE946 ALABEDE GANIAT, ADEDOYIN947 BELLO HASSAN, ADESOLA948 ILODUBA NONSO, GERALD949 ADENIYI ISIRAT, MOJISOLA950 ILEOGBEN CHARLES, IMEVBORE951 MBAHOTU BARTHOLOME,952 OZOYA IZEGAEGBE, & OLUWAFUNKE953 ALIMI NURUDEEN, ADISA954 OKECHUKWU ARINZE, BENEDICT955 LAWAL OLAYINKA, AKINNIRAN956 SHOKOYA YINUS, ADEKUNLE957 BATULA ALHAJI, BOONYAMIN ADISA
958 ABOLUWOYE AKINWANDE, EBENEZER959 IKPONG SEBASTIAN, UKO960 LATINWO ADEMOLA,961 EGWU FELICIA,962 AKOMOLEHIN FRANCIS, OLUGBENGA963 HABEEB SHAKIRU, ALOWONLE O964 IGE GABRIEL, OLORUNSOGO965 ONIWINDE ADEBOYE, TAIWO
(ALLEGED DECEASED)966 AKINDURO LISA,967 SOETAN A.OLUWOLE,, EST
OLUGBEMIGA & ORS(A968 SADIQ BABATUNDE, OLAOYE969 BASHIRU RASAK, MATTHEW970 OGBEMUDIA ALFRED, OGHOGHO971 OBI CHITOM, CLARE972 OKEKE JUDE, MADUABUCHI973 NWAKA WILSON, AFAMEFUNA974 JAGUNNA MONSURAT., T975 OMOYOSOYE EMMANUEL, DIRAN976 SULAIMON MOHAMMED,977 ODEKOLA KAZEEM, ATANDA978 ONYIA UCHENNA, CHINYERE979 ESAN THEOPHILUS, KOLAWOLE980 ERINFOLAMI OLOLADEBALOGUN,
GAFAR981 ONOGOMUNO JULIET, OGNALE MISS982 ADEYEMI JOSIAH, ADEKUNLE983 ADALEMO SIKIRU, SEGUN984 ARAH NNAMDI, CHUKWUDUBEM985 TOBUN OLUJOKE, FOLAKE986 NATHAN EJIKE, JOSIAH EJERE987 ALAKE-PRATT KEHINDE, TITILOLA988 NWABUIKWU SUNDAY, JOSEPH989 AROWOSEGBE OLUWABAMIGBE,990 EGHO PETER, ISI991 ADEOSUN ADEBUKOLA, OLUWATOSIN992 OLUWATOSIN OLUWAPELUMI,
ADESOLA993 SOJI-OYAWOYE DAMILOLA,994 JIMOH-KUKU ISMAIL, OLANIRAN995 AKINDIPE IDOWU, OMONIYI996 AKINDIPE KEHINDE, OMOWUNMI997 OWOEYE OLAWALE,998 OWOEYE OLAWALE,999 LAMKHADE KAMAL, BHIVSEN
1000 OLAWALE TOLULOPE, ESTHER1001 ADEYEMI ADESEGUN, ADEYOMI1002 OTU ENANG, EYO1003 OKARO NNEKA, UZOAMAKA1004 LAWOYIN LOLADE, ABAYOMI1005 OWOFADEJUIBUKUNOLUWA SAMUEL,1006 OGBODO IFEANYICHUKWU, MBA1007 ADEJUMO GOODNESS,
AYANFEOLUWA1008 OYEDAPO ADESOJI, MOSES
1009 TIMOTHY JOHNSON, OLUFEMI ADEOYE
1010 BAMISAYE MARGARET, OLAJUMOKE1011 JIMOH OLUWATOSIN, HAFIZ1012 ANIZOR CHIJIOKE, FRANCIS1013 GARBA KOKHAT, AARON1014 EZEIFE NKEIRU,1015 AWANG MARKUS, JOHN1016 ETOPAUL ITIOLA, NIHINLOLAMIWA1017 OLADEPO AKINTAYO,1018 OKEKE NJERITA, OGADIMMA1019 UGWUEKE OYINYE-CHI, MARY1020 AHUCHE CHIDINMA, CHRISTIANA1021 SHEM-KEZIA INVESTMENT, LTD1022 OJO TEMITOPE, SARAH1023 JIMOH RISIKAT, ADEBUKOLA1024 MEDOR PATIENCE, OBIAGHELI1025 OKOLI JOVITA, FRANK EMEKA1026 OKEKE CHINENYE, ADAKU1027 UKAH DORIS, IJEOMA1028 ABIODUN ADEDOYIN,1029 ACHAKOBE GENEVIEVE, ALICE
ANDREE1030 ODEKUNLE JESUJUWON,
OLUWASEGUN1031 ODEKUNLE ANUOLUWAPO,
CORNELIUS1032 OZIOMACHUKWU OKOLI,1033 ADEPOJU OLUTOYIN, SAMUEL1034 ODUOLA SAMSON, OLUWASEGUN1035 SALAKO ABIGAIL, OLUFUNMILAYO1036 OLAWOYE ADESHIBOKAN, IYABO1037 AGWUNOBI ANWULI, ISIOMA1038 OLUREMI CHARLES, OLUGBENGA1039 IFIDON IRIA,1040 OKOH CHUKWUDI, JOSEPH1041 ADENUGA PRECIOUS, ADEDAMOLA1042 OKOYE LAWRENCE, SUNDAY1043 OGINNI TAIWO, OLAKUNLE1044 ALUKO BOLUWATIFE,1045 MGBACHI LIVINUS, CHIBUZO1046 AJIBADE ADEBAYO, AIDEN1047 EKPO MICHAEL, EFFIOK1048 ODORO JOY, FRANCIS1049 ADEKOLA DANIEL, OREOLUWA1050 OLA-LAWAL OLANREWAJU,
NAZIRUDEEN1051 AKINBOYE KAYODE, BABATUNDE1052 SOWANDE MOJEED, ADISA1053 OYENIYI OLUWATOBI, OLAOLU1054 AKINWANDE OLUWAKEMI, ARINOLA1055 ARIKAIBE NNAMDI, HERBERT1056 HEADMAN INIE, FELIX1057 ENOBAHARE AUGUSTINE,
OSAYOMWANBO1058 ORJI CHUKWUDI,
3 3.8 UNCLAIMED DIVIDENDOTHER NATIONAL DISCLOSURE

3
ANNUAL REPORT 2020 - AXA MANSARD | 207
1059 GBADEBO-SODIMU FOLASADE, CHRISTIANA
1060 ADEDUGBE YETUNDE, ABIMBOLA1061 NWEZE GODSPOWER, IKECHUKWU1062 FAROTIMI FISAYO, ESTHER1063 AKINYINKA AKINWALE,1064 OLOMOLAIYE EBENEZER,
OBAMAYOWA1065 TELUWO ADETUTU, OLUWATOYIN1066 SHITU MOHAMMED, USMAN1067 EGBU VICTOR,1068 MALOMO FLORENCE, IDOWU
FOLASHADE1069 OMOTOSO GABRIEL, OLUTUNDE1070 OLAOSEBIKAN OLA-OLUWA, AJIBOLA1071 OGUNWUSI ADEDAPO, KOLAWOLE1072 ONOKPITE GODSPOWER,
OGHENEVBOGAGA1073 OFOMATA VINCENT, ONWURAH1074 OBOT OTOBONG, MFON1075 ADESHIPE KOLAWOLE, OLUFEMI1076 EBIEKPI ETIENE, PEARL1077 AJANYA UTENWOJO,1078 ALABI CHRISTABELLE,
OLUWADARASIMI1079 ALABI BENEDICT, OLUWADUNMININU1080 OLALEYE OLUWADARASINMI, ESTHER1081 IKPEKAOGU CHIEMELA, NINETTA1082 OMOLAKIN LEO, K.1083 AKI DAVID, EFEOGHENE1084 AKI JESSICA, EWOMAZIMO1085 FASAKIN BENSON, AKINTOLA1086 BABALOLA OLAMIDE, AKANBI1087 NJOKANMA CHIGBAMUME,
KENECHUKWU1088 TAIWO M., ADEKUNLE1089 MOTOLATOB NIG. LIMITED1090 LEWIS OLUWANINSOLA, MARTINA1091 STEVE-OLEKA OKECHUKWU,1092 SORINOLA MUSBAU, GBOLAHAN1093 IDAHOSA ELLIS, ORHUE1094 IDIAHOSA FOXY, IGIOGBE1095 OSEKWE VIVIAN, IFELUNWA1096 OBIDIEGWU OGECHUKWU,
FRANCISCA1097 DEINDE CHINENYE, MIRIAN1098 AKPELI EBIKE-OLAA,1099 OBADIARU SHEM, OSAWEMWENZE1100 NNAEBUE ANTONIA,1101 SHITTU ZUMU-NGAIH,1102 CHUKWU OBINNA, LUCIAN1103 KARIBI BRIGGS, PRISCA1104 OTOROWO DOUYE, MR1105 TOBUN ADEPELEWURAOLA,
ADEDOYIN V1106 SAANEE PATRICIA, NWAM
1107 OWUAMANAM JUDE, CHINOYE1108 ABOLO TONY,1109 AKINTOLA SOLOMON, BABATUNDE1110 KUPOLUYI SALEWA, VICTORIA1111 BUSARI SILEOLA, JOSEPHINE1112 ANYIAM SAMUEL, NNAMDI1113 EHILAWA KINGSLEY,1114 OLAONIPEKUN SAHEED, ADELANI1115 RUFAI RILWAN, KAYODE MR1116 MADUEKWE ONYEKACHI, VIRGINIA1117 LALA SAMUEL, ADEDIMEJI1118 ANIMASHAUN KAFILAT, FOLAKE1119 YAKUBU ALI,1120 OFFORNEJELU PATRICK, AMAELO1121 MONINA MATHIAS, AKPOVETA1122 ADENIREGUN ABIOLA, ATINUKE1123 OGEDEGBE ESEOGHENE, FIONA1124 AWOLUMATE SAMUEL, EHINMIDUN1125 IFEANAEME FRANCIS,1126 OJIEKHUDU ANDY, IMOBHIO1127 WILLIAMS EMMANUEL,1128 OTEPOLA TOLULOPE, DAMILOLA1129 SANYAOLU OLABODE, SUNDAY1130 ODIGIE OSBORNE, OSEREME1131 SALAMI BIOLA, TITILOPE1132 TOKODE OLUBUKAYO,1133 ADETILOYE KOYEJO, OLUYINKA1134 NOSIRU FEMI, MOSHOOD1135 UMEWUZIE JONATHAN, EKECHUKWU1136 ADEBAYO OLABODE, TUNDE1137 UBAH ANTHONY, OKECHUKWU1138 UDO NSIKAN, GEORGE1139 ALLI AKINOLA, SIKIRU1140 ADEBARI OLADIPUPO, ABDULKABIR1141 OGUNJI OLUFISAYO, OLUSOLA1142 SOBODU ADEKUNLE, ADEDEJI1143 OBI MICHAEL,1144 EZEIGBO STELLA, ADAMA1145 OGOGO JONATHAN, CHINEDU1146 AKPELI NINA,1147 OJOH CHRISTIAN, NWAOFEH1148 IDOWU JACOB, OLAYIWOLA1149 ADERIBIGBE WASIAT,1150 OKUDO THERESA, UCHENNA1151 ALARIMA P, OLUWAPEMISIRE1152 YINUSA RIDWAN, ADESHINA1153 ADEWUMI ADEOLA, OLUWASEUN1154 FAMAKINWA TAYO, ZACHARIAH1155 OMOREGIE GREG,1156 ADEBOYE OLUWOLE, MOSES1157 OLUWADAISI ADENIYI, MUYIWA1158 AJAYI AJIBOLA, OLUFUNSO1159 NDAJI GODFREY, IHEANYI CHUKWU1160 ONIWINDE OLUYINKA,1161 ADESIYAN AMOS, OLUFEMI
1162 ADEBAMBO OLUWABUKOLA, ALICE1163 AKINSIKU SALIU, AJISAFE1164 LATEEF RIDWAN, ADEGOKE1165 IHEGWORO KATE, NNENA1166 MATTHEW SOKOWONCIN, JOSEPH1167 GEORGE FAUSAT, MOSUNMOLA1168 OTOBO MELVIN, CHOJI ABIYE1169 ADESUNBO RAMON, ADEWALE1170 NWEJE ESTHER, EZINNE1171 OKPERE IFEANYI, CHUKWU1172 OLATUNJI MATTHEW, OLAJIDE1173 MONDAY CHINENYE, KELECHI1174 BAIYEWU AYO, OLA OLAYINKA1175 ASIBOR ROBERT, ENAHOLO1176 BEYIOKU SURAJDEEN, OLALEKAN1177 JOHNSON OLUWASEUN,1178 JOHNSON OLUWAFEMI,1179 AYEKOMILOGBON OLUWAYOMI,1180 ONAYEMI OLUSEGUN,
OLUFOLARANMI1181 ADESANYA SHAMSIDIN, OSARETIN1182 YUSUF BALLA-JOSE,1183 ABOLAJI YEMI, EMMANUEL1184 OLADIMEJI AKINOLA,1185 DICKSON REUBEN,1186 OLADIPO OLUSEYI, EKUNDAYO1187 IBOK FAITH, OKON1188 OKEBIODUN OLAOLUWA, EZEKIEL1189 AKPAN PETER, IWOK1190 SHOBOWALE BENSON, ABOSEDE
OMOWUNMI1191 OYELAYO EYITAYO, OYEYEMI1192 ADEWALE ADEGOKE, ADEKUNTE1193 ABIODUN TOMILOLA, LANKE1194 KINGSLEY ALOAYE, OGIRRI1195 FOLORUNSO OLUWAFOLAKEMI,1196 YUSUFF KEHINDE, OLAYINKA1197 GARBA SORONDINKI, NURADDEN1198 IHEGBU CHIDIEBERE, MACLAWRENCE1199 OTOWORO W, VANESSA1200 FAVOUR OLUWATOSIN, CHARLES
JOSEPH1201 AGORO AFOLABI,1202 ADEKANMBI ADERONKE,1203 OSHADARE OLUSHEYI, ADEOLA1204 IGBASANMI JOHN, OLATOMIDE1205 AROGUNDADE OLAMIDE, ALBERT1206 SANUSI ADO,1207 ODUWOLE OLADAYO,1208 AWOKOYA TEMITAYO, OLUWAROTIMI1209 OJO ADEMOLA, ABIODUN1210 LEMON BARIKUMA, KADILOBARI1211 IGHODALO MARK, OSAWENHENZE1212 EGBROKO SIMEON, OROMUNO1213 ORJI OGOCHUKWU, NNAMDI
OTHER NATIONAL DISCLOSURE3.8 UNCLAIMED DIVIDEND

208 | ANNUAL REPORT 2020 - AXA MANSARD
1214 AKWUKWAEGBU MARK, UDOHMBA1215 ARASE KINGSLEY, EDENABOYEN1216 ADETONA ADEMUYIWA, OLADIPUPO1217 GANIYU KAZEEM, KUNLE1218 MUSA MOHAMMED, BISHIR1219 EZENDIOKWERE BENJAMIN,1220 OKEKE CHISOM, ODIDIKA1221 NDUKWE GODWIN, CHIBUEZE1222 AKINPELU OKE, BABAJIDE1223 AFFIAH GLADYS, EMEM1224 OJUKOTOLA RAHAMON, OLUWOLE1225 ASEIMO REX, EBIKENA1226 ODUNTAN ADEOLA, OLUSOLA1227 EWURUM IKENNA, CHUKWUNENYE1228 MOT OLAYIWOLA, TOBUN1229 JAJI BABATUNDE, RAHMAN1230 OKOYE CHUKWUNENYE, KANAYO1231 TAYLOR TAIWO, JENNIFER1232 JUWE HELEN, INEH1233 ENEANYA HENRY, IZUCHUKWU1234 MATULUKO REBECCA, OPEYEMI1235 APARA OMOLAYO, BOLARINWA1236 DENNIS RAYMOND,1237 OTOWORO VENISSA,1238 OTOWORO WINNIEFRED,1239 AKPAN PRAISE, ITORO1240 AJIBADE ADEMIDE, ALEXANDER1241 IWAJOMO OLUSEGUN, OMOTAYO1242 EZIGBO CHIKE, KENNEDY1243 HAUWA TITI, MUSA1244 ABIDOYE MICHAEL, AKINTOLA1245 YAKUBU SHERIFF,1246 IJABADENIYI OLUWATOSIN,1247 BALOGUN MABEL, OLUWASANMI1248 OGUNNOWO SUNDAY, OLUTAYO1249 ADEWOLE HAMEED, ADEBOLA1250 BABAJI SHARIF, ABDULLAHI1251 DEDICATED SHAREHOLDERS ASS OF
NIG1252 SANYA ESTHER, IFEOLUWAKITAN1253 AMAMBA JANET, EMGBAM1254 BOLARINWA JACOB, AYODEJI1255 EKWENU ALOYSIUS, CHUKWUMA1256 OLOKOR MARTHA, ANAMALECHI1257 OLOKOR OROGHENE, SAMUEL
GODSOWN1258 ONYEBIGWA OGORCHUKWU, FRED
JNR1259 ONYEBIGWA IKECHUKWU, WILLIAMS1260 AKPELI SOLOMON,1261 THE ANJI COMPANY LIMITED1262 IDEH PATIENCE, JEDET1263 OKORONKWO STEPHEN, MBA1264 OBA NWAKAEGO, AGATHA1265 ADIO OLAOLUWA, SIMEON
1266 TRANSUNION SECURITIES & INVEST. COM LTD
1267 EFUNKOYA ADEKUNLE,1268 ONWUEGBULE SYLVESTER,
IBEAWUCHI1269 DUROJAIYE ANTHONIA, OLAIDE1270 OLAJIDE MICHAEL, OLUKAYODE1271 AKINYEMI GABRIEL, ADESHOKAN1272 DAFE NKIRU, PAT CHIEF MRS1273 ARIZECHI MICHAEL,1274 BALOGUN MOTADENI, ABIMBOLA1275 OLUFEMI EBUNOLUWA,1276 ONUIGBO CHIDINMA-HENRY,1277 ANIMASHAUN ADESHOLA, SAMSON1278 FATONA ADEYINKA, AUGUSTINE1279 ADEGUNWA SAMUEL, OLAJIDE1280 ADEYEMI MOFOLUWASO,1281 OYEWO OMOTAYO, OYELEYE1282 BLAMOH STEPHEN, ADEWALE1283 AFOLABI FUNMILAYO, ATINUKE1284 NNADOZIE CHIDI, AFAMEFUNA1285 QUADRI LUKMAN, AMOO1286 OWOLABI NURUDEEN, ADEKUNLE1287 DUROSIMI MORIAM, TOLANI(ALHAJA)1288 ODUNSI TOLULOPE, JOSHUA1289 JIBRO VICTOR, ABRAK1290 OSABUOHIEN KINGSLEY, OSARODION1291 BAMIGBOYE OLUWADARE,
OLAYIWOLA1292 AYODELE EREDOLA, OLUBUNMI1293 OLAYEYE RAOLAT, TOLANI1294 PITAN ABOSEDE, ABIODUN1295 BAKARE ADEBISI, OLUWAYEMISI1296 ADEYEMO OYINADE, MOROLAYO1297 BAMISILE ADE, OJO1298 LAWAL ADEYEMI, OLUGBENGA1299 SOSANWO KOLAWOLE,1300 SOWEMIMO DEMOLA, JIMOH1301 ODEYEMI ABIMBOLA, TOLULOPE1302 BELLO OLATUNJI,1303 FADUNMOYE OYE,1304 SEBUTU OLUREMI,1305 JATAU ISA,1306 IBRAHIM RABI, ATU1307 ADEOTI COMFORT, OLUWAKEMI1308 OHWOVORIOLE AKPIFO, ONOME1309 ASAKE ODUNAYO, OLUFEMI1310 EDU OMAMOFE, EYINMISAN1311 JOSEPH IFEOLUWA, SAMUEL1312 OGUJIUBA OKECHUKWU, MICHEAL1313 ASHAJU BABATOPE, JULIUS1314 OMOH CLEMENT,1315 OGUNDIYAN OLATUNJI, OLUWATOSIN1316 LIJOFI RACHEAL, DAMILOLA1317 EGBOWOROMO BENJAMIN,
EYITOKUNBO
1318 ENWEZOR ROSE, NDIBULUM EGBUNIKE MRS
1319 ADEYEMI KAYODE,1320 AMOSU MARTINA,1321 AMOSU OLUWABUSAYO, SHILOH1322 AMOSU IBUKUNOLUWA, ZION1323 AMOSU EBUNOLUWA, TRINITY1324 OLUSEYI &, MARTINA AMOSU1325 OLORUNTOBA ADESOYE, ADEOLU1326 ADEGOKE SAMSON, OLUTAYO1327 IZUAKOR KINGSLEY, NNAMDI1328 ALABI ABIGAEL, BOLAJOKO1329 AJAYI OLADUNNI, OLAPEJU1330 EKPEKI OMOWHARE, WILLIAM1331 ORORHO DAVID, ERUEMESIRI1332 ADEDIRAN ADENIYI, ADESOJI1333 BABALOLA ESTHER, OLUWATOYIN1334 LAWAL OLUWASEUN, ADESINA1335 FASUNHAN BUKOLA, MARGARET1336 CHUKWU EUCHARIA, NWAKAEGO1337 AKINOLA FUNMILAYO, CATHERINE1338 JOHN CHIMAOBI, ANTHONY1339 ONAH THOMAS, AWUGO1340 EZILEANYI INNOCENT, CHIWETALU1341 OSOTA OBAFUNMILAYO, OLABOYE1342 ESEZOBOR OHIS,1343 J.A. DINA INVESTMENTS LIMITED1344 RAJI OLADAPO, TAOUFIQUE1345 DELANO OREOLUWA,1346 OLABANJI MICHEAL, ARIYO1347 OGUNLANA MUSIBAU, OLULAJA1348 ADENIJI IYINOLUWA, OLOHIJE
ESTHER1349 AYANKAYODE OBALALARO,1350 ASUQUO DANIEL, UDOM1351 BELLO MUILI, MORAKINYO1352 TAIWO OLUWASEUN, KOLAWOLE1353 BANWO ADERONKE,1354 BANWO IBUKUN,1355 ANYANWU CHIOMA, CHRISTIANA1356 ANENE ONYENWE, EMMANUEL S1357 FIRST CROWN, CONSULTING1358 GBADAMOSI AHMMED, AKANDE1359 LAWAL BABATUNDE, ISIAKA1360 AWOKOYA TEMITAYO, OLUWAROTIMI1361 OMONIYI KIKEYEMI, ELIZABET1362 SHOPEJU EFUNREMI, ADETUTU1363 PAM SIMI, SARAH1364 FAGBAYI RILWAN, OLARIBIGBE
TEMITOPE1365 TOPMOST FIN.& INV. LTD.TRADED-
STOCK-A/C1366 ADEOLA GBENGA,1367 ASOGWA JOHN, OKWUDILI1368 AKPAN NYONG,1369 DOSUMU MUYIDEEN, OLASUNKANMI
3 3.8 UNCLAIMED DIVIDENDOTHER NATIONAL DISCLOSURE

3
ANNUAL REPORT 2020 - AXA MANSARD | 209
1370 OGBU EMMANUEL,1371 EGWUATU NGOZI, MARYROSE1372 OTEGBADE DAVID, OLAMIDE1373 FALETI AYOMIDE, ADESANYA1374 OSOBUKOLA FOLORUNSO, OMONIYI1375 MUSTAPHA ADEWUNMI,1376 SHOLLYVEN COMMUNICATIONS1377 AZEEZ AMINAT, OLUREMI1378 OLADOKUN HEPHZIBAH,
OMONIBUNKUN1379 AKPELI EBIKETON,1380 ADENOLA BAMIDELE, ABAYOMI1381 AKINYEMI ASHRAF, ADEMOLA ALH1382 OLAFISOYE-ORAGBADE TOLULOPE,
JOHN A.1383 OLAFISOYE-ORAGBADE OLUWATOSIN,
DAVID1384 OLAFISOYE-ORAGBADE OLUWATOBI,
SMITH1385 SOSANYA VICTOR, OLUSEGUN1386 OLAYINKA &, ABIMBOLA OLAJIDE1387 SOBANDE OLAJIDE, ODUNAYO1388 AYO-VAUGHAN DANIEL,1389 AD-MAT INVESTMENT CO LTD1390 ADEJARE ADESANMI, ADEDAMOLA1391 KOTUN AZEEZAT, MOYOSOLA1392 AROGUNDADE FESTUS, OLUFEMI1393 OPARA CLEMENT, ANAELE CHUKWUDI1394 ADEWUMI MICHAEL, ADEMOLA1395 AISHIDA OLADELE, SIJUOLA1396 SULAIMAN AKEEM, ADISA1397 SALAMI MAMMAN, JIMOH1398 EMON STEVE-MARIO,1399 BASSEY MFON,1400 ANYANWU FORTUNE, CHIGOZIE1401 DIKEOGU RICHARD, UKACHUKWU1402 BENJAMIN-ADE ENIOLA, JOSEPH1403 HESKY SOLAR SERVICES1404 UTHMAN OLUFUNMI, M.1405 ELEZUA IKENNA,1406 SHOFOLA KAMORUDIN, O.O.1407 KAMORUDEEN AZEEZAT, ABISOLA
AJOKE1408 AKINLUYI MAKINDE,1409 AKINLUYI TOYOLE,1410 AKINLUYI FIKAYO,1411 ADEFOWOKAN TIMOTHY, OLATUNDE1412 AMAYESHOLA ITSEORITSETUMARA,
SAMUELLE1413 AKINADE EZEKIEL, A.1414 AMAYESHOLA GUY, TORITSEJU1415 IDOWU MORAYO, OLABISI (MRS)1416 MUOH FLORENCE, ELIZABETH1417 EYANUKU PETER, ONOBRHIE JOHN1418 ADELEKE ADEBAYO, ADETUNJI1419 AKINOLA OLADUNMIYE,
1420 ADEWUNNU KAZEEM, ODUBOLA1421 BABA KABIRU, IBRAHIM1422 OPAOGUN OMOBOLANLE, IDOWU1423 ALABI OLAKUNLE, WAHAB1424 SHEHU MALLAM, MIKAIL1425 AFOLABI IBRAHIM, ABIMBOLA1426 BALOGUN OLAKUNLE,1427 OKUNADE OLALEKAN, OLAMIDE1428 BANKOLE TAIBAT, OLAITAN1429 NWOKO JOY, AJUMA1430 OLADIMEJI LAIDE, GANIYAT1431 NWEKE VICTOR, NNAMDI1432 OSADIPE JOSEPH, BODUNDE1433 AJAYI OLUDAPO, EMMANUEL1434 FAMUYON YUNUSA, AGBOOLA1435 ODUSOLA GANIYU, ALADE1436 EZE KENNETH, AZUBUIKE1437 BALOGUN MOSHOOD, ISHOLA1438 HASSAN HAKEEM, ADEBAYO1439 AIYEGBUSI ENIOLA, DEBORAH1440 AIYEGBUSI AYOMIDE, AMANDA1441 IMADOJEMU PERKINS, OLUMESE1442 ADAMU ALIU,1443 ADESHINA IMRAN, TAJUDEEN1444 ADELE ABIODUN, IDRIS1445 ADELEKE OLUGBENGA, MOSES1446 MABOREJE FIYINFOLUWA, ADORA1447 SANNI QUADRI, IDOWU1448 OKEKE IKECHUKWU, ERNEST1449 OLUBOBADE ADEOLA, OLAMIDE1450 MADUFORO GOLDEN, CLEMENT1451 ODUNTAN OMOTAYO, MORENIKE1452 GANIU SEFIAT, ABOLORE1453 CHIKELUBA AGWUNA, THOMAS1454 HASSAN OLAMILEKAN, LUKMAN1455 EKPO LARRY,1456 ALIU IBRAHIM, ABIODUN1457 OBOBOR RAPHAEL,1458 ONWUKA LAZARUS, NNADOZIE1459 MAKINDE FOLASHADE, ADETORERA1460 BOLUMOLE OLAYINKA, OWOLABI1461 EGWUATU GLORY, CHINNEDU1462 OKEKE IKECHUKWU, OBIAJULU1463 IGHOREMUSE JOHNSON,
OBORERHIRI1464 OSIKALU LUCIA, FUNMILAYO1465 LAYODE NATHAN, ADETUNJI1466 SOETAN OLUGBEMIGA, OLUMIDE1467 JOODA AYINDE, SURAJU1468 ALLI FATIMOH, IYABO1469 EKE CHIBUZOR, EMMANUEL1470 AWOYINKA BOLAKALE, TITILAYO1471 ONWUZOLUM KENNETH,
KENECHUKWU1472 NWOSU FESTUS, EYIUCHE
1473 DANIEL MAJEKODUNMI,1474 OMOYELE OLUWAMUYIWA,1475 DARAMOLA BABATUNDE,1476 ONI IFEOMA,1477 DIDAM POLYCARP1478 EFEGUOM ORIERO,1479 EGBAI ALFRED,1480 EGERUE ONYEMA,1481 OSAGIE UYI,1482 OSHO-SMITH NJAKA, NWANNEKA1483 EKEOBA CATHERINE,1484 OSSAI ADAKU,1485 OSUNDIRAN TOLUWANIMI,1486 EMMANUEL OCHEME,1487 EREGIE ELFREDA,1488 FEMI ABIMBOLA,1489 TEMILOLUWA OGUNREMI,1490 THOMAS BABAWANDE, SAMUEL1491 TUBI MAKANJUOLA,1492 UCHENNA EBERE-ANYIAM,1493 UGAR ROSELINE,1494 YUSUF OMOSHOLA,1495 RAMESH SUMAN,1496 SAMUEL UDOH,1497 SULE SUNDAY,1498 IZEVBEKHAI ERAGBAI,1499 OGUNLEYE OLANREWAJU,
OLUKAYODE1500 OGUNDOKUN OLUWAFUNMILAYO,1501 OGUNDIPE OYEDOYIN,1502 ODUSOTE ADETOLA,1503 OBBA JUDITH,1504 OBAFEMI OLAWALE,1505 NJOKU GABRIEL,1506 LIYIDE AJIBOLA,1507 OGUNLEYE TEJUMADE,1508 ADENEYE ADEWALE,1509 ADEOLA OLUSHOLA,1510 ADEOLU ADEOSUN,1511 ADETUNJI VICTORIA,1512 ADEUSI ADETUTU,1513 ADEWALE OLUFUNTO,1514 KAYODE ADEDOYIN,1515 ADEWOYE SOPHIA,1516 KAMSON KEHINDE,1517 JOANA IGBEDION,1518 JIDE LAWANI,1519 AGHARESE IGIEBOR,1520 JAJI SANUSI,1521 IYAMU IRENE,1522 AJIBULU ADESEYE,1523 AKINFOLARIN CHRISTIANA,1524 ISIMAH HILLARY,1525 INYANG VICTOR,1526 AKINLABI DOTUN,
OTHER NATIONAL DISCLOSURE3.8 UNCLAIMED DIVIDEND

210 | ANNUAL REPORT 2020 - AXA MANSARD
1527 HASSAN MORENIKE,1528 GEOFFERY ALOZIE,1529 GANZALLO VICTOR,1530 AKPAIBOR BRUNO,1531 AKPETI PEREWARE, STEPHEN1532 AKWARA HENRY,1533 ALAMUTU AYODEJI,1534 ALFRED TABITI,1535 ARIBIYI KEHINDE,1536 OKOCHA ANTHONY,1537 OKUGO IKECHUKWU,1538 ARIORI OLUWAYEMISI, GANIAT1539 OLOLOLA RUFAI,1540 ASAOLU OLUWASEUN, ABIOLA1541 OLU-OTUNIYI OMOLOLA,1542 OLUSOJI OSUNSEDO,1543 AWOYEMI OLUBODE,1544 OLUYEMI OLUFUNKE,1545 BADARU OLUMIDE,1546 CHIBOKA NNAMDI,1547 CHUKWUJINDU IKENNA,1548 WASIU ADEWALE, AZEEZ1549 SERIKI ODUNAYO, ODUNOLA1550 NNANTA MOSES, IHEANACHO1551 SALAMI MUINAT, ABIOLA1552 AJAO ADEFUNSHO, ADEYI1553 OLALEKAN OLUBUNMI, OLURONKE1554 ADEYEMI OLUSEYI, DANIEL1555 KESHINRO CHARLES, OLUFEMI1556 EGBUNIKE UZOMA, & PATRICIA
MR&MRS1557 ALABI SEUN, OLUKEMI1558 RAMONI MUDASIRU, OLAWALE1559 IBE LEO,1560 OKUNLAYA MAROOF, AREMU ROTIMI1561 OGUNDEJI MOSES, AYODELE1562 ONYEMAIKE OKEY, J.1563 ABE MAKANJUOLA, FISAYO1564 ADELEKE OLUWASEGUN, EBENEZER1565 IBIKUNLE ITUNNU,1566 ODURONBI PEACE, ESTHER1567 MGBEMENA IKE, EMMA ROBINSON1568 IBIKUNLE OYERINDE, SIMEON1569 OKOH EDWIN, OKECHUKWU1570 ANI PRECIOUS, OGOCHUKWU1571 OLADOKE SUNDAY, ISAAC1572 JOSEPH ABIMIKU, AGUM1573 ODUNAYO OMOTAYO, ADEBAYO1574 ODUNAYO TEMITOPE, TITILOPE1575 AMAEFULE BENEDICT, ONYEMAUCHE1576 AGBOOLA OLADIPO, BABATUNDE1577 AFINJU TAIWO, ANUOLUWA1578 IMADU ESSANG,1579 OJUOLAPE AFEEZ, OLUWATOYIN1580 OYETUNJI AYOOLA, AKANBI
1581 ONYEMMA KOSISOCHUKWU, MORGAN1582 SALAMI YUSUFU, BISI1583 NZEKWE IFEYINWA, FLORENCE1584 AKITOYE ADESEGUN,1585 BALOGUN SARATA, IYABO1586 OGBOLE LINDA,1587 EKO YELLOW PAGE VEN1588 IDAHOR BETTY, ENOTIENWONWAN1589 IWEGBUE IGNATIUS, EFAMEFUNE1590 ELEKEDE BABATUNDE, SULAY ENIOLA1591 ADEAGBO RUFUS, ADEWALE AKANNI1592 ANUMBA TOBIAS, IKECHUKWU1593 BABARINDE OLUSHOLA, ALADE1594 EMENUWA &, IJEOMA JAJA-WACHUKU1595 ADETAYO MICHEAL, AYODELE1596 SHELLENG IBRAHIM,1597 OWOEYE ABIODUN, OLUFEMI1598 OGUNNUBI BOLANLE, EMMANUEL1599 ADELOPO ABDULRAMON, ABIODUN1600 OBIKA IK, HENRY1601 KOMOLAFE ABIMBOLA, ADETOKUNBO1602 IFEANYI OKEY, FESTUS1603 OJUKWU OBINNA,1604 EDEH BENJAMIN, IKECHUKWU1605 MEGBOPE TOLULOPE,1606 OYEDOKUN DAMILOLA, OREOLUWA1607 VINSTAR CONSULTING1608 NWOGU PRECIOUS, ONYEDIKACHI1609 ADEBISI KAYODE, EMMANUEL1610 UMEZE NZE, INNOCENT1611 BELLO RAFIU, ADISA1612 APEL CAPITAL, & TRUST LTD -
NOMINEES 21613 ODUFUWA ISAIAH, SUNKANMI1614 ONYIA ISRAEL, CHUKWUKA1615 OLADOKUN OLUWAFEMI, ADEWALE1616 BALOGUN ADENIKE, TAIBAT1617 ADENIKA AKINBOWALE, SAMUEL1618 AKINDURO ERIC, AKINNIFESI1619 ANOSIE IFEANYICHUKWU, DANIEL1620 KAZEEM RUKAYAT, OYINKANSOLA1621 VINCENT OLUWATOMI,1622 YINUSA SHERIFAT, ABIOLA1623 FALETI AYOMIPOSI, ADEPEJU1624 DANIELS VICTORY, AGAMWONYI1625 OKUNROBO MARY, ABIEYUWA1626 JOHN MFOMABASI, FAVOUR1627 OLANIYAN MOSES, OLUDELE1628 SALAMI IYABO, WASILAT1629 EBEIYAMBA IYAMBA, EKPO1630 IKEDIASHI EZINWA, RITA1631 LARAIYETAN OLUSEGUN, HENRY1632 OLINMAH GRACE, CHIBUZOR1633 ORORHO OGHENERUKEVWE,
PATIENCE
1634 AJANI TAJUDEEN, BAYONLE TEMILOLA
1635 OLAWOYE GRACE, OBAFUNKE1636 KALU CHUKWUNONSO,1637 ADEBAYO IBIKUNLE,1638 OSIFESO ADEWUNMI, BABATUNDE1639 BAIYEWU OLUFEYIKEMI, OLAMIDE1640 UKAEGBU KENNETH, CHIDUBEM1641 SALAKO VICTORIA, OLUBUNMI1642 ADEFUNMILAYO TOPE, DAMILOLA1643 OLOIDI OLUWAPELUMI, AYODEJI1644 OKORIE ONYEBUCHI, ERIC1645 TAIWO MAKINDE,1646 EGBINOLA OLUREMILEKUN,
AYOTUNDE1647 OYETOLA OLUSHOLA, DEBOLA1648 ODUNMBAKU CHARLES, OLUJIDE1649 AZEEZ RIDWAN, OKIKIOLA1650 UWEM JOHN,1651 AKANNI ZUBAIR, OLANIYI SULAIMON1652 OLADAPO DIXON, TUNDE1653 OLADIPO OLATOYE, ADISA1654 YINUSA MUSIBAU, ALAO1655 ADEBOGUN WINIFRED, AYOMIPOSI C1656 HABIBA BARYAT, BATURE1657 ALOBA GRACE, TITILAYO1658 OMOTOSHO ABIODUN, OKITIKAN1659 TAIWO SUNDAY, SAMSON1660 ORJI MADUABUCHI, UGWUALASI1661 OKAFOR OKWUCHUKWU, KENNETH1662 UKPONG OMOTOYOSI, ADEKEMI1663 ADEYEMO TITI, LATIFAT1664 OGUNOYE PRISCILLA, OLUWATOBI1665 ADEBAYO RAMONI, AKANO1666 AJAYI RAMOTA, TOWOBOLA1667 OHWOVORIOLE DOHWODESE,
OGHENERUME1668 MBANUGO, ADAOBI, NKIRUKA1669 OGUNMUYIWA A, DAVID1670 ISSA ABIODUN, AHMED1671 AZEEZ AL-AMEEN, ISHOLA1672 OKEKE FRANCES, UBANAGU1673 AKINGBESOTE OLUWAMAYOWA, O.1674 AKINGBESOTE ABIMBOLA,1675 OLUWAFEMI MONISOLA, IDOWU1676 OPEODU ADEBOLA, AFEEZ1677 OMOGOLOR OGORCHUKWU,
ANTHONY1678 OLORUNFUNMI YINUSA, ADEKUNLE1679 MOMODU OSIRIAME,1680 ABDULLAZEEZ MAONELI, MOHAMMED1681 AREMU OLAWUMI, MARY1682 UGWU ONUORAH, MARTINS1683 YUSUFF NURUDEEN, ABUBAKAR1684 OKEKE EMMANUEL, EBUKA1685 OKUNOLA EMMANUEL, OLANREWAJU
3 3.8 UNCLAIMED DIVIDENDOTHER NATIONAL DISCLOSURE

3
ANNUAL REPORT 2020 - AXA MANSARD | 211
1686 GBADERO MICHAEL, KAYODE1687 OMOSUNLADE ABDULAI,1688 ODIA EROMOSELE, BENEDICT (DR)1689 ADEBAYO OLUSESAN, STEPHEN1690 OBARINDE ISAAC, OBATOSHO1691 OKE EZEKIEL, OLUKUNLE1692 AILENDE PROVIDENCE, O.1693 SARUMI TUNDE, KABIR1694 OTTIH ADAEZE, MAUREEN1695 OGUNNAIKE BABATUNDE, ADEBANJO1696 OSANAKPO ELIZABETH, UFELI1697 OKI ISIAKA, AYODELE1698 AMOBI OGOCHUKWU, CELESTINA1699 MPAMAUGO EDITH, NWANWEREUCHE1700 AKINWALE OLUWADAARA, INIOLUWA
DAVID1701 UKWO GODWIN, IKPAI1702 BALOGUN NURUDEEN,1703 SURAKAT RASAQ, OLAWALE1704 OREFUWA OLUWATOBI, S1705 OYIODO MOSES, JONAH1706 SHODEKE OMOLARA, DORCAS1707 ADEDOYIN MATTHEW, ADEREMI1708 TAKIM MACDUFF, OJONG1709 VINCENT O, VALENTINA1710 BEKUNMI AKINSOLA,1711 ADEFEHINTI OLUWAKEMI, AJOKE1712 ADEBAYO RASHIDA, AJOKE1713 GARUBA SOBUR, ABIODUN1714 OYEDELE ABDULAZEEZ, ADEMOLA1715 ADESINA OLALEKAN, OLADEPO1716 OKORO GODWIN, C.1717 IKIROMA TONYE, H.1718 JINADU SAMUSIDEEN, SEGUN
MOBOLAJI1719 RAIMI RAMONI, ADEMOLA1720 OBOH KINGSLEY, OREDIA1721 SALAKO ANTHONIA, OLUWATOYIN1722 FOMBA SUCCESS ENTERPRISES1723 ODESEYE TAOFEEK, OLUFEMI1724 OGUNNOWO OLUYEMISI, WEMIMO1725 EFUNTADE OLUWAFEMI,1726 GIDADO OWOLABI, QUADRI1727 IGBASANMI JOHN, OLATOMIDE1728 EMUCHAY CHINYERE, PRECIOUS1729 ADEWUSI MICHAEL, OLUSEGUN1730 KEFFI STREET MGT LTD CLIENT ACCT1731 ADEBISI JOHN, ADETUNJI1732 AJUMOBI GRACE, OMONIYI1733 OKO-OBOH HOPE,1734 D-BEST ACHIEVERS SHAREHOLDERS
ASS1735 AKINWANDE OLUWASEYI,
SAKIRUDEEN1736 ADEDIGBA OLABISI,1737 SAAIIO VENTURES
1738 OGUNSAMI AYODELE, ADEWALE1739 AROYEHUN OLAKUNLE,1740 ONWUAMA CHIGOZIE, EMMANUEL1741 KOLA-TAIWO MOLABO, OLUBUSAYO1742 SOJINRIN OLUWABUSOLA, OLAKUNLE1743 OKUNOWO OLAMIDE, OLABISI1744 OYEWOLE ISAIAH, OLUWATOSIN1745 OKOYE SOMADINA, DANIEL1746 OBOLI PAUL, CHIDU1747 IWUEKE BEN, CHIBUZO1748 MOORE ABDUL, SALAMI1749 BUHARI MICHAEL, YACOUB1750 JOSEPH PRIVELAR, TOCHUKWU1751 FATONA KARAMOT, FOLASHADE1752 ODUSINA OLUWASEGUN,
IBUKUNOLUWA1753 IBEZIM AKACHUKWU,1754 LAWAL MUFUTAU, ASHERU1755 SULE ANARUGU, SHEHU1756 LAWAL ADEDOYIN, ADETOUN1757 ADETUNJI ADEKUNLE, EMMANUEL1758 ONONIWU EMMANUELCHRISTOPHER,
N1759 GBADEBO MICHAEL, OLASEHINDE1760 KULEPA AKEEM, ADEWALE1761 NDIDI EMMANUEL, CHIEME1762 EDAH JACKSON, ERINIEOERE1763 OYELAKIN OMOSHALEWA, SHERIFAT1764 AKINPELU ABOSEDE, HANNA
OLUWASEUN1765 OHALEKWU CHRISTIAN, ELELIA1766 OLATUNJI TITILAYO, OLUWASEUN1767 CHUKWU JULIET, NNENNA1768 IBANGA BARRY, UBONG1769 TAIWO KASHIMAWO, AKANJI1770 DISU SHERIFAT, ADETOLA1771 NWACHUKWU GODWIN,1772 OWOSHO SHOGO, SAMSON1773 OGUIKE-OLERU FABIAN, NNAMDI1774 OYINLOYE MUYIWA, EMMANUEL1775 KADIRI ABAYOMI, SHEWU1776 IWU ELIZABETH, ADA1777 OLADOSU ISLAMIYAT, ADETUTU1778 EZENGIGE CHINEDU, JOSEPH1779 AKINYERA OLUWASANMI,
AKINTOYINBO1780 IWU GABRIEL, CHINEYE1781 MAJAAGUN IYABO, MUIBAT1782 RAHEEM KAMORU, DADUNOLA1783 OKOSUN ADESUA, OSEZELE
DANIELLE1784 MEADOWS JIDEOLUWA, BABAJIDE1785 SANNI WAHEED, ADEWOLE1786 OBIORAH EMMANUEL, T1787 ALONGE SAKA, ISHOLA1788 OYEDEJI AKINDELE, OLAWUMI
1789 TANDU TANDU, OSAJI1790 AKINBANDE OLUFUNMILOLA,
BAMIDELE1791 MAKU OLUSEYE, OLUGBEMIGA1792 ADEOYE OLUGBENGA, ADEYEMI1793 FRANCIS OLAMIDE, LOLA ABOSEDE1794 ANUSI CHINWENDU, DANIEL1795 SODEINDE EBENEZER, OLATUNJI1796 UKAEGBU OGEMUDI, PASCAL1797 OLADJI BABATUNDE, ALABI
OLADEHINDE1798 AJAYI ADEDAYO, DAVID1799 BAMGBOSE STEPHEN, ISHOLA1800 OLOFA RILWAN, ADEYEMI1801 CHUKWUDE MARIA, NWANNEKA1802 AZAGE JOSEPH, MICHEAL1803 OGUNLEYE OLORUNFEMI,1804 AKANDE SOLOMON, SUNDAY1805 KENTEBE JOSEPHINE, BIERIDE1806 OHADOMERE OSINACHI, EMMANUEL1807 ADAGUN MUAHBAT, OPENIMONI1808 KAREEM SULAIMON, OLATUNJI1809 ADELEYE ESTHER, OLUWAGBOTEMI1810 OWODEYI LATEEF,1811 OYELADE MOSES, IBIKUNLE1812 NURUDEEN OLUSEGUN, OYELEYE1813 ADEBAMOWO OLUSANYA,1814 ENYAMUKE UFUOMA,1815 OLOLO PETER, UKUORITSEMOFE1816 OLUGBOSUN ARIYO, AYO1817 IMANZENOBE ANTHONY,1818 OYINLOYE MUYIWA, EMMANUEL1819 OGUNTOYE OLUWATOPE, LAWRENCE1820 ANI-OTOIBHI IHINOSEN, AUSTEN1821 AJAYI OLAKUNLE, JAYEOLA1822 AJAO MOSUDI, AYINDE1823 SHOFOLAHAN SUNDAY, O.1824 AKINSANYA FOLASHADE, OMOLAYO1825 ORENIYI TEMITOPE, LEKE1826 AJAYI JAMES, OLAWALE1827 ABDULRASHEED BASHIR,1828 TICKLE CONSULTING LIMTED1829 OWOJORI ANTHONY, ADEKUNLE1830 ADINDU BERNICE, OGECHI1831 UKPAI IFEOMA, MIRACLE1832 ADELEKE FLORENCE, OLUWAYEMISI1833 OKUNIYI OLUWAMAYOWA, ADEDEJI1834 AMOO ABOLUSODUN, MUNIRU1835 ADENIJI STEPHEN, AYOKUNLE1836 OGUNOYE PRISCILLA, OLUWATOBI1837 TIAMIYU MUSTAPHA, OLADELE1838 OSHIN ADEBAYO, DAMILARE1839 OLASEGE BABATUNDE, HAMZAT1840 ANAGBOGU MICHAEL, MATTHEW1841 AJAYI ADEKUNLE, OBAFEMI
OTHER NATIONAL DISCLOSURE3.8 UNCLAIMED DIVIDEND

212 | ANNUAL REPORT 2020 - AXA MANSARD
1842 EMIOLA AUGUSTINE, JAIYEOLA1843 ODUFOWOKAN ABIDEMI, ADEBUKOLA1844 ODUSOTE OLATUNBOSUN, ANIKE1845 MUSTAPHA ZAINAB, AJOKE1846 OLATUNJI BOLANLE, SEGUN1847 AZEEZ JELILI,1848 TAIWO DAMOLA, OMOLOLU1849 TAIWO OLUNIFESIMI, EBUNOLUWA
BOLUTIFE1850 KOLA-TAIWO MOFINYINFOLUWA,
OLUWAKAMIYE1851 TAIWO OLUFISAYO, OLUTIMILEHIN
OLATOUN1852 TAIWO TOLULOPE, YOMI1853 ADEBOYE EMMANUEL, ADEWALE1854 IMOHI IBRAHIM, (MR)1855 ALAKE OLUWATOSIN, OLAJUMOKE1856 OMOLE ABRAHAM, OLAMILEKAN1857 ADEBOYEKU BOLUWAJI, VALENTINE1858 FOWOWE MICHAEL, OLASUPO ABIOLA1859 ODESANYA ELIZABETH TITILAYO1860 APU OKEOGHENE, ANIEFIOK1861 DANJUMA KAMORUDEEN, AJAO1862 ODEJAYI ADEOLU, IBITAYO1863 OMIPIDAN JONAH, OMOTAYO1864 EDACHE MORGAN, ABOJE1865 OLUWADAIRO OLUFUNMILAYO,
OMOLOLA1866 DUPEX STATRITE VENTURES NIG. LTD.1867 OSHO MICHAEL, BAMITALE1868 KOMOLAFE MICHAEL, SEGUN1869 DAVIES KOLAWOLE, CHRISTOPHER1870 OLADOSU OLAYINKA, OLUWATOSIN1871 DAVID SIMI, OLANIKE1872 EMI CAPITAL RESOURCES LTD-
DEPOSIT A/C1873 AJANI WAHAB, ABIDOYE1874 AMAYO LOVETH,1875 OLADOKUN BREAKTHROUGH,
OLUWAJOMILOJU1876 TOHIR FOLORUNSHO, ISMAILA1877 MPAMAUGO SAMUEL, CHINENYE1878 WILLIAMS JOHN, ADEBAYO1879 AREOLA OLUWAFUNSO, EMMANUEL1880 EZECHUKWU AUGUSTINE, NNAEMEKA1881 OLAYIWOLA ADEMOLA, KAZEEM1882 BABATUNDE ESTHER, AINA1883 ALABI DAMILARE,1884 AZEEZ RASAKI, KOLAWOLE1885 ODUSANYA ADEOLA, ELIZABETH1886 OBIDEYI EFUNYEMI, OLATUNDE1887 QUADRI SULAIMON,1888 AWOFISAYO DAVID, OLUGBEMIGA1889 IHEANACHO STEPHEN, CHINONSO1890 ADESINA JOHNSON, GBADEBO1891 IBRAHIM MUHIZ, ABIODUN
1892 OGUNTUNWASE BAMIDELE, ABIODUN1893 ADELANWA KUBURAT, AYOKA1894 ECHEFU EBERECHUKWU, FRANCIS1895 ANIGIORO AMOS, OLADAPO1896 NJOKU CHRISTIAN, CHINONYEREM1897 SAKA RASHIDAT, OMOBOLANLE1898 NWAOHA CHINONYEREM,1899 AJUMOBI JOSEPH, OLUYEMI { EST.}1900 ADEGBITE ISAAC, ADEREMI1901 SAKA LUKUMON, OMOTAYO1902 OVIOSUN ENAHORO,1903 OLADIMEJI LAWAL, ADEBESHIN1904 OLAPO OLADEJI, KOLAWOLE1905 NWOTAM JENNIFER, CHINENYE1906 ONYEMMA JESSICA, NWAKAEGO1907 ORIADE ABIODUN, JOB1908 IGBASANMI DEBORAH, MOPENRE1909 ALAGA KOLAWOLE, MUFTAU1910 ANENE PATRICK, NNAMDI1911 OPE CHRISTANAH, EMI-OLA1912 OLALEYE ADEYEMI, ELIJAH1913 OLORUNTOLA AINA, ELIZABETH1914 SALAMI RASHEEDAT, ABOSEDE1915 TAIWO TEMITOPE, SUZAN1916 ADEKOYA BABATUNDE, ABIODUN1917 IDOWU SANNI, QUADRI1918 ODUNTAN AZEEZAT, ADESEWA (MISS)1919 OYEBANJI GRACE, ABIMBOLA1920 CHUKWUEBUKA PROMISE,
UGOCHUKWU1921 EVRO JOHNSON, EFE1922 ADEBISI ADENIYI, ARAUNSI1923 UGOH BENNY, ODIGWE1924 KUYE ADEBOWALE, EZEKIEL1925 OBATAYO JOHN, OLUWAFEMI1926 ADEOYE ABIMBOLA, ADEPEJU1927 AJAYI OLUKAYODE, FEYI1928 LAIYENBI KASSIM, ADEWALE1929 AKIBU SULEIMAN, KAYODE1930 OMOLERE AKINWUMI, BAMIDELE1931 OKEOWO BABAJIDE, GEORGE1932 JINADU ABIODUN, (WEB PORTAL)1933 OTSEME GODWIN, OGBU1934 ABDULAZEEZ AYOMIDE,
ABDUSSALAAM1935 MUSA MOMOH, SANI1936 UGWU MARTINS, ONUORAH1937 OYETUNDE SURAJU,1938 BENJAMIN-ADE ENIOLA, JOSEPH1939 ELUSHADE IBIYINKA, OLUBUNMI1940 RASAQ OLALEKAN, MUMUNI1941 FAYESE STEPHEN, OLATUNJI1942 ADENRELE RAHEEMOT, YETUNDE
OMOTOLA (ALLEGED DECEASED PHC NO. 2469L/2014)
1943 OREFUWA BABATUNDE, ADEMOLA1944 STOKCREST NIGERIA LIMITED1945 OYETUNDE OLUWAFEMI, TIMOTHY1946 SOFOLUKE OLATUNJI, SIGISMUND1947 EGWUATU EDEBEATU, ROWLAND1948 ABOLAJI OLUFEMI, OLAJIDE1949 ADENIYI ABDUL, MUFUTAU1950 ADEYEMI OLUTOSIN, JOSEPH1951 SALIMON IBRAHEEM, AJAO JAIYEOLA1952 ELYONS ASSET MANAGEMENT LIMITED1953 FATOLA JOSEPH, OLUFUNMILADE1954 KUDAISI AFOLABI, IBRAHIM1955 KUDAISI MOJISOLA, HABEBAT1956 KUDAISI MOBOLAJI, SULAIMON1957 SHOFOLAHAN CHARLES, OLUSEGUN1958 SHOFOLAHAN ELIZABETH, BUKOLA1959 SHOFOLAHAN ANTHONIA,
OLUWATOYIN1960 SHOFOLAHAN FRANCISCA, BOLATITO1961 HAMILTON RACHAEL, OLUFUNKE1962 HAMILTON OLADAYO, NICHOLAS1963 HAMILTON ANJOLAOLUWA, JOHN-
BOSCO1964 OLUKOGA TEMITOPE, DORCAS1965 AJALA ESTHER, NIHINLOLA1966 ORENIYI IFEOLUWA, DEBORAH1967 OKOROAFOR IGNATIUS, EJILUGWU1968 ABIDOYE MAJEED, TUNJI1969 IGBRUDE ESTHER, TSANG1970 OMOGHENE-MILLER DIVINE,1971 EFE MILLER,1972 AJIRIOGHENE MILLER, OKE1973 ABIDOYE LATEEF, BOLAJI1974 ABIDOYE TAOFIK, OWOLABI1975 AKANDE OMOLABAKE,1976 NANSHAP STEPHEN, RICHARD1977 NANSHAP ESTHER,1978 MGBEAHURU PETER, ENYEREIBE
EMMA1979 VINCENT CHRISTIE, O1980 SANYAOLU JONATHAN, AYO1981 AFOLARIN GANI, KOLA1982 ADIGUN OMOWUMI, T.1983 IKUBOLAJE GBENGA, AMOS1984 AILERU SALIMOTU, AMOPE1985 ADIO ODUNOLA, E.1986 GBEGBAJE ELIZABETH, MEJEBI1987 ASIYANBI OLUFEMI, OLADELE1988 ODUSANYA OYINDAMOLA, ANUOLUWA1989 PORTFOLIO MANAGER, ACCOUNT1990 ODEBIYI ANTHONY, ADENIYI1991 MARTINS HAKEEM, ABIOLA1992 OSILEYEOLUGBENGA AFOLABI,1993 WILLIAMS ALADE,1994 OREFUWA TEMITOPE, M
3 3.8 UNCLAIMED DIVIDENDOTHER NATIONAL DISCLOSURE

3
ANNUAL REPORT 2020 - AXA MANSARD | 213
1995 OREFUWA OLUWAGBENGA, GABRIEL1996 IGBASANMI BUKOLA, AKINRINBIDO1997 AKINTUNDE MARY, ADEOLA1998 ADU AYODELE,1999 OSHIN ADESEGUN,2000 AKINWALE ADEMOLA,2001 OLOYE WASIU, ADEKUNLE2002 OYENIRAN KOLA,2003 SALIU FAUSAT, REMILEKUN2004 SALIU HAMMED,2005 AWONAIKE RACHAEL, MOSEBOLATAN2006 AYO DURODOLA,2007 BLAIZE ROTIMI, FAROUK2008 AYODELE OLUSHOLA, OMOTAYO2009 ADEGBULUGBE BOSE, COMFORT2010 ABRAHAM KEHINDE, P2011 ABRAHAM TAIWO, P2012 NWABUGHOGU BRIGHT,2013 OGUNWALE BUKUNMI, BENJAMIN2014 NUEL DELLY IND. & SER. LTD.2015 MACAULAY KAREEM, ABIODUN2016 EMOEKPERE VICTORIA, JOY2017 TIAMIYU MUSTAPHA, OLADELE2018 CLEMENT ADEBAYO, NATHANIEL2019 SALEMSON SHAREHOLDERS ASS OF
NIGERIA2020 ERINFOLAMI BOSERECALEB,
IJAODOLATIOLUWA2021 NWOKO EDWIN, ONUWA
CHIKWEKWEM2022 FOLAMI & ASSOCIATES2023 AKINADE TAOFEEK, ADEMUYIWA2024 BABATUNDE SAHEED-OLADIMEJI,2025 EDUN OLUGBEMI, OLUKAYODE2026 OPEGBUYI OKANLAWON, TAJUDEEN2027 ADESIYAN ADEDAYO, OLUDARE2028 ADEGBAMIYE JOHNSON, ADEKUNLE2029 USIAPHRE PATRICK, ONOME2030 ABDULAZEEZ AISHA, AYOKA2031 BALOGUN OLUWATOYIN,2032 OHADOMERE OSINACHI, EMMANUEL2033 ODUSANYA OPE, ANIKE2034 NWAGBOM CONSTANTINA,
ONYEKACHI2035 ANYIKA ROSEMARY, NGOZI2036 OYEDELE ABDULAZEEZ, ADEMOLA
TAIWO2037 BAMISAYE GABRIEL, KAYODE2038 SHERIFFDEEN MORWAN, ADEWALE A2039 OYEWO MAHMOOD, BUSAYO2040 ISAIAH PRINCE, JOSHUA2041 OLOWOOKERE ENIOLA, ABOSEDE2042 MUDASHIRU USMAN, AKANBI2043 EDACHE MORGAN, ABOJE2044 MBASOH WALTER,
MMADUABUCHUKWU
2045 OPARA CLEMENT, ANAELE CHUKWUDI2046 MBAM UCHENNA, FABIAN2047 GIWA LATEEF, ABIODUN2048 SALAMI ADETOKUNBOH2049 BODUNRIN OLABISI, FOLASHADE2050 AJAYI HALLELUYAH, OGOOLUWA2051 BADMUS ABDULRAHMON, ABIODUN2052 HAMZA RIDHWAN, BOLADALE2053 DISU SURAJU, OLA2054 AKINLOLU AKINDURO,2055 EFEMENAH FESTUS, UMUKORO2056 AKINBO OLAYIWOLA, ADIO2057 SERIKI IDRIS, ABIODUN2058 SALAU MOHAMMED, ADEBANJO2059 ADEKOLA AHMAD, ADEKUNLE2060 OKELEYE ADENIKE, ELIZABETH2061 ODUNUGA SAMIAT, ADEBANKE2062 SABA ABIOLA, MARIAM2063 MAKANJUOLA OLADAYO, ABDUL
YEKINI2064 AMAO ADEDOYINSOLA, ABIODUN2065 BAMGBALA OLAYEMI,2066 MOSES OLUKUNLE, KOLAWOLE2067 OLUSANYA OLUREMI, OLUKUNLE2068 AZEEZ JIMOH, OGUNBANWO2069 ERINFOLAMI SALEMSON,
ADEMOLATEMILOLUWA2070 ADEBAYO TOMIWA, OLUWANIYI2071 ABAH SUNDAY, DANIEL2072 MOSHOOD ISIAKA, TUNDE2073 JIMOH RASHEEDAT, ADUNNI2074 ODUNTAN MUIBI-ISHOLA,2075 OYENUGA FOLASADE, MARY2076 OGUNSANWO OLUMIDE, DADA2077 OTENAIKE OLUWASEUN, DARE2078 GIWA LATEEF, ABIODUN2079 ALABI DAVID, OLUWAFOLAHANMI A2080 ALABI EMMANUEL, OMOLAYO A2081 ISIAKA AZEEZ, OLAMILEKAN2082 DARA ABIDEMI, OWADAPO2083 PATRICK UGOCHUKWU, NNAMDI2084 AZEEZ ABOLANLE, AYINKE2085 AKANDE JOSEPH, KAYODE2086 OYEBADE YINKA, MICHAEL2087 QUANTUM SECURITIES-DEPOSIT, A/C2088 FRACTIONAL A/C (RECONSTRUCTION)
-2089 SFS RESEARCH2090 AKINBO OLADIMEJI, AYINLA2091 CHIKEZIE CHINYERE, MORIN2092 ADEYEMI STANLEY,2093 LAWAL OLAYEMI, BASIRAT2094 GIWA ISMAILA, OLALEKAN2095 ADEDEJI ADEWOLE, JOSEPH2096 OTOROLEHI-OKEZIE VICTORIA,
2097 SALAM ABASS,2098 CHRIS OKAFOR, NGOZI2099 IKHELOWA MOHAMMED, OMOLHUDU2100 OLUSANYA OLUMIDE, ADEYIGA2101 SHODEKE OLAYINKA, SIMISOLA2102 SOUNOUKINI RACHEAL, PRUDENCE2103 ELUDOYIN AKINOLA,2104 LAWAL OLANIYI, KAZEEM2105 OMOLU MARVIS, OSSAI2106 ISAIAH EMEKA, PHILIP2107 SHOKUNBI KHADIJAT, OLASUMBO2108 OKAFOR EMMANUEL, NKWACHUKWU
MR & MRS2109 IBRAHIM LUKMON, ADISA2110 LASOJU AGNES, MODUPE2111 OKAFOR EMMANUEL, NKWACHUKWU2112 OKOROIGWE ESTHER, ONYEKACHI2113 ALAKA-COKER KOLAPO,2114 UGWUEZUMBA SAMUEL,2115 ORAGWU ALUBA, I. & PETER O.2116 FARAMADE OYENIYI,2117 LAIYENBI KARIMO, MOPELOLA O2118 KREUGER GLOBAL, RESOURCES LTD2119 VICTOR AKINBAYO/TRADING, A/C2120 ISAIAH ROSELINE, NGOZI2121 OLALEKAN SUNDAY, OLUYEMI2122 LASOJU ABIKE, MARY2123 LASOJU OLAKUNLE, OLADIPO2124 ESEAGWU EZEKIEL, CHIJIOKE2125 MUSA ILIYASU, ISAH2126 ELNICK ENG CONSTRUCTION LTD2127 BRADFORD BINGLEY INVESTMENT LTD2128 AJAYI OLUWAFEMI, PHILIP2129 MONYE ANTHONY, BIACHI2130 OLAOSEBIKAN OLA-OLUWA, AJIBOLA2131 ADEWUMI ATINUKE, OLUKEMI2132 NWOKOLO GOODNESS,2133 AJAYI OLUWAFEMI, PHILIP PAUL
OSINEYE2134 OTEBIYI OLADEJI,
OTHER NATIONAL DISCLOSURE3.8 UNCLAIMED DIVIDEND

214 | ANNUAL REPORT 2020 - AXA MANSARD

3
ANNUAL REPORT 2020 - AXA MANSARD | 215
3.9 (To be stamped by bankers)
AffixCurrentPassport
PhotoPlease write your name at theback of your passportphotograph
E-MANDATE ACTIVATION FORM
InstructionPlease complete all sections of this form to make it eligible for processingand return to the address belowThe Registrar,DataMax Registrars Limited2C, Gbagada Expressway, By Beko Ransome Kuti Park, Gbagada,P.M.B 10007, Shomolu,Lagos State.
I/ We hereby request that you forward until further notice, all future dividend/ interest to which I/we become entitled for the company indicated, to the branch of the Bank named below.
Bank Verification Number
Bank Name
Bank Account Number
Account Opening Date
*
Shareholder Account Information** Surname / Company’s Name First Name Other Names
Address:
* The Bank stamp and signature of the authorised signatory of your bank isrequired to confirm that the Bank details and signature(s) is/are that ofthe shareholder(s) or an authorised signatory, before returning to theRegistrars.
** Please ensure that the name on your Bank Account corresponds with that in our records as any contrary Name(s) would void your request
City
Previous Address (If any)
CHN (If any)
State Country
Mobile Telephone 1 Mobile Telephone 2
Email Address
*** Signature(s)
*** The signature(s) must correspond with your specimen held in ourrecords as any contrary signature(s) or non-existence in our records would void your request.
Company Seal/ Incorporation Number (Corporate Shareholder)
When completed on behalf of a corporate body, each signatory should state the representative capacity e.g. Company Secretary, Directors etc.
DATAMAX REGISTRARS LIMITEDwww.datamaxgroup.ng; E-Mail: [email protected] or the completed form can be submitted through any Bank nearest to you.
• • DataMax Registrars Limited hereby disclaims liability or responsibility for any errors/omissions in any document transmitted electronically.
Only Clearing Banks are acceptable
AUTHORISED SIGNATORY AND STAMP OF BANKERS
Kindly tick & quote your shareholder account no in the boxbelow
Tick Name of Company ShareholderNumber
AXA Mansard Insurance Plc.
Guaranty Trust Bank Plc.
Kogi State Bond Series 1
Kogi State Bond Series 2
Notore Chemical Industry Plc.
Seplat Petroleum Development Plc.
I/We confirm that all information supplied is to the best of my/our knowledge correct and hereby covenant to indemnify and forever keep indemnified the security issuer, the directors, the security registrar, the directors and officers of the security registrar fromand against all losses in respect thereof and all claims, actions, proceedings, demands, cost, expenses whatsoever which may be made or brought against them by reason of compliance with this request Help desk , Telephone No. Tel: 07064000751, 07064000752, 07064000758, 0700DATAMAX Email: [email protected] www.datamaxgroup.ng or send e-mail [email protected]
Please go to https://datamaxgroup.ng/legal-notice/ to see information about our privacy policy

216 | ANNUAL REPORT 2020 - AXA MANSARD

3
ANNUAL REPORT 2020 - AXA MANSARD | 217
3.10 PROXY FORM
3.10 PROXY FORM
OTHER NATIONAL DISCLOSURE
AXA MANSARD INSURANCE PLC RC 133276
TWENTY-NINTH (29th) ANNUAL GENERAL MEETING to be held at Lagos Oriental Hotel, No 3, Lekki Road, Victoria Island, Lagos on Friday, May 7, 2021 at 10:00 a.m.
I/We ---------------------------------------- being Shareholder(s) of AXA Mansard Insurance plc hereby (please see Notes below for the list of nominated proxies) -------------------------------- ----- ----- ------ or failing him/her ---------------------------------------------- ------ ------ ---- or --------------------------------------------------------------- as my/our Proxy to act and vote for me/us and on my/our behalf at the 29TH Annual General Meeting of the Company to be held on May 7, 2021 and at any adjournment thereof.
Dated this ------------------------- day of ------------------------- 2021.
Shareholder’s Signature ------------------------------------------
NUMBER OF SHARES:
RESOLUTIONS FOR AGAINST
ORDINARY BUSINESS
1. To receive the Audited Financial Statements for the year ended December 31, 2020, and the Reports of the Directors, Auditor and Audit Committee thereon;
2. To elect a Director i. Mr. Kuldeep Kaushik as Director.
3. To declare a dividend.
4. To authorize the Directors to fix the remuneration of the Auditors.
5. To disclose the remuneration of Managers.
5. To elect members of the Statutory Audit Committee.
Please indicate with an “X” how you wish your votes to be cast on the resolutions set above. Unless otherwise instructed, the Proxy will vote or abstain from voting at his/her/its discretion.
Before posting please tear off this part and retain it for admission to the meeting
ADMISSION CARD
Name of Shareholder (in BLOCK LETTERS)
________________________________________________________________________________________________________
Shareholder’s Account No: ____________________________________________________
Number of shares: ____________________________________________________
Please admit _________________________________________to the 29th Annual General Meeting of AXA MANSARD INSURANCE PLC to be held at Lagos Oriental Hotel, No 3, Lekki Road, Victoria Island, Lagos on Friday, May 7, 2021 at 10:00 a.m.
Signature of person attending: ____________________________________________________
The Shareholder or his /her/its proxy is required to produce this admission card in order to obtain entrance to the Annual General Meeting.
Please be advised that to enable a Proxy gain entrance to the meeting, the Proxy Form should be duly completed and delivered to the office of the Registrars, DataMax Registrars Limited not later than 48 hours before the time fixed for the meeting.

218 | ANNUAL REPORT 2020 - AXA MANSARD
NOTES
1. In the interest of public safety and having regard to the Nigerian Centre for Disease Control (NCDC) COVID-19 Guidance for Safe Mass Gatherings in Nigeria, the guidelines of the Corporate Affairs Commission (CAC) on holding Annual General Meetings and the restrictions on public gatherings by the Lagos State Government, this Proxy Form has been prepared to enable shareholders entitled to attend and vote at the Annual General Meeting exercise their right to vote despite not being physically present at the meeting.
2. Members may appoint a Proxy of their choice from the following persons:
� Mr. Olusola Adeeyo – Chairman
� Mr. Kunle Ahmed – Chief Executive Officer
� Chief Timothy Adesiyan – Shareholder
� Mrs. Ganiat Adetutu Siyonbola – Shareholder
� Sir Sunny Nwosu – Shareholder
� Mr. Olufemi Abolude – Shareholder
� Mr. Opeyemi Ojedele-Akinwonmi – Shareholder
� Mrs. Bisi Bakare – Shareholder
� Mr Gbola Akinola – Shareholder
� Mr. Oladimeji Adeleke – Shareholder
3. The completed proxy form must be deposited at the office of the Registrar, DataMax Registrars Limited, No. 2C, Gbagada Phase 1, Lagos, or sent via email to [email protected] not less than forty-eight (48) hours before the time fixed for the meeting.
4. If the Shareholder is a Corporation, this form must be executed under its Common Seal or under the hand of some officers or an Attorney duly authorized.
5. The Proxy must produce the Admission Card sent with the Notice of the meeting to gain entrance to the meeting.
6. In line with the Corporate Affairs Commission Guidelines, the Company has made arrangements at its cost, for the stamping of the duly completed and signed proxy forms submitted to the Company’s Registrars within the stipulated time.
Signature of the person attending: ______________________________________________________________________________
3 3.10 PROXY FORMOTHER NATIONAL DISCLOSURE

3
ANNUAL REPORT 2020 - AXA MANSARD | 219
3.11 CORPORATE DIRECTORY
EXECUTIVE SUITEKunle Ahmed Chief Executive Officer
Rashidat Adebisi Executive Director
RETAIL SOLUTIONSAdeola Adebanjo Head Retail Solutions
Wahen Egbe Head, Sales Advisor & Expansion
Olufemi Abolude Group Head, Retail Sales Lagos Mainland and South west
Patience Onichabor Group Head, Retail Sales Lagos Mainland
Albert Chukwuemeka Group Head, Retail Sales Upcountry
Latifah Aliu Group Head, Retail Sales Lagos Island
COMMERCIAL SOLUTIONSAkinlolu Akinyele Group Head, Energy and Emerging
Corporates
Abisola Nwoboshi Group Head, Property and Liability, Corporate Business Group
Akeem Adediran Group Head, Public Sector and Infrastructure
Sunday Sule Head, Public Sector North
Opeyemi Ojedele- Akinwonmi
Group Head, Motor, Marine and Downstream
Ademola Lawson Head, Upstream and Aviation
Kemi Allison Head, Fire and Engineering (CBG)
Bode Aboyeji Head, Liability and Casualty
RISK MANAGEMENTSamira Nwaturuocha Chief Risk Officer
Olanrewaju Ibidapo Deputy Chief Risk Officer
FINANCENgozi Ola-Israel Chief Financial Officer
Adekunle Akinbowale Group Head Settlement
Alex Edafe Chief Investment Officer
Abayomi Taiwo Head, Taxation and Control
Gigaloluwa Ilori Head, Strategy Group Controlling
Chiazam Iwunoh Head, Property & Casualty/Life Reporting
TECHNICALAdebola Surakat Head Claims Services
Olaniyi Abijo Head Fire & Special Risk
Olanrewaju Ibidapo Head, Financial and Operational Risk
Adeniyi Oladunjoye Head, Marine, Aviation & GIT
TECHNOLOGYTaiwo Aluko Chief Information Officer
Efosa Idemudia Head, Business Solutions and Service Management
Chizuru Nwankwonta Head, Governance and Strategy
Funmilayo Runsewe Head, Information Security
ACTUARIAL SERVICESJolaolu Fakoya Chief Actuary/Head Life & Savings
Titilope Okanlawon Head Life Underwriting
COMPLIANCEBabajide Babalola Chief Compliance Officer
AXA DirectBayo Adesanya Chief Digital Officer
Kofoworola Akingbola
Head Digital Marketing
Alfred Egbai Head Emerging Customer & Alternative Channel
MARKETING & CUSTOMER ENGAGEMENTOlajumoke Odunlami Chief Marketing Officer
Emeka Muonaka Head Customer Engagement
Nkiru Umeh Head, Brand, Communications & Product Launches
Chukwuma Ibobo Head, Customer Analytics
COMPANY SECRETARIATOmowunmi Adewusi Company Secretary
Oyedoyin Awoyinfa Head Legal
SYSCONOlusola Odumuyiwa Chief Audit Officer
Adetola Aigbogun Head Audit & Investigation
Fiyinfoluwa Bamigbola
Head IT Audit & Systems Assurance
OTHER NATIONAL DISCLOSURE3.11 CORPORATE DIRECTORY

220 | ANNUAL REPORT 2020 - AXA MANSARD
AXA MANSARD HEALTHTope Adeniyi Chief Executive Officer
Chidi Onyedika Chief Operating Officer
Kayode Elusakin Group Head Institutional Business
Aanuoluwapo Soyoye
Head Health Claims
Ayodele Akeeb Head Retail, Partnership and Public Sector
Adesayo Osisanya Head Human Capital & Legal/ Company Secretary
Hope Okunfeyiwa Head Financial Control Services
AXA MANSARD INVESTMENTSDeji Tunde-Anjous Chief Executive Officer
Alex Edafe Chief Operating Officer
Taiye Owonubi Chief Investment Officer
Renah Osiemi Head, Sales and Solution Development
Afolabi Odumuyiwa Head Client Services
Uzoamaka Onumajuru
Head, AXA Wealth Management
Olabode Makinde Head, Investment Operations
3 3.11 CORPORATE DIRECTORYOTHER NATIONAL DISCLOSURE

3
ANNUAL REPORT 2020 - AXA MANSARD | 221
3.12 CORPORATE ADDRESSES
3.12 CORPORATE ADDRESSES
OTHER NATIONAL DISCLOSURE
HEAD OFFICE
AXA Mansard Insurance plcSanta Clara CourtPlot 1412 Ahmadu Bello WayVictoria IslandLagos StateTel: 0700-626-7273, 01-4485482
Email: [email protected]
SUBSIDIARIES
AXA Mansard Investments LimitedPlot 927/928 Bishop Aboyade ColeVictoria Island Lagos StateTel: 01-2701559
E-mail: [email protected]
AXA Mansard Health Limited84B, Ozumba Mbadiwe Street,Victoria Island Lagos StateTel: 01-4606655-9
E-mail: [email protected]
REGIONAL OFFICES
ABUJAPlot 1568, Muhammadu Buhari Way,Area 11 Garki, Abuja
Tel: (081) 50490161
PORT HARCOURTPlot 12 Ezimgbu Link Road,G.R.A. Phase IVPort HarcourtRivers State, Nigeria.Tel: (081) 13936051
MINNASuite 4A Shamras Plaza,Along Bosso Road, opposite Murtala Park,Central Business District, Minna, Niger StateTel:, (080) 73990861
Niger State
KADUNA3B Ribadu Road, Off Tafawa Balewa Way,Doctor’s Quarters - Ungwan Rimi,
Kaduna State
FRANCHISE OFFICES
ABUJASuite B2, Berger Paint Plaza, 6 Alexandria Crescent, Wuse 2
Abuja
LEKKI5, Emma Abimbola Street Viva Mall, Lekki Phase 1Lagos State
EGBEDA24 Egbeda Akowonjo Road,Egbeda
Lagos State
ANTHONY8 Anthony VillageIkeja
Lagos State
WELCOME CENTERS
ABUJAPlot 1568 Muhammadu Buhari Way
Area 11,Garki, Abuja
ALAUSAThe Heritage Place199B Obafemi Awolowo Way
Alausa-Ikeja, Lagos.
YABA176, Herbert Macaulay,
Adekunle, Yaba, Lagos.
FESTACShop 1, festival mallJanet Fajemegbesin StreetAmuwo-Odofin
Lagos State
IKOTABlock K (Suites 4-6 & 15-17),Road 5, Ikota Shopping Complex,
Ikota, Ajah, Lagos State.

222 | ANNUAL REPORT 2020 - AXA MANSARD
3 3.12 CORPORATE ADDRESSESOTHER NATIONAL DISCLOSURE
EPEFirst floor, Oando Service Station71/73 Lagos road
Epe
APAPA12/14 wharf road Apapa
Lagos State
OGBA18 Ijaiye Road Ogba, Ikeja
Lagos State
ENUGUBethel Plaza (Suite A5),Plot 6, Garden Avenue, Opp. Diamond Bank,
Enugu, Enugu State
BENIN15 Sapele Road Benin City
Edo State
UYO140 Olusegun Obasanjo Road (Formerly Abak Road)
Akwa Ibom State
ILORIN30 Ibrahim Taiwo Road Ilorin
Kwara State
ABEOKUTAOffice N0 A002, Block A, Providence Centre Shopping Mall & OfficesMKO Abiola Way, Abeokuta
Ogun State
AHMADU BELLO WAY-V/IPlot 1412, Ahmadu Bello Way,
Victoria Island, Lagos.
OPEBI15/17 Opebi Road
Opebi, Ikeja, Lagos.
ONIKAN2 McCarthy Street, Onikan
Lagos State
PORT HARCOURTPlot 12 Ezimgbu Link Road,Off Stadium Road, GRA Phase IV
Port Harcourt, Rivers State.
IBADAN Broking House,1 Alh. Jimoh Odutola RoadDugbe, Ibadan
Oyo State
SURULERE82 Adeniran Ogunsanya Street, Surulere
Lagos State
KADUNA3B Ribadu Road, Off Tafawa Balewa Way,Doctor’s Quarters - Ungwan Rimi GRA,
Kaduna State
VICTORIA ISLAND84 Ozumba Mbadiwe StreetVictoria Island
Lagos State
LEKKIPlot 3A Kayode Otitoju StreetOff Admiralty RoadAdmiralty Way Lekki
Phase 1, Lagos State