Corporate Farming vis-a-vis Contract Farming in India - RVSKVV
Upload
khangminh22Category
view
3download
0
FACTORS INFLUENCING RABBIT FARMING; A CASE OF RABBIT PRODUCTION
PROJECT IN ABOTHUGUCHI WEST DIVISION, MERU COUNTY, KENYA
EMMA MARY NJERI MBUTU
A RESEARCH REPORT SUBMITTED IN PARTIAL FULFILMENT OF THE
REQUIREMENT FOR THE AWARD OF MASTER OF ARTS DEGREE IN PROJECT
PLANNING AND MANAGEMENT OF THE UNIVERSITY OF NAIROBI
2013
ii
DECLARATION
This research report is my original work and has not been presented to any other institution of
higher learning for award of certificate, diploma or degree.
Signature ………………………………….. Date…………………………………
Emma Mary Njeri Mbutu
L50/77619/2012
This research report has been submitted for examination with our approval as university
supervisors
Signed ……………………………………..Date………………………………..
Dr. Cecilia N. Ritho
Lecturer
Department of Agricultural Economics
University of Nairobi
Signed ……………………………………..Date…………………………………..
Chandi J. Rugendo
School of Continuity and Distance Learning
Department of Extra Mural Studies
University of Nairobi
iii
DEDICATION
This report is dedicated to my husband, Peter I. Mwangi; whose words of encouragement has
been great, also to my first born son Amos in his university second year who has been offering
the competition spirit and my second son David who gained that education is for forever. To my
mother Alice Mbutu for her words of wisdom.
iv
ACKNOWLEDGEMENT
I wish to acknowledge all who have supported me during development of this report. To my
supervisors; Dr. Cecilia N. Ritho of Department of Agricultural Economics and Chandi J.
Rugendo of Department of Extra Mural Studies, University of Nairobi for their continued
guidance. To the Ministry of Livestock Development Staff; Meru Central District led by the
District Livestock Production Officer, Mr Mboroki K.G. for availing the information about the
district and Henry M. Kinyua for availing Abothuguchi West division information. I appreciate
my colleagues for the support they have offered me during the whole period of my studies. I
recognize my group members in Nkubu who encouraged each other during all the tasks and
consultation
v
Table of Contents
PAGE
DECLARATION ....................................................................................................................... ii
DEDICATION .......................................................................................................................... iii
ACKNOWLEDGEMENT ..........................................................................................................iv
LIST OF TABLES .....................................................................................................................ix
ABBREVIATIONS AND ACRONYMS .................................................................................... x
ABSTRACT ..............................................................................................................................xi
CHAPTER ONE ......................................................................................................................... 1
INTRODUCTION ...................................................................................................................... 1
1.1 Background to the Study ................................................................................................1
1.2. Statement of the Problem. .............................................................................................5
1.3 Purpose of the study .......................................................................................................7
1.4 Objective of the study.....................................................................................................7
1.5. Specific Objectives ........................................................................................................8
1.6. Research Questions. ......................................................................................................8
1.7. Justification of the Study. ..............................................................................................9
1.8. Delimitation of the study ...............................................................................................9
1.9. Assumption of the study ............................................................................................... 9
1.10. Definition of significant terms. .................................................................................. 10
CHAPTER TWO ...................................................................................................................... 11
LITERATURE REVIEW .......................................................................................................... 11
2.1 Introduction .................................................................................................................. 11

vi
2.2 Demographic factors .................................................................................................... 11
2.3. Level of Attitude ......................................................................................................... 12
2.4. Income level at household ........................................................................................... 13
2.5. Rabbits Products ......................................................................................................... 15
2.5.1. History about rabbits keeping ................................................................................. 16
2.5.2 Rabbit- other benefits: ............................................................................................. 19
2.6 Conceptual framework ................................................................................................. 21
CHAPTER THREE................................................................................................................... 22
RESEARCH METHODOLOGY .............................................................................................. 22
3.1 Introduction .................................................................................................................. 22
3.2 Research Design ........................................................................................................... 22
3.3 Target Population ......................................................................................................... 22
3.4 Sample and Sampling Procedure .................................................................................. 23
3.5 Research Instruments ................................................................................................... 25
3.6 Pilot Study ................................................................................................................... 25
3.7 Reliability .................................................................................................................... 25
3.8 Validity ........................................................................................................................ 25
3.9. Methods of Data Collection ......................................................................................... 26
3.10 Data Analysis ............................................................................................................ 26
3.11. Ethical considerations ................................................................................................ 27
CHAPTER FOUR ..................................................................................................................... 30
DATA ANALYSIS, PRESENTATION AND INTERPRETATION ......................................... 30
4.1 Introduction .................................................................................................................. 30
vii
4.2 Response rates .............................................................................................................. 30
4.3 General characteristics ................................................................................................. 30
4.3.1 Distribution of number of rabbits owned and the rabbit farmers Age ....................... 30
4.3.2 Distribution of rabbits farmers and their education level .......................................... 31
4.3.3 Number of rabbits owned and gender of household ................................................. 32
4.3.4 Number of rabbits owned and the size of family ...................................................... 32
4.3.5 Number of rabbits owned and the size of the farm ................................................... 33
4.4 Households income ...................................................................................................... 33
4.4.1 Number of rabbits owned and the source of household income ................................ 33
4.4.2 Number of rabbits owned and the level of household income ................................... 34
4.5 Household members involvement in rabbit farming activities ....................................... 35
4.5.1 Level of involvement towards rabbit farming activities ............................................ 35
4.5.2 Readiness to source for rabbit farming information .................................................. 36
4.5.3 Rabbit farming training and frequency of training.................................................... 36
4.6 Rabbit products and their influence to rabbit farming ................................................... 37
4.7 Number of rabbits farmers own and the period they started to rear rabbits .................... 39
CHAPTER FIVE ...................................................................................................................... 40
SUMMARY, DISCUSSIONS, CONCLUSIONS AND RECOMMENDATIONS ..................... 40
5.1 Introduction .................................................................................................................. 40
5.2 The Summary and discussion of the findings of the research ........................................ 40
5.2.1 Influence of demographic factors on rabbit farming. ................................................ 40
5.2.2 Influence of income on rabbit farming. .................................................................... 41
5.2.3 Influence of attitude rabbit farming. ......................................................................... 42
viii
5.2.4 Influence of rabbit products towards rabbit farming. ................................................ 43
5.3 Conclusions .................................................................................................................. 44
5.4 Recommendations ........................................................................................................ 46
5.5 Suggestions on other issues requiring research ............................................................. 47
REFERENCES ......................................................................................................................... 48
APPENDICES .......................................................................................................................... 54
Appendix 1: Letter of Transmittal of data collection .................................................................. 54
Appendix 2: Questionnaire for the study ................................................................................... 55
ix
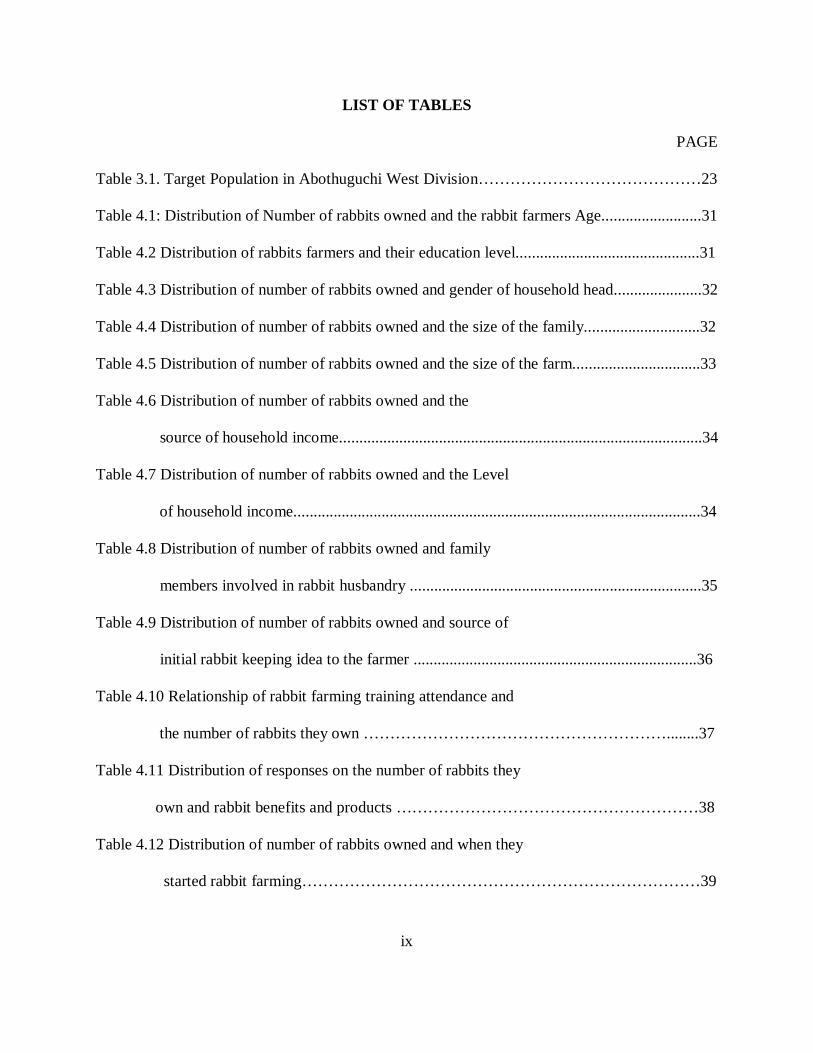
LIST OF TABLES
PAGE
Table 3.1. Target Population in Abothuguchi West Division……………………………………23
Table 4.1: Distribution of Number of rabbits owned and the rabbit farmers Age.........................31
Table 4.2 Distribution of rabbits farmers and their education level..............................................31
Table 4.3 Distribution of number of rabbits owned and gender of household head......................32
Table 4.4 Distribution of number of rabbits owned and the size of the family.............................32
Table 4.5 Distribution of number of rabbits owned and the size of the farm................................33
Table 4.6 Distribution of number of rabbits owned and the
source of household income...........................................................................................34
Table 4.7 Distribution of number of rabbits owned and the Level
of household income......................................................................................................34
Table 4.8 Distribution of number of rabbits owned and family
members involved in rabbit husbandry .........................................................................35
Table 4.9 Distribution of number of rabbits owned and source of
initial rabbit keeping idea to the farmer .......................................................................36
Table 4.10 Relationship of rabbit farming training attendance and
the number of rabbits they own …………………………………………………........37
Table 4.11 Distribution of responses on the number of rabbits they
own and rabbit benefits and products …………………………………………………38
Table 4.12 Distribution of number of rabbits owned and when they
started rabbit farming…………………………………………………………………39
x
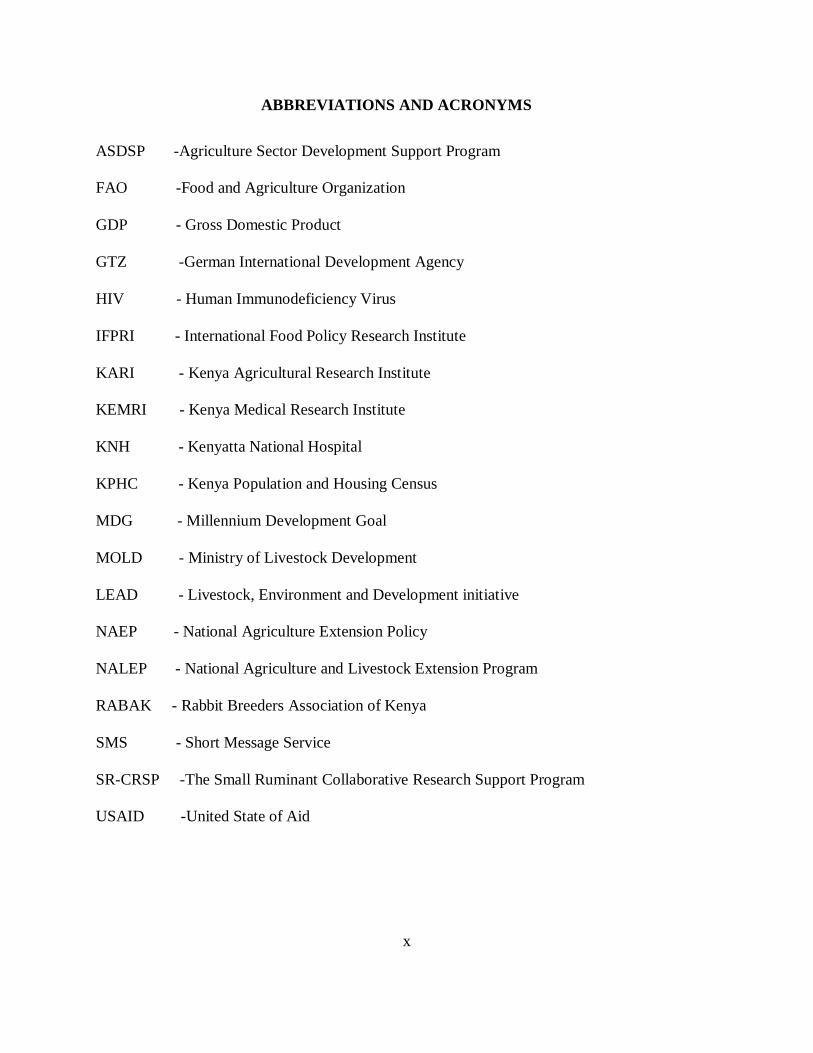
ABBREVIATIONS AND ACRONYMS
ASDSP -Agriculture Sector Development Support Program
FAO -Food and Agriculture Organization
GDP - Gross Domestic Product
GTZ -German International Development Agency
HIV - Human Immunodeficiency Virus
IFPRI - International Food Policy Research Institute
KARI - Kenya Agricultural Research Institute
KEMRI - Kenya Medical Research Institute
KNH - Kenyatta National Hospital
KPHC - Kenya Population and Housing Census
MDG - Millennium Development Goal
MOLD - Ministry of Livestock Development
LEAD - Livestock, Environment and Development initiative
NAEP - National Agriculture Extension Policy
NALEP - National Agriculture and Livestock Extension Program
RABAK - Rabbit Breeders Association of Kenya
SMS - Short Message Service
SR-CRSP -The Small Ruminant Collaborative Research Support Program
USAID -United State of Aid
xi
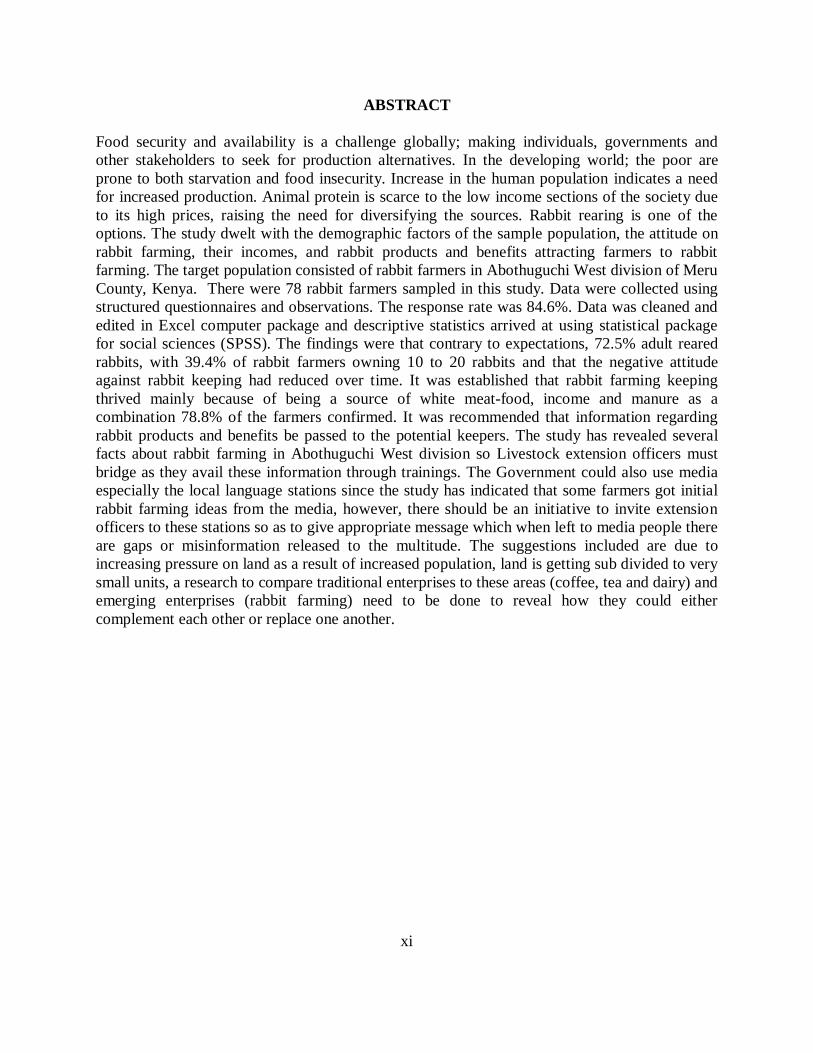
ABSTRACT
Food security and availability is a challenge globally; making individuals, governments and other stakeholders to seek for production alternatives. In the developing world; the poor are prone to both starvation and food insecurity. Increase in the human population indicates a need for increased production. Animal protein is scarce to the low income sections of the society due to its high prices, raising the need for diversifying the sources. Rabbit rearing is one of the options. The study dwelt with the demographic factors of the sample population, the attitude on rabbit farming, their incomes, and rabbit products and benefits attracting farmers to rabbit farming. The target population consisted of rabbit farmers in Abothuguchi West division of Meru County, Kenya. There were 78 rabbit farmers sampled in this study. Data were collected using structured questionnaires and observations. The response rate was 84.6%. Data was cleaned and edited in Excel computer package and descriptive statistics arrived at using statistical package for social sciences (SPSS). The findings were that contrary to expectations, 72.5% adult reared rabbits, with 39.4% of rabbit farmers owning 10 to 20 rabbits and that the negative attitude against rabbit keeping had reduced over time. It was established that rabbit farming keeping thrived mainly because of being a source of white meat-food, income and manure as a combination 78.8% of the farmers confirmed. It was recommended that information regarding rabbit products and benefits be passed to the potential keepers. The study has revealed several facts about rabbit farming in Abothuguchi West division so Livestock extension officers must bridge as they avail these information through trainings. The Government could also use media especially the local language stations since the study has indicated that some farmers got initial rabbit farming ideas from the media, however, there should be an initiative to invite extension officers to these stations so as to give appropriate message which when left to media people there are gaps or misinformation released to the multitude. The suggestions included are due to increasing pressure on land as a result of increased population, land is getting sub divided to very small units, a research to compare traditional enterprises to these areas (coffee, tea and dairy) and emerging enterprises (rabbit farming) need to be done to reveal how they could either complement each other or replace one another.
1
CHAPTER ONE
INTRODUCTION
1.1 Background to the Study
According to Andersen et, al. (1999) seventy three million people will be added every year
between 1995 and 2020 which is at thirty two percent to reach 7.5 billion world populations.
Mirkin (2005) presented a report on world demographic trends to the UN which indicated that
the world population stood at 6.5 billion and was expected to reach the 7 billion mark in 2013
due to dynamic population change as reflected in new and diverse patterns of family formation,
childbearing, mortality, ageing, urbanization and migration. This population growth will mainly
be in the cities and rural areas of developing world which will lead to an increase in world food
demand for both the cereals and meat. The WorldWatch Institute (2004) concerned with Vision
for Sustainable World noted that food productivity of farmland in the world is gradually lagging
behind population growth.
International Food Policy Research Institute, Food Policy Report by Andersen (1999) also
reported that the volume of meat consumed in the developing world grew three times faster than
developed world, which according to FAO (2006) through LEAD initiative showed that more
than two third of agriculture land has been allocated to livestock production while a third is left
for crop production leading to decrease in forest and grassland sizes as more were opened to
create more space for production. IFPRI (1999) state that there has been a success in improving
agricultural productivity in the world, however in the Sub-Saharan African food situation is still
extremely difficult as large-scale breakthroughs in agricultural productivity and improvements in
food security are yet to occur in the region.
2
Chauvin et, al. (2012) reported to UNDP that African countries’ agricultural sector provides a
relatively large share of GDP but productivity in the sector has lagged behind that of other
continents and the potential that Africa can reach in the sector. Agricultural productivity is below
yield potentials, agricultural mechanization is weak and declining. The rural population has been
unable to transform their basic agriculture, which is a major economic activity, which led to
World Bank in its 2008 World Development Report, to devote to Agriculture and Rural
Development as the center of the development agenda to achieve Millennium Development
Goals of halving extreme poverty and hunger by 2015.
Kenya Vision 2030 (2007) has the details of how Kenya government consultatively developed a
development strategy that was called Vision 2030. It aimed to move the country economy to
middle income by 2030 through three pillars namely Social, Political and Economics. Through
the Economic pillar, Agriculture’s contribution shall be enhanced by promoting innovation,
commercially oriented and modern farming techniques in order to improve on agricultural
productivity.
FAO (2008) has stated that meat is part of a balanced diet that contributes valuable nutrients that
are beneficial to health, since meat and meat products contain important levels of protein,
vitamins, minerals and micronutrients which are essential for growth and development. In the
developed and industrialized countries per capita consumption of meat is high as indicated in the
FAO (2008), it is at 82.9 kg/year, while at 31.1 kg/year in developing countries. Average global
per capita meat consumption is 42.1 kg/year against the recommended daily animal-sourced
protein per capita of 50 kg per year. In the developing countries the level is insufficient and often
leads to under-nourishment and malnutrition. FAO (2004) estimates that more than 2 billion
3
people in the world are deficient in key vitamins and minerals, particularly vitamin A, iodine,
iron and zinc and more than half of this are in Africa. Deficiencies being inadequacy or low
levels occur when people have limited access to micronutrient-rich foods such as meat, fish, fruit
and vegetables. The report further state that most people with micronutrient deficiencies live in
low income countries and are typically deficient in more than one micronutrient. FAO (2010)
indicated that a rise in global population mirrors the growth of the meat industry and that
generally, in developing countries when people have more money, they increase the meat and
animal products in their diets which have promoted demand for cheap protein, and however, the
space for expansion in livestock production is limited. According to FAO (1982) by the year
2000 the meat requirements of one-third of the human population was to be satisfied by the
supply of pork, poultry and rabbit meat. The Organization has a program in meat and meat
products which aims to assist the member countries in exploiting the opportunities for livestock
development and poverty alleviation through the promotion of safe and efficient production,
processing and marketing of meat and meat products.
According to Ministry of Agriculture program document, ASDSP (2011) Kenya land area is
approximately five eighty seven thousand Kilometers squared (587,000km2) with estimated
population of forty million, eight sixty three thousand (40,863,000) people and a growth rate of
2.7%. ASDSP (2011) explains that life expectancy is at 55years for women and 53 years for men
having reduced from 69 and 67 respectively, which is mostly due to lifestyle changes in both
behavior and diet. It also noted that nearly half of Kenyan population lives below poverty line
which is 45.9% nationally and 49.1% in the rural areas. According to the report, the poorest 10%
human population in Kenya consumption is 2.5% of national food consumption, yet they
4
contribute very little of what they consume. The economic review of agriculture 2007 indicates
that 51% of the Kenyan population lack access to adequate food. This inaccessibility to food is
closely linked to poverty which stands at 46% (National Economic Survey, 2008).
FAO (2008) estimate shows that the average global per capita meat consumption is 42.1 kg/year
with 82.9 kg/year in developed and 31.1 kg/year in developing countries against the
recommended daily animal-sourced protein per capita of 50 kg per year. FAOSTAT (2007) puts
red meat supply including offal at 16.34 kg per capita in Kenya which is below level identified
by FAO for the developing countries like Kenya as well as below the recommended FAO protein
per capita. This identifies a gap that need to be addressed to improve on supply of animal source
protein. In Meru Central district (2011), Annual Livestock Production report, the district
population of 141,768 persons was estimated to have consumed red meat which amounted to
442,940 kilograms which shows that within that year each person consumed approximately 3 kg
per year of meat. This is just the official figure that does not include the meat not inspected or the
meat from neighbouring districts. This is below the FAO recommended figure of 50 kg per year.
Agriculture has been the mainstay of the Kenyan’s economy, providing 26% of the GDP while
80% of the rural population derives their livelihood from agriculture and other related activities.
Kenya Government has strived to achieve national, household and individual food security
throughout the country through increased production of major food crops. The government has
been having programs meant to assist in improved food production, for example, SR-CRSP by
KARI supported by USAID for the last 10 years was initiated due to increasing demand for
animal products. The government appreciated that a proportional share of small ruminant
productivity is necessary to improve on food availability without environmental degradation. It
5
has successfully brought awareness of significance of small ruminant industry to policy makers.
It has also successfully lobbied to have rabbits included in the list of small ruminants for their
efficiency to convert fodder to food as the whole point of meat production is to convert plant
proteins of little or no use to people as food into high-value animal protein. Cheeke (1980) noted
that recently there has been increased awareness of the advantages of rabbit meat production in
developing countries as a means to alleviate food shortages which is attributed to the rabbit
having a high rate of reproduction; early maturity; rapid growth rate; high genetic selection
potential; efficient feed and land space utilization; limited competition with humans for similar
foods; and high-quality nutritious meat. Lukefahr (1987) indicated that rabbit rearing should be
strongly integrated into traditional farming practices to ensure the recycling of garden and/or
kitchen refuse as rabbit feed and the conversion of rabbit manure into compost for enhancing
farm soil. Such applied integration may give increased yields while requiring only marginal
capital expenditure.
Lukefahr (1987) stated that correct care and management are necessary if rabbit production is to
be successful. He noted that in many cultures, livestock have to scavenge for their own food, find
shelter and water under open conditions which can only supports limited production. He
indicates that for many farmers, rabbits are not easy to rear as they require meticulous care and
labour. Confinement rearing and lack of technical knowledge have been identified as traditional
hindrance to rabbit farming in many developing countries.
1.2. Statement of the Problem.
In 1992 the Government of Federal Republic of Germany through its GTZ component, together
with Government of Kenya (GOK) through its Ministry of Agriculture; Livestock Production
6
Department funded a project Integrated Small Livestock Project (ISLP - 1992) that had four
components; dairy goat production, poultry, rabbit and beekeeping targeting small scale farmers.
The objective was to improve production of the named enterprises, improve food security and
incomes. While dairy goat and poultry production farmer groups were formed and still carrying
out their activities as witnessed in the field, the beekeeping farmer groups declined and those for
rabbit production collapsed leaving only a few individual farmers continuing with rabbit
production. In 2000 Sweden Government through its SIDA component, together with GOK
Ministry of Agriculture and Ministry of Livestock Development funded an extension program
National Agriculture and Livestock Extension Program (NALEP 2000 -2012) that targeted
farmer groups who had a common interest in farm production, farm produce marketing and value
addition. Among the enterprises targeted was rabbit production. According NALEP Report
(2012) Thika district which was among the pilot district had a target of 23 Focal Areas (FA),
during which 20 Focal areas were successfully implemented, within those FA total of 5 rabbit
production Common Interest Groups (CIG) were formed with 25 members (10 youths and 15
women). The following year Rabbit CIGs increased from 5 to 7 CIGs while membership
increased from 25 to 35 members (10 youths 5 women and 18 men). In 2005 a self help group
with 50 members (30 women 10 men and 10 youths was registered, in five years the growth of
membership grew at fifty percent, that is, at ten percent each year. In 2010 the GOK through the
Ministry of Livestock Development initiated a Rabbit Production Project; Rabbit Production
(2011 – 2014) in twenty two districts spread across the country, following the Impact
Assessment Report (2006) on NALEP which had identified rabbit production as a means to
address food security as a source of animal protein and a source of income for small scale
farmers as well as the poor farmers in both the urban and rural areas, however, the uptake and
7
adoption rates for the enterprise have remained low. Following these deliberate initiatives to
increase rabbit population and adoption rates remaining low and slow there is need to establish
how several factors influence rabbit production.
1.3 Purpose of the study
The study assessed the factors influencing rabbit farming; a case of rabbit production project in
Abothuguchi West Division, Meru Central district, Meru County. The GOK allocated resources
towards promotion of rabbit production project in the district yet population figures and trends
indicate that there are minimal changes in adoption rate and rabbit population.
1.4 Objective of the study
After several initiatives contributing towards rabbit production promotion; Integrated Small
Livestock Project (1992 – 1998), NALEP (2000 – 2012) and the Ministry of Livestock
Development Rabbit production Project (2011- 2014) there was need to establish how various
factors influence rabbit farming.
8
1.5. Specific Objectives
1. To find out how demographic factors influence rabbit farming in Abothuguchi West
division, Meru Central district.
2. To find out the relationship between rabbit farming and the farmers’ attitude in
Abothuguchi West division, Meru Central district.
3. To determine how the level of family incomes influence rabbit farming in Abothuguchi
West division, Meru Central district.
4. To find out how rabbit products influence rabbit farming in Abothuguchi West division,
Meru Central district.
1.6. Research Questions.
1. How do demographic factors influence rabbit farming in Abothuguchi West division,
Meru Central district?
2. What is the relationship between farmers’ attitude and rabbit farming among rabbit
farmers in Abothuguchi West division, Meru Central district?
3. How do family incomes influence rabbit farming in Abothuguchi West division, Meru
Central district?
4. How do rabbit products influence rabbit farming in Abothuguchi West division, Meru
Central district?
9
1.7. Justification of the Study.
According to Micro-report No. 184, livestock sector employs close to 50 percent of Kenya’s
agricultural labor force and it is estimated that livestock sector contribution to Kenya GDP at 5.6
percent while its contribution to agricultural GDP is estimated at 30 percent. Expansion of the
sector would contribute much more towards wealth and job creation, as well as improve food
security and diet improvement. It was important to have the study so that as the government
continue to fund for rabbit production project, then it would be possible for the government and
other private investors to strategize on how to expand and sustain the rabbit production as source
of income and its contribution towards food security especially among the 49.1% rural poor
community. The entrepreneurs would make use of the value chain to ensure its enrichment, with
some opting for production and breeding, others on support services e.g. (feeds and drugs
manufacturers, equipment provision), and others on processing and value addition.
1.8. Delimitation of the study
The research project was carried out in Abothuguchi West division; Meru Central district
focusing on rabbit production farmers, with the sample size of 78 farmers. The study was on
demographic factors, income, farmers’ attitude and rabbit products and how they influenced
rabbit farming in the area of study.
1.9. Assumption of the study
The rabbit farmers would be ready to provide truthful responses since their confidentiality would
be guaranteed. It was also necessary to assume that rabbit production project support in
Abothuguchi West division would continue to the final phase. Expectations were that response

10
rate would be a hundred percent, it was not possible since it is a tea zone and it was during a tea
picking season, which was at its highest since there were rains and cold season had not set in
the area.
1.10. Definition of significant terms.
Rabbit products- These are what one get from rabbit farming that the farmer benefit from. In case
of rabbit farming they include food (white meat), manure, income from products or rabbit
sale, skin/fur.
Rabbit productivity - This is the level of production in various products from the rabbits, when
good husbandry is practiced then the productivity goes up and benefits are more. Poor
rabbit husbandry gives poor/low production level and subsequently low benefits.
Total farm income- this is the income that a farmer gets from the farming activities he undertakes
in his farm.
Livestock officer- Personnel in Ministry of Livestock Development deployed in the field to
disseminate information concerning livestock enterprises, rabbits included.
11
CHAPTER TWO
LITERATURE REVIEW
2.1 Introduction
The chapter provides a solid background for the research study through review of the objectives
which are demographic factors, level of attitudes, income levels and rabbit products and their
influence on rabbit farming. Source of review included books, publications, journals, reports and
other information from the internet.
2.2 Demographic factors
Demographic factors are characteristics assigned to age, sex, marital status, religion, birth rate,
death rate, family size, and marriage age. Heller (2010) as he examined implications of
demographic factors on infrastructure development in the developing world stated that
demographic factors are key to development but are often ignored. He recommended to policy
makers to consider population and its indicators as they make development choices since there is
a connection between these factors and development. Duncan (2004) looked at age as aspect of
demographic factors in relation to food consumption. He indicated that as a population age, that
is having more elderly people than young ones, food consumption per capita decline as well as
change in dietary patterns due to change in preference.
Sadik (1989) did a study and presented her findings to a UNFPA forum; she said that in
developing world women are responsible for half of food produced, in time and energy spent on
cultivation, harvesting, processing and preparation of food, however, most governments are yet
to recognize this role. Women are pivotal in family planning services, improvement in nutrition,
access to education and health. The governments need to make deliberate efforts to recognize
12
women roles which would ensure adequate food production. She also advised that special
agricultural and environmental extension services should be made available to women since they
carry out much of land and water management. The report concluded that better educated women
are more effective as farmers and environmental managers.
Hadrich (2011) stated that human capital in terms of age, experience, education, and
management capabilities of the farm operators can be considered important as they contributed
to reduce the marginal factor cost. Sumner and Leiby (1987) indicated that when younger
farmers have education and an initial finance they tend to adopt technology faster than older
farmers. Moreover they are more flexible to changing prices and technology thereby achieves
higher production and profits.
Quisumbing (1995) showed that in general, male and female farmers are equally efficient as
farm managers. However, where women farmers' yields are lower it can be attributed to use of
lower levels of inputs and human capital as compared to men. The author agrees further that
level of education for both men and women are significant in dynamic agricultural settings where
modern technologies have been introduced. The report concluded that farmers with more
education were more likely to adopt new technologies.
2.3. Level of Attitude
Attitudes being evaluations of associated beliefs and behaviors towards some object are subject
to changes brought about by social influence and they are not stable. Increase in communication
and different behaviour of other people influence attitude. Boninger et, al. (1995) noted that
media may describe events where people engage in dramatic acts due to passionately held
13
attitudes while others are unmoved by the same issues. This variability in how much people
invest in attitudes is called attitude strength whose indicators are the extremity, the accessibility
and the certainty with which they are held and have been used to gauge attitude strength. They
also stated that there is evidence that, attitudes people consider important are firm and exert great
influence on social perception and behaviour. These important attitudes are beliefs having
definitive characteristics which include resistant to change, are stable over time, they impact on
cognition and behaviour. This is an indication of selective exposure to relevant information,
better memory for that information and the way it is organized once in the memory. Ira (1988)
noted that attaching importance to an attitude is making a commitment to think about an object,
gather information on the object and use that information together with attitude to make relevant
decisions.
Xu et, al. (2005) noted there are positive and statistically significant correlations of producers’
risk attitudes in various areas of the farm business just as there are also some differences in
producers’ willingness to risk, especially in the finance area. Lien (2008) stated that many
farmers important decisions have an emotional impact and these decisions will affect both future
lifestyle and one’s identity as a farmer, possibly for several generations.
2.4. Income level at household
Income is a factor among the socioeconomic; Boskey (2009) defined socioeconomic as a
combination of factors which include income, level of education and occupation, including a
way of looking at how individuals or families fit into society as they use economic and social
measures that impact on their health and well being. Business dictionary describe income as the
flow of cash or cash-equivalents received from work as wage and salary, from capital as interest

14
and profit or land as rent. Ahearn et, al. (1985) indicated that there is a circular flow of income
between different sectors. It revolves around businesses that produce goods and services to
generate income that can then be used for factors of production in firms or households and other
potions put aside for savings and taxation. Income is shared between personal income, whereby
some is distributed among people or income groups and the other portion distributed to factors of
production (labour, land and capital).
Okello (2004) report indicated that differences in income and social services have caused
inequality in Kenya which is manifested in different forms. He gave an example of total income
control in Kenyan households. Top 10% wealthy households control 42% of total income while
the bottom 10% poor households control less than 1% of the income. Business dictionary state
that as levels of income change in the households, then food consumption in those households
also changes. Especially the income dependent goods sell more than non income dependent
goods when income improves, for instance, demand for staple food does not increase while that
restaurant foods increase with individual income.
Schnepf (2012) noted that within farming community there are two incomes, net cash income
and net farm income, whereby net cash income is generally less variable than net farm income.
He defined net cash income as a flow of cash at farm level where farmers are able to meet family
living expenses and make debt payments. This does not include crops that are produced,
harvested and kept on-farm storage. They must be sold so as to be counted as part of the
household’s cash flow. To reduce variability in net cash income decisions on produce sales and
input purchases are made at appropriate time. He described net farm income as farmers’ net
value added to the national economy within a calendar year as cash or noncash form. It includes
15
the value of home consumption, changes in inventories, capital replacement, and implicit rent
and expenses related to the farmers’ dwelling that are not reflected in cash transactions. A crop
which is grown, harvested and it is on farm storage has to be included in the farm’s net income
calculation. However, off- farm income are not included in net farm income calculations.
Ahearn et, al. (1985) concluded that off-farm income reduces income inequality in the United
States and higher incomes from farm production reduce the need to look for additional income
from off-farm sources.
2.5. Rabbits Products
According to United State Department of Agriculture, circular Number 549 results, extensive test
had shown that domestic rabbit meat is the most nutritious meat known to man. It is all white
meat that has cholesterol levels and fat percentage at a much lower level than chicken, turkey,
beef, or pork meat. Compared cholesterol level showed that rabbit meat has 82mg, chicken has
110mg, beef has 115mg and mutton has 125mg per 8 ounces serving of all the mentioned meat..
Nutritional Value of Rabbit Meat, Issue Number 5 (2004) state that rabbit meat is fit to provide
special diet for people having heart diseases and for the aged. Rabbit from farm to table can be as
fresh or frozen rabbit meat which is sold all year round. Rabbit sold in United State of America
as food are labeled as fryer they are young rabbit weighing between 1.5 to 3.5 pounds and at less
than 12 weeks of age. The flesh is tender, fine grained and pearly pink color should be cooked as
young poultry. Mature rabbits are labeled as roasters, they weigh over 4 pounds at over 8 months
of age. The flesh is firm, coarse grained and is slightly darker in color and less tender, stewing
would be better. The inner organs, the liver and the heart are called Giblets.
16
Cheeke (1980) stated that a doe rabbit that weighs 10 pounds can produce 320 pounds of meat
per year, since it gives kids four times per year and during each time it produces a litter size of
eight kids. Alternatively a cow produces 240 pounds of meat and it takes 2 acres of land to raise
a cow. A kid rabbit feeding from its mother’s milk can achieve double weight in 6 days as
compared to a piglet that doubles weight at 14 days or calves at 47days and human at 160 days.
Therefore rabbits are among the most productive animals among the domestic livestock. Rabbits
rearing is done off the ground in raised cages and therefore give one of the cleanest meats.
Lukefahr (1985) noted that as the human population in the world increases, the land and water to
produce food will decrease. Most of the countries in the tropics and sub tropics need to produce
more meat in order to supply their increasing population with animal protein The rabbit will play
a more increasing role to supply animal protein. The rabbit has several points in its favor as a
meat producer which includes feeding rabbit on a great variety of locally available foods (weeds,
and kitchen vegetables). Due to rabbit small size its handling is easy and therefore can be cared
for by members of all genders. The carcass is small enough and a household would be able to
utilize it without having to store for a later use. A female adult rabbit will produce average of 6
to 8 young ones every 2 months and they are ready for consumption after 5 to 6 months. Herd
size (the number of rabbits in the herd) can easily be matched to the rabbit’s keeper resources.
2.5.1. History about rabbits keeping
National statistics do not include rabbit production and the few basic statistics from (FAO 2008)
survey suggested a possible world output of roughly 1 million tonnes of carcasses which would
mean a per capita consumption of approximately 200 g of rabbit meat per person. Albama
University (1989) documented a historical description of how rabbit keeping started in the world.
17
The document analyzes that the wild rabbit Oryctolagus cuniculus of southern Europe and North
Africa was discovered by Phoenicians (Greeks) when they reached the shores of Spain about
1000 BC. The Romans contributed to spreading of the rabbit throughout the Roman Empire as a
game animal which was a better alternative as it saved waste over bigger animals’, because the
hunted rabbit was all eaten since there was no refrigeration. In the sixteenth century there was a
first indication of controlled breeding as domestication was started by the monks, since it
provided them with a more delectable dish than the tougher wild rabbit which then spread across
France, Italy, Flanders and England. Albama University records that an organisation (Agricola
1595) had mentioned the existence of grey-brown (wild), white, black, piebald (black and white)
and ash-grey rabbits while (Olivier de Serres 1606) classified three types of rabbit: the wild
rabbit, the semi-wild or "warren" rabbit raised inside walls or ditches, and the domesticated or
hutch-bred rabbit. Rabbit rearing in hutches (domestication) sprang up all over rural Western
Europe and also in city suburbs where they were kept in the back yard together with poultry.
European colonial expansion saw the introduction of the rabbit in many countries where it was
unknown, such as Australia and New Zealand. Sailing vessels distributed rabbits on islands in
various sea lanes to be used as a source of food by sailors’.
Cheeke (1980) appreciated that due to rabbit domestication activities like hutch rearing system
and selection of breeding materials rabbit population exploded. Backyard rabbit production had
to shift to rational production that led to rationalized breeding techniques and hutch hygiene
improvement through formation of breeders associations. The Second World War saw the
extensive development of rabbit production throughout Europe and Japan to cope with meat
shortages. Under these demanding conditions, rabbits demonstrated their highly efficient feed-
18
conversion capacity. Europe accounts for 85% of world rabbit meat output since there is
Industrial rabbit production in units of 200 to 1 000 hybrid does reared in buildings with artificial
light and controlled ventilation. The breeding females are exposed to artificial lighting for 15 to
16 hours a day and produce all through the year. They are reared in one- to four-storey mesh
cages (flat-deck and battery).
In Africa, several countries have been promoting rabbit production. The Ghana government
started the National Rabbit Project in 1971. By 1974 the rabbit breeding herd at Kwabenya, near
Legon, had increased to approximately 698 and by 1975 to approximately 1,478 as stated by
Mamattah (1978). The project was promoting rabbit production on a small backyard scale, using
breeding rabbits (materials) from government Rabbits centre. In Malawi, rabbit production is on
a small scale only and there are no development schemes in operation. Most of the rabbits are
kept near the main urban areas of Lilongwe, Blantyre and Zomba whereby the herd size do not
exceed 30 in number as McNitt (1980) observed. The two main African rabbit producers are
Ghana and Egypt both with 7 000-8 000 tonnes of carcasses a year. Far behind come Algeria and
the Sudan, with 1 000-2 000 tonnes a year.
Borter (2011) indicated that in Kenya rabbit production dates back to colonial times and there
were efforts to promote it in 1980s through National Rabbit Development Program funded by
Government of Kenya and German International Development Agency (GTZ). National
Breeding Station in Ngong Veterinary Farm was set up with an objective of providing breeding
materials to the farmers throughout the country. Breeding stock was imported from West
Germany (now called Federal Republic of Germany). Despite efforts to promote, socio-cultural
factors remained a hindrance to widespread adoption of rabbit. This was due to fact that rabbit
19
keeping was for young boys and other social groups gave it little attention. Due to poor response
from farmers, multiplication centers were closed except Ngong Veterinary farm. Recently there
has been renewed interest with numerous rabbit keeping groups with membership stretching
through different gender groups have sprung up and have registered under an umbrella
association called Rabbit Breeders Association of Kenya (RABAK) based in Thika. Rabbit
production is one of the growing livestock enterprises in the country, though there has been no
study yet to ascertain the reasons for this. It is speculated that reduction in land size holdings has
pushed farmers to choose livestock enterprises such as rabbit which have low demand on land
and resources. The rabbit population is 600,000 rabbits concentrated in Central, Western and Rift
Valley provinces (MOLD, 2010). Kenya has only recorded exports of rabbit meat to Sudan over
the period 2000 – 2010 with highest export value being Kshs 0.49 million in 2008.
2.5.2 Rabbit- other benefits:
Rabbits have been associated with several benefits, INFRA – FAO Survey (1981) reported that
rabbits have other useful by products e.g. skin, wool and organic manure. The best quality skins
are used after tanning for garments, linings and gloves. Russia and Poland make domestic use of
all the skins they produce. The wool of the Angora rabbit forms a special sector of the
international wool trade. Wool production is mainly concentrated in Czechoslovakia (80-120
tonnes a year), France (100 tonnes) and the Federal Republic of Germany (30-40 tonnes).
Domestic Rabbit magazine (1990) stated that manure from rabbits has the following percentages
of dry material; 2.20% Nitrogen, 87% Phosphorus, 2.30% Potassium, 36% Sulfur, 1.26%
Calcium and 40% Magnesium.

20
Success of Rabbit production project would be ensured through a successful program, to train
farmers and offer extension support. Developing countries experience technical problems, total
failure attributed to inadequate education or lack of extension follow-up in methods of small-
scale rabbit raising as (Borter and Mwanza 2011) noted.
21
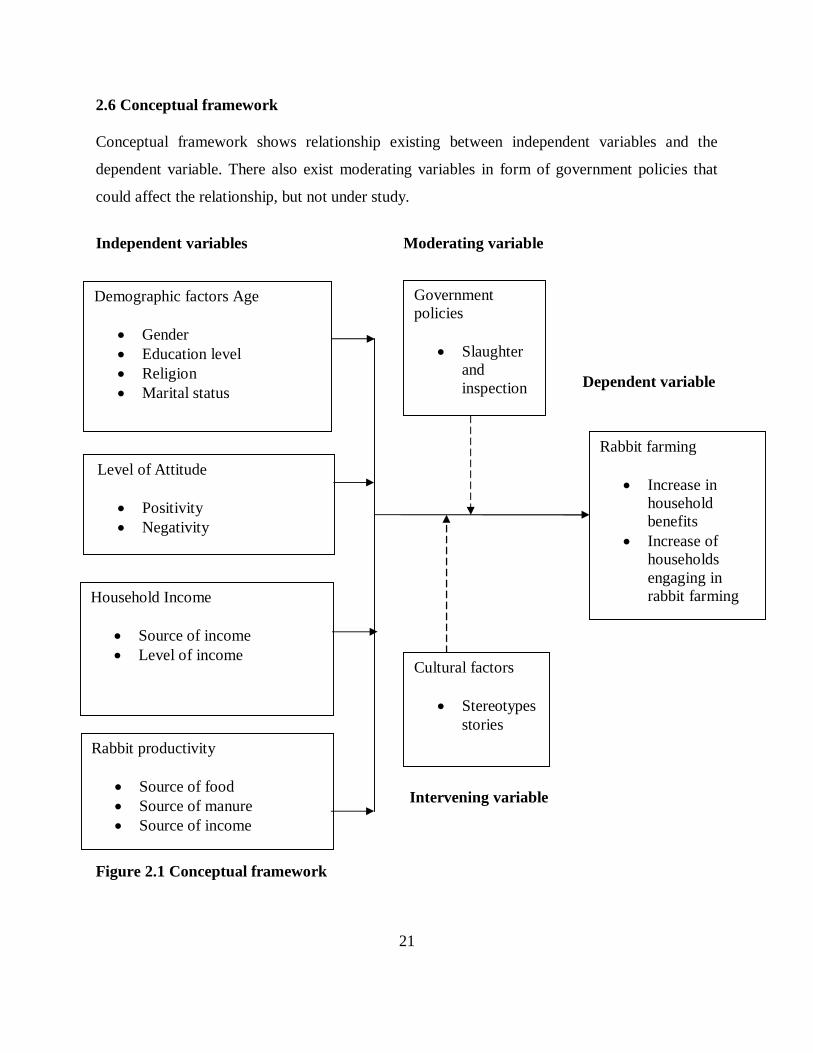
2.6 Conceptual framework
Conceptual framework shows relationship existing between independent variables and the
dependent variable. There also exist moderating variables in form of government policies that
could affect the relationship, but not under study.
Independent variables Moderating variable
Dependent variable
Intervening variable
Figure 2.1 Conceptual framework
Government policies
Slaughter and inspection
Rabbit farming
Increase in household benefits
Increase of households engaging in rabbit farming
Level of Attitude
Positivity Negativity
Household Income
Source of income Level of income
Cultural factors
Stereotypes stories
Rabbit productivity
Source of food Source of manure Source of income
Demographic factors Age
Gender Education level Religion Marital status
22
CHAPTER THREE
RESEARCH METHODOLOGY
3.1 Introduction
This chapter reviewed the research methodology used to conduct this study; the research design,
sample and sampling procedure, research instruments used, data collection tools and the data
analysis method.
3.2 Research Design
The study carried out about an existing situation where environment was not manipulated which
(Kombo et al 2006) describes as descriptive survey and stated it was appropriate for behavioural
science as it seeked to find out factors associated with certain occurrences, outcomes and
condition of behaviour. It involved collection of information through use of interviews and
questionnaire administration to assist in revealing the nature of existing situation as Orodho,
(2003) prescribes.
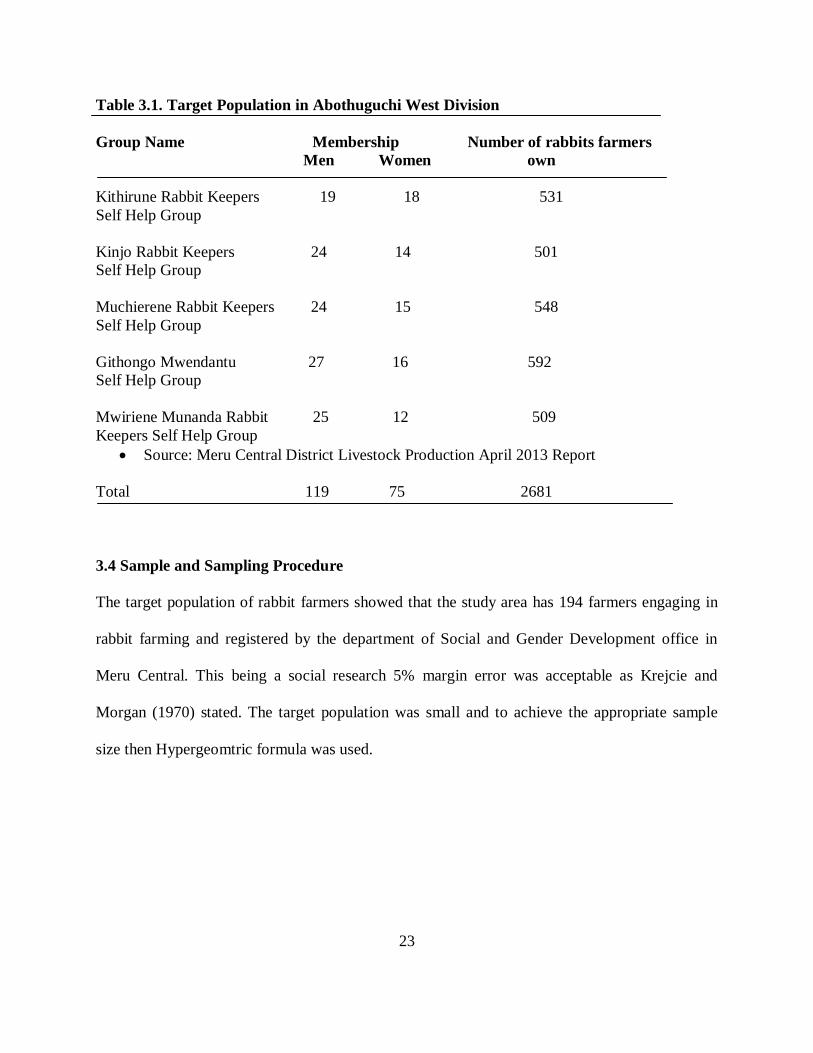
3.3 Target Population
The target population was rabbit farming farmers who are in registered group within
Abothuguchi West division of Meru Central district Meru County. There are five rabbit farmers
registered group with a membership of 194 farmers (119 men and 75 women) who have 2681
rabbits. The division has an area of 61.4km2 and estimated human population 38000 and
Divisional Annual Livestock Production report (2012).
23
Table 3.1. Target Population in Abothuguchi West Division
Group Name Membership Number of rabbits farmers Men Women own Kithirune Rabbit Keepers 19 18 531 Self Help Group Kinjo Rabbit Keepers 24 14 501 Self Help Group Muchierene Rabbit Keepers 24 15 548 Self Help Group Githongo Mwendantu 27 16 592 Self Help Group Mwiriene Munanda Rabbit 25 12 509 Keepers Self Help Group
Source: Meru Central District Livestock Production April 2013 Report Total 119 75 2681
3.4 Sample and Sampling Procedure
The target population of rabbit farmers showed that the study area has 194 farmers engaging in
rabbit farming and registered by the department of Social and Gender Development office in
Meru Central. This being a social research 5% margin error was acceptable as Krejcie and
Morgan (1970) stated. The target population was small and to achieve the appropriate sample
size then Hypergeomtric formula was used.

24
n = NZ2pq
E2 (N -1) +Z2pq
N – Target population
n – Desired sample
Z – Value corresponding to level of confidence required (level of confidence at 95%)
p – Proportion belonging to a specified category (50%)
q – Proportion not belonging to specified category (50%)
(When proportions are not known)
E – Margin of error (0.05)
n = 194(1.96) (1.96) (0.5) (0.5) = 128.907
(0.05) (0.05) (194 - 1) + (1.96) (1.96) (0.5) (0.5)
Adjusted minimum sample size calculated using the formula below;
n1 = n
1 + n/N
n1 – Adjusted minimum sample size
n – Minimum sample size
N – Target population
n1 = 128.907 = 77.44 (sample size of 78 farmers)
1 + 128.907/194
25
3.5 Research Instruments
The research instruments used to study the research objectives included questionnaire, interviews
and observation for primary data collection to rabbit farmers in the study area. The
questionnaires were designed having open ended and closed questions. As the data was being
collected it was prudent to observe that only rabbit farmers were interviewed by observing
presence of rabbits on the farm. The questionnaire had four sections where each section
represented each objective to make it standard and objective.
3.6 Pilot Study
Pilot testing was done in the neighbouring division; Abothuguchi Central Rabbit farmers
registered in three groups having 40 members (19 men and 21 women). A questionnaire was
administered to sampled 20 farmers, but the results are not included in the analysis. This assisted
to ensure clarity of the questions as farmers responded.
3.7 Reliability
Method of Test-retest enhanced reliability of the instrument, which was prepared and
administered to the participants at two different times to reduce error registering the two results
that were correlated. It was important for test-retest activity to reduce random errors that may
result from inaccurate coding and ambiguous instructions during the study if not improved.
3.8 Validity
The pilot study conducted enhanced the data collection, as the instruments were refined to
improve validity and reliability. The study was done in a division neighbouring the area of study.
Sampling validity employed measured the degree to which data collected using a particular
26
instrument represents a specific concept. Mugenda and Mugenda (2003) stated sampling validity
is employed so as to circumvent the problem associated with content validity. Orodho (2005)
stated that validity is the degree to which a test that measures how well the results obtained from
analysis represents the study under research.
3.9. Methods of Data Collection
The 78 questionnaires were taken to the respondents individually, some filled immediately while
others requested to be given time and it was granted. The questionnaires had both open and close
ended questions along the four variables contributing towards rabbit farming in the district.
During presentation of the questionnaire it was important to observe that only those with rabbits
on farm were included to avoid respondents give here say information, but to give real
information on what they experience as they undertake rabbit farming. During the period of
administering questionnaires the sampled rabbit farmers indicated that the minimum education
level among them was primary level, therefore, could actively fill in the questionnaires, however,
some felt that the interviewer would fill in the questionnaires. For those who were not ready to
write interviewers used the local language to explain the questions, as the farmers responded
answers were filled. The interviewers picked the rest of the questionnaires after one week. The
response rate was 88.4 %.
3.10 Data Analysis
Data analysis started with checking the questionnaires returned for completeness and
consistency. During data cleaning process on 88.4% response rate declined to 84.6% because
among the returned questionnaires, 3 were not possible to analyse since they lacked much of the
information. Responses were organized and coded to enhance analysis and categorization. For

27
statistical analysis of this study, the statistical software package SPSS was utilized. The data
collected was entered in the SPSS v16.0. The statistical analyses included descriptive statistics
for the independent and dependent variables in this study. The independent variables descriptive
statistics were presented using tables showing frequencies, percentages and number of
participants in each category illustrating participants’ distribution. Mean and standard deviation
were used to analyse the spread of distribution. Correlations of different variables were done.
Finally regression analysis of the independent variables was done to indicate the relationship
between the variables. This relationship was described in the following formula.
y=b0+b1X1+b2X2+b3X3+b4X4; Where y represent rabbit farming as indicated by number of rabbits
owned, X1 represent rabbit farmers age, X2 represent household monthly income, X3 represent
number of trainings and X4 represent who introduced the farmer to rabbit farming.
3.11. Ethical considerations
The participants were requested for their participation and it was explained to them about the
purpose of study and none was coerced to respond just as none was bribed to respond. The
interviewer expressly assured them of confidentiality about their responses.
28
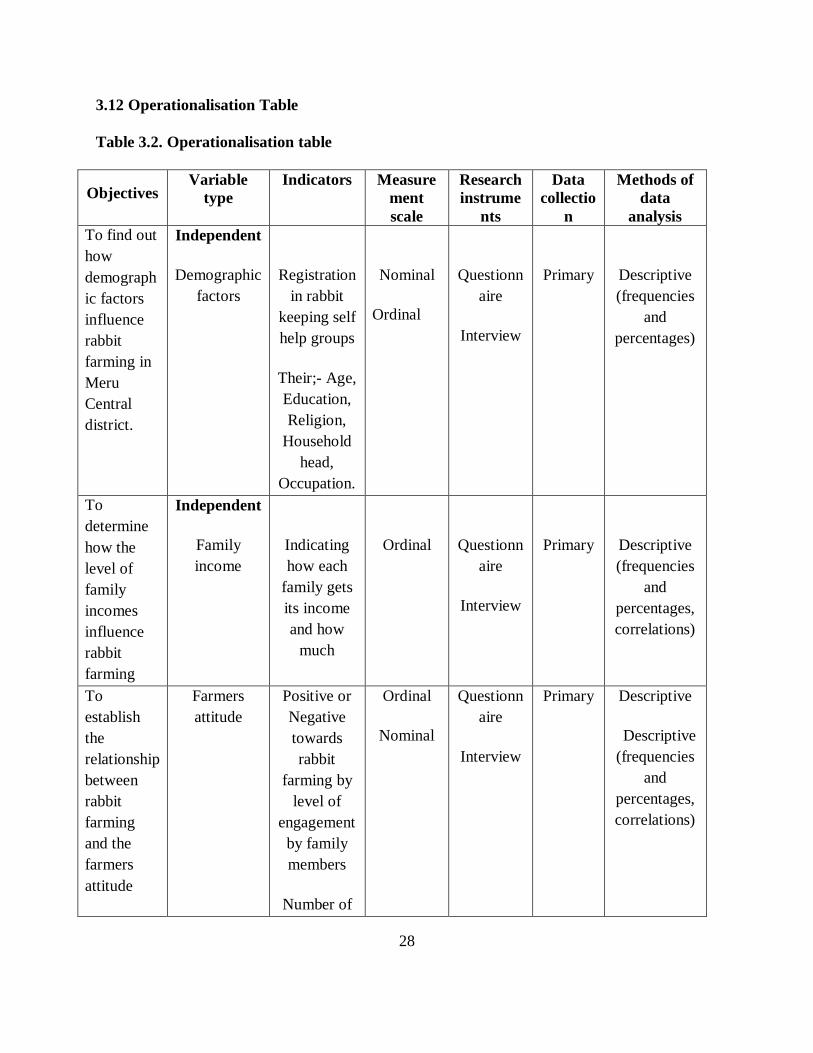
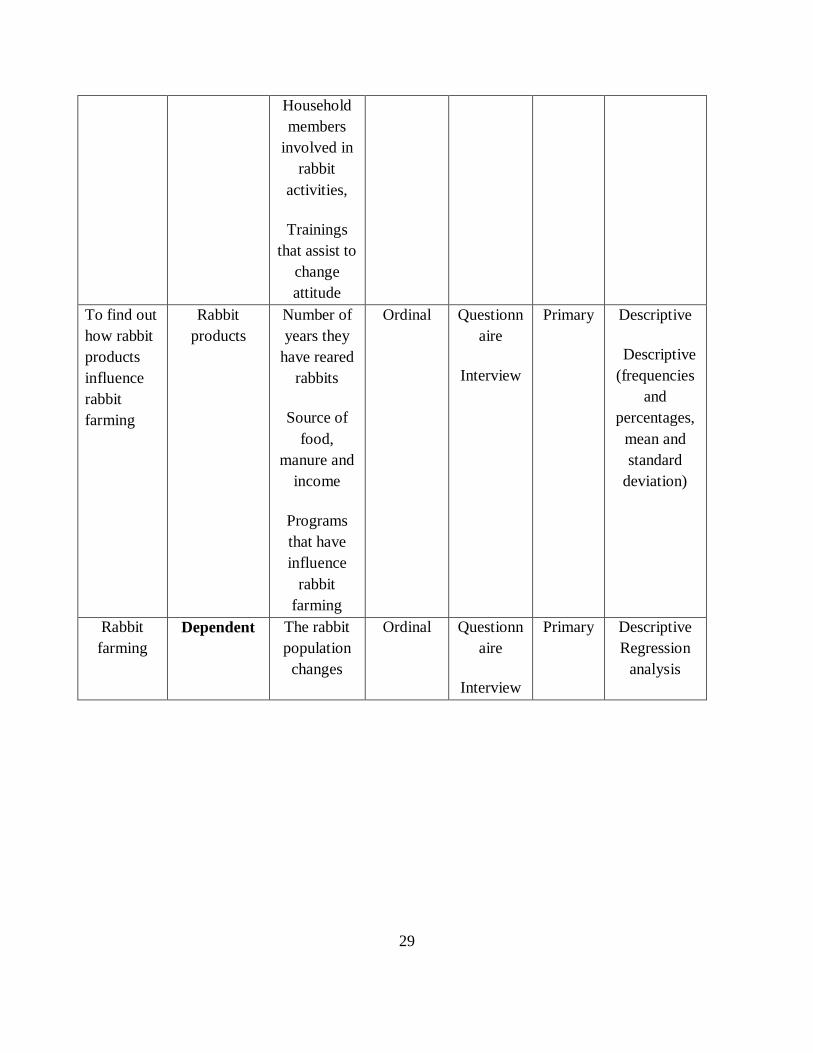
3.12 Operationalisation Table
Table 3.2. Operationalisation table
Objectives Variable
type Indicators Measure
ment scale
Research instrume
nts
Data collectio
n
Methods of data
analysis To find out how demographic factors influence rabbit farming in Meru Central district.
Independent
Demographic factors
Registration in rabbit
keeping self help groups
Their;- Age, Education, Religion,
Household head,
Occupation.
Nominal
Ordinal
Questionnaire
Interview
Primary
Descriptive (frequencies
and percentages)
To determine how the level of family incomes influence rabbit farming
Independent
Family income
Indicating how each
family gets its income and how
much
Ordinal
Questionnaire
Interview
Primary
Descriptive (frequencies
and percentages, correlations)
To establish the relationship between rabbit farming and the farmers attitude
Farmers attitude
Positive or Negative towards rabbit
farming by level of
engagement by family members
Number of
Ordinal
Nominal
Questionnaire
Interview
Primary Descriptive
Descriptive (frequencies
and percentages, correlations)
29
Household members
involved in rabbit
activities,
Trainings that assist to
change attitude
To find out how rabbit products influence rabbit farming
Rabbit products
Number of years they
have reared rabbits
Source of food,
manure and income
Programs that have influence
rabbit farming
Ordinal
Questionnaire
Interview
Primary Descriptive
Descriptive (frequencies
and percentages,
mean and standard
deviation)
Rabbit farming
Dependent The rabbit population
changes
Ordinal Questionnaire
Interview
Primary Descriptive Regression
analysis
30
CHAPTER FOUR
DATA ANALYSIS, PRESENTATION AND INTERPRETATION
4.1 Introduction
This chapter presents of the findings of four main factors influencing of rabbit farming in
Abothuguchi West division in Meru Central district, Meru County, Kenya. The four factors
include; demographic factors, Income, household members participation in rabbit farming
activities and rabbit products. The chapter focuses on data analysis, interpretation and
presentation.
4.2 Response rates
The targeted sample of the study was 78 farmers but only 69 questionnaires were returned.
During data cleaning 3 more questionnaires were found incomplete making the response rate
84.6% which was well above the acceptable level of 75%.
4.3 General characteristics
The first specific objective of the study focused on the general characteristics (age, level of
education, marital status, family size and region) of rabbit farmers and their likely influence on
rabbit production
4.3.1 Distribution of number of rabbits owned and the rabbit farmers Age
General interacting with the rabbit farmers in Abothuguchi West division revealed that
traditionally, the Ameru adult men and women did not engage in rabbit farming. Only young
boys reared rabbits as pets, or for slaughter for home cooked meat with no supervision from the
parents. The study found that the trend is changing as both adult and young farmers are keeping
31
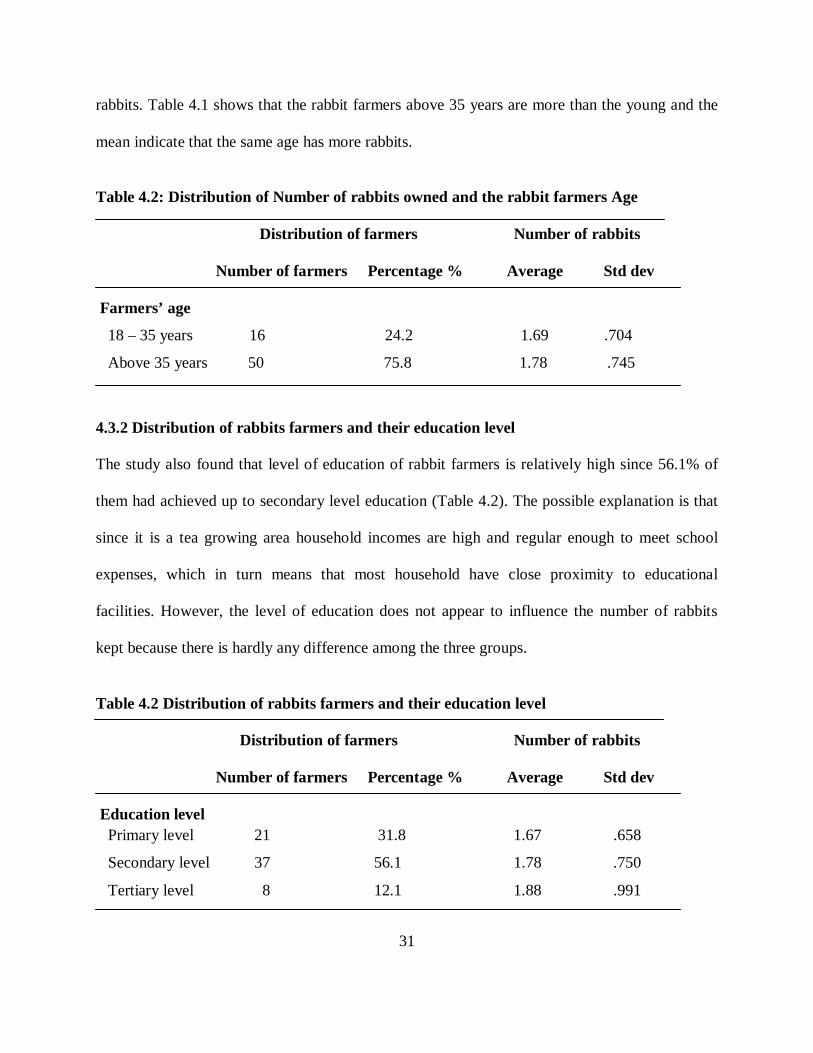
rabbits. Table 4.1 shows that the rabbit farmers above 35 years are more than the young and the
mean indicate that the same age has more rabbits.
Table 4.2: Distribution of Number of rabbits owned and the rabbit farmers Age
Distribution of farmers Number of rabbits
Number of farmers Percentage % Average Std dev
Farmers’ age
18 – 35 years 16 24.2 1.69 .704
Above 35 years 50 75.8 1.78 .745
4.3.2 Distribution of rabbits farmers and their education level
The study also found that level of education of rabbit farmers is relatively high since 56.1% of
them had achieved up to secondary level education (Table 4.2). The possible explanation is that
since it is a tea growing area household incomes are high and regular enough to meet school
expenses, which in turn means that most household have close proximity to educational
facilities. However, the level of education does not appear to influence the number of rabbits
kept because there is hardly any difference among the three groups.
Table 4.2 Distribution of rabbits farmers and their education level
Distribution of farmers Number of rabbits
Number of farmers Percentage % Average Std dev
Education level Primary level 21 31.8 1.67 .658
Secondary level 37 56.1 1.78 .750
Tertiary level 8 12.1 1.88 .991
32
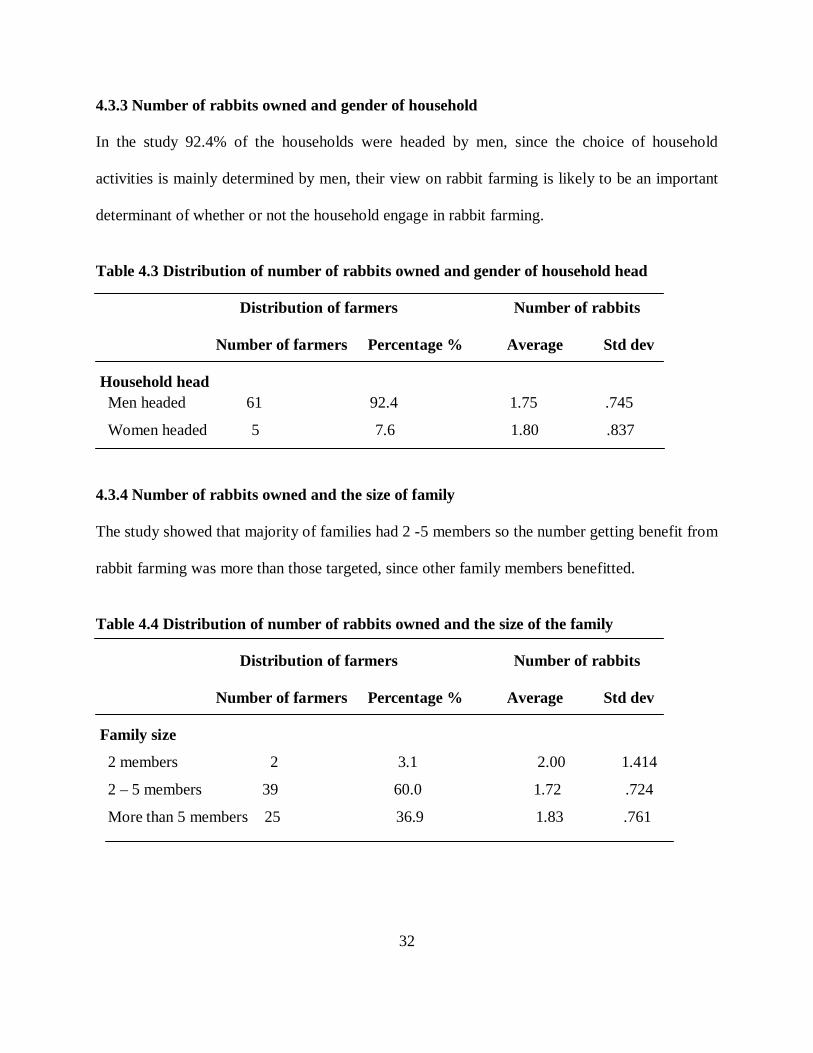
4.3.3 Number of rabbits owned and gender of household
In the study 92.4% of the households were headed by men, since the choice of household
activities is mainly determined by men, their view on rabbit farming is likely to be an important
determinant of whether or not the household engage in rabbit farming.
Table 4.3 Distribution of number of rabbits owned and gender of household head
Distribution of farmers Number of rabbits
Number of farmers Percentage % Average Std dev
Household head Men headed 61 92.4 1.75 .745
Women headed 5 7.6 1.80 .837
4.3.4 Number of rabbits owned and the size of family
The study showed that majority of families had 2 -5 members so the number getting benefit from
rabbit farming was more than those targeted, since other family members benefitted.
Table 4.4 Distribution of number of rabbits owned and the size of the family
Distribution of farmers Number of rabbits
Number of farmers Percentage % Average Std dev
Family size
2 members 2 3.1 2.00 1.414
2 – 5 members 39 60.0 1.72 .724
More than 5 members 25 36.9 1.83 .761
33
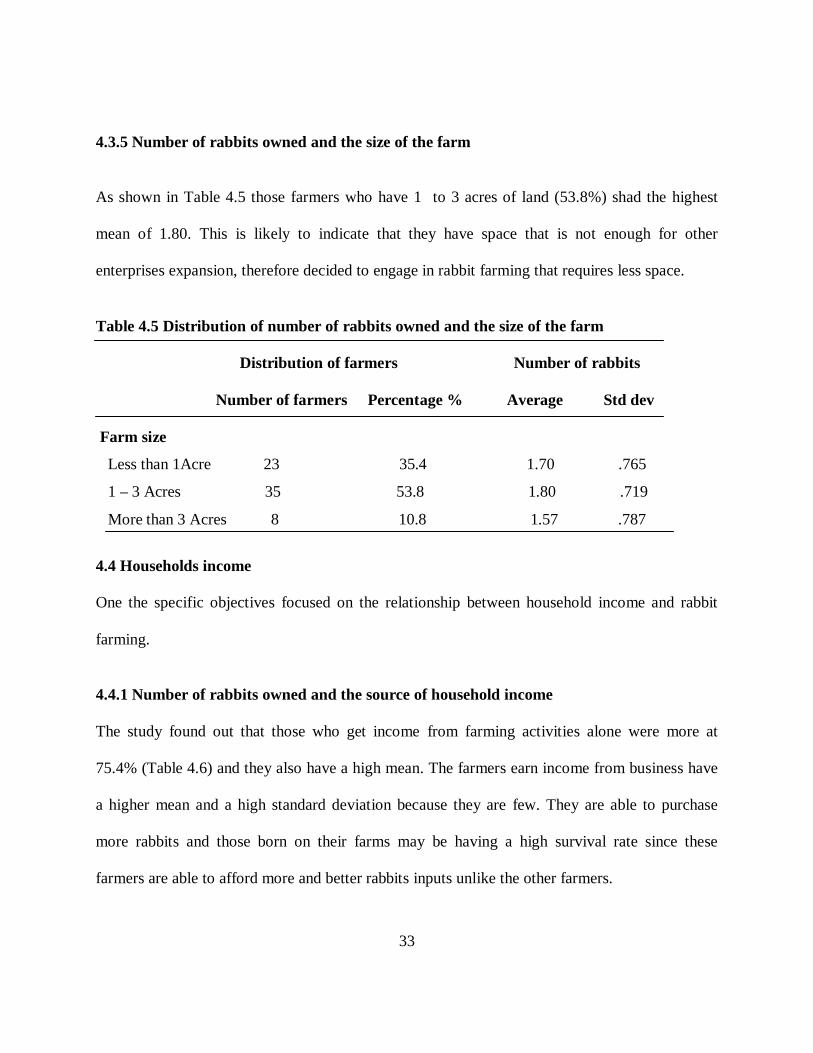
4.3.5 Number of rabbits owned and the size of the farm
As shown in Table 4.5 those farmers who have 1 to 3 acres of land (53.8%) shad the highest
mean of 1.80. This is likely to indicate that they have space that is not enough for other
enterprises expansion, therefore decided to engage in rabbit farming that requires less space.
Table 4.5 Distribution of number of rabbits owned and the size of the farm
Distribution of farmers Number of rabbits
Number of farmers Percentage % Average Std dev
Farm size
Less than 1Acre 23 35.4 1.70 .765
1 – 3 Acres 35 53.8 1.80 .719
More than 3 Acres 8 10.8 1.57 .787
4.4 Households income
One the specific objectives focused on the relationship between household income and rabbit
farming.
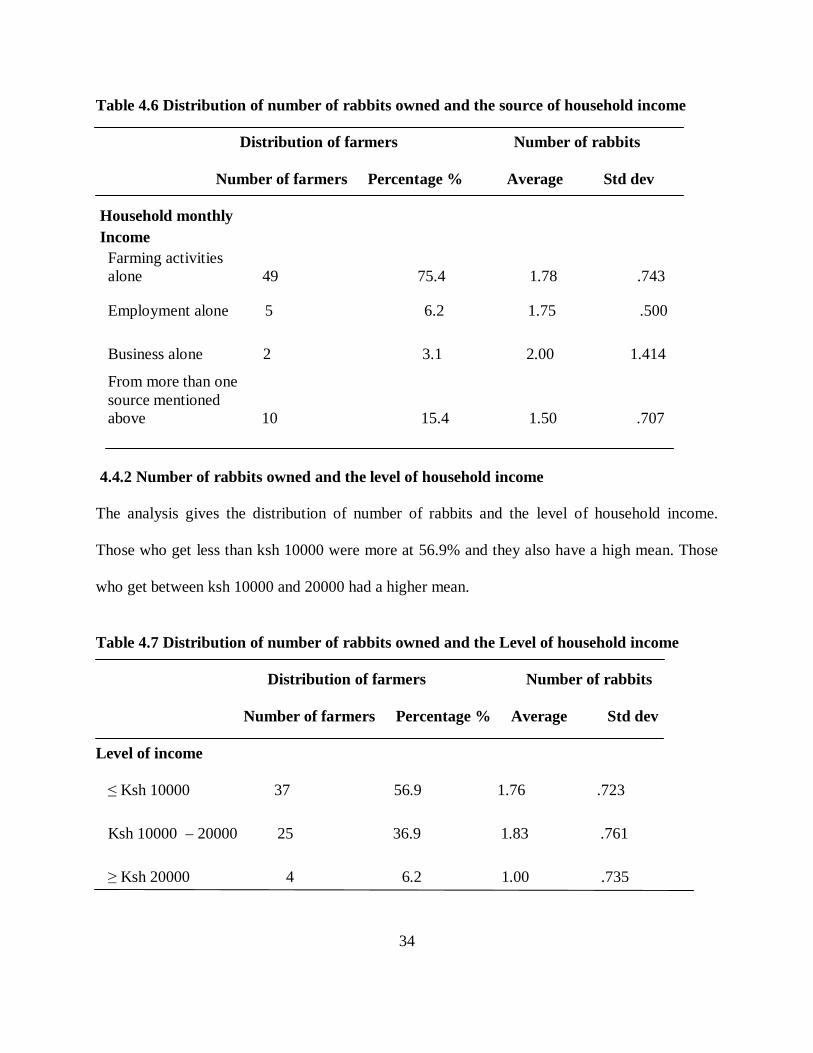
4.4.1 Number of rabbits owned and the source of household income
The study found out that those who get income from farming activities alone were more at
75.4% (Table 4.6) and they also have a high mean. The farmers earn income from business have
a higher mean and a high standard deviation because they are few. They are able to purchase
more rabbits and those born on their farms may be having a high survival rate since these
farmers are able to afford more and better rabbits inputs unlike the other farmers.
34
Table 4.6 Distribution of number of rabbits owned and the source of household income
Distribution of farmers Number of rabbits
Number of farmers Percentage % Average Std dev
Household monthly Income Farming activities alone 49 75.4 1.78 .743
Employment alone 5 6.2 1.75 .500
Business alone 2 3.1 2.00 1.414
From more than one source mentioned above 10 15.4 1.50 .707
4.4.2 Number of rabbits owned and the level of household income
The analysis gives the distribution of number of rabbits and the level of household income.
Those who get less than ksh 10000 were more at 56.9% and they also have a high mean. Those
who get between ksh 10000 and 20000 had a higher mean.
Table 4.7 Distribution of number of rabbits owned and the Level of household income
Distribution of farmers Number of rabbits
Number of farmers Percentage % Average Std dev
Level of income
≤ Ksh 10000 37 56.9 1.76 .723
Ksh 10000 – 20000 25 36.9 1.83 .761
≥ Ksh 20000 4 6.2 1.00 .735
35
4.5 Household members involvement in rabbit farming activities
The extent to which household members are engaged in rabbit farming activities, readiness to
look for rabbit farming information from various sources as well as attendance of rabbit farming
training sessions are all signs that views and perception of rabbit farming are changing.
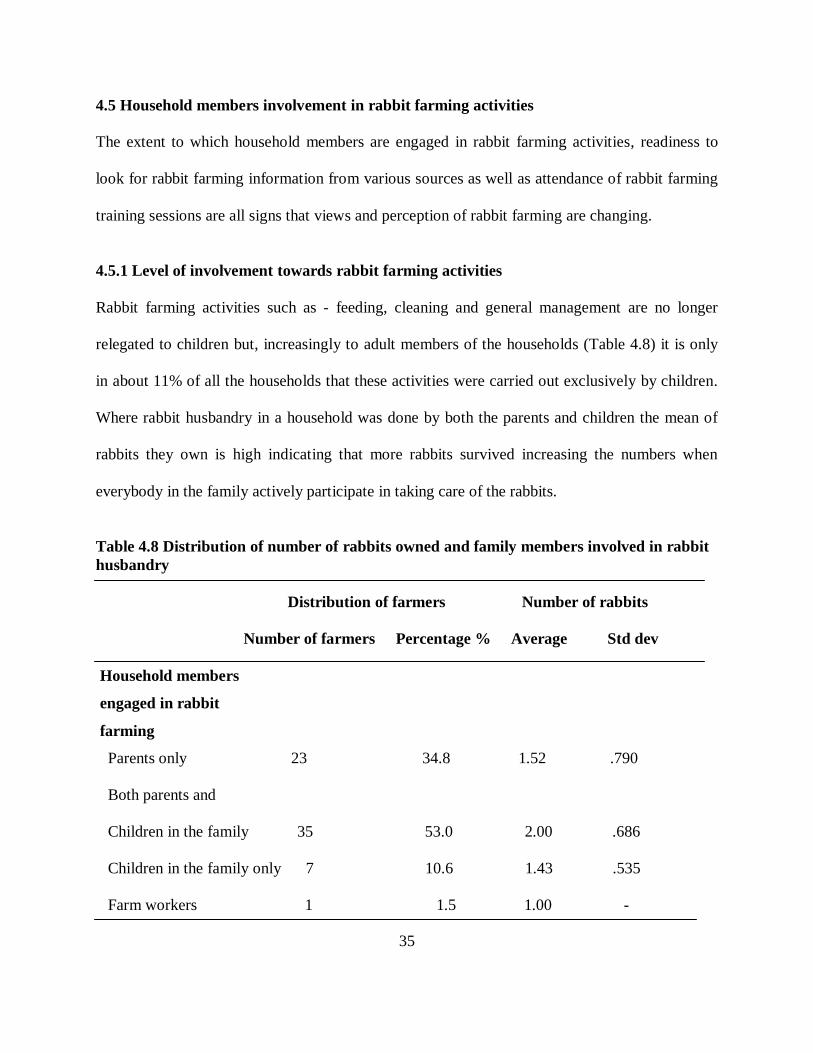
4.5.1 Level of involvement towards rabbit farming activities
Rabbit farming activities such as - feeding, cleaning and general management are no longer
relegated to children but, increasingly to adult members of the households (Table 4.8) it is only
in about 11% of all the households that these activities were carried out exclusively by children.
Where rabbit husbandry in a household was done by both the parents and children the mean of
rabbits they own is high indicating that more rabbits survived increasing the numbers when
everybody in the family actively participate in taking care of the rabbits.
Table 4.8 Distribution of number of rabbits owned and family members involved in rabbit husbandry
Distribution of farmers Number of rabbits
Number of farmers Percentage % Average Std dev
Household members
engaged in rabbit
farming
Parents only 23 34.8 1.52 .790
Both parents and
Children in the family 35 53.0 2.00 .686
Children in the family only 7 10.6 1.43 .535
Farm workers 1 1.5 1.00 -
36
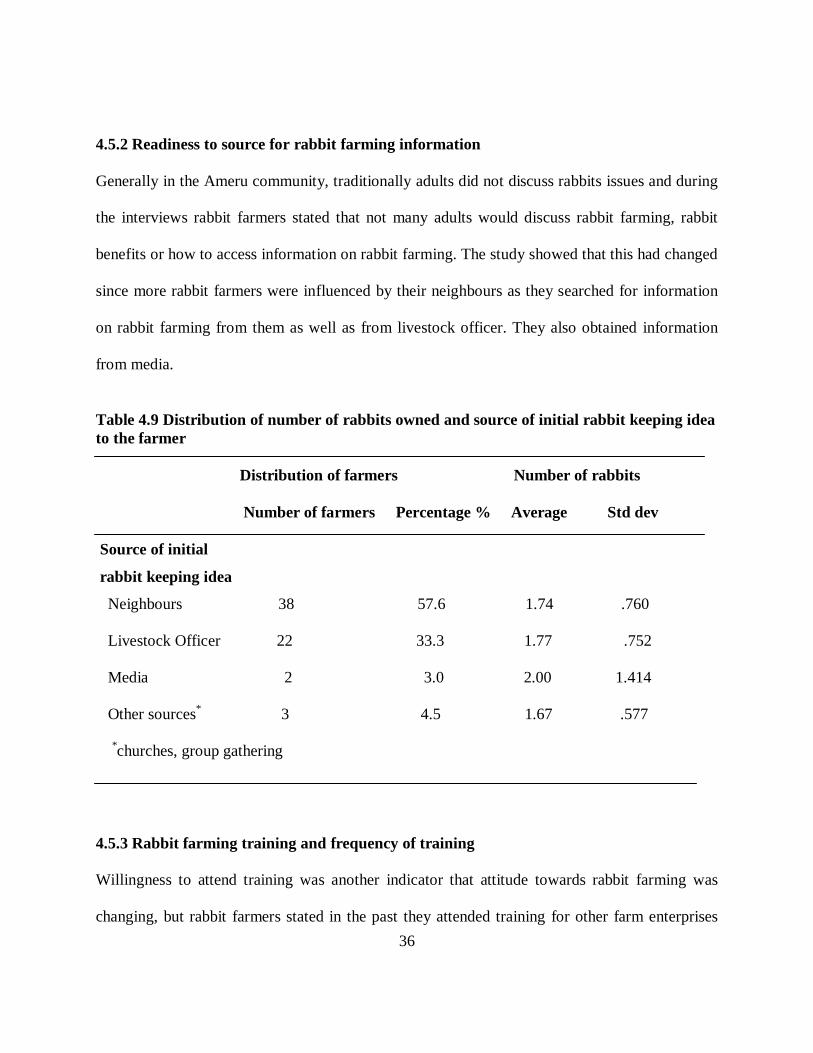
4.5.2 Readiness to source for rabbit farming information
Generally in the Ameru community, traditionally adults did not discuss rabbits issues and during
the interviews rabbit farmers stated that not many adults would discuss rabbit farming, rabbit
benefits or how to access information on rabbit farming. The study showed that this had changed
since more rabbit farmers were influenced by their neighbours as they searched for information
on rabbit farming from them as well as from livestock officer. They also obtained information
from media.
Table 4.9 Distribution of number of rabbits owned and source of initial rabbit keeping idea to the farmer
Distribution of farmers Number of rabbits
Number of farmers Percentage % Average Std dev
Source of initial
rabbit keeping idea
Neighbours 38 57.6 1.74 .760
Livestock Officer 22 33.3 1.77 .752
Media 2 3.0 2.00 1.414
Other sources* 3 4.5 1.67 .577
*churches, group gathering
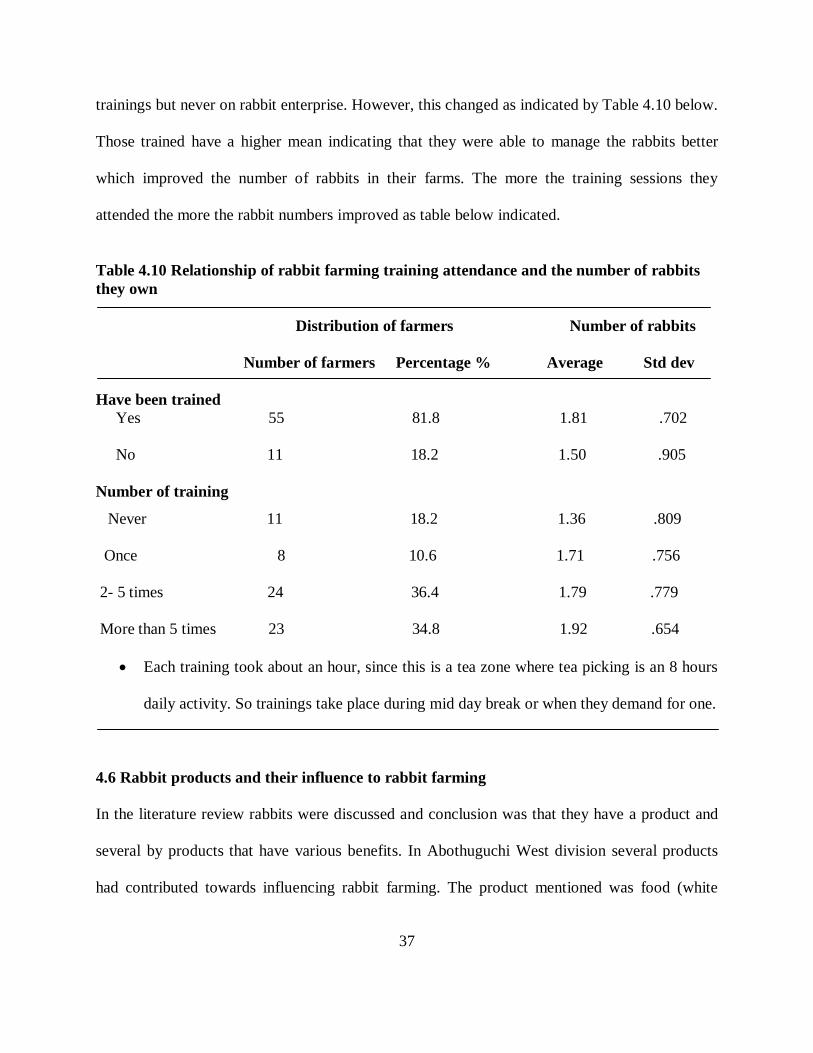
4.5.3 Rabbit farming training and frequency of training
Willingness to attend training was another indicator that attitude towards rabbit farming was
changing, but rabbit farmers stated in the past they attended training for other farm enterprises
37
trainings but never on rabbit enterprise. However, this changed as indicated by Table 4.10 below.
Those trained have a higher mean indicating that they were able to manage the rabbits better
which improved the number of rabbits in their farms. The more the training sessions they
attended the more the rabbit numbers improved as table below indicated.
Table 4.10 Relationship of rabbit farming training attendance and the number of rabbits they own
Distribution of farmers Number of rabbits
Number of farmers Percentage % Average Std dev
Have been trained Yes 55 81.8 1.81 .702
No 11 18.2 1.50 .905
Number of training
Never 11 18.2 1.36 .809
Once 8 10.6 1.71 .756
2- 5 times 24 36.4 1.79 .779
More than 5 times 23 34.8 1.92 .654
Each training took about an hour, since this is a tea zone where tea picking is an 8 hours
daily activity. So trainings take place during mid day break or when they demand for one.
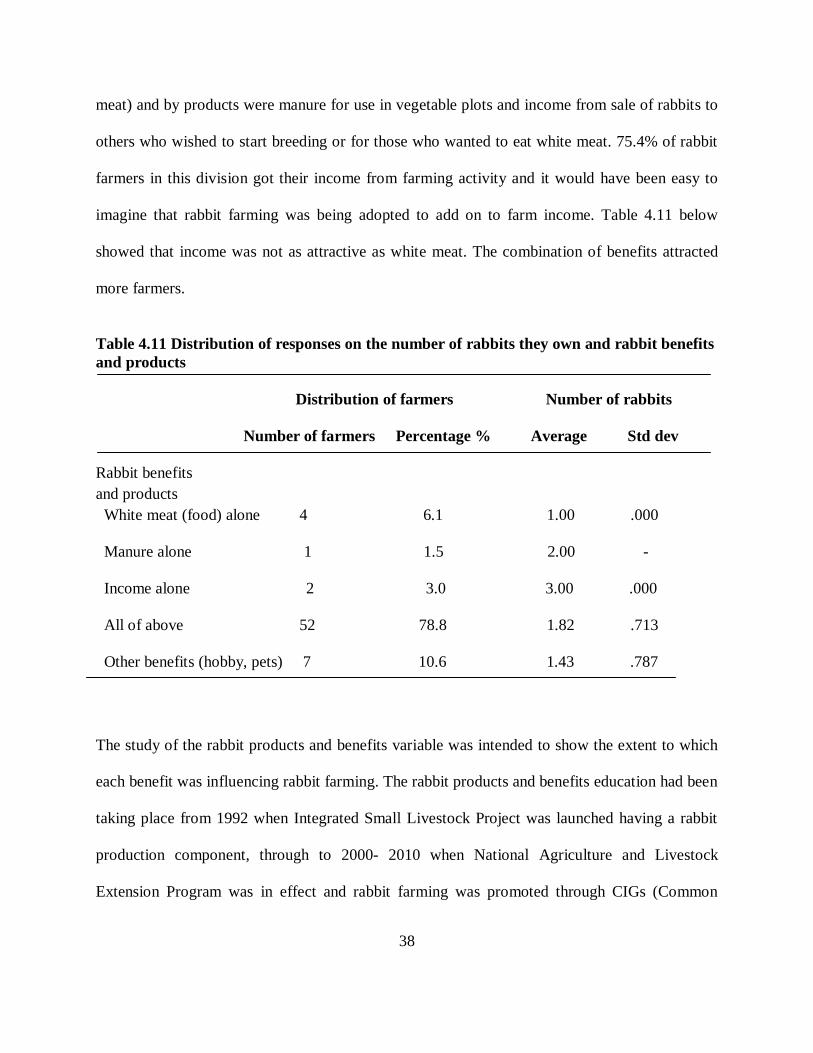
4.6 Rabbit products and their influence to rabbit farming
In the literature review rabbits were discussed and conclusion was that they have a product and
several by products that have various benefits. In Abothuguchi West division several products
had contributed towards influencing rabbit farming. The product mentioned was food (white
38
meat) and by products were manure for use in vegetable plots and income from sale of rabbits to
others who wished to start breeding or for those who wanted to eat white meat. 75.4% of rabbit
farmers in this division got their income from farming activity and it would have been easy to
imagine that rabbit farming was being adopted to add on to farm income. Table 4.11 below
showed that income was not as attractive as white meat. The combination of benefits attracted
more farmers.
Table 4.11 Distribution of responses on the number of rabbits they own and rabbit benefits and products
Distribution of farmers Number of rabbits
Number of farmers Percentage % Average Std dev
Rabbit benefits and products White meat (food) alone 4 6.1 1.00 .000
Manure alone 1 1.5 2.00 -
Income alone 2 3.0 3.00 .000
All of above 52 78.8 1.82 .713
Other benefits (hobby, pets) 7 10.6 1.43 .787
The study of the rabbit products and benefits variable was intended to show the extent to which
each benefit was influencing rabbit farming. The rabbit products and benefits education had been
taking place from 1992 when Integrated Small Livestock Project was launched having a rabbit
production component, through to 2000- 2010 when National Agriculture and Livestock
Extension Program was in effect and rabbit farming was promoted through CIGs (Common
39
Interest Group) and the 2011- 2014 Rabbit Production Project that currently is promoting rabbit
production through registered groups. Table 4.12 below illustrated this. NALEP program period
2000 to 2010 had contributed more towards enlightening farmers on rabbit products and benefits.
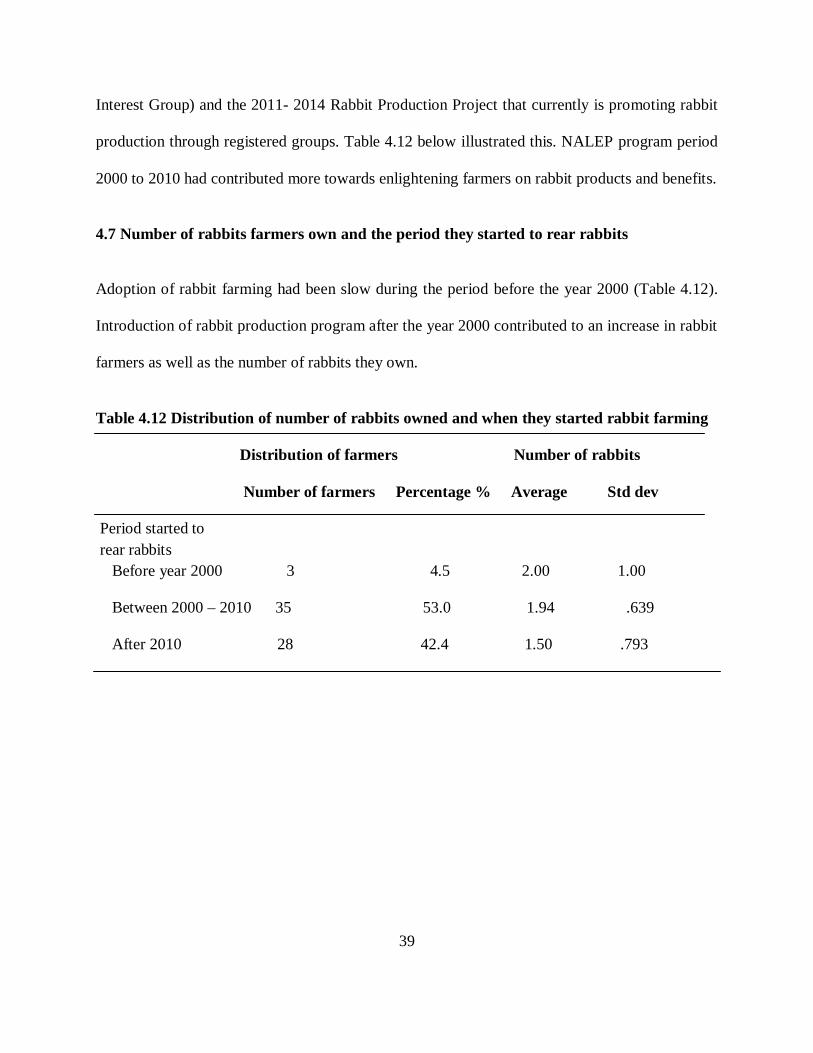
4.7 Number of rabbits farmers own and the period they started to rear rabbits
Adoption of rabbit farming had been slow during the period before the year 2000 (Table 4.12).
Introduction of rabbit production program after the year 2000 contributed to an increase in rabbit
farmers as well as the number of rabbits they own.
Table 4.12 Distribution of number of rabbits owned and when they started rabbit farming
Distribution of farmers Number of rabbits
Number of farmers Percentage % Average Std dev
Period started to rear rabbits Before year 2000 3 4.5 2.00 1.00
Between 2000 – 2010 35 53.0 1.94 .639
After 2010 28 42.4 1.50 .793
40
CHAPTER FIVE
SUMMARY, DISCUSSIONS, CONCLUSIONS AND RECOMMENDATIONS
5.1 Introduction
The chapter summarizes the findings and makes conclusions as per the four research objectives
of the study. The collected data was analyzed and interpreted according to these research
objectives; to find out how demographic factors influence rabbit farming, to determine how the
farmers’ attitude influence rabbit to determine how the level of family incomes influence rabbit
farming and to find out how rabbit products influence rabbit farming in Abothuguchi West
division, Meru Central district.
5.2 The Summary and discussion of the findings of the research
These were the findings of each objective as given by the rabbit farmers who participated on the
research.
5.2.1 Influence of demographic factors on rabbit farming.
Among the rabbit farmers in Abothuguchi West division; 23.2% were youth who are engage in
rabbit farming while 72.5% are beyond youth age bracket which is contrary to belief that rabbit
farming was a small boys activity, this gender category once convinced that rabbit farming is a
worth enterprise, has resources to expand it further which would increase rabbit population as
well as the number of farmers engaging in rabbit farming. Also the study showed that 92.4% of
the households were headed by men. Much of the decisions in a farming community are made by
men since they own land which is a factor of production. Once convinced about productivity of a
new technology or a new enterprise, they make decisions for the household to adopt, so once this
gender category adopt rabbit farming there would be an increase in rabbit population and number
41
of households keeping rabbits. The study indicated that education level is high since 56.1% had
up to secondary level education; this has led to rabbit farmers being able to source for rabbit
information and implement. In the process of sourcing for rabbit information they are likely to
discover other rabbit benefits that would be exploited to make rabbit farming to be more worth
an enterprise to engage in. All the rabbit farmers interviewed belonged to either Protestant or
Roman Catholic faith which indicated that these two sects had no religious instructions
forbidding the farmers from keeping rabbits. Generally the community in the Meru Central
district is a rural community likely to have a similar sect composition as the sample since there
were no mosques or temples in the area, which would make it easier to adopt rabbit farming if
trained to realize other rabbit benefits and value addition that would contribute more income to
the farming community.
5.2.2 Influence of income on rabbit farming.
The responses indicated that 75.4% of respondents get their family income from farming
activities only; they had reasons to explore more farm enterprises in order to improve on their
incomes levels, however, in Table 4.12 income as benefit was shown to have attracted 3.0% of
rabbit farmers. So the study showed that income as a factor contributed minimally, it could be
that since the study area was a tea zone the rabbit farmers received a higher income from other
enterprises, for instance tea and dairy. The sizes of families and farm size in the study area
indicate that the land is under pressure and further land sub division would reduce economic land
unit for dairy and tea production to uneconomical units. The farmers in these areas would have to
explore other enterprises to engage in order to sustain their income levels. Rabbit farming
requires less space than the other enterprises mentioned.
42
The change agents; extension officers need to avail more information about rabbit farming to the
community in Meru County in order to enhance sources of income to the majority of the farming
families.
5.2.3 Influence of attitude rabbit farming.
Attitude which is a belief is not measurable but other responses and actions give guidance on
whether one has a positive or negative attitude. Having high population of rabbits, seeking to
source for more information about rabbits and a deviation from what tradition indicate that rabbit
farming was a young boys activity to that other gender in the society were now ready to engage
in the enterprise. Among the farmers who responded 42.4% owned 1- 10 rabbits, 39.4% owned
10 – 20 rabbits and 17.4% owned more than 20 rabbits average number of rabbits per farmer
were 14 rabbits. Most of the rabbit farmers were having rabbits above the economic unit of four
does and one buck, which showed that the enterprise was gaining on population. To sustain the
growth the income aspect would have to be enhanced by improving on networking and linkage
to other rabbit farmers in other regions to expand the market. In the research 93.9% of the
respondents were ready to source for more information about rabbit farming and only 6.1% that
would not really bother to seek for more information. Youth engaged in rabbit farming were
23.2% while 72.5% are beyond youth age bracket. The youth complain that their parents have
not provided them with land portions that they could develop or use as collateral to source for
funds. The study indicated that rabbit farming is mostly done by the family members as only
1.4% workers are instructed to rear on family behalf. In 34.8% rabbit farming was done by only
the parents, while 53% of families involved both the parents and the children. This indicate a
positive change of attitude since in Ameru community rabbit farming and its consumption has

43
never been an adult activity and it was always associated with small boys, however, findings on
Table 4.1 showed that 72.5% of the rabbit farmers were male adults which was a shift from
traditional beliefs. Trainings and being able to discuss rabbit farming with even neighbours has
led to a shift in belief which was previously negative to being positive increasing rabbit keeping
in the years after 2000. NALEP program contributed greatly towards attitude change as more
farmers joined rabbit farming Common Interest Groups, the follow up Rabbit Production Project
has enhanced rabbit farming. Among the rabbit farmers 56.1% had secondary level and 12.1%
had achieved tertiary level, it was easy train them on new production systems and enterprises,
just as it was easy to source for information increasing the chances of people changing their
attitude.
5.2.4 Influence of rabbit products towards rabbit farming.
The respondents agreed that there are several benefits to be achieved from rabbit farming; the
78.8% of rabbit farmers were convinced that a combination of benefits (white meat, manure,
income) attracted them. The white meat benefit attracted more farmers than income contrary to
belief that farmers in Abothuguchi West division would start rabbit farming for income. Farmers
in these area have other enterprises like tea, coffee, dairy for income, food crops (potatoes,
maize, beans and vegetables) for home consumption and the excess sold for income. Manure
from dairy was used to support those crops grown purely for income, while the interviewed
rabbir farmers said that the rabbit manure was used for the other food crops. An increase in
rabbit population would cause an increase in the amount of manure thus an increase in food
crops to get enough for home consumption and much more for sale which would improve the
farm income. The linear regression model showed that a unit increase in rabbit products would
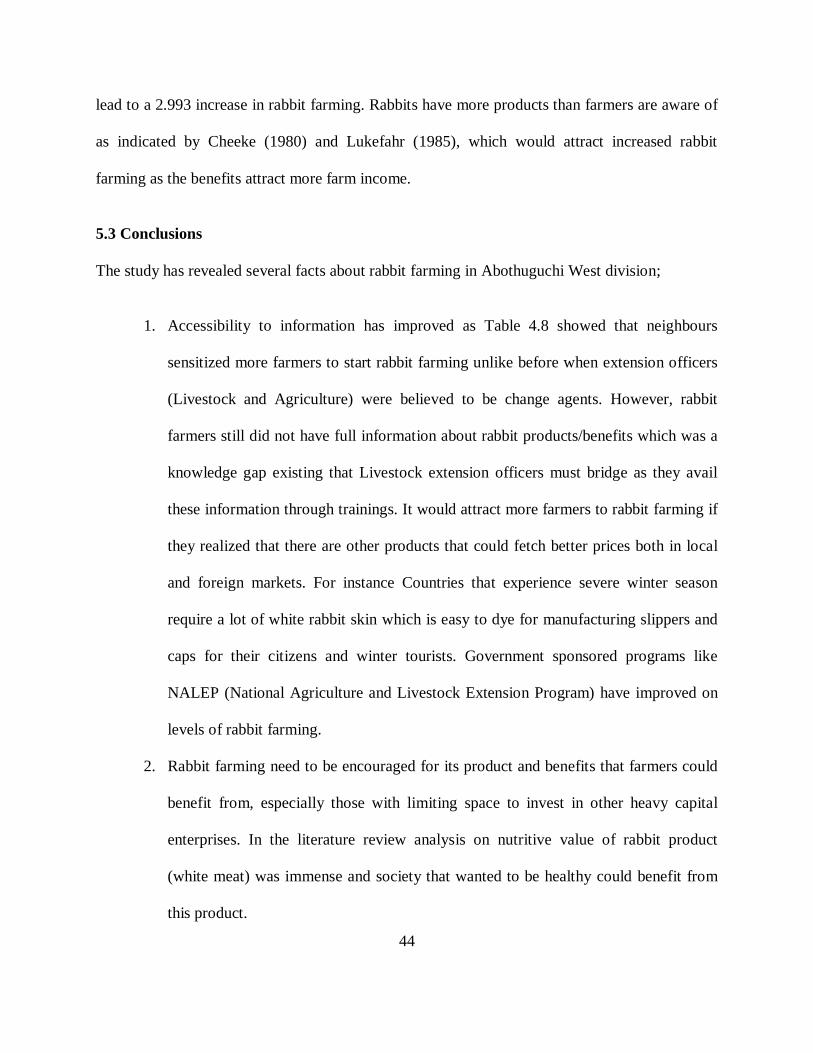
44
lead to a 2.993 increase in rabbit farming. Rabbits have more products than farmers are aware of
as indicated by Cheeke (1980) and Lukefahr (1985), which would attract increased rabbit
farming as the benefits attract more farm income.
5.3 Conclusions
The study has revealed several facts about rabbit farming in Abothuguchi West division;
1. Accessibility to information has improved as Table 4.8 showed that neighbours
sensitized more farmers to start rabbit farming unlike before when extension officers
(Livestock and Agriculture) were believed to be change agents. However, rabbit
farmers still did not have full information about rabbit products/benefits which was a
knowledge gap existing that Livestock extension officers must bridge as they avail
these information through trainings. It would attract more farmers to rabbit farming if
they realized that there are other products that could fetch better prices both in local
and foreign markets. For instance Countries that experience severe winter season
require a lot of white rabbit skin which is easy to dye for manufacturing slippers and
caps for their citizens and winter tourists. Government sponsored programs like
NALEP (National Agriculture and Livestock Extension Program) have improved on
levels of rabbit farming.
2. Rabbit farming need to be encouraged for its product and benefits that farmers could
benefit from, especially those with limiting space to invest in other heavy capital
enterprises. In the literature review analysis on nutritive value of rabbit product
(white meat) was immense and society that wanted to be healthy could benefit from
this product.
45
3. Animal protein is scarce to the low income sections of our society due to high prices.
So to improve their diet other animal protein sources need to be expanded, so that
they can be able to access their food and eventually sell the excess for an income.
Animal protein consumed in the country and in the Meru Central district is below the
FAO recommended quantity, and then rabbit farming would assist in bridging the gap
if more farmers started rearing rabbits to supplement the shortage, especially the
resource poor who are not likely to be able to purchase other animal proteins due to
high prices.
4. Environmentally rabbit farming is friendly since rabbits are known for being prolific,
rabbits are also herbivores which efficiently convert fodder to food. Rabbit rearing
does not require forest and grassland clearing of the magnitude required for cattle
production, they do not require a whole crop field feed to convert it to meat, they do
not trample on soils loosening them and they release dung in form of small and dry
pellets which retain their nitrogen and efficiently fertilize the soil, so would be
appropriate for urban farming since it would be easy to control the pollution
encountered from other livestock enterprises.
5. Rabbit rearing would also help address some of the MDG goals; MDG goal number
one is Eradicating extreme poverty and hunger, number six is Combating HIV /AIDS,
malaria and other diseases and number seven is Ensuring environmental
sustainability. Also the country’s development plan Vision 2030 through its economic
pillar, has targeted agriculture and livestock production improvement to ensure food
security and value addition on farm produce to increase wealth and job creation,
rabbit farming could contribute to that vision.
46
5.4 Recommendations
The findings and conclusion of this study indicate that due to governments programs in the
Abothuguchuci West promoting rabbit farming more farmers are accepting rabbit as a source of
food, manure and income. However, more information about other rabbit benefits have not been
availed to farmers which would encourage many more as they explore and engage other lucrative
markets to increase their income.
1. The Government could use media especially the local language stations since the study
has indicated that some farmers got initial rabbit farming ideas from the media, however,
there should be an initiative to invite extension officers to these stations so as to give
appropriate message which when left to media people there are gaps or misinformation
released to the multitude.
2. The rabbit farming inputs like breeding materials should be made available to avoid
inbreeding that would otherwise affect rabbit farming if not controlled as their
multiplication is very high. Also the rabbit supplement feeds were not available in the
local markets, once the rabbit population increases agro vet traders need to avail the feeds
and other requirements.
3. The youth should be empowered to participate in farming activities especially rabbit
farming by availing funds since their borrowing power is limited by lack of collateral.
The older generation should be encouraged to support the youth by sharing out some land
that they would utilize for farming activities.
47
5.5 Suggestions on other issues requiring research
Due to increasing pressure on land as a result of increased population, land is getting sub divided
to very small units, a research to compare traditional enterprises to these areas (coffee, tea and
dairy) and emerging enterprises (rabbit farming) need to be done to reveal how they could either
complement each other or replace one another.
Since 1992 when government started to support projects promoting rabbit farming, there are
farmers who persisted while other stopped along the way, it would be important to understand
the reasons why some continued and others stopped for future planning.
48
REFERENCES
Abelson, R.P. (1988). Conviction, American Psychologist. Psychologist at play
Ahearn M, Johnson J. and Strickland R. (1985). “The Distribution of Income and Wealth of
Farm Operator Households. ” American Journal of Agricultural Economics. 67: 1087-
94
Alabama University. (1989). Nutritional Information. Crossroads Rabbitry, Heflin, AL
Andersen P. P., Rajul P.L., and Rosegrant M.W. (1999). World Food Prospects : Critical issues
for the early twenty -first century Food Policy Report
International Food Policy Research Institute Washington , D.C.
Borter, D.K. and Mwanza, R.N. (2011). Rabbit Production in Kenya, Current Status and way
Forward Animal Production Division
Boninger, D.S., Krosnick J.A, and Berent M.K. (1995) The origins of attitude importance: Self-
interest, social identification, and values Journal of personality and social psychology, 68: 103-
373-226
Boskey E., PhD (2009). Socioeconomic status (SES) http://std.about.com/od/glossary/g/sesgloss.
htm
Chauvin, N. D., Mulangu F. and Guido P. (2012). Food Production and Consumption Trends in
Sub-Saharan Africa: Prospects for the Transformation of the Agricultural Sector
Cheeke, P.R., (1980). The potential role of the rabbit in meeting world food needs. Journal of
applied rabbit research 3 (3)
49
Claire S., (1962). Research methods in social science. Published for the Society for Psychology
study social issue. New York
Duncan, R., Shi, Q. and Tyers, R.(2004): Demographic Change and Demand for Food in
Australia* Working Papers in Economics and Econometrics No. 441
FAO (1982). FAO Expert Consultation on Rural Poultry and Rabbit Production. FAO
Production Yearbook 1981, Vol. 36. Rome, FAO.
FAO (2004). The State of Food Insecurity in the World 2004; Monitoring Progress Towards the
World Food Summit and Published in 2004 by the Food and Agriculture Organization of
the United Nations
FAO (2006). The Livestock Report by Animal Production and Health Division.
FAOSTAT (2007). Commodity Balances, Livestock and Fish, Primary Equivalent
FAO (2008). World Food Outlook Produced by: Economic and Social Development Department
FAO (2010). UN Food and Agricultural Organization (FAO), Livestock in a Changing
Landscape. Published in March 2010 by Island Press
Government of the Republic of Kenya (2007). Kenya Vision 2030
Hadrich J.C., (2011). Human capital and its effect on the farm business life cycle. Department of
Agribusiness & Applied Economics North Dakota State University Selected paper
prepared for presentation at the Agricultural & Applied Economics Association 2011
Annual Meeting, Pittsburgh, Pennsylvania.
50
Heller P.,(2010). People and Places: Can They Align to Bring Growth to Africa?
www.cgdev.org
Ira J. R. and Stephen J. R., (2007). Psychologist at Play: Robert P. Abelson's Life and
Contributions to Psychological Science Perspectives on Psychological Science Vol. 2,
No. 1
Journal of Biology, Agriculture and Healthcare, (2012) Vol 2, No.3, www.iiste.org
Kombo, D.K. and Tromp D.L. (2006) Proposal and Thesis Writing; Don Bosco Printing press, Makuyu,
Kenya
Lebas, F., Coudert, P., Rouvier, R. & De Rochambeau, H. (1984). The rabbit: husbandry, health
and production. Rome, FAO.
Lien, G., Flaten, O., Koesling, M. and Løes, A.-K., (2008). Exits among Norwegian organic farmers
– what are the reasons? Results from a survey in fall 2008, NILF Discussion paper 2008-1,
Norwegian Agricultural Economics Research Institute, Oslo
Lukefahr, S.D. & Goldman, M. (1985). A technical assessment of production and economic
aspects of small-scale rabbit farming in Cameroon.
Lukefahr, S.D. & Goldman, M. (1987). Cameroon, West Africa: economic feasibility of rabbit
farming under intensive and subsistence management systems of production.
Mamattah, N. (1978). Sociological aspects of introducing rabbits into farm practices.
McNitt, J.I, Patton N.M. Lukefahr S.D. and Cheeke P.R., (1996). The rabbit Production (7th
Edition) Interstate Publisher, Inc.Danville, IL

51
microREPORT #184, (2012). End Market Analysis of Kenyan Livestock and Meat
Ministry of Agriculture (2006). Impact Assessment Report by NALEP
Ministry of Agriculture (2011). Agricultural Sector Development Support Program document
Ministry of Planning (2008). National Economic Survey.
Moreki, J.C. Commercial Rabbit Production Poultry and Rabbits Section, Non-Ruminants
Division Department of Animal, Production
Orodho, J. (2005) Elements of education and social sciences; Research methods. Nairobi;
Mazola Publishers.
Schnepf R. (2012) U.S. Farm Income Specialist in Agricultural Policy
Sumner, D.A., and Leiby J.D.. (1987). “An Econometric Analysis of the Effects of Human
Capital on Size and Growth among Dairy Farms.” American Journal of Agricultural
Economics. 69(2):465-470.
The Writing Center at UNC Chapel Hill. (2012). Literature Reviews · SASB North Suite 0127 ·
UNC-CH · Chapel Hill, NC 27599 ·
Thompson, Robert L.(1990). "U.S. Agriculture Policy: Components, Goals, and Possibilities for
Change." Food Policy 15 (June 1990)
UN Human Development report (1998). State of Human Development
Mirkin B., (2005). Major Trends Include Ageing; Urbanization of Population; Reduction of Family Size,
Fertility Levels; Increases in Family Planning. UN Document POP/925. The Chief of the
52
Population Policy Section of the Population Division, Department of Economic and Social
Affairs.
Ministry of Agriculture, KARI: The Small Ruminant Collaborative Research Support Program
(SR-CRSP)
Muyanga, M. and T. S. Jayne (2006). Agricultural Extension in Kenya: Practice and Policy
Lessons. Tegemeo Working paper 26/2006. Tegemeo Institute of Agricultural Policy an
Development,Egerton University, Nairobi.
Okello D. (2004). Pulling Apart Facts and Figures on Inequality in Kenya, Published by:
Society for International Development, Eastern Africa Regional Office Nairobi
Orodho, J. (2005) Elements of education and social sciences; Research methods. Nairobi;
Mazola Publishers.
Quisumbing A.R., (1995). Gender differences in agricultural productivity: a survey of empirical
evidence FCND DISCUSSION PAPER NO. 5 Food Consumption and Nutrition Division
International Food Policy Research Institute
USCS 6502 Title 7, Agriculture; Organic Certification
William C. Sons & Co. Ltd (2009) Collins English Dictionary - Complete & Unabridged 10th
Edition HarperCollins Publishers
WorldWatch Institute Magazine, July/August (2004) Vol 17,No. 4

53
Xu P., Alexander C. and Musser W. (2005). Effects of Farmers’ Risk Attitudes and Personality
Types on Production
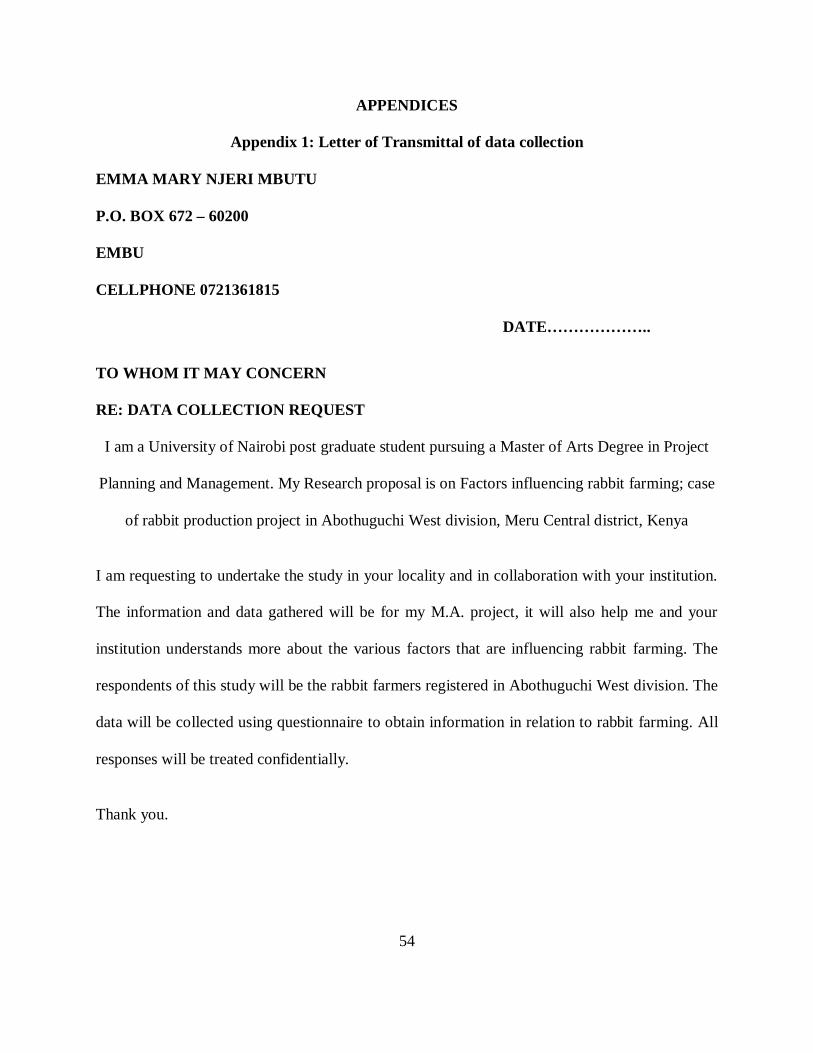
54
APPENDICES
Appendix 1: Letter of Transmittal of data collection
EMMA MARY NJERI MBUTU
P.O. BOX 672 – 60200
EMBU
CELLPHONE 0721361815
DATE………………..
TO WHOM IT MAY CONCERN
RE: DATA COLLECTION REQUEST
I am a University of Nairobi post graduate student pursuing a Master of Arts Degree in Project
Planning and Management. My Research proposal is on Factors influencing rabbit farming; case
of rabbit production project in Abothuguchi West division, Meru Central district, Kenya
I am requesting to undertake the study in your locality and in collaboration with your institution.
The information and data gathered will be for my M.A. project, it will also help me and your
institution understands more about the various factors that are influencing rabbit farming. The
respondents of this study will be the rabbit farmers registered in Abothuguchi West division. The
data will be collected using questionnaire to obtain information in relation to rabbit farming. All
responses will be treated confidentially.
Thank you.
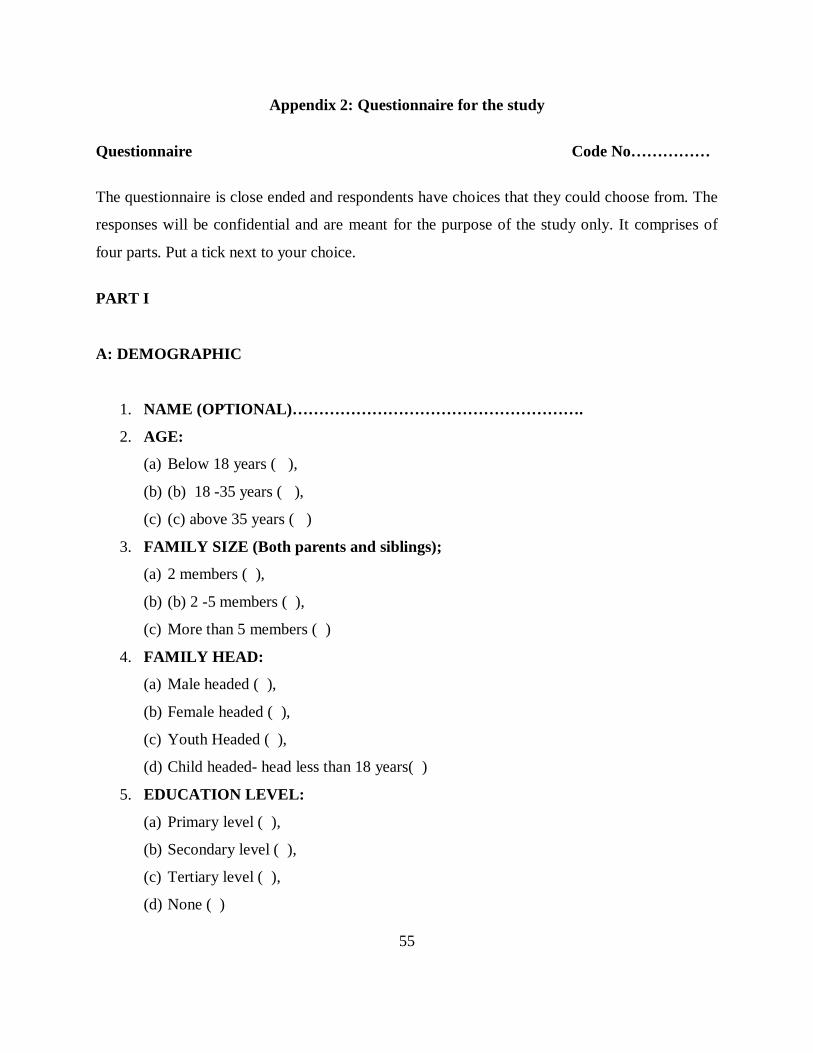
55
Appendix 2: Questionnaire for the study
Questionnaire Code No……………
The questionnaire is close ended and respondents have choices that they could choose from. The
responses will be confidential and are meant for the purpose of the study only. It comprises of
four parts. Put a tick next to your choice.
PART I
A: DEMOGRAPHIC
1. NAME (OPTIONAL)……………………………………………….
2. AGE:
(a) Below 18 years ( ),
(b) (b) 18 -35 years ( ),
(c) (c) above 35 years ( )
3. FAMILY SIZE (Both parents and siblings);
(a) 2 members ( ),
(b) (b) 2 -5 members ( ),
(c) More than 5 members ( )
4. FAMILY HEAD:
(a) Male headed ( ),
(b) Female headed ( ),
(c) Youth Headed ( ),
(d) Child headed- head less than 18 years( )
5. EDUCATION LEVEL:
(a) Primary level ( ),
(b) Secondary level ( ),
(c) Tertiary level ( ),
(d) None ( )

56
6. RELIGION/SECT:
(a) Catholic ( ),
(b) Protestant ( ),
(c) Islam ( ),
(d) Others (Buddhist) ( )
B: SOCIAL ECONOMICS
7. FARM SIZE:
(a) Less than 1 Acre ( ),
(b) 1 – 3 Acres ( ),
(c) More than 3 Acres ( )
8. SOURCE OF INCOME\
(a) From the farm ( ),
(b) From employment ( ),
(c) From business ( ),
(d) A combination of those above( )
9. TOTAL MONTHLY INCOME
(a) Below Kshs.10, 000 ( ),
(b) Between Kshs. 10,000 – 20, 000 ( ),
(c) Above Kshs. 20,000 ( )
10. TOTAL COST OF FAMILY FOOD PER MONTH:
(a) Below Kshs. 5,000 ( ),
(b) Between Kshs. 5,000 – 10,000 ( ),
(c) Above Kshs. 10,000 ( )
11. FARM ENTERPRISES:
(a) Cash crops; Tea ( ), Coffee ( ),
(b) Food crops; Cereals – maize, beans ( ),
(c) Traditional foods sweet potatoes, yams ( ),
(d) Livestock; Cattle ( ), Shoats ( ), Poultry ( ), Rabbits ( )
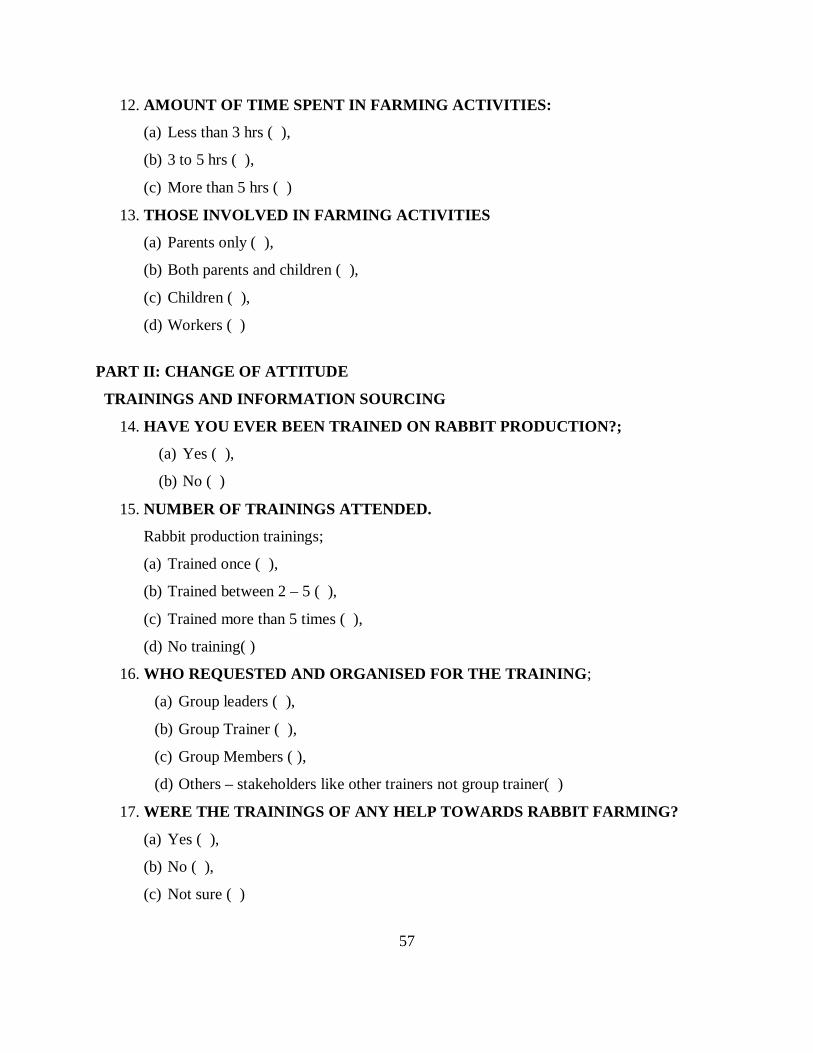
57
12. AMOUNT OF TIME SPENT IN FARMING ACTIVITIES:
(a) Less than 3 hrs ( ),
(b) 3 to 5 hrs ( ),
(c) More than 5 hrs ( )
13. THOSE INVOLVED IN FARMING ACTIVITIES
(a) Parents only ( ),
(b) Both parents and children ( ),
(c) Children ( ),
(d) Workers ( )
PART II: CHANGE OF ATTITUDE
TRAININGS AND INFORMATION SOURCING
14. HAVE YOU EVER BEEN TRAINED ON RABBIT PRODUCTION?;
(a) Yes ( ),
(b) No ( )
15. NUMBER OF TRAININGS ATTENDED.
Rabbit production trainings;
(a) Trained once ( ),
(b) Trained between 2 – 5 ( ),
(c) Trained more than 5 times ( ),
(d) No training( )
16. WHO REQUESTED AND ORGANISED FOR THE TRAINING;
(a) Group leaders ( ),
(b) Group Trainer ( ),
(c) Group Members ( ),
(d) Others – stakeholders like other trainers not group trainer( )
17. WERE THE TRAININGS OF ANY HELP TOWARDS RABBIT FARMING?
(a) Yes ( ),
(b) No ( ),
(c) Not sure ( )
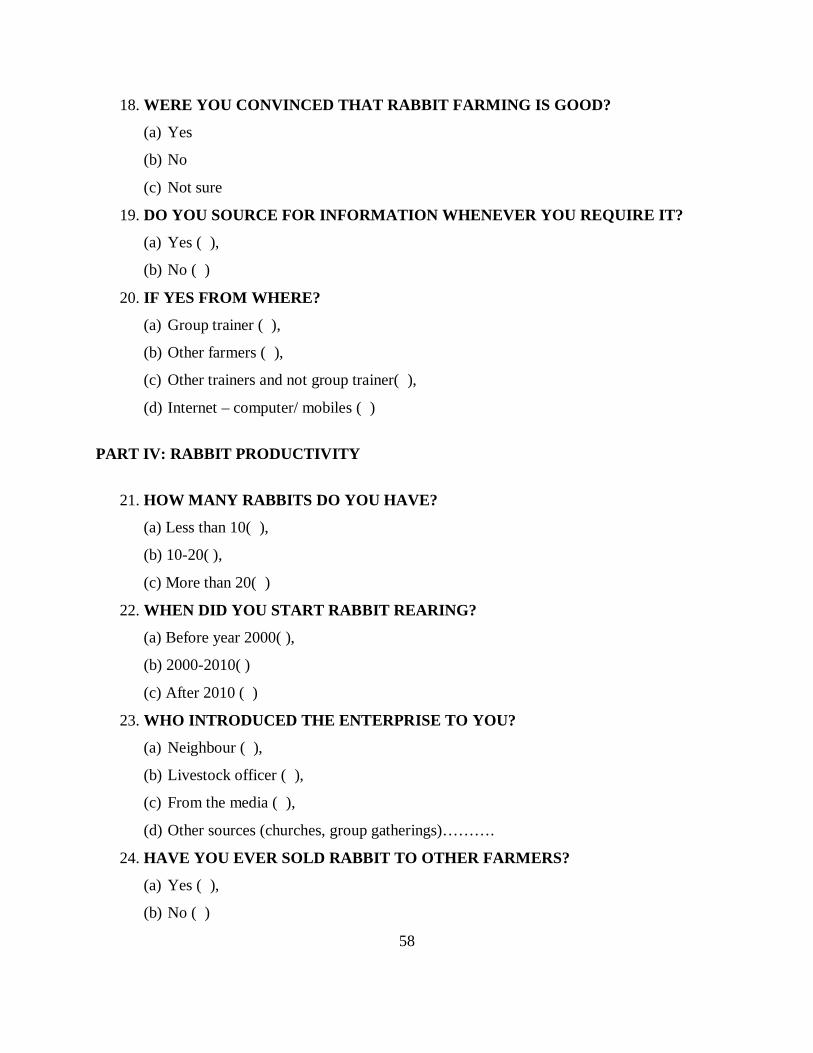
58
18. WERE YOU CONVINCED THAT RABBIT FARMING IS GOOD?
(a) Yes
(b) No
(c) Not sure
19. DO YOU SOURCE FOR INFORMATION WHENEVER YOU REQUIRE IT?
(a) Yes ( ),
(b) No ( )
20. IF YES FROM WHERE?
(a) Group trainer ( ),
(b) Other farmers ( ),
(c) Other trainers and not group trainer( ),
(d) Internet – computer/ mobiles ( )
PART IV: RABBIT PRODUCTIVITY
21. HOW MANY RABBITS DO YOU HAVE?
(a) Less than 10( ),
(b) 10-20( ),
(c) More than 20( )
22. WHEN DID YOU START RABBIT REARING?
(a) Before year 2000( ),
(b) 2000-2010( )
(c) After 2010 ( )
23. WHO INTRODUCED THE ENTERPRISE TO YOU?
(a) Neighbour ( ),
(b) Livestock officer ( ),
(c) From the media ( ),
(d) Other sources (churches, group gatherings)……….
24. HAVE YOU EVER SOLD RABBIT TO OTHER FARMERS?
(a) Yes ( ),
(b) No ( )
59
25. FOR WHAT PURPOSE DID THEY BUY RABBITS?
(a) Slaughter ( ),
(b) Breeding ( )
26. WHICH PRODUCTS DO YOU BENEFIT FROM RABBIT FARMING?
(a) White meat – food
(b) Manure
(c) Income
(d) All of above
(e) Others (hobby, pets, aesthetic)
Copyright © 2022 FDOKUMEN