
Factors associated with eating out of home in Vietnamese adolescents
32
Factors associated with eating out of home in Vietnamese adolescents 1 2 3 4 5 6 7 8 9 10 11 12 13 Lachat Carl 1,2 , Khanh Le Nguyen Bao 3 , Huynh Thi Thanh Tuyen 2 , Verstraeten Roosmarijn², Nago Eunice 2,4 , Roberfroid Dominique 1 , Kolsteren Patrick 1,2,* 1 Nutrition and Child Health Unit, Institute of Tropical Medicine, Nationalestraat 155 B- 2000 Antwerp, Belgium; 2 Department of Food Safety and Food Quality, Faculty of Bioscience Engineering, Ghent University, Coupure links 653, 9000 Gent, Belgium; 3 National Institute of Nutrition, Tang Bat Ho 48b, Hanoi, Vietnam; 4 Department of Nutrition and Food Science, Faculty of Agricultural Sciences, University of Abomey-Calavi, 01 BP 526 Cotonou, Benin; Email adresses: [email protected] (C. Lachat), [email protected] (B. Khanh); 14 [email protected] ; (T. Huynh) [email protected] (R. Verstraeten), 15 [email protected] (E. Nago); [email protected] (D. Roberfroid); 16 [email protected] (P. Kolsteren) 17 18 19 20 21 22 23 24 Keywords: Eating; Life Style; Food Habits; Vietnam; Adolescents Running head: Associations of eating out in Vietnam Number of words: 3100 Number of tables: 4 Number of figures: 1 Additional files: 1 1
-
Upload
independent -
Category
Documents
-
view
1 -
download
0
Transcript of Factors associated with eating out of home in Vietnamese adolescents
Factors associated with eating out of home in Vietnamese adolescents 1
2
3
4
5
6
7
8
9
10
11
12
13
Lachat Carl1,2, Khanh Le Nguyen Bao3, Huynh Thi Thanh Tuyen2, Verstraeten
Roosmarijn², Nago Eunice2,4, Roberfroid Dominique1, Kolsteren Patrick1,2,*
1 Nutrition and Child Health Unit, Institute of Tropical Medicine, Nationalestraat 155 B-
2000 Antwerp, Belgium;
2 Department of Food Safety and Food Quality, Faculty of Bioscience Engineering,
Ghent University, Coupure links 653, 9000 Gent, Belgium;
3 National Institute of Nutrition, Tang Bat Ho 48b, Hanoi, Vietnam;
4 Department of Nutrition and Food Science, Faculty of Agricultural Sciences,
University of Abomey-Calavi, 01 BP 526 Cotonou, Benin;
Email adresses:
[email protected] (C. Lachat), [email protected] (B. Khanh); 14
[email protected]; (T. Huynh) [email protected] (R.
Verstraeten),
15
[email protected] (E. Nago); [email protected] (D. Roberfroid); 16
[email protected] (P. Kolsteren) 17
18
19
20
21
22
23
24
Keywords: Eating; Life Style; Food Habits; Vietnam; Adolescents
Running head: Associations of eating out in Vietnam
Number of words: 3100
Number of tables: 4
Number of figures: 1
Additional files: 1
1

List of abbreviations used 1
2
3
4
5
6
7
8
9
10
11
12
13
14
15
16
17
BMI Body Mass Index
IQR Inter Quartile Range
OH Out of Home
OR Odds Ratio
RE Retinol Equivalents
* Corresponding author
Patrick Kolsteren
Nutrition and Child Health Unit, Institute of Tropical Medicine,
Nationalestraat 155 B-2000 Antwerp, Belgium
“not for publication”
Tel: 0032 3 2476389 fax: 0032 3 2476543 [email protected]
2
3
1
2
3
4
5
6
7
8
9
10
11
12
13
14
15
16
17
Abstract
Eating out of home (OH) is nutritionally important in some developing countries. This
study identifies the factors associated with eating OH in Vietnamese adolescents. Data
was obtained from a cross-sectional cluster survey of 502 adolescents in rural and urban
areas in Vietnam. Factors associated with eating OH were recorded with a Likert scale
and analysed using factor analysis. Data on eating OH was collected using a frequency
questionnaire and a 1-day 24 h recall. A first pattern “Convenience” incorporated
preparation time, price, variety, taste, proximity and social aspects as items associated
with eating OH. A second pattern “Nutritional and food safety concerned” reflects
concerns with regard to hygiene, fat and salt content of the food prepared OH.
Adolescents characterised by the convenience pattern were more likely (OR=1.51,
P<0.001) to eat OH more frequently. The highest tertile of the Nutritional and food
safety concerned pattern was less likely (OR=0.61, P=0.03) to eat OH compared to
lower tertiles. Both patterns were not associated with the % energy from eating OH per
day. Convenience and to a lesser extent nutritional and food safety concerns are
significant factors associated with the frequency of eating OH in Vietnamese
adolescents.
Introduction
Foods prepared out of home (OH) have taken a predominant place in the diet worldwide
(Bezerra & Sichieri, 2009; Orfanos et al., 2009; Vandevijvere et al., 2009). This is potentially
worrying since data from the USA indicate that increased eating OH is an important driver of
the obesity epidemic (Kant & Graubard, 2004). Those who eat more OH tend to have a
higher energy intake (French et al., 2001; Satia et al., 2004; Taveras et al., 2005) and a higher
body mass index (BMI) (Kant & Graubard, 2004; Thompson et al., 2004; Bezerra & Sichieri,
2009). Although data on the nutritional importance of eating OH is scanty for low- and
middle-income countries, researchers also argued that increases in eating OH have been
fuelling the dietary changes in these countries (Adair & Popkin, 2005).
20
25
30
35
40
Vietnam is a country affected with various nutritional deficiencies (Thang & Popkin, 2003).
At the same time, diet-related diseases such as obesity are emerging rapidly in urban areas of
the country (Hong et al., 2007; van Lierop et al., 2008). Since adolescents represent a large
share of the population in low- and middle-income countries and since eating habits are
known to track from adolescents into adulthood (Kelder et al., 1994), they are a key target
group for public health interventions (WHO, 2003).
In contrast to the literature in high income countries, eating OH in Vietnam has a number of
beneficial nutritional characteristics. In a sample of school going adolescents, OH foods
accounted for 21% of the total daily energy intake and provided substantial amounts of fruits,
vegetables, Fe and Zn. At the same time however, eating OH was positively associated with a
higher energy intake from fat and the consumption of sugary products (Lachat et al., 2009).
4

Improving eating OH is a potential interesting way to improve dietary intakes of large
populations (You et al., 2009). When developing interventions to improve dietary habits and
eating OH however, contexts-specific determinants (Sandvik, et al., 2010; Ruxton & Kirk,
1996) of eating behaviour need to be taken into account. Data mainly from high income
countries have shown that the dietary quality tends to increase with socio-economic status
(Darmon & Drewnowski, 2008) and that factors such as demography (Jackson et al., 2003;
Kremers et al. 2007; Wang et al. 2002), gender (Kremers et al., 2007; Lien et al., 2002;
Milligan et al., 1998; Neumark-Sztainer et al., 2003) household wealth status (Ruxton &
Kirk, 1996; Neumark-Sztainer et al., 2003; Bere et al.,2008) and parental education level
(Ruxton & Kirk, 1996; Neumark-Sztainer et al., 2003; van der Horst et al., 2007) are
significant factors associated with the quality of adolescents’ diets.
45
50
55
60
65
Despite its nutritional importance, quantitative and qualitative data on the associations of
eating OH is lacking for low- and middle-income countries. The aim of this study was to
identify the factors associated with eating OH in Vietnamese adolescents and to evaluate their
association with dietary intake, the frequency of eating OH and the energy contribution of
eating OH on a daily basis.
Materials and methods
Sample
Data was obtained from a cross-sectional cluster survey of adolescents from 4 schools in
Hanam and 4 schools in Hanoi in Vietnam in 2006-2007. All children of grade 11 in each
school were invited to participate. In a first survey, food intake and anthropometric data were
collected and in a second survey the same adolescents completed a form with socio-economic
5
information and factors associated with eating OH. The selection of the schools was done by
the Vietnamese authorities to make sure that the schools did not have an intervention that
would bias our findings.
70
75
80
85
90
The study protocol was approved by the Medical Research Ethics Committee of the National
Institute of Nutrition of Vietnam. Written informed consent was obtained from the
adolescents and their parents prior to data collection.
Anthropometric measurements (weight and height) were carried out in double by experienced
researchers. Age (calculated from date of birth from the medical records at school) and
gender specific cut-off values were used to determine BMI categories (Cole et al., 2000; Cole
et al., 2007). Since only 2 adolescents in the sample were obese, the categories of ‘obese’ and
‘overweight’ were merged into one category ‘overweight’ for the analysis.
Eating OH
Eating OH was assessed using both the frequency of eating OH and the % energy intake from
OH foods on a daily basis. Data on the frequency of eating OH were collected using 6
frequency questions (taking breakfast from the school tuck shop, taking lunch at the school,
eating OH during schooldays, eating OH during weekend days, drinking soft drinks OH
during schooldays and drinking soft drinks OH during weekend days). The answers were
summed to produce a total score for weekly frequency of eating OH. The % energy intake
from OH foods was measured with a 1 day interviewer administered 24-hour recall. All foods
and drinks prepared OH were classified as OH foods, regardless of their place of
consumption. The composition of the foods and drinks was obtained from the Vietnamese
food composition table (National Institute of Nutrition, 1972). We used a dietary diversity
6

score as a measure of dietary quality as described earlier (Kennedy et al., 2007) by counting
food groups: cereals, root/tubers, vegetables, fruits, meat/poultry/offal, eggs/dairy,
fish/seafood, pulses/legumes/nuts, oil/fats, sugar/confectionary/soft drinks and miscellaneous
(inc. spices and alcohol) for which at least 10g was consumed per day. The classification was
based on food groups used at the National Institute for Nutrition in Vietnam. To calculate
energy density, the energy contribution from all food and drinks consumed was divided by
the weight. Since both the frequency of eating OH and the % energy from OH food were
highly skewed, both variables were categorised as tertiles for the analysis.
95
100
105
110
115
Socio-economic data
We used location (Hanam as rural and Hanoi as urban) of schools, household wealth, amount
of pocket money, gender and education of the parents as socio-economic variables. We
recorded household assets such as air-conditioning, refrigerator, car, television, motorcycles,
computer and the type of house and converted them into their financial equivalent as a
measure of household wealth status. The weekly amount of pocket money of the adolescents
was used as a proxy of individual wealth. We compared the highest tertile (indicated as
“high”) with the two lowest tertiles (indicated as “lower”) of the wealth variables. The
education level of the parents was grouped as “College, university or higher education” and
“Senior secondary or lower”.
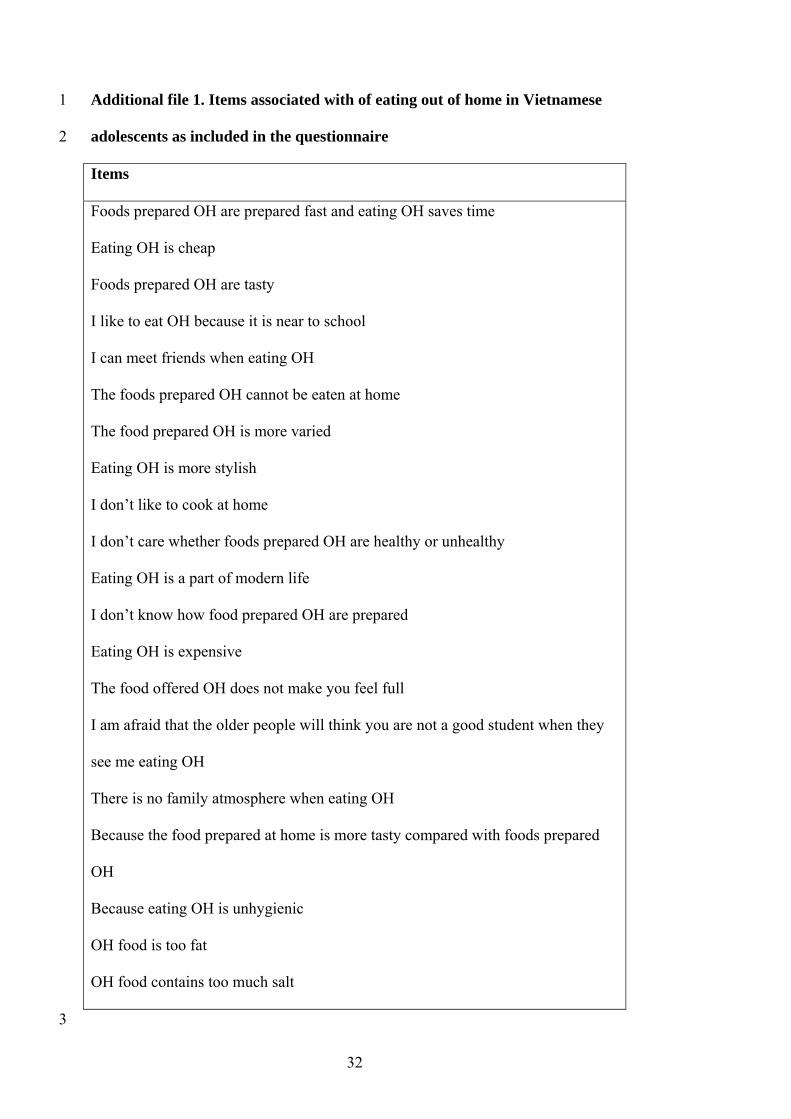
Factors associated with eating OH
Focus group discussions with the adolescents in 2 rural and 2 urban schools were carried out
to obtain the most important factors associated with eating OH. Each focus group comprised
8-10 participants and was balanced in terms of gender. The discussions were exploratory
using open ended questions, moderated by an experienced Vietnamese researcher, recorded
7

digitally and transcribed manually. Recurring factors were retained as associations of eating
OH. The factors associated with eating OH were recorded in a 5-option Likert scale (Likert,
1932). We added the option “I don’t know” since we were unsure how well the adolescents
could fill out the scales. A pretest in a neighbouring school (not included in the sample)
showed that adolescents had no difficulty with the forms and that the different constructs of
the test version had an acceptable internal consistency (Cronbach's =0.70). The final
questionnaire contained items with a Cronbach's =0.73 (Additional file 1). The consistency
of the questions in rural and urban areas separately were both acceptable (Cronbach's =0.70
and =0.76 respectively). “I don’t know” responses were recoded as missing. Only
adolescents that provided valid responses (all answers apart from missing and “I don’t
know”) for >80% of the questions were retained for analysis.
120
125
130
135
140
Analysis
Data were entered in double using EpiData (Odense, Denmark) and analysed using Stata
(StataCorp, Texas, USA). Factor analysis was used to identify patterns in the associations of
eating OH. The covariance matrix was rotated to produce orthogonal and independent factors.
A screeplot of eigenvalues and the Kaiser criterion (Kaiser, 1960) were used to select the
factors for analysis. Factors retained for analysis were subsequently examined visually for
meaningful patterns in associations of eating OH. Items with factor loadings >0.3 were
considered to be more important in explaining variability in the factors and were taken into
account to identify patterns in the associated factors. The factors retained for analysis were
categorised into tertiles in the models.
The association of the factors of eating OH was analysed using 2 dependent variables:
frequency of eating OH per week and % energy intake from OH foods on a daily basis.
8
Differences in dietary intake between the patterns of factors were analysed using a Kruskal-
Wallis test. Since intakes of fruit and vegetables, vitamin A, Na, Fe and Zn potentially
depend on the energy consumed, we used energy adjusted estimates in the models (Willett,
1998). The socio-economic associations with the associated factors and frequency of eating
OH were analysed using logit models for ordinal dependent variables (Williams, 2006).
Predictors with P<0.20 in a bivariate model were included in an adjusted model. Ordinal
regression models only provide valid estimates when the odds ratios (OR) of the sub-models
are proportional. When the OR were not proportional (as assessed using a Likelihood-ratio
test), we reported the results of the sub-models in the text.
145
150
d 155
chools.
160
165
We previously observed differences of eating OH in rural and urban areas and tested for
interactions of locality and factors associated with eating OH. The interaction terms were
considered significant at Pi<0.10. All other analyses were carried out with a significance
level of P<0.05. Given the highly skewed distribution, the frequency of eating OH is reporte
as median and interquartile range (IQR). All other data are reported as means and SD,
adjusted for the clustering in s
Results
Characteristics of the respondents
Complete data were available for 502 adolescents. In total 8 adolescents were excluded from
analysis because they did not provide valid responses. A total of 308 adolescents (61%) were
from rural areas. On average the adolescents were 16.40.4 years with a BMI of 19.52.3
kg.m-2 with no significance differences in rural and urban areas (P=0.25 and P=0.60 for age
9
and BMI respectively). Of the total sample, 22.0%, 4.0% and 0.4% were underweight,
overweight and obese respectively.
Frequency and energy contribution of eating OH
170
175
180
185
One quarter (27.3%) of the adolescents did not have any food or beverage OH on a weekly
basis. The median of the frequency of eating OH was 3 times a week (IQR=0-7). Children in
urban areas (Median=5 times, IQR=1-9) consumed OH foods more frequently on a weekly
basis compared to those in rural areas (Median=1 / week, IQR=0-3). Females (Median= 3/
week, IQR=1-8) ate more frequently OH compared with males (Median=2 / week, IQR=0-7),
though this difference was marginally not significant (P=0.07). Compared with normal BMI
adolescents, underweight and overweight adolescents did not significantly eat out more often
(P=0.39 and P=0.24 respectively)
On average, adolescents in the sample consumed 24.620.3% of their daily energy intake
from OH foods. The energy contribution from OH foods was lower in rural areas compared
to urban areas (13.415.3% energy per day in rural vs. 31.620.0% energy per day in urban
areas). On a daily basis, females had a higher energy contribution from eating OH compared
with males (27.5±21.5% and 19.5±16.8% of the total energy intake respectively, P<0.001).
Underweight children did not have different % daily energy contribution from OH eating
compared to normal BMI children (P=0.78). Overweight children had a higher daily energy
contribution from OH eating compared to normal BMI children (35.3±26.5% vs.
24.3±20.0%) but this difference was marginally not significant (P=0.055).
Factors associated with eating OH
10

190
195
200
205
210
Two factors, explaining almost 60% of the variability in the matrix were retained for analysis
(Figure 1). We identified 2 patterns: a first one labelled “Convenience” pattern that was
characterised by short preparation time, taste, low price and variety of foods offered OH and
proximity to school and opportunity to meet friends when eating OH (Table 1). The second
one incorporated items related to the fat and salt content and food safety aspects of the food
served OH and was labelled “Nutritional and food safety concerned” pattern. The factor
analysis produced similar results when carried out for adolescents in rural and urban areas
separately (not shown).
In contrast to the Nutritional and food safety concerned pattern, the Convenience pattern was
associated with differences in dietary intake per day. Adolescents with higher scores for
Convenience had a lower total energy and energy density on a daily basis (Table 2). The
profiles were not associated with differences in other dietary parameters.
Convenience and eating OH
Adolescents with higher scores for the Convenience pattern were more likely to report higher
frequencies of eating OH (Table 3). Higher tertiles of Convenience were 50% more likely to
report higher frequencies of eating OH. The OR of the models with frequency of eating OH
as outcome were not proportional (P<0.001). Adolescents in the highest tertile of
“Convenience” ate more frequently OH compared to the 2 lower tertiles (OR=1.97, P<0.001).
Similarly, the adolescents in the 2 highest tertiles of Convenience ate OH more frequently
compared to the lowest tertile (OR=1.74, P=0.005). The Convenience pattern was not
associated with higher energy intakes from OH foods on a daily basis. The OR of the models
was proportional (P=0.54).
11

The interaction between the Convenience pattern and location was significant in the model
with frequency of eating OH as an outcome (P
215
220
225
230
235
i=0.003) and the model with % energy from
OH foods (Pi=0.004). The association of the Convenience pattern with frequency of eating
OH was particularly present in the urban area (OR=1.65, P=0.02) and less in the rural one
(OR=1.31, P=0.05). The Convenience pattern was not associated with % energy of OH foods
in either rural (OR=0.89, P=0.55) or urban (OR=1.17, P=0.22) areas.
The interaction between the Convenience pattern and gender was not significant in the model
with frequency of eating OH (Pi=0.48) but it was so in the model with % energy contribution
from OH eating (Pi=0.02). Stratified analysis of the latter model however, revealed no gender
differences in the association of convenience and % energy contribution of OH eating
(females: OR=1.05, P=0.68; males: OR=1.10, P= 0.44).
Nutritional and food safety concerns and eating OH
Overall, the Nutritional and food safety concerned pattern was not associated with the
frequency of eating OH (Table 4). The OR of both categories of the Nutritional and food
safety concerned pattern however, were not proportional for the model comparing frequency
of eating OH (P<0.001). Adolescents in the highest tertile of Nutritional and food safety
concerned pattern were 40% (OR=0.61, P=0.03) less likely to eat OH compared to those in
the lowest 2 tertiles. The OR comparing the adolescents in the lowest tertile vs. the highest 2
tertiles were not significant (OR=0.88, P=0.30).
The Nutritional and food safety concerned pattern was not associated with differences in %
energy contribution from OH foods. The OR for the model with % energy from OH foods as
outcome were proportional (P=0.52).
12

240
245
250
255
260
Although the interaction between locality and the Nutritional and food safety concerned
pattern was significant (Pi=0.004) in the model with frequency of eating OH as outcome, no
differences were observed in rural and urban areas.
The interaction between gender and the Nutritional and food safety concerned pattern was
significant for both models with frequency of eating OH as outcome (Pi=0.08), and energy %
contribution from OH foods (Pi=0.04). The stratified analysis however, showed no
differences between the genders in either the association of Nutritional and food safety
concerned patterns with the frequency of eating OH (females: OR=0.87, P=0.39; males:
OR=0.63, P=0.16) or the % energy contribution from OH foods (females: OR=0.93, P=0.66;
males: OR=0.86, P=0.45).
Discussion
Context-specific, culturally acceptable and population based strategies are required to address
the prevailing nutritional problems effectively. Eating OH is important in the diet of
Vietnamese adolescents in particular those residing in urban areas and offers a potential
effective way to address the current dietary challenges.
A pattern of convenience towards eating OH was associated with higher frequencies of eating
OH per week and lower energy intake and energy density per day. The items characterising
this pattern were fast preparation time, cheap price, taste and variety of the food, proximity,
opportunity to meet friends and not having to cook at home. These findings support those of
previous studies that have looked at determinants of eating habits. Taste of the food offered,
convenience and the opportunity to meet friends are known to be important reasons for eating
13
265
270
275
280
285
OH (Rydell et al., 2008; Lucan et al., 2010). Data from Nairobi have shown how households
with less time available to prepare food at home ate out more frequently (van't Riet et al.,
2001). Proximity of eating establishments has been reported earlier to be a key factors
associated with eating OH for school going adolescents in the USA (Davis & Carpenter,
2009). Studies have argued that the dietary environment has a profound influence on diets of
individuals (Story et al., 2002; Swinburn et al., 1999) but the association of proximity of
eating establishment (in particular fast food outlets) and dietary quality or nutritional status
however, is inconsistent (Cummins & Macintyre, 2006). The adolescents in our study
reported eating OH was “a part of modern life” as an item associated with eating OH. Warde
and Martens previously described how eating OH in the UK is associated with sophistication
and style (Warde & Martens, 1998).
A second pattern of factors associated with eating OH reflected nutritional (fat and salt
content of food prepared OH) and food safety concerns with regard to eating OH.
Adolescents of the highest tertile of this pattern ate OH less frequently compared to those in
the lower tertiles. There is very little information on how nutrition or health consciousness
influences eating OH. Yen et al. previously reported differences in foods consumed at home
and OH by levels of nutritional knowledge (Yen et al., 2008). Use of fast food restaurants
was inversely associated with concerns about healthy eating in a sample of US adolescents
(French et al., 2001) and self-rated health (Satia et al., 2004). In addition, some have argued
that health conscious consumers eat OH less frequently compared to their peers and that
specific actions are needed to reach this population to promote healthy eating OH (Lachat et
al., 2011).
14
Neither the Convenience nor the Nutritional and food safety concerned pattern was associated
with differences in % energy from OH foods. This is likely attributable to the heterogeneity
and type of the foods consumed when eating OH. These foods included soups, fruits as well
as high energy dense foods (Lachat et al., 2009).
290
295
300
305
310
The Convenience pattern, associated with higher frequencies of eating OH, was negatively
associated with total energy intake and energy density on a daily basis. This is in contrast
with the available evidence. Various studies from industrialised countries have shown that
frequency of eating OH is associated with higher energy intakes per day (French et al., 2001;
Satia et al., 2004; Taveras et al., 2005). In our study, soups and fruits featured as the most
popular OH foods and the energy density of OH foods was lower compared to foods prepared
at home (137.595.0 kcal/100g vs. 222.8 51.8 kcal/100g).
We observed important differences between urban and rural areas. Eating OH was more
important in the diet of urban children compared to that of the rural ones and the association
between the Convenience pattern and the frequency of eating OH was slightly more
pronounced in urban areas. This corresponds with available data on street food consumption
in low and middle income countries (Dawson & Canet, 1991; FAO, 1990). We previously
documented how in urban areas, fruits and beef noodle soups were relatively more frequently
consumed as OH foods (Lachat et al., 2009). In rural areas, sweet desserts, fried meat, bread
with liver pâté, rice doughnuts topped the list of OH foods.
Neither gender nor nutrition status significantly modified the relationship with the patterns
identified and the dietary outcomes or socio-economic status. Although females ate more
frequently OH and had higher % energy intakes from OH food, we did not observe gender
15

differences in the associations of the patterns and the frequency of eating OH or the % energy
contribution of eating OH on a daily basis. Similarly, although overweight children had a
slightly (although marginally not significant) higher energy contribution from OH eating
compared to their normal BMI peers, adding the nutrition status to the models did not
significantly modify the associations.
315
320
325
330
335
Adolescents with higher amounts of pocket money ate OH more frequently compared to their
peers. In addition, adolescents from wealthier households had a higher energy contribution
from foods OH. The socio-economic gradient in dietary quality of adolescents has been
described earlier (Darmon & Drewnowski, 2008; Neumark-Sztainer et al., 2003; Ruxton &
Kirk, 1996). Our findings expand the available evidence and suggest that a higher socio-
economic status can mediate dietary intake through differences in eating OH.
We acknowledge a number of limitations of this study. We used convenience sampling to
recruit our participants which impairs generalisation of our findings (Lachat et al., 2009). We
did not attempt to exclude over and under reporting children due to lack of valid equations to
calculate the Basal Metabolic Rate of non-Caucasian adolescents (Torun, 2005). We did not
collect information regarding the price of the foods in the analysis. We acknowledge that the
financial cost of eating OH is a potential important covariate for this analysis which was not
assessed. Lastly, we used factor analysis to identify patterns in items in the questionnaire.
This approach is appropriate for this study since it takes the relationships between items into
account to identify patterns. The disadvantage however, is that the findings are largely data
driven and require additional studies to be generalised. Despite these conceptual differences
however, the findings of our study are robust, sensible and confirm various previous results
of studies that have looked at eating OH.
16

340 In conclusion, we report that convenience and to a lesser extent nutritional and food safety
concerns are important factors associated with the frequency of eating OH in Vietnamese
adolescents in particular those residing in rural areas. In addition, pocket money and
accumulated household wealth were significant predictors of frequency of eating OH and %
energy contribution of OH respectively.
17

345
350
355
Acknowledgements
We thank the staff of the staff of the Department of Occupational and School Nutrition and
Prof. Khan Director of the National Institute of Nutrition of Vietnam and teachers and pupils
of the schools selected in the study. This study was funded by both the Nutricia Research
Foundation and Nutrition Third World. The sponsors were not involved in the study design,
collection, analysis or interpretation of the data. The first and corresponding authors had
access to all data at all times and had the final responsibility to submit the manuscript for
publication.
Conflict of interest
The authors declare that they have no competing interests. LC, KLNB and KP designed and
carried out the study. LC drafted the manuscript and LC, HTTT, NE and VR analysed the
data. All authors critically revised the drafted manuscript.
18

360
365
370
375
380
References
Adair LS , Popkin BM (2005). Are child eating patterns being transformed globally? Obesity
Research, 13, 1281-1299.
Bere E, van Lenthe F, Klepp KI and Brug J (2008). Why do parents education level and
income affect the amount of fruits and vegetables adolescents eat. European Journal of
Public Health, 18, 611-615.
Bezerra IN , Sichieri R (2009). Eating out of home and obesity: a Brazilian nationwide
survey. Public Health Nutrition, 12, 2037-2043.
Cole TJ, Bellizzi MC, Flegal KM and Dietz WH (2000). Establishing a standard definition
for child overweight and obesity worldwide: international survey. British Medical Journal,
320, 1240-1243.
Cole TJ, Flegal KM, Nicholls D and Jackson AA (2007). Body mass index cut offs to define
thinness in children and adolescents: international survey. British Medical Journal, 335, 194-
197.
Cummins S , Macintyre S (2006). Food environments and obesity - neighbourhood or nation?
International Journal of Epidemiology, 35, 100-104.
Darmon N , Drewnowski A (2008). Does social class predict diet quality? American Journal
of Clinical Nutrition, 87, 1107-1117.
Davis B , Carpenter C (2009). Proximity of Fast-Food Restaurants to Schools and Adolescent
Obesity. American Journal of Public Health, 99, 505-510.
19
Dawson RJ and Canet C (1991). International activities in street foods. Food Control, 2, 135-
139.
FAO. (1990). Street foods. FAO Food and Nutrition paper 46. Report of an FAO
consultation. Jogjakarta, Indonesia December 1988. Rome, Food and Agricultural
Organisation of the United Nations.
385
390
395
400
French SA, Story M, Neumark-Sztainer D, Fulkerson JA and Hannan P (2001). Fast food
restaurant use among adolescents: associations with nutrient intake, food choices and
behavioral and psychosocial variables. International Journal of Obesity, 25, 1823-1833.
Hong TK, Dibley MJ, Sibbritt D, Binh PNT, Trang NHHD and Hanh TTM (2007).
Overweight and obesity are rapidly emerging among adolescents in Ho Chi Minh City,
Vietnam, 2002-2004. International Journal of Pediatric Obesity, 2, 194-201.
Jackson RT, Rashed M and Saad-Eldin R (2003). Rural urban differences in weight, body
image, and dieting behavior among adolescent Egyptian schoolgirls. International Journal of
Food Science & Nutrition, 54, 1-11.
Kaiser HF (1960). The Application of Electronic Computers to Factor Analysis. Educational
& Psychological Measurement, 20, 141-151.
Kant AK , Graubard BI (2004). Eating out in America, 1987-2000: trends and nutritional
correlates. Preventive Medicine, 38, 243-249.
Kelder SH, Perry CL, Klepp KI and Lytle LL (1994). Longitudinal Tracking of Adolescent
Smoking, Physical-Activity, and Food Choice Behaviors. American Journal of Public Health,
84, 1121-1126.
20

Kennedy GL, Pedro MR, Seghieri C, Nantel G and Brouwer I (2007). Dietary diversity score
is a useful indicator of micronutrient intake in non-breast-feeding Filipino children. Journal
of Nutrition, 137, 472-477. 405
410
415
420
Kremers SPJ, de Bruijn GJ, Droomers M, van Lenthe F and Brug J (2007). Moderators of
environmental intervention effects on diet and activity in youth. American Journal of
Preventive Medicine, 32, 163-172.
Lachat C, Le NBK, Nguyen CK, Nguyen QD, Nguyen DVA, Roberfroid D et al. (2009).
Eating out of home in Vietnamese adolescents: socioeconomic factors and dietary
associations. American Journal of Clinical Nutrition, 90, 1648-1655.
Lachat C, Naska A, Trichopoulou A, Engeset D, Fairgrieve A, Ávila Marques H et al. (2011).
Essential actions for caterers to promote healthy eating out among European Consumers:
results from a participatory stakeholder analysis in the HECTOR project. Public Health
Nutrition, 14, 193-202.
Lien N, Jacobs DR and Klepp KI (2002). Exploring predictors of eating behaviour among
adolescents by gender and socio-economic status. Public Health Nutrition, 5, 671-681.
Likert R (1932). A Technique for the Measurement of Attitudes. Archives of Psychology,
140.
Lucan SC, Barg FK and Long JA (2010). Promoters and Barriers to Fruit, Vegetable, and
Fast-Food Consumption Among Urban, Low-Income African Americans-A Qualitative
Approach. American Journal of Public Health, 100, 631-635.
21

Milligan RAK, Burke V, Beilin LJ, Dunbar DL, Spencer MJ, Balde E et al. (1998). Influence
of gender and socio-economic status on dietary patterns and nutrient intakes in 18-year-old
Australians. Australian New Zealand Journal of Public Health, 22, 485-493. 425
430
435
440
National Institute of Nutrition (1972). Food products in Vietnam: composition and nutritive
value Hanoi: NIN.
Neumark-Sztainer D, Hannan PJ, Story M, Croll J and Perry C (2003). Family meal patterns:
Associations with sociodemographic characteristics and improved dietary intake among
adolescents. Journal of the American Dietetic Association, 103, 317-322.
Orfanos P, Naska A, Trichopoulou A, Grioni S, Boer JMA, van Bakel MME et al. (2009).
Eating out of home: energy, macro- and micronutrient intakes in 10 European countries. The
European Prospective Investigation into Cancer and Nutrition. European Journal of Clinical
Nutrition, 63, S239-S262.
Ruxton CHS , Kirk TR (1996). Relationships between social class, nutrient intake and dietary
patterns in Edinburgh schoolchildren. International Journal of Food Science and Nutrition,
47, 341-349.
Rydell SA, Harnack LJ, Oakes JM, Story M, Jeffery RW and French SA (2008). Why Eat at
Fast-Food Restaurants: Reported Reasons among Frequent Consumers. Journal of the
American Dietetic Association, 108, 2066-2070.
Sandvik C, Gjestad R, Samdal O, Brug J and Klepp KI (2010). Does socio-economic status
moderate the associations between psychosocial predictors and fruit intake in schoolchildren?
The Pro Children study. Health Education Research, 25, 121-134.
22

Satia JA, Galanko JA and Siega-Riz AM (2004). Eating at fast-food restaurants is associated
with dietary intake, demographic, psychosocial and behavioural factors among African
Americans in North Carolina. Public Health Nutrition, 7, 1089-1096.
445
450
455
460
Story M, Neumark-Sztainer D and French S (2002). Individual and environmental influences
on adolescent eating behaviors. Journal of the American Dietetic Association, 102, S40-S51.
Swinburn B, Egger G and Raza F (1999). Dissecting obesogenic environments: The
development and application of a framework for identifying and prioritizing environmental
interventions for obesity. Preventive Medicine, 29, 563-570.
Taveras EM, Berkey CS, Rifas-Shiman SL, Ludwig DS, Rockett HRH, Field AE et al.
(2005). Association of consumption of fried food away from home with body mass index and
diet quality in older children and adolescents. Pediatrics, 116, E518-E524.
Thang NM, Popkin B (2003). Child malnutrition in Vietnam and its transition in an era of
economic growth. Journal of Human Nutrition & Dietetics, 16, 233-244.
Thompson OM, Ballew C, Resnicow K, Must A, Bandini LG, Cyr H et al. (2004). Food
purchased away from home as a predictor of change in BMI z-score among girls.
International Journal of Obesity, 28, 282-289.
Torun B (2005). Energy requirements of children and adolescents. Public Health Nutrition, 8,
968-993.
van der Horst K, Oenema A, Ferreira I, Wendel-Vos W, Giskes K, van Lenthe F et al. (2007).
A systematic review of environmental correlates of obesity-related dietary behaviors in
youth. Health Education Research, 22, 203-226.
23

465
470
475
480
485
van Lierop A, Nguyen VN, Doak C, Le QH, Tran QB, Hoekstra J et al. (2008). Regional
clustering of anthropometric dimensions of primary school children in rural and suburban
Vietnam. Asia Pacific Journal of Clinical Nutrition, 17, 603-607.
van't Riet H, den Hartog AP, Mwangi AM, Mwadime RKN, Focken DWJ and van Staveren
WA (2001). The role of street foods in the dietary pattern of two low-income groups in
Nairobi. European Journal of Clinical Nutrition, 55, 562-570.
Vandevijvere S, Lachat C, Kolsteren P and Van Oyen H (2009). Eating out of home in
Belgium: current situation and policy implications. British Journal of Nutrition, 102, 921-
928.
Wang YF, Bentley ME, Zhai FY and Popkin BM (2002). Tracking of dietary intake patterns
of Chinese from childhood to adolescence over a six-year follow-up period. Journal of
Nutrition, 132, 430-438.
Warde A and Martens L (1998). Eating out and the commercialisation of mental life. British
Food Journal, 100, 147-153.
WHO (2003). Diet, Nutrition and the Prevention of Chronic Diseases. WHO Technical
Report Series nr 916 Geneva: World Health Organisation.
Willett WC, (1998). Nutritional epidemiology. (vols. 30) New York: Oxford University
Press.
Williams R (2006). Generalized ordered logit /partial proportional-odds models for ordinal
dependent variables. Stata Journal, 6, 58-82.
Yen ST, Lin BH and Davis CG (2008). Consumer knowledge and meat consumption at home
and away from home. Food Policy, 33, 631-639.
24
You W, Zhang G, Davy BM, Carlson A and Lin BH (2009). Food Consumed Away from
Home Can Be a Part of a Healthy and Affordable Diet. Journal of Nutrition, 139, 1994-1999.
490
25
26
Table 1: Factor loadings of items associated with eating OH*
Convenience
pattern
Nutrition
and food
safety
concerned
pattern
% of variance explained 35.5% 23.6%
Eigenvalue of the factor 2.3 1.5
Factors
OH foods are prepared fast 0.54 -0.03
Eating OH is cheap 0.46 -0.02
OH foods are tasty 0.69 0.02
It is near to the school 0.43 -0.07
I can meet friends when eating OH 0.43 -0.04
Foods I eat OH cannot be eaten at home 0.16 0.00
There is more variety when eating OH 0.63 0.07
Eating OH is more stylish 0.25 -0.07
I don’t like to cook at home 0.49 -0.09
I don’t know foods OH are prepared 0.05 0.15
I don’t care whether eating OH are healthy or not 0.16 -0.08
Eating OH is expensive -0.11 0.18
It cannot satisfy my appetite when eating OH -0.05 0.11
I am afraid older people will think I am not a good student when eating OH -0.05 0.22
There is no family atmosphere when eating OH 0.00 0.24
Food prepared at home is more tasty 0.15 0.25
OH food is unhygienic 0.05 0.35
OH food is too fat 0.01 0.74
OH food contains too much salt -0.03 0.75
Eating OH is a part of modern life 0.41 -0.18
* Result from factor analysis of associations of eating OH in Vietnamese adolescents (n=502),
Factor loadings >0.3 are indicated in bold and were considered meaningful to identify a
pattern
Table 2: Dietary characteristics of tertiles of “Convenience” and “Nutrition and food safety concerned” patterns towards eating OH in
Vietnamese adolescents
495
Convenience pattern Nutrition and food safety concerned pattern
Low Middle High P* Low Middle High P*
Total energy intake (kcal/day) † 2540.4927.5 2296.7808.3 2313.2842.1 0.03 2476.8826.9 2353.2879.3 2320.3888.2 0.09
Energy density (kcal/100g) † 195.345.9 182.247.7 184.945.4 0.03 183.246.6 191.147.4 188.045.7 0.27
DDS†,‡ 6.81.4 6.81.4 6.91.4 0.80 6.91.4 6.81.3 6.71.5 0.50
Energy from fat (%)† 17.37.2% 17.97.2% 18.76.8% 0.10 18.67.0% 17.37.0% 18.07.2% 0.80
Fruits and vegetables (g/day) †,§ 466.5383.6 448.2329.9 432.8310.0 0.26 461.4382.2 438.9332.5 447.2309.4 0.76
Na (mg/day) † , § 1576.8874.2 1392.3998.7 1461.8875.4 0.60 1595.4925.8 1381.4866.1 1454.2955.7 0.26
Vitamin A (RE/day) † , §, 950.41104.8 825.4661.8 960.41056.8 0.88 937.71202.7 915.0847.9 883.9789.2 0.57
Fe (mg/day) † , § 17.28.9 16.28.3 16.58.1 0.10 17.28.1 16.58.9 16.18.3 0.98
Zn (mg/day) † , § 11.55.6 10.24.5 10.54.2 0.29 11.24.8 10.55.0 10.54.7 0.33 * Kruskal-Wallis test comparing differences in dietary intake between different tertiles of Convenience and Nutrition and food safety concerned
pattern of eating OH † Means and SD, ‡ DDS is the Dietary diversity score expressed as number of food groups for which >10g was consumed, §
The estimates were adjusted for total energy intake when comparing intakes between groups as suggested by Willet (49). The tabulated figures are
non-adjusted. RE: Retinol equivalents500
27

Table 3: Convenience pattern and socio-economic predictors as factors associated with
eating OH in Vietnamese adolescents
Frequency of
eating OH*
% energy contribution
from OH foods†
OR‡ P OR P
Convenience pattern OH§ (n=502) 1.51 <0.001 0.96 0.75
Accumulated household wealth
High (n=237) vs. lower (n=265) 1.24 0.34
1.7 0.07
Pocket money
High (n= 183) vs. lower (n=319) 1.99 <0.001
1.4 0.21
Gender
Male (n=182) vs. female (n= 20) 0.66 0.24
0.4 0.007
Location
Rural (n=194) vs. urban (n=308) 2.5 0.1
0.1 <0.001
Education of father
College, university or higher education
(n=159) vs. Senior secondary or lower
(n=289)
-¶ -
1.2 0.71
Education of mother
College, university or higher education
(n=158) vs. Senior secondary or lower
(n=292)
-¶ -
0.8 0.40
Nutrition status√
Overweight (n=22) vs normal BMI
children (n=367)
-¶ -
1.5 0.53 * Categorical regression analysis with frequency of eating OH per week (categorised as tertiles) as dependent
variable † Categorical regression analysis with % energy contribution per day from OH foods (categorised as
tertiles) as dependent variable All models were adjusted for clustering in schools. Predictors with P<0.20 in
bivariate models were included in the adjusted models
505
510
‡ Odds ratio, § Variable representing a pattern of
Convenience with regard to eating OH. The variable was obtained from factor analysis and categorised as
tertiles. The highest category is the highest tertile and lower the 2 lowest tertiles. The categorisation was done
a priori and separately for rural and urban areas. ¶Not included in the adjusted model since P>0.20 in the crude
model with bivariate associations. √Underweight children did not differ in frequency and energy contribution
from OH eating and this category was therefore not included in the models.
28
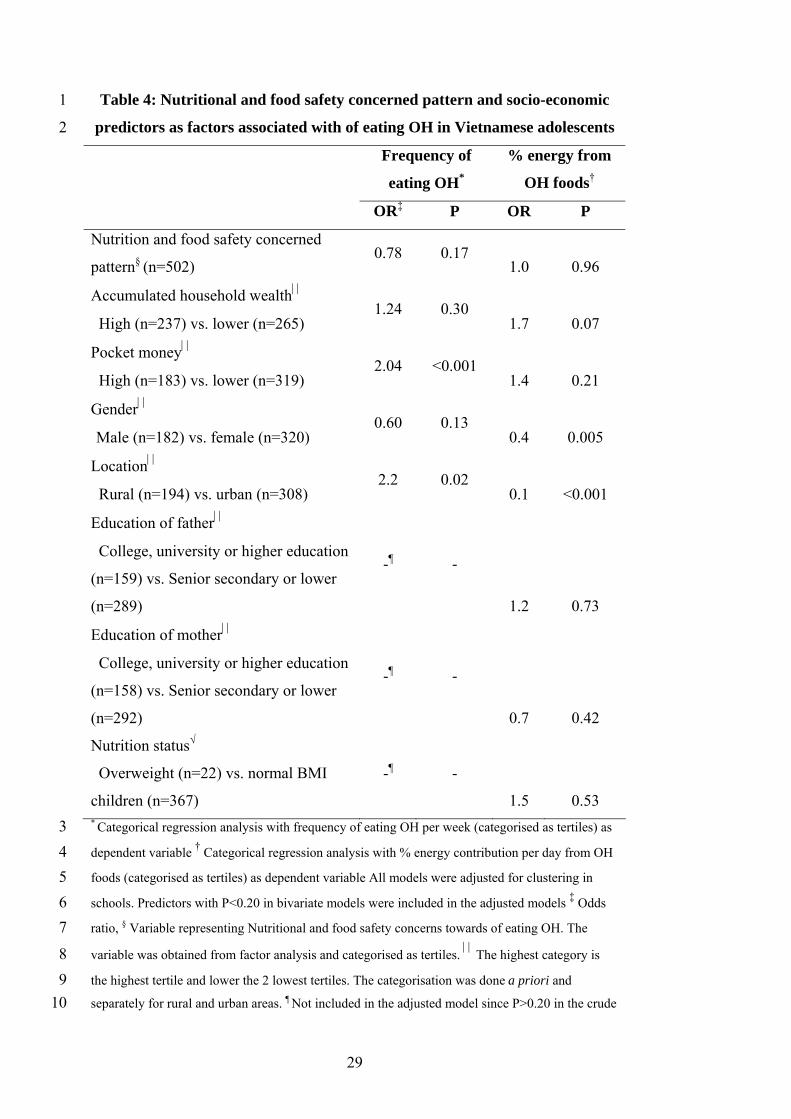
Table 4: Nutritional and food safety concerned pattern and socio-economic
predictors as factors associated with of eating OH in Vietnamese adolescents
1
2
Frequency of
eating OH*
% energy from
OH foods†
OR‡ P OR P
Nutrition and food safety concerned
pattern§ (n=502) 0.78 0.17
1.0 0.96
Accumulated household wealth
High (n=237) vs. lower (n=265) 1.24 0.30
1.7 0.07
Pocket money
High (n=183) vs. lower (n=319) 2.04 <0.001
1.4 0.21
Gender
Male (n=182) vs. female (n=320) 0.60 0.13
0.4 0.005
Location
Rural (n=194) vs. urban (n=308) 2.2 0.02
0.1 <0.001
Education of father
College, university or higher education
(n=159) vs. Senior secondary or lower
(n=289)
-¶ -
1.2 0.73
Education of mother
College, university or higher education
(n=158) vs. Senior secondary or lower
(n=292)
-¶ -
0.7 0.42
Nutrition status√
Overweight (n=22) vs. normal BMI
children (n=367)
-¶ -
1.5 0.53 * Categorical regression analysis with frequency of eating OH per week (categorised as tertiles) as
dependent variable
3
4
5
6
7
8
9
10
† Categorical regression analysis with % energy contribution per day from OH
foods (categorised as tertiles) as dependent variable All models were adjusted for clustering in
schools. Predictors with P<0.20 in bivariate models were included in the adjusted models ‡ Odds
ratio, § Variable representing Nutritional and food safety concerns towards of eating OH. The
variable was obtained from factor analysis and categorised as tertiles. The highest category is
the highest tertile and lower the 2 lowest tertiles. The categorisation was done a priori and
separately for rural and urban areas. ¶ Not included in the adjusted model since P>0.20 in the crude
29

model with bivariate associations. √Underweight children did not differ in frequency and energy
contribution from OH eating and this category was therefore not included in the models.
1
2
30
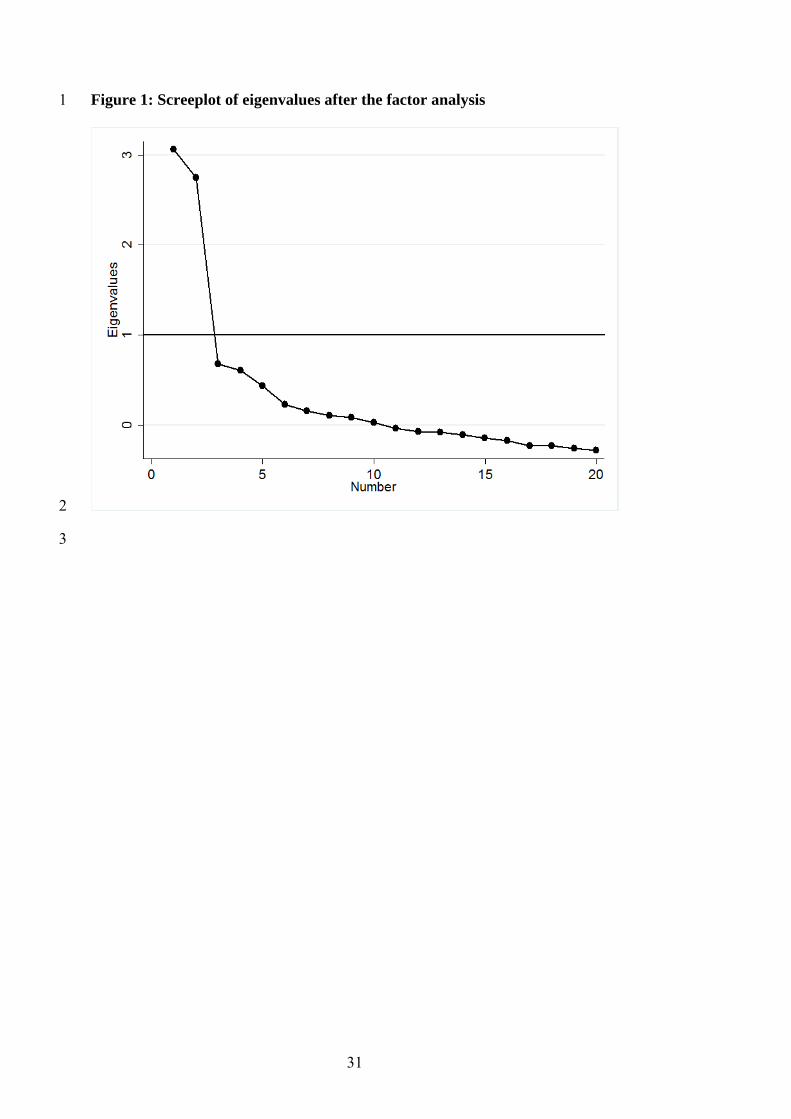
Figure 1: Screeplot of eigenvalues after the factor analysis 1
2
3
31
32
1
2
Additional file 1. Items associated with of eating out of home in Vietnamese
adolescents as included in the questionnaire
Items
Foods prepared OH are prepared fast and eating OH saves time
Eating OH is cheap
Foods prepared OH are tasty
I like to eat OH because it is near to school
I can meet friends when eating OH
The foods prepared OH cannot be eaten at home
The food prepared OH is more varied
Eating OH is more stylish
I don’t like to cook at home
I don’t care whether foods prepared OH are healthy or unhealthy
Eating OH is a part of modern life
I don’t know how food prepared OH are prepared
Eating OH is expensive
The food offered OH does not make you feel full
I am afraid that the older people will think you are not a good student when they
see me eating OH
There is no family atmosphere when eating OH
Because the food prepared at home is more tasty compared with foods prepared
OH
Because eating OH is unhygienic
OH food is too fat
OH food contains too much salt
3