Factors affecting the availability of thick epiphyte mats and other potential nest platforms for...
21
See discussions, stats, and author profiles for this publication at: https://www.researchgate.net/publication/233690258 Factors affecting the availability of thick epiphyte mats and other potential nest platforms for Marbled Murrelets in... Article in Canadian Journal of Forest Research · April 2010 DOI: 10.1139/X10-034 CITATIONS 7 READS 35 8 authors, including: Some of the authors of this publication are also working on these related projects: Arctic Shorebird Demographics Network View project The influence of predation danger on the distribution of non-breeding shorebirds in tropical coasts View project Robert A Ronconi Environment and Climate Change Canada 45 PUBLICATIONS 433 CITATIONS SEE PROFILE Volker Bahn Wright State University 37 PUBLICATIONS 503 CITATIONS SEE PROFILE Alvin Cober Ministry of Forests, Lands and Natural Resourc… 3 PUBLICATIONS 7 CITATIONS SEE PROFILE David B Lank Simon Fraser University 158 PUBLICATIONS 3,547 CITATIONS SEE PROFILE All content following this page was uploaded by David B Lank on 03 December 2016. The user has requested enhancement of the downloaded file. All in-text references underlined in blue are added to the original document and are linked to publications on ResearchGate, letting you access and read them immediately.
Transcript of Factors affecting the availability of thick epiphyte mats and other potential nest platforms for...

Seediscussions,stats,andauthorprofilesforthispublicationat:https://www.researchgate.net/publication/233690258
FactorsaffectingtheavailabilityofthickepiphytematsandotherpotentialnestplatformsforMarbledMurreletsin...
ArticleinCanadianJournalofForestResearch·April2010
DOI:10.1139/X10-034
CITATIONS
7
READS
35
8authors,including:
Someoftheauthorsofthispublicationarealsoworkingontheserelatedprojects:
ArcticShorebirdDemographicsNetworkViewproject
Theinfluenceofpredationdangeronthedistributionofnon-breedingshorebirdsintropicalcoastsView
project
RobertARonconi
EnvironmentandClimateChangeCanada
45PUBLICATIONS433CITATIONS
SEEPROFILE
VolkerBahn
WrightStateUniversity
37PUBLICATIONS503CITATIONS
SEEPROFILE
AlvinCober
MinistryofForests,LandsandNaturalResourc…
3PUBLICATIONS7CITATIONS
SEEPROFILE
DavidBLank
SimonFraserUniversity
158PUBLICATIONS3,547CITATIONS
SEEPROFILE
AllcontentfollowingthispagewasuploadedbyDavidBLankon03December2016.
Theuserhasrequestedenhancementofthedownloadedfile.Allin-textreferencesunderlinedinblueareaddedtotheoriginaldocumentandarelinkedtopublicationsonResearchGate,lettingyouaccessandreadthemimmediately.

Factors affecting the availability of thick epiphytemats and other potential nest platforms forMarbled Murrelets in British Columbia
Alan E. Burger, Robert A. Ronconi, Michael P. Silvergieter, Catherine Conroy,Volker Bahn, Irene A. Manley, Alvin Cober, and David B. Lank
Abstract: Nest platforms (mossy pads, limbs, and deformities >15 cm in diameter) are key requirements in the forest nest-ing habitat of the threatened Marbled Murrelet (Brachyramphus marmoratus (J.F. Gmelin, 1789)). Little is known aboutfactors that affect the availability of platforms or the growth of canopy epiphytes that provide platforms. We examinedvariables affecting these parameters in coastal trees in British Columbia using data from 29 763 trees at 1412 sites in 170watersheds. Tree diameter (diameter at breast height (DBH)) was the most important predictor of platform availability inthe pooled data and within each of six regions. In most regions, platforms become available at DBH > 60 cm, but on EastVancouver Island, DBH needs to be >96 cm and possibly on the Central Coast >82 cm. Other regional predictors of plat-forms included tree height, tree species, and to a lesser extent elevation, slope, and latitude. Most (72%) trees providingplatforms had epiphytes (mainly moss) covering one third or more of branch surfaces and 81% had intermediate or thickepiphyte mats. Mistletoe deformities provided <7% of platforms. Our model predictions help to define and manage suit-able habitat for nesting Marbled Murrelets and also contribute to understanding forest canopy ecosystems.
Resume : Les plateformes de nidification (coussins de mousse, branches et difformites >15 cm de diametre) constituentdes attributs indispensables de l’habitat forestier de nidification de l’alque marbree (Brachyramphus marmoratus (J.F.Gmelin, 1789)), une espece menacee. On sait peu de choses des facteurs qui affectent la disponibilite des plateformes oula croissance des epiphytes de la canopee qui fournissent des plateformes. Nous avons examine les variables qui affectentces parametres chez les arbres cotiers de la Colombie-Britannique en utilisant les donnees de 29 763 arbres repartis dans1 412 sites et 170 bassins versants. Le diametre des arbres (le diametre a la hauteur de poitrine (DHP)) etait la meilleurevariable predictive de la disponibilite de plateformes que toutes les donnees soient regroupees ou dans chacune des six re-gions d’ou provenaient ces donnees. Dans la plupart des regions, des plateformes devenaient disponibles quand le DHP de-passait 60 cm, mais dans l’est de l’ıle de Vancouver le DHP devait etre >96 cm, et possiblement >82 cm dans la regionde la Cote Centrale. Les autres variables predictives des plateformes dans les modeles regionaux incluaient la hauteur del’arbre, l’essence et, a un moindre degre, l’altitude, la pente et la latitude. La plupart (72 %) des arbres fournissant des pla-teformes avaient des epiphytes (surtout des mousses) sur au moins un tiers de la surface des branches et 81 % avaient descoussins d’epiphytes moyens ou epais. Les difformites causees par le gui ont fourni <7 % des plateformes. Les predictionsde notre modele aident a definir et a amenager des habitats de qualite pour les alques en nidification et elles contribuentaussi a la comprehension des ecosystemes de la canopee forestiere.
[Traduit par la Redaction]
Introduction
Many ecological studies, especially those linked with for-est management and habitat mapping, focus on coarse-scalecorrelates and predictors of an organism’s habitat needs(Manly et al. 2002; Scott et al. 2002). Fine-scale analysesare, however, needed to understand the processes that lead
to coarser habitat patterns (Huston 2002). Numerous analy-ses have been applied to understand and predict the forestnesting habitats of the Marbled Murrelet (Brachyramphusmarmoratus (J.F. Gmelin, 1789)) because loss of nestinghabitat is a prime reason for its listing as a threatened spe-cies in Canada and the United States (see reviews by Ralphet al. 1995; Burger 2002; McShane et al. 2004; Piatt et al.
Received 16 July 2009. Accepted 25 January 2010. Published on the NRC Research Press Web site at cjfr.nrc.ca on 16 April 2010.
A.E. Burger.1 Department of Biology, University of Victoria, Victoria, BC V8W 3N5, Canada.R.A. Ronconi. Department of Biology, Dalhousie University, Halifax, NS B3H 4J1, Canada.M.P. Silvergieter, I.A. Manley,2 and D.B. Lank. Centre for Wildlife Ecology, Department of Biological Sciences, Simon FraserUniversity, Burnaby, BC V5A 1S6, Canada.C. Conroy. 255 Lindsay Street, Kimberley, BC V1A 1L4, Canada.V. Bahn. Department of Biological Sciences, Wright State University, Dayton, OH 45435, USA.A. Cober. British Columbia Ministry of Environment, P.O. Box 39, Queen Charlotte, BC V0T 1S0, Canada.
1Corresponding author (e-mail: [email protected]).2Present address: Fish and Wildlife Compensation Program - Columbia Basin, 103-333 Victoria Street, Nelson, BC V1L 4K3, Canada.
727
Can. J. For. Res. 40: 727–746 (2010) doi:10.1139/X10-034 Published by NRC Research Press

2006). These analyses have focused on landscape- andpatch-scale predictors and revealed the Marbled Murrelet’sdependence, through most of its range, on old (>200 years)coniferous forests. The key requirements provided by large,old trees appear to be a platform of sufficient area to accom-modate the nest (which is a simple depression in the moss orduff), sufficient height for the bird to make stall landingsand dropoff takeoffs, and gaps in the forest canopy to accessthe nest sites (see reviews cited above).
Although the importance of potential nest platforms (con-sidered to be structures >15 cm in diameter) is widely rec-ognized in predicting suitable nesting habitat (Waterhouseet al. 2009), the fine-scale factors that affect the availabilityof such platforms within individual trees remain poorlyknown. Most nest platforms consist of mossy mats on largecanopy limbs, but thick bare limbs, mistletoe infestations(witches brooms), and other deformities also serve as nestsites (Nelson 1997; Burger 2002). In this paper, we analysefactors affecting the availability of canopy platforms and ep-iphytes, focusing on their potential as nest sites for theMarbled Murrelet, but with the goal of also providing im-portant information on the neglected canopy ecosystem.
Marbled Murrelets are small diving seabirds (family Alci-dae) that forage in nearshore coastal waters and usually nestin forests within 30 km of the ocean (Nelson 1997; Burger2002). Being adapted for underwater locomotion using wingpropulsion, Marbled Murrelets have stubby wings, highwing loading, rapid flight, and low maneuverability in flight.These anatomical and behavioral attributes underlie their useof tall old-growth forests as nest sites. Management guide-lines for this species focus on the maintenance of existingold seral forests thought to be suitable as nesting habitat(e.g., CMMRT 2003; IWMS 2004). Research has improvedknowledge of the forest types used for nesting by MarbledMurrelets, but significant data gaps remain that hinder man-agement compatible with sustainable timber extraction(Burger 2002; McShane et al. 2004). Information on the fac-tors affecting the availability of potential nest platforms atthe finest spatial scale (tree or canopy) is scarce. Using a da-tabase with samples from most of the species’ range in Brit-ish Columbia, our goal is to explain and predict theavailability of platforms and the development of epiphytesthat are integral to most platforms. We also investigate theavailability of deformities caused by mistletoe. Given theimportance of platforms in Marbled Murrelet nesting habitat,our study provides information applicable to field manage-ment and conservation policy.
Although we focus on the nesting requirements of theMarbled Murrelet, our work also contributes to a broaderunderstanding of the canopy microhabitat in coastal forestsof the Pacific Northwest. These forests are of great eco-nomic and cultural importance in both Canada and theUnited States. Consequently, they have been well studied,but information on the structure and function of the forestcanopy in this region remains sparse (Ishii et al. 2004). Thedevelopment of large mats of epiphytes and accumulated lit-ter is of particular importance in providing physical structureto these canopy ecosystems (McCune 1993; Lyons et al.2000) as well as providing habitat resources to a wide rangeof canopy organisms (e.g., Carey 1996; Fagan et al. 2006).
Methods
RegionsFor geographical analysis, we used six conservation re-
gions identified by the Canadian Marbled Murrelet Recov-ery Team (CMMRT 2003) (Fig. 1): Haida Gwaii/QueenCharlotte Islands (hereafter Haida Gwaii (HG)), NorthernMainland Coast (NC), Central Mainland Coast (CC), South-ern Mainland Coast (SC), East Vancouver Island (EVI), andWest and North Vancouver Island (WNVI). Although basedon forestry and wildlife administrative boundaries, the re-gions provide biologically relevant divisions, including threelatitudinal divisions of the mainland coast (NC, CC, and SC,which together span 78 of latitude), division of VancouverIsland into the wetter WNVI and drier EVI, and separationof the biogeographically isolated HG archipelago (Meidingerand Pojar 1991). There were no data from the Alaska Borderregion where few Marbled Murrelets nest (Fig. 1).
Data sources and sampling randomizationWe collated data derived from habitat plots or transects
from six sources. Five sources were past studies on theMarbled Murrelet: (i) in Clayoquot Sound (WNVI region)by the British Columbia Ministry of Environment (e.g.,Bahn and Newsom 2002; Rodway and Regehr 2002), (ii) onthe Sunshine Coast (SC region) by Manley (1999), (iii) onHG by I.A. Manley and A. Cober for the British ColumbiaMinistry of Environment (McLennan et al. 2000), (iv) inDesolation Sound (SC), Clayoquot Sound (WNVI and EVI),and the Woss landscape unit (WNVI) by a Simon FraserUniversity (SFU) research team (e.g., Malt and Lank 2009;Silvergieter 2009), and (v) on southwest Vancouver Island(WNVI) and southeast Vancouver Island (EVI) by a Univer-sity of Victoria research team (e.g., Burger et al. 2000; Bur-ger and Bahn 2004). These samples included all habitatstudies with compatible data that were available to us. In2008, A.E. Burger and M. P. Silvergieter undertook fieldstudies specifically for this project on the NC (Prince Rupertand Kitimat areas), CC (Broughton Archipelago, Knight In-let, and Bella Coola areas), and EVI (between Sooke andCampbell River). The complete database has been archivedwith the British Columbia Wildlife Species Inventory(www.env.gov.bc.ca/fia/wsi.htm).
When applying classification trees (our method of analy-sis, see below) to ecological distribution data, Edwards etal. (2006) reported that probabilistic (spatially randomized)sampling produced more reliable predictive models thannonprobabilistic purposive sampling (subjectively samplingwhere the habitat element was expected to occur). Our sam-ples were drawn from studies that included both probabilis-tic and purposive sampling. Of the 29 763 trees sampled,19 149 (64.3%) were in plots located using stratified randomsampling (Burger et al. 2000; Bahn and Newsom 2002; non-nest SFU data, all new sampling in 2008) and 4293 (14.4%)were in plots associated with audiovisual surveys that werelocated in a nonrandom manner but were selected for crite-ria (e.g., visibility) other than the occurrence of platforms orsuitable nesting habitat (Manley 1999; Rodway and Regehr2002; Burger and Bahn 2004). These data (78.8% of trees)could be considered fully random when considering pres-ence or absence of platforms. There might have been some
728 Can. J. For. Res. Vol. 40, 2010
Published by NRC Research Press

bias towards presence of platforms in the additional 4854trees (16.3%) sampled in plots at or near nest sites (Manley1999; SFU nest site plots), but even in these plots, therewere always trees with and without platforms. In all of theaforementioned samples (95.1%), the trees were not subjec-tively sampled because they might have contained platformsand can therefore be considered as nonpurposive in thesense used by Edwards et al. (2006). Only the samples fromHG (1467 trees, 4.9%) were from trees selected becausethey were considered large enough to contain platforms(McLennan et al. 2000). We retained the HG samples inour pooled data because we felt that the effect of samplingbias would be minor and we wished to include this impor-tant part of the Marbled Murrelet’s range.
Field methods and data extractionData extracted covered both site and individual tree de-
scriptions (Table 1). Goals and methods differed among thestudies but most sampled habitat using plots (30 m � 30 m
square or 25 m radius circular) or, in HG, strip transects(30 m � 200 m; McLennan et al. 2000). With a few minordeviations (see below), all studies used the standardized pro-tocols for evaluating Marbled Murrelet forest habitat (Re-sources Inventory Committee (RIC) 1997; ResourcesInformation Standards Committee (RISC) 2001). These pro-tocols broadly follow the methods for classifying ecosystemsin British Columbia (Luttmerding et al. 1990) but includevariables specific to Marbled Murrelets, especially the rela-tive abundance of potential nest platforms, epiphytes (moss,lichens, ferns, and other plants growing on the limbs), andmistletoe infestations (Table 1).
Descriptions of the sites included latitude, elevation, as-pect, slope, topographic location in the valley, biogeoclimatic(BEC) subzone, and BEC site series (Table 1). There weretoo many data gaps to include site index, stand age class,stand height class, and crown closure (all defined by theBEC system: www.ilmb.gov.bc.ca/risc/pubs/teecolo/habitat/).Aspect was simplified to eight cardinal directions plus flat.
Fig. 1. Conservation regions recognized by the Canadian Marbled Murrelet Recovery Team (CMMRT 2003). We used the six southernregions for regional analyses; no data were available from the Alaska Border region.
Burger et al. 729
Published by NRC Research Press

BEC zones and subzones (Meidinger and Pojar 1991)were derived from BEC maps and site locations (Banner etal. 1993; Green and Klinka 1994). Most data (92.1% oftrees) were from the Coastal Western Hemlock (CWH)zone, which dominates all of the coastal regions, 4.6% werefrom the higher elevation Mountain Hemlock (MH) zone,and 3.3% (in EVI only) were from the dry Coastal Douglas-fir (CDF) zone. We grouped the 23 BEC subzones sampledinto nine groups (BECgrps) based on biogeoclimatic similar-ities (Banner at al. 1993; Green and Klinka 1994) and sam-ple size as follows: CDFmm (n = 967 trees), CWHd(CWHdm, CWHds1, and CWHds2; n = 2122), CWHm(CWHmm1, CWHmm2, CWHms1, and CWHms2; n =791), CWHvh (CWHvh1 and CWHvh2; n = 3291),CWHvm1 (n = 11 040), CWHvm2 (n = 6005), CWHw(CWHwh1, CWHwh2, CWHwm, CWHws1, and CWHws2;n = 1670), CWHx (CWHxm, CWHxm1, and CWHxm2; n= 1854), and MHm (MHmh1, MHmm1, and MHmm2; n =1325).
BEC site series are the fine-scale descriptions of soil,moisture, and vegetation conditions within smaller foreststands and are classified on the basis of soil pits or indicatorplant analysis (Banner at al. 1993; Green and Klinka 1994).Our data included 98 site series types, which we groupedinto four productivity classes (class 1 having the highestproductivity and 4 the lowest), based on predicted capabil-ities of the site series to grow trees to predetermined heights(Green and Klinka 1994). Previous work on Marbled Murre-let habitat has shown the value in grouping site series byproductivity (Burger and Bahn 2004).
Data recorded for each tree included species, diameter atbreast height (DBH), tree height, stratum reached, platformavailability, and mistletoe infestation (Table 1). In mostcases, a clinometer or laser rangefinder was used to measureone to five trees in the plot and the height of the remainderof trees in the plot was estimated using these as a reference;in some cases, all of the tree heights in a plot were esti-mated by experienced field personnel. A few trees weremeasured directly by tree climbers using a measured rope.In most studies, all trees ‡10 cm DBH were measured, in-cluding subcanopy, canopy, and emergent trees. In the HGsample, however, the trees were selected as those likely toprovide platforms (McLennan et al. 2000). As a result, theHG data included few subcanopy and smaller canopy treesand the frequency of platforms per tree was therefore in-flated relative to the other regions.
Snags (1653 tree records) were excluded from all analy-ses, leaving 29 763 live trees (Table 2). To simplify analysisof the most common tree species, the following categorieswere used with some species pooled as indicated (speciescodes follow the BEC system; Green and Klinka 1994): Fir= amabilis fir (Abies amabilis (Dougl. ex Loud.) (Ba), n =5224 trees) and grand fir (Abies grandis (Dougl. ex D. Don)(Bg) n = 102), Hem = western hemlock (Tsuga mertensiana(Bong.) Carr. (Hw), n = 11 630), mountain hemlock (Tsugaheterophylla (Raf.) Sarg. (Hm), n = 1464), and unidentifiedhemlock (n = 54), BL = broadleafed tree species includingred alder (Alnus rubra Bong. (Dr), n = 431) and bigleaf ma-ple (Acer macrophyllum Pursh (Mb), n = 147), Cw = west-ern redcedar (Thuja plicata Donn ex D. Don, n = 4876), Fd
Table 1. List of variables and their codes used in the analysis of platform and epiphyte availability.
Variable Short form Description
Dependent variablesPlatforms PLATpa Presence–absence of platforms (binary 0, 1)Platform codes PLATCODE Rank of number of platforms per tree (0–4) (see Methods)Epiphyte cover EpiCOV % of branch surfaces covered by epiphytes: 0 = none, 1 = trace, 2 = 1%–33%, 3 = 34%–
66%, 4 = 67%–100%Epiphyte thickness EpiTHICK Epiphyte thickness code: 1 = sparse, 2 = intermediate, 3 = thick mats
Predictor variablesRegion Region Marbled Murrelet management regions: HG, NC, CC, SC, WNVI, EVI (see Methods)Latitude UTM Latitude recorded in Universal Transverse Mercator northingElevation Elev Elevation (m)Slope Slope Mesoslope code 0–9 following the BC Biogeoclimatic (BEC) codes: www.ilmb.gov.bc.ca/
risc/pubs/teecolo/habitat/Aspect Aspect Facing direction of slope: N, NE, E, SE, S, SW, W, NW, FlatValley location ValLoc Location in valley: B = valley bottom, L = lower one third, M = midslope, U = upper one
third, R = ridge topBiogeoclimatic subzones BECgrp 22 biogeoclimatic subzones (Meidinger and Pojar 1991) were grouped into nine groups for
analysis (see Methods)Biogeoclimatic site series Site series Fine-scale biogeoclimatic description of the forest patch (Meidinger and Pojar 1991; Green
and Klinka 1994, p. 71), e.g., CWHwh1-01, CWHxm-04Productivity Produnit Site productivity unit derived from BEC site series (Green and Klinka 1994:197): classes 1
(highest) to 4Tree species TreeSp Species included in analysis: Fir, Hem, Cw, Yc, Ss, Fd, BL (see Methods for species codes)Tree diameter DBH Diameter at breast height (cm)Tree height TreeHt Height (m)Stratum Stratum Stratum reached for the tree: C = canopy, E = emergent, S = subcanopyMistletoe infection Mistletoe Mistletoe deformities rated 0 (no infection) through 6 (heavy infection) using the Hawks-
worth (1977) system
730 Can. J. For. Res. Vol. 40, 2010
Published by NRC Research Press

= Douglas-fir (Pseudotsuga menziesii (Mirb.) Franco, n =1806), Ss = Sitka spruce (Picea sitchensis (Bong.) Carr., n= 933), and Yc = yellow-cedar (Chamaecyparis nootkatensis(D. Don) Spach, n = 2610). Other species were too infre-quent to be considered for specific analysis.
We included scores of mistletoe infestation (Hawksworth1977) as a variable because a few Marbled Murrelet nestshave been found in these deformities in Oregon (Nelson1997). Infestations of parasitic mistletoe (primarily Arceu-thobium campylopodum Engelm.) cause deformities (witchesbrooms) in tree limbs, especially in western hemlock (Pojarand MacKinnon 1994). A few deformities caused by otherless common agents (other infections or physical damage)were likely included as mistletoe by field crews.
The availability of potential nest platforms (hereafter plat-forms) was assessed from the ground. Platforms were de-fined as limbs or deformities >15 cm in diameter, includingany epiphyte growth, and >10 m aboveground. Followingprotocols (RIC 1997; RISC 2001), each limb that met thesecriteria was counted as a single ‘‘platform’’, regardless ofhow many mossy pads or other potential nest sites might beon the limb. The samples obtained by the SFU teams fromSC, WNVI, and EVI were obtained to serve other purposes,and platform counts per tree included multiple platforms perlimb, if present. To combine the two methods of countingplatforms and to compensate for observer differences (whichwere greatest with large numbers of platforms), we rankedplatform counts (PLATCODE; Table 1) as follows: for datafollowing the standard protocols (RIC 1997; RISC 2001), 0= no platforms, 1 = 1 platform, 2 = 2–5 platforms, 3 = 6–10platforms, and 4 = >10 platforms; for the SFU data, 0 and 1were as above but 2 = 2–10 platforms, 3 = 11–20 platforms,and 4 = >20 platforms per tree. We also tested for effects ofplatform assessment method (RIC/RISC versus SFU) in ourstatistical analyses (see below). We acknowledge that amongthe many field observers involved, there would be variationin the assessment of subjective variables such as platformdiameter and tree height, but our large sample drawn frommultiple studies should reduce the effects of systematic ob-server bias for any variable.
Statistical analysisStatistical analyses used SPSS (version 15.0). Classifica-
tion and regression tree (CART) analysis (De’ath 2002) wasused to classify platform availability in trees based on pre-dictor variables. Classification trees were used with PLATpa(presence–absence) as a binary variable and PLATCODE(ranked counts, see Table 1) as an ordinal dependent varia-ble. To improve distribution of sample sizes and improve
the fit (percent correct classification) of CART models,PLATCODE scores were grouped as 0, 1–2, and 3–4 forCART analysis but remained ungrouped as raw data for fig-ures. Two advantages of using CART analysis with thesedata are the ability to classify multiple categorical dependentvariables (i.e., multiple platform categories or ranks) and theability to use cases with missing independent variables(Breiman et al. 1984; De’ath and Fabricius 2000). In SPSS,for cases in which the value for a variable is missing, otherindependent variables having high associations with theoriginal variable are used as surrogates in CART. Datawere filtered to include only selected tree species (above).
Classification trees were grown with the following rules:maximum classification tree depth 5, minimum cases in pa-rent node 100, minimum cases in terminal node 50, and treepruning (to avoid over fitting) using the 1 standard error rule(Breiman et al. 1984). For ordinal dependent variable mod-els, model fit (percent correct classification) was evaluatedwith resubstitution (Breiman et al. 1984; De’ath and Fabri-cius 2000). The importance of individual predictor variableswas assessed with normalized importance values, which give100% importance to the best predictor variable, and contri-bution of other variables are assessed relative to this varia-ble.
We tested for effects of platform count method (RIC/RISC versus SFU) by including method as a categorical de-pendent variable in preliminary CART models for the threeregions affected. For analysis of PLATCODE, method wasthe lowest ranked predictor variable for WNVI and EVI (im-portance values 1.3% and 0.0%, respectively) and thus hadno effect. For SC, method ranked as a tertiary predictor var-iable (47.5% importance) affecting platform classificationonly for trees <61 cm DBH. This split suggested that forsmall trees, the standard protocol (RIC 1997; RISC 2001)predicted greater platform counts than the SFU method.Method was not considered to be an important variable inplatform prediction and was removed from final models.
We also attempted using the information theoretic meth-ods (Burnham and Anderson 2002) applied to generalizedlinear models to identify variables and groups of variablesthat might explain platform availability and epiphyte devel-opment, but the occurrence of missing data for some varia-bles made this less suitable than the CART analysis. Inaddition, our data were more suited to nonparametric analy-ses (such as CART); many of our variables did not conformto the assumptions required for generalized linear modelsand similar models, and the large number of possible predic-tor variables (12) resulted in an unmanageable number ofcandidate models.
Table 2. Summary of sampling effort in the platform database.
Marbled Murrelet Conservation Region (see Fig. 1) No. of watersheds* No. of sites No. of trees (excluding snags)Haida Gwaii/QCI (HG) 18 65 1467Northern Mainland Coast (NC) 14 46 1627Central Mainland Coast (CC) 26 45 1709Southern Mainland Coast (SC) 44 495 8251East Vancouver Island (EVI) 35 87 3063West and North Vancouver Island (WNVI) 33 674 13646Total all regions 170 1412 29763
*These are minimum numbers because watersheds were not reported in all data sets.
Burger et al. 731
Published by NRC Research Press

Results
Regional breakdown of dataOverall, we had data from 29 763 trees (snags excluded),
1412 sites, and over 170 watersheds (Table 2). Missing datareduced sample sizes for some parameters. Most data camefrom the three southernmost regions, SC, EVI, and WNVI.Consequently, in addition to the pooled data set, we ana-lysed each region separately.
Relationships among the predictor variablesMost predictor variables showed significant intercorrela-
tions (Table 3). This is not surprising with environmentalvariables but also reflects the large sample sizes in the data-base. Most of the correlation coefficients were, however,small. The strongest and most consistent correlations werebetween DBH and tree height in all regions. In most re-gions, slope and elevation also showed strong positive corre-lations, indicating steeper slopes at higher elevations. Withinregions, latitude (northing) showed strong correlations withelevation and slope, reflecting broadscale topographicalclines (e.g., steeper and higher elevation terrain to the northof the sampled range on Vancouver Island).
Because DBH was such an important predictor of bothplatform and epiphyte development (see below), we testedfor differences in DBH among categories of each of the cat-egorical predictor variables (all data pooled). One-way AN-OVA showed significant (p < 0.001) differences amongcategories in all of the categorical predictor variables. Tu-key’s post hoc tests for significant differences among groupsshowed the following homogenous subsets (mean DBH inparentheses). Among the biogeoclimatic groups (BECgrp:F[8,28521] = 92.69), DBH was similar for most categories(CWHvm1–CWHx–CWHm–CWHvh–CDFmm–CWHvm2:mean DBH range 46.2–49.6 cm) but smaller in one (CWHd:mean DBH = 39.2 cm) and larger in two (MHm: mean =55.5 cm, CWHw: mean = 69.1 cm). DBH differed amongregions (F[5,29141] = 265.06): NC–CC–WNVI–EVI (meanrange 43.7–46.6 cm), SC (mean 52.8 cm), and HG (mean80.3 cm). Each tree species or species group had a meanDBH significantly different from each other (F[6,29140] =665.34), from smallest to largest: broadleafed trees (mean31.7 cm), firs (38.1 cm), hemlocks (41.7 cm), yellow cedar(59.9 cm), western redcedar (63.6 cm), Douglas-fir(68.0 cm), and Sitka spruce (88.3 cm). There were signifi-cant differences in DBH among aspect categories (F[8,28634]= 18.23), but no specific north–south or east–west gradientwas apparent: N–S (44.1 and 46.1 cm), S–W–NW–E–Flat(range of mean DBH 46.1–49.1 cm), E–Flat–SE (48.3–51.3 cm), and SE–NE–SW (51.3–53.6 cm). As expected,there were large differences in DBH with tree stratumreached (F[2,29125] = 11 540.8): subcanopy (mean 25.9 cm),canopy (68.7 cm), and emergent (115.5 cm). Finally, DBHvaried with tree location in the valley (F[4,24674] = 17.17):Lower–Mid–Bottom (range of means 45.0–47.2 cm), Bot-tom–Ridge (means 47.2 and 49.0 cm), and Ridge–Upper(means 49.0 and 51.0 cm). In summary, the largest DBHmeasurements came from CWHw zones, Sunshine Coastand HG, Douglas-fir and Sitka spruce, emergent trees, andin valley bottoms or the upper third of valleys. Thus, thesignificant role of DBH in all predictive models may, parti-
ally, have resulted from correlations with these categoricalpredictor variables.
Platform availability: CART resultsClassification trees evaluated the ability of the independ-
ent variables to classify trees by presence–absence of plat-forms and into three different platform codes (PLATCODEranked as 0, 1–2, and 3–4). Figure 2 illustrates an exampleof a classification tree for data pooled among all regions.The first split identifies that trees with a DBH £ 61 cm areunlikely to provide platforms. For example, 19 063 treeswith DBH < 61 cm had no platforms (92.9% of trees of thissize). Further classification was based on DBH and region;smaller trees (<61 cm DBH in one split and 62–82 cm inanother split of larger trees) in HG were more likely tohave platforms than similar-sized trees in other regions. Inthe remaining regions, the presence of mistletoe deformitiesmade a small difference to the availability of platforms. Inmost models, the number of samples involved in splits afterthe third (tertiary) node was small, and we therefore focuson the first three variables selected. With samples pooledfrom all regions, results were identical for presence–absencemodels and PLATCODE models (Table 4).
Classification trees were also analysed for each regionseparately (Table 4). For all regions, tree diameter (DBH)was the primary predictor variable. In most regions, DBHof approximately 60 cm was an important threshold distin-guishing between trees with and without platforms, butthresholds were larger in the CC and EVI where trees withDBH < 82 cm (CC) and DBH < 96 cm (EVI) were unlikelyto have platforms. DBH also reappears as a secondary andtertiary selector in some regions, making finer-scale separa-tions of trees more likely to provide platforms. Other predic-tors included elevation (in HG, platforms were more likelyat lower elevation), slope (in HG, platforms were morelikely on slopes at elevations >98 m, but in the same region,platforms were more likely on moderate slopes in hemlock,Sitka spruce, and yellow cedar trees), and latitude within aregion (in the large WNVI region, platforms on larger treeswere more likely south of Nitinat Lake than in the north).Tree species were selected in the top three CART nodes inonly three regions (HG, SC, and EVI), where larger Sitkaspruce, yellow cedar, and Douglas-fir were consistentlymore likely to provide platforms, while western redcedarwas consistently less likely to provide them. Firs and hem-locks showed more complex effects: platforms were morelikely on larger hemlocks than most other species on HGbut less likely in the SC and EVI regions; platforms weremore likely on larger firs on EVI but less likely on SC.Larger broadleafed trees provided platforms on SC but noton EVI. Mistletoe deformities seemed important only onEVI, making a minor improvement for large trees of DBH96–152 cm.
In general, there was a high percentage of cases correctlyclassified for each region (Table 4), typically >80%. How-ever, closer examination of correct classifications by eachof the categories showed that some categories were moreeasily classified than others (Table 5). In general, PLATCO-DEs of 0 (no platforms) had the greatest correct classifica-tion (mean > 80%) than did presence (mean 60%) orPLATCODEs 1–2 (mean 51%) and 3–4 (mean 18%). This
732 Can. J. For. Res. Vol. 40, 2010
Published by NRC Research Press

primarily reflects the uneven distribution of sample sizes bycategory. For example, in HG, there was very poor classifi-cation of trees with no platforms because only 20% of thetrees in this data set lacked platforms. By contrast, in eachof the other regions, 73%–93% of the trees contained noplatforms and thus achieved greater classification accuracy.This reflects the difference in sampling method in HG (seeMethods).
Table 6 summarizes the relative importance of each inde-pendent (predictor) variable in the different CART models.In all models, DBH was the most important predictor. Treeheight and stratum reached were the second and third mostimportant predictors in most models. Despite the importanceof tree height and stratum, these variables appeared in fewclassifications, likely because tree height was highly corre-lated with DBH (Table 3), making tree height a redundantpredictor once DBH was included. BECgrp was a relativelyimportant predictor only in the models with data pooled,likely because these biogeoclimatic categories were broadlycorrelated with general regions in British Columbia. Treespecies was a moderately important predictor in most mod-els. There was little support for other predictor variables ex-
cept in the HG region where elevation, slope, aspect, andlatitude show complex effects on platform development.
In summary, the CART models indicated that DBH wasthe important predictor of platforms in trees in all regions.Threshold values suggest that trees must have a DBH >60 cm for platform development but larger on EVI(>96 cm) and possibly on CC (>82 cm). Depending on theregion, other predictors of platforms in trees included treeheight, tree species, and to a lesser extent elevation, slope,and latitude.
Trends in the platform dataPlots of raw data are useful to visualize modeling results
and help interpret parameter estimates. Figure 3 shows therelationships between DBH and platform occurrence (PLAT-CODE) for each tree species and region. As predicted in theCART models, platforms generally appear in trees >60 cmDBH. One noticeable trend includes higher platform rankingand platforms in smaller trees for HG relative to other re-gions, in part an artifact of the sampling method (see Meth-ods), but possibly also reflecting more favorable conditionsfor canopy epiphyte development in that region. Also,
Table 3. Spearman rank correlations among predictor variables for Marbled Murrelet platforms and epiphyte development.
Region Variable DBHTreeheight Elevation Slope
Productivityunit
Northing(UTM) Mistletoe Region
All data DBH —Tree height 0.804** —Elevation 0.036** –0.117** —Slope –0.024** –0.111** 0.480** —Productivity unit 0.026** –0.148** 0.193** 0.181** —Northing (UTM) 0.076** –0.031** 0.079** 0.183** 0.109** —Mistletoe 0.206** 0.192** 0.011 0.040** 0.039** 0.010 —
HG DBH — 0.851** –0.143** –0.037 –0.210** –0.030 0.069** NCTree height 0.579** — –0.161** –0.054* –0.290** 0.003 0.043Elevation 0.119** –0.030 — 0.505** 0.511** 0.274** –0.032Slope 0.220** 0.154** 0.656** — 0.328** 0.242** –0.041Productivity unit –0.263** –0.409** –0.149** –0.308** — 0.044 0.003Northing (UTM) –0.121** 0.010 –0.400** –0.269** 0.243** — –0.118**Mistletoe –0.129** 0.109** –0.157** –0.136** –0.044 0.204** —
CC DBH — 0.725** 0.400** –0.069** –0.140** –0.395** 0.149** SCTree height 0.875** — 0.110** –0.034** –0.160** –0.169** 0.108**Elevation –0.029 –0.004 — –0.017 0.192** –0.699** –0.003Slope –0.103** –0.106** 0.320** — 0.007 0.204** 0.119**Productivity unit –0.023 –0.072** 0.476** 0.150** — –0.065** –0.180**Northing (UTM) 0.029 0.021 0.266** 0.175** 0.088** — 0.022Mistletoe 0.031 0.027 –0.034 –0.023 –0.025 –0.101** —
WNVI DBH — 0.868** –0.091** –0.082** 0.022 –0.140** 0.350** EVITree height 0.851** — –0.132** –0.134** –0.061** –0.216** 0.330**Elevation –0.054** –0.135** — 0.383** 0.044* 0.505** 0.001Slope –0.010 –0.115** 0.535** — 0.043* 0.215** –0.058**Productivity unit –0.113** –0.223** 0.136** 0.240** — –0.131** 0.138**Northing (UTM) –0.030** –0.044** 0.258** 0.159** –0.097** — –0.038*Mistletoe 0.226** 0.224** –0.010 0.053** –0.023* 0.051** —
Note: Values below the diagonal are for regions listed in the first column and values above the diagonal are for regions listed in the last column. Regionsare defined in Table 2. Rank correlations were used because several variables are ranked variables (productivity unit, slope code, mistletoe). Correlationswere computed for all continuous and ranked variables (*p < 0.05, **p < 0.01).
Burger et al. 733
Published by NRC Research Press

Fig. 2. Classification tree for presence and absence of potential nest platforms using all data pooled across six regions: Haida Gwaii (HG),North Coast (NC), Central Coast (CC), Southern Mainland Coast (SC), East Vancouver Island (EVI), West and North Vancouver Island(WNVI). The first split (node 2) shows that trees with a DBH > 61 cm are more likely to have platforms present.
734 Can. J. For. Res. Vol. 40, 2010
Published by NRC Research Press

Table 4. Factors influencing the occurrence and number of platforms in trees in British Columbia.
Data set n % correct classification Primary variable Secondary variable Tertiary variable
Platform (presence–absence)All data 29213 87.1 DBH (>61 cm) If DBH < 61 cm, then Region (HG > others) If DBH > 61 cm, then DBH (>82 cm)HG 1440 81.0 DBH (>58 cm) If DBH < 58 cm, then Elev (<98 m) If Elev > 98 m, then Slope code (>0)NC 1627 87.0 DBH (>60 cm) DBH (>76 cm)CC 1665 94.5 DBH (>82 cm) DBH (>130 cm) If DBH > 130 cm, then Aspect (E, SW, W, S, NE > SE, N,
Flat)SC 8069 85.2 DBH (>61 cm) DBH (>80 cm) If DBH < 80 cm, then TreeSp (Yc, Fd, BL, Ss > Hem, Fir, Cw)WNVI 13433 89.0 DBH (>61 cm) DBH (>85 cm) If DBH < 61 cm, then Stratum (C, E > S)EVI 2977 91.8 DBH (>96 cm) TreeSp (Fd, Fir, Yc > Hem, BL, Cw)
PLATCODE (ranked 0, 1–2, 3–4)All data 29213 83.1 DBH (>61 cm) If DBH < 61 cm, then Region (HG > others) If DBH > 61 cm, then DBH (>82 cm)HG 1440 64.6 DBH (>79 cm) TreeSp (Ss, Hem, Yc > Cw) If TreeSp Ss, Hem, Yc, then Slope code (<5)NC 1627 84.4 DBH (>60 cm) DBH (>76 cm)CC 1665 94.5 DBH (>82 cm) DBH (>130 cm) If DBH < 130 cm, then TreeHt (<26 m)SC 8069 82.0 DBH (>61 cm) DBH (>80 cm) If DBH < 80 cm, then TreeSp (Yc, Fd, BL, Ss > Hem, Fir, Cw)WNVI 13433 84.8 DBH (>61 cm) DBH (>85 cm) UTM northing (South > North); split at northing 5394834EVI 2977 90.1 DBH (>96 cm) DBH (>153 cm) If DBH < 153 cm, then Mistletoe (>0)
Note: Classification trees were used to classify platform presence–absence and coded number of platforms per tree (PLATCODE). Parentheses indicate thresholds in classification. For example, the pri-mary variable for platform presence–absence classification with all data showed platforms to be more likely for trees with DBH > 61 cm (primary variable), but if DBH was <61 cm, then platforms weremore likely in HG than in other regions (secondary variable). Unless indicated by an ‘‘if’’, the secondary and tertiary predictors are branches off the preceding split that indicated greater platform develop-ment. Fir, amabilis and grand fir; Hem, western and mountain hemlock; BL, broadleafed species; Ss, Sitka spruce; Fd, Douglas-fir; Yc, yellow-cedar; Cw, western redcedar. Other variables are defined inTable 1.
Burger
etal.
735
Publishedby
NR
CR
esearchPress

within regions, some species show greater platform develop-ment relative to tree size than other species (e.g., Sitkaspruce and hemlocks relative to western redcedar). The lownumber of platforms on western redcedar is striking: evenvery large cedars fail to provide more than five platformsper tree (PLATCODE > 2), especially on EVI and the CC.Yellow cedar, which tends to have more horizontal thickerlimbs than western redcedar, provided higher numbers ofplatforms than western redcedar. Large firs and hemlocksprovide more platforms on WNVI than on NC and SC. Dou-
glas-fir provides more platforms in WNVI and SC than onEVI and CC (the species is not found on NC or HG).
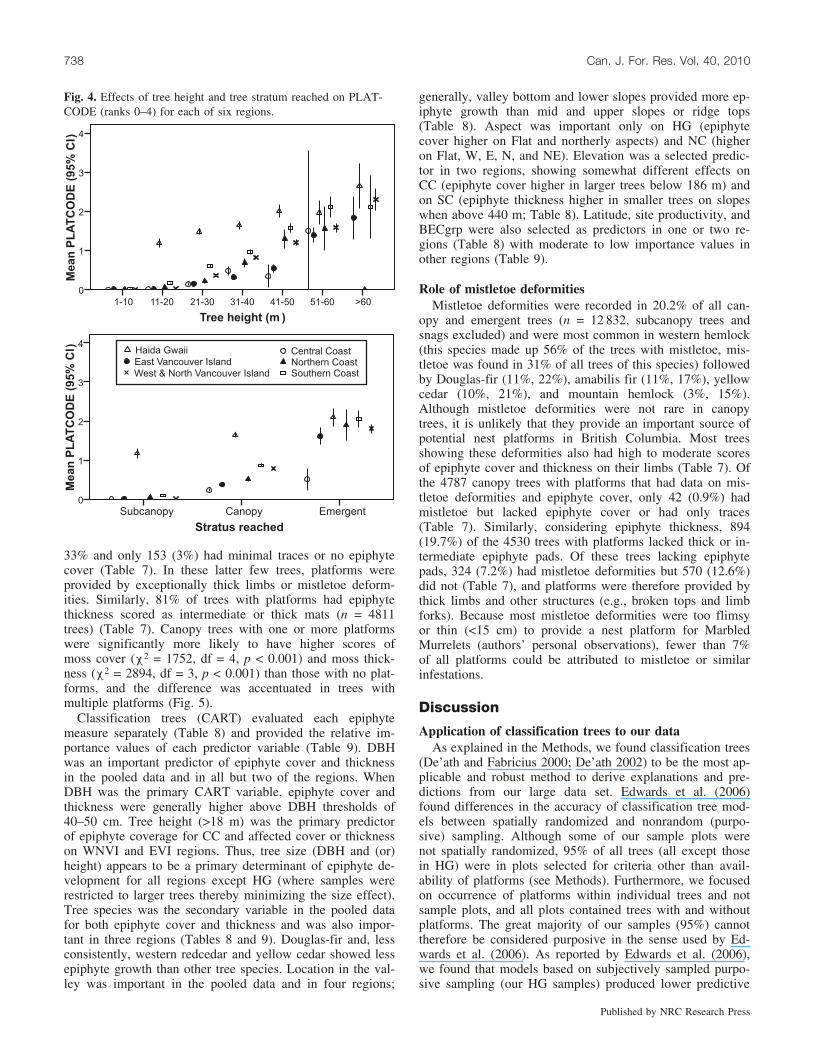
Although not selected in CART models because of corre-lations with DBH, tree height and stratum were also impor-tant indicators of platform occurrence and abundance(Table 6). Apart from the divergent HG data, platforms be-gin to appear regularly in trees >30 m tall and continue toincrease with increasing height (Fig. 4). Platforms are rarein subcanopy trees and are most abundant in the large emer-gent trees, although less so on CC (Fig. 4).
Table 5. Summary of model fit for CART models classifying trees by presence–absence and into threecategories (PLATCODE 0, 1–2, 3–4) of platform abundance.
% correct classification
All data HG NC CC SC WNVI EVI AveragePlatform
Absent (0) 92.2 16.9 93.1 99.7 91.0 95.8 98.5 83.9Present (1) 69.4 97.6 56.6 21.8 69.2 59.0 45.5 59.9Overall 87.1 81.0 87.0 94.5 85.2 89.0 91.8 87.9
Platform code0 94.0 0.0 93.1 99.6 92.1 95.8 98.7 81.91–2 55.1 98.2 52.6 25.5 60.5 38.6 24.6 50.73–4 12.7 15.4 0.0 0.0 13.9 33.1 51.1 18.0Overall 83.1 64.6 84.4 94.5 82.0 84.8 90.1 83.4
Note: See Table 2 for region abbreviations.
Table 6. Summary of importance values of each independent (predictor) variable in the CART models for platform availability.
Normalized importance values of independent variables in CART models
Dependent variableIndependentvariable All data HG NC CC SC WNVI EVI
Platform (presence–absence) DBH 100 100 100 100 100 100 100Stratum 58 53 25 12 59 30 38Region 44 na na na na na naTreeHt 43 69 63 47 37 52 57BECgrp 26 6 0 3 4 0 0Mistletoe 11 1 1 0 0 15 42TreeSp 6 19 15 7 48 10 0UTM northing 3 33 5 4 12 10 1Elev 1 85 5 10 9 1 1Aspect 0 58 5 10 8 1 2ValLoc 0 0 0 11 5 0 1Slope 0 28 0 10 2 0 0Produnit 0 14 0 4 2 3 6
PLATCODE (ranked 0, 1–2, 3–4) DBH 100 100 100 100 100 100 100Stratum 59 16 24 18 60 27 36Region 51 na na na na na naTreeHt 44 63 63 47 37 51 54BECgrp 31 0 0 3 5 1 0TreeSp 9 56 16 16 51 10 0Mistletoe 9 9 1 0 0 15 43UTM northing 4 10 4 5 13 10 2Elev 3 6 5 15 10 0 1Slope 1 30 0 9 0 1 0Produnit 1 10 0 6 1 3 6ValLoc 1 0 0 13 4 2 3Aspect 0 13 5 12 5 1 4
Note: Importance values are normalized such that the most important predictor receives 100% importance and the contributions of other predictors aregauged relative to this most important predictor. See Table 1 for explanation of codes and Table 2 for region abbreviations. na, not applicable.
736 Can. J. For. Res. Vol. 40, 2010
Published by NRC Research Press

Epiphyte developmentEpiphytes (mossy pads) are important in providing poten-
tial nest platforms for nesting murrelets, but this paper is thefirst to analyse the proportion of platforms provided by epi-phytes and whether epiphytic growth varies with region, treespecies, and other habitat features. Epiphyte development on
branches was measured as epiphyte cover (percentage ofbranch surfaces covered) and by epiphyte thickness rank(Table 1). As expected, most platforms were provided bythick, mossy mats that developed on the limbs of canopytrees: out of 5088 trees with one or more platforms that hadepiphyte data, most (72%) had epiphyte cover higher than
Fig. 3. Effects of region and tree diameter (DBH) on PLATCODE (ranks 0–4) for seven tree species or species groups.
Burger et al. 737
Published by NRC Research Press
33% and only 153 (3%) had minimal traces or no epiphytecover (Table 7). In these latter few trees, platforms wereprovided by exceptionally thick limbs or mistletoe deform-ities. Similarly, 81% of trees with platforms had epiphytethickness scored as intermediate or thick mats (n = 4811trees) (Table 7). Canopy trees with one or more platformswere significantly more likely to have higher scores ofmoss cover (c2 = 1752, df = 4, p < 0.001) and moss thick-ness (c2 = 2894, df = 3, p < 0.001) than those with no plat-forms, and the difference was accentuated in trees withmultiple platforms (Fig. 5).
Classification trees (CART) evaluated each epiphytemeasure separately (Table 8) and provided the relative im-portance values of each predictor variable (Table 9). DBHwas an important predictor of epiphyte cover and thicknessin the pooled data and in all but two of the regions. WhenDBH was the primary CART variable, epiphyte cover andthickness were generally higher above DBH thresholds of40–50 cm. Tree height (>18 m) was the primary predictorof epiphyte coverage for CC and affected cover or thicknesson WNVI and EVI regions. Thus, tree size (DBH and (or)height) appears to be a primary determinant of epiphyte de-velopment for all regions except HG (where samples wererestricted to larger trees thereby minimizing the size effect).Tree species was the secondary variable in the pooled datafor both epiphyte cover and thickness and was also impor-tant in three regions (Tables 8 and 9). Douglas-fir and, lessconsistently, western redcedar and yellow cedar showed lessepiphyte growth than other tree species. Location in the val-ley was important in the pooled data and in four regions;
generally, valley bottom and lower slopes provided more ep-iphyte growth than mid and upper slopes or ridge tops(Table 8). Aspect was important only on HG (epiphytecover higher on Flat and northerly aspects) and NC (higheron Flat, W, E, N, and NE). Elevation was a selected predic-tor in two regions, showing somewhat different effects onCC (epiphyte cover higher in larger trees below 186 m) andon SC (epiphyte thickness higher in smaller trees on slopeswhen above 440 m; Table 8). Latitude, site productivity, andBECgrp were also selected as predictors in one or two re-gions (Table 8) with moderate to low importance values inother regions (Table 9).
Role of mistletoe deformitiesMistletoe deformities were recorded in 20.2% of all can-
opy and emergent trees (n = 12 832, subcanopy trees andsnags excluded) and were most common in western hemlock(this species made up 56% of the trees with mistletoe, mis-tletoe was found in 31% of all trees of this species) followedby Douglas-fir (11%, 22%), amabilis fir (11%, 17%), yellowcedar (10%, 21%), and mountain hemlock (3%, 15%).Although mistletoe deformities were not rare in canopytrees, it is unlikely that they provide an important source ofpotential nest platforms in British Columbia. Most treesshowing these deformities also had high to moderate scoresof epiphyte cover and thickness on their limbs (Table 7). Ofthe 4787 canopy trees with platforms that had data on mis-tletoe deformities and epiphyte cover, only 42 (0.9%) hadmistletoe but lacked epiphyte cover or had only traces(Table 7). Similarly, considering epiphyte thickness, 894(19.7%) of the 4530 trees with platforms lacked thick or in-termediate epiphyte pads. Of these trees lacking epiphytepads, 324 (7.2%) had mistletoe deformities but 570 (12.6%)did not (Table 7), and platforms were therefore provided bythick limbs and other structures (e.g., broken tops and limbforks). Because most mistletoe deformities were too flimsyor thin (<15 cm) to provide a nest platform for MarbledMurrelets (authors’ personal observations), fewer than 7%of all platforms could be attributed to mistletoe or similarinfestations.
Discussion
Application of classification trees to our dataAs explained in the Methods, we found classification trees
(De’ath and Fabricius 2000; De’ath 2002) to be the most ap-plicable and robust method to derive explanations and pre-dictions from our large data set. Edwards et al. (2006)found differences in the accuracy of classification tree mod-els between spatially randomized and nonrandom (purpo-sive) sampling. Although some of our sample plots werenot spatially randomized, 95% of all trees (all except thosein HG) were in plots selected for criteria other than avail-ability of platforms (see Methods). Furthermore, we focusedon occurrence of platforms within individual trees and notsample plots, and all plots contained trees with and withoutplatforms. The great majority of our samples (95%) cannottherefore be considered purposive in the sense used by Ed-wards et al. (2006). As reported by Edwards et al. (2006),we found that models based on subjectively sampled purpo-sive sampling (our HG samples) produced lower predictive
Fig. 4. Effects of tree height and tree stratum reached on PLAT-CODE (ranks 0–4) for each of six regions.
738 Can. J. For. Res. Vol. 40, 2010
Published by NRC Research Press

accuracy than those from randomized data (our other re-gions). The trends and predictions derived from the HGdata were generally similar to those from other regions, re-flecting the importance of DBH even though small trees hadnot been included. Further sampling is needed to determineif some of the differences between HG and other regionswere due to nonrandomized sampling or genuinely reflectthe conditions affecting platform availability on HG.
We used resubstitution as the method for estimating theaccuracy of our classification trees because this gave usgreater flexibility in pruning the trees with the SPSS soft-ware used. Edwards et al. (2006) found that cross-validationgave more realistic estimates of classification tree accuracythan resubstitution, but in their tests with randomized non-purposive samples (which most closely resemble our sam-pling mix), the differences in model accuracy they reportedwere <10%. Differences in accuracy between these twomethods were also around 10% in tests done by De’ath andFabricius (2000). The accuracy of our predictions mighttherefore be slightly overestimated. Of course, the accuracyof our models would best be tested by applying our predic-tions to an independent fully randomized data set (Scott etal. 2002; Edwards et al. 2006), but that was not possiblewith the resources of our study and remains an important fu-ture goal.
How many platforms are needed?Although a pair of nesting Marbled Murrelets requires
only a single platform for each nesting attempt, most nestsare in trees with multiple platforms and stands with treesproviding multiple platforms are more likely to be used bynesting Marbled Murrelets than those with few platforms(Burger 2002; Silvergieter 2009). Multiple platforms provid-ing alternative nesting sites are important because MarbledMurrelets frequently switch nest sites (Burger et al. 2009)and there are theoretical reasons to expect lower nest preda-tion in habitat that offers a large number of potential nestsites (i.e., platforms) to confound a predator (Chalfoun and
Martin 2009). The classification of a potential nest platformused in British Columbia (RIC 1997; RISC 2001) is basedon limb diameter (including epiphytes if present) and makesno assumptions about suitability for Marbled Murrelets. Anunknown but likely substantial proportion of our potentialplatforms would not be suitable for nesting Marbled Murre-lets, e.g., not sufficiently level or lacking canopy gaps foraccess (Nelson 1997; Burger 2002). For these reasons, wefocus not only on the presence and absence of platforms ina tree but also the approximate number of platforms in thetree as indicators of suitability for nesting Marbled Murre-lets. The numbers of platforms would also be a good indica-tor of the structural complexity and community diversity ofcanopy ecosystems.
Factors affecting platform availability: tree and standage
From a management perspective, availability of potentialnest platforms relative to tree age would be very valuableinformation. One could then begin to address the questionof how old stands have to be to provide platforms and suit-able nesting habitat in each region and in various landscapesituations affected by tree species, biogeoclimatic condi-tions, elevation, slope, and aspect. Unfortunately, it was notpractical to core each tree to measure its age in the MarbledMurrelet habitat studies that provided our samples, and standage was rarely given in the data. Although we expect gen-eral correlations between tree size (DBH and height) andage, the rate of tree growth is strongly affected by a widerange of environmental factors and there is no simple age–size relationship. In western hemlock, the numerically domi-nant tree species across the British Columbia coast, tree ageis a poor predictor of tree size and epiphyte cover (Lyons etal. 2000). Although epiphyte biomass in the canopy (whichcontributes to platforms) tends to increase with stand age inthe Pacific Northwest (McCune 1993), tree size and struc-ture were better predictors of epiphyte biomass than treeage (Lyons et al. 2000; Pipp et al. 2001).
Table 7. Numbers of canopy and emergent trees showing epiphyte cover and thickness and mistletoe deformities relative to epiphyteoccurrence.
All canopy trees* Trees with platforms*
VariableTrees withplatforms
Trees with noplatforms All trees No mistletoe Mistletoe No mistletoe Mistletoe
Epiphyte cover (%)0 42 349 391 366 12 30 11<1 (trace) 111 1071 1182 966 112 80 311–33 1291 3228 4519 3598 721 865 36434–66 1772 2261 4033 2930 791 1112 48567–100 1872 903 2775 1963 699 1258 551Total 5088 7812 12900 9823 2335 3345 1442
Epiphyte thickness score0 (no epiphytes) 44 351 395 366 12 30 111 (sparse) 876 4695 5571 4388 833 540 3132 (intermediate) 1789 1790 3579 2668 798 1196 5383 (thick mats) 2102 839 2941 2082 615 1391 511Total 4811 7675 12486 9504 2258 3157 1373
Note: Snags and subcanopy trees were omitted.*Sample sizes differ among columns because not all trees had mistletoe data.
Burger et al. 739
Published by NRC Research Press

Our continuing study will investigate the size–age rela-tionships in our data in an effort to provide predictions onplatform availability relative to stand and tree age, but untilthese complex relationships are resolved, we focus on DBH,mediated by regional and local conditions and tree species,as the most reliable predictor of platform availability. Since
DBH is readily and accurately measured, we recommendthat this also be the primary management measure forground-based management of habitat at the stand level.Tree height, which is the standard measure of tree size inforest cover mapping (Green and Klinka 1994) and in as-sessing Marbled Murrelet habitat using aerial photographs
Fig. 5. Frequency distributions of canopy and emergent trees showing the relationships between epiphyte cover (left graphs) and epiphytethickness (right graphs) and numbers of potential nest platforms per tree. Trees with platforms generally had some epiphyte cover and thosewith multiple platforms almost invariably had thick mossy mats.
740 Can. J. For. Res. Vol. 40, 2010
Published by NRC Research Press

Table 8. Factors influencing epiphyte development on trees in British Columbia.
Data set n% correctclassification Primary variable Secondary variable Tertiary variable
Epiphyte cover (ranked 0–4)All data 26878 44 DBH (>41 cm) TreeSp (Fir, Hem, Ss, BL, Yc > Fd, Cw) ValLoc (B, L > M, U, R)HG 1440 58 Aspect (Flat, NW, N, NE > W,
SW, S, SE, E)If Aspect Flat, NW, N, NE, then UTM north-
ing (S > N at UTM 5973326)If Aspect W, SW, S, SE, E, then UTM northing
(N > S at UTM 5916222)NC 1594 49 DBH (>36 cm) If DBH <36 cm, then Aspect (Flat, W, E, N,
NE > NW, SW, S, SE)If Aspect Flat, W, E, N, NE, then DBH
(>16 cm)CC 1654 59 TreeHt (>18 m) If TreeHt > 18 m, then Elev (<186 m) If TreeHt < 18 m, then TreeSp (Hem, Fir, Ss,
BL > Yc, Cw, Fd)SC 5900 52 Produnit (£2) If Produnit > 2, then DBH (>52 cm) If DBH < 52 cm, then ValLoc (B, L > M, U, R)WNVI 13312 44 DBH (>44 cm) If DBH < 44 cm, then ValLoc (B, L > M, U,
R)If DBH > 44 cm, then TreeSp (Fir, Hem, Ss, BL
> Cw, Yc, Fd)EVI 2978 61 TreeHt (>28 m) If TreeHt < 28 m, then Produnit (£2) If Produnit £ 2, then ValLoc (L, B > M)
Epiphyte thickness (ranked 0–3)All data 26139 63 DBH (>46 cm) TreeSp (Fir, Hem, Ss, Cw, BL, Yc > Fd) If DBH < 46 cm, then ValLoc (B, L > M, U, R)HG 1440 66 UTM (N > S at UTM 5975755) If UTM S, then UTM (N > S at UTM
5957294)If UTM S, then UTM (N > S at UTM 5863508)
NC 1627 64 DBH (>40 cm) DBH (>84 cm) If DBH < 84 cm, then BECgrp (MHm,CWHvm1, CWHw > CWHvh)
CC 1654 74 ValLoc (B > U, L, M) If ValLoc B, then TreeHt (>21 m) If ValLoc U, L, M, then DBH (>46 cm)SC 5304 65 DBH (>52 cm) If DBH < 52 cm, then ValLoc (B, L > M, U,
R)If ValLoc M, U, R, then Elev (>440 m)
WNVI 13139 65 DBH (>51 cm) TreeHt (>40 m) DBH (>85 cm)EVI 2975 72 Produnit (£2) If Produnit £ 2, then ValLoc (L, B > M) If Produnit > 2, then TreeSp (Fir, Hem, BL, Cw,
Yc, Ss > Fd)
Note: Classification and regression trees (CART) were used to classify epiphyte cover (ranked 0–4) and epiphyte thickness (ranked 0–3). Parentheses indicate thresholds in classification. Unless indicatedby an ‘‘if’’, the secondary and tertiary predictors are branches off the preceding split that indicated greater platform development. For abbreviations, see Tables 1 and 2.
Burger
etal.
741
Publishedby
NR
CR
esearchPress

or low-level aerial surveys (Burger 2004), is strongly corre-lated with DBH (Table 3) and could serve equally wellwhen DBH is impractical.
Factors affecting platform availability: tree sizeTree size, as indicated by diameter (DBH), was the domi-
nant factor in separating trees with platforms from thosewithout and in determining the relative abundance of plat-forms within trees. This applied to the pooled data from allregions and within each region. DBH was often a secondaryand tertiary factor as well, indicating that other variables hadrelatively little influence in some regions. Tree height didnot appear in any CART models, undoubtedly because itwas significantly correlated with DBH, but when investi-gated independently, tree height and stratum were also im-portant predictors of platform abundance. Obviously, it isthe overall size and age of trees that is important here andnot only diameter, but DBH appears to be the most reliableand consistent measure of tree size.
In the pooled data and in four of the six regions, tree di-ameter of about 60 cm appeared to be the primary factor af-fecting platform availability. The plots of platformabundance compared with DBH (Fig. 3) indicate that therewas, indeed, a threshold response at about 60 cm for mostspecies of trees in most regions. In other words, epiphytegrowth exceeds the defined threshold for potential nest plat-forms (15 cm diameter) when most trees are above 60 cm in
diameter. There were some important variations around thisgeneral trend. In the CC and EVI regions, the CART modelsindicate the need for somewhat larger trees (82 and 96 cm,respectively), which is also seen in the graphs (Fig. 3). Therequirement for larger trees in CC is not clear because thisregion falls geographically and climatically between the SCand NC regions where larger trees are not indicated. Most ofEVI falls within the drier leeward side of Vancouver Islandin the Coastal Douglas-fir (CDF) or Coastal Western Hem-lock – Very Dry Maritime (CWHxm) subzones (Green andKlinka 1994). Consequently, epiphyte growth in tree cano-pies is slower than in the moister parts of the British Colum-bia coast, explaining the requirement for larger trees toprovide platforms.
Our data indicate some differences in platform availabilityrelative to tree size in HG. The CART models showed dif-ferences between this region and the other five regions.Overall and for most tree species, platform counts werehigher on HG than in other regions, especially for smallertrees (Figs. 3 and 4). This result was largely due to an arti-fact in the sampling methods. Sampling on HG was focusedon trees that might provide platforms (McLennan et al.2000); consequently, many smaller trees lacking platformswere omitted, thereby inflating the mean platform counts.Further research is needed to see if this isolated region doesdiffer from the rest of coastal British Columbia in platformavailability.
Table 9. Summary of importance values of each independent (predictor) variable in the CART models for epiphyte development (Table 8).
Normalized importance values of independent variables in CART models
Dependent variableIndependentvariable All data HG NC CC SC WNVI EVI
Epiphyte cover (ranked 0–4) DBH 100 14 100 78 60 100 78TreeHt 78 19 83 72 51 86 65BECgrp 58 40 10 26 51 47 44Region 56 na na na na na naStratum 51 6 56 63 29 58 49ValLoc 42 0 6 46 47 56 94TreeSp 41 77 17 54 32 50 59Produnit 34 24 10 40 73 63 52Elev 30 69 10 58 92 46 100UTM northing 26 100 28 46 100 42 100Slope 22 38 6 57 63 34 57Aspect 20 76 20 100 49 35 90Mistletoe 20 24 3 3 12 21 30
Epiphyte thickness (ranked 0–3) DBH 100 1 100 82 100 100 50TreeHt 71 15 65 64 54 84 36Stratum 65 3 47 67 46 69 6Region 46 na na na na na naBECgrp 39 24 11 34 16 3 4UTM northing 28 100 27 38 59 13 100TreeSp 24 14 34 57 21 22 41Produnit 15 3 11 67 95 4 45Elev 15 26 17 49 55 4 72ValLoc 12 0 0 100 48 8 73Mistletoe 11 8 6 10 7 17 6Slope 8 14 1 21 31 5 8Aspect 7 41 2 47 38 8 86
Note: Importance values are normalized such that the most important predictor receives 100% importance and the contribution of other predictors aregauged relative to this most important predictor. See Table 1 for explanation of codes and Table 2 for region abbreviations. na, not applicable.
742 Can. J. For. Res. Vol. 40, 2010
Published by NRC Research Press

Factors affecting platform availability: tree speciesTree species was an important factor affecting platform
availability in the HG, SC, and EVI regions and was se-lected in the less important outer branches of CART models(not shown in Table 4) for the pooled data (Fig. 2) and insome regions too. In regions where these species were com-mon, Sitka spruce, Douglas-fir, and yellow cedar were con-sistently more likely to provide platforms and westernredcedar consistently less likely to provide platforms thanthe other tree species. In part, this is related to the canopymicrostructure. Branches in the first three species tend to befairly horizontal and thick, providing a wide base and pro-moting epiphyte retention and the development of thickmossy mats. In contrast, the thin downward-sweepingboughs of western redcedar retain relatively little moss orother epiphytes, and in this species, potential platformswere often provided by deformities related to leader death(‘‘chandelier growth’’). Fir species (mostly amabilis fir witha smaller sample of grand fir) and hemlocks (mostly westernhemlock with some mountain hemlock at higher elevations)were inconsistent in providing platforms. Firs provided moreplatforms than other species of similar size on EVI butfewer on SC. Likewise, hemlocks provided more platformson HG but fewer on SC and EVI. Hemlocks were the mostcommon species in most regions (>40% of the sampled treesin all regions except EVI where they comprised 27% oftrees) and grow in a wide range of edaphic and microcli-matic conditions (Pojar and MacKinnon 1994). In some sit-uations, epiphytic development is evidently rapid onhemlock trees, promoting development of platforms,whereas in drier conditions such as on EVI and parts of SC,this ubiquitous species will have little epiphyte growth andfew platforms.
One interesting result is that the small sample of broad-leafed deciduous trees (red alder and bigleaf maple) showedquite high numbers of platforms (for trees >60 cm DBH onEVI and SC and >80 cm for WNVI) (Fig. 3). Out of morethan 200 Marbled Murrelet nests found in British Columbiaby telemetry and other means (Burger 2002; D.B. Lank, un-published data), only one has been in a broadleafed tree (ared alder on the SC region; Bradley and Cooke 2001).Clearly, there are factors other than availability of platformsthat influence the selection of nest sites by Marbled Murre-lets. The structure of the canopy is likely important too, andthe thick summer foliage of broadleafed trees might hinderaccess to flying Marbled Murrelets.
Factors affecting platform availability: epiphytesThe Marbled Murrelet habitat sampling protocols (RIC
1997; RISC 2001) did not provide information on the spe-cific structures that provide the platforms in each tree (e.g.,mossy mats, bare limbs, broken limbs, mistletoe deform-ities); this should be included in future revisions of the pro-tocol. It is clear from our data, however, that theoverwhelming majority of platforms were provided by epi-phyte growth, specifically thick mossy mats that might alsoinclude minor amounts of ferns, lichens, and a few vascularplants. All Marbled Murrelet nests located in British Colum-bia except one on a thick bare limb were depressions onmossy pads, whether in trees or on cliffs (Bradley andCooke 2001; Burger 2002; D.B. Lank and M.P. Silvergieter,
unpublished data). This is also the most common nest sub-strate throughout the species range, although a few nests inWashington, Oregon, and California have been found in duffon thick limbs in drier areas and on mistletoe deformities(Nelson 1997; McShane et al. 2004). In our data, most(72%) trees providing platforms had epiphytes covering onethird or more of branches and 81% had epiphyte thicknessscored as intermediate or thick mats (thickness score 2 or3). Canopy trees with one or more platforms were signifi-cantly more likely to have higher scores of moss cover andmoss thickness than those with no platforms, and nearly alltrees with multiple platforms had both high epiphyte cover(usually >67%) and intermediate or thick mossy pads.
As expected, because most platforms were provided byepiphytes, the predictors of epiphyte cover and thicknesswere similar to those predicting platforms, including astrong effect of tree size (DBH and height) and less consis-tent effects of tree species, latitude, elevation, aspect, loca-tion in the valley, and site productivity. There was morediversity in the primary, secondary, and tertiary predictorsin CART models for epiphyte cover and thickness than forthe platform models, and the percent correct classificationwas often lower for epiphytes (44%–74%) than for platforms(65%–95%). This is in part because epiphyte cover (five cat-egories) and thickness (four categories) were more finelyclassified than platform presence–absence (two categories)and the modified PLATCODE (three categories). In addi-tion, high epiphyte cover and thickness could occur onsmaller trees with narrow limbs (notice the lower DBHthresholds in CART models for epiphytes compared withthose for platforms) so that many trees heavily covered withepiphytes might not have provided platforms. It is clearlythe combination of large trees (with thicker limbs) and thickepiphyte cover that provides optimal conditions for potentialnest platforms.
In general, the effects of tree species on epiphyte coverand thickness mirrored their effects on platforms. Relativeto most other species, yellow cedar had higher epiphyticcover and thickness, while western redcedar had less. Bycontrast, Douglas-fir, which provided higher numbers ofplatforms than expected in EVI and SC, was among the spe-cies showing less epiphytic growth than other species ofcomparable size in the pooled, WNVI, and EVI samples.This apparent paradox is likely due to the thick limbs ofDouglas-fir providing platforms without the need for thickepiphytic growth and to the prevalence of large trees of thisspecies in the drier EVI and SC regions where epiphytegrowth is often inhibited.
Our finding that tree size (DBH or height) is the mostconsistent predictor of epiphyte cover and thickness is con-sistent with other studies from the Pacific Northwest.McCune (1993) showed that epiphyte biomass increasedwith stand age but tree size was the strongest predictorwithin stands. He also suggested that bryophyte biomass inthe canopy (the greatest contributor to Marbled Murreletnest platforms) would only increase in late succession andin trees >200 years old. Lyons et al. (2000) found that can-opy height and tree size were the main influences on epi-phyte cover in western hemlock trees in Washington; largetrees (>37 m tall) had twice the epiphyte cover found in me-dium-sized trees (12–37 m) and three times that of small
Burger et al. 743
Published by NRC Research Press

trees (<12 m). They also concluded that tree size was a bet-ter predictor of epiphyte cover than tree age.
Factors affecting platform availability: mistletoedeformities
Eighteen Marbled Murrelet nests have been found in mis-tletoe deformities (witches brooms) in Oregon, some in trees66–150 years old, younger than typical old-growth (Nelson1997; Nelson and Wilson 2002). It is therefore relevant toknow to what extent mistletoe infestations might provide po-tential nest platforms in British Columbia and serve as alter-native sites to the typical mossy platforms on large late-seraltrees. Although mistletoe deformities were not uncommon(found in 20% of all canopy and emergent trees and in allregions), most trees with these deformities also had inter-mediate or thick mossy pads on their limbs that would bemore likely to provide a nest platform. Our data indicatethat mistletoe or similar infestations provide fewer than 7%of potential platforms for Marbled Murrelets in British Co-lumbia. Unfortunately, the standard mistletoe scoring systemused (Hawksworth 1977) provides no information on thesize of the deformities or their suitability as potential nestplatforms to refine this estimate. No Marbled Murrelet nestshave been found in a mistletoe deformity in British Colum-bia (Burger 2002; D.B. Lank, unpublished data), andalthough we do not rule out the possibility of such deform-ities providing a small number of nest sites, their role inmanagement of nesting habitat must be considered negli-gible.
Management implicationsOur results provide important benchmarks in the manage-
ment of nesting habitat for the Marbled Murrelet. In particu-lar, our results should help to ensure that forests maintainedas habitat (e.g., Wildlife Habitat Areas; IWMS 2004) in-clude adequate platforms and a suitable proportion of thosetree species that are most likely to provide platforms, to de-velop policies and field practices for partial-retention cuttingthat ensure retention of suitable trees with platforms so thatmurrelets might still nest, and to facilitate the recruitment ofolder second-growth forests to provide future habitat inareas where old forests are severely depleted.
Throughout most of the range in British Columbia, man-agers should not expect habitat to be suitable until a sub-stantial proportion of the trees in a stand exceed 60 cm indiameter. The threshold is larger (90–100 cm DBH) on EVIand perhaps also on CC (~80 cm). For EVI, this differenceis important. Within British Columbia, this coastal regionhas experienced the greatest loss of likely forest nesting hab-itat due to logging, urbanization, and agriculture (probably>75% of the preindustrial habitat; Burger 2002), and theCanadian Marbled Murrelet Recovery Team has recom-mended retention of 95% of the remaining habitat with re-cruitment required to increase habitat area (CMMRT 2003).If trees take longer to reach the threshold for providing po-tential nest platforms on EVI, then recovery of the MarbledMurrelet in this region can be expected to be more pro-tracted and require more careful management and selectionof habitat for recruitment.
In addition to DBH, our CART models provide managerswith simple guidelines to the regional factors likely to be
important in providing platforms and promoting epiphytegrowth. The large samples of trees used in our analyses andthe high proportion of correct classification in our modelsgive reasonable confidence in the application of these datato management in British Columbia, although extrapolationof our results outside our study area (e.g., in the Alaska Bor-der region in British Columbia and in the United States) re-quires caution and additional testing.
Our data indicate that Sitka spruce (generally on flood-plains and lower slopes), Douglas-fir (in drier BEC sub-zones), and yellow cedar (generally in higher elevations)should provide potential nest platforms more often thanother species, whereas the widespread western redcedar isconsistently poor. Hemlock and fir species frequently pro-vide platforms, but local research is needed to determinewhether they are a preferred species or not. Species compo-sition should therefore be considered when selecting standsfor maintaining Marbled Murrelet habitat and in developingregional algorithms for identifying suitable habitat forMarbled Murrelets (e.g., McLennan et al. 2000; Hobbs2003). Species composition might be particularly importantwhere managers are selecting regenerating immature forestfor future recruitment of Marbled Murrelet habitat.
Habitat recruitment is not a major focus of managementin British Columbia at present, but the dearth of availableold-seral habitat in the southern mainland (SC) and EVI(Burger 2002; CMMRT 2003) means that recruitment of re-generating forest as nesting habitat is likely to be an impor-tant option in the near future. Similarly, partial-retentioncutting is not a recommended forestry practice in MarbledMurrelet habitat at present (IWMS 2004) and it is notknown whether removal of some canopy trees affects theprobability of Marbled Murrelets nesting. But this form oflogging is becoming more common in British Columbia andour data will assist in determining the size and species oftrees to leave standing to maximize the probability of retain-ing nesting capability for Marbled Murrelets.
Relevance of our data to canopy ecosystemsBecause they are hard to access, canopy communities in
tall forests remain poorly understood but are often importantcomponents in the overall forest ecosystem (Lowman andRinker 2004). Although focused on potential nest sites forMarbled Murrelets, our data and classification models pro-vide much-needed information on the development of epi-phytes and occurrence of mistletoe deformities, which bothcontribute to the physical structure and habitat complexityof the coastal forest canopies in the Pacific Northwest. Thelarge mats of epiphytes and litter that accumulate on thecanopy boughs are important habitat for a wide range ofcanopy plants (McCune 1993; Lyons et al. 2000) as well asinvertebrates (Fagan et al. 2006) and arboreal mammals(Carey 1996). Our data show the size of trees and other fac-tors affecting epiphyte development and could be used inpredictive models for canopy organisms in the same way asin our Marbled Murrelet analysis.
AcknowledgementsThis study was funded by the Forest Science Program of
the British Columbia Forest Investment Account and bygrants from the Natural Sciences and Engineering Research
744 Can. J. For. Res. Vol. 40, 2010
Published by NRC Research Press

Council of Canada to A.E.B. and D.B.L. We thank the Uni-versity of Victoria and Simon Fraser University for adminis-tering the FSP grants and for providing essential logisticsupport. We thank the many people who collected the fielddata that we have analysed and the agencies that supportedthat research over the past 18 years (see the original publica-tions). Our sample was considerably improved by field workdone in 2008 and we thank Michelle Paleczny, Natalie Ar-seneau, and Eyske Siemens for their huge contributions asfield researchers. For logistical, mapping, and other help inthe 2008 field season, we thank Ken Dunsworth and VolkerMichelfelder (BC Ministry of Environment, Bella Coola),Steven Hodgson (BC Parks, Bella Coola), Scott Rogers(Rainforest Research, Broughton Archipelago), Trudy Chat-win and Monica Mather (BC Ministry of Environment, Na-naimo), and Mike Grainger (BC Ministry of Forests andRange, Prince Rupert). We thank Louise Waterhouse (BCMinistry of Forests and Range, Nanaimo) for valuable inputin the design, analysis, and writeup of this study and LindaSinclair for providing the regional map.
ReferencesBahn, V., and Newsom, D. 2002. Can marbled murrelet use of
nesting habitat be predicted from mapped forest characteristics?In Multi-scale studies of populations, distribution and habitat as-sociations of marbled murrelets in Clayoquot Sound, British Co-lumbia. Edited by A.E. Burger and T.A. Chatwin. BritishColumbia Ministry of Water, Land and Air Protection, Victoria,B.C. pp. 89–99.
Banner, A., MacKenzie, W.H., Haeussler, S., Thomson, S., Pojar,J., and Trowbridge, R.L. 1993. A field guide to site identifica-tion and interpretation for the Prince Rupert Forest Region.Land Management Handbook 26. British Columbia Ministry ofForests, Victoria, B.C. Available from www.for.gov.bc.ca/hfd/pubs/Docs/Lmh/Lmh26.htm.
Bradley, R.W., and Cooke, F. 2001. Cliff and deciduous tree nestsof Marbled Murrelets in southwestern British Columbia. North-west. Nat. 82(2): 52–57. doi:10.2307/3536786.
Breiman, L., Friedman, J.H., Olshen, R.A., and Stone, C.J. 1984.Classification and regression trees. Wadsworth InternationalGroup, Belmont, Calif.
Burger, A.E. 2002. Conservation assessment of Marbled Murreletsin British Columbia: review of the biology, populations, habitatassociations, and conservation. Technical Report Series No. 387.Canadian Wildlife Service, Delta, B.C. Available from www.sfu.ca/biology/wildberg/bertram/mamurt/links.htm.
Burger, A.E. (Editor). 2004. Standard methods for identifying andranking nesting habitat of Marbled Murrelets (Brachyramphusmarmoratus) in British Columbia using airphoto interpretationand low-level aerial surveys. British Columbia Ministry ofWater, Land and Air Protection, Victoria, B.C. Available fromwww.env.gov.bc.ca/wld/documents/fia_docs/mamu_standard.pdf.
Burger, A.E., and Bahn, V. 2004. Inland habitat associations ofmarbled murrelets on southwest Vancouver Island, British Co-lumbia. J. Field Ornithol. 75: 53–66.
Burger, A.E., Bahn, V., and Tillmanns, A.R.M. 2000. Comparisonof coastal fringe and interior forests as reserves for MarbledMurrelets on Vancouver Island. Condor, 102(4): 915–920.doi:10.1650/0010-5422(2000)102[0915:COCFAI]2.0.CO;2.
Burger, A.E., Manley, I.A., Silvergieter, M., Lank, D.B., Jordan,K.M., Bloxton, T.D., and Raphael, M.G. 2009. Re-use of nestsites by Marbled Murrelets (Brachyramphus marmoratus) in
British Columbia. Northwest. Nat. 90(3): 217–226. doi:10.1898/NWN08-50.1.
Burnham, K.P., and Anderson, D.R. 2002. Model selection andmultimodel inference: a practical information-theoretic ap-proach. Springer-Verlag, New York.
Carey, A.B. 1996. Interactions of Northwest forest canopies and ar-boreal mammals. Northwest Sci. 70: 72–78.
Chalfoun, A.D., and Martin, T.E. 2009. Habitat structure mediatespredation risk for sedentary prey: experimental tests of alterna-tive hypotheses. J. Anim. Ecol. 78(3): 497–503. doi:10.1111/j.1365-2656.2008.01506.x. PMID:19040684.
CMMRT. 2003. Marbled Murrelet Conservation Assessment 2003,Part B — Marbled Murrelet Recovery Team advisory documenton conservation and management. Canadian Wildlife Service,Delta, B.C. Available from www.sfu.ca/biology/wildberg/bertram/mamurt/links.htm.
De’ath, G. 2002. Multivariate regression trees: a new technique formodeling species–environment relationships. Ecology, 83:1105–1117. doi:10.2307/3071917.
De’ath, G., and Fabricius, K.E. 2000. Classification and regressiontrees: a powerful yet simple technique for ecological data analy-sis. Ecology, 81(11): 3178–3192. doi:10.1890/0012-9658(2000)081[3178:CARTAP]2.0.CO;2.
Edwards, T.C., Jr., Cutler, D.R., Zimmermann, N.E., Geiser, L.,and Moisen, G.G. 2006. Effects of sample survey design on theaccuracy of classification tree models in species distributionmodels. Ecol. Model. 199(2): 132–141. doi:10.1016/j.ecolmodel.2006.05.016.
Fagan, L.L., Didham, R.K., Winchester, N.N., Behan-Pelletier, V.,Clayton, M., Lindquist, E., and Ring, R.A. 2006. An experimen-tal assessment of biodiversity and species turnover in terrestrialvs. canopy leaf litter. Oecologia (Berl.), 147(2): 335–347.doi:10.1007/s00442-005-0262-6.
Green, R.N., and Klinka, K. 1994. A field guide to site identifica-tion and interpretation for the Vancouver Forest Region. LandManagement Handbook No. 28. British Columbia Ministry ofForests, Research Branch, Victoria, B.C.
Hawksworth, F.G. 1977. The 6-class dwarf mistletoe rating system.U.S. For. Serv. Gen. Tech. Rep. RM-48.
Hobbs, J. 2003. Marbled murrelet nesting habitat in the mid coastforest district: an assessment of the mid coast model. Availablefrom British Columbia Ministry of Water, Land and Air Protec-tion, Victoria, B.C.
Huston, M.A. 2002. Critical issues for improving predictions. InPredicting species occurrences: issues of accuracy and scale.Edited by J.M. Scott, P.J. Heglund, M.L. Morrison, J.B. Haufler,M.G. Raphael, W.A. Wall, and F.B. Samson. Island Press, Wa-shington, D.C. pp. 7–21.
Ishii, H.T., Van Pelt, R., Parker, G.G., and Nadkarni, N.M. 2004.Age-related development of canopy structure and its ecologicalfunctions. In Forest canopies. 2nd ed. Edited by M.D. Lowmanand H.B. Rinker. Academic Press, New York. pp. 102–117.
IWMS. 2004. Identified Wildlife Management Strategy. Accountsand measures for managing identified wildlife: Marbled Murre-let Brachyramphus marmoratus. British Columbia Ministry ofWater, Land and Air Protection, Victoria, B.C. Available fromwww.env.gov.bc.ca/wld/frpa/iwms/accounts.html.
Lowman, M.D., and Rinker, H.B. (Editors). 2004. Forest canopies.2nd ed. Academic Press, New York.
Luttmerding, H.A., Demarchi, D.A., Lea, E.C., Meidinger, D.V.,and Vold, T. 1990. Describing ecosystems in the field. BritishColumbia Ministry of Environment and Forestry, Victoria, B.C.
Lyons, B., Nadkarni, N.M., and North, M.P. 2000. Spatial distribu-tion and succession of epiphytes on Tsuga heterophylla (western
Burger et al. 745
Published by NRC Research Press

hemlock) in an old-growth Douglas-fir forest. Can. J. Bot. 78(7):957–968. doi:10.1139/cjb-78-7-957.
Malt, J.M., and Lank, D.B. 2009. Marbled murrelet nest predationrisk in managed forest landscapes: dynamic fragmentation ef-fects at multiple scales. Ecol. Appl. 19(5): 1274–1287. doi:10.1890/08-0598.1. PMID:19688934.
Manley, I.A. 1999. Behaviour and habitat selection of MarbledMurrelets nesting on the Sunshine Coast. M.Sc. thesis, Depart-ment of Biological Sciences, Simon Fraser University, Burnaby,B.C.
Manly, B.F.J., McDonald, L.L., Thomas, D.L., McDonald, T.L.,and Erickson, W.P. 2002. Resource selection by animals: statis-tical design and analysis for field studies. 2nd ed. Kluwer Aca-demic, Dordrecht, The Netherlands.
McCune, B. 1993. Gradients in epiphyte biomass in three Pseudot-suga–Tsuga forests of different ages in western Oregon and Wa-shington. Bryologist, 96(3): 405–411. doi:10.2307/3243870.
McLennan, D., Veenstra, V., and Manley, I.A. 2000. Preliminarylandscape-level habitat suitability algorithms for Marbled Murre-let and Queen Charlotte Goshawk on the Queen Charlotte Is-lands/Haida Gwaii. British Columbia Ministry of Environment,Lands and Parks, Smithers, B.C., and Oikos Ecological ServicesLtd., Smithers, B.C.
McShane, C., Hamer, T., Carter, H., Swartzman, G., Friesen, V.,Ainley, D., Tressler, R., Nelson, K., Burger, A., Spear, L.,Mohagen, T., Martin, R., Henkel, L., Prindle, K., Strong, C.,and Keany, J. 2004. Evaluation report for the 5-year status re-view of the Marbled Murrelet in Washington, Oregon and Cali-fornia. Available from EDAW Inc., Seattle, Wash. Prepared forthe U.S. Fish and Wildlife Service, Region 1, Portland, Oreg.
Meidinger, D., and Pojar, J. (Editors). 1991. Ecosystems of BritishColumbia. B.C. Minist. For. Spec. Rep. Ser. 6.
Nelson, K. 1997. Marbled Murrelet (Brachyramphus marmoratus).In Birds of North America. No. 276. Edited by A. Poole and G.Gill. Academy of Natural Sciences, Philadelphia, Pa., and Amer-ican Ornithologists’ Union, Washington, D.C.
Nelson, S.K., and Wilson, A.K. 2002. Marbled Murrelet habitatcharacteristics on state lands in western Oregon. Report to Ore-gon Department of Forestry. Available from Oregon Coopera-tive Fish and Wildlife Research Unit, Oregon State University,Corvallis, Ore.
Piatt, J.F., Kuletz, K.J., Burger, A.E., Hatch, S.A., Friesen, V.L.,Birt, T.P., Arimitsu, M.L., Drew, G.S., Harding, A.M.A., and
Bixler, K.S. 2006. Status review of the Marbled Murrelet (Bra-chyramphus marmoratus) in Alaska and British Columbia. U.S.Geol. Surv. Open-File Rep. 2006-1387. Available from pubs.usgs.gov/of/2006/1387/.
Pipp, A.K., Henderson, C., and Callaway, R.M. 2001. Effects offorest age and forest structure on epiphytic lichen biomass anddiversity in a Douglas-fir forest. Northwest Sci. 75: 12–24.
Pojar, J., and MacKinnon, A. 1994. Plants of coastal British Co-lumbia. Lone Pine, Vancouver, B.C.
Ralph, C.J., Hunt, G.L., Jr., Raphael, M.G., and Piatt, J.F. (Edi-tors). 1995. Ecology and conservation of the Marbled Murreletin North America. U.S. For. Serv. Gen. Tech. Rep. PSW-GTR-152. Available from www.fs.fed.us/psw/rsl/projects/wild/gtr152/.
RIC. 1997. Standardized inventory methodologies for componentsof British Columbia’s biodiversity: Marbled Murrelets in marineand terrestrial habitats. Version 1.1. Publ. No. 208. Ministry ofEnvironment, Lands and Parks, British Columbia Resources In-ventory Committee, Victoria, B.C.
RISC. 2001. Inventory methods for Marbled Murrelets in marineand terrestrial habitats. Version 2.0. Standards for componentsof British Columbia’s biodiversity. No. 10. Ministry of Environ-ment, Lands and Parks, Resources Inventory Branch, Victoria,B.C. Available from archive.ilmb.gov.bc.ca/risc/pubs/tebiodiv/.
Rodway, M.S., and Regehr, H.M. 2002. Inland activity and foreststructural characteristics as indicators of Marbled Murrelet nest-ing habitat in Clayoquot Sound. In Multi-scale studies of popu-lations, distribution and habitat associations of MarbledMurrelets in Clayoquot Sound, British Columbia. Edited byA.E. Burger and T.A. Chatwin. British Columbia Ministry ofWater, Land and Air Protection, Victoria, B.C. pp. 57–87.
Scott, J.M., Heglund, P.J., Morrison, M.L., Haufler, J.B., Raphael,M.G., Wall, W.A., and Samson, F.B. (Editors). 2002. Predictingspecies occurrences: issues of accuracy and scale. Island Press,Washington, D.C.
Silvergieter, M.P. 2009. Multi-scale analyses of nest site selectionand fledging success by marbled murrelets (Brachyramphusmarmoratus) in British Columbia. M.Sc. thesis, Department ofBiological Sciences, Simon Fraser University, Burnaby, B.C.
Waterhouse, F.L., Burger, A.E., Lank, D.B., Ott, P.K., Krebs, E.A.,and Parker, N. 2009. Using the low-level aerial survey methodto identify Marbled Murrelet nesting habitat. B.C. J. Ecosyst.Manag. 10: 80–96. Available from www.forrex.org/publications/jem/ISS50/vol10_no1_art8.pdf.
746 Can. J. For. Res. Vol. 40, 2010
Published by NRC Research Press