
Subatomic mechanism of the oscillatory magnetoresistance in ...

Face the Hierarchy: ERP and Oscillatory Brain Responsesin Social Rank ProcessingAudrey Breton1*, Karim Jerbi2, Marie-Anne Henaff2, Anne Cheylus1, Jean-Yves Baudouin1,3,
Christina Schmitz2, Pierre Krolak-Salmon2, Jean-Baptiste Van der Henst1*
1 CNRS, Laboratoire Langage, Cerveau et Cognition (L2C2), Universite Lyon 1, UMR 5304, Bron, France, 2 CNRS/INSERM, Centre de Recherche en Neuroscience de Lyon
(CNRL), U1028, UMR5292, Bron, France, 3 Universite de Bourgogne, Pole AAFE, Dijon, France
Abstract
Recognition of social hierarchy is a key feature that helps us navigate through our complex social environment.Neuroimaging studies have identified brain structures involved in the processing of hierarchical stimuli but the precisetemporal dynamics of brain activity associated with such processing remains largely unknown. Here, we usedelectroencephalography to examine the effect of social hierarchy on neural responses elicited by faces. In contrast toprevious studies, the key manipulation was that a hierarchical context was constructed, not by varying facial expressions,but by presenting neutral-expression faces in a game setting. Once the performance-based hierarchy was established,participants were presented with high-rank, middle-rank and low-rank player faces and had to evaluate the rank of eachface with respect to their own position. Both event-related potentials and task-related oscillatory activity were investigated.Three main findings emerge from the study. First, the experimental manipulation had no effect on the early N170component, which may suggest that hierarchy did not modulate the structural encoding of neutral-expression faces.Second, hierarchy significantly modulated the amplitude of the late positive potential (LPP) within a 400–700 ms time-window, with more a prominent LPP occurring when the participants processed the face of the highest-rank player. Third,high-rank faces were associated with the highest reduction of alpha power. Taken together these findings provide novelelectrophysiological evidence for enhanced allocation of attentional resource in the presence of high-rank faces. At abroader level, this study brings new insights into the neural processing underlying social categorization.
Citation: Breton A, Jerbi K, Henaff M-A, Cheylus A, Baudouin J-Y, et al. (2014) Face the Hierarchy: ERP and Oscillatory Brain Responses in Social RankProcessing. PLoS ONE 9(3): e91451. doi:10.1371/journal.pone.0091451
Editor: Alexandra Key, Vanderbilt University, United States of America
Received October 23, 2013; Accepted February 11, 2014; Published March 12, 2014
Copyright: � 2014 Breton et al. This is an open-access article distributed under the terms of the Creative Commons Attribution License, which permitsunrestricted use, distribution, and reproduction in any medium, provided the original author and source are credited.
Funding: This study was supported by CNRS, INSERM and DGA. The funders had no role in study design, data collection and analysis, decision to publish, orpreparation of the manuscript.
Competing Interests: The authors have declared that no competing interests exist.
* E-mail: [email protected] (AB); [email protected] (JBVDH)
Introduction
Living in a sophisticated social environment is cognitively more
demanding than living alone. According to the social brain
hypothesis, this demand exerts selective pressure on the brain of
social species [1]. A recurring feature that contributes to the
complexity of social environments is hierarchy. A large proportion of
primates’ social relationships are indeed asymmetrical: some
individuals have priority of access to resources, some are endowed
with greater social prestige, and some exert control over others.
Humans are no exception: although the hierarchical organization
varies among cultures, all current and past societies have shown
some degree of stratification [2], [3] and developmental studies
have reported that children as young as two-year old form stable
hierarchies [4]. The evolutionary importance of hierarchy
manifests itself through its consequences on reproductive success
since high-rank individuals tend to have more offspring than low-
rank individuals [5], [6].
In order to successfully navigate their social environment,
humans need to categorize individuals according to their status.
Behavioral studies indicate that adults and even infants display a
remarkable ability to recognize social asymmetries [7], [8]. At the
brain level, although recent fMRI studies have reported a wide
range of brain structures involved in the processing of hierarchical
stimuli, such as the medial, dorsolateral and ventrolateral
prefrontal cortices [9], [10], [11], the amygdala and anterior
hippocampus [12], the temporal dynamics of the neural response
associated with such processing remains unknown. When does the
neural response elicited by the hierarchical nature of stimuli
emerge and what is the nature of the rapid subprocesses elicited by
those stimuli? To address these questions we used electroenceph-
alography (EEG) and investigate the neural mechanisms involved
in processing faces that were embedded in a learned hierarchical
context. Faces were used as stimuli because they are highly
relevant to socio-cognitive processes and can therefore be easily
linked with social aspects of the environment. However, in order to
avoid any confound with physical modification of the face [13], the
manipulation of social rank should not be associated with any
specific facial expressions. Consequently, the key manipulation
consisted of presenting faces with neutral expressions in a game
context where the subject had to rank other players performance
with respect to his own.
Identifying one person’s rank is a form of social categorization
as it consists of associating an individual with scalar social
categories (High-status.Intermediate-status.Low-status). Previ-
ous EEG studies have mainly investigated the social categorization
PLOS ONE | www.plosone.org 1 March 2014 | Volume 9 | Issue 3 | e91451
of faces through dichotomic categories such as race (i.e. racial
ingroup vs. racial outgroup faces), gender (female vs. male faces) or
familiarity (familiar vs. stranger faces). A critical issue was whether
these categories modulate the amplitude of the well-known face-
related N170 component, which is thought to depict an early stage
of processing associated with the structural encoding of faces ([14],
see [15] for a review). Many studies report that the N170
component is insensitive to social categories (familiarity: [16–22],
gender: [23], [24], race: [25–27],) and suggest that social
information conveyed by a face is processed only after its
structural encoding. This sequential view has been challenged by
a significant number of studies that did observe an influence of
social categories on the electric N170 or magnetic M170
(familiarity: [28–33], gender: [13], race: [34–36]). Interestingly,
one of the only EEG investigations which has explored facial
expressions related to hierarchy reported that facial expressions of
dominance elicited a N170-like component whose amplitude was
greater for facial expressions of submission [37]. However, this
study did not only manipulate hierarchy as physical properties of
faces were also varied. Taken together, these results suggest that
whether the N170 is modulated by hierarchy is still an open
question.
While the aforementioned N170 findings are partly inconsistent,
the literature concurs that social categorization modulates the Late
Positive Potential (LPP), revealing an influence of higher-order
cognitive processes. The LPP associated with familiar faces has
been interpreted as the activation of semantic and personal
identity representations [18], [20], [38], while those elicited by
race and gender have been interpreted as the cognitive assessment
of face and category-related information [35], [39] or as the
manifestation of evaluative social judgments [27]. In light of these
results, it could be expected that hierarchy, being a major feature
of social categorization, would modulate the LPP elicited by faces.
To the best of our knowledge, there is so far no clear evidence for
this hypothesis in the literature.
Hence, the first goal of this study is to determine whether
hierarchy influences the early structural processing of faces or/and
whether it influences a higher-order processing stage. In addition,
the second goal of this study is to further explore the cortical
mechanisms related to hierarchical face processing by investigating
the putative involvement of neural oscillations. A parallel stream of
research has shown that the perception of faces has been
associated with suppressions in alpha-band power (9–12 Hz) in
the occipito-parietal areas [40], [41]. However, whether such
oscillatory power modulations are differentially affected by social
rank remains unknown.
In the current experiment, the social hierarchy was learned
through direct experience in a competitive game. This procedure
differs from previous fMRI studies in which participants did not
observe the building of the hierarchy but were directly provided
with status information through perceptual cues, such as body
posture [10], uniforms [42], stars [9], or through famous
individuals [11]. The only brain study where hierarchy was
acquired through experience is that of Kumaran et al. [12] in
which participants learned the status of individuals on the basis of
a transitive reasoning task. This type of task is often used in
ethology in order to show that the verticality of hierarchical
relations tends to shape the inferential abilities of social species
[43–46]. Typically, those tasks involve a wide range of pairwise
relations (A.B; B.C; C.D; D.E; E.F; F.G) from which new
relations can be drawn (i.e. B.E) and from which the entire
hierarchy can be built (A.B.C.D.E.F.G). Here, we used a
simpler procedure in which participants were directly provided
with the whole ranking of four players. This is a relatively
ecological procedure as in a wide range of human competitive
activities the full hierarchy is communicated and does not need to
be inferred from adjacent dyads. University rankings, sports
rankings, the Forbes world’s billionaires list are typical examples.
Moreover, transitivity tasks are used when the hierarchy is fully
vertical but this was not the case in the present task as two players
had the same rank (i.e. the participant and one of the other
players, see below).
Materials and Methods
Ethics StatementAll participants gave written informed consent for the study
which was approved by the local Ethical Committee (Comite de
Protection des Personnes, Gerling agency- File no: 90788200730).
All participants consented to participate in the research on their
own behalf. Prior to the task, the experimenters made sure that
participants had the capacity to consent by asking a series of
questions about their understanding of the study.
ParticipantsSixteen right-handed healthy male volunteers aged between 19
and 27 years (mean = 21.05 years 6 1.6 SD, median = 20.96
years) participated in this study. All participants were French, had
comparable educational backgrounds and had normal or correct-
ed-to-normal vision. To avoid possible confounds from gender-
related differences in sensitivity to competitive settings [47] only
male volunteers were tested, and they were confronted only with
male faces. Participants were compensated for their participation.
StimuliThe stimulus set consisted of 36 high-resolution photographs of
neutral male faces picked from the NimStim Set of Facial
Expressions standardized database [48] and from the stimuli set
used by Baudouin and Gallay [49]. No remarkable details, such as
glasses, earrings, piercings or mustaches, were visible on the faces.
All pictures were transformed into grayscale images and normal-
ized in size, luminance and contrast. They were displayed on a
screen with a light grey background and subtended a horizontal
visual angle of 9.8u and a vertical angle of 7.7u at a viewing
distance of one meter (480 6 374 pixels).
Design and ProcedureUpon his arrival to the laboratory, the participant’s face was
photographed and inserted into the group of faces as a landmark
of his position. We created a competitive context to ensure that the
participant really believed he was included in a hierarchy. As a
cover story, he was told that he was participating in the second
part of a research project conducted on network games and visual
perception. In the first part, other volunteers supposedly already
completed the same games that the participant would play, and
their scores and pictures had been stored in the database. For each
game, the participant was told that his performance would be
compared to 3 ‘‘former players’’, represented by their photo-
graphs, and randomly chosen from the database. Participant was
told that these ‘‘former players’’ have been previously ranked
according to their scores as the best, middle or worst competitor.
Participants were thus presented with faces of three ranks
corresponding to three player rank conditions: highest,middle and lowest rank. Additional filler stimuli included
faces referring to players whose ranks were unknown. Participants
were provided with information regarding their own status, which
could be equal to the highest, middle or lowest rank. The ranks of
the supposed players and of the participant were thus manipulated
Influence of Hierarchy on Face Processing
PLOS ONE | www.plosone.org 2 March 2014 | Volume 9 | Issue 3 | e91451
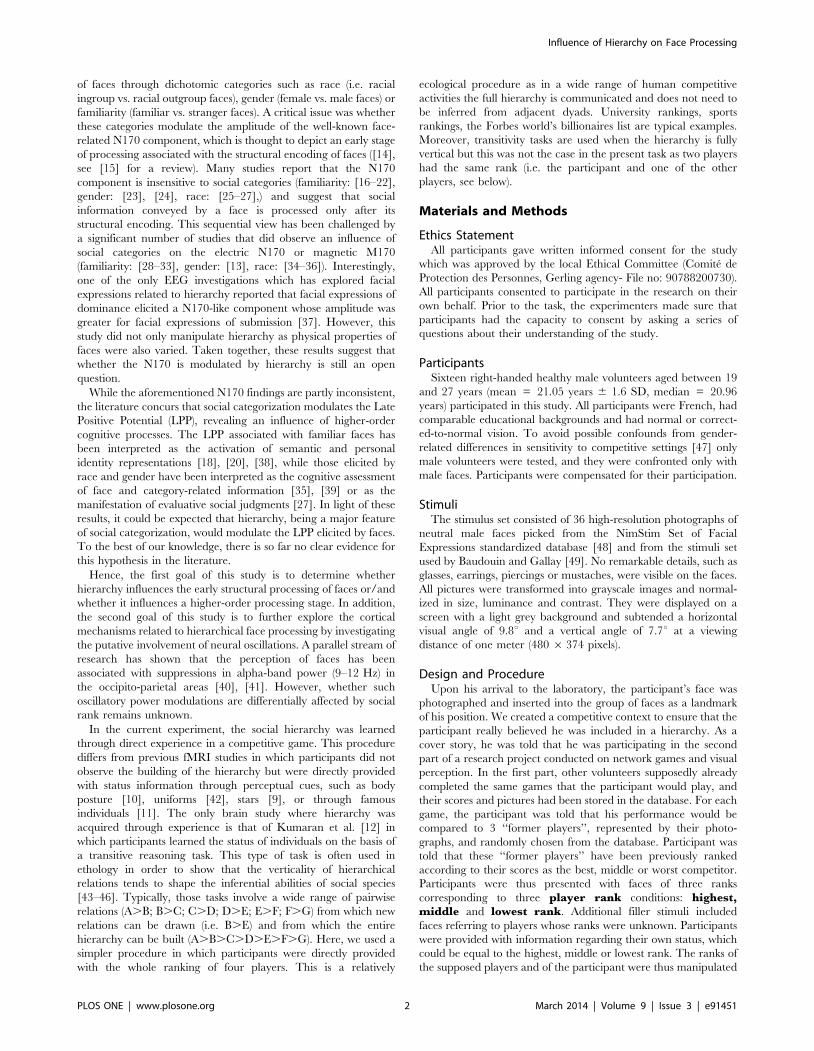
in a systematic way, giving rise to a 3-by-3 within-subject design
(Figure 1). In each block, participants saw his face and four other
faces, corresponding to the three rank conditions (i.e., highest,
middle and lowest) and one filler face whose rank was unknown.
Four different faces were used in each block so that a given face
never occurred in two different blocks. Participant rank was
manipulated across blocks and not within each block: in three
blocks, the participant had the highest rank (two players were
lower than him and one equal to him). In three other blocks, he
was in the middle position (one player higher, one lower and one
equal to him) and in three blocks, he had the lowest rank (two
players were higher and one equal to him). Thus, the three
participant rank conditions were highest, middle or lowest.The order of these blocks was set randomly across participants.
Moreover the presentation of faces was counterbalanced across
participants so that each face was equiprobably associated with
each possible rank.
The participant was comfortably seated inside a dimly lit
Faraday cage in front of a screen. He first performed a training
session constructed as an experimental block. The experiment was
designed using Presentation 14.3 (Neurobehavioral System,
http://www.neurobs.com/) and was divided into nine blocks,
including the nine different game sequences. Each experimental
block was designed to adhere to the following sequence: a game
phase that served to contextualize faces within a hierarchy and
manipulate participant and player ranks (Phase 1), a ranking
restitution phase (Phase 2), and a face rank evaluation phase
(Phase 3). Each participant took part in the three phases. EEG was
only analyzed in the third phase. After the last phase was
completed, the participant was instructed to start the next block.
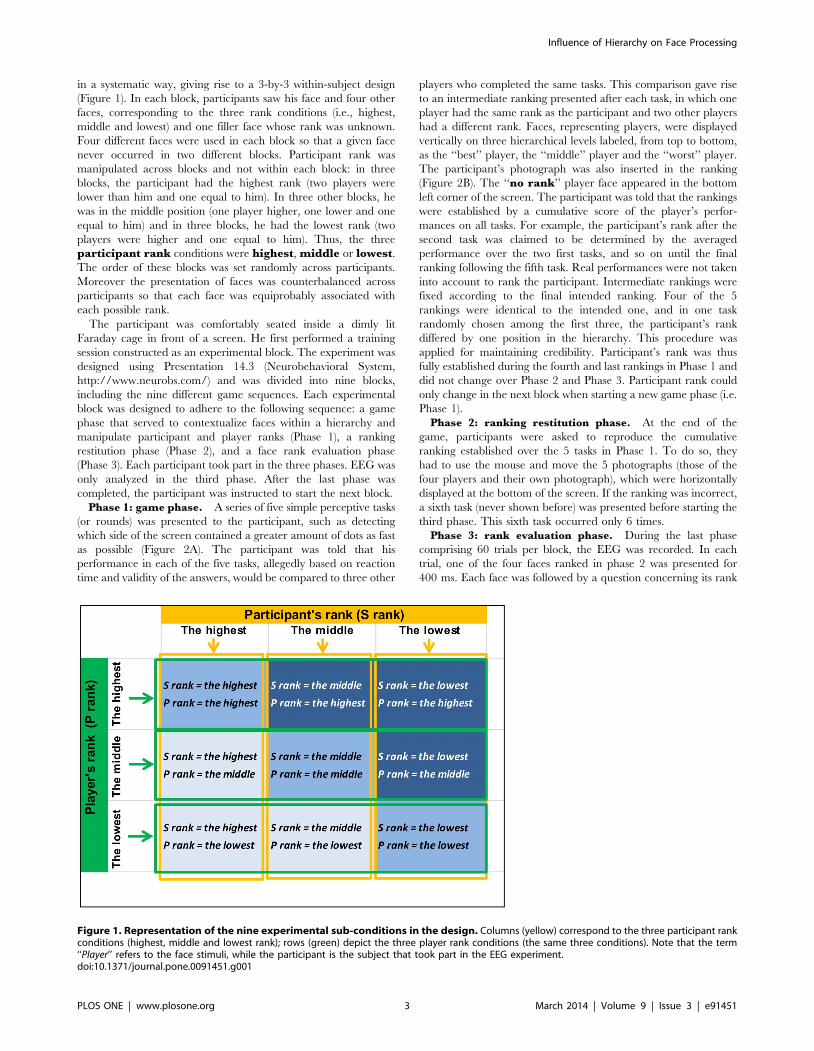
Phase 1: game phase. A series of five simple perceptive tasks
(or rounds) was presented to the participant, such as detecting
which side of the screen contained a greater amount of dots as fast
as possible (Figure 2A). The participant was told that his
performance in each of the five tasks, allegedly based on reaction
time and validity of the answers, would be compared to three other
players who completed the same tasks. This comparison gave rise
to an intermediate ranking presented after each task, in which one
player had the same rank as the participant and two other players
had a different rank. Faces, representing players, were displayed
vertically on three hierarchical levels labeled, from top to bottom,
as the ‘‘best’’ player, the ‘‘middle’’ player and the ‘‘worst’’ player.
The participant’s photograph was also inserted in the ranking
(Figure 2B). The ‘‘no rank’’ player face appeared in the bottom
left corner of the screen. The participant was told that the rankings
were established by a cumulative score of the player’s perfor-
mances on all tasks. For example, the participant’s rank after the
second task was claimed to be determined by the averaged
performance over the two first tasks, and so on until the final
ranking following the fifth task. Real performances were not taken
into account to rank the participant. Intermediate rankings were
fixed according to the final intended ranking. Four of the 5
rankings were identical to the intended one, and in one task
randomly chosen among the first three, the participant’s rank
differed by one position in the hierarchy. This procedure was
applied for maintaining credibility. Participant’s rank was thus
fully established during the fourth and last rankings in Phase 1 and
did not change over Phase 2 and Phase 3. Participant rank could
only change in the next block when starting a new game phase (i.e.
Phase 1).
Phase 2: ranking restitution phase. At the end of the
game, participants were asked to reproduce the cumulative
ranking established over the 5 tasks in Phase 1. To do so, they
had to use the mouse and move the 5 photographs (those of the
four players and their own photograph), which were horizontally
displayed at the bottom of the screen. If the ranking was incorrect,
a sixth task (never shown before) was presented before starting the
third phase. This sixth task occurred only 6 times.
Phase 3: rank evaluation phase. During the last phase
comprising 60 trials per block, the EEG was recorded. In each
trial, one of the four faces ranked in phase 2 was presented for
400 ms. Each face was followed by a question concerning its rank
Figure 1. Representation of the nine experimental sub-conditions in the design. Columns (yellow) correspond to the three participant rankconditions (highest, middle and lowest rank); rows (green) depict the three player rank conditions (the same three conditions). Note that the term‘‘Player’’ refers to the face stimuli, while the participant is the subject that took part in the EEG experiment.doi:10.1371/journal.pone.0091451.g001
Influence of Hierarchy on Face Processing
PLOS ONE | www.plosone.org 3 March 2014 | Volume 9 | Issue 3 | e91451
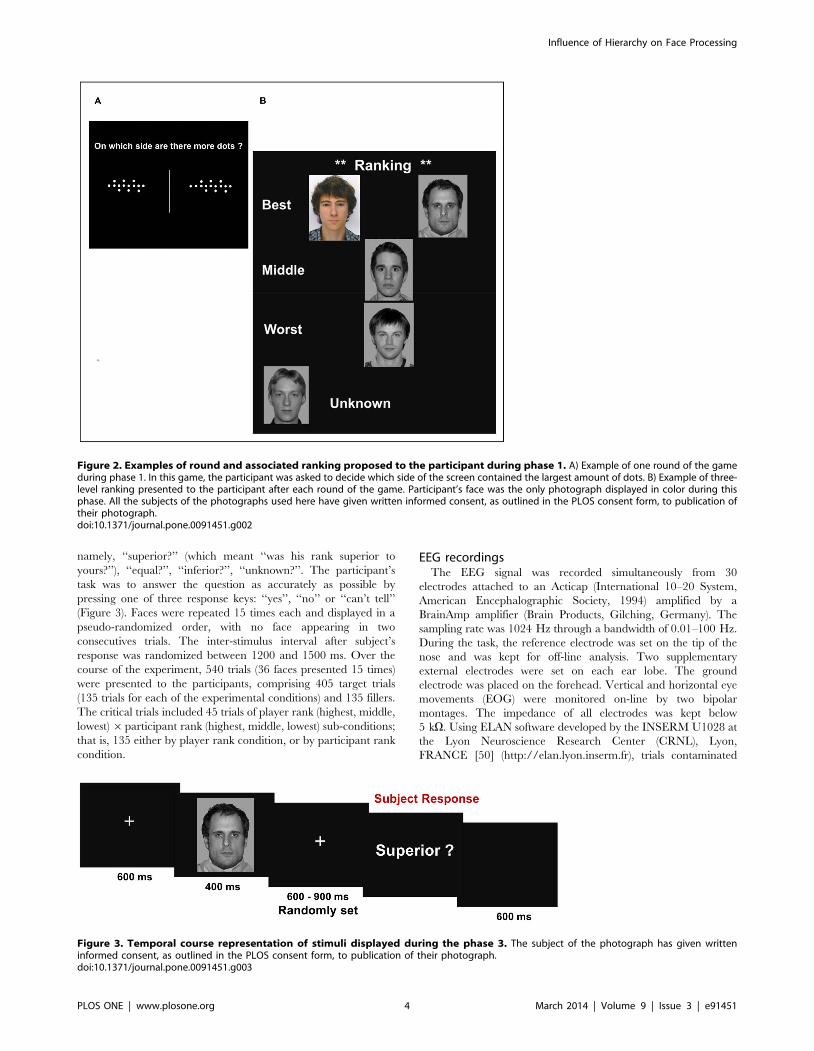
namely, ‘‘superior?’’ (which meant ‘‘was his rank superior to
yours?’’), ‘‘equal?’’, ‘‘inferior?’’, ‘‘unknown?’’. The participant’s
task was to answer the question as accurately as possible by
pressing one of three response keys: ‘‘yes’’, ‘‘no’’ or ‘‘can’t tell’’
(Figure 3). Faces were repeated 15 times each and displayed in a
pseudo-randomized order, with no face appearing in two
consecutives trials. The inter-stimulus interval after subject’s
response was randomized between 1200 and 1500 ms. Over the
course of the experiment, 540 trials (36 faces presented 15 times)
were presented to the participants, comprising 405 target trials
(135 trials for each of the experimental conditions) and 135 fillers.
The critical trials included 45 trials of player rank (highest, middle,
lowest)6participant rank (highest, middle, lowest) sub-conditions;
that is, 135 either by player rank condition, or by participant rank
condition.
EEG recordingsThe EEG signal was recorded simultaneously from 30
electrodes attached to an Acticap (International 10–20 System,
American Encephalographic Society, 1994) amplified by a
BrainAmp amplifier (Brain Products, Gilching, Germany). The
sampling rate was 1024 Hz through a bandwidth of 0.01–100 Hz.
During the task, the reference electrode was set on the tip of the
nose and was kept for off-line analysis. Two supplementary
external electrodes were set on each ear lobe. The ground
electrode was placed on the forehead. Vertical and horizontal eye
movements (EOG) were monitored on-line by two bipolar
montages. The impedance of all electrodes was kept below
5 kV. Using ELAN software developed by the INSERM U1028 at
the Lyon Neuroscience Research Center (CRNL), Lyon,
FRANCE [50] (http://elan.lyon.inserm.fr), trials contaminated
Figure 2. Examples of round and associated ranking proposed to the participant during phase 1. A) Example of one round of the gameduring phase 1. In this game, the participant was asked to decide which side of the screen contained the largest amount of dots. B) Example of three-level ranking presented to the participant after each round of the game. Participant’s face was the only photograph displayed in color during thisphase. All the subjects of the photographs used here have given written informed consent, as outlined in the PLOS consent form, to publication oftheir photograph.doi:10.1371/journal.pone.0091451.g002
Figure 3. Temporal course representation of stimuli displayed during the phase 3. The subject of the photograph has given writteninformed consent, as outlined in the PLOS consent form, to publication of their photograph.doi:10.1371/journal.pone.0091451.g003
Influence of Hierarchy on Face Processing
PLOS ONE | www.plosone.org 4 March 2014 | Volume 9 | Issue 3 | e91451
by ocular movements, blinks (EOG activity greater than 100 mv
for 100 ms) or electrical artifacts (voltage changes on any scalp
electrode greater than 6150 mv) were rejected off-line before
averaging. After these artifact rejections, we kept a minimum of 25
valid trials for each subject for each player’s rank (3) 6participant’s rank (3) sub-condition (max number of trials for
each condition = 44; median number of trials in each condition
between 37.5 and 40).
ERPs analysis. The EEG signal was band-pass filtered
between 0.05 and 35 Hz and segmented into temporal epochs of
1200 ms, 200 ms prior to the stimulus onset and 1000 ms post-
stimulus. For each subject, segments were then averaged across the
9 hierarchy conditions depicted in Figure 1. The averaged activity
from 2200 ms to 0 ms pre-stimulus was used as the baseline [51].
The early P100 ERP was measured on occipital sites (O1 and O2)
and the N170 ERP was measured on temporo-parietal sites (P7
and P8). Peak latency was defined as the latency of the maximum
amplitude. For each participant, the average amplitude of the
evoked potentials was computed within a 40 ms time-window
centered on the peak latencies, i.e., 96–136 ms for P100 and 137–
177 ms for N170. To examine the LPP, we selected a cluster of
nine electrodes covering the frontal (F3-Fz-F4), central (C3-Cz-
C4), and parietal (P3-Pz-P4) regions over the scalp. The average
amplitude of the LPP was calculated for each sub-condition in the
400–700 ms time window [52].
To determine the time course associated with the neural
processing of both player rank and participant rank, mean signals
and latencies associated with early potentials and mean amplitude
corresponding to late potentials were submitted to distinct
repeated measure ANOVAs. For early components, the ANOVA
used ranks of players (3 levels: highest, middle and lowest), ranks of
participants (the same 3 levels) and electrodes of interest (2 levels)
as subject factors. For late components, the ANOVA tested the
topography of the ERP waves by including, instead of the
electrodes, the spatial parameters caudality (frontal, central and
parietal) and laterality (left, midline and right) as supplementary
within subject factors. The effect of relative hierarchical status
(Superior, Equal or Inferior) on the perception of faces was studied
by examining the interaction between face and participant ranks.
Least significant difference (LSD) Fischer tests were used for post-
hoc comparisons.
Time-frequency analysis. The non-filtered EEG signal was
analyzed in the time-frequency (TF) domain by convolution with
complex Gaussian Morlet’s wavelets [53]. This analysis enabled us
to explore spectral power variations generated by the perception of
faces embedded in different hierarchical contexts. Based on
previous reports of alpha-range modulations in face perception
[41], we specifically focused the TF assessment of task-related
power changes to the alpha-band (9–12 Hz). After artifact
rejections, data were segmented and averaged for each sub-
condition using [2300; 250 ms] as the baseline interval. This
interval was chosen to avoid smearing artifacts generated by
computing wavelets and to include at least two periods of the
oscillatory response (at 10 Hz, 200 ms are needed for achieving
two oscillatory cycles). The same Elan software was used to display
TF maps on the [2300–1000 ms] 6 [1–90 Hz] domain. First, we
evaluated absolute power variations of alpha rhythms associated
with face perception defined as energy increases or decreases
relative to the energy level prior to face presentation. In each of
the nine sub-conditions, the energy in the [9–12 Hz] 6 [0–
1000 ms] domain was compared with a tile of the same frequency
extent chosen in its respective baseline period [2300;250 ms],
using Wilcoxon matched paired nonparametric tests. The result of
a Wilcoxon test is a Z score that indexes the spectral powerdifference between two conditions. This score was used to generate
statistical TF maps representing spectral energy modulations
across time and frequency bands for each electrode. Associated
with the Z score, the p value was represented in topographic maps.
These maps allowed us to identify temporal intervals and scalp
regions supporting statistically significant variations (i.e., p,0.05)
compared to the baseline. Second, to detect relative differences in
the alpha oscillatory response depending on player or/and
participant ranks, the same statistical analysis conducted for
evoked potential was performed on TF signal. According to the
Wilcoxon results, we delineated a 300 ms temporal window in
which the alpha power statistically decreased compared to the
baseline. Based on the averaged frequency profile between 9 and
12 Hz, the mean alpha power was computed on the [400 ms–
700 ms] interval in each sub-condition. We selected the same
cluster of 9 electrodes described above (F3, Fz, F4, C3, Cz, C4, P3,
Pz and P4) and we compared the alpha mean responses over this
temporal interval using an ANOVA including the topographic
variables caudality and laterality (3 levels each – see above), the
ranks of players (3 levels: highest, middle and lowest) and the ranks
of participants (the same 3 levels). Post-hoc analysis consisted of
LSD Fisher’s tests.
Results
Behavioral dataParticipants were very accurate in categorizing player ranks,
obtaining more than 95% correct responses (mean number of
misses 6 SE = 27 6 30.1 among 540 trials, minimum number of
misses = 5, maximum number = 105).
Electrophysiological dataP100. The P100 showed a mean latency of 116 ms after face
onset (Figure 4A, top left). The amplitude of this potential was
neither subject to a main effect of electrodes (F(1,15) = 0,09; p =
0.76) nor to participant rank (F(2,30) = 0,41; p = 0.66) nor to
player rank (F(2,30) = 0,81; p = 0.45). No participant rank 6player rank interaction was observed (F(4,60) = 0,48; p = 0.74)
and the triple interaction was not significant (F(4,60) = 0,47; p =
0.75).
The N170 component reached its maximal amplitude at
157 ms (Figure 4A, top-right). The ANOVA revealed that the
N170 amplitude was neither sensitive to hemisphere (F(1,15) =
0,96; p = 0.34), nor to participant rank (F(2,30) = 0,45; p =
0.63), nor to player rank (F(2,30) = 0,87; p = 0.42). Moreover,
there was no player rank6participant rank interaction (F(4,60) =
0,51; p = 0.72), and no player rank 6 participant rank 6hemisphere interaction (F(4,60) = 0,94; p = 0.44). Moreover, the
N170 latency was neither sensitive to hemisphere (F(1,15) = 1,51;
p = 0.23), nor to participant rank (F(2,30) = 1,13; p = 0.33), nor
to player rank (F(2,30) = 0,60; p = 0.55), and there was no
significant interaction observed.
Late Positive Potential. As shown in Figure 4, we also
observed the LPP between 400 and 700 ms over nine recording
sites (Table 1 – Figure 4A, bottom). The ANOVA revealed a main
effect of caudality (F(2,30) = 25,81; p , 0.001). The LPP followed
a frontal , central , parietal amplitude gradient, consistent with
the scalp distribution described in the literature [54]. The
ANOVA also showed a main effect of laterality (F(2,30) =
18,18; p , 0.001). Post-hoc LSD tests indicated that the LPP was
of greater amplitude over midline regions compared to left (p ,
0.01) or right domains (p , 0.001) and larger over left regions
Influence of Hierarchy on Face Processing
PLOS ONE | www.plosone.org 5 March 2014 | Volume 9 | Issue 3 | e91451
N170.
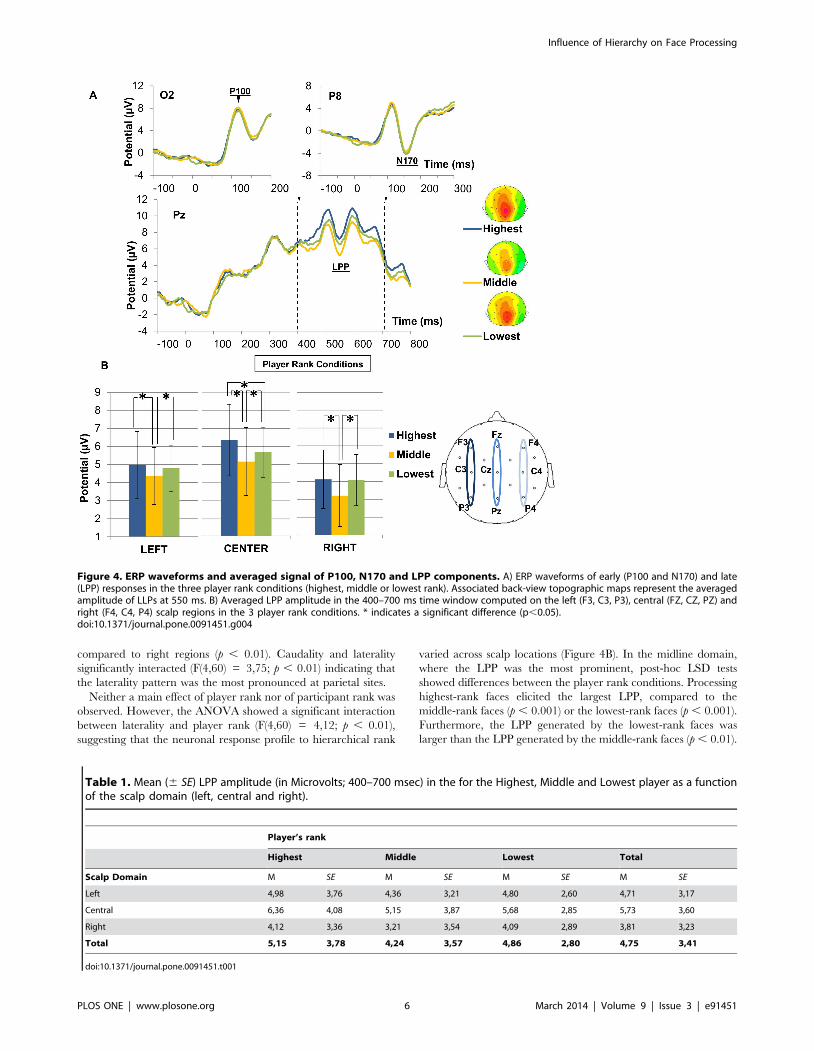
compared to right regions (p , 0.01). Caudality and laterality
significantly interacted (F(4,60) = 3,75; p , 0.01) indicating that
the laterality pattern was the most pronounced at parietal sites.
Neither a main effect of player rank nor of participant rank was
observed. However, the ANOVA showed a significant interaction
between laterality and player rank (F(4,60) = 4,12; p , 0.01),
suggesting that the neuronal response profile to hierarchical rank
varied across scalp locations (Figure 4B). In the midline domain,
where the LPP was the most prominent, post-hoc LSD tests
showed differences between the player rank conditions. Processing
highest-rank faces elicited the largest LPP, compared to the
middle-rank faces (p , 0.001) or the lowest-rank faces (p , 0.001).
Furthermore, the LPP generated by the lowest-rank faces was
larger than the LPP generated by the middle-rank faces (p , 0.01).
Figure 4. ERP waveforms and averaged signal of P100, N170 and LPP components. A) ERP waveforms of early (P100 and N170) and late(LPP) responses in the three player rank conditions (highest, middle or lowest rank). Associated back-view topographic maps represent the averagedamplitude of LLPs at 550 ms. B) Averaged LPP amplitude in the 400–700 ms time window computed on the left (F3, C3, P3), central (FZ, CZ, PZ) andright (F4, C4, P4) scalp regions in the 3 player rank conditions. * indicates a significant difference (p,0.05).doi:10.1371/journal.pone.0091451.g004
Table 1. Mean (6 SE) LPP amplitude (in Microvolts; 400–700 msec) in the for the Highest, Middle and Lowest player as a functionof the scalp domain (left, central and right).
Player’s rank
Highest Middle Lowest Total
Scalp Domain M SE M SE M SE M SE
Left 4,98 3,76 4,36 3,21 4,80 2,60 4,71 3,17
Central 6,36 4,08 5,15 3,87 5,68 2,85 5,73 3,60
Right 4,12 3,36 3,21 3,54 4,09 2,89 3,81 3,23
Total 5,15 3,78 4,24 3,57 4,86 2,80 4,75 3,41
doi:10.1371/journal.pone.0091451.t001
Influence of Hierarchy on Face Processing
PLOS ONE | www.plosone.org 6 March 2014 | Volume 9 | Issue 3 | e91451
We ensured that this averaged LPP pattern in the midline domain
was observed at the subject-level by plotting for each subject the
pairwise comparison of LPP amplitude in the three players rank
conditions (see Figure S1). In the left and right lateralized regions,
the LPP evoked by the middle-rank faces was significantly lower
than this evoked by the highest-rank faces (left-lateralized sites: p ,
0.001, right-lateralized sites: p , 0.001) or by lowest-rank faces
(left-lateralized sites: p , 0.05, right-lateralized sites: p , 0.001),
but there was no significant difference between these two
hierarchical ranks (left-lateralized sites: p = 0.1, right-lateralized
sites: p = 0.68). Finally, there was no interaction between player
and participant rank (F(4,60) = 1,02; p = 0.4).
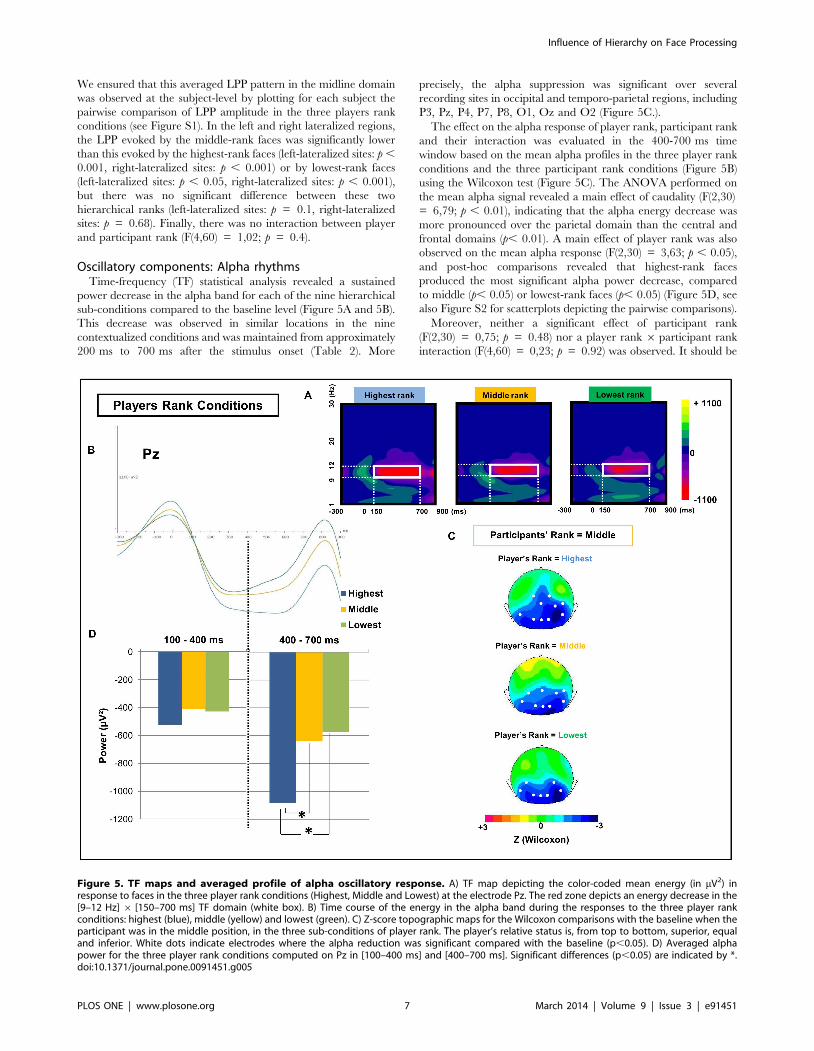
Oscillatory components: Alpha rhythmsTime-frequency (TF) statistical analysis revealed a sustained
power decrease in the alpha band for each of the nine hierarchical
sub-conditions compared to the baseline level (Figure 5A and 5B).
This decrease was observed in similar locations in the nine
contextualized conditions and was maintained from approximately
200 ms to 700 ms after the stimulus onset (Table 2). More
precisely, the alpha suppression was significant over several
recording sites in occipital and temporo-parietal regions, including
P3, Pz, P4, P7, P8, O1, Oz and O2 (Figure 5C.).
The effect on the alpha response of player rank, participant rank
and their interaction was evaluated in the 400-700 ms time
window based on the mean alpha profiles in the three player rank
conditions and the three participant rank conditions (Figure 5B)
using the Wilcoxon test (Figure 5C). The ANOVA performed on
the mean alpha signal revealed a main effect of caudality (F(2,30)
= 6,79; p , 0.01), indicating that the alpha energy decrease was
more pronounced over the parietal domain than the central and
frontal domains (p, 0.01). A main effect of player rank was also
observed on the mean alpha response (F(2,30) = 3,63; p , 0.05),
and post-hoc comparisons revealed that highest-rank faces
produced the most significant alpha power decrease, compared
to middle (p, 0.05) or lowest-rank faces (p, 0.05) (Figure 5D, see
also Figure S2 for scatterplots depicting the pairwise comparisons).
Moreover, neither a significant effect of participant rank
(F(2,30) = 0,75; p = 0.48) nor a player rank 6 participant rank
interaction (F(4,60) = 0,23; p = 0.92) was observed. It should be
Figure 5. TF maps and averaged profile of alpha oscillatory response. A) TF map depicting the color-coded mean energy (in mV2) inresponse to faces in the three player rank conditions (Highest, Middle and Lowest) at the electrode Pz. The red zone depicts an energy decrease in the[9–12 Hz] 6 [150–700 ms] TF domain (white box). B) Time course of the energy in the alpha band during the responses to the three player rankconditions: highest (blue), middle (yellow) and lowest (green). C) Z-score topographic maps for the Wilcoxon comparisons with the baseline when theparticipant was in the middle position, in the three sub-conditions of player rank. The player’s relative status is, from top to bottom, superior, equaland inferior. White dots indicate electrodes where the alpha reduction was significant compared with the baseline (p,0.05). D) Averaged alphapower for the three player rank conditions computed on Pz in [100–400 ms] and [400–700 ms]. Significant differences (p,0.05) are indicated by *.doi:10.1371/journal.pone.0091451.g005
Influence of Hierarchy on Face Processing
PLOS ONE | www.plosone.org 7 March 2014 | Volume 9 | Issue 3 | e91451

noted that similar results were obtained when we performed the
same statistical analysis on time windows shifted by 6 50 ms
compared to the initial interval.
Discussion
This study aimed to gain some insight in the temporal resolution
of the brain response elicited by faces associated with distinct
hierarchical ranks. Three results were found: 1) there was no
influence of hierarchy on the amplitude of early components, the
occipital P100 and the occipito-temporal N170, 2) highest-rank
faces elicited a higher LPP and 3) those faces yielded a stronger
alpha suppression. The first result differs from findings of an
earlier ERP study that investigated the processing of status
conveyed by facial postures [37]. In the latter study, participants
were presented with faces with dominant, submissive or neutral
expressions and asked to make gender judgments. The authors
report that the amplitude of an N200 component, whose
topography is similar to that of N170, was largest for dominant
faces and smallest for submissive ones. The discrepancy between
this observation and the lack of N170 modulation in the current
study is most likely due to differences between the two experiment
designs. First, head orientation and gaze direction, which were
used by Chiao and colleagues to manipulate dominance and
submission, can influence facial processing regardless of the
expressions they may convey. For instance, several ERP studies
have reported a greater N170 amplitude for faces with a direct
gaze compared to faces with an averted gaze [55–57]. Second, it is
not clear to which extent facial expression and gaze orientation
convey dominance or submissiveness when the participants are not
asked to evaluate hierarchy but instead instructed to make a
gender judgment. As an example, a downward gaze orientation
could express submission in an explicit hierarchy context, but in
the absence of such context, it could simply indicate attentional
focus on a downward point in space.
In the current experiment, the absence of N170 effect might
simply reflect a null finding and should therefore not necessarily be
interpreted as indicating that the hierarchy does not modulate this
waveform. It is however worth considering, from methodological
and conceptual viewpoints, why we might not have facilitated the
observation of an N170 modulation. First, one reason may result
from the specific requirements of the task. It has been proposed
that task demands are likely to modify face processing [58], [59]
and the N170 amplitude [36], [60], [61]. Consequently, it might
be that specific task constraints and the hierarchy manipulation of
the present experiment interacted in such a way that no
modulation on the N170 could be observed. Some authors have
proposed that the discrepancy between studies reporting an
influence of social category on the N170 amplitude and those
reporting no modulation may be accounted for by task demands
and stimuli presentation. In particular, they claim that top-down
social influences are more likely when 1) the task requires
attending to the social dimension investigated [34], [35], [62]
and 2) when faces are presented in the context of other faces rather
than nonface stimuli [34]. Given that these two criteria were
satisfied in the current experiment, top-down hierarchical effects
on the N170 should have been facilitated. On the other hand, in
contrast with previous studies, which examined only two
antagonistic social categories, the present experiment involves
three categories (i.e. three ranks) and one cannot exclude that this
increase in task complexity might have obfuscated the modulation
of the N170.
Second, in contrast with some other social categories, such as
sex and race, which are also perceptual categories, the type of
hierarchy investigated here is purely social. Yet, perceptual
expertise is likely to play a role in modulating the N170 in a
social context, and might explain previous reports of a modulation
of this component. As observed by Wiese et al. [63], the left-
hemispheric N170 effects significantly correlated with the own-
race bias, meaning that when participants had greater expertise
with other race faces, the N170 amplitude elicited by other-race
faces tends to diminish. This result suggests that when a
participant has a high perceptual expertise in processing faces
from a given social category (e.g. own-race faces) and a low
perceptual expertise in the opposite category (e.g. other-race faces),
N170 effects are more likely to occur. In the present experiment
none of the faces’ ranks could be associated with different levels of
perceptual expertise: all faces were own-race, own-sex and own-
age, and participants were equally presented within the three
categories of faces. Furthermore, all faces were neutral and were
counterbalanced across participants.
Third, a hierarchical rank is a less stable social category than the
ones typically investigated in the field of face processing. In most
primate species, social competition typically results in transient
outcomes. An individual who occupies the highest rank at a given
time will not necessarily do so later. Even more important is the
fact that, in the human species, social hierarchies are context
dependent; a chess master will not necessarily end up being a kung
fu master. In the present experiment, it is very unlikely that
participants will view the highest-ranking individuals to prevail in
any type of social competition. In contrast, sex, race, and
familiarity do not usually change over time and across contexts.
Given that the social modulation of the N170 has only been
observed with such categories it could be that this modulation
cannot be generalized over more tenuous social categories, such as
those involved by social hierarchy.
Finally, one can also consider that the type of social hierarchy
investigated may determine the incidence of top-down effects on
the N170. This echoes with the literature on familiarity which
Table 2. Mean (6 SE) alpha power (in Microvolts2) computed on Pz for the Highest, Middle and Lowest player as a function of thetime interval ([100–400 ms] and [400–700 ms]).
Player’s rank
Highest Middle Lowest Total
Time Window M SE M SE M SE M SE
100–400 ms 2523,6 1838,2 2409,4 2234,8 2427,5 1716,5 2453,5 1901,4
400–700 ms 21082,8 2512,5 2639,3 2755,6 2573,9 2761,1 2765,3 2631,2
Total 2803,2 2184,1 2524,3 2470,7 2500,7 2262,8 2609,4 2288,8
doi:10.1371/journal.pone.0091451.t002
Influence of Hierarchy on Face Processing
PLOS ONE | www.plosone.org 8 March 2014 | Volume 9 | Issue 3 | e91451
shows that the type of familiar faces affects the N170 amplitude.
Several authors report that while famous faces did not elicit a
larger N170/M170 amplitude as compared to unknown faces,
faces of personal importance to the participant did [29], [31]. In
the present experiment, hierarchy is revealed by the level of
cognitive performance and is thus related to some form of prestige.
However, other forms of prestige, including more qualitative
differences (e.g. moral prestige, accomplishing a feat), and other
kinds of hierarchy, namely power and dominance, might have a
greater social impact and might modulate the N170. Future
research should examine this issue.
Although, we did not find any influence of hierarchical status on
the N170, we did observe an effect on a later processing stage,
revealed by the modulation of a positive potential in the 400–
700 ms time-window. Interestingly, as indicated above, such LPP
modulations have been repeatedly observed during social catego-
rization of faces. In the present experiment, we observed that
highest-rank faces yielded greater LPP amplitude than middle- or
lowest-rank faces, regardless of the participant’s rank. This effect
may be explained by considering that high-status-related infor-
mation is likely to be more relevant than low-status-related
information. A higher status is socially and evolutionarily more
desirable than a lower status, and high-status individuals exert a
greater social influence. Cognitive resources are thus likely to be
allocated to high-status information. In line with this view, it has
been observed that people target more of their eye fixations at
high-status individuals, indicating a greater level of attention to
these individuals [64], [65] and remember them better [66]. They
are also more likely to search for information on those individuals
than low-ranking individuals especially in high motivational
contexts [67]. The LPP has been observed when a large amount
of cognitive resources is involved [68] as well as in relation to
motivationally relevant pictures that are likely to recruit these
resources [52], [54], [69–71]. For instance, Schupp et al. [69]
report that a threatening face, whose processing is of high
evolutionary importance, elicits a late and sustained positive
potential over centro-parietal sensors, compared to neutral and
friendly faces. The LPP has been largely conceived as indexing the
processing of significant stimuli such as arousing pleasant and
unpleasant pictures [72–74] as well as the evaluative or non-
evaluative categorizations associated with affective and attitudinal
judgments [75], [76]. Within this framework, the LPP is typically
viewed as the activation of motivational systems [54], [71], [77]. In
line with this view, the higher LPP amplitude observed for highest-
rank faces may thus reflect the recruitment of attentional and
motivational resources dedicated to the evaluation of highly
significant social stimuli.
Another result in line with the interpretation that the LPP
indexes attentional and motivational effects is the greater LPP
amplitude for the lowest rank faces compared to the middle rank
faces. Lowest rank faces refer to individuals who occupy the worst
position in the hierarchy. Generally speaking, the low-end of a
social scale is of critical importance. Not only does a low social
rank decrease reproductive success [5], [6], but in stable
hierarchies, it also results in greater stress and in poorer health
[78]. Hence, tracking the low-end of a social scale might be more
valuable than tracking the middle part of the scale so as lowest
rank faces might be cognitively and emotionally more significant
than middle rank faces.
At a more mechanistic level, a key issue worth being addressed
relates to the brain structures generating and modulating the LPP
reported here. Interestingly, recent studies have tried to identify
the structures generating and modulating the LPP elicited by
emotional pictures [79–81]. This work consists in combining EEG
and fMRI techniques and analyzing the relationship between the
EEG and BOLD signals. Those studies reported that the LPP
amplitude correlated with BOLD activity in visual cortical
structures but also in corticolimbic and subcortical structures,
including the amygdala and insula (see [80], [81]). These results
have been interpreted in line with the reentrant feedback
hypothesis which stipulates that in the context of motivationally
relevant stimuli, deep structures, such as the amygdala, and
cortical structures modulate the visual cortices by reentrant
feedback [80], [81].
The activation of amygdala in those studies should be related
with the work of Kumaran et al. [12] which focuses on the
representation of social and non-social hierarchies. These authors
observed that the neural activity in the amygdala specifically
correlated with the knowledge of a social hierarchy and also
correlated with the motivational value associated with individuals
according to their social rank. Interestingly, the activation of
amygdala has also been reported in the context of unstable
hierarchies, in which the rank of participants was moved up and
moved down during a game phase [9]. In particular, viewing a
high-rank player resulted in greater activity in the right amygdala
[9], (see also [82]).
Following the perspective of this work, which links activity in the
amygdala with the processing of highly motivational stimuli, it
might be worth investigating in the future whether the LPP
amplitude found in a hierarchical context correlates with the
neural activity in the amygdala. Indeed, in the current experiment,
participants were directly embedded in the hierarchy and
consequently ranks clearly established distinct social values, with
the highest rank being of highest value. Of course, other structures
might also be implicated in the LPP modulation we observed, and
could include regions specifically involved in the processing of
social and hierarchical stimuli, such as the dorsolateral prefrontal
cortex [9], [83], the ventrolateral prefrontal cortex [10], [11], or
regions involved in value comparison, such as the ventromedial
prefrontal cortex [84], the latter being also known to correlate with
the LPP amplitude [81].
To more precisely determine the nature of the processes
involved in status categorization, we also investigated alpha
oscillations, which have previously been shown to be modulated
by face processing [40], [41]. Our findings indicate that while all
faces elicited a significant alpha desynchronization, the extent of
the desynchronization depended on the absolute rank of the face.
Highest-rank faces were associated with stronger alpha suppres-
sion. This effect was observed irrespective of the relative position
of the participant and was maximal approximately 400 ms after
the face onset. Synchronization in the alpha-band has traditionally
been interpreted as a marker of cortical idling, but recent
approaches consider the role of alpha oscillations to be related
to functional inhibition (see [85] for a review) and cortical
excitability [86]. Indeed, the oscillatory pattern is often charac-
terized by a decrease of alpha activity in cortical regions
specifically involved in the task and by an increase of alpha
activity in task-irrelevant regions. Therefore, alpha synchroniza-
tion can be seen as a way to neutralize task-irrelevant regions [85],
while alpha desynchronization would indicate a greater engage-
ment of the regions affected by this suppression. According to this
view, greater alpha suppression observed for the highest-rank faces
would reflect a greater allocation of cognitive resources to these
stimuli. This hypothesis is perfectly in line with the above cited
findings indicating that high-status-related stimuli tend to capture
more of our cognitive resources.
Interestingly, alpha suppression has also been reported for
another type of social categorization, namely familiarity [41]. Zion
Influence of Hierarchy on Face Processing
PLOS ONE | www.plosone.org 9 March 2014 | Volume 9 | Issue 3 | e91451
and colleagues observed that at occipital sites in the 200–800 ms
time window, the alpha suppression was stronger for famous faces
than for unfamiliar faces. The authors attribute this effect to the
use of semantic knowledge associated with faces. However, in the
present experiment, the amount of semantic information associ-
ated with a face is similar for the three hierarchical conditions. It is
rather the relevance of face-associated ranks that differs among the
conditions: the highest-rank position is the most relevant and
should attract attention more. This is consistent with a wide range
of studies showing that alpha suppression is associated with
attention [87–92].
Taken together the LPP and alpha oscillations results showed
that the only experimental variable which significantly modulated
the brain response was player rank. Participant rank had no effect
and did not interact with player rank. Hence, no matter the
participant’s position in the hierarchy, player’s faces elicited
similar brain responses. For instance, this means that when
participants had a high or a low social rank, viewing the face of the
highest player in the hierarchy resulted in a similar effect. Yet, we
could have expected that when participants are in a low social
position, viewing a high-rank face would have a greater impact
than when they are in a high social position. Indeed, in a low social
position, the faces of highest rank players might elicit a greater
motivational relevance as they refer to players who achieved a
much better level of performance than that of participants’. In
contrast, when participants are in the highest social position, high-
rank faces might have a weaker social value. Overall, this pattern
of results suggests that the brain response is more sensitive to the
faces’ absolute ranks than to the social distance between the
participant’s rank and the player’s rank. However, it should be
noted that in the current experiment, participants’ social position
was temporary and changing (it was counterbalanced across the
highest, middle and lowest ranks). It follows that the social distance
between the participants and the other players was not a very
stable variable. This contrasts with standard human organizations
in which people ranks last for much longer time. In such contexts,
the social distance is a less noisy variable and is therefore more
likely to influence cognitive processing. Future work could thus
investigate whether stable social distance modulates face process-
ing in such ecological organizations.
In conclusion, this study provides new insight into the neural
processing underlying status perception and, at a broader level,
social categorization. Most electrophysiological studies addressing
the social categorization of faces investigate features that are often
not purely social because they include encyclopedic knowledge (for
famous faces) or physical differences [13]. In the present work,
social rank was manipulated without being associated with a
particular physical posture so that each face could be assigned to
each of the three ranks explored. It is also worth noting that many
studies that explore the impact of familiarity on face processing use
well-known politicians and artists to manipulate fame, which is
obviously a mark of prestige and high status. It is possible that the
similar pattern of results between these studies and ours may
originate from the common social parameter that serves to
categorize faces, namely status. Overall, our results are consistent
with the view that adaptive monitoring of our social environment
requires enhanced tracking of the upper end of the social scale but
of course further work is needed to determine whether the effects
reported here reflect the involvement of hierarchy-specific
mechanisms or more general mechanisms.
Supporting Information
Figure S1 Scatterplots depicting the pairwise compar-isons of LPP amplitude for the three players rankconditions. Top left: highest vs middle, top right: highest vs
lowest, bottom: middle vs lowest. Values were computed on the
central scalp region (FZ, CZ, PZ) where the effect was significant.
Each dot refers to one particular participant. This particular LPP
pattern was observed for a large proportion of subjects: in the
midline region, 75% of them displayed a larger LPP for the highest
player compared to the middle one, 62,5% compared to the lowest
one, and 81,25% of them showed a larger LPP for the lowest
player compared to the middle one.
(DOC)
Figure S2 Scatterplots depicting the pairwise compar-isons of averaged alpha power for the three player rankconditions. Top left: highest vs middle, top right: highest vs
lowest, bottom: middle vs lowest. Values were computed on Pz in
[400–700 ms] where the effect was significant. Each dot refers to
one particular participant.
(DOC)
Acknowledgments
We are grateful to Pierre-Emmanuel Aguera, Rawan Charafeddine,
Raphael Fargier, Emily Hewitt, Eric Koun, Romain Ligneul, Emmanuel
Maby, Romain Mathieu, Mathilde Menoret, Nicola Spotorno, and Teal
Patterson for their suggestions and their help in conducting the study.
Author Contributions
Conceived and designed the experiments: AB AC CS JBVDH JYB KJ
MAH PKS. Performed the experiments: AB KJ MAH JBVDH. Analyzed
the data: AB AC JBVDH KJ MAH. Contributed reagents/materials/
analysis tools: AB AC KJ. Wrote the paper: AB JBVDH JYB KJ MAH
PKS.
References
1. Dunbar RIM, Shultz S (2007) Evolution in the social brain. Science 317: 1344–
1347
2. Brown DE (1991) Human universals. Temple University Press.
3. Fiske AP (1992) The four elementary forms of sociality: framework for a unified
theory of social relations. Psychol Rev 99: 689–723.
4. Boyce WT (2004) Social Stratification, Health, and Violence in the Very Young.Ann N Y Acad Sci 1036: 47–68.
5. Ellis L (1995) Dominance and reproductive success among nonhuman animals:
A cross-species comparison. Ethol Sociobiol 16: 257–333.
6. Fieder M, Huber S, Bookstein FL, Iber K, Schafer K, et al. (2005) Status and
Reproduction in Humans: New Evidence for the Validity of Evolutionary
Explanations on Basis of a University Sample. Ethology 111: 940–950.
7. Thomsen L, Frankenhuis WE, Ingold-Smith MC, Carey S (2011) Big and
mighty: preverbal infants mentally represent social dominance. Science 331:
477–480.
8. Zitek EM, Tiedens LZ (2012) The fluency of social hierarchy: The ease with
which hierarchical relationships are seen, remembered, learned, and liked.
J Personal Soc Psychol J Personal Soc Psychol 102: 98–115.
9. Zink CF, Tong Y, Chen Q, Bassett DS, Stein JL, et al. (2008) Know Your Place:
Neural Processing of Social Hierarchy in Humans. Neuron 58: 273–283.
10. Marsh AA, Blair KS, Jones MM, Soliman N, Blair RJR (2009) Dominance and
submission: The ventrolateral prefrontal cortex and responses to status cues.
J Cogn Neurosci 21: 713–724.
11. Farrow TFD, Jones SC, Kaylor-Hughes CJ, Wilkinson ID, Woodruff PWR, et
al. (2011) Higher or lower? The functional anatomy of perceived allocentric
social hierarchies. NeuroImage 57: 1552–1560.
12. Kumaran D, Melo HL, Duzel E (2012) The Emergence and Representation of
Knowledge about Social and Nonsocial Hierarchies. Neuron 76: 653–666.
13. Freeman JB, Ambady N, Holcomb PJ (2010) The face-sensitive N170 encodes
social category information. Neuroreport 21: 24–28.
14. Bentin S, Allison T, Puce A, Perez E, McCarthy G (1996) Electrophysiological
studies of face perception in humans. J Cogn Neurosci 8: 551–565.
15. Eimer M (2011) The face-sensitive N170 component of the event-related brain
potential. Oxf Handb Face Percept.329344
Influence of Hierarchy on Face Processing
PLOS ONE | www.plosone.org 10 March 2014 | Volume 9 | Issue 3 | e91451

16. Rossion B, Campanella S, Gomez CM, Delinte A, Debatisse D, et al. (1999)
Task modulation of brain activity related to familiar and unfamiliar faceprocessing: An ERP study. Clin Neurophysiol 110: 449–462.
17. Bentin S, Deouell LY (2000) Structural encoding and identification in face
processing: ERP evidence for separate mechanisms. Cogn Neuropsychol 17: 35–
55.
18. Eimer M (2000) Event-related brain potentials distinguish processing stages
involved in face perception and recognition. Clin Neurophysiol 111: 694–705.
19. Schweinberger SR, Pickering EC, Jentzsch I, Burton AM, Kaufmann JM (2002)
Event-related brain potential evidence for a response of inferior temporal cortex
to familiar face repetitions. Cogn Brain Res 14: 398–409.
20. Schweinberger SR, Pickering EC, Burton AM, Kaufmann JM (2002) Human
brain potential correlates of repetition priming in face and name recognition.
Neuropsychologia 40: 2057–2073.
21. Henson RN, Goshen-Gottstein Y, Ganel T, Otten LJ, Quayle A, et al. (2003)
Electrophysiological and haemodynamic correlates of face perception, recogni-
tion and priming. Cereb Cortex 13: 793–805.
22. Jemel B, Calabria M, Delvenne J-F, Crommelinck M, Bruyer R (2003)
Differential involvement of episodic and face representations in ERP repetition
effects. Neuroreport 14: 525–530.
23. Mouchetant-Rostaing Y, Giard MH (2003) Electrophysiological correlates of age
and gender perception on human faces. J Cogn Neurosci 15: 900–910.
24. Mouchetant-Rostaing Y, Giard MH, Bentin S, Aguera PE, Pernier J (2000)Neurophysiological correlates of face gender processing in humans.
Eur J Neurosci 12: 303–310.
25. Caldara R, Thut G, Servoir P, Michel CM, Bovet P, et al. (2003) Face versus
non-face object perception and the other-race’ effect: a spatio-temporal event-
related potential study. Clin Neurophysiol 114: 515–528.
26. Caldara R, Rossion B, Bovet P, Hauert CA (2004) Event-related potentials and
time course of the "other-race" face classification advantage. Neuroreport 15:
905–910.
27. Ito TA, Thompson E, Cacioppo JT (2004) Tracking the timecourse of socialperception: The effects of racial cues on event-related brain potentials. Pers Soc
Psychol Bull 30: 1267–1280.
28. Caharel S, Poiroux S, Bernard C, Thibaut F, Lalonde R, et al. (2002) ERPs
associated with familiarity and degree of familiarity during face recognition.
Int J Neurosci 112: 1499–1512.
29. Caharel S, Courtay N, Bernard C, Lalonde R, Rebaı M (2005) Familiarity and
emotional expression influence an early stage of face processing: An
electrophysiological study. Brain Cogn 59: 96–100.
30. Caharel S, Fiori N, Bernard C, Lalonde R, Rebaı M (2006) The effects of
inversion and eye displacements of familiar and unknown faces on early and late-
stage ERPs. Int J Psychophysiol 62: 141–151.
31. Kloth N, Dobel C, Schweinberger SR, Zwitserlood P, Bolte J, et al. (2006)
Effects of personal familiarity on early neuromagnetic correlates of faceperception. Eur J Neurosci 24: 3317–3321.
32. Harris AM, Aguirre GK (2008) The effects of parts, wholes, and familiarity on
face-selective responses in MEG. J Vis 8: 1–12.
33. Wild-Wall N, Dimigen O, Sommer W (2008) Interaction of facial expressionsand familiarity: ERP evidence. Biol Psychol 77: 138–149.
34. Ito TA, Urland GR (2005) The influence of processing objectives on the
perception of faces: An ERP study of race and gender perception. Cogn Affect
Behav Neurosci 5: 21–36.
35. Walker PM, Silvert L, Hewstone M, Nobre AC (2008) Social contact and other-
race face processing in the human brain. Soc Cogn Affect Neurosci 3: 16–25.
36. Senholzi KB, Ito TA (2013) Structural face encoding: How task affects the
N170’s sensitivity to race. Soc Cogn Affect Neurosci 8: 937–942.
37. Chiao JY, Adams RB, Tse PU, Lowenthal WT, Richeson JA, et al. (2008)
Knowing who’s boss: fMRI and ERP investigations of social dominance
perception. Group Process Intergroup Relat 11: 201–214.
38. Paller KA, Gonsalves B, Grabowecky M, Bozic VS, Yamada S (2000)Electrophysiological correlates of recollecting faces of known and unknown
individuals. Neuroimage 11: 98–110.
39. Ito TA, Urland GR (2003) Race and gender on the brain: Electrocortical
measures of attention to the race and gender of multiply categorizable
individuals. J Pers Soc Psychol 85: 616–626.
40. Lachaux JP, George N, Tallon-Baudry C, Martinerie J, Hugueville L, et al.
(2005) The many faces of the gamma band response to complex visual stimuli.
Neuroimage 25: 491–501.
41. Zion-Golumbic E, Kutas M, Bentin S (2010) Neural dynamics associated withsemantic and episodic memory for faces: Evidence from multiple frequency
bands. J Cogn Neurosci 22: 263–277.
42. Chiao JY, Harada T, Oby ER, Li Z, Parrish T, et al. (2009) Neural
representations of social status hierarchy in human inferior parietal cortex.
Neuropsychologia 47: 354–363.
43. Cheney DL, Seyfarth RM (1990) The representation of social relations by
monkeys. Cognition 37: 167–196.
44. Bond AB, Kamil AC, Balda RP (2004) Pinyon jays use transitive inference topredict social dominance. Nature 430: 778–781.
45. Grosenick L, Clement TS, Fernald RD (2007) Fish can infer social rank by
observation alone. Nature 445: 429–432.
46. MacLean EL, Merritt DJ, Brannon EM (2008) Social complexity predictstransitive reasoning in prosimian primates. Anim Behav 76: 479–486.
47. Niederle M, Vesterlund L (2007) Do Women Shy Away From Competition? DoMen Compete Too Much? Q J Econ 122: 1067–1101.
48. Tottenham N, Tanaka JW, Leon AC, McCarry T, Nurse M, et al. (2009) The
NimStim set of facial expressions: Judgments from untrained research
participants. Psychiatry Res 168: 242–249.
49. Baudouin JY, Gallay M (2006) Is face distinctiveness gender based? J ExpPsychol Hum Percept Perform 32: 789–798.
50. Aguera PE, Jerbi K, Caclin A, Bertrand O (2011) ELAN: A software package foranalysis and visualization of MEG, EEG, and LFP signals. Comput Intell
Neurosci 2011: 5.
51. George N, Evans J, Fiori N, Davidoff J, Renault B (1996) Brain events related tonormal and moderately scrambled faces. Cogn Brain Res 4: 65–76.
52. Pastor MC, Bradley MM, Low A, Versace F, Molto J, et al. (2008) Affectivepicture perception: emotion, context, and the late positive potential. Brain Res
1189: 145–151.
53. Tallon-Baudry C, Bertrand O, Delpuech C, Pernier J (1996) Stimulus specificity
of phase-locked and non-phase-locked 40 Hz visual responses in human.J Neurosci 16: 4240–4249.
54. Schupp HT, Cuthbert BN, Bradley MM, Cacioppo JT, Ito T, et al. (2000)
Affective picture processing: the late positive potential is modulated by
motivational relevance. Psychophysiology 37: 257–261.
55. Conty L, N9Diaye K, Tijus C, George N (2007) When eye creates the contact!ERP evidence for early dissociation between direct and averted gaze motion
processing. Neuropsychologia 45: 3024–3037.
56. Farroni T, Csibra G, Simion F, Johnson MH (2002) Eye contact detection in
humans from birth. Proc Natl Acad Sci 99: 9602–9605.
57. Itier RJ, Alain C, Kovacevic N, McIntosh AR (2007) Explicit versus implicit
gaze processing assessed by ERPs. Brain Res 1177: 79–89.
58. Schyns PG, Oliva A (1999) Dr. Angry and Mr. Smile: when categorizationflexibly modifies the perception of faces in rapid visual presentations. Cognition
69: 243–265.
59. Smith ML, Gosselin F, Schyns PG (2007) From a face to its category via a few
information processing states in the brain. Neuroimage 37: 974–984.
60. Tanaka J, Luu P, Weisbrod M, Kiefer M (1999) Tracking the time course of
object categorization using event-related potentials. NeuroReport 10: 829–835.
61. Goffaux V, Jemel B, Jacques C, Rossion B, Schyns P. (2003) ERP evidence fortask modulations on face perceptual processing at different spatial scales. Cogn
Sci 27: 313–325.
62. Marzi T, Viggiano MP (2007) Interplay between familiarity and orientation in
face processing: An ERP study. Int J Psychophysiol 65: 182–192.
63. Wiese H, Kaufmann JM, Schweinberger SR (2012) The Neural Signature of theOwn-Race Bias: Evidence from Event-Related Potentials. Cereb Cortex (in
press).
64. Maner JK, DeWall CN, Gailliot MT (2008) Selective attention to signs of
success: Social dominance and early stage interpersonal perception. Pers SocPsychol Bull 34: 488–501
65. Dalmaso M, Pavan G, Castelli L, Galfano G (2012) Social status gates socialattention in humans. Biol Lett 8: 450–452.
66. Ratcliff NJ, Hugenberg K, Shriver ER, Bernstein MJ (2011) The allure of status:
High-status targets are privileged in face processing and memory. Pers Soc
Psychol Bull 37: 1003–1015.
67. Wheeler L (1966) Motivation as a determinant of upward comparison. J Exp SocPsychol 1: 27–31.
68. Ritter W, Ruchkin DS (1992) A Review of Event-Related Potential ComponentsDiscovered in the Context of Studying P3a. Ann N Y Acad Sci 658: 1–32.
69. Schupp HT, Ohman A, Junghofer M, Weike AI, Stockburger J, et al. (2004) The
facilitated processing of threatening faces: an ERP analysis. Emotion 4:189–200.
70. Moser JS, Hajcak G, Bukay E, Simons RF (2006) Intentional modulation of
emotional responding to unpleasant pictures: an ERP study. Psychophysiology43: 292–296.
71. Lang PJ, Bradley MM (2010) Emotion and the motivational brain. Biol Psychol84: 437–450.
72. Cuthbert BN, Schupp HT, Bradley MM, Birbaumer N, Lang PJ (2000) Brain
potentials in affective picture processing: covariation with autonomic arousal andaffective report. Biol Psychol 52: 95–111.
73. Keil A, Bradley MM, Hauk O, Rockstroh B, Elbert T, et al. (2002) Large-scaleneural correlates of affective picture processing. Psychophysiology 39: 641–649.
74. Hajcak G, Nieuwenhuis S (2006) Reappraisal modulates the electrocortical
response to unpleasant pictures. Cogn Affect Behav Neurosci 6: 291–297.
75. Cacioppo JT, Berntson GG (1994) Relationship between attitudes and
evaluative space: A critical review, with emphasis on the separability of positiveand negative substrates. Psychol Bull 115: 401–423
76. Crites SL, Cacioppo JT (1996) Electrocortical differentiation of evaluative andnonevaluative categorizations. Psychol Sci 7: 318–321
77. Bradley MM (2009) Natural selective attention: Orienting and emotion.
Psychophysiology 46: 1–11
78. Sapolsky RM (2005) The Influence of Social Hierarchy on Primate Health.
Science 308: 648–652.
79. Sabatinelli D, Bradley MM, Lang PJ, Costa VD, Versace F (2007) Pleasure
rather than salience activates human nucleus accumbens and medial prefrontalcortex. J Neurophysiol 98: 1374–1379.
80. Sabatinelli D, Keil A, Frank DW, Lang PJ (2013) Emotional perception:
Correspondence of early and late event-related potentials with cortical and
subcortical functional MRI. Biol Psychol 92: 513–519.
Influence of Hierarchy on Face Processing
PLOS ONE | www.plosone.org 11 March 2014 | Volume 9 | Issue 3 | e91451

81. Liu Y, Huang H, McGinnis-Deweese M, Keil A, Ding M (2012) Neural
Substrate of the Late Positive Potential in Emotional Processing. J Neurosci 32:
14563–14572.
82. Rilling JK, Winslow JT, Kilts CD (2004) The neural correlates of mate
competition in dominant male rhesus macaques. Biol Psychiatry 56: 364–375.
83. Mah L, Arnold MC, Grafman J (2004) Impairment of social perception
associated with lesions of the prefrontal cortex. Am J Psychiatry 161: 1247–1255.
84. Hunt LT, Kolling N, Soltani A, Woolrich MW, Rushworth MFS, et al. (2012)
Mechanisms underlying cortical activity during value-guided choice. Nat
Neurosci 15: 470–476.
85. Jensen O, Mazaheri A (2010) Shaping functional architecture by oscillatory
alpha activity: gating by inhibition. Front. Hum. Neurosci. 4: 1–8.
86. Klimesch W, Sauseng P, Hanslmayr S (2007) EEG alpha oscillations: the
inhibition–timing hypothesis. Brain Res Rev 53: 63–88.
87. Fries P, Reynolds JH, Rorie AE, Desimone R (2001) Modulation of oscillatory
neuronal synchronization by selective visual attention. Science 291: 1560–1563.88. Herrmann CS, Knight RT (2001) Mechanisms of human attention: event-
related potentials and oscillations. Neurosci Biobehav Rev 25: 465–476.
89. Sauseng P, Klimesch W, Stadler W, Schabus M, Doppelmayr M, et al. (2005) Ashift of visual spatial attention is selectively associated with human EEG alpha
activity. Eur J Neurosci 22: 2917–2926.90. Thut G, Nietzel A, Brandt SA, Pascual-Leone A (2006) Alpha-Band
electroencephalographic activity over occipital cortex indexes visuospatial
attention bias and predicts visual target detection. J Neurosci 26: 9494–950291. Knyazev GG (2007) Motivation, emotion, and their inhibitory control mirrored
in brain oscillations. Neurosci Biobehav Rev 31: 377–395.92. Lachaux J-P, Baillet S, Adam C, Ducorps A, Jerbi K, et al. (2007) A
simultaneous MEG and intracranial EEG study of task-related brain oscillations.Int Congr Ser 1300: 421–424.
Influence of Hierarchy on Face Processing
PLOS ONE | www.plosone.org 12 March 2014 | Volume 9 | Issue 3 | e91451
Copyright © 2022 FDOKUMEN