Covert Tracking: A Combined ERP and Fixational Eye Movement Study
Eye Movement Analysis of Digital Learning Content for ... - MDPI
15
sustainability Article Eye Movement Analysis of Digital Learning Content for Educational Innovation Xiaolong Liu 1 , Xuebai Zhang 2, * , Wei-Wen Chen 3 and Shyan-Ming Yuan 3, * 1 College of Computer and Information Sciences, Fujian Agriculture and Forestry University, Fuzhou 350002, China; [email protected] 2 School of Computer and Information Engineering, Xiamen University of Technology, Xiamen 361024, China 3 Department of Computer Science, National Chiao Tung University, Hsinchu 300, Taiwan; [email protected] * Correspondence: [email protected] (X.Z.); [email protected] (S.M.Y.); Tel.: +86-0592-629-1920 (X.Z.); +886-03-5712121 # 56631 (S.M.Y.) Received: 29 January 2020; Accepted: 22 March 2020; Published: 23 March 2020 Abstract: Eye movement technology is highly valued for evaluating and improving digital learning content. In this paper, an educational innovation study of eye movement behaviors on digital learning content is presented. We proposed three new eye movement metrics to explain eye movement behaviors. In the proposed method, the digital content, which were slide-deck-like works, were classified into page categories according to the characteristics of each page. We interpreted the subjects’ eye movement behaviors on the digital slide decks. After data regularization and filtering, the results were analyzed to give directions for how to design an attractive digital learning content from the viewpoint of eye movement behaviors. The relationships between the subjects’ evaluation scores, page categories, and eye movement metrics are discussed. The results demonstrated that the proposed fixation time percentage (FTP) was a representative, strong, and stable eye movement metric to measure the subjects’ interest. Moreover, a reasonable portion of semantic content had a positive influence on the subjects’ interest. Keywords: eye tracking technology; digital learning; fixation time percentage; eye movement 1. Introduction As an intuitive way to inspect what is attractive to humans through the fixation of gaze since the very beginning of human attention studying, eye movement has been a popular research area in human–computer interaction research for decades. McCormick and Sanders [1] indicated that 80% of humanity’s cognitive information processing is through vision. Recently, with the popularity of low-cost eye trackers and open source eye movement data analytic software, one of the significant areas of progress in eye movement and concentration research is that we can now obtain eye movement data more precisely and easily [2]. A large number of studies have been focused on the eye movement research of evaluating the usability of a system, studying interface design and implementing remote manipulation applications for those with disabilities [3–5]. Currently, with the major development and widespread reach of digital content, the habit of reading has gradually changed from reading paper books to reading electronic books. More and more schools began to adopt digital learning courses [6]. Thus, studies on reading habits through eye movement drew attention from educators and human behavior researchers. For educators in the area of educational innovation, eye movement data is an excellent opportunity to evaluate and improve digital learning content to obtain more interest from readers [7–9]. Therefore, eye tracking technology is highly valued in e-learning and educational innovations [10,11]. The researchers indeed found Sustainability 2020, 12, 2518; doi:10.3390/su12062518 www.mdpi.com/journal/sustainability
-
Upload
khangminh22 -
Category
Documents
-
view
1 -
download
0
Transcript of Eye Movement Analysis of Digital Learning Content for ... - MDPI
sustainability
Article
Eye Movement Analysis of Digital Learning Contentfor Educational Innovation
Xiaolong Liu 1 , Xuebai Zhang 2,* , Wei-Wen Chen 3 and Shyan-Ming Yuan 3,*1 College of Computer and Information Sciences, Fujian Agriculture and Forestry University,
Fuzhou 350002, China; [email protected] School of Computer and Information Engineering, Xiamen University of Technology, Xiamen 361024, China3 Department of Computer Science, National Chiao Tung University, Hsinchu 300, Taiwan;
[email protected]* Correspondence: [email protected] (X.Z.); [email protected] (S.M.Y.);
Tel.: +86-0592-629-1920 (X.Z.); +886-03-5712121 # 56631 (S.M.Y.)
Received: 29 January 2020; Accepted: 22 March 2020; Published: 23 March 2020�����������������
Abstract: Eye movement technology is highly valued for evaluating and improving digital learningcontent. In this paper, an educational innovation study of eye movement behaviors on digital learningcontent is presented. We proposed three new eye movement metrics to explain eye movementbehaviors. In the proposed method, the digital content, which were slide-deck-like works, wereclassified into page categories according to the characteristics of each page. We interpreted thesubjects’ eye movement behaviors on the digital slide decks. After data regularization and filtering,the results were analyzed to give directions for how to design an attractive digital learning contentfrom the viewpoint of eye movement behaviors. The relationships between the subjects’ evaluationscores, page categories, and eye movement metrics are discussed. The results demonstrated thatthe proposed fixation time percentage (FTP) was a representative, strong, and stable eye movementmetric to measure the subjects’ interest. Moreover, a reasonable portion of semantic content had apositive influence on the subjects’ interest.
Keywords: eye tracking technology; digital learning; fixation time percentage; eye movement
1. Introduction
As an intuitive way to inspect what is attractive to humans through the fixation of gaze sincethe very beginning of human attention studying, eye movement has been a popular research area inhuman–computer interaction research for decades. McCormick and Sanders [1] indicated that 80%of humanity’s cognitive information processing is through vision. Recently, with the popularity oflow-cost eye trackers and open source eye movement data analytic software, one of the significantareas of progress in eye movement and concentration research is that we can now obtain eye movementdata more precisely and easily [2]. A large number of studies have been focused on the eye movementresearch of evaluating the usability of a system, studying interface design and implementing remotemanipulation applications for those with disabilities [3–5].
Currently, with the major development and widespread reach of digital content, the habit ofreading has gradually changed from reading paper books to reading electronic books. More andmore schools began to adopt digital learning courses [6]. Thus, studies on reading habits through eyemovement drew attention from educators and human behavior researchers. For educators in the areaof educational innovation, eye movement data is an excellent opportunity to evaluate and improvedigital learning content to obtain more interest from readers [7–9]. Therefore, eye tracking technologyis highly valued in e-learning and educational innovations [10,11]. The researchers indeed found
Sustainability 2020, 12, 2518; doi:10.3390/su12062518 www.mdpi.com/journal/sustainability

Sustainability 2020, 12, 2518 2 of 15
an attention pattern in the research of web viewing [12], from which the results point out that theattention models are quite different between the semantic and graphic content. Several studies [13,14]also indicated that font size and style have a major amount of influence on human attention.
Eye tracking analysis plays a crucial role in human behavior research, and there are still manyquestions about the relationship between the degree of interest and the eye movement behaviors.An ideal and precise model can draw viewers’ interest or attention towards a simple sentence, or evena formula [15]. For educators or designers, it is very convenient to evaluate how attractive an e-bookor a digital learning slide deck is using metrics. Furthermore, researchers can utilize such modelsto improve their design and layout, to obtain more attention. Unfortunately, there is currently nosimple and stable coefficient to measure or predict the degree of interest in a digital learning area.Though there are many studies on eye movement and degree of interest [16], the behaviors changewith the viewing environment, which means that we cannot simply consider every viewing behavioras being directly comparable.
While studying digital learning content, we found that the pages or slide decks have their ownunique features, correlated with the eye movement behaviors of the digital learning process. Therefore,in this paper, a study on eye movement behaviors while reading digital learning content is presentedto reveal the regular pattern of eye viewing on different types of slides. Three new eye movementmetrics are proposed to explain eye movement behaviors: Fixation time percentage (FTP) representsthe percentage of the total fixation time in the whole reading process; Mean time to fixation (MTTF)represents the average time to the next fixation to be generated; Spatial diversity of fixations (SDOF)represents the average distance from each fixation point to the mean point in a certain page of a slidedeck. The digital content, which was a slide-like work edited online with the software Microsoft Sway,was classified according to the characteristics of each page. The experiment was carried out to interpretthe eye movement behaviors on the digital content, and the result was analyzed to give directionsof how to design attractive digital learning content from the viewpoint of eye movement behaviors.Furthermore, this paper also attempts to find the relationship between the subjects’ evaluation scores,page categories, and the proposed eye movement metrics, including:
(1) The relationship between the eye movement indicators and scores.(2) The relationship between the page categories and the subjects’ evaluation scores.(3) The relationship between the eye movement indicators and page categories.
The rest of this paper is organized as follows: Section 2 presents the related work of eye tracking.The proposed methods for analyzing eye movement data and the hypothesis about these statistics isdescribed in Section 3. Section 4 presents the experimental results, the hypothesis evaluation, and thediscussion of the relationship between subjects’ evaluation scores, page categories, and the proposedeye movement metrics. Finally, the conclusions and the future work are presented in Section 5.
2. Related Work
Human eye movement and concentration have been studied for decades. Researchers work onrecording eye movement data with eye trackers, which have two parts: records about the positionsand about the times of gaze. Fixation identification is the key technique that transfers eye movementdata into relevant human eye behaviors [17], such as fixation and saccade. Salvucci and Goldberg [18]proposed several algorithms to achieve fixation identification from different angles. The methods forfixation identification can roughly be divided into spatial methods and temporal methods. Spatialmethods include velocity-based, dispersion-based, and area-based methods. All of them emphasizethe moving distance while eye scanning, which takes advantage of the fact that the fixation behaviorhas a lower moving distance than the saccade behavior. On the other hand, in temporal methods, theduration sensitive and locally adaptive methods are based on the fact that fixations are rarely lessthan 100 ms and often in the range of 200–400 ms, making fixation identification successful as well.
Sustainability 2020, 12, 2518 3 of 15
These fixation identification methods can lead to similar results, providing a foundation for further eyemovement analysis.
Subsequently, a great amount of the following eye tracking studies paid attention to the area ofinterest (AOI) [2], which usually represents an area of a graphic or an object that is attractive to humanconcentration. AOI-based algorithms provide an effective method for translating subject concentrationsraw data into an analyzable number. While the AOI method has its own limitations [7], it still is apopular analytic tool for eye research. To interpret eye movement data more intuitively and deeply,several visual analytic mythologies are widely used [19,20]. The scan path allows us to determine howpeople redirect their attention between elements; duration plots and heat maps provide an intuitiveway to understand which part of an image received the most attention; the cover plot highlights theimage area covered by fixations. Furthermore, we can classify the fixation data to select the mostsuitable analytic metric while researching large data or data with high variations with a summary mapof the time clusters [21]. These visualization modalities and other visual metrics provide observerswith an opportunity to examine other aspects of information.
With the major development and wide spread of neural networks and machine learning, manyresearchers have attempted to analyze eye movements with learning-based methods [22,23] to improveobject detection results by training the model with eye movement data. The features that can drive anobserver’s attention are classified into two levels. The low-level features include the luminance, color,edge, and density, whereas the high-level features, which can only be recognized in higher brain visualneural areas, include the content and semantic text in pictures. These two types of statics are usedin learning-based methods to construct the saliency model, which represents human attention moreprecisely than a heat map.
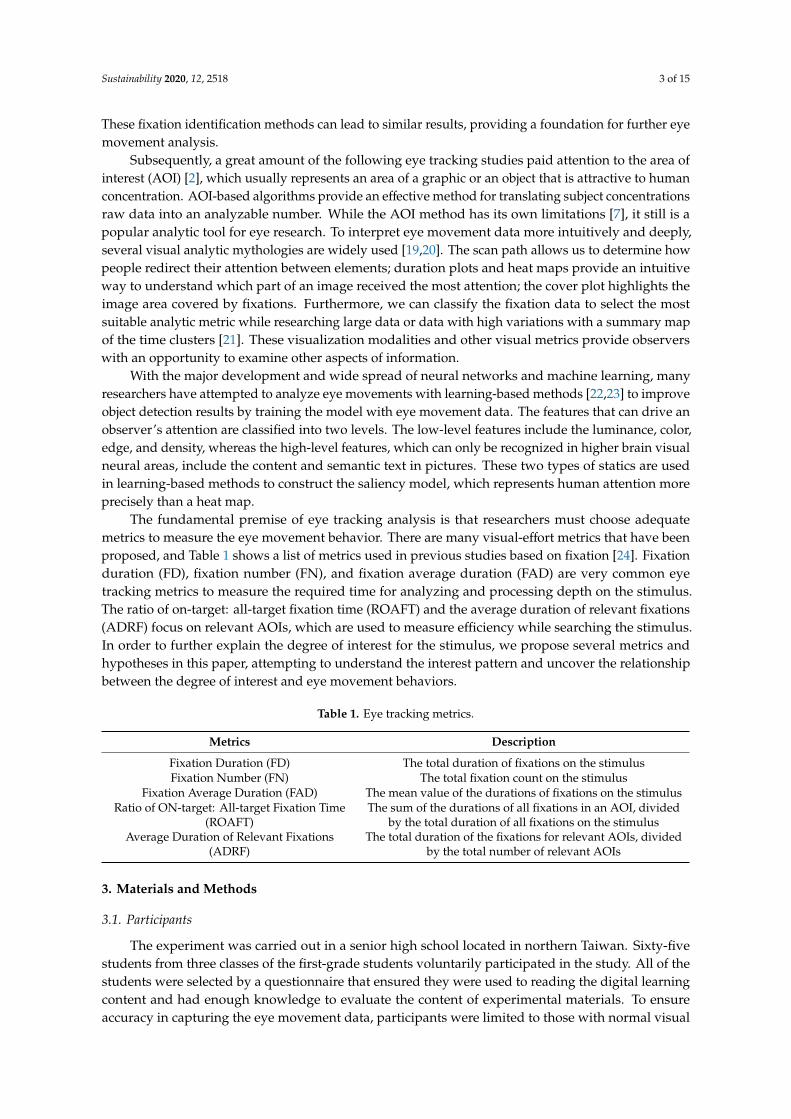
The fundamental premise of eye tracking analysis is that researchers must choose adequatemetrics to measure the eye movement behavior. There are many visual-effort metrics that have beenproposed, and Table 1 shows a list of metrics used in previous studies based on fixation [24]. Fixationduration (FD), fixation number (FN), and fixation average duration (FAD) are very common eyetracking metrics to measure the required time for analyzing and processing depth on the stimulus.The ratio of on-target: all-target fixation time (ROAFT) and the average duration of relevant fixations(ADRF) focus on relevant AOIs, which are used to measure efficiency while searching the stimulus.In order to further explain the degree of interest for the stimulus, we propose several metrics andhypotheses in this paper, attempting to understand the interest pattern and uncover the relationshipbetween the degree of interest and eye movement behaviors.
Table 1. Eye tracking metrics.
Metrics Description
Fixation Duration (FD) The total duration of fixations on the stimulusFixation Number (FN) The total fixation count on the stimulus
Fixation Average Duration (FAD) The mean value of the durations of fixations on the stimulusRatio of ON-target: All-target Fixation Time
(ROAFT)The sum of the durations of all fixations in an AOI, divided
by the total duration of all fixations on the stimulusAverage Duration of Relevant Fixations
(ADRF)The total duration of the fixations for relevant AOIs, divided
by the total number of relevant AOIs
3. Materials and Methods
3.1. Participants
The experiment was carried out in a senior high school located in northern Taiwan. Sixty-fivestudents from three classes of the first-grade students voluntarily participated in the study. All of thestudents were selected by a questionnaire that ensured they were used to reading the digital learningcontent and had enough knowledge to evaluate the content of experimental materials. To ensureaccuracy in capturing the eye movement data, participants were limited to those with normal visual
Sustainability 2020, 12, 2518 4 of 15
acuity or fully corrected visual acuity. The total effective sample size of this study included the datafrom students who completed the task, as their eye movement data were recorded successfully foranalysis, while 23 students’ eye movement records were counted as being invalid. Specially, sevenstudents’ eye movement records failed due to human errors. The recording system can only recorddata from one Chrome browser. However, during the experiment the researcher activated more thanone Chrome browser at a time, which lead to an error in the URL event record. Five students’ eyemovement records were also discarded due to data loss caused by the recording system. The remaining11 records failed with unknown problems. Thus, the total effective sample size of this study was 42.The average age of the sample was 15.8 years (SD = 0.42).
3.2. The Tasks and Materials
In our experiments, the students were asked independently to read and evaluate the selectedmaterials and to submit their assessment. At the same time, their eye movement behaviors wererecorded through eye trackers.
The experiment materials were from a previous work [25], where 20 students participated inre-editing a section of the textbook in an online web environment. They were provided with a textbook(a pdf file) and were asked to search for relative multimedia as content to complete their editing usingMicrosoft Sway. Each student was required to complete a slide deck that was restricted in the rangeof 8 to 12 pages. We successfully collected the work of 20 students, that is, 20 online slide decks.These works were page-turned, which allowed us to study the eye movement behavior page by page.Among them, we further selected six slide decks as experimental materials. To identify the qualityof the work, two experts rated each work based on assessment scale that is the same as the studentassessment scale defined in Section 3.5.
Finally, six different Microsoft Sway slide decks were selected as learning content for the studentsto read in this experiment. Two of them had high evaluation scores, two had medium evaluationscores, and two had low evaluation scores. We scored each of them with the measurement and dividedthem into three groups by their score. The scores were regarded as a metric to measure the degree ofinterest. The two slide decks with high evaluation scores were named #1 and #2. The two slide deckswith medium evaluation scores were named #3 and #4. The two slide decks with low evaluation scoreswere named #5 and #6.
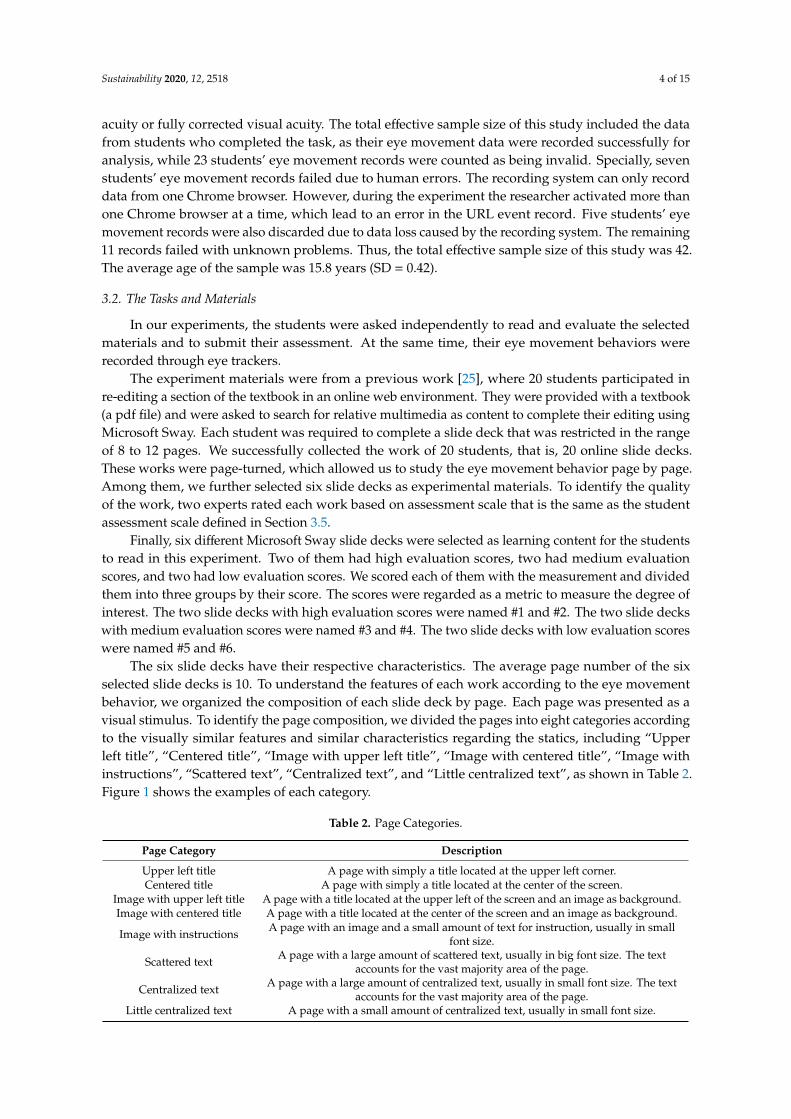
The six slide decks have their respective characteristics. The average page number of the sixselected slide decks is 10. To understand the features of each work according to the eye movementbehavior, we organized the composition of each slide deck by page. Each page was presented as avisual stimulus. To identify the page composition, we divided the pages into eight categories accordingto the visually similar features and similar characteristics regarding the statics, including “Upperleft title”, “Centered title”, “Image with upper left title”, “Image with centered title”, “Image withinstructions”, “Scattered text”, “Centralized text”, and “Little centralized text”, as shown in Table 2.Figure 1 shows the examples of each category.
Table 2. Page Categories.
Page Category Description
Upper left title A page with simply a title located at the upper left corner.Centered title A page with simply a title located at the center of the screen.
Image with upper left title A page with a title located at the upper left of the screen and an image as background.Image with centered title A page with a title located at the center of the screen and an image as background.
Image with instructions A page with an image and a small amount of text for instruction, usually in smallfont size.
Scattered text A page with a large amount of scattered text, usually in big font size. The textaccounts for the vast majority area of the page.
Centralized text A page with a large amount of centralized text, usually in small font size. The textaccounts for the vast majority area of the page.
Little centralized text A page with a small amount of centralized text, usually in small font size.
Sustainability 2020, 12, 2518 5 of 15
Figure 1. (a) “Upper left title” page; (b) “Centered title” page; (c) “Image with upper left title” page;(d) “Image with centered title” page; (e) “Image with instructions” page; (f) “Scattered text” page;(g) “Centralized text” page; (h) “Little centralized text” page.
3.3. Procedure
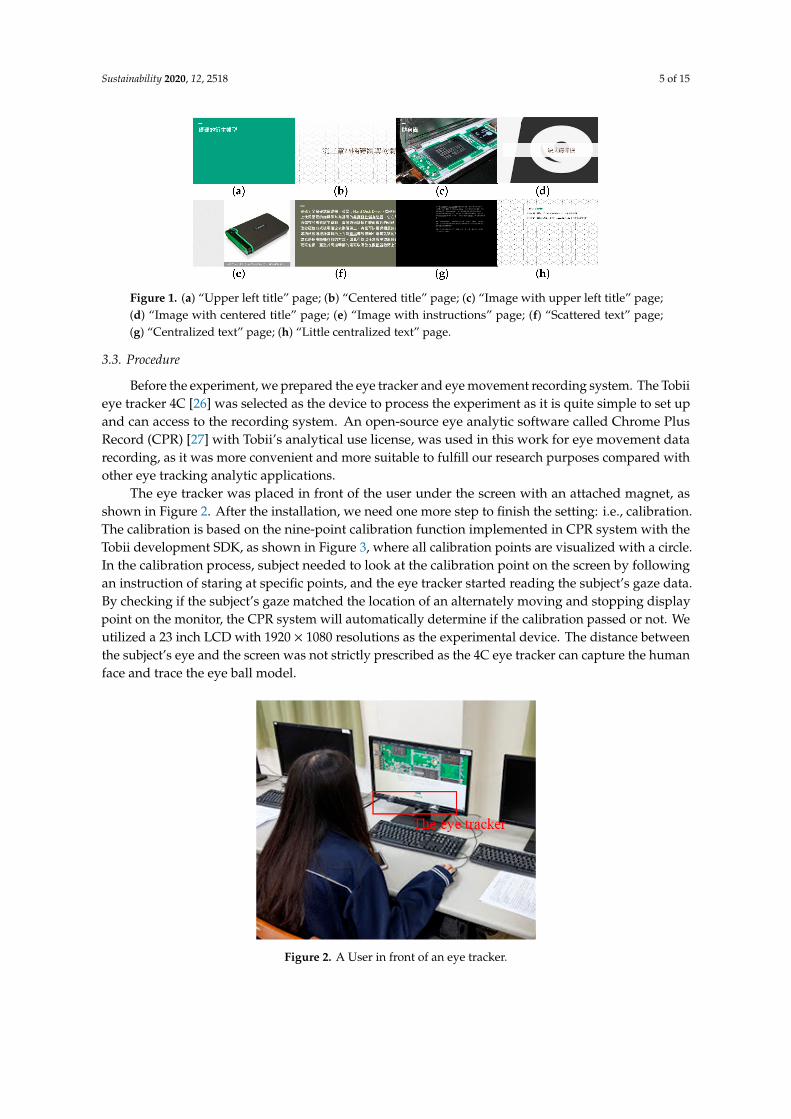
Before the experiment, we prepared the eye tracker and eye movement recording system. The Tobiieye tracker 4C [26] was selected as the device to process the experiment as it is quite simple to set upand can access to the recording system. An open-source eye analytic software called Chrome PlusRecord (CPR) [27] with Tobii’s analytical use license, was used in this work for eye movement datarecording, as it was more convenient and more suitable to fulfill our research purposes compared withother eye tracking analytic applications.
The eye tracker was placed in front of the user under the screen with an attached magnet, asshown in Figure 2. After the installation, we need one more step to finish the setting: i.e., calibration.The calibration is based on the nine-point calibration function implemented in CPR system with theTobii development SDK, as shown in Figure 3, where all calibration points are visualized with a circle.In the calibration process, subject needed to look at the calibration point on the screen by followingan instruction of staring at specific points, and the eye tracker started reading the subject’s gaze data.By checking if the subject’s gaze matched the location of an alternately moving and stopping displaypoint on the monitor, the CPR system will automatically determine if the calibration passed or not. Weutilized a 23 inch LCD with 1920 × 1080 resolutions as the experimental device. The distance betweenthe subject’s eye and the screen was not strictly prescribed as the 4C eye tracker can capture the humanface and trace the eye ball model.
Figure 2. A User in front of an eye tracker.

Sustainability 2020, 12, 2518 6 of 15
Figure 3. Nine-point calibration.
Before the experiment, the subjects were clearly informed that the experiment would store theireye tracking data for further analysis in this work. To start the experiment, we first asked the subject tosit in front of the prepared screen with the eye tracker placed in front of them. The calibration processwas conducted for each subject to adjust the eye tracker. Only once the subject passed the calibration,was he or she allowed to go on with the next step. Secondly, after calibration, we asked the subject toread the Microsoft Sway slide decks in order, while we recorded the eye movement behaviors withthe CPR system. To prevent the influence of the reading order on the evaluation scores, the readingorder of the slide decks for each participant were randomly arranged. Thirdly, after reading each slidedeck, the participant was asked to evaluate each work by filling in the assessment questionnaire that isdefined in Section 3.4. The steps mentioned above, including calibration and reading and filling in thequestionnaire were repeated until all of the six slide decks were successfully evaluated. In general, ittook 10 minutes for each participant to evaluate one slide deck. Finally, the experimental instructorchecked the completion of the entire process. If the data were correctly recorded into the database, weexported them as a csv file for further analysis.
3.4. Questionnaire
The participants were asked to fill in an assessment questionnaire after reading each of the sixselected works. There were a total of six items in the questionnaire, including “Does the text properlymatch the media?”, “Is the layout logical?”, ”Is the layout creative?”, “Is the content complete?”, “Isthe content correct?”, and “Is the key point described clearly?”. The question responses for each itemwere captured using a 5-point Likert scale, ranging from 1 (strongly disagree) to 5 (strongly agree).The assessment criteria were divided into two topic areas, namely content and design [28]. Each areawas further subdivided into individual items.
3.5. Measured Values
We mainly focused on the information provided by GazeFixation.csv, URLEvent.csv, andRawdata.csv, which were generated by the CPR system. The GazeFixation file recorded the informationregarding the fixations, including the fixation ID, subject name, start time of the fixation in milliseconds,duration in milliseconds, the position information in pixels, and the scrollTop property information inpixels. The threshold for a meaningful fixation in this work was defined as 250 ms. The URLEventfile shows the information of the webpages visited by the subjects, including the URL ID, subjectname, webpage URL, keyword, and visiting time. Combining GazeFixation with the webpage viewinginformation provided by the URLEvent file, we were able to analyze the eye behaviors for eachslide deck. Furthermore, after separating the slide decks into several single pages, we were able toanalyze the eye movement deeply on each certain page. The Rawdata file recorded the raw mouse
Sustainability 2020, 12, 2518 7 of 15
and eye movement data, including the event ID, the subject name, the event time, the mouse positioninformation, the gaze point position information, and the scrollTop information. It provided theinformation of single movements of the subject’s eye and mouse, allowing us to study any single eventduring the reading process.
We used the following common eye tracking metrics to represent a slide deck or a page: duration,fixation duration (FD), fixation number (FN), and fixation average duration (FAD). The durationreferred to the total duration of viewing on this slide deck. FD referred to the total duration of fixationson this slide deck. A longer duration or a longer fixation duration indicated that the participantconsidered that information to be important and was more focused on it [29]. FN referred to the totalfixation count in the slide deck. A higher fixation count indicated more devoted attention was given tothis stimulus [30]. FAD was the mean value of the durations of fixations on this slide deck. A longerFAD indicated more overall effort spent by a participant during the experiment [31].
In addition, we proposed several new fixation-based metrics to measure the depth of student’sprocessing in the content, including the fixation time percentage (FTP), mean time to fixation (MTTF),and spatial diversity of fixations (SDOF). In the experiment, we researched whether the proposedmetrics were stable or not in measuring the subjects’ interest while viewing the slide decks. FTP wasdefined as the percentage of total fixation duration takes of total viewing duration on the page/slidedeck, can be obtained by using the following equation:
Fixation time percentage = (all fixation duration)/(total viewing duration). (1)
FTP is a metric that focuses on the proportion of all fixation duration in the total viewing durationof a stimulus. It is different from the metrics, such as the Ratio of Fixation Time and ROAFT [32],which focus on the ratio of fixation duration of an AOI in all fixation duration of the stimulus. FTP issupposed to explain the subject’s attention while viewing the slide decks. In general, a larger fixationtime percentage means that the participant pays more attention and is more concerned with the contentof the slide deck. MTTF is the average time until the next fixation is generated, which is calculated asthe following equation:
Mean time to fixation = (total viewing duration)/(fixation number). (2)
While studying deeply page by page, we find that the characteristics of each page, such as thedensity and layout of the visual elements on the screen, have a strong connection with the MTTF.For example, a page with a small font size and high density of text leads to a small MTTF. On the otherhand, a page that is text-only with a large font size and low density, leads to a large MTTF. Therefore,in the experiment we also attempted to determine whether MTTF was a representative metric or not tomeasure the subjects’ interest while viewing slide decks. The SDOF is the average distance (pixel) tothe mean point of all fixation points. It was utilized to evaluate the balance of visual elements on thescreen, usually referred to as the mean point. The SDOF is described with the following equation:
Spatial diversity of fixations = (total distance from each fixation to the mean point)/(fixation number).
(3)
We bring two definitions of the mean point here. One is the average position of all fixation points,the other is the average point weighted by the duration of fixation. In general, these two mean fixationpoints were located at almost the same location. However, in some special cases, the two mean fixationpoints did not fall in the same position, such as a small-type page where participants gave an extremelyshort viewing duration. We speculated that during the viewing process, the subjects made fixations onsearching for the “next page” button that is on the bottom right corner of the screen. Due to the lack ofcontent, the page was not attractive enough for the subjects. The existence of the difference betweenthe two versions of mean point demonstrated the inconsistency of the fixation durations. Being aware
Sustainability 2020, 12, 2518 8 of 15
of that, we conducted a filter to clear the unnecessary fixation points in the research. We will discussthe filtering method in Section 3.6. As the two different definitions usually cause the same results, wesimply use “average fixation point” here. In the experiment, we also attempted to determine whetherthe SDOF could represent the degree of dispersion of the fixations, or whether a lower SDOF indicateda higher attraction of the page.
3.6. Regularization and Filters
Before the analysis of the data, we needed to arrange the raw data, transforming it into readabledata. There were two parts to preprocess the data: data regularization and fixation filtering. The datapreprocessing can be separated into five steps:
(1) Reading order recoveryTo prevent the results from being affected by the reading order, we made a random reading orderlist for each participant while doing the experiment. Thus, the first task of the data regularizationwas to rearrange the reading order of the record corresponding to the real order. In this step, weused the timestamp obtained from the URLEvent.csv generated by CPR system and the URL ofthe slide decks to cut the viewing process into several sections, and we then arranged everyone’ssection records in a uniform order.
(2) Video offset recoveryIn this step, we recovered the “frame loss” of the generated video. The frame loss representssome of the frames that caused timestamp offsets in the video that were not recorded duringthe experiment process. The CPR system provided us eye tracking data and screen records.However, the qualities of the generated videos were not consistent. We speculated that the poorperformance of the operating computer could not fully support the CPR system. As a result,these screen videos faced a problem named “frame loss”, which means that some frames were notrecorded during the experiment process, resulting in timestamp offset in the video. The imagesdisplayed by the video did not match with the event recorded in the database. To solve thisproblem, we assumed that the frame lost rate was consistent in one video, computing the realFPS and scaling the video to the correct length. After recovery, we found that the events and theimages finally matched, proving the effectiveness of the recovery method.
(3) Timestamp labelingTo analyze the eye movement behavior of the slide deck by page, we labeled the timing of pageswitching manually to get the information regarding page switching during the reading process.We manually sampled the timestamp three times to reduce the artificial error made by humans.Finally, each timestamp was labeled as the mean value of three samples. The difference betweenthree different timestamps was narrowed down to less than 0.5 seconds. The process of dataregularization was finished when the labeling was complete.
(4) Button maskAs described in Section 3.5, we knew that the fixations on the “next page” button of the screenmight change the position of the weighting mean fixation point to be different from that of anothermean point. A feature of Sway’s slide decks is that there is a button on the bottom right cornerfor users to skip to the next page. However, the button caused the visual offset, reflected in theinconsistency of the calculated mean point. Obviously, the gazes generated in these areas didnot represent the influence of the page itself. Thus, we masked these areas to filter the fixations.The mask size was 167 × 190, located in the bottom right corner of the page.
(5) Outlier removalDuring the experiment, some fixations had singular durations with either extremely high or lowvalues. We filtered these extreme values in order to make the data distribution correspond to anormal distribution. The standard deviation method, which is common in statistics, was used toremove the outliers.
Sustainability 2020, 12, 2518 9 of 15
After these steps, the data preprocessing was complete. Figure 4 shows an example of thecomparison of the original fixation data and the filtered data, where the yellow circles represent thefixations. It can be found that the filters improved the performance on the normality test.
Figure 4. Comparison of the original fixation data and filtered data: (a) original data; (b) filtered data.
4. Results and Discussions
4.1. The Relationship between Eye Movement Indicators and Scores
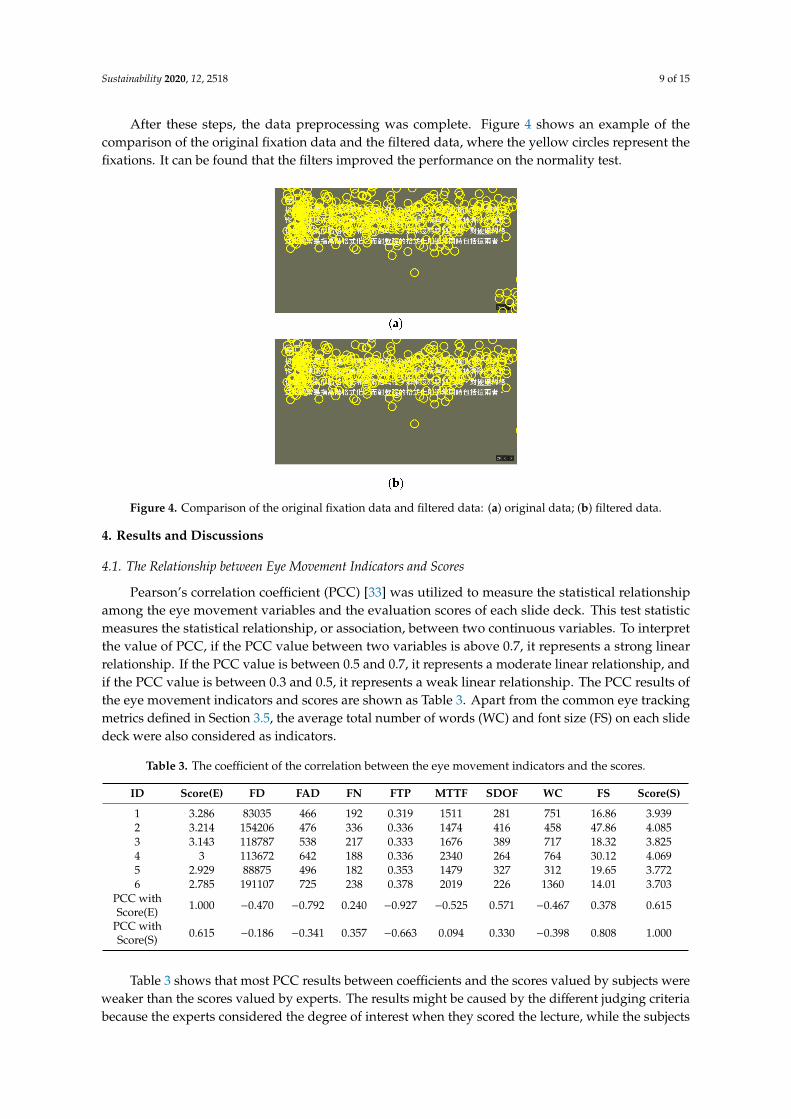
Pearson’s correlation coefficient (PCC) [33] was utilized to measure the statistical relationshipamong the eye movement variables and the evaluation scores of each slide deck. This test statisticmeasures the statistical relationship, or association, between two continuous variables. To interpretthe value of PCC, if the PCC value between two variables is above 0.7, it represents a strong linearrelationship. If the PCC value is between 0.5 and 0.7, it represents a moderate linear relationship, andif the PCC value is between 0.3 and 0.5, it represents a weak linear relationship. The PCC results ofthe eye movement indicators and scores are shown as Table 3. Apart from the common eye trackingmetrics defined in Section 3.5, the average total number of words (WC) and font size (FS) on each slidedeck were also considered as indicators.
Table 3. The coefficient of the correlation between the eye movement indicators and the scores.
ID Score(E) FD FAD FN FTP MTTF SDOF WC FS Score(S)
1 3.286 83035 466 192 0.319 1511 281 751 16.86 3.9392 3.214 154206 476 336 0.336 1474 416 458 47.86 4.0853 3.143 118787 538 217 0.333 1676 389 717 18.32 3.8254 3 113672 642 188 0.336 2340 264 764 30.12 4.0695 2.929 88875 496 182 0.353 1479 327 312 19.65 3.7726 2.785 191107 725 238 0.378 2019 226 1360 14.01 3.703
PCC withScore(E) 1.000 −0.470 −0.792 0.240 −0.927 −0.525 0.571 −0.467 0.378 0.615
PCC withScore(S) 0.615 −0.186 −0.341 0.357 −0.663 0.094 0.330 −0.398 0.808 1.000
Table 3 shows that most PCC results between coefficients and the scores valued by subjects wereweaker than the scores valued by experts. The results might be caused by the different judging criteriabecause the experts considered the degree of interest when they scored the lecture, while the subjects

Sustainability 2020, 12, 2518 10 of 15
needed to understand the content first. Despite the PCC results between the eye movement indicatorsand the scores valued by experts and students being different, the PCC result between Score(S) andScore(E) was 0.615, which still represents a moderate linear relationship. In addition, Table 3 showsa negative linear relationship between the scores and the FAD, FTP, and WC, and a positive linearrelationship between the SDOF, FS, and scores.
In terms of the proposed metric FTP, the results in Table 3 show that the FTP achieved a verystrong negative linear relationship with the scores, which indicates that FTP was a significant metricto measure the participations’ interest and predict the evaluation score of the content. The resultsdemonstrated that a high FTP value would lead to a low score, which is because a longer fixationduration corresponded to more difficult-to-process context in the digital learning content, whichreflected the degree of cognitive difficulty in the region [32,34]. Therefore, a slide deck with small fontand massive content would make subject feel tired and more difficult to understand, and hence wouldinfluence the scores.
In terms of the other proposed metric MTTF, the results in Table 3 showed that MTTF appeared tonot have a good performance on the correlation coefficient with the scores. It indicated that the “timeto fixation (TTF)” was not a significant metric for measuring the participants’ interest or predictingthe evaluation score of the content. With respected to the SDOF, the results in Table 3 did not show astronger relationship with the scores. Table 3 indicates that only the SDOF had a positive moderatelinear relationship with the scores. We assume that not only diversity but also brightness, contrast, orother features can affect human interest, so there are still more facts to be discovered. In addition, theSDOF was the only spatial metric in the research. The result proved that the spatial features of eyemovement had a relationship with the degree of interest, just as the temporal features did. Table 3 alsodemonstrates that the fixation average duration (FAD), word count (WC), and font size (FS) had aninfluence on the eye movement behaviors and the subjects’ degree of interest. This fact proved ourhypothesis and demonstrated a similar result to the previous related work [13,14].
After the PCC test, we also used regression analysis to further examine the relationship of scoresand the combination of multiple eye movement metrics, to attempt to determine more significantfeatures. However, the final results showed that only FTP could pass the F test where the P-valueof Significance F equaled 0.007761. The regression models were not significant in terms of other eyemovement metrics and their combination. In addition, the P-value of FTP in the regression modelwas less than the common significant level of 95% confidence. The proposed metric FTP was furtherdemonstrated to be significant in the regression model with the evaluating scores.
4.2. The Relationship between Page Categories and Scores
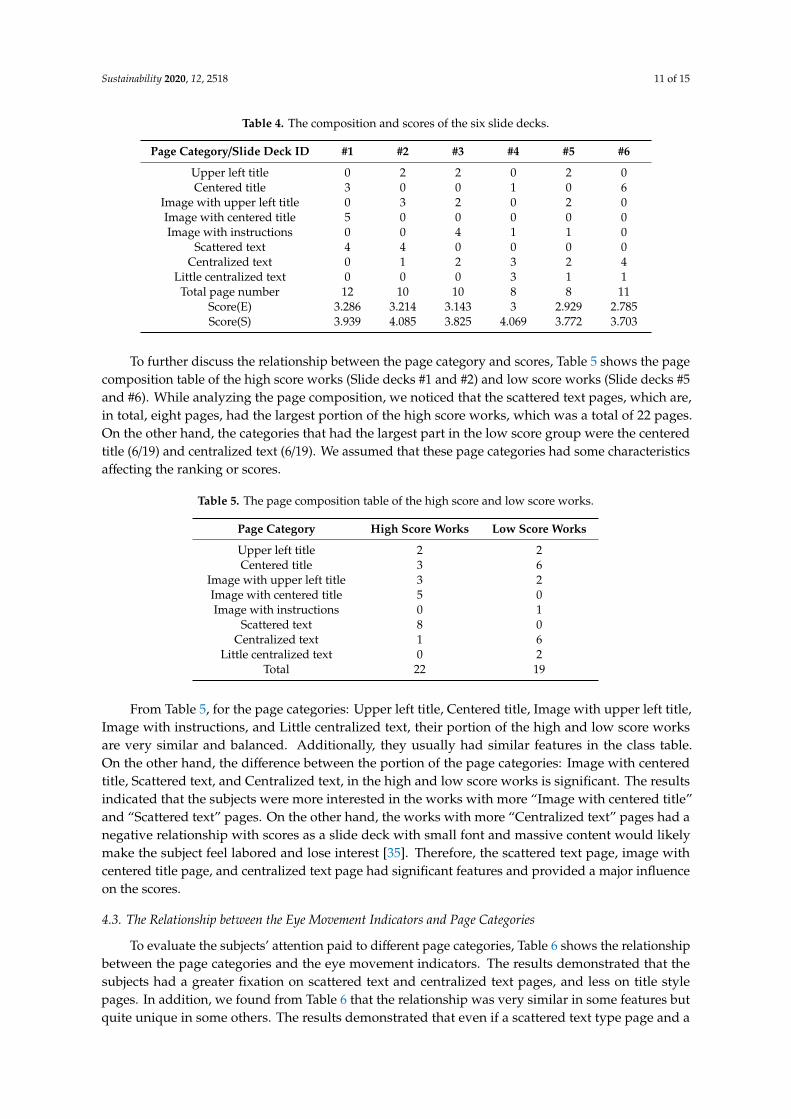
Table 4 shows the compositions of the six slide decks with respect to the eight categories definedin Section 3.2. The average page number of the six selected slide decks is 10. The final scores of eachwork for experts and students are also shown in Table 4, where score(E) represents the score resultsfrom experts, and score(S) represents the score results from subjects. The scores were calculated basedon the questionnaire defined in Section 3.4. Table 4 shows that the Slide decks #1, #2, and #3 resulted ina higher score(E) than Slide decks #4, #5, and #6, which indicates that based on the experts’ opinions,Slide decks #1, #2, and #3 are better works. On the other side, the score results from the subjectsscore(S) are similar to the experts’ scores, and the Slide decks #1, #2, and #4 resulted in a higher score(S)than Slide decks #3, #5, and #6. Therefore, in accordance with the score results from both experts andsubjects, we can conclude that the Slide decks #1 and #2 are relatively better works, whereas Slidedecks #5 and #6 are relatively worse works.
Sustainability 2020, 12, 2518 11 of 15
Table 4. The composition and scores of the six slide decks.
Page Category/Slide Deck ID #1 #2 #3 #4 #5 #6
Upper left title 0 2 2 0 2 0Centered title 3 0 0 1 0 6
Image with upper left title 0 3 2 0 2 0Image with centered title 5 0 0 0 0 0Image with instructions 0 0 4 1 1 0
Scattered text 4 4 0 0 0 0Centralized text 0 1 2 3 2 4
Little centralized text 0 0 0 3 1 1Total page number 12 10 10 8 8 11
Score(E) 3.286 3.214 3.143 3 2.929 2.785Score(S) 3.939 4.085 3.825 4.069 3.772 3.703
To further discuss the relationship between the page category and scores, Table 5 shows the pagecomposition table of the high score works (Slide decks #1 and #2) and low score works (Slide decks #5and #6). While analyzing the page composition, we noticed that the scattered text pages, which are,in total, eight pages, had the largest portion of the high score works, which was a total of 22 pages.On the other hand, the categories that had the largest part in the low score group were the centeredtitle (6/19) and centralized text (6/19). We assumed that these page categories had some characteristicsaffecting the ranking or scores.
Table 5. The page composition table of the high score and low score works.
Page Category High Score Works Low Score Works
Upper left title 2 2Centered title 3 6
Image with upper left title 3 2Image with centered title 5 0Image with instructions 0 1
Scattered text 8 0Centralized text 1 6
Little centralized text 0 2Total 22 19
From Table 5, for the page categories: Upper left title, Centered title, Image with upper left title,Image with instructions, and Little centralized text, their portion of the high and low score worksare very similar and balanced. Additionally, they usually had similar features in the class table.On the other hand, the difference between the portion of the page categories: Image with centeredtitle, Scattered text, and Centralized text, in the high and low score works is significant. The resultsindicated that the subjects were more interested in the works with more “Image with centered title”and “Scattered text” pages. On the other hand, the works with more “Centralized text” pages had anegative relationship with scores as a slide deck with small font and massive content would likelymake the subject feel labored and lose interest [35]. Therefore, the scattered text page, image withcentered title page, and centralized text page had significant features and provided a major influenceon the scores.
4.3. The Relationship between the Eye Movement Indicators and Page Categories
To evaluate the subjects’ attention paid to different page categories, Table 6 shows the relationshipbetween the page categories and the eye movement indicators. The results demonstrated that thesubjects had a greater fixation on scattered text and centralized text pages, and less on title stylepages. In addition, we found from Table 6 that the relationship was very similar in some features butquite unique in some others. The results demonstrated that even if a scattered text type page and a
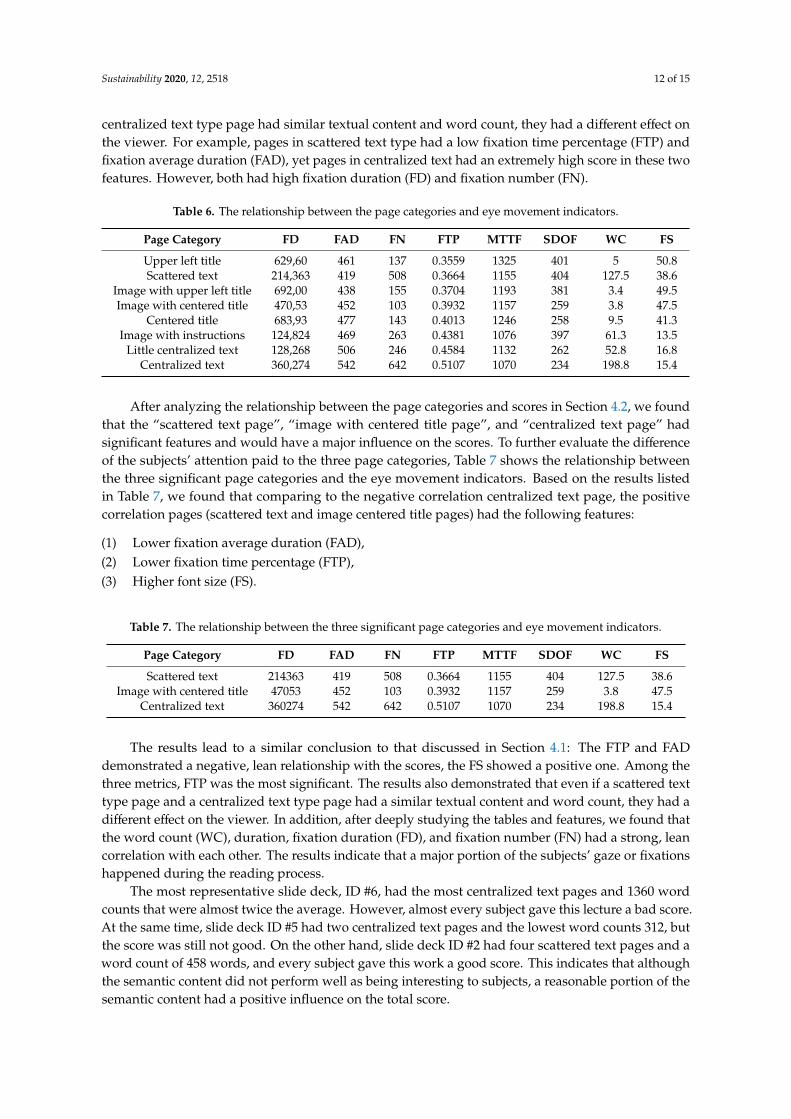
Sustainability 2020, 12, 2518 12 of 15
centralized text type page had similar textual content and word count, they had a different effect onthe viewer. For example, pages in scattered text type had a low fixation time percentage (FTP) andfixation average duration (FAD), yet pages in centralized text had an extremely high score in these twofeatures. However, both had high fixation duration (FD) and fixation number (FN).
Table 6. The relationship between the page categories and eye movement indicators.
Page Category FD FAD FN FTP MTTF SDOF WC FS
Upper left title 629,60 461 137 0.3559 1325 401 5 50.8Scattered text 214,363 419 508 0.3664 1155 404 127.5 38.6
Image with upper left title 692,00 438 155 0.3704 1193 381 3.4 49.5Image with centered title 470,53 452 103 0.3932 1157 259 3.8 47.5
Centered title 683,93 477 143 0.4013 1246 258 9.5 41.3Image with instructions 124,824 469 263 0.4381 1076 397 61.3 13.5
Little centralized text 128,268 506 246 0.4584 1132 262 52.8 16.8Centralized text 360,274 542 642 0.5107 1070 234 198.8 15.4
After analyzing the relationship between the page categories and scores in Section 4.2, we foundthat the “scattered text page”, “image with centered title page”, and “centralized text page” hadsignificant features and would have a major influence on the scores. To further evaluate the differenceof the subjects’ attention paid to the three page categories, Table 7 shows the relationship betweenthe three significant page categories and the eye movement indicators. Based on the results listedin Table 7, we found that comparing to the negative correlation centralized text page, the positivecorrelation pages (scattered text and image centered title pages) had the following features:
(1) Lower fixation average duration (FAD),(2) Lower fixation time percentage (FTP),(3) Higher font size (FS).
Table 7. The relationship between the three significant page categories and eye movement indicators.
Page Category FD FAD FN FTP MTTF SDOF WC FS
Scattered text 214363 419 508 0.3664 1155 404 127.5 38.6Image with centered title 47053 452 103 0.3932 1157 259 3.8 47.5
Centralized text 360274 542 642 0.5107 1070 234 198.8 15.4
The results lead to a similar conclusion to that discussed in Section 4.1: The FTP and FADdemonstrated a negative, lean relationship with the scores, the FS showed a positive one. Among thethree metrics, FTP was the most significant. The results also demonstrated that even if a scattered texttype page and a centralized text type page had a similar textual content and word count, they had adifferent effect on the viewer. In addition, after deeply studying the tables and features, we found thatthe word count (WC), duration, fixation duration (FD), and fixation number (FN) had a strong, leancorrelation with each other. The results indicate that a major portion of the subjects’ gaze or fixationshappened during the reading process.
The most representative slide deck, ID #6, had the most centralized text pages and 1360 wordcounts that were almost twice the average. However, almost every subject gave this lecture a bad score.At the same time, slide deck ID #5 had two centralized text pages and the lowest word counts 312, butthe score was still not good. On the other hand, slide deck ID #2 had four scattered text pages and aword count of 458 words, and every subject gave this work a good score. This indicates that althoughthe semantic content did not perform well as being interesting to subjects, a reasonable portion of thesemantic content had a positive influence on the total score.
Sustainability 2020, 12, 2518 13 of 15
5. Conclusions
This paper presents a study on eye movement behaviors while reading digital learning content.The CPR system and Tobii eye tracker 4C were utilized to process the experiments with 42 effectiverecords. After data preprocessing, the Pearson’s correlation coefficient test was applied to measure thelinear relationship between the scores and the eye movement indicators. For the proposed three neweye movement metrics: FTP, MTTF, and SDOF, FTP was proven to be a symbolic, strong, and stablemetric to measure the subjects’ interest, and the SDOF also showed a moderate to strong correlationwith the scores.
According to the collected eye movement and page categories, we found the scattered text page,image with centered title page, and centralized text page had significant features and had a greatinfluence on the scores. The highly scored lectures had the common following features: (1) a lowerfixation average duration (FAD); (2) a lower fixation time percentage (FTP); and (3) a higher font size(FS). We also found that the word count (WC), duration, fixation duration (FD), and fixation number(FN) had a strong, lean correlation with each other. The result indicated that a major portion of thesubjects’ gaze or fixations happened during the reading process. From the results, we proposed that areasonable portion of semantic content had a positive influence on the subjects’ interest as well.
For future work, research could focus on the visual stimulation, as the visual elements includingbrightness, contrast, or animation may also have an influence on the fixation behaviors. In our research,we proved that the spatial features also had a correlation with the subjects’ value. However, it onlymade use of a modest number of samples that may not adequately represent the e-learning content.Moreover, as the score in this work was calculated with respect to each slide deck, the PCC results canonly reflect the relationship among the eye movement variables and the scores of each slide deck. Inthe future, we will attempt to design a work where the score is respectively evaluated for each pagecategory to further study the relationship among the eye movement variables and the score of eachpage category.
Author Contributions: Conceptualization, X.Z. and S.-M.Y.; Data curation, W.-W.C.; Formal analysis, X.Z.;Funding acquisition, X.L. and S.-M.Y.; Investigation, W.-W.C.; Methodology, X.L., X.Z. and S.-M.Y.; Projectadministration, S.-M.Y.; Resources, W.-W.C.; Software, X.Z. and S.-M.Y.; Supervision, S.-M.Y.; Validation, X.L., X.Z.and S.-M.Y.; Writing – original draft, X.L. and W.-W.C.; Writing – review & editing, X.L. and X.Z. All authors haveread and agreed to the published version of the manuscript.
Funding: This research was funded by (MOE (Ministry of Education in China) Project of Humanities and SocialSciences) grant number (17YJC880076), (XIAMEN UNIVERSITY OF TECHNOLOGY) grant number (YKJ19004R),(Distinguished Young Scholars of Fujian Agriculture and Forestry University) grant number (xjq201809), and (theMOST OF TAIWAN) grant number (108-2511-H-009-009-MY3).
Conflicts of Interest: The authors declare no conflict of interest. The funders had no role in the design of thestudy; in the collection, analyses, or interpretation of data; in the writing of the manuscript or in the decision topublish the results.
References
1. Sanders, M.S.; McCormick, E.J. Human Factors in Engineering and Design; McGraw-Hill:New York, NY, USA, 1982.
2. Zhang, X.; Yuan, S.M.; Chen, M.D.; Liu, X. A complete system for analysis of video lecture based on eyetracking. IEEE Access 2018, 6, 49056–49066. [CrossRef]
3. Kuperman, V.; Matsuki, K.; Dyke, J.A.V. Contributions of Reader- and Text-Level Characteristics toEye-Movement Patterns during Passage Reading. J. Exp. Psychol. Learn. Mem. Cognit. 2018, 44, 11.[CrossRef] [PubMed]
4. Javadi, E.; Gebauer, J.; Mahoney, J.T. The Impact of User Interface Design on Idea Integration in ElectronicBrainstorming: An Attention-Based View. J. Assoc. Inf. Syst. 2013, 14, 1–21. [CrossRef]
5. Zhang, X.; Liu, X.; Yuan, S.M.; Lin, S.F. Eye Tracking Based Control System for Natural Human-ComputerInteraction. Comput. Intell. Neurosci. 2017, 2017, 1–9. [CrossRef] [PubMed]
Sustainability 2020, 12, 2518 14 of 15
6. Vymetalkova, D.; Milkova, E. Experimental Verification of Effectiveness of English Language Teaching UsingMyEnglishLab. Sustainability 2019, 11, 1357. [CrossRef]
7. Orquin, J.L.; Ashby, N.J.S.; Clarke, A.D.F. Areas of Interest as a Signal Detection Problem in BehavioralEye-Tracking Research. J. Behav. Decis. Mak. 2016, 29, 103–115. [CrossRef]
8. Sibert, L.E.; Jacob, R.J.K. Evaluation of eye gaze interaction. In Proceedings of the SIGCHI Conference onHuman Factors in Computing Systems, The Hague, The Netherlands, 1–6 April 2000.
9. Jamet, E. An eye-tracking study of cueing effects in multimedia learning. Comput. Hum. Behav. 2014, 32, 47–53.[CrossRef]
10. Daraghmi, E.Y.; Fan, C.; Lin, W.; Peng, Z.; Yuan, S.M. Eye-Tracking Assisted Self-Directed LearningSystem. In Proceedings of the 2015 IEEE 15th International Conference on Advanced Learning Technologies,Hualien, Taiwan, 6–9 July 2015; pp. 52–54.
11. Njeru, A.M.; Paracha, S. Learning analytics: Supporting at-risk student through eye-tracking and a robustintelligent tutoring system. In Proceedings of the 2017 International Conference on Applied SystemInnovation (ICASI), Sapporo, Japan, 13–17 May 2017; pp. 1002–1005.
12. Stenfors, I.; Morn, J.; Balkenius, C. Behavioural Strategies in Web Interaction. A View from Eye-movementResearch. Minds Eye Cognit. Appl. Asp. Eye Mov. Res. 2003, 14, 633–644.
13. Beymer, D.; Russell, D.; Orton, P. An eye tracking study of how font size and type influence online reading.In Proceedings of the 22nd British HCI Group Annual Conference on People and Computers: Culture,Creativity, Interaction, Liverpool, UK, 1–5 September 2008; Volume 2.
14. Kanonidou, E.; Gottlob, I.; Proudlock, F.A. The Effect of Font Size on Reading Performance in StrabismicAmblyopia: An Eye Movement Investigation. Investig. Ophthalmol. Vis. Sci. 2014, 55, 451. [CrossRef]
15. Jianu, R.; Alam, S.S. A Data Model and Task Space for Data of Interest (DOI) Eye-Tracking Analyses.IEEE Trans. Vis. Comput. Graph. 2018, 24, 1232–1245. [CrossRef]
16. Li, K.; Liu, Y. Effect of disparity and viewing ambient illumination on stereoscopic viewing: An eye movementapproach: Effect of disparity and ambient illumination. J. Soc. Inf. Disp. 2018, 26, 14–20. [CrossRef]
17. Chamberlain, L. Eye Tracking Methodology; Theory and Practice. Qual. Market Res. 2007, 10, 217–220.[CrossRef]
18. Salvucci, D.D.; Goldberg, J.H. Identifying fixations and saccades in eye-tracking protocols. In Proceedingsof the 2000 Symposium on Eye Tracking Research & Applications, Palm Beach Gardens, FL, USA,6–8 November 2000; pp. 71–78.
19. Bylinskii, Z.; Borkin, M. Eye Fixation Metrics for Large Scale Analysis of Information Visualizations; ETVIS 2015;Mathematics and Visualization; Springer: Chicago, IL, USA; pp. 235–255.
20. Al-Rahayfeh, A.; Faezipour, M. Eye Tracking and Head Movement Detection: A State-of-Art Survey. IEEE J.Transl. Eng. Health Med. 2013, 1, 2100212. [CrossRef]
21. Andrienko, G.L.; Andrienko, N.V.; Burch, M.; Weiskopf, D.; Graphics, C. Visual Analytics Methodology forEye Movement Studies. IEEE Trans. Vis. Comput. Graph. 2012, 18, 2889–2898. [CrossRef] [PubMed]
22. Shen, C.; Huang, X.; Zhao, Q. Predicting Eye Fixations on Webpage with an Ensemble of Early Features andHigh-Level Representations from Deep Network. IEEE Trans. Multimed. 2015, 17, 2084–2093. [CrossRef]
23. Ren, Y.; Wang, Z.; Xu, M. Learning-Based Saliency Detection of Face Images. IEEE Access 2017, 5, 6502–6514.[CrossRef]
24. Sharafi, Z.; Shaffer, T.; Sharif, B.; Gueheneuc, Y.G. Eye-Tracking Metrics in Software Engineering.In Proceedings of the 2015 Asia-Pacific Software Engineering Conference (APSEC), New Delhi, India,1–4 December 2015; pp. 96–103.
25. Zhang, X.; Liu, X.; Yuan, S.-M.; Fan, C.-C.; Sun, C.-T. Exploring Students’ Behaviors in Editing LearningEnvironment, in Intelligent Tutoring Systems; Springer International Publishing: Montreal, QC, Canada, 2018;pp. 399–404.
26. Tobii Gaming. Tobii Eye Tracker 4C-The Game-Changing Eye Tracking Peripheral for PC Gaming. Availableonline: https://gaming.tobii.com/product/tobii-eye-tracker-4c/ (accessed on 10 November 2019).
27. Chen, Y.-J. Eye- and Mouse-Tracking Analysis System for Webpages. Master’s Thesis, Institute of ComputerScience and Engineering, National Chiao Tung University, Hsinchu City, Taiwan, 2018.
28. Gray, K.; Thompson, C.; Sheard, J.; Clerehan, R.; Hamilton, M. Students as Web 2.0 authors: Implications forassessment design and conduct. Australas. J. Educ. Technol. 2010, 26, 105–122. [CrossRef]
Sustainability 2020, 12, 2518 15 of 15
29. Van, B.; Ineke, W.A.; Albert, P. Design principles and outcomes of peer assessment in higher education.Stud. High. Educ. 2006, 31, 341–356.
30. Ali, N.; Sharafi, Z.; Guéhéneuc, Y.-G.; Antoniol, G. An empirical study on the importance of source codeentities for requirements traceability. Empir. Softw. Eng. 2015, 20, 442–478. [CrossRef]
31. Crosby, M.E.; Scholtz, J.; Wiedenbeck, S. The roles beacons play in comprehension for novice and expertprogrammers. In Proceedings of the 14th Workshop of the Psychology of Programming Interest Group,Brunel University, London, UK, 18–21 April 2002; pp. 18–21.
32. Garlandini, S.; Fabrikant, S.I. Evaluating the Effectiveness and Efficiency of Visual Variables for GeographicInformation Visualization. In Lecture Notes in Computer Science; Springer: Berlin/Heidelberg, Germany, 2009;Volume 5756, pp. 195–211.
33. Mu, Y.; Liu, X.; Wang, L. A Pearson’s correlation coefficient based decision tree and its parallel implementation.Inf. Sci. 2017, 435, 40–58. [CrossRef]
34. Soh, Z.; Sharafi, Z.; den Plas, B.V.; Porras, G.C.; Guéhéneuc, Y.-G.; Antoniol, G. Professional status andexpertise for UML class diagram comprehension: An empirical study. In Proceedings of the 20th InternationalConference on Program Comprehension (ICPC), Passau, Germany, 11–13 June 2012; pp. 163–172.
35. Huang, M.S.; Hsiao, W.H.; Chang, T.S. Design and implementation of a cooperative learning system fordigital content design curriculum: Investigation on learning effectiveness and social presence. Turkish OnlineJ. Educ. Technol. 2012, 11, 94–107.
© 2020 by the authors. Licensee MDPI, Basel, Switzerland. This article is an open accessarticle distributed under the terms and conditions of the Creative Commons Attribution(CC BY) license (http://creativecommons.org/licenses/by/4.0/).