Sensitivity of eye-movement measures to in-vehicle task difficulty
24
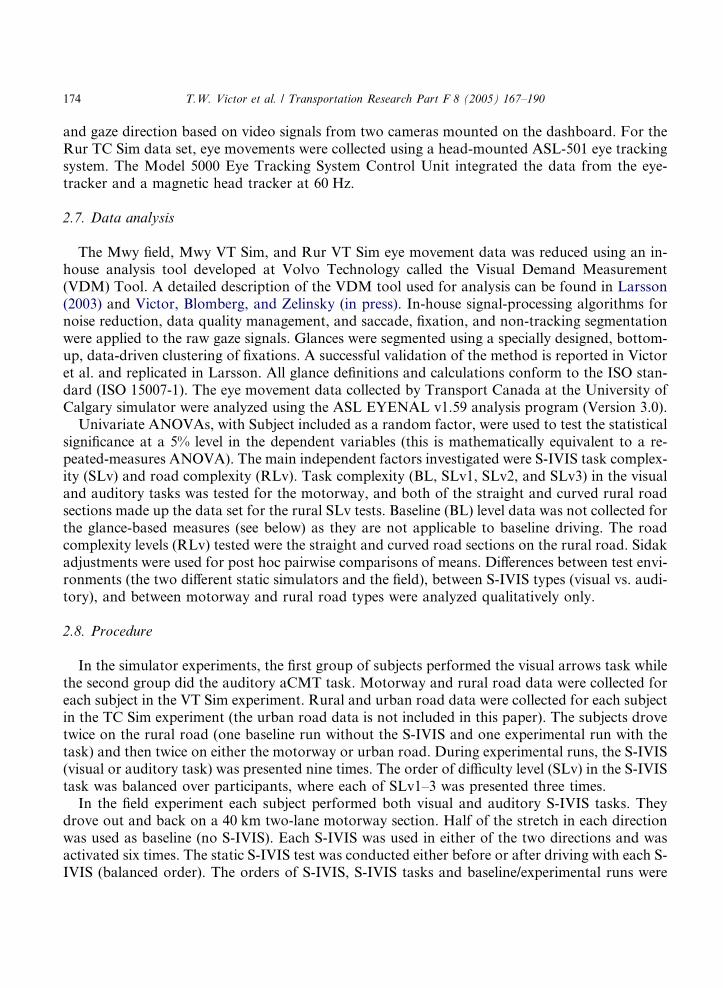
Sensitivity of eye-movement measures to in-vehicle task difficulty Trent W. Victor a,b, * , Joanne L. Harbluk c,1 , Johan A. Engstro ¨m a,2 a Volvo Technology Corporation, Go ¨ taverksgatan 10, 405 08 Go ¨ teborg, Sweden b Department of Psychology, Uppsala University, Tra ¨ dga ˚ rdsgatan 20, Box 1225, 751 42 Uppsala, Sweden c Transport Canada, 330 Sparks St, Ottawa, Ontario, Canada K1A 0N5 Abstract Eye-movement measures were found to be highly sensitive to the demands of visual and auditory in-vehi- cle tasks as well as driving task demands. Two newer measures, Percent road centre and Standard deviation of gaze, were found to be more sensitive, more robust, more reliable, and easier to calculate than established glance-based measures. The eye-movement measures were collected by two partners within the EU project HASTE to determine their sensitivity to increasingly demanding in-vehicle tasks by means of artificial, or surrogate, In-vehicle Information Systems (S-IVIS). Data from 119 subjects were collected from four routes: a motorway in real traffic with an instrumented vehicle, a motorway in a fixed base simulator, and from rural roads in two different fixed base simulators. As the visual task became more difficult, drivers looked less at the road centre area ahead, and looked at the display more often, for longer periods, and for more varied durations. The auditory task led to an increasing gaze concentration to road centre. Gaze concentration to the road centre area was also found as driving task complexity increased, as shown in 1369-8478/$ - see front matter Ó 2005 Elsevier Ltd. All rights reserved. doi:10.1016/j.trf.2005.04.014 * Corresponding author. Address: Volvo Technology Corporation, Go ¨ taverksgatan 10, 405 08 Go ¨ teborg, Sweden. Tel.: +46 708 66 58 21; fax: +46 31 666 450. E-mail addresses: [email protected] (T.W. Victor), [email protected] (J.L. Harbluk), johan.a.engstrom@vol- vo.com (J.A. Engstro ¨m). 1 Tel.: +1 613 998 1971; fax: +1 613 990 2913. 2 Tel.: +46 31 322 27 80. www.elsevier.com/locate/trf Transportation Research Part F 8 (2005) 167–190
Transcript of Sensitivity of eye-movement measures to in-vehicle task difficulty

www.elsevier.com/locate/trf
Transportation Research Part F 8 (2005) 167–190
Sensitivity of eye-movement measuresto in-vehicle task difficulty
Trent W. Victor a,b,*, Joanne L. Harbluk c,1, Johan A. Engstrom a,2
a Volvo Technology Corporation, Gotaverksgatan 10, 405 08 Goteborg, Swedenb Department of Psychology, Uppsala University, Tradgardsgatan 20, Box 1225, 751 42 Uppsala, Sweden
c Transport Canada, 330 Sparks St, Ottawa, Ontario, Canada K1A 0N5
Abstract
Eye-movement measures were found to be highly sensitive to the demands of visual and auditory in-vehi-
cle tasks as well as driving task demands. Two newer measures, Percent road centre and Standard deviation
of gaze, were found to be more sensitive, more robust, more reliable, and easier to calculate than establishedglance-based measures. The eye-movement measures were collected by two partners within the EU project
HASTE to determine their sensitivity to increasingly demanding in-vehicle tasks by means of artificial, or
surrogate, In-vehicle Information Systems (S-IVIS). Data from 119 subjects were collected from four
routes: a motorway in real traffic with an instrumented vehicle, a motorway in a fixed base simulator,
and from rural roads in two different fixed base simulators. As the visual task became more difficult, drivers
looked less at the road centre area ahead, and looked at the display more often, for longer periods, and for
more varied durations. The auditory task led to an increasing gaze concentration to road centre. Gaze
concentration to the road centre area was also found as driving task complexity increased, as shown in
1369-8478/$ - see front matter � 2005 Elsevier Ltd. All rights reserved.
doi:10.1016/j.trf.2005.04.014
* Corresponding author. Address: Volvo Technology Corporation, Gotaverksgatan 10, 405 08 Goteborg, Sweden.
Tel.: +46 708 66 58 21; fax: +46 31 666 450.
E-mail addresses: [email protected] (T.W. Victor), [email protected] (J.L. Harbluk), johan.a.engstrom@vol-
vo.com (J.A. Engstrom).1 Tel.: +1 613 998 1971; fax: +1 613 990 2913.2 Tel.: +46 31 322 27 80.

168 T.W. Victor et al. / Transportation Research Part F 8 (2005) 167–190
differences between rural curved- and straight sections, between rural and motorway road types, and
between simulator and field motorways.
� 2005 Elsevier Ltd. All rights reserved.
Keywords: Eye movement; Driver distraction; Driver workload; Road safety; Evaluation methodology
1. Introduction
Looking in the wrong direction or taking your mind off driving at a critical moment can lead todisastrous consequences while driving. Today, driver inattention or distraction is estimated to beresponsible for 25–30% of police-reported traffic crashes, or 1.2 million crashes per year in theUnited States, according to the National Highway Traffic Safety Administration (NHTSA) (Shel-ton, 2001). Already in 1977, ‘‘recognition errors’’ predominated the causes that led to the conclu-sion that human factors are involved in 92.6% of accidents (Treat et al., 1977). Now, in additionto this problem, there is a growing concern over the detrimental effects resulting from increasedinteractions with new technology in vehicles. In this paper, we focus on understanding and quan-tifying the effects that these systems have on drivers� eye movements.
Central to understanding how eye movements are related to these crashes is to understand thethree main factors influencing event detection. Here, event detection is defined as ‘‘detection thatsomething occurs’’, for example, lane drifts, object appearances, brake events. First, detection per-formance has been shown to be highly dependent on stimulus saliency properties such as size, col-or, contrast, movement, and luminance (Neumann & Sanders, 1996; Stelmach, Bourassa, & diLollo, 1984). Second, limitations of the visual system limit event detection performance. A dra-matic reduction in the performance of many visual functions occurs towards visual field peripherybecause of a decreasing density of receptors in the retina, and because central visual regions re-ceive a higher proportion of cortical processing (Findlay & Gilchrist, 2003). Thus, delays in reac-tions strongly depend on the coincidences of looking away at the onset of critical events (e.g.Lamble, Laakso, & Summala, 1999). Another limitation of our visual system has been madeapparent by Change Blindness research (Rensink, 2002). The visual system�s ability to respondis severely impaired by visual transients (low-level feature detection mechanisms) being maskedby common visual disruptions such as saccades (fast eye movements), blinks, mud splashes,and occlusions (Rensink, 2002; Stelmach et al., 1984).
Third, cognitive functions, such as expectation, attention, and processing demands, play animportant role. When observers attend to particular objects or events in a scene, they often failto report the appearance of other, unexpected items, as shown by the Inattentional Blindness par-adigm (Mack & Rock, 1998). In direct support of this, Green (2000) found that the most impor-tant variable affecting brake reaction time is driver expectation. In a comprehensive review ofbrake reaction time studies, he showed that surprise intrusions give much longer reaction times(1.5 s) than unexpected (1.25 s), and expected signals (0.75 s). Similarly, Rumar (1990) foundlapses in cognitive expectation and difficulties with perceptual thresholds to be the main causesfor late detection of traffic conflicts.
Eye movements are motivated by the need to improve the acuity of an interesting stimulus sothat fixations can be used to guide actions and to recognize objects and events (Land & Hayhoe,

T.W. Victor et al. / Transportation Research Part F 8 (2005) 167–190 169
2001; Leigh & Zee, 1999). Much research has shown that drivers look to a future-path, road cen-tre region a few degrees down from true horizon about 80–90% of the time and only rarely at lanemarkings near the vehicle during normal driving (Harbluk, Noy, & Eizenman, 2002; Recarte &Nunes, 2000; Rockwell, 1972; Victor & Johansson, submitted for publication; Wierwille, 1993a,1993b; Wann & Swapp, 2001). Confirming this, Land and Horwood pinpointed two distinct re-gions of information uptake in the visual control of steering: (1) a feed-forward, far-road areawhich attracts gaze fixations at about 4� down from true horizon, and (2) a feedback, near-roadarea at the sides at about 7� which is viewed peripherally. Wann and Swapp (2001) have recentlyshown that this road centre point corresponds to a point on the future path in both curved andstraight sections. So, changes to eye movements because of in-vehicle tasks will be made from thisstarting point.
1.1. Effects of visual tasks: Measures of visual time-sharing
A major differentiating factor regarding in-vehicle task types is whether or not a task requiresvision to support its execution. Visual tasks may be accompanied by a cognitive component, butauditory and cognitive (thinking) tasks are generally not accompanied by a visual component sup-porting task goals.
When in-vehicle tasks require vision, a timesharing behavior is exhibited with the eyes beingcontinuously shifted back and forth between the road and the in-vehicle task. Glance-based mea-sures, such as total glance duration, glance frequency, glance duration, and total task duration arethe central measures of interest in assessing the visual demand of in-vehicle information systems.A glance describes the transition to a given area, such as a display, and one or more consecutivefixations on the display until the eyes are moved to a new location. See Lansdown (2001) for areview of visual demand research; see European Commission (1998) and AAM (2002) for exam-ples of recommended glance-based safety criteria; and ISO (15007-1, 15007-2) for specifications ofvisual demand measurement.
Glance frequency, total glance duration, and total task duration have been shown to vary con-siderably with different in-vehicle tasks (Dingus, Antin, Hulse, & Wierwille, 1989; Lansdown,2001; Wierwille, 1993a, 1993b). Correlations between these three glance based measures andlane-keeping measures is generally high (see Dingus et al., 1989; Green, 1999; Zwahlen, Adams,& de Bald, 1988). Wierwille and Tijerina (1998) devised a model that successfully predicts crashrates from glance frequency and duration together with frequency of device use. Because the rangeof glance frequency and total glance duration are consistent between different studies, these mea-sures can be considered as highly reliable.
However, the sensitivity of glance duration to visual demand and its prediction of lateralcontrol seems to be limited (Green, 1999; Lansdown, 2001). Some, but not all studies, indicatesignificant differences relating to task complexity (e.g. Lansdown & Fowkes, 1998). As shownby on-road occlusion studies (Senders, Kristofferson, Levison, Dietrich, & Ward, 1967), wherevision has been blocked momentarily, drivers dramatically increase eyes-off-road-times as speedis reduced. This result indicates that glance duration as a measure must be considered in relationto the driving demand imposed by the situation, for example speed. Further complicating theinterpretation is the fact that off-road glances give graded amounts of driving informationdepending on their eccentricity. In-vehicle glances are not simply on or off road, display position

170 T.W. Victor et al. / Transportation Research Part F 8 (2005) 167–190
makes a difference. More information for lateral position and longitudinal object detection isavailable from peripheral vision during in-vehicle glances to high and centrally placed displaysthan glances to low placed displays (Lamble et al., 1999; Summala, Nieminen, & Punto, 1996).
Recently, Victor and Johansson (submitted for publication) successfully used Percent road centreto measure the on-road glances of the time-sharing behavior in 13 visual tasks. Strong correlationswith glance frequency, total glance duration, and total task duration were found. Instead of mea-suring the glances off road, this measure focuses on measuring how much time is spent monitoringthe road centre area while performing a visual task. The rationale behind this measure incorporatesthe finding that drivers time share not only between the road centre and in-vehicle tasks, but alsotime share between road centre and other driving related objects such as signs, bicyclists, mirrors,scenery and so on (Land, 1998). If the road centre area is as important for path control as describedabove, then measuring howmuch action guidance information drivers are receiving may closely re-late to driving performance measures and peripheral event detection probability. Victor andJohansson (submitted for publication) also showed that when drivers do make fixations back to-wards the road during visual time-sharing, they are highly concentrated to road centre.
1.2. Effects of driving task demand during visual tasks
In curve negotiation, gaze spatially concentrates further from its normal driving level to theroad centre, future path region (Land & Lee, 1994; Wann & Swapp, 2000). Thus, as steering de-mands increase, the need to monitor the future path region with the highest acuity is greater andfixations to this region are increased. Senders et al. (1967) found that drivers devote more atten-tion to the control of the vehicle by adapting their behavior by slowing down, looking more fre-quently, or looking for a longer period at the road as the driving task becomes more difficult.Drivers also compensate for both anticipated and unanticipated increases in driving task demandsby adapting their in-vehicle glance behavior (Wierwille, Antin, Dingus, & Hulse, 1988). Glancesaway from the vehicle path are generally timed to coincide with a low probability of the occur-rence of unexpected events and to affect driving control as little as possible (Lansdown, 2001;Rockwell, 1972; Senders et al., 1967; Wierwille, 1993a, 1993b). Drivers increase viewing time inthe forward central view by forgoing a proportion of glance time to information systems, presum-ably because they are under greater pressure to return and hold their gaze on the road (Wierwille,1993a, 1993b).
1.3. Effects of auditory and cognitive tasks
As cognitive and auditory demands increase, drivers increase their monitoring of the futurepath region. This spatial gaze concentration effect has reliably been found for cognitive and audi-tory tasks (Hammel, Fisher, & Pradhan, 2002; Harbluk et al., 2002; Nunes & Recarte, 2002; Re-carte & Nunes, 2000, 2003; Victor & Johansson, submitted for publication), alcohol, anxiety, andfatigue (for details see Victor & Johansson, submitted for publication). Significant reduction inhorizontal and vertical variability of gaze angle, longer fixations (more staring), and reducedglance frequency at mirrors and speedometer are typically found.
Cognitive secondary task demands also produce event detection performance deteriorationduring driving (Lamble et al., 1999; Recarte & Nunes, 2003; Olsson & Burns, 2000). Recarte

T.W. Victor et al. / Transportation Research Part F 8 (2005) 167–190 171
and Nunes (2003) found that a significant reduction in event detection performance accompaniedthe spatial gaze concentration effect caused by their cognitive task. In the particular case of mobilephones, a meta-analysis by Horrey and Wickens (2004) of 16 studies performed gave overwhelm-ing evidence that drivers� reaction times are significantly increased by phone conversation. Moreresearch is needed to determine the causality between cognitive factors, spatial gaze concentra-tion, and reduced event detection performance.
1.4. The significance of gaze concentration
Gaze concentration can be seen as either an increased priority in action guidance at the expenseof recognition-tasks, or as a disturbance of recognition-task processing leaving proportionatelymore fixations on the action guidance task, or a combination of both. In any case, reduced eventdetection performance occurs together with spatial gaze concentration, increased visual angle torelevant stimuli, and cognitive factors exhibited in both visual and cognitive tasks. It can also bepredicted that fixations away from the future path region will result in deteriorated path control,such as standard deviation of lane keeping, because of the reduced retinal sensitivity when lookingaway.
1.5. Objectives
This paper aims to answer four research questions. How are eye movements influenced by (1)different in-vehicle task types (visual and auditory), (2) increasing in-vehicle task difficulty, and (3)driving task complexity? Lastly, (4) which measures are most suitable and sensitive to thesechanges in eye movements?
2. Method
Data were collected at three experimental sites: (1) the Volvo Technology fixed base simulator,(2) Transport Canada used the University of Calgary fixed base simulator, and (3) field tests withan instrumented vehicle on a motorway outside of Linkoping, Sweden.
A key idea behind the HASTE experiments from which the current results were obtained was tovary the visual and auditory load systematically by means of a surrogate in-vehicle informationsystem, S-IVIS (see e.g. Jamson &Merat, this issue, for more detail). The common HASTE exper-imental methodology, found in Ostlund et al. (2004), was applied across the three experiments. Asfar as possible, the same scenarios and dependent measures were used in all three experiments.The effects of the visual and auditory S-IVIS were analyzed separately given that the tasks werenot directly comparable.
2.1. The visual task
The visual S-IVIS task, referred to as the visual task, was designed and pre-tested to producethree incremental levels of difficulty (SLv1–3). Briefly described, the subjects were presented withmatrices of arrows on a 6.400 · 6.400 LCD touch screen positioned to the right of the steering wheel.

172 T.W. Victor et al. / Transportation Research Part F 8 (2005) 167–190
Each task lasted 30 s and consisted of six presentations of matrices, one every 5 s, for each of thethree levels. Level 1 was a singleton arrow (or not) in a display of 16 uniform arrows. Level 2 was16 uniform or mixed distractors of either target present or absent. Level 3 was 36 uniform ormixed distractors with the target being either present or absent. The start and end of each matrixpresentation was signaled by a sound. The driver responded ‘‘yes’’ or ‘‘no’’ on the touch screen,whether a target arrow was present.
2.2. The auditory task
The auditory task was an auditory working memory task, called auditory continuous memorytask (aCMT), wherein the driver was required to remember 2, 3 or 4 target sounds, correspondingto SLv1, 2, and 3. After being presented the target sounds, a series of 15 sounds are played backfor the driver to keep track of the number of times each target sound was played over a span of30 s. Subjects discriminated the sounds and responded verbally.
2.3. Driving environments
The road designs were implemented at the various sites to be as similar as possible. More spe-cific detail on the road designs can be found in Ostlund et al. (2004). The relationship between thetest sites, road type, complexity levels, and data set names used here are presented in Table 1.
The simulated 110 km/h, four lane motorway used in the Mwy VT Sim data set was 46 km long,had 3.75 m wide driving lanes, and had emergency shoulders. There were two routes; one for thebaseline run and one for the experimental run.
The field experiment (Mwy field) used a 110 km/h, four lane, rather straight motorway sectionoutside of Linkoping, Sweden. It was 38 km long, and had 3.75 m wide lanes. There was very littletraffic and the landscape was open. Each participant drove twice on the road; once in eachdirection.
The simulated rural road used in both the Volvo Technology and Transport Canada simulatorstudies was just over 29 km long, had one 3.65 m lane per direction, and did not have shoulders.The minimum radius of curvature was 510 m. There were two equivalent routes in the VT Simexperiment used in counterbalance; one for the baseline run and one for the experimental run.
Table 1
Relationship between sites, road categories, road complexity levels, and names of data sets
Test sites Road type Complexity level (RLv) Name of data set
Swedish field experiment on-road in Linkoping Motorway Mwy field
Simulator at Volvo Technology, Sweden Motorway Mwy VT Sim
Rural Rur VT Sim
Rural straight (RLv1) Rur VT Sim straight
Rural curve (RLv2) Rur VT Sim curve
Simulator at University of Calgary,
for Transport Canada
Rural Rur TC Sim
Rural straight (RLv1) Rur TC Sim straight
Rural curve (RLv2) Rur TC Sim curve

T.W. Victor et al. / Transportation Research Part F 8 (2005) 167–190 173
The TC Sim experiment used the same route driven twice. The rural roads differed slightly in theirappearance to resemble either a Swedish 90 km/h rural road or a paved secondary rural 100 km/hhighway in North America.
Each rural route consisted of three repetitions of three driving sections, which were designed tovary in terms of workload and driving difficulty. These are referred to as sections of different roadcomplexity level (RLv1–3). These were RLv1, consisting of straight roads, requiring minimalworkload compared to other scenarios, and RLv2, consisting of gentle s-shaped curves, which re-quired some negotiation by the driver. A third level with discrete critical events that lead to amajor reduction of speed by the driver was also driven. The data from this third level are notincluded in this analysis.
2.4. Experimental design
The main independent variable was S-IVIS task difficulty level (SLv), which was varied on fourlevels: baseline or normal driving (no S-IVIS) and three S-IVIS task difficulty levels (SLv1–3). Inthe simulators, each subject only used one S-IVIS type (visual Arrows or auditory aCMT). In thefield trials, however, subjects used both S-IVIS types. SLv was treated as a within-subjects factor(subjects were exposed to all difficulty levels). The S-IVIS levels (SLv1–3) were all included andcounterbalanced in a single test drive. Baseline data were collected during a separate drive for eachsubject. The order of the driving conditions was counterbalanced across subjects.
2.5. Subjects
In total 119 different subjects participated across the three experiments. Twenty-four subjects(12 males and 12 females) with a mean age of 34 years (range 25–46) participated in the Mwy fieldexperiment. Forty-eight subjects (37 males and 11 females) with a mean age of 40.6 years (range25–62) participated in the VT Sim (Mwy VT Sim and Rur VT Sim data sets) simulator experi-ment. Forty-seven subjects (23 females and 24 males) with an age range of 20–35 years partici-pated in the TC Sim experiment. Twenty-four subjects participated in the visual S-IVIS taskand 23 subjects participated in the auditory S-IVIS task in the TC Sim experiment.
2.6. Equipment
The Volvo Technology Corporation driving simulator is a fixed-base, static driving simulatorequipped with an automatic transmission Volvo S80 car. The display system projects onto acurved screen with a horizontal field of view of 135�. Transport Canada carried out the researchusing the fixed-base, static Saturn SL1 car University of Calgary Driving Simulator (UCDS).Three projectors display a simulated visual environment that encompasses 150� of the driver�s for-ward view. An instrumented Volvo S80 car was used for the Mwy field experiment. It wasequipped with numerous sensors and logging equipment for the collection of driving performancedata, eye movement data, and physiological data (see also Engstrom, Johansson, & Ostlund, thisissue).
For the Mwy VT Sim, Rur VT Sim, and Mwy field data sets, eye movements were measured at60 Hz by means of the Seeing Machines� faceLAB, v. 3.0. FaceLAB determines 3D head position
174 T.W. Victor et al. / Transportation Research Part F 8 (2005) 167–190
and gaze direction based on video signals from two cameras mounted on the dashboard. For theRur TC Sim data set, eye movements were collected using a head-mounted ASL-501 eye trackingsystem. The Model 5000 Eye Tracking System Control Unit integrated the data from the eye-tracker and a magnetic head tracker at 60 Hz.
2.7. Data analysis
The Mwy field, Mwy VT Sim, and Rur VT Sim eye movement data was reduced using an in-house analysis tool developed at Volvo Technology called the Visual Demand Measurement(VDM) Tool. A detailed description of the VDM tool used for analysis can be found in Larsson(2003) and Victor, Blomberg, and Zelinsky (in press). In-house signal-processing algorithms fornoise reduction, data quality management, and saccade, fixation, and non-tracking segmentationwere applied to the raw gaze signals. Glances were segmented using a specially designed, bottom-up, data-driven clustering of fixations. A successful validation of the method is reported in Victoret al. and replicated in Larsson. All glance definitions and calculations conform to the ISO stan-dard (ISO 15007-1). The eye movement data collected by Transport Canada at the University ofCalgary simulator were analyzed using the ASL EYENAL v1.59 analysis program (Version 3.0).
Univariate ANOVAs, with Subject included as a random factor, were used to test the statisticalsignificance at a 5% level in the dependent variables (this is mathematically equivalent to a re-peated-measures ANOVA). The main independent factors investigated were S-IVIS task complex-ity (SLv) and road complexity (RLv). Task complexity (BL, SLv1, SLv2, and SLv3) in the visualand auditory tasks was tested for the motorway, and both of the straight and curved rural roadsections made up the data set for the rural SLv tests. Baseline (BL) level data was not collected forthe glance-based measures (see below) as they are not applicable to baseline driving. The roadcomplexity levels (RLv) tested were the straight and curved road sections on the rural road. Sidakadjustments were used for post hoc pairwise comparisons of means. Differences between test envi-ronments (the two different static simulators and the field), between S-IVIS types (visual vs. audi-tory), and between motorway and rural road types were analyzed qualitatively only.
2.8. Procedure
In the simulator experiments, the first group of subjects performed the visual arrows task whilethe second group did the auditory aCMT task. Motorway and rural road data were collected foreach subject in the VT Sim experiment. Rural and urban road data were collected for each subjectin the TC Sim experiment (the urban road data is not included in this paper). The subjects drovetwice on the rural road (one baseline run without the S-IVIS and one experimental run with thetask) and then twice on either the motorway or urban road. During experimental runs, the S-IVIS(visual or auditory task) was presented nine times. The order of difficulty level (SLv) in the S-IVIStask was balanced over participants, where each of SLv1–3 was presented three times.
In the field experiment each subject performed both visual and auditory S-IVIS tasks. Theydrove out and back on a 40 km two-lane motorway section. Half of the stretch in each directionwas used as baseline (no S-IVIS). Each S-IVIS was used in either of the two directions and wasactivated six times. The static S-IVIS test was conducted either before or after driving with each S-IVIS (balanced order). The orders of S-IVIS, S-IVIS tasks and baseline/experimental runs were

T.W. Victor et al. / Transportation Research Part F 8 (2005) 167–190 175
balanced. An experimenter accompanied the participants in the front passenger seat. The exper-imenter controlled all equipment, instructed the participants on some occasions, and administeredquestions on driving performance during the runs.
3. Results
Consistent with expectations, the data show that increases in task difficulty produces both agaze concentration to the road centre area and an increase in display viewing time.
The first striking feature about the gaze data, as can be seen in Fig. 1(a)–(d), is that it is veryconcentrated to a region straight ahead. Fig. 1(b) shows a side view with this concentration appar-ent in normal baseline driving on a motorway in the field. The two baselines, Fig. 1(a) and (b), arecollected in different sections of the same motorway and are very similar. As can be seen in Fig.1(c), this general pattern changes quite dramatically when a visual task is introduced. A concen-tration effect is seen in the upper on-road cluster and clusters of fixations are introduced where thein-vehicle visual task display is. During the auditory task, a concentration effect is also visible(Fig. 1(d)).
3.1. Visual task
For the visual task, six measures were analyzed. The first five measures required glance segmen-tation of the gaze signal, and last measure, percent road centre, used gaze data points marked asfixations as input.
In total, 3353 glances were analyzed. 1299 glances for Mwy VT Sim, 618 glances for Mwy VTfield, and 1436 glances for Rur VT Sim. The distributions of single glance durations to the S-IVISdisplay for the three data sets are presented in Fig. 2. The Mwy VT Sim and Rur VT Sim data inFig. 2(b) and (c) look very similar. Both of these distributions exhibit an unusual second peak ataround 0.3–0.4 s. Fig. 2(a), indicates that drivers performed fewer check glances in the on-roadfield environment Mwy field, perhaps due to increased driving demands.
The 400 ms peaks present an important methodological issue since the ‘‘check’’ glances affectthe eye-movement measures. Single �check glances� (300 ms) have been found not to have an ad-verse affect on driving performance (Wierwille, 1993a, 1993b) and thus it has been suggested thatone or two �check glances� could be excluded from total glance duration calculation but not multi-ple check glances (AAM, 2002). Because the check glances are so numerous here, they are in-cluded in the analysis.
3.1.1. Mean glance duration (MGD)Glance duration refers to the time from the moment at which the direction of gaze moves to-
wards the S-IVIS display to the moment it moves away from it. It includes transition time to theS-IVIS display and any series of fixations within the display area.
Mean glance durations increase as a function of task difficulty, as can be seen in Fig. 3. Signif-icant main effects of task difficulty SLv were found in Mwy VT Sim F(2,37) = 13.39, p < .001,Mwy field F(2,37) = 36.69, p < .001, and Rur VT Sim F(2,42) = 10.23, p < .001, As can be seenin Table 2, the post hoc comparisons show that the SLv 3 task induced significantly longer glances

Fig. 1. (a)–(d) Examples of fixation density plots of eye movements in different conditions. The plots represent a
combination of all the different subject data within a particular condition. Frequency is normalized to units representing
percent of total frequency. (a) Visual task baseline Mwy field, (b) auditory task baseline Mwy field, (c) visual task SLv3
Mwy field and (d) auditory task SLv3 Mwy field.
176 T.W. Victor et al. / Transportation Research Part F 8 (2005) 167–190
to the display than SLv 1 and SLv2 in both the Rur VT Sim and Mwy field data sets. SLv 2 andSLv3 showed significantly longer glances than SLv1 in the Mwy VT Sim data set.
Significantly lower mean glance duration in curves than in straight sections was found inthe Rur VT Sim data set F(1,25) = 10.29, p < .01. Despite there being more check glances in

Fig. 2. (a)–(c) Distribution of single glance durations in three road types. (a) Single glance durations on the motorway
in the field, Mwy field, N = 618. (b) Single glance durations on a simulated motorway, Mwy VT Sim, N = 1299.
(c) Single glance durations on a simulated rural road, Rur VT Sim, N = 1436.
T.W. Victor et al. / Transportation Research Part F 8 (2005) 167–190 177
the simulator environment, it is noted that the mean glance durations for the Mwy field data areshorter than the Mwy VT Sim data and instead very similar to the Rur VT Sim curve data.
3.1.2. Percent glance durations exceeding 2 s (PGD > 2)Percent glance durations exceeding 2 s is the percentage of the total amount of glances toward
the S-IVIS display during a visual task that had a duration longer than two seconds. Percentglance durations exceeding 2 s increased with task difficulty, as can be seen in Fig. 4. SignificantSLv main effects were found for both Mwy VT Sim F(2,37) = 14.69, p < .001 and Rur VT SimF(2,45) = 18.36, p < .001. The pairwise comparisons in Table 2 show that SLv2 and SLv3 were

0.8
0.9
1
1.1
1.2
1.3
1.4
1.5
1.6
SLv1 SLv2 SLv3
Mea
nG
lanc
eD
urat
ion
(s)
Mw y VTSim
Mw y Field
Rur VT Sim Straight
Rur VT Sim Curve
Fig. 3. Mean glance durations for the three visual task difficulty levels.
178 T.W. Victor et al. / Transportation Research Part F 8 (2005) 167–190
significantly larger than SLv1 in Mwy VT Sim. The Rur VT Sim data set showed a significant dif-ference between SLv3 and SLv2, but not SLv2 and SLv1.
Significantly fewer long glances in curves than in straight sections were found in Rur VT Simdata set F(1,22) = 12.97, p < .01. The Mwy VT Sim data showed about the same results as the RurVT Sim straight section, and the curved section produced the lowest means.
3.1.3. Standard deviation of glance duration (SDGD)Standard deviation of glance duration is the standard deviation of the duration of the glances
made to the S-IVIS display during a visual task. Standard deviation of glance duration increasedas a function of S-IVIS difficulty. Significant main effects of SLv for Standard deviation of glanceduration were found for the only two data sets that this measure was calculated for, Mwy VTSim data set F(2,37) = 18.51, p < .001 and Rur VT Sim F(2,43) = 10.67, p < .001. As shown inTable 2 the standard deviation of glance duration in SLv3 was significantly larger than SLv1in both Rur VT Sim and Mwy VT Sim, SLv3 was also significantly larger than SLv2 in RurVT Sim, and SLv2 was significantly larger than SLv1 in Mwy VT Sim. Smaller Standarddeviation of glance duration in curves than in straight sections was found in the Rur VT SimF(1,22) = 10.01, p < .01.
3.1.4. Glance frequency (GF)
Glance frequency is the total number of glances made to the S-IVIS display during a visualtask, where each glance is separated by at least one glance to a different target. Glance frequencyincreases with S-IVIS difficulty as can be seen in Fig. 5. Significant SLv main effects were found inMwy VT Sim F(2,40) = 13.18, p < .001, Mwy field F(2,39) = 7.65, p < .01, and Rur VT SimF(2,41) = 9,53, p < .001. Glances to SLv3 and SLv2 were significantly more frequent than thoseto SLv1 in the Mwy VT Sim and Rur VT Sim data sets, and glances in SLv3 were significantlymore numerous than only SLv2, as can be seen in Table 2. One anomaly was found in theMwy field data set, as SLv1 received more glances than SLv2 in the Mwy field data set.
No significant main effects were found in glance frequency between curves and straight sections,although there was a trend for higher values in curves. The Mwy VT Sim and the Rur VT Sim

Table 2
Post hoc pairwise comparisons for all dependent measures
SLv1 SLv2 SLv3
Mwy
VT Sim
Mwy
field
Rur
TC Sim
Rur
VT Sim
Mwy
VT Sim
Mwy
field
Rur
TC Sim
Rur
VT Sim
Mwy
VT Sim
Mwy
field
Rur
TC Sim
Rur
VT Sim
BL Percent road centre
(visual task)
* * * * * * * * * * * *
Percent road centre
(auditory task)
* * – – * – – – * – – –
Standard Deviation of Gaze * * * * * * * * * * * *
SLv1 Mean glance duration * – n/a – * * n/a *
Standard deviation of
glance duration
* n/a n/a – * n/a n/a *
Percent glances exceeding 2 s * n/a n/a – * n/a n/a *
Glance frequency * – n/a * * – n/a *
Total glance duration * – n/a * * * n/a *
Percent road centre
(visual task)
* – * * * * * *
Percent road centre
(auditory task)
– – – – – – – –
Standard deviation of gaze – – – – – – – –
SLv2 Mean glance duration – * n/a *
Standard deviation of
glance duration
– n/a n/a *
Percent glances exceeding 2 s – n/a n/a *
Glance frequency – * n/a –
Total glance duration – * n/a *
Percent road centre
(visual task)
– * * *
Percent road centre
(auditory task)
– – – –
Standard deviation of gaze – – – –
n/a = not applicable.* p < .05.
– p > .05.
T.W.Victo
retal./TransportationResea
rchPartF8(2005)167–190
179

5
6
7
8
9
10
11
SLv1 SLv2 SLv3
Gla
nce
Freq
uenc
y
Mw y VTSim
Mw y Field
Rur VT Sim Straight
Rur VT Sim Curve
Fig. 5. Glance frequency in the three visual task difficulty levels.
0.0
5.0
10.0
15.0
20.0
25.0
30.0
35.0
SLv1 SLv2 SLv3
Perc
ent G
lanc
edu
ratio
ns>
2s
Mw y VTSim
Rur VT Sim Straight
Rur VT Sim Curve
Fig. 4. Percent glance durations exceeding 2 s for the three visual task difficulty levels.
180 T.W. Victor et al. / Transportation Research Part F 8 (2005) 167–190
showed similar results. The Mwy field results were also similar to these with the anomalous excep-tion of SLv2.
3.1.5. Total glance duration (TGD)Total glance duration is the total amount of time which glances are associated with the S-IVIS
display. Visual task difficulty produced strong increases in total glance duration, and these differ-ences were more pronounced than the other glance based measures, see Fig. 6. Drivers spentgreater amounts of time looking away from the road when they are performing more demandingin-vehicle tasks. Significant SLv main effects were found in Mwy VT Sim F(2,36) = 33.71, p < .01,Mwy field F(2,32) = 77.33, p < .001, and Rur VT Sim F(2,44) = 40.45, p < .001. Total glanceduration yielded the largest number of significant differences of all the five glance based measuresin the post hoc tests (Table 2). Total glance duration in SLv3 was significantly longer than SLv1 inall data sets. SLv3 was significantly larger than SLv2 only in the Mwy field and Rur VT Sim datasets. SLv 2 was significantly larger than SLv1 only in the Mwy VT Sim and Rur VT Sim data sets.

5
6
7
8
9
10
11
12
13
14
15
SLv1 SLv2 SLv3
Tota
l Gla
nce
Dur
atio
n(s
)
Mw y VT Sim
Mw y Field
Rur VT Sim Straight
Rur VT Sim Curve
Fig. 6. Total glance duration in the three visual task difficulty levels.
T.W. Victor et al. / Transportation Research Part F 8 (2005) 167–190 181
Significantly shorter total glance duration was shown for curves than straight sections in theRur VT Sim data set F(1,28) = 16.75, p < .001. The Mwy field data were considerably lower thanthe other data except for a portion of the Rur VT Sim curve data.
3.1.6. Percent road centre (PRC) in the visual task
Percent road centre is the percentage of gaze data points labelled as fixations during a task thatfall within the road centre area. Thus, the calculation of percent road centre does not require thegaze signal to be segmented into glances. Calculations based on gaze data (raw eye movementdata not segmented into fixations and saccades) would probably have yielded similar results.Importantly, PRC was the only measure that could be calculated for baseline driving, and forboth the visual and auditory task types.
In the data analyzed at Volvo (the Mwy field and VT Sim experiment data) the road centre areawas defined as a circle of 16� diameter, centred around the road centre point. For each subject, theroad centre point was determined as the mode, or most frequent gaze angle. The mode was cal-culated by binning the data in 128 · 128 bins for a 120 · 120� portion of the data in the forwardview. For the Rur TC Sim data, the road centre area was defined as a 20� (horizontal) · 15� (ver-tical) rectangular area centred around the road centre point, determined as subject�s mean fixa-tion. Mean fixation was calculated by including only those fixations that were in the forwardview (i.e. the central projection screen).
Percent road centre decreased sharply from baseline when a visual task was performed and de-creased further as task difficulty increased, as can be seen in Fig. 7. The drop from baseline drivingto SLv1 was comparatively the largest. Significant task difficulty main effects were found in alldata sets; Mwy VT Sim F(2,38) = 15.48, p < .001, Mwy field F(3,49) = 90.27, p < .001, Rur TCSim F(3,66) = 68.71, p < .001, and Rur VT Sim F(2,41) = 43.41, p < .001. As shown in Table 2,subjects looked significantly less at the road centre area in all visual tasks (SLv1–3) as comparedto baseline driving. Additionally, subjects looked significantly less at the road centre in SLv3 thanin SLv1 in all data sets. Slv2 produced significantly less gazing at the road centre than SLv1 in alldata sets except Mwy field. Finally, SLv3 caused significantly less gazing at road centre than SLv2in all data sets except Mwy VT Sim. Thus, PRC was able to discriminate between each difficultylevel as well as baseline.

30
40
50
60
70
80
90
Base
line
SLv1
SLv2
SLv3
Base
line
SLv1
SLv2
SLv3
Visual Task Auditory Task
Perc
ent R
oad
Cen
tre Mwy VTSim
Mwy Field
Rur TCSim Straight
Rur TCSim Curve
RurVT Sim Straight
RurVT Sim Curve
Fig. 7. Percent road centre in the visual and auditory tasks, including baselines and the three task difficulty levels per
task type.
182 T.W. Victor et al. / Transportation Research Part F 8 (2005) 167–190
Subjects looked significantly more at the road centre area in curves than in straight sections inboth the Rur VT Sim F(1,52) = 5.23, p < .05 and Rur TC Sim F(1,25) = 5.42, p < .05 data sets.
3.2. Auditory task
3.2.1. Percent road centre in the auditory task
Percent road centre increased when the auditory tasks were performed, as can be seen in Fig. 7.However, task difficulty main effects were only found in the Mwy VT Sim F(3,65) = 82.10,p < .001. As shown in Table 2, subjects looked significantly more at road centre in SLv1 thanin baseline driving in the Mwy VT Sim and Mwy field data sets. SLv2 and SLv3 also producedsignificantly more gazing at road centre than baseline in the Mwy VT Sim data set.
Subjects looked significantly more at road centre in curves than in straight sections in the RurTC Sim data set F(1,23) = 6.34, p < .05, the same finding as PRC in the visual task. The Rur VTSim data showed the same trend. The baseline PRC is highest in rural curves, followed by ruralstraight sections, the simulated motorway and finally the field motorway. This same trend as isevident in the visual PRC data.
3.2.2. Standard deviation of gaze (SDG)Standard deviation of gaze is the standard deviation of the combined horizontal and vertical
angles. The combined angle is the square root of the sum of squared vertical and squared hori-zontal angles (Pythagoras theorem) and thus is a one-dimensional angle between the zero inter-cept and gaze point. Alternatively, it can be calculated using distance in cm between thefixation points after gaze is projected onto a forward plane. For the Mwy field and VT Sim datasets, standard deviation of gaze was calculated by combining the horizontal (yaw) and vertical(pitch) gaze angle components using Pythagoras theorem. For the TC Sim data set. standard devi-ation of gaze was similarly calculated using gaze position instead of gaze angle.

0
2
4
6
8
10
12
Baseline SLv1 SLv2 SLv3
SDof
Gaz
e An
gle
(deg
)
1015202530354045505560
SD o
f Gaz
e Po
sitio
n (c
m)
Mwy VT SimMwy FieldRur VT Sim StraightRur VT Sim CurveRur TC Sim StraightRur TC Sim Curve
Fig. 8. Standard deviation of gaze in the auditory tasks, including baselines and the three task difficulty levels. Note
that Rur TC Sim Straight, and Rur TC Sim Curve data in cm are on right Y-axis, the rest of the data reads to the left in
degrees.
T.W. Victor et al. / Transportation Research Part F 8 (2005) 167–190 183
Standard deviation of gaze was reduced when the auditory tasks were performed, as can be seenin Fig. 8. Significant main effects for task difficulty were found in all data sets, Mwy VT SimF(3,69) = 8.34, p < .001, Mwy field F(3,65) = 7.61, p < .001, Rur TC Sim F(3,70) = 10.86,p < .001, and Rur VT Sim F(3,65) = 3.88, p < .05. The reductions from baseline ranged at mostbetween 23% and 37%. Standard deviation of gaze was significantly reduced in all auditory taskscompared to baseline, as can be seen in Table 2. There was a tendency that gaze was more con-centrated in curves than in straight sections. Also in line with the other results, gaze is more con-centrated in rural driving than in motorway driving. The difference between the field motorwayand the simulated motorway is also very evident. All in all, the gaze concentration effect was muchmore pronounced in the standard deviation of gaze measure than in the PRC measure.
3.3. Sensitivity of dependent variables
The pairwise comparisons for the visual task in Table 2 show that all measures were sensitive tovisual task difficulty. Percent road centre was sensitive in 22 (92%) of 24 pairwise comparisons,including comparisons with baseline. Total glance duration was sensitive in 7 (78%) of 9 compar-isons, followed by Mean glance durations at 6 (67%) of 9, and glance frequency at 5 (56%) of 9.Standard deviation of glance duration and percent of glances exceeding 2 s were both sensitive in4 (80%) of 5 comparisons.
The pairwise comparisons for the auditory task in Table 2 show that both standard deviation ofgaze and percent road centre were sensitive to task difficulty. Standard deviation of gaze was mostsensitive in 12 (50%) of 24 pairwise comparisons and Percent road centre was sensitive to 4 (17%)of 24 comparisons.
3.4. Sensitivity of road environments
Regarding road type sensitivity to the visual task, Table 2 shows that the Rur VT Sim data setwas sensitive in 17 (81%) of 21 pairwise comparisons, followed by Mwy VT Sim�s 15 (71%) of 21,

184 T.W. Victor et al. / Transportation Research Part F 8 (2005) 167–190
Mwy field�s 10 (67%) of 15, and Rur TC Sim�s 6 (100%) of 6. For the auditory task, the Mwy VTSim data set was most sensitive in 6 (50%) of 12 pairwise comparisons, followed by Mwy field�s 4(33%) of 12, and Rur VT Sim, and Rur TC Sim which showed a sensitivity in 3 (25%) of 12comparisons.
4. Discussion
In-vehicle tasks requiring vision cause drivers to look less at the road ahead and look more of-ten, for longer periods, and for more varied durations at the in-vehicle display. Auditory taskscause drivers to look more concentrated at the road centre area at the expense of glances tothe road scene periphery, (e.g. signs), and at the expense of glances inside the vehicle, (e.g. thespeedometer). Density plots of eye movement behavior also show a dramatically increased con-centration of gaze to the road centre area when the drivers look back to the road scene while per-forming visual tasks. The results clearly show that drivers adapt their eye movement behaviour tothe driving task complexity, as shown in differences between the rural curves and straight sections,rural and motorway road types, simulator and field motorways, and different simulators. In gen-eral, drivers increase viewing time in the road centre area when demands increase; either as a con-sequence of looking away from the road during visual tasks, as a consequence of cognitive orauditory task demands, or as a consequence of increased driving task demands.
4.1. Effects of visual and auditory task types
The visual and auditory task types caused very different types of changes to eye movementbehavior. Visual tasks cause drivers to look away from the road, and auditory tasks cause driversto concentrate their gaze to the road centre area. The baseline and auditory task density plots inFig. 1 are very similar to those plotted in Nunes and Recarte (2002), showing a concentration ofgaze in auditory tasks. But Fig. 1 shows something new-gaze concentration of on-road glances invisual tasks have not previously been visualized. One important similarity between the visual andauditory task is that the gaze concentration effect intensifies quite dramatically when a visual taskis introduced. So, in addition to losing information about the driving environment when lookingat an in-vehicle display, the returning glances to the road are aimed increasingly at the road centreduring a visual task. Although no metrics of the spatial concentration of gaze in the forward viewduring the visual task are provided here, the effect is evident in Fig. 1(c) and significant in Victorand Johansson (submitted for publication).
All visual task measures reflected the time-sharing character of the eye movements betweenroad and the in-vehicle display. With PRC and the glance-based measures both sides of thetime-sharing behaviour are captured. Although all visual tasks here were 30 s long, comparisonsto real-world tasks are possible given the stability generally found in glance based measures. SLv1in the visual task is comparable to the radio task data reported by Dingus et al. (1989) and Victorand Johansson (submitted for publication) with total glance durations in the seven second range.SLvs2–3 are roughly equivalent to a moderate-to-difficult navigation system tasks, also reportedin Dingus et al., and Victor and Johansson. Other than the check glances, the glance distributionsare very similar to previously reported data (e.g. Rockwell, 1988).

T.W. Victor et al. / Transportation Research Part F 8 (2005) 167–190 185
Qualitative comparisons show that the auditory task had about the same or weaker effects thanthose reported in literature. Harbluk et al. (2002) found a significant increase in percent road cen-tre from a baseline of 78.6% to a task at 82.7% and Victor and Johansson found an increase froma baseline of 80.5% to a task at 89.4%. Recarte and Nunes (2000) and Nunes and Recarte (2002)showed an on-road reduction in standard deviation of gaze from 8.9� to 11� in baseline to a taskat 5.9�, Victor and Johansson (submitted for publication) found a reduction from motorway base-line of 9.2� to a task at 5�. Hammel et al. (2002) found a reduction in their simulator from 8.2� atbaseline to a task at 5.3�. The Mwy field data in our study shows less gaze concentration overallthan have otherwise been found in the field, perhaps because of a more relaxed driving environ-ment than otherwise has been tested on-road, but the simulator data are very similar to previousresults.
4.2. Effects of increasing task difficulty
As the visual task became more difficult, all measures clearly showed that drivers look more atthe display and less at the road ahead. Although this is a rather intuitive finding and is supportedby all literature, the task difficulty is systematically controlled here. We are also able to show herethe relative sensitivity of the measures, i.e. that percent road centre is most sensitive to task dif-ficulty, followed by total glance duration (see below). Importantly, the different measures reflectdifferent aspects of the changes to behavior (e.g. frequency, length, variance). For example, fre-quent short glances and infrequent long glances may yield the same PRC or TGD value. Ifchanges in glance strategy are of interest then measures of frequency and glance duration charac-teristics are needed.
Although the results show significant gaze concentration caused by the auditory task (measuredby SDG and PRC) in comparison with baseline, they do not show significant increases in gazeconcentration between tasks (SLv1–3). To our knowledge, significant differences between differentauditory or cognitive tasks in gaze concentration have not been shown previously in other re-search either, only differences with baseline. In general, the changes to eye movements causedby the auditory task were weaker in magnitude than the effects of the visual task. In this particulartask, one explanation for the apparent reduction in more difficult tasks as compared to the easiertask (SLv1) could be that drivers may have found the task too difficult and stopped trying onsome of the sounds, thereby freeing up cognitive resources, which in turn counteracted the gazeconcentration effect.
4.3. Effects of driving task complexity
Drivers adapt their eye movement behaviour to the driving environment. In general, theyincrease viewing time in the road centre area when driving task difficulty increases, as evidencedby the spatial gaze concentration being highest in the rural curves, followed by rural straightsections, the simulated motorway, and the field motorway. In curves, drivers consistently showshorter single glance durations, fewer glances exceeding 2 s, less variation of single glance dura-tions, less total glance duration, and higher proportion of fixations on the road centre region.These findings are in line with previous research (e.g. Wierwille, 1993a, 1993b; Senders et al.,1967).

186 T.W. Victor et al. / Transportation Research Part F 8 (2005) 167–190
The field motorway had a lower baseline PRC than the other road types, indicating that thepath control task did not require as much visual guidance and/or that there was simply moreto look at. Importantly, drivers were also less susceptible to take their eyes off the road to dothe in-vehicle tasks than they were in the simulated roads, as indicated by the disappearance ofcheck glances, shorter durations and less frequent glances to the display. Perhaps this reflects adifference in perceived risk between these settings. More comparative research is needed.
4.4. Implications of off-road glances and gaze concentration for safety
As reported in Engstrom et al. (this issue), results from the Mwy field and VT Sim studies alsoshow that the amount of time spent looking at road centre has a strong relationship to path-con-trol measures. As expected, when drivers look away from the road in the visual task, standarddeviation of lane position deteriorates. But Engstrom et al. also show that the increased spatialgaze concentration in the auditory tasks is associated with improved lane keeping performance(reduced lateral variation and an increased number of steering microcorrections). Similarly, Hor-rey and Wickens (2004) have shown in a review that the impact of talking on a mobile phone ondriving performance is primarily on reaction time, not tracking performance. Seppelt and Wic-kens (2003) also come to the conclusion that drivers prioritize their lane keeping performanceand do not protect their hazard response from interference. Recarte and Nunes (2000, 2003) haveshown that the gaze concentration effect is associated with loss of peripheral event detection capa-bility. Recognition of events and hazards, as well as planning-related eye movements generally re-quire eye movements away from road centre region towards peripheral objects (e.g. signs, othervehicles, pedestrians). Taken together, these findings indicate that drivers prioritize the visualguidance of their path-control task over recognition and planning tasks.
4.5. Sensitivity and suitability of eye movement measures
Percent road centre was the most sensitive measure and was alone in being able to compareboth visual and auditory task types with baseline driving. The most sensitive visual task measureswere those where glance duration and frequency are implicitly combined––percent road centreand Total glance duration. But if changes in glance strategy are of interest then glance frequencyand percent glance durations exceeding 2 s or mean glance duration are recommended. In theauditory task, standard deviation of gaze was more than twice as sensitive as percent road centre.PRC only picked up the larger effects in the motorway data sets. Similarly, Harbluk et al. (2002)and Victor and Johansson (submitted for publication) both used PRC on the motorway whenthey found their effects. SDG is better because it is sensitive to the smaller changes in gaze con-centration in the rural environment. Yet curiously, it was in PRC that differences between curvedand straight road types were picked up.
Glance based measures are notoriously difficult and/or time consuming to collect and analyze.This is a main reason why they are not as frequently used as the vehicle performance measures.Measurements of glances are sensitive to signal noise because a glance is a rather long, cohesive,ordered sequence of data. The gaze signal noise in eye-trackers increases at larger visual angles, asthe eye rotates away from the camera. Therefore, sophisticated analysis procedures are required

T.W. Victor et al. / Transportation Research Part F 8 (2005) 167–190 187
so that the noise does not break up one glance into several smaller glances. Importantly, measure-ment accuracy is better in the forward view, and therefore, it makes more sense to measure wherethe accuracy is best (as in PRC) rather than at the limits of measurement (measuring glances todisplays at large visual angles). Other factors, such as seating position and movement front- orbackwards greatly change the visual angles to eccentric displays, whereas the central area remainscentral.
In contrast to glance-based measures, PRC and SDG do not rely on measuring an ordered se-quence of data, only on measuring single data points, and thus they are more robust and easier tomeasure. Note that PRC and SDG, could have been based on raw, unfiltered, unsegmented gazedata. Eye movement measures can be further developed and improved upon.
4.6. Determining visual behavior safety criteria
At what point does a task become unsafe? Suggestions for safety norms have been proposed.European Commission (1998) recommends a maximum of two second single glance duration,which is a little difficult to interpret, and a maximum of four glances per task. It seems unneces-sarily restrictive that evidence of a single glance longer than two seconds by a single subject couldcreate a fail situation. AAM (2002) single glance duration recommendation includes the words‘‘generally should not exceed 2 s’’ (p. 23) which makes more sense given the fact that percentagesof glances longer than two seconds are often above 10% (e.g. Rockwell, 1988; Victor & Johansson,submitted for publication). A threshold for what constitutes ‘‘generally greater’’ can be deter-mined by setting a threshold value on the PGD > 2 measure. Arguably, the PGD > 2 measure car-ries more quantifiable and safety relevant information than mean glance duration.
Various total glance duration recommendations have also been made, for example 20 s (AAM,2002). However, these safety norms cannot be used to compare tasks with baseline driving, asPRC and SDG can. Using PRC and SDG, it is possible to create new safety thresholds thatare relative to baseline driving. Thus, a task can be evaluated with respect to its impact upon nor-mal driving. Clearly, more consideration of this issue is required.
4.7. Conclusions
During visual tasks drivers dramatically reduce their viewing time in the road centre area andspatially concentrate the few exterior fixations they do make to the road centre area. In contrast,auditory tasks cause drivers to increase their road viewing time and to spatially concentrate theirgaze at the road centre area at the expense of peripheral glances. As driving task complexity in-creases, drivers similarly increase their road viewing time and spatially concentrate their gaze onthe road centre area. It can be expected that these behaviors are closely tied to correspondingevent detection performance changes and changes in lane keeping measures. In general, percentroad centre and standard deviation of gaze were more robust, reliable, easier to calculate, andmore sensitive than glance-based measures.
These findings point out the importance of visual guidance for continuous actions. Just as �gazelead� is critical for the execution of everyday activities (Land & Hayhoe, 2001), it is critical fordriving performance.

188 T.W. Victor et al. / Transportation Research Part F 8 (2005) 167–190
Acknowledgements
We thank Geoff Ho, Emma Johansson, Petter Larsson, Anders Agnvall, Joakim Ostlund, theCognitive Ergonomics Research Lab (CERL) at the University of Calgary, the University of Cal-gary Driving Simulator (UCDS), and the Swedish National Road and Transport Research Insti-tute (VTI) for assistance.
References
Dingus, T. A., Antin, J. F., Hulse, M. C., & Wierwille, W. W. (1989). Attentional demand requirements of a moving-
map navigation system. Transportation Research A, 23(4), 301–315.
Engstrom, J. A., Johansson, E. J., & Ostlund, J. (this issue). Effects of visual and cognitive load in real and simulated
motorway driving. Transportation Research: Part F.
European Commission (1998). European statement of principles on human machine interface for in-vehicle information
and communication systems. Expansion of the principles. November. Directorate-General XIII.
Findlay, J. M., & Gilchrist, I. D. (2003). Active vision: The psychology of looking and seeing. Oxford: Oxford
University Press.
Green, P. (1999). Visual and task demands of driver information systems (Technical Report No. UMTRI-98-16). Ann
Arbor, MI: The University of Michigan, Transportation Research Institute.
Green, M. (2000). ‘‘How long does it take to stop?’’ Methodological analysis of driver perception-brake times.
Transportation Human Factors, 2(3), 195–216.
Hammel, K. R., Fisher, D. L., & Pradhan, A. K. (2002). Verbal and spatial loading effects on eye movements in driving
simulators: A comparison to real world driving. In Proceedings of the human factors and ergonomics society 46th
annual meeting (pp. 2174–2178).
Harbluk, J. L., Noy, Y. I., & Eizenman, M. (2002). The impact of cognitive distraction on driver visual behaviour and
vehicle control. Transport Canada Technical Report. Available from http://www.tc.gc.ca/roadsafety/tp/tp13889/en/
menu.htm.
Horrey, W. J., & Wickens, C. D. (2004). The impact of cell phone conversations on driving: A meta-analytic approach
(Technical Report AHFD-04-2/GM-04-1). Warren, MI: General Motors Cooperation.
ISO 15007-1. Road vehicles––Measurement of driver visual behaviour with respect to transport information and control
systems Part 1: Definitions and parameters.
ISO 15007-2. Road vehicles––Measurement of driver visual behaviour with respect to transport information and control
systems Part 2: Equipment and procedures.
Jamson, H., & Merat, N. (this issue). Surrogate in-vehicle information systems and driver behaviour: Effects of visual
and cognitive load in simulated rural driving. Transportation Research: Part F.
Lamble, D., Laakso, M., & Summala, H. (1999). Detection thresholds in car following situations and peripheral vision:
Implications for positioning of visually demanding in-car displays. Ergonomics, 42(6), 807–815.
Land, M. F. (1998). The visual control of steering. In L. R. Harris & M. Jenkin (Eds.), Vision and Action (pp. 163–180).
Cambridge: Cambridge University Press.
Land, M. F., & Horwood, J. (1995). Which parts of the road guide steering? Nature, 377, 339–340.
Land, M. F., & Lee, D. N. (1994). Where we look when we steer. Nature, 369, 742–744.
Land, M. F., & Hayhoe, M. (2001). In what ways do eye movements contribute to everyday activities? Vision Research,
41, 3559–3565.
Lansdown, T. C. (2001). Causes, measures, and effects of driver visual workload. In P. A. Hancock & P. A. Desmond
(Eds.), Stress, workload, and fatigue (pp. 351–369). NJ: Erlbaum.
Lansdown, T. C., & Fowkes, M. (1998). An investigation into the utility of various metrics for the evaluation of driver
information systems. In A. G. Gale, I. D. Brown, C. M. Haslegrave, & S. P. Taylor (Eds.), Vision in vehicles (Vol.
VI, pp. 215–232). Amsterdam: North-Holland.

T.W. Victor et al. / Transportation Research Part F 8 (2005) 167–190 189
Larsson, P. (2003). Automatic visual behavior analysis (ISRN LITH-ISY-EX-3259-2002). M.Sc. Dissertation.
Linkoping, Sweden: Linkoping University.
Leigh, R. J., & Zee, D. S. (1999). The neurology of eye movements. Oxford: Oxford University Press.
Mack, A., & Rock, I. (1998). Inattentional blindness. Cambridge: MIT Press.
Neumann, O., & Sanders, A. F. (1996). Handbook of perception and action. Attention (Vol. 3). San Diego: Academic
Press.
Nunes, L., & Recarte, M. A. (2002). Cognitive demands of hands-free-phone conversation while driving. Transportation
Research Part F, 5, 133–144.
Olsson, S., & Burns, P. C. (2000). Measuring driver visual distraction with a peripheral detection task. Available from
www-nrd.nhtsa.dot.gov/departments/nrd-13/driver-distraction/Welcome.htm.
Ostlund, J., Nilsson, L., Carsten, O., Merat, N., Jamson, H., Jamson, S., et al. (2004). Deliverable 2––HMI and safety-
related driver performance (Report No. GRD1/2000/25361 S12.319626). Human Machine Interface And the Safety
of Traffic in Europe (HASTE) Project.
Recarte, M. A., & Nunes, L. M. (2000). Effects of verbal and spatial-imagery tasks on eye fixations while driving.
Journal of Experimental Psychology: Applied, 6(1), 31–43.
Recarte, M. A., & Nunes, L. M. (2003). Mental workload while driving: Effects on visual search, discrimination and
decision making. Journal of Experimental Psychology: Applied, 9(2), 119–137.
Rensink, R. A. (2002). Change detection. Annual Review of Psychology, 53, 245–277.
Rockwell, T. H. (1972). Eye movement analysis of visual information acquisition in driving: An overview. In:
Proceedings of the 6th biennial conference of the Australian road research board, August 1972, Canberra (pp. 316–
331).
Rockwell, T. H. (1988). Spare visual capacity in driving-revisited: new empirical results for an old idea. In A. G. Gale,
M. H. Freeman, C. M. Haslegrave, P. Smith, & S. P. Taylor (Eds.), Vision in vehicles (Vol. II, pp. 317–324).
Amsterdam: North-Holland.
Rumar, K. (1990). The basic driver error: Late detection. Ergonomics, 33(10/11), 1281–1290.
Senders, J. W., Kristofferson, A. B., Levison, W. H., Dietrich, C. W., & Ward, J. L. (1967). The attentional demand of
automobile driving. Highway Research Record, 195, 15–33.
Seppelt, B., & Wickens, C. D. (2003). In-vehicle tasks: Effects of modality, driving relevance, and redundancy (Technical
Report AHFD-03-16/GM-03-2). Aviation Human Factors Division, University of Illinois at Urbana-Champaign.
Shelton, L. R. (2001). Statement before the subcommittee on highways and transit, committee on transportation and
infrastructure, U.S. house of representatives, May 9, 2001. Available from http://www.nhtsa.dot.gov/nhtsa/announce/
testimony/distractiontestimony.html.
Stelmach, L. B., Bourassa, C. M., & di Lollo, V. (1984). Detection of stimulus change: The hypothetical roles of visual
transient responses. Perception and Psychophysics, 35(3), 245–255.
Summala, H., Nieminen, T., & Punto, M. (1996). Maintaining lane position with peripheral vision during in-vehicle
tasks. Human Factors, 38(3), 442–451.
The Alliance of Automobile Manufacturers (AAM) (2002). Statement of principles on human–machine interface
(HMI) for in-vehicle information and communication systems. Available from http://autoalliance.org/archives/
000098.html.
Treat, J. R., Tumbas, N. S., McDonald, S. T., Shinar, D., Hume, R. D., Mayer, R. E., et al. (1977). Tri-level study of the
causes of traffic accidents: Final report––executive summary (Technical Report DOT HS 805 099). US Washington,
DC: Department of Transportation, National Highway Traffic Safety Administration.
Victor, T., & Johansson, E. (submitted for publication). Using eye movements to measure driving information loss
while performing secondary tasks.
Victor, T., Blomberg, O., & Zelinsky, A. (in press). Automating driver visual behavior measurement. Vision in Vehicles
9.
Wann, J. P., & Swapp, D. K. (2000). Why you should look where you are going. Nature Neuroscience, 3(7), 647–648.
Wann, J. P., & Swapp, D. K. (2001). Where do we look when we steer and does it matter? Journal of Vision, 1(3), 185a,
doi:10.1167/1.3.185, http://journalofvision.org/1/3/185.
Wierwille, W. W. (1993a). Visual and manual demands of in-car controls and displays. In B. Peacock & W. Karwowski
(Eds.), Automotive ergonomics (pp. 299–320). London: Taylor and Francis.

190 T.W. Victor et al. / Transportation Research Part F 8 (2005) 167–190
Wierwille, W. W. (1993b). An initial model of visual sampling of in-car displays and controls. In A. G. Gale, I. D.
Brown, C. M. Haslegrave, H. W. Kruysse, & S. P. Taylor (Eds.), Vision in vehicles 4 (pp. 271–282). Amsterdam:
North-Holland.
Wierwille, W. W., Antin, J. F., Dingus, T. A., & Hulse, M. C. (1988). Visual attentional demand of an in-car navigation
display system. In A. G. Gale, M. H. Freeman, C. M. Haslegrave, P. Smith, & S. P. Taylor (Eds.), Vision in vehicles
2 (pp. 307–316). Amsterdam: North-Holland.
Wierwille, W. W., & Tijerina, L. (1998). Modelling the relationship between driver in-vehicle visual demands and
accident occurrence. In A. G. Gale, I. D. Brown, C. M. Haslegrave, & S. P. Taylor (Eds.), Vision in vehicles 6
(pp. 233–244). Amsterdam: North-Holland.
Zwahlen, H. T., Adams, C. C., Jr., & de Bald, D. P. (1988). Safety aspects of CRT touch panel controls in automobiles.
In A. G. Gale et al. (Eds.), Vision in vehicles 2 (pp. 335–344). The Netherlands: North Holland.