Extreme electric fields power catalysis in the active site of ketosteroid isomerase
58
magnetosphere can attain when the IMF points northward. REFERENCES AND NOTES 1. J. W. Dungey, Phys. Rev. Lett. 6, 47–48 (1961). 2. J. W. Dungey, in Geophysics: The Earth’s Environment, C. DeWitt, J. Hieblot, A. Lebeau, Eds. (Gordon and Breach, New York, 1963), pp. 505–550. 3. J. D. Menietti, J. L. Burch, J. Geophys. Res. 92, 7503–7518 (1987). 4. Q. Q. Shi et al., Nat. Commun. 4, 1466 (2013). 5. C. Y. Huang et al., J. Geophys. Res. 92, 2349–2363 (1987). 6. C. Y. Huang, J. D. Craven, L. A. Frank, J. Geophys. Res. 94, 10137–10143 (1989). 7. L. A. Frank, J. D. Craven, J. L. Burch, J. D. Winningham, Geophys. Res. Lett. 9, 1001–1004 (1982). 8. L. A. Frank et al., J. Geophys. Res. 91, 3177–3224 (1986). 9. W. K. Peterson, E. G. Shelley, J. Geophys. Res. 89, 6729–6736 (1984). 10. S. E. Milan, B. Hubert, A. Grocott, J. Geophys. Res. 110, A01212 (2005). 11. D. A. Hardy, W. J. Burke, M. S. Gussenhoven, J. Geophys. Res. 87, 2413–2430 (1982). 12. M. S. Gussenhoven, E. G. Mullen, J. Geophys. Res. 94, 17121–17132 (1989). 13. N. Østgaard, S. B. Mende, H. U. Frey, L. A. Frank, J. B. Sigwarth, Geophys. Res. Lett. 30, 2125 (2003). 14. R. C. Fear, S. E. Milan, J. Geophys. Res. 117, A03213 (2012). 15. A. Kullen, M. Brittnacher, J. A. Cumnock, L. G. Blomberg, J. Geophys. Res. 107, 1362 (2002). 16. N. Østgaard et al., J. Atmos. Sol. Terr. Phys. 69, 249–255 (2007). 17. A. Goudarzi, M. Lester, S. E. Milan, H. U. Frey, Ann. Geophys. 26, 201–210 (2008). 18. J. A. Cumnock et al., J. Geophys. Res. 116, A02218 (2011). 19. A. Kullen, in Auroral Phenomenology and Magnetospheric Processes: Earth and Other Planets, A. Keiling, E. Donovan, F. Bagenal, T. Karlsson, Eds. (Geophysical Monograph 197, American Geophysical Union, Washington, DC, 2012), pp. 69–80. 20. R. C. Fear, S. E. Milan, J. Geophys. Res. 117, A09230 (2012). 21. A. P. Walsh et al., J. Geophys. Res. 118, 6042–6054 (2013). 22. S. B. Mende et al., Space Sci. Rev. 91, 271–285 (2000). 23. N. A. Tsyganenko, in Proceedings of the Third International Conference on Substorms (ICS-3), Versailles, France, 12 to 17 May 1996 (SP 389, European Space Agency, Noordwijk, Netherlands, 1996), pp. 181–185. 24. C. T. Russell, Cosmic Electrodyn. 2, 184–196 (1971). 25. J. H. King, N. E. Papitashvili, J. Geophys. Res. 110, A02104 (2005). 26. A. N. Fazakerley et al ., in The Cluster Active Archive - Studying the Earth’ s Space Plasma Environment, H. Laakso, M. Taylor, P. Escoubet, Eds. (Springer, Dordrecht, Netherlands, 2010), pp. 129–144. 27. H. Rème et al., Ann. Geophys. 19, 1303–1354 (2001). ACKNOWLEDGMENTS Work in the UK was supported by Science and Technology Facilities Council (STFC) Ernest Rutherford Fellowship ST/K004298/1 and STFC grants ST/K001000/1 and ST/K000977/1. R.M. is supported by the Belgian Science Policy Office through the Solar-Terrestrial Center of Excellence. French participation in the Cluster project is funded by the Centre National d’Etudes Spatiales (CNES). IMAGE satellite work at the University of California, Berkeley, was supported through a Southwest Research Institute subcontract under NASA contract NAS5-96020. We acknowledge support from the International Space Science Institute through funding of its International Team on Polar Cap Arcs, and we are grateful for discussions with members of the team. Cluster data were obtained from the Cluster Active Archive (http://caa.estec.esa.int/caa/), and the IMAGE FUV data were provided by the NASA Space Science Data Center (http://nssdc. gsfc.nasa.gov/space/). The OMNI IMF data were obtained through NASA’s CDAWeb (http://cdaweb.gsfc.nasa.gov/), for which we acknowledge J. H. King, N. Papatashvilli, and the principal investigators of the magnetic field and plasma instruments on the Geotail and Advanced Composition Explorer (ACE) spacecraft. The DMSP particle detectors were designed by D. Hardy of Air Force Research Laboratory, and data were obtained from the Johns Hopkins University Applied Physics Laboratory. SUPPLEMENTARY MATERIALS www.sciencemag.org/content/346/6216/1506/suppl/DC1 Supplementary Text Fig. S1 References (28–38) Movie S1 12 June 2014; accepted 19 November 2014 10.1126/science.1257377 BIOPHYSICS Extreme electric fields power catalysis in the active site of ketosteroid isomerase Stephen D. Fried,* Sayan Bagchi,† Steven G. Boxer‡ Enzymes use protein architecture to impose specific electrostatic fields onto their bound substrates, but the magnitude and catalytic effect of these electric fields have proven difficult to quantify with standard experimental approaches. Using vibrational Stark effect spectroscopy, we found that the active site of the enzyme ketosteroid isomerase (KSI) exerts an extremely large electric field onto the C=O chemical bond that undergoes a charge rearrangement in KSI’ s rate-determining step. Moreover, we found that the magnitude of the electric field exerted by the active site strongly correlates with the enzyme’ s catalytic rate enhancement, enabling us to quantify the fraction of the catalytic effect that is electrostatic in origin. The measurements described here may help explain the role of electrostatics in many other enzymes and biomolecular systems. K etosteroid isomerase (KSI) is a small, pro- ficient enzyme with one of the highest known unimolecular rate constants in biochemistry (1, 2), which has prompted extensive study of its mechanism and the catalytic strategies it uses (3–5). In steroid biosyn- thesis and degradation, KSI alters the position of a C=C double bond (Fig. 1A) by first abstracting a nearby a proton (E•S ⇌ E•I), forming a charged enolate intermediate (E•I), and then reinserting the proton onto the steroid two carbons away (E•I ⇌ E•P). The removal of a proton in the first step initiates a rehybridization that converts the adjacent ketone group to a charged enolate, an unstable species that is normally high in free en- ergy and so slow to form. The reaction is therefore expected to produce an increase in dipole moment at the carbonyl bond ( jDm → rxn j), suggesting that KSI may facilitate this reaction by exerting an electric field (F → enz ) on this bond that stabilizes it in the intermediate form and the preceding transition state (Fig. 1B). Using vibrational Stark effects, we have measured the electric field that KSI exerts on this C=O bond, providing quantitative experimen- tal evidence for the connection between electro- statics and catalytic proficiency. The frequencies of certain vibrations (such as the C=O stretch) shift in a linear manner with the electric field experienced by that vibration from its environment, a phenomenon known as the linear vibrational Stark effect (6, 7). Through this effect, we have shown that vibrations can be used as probes of local electrostatic fields. The nitrile group has been widely deployed to mea- sure electric fields inside enzymes and their re- lationship to mutation (8), ligand occupancy (9), or conformational changes over the catalytic cycle (10). In this study, we have focused on the C=O group of the inhibitor 19-nortestosterone (19-NT) (Fig. 1C), because when 19-NT binds, the C=O group is loaded directly into the catalytic machinery ( 11, 12). In this way, 19-NT’ s C=O vibra- tional (infrared) frequency shift probes the electro- static environment that the substrate’ s C=O bond would experience in the active site, except 19-NT cannot react due to the position of the C=C bond. To calibrate the sensitivity of 19-NT’s C=O vi- brational frequency to an electric field, we used two complementary approaches. In Stark spec- troscopy (Fig. 2, A and B), an external electric field of known magnitude is applied to a frozen glass containing 19-NT, and the accompanying effect on the vibrational spectrum is recorded (7). By fitting the Stark spectrum (Fig. 2B) to deriv- atives of the absorption spectrum (Fig. 2A), the vibration’s difference dipole can be extracted: jDm → C¼O jƒ = 1.39 T 0.05 cm –1 /(MV/cm), where ƒ is the local field factor (fig. S1) (6, 7, 13). A vibra- tion’s difference dipole is its linear Stark tuning rate; that is, 19-NT’s C=O vibrational frequency shifts ~1.4/ƒ cm –1 for every MV/cm of electric field projected onto the C=O bond axis, whether the source of that field is an external voltage (as in Stark spectroscopy) or an organized environ- ment created by an enzyme active site (F → enz ) that we wish to characterize. Whenever an external field is applied to a vitreous sample, vibrational bands will broaden because 19-NT molecules (and their C=O bonds) are randomly oriented with respect to the fixed direction of the external electric field (6, 7). By contrast, a vibrational probe will have a fixed orientation with respect to a protein electric field when bound to a protein, and as such the linear Stark effect then produces spec- tral shifts instead of broadening. The C=O vibra- tion’ s Stark tuning rate does not appreciably change when C=O accepts a hydrogen bond (fig. S2), im- plying that the frequency still responds to fields linearly even when C=O participates in stronger interactions, although those interactions themselves are associated with larger electric fields (14). 1510 19 DECEMBER 2014 • VOL 346 ISSUE 6216 sciencemag.org SCIENCE Department of Chemistry, Stanford University, Stanford, CA 94305-1052, USA. *Present address: Protein and Nucleic Acid Chemistry Division, Medical Research Council Laboratory of Molecular Biology, Cambridge CB2 0QH, UK. †Present address: Physical and Materials Chemistry Division, National Chemical Laboratory (CSIR), Pune 411008, India. ‡Corresponding author. E-mail: [email protected] RESEARCH | REPORTS on December 18, 2014 www.sciencemag.org Downloaded from on December 18, 2014 www.sciencemag.org Downloaded from on December 18, 2014 www.sciencemag.org Downloaded from on December 18, 2014 www.sciencemag.org Downloaded from on December 18, 2014 www.sciencemag.org Downloaded from
Transcript of Extreme electric fields power catalysis in the active site of ketosteroid isomerase
magnetosphere can attain when the IMF pointsnorthward.
REFERENCES AND NOTES
1. J. W. Dungey, Phys. Rev. Lett. 6, 47–48 (1961).2. J. W. Dungey, in Geophysics: The Earth’s Environment,
C. DeWitt, J. Hieblot, A. Lebeau, Eds. (Gordon and Breach,New York, 1963), pp. 505–550.
3. J. D. Menietti, J. L. Burch, J. Geophys. Res. 92, 7503–7518 (1987).4. Q. Q. Shi et al., Nat. Commun. 4, 1466 (2013).5. C. Y. Huang et al., J. Geophys. Res. 92, 2349–2363 (1987).6. C. Y. Huang, J. D. Craven, L. A. Frank, J. Geophys. Res. 94,
10137–10143 (1989).7. L. A. Frank, J. D. Craven, J. L. Burch, J. D. Winningham,
Geophys. Res. Lett. 9, 1001–1004 (1982).8. L. A. Frank et al., J. Geophys. Res. 91, 3177–3224 (1986).9. W. K. Peterson, E. G. Shelley, J. Geophys. Res. 89, 6729–6736 (1984).10. S. E. Milan, B. Hubert, A. Grocott, J. Geophys. Res. 110, A01212 (2005).11. D. A. Hardy, W. J. Burke, M. S. Gussenhoven, J. Geophys. Res.
87, 2413–2430 (1982).12. M. S. Gussenhoven, E. G. Mullen, J. Geophys. Res. 94,
17121–17132 (1989).13. N. Østgaard, S. B. Mende, H. U. Frey, L. A. Frank,
J. B. Sigwarth, Geophys. Res. Lett. 30, 2125 (2003).14. R. C. Fear, S. E. Milan, J. Geophys. Res. 117, A03213 (2012).15. A. Kullen, M. Brittnacher, J. A. Cumnock, L. G. Blomberg,
J. Geophys. Res. 107, 1362 (2002).16. N. Østgaard et al., J. Atmos. Sol. Terr. Phys. 69, 249–255 (2007).17. A. Goudarzi, M. Lester, S. E. Milan, H. U. Frey, Ann. Geophys.
26, 201–210 (2008).18. J. A. Cumnock et al., J. Geophys. Res. 116, A02218 (2011).19. A. Kullen, in Auroral Phenomenology and Magnetospheric
Processes: Earth and Other Planets, A. Keiling, E. Donovan,F. Bagenal, T. Karlsson, Eds. (Geophysical Monograph 197,American Geophysical Union, Washington, DC, 2012), pp. 69–80.
20. R. C. Fear, S. E. Milan, J. Geophys. Res. 117, A09230 (2012).21. A. P. Walsh et al., J. Geophys. Res. 118, 6042–6054 (2013).22. S. B. Mende et al., Space Sci. Rev. 91, 271–285 (2000).23. N. A. Tsyganenko, in Proceedings of the Third International
Conference on Substorms (ICS-3), Versailles, France, 12 to 17May 1996 (SP 389, European Space Agency, Noordwijk,Netherlands, 1996), pp. 181–185.
24. C. T. Russell, Cosmic Electrodyn. 2, 184–196 (1971).25. J. H. King, N. E. Papitashvili, J. Geophys. Res. 110, A02104 (2005).26. A. N. Fazakerley et al., in The Cluster Active Archive - Studying the
Earth’s Space Plasma Environment, H. Laakso, M. Taylor, P. Escoubet,Eds. (Springer, Dordrecht, Netherlands, 2010), pp. 129–144.
27. H. Rème et al., Ann. Geophys. 19, 1303–1354 (2001).
ACKNOWLEDGMENTS
Work in the UK was supported by Science and TechnologyFacilities Council (STFC) Ernest Rutherford FellowshipST/K004298/1 and STFC grants ST/K001000/1 andST/K000977/1. R.M. is supported by the Belgian Science PolicyOffice through the Solar-Terrestrial Center of Excellence. Frenchparticipation in the Cluster project is funded by the Centre Nationald’Etudes Spatiales (CNES). IMAGE satellite work at the Universityof California, Berkeley, was supported through a SouthwestResearch Institute subcontract under NASA contract NAS5-96020.We acknowledge support from the International Space ScienceInstitute through funding of its International Team on Polar CapArcs, and we are grateful for discussions with members of theteam. Cluster data were obtained from the Cluster Active Archive(http://caa.estec.esa.int/caa/), and the IMAGE FUV data wereprovided by the NASA Space Science Data Center (http://nssdc.gsfc.nasa.gov/space/). The OMNI IMF data were obtained throughNASA’s CDAWeb (http://cdaweb.gsfc.nasa.gov/), for which weacknowledge J. H. King, N. Papatashvilli, and the principalinvestigators of the magnetic field and plasma instruments on theGeotail and Advanced Composition Explorer (ACE) spacecraft. TheDMSP particle detectors were designed by D. Hardy of Air ForceResearch Laboratory, and data were obtained from the JohnsHopkins University Applied Physics Laboratory.
SUPPLEMENTARY MATERIALS
www.sciencemag.org/content/346/6216/1506/suppl/DC1Supplementary TextFig. S1References (28–38)Movie S1
12 June 2014; accepted 19 November 201410.1126/science.1257377
BIOPHYSICS
Extreme electric fields powercatalysis in the active site ofketosteroid isomeraseStephen D. Fried,* Sayan Bagchi,† Steven G. Boxer‡
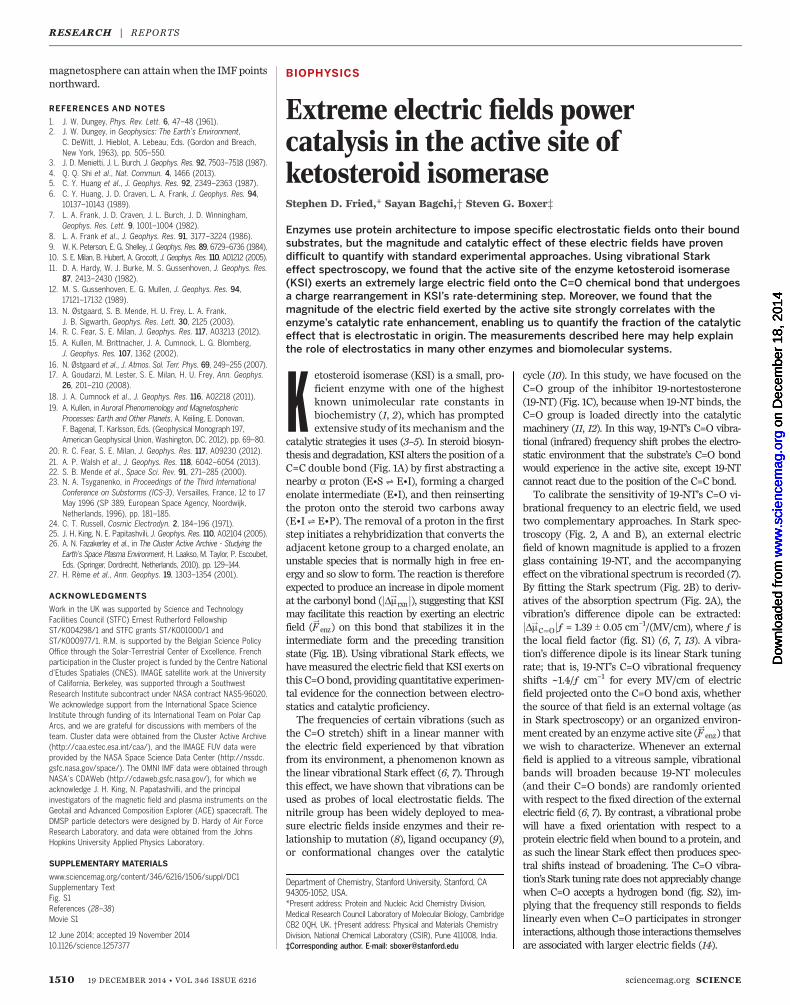
Enzymes use protein architecture to impose specific electrostatic fields onto their boundsubstrates, but the magnitude and catalytic effect of these electric fields have provendifficult to quantify with standard experimental approaches. Using vibrational Starkeffect spectroscopy, we found that the active site of the enzyme ketosteroid isomerase(KSI) exerts an extremely large electric field onto the C=O chemical bond that undergoesa charge rearrangement in KSI’s rate-determining step. Moreover, we found that themagnitude of the electric field exerted by the active site strongly correlates with theenzyme’s catalytic rate enhancement, enabling us to quantify the fraction of the catalyticeffect that is electrostatic in origin. The measurements described here may help explainthe role of electrostatics in many other enzymes and biomolecular systems.
Ketosteroid isomerase (KSI) is a small, pro-ficient enzyme with one of the highestknown unimolecular rate constants inbiochemistry (1, 2), which has promptedextensive study of its mechanism and the
catalytic strategies it uses (3–5). In steroid biosyn-thesis and degradation, KSI alters the position of aC=C double bond (Fig. 1A) by first abstracting anearby a proton (E•S ⇌ E•I), forming a chargedenolate intermediate (E•I), and then reinsertingthe proton onto the steroid two carbons away(E•I ⇌ E•P). The removal of a proton in the firststep initiates a rehybridization that converts theadjacent ketone group to a charged enolate, anunstable species that is normally high in free en-ergy and so slow to form. The reaction is thereforeexpected to produce an increase in dipole momentat the carbonyl bond (jDm→rxnj), suggesting that KSImay facilitate this reaction by exerting an electricfield (F
→
enz) on this bond that stabilizes it in theintermediate form and the preceding transitionstate (Fig. 1B). Using vibrational Stark effects, wehavemeasured the electric field that KSI exerts onthis C=Obond, providing quantitative experimen-tal evidence for the connection between electro-statics and catalytic proficiency.The frequencies of certain vibrations (such as
the C=O stretch) shift in a linear manner withthe electric field experienced by that vibrationfrom its environment, a phenomenon known asthe linear vibrational Stark effect (6, 7). Throughthis effect, we have shown that vibrations can beused as probes of local electrostatic fields. Thenitrile group has been widely deployed to mea-sure electric fields inside enzymes and their re-lationship to mutation (8), ligand occupancy (9),or conformational changes over the catalytic
cycle (10). In this study, we have focused on theC=O group of the inhibitor 19-nortestosterone(19-NT) (Fig. 1C), because when 19-NT binds, theC=O group is loaded directly into the catalyticmachinery (11, 12). In this way, 19-NT’s C=O vibra-tional (infrared) frequency shift probes the electro-static environment that the substrate’s C=O bondwould experience in the active site, except 19-NTcannot react due to the position of the C=C bond.To calibrate the sensitivity of 19-NT’s C=O vi-
brational frequency to an electric field, we usedtwo complementary approaches. In Stark spec-troscopy (Fig. 2, A and B), an external electricfield of known magnitude is applied to a frozenglass containing 19-NT, and the accompanyingeffect on the vibrational spectrum is recorded (7).By fitting the Stark spectrum (Fig. 2B) to deriv-atives of the absorption spectrum (Fig. 2A), thevibration’s difference dipole can be extracted:jDm→C¼Ojƒ = 1.39 T 0.05 cm–1/(MV/cm), where ƒ isthe local field factor (fig. S1) (6, 7, 13). A vibra-tion’s difference dipole is its linear Stark tuningrate; that is, 19-NT’s C=O vibrational frequencyshifts ~1.4/ƒ cm–1 for every MV/cm of electricfield projected onto the C=O bond axis, whetherthe source of that field is an external voltage (asin Stark spectroscopy) or an organized environ-ment created by an enzyme active site (F
→
enz) thatwe wish to characterize. Whenever an externalfield is applied to a vitreous sample, vibrationalbands will broaden because 19-NT molecules(and their C=O bonds) are randomly orientedwith respect to the fixed direction of the externalelectric field (6, 7). By contrast, a vibrational probewill have a fixed orientation with respect to aprotein electric field when bound to a protein, andas such the linear Stark effect then produces spec-tral shifts instead of broadening. The C=O vibra-tion’s Stark tuning rate does not appreciably changewhen C=O accepts a hydrogen bond (fig. S2), im-plying that the frequency still responds to fieldslinearly even when C=O participates in strongerinteractions, although those interactions themselvesare associated with larger electric fields (14).
1510 19 DECEMBER 2014 • VOL 346 ISSUE 6216 sciencemag.org SCIENCE
Department of Chemistry, Stanford University, Stanford, CA94305-1052, USA.*Present address: Protein and Nucleic Acid Chemistry Division,Medical Research Council Laboratory of Molecular Biology, CambridgeCB2 0QH, UK. †Present address: Physical and Materials ChemistryDivision, National Chemical Laboratory (CSIR), Pune 411008, India.‡Corresponding author. E-mail: [email protected]
RESEARCH | REPORTS
on
Dec
embe
r 18
, 201
4w
ww
.sci
ence
mag
.org
Dow
nloa
ded
from
o
n D
ecem
ber
18, 2
014
ww
w.s
cien
cem
ag.o
rgD
ownl
oade
d fr
om
on
Dec
embe
r 18
, 201
4w
ww
.sci
ence
mag
.org
Dow
nloa
ded
from
o
n D
ecem
ber
18, 2
014
ww
w.s
cien
cem
ag.o
rgD
ownl
oade
d fr
om
on
Dec
embe
r 18
, 201
4w
ww
.sci
ence
mag
.org
Dow
nloa
ded
from

We also pursued a second approach to cali-brate the sensitivity of 19-NT’s C=O frequencyshifts to electric fields and to assign these fre-quencies to an absolute field scale: Specifically,we measured 19-NT’s vibrational spectrum in aseries of solvents (table S1) and examined thecorrelation of the frequencies with the solvents’reaction fields, estimated bymolecular dynamics(MD) simulations (14). As shown in Fig. 2C, 19-NT’sC=O band shifts consistently to the red withincreasing solvent polarity, from 1690.2 cm–1 innonpolar hexane to 1634.0 cm–1 in water, so thatthe C=O frequency shifts across a 56 cm–1 spanfrom solvatochromic effects. The large redshift inwater reflects the large electric fields that arecreated by water’s hydrogen bonds (H-bonds).The trend in solvent shifts is strongly correlatedwith the average electric field that each solventexerts on the C=Obond (Fig. 2D and fig. S3A); thatis, the plot of observed frequency versus computedfield is linear (R2 = 0.99) and its slope corroboratesthe Stark tuning rate measured by Stark spectros-copy. The ~2-fold difference between the slope ofthis curve [0.702 cm–1/(MV/cm)] and themeasuredStark tuning rate is consistent with the currentunderstanding of the local field effect (ƒ~2), basedon other vibrational probes and electrostatic mod-els (text S1) (13, 14). The regression line impliesthat the frequency variation due to different mo-lecular environments can be well explained as afield effect and suggests that we canmodel 19-NT’sC=Opeak frequency in termsof the average electricfield experienced by the vibration.When 19-NT is bound to wild-type KSI, the
C=O probe engages in short, strong H-bonds with
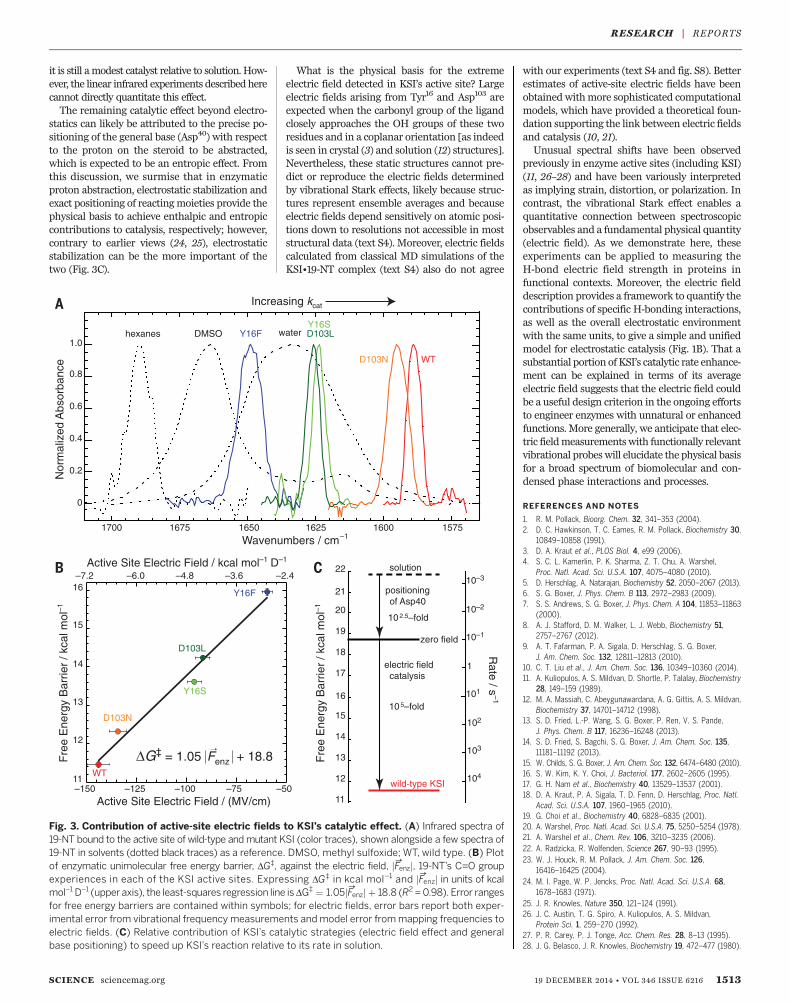
Tyr16 and Asp103 (11, 12), and its vibrationalfrequency reflects the electric field at a primarysite of charge rearrangement during KSI’s cata-lytic cycle. Notably, the C=O vibration red-shifts to1588.3 cm–1 (Fig. 3A), 46 cm–1 further to the redfrom the peak frequency in water, implying anextremely large electrostatic field. Attributing thefrequency shift to the Stark effect, the linear field-frequency relationship of Fig. 2D maps this fre-quency value to an ensemble-average electric fieldof –144 T 6 MV/cm. Although this highly red-shifted frequency lies outside the known linearrange from solvatochromism, additional lines ofevidence suggest that the C=O vibrational fre-quency maintains an approximately linear rela-tionship with the field in this regime; neglect ofhigher-order terms is expected to result in over-estimates of the electric field, but by nomore than10% (fig. S4 and text S2). Not only is the C=Obandextremely red-shifted in KSI, it is also extremelynarrow (Fig. 3A), suggesting a rather rigid envi-ronment (15) that greatly reduces the dispersionin the electric field. This is very different fromwhatis observed in H-bonding solvents like water thatexert large, but also highly inhomogeneous, elec-tric fields because solvent H-bonds can assume abroad distribution of conformations (dashedtraces in Fig. 3A and fig. S3, B and C) (14). Further-more, the position of the C=O band in wild-typeKSI is situated at the reddest (highest field) edge ofthe frequencies sampled by the C=O group inwater (see the red and dashed traces in Fig. 3A),suggesting that the active site achieves this largefield by restrictingH-bond conformations to thosethat are associated with the largest electric fields.
By exploring a series of structurally conserva-tive (but catalytically detrimental)mutants (tableS2), we could systematically perturb the catalyticefficacy of KSI and quantitatively evaluate itsrelationship to the electric field probed by theC=O vibration. In all cases, the assignment of thevibrational bands to 19-NT was confirmed withisotope replacement studies using C=18O 19-NT(figs. S5 and S6). TheH-bond provided by Tyr16 isknown to be essential for KSI’s catalysis, as theconservative Tyr16Phemutation diminishes KSI’srate by factors of ~104 (11, 16). This single pointmutation induced a blue shift from 1588.3 cm–1 to1647.5 cm–1 (Fig. 3A), implying a much smalleraverage electric field. (This change in field mag-nitude is comparable to that of the change insolvent field between hexane and water.) TheTyr16Ser mutation (17), although less conserva-tive than the Phe substitution, is actually lessdetrimental. This observation has been explainedby the suggestion that leaving a cavity in Tyr16’splace allows water to remain in the back pocketof the active site; these water molecules couldalso H-bond to the steroid substrate, therebypartially compensating for the loss of Tyr16’s keyH-bond (18). Indeed, the C=O stretching fre-quency in Tyr16Ser is not as dramatically blue-shifted as it is in Tyr16Phe. Asp103 is the otherprimary H-bond donor in KSI’s active site (Fig.1A). In the Asp103Asn mutant, the H-bondingproton is much less acidic, but N–H and O–Hbonds have similar sterics and dipole moments.Consistent with these considerations, the changein electric field and the rate impairment thismutation entails with respect to wild-type aremuch smaller compared to the other mutants.Although it is conventionally accepted that
KSI uses Tyr16’s and Asp103’s H-bonds to stabilizeits transition state (1, 11), these measurementsshow that the interaction between these H-bondsand the C=O group can be described fundamen-tally in terms of the electric field they produce. Inall the mutants studied, 19-NT’s C=O band re-mains relatively narrow, suggesting that electro-static rigidity is conferred by KSI’s scaffold,rather than by the H-bonding residues. Also,sizable electric fields persist in the KSI active siteafter removing the critical H-bond donated byTyr16 (–60 T 3 MV/cm), implying that a substan-tial electrostatic field contribution also arisesfrom the environment fashioned by the enzymescaffold (Fig. 3B). Nevertheless, that the Tyr16
H-bond alone contributes a static field of 84 T7 MV/cm without an accompanying increase inelectric field dispersion makes it quite distinctfrom water, which donates close to two H-bondsto C=O on average, but taken altogether theseH-bonds generate an average field of ~40MV/cmthat is also highly heterogeneous (13).The Asp40Asn mutant decreases KSI’s cata-
lytic rate by a factor of ~106 (16) but only blue-shifts the C=O vibrational frequency of bound19-NT by 6 cm–1 relative to wild-type KSI (tableS2). This behavior strongly contrasts withother mutants studied, which produce blue-shifts commensurate with their deleteriouseffect on catalysis (Fig. 3B). To explain this
SCIENCE sciencemag.org 19 DECEMBER 2014 • VOL 346 ISSUE 6216 1511
OH H
O
Asp40
O O
Tyr16 OH
CO2H
Asp103
E • I E • P
O
O
Asp40
O O
Tyr16 OH
CO2H
Asp103
H
O
O
Asp40
O O
Tyr16 OH
CO2H
Asp103
H H
E • S
E • 19-NT
O
OH
Asp40
O O
Tyr16 OH
CO2H
Asp103
H H
Reaction Coordinate, q
Fre
e E
nerg
y, G
no F
∆∆G‡ = –Fenz •(µTS – µS )
with Fenz
–Fenz •µS
–Fenz • µTS
C O
C O
∆µ rxn
µS µI
C OµS
µTSTS
µI
C=O C=O
C=O
C=O
C=O C=O
Fig. 1. Catalysis by ketosteroid isomerase. (A) The chemical mechanism of ketosteroid isomerase. Inthe first step, Asp40 removes an a proton from the steroid to form an enolate, stabilized by two H-bondsfrom Tyr16 and Asp103. This transformation results in an increase of the dipole moment along the C=Obond. E, enzyme; S, substrate; I, intermediate; P, product. (B) Simple model for electrostatic catalysis,illustrating the effect of an electric field from the organized environment of an enzymeactive site (F
→enz) on a
reaction’s activation barrier (DG‡). m→SC¼O, dipole of substrate’s C=O bond; m→TS
C¼O, dipole of transition state’sC=O bond. (C) Complex between KSI and the product-like inhibitor, 19-NT, used in this study to probeelectric fields in the KSI active site.
RESEARCH | REPORTS

observation, we posit that, whereas the functionof Tyr16 and Asp103 is to stabilize the reaction’stransition state by exerting electrostatic fieldsonto the carbonyl moiety, Asp40 provides anorthogonal catalytic function (text S3), by actingas the general base in the proton-transfer re-action (Fig. 1A).When nitrile vibrational probes were placed in
other locations around the KSI active site in pre-vious work, frequencies were found well withinthe range demarcated by the solvent series (9). Inother words, the extreme electric field experi-enced by 19-NT ’s C=O in wild-type KSI is specificto its precise position in the active site wherestrong local interactions and the collective effectof the overall enzyme architecture mutually re-inforce each other.A plot of each mutant’s apparent activation
barrier (calculated from the Michaelis-Mentenkcat) (fig. S7A) (16, 18, 19) against its correspond-ing ensemble-average active-site electric fieldmagnitude (derived from the field-frequency cal-ibration curve in Fig. 2D) reveals a robust lineartrend (Fig. 3B; see also fig. S7B). This relationshipsuggests that electric fields in KSI’s active site areintimately linked to catalysis. Moreover, this cor-
relation can be explained using the simplemodelfor electrostatic catalysis in Fig. 1B. The forma-tion of a transition state generally involves re-distribution of electron density, resulting in bondswith larger dipole moments than the analogousbonds in the substrate (e.g., jm→C¼O
TS j > jm→C¼OS j)
(20, 21). An electric fieldwill therefore differentiallystabilize the transition state in proportion to thereaction difference dipole (Dm→rxn ¼ m→C¼O
TS − m→C¼OS ),
altering the activation barrier by F→
enz ⋅ Dm→rxn
(Fig. 1B). If we make a simplifying assumptionthat the electric field experienced by the C=Obond is the same in the substrate and transitionstate, the model can be directly mapped onto thedata in Fig. 3B; the slope of the plot (1 D) corre-sponds to jDm→rxnj, and the intercept (18.8 kcalmol–1)corresponds to the hypothetical activation bar-rier if KSI contributed no stabilizing electricfield. The small value for jDm→rxnj implies that thereis a rather small perturbation in the electrostaticcharacter of the substrate upon activation, con-sistent with ab initio density functional theorycalculations (fig. S7C and table S3). Apparently,the very large field present in the KSI active siteis needed to leverage what small charge displace-ment is associated with the reaction’s transition
state. A chemical reaction with a larger chargedisplacement would consequently be exponen-tially more accelerated by these electric fields,suggesting that electric field effects may providea natural framework for explaining the catalysisof more proficient enzymes as well (22).By comparing the intercept extrapolated to
jF→enzj ¼ 0 from Fig. 3B (18.8 kcal mol–1) to wild-type KSI’s activation barrier (11.5 kcal mol–1), weestimate that the active site’s electric field con-tributes 7.3 T 0.4 kcal mol–1 to KSI’s barrierreduction. This corresponds to an ~105-fold rateenhancement and accounts for 70% of KSI’s cat-alytic speedup relative to an uncatalyzed ref-erence reaction in solution (Fig. 3C and text S3).Moreover, the electrostatic stabilization energy isquite similar to the enthalpic component of KSI’sbarrier reduction (9 kcal mol–1), suggesting thatthe thermodynamic manifestation of the electricfield effect is enthalpic (23). The active site’s sup-pression of electric field variability, as evidencedby the approximately lifetime-limited linewidthof the C=Ovibrational band in all theKSImutants,is possibly also an important catalytic feature; forexample, the Tyr16Phe mutant produces a smalleraverage electric field thanwater (Fig. 3A), although
1512 19 DECEMBER 2014 • VOL 346 ISSUE 6216 sciencemag.org SCIENCE
Fig. 2. Sensitivity of the C=Ostretch frequency of 19-NT toelectrostatic field. (A) Theabsorption spectrum of 19-NT(50 mM) in glassy 2-methyltetrahydrofuran at 77 K. (B) TheStark spectrum of 19-NT at1.0 MV/cm, shown as adifference between the field-onand field-off spectra. The Starktuning rate is related to thesecond derivative fittingparameter (figs. S1 and S2).(C) Infrared spectra of 19-NTdissolved in organic solvents ofvarious polarities or water; thesmall peak at 1615 cm–1 is theC=C stretch. (D) Plot of19-NT’s C=O peak frequency,nC¼O against the calculatedsolvent electric field, jF→solvj, theC=O group experiences in eachof those solvents (13, 14). Theleast-squares regression line isnC¼O ¼ 0:702jF→solvj þ 1689(R2 = 0.99). Error ranges forfrequencies are containedwithin symbols; for electricfields, error bars report thecorrelation-adjusted error ofthe average electric field from2-ns simulations.
16001620164016601700 1680Wavenumbers / cm–1
1.0
0.8
0.6
0.4
0.2
0
Nor
mal
ized
Abs
orba
nce
acetonitrile
watermethyl sulfoxide
hexanes tetrahydrofurandibutylether
pentanitrilechloroformdichloromethane
0
200
400
600
800
1640165016601670168016901700
absorptionnumerical fit
Wavenumbers / cm–1
ε / M
–1 c
m–1
∆ε /
M–1
cm
–1
–6
–4
–2
0
2
4
6
1640165016601670168016901700
Stark spectrumnumerical fit
Solvent Field / (MV/cm)
C=
O F
requ
ency
/ cm
–1
1630
1640
1650
1660
1670
1680
1690
-80 -70 -60 -50 -40 -30 -20 -10 0
νC=O = 0.702 Fsolv + 1689
RESEARCH | REPORTS
it is still amodest catalyst relative to solution. How-ever, the linear infrared experiments described herecannot directly quantitate this effect.The remaining catalytic effect beyond electro-
statics can likely be attributed to the precise po-sitioning of the general base (Asp40) with respectto the proton on the steroid to be abstracted,which is expected to be an entropic effect. Fromthis discussion, we surmise that in enzymaticproton abstraction, electrostatic stabilization andexact positioning of reactingmoieties provide thephysical basis to achieve enthalpic and entropiccontributions to catalysis, respectively; however,contrary to earlier views (24, 25), electrostaticstabilization can be the more important of thetwo (Fig. 3C).
What is the physical basis for the extremeelectric field detected in KSI’s active site? Largeelectric fields arising from Tyr16 and Asp103 areexpected when the carbonyl group of the ligandclosely approaches the OH groups of these tworesidues and in a coplanar orientation [as indeedis seen in crystal (3) and solution (12) structures].Nevertheless, these static structures cannot pre-dict or reproduce the electric fields determinedby vibrational Stark effects, likely because struc-tures represent ensemble averages and becauseelectric fields depend sensitively on atomic posi-tions down to resolutions not accessible in moststructural data (text S4). Moreover, electric fieldscalculated from classical MD simulations of theKSI•19-NT complex (text S4) also do not agree
with our experiments (text S4 and fig. S8). Betterestimates of active-site electric fields have beenobtained withmore sophisticated computationalmodels, which have provided a theoretical foun-dation supporting the link between electric fieldsand catalysis (10, 21).Unusual spectral shifts have been observed
previously in enzyme active sites (including KSI)(11, 26–28) and have been variously interpretedas implying strain, distortion, or polarization. Incontrast, the vibrational Stark effect enables aquantitative connection between spectroscopicobservables and a fundamental physical quantity(electric field). As we demonstrate here, theseexperiments can be applied to measuring theH-bond electric field strength in proteins infunctional contexts. Moreover, the electric fielddescription provides a framework to quantify thecontributions of specific H-bonding interactions,as well as the overall electrostatic environmentwith the same units, to give a simple and unifiedmodel for electrostatic catalysis (Fig. 1B). That asubstantial portion of KSI’s catalytic rate enhance-ment can be explained in terms of its averageelectric field suggests that the electric field couldbe a useful design criterion in the ongoing effortsto engineer enzymes with unnatural or enhancedfunctions. More generally, we anticipate that elec-tric fieldmeasurementswith functionally relevantvibrational probeswill elucidate the physical basisfor a broad spectrum of biomolecular and con-densed phase interactions and processes.
REFERENCES AND NOTES
1. R. M. Pollack, Bioorg. Chem. 32, 341–353 (2004).2. D. C. Hawkinson, T. C. Eames, R. M. Pollack, Biochemistry 30,
10849–10858 (1991).3. D. A. Kraut et al., PLOS Biol. 4, e99 (2006).4. S. C. L. Kamerlin, P. K. Sharma, Z. T. Chu, A. Warshel,
Proc. Natl. Acad. Sci. U.S.A. 107, 4075–4080 (2010).5. D. Herschlag, A. Natarajan, Biochemistry 52, 2050–2067 (2013).6. S. G. Boxer, J. Phys. Chem. B 113, 2972–2983 (2009).7. S. S. Andrews, S. G. Boxer, J. Phys. Chem. A 104, 11853–11863
(2000).8. A. J. Stafford, D. M. Walker, L. J. Webb, Biochemistry 51,
2757–2767 (2012).9. A. T. Fafarman, P. A. Sigala, D. Herschlag, S. G. Boxer,
J. Am. Chem. Soc. 132, 12811–12813 (2010).10. C. T. Liu et al., J. Am. Chem. Soc. 136, 10349–10360 (2014).11. A. Kuliopulos, A. S. Mildvan, D. Shortle, P. Talalay, Biochemistry
28, 149–159 (1989).12. M. A. Massiah, C. Abeygunawardana, A. G. Gittis, A. S. Mildvan,
Biochemistry 37, 14701–14712 (1998).13. S. D. Fried, L.-P. Wang, S. G. Boxer, P. Ren, V. S. Pande,
J. Phys. Chem. B 117, 16236–16248 (2013).14. S. D. Fried, S. Bagchi, S. G. Boxer, J. Am. Chem. Soc. 135,
11181–11192 (2013).15. W. Childs, S. G. Boxer, J. Am. Chem. Soc. 132, 6474–6480 (2010).16. S. W. Kim, K. Y. Choi, J. Bacteriol. 177, 2602–2605 (1995).17. G. H. Nam et al., Biochemistry 40, 13529–13537 (2001).18. D. A. Kraut, P. A. Sigala, T. D. Fenn, D. Herschlag, Proc. Natl.
Acad. Sci. U.S.A. 107, 1960–1965 (2010).19. G. Choi et al., Biochemistry 40, 6828–6835 (2001).20. A. Warshel, Proc. Natl. Acad. Sci. U.S.A. 75, 5250–5254 (1978).21. A. Warshel et al., Chem. Rev. 106, 3210–3235 (2006).22. A. Radzicka, R. Wolfenden, Science 267, 90–93 (1995).23. W. J. Houck, R. M. Pollack, J. Am. Chem. Soc. 126,
16416–16425 (2004).24. M. I. Page, W. P. Jencks, Proc. Natl. Acad. Sci. U.S.A. 68,
1678–1683 (1971).25. J. R. Knowles, Nature 350, 121–124 (1991).26. J. C. Austin, T. G. Spiro, A. Kuliopulos, A. S. Mildvan,
Protein Sci. 1, 259–270 (1992).27. P. R. Carey, P. J. Tonge, Acc. Chem. Res. 28, 8–13 (1995).28. J. G. Belasco, J. R. Knowles, Biochemistry 19, 472–477 (1980).
SCIENCE sciencemag.org 19 DECEMBER 2014 • VOL 346 ISSUE 6216 1513
1.0
0.8
0.6
0.4
0.2
0
Nor
mal
ized
Abs
orba
nce
165016751700
Wavenumbers / cm–116001625 1575
WTD103N
Y16FY16S
waterhexanes DMSO D103L
Increasing kcat
WT
D103N
Y16S
D103L
Y16F
11
12
13
14
15
16
–150 –125 –100 –75 –50Active Site Electric Field / (MV/cm)
Fre
e E
nerg
y B
arrie
r / k
cal m
ol–1
Active Site Electric Field / kcal mol–1 D–1
–7.2 –6.0 –4.8 –3.6 –2.4
∆G‡ = 1.05 Fenz + 18.8
11
12
13
14
15
16
Fre
e E
nerg
y B
arrie
r / k
cal m
ol–1
17
18
19
20
21
22 solution
zero field
wild-type KSI
electric field catalysis
positioningof Asp40
105–fold
102.5–fold
104
103
102
101
1
10–1
10–2
10–3
Rate / s
–1
Fig. 3. Contribution of active-site electric fields to KSI’s catalytic effect. (A) Infrared spectra of19-NT bound to the active site of wild-type andmutant KSI (color traces), shown alongside a few spectra of19-NT in solvents (dotted black traces) as a reference. DMSO, methyl sulfoxide; WT, wild type. (B) Plotof enzymatic unimolecular free energy barrier, DG‡, against the electric field, jF→enzj, 19-NT’s C=O groupexperiences in each of the KSI active sites. Expressing DG‡ in kcal mol–1 and jF→enzj in units of kcalmol–1 D–1 (upper axis), the least-squares regression line is DG‡ ¼ 1:05jF→enzj þ 18:8 (R2 =0.98). Error rangesfor free energy barriers are contained within symbols; for electric fields, error bars report both exper-imental error from vibrational frequency measurements andmodel error frommapping frequencies toelectric fields. (C) Relative contribution of KSI’s catalytic strategies (electric field effect and generalbase positioning) to speed up KSI’s reaction relative to its rate in solution.
RESEARCH | REPORTS

ACKNOWLEDGMENTS
We thank the laboratory of D. Herschlag for providing plasmidsof some of the KSI mutants. S.D.F thanks the NSF predoctoralfellowship program and the Stanford Bio-X interdisciplinary graduatefellowship for support. This work was supported in part by a grantfrom NIH (grant GM27738). S.D.F. designed the study. S.D.F. and S.B.
performed experiments and collected data. S.D.F. analyzed the data.S.D.F. and S.G.B. discussed results and wrote the manuscript.
SUPPLEMENTARY MATERIALS
www.sciencemag.org/content/346/6216/1510/suppl/DC1Materials and Methods
Supplementary Text S1 to S4Figs. S1 to S8Tables S1 to S3References (29–70)
8 August 2014; accepted 17 November 201410.1126/science.1259802
PALEOCEANOGRAPHY
A stagnation event in the deepSouth Atlantic during the lastinterglacial periodChristopher T. Hayes,1,2* Alfredo Martínez-García,3 Adam P. Hasenfratz,3 Samuel L. Jaccard,4
David A. Hodell,5 Daniel M. Sigman,6 Gerald H. Haug,3 Robert F. Anderson2
During the last interglacial period, global temperatures were ~2°C warmer than at presentand sea level was 6 to 8 meters higher. Southern Ocean sediments reveal a spike inauthigenic uranium 127,000 years ago, within the last interglacial, reflecting decreasedoxygenation of deep water by Antarctic Bottom Water (AABW). Unlike ice age reductions inAABW, the interglacial stagnation event appears decoupled from open ocean conditionsand may have resulted from coastal freshening due to mass loss from the Antarctic icesheet. AABW reduction coincided with increased North Atlantic Deep Water (NADW)formation, and the subsequent reinvigoration in AABW coincided with reduced NADWformation. Thus, alternation of deep water formation between the Antarctic and the NorthAtlantic, believed to characterize ice ages, apparently also occurs in warm climates.
The circulation and biological productivityof the Southern Ocean may help regulateatmospheric CO2 over millennial to glacial-interglacial time scales (1, 2). Evidenceunderpinning this view comes largely from
study of climate oscillations during ice ages.Here, we report evidence for rapid changes inSouthern Ocean circulation during the last inter-glacial period that is particularly relevant totoday’s warming climate. Authigenic uranium(aU), a redox-sensitive trace-element proxy forthe oxygen content in sediment pore waters (3),reveals a millennial-scale reduction in the ven-tilation of the deep Southern Ocean around127,000 years ago, when global temperatureswere ~2°C warmer than they are today (4, 5).Most sediment pore water oxygen concen-
trations are controlled primarily by the balancebetween diffusive supply from bottom water andconsumption by respiration of sedimentary or-ganic matter. We find evidence in samples fromOcean Drilling Program (ODP) Site 1094 (53.2°S5.1°E, 2807 m water depth, Fig. 1) for changes indeep water oxygen supply by combining aU mea-
surements with controls on the supply of or-ganic matter to the sediments. In this core, the230Th-normalized biogenic opal flux recordschanges in the vertical rain of organic matter(2, 6). Lateral supply of organic matter by se-diment redistribution, or focusing, is assessedby calculating the focusing factor, Y (7). For agecontrol during the period surrounding Termina-tion II (T-II), a new sea-surface temperaturerecord from Site 1094, based on the marine lipidindex, TEX86
L, was correlated to the Vostok icecore dD (7, 8) (Fig. 2A, fig. S1, and table S1).
The penultimate glacial period [marine iso-tope stage (MIS) 6] at Site 1094 is characterizedby low export production (Fig. 2B), typical ofthe Antarctic South Atlantic during ice ages(9). Although substantial sediment focusing oc-curred during MIS 6 (Y = 4, Fig. 2C), these gla-cial age sediments are low in biogenic opal, ourproxy of organic carbon export. Given the absenceof an enhanced supply of organic carbon to thesea floor (either vertically or laterally), the aUenrichment during glacial MIS 6 (Fig. 2E) mustbe due to low bottom water oxygen concentra-tions, consistent with sluggish ventilation of theSouthern Ocean during glacial periods (10). Thisscenario is corroborated by glacial-age aU enrich-ments observed in other sediment records fromthe Atlantic (9, 11) and Indian (12) sectors of theSouthern Ocean.During the deglacial period (T-II), export pro-
duction increased rapidly, with 230Th-normalizedopal fluxes increasing roughly 10-fold (Fig. 2B).Accounting for concurrent changes in sedimentfocusing, although aU concentrations decreased(Fig. 2E), the mass accumulation rate (MAR) ofaU increased from MIS 6 into the earliest partof T-II (Fig. 2D), consistent with an increased loadof organic matter to the sea floor enhancing aUdeposition. During the course of T-II, export pro-duction remained high or even increased, whereasaU MAR gradually decreased (Fig. 2D). We there-fore infer that the gradual deglacial decline in aUMAR was driven by increased oxygenation in deepwater as a consequence of increased SouthernOcean overturning during T-II.Against this backdrop of MIS 6–to–T-II changes
that are consistent with previous findings, weobserved an entirely unexpected feature in the
1514 19 DECEMBER 2014 • VOL 346 ISSUE 6216 sciencemag.org SCIENCE
1Department of Earth, Atmospheric and Planetary Sciences,Massachusetts Institute of Technology (MIT), Cambridge,MA 02142, USA. 2Lamont-Doherty Earth Observatory ofColumbia University, Palisades, NY 10964, USA. 3GeologicalInstitute, ETH Zürich, 8092 Zürich, Switzerland. 4Institute ofGeological Sciences and Oeschger Centre for Climate ChangeResearch, University of Bern, 3012 Bern, Switzerland.5Department of Earth Sciences, University of Cambridge,Cambridge CB2 3EQ, UK. 6Department of Geosciences,Princeton University, Princeton, NJ 08544, USA.*Corresponding author. E-mail: [email protected]
4
5
6
7
80
Dep
th [
km]
Oxygen [ml/l]34
34.65
34.65
34.6634.68
34.68
34.7
34.7
34.75
34.75
34.8
40˚S 45˚S 50˚S 60˚S
5
4
3
2
1
Salinity
60˚W 20˚W 20˚E
NADWCDW
AABWODP Site 1094
Fig. 1. Vertical section along 5°E in the South Atlantic putting ODP Site 1094 into hydrographiccontext. Color-mapped oxygen concentrations, with salinity contours overlain, as drawn from the 2009World Ocean Atlas (30, 31). ODP Site 1094 is marked with a white circle.The inset map indicates the plottedsection (red line) and the locations of other cores mentioned in the text: MD03-2664, white triangle; ODPSite 1089, white diamond; and PS2561-2, white square. Figure created with Ocean Data View (odv.awi.de).
RESEARCH | REPORTS

DOI: 10.1126/science.1259802, 1510 (2014);346 Science
et al.Stephen D. Friedketosteroid isomeraseExtreme electric fields power catalysis in the active site of
This copy is for your personal, non-commercial use only.
clicking here.colleagues, clients, or customers by , you can order high-quality copies for yourIf you wish to distribute this article to others
here.following the guidelines
can be obtained byPermission to republish or repurpose articles or portions of articles
): December 18, 2014 www.sciencemag.org (this information is current as of
The following resources related to this article are available online at
http://www.sciencemag.org/content/346/6216/1510.full.htmlversion of this article at:
including high-resolution figures, can be found in the onlineUpdated information and services,
http://www.sciencemag.org/content/suppl/2014/12/17/346.6216.1510.DC1.html can be found at: Supporting Online Material
http://www.sciencemag.org/content/346/6216/1510.full.html#relatedfound at:
can berelated to this article A list of selected additional articles on the Science Web sites
http://www.sciencemag.org/content/346/6216/1510.full.html#ref-list-1, 8 of which can be accessed free:cites 66 articlesThis article
http://www.sciencemag.org/content/346/6216/1510.full.html#related-urls1 articles hosted by HighWire Press; see:cited by This article has been
http://www.sciencemag.org/cgi/collection/biochemBiochemistry
subject collections:This article appears in the following
registered trademark of AAAS. is aScience2014 by the American Association for the Advancement of Science; all rights reserved. The title
CopyrightAmerican Association for the Advancement of Science, 1200 New York Avenue NW, Washington, DC 20005. (print ISSN 0036-8075; online ISSN 1095-9203) is published weekly, except the last week in December, by theScience
on
Dec
embe
r 18
, 201
4w
ww
.sci
ence
mag
.org
Dow
nloa
ded
from

www.sciencemag.org/content/346/6216/1510/suppl/DC1
Supplementary Materials for
Extreme electric fields power catalysis in the active site of ketosteroid isomerase
Stephen D. Fried, Sayan Bagchi, Steven G. Boxer*
*Corresponding author. E-mail: [email protected]
Published 18 December 2014, Science 346, 1510 (2014) DOI: 10.1126/science.1259802
This PDF file includes:
Materials and Methods Supplementary Text S1 to S4 Figs. S1 to S8 Tables S1 to S3 References

1
Supplementary Materials
Table of Contents
I. Materials and Methods A. Materials. . . . . . . . . 2 B. Expression and purification of KSI. . . . . 2 C. Isotopic labeling of 19-Nortestosterone sulfate. . . . 2 D. FTIR spectroscopy. . . . . . . 3 E. Vibrational Stark spectroscopy. . . . . . 5 F. MD simulations in solvents (Fig. 2D). . . . . 6 F.1. Parameterization F.2. Simulations F.3. Electric field calculations G. Ab initio calculation of Δµrxn. . . . . . 7 G.1. Locating the transition state (TS) G.2. Relaxation from TS to corresponding minima G.3. Evaluation of electrostatic properties H. Ab initio calculation of vibrational Stark effects. . . . 10 II. Supplementary Texts
1. The local field effect. . . . . . . 12 2. Quadratic Stark effects. . . . . . . 15 3. Evaluating the electrostatic contribution to catalysis and understanding the
Asp40Asn mutant. . . . . . . 21 4. Calculating electric fields in KSI and the role of dynamics. . 25
III. Supplementary Figures 1. Analysis of 19-nortestosterone’s vibrational Stark effect. . 29 2. Stark spectroscopy of 19-nortestosterone when hydrogen bonded. 30 3. MD simulations of solvent fields and linewidth analysis. . 32 4. Quadratic vibrational Stark effects. . . . . 34 5. FT-IR spectra of [18O]19-nortestosterone sulfate bound to KSI. 36 6. FT-IR spectra of [18O]19-nortestosterone sulfate. . . 38 7. Effect of quadratic Stark effect on electrostatic catalysis model. 39 8. MD simulations of 19-nortestosterone. . . . . 40
IV. Supplementary Tables 1. Spectral data for vibrational solvatochromism of 19-nortestosterone. 42 2. Spectral data for 19-nortestosterone sulfate bound to KSI. . 44 3. Ab initio electrostatic properties of reaction states. . . 45
2
I. Materials and Methods:
A. Materials. 19-Nortestosterone (19-NT) and 19-nortestosterone sulfate, sodium salt
(19-NT sulfate) were purchased from Steraloids (Newport, RI). Anhydrous solvents and
deuterium oxide (99.5% D or higher) were purchased from Acros Organics. All materials
were used as received without further purification.
B. Expression and purification of KSI. Wild-type KSI from Pseudomonas putida and
all mutants were over-expressed in BL-21 A1 cells (Invitrogen), isolated by affinity
chromatography using a custom-designed deoxycholate-bound column resin, and
purified by gel-filtration chromatography (GE Healthcare) as described previously (3). We
graciously thank the lab of Daniel Herschlag at Stanford for providing plasmids
containing genes for two of the KSI mutants (Y16S and D103L). Following purification,
KSI was concentrated to ca. 2 mM, and transferred into buffered D2O by serial dilution-
concentration cycles until the replacement factor exceeded 100. Following replacement
into D2O, KSI was further concentrated to ca. 3–4 mM for FTIR experiments. All KSI
genes were verified by standard DNA sequencing (Elim Biopharm), and all KSI proteins
were characterized by LC/ESI Mass Spectrometry using maximum entropy
deconvolution.
C. Isotopic labeling of 19-Nortestosterone sulfate. A 1–dram glass vial was charged
with 1.25 mg of 19-NT sulfate, 90 µL of [18O]H2O (Cambridge Isotopes, 97 atom% 18O),
and 10 µL of glacial acetic acid. 19-NT sulfate fully dissolved upon aspiration with
pipette following addition of acid. The vial was sealed and the reaction was allowed to
proceed at room temperature for 30 h. The reaction was monitored by taking small
aliquots from the vial, diluting with methanol, and performing mass spectrometry.
Afterwards, the reaction media was flash-frozen in liquid nitrogen and lyophilized in order
to isolate the isotopically-labeled steroid product. [18O]19-NT sulfate was characterized

3
by LCMS, UV-Vis spectroscopy, and IR spectroscopy. LCMS: mass calc’d for [18M]
C18H25O418OS is 356.15. Found: (–) 355.3 [18M – 1H]. N.B., a mass of 353.3 [16M – 1H]
was found on the non-isotopically enriched starting material. UV-Vis: λmax = 248 nm, ε248
= 14,000 M–1 cm–1; identical to the non-isotopically enriched starting material. IR (10 mM
in DMSO): C=18O frequency of 1640.8 cm–1. N.B., that the C=O frequency of the non-
isotopically enriched starting material is 1664.7 cm–1. The isotopic replacement yield
was estimated at 94% as determined from the relative intensities of the 355/353 signals
in ESI (–) and from fitting the IR spectrum to two pseudo-Voigt profiles. This yield is
close to the theoretical yield (97%) given the isotopic purity of the reaction medium.
D. FTIR spectroscopy. FTIR spectra were obtained on a Bruker Vertex 70
spectrometer with a liquid nitrogen-cooled mercury cadmium telluride (MCT) detector
using methods very similar to that described previously (14). A liquid demountable cell
was prepared with two windows (CaF2, 0.750 in thick, Red Optronics) separated using
two semicircular mylar spacers (75 µm and 100 µm for studies with organic solvents; 50
µm and 75 µm for studies on KSI). 15–25 µL of liquid sample was injected into the cell,
and for volatile solvents, the cell was sealed by wrapping parafilm around the screw
caps.
For solvatochromism studies, the samples were prepared by dissolving 19-NT in various
liquids to a concentration of 10 mM. 19-NT was soluble to 10 mM in all solvents studied
except for hexanes and water. To obtain a spectrum in hexanes, the sample was
prepared to saturation (ca. 1 mM). 19-NT was not detectably soluble in water, so to
obtain a spectrum in water, the compound 19-NT sulfate was used instead (sulfate
replaces the hydroxyl group on the D-ring, see Fig. 1C). Additionally, D2O was used in
place of natural abundance because the H–O–H bending band of H2O blocks nearly all
transmission of light in the C=O-stretching region of the mid-IR. Aside from water, 19-

4
NT sulfate was also soluble in DMSO, allowing us to compare the C=O frequencies
between these two molecules when they are in identical environments. The shift is 0.7
cm–1 – negligible relative to the full solvent-induced frequency span, which is over 56 cm–
1 (table S1). The reference sample in each case was the neat solvent. To acquire a
transmission spectrum, the cell was placed in the sample compartment, 5 min was
allowed to pass during which atmospheric CO2 was purged with a nitrogen flow, and
then 64 scans of the interferometer were acquired and averaged. The absorption
spectra were calculated by subtracting the negative log of the reference transmission
from that of the sample transmission.
For studies on KSI, infrared spectra were obtained using samples matched as perfectly
as possible using a ligand editing method introduced earlier (14) because the protein
presents a complex background arising from the amide region which overlaps the C=O
band of 19-NT sulfate. KSI was first buffer exchanged into 40 mM potassium phosphate
(KPi) in D2O, pD = 7.4, and then concentrated to around 4 mM. To prepare samples of
KSI for IR spectroscopy, the sample and reference would always be prepared in unison.
First, 15 µL of KSI was portioned twice into two separate tubes. Ligand stocks of 19-NT
sulfate, [18O]19-NT sulfate, and equilenin (a steroid analog that binds similarly to 19-NT)
were prepared at 80 mM in DMSO. Around 0.75 µL of ligand stock was added to the
KSI aliquots; the procedure was repeated for the two aliquots, except 19-NT sulfate
would be added to one and the reference ligand (either equilenin or [18O]19-NT sulfate)
would be added to the other. The liquids were mixed by stirring gently with the
micropipette tip. Similarity of preparation between the two samples was found to be of
paramount importance to reduce the background signal, which was necessary to
observe the desired C=O or C=18O vibrational band.
The typical KSI concentration was around 4 mM, and ligand concentration was around 3

5
mM. At these concentrations, 19-NT is >99% bound in the active site of WT KSI (KD of 5
µM) (29), and the KD would have to exceed 150 µM (higher than observed for any
mutant) for the percent bound to go below 90%, implying that the detected IR signals of
the ligand reflect that of the bound state.
Spectra of the sample and the reference were acquired one after the other. Unlike the
samples involving simple solvents, nitrogen purging was carried out for 10–15 minutes,
and 256–512 scans were acquired on the interferometer and averaged. Difference
spectra were obtained by subtracting the spectrum of the altered ligand (either
isotopically or equilenin) from the spectrum of 19-NT sulfate. Clear C=O features were
found in spectra for which the intensity of the amide I feature (as either a positive or
negative peak) was reduced to 1–5 mOD without further baseline modification (fig. S5A);
otherwise, the C=O feature was not distinguishable from the background. Detection of
the C=O feature was further facilitated by the particularly narrow linewidth of the band in
the KSI active site environment (Fig. 3A).
E. Vibrational Stark spectroscopy. Vibrational Stark spectra were recorded as
previously described (6, 7). A brief summary follows: dry 19-NT was dissolved to 50–
100 mM in the solvent of interest (or combined with 4 mM WT KSI in 50:50
D2O:glycer(ol-d3) to a final concentration of 3 mM) and 3–4 µL were loaded into a
custom-designed cell composed of two off-set CaF2 windows coated with a 4.5-nm layer
of Ni metal, displaced by 2 Teflon spacers of 26 µm thickness. Co-solvents for
dissolving 19-NT, which can disturb glass formation, were avoided.
The cell was rapidly immersed in a liquid nitrogen-filled cryostat and sealed, after which
it was connected to a high-voltage power supply. During acquisition, electric fields in the
range of 0.2–1.4 MV/cm were applied, and Stark spectra were obtained by taking the
difference between the field-on and field-off infrared transmission spectra. External

6
electric fields were based on the applied voltage and the distance between the windows
(measured by interferometry). The linear Stark tuning rates are extracted through a
procedure based on fitting the Stark spectrum to derivatives of the low-temperature
absorption spectrum (6, 7).
F. MD simulations in solvents (Fig. 2D). Simulations and electric field calculations of
19-NT dissolved in various organic solvents and water were carried out similarly to
previous work on acetophenone (14). Briefly: 19-NT was placed at the center of a cubic
box filled with solvent molecules, from which 2 nanosecond trajectories were simulated.
Snapshots were taken every 200 femtoseconds. From each snapshot, the electric field
exerted onto the C=O bond of 19-NT by the solvation environment was calculated. The
potential function and the parameters of the generalized AMBER force field (GAFF) were
used (30, 31). Simulations were carried out in GROMACS version 4.5.3. (32). Electric
field calculations were performed according to the prescriptions reported in previous
work (14). Details about the simulations follow.
F.1. Parameterization. The initial model of 19-NT was built by extracting the
coordinates of 19-nortestosterone hemisuccinate from a solution structure of its complex
with KSI (PDB: 1BUQ ) (12). The hemisuccinate moiety was edited off the steroid and a
single stereochemical inversion was implemented manually in PyMol. These
coordinates were used to create a starting structure of 19-NT to input into the
Antechamber program of AmberTools12 (30, 31), which parameterizes organic
molecules using the GAFF forcefield and the AM1-BCC procedure to assign atomic
charge parameters. For the organic solvent molecules, we used the GAFF parameters
of Caleman et al. (33), available at www.virtualchemistry.org. Water was modeled using
the TIP3P model (34).
F.2. Simulations. A cubic box of edge length 5.2 nm was specified around the 19-NT

7
solute, and filled with solvent molecules using the GENBOX utility in GROMACS and
starting coordinates from Caleman et al. (33). The solvent boxes were energy minimized
with 1000 steps of steepest descent, then equilibrated for 100 ps (2 fs time step) in an
NPT ensemble with a reference temperature of 300 K and a reference pressure of 1 bar.
In all cases, periodic boundary conditions were applied to the solvent box, and long-
range electrostatics were approximated with the particle mesh Ewald (PME) method (35),
using 1.0 nm as a cut-off. Lennard-Jones interactions were also cut off at distances
exceeding 1.0 nm. All bond vibrations were constrained using the LINCS algorithm (36).
During equilibration, the Bussi thermostat (37) and Berendsen barostat (38) were active.
Production dynamics were carried out for 2 ns in the NPT ensemble, continuing from the
final coordinates and velocities of the equilibration run. Temperature-coupling was
regulated using a stochastic dynamic integrator (39) and the Parrinello-Rahman barostat
was applied (40). Snapshots consisting of full-precision coordinates and forces were
outputted every 200 fs, and used as the basis for electric field calculations.
F.3. Electric field calculations. The electric field experienced by the C=O bond in 19-
NT was calculated identically to methods previously described (14). For each snapshot,
we found the electric field on the C-atom and O-atom of 19-NT’s carbonyl moiety, and
then projected those fields along the C=O bond unit vector evaluated at the
instantaneous geometry. The two numbers were then averaged to yield the
instantaneous electric field experienced by the C=O bond, and this process was
repeated for each snapshot. The solvent fields reported in Fig. 2D are ensemble
averages across the whole trajectory.
G. Ab initio calculation of Δµrxn. All ab initio electronic structure calculations described
here were carried out in Gaussian09 (41). A model molecule for 5-androstene-3,17-
dione consisting only of the A and B rings of the steroid (terminating the B-ring with

8
hydrogens at the sites where the fused C ring would connect) was built in GaussView
and geometry optimized by density functional theory (DFT) at the B3LYP/6-311++G**
level (42). This truncated 5-androstene (referred to as 5-andro) was used in place of the
full four-ring steroid for computational economy. In PyMol, 5-andro was aligned against
the cognate heavy atoms of the ligand (19-nortestosterone hemisuccinate) in the
solution structure 1BUQ (12). From this aligned frame, the coordinates of 5-andro along
with Asp40 up to the beta carbon (effectively truncating it into an acetate ion) were
extracted to create a bimolecular supermolecule that recapitulates the active site’s
geometry between the general base and 5-andro. The bimolecular system was subject
to geometry optimization at the B3LYP/6-311++G** level to generate the optimized
reactant state (RS – acetate/ketone).
G.1. Locating the transition state (TS). A simple model for the position of the
transferred proton in the product state (PS – acetic acid/dienolate) was made by
assuming the proton moves along the C4(5-andro)...O(acetic) vector and that the
O(acetic)–H bond length is 0.96 Å. The Cartesian coordinates of the transferred H+ in
the RS and PS were averaged to move the proton to half-way between the two sites.
The positions of C4(5-andro), H4β, and O(acetic), as well as the bond lengths of C4(5-
andro)...H4β and H4β...O(acetic) were all frozen. The resulting structure was submitted to
geometry optimization subject to these constraints at the same level of theory previously
employed. This optimization did not converge on the timescales sampled, however after
43 iterations, the coordinates that led to the lowest forces (both maximum and root-
mean-square) were taken on to the next step. The coordinates from the previous
optimization calculation were subjected to a single-point frequency calculation, which
rendered a single negative eigenvalue in the standard orientation. Visualization of the
normal mode of vibration that corresponds to the negative eigenvalue corresponded to

9
motion of H4β between C4 and O(acetic), with concomitant lengthening of C3=O and
planarization about C4 – in short, recapitulating chemical intuition of the reaction
coordinate. Starting with these coordinates, a transition state optimization job (Berny
algorithm) was commenced reading in the force constants from the checkpoint file of the
frequency calculation (i.e., the opt=(ts,rcfc) keyword was used). Additionally the
noeigentest keyword was necessary to commence the TS search because a second
(much smaller magnitude) negative eigenvalue manifests in the non-standard orientation.
G.2. Relaxation from TS to corresponding minima. During the transition state
calculation, the acetate fragment swung over considerably with respect to its initial
position in RS, rendering unlikely that the initial RS structure is the closest minimum to
the saddle point located. Therefore, to obtain the nearest minima corresponding to the
RS and PS, the TS structure was relaxed off the saddle point by standard optimization.
Subjecting the TS to such a calculation quickly furnished a minimum that corresponds to
the acetic acid/dienolate species (PS). From this PS, the proton on the acetic-acid was
re-positioned onto the C4 atom of 5-andro with the C4–H4β distance set to 1.10 Å and the
H4α–C4–H4β angle set to 109.5˚. This initial guess for RS was optimized resulting in a
new optimized RS much closer in structure to TS. All of these optimizations were
calculated at the B3LYP/6–311++G** level of theory. With these final coordinates of RS,
TS, and PS, the atom coordinate root-mean-square deviation between RS and TS is
0.98 Å, and between TS and PS is 0.036 Å.
G.3. Evaluation of electrostatic properties. Single-point calculations calling routines
to carry out population analysis were performed on the optimized structures of the RS,
TS, and PS at the same (B3LYP/6–311++G**) level of theory. In particular, we used the
CHelpG scheme of Breneman (43) and the Merz-Kollman scheme (44), which both
assign atomic charges by fitting against the electrostatic potential. To determine the

10
local dipole-moment on the C=O bond in the RS, TS, and PS states, we took the
average of the absolute value of the charges on the C-atom and O-atom (in e), multiplied
by the C=O bond length (in Å), and multiplied by 4.803 to convert from eÅ to D. The
critical quantity, Δ!µrxn , was evaluated by subtracting the C=O bond dipole in the RS
from the C=O bond dipole in the TS. The Merz-Kollman scheme was found to give a
more physically realistic value, and so was used in the discussion in the main text. The
full data set can be found in table S3.
The energies assigned to RS, TS, and PS can serve as qualitative benchmarks of the
calculations because of their relationship to kinetic and thermodynamic quantities.
∆E(RS→TS) was found to be 12.44 kcal mol–1, qualitatively consistent with the enthalpy
of activation (∆H‡) in solution (16.4 ± 2 kcal mol–1) (23). Additionally, ∆E(RS→PS) was
calculated to be 10.62 kcal mol–1, in good agreement with the measured ∆H˚ of 7 ± 2
kcal mol–1 for the solution proton transfer reaction (23). These findings support the
overall reliability of the DFT calculations, and in particular, support the use of a gas
phase model to describe the proton transfer process.
H. Ab initio calculation of vibrational Stark effects. As with the transition state
calculations, 19-NT was modeled in a truncated form that corresponded only to the A
and B rings of the 4-ring steroid. The initial model was geometry optimized in the gas
phase at the B3LYP/6-311G* level. The optimized structure was re-oriented such that
the C=O bond of 19-NT was along the x-axis of the Cartesian coordinate frame; these
coordinates were used as an input for 10 separate optimization/frequency calculations,
all of which were carried out at the B3LYP/6-311++G** level with anharmonic corrections
(45). In each calculation, an external electric field directed along the x-axis was
specified (with magnitudes ranging from +50 to –150 MV/cm), and the nosymm keyword

11
was included. The molecule’s geometry first relaxes to the presence of the field before
components of the Hessian matrix are evaluated, which was found to lead to better
agreement to experimental Stark tuning rates in previous work (46). Following
calculations, the C=O stretching normal mode was analyzed.
At zero external field, the potential energy distribution was 90% confined to the C-atom
and O-atom, and the displacement vectors were 100% along the CO-axis, supporting the
assumption that the vibration is well described as a one-dimensional oscillator. As the
field magnitude increased, the mode became more delocalized. At a field of 100 MV/cm,
still 81% of the potential energy distribution was confined to the C- and O-atoms and
99.7% of the displacement was along the CO-axis. However, at 150 MV/cm, the mode
structure became more complex, with only 50% localization on the C- and O-atoms. The
anharmonic frequencies and data are given in fig. S4, A and B.
12
Supplementary Texts:
1. The local field effect
The effective linear Stark tuning rate of 19-nortestosterone in liquid solution (from
comparing solvent-induced frequency shifts to their associated calculated electric fields)
is ca. 0.7 cm–1/(MV/cm), which is 2-fold lower than the measured difference dipole of 19-
nortestosterone in solid solution from Stark spectroscopy (1.4 cm–1/(MV/cm)). This
difference has also been observed for the carbonyl group in acetophenone (14). We
consider two possible origins for this difference: (1) the local field effect, ƒ (13, 47, 48),
and (2) the possibility that the induced portion of the difference dipole is reflected
differently in solvatochromism and Stark spectra due to quadratic Stark effects (see text
S2) (49). The first effect is more significant than the latter, as will be discussed in the
following.
Vibrational Stark spectroscopy involves the application of an external field onto a
sample to probe the response of vibrational chromophores to a defined field. For an
empty parallel plate capacitor, the electric field is uniform and given by Fext =V / d ; it
depends only on the voltage, V, and the distance between the two plates, d, which in our
experiments are both known accurately (to within about one part in a hundred). When a
capacitor is filled with a dielectric material (e.g., a frozen organic solvent), this
relationship holds in the macroscopic sense, but microscopically the local electric field
created by the external voltage may differ from V / d due to the heterogeneous
distribution of polarization induced in the medium by the external charges accrued on the
capacitor plates. This local field at a particular point in space will in general differ in
direction and magnitude, resulting in !Flocal = f
!Fext , where f is a tensor. Previous work
has suggested f is approximately diagonal (48), meaning it is well represented as a

13
scalar (ƒ), but its magnitude is not known experimentally, though several simple physical
models have been proposed (50). Because of this, Stark spectroscopy does not
determine the microscopic Stark tuning rate ( Δ !µC=O ), but an effective tuning rate
modified by the local field correction factor ( Δ !µC=O ƒ). Recent theoretical treatments of
the local field effect based on continuum dielectric theory estimated the local field
correction factor to be between 1.4–1.8 (SI of 10). That the slope of 19-
nortestosterone’s field-frequency relationship in Fig. 2D is about two-fold smaller than
the measured Stark tuning rate is consistent with the hypothesis that the tuning rate
determined from Stark spectroscopy is enhanced ca. two-fold via the local field effect.
A complete understanding of the local field effect is the subject of ongoing
research. We provide here a brief sensitivity analysis discussing how the value of ƒ
affects the major conclusions of this work; in particular, if it were close to 1 (as assumed
previously (51–53)). If we had considered ƒ to be unity, relative electric fields in solvents
and KSI could be determined directly from experimental quantities (the observed Stark
tuning rate and the frequency shifts), and the resultant electric fields would all be
approximately half the values reported in this paper. The rescaling would not affect the
primary conclusion of this work that KSI’s activation barrier correlates well with the active
site’s electric field, nor would it affect the value of the y-intercept in Fig. 3B (i.e., the
extrapolated activation barrier associated with zero electric field) and hence the value
given for the electrostatic contribution to KSI’s rate enhancement. The value of ƒ does
however affect the slope of Fig. 3B, and the extracted value given to Δ !µrxn ; namely, if
all the electric fields were half the size, then Δ !µrxn would be twice its reported value (2
D, instead of 1 D). This would exacerbate rather than assist agreement with the value
estimated from ab initio calculations (0.5 D); however, we note though that the

14
theoretical estimate for Δ !µrxn is expected to be crude and its value is not the primary
focus of this work.
15
2. Quadratic Stark effects
In the main text, to determine the electric field in the active sites of WT KSI and
its mutants, we developed a calibration curve relating 19-nortestosterone’s vibrational
frequency to electric field using a series of organic solvents and water as reference data.
According to MD simulations (and corroborated by the analytic Onsager model, Poisson-
Boltzmann models, and fully polarizable atomistic simulations (13)), solvation forces in
liquid solutions are capable of exerting electric fields whose average values are in the
range of 0 to –80 MV/cm. In this range, 19-nortestosterone’s vibrational frequency
varies strictly linearly with the calculated value of environment’s electric field (Fig. 2D).
This observation is in accordance with the Stark spectrum (Fig. 2B, fig. S1), which
because of its second-derivative lineshape, implies that the C=O vibration possesses a
large difference dipole ( Δ !µC=O ) and a small difference polarizability ( ΔαC=O ),
responsible for linear and quadratic Stark effects, respectively. It is also consistent with
earlier observations (9, 54), that other vibrational probes also demonstrate linear
frequency variation with respect to solvent fields.
However, the bathochromic shift induced by the active site of WT KSI is larger
than what is observed in organic solvents or even water (Fig. 3A), raising the question of
whether vibrational frequency still varies linearly with respect to electric field in the range
of –80 to –150 MV/cm, to which the solvent series cannot testify. To address this
question, we employ ab initio density functional theory (DFT) calculations (fig. S4, A and
B) and vibrational Stark spectroscopy (fig. S4, C to E).
The overall result of this inquiry (the details of which follows) is that 19-
nortestosterone’s vibration does possess a small quadratic Stark effect, and the first
onset of non-linearity begins around water’s average solvent field (–80 MV/cm; fig. S4F).
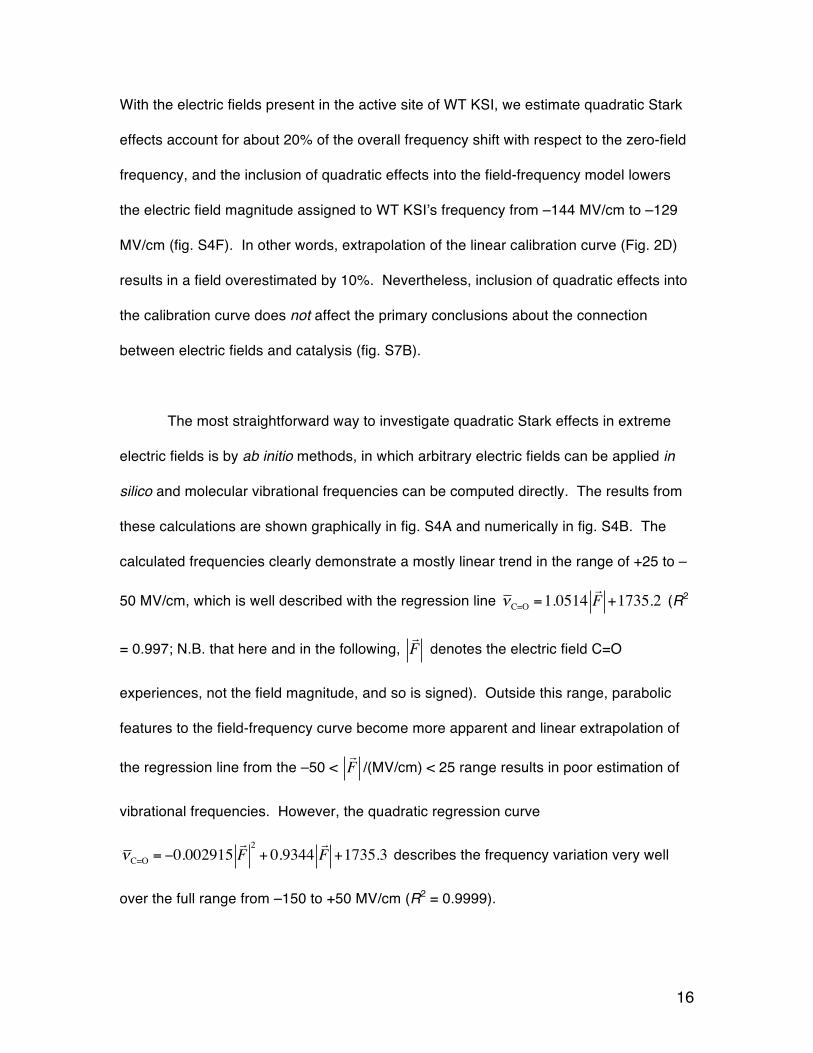
16
With the electric fields present in the active site of WT KSI, we estimate quadratic Stark
effects account for about 20% of the overall frequency shift with respect to the zero-field
frequency, and the inclusion of quadratic effects into the field-frequency model lowers
the electric field magnitude assigned to WT KSI’s frequency from –144 MV/cm to –129
MV/cm (fig. S4F). In other words, extrapolation of the linear calibration curve (Fig. 2D)
results in a field overestimated by 10%. Nevertheless, inclusion of quadratic effects into
the calibration curve does not affect the primary conclusions about the connection
between electric fields and catalysis (fig. S7B).
The most straightforward way to investigate quadratic Stark effects in extreme
electric fields is by ab initio methods, in which arbitrary electric fields can be applied in
silico and molecular vibrational frequencies can be computed directly. The results from
these calculations are shown graphically in fig. S4A and numerically in fig. S4B. The
calculated frequencies clearly demonstrate a mostly linear trend in the range of +25 to –
50 MV/cm, which is well described with the regression line νC=O =1.0514!F +1735.2 (R2
= 0.997; N.B. that here and in the following, !F denotes the electric field C=O
experiences, not the field magnitude, and so is signed). Outside this range, parabolic
features to the field-frequency curve become more apparent and linear extrapolation of
the regression line from the –50 < !F /(MV/cm) < 25 range results in poor estimation of
vibrational frequencies. However, the quadratic regression curve
νC=O = −0.002915!F
2+ 0.9344
!F +1735.3 describes the frequency variation very well
over the full range from –150 to +50 MV/cm (R2 = 0.9999).

17
The DFT calculations agree with the solvatochromism studies that 19-
nortestosterone’s C=O frequency obeys a linear field-dependence in the range
associated with organic solvents (0 to –40 MV/cm; Fig. 2B and fig. S3A), but suggest
that the linear field-dependence is not maintained to large electric fields. In fact, at a
field of –150 MV/cm, the linear model assigns a frequency shift that is significantly
different (30%) from the quadratic model. However, the DFT calculations do not
describe 19-nortestosterone’s vibrational frequency quantitatively: they overestimate the
zero-field frequency by 46 cm–1 and the microscopic Stark tuning rate by 0.35 cm–
1/(MV/cm), or about 50%. That DFT systematically overestimates Stark tuning rates by
ca. 50% is in line with previous studies and appears to be a fundamental deficiency of
single determinant methods (55, 56). Awareness of this deficiency makes us cautious to
use DFT’s prediction for the quadratic Stark tuning rate, which would likely be even less
accurate, as it is a higher-order effect. For instance, DFT predicts (incorrectly) that at
the solvent field created by water (–80 MV/cm), 19-nortestosterone’s C=O frequency
would lie outside the linear regime, which is inconsistent with experiment (Fig. 2D).
A second method to estimate quadratic Stark effects is to use vibrational Stark
spectroscopy to measure C=O’s difference dipole (linear Stark tuning rate) in different
environments. In Stark spectroscopy, a small external electric field (ca. 1 MV/cm) is
applied to a vibration in addition to the considerably larger matrix field supplied by the
environment (ca. 102 MV/cm), which can either be a solvent or a protein. In this context,
we use the term matrix field instead of solvent field since in Stark spectroscopy, 19-
nortestosterone is encased in a frozen glass instead of diffusing in liquid solution (57).
Therefore, the Stark tuning rate probed in Stark spectroscopy is effectively the derivative
of the field-frequency curve evaluated at the electric field equal to the matrix field, and
the matrix field can be determined from the peak frequency of 19-nortestosterone in the

18
low-temperature absorption spectrum (from a field-frequency model). In a quadratic
field-frequency curve, νC=O = − 12 a!F
2− b!F + c , a is the difference polarizability and b is
the intrinsic difference dipole. In the derivative of the field-frequency curve,
Δ!µC=O = −a
!F − b , −a
!F is the induced difference dipole, that is, the difference dipole
that is created by the matrix field, and b is the linear Stark tuning rate in zero electric field
(hence, intrinsic). Therefore, we can probe the quadratic Stark effect (a) by measuring
the sensitivity of the linear Stark tuning rate to electric field (environment). By way of
contrast, a vibration that has no quadratic Stark effect would have an identical difference
dipole in all environments.
We have measured the difference dipole of 19-nortestosterone in a typical
organic glass (2-methyltetrahydrofuran; Fig. 2, A and B, fig. S1), in a hydrogen-bonding
organic glass (ethanol; fig. S2), and bound to the active site of KSI (fig. S4, C to E). We
stress that the latter measurement is qualitative at best for several reasons. Firstly, the
analysis of the Stark effect depends on the absorption spectrum, which is reliably
obtained in the standard FT-IR experiment by acquiring spectra of carefully matched
(isotopically-substituted) samples. The same is not possible in our Stark experiment
because the sample cell is destroyed in the experiment. Therefore, the absorption
spectrum in fig. S4C is approximate. Moreover, the small number of data points in the
narrow spectral region (fig. S4D) precluded the standard lineshape analysis used to
extract the difference dipole (6, 7), forcing us to adopt a more qualitative method of
extracting the difference dipole that consisted of assuming negligible zeroth- and first-
derivative contributions and comparing the intensity of the spectral second-derivative to
that of the Stark spectrum (fig. S4E).

19
In these environments (glassy 2-methyl tetrahydrofuran, glassy ethanol, WT KSI
in vitreous water/glycerol), 19-nortestosterone’s vibrational frequency redshifts (1667,
1651, 1586 cm–1), which is interpreted as matrices of increasing electric field (–32, –54,
–147 MV/cm according to the original linear model function). The linear Stark tuning rate
increases (1.39 ± 0.05, 1.47 ± 0.1, 1.9 ± 0.25 cm–1/(MV/cm); mean ± std. dev. over three
independent experiments for each) across this series, implying a positive difference
polarizability – i.e., greater sensitivity to electric field at higher electric fields. This trend
is consistent with the prediction from DFT calculations. Experimental limitations
notwithstanding, these studies admit a value for the difference dipole in KSI that is larger
than the difference dipole in organic frozen glasses (1.4–1.5 cm–1/(MV/cm)), though not
by very much. Less important for our present discussion, the extinction coefficient
(related to the transition dipole) consistently decreases (850, 750, 300 M–1 cm–1) across
this series implying a negative transition polarizability (7). It is important to mention that
obtaining Stark spectra of 19-nortestosterone bound to KSI proved to be very
challenging due to the high background and low signal.
To devise a quadratic field-frequency model (fig. S4F), we examined the
relationship between difference dipole and matrix field (determined by inserting the low-
temperature absorption peak frequencies into the original linear field-frequency model),
admitting a regression of form Δ !µC=O = −0.0022!F + 0.626 (R2 = 0.999; N.B. assuming
ƒ=2). This equation was integrated to νC=O = −0.0011!F
2+ 0.626
!F +ν0 and ν0 was
obtained by fitting to the original solvatochromism data. The quadratic field-frequency
curve was used to re-evaluate the matrix fields, and the calculations described were
iterated until the quadratic field-frequency model converged (i.e., it self-consistently
describes the relationships among difference dipole, matrix field, and vibrational
20
frequency); this is given in fig. S4F. Although it is qualitatively similar to the field-
frequency curve calculated by DFT (fig. S4A), DFT substantially over-estimated the
quadratic Stark tuning rate (by 130%), as originally suspected.
Using the final field-frequency curve, we estimate that the electric field exerted by
WT KSI is –129 MV/cm, which differs from the original linear model by 10.4%. Because
this difference is quite small and does not appreciably change any aspect of the final
analysis (see fig. S7B), we chose to limit discussion in the main text to the linear model
for simplicity.
21
3. Evaluating the electrostatic contribution to catalysis and understanding the
Asp40Asn mutant
Questions such as “By how much does an enzyme accelerate a chemical
reaction?” and “What portion of the rate enhancement is due to electrostatic
interactions?” are old and commonly encountered in biochemistry textbooks. While
there is a great deal of experimental information on the former question, there is little
experimental information on the latter. The computational literature in this subject is also
vast, but is often in conflict and has seldom produced experimentally testable
predictions. The results in this paper provide the first direct information on the electric
fields in the active site of an enzyme and their connection to catalysis. We claim that the
extreme electric field in the active site of wild-type (WT) KSI is responsible for stabilizing
the transition state by 7 kcal mol–1 (a 105-fold rate enhancement) using the simple
electrostatic model depicted in Fig. 1B. However, to proceed with statements about
what fraction of the total catalytic effect this represents, one must decide upon a suitable
reference reaction.
As previously (58) we chose the acetate (AcO–)-catalyzed isomerization of 5-
androstene (S) in aqueous solution to be the reference reaction for comparison with
KSI’s enzyme catalyzed reaction (59, 60). The acetate-catalyzed reaction shares the
same chemical mechanism as KSI but differs greatly in its energetics and kinetics (59).
The bimolecular rate constant for AcO– + S → AcOH + I, kAcO, is 6.0 × 10⁻⁴ M–1 s–1 (59),
and the kcat of WT KSI is 2.4 × 10⁴ s–1 (16, 61). The ratio of these numbers, 4 × 10⁷ M,
can be regarded as the “effective molarity” of acetate in the vicinity of 5-androstene
when in the KSI•5-androstene (E•S) complex (60).
As pointed out by Jencks though, this is an unattainable concentration, and so
the rapid rate of the intramolecular enzymatic reaction must be ascribed to factors other

22
than local concentration (60). Here we have the opportunity to point out that the
100,000-fold rate effect we have assigned to electrostatic stabilization is unrelated to the
local concentration, and so accounting for this, we are left with an effective acetate
concentration of 400 M, a value which can sensibly be attributed to the combination of
increased local concentration (which can contribute up to 55 M-effect) and rotameric
selection. By comparing the total rate enhancement (4.0 × 10⁷ M) to the electrostatic
rate enhancement (105.3 ± 0.3) on a log basis, one calculates electrostatics account for 70
± 4 % of KSI’s barrier reduction, though the molarity scale introduces an arbitrary factor
into the comparison (60).
This analysis ends up to be numerically equivalent (but semantically different)
from the way Warshel and co-workers frame the problem (21), wherein enzyme and
solution rates are typically compared by subtracting ΔG‡cat
(the activation barrier for E•S
→ E•I) from ΔG‡w
(the activation barrier of the reference reaction AcO– + S → AcO– + I)
(62). The activation barriers are derived from the same two rate constants (kcat and kAcO)
stated above, and admit a ΔΔG‡ of 10.4 kcal mol–1 (corresponding to the same rate
enhancement).
Two notes must be made about the applicability of kcat and kAcO to the mechanism
under consideration. Firstly, kAcO corresponds to the reaction AcO– + S → AcOH + I.
However, the solution decomposition of intermediate (AcOH + I → AcO– + P) is very fast
(2.6 × 10³ M–1 s–1) (59), which means that the overall rate of AcO– + S → AcO– + P is
also effectively equal to kAcO.
Secondly, in the Michaelis-Menten model, kcat corresponds to the process E•S →
E + P; therefore, the kcat of KSI is a composite of rate constants for three microscopic
processes: the enolization reaction (E•S → E•I), the reketonization reaction (E•I → E•P),
and product release (E•P → E + P). It is generally believed that the enolization reaction

23
is rate-limiting (63, 64), although there is some evidence that in WT KSI, enolization is
fast enough that reketonization (1) and product release (2) are also partially rate-limiting.
The ideal comparison would be between kAcO and the microscopic rate constants for E•S
→ E•I for each of the mutants. In practice, microscopic rate constants have only been
evaluated for WT KSI (and from a different homolog) (2), whereas Michaelis-Menten kcat
values have been accurately determined for all mutants examined. In the main text and
in Fig. 3B, activation barriers were calculated on the basis of each enzyme’s kcat. We
believe kcat is a reasonable proxy for the rate of the reaction E•S → E•I because
enolization is rate-limiting for the KSI mutants studied and enolization is partially/mostly
rate limiting for WT KSI. Moreover, since kAcO is effectively the rate constant for the full
reaction AcO– + S → AcO– + P, it is quite appropriate to compare it to kcat (which
corresponds to E•S → E + P).
To make quantitative comparisons between the rates of KSI mutants in terms of
an electrostatic model, it is imperative that the mutants all use the same mechanism as
the reference reaction and be structurally similar to WT KSI. To this end, KSI is an ideal
system because its scaffold is quite rigid, and its structure is relatively robust to
perturbation from mutations. In particular, x-ray structures are available for the four
mutants (Tyr16Phe, Tyr16Ser, Asp103Asn, Asp103Leu) selected for analysis, and their
RMSD’s to WT are 0.14–0.38 Å for the whole enzyme, and 0.18–0.32 Å for the active
site residues (18, 19, 65, 66). The mutants also possess very similar KM-values (within a
factor of 2 from WT), suggesting a conserved binding mode with substrate (17, 19).
The Asp40Asn mutant is important to consider because it results in the largest
rate impairment (106-fold) of all the mutants considered (16) while also resulting in the
smallest blue-shift of 19-nortestosterone carbonyl’s frequency relative to WT among all
the mutants (6 cm–1). Taken at face value, this result could be interpreted as

24
contradictory evidence to the rate-electric field relationship (Fig. 3C); on the other hand,
the result can be understood by considering that Asp40 does not impact catalysis
through electrostatic stabilization of the transition state, but by providing a general base
to initiate proton abstraction. That Asp40Asn introduces a relatively small infrared
frequency shift at the C=O vibrational probe demonstrates that general base catalysis
and electrostatic catalysis are complementary and separate roles of the active site.
A related question is that if ablation of Asp40 decelerates KSI’s catalysis by 106-
fold, and the electrostatic effect of Asp40 is minimal, then how can electrostatics, which
contributes a ~105-fold rate enhancement (from extrapolation of Fig. 3C), be considered
the dominant contributor to KSI catalysis? The answer to this lies in the choice of the
reference reaction. While Asp40Asn is enormously damaging to KSI’s rate, it also alters
KSI’s mechanism (67), which makes it incomparable to the chosen reference reaction.
In particular, the identity of the base in the Asp40Asn-catalyzed reaction becomes a
hydroxide ion from solution (rather than Asp40), and the reketonization reaction
becomes strongly rate-limiting over enolization.
In summary, the adoption of the acetate-catalyzed reaction as the reference
reaction enables comparisons to other mutants which maintain the same mechanism;
however, it does not allow for incorporation of Asp40Asn into the rate-field model.

25
4. Calculating electric fields in KSI and implications for the role of dynamics
The electric field at a given point in space is fully determined by the coordinates
and charges of all the particles in a system. X-ray structures provide a high-resolution
set of atomic coordinates, and conventional force fields assign charges to all those
atoms. Therefore, a natural and appealing way to calculate the electric field KSI’s active
site exerts onto the C=O bond of the 19-nortestosterone inhibitor consists simply of
modeling the active site with static point charges placed on the crystallographic
coordinates.
As an illustration of this style of modeling, we used the x-ray crystal coordinates
of a reduced active site region (consisting of Asp103, Tyr16, and the steroid ligand) from
the 1.1-Å resolution structure 1OH0 (68), optimized the hydrogen positions using the
PDB2GMX module of GROMACS (32), and modeled the bond dipole moments on Tyr16
and Asp103 using the atomic charges on the O- and H-atoms of the AMBER force field
(69). In the original x-ray structure, the O19-NT•••OTyr16 and O19-NT•••OAsp103 distances are
both 2.5 Å, and these distances both expand to 2.6 Å once hydrogen atoms are inserted
and the energies relaxed. Calculating electric fields with this geometry and Coulomb’s
law, we found that the OH groups of Tyr16 and Asp103 exert fields of 30.2 MV/cm and
60.9 MV/cm respectively onto the carbonyl group of 19-nortestosterone. The fields are
very different despite similar O•••O distances because the Asp103 O–H bond vector is
more coplanar with the C=O bond vector. These values can be compared to the shift in
the electric field between WT KSI and the Tyr16Phe mutant (84 ± 7 MV/cm) and the
Asp103Leu mutant (52 ± 7 MV/cm), respectively, which ablate the electrostatic
interaction from the OH group but maintain the overall steric pattern. Although the
agreement between calculation and experiment is fair for Asp103, the model does not
26
capture the large electric field supplied by Tyr16 and incorrectly predicts that Asp103 is
electrostatically the more important residue.
This simple analysis illustrates why precise electrostatic information in enzyme
active sites cannot be accurately determined from crystal structures – even those that
are ultra-high resolution. The reason for this is that electric fields are extremely
sensitivity to geometry at even a few percent-of-an-Å length scales and especially to the
positions of hydrogens (which are the atoms that get closest to neighboring molecules) –
details that are inaccessible to conventional structural biology methods. Moreover,
proteins are not static and x-ray structures do not necessarily represent the most typical
conformation of a protein in solution. Computer models that account for all interactions
in a protein and average over many conformations are necessary, and such is achieved
practically by way of MD simulation.
However, MD simulations of the WT KSI•19-nortestosterone complex (modeled
with the AMBER99SB-ILDN force field (69)) initiated from the same 1OH0 crystal
structure also were unable to reproduce the extreme electric field at the C=O bond of 19-
nortestosterone. The mean electric field from a 10 ns trajectory was around –60.4
MV/cm (fig. S8, A and B displays the trajectory and histogram), very different from the
experimental value (ca. –140 MV/cm), and even smaller than the simulated electric field
in water.
Upon visualization, it was not difficult to discern why the simulated fields were so
low. We expect the C=O bond to experience large electric fields when it closely
approaches the O–H dipoles of the key active site residues, Tyr16 and Asp103.
However, during the simulation these close-contact geometries were relatively rare. 19-
nortestosterone was frequently found far away from the active site residues over the

27
trajectory, with an overall mean distance between the hydroxylic O of Tyr16 and the
carbonyl O of 19-nortestosterone (O19-NT•••OTyr16) distance of 5.5 Å (fig. S8C).
These observations suggest that the AMBER force field does not energetically
favor a tight hydrogen-bonding geometry between 19-nortestosterone and the key
catalytic residues. This supposition is verified from inspecting the van der Waals
parameters of the AMBER force field: the van der Waals radius (σij) for the O19-NT•••OTyr16
pair-wise interactions is 3.01 Å, and given εij = 0.21 kcal mol–1, the optimum distance
(with respect to this single interaction) is 3.35 Å, and at the crystallographic distance of
2.5 Å, the single van der Waals term adds a sizable energetic penalty of 5 kcal mol–1 to
the overall potential energy function (N.B.: the hydroxylic hydrogen does not participate
in van der Waals interactions in the AMBER or GAFF force fields). Ostensibly, KSI
utilizes a delicate network of interactions in order to offset the putative 4.5 kcal mol–1
penalty imposed by the close O19-NT•••OTyr16 distance, though the AMBER force field
apparently does not reproduce this correctly.
On the other hand, MD simulations confirmed the expectation that in frames
where 19-nortestosterone was in close contact with Tyr16 (O19-NT•••OTyr16 distance < 3 Å)
such as between 6 and 8 ns (fig. S8C), the electric field experienced by C=O was quite
large (between –90 and –120 MV/cm), as can be readily seen by comparing to the same
time window in fig. S8A. This observation suggests that fixed charges can
approximately reproduce the extreme electric fields given the correct geometry, although
it is quite likely accurate models of active site electric fields will require a higher-level
treatment (e.g., explicit polarization or a QM/MM treatment).
In principle, this difficulty could have been side-stepped by applying a restraint to
the O•••O distance – forcing it to remain close to the crystallographic value – or by pre-
28
selecting a reaction coordinate of interest and freezing the other degrees of freedom.
These strategies would invariably lead to larger electric fields at C=O and better
agreement between computation and experiment. We emphasize that the infrared
experiments on KSI•19-nortestosterone described in this paper were performed in the
steady-state, implying that the extreme electric fields detected correspond to a typical
KSI•19-nortestosterone configuration in thermal equilibrium, not to some rare excursion
of the field due to a fluctuation. In fact, the narrow linewidth of the C=O peak observed
in WT KSI (Fig. 3A) suggests prima facie that the enzyme makes fluctuations away from
the extreme electric field very rare. This reveals an important aspect about the nature of
KSI’s catalysis: rather than transiently sampling the catalytically conducive state
(corresponding to extreme electric fields at the C=O bond, and to short O19-NT•••OTyr16
distances of ca. 2.5 Å), KSI maintains it at equilibrium. In other words, the catalytic
power of KSI originates in its ability to bias the sampling of configurations to favor those
that are catalytically conducive (which may otherwise be only rarely sampled in solution)
(70).

29
Supplementary Figures:
Fig. S1. Analysis of 19-nortestosterone’s vibrational Stark effect. (A) Stark spectrum (dotted
black trace) at a field of 1.0 MV/cm of the C=O vibration of 19-nortestosterone (50 mM) dissolved
in 2-methyl tetrahydrofuran at 77 K (reproduced from Fig. 2B). The decomposition of the
numerical fit (thick black trace) to the derivative components (blue traces) is shown. The Stark
spectrum is dominated by the contribution of the second derivative, which implies that the
vibration’s sensitivity to electric fields is mostly linear, arising from the difference dipole. (B) Fitting
parameters for the Stark spectrum, corresponding to the contributions from the 0th (A), 1st (B),
and 2nd (C) derivative components respectively. Values and errors are the mean and std. dev.
over three repeats. The difference dipole is a derived quantity from the second derivative
component, and assumes the angle between the vibration’s difference dipole and transition dipole
is 0˚. This assumption is expected to hold for localized oscillators with 1-dimensional behavior,
and has been shown to be the case previously (6).

30
Fig. S2. Stark spectroscopy of 19-nortestosterone when hydrogen bonded. (A) Absorption
spectrum of 19-nortestosterone (100 mM) in glassy ethanol at 77 K. The main peak (at 1651 cm–
1) is red-shifted about 15 cm–1 relative to the C=O band in 2-methyl tetrahydrofuran, consistent
with a hydrogen bonding interaction. The smaller band at 1669 cm–1 is assigned to a non-
hydrogen-bonded population since it possesses a similar wavenumber as the C=O band in 2-
methtyl tetrahydrofuran (fig. S1). The two small bands at 1634 cm–1 and 1614 cm–1 are a Fermi
resonance and the C=C stretch respectively. (B) Stark spectrum at a field of 0.9 MV/cm (scaled to
1 MV/cm). (C) Fitting parameters for the Stark spectrum. Values and errors are the mean and
std. dev. over three repeats. (D) Decomposition of the numerical fit (thick black trace) to the
derivative components (blue traces). In both 2-methyl tetrahydrofuran and ethanol, the C=O
vibration’s Stark band is strongly second derivative in nature, leading to similar values for the
Stark tuning rate (C). The two Stark features corresponding to C=O (with and without a hydrogen

31
bond) are well fit to a common set of fitting parameters, supporting the assignment to C=O and
the claim that hydrogen bonding minimally affects the vibration’s Stark properties. The Fermi
resonance and C=C stretch do not produce observable Stark effects, implying that their
frequencies do not respond sensitively to electric fields (consistent with the observation in Fig. 2C
that the band’s frequency is not strongly affected by solvent variation).

32
Fig. S3. MD simulations of solvent fields and linewidth analysis. (A) The mean and standard
deviation of the distribution of electric fields experienced by the carbonyl group of 19-
nortestosterone in various organic solvents and water. The electric field is defined as the average
between the C- and O-atoms of the projections of the solvent field along the CO bond vector. As
shown in Fig. 2D, there is a strong correlation between the peak position and the mean solvent
field. (B) Plot of full-width at half-maximum of 19-nortestosterone’s C=O band against the central
frequency of the band across a series of solvents demonstrates a clear correlation (R2 = 0.91).
The trend can be qualitatively explained by noting that a solvent which exerts larger electric fields
(resulting in a more red-shifted peak frequency) will also produce a more heterogeneous

33
distribution of electric fields (resulting in a broader peak). While this qualitative relationship holds
across a series of solvents, it very clearly breaks down upon considering the C=O bands of 19-
nortestosterone bound to KSI (Fig. 3A, table S2), which were all very narrow though substantially
red-shifted. This observation supports the hypothesis that an enzyme active site supplies a
relatively rigid environment whose dynamic characteristics qualitatively differ from those of
disordered solvation environments. (C) C=O linewidth is well explained (R2 = 0.96) by the
standard deviation of the electric field distribution across the solvent series, providing evidence in
support of the notion that linewidth encodes information about a given environment’s degree of
electric field heterogeneity. For reference, the lifetime-limited linewidth of a typical C=O vibration
(ca. 1–2 ps) is between 5 and 2.5 cm–1.
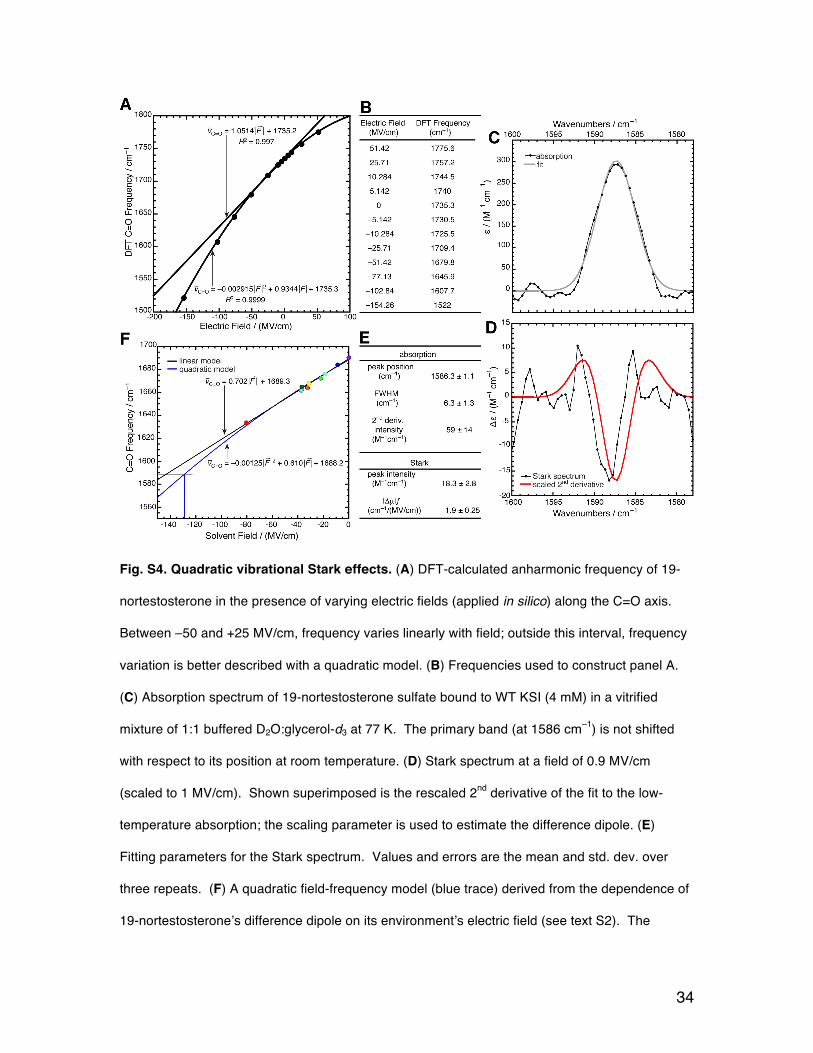
34
Fig. S4. Quadratic vibrational Stark effects. (A) DFT-calculated anharmonic frequency of 19-
nortestosterone in the presence of varying electric fields (applied in silico) along the C=O axis.
Between –50 and +25 MV/cm, frequency varies linearly with field; outside this interval, frequency
variation is better described with a quadratic model. (B) Frequencies used to construct panel A.
(C) Absorption spectrum of 19-nortestosterone sulfate bound to WT KSI (4 mM) in a vitrified
mixture of 1:1 buffered D2O:glycerol-d3 at 77 K. The primary band (at 1586 cm–1) is not shifted
with respect to its position at room temperature. (D) Stark spectrum at a field of 0.9 MV/cm
(scaled to 1 MV/cm). Shown superimposed is the rescaled 2nd derivative of the fit to the low-
temperature absorption; the scaling parameter is used to estimate the difference dipole. (E)
Fitting parameters for the Stark spectrum. Values and errors are the mean and std. dev. over
three repeats. (F) A quadratic field-frequency model (blue trace) derived from the dependence of
19-nortestosterone’s difference dipole on its environment’s electric field (see text S2). The

35
quadratic model is approximately linear between fields of 0–80 MV/cm, and so describes the
trends in solvent-induced frequency shifts identically to the linear model (Fig. 2D, black trace).
However, at large electric fields, the parabolic character is non-negligible. The lines in the
bottom-left corner illustrate that the C=O frequency of 19-nortestosterone in WT KSI (1588 cm–1)
corresponds to a field of –144 MV/cm in the original linear model, but to a slightly smaller field of
–129 MV/cm in the quadratic model (see fig. S7A).

36
Fig. S5. FT-IR spectra of [18O]19-nortestosterone sulfate bound to KSI and mutants. (A)
Raw absorption spectrum of WT KSI•19-nortestosterone at 77 K, illustrating the amide
background and its absorptivity relative to the C=O vibrational probe. KSI possesses a fairly
standard IR absorption spectrum for a protein (top right), with a large amide I band peaked at
1640 cm–1. The band near 1550 cm–1 is a superposition of vibrations arising from side-chains,
but is likely mostly due to the anti-symmetric carboxylate stretches of Asp’s and Glu’s. (B)
Difference IR spectra acquired by subtracting the spectrum of KSI•19-nortestosterone sulfate
from the spectrum of KSI•[18O]19-nortestosterone sulfate for WT KSI and the four mutants
studied. Positive bands correspond to the C=18O stretch and negative bands correspond to the
37
C=16O stretch – frequencies, linewidths, and errors are compiled in table S2. Spectra for Y16S
and D103N displaced for clarity. The differences in the linewidth and intensity between C=16O
and C=18O bands are likely due to baseline error resulting from the fact that the amide
background from KSI is higher in different parts of the spectral region. The differences in isotope
shifts among mutants are likely due to a Fermi resonance in the region.

38
Fig. S6. FT-IR spectra of [18O]19-nortestosterone sulfate. 19-nortestosterone sulfate,
dissolved in either dimethyl sulfoxide (DMSO, black) or water (red) in both its natural abundance
(solid) and 18O enriched isotopomer (dotted). The isotope shift in DMSO is 24 cm–1, but only 15
cm–1 in water. Isotopic substitution causes the C=O band to narrow significantly in water, but
broaden slightly in DMSO. These phenomena are possibly due to Fermi resonances (appear in
spectra as side bands), which can shift and change the intensity of the C=O band in an isotope-
dependent manner. This observation helps explain the isotope studies in KSI (fig. S5) in which
isotopic substitution has a non-uniform effect on the C=18O minus C=16O frequency difference in
different mutant backgrounds.

39
Fig. S7. Effect of quadratic Stark effect on electrostatic catalysis model. (A) The free
energy barriers for the conversion of 5-androstene to 4-androstene by WT KSI and mutants, and
those enzymes’ active site electric fields. The active site electric fields are determined from the
vibrational frequencies (table S2) using either a linear field-frequency model (Fig. 2D) or a
quadratic field-frequency model (fig. S4F). The conversion factor between MV/cm and kcal mol–1
D–1 is 0.04798. (B) The use of a quadratic model to derive active site electric fields does not
appreciably alter the catalytic model from Fig. 3, B and C. Replotting the catalytic data with the
updated electric field values admits a regression line (in blue) with a slightly larger slope and
intercept (ΔG‡ =1.27!Fenz +19.5 ) and an identical correlation coefficient (R2 = 0.98). The
original rate-field trend line is shown in black for comparison. Although the quadratic model
assigns WT KSI a lower electric field, it predicts a larger overall electrostatic contribution to
catalysis because of the larger value of Δ!µrxn . (C) Structural and electrostatic changes that
accompany formation of the transition state (Asp40 is shown above the substrate for clarity),
based on ab initio calculations in the gas phase. The DFT-calculated value for Δ!µrxn is 0.5 D
(table S3).

40
Fig. S8. MD simulations of 19-nortestosterone bound to KSI. (A) The electric field
experienced by the C=O vibration of 19-NT during a 10-ns trajectory in wild-type KSI. (B)
The associated electric field histogram has an asymmetric distribution with a noticeable
tail at high electric fields. (C) Trajectory of the distance between the carbonyl O of 19-
NT and the hydroxylic O of Tyr16 (dOO) in WT KSI•19-NT. The simulation samples a

41
wide distribution of distances with various residency times, but between t = 6 ns and t =
8 ns, the 19-NT molecule returns to a geometry resembling the crystal structure with a
short dOO. (D) Correlation plot showing the relationship between the electric field
experienced by the carbonyl of 19-NT in WT KSI and dOO. The plot shows that
snapshots associated with large electric fields (< –90 MV/cm) most frequently occur
when dOO < 4 Å.

42
Supplementary Tables:
Table S1. Spectral data for vibrational solvatochromism of 19-nortestosterone. All samples
were at 10 mM concentration, and spectra were obtained at room temperature. Frequencies in
this table correspond to the C=O stretching mode, which has some contribution from the
conjugated C=C. In most of these solvents, the C=C mode (which has some C=O contribution) is
observed between 1615–1620 cm–1. In contrast with the C=O mode, the C=C mode’s frequency
does not vary strongly or consistently with solvent polarity (Fig. 2C). Center frequencies and full-
width at half maxima (FWHM) were determined using two methods. For analysis, the data
obtained with peak picking were used; however, their similarity to the values obtained with curve
fitting attests to the robustness of the spectral data.
*The static dielectric constant at 25 ˚C. According to continuum dielectric theory, the dielectric
constant is related to the solvent’s reaction field (i.e., solvent field); concomitantly, a strong
correlation between increasing dielectric constant and decreasing frequency is observed. †These
two entries correspond to data for 19-nortestosterone sulfate. 19-nortestosterone sulfate is

43
soluble in water (19-nortestosterone is not), allowing the addition of an important solvent to the
study. Dimethylsulfoxide is the only solvent in which both steroids are soluble, permitting one to
observe that the two molecules possess similar C=O stretching frequency when in similar
environments.

44
Table S2. Spectral data for 19-nortestosterone sulfate bound to WT KSI and mutants.
Samples were prepared by combining 19-nortestoserone sulfate (or its isotopologue) with KSI (or
mutant) to form a complex, with final concentrations around 3 mM and 4 mM, respectively.
*The [18O]19-nortestosterone sulfate band was observed by referencing against an identical
sample except replacing [18O]19-nortestosterone sulfate with its natural abundance isotopologue.
For natural abundance 19-nortestosterone sulfate, the peak was observed either through ligand
editing (using equilenin as the ligand in the reference) or through isotope editing (using the
negative band from the experiments with [18O]19-nortestosterone sulfate). †For each mutant and
isotopologue, the C=O band was observed and recorded n times. The values and errors given
for peak positions and full-widths at half maximum (FWHM) are the means and standard
deviations from the distribution of independent measurements. ‡kcat from Michaelis-Menten
kinetics of each mutant with the steroid 5-androstene-3,17-dione as substrate. Values taken from
literature (16, 18, 19). § The larger than expected isotope shift may be explained by considering
Fermi resonance effects, see fig. S6.

45
Table S3. Ab initio electrostatic properties of reaction states. Charges and bond dipoles of
the C=O bond in the substrate (reactant) state and in the transition state corresponding to the first
chemical step of KSI’s mechanism (Fig. 1B), according to two population analysis methods. All
calculations carried out by density functional theory at the B3LYP/6–311++G** level in the gas
phase. Illustrations of the optimized structures corresponding to the reaction state and transition
state are shown in fig. S7C.
References 1. R. M. Pollack, Enzymatic mechanisms for catalysis of enolization: Ketosteroid isomerase.
Bioorg. Chem. 32, 341–353 (2004). Medline doi:10.1016/j.bioorg.2004.06.005
2. D. C. Hawkinson, T. C. Eames, R. M. Pollack, Energetics of 3-oxo-Δ5-steroid isomerase: Source of the catalytic power of the enzyme. Biochemistry 30, 10849–10858 (1991). Medline doi:10.1021/bi00109a007
3. D. A. Kraut, P. A. Sigala, B. Pybus, C. W. Liu, D. Ringe, G. A. Petsko, D. Herschlag, Testing electrostatic complementarity in enzyme catalysis: Hydrogen bonding in the ketosteroid isomerase oxyanion hole. PLOS Biol. 4, e99 (2006). Medline doi:10.1371/journal.pbio.0040099
4. S. C. L. Kamerlin, P. K. Sharma, Z. T. Chu, A. Warshel, Ketosteroid isomerase provides further support for the idea that enzymes work by electrostatic preorganization. Proc. Natl. Acad. Sci. U.S.A. 107, 4075–4080 (2010). Medline doi:10.1073/pnas.0914579107
5. D. Herschlag, A. Natarajan, Fundamental challenges in mechanistic enzymology: Progress toward understanding the rate enhancements of enzymes. Biochemistry 52, 2050–2067 (2013). Medline doi:10.1021/bi4000113
6. S. G. Boxer, Stark realities. J. Phys. Chem. B 113, 2972–2983 (2009). Medline doi:10.1021/jp8067393
7. S. S. Andrews, S. G. Boxer, Vibrational Stark effects of nitriles I. Methods and experimental results. J. Phys. Chem. A 104, 11853–11863 (2000). doi:10.1021/jp002242r
8. A. J. Stafford, D. M. Walker, L. J. Webb, Electrostatic effects of mutations of Ras glutamine 61 measured using vibrational spectroscopy of a thiocyanate probe. Biochemistry 51, 2757–2767 (2012). Medline doi:10.1021/bi201225p
9. A. T. Fafarman, P. A. Sigala, D. Herschlag, S. G. Boxer, Decomposition of vibrational shifts of nitriles into electrostatic and hydrogen-bonding effects. J. Am. Chem. Soc. 132, 12811–12813 (2010). Medline doi:10.1021/ja104573b
10. C. T. Liu, J. P. Layfield, R. J. Stewart 3rd, J. B. French, P. Hanoian, J. B. Asbury, S. Hammes-Schiffer, S. J. Benkovic, Probing the electrostatics of active site microenvironments along the catalytic cycle for Escherichia coli dihydrofolate reductase. J. Am. Chem. Soc. 136, 10349–10360 (2014). Medline doi:10.1021/ja5038947
11. A. Kuliopulos, A. S. Mildvan, D. Shortle, P. Talalay, Kinetic and ultraviolet spectroscopic studies of active-site mutants of delta 5-3-ketosteroid isomerase. Biochemistry 28, 149–159 (1989). Medline doi:10.1021/bi00427a022
12. M. A. Massiah, C. Abeygunawardana, A. G. Gittis, A. S. Mildvan, Solution structure of Δ5-3-ketosteroid isomerase complexed with the steroid 19-nortestosterone hemisuccinate. Biochemistry 37, 14701–14712 (1998). Medline doi:10.1021/bi981447b
13. S. D. Fried, L.-P. Wang, S. G. Boxer, P. Ren, V. S. Pande, Calculations of the electric fields in liquid solutions. J. Phys. Chem. B 117, 16236–16248 (2013). Medline doi:10.1021/jp410720y
46
http://www.ncbi.nlm.nih.gov/entrez/query.fcgi?cmd=Retrieve&db=PubMed&list_uids=1932007&dopt=Abstract
http://www.ncbi.nlm.nih.gov/entrez/query.fcgi?cmd=Retrieve&db=PubMed&list_uids=1932007&dopt=Abstract
http://www.ncbi.nlm.nih.gov/entrez/query.fcgi?cmd=Retrieve&db=PubMed&list_uids=2706241&dopt=Abstract

14. S. D. Fried, S. Bagchi, S. G. Boxer, Measuring electrostatic fields in both hydrogen-bonding and non-hydrogen-bonding environments using carbonyl vibrational probes. J. Am. Chem. Soc. 135, 11181–11192 (2013). Medline doi:10.1021/ja403917z
15. W. Childs, S. G. Boxer, Solvation response along the reaction coordinate in the active site of ketosteroid isomerase. J. Am. Chem. Soc. 132, 6474–6480 (2010). Medline doi:10.1021/ja1007849
16. S. W. Kim, K. Y. Choi, Identification of active site residues by site-directed mutagenesis of Δ5-3-ketosteroid isomerase from Pseudomonas putida biotype B. J. Bacteriol. 177, 2602–2605 (1995). Medline
17. G. H. Nam, D. S. Jang, S. S. Cha, T. H. Lee, D. H. Kim, B. H. Hong, Y. S. Yun, B. H. Oh, K. Y. Choi, Maintenance of α-helical structures by phenyl rings in the active-site tyrosine triad contributes to catalysis and stability of ketosteroid isomerase from Pseudomonas putida biotype B. Biochemistry 40, 13529–13537 (2001). Medline doi:10.1021/bi015547k
18. D. A. Kraut, P. A. Sigala, T. D. Fenn, D. Herschlag, Dissecting the paradoxical effects of hydrogen bond mutations in the ketosteroid isomerase oxyanion hole. Proc. Natl. Acad. Sci. U.S.A. 107, 1960–1965 (2010). Medline doi:10.1073/pnas.0911168107
19. G. Choi, N. C. Ha, M. S. Kim, B. H. Hong, B. H. Oh, K. Y. Choi, Pseudoreversion of the catalytic activity of Y14F by the additional substitution(s) of tyrosine with phenylalanine in the hydrogen bond network of Δ5-3-ketosteroid isomerase from Pseudomonas putida biotype B. Biochemistry 40, 6828–6835 (2001). Medline doi:10.1021/bi002767+
20. A. Warshel, Energetics of enzyme catalysis. Proc. Natl. Acad. Sci. U.S.A. 75, 5250–5254 (1978). Medline doi:10.1073/pnas.75.11.5250
21. A. Warshel, P. K. Sharma, M. Kato, Y. Xiang, H. Liu, M. H. Olsson, Electrostatic basis for enzyme catalysis. Chem. Rev. 106, 3210–3235 (2006). Medline doi:10.1021/cr0503106
22. A. Radzicka, R. Wolfenden, A proficient enzyme. Science 267, 90–93 (1995). Medline doi:10.1126/science.7809611
23. W. J. Houck, R. M. Pollack, Temperature effects on the catalytic activity of the D38E mutant of 3-oxo-Δ5-steroid isomerase: Favorable enthalpies and entropies of activation relative to the nonenzymatic reaction catalyzed by acetate ion. J. Am. Chem. Soc. 126, 16416–16425 (2004). Medline doi:10.1021/ja046819k
24. M. I. Page, W. P. Jencks, Entropic contributions to rate accelerations in enzymic and intramolecular reactions and the chelate effect. Proc. Natl. Acad. Sci. U.S.A. 68, 1678–1683 (1971). Medline doi:10.1073/pnas.68.8.1678
25. J. R. Knowles, Enzyme catalysis: Not different, just better. Nature 350, 121–124 (1991). Medline doi:10.1038/350121a0
26. J. C. Austin, T. G. Spiro, A. Kuliopulos, A. S. Mildvan, Substrate polarization by residues in Δ5-3-ketosteroid isomerase probed by site-directed mutagenesis and UV resonance Raman spectroscopy. Protein Sci. 1, 259–270 (1992). Medline doi:10.1002/pro.5560010208
47
http://www.ncbi.nlm.nih.gov/entrez/query.fcgi?cmd=Retrieve&db=PubMed&list_uids=7730300&dopt=Abstract
http://www.ncbi.nlm.nih.gov/entrez/query.fcgi?cmd=Retrieve&db=PubMed&list_uids=7809611&dopt=Abstract
http://www.ncbi.nlm.nih.gov/entrez/query.fcgi?cmd=Retrieve&db=PubMed&list_uids=5288752&dopt=Abstract
http://www.ncbi.nlm.nih.gov/entrez/query.fcgi?cmd=Retrieve&db=PubMed&list_uids=2005961&dopt=Abstract
http://www.ncbi.nlm.nih.gov/entrez/query.fcgi?cmd=Retrieve&db=PubMed&list_uids=2005961&dopt=Abstract

27. P. R. Carey, P. J. Tonge, Unlocking the secrets of enzyme power using Raman spectroscopy. Acc. Chem. Res. 28, 8–13 (1995). doi:10.1021/ar00049a002
28. J. G. Belasco, J. R. Knowles, Direct observation of substrate distortion by triosephosphate isomerase using Fourier transform infrared spectroscopy. Biochemistry 19, 472–477 (1980). Medline doi:10.1021/bi00544a012
29. G. Choi, N. C. Ha, S. W. Kim, D. H. Kim, S. Park, B. H. Oh, K. Y. Choi, Asp-99 donates a hydrogen bond not to Tyr-14 but to the steroid directly in the catalytic mechanism of Δ 5-3-ketosteroid isomerase from Pseudomonas putida biotype B. Biochemistry 39, 903–909 (2000). Medline doi:10.1021/bi991579k
30. J. Wang, R. M. Wolf, J. W. Caldwell, P. A. Kollman, D. A. Case, Development and testing of a general amber force field. J. Comput. Chem. 25, 1157–1174 (2004). Medline doi:10.1002/jcc.20035
31. A. Jakalian, D. B. Jack, C. I. Bayly, Fast, efficient generation of high-quality atomic charges. AM1-BCC model: II. Parameterization and validation. J. Comput. Chem. 23, 1623–1641 (2002). Medline doi:10.1002/jcc.10128
32. B. Hess, C. Kutzner, D. van der Spoel, E. Lindahl, GROMACS 4: Algorithms for highly efficient, load-balanced, and scalable molecular simulation. J. Chem. Theory Comput. 4, 435–447 (2008). doi:10.1021/ct700301q
33. C. Caleman, P. J. van Maaren, M. Hong, J. S. Hub, L. T. Costa, D. van der Spoel, Force field benchmark of organic liquids: Density, enthalpy of vaporization, heat capacities, surface tension, isothermal compressibility, volumetric expansion coefficient, and dielectric constant. J. Chem. Theory Comput. 8, 61–74 (2012). Medline doi:10.1021/ct200731v
34. W. L. Jorgensen, J. Chandrasekhar, J. D. Madura, R. W. Impey, M. L. Klein, Comparison of simple potential functions for simulating liquid water. J. Chem. Phys. 79, 926 (1983). doi:10.1063/1.445869
35. T. Darden, D. York, L. Pedersen, Particle mesh Ewald: An N⋅log(N) method for Ewald sums in large systems. J. Chem. Phys. 98, 10089 (1993). doi:10.1063/1.464397
36. B. Hess, P-LINCS: A parallel linear constraint solver for molecular simulation. J. Chem. Theory Comput. 4, 116–122 (2008). doi:10.1021/ct700200b
37. G. Bussi, D. Donadio, M. Parrinello, Canonical sampling through velocity rescaling. J. Chem. Phys. 126, 014101 (2007). Medline doi:10.1063/1.2408420
38. H. J. C. Berendsen, J. P. M. Postma, W. F. Van Gunsteren, A. DiNola, J. R. Haak, Molecular dynamics with coupling to an external bath. J. Chem. Phys. 81, 3684 (1984). doi:10.1063/1.448118
39. W. F. Van Gunsteren, H. J. C. Berendsen, A leap-frog algorithm for stochastic dynamics. Mol. Simul. 1, 173–185 (1988). doi:10.1080/08927028808080941
40. M. Parrinello, A. Rahman, Crystal structure and pair potentials: A molecular-dynamics study. Phys. Rev. Lett. 45, 1196–1199 (1980). doi:10.1103/PhysRevLett.45.1196
41. Gaussian 09, Revision D.01, M. J. Frisch, G. W. Trucks, H. B. Schlegel, G. E. Scuseria, M. A. Robb, J. R. Cheeseman, G. Scalmani, V. Barone, B. Mennucci, G. A. Petersson, H.
48

Nakatsuji, M. Caricato, X. Li, H. P. Hratchian, A. F. Izmaylov, J. Bloino, G. Zheng, J. L. Sonnenberg, M. Hada, M. Ehara, K. Toyota, R. Fukuda, J. Hasegawa, M. Ishida, T. Nakajima, Y. Honda, O. Kitao, H. Nakai, T. Vreven, J. A. Montgomery, Jr., J. E. Peralta, F. Ogliaro, M. Bearpark, J. J. Heyd, E. Brothers, K. N. Kudin, V. N. Staroverov, R. Kobayashi, J. Normand, K. Raghavachari, A. Rendell, J. C. Burant, S. S. Iyengar, J. Tomasi, M. Cossi, N. Rega, J. M. Millam, M. Klene, J. E. Knox, J. B. Cross, V. Bakken, C. Adamo, J. Jaramillo, R. Gomperts, R. E. Stratmann, O. Yazyev, A. J. Austin, R. Cammi, C. Pomelli, J. W. Ochterski, R. L. Martin, K. Morokuma, V. G. Zakrzewski, G. A. Voth, P. Salvador, J. J. Dannenberg, S. Dapprich, A. D. Daniels, Ö. Farkas, J. B. Foresman, J. V. Ortiz, J. Cioslowski, D. J. Fox (Gaussian, Inc., Wallingford CT, 2009).
42. P. J. Stephens, F. J. Devlin, C. F. Chabalowski, M. J. Frisch, Ab initio calculation of vibrational absorption and circular dichroism spectra using density functional force fields. J. Phys. Chem. 98, 11623–11627 (1994). doi:10.1021/j100096a001
43. C. M. Breneman, K. B. Wiberg, Determining atom-centered monopoles from molecular electrostatic potentials. The need for high sampling density in formamide conformational analysis. J. Comput. Chem. 11, 361–373 (1990). doi:10.1002/jcc.540110311
44. B. H. Besler, K. M. Merz Jr., P. A. Kollman, Atomic charges derived from semiempirical methods. J. Comput. Chem. 11, 431–439 (1990). doi:10.1002/jcc.540110404
45. C. Adamo, M. Cossi, N. Rega, V. Barone, in Theoretical Biochemistry: Processes and Properties of Biological Systems, Theoretical and Computational Chemistry, Vol. 9 (Elsevier, New York, 1990).
46. S. H. Brewer, S. Franzen, A quantitative theory and computational approach for the vibrational Stark effect. J. Chem. Phys. 119, 851 (2003). doi:10.1063/1.1578471
47. G. U. Bublitz, S. G. Boxer, Stark spectroscopy: Applications in chemistry, biology, and materials science. Annu. Rev. Phys. Chem. 48, 213–242 (1997). Medline doi:10.1146/annurev.physchem.48.1.213
48. B. E. Kohler, J. C. Woehl, Measuring internal electric fields with atomic resolution. J. Chem. Phys. 102, 7773 (1995). doi:10.1063/1.469030
49. E. Vauthey, J. Voss, C. De Caro, A. Renn, U. P. Wild, Spectral hole-burning and stark effect: Frequency dependence of the induced dipole moment of a squaraine dye in polymers. Chem. Phys. 184, 347–356 (1994). doi:10.1016/0301-0104(94)00078-6
50. C. J. F. Böttcher, Theory of Electric Polarization, 2nd ed. (Elsevier, Amsterdam, 1973).
51. S. Bagchi, S. D. Fried, S. G. Boxer, A solvatochromic model calibrates nitriles’ vibrational frequencies to electrostatic fields. J. Am. Chem. Soc. 134, 10373–10376 (2012). Medline doi:10.1021/ja303895k
52. M. Saggu, N. M. Levinson, S. G. Boxer, Direct measurements of electric fields in weak OH···π hydrogen bonds. J. Am. Chem. Soc. 133, 17414–17419 (2011). Medline doi:10.1021/ja2069592
53. I. T. Suydam, C. D. Snow, V. S. Pande, S. G. Boxer, Electric fields at the active site of an enzyme: Direct comparison of experiment with theory. Science 313, 200–204 (2006). Medline doi:10.1126/science.1127159
49

54. N. M. Levinson, S. D. Fried, S. G. Boxer, Solvent-induced infrared frequency shifts in aromatic nitriles are quantitatively described by the vibrational Stark effect. J. Phys. Chem. B 116, 10470–10476 (2012). Medline doi:10.1021/jp301054e
55. J. E. Gready, G. B. Backsay, N. S. Hush, Finite-field method calculations. IV. Higher-order moments, dipole moment gradients, polarisability gradients and field-induced shifts in molecular properties: Application to N2, CO, CN−, HCN and HNC. Chem. Phys. 31, 467–483 (1978). doi:10.1016/0301-0104(78)85136-2
56. C. W. Bauschlicher Jr., The effect of an external electric field on the vibrational frequency of CO. Chem. Phys. Lett. 118, 307–310 (1985). doi:10.1016/0009-2614(85)85321-5
57. G. U. Bublitz, S. G. Boxer, Effective polarity of frozen solvent glasses in the vicinity of dipolar solutes. J. Am. Chem. Soc. 120, 3988–3992 (1998). doi:10.1021/ja971665c
58. S. D. Fried, S. G. Boxer, Thermodynamic framework for identifying free energy inventories of enzyme catalytic cycles. Proc. Natl. Acad. Sci. U.S.A. 110, 12271–12276 (2013). Medline doi:10.1073/pnas.1310964110
59. B. Zeng, R. M. Pollack, Microscopic rate constants for the acetate ion catalyzed isomerization of 5-androstene-3,17-dione to 4-androstene-3,17-dione: A model for steroid isomerase. J. Am. Chem. Soc. 113, 3838–3842 (1991). doi:10.1021/ja00010a028
60. W. P. Jencks, Catalysis in Chemistry and Enzymology (Dover, New York, 1987).
61. D.-H. Kim, G. H. Nam, D. S. Jang, G. Choi, S. Joo, J. S. Kim, B. H. Oh, K. Y. Choi, Roles of active site aromatic residues in catalysis by ketosteroid isomerase from Pseudomonas putida biotype B. Biochemistry 38, 13810–13819 (1999). Medline doi:10.1021/bi991040m
62. A. Warshel, P. K. Sharma, Z. T. Chu, J. Åqvist, Electrostatic contributions to binding of transition state analogues can be very different from the corresponding contributions to catalysis: Phenolates binding to the oxyanion hole of ketosteroid isomerase. Biochemistry 46, 1466–1476 (2007). Medline doi:10.1021/bi061752u
63. L. A. Xue, P. Talalay, A. S. Mildvan, Studies of the mechanism of the Δ5-3-ketosteroid isomerase reaction by substrate, solvent, and combined kinetic deuterium isotope effects on wild-type and mutant enzymes. Biochemistry 29, 7491–7500 (1990). Medline doi:10.1021/bi00484a019
64. A. Kuliopulos, P. Talalay, A. S. Mildvan, Combined effects of two mutations of catalytic residues on the ketosteroid isomerase reaction. Biochemistry 29, 10271–10280 (1990). Medline doi:10.1021/bi00496a017
65. P. A. Sigala, J. M. M. Caaveiro, D. Ringe, G. A. Petsko, D. Herschlag, Hydrogen bond coupling in the ketosteroid isomerase active site. Biochemistry 48, 6932–6939 (2009). Medline doi:10.1021/bi900713j
66. D. S. Jang, H. J. Cha, S. S. Cha, B. H. Hong, N. C. Ha, J. Y. Lee, B. H. Oh, H. S. Lee, K. Y. Choi, Structural double-mutant cycle analysis of a hydrogen bond network in ketosteroid isomerase from Pseudomonas putida biotype B. Biochem. J. 382, 967–973 (2004). Medline doi:10.1042/BJ20031871
50
http://www.ncbi.nlm.nih.gov/entrez/query.fcgi?cmd=Retrieve&db=PubMed&list_uids=2223781&dopt=Abstract
http://www.ncbi.nlm.nih.gov/entrez/query.fcgi?cmd=Retrieve&db=PubMed&list_uids=2271654&dopt=Abstract

67. L. A. Xue, A. Kuliopulos, A. S. Mildvan, P. Talalay, Catalytic mechanism of an active-site mutant (D38N) of Δ5-3-ketosteroid isomerase. Direct spectroscopic evidence for dienol intermediates. Biochemistry 30, 4991–4997 (1991). Medline doi:10.1021/bi00234a022
68. S. W. Kim, S. S. Cha, H. S. Cho, J. S. Kim, N. C. Ha, M. J. Cho, S. Joo, K. K. Kim, K. Y. Choi, B. H. Oh, High-resolution crystal structures of Δ5-3-ketosteroid isomerase with and without a reaction intermediate analogue. Biochemistry 36, 14030–14036 (1997). Medline doi:10.1021/bi971546+
69. K. Lindorff-Larsen, S. Piana, K. Palmo, P. Maragakis, J. L. Klepeis, R. O. Dror, D. E. Shaw, Improved side-chain torsion potentials for the Amber ff99SB protein force field. Proteins 78, 1950–1958 (2010). Medline
70. T. C. Bruice, S. J. Benkovic, Chemical basis for enzyme catalysis. Biochemistry 39, 6267–6274 (2000). Medline doi:10.1021/bi0003689
51
http://www.ncbi.nlm.nih.gov/entrez/query.fcgi?cmd=Retrieve&db=PubMed&list_uids=2036366&dopt=Abstract
http://www.ncbi.nlm.nih.gov/entrez/query.fcgi?cmd=Retrieve&db=PubMed&list_uids=9369474&dopt=Abstract